UNITED STATES
SECURITIES AND EXCHANGE COMMISSION
WASHINGTON, D.C. 20549
FORM N-CSR
CERTIFIED SHAREHOLDER REPORT OF REGISTERED MANAGEMENT
INVESTMENT COMPANIES
Investment Company Act file number 811-1810
Oppenheimer Global Fund
(Exact name of registrant as specified in charter)
6803 South Tucson Way, Centennial, Colorado 80112-3924
(Address of principal executive offices) (Zip code)
Cynthia Lo Bessette
OFI Global Asset Management, Inc.
225 Liberty Street, New York, New York 10281-1008
(Name and address of agent for service)
Registrant’s telephone number, including area code: (303) 768-3200
Date of fiscal year end: September 30
Date of reporting period: 3/31/2018
Item 1. Reports to Stockholders.
| | | | | | |
| Semi-Annual Report | | 3/31/2018 | | | | |
Table of Contents
Class A Shares
AVERAGE ANNUAL TOTAL RETURNS AT 3/31/2018
| | | | | | | | | | | | |
| | | Class A Shares of the Fund | | |
| | | Without Sales Charge | | With Sales Charge | | MSCI All Country (AC) World Index |
6-Month | | | 6.98 | % | | | 0.83 | % | | | 4.71 | % |
1-Year | | | 23.23 | | | | 16.14 | | | | 14.85 | |
5-Year | | | 11.33 | | | | 10.02 | | | | 9.20 | |
10-Year | | | 7.90 | | | | 7.26 | | | | 5.57 | |
Performance data quoted represents past performance, which does not guarantee future results. The investment return and principal value of an investment in the Fund will fluctuate so that an investor’s shares, when redeemed, may be worth more or less than their original cost. Fund returns include changes in share price, reinvested distributions, and a 5.75% maximum applicable sales charge except where “without sales charge” is indicated. Current performance may be lower or higher than the performance quoted. Returns do not consider capital gains or income taxes on an individual’s investment. Returns for periods of less than one year are cumulative and not annualized. For performance data current to the most recent month-end, visit oppenheimerfunds.com or call 1.800.CALL OPP (225.5677). See Fund prospectuses and summary prospectuses for more information on share classes and sales charges.
2 OPPENHEIMER GLOBAL FUND
Fund Performance Discussion
For the six-month reporting period ended March 31, 2018, the Fund’s Class A shares (without sales charge) returned 6.98% versus the MSCI All Country World Index, its benchmark, which returned 4.71%. The Fund outperformed the Index in nine out of eleven sectors of the Index, led by our securities selections in the Industrials, Health Care and Real Estate sectors. Our overweight position in Information Technology was another top performer. In the Telecommunications, Utilities, Energy, and Consumer Staples sectors, our underweight positions were the major drivers of relative returns. We had no exposure to Utilities during the period. The only two detractors from performance versus the Index were the Consumer Discretionary and Financials sectors, due to stock selection.
MARKET OVERVIEW
After closing a strong 2017, markets went somewhat parabolic in January, making a correction of some sort likely, and we got one over the remainder of Q1. Given the unrealistically low level of volatility we had in 2017, it appears to us that markets are returning more to a state of normalcy than anything else. Valuations, though not necessarily high given the interest rate backdrop, are high relative to history and that makes them more vulnerable to a dose of bad news, and we got a bit of it in Q1 regarding trade. Most of the Trump administration’s economic agenda is pretty sound, good for both GDP growth and markets. However, trade wars are not good for markets and are certainly not good for the U.S. or world economy. Clearly, not everybody plays fair, including the U.S. in some circumstances. However, if the U.S. is to remain the world’s reserve currency, and have the privileges that come with that status, then we have to run a persistent and relatively large trade deficit to provide the dollars that the rest of the world
needs to conduct everyday commerce. No getting around it.
TOP INDIVIDUAL CONTRIBUTORS
Top performing stocks for the Fund this reporting period included Adobe Systems Incorporated, SAGE Therapeutics and Airbus SE.
Adobe Systems Incorporated is reaping the benefits of having made the transition to a cloud-based subscription model. This has customer benefits like easy updates, and a much lower upfront cost. Adobe benefits too. More of the customer’s dollars can go to software in the cloud as there is lower need for on-premise support and hardware. Also, piracy is lower. We continue to like Adobe.
SAGE Therapeutics is a biopharmaceutical company with a promising late stage pipeline addressing central nervous system disorders. During the fourth quarter of 2017 the company announced strong results from
3 OPPENHEIMER GLOBAL FUND
clinical trials related to postpartum depression and major depressive disorder. A commercial, on label treatment for postpartum depression would be the first of its kind.
Airbus SE is position we have held for many years now. The appeal is now pretty obvious. They have one competitor in a market that we believe is set to grow substantially over the next few decades. Broadening affluence, particularly in Asia, is driving this mega trend. If a customer places an order today they might not take delivery for 8 to 10 years. The backlog is substantial.
TOP INDIVIDUAL DETRACTORS
Detractors from performance this reporting period included ACADIA Pharmaceuticals, Industria de Diseno Textil, and Bayer.
ACADIA Pharmaceuticals’ share price had a lackluster reporting period. However, the company has some interesting upcoming pipeline opportunities, most notably with a Phase III clinical trial underway for a treatment related to Alzheimer’s psychosis. Alzheimer’s psychosis is a much larger addressable market than the market for Nuplazid, which is ACADIA’s commercial treatment for Parkinson’s psychosis.
Industria de Diseno Textil, better known as Inditex, is the most successful apparel company in the world, specializing in affordable, on-trend fashion, under the brand name Zara, among others. Though the retail business has been challenging, this company
has been doing well. The issue that has been difficult for Inditex has largely been strength in the euro. Currency, in our experience, giveth and taketh away, and is unlikely to be a persistent long run headwind. The operations of the company remain robust, and its competitive advantage compelling.
Bayer is in the final stretch of the regulatory approvals needed to acquire Monsanto. The combined company will be a dominant player in seed technology and crop protection, both of which are critical to improving farm yields.
OUTLOOK AND POSITIONING
Our thematic, long-term, investment style leads us toward quality businesses with sustainability of both enterprise and advantage. This, we believe, is an important buffer to rising chatter of protectionist trade policies. Our holdings are selected for the sustainability of their purpose and the sensibility of their price. If we have this combination well calibrated, and we believe we do, then our portfolio should be able to weather trade controversies relatively well.
Trade has always been a key contributor to the advancement of prosperity. At its core, trade is about specialization and scale advantages. That makes for higher levels of productivity and rising productivity is what creates higher living standards. The ability to produce more with the same or lower costs makes us collectively more prosperous. Turning back trade would, we fear, run the
4 OPPENHEIMER GLOBAL FUND
risk of making the world less efficient and less prosperous.
FUND UPDATE
Rajeev Bhaman, CFA, Director of Global Equities and Portfolio Manager of the Fund, has announced that he will be retiring on March 31, 2019. John Delano, CFA, will remain in his current role as Co-Portfolio Manager. After March 31, 2019, John will become the sole Portfolio Manager of the Fund and Sanjiv Talwar, M.D., PhD and Hugh Coffee will continue to serve as senior analysts. The long-term investment philosophy and process for the Fund has been consistent since 1969, and will remain so well into the future.
Rajeev has managed the Fund since 2004 and due to the Fund’s outstanding long-term, risk-adjusted performance, Rajeev has been nominated for Morningstar’s International Manager of the Year award twice in the last three years.
Rajeev has played a crucial role in helping build one of the longest-tenured global equity investment teams in the industry. OppenheimerFunds has expanded its international equity offerings to include a wide range of products that aim to meet an increasingly diverse set of investor needs. Rajeev has been instrumental in hiring and mentoring talent across OppenheimerFunds’ Global Equity team, including Justin Leverenz, Portfolio Manager of Oppenheimer Developing Markets Fund; Rezo Kanovich,
Portfolio Manager of Oppenheimer International Small-Mid Company Fund; and John Delano, Co-Portfolio Manager of Oppenheimer Global Fund.
John Delano has been Co-Portfolio Manager of the Fund since March 31, 2017 and was also nominated for Morningstar’s International Manager of the Year award in 2017. John has over 20 years industry experience and has been a critical member of the Global Team for over seven years, both as Co-Portfolio Manager and senior analyst, contributing to the long-term success of the strategy. Throughout his tenure on the Fund, John has continued to assume new leadership responsibilities of this Fund. John is the latest in a long line of Global Equity Team analysts who have successfully transitioned from analysts to portfolio managers. Currently, eight of the nine Global Equity Team portfolio managers started as analysts at the firm. As a testament to the Team’s commitment to continuity of investment leadership, John is only the fourth listed portfolio manager spanning the 50 year history of the Fund.
Since launching Oppenheimer Global Fund in 1969, the Oppenheimer Global Equity Team has continued to be an industry leader. The team has focused on finding quality companies with strong management, sustainable competitive advantages and enduring growth prospects. The team continues to serve long-term investors by finding fresh ideas, conducting deep due diligence and establishing positions that have great promise for the future. The flexible
5 OPPENHEIMER GLOBAL FUND
team structure of the Global Fund facilitates efficient information flow and decision making. The team is supported by the
| | |
 | | 
Rajeev Bhaman, CFA Portfolio Manager |
broader group of more than 20 investment professionals in the Global Equity franchise.
| | |
 | | 
John C. Delano, CFA Co-Portfolio Manager |
6 OPPENHEIMER GLOBAL FUND
Top Holdings and Allocations
TOP TEN COMMON STOCK HOLDINGS
| | |
| Alphabet, Inc., Cl. A | | 5.7% |
| Airbus SE | | 3.3 |
| LVMH Moet Hennessy Louis Vuitton SE | | 2.9 |
| Adobe Systems, Inc. | | 2.8 |
| S&P Global, Inc. | | 2.7 |
| Nidec Corp. | | 2.6 |
| Aetna, Inc. | | 2.5 |
| Citigroup, Inc. | | 2.3 |
| Maxim Integrated Products, Inc. | | 2.3 |
| Keyence Corp. | | 2.2 |
Portfolio holdings and allocations are subject to change. Percentages are as of March 31, 2018, and are based on net assets. For more current Top 10 Fund holdings, please visit oppenheimerfunds.com.
TOP TEN GEOGRAPHICAL HOLDINGS
| | |
| United States | | 47.1% |
| Japan | | 15.4 |
| France | | 9.6 |
| Germany | | 8.9 |
| United Kingdom | | 5.9 |
| Switzerland | | 3.0 |
| India | | 2.7 |
| China | | 2.3 |
| Spain | | 2.1 |
| Sweden | | 1.2 |
Portfolio holdings and allocation are subject to change. Percentages are as of March 31, 2018, and are based on total market value of investments.
REGIONAL ALLOCATION
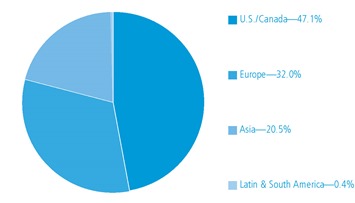
Portfolio holdings and allocations are subject to change. Percentages are as of March 31, 2018, and are based on the total market value of investments.
7 OPPENHEIMER GLOBAL FUND
Share Class Performance
AVERAGE ANNUAL TOTAL RETURNS WITHOUT SALES CHARGE AS OF 3/31/18
| | | | | | | | | | | | | | | | | | | | | | | | |
| | | Inception
Date | | | 6-Month | | | 1-Year | | | 5-Year | | | 10-Year | | |
| Class A (OPPAX) | | | 12/22/69 | | | | 6.98 | % | | | 23.23 | % | | | 11.33 | % | | | 7.90 | % | | | | |
| Class B (OGLBX) | | | 8/17/93 | | | | 6.55 | | | | 22.26 | | | | 10.46 | | | | 7.35 | | | | | |
| Class C (OGLCX) | | | 10/2/95 | | | | 6.57 | | | | 22.28 | | | | 10.50 | | | | 7.09 | | | | | |
| Class I (OGLIX) | | | 1/27/12 | | | | 7.19 | | | | 23.71 | | | | 11.81 | | | | 13.22 | * | | | | |
| Class R (OGLNX) | | | 3/1/01 | | | | 6.83 | | | | 22.90 | | | | 11.05 | | | | 7.59 | | | | | |
| Class Y (OGLYX) | | | 11/17/98 | | | | 7.09 | | | | 23.52 | | | | 11.60 | | | | 8.21 | | | | | |
AVERAGE ANNUAL TOTAL RETURNS WITH SALES CHARGE AS OF 3/31/18
| | | | | | | | | | | | | | | | | | | | | | | | |
| | | Inception
Date | | | 6-Month | | | 1-Year | | | 5-Year | | | 10-Year | | |
| Class A (OPPAX) | | | 12/22/69 | | | | 0.83 | % | | | 16.14 | % | | | 10.02 | % | | | 7.26 | % | | | | |
| Class B (OGLBX) | | | 8/17/93 | | | | 1.55 | | | | 17.26 | | | | 10.19 | | | | 7.35 | | | | | |
| Class C (OGLCX) | | | 10/2/95 | | | | 5.57 | | | | 21.28 | | | | 10.50 | | | | 7.09 | | | | | |
| Class I (OGLIX) | | | 1/27/12 | | | | 7.19 | | | | 23.71 | | | | 11.81 | | | | 13.22 | * | | | | |
| Class R (OGLNX) | | | 3/1/01 | | | | 6.83 | | | | 22.90 | | | | 11.05 | | | | 7.59 | | | | | |
| Class Y (OGLYX) | | | 11/17/98 | | | | 7.09 | | | | 23.52 | | | | 11.60 | | | | 8.21 | | | | | |
* Shows performance since inception.
Performance data quoted represents past performance, which does not guarantee future results. The investment return and principal value of an investment in the Fund will fluctuate so that an investor’s shares, when redeemed, may be worth more or less than their original cost. Current performance may be lower or higher than the performance quoted. Returns do not consider capital gains or income taxes on an individual’s investment. For performance data current to the most recent month-end, visit oppenheimerfunds.com or call 1.800. CALL OPP (225.5677). Fund returns include changes in share price, reinvested distributions, and the applicable sales charge: for Class A shares, the current maximum initial sales charge of 5.75%; for Class B shares, the contingent deferred sales charge of 5% (1-year) and 2% (5-year); and for Class C shares, the contingent deferred sales charge of 1% for the 1-year period. There is no sales charge for Class I, Class R and Class Y shares. Because Class B shares convert to Class A shares 72 months after purchase, the 10-year return for Class B shares uses Class A performance for the period after conversion. Returns for periods of less than one year are cumulative and not annualized. See Fund prospectuses and summary prospectuses for more information on share classes and sales charges.
The Fund’s performance is compared to the performance of the MSCI All Country (AC) World Index, a free float-adjusted market capitalization weighted index that is designed to measure the equity market performance of developed and emerging markets. The Index is unmanaged and cannot be purchased directly by investors. While index comparisons may be useful to provide a benchmark for the Fund’s performance, it must be noted that the Fund’s investments are not limited to the investments comprising the Index. Index performance includes reinvestment of income, but does not reflect transaction costs, fees, expenses or taxes. Index performance is shown for illustrative purposes only as a benchmark for the Fund’s
8 OPPENHEIMER GLOBAL FUND
performance, and does not predict or depict performance of the Fund. The Fund’s performance reflects the effects of the Fund’s business and operating expenses.
The Fund’s investment strategy and focus can change over time. The mention of specific fund holdings does not constitute a recommendation by OppenheimerFunds, Inc. or its affiliates.
Before investing in any of the Oppenheimer funds, investors should carefully consider a fund’s investment objectives, risks, charges and expenses. Fund prospectuses and summary prospectuses contain this and other information about the funds, and may be obtained by asking your financial advisor, visiting oppenheimerfunds.com, or calling 1.800.CALL OPP (225.5677). Read prospectuses and summary prospectuses carefully before investing.
Shares of Oppenheimer funds are not deposits or obligations of any bank, are not guaranteed by any bank, are not insured by the FDIC or any other agency, and involve investment risks, including the possible loss of the principal amount invested.
9 OPPENHEIMER GLOBAL FUND
Fund Expenses
Fund Expenses. As a shareholder of the Fund, you incur two types of costs: (1) transaction costs, which may include sales charges (loads) on purchase payments and/or contingent deferred sales charges on redemptions; and (2) ongoing costs, including management fees; distribution and service fees; and other Fund expenses. These examples are intended to help you understand your ongoing costs (in dollars) of investing in the Fund and to compare these costs with the ongoing costs of investing in other mutual funds.
The examples are based on an investment of $1,000.00 invested at the beginning of the period and held for the entire 6-month period ended March 31, 2018.
Actual Expenses. The first section of the table provides information about actual account values and actual expenses. You may use the information in this section for the class of shares you hold, together with the amount you invested, to estimate the expense that you paid over the period. Simply divide your account value by $1,000.00 (for example, an $8,600.00 account value divided by $1,000.00 = 8.60), then multiply the result by the number in the first section under the heading entitled “Expenses Paid During 6 Months Ended March 31, 2018” to estimate the expenses you paid on your account during this period.
Hypothetical Example for Comparison Purposes. The second section of the table provides information about hypothetical account values and hypothetical expenses based on the Fund’s actual expense ratio for each class of shares, and an assumed rate of return of 5% per year for each class before expenses, which is not the Fund’s actual return. The hypothetical account values and expenses may not be used to estimate the actual ending account balance or expenses you paid for the period. You may use this information to compare the ongoing costs of investing in the Fund and other funds. To do so, compare this 5% hypothetical example for the class of shares you hold with the 5% hypothetical examples that appear in the shareholder reports of the other funds.
Please note that the expenses shown in the table are meant to highlight your ongoing costs only and do not reflect any transactional costs, such as front-end or contingent deferred sales charges (loads). Therefore, the “hypothetical” section of the table is useful in comparing ongoing costs only, and will not help you determine the relative total costs of owning different funds. In addition, if these transactional costs were included, your costs would have been higher.
10 OPPENHEIMER GLOBAL FUND
| | | | | | | | | | | | | | | | | |
| Actual | | Beginning
Account Value
October 1, 2017 | | Ending
Account Value
March 31, 2018 | | Expenses
Paid During 6 Months Ended
March 31, 2018 | | |
| Class A | | | $ | 1,000.00 | | | | $ | 1,069.80 | | | | $ | 5.64 | | | |
| Class B | | | | 1,000.00 | | | | | 1,065.50 | | | | | 9.73 | | | |
| Class C | | | | 1,000.00 | | | | | 1,065.70 | | | | | 9.62 | | | |
| Class I | | | | 1,000.00 | | | | | 1,071.90 | | | | | 3.57 | | | |
| Class R | | | | 1,000.00 | | | | | 1,068.30 | | | | | 7.04 | | | |
| Class Y | | | | 1,000.00 | | | | | 1,070.90 | | | | | 4.45 | | | |
| | | | |
| Hypothetical | | | | | | | | | | | | | | | | | |
| (5% return before expenses) | | | | | | | | | | | | | | | | | |
| Class A | | | | 1,000.00 | | | | | 1,019.50 | | | | | 5.50 | | | |
| Class B | | | | 1,000.00 | | | | | 1,015.56 | | | | | 9.49 | | | |
| Class C | | | | 1,000.00 | | | | | 1,015.66 | | | | | 9.39 | | | |
| Class I | | | | 1,000.00 | | | | | 1,021.49 | | | | | 3.48 | | | |
| Class R | | | | 1,000.00 | | | | | 1,018.15 | | | | | 6.87 | | | |
| Class Y | | | | 1,000.00 | | | | | 1,020.64 | | | | | 4.34 | | | |
Expenses are equal to the Fund’s annualized expense ratio for that class, multiplied by the average account value over the period, multiplied by 182/365 (to reflect the one-half year period). Those annualized expense ratios, excluding indirect expenses from affiliated funds, based on the 6-month period ended March 31, 2018 are as follows:
| | | | | | |
| Class | | Expense Ratios | | | |
| Class A | | | 1.09 | % | | |
| Class B | | | 1.88 | | | |
| Class C | | | 1.86 | | | |
| Class I | | | 0.69 | | | |
| Class R | | | 1.36 | | | |
Class Y | | | 0.86 | | | |
The expense ratios reflect voluntary and/or contractual waivers and/or reimbursements of expenses by the Fund’s Manager and Transfer Agent. Some of these undertakings may be modified or terminated at any time, as indicated in the Fund’s prospectus. The “Financial Highlights” tables in the Fund’s financial statements, included in this report, also show the gross expense ratios, without such waivers or reimbursements and reduction to custodian expenses, if applicable.
11 OPPENHEIMER GLOBAL FUND
STATEMENT OF INVESTMENTS March 31, 2018 Unaudited
| | | | | | | | |
| | | Shares | | | Value | |
Common Stocks—97.8% | | | | | |
Consumer Discretionary—13.9% | | | | | |
Automobiles—1.0% | | | | | | | | |
Suzuki Motor Corp. | | | 2,148,700 | | | $ | 116,642,462 | |
Hotels, Restaurants & Leisure—0.8% | | | | | |
International Game Technology plc | | | 3,403,000 | | | | 90,962,190 | |
Household Durables—1.0% | | | | | |
Newell Brands, Inc. | | | 4,515,880 | | | | 115,064,622 | |
Internet & Catalog Retail—1.7% | | | | | |
JD.com, Inc., ADR1 | | | 4,652,266 | | | | 188,370,250 | |
Media—1.3% | | | | | | | | |
Walt Disney Co. (The) | | | 1,447,460 | | | | 145,382,883 | |
Specialty Retail—2.8% | | | | | |
Industria de Diseno Textil SA | | | 5,553,831 | | | | 174,068,887 | |
Tiffany & Co. | | | 1,378,598 | | | | 134,633,881 | |
| | | | | | | | 308,702,768 | |
Textiles, Apparel & Luxury Goods—5.3% | |
Brunello Cucinelli SpA | | | 1,046,631 | | | | 32,899,130 | |
Kering SA | | | 488,015 | | | | 234,000,735 | |
LVMH Moet Hennessy Louis | | | | | | | | |
Vuitton SE | | | 1,071,730 | | | | 330,509,771 | |
| | | | | | | 597,409,636 | |
Consumer Staples—4.3% | | | | | |
Food Products—2.1% | | | | | | | | |
Unilever plc | | | 4,275,585 | | | | 237,580,140 | |
Household Products—2.2% | | | | | |
Colgate-Palmolive Co. | | | 3,359,499 | | | | 240,808,888 | |
Energy—0.9% | | | | | | | | |
Energy Equipment & Services—0.9% | | | | | |
TechnipFMC plc | | | 3,300,564 | | | | 96,131,293 | |
Financials—19.1% | | | | | | | | |
Capital Markets—6.8% | | | | | |
Credit Suisse Group AG1 | | | 6,467,814 | | | | 108,526,347 | |
Goldman Sachs Group, Inc. (The) | | | 728,488 | | | | 183,476,988 | |
S&P Global, Inc. | | | 1,557,243 | | | | 297,526,847 | |
UBS Group AG1 | | | 9,741,558 | | | | 171,531,177 | |
| | | | | | | 761,061,359 | |
| | | | | | | | |
| | | Shares | | | Value | |
Commercial Banks—4.8% | | | | | |
Banco Bilbao | | | | | | | | |
Vizcaya Argentaria SA | | | 7,619,893 | | | $ | 60,330,148 | |
Citigroup, Inc. | | | 3,735,980 | | | | 252,178,650 | |
ICICI Bank Ltd., Sponsored ADR | | | 9,662,673 | | | | 85,514,656 | |
Societe Generale SA | | | 2,537,080 | | | | 138,030,594 | |
| | | | | | | | 536,054,048 | |
Insurance—5.6% | | | | | | | | |
Allianz SE | | | 910,791 | | | | 205,833,710 | |
Dai-ichi Life Holdings, Inc. | | | 7,239,000 | | | | 134,400,457 | |
FNF Group | | | 2,208,660 | | | | 88,390,573 | |
Prudential plc | | | 8,094,230 | | | | 202,334,051 | |
| | | | | | | | 630,958,791 | |
Real Estate Management & Development—1.9% | |
DLF Ltd. | | | 67,546,785 | | | | 210,199,293 | |
Health Care—16.0% | | | | | | | | |
Biotechnology—7.8% | | | | | |
ACADIA Pharmaceuticals, Inc.1 | | | 2,296,479 | | | | 51,601,883 | |
AnaptysBio, Inc.1 | | | 553,169 | | | | 57,573,830 | |
Biogen, Inc.1 | | | 350,220 | | | | 95,897,241 | |
BioMarin Pharmaceutical, Inc.1 | | | 517,814 | | | | 41,979,181 | |
Bluebird Bio, Inc.1 | | | 408,969 | | | | 69,831,457 | |
Blueprint Medicines Corp.1 | | | 852,303 | | | | 78,156,185 | |
Circassia Pharmaceuticals plc1,2 | | | 17,318,782 | | | | 20,814,076 | |
Gilead Sciences, Inc. | | | 1,271,540 | | | | 95,861,401 | |
GlycoMimetics, Inc.1 | | | 1,315,880 | | | | 21,356,732 | |
Ionis Pharmaceuticals, Inc.1 | | | 1,518,726 | | | | 66,945,442 | |
Loxo Oncology, Inc.1 | | | 553,760 | | | | 63,887,291 | |
MacroGenics, Inc.1,2 | | | 2,088,320 | | | | 52,542,131 | |
Sage Therapeutics, Inc.1 | | | 729,489 | | | | 117,498,793 | |
Shire plc | | | 934,432 | | | | 46,580,691 | |
| | | | | | | | 880,526,334 | |
Health Care Equipment & Supplies—1.3% | |
Swiss Medical SA1,2,3,4 | | | 587,287,440 | | | | 44,506,991 | |
12 OPPENHEIMER GLOBAL FUND
| | | | | | | | |
| | | Shares | | | Value | |
Health Care Equipment & Supplies (Continued) | |
Zimmer Biomet Holdings, Inc. | | | 925,744 | | | $ | 100,943,126 | |
| | | | | | | | 145,450,117 | |
Health Care Providers & Services—5.3% | |
Aetna, Inc. | | | 1,649,499 | | | | 278,765,331 | |
Anthem, Inc. | | | 1,040,012 | | | | 228,490,636 | |
Centene Corp.1 | | | 781,170 | | | | 83,483,638 | |
| | | | | | | | 590,739,605 | |
Pharmaceuticals—1.6% | | | | | |
Bayer AG | | | 1,136,985 | | | | 128,562,434 | |
Roche Holding AG | | | 226,591 | | | | 51,970,886 | |
| | | | | | | | 180,533,320 | |
Industrials—14.2% | | | | | | | | |
Aerospace & Defense—3.3% | | | | | |
Airbus SE | | | 3,224,778 | | | | 373,118,779 | |
Air Freight & Couriers—1.0% | | | | | |
United Parcel Service, Inc., Cl. B | | | 1,052,020 | | | | 110,104,413 | |
Airlines—0.9% | | | | | | | | |
| International Consolidated Airlines Group SA | | | 11,413,950 | | | | 98,580,874 | |
Building Products—1.2% | | | | | |
Assa Abloy AB, Cl. B | | | 6,401,588 | | | | 138,990,194 | |
Construction & Engineering—0.7% | | | | | |
FLSmidth & Co. AS1 | | | 1,151,138 | | | | 74,403,537 | |
Electrical Equipment—2.6% | | | | | |
Nidec Corp. | | | 1,909,716 | | | | 292,942,473 | |
Industrial Conglomerates—2.6% | | | | | |
3M Co. | | | 733,820 | | | | 161,088,167 | |
Siemens AG | | | 976,616 | | | | 124,567,544 | |
| | | | | | | | 285,655,711 | |
Machinery—1.4% | | | | | | | | |
FANUC Corp. | | | 399,800 | | | | 101,752,563 | |
Minebea Mitsumi, Inc. | | | 2,483,000 | | | | 53,547,752 | |
| | | | | | | | 155,300,315 | |
Professional Services—0.5% | | | | | |
Equifax, Inc. | | | 516,950 | | | | 60,901,879 | |
Information Technology—28.5% | | | | | |
| Electronic Equipment, Instruments, & Components—7.1% | |
Keyence Corp. | | | 396,106 | | | | 247,936,658 | |
Kyocera Corp. | | | 1,930,800 | | | | 109,446,263 | |
| | | | | | | | |
| | | Shares | | | Value | |
Electronic Equipment, Instruments, & Components (Continued) | |
Murata Manufacturing Co. Ltd. | | | 1,374,104 | | | $ | 189,682,872 | |
Omron Corp. | | | 1,981,700 | | | | 116,297,199 | |
TDK Corp. | | | 1,483,100 | | | | 132,212,912 | |
| | | | | | | | 795,575,904 | |
Internet Software & Services—8.5% | |
Alphabet, Inc., Cl. A1 | | | 615,013 | | | | 637,854,583 | |
Baidu, Inc., Sponsored ADR1 | | | 321,930 | | | | 71,851,557 | |
Facebook, Inc., Cl. A1 | | | 1,498,790 | | | | 239,491,654 | |
| | | | | | | | 949,197,794 | |
IT Services—1.6% | | | | | | | | |
Earthport plc1,2 | | | 58,117,076 | | | | 9,153,240 | |
PayPal Holdings, Inc.1 | | | 2,232,792 | | | | 169,401,929 | |
| | | | | | | | 178,555,169 | |
| Semiconductors & Semiconductor Equipment—2.5% | |
Maxim Integrated Products, Inc. | | | 4,220,473 | | | | 254,156,884 | |
Renesas Electronics Corp.1 | | | 3,065,900 | | | | 30,924,529 | |
| | | | | | | | 285,081,413 | |
Software—8.8% | | | | | | | | |
Adobe Systems, Inc.1 | | | 1,448,354 | | | | 312,960,332 | |
Capcom Co. Ltd. | | | 2,856,600 | | | | 66,224,139 | |
Intuit, Inc. | | | 1,414,060 | | | | 245,127,301 | |
Nintendo Co. Ltd. | | | 286,700 | | | | 127,844,428 | |
SAP SE | | | 2,218,953 | | | | 232,204,686 | |
| | | | | | | 984,360,886 | |
Materials—0.9% | | | | | | | | |
Chemicals—0.9% | | | | | | | | |
Linde AG1 | | | 496,026 | | | | 104,422,293 | |
Total Common Stocks | | | | | | | | |
(Cost $5,300,584,118) | | | | | | | 10,959,769,633 | |
| | |
| | | | | | | | |
Preferred Stocks—1.8% | | | | | |
| Bayerische Motoren Werke (BMW) AG, Preference | | | 2,140,141 | | | | 200,616,403 | |
13 OPPENHEIMER GLOBAL FUND
STATEMENT OF INVESTMENTS Unaudited / Continued
| | | | | | | | |
| | | Shares | | | Value | |
Preferred Stocks (Continued) | | | | | |
Zee Entertainment | | | | | | | | |
Enterprises Ltd., 6% | | | | | | | | |
Cum. Non-Cv. | | | 15,040,130 | | | $ | 1,738,725 | |
Total Preferred Stocks | | | | | |
(Cost $70,166,034) | | | | | | | 202,355,128 | |
| | | | | | | | |
| | | Shares | | | Value | |
Investment Company—0.2% | | | | | |
Oppenheimer Institutional Government Money Market Fund, Cl. E, 1.56%2,5 (Cost $21,989,897) | | | 21,989,897 | | | $ | 21,989,897 | |
| Total Investments, at Value (Cost $5,392,740,049) | | | 99.8% | | | | 11,184,114,658 | |
Net Other Assets (Liabilities) | | | 0.2 | | | | 23,054,521 | |
| | | | | | | | |
Net Assets | | | 100.0% | | | $ | 11,207,169,179 | |
| | | | | | | | |
Footnotes to Statement of Investments
1. Non-income producing security.
2. Is or was an affiliate, as defined in the Investment Company Act of 1940, as amended, at or during the reporting period, by virtue of the Fund owning at least 5% of the voting securities of the issuer or as a result of the Fund and the issuer having the same investment adviser. Transactions during the reporting period in which the issuer was an affiliate are as follows:
| | | | | | | | | | | | | | |
| | | Shares September 30, 2017 | | | Gross Additions | | | Gross Reductions | | | Shares March 31, 2018 |
Circassia Pharmaceuticals plc | | | 17,318,782 | | | | — | | | | — | | | 17,318,782 |
Earthport plc | | | 47,770,086 | | | | 10,346,990 | | | | — | | | 58,117,076 |
MacroGenics, Inc. | | | 1,836,284 | | | | 252,036 | | | | — | | | 2,088,320 |
Oppenheimer Institutional Government Money Market Fund, Cl. E | | | 94,728,986 | | | | 678,321,038 | | | | 751,060,127 | | | 21,989,897 |
Swiss Medical SA | | | 587,287,440 | | | | — | | | | — | | | 587,287,440 |
| | | Value | | | Income | | | Realized Gain (Loss) | | | Change in Unrealized Gain (Loss) |
Circassia Pharmaceuticals plc | | $ | 20,814,076 | | | $ | — | | | $ | — | | | $ 1,436,323 |
Earthport plc | | | 9,153,240 | | | | — | | | | — | | | (9,517,451) |
MacroGenics, Inc. | | | 52,542,131 | | | | — | | | | — | | | 13,842,775 |
| Oppenheimer Institutional Government Money Market Fund, Cl. E | | | 21,989,897 | | | | 610,728 | | | | — | | | — |
Swiss Medical SA | | | 44,506,991 | | | | — | | | | — | | | (5,817,206) |
| | | |
Total | | $ | 149,006,335 | | | $ | 610,728 | | | $ | — | | | $ (55,559) |
| | | |
14 OPPENHEIMER GLOBAL FUND
Footnotes to Statement of Investments (Continued)
3. Restricted security. The aggregate value of restricted securities at period end was $44,506,991, which represents 0.40% of the Fund’s net assets. See Note 4 of the accompanying Notes. Information concerning restricted securities is as follows:
| | | | | | | | | | | | | | | | |
| Security | | Acquisition Dates | | | Cost | | | Value | | | Unrealized Appreciation/ (Depreciation) | |
Swiss Medical SA | | | 5/16/94-7/10/02 | | | $ | 30,390,000 | | | $ | 44,506,991 | | | $ | 14,116,991 | |
4. The value of this security was determined using significant unobservable inputs. See Note 3 of the accompanying Notes.
5. Rate shown is the 7-day yield at period end.
Distribution of investments representing geographic holdings, as a percentage of total investments at value, is as follows:
| | | | | | |
| Geographic Holdings | | Value | | Percent |
United States | | $ 5,266,316,859 | | | 47.1 | % |
Japan | | 1,719,854,706 | | | 15.4 | |
France | | 1,075,659,880 | | | 9.6 | |
Germany | | 996,207,071 | | | 8.9 | |
United Kingdom | | 664,593,673 | | | 5.9 | |
Switzerland | | 332,028,410 | | | 3.0 | |
India | | 297,452,673 | | | 2.7 | |
China | | 260,221,807 | | | 2.3 | |
Spain | | 234,399,036 | | | 2.1 | |
Sweden | | 138,990,194 | | | 1.2 | |
Denmark | | 74,403,537 | | | 0.7 | |
Ireland | | 46,580,691 | | | 0.4 | |
Argentina | | 44,506,991 | | | 0.4 | |
Italy | | 32,899,130 | | | 0.3 | |
| | | | | | |
Total | | $ 11,184,114,658 | | | 100.0 | % |
| | | | | | |
See accompanying Notes to Financial Statements.
15 OPPENHEIMER GLOBAL FUND
STATEMENT OF ASSETS AND LIABILITIES March 31, 2018 Unaudited
| | | | |
Assets | | | | |
Investments, at value—see accompanying statement of investments: | | | | |
Unaffiliated companies (cost $5,169,757,509) | | $ | 11,035,108,323 | |
Affiliated companies (cost $222,982,540) | | | 149,006,335 | |
| | | | 11,184,114,658 | |
Cash | | | 7,007,625 | |
Receivables and other assets: | | | | |
Dividends | | | 24,625,164 | |
Shares of beneficial interest sold | | | 7,721,938 | |
Other | | | 1,140,319 | |
Total assets | | | 11,224,609,704 | |
Liabilities | | | | |
Payables and other liabilities: | | | | |
Shares of beneficial interest redeemed | | | 11,027,301 | |
Foreign capital gains tax | | | 2,270,508 | |
Trustees’ compensation | | | 1,855,068 | |
Distribution and service plan fees | | | 1,757,385 | |
Other | | | 530,263 | |
Total liabilities | | | 17,440,525 | |
| |
Net Assets | | $ | 11,207,169,179 | |
| | | | |
| | | | |
Composition of Net Assets | | | | |
| |
Paid-in capital | | $ | 4,923,303,719 | |
Accumulated net investment loss | | | (36,699,444 | ) |
Accumulated net realized gain on investments and foreign currency transactions | | | 531,066,808 | |
Net unrealized appreciation on investments and translation of assets and liabilities denominated in foreign currencies | | | 5,789,498,096 | |
Net Assets | | $ | 11,207,169,179 | |
| | | | |
16 OPPENHEIMER GLOBAL FUND
| | | | |
Net Asset Value Per Share | | | | |
| Class A Shares: | | | | |
| |
| Net asset value and redemption price per share (based on net assets of $7,163,069,376 and 74,730,839 shares of beneficial interest outstanding) | | | $ 95.85 | |
| |
| Maximum offering price per share (net asset value plus sales charge of 5.75% of offering price) | | | $ 101.70 | |
| |
| Class B Shares: | | | | |
| |
| Net asset value, redemption price (excludes applicable contingent deferred sales charge) and offering price per share (based on net assets of $5,011,883 and 57,687 shares of beneficial interest outstanding) | | | $ 86.88 | |
| |
| Class C Shares: | | | | |
| |
| Net asset value, redemption price (excludes applicable contingent deferred sales charge) and offering price per share (based on net assets of $670,027,629 and 7,595,105 shares of beneficial interest outstanding) | | | $ 88.22 | |
| |
| Class I Shares: | | | | |
| |
| Net asset value, redemption price and offering price per share (based on net assets of $1,338,645,558 and 13,945,373 shares of beneficial interest outstanding) | | | $ 95.99 | |
| |
| Class R Shares: | | | | |
| |
| Net asset value, redemption price (excludes applicable contingent deferred sales charge) and offering price per share (based on net assets of $237,116,175 and 2,486,258 shares of beneficial interest outstanding) | | | $ 95.37 | |
| |
| Class Y Shares: | | | | |
| |
| Net asset value, redemption price and offering price per share (based on net assets of $1,793,298,558 and 18,684,925 shares of beneficial interest outstanding) | | | $ 95.98 | |
See accompanying Notes to Financial Statements.
17 OPPENHEIMER GLOBAL FUND
STATEMENT
OF OPERATIONS For the Six Months Ended March 31, 2018 Unaudited
| | | | |
Investment Income | | | | |
Dividends: | | | | |
Unaffiliated companies (net of foreign withholding taxes of $4,217,435) | | $ | 60,180,102 | |
Affiliated companies | | | 610,728 | |
Interest | | | 21,041 | |
Total investment income | | | 60,811,871 | |
Expenses | | | | |
Management fees | | | 36,398,201 | |
Distribution and service plan fees: | | | | |
Class A | | | 8,547,260 | |
Class B | | | 50,501 | |
Class C | | | 3,389,326 | |
Class R | | | 597,307 | |
Transfer and shareholder servicing agent fees: | | | | |
Class A | | | 7,596,852 | |
Class B | | | 10,735 | |
Class C | | | 704,511 | |
Class I | | | 181,163 | |
Class R | | | 249,335 | |
Class Y | | | 1,807,046 | |
Shareholder communications: | | | | |
Class A | | | 18,094 | |
Class B | | | 721 | |
Class C | | | 2,923 | |
Class I | | | 1,479 | |
Class R | | | 417 | |
Class Y | | | 3,446 | |
Custodian fees and expenses | | | 336,037 | |
Borrowing fees | | | 191,935 | |
Trustees’ compensation | | | 75,745 | |
Other | | | 221,381 | |
Total expenses | | | 60,384,415 | |
Less reduction to custodian expenses | | | (4,825 | ) |
Less waivers and reimbursements of expenses | | | (423,636 | ) |
Net expenses | | | 59,955,954 | |
| |
Net Investment Income | | | 855,917 | |
18 OPPENHEIMER GLOBAL FUND
| | | | |
Realized and Unrealized Gain (Loss) | | | | |
Net realized gain on: | | | | |
Investment transactions in unaffiliated companies (net of foreign capital gains tax of $263,071) | | $ | 596,211,983 | |
Foreign currency transactions | | | 281,609 | |
| | | | |
Net realized gain | | | 596,493,592 | |
Net change in unrealized appreciation/depreciation on: | | | | |
Investment transactions in: | | | | |
Unaffiliated companies | | | 131,821,739 | |
Affiliated companies | | | (55,559 | ) |
Translation of assets and liabilities denominated in foreign currencies | | | 19,476 | |
| | | | |
Net change in unrealized appreciation/depreciation | | | 131,785,656 | |
Net Increase in Net Assets Resulting from Operations | | $ | 729,135,165 | |
| | | | |
See accompanying Notes to Financial Statements.
19 OPPENHEIMER GLOBAL FUND
STATEMENTS OF CHANGES IN NET ASSETS
| | | | | | |
| | | Six Months Ended
March 31, 2018
(Unaudited) | | | Year Ended September 30, 2017 |
Operations | | | | | | |
Net investment income | | $ | 855,917 | | | $ 35,610,880 |
Net realized gain | | | 596,493,592 | | | 626,551,589 |
Net change in unrealized appreciation/depreciation | | | 131,785,656 | | | 1,624,004,082 |
| | | |
Net increase in net assets resulting from operations | | | 729,135,165 | | | 2,286,166,551 |
| | | | | | |
Dividends and/or Distributions to Shareholders | | | | | | |
Dividends from net investment income: | | | | | | |
Class A | | | (38,721,320 | ) | | (42,236,881) |
Class B | | | — | | | — |
Class C | | | — | | | — |
Class I | | | (10,736,563 | ) | | (7,127,652) |
Class R | | | (714,339 | ) | | (865,556) |
Class Y | | | (13,116,559 | ) | | (11,116,294) |
| | | |
| | | (63,288,781 | ) | | (61,346,383) |
| | | | | | |
Distributions from net realized gain: | | | | | | |
Class A | | | (374,772,382 | ) | | — |
Class B | | | (611,217 | ) | | — |
Class C | | | (37,446,330 | ) | | — |
Class I | | | (60,384,463 | ) | | — |
Class R | | | (12,313,301 | ) | | — |
Class Y | | | (88,012,967 | ) | | — |
| | | |
| | | (573,540,660 | ) | | — |
| | | | | | |
Beneficial Interest Transactions | | | | | | |
Net increase (decrease) in net assets resulting from beneficial interest transactions: | | | | | | |
Class A | | | 84,514,984 | | | (920,066,944) |
Class B | | | (11,565,237 | ) | | (26,048,469) |
Class C | | | 18,069,244 | | | (124,211,126) |
Class I | | | 333,944,182 | | | 153,829,298 |
Class R | | | 8,144,685 | | | (33,027,629) |
Class Y | | | 193,036,097 | | | 103,330,001 |
| | | |
| | | 626,143,955 | | | (846,194,869) |
| | | | | | |
Net Assets | | | | | | |
Total increase | | | 718,449,679 | | | 1,378,625,299 |
Beginning of period | | | 10,488,719,500 | | | 9,110,094,201 |
| | | |
| End of period (including accumulated net investment income (loss) of $(36,699,444) and $25,733,420, respectively) | | $ | 11,207,169,179 | | | $ 10,488,719,500 |
| | | |
See accompanying Notes to Financial Statements.
20 OPPENHEIMER GLOBAL FUND
FINANCIAL HIGHLIGHTS
| | | | | | | | | | | | | | | | | | | | | | |
| Class A | | Six Months
Ended
March 31,
2018
(Unaudited) | | | Year Ended
September
30, 2017 | | | Year Ended
September
30, 2016 | | | Year Ended
September
30, 2015 | | | Year Ended
September
30, 2014 | | | Year Ended
September
30, 2013 |
Per Share Operating Data | | | | | | | | | | | | | | | | | | | | | | |
Net asset value, beginning of period | | | $95.03 | | | | $75.13 | | | | $74.79 | | | | $80.61 | | | | $76.06 | | | $60.82 |
Income (loss) from investment operations: | | | | | | | | | | | | | | | | | | | | | | |
Net investment income (loss)1 | | | (0.01) | | | | 0.31 | | | | 0.47 | | | | 0.612 | | | | 0.622 | | | 0.642 |
Net realized and unrealized gain (loss) | | | 6.51 | | | | 20.11 | | | | 3.75 | | | | (1.95) 2 | | | | 6.832 | | | 15.332 |
| | | |
Total from investment operations | | | 6.50 | | | | 20.42 | | | | 4.22 | | | | (1.34) | | | | 7.45 | | | 15.97 |
Dividends and/or distributions to shareholders: | | | | | | | | | | | | | | | | | | | | | | |
Dividends from net investment income | | | (0.53) | | | | (0.52) | | | | (0.52) | | | | (0.66) | | | | (0.61) | | | (0.63) |
Distributions from net realized gain | | | (5.15) | | | | 0.00 | | | | (3.36) | | | | (3.82) | | | | (2.29) | | | (0.10) |
| | | |
| Total dividends and/or distributions to shareholders | | | (5.68) | | | | (0.52) | | | | (3.88) | | | | (4.48) | | | | (2.90) | | | (0.73) |
Net asset value, end of period | | | $95.85 | | | | $95.03 | | | | $75.13 | | | | $74.79 | | | | $80.61 | | | $76.06 |
| | | |
| | | |
Total Return, at Net Asset Value3 | | | 6.98% | | | | 27.36% | | | | 5.62% | | | | (1.87)% | | | | 10.01% | | | 26.52% |
| | | |
Ratios/Supplemental Data | | | | | | | | | | | | | | | | | | | | | | |
Net assets, end of period (in thousands) | | | $7,163,069 | | | | $7,004,011 | | | | $6,391,711 | | | | $6,935,324 | | | | $7,351,617 | | | $7,497,366 |
Average net assets (in thousands) | | | $7,350,799 | | | | $6,491,885 | | | | $6,645,501 | | | | $7,558,014 | | | | $7,648,870 | | | $7,017,280 |
Ratios to average net assets:4 | | | | | | | | | | | | | | | | | | | | | | |
Net investment income (loss) | | | (0.02)% | | | | 0.37% | | | | 0.64% | | | | 0.76%2 | | | | 0.78%2 | | | 0.93%2 |
| Expenses excluding specific expenses listed below | | | 1.10% | | | | 1.13% | | | | 1.13% | | | | 1.13% | | | | 1.14% | | | 1.19% |
Interest and fees from borrowings | | | 0.00%5 | | | | 0.00%5 | | | | 0.00%5 | | | | 0.00%5 | | | | 0.00% | | | 0.00% |
| | | |
Total expenses6 | | | 1.10% | | | | 1.13% | | | | 1.13% | | | | 1.13% | | | | 1.14% | | | 1.19% |
| Expenses after payments, waivers and/or reimbursements and reduction to custodian expenses | | | 1.09% | | | | 1.12% | | | | 1.13%7 | | | | 1.13%7 | | | | 1.14%7 | | | 1.19%7 |
Portfolio turnover rate | | | 9% | | | | 7% | | | | 6% | | | | 11% | | | | 11% | | | 11% |
21 OPPENHEIMER GLOBAL FUND
FINANCIAL HIGHLIGHTS Continued
1. Per share amounts calculated based on the average shares outstanding during the period.
2. Net investment income (loss) per share, net realized and unrealized gain (loss) per share and the net investment income (loss) ratio include an adjustment for a prior period reclassification for the years ended September 30, 2013, 2014 and 2015. Please see Note 10 of the accompanying Notes to Financial Statements.
3. Assumes an initial investment on the business day before the first day of the fiscal period, with all dividends and distributions reinvested in additional shares on the reinvestment date, and redemption at the net asset value calculated on the last business day of the fiscal period. Sales charges are not reflected in the total returns. Total returns are not annualized for periods less than one full year. Returns do not reflect the deduction of taxes that a shareholder would pay on fund distributions or the redemption of fund shares.
4. Annualized for periods less than one full year.
5. Less than 0.005%.
6. Total expenses including indirect expenses from affiliated fund fees and expenses were as follows:
| | | | | | |
Six Months Ended March 31, 2018 | | | 1.10 | % | | |
Year Ended September 30, 2017 | | | 1.13 | % | | |
Year Ended September 30, 2016 | | | 1.13 | % | | |
Year Ended September 30, 2015 | | | 1.13 | % | | |
Year Ended September 30, 2014 | | | 1.14 | % | | |
Year Ended September 30, 2013 | | | 1.19 | % | | |
7. Waiver was less than 0.005%.
See accompanying Notes to Financial Statements.
22 OPPENHEIMER GLOBAL FUND
| | | | | | | | | | | | | | | | | | | | | | |
| Class B | | Six Months
Ended
March 31,
2018
(Unaudited) | | | Year Ended
September
30, 2017 | | | Year Ended
September
30, 2016 | | | Year Ended
September
30, 2015 | | | Year Ended
September
30, 2014 | | | Year Ended
September
30, 2013 |
Per Share Operating Data | | | | | | | | | | | | | | | | | | | | | | |
Net asset value, beginning of period | | | $86.46 | | | | $68.41 | | | | $68.44 | | | | $74.03 | | | | $70.04 | | | $56.03 |
Income (loss) from investment operations: | | | | | | | | | | | | | | | | | | | | | | |
Net investment income (loss)1 | | | (0.42) | | | | (0.44) | | | | (0.13) | | | | (0.02)2 | | | | (0.04) 2 | | | 0.012 |
Net realized and unrealized gain (loss) | | | 5.99 | | | | 18.49 | | | | 3.46 | | | | (1.75)2 | | | | 6.322 | | | 14.182 |
| | | |
Total from investment operations | | | 5.57 | | | | 18.05 | | | | 3.33 | | | | (1.77) | | | | 6.28 | | | 14.19 |
Dividends and/or distributions to shareholders: | | | | | | | | | | | | | | | | | | | | | | |
Dividends from net investment income | | | 0.00 | | | | 0.00 | | | | 0.00 | | | | 0.00 | | | | 0.00 | | | (0.08) |
Distributions from net realized gain | | | (5.15) | | | | 0.00 | | | | (3.36) | | | | (3.82) | | | | (2.29) | | | (0.10) |
| | | |
| Total dividends and/or distributions to shareholders | | | (5.15) | | | | 0.00 | | | | (3.36) | | | | (3.82) | | | | (2.29) | | | (0.18) |
Net asset value, end of period | | | $86.88 | | | | $86.46 | | | | $68.41 | | | | $68.44 | | | | $74.03 | | | $70.04 |
| | | |
| | | | | | | | | | | | | | | | | | | | | | |
Total Return, at Net Asset Value3 | | | 6.55% | | | | 26.40%4 | | | | 4.80% | | | | (2.62)% | | | | 9.14% | | | 25.39% |
| | | | | | | | | | | | | | | | | | | | | | |
Ratios/Supplemental Data | | | | | | | | | | | | | | | | | | | | | | |
Net assets, end of period (in thousands) | | | $5,012 | | | | $16,147 | | | | $36,722 | | | | $67,560 | | | | $109,495 | | | $144,206 |
Average net assets (in thousands) | | | $10,107 | | | | $24,913 | | | | $49,931 | | | | $89,091 | | | | $128,588 | | | $152,754 |
Ratios to average net assets:5 | | | | | | | | | | | | | | | | | | | | | | |
Net investment income (loss) | | | (0.94)% | | | | (0.60)% | | | | (0.20)% | | | | (0.03)%2 | | | | (0.06)%2 | | | 0.01%2 |
| Expenses excluding specific expenses listed below | | | 1.89% | | | | 1.90% | | | | 1.90% | | | | 1.90% | | | | 1.98% | | | 2.20% |
Interest and fees from borrowings | | | 0.00%6 | | | | 0.00%6 | | | | 0.00%6 | | | | 0.00%6 | | | | 0.00% | | | 0.00% |
| | | |
Total expenses7 | | | 1.89% | | | | 1.90% | | | | 1.90% | | | | 1.90% | | | | 1.98% | | | 2.20% |
| Expenses after payments, waivers and/or reimbursements and reduction to custodian expenses | | | 1.88% | | | | 1.89% | | | | 1.90%8 | | | | 1.90%8 | | | | 1.95% | | | 2.10% |
Portfolio turnover rate | | | 9% | | | | 7% | | | | 6% | | | | 11% | | | | 11% | | | 11% |
23 OPPENHEIMER GLOBAL FUND
FINANCIAL HIGHLIGHTS Continued
1. Per share amounts calculated based on the average shares outstanding during the period.
2. Net investment income (loss) per share, net realized and unrealized gain (loss) per share and the net investment income (loss) ratio include an adjustment for a prior period reclassification for the years ended September 30, 2013, 2014 and 2015. Please see Note 10 of the accompanying Notes to Financial Statements.
3. Assumes an initial investment on the business day before the first day of the fiscal period, with all dividends and distributions reinvested in additional shares on the reinvestment date, and redemption at the net asset value calculated on the last business day of the fiscal period. Sales charges are not reflected in the total returns. Total returns are not annualized for periods less than one full year. Returns do not reflect the deduction of taxes that a shareholder would pay on fund distributions or the redemption of fund shares.
4. The return does not include adjustments in accordance with generally accepted accounting principles required at the period end for financial reporting purposes.
5. Annualized for periods less than one full year.
6. Less than 0.005%.
7. Total expenses including indirect expenses from affiliated fund fees and expenses were as follows:
| | | | | | |
Six Months Ended March 31, 2018 | | | 1.89 | % | | |
Year Ended September 30, 2017 | | | 1.90 | % | | |
Year Ended September 30, 2016 | | | 1.90 | % | | |
Year Ended September 30, 2015 | | | 1.90 | % | | |
Year Ended September 30, 2014 | | | 1.98 | % | | |
Year Ended September 30, 2013 | | | 2.20 | % | | |
8. Waiver was less than 0.005%.
See accompanying Notes to Financial Statements.
24 OPPENHEIMER GLOBAL FUND
| | | | | | | | | | | | | | | | | | | | | | |
| Class C | | Six Months
Ended
March 31,
2018
(Unaudited) | | | Year Ended
September
30, 2017 | | | Year Ended
September
30, 2016 | | | Year Ended
September
30, 2015 | | | Year Ended
September
30, 2014 | | | Year Ended
September
30, 2013 |
Per Share Operating Data | | | | | | | | | | | | | | | | | | | | | | |
| Net asset value, beginning of period | | | $87.71 | | | | $69.39 | | | | $69.37 | | | | $75.10 | | | | $71.11 | | | $56.93 |
| Income (loss) from investment operations: | | | | | | | | | | | | | | | | | | | | | | |
| Net investment income (loss)1 | | | (0.35) | | | | (0.30) | | | | (0.08) | | | | (0.01)2 | | | | 0.032 | | | 0.142 |
| Net realized and unrealized gain (loss) | | | 6.01 | | | | 18.62 | | | | 3.46 | | | | (1.79) 2 | | | | 6.402 | | | 14.382 |
| | | |
| Total from investment operations | | | 5.66 | | | | 18.32 | | | | 3.38 | | | | (1.80) | | | | 6.43 | | | 14.52 |
| Dividends and/or distributions to shareholders: | | | | | | | | | | | | | | | | | | | | | | |
| Dividends from net investment income | | | 0.00 | | | | 0.00 | | | | 0.00 | | | | (0.11) | | | | (0.15) | | | (0.24) |
| Distributions from net realized gain | | | (5.15) | | | | 0.00 | | | | (3.36) | | | | (3.82) | | | | (2.29) | | | (0.10) |
| | | |
| Total dividends and/or distributions to shareholders | | | (5.15) | | | | 0.00 | | | | (3.36) | | | | (3.93) | | | | (2.44) | | | (0.34) |
| Net asset value, end of period | | | $88.22 | | | | $87.71 | | | | $69.39 | | | | $69.37 | | | | $75.10 | | | $71.11 |
| | | |
| | | | | | | | | | | | | | | | | | | | | | |
| Total Return, at Net Asset Value3 | | | 6.57% | | | | 26.40% | | | | 4.80% | | | | (2.60)% | | | | 9.20% | | | 25.62% |
| | | | | | | | | | | | | | | | | | | | | | |
| Ratios/Supplemental Data | | | | | | | | | | | | | | | | | | | | | | |
| Net assets, end of period (in thousands) | | | $670,028 | | | | $647,114 | | | | $626,045 | | | | $674,573 | | | | $695,102 | | | $666,584 |
| Average net assets (in thousands) | | | $681,948 | | | | $619,719 | | | | $653,577 | | | | $715,064 | | | | $699,835 | | | $623,949 |
| Ratios to average net assets:4 | | | | | | | | | | | | | | | | | | | | | | |
| Net investment income (loss) | | | (0.78)% | | | | (0.40)% | | | | (0.12)% | | | | (0.01)%2 | | | | 0.04%2 | | | 0.22%2 |
| Expenses excluding specific expenses listed below | | | 1.87% | | | | 1.89% | | | | 1.90% | | | | 1.90% | | | | 1.88% | | | 1.90% |
| Interest and fees from borrowings | | | 0.00%5 | | | | 0.00%5 | | | | 0.00%5 | | | | 0.00%5 | | | | 0.00% | | | 0.00% |
| | | |
| Total expenses6 | | | 1.87% | | | | 1.89% | | | | 1.90% | | | | 1.90% | | | | 1.88% | | | 1.90% |
| Expenses after payments, waivers and/or reimbursements and reduction to custodian expenses | | | 1.86% | | | | 1.88% | | | | 1.90%7 | | | | 1.90%7 | | | | 1.88%7 | | | 1.90%7 |
| Portfolio turnover rate | | | 9% | | | | 7% | | | | 6% | | | | 11% | | | | 11% | | | 11% |
25 OPPENHEIMER GLOBAL FUND
FINANCIAL HIGHLIGHTS Continued
1. Per share amounts calculated based on the average shares outstanding during the period.
2. Net investment income (loss) per share, net realized and unrealized gain (loss) per share and the net investment income (loss) ratio include an adjustment for a prior period reclassification for the years ended September 30, 2013, 2014 and 2015. Please see Note 10 of the accompanying Notes to Financial Statements.
3. Assumes an initial investment on the business day before the first day of the fiscal period, with all dividends and distributions reinvested in additional shares on the reinvestment date, and redemption at the net asset value calculated on the last business day of the fiscal period. Sales charges are not reflected in the total returns. Total returns are not annualized for periods less than one full year. Returns do not reflect the deduction of taxes that a shareholder would pay on fund distributions or the redemption of fund shares.
4. Annualized for periods less than one full year.
5. Less than 0.005%.
6. Total expenses including indirect expenses from affiliated fund fees and expenses were as follows:
| | | | | | |
Six Months Ended March 31, 2018 | | | 1.87 | % | | |
Year Ended September 30, 2017 | | | 1.89 | % | | |
Year Ended September 30, 2016 | | | 1.90 | % | | |
Year Ended September 30, 2015 | | | 1.90 | % | | |
Year Ended September 30, 2014 | | | 1.88 | % | | |
Year Ended September 30, 2013 | | | 1.90 | % | | |
7. Waiver was less than 0.005%.
See accompanying Notes to Financial Statements.
26 OPPENHEIMER GLOBAL FUND
| | | | | | | | | | | | | | | | | | | | | | |
| Class I | | Six Months
Ended
March 31, 2018
(Unaudited) | | | Year Ended
September
30, 2017 | | | Year Ended
September
30, 2016 | | | Year Ended
September
30, 2015 | | | Year Ended
September
30, 2014 | | | Year Ended
September
30, 2013 |
Per Share Operating Data | | | | | | | | | | | | | | | | | | | | | | |
| Net asset value, beginning of period | | | $95.35 | | | | $75.40 | | | | $75.07 | | | | $80.92 | | | | $76.36 | | | $61.08 |
| Income (loss) from investment operations: | | | | | | | | | | | | | | | | | | | | | | |
| Net investment income1 | | | 0.21 | | | | 0.70 | | | | 0.80 | | | | 0.952 | | | | 1.122 | | | 1.012 |
| Net realized and unrealized gain (loss) | | | 6.50 | | | | 20.10 | | | | 3.77 | | | | (1.96) 2 | | | | 6.702 | | | 15.332 |
| | | |
| Total from investment operations | | | 6.71 | | | | 20.80 | | | | 4.57 | | | | (1.01) | | | | 7.82 | | | 16.34 |
| Dividends and/or distributions to shareholders: | | | | | | | | | | | | | | | | | | | | | | |
| Dividends from net investment income | | | (0.92) | | | | (0.85) | | | | (0.88) | | | | (1.02) | | | | (0.97) | | | (0.96) |
| Distributions from net realized gain | | | (5.15) | | | | 0.00 | | | | (3.36) | | | | (3.82) | | | | (2.29) | | | (0.10) |
| | | |
| Total dividends and/or distributions to shareholders | | | (6.07) | | | | (0.85) | | | | (4.24) | | | | (4.84) | | | | (3.26) | | | (1.06) |
| Net asset value, end of period | | | $95.99 | | | | $95.35 | | | | $75.40 | | | | $75.07 | | | | $80.92 | | | $76.36 |
| | | |
| | | | | | | | | | | | | | | | | | | | | | |
| Total Return, at Net Asset Value3 | | | 7.19% | | | | 27.91% | | | | 6.05% | | | | (1.44)% | | | | 10.49% | | | 27.12% |
| | | | | | | | | | | | | | | | | | | | | | |
| Ratios/Supplemental Data | | | | | | | | | | | | | | | | | | | | | | |
| Net assets, end of period (in thousands) | | | $1,338,646 | | | | $1,005,841 | | | | $663,292 | | | | $499,965 | | | | $343,373 | | | $60,732 |
| Average net assets (in thousands) | | | $1,214,228 | | | | $778,861 | | | | $567,921 | | | | $433,479 | | | | $252,001 | | | $41,484 |
| Ratios to average net assets:4 | | | | | | | | | | | | | | | | | | | | | | |
| Net investment income | | | 0.42% | | | | 0.84% | | | | 1.11% | | | | 1.18%2 | | | | 1.40%2 | | | 1.44%2 |
| Expenses excluding specific expenses listed below | | | 0.69% | | | | 0.70% | | | | 0.71% | | | | 0.71% | | | | 0.70% | | | 0.71% |
| Interest and fees from borrowings | | | 0.00%5 | | | | 0.00%5 | | | | 0.00%5 | | | | 0.00%5 | | | | 0.00% | | | 0.00% |
| | | |
| Total expenses6 | | | 0.69% | | | | 0.70% | | | | 0.71% | | | | 0.71% | | | | 0.70% | | | 0.71% |
| Expenses after payments, waivers and/or reimbursements and reduction to custodian expenses | | | 0.69%7 | | | | 0.70%7 | | | | 0.71%7 | | | | 0.71%7 | | | | 0.70%7 | | | 0.71%7 |
| Portfolio turnover rate | | | 9% | | | | 7% | | | | 6% | | | | 11% | | | | 11% | | | 11% |
27 OPPENHEIMER GLOBAL FUND
FINANCIAL HIGHLIGHTS Continued
1. Per share amounts calculated based on the average shares outstanding during the period.
2. Net investment income (loss) per share, net realized and unrealized gain (loss) per share and the net investment income (loss) ratio include an adjustment for a prior period reclassification for the years ended September 30, 2013, 2014 and 2015. Please see Note 10 of the accompanying Notes to Financial Statements.
3. Assumes an initial investment on the business day before the first day of the fiscal period, with all dividends and distributions reinvested in additional shares on the reinvestment date, and redemption at the net asset value calculated on the last business day of the fiscal period. Sales charges are not reflected in the total returns. Total returns are not annualized for periods less than one full year. Returns do not reflect the deduction of taxes that a shareholder would pay on fund distributions or the redemption of fund shares.
4. Annualized for periods less than one full year.
5. Less than 0.005%.
6. Total expenses including indirect expenses from affiliated fund fees and expenses were as follows:
| | | | | | |
Six Months Ended March 31, 2018 | | | 0.69 | % | | |
Year Ended September 30, 2017 | | | 0.70 | % | | |
Year Ended September 30, 2016 | | | 0.71 | % | | |
Year Ended September 30, 2015 | | | 0.71 | % | | |
Year Ended September 30, 2014 | | | 0.70 | % | | |
Year Ended September 30, 2013 | | | 0.71 | % | | |
7. Waiver was less than 0.005%.
See accompanying Notes to Financial Statements.
28 OPPENHEIMER GLOBAL FUND
| | | | | | | | | | | | | | | | | | | | | | |
| Class R | | Six Months
Ended
March 31,
2018
(Unaudited) | | | Year Ended
September
30, 2017 | | | Year Ended
September
30, 2016 | | | Year Ended
September
30, 2015 | | | Year Ended
September
30, 2014 | | | Year Ended
September
30, 2013 |
Per Share Operating Data | | | | | | | | | | | | | | | | | | | | | | |
| Net asset value, beginning of period | | | $94.48 | | | | $74.69 | | | | $74.35 | | | | $80.17 | | | | $75.68 | | | $60.47 |
| Income (loss) from investment operations: | | | | | | | | | | | | | | | | | | | | | | |
| Net investment income (loss)1 | | | (0.14) | | | | 0.09 | | | | 0.28 | | | | 0.392 | | | | 0.412 | | | 0.442 |
| Net realized and unrealized gain (loss) | | | 6.48 | | | | 20.02 | | | | 3.72 | | | | (1.93) 2 | | | | 6.812 | | | 15.272 |
| | | |
| Total from investment operations | | | 6.34 | | | | 20.11 | | | | 4.00 | | | | (1.54) | | | | 7.22 | | | 15.71 |
| Dividends and/or distributions to shareholders: | | | | | | | | | | | | | | | | | | | | | | |
| Dividends from net investment income | | | (0.30) | | | | (0.32) | | | | (0.30) | | | | (0.46) | | | | (0.44) | | | (0.40) |
| Distributions from net realized gain | | | (5.15) | | | | 0.00 | | | | (3.36) | | | | (3.82) | | | | (2.29) | | | (0.10) |
| | | |
| Total dividends and/or distributions to shareholders | | | (5.45) | | | | (0.32) | | | | (3.66) | | | | (4.28) | | | | (2.73) | | | (0.50) |
| Net asset value, end of period | | | $95.37 | | | | $94.48 | | | | $74.69 | | | | $74.35 | | | | $80.17 | | | $75.68 |
| | | |
| | | | | | | | | | | | | | | | | | | | | | |
| Total Return, at Net Asset Value3 | | | 6.83% | | | | 27.04% | | | | 5.33% | | | | (2.13)% | | | | 9.73% | | | 26.16% |
| | | | | | | | | | | | | | | | | | | | | | |
| Ratios/Supplemental Data | | | | | | | | | | | | | | | | | | | | | | |
| Net assets, end of period (in thousands) | | | $237,116 | | | | $226,446 | | | | $210,141 | | | | $224,577 | | | | $236,838 | | | $214,310 |
| Average net assets (in thousands) | | | $241,388 | | | | $210,666 | | | | $217,020 | | | | $240,784 | | | | $232,983 | | | $200,060 |
| Ratios to average net assets:4 | | | | | | | | | | | | | | | | | | | | | | |
| Net investment income (loss) | | | (0.28)% | | | | 0.11% | | | | 0.39% | | | | 0.49%2 | | | | 0.52%2 | | | 0.64%2 |
| Expenses excluding specific expenses listed below | | | 1.37% | | | | 1.39% | | | | 1.39% | | | | 1.40% | | | | 1.40% | | | 1.47% |
| Interest and fees from borrowings | | | 0.00%5 | | | | 0.00%5 | | | | 0.00%5 | | | | 0.00%5 | | | | 0.00% | | | 0.00% |
| | | |
| Total expenses6 | | | 1.37% | | | | 1.39% | | | | 1.39% | | | | 1.40% | | | | 1.40% | | | 1.47% |
| Expenses after payments, waivers and/or reimbursements and reduction to custodian expenses | | | 1.36% | | | | 1.38% | | | | 1.39%7 | | | | 1.40%7 | | | | 1.40%7 | | | 1.47%7 |
| Portfolio turnover rate | | | 9% | | | | 7% | | | | 6% | | | | 11% | | | | 11% | | | 11% |
29 OPPENHEIMER GLOBAL FUND
FINANCIAL HIGHLIGHTS Continued
1. Per share amounts calculated based on the average shares outstanding during the period.
2. Net investment income (loss) per share, net realized and unrealized gain (loss) per share and the net investment income (loss) ratio include an adjustment for a prior period reclassification for the years ended September 30, 2013, 2014 and 2015. Please see Note 10 of the accompanying Notes to Financial Statements.
3. Assumes an initial investment on the business day before the first day of the fiscal period, with all dividends and distributions reinvested in additional shares on the reinvestment date, and redemption at the net asset value calculated on the last business day of the fiscal period. Sales charges are not reflected in the total returns. Total returns are not annualized for periods less than one full year. Returns do not reflect the deduction of taxes that a shareholder would pay on fund distributions or the redemption of fund shares.
| 4. | Annualized for periods less than one full year. |
| 6. | Total expenses including indirect expenses from affiliated fund fees and expenses were as follows: |
| | | | | | |
Six Months Ended March 31, 2018 | | | 1.37 | % | | |
Year Ended September 30, 2017 | | | 1.39 | % | | |
Year Ended September 30, 2016 | | | 1.39 | % | | |
Year Ended September 30, 2015 | | | 1.40 | % | | |
Year Ended September 30, 2014 | | | 1.40 | % | | |
Year Ended September 30, 2013 | | | 1.47 | % | | |
7. Waiver was less than 0.005%.
See accompanying Notes to Financial Statements.
30 OPPENHEIMER GLOBAL FUND
| | | | | | | | | | | | | | | | | | | | | | |
| Class Y | | Six Months
Ended
March 31,
2018
(Unaudited) | | | Year Ended
September
30, 2017 | | | Year Ended
September
30, 2016 | | | Year Ended
September
30, 2015 | | | Year Ended
September
30, 2014 | | | Year Ended
September
30, 2013 |
Per Share Operating Data | | | | | | | | | | | | | | | | | | | | | | |
Net asset value, beginning of period | | | $95.27 | | | | $75.32 | | | | $75.00 | | | | $80.81 | | | | $76.25 | | | $61.00 |
Income (loss) from investment operations: | | | | | | | | | | | | | | | | | | | | | | |
| Net investment income1 | | | 0.11 | | | | 0.49 | | | | 0.65 | | | | 0.782 | | | | 0.832 | | | 0.832 |
| Net realized and unrealized gain (loss) | | | 6.52 | | | | 20.16 | | | | 3.76 | | | | (1.94) 2 | | | | 6.842 | | | 15.352 |
| | | |
| Total from investment operations | | | 6.63 | | | | 20.65 | | | | 4.41 | | | | (1.16) | | | | 7.67 | | | 16.18 |
| Dividends and/or distributions to shareholders: | | | | | | | | | | | | | | | | | | | | | | |
| Dividends from net investment income | | | (0.77) | | | | (0.70) | | | | (0.73) | | | | (0.83) | | | | (0.82) | | | (0.83) |
| Distributions from net realized gain | | | (5.15) | | | | 0.00 | | | | (3.36) | | | | (3.82) | | | | (2.29) | | | (0.10) |
| | | |
| Total dividends and/or distributions to shareholders | | | (5.92) | | | | (0.70) | | | | (4.09) | | | | (4.65) | | | | (3.11) | | | (0.93) |
| Net asset value, end of period | | | $95.98 | | | | $95.27 | | | | $75.32 | | | | $75.00 | | | | $80.81 | | | $76.25 |
| | | |
| | | | | | | | | | | | | | | | | | | | | | |
| Total Return, at Net Asset Value3 | | | 7.09% | | | | 27.66% | | | | 5.87% | | | | (1.64)% | | | | 10.30% | | | 26.85% |
| | | | | | | | | | | | | | | | | | | | | | |
| Ratios/Supplemental Data | | | | | | | | | | | | | | | | | | | | | | |
| Net assets, end of period (in thousands) | | | $1,793,298 | | | | $1,589,161 | | | | $1,182,183 | | | | $1,256,847 | | | | $1,480,337 | | | $1,330,188 |
| Average net assets (in thousands) | | | $1,752,466 | | | | $1,302,607 | | | | $1,248,978 | | | | $1,302,957 | | | | $1,454,338 | | | $1,147,539 |
| Ratios to average net assets:4 | | | | | | | | | | | | | | | | | | | | | | |
| Net investment income | | | 0.23% | | | | 0.59% | | | | 0.90% | | | | 0.96%2 | | | | 1.04%2 | | | 1.21%2 |
| Expenses excluding specific expenses listed below | | | 0.87% | | | | 0.89% | | | | 0.90% | | | | 0.90% | | | | 0.89% | | | 0.92% |
| Interest and fees from borrowings | | | 0.00%5 | | | | 0.00%5 | | | | 0.00%5 | | | | 0.00%5 | | | | 0.00% | | | 0.00% |
| | | |
| Total expenses6 | | | 0.87% | | | | 0.89% | | | | 0.90% | | | | 0.90% | | | | 0.89% | | | 0.92% |
| Expenses after payments, waivers and/or reimbursements and reduction to custodian expenses | | | 0.86% | | | | 0.88% | | | | 0.90%7 | | | | 0.90%7 | | | | 0.89%7 | | | 0.92%7 |
| Portfolio turnover rate | | | 9% | | | | 7% | | | | 6% | | | | 11% | | | | 11% | | | 11% |
31 OPPENHEIMER GLOBAL FUND
FINANCIAL HIGHLIGHTS Continued
1. Per share amounts calculated based on the average shares outstanding during the period.
2. Net investment income (loss) per share, net realized and unrealized gain (loss) per share and the net investment income (loss) ratio include an adjustment for a prior period reclassification for the years ended September 30, 2013, 2014 and 2015. Please see Note 10 of the accompanying Notes to Financial Statements.
3. Assumes an initial investment on the business day before the first day of the fiscal period, with all dividends and distributions reinvested in additional shares on the reinvestment date, and redemption at the net asset value calculated on the last business day of the fiscal period. Sales charges are not reflected in the total returns. Total returns are not annualized for periods less than one full year. Returns do not reflect the deduction of taxes that a shareholder would pay on fund distributions or the redemption of fund shares.
4. Annualized for periods less than one full year.
5. Less than 0.005%.
6. Total expenses including indirect expenses from affiliated fund fees and expenses were as follows:
| | | | | | |
Six Months Ended March 31, 2018 | | | 0.87 | % | | |
Year Ended September 30, 2017 | | | 0.89 | % | | |
Year Ended September 30, 2016 | | | 0.90 | % | | |
Year Ended September 30, 2015 | | | 0.90 | % | | |
Year Ended September 30, 2014 | | | 0.89 | % | | |
Year Ended September 30, 2013 | | | 0.92 | % | | |
7. Waiver was less than 0.005%.
See accompanying Notes to Financial Statements.
32 OPPENHEIMER GLOBAL FUND
NOTES TO FINANCIAL STATEMENTS March 31, 2018 Unaudited
1. Organization
Oppenheimer Global Fund (the “Fund”) is a diversified open-end management investment company registered under the Investment Company Act of 1940 (“1940 Act”), as amended. The Fund’s investment objective is to seek capital appreciation. The Fund’s investment adviser is OFI Global Asset Management, Inc. (“OFI Global” or the “Manager”), a wholly-owned subsidiary of OppenheimerFunds, Inc. (“OFI” or the “Sub-Adviser”). The Manager has entered into a sub-advisory agreement with OFI.
The Fund offers Class A, Class C, Class I, Class R and Class Y shares, and previously offered Class B shares for new purchase through June 29, 2012. Subsequent to that date, no new purchases of Class B shares are permitted, however reinvestment of dividend and/or capital gain distributions and exchanges of Class B shares into and from other Oppenheimer funds are allowed. Class A shares are sold at their offering price, which is normally net asset value plus a front-end sales charge. Class C and Class R shares are sold, and Class B shares were sold, without a front-end sales charge but may be subject to a contingent deferred sales charge (“CDSC”). Class R shares are sold only through retirement plans. Retirement plans that offer Class R shares may impose charges on those accounts. Class I and Class Y shares are sold to certain institutional investors or intermediaries without either a front-end sales charge or a CDSC, however, the intermediaries may impose charges on their accountholders who beneficially own Class I and Class Y shares. All classes of shares have identical rights and voting privileges with respect to the Fund in general and exclusive voting rights on matters that affect that class alone. Earnings, net assets and net asset value per share may differ due to each class having its own expenses, such as transfer and shareholder servicing agent fees and shareholder communications, directly attributable to that class. Class A, B, C and R shares have separate distribution and/or service plans under which they pay fees. Class I and Class Y shares do not pay such fees. Class B shares will automatically convert to Class A shares 72 months after the date of purchase.
The following is a summary of significant accounting policies followed in the Fund’s preparation of financial statements in accordance with accounting principles generally accepted in the United States (“U.S. GAAP”).
2. Significant Accounting Policies
Security Valuation. All investments in securities are recorded at their estimated fair value, as described in Note 3.
Foreign Currency Translation. The books and records of the Fund are maintained in U.S. dollars. Any foreign currency amounts are translated into U.S. dollars on the following basis:
(1) Value of investment securities, other assets and liabilities — at the exchange rates prevailing at market close as described in Note 3.
(2) Purchases and sales of investment securities, income and expenses — at the rates of exchange prevailing on the respective dates of such transactions.
Although the net assets and the values are presented at the foreign exchange rates at market close, the Fund does not isolate the portion of the results of operations resulting from
33 OPPENHEIMER GLOBAL FUND
NOTES TO FINANCIAL STATEMENTS Unaudited / Continued
2. Significant Accounting Policies (Continued)
changes in foreign exchange rates on investments from the fluctuations arising from changes in prices of securities held. Such fluctuations are included with the net realized and unrealized gains or losses from investments shown in the Statement of Operations.
For securities, which are subject to foreign withholding tax upon disposition, realized and unrealized gains or losses on such securities are recorded net of foreign withholding tax.
Reported net realized foreign exchange gains or losses arise from sales of foreign currencies, currency gains or losses realized between the trade and settlement dates on securities transactions, the difference between the amounts of dividends, interest, and foreign withholding tax reclaims recorded on the Fund’s books, and the U.S. dollar equivalent of the amounts actually received or paid. Net unrealized foreign exchange gains and losses arise from changes in the value of assets and liabilities other than investments in securities, resulting from changes in the exchange rate.
Allocation of Income, Expenses, Gains and Losses. Income, expenses (other than those attributable to a specific class), gains and losses are allocated on a daily basis to each class of shares based upon the relative proportion of net assets represented by such class. Operating expenses directly attributable to a specific class are charged against the operations of that class.
Dividends and Distributions to Shareholders. Dividends and distributions to shareholders, which are determined in accordance with income tax regulations and may differ from U.S. GAAP, are recorded on the ex-dividend date. Income and capital gain distributions, if any, are declared and paid annually or at other times as determined necessary by the Manager.
Investment Income. Dividend income is recorded on the ex-dividend date or upon ex-dividend notification in the case of certain foreign dividends where the ex-dividend date may have passed. Non-cash dividends included in dividend income, if any, are recorded at the fair value of the securities received. Withholding taxes on foreign dividends, if any, and capital gains taxes on foreign investments, if any, have been provided for in accordance with the Fund’s understanding of the applicable tax rules and regulations. Interest income, if any, is recognized on an accrual basis. Discount and premium, which are included in interest income on the Statement of Operations, are amortized or accreted daily.
Custodian Fees. “Custodian fees and expenses” in the Statement of Operations may include interest expense incurred by the Fund on any cash overdrafts of its custodian account during the period. Such cash overdrafts may result from the effects of failed trades in portfolio securities and from cash outflows resulting from unanticipated shareholder redemption activity. The Fund pays interest to its custodian on such cash overdrafts, to the extent they are not offset by positive cash balances maintained by the Fund, at a rate equal to the Federal Funds Rate plus 2.00%. The “Reduction to custodian expenses” line item, if applicable, represents earnings on cash balances maintained by the Fund during the period. Such interest
34 OPPENHEIMER GLOBAL FUND
2. Significant Accounting Policies (Continued)
expense and other custodian fees may be paid with these earnings.
Security Transactions. Security transactions are recorded on the trade date. Realized gains and losses on securities sold are determined on the basis of identified cost.
Indemnifications. The Fund’s organizational documents provide current and former Trustees and officers with a limited indemnification against liabilities arising in connection with the performance of their duties to the Fund. In the normal course of business, the Fund may also enter into contracts that provide general indemnifications. The Fund’s maximum exposure under these arrangements is unknown as this would be dependent on future claims that may be made against the Fund. The risk of material loss from such claims is considered remote.
Federal Taxes. The Fund intends to comply with provisions of the Internal Revenue Code applicable to regulated investment companies and to distribute substantially all of its investment company taxable income to shareholders. Therefore, no federal income or excise tax provision is required. The Fund files income tax returns in U.S. federal and applicable state jurisdictions. The statute of limitations on the Fund’s tax return filings generally remains open for the three preceding fiscal reporting period ends. The Fund has analyzed its tax positions for the fiscal year ended September 30, 2017, including open tax years, and does not believe there are any uncertain tax positions requiring recognition in the Fund’s financial statements.
During the fiscal year ended September 30, 2017, the Fund utilized $33,547,144 of capital loss carryforwards to offset capital gains realized in that fiscal year. Capital loss carryforwards with no expiration, if any, must be utilized prior to those with expiration dates. Capital losses with no expiration will be carried forward to future years if not offset by gains.
Net investment income (loss) and net realized gain (loss) may differ for financial statement and tax purposes. The character of dividends and distributions made during the fiscal year from net investment income or net realized gains are determined in accordance with federal income tax requirements, which may differ from the character of net investment income or net realized gains presented in those financial statements in accordance with U.S. GAAP. Also, due to timing of dividends and distributions, the fiscal year in which amounts are distributed may differ from the fiscal year in which the income or net realized gain was recorded by the Fund.
The aggregate cost of securities and other investments and the composition of unrealized appreciation and depreciation of securities and other investments for federal income tax purposes at period end are noted in the following table. The primary difference between book and tax appreciation or depreciation of securities and other investments, if applicable, is attributable to the tax deferral of losses or tax realization of financial statement unrealized gain or loss.
| | | | |
Federal tax cost of securities | | $ | 5,405,395,535 | |
| | | | |
Gross unrealized appreciation | | $ | 6,007,852,536 | |
| |
Gross unrealized depreciation | | | (231,009,926 | ) |
| | | | |
Net unrealized appreciation | | $ | 5,776,842,610 | |
| | | | |
35 OPPENHEIMER GLOBAL FUND
NOTES TO FINANCIAL STATEMENTS Unaudited / Continued
2. Significant Accounting Policies (Continued)
Certain foreign countries impose a tax on capital gains which is accrued by the Fund based on unrealized appreciation, if any, on affected securities. The tax is paid when the gain is realized.
Use of Estimates. The preparation of financial statements in conformity with U.S. GAAP requires management to make estimates and assumptions that affect the reported amounts of assets and liabilities and disclosure of contingent assets and liabilities at the date of the financial statements and the reported amounts of increases and decreases in net assets from operations during the reporting period. Actual results could differ from those estimates.
3. Securities Valuation
The Fund calculates the net asset value of its shares as of 4:00 P.M. Eastern Time, on each day the New York Stock Exchange (the “Exchange”) is open for trading, except in the case of a scheduled early closing of the Exchange, in which case the Fund will calculate net asset value of the shares as of the scheduled early closing time of the Exchange.
The Fund’s Board has adopted procedures for the valuation of the Fund’s securities and has delegated the day-to-day responsibility for valuation determinations under those procedures to the Manager. The Manager has established a Valuation Committee which is responsible for determining a fair valuation for any security for which market quotations are not readily available. The Valuation Committee’s fair valuation determinations are subject to review, approval and ratification by the Fund’s Board at least quarterly or more frequently, if necessary.
Valuation Methods and Inputs
Securities are valued primarily using unadjusted quoted market prices, when available, as supplied by third party pricing services or broker-dealers.
The following methodologies are used to determine the market value or the fair value of the types of securities described below:
Equity securities traded on a securities exchange (including exchange-traded derivatives other than futures and futures options) are valued based on the official closing price on the principal exchange on which the security is traded, as identified by the Manager, prior to the time when the Fund’s assets are valued. If the official closing price is unavailable, the security is valued at the last sale price on the principal exchange on which it is traded, or if no sales occurred, the security is valued at the mean between the quoted bid and asked prices. Over-the-counter equity securities are valued at the last published sale price, or if no sales occurred, at the mean between the quoted bid and asked prices. Events occurring after the close of trading on foreign exchanges may result in adjustments to the valuation of foreign securities to more accurately reflect their fair value as of the time when the Fund’s assets are valued.
Shares of a registered investment company that are not traded on an exchange are valued at that investment company’s net asset value per share.
Securities for which market quotations are not readily available, or when a significant event has occurred that would materially affect the value of the security, are fair valued either (i) by
36 OPPENHEIMER GLOBAL FUND
3. Securities Valuation (Continued)
a standardized fair valuation methodology applicable to the security type or the significant event as previously approved by the Valuation Committee and the Fund’s Board or (ii) as determined in good faith by the Manager’s Valuation Committee. The Valuation Committee considers all relevant facts that are reasonably available, through either public information or information available to the Manager, when determining the fair value of a security. Those standardized fair valuation methodologies include, but are not limited to, valuing securities at the last sale price or initially at cost and subsequently adjusting the value based on: changes in company specific fundamentals, changes in an appropriate securities index, or changes in the value of similar securities which may be further adjusted for any discounts related to security-specific resale restrictions. When possible, such methodologies use observable market inputs such as unadjusted quoted prices of similar securities, observable interest rates, currency rates and yield curves. The methodologies used for valuing securities are not necessarily an indication of the risks associated with investing in those securities nor can it be assured that the Fund can obtain the fair value assigned to a security if it were to sell the security.
To assess the continuing appropriateness of security valuations, the Manager regularly compares prior day prices and sale prices to the current day prices and challenges those prices exceeding certain tolerance levels with the third party pricing service or broker source. For those securities valued by fair valuations, whether through a standardized fair valuation methodology or a fair valuation determination, the Valuation Committee reviews and affirms the reasonableness of the valuations based on such methodologies and fair valuation determinations on a regular basis after considering all relevant information that is reasonably available.
Classifications
Each investment asset or liability of the Fund is assigned a level at measurement date based on the significance and source of the inputs to its valuation. Various data inputs may be used in determining the value of each of the Fund’s investments as of the reporting period end.
These data inputs are categorized in the following hierarchy under applicable financial accounting standards:
1) Level 1-unadjusted quoted prices in active markets for identical assets or liabilities (including securities actively traded on a securities exchange)
2) Level 2-inputs other than unadjusted quoted prices that are observable for the asset or liability (such as unadjusted quoted prices for similar assets and market corroborated inputs such as interest rates, prepayment speeds, credit risks, etc.)
3) Level 3-significant unobservable inputs (including the Manager’s own judgments about assumptions that market participants would use in pricing the asset or liability).
The inputs used for valuing securities are not necessarily an indication of the risks associated with investing in those securities.
The Fund classifies each of its investments in investment companies which are publicly offered as Level 1. Investment companies that are not publicly offered, if any, are classified as
37 OPPENHEIMER GLOBAL FUND
NOTES TO FINANCIAL STATEMENTS Unaudited / Continued
3. Securities Valuation (Continued)
Level 2 in the fair value hierarchy.
The table below categorizes amounts that are included in the Fund’s Statement of Assets and Liabilities at period end based on valuation input level:
| | | | | | | | | | | | | | |
| | | Level 1—
Unadjusted Quoted Prices | | | Level 2— Other Significant
Observable Inputs | | | Level 3— Significant Unobservable Inputs | | | Value |
Assets Table | | | | | | | | | | | | | | |
Investments, at Value: | | | | | | | | | | | | | | |
Common Stocks | | | | | | | | | | | | | | |
Consumer Discretionary | | $ | 674,413,826 | | | $ | 888,120,985 | | | $ | — | | | $1,562,534,811 |
Consumer Staples | | | 240,808,888 | | | | 237,580,140 | | | | — | | | 478,389,028 |
Energy | | | — | | | | 96,131,293 | | | | — | | | 96,131,293 |
Financials | | | 907,087,714 | | | | 1,231,185,777 | | | | — | | | 2,138,273,491 |
Health Care | | | 1,504,814,298 | | | | 247,928,087 | | | | 44,506,991 | | | 1,797,249,376 |
Industrials | | | 332,094,459 | | | | 1,257,903,716 | | | | — | | | 1,589,998,175 |
Information Technology | | | 1,930,844,240 | | | | 1,261,926,926 | | | | — | | | 3,192,771,166 |
Materials | | | — | | | | 104,422,293 | | | | — | | | 104,422,293 |
Preferred Stocks | | | 1,738,725 | | | | 200,616,403 | | | | — | | | 202,355,128 |
Investment Company | | | 21,989,897 | | | | — | | | | — | | | 21,989,897 |
| | | |
Total Assets | | $ | 5,613,792,047 | | | $ | 5,525,815,620 | | | $ | 44,506,991 | | | $ 11,184,114,658 |
| | | |
Forward currency exchange contracts and futures contracts, if any, are reported at their unrealized appreciation/depreciation at measurement date, which represents the change in the contract’s value from trade date. All additional assets and liabilities included in the above table are reported at their market value at measurement date.
The table below shows the transfers between Level 1 and Level 2. The Fund’s policy is to recognize transfers in and transfers out as of the beginning of the reporting period.
| | | | | | |
| | | Transfers out of Level 1* | | | Transfers into
Level 2* |
Assets Table | | | | | | |
Investments, at Value: | | | | | | |
Common Stocks | | | | | | |
Information Technology | | $ | (231,099,995 | ) | | $ 231,099,995 |
| | | |
Total Assets | | $ | (231,099,995 | ) | | $ 231,099,995 |
| | | |
* Transfers from Level 1 to Level 2 are a result of a change in pricing methodology to the use of a valuation determined based on observable market information other than quoted prices from an active market due to a lack of available unadjusted quoted prices.
4. Investments and Risks
Risks of Foreign Investing. The Fund may invest in foreign securities which are subject to special risks. Securities traded in foreign markets may be less liquid and more volatile than
38 OPPENHEIMER GLOBAL FUND
4. Investments and Risks (Continued)
those traded in U.S. markets. Foreign issuers are usually not subject to the same accounting and disclosure requirements that U.S. companies are subject to, which may make it difficult for the Fund to evaluate a foreign company’s operations or financial condition. A change in the value of a foreign currency against the U.S. dollar will result in a change in the U.S. dollar value of investments denominated in that foreign currency and in the value of any income or distributions the Fund may receive on those investments. The value of foreign investments may be affected by exchange control regulations, foreign taxes, higher transaction and other costs, delays in the settlement of transactions, changes in economic or monetary policy in the United States or abroad, expropriation or nationalization of a company’s assets, or other political and economic factors. In addition, due to the inter-relationship of global economies and financial markets, changes in political and economic factors in one country or region could adversely affect conditions in another country or region. Investments in foreign securities may also expose the Fund to time-zone arbitrage risk. Foreign securities may trade on weekends or other days when the Fund does not price its shares. At times, the Fund may emphasize investments in a particular country or region and may be subject to greater risks from adverse events that occur in that country or region. Foreign securities and foreign currencies held in foreign banks and securities depositories may be subject to limited or no regulatory oversight.
Investments in Affiliated Funds. The Fund is permitted to invest in other mutual funds advised by the Manager (“Affiliated Funds”). Affiliated Funds are open-end management investment companies registered under the 1940 Act, as amended. The Manager is the investment adviser of, and the Sub-Adviser provides investment and related advisory services to, the Affiliated Funds. When applicable, the Fund’s investments in Affiliated Funds are included in the Statement of Investments. Shares of Affiliated Funds are valued at their net asset value per share. As a shareholder, the Fund is subject to its proportional share of the Affiliated Funds’ expenses, including their management fee. The Manager will waive fees and/ or reimburse Fund expenses in an amount equal to the indirect management fees incurred through the Fund’s investment in the Affiliated Funds.
Each of the Affiliated Funds in which the Fund invests has its own investment risks, and those risks can affect the value of the Fund’s investments and therefore the value of the Fund’s shares. To the extent that the Fund invests more of its assets in one Affiliated Fund than in another, the Fund will have greater exposure to the risks of that Affiliated Fund.
Investments in Money Market Instruments. The Fund is permitted to invest its free cash balances in money market instruments to provide liquidity or for defensive purposes. The Fund may invest in money market instruments by investing in Class E shares of Oppenheimer Institutional Government Money Market Fund (“IGMMF”), which is an Affiliated Fund. IGMMF is regulated as a money market fund under the 1940 Act, as amended. The Fund may also invest in money market instruments directly or in other affiliated or unaffiliated money market funds.
Restricted Securities. At period end, investments in securities included issues that are
39 OPPENHEIMER GLOBAL FUND
NOTES TO FINANCIAL STATEMENTS Unaudited / Continued
4. Investments and Risks (Continued)
restricted. A restricted security may have a contractual restriction on its resale and is valued under methods approved by the Board of Trustees as reflecting fair value. Securities that are restricted are marked with an applicable footnote on the Statement of Investments. Restricted securities are reported on a schedule following the Statement of Investments.
Equity Security Risk. Stocks and other equity securities fluctuate in price. The value of the Fund’s portfolio may be affected by changes in the equity markets generally. Equity markets may experience significant short-term volatility and may fall sharply at times. Different markets may behave differently from each other and U.S. equity markets may move in the opposite direction from one or more foreign stock markets. Adverse events in any part of the equity or fixed-income markets may have unexpected negative effects on other market segments.
The prices of individual equity securities generally do not all move in the same direction at the same time and a variety of factors can affect the price of a particular company’s securities. These factors may include, but are not limited to, poor earnings reports, a loss of customers, litigation against the company, general unfavorable performance of the company’s sector or industry, or changes in government regulations affecting the company or its industry.
5. Market Risk Factors
The Fund’s investments in securities and/or financial derivatives may expose the Fund to various market risk factors:
Commodity Risk. Commodity risk relates to the change in value of commodities or commodity indexes as they relate to increases or decreases in the commodities market. Commodities are physical assets that have tangible properties. Examples of these types of assets are crude oil, heating oil, metals, livestock, and agricultural products.
Credit Risk. Credit risk relates to the ability of the issuer of debt to meet interest and principal payments, or both, as they come due. In general, lower-grade, higher-yield debt securities are subject to credit risk to a greater extent than lower-yield, higher-quality securities.
Equity Risk. Equity risk relates to the change in value of equity securities as they relate to increases or decreases in the general market.
Foreign Exchange Rate Risk. Foreign exchange rate risk relates to the change in the U.S. dollar value of a security held that is denominated in a foreign currency. The U.S. dollar value of a foreign currency denominated security will decrease as the dollar appreciates against the currency, while the U.S. dollar value will increase as the dollar depreciates against the currency.
Interest Rate Risk. Interest rate risk refers to the fluctuations in value of fixed-income securities resulting from the inverse relationship between price and yield. For example, an increase in general interest rates will tend to reduce the market value of already issued fixed-income investments, and a decline in general interest rates will tend to increase their value. In addition, debt securities with longer maturities, which tend to have higher yields, are subject to potentially greater fluctuations in value from changes in interest rates than
40 OPPENHEIMER GLOBAL FUND
5. Market Risk Factors (Continued)
obligations with shorter maturities.
Volatility Risk. Volatility risk refers to the magnitude of the movement, but not the direction of the movement, in a financial instrument’s price over a defined time period. Large increases or decreases in a financial instrument’s price over a relative time period typically indicate greater volatility risk, while small increases or decreases in its price typically indicate lower volatility risk.
6. Shares of Beneficial Interest
The Fund has authorized an unlimited number of no par value shares of beneficial interest of each class. Transactions in shares of beneficial interest were as follows:
| | | | | | | | | | | | | | | | |
| | | Six Months Ended March 31, 2018 | | | Year Ended September 30, 2017 | |
| | | Shares | | | Amount | | | Shares | | | Amount | |
Class A | | | | | | | | | | | | | | | | |
Sold | | | 3,989,934 | | | $ | 392,684,104 | | | | 6,433,902 | | | $ | 547,247,449 | |
Dividends and/or distributions reinvested | | | 4,238,234 | | | | 397,122,542 | | | | 541,775 | | | | 40,324,338 | |
Redeemed | | | (7,198,434 | ) | | | (705,291,662 | ) | | | (18,353,447 | ) | | | (1,507,638,731 | ) |
Net increase (decrease) | | | 1,029,734 | | | $ | 84,514,984 | | | | (11,377,770 | ) | | $ | (920,066,944 | ) |
| | | | |
| | | | | | | | | | | | | | | | |
Class B | | | | | | | | | | | | | | | | |
Sold | | | 1,150 | | | $ | 101,247 | | | | 5,274 | | | $ | 393,753 | |
Dividends and/or distributions reinvested | | | 7,132 | | | | 607,273 | | | | — | | | | — | |
Redeemed | | | (137,342 | ) | | | (12,273,757 | ) | | | (355,355 | ) | | | (26,442,222 | ) |
Net decrease | | | (129,060 | ) | | $ | (11,565,237 | ) | | | (350,081 | ) | | $ | (26,048,469 | ) |
| | | | |
| | | | | | | | | | | | | | | | |
Class C | | | | | | | | | | | | | | | | |
Sold | | | 537,434 | | | $ | 48,686,009 | | | | 564,535 | | | $ | 44,199,282 | |
Dividends and/or distributions reinvested | | | 426,723 | | | | 36,890,162 | | | | — | | | | — | |
Redeemed | | | (746,948 | ) | | | (67,506,927 | ) | | | (2,209,039 | ) | | | (168,410,408 | ) |
Net increase (decrease) | | | 217,209 | | | $ | 18,069,244 | | | | (1,644,504 | ) | | $ | (124,211,126 | ) |
| | | | |
| | | | | | | | | | | | | | | | |
Class I | | | | | | | | | | | | | | | | |
Sold | | | 4,556,232 | | | $ | 451,891,090 | | | | 4,319,849 | | | $ | 365,934,345 | |
Dividends and/or distributions reinvested | | | 755,465 | | | | 70,802,182 | | | | 95,139 | | | | 7,081,167 | |
Redeemed | | | (1,915,707 | ) | | | (188,749,090 | ) | | | (2,662,644 | ) | | | (219,186,214 | ) |
Net increase | | | 3,395,990 | | | $ | 333,944,182 | | | | 1,752,344 | | | $ | 153,829,298 | |
| | | | |
| | | | | | | | | | | | | | | | |
Class R | | | | | | | | | | | | | | | | |
Sold | | | 315,654 | | | $ | 30,903,687 | | | | 447,331 | | | $ | 37,419,785 | |
Dividends and/or distributions reinvested | | | 135,511 | | | | 12,644,541 | | | | 11,271 | | | | 835,902 | |
Redeemed | | | (361,669 | ) | | | (35,403,543 | ) | | | (875,397 | ) | | | (71,283,316 | ) |
Net increase (decrease) | | | 89,496 | | | $ | 8,144,685 | | | | (416,795 | ) | | $ | (33,027,629 | ) |
| | | | |
41 OPPENHEIMER GLOBAL FUND
NOTES TO FINANCIAL STATEMENTS Unaudited / Continued
6. Shares of Beneficial Interest (Continued)
| | | | | | | | | | | | | | | | |
| | | Six Months Ended March 31, 2018 | | | Year Ended September 30, 2017 | |
| | | Shares | | | Amount | | | Shares | | | Amount | |
Class Y | | | | | | | | | | | | | | | | |
Sold | | | 3,399,165 | | | $ | 334,273,965 | | | | 7,213,862 | | | $ | 617,609,464 | |
Dividends and/or distributions reinvested | | | 1,004,247 | | | | 94,158,133 | | | | 140,261 | | | | 10,445,234 | |
Redeemed | | | (2,399,721 | ) | | | (235,396,001 | ) | | | (6,367,906 | ) | | | (524,724,697 | ) |
Net increase | | | 2,003,691 | | | $ | 193,036,097 | | | | 986,217 | | | $ | 103,330,001 | |
| | | | | | | | | | | | | | | | |
7. Purchases and Sales of Securities
The aggregate cost of purchases and proceeds from sales of securities, other than short-term obligations and investments in IGMMF, for the reporting period were as follows:
| | | | | | | | |
| | | Purchases | | | Sales | |
Investment securities | | $ | 1,010,591,624 | | | | $957,039,050 | |
8. Fees and Other Transactions with Affiliates
Management Fees. Under the investment advisory agreement, the Fund pays the Manager a management fee based on the daily net assets of the Fund at an annual rate as shown in the following table:
| | | | | |
| Fee Schedule | | |
Up to $250 million | | | | 0.80% | |
Next $250 million | | | | 0.77 | |
Next $500 million | | | | 0.75 | |
Next $1.0 billion | | | | 0.69 | |
Next $1.5 billion | | | | 0.67 | |
Next $2.5 billion | | | | 0.65 | |
Next $2.5 billion | | | | 0.63 | |
Next $2.5 billion | | | | 0.60 | |
Next $4.0 billion | | | | 0.58 | |
Next $8.0 billion | | | | 0.56 | |
Over $23.0 billion | | | | 0.54 | |
The Fund’s effective management fee for the reporting period was 0.65% of average annual net assets before any applicable waivers.
Sub-Adviser Fees. The Manager has retained the Sub-Adviser to provide the day-to-day portfolio management of the Fund. Under the Sub-Advisory Agreement, the Manager pays the Sub-Adviser an annual fee in monthly installments, equal to a percentage of the investment management fee collected by the Manager from the Fund, which shall be calculated after any investment management fee waivers. The fee paid to the Sub-Adviser is paid by the Manager, not by the Fund.
Transfer Agent Fees. OFI Global (the “Transfer Agent”) serves as the transfer and shareholder servicing agent for the Fund. The Fund pays the Transfer Agent a fee based on
42 OPPENHEIMER GLOBAL FUND
8. Fees and Other Transactions with Affiliates (Continued)
annual net assets, which shall be calculated after any applicable fee waivers. Fees incurred and average net assets for each class with respect to these services are detailed in the Statement of Operations and Financial Highlights, respectively.
Sub-Transfer Agent Fees. The Transfer Agent has retained Shareholder Services, Inc., a wholly-owned subsidiary of OFI (the “Sub-Transfer Agent”), to provide the day-to-day transfer agent and shareholder servicing of the Fund. Under the Sub-Transfer Agency Agreement, the Transfer Agent pays the Sub-Transfer Agent an annual fee in monthly installments, equal to a percentage of the transfer agent fee collected by the Transfer Agent from the Fund, which shall be calculated after any applicable fee waivers. The fee paid to the Sub-Transfer Agent is paid by the Transfer Agent, not by the Fund.
Trustees’ Compensation. The Fund has adopted an unfunded retirement plan (the “Plan”) for the Fund’s Independent Trustees. Benefits are based on years of service and fees paid to each Trustee during their period of service. The Plan was frozen with respect to adding new participants effective December 31, 2006 (the “Freeze Date”) and existing Plan Participants as of the Freeze Date will continue to receive accrued benefits under the Plan. Active Independent Trustees as of the Freeze Date have each elected a distribution method with respect to their benefits under the Plan.
During the reporting period, the Fund’s projected benefit obligations, payments to retired Trustees and accumulated liability were as follows:
| | | | |
Projected Benefit Obligations Increased | | | $ — | |
Payments Made to Retired Trustees | | | 91,940 | |
Accumulated Liability as of March 31, 2018 | | | 792,819 | |
The Fund’s Board of Trustees (“Board”) has adopted a compensation deferral plan for Independent Trustees that enables Trustees to elect to defer receipt of all or a portion of the annual compensation they are entitled to receive from the Fund. For purposes of determining the amount owed to the Trustee under the plan, deferred amounts are treated as though equal dollar amounts had been invested in shares of the Fund or in other Oppenheimer funds selected by the Trustee. The Fund purchases shares of the funds selected for deferral by the Trustee in amounts equal to his or her deemed investment, resulting in a Fund asset equal to the deferred compensation liability. Such assets are included as a component of “Other” within the asset section of the Statement of Assets and Liabilities. Deferral of Trustees’ fees under the plan will not affect the net assets of the Fund and will not materially affect the Fund’s assets, liabilities or net investment income per share. Amounts will be deferred until distributed in accordance with the compensation deferral plan.
Distribution and Service Plan (12b-1) Fees. Under its General Distributor’s Agreement with the Fund, OppenheimerFunds Distributor, Inc. (the “Distributor”) acts as the Fund’s principal underwriter in the continuous public offering of the Fund’s classes of shares.
43 OPPENHEIMER GLOBAL FUND
NOTES TO FINANCIAL STATEMENTS Unaudited / Continued
8. Fees and Other Transactions with Affiliates (Continued)
Service Plan for Class A Shares. The Fund has adopted a Service Plan (the “Plan”) for Class A shares pursuant to Rule 12b-1 under the 1940 Act. Under the Plan, the Fund reimburses the Distributor for a portion of its costs incurred for services provided to accounts that hold Class A shares. Reimbursement is made periodically at an annual rate of up to 0.25% of the daily net assets of Class A shares of the Fund. The Distributor currently uses all of those fees to pay dealers, brokers, banks and other financial institutions periodically for providing personal service and maintenance of accounts of their customers that hold Class A shares. Any unreimbursed expenses the Distributor incurs with respect to Class A shares in any fiscal year cannot be recovered in subsequent periods. Fees incurred by the Fund under the Plan are detailed in the Statement of Operations.
Distribution and Service Plans for Class B, Class C and Class R Shares. The Fund has adopted Distribution and Service Plans (the “Plans”) for Class B, Class C and Class R shares pursuant to Rule 12b-1 under the 1940 Act to compensate the Distributor for distributing those share classes, maintaining accounts and providing shareholder services. Under the Plans, the Fund pays the Distributor an annual asset-based sales charge of 0.75% on Class B and Class C shares’ daily net assets and 0.25% on Class R shares’ daily net assets. The Fund also pays a service fee under the Plans at an annual rate of 0.25% of daily net assets. The Plans continue in effect from year to year only if the Fund’s Board of Trustees votes annually to approve their continuance at an in person meeting called for that purpose. Fees incurred by the Fund under the Plans are detailed in the Statement of Operations.
Sales Charges. Front-end sales charges and CDSC do not represent expenses of the Fund. They are deducted from the proceeds of sales of Fund shares prior to investment or from redemption proceeds prior to remittance, as applicable. The sales charges retained by the Distributor from the sale of shares and the CDSC retained by the Distributor on the redemption of shares is shown in the following table for the period indicated.
| | | | | | | | | | | | | | | | | | | | |
| Six Months Ended | | Class A
Front-End
Sales Charges
Retained by
Distributor | | | Class A
Contingent
Deferred
Sales Charges
Retained by
Distributor | | | Class B
Contingent
Deferred
Sales Charges
Retained by
Distributor | | | Class C
Contingent
Deferred
Sales Charges
Retained by
Distributor | | | Class R
Contingent
Deferred
Sales Charges
Retained by
Distributor | |
March 31, 2018 | | | $396,723 | | | | $2,247 | | | | $2,558 | | | | $13,611 | | | | $— | |
Waivers and Reimbursements of Expenses. Effective for the period January 1, 2017 through December 31, 2017, the Transfer Agent voluntarily waived and/or reimbursed Fund expenses in an amount equal to 0.015% of average annual net assets for Classes A, B, C, R and Y.
During the reporting period, the Transfer Agent waived fees and/or reimbursed the Fund for transfer agent and shareholder servicing agent fees as follows:
44 OPPENHEIMER GLOBAL FUND
8. Fees and Other Transactions with Affiliates (Continued)
| | | | |
Class A | | | $272,840 | |
Class B | | | 488 | |
Class C | | | 25,179 | |
Class R | | | 8,898 | |
Class Y | | | 63,415 | |
The Manager will waive fees and/or reimburse Fund expenses in an amount equal to the indirect management fees incurred through the Fund’s investment in IGMMF. During the reporting period, the Manager waived fees and/or reimbursed the Fund $52,816 for IGMMF management fees. This fee waiver and/or expense reimbursement may not be amended or withdrawn for one year from the date of the Fund’s prospectus, unless approved by the Board.
9. Borrowings and Other Financing
Joint Credit Facility. A number of mutual funds managed by the Manager participate in a $1.875 billion revolving credit facility (the “Facility”) intended to provide short-term financing, if necessary, subject to certain restrictions in connection with atypical redemption activity. Expenses and fees related to the Facility are paid by the participating funds and are disclosed separately or as other expenses on the Statement of Operations. The Fund did not utilize the Facility during the reporting period.
10. Prior Period Reclassification
An adjustment to reflect a prior period reclassification between net investment income and net change in unrealized appreciation (depreciation) on investments and/or net realized gain (loss) on investments during the years ending September 30, 2013, 2014 and 2015 has been made to properly reflect income distributions received by the Fund from two of its investments.
The following adjustments are reflected in the respective fiscal years in the Statements of Changes in Net Assets and the Financial Highlights:
| | | | | | | | | | | | |
| | | 2013 | | | 2014 | | | 2015 | |
Net investment income (loss) | | | $3,724,100 | | | | 5,397,233 | | | | $6,584,912 | |
Net realized income (loss) on investments | | | — | | | | (1,416,825) | | | | — | |
Net unrealized change in appreciation (depreciation) | | | (3,724,100) | | | | (3,980,408) | | | | (6,584,912) | |
The cumulative impact of these adjustments also are reflected in the respective component of net assets on the Statement of Assets and liabilities and had no impact on total net assets or net asset values per share of the Fund.
45 OPPENHEIMER GLOBAL FUND
PORTFOLIO PROXY VOTING POLICIES AND GUIDELINES;
UPDATES TO STATEMENT OF INVESTMENTS Unaudited
The Fund has adopted Portfolio Proxy Voting Policies and Guidelines under which the Fund votes proxies relating to securities (“portfolio proxies”) held by the Fund. A description of the Fund’s Portfolio Proxy Voting Policies and Guidelines is available (i) without charge, upon request, by calling the Fund toll-free at 1.800.CALL OPP (225.5677), (ii) on the Fund’s website at www.oppenheimerfunds.com, and (iii) on the SEC’s website at www.sec.gov. In addition, the Fund is required to file Form N-PX, with its complete proxy voting record for the 12 months ended June 30th, no later than August 31st of each year. The Fund’s voting record is available (i) without charge, upon request, by calling the Fund toll-free at 1.800.CALL OPP (225.5677), and (ii) in the Form N-PX filing on the SEC’s website at www.sec.gov.
The Fund files its complete schedule of portfolio holdings with the SEC for the first quarter and the third quarter of each fiscal year on Form N-Q. The Fund’s Form N-Q filings are available on the SEC’s website at www.sec.gov. Those forms may be reviewed and copied at the SEC’s Public Reference Room in Washington, D.C. Information on the operation of the Public Reference Room may be obtained by calling 1-800-SEC-0330.
Householding—Delivery of Shareholder Documents
This is to inform you about OppenheimerFunds’ “householding” policy. If more than one member of your household maintains an account in a particular fund, OppenheimerFunds will mail only one copy of the fund’s prospectus (or, if available, the fund’s summary prospectus), annual and semiannual report and privacy policy. The consolidation of these mailings, called householding, benefits your fund through reduced mailing expense, and benefits you by reducing the volume of mail you receive from OppenheimerFunds. Householding does not affect the delivery of your account statements.
Please note that we will continue to household these mailings for as long as you remain an OppenheimerFunds shareholder, unless you request otherwise. If you prefer to receive multiple copies of these materials, please call us at 1.800.CALL-OPP (225-5677). You may also notify us in writing or via email. We will begin sending you individual copies of the prospectus (or, if available, the summary prospectus), reports and privacy policy within 30 days of receiving your request to stop householding.
46 OPPENHEIMER GLOBAL FUND
DISTRIBUTION SOURCES Unaudited
For any distribution that took place over the last six months of the Fund’s reporting period, the table below details on a per-share basis the percentage of the Fund’s total distribution payment amount that was derived from the following sources: net income, net profit from the sale of securities, and other capital sources. Other capital sources represent a return of capital. A return of capital may occur, for example, when some or all of the money that you invested in the Fund is paid back to you. A return of capital distribution does not necessarily reflect the Fund’s investment performance and should not be confused with “yield” or “income.” You should not draw any conclusions about each Fund’s investment performance from the amounts of these distributions. This information is based upon income and capital gains using generally accepted accounting principles as of the date of each distribution. Because the Fund is actively managed, the relative amount of the Fund’s total distributions derived from various sources over the calendar year may change. Please note that this information should not be used for tax reporting purposes as the tax character of distributable income may differ from the amounts used for this notification. You will receive IRS tax forms in the first quarter of each calendar year detailing the actual amount of the taxable and non-taxable portion of distributions paid to you during the tax year.
For the most current information, please go to oppenheimerfunds.com. Select your Fund, and scroll down to the ‘Dividends’ table under ‘Analytics’. The Fund’s latest distribution information will be followed by the sources of any distribution, updated daily.
| | | | | | | | | | | | | | | | |
| Fund Name | | Pay
Date | | | Net Income | | | Net Profit
from Sale | | | Other
Capital
Sources | |
Oppenheimer Global Fund | | | 12/6/17 | | | | 5.1% | | | | 90.1% | | | | 4.8% | |
47 OPPENHEIMER GLOBAL FUND
OPPENHEIMER GLOBAL FUND
| | |
| Trustees and Officers | | Brian F. Wruble, Chairman of the Board of Trustees and Trustee |
| | Beth Ann Brown, Trustee |
| | Edmund P. Giambastiani, Jr., Trustee |
| | Elizabeth Krentzman, Trustee |
| | Mary F. Miller, Trustee |
| | Joel W. Motley, Trustee |
| | Joanne Pace, Trustee |
| | Daniel Vandivort, Trustee |
| | Arthur P. Steinmetz, Trustee, President and Principal Executive Officer |
| | Rajeev Bhaman, Vice President |
| | John Delano, Vice President |
| | Cynthia Lo Bessette, Secretary and Chief Legal Officer |
| | Jennifer Foxson, Vice President and Chief Business Officer |
| | Mary Ann Picciotto, Chief Compliance Officer and Chief Anti-Money |
| | Laundering Officer |
| | Brian S. Petersen, Treasurer and Principal Financial & Accounting Officer |
| |
| Manager | | OFI Global Asset Management, Inc. |
| |
| Sub-Adviser | | OppenheimerFunds, Inc. |
| |
| Distributor | | OppenheimerFunds Distributor, Inc. |
| |
| Transfer and Shareholder Servicing Agent | | OFI Global Asset Management, Inc. |
| |
| Sub-Transfer Agent | | Shareholder Services, Inc. |
| | DBA OppenheimerFunds Services |
| |
Independent Registered Public Accounting Firm | | KPMG LLP |
| |
| Legal Counsel | | Kramer Levin Naftalis & Frankel LLP |
| |
| | The financial statements included herein have been taken from the records of the Fund without examination of those records by the independent registered public accounting firm. |
© 2018 OppenheimerFunds, Inc. All rights reserved.
48 OPPENHEIMER GLOBAL FUND
PRIVACY NOTICE
As an Oppenheimer fund shareholder, you are entitled to know how we protect your personal information and how we limit its disclosure.
Information Sources
We obtain non-public personal information about our shareholders from the following sources:
| · | | Applications or other forms. |
| · | | When you create a user ID and password for online account access. |
| · | | When you enroll in eDocs Direct,SM our electronic document delivery service. |
| · | | Your transactions with us, our affiliates or others. |
| · | | Technologies on our website, including: “cookies” and web beacons, which are used to collect data on the pages you visit and the features you use. |
If you visit oppenheimerfunds.com and do not log on to the secure account information areas, we do not obtain any personal information about you. When you do log on to a secure area, we do obtain your user ID and password to identify you. We also use this information to provide you with products and services you have requested, to inform you about products and services that you may be interested in and assist you in other ways.
We do not collect personal information through our website unless you willingly provide it to us, either directly by email or in those areas of the website that request information. In order to update your personal information (including your mailing address, email address and phone number) you must first log on and visit your user profile.
If you have set your browser to warn you before accepting cookies, you will receive the warning message with each cookie. You can refuse cookies by turning them off in your browser. However, doing so may limit your access to certain sections of our website.
We use cookies to help us improve and manage our website. For example, cookies help us recognize new versus repeat visitors to the site, track the pages visited, and enable some special features on the website. This data helps us provide better service for our website visitors.
Protection of Information
We do not disclose any non-public personal information (such as names on a customer list) about current or former customers to anyone, except as permitted by law.
Disclosure of Information
Copies of confirmations, account statements and other documents reporting activity in your fund accounts are made available to your financial advisor (as designated by you). We may also use details about you and your investments to help us, our financial service affiliates, or firms that jointly market their financial products and services with ours, to better serve your investment needs or suggest educational material that may be of interest to you. If this requires us to provide you with an opportunity to “opt in” or “opt out” of such information sharing with a firm not affiliated with us, you will receive notification on how to do so, before any such sharing takes place.
Right of Refusal
We will not disclose your personal information to unaffiliated third parties (except as permitted by law), unless we first offer you a reasonable opportunity to refuse or “opt out” of such disclosure.
49 OPPENHEIMER GLOBAL FUND
PRIVACY NOTICE Continued
Internet Security and Encryption
In general, the email services provided by our website are encrypted and provide a secure and private means of communication with us. To protect your own privacy, confidential and/ or personal information should only be communicated via email when you are advised that you are using a secure website.
As a security measure, we do not include personal or account information in non-secure emails, and we advise you not to send such information to us in non-secure emails. Instead, you may take advantage of the secure features of our website to encrypt your email correspondence. To do this, you will need to use a browser that supports Secure Sockets Layer (SSL) protocol.
| · | | All transactions conducted via our websites, including redemptions, exchanges and purchases, are secured by the highest encryption standards available. SSL is used to establish a secure connection between your PC and OppenheimerFunds’ server. It transmits information in an encrypted and scrambled format. |
| · | | Encryption is achieved through an electronic scrambling technology that uses a “key” to code and then decode the data. Encryption acts like the cable converter box you may have on your television set. It scrambles data with a secret code so that no one can make sense of it while it is being transmitted. When the data reaches its destination, the same software unscrambles the data. |
| · | | You can exit the secure area by closing your browser or, for added security, you can use the Log Out button before you close your browser. |
Other Security Measures
We maintain physical, electronic and procedural safeguards to protect your personal account information. Our employees and agents have access to that information only so that they may offer you products or provide services, for example, when responding to your account questions.
How You Can Help
You can also do your part to keep your account information private and to prevent unauthorized transactions. If you obtain a user ID and password for your account, safeguard that information. Strengthening your online credentials–your online security profile–typically your user name, password, and security questions and answers, can be one of your most important lines of defense on the Internet. For additional information on how you can help prevent identity theft, visit https://www.oppenheimerfunds.com/security.
Who We Are
This joint notice describes the privacy policies of the Oppenheimer funds, OppenheimerFunds, Inc., each of its investment adviser subsidiaries, OppenheimerFunds Distributor, Inc. and OFI Global Trust Co. It applies to all Oppenheimer fund accounts you presently have, or may open in the future, using your Social Security number—whether or not you remain a shareholder of our funds. This notice was last updated as of November 2017. In the event it is updated or changed, we will post an updated notice on our website at oppenheimerfunds.com. If you have any questions about this privacy policy, email us by clicking on the Contact Us section of our website at oppenheimerfunds.com, write to us at P.O. Box 5270, Denver, CO 80217-5270, or call us at 800 CALL OPP (225 5677).
50 OPPENHEIMER GLOBAL FUND
THIS PAGE INTENTIONALLY LEFT BLANK.
51 OPPENHEIMER GLOBAL FUND
THIS PAGE INTENTIONALLY LEFT BLANK.
52 OPPENHEIMER GLOBAL FUND
THIS PAGE INTENTIONALLY LEFT BLANK.
53 OPPENHEIMER GLOBAL FUND
THIS PAGE INTENTIONALLY LEFT BLANK.
54 OPPENHEIMER GLOBAL FUND
THIS PAGE INTENTIONALLY LEFT BLANK.
55 OPPENHEIMER GLOBAL FUND
| | | | |
| | 
| | |
| | Visit us at oppenheimerfunds.com for 24-hr access to account information and transactions or call us at 800.CALL OPP (800.225.5677) for 24-hr automated information and automated transactions. Representatives also available Mon–Fri 8am-8pm ET. | | |
Visit Us oppenheimerfunds.com Call Us 800 225 5677 Follow Us | | | | |

| | Oppenheimer funds are distributed by OppenheimerFunds Distributor, Inc. 225 Liberty Street, New York, NY 10281-1008 © 2018 OppenheimerFunds Distributor, Inc. All rights reserved. RS0330.001.0318 May 25, 2018 | | |
Item 2. Code of Ethics.
Not applicable to semiannual reports.
Item 3. Audit Committee Financial Expert.
Not applicable to semiannual reports.
Item 4. Principal Accountant Fees and Services.
Not applicable to semiannual reports.
Item 5. Audit Committee of Listed Registrants
Not applicable.
Item 6. Schedule of Investments.
a) Not applicable. The complete schedule of investments is included in Item 1 of this Form N-CSR.
b) Not applicable.
Item 7. Disclosure of Proxy Voting Policies and Procedures for Closed-End Management Investment Companies.
Not applicable.
Item 8. Portfolio Managers of Closed-End Management Investment Companies.
Not applicable.
Item 9. Purchases of Equity Securities by Closed-End Management Investment Company and Affiliated Purchasers.
Not applicable.
Item 10. Submission of Matters to a Vote of Security Holders.
The Fund’s Governance Committee Provisions with Respect to Nominations of Directors/Trustees to the Respective Boards
None
Item 11. Controls and Procedures.
Based on their evaluation of the registrant’s disclosure controls and procedures (as defined in rule 30a-3(c) under the Investment Company Act of 1940 (17 CFR 270.30a-3(c)) as of 3/31/2018, the registrant’s principal executive officer and principal financial officer found the registrant’s disclosure controls and procedures to provide reasonable assurances that information required to be disclosed by the registrant in the reports that it files under the Securities Exchange Act of 1934 (a) is accumulated and communicated to registrant’s management, including its principal executive officer and principal financial officer, to allow timely decisions regarding required disclosure, and (b) is recorded, processed, summarized and reported, within the time periods specified in the rules and forms adopted by the U.S. Securities and Exchange Commission.
There have been no changes in the registrant’s internal controls over financial reporting that occurred during the registrant’s second fiscal quarter of the period covered by this report that have materially affected, or are reasonably likely to materially affect, the registrant’s internal control over financial reporting.
Item 12. Disclosure of Securities Lending Activities for Closed-End Management Investment Companies.
Not applicable.
Item 13. Exhibits.
(a) (1) Exhibit attached hereto.
(2) Exhibits attached hereto.
SIGNATURES
Pursuant to the requirements of the Securities Exchange Act of 1934 and the Investment Company Act of 1940, the registrant has duly caused this report to be signed on its behalf by the undersigned, thereunto duly authorized.
Oppenheimer Global Fund
| | |
| By: | | /s/ Arthur P. Steinmetz |
| | | Arthur P. Steinmetz |
| | | Principal Executive Officer |
| Date: | | 5/18/2018 |
Pursuant to the requirements of the Securities Exchange Act of 1934 and the Investment Company Act of 1940, this report has been signed below by the following persons on behalf of the registrant and in the capacities and on the dates indicated.
| | |
| By: | | /s/ Arthur P. Steinmetz |
| | | Arthur P. Steinmetz |
| | | Principal Executive Officer |
| Date: | | 5/18/2018 |
| By: | | /s/ Brian S. Petersen |
| | | Brian S. Petersen |
| | | Principal Financial Officer |
| Date: | | 5/18/2018 |