UNITED STATES
SECURITIES AND EXCHANGE COMMISSION
Washington, D.C. 20549
FORM N-CSR
CERTIFIED SHAREHOLDER REPORT OF REGISTERED
MANAGEMENT INVESTMENT COMPANIES
Investment Company Act file number: 811-04033
Sit Mutual Funds II, Inc.
(Exact name of registrant as specified in charter)
3300 IDS Center
80 South Eighth Street
Minneapolis, MN 55402
(Address of principal executive offices)
Paul E. Rasmussen, VP Treasurer
Sit Mutual Funds, Inc.
3300 IDS Center
80 South Eighth Street
Minneapolis, MN 55402
(Name and address of agent for service)
Copy to:
Mike Radmer, Esq.
Dorsey & Whitney
Suite 1500
50 South Sixth Street
Minneapolis, MN 55402-1498
Registrant’s telephone number, including area code:
(612) 334-5888
Date of fiscal year end: March 31, 2011
Date of reporting period: September 30, 2010
Item 1: Reports to Stockholders

|
Sit Mutual Funds HIGH INCOME MUNICIPAL BOND FUND SEMI-ANNUAL REPORT TABLE OF CONTENTS |
| | | | |
| | | Page | |
| |
Chairman’s Letter | | | 2 | |
| |
Fund Review and Schedule of Investments | | | 4 | |
| |
Statement of Assets and Liabilities | | | 16 | |
| |
Statement of Operations | | | 17 | |
| |
Statements of Changes in Net Assets | | | 18 | |
| |
Financial Highlights | | | 19 | |
| |
Notes to Financial Statements | | | 20 | |
| |
Expense Example | | | 23 | |
| |
Additional Information | | | 24 | |
This document must be preceded or accompanied by a Prospectus.
CHAIRMAN’S LETTER
Six Months Ended September 30, 2010
Dear fellow shareholders:
U.S. fixed-income markets continued to post strong performance during the six-month period, driven by the uncertain state of the economy and mixed signs of improvement in selected economic sectors. Slowing economic growth resulted in market expectations that the Federal Reserve will not only keep the federal funds rate very low for an extended period of time, but that another round of “quantitative easing” (QE2) in the form of large-scale asset purchases will be undertaken to keep the economic recovery on track and allay fears of a double-dip recession.
Taxable bond yields declined and the yield curve continued to flatten during the six-month period, as shorter-term yields approached historic absolute lows and longer-term yields declined. Specifically, the 2-year maturity U.S. Treasury note yield decreased 60 basis points to 0.42%, while the 30-year U.S. Treasury bond yield decreased 102 basis points to 3.69%. Most taxable bond sectors provided strong returns, with the commercial mortgage-backed sector performing best, as businesses recorded increasing profits and high levels of cash, followed by the longer-duration corporate sector, where financials performed particularly well. The U.S. Treasury sector also provided strong returns, as continued rhetoric from the Fed regarding additional Treasury bond purchases supported prices in that sector. Returns on asset-backed securities basically matched those of the Aggregate Index and were led by the credit card sector. The mortgage-backed securities sector underperformed due to its shorter duration.
Tax-exempt municipal bond yields also declined during the six-month period. Long-term municipal yields fell to below the 4.90% level by the end of August, a range not sustained since the first quarter of 2008. The Bond Buyer 40-Bond Index yield ended the period 39 basis points lower, at 4.87%. Positive bond fund flows and light issuance contributed to the continued decline in yields. Tax-exempt municipals provided strong returns, with longer maturity and lower-rated bonds seeing the greatest price strength as investors sought out their attractive absolute yields. Among revenue bonds, the longer duration industrial revenue, special tax and hospital sectors posted the best performance, while shorter duration prerefunded bonds lagged.
Turning to the U.S. economy, second quarter 2010 real GDP growth was +1.7%, and showed continued deceleration from the +3.7% and +5.0% growth rates posted in the first quarter of 2010 and the fourth quarter of 2009, respectively. Revisions going into the final second quarter figure included stronger consumer spending and greater inventory accumulation, which were offset by faster import growth and lower government spending, particularly at the state and local level. In the second quarter of 2010, the residential investment component recorded its first year-over-year gain in many quarters. Reports suggest that housing demand has stabilized, after hitting bottom following the expiration of the homebuyer tax credit, and mortgage rates are now at record lows. In addition, the August Institute of Supply Management’s (ISM) Manufacturing Index report indicates that the manufacturing sector is slowing, but remains expansionary.
Consumer spending grew in August, buoyed by higher personal income. However, the increase in wages, in part, reflected an extension of unemployment benefits that has resulted in a record level of “transfer” payments, in aggregate totaling 18.5% of personal income. We believe that the consumer remains the key economic driver; thus, employment trends will continue to be the dominant factor affecting the prospects for recovery. While job creation has been positive, the number of jobs created year to date has only averaged 68,000 per month and represents a small fraction (i.e., less than 10%) of the jobs lost in 2008 and 2009. As such, economists project the unemployment rate, currently at 9.6%, will average at least 9% through 2011.
Inflation is expected to remain subdued, as the slowing pace of economic recovery has limited companies’ ability to pass along higher commodity and other costs. In fact, deflation is a bigger concern of monetary authorities, as revealed in the Fed’s September 21st policy statement.
Regarding the fiscal outlook, with only September remaining to be reported, the Congressional Budget Office estimates that the federal deficit was slightly less than $1.3 trillion in fiscal year 2010, compared with a deficit of slightly more than $1.4 trillion in 2009. Receipts have generally been higher, reflecting improved economic conditions (as well as the Fed’s remittances of earnings on its huge portfolio of assets), while spending outlays on the financial crisis were lower versus the prior year. Looking forward, the deficit for fiscal 2011 will probably be smaller, but not significantly smaller, than fiscal 2010. Any decline in the fiscal 2011 deficit will depend heavily on whether Congress extends any or all of the Bush tax cuts beyond this year. Allowing all of the Bush tax cuts to expire on schedule would raise just under $200 billion in revenue in fiscal 2011, according to Treasury estimates.
Congress returns for a “lame duck” session on November 15th with less than seven working weeks through the end of the year to pass legislation. How much of Congress’ vast agenda will get done when it reconvenes is debatable and very dependent on the outcome of the elections. Pundits believe that the Republican Party is likely to retake leadership of the House and, possibly, the Senate. If so, Republicans would get significant input into what passes after the election; this will either result in gridlock or bipartisanship, depending on which side “blinks” first. Any bill that is still pending at the end of the congressional session dies, forcing lawmakers to start from scratch, reintroducing it at the start of a new two-year term.
The Federal Reserve’s U.S. trade-weighted major currencies dollar index was down -5.1% from its recent peak in June 2010, as the slowing U.S. economic recovery refocused attention on our country’s economic and fiscal problems, and away from Europe’s economic and social woes. The U.S. greenback is now trading at new lows relative to the yen and other major currencies. Expectations that the Fed will pursue another round of quantitative easing have
| | |
| 2 | | SIT MUTUAL FUNDS SEMI-ANNUAL REPORT |
exacerbated the U.S. dollar’s decline, as well as driven the price of gold to a record high and U.S. stocks to a five-month high.
Strategy Summary
The Federal Reserve is expected to restart a bond-buying program after the Federal Open Market Committee (FOMC) meets on November 2nd-3rd. Predictions focus on a liquidity injection of up to $1 trillion over roughly 12 months using an “incremental” approach to quantitative easing. In other words, rather than announce massive bond purchases with a finite end to shock the U.S. financial system back to life as they did in 2009, Fed officials are considering a more open-ended, smaller-scale program that can be adjusted as the recovery unfolds. The risk is that markets may be disappointed if they don’t perceive the total amount of purchases to be substantial enough. In this environment, we expect subpar economic growth (i.e., 2.0%) over the next few quarters, followed by a slight acceleration (i.e., 2.5%) in the second half of 2011, as consumer spending remains subdued. These assumptions yield annual growth rates of +2.7% in 2010 and +2.1% in 2011, compared with -2.6% in 2009.
Looking forward, we continue to believe that the Fed’s massive monetary stimulus plan is likely to result in a modestly positive inflationary environment in the intermediate term, and that, combined with a potentially positive surprise in the residential housing market next year from the currently dire outlook, is likely to push interest rates higher. As such, we believe U.S. Treasury securities should be underweighted due to their currently low absolute yields. We continue to focus on older vintage, high-coupon, agency mortgage pass-through securities that provide high levels of income at stable price levels.
While some initiatives would have or did make things worse, the popular TALF program morphed in such a way that it rejuvenated auto loan and credit card financing. It’s no surprise that going from an environment in which no car loans were available at any rate to normalized access to financing at 4% has caused car sales to continue to recover well after the “Cash For Clunkers” program ended. One can simply compare the dismal 2008 and improving 2009 holiday season spending to see the impact from renewed credit card lending and increased consumer confidence. Access to the bond market and other lending sources for corporations, banks in particular, has greatly improved profit expectations for 2010.
Demand for tax-exempt municipals has continued to benefit from the relative reduction in new issue supply that has resulted from the shift toward taxable BuildAmerica Bonds (BABs), which has doubled in volume since one year ago. Year to date, approximately one-third of municipal new issuance continues to be taxable. Legislation to extend the issuance of the Build America Bonds program remains in negotiations. While we believe the BAB extension will eventually pass, the surrounding uncertainty could result in temporary supply imbalances and dislocations in yields, particularly if issuers decide to push BAB issuance forward, prior to the current program’s expiration on December 31st, 2010, or if extension efforts fail and the market sees a resurgence in tax-exempt issuance.
As of September 30th, relative yield ratios of high grade municipals to Treasuries remained at the cheap end of their longer term historical valuation ranges and, more importantly, relative yield ratios of lower-rated, investment grade municipals to Treasuries continued to be very attractively valued. Although credit spreads for lower-rated bonds have narrowed substantially over the past year, we believe the absolute yields offered by these bonds remain attractive. We believe that the tax-exempt yield curve will continue to flatten and that credit spreads on lower-rated bonds will continue to narrow, particularly as investors seek out alternatives to very low short-term yields. While fiscal stresses continue to make headlines, we believe that issuance trends will have a greater impact on tax-exempt yield levels than credit concerns. We believe a broad-based crisis will be averted as municipalities eventually successfully address projected budget gaps with tax increases and reduced spending, including pension reform. In addition, we expect revenue streams to gradually improve as the economic recovery stabilizes. As always, diversification remains a key factor in managing risk.
We appreciate your continued interest in the Sit family of funds. With best wishes,

Roger J. Sit
Chairman and President
Sit Mutual Funds
|
Sit High Income Municipal Bond Fund |
OBJECTIVE & STRATEGY
The Fund seeks high current income that is exempt from federal regular income tax. The Fund seeks to achieve its objective by investing primarily in municipal securities that generate interest income that is exempt from regular federal income tax. During normal market conditions, the Fund invests 100% (and, as a fundamental policy, no less than 80%) of its net assets in such tax-exempt municipal securities.
The Fund provided investors with a +6.73% total return for the six months ended September 30, 2010 compared to a +5.50% return for the Barclays Municipal Bond Index. As of September 30, 2010, the Fund’s 30-day SEC yield remains attractive at 4.92%, and its 12-month distribution rate was 4.98%.
The tax-exempt bond yield curve has flattened considerably over the past six months. While short rates were relatively unchanged at very low levels, long-term yields fell nearly 50 basis points, mainly due to strong mutual fund inflows, the continuing effects of Build America Bonds (BABs), which reduced tax-exempt bond supply in the marketplace, and the continued appetite for risk among tax-exempt bond investors. Spreads tightened considerably for lower-rated and non-rated credits during the period. Much of the spread tightening was a result of investors’ quest for yield rather than improving credit fundamentals. This tightening has now mostly, but not completely, retraced the widening that occurred from mid-2007, the beginning of the liquidity and credit crisis, through 2008. Total tax-exempt issuance has increased from the depressed levels of 2008, but remains moderate because BABs and other taxable municipal bonds are soaking up approximately 30% of municipal issuance. The Fed is likely on the sidelines in terms of interest rate policy until mid to late 2011 or early 2012. The Fed will need to see sustainable positive growth, a significantly improving employment picture, and/or a fanning of inflation to start to raise short-term interest rates. We do not expect to see any of these until mid-2011 at the earliest. The Fund’s net asset value rose during this period from $8.72 at March 31, 2010 to $9.08 at September 30, 2010. The Fund experienced an increase in net assets over the period to approximately $90 million, up from $70 million.
The Fund’s most significant investments during the period were in the healthcare (primarily hospitals) sector (23%), the multi-family housing (primarily senior living) sector (14%), the other revenue (primarily tax increment financing and land-secured) sector (15%), and the education (primarily charter schools) sector (15%). The sector overweight in education was responsible for much of the Fund’s outperformance during the period. The Fund will maintain significant weightings in these sectors going forward, but the weightings should decrease somewhat as the Fund grows and becomes more diversified. Over 350 credits (over 70% of which were rated) in forty-seven states and territories were held in the Fund as of September 30, 2010. The Fund’s overall credit quality has remained BBB.
HYPOTHETICAL GROWTH OF $10,000
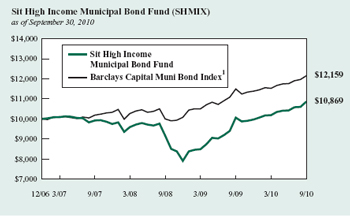
The chart above illustrates the total value of a hypothetical $10,000 investment in the Fund over the past 10 years (or for the life of the Fund if shorter) as compared to the performance of the Barclays Capital Municipal Bond Index. Past performance does not guarantee future results. Returns include the reinvestment of distributions. The chart does not reflect the deduction of taxes that a shareholder would pay on Fund distributions or the redemption of Fund shares.
1 The Barclays Capital Municipal Bond Index is an unmanaged, rules-based, market-value-weighted index for the long-term tax-exempt bond market. The index includes bonds with a minimum credit rating of BBB. The returns include the reinvestment of income and do not include any transaction costs, management fees or other costs. It is not possible to invest directly in an index.
We expect duration to remain relatively steady over the next six to twelve months. Demand should remain robust for lower-rated and non-rated bonds, as after-tax yields on these securities far exceed most opportunities available in the taxable market. This market anomaly, with long tax-exempt bonds yielding more than comparable maturity U.S. Treasuries, should benefit the Fund’s performance until this relationship normalizes. In the coming year, the Fund will likely see a significant increase in the emphasis on non-rated credits as their availability in the marketplace increases.
Michael C. Brilley
Debra A. Sit, CFA
Paul J. Jungquist, CFA
Portfolio Managers
| | |
| 4 | | SIT MUTUAL FUNDS SEMI-ANNUAL REPORT |
COMPARATIVE RATES OF RETURN
as of September 30, 2010
| | | | | | | | |
| | | Six
Month | | One Year | | Three
Year | | Since
Inception
(12/31/06) |
Sit High Income Municipal Bond Fund | | 6.73% | | 8.06% | | 3.07% | | 2.25% |
Barclays Capital Muni Bond Index 1 | | 5.50 | | 5.80 | | 6.04 | | 5.35 |
Barclays Capital High Yield Muni Bond Index/5 Yr 2 | | 4.86 | | 9.31 | | 3.25 | | 3.04 |
Composite Index 3 | | 5.19 | | 7.55 | | 4.70 | | 4.24 |
Performance figures are historical and do not guarantee future results. Investment returns and principal value will vary, and you may have a gain or loss when you sell shares. Current performance may be lower or higher than the performance data quoted. Contact the Fund for performance data current to the most recent month-end. Returns include changes in share price as well as reinvestment of all dividends and capital gains. Returns do not reflect the deduction of the 2% redemption fee imposed if shares are redeemed or exchanged within 30 calendar days from their date of purchase. If imposed, the fee would reduce the performance quoted. Returns do not reflect the deduction of taxes that a shareholder would pay on Fund distributions or the redemption of Fund shares. Management fees and administrative expenses are included in the Fund’s performance. Returns for periods greater than one year are compounded average annual rates of return.
1 The Barclays Capital Municipal Bond Index is an unmanaged, rules-based, market-value-weighted index for the long-term tax-exempt bond market. The index includes investment grade bonds with a minimum credit rating of BBB. The returns include the reinvestment of income and do not include any transaction costs, management fees or other costs. It is not possible to invest directly in an index.
2 The Barclays Capital 5-Year High Yield Municipal Bond Index is the 5 year (4-6) component of the High-Yield Municipal Bond Index, an unmanaged, rules-based, market-value-weighted index made up of bonds that are non-investment grade, unrated, or rated below BB+. The returns include the reinvestment of income and do not include any transaction costs, management fees or other costs. It is not possible to invest directly in an index.
3 A composite index comprised of 50% Barclays Capital Municipal Bond Index and 50% Barclays Capital 5-Year High-Yield Municipal Bond Index.
FUND DIVERSIFICATION
| | | | |
Hospital/Health Care | | | 22.5 | % |
Other Revenue | | | 15.4 | % |
Education/Student Loan | | | 15.0 | % |
Multifamily Mortgage Revenue | | | 13.6 | % |
Insured | | | 8.3 | % |
Sectors less than 5.0% | | | 23.2 | % |
Cash & other net assets | | | 2.0 | % |
Based on total net assets as of September 30, 2010. Subject to change.
PORTFOLIO SUMMARY
| | |
Net Asset Value 9/30/10: | | $9.08 Per Share |
Net Asset Value 3/31/10 | | $8.72 Per Share |
Total Net Assets: | | $89.8 Million |
30-day SEC Yield 4: | | 4.92% |
Tax Equivalent Yield 5: | | 7.57% |
12-month Distribution Rate 4: | | 4.98% |
Average Maturity: | | 14.7 Years |
Effective Duration 6: | | 6.2 Years |
4 The SEC Yield reflects the rate at which the Fund is earning income on its current portfolio of securities, while the distribution rate reflects the Fund’s past dividends paid to shareholders based on the net investment income distributed and the average NAV during the past 12 months. Accordingly, the Fund’s SEC yield and distribution rate may differ.
5 The tax-equivalent yield is based on an assumed tax rate of 35.0%.
6 Duration is a measure of estimated price sensitivity relative to changes in interest rates. Portfolios with longer durations are typically more sensitive to changes in interest rates. For example, if interest rates rise by 1%, the market value of a security with an effective duration of 5 years would decrease by 5%, with all other factors being constant. The correlation between duration and price sensitivity is greater for securities rated investment-grade than it is for securities rated below investment-grade. Duration estimates are based on assumptions by the Adviser and are subject to a number of limitations. Effective duration is calculated based on historical price changes of securities held by the Fund, and therefore is a more accurate estimate of price sensitivity provided interest rates remain within their historical range.
QUALITY RATINGS (% of Total Net Assets)
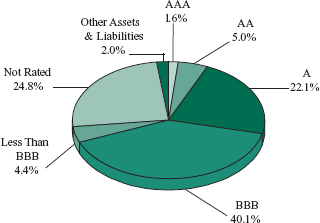
Lower of Moody’s, S&P, Fitch or Duff & Phelps ratings used.
| | | | | | |
| Adviser’s Assessment of Non-Rated Securities: |
AAA | | | 0.0% | | | |
AA | | | 0.3 | | | |
A | | | 2.0 | | | |
BBB | | | 8.7 | | | |
BB | | | 11.5 | | | |
<BB | | | 2.3 | | | |
| | | | | | |
Total | | | 24.8% | | | |
SCHEDULE OF INVESTMENTS (Unaudited)
September 30, 2010
Sit High Income Municipal Bond Fund
| | | | | | | | | | | | | | |
Principal
Amount ($) | | | Name of Issuer | | Coupon
Rate (%) | | Maturity
Date | | | Fair
Value ($) | |
| Municipal Bonds - 95.3% | | | | | | | | | | |
| Alabama - 1.2% | | | | | | | | | | |
| | 300,000 | | | Bessemer Medical Clinic Rev. (Bessemer Carraway) (NATL-RE Insured) | | 7.25 | | | 4/1/15 | | | | 300,924 | |
| | 250,000 | | | Cullman Co. Health Care Auth. Rev. | | 6.25 | | | 2/1/23 | | | | 261,022 | |
| | 100,000 | | | Huntsville-Redstone Village Special Care Facs. Auth. Rev. | | 5.25 | | | 1/1/15 | | | | 100,388 | |
| | 150,000 | | | Pell City Special Care Rev. (Noland Health Services) | | 5.25 | | | 12/1/27 | | | | 151,058 | |
| | 260,000 | | | University of Alabama Birmingham Hospital Rev. | | 5.75 | | | 9/1/22 | | | | 289,624 | |
| | | | | | | | | | | | | | |
| | | | |
| | | | | | | | | | | | | 1,103,016 | |
| | | | | | | | | | | | | | |
| | | |
| Alaska - 0.9% | | | | | | | | | | |
| | 250,000 | | | AK Industrial Dev. & Export Rev. (Boys & Girls Home) | | 5.50 | | | 12/1/12 | | | | 243,912 | |
| | 150,000 | | | Aleutians East Borough Rev. (Aleutian Pribilof Islands) (ACA Insured) | | 5.00 | | | 6/1/20 | | | | 139,425 | |
| | 300,000 | | | Aleutians East Borough Rev. (Aleutian Pribilof Islands) (ACA Insured) | | 5.50 | | | 6/1/25 | | | | 274,953 | |
| | 150,000 | | | Matanuska-Susitna Boro C.O.P (Animal Care) 9 | | 5.75 | | | 3/1/23 | | | | 161,652 | |
| | | | | | | | | | | | | | |
| | | | |
| | | | | | | | | | | | | 819,942 | |
| | | | | | | | | | | | | | |
| | | |
| Arizona - 5.6% | | | | | | | | | | |
| | 90,290 | | | AZ Health Facs. Auth. Rev. (New Arizona Family Proj.) | | 5.25 | | | 7/1/27 | | | | 74,650 | |
| | 250,000 | | | Festival Ranch Community Facs. District G.O. | | 6.25 | | | 7/15/24 | | | | 263,960 | |
| | 250,000 | | | Flagstaff Industrial Dev. Auth. Rev. (Sr. Living Community) | | 5.50 | | | 7/1/22 | | | | 228,112 | |
| | 1,000,000 | | | Goodyear McDowell Rd. Comm. Corridor Improvement Dist. Special Assessment (AMBAC Insured) | | 5.25 | | | 1/1/32 | | | | 1,021,280 | |
| | 210,000 | | | Pima Co. Industrial Dev. Auth. Education Rev. (American Charter Schools Foundation Proj.) | | 5.13 | | | 7/1/15 | | | | 214,733 | |
| | 180,000 | | | Pima Co. Industrial Dev. Auth. Education Rev. (AZ Charter Schools Proj.) | | 6.10 | | | 7/1/24 | | | | 180,295 | |
| | 250,000 | | | Pima Co. Industrial Dev. Auth. Education Rev. (AZ Charter Schools Proj.) | | 5.00 | | | 7/1/26 | | | | 221,925 | |
| | 250,000 | | | Pima Co. Industrial Dev. Auth. Education Rev. (AZ Charter Schools Proj.) | | 6.75 | | | 7/1/31 | | | | 250,773 | |
| | 450,000 | | | Pima Co. Industrial Dev. Auth. Education Rev. (Cambridge Academy) | | 5.88 | | | 4/1/22 | | | | 462,024 | |
| | 90,000 | | | Pima Co. Industrial Dev. Auth. Education Rev. (Center For Academic Success Proj.) 4 | | 5.38 | | | 7/1/22 | | | | 87,436 | |
| | 250,000 | | | Pima Co. Industrial Dev. Auth. Education Rev. (Coral Academy Science Proj.) | | 6.38 | | | 12/1/18 | | | | 257,423 | |
| | 250,000 | | | Pima Co. Industrial Dev. Auth. Education Rev. (Tucson Country Day School Proj.) | | 5.00 | | | 6/1/22 | | | | 234,807 | |
| | 200,000 | | | Pima Co. Industrial Dev. Auth. Rev. (Tucson Electric Power Company Proj.) | | 5.75 | | | 9/1/29 | | | | 207,496 | |
| | 200,000 | | | Pinal Co. Industrial Dev. Rev. (Florence West Prison) (ACA Insured) 9 | | 5.25 | | | 10/1/18 | | | | 203,010 | |
| | 505,000 | | | Southside Community Special Assessment Rev. (Prescott Valley) | | 6.13 | | | 7/1/18 | | | | 489,375 | |
| | 300,000 | | | University Medical Center Corp. Hospital Rev. | | 6.25 | | | 7/1/29 | | | | 327,849 | |
| | 270,000 | | | West Campus Hsg. LLC Rev. (AZ State Univ. West Campus) (AMBAC Insured) | | 5.00 | | | 7/1/25 | | | | 269,141 | |
| | | | | | | | | | | | | | |
| | | | |
| | | | | | | | | | | | | 4,994,289 | |
| | | | | | | | | | | | | | |
| | | |
| Arkansas - 0.6% | | | | | | | | | | |
| | 500,000 | | | Benton Co. Public Facs. Board Charter School Lease Rev. | | 5.75 | | | 6/1/30 | | | | 527,260 | |
| | | | | | | | | | | | | | |
| | | |
| California - 13.4% | | | | | | | | | | |
| | 250,000 | | | Agua Caliente Band of Cahuilla Indians Rev. 4 | | 6.00 | | | 7/1/18 | | | | 246,492 | |
| | 235,000 | | | Alameda Corridor Transportation Auth. Rev. Capital Appreciation (AMBAC Insured) 6 | | 6.71 | | | 10/1/24 | | | | 201,917 | |
| | 90,000 | | | Bell Community Hsg. Auth. Lease Rev. (AMBAC Insured) 9 | | 5.00 | | | 10/1/30 | | | | 75,362 | |
| | 150,000 | | | CA Co. Tobacco Securitization Agy. Asset-Backed Bond Rev. | | 5.10 | | | 6/1/28 | | | | 126,029 | |
| | 250,000 | | | CA Finance Auth. Rev. (Kern Regional Center Proj.) 9 | | 6.88 | | | 5/1/25 | | | | 273,850 | |
| | 250,000 | | | CA Finance Auth. Rev. (Literacy First Proj.) | | 5.50 | | | 9/1/22 | | | | 252,845 | |
| | 250,000 | | | CA Health Facs. Finance Auth. Rev. (Sutter Health) (NATL-RE Insured) | | 5.38 | | | 8/15/30 | | | | 250,143 | |
| | 500,000 | | | CA Housing Finance Agency Rev. (Non Ace-Mortgage) | | 5.45 | | | 8/1/33 | | | | 506,290 | |
| | 250,000 | | | CA Hsg. Finance Agy. Home Mtg. Rev. | | 5.20 | | | 8/1/28 | | | | 254,713 | |
| | 125,000 | | | CA Mobilehome Park Financing Rev. (Ranch Vallecitos) (ACA Insured) | | 5.25 | | | 11/15/36 | | | | 108,709 | |
| | 430,000 | | | CA Municipal Finance Auth. C.O.P. (Community Hospitals) | | 5.25 | | | 2/1/37 | | | | 411,076 | |
| | 400,000 | | | CA Municipal Finance Auth. Educational Fac. Rev. (King/Chavez) | | 8.00 | | | 10/1/22 | | | | 466,236 | |
| | 250,000 | | | CA Municipal Finance Auth. Rev. Sr. Living (Pilgrim Place Claremont) (CA MTG Insured) | | 5.88 | | | 5/15/29 | | | | 268,053 | |
See accompanying notes to financial statements.
| | |
| 6 | | SIT MUTUAL FUNDS SEMI-ANNUAL REPORT |
| | | | | | | | | | | | | | |
Principal
Amount ($) | | | Name of Issuer | | Coupon
Rate (%) | | Maturity
Date | | | Fair Value ($) | |
| 250,000 | | | CA School Facs. Finance Auth. Rev. (Azusa Unified School District) (AGM Insured) 6 | | 6.00 | | | 8/1/29 | | | | 190,330 | |
| | 500,000 | | | CA State Public Works Lease Rev. (CA State Univ. ) 9 | | 5.40 | | | 3/1/26 | | | | 533,905 | |
| | 350,000 | | | CA Statewide Communities Dev. Auth. Rev. (American Baptist) | | 5.75 | | | 10/1/25 | | | | 356,769 | |
| | 140,000 | | | CA Statewide Communities Dev. Auth. Rev. (Lancer Education Student Hsg. Proj.) | | 5.40 | | | 6/1/17 | | | | 139,756 | |
| | 100,000 | | | CA Statewide Communities Dev. Auth. Special Tax (Orinda Proj.) | | 6.00 | | | 9/1/29 | | | | 92,047 | |
| | 400,000 | | | CA Variable Purpose G.O. | | 6.00 | | | 3/1/33 | | | | 455,520 | |
| | 500,000 | | | Center Unified School District G.O. (1991 Election) (NATL-RE Insured) 6 | | 6.07 | | | 8/1/31 | | | | 134,505 | |
| | 380,000 | | | Eden Township Healthcare District, C.O.P. | | 5.75 | | | 6/1/25 | | | | 393,125 | |
| | 250,000 | | | El Paso De Robles Redevelopment Agency Tax Allocation | | 6.38 | | | 7/1/33 | | | | 262,178 | |
| | 245,000 | | | Foothill/Eastern Corridor Agy. Toll Road Rev. Ref. 6 | | 9.65 | | | 1/15/22 | | | | 115,775 | |
| | 250,000 | | | Glendale Redev. Agy. Tax Allocation | | 5.50 | | | 12/1/24 | | | | 257,750 | |
| | 500,000 | | | Hartnell Community College G.O. 6 | | 7.00 | | | 8/1/34 | | | | 274,880 | |
| | 395,000 | | | Hawthorne School District G.O. (1997 Election) (NATL-RE Insured) 6 | | 6.70 | | | 11/1/26 | | | | 146,087 | |
| | 1,000,000 | | | La Mirada Redevelopment Agency Tax Allocation (Merged Proj.) (NATL-RE Insured) 6 | | 6.70 | | | 8/15/27 | | | | 363,960 | |
| | 250,000 | | | Lancaster Redev. Agy. Tax Allocation (Redev. Projs.) | | 6.00 | | | 8/1/24 | | | | 276,882 | |
| | 275,000 | | | Lemon Grove Community Dev. Agency Tax Allocation (Redev. Proj.) | | 5.15 | | | 8/1/25 | | | | 275,358 | |
| | 15,000 | | | Los Angeles Regional Airports Improvement Lease Rev. 9 | | 10.25 | | | 1/1/13 | | | | 15,594 | |
| | 150,000 | | | Mill Valley C.O.P. (The Redwoods) (NATL-RE IBC CA MTG Insured) | | 5.75 | | | 12/1/20 | | | | 150,621 | |
| | 500,000 | | | Moreno Valley Unified School District G.O. (NATL-RE Insured) 6 | | 6.20 | | | 8/1/23 | | | | 247,100 | |
| | 120,000 | | | Palm Desert Finance Auth. Tax Allocation Rev. Ref. (NATL-RE Insured) | | 5.00 | | | 10/1/23 | | | | 123,642 | |
| | 250,000 | | | Palmdale Community Redev. Agy. Tax Allocation (AMBAC Insured) 6 | | 6.95 | | | 12/1/20 | | | | 152,155 | |
| | 450,000 | | | Rialto Redev. Agy. Tax Allocation (Merged Proj.) | | 6.25 | | | 9/1/37 | | | | 483,048 | |
| | 500,000 | | | Richmond Community Redev. Agy. Tax Allocation | | 6.00 | | | 9/1/30 | | | | 525,525 | |
| | 250,000 | | | Richmond Joint Powers Lease Rev. (Point Potrero) | | 6.25 | | | 7/1/24 | | | | 281,112 | |
| | 500,000 | | | Riverside Co. Asset Leasing Rev. (Riverside Co. Hospital) (NATL-RE Insured) 6 | | 6.10 | | | 6/1/22 | | | | 266,635 | |
| | 200,000 | | | Riverside Co. Asset Leasing Rev. (Riverside Co. Hospital) (NATL-RE Insured) 6 | | 6.60 | | | 6/1/24 | | | | 93,382 | |
| | 250,000 | | | Riverside Co. Redev. Agy. Tax Allocation (Interstate 215 Corridor) | | 6.00 | | | 10/1/25 | | | | 264,845 | |
| | 250,000 | | | Rohnert Park Community Dev. Tax Allocation (NATL-RE Insured) 6 | | 7.75 | | | 8/1/30 | | | | 74,220 | |
| | 250,000 | | | San Gorgonio Health Care G.O. (Election 2006) | | 7.00 | | | 8/1/27 | | | | 281,710 | |
| | 300,000 | | | Sierra View Health Care District Rev. | | 5.00 | | | 7/1/19 | | | | 311,997 | |
| | 250,000 | | | South Bayside Waste Management Rev. (Shoreway Environmental Center) | | 6.25 | | | 9/1/29 | | | | 277,573 | |
| | 500,000 | | | Tustin Unified School District G.O. Capital Appreciation 6 | | 6.05 | | | 8/1/28 | | | | 317,075 | |
| | 500,000 | | | Val Verde Unified School District G.O. Capital Appreciation (AGM Insured) 6 | | 6.13 | | | 8/1/34 | | | | 264,315 | |
| | 235,000 | | | Vallejo City Unified School District Special Tax (Community Facilities District No. 2) (XLCA Insured) | | 4.15 | | | 9/1/31 | | | | 168,916 | |
| | | | | | | | | | | | | | |
| | | | |
| | | | | | | | | | | | | 12,010,007 | |
| | | | | | | | | | | | | | |
| | | |
| Colorado - 4.3% | | | | | | | | | | |
| | 250,000 | | | CO Education & Cultural Facs. Auth. Rev. (CO Springs Charter Academy Proj.) | | 5.60 | | | 7/1/34 | | | | 258,518 | |
| | 500,000 | | | CO Education & Cultural Facs. Auth. Rev. Ref. (Vail Mountain School Proj.) | | 6.00 | | | 5/1/30 | | | | 515,775 | |
| | 250,000 | | | CO Health Facs. Auth. Rev. (American Baptist Homes) | | 6.50 | | | 8/1/15 | | | | 253,585 | |
| | 500,000 | | | CO Health Facs. Auth. Rev. (Total Long Term Care Nat’l) | | 6.00 | | | 11/15/30 | | | | 501,840 | |
| | 500,000 | | | Delta Co. Memorial Hospital District Rev. | | 5.50 | | | 9/1/30 | | | | 507,685 | |
| | 195,000 | | | Denver Health & Hospital Auth. Healthcare Rev. 1 | | 1.30 | | | 12/1/33 | | | | 134,971 | |
| | 150,000 | | | E-470 Public Highway Auth. Rev. (NATL-RE Insured) | | 5.50 | | | 9/1/24 | | | | 155,143 | |
| | 1,000,000 | | | E-470 Public Highway Auth. Rev. Capital Appreciation (NATL-RE Insured) 6 | | 6.20 | | | 9/1/28 | | | | 332,510 | |
| | 350,000 | | | Gunnison Co. (Western State College) | | 6.10 | | | 7/15/19 | | | | 363,510 | |
| | 750,000 | | | Regional Transportation District Private Activity Rev. (Denver Trans. Partners) | | 6.00 | | | 1/15/34 | | | | 797,888 | |
| | | | | | | | | | | | | | |
| | | | |
| | | | | | | | | | | | | 3,821,425 | |
| | | | | | | | | | | | | | |
| | | |
| Connecticut - 1.0% | | | | | | | | | | |
| | 250,000 | | | CT Dev. Auth. First Mtg. Gross Rev. (Church Homes, Inc.) | | 5.70 | | | 4/1/12 | | | | 250,392 | |
| | 50,000 | | | CT Dev. Auth. Pollution Control Rev. Ref. (CT Light & Power) | | 5.85 | | | 9/1/28 | | | | 51,000 | |
| | 250,000 | | | Hamden Facs. Rev. (Whitney Center Proj.) | | 6.13 | | | 1/1/14 | | | | 253,425 | |
See accompanying notes to financial statements.
SCHEDULE OF INVESTMENTS (Unaudited)
September 30, 2010
Sit High Income Municipal Bond Fund (Continued)
| | | | | | | | | | | | | | |
Principal
Amount ($) | | | Name of Issuer | | Coupon
Rate (%) | | Maturity
Date | | | Fair Value ($) | |
| 250,000 | | | Harbor Point Infrastructure Improvement District Special Obligation Rev. Tax Allocation | | 7.00 | | | 4/1/22 | | | | 267,907 | |
| | 250,000 | | | Mashantucket Western Pequot Tribe Sub. Special Rev. 2, 4, 5 | | 5.75 | | | 9/1/18 | | | | 117,498 | |
| | | | | | | | | | | | | | |
| | | | |
| | | | | | | | | | | | | 940,222 | |
| | | | | | | | | | | | | | |
| | | |
| District of Columbia - 1.1% | | | | | | | | | | |
| | 250,000 | | | DC Rev. (Friendship Public Charter School) (ACA Insured) | | 5.00 | | | 6/1/26 | | | | 231,515 | |
| | 1,000,000 | | | Metro DC Airports Dulles Toll Road Capital Apprec. Rev. (Assured Guaranty) 6 | | 6.50 | | | 10/1/41 | | | | 784,240 | |
| | | | | | | | | | | | | | |
| | | | |
| | | | | | | | | | | | | 1,015,755 | |
| | | | | | | | | | | | | | |
| | | |
| Florida - 6.5% | | | | | | | | | | |
| | 150,000 | | | Alachua Co. Health Facs. Rev. (Shands Health Care) | | 6.75 | | | 12/1/30 | | | | 167,309 | |
| | 500,000 | | | Bay Co. Educational Facs. Rev. (Bay Haven Charter) | | 5.25 | | | 9/1/30 | | | | 492,690 | |
| | 100,000 | | | Connerton West Community Dev. District Cap. Improvement Special Assessment Rev. (Pasco Co.) 2, 5 | | 5.13 | | | 5/1/16 | | | | 38,030 | |
| | 250,000 | | | Gramercy Farms Community Dev. District Special Assessment 2, 5 | | 5.10 | | | 5/1/14 | | | | 109,925 | |
| | 205,000 | | | Heritage Landing Community Dev. Special Assessment (Radian-IBCC Insured) | | 5.60 | | | 5/1/36 | | | | 184,711 | |
| | 150,000 | | | Highlands Co. Health Facs. Auth. Rev. (Adventist Health) | | 5.00 | | | 11/15/31 | | | | 152,430 | |
| | 135,000 | | | Jacksonville Economic Dev. Rev. (Mayo Clinic) | | 5.50 | | | 11/15/36 | | | | 138,146 | |
| | 100,000 | | | Lake Ashton Community Dev. District Cap. Improvement Special Assessment Rev. 2, 5 | | 5.00 | | | 11/1/11 | | | | 36,030 | |
| | 200,000 | | | Lakeland Retirement Community Rev. Ref. (Carpenters) | | 5.88 | | | 1/1/19 | | | | 208,266 | |
| | 250,000 | | | Lee Co. Industrial Dev. Auth. Health Care Facs. Rev. (Lee Charter Foundation) | | 5.25 | | | 6/15/27 | | | | 226,445 | |
| | 250,000 | | | Lee Co. Industrial Dev. Auth. Health Care Facs. Rev. Ref. (Shell Point/Alliance Community) | | 5.00 | | | 11/15/29 | | | | 222,550 | |
| | 250,000 | | | Leesburg Capital Improvement Rev. (NATL-RE FGIC Insured) | | 5.25 | | | 10/1/34 | | | | 254,783 | |
| | 50,000 | | | Miami Special Rev. Ref. (NATL-RE Insured) 6 | | 6.75 | | | 1/1/15 | | | | 38,646 | |
| | 400,000 | | | Miami-Dade Co. Special Obligation Rev. Ref. Sub. (NATL-RE Insured) 6 | | 7.01 | | | 10/1/24 | | | | 180,604 | |
| | 125,000 | | | Miami-Dade Co. Special Obligation Rev. Ref. Sub. (NATL-RE Insured) 6 | | 7.30 | | | 10/1/25 | | | | 52,859 | |
| | 820,000 | | | Palm Bay Utility Rev. (NATL-RE FGIC Insured) 6 | | 5.92 | | | 10/1/31 | | | | 263,343 | |
| | 210,000 | | | Palm Beach Co. Health Rev. (Abbey Delray South) | | 5.50 | | | 10/1/11 | | | | 210,456 | |
| | 100,000 | | | Palm Beach Co. Health Rev. Ref. (Acts Retirement) | | 5.00 | | | 11/15/20 | | | | 101,842 | |
| | 250,000 | | | Pinellas Co. Educational Facs. Auth. Rev. (Barry University Proj.) (Radian Insured) | | 6.25 | | | 10/1/15 | | | | 253,055 | |
| | 245,000 | | | Sail Harbour Community Dev. District Special Assessment (Radian-IBCC Insured) | | 5.50 | | | 5/1/36 | | | | 223,707 | |
| | 200,000 | | | Sarasota Co. Health Facs. Auth. Retirement Rev. Ref. (Village on the Isle) | | 5.50 | | | 1/1/27 | | | | 193,312 | |
| | 250,000 | | | Sarasota National Community Dev. District Special Assessment Rev. 2, 5 | | 5.30 | | | 5/1/39 | | | | 41,588 | |
| | 50,000 | | | Seminole Tribe Special Obligation Rev. 4 | | 5.75 | | | 10/1/22 | | | | 50,202 | |
| | 300,000 | | | South Lake Co. Hospital District Rev. | | 6.00 | | | 4/1/29 | | | | 318,441 | |
| | 100,000 | | | St. Johns Co. Industrial Dev. Auth. Rev. (Presbyterian Retirement) | | 5.63 | | | 8/1/34 | | | | 98,253 | |
| | 150,000 | | | St. Johns Co. Industrial Dev. Auth. Rev. (Presbyterian Retirement) | | 5.88 | | | 8/1/40 | | | | 154,907 | |
| | 250,000 | | | St. Johns Co. Industrial Dev. Auth. Rev. Ref. (Glenmoor) | | 5.00 | | | 1/1/16 | | | | 236,057 | |
| | 150,000 | | | Stoneybrook South Community Dev. District Special Assessment Rev. 2, 5 | | 5.45 | | | 11/1/15 | | | | 64,455 | |
| | 300,000 | | | Tallahassee Health Facs. Rev. (Memorial Health Care) | | 6.38 | | | 12/1/30 | | | | 300,399 | |
| | 185,000 | | | Tampa Hospital Rev. (H. Lee Moffitt) | | 5.75 | | | 7/1/29 | | | | 185,603 | |
| | 140,000 | | | Village Community Dev. Dist # 5 Special Assessment Rev. | | 6.50 | | | 5/1/33 | | | | 145,628 | |
| | 25,000 | | | Waters Edge Community Dev. District Cap. Improvement Special Assessment Rev. 2, 5 | | 5.00 | | | 11/1/12 | | | | 12,005 | |
| | 500,000 | | | West Orange Healthcare District Rev. | | 5.80 | | | 2/1/31 | | | | 504,490 | |
| | | | | | | | | | | | | | |
| | | | |
| | | | | | | | | | | | | 5,861,167 | |
| | | | | | | | | | | | | | |
| | | |
| Georgia - 1.7% | | | | | | | | | | |
| | 250,000 | | | Atlanta Airport General Rev. Ref. (NATL-RE FGIC Insured) | | 5.75 | | | 1/1/20 | | | | 253,317 | |
| | 250,000 | | | Atlanta Water & Waste Water Rev. | | 6.00 | | | 11/1/29 | | | | 281,878 | |
| | 100,000 | | | Chatham Co. Hospital Rev. Ref. Improvement (Memorial Medical Center) (AMBAC Insured) | | 5.50 | | | 1/1/21 | | | | 100,023 | |
| | 250,000 | | | DeKalb Co. Hospital Auth. Rev. (De Kalb Medical Center) | | 6.00 | | | 9/1/30 | | | | 262,565 | |
| | 500,000 | | | Gainesville & Hall Co. Development Auth. Rev. | | 6.38 | | | 11/15/29 | | | | 533,980 | |
| | 100,000 | | | Medical Center Hospital Auth. Rev. Ref. (Spring Harbor Green Island Proj.) | | 5.25 | | | 7/1/27 | | | | 90,370 | |
| | | | | | | | | | | | | | |
| | | | |
| | | | | | | | | | | | | 1,522,133 | |
| | | | | | | | | | | | | | |
See accompanying notes to financial statements.
| | |
| 8 | | SIT MUTUAL FUNDS SEMI-ANNUAL REPORT |
| | | | | | | | | | | | | | |
Principal
Amount ($) | | | Name of Issuer | | Coupon
Rate (%) | | Maturity
Date | | | Fair
Value ($) | |
| Guam - 0.4% | | | | | | | | | | |
| | 300,000 | | | Guam Govt. G.O. | | 5.75 | | | 11/15/14 | | | | 315,108 | |
| | 100,000 | | | Northern Mariana Islands Commonwealth G.O. | | 5.00 | | | 10/1/22 | | | | 89,672 | |
| | | | | | | | | | | | | | |
| | | | |
| | | | | | | | | | | | | 404,780 | |
| | | | | | | | | | | | | | |
| | | |
| Hawaii - 1.0% | | | | | | | | | | |
| | 400,000 | | | HI Dept. Budget & Finance Special Purpose Rev. | | 6.40 | | | 11/15/14 | | | | 404,584 | |
| | 500,000 | | | HI Pacific Health Special Obligation Group Purpose Rev. | | 5.25 | | | 7/1/30 | | | | 496,315 | |
| | | | | | | | | | | | | | |
| | | | |
| | | | | | | | | | | | | 900,899 | |
| | | | | | | | | | | | | | |
| | | |
| Idaho - 1.2% | | | | | | | | | | |
| | 250,000 | | | ID Hsg. & Fin. Assoc. Nonprofit Facs. Rev. (Compass Public Charter School Proj.) | | 5.50 | | | 7/1/30 | | | | 250,538 | |
| | 335,000 | | | ID Hsg. & Fin. Assoc. Nonprofit Facs. Rev. (Idaho Arts Charter School Proj.) | | 5.50 | | | 12/1/18 | | | | 333,449 | |
| | 150,000 | | | ID Hsg. & Fin. Assoc. Nonprofit Facs. Rev. (Liberty Charter School Proj.) | | 5.50 | | | 6/1/21 | | | | 153,090 | |
| | 100,000 | | | ID Hsg. & Fin. Assoc. Nonprofit Facs. Rev. (North Star Charter School) | | 9.00 | | | 7/1/21 | | | | 117,495 | |
| | 220,000 | | | ID Hsg. & Fin. Assoc. Nonprofit Facs. Rev. (Victory Charter School Proj.) | | 5.63 | | | 7/1/21 | | | | 222,803 | |
| | | | | | | | | | | | | | |
| | | | |
| | | | | | | | | | | | | 1,077,375 | |
| | | | | | | | | | | | | | |
| | | |
| Illinois - 4.9% | | | | | | | | | | |
| | 320,000 | | | Cook Co. School District No. 148 Rev. (Dolton) | | 5.50 | | | 12/1/27 | | | | 327,152 | |
| | 150,000 | | | Harvey Ref. & Improvement G.O. | | 5.50 | | | 12/1/27 | | | | 149,988 | |
| | 210,000 | | | IL Dev. Fin. Auth. Rev. (Provena Health) (NATL-RE Insured) | | 5.13 | | | 5/15/23 | | | | 210,036 | |
| | 170,000 | | | IL Fin. Auth. Rev. (Community Rehab. Providers Facs.) | | 4.20 | | | 7/1/11 | | | | 169,107 | |
| | 150,000 | | | IL Fin. Auth. Rev. (Elmhurst Memorial) | | 5.63 | | | 1/1/37 | | | | 146,271 | |
| | 250,000 | | | IL Fin. Auth. Rev. (IL Institute of Technology) | | 6.25 | | | 2/1/19 | | | | 272,437 | |
| | 205,000 | | | IL Fin. Auth. Rev. (International Ice Center) 2, 5 | | 7.00 | | | 12/1/35 | | | | 18,323 | |
| | 100,000 | | | IL Fin. Auth. Rev. (Noble Network Charter School) (ACA Insured) | | 4.30 | | | 9/1/15 | | | | 91,212 | |
| | 250,000 | | | IL Fin. Auth. Rev. (Noble Network Charter School) (ACA Insured) | | 5.00 | | | 9/1/27 | | | | 200,858 | |
| | 165,000 | | | IL Fin. Auth. Rev. (OSF Healthcare Sys.) | | 5.25 | | | 11/15/22 | | | | 172,085 | |
| | 250,000 | | | IL Fin. Auth. Rev. (Rush Univ. Medical Center) | | 6.38 | | | 11/1/29 | | | | 275,580 | |
| | 250,000 | | | IL Fin. Auth. Rev. (Sedgebrook, Inc. Facs. Proj.) 2, 5 | | 5.40 | | | 11/15/16 | | | | 63,400 | |
| | 150,000 | | | IL Fin. Auth. Rev. (Swedish American Hospital) (AMBAC Insured) | | 5.00 | | | 11/15/23 | | | | 152,443 | |
| | 350,000 | | | IL Fin. Auth. Rev. (Swedish Covenant) | | 5.75 | | | 8/15/29 | | | | 360,192 | |
| | 350,000 | | | IL Fin. Auth. Rev. (Tabor Hills Supportive Living Proj.) | | 5.25 | | | 11/15/26 | | | | 317,044 | |
| | 100,000 | | | IL Fin. Auth. Rev. (Wesleyan Univ.) (CIFG Insured) | | 4.20 | | | 9/1/20 | | | | 96,238 | |
| | 150,000 | | | IL Fin. Auth. Rev. Ref. (Christian Homes, Inc. Proj.) | | 5.25 | | | 5/15/12 | | | | 150,801 | |
| | 200,000 | | | IL Fin. Auth. Sports Facs. Rev. (North Shore Ice Arena Proj.) | | 6.25 | | | 12/1/38 | | | | 162,302 | |
| | 150,000 | | | IL Health Facs. Auth. Rev. (Centegra Health Sys.) (AMBAC-TCRS Insured) | | 5.25 | | | 9/1/24 | | | | 150,030 | |
| | 210,000 | | | IL Health Facs. Auth. Rev. (Ingalls Health System Proj.) (NATL-RE Insured) | | 6.25 | | | 5/15/14 | | | | 211,839 | |
| | 100,000 | | | IL Health Facs. Auth. Rev. Ref. (Sinai Health) (FHA Insured) | | 5.00 | | | 8/15/24 | | | | 104,561 | |
| | 100,000 | | | Lake Co. Community School District #3 G.O. (Beach Park) (AMBAC Insured) 6 | | 6.47 | | | 2/1/19 | | | | 75,074 | |
| | 82,000 | | | Manhattan Special Service Area Special Tax No. 07-6 (Groebe Farm-Stonegate) | | 5.75 | | | 3/1/22 | | | | 53,035 | |
| | 90,000 | | | Southwestern IL Dev. Auth. Tax Allocation Ref. (Local Govt. Program) | | 7.00 | | | 10/1/22 | | | | 87,376 | |
| | 500,000 | | | Winnebago & Stephenson Co. G.O. (School District 321) (NATL-RE FGIC Insured) 6 | | 5.25 | | | 1/1/19 | | | | 356,245 | |
| | | | | | | | | | | | | | |
| | | | |
| | | | | | | | | | | | | 4,373,629 | |
| | | | | | | | | | | | | | |
| | | |
| Indiana - 2.2% | | | | | | | | | | |
| | 250,000 | | | Crown Point Economic Dev. Rev. (Wittenberg Village Proj.) | | 6.50 | | | 11/15/13 | | | | 250,112 | |
| | 205,000 | | | Delaware Co. Hospital Rev. (Cardinal Health System) | | 5.00 | | | 8/1/24 | | | | 198,618 | |
| | 370,000 | | | East Chicago Redev. Tax Allocation (Harborside) | | 5.50 | | | 1/15/16 | | | | 379,605 | |
| | 250,000 | | | Hammond Public Improvement Board Rev. | | 6.50 | | | 8/15/25 | | | | 263,313 | |
| | 215,000 | | | IN Finance Auth. Rev. (Drexel Foundation Education Facs. Proj.) | | 6.00 | | | 10/1/21 | | | | 226,924 | |
| | 200,000 | | | IN Health & Education Fac. Finance Auth. Hospital Rev. | | 5.50 | | | 3/1/22 | | | | 211,230 | |
| | 100,000 | | | Richmond Hospital Auth. Rev. (Reid Hospital) | | 6.50 | | | 1/1/29 | | | | 111,752 | |
See accompanying notes to financial statements.
SCHEDULE OF INVESTMENTS (Unaudited)
September 30, 2010
Sit High Income Municipal Bond Fund (Continued)
| | | | | | | | | | | | |
Principal
Amount ($) | | Name of Issuer | | Coupon
Rate (%) | | Maturity
Date | | | Fair Value ($) | |
150,000 | | St. Joseph Co. Economic Dev. Rev. (Holy Cross Village) | | 5.70 | | | 5/15/28 | | | | 140,066 | |
150,000 | | St. Joseph Co. Hospital Auth. Health Facs. Rev. (Madison Center) 2, 5 | | 5.80 | | | 2/15/24 | | | | 57,315 | |
250,000 | | St. Joseph Co. Hospital Auth. Health Facs. Rev. (Madison Center) 2, 5 | | 5.25 | | | 2/15/28 | | | | 95,525 | |
| | | | | | | | | | | | |
| | | | |
| | | | | | | | | | | 1,934,460 | |
| | | | | | | | | | | | |
|
Iowa - 0.4% | |
150,000 | | IA Finance Auth. Sr. Hsg. Rev. Ref. (Walnut Ridge Proj.) | | 5.00 | | | 12/1/14 | | | | 140,274 | |
100,000 | | IA Finance Auth. Sr. Living Facs. Rev. (Deerfield Retirement Community, Inc.) | | 5.00 | | | 11/15/21 | | | | 78,848 | |
200,000 | | IA Finance Auth. Sr. Living Facs. Rev. (Deerfield Retirement Community, Inc.) | | 5.50 | | | 11/15/27 | | | | 152,414 | |
| | | | | | | | | | | | |
| | | | |
| | | | | | | | | | | 371,536 | |
| | | | | | | | | | | | |
|
Kansas - 0.9% | |
500,000 | | Overland Park Transportation Dev. District Sales Tax Rev. (Oak Park Mall Proj.) | | 5.90 | | | 4/1/32 | | | | 516,140 | |
500,000 | | Wyandotte Co. Govt. Special Obligation Rev. 6 | | 6.07 | | | 6/1/21 | | | | 284,395 | |
| | | | | | | | | | | | |
| | | | |
| | | | | | | | | | | 800,535 | |
| | | | | | | | | | | | |
|
Kentucky - 0.4% | |
140,000 | | Jefferson Co. Mtg. Rev. (Christian Church Homes) | | 6.13 | | | 11/15/13 | | | | 140,291 | |
250,000 | | Louisville/Jefferson Co. Health Fac. Rev. (Jewish Hospital St. Mary’s Healthcare) | | 6.00 | | | 2/1/22 | | | | 260,167 | |
| | | | | | | | | | | | |
| | | | |
| | | | | | | | | | | 400,458 | |
| | | | | | | | | | | | |
|
Louisiana - 1.1% | |
195,000 | | LA Local Govt. Rev. (Capital Projects & Equipment Acquisition) (ACA Insured) | | 6.55 | | | 9/1/25 | | | | 183,187 | |
250,000 | | LA Public Facs. Auth. Hospital Rev. | | 6.75 | | | 7/1/39 | | | | 276,205 | |
150,000 | | New Orleans Aviation Board Gulf Opportunity Zone (Consolidated Rental Car) | | 6.00 | | | 1/1/25 | | | | 162,666 | |
250,000 | | New Orleans Sewer Service Rev. Ref. (Assured Guaranty) | | 6.00 | | | 6/1/24 | | | | 276,090 | |
125,000 | | St. John Baptist Parish Rev. (Marathon Oil Corp.) | | 5.13 | | | 6/1/37 | | | | 125,313 | |
| | | | | | | | | | | | |
| | | | |
| | | | | | | | | | | 1,023,461 | |
| | | | | | | | | | | | |
|
Maine - 0.2% | |
155,000 | | ME Education Auth. Student Loan Rev. (Assured Guaranty) | | 5.63 | | | 12/1/27 | | | | 167,623 | |
| | | | | | | | | | | | |
|
Maryland - 0.7% | |
250,000 | | Howard Co. Retirement Community Rev. (Vantage House) | | 5.25 | | | 4/1/27 | | | | 210,168 | |
125,000 | | MD State Health & Higher Education Facs. Rev. (King Farm Pres) | | 5.00 | | | 1/1/17 | | | | 121,014 | |
250,000 | | MD State Health & Higher Education Facs. Rev. (Patterson Park) | | 5.10 | | | 7/1/20 | | | | 260,810 | |
| | | | | | | | | | | | |
| | | | |
| | | | | | | | | | | 591,992 | |
| | | | | | | | | | | | |
|
Massachusetts - 1.3% | |
330,000 | | MA Development Finance Agency Facs. Rev. | | 6.25 | | | 6/1/14 | | | | 330,247 | |
500,000 | | MA Education Finance Auth. Education Loan Rev. | | 5.20 | | | 1/1/27 | | | | 517,030 | |
100,000 | | MA Health & Education Facilities Auth. Rev. (Valley Regional Health System) (AMBAC Insured) | | 5.75 | | | 7/1/18 | | | | 100,025 | |
185,000 | | MA Health & Education Facilities Auth. Rev. (Quincy Medical Center) | | 5.13 | | | 1/15/12 | | | | 186,384 | |
| | | | | | | | | | | | |
| | | | |
| | | | | | | | | | | 1,133,686 | |
| | | | | | | | | | | | |
|
Michigan - 3.5% | |
350,000 | | Advanced Technology Academy Public School Rev. | | 6.00 | | | 11/1/28 | | | | 350,865 | |
170,000 | | Benton Township Sewer Improvement G.O. (AMBAC Insured) | | 5.50 | | | 8/1/20 | | | | 170,336 | |
240,000 | | Detroit Convention Fac. Capital Appreciation Rev. (NATL-RE Insured) 6 | | 6.17 | | | 9/30/14 | | | | 213,934 | |
190,000 | | Detroit Downtown Dev. Auth. Tax Allocation (Dev. Area No. 1) (NATL-RE Insured) | | 4.75 | | | 7/1/25 | | | | 179,010 | |
150,000 | | Detroit G.O. (XLCA Insured) | | 5.25 | | | 4/1/20 | | | | 137,059 | |
100,000 | | Detroit Sewage Disposal System Rev. Ref. Second Lien (NATL-RE Insured) | | 5.50 | | | 7/1/22 | | | | 110,487 | |
250,000 | | Grand Traverse Academy Public School Academy Rev. Ref. | | 5.00 | | | 11/1/22 | | | | 232,782 | |
50,000 | | Kentwood Economic Ltd. Obligation Rev. (Holland Home) | | 5.25 | | | 11/15/14 | | | | 49,814 | |
200,000 | | MI Public Education Facs. Auth. Rev. Ref. (Bradford Academy) | | 8.00 | | | 9/1/21 | | | | 227,888 | |
See accompanying notes to financial statements.
| | |
| 10 | | SIT MUTUAL FUNDS SEMI-ANNUAL REPORT |
| | | | | | | | | | | | |
Principal
Amount ($) | | Name of Issuer | | Coupon
Rate (%) | | Maturity Date | | | Fair Value ($) | |
155,000 | | MI Public Education Facs. Auth. Rev. Ref. (Bradford Proj.) 4 | | 6.00 | | | 9/1/16 | | | | 165,300 | |
150,000 | | MI Public Education Facs. Auth. Rev. Ref. (Landmark Academy) | | 6.00 | | | 6/1/20 | | | | 158,200 | |
400,000 | | MI State Hospital Finance Auth. Rev. (Hospital-Crittenton) | | 5.63 | | | 3/1/27 | | | | 403,620 | |
40,000 | | MI State Hospital Finance Auth. Rev. Ref. (Detroit Medical Group) (AMBAC Insured) | | 5.25 | | | 8/15/27 | | | | 37,707 | |
150,000 | | MI Strategic Fund Rev. Ref. (Detroit Edison) (XLCA-ICR Insured) | | 5.45 | | | 9/1/29 | | | | 150,968 | |
300,000 | | MI Tobacco Settlement Finance Auth. Sr. Rev. | | 5.13 | | | 6/1/22 | | | | 275,805 | |
290,000 | | Saginaw Hospital Finance Auth. Rev. (Covenant Medical Center Proj.) | | 6.50 | | | 7/1/30 | | | | 293,132 | |
| | | | | | | | | | | | |
| | | | |
| | | | | | | | | | | 3,156,907 | |
| | | | | | | | | | | | |
|
Minnesota - 3.8% | |
350,000 | | Anoka Co. Hsg. & Redev. Rev. 9 | | 6.88 | | | 5/1/40 | | | | 360,108 | |
100,000 | | Cloquet Hsg. Fac. Rev. Ref. (HADC Cloquet LLC Proj.) | | 5.50 | | | 8/1/25 | | | | 91,990 | |
90,000 | | Columbia Heights Economic Dev. Auth. Tax Increment Rev. (Huset Park Area Redev.) | | 5.00 | | | 2/15/17 | | | | 85,787 | |
250,000 | | Oak Park Heights Hsg. Rev. (Oakgreen Commons Proj.) | | 6.00 | | | 8/1/25 | | | | 250,343 | |
350,000 | | Sartell Health Care & Hsg. Facs. Rev. (Foundation for Healthcare Proj.) | | 6.63 | | | 9/1/29 | | | | 351,404 | |
430,000 | | Sauk Rapids Health Care & Hsg. Facs. Rev. (Good Shepherd Lutheran Home Proj.) | | 7.25 | | | 1/1/29 | | | | 451,685 | |
70,000 | | St. Cloud Hsg. & Redev. Auth. Multifamily Rev. (Germain Towers Proj.) (HUD Section 8) | | 5.90 | | | 9/1/20 | | | | 63,622 | |
285,000 | | St. Paul Hsg. & Redev. Auth. Tax Increment Rev. (Emerald Gardens Proj.) | | 6.50 | | | 3/1/29 | | | | 294,294 | |
150,000 | | St. Paul Hsg. & Redev. Auth. Tax Increment Rev. (US Bank Operations) | | 6.50 | | | 8/1/22 | | | | 148,764 | |
375,000 | | St. Paul Port Auth. Lease Rev. (Regions Hospital Parking Ramp Proj.) | | 5.00 | | | 8/1/36 | | | | 341,111 | |
400,000 | | St. Paul Port Auth. Solid Waste Disposal Rev. (Ecullet Proj.) | | 6.25 | | | 11/1/15 | | | | 411,344 | |
225,000 | | White Earth Band of Chippewa Indians Rev. (ACA Insured) | | 7.00 | | | 12/1/11 | | | | 229,466 | |
300,000 | | Winsted Health Care Rev. (St. Mary’s Care Center Proj.) | | 6.00 | | | 9/1/25 | | | | 294,768 | |
| | | | | | | | | | | | |
| | | | |
| | | | | | | | | | | 3,374,686 | |
| | | | | | | | | | | | |
|
Missouri - 4.0% | |
390,000 | | Community Memorial Hospital District Rev. | | 6.68 | | | 12/1/34 | | | | 344,015 | |
315,000 | | Fenton Tax Increment Rev. (Gravois Bluffs Redev.) | | 4.50 | | | 4/1/21 | | | | 315,608 | |
300,000 | | Independence 39th St. Transportation District Rev. Ref. & Improvement | | 6.88 | | | 9/1/32 | | | | 302,067 | |
140,000 | | Joplin Industrial Dev. Auth. Rev. Ref. (Christian Homes, Inc. Proj.) | | 5.50 | | | 5/15/17 | | | | 139,452 | |
500,000 | | Kansas City Industrial Dev. Auth. Multifamily Hsg. Rev. (Grand Blvd. Lofts) | | 5.00 | | | 1/1/12 | | | | 499,960 | |
690,000 | | Kansas City Special Obligation Capital Appreciation Rev. 6 | | 6.55 | | | 2/1/23 | | | | 384,213 | |
250,000 | | Kirkwood Industrial Dev. Auth. Retirement Community Rev. | | 6.50 | | | 5/15/15 | | | | 251,472 | |
250,000 | | Kirkwood Industrial Dev. Auth. Retirement Community Rev. | | 8.00 | | | 5/15/21 | | | | 265,287 | |
100,000 | | Lakeside 370 Levee District Improvement Special Tax | | 7.00 | | | 4/1/28 | | | | 97,930 | |
240,000 | | MO Dev. Finance Board Rev. (Arnold Road Infrastructure) | | 5.00 | | | 11/1/27 | | | | 240,048 | |
250,000 | | MO Health & Educational Facs. Auth. (Senior Living Facs.-Lutheran Senior) | | 5.38 | | | 2/1/35 | | | | 248,805 | |
500,000 | | St. Joseph Industrial Development Auth. Tax Increment Rev. (Shoppes North Village) | | 4.25 | | | 11/1/11 | | | | 500,800 | |
| | | | | | | | | | | | |
| | | | |
| | | | | | | | | | | 3,589,657 | |
| | | | | | | | | | | | |
|
Nevada - 2.2% | |
215,000 | | Clark Co. Improvement District Special Assessment (128 Summerlin) | | 5.00 | | | 2/1/20 | | | | 185,599 | |
250,000 | | Las Vegas Paiute Tribe Rev. (ACA Insured) | | 6.63 | | | 11/1/17 | | | | 215,150 | |
200,000 | | Mesquite Redev. Agy. Tax Allocation Rev. | | 6.00 | | | 6/1/15 | | | | 208,374 | |
160,000 | | North Las Vegas Local Improvement Ref. (Special Improvement District No. 60-B) | | 5.10 | | | 12/1/22 | | | | 138,238 | |
425,000 | | Sparks Redev. Agy. Tax Increment Rev. (Redev. Area No. 1 Proj.) | | 5.00 | | | 1/15/22 | | | | 435,412 | |
400,000 | | Sparks Redev. Agy. Tax Increment Rev. (Redev. Area No. 2 Proj.) | | 6.40 | | | 6/1/20 | | | | 391,236 | |
300,000 | | Sparks Tourism Improvement District No. 1 Sr. Sales Tax Rev. 4 | | 6.50 | | | 6/15/20 | | | | 300,681 | |
150,000 | | Sparks Tourism Improvement District No. 1 Sr. Sales Tax Rev. 4 | | 6.75 | | | 6/15/28 | | | | 145,320 | |
| | | | | | | | | | | | |
| | | | |
| | | | | | | | | | | 2,020,010 | |
| | | | | | | | | | | | |
|
New Hampshire - 0.2% | |
600,000 | | Manchester Hsg. & Redev. Auth. Rev. (ACA Insured) 6 | | 6.91 | | | 1/1/27 | | | | 160,752 | |
| | | | | | | | | | | | |
See accompanying notes to financial statements.
SCHEDULE OF INVESTMENTS (Unaudited)
September 30, 2010
Sit High Income Municipal Bond Fund (Continued)
| | | | | | | | | | | | | | |
Principal
Amount ($) | | Name of Issuer | | Coupon
Rate (%) | | | Maturity Date | | | Fair Value ($) | |
New Jersey - 0.7% | | | | | | | | | | | | |
100,000 | | NJ Education Facs. Rev. Ref. (Univ. Medical & Dentistry) | | | 7.13 | | | | 12/1/23 | | | | 119,640 | |
230,000 | | NJ Health Care Facs. Finance Auth. Rev. (AMBAC Insured) | | | 6.25 | | | | 7/1/16 | | | | 230,467 | |
145,000 | | NJ Health Care Rev. (St. Josephs Health Care System) | | | 5.75 | | | | 7/1/15 | | | | 158,035 | |
250,000 | | NJ Transportation Auth. Capital Appreciation Rev. 6 | | | 5.85 | | | | 12/15/25 | | | | 121,700 | |
| | | | | | | | | | | | | | |
| | | | |
| | | | | | | | | | | | | 629,842 | |
| | | | | | | | | | | | | | |
|
New Mexico - 0.5% | |
400,000 | | Farmington Pollution Control Rev. Ref. (San Juan) | | | 5.20 | | | | 6/1/40 | | | | 407,984 | |
| | | | | | | | | | | | | | |
|
New York - 0.8% | |
250,000 | | Brooklyn Arena Local Dev. Corp. (Barclays Center) | | | 6.00 | | | | 7/15/30 | | | | 268,763 | |
250,000 | | NY Dorm Auth. Rev. (Frances Schervier Home) (Radian Insured) | | | 5.50 | | | | 7/1/27 | | | | 250,048 | |
200,000 | | Seneca Nation Indians Capital Improvement Auth. Special Obligation Rev. 4 | | | 5.00 | | | | 12/1/23 | | | | 165,854 | |
| | | | | | | | | | | | | | |
| | | | |
| | | | | | | | | | | | | 684,665 | |
| | | | | | | | | | | | | | |
|
North Carolina - 0.2% | |
240,000 | | Buncome Co. Proj. Dev. Finance Rev. (Woodfin Downtown Corridor Dev.) | | | 6.75 | | | | 8/1/24 | | | | 225,221 | |
| | | | | | | | | | | | | | |
|
North Dakota - 0.5% | |
20,371 | | City of Washburn (Bismarck State College Foundation) | | | 5.01 | | | | 4/1/32 | | | | 20,939 | |
250,000 | | Grand Forks Healthcare System Rev. (Altru Health) (NATL-RE Insured) | | | 5.63 | | | | 8/15/27 | | | | 250,065 | |
200,000 | | Langdon Health Care Facs. Rev. (Cavalier Co. Memorial Hospital Proj.) | | | 6.20 | | | | 1/1/25 | | | | 205,664 | |
| | | | | | | | | | | | | | |
| | | | |
| | | | | | | | | | | | | 476,668 | |
| | | | | | | | | | | | | | |
|
Ohio - 2.2% | |
250,000 | | Bowling Green Student Hsg. Rev. (State Univ. Proj.) | | | 5.75 | | | | 6/1/31 | | | | 256,125 | |
395,000 | | Buckeye Tobacco Settlement Finance Auth. Asset-Backed Sr. Rev. | | | 5.13 | | | | 6/1/24 | | | | 337,930 | |
245,000 | | Cleveland-Cuyahoga Co. Port Auth. Dev. Rev. (St. Clarence Proj.) | | | 6.00 | | | | 5/1/21 | | | | 233,375 | |
140,900 | | Cuyahoga Co. Hsg. Mtg. Sr. Rev. (R H Myers Apts. Proj.) (GNMA Collateralized) | | | 5.70 | | | | 3/20/42 | | | | 151,059 | |
205,000 | | Hamilton Co. Healthcare Rev. Ref. (Life Enriching) | | | 5.00 | | | | 1/1/27 | | | | 202,513 | |
250,000 | | OH Air Quality Dev. Auth. Rev. (Ohio Power Co.) (AMBAC Insured) | | | 5.15 | | | | 5/1/26 | | | | 250,433 | |
150,000 | | Ross Co. Hospital Rev. Ref. (Adena Health System) | | | 5.75 | | | | 12/1/28 | | | | 159,630 | |
250,000 | | Toledo-Lucas Co. Special Assessment Rev. (Crocker Park) | | | 5.38 | | | | 12/1/35 | | | | 236,320 | |
170,000 | | Toledo-Lucas Co. Special Assessment Rev. (Town Square) | | | 5.40 | | | | 11/1/36 | | | | 142,824 | |
| | | | | | | | | | | | | | |
| | | | |
| | | | | | | | | | | | | 1,970,209 | |
| | | | | | | | | | | | | | |
|
Oklahoma - 0.3% | |
250,000 | | Langston Economic Dev. Rev. (Langston Univ./LDF) (ACA Insured) | | | 5.00 | | | | 5/1/35 | | | | 231,978 | |
| | | | | | | | | | | | | | |
|
Oregon - 0.7% | |
150,000 | | Forest Grove Campus Improvement Rev. (Pacific Univ.) | | | 6.00 | | | | 5/1/30 | | | | 157,622 | |
200,000 | | Redmond Airport Rev. | | | 5.50 | | | | 6/1/24 | | | | 210,398 | |
300,000 | | Western Generation Agy. Rev. (Wauna Cogeneration) | | | 5.00 | | | | 1/1/21 | | | | 287,997 | |
| | | | | | | | | | | | | | |
| | | | |
| | | | | | | | | | | | | 656,017 | |
| | | | | | | | | | | | | | |
|
Pennsylvania - 3.5% | |
500,000 | | Allegheny Co. Industrial Development Auth. Charter School Rev. (Propel Charter-East) | | | 5.90 | | | | 8/15/26 | | | | 512,750 | |
300,000 | | Chester Co. Health & Education Facs. Auth. Hospital Rev. | | | 6.75 | | | | 7/1/31 | | | | 303,159 | |
170,000 | | Crawford Co. Industrial Dev. Rev. (Allegheny College) | | | 6.00 | | | | 11/1/31 | | | | 183,093 | |
250,000 | | Erie Co. Hospital Auth. Rev. (St. Vincent Health Center Proj.) | | | 7.00 | | | | 7/1/27 | | | | 258,195 | |
250,000 | | Lehigh Co. General Purpose Auth. Rev. (Saint Luke’s Bethlehem) 1 | | | 1.27 | | | | 8/15/42 | | | | 163,953 | |
500,000 | | Luzerne Co. G.O. (FSA Insured) | | | 7.00 | | | | 11/1/26 | | | | 583,420 | |
60,000 | | Montgomery Co. Industrial Dev. Auth. Rev. (Whitemarsh) | | | 6.00 | | | | 2/1/21 | | | | 57,111 | |
250,000 | | PA Turnpike Commission Rev. Capital Appreciation 6 | | | 5.75 | | | | 12/1/28 | | | | 195,770 | |
500,000 | | PA Turnpike Commission Rev. Capital Appreciation (AGM Insured) 6 | | | 6.25 | | | | 6/1/33 | | | | 405,625 | |
See accompanying notes to financial statements.
| | |
| 12 | | SIT MUTUAL FUNDS SEMI-ANNUAL REPORT |
| | | | | | | | | | | | |
Principal
Amount ($) | | Name of Issuer | | Coupon
Rate (%) | | Maturity Date | | | Fair
Value ($) | |
400,000 | | Philadelphia Hospital & Higher Education Facs. Auth. Hospital Rev. (Temple Univ. Hospital) | | 6.63 | | | 11/15/23 | | | | 400,128 | |
100,000 | | Quakertown General Auth. Health Rev. (Lifequest) (GNMA Collateralized) | | 6.05 | | | 7/20/24 | | | | 105,850 | |
| | | | | | | | | | | | |
| | | | |
| | | | | | | | | | | 3,169,054 | |
| | | | | | | | | | | | |
|
Puerto Rico - 0.4% | |
500,000 | | Puerto Rico Sales Tax Financing Corp. Rev. 6 | | 6.13 | | | 8/1/29 | | | | 339,260 | |
| | | | | | | | | | | | |
|
Rhode Island - 0.9% | |
350,000 | | RI Health & Education Building Corp. Rev. (Johnson & Wales) (AMBAC Insured) | | 6.10 | | | 4/1/26 | | | | 350,371 | |
200,000 | | RI Health & Education Building Corp. Rev. (Steere House Proj.) | | 5.80 | | | 7/1/20 | | | | 200,000 | |
250,000 | | RI Health & Education Building Corp. Rev. Ref. (Univ. of RI) | | 6.50 | | | 9/15/28 | | | | 286,368 | |
| | | | | | | | | | | | |
| | | | |
| | | | | | | | | | | 836,739 | |
| | | | | | | | | | | | |
|
South Carolina - 0.2% | |
150,000 | | SC Jobs Economic Dev. Auth. Hospital Rev. Ref. & Improvement (Hampton Medical) | | 4.75 | | | 11/1/12 | | | | 152,059 | |
| | | | | | | | | | | | |
|
South Dakota - 0.5% | |
480,000 | | Aberdeen Economic Dev. Rev. (Presentation College) | | 5.63 | | | 5/1/29 | | | | 490,858 | |
| | | | | | | | | | | | |
|
Tennessee - 1.4% | |
200,000 | | Blount Co. Health & Education Facs. Rev. (Asbury, Inc.) | | 5.13 | | | 4/1/23 | | | | 177,870 | |
500,000 | | Johnson City Health & Education Facs. Rev. (Mtn. States) | | 5.63 | | | 7/1/30 | | | | 522,275 | |
250,000 | | Metro Govt. Nashville & Davidson Co. Industrial Dev. Board Rev. Escrowed to Maturity | | 9.75 | | | 2/15/15 | | | | 278,760 | |
250,000 | | Metro Govt. Nashville & Davidson Co. Industrial Dev. Board Rev. Escrowed to Maturity | | 9.75 | | | 2/15/15 | | | | 278,760 | |
| | | | | | | | | | | | |
| | | | |
| | | | | | | | | | | 1,257,665 | |
| | | | | | | | | | | | |
|
Texas - 10.4% | |
160,000 | | Bexar Co. Health Facs. Dev. Corp. Rev. | | 5.88 | | | 7/1/30 | | | | 164,832 | |
500,000 | | Bexar Co. Hsg. Fin. Corp. Rev. (American Opportunity) (NATL-RE Insured) | | 5.70 | | | 1/1/21 | | | | 476,085 | |
100,000 | | Bexar Co. Hsg. Fin. Corp. Rev. (American Opportunity) (NATL-RE Insured) | | 5.80 | | | 1/1/31 | | | | 90,604 | |
150,000 | | Bexar Co. Hsg. Fin. Corp. Rev. (Dymaxion & Marbach Park Apts. Proj.) (NATL-RE Insured) | | 6.10 | | | 8/1/30 | | | | 142,707 | |
300,000 | | Brazos Co. Health Facs. Development Corp. Rev. (Franciscan Services Corp.) | | 5.38 | | | 1/1/32 | | | | 302,151 | |
500,000 | | Capital Area Cultural Education Facs. Finance Corp. Rev. | | 5.75 | | | 4/1/26 | | | | 526,930 | |
400,000 | | Central TX Regional Mobility Auth. Rev. | | 5.75 | | | 1/1/25 | | | | 426,244 | |
250,000 | | Clifton Higher Education Finance Corp. Education Rev. (Uplift Education Proj.) | | 6.00 | | | 12/1/30 | | | | 258,043 | |
100,000 | | Clifton Higher Education Rev. Ref. (Tejano Center Community) | | 7.75 | | | 2/15/18 | | | | 118,303 | |
162,877 | | Galveston Co. Municipal Utilities Bond Anticipation Notes Rev. | | 6.16 | | | 3/1/11 | | | | 130,318 | |
250,000 | | Harris Co. Cultural Education Facs. Finance Corp. Rev. (Space Center Houston Proj.) | | 6.75 | | | 8/15/21 | | | | 264,497 | |
55,000 | | Harris Co. Hsg. Fin. Corp. Multi Family Hsg. Rev. Sr. Lien (Windsor Hsg. Found.) Escrowed to Maturity | | 6.30 | | | 6/1/25 | | | | 55,247 | |
500,000 | | Harrison Co. Health Facs. Dev. Corp. Rev. (Good Shephard Health System) | | 5.25 | | | 7/1/28 | | | | 492,020 | |
350,000 | | Houston Hotel Occupancy Tax & Special Rev. (AMBAC Insured) 6 | | 6.34 | | | 9/1/23 | | | | 176,498 | |
195,000 | | Kerrville Health Facs. Rev. (Sid Peterson) | | 5.45 | | | 8/15/35 | | | | 187,046 | |
240,000 | | Lewisville Combination Contract Improvement Rev. Special Assessment | | 6.75 | | | 10/1/32 | | | | 251,618 | |
400,000 | | North TX Tollway Auth. Rev. Ref. | | 6.13 | | | 1/1/31 | | | | 432,988 | |
200,000 | | North TX Tollway Auth. Rev. Ref. First Tier | | 5.63 | | | 1/1/33 | | | | 213,012 | |
500,000 | | Port of Corpus Christi Auth. Rev. Ref. (Union Pacific Corp. Proj.) | | 5.65 | | | 12/1/22 | | | | 506,585 | |
100,000 | | Richardson Hospital Auth. Rev. Ref. (Baylor/Richardson Proj.) | | 5.63 | | | 12/1/28 | | | | 98,593 | |
185,000 | | Rio Grande Valley Health Facs. Dev. Corp. Hospital Rev. (Valley Baptist) (NATL-RE Insured) | | 6.40 | | | 8/1/12 | | | | 185,559 | |
275,000 | | Tarrant Co. Cultural Education Facs. Fin. Rev. (Air Force Village) | | 5.75 | | | 11/15/19 | | | | 293,329 | |
200,000 | | Tarrant Co. Cultural Education Facs. Fin. Rev. (Air Force Village) | | 5.13 | | | 5/15/27 | | | | 189,174 | |
50,000 | | Tarrant Co. Cultural Education Facs. Fin. Rev. (C.C. Young Memorial Home Proj.) | | 5.00 | | | 2/15/13 | | | | 49,110 | |
250,000 | | Tarrant Co. Cultural Education Facs. Fin. Rev. (C.C. Young Memorial Home Proj.) | | 6.50 | | | 2/15/14 | | | | 251,290 | |
190,000 | | Tarrant Co. Cultural Education Facs. Fin. Rev. (Edgemere) | | 6.00 | | | 11/15/26 | | | | 194,969 | |
250,000 | | Tarrant Co. Cultural Education Facs. Fin. Rev. (Mirador Proj.) | | 6.25 | | | 11/15/14 | | | | 251,210 | |
250,000 | | Tarrant Co. Cultural Education Facs. Fin. Rev. (Mirador Proj.) | | 7.75 | | | 11/15/19 | | | | 271,230 | |
500,000 | | Tarrant Co. Cultural Education Facs. Fin. Rev. (Sr. Living Center Proj.) | | 6.50 | | | 11/15/14 | | | | 500,645 | |
See accompanying notes to financial statements.
SCHEDULE OF INVESTMENTS (Unaudited)
September 30, 2010
Sit High Income Municipal Bond Fund (Continued)
| | | | | | | | | | | | |
Principal
Amount ($) | | Name of Issuer | | Coupon
Rate (%) | | | Maturity
Date | | | Fair
Value ($) |
410,000 | | Tom Green Co. Hsg. Finance Corp. Mtg. Rev. 6 | | | 28.62 | | | | 3/1/16 | | | 77,904 |
| 250,000 | | Travis Co. Health Facs. Dev. Corp. Rev. (Querencia Barton Creek Proj.) | | | 5.10 | | | | 11/15/15 | | | 248,075 |
| 450,000 | | Travis Co. Health Facs. Dev. Corp. Rev. (Westminster Manor) | | | 6.25 | | | | 11/1/16 | | | 457,141 |
| 500,000 | | TX Private Activity Surface Transportation Corp. Rev. (LBJ Infrastructure) | | | 7.50 | | | | 6/30/33 | | | 572,595 |
| 400,000 | | TX Public Finance Auth. Charter School Finance Corp. Rev. (Idea Public School) (ACA Insured) | | | 5.00 | | | | 8/15/30 | | | 376,904 |
| 150,000 | | TX Public Finance Auth. Charter School Finance Corp. Rev. (Uplift Education) | | | 5.35 | | | | 12/1/17 | | | 158,011 |
| | | | | | | | | | | | |
| | | | |
| | | | | | | | | | | | 9,391,467 |
| | | | | | | | | | | | |
|
| Utah - 1.2% |
| 200,000 | | Provo Charter School Rev. (Freedom Academy Foundation) | | | 5.50 | | | | 6/15/37 | | | 164,150 |
| 200,000 | | UT Associated Minicipal Power System Rev. | | | 5.00 | | | | 5/1/27 | | | 172,674 |
| 250,000 | | UT Charter School Finance Auth. Rev. (North Davis Prep.) | | | 5.75 | | | | 7/15/20 | | | 252,960 |
| 500,000 | | UT Charter School Finance Auth. Rev. (Paradigm High School) | | | 5.75 | | | | 7/15/20 | | | 502,180 |
| | | | | | | | | | | | |
| | | | |
| | | | | | | | | | | | 1,091,964 |
| | | | | | | | | | | | |
|
| Virgin Islands - 0.3% |
| 250,000 | | Virgin Islands Public Finance Auth Rev. (Diago) | | | 6.75 | | | | 10/1/37 | | | 282,140 |
| | | | | | | | | | | | |
|
| Virginia - 0.4% |
| 250,000 | | VA Housing Development Auth. Commonwealth Mortgage Rev. (G.O. of Auth. Insured) | | | 6.00 | | | | 7/1/25 | | | 277,228 |
| 100,000 | | VA Tobacco Settlement Finance Corp. Sr. Rev. | | | 5.00 | | | | 6/1/47 | | | 67,821 |
| | | | | | | | | | | | |
| | | | |
| | | | | | | | | | | | 345,049 |
| | | | | | | | | | | | |
|
| Washington - 2.2% |
| 170,000 | | Kalispel Tribe Indians Priority District Rev. | | | 6.20 | | | | 1/1/16 | | | 162,137 |
| 100,000 | | Quinault Indian Nation Rev. Ref. & Improvement (Beach) (ACA Insured) | | | 5.80 | | | | 12/1/15 | | | 88,465 |
| 350,000 | | WA Health Care Auth. Rev. (Seattle Cancer Care) | | | 6.50 | | | | 3/1/24 | | | 388,237 |
| 500,000 | | WA Health Care Auth. Rev. (Seattle Cancer Care) | | | 7.13 | | | | 3/1/29 | | | 564,925 |
| 500,000 | | WA Health Care Facs. Auth. Rev. (Overlake Hospital Medical Center) | | | 5.25 | | | | 7/1/23 | | | 527,890 |
| 100,000 | | WA Hsg. Finance Commission Nonprofit Rev. (Skyline at First Hill Proj.) | | | 5.10 | | | | 1/1/13 | | | 96,218 |
| 150,000 | | WA Hsg. Finance Commission Nonprofit Rev. (Skyline at First Hill Proj.) | | | 5.25 | | | | 1/1/17 | | | 133,344 |
| | | | | | | | | | | | |
| | | | |
| | | | | | | | | | | | 1,961,216 |
| | | | | | | | | | | | |
|
| Wisconsin - 3.3% |
| 110,000 | | Milwaukee Redev. Auth. Rev. (Academy of Learning) | | | 5.50 | | | | 8/1/22 | | | 99,152 |
| 500,000 | | WI Health & Education Facs. Auth. Rev. (Aurora Health Care Proj.) | | | 5.60 | | | | 2/15/29 | | | 500,245 |
| 290,000 | | WI Health & Education Facs. Auth. Rev. (Aurora Health Care Proj.) | | | 6.40 | | | | 4/15/33 | | | 298,941 |
| 100,000 | | WI Health & Education Facs. Auth. Rev. (Beaver Dam Community Hospital, Inc.) | | | 6.00 | | | | 8/15/19 | | | 101,891 |
| 375,000 | | WI Health & Education Facs. Auth. Rev. (Beaver Dam Community Hospital, Inc.) | | | 6.50 | | | | 8/15/24 | | | 375,120 |
| 100,000 | | WI Health & Education Facs. Auth. Rev. (Beaver Dam Community Hospital, Inc.) | | | 6.75 | | | | 8/15/34 | | | 101,345 |
| 250,000 | | WI Health & Education Facs. Auth. Rev. (Beloit College) | | | 6.00 | | | | 6/1/30 | | | 263,280 |
| 100,000 | | WI Health & Education Facs. Auth. Rev. (Marshfield Clinic) (NATL-RE Insured) | | | 5.63 | | | | 2/15/17 | | | 100,132 |
| 500,000 | | WI Health & Education Facs. Auth. Rev. (Sinai Samaritan Medical Center) (NATL-RE Insured) | | | 5.88 | | | | 8/15/26 | | | 500,185 |
| 250,000 | | WI Health & Education Facs. Auth. Rev. (St. Johns Communities, Inc.) | | | 5.40 | | | | 9/15/14 | | | 250,622 |
| 250,000 | | WI Health & Education Facs. Auth. Rev. Ref. (Three Pillars) | | | 5.60 | | | | 8/15/23 | | | 254,195 |
| 100,000 | | WI Health & Education Facs. Auth. Rev. Ref. (Three Pillars) | | | 5.75 | | | | 8/15/26 | | | 101,189 |
| | | | | | | | | | | | |
| | | | |
| | | | | | | | | | | | 2,946,297 |
| | | | | | | | | | | | |
| Total Municipal Bonds | | | | | | | | | | |
| (cost: $83,745,284) | | | | | | | | | | 85,644,014 |
| | | | | | | | | | | | |
See accompanying notes to financial statements.
| | |
| 14 | | SIT MUTUAL FUNDS SEMI-ANNUAL REPORT |
| | | | | | |
| | |
Quantity | | Name of Issuer | | Fair Value ($) | |
| | |
Closed-End Mutual Funds - 2.7% | | | | |
| 40,000 | | BlackRock Long-Term Municipal Advantage Trust (BTA) | | | 464,800 | |
| 5,000 | | BlackRock MuniHoldings Florida Insured Fund (MFL) | | | 73,100 | |
| 35,000 | | DWS Municipal Income Trust (KTF) | | | 466,550 | |
| 10,000 | | DWS Strategic Municipal Income Trust (KSM) | | | 138,500 | |
| 20,000 | | Invesco Municipal Income Opportunities Trust (OIA) | | | 137,800 | |
| 26,000 | | Invesco Van Kampen Advantage Muni Income Trust (VKI) | | | 334,880 | |
| 19,700 | | Invesco Van Kampen Trust for Investment Grade Municipals (VGM) | | | 296,485 | |
| 75,000 | | MFS High Income Municipal Trust (CXE) | | | 390,000 | |
| 10,000 | | PIMCO California Municipal Income Fund II (PCK) | | | 97,800 | |
| | | | | | |
| |
Total Closed-End Mutual Funds | | | | |
(cost: $2,059,479) | | | 2,399,915 | |
| | | | | | |
| |
Short-Term Securities - 3.1% | | | | |
| 2,823,142 | | Dreyfus Tax-Exempt Cash Management Fund, 0.12% | | | | |
Total Short-Term Securities | | | | |
(cost: $2,823,142) | | | 2,823,142 | |
| | | | | | |
| |
Total Investments in Securities - 101.1% | | | | |
(cost: $88,627,905) | | | 90,867,071 | |
Other Assets and Liabilities, net - (1.1%) | | | (1,023,283 | ) |
| | | | | | |
| |
Total Net Assets - 100.0% | | | $89,843,788 | |
| | | | | | |
| 1 | Variable rate security. Rate disclosed is as of September 30, 2010. |
| 2 | Securities considered illiquid by the Investment Adviser. The total value of such securities as of September 30, 2010 was $654,094 and represented 0.7% of net assets. |
| 4 | 144A Restricted Security. The total value of such securities as of September 30, 2010 was $1,278,783 and represented 1.4% of net assets. These securities have been determined to be liquid by the Adviser in accordance with guidelines established by the Board of Directors. |
| 5 | The issuer is in default of certain debt covenants. Income is not being accrued. The total value of such securities as of September 30, 2010 was $654,094 and represented 0.7% of net assets. |
| 6 | Zero coupon security. Rate disclosed is the effective yield on purchase date. |
| 9 | Municipal Lease Security. The total value of such securities as of September 30, 2010 was $1,623,481 and represented 1.8% of net assets. These securities have been determined to be liquid by the Adviser in accordance with guidelines established by the Board of Directors. |
Numeric footnotes not disclosed are not applicable to this Schedule of Investments.
A summary of the inputs used to value the Fund’s net assets as of September 30, 2010 is as follows (see Note 2 - significant accounting policies in the notes to financial statements):
| | | | | | | | | | | | | | |
| | | Investment in Securities | |
| | | Level 1
Quoted
Price | | | Level 2
Other significant
observable inputs | | | Level 3 Significant
unobservable inputs | | Total | |
| | | | | | | | | | | | | | |
Short-Term Securities | | | $2,823,142 | | | | — | | | — | | | $2,823,142 | |
Closed-End Mutual Funds | | | 2,399,915 | | | | — | | | — | | | 2,399,915 | |
Municipal Bonds | | | — | | | | $85,644,014 | | | — | | | 85,644,014 | |
Total: | | | $5,223,057 | | | | $85,644,014 | | | — | | | $90,867,071 | |
See accompanying notes to financial statements.
STATEMENT OF ASSETS AND LIABILITIES (Unaudited)
September 30, 2010
Sit High Income Municipal Bond Fund
| | | | |
ASSETS | | | | |
Investments in securities, at identified cost | | | $88,627,905 | |
| | | | |
| |
Investments in securities, at fair value - see accompanying schedule for detail | | | $90,867,071 | |
Accrued interest and dividends receivable | | | 1,214,200 | |
Other receivables | | | 625 | |
| | | | |
| |
Total assets | | | 92,081,896 | |
| | | | |
| |
LIABILITIES | | | | |
Disbursements in excess of cash balances | | | 468,529 | |
Payable for investment securities purchased | | | 1,532,156 | |
Payable for Fund shares redeemed | | | 139,029 | |
Cash portion of dividends payable to shareholders | | | 40,115 | |
Accrued investment management fees | | | 58,279 | |
| | | | |
| |
Total liabilities | | | 2,238,108 | |
| | | | |
| |
Net assets applicable to outstanding capital stock | | | $89,843,788 | |
| | | | |
| |
Net assets consist of: | | | | |
Capital (par value and paid-in surplus) | | | $88,327,823 | |
Accumulated net realized gain (loss) from security transactions | | | (723,201 | ) |
Unrealized appreciation (depreciation) on investments | | | 2,239,166 | |
| | | | |
| | | $89,843,788 | |
| | | | |
| |
Outstanding shares | | | 9,894,700 | |
| | | | |
| |
Net asset value per share of outstanding capital stock | | | $9.08 | |
| | | | |
See accompanying notes to financial statements.
| | |
| 16 | | SIT MUTUAL FUNDS SEMI-ANNUAL REPORT |
STATEMENT OF OPERATIONS (Unaudited)
Six Months Ended September 30, 2010
Sit High Income Municipal Bond Fund
| | | | |
Investment income: | | | | |
Income: | | | | |
Dividends | | | $74,309 | |
Interest | | | 2,271,881 | |
| | | | |
Total income | | | 2,346,190 | |
| | | | |
| |
Expenses (note 4): | | | | |
Investment management fees | | | 242,712 | |
Regulatory expenses | | | 19,646 | |
Fund administration services | | | 74,975 | |
Custodian fees | | | 2,872 | |
| | | | |
Total expenses | | | 340,205 | |
| | | | |
| |
Net investment income | | | 2,005,985 | |
| | | | |
| |
Realized and unrealized gain (loss) on investments: | | | | |
Net realized gain (loss) on investments | | | 327,229 | |
| |
Net change in unrealized appreciation (depreciation) on investments | | | 2,924,134 | |
| | | | |
| |
Net gain (loss) on investments | | | 3,251,363 | |
| | | | |
| |
Net increase (decrease) in net assets resulting from operations | | | $5,257,348 | |
| | | | |
See accompanying notes to financial statements.
STATEMENTS OF CHANGES IN NET ASSETS
Sit High Income Municipal Bond Fund
| | | | | | | | | | | | |
| | | Six Months Ended
September 30, 2010
(Unaudited) | | Year
Ended
March 31,
2010 | |
Operations: | | | | | | | | | | | | |
Net investment income | | | | | $2,005,985 | | | | | | $2,758,525 | |
Net realized gain (loss) on investments | | | | | 327,229 | | | | | | (55,259 | ) |
Net change in unrealized appreciation (depreciation) of investments | | | | | 2,924,134 | | | | | | 6,248,944 | |
| | | | | | | | | | | | |
| | | | |
Net increase (decrease) in net assets resulting from operations | | | | | 5,257,348 | | | | | | 8,952,210 | |
| | | | | | | | | | | | |
| | | | |
Distributions from: | | | | | | | | | | | | |
Net investment income | | | | | (2,005,985 | ) | | | | | (2,758,525 | ) |
Net realized gains on investments | | | | | — | | | | | | — | |
| | | | | | | | | | | | |
| | | | |
Total distributions | | | | | (2,005,985 | ) | | | | | (2,758,525 | ) |
| | | | | | | | | | | | |
| | | | |
Capital share transactions: | | | | | | | | | | | | |
Proceeds from shares sold | | | | | 21,441,930 | | | | | | 34,802,159 | |
Reinvested distributions | | | | | 2,088,332 | | | | | | 2,315,720 | |
Payments for shares redeemed | | | | | (6,841,261 | ) | | | | | (7,110,442 | ) |
| | | | | | | | | | | | |
| | | | |
Increase (decrease) in net assets from capital transactions | | | | | 16,689,001 | | | | | | 30,007,437 | |
| | | | | | | | | | | | |
| | | | |
Total increase (decrease) in net assets | | | | | 19,940,364 | | | | | | 36,201,122 | |
| | | | |
Net assets: | | | | | | | | | | | | |
Beginning of period | | | | | 69,903,424 | | | | | | 33,702,302 | |
| | | | | | | | | | | | |
End of period | | | | | $89,843,788 | | | | | | $69,903,424 | |
| | | | | | | | | | | | |
| | | | |
Capital transactions in shares: | | | | | | | | | | | | |
Sold | | | | | 2,412,022 | | | | | | 4,166,672 | |
Reinvested distributions | | | | | 234,635 | | | | | | 275,269 | |
Redeemed | | | | | (767,196 | ) | | | | | (824,541 | ) |
| | | | | | | | | | | | |
| | | | |
Net increase (decrease) | | | | | 1,879,461 | | | | | | 3,617,400 | |
| | | | | | | | | | | | |
See accompanying notes to financial statements.
| | |
| 18 | | SIT MUTUAL FUNDS SEMI-ANNUAL REPORT |
FINANCIAL HIGHLIGHTS
Per share income and capital changes for a share outstanding throughout the period.
Sit High Income Municipal Bond Fund
| | | | | | | | | | | | | | | | | | | | |
| | | Six Months Ended
September 30, 2010 | | | Year Ended March 31, | | | Three months
ended
March 31, | |
| | | | (Unaudited) | | | | 2010 | | | | 2009 | | | | 2008 | | | | 2007 | |
Net Asset Value: | | | | | | | | | | | | | | | | | | | | |
Beginning of period | | | $8.72 | | | | $7.66 | | | | $9.12 | | | | $10.01 | | | | $10.00 | |
Operations: | | | | | | | | | | | | | | | | | | | | |
Net investment income 1 | | | 0.22 | | | | 0.43 | | | | 0.44 | | | | 0.41 | | | | 0.08 | |
Net realized and unrealized gains (losses) on investments | | | 0.36 | | | | 1.06 | | | | (1.46) | | | | (0.89) | | | | 0.01 | |
| | | | | |
Total from operations | | | 0.58 | | | | 1.49 | | | | (1.02) | | | | (0.48) | | | | 0.09 | |
Distributions from: | | | | | | | | | | | | | | | | | | | | |
Net investment income | | | (0.22) | | | | (0.43) | | | | (0.44) | | | | (0.41) | | | | (0.08) | |
Net Asset Value: | | | | | | | | | | | | | | | | | | | | |
End of period | | | $9.08 | | | | $8.72 | | | | $7.66 | | | | $9.12 | | | | $10.01 | |
| | | | | |
Total investment return 2 | | | 6.73% | | | | 19.84% | | | | (11.45%) | | | | (4.89%) | | | | 0.90% | |
| | | | | |
Net assets at end of period (000’s omitted) | | | $89,844 | | | | $69,903 | | | | $33,702 | | | | $24,777 | | | | $9,480 | |
| | | | | |
Ratios: 3 | | | | | | | | | | | | | | | | | | | | |
Expenses (without waiver) 4 | | | 0.84% | | | | 0.91% | | | | 0.93% | | | | 1.14% | | | | 4.69% | |
Expenses (with waiver) 4 | | | n/a | | | | n/a | | | | 0.85% | | | | 0.85% | | | | 0.85% | |
Net investment income (with waiver) | | | 4.96% | | | | 5.13% | | | | 5.26% | | | | 4.30% | | | | 3.18% | |
| | | | | |
Portfolio turnover rate (excluding short-term securities) | | | 10.72% 5 | | | | 24.20% | | | | 29.27% | | | | 19.38% | | | | 0.00% | |
| 1 | The net investment income per share is based on average shares outstanding for the period. |
| 2 | Total investment return is based on the change in net asset value of a share during the period (not annualized) and assumes reinvestment of distributions at net asset value. |
| 3 | The ratio information is calculated based on average daily net assets (annualized). Prior to March 31, 2009, total Fund expenses were limited to 0.85% of average daily net assets. During those periods, the investment adviser voluntarily absorbed expenses that were otherwise payable by the Fund. |
| 4 | In addition to fees and expenses which the Fund bears directly, the Fund indirectly bears a pro rata share of the fees and expenses of the acquired funds in which it invests. Such indirect expenses are not included in the above reported expense ratios. |
NOTES TO FINANCIAL STATEMENTS (Unaudited)
Six Months Ended September 30, 2010
The Sit High Income Municipal Bond Fund (the Fund) is a no-load fund, and is registered under the Investment Company Act of 1940 (as amended) as a diversified, open-end management investment company, or series thereof. The Fund is a series fund of Sit Mutual Funds II, Inc. The Fund has 10 billion authorized shares of capital stock that have a par value of $0.001. The Fund’s objective is to seek high current income that is exempt from regular income tax.
| (2) | Significant Accounting Policies |
Short-Term Trading (Redemption) Fees
The Fund charges a redemption fee equal to 2.00% of the proceeds on shares held for less than 30 calendar days. The fee is retained by the Fund for the benefit of its long-term shareholders and accounted for as an addition to paid in capital.
Investments in Securities
Investments in securities traded on national or international securities exchanges are valued at the last sales price prior to the time when assets are valued. Securities traded on the over-the-counter market are valued at the last reported sales price or if the last sales price is not available at the last reported bid price. The sale and bid prices or prices deemed best to reflect fair value quoted by dealers who make markets in these securities are obtained from independent pricing services. The pricing service may use models that price securities based on current yields and relative security characteristics, such as coupon rate, maturity date, issuer credit quality, and prepayment speeds as applicable. When market quotations are not readily available, or when the Adviser becomes aware that a significant event impacting the value of a security or group of securities has occurred after the closing of the exchange on which the security or securities principally trade, but before the calculation of the daily net asset value, securities are valued at fair value as determined in good faith using procedures established by the Board of Directors. Debt securities of sufficient credit quality maturing in less than 60 days when acquired, or which subsequently are within 60 days of maturity, are valued at amortized cost.
Security transactions are accounted for on the date the securities are purchased or sold. Gains and losses are calculated on the identified cost basis. Interest, including level-yield amortization of long-term bond premium and discount, is recorded on the accrual basis.
Delivery and payment for securities which have been purchased by the Fund on a forward commitment or when-issued basis can take place two weeks or more after the transaction date. During this period, such securities are subject to market fluctuations and may increase or decrease in value prior to delivery.
Fair Value Measurements
The inputs and valuations techniques used to measure fair value of the Fund’s net assets are summarized into three levels as described in the hierarchy below:
| | • | | Level 1 – quoted prices for active markets for identical securities. An active market for the security is a market in which transactions occur with sufficient frequency and volume to provide pricing information on an ongoing basis. A quoted price in an active market provides the most reliable evidence of fair value. |
| | • | | Level 2 – other significant observable inputs including quoted prices for similar securities, interest rates, prepayment speeds, credit risk, etc. or quoted prices for identical or similar assets in markets that are not active. These are primarily inputs that are derived principally from or corroborated by observable market data. An adjustment to any observable input that is significant to the fair value may render the measurement a Level 3 measurement. |
| | • | | Level 3 – significant unobservable inputs, including the Fund’s own assumptions in determining the fair value of investments. |
The inputs or methodology used for valuing securities are not necessarily an indication of the risk associated with investing in those securities.
A summary of the levels for the Fund’s investments as of September 30, 2010 is included with the Fund’s schedule of investments.
| | |
| 20 | | SIT MUTUAL FUNDS SEMI-ANNUAL REPORT |
NOTES TO FINANCIAL STATEMENTS (Unaudited)
Six Months Ended September 30, 2010 (Continued)
New Accounting Pronouncements
In January 2010, the Financial Accounting Standards Board (“FASB”) issued Accounting Standards Update (“ASU”) No. 2010-06 “Improving Disclosures about Fair Value Measurements”. ASU 2010-06 amends FASB Accounting Standards Codification Topic 820, Fair Value Measurements and Disclosures, to require additional disclosures regarding fair value measurements. Certain disclosures required by ASU No. 2010-06 are currently effective for interim and annual reporting periods beginning after December 15, 2009, and other required disclosures are effective for fiscal years beginning after December 15, 2010, and for interim periods within those fiscal years. Management has evaluated the impact and has incorporated the appropriate disclosures required by ASU No. 2010-06 in the Funds’ financial statement disclosures.
Federal Taxes
The Fund’s policy is to comply with the requirements of the Internal Revenue Code applicable to regulated investment companies and to distribute all of its taxable income to shareholders. The Fund has recorded in its financial statements the full benefit of its tax positions taken in connection with the RIC qualification and distribution requirements of the RIC. Therefore, no income tax provision is required. Also, in order to avoid the payment of any federal excise taxes, the Fund will distribute substantially all of its net investment income and net realized gains on a calendar year basis.
Management has analyzed the Fund’s tax positions taken in federal tax returns for all open tax years and has concluded that as of March 31, 2010, no provision for income tax would be required in the Fund’s financial statements. The Fund’s federal and state income and federal excise returns for the 2007, 2008 and 2009 tax years for which the applicable statutes of limitations have not expired remain subject to examination by the Internal Revenue Service and state departments of revenue.
At September 30, 2010, the gross unrealized appreciation (depreciation) on investments and cost of securities on a tax basis for federal income tax purposes are identical to book and are as follows:
| | | | | | | | |
Unrealized
Appreciation | | Unrealized
Depreciation | | Net Unrealized
Appreciation | | Cost of Securities
on a Tax Basis | | |
$4,565,515 | | ($2,326,349) | | $2,239,166 | | $88,627,905 | |
Net investment income and net realized gains may differ for financial statement and tax purposes. The character of distributions made during the year for net investment income or net realized gains may also differ from its ultimate characterization for tax purposes. The tax character of distributions paid during the fiscal years ended March 31, 2010 and 2009 were as follows:
| | | | | | | | |
| | | Ordinary Income | | Long Term Capital Gain | | Total | |
Year ended March 31, 2010 | | $2,758,525 | | — | | $ | 2,758,525 | |
Year ended March 31, 2009 | | 1,754,686 | | — | | | 1,754,686 | |
As of March 31, 2010, the components of distributable earnings on a tax basis were as follows:
| | | | | | | | |
Undistributed Ordinary Income | | Undistributed
Tax Exempt
Income | | Accumulated
Gain (Loss) | | Unrealized
Appreciation (Depreciation) | | |
$72,633 | | $257,496 | | ($1,050,430) | | ($684,968) | |
Net capital loss carryovers and post-October capital losses, if any, as of March 31, 2010, are available to offset future realized capital gains and thereby reduce future capital gains distributions. The net capital loss carryovers and the post-October capital losses deferred as of March 31, 2010 for the Fund, were as follows:
| | | | | | | | | | |
Capital Loss Carryover Expiring in: | | Net Capital
Loss
Carryover | | Post-October
Capital Loss
Deferral | | Accumulated
Capital and
Other Losses |
| 2016 | | 2017 | | 2018 | | | |
| |
$27,089 | | $120,604 | | $796,008 | | $943,701 | | $106,729 | | $1,050,430 |
NOTES TO FINANCIAL STATEMENTS (Unaudited)
Six Months Ended September 30, 2010 (Continued)
Distributions
Distributions to shareholders are recorded as of the close of business on the record date. Such distributions are payable in cash or reinvested in additional shares of the Fund’s capital stock. Distributions from net investment income are declared daily and paid monthly for the Fund. Distributions from net realized gains, if any, will be made annually for the Fund.
Use of Estimates
The preparation of financial statements in conformity with U.S. generally accepted accounting principles requires management to make certain estimates and assumptions that affect the reported amounts of assets and liabilities and disclosure of contingent assets and liabilities at the date of the financial statements and the reported results. Actual results could differ from those estimates.
Guarantees and Indemnifications
Under the Fund’s organizational documents, its officers and directors are indemnified against certain liability arising out of the performance of their duties to the Fund. In addition, certain of the Fund’s contracts with its service providers contain general indemnification clauses. The Fund’s maximum exposure under these arrangements is unknown since the amount of any future claims that may be made against the Fund cannot be determined and the Fund has no historical basis for predicting the likelihood of any such claims.
| (3) | Investment Security Transactions |
The cost of purchases of and proceeds from sales and maturities of investment securities, other than short-term securities, for the period ended September 30, 2010, were as follows:
| | | | | | |
| Purchases | | Proceeds | | | |
| | | |
$24,081,938 | | $ | 8,408,209 | | |
| (4) | Affiliated Fees and Transactions |
Investment Adviser
The Fund has entered into an investment management agreement with Sit Investment Associates Inc. (SIA), under which SIA manages the Fund’s assets and provides research, statistical and advisory services, and pays related office rental, executive expenses and executive salaries. The fee for investment management and advisory services is based on the average daily net assets of the Funds at the annual rate of 0.60%. The Fund is obligated to pay all of its other operating expenses (including, but not limited to, custody, regulatory, and fund administration fees).
Transactions with affiliates
The investment adviser, affiliates of the investment adviser, directors and officers of the Fund as a whole owned 26,300 shares of the Fund as of September 30, 2010, which represented 0.3% of all shares outstanding.
Management has evaluated the impact of all subsequent events on the Fund through the date the financial statements were issued, and has determined that there were no subsequent events that would require disclosure in or adjustments to the financial statements.
| | |
| 22 | | SIT MUTUAL FUNDS SEMI-ANNUAL REPORT |
EXPENSE EXAMPLE (Unaudited)
As a shareholder of the Fund, you incur two types of costs: (1) transaction costs, including redemption fees and (2) ongoing costs, including management fees; and other Fund expenses. This Example is intended to help you understand your ongoing costs (in dollars) of investing in the Fund and to compare these costs with the ongoing costs of investing in other mutual funds.
The Example is based on an investment of $1,000 invested at the beginning of the period and held for the entire period April 1, 2010 to September 30, 2010.
Actual Expenses
The first line of the table below provides information about actual account values and actual expenses. You may use the information in this line, together with the amount you invested, to estimate the expenses that you paid over the period. Simply divide your account value by $1,000 (for example, an $8,600 account value divided by $1,000 = 8.6), then multiply the result by the number in the first line under the heading entitled “Expenses Paid During Period” to estimate the expenses you paid on your account during this period.
Hypothetical Example for Comparison Purposes
The second line of the table below provides information about hypothetical account values and hypothetical expenses based on the Fund’s actual expense ratio and an assumed rate of return of 5% per year before expenses, which is not the Fund’s actual return. The hypothetical account values and expenses may not be used to estimate the actual ending account balance or expenses you paid for the period. You may use this information to compare the ongoing costs of investing in the Fund and other funds. To do so, compare this 5% hypothetical example with the 5% hypothetical examples that appear in the shareholder reports of the other funds.
Please note that the expenses shown in the table are meant to highlight your ongoing costs only and do not reflect any transactional costs, such as redemption fees. Therefore, the second line of the table is useful in comparing ongoing costs only, and will not help you determine the relative total costs of owning different funds. In addition, if these transactional costs (redemption fees) were included, your costs would have been higher.
| | | | | | |
| Sit High Income Muni Bond Fund | | Beginning
Account Value
(4/1/10) | | Ending
Account Value
(9/30/10) | | Expenses Paid
During Period*
(4/1/10 - 9/30/10) |
Actual | | $1,000 | | $1,067.30 | | $4.35 |
Hypothetical (5% return before expenses) | | $1,000 | | $1,020.86 | | $4.26 |
*Expenses are equal to the Fund’s annualized expense ratio of 0.84%, multiplied by the average account value over the period, multiplied by 183/365 (to reflect the one-half year period.)
ADDITIONAL INFORMATION (Unaudited)
PROXY VOTING
The Fund follows certain policies and procedures for voting proxies for securities held in the portfolio. A description of the Fund’s proxy voting policies and procedures is available without charge upon request by calling the Fund at 1-800-332-5580.
Information regarding how the Fund voted proxies relating to its portfolio securities during the most recent twelve-month period ended June 30 is available without charge upon request by calling the Fund at 1-800-332-5580, and is available on the U.S. Securities and Exchange Commission’s website at www.sec.gov.
AVAILABILITY OF QUARTERLY PORTFOLIO SCHEDULES
The Fund files its complete schedule of portfolio holdings with the U.S. Securities and Exchange Commission (SEC) for the first and third quarters of each fiscal year on Form N-Q. The Fund’s Form N-Qs are available without charge upon request by calling the Funds at 1-800-332-5580 and are available on the SEC’s website at www.sec.gov. In addition, the Fund’s Form N-Qs may be reviewed and copied at the SEC’s Public Reference Room in Washington, DC. Information on the operation of the Public Reference Room may be obtained by calling 1-202-551-8090.
| | |
| 24 | | SIT MUTUAL FUNDS SEMI-ANNUAL REPORT |

|
Sit Mutual Funds BOND FUNDS SEMI-ANNUAL REPORT TABLE OF CONTENTS |
| | | | | | |
| | | Page |
| | |
Chairman’s Letter | | | 2 | | | |
| | |
Fund Reviews and Schedules of Investments | | | | | | |
| | |
U.S. Government Securities Fund | | | 4 | | | |
| | |
Tax-Free Income Fund | | | 10 | | | |
| | |
Minnesota Tax-Free Income Fund | | | 24 | | | |
| | |
Statements of Assets and Liabilities | | | 36 | | | |
| | |
Statements of Operations | | | 37 | | | |
| | |
Statements of Changes in Net Assets | | | 38 | | | |
| | |
Financial Highlights | | | 40 | | | |
| | |
Notes to Financial Statements | | | 44 | | | |
| | |
Expense Example | | | 49 | | | |
| | |
Additional Information | | | 50 | | | |
This document must be preceded or accompanied by a Prospectus.
CHAIRMAN’S LETTER
Six Months Ended September 30, 2010
Dear fellow shareholders:
U.S. fixed-income markets continued to post strong performance during the six-month period, driven by the uncertain state of the economy and mixed signs of improvement in selected economic sectors. Slowing economic growth resulted in market expectations that the Federal Reserve will not only keep the federal funds rate very low for an extended period of time, but that another round of “quantitative easing” (QE2) in the form of large-scale asset purchases will be undertaken to keep the economic recovery on track and allay fears of a double-dip recession.
Taxable bond yields declined and the yield curve continued to flatten during the six-month period, as shorter-term yields approached historic absolute lows and longer-term yields declined. Specifically, the 2-year maturity U.S.Treasury note yield decreased 60 basis points to 0.42%, while the 30-year U.S. Treasury bond yield decreased 102 basis points to 3.69%. Most taxable bond sectors provided strong returns, with the commercial mortgage-backed sector performing best, as businesses recorded increasing profits and high levels of cash, followed by the longer-duration corporate sector, where financials performed particularly well. The U.S. Treasury sector also provided strong returns, as continued rhetoric from the Fed regarding additional Treasury bond purchases supported prices in that sector. Returns on asset-backed securities basically matched those of the Aggregate Index and were led by the credit card sector. The mortgage-backed securities sector underperformed due to its shorter duration.
Tax-exempt municipal bond yields also declined during the six-month period. Long-term municipal yields fell to below the 4.90% level by the end of August, a range not sustained since the first quarter of 2008. The Bond Buyer 40-Bond Index yield ended the period 39 basis points lower, at 4.87%. Positive bond fund flows and light issuance contributed to the continued decline in yields. Tax-exempt municipals provided strong returns, with longer maturity and lower-rated bonds seeing the greatest price strength as investors sought out their attractive absolute yields. Among revenue bonds, the longer duration industrial revenue, special tax and hospital sectors posted the best performance, while shorter duration prerefunded bonds lagged.
Turning to the U.S. economy, second quarter 2010 real GDP growth was +1.7%, and showed continued deceleration from the +3.7% and +5.0% growth rates posted in the first quarter of 2010 and the fourth quarter of 2009, respectively. Revisions going into the final second quarter figure included stronger consumer spending and greater inventory accumulation, which were offset by faster import growth and lower government spending, particularly at the state and local level. In the second quarter of 2010, the residential investment component recorded its first year-over-year gain in many quarters. Reports suggest that housing demand has stabilized, after hitting bottom following the expiration of the homebuyer tax credit, and mortgage rates are now at record lows. In addition, the August Institute of Supply Management’s (ISM) Manufacturing Index report indicates that the manufacturing sector is slowing, but remains expansionary.
Consumer spending grew in August, buoyed by higher personal income. However, the increase in wages, in part, reflected an extension of unemployment benefits that has resulted in a record level of “transfer” payments, in aggregate totaling 18.5% of personal income. We believe that the consumer remains the key economic driver; thus, employment trends will continue to be the dominant factor affecting the prospects for recovery. While job creation has been positive, the number of jobs created year to date has only averaged 68,000 per month and represents a small fraction (i.e., less than 10%) of the jobs lost in 2008 and 2009. As such, economists project the unemployment rate, currently at 9.6%, will average at least 9% through 2011.
Inflation is expected to remain subdued, as the slowing pace of economic recovery has limited companies’ ability to pass along higher commodity and other costs. In fact, deflation is a bigger concern of monetary authorities, as revealed in the Fed’s September 21st policy statement.
Regarding the fiscal outlook, with only September remaining to be reported, the Congressional Budget Office estimates that the federal deficit was slightly less than $1.3 trillion in fiscal year 2010, compared with a deficit of slightly more than $1.4 trillion in 2009. Receipts have generally been higher, reflecting improved economic conditions (as well as the Fed’s remittances of earnings on its huge portfolio of assets), while spending outlays on the financial crisis were lower versus the prior year. Looking forward, the deficit for fiscal 2011 will probably be smaller, but not significantly smaller, than fiscal 2010. Any decline in the fiscal 2011 deficit will depend heavily on whether Congress extends any or all of the Bush tax cuts beyond this year. Allowing all of the Bush tax cuts to expire on schedule would raise just under $200 billion in revenue in fiscal 2011, according to Treasury estimates.
Congress returns for a “lame duck” session on November 15th with less than seven working weeks through the end of the year to pass legislation. How much of Congress’ vast agenda will get done when it reconvenes is debatable and very dependent on the outcome of the elections. Pundits believe that the Republican Party is likely to retake leadership of the House and, possibly, the Senate. If so, Republicans would get significant input into what passes after the election; this will either result in gridlock or bipartisanship, depending on which side “blinks” first. Any bill that is still pending at the end of the congressional session dies, forcing lawmakers to start from scratch, reintroducing it at the start of a new two-year term.
The Federal Reserve’s U.S. trade-weighted major currencies dollar index was down -5.1% from its recent peak in June 2010, as the slowing U.S. economic recovery refocused attention on our country’s economic and fiscal problems, and away from Europe’s economic and social woes. The U.S. greenback is now trading at new lows relative to the yen and other major currencies. Expectations that the Fed will pursue another round of quantitative easing have
| | |
2 | | SIT MUTUAL FUNDS SEMI-ANNUAL REPORT |
exacerbated the U.S. dollar’s decline, as well as driven the price of gold to a record high and U.S. stocks to a five-month high.
Strategy Summary
The Federal Reserve is expected to restart a bond-buying program after the Federal Open Market Committee (FOMC) meets on November 2nd-3rd. Predictions focus on a liquidity injection of up to $1 trillion over roughly 12 months using an “incremental” approach to quantitative easing. In other words, rather than announce massive bond purchases with a finite end to shock the U.S. financial system back to life as they did in 2009, Fed officials are considering a more open-ended, smaller-scale program that can be adjusted as the recovery unfolds. The risk is that markets may be disappointed if they don’t perceive the total amount of purchases to be substantial enough. In this environment, we expect subpar economic growth (i.e., 2.0%) over the next few quarters, followed by a slight acceleration (i.e., 2.5%) in the second half of 2011, as consumer spending remains subdued. These assumptions yield annual growth rates of +2.7% in 2010 and +2.1% in 2011, compared with -2.6% in 2009.
Looking forward, we continue to believe that the Fed’s massive monetary stimulus plan is likely to result in a modestly positive inflationary environment in the intermediate term, and that, combined with a potentially positive surprise in the residential housing market next year from the currently dire outlook, is likely to push interest rates higher. As such, we believe U.S. Treasury securities should be underweighted due to their currently low absolute yields. We continue to focus on older vintage, high-coupon, agency mortgage pass-through securities that provide high levels of income at stable price levels.
Demand for tax-exempt municipals has continued to benefit from the relative reduction in new issue supply that has resulted from the shift toward taxable Build America Bonds (BABs), which has doubled in volume since one year ago. Year to date, approximately one-third of municipal new issuance continues to be taxable. Legislation to extend the issuance of the Build America Bonds program remains
in negotiations. While we believe the BAB extension will eventually pass, the surrounding uncertainty could result in temporary supply imbalances and dislocations in yields, particularly if issuers decide to push BAB issuance forward, prior to the current program’s expiration on December 31st, 2010, or if extension efforts fail and the market sees a resurgence in tax-exempt issuance.
As of September 30th, relative yield ratios of high grade municipals to Treasuries remained at the cheap end of their longer term historical valuation ranges and, more importantly, relative yield ratios of lower-rated, investment grade municipals to Treasuries continued to be very attractively valued. Although credit spreads for lower-rated bonds have narrowed substantially over the past year, we believe the absolute yields offered by these bonds remain attractive. We believe that the tax-exempt yield curve will continue to flatten and that credit spreads on lower-rated bonds will continue to narrow, particularly as investors seek out alternatives to very low short-term yields. While fiscal stresses continue to make headlines, we believe that issuance trends will have a greater impact on tax-exempt yield levels than credit concerns. We believe a broad-based crisis will be averted as municipalities eventually successfully address projected budget gaps with tax increases and reduced spending, including pension reform. In addition, we expect revenue streams to gradually improve as the economic recovery stabilizes. As always, diversification remains a key factor in managing risk.
We appreciate your continued interest in the Sit family of funds.
With best wishes,

Roger J. Sit
Chairman and President
Sit Mutual Funds
|
Sit U.S. Government Securities Fund |
OBJECTIVE & STRATEGY
The objective of the U.S. Government Securities Fund is to provide high current income and safety of principal, which it seeks to attain by investing solely in debt obligations issued, guaranteed or insured by the U.S. government or its agencies or its instrumentalities.
Agency mortgage securities and U.S. Treasury securities are the principal holdings in the Fund. The mortgage securities that the Fund purchases consist of pass-through securities including those issued by Government National Mortgage Association (GNMA), Federal National Mortgage Asociation (FNMA), and Federal Home Loan Mortgage Corporation (FHLMC).
The Sit U.S. Government Securities Fund provided a return of +2.62% during the 6-month period ended September 30, 2010, compared to the return of the Barclays Intermediate Government Bond Index of +5.45%. The Fund’s 30-day SEC yield was 3.47% and its 12-month distribution rate was 3.04%.
During the 6-month period, the Fund benefited from the income advantage produced by its holdings in older-vintage, higher-coupon mortgage pass-through securities and collateralized mortgage obligations. The Fund also benefited from its allocation to U.S. Treasury bonds, as Treasury bond prices increased during the period. Returns were negatively impacted from modest price declines in its mortgage holdings, as investor concern over the future of the Federal housing agencies, Fannie Mae and Freddie Mac, served to reduce investor demand for most mortgage securities. In addition, continuous congressional proposals to refinance all mortgages that were securitized into bonds insured by Fannie Mae and Freddie Mac caused investor uncertainty to rise and prices of these securities to fall. An underweight in the U.S. Treasury sector, relative to the benchmark, also negatively impacted the Fund’s performance. Treasury bond prices rose as a result of the Federal Reserve’s announcement in the third quarter that the proceeds from maturing mortgage and agency securities, which it purchased following the liquidity crisis of 2008, would be used to purchase additional U.S. Treasury securities.
Looking forward, we continue to believe that the intermediate term inflationary environment that is likely to result from the Federal government’s massive monetary stimulus plan, combined with a potentially positive surprise to the upside in the residential housing market going into 2011, is likely to push interest rates higher. As such, we are maintaining an underweight to the U.S. Treasury sector. We also continue to focus on high-coupon, agency mortgage pass-through securities that are of older vintage, as these continue to provide high levels of income at stable price levels, especially relative to the low absolute levels of shorter-term interest rates available from
HYPOTHETICAL GROWTH OF $10,000
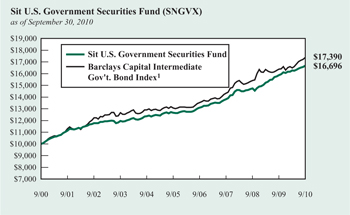
The chart above illustrates the total value of a hypothetical $10,000 investment in the Fund over the past 10 years (or for the life of the Fund if shorter) as compared to the performance of the Barclays Capital Intermediate Government Bond Index. Past performance does not guarantee future results. Returns include the reinvestment of distributions. The chart does not reflect the deduction of taxes that a shareholder would pay on Fund distributions or the redemption of Fund shares.
1 The Barclays Capital Intermediate Government Bond Index is a sub-index of the Barclays Capital Government Bond Index covering issues with remaining maturities of between three and five years. The Barclays Capital Government Bond Index is an index that measures the performance of all public U.S. government obligations with remaining maturities of one year or more. The returns include the reinvestment of income and do not include any transaction costs, management fees or other costs. It is not possible to invest directly in an index.
other investment alternatives. This high level of income has been a fundamental focus of the Fund since its inception.
Michael C. Brilley
Bryce A. Doty, CFA
Senior Portfolio Managers
Mark H. Book, CFA
Portfolio Manager
| | |
| 4 | | SIT MUTUAL FUNDS SEMI-ANNUAL REPORT |
COMPARATIVE RATES OF RETURNS
as of September 30, 2010
| | | | | | |
| | | Sit U.S. Government Securities Fund | | Barclays Capital Inter. Gov’t Bond Index1 | | Lipper U.S. Gov’t Fund Index2 |
Six Month | | 2.62% | | 5.45% | | n/a |
One Year | | 5.13 | | 6.19 | | 8.22% |
Five Years | | 5.69 | | 5.87 | | 5.66 |
Ten Years | | 5.26 | | 5.69 | | 5.66 |
Since Inception (6/2/87) | | 6.57 | | 6.75 | | 6.39 |
Performance figures are historical and do not guarantee future results. Investment returns and principal value will vary, and you may have a gain or loss when you sell shares. Current performance may be lower or higher than the performance data quoted. Contact the Fund for performance data current to the most recent month-end. Returns include changes in share price as well as reinvestment of all dividends and capital gains and all fee waivers. Without the fee waivers total return and yield figures would have been lower. Returns do not reflect the deduction of taxes that a shareholder would pay on Fund distributions or the redemption of Fund shares. Management fees and administrative expenses are included in the Fund’s performance. Returns for periods greater than one year are compounded average annual rates of return.
1 The Barclays Capital Intermediate Government Bond Index is a sub-index of the Barclays Capital Government Bond Index covering issues with remaining maturities of between three and five years. The Barclays Capital Government Bond Index is an index that measures the performance of all public U.S. government obligations with remaining maturities of one year or more. The returns include the reinvestment of income and do not include any transaction costs, management fees or other costs. It is not possible to invest directly in an index.
2 The Lipper returns are obtained from Lipper Analytical Services, Inc., a large independent evaluator of mutual funds.
FUND DIVERSIFICATION
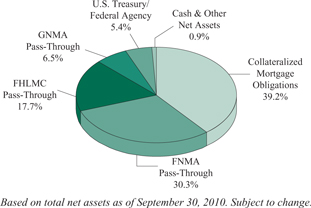
PORTFOLIO SUMMARY
| | |
Net Asset Value 9/30/10: | | $11.27 Per Share |
Net Asset Value 3/31/10: | | $11.13 Per Share |
Total Net Assets: | | $980.8 Million |
30-day SEC Yield 3: | | 3.47% |
12-month Distribution Rate 3: | | 3.04% |
Average Maturity: | | 22.3 Years |
Effective Duration 4: | | 1.1 Years |
3 The SEC Yield reflects the rate at which the Fund is earning income on its current portfolio of securities, while the distribution rate reflects the Fund’s past dividends paid to shareholders based on the net investment income distributed and the average NAV during the past 12 months. Accordingly, the Fund’s SEC yield and distribution rate may differ.
4 Duration is a measure of estimated price sensitivity relative to changes in interest rates. Portfolios with longer durations are typically more sensitive to changes in interest rates. For example, if interest rates rise by 1%, the market value of a security with an effective duration of 5 years would decrease by 5%, with all other factors being constant. The correlation between duration and price sensitivity is greater for securities rated investment-grade than it is for securities rated below investment-grade. Duration estimates are based on assumptions by the Adviser and are subject to a number of limitations. Effective duration is calculated based on historical price changes of securities held by the Fund, and therefore is a more accurate estimate of price sensitivity provided interest rates remain within their historical range.
| | | | |
| ESTIMATED AVERAGE LIFE PROFILE | |
0-1 Year | | | 0.9 | % |
1-5 Years | | | 93.3 | % |
5-10 Years | | | 4.6 | % |
10-20 Years | | | 0.0 | % |
20+ Years | | | 1.2 | % |
The Adviser’s estimates of the dollar weighted average life of the portfolio’s securities, which may vary from their stated maturities.
SCHEDULE OF INVESTMENTS (Unaudited)
September 30, 2010
Sit U.S. Government Securities Fund
| | | | | | | | | | | | |
| Principal Amount ($) | | |
| Coupon Rate
(%) |
| | Maturity Date | | | Fair Value ($) | |
| |
| Mortgage Pass-Through Securities - 54.5% | | | | |
| Federal Home Loan Mortgage Corporation - 17.7% | | | | |
| | 230,372 | | | | 5.50 | | | 8/1/17-3/1/33 | | | 247,107 | |
| | 342,935 | | | | 6.38 | | | 12/1/26-12/1/27 | | | 375,750 | |
| | 20,873,214 | | | | 6.50 | | | 4/1/28-10/1/36 | | | 22,813,316 | |
| | 1,108,764 | | | | 6.88 | | | 2/17/31 | | | 1,219,720 | |
| | 51,834,103 | | | | 7.00 | | | 2/1/16-1/1/39 | | | 58,005,345 | |
| | 191,133 | | | | 7.38 | | | 12/17/24 | | | 215,796 | |
| | 60,864,639 | | | | 7.50 | | | 9/1/26-10/1/38 | | | 69,115,390 | |
| | 167,128 | | | | 7.95 | | | 10/1/25-11/1/25 | | | 191,402 | |
| | 2,489,256 | | | | 8.00 | | | 5/1/17-1/1/37 | | | 2,860,478 | |
| | 35,948 | | | | 8.25 | | | 12/1/17 | | | 39,759 | |
| | 4,068,428 | | | | 8.50 | | | 5/1/16-8/1/36 | | | 4,717,687 | |
| | 7,142,685 | | | | 9.00 | | | 11/1/15-11/1/36 | | | 8,225,902 | |
| | 137,123 | | | | 9.25 | | | 6/1/16-3/1/19 | | | 146,766 | |
| | 796,466 | | | | 9.50 | | | 10/1/16-12/17/21 | | | 906,679 | |
| | 108,408 | | | | 9.75 | | | 12/1/16-12/1/17 | | | 118,156 | |
| | 3,006,284 | | | | 10.00 | | | 9/1/20-7/1/30 | | | 3,475,420 | |
| | 19,766 | | | | 10.25 | | | 2/1/17 | | | 19,859 | |
| | 148,355 | | | | 10.50 | | | 10/1/13-6/1/19 | | | 167,365 | |
| | 952,245 | | | | 11.00 | | | 9/17/16-8/25/20 | | | 1,062,884 | |
| | 10,439 | | | | 13.00 | | | 5/1/17 | | | 12,676 | |
| | | | | | | | | | | | |
| | | | | | | | | | | 173,937,457 | |
| | | | | | | | | | | | |
| Federal National Mortgage Association - 30.3% | | | | |
| | 11,569 | | | | 5.74 | | | 3/1/19 1 | | | 12,122 | |
| | 72,066 | | | | 5.76 | | | 3/1/33 | | | 78,262 | |
| | 1,956,605 | | | | 6.00 | | | 9/1/28-9/1/37 | | | 2,126,198 | |
| | 592,979 | | | | 6.15 | | | 8/1/36 | | | 644,723 | |
| | 427,871 | | | | 6.20 | | | 11/1/27 | | | 472,634 | |
| | 126,648 | | | | 6.35 | | | 10/1/30 | | | 141,953 | |
| | 79,469 | | | | 6.49 | | | 2/1/32 | | | 88,645 | |
| | 22,188,005 | | | | 6.50 | | | 1/1/22-8/1/37 | | | 24,516,862 | |
| | 1,403,477 | | | | 6.74 | | | 12/1/15 | | | 1,619,920 | |
| | 199,911 | | | | 6.91 | | | 11/1/26-8/1/27 | | | 226,784 | |
| | 266,951 | | | | 6.95 | | | 8/1/21 | | | 278,672 | |
| | 116,002,497 | | | | 7.00 | | | 6/1/17-1/1/39 | | | 130,900,400 | |
| | 73,110,804 | | | | 7.50 | | | 11/1/12-4/1/38 | | | 82,074,376 | |
| | 324,028 | | | | 7.52 | | | 6/1/16 1 | | | 337,395 | |
| | 191,810 | | | | 7.62 | | | 12/1/16 | | | 201,903 | |
| | 420,630 | | | | 7.95 | | | 9/15/20 | | | 474,472 | |
| | 12,321,686 | | | | 8.00 | | | 4/1/16-3/1/38 | | | 14,181,983 | |
| | 600,720 | | | | 8.16 | | | 11/15/31 1 | | | 709,728 | |
| | 33,268 | | | | 8.25 | | | 4/1/22 | | | 35,726 | |
| | 296,671 | | | | 8.33 | | | 7/15/20 | | | 340,986 | |
| | 139,208 | | | | 8.46 | | | 9/15/30 | | | 159,464 | |
| | 1,452,817 | | | | 8.48 | | | 3/15/32 1 | | | 1,731,212 | |
| | 15,110,337 | | | | 8.50 | | | 9/1/12-12/1/37 | | | 17,495,732 | |
| | 238,436 | | | | 8.53 | | | 7/20/30 1 | | | 272,925 | |
| | 176,021 | | | | 8.63 | | | 7/20/28 1 | | | 198,202 | |
| | 7,758,295 | | | | 9.00 | | | 10/1/19-2/1/38 | | | 8,930,790 | |
| | 120,042 | | | | 9.25 | | | 10/1/16-2/1/17 | | | 131,939 | |
| | | | | | | | | | | | |
| Principal
Amount ($) |
| |
| Coupon Rate
(%) |
| | Maturity Date | | | Fair Value ($) | |
| | | |
| | 57,674 | | | | 9.28 | | | 12/15/25 1 | | | 66,707 | |
| | 135,857 | | | | 9.40 | | | 5/15/28 | | | 158,579 | |
| | 4,270,849 | | | | 9.50 | | | 11/1/18-8/1/31 | | | 4,835,930 | |
| | 474,716 | | | | 9.71 | | | 8/20/25 1 | | | 541,866 | |
| | 221,840 | | | | 9.75 | | | 1/15/13-4/1/25 | | | 246,666 | |
| | 1,366,408 | | | | 10.00 | | | 7/1/13-6/1/30 | | | 1,548,007 | |
| | 156,913 | | | | 10.01 | | | 7/15/20 1 | | | 176,613 | |
| | 169,091 | | | | 10.18 | | | 7/1/20 | | | 189,158 | |
| | 42,218 | | | | 10.25 | | | 8/15/13 | | | 45,808 | |
| | 326,329 | | | | 10.50 | | | 5/1/15-6/1/28 | | | 375,445 | |
| | 102,086 | | | | 10.99 | | | 8/15/20 1 | | | 115,926 | |
| | 13,730 | | | | 11.00 | | | 4/1/17 | | | 13,831 | |
| | 47,173 | | | | 11.41 | | | 12/15/26 1 | | | 54,326 | |
| | | | | | | | | | | | |
| | | | | | | | | | | 296,752,870 | |
| | | | | | | | | | | | |
| Government National Mortgage Association - 6.5% | |
| | 1,276,418 | | | | 5.45 | | | 7/15/27 | | | 1,349,008 | |
| | 311,091 | | | | 5.50 | | | 9/15/25 | | | 337,404 | |
| | 3,740,244 | | | | 5.61 | | | 11/15/34 | | | 3,977,424 | |
| | 500,851 | | | | 5.76 | | | 3/20/33-6/20/33 | | | 546,834 | |
| | 425,468 | | | | 6.00 | | | 9/15/18-11/20/28 | | | 465,897 | |
| | 77,511 | | | | 6.05 | | | 3/20/33 | | | 84,868 | |
| | 4,288,002 | | | | 6.09 | | | 7/15/41 | | | 4,543,806 | |
| | 2,882,943 | | | | 6.15 | | | 1/15/42 | | | 3,034,908 | |
| | 1,224,684 | | | | 6.20 | | | 3/15/32 | | | 1,353,291 | |
| | 490,950 | | | | 6.25 | | | 5/15/13-1/15/24 | | | 542,812 | |
| | 6,298,620 | | | | 6.35 | | | 4/20/30-11/20/31 | | | 6,857,926 | |
| | 512,337 | | | | 6.38 | | | 8/15/26-4/15/28 | | | 570,475 | |
| | 349,743 | | | | 6.49 | | | 11/20/31-6/20/32 | | | 390,268 | |
| | 4,236,520 | | | | 6.50 | | | 6/15/26-7/20/38 | | | 4,688,660 | |
| | 114,252 | | | | 6.57 | | | 9/20/32-3/20/33 | | | 128,983 | |
| | 389,127 | | | | 6.75 | | | 9/15/15-6/15/29 | | | 439,748 | |
| | 938,291 | | | | 6.91 | | | 7/20/26-2/20/27 | | | 1,061,918 | |
| | 3,184,178 | | | | 6.93 | | | 2/20/25-9/15/39 | | | 3,384,155 | |
| | 1,884,522 | | | | 7.00 | | | 6/20/38-2/20/39 | | | 2,067,039 | |
| | 164,798 | | | | 7.02 | | | 4/20/26 | | | 184,888 | |
| | 278,692 | | | | 7.05 | | | 2/15/23-4/20/27 | | | 313,094 | |
| | 896,972 | | | | 7.10 | | | 5/20/25 | | | 1,008,910 | |
| | 324,190 | | | | 7.15 | | | 12/20/26-4/20/27 | | | 365,319 | |
| | 154,212 | | | | 7.25 | | | 5/15/29-6/15/29 | | | 175,378 | |
| | 53,366 | | | | 7.27 | | | 7/20/22 | | | 59,900 | |
| | 56,686 | | | | 7.38 | | | 1/15/29 | | | 64,656 | |
| | 7,714,653 | | | | 7.50 | | | 5/15/16-3/15/39 | | | 8,667,480 | |
| | 59,993 | | | | 7.55 | | | 10/20/22 | | | 68,686 | |
| | 2,687,296 | | | | 7.60 | | | 12/15/33 | | | 2,860,840 | |
| | 96,511 | | | | 7.63 | | | 12/15/29 | | | 112,806 | |
| | 68,126 | | | | 7.65 | | | 7/20/22 | | | 78,203 | |
| | 464,718 | | | | 7.75 | | | 6/15/20-11/15/20 | | | 531,031 | |
| | 51,368 | | | | 7.90 | | | 1/20/21 | | | 57,002 | |
| | 791,287 | | | | 7.95 | | | 2/15/20-3/20/27 | | | 923,418 | |
| | 540,670 | | | | 7.99 | | | 2/20/21-6/20/22 | | | 621,437 | |
| | 7,884,804 | | | | 8.00 | | | 10/15/14-9/15/31 | | | 9,049,288 | |
| | 422,782 | | | | 8.10 | | | 5/20/19-7/20/20 | | | 475,475 | |
See accompanying notes to financial statements.
| | |
6 | | SIT MUTUAL FUNDS SEMI-ANNUAL REPORT |
| | | | | | | | | | | | |
| Principal Amount ($) | | |
| Coupon Rate
(%) |
| | Maturity Date | | | Fair Value ($) | |
| | | |
| | 364,046 | | | | 8.25 | | | 12/15/11-2/15/20 | | | 407,779 | |
| | 34,528 | | | | 8.38 | | | 10/15/19 | | | 39,283 | |
| | 183,206 | | | | 8.40 | | | 2/15/19-2/15/20 | | | 209,281 | |
| | 408,760 | | | | 8.50 | | | 1/15/12-12/20/26 | | | 473,689 | |
| | 37,526 | | | | 8.60 | | | 6/15/18 | | | 42,410 | |
| | 31,202 | | | | 8.63 | | | 10/15/18 | | | 34,655 | |
| | 33,574 | | | | 8.75 | | | 11/15/11 | | | 35,426 | |
| | 138,723 | | | | 9.00 | | | 6/15/11-7/15/17 | | | 154,442 | |
| | 18,046 | | | | 9.10 | | | 5/15/18 | | | 20,589 | |
| | 620 | | | | 9.25 | | | 11/15/10 | | | 644 | |
| | 181,079 | | | | 9.50 | | | 11/15/10-10/20/19 | | | 206,326 | |
| | 12,795 | | | | 9.75 | | | 12/15/10-11/15/12 | | | 13,961 | |
| | 262,362 | | | | 10.00 | | | 11/15/17-6/15/21 | | | 309,439 | |
| | 418,489 | | | | 10.50 | | | 2/15/20-8/15/21 | | | 472,323 | |
| | 23,319 | | | | 11.50 | | | 8/15/18 | | | 25,372 | |
| | | | | | | | | | | | |
| | | | | | | | | | | 63,888,854 | |
| | | | | | | | | | | | |
| Total Mortgage Pass-Through Securities
(cost: $522,372,337) | | | 534,579,181 | |
| | | | | | | | | | | | |
| |
| U.S. Treasury / Federal Agency Securities - 5.4% | | | | |
| U.S. Treasury Note: | | | | | | | |
| | 12,000,000 | | | | 0.88 | | | 4/30/11 | | | 12,045,468 | |
| | 10,000,000 | | | | 2.63 | | | 4/30/16 | | | 10,607,030 | |
| U.S. Treasury Strips: | | | | | | | |
| | 22,000,000 | | | | 3.94 | | | 2/15/19 6 | | | 17,988,520 | |
| | 32,150,000 | | | | 4.18 | | | 2/15/36 6 | | | 12,054,321 | |
| | | | | | | | | | | | |
| Total U.S. Treasury / Federal Agency Securities
(cost: $50,385,636) | | | 52,695,339 | |
| | | | | | | | | | | | |
| |
| Collateralized Mortgage Obligations - 39.2% | | | | |
| Federal Home Loan Mortgage Corporation - 10.4% | | | | |
| | 131,129 | | | | 5.40 | | | 3/25/44 | | | 137,726 | |
| | 315,365 | | | | 5.50 | | | 2/15/34 | | | 326,247 | |
| | 280,081 | | | | 6.00 | | | 9/15/21-6/15/28 | | | 294,557 | |
| | 125,006 | | | | 6.09 | | | 9/25/29 | | | 130,647 | |
| | 250,000 | | | | 6.28 | | | 10/27/31 | | | 255,713 | |
| | 5,118,187 | | | | 6.50 | | | 9/15/23-10/25/43 | | | 5,745,791 | |
| | 152,107 | | | | 6.70 | | | 9/15/23 | | | 176,159 | |
| | 406,922 | | | | 6.95 | | | 3/15/28 | | | 418,847 | |
| | 48,869,651 | | | | 7.00 | | | 12/15/20-3/25/43 | | | 54,448,374 | |
| | 1,133,036 | | | | 7.15 | | | 9/25/28 | | | 1,225,095 | |
| | 1,528,036 | | | | 7.27 | | | 8/25/28 | | | 1,603,482 | |
| | 21,631,322 | | | | 7.50 | | | 6/15/17-3/25/44 | | | 25,712,646 | |
| | 6,487,231 | | | | 8.00 | | | 3/15/21-1/15/30 | | | 7,684,187 | |
| | 103,142 | | | | 8.25 | | | 6/15/22 | | | 120,966 | |
| | 594,284 | | | | 8.30 | | | 11/15/20 | | | 712,398 | |
| | 1,147,245 | | | | 8.50 | | | 10/15/22-3/15/32 | | | 1,329,245 | |
| | 13,007 | | | | 9.15 | | | 10/15/20 | | | 14,418 | |
| | | | | | | | | | | | |
| Principal
Amount ($) |
| |
| Coupon Rate
(%) |
| | Maturity Date | | | Fair Value ($) | |
| | | |
| | 1,688,461 | | | | 9.50 | | | 2/15/20-2/25/42 | | | 1,983,067 | |
| | 146,584 | | | | 10.00 | | | 6/15/20 | | | 179,290 | |
| | | | | | | | | | | | |
| | | | | | | | | | | 102,498,855 | |
| | | | | | | | | | | | |
| Federal National Mortgage Association - 17.7% | | | | |
| | 154,403 | | | | 0.60 | | | 11/25/32 1 | | | 137,796 | |
| | 682,613 | | | | 5.50 | | | 1/25/37 | | | 742,074 | |
| | 540,932 | | | | 6.47 | | | 10/25/31 | | | 558,880 | |
| | 3,185,603 | | | | 6.50 | | | 12/25/23-12/25/42 | | | 3,400,139 | |
| | 305,103 | | | | 6.51 | | | 3/25/29 | | | 353,154 | |
| | 1,119,098 | | | | 6.59 | | | 10/25/31 | | | 1,203,524 | |
| | 9,044,153 | | | | 6.75 | | | 4/25/37 | | | 10,200,109 | |
| | 285,660 | | | | 6.83 | | | 7/25/31 | | | 284,823 | |
| | 46,321 | | | | 6.85 | | | 12/18/27 | | | 52,341 | |
| | 1,640,081 | | | | 6.88 | | | 6/25/42 1 | | | 1,866,066 | |
| | 26,878,923 | | | | 7.00 | | | 1/25/21-8/25/44 | | | 30,235,207 | |
| | 954,773 | | | | 7.13 | | | 1/17/37 | | | 954,543 | |
| | 2,524,146 | | | | 7.29 | | | 6/17/40 1 | | | 2,909,731 | |
| | 2,165,680 | | | | 7.37 | | | 6/25/42 1 | | | 2,550,089 | |
| | 489,204 | | | | 7.38 | | | 12/25/42 1 | | | 576,038 | |
| | 6,122,293 | | | | 7.43 | | | 2/25/42 1 | | | 7,209,000 | |
| | 56,995,651 | | | | 7.50 | | | 8/20/27-1/25/48 | | | 65,856,355 | |
| | 23,907 | | | | 7.70 | | | 3/25/23 | | | 27,604 | |
| | 13,058,475 | | | | 7.74 | | | 7/25/37 1 | | | 14,554,006 | |
| | 216,538 | | | | 7.80 | | | 6/25/26 | | | 216,469 | |
| | 598,477 | | | | 8.00 | | | 7/25/22-7/25/44 | | | 712,283 | |
| | 8,782,194 | | | | 8.50 | | | 1/25/21-10/25/30 | | | 10,695,953 | |
| | 25,442 | | | | 8.70 | | | 12/25/19 | | | 28,456 | |
| | 37,349 | | | | 8.75 | | | 9/25/20 | | | 41,246 | |
| | 2,088,150 | | | | 8.89 | | | 11/25/37 1 | | | 2,424,803 | |
| | 120,227 | | | | 8.95 | | | 10/25/20 | | | 139,493 | |
| | 4,149,052 | | | | 9.00 | | | 7/25/19-6/25/30 | | | 4,867,690 | |
| | 81,037 | | | | 9.05 | | | 12/25/18 | | | 99,270 | |
| | 87,301 | | | | 9.25 | | | 1/25/20 | | | 101,582 | |
| | 3,270,446 | | | | 9.39 | | | 2/25/44 1 | | | 3,940,888 | |
| | 1,698,253 | | | | 9.47 | | | 6/25/32 1 | | | 1,981,519 | |
| | 4,189,924 | | | | 9.50 | | | 12/25/18-12/25/41 | | | 5,125,793 | |
| | 191,008 | | | | 9.60 | | | 3/25/20 | | | 223,521 | |
| | | | | | | | | | | | |
| | | | | | | | | | | 174,270,445 | |
| | | | | | | | | | | | |
| Government National Mortgage Association - 6.6% | | | | |
| | 49,708,734 | | | | 7.00 | | | 9/16/23-6/20/40 | | | 56,313,471 | |
| | 435,560 | | | | 7.50 | | | 6/20/26-5/16/27 | | | 509,197 | |
| | 4,684,445 | | | | 8.00 | | | 10/16/29-3/16/30 | | | 5,553,994 | |
| | 2,137,864 | | | | 8.50 | | | 9/20/30-2/20/32 | | | 2,152,763 | |
| | | | | | | | | | | | |
| | | | | | | | | | | 64,529,425 | |
| | | | | | | | | | | | |
| Vendee Mortgage Trust - 4.5% | | | | |
| | 1,203,531 | | | | 6.00 | | | 2/15/30 | | | 1,275,821 | |
| | 21,408,184 | | | | 6.50 | | | 1/15/29-8/15/31 | | | 24,177,867 | |
| | 3,275,641 | | | | 7.00 | | | 3/15/28 | | | 3,756,751 | |
| | 681,819 | | | | 7.25 | | | 9/15/25 | | | 777,796 | |
| | 3,966,908 | | | | 7.75 | | | 5/15/22-9/15/24 | | | 4,677,021 | |
See accompanying notes to financial statements.
SCHEDULE OF INVESTMENTS (Unaudited)
September 30, 2010
Sit U.S. Government Securities Fund (Continued)
| | | | | | | | |
Principal Amount ($)/ Quantity | | Coupon Rate (%) | | Maturity Date | | Fair Value ($) | |
| | | |
7,336,187 | | 8.11 | | 3/15/25 1 | | | 8,801,132 | |
322,097 | | 8.29 | | 12/15/26 | | | 387,588 | |
| | | | |
| | | 43,853,976 | |
| | | | |
Total Collateralized Mortgage Obligations
(cost: $374,658,814) | | | 385,152,701 | |
| | | | |
Short-Term Securities - 2.1% | | | | |
20,841,428 | | Dreyfus Cash Mgmt. Fund, 0.06% | | | | |
Total Short-Term Securities
(cost: $20,841,428) | | | 20,841,428 | |
| | | | |
Total Investments in Securities - 101.2%
(cost: $968,258,215) | | | 993,268,649 | |
| | | | | | | | |
| | | | | | |
| | | |
| Contracts | | | | Fair Value ($) | |
| |
Call Options Written 10 - 0.0% | | | | |
| | U.S. Treasury 2 Year Future
Call Options: | | | | |
| (300) | | $110 strike, October 2010 expiration | | | (46,875 | ) |
| (550) | | $110 strike, November 2010 expiration | | | (137,500 | ) |
| (200) | | $110 strike, February 2011 expiration | | | (140,625 | ) |
| | | | | | |
Total Call Options Written
(premiums received: $261,869) | | | (325,000 | ) |
| | | | | | |
Other Assets and Liabilities, net - (1.2%) | | | (12,097,813 | ) |
| | | | | | |
Total Net Assets - 100.0% | | $ | 980,845,836 | |
| | | | | | |
| | | | | |
| 1 | Variable rate security. Rate disclosed is as of September 30, 2010. |
| 6 | Zero coupon security. Rate disclosed is the effective yield on purchase date. |
| 10 | The amount of $1,200,000 in cash was segregated with the broker to cover call options written as of September 30, 2010. |
Numeric footnotes not disclosed are not applicable to this Schedule of Investments.
For a complete list of security holdings refer to our company website at www.sitfunds.com.
A summary of the inputs used to value the Fund’s net assets as of September 30, 2010 is as follows (see Note 2 - significant accounting policies in the notes to financial statements):
| | | | | | | | | | | | | | |
| | | Investment in Securities | |
| | | Level 1 Quoted Price | | | Level 2 Other significant
observable inputs | | | Level 3 Significant unobservable inputs | | Total | |
Short-Term Securities | | | $20,841,428 | | | | — | | | — | | | $20,841,428 | |
Collateralized Mortgage Obligations | | | — | | | | $385,152,701 | | | — | | | 385,152,701 | |
Mortgage Pass-Through Securities | | | — | | | | 534,579,181 | | | — | | | 534,579,181 | |
U.S. Treasury / Federal Agency Securities | | | — | | | | 52,695,339 | | | — | | | 52,695,339 | |
Call Options Written | | | (325,000 | ) | | | — | | | — | | | (325,000 | ) |
Total: | | | $20,516,428 | | | | $972,427,221 | | | — | | | $992,943,649 | |
| | |
| See accompanying notes to financial statements. |
8 | | SIT MUTUAL FUNDS SEMI-ANNUAL REPORT |
[This page intentionally left blank.]
OBJECTIVE & STRATEGY
The objective of the Tax-Free Income Fund is to provide a high level of current income that is exempt from federal income tax, consistent with preservation of capital, by investing primarily in investment-grade municipal securities.
Such municipal securities generate interest income that is exempt from both federal regular income tax and federal alternative minimum tax. During normal market conditions, the Fund invests 100% of its net assets in such tax-exempt municipal securities.
The Sit Tax-Free Income Fund provided a total return of +5.15% for the six-month period ended September 30, 2010, compared with a total return of +4.25% for the Barclays Capital 5-Year Municipal Bond Index. As of September 30, 2010, the Fund’s 30-day SEC yield was 5.06% and its 12-month distribution rate was 4.50%.
Tax-exempt municipal bond yields declined during the six-month period, resulting in solid returns for the asset class. The yield curve flattened as yields on longer maturity bonds fell more than yields on shorter maturity bonds. In addition, yield spreads on lower rated credits narrowed further from the historically wide levels that prevailed during the financial turmoil of 2008 as investors continued to be less risk averse as they reached for higher yields.
The Fund’s solid outperformance was attributable to a broad improvement in prices for the types of bonds in which it invests, thus helping it to continue to recoup much of the price depreciation that occurred in the second half of 2008. Of the significant sectors in which the Fund invests, closed-end bond funds provided the best relative return, followed by education bonds and then hospital bonds. The Fund’s holdings in single family and multifamily housing bonds also outperformed the benchmark, but by a lesser amount. These five sectors represent almost two-thirds of the Fund’s holdings. The Fund also benefited from improving prices in A-rated and BBB-rated securities and non-rated bonds that, in aggregate, represent over two-thirds of its investments. Finally, the Fund benefited from its longer-than-benchmark duration positioning, as longer maturity bonds substantially outperformed shorter maturity bonds. The Fund’s duration shortened slightly during the period from 5.8 years to 5.7 years on September 30, 2010.
Looking forward, we expect a moderate economic growth to continue through 2011. We believe the Federal Reserve will keep short-term interest rates low at least though the first half of 2011, as unemployment is expected to remain at historically high levels. In this
HYPOTHETICAL GROWTH OF $10,000
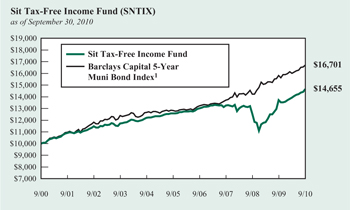
The chart above illustrates the total value of a hypothetical $10,000 investment in the Fund over the past 10 years (or for the life of the Fund if shorter) as compared to the performance of the Barclays Capital 5-Year Municipal Bond Index. Past performance does not guarantee future results. Returns include the reinvestment of distributions. The chart does not reflect the deduction of taxes that a shareholder would pay on Fund distributions or the redemption of Fund shares.
1 The Barclays Capital 5-Year Municipal Bond Index is the 5 year (4-6) component of the Municipal Bond Index, an unmanaged, rules-based, market-value-weighted index for the long-term tax-exempt bond market. The index includes bonds with a minimum credit rating of BBB. The returns include the reinvestment of income and do not include any transaction costs, management fees or other costs. It is not possible to invest directly in an index.
environment, we expect the municipal bond market to provide attractive returns with continued narrowing of yield spreads and the strongest relative performance from longer duration bonds. Longer maturity and lower rated bonds with stable credit outlooks continue to offer attractive yields. Diversification remains a key factor in managing risk.
Michael C. Brilley
Debra A. Sit, CFA
Paul J. Jungquist, CFA
Senior Portfolio Managers
| | |
10 | | SIT MUTUAL FUNDS SEMI-ANNUAL REPORT |
COMPARATIVE RATES OF RETURNS
| | | | | | |
as of September 30, 2010 | | | | | | |
| | | Sit Tax-Free Income Fund | | Barclays Capital 5-Year Muni Bond Index1 | | Lipper General Muni. Bond Fund Index2 |
| | | |
Six Month | | 5.15% | | 4.25% | | n/a |
One Year | | 6.81 | | 5.63 | | 5.77% |
Five Years | | 3.07 | | 5.40 | | 4.32 |
Ten Years | | 3.90 | | 5.26 | | 5.11 |
Since Inception (9/29/88) | | 5.38 | | 5.88 | | 6.05 |
Performance figures are historical and do not guarantee future results. Investment returns and principal value will vary, and you may have a gain or loss when you sell shares. Current performance may be lower or higher than the performance data quoted. Contact the Fund for performance data current to the most recent month-end. Returns include changes in share price as well as reinvestment of all dividends and capital gains and all fee waivers. Without the fee waivers total return and yield figures would have been lower. Returns do not reflect the deduction of taxes that a shareholder would pay on Fund distributions or the redemption of Fund shares. Management fees and administrative expenses are included in the Fund’s performance. Returns for periods greater than one year are compounded average annual rates of return.
1 The Barclays Capital 5-Year Municipal Bond Index is the 5 year (4-6) component of the Municipal Bond Index, an unmanaged, rules-based, market-value-weighted index for the long-term tax-exempt bond market. The index includes bonds with a minimum credit rating of BBB. The returns include the reinvestment of income and do not include any transaction costs, management fees or other costs. It is not possible to invest directly in an index.
2 The Lipper returns are obtained from Lipper Analytical Services, Inc., a large independent evaluator of mutual funds.
| | | | |
FUND DIVERSIFICATION | | | | |
| |
Other Revenue | | | 16.5 | % |
Hospital/Health Care | | | 15.2 | % |
Education/Student Loan | | | 14.4 | % |
Multifamily Mortgage | | | 11.8 | % |
Single Family Mortgage | | | 9.6 | % |
Mutual Funds | | | 6.7 | % |
Sectors less than 5% | | | 21.6 | % |
Cash & Other Net Assets | | | 4.2 | % |
Based on total net assets as of September 30, 2010. Subject to change.
| | |
| |
Net Asset Value 9/30/10: | | $9.15 Per Share |
Net Asset Value 3/31/10: | | $8.90 Per Share |
Total Net Assets: | | $164.2 Million |
30-day SEC Yield 3: | | 5.06% |
Tax Equivalent Yield 4: | | 7.78% |
12-month Distribution Rate 3: | | 4.50% |
Average Maturity: | | 15.2 Years |
Effective Duration 5: | | 5.7 Years |
3 The SEC Yield reflects the rate at which the Fund is earning income on its current portfolio of securities, while the distribution rate reflects the Fund’s past dividends paid to shareholders based on the net investment income distributed and the average NAV during the past 12 months. Accordingly, the Fund’s SEC yield and distribution rate may differ.
4 The tax-equivalent yield is based on an assumed tax rate of 35.0%.
5 Duration is a measure of estimated price sensitivity relative to changes in interest rates. Portfolios with longer durations are typically more sensitive to changes in interest rates. For example, if interest rates rise by 1%, the market value of a security with an effective duration of 5 years would decrease by 5%, with all other factors being constant. The correlation between duration and price sensitivity is greater for securities rated investment-grade than it is for securities rated below investment-grade. Duration estimates are based on assumptions by the Adviser and are subject to a number of limitations. Effective duration is calculated based on historical price changes of securities held by the Fund, and therefore is a more accurate estimate of price sensitivity provided interest rates remain within their historical range.
QUALITY RATINGS (% of Total Net Assets)
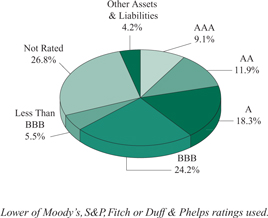
| | | | | | |
Adviser’s Assessment of Non-Rated Securities: |
| AAA | | | 0.4 | % | | |
| AA | | | 1.5 | | | |
| A | | | 1.0 | | | |
| BBB | | | 6.6 | | | |
| BB | | | 11.8 | | | |
| <BB | | | 5.5 | | | |
| | | | | | |
| Total | | | 26.8 | % | | |
SCHEDULE OF INVESTMENTS (Unaudited)
September 30, 2010
Sit Tax-Free Income Fund
| | | | | | | | | | | | | | |
Principal Amount ($) | | | Name of Issuer | | Coupon Rate (%) | | Maturity Date | | | Fair Value ($) | |
| | | |
| Municipal Bonds - 89.0% | | | | | | | | | | |
| | | |
| Alabama - 0.6% | | | | | | | | | | |
| | 400,000 | | | ASMS Public Education Building Rev. (ASMSF LLC Proj.) (AMBAC Insured) 9 | | 4.38 | | | 9/1/26 | | | | 411,736 | |
| | 215,000 | | | Birmingham-Southern College Private Education Building Rev. | | 5.35 | | | 12/1/19 | | | | 206,845 | |
| | 290,000 | | | University of West Alabama General Fee Rev. (AMBAC Insured) | | 5.10 | | | 1/1/19 | | | | 290,716 | |
| | | | | | | | | | | | | | |
| | | | | | | | | | | | | 909,297 | |
| | | | | | | | | | | | | | |
| Alaska - 0.3% | | | | | | | | | | |
| | 500,000 | | | AK Hsg. Finance Corp. Mtg. Rev. (GO of Corp. Insured) | | 4.50 | | | 12/1/35 | | | | 497,500 | |
| | | | | | | | | | | | | | |
| | | |
| Arizona - 3.2% | | | | | | | | | | |
| | 1,069,956 | | | AZ Health Facs. Auth. Rev. (New Arizona Family Proj.) | | 5.25 | | | 7/1/27 | | | | 884,592 | |
| | 345,000 | | | Pima Co. Industrial Dev. Auth. Education Rev. (American Charter Schools Foundation Proj.) | | 5.13 | | | 7/1/15 | | | | 352,776 | |
| | 105,000 | | | Pima Co. Industrial Dev. Auth. Education Rev. (AZ Charter Schools Proj.) | | 5.00 | | | 7/1/12 | | | | 106,133 | |
| | 465,000 | | | Pima Co. Industrial Dev. Auth. Education Rev. (AZ Charter Schools Proj.) | | 4.65 | | | 7/1/14 | | | | 459,304 | |
| | 190,000 | | | Pima Co. Industrial Dev. Auth. Education Rev. (AZ Charter Schools Proj.) | | 6.10 | | | 7/1/24 | | | | 190,312 | |
| | 500,000 | | | Pima Co. Industrial Dev. Auth. Education Rev. (AZ Charter Schools Proj.) | | 5.00 | | | 7/1/26 | | | | 443,850 | |
| | 450,000 | | | Pima Co. Industrial Dev. Auth. Education Rev. (Center For Academic Success Proj.) 4 | | 5.38 | | | 7/1/22 | | | | 437,180 | |
| | 490,000 | | | Pima Co. Industrial Dev. Auth. Education Rev. (Choice Education & Dev. Corp. Proj.) | | 6.00 | | | 6/1/16 | | | | 487,168 | |
| | 250,000 | | | Pima Co. Industrial Dev. Auth. Education Rev. (Coral Academy Science Proj.) | | 6.38 | | | 12/1/18 | | | | 257,423 | |
| | 250,000 | | | Pima Co. Industrial Dev. Auth. Education Rev. (Noah Webster Basic School Proj.) | | 5.25 | | | 12/15/16 | | | | 254,318 | |
| | 400,000 | | | Pima Co. Industrial Dev. Auth. Education Rev. (Tucson Country Day School Proj.) | | 5.00 | | | 6/1/22 | | | | 375,692 | |
| | 50,000 | | | Pima Co. Industrial Dev. Auth. Rev. (AZ Charter Schools Proj.) | | 5.00 | | | 7/1/12 | | | | 52,322 | |
| | 250,000 | | | Pima Co. Industrial Dev. Auth. Rev. (Tucson Electric Power Company Proj.) | | 5.75 | | | 9/1/29 | | | | 259,370 | |
| | 500,000 | | | Quail Creek Community Facs. District G.O. | | 5.15 | | | 7/15/16 | | | | 488,620 | |
| | 250,000 | | | Westpark Community Facs. District G.O. | | 4.90 | | | 7/15/16 | | | | 241,953 | |
| | | | | | | | | | | | | | |
| | | | | | | | | | | | | 5,291,013 | |
| | | | | | | | | | | | | | |
| Arkansas - 0.1% | | | | | | | | | | |
| | 200,000 | | | Independence Co. Pollution Control Rev. Ref. (Entergy, Inc. Proj.) | | 5.00 | | | 1/1/21 | | | | 200,158 | |
| | | | | | | | | | | | | | |
| | | |
| California - 10.2% | | | | | | | | | | |
| | 500,000 | | | Agua Caliente Band of Cahuilla Indians Rev. 4 | | 6.00 | | | 7/1/18 | | | | 492,985 | |
| | 250,000 | | | Alameda Corridor Transportation Auth. Rev. Capital Appreciation (AMBAC Insured) 6 | | 6.71 | | | 10/1/24 | | | | 214,805 | |
| | 350,000 | | | CA Co. Tobacco Securitization Agy. Asset-Backed Bond Rev. | | 5.10 | | | 6/1/28 | | | | 294,067 | |
| | 340,000 | | | CA Co. Tobacco Securitization Agy. Rev. (Golden Gate Tobacco Proj.) | | 4.50 | | | 6/1/21 | | | | 307,693 | |
| | 500,000 | | | CA Co. Tobacco Securitization Agy. Rev. (Golden Gate Tobacco Proj.) | | 5.00 | | | 6/1/36 | | | | 382,975 | |
| | 350,000 | | | CA Community Hsg. Fin. Agy. Lease Rev. Pass Thru Obligation | | 4.85 | | | 11/1/12 | | | | 229,068 | |
| | 500,000 | | | CA Department of Veteran Affairs Home Purchase Rev. (AMBAC Insured) | | 5.35 | | | 12/1/27 | | | | 512,035 | |
| | 600,000 | | | CA Finance Auth. Education Rev. (American Heritage Education Foundation Proj.) | | 5.25 | | | 6/1/26 | | | | 583,110 | |
| | 250,000 | | | CA Finance Auth. Rev. (Kern Regional Center Proj.) 9 | | 6.88 | | | 5/1/25 | | | | 273,850 | |
| | 250,000 | | | CA Finance Auth. Rev. (Literacy First Proj.) | | 5.50 | | | 9/1/22 | | | | 252,845 | |
| | 495,000 | | | CA Govt. Finance Auth. Lease Rev. (Placer Co. Transportation Proj.) | | 6.00 | | | 12/1/28 | | | | 511,939 | |
| | 250,000 | | | CA Hsg. Finance Agy. Home Mtg. Rev. | | 5.20 | | | 8/1/28 | | | | 254,713 | |
| | 250,000 | | | CA Hsg. Finance Agy. Home Mtg. Rev. | | 5.50 | | | 8/1/38 | | | | 253,443 | |
| | 500,000 | | | CA Infrastructure & Economic Dev. Bank Rev. | | 6.00 | | | 2/1/30 | | | | 536,125 | |
| | 210,000 | | | CA Public Works Board Lease Rev. (Various CA State Univ. Proj.) 9 | | 5.25 | | | 12/1/13 | | | | 210,634 | |
| | 625,000 | | | CA Public Works Board Lease Rev. (Various CA State Univ. Proj.) | | 5.50 | | | 12/1/18 | | | | 626,488 | |
| | 500,000 | | | CA School Facs. Finance Auth. Rev. (Azusa Unified School District) (AGM Insured) 6 | | 6.00 | | | 8/1/29 | | | | 380,660 | |
| | 585,000 | | | CA Statewide Communities Dev. Auth. Multifamily Rev. (Orange Tree Proj.) (GNMA Collateral) | | 6.15 | | | 11/20/36 | | | | 725,178 | |
| | 500,000 | | | CA Statewide Communities Dev. Auth. Rev. (Lancer Education Student Hsg. Proj.) | | 5.40 | | | 6/1/17 | | | | 499,130 | |
| | 510,000 | | | CA Statewide Communities Dev. Auth. Rev. (Sunedison Irvine School District) | | 5.25 | | | 1/1/16 | | | | 511,346 | |
| | 250,000 | | | CA Statewide Communities Dev. Auth. School Facs. Rev. (Aspire Public Schools) | | 5.00 | | | 7/1/20 | | | | 261,328 | |
| | 450,000 | | | CA Statewide Communities Dev. Auth. Special Tax (Orinda Proj.) | | 6.00 | | | 9/1/29 | | | | 414,212 | |
| | 1,000,000 | | | Colton Joint Unified School District (AGM Insured) 6 | | 5.80 | | | 8/1/35 | | | | 554,380 | |
See accompanying notes to financial statements.
| | |
12 | | SIT MUTUAL FUNDS SEMI-ANNUAL REPORT |
| | | | | | | | | | | | | | |
Principal Amount ($) | | | Name of Issuer | | Coupon Rate (%) | | Maturity Date | | | Fair Value ($) | |
| | | | |
| | 235,000 | | | Garden Grove C.O.P (Bahia Village/Emerald Isle Proj.) (AGM insured) | | 5.70 | | | 8/1/23 | | | | 235,595 | |
| | 500,000 | | | Hartnell Community College G.O. 6 | | 7.00 | | | 8/1/34 | | | | 274,880 | |
| | 500,000 | | | Hawthorne School District C.O.P (AGM Insured) 6 | | 6.00 | | | 12/1/29 | | | | 417,800 | |
| | 500,000 | | | Lemon Grove Community Dev. Agency Tax Allocation (Redev. Proj.) | | 5.15 | | | 8/1/25 | | | | 500,650 | |
| | 500,000 | | | Northern CA Gas Auth. No. 1 Rev. 1 | | 1.08 | | | 7/1/27 | | | | 349,770 | |
| | 650,000 | | | Poway Unified School District (AMBAC Insured) | | 5.00 | | | 9/15/31 | | | | 652,639 | |
| | 600,000 | | | Redondo Beach School District G.O. 6 | | 6.38 | | | 8/1/34 | | | | 459,000 | |
| | 500,000 | | | Richmond Community Redev. Agy. Tax Allocation | | 6.00 | | | 9/1/30 | | | | 525,525 | |
| | 500,000 | | | Riverside Co. Redev. Agy. Tax Allocation (Interstate 215 Corridor) | | 6.00 | | | 10/1/25 | | | | 529,690 | |
| | 500,000 | | | Sacramento Co. Water Financing Auth. Rev. (NATL-RE FGIC Insured) 1 | | 0.77 | | | 6/1/39 | | | | 297,945 | |
| | 1,000,000 | | | San Bernardino City Unified School District G.O. Capital Appreciation (NATL-RE Insured) 6 | | 4.72 | | | 8/1/29 | | | | 315,910 | |
| | 500,000 | | | San Francisco City & Co. C.O.P (San Bruno Jail Proj.) (AMBAC Insured) 9 | | 5.25 | | | 10/1/33 | | | | 500,070 | |
| | 250,000 | | | San Joaquin Hills Toll Road Rev. Ref. (NATL-RE Insured) | | 5.25 | | | 1/15/30 | | | | 234,995 | |
| | 320,000 | | | Santa Paula Utilities Auth. Rev. (Wastewater Enterprise) | | 5.00 | | | 2/1/30 | | | | 333,059 | |
| | 40,000 | | | Santa Rosa Rancheria Tachi Yokut Tribe Enterprise Rev. 4 | | 4.50 | | | 3/1/11 | | | | 40,013 | |
| | 385,000 | | | Santa Rosa Rancheria Tachi Yokut Tribe Enterprise Rev. 4 | | 4.88 | | | 3/1/16 | | | | 352,960 | |
| | 350,000 | | | Southwest Community Finance Auth. Rev. (Riverside Co. Proj.) 9 | | 6.00 | | | 5/1/24 | | | | 391,514 | |
| | 500,000 | | | Tustin Unified School District G.O. Capital Appreciation 6 | | 6.05 | | | 8/1/28 | | | | 317,075 | |
| | 500,000 | | | Val Verde Unified School District G.O. Capital Appreciation (AGM Insured) 6 | | 6.13 | | | 8/1/34 | | | | 264,315 | |
| | 250,000 | | | Vallejo City Unified School District Special Tax (Community Facilities District No. 2) (XLCA Insured) | | 4.15 | | | 9/1/31 | | | | 179,698 | |
| | 500,000 | | | Westminster School District G.O. 6 | | 5.37 | | | 8/1/24 | | | | 252,405 | |
| | | | | | | | | | | | | | |
| | | | |
| | | | | | | | | | | | | 16,708,517 | |
| | | | | | | | | | | | | | |
| Colorado - 3.9% | | | | | | | | | | |
| | 250,000 | | | CO Education & Cultural Facs. Auth. Rev. (CO Springs Charter Academy Proj.) | | 5.60 | | | 7/1/34 | | | | 258,518 | |
| | 500,000 | | | CO Education & Cultural Facs. Auth. Rev. Ref. (Vail Mountain School Proj.) | | 6.00 | | | 5/1/30 | | | | 515,775 | |
| | 250,000 | | | CO Health Facs. Auth. Rev. (American Baptist Homes) | | 6.50 | | | 8/1/15 | | | | 253,585 | |
| | 35,000 | | | CO Health Facs. Auth. Rev. (Porter Place Proj.) (GNMA collateralized) | | 5.10 | | | 1/20/11 | | | | 35,148 | |
| | 250,000 | | | CO Health Facs. Auth. Rev. (Total Long Term Care Nat’l) | | 6.00 | | | 11/15/30 | | | | 250,920 | |
| | 500,000 | | | CO Hsg. Finance Auth. Single Family Mtg. Rev. | | 5.50 | | | 11/1/29 | | | | 531,600 | |
| | 625,000 | | | CO Hsg. Finance Auth. Single Family Mtg. Rev. (FHA Insured) | | 5.00 | | | 11/1/34 | | | | 635,263 | |
| | 1,000,000 | | | Compark Business Campus Metro District G.O. (Radian Insured) | | 5.75 | | | 12/1/27 | | | | 918,150 | |
| | 250,000 | | | Denver City & Co. Excise Tax Rev. Ref. (Assured Guaranty) | | 6.00 | | | 9/1/23 | | | | 299,068 | |
| | 970,000 | | | Denver Health & Hospital Auth. Healthcare Rev. 1 | | 1.30 | | | 12/1/33 | | | | 671,395 | |
| | 747,045 | | | Lyons Rev. (Longmont Humane Society Proj.) | | 4.75 | | | 11/30/16 | | | | 699,346 | |
| | 500,000 | | | Maher Ranch Metro District No. 4 Ref. G.O. (Radian insured) | | 5.25 | | | 12/1/36 | | | | 437,095 | |
| | 500,000 | | | Regional Transportation District Private Activity Rev. (Denver Trans. Partners) | | 6.00 | | | 1/15/34 | | | | 531,925 | |
| | 350,000 | | | University of Colorado Hospital Auth. (AMBAC Insured) | | 5.00 | | | 11/15/29 | | | | 350,014 | |
| | | | | | | | | | | | | | |
| | | | |
| | | | | | | | | | | | | 6,387,802 | |
| | | | | | | | | | | | | | |
| Connecticut - 1.2% | | | | | | | | | | |
| | 250,000 | | | CT Dev. Auth. First Mtg. Gross Rev. (Church Homes, Inc.) | | 5.70 | | | 4/1/12 | | | | 250,393 | |
| | 500,000 | | | CT Hsg. Finance Auth. Rev. (GO of Auth.) | | 4.75 | | | 11/15/35 | | | | 513,770 | |
| | 500,000 | | | Hamden Facs. Rev. (Whitney Center Proj.) | | 6.13 | | | 1/1/14 | | | | 506,850 | |
| | 500,000 | | | Harbor Point Infrastructure Improvement District Special Obligation Rev. Tax Allocation | | 7.00 | | | 4/1/22 | | | | 535,815 | |
| | 300,000 | | | Mashantucket Western Pequot Tribe Sub. Special Rev. 2, 4, 5 | | 5.75 | | | 9/1/18 | | | | 140,997 | |
| | | | | | | | | | | | | | |
| | | | |
| | | | | | | | | | | | | 1,947,825 | |
| | | | | | | | | | | | | | |
| Delaware - 0.2% | | | | | | | | | | |
| | 500,000 | | | Millsboro Special Obligation Rev. (Plantation Lakes Dev. District) | | 5.45 | | | 7/1/36 | | | | 370,730 | |
| | | | | | | | | | | | | | |
| District of Columbia - 0.3% | | | | | | | | | | |
| | 520,000 | | | District of Columbia (Howard University) (NATL-RE Insured) | | 5.00 | | | 10/1/20 | | | | 520,634 | |
| | | | | | | | | | | | | | |
| | |
| See accompanying notes to financial statements. | | |
SEPTEMBER 30, 2010 | | 13 |
SCHEDULE OF INVESTMENTS (Unaudited)
September 30, 2010
Sit Tax-Free Income Fund (Continued)
| | | | | | | | | | | | | | | | |
Principal Amount ($) | | | Name of Issuer | | Coupon Rate (%) | | | Maturity Date | | | Fair Value ($) | |
| | | |
| Florida - 5.7% | | | | | | | | | | | | |
| | 500,000 | | | Bay Co. Educational Facs. Rev. (Bay Haven Charter) | | | 5.25 | | | | 9/1/30 | | | | 492,690 | |
| | 1,000,000 | | | Capital Trust Agy. Rev. (American Opportunity Proj.) | | | 5.88 | | | | 6/1/38 | | | | 402,800 | |
| | 335,000 | | | Capital Trust Agy. Rev. (Golf Villas, Rivermill, and Village Square Apartments Proj.) | | | 4.75 | | | | 6/1/13 | | | | 251,250 | |
| | 25,000 | | | Clearwater Hsg. Auth. Rev. Ref. (Hamptons at Clearwater Proj.) (ACA Insured) | | | 5.40 | | | | 5/1/13 | | | | 25,269 | |
| | 400,000 | | | Connerton West Community Dev. District Cap. Improvement Special Assessment Rev. (Pasco Co.) 2, 5 | | | 5.13 | | | | 5/1/16 | | | | 152,120 | |
| | 100,000 | | | Fiddlers Creek Community Dev. District No. 2 Special Assessment Rev. 2, 5 | | | 5.75 | | | | 5/1/13 | | | | 39,010 | |
| | 25,000 | | | FL Board Public Education Capital Outlay G.O. Ref. | | | 5.00 | | | | 6/1/24 | | | | 25,085 | |
| | 35,000 | | | FL Correctional Privatization Commission C.O.P (Columbia Co. Proj.) (AMBAC Insured) 9 | | | 5.00 | | | | 8/1/17 | | | | 35,064 | |
| | 45,000 | | | Forest Creek Community Dev. District Capital Improvement Special Assessment Rev. | | | 7.00 | | | | 11/1/13 | | | | 43,665 | |
| | 250,000 | | | Gramercy Farms Community Dev. District Special Assessment 2, 5 | | | 5.10 | | | | 5/1/14 | | | | 109,925 | |
| | 80,000 | | | Highlands Co. Health Facs. Auth. Rev. (Adventist Health) | | | 5.00 | | | | 11/15/30 | | | | 81,406 | |
| | 500,000 | | | Highlands Co. Health Facs. Auth. Rev. (Adventist Health) | | | 5.00 | | | | 11/15/31 | | | | 508,100 | |
| | 445,000 | | | Jacksonville Economic Dev. Commission Health Care Facs. Rev. Ref. | | | 6.00 | | | | 9/1/17 | | | | 463,610 | |
| | 500,000 | | | Jacksonville Sales Tax Rev. | | | 4.63 | | | | 10/1/25 | | | | 500,400 | |
| | 500,000 | | | Lake Ashton Community Dev. District Cap. Improvement Special Assessment Rev. 2, 5 | | | 5.00 | | | | 11/1/11 | | | | 180,150 | |
| | 1,000,000 | | | Lee Co. Industrial Dev. Auth. Health Care Facs. Rev. (Lee Charter Foundation) | | | 5.25 | | | | 6/15/27 | | | | 905,780 | |
| | 250,000 | | | Leesburg Capital Improvement Rev. (NATL-RE FGIC Insured) | | | 5.25 | | | | 10/1/34 | | | | 254,783 | |
| | 250,000 | | | Magnolia Creek Community Dev. District Rev. 2, 5 | | | 5.60 | | | | 5/1/14 | | | | 125,075 | |
| | 100,000 | | | Miami Beach Stormwater Rev. (NATL-RE FGIC Insured) | | | 5.25 | | | | 9/1/25 | | | | 101,306 | |
| | 40,000 | | | Miami-Dade Co. Public Service Tax Rev. (UMSA Public Improvements Proj.) (AGM Insured) | | | 5.00 | | | | 10/1/23 | | | | 40,237 | |
| | 265,000 | | | Miami-Dade Co. Special Obligation (NATL-RE Insured) 6 | | | 5.44 | | | | 10/1/33 | | | | 62,773 | |
| | 250,000 | | | Naples Hospital Rev. (Naples Community Hospital, Inc. Proj.) (NATL-RE Insured) | | | 5.50 | | | | 10/1/26 | | | | 252,210 | |
| | 1,000,000 | | | New River Community Dev. District Cap. Improvement Special Assessment Rev. 2, 5 | | | 5.00 | | | | 5/1/13 | | | | 447,800 | |
| | 90,000 | | | Palm Beach Co. Health Facs. Auth. Rev. (Jupiter Medical Center, Inc. Proj.) (AGM Insured) | | | 5.25 | | | | 8/1/18 | | | | 90,134 | |
| | 10,000 | | | Parklands Lee Community Dev. District Special Assessment 2, 5 | | | 5.13 | | | | 5/1/11 | | | | 5,003 | |
| | 750,000 | | | Riverwood Estates Community Dev. District Special Assessment 2, 5 | | | 5.00 | | | | 5/1/13 | | | | 129,600 | |
| | 750,000 | | | Sarasota Co. Health Facs. Auth. Retirement Rev. Ref. (Village on the Isle) | | | 5.50 | | | | 1/1/27 | | | | 724,920 | |
| | 250,000 | | | Sarasota National Community Dev. District Special Assessment Rev. 2, 5 | | | 5.30 | | | | 5/1/39 | | | | 41,588 | |
| | 500,000 | | | Seminole Tribe Special Obligation Rev. 4 | | | 5.50 | | | | 10/1/24 | | | | 494,380 | |
| | 250,000 | | | St. Johns Co. Industrial Dev. Auth. Rev. (Presbyterian Retirement) | | | 5.88 | | | | 8/1/40 | | | | 258,178 | |
| | 1,000,000 | | | Stoneybrook South Community Dev. District Special Assessment Rev. 2, 5 | | | 5.45 | | | | 11/1/15 | | | | 429,700 | |
| | 750,000 | | | Tolomato Community Dev. District Special Assessment | | | 6.38 | | | | 5/1/17 | | | | 647,310 | |
| | 670,000 | | | Waters Edge Community Dev. District Cap. Improvement Special Assessment Rev. 2, 5 | | | 5.00 | | | | 11/1/12 | | | | 321,734 | |
| | 500,000 | | | Waterset North Community Dev. District Special Assessment Rev. 2, 5 | | | 6.55 | | | | 11/1/15 | | | | 299,555 | |
| | 250,000 | | | West Orange Healthcare District Rev. | | | 5.80 | | | | 2/1/31 | | | | 252,245 | |
| | 50,000 | | | West Villages Improvement District Special Assessment Rev. (Unit of Dev. No. 3) 2, 5 | | | 5.50 | | | | 5/1/37 | | | | 23,154 | |
| | 450,000 | | | Zephyr Ridge Community Dev. District Special Assessment Rev. 2, 5 | | | 5.25 | | | | 5/1/13 | | | | 179,285 | |
| | | | | | | | | | | | | | | | |
| | | | |
| | | | | | | | | | | | | | | 9,397,294 | |
| | | | | | | | | | | | | | | | |
| Georgia - 1.5% | | | | | | | | | | | | |
| | 500,000 | | | Atlanta Airport General Rev. Ref. (NATL-RE FGIC Insured) | | | 5.75 | | | | 1/1/20 | | | | 506,635 | |
| | 1,405,000 | | | East Point Tax Allocation | | | 8.00 | | | | 2/1/26 | | | | 1,432,960 | |
| | 225,000 | | | Gainesville & Hall Co. Development Auth. Rev. | | | 6.38 | | | | 11/15/29 | | | | 240,291 | |
| | 250,000 | | | Medical Center Hospital Auth. Rev. Ref. (Spring Harbor Green Island Proj.) | | | 5.25 | | | | 7/1/27 | | | | 225,925 | |
| | | | | | | | | | | | | | | | |
| | | | |
| | | | | | | | | | | | | | | 2,405,811 | |
| | | | | | | | | | | | | | | | |
| Guam - 0.2% | | | | | | | | | | | | |
| | 450,000 | | | Northern Mariana Islands Commonwealth G.O. | | | 5.00 | | | | 10/1/22 | | | | 403,524 | |
| | | | | | | | | | | | | | | | |
| Hawaii - 0.7% | | | | | | | | | | | | |
| | 500,000 | | | HI Dept. Budget & Finance Special Purpose Rev. | | | 6.40 | | | | 11/15/14 | | | | 505,730 | |
| | |
| See accompanying notes to financial statements. |
14 | | SIT MUTUAL FUNDS SEMI-ANNUAL REPORT |
| | | | | | | | | | | | | | |
| Principal Amount ($) | | | Name of Issuer | | Coupon
Rate (%) | |
| Maturity
Date |
| |
| Fair
Value ($) |
|
| | | | |
| | 500,000 | | | HI Pacific Health Special Obligation Group Purpose Rev. | | 5.25 | | | 7/1/30 | | | | 496,315 | |
| | 200,000 | | | HI Pacific Health Special Purpose Rev. | | 5.63 | | | 7/1/30 | | | | 211,278 | |
| | | | | | | | | | | | | | |
| | | | | | | | | | | | | 1,213,323 | |
| | | | | | | | | | | | | | |
| Idaho - 0.7% | | | | | | | | | | |
| | 320,000 | | | ID Hsg. & Fin. Assoc. Nonprofit Facs. Rev. (Compass Public Charter School Proj.) | | 5.50 | | | 7/1/30 | | | | 320,688 | |
| | 250,000 | | | ID Hsg. & Fin. Assoc. Nonprofit Facs. Rev. (Idaho Arts Charter School Proj.) | | 5.50 | | | 12/1/18 | | | | 248,843 | |
| | 250,000 | | | ID Hsg. & Fin. Assoc. Nonprofit Facs. Rev. (Liberty Charter School Proj.) | | 5.50 | | | 6/1/21 | | | | 255,150 | |
| | 250,000 | | | ID Hsg. & Fin. Assoc. Nonprofit Facs. Rev. (Victory Charter School Proj.) | | 5.63 | | | 7/1/21 | | | | 253,185 | |
| | | | | | | | | | | | | | |
| | | | | | | | | | | | | 1,077,866 | |
| | | | | | | | | | | | | | |
| Illinois - 7.5% | | | | | | | | | | |
| | 10,000 | | | Chicago Metro Hsg. Dev. Corp. Mtg. Rev. Ref. (Section 8) (FHA Insured) | | 6.85 | | | 7/1/22 | | | | 10,021 | |
| | 500,000 | | | Harvey Ref. & Improvement G.O. | | 5.50 | | | 12/1/27 | | | | 499,960 | |
| | 500,000 | | | IL Dev. Ref. Auth. Rev. Ref. (Chicago Charter School Foundation Proj.) | | 5.00 | | | 12/1/36 | | | | 468,125 | |
| | 500,000 | | | IL Fin. Auth. Rev. (Luther Hillside Village Proj.) | | 5.25 | | | 2/1/37 | | | | 485,385 | |
| | 500,000 | | | IL Fin. Auth. Rev. (Montgomery Place Proj.) | | 5.75 | | | 5/15/38 | | | | 430,505 | |
| | 350,000 | | | IL Fin. Auth. Rev. (Sedgebrook, Inc. Facs. Proj.) 2, 5 | | 5.40 | | | 11/15/16 | | | | 88,760 | |
| | 500,000 | | | IL Fin. Auth. Rev. (Tabor Hills Supportive Living Proj.) | | 5.25 | | | 11/15/26 | | | | 452,920 | |
| | 1,000,000 | | | IL Fin. Auth. Sports Facs. Rev. (North Shore Ice Arena Proj.) | | 6.25 | | | 12/1/38 | | | | 811,510 | |
| | 500,000 | | | IL Fin. Auth. Sports Facs. Rev. (United Sports Organizations of Barrington Proj.) 2, 4, 5 | | 6.13 | | | 10/1/27 | | | | 150,440 | |
| | 500,000 | | | IL Fin. Auth. Sports Facs. Rev. (United Sports Organizations of Barrington Proj.) 2, 4, 5 | | 6.25 | | | 10/1/37 | | | | 150,070 | |
| | 175,000 | | | IL Health Facs. Auth. Rev. (Elmhurst Memorial Healthcare Proj.) | | 6.25 | | | 1/1/17 | | | | 181,629 | |
| | 210,000 | | | IL Health Facs. Auth. Rev. (Ingalls Health System Proj.) (NATL-RE Insured) | | 6.25 | | | 5/15/14 | | | | 211,840 | |
| | 115,000 | | | Lombard Public Facs. Corp. Rev. First Tier (Conference Center & Hotel Proj.) | | 6.38 | | | 1/1/15 | | | | 100,397 | |
| | 1,925,000 | | | Lombard Public Facs. Corp. Rev. First Tier (Conference Center & Hotel Proj.) | | 5.25 | | | 1/1/36 | | | | 1,424,635 | |
| | 550,000 | | | Lombard Public Facs. Corp. Rev. First Tier (Conference Center & Hotel Proj.) (ACA Insured) | | 5.50 | | | 1/1/25 | | | | 376,871 | |
| | 2,000,000 | | | Malta Tax Allocation Rev. | | 5.75 | | | 12/30/25 | | | | 1,312,800 | |
| | 818,000 | | | Manhattan Special Service Area Special Tax No. 07-6 (Groebe Farm-Stonegate) | | 5.75 | | | 3/1/22 | | | | 529,058 | |
| | 500,000 | | | Metropolitan Pier & Expo Rev. Ref. (McCormick Proj.) (AMBAC Insured) | | 5.25 | | | 6/15/27 | | | | 500,505 | |
| | 2,475,000 | | | Southwestern IL Dev. Auth. Rev. (Anderson Hospital Proj.) | | 5.63 | | | 8/15/29 | | | | 2,476,584 | |
| | 465,000 | | | Southwestern IL Dev. Auth. Rev. (Village of Sauget Proj.) | | 5.63 | | | 11/1/26 | | | | 339,683 | |
| | 665,000 | | | Southwestern IL Dev. Auth. Tax Allocation Ref. (Local Govt. Program) | | 7.00 | | | 10/1/22 | | | | 645,615 | |
| | 145,000 | | | Upper Illinois River Valley Dev. Auth. Rev. (Morris Hospital Proj.) | | 6.05 | | | 12/1/11 | | | | 150,327 | |
| | 440,000 | | | Will Co. Special Education Rev. (GO of District Insured) | | 5.40 | | | 1/1/18 | | | | 479,200 | |
| | | | | | | | | | | | | | |
| | | | | | | | | | | | | 12,276,840 | |
| | | | | | | | | | | | | | |
| Indiana - 2.1% | | | | | | | | | | |
| | 250,000 | | | Crown Point Economic Dev. Rev. (Wittenberg Village Proj.) | | 6.50 | | | 11/15/13 | | | | 250,113 | |
| | 100,000 | | | Elkhart Co. Hospital Auth. Rev. (Elkhart General Hospital Proj.) (AMBAC-TCRS Insured) | | 5.25 | | | 8/15/28 | | | | 100,076 | |
| | 400,000 | | | Hammond Public Improvement Board Rev. | | 6.50 | | | 8/15/25 | | | | 421,300 | |
| | 500,000 | | | IN Finance Auth. Hospital Rev. (Floyd Memorial Hospital & Health Proj.) | | 5.13 | | | 3/1/30 | | | | 507,255 | |
| | 250,000 | | | IN Finance Auth. Rev. (Drexel Foundation Education Facs. Proj.) | | 6.00 | | | 10/1/21 | | | | 263,865 | |
| | 215,000 | | | IN Health Facs. Fin. Auth. Health Facs. Rev. (Holy Cross Health System Corp.) (NATL-RE Insured) | | 5.00 | | | 12/1/28 | | | | 215,159 | |
| | 360,000 | | | IN Health Facs. Fin. Auth. Hospital Rev. (Community Foundation Northwest IN) | | 6.38 | | | 8/1/21 | | | | 368,770 | |
| | 50,000 | | | IN Health Facs. Fin. Auth. Hospital Rev. (Community Foundation Northwest IN) | | 6.38 | | | 8/1/31 | | | | 50,904 | |
| | 305,000 | | | IN Health Facs. Fin. Auth. Hospital Rev. (Community Hospital of Anderson Proj.) | | 6.00 | | | 1/1/23 | | | | 305,372 | |
| | 75,000 | | | IN Health Facs. Fin. Auth. Hospital Rev. (Community Hospital of Anderson Proj.) (NATL-RE Insured) | | 6.00 | | | 1/1/14 | | | | 75,198 | |
| | 300,000 | | | IN Health Facs. Fin. Auth. Hospital Rev. Ref. (Jackson Proj.) (Radian-IBCC Insured) | | 5.13 | | | 2/15/17 | | | | 300,312 | |
| | 400,000 | | | St. Joseph Co. Hospital Auth. Health Facs. Rev. (Madison Center) 2, 5 | | 5.25 | | | 2/15/28 | | | | 152,840 | |
| | 500,000 | | | Vigo Co. Hospital Auth. Rev. (Union Hospital, Inc. Proj.) 4 | | 5.50 | | | 9/1/27 | | | | 496,170 | |
| | | | | | | | | | | | | | |
| | | | | | | | | | | | | 3,507,334 | |
| | | | | | | | | | | | | | |
| | |
| See accompanying notes to financial statements. | | |
SEPTEMBER 30, 2010 | | 15 |
SCHEDULE OF INVESTMENTS (Unaudited)
September 30, 2010
Sit Tax-Free Income Fund (Continued)
| | | | | | | | | | | | | | | | |
Principal Amount ($) | | | Name of Issuer | | Coupon Rate (%) | | | Maturity Date | | | Fair Value ($) | |
| | | |
| Iowa - 1.0% | | | | | | | | | | | | |
| | 405,000 | | | Dickinson Co. Hsg. Sr. Rev. (Spirit Lake - GEAC LLC Proj.) | | | 5.38 | | | | 12/1/16 | | | | 391,202 | |
| | 410,000 | | | IA Finance Auth. Sr. Hsg. Rev. Ref. (Walnut Ridge Proj.) | | | 5.00 | | | | 12/1/14 | | | | 383,416 | |
| | 500,000 | | | IA Finance Auth. Sr. Living Facs. Rev. (Deerfield Retirement Community, Inc.) | | | 5.00 | | | | 11/15/21 | | | | 394,240 | |
| | 500,000 | | | IA Student Loan Liquidity Corp. Rev. | | | 5.25 | | | | 12/1/24 | | | | 539,190 | |
| | | | | | | | | | | | | | | | |
| | | | |
| | | | | | | | | | | | | | | 1,708,048 | |
| | | | | | | | | | | | | | | | |
| | Kansas - 0.8% | | | | | | | | | | | | |
| | 500,000 | | | Overland Park Transportation Dev. District Sales Tax Rev. (Oak Park Mall Proj.) | | | 5.90 | | | | 4/1/32 | | | | 516,140 | |
| | 500,000 | | | Wyandotte Co. Govt. Special Obligation Rev. 6 | | | 6.07 | | | | 6/1/21 | | | | 284,395 | |
| | 465,000 | | | Wyandotte Co. Govt. Special Obligation Rev. (AMBAC Insured) | | | 5.00 | | | | 12/1/15 | | | | 468,390 | |
| | | | | | | | | | | | | | | | |
| | | | |
| | | | | | | | | | | | | | | 1,268,925 | |
| | | | | | | | | | | | | | | | |
| | Louisiana - 3.1% | | | | | | | | | | | | |
| | 307,863 | | | Denham Springs/Livingston Hsg. & Mtg. Finance Auth. Rev. | | | 5.00 | | | | 11/1/40 | | | | 319,488 | |
| | 1,200,000 | | | Jefferson Parish Finance Auth. Single Family Mtg. Rev. | | | 5.00 | | | | 6/1/38 | | | | 1,264,200 | |
| | 1,805,000 | | | LA Hsg. Fin. Agy. Single Family Mtg. Rev. | | | 5.70 | | | | 12/1/38 | | | | 1,951,783 | |
| | 200,000 | | | LA Hsg. Fin. Agy. Single Family Mtg. Rev. (Home Ownership Program) | | | 6.00 | | | | 12/1/28 | | | | 218,570 | |
| | 750,000 | | | LA Public Facs. Auth. Rev. Ref. (Tulane Univ. Proj.) (NATL-RE Insured) 1 | | | 0.95 | | | | 2/15/36 | | | | 549,780 | |
| | 143,000 | | | Lafayette Public Finance Auth. Single Family Mortgage-Backed Rev. | | | 5.35 | | | | 1/1/41 | | | | 151,138 | |
| | 250,000 | | | New Orleans Aviation Board Gulf Opportunity Zone (Consolidated Rental Car) | | | 6.00 | | | | 1/1/25 | | | | 271,110 | |
| | 275,000 | | | St. John Baptist Parish Rev. (Marathon Oil Corp.) | | | 5.13 | | | | 6/1/37 | | | | 275,688 | |
| | | | | | | | | | | | | | | | |
| | | | |
| | | | | | | | | | | | | | | 5,001,757 | |
| | | | | | | | | | | | | | | | |
| | Maine - 0.3% | | | | | | | | | | | | |
| | 390,000 | | | ME Education Auth. Student Loan Rev. (Assured Guaranty) | | | 5.63 | | | | 12/1/27 | | | | 421,762 | |
| | | | | | | | | | | | | | | | |
| | Maryland - 0.3% | | | | | | | | | | | | |
| | 515,000 | | | MD Health & Higher Education Facs. Auth. Rev. (Patterson Park School) | | | 5.75 | | | | 7/1/30 | | | | 532,108 | |
| | | | | | | | | | | | | | | | |
| | Massachusetts - 1.1% | | | | | | | | | | | | |
| | 215,000 | | | MA Dev. Fin. Agy. Rev. (Applewild School Issue) (NATL-RE-IBC Radian Insured) | | | 5.75 | | | | 8/1/29 | | | | 219,629 | |
| | 250,000 | | | MA Dev. Fin. Agy. Rev. (Carleton-Willard Vlg.) | | | 5.63 | | | | 12/1/30 | | | | 257,835 | |
| | 350,000 | | | MA Dev. Fin. Agy. Rev. (Emerson College) | | | 5.50 | | | | 1/1/30 | | | | 377,325 | |
| | 240,000 | | | MA Development Finance Agency Facs. Rev. | | | 6.25 | | | | 6/1/14 | | | | 240,180 | |
| | 500,000 | | | MA Education Finance Auth. Education Rev. | | | 5.15 | | | | 1/1/26 | | | | 518,590 | |
| | 250,000 | | | MA Education Finance Auth. Education Rev. | | | 5.25 | | | | 1/1/28 | | | | 259,823 | |
| | | | | | | | | | | | | | | | |
| | | | |
| | | | | | | | | | | | | | | 1,873,382 | |
| | | | | | | | | | | | | | | | |
| | Michigan - 2.1% | | | | | | | | | | | | |
| | 470,000 | | | Flint Hospital Building Auth. Rev. (Hurley Medical Center) | | | 6.00 | | | | 7/1/20 | | | | 471,481 | |
| | 500,000 | | | MI Hospital Finance Auth. Rev. Ref. (Mclaren Health Care Proj.) (NATL-RE-IBC Insured) | | | 5.00 | | | | 6/1/28 | | | | 500,020 | |
| | 115,000 | | | MI Public Education Facs. Auth. Ltd. Rev. Ref. (Black River School Proj.) | | | 5.13 | | | | 9/1/11 | | | | 115,941 | |
| | 500,000 | | | MI Public Education Facs. Auth. Ltd. Rev. Ref. (Nataki Talibah Proj.) (Q-SBLF Insured) | | | 6.25 | | | | 10/1/23 | | | | 456,390 | |
| | 500,000 | | | MI Public Education Facs. Auth. Ltd. Rev. Ref. (Richfield Public School Proj.) | | | 5.00 | | | | 9/1/22 | | | | 465,895 | |
| | 650,000 | | | MI Public Education Facs. Auth. Rev. Ref. (Bradford Proj.) 4 | | | 6.00 | | | | 9/1/16 | | | | 693,193 | |
| | 300,000 | | | MI Tobacco Settlement Finance Auth. Sr. Rev. | | | 5.13 | | | | 6/1/22 | | | | 275,805 | |
| | 500,000 | | | Saginaw Hospital Finance Auth. Rev. (Covenant Medical Center Proj.) | | | 6.50 | | | | 7/1/30 | | | | 505,400 | |
| | | | | | | | | | | | | | | | |
| | | | |
| | | | | | | | | | | | | | | 3,484,125 | |
| | | | | | | | | | | | | | | | |
| | Minnesota - 2.0% | | | | | | | | | | | | |
| | 2,077,592 | | | Intermediate School District 287 Lease Rev. | | | 5.30 | | | | 11/1/32 | | | | 2,101,921 | |
| | 595,000 | | | MN Hsg. Fin. Agy. Residential Hsg. Rev. | | | 5.10 | | | | 1/1/40 | | | | 612,737 | |
| | 577,211 | | | St. Paul Hsg. & Redev. Auth. Rev. (Nursing Home NTS-Episcopal) | | | 5.63 | | | | 10/1/33 | | | | 520,609 | |
| | | | | | | | | | | | | | | | |
| | | | |
| | | | | | | | | | | | | | | 3,235,267 | |
| | | | | | | | | | | | | | | | |
| | |
See accompanying notes to financial statements. |
16 | | SIT MUTUAL FUNDS SEMI-ANNUAL REPORT |
| | | | | | | | | | | | | | |
Principal
Amount ($) | | | Name of Issuer | | Coupon Rate (%) | | Maturity Date | | | Fair Value ($) | |
| | | |
| Mississippi - 0.4% | | | | | | | | | | |
| | 200,000 | | | MS Home Corp. Single Family Mtg. Rev. (GNMA/FNMA/FHLMC Collateralized) | | 5.60 | | | 6/1/38 | | | | 218,912 | |
| | 340,000 | | | MS Home Corp. Single Family Mtg. Rev. (GNMA/FNMA/FHLMC Collateralized) | | 6.75 | | | 6/1/39 | | | | 378,294 | |
| | | | | | | | | | | | | | |
| | | | |
| | | | | | | | | | | | | 597,206 | |
| | | | | | | | | | | | | | |
| | Missouri - 3.3% | | | | | | | | | | |
| | 500,000 | | | Chillicothe Tax Increment Rev. (South U.S. 65 Proj.) | | 5.63 | | | 4/1/27 | | | | 442,260 | |
| | 500,000 | | | Community Memorial Hospital District Rev. | | 6.68 | | | 12/1/34 | | | | 441,045 | |
| | 250,000 | | | Independence 39th St. Transportation District Rev. Ref. & Improvement | | 6.88 | | | 9/1/32 | | | | 251,723 | |
| | 1,000,000 | | | Joplin Industrial Dev. Auth. Rev. Ref. (Christian Homes, Inc. Proj.) | | 5.50 | | | 5/15/17 | | | | 996,090 | |
| | 500,000 | | | Kansas City Industrial Dev. Auth. Multifamily Hsg. Rev. (Grand Blvd. Lofts) | | 5.00 | | | 1/1/12 | | | | 499,960 | |
| | 500,000 | | | Kirkwood Industrial Dev. Auth. Retirement Community Rev. (Aberdeen Heights) | | 7.00 | | | 11/15/15 | | | | 503,440 | |
| | 750,000 | | | Lakeside 370 Levee District Improvement Special Tax | | 7.00 | | | 4/1/28 | | | | 734,475 | |
| | 250,000 | | | MO Dev. Finance Board Facs. Rev. (Independence - Centerpoint Proj.) | | 5.13 | | | 4/1/25 | | | | 257,873 | |
| | 400,000 | | | MO Health & Education Facs. Auth. Education Facs. Rev. (Riverside Horizons) (ACA Insured) | | 4.50 | | | 5/1/27 | | | | 381,804 | |
| | 250,000 | | | MO Health & Educational Facs. Auth. (Senior Living Facs.-Lutheran Senior) | | 5.38 | | | 2/1/35 | | | | 248,805 | |
| | 500,000 | | | Moberly Industrial Dev. Auth. (Annual Appropriation Proj.) | | 6.00 | | | 9/1/24 | | | | 516,925 | |
| | 205,000 | | | University City Industrial Dev. Auth. Hsg. Rev. Ref. (Canterbury Proj.) (GNMA Collateralized) | | 5.75 | | | 12/20/15 | | | | 205,283 | |
| | | | | | | | | | | | | | |
| | | | |
| | | | | | | | | | | | | 5,479,683 | |
| | | | | | | | | | | | | | |
| | Montana - 0.5% | | | | | | | | | | |
| | 801,997 | | | MT Facs. Finance Auth. Rev. (Great Falls Pre-Release Services Proj.) | | 5.08 | | | 4/1/21 | | | | 890,216 | |
| | | | | | | | | | | | | | |
| | | |
| | Nebraska - 0.2% | | | | | | | | | | |
| | 500,000 | | | Mead Village Tax Allocation Rev. (E3 Biofuels - Mead LLC Proj.) 2, 5 | | 5.13 | | | 7/1/12 | | | | 314,185 | |
| | | | | | | | | | | | | | |
| | | |
| | Nevada - 2.8% | | | | | | | | | | |
| | 250,000 | | | Clark Co. Economic Dev. Rev. (Alexander Dawson School Proj.) | | 5.38 | | | 5/15/33 | | | | 252,853 | |
| | 415,000 | | | Clark Co. Improvement Special Assessment (Summerlin Proj.) | | 4.85 | | | 2/1/17 | | | | 377,970 | |
| | 600,000 | | | Las Vegas Paiute Tribe Rev. (ACA Insured) | | 6.63 | | | 11/1/17 | | | | 516,360 | |
| | 750,000 | | | Las Vegas Redev. Agy. Tax Allocation Rev. 9 | | 7.50 | | | 6/15/23 | | | | 888,563 | |
| | 300,000 | | | North Las Vegas LOC Improvement Special Assessment Ref. | | 4.50 | | | 12/1/10 | | | | 300,129 | |
| | 80,000 | | | NV Hsg. Dev. Single Family Mtg. Program Mezzanine | | 5.30 | | | 4/1/16 | | | | 80,152 | |
| | 550,000 | | | NV Hsg. Dev. Single Family Mtg. Program Mezzanine (GNMA/FNMA/FHLMC Collateralized) | | 5.10 | | | 10/1/40 | | | | 565,664 | |
| | 500,000 | | | Sparks Redev. Agy. Tax Increment Rev. (Redev. Area No. 1 Proj.) | | 5.00 | | | 1/15/22 | | | | 512,250 | |
| | 275,000 | | | Sparks Redev. Agy. Tax Increment Rev. (Redev. Area No. 2 Proj.) | | 6.13 | | | 6/1/15 | | | | 279,370 | |
| | 500,000 | | | Sparks Redev. Agy. Tax Increment Rev. (Redev. Area No. 2 Proj.) | | 6.40 | | | 6/1/20 | | | | 489,045 | |
| | 250,000 | | | Sparks Tourism Improvement District No. 1 Sr. Sales Tax Rev. 4 | | 6.50 | | | 6/15/20 | | | | 250,568 | |
| | | | | | | | | | | | | | |
| | | | |
| | | | | | | | | | | | | 4,512,924 | |
| | | | | | | | | | | | | | |
| | New Hampshire - 0.6% | | | | | | | | | | |
| | 890,000 | | | Manchester Hsg. & Redev. Auth. Rev. (ACA Insured) | | 6.75 | | | 1/1/15 | | | | 882,132 | |
| | 200,000 | | | Manchester Hsg. & Redev. Auth. Rev. (Radian-IBCC ACA Insured) 6 | | 5.25 | | | 1/1/19 | | | | 107,722 | |
| | | | | | | | | | | | | | |
| | | | |
| | | | | | | | | | | | | 989,854 | |
| | | | | | | | | | | | | | |
| | New Jersey - 1.7% | | | | | | | | | | |
| | 750,000 | | | NJ Higher Education Assistance Auth. Student Loan Rev. | | 5.00 | | | 6/1/27 | | | | 777,135 | |
| | 250,000 | | | NJ Higher Education Assistance Auth. Student Loan Rev. | | 5.00 | | | 12/1/28 | | | | 259,063 | |
| | 250,000 | | | NJ Higher Education Assistance Auth. Student Loan Rev. | | 4.75 | | | 12/1/29 | | | | 255,643 | |
| | 965,000 | | | NJ Hsg. & Mtg. Finance Agy. Rev. | | 5.05 | | | 10/1/39 | | | | 992,541 | |
| | 1,000,000 | | | NJ Transportation Auth. Capital Appreciation Rev. 6 | | 5.85 | | | 12/15/25 | | | | 486,800 | |
| | | | | | | | | | | | | | |
| | | | |
| | | | | | | | | | | | | 2,771,182 | |
| | | | | | | | | | | | | | |
| | New Mexico - 1.5% | | | | | | | | | | |
| | 330,000 | | | NM Mtg. Fin. Auth. Forward Mortgage-Backed (GNMA/FNMA Collateralized) | | 6.95 | | | 1/1/26 | | | | 334,835 | |
| | |
| See accompanying notes to financial statements. | | |
SEPTEMBER 30, 2010 | | 17 |
SCHEDULE OF INVESTMENTS (Unaudited)
September 30, 2010
Sit Tax-Free Income Fund (Continued)
| | | | | | | | | | | | |
Principal
Amount ($) | | Name of Issuer | | Coupon Rate (%) | | Maturity Date | | | Fair Value ($) | |
| | | | |
495,000 | | NM Mtg. Fin. Auth. Single Family Mtg. Rev. (GNMA/FNMA/FHLMC Collateralized) | | 4.80 | | | 9/1/29 | | | | 509,459 | |
495,000 | | NM Mtg. Fin. Auth. Single Family Mtg. Rev. (GNMA/FNMA/FHLMC Collateralized) | | 5.35 | | | 9/1/30 | | | | 526,338 | |
985,000 | | NM Mtg. Fin. Auth. Single Family Mtg. Rev. (GNMA/FNMA/FHLMC Collateralized) | | 5.25 | | | 9/1/34 | | | | 1,025,749 | |
| | | | | | | | | | | | |
| | | | | | | | | | | 2,396,381 | |
| | | | | | | | | | | | |
| | | |
New York - 0.6% | | | | | | | | | | |
225,000 | | Madison Co. Industrial Dev. Agy. Civic Facs. Rev. (Oneida Health Systems, Inc. Proj.) | | 4.50 | | | 2/1/17 | | | | 223,884 | |
250,000 | | Seneca Nation Indians Capital Improvement Auth. Special Obligation Rev. 4 | | 5.00 | | | 12/1/23 | | | | 207,318 | |
650,000 | | Ulster Co. Industrial Dev. Agy. Civic Facs. Rev. | | 5.25 | | | 9/15/16 | | | | 617,591 | |
| | | | | | | | | | | | |
| | | | | | | | | | | 1,048,793 | |
| | | | | | | | | | | | |
| | | |
North Carolina - 0.4% | | | | | | | | | | |
750,000 | | Buncome Co. Proj. Dev. Finance Rev. (Woodfin Downtown Corridor Dev.) | | 6.75 | | | 8/1/24 | | | | 703,815 | |
| | | | | | | | | | | | |
| | | |
North Dakota - 0.3% | | | | | | | | | | |
145,505 | | City of Washburn (Bismarck State College Foundation) | | 5.01 | | | 4/1/32 | | | | 149,568 | |
250,000 | | Langdon Health Care Facs. Rev. (Cavalier Co. Memorial Hospital Proj.) | | 6.20 | | | 1/1/25 | | | | 257,080 | |
| | | | | | | | | | | | |
| | | | | | | | | | | 406,648 | |
| | | | | | | | | | | | |
| | | |
Ohio - 1.9% | | | | | | | | | | |
330,000 | | Blue Ash Tax Allocation Rev. (Duke Realty Ohio Proj.) | | 5.00 | | | 12/1/21 | | | | 324,766 | |
425,000 | | Buckeye Tobacco Settlement Finance Auth. Asset-Backed Sr. Rev. | | 5.13 | | | 6/1/24 | | | | 363,596 | |
245,000 | | Cleveland-Cuyahoga Co. Port Auth. Dev. Rev. (Fairmount Proj.) | | 5.13 | | | 5/15/25 | | | | 220,767 | |
730,000 | | Cleveland-Cuyahoga Co. Port Auth. Dev. Rev. (St. Clarence Proj.) | | 6.00 | | | 5/1/21 | | | | 695,362 | |
736,400 | | Cuyahoga Co. Hsg. Mtg. Sr. Rev. (R H Myers Apts. Proj.) (GNMA Collateralized) | | 5.70 | | | 3/20/42 | | | | 789,494 | |
250,000 | | Erie Co. Hospital Facs. Rev. (Firelands Regional Medical Center Proj.) | | 5.63 | | | 8/15/32 | | | | 250,605 | |
250,000 | | OH Air Quality Dev. Auth. Rev. (Ohio Power Co.) (AMBAC Insured) | | 5.15 | | | 5/1/26 | | | | 250,433 | |
190,000 | | OH Hsg. Finance Agy. Residential Mtg. Rev. (GNMA/FNMA/FHLMC Collateralized) | | 5.45 | | | 9/1/33 | | | | 199,437 | |
| | | | | | | | | | | | |
| | | | | | | | | | | 3,094,460 | |
| | | | | | | | | | | | |
| | | |
Oklahoma - 0.3% | | | | | | | | | | |
500,000 | | Citizen Potawatomi Nation Sr. Obligation Tax Rev. | | 6.50 | | | 9/1/16 | | | | 492,015 | |
| | | | | | | | | | | | |
| | | |
Oregon - 0.6% | | | | | | | | | | |
230,000 | | OR G.O. (Veterans Welfare Proj.) | | 5.25 | | | 10/1/42 | | | | 232,302 | |
785,000 | | Western Generation Agy. Rev. (Wauna Cogeneration) | | 5.00 | | | 1/1/21 | | | | 741,189 | |
| | | | | | | | | | | | |
| | | | | | | | | | | 973,491 | |
| | | | | | | | | | | | |
| | | |
Pennsylvania - 2.8% | | | | | | | | | | |
250,000 | | Allegheny Co. Industrial Dev. Auth. Charter School Rev. (Propel Charter-McKeesport) | | 5.90 | | | 8/15/26 | | | | 256,375 | |
490,000 | | Butler Co. General Auth. Rev. (Butler Area School District Proj.) (AGM GO Of District Insured) 1 | | 1.06 | | | 10/1/34 | | | | 304,697 | |
250,000 | | Erie Co. Hospital Auth. Rev. (St. Vincent Health Center Proj.) | | 7.00 | | | 7/1/27 | | | | 258,195 | |
600,000 | | Geisinger Auth. Health System Rev. (Geisinger Health System Proj.) 1 | | 1.08 | | | 5/1/37 | | | | 414,852 | |
250,000 | | Lehigh Co. General Purpose Auth. Rev. (Saint Luke’s Bethlehem) 1 | | 1.27 | | | 8/15/42 | | | | 163,953 | |
500,000 | | Luzerne Co. G.O. (FSA Insured) | | 7.00 | | | 11/1/26 | | | | 583,420 | |
500,000 | | PA Economic Dev. Fin. Auth. Health Systems Rev. (Albert Einstein Health Care) | | 6.25 | | | 10/15/23 | | | | 546,450 | |
500,000 | | PA Hsg. Finance Agy. Single Family Mtg. Rev. | | 4.75 | | | 10/1/28 | | | | 514,390 | |
250,000 | | PA Hsg. Finance Agy. Single Family Mtg. Rev. | | 4.75 | | | 10/1/39 | | | | 250,000 | |
500,000 | | PA Turnpike Commission Rev. Capital Appreciation 6 | | 6.00 | | | 12/1/30 | | | | 382,145 | |
500,000 | | PA Turnpike Commission Rev. Capital Appreciation 6 | | 5.73 | | | 12/1/38 | | | | 376,350 | |
500,000 | | PA Turnpike Commission Rev. Capital Appreciation (AGM Insured) 6 | | 6.25 | | | 6/1/33 | | | | 405,625 | |
160,000 | | Philadelphia Hospital & Higher Education Facs. Auth. Hospital Rev. (Temple Univ. Hospital) | | 6.63 | | | 11/15/23 | | | | 160,051 | |
| | | | | | | | | | | | |
| | | | | | | | | | | 4,616,503 | |
| | | | | | | | | | | | |
Puerto Rico - 0.9% | | | | | | | | | | |
500,000 | | Puerto Rico Electric Power Auth. Rev. Ref. 1 | | 1.04 | | | 7/1/25 | | | | 383,245 | |
| | |
See accompanying notes to financial statements |
18 | | SIT MUTUAL FUNDS SEMI-ANNUAL REPORT |
| | | | | | | | | | | | | | |
| | | | | |
Principal
Amount ($) | | | Name of Issuer | | Coupon
Rate (%) | | Maturity Date | | | Fair
Value ($) | |
| | | | |
| | 500,000 | | | Puerto Rico Highways & Transportation Auth. Rev. Ref. (AMBAC Insured) 1 | | 0.89 | | | 7/1/45 | | | | 266,375 | |
| | 500,000 | | | Puerto Rico Sales Tax Financing Corp. Rev. 1 | | 1.24 | | | 8/1/17 | | | | 294,855 | |
| | 250,000 | | | Puerto Rico Sales Tax Financing Corp. Rev. | | 5.00 | | | 8/1/35 | | | | 258,425 | |
| | 300,000 | | | Puerto Rico Sales Tax Financing Corp. Rev. | | 6.00 | | | 8/1/39 | | | | 334,923 | |
| | | | | | | | | | | | | | |
| | | | | | | | | | | | | 1,537,823 | |
| | | | | | | | | | | | | | |
| | | |
| | Rhode Island - 1.0% | | | | | | | | | | |
| | 565,000 | | | RI Health & Education Building Corp. Rev. (Steere House Proj.) | | 5.80 | | | 7/1/20 | | | | 565,000 | |
| | 500,000 | | | RI Hsg. & Mtg. Finance Corp. Rev. (Home Ownership Opportunity Proj.) | | 5.63 | | | 10/1/38 | | | | 529,930 | |
| | 500,000 | | | RI Student Loan Auth. Sr. Rev. | | 5.75 | | | 12/1/27 | | | | 525,395 | |
| | | | | | | | | | | | | | |
| | | | | | | | | | | | | 1,620,325 | |
| | | | | | | | | | | | | | |
| | | |
| | South Carolina - 0.6% | | | | | | | | | | |
| | 500,000 | | | SC Education Assistance Auth. Student Loan Rev. | | 5.10 | | | 10/1/29 | | | | 522,385 | |
| | 250,000 | | | SC Jobs Economic Dev. Auth. Health Care Facs. Rev. (Woodlands at Furman Proj.) | | 6.00 | | | 11/15/27 | | | | 214,360 | |
| | 250,000 | | | SC Jobs Economic Dev. Auth. Health Care Facs. Rev. (Woodlands at Furman Proj.) | | 5.15 | | | 11/15/42 | | | | 242,663 | |
| | | | | | | | | | | | | | |
| | | | | | | | | | | | | 979,408 | |
| | | | | | | | | | | | | | |
| | | |
| | Tennessee - 1.4% | | | | | | | | | | |
| | 495,000 | | | Metro Govt. Nashville & Davidson Co. Health & Education Facs. Rev. (Prestige Proj.) 2, 5 | | 7.50 | | | 12/20/40 | | | | 301,440 | |
| | 240,000 | | | Metro Govt. Nashville & Davidson Co. Industrial Dev. Board Rev. (GNMA Collateralized) | | 6.63 | | | 3/20/36 | | | | 249,619 | |
| | 250,000 | | | Metro Govt. Nashville & Davidson Co. Industrial Dev. Board Rev. Escrowed to Maturity | | 9.75 | | | 2/15/15 | | | | 278,760 | |
| | 250,000 | | | Metro Govt. Nashville & Davidson Co. Industrial Dev. Board Rev. Escrowed to Maturity | | 9.75 | | | 2/15/15 | | | | 278,760 | |
| | 1,850,000 | | | Shelby Co. Health, Education & Hsg. Facs. Rev. (CME Memphis Apts. Proj.) 2, 5 | | 5.35 | | | 1/1/19 | | | | 196,840 | |
| | 7,875,000 | | | Shelby Co. Health, Education & Hsg. Facs. Rev. (CME Memphis Apts. Proj.) 2, 5 | | 5.55 | | | 1/1/29 | | | | 791,359 | |
| | 1,630,000 | | | Shelby Co. Health, Education & Hsg. Facs. Rev. (CME Memphis Apts. Proj.) 2, 5 | | 6.00 | | | 1/1/29 | | | | 16 | |
| | 1,000,000 | | | Shelby Co. Health, Education & Hsg. Facs. Rev. (Eastwood Park Apts. Proj.) 2, 5 | | 6.40 | | | 9/1/25 | | | | 149,990 | |
| | 405,000 | | | Shelby Co. Health, Education & Hsg. Facs. Rev. (Eastwood Park Apts. Proj.) 2, 5, 6 | | 7.50 | | | 9/1/25 | | | | 4 | |
| | | | | | | | | | | | | | |
| | | | | | | | | | | | | 2,246,788 | |
| | | | | | | | | | | | | | |
| | | |
| | Texas - 9.5% | | | | | | | | | | |
| | 100,000 | | | Bexar Co. Hsg. Fin. Corp. Rev. (Dublin Kingswood & Waterford Apts.) | | 7.50 | | | 12/1/14 | | | | 93,160 | |
| | 250,000 | | | Bexar Co. Hsg. Fin. Corp. Rev. (Dymaxion & Marbach Park Apts. Proj.) (NATL-RE Insured) | | 6.10 | | | 8/1/30 | | | | 237,845 | |
| | 540,000 | | | Bexar Co. Hsg. Fin. Corp. Rev. (Honey Creek Apartments Proj.) 2, 5 | | 8.00 | | | 4/1/30 | | | | 273,856 | |
| | 440,000 | | | Bexar Co. Hsg. Fin. Corp. Rev. (Waterford Proj.) | | 6.50 | | | 12/1/21 | | | | 429,396 | |
| | 250,000 | | | Capital Area Cultural Education Facs. Rev. (Roman Catholic Diocese) | | 5.50 | | | 4/1/24 | | | | 260,130 | |
| | 250,000 | | | Clifton Higher Education Finance Corp. Education Rev. (Uplift Education Proj.) | | 6.00 | | | 12/1/30 | | | | 258,043 | |
| | 1,920,000 | | | Dallas Hsg. Finance Corp. Multifamily Mtg. Rev. (Towne Center Apts.) (GNMA Collateralized) | | 6.75 | | | 10/20/32 | | | | 1,980,288 | |
| | 201,657 | | | El Paso Hsg. Finance Corp. Single Family Mtg. Rev. (GNMA Collateralized) | | 6.18 | | | 4/1/33 | | | | 214,605 | |
| | 1,327,160 | | | Galveston Co. Municipal Utility District No. 52 | | 6.16 | | | 3/1/11 | | | | 1,061,861 | |
| | 500,000 | | | Harris Co. Cultural Education Facs. Finance Corp. Rev. (Space Center Houston Proj.) | | 6.75 | | | 8/15/21 | | | | 528,995 | |
| | 100,000 | | | Harris Co. Special Rev. Sr. Lien (Houston Sports Auth. Proj.) (NATL-RE Insured) | | 5.00 | �� | | 11/15/28 | | | | 94,084 | |
| | 500,000 | | | Harrison Co. Health Facs. Dev. Corp. Rev. (Good Shephard Health System) | | 5.25 | | | 7/1/28 | | | | 492,020 | |
| | 455,000 | | | La Vernia Higher Education Finance Corp. Rev. (Friends Life Proj.) | | 6.00 | | | 2/15/18 | | | | 459,532 | |
| | 750,000 | | | North TX Tollway Auth. Rev. Ref. | | 6.13 | | | 1/1/31 | | | | 811,853 | |
| | 750,000 | | | Port of Corpus Christi Auth. Rev. Ref. (Union Pacific Corp. Proj.) | | 5.65 | | | 12/1/22 | | | | 759,878 | |
| | 1,205,000 | | | Richardson Hospital Auth. Rev. Ref. (Baylor/Richardson Proj.) | | 5.63 | | | 12/1/28 | | | | 1,188,046 | |
| | 265,000 | | | Rio Grande Valley Health Facs. Dev. Corp. Hospital Rev. (Valley Baptist) (NATL-RE Insured) | | 6.40 | | | 8/1/12 | | | | 265,800 | |
| | 250,000 | | | Tarrant Co. Cultural Education Facs. Fin. Rev. (Buckingham Sr. Living Proj.) | | 5.25 | | | 11/15/16 | | | | 252,068 | |
| | 300,000 | | | Tarrant Co. Cultural Education Facs. Fin. Rev. (C.C. Young Memorial Home Proj.) | | 5.00 | | | 2/15/13 | | | | 294,660 | |
| | 500,000 | | | Tarrant Co. Cultural Education Facs. Fin. Rev. (C.C. Young Memorial Home Proj.) | | 6.50 | | | 2/15/14 | | | | 502,580 | |
| | 490,000 | | | Tarrant Co. Cultural Education Facs. Fin. Rev. (Crossroads Apts. Proj.) 2, 5 | | 7.25 | | | 12/1/36 | | | | 5 | |
| | 250,000 | | | Tarrant Co. Cultural Education Facs. Fin. Rev. (Mirador Proj.) | | 7.75 | | | 11/15/19 | | | | 271,230 | |
| | 500,000 | | | Tarrant Co. Cultural Education Facs. Fin. Rev. (Sr. Living Center Proj.) | | 6.50 | | | 11/15/14 | | | | 500,645 | |
| | |
| See accompanying notes to financial statements. | | |
SEPTEMBER 30, 2010 | | 19 |
SCHEDULE OF INVESTMENTS (Unaudited)
September 30, 2010
Sit Tax-Free Income Fund (Continued)
| | | | | | | | | | | | | | |
| | | | | |
Principal
Amount ($) | | Name of Issuer | | Coupon
Rate (%) | | | Maturity Date | | | Fair Value ($) | |
| | | | |
| 250,000 | | Travis Co. Health Facs. Dev. Corp. Rev. (Westminster Manor) | | | 6.25 | | | | 11/1/16 | | | | 253,968 | |
| 500,000 | | TX Municipal Gas Acquisition & Supply Corp. I Sr. Lien Rev. 1 | | | 1.65 | | | | 12/15/26 | | | | 359,030 | |
| 60,000 | | TX Municipal Gas Acquisition & Supply Corp. I Sr. Lien Rev. | | | 6.25 | | | | 12/15/26 | | | | 67,118 | |
| 300,000 | | TX Municipal Gas Acquisition & Supply Corp. II Rev. 1 | | | 1.07 | | | | 9/15/27 | | | | 219,474 | |
| 750,000 | | TX Private Activity Surface Transportation Corp. Rev. (LBJ Infrastructure) | | | 7.50 | | | | 6/30/33 | | | | 858,893 | |
| 250,000 | | TX Public Finance Auth. Charter School Finance Corp. Rev. (Cosmos Foundation, Inc.) | | | 6.00 | | | | 2/15/30 | | | | 259,413 | |
| 710,000 | | TX Public Finance Auth. Charter School Finance Corp. Rev. (Ed-Burnham Wood Proj.) | | | 5.50 | | | | 9/1/18 | | | | 708,616 | |
| 500,000 | | TX Public Finance Auth. Charter School Finance Corp. Rev. (Idea Public School) (ACA Insured) | | | 5.00 | | | | 8/15/30 | | | | 471,130 | |
| 1,000,000 | | TX Public Finance Auth. Charter School Finance Corp. Rev. (Kipp, Inc. Proj.) (ACA Insured) | | | 5.00 | | | | 2/15/28 | | | | 972,780 | |
| 195,000 | | TX Public Property Finance Corp. Mental Health & Mental Retardation Rev. | | | 6.20 | | | | 9/1/16 | | | | 196,632 | |
| | | | | | | | | | | | | | |
| | | | |
| | | | | | | | | | | | | 15,597,634 | |
| | | | | | | | | | | | | | |
Utah - 0.7% | | | | | | | | | | | | |
| 250,000 | | Provo Charter School Rev. (Freedom Academy Foundation) | | | 5.50 | | | | 6/15/37 | | | | 205,188 | |
| 857,000 | | UT Assoc. Municipal Power System Rev. | | | 5.00 | | | | 5/1/27 | | | | 744,519 | |
| 250,000 | | UT Charter School Finance Auth. Rev. (North Davis Prep.) | | | 5.75 | | | | 7/15/20 | | | | 252,960 | |
| | | | | | | | | | | | | | |
| | | | |
| | | | | | | | | | | | | 1,202,667 | |
| | | | | | | | | | | | | | |
Virginia - 1.5% | | | | | | | | | | | | |
| 500,000 | | Farms New Kent Community Dev. Auth. Special Assessment | | | 5.13 | | | | 3/1/36 | | | | 367,115 | |
| 1,500,000 | | VA Hsg. Dev. Auth. Commonwealth Mtg. Rev. (NATL-RE GO of Authority Insured) | | | 5.38 | | | | 7/1/36 | | | | 1,527,585 | |
| 500,000 | | VA Hsg. Dev. Auth. Rev. (Rental Hsg. Proj.) | | | 5.00 | | | | 12/1/39 | | | | 515,580 | |
| | | | | | | | | | | | | | |
| | | | |
| | | | | | | | | | | | | 2,410,280 | |
| | | | | | | | | | | | | | |
Washington - 1.2% | | | | | | | | | | | | |
| 830,000 | | Kalispel Tribe Indians Priority District Rev. | | | 6.20 | | | | 1/1/16 | | | | 791,613 | |
| 250,000 | | WA Health Care Facs. Auth. Rev. (Overlake Hospital Medical Center) | | | 5.25 | | | | 7/1/23 | | | | 263,945 | |
| 980,000 | | WA Hsg. Finance Commission Nonprofit Rev. (Skyline at First Hill Proj.) | | | 5.10 | | | | 1/1/13 | | | | 942,936 | |
| | | | | | | | | | | | | | |
| | | | |
| | | | | | | | | | | | | 1,998,494 | |
| | | | | | | | | | | | | | |
West Virginia - 0.8% | | | | | | | | | | | | |
| 1,350,000 | | Pleasants Co. Pollution Control Rev. (Monongahela Power Co.) (AMBAC Insured) | | | 6.15 | | | | 5/1/15 | | | | 1,352,525 | |
| | | | | | | | | | | | | | |
| | | |
Wisconsin - 4.4% | | | | | | | | | | | | |
| 250,000 | | WI General Fund Rev. Appropriation Rev. 9 | | | 6.00 | | | | 5/1/27 | | | | 299,278 | |
| 550,000 | | WI Health & Education Facs. Auth. Rev. (Agnesian Healthcare, Inc. Proj.) | | | 6.00 | | | | 7/1/17 | | | | 558,283 | |
| 340,000 | | WI Health & Education Facs. Auth. Rev. (Agnesian Healthcare, Inc. Proj.) | | | 6.00 | | | | 7/1/21 | | | | 343,329 | |
| 200,000 | | WI Health & Education Facs. Auth. Rev. (Agnesian Healthcare, Inc., Proj.) (NATL-RE Insured) | | | 5.13 | | | | 7/1/23 | | | | 200,058 | |
| 225,000 | | WI Health & Education Facs. Auth. Rev. (Aurora Health Care Proj.) | | | 5.50 | | | | 2/15/15 | | | | 225,191 | |
| 1,000,000 | | WI Health & Education Facs. Auth. Rev. (Aurora Health Care Proj.) | | | 5.60 | | | | 2/15/29 | | | | 1,000,490 | |
| 250,000 | | WI Health & Education Facs. Auth. Rev. (Aurora Health Care Proj.) | | | 6.40 | | | | 4/15/33 | | | | 257,708 | |
| 500,000 | | WI Health & Education Facs. Auth. Rev. (Aurora Health Care Proj.) (ACA-CBI Insured) | | | 5.63 | | | | 11/15/32 | | | | 500,255 | |
| 500,000 | | WI Health & Education Facs. Auth. Rev. (Aurora Medical Group Proj.) (AGM Insured) | | | 5.75 | | | | 11/15/25 | | | | 500,765 | |
| 500,000 | | WI Health & Education Facs. Auth. Rev. (Beaver Dam Community Hospital, Inc.) | | | 6.75 | | | | 8/15/34 | | | | 506,725 | |
| 250,000 | | WI Health & Education Facs. Auth. Rev. (Beloit College) | | | 6.00 | | | | 6/1/30 | | | | 263,280 | |
| 450,000 | | WI Health & Education Facs. Auth. Rev. (Blood Center Southeastern Proj.) | | | 5.50 | | | | 6/1/24 | | | | 467,195 | |
| 900,000 | | WI Health & Education Facs. Auth. Rev. (Divine Savior, Inc. Proj.) (ACA-CBI Insured) | | | 5.70 | | | | 6/1/28 | | | | 900,036 | |
| 500,000 | | WI Health & Education Facs. Auth. Rev. (Ministry Health Care, Inc.) | | | 5.50 | | | | 8/15/30 | | | | 529,660 | |
| 250,000 | | WI Health & Education Facs. Auth. Rev. (St. Johns Communities, Inc.) | | | 5.40 | | | | 9/15/14 | | | | 250,623 | |
| 205,000 | | WI Health & Education Facs. Auth. Rev. (Synergy Health, Inc. Proj.) | | | 6.00 | | | | 11/15/23 | | | | 215,092 | |
| 250,000 | | WI Health & Education Facs. Auth. Rev. (Synergy Health, Inc. Proj.) | | | 6.00 | | | | 11/15/32 | | | | 259,390 | |
| | | | | | | | | | | | | | |
| | | | |
| | | | | | | | | | | | | 7,277,358 | |
| | | | | | | | | | | | | | |
| | | |
Total Municipal Bonds
(cost: $169,108,290) | | | | | | | | | | | 146,151,500 | |
| | | | | | | | | | | | | | |
| | |
See accompanying notes to financial statements. |
| 20 | | SIT MUTUAL FUNDS SEMI-ANNUAL REPORT |
| | | | | | |
| | |
| Quantity | | Name of Issuer | | Fair Value ($) | |
Closed-End Mutual Funds - 6.8% | | | | |
45,400 | | BlackRock Long-Term Municipal Advantage Trust (BTA) | | | 527,548 | |
33,800 | | BlackRock MuniHoldings Florida Insured Fund (MFL) | | | 494,156 | |
54,500 | | BlackRock MuniYield Florida Fund (MYF) | | | 815,865 | |
66,500 | | BlackRock MuniYield Insured Fund (MYI) | | | 942,305 | |
23,700 | | BlackRock MuniYield Michigan Insured Fund (MIY) | | | 352,419 | |
23,000 | | BlackRock MuniYield Michigan Insured Fund II (MYM) | | | 312,110 | |
208,600 | | DWS Municipal Income Trust (KTF) | | | 2,780,638 | |
12,390 | | Eaton Vance National Municipal Income Trust (FEV) | | | 160,451 | |
28,200 | | Invesco PA Value Muni Income Trust (VPV) | | | 408,054 | |
17,300 | | Invesco Quality Muni (IQT) | | | 249,120 | |
9,100 | | Invesco Select Sector Muni Trust (VKL) | | | 115,570 | |
36,800 | | Invesco Van Kampen Advantage Muni Income Trust (VKI) | | | 473,984 | |
25,889 | | Invesco Van Kampen Trust for Investment Grade Municipals (VGM) | | | 389,635 | |
25,923 | | Managed Duration Investment Grade (MZF) | | | 395,585 | |
11,700 | | Nuveen Michigan Premium Income Municipal Fund (NMP) | | | 164,853 | |
21,500 | | Nuveen Premier Municipal Income Fund (NPF) | | | 313,685 | |
81,332 | | Nuveen Premium Income Fund (NPM) | | | 1,215,913 | |
77,011 | | Putnam Municipal Opportunities Trust (PMO) | | | 943,385 | |
| | | | | | |
Total Closed-End Mutual Funds
(cost: $9,796,399) | | | 11,055,276 | |
| | | | | | |
Short-Term Securities - 3.8% | | | | |
6,222,620 | | Dreyfus Tax-Exempt Cash Management Fund, 0.12% | | | | |
Total Short-Term Securities
(cost: $6,222,620) | | | 6,222,620 | |
| | | | | | |
Total Investments in Securities - 99.6%
(cost: $185,127,309) | | | 163,429,396 | |
Other Assets and Liabilities, net - 0.4% | | | 728,983 | |
| | | | | | |
Total Net Assets - 100.0% | | $ | 164,158,379 | |
| | | | | | |
| 1 | Variable rate security. Rate disclosed is as of September 30, 2010. |
| 2 | Securities considered illiquid by the Investment Adviser. The total value of such securities as of September 30, 2010 was $5,194,501 and represented 3.2% of net assets. |
| 4 | 144A Restricted Security. The total value of such securities as of September 30, 2010 was $3,906,274 and represented 2.4% of net assets. These securities have been determined to be liquid by the Adviser in accordance with guidelines established by the Board of Directors. |
| 5 | The issuer is in default of certain debt covenants. Income is not being accrued. The total value of such securities as of September 30, 2010 was $5,194,501 and represented 3.2% of net assets. |
| 6 | Zero coupon security. Rate disclosed is the effective yield on purchase date. |
| 9 | Municipal Lease Security. The total value of such securities as of September 30, 2010 was $3,010,709 and represented 1.8% of net assets. These securities have been determined to be liquid by the Adviser in accordance with guidelines established by the Board of Directors. |
Numeric footnotes not disclosed are not applicable to this Schedule of Investments.
| | |
| See accompanying notes to financial statements. | | |
SEPTEMBER 30, 2010 | | 21 |
SCHEDULE OF INVESTMENTS (Unaudited)
September 30, 2010
Sit Tax-Free Income Fund (Continued)
A summary of the inputs used to value the Fund’s net assets as of September 30, 2010 is as follows (see Note 2 - significant accounting policies in the notes to financial statements):
| | | | | | | | | | | | | | |
| | | Investment in Securities | |
| | | Level 1
Quoted Price | | | Level 2 Other significant
observable inputs | | | Level 3 Significant
unobservable inputs | | Total | |
Short-Term Securities | | $ | 6,222,620 | | | | — | | | — | | $ | 6,222,620 | |
Closed-End Mutual Funds | | | 11,055,276 | | | | — | | | — | | | 11,055,276 | |
Municipal Bonds | | | — | | | $ | 146,151,500 | | | — | | | 146,151,500 | |
Total: | | $ | 17,277,896 | | | $ | 146,151,500 | | | — | | $ | 163,429,396 | |
See accompanying notes to financial statements.
| | |
22 | | SIT MUTUAL FUNDS SEMI-ANNUAL REPORT |
[This page intentionally left blank.]
|
Sit Minnesota Tax-Free Income Fund |
OBJECTIVE & STRATEGY
The investment objective of the Minnesota Tax-Free Income Fund is to provide a high level of current income exempt from federal regular income tax and Minnesota regular personal income tax as is consistent with the preservation of capital.
During normal market conditions, the Fund invests 100% of its net assets in municipal securities that generate interest income that is exempt from federal regular income tax and Minnesota regular personal income tax. The Fund anticipates that substantially all of its distributions to its shareholders will be exempt as such. For investors subject to the alternative minimum tax (“AMT”), up to 20% of the Fund’s income may be alternative minimum taxable income.
The Sit Minnesota Tax-Free Income Fund provided a total return of +5.35% for the 6-month period ended September 30, 2010, compared with a total return of +4.25% for the Barclays Capital 5-Year Municipal Bond Index. As of September 30, 2010, the Fund’s 30-day SEC yield was 4.29% and its 12-month distribution rate was also 4.29%.
Tax-exempt municipal bond yields declined during the six-month period, resulting in solid returns for the asset class. The yield curve flattened as yields on longer maturity bonds fell more than yields on shorter maturity bonds. In addition, yield spreads on lower rated credits narrowed further from the historically wide levels that prevailed during the financial turmoil of 2008 as investors continued to be less risk averse as they reached for higher yields.
The Fund’s solid outperformance was attributable to a broad improvement in prices for the types of bonds in which it invests, thus helping it to fully recoup much of the price depreciation that occurred in the second half of 2008. Of the significant industries in which the Fund invests, other revenue bonds provided the best relative return, followed by education bonds and then multifamily housing and hospital bonds. These four industries represent almost two-thirds of the Fund’s holdings. The Fund also benefited from improving prices in A-rated and BBB-rated securities and non-rated bonds that, in aggregate, represent over two-thirds of its investments. We believe that the Fund’s duration positioning, which was little changed during the period at 4.8 years, was a less significant contributor to the Fund’s performance.
Looking forward, we expect moderate economic growth to continue through 2011. We believe the Federal Reserve will keep short-term interest rates low at least though the first half of 2011, as unemployment is expected to remain at historically high levels. In this environment, we expect the municipal bond market to provide attractive returns with continued narrowing of yield spreads and the strongest relative performance from longer duration bonds. Longer maturity
HYPOTHETICAL GROWTH OF $10,000

The chart above illustrates the total value of a hypothetical $10,000 investment in the Fund over the past 10 years (or for the life of the Fund if shorter) as compared to the performance of the Barclays Capital 5-Year Municipal Bond Index. Past performance does not guarantee future results. Returns include the reinvestment of distributions. The chart does not reflect the deduction of taxes that a shareholder would pay on Fund distributions or the redemption of Fund shares.
1 The Barclays Capital 5-Year Municipal Bond Index is the 5 year (4-6) component of the Municipal Bond Index, an unmanaged, rules-based, market-value-weighted index for the long-term tax-exempt bond market. The index includes bonds with a minimum credit rating of BBB. The returns include the reinvestment of income and do not include any transaction costs, management fees or other costs. It is not possible to invest directly in an index.
and lower rated bonds with stable credit outlooks continue to offer attractive yields. The ratings outlook for Minnesota municipal bonds has benefited from a more stable fiscal environment, relative to other states. Diversification remains a key factor in managing risk.
Michael C. Brilley
Debra A. Sit, CFA
Paul J. Jungquist, CFA
Senior Portfolio Managers
| | |
24 | | SIT MUTUAL FUNDS SEMI-ANNUAL REPORT |
COMPARATIVE RATES OF RETURNS
as of September 30, 2010
| | | | | | | | | | |
| | | Sit Minnesota Tax-Free Income Fund | | | Barclays Capital 5-Year Muni. Bond Index1 | | | Lipper MN Muni. Bond Fund Index2 |
| | | |
Six Month | | | 5.35% | | | | 4.25% | | | n/a |
One Year | | | 7.54 | | | | 5.63 | | | 5.84% |
Five Years | | | 4.51 | | | | 5.40 | | | 4.47 |
Ten Years | | | 4.96 | | | | 5.26 | | | 5.10 |
Since Inception (12/1/93) | | | 5.03 | | | | 5.11 | | | 4.84 |
Performance figures are historical and do not guarantee future results. Investment returns and principal value will vary, and you may have a gain or loss when you sell shares. Current performance may be lower or higher than the performance data quoted. Contact the Fund for performance data current to the most recent month-end. Returns include changes in share price as well as reinvestment of all dividends and capital gains. Returns do not reflect the deduction of taxes that a shareholder would pay on Fund distributions or the redemption of Fund shares. Management fees and administrative expenses are included in the Fund’s performance. Returns for periods greater than one year are compounded average annual rates of return.
1 The Barclays Capital 5-Year Municipal Bond Index is the 5 year (4-6) component of the Municipal Bond Index, an unmanaged, rules-based, market-value-weighted index made for the long-term tax-exempt bond market. The index includes bonds with a minimum credit rating of BBB. The returns include the reinvestment of income and do not include any transaction costs, management fees or other costs. It is not possible to invest directly in an index.
2 The Lipper returns are obtained from Lipper Analytical Services, Inc., a large independent evaluator of mutual funds.
| | | | |
| FUND DIVERSIFICATION | |
| |
Hospital/Health Care | | | 22.6 | % |
Multifamily Mortgage | | | 18.6 | % |
Single Family Mortgage | | | 12.8 | % |
Other Revenue | | | 9.2 | % |
Education/Student Loan | | | 8.8 | % |
Sectors less than 6.0% | | | 23.6 | % |
Cash & Other Net Assets | | | 4.4 | % |
Based on total net assets as of September 30, 2010. Subject to change.
PORTFOLIO SUMMARY
| | |
| | |
Net Asset Value 9/30/10: | | $10.19 Per Share |
Net Asset Value 3/31/10: | | $9.88 Per Share |
Total Net Assets: | | $307.8 Million |
30-day SEC Yield 3: | | 4.29% |
Tax Equivalent Yield 4: | | 7.16% |
12-month Distribution Rate 3: | | 4.29% |
Average Maturity: | | 14.6 Years |
Effective Duration 5: | | 4.8 Years |
3 The SEC Yield reflects the rate at which the Fund is earning income on its current portfolio of securities, while the distribution rate reflects the Fund’s past dividends paid to shareholders based on the net investment income distributed and the average NAV during the past 12 months. Accordingly, the Fund’s SEC yield and distribution rate may differ.
4 The tax-equivalent yield is based on an assumed federal tax rate of 35.0% and a Minnesota tax rate of 7.85%, a total rate of 42.85%.
5 Duration is a measure of estimated price sensitivity relative to changes in interest rates. Portfolios with longer durations are typically more sensitive to changes in interest rates. For example, if interest rates rise by 1%, the market value of a security with an effective duration of 5 years would decrease by 5%, with all other factors being constant. The correlation between duration and price sensitivity is greater for securities rated investment-grade than it is for securities rated below investment-grade. Duration estimates are based on assumptions by the Adviser and are subject to a number of limitations. Effective duration is calculated based on historical price changes of securities held by the Fund, and therefore is a more accurate estimate of price sensitivity provided interest rates remain within their historical range.
QUALITY RATINGS (% of Total Net Assets)
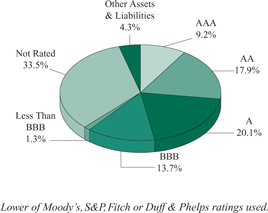
Adviser’s Assessment of Non-Rated Securities:
| | | | | | |
AAA | | | 0.1% | | | |
AA | | | 2.1 | | | |
A | | | 4.5 | | | |
BBB | | | 13.4 | | | |
BB | | | 12.9 | | | |
<BB | | | 0.5 | | | |
| | | | | | |
Total | | | 33.5% | | | |
SCHEDULE OF INVESTMENTS (Unaudited)
September 30, 2010
Sit Minnesota Tax-Free Income Fund
| | | | | | | | | | | | | | | | |
Principal
Amount ($) | | | Name of Issuer | | Coupon Rate (%) | | | Maturity Date | | | Fair Value ($) | |
| | | |
| Municipal Bonds - 94.8% | | | | | | | | | | | | |
| Education/Student Loan - 8.8% | | | | | | | | | | | | |
| | 1,070,000 | | | Brooklyn Park Lease Rev. (Prairie Seeds Academy Proj.) | | | 8.00 | | | | 3/1/20 | | | | 1,162,555 | |
| | 5,038,161 | | | Intermediate School District 287 Lease Rev. | | | 5.30 | | | | 11/1/32 | | | | 5,097,158 | |
| | 775,000 | | | Minneapolis Educational Fac. Lease Rev. (Seed/Harvest Preparatory Proj.) (LOC-U.S. Bank) | | | 5.13 | | | | 1/1/16 | | | | 640,824 | |
| | 875,000 | | | Minneapolis Educational Fac. Lease Rev. (Seed/Harvest Preparatory Proj.) (LOC-U.S. Bank) | | | 6.25 | | | | 1/1/21 | | | | 686,254 | |
| | 700,000 | | | MN Higher Education Fac. Auth. Rev. (Augsburg College) | | | 5.00 | | | | 5/1/23 | | | | 717,269 | |
| | 700,000 | | | MN Higher Education Fac. Auth. Rev. (Augsburg College) | | | 5.05 | | | | 10/1/13 | | | | 701,225 | |
| | 150,000 | | | MN Higher Education Fac. Auth. Rev. (Augsburg College) | | | 5.20 | | | | 10/1/16 | | | | 150,165 | |
| | 75,000 | | | MN Higher Education Fac. Auth. Rev. (Augsburg College) | | | 5.30 | | | | 10/1/27 | | | | 75,002 | |
| | 165,000 | | | MN Higher Education Fac. Auth. Rev. (Augsburg College) | | | 5.60 | | | | 12/1/12 | | | | 167,148 | |
| | 910,000 | | | MN Higher Education Fac. Auth. Rev. (Bethel Univ.) | | | 5.50 | | | | 5/1/14 | | | | 944,361 | |
| | 600,000 | | | MN Higher Education Fac. Auth. Rev. (Bethel Univ.) | | | 5.50 | | | | 5/1/22 | | | | 623,106 | |
| | 160,000 | | | MN Higher Education Fac. Auth. Rev. (Bethel Univ.) | | | 5.50 | | | | 5/1/23 | | | | 165,432 | |
| | 2,283,135 | | | MN Higher Education Fac. Auth. Rev. (College of St. Benedict) | | | 4.49 | | | | 10/1/16 | | | | 2,297,724 | |
| | 1,863,269 | | | MN Higher Education Fac. Auth. Rev. (College of St. Catherine) | | | 4.75 | | | | 4/26/27 | | | | 1,819,743 | |
| | 500,000 | | | MN Higher Education Fac. Auth. Rev. (Hamline Univ.) | | | 5.00 | | | | 10/1/29 | | | | 515,485 | |
| | 500,000 | | | MN Higher Education Fac. Auth. Rev. (St. Mary’s Univ.) | | | 5.00 | | | | 3/1/26 | | | | 518,405 | |
| | 1,400,000 | | | MN Higher Education Fac. Auth. Rev. (St. Scholastica College) | | | 5.00 | | | | 12/1/27 | | | | 1,438,948 | |
| | 500,000 | | | MN Higher Education Fac. Auth. Rev. (Univ. of St. Thomas) | | | 5.00 | | | | 4/1/23 | | | | 541,670 | |
| | 1,250,000 | | | MN Higher Education Fac. Auth. Rev. (Univ. of St. Thomas) | | | 6.00 | | | | 10/1/25 | | | | 1,374,550 | |
| | 1,000,000 | | | MN Higher Education Fac. Auth. Rev. (Univ. of St. Thomas) (GO of Univ. Insured) | | | 5.00 | | | | 10/1/39 | | | | 1,053,320 | |
| | 252,474 | | | MN Higher Education Fac. Auth. Rev. Lease Rev. (Concordia Univ.) | | | 5.25 | | | | 4/25/14 | | | | 254,481 | |
| | 747,730 | | | Olmsted Co. Hsg. & Redev. Auth. (Schaeffer Academy Proj.) | | | 4.98 | | | | 4/25/27 | | | | 627,316 | |
| | 340,000 | | | Pine City Lease Rev. (Lakes International Language Academy Proj.) | | | 5.75 | | | | 5/1/16 | | | | 343,696 | |
| | 300,000 | | | Pine City Lease Rev. (Lakes International Language Academy Proj.) | | | 6.00 | | | | 5/1/26 | | | | 287,682 | |
| | 415,000 | | | Ramsey Lease Rev. (Pact Charter School Proj.) | | | 5.65 | | | | 12/1/13 | | | | 423,175 | |
| | 685,000 | | | St. Paul Hsg. & Redev. Auth. Lease Rev. (Community of Peace Academy Proj.) | | | 4.35 | | | | 12/1/12 | | | | 705,132 | |
| | 600,000 | | | St. Paul Hsg. & Redev. Auth. Lease Rev. (Community of Peace Academy Proj.) | | | 4.35 | | | | 12/1/14 | | | | 608,652 | |
| | 1,500,000 | | | St. Paul Hsg. & Redev. Auth. Lease Rev. (Community of Peace Academy Proj.) | | | 5.00 | | | | 12/1/18 | | | | 1,529,310 | |
| | 605,000 | | | St. Paul Hsg. & Redev. Auth. Lease Rev. (Hmong Academy Proj.) | | | 5.50 | | | | 9/1/18 | | | | 594,703 | |
| | 370,000 | | | St. Paul Hsg. & Redev. Auth. Lease Rev. (New Spirit Charter School Proj.) | | | 6.50 | | | | 12/1/12 | | | | 385,958 | |
| | 500,000 | | | St. Paul Hsg. & Redev. Auth. Rev. Ref. (St. Paul Academy & Summit School) | | | 5.00 | | | | 10/1/24 | | | | 537,540 | |
| | 100,000 | | | Victoria Private School Fac. Rev. (Holy Family Catholic High School Proj.) | | | 5.20 | | | | 9/1/11 | | | | 100,142 | |
| | | | | | | | | | | | | | | | |
| | | | |
| | | | | | | | | | | | | | | 27,088,131 | |
| | | | | | | | | | | | | | | | |
| Escrowed To Maturity/Prerefunded - 1.9% | | | | | | | | | | | | |
| | 3,500,000 | | | Marshall Medical Center Gross Rev. (Avera Marshall Regional Medical Center Proj.) | | | 4.75 | | | | 11/1/28 | | | | 4,007,325 | |
| | 50,000 | | | Marshall Medical Center Gross Rev. (Weiner Memorial Medical Center Proj.) | | | 5.00 | | | | 11/1/14 | | | | 55,583 | |
| | 850,000 | | | Marshall Medical Center Gross Rev. (Weiner Memorial Medical Center Proj.) | | | 5.85 | | | | 11/1/23 | | | | 966,697 | |
| | 100,000 | | | Marshall Medical Center Gross Rev. (Weiner Memorial Medical Center Proj.) | | | 6.00 | | | | 11/1/28 | | | | 114,181 | |
| | 50,000 | | | Northfield Hospital Rev. | | | 6.00 | | | | 11/1/21 | | | | 52,928 | |
| | 315,000 | | | Roseville Dev. Rev. Ref. (Roseville Office Plaza Proj.) | | | 4.63 | | | | 8/1/12 | | | | 328,526 | |
| | 350,000 | | | St. Paul Hsg. & Redev. Auth. Lease Rev. (Community of Peace Academy) | | | 6.38 | | | | 12/1/11 | | | | 359,912 | |
| | | | | | | | | | | | | | | | |
| | | | |
| | | | | | | | | | | | | | | 5,885,152 | |
| | | | | | | | | | | | | | | | |
| General Obligation - 0.5% | | | | | | | | | | | | |
| | 650,000 | | | Dakota Co. Community Dev. Agy. Sr. Hsg. Facs. G.O. | | | 5.00 | | | | 1/1/26 | | | | 714,714 | |
| | 300,000 | | | Metropolitan Council Minneapolis/St. Paul Metro Area Transit G.O. | | | 4.50 | | | | 3/1/26 | | | | 317,343 | |
| | 500,000 | | | Northern Mariana Islands Commonwealth G.O. | | | 5.00 | | | | 10/1/22 | | | | 448,360 | |
| | |
See accompanying notes to financial statements. |
26 | | SIT MUTUAL FUNDS SEMI-ANNUAL REPORT |
| | | | | | | | | | | | | | |
Principal
Amount ($) | | | Name of Issuer | | Coupon Rate (%) | | Maturity Date | | | Fair Value ($) | |
| | | | |
| | 100,000 | | | St. Paul Street Improvement Special Assessment G.O. | | 5.30 | | | 3/1/12 | | | | 100,386 | |
| | 30,000 | | | Winona Water & Sewer G.O. | | 4.90 | | | 2/1/13 | | | | 30,105 | |
| | | | | | | | | | | | | | |
| | | | | | | | | | | | | 1,610,908 | |
| | | | | | | | | | | | | | |
| Hospital/Health Care - 22.6% | | | | | | | | | | |
| | 1,500,000 | | | Bemidji Health Care Facs. Rev. (North Country Health Services Proj.) (Radian Insured) | | 5.00 | | | 9/1/24 | | | | 1,508,115 | |
| | 250,000 | | | Bemidji Health Care Facs. Rev. Ref. (North County Health Services Proj.) | | 5.00 | | | 9/1/24 | | | | 253,828 | |
| | 435,000 | | | Bemidji Health Care Facs. Rev. Ref. (North County Health Services Proj.) | | 5.00 | | | 9/1/21 | | | | 450,521 | |
| | 4,025,000 | | | Breckenridge Rev. (Catholic Health Initiatives Proj.) | | 5.00 | | | 5/1/30 | | | | 4,156,738 | |
| | 100,000 | | | Carlton Health Care & Hsg. Fac. Rev. Ref. (Faith Care Center Proj.) | | 5.00 | | | 4/1/13 | | | | 103,371 | |
| | 400,000 | | | Carlton Health Care & Hsg. Fac. Rev. Ref. (Faith Care Center Proj.) | | 5.20 | | | 4/1/16 | | | | 396,720 | |
| | 1,000,000 | | | Chippewa Co. Gross Rev. (Montevideo Hospital Proj.) | | 4.63 | | | 3/1/14 | | | | 1,028,460 | |
| | 365,000 | | | Cold Spring Health Care Facs. Rev. (Assumption Home, Inc. Proj.) | | 7.25 | | | 3/1/23 | | | | 387,991 | |
| | 135,000 | | | Cold Spring Nursing Home & Sr. Hsg. Rev. (Assumption Home, Inc. Proj.) | | 4.70 | | | 3/1/14 | | | | 137,954 | |
| | 145,000 | | | Cold Spring Nursing Home & Sr. Hsg. Rev. (Assumption Home, Inc. Proj.) | | 4.80 | | | 3/1/15 | | | | 145,212 | |
| | 150,000 | | | Cold Spring Nursing Home & Sr. Hsg. Rev. (Assumption Home, Inc. Proj.) | | 4.90 | | | 3/1/16 | | | | 145,510 | |
| | 25,000 | | | Crookston Nursing Home & Multifamily Hsg. Rev. (Villa St. Vincent Proj.) | | 5.50 | | | 9/1/11 | | | | 25,026 | |
| | 400,000 | | | Cuyuna Range Hospital District Health Fac. Gross Rev. | | 5.20 | | | 6/1/25 | | | | 397,940 | |
| | 405,000 | | | Detroit Lakes Hsg. & Health Facs. Rev. Ref. (CDL Homes Proj.) | | 2.14 | | | 8/1/34 | | | | 405,304 | |
| | 1,500,000 | | | Detroit Lakes Hsg. Rev. Ref. (Mankato Lutheran Proj.) | | 2.39 | | | 8/1/34 | | | | 1,499,910 | |
| | 1,500,000 | | | Douglas Co. Gross Health Care Facs. Rev. (Douglas Co. Hospital Proj.) | | 6.00 | | | 7/1/28 | | | | 1,570,755 | |
| | 135,000 | | | Duluth Economic Dev. Auth. Health Care Fac. Rev. (St. Luke’s Hospital Proj.) | | 6.00 | | | 6/15/12 | | | | 139,248 | |
| | 928,415 | | | Duluth Hsg. & Redev. Auth. Sr. Hsg. (Lakeshore Proj.) | | 4.00 | | | 8/20/24 | | | | 895,428 | |
| | 758,237 | | | Duluth Sr. Hsg. Loan Participation (Lakeshore Proj.) | | 5.20 | | | 12/20/35 | | | | 715,374 | |
| | 660,000 | | | Elk River Rev. (Care Choice Member Proj.) | | 5.60 | | | 8/1/13 | | | | 660,640 | |
| | 115,000 | | | Elk River Rev. (Care Choice Member Proj.) | | 5.75 | | | 8/1/23 | | | | 107,226 | |
| | 1,925,000 | | | Glencoe Health Care Fac. Rev. (Glencoe Regional Health Services Proj.) | | 5.00 | | | 4/1/25 | | | | 1,931,526 | |
| | 120,000 | | | Hastings Health Care Fac. Rev. (Augustana Home of Hastings Proj.) | | 5.20 | | | 11/1/10 | | | | 119,960 | |
| | 125,000 | | | Hastings Health Care Fac. Rev. (Augustana Home of Hastings Proj.) | | 5.30 | | | 11/1/11 | | | | 125,010 | |
| | 135,000 | | | Hastings Health Care Fac. Rev. (Augustana Home of Hastings Proj.) | | 5.40 | | | 11/1/12 | | | | 135,070 | |
| | 140,000 | | | Hastings Health Care Fac. Rev. (Augustana Home of Hastings Proj.) | | 5.50 | | | 11/1/13 | | | | 140,080 | |
| | 970,000 | | | Hastings Health Care Fac. Rev. (Regina Medical Center) (ACA insured) | | 5.25 | | | 9/15/18 | | | | 970,349 | |
| | 705,000 | | | Hastings Health Care Fac. Rev. (Regina Medical Center) (ACA insured) | | 5.30 | | | 9/15/28 | | | | 677,364 | |
| | 275,000 | | | Inver Grove Heights Nursing Home Rev. Ref. (Presbyterian Homes Care) | | 5.00 | | | 10/1/11 | | | | 280,420 | |
| | 1,000,000 | | | Maple Grove Health Care Fac. Rev. (North Memorial Health Care Proj.) | | 5.00 | | | 9/1/20 | | | | 1,045,130 | |
| | 780,000 | | | Maple Grove Health Care Fac. Rev. (North Memorial Health Care Proj.) | | 5.00 | | | 9/1/29 | | | | 786,053 | |
| | 1,200,000 | | | Maple Grove Health Care System Rev. (Maple Grove Hospital Corp.) | | 5.25 | | | 5/1/25 | | | | 1,261,440 | |
| | 1,500,000 | | | Maple Grove Health Care System Rev. (Maple Grove Hospital Corp.) | | 5.25 | | | 5/1/28 | | | | 1,542,780 | |
| | 150,000 | | | Marshall Medical Center Gross Rev. (Weiner Memorial Medical Center) | | 4.85 | | | 11/1/11 | | | | 156,343 | |
| | 500,000 | | | Meeker Co. Hospital Facs. Gross Rev. (Memorial Hospital Proj.) | | 5.00 | | | 11/1/14 | | | | 517,325 | |
| | 1,000,000 | | | Meeker Co. Hospital Facs. Gross Rev. (Memorial Hospital Proj.) | | 5.63 | | | 11/1/22 | | | | 1,037,460 | |
| | 600,000 | | | Minneapolis & St. Paul Hsg. & Redev. Auth. Rev. (Health Partners) | | 5.88 | | | 12/1/29 | | | | 609,192 | |
| | 220,000 | | | Minneapolis Health Care Fac. Rev. (Augustana Chapel View Homes Proj.) | | 4.55 | | | 6/1/11 | | | | 222,079 | |
| | 240,000 | | | Minneapolis Health Care Fac. Rev. (Augustana Chapel View Homes Proj.) | | 4.80 | | | 6/1/13 | | | | 241,668 | |
| | 250,000 | | | Minneapolis Health Care Fac. Rev. (Augustana Chapel View Homes Proj.) | | 4.90 | | | 6/1/14 | | | | 251,562 | |
| | 255,000 | | | Minneapolis Health Care Fac. Rev. (Augustana Chapel View Homes Proj.) | | 5.00 | | | 6/1/15 | | | | 255,166 | |
| | 270,000 | | | Minneapolis Health Care Fac. Rev. (Augustana Chapel View Homes Proj.) | | 5.10 | | | 6/1/16 | | | | 264,241 | |
| | 285,000 | | | Minneapolis Health Care Fac. Rev. (Augustana Chapel View Homes Proj.) | | 5.25 | | | 6/1/17 | | | | 279,100 | |
| | 1,470,000 | | | Minneapolis Health Care Fac. Rev. (Jones-Harrison Residence Proj.) | | 5.40 | | | 10/1/25 | | | | 1,416,463 | |
| | 1,000,000 | | | Minneapolis Health Care System Rev. (Fairview Health Services Proj.) | | 6.00 | | | 11/15/18 | | | | 1,158,730 | |
| | 520,000 | | | Minneapolis Health Care System Rev. (Fairview Health Services Proj.) | | 6.38 | | | 11/15/23 | | | | 608,816 | |
| | 1,000,000 | | | Minneapolis Hsg. & Health Care Facs. Rev. Ref. (Providence Proj.) | | 5.50 | | | 10/1/14 | | | | 1,007,480 | |
See accompanying notes to financial statements.
SCHEDULE OF INVESTMENTS (Unaudited)
September 30, 2010
Sit Minnesota Tax-Free Income Fund (Continued)
| | | | | | | | | | | | | | |
Principal
Amount ($) | | | Name of Issuer | | Coupon
Rate (%) | | Maturity
Date | | | Fair Value ($) | |
| | | | |
| | 315,000 | | | Minneapolis Hsg. Fac. Rev. (Augustana Chapel View Homes Proj.) | | 5.20 | | | 1/1/11 | | | | 315,797 | |
| | 200,000 | | | Minneapolis Hsg. Fac. Rev. (Augustana Chapel View Homes Proj.) | | 5.50 | | | 6/1/27 | | | | 190,142 | |
| | 500,000 | | | Minneapolis Hsg. Fac. Rev. (Augustana Chapel View Homes Proj.) | | 5.75 | | | 1/1/19 | | | | 499,930 | |
| | 530,000 | | | Minneapolis Hsg. Fac. Rev. (Augustana Chapel View Homes Proj.) | | 5.80 | | | 1/1/24 | | | | 505,450 | |
| | 250,000 | | | Minneapolis Pooled Rev. (Care Choice Member Proj.) | | 5.75 | | | 4/1/19 | | | | 242,250 | |
| | 250,000 | | | MN Agricultural & Economic Dev. Board Rev. (Evangelical Lutheran Good Samaritan Society Proj.) | | 5.50 | | | 2/1/12 | | | | 261,060 | |
| | 405,000 | | | MN Agricultural & Economic Dev. Board Rev. (Evangelical Lutheran Good Samaritan Society Proj.) | | 6.55 | | | 8/1/16 | | | | 414,068 | |
| | 1,330,000 | | | MN Agricultural & Economic Dev. Board Rev. (Evangelical Lutheran Good Samaritan Society Proj.) | | 6.63 | | | 8/1/25 | | | | 1,358,502 | |
| | 10,000 | | | MN Agricultural & Economic Dev. Board Rev. (Fairview Health Care System Proj.) | | 6.38 | | | 11/15/22 | | | | 10,122 | |
| | 130,000 | | | MN Agricultural & Economic Dev. Board Rev. (Fairview Health Care System Proj.) | | 6.38 | | | 11/15/29 | | | | 131,490 | |
| | 110,000 | | | Moose Lake Community Hospital District Health Facs. Rev. Ref. | | 4.10 | | | 12/1/10 | | | | 109,673 | |
| | 150,000 | | | New Hope Health Care Facs. Rev. (MN Masonic Home North Ridge Proj.) | | 5.60 | | | 3/1/12 | | | | 150,502 | |
| | 920,000 | | | New Hope Health Care Facs. Rev. (MN Masonic Home North Ridge Proj.) | | 5.88 | | | 3/1/29 | | | | 884,166 | |
| | 1,175,000 | | | New Hope Health Care Facs. Rev. (MN Masonic Home North Ridge Proj.) | | 5.90 | | | 3/1/19 | | | | 1,166,493 | |
| | 900,000 | | | Northfield Hospital Rev. | | 5.50 | | | 11/1/15 | | | | 983,736 | |
| | 775,000 | | | Olmsted Co. Health Care Fac. Rev. (Olmsted Medical Center Proj.) | | 5.45 | | | 7/1/13 | | | | 775,845 | |
| | 900,000 | | | Olmsted Co. Health Care Fac. Rev. (Olmsted Medical Center Proj.) | | 5.55 | | | 7/1/19 | | | | 902,970 | |
| | 100,000 | | | Redwood Falls Hospital Fac. Gross Rev. (Redwood Area Hospital Proj.) | | 5.00 | | | 12/1/10 | | | | 100,119 | |
| | 1,000,000 | | | Redwood Falls Hospital Fac. Gross Rev. (Redwood Area Hospital Proj.) | | 5.00 | | | 12/1/21 | | | | 1,024,450 | |
| | 100,000 | | | Rochester Health Care Facs. Rev. (Mayo Clinic Proj.) | | 5.00 | | | 11/15/36 | | | | 104,221 | |
| | 500,000 | | | Rochester Health Care Facs. Rev. (Olmsted Medical Center Proj.) | | 5.13 | | | 7/1/20 | | | | 525,220 | |
| | 1,000,000 | | | Rochester Health Care Facs. Rev. (Olmsted Medical Center Proj.) | | 5.88 | | | 7/1/30 | | | | 1,028,680 | |
| | 1,020,000 | | | Sartell Health Care & Hsg. Facs. Rev. (Foundation for Healthcare Proj.) | | 6.63 | | | 9/1/29 | | | | 1,024,090 | |
| | 100,000 | | | Sauk Rapids Health Care & Hsg. Facs. Rev. (Good Shepherd Lutheran Home Proj.) | | 5.00 | | | 1/1/12 | | | | 101,682 | |
| | 115,000 | | | Sauk Rapids Health Care & Hsg. Facs. Rev. (Good Shepherd Lutheran Home Proj.) | | 5.00 | | | 1/1/13 | | | | 117,796 | |
| | 1,000,000 | | | Sauk Rapids Health Care & Hsg. Facs. Rev. (Good Shepherd Lutheran Home Proj.) | | 6.75 | | | 1/1/24 | | | | 1,051,130 | |
| | 1,000,000 | | | Sauk Rapids Health Care & Hsg. Facs. Rev. (Good Shepherd Lutheran Home Proj.) | | 7.25 | | | 1/1/29 | | | | 1,050,430 | |
| | 125,000 | | | Shakopee Health Care Facs. Rev. (St. Francis Regional Medical Center Proj.) | | 5.10 | | | 9/1/25 | | | | 125,289 | |
| | 3,475,000 | | | Shakopee Health Care Facs. Rev. (St. Francis Regional Medical Center Proj.) | | 5.25 | | | 9/1/34 | | | | 3,400,739 | |
| | 4,000,000 | | | St. Cloud Health Care Rev. (CentraCare Health System) | | 5.00 | | | 5/1/25 | | | | 4,137,640 | |
| | 1,000,000 | | | St. Louis Park Health Care Facs. Rev. (Park Nicollet Health Proj.) | | 5.50 | | | 7/1/23 | | | | 1,074,580 | |
| | 2,000,000 | | | St. Louis Park Health Care Facs. Rev. (Park Nicollet Health Proj.) | | 5.50 | | | 7/1/29 | | | | 2,087,320 | |
| | 200,000 | | | St. Paul Hsg. & Redev. Auth. Health Care Rev. (Gillette Childrens Hospital Proj.) | | 5.00 | | | 2/1/13 | | | | 206,052 | |
| | 210,000 | | | St. Paul Hsg. & Redev. Auth. Health Care Rev. (Gillette Childrens Hospital Proj.) | | 5.00 | | | 2/1/14 | | | | 217,955 | |
| | 160,000 | | | St. Paul Hsg. & Redev. Auth. Health Care Rev. (Gillette Childrens Hospital Proj.) | | 5.00 | | | 2/1/15 | | | | 166,181 | |
| | 200,000 | | | St. Paul Hsg. & Redev. Auth. Health Care Rev. (Model Cities Health Center) | | 6.50 | | | 11/1/11 | | | | 203,164 | |
| | 60,000 | | | St. Paul Hsg. & Redev. Auth. Health Care Rev. (Regions Hospital Proj.) | | 5.00 | | | 5/15/11 | | | | 60,149 | |
| | 1,365,000 | | | St. Paul Hsg. & Redev. Auth. Health Care Rev. (Regions Hospital Proj.) | | 5.20 | | | 5/15/13 | | | | 1,367,907 | |
| | 2,070,000 | | | St. Paul Hsg. & Redev. Auth. Health Care Rev. (Regions Hospital Proj.) | | 5.25 | | | 5/15/18 | | | | 2,072,049 | |
| | 1,924,035 | | | St. Paul Hsg. & Redev. Auth. Rev. (Nursing Home NTS-Episcopal) | | 5.63 | | | 10/1/33 | | | | 1,735,364 | |
| | 50,000 | | | St. Paul Hsg. & Redev. Auth. Rev. (Regions Hospital Proj.) | | 5.30 | | | 5/15/28 | | | | 50,005 | |
| | 1,210,000 | | | St. Paul Hsg. & Redev. Auth. Rev. Ref. (Franciscan Health Community) | | 7.00 | | | 7/1/21 | | | | 1,210,859 | |
| | 2,500,000 | | | Stillwater Health Care Rev. (Health System Obligation Proj.) | | 5.00 | | | 6/1/25 | | | | 2,555,350 | |
| | 750,000 | | | Stillwater Health Care Rev. (Health System Obligation Proj.) | | 5.00 | | | 6/1/35 | | | | 750,255 | |
| | 1,000,000 | | | Winsted Health Care Rev. (St. Mary’s Care Center Proj.) | | 6.00 | | | 9/1/25 | | | | 982,560 | |
| | | | | | | | | | | | | | |
| | | | | | | | | | | | | 69,605,510 | |
| | | | | | | | | | | | | | |
| Industrial/Pollution Control - 3.0% | | | | | | | | | | |
| 640,000 | | | Cohasset Pollution Control Rev. Ref. (Allete, Inc. Proj.) | | 4.95 | | | 7/1/22 | | | | 660,051 | |
| | 1,600,000 | | | Cohasset Pollution Control Rev. Ref. (Allete, Inc. Proj.) (Radian-IBCC Insured) | | 4.95 | | | 7/1/22 | | | | 1,650,128 | |
| | 500,000 | | | Otter Tail Co. Rev. Sub. (Otter Tail Proj.) 2, 5, 8 | | 7.50 | | | 11/1/19 | | | | 141,610 | |
| | 505,000 | | | Owatonna Industrial Dev. Rev. (Slidell, Inc. Proj.) 2, 8 | | 7.38 | | | 5/1/17 | | | | 252,500 | |
| | 895,000 | | | Puerto Rico Childrens Trust Fund Tobacco Settlement Rev. | | 5.38 | | | 5/15/33 | | | | 895,976 | |
See accompanying notes to financial statements.
| | |
28 | | SIT MUTUAL FUNDS SEMI-ANNUAL REPORT |
| | | | | | | | | | | | |
Principal
Amount ($) | | Name of Issuer | | Coupon Rate (%) | | Maturity
Date | | | Fair Value ($) | |
| | | | |
2,000,000 | | St. Paul Port Auth. Solid Waste Disposal Rev. (Ecullet Proj.) | | 6.25 | | | 11/1/15 | | | | 2,056,720 | |
750,000 | | Virgin Islands Tobacco Settlement Financing Corp. Asset-Backed Rev. | | 4.95 | | | 5/15/14 | | | | 756,030 | |
1,035,000 | | Virgin Islands Tobacco Settlement Financing Corp. Asset-Backed Rev. | | 5.00 | | | 5/15/21 | | | | 1,001,797 | |
1,870,000 | | White Earth Band of Chippewa Indians Rev. (ACA Insured) | | 7.00 | | | 12/1/11 | | | | 1,907,119 | |
| | | | | | | | | | | | |
| | | | | | | | | | | 9,321,931 | |
| | | | | | | | | | | | |
| | | |
Insured - 5.4% | | | | | | | | | | |
2,000,000 | | Guam Power Auth. Rev. (AGM Insured) | | 5.00 | | | 10/1/37 | | | | 2,050,660 | |
500,000 | | Minneapolis & St. Paul Hsg. & Redev. Rev. (Children’s Hospital) (AGM Insured) | | 5.00 | | | 8/15/34 | | | | 523,385 | |
100,000 | | Minneapolis & St. Paul Metro Airport Comm. Rev. Ref. (NATL-RE IBC FGIC Insured) | | 5.00 | | | 1/1/31 | | | | 103,080 | |
1,750,000 | | Minneapolis & St. Paul Metro Airport Commission Rev. (NATL-RE FGIC Insured) | | 5.00 | | | 1/1/25 | | | | 1,879,903 | |
1,000,000 | | Minneapolis & St. Paul Metro Airport Commission Rev. (NATL-RE FGIC Insured) 8 | | 5.75 | | | 1/1/14 | | | | 1,009,980 | |
2,010,000 | | Minneapolis & St. Paul Metro Airport Commission Rev. Ref. (NATL-RE FGIC Insured) | | 5.00 | | | 1/1/22 | | | | 2,128,892 | |
350,000 | | Plymouth Health Facs. Rev. (West Health Proj.) (AGM Insured) | | 6.13 | | | 6/1/24 | | | | 350,592 | |
600,000 | | Puerto Rico Electric Power Auth. Rev. Ref. (AGM Insured) 1 | | 0.88 | | | 7/1/29 | | | | 467,052 | |
1,000,000 | | Puerto Rico Govt. Dev. Bank Rev. Ref. (NATL-RE Commonwealth Guaranteed) | | 4.75 | | | 12/1/15 | | | | 1,041,320 | |
1,000,000 | | Puerto Rico Highway & Transportation Auth. Rev. (AGM Insured) | | 4.95 | | | 7/1/26 | | | | 1,076,450 | |
160,000 | | Puerto Rico Industrial, Tourist, Education, Medical & Envir. Control Facs. Rev. (NATL-RE Insured) | | 6.25 | | | 7/1/16 | | | | 160,669 | |
1,000,000 | | Puerto Rico Public Improvement G.O. (AGM Insured) | | 5.25 | | | 7/1/20 | | | | 1,133,320 | |
1,000,000 | | Puerto Rico Public Improvement G.O. (Assured Guaranty) 1 | | 3.26 | | | 7/1/20 | | | | 898,820 | |
1,000,000 | | St. Cloud Health Care Rev. (CentraCare Health System Proj.) (Assured Guaranty) | | 5.50 | | | 5/1/39 | | | | 1,065,910 | |
2,105,000 | | St. Paul Hsg. & Redev. Sales Tax Rev. Ref. (Civic Center) (AGM Insured) | | 7.10 | | | 11/1/23 | | | | 2,592,876 | |
| | | | | | | | | | | | |
| | | | | | | | | | | 16,482,909 | |
| | | | | | | | | | | | |
| | | |
Multifamily Mortgage - 18.6% | | | | | | | | | | |
1,520,000 | | Apple Valley Multifamily Hsg. Rev. Ref. (GNMA Collateralized) | | 5.25 | | | 8/1/18 | | | | 1,522,341 | |
605,000 | | Austin Hsg. & Redev. Auth. Governmental Hsg. Gross Rev. (Courtyard Residence Proj.) | | 7.15 | | | 1/1/20 | | | | 605,968 | |
500,000 | | Austin Hsg. & Redev. Auth. Governmental Hsg. Gross Rev. (Courtyard Residence Proj.) | | 7.25 | | | 1/1/32 | | | | 500,490 | |
2,635,000 | | Carver Co. Hsg. & Redev. Gross Rev. & Limited Tax Ref. (Lake Grace Apartments Proj.) | | 6.00 | | | 7/1/28 | | | | 2,635,501 | |
405,000 | | Chaska Multifamily Hsg. Rev. (West Suburban Hsg. Partners Proj.) 8 | | 5.38 | | | 9/1/14 | | | | 398,743 | |
500,000 | | Cloquet Hsg. Fac. Rev. Ref. (HADC Cloquet LLC Proj.) | | 5.50 | | | 8/1/25 | | | | 459,950 | |
100,000 | | Columbia Heights Multifamily & Health Care Fac. Rev. (Crest View Corp Proj.) | | 5.30 | | | 7/1/17 | | | | 92,760 | |
700,000 | | Coon Rapids Multifamily Hsg. Rev. Ref. (Margaret Place Apartments) | | 6.50 | | | 5/1/25 | | | | 700,308 | |
170,000 | | Coon Rapids Senior Hsg. Rev. Ref. (Epiphany Sr. Citizens Hsg. Corp. Proj.) | | 5.50 | | | 11/1/10 | | | | 169,963 | |
545,000 | | Coon Rapids Senior Hsg. Rev. Ref. (Epiphany Sr. Citizens Hsg. Corp. Proj.) | | 5.80 | | | 11/1/15 | | | | 545,191 | |
2,565,000 | | Cottage Grove Sr. Hsg. Rev. (PHS, Inc. Proj.) | | 5.00 | | | 12/1/31 | | | | 2,245,683 | |
136,000 | | Eden Prairie Multifamily Hsg. Rev. Ref. (Rolling Hills Proj.) | | 9.00 | | | 4/1/43 | | | | 136,118 | |
470,000 | | Eden Prairie Multifamily Hsg. Rev. Ref. (Rolling Hills Proj.) (GNMA Collateralized) | | 6.00 | | | 8/20/21 | | | | 501,086 | |
675,000 | | Eden Prairie Multifamily Hsg. Rev. Ref. (Rolling Hills Proj.) (GNMA Collateralized) | | 6.15 | | | 8/20/31 | | | | 716,695 | |
1,485,000 | | Eden Prairie Multifamily Hsg. Rev. Ref. (Rolling Hills Proj.) (GNMA Collateralized) | | 6.20 | | | 2/20/43 | | | | 1,575,377 | |
70,000 | | Eveleth Multifamily Hsg. Rev. Sr. (Manor House Woodland Proj.) | | 4.95 | | | 10/1/10 | | | | 70,001 | |
100,000 | | Eveleth Multifamily Hsg. Rev. Sr. (Manor House Woodland Proj.) | | 5.00 | | | 10/1/11 | | | | 101,971 | |
155,000 | | Eveleth Multifamily Hsg. Rev. Sr. (Manor House Woodland Proj.) | | 5.10 | | | 10/1/12 | | | | 156,548 | |
165,000 | | Eveleth Multifamily Hsg. Rev. Sr. (Manor House Woodland Proj.) | | 5.15 | | | 10/1/13 | | | | 167,736 | |
300,000 | | Fairmont Hsg. Fac. Rev. (Goldfinch Estates-GEAC Proj.) | | 5.75 | | | 10/1/17 | | | | 291,843 | |
290,000 | | Fairmont Hsg. Fac. Rev. (Goldfinch Estates-GEAC Proj.) | | 6.00 | | | 10/1/21 | | | | 283,394 | |
405,000 | | Fairmont Hsg. Fac. Rev. (Homestead-GEAC Proj.) | | 6.63 | | | 10/1/11 | | | | 411,476 | |
295,000 | | Fairmont Hsg. Fac. Rev. (Homestead-GEAC Proj.) | | 6.88 | | | 10/1/14 | | | | 300,859 | |
695,000 | | Golden Valley Rev. (Covenant Retirement Communities Proj.) | | 5.50 | | | 12/1/25 | | | | 684,554 | |
2,000,000 | | Golden Valley Rev. (Covenant Retirement Communities Proj.) | | 5.50 | | | 12/1/29 | | | | 1,917,560 | |
500,000 | | Grand Rapids Hsg. & Redev. Auth. (Lakeshore Place & Forest Park West Apartments Proj.) | | 5.20 | | | 10/1/19 | | | | 500,125 | |
1,660,000 | | Grand Rapids Hsg. & Redev. Auth. (Lakeshore Place & Forest Park West Apartments Proj.) | | 5.30 | | | 10/1/29 | | | | 1,619,247 | |
| | |
See accompanying notes to financial statements. | | |
SEPTEMBER 30, 2010 | | 29 |
SCHEDULE OF INVESTMENTS (Unaudited)
September 30, 2010
Sit Minnesota Tax-Free Income Fund (Continued)
| | | | | | | | | | | | |
Principal Amount ($) | | Name of Issuer | | Coupon
Rate (%) | | Maturity
Date | | | Fair Value ($) | |
| | | | |
245,000 | | Inver Grove Heights Nursing Home Rev. Ref. (Presbyterian Homes) | | 5.50 | | | 10/1/33 | | | | 230,697 | |
1,295,000 | | Lake Crystal Hsg. Rev. (Ecumen-Second Century Proj.) | | 5.63 | | | 9/1/28 | | | | 1,305,218 | |
1,400,000 | | Maplewood Multifamily Hsg. Rev. (Park Edge Apartments Proj.) 8 | | 6.50 | | | 5/1/29 | | | | 1,367,478 | |
2,765,000 | | Minneapolis & St. Paul Hsg. & Redev. Auth. Multifamily Hsg. Rev. (GNMA Collateralized) 8 | | 4.75 | | | 1/20/42 | | | | 2,711,774 | |
790,000 | | Minneapolis Multifamily Hsg. Rev. (Blaisdell Apartments Proj.) 8 | | 5.10 | | | 4/1/17 | | | | 759,316 | |
305,000 | | Minneapolis Multifamily Hsg. Rev. (Garr Scott Loft Proj.) (LOC U.S. Bank) 8 | | 5.95 | | | 5/1/30 | | | | 305,531 | |
3,025,000 | | Minneapolis Multifamily Hsg. Rev. (Nicollet Towers) (HUD Section 8) | | 6.00 | | | 12/1/19 | | | | 3,028,872 | |
1,200,000 | | Minneapolis Multifamily Hsg. Rev. (Riverside Plaza Proj.) (GNMA Collateralized FHA Insured) 8 | | 5.10 | | | 12/20/18 | | | | 1,201,200 | |
150,000 | | Minneapolis Multifamily Hsg. Rev. Ref. (Keeler Apartments Proj.) | | 4.50 | | | 10/1/12 | | | | 151,084 | |
580,000 | | Minneapolis Multifamily Hsg. Rev. Ref. (Keeler Apartments Proj.) | | 4.65 | | | 10/1/15 | | | | 580,255 | |
415,000 | | Minnetonka Multifamily Hsg. Rev. Ref. (Archer Heights Apartments Proj.) (GNMA Collateralized) 8 | | 5.10 | | | 7/20/13 | | | | 419,914 | |
975,000 | | Minnetonka Multifamily Hsg. Rev. Ref. (Archer Heights Apartments Proj.) (GNMA Collateralized) 8 | | 5.20 | | | 1/20/18 | | | | 984,740 | |
85,000 | | MN Hsg. Fin. Agy. Rental Hsg. (GO of AGY. Insured) 8 | | 4.88 | | | 8/1/24 | | | | 85,858 | |
125,000 | | MN Hsg. Fin. Agy. Rental Hsg. (GO of AGY. Insured) 8 | | 5.45 | | | 8/1/11 | | | | 125,325 | |
1,650,000 | | MN Hsg. Fin. Agy. Residential Hsg. Rev. 8 | | 5.10 | | | 8/1/47 | | | | 1,655,429 | |
1,350,000 | | MN Hsg. Fin. Agy. Residential Hsg. Rev. (GO of AGY. Insured) 8 | | 5.00 | | | 7/1/21 | | | | 1,396,170 | |
370,000 | | Moorhead Sr. Hsg. Rev. (Sheyenne Crossing Proj.) | | 5.00 | | | 4/1/13 | | | | 382,473 | |
170,000 | | Moorhead Sr. Hsg. Rev. (Sheyenne Crossing Proj.) | | 5.10 | | | 4/1/14 | | | | 173,096 | |
500,000 | | North Oaks Sr. Hsg. Rev. (Presbyterian Homes North Oaks Proj.) | | 5.25 | | | 10/1/13 | | | | 512,045 | |
1,565,000 | | North Oaks Sr. Hsg. Rev. (Presbyterian Homes North Oaks Proj.) | | 5.63 | | | 10/1/17 | | | | 1,637,240 | |
500,000 | | North Oaks Sr. Hsg. Rev. (Presbyterian Homes North Oaks Proj.) | | 5.75 | | | 10/1/22 | | | | 514,490 | |
120,000 | | Norwood Young America Economic Dev. Auth. Govt. Rev. (Harbor at Peace Village) | | 5.35 | | | 8/1/15 | | | | 121,752 | |
200,000 | | Norwood Young America Economic Dev. Auth. Govt. Rev. (Harbor at Peace Village) | | 5.63 | | | 8/1/20 | | | | 199,014 | |
550,000 | | Norwood Young America Economic Dev. Auth. Govt. Rev. (Harbor at Peace Village) | | 5.75 | | | 8/1/25 | | | | 537,092 | |
250,000 | | Norwood Young America Economic Dev. Auth. Govt. Rev. (Harbor at Peace Village) | | 6.00 | | | 8/1/31 | | | | 244,455 | |
750,000 | | Oak Park Heights Hsg. Rev. (Oakgreen Commons Proj.) | | 6.00 | | | 8/1/25 | | | | 751,028 | |
310,000 | | Oakdale Multifamily Sr. Hsg. Rev. Ref. (Oak Meadows Proj.) | | 5.00 | | | 4/1/12 | | | | 316,566 | |
370,000 | | Oronoco Multifamily Hsg. Rev. Ref. (Wedum Shorewood Campus Proj.) | | 4.70 | | | 6/1/11 | | | | 373,955 | |
125,000 | | Pine City Health Care & Hsg. Rev. (North Branch Sr. Living Proj.) (GNMA Collateralized) | | 4.50 | | | 10/20/16 | | | | 132,678 | |
500,000 | | Richfield Sr. Hsg. Rev. Ref. (Richfield Sr. Hsg., Inc. Proj.) | | 5.00 | | | 12/1/15 | | | | 499,065 | |
430,000 | | Rochester Health Care & Hsg. Rev. (Samaritan Bethany, Inc. Proj.) | | 5.25 | | | 12/1/17 | | | | 438,716 | |
455,000 | | Rochester Health Care & Hsg. Rev. (Samaritan Bethany, Inc. Proj.) | | 5.50 | | | 12/1/18 | | | | 465,169 | |
475,000 | | Rochester Health Care & Hsg. Rev. (Samaritan Bethany, Inc. Proj.) | | 5.75 | | | 12/1/19 | | | | 486,514 | |
2,800,000 | | Rochester Multifamily Rev. Ref. (Weatherstone Townhomes Apartments Proj.) 8 | | 6.38 | | | 9/1/37 | | | | 3,152,100 | |
1,195,000 | | St. Cloud Hsg. & Redev. Auth. Multifamily Rev. (Germain Towers Proj.) (HUD Section 8) | | 5.90 | | | 9/1/20 | | | | 1,086,124 | |
600,000 | | St. Cloud Hsg. & Redev. Auth. MultifamilyHsg. Rev. Ref. (Northway Manor Apts. Proj.) (HUD Sect. 8) | | 5.35 | | | 12/1/18 | | | | 545,388 | |
240,000 | | St. Paul Hsg. & Redev. Auth. Health Care Rev. (Carondelet Village Proj.) | | 5.13 | | | 2/1/22 | | | | 240,710 | |
275,000 | | St. Paul Hsg. & Redev. Auth. Health Care Rev. (Carondelet Village Proj.) | | 5.13 | | | 8/1/22 | | | | 277,236 | |
175,000 | | St. Paul Hsg. & Redev. Auth. Health Care Rev. (Carondelet Village Proj.) | | 5.38 | | | 2/1/24 | | | | 176,710 | |
150,000 | | St. Paul Hsg. & Redev. Auth. Health Care Rev. (Carondelet Village Proj.) | | 5.38 | | | 8/1/24 | | | | 151,380 | |
150,000 | | St. Paul Hsg. & Redev. Auth. Health Care Rev. (Carondelet Village Proj.) | | 5.50 | | | 2/1/25 | | | | 151,767 | |
3,000,000 | | St. Paul Hsg. & Redev. Auth. Health Care Rev. (Carondelet Village Proj.) | | 6.25 | | | 8/1/30 | | | | 3,129,960 | |
155,000 | | St. Paul Hsg. & Redev. Auth. Multifamily Ref. Rev. (Sun Cliffe Apts. Proj.) (GNMA Collat. FHA Insd.) | | 5.88 | | | 7/1/15 | | | | 155,431 | |
1,000,000 | | St. Paul Hsg. & Redev. Auth. Multifamily Ref. Rev. Ref. (Series Center Proj.) | | 5.20 | | | 11/1/22 | | | | 942,860 | |
450,000 | | St. Paul Hsg. & Redev. Auth. Rev. (Rossy & Richard Schaller Proj.) | | 4.80 | | | 10/1/18 | | | | 439,659 | |
400,000 | | St. Paul Hsg. & Redev. Auth. Rev. (Rossy & Richard Schaller Proj.) | | 5.15 | | | 10/1/42 | | | | 325,824 | |
600,000 | | Stillwater Multifamily Hsg. Rev. (Orleans Homes LP Proj.) 8 | | 5.00 | | | 2/1/17 | | | | 583,152 | |
120,000 | | Victoria Sr. Hsg. Rev. (Chanhassen, Inc. Proj.) | | 5.50 | | | 8/1/18 | | | | 117,674 | |
670,000 | | Washington Co. Hsg. & Redev. Auth. Govt. Hsg. Rev. Ref. (Briar Pond Apartments Proj.) (GNMA Collat.) | | 5.50 | | | 2/20/14 | | | | 670,730 | |
695,000 | | Washington Co. Hsg. & Redev. Auth. Govt. Hsg. Rev. Ref. (Woodland Park Apartments Proj.) (CNTY Gty.) | | 4.70 | | | 10/1/26 | | | | 704,410 | |
| | |
See accompanying notes to financial statements. |
30 | | SIT MUTUAL FUNDS SEMI-ANNUAL REPORT |
| | | | | | | | | | | | |
Principal
Amount ($) | | Name of Issuer | | Coupon
Rate (%) | | Maturity Date | | | Fair Value ($) | |
| | | | |
850,000 | | Willmar Hsg. & Redev. Auth. Multifamily Rev. (Copperleaf) | | 8.00 | | | 3/15/41 | | | | 867,561 | |
250,000 | | Woodbury Economic Dev. Auth. Sr. Hsg. Rev. (Summerhouse) | | 5.75 | | | 6/1/41 | | | | 236,910 | |
| | | | | | | | | | | | |
| | | | | | | | | | | 57,361,283 | |
| | | | | | | | | | | | |
Municipal Lease 9 - 2.7% | | | | | | | | | | |
200,000 | | Andover Economic Dev. Auth. Public Fac. Lease Rev. (Community Center Proj.) | | 5.13 | | | 2/1/24 | | | | 220,382 | |
300,000 | | Andover Economic Dev. Auth. Public Fac. Lease Rev. (Community Center Proj.) Prerefunded | | 5.13 | | | 2/1/24 | | | | 330,573 | |
500,000 | | Anoka Co. Hsg. & Redev. Rev. | | 5.63 | | | 5/1/22 | | | | 515,285 | �� |
500,000 | | Anoka Co. Hsg. & Redev. Rev. | | 6.63 | | | 5/1/30 | | | | 514,605 | |
500,000 | | Anoka Co. Hsg. & Redev. Rev. | | 6.88 | | | 5/1/40 | | | | 514,440 | |
1,710,168 | | Carver Scott Co. Lease Purchase Agreement | | 5.00 | | | 8/4/20 | | | | 1,570,191 | |
500,000 | | Guam Govt. Department of Education C.O.P. (John F. Kennedy High School) | | 5.50 | | | 12/1/15 | | | | 503,755 | |
55,000 | | Hennepin Co. Hsg. & Redev. Auth. Rev. | | 5.70 | | | 8/1/13 | | | | 55,179 | |
357,488 | | Intermediate School District 287 Lease Rev. | | 4.78 | | | 3/15/13 | | | | 360,920 | |
300,000 | | Virginia Hsg. & Redev. Auth. Health Care Fac. Lease Rev. | | 4.50 | | | 10/1/10 | | | | 300,018 | |
1,250,000 | | Virginia Hsg. & Redev. Auth. Health Care Fac. Lease Rev. | | 5.13 | | | 10/1/20 | | | | 1,291,425 | |
400,000 | | Virginia Hsg. & Redev. Auth. Health Care Fac. Lease Rev. | | 5.25 | | | 10/1/25 | | | | 406,232 | |
150,000 | | Virginia Hsg. & Redev. Auth. Health Care Fac. Lease Rev. | | 5.25 | | | 10/1/14 | | | | 161,788 | |
245,000 | | Virginia Hsg. & Redev. Auth. Health Care Fac. Lease Rev. | | 5.38 | | | 10/1/30 | | | | 247,188 | |
1,378,393 | | Winona School District 861 Lease Purchase | | 6.04 | | | 8/1/24 | | | | 1,379,220 | |
| | | | | | | | | | | | |
| | | | | | | | | | | 8,371,201 | |
| | | | | | | | | | | | |
Other Revenue Bonds - 9.2% | | | | | | | | | | |
263,000 | | Columbia Heights Economic Dev. Auth. Tax Increment Rev. (Huset Park Area Redev.) | | 5.00 | | | 2/15/17 | | | | 250,689 | |
510,000 | | Columbia Heights Economic Dev. Auth. Tax Increment Rev. (Huset Park Area Redev.) | | 5.20 | | | 2/15/22 | | | | 457,159 | |
900,000 | | Commissioner of Iron Range Resources & Rehabilitation Gross Rev. (Giant’s Ridge Recreation Area) | | 7.25 | | | 11/1/16 | | | | 918,594 | |
710,840 | | Crystal Governmental Fac. Rev. | | 5.10 | | | 12/15/26 | | | | 598,129 | |
400,000 | | Guam Govt. Section 30 Limited Obligation Rev. | | 5.38 | | | 12/1/24 | | | | 422,644 | |
1,000,000 | | Guam Govt. Section 30 Limited Obligation Rev. | | 5.50 | | | 12/1/19 | | | | 1,113,080 | |
145,000 | | Lakeville Liquor Rev. | | 5.00 | | | 2/1/11 | | | | 145,841 | |
190,000 | | Lakeville Liquor Rev. | | 5.00 | | | 2/1/17 | | | | 189,783 | |
210,000 | | Lakeville Liquor Rev. | | 5.00 | | | 2/1/22 | | | | 193,784 | |
230,000 | | McLeod Co. Commercial Dev. Rev. (Southwest MN Foundation) | | 5.13 | | | 12/1/31 | | | | 231,279 | |
405,000 | | Minneapolis Community Dev. Agy. Limited Tax Common Bond Fund (Discount Steel) 8 | | 5.25 | | | 6/1/19 | | | | 405,733 | |
40,000 | | Minneapolis Community Dev. Agy. Limited Tax Common Bond Fund (LOC U.S. Bank) | | 6.00 | | | 6/1/11 | | | | 40,318 | |
160,000 | | Minneapolis Community Dev. Agy. Limited Tax Common Bond Fund (LOC U.S. Bank) | | 6.00 | | | 12/1/20 | | | | 160,656 | |
475,000 | | Minneapolis Tax Increment Rev. (Grant Park Proj.) | | 5.00 | | | 2/1/16 | | | | 475,399 | |
80,000 | | Minneapolis Tax Increment Rev. Ref. (East River/Unocal Site Proj.) | | 4.80 | | | 2/1/12 | | | | 80,393 | |
245,000 | | Minneapolis Tax Increment Rev. Ref. (East River/Unocal Site Proj.) | | 5.10 | | | 2/1/17 | | | | 238,064 | |
240,000 | | Minneapolis Tax Increment Rev. Ref. (East River/Unocal Site Proj.) | | 5.20 | | | 2/1/21 | | | | 223,738 | |
450,000 | | Minneapolis Tax Increment Rev. Ref. (St. Anthony Falls Proj.) | | 4.50 | | | 2/1/13 | | | | 444,874 | |
100,000 | | Minneapolis Tax Increment Rev. Ref. (St. Anthony Falls Proj.) | | 4.60 | | | 2/1/11 | | | | 100,036 | |
125,000 | | Minneapolis Tax Increment Rev. Ref. (St. Anthony Falls Proj.) | | 4.70 | | | 2/1/12 | | | | 125,175 | |
125,000 | | Minneapolis Tax Increment Rev. Ref. (St. Anthony Falls Proj.) | | 4.80 | | | 2/1/13 | | | | 124,524 | |
1,190,000 | | Mound Hsg. & Redev. Auth. Tax Increment Rev. Ref. (Metroplain Proj.) | | 5.00 | | | 2/15/27 | | | | 1,151,170 | |
280,000 | | Puerto Rico Infrastucture Financing Auth. Special Tax Rev. Ref. (AMBAC Insured) 6 | | 8.40 | | | 7/1/28 | | | | 102,385 | |
500,000 | | St. Anthony Hsg. & Redev. Auth. Tax Increment Rev. (Silver Lake Village Hsg.) | | 4.75 | | | 2/1/17 | | | | 483,240 | |
500,000 | | St. Anthony Hsg. & Redev. Auth. Tax Increment Rev. (Silver Lake Village Hsg.) | | 4.90 | | | 2/1/22 | | | | 447,740 | |
500,000 | | St. Paul Hsg. & Redev. Auth. Rev. (Jimmy Lee Recreation Center Proj.) | | 4.75 | | | 12/1/26 | | | | 533,095 | |
500,000 | | St. Paul Hsg. & Redev. Auth. Rev. (Jimmy Lee Recreation Center Proj.) | | 5.00 | | | 12/1/32 | | | | 525,460 | |
1,195,000 | | St. Paul Hsg. & Redev. Auth. Tax Increment Rev. (9th St. Lofts Proj.) | | 6.38 | | | 2/15/28 | | | | 1,064,434 | |
1,093,000 | | St. Paul Hsg. & Redev. Auth. Tax Increment Rev. (Drake Marble Proj.) | | 6.75 | | | 3/1/28 | | | | 1,080,802 | |
| | |
| See accompanying notes to financial statements. | | |
SEPTEMBER 30, 2010 | | 31 |
SCHEDULE OF INVESTMENTS (Unaudited)
September 30, 2010
Sit Minnesota Tax-Free Income Fund(Continued)
| | | | | | | | | | | | |
Principal
Amount ($) | | Name of Issuer | | Coupon
Rate (%) | | Maturity
Date | | | Fair Value ($) | |
| | | | |
505,000 | | St. Paul Hsg. & Redev. Auth. Tax Increment Rev. (Emerald Gardens Proj.) | | 5.00 | | | 3/1/15 | | | | 514,070 | |
500,000 | | St. Paul Hsg. & Redev. Auth. Tax Increment Rev. (Emerald Gardens Proj.) | | 6.50 | | | 3/1/29 | | | | 516,305 | |
1,077,000 | | St. Paul Hsg. & Redev. Auth. Tax Increment Rev. (North Quadrant Owner Occupied Proj.) | | 7.00 | | | 2/15/28 | | | | 1,024,044 | |
958,000 | | St. Paul Hsg. & Redev. Auth. Tax Increment Rev. (North Quadrant Owner Occupied Proj.) | | 7.50 | | | 2/15/28 | | | | 954,197 | |
2,985,000 | | St. Paul Hsg. & Redev. Auth. Tax Increment Rev. (Upper Landing Proj.) | | 6.80 | | | 3/1/29 | | | | 2,986,373 | |
1,879,000 | | St. Paul Hsg. & Redev. Auth. Tax Increment Rev. (Upper Landing Proj.) | | 6.90 | | | 3/1/29 | | | | 1,883,190 | |
100,000 | | St. Paul Hsg. & Redev. Auth. Tax Increment Rev. (US Bank Operations Center Proj.) | | 5.70 | | | 8/1/12 | | | | 100,084 | |
775,000 | | St. Paul Hsg. & Redev. Auth. Tax Increment Rev. (US Bank Operations Center Proj.) | | 6.13 | | | 8/1/19 | | | | 771,009 | |
390,000 | | St. Paul Port Auth. Lease Rev. (Regions Hospital Parking Ramp Proj.) | | 5.00 | | | 8/1/11 | | | | 395,148 | |
805,000 | | St. Paul Port Auth. Lease Rev. (Regions Hospital Parking Ramp Proj.) | | 5.00 | | | 8/1/21 | | | | 828,321 | |
2,150,000 | | St. Paul Port Auth. Lease Rev. (Regions Hospital Parking Ramp Proj.) | | 5.00 | | | 8/1/36 | | | | 1,955,705 | |
715,000 | | St. Paul Recreational Facs. Gross Rev. (Highland National Proj.) | | 5.00 | | | 10/1/25 | | | | 772,686 | |
475,000 | | Steele Co. Health Care Fac. Gross Rev. Ref. Crossover | | 4.65 | | | 6/1/20 | | | | 485,255 | |
300,000 | | Steele Co. Health Care Fac. Gross Rev. Ref. Crossover | | 5.00 | | | 6/1/30 | | | | 301,878 | |
1,000,000 | | Virgin Islands Public Finance Auth. Rev. (Diago Proj.) | | 6.63 | | | 10/1/29 | | | | 1,142,670 | |
1,000,000 | | Virgin Islands Public Finance Auth. Rev. (Matching Fund Loan Note-Sr. Lien) | | 5.00 | | | 10/1/29 | | | | 1,022,920 | |
95,000 | | Virgin Islands Public Finance Auth. Rev. Gross Receipts Taxes Loan | | 5.63 | | | 10/1/10 | | | | 95,011 | |
125,000 | | Virgin Islands Public Finance Auth. Sr. Lien Rev. | | 5.25 | | | 10/1/21 | | | | 130,883 | |
| | | | | | | | | | | | |
| | | | | | | | | | | 28,207,967 | |
| | | | | | | | | | | | |
Public Facilities - 0.7% | | | | | | | | | | |
50,000 | | MN Agricultural Society State Fair Rev. | | 5.00 | | | 9/15/20 | | | | 51,171 | |
205,000 | | Rockville Economic Dev. Auth. Public Project Lease Rev. | | 4.00 | | | 2/1/14 | | | | 214,389 | |
135,000 | | Spring Grove Economic Dev. Auth. Public Proj. Rev. | | 4.63 | | | 2/1/12 | | | | 135,877 | |
255,000 | | Spring Grove Economic Dev. Auth. Public Proj. Rev. | | 5.00 | | | 2/1/16 | | | | 256,163 | |
125,000 | | Spring Grove Economic Dev. Auth. Public Proj. Rev. | | 5.10 | | | 2/1/18 | | | | 125,390 | |
1,075,000 | | St. Paul Hsg. & Redev. Auth. Parking Rev. (Smith Ave. Proj.) | | 5.00 | | | 8/1/35 | | | | 1,099,908 | |
205,000 | | Victoria Recreational Fac. Gross Rev. Ref. | | 4.55 | | | 8/1/17 | | | | 196,220 | |
| | | | | | | | | | | | |
| | | | | | | | | | | 2,079,118 | |
| | | | | | | | | | | | |
Sales Tax Revenue - 1.1% | | | | | | | | | | |
500,000 | | Puerto Rico Sales Tax Financing Corp. Rev. | | 6.00 | | | 8/1/39 | | | | 558,205 | |
1,250,000 | | Puerto Rico Sales Tax Financing Corp. Rev. 6 | | 6.13 | | | 8/1/29 | | | | 848,150 | |
1,500,000 | | Puerto Rico Sales Tax Financing Corp. Rev. 6 | | 6.25 | | | 8/1/33 | | | | 1,047,840 | |
1,000,000 | | Puerto Rico Sales Tax Financing Corp. Rev. 6 | | 6.75 | | | 8/1/32 | | | | 863,100 | |
| | | | | | | | | | | | |
| | | | | | | | | | | 3,317,295 | |
| | | | | | | | | | | | |
Single Family Mortgage - 12.8% | | | | | | | | | | |
1,495,086 | | Dakota Co. Community Dev. Agy. Single Family Mtg. Rev. (GNMA-FNMA-FHLMC) 8 | | 5.13 | | | 12/1/40 | | | | 1,576,389 | |
323,815 | | Dakota Co. Community Dev. Agy. Single Family Mtg. Rev. (GNMA-FNMA-FHLMC) 8 | | 5.15 | | | 12/1/38 | | | | 338,834 | |
2,011,677 | | Dakota Co. Community Dev. Agy. Single Family Mtg. Rev. (GNMA-FNMA-FHLMC) 8 | | 5.30 | | | 12/1/39 | | | | 2,137,507 | |
286,773 | | Minneapolis St. Paul Hsg. Fin. Board Single Family Mtg. Rev. (GNMA-FNMA) 8 | | 5.00 | | | 12/1/38 | | | | 290,825 | |
307,102 | | Minneapolis St. Paul Hsg. Fin. Board Single Family Mtg. Rev. (GNMA-FNMA) | | 5.70 | | | 4/1/27 | | | | 325,992 | |
778,751 | | Minneapolis St. Paul Hsg. Fin. Board Single Family Mtg. Rev. (GNMA-FNMA-FHLMC) | | 5.10 | | | 4/1/27 | | | | 830,990 | |
3,153,152 | | Minneapolis St. Paul Hsg. Fin. Board Single Family Mtg. Rev. (GNMA-FNMA-FHLMC) 8 | | 5.25 | | | 12/1/40 | | | | 3,343,003 | |
1,389,055 | | Minneapolis St. Paul Hsg. Fin. Board Single Family Mtg. Rev. (GNMA-FNMA-FHLMC) | | 5.45 | | | 4/1/27 | | | | 1,487,747 | |
735,000 | | Minneapolis St. Paul Hsg. Fin. Board Single Family Mtg. Rev. (GNMA-FNMA-FHLMC) 8 | | 5.52 | | | 3/1/41 | | | | 791,441 | |
6,180,000 | | MN Hsg. Fin. Agy. Residential Hsg. Rev. | | 5.10 | | | 1/1/40 | | | | 6,364,226 | |
270,000 | | MN Hsg. Fin. Agy. Single Family Mtg. Rev. 8 | | 4.30 | | | 7/1/11 | | | | 274,590 | |
1,725,000 | | MN Hsg. Fin. Agy. Single Family Mtg. Rev. | | 5.00 | | | 7/1/38 | | | | 1,794,328 | |
1,980,000 | | MN Hsg. Fin. Agy. Single Family Mtg. Rev. | | 5.05 | | | 7/1/34 | | | | 2,043,459 | |
495,000 | | MN Hsg. Fin. Agy. Single Family Mtg. Rev. 8 | | 5.10 | | | 7/1/20 | | | | 503,677 | |
330,000 | | MN Hsg. Fin. Agy. Single Family Mtg. Rev. | | 5.20 | | | 1/1/23 | | | | 355,242 | |
| | |
See accompanying notes to financial statements |
32 | | SIT MUTUAL FUNDS SEMI-ANNUAL REPORT |
| | | | | | | | | | | | | | |
| | | Principal Amount ($) | | Name of Issuer | | Coupon
Rate (%) | | Maturity
Date | | | Fair Value ($) | |
| | | | | |
| | 45,000 | | MN Hsg. Fin. Agy. Single Family Mtg. Rev. | | 5.30 | | | 7/1/11 | | | | 45,782 | |
| | 110,000 | | MN Hsg. Fin. Agy. Single Family Mtg. Rev. | | 5.45 | | | 1/1/17 | | | | 111,137 | |
| | 40,000 | | MN Hsg. Fin. Agy. Single Family Mtg. Rev. | | 5.70 | | | 1/1/17 | | | | 40,418 | |
| | 325,000 | | MN Hsg. Fin. Agy. Single Family Mtg. Rev. 8 | | 5.85 | | | 7/1/19 | | | | 340,372 | |
| | 1,365,000 | | MN Hsg. Fin. Agy. Single Family Mtg. Rev. | | 5.90 | | | 7/1/28 | | | | 1,457,492 | |
| | 1,800,000 | | MN Hsg. Fin. Agy. Single Family Mtg. Rev. 8 | | 6.00 | | | 7/1/22 | | | | 1,825,938 | |
| | 465,000 | | MN Hsg. Fin. Agy. Single Family Mtg. Rev. (GO of AGY. Insured) | | 4.30 | | | 1/1/18 | | | | 482,935 | |
| | 1,000,000 | | MN Hsg. Fin. Agy. Single Family Mtg. Rev. (GO of AGY. Insured) 8 | | 4.75 | | | 7/1/27 | | | | 1,007,440 | |
| | 1,950,000 | | MN Hsg. Fin. Agy. Single Family Mtg. Rev. (GO of AGY. Insured) 8 | | 4.80 | | | 7/1/26 | | | | 1,981,064 | |
| | 725,000 | | MN Hsg. Fin. Agy. Single Family Mtg. Rev. (GO of AGY. Insured) | | 5.00 | | | 1/1/20 | | | | 732,540 | |
| | 1,115,000 | | MN Hsg. Fin. Agy. Single Family Mtg. Rev. (GO of AGY. Insured) 8 | | 5.00 | | | 1/1/37 | | | | 1,165,688 | |
| | 1,935,000 | | MN Hsg. Fin. Agy. Single Family Mtg. Rev. (GO of AGY. Insured) 8 | | 5.15 | | | 7/1/28 | | | | 1,989,257 | |
| | 1,935,000 | | MN Hsg. Fin. Agy. Single Family Mtg. Rev. (GO of AGY. Insured) 8 | | 5.25 | | | 7/1/33 | | | | 1,980,086 | |
| | 1,355,000 | | MN Hsg. Fin. Agy. Single Family Mtg. Rev. (GO of AGY. Insured) 8 | | 5.50 | | | 7/1/28 | | | | 1,422,560 | |
| | 210,000 | | MN Hsg. Fin. Agy. Single Family Mtg. Rev. (GO of AGY. Insured) | | 5.60 | | | 7/1/13 | | | | 210,672 | |
| | 1,435,000 | | MN Hsg. Fin. Agy. Single Family Mtg. Rev. (GO of AGY. Insured) 8 | | 5.65 | | | 7/1/33 | | | | 1,505,272 | |
| | 180,000 | | MN Hsg. Fin. Agy. Single Family Mtg. Rev. (GO of AGY. Insured) | | 5.90 | | | 7/1/25 | | | | 180,239 | |
| | 15,000 | | MN Hsg. Fin. Agy. Single Family Mtg. Rev. (GO of AGY. Insured) 8 | | 5.90 | | | 7/1/29 | | | | 15,065 | |
| | 35,000 | | MN Hsg. Fin. Agy. Single Family Mtg. Rev. (GO of AGY. Insured) | | 6.00 | | | 1/1/16 | | | | 35,088 | |
| | 360,000 | | MN Hsg. Fin. Agy. Single Family Mtg. Rev. (NATL-RE Insured) | | 5.35 | | | 7/1/17 | | | | 375,275 | |
| | | | | | | | | | | | | | |
| | | | | | | | | | | | | 39,362,570 | |
| | | | | | | | | | | | | | |
| | | |
| | Transportation - 2.2% | | | | | | | | |
| | 20,000 | | Minneapolis & St. Paul Metro Airport Commission Rev. (NATL-RE FGIC Insured) 8 | | 5.75 | | | 1/1/16 | | | | 20,161 | |
| | 2,500,000 | | Minneapolis & St. Paul Metro Airport Commission Rev. Ref. 8 | | 5.00 | | | 1/1/22 | | | | 2,679,550 | |
| | 3,500,000 | | Minneapolis & St. Paul Metro Airport Commission Sub. Rev. (AMBAC Insured) 8 | | 5.00 | | | 1/1/25 | | | | 3,568,180 | |
| | 1,000,000 | | Puerto Rico Highways & Transportation Auth. Rev. Ref. (AMBAC Insured) 1 | | 0.89 | | | 7/1/45 | | | | 532,750 | |
| | | | | | | | | | | | | | |
| | | | | | | | | | | | | 6,800,641 | |
| | | | | | | | | | | | | | |
| | | |
| | Utility - 5.3% | | | | | | | | |
| | 1,000,000 | | Chaska Electric Rev. Ref. (Generating Facs. Proj.) | | 5.25 | | | 10/1/25 | | | | 1,065,500 | |
| | 1,465,000 | | MN Municipal Power Agy. Electric Rev. | | 5.00 | | | 10/1/35 | | | | 1,515,381 | |
| | 700,000 | | MN Municipal Power Agy. Electric Rev. | | 5.25 | | | 10/1/27 | | | | 764,141 | |
| | 2,000,000 | | MN Municipal Power Agy. Electric Rev. | | 5.25 | | | 10/1/24 | | | | 2,130,440 | |
| | 250,000 | | North Branch Electric System Rev. | | 5.00 | | | 8/1/22 | | | | 265,423 | |
| | 500,000 | | North Branch Electric System Rev. | | 5.75 | | | 8/1/28 | | | | 534,110 | |
| | 885,000 | | Puerto Rico Electric Power Auth. Rev. | | 5.00 | | | 7/1/21 | | | | 949,587 | |
| | 2,000,000 | | Puerto Rico Electric Power Auth. Rev. (NATL-RE FGIC Insured) | | 5.00 | | | 7/1/22 | | | | 2,097,140 | |
| | 1,250,000 | | Puerto Rico Electric Power Auth. Rev. Ref. 1 | | 1.04 | | | 7/1/25 | | | | 958,113 | |
| | 2,000,000 | | Southern MN Power Agy. Power Supply System Rev. | | 5.25 | | | 1/1/30 | | | | 2,171,200 | |
| | 3,350,000 | | Southern MN Power Agy. Power Supply System Rev. (NATL-RE Insured) 1 | | 2.79 | | | 1/1/13 | | | | 3,208,965 | |
| | 780,000 | | Virgin Islands Water & Power Auth. Water System Rev. Ref. | | 5.50 | | | 7/1/17 | | | | 781,490 | |
| | | | | | | | | | | | | | |
| | | | | | | | | | | | | 16,441,490 | |
| | | | | | | | | | | | | | |
| | Total Municipal Bonds
(cost: $287,178,838) | | | | | | | 291,936,106 | |
| | | | | | | | | | | | | | |
| | |
| See accompanying notes to financial statements. | | |
SEPTEMBER 30, 2010 | | 33 |
SCHEDULE OF INVESTMENTS (Unaudited)
September 30, 2010
Sit Minnesota Tax-Free Income Fund (Continued)
| | | | | | |
| Quantity | | Name of Issuer | | Fair Value ($) | |
Closed-End Mutual Funds - 0.8% | | | | |
| 43,192 | | First American Minnesota Municipal Income Fund II (MXN) | | | 665,157 | |
| 116,800 | | MN Municipal Income Portfolio (MXA) | | | 1,845,440 | |
| | | | | | |
| |
Total Closed-End Mutual Funds
(cost: $2,132,459) | | | 2,510,597 | |
| | | | | | |
| |
| Short-Term Securities - 3.1% | | | | |
| 9,381,492 | | Wells Fargo Minnesota Municipal Cash Fund, 0.01% | | | | |
Total Short-Term Securities
(cost: $9,381,492) | | | 9,381,492 | |
| | | | | | |
| |
Total Investments in Securities - 98.7%
(cost: $298,692,789) | | | 303,828,195 | |
| Other Assets and Liabilities, net - 1.3% | | | 3,991,909 | |
| | | | | | |
Total Net Assets - 100.0% | | $ | 307,820,104 | |
| | | | | | |
| 1 | Variable rate security. Rate disclosed is as of September 30, 2010. |
| 2 | Securities considered illiquid by the Investment Adviser. The total value of such securities as of September 30, 2010 was $394,110 and represented 0.1% of net assets. |
| 5 | The issuer is in default of certain debt covenants. Income is not being accrued. The total value of such securities as of September 30, 2010 was $141,610 and represented 0.0% of net assets. |
| 6 | Zero coupon security. Rate disclosed is the effective yield on purchase date. |
| 8 | Securities the income from which is treated as a tax preference that is included in alternative minimum taxable income for purposes of computing federal alternative minimum tax (AMT). At September 30, 2010, 14.9% of net assets in the Fund was invested in such securities. |
| 9 | Municipal Lease Security. The total value of such securities as of September 30, 2010 was $8,371,201 and represented 2.7% of net assets. These securities have been determined to be liquid by the Adviser in accordance with guidelines established by the Board of Directors. |
Numeric footnotes not disclosed are not applicable to this Schedule of Investments.
A summary of the inputs used to value the Fund’s net assets as of September 30, 2010 is as follows (see Note 2 - significant accounting policies in the notes to financial statements):
| | | | | | | | | | | | | | |
| | | Investment in Securities | |
| | | Level 1 Quoted Price | | | Level 2 Other significant
observable inputs | | | Level 3 Significant
unobservable inputs | | Total | |
Short-Term Securities | | | $9,381,492 | | | | — | | | — | | | $9,381,492 | |
Closed-End Mutual Funds | | | 2,510,597 | | | | — | | | — | | | 2,510,597 | |
Municipal Bonds | | | — | | | | $291,936,106 | | | — | | | 291,936,106 | |
Total: | | | $11,892,089 | | | | $291,936,106 | | | — | | | $303,828,195 | |
| | |
| See accompanying notes to financial statements. |
34 | | SIT MUTUAL FUNDS SEMI-ANNUAL REPORT |
[This page intentionally left blank.]
STATEMENTS OF ASSETS AND LIABILITIES (Unaudited)
September 30, 2010
| | | | | | | | | | | | |
| | | Sit U.S.
Government
Securities
Fund | | | Sit Tax-Free
Income
Fund | | | Sit Minnesota
Tax-Free
Income
Fund | |
ASSETS | | | | | | | | | | | | |
Investments in securities, at identified cost | | | $968,258,215 | | | | $185,127,309 | | | | $298,692,789 | |
| | | | | | | | | | | | |
| | | |
Investments in securities, at fair value - see accompanying schedule for detail | | | $993,268,649 | | | | $163,429,396 | | | | $303,828,195 | |
Cash in bank on demand deposit | | | — | | | | — | | | | 100,271 | |
Restricted cash | | | 1,200,000 | | | | — | | | | — | |
Accrued interest and dividends receivable | | | 5,129,090 | | | | 2,172,886 | | | | 4,185,077 | |
Receivable for investment securities sold | | | — | | | | 697,898 | | | | — | |
Receivable for principal paydowns | | | 59,032 | | | | — | | | | — | |
Other receivables | | | — | | | | 16,750 | | | | 28,198 | |
Receivable for Fund shares sold | | | 1,884,896 | | | | 71,350 | | | | 658,472 | |
| | | | | | | | | | | | |
| | | |
Total assets | | | 1,001,541,667 | | | | 166,388,280 | | | | 308,800,213 | |
| | | | | | | | | | | | |
| | | |
LIABILITIES | | | | | | | | | | | | |
Disbursements in excess of cash balances | | | 13,833,572 | | | | 421,202 | | | | — | |
Payable for investment securities purchased | | | 2,102,696 | | | | 1,452,535 | | | | — | |
Payable for Fund shares redeemed | | | 3,718,255 | | | | 107,258 | | | | 553,782 | |
Cash portion of dividends payable to shareholders | | | 71,596 | | | | 130,296 | | | | 225,131 | |
Other payables | | | 2,926 | | | | 12,112 | | | | — | |
Accrued investment management fees | | | 641,786 | | | | 106,498 | | | | 201,196 | |
Outstanding options written, at fair value (premiums received $261,869) | | | 325,000 | | | | — | | | | — | |
| | | | | | | | | | | | |
| | | |
Total liabilities | | | 20,695,831 | | | | 2,229,901 | | | | 980,109 | |
| | | | | | | | | | | | |
| | | |
Net assets applicable to outstanding capital stock | | | $980,845,836 | | | | $164,158,379 | | | | $307,820,104 | |
| | | | | | | | | | | | |
| | | |
Net assets consist of: | | | | | | | | | | | | |
Capital (par value and paid-in surplus) | | | $955,183,310 | | | | $210,024,121 | | | | $312,331,613 | |
Accumulated net realized gain (loss) from security transactions and written options | | | 715,223 | | | | (24,167,829) | | | | (9,646,915) | |
Unrealized appreciation (depreciation) on investments and written options. | | | 24,947,303 | | | | (21,697,913) | | | | 5,135,406 | |
| | | | | | | | | | | | |
| | | $980,845,836 | | | | $164,158,379 | | | | $307,820,104 | |
| | | | | | | | | | | | |
| | | |
Outstanding shares | | | 87,005,358 | | | | 17,943,828 | | | | 30,201,527 | |
| | | | | | | | | | | | |
| | | |
Net asset value per share of outstanding capital stock | | | $11.27 | | | | $9.15 | | | | $10.19 | |
| | | | | | | | | | | | |
See accompanying notes to financial statements.
| | |
36 | | SIT MUTUAL FUNDS SEMI-ANNUAL REPORT |
STATEMENTS OF OPERATIONS (Unaudited)
Six Months Ended September 30, 2010
| | | | | | | | | | | | |
| | | Sit U.S.
Government
Securities
Fund | | | Sit Tax-Free
Income
Fund | | | Sit Minnesota
Tax-Free
Income
Fund | |
| | | |
Investment income: | | | | | | | | | | | | |
Income: | | | | | | | | | | | | |
Dividends | | | — | | | | $342,815 | | | | $74,721 | |
Interest | | $ | 15,239,563 | | | | 3,826,944 | | | | 7,442,343 | |
| | | | | | | | | | | | |
Total income | | | 15,239,563 | | | | 4,169,759 | | | | 7,517,064 | |
| | | | | | | | | | | | |
| | | |
Expenses (note 4): | | | | | | | | | | | | |
Investment management fee | | | 3,599,558 | | | | 628,398 | | | | 1,190,021 | |
| | | | | | | | | | | | |
Total expenses | | | 3,599,558 | | | | 628,398 | | | | 1,190,021 | |
| | | | | | | | | | | | |
Less fees and expenses absorbed by investment adviser | | | (551,753 | ) | | | — | | | | — | |
| | | | | | | | | | | | |
Total net expenses | | | 3,047,805 | | | | — | | | | — | |
| | | | | | | | | | | | |
| | | |
Net investment income | | | 12,191,758 | | | | 3,541,361 | | | | 6,327,043 | |
| | | | | | | | | | | | |
| | | |
Realized and unrealized gain (loss): | | | | | | | | | | | | |
Net realized gain (loss) on investments | | | 3,792,251 | | | | (380,993 | ) | | | (133,759 | ) |
Net realized gain (loss) on written options | | | (1,534,597 | ) | | | — | | | | — | |
| | | |
Net change in unrealized appreciation (depreciation) on investments | | | 9,859,571 | | | | 4,709,365 | | | | 9,372,391 | |
Net change in unrealized appreciation (depreciation) on written options | | | (63,131 | ) | | | — | | | | — | |
| | | | | | | | | | | | |
| | | |
Net gain (loss) | | | 12,054,094 | | | | 4,328,372 | | | | 9,238,632 | |
| | | | | | | | | | | | |
| | | |
Net increase (decrease) in net assets resulting from operations | | $ | 24,245,852 | | | $ | 7,869,733 | | | $ | 15,565,675 | |
| | | | | | | | | | | | |
See accompanying notes to financial statements.
STATEMENTS OF CHANGES IN NET ASSETS
| | | | | | | | | | | | |
| | | Sit U.S. Government
Securities Fund | | | |
| | | Six Months
Ended
September 30, 2010
(Unaudited) | | Year
Ended
March 31,
2010 | | | |
Operations: | | | | | | | | | | | | |
Net investment income | | | $12,191,758 | | | | | | $20,847,075 | | | |
Net realized gain (loss) on investments and written options | | | 2,257,654 | | | | | | 1,211,894 | | | |
Net change in unrealized appreciation (depreciation) of investments and written options | | | 9,796,440 | | | | | | 11,215,967 | | | |
| | | | | | | | | | | | |
| | | | |
Net increase (decrease) in net assets resulting from operations | | | 24,245,852 | | | | | | 33,274,936 | | | |
| | | | | | | | | | | | |
| | | | |
Distributions from: | | | | | | | | | | | | |
Net investment income | | | (12,151,694) | | | | | | (20,847,075) | | | |
Net realized gains on investments | | | — | | | | | | — | | | |
| | | | | | | | | | | | |
| | | | |
Total distributions | | | (12,151,694) | | | | | | (20,847,075) | | | |
| | | | | | | | | | | | |
| | | | |
Capital share transactions: | | | | | | | | | | | | |
Proceeds from shares sold | | | 387,082,634 | | | | | | 639,424,752 | | | |
Reinvested distributions | | | 12,995,071 | | | | | | 20,634,489 | | | |
Payments for shares redeemed | | | (200,046,192) | | | | | | (294,396,778) | | | |
| | | | | | | | | | | | |
| | | | |
Increase (decrease) in net assets from capital transactions | | | 200,031,513 | | | | | | 365,662,463 | | | |
| | | | | | | | | | | | |
| | | | |
Total increase (decrease) in net assets | | | 212,125,671 | | | | | | 378,090,324 | | | |
| | | | |
Net assets: | | | | | | | | | | | | |
Beginning of period | | | 768,720,165 | | | | | | 390,629,841 | | | |
| | | | | | | | | | | | |
End of period | | | $980,845,836 | | | | | | $768,720,165 | | | |
| | | | | | | | | | | | |
| | | | |
Capital transactions in shares: | | | | | | | | | | | | |
Sold | | | 34,680,255 | | | | | | 57,843,581 | | | |
Reinvested distributions | | | 1,159,261 | | | | | | 1,873,419 | | | |
Redeemed | | | (17,913,654) | | | | | | (26,674,510) | | | |
| | | | | | | | | | | | |
| | | | |
Net increase (decrease) | | | 17,925,862 | | | | | | 33,042,490 | | | |
| | | | | | | | | | | | |
| | |
See accompanying notes to financial statements. |
38 | | SIT MUTUAL FUNDS SEMI-ANNUAL REPORT |
STATEMENTS OF CHANGES IN NET ASSETS (Continued)
| | | | | | | | | | | | | | | | | | | | |
Sit Tax-Free
Income Fund | | | Sit Minnesota Tax-Free
Income Fund | | | |
Six Months
Ended
September 30, 2010
(Unaudited) | | | Year
Ended
March 31,
2010 | | | Six Months
Ended
September 30, 2010
(Unaudited) | | | Year
Ended
March 31,
2010 | | |
| | | | | $3,541,361 | | | | $7,118,383 | | | | $6,327,043 | | | | $12,201,424 | | |
| | | | | (380,993 | ) | | | (3,457,582 | ) | | | (133,759 | ) | | | (162,527 | ) | |
| | | | | 4,709,365 | | | | 20,199,958 | | | | 9,372,391 | | | | 25,366,293 | | |
| | | | | | | | | | | | | | | | | | | |
| | | | | 7,869,733 | | | | 23,860,759 | | | | 15,565,675 | | | | 37,405,190 | | |
| | | | | | | | | | | | | | | | | | | |
| | | | | (3,541,361 | ) | | | (7,118,383 | ) | | | (6,327,043 | ) | | | (12,192,570 | ) | |
| | | | | — | | | | — | | | | — | | | | — | | |
| | | | | | | | | | | | | | | | | | | |
| | | | | (3,541,361 | ) | | | (7,118,383 | ) | | | (6,327,043 | ) | | | (12,192,570 | ) | |
| | | | | | | | | | | | | | | | | | | |
| | | | | 14,539,237 | | | | 26,169,711 | | | | 36,439,811 | | | | 61,824,061 | | |
| | | | | 3,221,826 | | | | 5,683,304 | | | | 5,835,199 | | | | 9,569,010 | | |
| | | | | (11,425,963 | ) | | | (33,880,998 | ) | | | (34,499,576 | ) | | | (49,923,087 | ) | |
| | | | | | | | | | | | | | | | | | | |
| | | | | 6,335,100 | | | | (2,027,983 | ) | | | 7,775,434 | | | | 21,469,984 | | |
| | | | | | | | | | | | | | | | | | | |
| | | | | 10,663,472 | | | | 14,714,393 | | | | 17,014,066 | | | | 46,682,604 | | |
| | | | | 153,494,907 | | | | 138,780,514 | | | | 290,806,038 | | | | 244,123,434 | | |
| | | | | | | | | | | | | | | | | | | |
| | | | | $164,158,379 | | | | $153,494,907 | | | | $307,820,104 | | | | $290,806,038 | | |
| | | | | | | | | | | | | | | | | | | |
| | | | | 1,604,635 | | | | 3,016,955 | | | | 3,632,500 | | | | 6,414,784 | | |
| | | | | 356,998 | | | | 667,682 | | | | 581,785 | | | | 1,004,735 | | |
| | | | | (1,266,111 | ) | | | (3,939,909 | ) | | | (3,447,671 | ) | | | (5,194,472 | ) | |
| | | | | | | | | | | | | | | | | | | |
| | | | | 695,522 | | | | (255,272) | | | | 766,614 | | | | 2,225,047 | | |
| | | | | | | | | | | | | | | | | | | |
| | |
See accompanying notes to financial statements. | | |
SEPTEMBER 30, 2010 | | 39 |
FINANCIAL HIGHLIGHTS
Per share income and capital changes for a share outstanding throughout the period.
Sit U.S. Government Securities Fund
| | | | | | | | | | | | | | | | | | | | | | | | |
| | |
| Six Months Ended
September 30, 2010 |
| | | Years Ended March 31, | |
| | | | (Unaudited) | | | | 2010 | | | | 2009 | | | | 2008 | | | | 2007 | | | | 2006 | |
Net Asset Value: | | | | | | | | | | | | | | | | | | | | | | | | |
Beginning of period | | | $11.13 | | | | $10.84 | | | | $10.92 | | | | $10.56 | | | | $10.45 | | | | $10.62 | |
Operations: | | | | | | | | | | | | | | | | | | | | | | | | |
Net investment income 1 | | | 0.15 | | | | 0.44 | | | | 0.52 | | | | 0.50 | | | | 0.48 | | | | 0.43 | |
Net realized and unrealized gains (losses) on investments and written options | | | 0.14 | | | | 0.29 | | | | (0.08 | ) | | | 0.36 | | | | 0.11 | | | | (0.17 | ) |
| | | | |
Total from operations | | | 0.29 | | | | 0.73 | | | | 0.44 | | | | 0.86 | | | | 0.59 | | | | 0.26 | |
| | | | |
Distributions from: | | | | | | | | | | | | | | | | | | | | | | | | |
Net investment income | | | (0.15 | ) | | | (0.44 | ) | | | (0.52 | ) | | | (0.50 | ) | | | (0.48 | ) | | | (0.43 | ) |
Net Asset Value: | | | | | | | | | | | | | | | | | | | | | | | | |
End of period | | | $11.27 | | | | $11.13 | | | | $10.84 | | | | $10.92 | | | | $10.56 | | | | $10.45 | |
| | | | |
Total investment return 2 | | | 2.62% | | | | 6.88% | | | | 4.18% | | | | 8.37% | | | | 5.81% | | | | 2.45% | |
| | | | |
Net assets at end of period (000’s omitted) | | | $980,846 | | | | $768,720 | | | | $390,630 | | | | $254,677 | | | | $198,378 | | | | $234,395 | |
| | | | | | |
Ratios: 3 | | | | | | | | | | | | | | | | | | | | | | | | |
Expenses (without waiver) 4 | | | 0.81% | | | | 0.82% | | | | 0.83% | | | | 0.85% | | | | 0.85% | | | | 0.84% | |
Expenses (with waiver) 4 | | | 0.69% | | | | 0.80% | | | | 0.80% | | | | 0.80% | | | | 0.80% | | | | 0.80% | |
Net investment income (with waiver) | | | 2.75% | | | | 3.85% | | | | 4.87% | | | | 4.66% | | | | 4.61% | | | | 4.03% | |
| | | | | | |
Portfolio turnover rate (excluding short-term securities) | | | 27.13% | 5 | | | 66.89% | | | | 59.63% | | | | 67.42% | | | | 43.98% | | | | 60.37% | |
| 1 | The net investment income per share is based on average shares outstanding for the period. |
| 2 | Total investment return is based on the change in net asset value of a share during the period (not annualized) and assumes reinvestment of distributions at net asset value. |
| 3 | The ratio information is calculated based on average daily net assets (annualized). Total Fund expenses are limited to 1.00% of average daily net assets for the first $50 million in Fund net assets and 0.80% of average daily net assets for Fund net assets exceeding $50 million. However, during the periods above, the investment adviser voluntarily absorbed expenses that were otherwise payable by the Fund. |
| 4 | In addition to fees and expenses which the Fund bears directly, the Fund indirectly bears a pro rata share of the fees and expenses of the acquired funds in which it invests. Such indirect expenses are not included in the above reported expense ratios. |
| | |
40 | | SIT MUTUAL FUNDS SEMI-ANNUAL REPORT |
FINANCIAL HIGHLIGHTS
Per share income and capital changes for a share outstanding throughout the period.
Sit Tax-Free Income Fund
| | | | | | | | | | | | | | | | | | | | | | | | |
| | | Six Months Ended
September 30, 2010 (Unaudited) | | | | | | Years Ended March 31, | | | | |
| | | | 2010 | | | 2009 | | | 2008 | | | 2007 | | | 2006 | |
| | |
Net Asset Value: | | | | | | | | | | | | | | | | | | | | | | | | |
Beginning of period | | | $8.90 | | | | $7.93 | | | | $9.16 | | | | $9.72 | | | | $9.72 | | | | $9.77 | |
Operations: | | | | | | | | | | | | | | | | | | | | | | | | |
Net investment income 1 | | | 0.20 | | | | 0.41 | | | | 0.41 | | | | 0.40 | | | | 0.38 | | | | 0.37 | |
Net realized and unrealized gains (losses) on investments | | | 0.25 | | | | 0.97 | | | | (1.23 | ) | | | (0.56 | ) | | | — | | | | (0.05 | ) |
Total from operations | | | 0.45 | | | | 1.38 | | | | (0.82 | ) | | | (0.16 | ) | | | 0.38 | | | | 0.32 | |
Distributions from: | | | | | | | | | | | | | | | | | | | | | | | | |
Net investment income | | | (0.20 | ) | | | (0.41 | ) | | | (0.41 | ) | | | (0.40 | ) | | | (0.38 | ) | | | (0.37 | ) |
Net Asset Value: | | | | | | | | | | | | | | | | | | | | | | | | |
End of period | | | $9.15 | | | | $8.90 | | | | $7.93 | | | | $9.16 | | | | $9.72 | | | | $9.72 | |
Total investment return 2 | | | 5.15% | | | | 17.71% | | | | (9.14% | ) | | | (1.72% | ) | | | 4.00% | | | | 3.35% | |
Net assets at end of period (000’s omitted) | | | $164,158 | | | | $153,495 | | | | $138,781 | | | | $322,590 | | | | $377,549 | | | | $366,948 | |
Ratios: 3 | | | | | | | | | | | | | | | | | | | | | | | | |
Expenses (without waiver) 4 | | | 0.80% | | | | 0.80% | | | | 0.80% | | | | 0.80% | | | | 0.80% | | | | 0.80% | |
Expenses (with waiver) 4 | | | 0.80% | | | | 0.80% | | | | 0.79% | | | | 0.77% | | | | 0.77% | | | | 0.77% | |
Net investment income (with waiver) | | | 4.51% | | | | 4.79% | | | | 4.63% | | | | 4.18% | | | | 3.93% | | | | 3.81% | |
Portfolio turnover rate (excluding short-term securities) | | | 11.82% | 5 | | | 27.30% | | | | 18.51% | | | | 42.93% | | | | 50.67% | | | | 32.93% | |
| 1 | The net investment income per share is based on average shares outstanding for the period. |
| 2 | Total investment return is based on the change in net asset value of a share during the period (not annualized) and assumes reinvestment of distributions at net asset value. |
| 3 | The ratio information is calculated based on average daily net assets (annualized). Total Fund expenses are limited to 0.80% of average daily net assets. However, during the periods above, the investment adviser voluntarily absorbed expenses that were otherwise payable by the Fund. |
| 4 | In addition to fees and expenses which the Fund bears directly, the Fund indirectly bears a pro rata share of the fees and expenses of the acquired funds in which it invests. Such indirect expenses are not included in the above reported expense ratios. |
FINANCIAL HIGHLIGHTS
Per share income and capital changes for a share outstanding throughout the period.
Sit Minnesota Tax-Free Income Fund
| | | | | | | | | | | | | | | | | | | | | | | | |
| | | Six Months Ended
September 30, 2010 | | | Years Ended March 31, | |
| | | | (Unaudited) | | | | 2010 | | | | 2009 | | | | 2008 | | | | 2007 | | | | 2006 | |
Net Asset Value: | | | | | | | | | | | | | | | | | | | | | | | | |
Beginning of period | | | $9.88 | | | | $8.97 | | | | $9.76 | | | | $10.21 | | | | $10.12 | | | | $10.09 | |
Operations: | | | | | | | | | | | | | | | | | | | | | | | | |
Net investment income 1 | | | 0.21 | | | | 0.43 | | | | 0.43 | | | | 0.43 | | | | 0.42 | | | | 0.41 | |
Net realized and unrealized gains (losses) on investments | | | 0.31 | | | | 0.91 | | | | (0.79 | ) | | | (0.45 | ) | | | 0.09 | | | | 0.03 | |
Total from operations | | | 0.52 | | | | 1.34 | | | | (0.36 | ) | | | (0.02 | ) | | | 0.51 | | | | 0.44 | |
Distributions from: | | | | | | | | | | | | | | | | | | | | | | | | |
Net investment income | | | (0.21 | ) | | | (0.43 | ) | | | (0.43 | ) | | | (0.43 | ) | | | (0.42 | ) | | | (0.41 | ) |
Net Asset Value: | | | | | | | | | | | | | | | | | | | | | | | | |
End of period | | | $10.19 | | | | $9.88 | | | | $8.97 | | | | $9.76 | | | | $10.21 | | | | $10.12 | |
Total investment return 2 | | | 5.35% | | | | 15.22% | | | | (3.67% | ) | | | (0.25% | ) | | | 5.17% | | | | 4.46% | |
Net assets at end of period (000’s omitted) | | | $307,820 | | | | $290,806 | | | | $244,123 | | | | $307,738 | | | | $288,922 | | | | $263,312 | |
| | | | | | |
Ratios: 3 | | | | | | | | | | | | | | | | | | | | | | | | |
Expenses 4 | | | 0.80% | | | | 0.80% | | | | 0.80% | | | | 0.80% | | | | 0.80% | | | | 0.80% | |
Net investment income | | | 4.25% | | | | 4.52% | | | | 4.65% | | | | 4.25% | | | | 4.17% | | | | 4.07% | |
| | | | | | |
Portfolio turnover rate (excluding short-term securities) | | | 5.56% | 5 | | | 11.46% | | | | 15.68% | | | | 37.48% | | | | 28.42% | | | | 54.91% | |
| 1 | The net investment income per share is based on average shares outstanding for the period. |
| 2 | Total investment return is based on the change in net asset value of a share during the period (not annualized) and assumes reinvestment of distributions at net asset value. |
| 3 | The ratio information is calculated based on average daily net assets. |
| 4 | In addition to fees and expenses which the Fund bears directly, the Fund indirectly bears a pro rata share of the fees and expenses of the acquired funds in which it invests. Such indirect expenses are not included in the above reported expense ratios. |
| | |
42 | | SIT MUTUAL FUNDS SEMI-ANNUAL REPORT |
[This page intentionally left blank.]
NOTES TO FINANCIAL STATEMENTS (Unaudited)
Six Months Ended September 30, 2010
The Sit Mutual Funds (the Funds) are no-load funds, and are registered under the Investment Company Act of 1940 (as amended) as diversified (except Minnesota Tax-Free Income Fund which is non-diversified), open-end management investment companies, or series thereof. The Sit Minnesota Tax-Free Income Fund and the Sit Tax-Free Income Fund are series funds of Sit Mutual Funds II, Inc. Each fund has 10 billion authorized shares of capital stock. Shares in the U.S. Government Securities Fund have a par value of $0.01, and shares in other funds have a par value of $0.001. This report covers three of the bond funds of the Sit Mutual Funds.
The investment objective for each of these Funds is as follows:
| | |
| Fund | | Investment Objective |
U.S. Government Securities | | High level of current income and safety of principal. |
Tax-Free Income | | High level of current income that is exempt from federal income tax, consistent with the preservation of capital. |
Minnesota Tax-Free Income | | High level of current income that is exempt from federal regular income tax and Minnesota regular personal income tax, consistent with the preservation of capital. |
| (2) | Significant Accounting Policies |
Investments in Securities
Investments in securities traded on national or international securities exchanges are valued at the last reported sales price prior to the time when assets are valued. Securities traded on the over-the-counter market are valued at the last reported sales price or if the last sales price is not available at the last reported bid price. The sale and bid prices or prices deemed best to reflect fair value quoted by dealers who make markets in these securities are obtained from independent pricing services. The pricing service may use models that price securities based on current yields and relative security characteristics, such as coupon rate, maturity date, issuer credit quality, and prepayment speeds as applicable. When market quotations are not readily available, or when the Adviser becomes aware that a significant event impacting the value of a security or group of securities has occurred after the closing of the exchange on which the security or securities principally trade, but before the calculation of the daily net asset value, securities are valued at fair value as determined in good faith using procedures established by the Board of Directors. Debt securities of sufficient credit quality maturing in less than 60 days when acquired, or which subsequently are within 60 days of maturity, are valued at amortized cost.
Security transactions are accounted for on the date the securities are purchased or sold. Gains and losses are calculated on the identified cost basis. Interest, including level-yield amortization of long-term bond premium and discount, is recorded on the accrual basis. Dividends received from closed-end fund holdings are included in Dividend Income and distributions from capital gains, if any, are included in Net Realized Gain (Loss).
Delivery and payment for securities which have been purchased by the Funds on a forward commitment or when-issued basis can take place two weeks or more after the transaction date. During this period, such securities are subject to market fluctuations and may increase or decrease in value prior to delivery.
The Minnesota Tax-Free Income Fund concentrates its investments in Minnesota, and therefore may have more credit risk related to the economic conditions in the state of Minnesota than a portfolio with broader geographical diversification.
Derivative Instruments
The Funds have adopted derivative instrument disclosure standards in order to enable investors to understand how and why the Funds use derivatives, how derivatives are accounted for, and how derivative instruments affect the Funds’ financial statements.
To hedge interest rate risk, the U.S. Government Securities Fund purchased put option and wrote call option contracts traded on a U.S. exchange. Risks of purchasing and writing options include the possibility of an illiquid market and that a change in the value of the option may not correlate with changes in the value of the underlying securities.
| | |
44 | | SIT MUTUAL FUNDS SEMI-ANNUAL REPORT |
NOTES TO FINANCIAL STATEMENTS (Unaudited)
Six Months Ended September 30, 2010 (Continued)
The premiums paid for the options represent the cost of the investment and the options are valued daily at their closing price. The Funds recognize a realized gain or loss when the option is sold or expired. Option holdings within the Funds, which may include put options and call options, are subject to loss of value with the passage of time, and may experience a total loss of value upon expiration. With options, there is minimal counterparty risk to the Funds since they are exchange traded. During the six months ended September 30, 2010, the average cost for purchased options and premium received in the U.S. Government Securities Fund for written options were $77,562 and $272,173, respectively.
Balance Sheet – Values of derivatives as of September 30, 2010
U.S. Government Securities Fund
| | | | | | | | |
| | Asset Derivatives | | Liability Derivatives |
| | |
| | Balance Sheet
Location | | Value | | Balance Sheet
Location | | Value |
| | |
Interest rate risk: | | | | | | | | |
Written call options | | — | | — | | Outstanding options
written, at value | | $325,000 |
The effect of derivative instruments on the statement of operations for the period ended September 30, 2010:
U.S. Government Securities Fund
| | | | |
| | Amount of Realized
Gain (Loss) on Derivatives 1 | | Change in Unrealized
Appreciation (Depreciation) on Derivatives 2 |
| | |
Interest rate risk: | | | | |
Purchased put options | | ($135,827) | | $163,624 |
Written call options | | (1,534,597) | | (63,131) |
1Statement of Operations location: Net realized gain (loss) on investments and net realized gain (loss) on written options.
2Statement of Operations location: Net change in unrealized appreciation (depreciation) on investments and net change in unrealized appreciation (depreciation) on written options.
Transactions in written options for the six months ended September 30, 2010 were as follows:
| | | | | | |
| | Number of
Contracts | | | Premium | |
Outstanding, March 31, 2010 | | — | | | — | |
Call options written | | 3,700 | | | $1,112,231 | |
Call options expired | | (1,000) | | | (78,101) | |
Call options closed | | (1,650) | | | (772,261) | |
Outstanding, September 30, 2010 | | 1,050 | | | $261,869 | |
Fair Value Measurements
The inputs and valuations techniques used to measure fair value of the Funds’ net assets are summarized into three levels as described in the hierarchy below:
| | • | | Level 1 – quoted prices for active markets for identical securities. An active market for the security is a market in which transactions occur with sufficient frequency and volume to provide pricing information on an ongoing basis. A quoted price in an active market provides the most reliable evidence of fair value. |
| | • | | Level 2 – other significant observable inputs including quoted prices for similar securities, interest rates, prepayment speeds, credit risk, etc. or quoted prices for identical or similar assets in markets that are not active. These are primarily inputs that are derived principally from or corroborated by observable market data. An adjustment to any observable input that is significant to the fair value may render the measurement a Level 3 measurement. |
NOTES TO FINANCIAL STATEMENTS (Unaudited)
Six Months Ended September 30, 2010 (Continued)
| | • | | Level 3 – significant unobservable inputs, including the Funds’ own assumptions in determining the fair value of investments. The inputs or methodology used for valuing securities are not necessarily an indication of the risk associated with investing in those securities. |
A summary of the levels for the Funds’ investments as of September 30, 2010 is included with the Funds’ schedule of investments.
New Accounting Pronouncements
In January 2010, the Financial Accounting Standards Board (“FASB”) issued Accounting Standards Update (“ASU”) No. 2010-06 “Improving Disclosures about Fair Value Measurements”. ASU 2010-06 amends FASB Accounting Standards Codification Topic 820, Fair Value Measurements and Disclosures, to require additional disclosures regarding fair value measurements. Certain disclosures required by ASU No. 2010-06 are currently effective for interim and annual reporting periods beginning after December 15, 2009, and other required disclosures are effective for fiscal years beginning after December 15, 2010, and for interim periods within those fiscal years. Management has evaluated the impact and has incorporated the appropriate disclosures required by ASU No. 2010-06 in the Funds’ financial statement disclosures.
Federal Taxes
The Funds’ policy is to comply with the requirements of the Internal Revenue Code applicable to regulated investment companies and to distribute all of its taxable income to shareholders. The Funds have recorded in their financial statements the full benefit of their tax positions taken in connection with the RIC qualification and distribution requirements of the RIC. Therefore, no income tax provision is required. Also, in order to avoid the payment of any federal excise taxes, the Funds will distribute substantially all of their net investment income and net realized gains on a calendar year basis.
Management has analyzed the Funds’ tax positions taken in federal tax returns for all open tax years and has concluded that as of March 31, 2010, no provision for income tax would be required in the Funds’ financial statements. The Funds’ federal and state income and federal excise returns for the 2007, 2008, 2009, and 2010 tax years for which the applicable statutes of limitations have not expired remain subject to examination by the Internal Revenue Service and state departments of revenue.
At September 30, 2010, the gross unrealized appreciation (depreciation) on investments and cost of securities on a tax basis for federal income tax purposes were as follows:
| | | | | | | | | | | | | | |
| | | Unrealized Appreciation | | | Unrealized Depreciation | | | Net Unrealized Appreciation (Depreciation) | | Cost of Securities on a Tax Basis | |
U.S. Government Securities | | | $27,935,981 | | | | ($2,925,547) | | | $25,010,434 | | | $968,258,215 | |
Tax-Free Income | | | 4,199,531 | | | | (25,897,444) | | | (21,697,913) | | | 185,127,309 | |
Minnesota Tax-Free Income | | | 9,482,342 | | | | (4,346,936) | | | 5,135,406 | | | 298,692,789 | |
Net investment income and net realized gains may differ for financial statement and tax purposes. The character of distributions made during the year for net investment income or net realized gains may also differ from its ultimate characterization for tax purposes. The tax character of distributions paid during the fiscal years ended March 31, 2010 and 2009 were as follows:
| | | | | | | | | | | | |
| Year Ended March 31, 2010: | | | | | | | | | |
| | | |
| | | Ordinary Income | | | Long Term Capital Gain | | | Total | |
U.S. Government Securities | | | $20,847,075 | | | | — | | | | $20,847,075 | |
Tax-Free Income* | | | 7,118,383 | | | | — | | | | 7,118,383 | |
Minnesota Tax-Free Income* | | | 12,192,570 | | | | — | | | | 12,192,570 | |
* 100% of dividends were derived from interest on tax-exempt securities. | |
| | |
46 | | SIT MUTUAL FUNDS SEMI-ANNUAL REPORT |
NOTES TO FINANCIAL STATEMENTS (Unaudited)
Six Months Ended September 30, 2010 (Continued)
| | | | | | | | | | | | |
| Year Ended March 31, 2009: | | | | | | | | | |
| | | |
| | | Ordinary Income | | | Long Term Capital Gain | | | Total | |
U.S. Government Securities | | | $15,877,972 | | | | — | | | $ | 15,877,972 | |
Tax-Free Income* | | | 11,001,617 | | | | — | | | | 11,001,617 | |
Minnesota Tax-Free Income* | | | 12,675,801 | | | | — | | | | 12,675,801 | |
* 100% of dividends were derived from interest on tax-exempt securities. | |
As of March 31, 2010, the components of distributable earnings on a tax basis were as follows:
| | | | | | | | | | | | |
| | | Undistributed Ordinary Income | | | Accumulated Gain (Loss) | | | Unrealized Appreciation (Depreciation) | |
U.S. Government Securities | | | $1,215,104 | | | | ($1,706,055) | | | | $15,314,487 | |
Tax-Free Income | | | 601,919 | | | | (23,786,836) | | | | (26,407,278) | |
Minnesota Tax-Free Income | | | 1,135,304 | | | | (9,513,156) | | | | (4,236,985) | |
Net capital loss carryovers and post-October capital losses, if any, as of March 31, 2010, are available to offset future realized capital gains and thereby reduce future capital gains distributions. The net capital loss carryovers and the post-October capital losses deferred as of March 31, 2010, were as follows:
| | | | | | | | | | | | | | | | | | | | | | | | |
| | | Capital Loss Carryover Expiring in: | | | Net Capital | | | Post-October Capital Loss | | | Accumulated Capital and | |
| | | 2011 | | | 2012 | | | 2013-2018 | | | Loss Carryover | | | Deferral | | | Other Losses | |
U.S. Government Securities | | | — | | | | $40,001 | | | | $1,666,054 | | | | $1,706,055 | | | | — | | | | $1,706,055 | |
Tax-Free Income | | | — | | | | 1,461,177 | | | | 20,449,647 | | | | 21,910,824 | | | | $1,876,012 | | | | 23,786,836 | |
Minnesota Tax-Free Income | | $ | 1,127,877 | | | | 403,028 | | | | 7,904,692 | | | | 9,435,597 | | | | 77,559 | | | | 9,513,156 | |
Distributions
Distributions to shareholders are recorded as of the close of business on the record date. Such distributions are payable in cash or reinvested in additional shares of the Funds’ capital stock. Distributions from net investment income are declared daily and paid monthly for the Funds. Distributions from net realized gains, if any, will be made annually for each of the Funds.
Use of Estimates
The preparation of financial statements in conformity with U.S. generally accepted accounting principles requires management to make certain estimates and assumptions that affect the reported amounts of assets and liabilities and disclosure of contingent assets and liabilities at the date of the financial statements and the reported results. Actual results could differ from those estimates.
Guarantees and Indemnifications
Under each Fund’s organizational documents, its officers and directors are indemnified against certain liability arising out of the performance of their duties to each Fund. In addition, certain of each Fund’s contracts with its service providers contain general indemnification clauses. Each Fund’s maximum exposure under these arrangements is unknown since the amount of any future claims that may be made against each Fund cannot be determined and each Fund has no historical basis for predicting the likelihood of any such claims.
| (3) | Investment Security Transactions |
The cost of purchases of and proceeds from sales and maturities of investment securities, other than short-term securities, for the period ended September 30, 2010, were as follows:
| | | | | | | | |
| | | Purchases | | | Proceeds | |
U.S. Government Securities | | $ | 415,575,639 | | | $ | 230,936,779 | |
Tax-Free Income | | | 22,143,376 | | | | 17,975,583 | |
Minnesota Tax-Free Income | | | 23,550,749 | | | | 15,876,556 | |
NOTES TO FINANCIAL STATEMENTS (Unaudited)
Six Months Ended September 30, 2010 (Continued)
(4) Affiliated Fees and Transactions
Investment Adviser
The Funds each have entered into an investment management agreement with Sit Investment Associates Inc. (SIA), under which SIA manages the Funds’ assets and provides research, statistical and advisory services, and pays related office rental, executive expenses and executive salaries. SIA also is obligated to pay all of the Funds’ expenses (excluding extraordinary expenses, stock transfer taxes, interest, brokerage commissions, and other transaction charges relating to investing activities). The fee for investment management and advisory services is based on the average daily net assets of the Funds at the annual rate of:
| | | | | | | | |
| | | Average Daily Net Assets | | | |
Tax-Free Income | | | | 0.80% | | | | |
Minnesota Tax-Free Income | | | | 0.80% | | | | |
| | | | | First $50 Million | | Over
$50 Million | |
U.S. Government Securities | | | | 1.00% | | | 0.80% | |
For the period October 1, 1993, through December 31, 2011, the Adviser has voluntarily agreed to limit the flat monthly fee (and, thereby, all Fund expenses, except extraordinary expenses, interest, brokerage commissions and other transaction charges not payable by the Adviser) of the Tax-Free Income Fund to an annual rate of 0.70% of the Fund’s average daily net assets in excess of $250 million and 0.60% of the Fund’s average daily net assets in excess of $500 million. After December 31, 2011, this voluntary fee waiver may be discontinued by the Adviser in its sole discretion.
For the period October 1, 1993, through December 31, 2010, the Adviser has voluntarily agreed to limit the flat monthly fee (and, thereby, all Fund expenses, except extraordinary expenses, interest, brokerage commissions and other transaction charges not payable by the Adviser) of the U.S. Government Securities Fund to an annual rate of 0.80% of the Fund’s average daily net assets. After December 31, 2010, this voluntary fee waiver may be discontinued by the Adviser in its sole discretion. In February 2010, Federal National Mortgage Association (FNMA) and Federal Home Loan Mortgage Corp. (FHLMC) announced programs to purchase delinquent mortgage loans from their guaranteed securities during March and April, 2010. These purchases caused the U.S. Government Securities Fund to incur losses recorded as a reduction of income. In response and to offset part of the losses, the Adviser voluntarily waived its management fee in April.
Transactions with affiliates
The investment adviser, affiliates of the investment adviser, directors and officers of the Funds as a whole owned the following shares as of September 30, 2010:
| | | | |
| | | Shares | | % Shares Outstanding |
U.S. Government Securities | | 1,090,829 | | 1.3 |
Tax-Free Income | | 1,303,038 | | 7.3 |
Minnesota Tax-Free Income | | 2,073,169 | | 6.9 |
(5) Subsequent Events
Management has evaluated the impact of all subsequent events on the Funds through the date the financial statements were issued, and has determined that there were no subsequent events that would require disclosure in or adjustments to the financial statements.
| | |
48 | | SIT MUTUAL FUNDS SEMI-ANNUAL REPORT |
EXPENSE EXAMPLE (Unaudited)
As a shareholder of the Funds, you incur two types of costs: (1) transaction costs, including redemption fees and (2) ongoing costs, including management fees; and other Fund expenses. This Example is intended to help you understand your ongoing costs (in dollars) of investing in the Funds and to compare these costs with the ongoing costs of investing in other mutual funds.
The Example is based on an investment of $1,000 invested at the beginning of the period and held for the entire period April 1, 2010 to September 30, 2010.
Actual Expenses
The first line of the table below provides information about actual account values and actual expenses. You may use the information in this line, together with the amount you invested, to estimate the expenses that you paid over the period. Simply divide your account value by $1,000 (for example, an $8,600 account value divided by $1,000 = 8.6), then multiply the result by the number in the first line under the heading entitled “Expenses Paid During Period” to estimate the expenses you paid on your account during this period.
Hypothetical Example for Comparison Purposes
The second line of the table below provides information about hypothetical account values and hypothetical expenses based on the Fund’s actual expense ratio and an assumed rate of return of 5% per year before expenses, which is not the Fund’s actual return. The hypothetical account values and expenses may not be used to estimate the actual ending account balance or expenses you paid for the period. You may use this information to compare the ongoing costs of investing in the Fund and other funds. To do so, compare this 5% hypothetical example with the 5% hypothetical examples that appear in the shareholder reports of the other funds.
Please note that the expenses shown in the table are meant to highlight your ongoing costs only and do not reflect any transactional
costs, such as redemption fees. Therefore, the second line of the table is useful in comparing ongoing costs only, and will not help you determine the relative total costs of owning different funds. In addition, if these transactional costs (redemption fees) were included, your costs would have been higher.
| | | | | | | | |
| | | Beginning Account Value (4/1/10) | | Ending Account Value (9/30/10) | | | Expenses Paid During Period* (4/1/10- 9/30/10) |
U.S. Government Securities Fund |
Actual | | $1,000 | | | $1,026.20 | | | $3.50 |
Hypothetical (5% return before expenses) | | $1,000 | | | $1,021.61 | | | $3.50 |
Tax-Free Income Fund |
Actual | | $1,000 | | | $1,051.50 | | | $4.11 |
Hypothetical (5% return before expenses) | | $1,000 | | | $1,021.06 | | | $4.05 |
Minnesota Tax-Free Income Fund |
Actual | | $1,000 | | | $1,053.50 | | | $4.12 |
Hypothetical (5% return before expenses) | | $1,000 | | | $1,021.06 | | | $4.05 |
*Expenses are equal to the Fund’s annualized expense ratio of 0.69% for the U.S. Government Securities Fund and 0.80% for the Tax-Free Income Fund and Minnesota Tax-Free Income Fund, multiplied by the average account value over the period, multiplied by 183/365 (to reflect the one-half year period.)
ADDITIONAL INFORMATION (Unaudited)
PROXY VOTING
Each Fund follows certain policies and procedures for voting proxies for securities held in each portfolio. A description of the Funds’ proxy voting policies and procedures is available without charge upon request by calling the Funds at 1-800-332-5580.
Information regarding how each Fund voted proxies relating to its portfolio securities during the most recent twelve-month period ended June 30 is available without charge upon request by calling the Funds at 1-800-332-5580, and is available on the U.S. Securities and Exchange Commission’s website at www.sec.gov.
AVAILABILITY OF QUARTERLY PORTFOLIO SCHEDULES
The Funds file their complete schedules of portfolio holdings with the U.S. Securities and Exchange Commission (SEC) for the first and third quarters of each fiscal year on Form N-Q. The Funds’ Form N-Qs are available without charge upon request by calling the Funds’ at 1-800-332-5580 and are available on the SEC’s website at www.sec.gov. In addition, the Funds’ Form N-Qs may be reviewed and copied at the SEC’s Public Reference Room in Washington, DC. Information on the operation of the Public Reference Room may be obtained by calling 1-202-551-8090.
| | |
50 | | SIT MUTUAL FUNDS SEMI-ANNUAL REPORT |
[This page intentionally left blank.]
[This page intentionally left blank.]
Item 2: Code of Ethics. Not applicable to Semi-Annual Report.
Item 3: Audit Committee Financial Expert. Not applicable to Semi-Annual Report.
Item 4: Principal Accountant Fees and Services. Not applicable to Semi-Annual Report.
Item 5: Audit Committee of Listed Registrants.
Not applicable to open-end investment companies.
Item 6: Schedule of Investments.
The schedule of investments is included as part of the report to shareholders filed under Item 1 of this Form.
Item 7: Disclosure of Proxy Voting Policies and Procedures for Closed-End Management Investment Companies.
Not applicable to open-end investment companies.
Item 8: Portfolio Managers of Closed-End Management Companies.
Not applicable to open-end investment companies.
Item 9: Purchases of Equity Securities by Closed-End Management Investment Company and Affiliated Purchasers.
Not applicable to open-end investment companies.
Item 10. Submission of Matters to a vote of Security Holders.
There have been no material changes to the procedures by which shareholders may recommend nominees to the registrant’s board of directors.
Item 11: Controls and Procedures -
(a) Based on their evaluation of the Registrant’s Disclosure Controls and Procedures as of a date within 90 days of the Filing Date, the Registrant’s Chairman and Treasurer have determined that the Disclosure Controls and Procedures (as defined in Rule 30a-2(c) under the Act) are designed to ensure that information required to be disclosed by the Registrant is recorded, processed, summarized and reported by the filing Date, and that information required to be disclosed in the report is communicated to the Registrant’s management, as appropriate, to allow timely decisions regarding required disclosure.
b) There were no changes in the Registrant’s internal control over financial reporting as defined in Rule 30a-3(d) under the Act) that occurred during the Registrant’s last fiscal half-year that has materially affected, or is reasonably likely to materially affect, the Registrant’s internal control over financial reporting.
Item 12: Exhibits:
(a) The following exhibits are attached to this Form N-CSR:
(2) A separate certification for each principal executive and principal financial officer of the registrant as required by Rule 30a-2(a) under the Act (17 CFR 270.30a-2) (certification required by Section 302 of the Sarbanes-Oxley Act of 2002).
(b) Certification required by Rule 30a-2(b) under the Act (certification required by Section 906 of the Sarbanes-Oxley Act of 2002).
SIGNATURES
Pursuant to the requirements of the Securities Exchange Act of 1934 and the Investment Company Act of 1940, the registrant has duly caused this report to be signed on its behalf by the undersigned, thereunto duly authorized.
SIT MUTUAL FUNDS II, INC.
| | | | |
By (Signature and Title) | | /s/ PAUL E. RASMUSSEN | | |
| | Paul E. Rasmussen | | |
| | Vice President, Treasurer | | |
Date November 30, 2010
Pursuant to the requirements of the Securities Exchange Act of 1934 and the Investment Company Act of 1940, this report has been signed below by the following persons on behalf of the registrant and in the capacities and on the dates indicated.
| | | | |
By (Signature and Title) | | /s/ PAUL E. RASMUSSEN | | |
| | Paul E. Rasmussen | | |
| | Vice President, Treasurer | | |
Date November 30, 2010
| | | | |
By (Signature and Title) | | /s/ ROGER J. SIT | | |
| | Roger J. Sit | | |
| | Chairman | | |
Date November 30, 2010