UNITED STATES
SECURITIES AND EXCHANGE COMMISSION
Washington, D.C. 20549
FORM N-CSR
CERTIFIED SHAREHOLDER REPORT OF REGISTERED MANAGEMENT INVESTMENT COMPANIES
Investment Company Act file number: 811-04033
Sit Mutual Funds II, Inc.
(Exact name of registrant as specified in charter)
3300 IDS Center
80 South Eighth Street
Minneapolis, MN 55402
(Address of principal executive offices)
Paul E. Rasmussen, VP Treasurer
Sit Mutual Funds, Inc.
3300 IDS Center
80 South Eighth Street
Minneapolis, MN 55402
(Name and address of agent for service)
Copy to:
Mike Radmer, Esq.
Dorsey & Whitney
Suite 1500
50 South Sixth Street
Minneapolis, MN 55402-1498
Registrant’s telephone number, including area code: (612) 332-3223
Date of fiscal year end: March 31, 2013
Date of reporting period: September 30, 2012
| Item 1: | Reports to Stockholders |

|
Sit Mutual Funds BOND FUNDS SEMI-ANNUAL REPORT TABLE OF CONTENTS |
This document must be preceded or accompanied by a Prospectus.
CHAIRMAN’S LETTER
October 15, 2012
Dear fellow shareholders:
Over the six-month period ended September 30th, 2012, the U.S. fixed-income markets experienced very robust performance. In July, the 30-year U.S. Treasury bond traded at its lowest yield in recent history, while short Treasury bills continued to yield next to nothing. The low yield levels on Treasury securities were due, at least in part, to a variety of economic concerns that are ongoing both domestically and abroad. Additionally, the political picture in the U.S. is murky, and particularly so with respect to what might be done to mitigate the impacts of the upcoming “fiscal cliff “ described in further detail below.
The 30-year Treasury bond ended September yielding 2.82%. Historically low Treasury rates persisted even after an announcement by the Federal Reserve in early September that promised yet another round of quantitative easing (i.e. more printing of money). Broader evidence of the low interest rate environment is indicated by the fact that yields on all Treasury maturities longer than seven years declined by at least 50 basis points since the end of March. The six-month yield declines are on top of the more than 100 basis point declines over the prior 12 months. It would appear that near-term economic and political worries, along with large purchases by the Fed and China, are driving the Treasury market more than concerns of longer-term inflationary risk.
Further highlighting the strong returns of the U.S. fixed income markets is the performance of corporate bonds. The low level of total return potential offered by Treasuries led some taxable investors to reach for yield elsewhere. The increased demand for taxable corporate bonds easily absorbed the relatively strong supply that occurred over the period. Corporate yield spreads tightened 43 basis points in the third quarter alone, led by financials which tightened 74 basis points. Meanwhile, in the tax-exempt bond market, rates have also approached historically low yields. The tax-exempt yield curve flattened over the period as long-term bond yields declined substantially while intermediate and short yields decreased to a lesser extent.
Global
The still deteriorating fiscal and economic conditions in Europe are weighing heavily on many investors. The sovereign debt crisis continues to carry on as many major European banks and governments remain in a fragile financial position. European governments are generally sticking with unpopular austerity measures and/or tax increases. High levels of unemployment in many Eurozone countries, and especially high youth unemployment, have led to civil unrest and protests spreading from Greece to Spain and Italy. At least six of the 17 nations that use the euro currency are likely in a recession and solutions to the economic malaise have proven elusive. In addition to concerns in Europe, hopes of a global boost from Asia and South America are dimming as economies in those regions also experienced weakening growth in the second quarter. China’s economy demonstrated signs of a slowdown, potentially signaling a deterioration
of demand world-wide. Growth in China is now expected to fall below +8.0% this year for the first time since 2009. Brazil’s economic growth was disappointing for the second quarter as well. It is our expectation that the global economy will continue to struggle and show signs of weakness well into 2013, motivating some investors to continue to look to U.S. Treasury bonds as a safe haven despite their already low yields.
Domestic
Mirroring some of the global concerns described above, the U.S. has had its own fiscal issues and economic data has continued to show somewhat mixed results over the past six months. The level of U.S. national debt continues to be a major concern; the debt ceiling limit is expected to be reached later this calendar year. Additionally, the looming “fiscal cliff,” which is comprised of forced spending cuts coupled with tax increases in 2013, is starting to impact U.S. economic activity. Unemployment and underemployment are still relatively high, while the labor participation rate has declined to levels which are at 30-year lows. The U.S. economy is growing, but at a lackluster pace. The likelihood of slow and slowing growth is evident on many corporate balance sheets, where instead of investing in new opportunities, companies are opting to build up their cash positions instead. With the added uncertainty surrounding an election year, it’s extremely difficult to predict what political action, if any, might be taken to mitigate either the fiscal or economic challenges before the calendar rolls over.
Three years after working out of the most recent recession, the economy and investors are once again faced with uncertainty, head-winds and slow growth. As a result of the mixed economic data, general feelings of uneasiness and doubt that political leaders will reach a timely compromise, we expect enough investors to stay entrenched in U.S. Treasury bonds to keep short-term rates relatively stable over the next six months. This demand for Treasury bonds should counter the normal trend of higher yields from increased inflation concerns resulting from the additional quantitative easing by the Federal Reserve. We further believe that potential tax increases, the current political climate and financial market uncertainty will continue to weigh on economic activity, and the overall recovery will remain sluggish.
Federal Reserve
Minutes of the Federal Reserve’s September 12th to 13th meeting showed that the Fed has structured its latest stimulus program around the purchase of mortgage bonds in an attempt to further reduce mortgage rates. Members agreed that they should attempt to stimulate a housing recovery as a means to lift the broader economy. The Fed said it would keep buying mortgage bonds until the job market showed substantial improvement. The Fed also extended its plan to keep its benchmark short-term interest rate near zero until mid-2015 and left open the possibility of taking other steps. Since 2008,
| | |
2 | | SIT MUTUAL FUNDS SEMI-ANNUAL REPORT |
the Fed has already purchased more than $2 trillion in bonds. The latest program seeks to effectively print money to buy $40 billion mortgage bonds a month without an end date set. In comments made after the meeting, Chairman Bernanke elaborated on the Fed’s position stating that the Fed needs to drive down long-term borrowing rates because the economy isn’t growing fast enough to reduce high unemployment. He also sought to reassure investors about the Fed’s timetable for keeping its short-term rate at ultra-low levels.
The actions of the Fed have undoubtedly impacted Treasury rates. After closing March at 3.34%, the yield of the 30-year maturity U.S. Treasury bond first dipped below 3.00% in mid-May and continued to fall until reaching a low of 2.46% on July 25th. In the seven weeks leading up to the Fed’s September meeting, rates started trending upwards. The yield on the 30-year Treasury bond then peaked at 3.09% shortly after the meeting, before ultimately ending the quarter at 2.82%.
Strategy Summary
Going forward, our taxable fixed-income strategy will remain focused on seasoned, high coupon agency mortgage securities, as these structures continue to provide high levels of income at stable price levels. The income advantage is even more pronounced when compared to the low absolute levels of shorter term interest rates available with other investment alternatives. This high level of income and the stability of principal has been a core fundamental focus of our strategy since the inception of our U.S. Government Securities Fund.
The tax-exempt fixed-income strategy employed in managing both the Tax-Free Income Fund and the Minnesota Tax-Free Income Fund
will continue to focus heavily on the use of premium coupon bonds and bonds structured with put, call, sinking fund and prepayment provisions that provide regular cash flow. This strategy should have the effect of stabilizing prices of the Funds when yields start to rise. When making purchases for the Funds, we believe a bond’s yield, both on an absolute and relative basis, will continue to be the best indicator of long-term value and short-term trading opportunities will receive less focus. We believe the Funds’ durations, credit quality and industry weightings have them well-positioned for the current economic and interest rate environment. Diversification remains a key factor in managing credit risk for these Funds.
These strategies have served us very well in the past and we believe that they will remain an excellent way to achieve a superior risk-adjusted return over the next six months and beyond.
We appreciate your continued interest in the Sit family of funds.
With best wishes,

Roger J. Sit
Chairman and President
Sit Mutual Funds
|
|
Sit U.S. Government Securities Fund |
OBJECTIVE & STRATEGY
The objective of the U.S. Government Securities Fund is to provide high current income and safety of principal, which it seeks to attain by investing solely in debt obligations issued, guaranteed or insured by the U.S. government or its agencies or its instrumentalities.
Agency mortgage securities and U.S. Treasury securities are the principal holdings in the Fund. The mortgage securities that the Fund purchases consist of pass-through securities including those issued by Government National Mortgage Association (GNMA), Federal National Mortgage Asociation (FNMA), and Federal Home Loan Mortgage Corporation (FHLMC).
The Sit U.S. Government Securities Fund provided a return of +1.59% during the 6-month period ended September 30, 2012, compared to the return of the Barclays Intermediate Government Bond Index of +2.08%. The Fund’s 30-day SEC yield was 2.08% and its 12-month distribution rate was 2.16%.
During the six-month period, the Fund benefited from the income advantage provided by its holdings in old, higher coupon mortgage pass through securities and collateralized mortgage obligations. These securities are the primary reason the Fund yields much more than the 0.55% of income offered by the benchmark. Domestic economic uncertainty and continued European fiscal issues produced higher demand for U.S. Treasury obligations, which are typically considered the safest investment option. The Funds underweight position in U.S. Treasury bonds relative to the benchmark negatively impacted performance.
In the third quarter, the Federal Reserve announced yet another bond buying program (commonly referred to as Quantitative Easing or QE). The Federal Reserve intends to purchase $40 billion of recently originated mortgages every month, in addition to the purchases for reinvesting payments from their current mortgage holdings. The program differs from previous purchase programs, as there is no defined limit in amount or timeline; hence the program has been popularly referred to as “QE Infinity”. The timing and amounts can be changed at any time based on economic circumstances. The Fund does not invest in mortgages that are likely to be significantly influenced by the purchase program. Given the seasoned nature of the mortgages in the Fund, we expect refinancing to remain relatively stable and any impact on the Fund to be modest.
Looking forward, we believe the impending potential tax increases, current political climate, and financial market uncertainty will weigh on economic activity and the recovery will continue to be sluggish. We view the Federal Government’s massive monetary stimulus as inflationary in the intermediate term and maintain an underweight position in U.S. Treasuries. Given the uncertain environment domestically and abroad, we continue to focus on old, high coupon agency
HYPOTHETICAL GROWTH OF $10,000
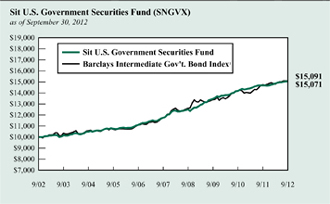
The chart above illustrates the total value of a hypothetical $10,000 investment in the Fund over the past 10 years (or for the life of the Fund if shorter) as compared to the performance of the Barclays Intermediate Government Bond Index. Past performance does not guarantee future results. Returns include the reinvestment of distributions. The chart does not reflect the deduction of taxes that a shareholder would pay on Fund distributions or the redemption of Fund shares.
1 The Barclays Intermediate Government Bond Index is a sub-index of the Barclays Government Bond Index covering issues with remaining maturities of between three and five years. The Barclays Government Bond Index is an index that measures the performance of all public U.S. government obligations with remaining maturities of one year or more. The returns include the reinvestment of income and do not include any transaction costs, management fees or other costs. It is not possible to invest directly in an index. This is the Fund’s primary index.
mortgage securities, as these continue to provide high levels of income at stable price levels, especially relative to the low absolute levels of shorter term interest rates available from other investment alternatives. This high level of income and stability of principal has been a core fundamental focus of the Fund since its inception.
Michael C. Brilley
Bryce A. Doty, CFA
Senior Portfolio Managers
Mark H. Book, CFA
Portfolio Manager
| | |
4 | | SIT MUTUAL FUNDS SEMI-ANNUAL REPORT |
COMPARATIVE RATES OF RETURNS
as of September 30, 2012
| | | | | | | | | | | | | | | |
| | | Sit U.S. Government Securities Fund | | Barclays Inter. Gov’t
Bond Index1 | | Lipper U.S. Gov’t Fund
Index2 |
Six Month | | | | 1.59 | % | | | | 2.08 | % | | | | n/a | |
One Year | | | | 2.63 | | | | | 2.39 | | | | | 3.93 | % |
Five Years | | | | 5.14 | | | | | 5.20 | | | | | 6.09 | |
Ten Years | | | | 4.19 | | | | | 4.20 | | | | | 4.55 | |
Since Inception (6/2/87) | | | | 6.29 | | | | | 6.45 | | | | | 6.26 | |
Performance figures are historical and do not guarantee future results. Investment returns and principal value will vary, and you may have a gain or loss when you sell shares. Current performance may be lower or higher than the performance data quoted. Contact the Fund for performance data current to the most recent month-end. Returns include changes in share price as well as reinvestment of all dividends and capital gains and all fee waivers. Without the fee waivers total return and yield figures would have been lower. Returns do not reflect the deduction of taxes that a shareholder would pay on Fund distributions or the redemption of Fund shares. Management fees and administrative expenses are included in the Fund’s performance. Returns for periods greater than one year are compounded average annual rates of return.
1 The Barclays Intermediate Government Bond Index is a sub-index of the Barclays Government Bond Index covering issues with remaining maturities of between three and five years. The Barclays Government Bond Index is an index that measures the performance of all public U.S. government obligations with remaining maturities of one year or more. The returns include the reinvestment of income and do not include any transaction costs, management fees or other costs. It is not possible to invest directly in an index.
2 The Lipper returns are obtained from Lipper Analytical Services, Inc., a large independent evaluator of mutual funds.
FUND DIVERSIFICATION
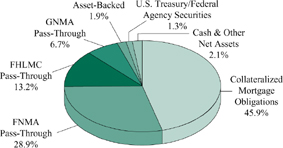
Based on total net assets as of September 30, 2012. Subject to change.
PORTFOLIO SUMMARY
| | |
Net Asset Value 9/30/12: | | $11.39 Per Share |
Net Asset Value 3/31/12: | | $11.31 Per Share |
Total Net Assets: | | $1,754.1 Million |
30-day SEC Yield 3: | | 2.08% |
12-month Distribution Rate 3: | | 2.16% |
Effective Duration 4: | | 1.9 Years |
3 The SEC Yield reflects the rate at which the Fund is earning income on its current portfolio of securities, while the distribution rate reflects the Fund’s past dividends paid to shareholders based on the net investment income distributed and the average NAV during the past 12 months. Accordingly, the Fund’s SEC yield and distribution rate may differ.
4 Duration is a measure of estimated price sensitivity relative to changes in interest rates. Portfolios with longer durations are typically more sensitive to changes in interest rates. For example, if interest rates rise by 1%, the market value of a security with an effective duration of 5 years would decrease by 5%, with all other factors being constant. The correlation between duration and price sensitivity is greater for securities rated investment-grade than it is for securities rated below investment-grade. Duration estimates are based on assumptions by the Adviser and are subject to a number of limitations. Effective duration is calculated based on historical price changes of securities held by the Fund, and therefore is a more accurate estimate of price sensitivity provided interest rates remain within their historical range.
ESTIMATED AVERAGE LIFE
| | | | |
0-1 Year | | | 2.1 | % |
1-5 Years | | | 97.0 | % |
5-10 Years | | | 0.9 | % |
10-20 Years | | | 0.0 | % |
20+ Years | | | 0.0 | % |
The Adviser’s estimates of the dollar weighted average life of the portfolio’s securities, which differ from their stated maturities. The Fund’s average stated maturity was 22.1 years as of September 30, 2012.
SCHEDULE OF INVESTMENTS (Unaudited)
September 30, 2012
Sit U.S. Government Securities Fund
| | | | | | | | | | | | | | |
Principal Amount ($) | | | Coupon Rate (%) | | | Maturity Date | | | Fair Value ($) | |
|
| Mortgage Pass-Through Securities - 48.8% | |
| Federal Home Loan Mortgage Corporation - 13.2% | |
| | 24,977,102 | | | | 2.50 | | | | 4/1/27 | | | | 26,281,150 | |
| | 36,579,276 | | | | 3.00 | | | | 4/1/27 | | | | 38,681,769 | |
| | 208,734 | | | | 5.50 | | | | 8/1/17-3/1/33 | | | | 228,933 | |
| | 241,460 | | | | 6.38 | | | | 12/1/26-12/1/27 | | | | 276,182 | |
| | 20,410,795 | | | | 6.50 | | | | 11/1/27-9/1/39 | | | | 23,196,012 | |
| | 864,573 | | | | 6.88 | | | | 2/17/31 | | | | 1,036,169 | |
| | 72,467,083 | | | | 7.00 | | | | 2/1/16-1/1/39 | | | | 83,651,208 | |
| | 103,397 | | | | 7.38 | | | | 12/17/24 | | | | 115,696 | |
| | 34,403,343 | | | | 7.50 | | | | 9/1/26-10/1/38 | | | | 41,393,005 | |
| | 149,062 | | | | 7.95 | | | | 10/1/25-11/1/25 | | | | 169,642 | |
| | 2,237,857 | | | | 8.00 | | | | 5/1/17-1/1/37 | | | | 2,647,520 | |
| | 27,177 | | | | 8.25 | | | | 12/1/17 | | | | 28,327 | |
| | 4,064,598 | | | | 8.50 | | | | 5/1/16-8/1/36 | | | | 4,856,317 | |
| | 4,850,782 | | | | 9.00 | | | | 11/1/15-11/1/36 | | | | 5,795,029 | |
| | 93,335 | | | | 9.25 | | | | 6/1/16-3/1/19 | | | | 97,641 | |
| | 544,285 | | | | 9.50 | | | | 10/1/16-12/17/21 | | | | 626,322 | |
| | 56,084 | | | | 9.75 | | | | 12/1/16-12/1/17 | | | | 61,274 | |
| | 1,938,245 | | | | 10.00 | | | | 9/1/20-7/1/30 | | | | 2,281,626 | |
| | 9,871 | | | | 10.25 | | | | 2/1/17 | | | | 9,903 | |
| | 97,739 | | | | 10.50 | | | | 10/1/13-6/1/19 | | | | 115,779 | |
| | 524,993 | | | | 11.00 | | | | 9/17/16-8/25/20 | | | | 574,377 | |
| | 2,400 | | | | 13.00 | | | | 5/1/17 | | | | 2,682 | |
| | | | | | | | | | | | | | |
| | | |
| | | | | | | | | | | | | 232,126,563 | |
| | | | | | | | | | | | | | |
|
| Federal National Mortgage Association - 28.9% | |
| | 7,361 | | | | 4.99 | | | | 3/1/19 | 1 | | | 7,702 | |
| | 68,880 | | | | 5.76 | | | | 3/1/33 | | | | 77,229 | |
| | 1,948,129 | | | | 5.81 | | | | 1/1/29 | | | | 2,270,237 | |
| | 1,211,339 | | | | 5.92 | | | | 1/1/35 | | | | 1,352,667 | |
| | 3,748,843 | | | | 5.94 | | | | 7/1/27 | | | | 4,566,911 | |
| | 5,223,726 | | | | 5.96 | | | | 11/1/27-6/1/28 | | | | 6,141,625 | |
| | 1,349,846 | | | | 6.00 | | | | 9/1/28-9/1/37 | | | | 1,507,329 | |
| | 1,796,442 | | | | 6.15 | | | | 6/1/28 | | | | 2,122,574 | |
| | 491,170 | | | | 6.15 | | | | 6/1/33 | 1 | | | 524,794 | |
| | 156,579 | | | | 6.20 | | | | 11/1/27 | | | | 178,783 | |
| | 3,979,873 | | | | 6.21 | | | | 12/1/29 | | | | 4,835,270 | |
| | 2,523,736 | | | | 6.34 | | | | 4/1/28 | | | | 2,926,258 | |
| | 3,663,824 | | | | 6.35 | | | | 2/1/25-10/1/30 | | | | 4,231,218 | |
| | 1,817,114 | | | | 6.45 | | | | 11/1/24 | | | | 2,158,906 | |
| | 4,428,405 | | | | 6.49 | | | | 10/15/28-2/1/32 | | | | 5,178,905 | |
| | 94,052,556 | | | | 6.50 | | | | 1/1/22-6/1/40 | | | | 107,258,144 | |
| | 1,459,585 | | | | 6.65 | | | | 1/1/28 | | | | 1,750,502 | |
| | 5,548,173 | | | | 6.74 | | | | 12/1/15-7/1/29 | | | | 6,801,442 | |
| | 180,348 | | | | 6.91 | | | | 11/1/26-8/1/27 | | | | 206,945 | |
| | 3,224,765 | | | | 6.94 | | | | 7/1/29 | | | | 4,072,330 | |
| | 168,613 | | | | 6.95 | | | | 8/1/21 | 1 | | | 178,455 | |
| | 199,685,741 | | | | 7.00 | | | | 6/1/17-1/1/40 | | | | 236,803,550 | |
| | 1,267,524 | | | | 7.20 | | | | 3/1/18 | | | | 1,420,708 | |
| | 112,701 | | | | 7.32 | | | | 6/1/16 | | | | 112,827 | |
| | 1,278,993 | | | | 7.34 | | | | 7/1/30 | | | | 1,665,447 | |
| | | | | | | | | | | | | | |
Principal Amount ($) | | | Coupon Rate (%) | | | Maturity Date | | | Fair Value ($) | |
| | | |
| | 55,703,050 | | | | 7.50 | | | | 6/1/22-4/1/38 | | | | 66,181,743 | |
| | 142,539 | | | | 7.62 | | | | 12/1/16 | | | | 144,449 | |
| | 296,538 | | | | 7.95 | | | | 9/15/20 | | | | 339,088 | |
| | 12,050,833 | | | | 8.00 | | | | 4/1/16-3/1/38 | | | | 14,660,701 | |
| | 421,468 | | | | 8.17 | | | | 11/15/31 | | | | 512,452 | |
| | 10,687 | | | | 8.25 | | | | 4/1/22 | | | | 10,919 | |
| | 185,266 | | | | 8.33 | | | | 7/15/20 | | | | 213,846 | |
| | 1,154,546 | | | | 8.46 | | | | 7/20/30-3/15/32 | | | | 1,364,654 | |
| | 91,399 | | | | 8.49 | | | | 9/15/30 | | | | 107,376 | |
| | 10,360,409 | | | | 8.50 | | | | 2/1/16-12/1/37 | | | | 12,876,311 | |
| | 123,982 | | | | 8.52 | | | | 7/20/28 | | | | 132,490 | |
| | 35,858 | | | | 8.83 | | | | 12/15/25 | | | | 38,745 | |
| | 5,351,517 | | | | 9.00 | | | | 10/1/19-2/1/38 | | | | 6,501,461 | |
| | 87,515 | | | | 9.25 | | | | 10/1/16-2/1/17 | | | | 95,175 | |
| | 100,768 | | | | 9.34 | | | | 5/15/28 | | | | 109,063 | |
| | 3,027,526 | | | | 9.50 | | | | 11/1/18-8/1/31 | | | | 3,541,393 | |
| | 278,087 | | | | 9.72 | | | | 8/20/25 | | | | 327,945 | |
| | 110,358 | | | | 9.75 | | | | 1/15/13-4/1/25 | | | | 130,251 | |
| | 849,025 | | | | 10.00 | | | | 2/1/15-6/1/30 | | | | 1,000,703 | |
| | 67,849 | | | | 10.18 | | | | 7/1/20 | | | | 73,303 | |
| | 841 | | | | 10.25 | | | | 8/15/13 | | | | 843 | |
| | 203,376 | | | | 10.50 | | | | 5/1/15-6/1/28 | | | | 236,579 | |
| | 46,061 | | | | 10.58 | | | | 8/15/20 | | | | 47,533 | |
| | 16,361 | | | | 10.91 | | | | 12/15/26 | | | | 16,450 | |
| | | | | | | | | | | | | | |
| | | |
| | | | | | | | | | | | | 507,014,231 | |
| | | | | | | | | | | | | | |
|
| Government National Mortgage Association - 6.7% | |
| | 6,455,120 | | | | 5.40 | | | | 10/15/43 | | | | 6,706,702 | |
| | 1,179,785 | | | | 5.45 | | | | 7/15/27 | | | | 1,277,407 | |
| | 219,007 | | | | 5.50 | | | | 9/15/25 | | | | 242,966 | |
| | 3,718,306 | | | | 5.67 | | | | 4/15/42 | | | | 3,934,415 | |
| | 177,688 | | | | 5.76 | | | | 3/20/33-5/20/33 | | | | 199,729 | |
| | 7,800,888 | | | | 5.85 | | | | 12/15/30 | | | | 8,294,599 | |
| | 2,093,454 | | | | 5.95 | | | | 3/15/37 | | | | 2,231,236 | |
| | 2,900,634 | | | | 6.00 | | | | 9/15/18-11/20/34 | | | | 3,302,732 | |
| | 4,558,289 | | | | 6.09 | | | | 3/15/41 | | | | 4,599,493 | |
| | 765,608 | | | | 6.20 | | | | 3/15/32 | | | | 873,853 | |
| | 2,876,988 | | | | 6.25 | | | | 5/15/13-4/15/29 | | | | 3,355,872 | |
| | 1,931,351 | | | | 6.35 | | | | 4/20/30-11/20/31 | | | | 2,205,953 | |
| | 459,032 | | | | 6.38 | | | | 8/15/26-4/15/28 | | | | 520,691 | |
| | 321,353 | | | | 6.49 | | | | 11/20/31-6/20/32 | | | | 366,511 | |
| | 36,647,239 | | | | 6.50 | | | | 11/15/23-3/20/41 | | | | 42,066,934 | |
| | 108,022 | | | | 6.57 | | | | 9/20/32-3/20/33 | | | | 124,743 | |
| | 79,673 | | | | 6.58 | | | | 2/20/28 | | | | 94,253 | |
| | 734,532 | | | | 6.75 | | | | 9/15/15-6/15/29 | | | | 805,919 | |
| | 670,314 | | | | 6.91 | | | | 7/20/26-2/20/27 | | | | 797,905 | |
| | 15,839,935 | | | | 7.00 | | | | 5/15/24-2/20/39 | | | | 18,420,718 | |
| | 151,669 | | | | 7.02 | | | | 4/20/26 | | | | 180,682 | |
| | 164,284 | | | | 7.05 | | | | 2/15/23-4/20/27 | | | | 196,050 | |
| | 563,778 | | | | 7.10 | | | | 5/20/25 | | | | 669,927 | |
| | 271,454 | | | | 7.15 | | | | 3/20/27-4/20/27 | | | | 326,335 | |
| | 145,872 | | | | 7.25 | | | | 5/15/29-6/15/29 | | | | 176,101 | |
| | |
| See accompanying notes to financial statements. | | |
6 | | SIT MUTUAL FUNDS SEMI-ANNUAL REPORT |
| | | | | | | | | | | | | | |
Principal Amount ($) | | | Coupon Rate (%) | | | Maturity Date | | | Fair Value ($) | |
| | | |
| | 46,392 | | | | 7.27 | | | | 7/20/22 | | | | 54,291 | |
| | 53,504 | | | | 7.38 | | | | 1/15/29 | | | | 64,906 | |
| | 4,236,325 | | | | 7.50 | | | | 12/15/23-3/15/39 | | | | 5,025,022 | |
| | 19,764 | | | | 7.55 | | | | 10/20/22 | | | | 22,326 | |
| | 2,599,191 | | | | 7.60 | | | | 12/15/33 | | | | 2,727,385 | |
| | 52,718 | | | | 7.63 | | | | 12/15/29 | | | | 55,102 | |
| | 55,937 | | | | 7.65 | | | | 7/20/22 | | | | 63,573 | |
| | 324,816 | | | | 7.75 | | | | 6/15/20-11/15/20 | | | | 369,003 | |
| | 32,916 | | | | 7.90 | | | | 1/20/21 | | | | 33,241 | |
| | 583,082 | | | | 7.95 | | | | 2/15/20-3/20/27 | | | | 625,846 | |
| | 379,146 | | | | 7.99 | | | | 2/20/21-6/20/22 | | | | 429,727 | |
| | 3,413,063 | | | | 8.00 | | | | 10/15/14-8/20/33 | | | | 4,084,616 | |
| | 280,831 | | | | 8.10 | | | | 5/20/19-1/20/20 | | | | 306,349 | |
| | 235,391 | | | | 8.25 | | | | 8/15/15-2/15/20 | | | | 260,520 | |
| | 114,638 | | | | 8.40 | | | | 2/15/19-2/15/20 | | | | 117,169 | |
| | 245,476 | | | | 8.50 | | | | 4/15/15-12/20/26 | | | | 292,729 | |
| | 28,257 | | | | 8.60 | | | | 6/15/18 | | | | 28,373 | |
| | 18,751 | | | | 8.63 | | | | 10/15/18 | | | | 20,711 | |
| | 106,557 | | | | 9.00 | | | | 1/15/17-12/15/20 | | | | 124,789 | |
| | 14,476 | | | | 9.10 | | | | 5/15/18 | | | | 16,562 | |
| | 122,609 | | | | 9.50 | | | | 11/20/16-8/20/19 | | | | 138,163 | |
| | 168,443 | | | | 10.00 | | | | 11/15/17-6/15/21 | | | | 191,223 | |
| | 256,696 | | | | 10.50 | | | | 2/15/20-8/15/21 | | | | 292,920 | |
| | 4,453 | | | | 11.50 | | | | 8/15/18 | | | | 4,604 | |
| | | | | | | | | | | | | | |
| | | |
| | | | | | | | | | | | | 117,320,876 | |
| | | | | | | | | | | | | | |
| Total Mortgage Pass-Through Securities | |
| (cost: $823,577,971) | | | | 856,461,670 | |
| | | | | | | | | | | | | | |
|
| U.S. Treasury / Federal Agency Securities - 1.3% | |
| North American Development Bank: | |
| | 5,200,000 | | | | 4.38 | | | | 2/11/20 | | | | 5,898,879 | |
| Tennessee Valley Authority: | |
| | 5,000,000 | | | | 6.25 | | | | 12/15/17 | | | | 6,372,839 | |
| Treasury Note: | |
| | 10,000,000 | | | | 0.50 | | | | 7/31/17 | | | | 9,950,779 | |
| | | | | | | | | | | | | | |
|
| Total U.S. Treasury / Federal Agency Securities | |
| (cost: $22,019,166) | | | | 22,222,497 | |
| | | | | | | | | | | | | | |
|
| Collateralized Mortgage Obligations - 45.9% | |
| Federal Home Loan Mortgage Corporation - 12.2% | |
| | 69,058 | | | | 5.11 | | | | 3/25/44 | 1 | | | 70,341 | |
| | 3,944,676 | | | | 6.00 | | | | 9/15/21-5/15/36 | | | | 4,528,703 | |
| | 16,830,680 | | | | 6.50 | | | | 9/15/23-10/25/43 | | | | 19,420,259 | |
| | 1,189,939 | | | | 6.50 | | | | 9/25/43 | 1 | | | 1,358,112 | |
| | 119,248 | | | | 6.70 | | | | 9/15/23 | | | | 134,917 | |
| | 266,149 | | | | 6.95 | | | | 3/15/28 | | | | 310,343 | |
| | 136,947,488 | | | | 7.00 | | | | 12/15/20-9/25/43 | | | | 154,159,753 | |
| | 21,054,023 | | | | 7.50 | | | | 10/15/21-9/25/43 | | | | 25,452,784 | |
| | 4,522,207 | | | | 8.00 | | | | 3/15/21-1/15/30 | | | | 5,262,437 | |
| | 65,384 | | | | 8.25 | | | | 6/15/22 | | | | 75,534 | |
| | 372,287 | | | | 8.30 | | | | 11/15/20 | | | | 425,525 | |
| | | | | | | | | | | | | | |
Principal Amount ($) | | | Coupon Rate (%) | | | Maturity Date | | | Fair Value ($) | |
| | | |
| | 756,890 | | | | 8.50 | | | | 10/15/22-3/15/32 | | | | 882,332 | |
| | 406,700 | | | | 9.00 | | | | 12/15/19 | | | | 458,956 | |
| | 9,477 | | | | 9.15 | | | | 10/15/20 | | | | 10,468 | |
| | 1,873,367 | | | | 9.50 | | | | 2/15/20-2/25/42 | | | | 2,206,762 | |
| | | | | | | | | | | | | | |
| | | |
| | | | | | | | | | | | | 214,757,226 | |
| | | | | | | | | | | | | | |
| Federal National Mortgage Association - 27.4% | |
| | 9,648,013 | | | | 4.00 | | | | 10/25/22 | | | | 10,140,303 | |
| | 14,421,855 | | | | 4.50 | | | | 6/25/21 | | | | 15,712,063 | |
| | 4,668,202 | | | | 6.45 | | | | 9/25/37 | | | | 5,289,533 | |
| | 65,800,368 | | | | 6.50 | | | | 12/25/23-12/25/42 | | | | 75,304,060 | |
| | 194,089 | | | | 6.59 | | | | 3/25/29 | 1 | | | 222,932 | |
| | 1,338,575 | | | | 6.63 | | | | 6/25/42 | 1 | | | 1,535,651 | |
| | 24,506,292 | | | | 6.75 | | | | 6/25/32-4/25/37 | | | | 28,013,477 | |
| | 5,608,738 | | | | 6.82 | | | | 10/25/42 | 1 | | | 6,625,788 | |
| | 31,303 | | | | 6.85 | | | | 12/18/27 | | | | 36,276 | |
| | 4,254,155 | | | | 6.99 | | | | 8/25/37 | 1 | | | 4,665,153 | |
| | 140,343,988 | | | | 7.00 | | | | 1/25/21-3/25/45 | | | | 160,229,090 | |
| | 743,565 | | | | 7.01 | | | | 12/25/42 | 1 | | | 877,274 | |
| | 5,277,640 | | | | 7.03 | | | | 2/25/42 | 1 | | | 6,206,299 | |
| | 1,830,666 | | | | 7.11 | | | | 6/25/42 | 1 | | | 2,182,947 | |
| | 4,375,659 | | | | 7.25 | | | | 10/25/42 | 1 | | | 5,203,727 | |
| | 80,476,962 | | | | 7.50 | | | | 8/20/27-1/25/48 | | | | 93,678,932 | |
| | 1,333,586 | | | | 7.50 | | | | 6/19/30 | 1 | | | 1,502,512 | |
| | 1,109,704 | | | | 7.52 | | | | 6/17/40 | 1 | | | 1,157,766 | |
| | 36,914 | | | | 7.70 | | | | 3/25/23 | | | | 42,676 | |
| | 8,080,400 | | | | 7.95 | | | | 7/25/37 | 1 | | | 8,964,291 | |
| | 7,414,333 | | | | 8.00 | | | | 7/25/22-7/25/44 | | | | 8,635,056 | |
| | 18,003,654 | | | | 8.50 | | | | 1/25/21-10/25/30 | | | | 21,616,923 | |
| | 1,345,510 | | | | 8.50 | | | | 11/25/37 | 1 | | | 1,608,150 | |
| | 1,307,246 | | | | 8.62 | | | | 11/25/37 | 1 | | | 1,512,120 | |
| | 17,656 | | | | 8.70 | | | | 12/25/19 | | | | 20,167 | |
| | 22,817 | | | | 8.75 | | | | 9/25/20 | | | | 25,042 | |
| | 102,551 | | | | 8.95 | | | | 10/25/20 | | | | 117,729 | |
| | 3,120,504 | | | | 9.00 | | | | 7/25/19-10/25/30 | | | | 3,674,069 | |
| | 45,937 | | | | 9.05 | | | | 12/25/18 | | | | 50,807 | |
| | 54,626 | | | | 9.25 | | | | 1/25/20 | | | | 62,613 | |
| | 77,784 | | | | 9.34 | | | | 10/25/42 | 1 | | | 94,042 | |
| | 1,099,579 | | | | 9.43 | | | | 6/25/32 | 1 | | | 1,271,696 | |
| | 2,324,706 | | | | 9.47 | | | | 2/25/44 | 1 | | | 2,912,859 | |
| | 3,662,292 | | | | 9.50 | | | | 12/25/18-12/25/41 | | | | 4,552,890 | |
| | 132,779 | | | | 9.60 | | | | 3/25/20 | | | | 153,787 | |
| | 327,280 | | | | 10.06 | | | | 3/25/39 | 1 | | | 389,515 | |
| | 3,327,210 | | | | 10.25 | | | | 9/25/42 | 1 | | | 4,090,003 | |
| | 1,710,838 | | | | 11.17 | | | | 6/25/44 | 1 | | | 2,115,420 | |
| | | | | | | | | | | | | | |
| | | |
| | | | | | | | | | | | | 480,493,638 | |
| | | | | | | | | | | | | | |
| Government National Mortgage Association - 3.0% | |
| | 933,498 | | | | 6.50 | | | | 9/20/28-3/20/31 | | | | 1,099,443 | |
| | 1,261,993 | | | | 6.96 | | | | 3/16/41 | 1 | | | 1,317,889 | |
| | 41,016,729 | | | | 7.00 | | | | 9/16/23-5/20/42 | | | | 46,383,917 | |
| | 186,698 | | | | 7.50 | | | | 5/16/27 | | | | 228,480 | |
| | 2,197,725 | | | | 8.00 | | | | 10/16/29-1/16/30 | | | | 2,574,440 | |
| | |
| See accompanying notes to financial statements. | | |
SEPTEMBER 30, 2012 | | 7 |
SCHEDULE OF INVESTMENTS (Unaudited)
September 30, 2012
Sit U.S. Government Securities Fund (Continued)
| | | | | | | | | | | | | | |
Principal Amount ($) | | | Coupon Rate (%) | | | Maturity Date | | | Fair Value ($) | |
| | | |
| | 53,591 | | | | 8.50 | | | | 2/20/32 | | | | 68,342 | |
| | | | | | | | | | | | | | |
| | | |
| | | | | | | | | | | | | 51,672,511 | |
| | | | | | | | | | | | | | |
|
| Vendee Mortgage Trust - 3.3% | |
| | 9,532,150 | | | | 3.75 | | | | 12/15/33 | | | | 10,271,034 | |
| | 690,880 | | | | 6.00 | | | | 2/15/30 | | | | 724,722 | |
| | 20,153,893 | | | | 6.50 | | | | 1/15/29-8/15/31 | | | | 24,273,698 | |
| | 3,280,289 | | | | 6.75 | | | | 6/15/26 | | | | 3,888,658 | |
| | 3,028,839 | | | | 7.00 | | | | 3/15/28 | | | | 3,639,002 | |
| | 383,406 | | | | 7.02 | | | | 7/15/30 | 1 | | | 448,402 | |
| | 1,900,511 | | | | 7.25 | | | | 9/15/22-9/15/25 | | | | 2,167,242 | |
| | 976,725 | | | | 7.50 | | | | 6/15/30 | | | | 1,129,360 | |
| | 3,149,189 | | | | 7.75 | | | | 5/15/22-9/15/24 | | | | 3,678,748 | |
| | 5,821,276 | | | | 7.99 | | | | 3/15/25 | 1 | | | 7,020,482 | |
| | 562,676 | | | | 8.00 | | | | 2/15/25 | | | | 662,095 | |
| | 203,205 | | | | 8.29 | | | | 12/15/26 | | | | 241,966 | |
| | | | | | | | | | | | | | |
| | | |
| | | | | | | | | | | | | 58,145,409 | |
| | | | | | | | | | | | | | |
|
| Total Collateralized Mortgage Obligations | |
| (cost: $797,739,028) | | | | 805,068,784 | |
| | | | | | | | | | | | | | |
|
| Asset-Backed Securities - 1.9% | |
| Federal Home Loan Mortgage Corporation - 0.5% | |
| | 36,503 | | | | 6.09 | | | | 9/25/29 | 1 | | | 37,738 | |
| | 250,000 | | | | 6.28 | | | | 10/27/31 | 1 | | | 281,354 | |
| | 345,470 | | | | 7.00 | | | | 11/25/30 | 1 | | | 359,580 | |
| | 3,744,027 | | | | 7.15 | | | | 9/25/28 | 1 | | | 4,196,886 | |
| | 2,880,495 | | | | 7.16 | | | | 7/25/29 | | | | 3,040,170 | |
| | 1,044,097 | | | | 7.27 | | | | 8/25/28 | 1 | | | 1,125,015 | |
| | | | | | | | | | | | | | |
| | | |
| | | | | | | | | | | | | 9,040,743 | |
| | | | | | | | | | | | | | |
|
| Federal National Mortgage Association - 0.2% | |
| | 87,961 | | | | 0.56 | | | | 11/25/32 | 1 | | | 81,237 | |
| | 514,232 | | | | 4.68 | | | | 10/25/33 | 1 | | | 515,171 | |
| | 422,275 | | | | 5.41 | | | | 9/26/33 | 1 | | | 428,576 | |
| | 156,776 | | | | 5.75 | | | | 2/25/33 | 1 | | | 168,093 | |
| | 294,524 | | | | 6.47 | | | | 10/25/31 | 1 | | | 308,808 | |
| | 593,992 | | | | 6.58 | | | | 5/25/32 | 1 | | | 601,454 | |
| | 1,359,874 | | | | 6.59 | | | | 10/25/31 | 1 | | | 1,526,189 | |
| | 156,202 | | | | 6.83 | | | | 7/25/31 | 1 | | | 163,103 | |
| | 57,732 | | | | 7.80 | | | | 6/25/26 | 1 | | | 57,801 | |
| | | | | | | | | | | | | | |
| | | |
| | | | | | | | | | | | | 3,850,432 | |
| | | | | | | | | | | | | | |
| | | | | | | | | | |
Principal Amount ($)/ Contracts | | Coupon Rate (%) | | Maturity Date | | | Fair Value ($) | |
|
Small Business Administration - 1.2% | |
| 3,364,459 | | 6.77 | | | 11/1/28 | | | | 3,957,022 | |
| 4,892,072 | | 7.13 | | | 10/1/20 | | | | 5,466,901 | |
| 5,645,071 | | 7.33 | | | 8/1/20 | | | | 6,366,198 | |
| 4,424,464 | | 8.03 | | | 5/1/20 | | | | 5,026,179 | |
| | | | | | | | | | |
| | | |
| | | | | | | | | 20,816,300 | |
| | | | | | | | | | |
| |
Total Asset-Backed Securities
(cost: $33,364,282) | | | | 33,707,475 | |
| | | | | | | | | | |
|
Put Options Purchased 10 - 0.0% | |
| 150 | | U.S. Treasury 5 Year Future Put Options: $124.00 strike November 2012 expiration | | | | | |
|
Total Put Options Purchased | |
(cost: $41,666) | | | | 7,031 | |
| | | | | | | | | | |
| |
Total Investments in Securities - 97.9%
(cost: $1,676,742,113) | | | | 1,717,467,457 | |
| | | | | | | | | | |
|
Call Options Written 10 - 0.0% | |
| (1,000) | | U.S. Treasury 2 Year Future Call Options: $110.25 strike November 2012 expiration | | | | | |
|
Total Call Options Written | |
(premiums received: $89,421) | | | | (93,750 | ) |
| | | | | | | | | | |
| |
Other Assets and Liabilities, net - 2.1% | | | | 36,761,206 | |
| | | | | | | | | | |
| |
Total Net Assets - 100.0% | | | $ | 1,754,134,913 | |
| | | | | | | | | | |
| 1 | Variable rate security. Rate disclosed is as of September 30, 2012. |
| 10 | The amount of $1,500,000 in cash was segregated with the broker to cover put options purchased and call options written as of September 30, 2012. |
Numeric footnotes not disclosed are not applicable to this Schedule of Investments.
| | |
| See accompanying notes to financial statements. | | |
8 | | SIT MUTUAL FUNDS SEMI-ANNUAL REPORT |
A summary of the levels for the Fund’s investments as of September 30, 2012 is as follows (see Note 2 - significant accounting policies in the notes to financial statements):
| | | | | | | | | | | | | | | | | | | | |
| | | Investment in Securities |
| | | Level 1 Quoted Price ($) | | Level 2 Other significant observable inputs ($) | | Level 3 Significant unobservable inputs ($) | | Total ($) |
Assets | | | | | | | | | | | | | | | | | | | | |
Mortgage Pass-Through Securities | | | | — | | | | | 856,461,670 | | | | | — | | | | | 856,461,670 | |
U.S. Treasury / Federal Agency Securities | | | | — | | | | | 22,222,497 | | | | | — | | | | | 22,222,497 | |
Collateralized Mortgage Obligations | | | | — | | | | | 805,068,784 | | | | | — | | | | | 805,068,784 | |
Asset-Backed Securities | | | | — | | | | | 33,707,475 | | | | | — | | | | | 33,707,475 | |
Put Options Purchased | | | | 7,031 | | | | | — | | | | | — | | | | | 7,031 | |
| | | | |
| | | | 7,031 | | | | | 1,717,460,426 | | | | | — | | | | | 1,717,467,457 | |
| | | | |
Liabilities | | | | | | | | | | | | | | | | | | | | |
Call Options Written | | | | (93,750 | ) | | | | — | | | | | — | | | | | (93,750 | ) |
For the reporting period, there were no transfers between levels 1, 2 and 3.
| | |
| See accompanying notes to financial statements. | | |
SEPTEMBER 30, 2012 | | 9 |
OBJECTIVE & STRATEGY
The objective of the Tax-Free Income Fund is to provide a high level of current income that is exempt from federal income tax, consistent with preservation of capital, by investing primarily in investment-grade municipal securities.
Such municipal securities generate interest income that is exempt from both federal regular income tax and federal alternative minimum tax. During normal market conditions, the Fund invests 100% of its net assets in such tax-exempt municipal securities.
The Sit Tax-Free Income Fund provided a total return of +5.93% for the six-month period ended September 30, 2012, compared with a total return of +2.58% for the Barclays Capital 5-Year Municipal Bond Index. As of September 30, 2012, the Fund’s 30-day SEC yield was 4.04% and its 12-month distribution rate was 4.30%.
Tax-exempt municipal bond yields continued to decline during the six-month period, resulting in strong returns for the asset class. The tax-exempt yield curve flattened as long-term bond yields declined substantially while intermediate and short yields decreased to a lesser extent. Credit spreads also narrowed during the period.
The Fund’s outperformance during this period was due to several factors including duration, quality, and industry positioning.The Fund benefited from its longer duration versus the benchmark. From a quality perspective, the Fund benefited by having considerable exposure to bonds rated in the BBB to AA rating categories. The rated bonds in the Fund performed exceptionally well, and the Fund also benefited from its meaningful allocation to non-rated bonds. Sixteen of the eighteen industry sectors in the portfolio outperformed the benchmark return during the period. The largest industry sectors in the portfolio were other revenue, single family mortgage revenue, multi-family mortgage revenue, education/student loan revenue, and healthcare. These five sectors comprised two-thirds of the portfolio, and each outperformed the benchmark return. Lastly, the Fund’s investment in closed-end bond funds produced an impressive total return during the six-month period of nearly +11%.
The Fund maintains its duration longer than its benchmark, with significant weightings in intermediate and longer-term bonds. The Fund will likely shorten its duration over the course of the next year, however, if long-term yields continue to decline. Although the tax-exempt yield curve continued to flatten during the period, it remains relatively steep on a historical basis. While credit spreads have tightened markedly since the 2008 financial crisis, we believe that credit spreads for many bonds rated A and below, as well as select non-rated bonds, remain attractive. Therefore, even with the strong returns
HYPOTHETICAL GROWTH OF $10,000
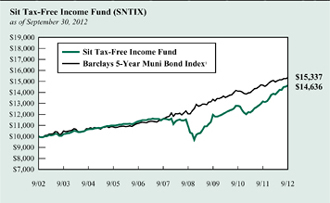
The chart above illustrates the total value of a hypothetical $10,000 investment in the Fund over the past 10 years (or for the life of the Fund if shorter) as compared to the performance of the Barclays 5-Year Municipal Bond Index. Past performance does not guarantee future results. Returns include the reinvestment of distributions. The chart does not reflect the deduction of taxes that a shareholder would pay on Fund distributions or the redemption of Fund shares.
1 The Barclays 5-Year Municipal Bond Index is the 5 year (4-6) component of the Municipal Bond Index, an unmanaged, rules-based, market-value-weighted index for the long-term tax-exempt bond market. The index includes bonds with a minimum credit rating of BBB. The returns include the reinvestment of income and do not include any transaction costs, management fees or other costs. It is not possible to invest directly in an index. This is the Fund’s primary index.
provided by the Fund over the past year and the low level of absolute yields at present, we believe the Fund’s duration, credit quality and industry weightings have it well-positioned for the current environment. As always, our strategy continues to emphasize income, which we believe is the primary driver of return over the long run. Diversification remains a key factor in managing risk.
Michael C. Brilley
Debra A. Sit, CFA
Paul J. Jungquist, CFA
Senior Portfolio Managers
| | |
10 | | SIT MUTUAL FUNDS SEMI-ANNUAL REPORT |
COMPARATIVE RATES OF RETURNS
as of September 30, 2012
| | | | | | | | | | | | |
| | | Sit
Tax-Free
Income
Fund | | | Barclays
5-Year Muni
Bond Index1 | | | Lipper
General
Muni. Bond
Fund Index2 | |
Six Month | | | 5.93 | % | | | 2.58 | % | | | n/a | |
One Year | | | 11.22 | | | | 4.68 | | | | 10.68 | % |
Five Years | | | 4.82 | | | | 5.72 | | | | 5.66 | |
Ten Years | | | 3.88 | | | | 4.37 | | | | 4.72 | |
Since Inception (9/29/88) | | | 5.51 | | | | 5.74 | | | | 6.11 | |
| | | | | | | | | | | | | |
Performance figures are historical and do not guarantee future results. Investment returns and principal value will vary, and you may have a gain or loss when you sell shares. Current performance may be lower or higher than the performance data quoted. Contact the Fund for performance data current to the most recent month-end. Returns include changes in share price as well as reinvestment of all dividends and capital gains and all fee waivers. Without the fee waivers total return and yield figures would have been lower. Returns do not reflect the deduction of taxes that a shareholder would pay on Fund distributions or the redemption of Fund shares. Management fees and administrative expenses are included in the Fund’s performance. Returns for periods greater than one year are compounded average annual rates of return.
1 The Barclays 5-Year Municipal Bond Index is the 5 year (4-6) component of the Municipal Bond Index, an unmanaged, rules-based, market-value-weighted index for the long-term tax-exempt bond market. The index includes bonds with a minimum credit rating of BBB. The returns include the reinvestment of income and do not include any transaction costs, management fees or other costs. It is not possible to invest directly in an index.
2 The Lipper returns are obtained from Lipper Analytical Services, Inc., a large independent evaluator of mutual funds.
FUND DIVERSIFICATION
| | | | | | |
Other Revenue | | | 15.1 | % | | |
Single Family Mortgage | | | 14.8 | % | | |
Multifamily Mortgage | | | 13.1 | % | | |
Education/Student Loan | | | 12.8 | % | | |
Hospital/Health Care | | | 9.6 | % | | |
Closed-End Mutual Funds | | | 6.9 | % | | |
Insured | | | 6.0 | % | | |
General Obligation | | | 5.9 | % | | |
Sectors less than 5%. | | | 12.0 | % | | |
Cash & Other Net Assets | | | 3.8 | % | | |
| | | | | | | |
Based on total net assets as of September 30, 2012. Subject to change.
PORTFOLIO SUMMARY
| | |
Net Asset Value 9/30/12: | | $9.58 Per Share |
Net Asset Value 3/31/12: | | $9.23 Per Share |
Total Net Assets: | | $175.1 Million |
30-day SEC Yield 3: | | 4.04% |
Tax Equivalent Yield 4: | | 6.22% |
12-month Distribution Rate 3: | | 4.30% |
Average Maturity: | | 16.8 Years |
Effective Duration 5: | | 6.1 Years |
3 The SEC Yield reflects the rate at which the Fund is earning income on its current portfolio of securities, while the distribution rate reflects the Fund’s past dividends paid to shareholders based on the net investment income distributed and the average NAV during the past 12 months. Accordingly, the Fund’s SEC yield and distribution rate may differ.
4 The tax-equivalent yield is based on an assumed tax rate of 35.0%.
5 Duration is a measure of estimated price sensitivity relative to changes in interest rates. Portfolios with longer durations are typically more sensitive to changes in interest rates. For example, if interest rates rise by 1%, the market value of a security with an effective duration of 5 years would decrease by 5%, with all other factors being constant. The correlation between duration and price sensitivity is greater for securities rated investment-grade than it is for securities rated below investment-grade. Duration estimates are based on assumptions by the Adviser and are subject to a number of limitations. Effective duration is calculated based on historical price changes of securities held by the Fund, and therefore is a more accurate estimate of price sensitivity provided interest rates remain within their historical range.
QUALITY RATINGS (% of Total Net Assets)
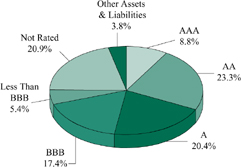
Lower of Moody’s, S&P, Fitch or Duff & Phelps ratings used.
| | | | | | |
| Adviser’s Assessment of Non-Rated Securities: |
AAA | | 0.0% | | | | |
AA | | 1.5 | | | | |
A | | 0.7 | | | | |
BBB | | 5.2 | | | | |
BB | | 8.4 | | | | |
<BB | | 5.1 | | | | |
| | | | | | |
Total | | 20.9% | | | | |
SCHEDULE OF INVESTMENTS (Unaudited)
September 30, 2012
Sit Tax-Free Income Fund
| | | | | | | | | | | | | | | | |
Principal
Amount ($) | | | Name of Issuer | | Coupon
Rate (%) | | | Maturity Date | | | Fair
Value ($) | |
| | | |
| | Municipal Bonds - 89.3% | | | | | | | | | | | | |
| | Alabama - 0.3% | | | | | | | | | | | | |
| | 500,000 | | | Pell City Special Care Facs. Finance Rev. | | | 5.00 | | | | 12/1/39 | | | | 536,865 | |
| | | | | | | | | | | | | | | | |
| | | |
| | Alaska - 0.9% | | | | | | | | | | | | |
| | 415,000 | | | AK Hsg. Finance Corp. Mtg. Rev. | | | 4.25 | | | | 12/1/40 | | | | 425,275 | |
| | 500,000 | | | AK Hsg. Finance Corp. Mtg. Rev. (GO of Corp. Insured) | | | 4.50 | | | | 12/1/35 | | | | 525,305 | |
| | 250,000 | | | AK Industrial Dev. & Export Auth. Rev. (Boys & Girls Home) 2, 5 | | | 5.50 | | | | 12/1/12 | | | | 85,012 | |
| | 500,000 | | | Koyukuk Health Facility Rev. (Tanana Chief’s Conf. Health Care) | | | 7.00 | | | | 10/1/23 | | | | 550,140 | |
| | | | | | | | | | | | | | | | |
| | | | |
| | | | | | | | | | | | | | | 1,585,732 | |
| | | | | | | | | | | | | | | | |
| | | |
| | Arizona - 3.6% | | | | | | | | | | | | |
| | 250,000 | | | AZ Health Facs. Auth. Rev. (Beatitudes Campus Proj.) | | | 5.10 | | | | 10/1/22 | | | | 247,070 | |
| | 986,462 | | | AZ Health Facs. Auth. Rev. (New Arizona Family Proj.) | | | 5.25 | | | | 7/1/27 | | | | 1,045,216 | |
| | 250,000 | | | Festival Ranch Community Facs. District G.O. | | | 6.25 | | | | 7/15/24 | | | | 274,802 | |
| | 200,000 | | | Flagstaff Industrial Dev. Auth. Rev. (Sr. Living Community Proj.) | | | 5.50 | | | | 7/1/22 | | | | 202,788 | |
| | 850,000 | | | Phoenix Industrial Development Authority | | | 5.25 | | | | 6/1/34 | | | | 949,688 | |
| | 300,000 | | | Pima Co. Industrial Dev. Auth. Education Rev. (AZ Charter Schools Proj.) | | | 6.70 | | | | 7/1/21 | | | | 300,813 | |
| | 495,000 | | | Pima Co. Industrial Dev. Auth. Education Rev. (AZ Charter Schools Proj.) | | | 5.00 | | | | 7/1/26 | | | | 456,891 | |
| | 250,000 | | | Pima Co. Industrial Dev. Auth. Education Rev. (AZ Charter Schools Proj.) | | | 6.75 | | | | 7/1/31 | | | | 250,478 | |
| | 345,000 | | | Pima Co. Industrial Dev. Auth. Education Rev. (Choice Education & Dev. Corp. Proj.) | | | 6.00 | | | | 6/1/16 | | | | 354,726 | |
| | 500,000 | | | Pima Co. Industrial Dev. Auth. Education Rev. (Coral Academy Science Proj.) | | | 6.38 | | | | 12/1/18 | | | | 521,005 | |
| | 250,000 | | | Pima Co. Industrial Dev. Auth. Education Rev. (P.L.C. Charter Schools Proj.) | | | 6.00 | | | | 4/1/16 | | | | 250,408 | |
| | 400,000 | | | Pima Co. Industrial Dev. Auth. Education Rev. (Tucson Country Day School Proj.) | | | 5.00 | | | | 6/1/22 | | | | 400,136 | |
| | 500,000 | | | Quail Creek Community Facs. District G.O. | | | 5.15 | | | | 7/15/16 | | | | 515,880 | |
| | 500,000 | | | Quechan Indian Tribe of Fort Yuma Rev. (Tribal Economic Dev.) | | | 9.75 | | | | 5/1/25 | | | | 528,345 | |
| | | | | | | | | | | | | | | | |
| | | | |
| | | | | | | | | | | | | | | 6,298,246 | |
| | | | | | | | | | | | | | | | |
| | | |
| | Arkansas - 0.3% | | | | | | | | | | | | |
| | 460,000 | | | Rogers Rev. (Sales & Use Tax) | | | 4.13 | | | | 11/1/31 | | | | 501,667 | |
| | | | | | | | | | | | | | | | |
| | | |
| | California - 12.5% | | | | | | | | | | | | |
| | 350,000 | | | Acalanes Union High School District G.O. 6 | | | 3.02 | | | | 8/1/39 | | | | 240,583 | |
| | 500,000 | | | Agua Caliente Band of Cahuilla Indians Rev. 4 | | | 6.00 | | | | 7/1/18 | | | | 491,895 | |
| | 250,000 | | | Alameda Corridor Transportation Auth. Rev. Capital Appreciation (AMBAC Insured) 6 | | | 6.71 | | | | 10/1/24 | | | | 277,695 | |
| | 250,000 | | | Alameda Corridor Transportation Auth. Rev. Sr. Lien (NATL-RE Insured) | | | 5.25 | | | | 10/1/21 | | | | 250,342 | |
| | 400,000 | | | Brea Redevelopment Agency Capital Appreciation Tax Allocation 6 | | | 7.03 | | | | 8/1/29 | | | | 140,560 | |
| | 500,000 | | | CA Co. Tobacco Securitization Agy. Rev. (Golden Gate Tobacco Proj.) | | | 5.00 | | | | 6/1/36 | | | | 406,590 | |
| | 336,601 | | | CA Community Hsg. Fin. Agy. Lease Rev. Pass Thru Obligation 2, 5 | | | 4.85 | | | | 11/1/12 | | | | 20,196 | |
| | 250,000 | | | CA Finance Auth. Education Rev. (American Heritage Education Foundation Proj.) | | | 5.25 | | | | 6/1/26 | | | | 238,938 | |
| | 250,000 | | | CA Finance Auth. Rev. (Kern Regional Center Proj.) 9 | | | 6.88 | | | | 5/1/25 | | | | 299,005 | |
| | 350,000 | | | CA Finance Auth. Rev. (Literacy First Proj.) | | | 5.50 | | | | 9/1/22 | | | | 367,860 | |
| | 495,000 | | | CA Govt. Finance Auth. Lease Rev. (Placer Co. Transportation Proj.) | | | 6.00 | | | | 12/1/28 | | | | 506,152 | |
| | 285,000 | | | CA Hsg. Finance Agy. Home Mtg. Rev. | | | 5.20 | | | | 8/1/28 | | | | 293,408 | |
| | 205,000 | | | CA Hsg. Finance Agy. Home Mtg. Rev. | | | 5.50 | | | | 8/1/38 | | | | 208,969 | |
| | 500,000 | | | CA Infrastructure & Economic Dev. Bank Rev. | | | 6.00 | | | | 2/1/30 | | | | 547,205 | |
| | 500,000 | | | CA School Facs. Finance Auth. Rev. (Azusa Unified School District) (AGM Insured) 6 | | | 6.00 | | | | 8/1/29 | | | | 499,650 | |
| | 250,000 | | | CA Statewide Communities Dev. Auth. Multifamily Rev. (Bel Mar Apts. Proj.) (FNMA Collateral) | | | 4.70 | | | | 7/15/32 | | | | 274,305 | |
| | 250,000 | | | CA Statewide Communities Dev. Auth. Rev. (Kaiser Permanente Proj.) | | | 5.50 | | | | 11/1/32 | | | | 250,885 | |
| | 235,000 | | | CA Statewide Communities Dev. Auth. Rev. (Sunedison Huntington Beach Solar Proj.) | | | 6.00 | | | | 1/1/21 | | | | 254,653 | |
| | 500,000 | | | CA Statewide Communities Dev. Auth. Rev. (Sunedison Irvine School District) | | | 5.25 | | | | 1/1/16 | | | | 507,880 | |
| | 500,000 | | | CA Statewide Communities Dev. Auth. Rev. C.O.P (Internext Group) | | | 5.38 | | | | 4/1/30 | | | | 501,410 | |
| | 400,000 | | | Carlsbad Unified School District G.O. Capital Appreciation 6 | | | 6.13 | | | | 8/1/31 | | | | 318,036 | |
| | 2,300,000 | | | Ceres Unified School District G.O. Capital Appreciation (NATL-RE FGIC Insured) 6 | | | 5.91 | | | | 8/1/27 | | | | 969,358 | |
| | 1,000,000 | | | Colton Joint Unified School District G.O. (AGM Insured) 6 | | | 5.80 | | | | 8/1/35 | | | | 708,980 | |
| | |
| See accompanying notes to financial statements. | | |
12 | | SIT MUTUAL FUNDS SEMI-ANNUAL REPORT |
| | | | | | | | | | | | | | | | |
Principal
Amount ($) | | | Name of Issuer | | Coupon
Rate (%) | | | Maturity
Date | | | Fair
Value ($) | |
| | | | |
| | 250,000 | | | Eden Township Hospital District C.O.P. | | | 6.00 | | | | 6/1/25 | | | | 277,545 | |
| | 500,000 | | | Encinitas Union School District G.O. Capital Appreciation 6 | | | 6.75 | | | | 8/1/35 | | | | 383,895 | |
| | 1,000,000 | | | Glendale Unified School District G.O. Capital Appreciation 6 | | | 6.22 | | | | 9/1/27 | | | | 459,020 | |
| | 500,000 | | | Hartnell Community College G.O. 6 | | | 7.00 | | | | 8/1/34 | | | | 372,130 | |
| | 500,000 | | | Hawthorne School District C.O.P. (AGM Insured) 6 | | | 6.00 | | | | 12/1/29 | | | | 491,745 | |
| | 1,045,000 | | | Hayward Unified School District G.O. Capital Appreciation (AGM Insured) 6 | | | 5.48 | | | | 8/1/33 | | | | 350,953 | |
| | 250,000 | | | Imperial Community College District G.O. Capital Appreciation (AGM Insured) 6 | | | 0.97 | | | | 8/1/40 | | | | 253,810 | |
| | 215,000 | | | Lindsay-Strathmore Irrigation District C.O.P. 9 | | | 4.50 | | | | 8/1/30 | | | | 230,538 | |
| | 1,100,000 | | | Los Alamitos Unified School District Capital Appreciation C.O.P. 6 | | | 3.24 | | | | 8/1/34 | | | | 672,188 | |
| | 560,000 | | | Manteca Unified School District Capital Appreciation C.O.P. (NATL-RE Insured) 6 | | | 7.55 | | | | 9/15/25 | | | | 283,119 | |
| | 250,000 | | | Marina Coast Water District Rev. | | | 5.00 | | | | 6/1/20 | | | | 286,408 | |
| | 250,000 | | | Martinez Unified School District G.O. 6 | | | 6.13 | | | | 8/1/35 | | | | 275,395 | |
| | 500,000 | | | Northern CA Gas Auth. No. 1 Rev. 1 | | | 1.03 | | | | 7/1/27 | | | | 364,215 | |
| | 1,000,000 | | | Oak Grove School District G.O. 6 | | | 6.96 | | | | 6/1/41 | | | | 155,370 | |
| | 2,100,000 | | | Pittsburg CA Unified School District Rev. Capital Appreciation (AGM GO of District Insured) 6 | | | 7.12 | | | | 9/1/29 | | | | 743,274 | |
| | 500,000 | | | Placentia-Yorba Linda Unified School District C.O.P. Capital Appreciation (AGM Insured) 6 | | | 6.25 | | | | 10/1/28 | | | | 462,795 | |
| | 600,000 | | | Redondo Beach School District G.O. 6 | | | 6.38 | | | | 8/1/34 | | | | 596,082 | |
| | 500,000 | | | Richmond Community Redev. Agy. Tax Allocation | | | 6.00 | | | | 9/1/30 | | | | 559,045 | |
| | 250,000 | | | Richmond Joint Powers Fin. Auth. Rev. (Point Potrero) | | | 6.25 | | | | 7/1/24 | | | | 285,070 | |
| | 1,000,000 | | | Robla School District G.O. (AGM Insured) 6 | | | 6.51 | | | | 8/1/36 | | | | 294,760 | |
| | 500,000 | | | Sacramento Co. Water Financing Auth. Rev. (NATL-RE FGIC Insured) 1 | | | 0.85 | | | | 6/1/39 | | | | 324,935 | |
| | 1,000,000 | | | San Bernardino City Unified School District G.O. Capital Appreciation (NATL-RE Insured) 6 | | | 4.72 | | | | 8/1/29 | | | | 411,160 | |
| | 250,000 | | | San Bernardino Joint Powers Financing Auth. Rev. (City Hall Proj.) (NATL-RE Insured) | | | 5.60 | | | | 1/1/15 | | | | 245,182 | |
| | 250,000 | | | San Joaquin Hills Toll Road Rev. Ref. (NATL-RE Insured) | | | 5.25 | | | | 1/15/30 | | | | 250,625 | |
| | 250,000 | | | South Bayside Waste Management Auth. Rev. (Shoreway Environmental) | | | 6.25 | | | | 9/1/29 | | | | 286,322 | |
| | 500,000 | | | Southern Kern Unified School District G.O. (AGM Insured) 6 | | | 4.50 | | | | 11/1/31 | | | | 487,235 | |
| | 350,000 | | | Southwest Community Finance Auth. Rev. (Riverside Co. Proj.) 9 | | | 6.00 | | | | 5/1/24 | | | | 402,766 | |
| | 350,000 | | | Sulphur Springs Union School District C.O.P. Capital Appreciation (AGM Insured) 6 | | | 1.31 | | | | 12/1/37 | | | | 360,370 | |
| | 755,000 | | | Sutter Union High School District G.O. Capital Appreciation6 | | | 7.25 | | | | 8/1/33 | | | | 224,235 | |
| | 600,000 | | | Tracy Joint Unified School District G.O. Capital Appreciation6 | | | 3.07 | | | | 8/1/41 | | | | 298,344 | |
| | 500,000 | | | Tustin Unified School District G.O. Capital Appreciation 6 | | | 6.05 | | | | 8/1/28 | | | | 386,445 | |
| | 400,000 | | | Upland C.O.P. (San Antonio Community Hospital Proj.) | | | 6.38 | | | | 1/1/32 | | | | 475,200 | |
| | 500,000 | | | Val Verde Unified School District G.O. Capital Appreciation (AGM Insured) 6 | | | 6.13 | | | | 8/1/34 | | | | 353,400 | |
| | 400,000 | | | Walnut Public Financing Auth. Tax Allocation (AMBAC Insured) | | | 5.38 | | | | 9/1/22 | | | | 400,920 | |
| | 300,000 | | | West Contra Costa Healthcare District C.O.P. | | | 6.00 | | | | 7/1/32 | | | | 345,861 | |
| | 500,000 | | | Westminster School District G.O. 6 | | | 5.37 | | | | 8/1/24 | | | | 310,885 | |
| | | | | | | | | | | | | | | | |
| | | | |
| | | | | | | | | | | | | | | 21,935,797 | |
| | | | | | | | | | | | | | | | |
| | | |
| | Colorado - 2.8% | | | | | | | | | | | | |
| | 250,000 | | | CO Education & Cultural Facs. Auth. Rev. (CO Springs Charter Academy Proj.) | | | 5.60 | | | | 7/1/34 | | | | 262,642 | |
| | 500,000 | | | CO Education & Cultural Facs. Auth. Rev. Ref. (Vail Mountain School Proj.) | | | 6.00 | | | | 5/1/30 | | | | 534,495 | |
| | 500,000 | | | CO Health Facs. Auth. Rev. (Evangelical Lutheran Good Samaritan) | | | 5.00 | | | | 12/1/42 | | | | 532,325 | |
| | 575,000 | | | CO Hsg. Finance Auth. Multifamily Rev. | | | 3.90 | | | | 10/1/42 | | | | 575,000 | |
| | 400,000 | | | CO Hsg. Finance Auth. Single Family Mtg. Rev. | | | 5.50 | | | | 11/1/29 | | | | 414,612 | |
| | 625,000 | | | CO Hsg. Finance Auth. Single Family Mtg. Rev. (FHA Insured) | | | 5.00 | | | | 11/1/34 | | | | 657,294 | |
| | 955,000 | | | Denver Health & Hospital Auth. Healthcare Rev. 1 | | | 1.38 | | | | 12/1/33 | | | | 731,692 | |
| | 557,749 | | | Lyons Rev. (Longmont Humane Society Proj.) | | | 4.75 | | | | 11/30/16 | | | | 563,700 | |
| | 500,000 | | | Regional Transportation District Private Activity Rev. (Denver Trans. Partners) | | | 6.00 | | | | 1/15/34 | | | | 583,880 | |
| | | | | | | | | | | | | | | | |
| | | | |
| | | | | | | | | | | | | | | 4,855,640 | |
| | | | | | | | | | | | | | | | |
| | | |
| | Connecticut - 2.0% | | | | | | | | | | | | |
| | 500,000 | | | CT Health & Educational Fac. Auth. Rev. (Stamford Hospital) | | | 5.13 | | | | 7/1/35 | | | | 552,710 | |
| | |
| See accompanying notes to financial statements. | | |
SEPTEMBER 30, 2012 | | 13 |
SCHEDULE OF INVESTMENTS (Unaudited)
September 30, 2012
Sit Tax-Free Income Fund (Continued)
| | | | | | | | | | | | | | | | |
Principal
Amount ($) | | | Name of Issuer | | Coupon
Rate (%) | | | Maturity
Date | | | Fair
Value ($) | |
| | | | |
| | 1,000,000 | | | CT Hsg. Finance Auth. Rev. | | | 4.00 | | | | 11/15/34 | | | | 1,025,680 | |
| | 210,000 | | | CT Hsg. Finance Auth. Rev. | | | 5.15 | | | | 11/15/34 | | | | 224,425 | |
| | 500,000 | | | CT Hsg. Finance Auth. Rev. (GO of Auth.) | | | 3.75 | | | | 11/15/35 | | | | 508,855 | |
| | 500,000 | | | CT Hsg. Finance Auth. Rev. (GO of Auth.) | | | 4.75 | | | | 11/15/35 | | | | 538,140 | |
| | 425,000 | | | CT Hsg. Finance Auth. Rev. (GO of Auth.) | | | 4.90 | | | | 11/15/36 | | | | 464,142 | |
| | 147,850 | | | Hamden Facs. Rev. (Whitney Center Proj.) | | | 6.13 | | | | 1/1/14 | | | | 148,066 | |
| | 300,000 | | | Mashantucket Western Pequot Tribe Sub. Special Rev. 2, 4, 5 | | | 5.75 | | | | 9/1/18 | | | | 119,346 | |
| | | | | | | | | | | | | | | | |
| | | | |
| | | | | | | | | | | | | | | 3,581,364 | |
| | | | | | | | | | | | | | | | |
| | | |
| | Delaware - 0.1% | | | | | | | | | | | | |
| | 310,000 | | | Millsboro Special Obligation Rev. (Plantation Lakes Dev. District) | | | 5.45 | | | | 7/1/36 | | | | 239,962 | |
| | | | | | | | | | | | | | | | |
| | | |
| | Florida - 7.2% | | | | | | | | | | | | |
| | 250,000 | | | Alachua County Health Facs. Auth. Rev. (Oak Hammock University) | | | 8.00 | | | | 10/1/32 | | | | 299,872 | |
| | 375,000 | | | Alachua County Health Facs. Auth. Rev. (Terraces Bonita Springs District) | | | 7.13 | | | | 11/15/16 | | | | 379,800 | |
| | 500,000 | | | Bay Co. Educational Facs. Rev. (Bay Haven Charter) | | | 5.25 | | | | 9/1/30 | | | | 514,005 | |
| | 410,000 | | | Boynton Beach Rev. (Charter Schools Boynton Beach, Inc.) | | | 6.25 | | | | 6/1/27 | | | | 419,209 | |
| | 335,000 | | | Capital Trust Agy. Rev. (Golf Villas, Rivermill, and Village Square Apartments Proj.) 2, 5 | | | 4.75 | | | | 6/1/13 | | | | 190,943 | |
| | 1,000,000 | | | Capital Trust Agy. Rev. (Golf Villas, Rivermill, and Village Square Apartments Proj.) 2, 5 | | | 5.88 | | | | 6/1/38 | | | | 569,980 | |
| | 415,000 | | | Collier Co. Industrial Dev. Auth. Rev. (NCH Healthcare System Proj.) | | | 6.25 | | | | 10/1/39 | | | | 485,695 | |
| | 100,000 | | | Fiddlers Creek Community Dev. District No. 2 Special Assessment Rev. 2, 5 | | | 5.75 | | | | 5/1/13 | | | | 52,522 | |
| | 500,000 | | | FL Governmental Utility Auth. Rev. | | | 5.00 | | | | 10/1/37 | | | | 546,515 | |
| | 250,000 | | | FL Hsg. Finance Corp. (GNMA/FNMA Collateralized) | | | 5.00 | | | | 7/1/26 | | | | 280,508 | |
| | 320,000 | | | FL Hsg. Finance Corp. (GNMA/FNMA/FHLMC Collateralized) | | | 5.00 | | | | 7/1/39 | | | | 342,090 | |
| | 250,000 | | | FL Mid-Bay Bridge Authority 6 | | | 6.95 | | | | 10/1/21 | | | | 143,315 | |
| | 15,000 | | | Forest Creek Community Dev. District Capital Improvement Special Assessment Rev. 2, 5 | | | 7.00 | | | | 11/1/13 | | | | 14,845 | |
| | 135,000 | | | Gramercy Farms Community Dev. District Special Assessment 2, 5 | | | 5.10 | | | | 5/1/14 | | | | 1 | |
| | 535,000 | | | Gramercy Farms Community Dev. District Special Assessment 6 | | | 3.24 | | | | 5/1/39 | | | | 81,352 | |
| | 500,000 | | | Highlands Co. Health Facs. Auth. Rev. (Adventist Health) 1 | | | 5.00 | | | | 11/15/31 | | | | 543,700 | |
| | 400,000 | | | Jacksonville Economic Dev. Commission Health Care Facs. Rev. Ref. | | | 6.00 | | | | 9/1/17 | | | | 455,336 | |
| | 500,000 | | | Lake Ashton Community Dev. District Cap. Improvement Special Assessment Rev. 2, 5 | | | 5.00 | | | | 3/31/14 | | | | 170,930 | |
| | 500,000 | | | Lakewood Ranch Stewardship District Cap. Improvement Special Assesment Rev. (Lakewood Center) | | | 7.40 | | | | 5/1/30 | | | | 550,475 | |
| | 250,000 | | | Lexington Oaks Community Dev. District Special Assessment Rev. | | | 5.65 | | | | 5/1/33 | | | | 271,992 | |
| | 250,000 | | | Magnolia Creek Community Dev. District Rev. 2, 5 | | | 5.60 | | | | 5/1/14 | | | | 100,088 | |
| | 500,000 | | | Martin County Health Facs. Auth. Rev. (Martin Memorial Medical Center) | | | 5.50 | | | | 11/15/32 | | | | 558,900 | |
| | 750,000 | | | Mediterra South Community Dev. District Special Assessment | | | 5.10 | | | | 5/1/31 | | | | 769,132 | |
| | 230,000 | | | New River Community Dev. District Cap. Improvement Special Assessment Rev. 2, 5 | | | 5.00 | | | | 5/1/13 | | | | 2 | |
| | 135,000 | | | New River Community Dev. District Cap. Improvement Special Assessment Rev. 6 | | | 1.96 | | | | 5/1/15 | | | | 119,571 | |
| | 275,000 | | | New River Community Dev. District Cap. Improvement Special Assessment Rev. 6 | | | 1.85 | | | | 5/1/18 | | | | 124,074 | |
| | 140,000 | | | New River Community Dev. District Cap. Improvement Special Assessment Rev. 6 | | | 0.40 | | | | 5/1/38 | | | | 96,802 | |
| | 350,000 | | | New River Community Dev. District Cap. Improvement Special Assessment Rev. 6 | | | 0.80 | | | | 5/1/38 | | | | 155,008 | |
| | 265,000 | | | Pinellas Co. Educational Facilities Auth. Rev. | | | 6.13 | | | | 9/15/21 | | | | 286,719 | |
| | 750,000 | | | Sarasota Co. Health Facs. Auth. Retirement Rev. Ref. (Village on the Isle) | | | 5.50 | | | | 1/1/27 | | | | 795,158 | |
| | 500,000 | | | Seminole Tribe Special Obligation Rev. 4 | | | 5.50 | | | | 10/1/24 | | | | 538,785 | |
| | 250,000 | | | Seven Oaks Community Dev. District Special Assessment Rev. | | | 5.50 | | | | 5/1/33 | | | | 266,880 | |
| | 600,000 | | | Tallahassee Health Facs. Rev. (Memorial Health Care Proj.) | | | 6.38 | | | | 12/1/30 | | | | 602,196 | |
| | 295,000 | | | Tolomato Community Dev. District Special Assessment2, 5 | | | 6.38 | | | | 5/1/17 | | | | 134,139 | |
| | 110,000 | | | Tolomato Community Dev. District Special Assessment | | | 6.38 | | | | 5/1/17 | | | | 106,782 | |
| | 105,000 | | | Tolomato Community Dev. District Special Assessment2, 5 | | | 6.38 | | | | 5/1/17 | | | | 1 | |
| | 10,000 | | | Tolomato Community Dev. District Special Assessment2, 5 | | | 6.38 | | | | 5/1/17 | | | | 5,348 | |
| | 40,000 | | | Tolomato Community Dev. District Special Assessment6 | | | 6.61 | | | | 5/1/39 | | | | 28,701 | |
| | 85,000 | | | Tolomato Community Dev. District Special Assessment6 | | | 6.61 | | | | 5/1/40 | | | | 48,963 | |
| | 45,000 | | | Tolomato Community Dev. District Special Assessment6 | | | 6.61 | | | | 5/1/40 | | | | 19,068 | |
| | 500,000 | | | Viera East Community Dev. District Special Assessment Rev. Ref. | | | 5.00 | | | | 5/1/26 | | | | 504,150 | |
| | |
| See accompanying notes to financial statements. | | |
14 | | SIT MUTUAL FUNDS SEMI-ANNUAL REPORT |
| | | | | | | | | | | | | | | | |
Principal
Amount ($) | | | Name of Issuer | | Coupon
Rate (%) | | | Maturity
Date | | | Fair
Value ($) | |
| | | | |
| | 500,000 | | | Waterlefe Community Dev. District Special Assessment | | | 4.88 | | | | 5/1/31 | | | | 506,675 | |
| | 10,000 | | | Waters Edge Community Dev. District Cap. Improvement Rev. | | | 5.35 | | | | 5/1/39 | | | | 10,064 | |
| | 685,000 | | | Waters Edge Community Dev. District Cap. Improvement Rev. 6 | | | 6.64 | | | | 5/1/39 | | | | 322,053 | |
| | 97,556 | | | Waters Edge Community Dev. District Cap. Improvement Special Assessment Rev. | | | 5.00 | | | | 11/1/12 | | | | 24,403 | |
| | 50,000 | | | West Villages Improvement District Special Assessment Rev. (Unit of Dev. No. 3) 2, 5 | | | 5.50 | | | | 5/1/37 | | | | 22,367 | |
| | 450,000 | | | Zephyr Ridge Community Dev. District Special Assessment Rev. 2, 5 | | | 5.25 | | | | 5/1/13 | | | | 179,186 | |
| | | | | | | | | | | | | | | | |
| | | | |
| | | | | | | | | | | | | | | 12,638,300 | |
| | | | | | | | | | | | | | | | |
| | | |
| | Georgia - 2.4% | | | | | | | | | | | | |
| | 198,019 | | | Alpharetta Dev. Auth. Rev (Fulton Science Academy) | | | 6.25 | | | | 7/1/31 | | | | 113,861 | |
| | 250,000 | | | Atlanta Water and Wastewater Rev. (NATL-RE Insured) | | | 5.00 | | | | 11/1/39 | | | | 250,422 | |
| | 1,320,000 | | | East Point Tax Allocation | | | 8.00 | | | | 2/1/26 | | | | 1,322,112 | |
| | 1,000,000 | | | GA Housing & Finance Authority Rev. | | | 4.00 | | | | 12/1/37 | | | | 1,026,250 | |
| | 300,000 | | | GA State Environmental Loan Acquisition Corp. Rev. | | | 5.13 | | | | 2/15/31 | | | | 349,335 | |
| | 750,000 | | | GA State Environmental Loan Acquisition Corp. Rev. | | | 5.13 | | | | 3/15/31 | | | | 872,048 | |
| | 250,000 | | | Private Colleges & Universities Auth. Rev. (Mercer University) | | | 5.00 | | | | 10/1/32 | | | | 270,522 | |
| | | | | | | | | | | | | | | | |
| | | | |
| | | | | | | | | | | | | | | 4,204,550 | |
| | | | | | | | | | | | | | | | |
| | | |
| | Guam - 0.2% | | | | | | | | | | | | |
| | 435,000 | | | Northern Mariana Islands Commonwealth G.O. | | | 5.00 | | | | 10/1/22 | | | | 389,603 | |
| | | | | | | | | | | | | | | | |
| | | |
| | Hawaii - 0.2% | | | | | | | | | | | | |
| | 250,000 | | | HI State Dept. of Budget & Fin. Rev. (Kahala Nui Proj.) | | | 5.25 | | | | 11/15/37 | | | | 266,575 | |
| | | | | | | | | | | | | | | | |
| | | |
| | Idaho - 0.6% | | | | | | | | | | | | |
| | 570,000 | | | ID Hsg. & Fin. Assoc. Nonprofit Facs. Rev. (Compass Public Charter School Proj.) | | | 5.50 | | | | 7/1/30 | | | | 584,410 | |
| | 500,000 | | | ID Hsg. & Fin. Assoc. Nonprofit Facs. Rev. (Idaho Arts Charter School Proj.) | | | 5.75 | | | | 12/1/32 | | | | 529,175 | |
| | | | | | | | | | | | | | | | |
| | | | |
| | | | | | | | | | | | | | | 1,113,585 | |
| | | | | | | | | | | | | | | | |
| | | |
| | Illinois - 6.7% | | | | | | | | | | | | |
| | 375,000 | | | Chicago Board of Education G.O. | | | 5.50 | | | | 12/1/39 | | | | 438,862 | |
| | 1,000,000 | | | Dekalb, Kane & Lasalle Counties Comm. College Dist. No. 523 G.O. Capital Appreciation 6 | | | 6.58 | | | | 2/1/30 | | | | 402,280 | |
| | 500,000 | | | Harvey Ref. & Improvement G.O. | | | 5.50 | | | | 12/1/27 | | | | 476,710 | |
| | 265,000 | | | IL C.O.P. (NATL-RE Insured) | | | 5.80 | | | | 7/1/17 | | | | 265,366 | |
| | 795,000 | | | IL Fin. Auth. Rev. (Columbia College) (XLCA Insured) | | | 4.75 | | | | 12/1/23 | | | | 821,696 | |
| | 500,000 | | | IL Fin. Auth. Rev. (Lake Forest College) | | | 5.75 | | | | 10/1/32 | | | | 524,030 | |
| | 750,000 | | | IL Fin. Auth. Rev. (Noble Network Charter Schools) (ACA Insured) | | | 5.00 | | | | 9/1/27 | | | | 749,970 | |
| | 395,000 | | | IL Fin. Auth. Rev. (TEMPS-50-The Admiral at the Lake Proj.) | | | 6.00 | | | | 5/15/17 | | | | 395,359 | |
| | 250,000 | | | IL Fin. Auth. Rev. (UNO Charter School Network) | | | 6.88 | | | | 10/1/31 | | | | 280,532 | |
| | 1,000,000 | | | IL Fin. Auth. Sports Facs. Rev. (North Shore Ice Arena Proj.) | | | 6.25 | | | | 12/1/38 | | | | 551,450 | |
| | 500,000 | | | IL Fin. Auth. Sports Facs. Rev. (United Sports Organizations of Barrington Proj.) 2, 4, 5 | | | 6.13 | | | | 10/1/27 | | | | 29,895 | |
| | 500,000 | | | IL Fin. Auth. Sports Facs. Rev. (United Sports Organizations of Barrington Proj.) 2, 4, 5 | | | 6.25 | | | | 10/1/37 | | | | 29,895 | |
| | 110,000 | | | IL Health Facs. Auth. Rev. (Ingalls Health System Proj.) (NATL-RE Insured) | | | 6.25 | | | | 5/15/14 | | | | 110,405 | |
| | 380,000 | | | IL Housing Dev. Auth. (AMBAC GO of Authority Insured) | | | 4.50 | | | | 7/1/47 | | | | 382,329 | |
| | 500,000 | | | IL Sports Facs. Auth. (AMBAC Insured) | | | 5.00 | | | | 6/15/32 | | | | 505,040 | |
| | 250,000 | | | Lake Co. Community Consolidated School District No. 50 Woodland G.O. | | | 5.63 | | | | 1/1/26 | | | | 303,588 | |
| | 115,000 | | | Lombard Public Facs. Corp. Rev. First Tier (Conference Center & Hotel Proj.) | | | 6.38 | | | | 1/1/15 | | | | 90,771 | |
| | 1,925,000 | | | Lombard Public Facs. Corp. Rev. First Tier (Conference Center & Hotel Proj.) | | | 5.25 | | | | 1/1/36 | | | | 1,004,946 | |
| | 550,000 | | | Lombard Public Facs. Corp. Rev. First Tier (Conference Center & Hotel Proj.) (ACA Insured) | | | 5.50 | | | | 1/1/25 | | | | 355,272 | |
| | 250,000 | | | Macon County School District No. 61 Decatur G.O. (AGM Insured) | | | 5.25 | | | | 1/1/37 | | | | 283,045 | |
| | 1,945,000 | | | Malta Tax Allocation Rev. | | | 5.75 | | | | 12/30/25 | | | | 1,244,878 | |
| | 818,000 | | | Manhattan Special Service Area Special Tax No. 07-6 (Groebe Farm-Stonegate) 2, 5 | | | 5.75 | | | | 3/1/22 | | | | 225,097 | |
| | 310,000 | | | Northern Illinios University Rev. (Auxiliary Facs.) (AGM Insured) | | | 5.50 | | | | 4/1/26 | | | | 354,144 | |
| | 500,000 | | | Railsplitter Tobacco Settlement Auth. Rev. | | | 6.25 | | | | 6/1/24 | | | | 562,600 | |
| | 415,000 | | | Southwestern IL Dev. Auth. Rev. (Village of Sauget Proj.) | | | 5.63 | | | | 11/1/26 | | | | 355,132 | |
| | |
| See accompanying notes to financial statements. | | |
SEPTEMBER 30, 2012 | | 15 |
SCHEDULE OF INVESTMENTS (Unaudited)
September 30, 2012
Sit Tax-Free Income Fund (Continued)
| | | | | | | | | | | | | | | | |
| Principal | | | | | Coupon | | | Maturity | | | Fair | |
| Amount ($) | | | Name of Issuer | | Rate (%) | | | Date | | | Value ($) | |
| | | | |
| | 605,000 | | | Southwestern IL Dev. Auth. Tax Allocation Ref. (Local Govt. Program) | | | 7.00 | | | | 10/1/22 | | | | 629,291 | |
| | 280,000 | | | St. Clair Co. Township High School District No. 203 O’Fallon G.O. (AMBAC Insured) | | | 5.75 | | | | 12/1/26 | | | | 319,533 | |
| | | | | | | | | | | | | | | | |
| | | | |
| | | | | | | | | | | | | | | 11,692,116 | |
| | | | | | | | | | | | | | | | |
| | | |
| Indiana - 3.4% | | | | | | | | | | | | |
| | 700,000 | | | Carmel Multifamily Hsg. Rev. (Barrington Carmel Proj.) | | | 6.00 | | | | 11/15/22 | | | | 696,794 | |
| | 300,000 | | | Damon Run Conservancy Dist. G.O. (St Intercept Insured) | | | 6.10 | | | | 7/1/25 | | | | 333,027 | |
| | 370,000 | | | East Chicago Redev. Commission Tax Allocation (Harborside Redev. Proj.) | | | 5.50 | | | | 1/15/16 | | | | 372,819 | |
| | 100,000 | | | Elkhart Co. Hospital Auth. Rev. (Elkhart General Hospital Proj.) (AMBAC-TCRS Insured) | | | 5.25 | | | | 8/15/28 | | | | 100,104 | |
| | 500,000 | | | Hammond Local Public Improvement Bond Bank | | | 4.00 | | | | 2/15/14 | | | | 506,970 | |
| | 400,000 | | | Hammond Local Public Improvement Bond Bank | | | 6.50 | | | | 8/15/25 | | | | 420,260 | |
| | 250,000 | | | Hammond Local Public Improvement Bond Bank | | | 6.50 | | | | 8/15/30 | | | | 261,495 | |
| | 525,000 | | | IN Finance Auth. Educational Facs. Rev. (Marian University Proj.) | | | 6.50 | | | | 9/15/30 | | | | 598,001 | |
| | 300,000 | | | IN Finance Auth. Rev. (BHI Senior Living) | | | 5.50 | | | | 11/15/26 | | | | 333,153 | |
| | 295,000 | | | IN Finance Auth. Rev. (Parkview Health System) | | | 5.75 | | | | 5/1/31 | | | | 341,085 | |
| | 350,000 | | | IN Health & Educational Fac. Fin. Auth. Rev. (Schneck Memorial Hospital Proj.) | | | 5.25 | | | | 2/15/30 | | | | 364,700 | |
| | 305,000 | | | IN Health Facs. Fin. Auth. Hospital Rev. (Community Hospital of Anderson Proj.) | | | 6.00 | | | | 1/1/23 | | | | 305,686 | |
| | 1,000,000 | | | Mt. Vernon School Building Corp. Rev. (State Aid Withholding) | | | 5.00 | | | | 1/15/37 | | | | 1,057,830 | |
| | 250,000 | | | St. Joseph Co. Health Facs. Rev. (Holy Cross Village) 1 | | | 6.25 | | | | 5/15/39 | | | | 259,258 | |
| | 340,555 | | | St. Joseph Co. Hospital Auth. Health Facs. Rev. (Madison Center) 2, 5 | | | 5.25 | | | | 2/15/28 | | | | 40,877 | |
| | | | | | | | | | | | | | | | |
| | | | |
| | | | | | | | | | | | | | | 5,992,059 | |
| | | | | | | | | | | | | | | | |
| | | |
| Iowa - 0.5% | | | | | | | | | | | | |
| | 250,000 | | | IA Student Loan Liquidity Corp. Rev. | | | 5.80 | | | | 12/1/31 | | | | 270,200 | |
| | 225,000 | | | Mason City Community School District Rev. | | | 5.00 | | | | 7/1/29 | | | | 245,002 | |
| | 250,000 | | | Waterloo Community School District Rev. | | | 5.00 | | | | 7/1/29 | | | | 273,012 | |
| | | | | | | | | | | | | | | | |
| | | | |
| | | | | | | | | | | | | | | 788,214 | |
| | | | | | | | | | | | | | | | |
| | | |
| Kansas - 0.3% | | | | | | | | | | | | |
| | 500,000 | | | Wyandotte Co./Kansas City Board of Public Utility Rev. (Office Building Complex) (NATL-RE Insured) | | | 5.00 | | | | 5/1/21 | | | | 501,720 | |
| | | | | | | | | | | | | | | | |
| | | |
| Kentucky - 0.4% | | | | | | | | | | | | |
| | 200,000 | | | KY Hsg. Corp. Rev. Ref. | | | 4.75 | | | | 7/1/35 | | | | 214,038 | |
| | 425,000 | | | Pikeville Hospital Rev. Ref. (Pikeville Medical Center) | | | 6.50 | | | | 3/1/41 | | | | 508,746 | |
| | | | | | | | | | | | | | | | |
| | | | |
| | | | | | | | | | | | | | | 722,784 | |
| | | | | | | | | | | | | | | | |
| | | |
| Louisiana - 2.5% | | | | | | | | | | | | |
| | 204,762 | | | Denham Springs/Livingston Hsg. & Mtg. Finance Auth. Rev. | | | 5.00 | | | | 11/1/40 | | | | 209,121 | |
| | 860,000 | | | Jefferson Parish Finance Auth. Single Family Mtg. Rev. | | | 5.00 | | | | 6/1/38 | | | | 915,117 | |
| | 160,000 | | | LA Hsg. Fin. Agy. Single Family Mtg. Rev. (Home Ownership Program) | | | 6.00 | | | | 12/1/28 | | | | 172,346 | |
| | 1,245,000 | | | LA Hsg. Fin. Agy. Single Family Mtg. Rev. (Home Ownership Program) | | | 5.70 | | | | 12/1/38 | | | | 1,326,672 | |
| | 385,000 | | | LA Hsg. Fin. Agy. Single Family Mtg. Rev. (Mtg. Backed Securities Program) | | | 4.60 | | | | 6/1/29 | | | | 426,149 | |
| | 250,000 | | | LA Public Facs. Auth. Rev. (Belle-Chase Educational Foundation Proj.) (NATL-RE Insured) | | | 6.50 | | | | 5/1/31 | | | | 286,825 | |
| | 750,000 | | | LA Public Facs. Auth. Rev. (Tulane Univ. Proj.) (NATL-RE Insured) 1 | | | 0.99 | | | | 2/15/36 | | | | 672,188 | |
| | 190,000 | | | LA University & Agricultural & Mechanical College Rev. (Health Sciences Center Proj.) (NATL-RE Insured) | | | 6.20 | | | | 5/1/20 | | | | 190,788 | |
| | 90,000 | | | Lafayette Public Finance Auth. Single Family Mortgage-Backed Rev. | | | 5.35 | | | | 1/1/41 | | | | 90,422 | |
| | | | | | | | | | | | | | | | |
| | | | |
| | | | | | | | | | | | | | | 4,289,628 | |
| | | | | | | | | | | | | | | | |
| | | |
| Maine - 0.6% | | | | | | | | | | | | |
| | 325,000 | | | ME Education Auth. Student Loan Rev. (Assured Guaranty) | | | 5.63 | | | | 12/1/27 | | | | 370,757 | |
| | 500,000 | | | ME Health & Higher Educational Facs. Auth. Rev. (ME General Medical Center) | | | 7.50 | | | | 7/1/32 | | | | 624,825 | |
| | | | | | | | | | | | | | | | |
| | | | |
| | | | | | | | | | | | | | | 995,582 | |
| | | | | | | | | | | | | | | | |
| | | |
| Maryland - 0.7% | | | | | | | | | | | | |
| | 235,000 | | | MD Community Dev. Administration Rev. | | | 5.13 | | | | 9/1/30 | | | | 265,209 | |
| | |
| See accompanying notes to financial statements. | | |
16 | | SIT MUTUAL FUNDS SEMI-ANNUAL REPORT |
| | | | | | | | | | | | | | | | |
| Principal | | | | | Coupon | | | Maturity | | | Fair | |
| Amount ($) | | | Name of Issuer | | Rate (%) | | | Date | | | Value ($) | |
| | | | |
| | 575,000 | | | MD Health & Higher Educational Facs. Auth. Rev. (Adventist Healthcare) | | | 6.25 | | | | 1/1/31 | | | | 672,784 | |
| | 500,000 | | | Montgomery County Housing Opportunites Commission Single Family Mtg. Rev. 6 | | | 5.62 | | | | 7/1/28 | | | | 208,135 | |
| | | | | | | | | | | | | | | | |
| | | | |
| | | | | | | | | | | | | | | 1,146,128 | |
| | | | | | | | | | | | | | | | |
| | | |
| Massachusetts - 1.3% | | | | | | | | | | | | |
| | 70,000 | | | MA Development Finance Agency Facs. Rev. | | | 6.25 | | | | 6/1/14 | | | | 47,643 | |
| | 415,000 | | | MA Education Finance Auth. Education Rev. | | | 5.15 | | | | 1/1/26 | | | | 473,079 | |
| | 235,000 | | | MA Education Finance Auth. Education Rev. | | | 5.25 | | | | 1/1/28 | | | | 264,514 | |
| | 250,000 | | | MA Housing Finance Agy. Rev. | | | 3.50 | | | | 12/1/31 | | | | 251,912 | |
| | 400,000 | | | MA Housing Finance Agy. Rev. | | | 4.05 | | | | 12/1/32 | | | | 413,628 | |
| | 250,000 | | | MA Housing Finance Agy. Rev. | | | 4.75 | | | | 6/1/35 | | | | 269,122 | |
| | 500,000 | | | MA Housing Finance Agy. Rev. (FHA Insured) | | | 5.30 | | | | 12/1/38 | | | | 538,795 | |
| | | | | | | | | | | | | | | | |
| | | | |
| | | | | | | | | | | | | | | 2,258,693 | |
| | | | | | | | | | | | | | | | |
| | | |
| Michigan - 2.0% | | | | | | | | | | | | |
| | 335,000 | | | Advanced Technology Academy Rev. | | | 6.00 | | | | 11/1/28 | | | | 344,773 | |
| | 250,000 | | | MI Hospital Finance Auth. Rev. (Mid-Michigan Obligation Group Proj.) | | | 6.13 | | | | 6/1/34 | | | | 293,625 | |
| | 850,000 | | | MI Hospital Finance Auth. Rev. Ref. (Presbyterian Village) | | | 5.25 | | | | 11/15/25 | | | | 859,086 | |
| | 250,000 | | | MI Hsg. Dev. Auth. (GO of Authority Insured) | | | 4.63 | | | | 10/1/41 | | | | 263,268 | |
| | 500,000 | | | MI Public Education Facs. Auth. Ltd. Rev. Ref. (Nataki Talibah Proj.) (Q-SBLF Insured) | | | 6.25 | | | | 10/1/23 | | | | 502,765 | |
| | 280,000 | | | MI Public Education Facs. Auth. Ltd. Rev. Ref. (Richfield Public School Proj.) | | | 5.00 | | | | 9/1/22 | | | | 282,176 | |
| | 465,000 | | | MI Public Education Facs. Auth. Rev. Ref. (Bradford Proj.) 4 | | | 6.00 | | | | 9/1/16 | | | | 426,121 | |
| | 335,000 | | | MI Tobacco Settlement Finance Auth. Sr. Rev. | | | 5.13 | | | | 6/1/22 | | | | 294,465 | |
| | 300,000 | | | Oakland County Economic Development Corp. Rev. (Roman Catholic Archdiocese Proj.) | | | 6.50 | | | | 12/1/20 | | | | 312,300 | |
| | | | | | | | | | | | | | | | |
| | | | |
| | | | | | | | | | | | | | | 3,578,579 | |
| | | | | | | | | | | | | | | | |
| | | |
| Minnesota - 2.3% | | | | | | | | | | | | |
| | 1,975,445 | | | Intermediate School District 287 Lease Rev. | | | 5.30 | | | | 11/1/32 | | | | 2,077,517 | |
| | 500,000 | | | Minneapolis Mulitfamily Hsg. Rev. (Riverside Plaza) | | | 6.00 | | | | 11/1/13 | | | | 498,155 | |
| | 290,000 | | | MN Hsg. Fin. Agy. Mtg. Rev. (Mtg. Backed Securities Program) (GNMA/FNMA Collateralized) | | | 4.40 | | | | 7/1/32 | | | | 298,787 | |
| | 520,000 | | | MN Hsg. Fin. Agy. Residential Hsg. Rev. | | | 5.10 | | | | 1/1/40 | | | | 558,069 | |
| | 500,000 | | | Wayzata Sr. Housing Rev. (Folkestone Senior Living Community) | | | 5.30 | | | | 5/1/27 | | | | 517,265 | |
| | | | | | | | | | | | | | | | |
| | | | |
| | | | | | | | | | | | | | | 3,949,793 | |
| | | | | | | | | | | | | | | | |
| Mississippi - 0.4% | | | | | | | | | | | | |
| | 300,000 | | | MS Development Bank Rev. (Magnolia Reg. Health Center Proj.) | | | 6.50 | | | | 10/1/31 | | | | 358,017 | |
| | 135,000 | | | MS Home Corp. Single Family Mtg. Rev. (GNMA/FNMA/FHLMC Collateralized) | | | 5.60 | | | | 6/1/38 | | | | 141,172 | |
| | 215,000 | | | MS Home Corp. Single Family Mtg. Rev. (GNMA/FNMA/FHLMC Collateralized) | | | 6.75 | | | | 6/1/39 | | | | 226,199 | |
| | | | | | | | | | | | | | | | |
| | | | |
| | | | | | | | | | | | | | | 725,388 | |
| | | | | | | | | | | | | | | | |
| | | |
| Missouri - 1.6% | | | | | | | | | | | | |
| | 500,000 | | | Chillicothe Tax Increment Rev. (South U.S. 65 Proj.) | | | 5.63 | | | | 4/1/27 | | | | 489,095 | |
| | 480,000 | | | Community Memorial Hospital District Rev. | | | 6.68 | | | | 12/1/34 | | | | 461,722 | |
| | 250,000 | | | Independence 39th St. Transportation District Rev. Ref. & Improvement | | | 6.88 | | | | 9/1/32 | | | | 259,498 | |
| | 500,000 | | | Kansas City Industrial Dev. Auth. Rev. (Kansas City Pkg. LLC) | | | 5.45 | | | | 9/1/23 | | | | 536,860 | |
| | 750,000 | | | Lakeside 370 Levee District Improvement Special Tax 2, 5 | | | 7.00 | | | | 4/1/28 | | | | 496,845 | |
| | 500,000 | | | Moberly Industrial Dev. Auth. (Annual Appropriation Proj.) 2, 5 | | | 6.00 | | | | 9/1/24 | | | | 99,945 | |
| | 250,000 | | | St. Louis Co. Industrial Dev. Auth. Rev. (Nazareth Living Center) | | | 5.88 | | | | 8/15/32 | | | | 254,480 | |
| | 250,000 | | | St. Louis Co. Industrial Dev. Auth. Rev. Ref. (Friendship Village Sunset Hills) | | | 5.00 | | | | 9/1/32 | | | | 269,458 | |
| | | | | | | | | | | | | | | | |
| | | | |
| | | | | | | | | | | | | | | 2,867,903 | |
| | | | | | | | | | | | | | | | |
| | | |
| Montana - 0.7% | | | | | | | | | | | | |
| | 175,000 | | | MT Board of Housing Single Family Rev. (GO of BRD Insured) | | | 4.70 | | | | 12/1/26 | | | | 189,313 | |
| | |
| See accompanying notes to financial statements. | | |
SEPTEMBER 30, 2012 | | 17 |
SCHEDULE OF INVESTMENTS (Unaudited)
September 30, 2012
Sit Tax-Free Income Fund (Continued)
| | | | | | | | | | | | | | | | |
| Principal | | | | | Coupon | | | Maturity | | | Fair | |
| Amount ($) | | | Name of Issuer | | Rate (%) | | | Date | | | Value ($) | |
| | | | |
| | 240,000 | | | MT Board of Housing Single Family Rev. (GO of BRD Insured) | | | 4.85 | | | | 6/1/28 | | | | 269,011 | |
| | 687,061 | | | MT Facs. Finance Auth. Rev. (Great Falls Pre-Release Services Proj.) | | | 5.08 | | | | 4/1/21 | | | | 769,027 | |
| | | | | | | | | | | | | | | | |
| | | | |
| | | | | | | | | | | | | | | 1,227,351 | |
| | | | | | | | | | | | | | | | |
| | | |
| Nevada - 2.0% | | | | | | | | | | | | |
| | 250,000 | | | Clark Co. Economic Dev. Rev. (Alexander Dawson School Proj.) | | | 5.38 | | | | 5/15/33 | | | | 252,778 | |
| | 415,000 | | | Clark Co. Improvement Special Assessment (Summerlin Proj.) | | | 4.85 | | | | 2/1/17 | | | | 406,808 | |
| | 600,000 | | | Las Vegas Paiute Tribe Rev. (ACA Insured) | | | 6.63 | | | | 11/1/17 | | | | 586,200 | |
| | 750,000 | | | Las Vegas Redev. Agy. Tax Allocation Rev. | | | 7.50 | | | | 6/15/23 | | | | 853,448 | |
| | 425,000 | | | NV Hsg. Dev. Single Family Mtg. Program Mezzanine (GNMA/FNMA/FHLMC Collateralized) | | | 5.10 | | | | 10/1/40 | | | | 457,402 | |
| | 500,000 | | | Sparks Redev. Agy. Tax Increment Rev. (Redev. Area No. 1 Proj.) | | | 5.00 | | | | 1/15/22 | | | | 525,725 | |
| | 420,000 | | | Sparks Redev. Agy. Tax Increment Rev. (Redev. Area No. 2 Proj.) | | | 6.40 | | | | 6/1/20 | | | | 449,345 | |
| | | | | | | | | | | | | | | | |
| | | | |
| | | | | | | | | | | | | | | 3,531,706 | |
| | | | | | | | | | | | | | | | |
| New Hampshire - 1.1% | | | | | | | | | | | | |
| | 890,000 | | | Manchester Hsg. & Redev. Auth. Rev. (ACA Insured) | | | 6.75 | | | | 1/1/15 | | | | 866,744 | |
| | 550,000 | | | NH Health & Educ. Facs. Auth. Rev. (Covenant Health System Obligation Group) (GO of BD BK Insured) | | | 5.00 | | | | 7/1/42 | | | | 595,892 | |
| | 400,000 | | | NH Health & Educ. Facs. Auth. Rev. (Wentworth Douglas Hospital) | | | 6.00 | | | | 1/1/34 | | | | 461,848 | |
| | | | | | | | | | | | | | | | |
| | | | |
| | | | | | | | | | | | | | | 1,924,484 | |
| | | | | | | | | | | | | | | | |
| | | |
| New Jersey - 1.1% | | | | | | | | | | | | |
| | 250,000 | | | NJ Economic Dev. Auth. Rev. Ref. (Harrogate Inc.) | | | 5.75 | | | | 12/1/16 | | | | 250,292 | |
| | 145,000 | | | NJ Higher Education Assistance Auth. Student Loan Rev. | | | 5.00 | | | | 6/1/27 | | | | 153,001 | |
| | 250,000 | | | NJ Higher Education Assistance Auth. Student Loan Rev. | | | 5.00 | | | | 12/1/28 | | | | 278,705 | |
| | 35,000 | | | NJ Higher Education Assistance Auth. Student Loan Rev. | | | 4.75 | | | | 12/1/29 | | | | 36,334 | |
| | 725,000 | | | NJ Hsg. & Mtg. Finance Agy. Rev. | | | 5.05 | | | | 10/1/39 | | | | 776,649 | |
| | 400,000 | | | NJ Hsg. & Mtg. Finance Agy. Single Family Mtg. Rev. | | | 4.50 | | | | 10/1/30 | | | | 434,540 | |
| | | | | | | | | | | | | | | | |
| | | | |
| | | | | | | | | | | | | | | 1,929,521 | |
| | | | | | | | | | | | | | | | |
| | | |
| New Mexico - 1.6% | | | | | | | | | | | | |
| | 390,000 | | | NM Mtg. Fin. Auth. Single Family Mtg. Rev. (GNMA/FNMA/FHLMC Collateralized) | | | 4.80 | | | | 9/1/29 | | | | 425,186 | |
| | 360,000 | | | NM Mtg. Fin. Auth. Single Family Mtg. Rev. (GNMA/FNMA/FHLMC Collateralized) | | | 5.35 | | | | 9/1/30 | | | | 383,634 | |
| | 755,000 | | | NM Mtg. Fin. Auth. Single Family Mtg. Rev. (GNMA/FNMA/FHLMC Collateralized) | | | 5.25 | | | | 9/1/34 | | | | 828,590 | |
| | 515,000 | | | NM Mtg. Fin. Auth. Single Family Mtg. Rev. (GNMA/FNMA/FHLMC Collateralized) | | | 3.90 | | | | 9/1/42 | | | | 522,303 | |
| | 540,000 | | | NM Mtg. Fin. Auth. Single Family Mtg. Rev. (GNMA/FNMA/FHLMC Collateralized) | | | 4.13 | | | | 9/1/42 | | | | 560,288 | |
| | | | | | | | | | | | | | | | |
| | | | |
| | | | | | | | | | | | | | | 2,720,001 | |
| | | | | | | | | | | | | | | | |
| | | |
| New York - 1.7% | | | | | | | | | | | | |
| | 250,000 | | | Albany Capital Resource Corp. Rev. (The College of Saint Rose) | | | 5.63 | | | | 7/1/31 | | | | 274,902 | |
| | 250,000 | | | Chautauqua County Capital Resource Corp. Rev. (Women’s Christian Assn. Proj.) | | | 6.75 | | | | 11/15/16 | | | | 275,472 | |
| | 500,000 | | | New York City Housing Development Corp. | | | 4.20 | | | | 5/1/37 | | | | 514,075 | |
| | 250,000 | | | New York City Housing Development Corp. Multifamily Mtg. Rev. | | | 4.60 | | | | 11/1/36 | | | | 266,422 | |
| | 500,000 | | | NY Mortgage Agency Rev. | | | 4.13 | | | | 10/1/40 | | | | 519,945 | |
| | 495,000 | | | NY Mortgage Agency Rev. | | | 4.75 | | | | 10/1/42 | | | | 525,215 | |
| | 200,000 | | | NY State Dormitory Auth. Rev. Ref. (Miriam Osborne Memorial Home) | | | 5.00 | | | | 7/1/42 | | | | 212,582 | |
| | 400,000 | | | NY State Housing Finance Agency Rev. (Affordable Hsg. Proj.) | | | 4.88 | | | | 11/1/42 | | | | 432,784 | |
| | | | | | | | | | | | | | | | |
| | | | |
| | | | | | | | | | | | | | | 3,021,397 | |
| | | | | | | | | | | | | | | | |
| | | |
| North Dakota - 0.8% | | | | | | | | | | | | |
| | 1,000,000 | | | North Dakota Hsg. Fin. Agy. Rev. | | | 3.60 | | | | 7/1/32 | | | | 1,007,670 | |
| | 385,000 | | | North Dakota Hsg. Fin. Agy. Rev. (GO of Agency Insured) | | | 4.75 | | | | 7/1/30 | | | | 420,713 | |
| | | | | | | | | | | | | | | | |
| | | | |
| | | | | | | | | | | | | | | 1,428,383 | |
| | | | | | | | | | | | | | | | |
| | | |
| Ohio - 2.2% | | | | | | | | | | | | |
| | 425,000 | | | Buckeye Tobacco Settlement Finance Auth. Asset-Backed Sr. Rev. | | | 5.13 | | | | 6/1/24 | | | | 358,190 | |
| | |
| See accompanying notes to financial statements. | | |
18 | | SIT MUTUAL FUNDS SEMI-ANNUAL REPORT |
| | | | | | | | | | | | | | | | |
| Principal | | | | | Coupon | | | Maturity | | | Fair | |
| Amount ($) | | | Name of Issuer | | Rate (%) | | | Date | | | Value ($) | |
| | | | |
| | 250,000 | | | Butler Co. Hospital Facs. Rev. (Kettering Health Network) | | | 6.38 | | | | 4/1/36 | | | | 303,315 | |
| | 815,000 | | | Cleveland-Cuyahoga Co. Port Auth. Dev. Rev. (St. Clarence Proj.) | | | 6.00 | | | | 5/1/21 | | | | 815,799 | |
| | 703,500 | | | Cuyahoga Co. Hsg. Mtg. Sr. Rev. (R H Myers Apts. Proj.) (GNMA Collateralized) | | | 5.70 | | | | 3/20/42 | | | | 772,394 | |
| | 250,000 | | | Lucas Co. Health Facs. Rev. (Sunset Retirement Communities) | | | 5.00 | | | | 8/15/21 | | | | 275,172 | |
| | 550,000 | | | Lucas Co. Hospital Rev. (Promedica Health Care Proj.) | | | 6.50 | | | | 11/15/37 | | | | 688,242 | |
| | 115,000 | | | OH Hsg. Finance Agy. Residential Mtg. Rev. (GNMA/FNMA/FHLMC Collateralized) | | | 5.45 | | | | 9/1/33 | | | | 119,564 | |
| | 500,000 | | | Portage Co. Port Auth. Rev. (Northeast Ohio Medical Univ. Proj.) | | | 5.00 | | | | 12/1/37 | | | | 538,930 | |
| | | | | | | | | | | | | | | | |
| | | | |
| | | | | | | | | | | | | | | 3,871,606 | |
| | | | | | | | | | | | | | | | |
| | | |
| Oklahoma - 0.7% | | | | | | | | | | | | |
| | 400,000 | | | Citizen Potawatomi Nation Sr. Obligation Tax Rev. | | | 6.50 | | | | 9/1/16 | | | | 397,008 | |
| | 375,000 | | | Delaware Co. Justice Auth. Rev. | | | 3.75 | | | | 9/1/29 | | | | 378,829 | |
| | 400,000 | | | Fort Sill Apache Tribe Economic Dev. Auth. | | | 8.50 | | | | 8/25/26 | | | | 441,324 | |
| | | | | | | | | | | | | | | | |
| | | | |
| | | | | | | | | | | | | | | 1,217,161 | |
| | | | | | | | | | | | | | | | |
| | | |
| Oregon - 0.6% | | | | | | | | | | | | |
| | 250,000 | | | Salem Hospital Facility Auth. Rev. (Capital Manor, Inc.) | | | 5.63 | | | | 5/15/32 | | | | 263,080 | |
| | 430,000 | | | Western Generation Agy. Rev. (Wauna Cogeneration Proj.) | | | 5.00 | | | | 1/1/21 | | | | 430,718 | |
| | 300,000 | | | Western Generation Agy. Rev. (Wauna Cogeneration) | | | 5.00 | | | | 1/1/21 | | | | 300,210 | |
| | | | | | | | | | | | | | | | |
| | | | |
| | | | | | | | | | | | | | | 994,008 | |
| | | | | | | | | | | | | | | | |
| | | |
| Pennsylvania - 3.3% | | | | | | | | | | | | |
| | 235,000 | | | Allegheny Co. Industrial Dev. Auth. Charter School Rev. (Propel Charter-McKeesport) | | | 5.90 | | | | 8/15/26 | | | | 250,195 | |
| | 485,000 | | | Butler Co. General Authority Rev. (School District Proj.) (AGM GO of District) 1 | | | 1.01 | | | | 10/1/34 | | | | 348,380 | |
| | 250,000 | | | Central Bradford Progress Auth. Rev. (Guthrie Healthcare System) | | | 5.50 | | | | 12/1/31 | | | | 294,522 | |
| | 250,000 | | | Erie Co. Hospital Auth. Rev. (St. Vincent Health Center Proj.) | | | 7.00 | | | | 7/1/27 | | | | 274,885 | |
| | 600,000 | | | Geisinger Auth. Health System Rev. (Geisinger Health System Proj.) 1 | | | 1.07 | | | | 5/1/37 | | | | 447,978 | |
| | 250,000 | | | Lehigh Co. General Purpose Auth. Rev. (Saint Luke’s Bethlehem) 1 | | | 1.31 | | | | 8/15/42 | | | | 165,795 | |
| | 500,000 | | | Luzerne Co. G.O. (FSA Insured) | | | 7.00 | | | | 11/1/26 | | | | 606,125 | |
| | 280,000 | | | PA Higher Educational Facs. Auth. Rev. (AICUP Financing Program) | | | 5.38 | | | | 5/1/42 | | | | 293,563 | |
| | 500,000 | | | PA Housing Finance Agy. Single Family Mtg. Rev. | | | 4.85 | | | | 10/1/37 | | | | 533,365 | |
| | 300,000 | | | PA Hsg. Finance Agy. Rev. | | | 5.00 | | | | 10/1/25 | | | | 336,420 | |
| | 500,000 | | | PA Hsg. Finance Agy. Rev. (GO of Agency Insured) | | | 4.63 | | | | 10/1/29 | | | | 537,605 | |
| | 500,000 | | | PA Hsg. Finance Agy. Single Family Mtg. Rev. | | | 4.75 | | | | 10/1/28 | | | | 546,340 | |
| | 210,000 | | | PA Hsg. Finance Agy. Single Family Mtg. Rev. | | | 4.75 | | | | 10/1/39 | | | | 214,175 | |
| | 500,000 | | | PA Turnpike Commission Rev. Capital Appreciation 6 | | | 5.13 | | | | 12/1/35 | | | | 473,410 | |
| | 500,000 | | | PA Turnpike Commission Rev. Capital Appreciation (AGM Insured) 6 | �� | | 6.25 | | | | 6/1/33 | | | | 532,410 | |
| | | | | | | | | | | | | | | | |
| | | | |
| | | | | | | | | | | | | | | 5,855,168 | |
| | | | | | | | | | | | | | | | |
| | | |
| Puerto Rico - 2.6% | | | | | | | | | | | | |
| | 285,000 | | | Puerto Rico Commonwealth Aqueduct & Sewer Auth. Rev. | | | 6.00 | | | | 7/1/38 | | | | 298,213 | |
| | 500,000 | | | Puerto Rico Electric Power Auth. Rev. 1 | | | 0.99 | | | | 7/1/25 | | | | 389,680 | |
| | 450,000 | | | Puerto Rico Public Finance Corp. Commonwealth Appropriation Rev. 9 | | | 5.50 | | | | 8/1/31 | | | | 472,118 | |
| | 1,775,000 | | | Puerto Rico Public Improvement G.O. | | | 5.50 | | | | 7/1/39 | | | | 1,833,025 | |
| | 250,000 | | | Puerto Rico Public Improvement G.O. (AGM Insured) | | | 5.50 | | | | 7/1/27 | | | | 282,588 | |
| | 350,000 | | | Puerto Rico Public Improvement G.O. (AGM Insured) | | | 5.00 | | | | 7/1/35 | | | | 363,114 | |
| | 300,000 | | | Puerto Rico Sales Tax Financing Corp. Rev. | | | 6.00 | | | | 8/1/39 | | | | 336,807 | |
| | 250,000 | | | Puerto Rico Sales Tax Financing Corp. Rev. | | | 5.25 | | | | 8/1/40 | | | | 274,238 | |
| | 500,000 | | | Puerto Rico Sales Tax Financing Corp. Rev. 1 | | | 1.23 | | | | 8/1/57 | | | | 285,650 | |
| | | | | | | | | | | | | | | | |
| | | | |
| | | | | | | | | | | | | | | 4,535,433 | |
| | | | | | | | | | | | | | | | |
| | | |
| Rhode Island - 0.3% | | | | | | | | | | | | |
| | 500,000 | | | RI Hsg. & Mortgage Finance Corp. Rev. | | | 4.00 | | | | 10/1/28 | | | | 510,495 | |
| | | | | | | | | | | | | | | | |
| | |
| See accompanying notes to financial statements. | | |
SEPTEMBER 30, 2012 | | 19 |
SCHEDULE OF INVESTMENTS (Unaudited)
September 30, 2012
Sit Tax-Free Income Fund (Continued)
| | | | | | | | | | | | | | | | |
| Principal | | | | | Coupon | | | Maturity | | | Fair | |
| Amount ($) | | | Name of Issuer | | Rate (%) | | | Date | | | Value ($) | |
| | | |
| South Carolina - 0.3% | | | | | | | | | | | | |
| | 410,000 | | | SC Education Assistance Auth. Student Loan Rev. | | | 5.10 | | | | 10/1/29 | | | | 455,297 | |
| | 76,190 | | | SC Jobs Economic Dev. Auth. Health Care Facs. Rev. (Woodlands at Furman Proj.) 6 | | | 0.40 | | | | 11/15/47 | | | | 379 | |
| | 177,778 | | | SC Jobs Economic Dev. Auth. Health Care Facs. Rev. (Woodlands at Furman Proj.) | | | 6.00 | | | | 11/15/47 | | | | 126,217 | |
| | | | | | | | | | | | | | | | |
| | | | |
| | | | | | | | | | | | | | | 581,893 | |
| | | | | | | | | | | | | | | | |
| | | |
| South Dakota - 0.2% | | | | | | | | | | | | |
| | | | |
| | 250,000 | | | SD Health & Educational Facs. Auth. Rev. | | | 5.00 | | | | 9/1/32 | | | | 266,305 | |
| | | | | | | | | | | | | | | | |
| | | |
| Tennessee - 0.9% | | | | | | | | | | | | |
| | 495,000 | | | Metro Govt. Nashville & Davidson Co. Health & Education Facs. Rev. (Prestige Proj.) 2, 5 | | | 7.50 | | | | 12/20/40 | | | | 272,235 | |
| | 1,850,000 | | | Shelby Co. Health, Education & Hsg. Facs. Rev. (CME Memphis Apts. Proj.) 2, 5 | | | 5.35 | | | | 1/1/19 | | | | 241,980 | |
| | 7,875,000 | | | Shelby Co. Health, Education & Hsg. Facs. Rev. (CME Memphis Apts. Proj.) 2, 5 | | | 5.55 | | | | 1/1/29 | | | | 790,492 | |
| | 1,630,000 | | | Shelby Co. Health, Education & Hsg. Facs. Rev. (CME Memphis Apts. Proj.) 2, 5 | | | 6.00 | | | | 1/1/29 | | | | 16 | |
| | 210,000 | | | Tennessee Housing Dev. Agy. Rev. | | | 4.20 | | | | 7/1/42 | | | | 215,669 | |
| | | | | | | | | | | | | | | | |
| | | | |
| | | | | | | | | | | | | | | 1,520,392 | |
| | | | | | | | | | | | | | | | |
| | | |
| Texas - 6.8% | | | | | | | | | | | | |
| | 1,000,000 | | | Arlington Higher Education Finance Corp., Education Rev. (Arlington Classics Academy) | | | 7.00 | | | | 8/15/28 | | | | 1,084,160 | |
| | 65,000 | | | Bexar Co. Hsg. Fin. Corp. Rev. (Dublin Kingswood & Waterford Apts.) | | | 7.50 | | | | 12/1/14 | | | | 60,115 | |
| | 250,000 | | | Bexar Co. Hsg. Fin. Corp. Rev. (Dymaxion & Marbach Park Apts. Proj.) (NATL-RE Insured) | | | 6.10 | | | | 8/1/30 | | | | 252,500 | |
| | 540,000 | | | Bexar Co. Hsg. Fin. Corp. Rev. (Honey Creek Apartments Proj.) 2, 5 | | | 8.00 | | | | 4/1/30 | | | | 237,605 | |
| | 440,000 | | | Bexar Co. Hsg. Fin. Corp. Rev. (Waterford Proj.) | | | 6.50 | | | | 12/1/21 | | | | 439,947 | |
| | 1,844,000 | | | Dallas Hsg. Finance Corp. Multifamily Mtg. Rev. (Towne Center Apts.) (GNMA Collateralized) | | | 6.75 | | | | 10/20/32 | | | | 1,866,995 | |
| | 1,465,449 | | | Galveston Co. Municipal Utility | | | 6.01 | | | | 2/27/13 | | | | 1,172,476 | |
| | 600,000 | | | Harris Co. Cultural Education Facs. Finance Corp. Rev. (Space Center Houston Proj.) 4 | | | 6.75 | | | | 8/15/21 | | | | 662,286 | |
| | 620,000 | | | Harris Co. Housing Finance Corp. Rev. (FHA/VA/VEREX Mtgs.) 6 | | | 10.34 | | | | 10/15/15 | | | | 440,343 | |
| | 240,000 | | | Houston Hotel Occupancy Rev. Ref. | | | 5.25 | | | | 9/1/29 | | | | 268,243 | |
| | 500,000 | | | Houston Hotel Occupancy Rev. Ref. (Convention & Entertainment Facs.) | | | 5.00 | | | | 9/1/30 | | | | 515,430 | |
| | 500,000 | | | Newark Cultural Education Facs. Finance Corp. Rev. (A.W. Brown-Fellowship Leadership) | | | 6.00 | | | | 8/15/32 | | | | 528,345 | |
| | 250,000 | | | Tarrant Co. Cultural Education Facs. Fin. Rev. (Mirador Proj.) | | | 7.75 | | | | 11/15/19 | | | | 286,995 | |
| | 550,000 | | | Travis Co. Health Facs. Dev. Corp. Rev. (First Mortgage - Longhorn Village Proj.) | | | 5.50 | | | | 1/1/17 | | | | 550,578 | |
| | 500,000 | | | Travis Co. Health Facs. Dev. Corp. Rev. (First Mortgage - Longhorn Village Proj.) | | | 6.00 | | | | 1/1/22 | | | | 512,035 | |
| | 250,000 | | | Travis Co. Health Facs. Dev. Corp. Rev. (Westminster Manor) | | | 6.25 | | | | 11/1/16 | | | | 257,862 | |
| | 500,000 | | | TX Municipal Gas Acquisition & Supply Corp. I Sr. Lien Rev. 1 | | | 1.71 | | | | 12/15/26 | | | | 376,995 | |
| | 300,000 | | | TX Municipal Gas Acquisition & Supply Corp. II Rev. 1 | | | 1.13 | | | | 9/15/27 | | | | 236,052 | |
| | 750,000 | | | TX Private Activity Surface Transportation Corp. Rev. (LBJ Infrastructure) | | | 7.50 | | | | 6/30/33 | | | | 953,918 | |
| | 250,000 | | | TX Public Finance Auth. Charter School Finance Corp. Rev. (Cosmos Foundation, Inc.) | | | 6.00 | | | | 2/15/30 | | | | 287,178 | |
| | 450,000 | | | TX Turnpike Auth. Rev. (AMBAC Insured) | | | 5.00 | | | | 8/15/42 | | | | 453,096 | |
| | 500,000 | | | West Travis Co. Public Utility Agy. Rev. | | | 5.00 | | | | 8/15/25 | | | | 516,000 | |
| | | | | | | | | | | | | | | | |
| | | | |
| | | | | | | | | | | | | | | 11,959,154 | |
| | | | | | | | | | | | | | | | |
| | | |
| Utah - 1.7% | | | | | | | | | | | | |
| | 332,000 | | | UT Assoc. Municipal Power System Rev. | | | 4.75 | | | | 5/1/22 | | | | 332,040 | |
| | 857,000 | | | UT Assoc. Municipal Power System Rev. | | | 5.00 | | | | 5/1/27 | | | | 857,181 | |
| | 290,000 | | | UT Hsg. Corp. Single Family Mtg. Rev. | | | 5.75 | | | | 1/1/33 | | | | 328,205 | |
| | 500,000 | | | UT Hsg. Corp. Single Family Mtg. Rev. | | | 4.60 | | | | 7/1/34 | | | | 540,945 | |
| | 500,000 | | | UT Hsg. Corp. Single Family Mtg. Rev. (State Street Plaza Proj.) (FHLMC Collateralized) | | | 4.10 | | | | 7/1/30 | | | | 530,545 | |
| | 300,000 | | | UT Infrastructure Agy. Rev. (AGM Insured) | | | 5.50 | | | | 10/15/30 | | | | 359,037 | |
| | | | | | | | | | | | | | | | |
| | | | |
| | | | | | | | | | | | | | | 2,947,953 | |
| | | | | | | | | | | | | | | | |
| | | |
| Virginia - 1.2% | | | | | | | | | | | | |
| | 500,000 | | | Farms New Kent Community Dev. Auth. Special Assessment | | | 5.13 | | | | 3/1/36 | | | | 314,920 | |
| | 275,000 | | | Loudoun Co. Industrial Dev. Auth. Rev. (Falcons Landing) | | | 6.00 | | | | 8/1/28 | | | | 294,704 | |
| | 250,000 | | | VA Hsg. Dev. Auth. Rev. (GO of Authority Insured) | | | 6.25 | | | | 7/1/31 | | | | 287,102 | |
| | |
| See accompanying notes to financial statements. | | |
20 | | SIT MUTUAL FUNDS SEMI-ANNUAL REPORT |
| | | | | | | | | | | | | | |
| Principal | | | | | | | | | | | |
| Amount ($)/ | | | | Coupon | | | Maturity | | | Fair | |
| Quantity | | Name of Issuer | | Rate (%) | | | Date | | | Value ($) | |
| | | | |
| 375,000 | | VA Hsg. Dev. Auth. Rev. (GO of Authority Insured) | | | 3.75 | | | | 3/1/34 | | | | 382,058 | |
| 250,000 | | VA Hsg. Dev. Auth. Rev. (Rental Hsg. Proj.) | | | 4.60 | | | | 12/1/38 | | | | 266,028 | |
| 500,000 | | VA Hsg. Dev. Auth. Rev. (Rental Hsg. Proj.) | | | 5.00 | | | | 12/1/39 | | �� | | 538,670 | |
| | | | | | | | | | | | | | |
| | | | |
| | | | | | | | | | | | | 2,083,482 | |
| | | | | | | | | | | | | | |
| | | |
| Washington - 1.2% | | | | | | | | | | | | |
| 260,000 | | Grant Co. Public Hospital District No. 1 | | | 5.25 | | | | 9/1/13 | | | | 260,593 | |
| 540,000 | | Greater Wenatchee Regional Events Center Public Facs. District Sales Tax Financing Rev. Ref. | | | 5.00 | | | | 9/1/27 | | | | 537,732 | |
| 480,000 | | Kalispel Tribe Indians Priority District Rev. | | | 6.20 | | | | 1/1/16 | | | | 468,346 | |
| 500,000 | | WA Health Care Facs. Auth. Rev. (Swedish Health Services Proj.) | | | 6.50 | | | | 11/15/27 | | | | 594,920 | |
| 300,000 | | WA Hsg. Finance Commission Single Family Mtg. Rev. | | | 4.60 | | | | 10/1/33 | | | | 325,941 | |
| | | | | | | | | | | | | | |
| | | | |
| | | | | | | | | | | | | 2,187,532 | |
| | | | | | | | | | | | | | |
| | | |
Wisconsin - 1.9% | | | | | | | | | | | | |
| 500,000 | | Oconto Waterworks & Sewer System Rev. | | | 4.00 | | | | 5/1/32 | | | | 517,730 | |
| 250,000 | | WI General Fund Rev. Appropriation Rev. | | | 6.00 | | | | 5/1/27 | | | | 313,922 | |
| 250,000 | | WI Health & Education Facs. Auth. Rev. (Aurora Health Care Proj.) | | | 6.40 | | | | 4/15/33 | | | | 254,122 | |
| 500,000 | | WI Health & Education Facs. Auth. Rev. (Beaver Dam Community Hospital, Inc.) | | | 6.75 | | | | 8/15/34 | | | | 514,670 | |
| 250,000 | | WI Health & Education Facs. Auth. Rev. (Marshfield Clinic Proj.) | | | 5.00 | | | | 2/15/40 | | | | 269,992 | |
| 200,000 | | WI Health & Education Facs. Auth. Rev. (Synergy Health, Inc. Proj.) | | | 6.00 | | | | 11/15/23 | | | | 209,638 | |
| 200,000 | | WI Public Finance Auth. Rev. (Glenridge Palmer Ranch Proj.) | | | 7.00 | | | | 6/1/20 | | | | 226,580 | |
| 500,000 | | WI Public Finance Auth. Rev. (Glenridge Palmer Ranch Proj.) | | | 8.25 | | | | 6/1/46 | | | | 593,530 | |
| 340,000 | | WI Public Finance Auth. Rev. (Horizon Academy West Charter School) | | | 5.25 | | | | 9/1/22 | | | | 340,245 | |
| | | | | | | | | | | | | | |
| | | | |
| | | | | | | | | | | | | 3,240,429 | |
| | | | | | | | | | | | | | |
| | | |
Wyoming - 0.6% | | | | | | | | | | | | |
| 1,000,000 | | WY Community Dev. Auth. Rev. | | | 4.25 | | | | 12/1/37 | | | | 1,025,960 | |
| | | | | | | | | | | | | | |
| | | |
Total Municipal Bonds
(cost: $168,405,513) | | | | | | | | | | | 156,236,287 | |
| | | | | | | | | | | | | | |
| | | |
Closed-End Mutual Funds - 6.9% | | | | | | | | | | | | |
| 34,800 | | AllianceBernstein National Municipal Income Fund, Inc. (AFB) | | | | | | | | | | | 574,548 | |
| 45,400 | | BlackRock Long-Term Municipal Advantage Trust (BTA) | | | | | | | | | | | 598,372 | |
| 33,800 | | BlackRock MuniHoldings Florida Insured Fund (MFL) | | | | | | | | | | | 551,278 | |
| 54,500 | | BlackRock MuniYield Florida Fund (MYF) | | | | | | | | | | | 931,405 | |
| 73,100 | | BlackRock MuniYield Insured Fund (MYI) | | | | | | | | | | | 1,159,366 | |
| 23,700 | | BlackRock MuniYield Michigan Insured Fund (MIY) | | | | | | | | | | | 386,784 | |
| 23,000 | | BlackRock MuniYield Michigan Insured Fund II (MYM) | | | | | | | | | | | 340,630 | |
| 208,600 | | DWS Municipal Income Trust (KTF) | | | | | | | | | | | 3,151,946 | |
| 31,200 | | Invesco PA Value Muni Income Trust (VPV) | | | | | | | | | | | 500,136 | |
| 7,900 | | Invesco Quality Muni (IQT) | | | | | | | | | | | 120,317 | |
| 43,300 | | Invesco Van Kampen Advantage Muni Income Trust (VKI) | | | | | | | | | | | 608,365 | |
| 32,389 | | Invesco Van Kampen Trust for Investment Grade Municipals (VGM) | | | | | | | | | | | 527,294 | |
| 25,923 | | Managed Duration Investment Grade (MZF) | | | | | | | | | | | 424,879 | |
| 5,000 | | Nuveen Michigan Premium Income Municipal Fund (NMP) | | | | | | | | | | | 77,500 | |
| 21,500 | | Nuveen Premier Municipal Income Fund (NPF) | | | | | | | | | | | 332,605 | |
| | | | |
| 114,332 | | Nuveen Premium Income Fund (NPM) | | | | | | | | | | | 1,788,152 | |
| | | | | | | | | | | | | | |
| | | |
Total Closed-End Mutual Funds
(cost: $9,759,897) | | | | | | | | | | | 12,073,577 | |
| | | | | | | | | | | | | | |
| | |
| See accompanying notes to financial statements. | | |
SEPTEMBER 30, 2012 | | 21 |
SCHEDULE OF INVESTMENTS (Unaudited)
September 30, 2012
Sit Tax-Free Income Fund (Continued)
| | | | | | |
| | | | | Fair | |
| Quantity | | Name of Issuer | | Value($) | |
| |
| Short-Term Securities - 3.7% | | | | |
| 6,523,146 | | Dreyfus Tax-Exempt Cash Management Fund, 0.004% | | | | |
Total Short-Term Securities
(cost: $6,523,146) | | | 6,523,146 | |
| | | | | | |
| |
Total Investments in Securities - 99.9%
(cost: $184,688,556) | | | 174,833,010 | |
Other Assets and Liabilities, net - 0.1% | | | 230,694 | |
| | | | | | |
| |
Total Net Assets - 100.0% | | $ | 175,063,704 | |
| | | | | | |
| 1 | Variable rate security. Rate disclosed is as of September 30, 2012. |
| 2 | Securities considered illiquid by the Investment Adviser. The total value of such securities as of September 30, 2012 was $4,129,788 and represented 2.4% of net assets. |
| 4 | 144A Restricted Security. The total value of such securities as of September 30, 2012 was $2,298,223 and represented 1.3% of net assets. These securities been determined to be liquid by the Adviser in accordance with guidelines established by the Board of Directors. |
| 5 | The issuer is in default of certain debt covenants. Income is not being accrued. The total value of such securities as of September 30, 2012 was $4,129,788 and represented 2.4% of net assets. |
| 6 | Zero coupon security. Rate disclosed is the effective yield on purchase date. |
| 9 | Municipal Lease Security. The total value of such securities as of September 30, 2012 was $1,404,427 and represented 0.8% of net assets. These securities have been determined to be liquid by the Adviser in accordance with guidelines established by the Board of Directors. |
Numeric footnotes not disclosed are not applicable to this Schedule of Investments.
A summary of the levels for the Fund’s investments as of September 30, 2012 is as follows (See Note 2 - significant accounting policies in the notes to financial statements):
| | | | | | | | | | | | | | |
| | | Investment in Securities | |
| | | Level 1 | | | Level 2 | | | Level 3 | | | |
| | | Quoted | | | Other significant | | | Significant | | | |
| | | Price ($) | | | observable inputs ($) | | | unobservable inputs ($) | | Total ($) | |
| | | | |
Short-Term Securities | | | 6,523,146 | | | | — | | | — | | | 6,523,146 | |
Closed-End Mutual Funds | | | 12,073,577 | | | | — | | | — | | | 12,073,577 | |
Municipal Bonds | | | — | | | | 156,236,287 | | | — | | | 156,236,287 | |
| | | | |
| | | | |
Total: | | | 18,596,723 | | | | 156,236,287 | | | — | | | 174,833,010 | |
| | | | |
For the reporting period, there were no transfers between levels 1, 2 and 3.
| | |
| See accompanying notes to financial statements. | | |
22 | | SIT MUTUAL FUNDS SEMI-ANNUAL REPORT |
[This page intentionally left blank.]
|
|
Sit Minnesota Tax-Free Income Fund |
OBJECTIVE & STRATEGY
The investment objective of the Minnesota Tax-Free Income Fund is to provide a high level of current income exempt from federal regular income tax and Minnesota regular personal income tax as is consistent with the preservation of capital.
During normal market conditions, the Fund invests 100% of its net assets in municipal securities that generate interest income that is exempt from federal regular income tax and Minnesota regular personal income tax. The Fund anticipates that substantially all of its distributions to its shareholders will be exempt as such. For investors subject to the alternative minimum tax (“AMT”), up to 20% of the Fund’s income may be alternative minimum taxable income.
The Sit Minnesota Tax-Free Income Fund provided a total return of +4.08% for the six-month period ended September 30, 2012, compared with a total return of +2.58% for the Barclays Capital 5-Year Municipal Bond Index. As of September 30, 2012, the Fund’s 30-day SEC yield was 3.60% and its 12-month distribution rate was 3.89%.
Tax-exempt municipal bond yields continued to decline during the six-month period, resulting in strong returns for the asset class. The tax-exempt yield curve flattened as long-term bond yields declined substantially while intermediate and short yields decreased to a lesser extent. Credit spreads also narrowed during the period. The State of Minnesota’s revenues in fiscal 2012 exceeded its budget forecast, improving the state’s fiscal position. Moreover, the state continues to have a lower unemployment rate and a higher level of economic growth than the nation, which benefits both general obligation and revenue bonds. While total municipal bond issuance in Minnesota during the first nine-months of 2012 is well above the same period in 2011, much of the issuance has been to refund existing issues. Furthermore, much of the supply in Minnesota this year has been issued at relatively low yields, challenging the investment opportunities for the Fund.
The Fund’s outperformance during this period was due predominantly to duration and to a lesser extent, quality and industry positioning.The Fund benefited from its longer duration versus the benchmark, as longer bonds performed much better than shorter bonds. From a quality perspective, the Fund maintained its average credit quality at A, but benefited from having a meaningful portion of the portfolio invested in non-rated or below investment grade bonds. In terms of industry positioning, the largest industry sectors in the portfolio were multi-family mortgage revenue, healthcare, single family mortgage revenue, education/student loan revenue, and other revenue bonds. These five sectors comprised nearly three-fourths of the portfolio, and each outperformed the benchmark return. Out of the eighteen industry sectors in the portfolio only one, escrowed to maturity/pre-refunded bonds, lagged the benchmark return.
The Fund maintains its duration longer than its benchmark, with significant weightings in intermediate and longer-term bonds.Although the tax-exempt yield curve continued to flatten during the period, it
HYPOTHETICAL GROWTH OF $10,000
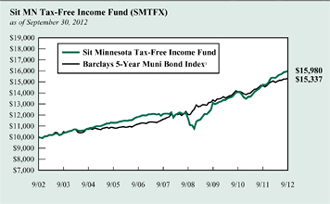
The chart above illustrates the total value of a hypothetical $10,000 investment in the Fund over the past 10 years (or for the life of the Fund if shorter) as compared to the performance of the Barclays 5-Year Municipal Bond Index. Past performance does not guarantee future results. Returns include the reinvestment of distributions. The chart does not reflect the deduction of taxes that a shareholder would pay on Fund distributions or the redemption of Fund shares.
1 The Barclays 5-Year Municipal Bond Index is the 5 year (4-6) component of the Municipal Bond Index, an unmanaged, rules-based, market-value-weighted index for the long-term tax-exempt bond market. The index includes bonds with a minimum credit rating of BBB. The returns include the reinvestment of income and do not include any transaction costs, management fees or other costs. It is not possible to invest directly in an index. This is the Fund’s primary index.
remains relatively steep on a historical basis. While credit spreads have tightened markedly since the 2008 financial crisis, we believe that credit spreads for many bonds rated A and below, as well as for select non-rated bonds, remain attractive. Therefore, even with the strong returns provided by the Fund over the past year and the low level of absolute yields at present, we believe the Fund’s duration, credit quality and industry weightings have it well-positioned for the current environment. As always, our strategy continues to emphasize income, which we believe is the primary driver of return over the long run.
Michael C. Brilley
Debra A. Sit, CFA
Paul J. Jungquist, CFA
Senior Portfolio Managers
| | |
24 | | SIT MUTUAL FUNDS SEMI-ANNUAL REPORT |
COMPARATIVE RATES OF RETURNS
as of September 30, 2012
| | | | | | |
| | | Sit
Minnesota
Tax-Free
Income Fund | | Barclays
5-Year
Muni. Bond
Index1 | | Lipper MN
Muni. Bond
Fund Index2 |
Six Month | | 4.08% | | 2.58% | | n/a |
One Year | | 8.44 | | 4.68 | | 8.14% |
Five Years | | 5.72 | | 5.72 | | 5.59 |
Ten Years | | 4.80 | | 4.37 | | 4.59 |
Since Inception (12/1/93) | | 5.20 | | 5.01 | | 4.95 |
| | | | | | | |
Performance figures are historical and do not guarantee future results. Investment returns and principal value will vary, and you may have a gain or loss when you sell shares. Current performance may be lower or higher than the performance data quoted. Contact the Fund for performance data current to the most recent month-end. Returns include changes in share price as well as reinvestment of all dividends and capital gains. Returns do not reflect the deduction of taxes that a shareholder would pay on Fund distributions or the redemption of Fund shares. Management fees and administrative expenses are included in the Fund’s performance. Returns for periods greater than one year are compounded average annual rates of return.
1 The Barclays 5-Year Municipal Bond Index is the 5 year (4-6) component of the Municipal Bond Index, an unmanaged, rules-based, market-value-weighted index made for the long-term tax-exempt bond market. The index includes bonds with a minimum credit rating of BBB. The returns include the reinvestment of income and do not include any transaction costs, management fees or other costs. It is not possible to invest directly in an index.
2 The Lipper returns are obtained from Lipper Analytical Services, Inc., a large independent evaluator of mutual funds.
FUND DIVERSIFICATION
| | | | | | |
Multifamily Mortgage | | | 19.0 | % | | |
Hospital/Health Care | | | 17.8 | % | | |
Single Family Mortgage | | | 14.0 | % | | |
Education/Student Loan | | | 10.6 | % | | |
Other Revenue | | | 8.7 | % | | |
Utility | | | 6.1 | % | | |
Sectors less than 5.0% | | | 13.9 | % | | |
Cash & Other Net Assets | | | 9.9 | % | | |
Based on total net assets as of September 30, 2012. Subject to change.
PORTFOLIO SUMMARY
| | |
Net Asset Value 9/30/12: | | $10.65 Per Share |
Net Asset Value 3/31/12: | | $10.42 Per Share |
Total Net Assets: | | $377.1 Million |
30-day SEC Yield 3: | | 3.60% |
Tax Equivalent Yield 4: | | 6.01% |
12-month Distribution Rate 3: | | 3.89% |
Average Maturity: | | 14.7 Years |
Effective Duration 5: | | 4.4 Years |
3 The SEC Yield reflects the rate at which the Fund is earning income on its current portfolio of securities, while the distribution rate reflects the Fund’s past dividends paid to shareholders based on the net investment income distributed and the average NAV during the past 12 months. Accordingly, the Fund’s SEC yield and distribution rate may differ.
4 The tax-equivalent yield is based on an assumed federal tax rate of 35.0% and a Minnesota tax rate of 7.85%, for an effective combined tax rate of 40.1%.
5 Duration is a measure of estimated price sensitivity relative to changes in interest rates. Portfolios with longer durations are typically more sensitive to changes in interest rates. For example, if interest rates rise by 1%, the market value of a security with an effective duration of 5 years would decrease by 5%, with all other factors being constant. The correlation between duration and price sensitivity is greater for securities rated investment-grade than it is for securities rated below investment-grade. Duration estimates are based on assumptions by the Adviser and are subject to a number of limitations. Effective duration is calculated based on historical price changes of securities held by the Fund, and therefore is a more accurate estimate of price sensitivity provided interest rates remain within their historical range.
QUALITY RATINGS (% of Total Net Assets)
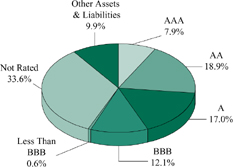
Lower of Moody’s, S&P, Fitch or Duff & Phelps ratings used.
| | | | |
Adviser’s Assessment of Non-Rated Securities: |
AAA | | 0.0% | | |
AA | | 1.9 | | |
A | | 2.5 | | |
BBB | | 12.5 | | |
BB | | 16.4 | | |
<BB | | 0.3 | | |
| | | | |
Total | | 33.6% | | |
SCHEDULE OF INVESTMENTS (Unaudited)
September 30, 2012
Sit Minnesota Tax-Free Income Fund
| | | | | | | | | | | | | | | | |
Principal
Amount ($) | | | Name of Issuer | | Coupon
Rate (%) | | | Maturity Date | | | Fair
Value ($) | |
| | | |
| | Municipal Bonds - 89.1% | | | | | | | | | | | | |
| | Education/Student Loan - 10.6% | | | | | | | | | | | | |
| | 1,070,000 | | | Brooklyn Park Lease Rev. (Prairie Seeds Academy Proj.) | | | 8.00 | | | | 3/1/20 | | | | 1,197,737 | |
| | 2,500,000 | | | Duluth Hsg. & Redev. Auth. Lease Rev. (Public Schools Academy) | | | 5.00 | | | | 11/1/21 | | | | 2,604,550 | |
| | 6,617,742 | | | Intermediate School District 287 Lease Rev. | | | 5.30 | | | | 11/1/32 | | | | 6,959,681 | |
| | 545,000 | | | Minneapolis Educational Fac. Lease Rev. (Seed/Harvest Preparatory Proj.) (LOC-U.S. Bank) | | | 5.13 | | | | 1/1/16 | | | | 431,733 | |
| | 875,000 | | | Minneapolis Educational Fac. Lease Rev. (Seed/Harvest Preparatory Proj.) (LOC-U.S. Bank) | | | 6.25 | | | | 1/1/21 | | | | 656,250 | |
| | 910,000 | | | MN Higher Education Fac. Auth. Rev. (Bethel Univ.) | | | 5.50 | | | | 5/1/14 | | | | 939,338 | |
| | 600,000 | | | MN Higher Education Fac. Auth. Rev. (Bethel Univ.) | | | 5.50 | | | | 5/1/22 | | | | 640,758 | |
| | 160,000 | | | MN Higher Education Fac. Auth. Rev. (Bethel Univ.) | | | 5.50 | | | | 5/1/23 | | | | 170,315 | |
| | 1,000,000 | | | MN Higher Education Fac. Auth. Rev. (Bethel Univ.) | | | 5.50 | | | | 5/1/37 | | | | 1,046,090 | |
| | 1,649,463 | | | MN Higher Education Fac. Auth. Rev. (College of St. Benedict) | | | 4.49 | | | | 10/1/16 | | | | 1,686,394 | |
| | 250,000 | | | MN Higher Education Fac. Auth. Rev. (College of St. Benedict) | | | 5.13 | | | | 3/1/36 | | | | 265,268 | |
| | 1,713,080 | | | MN Higher Education Fac. Auth. Rev. (College of St. Catherine) | | | 4.75 | | | | 4/26/27 | | | | 1,719,041 | |
| | 400,000 | | | MN Higher Education Fac. Auth. Rev. (College of St. Scholastica Inc.) | | | 4.00 | | | | 12/1/32 | | | | 404,996 | |
| | 750,000 | | | MN Higher Education Fac. Auth. Rev. (Hamline Univ.) | | | 6.00 | | | | 10/1/32 | | | | 887,438 | |
| | 1,000,000 | | | MN Higher Education Fac. Auth. Rev. (Hamline Univ.) | | | 6.00 | | | | 10/1/40 | | | | 1,156,580 | |
| | 750,000 | | | MN Higher Education Fac. Auth. Rev. (Macalester College-Seven-I) | | | 5.00 | | | | 6/1/35 | | | | 868,830 | |
| | 435,000 | | | MN Higher Education Fac. Auth. Rev. (St. Catherine Univ.) | | | 5.00 | | | | 10/1/32 | | | | 493,229 | |
| | 1,400,000 | | | MN Higher Education Fac. Auth. Rev. (St. Scholastica College) | | | 5.00 | | | | 12/1/27 | | | | 1,480,878 | |
| | 1,800,000 | | | MN Higher Education Fac. Auth. Rev. (St. Scholastica College) | | | 6.30 | | | | 12/1/40 | | | | 2,067,984 | |
| | 500,000 | | | MN Higher Education Fac. Auth. Rev. (St. Scholastica College-H) | | | 5.25 | | | | 12/1/35 | | | | 550,075 | |
| | 1,250,000 | | | MN Higher Education Fac. Auth. Rev. (Univ. of St. Thomas) | | | 6.00 | | | | 10/1/25 | | | | 1,388,638 | |
| | 132,587 | | | MN Higher Education Fac. Auth. Rev. Lease Rev. (Concordia Univ.) | | | 5.25 | | | | 4/25/14 | | | | 134,470 | |
| | 2,500,000 | | | MN Office of Higher Education Rev. (Suppl. Student Loan Prog.) | | | 5.00 | | | | 11/1/29 | | | | 2,828,025 | |
| | 708,097 | | | Olmsted Co. Hsg. & Redev. Auth. (Schaeffer Academy Proj.) | | | 4.98 | | | | 4/25/27 | | | | 644,864 | |
| | 440,000 | | | Pine City Lease Rev. (Lakes International Language Academy Proj.) | | | 5.75 | | | | 5/1/16 | | | | 456,557 | |
| | 830,000 | | | Pine City Lease Rev. (Lakes International Language Academy Proj.) | | | 6.00 | | | | 5/1/26 | | | | 850,086 | |
| | 215,000 | | | Ramsey Lease Rev. (Pact Charter School Proj.) | | | 5.65 | | | | 12/1/13 | | | | 218,307 | |
| | 1,650,000 | | | Ramsey Lease Rev. (Pact Charter School Proj.) | | | 6.50 | | | | 12/1/22 | | | | 1,720,884 | |
| | 350,000 | | | St. Paul Hsg. & Redev. Auth. Lease Rev. (Community of Peace Academy Proj.) | | | 4.35 | | | | 12/1/12 | | | | 350,350 | |
| | 1,500,000 | | | St. Paul Hsg. & Redev. Auth. Lease Rev. (Community of Peace Academy Proj.) | | | 5.00 | | | | 12/1/18 | | | | 1,536,585 | |
| | 600,000 | | | St. Paul Hsg. & Redev. Auth. Lease Rev. (Hmong Academy Proj.) | | | 5.50 | | | | 9/1/18 | | | | 622,218 | |
| | 130,000 | | | St. Paul Hsg. & Redev. Auth. Lease Rev. (New Spirit Charter School Proj.) | | | 6.50 | | | | 12/1/12 | | | | 130,471 | |
| | 600,000 | | | St. Paul Hsg. & Redev. Auth. Lease Rev. (Nova Classical Academy Proj.) | | | 5.70 | | | | 9/1/21 | | | | 649,212 | |
| | 500,000 | | | St. Paul Hsg. & Redev. Auth. Rev. Ref. (St. Paul Academy & Summit School) | | | 5.00 | | | | 10/1/24 | | | | 553,040 | |
| | 1,610,000 | | | Victoria Private School Fac. Rev. (Holy Family Catholic High) | | | 4.00 | | | | 9/1/23 | | | | 1,623,105 | |
| | | | | | | | | | | | | | | | |
| | | | |
| | | | | | | | | | | | | | | 39,933,977 | |
| | | | | | | | | | | | | | | | |
| | | |
| | General Obligation - 2.5% | | | | | | | | | | | | |
| | 1,000,000 | | | Bemidji Sales Tax G.O. | | | 5.00 | | | | 2/1/34 | | | | 1,173,990 | |
| | 1,350,000 | | | Bemidji Sales Tax G.O. | | | 6.00 | | | | 2/1/41 | | | | 1,688,715 | |
| | 650,000 | | | Dakota Co. Community Dev. Agy. Sr. Hsg. Facs. G.O. | | | 5.00 | | | | 1/1/26 | | | | 744,497 | |
| | 495,000 | | | Northern Mariana Islands Commonwealth G.O. 11 | | | 5.00 | | | | 10/1/22 | | | | 443,342 | |
| | 1,500,000 | | | Puerto Rico Public Improvement G.O. 11 | | | 5.50 | | | | 7/1/39 | | | | 1,549,035 | |
| | 1,000,000 | | | Puerto Rico Public Improvement G.O. 11 | | | 5.75 | | | | 7/1/36 | | | | 1,059,860 | |
| | 1,000,000 | | | Puerto Rico Public Improvement G.O. 11 | | | 6.00 | | | | 7/1/28 | | | | 1,097,640 | |
| | 1,500,000 | | | Puerto Rico Public Improvement G.O. 11 | | | 6.50 | | | | 7/1/40 | | | | 1,696,485 | |
| | | | | | | | | | | | | | | | |
| | | | |
| | | | | | | | | | | | | | | 9,453,564 | |
| | | | | | | | | | | | | | | | |
| | | |
| | Hospital/Health Care - 17.8% | | | | | | | | | | | | |
| | 4,025,000 | | | Breckenridge Rev. (Catholic Health Initiatives Proj.) | | | 5.00 | | | | 5/1/30 | | | | 4,238,526 | |
| | |
| See accompanying notes to financial statements. | | |
26 | | SIT MUTUAL FUNDS SEMI-ANNUAL REPORT |
| | | | | | | | | | | | | | | | |
Principal
Amount ($) | | | Name of Issuer | | Coupon
Rate (%) | | | Maturity
Date | | | Fair Value ($) | |
| | | | |
| | 400,000 | | | Carlton Health Care & Hsg. Fac. Rev. Ref. (Faith Care Center Proj.) | | | 5.20 | | | | 4/1/16 | | | | 412,156 | |
| | 365,000 | | | Cold Spring Health Care Facs. Rev. (Assumption Home, Inc. Proj.) | | | 7.25 | | | | 3/1/23 | | | | 400,025 | |
| | 1,000,000 | | | Cuyuna Range Hosp. Dist. Health Facs. Rev. | | | 5.20 | | | | 6/1/25 | | | | 1,018,470 | |
| | 390,000 | | | Detroit Lakes Hsg. & Health Facs. Rev. Ref. (CDL Homes Proj.) | | | 2.14 | | | | 8/1/34 | | | | 390,448 | |
| | 1,500,000 | | | Detroit Lakes Hsg. Rev. Ref. (Mankato Lutheran Proj.) | | | 2.39 | | | | 8/1/34 | | | | 1,493,145 | |
| | 1,500,000 | | | Douglas Co. Gross Health Care Facs. Rev. (Douglas Co. Hospital Proj.) | | | 6.00 | | | | 7/1/28 | | | | 1,660,965 | |
| | 2,000,000 | | | Duluth Economic Dev. Auth. Rev. (St. Lukes Hospital Oblig. Group) | | | 4.75 | | | | 6/15/22 | | | | 2,001,400 | |
| | 1,600,000 | | | Duluth Economic Dev. Auth. Rev. (St. Lukes Hospital Oblig. Group) | | | 5.75 | | | | 6/15/32 | | | | 1,649,072 | |
| | 2,500,000 | | | Duluth Economic Dev. Auth. Rev. (St. Lukes Hospital Oblig. Group) | | | 6.00 | | | | 6/15/39 | | | | 2,587,150 | |
| | 160,000 | | | Elk River Rev. (Care Choice Member Proj.) | | | 5.60 | | | | 8/1/13 | | | | 160,021 | |
| | 1,925,000 | | | Glencoe Health Care Fac. Rev. (Glencoe Regional Health Services Proj.) | | | 5.00 | | | | 4/1/25 | | | | 1,953,990 | |
| | 970,000 | | | Hastings Health Care Fac. Rev. (Regina Medical Center) (ACA Insured) | | | 5.25 | | | | 9/15/18 | | | | 971,533 | |
| | 705,000 | | | Hastings Health Care Fac. Rev. (Regina Medical Center) (ACA Insured) | | | 5.30 | | | | 9/15/28 | | | | 705,303 | |
| | 780,000 | | | Maple Grove Health Care Fac. Rev. (North Memorial Health Care Proj.) | | | 5.00 | | | | 9/1/29 | | | | 799,789 | |
| | 1,200,000 | | | Maple Grove Health Care System Rev. (Maple Grove Hospital Corp.) | | | 5.25 | | | | 5/1/25 | | | | 1,277,496 | |
| | 1,500,000 | | | Maple Grove Health Care System Rev. (Maple Grove Hospital Corp.) | | | 5.25 | | | | 5/1/28 | | | | 1,587,555 | |
| | 600,000 | | | Minneapolis & St. Paul Hsg. & Redev. Auth. Rev. (Health Partners) | | | 5.88 | | | | 12/1/29 | | | | 616,860 | |
| | 255,000 | | | Minneapolis Health Care Fac. Rev. (Augustana Chapel View Homes Proj.) | | | 5.00 | | | | 6/1/15 | | | | 255,275 | |
| | 270,000 | | | Minneapolis Health Care Fac. Rev. (Augustana Chapel View Homes Proj.) | | | 5.10 | | | | 6/1/16 | | | | 270,294 | |
| | 1,470,000 | | | Minneapolis Health Care Fac. Rev. (Jones-Harrison Residence Proj.) | | | 5.40 | | | | 10/1/25 | | | | 1,486,626 | |
| | 835,000 | | | Minneapolis Hsg. & Health Care Facs. Rev. Ref. (Providence Proj.) | | | 5.50 | | | | 10/1/14 | | | | 866,454 | |
| | 200,000 | | | Minneapolis Hsg. Fac. Rev. (Augustana Chapel View Homes Proj.) | | | 5.50 | | | | 6/1/27 | | | | 199,992 | |
| | 500,000 | | | Minneapolis Hsg. Fac. Rev. (Augustana Chapel View Homes Proj.) | | | 5.75 | | | | 1/1/19 | | | | 500,615 | |
| | 530,000 | | | Minneapolis Hsg. Fac. Rev. (Augustana Chapel View Homes Proj.) | | | 5.80 | | | | 1/1/24 | | | | 530,514 | |
| | 180,000 | | | Minneapolis Pooled Rev. (Care Choice Member Proj.) | | | 5.75 | | | | 4/1/19 | | | | 180,054 | |
| | 2,705,000 | | | Minneapolis Rev. Ref. (Walker Campus) | | | 4.50 | | | | 11/15/20 | | | | 2,773,409 | |
| | 1,100,000 | | | Minneapolis Rev. Ref. (Walker Campus) | | | 5.00 | | | | 11/15/24 | | | | 1,141,569 | |
| | 10,000 | | | MN Agricultural & Economic Dev. Board Rev. (Fairview Health Care System Proj.) | | | 6.38 | | | | 11/15/22 | | | | 10,025 | |
| | 130,000 | | | MN Agricultural & Economic Dev. Board Rev. (Fairview Health Care System Proj.) | | | 6.38 | | | | 11/15/29 | | | | 130,277 | |
| | 550,000 | | | Moorhead Economic Dev. Auth. Rev. | | | 4.60 | | | | 9/1/25 | | | | 552,519 | |
| | 1,300,000 | | | New Hope Health Care Facs. Rev. (MN Masonic Home North Ridge Proj.) | | | 5.88 | | | | 3/1/29 | | | | 1,300,533 | |
| | 1,175,000 | | | New Hope Health Care Facs. Rev. (MN Masonic Home North Ridge Proj.) | | | 5.90 | | | | 3/1/19 | | | | 1,176,187 | |
| | 1,500,000 | | | Rochester Health Care Facs. Rev. (Olmsted Medical Center Proj.) | | | 5.88 | | | | 7/1/30 | | | | 1,651,230 | |
| | 1,270,000 | | | Sartell Health Care & Hsg. Facs. Rev. (Foundation for Healthcare Proj.) | | | 6.63 | | | | 9/1/29 | | | | 1,270,648 | |
| | 1,000,000 | | | Sauk Rapids Health Care & Hsg. Facs. Rev. (Good Shepherd Lutheran Home Proj.) | | | 6.75 | | | | 1/1/24 | | | | 1,059,310 | |
| | 1,000,000 | | | Sauk Rapids Health Care & Hsg. Facs. Rev. (Good Shepherd Lutheran Home Proj.) | | | 7.25 | | | | 1/1/29 | | | | 1,064,920 | |
| | 3,475,000 | | | Shakopee Health Care Facs. Rev. (St. Francis Regional Medical Center Proj.) | | | 5.25 | | | | 9/1/34 | | | | 3,550,060 | |
| | 4,000,000 | | | St. Cloud Health Care Rev. (CentraCare Health System) | | | 5.00 | | | | 5/1/25 | | | | 4,177,920 | |
| | 2,000,000 | | | St. Louis Park Health Care Facs. Rev. (Park Nicollet Health Proj.) | | | 5.50 | | | | 7/1/29 | | | | 2,237,500 | |
| | 350,000 | | | St. Paul Hsg. & Redev. Auth. Health Care Rev. (Gillette Childrens Specialty Proj.) | | | 5.00 | | | | 2/1/20 | | | | 361,046 | |
| | 500,000 | | | St. Paul Hsg. & Redev. Auth. Health Care Rev. (Gillette Childrens Specialty Proj.) | | | 5.00 | | | | 2/1/21 | | | | 514,305 | |
| | 4,200,000 | | | St. Paul Hsg. & Redev. Auth. Health Care Rev. (HealthPartners Oblig. Group Proj.) | | | 5.25 | | | | 5/15/36 | | | | 4,384,842 | |
| | 700,000 | | | St. Paul Hsg. & Redev. Auth. Health Care Rev. (Regions Hospital Proj.) | | | 5.20 | | | | 5/15/13 | | | | 702,317 | |
| | 2,120,000 | | | St. Paul Hsg. & Redev. Auth. Health Care Rev. (Regions Hospital Proj.) | | | 5.25 | | | | 5/15/18 | | | | 2,124,812 | |
| | 2,393,234 | | | St. Paul Hsg. & Redev. Auth. Rev. (Nursing Home NTS-Episcopal) | | | 5.63 | | | | 10/1/33 | | | | 2,441,817 | |
| | 50,000 | | | St. Paul Hsg. & Redev. Auth. Rev. (Regions Hospital Proj.) | | | 5.30 | | | | 5/15/28 | | | | 50,054 | |
| | 2,500,000 | | | Stillwater Health Care Rev. (Health System Obligation Proj.) | | | 5.00 | | | | 6/1/25 | | | | 2,590,425 | |
| | 525,000 | | | West St. Paul Health Care (Walker Thompson Hill) | | | 6.75 | | | | 9/1/31 | | | | 572,744 | |
| | 500,000 | | | Winona Health Care Facs. Rev. (Winona Health Obligation) | | | 5.00 | | | | 7/1/34 | | | | 527,900 | |
| | 1,300,000 | | | Winsted Health Care Rev. (St. Mary’s Care Center Proj.) | | | 6.00 | | | | 9/1/25 | | | | 1,366,781 | |
| | |
| See accompanying notes to financial statements. | | |
SEPTEMBER 30, 2012 | | 27 |
SCHEDULE OF INVESTMENTS (Unaudited)
September 30, 2012
Sit Minnesota Tax-Free Income Fund (Continued)
| | | | | | | | | | | | | | | | |
Principal
Amount ($) | | | Name of Issuer | | Coupon
Rate (%) | | | Maturity
Date | | | Fair
Value ($) | |
| | | | |
| | 1,250,000 | | | Winsted Health Care Rev. (St. Mary’s Care Center Proj.) | | | 6.50 | | | | 9/1/34 | | | | 1,312,825 | |
| | | | | | | | | | | | | | | | |
| | | | |
| | | | | | | | | | | | | | | 67,259,703 | |
| | | | | | | | | | | | | | | | |
| | | |
| | Industrial/Pollution Control - 1.8% | | | | | | | | | | | | |
| | 2,250,000 | | | Moorhead Rev. (Amer. Crystal Sugar Co. Recovery Zone Fac.) | | | 5.65 | | | | 6/1/27 | | | | 2,483,752 | |
| | 505,000 | | | Owatonna Industrial Dev. Rev. (Slidell, Inc. Proj.) 8 | | | 7.38 | | | | 5/1/17 | | | | 176,593 | |
| | 1,655,000 | | | St. Paul Port Auth. Solid Waste Disposal Rev. (Ecullet Proj.) | | | 6.25 | | | | 11/1/15 | | | | 1,747,746 | |
| | 2,000,000 | | | Tobacco Securitization Auth. (Tobacco Settlement Proj.) | | | 5.25 | | | | 3/1/31 | | | | 2,256,600 | |
| | | | | | | | | | | | | | | | |
| | | | |
| | | | | | | | | | | | | | | 6,664,691 | |
| | | | | | | | | | | | | | | | |
| | | |
| | Insured - 3.3% | | | | | | | | | | | | |
| | 500,000 | | | Minneapolis & St. Paul Hsg. & Redev. Rev. (Children’s Hospital) (AGM Insured) | | | 5.00 | | | | 8/15/34 | | | | 550,885 | |
| | 2,010,000 | | | Minneapolis & St. Paul Metro Airport Commission Rev. Ref. (NATL-RE FGIC Insured) | | | 5.00 | | | | 1/1/22 | | | | 2,170,257 | |
| | 1,750,000 | | | Minneapolis & St. Paul Metro Airport Commission Rev. Ref. (NATL-RE FGIC Insured) | | | 5.00 | | | | 1/1/25 | | | | 1,924,878 | |
| | 1,025,000 | | | Minneapolis Health Care Facs. Rev. (Fairview Health Svcs.) (Assured Guaranty) | | | 6.50 | | | | 11/15/38 | | | | 1,271,964 | |
| | 350,000 | | | Plymouth Health Facs. Rev. (West Health Proj.) (AGM Insured) | | | 6.13 | | | | 6/1/24 | | | | 350,959 | |
| | 600,000 | | | Puerto Rico Public Improvement G.O. (AGM Insured) 11 | | | 5.13 | | | | 7/1/30 | | | | 600,426 | |
| | 1,000,000 | | | Puerto Rico Public Improvement G.O. (AGM Insured) 11 | | | 5.25 | | | | 7/1/20 | | | | 1,128,460 | |
| | 1,000,000 | | | Puerto Rico Public Improvement G.O. (Assured Guaranty) 1, 11 | | | 3.32 | | | | 7/1/20 | | | | 1,003,900 | |
| | 1,000,000 | | | St. Cloud Health Care Rev. (CentraCare Health System Proj.) (Assured Guaranty) | | | 5.50 | | | | 5/1/39 | | | | 1,113,470 | |
| | 1,910,000 | | | St. Paul Hsg. & Redev. Sales Tax Rev. Ref. (Civic Center) (AGM Insured) | | | 7.10 | | | | 11/1/23 | | | | 2,264,592 | |
| | | | | | | | | | | | | | | | |
| | | | |
| | | | | | | | | | | | | | | 12,379,791 | |
| | | | | | | | | | | | | | | | |
| | | |
| | Multifamily Mortgage - 19.0% | | | | | | | | | | | | |
| | 785,000 | | | Anoka Co. Hsg. & Redev. Rev. (Recovery Zone Fac.-Park River Estates) | | | 6.50 | | | | 11/1/25 | | | | 841,598 | |
| | 250,000 | | | Bloomington Hsg. Rev. Sr. (Gideon Pond Commons LLC) | | | 5.25 | | | | 6/1/21 | | | | 266,440 | |
| | 300,000 | | | Bloomington Hsg. Rev. Sr. (Gideon Pond Commons LLC) | | | 5.25 | | | | 12/1/21 | | | | 318,927 | |
| | 375,000 | | | Bloomington Hsg. Rev. Sr. (Gideon Pond Commons LLC) | | | 5.38 | | | | 6/1/22 | | | | 401,115 | |
| | 385,000 | | | Bloomington Hsg. Rev. Sr. (Gideon Pond Commons LLC) | | | 5.38 | | | | 12/1/22 | | | | 410,783 | |
| | 1,000,000 | | | Bloomington Hsg. Rev. Sr. (Gideon Pond Commons LLC) | | | 6.00 | | | | 12/1/30 | | | | 1,076,610 | |
| | 150,000 | | | Cambridge Hsg. & Health Care Facs. Rev. (Grandview West Proj.) | | | 5.50 | | | | 10/1/13 | | | | 150,248 | |
| | 500,000 | | | Cambridge Hsg. & Health Care Facs. Rev. (Grandview West Proj.) | | | 5.80 | | | | 10/1/18 | | | | 500,585 | |
| | 1,000,000 | | | Cambridge Hsg. & Health Care Facs. Rev. (Grandview West Proj.) | | | 6.00 | | | | 10/1/28 | | | | 1,000,680 | |
| | 980,000 | | | Champlin Multifamily Hsg. Rev. (Champlin Drive Apts.) | | | 6.00 | | | | 1/1/27 | | | | 1,048,326 | |
| | 215,000 | | | Chaska Multifamily Hsg. Rev. (West Suburban Hsg. Partners Proj.) 8 | | | 5.38 | | | | 9/1/14 | | | | 214,986 | |
| | 500,000 | | | Cloquet Hsg. Fac. Rev. Ref. (HADC Cloquet LLC Proj.) | | | 5.50 | | | | 8/1/25 | | | | 501,425 | |
| | 250,000 | | | Columbia Heights Multifamily & Health Care Fac. Rev. (Crest View Corp Proj.) | | | 5.30 | | | | 7/1/17 | | | | 231,590 | |
| | 1,200,000 | | | Coon Rapids Multifamily Hsg. Rev. Ref. (Margaret Place Apartments) | | | 6.50 | | | | 5/1/25 | | | | 1,200,672 | |
| | 2,530,000 | | | Cottage Grove Sr. Hsg. Rev. (PHS, Inc. Proj.) | | | 5.00 | | | | 12/1/31 | | | | 2,546,900 | |
| | 2,315,000 | | | Cottage Grove Sr. Hsg. Rev. (PHS, Inc. Proj.) | | | 6.00 | | | | 12/1/46 | | | | 2,357,665 | |
| | 470,000 | | | Eden Prairie Multifamily Hsg. Rev. Ref. (Rolling Hills Proj.) (GNMA Collateralized) | | | 6.00 | | | | 8/20/21 | | | | 490,224 | |
| | 675,000 | | | Eden Prairie Multifamily Hsg. Rev. Ref. (Rolling Hills Proj.) (GNMA Collateralized) | | | 6.15 | | | | 8/20/31 | | | | 704,099 | |
| | 1,635,000 | | | Eden Prairie Multifamily Hsg. Rev. Ref. (Rolling Hills Proj.) (GNMA Collateralized) | | | 6.20 | | | | 2/20/43 | | | | 1,705,534 | |
| | 80,000 | | | Eveleth Multifamily Hsg. Rev. Sr. (Manor House Woodland Proj.) | | | 5.10 | | | | 10/1/12 | | | | 80,000 | |
| | 165,000 | | | Eveleth Multifamily Hsg. Rev. Sr. (Manor House Woodland Proj.) | | | 5.15 | | | | 10/1/13 | | | | 165,013 | |
| | 1,660,000 | | | Grand Rapids Hsg. & Redev. Auth. (Lakeshore Place & Forest Park West Apartments Proj.) | | | 5.30 | | | | 10/1/29 | | | | 1,660,564 | |
| | 250,000 | | | Inver Grove Heights Nursing Home Rev. Ref. (Presbyterian Homes) | | | 5.38 | | | | 10/1/26 | | | | 253,722 | |
| | 245,000 | | | Inver Grove Heights Nursing Home Rev. Ref. (Presbyterian Homes) | | | 5.50 | | | | 10/1/33 | | | | 248,104 | |
| | 1,400,000 | | | Maplewood Multifamily Hsg. Rev. (Park Edge Apartments Proj.) 8 | | | 6.50 | | | | 5/1/29 | | | | 1,400,420 | |
| | 2,765,000 | | | Minneapolis & St. Paul Hsg. & Redev. Auth. Multifamily Hsg. Rev. (GNMA Collateralized) 8 | | | 4.75 | | | | 1/20/42 | | | | 2,807,747 | |
| | 680,000 | | | Minneapolis Hsg. Rev. (Keeler Apartments Proj.) | | | 5.00 | | | | 10/1/37 | | | | 666,679 | |
| | 4,000,000 | | | Minneapolis Mulitfamily Hsg. Rev. (Riverside Plaza) | | | 6.00 | | | | 11/1/13 | | | | 3,985,240 | |
| | 595,000 | | | Minneapolis Multifamily Hsg. Rev. (Blaisdell Apartments Proj.) 8 | | | 5.10 | | | | 4/1/17 | | | | 588,265 | |
| | |
| See accompanying notes to financial statements. | | |
28 | | SIT MUTUAL FUNDS SEMI-ANNUAL REPORT |
| | | | | | | | | | | | | | | | |
Principal
Amount ($) | | | Name of Issuer | | Coupon
Rate (%) | | | Maturity
Date | | | Fair Value ($) | |
| | | | |
| | 295,000 | | | Minneapolis Multifamily Hsg. Rev. (Garr Scott Loft Proj.) (LOC U.S. Bank) 8 | | | 5.95 | | | | 5/1/30 | | | | 295,876 | |
| | 145,000 | | | Minnetonka Multifamily Hsg. Rev. Ref. (Archer Heights Apartments Proj.) (GNMA Collateralized) 8 | | | 5.10 | | | | 7/20/13 | | | | 145,386 | |
| | 975,000 | | | Minnetonka Multifamily Hsg. Rev. Ref. (Archer Heights Apartments Proj.) (GNMA Collateralized) 8 | | | 5.20 | | | | 1/20/18 | | | | 976,999 | |
| | 1,750,000 | | | MN Hsg. Fin. Agy. Rental Hsg. 8 | | | 5.10 | | | | 8/1/47 | | | | 1,792,595 | |
| | 85,000 | | | MN Hsg. Fin. Agy. Rental Hsg. (GO of AGY. Insured) 8 | | | 4.88 | | | | 8/1/24 | | | | 85,944 | |
| | 250,000 | | | MN Hsg. Fin. Agy. Rental Hsg. (GO of AGY. Insured) | | | 5.05 | | | | 8/1/31 | | | | 278,198 | |
| | 2,560,000 | | | MN Hsg. Fin. Agy. Rental Hsg. (GO of AGY. Insured) | | | 5.25 | | | | 8/1/40 | | | | 2,793,242 | |
| | 1,660,000 | | | MN Hsg. Fin. Agy. Rental Hsg. (GO of AGY. Insured) | | | 5.45 | | | | 8/1/41 | | | | 1,854,718 | |
| | 1,185,000 | | | MN Hsg. Fin. Agy. Residential Hsg. Rev. (GO of AGY. Insured) 8 | | | 5.00 | | | | 7/1/21 | | | | 1,254,974 | |
| | 485,000 | | | Moorhead Economic Dev. Auth. Rev. Ref. (EverCare Sr. Living LLC) | | | 4.55 | | | | 9/1/24 | | | | 487,871 | |
| | 280,000 | | | Moorhead Economic Dev. Auth. Rev. Ref. (EverCare Sr. Living LLC) | | | 4.65 | | | | 9/1/26 | | | | 281,688 | |
| | 210,000 | | | Moorhead Economic Dev. Auth. Rev. Ref. (EverCare Sr. Living LLC) | | | 4.70 | | | | 9/1/27 | | | | 211,457 | |
| | 1,000,000 | | | Moorhead Health Care Rev. Ref. (EverCare Sr. Living LLC) | | | 5.00 | | | | 9/1/32 | | | | 1,001,260 | |
| | 250,000 | | | Moorhead Health Care Rev. Ref. (EverCare Sr. Living LLC) | | | 5.13 | | | | 9/1/37 | | | | 248,682 | |
| | 500,000 | | | North Oaks Sr. Hsg. Rev. (Presbyterian Homes North Oaks Proj.) | | | 5.25 | | | | 10/1/13 | | | | 509,240 | |
| | 1,565,000 | | | North Oaks Sr. Hsg. Rev. (Presbyterian Homes North Oaks Proj.) | | | 5.63 | | | | 10/1/17 | | | | 1,707,556 | |
| | 650,000 | | | North Oaks Sr. Hsg. Rev. (Presbyterian Homes North Oaks Proj.) | | | 5.75 | | | | 10/1/22 | | | | 700,550 | |
| | 1,000,000 | | | North Oaks Sr. Hsg. Rev. (Presbyterian Homes North Oaks Proj.) | | | 6.00 | | | | 10/1/33 | | | | 1,061,070 | |
| | 60,000 | | | Norwood Young America Economic Dev. Auth. Govt. Rev. (Harbor at Peace Village) | | | 5.35 | | | | 8/1/15 | | | | 60,188 | |
| | 200,000 | | | Norwood Young America Economic Dev. Auth. Govt. Rev. (Harbor at Peace Village) | | | 5.63 | | | | 8/1/20 | | | | 200,526 | |
| | 550,000 | | | Norwood Young America Economic Dev. Auth. Govt. Rev. (Harbor at Peace Village) | | | 5.75 | | | | 8/1/25 | | | | 551,040 | |
| | 425,000 | | | Norwood Young America Economic Dev. Auth. Govt. Rev. (Harbor at Peace Village) | | | 6.00 | | | | 8/1/31 | | | | 426,028 | |
| | 1,000,000 | | | Oak Park Heights Hsg. Rev. (Oakgreen Commons Proj.) | | | 6.00 | | | | 8/1/25 | | | | 1,054,190 | |
| | 420,000 | | | Richfield Sr. Hsg. Rev. Ref. (Richfield Sr. Hsg., Inc. Proj.) | | | 5.00 | | | | 12/1/15 | | | | 413,326 | |
| | 430,000 | | | Rochester Health Care & Hsg. Rev. (Samaritan Bethany, Inc. Proj.) | | | 5.25 | | | | 12/1/17 | | | | 455,185 | |
| | 455,000 | | | Rochester Health Care & Hsg. Rev. (Samaritan Bethany, Inc. Proj.) | | | 5.50 | | | | 12/1/18 | | | | 488,643 | |
| | 475,000 | | | Rochester Health Care & Hsg. Rev. (Samaritan Bethany, Inc. Proj.) | | | 5.75 | | | | 12/1/19 | | | | 518,173 | |
| | 250,000 | | | Rochester Health Care & Hsg. Rev. (Samaritan Bethany, Inc. Proj.) (Gty. Agmt. Samaritan Bethany) | | | 7.38 | | | | 12/1/41 | | | | 281,832 | |
| | 4,000,000 | | | Rochester Multifamily Hsg. Rev. (Essex Place Apartments Proj.) (FHLMC) | | | 3.75 | | | | 6/1/29 | | | | 4,171,520 | |
| | 2,200,000 | | | Sartell Health Care & Hsg. Fac. Rev. (Country Manor Campus LLC Proj.) | | | 4.00 | | | | 9/1/20 | | | | 2,181,256 | |
| | 1,135,000 | | | Sartell Health Care & Hsg. Fac. Rev. (Country Manor Campus LLC Proj.) | | | 5.25 | | | | 9/1/27 | | | | 1,169,481 | |
| | 240,000 | | | St. Paul Hsg. & Redev. Auth. Health Care Rev. (Carondelet Village Proj.) | | | 5.13 | | | | 2/1/22 | | | | 252,204 | |
| | 275,000 | | | St. Paul Hsg. & Redev. Auth. Health Care Rev. (Carondelet Village Proj.) | | | 5.13 | | | | 8/1/22 | | | | 288,307 | |
| | 175,000 | | | St. Paul Hsg. & Redev. Auth. Health Care Rev. (Carondelet Village Proj.) | | | 5.38 | | | | 2/1/24 | | | | 183,738 | |
| | 150,000 | | | St. Paul Hsg. & Redev. Auth. Health Care Rev. (Carondelet Village Proj.) | | | 5.38 | | | | 8/1/24 | | | | 157,389 | |
| | 150,000 | | | St. Paul Hsg. & Redev. Auth. Health Care Rev. (Carondelet Village Proj.) | | | 5.50 | | | | 2/1/25 | | | | 157,716 | |
| | 3,000,000 | | | St. Paul Hsg. & Redev. Auth. Health Care Rev. (Carondelet Village Proj.) | | | 6.25 | | | | 8/1/30 | | | | 3,248,940 | |
| | 1,285,000 | | | St. Paul Hsg. & Redev. Auth. Multifamily Ref. Rev. Ref. (Series Center Proj.) | | | 5.20 | | | | 11/1/22 | | | | 1,295,961 | |
| | 2,985,000 | | | St. Paul Hsg. & Redev. Auth. Multifamily Rev. Ref. (Univ. & Dale Proj.) (GNMA Collateralized) 8 | | | 4.82 | | | | 7/20/46 | | | | 3,098,430 | |
| | 445,000 | | | Stillwater Multifamily Hsg. Rev. (Orleans Homes LP Proj.) 8 | | | 5.00 | | | | 2/1/17 | | | | 455,773 | |
| | 120,000 | | | Victoria Sr. Hsg. Rev. (Chanhassen, Inc. Proj.) | | | 5.50 | | | | 8/1/18 | | | | 120,066 | |
| | 695,000 | | | Washington Co. Hsg. & Redev. Auth. Govt. Hsg. Rev. Ref. (Woodland Park Apartments Proj.) (CNTY Gty.) | | | 4.70 | | | | 10/1/26 | | | | 697,238 | |
| | 2,000,000 | | | Wayzata Sr. Hsg. Rev. (Folkestone Sr. Living Community) | | | 4.88 | | | | 5/1/19 | | | | 2,021,800 | |
| | 730,000 | | | Wayzata Sr. Hsg. Rev. (Folkestone Sr. Living Community) | | | 5.20 | | | | 5/1/25 | | | | 756,776 | |
| | 770,000 | | | Wayzata Sr. Hsg. Rev. (Folkestone Sr. Living Community) | | | 5.25 | | | | 5/1/26 | | | | 797,420 | |
| | 790,000 | | | Wayzata Sr. Hsg. Rev. (Folkestone Sr. Living Community) | | | 5.25 | | | | 11/1/26 | | | | 818,132 | |
| | 1,250,000 | | | Wayzata Sr. Hsg. Rev. (Folkestone Sr. Living Community) | | | 5.50 | | | | 11/1/32 | | | | 1,288,750 | |
| | 270,000 | | | Willmar Hsg. & Redev. Auth. Multifamily Rev. (Copperleaf) | | | 8.00 | | | | 3/15/41 | | | | 272,886 | |
| | 250,000 | | | Woodbury Economic Dev. Auth. Sr. Hsg. Rev. (Summerhouse) | | | 5.75 | | | | 6/1/41 | | | | 253,358 | |
| | | | | | | | | | | | | | | | |
| | | | |
| | | | | | | | | | | | | | | 71,647,739 | |
| | | | | | | | | | | | | | | | |
| | | |
| | Municipal Lease 9 - 2.5% | | | | | | | | | | | | |
| | 500,000 | | | Anoka Co. Hsg. & Redev. Rev. | | | 5.63 | | | | 5/1/22 | | | | 550,320 | |
| | |
| See accompanying notes to financial statements. | | |
SEPTEMBER 30, 2012 | | 29 |
SCHEDULE OF INVESTMENTS (Unaudited)
September 30, 2012
Sit Minnesota Tax-Free Income Fund (Continued)
| | | | | | | | | | | | | | | | |
| Principal | | | | | Coupon | | | Maturity | | | Fair | |
| Amount ($) | | | Name of Issuer | | Rate (%) | | | Date | | | Value ($) | |
| | | | |
| | 500,000 | | | Anoka Co. Hsg. & Redev. Rev. | | | 6.63 | | | | 5/1/30 | | | | 548,460 | |
| | 500,000 | | | Anoka Co. Hsg. & Redev. Rev. | | | 6.88 | | | | 5/1/40 | | | | 548,010 | |
| | 1,417,576 | | | Carver Scott Co. Lease Purchase Agreement | | | 5.00 | | | | 8/4/20 | | | | 1,456,914 | |
| | 18,000 | | | Hennepin Co. Hsg. & Redev. Auth. Rev. | | | 5.70 | | | | 8/1/13 | | | | 18,071 | |
| | 74,914 | | | Intermediate School District 287 Lease Rev. | | | 4.78 | | | | 3/15/13 | | | | 75,132 | |
| | 2,000,000 | | | MN Hsg. Fin. Agy. Non-Profit Hsg. Rev. (St. Appropriation) | | | 5.00 | | | | 8/1/31 | | | | 2,296,820 | |
| | 500,000 | | | Puerto Rico Public Finance Corp. (Commonwealth Appropriation) 11 | | | 5.50 | | | | 8/1/31 | | | | 524,575 | |
| | 150,000 | | | St. Paul Port Auth. Lease Rev. (Office Building) | | | 5.25 | | | | 12/1/27 | | | | 151,108 | |
| | 1,250,000 | | | Virginia Hsg. & Redev. Auth. Health Care Fac. Lease Rev. | | | 5.13 | | | | 10/1/20 | | | | 1,320,875 | |
| | 400,000 | | | Virginia Hsg. & Redev. Auth. Health Care Fac. Lease Rev. | | | 5.25 | | | | 10/1/25 | | | | 415,936 | |
| | 245,000 | | | Virginia Hsg. & Redev. Auth. Health Care Fac. Lease Rev. | | | 5.38 | | | | 10/1/30 | | | | 257,365 | |
| | 1,171,787 | | | Winona School District 861 Lease Purchase | | | 6.04 | | | | 8/1/24 | | | | 1,173,545 | |
| | | | | | | | | | | | | | | | |
| | | | |
| | | | | | | | | | | | | | | 9,337,131 | |
| | | | | | | | | | | | | | | | |
| | | |
| Other Revenue Bonds - 8.7% | | | | | | | | | | | | |
| | 1,030,000 | | | Bloomington Port Auth. Recovery Zone Fac. Rev. (Radisson Blu MOA LLC) | | | 6.25 | | | | 12/1/16 | | | | 1,089,400 | |
| | 510,000 | | | Columbia Heights Economic Dev. Auth. Tax Increment Rev. (Huset Park Area Redev.) | | | 5.20 | | | | 2/15/22 | | | | 484,102 | |
| | 652,671 | | | Crystal Governmental Fac. Rev. | | | 5.10 | | | | 12/15/26 | | | | 745,416 | |
| | 1,000,000 | | | Guam Govt. Hotel Occupancy Tax Rev. 11 | | | 6.00 | | | | 11/1/26 | | | | 1,178,930 | |
| | 230,000 | | | McLeod Co. Commercial Dev. Rev. (Southwest MN Foundation) | | | 5.13 | | | | 12/1/31 | | | | 240,283 | |
| | 475,000 | | | Minneapolis Community Dev. Agy. Limited Tax Common Bond Fund (Discount Steel) 8 | | | 5.25 | | | | 6/1/19 | | | | 476,962 | |
| | 1,500,000 | | | Minneapolis National Marrow Donor Program Rev. | | | 4.88 | | | | 8/1/25 | | | | 1,558,065 | |
| | 325,000 | | | Minneapolis Tax Increment Rev. (Grant Park Proj.) | | | 5.00 | | | | 2/1/16 | | | | 331,364 | |
| | 245,000 | | | Minneapolis Tax Increment Rev. Ref. (East River/Unocal Site Proj.) | | | 5.10 | | | | 2/1/17 | | | | 251,750 | |
| | 240,000 | | | Minneapolis Tax Increment Rev. Ref. (East River/Unocal Site Proj.) | | | 5.20 | | | | 2/1/21 | | | | 242,182 | |
| | 165,000 | | | Minneapolis Tax Increment Rev. Ref. (St. Anthony Falls Proj.) | | | 4.50 | | | | 2/1/13 | | | | 165,645 | |
| | 125,000 | | | Minneapolis Tax Increment Rev. Ref. (St. Anthony Falls Proj.) | | | 4.80 | | | | 2/1/13 | | | | 125,635 | |
| | 1,000,000 | | | MN Development Rev. Limited Tax Supported Comm. Board | | | 6.00 | | | | 12/1/40 | | | | 1,177,900 | |
| | 2,000,000 | | | MN Development Rev. Limited Tax Supported Comm. Board | | | 6.25 | | | | 12/1/30 | | | | 2,477,860 | |
| | 1,185,000 | | | Mound Hsg. & Redev. Auth. Tax Increment Rev. Ref. (Metroplain Proj.) | | | 5.00 | | | | 2/15/27 | | | | 1,188,934 | |
| | 280,000 | | | Puerto Rico Infrastucture Financing Auth. Special Tax Rev. Ref. (AMBAC Insured) 6, 11 | | | 8.40 | | | | 7/1/28 | | | | 117,309 | |
| | 500,000 | | | St. Anthony Hsg. & Redev. Auth. Tax Increment Rev. (Silver Lake Village Hsg.) | | | 4.75 | | | | 2/1/17 | | | | 506,785 | |
| | 500,000 | | | St. Anthony Hsg. & Redev. Auth. Tax Increment Rev. (Silver Lake Village Hsg.) | | | 4.90 | | | | 2/1/22 | | | | 500,895 | |
| | 1,000,000 | | | St. Louis Park Economic Dev. Auth. Tax Increment Rev. (Hoigaard Vlg.) | | | 5.00 | | | | 2/1/23 | | | | 1,047,730 | |
| | 500,000 | | | St. Paul Hsg. & Redev. Auth. Rev. (Jimmy Lee Recreation Center Proj.) | | | 4.75 | | | | 12/1/26 | | | | 549,705 | |
| | 500,000 | | | St. Paul Hsg. & Redev. Auth. Rev. (Jimmy Lee Recreation Center Proj.) | | | 5.00 | | | | 12/1/32 | | | | 541,595 | |
| | 1,125,000 | | | St. Paul Hsg. & Redev. Auth. Tax Increment Rev. (9th St. Lofts Proj.) | | | 6.38 | | | | 2/15/28 | | | | 1,105,988 | |
| | 1,009,000 | | | St. Paul Hsg. & Redev. Auth. Tax Increment Rev. (Drake Marble Proj.) | | | 6.75 | | | | 3/1/28 | | | | 1,009,575 | |
| | 370,000 | | | St. Paul Hsg. & Redev. Auth. Tax Increment Rev. (Emerald Gardens Proj.) | | | 5.00 | | | | 3/1/15 | | | | 378,732 | |
| | 765,000 | | | St. Paul Hsg. & Redev. Auth. Tax Increment Rev. (Emerald Gardens Proj.) | | | 6.50 | | | | 3/1/29 | | | | 824,112 | |
| | 1,049,000 | | | St. Paul Hsg. & Redev. Auth. Tax Increment Rev. (North Quadrant Owner Occupied Proj.) | | | 7.00 | | | | 2/15/28 | | | | 1,050,542 | |
| | 899,000 | | | St. Paul Hsg. & Redev. Auth. Tax Increment Rev. (North Quadrant Owner Occupied Proj.) | | | 7.50 | | | | 2/15/28 | | | | 899,530 | |
| | 2,841,000 | | | St. Paul Hsg. & Redev. Auth. Tax Increment Rev. (Upper Landing Proj.) | | | 6.80 | | | | 3/1/29 | | | | 2,842,960 | |
| | 1,782,000 | | | St. Paul Hsg. & Redev. Auth. Tax Increment Rev. (Upper Landing Proj.) | | | 6.90 | | | | 3/1/29 | | | | 1,783,372 | |
| | 805,000 | | | St. Paul Port Auth. Lease Rev. (Regions Hospital Parking Ramp Proj.) | | | 5.00 | | | | 8/1/21 | | | | 844,204 | |
| | 2,525,000 | | | St. Paul Port Auth. Lease Rev. (Regions Hospital Parking Ramp Proj.) | | | 5.00 | | | | 8/1/36 | | | | 2,570,728 | |
| | 2,000,000 | | | St. Paul Port Auth. Rev. (Amherst H. Wilder Fndtn.-3) | | | 5.00 | | | | 12/1/36 | | | | 2,231,160 | |
| | 715,000 | | | St. Paul Recreational Facs. Gross Rev. (Highland National Proj.) | | | 5.00 | | | | 10/1/25 | | | | 791,512 | |
| | 300,000 | | | Steele Co. Health Care Fac. Gross Rev. Ref. Crossover | | | 5.00 | | | | 6/1/30 | | | | 305,724 | |
| | 1,000,000 | | | Virgin Islands Public Finance Auth. Rev. (Diago Proj.) 11 | | | 6.63 | | | | 10/1/29 | | | | 1,178,440 | |
| | | | | | | | | | | | | | | | |
| | | | |
| | | | | | | | | | | | | | | 32,815,026 | |
| | | | | | | | | | | | | | | | |
| | |
| See accompanying notes to financial statements. | | |
30 | | SIT MUTUAL FUNDS SEMI-ANNUAL REPORT |
| | | | | | | | | | | | | | | | |
| Principal | | | | | Coupon | | | Maturity | | | Fair | |
| Amount ($) | | | Name of Issuer | | Rate (%) | | | Date | | | Value ($) | |
| | | |
| Public Facilities - 0.3% | | | | | | | | | | | | |
| | 1,075,000 | | | St. Paul Hsg. & Redev. Auth. Parking Rev. (Smith Ave. Proj.) | | | 5.00 | | | | 8/1/35 | | | | 1,141,005 | |
| | | | | | | | | | | | | | | | |
| | | |
| Sales Tax Revenue - 0.8% | | | | | | | | | | | | |
| | 1,000,000 | | | Puerto Rico Sales Tax Financing Corp. Rev. 11 | | | 5.25 | | | | 8/1/40 | | | | 1,096,950 | |
| | 500,000 | | | Puerto Rico Sales Tax Financing Corp. Rev. 11 | | | 6.00 | | | | 8/1/39 | | | | 561,345 | |
| | 1,500,000 | | | Puerto Rico Sales Tax Financing Corp. Rev. 6, 11 | | | 6.25 | | | | 8/1/33 | | | | 1,304,835 | |
| | | | | | | | | | | | | | | | |
| | | | |
| | | | | | | | | | | | | | | 2,963,130 | |
| | | | | | | | | | | | | | | | |
| | | |
| Single Family Mortgage - 14.0% | | | | | | | | | | | | |
| | 1,895,000 | | | Dakota Co. Community Dev. Agy. Single Family Mtg. Rev. (GNMA) | | | 4.45 | | | | 12/1/32 | | | | 2,065,626 | |
| | 990,000 | | | Dakota Co. Community Dev. Agy. Single Family Mtg. Rev. (GNMA-FNMA-FHLMC) | | | 4.63 | | | | 12/1/30 | | | | 1,074,061 | |
| | 1,285,000 | | | Dakota Co. Community Dev. Agy. Single Family Mtg. Rev. (GNMA-FNMA-FHLMC) | | | 4.88 | | | | 12/1/33 | | | | 1,413,449 | |
| | 906,460 | | | Dakota Co. Community Dev. Agy. Single Family Mtg. Rev. (GNMA-FNMA-FHLMC) 8 | | | 5.13 | | | | 12/1/40 | | | | 960,622 | |
| | 404,519 | | | Dakota Co. Community Dev. Agy. Single Family Mtg. Rev. (GNMA-FNMA-FHLMC) 8 | | | 5.15 | | | | 12/1/38 | | | | 418,451 | |
| | 1,145,686 | | | Dakota Co. Community Dev. Agy. Single Family Mtg. Rev. (GNMA-FNMA-FHLMC) 8 | | | 5.30 | | | | 12/1/39 | | | | 1,220,191 | |
| | 940,000 | | | Minneapolis St. Paul Hsg. Fin. Board Single Family Mtg. Rev. (GNMA-FNMA) | | | 4.45 | | | | 12/1/27 | | | | 1,035,269 | |
| | 160,193 | | | Minneapolis St. Paul Hsg. Fin. Board Single Family Mtg. Rev. (GNMA-FNMA) 8 | | | 5.00 | | | | 12/1/38 | | | | 165,196 | |
| | 157,982 | | | Minneapolis St. Paul Hsg. Fin. Board Single Family Mtg. Rev. (GNMA-FNMA) | | | 5.70 | | | | 4/1/27 | | | | 164,725 | |
| | 403,279 | | | Minneapolis St. Paul Hsg. Fin. Board Single Family Mtg. Rev. (GNMA-FNMA-FHLMC) | | | 5.10 | | | | 4/1/27 | | | | 423,077 | |
| | 1,773,036 | | | Minneapolis St. Paul Hsg. Fin. Board Single Family Mtg. Rev. (GNMA-FNMA-FHLMC) 8 | | | 5.25 | | | | 12/1/40 | | | | 1,891,209 | |
| | 846,992 | | | Minneapolis St. Paul Hsg. Fin. Board Single Family Mtg. Rev. (GNMA-FNMA-FHLMC) | | | 5.45 | | | | 4/1/27 | | | | 898,294 | |
| | 375,000 | | | Minneapolis St. Paul Hsg. Fin. Board Single Family Mtg. Rev. (GNMA-FNMA-FHLMC) 8 | | | 5.52 | | | | 3/1/41 | | | | 403,402 | |
| | 5,935,000 | | | MN Hsg. Fin. Agy. Homeownership Fin. (GNMA-FNMA) | | | 4.40 | | | | 7/1/32 | | | | 6,114,830 | |
| | 5,750,000 | | | MN Hsg. Fin. Agy. Homeownership Fin. (GNMA-FNMA-FHLMC) | | | 4.45 | | | | 7/1/31 | | | | 6,272,905 | |
| | 3,070,000 | | | MN Hsg. Fin. Agy. Homeownership Fin. (GNMA-FNMA-FHLMC) | | | 4.70 | | | | 1/1/31 | | | | 3,419,182 | |
| | 5,490,000 | | | MN Hsg. Fin. Agy. Residential Hsg. Rev. | | | 5.10 | | | | 1/1/40 | | | | 5,891,923 | |
| | 495,000 | | | MN Hsg. Fin. Agy. Residential Hsg. Rev. (GO of AGY. Insured) | | | 3.85 | | | | 1/1/29 | | | | 524,581 | |
| | 3,880,000 | | | MN Hsg. Fin. Agy. Residential Hsg. Rev. (GO of AGY. Insured) | | | 3.90 | | | | 7/1/30 | | | | 4,122,228 | |
| | 200,000 | | | MN Hsg. Fin. Agy. Residential Hsg. Rev. (GO of AGY. Insured) 8 | | | 5.10 | | | | 7/1/38 | | | | 207,650 | |
| | 730,000 | | | MN Hsg. Fin. Agy. Rev. (GNMA-FNMA Collateralized) | | | 5.00 | | | | 1/1/31 | | | | 802,693 | |
| | 190,000 | | | MN Hsg. Fin. Agy. Single Family Mtg. Rev. | | | 4.90 | | | | 7/1/29 | | | | 207,863 | |
| | 1,070,000 | | | MN Hsg. Fin. Agy. Single Family Mtg. Rev. | | | 5.00 | | | | 7/1/38 | | | | 1,126,485 | |
| | 1,765,000 | | | MN Hsg. Fin. Agy. Single Family Mtg. Rev. | | | 5.05 | | | | 7/1/34 | | | | 1,920,973 | |
| | 260,000 | | | MN Hsg. Fin. Agy. Single Family Mtg. Rev. 8 | | | 5.10 | | | | 7/1/20 | | | | 260,426 | |
| | 275,000 | | | MN Hsg. Fin. Agy. Single Family Mtg. Rev. | | | 5.20 | | | | 1/1/23 | | | | 290,824 | |
| | 1,015,000 | | | MN Hsg. Fin. Agy. Single Family Mtg. Rev. | | | 5.90 | | | | 7/1/28 | | | | 1,087,410 | |
| | 880,000 | | | MN Hsg. Fin. Agy. Single Family Mtg. Rev. (GO of AGY. Insured) 8 | | | 4.75 | | | | 7/1/27 | | | | 914,135 | |
| | 1,915,000 | | | MN Hsg. Fin. Agy. Single Family Mtg. Rev. (GO of AGY. Insured) 8 | | | 4.80 | | | | 7/1/26 | | | | 1,993,400 | |
| | 590,000 | | | MN Hsg. Fin. Agy. Single Family Mtg. Rev. (GO of AGY. Insured) 8 | | | 5.00 | | | | 1/1/37 | | | | 613,181 | |
| | 1,520,000 | | | MN Hsg. Fin. Agy. Single Family Mtg. Rev. (GO of AGY. Insured) 8 | | | 5.15 | | | | 7/1/28 | | | | 1,608,798 | |
| | 1,530,000 | | | MN Hsg. Fin. Agy. Single Family Mtg. Rev. (GO of AGY. Insured) 8 | | | 5.25 | | | | 7/1/33 | | | | 1,615,420 | |
| | 880,000 | | | MN Hsg. Fin. Agy. Single Family Mtg. Rev. (GO of AGY. Insured) 8 | | | 5.50 | | | | 7/1/28 | | | | 901,956 | |
| | 945,000 | | | MN Hsg. Fin. Agy. Single Family Mtg. Rev. (GO of AGY. Insured) 8 | | | 5.65 | | | | 7/1/33 | | | | 996,597 | |
| | | | | | | | | | | | | | | | |
| | | | |
| | | | | | | | | | | | | | | 53,027,032 | |
| | | | | | | | | | | | | | | | |
| | | |
| Transportation - 1.7% | | | | | | | | | | | | |
| | 2,500,000 | | | Minneapolis & St. Paul Metro Airport Commission Rev. Ref. 8 | | | 5.00 | | | | 1/1/22 | | | | 2,838,200 | |
| | 3,500,000 | | | Minneapolis & St. Paul Metro Airport Commission Sub. Rev. (AMBAC Insured) 8 | | | 5.00 | | | | 1/1/25 | | | | 3,634,470 | |
| | | | | | | | | | | | | | | | |
| | | | |
| | | | | | | | | | | | | | | 6,472,670 | |
| | | | | | | | | | | | | | | | |
| | | |
| Utility - 6.1% | | | | | | | | | | | | |
| | 1,000,000 | | | Central MN Municipal Power Agy. Electric Rev. (Southeast Twin Cities Transmission Proj.) | | | 5.00 | | | | 1/1/42 | | | | 1,121,900 | |
| | |
| See accompanying notes to financial statements. | | |
SEPTEMBER 30, 2012 | | 31 |
SCHEDULE OF INVESTMENTS (Unaudited)
September 30, 2012
Sit Minnesota Tax-Free Income Fund (Continued)
| | | | | | | | | | | | | | |
| Principal | | | | | | | | | | | |
| Amount ($)/ | | | | Coupon | | | Maturity | | | Fair | |
| Quantity | | Name of Issuer | | Rate (%) | | | Date | | | Value ($) | |
| | | | |
| 1,000,000 | | Chaska Electric Rev. Ref. (Generating Facs. Proj.) | | | 5.25 | | | | 10/1/25 | | | | 1,078,610 | |
| 2,000,000 | | MN Municipal Power Agy. Electric Rev. | | | 5.00 | | | | 10/1/25 | | | | 2,323,040 | |
| 1,000,000 | | MN Municipal Power Agy. Electric Rev. | | | 5.00 | | | | 10/1/30 | | | | 1,135,340 | |
| 1,465,000 | | MN Municipal Power Agy. Electric Rev. | | | 5.00 | | | | 10/1/35 | | | | 1,549,120 | |
| 2,000,000 | | MN Municipal Power Agy. Electric Rev. | | | 5.25 | | | | 10/1/24 | | | | 2,163,480 | |
| 700,000 | | MN Municipal Power Agy. Electric Rev. | | | 5.25 | | | | 10/1/27 | | | | 790,090 | |
| 1,000,000 | | MN Municipal Power Agy. Electric Rev. | | | 5.25 | | | | 10/1/35 | | | | 1,130,990 | |
| 500,000 | | North Branch Electric System Rev. | | | 5.75 | | | | 8/1/28 | | | | 545,535 | |
| 500,000 | | Puerto Rico Aqueduct & Sewer Auth. Rev. 11 | | | 5.75 | | | | 7/1/37 | | | | 523,915 | |
| 1,250,000 | | Puerto Rico Electric Power Auth. Rev. Ref. 1, 11 | | | 0.99 | | | | 7/1/25 | | | | 974,200 | |
| 2,000,000 | | Southern MN Power Agy. Power Supply System Rev. | | | 5.25 | | | | 1/1/30 | | | | 2,284,340 | |
| 3,450,000 | | Southern MN Power Agy. Power Supply System Rev. (NATL-RE Insured) 1 | | | 2.85 | | | | 1/1/13 | | | | 3,451,276 | |
| 1,000,000 | | St. Paul Port Auth. Rev. (Energy Park Utility Company Proj.) 8 | | | 5.45 | | | | 8/1/28 | | | | 1,018,990 | |
| 780,000 | | Virgin Islands Water & Power Auth. Water System Rev. Ref. 11 | | | 5.50 | | | | 7/1/17 | | | | 781,872 | |
| 2,000,000 | | Western MN Municipal Power Agy. Rev. | | | 3.00 | | | | 1/1/28 | | | | 1,996,340 | |
| | | | | | | | | | | | | | |
| | | | |
| | | | | | | | | | | | | 22,869,038 | |
| | | | | | | | | | | | | | |
| | | |
Total Municipal Bonds
(cost: $317,813,891) | | | | | | | | | | | 335,964,497 | |
| | | | | | | | | | | | | | |
| | | |
Short-Term Securities - 4.5% | | | | | | | | | | | | |
| 1,310,000 | | Hennepin Co. G.O. 1 | | | 0.17 | | | | 12/1/25 | | | | 1,310,000 | |
| 8,875,000 | | Minneapolis & St. Paul Hsg. & Redev. Auth. Rev. (Allina Health) 1 | | | 0.17 | | | | 11/15/34 | | | | 8,875,000 | |
| 1,975,000 | | Minneapolis Hsg. Dev. Rev. (One Ten Grant Proj.) (FNMA) 1 | | | 0.19 | | | | 9/1/26 | | | | 1,975,000 | |
| 5,000,000 | | Rochester Health Care Facs. Rev. (Mayo Foundation) 1 | | | 0.17 | | | | 8/15/32 | | | | 5,000,000 | |
| | | | | | | | | | | | | | |
| | | |
Total Short-Term Securities
(cost: $17,160,000) | | | | | | | | | | | 17,160,000 | |
| | | | | | | | | | | | | | |
| | | |
Closed-End Mutual Funds - 1.0% | | | | | | | | | | | | |
| 74,700 | | Delaware Investments Minnesota Municipal Income Fund II (VMM) | | | | | | | | | | | 1,152,621 | |
| 37,696 | | First American Minnesota Municipal Income Fund II (MXN) | | | | | | | | | | | 635,178 | |
| 111,197 | | MN Municipal Income Portfolio (MXA) | | | | | | | | | | | 1,991,538 | |
| | | | | | | | | | | | | | |
| | | |
Total Closed-End Mutual Funds
(cost: $3,123,167) | | | | | | | | | | | 3,779,337 | |
| | | | | | | | | | | | | | |
| | | |
Total Investments in Securities - 94.6%
(cost: $338,097,058) | | | | | | | | | | | 356,903,834 | |
Other Assets and Liabilities, net - 5.4% | | | | | | | | | | | 20,214,894 | |
| | | | | | | | | | | | | | |
| | | |
Total Net Assets - 100.0% | | | | | | | | | | $ | 377,118,728 | |
| | | | | | | | | | | | | | |
| 1 | Variable rate security. Rate disclosed is as of September 30, 2012. |
| 6 | Zero coupon security. Rate disclosed is the effective yield on purchase date. |
| 8 | Securities the income from which is treated as a tax preference that is included in alternative minimum taxable income for purposes of computing federal alternative minimum tax (AMT). At September 30, 2012, 9.4% of net assets in the Fund was invested in such securities. |
| 9 | Municipal Lease Security. The total value of such securities as of September 30, 2012 was $9,337,131 and represented 2.5% of net assets. These securities have been determined to be liquid by the Adviser in accordance with guidelines established by the Board of Directors. |
| 11 | The Fund may invest in obligations issued by U.S. territories, for example Guam, Puerto Rico, and Virgin Islands. The total value of such securities as of September 30, 2012 was $16,821,519 and represented 4.5% of net assets. |
Numeric footnotes not disclosed are not applicable to this Schedule of Investments.
| | |
| See accompanying notes to financial statements. | | |
32 | | SIT MUTUAL FUNDS SEMI-ANNUAL REPORT |
A summary of the levels for the Fund’s investments as of September 30, 2012 is as follows (See Note 2 - significant accounting policies in the notes to financial statements):
| | | | | | | | | | | | | | |
| | | Investment in Securities | |
| | | Level 1 | | | Level 2 | | | Level 3 | | | |
| | | Quoted | | | Other significant | | | Significant | | | |
| | | Price ($) | | | observable inputs ($) | | | unobservable inputs ($) | | Total ($) | |
Short-Term Securities | | | — | | | | 17,160,000 | | | — | | | 17,160,000 | |
Closed-End Mutual Funds | | | 3,779,337 | | | | — | | | — | | | 3,779,337 | |
Municipal Bonds | | | — | | | | 335,964,497 | | | — | | | 335,964,497 | |
| | | | |
Total: | | | 3,779,337 | | | | 353,124,497 | | | — | | | 356,903,834 | |
For the reporting period, there were no transfers between levels 1, 2 and 3.
| | |
| See accompanying notes to financial statements. | | |
SEPTEMBER 30, 2012 | | 33 |
STATEMENTS OF ASSETS AND LIABILITIES (Unaudited)
September 30, 2012
| | | | | | | | | | | | |
| | | Sit U.S. | | | | | | Sit Minnesota | |
| | | Government | | | Sit Tax-Free | | | Tax-Free | |
| | | Securities | | | Income | | | Income | |
| | | Fund | | | Fund | | | Fund | |
ASSETS | | | | | | | | | | | | |
Investments in securities, at identified cost | | $ | 1,676,742,113 | | | $ | 184,688,556 | | | $ | 338,097,058 | |
| | | | | | | | | | | | |
| | | |
Investments in securities, at fair value - see accompanying schedule for detail | | $ | 1,717,467,457 | | | $ | 174,833,010 | | | $ | 356,903,834 | |
Cash in bank on demand deposit | | | 19,919,793 | | | | 390,174 | | | | 24,491,105 | |
Restricted cash | | | 1,500,000 | | | | — | | | | — | |
Accrued interest and dividends receivable | | | 8,867,067 | | | | 2,178,143 | | | | 4,648,028 | |
Receivable for principal paydowns | | | 122,853 | | | | — | | | | — | |
Other receivables | | | — | | | | 192,700 | | | | 21,000 | |
Receivable for Fund shares sold | | | 9,418,053 | | | | 659,383 | | | | 657,263 | |
| | | | | | | | | | | | |
| | | |
Total assets | | | 1,757,295,223 | | | | 178,253,410 | | | | 386,721,230 | |
| | | | | | | | | | | | |
| | | |
LIABILITIES | | | | | | | | | | | | |
Payable for investment securities purchased | | | — | | | | 2,440,965 | | | | 8,560,288 | |
Payable for Fund shares redeemed. | | | 1,816,199 | | | | 514,015 | | | | 505,329 | |
Cash portion of dividends payable to shareholders | | | 88,480 | | | | 120,828 | | | | 289,808 | |
Accrued investment management fees. | | | 1,161,881 | | | | 113,898 | | | | 247,077 | |
Outstanding options written, at fair value (premiums received $89,421) | | | 93,750 | | | | — | | | | — | |
| | | | | | | | | | | | |
| | | |
Total liabilities | | | 3,160,310 | | | | 3,189,706 | | | | 9,602,502 | |
| | | | | | | | | | | | |
| | | |
Net assets applicable to outstanding capital stock | | $ | 1,754,134,913 | | | $ | 175,063,704 | | | $ | 377,118,728 | |
| | | | | | | | | | | | |
| | | |
Net assets consist of: | | | | | | | | | | | | |
Capital (par value and paid-in surplus) | | $ | 1,716,157,441 | | | $ | 212,781,316 | | | $ | 366,138,744 | |
Undistributed (distributions in excess of) net investment income | | | (168,633 | ) | | | — | | | | — | |
Accumulated net realized gain (loss) from security transactions and written options | | | (2,574,910 | ) | | | (27,862,066 | ) | | | (7,826,792 | ) |
Unrealized appreciation (depreciation) on investments and written options | | | 40,721,015 | | | | (9,855,546 | ) | | | 18,806,776 | |
| | | | | | | | | | | | |
| | $ | 1,754,134,913 | | | $ | 175,063,704 | | | $ | 377,118,728 | |
| | | | | | | | | | | | |
| | | |
Outstanding shares | | | 154,051,493 | | | | 18,275,633 | | | | 35,424,067 | |
| | | | | | | | | | | | |
| | | |
Net asset value per share of outstanding capital stock | | | $11.39 | | | | $9.58 | | | | $10.65 | |
| | | | | | | | | | | | |
| | |
| See accompanying notes to financial statements. | | |
34 | | SIT MUTUAL FUNDS SEMI-ANNUAL REPORT |
STATEMENTS OF OPERATIONS (Unaudited)
Six Months Ended September 30, 2012
| | | | | | | | | | | | |
| | | Sit U.S. | | | | | | Sit Minnesota | |
| | | Government | | | Sit Tax-Free | | | Tax-Free | |
| | | Securities | | | Income | | | Income | |
| | | Fund | | | Fund | | | Fund | |
Investment income: | | | | | | | | | | | | |
Income: | | | | | | | | | | | | |
Dividends | | | — | | | | $350,630 | | | | $69,013 | |
Interest | | | $22,129,447 | | | | 3,738,182 | | | | 8,012,437 | |
| | | | | | | | | | | | |
| | | |
Total income. | | | 22,129,447 | | | | 4,088,812 | | | | 8,081,450 | |
| | | | | | | | | | | | |
| | | |
Expenses (note 4): | | | | | | | | | | | | |
Investment management fee | | | 6,987,502 | | | | 667,596 | | | | 1,448,039 | |
| | | | | | | | | | | | |
| | | |
Total expenses | | | 6,987,502 | | | | 667,596 | | | | 1,448,039 | |
| | | | | | | | | | | | |
| | | |
Net investment income | | | 15,141,945 | | | | 3,421,216 | | | | 6,633,411 | |
| | | | | | | | | | | | |
| | | |
Realized and unrealized gain (loss): | | | | | | | | | | | | |
Net realized gain (loss) on investments | | | 607,102 | | | | (1,153,175 | ) | | | 164,917 | |
Net realized gain (loss) on written options | | | (338,229 | ) | | | — | | | | — | |
| | | |
Net change in unrealized appreciation (depreciation) on investments | | | 10,438,680 | | | | 7,208,549 | | | | 7,504,549 | |
Net change in unrealized appreciation (depreciation) on written options | | | 86,636 | | | | — | | | | — | |
| | | | | | | | | | | | |
| | | |
Net gain (loss) | | | 10,794,189 | | | | 6,055,374 | | | | 7,669,466 | |
| | | | | | | | | | | | |
| | | |
Net increase (decrease) in net assets resulting from operations | | | $25,936,134 | | | | $9,476,590 | | | | $14,302,877 | |
| | | | | | | | | | | | |
| | |
| See accompanying notes to financial statements. | | |
SEPTEMBER 30, 2012 | | 35 |
STATEMENTS OF CHANGES IN NET ASSETS
| | | | | | | | |
| | | Sit U.S. Government | |
| | | Securities Fund | |
| | | Six Months | | | Year | |
| | | Ended | | | Ended | |
| | | September 30, 2012 | | | March 31, | |
| | | (Unaudited) | | | 2012 | |
Operations: | | | | | | | | |
Net investment income. | | | $15,141,945 | | | | $36,722,603 | |
Net realized gain (loss) on investments and written options | | | 268,873 | | | | (1,958,679 | ) |
Net change in unrealized appreciation (depreciation) of investments and written options | | | 10,525,316 | | | | 2,451,072 | |
| | | | | | | | |
| | |
Net increase (decrease) in net assets resulting from operations | | | 25,936,134 | | | | 37,214,996 | |
| | | | | | | | |
| | |
Distributions from: | | | | | | | | |
Net investment income. | | | (15,215,548 | ) | | | (36,820,960 | ) |
Net realized gains on investments | | | — | | | | — | |
| | | | | | | | |
| | |
Total distributions | | | (15,215,548 | ) | | | (36,820,960 | ) |
| | | | | | | | |
| | |
Capital share transactions: | | | | | | | | |
Proceeds from shares sold | | | 686,284,297 | | | | 1,318,167,314 | |
Reinvested distributions | | | 14,465,467 | | | | 35,123,932 | |
Payments for shares redeemed | | | (461,489,640 | ) | | | (906,684,901 | ) |
| | | | | | | | |
| | |
Increase (decrease) in net assets from capital transactions | | | 239,260,124 | | | | 446,606,345 | |
| | | | | | | | |
| | |
Total increase (decrease) in net assets | | | 249,980,710 | | | | 447,000,381 | |
| | |
Net assets: | | | | | | | | |
Beginning of period | | | 1,504,154,203 | | | | 1,057,153,822 | |
| | | | | | | | |
End of period * | | $ | 1,754,134,913 | | | $ | 1,504,154,203 | |
| | | | | | | | |
| | |
Capital transactions in shares: | | | | | | | | |
Sold | | | 60,399,638 | | | | 116,325,137 | |
Reinvested distributions | | | 1,272,775 | | | | 3,102,575 | |
Redeemed. | | | (40,619,538 | ) | | | (80,092,613 | ) |
| | | | | | | | |
| | |
Net increase (decrease) | | | 21,052,875 | | | | 39,335,099 | |
| | | | | | | | |
* Includes undistributed (distributions in excess of) net investment income | | | ($168,633 | ) | | | ($95,030 | ) |
| | |
| See accompanying notes to financial statements. | | |
36 | | SIT MUTUAL FUNDS SEMI-ANNUAL REPORT |
| | | | | | | | | | | | | | |
| Sit Tax-Free | | | Sit Minnesota Tax-Free | |
| Income Fund | | | Income Fund | |
| Six Months | | | Year | | | Six Months | | | Year | |
| Ended | | | Ended | | | Ended | | | Ended | |
| September 30, 2012 | | | March 31, | | | September 30, 2012 | | | March 31, | |
| (Unaudited) | | | 2012 | | | (Unaudited) | | | 2012 | |
| | | | | | | | | | | | | | |
| | $3,421,216 | | | | $6,787,389 | | | | $6,633,411 | | | | $13,371,060 | |
| | (1,153,175) | | | | (2,069,714 | ) | | | 164,917 | | | | (217,285 | ) |
| | | |
| | 7,208,549 | | | | 13,745,427 | | | | 7,504,549 | | | | 22,570,734 | |
| | | | | | | | | | | | | | |
| | | |
| | 9,476,590 | | | | 18,463,102 | | | | 14,302,877 | | | | 35,724,509 | |
| | | | | | | | | | | | | | |
| | | |
| | | | | | | | | | | | | | |
| | (3,427,645) | | | | (6,775,942 | ) | | | (6,613,507 | ) | | | (13,341,328 | ) |
| | — | | | | — | | | | — | | | | — | |
| | | | | | | | | | | | | | |
| | | |
| | (3,427,645) | | | | (6,775,942 | ) | | | (6,613,507 | ) | | | (13,341,328 | ) |
| | | | | | | | | | | | | | |
| | | |
| | | | | | | | | | | | | | |
| | 32,332,458 | | | | 21,411,960 | | | | 53,525,456 | | | | 90,943,436 | |
| | 2,823,466 | | | | 5,261,111 | | | | 5,147,855 | | | | 10,364,131 | |
| | (20,800,553) | | | | (24,071,890 | ) | | | (33,043,546 | ) | | | (68,996,376 | ) |
| | | | | | | | | | | | | | |
| | | |
| | 14,355,371 | | | | 2,601,181 | | | | 25,629,765 | | | | 32,311,191 | |
| | | | | | | | | | | | | | |
| | | |
| | 20,404,316 | | | | 14,288,341 | | | | 33,319,135 | | | | 54,694,372 | |
| | | |
| | | | | | | | | | | | | | |
| | 154,659,388 | | | | 140,371,047 | | | | 343,799,593 | | | | 289,105,221 | |
| | | | | | | | | | | | | | |
| $ | 175,063,704 | | | $ | 154,659,388 | | | $ | 377,118,728 | | | $ | 343,799,593 | |
| | | | | | | | | | | | | | |
| | | |
| | | | | | | | | | | | | | |
| | 3,433,674 | | | | 2,401,193 | | | | 5,069,042 | | | | 8,935,602 | |
| | 298,022 | | | | 587,524 | | | | 486,389 | | | | 1,020,103 | |
| | (2,203,923) | | | | (2,709,838 | ) | | | (3,132,977 | ) | | | (6,837,473 | ) |
| | | | | | | | | | | | | | |
| | | |
| | 1,527,773 | | | | 278,879 | | | | 2,422,454 | | | | 3,118,232 | |
| | | | | | | | | | | | | | |
| | — | | | | ($6,429 | ) | | | — | | | | ($19,904 | ) |
FINANCIAL HIGHLIGHTS
Per share income and capital changes for a share outstanding throughout the period. See accompanying notes to financial statements.
Sit U.S. Government Securities Fund
| | | | | | | | | | | | | | | | | | | | | | | | |
| | | Six Months Ended | | | | | | | | | | | | | | | | |
| | | September 30, 2012 | | | Years Ended March 31, | |
| | | (Unaudited) | | | 2012 | | | 2011 | | | 2010 | | | 2009 | | | 2008 | |
Net Asset Value: | | | | | | | | | | | | | | | | | | | | | | | | |
Beginning of period | | | $11.31 | | | | $11.29 | | | | $11.13 | | | | $10.84 | | | | $10.92 | | | | $10.56 | |
| | | | |
Operations: | | | | | | | | | | | | | | | | | | | | | | | | |
Net investment income 1 | | | 0.10 | | | | 0.31 | | | | 0.32 | | | | 0.44 | | | | 0.52 | | | | 0.50 | |
Net realized and unrealized gains (losses) on investments and written options | | | 0.08 | | | | 0.02 | | | | 0.16 | | | | 0.29 | | | | (0.08 | ) | | | 0.36 | |
| | | | |
Total from operations | | | 0.18 | | | | 0.33 | | | | 0.48 | | | | 0.73 | | | | 0.44 | | | | 0.86 | |
| | | | |
Distributions from: | | | | | | | | | | | | | | | | | | | | | | | | |
Net investment income | | | (0.10 | ) | | | (0.31 | ) | | | (0.32 | ) | | | (0.44 | ) | | | (0.52 | ) | | | (0.50 | ) |
Net realized gains | | | — | | | | — | | | | (— | )2 | | | — | | | | — | | | | — | |
| | | | |
Total Distributions | | | (0.10 | ) | | | (0.31 | ) | | | (0.32 | ) | | | (0.44 | ) | | | (0.52 | ) | | | (0.50 | ) |
| | | | |
Net Asset Value: | | | | | | | | | | | | | | | | | | | | | | | | |
End of period | | | $11.39 | | | | $11.31 | | | | $11.29 | | | | $11.13 | | | | $10.84 | | | | $10.92 | |
| | | | |
Total investment return 3 | | | 1.59% | | | | 2.98% | | | | 4.37% | | | | 6.88% | | | | 4.18% | | | | 8.37% | |
| | | | |
Net assets at end of period (000’s omitted) | | | $1,754,135 | | | | $1,504,154 | | | | $1,057,154 | | | | $768,720 | | | | $390,630 | | | | $254,677 | |
| | | | | | |
Ratios: 4 | | | | | | | | | | | | | | | | | | | | | | | | |
Expenses (without waiver) 5 | | | 0.80% | | | | 0.80% | | | | 0.81% | | | | 0.82% | | | | 0.83% | | | | 0.85% | |
Expenses (with waiver) 5 | | | 0.80% | | | | 0.80% | | | | 0.75% | | | | 0.80% | | | | 0.80% | | | | 0.80% | |
Net investment income (with waiver) | | | 1.73% | | | | 2.73% | | | | 2.88% | | | | 3.85% | | | | 4.87% | | | | 4.66% | |
| | | | | | |
Portfolio turnover rate (excluding short-term securities) | | | 20.36%6 | | | | 33.82% | | | | 45.80% | | | | 66.89% | | | | 59.63% | | | | 67.42% | |
| 1 | The net investment income per share is based on average shares outstanding for the period. |
| 2 | Amount represents less than $0.01 per share. |
| 3 | Total investment return is based on the change in net asset value of a share during the period (not annualized) and assumes reinvestment of distributions at net asset value. |
| 4 | The ratio information is calculated based on average daily net assets (annualized). Effective November 1, 2010, total Fund expenses are calculated at 0.80% of average daily net assets. Prior to this date, expenses were calculated at a higher rate and the investment adviser voluntarily waived expenses that were otherwise payable by the Fund. |
| 5 | Ratios are annualized for periods less than one year. In addition to fees and expenses which the Fund bears directly, the Fund indirectly bears a pro rata share of the fees and expenses of the acquired funds in which it invests. Such indirect expenses are not included in the above reported expense ratios. |
| | |
38 | | SIT MUTUAL FUNDS SEMI-ANNUAL REPORT |
FINANCIAL HIGHLIGHTS
Per share income and capital changes for a share outstanding throughout the period. See accompanying notes to financial statements.
Sit Tax-Free Income Fund
| | | | | | | | | | | | | | | | | | | | | | | | |
| | | Six Months Ended | | | | | | | | | | | | | | | | |
| | | September 30, 2012 | | | Years Ended March 31, | |
| | | (Unaudited) | | | 2012 | | | 2011 | | | 2010 | | | 2009 | | | 2008 | |
Net Asset Value: | | | | | | | | | | | | | | | | | | | | | | | | |
Beginning of period | | | $9.23 | | | | $8.52 | | | | $8.90 | | | | $7.93 | | | | $9.16 | | | | $9.72 | |
| | | | |
Operations: | | | | | | | | | | | | | | | | | | | | | | | | |
Net investment income 1 | | | 0.19 | | | | 0.41 | | | | 0.41 | | | | 0.41 | | | | 0.41 | | | | 0.40 | |
Net realized and unrealized gains (losses) on investments | | | 0.35 | | | | 0.71 | | | | (0.38 | ) | | | 0.97 | | | | (1.23 | ) | | | (0.56 | ) |
| | | | |
Total from operations | | | 0.54 | | | | 1.12 | | | | 0.03 | | | | 1.38 | | | | (0.82 | ) | | | (0.16 | ) |
| | | | |
Distributions from: | | | | | | | | | | | | | | | | | | | | | | | | |
Net investment income | | | (0.19 | ) | | | (0.41 | ) | | | (0.41 | ) | | | (0.41 | ) | | | (0.41 | ) | | | (0.40 | ) |
| | | | |
Net Asset Value: | | | | | | | | | | | | | | | | | | | | | | | | |
End of period | | | $9.58 | | | | $9.23 | | | | $8.52 | | | | $8.90 | | | | $7.93 | | | | $9.16 | |
| | | | |
Total investment return 2 | | | 5.93% | | | | 13.41% | | | | 0.26% | | | | 17.71% | | | | (9.14% | ) | | | (1.72% | ) |
| | | | |
Net assets at end of period (000’s omitted) | | | $175,064 | | | | $154,659 | | | | $140,371 | | | | $153,495 | | | | $138,781 | | | | $322,590 | |
| | | | | | |
Ratios: 3 | | | | | | | | | | | | | | | | | | | | | | | | |
Expenses (without waiver) 4 | | | 0.80% | | | | 0.80% | | | | 0.80% | | | | 0.80% | | | | 0.80% | | | | 0.80% | |
Expenses (with waiver) 4 | | | 0.80% | | | | 0.80% | | | | 0.80% | | | | 0.80% | | | | 0.79% | | | | 0.77% | |
Net investment income (without waiver) | | | 4.10% | | | | 4.62% | | | | 4.63% | | | | 4.79% | | | | 4.63% | | | | 4.18% | |
| | | | | | |
Portfolio turnover rate (excluding short-term securities) | | | 13.84%5 | | | | 37.18% | | | | 30.23% | | | | 27.30% | | | | 18.51% | | | | 42.93% | |
| 1 | The net investment income per share is based on average shares outstanding for the period. |
| 2 | Total investment return is based on the change in net asset value of a share during the period (not annualized) and assumes reinvestment of distributions at net asset value. |
| 3 | The ratio information is calculated based on average daily net assets (annualized). Total Fund expenses are limited to 0.80% of average daily net assets. However, during the periods above, the investment adviser voluntarily absorbed expenses that were otherwise payable by the Fund. |
| 4 | Ratios are annualized for periods less than one year. In addition to fees and expenses which the Fund bears directly, the Fund indirectly bears a pro rata share of the fees and expenses of the acquired funds in which it invests. Such indirect expenses are not included in the above reported expense ratios. |
FINANCIAL HIGHLIGHTS
Per share income and capital changes for a share outstanding throughout the period. See accompanying notes to financial statements.
Sit Minnesota Tax-Free Income Fund
| | | | | | | | | | | | | | | | | | | | | | | | |
| | | Six Months Ended | | | | | | | | | | | | | | | | |
| | | September 30, 2012 | | | Years Ended March 31, | |
| | | (Unaudited) | | | 2012 | | | 2011 | | | 2010 | | | 2009 | | | 2008 | |
Net Asset Value: | | | | | | | | | | | | | | | | | | | | | | | | |
Beginning of period | | | $10.42 | | | | $9.67 | | | | $9.88 | | | | $8.97 | | | | $9.76 | | | | $10.21 | |
| | | | |
Operations: | | | | | | | | | | | | | | | | | | | | | | | | |
Net investment income 1 | | | 0.19 | | | | 0.44 | | | | 0.43 | | | | 0.43 | | | | 0.43 | | | | 0.43 | |
Net realized and unrealized gains (losses) on investments | | | 0.23 | | | | 0.75 | | | | (0.21 | ) | | | 0.91 | | | | (0.79 | ) | | | (0.45 | ) |
| | | | |
Total from operations | | | 0.42 | | | | 1.19 | | | | 0.22 | | | | 1.34 | | | | (0.36 | ) | | | (0.02 | ) |
| | | | |
Distributions from: | | | | | | | | | | | | | | | | | | | | | | | | |
Net investment income | | | (0.19 | ) | | | (0.44 | ) | | | (0.43 | ) | | | (0.43 | ) | | | (0.43 | ) | | | (0.43 | ) |
| | | | |
Net Asset Value: | | | | | | | | | | | | | | | | | | | | | | | | |
End of period | | | $10.65 | | | | $10.42 | | | | $9.67 | | | | $9.88 | | | | $8.97 | | | | $9.76 | |
| | | | |
Total investment return 2 | | | 4.08% | | | | 12.48% | | | | 2.22% | | | | 15.22% | | | | (3.67% | ) | | | (0.25% | ) |
| | | | |
Net assets at end of period (000’s omitted) | | | $377,119 | | | | $343,800 | | | | $289,105 | | | | $290,806 | | | | $244,123 | | | | $307,738 | |
| | | | | | |
Ratios: 3 | | | | | | | | | | | | | | | | | | | | | | | | |
Expenses 4 | | | 0.80% | | | | 0.80% | | | | 0.80% | | | | 0.80% | | | | 0.80% | | | | 0.80% | |
Net investment income | | | 3.66% | | | | 4.32% | | | | 4.35% | | | | 4.52% | | | | 4.65% | | | | 4.25% | |
| | | | | | |
Portfolio turnover rate (excluding short-term securities) | | | 7.80%5 | | | | 15.06% | | | | 24.48% | | | | 11.46% | | | | 15.68% | | | | 37.48% | |
| 1 | The net investment income per share is based on average shares outstanding for the period. |
| 2 | Total investment return is based on the change in net asset value of a share during the period (not annualized) and assumes reinvestment of distributions at net asset value. |
| 3 | The ratio information is calculated based on average daily net assets (annualized). |
| 4 | Ratios are annualized for periods less than one year. In addition to fees and expenses which the Fund bears directly, the Fund indirectly bears a pro rata share of the fees and expenses of the acquired funds in which it invests. Such indirect expenses are not included in the above reported expense ratios. |
| | |
40 | | SIT MUTUAL FUNDS SEMI-ANNUAL REPORT |
[This page intentionally left blank.]
NOTES TO FINANCIAL STATEMENTS (Unaudited)
Six Months Ended September 30, 2012
The Sit Mutual Funds (the Funds) are no-load funds, and are registered under the Investment Company Act of 1940 (as amended) as diversified (except Minnesota Tax-Free Income Fund which is non-diversified), open-end management investment companies, or series thereof. The Sit Minnesota Tax-Free Income Fund and the Sit Tax-Free Income Fund are series funds of Sit Mutual Funds II, Inc. Each fund has 10 billion authorized shares of capital stock. Shares in the U.S. Government Securities Fund have a par value of $0.01, and shares in other funds have a par value of $0.001. This report covers the bond funds of the Sit Mutual Funds.
The investment objective for each of these Funds is as follows:
| | |
Fund | | Investment Objective |
U.S. Government Securities | | High level of current income and safety of principal. |
Tax-Free Income | | High level of current income that is exempt from federal income tax, consistent with the preservation of capital. |
Minnesota Tax-Free Income | | High level of current income that is exempt from federal regular income tax and Minnesota regular personal income tax, consistent with the preservation of capital. |
| (2) | Significant Accounting Policies |
Investments in Securities
Investment securities are carried at fair value based upon closing market quotations on the last business day of the period. Investments in securities traded on national or international securities exchanges are valued at the last reported sales price prior to the time when assets are valued. Securities traded on the over-the-counter market are valued at the last reported sales price or if the last sales price is not available, at the last reported bid price. Consistent with the Funds’ valuation policies and procedures, the current fair value of certain fixed income securities is provided by an independent pricing service. Fixed income securities for which prices are not available from an independent pricing service but where an active market exists are valued using market quotations obtained from broker-dealers or quotation systems. Securities for which market quotations are not available, such as private placement securities, are valued at fair value according to methods selected in good faith by Sit Investment Associates, Inc. (the “Adviser”) and may include dealer-supplied valuations or other inputs and assumptions that pricing services would typically utilize. Short-term investments of sufficient credit quality with maturities of 60 days or less when acquired, or which subsequently are within 60 days of maturity, are valued at amortized cost, which approximates fair value. Option and future contracts entered into and held by the Funds are valued at the close of the securities and commodities exchange on which they are traded.
Security transactions are accounted for on the date the securities are purchased or sold. Gains and losses are calculated on the identified-cost basis. Interest, including level-yield amortization of long-term bond premium and discount, is recorded on the accrual basis. Dividends received from closed-end fund holdings are included in Dividend Income and distributions from capital gains, if any, are included in Net Realized Gain (Loss).
Delivery and payment for securities which have been purchased by the Funds on a forward commitment or when-issued basis can take place two weeks or more after the transaction date. During this period, such securities are subject to market fluctuations and may increase or decrease in value prior to delivery.
The Minnesota Tax-Free Income Fund concentrates its investments in Minnesota, and therefore may have more credit risk related to the economic conditions in the state of Minnesota than a portfolio with broader geographical diversification.
Derivative Instruments
The Funds apply derivative instrument disclosure standards in order to enable investors to understand how and why the Funds use derivatives, how derivatives are accounted for, and how derivative instruments affect the Funds’ financial statements.
| | |
42 | | SIT MUTUAL FUNDS SEMI-ANNUAL REPORT |
NOTES TO FINANCIAL STATEMENTS (Unaudited)
Six Months Ended September 30, 2012 (Continued)
To hedge interest rate risk, the U.S. Government Securities Fund purchased put option and wrote call option contracts traded on a U.S. exchange. Risks of purchasing and writing options include the possibility of an illiquid market and that a change in the value of the option may not correlate with changes in the value of the underlying securities.
The premiums paid for the options represent the cost of the investment and the options are valued daily at their closing price. The Fund recognizes a realized gain or loss when the option is sold or expired. Option holdings within the Fund, which may include put options and call options, are subject to loss of value with the passage of time, and may experience a total loss of value upon expiration. With options, there is minimal counterparty risk to the Fund since they are exchange traded. During the six months ended September 30, 2012, the average volume of derivative activity in the U.S. Government Securities Fund were as follows:
| | | | | | | | | | | | |
| | | | | | Average | | | Average | |
| | | Average | | | Premium | | | Notional | |
| | | Cost | | | Received | | | Amount | |
Purchased Put Options | | | $95,412 | | | | — | | | | $233,333 | |
Written Call Options | | | — | | | | $153,571 | | | | 2,200,000 | |
The number of open option contracts outstanding as of September 30, 2012 also serve as indicators of the volume of activity for the Fund throughout the period.
Balance Sheet - Values of derivatives as of September 30, 2012
U.S. Government Securities Fund
| | | | | | | | |
| | | Asset Derivatives Value 1 | | | Liability Derivatives Value 2 | |
Interest rate risk: | | | | | | | | |
Purchased put options | | | $7,031 | | | | — | |
Written call options | | | — | | | | $93,750 | |
1 Statement of Assets and Liabilities location: Investments in securities, at fair value.
2 Statement of Assets and Liabilities location: Outstanding options written, at fair value.
The effect of derivative instruments on the statement of operations for the six months ended September 30, 2012:
U.S. Government Securities Fund
| | | | |
| | | Amount of Realized | | Change in Unrealized |
| | | Gain (Loss) on Derivatives 3 | | Appreciation (Depreciation) on Derivatives 4 |
Interest rate risk: | | | | |
Purchased put options | | ($509,910) | | $64,103 |
Written call options | | (338,229) | | 86,636 |
| 3 | Statement of Operations location: Net realized gain (loss) on investments and net realized gain (loss) on written options, respectively. |
| 4 | Statement of Operations location: Net change in unrealized appreciation (depreciation) on investments and net change in unrealized appreciation (depreciation) on written options, respectively. |
Transactions in written options for the six months ended September 30, 2012 were as follows:
| | | | | | | | |
| | | Number of | | | | |
| | | Contracts | | | Premium | |
| | | | |
Outstanding, March 31, 2012 | | | 800 | | | $ | 96,536 | |
Call options written | | | 7,050 | | | | 1,260,897 | |
Call options expired | | | — | | | | — | |
Call options closed | | | (6,850) | | | | (1,268,012 | ) |
| | | | |
Outstanding, September 30, 2012 | | | 1,000 | | | $ | 89,421 | |
| | | | |
NOTES TO FINANCIAL STATEMENTS (Unaudited)
Six Months Ended September 30, 2012 (Continued)
Fair Value Measurements
The inputs and valuations techniques used to measure fair value of the Funds’ net assets are summarized into three levels as described in the hierarchy below:
| | • | Level 1 – quoted prices for active markets for identical securities. An active market for the security is a market in which transactions occur with sufficient frequency and volume to provide pricing information on an ongoing basis. A quoted price in an active market provides the most reliable evidence of fair value. |
| | • | Level 2 – debt securities are valued based on evaluated prices received from independent pricing services or from dealers who make markets in such securities. For corporate bonds, U.S. government and government agency obligations, and municipal securities the pricing services utilize matrix pricing which considers yield or price of bonds of comparable quality, coupon, maturity, and type as well as dealer supplied prices. For asset-backed securities and mortgage-backed securities, the pricing services utilize matrix pricing which considers prepayment speed assumptions, attributes of the collateral, yield or price of bonds of comparable quality, coupon, maturity, and type as well as dealer supplied prices. All of these inputs are derived principally from or corroborated by observable market data. An adjustment to any observable input that is significant to the fair value may render the measurement a Level 3 measurement. |
| | • | Level 3 – significant unobservable inputs, including the Adviser’s own assumptions in determining the fair value of investments. |
The inputs or methodology used for valuing securities are not necessarily an indication of the risk associated with investing in those securities.
The fair value of the Funds’ bonds are generally based on quotes received from brokers or independent pricing services. Bonds with quotes that are based on actual trades with a sufficient level of activity on or near the measurement date are classified as Level 2 assets.
At the end of each calendar quarter, management evaluates the Level 2 and 3 assets and liabilities for changes in liquidity, including but not limited to: whether a broker is willing to execute at the quoted price, the depth and consistency of prices from third party services, and the existence of contemporaneous, observable trades in the market. Additionally, management evaluates the Level 1 and 2 assets and liabilities on a quarterly basis for changes in listings or delistings on national exchanges. Due to the inherent uncertainty of determining the fair value of investments that do not have a readily available market value, the fair value of the Funds’ investments may fluctuate from period to period. Additionally, the fair value of investments may differ significantly from the values that would have been used had a ready market existed for such investments and may differ materially from the values the Fund may ultimately realize. Further, such investments may be subject to legal and other restrictions on resale or otherwise are less liquid than publicly traded securities.
A summary of the levels for the Funds’ investments as of September 30, 2012 is included with the Funds’ schedules of investments.
Federal Taxes
The Funds’ policy is to comply with the requirements of the Internal Revenue Code applicable to regulated investment companies and to distribute all of its taxable income to shareholders. The Funds have recorded in their financial statements the full benefit of their tax positions taken in connection with the RIC qualification and distribution requirements of the RIC. Therefore, no income tax provision is required. Also, in order to avoid the payment of any federal excise taxes, the Funds will distribute substantially all of their net investment income and net realized gains on a calendar year basis.
Management has analyzed the Funds’ tax positions taken in federal tax returns for all open tax years and has concluded that as of September 30, 2012, no provision for income tax would be required in the Funds’ financial statements. The Funds’ federal and state income and federal excise returns for the 2009, 2010, and 2011 tax years for which the applicable statutes of limitations have not expired remain subject to examination by the Internal Revenue Service and state departments of revenue.
| | |
44 | | SIT MUTUAL FUNDS SEMI-ANNUAL REPORT |
NOTES TO FINANCIAL STATEMENTS (Unaudited)
Six Months Ended September 30, 2012 (Continued)
At September 30, 2012, the gross unrealized appreciation (depreciation) on investments and cost of securities on a tax basis for federal income tax purposes were as follows:
| | | | | | | | | | | | | | |
| | | Unrealized
Appreciation | | | Unrealized
Depreciation | | | Net Unrealized
Appreciation (Depreciation) | | Cost of Securities
on a Tax Basis | |
U.S. Government Securities | | | $52,914,517 | | | | ($12,189,173 | ) | | $40,725,344 | | | $1,676,742,113 | |
Tax-Free Income | | | 11,917,304 | | | | (21,772,850 | ) | | (9,855,546) | | | 184,688,556 | |
Minnesota Tax-Free Income | | | 19,985,968 | | | | (1,179,192 | ) | | 18,806,776 | | | 338,097,058 | |
Net investment income and net realized gains may differ for financial statement and tax purposes. The character of distributions made during the year for net investment income or net realized gains may also differ from its ultimate characterization for tax purposes. The tax character of distributions paid during the fiscal years ended March 31, 2012 and 2011 were as follows:
Year Ended March 31, 2012:
| | | | | | | | | | | | | | |
| | | Ordinary Income | | | Tax-Exempt
Income | | | Long Term
Capital Gain | | Total | |
U.S. Government Securities | | | $36,820,960 | | | | — | | | — | | | $36,820,960 | |
Tax-Free Income* | | | 83,152 | | | | $6,692,790 | | | — | | | 6,775,942 | |
Minnesota Tax-Free Income* | | | 83,224 | | | | 13,258,104 | | | — | | | 13,341,328 | |
| | * | 98.8% and 99.4% of dividends were derived from interest on tax-exempt securities, on the Tax-Free Income and Minnesota Tax-Free Income Funds, respectively. |
Year Ended March 31, 2011:
| | | | | | | | | | | | | | | | |
| | | Ordinary Income | | | Tax-Exempt
Income | | | Long Term
Capital Gain | | | Total | |
U.S. Government Securities | | | $26,999,851 | | | | — | | | | $271,533 | | | | $27,271,384 | |
Tax-Free Income* | | | 49,497 | | | | $7,034,048 | | | | — | | | | 7,083,545 | |
Minnesota Tax-Free Income* | | | 29,469 | | | | 12,812,808 | | | | — | | | | 12,842,277 | |
| | * | 99.3% and 99.8% of dividends were derived from interest on tax-exempt securities, on the Tax-Free Income and Minnesota Tax-Free Income Funds, respectively. |
As of March 31, 2012 the components of distributable earnings on a tax basis were as follows:
| | | | | | | | | | | | | | |
| | | Undistributed Ordinary Income | | Undistributed Tax-Exempt Income | | | Accumulated Gain (Loss) | | | Unrealized Appreciation (Depreciation) | |
U.S. Government Securities | | — | | | — | | | | ($3,027,216 | ) | | | $30,379,132 | |
Tax-Free Income | | — | | | $148,899 | | | | (26,731,415 | ) | | | (17,041,571 | ) |
Minnesota Tax-Free Income | | — | | | 253,624 | | | | (8,108,918 | ) | | | 11,419,436 | |
NOTES TO FINANCIAL STATEMENTS (Unaudited)
Six Months Ended September 30, 2012 (Continued)
Net capital loss carryovers and late year losses, if any, as of March 31, 2012, are available to offset future realized capital gains and thereby reduce future capital gains distributions. Under the Regulated Investment Company Modernization Act of 2010 (“Act”), the Funds’ are permitted to carry forward capital losses incurred in taxable years beginning after December 22, 2010 for an unlimited period. Any losses incurred during those future taxable years will be required to be utilized prior to any losses incurred in pre-enactment taxable years. Additionally, post-enactment capital losses that are carried forward will retain their character as either short-term or long-term capital losses, and will not be considered exclusively short-term as under previous law. The Funds’ first fiscal year end subject to the Modernization Act is March 31, 2012. The net capital loss carryovers and the expiration dates for capital losses carryover from pre-enactment taxable years and the late year losses deferred as of March 31, 2012, were as follows:
| | | | | | | | | | | | | | | | | | | | | | | | |
| | | Pre-Enactment | | | Post-Enactment | | | Late Year Losses Deferred | | | Accumulated Capital and Other Losses | |
| | | Net Capital Loss | | | Unlimited Period of Net | | | |
| | | Carryover Expiring in: | | | Capital Loss Carryover | | | |
| | | | | | |
| | | 2013 | | | 2014-2019 | | | Short-Term | | | Long-Term | | | |
| | | | |
U.S. Government Securities | | | — | | | | — | | | | $1,791,533 | | | | $1,235,683 | | | | — | | | | $3,027,216 | |
Tax-Free Income | | | $3,741,370 | | | | $19,109,911 | | | | — | | | | 3,801,560 | | | | $78,574 | | | | 26,731,415 | |
Minnesota Tax-Free Income | | | 396,122 | | | | 7,508,570 | | | | — | | | | 204,134 | | | | 92 | | | | 8,108,918 | |
For the year ended March 31, 2012, the Funds’ utilized capital losses and expired capital losses as follows:
| | | | | | | | |
| | | Utilized | | Expiring In | | Expired | |
Tax-Free Income | | — | | 2012 | | $ | 1,461,177 | |
Minnesota Tax-Free Income | | — | | 2012 | | | 403,028 | |
Distributions
Distributions to shareholders are recorded as of the close of business on the record date. Such distributions are payable in cash or reinvested in additional shares of the Funds’ capital stock. Distributions from net investment income are declared daily and paid monthly for the Funds. Distributions from net realized gains, if any, will be made annually for each of the Funds.
Use of Estimates
The preparation of financial statements in conformity with U.S. generally accepted accounting principles requires management to make certain estimates and assumptions that affect the reported amounts of assets and liabilities and disclosure of contingent assets and liabilities at the date of the financial statements and the reported results for the respective periods. Actual results could differ from those estimates.
Guarantees and Indemnifications
Under each Fund’s organizational documents, its officers and directors are indemnified against certain liabilities arising out of the performance of their duties to each Fund. In addition, certain of each Fund’s contracts with its service providers contain general indemnification clauses. Each Fund’s maximum exposure under these arrangements is unknown since the amount of any future claims that may be made against each Fund cannot be determined and each Fund has no historical basis for predicting the likelihood of any such claims.
| (3) | Investment Security Transactions |
The cost of purchases of and proceeds from sales and maturities of investment securities, other than short-term securities, for the six months ended September 30, 2012, were as follows:
| | | | | | | | | | | | | | | | |
| | | Purchases | | | Proceeds | |
| | | | |
| | | U.S. Government | | | Other | | | U.S. Government | | | Other | |
| | | | |
U.S. Government Securities | | | $612,900,824 | | | | — | | | | $338,916,192 | | | | — | |
Tax-Free Income | | | — | | | | $35,257,962 | | | | — | | | | $22,114,539 | |
Minnesota Tax-Free Income | | | — | | | | 55,116,053 | | | | — | | | | 26,108,912 | |
| | |
46 | | SIT MUTUAL FUNDS SEMI-ANNUAL REPORT |
NOTES TO FINANCIAL STATEMENTS (Unaudited)
Six Months Ended September 30, 2012 (Continued)
| (4) | Affiliated Fees and Transactions |
Investment Adviser
The Funds each have entered into an investment management agreement with Sit Investment Associates Inc. (SIA), under which SIA manages the Funds’ assets and provides research, statistical and advisory services, and pays related office rental, executive expenses and executive salaries. SIA also is obligated to pay all of the Funds’ expenses (excluding extraordinary expenses, stock transfer taxes, interest, brokerage commissions, and other transaction charges relating to investing activities). The fee for investment management and advisory services is based on the average daily net assets of the Funds at the annual rate of:
| | |
| | | Average Daily Net Assets |
U.S. Government Securities | | 0.80% |
Tax-Free Income | | 0.80% |
Minnesota Tax-Free Income | | 0.80% |
Transactions with affiliates
The investment adviser, affiliates of the investment adviser, directors and officers of the Funds as a whole owned the following shares as of September 30, 2012:
| | | | | | |
| | | Shares | | | % Shares Outstanding |
U.S. Government Securities | | | 3,136,202 | | | 2.0 |
Tax-Free Income | | | 2,892,878 | | | 15.8 |
Minnesota Tax-Free Income | | | 3,155,859 | | | 8.9 |
Management has evaluated the impact of all subsequent events on the Funds through the date the financial statements were issued, and has determined that there were no subsequent events that would require disclosure in or adjustments to the financial statements.
EXPENSE EXAMPLE (Unaudited)
As a shareholder of the Funds, you incur two types of costs: (1) transaction costs, including redemption fees and (2) ongoing costs, including management fees; and other Fund expenses. This Example is intended to help you understand your ongoing costs (in dollars) of investing in the Funds and to compare these costs with the ongoing costs of investing in other mutual funds.
The Example is based on an investment of $1,000 invested at the beginning of the period and held for the entire period April 1, 2012 to September 30, 2012.
Actual Expenses
The first line of the following table provides information about actual account values and actual expenses. You may use the information in this line, together with the amount you invested, to estimate the expenses that you paid over the period. Simply divide your account value by $1,000 (for example, an $8,600 account value divided by $1,000 = 8.6), then multiply the result by the number in the first line under the heading entitled “Expenses Paid During Period” to estimate the expenses you paid on your account during this period.
Hypothetical Example for Comparison Purposes
The second line of the table provides information about hypothetical account values and hypothetical expenses based on the Fund’s actual expense ratio and an assumed rate of return of 5% per year before expenses, which is not the Fund’s actual return. The hypothetical account values and expenses may not be used to estimate the actual ending account balance or expenses you paid for the period. You may use this information to compare the ongoing costs of investing in the Fund and other funds. To do so, compare this 5% hypothetical example with the 5% hypothetical examples that appear in the shareholder reports of the other funds.
Please note that the expenses shown in the table are meant to highlight your ongoing costs only and do not reflect any transactional costs, such as redemption fees. Therefore, the second line of the table is useful in comparing ongoing costs only, and will not help you determine the relative total costs of owning different funds. In addition, if these transactional costs (redemption fees) were included, your costs would have been higher.
| | | | | | |
| | | Beginning Account Value (4/1/12) | | Ending Account Value (9/30/12 ) | | Expenses Paid During Period* (4/1/12- 9/30/12) |
| U.S. Government Securities Fund |
Actual | | $1,000 | | $1,015.90 | | $4.04 |
Hypothetical | | $1,000 | | $1,021.06 | | $4.05 |
| | | | | | | |
| Tax-Free Income Fund |
Actual | | $1,000 | | $1,059.30 | | $4.13 |
Hypothetical | | $1,000 | | $1,021.06 | | $4.05 |
| | | | | | | |
| Minnesota Tax-Free Income Fund |
Actual | | $1,000 | | $1,040.80 | | $4.09 |
Hypothetical | | $1,000 | | $1,021.06 | | $4.05 |
*Expenses are equal to the Funds’ annualized expense ratio of 0.80% multiplied by the average account value over the period, multiplied by 183/365 (to reflect the one-half year period.)
| | |
48 | | SIT MUTUAL FUNDS SEMI-ANNUAL REPORT |
[This page intentionally left blank.]
ADDITIONAL INFORMATION (Unaudited)
PROXY VOTING
Each fund follows certain policies and procedures for voting proxies for securities held in each portfolio. A description of the Funds’ proxy voting policies and procedures is available without charge upon request by calling the Funds at 1-800-332-5580.
Information regarding how each Fund voted proxies relating to its portfolio securities during the most recent twelve-month period ended June 30 is available without charge upon request by calling the Funds at 1-800-332-5580, and is available on the U.S. Securities and Exchange Commission’s website at www.sec.gov.
AVAILABILITY OF QUARTERLY PORTFOLIO SCHEDULES
The Funds’ file their complete schedules of portfolio holdings with the U.S. Securities and Exchange Commission (SEC) for the first and third quarters of each fiscal year on Form N-Q. The Funds’ Form N-Qs are available without charge upon request by calling the Funds at 1-800-332-5580 and are available on the SEC’s website at www.sec.gov. In addition, the Funds’ Form N-Qs may be reviewed and copied at the SEC’s Public Reference Room in Washington, DC. Information on the operation of the Public Reference Room may be obtained by calling 1-202-551-8090.
| | |
50 | | SIT MUTUAL FUNDS SEMI-ANNUAL REPORT |
[This page intentionally left blank.]
[This page intentionally left blank.]
Sit Bond 9-2012
| Item 2: | Code of Ethics. Not applicable to Semi-Annual Report. |
| Item 3: | Audit Committee Financial Expert. Not applicable to Semi-Annual Report. |
| Item 4: | Principal Accountant Fees and Services. Not applicable to Semi-Annual Report. |
| Item 5: | Audit Committee of Listed Registrants. |
Not applicable to open-end investment companies.
| Item 6: | Schedule of Investments. |
The schedule of investments is included as part of the report to shareholders filed under Item 1 of this Form.
| Item 7: | Disclosure of Proxy Voting Policies and Procedures for Closed-End Management Investment Companies. |
Not applicable to open-end investment companies.
| Item 8: | Portfolio Managers of Closed-End Management Companies. |
Not applicable to open-end investment companies.
| Item 9: | Purchases of Equity Securities by Closed-End Management Investment Company and Affiliated Purchasers. |
Not applicable to open-end investment companies.
| Item 10. | Submission of Matters to a vote of Security Holders. |
There have been no material changes to the procedures by which shareholders may recommend nominees to the registrant’s board of directors.
| Item 11: | Controls and Procedures - |
| (a) | | Based on their evaluation of the Registrant’s Disclosure Controls and Procedures as of a date within 90 days of the Filing Date, the Registrant’s Chairman and Treasurer have determined that the Disclosure Controls and Procedures (as defined in Rule 30a-2(c) under the Act) are designed to ensure that information required to be disclosed by the Registrant is recorded, processed, summarized and reported by the filing Date, and that information required to be disclosed in the report is communicated to the Registrant’s management, as appropriate, to allow timely decisions regarding required disclosure. |
| b) | | There were no changes in the Registrant’s internal control over financial reporting as defined in Rule 30a-3(d) under the Act) that occurred during the Registrant’s last fiscal half-year that has materially affected, or is reasonably likely to materially affect, the Registrant’s internal control over financial reporting. |
| (a) | | The following exhibits are attached to this Form N-CSR: |
| | (2) | | A separate certification for each principal executive and principal financial officer of the registrant as required by Rule 30a-2(a) under the Act (17 CFR 270.30a-2) (certification required by Section 302 of the Sarbanes-Oxley Act of 2002). |
| (b) | | Certification required by Rule 30a-2(b) under the Act (certification required by Section 906 of the Sarbanes-Oxley Act of 2002). |
SIGNATURES
Pursuant to the requirements of the Securities Exchange Act of 1934 and the Investment Company Act of 1940, the registrant has duly caused this report to be signed on its behalf by the undersigned, thereunto duly authorized.
SIT MUTUAL FUNDS II, INC.
| | |
| By (Signature and Title) | | /s/ Paul E. Rasmussen |
| | Paul E. Rasmussen, Vice President, Treasurer |
Pursuant to the requirements of the Securities Exchange Act of 1934 and the Investment Company Act of 1940, this report has been signed below by the following persons on behalf of the registrant and in the capacities and on the dates indicated.
| | |
| By (Signature and Title) | | /s/ Paul E. Rasmussen |
| | Paul E. Rasmussen, Vice President, Treasurer |
| | |
| By (Signature and Title) | | /s/ Roger J. Sit |
| | Roger J. Sit, Chairman |