UNITED STATES SECURITIES AND EXCHANGE COMMISSION
Washington, D.C. 20549
FORM N-CSR
----------
CERTIFIED SHAREHOLDER REPORT OF REGISTERED
MANAGEMENT INVESTMENT COMPANIES
Investment Company Act file number: 811-04033
----------
Sit Mutual Funds II, Inc.
(Exact name of registrant as specified in charter)
3300 IDS Center
80 South Eighth Street
Minneapolis, MN 55402
(Address of principal executive offices)
Paul E. Rasmussen, VP Treasurer
Sit Mutual Funds, Inc.
3300 IDS Center
80 South Eighth Street
Minneapolis, MN 55402
(Name and address of agent for service)
Copy to:
Mike Radmer, Esq.
Dorsey & Whitney
Suite 1500
50 South Sixth Street
Minneapolis, MN 55402-1498
Registrant’s telephone number, including area code:
(612) 332-3223
Date of fiscal year end: March 31, 2015
Date of reporting period: September 30, 2014
Item 1: Reports to Stockholders
Sit Mutual Funds
BOND FUNDS SEMI-ANNUAL REPORT
TABLE OF CONTENTS
This document must be preceded or accompanied by a Prospectus.
|
|
CHAIRMAN’S LETTER November 5, 2014 |
Dear fellow shareholders:
During the 6-month period ending September 30, 2014, U.S. fixed income markets experienced across the board price gains. While markets have accepted the steady path that the U.S. Federal Reserve (the “Fed”) has taken to “taper” Quantitative Easing, its bond buying program projected to end in October, attention has turned to when the Fed will raise short term interest rates from their historically low levels. These tools have been used by the Fed to achieve its primary objectives – maximum employment and stable prices – as the U.S. economy recovered from the Great Recession of the past decade.
Tapering of the bond buying program, set in place by then Fed Chair Ben Bernanke, was formally announced in December 2013 and rolled out this past January. Careful not to disrupt capital markets, the Fed has followed a steady course to reduce its purchases of U.S. Treasury and mortgage-backed securities, which has been carried out at subsequent Federal Open Market Committee (FOMC) meetings. While Chairman Bernanke did not specifically address timing of the interest rate hike prior to leaving office at the end of January 2014, his initial implications were that inflation approaching 2% and unemployment levels below 6.5% would trigger the Fed to move on short-term rates, which have been at near zero since 2008.
Shortly after JanetYellen took over as Fed Chair in February 2014, against the backdrop of a declining unemployment rate but tepid inflation and economic growth data, the FOMC unanimously decided the 6.5% unemployment threshold was “outdated” according to its meeting minutes. Mindful of the impact a rate increase could have on a still recovering economy, the Fed has assured markets that its strategy is to keep rates low for a “considerable time” after the bond buying program is completed. A more complete analysis of economic and inflationary data would be used to assess the appropriate time to raise rates. As domestic economic data rebounded from a difficult winter, attention has shifted to the timing of this potential rate increase.
We have witnessed a year-long flattening of the Treasury yield curve. Earlier this year, long bonds rallied on the backs of mixed U.S. economic data and a flight to quality amid geopolitical risks in Ukraine and the Middle East. More recently, short term rates have begun to creep up which has also contributed to the flattening yield curve. In anticipation of the projected 2015 interest rate increase, the 2-year Treasury yield has settled in at a level above 0.50%, a noteworthy move after being below that threshold the prior three years. A side effect of increasing short-term rates is the reduction of future inflationary pressures, which decreases the required market yield on longer maturities, contributing further to the flattening yield curve.
Performance for the 6-month period supports these developments, with the 2-year Treasury return just +0.30% compared to the 10-year and 30-year Treasuries which gained +3.43% and +8.74%, respectively. The 30-year Treasury bond ended September yielding
3.20% while the 10-year Treasury note was yielding 2.49%, a drop of 77 and 54 basis points, respectively, since March 31. The tax-exempt bond market experienced similar results for the 6-month period as short-term bonds returned +0.30%, while 10-year bonds gained +3.99% and long term (22+ years) bonds were up +6.52%.
Global
A growing number of economic indicators confirm that activity across Europe is decelerating and deflationary pressures continue to mount. Reflecting the weakening outlook in the euro area, the European Central Bank (ECB) cut interest rates again in early September, in an attempt to further stimulate growth and stave off deflation. Additionally, the ECB plans to restart its covered bond purchases and to start a “sizeable” asset-backed security purchase program in October, coinciding with the asset quality review/stress tests. The targeted longer-term refinancing operation will continue with the hope that banks will participate in this voluntary program. Most recently, 255 banks participated and borrowed €83.6 billion in new four-year loans at an interest rate of 0.15%, well short of the €100 billion anticipated by the market. If the above measures prove insufficient, ECB President Mario Draghi suggested in September that large scale purchases of government bonds remain an option, if inflation remains too low.
In Japan, “Abenomics” (the economic stimulus package put in place by Prime Minister Shinzo Abe) has been dealt a setback, as the April 1st consumption tax hike has weighed on the Japanese economy to a greater extent than initially expected. Economic growth contracted sharply during the second calendar quarter, and recent indicators suggest a muted recovery, with domestic consumption yet to rebound, real wages under pressure, capital spending indicators slowing, and a recovery in exports remaining absent. To be sure, some positive signs still persist. The employment situation remains healthy, with the unemployment rate remains near multi-year lows, and surveys show optimism remains elevated among the corporate sector. The economy will likely return to modest growth in coming quarters, but the consumption tax hike has clearly been a greater obstacle than expected.
Elsewhere in Asia, after China’s growth stabilized in the June quarter, concerns over a slowdown are re-emerging after much weaker than expected August data. Industrial production growth declined to 6.9% year-over-year in August, marking the lowest rate since 2009. While exports showed strength from a recovery in developed markets, domestic demand has remained weak mostly due to the cooling property market. Policy makers have been using targeted easing to help stabilize growth, which include liquidity injections, tax breaks, and newly-announced loosened mortgage policies. While economic growth likely slowed down in the third quarter, we could see some improvement in the fourth quarter given recent easing measures.
| | |
2 | | SIT MUTUAL FUNDS SEMI-ANNUAL REPORT |
Domestic
In the U.S., the (subpar) economic recovery remains on track. The third estimate of second quarter real GDP growth was quite strong at 4.6%. Although second quarter growth was robust, taken in the context of an equally weak first quarter, largely as a result of the unusually cold winter, the average growth for the first two quarters of 2014 was just 1.2%.
The most recent employment report, released on October 3, showed September nonfarm payrolls jobs at a strong 248,000, well above the consensus estimate of 215,000. Additionally, July and August payrolls were revised up by a combined 69,000. The unemployment rate fell from 6.1% to 5.9%, the lowest level since July 2008. However, this was at least partially aided by a decline in the labor force participation rate to a new cyclical low of 62.7 percent. Moreover, when viewed by age cohort, the labor force participation rate rose for workers between the ages of 16 and 24, while it fell for all other age groups, perhaps suggesting a mismatch in job skills among core age workers and early retirement for those 55+.
Inflation, as measured by the headline Consumer Price Index for All Urban Consumers (CPI), increased 0.1% in September, versus a decline of -0.2% in August. On a year-over-year basis, inflation stands at 1.7%, coming in below the 2% level for the second straight month. Core CPI, which excludes the volatile food and energy sectors, increased by 0.1% in September, and at 1.7% on a year-over-year basis, remains comfortably below the 2% level. Inflation remains very controlled and does not appear likely to be a concern in the near to intermediate term. The Fed’s bias is clearly on generating better growth in the economy; however, as growth begins to accelerate with conviction, inflation will become a much bigger risk and concern.
Although second quarter growth was strong, average growth for the first half of 2014 was a disappointing 1.2%. Nonetheless, we believe that the subpar economic recovery remains on track. As has been the case throughout this recovery, economic data remains quite mixed and consumer spending continues to be cautious. However, job growth is showing legitimate signs of improvement.
Strategy Summary
The U.S. Government Securities Fund continues to favor seasoned, high coupon agency-backed securities. As mortgage rates have increased from all-time lows, we see long-term income stability and principal preservation returning to the market. The Sit Quality Income Fund remains a sturdy performer, building off a strong 2013 while maintaining focus on securities with relatively high levels of income and credit quality. We believe the Fund’s stable price and 1.03% 30-day SEC yield as of September 30 make it a good alternative to cash reserves.
The Tax-Free Income Fund and the Minnesota Tax-Free Income Fund strategies are focused on the use of high coupon bonds and bonds structured with put, call, sinking fund and prepayment provisions that provide regular cash flow. As market fundamentals, alongside strong Treasury markets, have made for price appreciation, we continue to look for sectors and security structures which provide added yield while positioning our portfolios in a more defensive nature in advance of potentially rising interest rates. Our strategy remains focused on securities that provide a high level of interest income, which is the primary source of returns over longer term cycles.
We appreciate your continued interest in the Sit family of funds.
With best wishes,

Roger J. Sit
Chairman and President
Sit Mutual Funds
Sit U.S. Government Securities Fund
OBJECTIVE & STRATEGY
The objective of the U.S. Government Securities Fund is to provide high current income and safety of principal, which it seeks to attain by investing solely in debt obligations issued, guaranteed or insured by the U.S. government or its agencies or its instrumentalities.
Agency mortgage securities and U.S. Treasury securities are the principal holdings in the Fund. The mortgage securities that the Fund purchases consist of pass-through securities including those issued by Government National Mortgage Association (GNMA), Federal National Mortgage Association (FNMA), and Federal Home Loan Mortgage Corporation (FHLMC).
The Sit U.S. Government Securities Fund provided a return of +0.95% during the 6-month period ended September 30, 2014, compared to the return of the Barclays Intermediate Government Bond Index of +0.92%. The Fund’s 30-day SEC yield was 2.58% and its 12-month distribution rate was 1.58%.
During the 6-month period, the Fund benefitted from the income advantage provided by its holdings in old, higher coupon mortgage pass through securities and collateralized mortgage obligations. The continued reduction in the Federal Reserve’s asset purchase program and anticipation of the first increase in the federal funds rate drove shorter term interest rates higher. Prices of mortgage-backed securities modestly underperformed during the period due to reduced demand from the Federal Reserve and higher interest rate expectations. However, the income generated by the securities more than offset the underperformance, leading to positive total return for mortgages overall. Prepayment activity on the mortgages held in the Fund has returned to historical levels, which has also benefitted performance by increasing income.
Looking forward, we expect slow economic growth to persist. The Federal Reserve has stated it will end asset purchases before year-end. These factors will likely cause the yield curve to flatten further. Eventually, short term yields should increase as market participants begin to anticipate the Federal Reserve’s first increase in short term rates in more than a decade. Longer term yields will be relatively more stable as the inflationary pressures of asset purchases are removed. We believe as financial markets become less supported by the Federal Reserve’s asset purchase program, a more normalized and healthy marketplace will resume. We have positioned the Fund defensively to maximize return potential while preserving income. We continue to focus on old, high coupon agency mortgage securities that should provide relatively stable income and price levels. This high level of income and stability of principal has been a fundamental focus of the Fund since its inception.
Michael C. Brilley Bryce A. Doty, CFA
Senior Portfolio Managers
Mark H. Book, CFA
Portfolio Manager
HYPOTHETICAL GROWTH OF $10,000
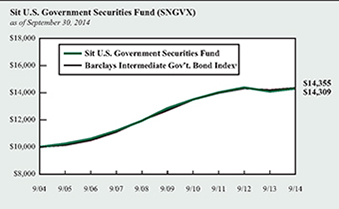
The chart above illustrates the total value of a hypothetical $10,000 investment in the Fund over the past 10 years (or for the life of the Fund if shorter) as compared to the performance of the Barclays Intermediate Government Bond Index. Past performance does not guarantee future results. Returns include the reinvestment of distributions. The chart does not reflect the deduction of taxes that a shareholder would pay on Fund distributions or the redemption of Fund shares.
1 The Barclays Intermediate Government Bond Index is a sub-index of the Barclays Government Bond Index covering issues with remaining maturities of between three and five years. The Barclays Government Bond Index is an index that measures the performance of all public U.S. government obligations with remaining maturities of one year or more. The returns include the reinvestment of income and do not include any transaction costs, management fees or other costs. It is not possible to invest directly in an index. This is the Fund’s primary index.
| | |
4 | | SIT MUTUAL FUNDS SEMI-ANNUAL REPORT |
COMPARATIVE RATES OF RETURNS
as of September 30, 2014
| | | | | | | | | | | | | | | |
| | | Sit U.S.
Government
Securities
Fund | | Barclays
Inter. Gov’t
Bond Index1 | | Lipper
U.S.
Gov’t Fund
Index2 |
| | | |
Six Months | | | | 0.95 | % | | | | 0.92 | % | | | | n/a | |
| | | |
One Year | | | | 1.59 | | | | | 1.14 | | | | | 3.54 | % |
| | | |
Five Years | | | | 2.17 | | | | | 2.50 | | | | | 3.53 | |
| | | |
Ten Years | | | | 3.65 | | | | | 3.68 | | | | | 4.05 | |
| | | |
Since Inception (6/2/87) | | | | 5.80 | | | | | 5.98 | | | | | 5.80 | |
Performance figures are historical and do not guarantee future results. Investment returns and principal value will vary, and you may have a gain or loss when you sell shares. Current performance may be lower or higher than the performance data quoted. Contact the Fund for performance data current to the most recent month-end. Returns include changes in share price as well as reinvestment of all dividends and capital gains and all fee waivers. Without the fee waivers total return and yield figures would have been lower. Returns do not reflect the deduction of taxes that a shareholder would pay on Fund distributions or the redemption of Fund shares. Management fees and administrative expenses are included in the Fund’s performance. Returns for periods greater than one year are compounded average annual rates of return.
1 The Barclays Intermediate Government Bond Index is a sub-index of the Barclays Government Bond Index covering issues with remaining maturities of between three and five years. The Barclays Government Bond Index is an index that measures the performance of all public U.S. government obligations with remaining maturities of one year or more. The returns include the reinvestment of income and do not include any transaction costs, management fees or other costs. It is not possible to invest directly in an index.
2 The Lipper returns are obtained from Lipper Analytical Services, Inc., a large independent evaluator of mutual funds.
FUND DIVERSIFICATION
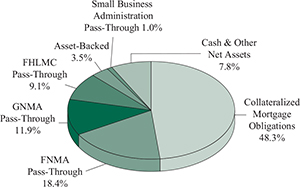
Based on total net assets as of September 30, 2014. Subject to change.
PORTFOLIO SUMMARY
| | |
| Net Asset Value 9/30/14: | | $ 11.05 Per Share |
| Net Asset Value 3/31/14: | | $ 11.04 Per Share |
| Total Net Assets: | | $ 611.9 Million |
| Effective Duration 3: | | 3.0 Years |
3 Duration is a measure of estimated price sensitivity relative to changes in interest rates. Portfolios with longer durations are typically more sensitive to changes in interest rates. For example, if interest rates rise by 1%, the fair value of a security with an effective duration of 5 years would decrease by 5%, with all other factors being constant. The correlation between duration and price sensitivity is greater for securities rated investment-grade than it is for securities rated below investment-grade. Duration estimates are based on assumptions by the Adviser and are subject to a number of limitations. Effective duration is calculated based on historical price changes of securities held by the Fund, and therefore is a more accurate estimate of price sensitivity provided interest rates remain within their historical range.
ESTIMATED AVERAGE LIFE
| | | | |
0-1 Year | | | 7.6 | % |
1-5 Years | | | 88.7 | % |
5-10 Years | | | 3.7 | % |
10-20 Years | | | 0.0 | % |
20+ Years | | | 0.0 | % |
The table represents the Adviser’s estimates of the dollar weighted average life of the portfolio’s securities, which differ from their stated maturities. The Fund’s average stated maturity was 18.4 years as of September 30, 2014.
|
|
|
SCHEDULE OF INVESTMENTS (Unaudited) September 30, 2014 Sit U.S. Government Securities Fund |
| | | | | | | | | | | | |
| |
| | | |
Principal Amount ($) | | Coupon Rate (%) | | | Maturity Date | | | Fair Value ($) | |
| |
|
Mortgage Pass-Through Securities - 40.4% | |
Federal Home Loan Mortgage Corporation - 9.1% | |
| 744,926 | | | 4.00 | | | | 7/1/25 | | | | 795,089 | |
| 393,300 | | | 5.82 | | | | 10/1/37 | | | | 437,426 | |
| 102,099 | | | 6.38 | | | | 12/1/26-12/1/27 | | | | 114,970 | |
| 16,004,879 | | | 6.50 | | | | 11/1/27-9/1/39 | | | | 18,409,301 | |
| 527,556 | | | 6.88 | | | | 2/17/31 | | | | 610,867 | |
| 23,526,964 | | | 7.00 | | | | 8/1/27-1/1/39 | | | | 26,152,493 | |
| 71,687 | | | 7.38 | | | | 12/17/24 | | | | 82,217 | |
| 2,415,214 | | | 7.50 | | | | 1/1/31-10/1/38 | | | | 2,817,831 | |
| 85,754 | | | 7.95 | | | | 10/1/25-11/1/25 | | | | 87,310 | |
| 837,840 | | | 8.00 | | | | 5/1/31-1/1/37 | | | | 959,865 | |
| 7,446 | | | 8.25 | | | | 12/1/17 | | | | 7,471 | |
| 1,564,574 | | | 8.50 | | | | 10/1/19-3/1/31 | | | | 1,832,130 | |
| 1,772,461 | | | 9.00 | | | | 11/1/15-5/1/31 | | | | 1,961,065 | |
| 23,272 | | | 9.25 | | | | 2/1/18-3/1/19 | | | | 23,437 | |
| 336,536 | | | 9.50 | | | | 4/1/18-12/17/21 | | | | 372,253 | |
| 8,730 | | | 9.75 | | | | 12/1/16-12/1/17 | | | | 8,789 | |
| 1,066,836 | | | 10.00 | | | | 9/1/20-7/1/30 | | | | 1,149,066 | |
| 63,200 | | | 10.50 | | | | 6/1/19 | | | | 70,460 | |
| 64,183 | | | 11.00 | | | | 8/25/20 | | | | 64,591 | |
| | | | | | | | | | | | |
| | | |
| | | | | | | | | | | 55,956,631 | |
| | | | | | | | | | | | |
|
Federal National Mortgage Association - 18.4% | |
| 3,434 | | | 3.74 | | | | 3/1/19 | 1 | | | 3,433 | |
| 1,394,996 | | | 5.50 | | | | 12/1/32 | | | | 1,554,826 | |
| 2,364,640 | | | 5.61 | | | | 11/1/22 | | | | 2,567,854 | |
| 65,270 | | | 5.76 | | | | 3/1/33 | | | | 72,677 | |
| 3,017,835 | | | 5.96 | | | | 6/1/28 | | | | 3,268,970 | |
| 1,770,696 | | | 6.00 | | | | 9/1/28-10/1/39 | | | | 1,998,937 | |
| 472,686 | | | 6.15 | | | | 6/1/33 | 1 | | | 484,518 | |
| 129,019 | | | 6.20 | | | | 11/1/27 | | | | 149,789 | |
| 103,630 | | | 6.35 | | | | 10/1/30 | | | | 121,216 | |
| 25,566,877 | | | 6.50 | | | | 1/1/22-6/1/40 | | | | 29,043,586 | |
| 118,655 | | | 6.91 | | | | 11/1/26-8/1/27 | | | | 127,499 | |
| 136,185 | | | 6.95 | | | | 8/1/21 | 1 | | | 138,866 | |
| 44,834,308 | | | 7.00 | | | | 6/1/17-5/1/39 | | | | 51,715,415 | |
| 6,806,123 | | | 7.50 | | | | 6/1/22-2/1/38 | | | | 7,781,325 | |
| 53,008 | | | 7.62 | | | | 12/1/16 | | | | 55,563 | |
| 178,250 | | | 7.95 | | | | 9/15/20 | | | | 197,196 | |
| 3,464,040 | | | 8.00 | | | | 4/1/16-3/1/38 | | | | 4,146,672 | |
| 277,708 | | | 8.09 | | | | 11/15/31 | | | | 333,972 | |
| 59,764 | | | 8.30 | | | | 7/20/28 | | | | 61,749 | |
| 95,693 | | | 8.31 | | | | 7/20/30 | | | | 101,795 | |
| 104,822 | | | 8.33 | | | | 7/15/20 | | | | 114,980 | |
| 48,907 | | | 8.47 | | | | 9/15/30 | | | | 56,333 | |
| 3,288,565 | | | 8.50 | | | | 2/1/16-1/1/37 | | | | 3,910,317 | |
| 41,931 | | | 8.94 | | | | 3/15/22 | | | | 43,243 | |
| 1,436,766 | | | 9.00 | | | | 10/1/19-2/1/38 | | | | 1,643,260 | |
| 103,145 | | | 9.25 | | | | 10/1/16-5/15/28 | | | | 113,142 | |
| 1,649,800 | | | 9.50 | | | | 5/1/19-8/1/31 | | | | 1,934,090 | |
| 39,112 | | | 9.56 | | | | 7/15/20 | | | | 39,843 | |
| 329,369 | | | 9.72 | | | | 8/20/25 | | | | 377,457 | |
| | | | | | | | | | | | |
| |
| | | |
Principal Amount ($) | | Coupon Rate (%) | | | Maturity Date | | | Fair Value ($) | |
| |
| | | |
| 70,396 | | | 9.75 | | | | 10/1/21-4/1/25 | | | | 78,495 | |
| 325,143 | | | 10.00 | | | | 3/1/15-6/1/30 | | | | 383,568 | |
| 17,229 | | | 10.04 | | | | 8/15/20 | | | | 17,324 | |
| 5,702 | | | 10.18 | | | | 7/1/20 | | | | 5,741 | |
| 83,154 | | | 10.50 | | | | 6/1/28 | | | | 91,856 | |
| | | | | | | | | | | | |
| | | |
| | | | | | | | | | | 112,735,507 | |
| | | | | | | | | | | | |
|
Government National Mortgage Association - 11.9% | |
| 21,167,635 | | | 4.00 | | | | 12/15/24-12/20/31 | | | | 22,244,371 | |
| 2,450,803 | | | 4.25 | | | | 10/20/31-3/20/37 | | | | 2,593,220 | |
| 5,788,074 | | | 4.50 | | | | 6/15/40 | | | | 6,365,545 | |
| 3,939,645 | | | 4.75 | | | | 9/20/31 | | | | 4,271,607 | |
| 174,617 | | | 5.50 | | | | 9/15/25 | | | | 195,157 | |
| 1,421,584 | | | 5.75 | | | | 10/20/31 | | | | 1,624,754 | |
| 168,660 | | | 5.76 | | | | 3/20/33-5/20/33 | | | | 189,006 | |
| 1,877,722 | | | 6.00 | | | | 6/15/23-11/20/34 | | | | 2,110,034 | |
| 375,583 | | | 6.20 | | | | 3/15/32 | | | | 426,317 | |
| 2,175,829 | | | 6.25 | | | | 12/15/23-4/15/29 | | | | 2,405,539 | |
| 1,062,877 | | | 6.35 | | | | 4/20/30-6/20/31 | | | | 1,201,412 | |
| 270,477 | | | 6.38 | | | | 8/15/26-4/15/28 | | | | 305,267 | |
| 165,520 | | | 6.49 | | | | 4/20/32-6/20/32 | | | | 187,996 | |
| 16,517,702 | | | 6.50 | | | | 11/15/23-3/20/41 | | | | 18,945,020 | |
| 72,358 | | | 6.57 | | | | 3/20/33 | | | | 74,905 | |
| 580,041 | | | 6.75 | | | | 9/15/15-5/15/29 | | | | 619,142 | |
| 429,816 | | | 6.91 | | | | 7/20/26-2/20/27 | | | | 473,684 | |
| 4,824,133 | | | 7.00 | | | | 5/15/24-1/20/39 | | | | 5,522,428 | |
| 136,377 | | | 7.02 | | | | 4/20/26 | | | | 146,544 | |
| 72,537 | | | 7.05 | | | | 9/20/26 | | | | 75,903 | |
| 339,072 | | | 7.10 | | | | 5/20/25 | | | | 373,039 | |
| 189,744 | | | 7.15 | | | | 4/20/27 | | | | 211,219 | |
| 58,570 | | | 7.25 | | | | 5/15/29 | | | | 60,424 | |
| 373,440 | | | 7.50 | | | | 1/20/38-3/15/39 | | | | 429,853 | |
| 56,802 | | | 7.75 | | | | 6/15/20 | | | | 61,322 | |
| 233,350 | | | 7.95 | | | | 7/20/25-4/20/26 | | | | 256,268 | |
| 92,041 | | | 7.99 | | | | 6/20/22 | | | | 100,807 | |
| 578,701 | | | 8.00 | | | | 6/20/31 | | | | 696,987 | |
| 83,147 | | | 8.25 | | | | 4/15/19 | | | | 90,875 | |
| 85,068 | | | 8.50 | | | | 9/15/16-12/20/26 | | | | 97,802 | |
| 57,224 | | | 9.00 | | | | 12/15/20 | | | | 66,098 | |
| 41,622 | | | 10.00 | | | | 10/15/19 | | | | 43,129 | |
| 74,902 | | | 10.50 | | | | 2/15/20-8/15/21 | | | | 82,563 | |
| | | | | | | | | | | | |
| | | |
| | | | | | | | | | | 72,548,237 | |
| | | | | | | | | | | | |
|
Small Business Administration - 1.0% | |
| 5,985,364 | | | 5.33 | | | | 8/25/36-9/25/36 | | | | 6,345,147 | |
| | | | | | | | | | | | |
| |
Total Mortgage Pass-Through Securities
(cost: $244,799,556) | | | | 247,585,522 | |
| | | | | | | | | | | | |
| | |
See accompanying notes to financial statements. |
6 | | SIT MUTUAL FUNDS SEMI-ANNUAL REPORT |
| | | | | | | | | | | | |
| |
| | | |
Principal Amount ($) | | Coupon Rate (%) | | | Maturity Date | | | Fair Value ($) | |
| |
|
U.S. Treasury / Federal Agency Securities - 0.2% | |
U.S. Treasury Note: | | | | | | | | | |
| 1,500,000 | | | 1.50 | | | | 1/31/19 | | | | | |
| |
Total U.S. Treasury / Federal Agency Securities
(cost: $1,489,722) | | | | 1,490,625 | |
| | | | | | | | | | | | |
|
Collateralized Mortgage Obligations - 48.3% | |
Federal Home Loan Mortgage Corporation - 16.3% | |
| 22,733 | | | 4.72 | | | | 3/25/44 | 1 | | | 22,864 | |
| 1,905,548 | | | 6.00 | | | | 9/15/21-5/15/36 | | | | 2,096,785 | |
| 122,219 | | | 6.25 | | | | 5/15/29 | | | | 124,326 | |
| 19,149,219 | | | 6.50 | | | | 9/15/23-10/25/43 | | | | 22,017,648 | |
| 974,630 | | | 6.50 | | | | 9/25/43 | 1 | | | 1,108,260 | |
| 85,311 | | | 6.70 | | | | 9/15/23 | | | | 97,147 | |
| 453,518 | | | 6.95 | | | | 3/15/28 | | | | 522,261 | |
| 46,325,471 | | | 7.00 | | | | 12/15/20-7/25/43 | | | | 51,846,968 | |
| 14,156,645 | | | 7.50 | | | | 10/15/21-9/25/43 | | | | 16,675,784 | |
| 3,355,535 | | | 8.00 | | | | 7/15/21-1/15/30 | | | | 3,856,021 | |
| 45,038 | | | 8.25 | | | | 6/15/22 | | | | 50,888 | |
| 241,214 | | | 8.30 | | | | 11/15/20 | | | | 270,538 | |
| 483,855 | | | 8.50 | | | | 10/15/22-3/15/32 | | | | 559,054 | |
| 208,203 | | | 9.00 | | | | 12/15/19 | | | | 226,924 | |
| 5,032 | | | 9.15 | | | | 10/15/20 | | | | 5,455 | |
| 190,776 | | | 9.50 | | | | 2/15/20 | | | | 208,792 | |
| | | | | | | | | | | | |
| |
| | | | 99,689,715 | |
| | | | | | | | | | | | |
Federal National Mortgage Association - 24.7% | |
| 11,547,811 | | | 4.50 | | | | 6/25/21 | | | | 11,993,672 | |
| 134,958 | | | 6.43 | | | | 3/25/29 | 1 | | | 151,074 | |
| 1,861,712 | | | 6.49 | | | | 9/25/37 | 1 | | | 2,140,103 | |
| 18,339,527 | | | 6.50 | | | | 8/20/28-11/25/42 | | | | 20,131,849 | |
| 4,172,054 | | | 6.53 | | | | 2/25/42 | 1 | | | 4,839,115 | |
| 591,012 | | | 6.58 | | | | 12/25/42 | 1 | | | 690,001 | |
| 3,743,718 | | | 6.60 | | | | 10/25/42 | 1 | | | 4,233,767 | |
| 13,502,606 | | | 6.75 | | | | 6/25/32-4/25/37 | | | | 15,126,047 | |
| 21,055 | | | 6.85 | | | | 12/18/27 | | | | 23,764 | |
| 1,604,204 | | | 6.88 | | | | 8/25/37 | 1 | | | 1,791,385 | |
| 24,811,444 | | | 7.00 | | | | 1/25/21-3/25/45 | | | | 28,995,091 | |
| 35,489,242 | | | 7.50 | | | | 8/20/27-1/25/48 | | | | 41,710,235 | |
| 1,199,914 | | | 7.50 | | | | 6/19/41 | 1 | | | 1,404,556 | |
| 32,386 | | | 7.75 | | | | 8/1/22 | | | | 36,348 | |
| 1,383,043 | | | 8.00 | | | | 7/25/22-7/25/44 | | | | 1,581,807 | |
| 846,546 | | | 8.28 | | | | 11/25/37 | 1 | | | 1,036,299 | |
| 771,599 | | | 8.38 | | | | 11/25/37 | 1 | | | 877,560 | |
| 1,456,531 | | | 8.50 | | | | 1/25/21-6/25/30 | | | | 1,731,347 | |
| 37,813 | | | 8.70 | | | | 12/25/19 | | | | 42,294 | |
| 13,760 | | | 8.75 | | | | 9/25/20 | | | | 14,803 | |
| 58,607 | | | 8.80 | | | | 10/25/42 | 1 | | | 68,141 | |
| 55,118 | | | 8.95 | | | | 10/25/20 | | | | 61,880 | |
| 2,081,913 | | | 9.00 | | | | 7/25/19-10/25/30 | | | | 2,444,318 | |
| 20,274 | | | 9.05 | | | | 12/25/18 | | | | 21,757 | |
| 33,041 | | | 9.25 | | | | 1/25/20 | | | | 36,878 | |
| | | | | | | | | | | | |
| |
| | | |
Principal Amount ($) | | Coupon Rate (%) | | | Maturity Date | | | Fair Value ($) | |
| |
| | | |
| 729,399 | | | 9.37 | | | | 6/25/32 | 1 | | | 828,894 | |
| 868,376 | | | 9.50 | | | | 12/25/18-12/25/41 | | | | 1,022,418 | |
| 111,349 | | | 9.60 | | | | 3/25/20 | | | | 125,731 | |
| 3,392,489 | | | 10.29 | | | | 7/25/37 | 1 | | | 3,696,843 | |
| 2,474,475 | | | 10.59 | | | | 9/25/42 | 1 | | | 3,094,717 | |
| 1,154,410 | | | 11.22 | | | | 6/25/44 | 1 | | | 1,382,653 | |
| 115,605 | | | 12.15 | | | | 3/25/39 | 1 | | | 137,059 | |
| | | | | | | | | | | | |
| | | |
| | | | | | | | | | | 151,472,406 | |
| | | | | | | | | | | | |
Government National Mortgage Association - 3.0% | |
| 489,991 | | | 6.50 | | | | 9/20/28 | | | | 552,611 | |
| 1,667,150 | | | 6.65 | | | | 9/20/44 | | | | 1,946,919 | |
| 622,360 | | | 6.88 | | | | 3/16/41 | 1 | | | 658,481 | |
| 12,624,061 | | | 7.00 | | | | 9/16/23-5/20/42 | | | | 13,647,438 | |
| 989,263 | | | 7.19 | | | | 12/20/33 | 1 | | | 1,168,617 | |
| 135,703 | | | 7.50 | | | | 5/16/27 | | | | 155,731 | |
| 38,378 | | | 8.50 | | | | 2/20/32 | | | | 46,683 | |
| | | | | | | | | | | | |
| | | |
| | | | | | | | | | | 18,176,480 | |
| | | | | | | | | | | | |
Vendee Mortgage Trust - 4.3% | | | | | |
| 7,260,313 | | | 3.75 | | | | 12/15/33 | | | | 7,519,013 | |
| 90,873 | | | 6.00 | | | | 2/15/30 | | | | 91,452 | |
| 5,181,070 | | | 6.50 | | | | 8/15/31 | | | | 5,923,222 | |
| 272,905 | | | 6.99 | | | | 7/15/30 | 1 | | | 306,799 | |
| 2,349,382 | | | 7.00 | | | | 3/15/28 | | | | 2,714,180 | |
| 1,478,151 | | | 7.25 | | | | 9/15/22-9/15/25 | | | | 1,646,606 | |
| 2,363,636 | | | 7.75 | | | | 5/15/22-9/15/24 | | | | 2,731,975 | |
| 4,128,450 | | | 7.82 | | | | 3/15/25 | 1 | | | 4,721,097 | |
| 415,785 | | | 8.00 | | | | 2/15/25 | | | | 489,284 | |
| 178,046 | | | 8.29 | | | | 12/15/26 | | | | 213,358 | |
| | | | | | | | | | | | |
| | | |
| | | | | | | | | | | 26,356,986 | |
| | | | | | | | | | | | |
| |
Total Collateralized Mortgage Obligations
(cost: $293,284,572) | | | | 295,695,587 | |
| | | | | | | | | | | | |
| |
Asset-Backed Securities - 3.5% | | | | | |
Federal Home Loan Mortgage Corporation - 0.6% | |
| 5,681 | | | 6.09 | | | | 9/25/29 | 1 | | | 5,688 | |
| 250,000 | | | 6.28 | | | | 10/27/31 | 14 | | | 285,231 | |
| 2,625,021 | | | 7.16 | | | | 7/25/29 | | | | 2,969,772 | |
| | | | | | | | | | | | |
| | | |
| | | | | | | | | | | 3,260,691 | |
| | | | | | | | | | | | |
Federal National Mortgage Association - 0.4% | |
| 49,725 | | | 0.49 | | | | 11/25/32 | 1 | | | 45,522 | |
| 416,717 | | | 4.70 | | | | 10/25/33 | 14 | | | 442,816 | |
| 422,275 | | | 5.41 | | | | 9/26/33 | 14 | | | 459,793 | |
| 142,758 | | | 5.69 | | | | 2/25/33 | 14 | | | 157,803 | |
| 145,651 | | | 6.47 | | | | 10/25/31 | 14 | | | 151,975 | |
| 899,596 | | | 6.59 | | | | 10/25/31 | 14 | | | 977,458 | |
| 230,118 | | | 6.70 | | | | 5/25/32 | 1 | | | 231,417 | |
| 54,395 | | | 6.83 | | | | 7/25/31 | 14 | | | 56,301 | |
| 26,200 | | | 7.80 | | | | 6/25/26 | 1 | | | 25,992 | |
| | | | | | | | | | | | |
| | | |
| | | | | | | | | | | 2,549,077 | |
| | | | | | | | | | | | |
| | |
See accompanying notes to financial statements. |
SEPTEMBER 30, 2014 | | 7 |
|
|
|
SCHEDULE OF INVESTMENTS (Unaudited) September 30, 2014 Sit U.S. Government Securities Fund (Continued) |
| | | | | | | | | | | | |
| |
Principal Amount ($) / Contracts | | Coupon Rate (%) | | | Maturity Date | | | Fair Value($) | |
| |
|
Small Business Administration - 2.5% | |
| 6,277,459 | | | 5.87 | | | | 7/1/28 | | | | 7,044,889 | |
| 2,343,882 | | | 7.13 | | | | 10/1/20 | | | | 2,547,129 | |
| 2,972,919 | | | 7.33 | | | | 8/1/20 | | | | 3,241,977 | |
| 2,301,038 | | | 8.03 | | | | 5/1/20 | | | | 2,537,783 | |
| | | | | | | | | | | | |
| | | |
| | | | | | | | | | | 15,371,778 | |
| | | | | | | | | | | | |
| |
Total Asset-Backed Securities
(cost: $21,140,099) | | | | 21,181,546 | |
| | | | | | | | | | | | |
|
Put Options Purchased 10 - 0.1% | |
| 3,000 | |
| U.S. Treasury 5 Year Future
Put Options: $ 116.75 strike
November 2014 expiration |
| | | 70,312 | |
| 750 | |
| U.S. Treasury 5 Year Future
Put Options: $ 117 strike
December 2014 expiration |
| | | 105,469 | |
| 2,000 | |
| U.S. Treasury 5 Year Future
Put Options: $ 117.50 strike
November 2014 expiration |
| | | 218,750 | |
| | | | | | | | | | | | |
| |
Total Put Options Purchased
(cost: $896,622) | | | | 394,531 | |
| | | | | | | | | | | | |
| |
Total Investments in Securities - 92.5%
(cost: $561,610,571) | | | | 566,347,811 | |
| | | | | | | | | | | | |
|
Call Options Written 10 - (0.2%) | |
| (500) | |
| U.S. Treasury 2 Year Future
Call Options: $ 109.00 strike December 2014 expiration |
| | | (453,125 | ) |
| (1,600) | |
| U.S. Treasury 2 Year Future
Call Options: $ 109.25 strike December 2014 expiration |
| | | (800,000 | ) |
| (500) | |
| U.S. Treasury 2 Year Future
Call Options: $ 109.25 strike
November 2014 expiration |
| | | (210,938 | ) |
| | | | | | | | | | | | |
| |
Total Call Options Written
(premiums received: $1,443,079) | | | | (1,464,063 | ) |
| | | | | | | | | | | | |
| |
Other Assets and Liabilities, net - 7.7% | | | | 47,030,062 | |
| | | | | | | | | | | | |
| |
Total Net Assets - 100.0% | | | | $611,913,810 | |
| | | | | | | | | | | | |
| 1 | Variable rate security. Rate disclosed is as of September 30, 2014. |
| 10 | The amount of $17,000,000 in cash was segregated with the broker to cover margin requirements for derivative transactions as of September 30, 2014. |
| 14 | Step Coupon: A bond that pays an initial coupon rate for the first period and then a higher coupon rate for the following periods. Rate disclosed is as of September 30, 2014. |
Numeric footnotes not disclosed are not applicable to this Schedule of Investments.
| | |
See accompanying notes to financial statements. |
8 | | SIT MUTUAL FUNDS SEMI-ANNUAL REPORT |
For a detailed list of security holdings, refer to our company website at www.sitfunds.com.
A summary of the levels for the Fund’s investments as of September 30, 2014 is as follows (see Note 2 - significant accounting policies in the notes to financial statements):
| | | | | | | | | | | | | | |
| | | Investment in Securities | |
| | | Level 1 | | | Level 2 | | | Level 3 | | | |
| | | Quoted
Price ($) | | | Other significant
observable inputs ($) | | | Significant
unobservable inputs ($) | | Total ($) | |
| | | | |
Assets | | | | | | | | | | | | | | |
Mortgage Pass-Through Securities | | | — | | | | 247,585,522 | | | — | | | 247,585,522 | |
U.S. Treasury / Federal Agency | | | | | | | | | | | | | | |
Securities | | | — | | | | 1,490,625 | | | — | | | 1,490,625 | |
Collateralized Mortgage | | | | | | | | | | | | | | |
Obligations | | | — | | | | 295,695,587 | | | — | | | 295,695,587 | |
Asset-Backed Securities | | | — | | | | 21,181,546 | | | — | | | 21,181,546 | |
Put Options Purchased | | | 394,531 | | | | — | | | — | | | 394,531 | |
| | | | |
| | | | |
| | | 394,531 | | | | 565,953,280 | | | — | | | 566,347,811 | |
| | | | |
| | | | |
Liabilities | | | | | | | | | | | | | | |
Call Options Written | | | (1,464,063) | | | | — | | | — | | | (1,464,063) | |
| | | | |
For the reporting period, there were no transfers between levels 1, 2 and 3.
| | |
See accompanying notes to financial statements. |
SEPTEMBER 30, 2014 | | 9 |
OBJECTIVE & STRATEGY
The objective of the Quality Income Fund is to provide high current income and safety of principal, which it seeks to attain by investing at least 80% of its assets in debt securities issued by the U.S. government and its agencies, debt securities issued by corporations, mortgage and other asset-backed securities. The Fund invests at least 50% of its assets in U.S. government debt securities, which are securities issued, guaranteed or insured by the U.S. government, its agencies or instrumentalities.
The Sit Quality Income Fund provided a return of +0.47% during the 6-month period ended September 30, 2014, compared to the return of the Barclays 1-3 year Government/Credit Bond Index of +0.36%. The Fund’s 30-day SEC yield was 1.03% and its 12-month distribution rate was 0.76%.
During the 6-month period, the Fund benefitted from the income advantage primarily produced by its holdings in non-agency residential mortgage and corporate securities. Taxable municipal bonds held in the Fund performed particularly well, as investors reach for yield while remaining in high quality assets, which resulted in more price appreciation than other sectors. The continued reduction in the Federal Reserve’s asset purchase program and anticipation of the first increase in the federal funds rate drove shorter-term interest rates higher. Mortgage-backed securities underperformed during the period as reduced demand from the Federal Reserve and higher interest rate expectations caused prices to fall. However, the income generated by the securities more than offset the declines, leading to positive total return for mortgages overall. Like mortgages, U.S. Treasuries provided positive return on an absolute basis, but the sector underperformed relative to the benchmark. Thus, the Fund’s underweight position in U.S. Treasury securities benefitted performance.
Looking forward, we expect slow economic growth to persist. The Federal Reserve has stated it will end asset purchases before year-end. These factors will likely cause the yield curve to flatten further. Eventually, short term yields should increase as market participants begin to anticipate the Federal Reserve’s first increase in short-term rates in more than a decade. Longer term yields will be relatively more stable as the inflationary pressures of asset purchases are removed. We believe as financial markets become less supported by the Federal Reserve’s asset purchase program, a more normalized and healthy marketplace will resume. We have positioned the Fund defensively, in both credit quality and interest rate sensitivity to maximize return potential while preserving income. We focus on a mix of Treasury,
HYPOTHETICAL GROWTH OF $10,000
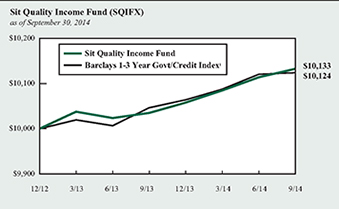
The chart above illustrates the total value of a hypothetical $10,000 investment in the Fund over the past 10 years (or for the life of the Fund if shorter) as compared to the performance of the Barclays 1-3 Year Government/Credit Index. Past performance does not guarantee future results. Returns include the reinvestment of distributions. The chart does not reflect the deduction of taxes that a shareholder would pay on Fund distributions or the redemption of Fund shares.
1 The Barclays 1-3 Year Government/Credit Index is an unmanaged index of Treasury or government agency securities and investment grade corporate debt securities with maturities of one to three years. The returns include the reinvestment of income and do not include any transaction costs, management fees or other costs. It is not possible to invest directly in an index.
agency and credit sectors that provide relatively high levels of income and stable prices. The dual goals of principal stability and income are the primary objectives of the Fund.
Michael C. Brilley
Bryce A. Doty, CFA
Senior Portfolio Managers
Mark H. Book, CFA
Chris M. Rasmussen, CFA
Portfolio Managers
| | |
10 | | SIT MUTUAL FUNDS SEMI-ANNUAL REPORT |
COMPARATIVE RATES OF RETURNS
as of September 30, 2014
| | | | | | | | | | | | | | | |
| | | Sit Quality
Income Fund | | Barclays 1-3 Year
Government/Credit
Index1 | | Lipper
Short
Investment
Grade Bond
Index2 |
| | | |
Six Months | | | | 0.47 | % | | | | 0.36 | % | | | | n/a | |
| | | |
One Year | | | | 0.97 | | | | | 0.77 | | | | | 1.51 | % |
| | | |
Since Inception (12/31/12) | | | | 0.76 | | | | | 0.71 | | | | | 1.00 | |
Performance figures are historical and do not guarantee future results. Investment returns and principal value will vary, and you may have a gain or loss when you sell shares. Current performance may be lower or higher than the performance data quoted. Contact the Fund for performance data current to the most recent month-end. Returns include changes in share price as well as reinvestment of all dividends and capital gains and all fee waivers. Without the fee waivers total return and yield figures would have been lower. Returns do not reflect the deduction of taxes that a shareholder would pay on Fund distributions or the redemption of Fund shares. Management fees and administrative expenses are included in the Fund’s performance. Returns for the periods greater than one year are compounded average annual rates of return.
1 The Barclays 1-3 Year Government/Credit Index is an unmanaged index of Treasury or government agency securities and investment grade corporate debt securities with maturities of one to three years. The returns include the reinvestment of income and do not include any transaction costs, management fees or other costs. It is not possible to invest directly in an index.
2 The Lipper returns are obtained from Lipper Analytical Services, Inc., a large independent evaluator of mutual funds.
FUND DIVERSIFICATION
| | | | |
U.S. Treasury/Federal Agency Securities | | | 47.5 | % |
Corporate Bonds | | | 27.7 | % |
Asset Backed (Non-Agency) | | | 12.1 | % |
Mortgage Pass-Through (Agency) | | | 7.5 | % |
Other Bonds & Other Net Assets | | | 5.2 | % |
Based on total net assets as of September 30, 2014. Subject to change.
PORTFOLIO SUMMARY
| | |
| Net Asset Value 9/30/14: | | $ 9.98 Per Share |
| Net Asset Value 3/31/14: | | $ 9.97 Per Share |
| Total Net Assets: | | $ 100.5 Million |
| Average Maturity: | | 6.3 Years |
| Effective Duration 3: | | 0.5 Years |
3 Duration is a measure of estimated price sensitivity relative to changes in interest rates. Portfolios with longer durations are typically more sensitive to changes in interest rates. For example, if interest rates rise by 1%, the fair value of a security with an effective duration of 5 years would decrease by 5%, with all other factors being constant. The correlation between duration and price sensitivity is greater for securities rated investment-grade than it is for securities rated below investment-grade. Duration estimates are based on assumptions by the Adviser and are subject to a number of limitations. Effective duration is calculated based on historical price changes of securities held by the Fund, and therefore is a more accurate estimate of price sensitivity provided interest rates remain within their historical range.
QUALITY RATINGS (% of Total Net Assets)
Lower of Moody’s, S&P, Fitch or Duff & Phelps ratings used.
|
|
|
SCHEDULE OF INVESTMENTS (Unaudited) September 30, 2014 Sit Quality Income Fund |
| | | | | | | | | | |
Principal Amount ($) | | Name of Issuer | | Coupon
Rate (%) | | Maturity
Date | | | Fair
Value ($) |
|
Asset-Backed Securities - 12.3% |
|
Agency - 0.2% |
| 180,394 | | FNMA REMICS, Series 2001-W2, Class AS5 14 | | 6.47 | | | 10/25/31 | | | 188,226 |
| | | | | | | | | | |
|
Non-Agency - 12.1% |
| 159,022 | | Ace Securities Corp. Home Equity Loan Trust Series 2004-SD1 1 | | 0.64 | | | 11/25/33 | | | 156,215 |
| 277,538 | | Aegis Asset Backed Securities Trust, Series 2005-2, Class M1 1 | | 0.57 | | | 6/25/35 | | | 273,819 |
| 36,481 | | Bayview Financial Mortgage Pass-Through Trust, Series 2005-B, Class 1A5 14 | | 5.66 | | | 4/28/39 | | | 36,422 |
| 960,586 | | Bear Stearns Asset Backed Securities Trust 2005-SD2, Class 1A2 1 | | 0.62 | | | 3/25/35 | | | 956,971 |
| 68,045 | | Bear Stearns Asset Backed Securities Trust, Series 2005-SD2, Class 1A3 1 | | 0.55 | | | 3/25/35 | | | 67,630 |
| 213,456 | | Centex Home Equity Loan Trust, Series 2004-A, Class AF4 14 | | 5.01 | | | 8/25/32 | | | 214,728 |
| 310,000 | | Centex Home Equity Loan Trust, Series 2004-A, Class AF5 14 | | 5.43 | | | 1/25/34 | | | 315,441 |
| 663,874 | | Centex Home Equity Loan Trust, Series 2004-D, Class AF4 14 | | 4.68 | | | 6/25/32 | | | 683,243 |
| 258,359 | | CIT Home Equity Loan Trust 2003-1, Class A4 14 | | 3.93 | | | 3/20/32 | | | 264,775 |
| 511,188 | | CIT Home Equity Loan Trust, Series 2003-1, Class A6 14 | | 4.06 | | | 10/20/32 | | | 525,192 |
| 555,444 | | Citifinancial Mortgage Securities, Inc., Series 2004-1, Class AF3 14 | | 3.77 | | | 4/25/34 | | | 564,255 |
| 18,439 | | Conseco Financial Corp., Series 1996-4, Class A6 | | 7.40 | | | 6/15/27 | | | 18,496 |
| 96,056 | | Conseco Financial Corp., Series 1997-3, Class A6 | | 7.32 | | | 3/15/28 | | | 101,974 |
| 85,562 | | Conseco Financial Corp., Series 1997-4, Class A7 1 | | 7.36 | | | 2/15/29 | | | 88,349 |
| 44,207 | | Conseco Financial Corp., Series 1997-6, Class A6 | | 6.90 | | | 1/15/29 | | | 46,025 |
| 146,980 | | Conseco Financial Corp., Series 1997-6, Class A7 | | 7.14 | | | 1/15/29 | | | 153,448 |
| 111,520 | | Conseco Financial Corp., Series 1997-7, Class A7 1 | | 6.96 | | | 7/15/28 | | | 116,440 |
| 267,689 | | Conseco Financial Corp., Series 1998-1, Class A6 1 | | 6.33 | | | 11/1/29 | | | 276,298 |
| 43,458 | | Countrywide Asset-Backed Certificates, Series 2004-15, Class AF4 1 | | 4.61 | | | 12/25/32 | | | 43,365 |
| 422,207 | | Countrywide Asset-Backed Certificates, Series 2004-S1, Class A3 14 | | 5.12 | | | 2/25/35 | | | 430,748 |
| 173,283 | | Credit-Based Asset Servicing and Securitization, LLC, Series 2005-CB5, Class AF2 14 | | 4.29 | | | 8/25/35 | | | 174,968 |
| 16,139 | | Deutsche Financial Capital Securitization LLC, Series 1998-I, Class A4 | | 6.38 | | | 4/15/28 | | | 16,251 |
| 68,079 | | Deutsche Financial Capital Securitization, LLC, Series 1998-I, Class A3 | | 6.10 | | | 4/15/28 | | | 68,471 |
| 556,068 | | First Alliance Mortgage Loan Trust, Series 1997-4, Class A2 14 | | 7.63 | | | 4/20/29 | | | 564,424 |
| 278,269 | | First Franklin Mortgage Loan Trust, Series 2005-FF2, Class M2 1 | | 0.81 | | | 3/25/35 | | | 277,966 |
| 168,370 | | Green Tree Mortgage Loan Trust 2005-HE1, Class A5 1, 4 | | 0.53 | | | 12/25/32 | | | 168,121 |
| 11,880 | | Home Loan Trust, Series 1999-HI1, Class A6 14 | | 7.58 | | | 9/25/29 | | | 11,854 |
| 500,000 | | HSBC Home Equity Loan Trust USA, Series 2007-2, Class A4 1 | | 0.45 | | | 7/20/36 | | | 489,637 |
| 301,432 | | Irwin Home Equity Loan Trust, Series 2005-1, Class 2A3 14 | | 5.32 | | | 6/25/35 | | | 296,408 |
| 892,475 | | Irwin Whole Loan Home Equity Trust 2003-B, Class M 1 | | 3.15 | | | 11/25/32 | | | 900,599 |
| 275,816 | | Irwin Whole Loan Home Equity Trust, Series 2003-D, Class M1 1 | | 1.25 | | | 11/25/28 | | | 270,050 |
| 696,564 | | Irwin Whole Loan Home Equity Trust, Series 2005-C, Class 1M2 14 | | 5.75 | | | 4/25/30 | | | 727,080 |
| 37,607 | | JP Morgan Mortgage Acquisition Corp., Series 2005-OPT2, Class A3 1 | | 0.39 | | | 12/25/35 | | | 37,566 |
| 243,614 | | Morgan Stanley Home Equity Loan Trust, Series 2005-3, Class M1 1 | | 0.60 | | | 8/25/35 | | | 243,160 |
| 59,468 | | New Century Home Equity Loan Trust, Series 2003-5, Class AI7 1 | | 5.15 | | | 11/25/33 | | | 60,840 |
| 271,233 | | NovaStar Mortgage Funding Trust, Series 2004-2, Class M2 1 | | 1.17 | | | 9/25/34 | | | 268,381 |
| 750,000 | | Popular ABS Mortgage Pass-Through Trust Series 2005-1, Class AF5 14 | | 5.23 | | | 5/25/35 | | | 776,219 |
| 141,656 | | Popular ABS Mortgage Pass-Through Trust, Series 2004-4, Class AF4 1 | | 4.63 | | | 9/25/34 | | | 142,888 |
| 241,826 | | Popular ABS Mortgage Pass-Through Trust, Series 2004-5, Class AF4 1 | | 4.66 | | | 12/25/34 | | | 243,176 |
| 131,232 | | Residential Asset Mortgage Products Trust, Series 2003-RZ5, Class A7 14 | | 5.47 | | | 9/25/33 | | | 135,578 |
| 11,381 | | Residential Asset Mortgage Products Trust, Series 2003-RZ3, Class A6 14 | | 3.90 | | | 3/25/33 | | | 11,618 |
| 61,832 | | Residential Asset Mortgage Products Trust, Series 2004-RS12, Class A16 | | 4.55 | | | 12/25/34 | | | 62,593 |
| 364,325 | | Residential Asset Mortgage Products Trust, Series 2004-RZ1, Class A11 1 | | 0.63 | | | 3/25/34 | | | 360,658 |
| 260,290 | | Residential Asset Securities Corp., Series 2004-KS2, Class AI4 1 | | 4.18 | | | 12/25/31 | | | 262,242 |
| 42,041 | | Structured Asset Investment Loan Trust, Series 2005-4, Class M1 1 | | 0.75 | | | 5/25/35 | | | 41,980 |
| | |
See accompanying notes to financial statements. |
12 | | SIT MUTUAL FUNDS SEMI-ANNUAL REPORT |
| | | | | | | | | | |
Principal
Amount ($) | | Name of Issuer | | Coupon
Rate (%) | | Maturity Date | | | Fair Value ($) |
| | | | |
| 133,492 | | Vanderbilt Mortgage Finance, Series 2002-B, Class A4 | | 5.84 | | | 2/7/26 | | | 135,575 |
| 29,917 | | Wells Fargo Home Equity Asset-Backed Securities Trust, Series 2004-2, Class AI6 1 | | 5.00 | | | 10/25/34 | | | 30,125 |
| | | | | | | | | | |
| | | | |
| | | | | | | | | | 12,112,262 |
| | | | | | | | | | |
| | |
Total Asset-Backed Securities
(cost: $12,273,095) | | | | | | 12,300,488 |
| | | | | | | | | | |
| | |
Collateralized Mortgage Obligations - 14.5% | | | | | | |
|
Agency - 10.8% |
| 66,028 | | FHLMC REMICS, Series 2627, Class MC | | 4.50 | | | 6/15/18 | | | 69,192 |
| 225,725 | | FHLMC REMICS, Series 2631, Class LC | | 4.50 | | | 6/15/18 | | | 236,259 |
| 129,099 | | FHLMC REMICS, Series 2646, Class MT | | 3.50 | | | 11/15/32 | | | 132,692 |
| 387,384 | | FHLMC REMICS, Series 2685, Class ND | | 4.00 | | | 10/15/18 | | | 403,816 |
| 818,954 | | FHLMC REMICS, Series 2770, Class TW | | 4.50 | | | 3/15/19 | | | 869,091 |
| 300,000 | | FHLMC REMICS, Series 2776, Class CG | | 5.00 | | | 4/15/19 | | | 323,465 |
| 55,209 | | FHLMC REMICS, Series 3634, Class EA | | 4.00 | | | 11/15/23 | | | 56,283 |
| 91,395 | | FHLMC REMICS, Series 3637, Class LJ | | 3.50 | | | 2/15/25 | | | 95,178 |
| 467,068 | | FHLMC REMICS, Series 3645, Class EH | | 3.00 | | | 12/15/20 | | | 482,750 |
| 97,094 | | FHLMC REMICS, Series 3711, Class AG | | 3.00 | | | 8/15/23 | | | 98,439 |
| 320,453 | | FHLMC REMICS, Series 3777, Class DA | | 3.50 | | | 10/15/24 | | | 335,851 |
| 372,120 | | FHLMC REMICS, Series 3815, Class BD | | 3.00 | | | 10/15/20 | | | 382,579 |
| 300,000 | | FHLMC, Series K501, Class A2 | | 1.66 | | | 11/25/16 | | | 304,331 |
| 71,074 | | FNMA REMICS, Series 2001-53, Class GB | | 5.00 | | | 9/25/16 | | | 71,962 |
| 152,215 | | FNMA REMICS, Series 2002-94, Class HQ | | 4.50 | | | 1/25/18 | | | 158,826 |
| 215,815 | | FNMA REMICS, Series 2003-52, Class NA | | 4.00 | | | 6/25/23 | | | 227,755 |
| 201,632 | | FNMA REMICS, Series 2004-101, Class BH | | 5.00 | | | 1/25/20 | | | 212,786 |
| 311,730 | | FNMA REMICS, Series 2005-19, Class PA | | 5.50 | | | 7/25/34 | | | 339,803 |
| 173,327 | | FNMA REMICS, Series 2005-24, Class A | | 4.50 | | | 7/25/32 | | | 177,074 |
| 94,202 | | FNMA REMICS, Series 2005-68, Class PC | | 5.50 | | | 7/25/35 | | | 101,211 |
| 17,433 | | FNMA REMICS, Series 2007-100, Class ND | | 5.75 | | | 10/25/35 | | | 17,657 |
| 846,383 | | FNMA REMICS, Series 2008-18, Class NB | | 4.50 | | | 5/25/20 | | | 889,188 |
| 327,160 | | FNMA REMICS, Series 2008-65, Class CD | | 4.50 | | | 8/25/23 | | | 347,409 |
| 214,493 | | FNMA REMICS, Series 2009-70, Class A1 | | 4.00 | | | 8/25/19 | | | 223,185 |
| 220,852 | | FNMA REMICS, Series 2009-71, Class MB | | 4.50 | | | 9/25/24 | | | 237,168 |
| 141,442 | | FNMA REMICS, Series 2009-76, Class MA | | 4.00 | | | 9/25/24 | | | 146,707 |
| 818,219 | | FNMA REMICS, Series 2009-87, Class A | | 4.50 | | | 12/25/38 | | | 854,178 |
| 245,818 | | FNMA REMICS, Series 2009-88, Class DA | | 4.50 | | | 10/25/20 | | | 259,497 |
| 979,956 | | FNMA REMICS, Series 2010-25, Class ND | | 3.50 | | | 3/25/25 | | | 1,018,872 |
| 161,932 | | FNMA REMICS, Series 2010-28, Class DA | | 5.00 | | | 9/25/28 | | | 171,710 |
| 356,334 | | FNMA REMICS, Series 2011-16, Class GE | | 2.75 | | | 3/25/26 | | | 366,111 |
| 98,472 | | FNMA REMICS, Series 2011-32, Class QD | | 3.50 | | | 10/25/28 | | | 99,814 |
| 113,968 | | FNMA REMICS, Series 2012-19, Class GH | | 3.00 | | | 11/25/30 | | | 118,432 |
| 222,896 | | GNMA, Series 2007-48, Class FM 1 | | 0.40 | | | 4/20/37 | | | 223,023 |
| 185,486 | | GNMA, Series 2009-10, Class PA | | 4.50 | | | 12/20/38 | | | 196,219 |
| 65,935 | | GNMA, Series 2010-108, Class BH | | 2.25 | | | 12/20/36 | | | 66,733 |
| 188,782 | | GNMA, Series 2010-61, Class DA | | 4.00 | | | 12/20/23 | | | 199,141 |
| 69,422 | | GNMA, Series 2010-61, Class EA | | 5.00 | | | 9/20/31 | | | 71,434 |
| 273,295 | | Vendee Mortgage Trust, Series 1993-1, Class ZB | | 7.25 | | | 2/15/23 | | | 312,681 |
| | | | | | | | | | |
| | | | |
| | | | | | | | | | 10,898,502 |
| | | | | | | | | | |
|
Non-Agency - 3.7% |
| 39,905 | | Alternative Loan Trust, Series 2003-20CB, Class 1A2 | | 5.50 | | | 10/25/33 | | | 40,944 |
| 857,579 | | American Home Mortgage Investment Trust 2004-3, Class 5A 1 | | 2.07 | | | 10/25/34 | | | 860,521 |
| 46,770 | | American Home Mortgage Investment Trust, Series 2004-3, Class 6A4 14 | | 5.01 | | | 10/25/34 | | | 47,059 |
| | |
See accompanying notes to financial statements. |
SEPTEMBER 30, 2014 | | 13 |
|
|
|
SCHEDULE OF INVESTMENTS (Unaudited) September 30, 2014 Sit Quality Income Fund (Continued) |
| | | | | | | | | | |
Principal
Amount ($) | | Name of Issuer | | Coupon
Rate (%) | | Maturity Date | | | Fair Value ($) |
| | | | |
| 90,473 | | Banc of America Mortgage Trust 2004-1, Class 4A1 | | 5.00 | | | 2/25/19 | | | 93,532 |
| 39,318 | | Banc of America Mortgage Trust, Series 2004-3, Class 1A26 | | 5.50 | | | 4/25/34 | | | 40,342 |
| 146,738 | | Deutsche Mortgage Securities, Inc. Mortgage Loan Trust, Series 2004-1, Class 2A1 | | 4.75 | | | 10/25/18 | | | 148,467 |
| 469,207 | | Deutsche Mortgage Securities, Inc. Mortgage Loan Trust, Series 2004-1, Class 2A3 | | 4.75 | | | 10/25/18 | | | 472,007 |
| 151,254 | | GSR Mortgage Loan Trust 2005-5F, Class 8A1 1 | | 0.65 | | | 6/25/35 | | | 146,107 |
| 70,991 | | Master Asset Securitization Trust, Series 2003-4, Class CA1 | | 8.00 | | | 5/25/18 | | | 74,070 |
| 96,746 | | MASTR Alternative Loan Trust, Series 2003-4, Class 2A1 | | 6.25 | | | 6/25/33 | | | 102,411 |
| 266,634 | | MASTR Alternative Loan Trust, Series 2003-5, Class 4A1 | | 5.50 | | | 7/25/33 | | | 283,575 |
| 405,837 | | MASTR Alternative Loan Trust, Series 2003-8, Class 3A1 | | 5.50 | | | 12/25/33 | | | 430,930 |
| 94,000 | | MASTR Asset Securitization Trust, Series 2005-2, Class 1A3 | | 5.35 | | | 11/25/35 | | | 98,100 |
| 57,298 | | RAAC Trust, Series 2004-SP3, Class AI5 1 | | 4.89 | | | 12/25/32 | | | 58,597 |
| 122,043 | | Residential Asset Securitization Trust, Series 2003-A14, Class A1 | | 4.75 | | | 2/25/19 | | | 125,003 |
| 40,618 | | Residential Funding Mortgage Securities I Trust, Series 2003-S13, Class A3 | | 5.50 | | | 6/25/33 | | | 40,769 |
| 315,367 | | Sequoia Mortgage Trust, Series 2012-1, Class 2A1 1 | | 3.47 | | | 1/25/42 | | | 319,493 |
| 58,286 | | Structured Asset Sec Corp. Mortgage Pass Through Certificates, Series 2003-16, Class A2 | | 4.75 | | | 6/25/33 | | | 58,722 |
| 111,266 | | WaMu Mortgage Pass Through Certificates, Series 2002-AR2 Class A 1 | | 1.93 | | | 2/27/34 | | | 110,199 |
| 145,622 | | WaMu Mortgage Pass Through Certificates, Series 2004-CB2, Class 7A | | 5.50 | | | 8/25/19 | | | 150,189 |
| | | | | | | | | | |
| | | | |
| | | | | | | | | | 3,701,037 |
| | | | | | | | | | |
| | |
Total Collateralized Mortgage Obligations
(cost: $14,555,580) | | | | | | 14,599,539 |
| | | | | | | | | | |
| | |
Corporate Bonds - 27.7% | | | | | | |
| 804,325 | | America West Airlines 2000-1 Pass Through Trust | | 8.06 | | | 7/2/20 | | | 916,930 |
| 750,000 | | Anheuser-Busch InBev Worldwide, Inc. | | 7.75 | | | 1/15/19 | | | 905,466 |
| 875,000 | | Arizona Public Service Co. | | 8.75 | | | 3/1/19 | | | 1,111,545 |
| 850,000 | | Atlantic City Electric Co. | | 7.75 | | | 11/15/18 | | | 1,025,929 |
| 600,000 | | Baker Hughes, Inc. | | 7.50 | | | 11/15/18 | | | 728,079 |
| 1,000,000 | | Bear Stearns Companies, LLC | | 4.65 | | | 7/2/18 | | | 1,090,641 |
| 1,000,000 | | Crown Castle Towers, LLC 4 | | 4.17 | | | 8/15/17 | | | 1,053,455 |
| 1,000,000 | | Halliburton Co. | | 5.90 | | | 9/15/18 | | | 1,147,838 |
| 1,500,000 | | HSBC USA Capital Trust III (Subordinated) | | 7.75 | | | 11/15/26 | | | 1,518,201 |
| 1,000,000 | | International Business Machines Corp. | | 7.63 | | | 10/15/18 | | | 1,213,541 |
| 500,000 | | Jersey Central Power & Light Co. | | 4.80 | | | 6/15/18 | | | 532,895 |
| 500,000 | | John Deere Capital Corp. | | 1.55 | | | 12/15/17 | | | 500,863 |
| 1,000,000 | | Lender Processing Services, Inc./Black Knight Lending Solutions, Inc. | | 5.75 | | | 4/15/23 | | | 1,045,000 |
| 500,000 | | Lubrizol Corp. | | 8.88 | | | 2/1/19 | | | 631,160 |
| 850,000 | | Macy’s Retail Holdings, Inc. | | 7.88 | | | 8/15/36 | | | 935,711 |
| 1,400,000 | | Manufacturers & Traders Trust Co. 1 | | 5.63 | | | 12/1/21 | | | 1,452,500 |
| 934,097 | | Northwest Airlines 1999-2 Class A Pass Through Trust | | 7.58 | | | 3/1/19 | | | 1,048,524 |
| 770,553 | | Northwest Airlines 2002-1 Class G-2 Pass Through Trust | | 6.26 | | | 11/20/21 | | | 833,121 |
| 1,000,000 | | PacifiCorp. | | 5.50 | | | 1/15/19 | | | 1,133,372 |
| 25,000 | | PartnerRe Finance A LLC | | 6.88 | | | 6/1/18 | | | 28,743 |
| 950,000 | | PepsiCo, Inc. | | 7.90 | | | 11/1/18 | | | 1,166,805 |
| 500,000 | | Principal Life Income Funding Trusts 1 | | 3.95 | | | 4/1/16 | | | 513,905 |
| 800,000 | | Prudential Financial, Inc. 1 | | 4.82 | | | 8/10/18 | | | 845,168 |
| 1,000,000 | | Puget Sound Energy, Inc. | | 6.74 | | | 6/15/18 | | | 1,160,667 |
| 500,000 | | Royal Bank of Canada | | 1.20 | | | 9/19/17 | | | 497,341 |
| 500,000 | | SBA Tower Trust 4 | | 2.24 | | | 4/16/18 | | | 492,775 |
| 250,000 | | Security Benefit Life Insurance Co. (Subordinated) 4 | | 8.75 | | | 5/15/16 | | | 270,372 |
| 1,000,000 | | Statoil ASA | | 1.95 | | | 11/8/18 | | | 1,003,652 |
| 1,000,000 | | Toyota Motor Credit Corp. | | 2.00 | | | 10/24/18 | | | 1,001,436 |
| | |
See accompanying notes to financial statements. |
14 | | SIT MUTUAL FUNDS SEMI-ANNUAL REPORT |
| | | | | | | | | | |
Principal Amount ($) | | Name of Issuer | | Coupon
Rate (%) | | Maturity Date | | | Fair Value ($) |
| | | | |
| 800,000 | | Westar Energy, Inc. | | 8.63 | | | 12/1/18 | | | 1,006,626 |
| 1,000,000 | | Whitney National Bank | | 5.88 | | | 4/1/17 | | | 1,050,576 |
| | | | | | | | | | |
| | |
Total Corporate Bonds
(cost: $27,950,328) | | | | | | 27,862,837 |
| | | | | | | | | | |
| | |
Foreign Government Bonds - 0.6% | | | | | | |
| 500,000 | | Province of Nova Scotia Canada | | 9.50 | | | 2/1/19 | | | 645,597 |
| | | | | | | | | | |
(cost: $648,564) | | | | | | |
Mortgage Pass-Through Securities - 7.5% | | | | | | |
Federal Home Loan Mortgage Corporation - 3.2% | | | | | | |
| 101,984 | | Freddie Mac | | 3.50 | | | 7/1/26 | | | 107,398 |
| 127,289 | | Freddie Mac | | 4.50 | | | 1/1/18 | | | 134,258 |
| 138,794 | | Freddie Mac | | 4.50 | | | 12/1/18 | | | 146,426 |
| 79,600 | | Freddie Mac | | 4.50 | | | 5/1/19 | | | 83,994 |
| 168,155 | | Freddie Mac | | 4.50 | | | 6/1/19 | | | 177,411 |
| 131,063 | | Freddie Mac | | 4.50 | | | 6/1/19 | | | 138,273 |
| 170,669 | | Freddie Mac | | 4.50 | | | 1/1/21 | | | 182,710 |
| 111,545 | | Freddie Mac | | 4.50 | | | 12/1/21 | | | 119,405 |
| 163,249 | | Freddie Mac | | 4.50 | | | 10/1/23 | | | 176,231 |
| 184,759 | | Freddie Mac | | 4.50 | | | 7/1/26 | | | 197,694 |
| 117,025 | | Freddie Mac | | 5.00 | | | 3/1/18 | | | 123,521 |
| 108,276 | | Freddie Mac | | 5.00 | | | 10/1/18 | | | 114,316 |
| 134,983 | | Freddie Mac | | 5.00 | | | 8/1/19 | | | 143,872 |
| 50,572 | | Freddie Mac | | 5.00 | | | 10/1/25 | | | 55,653 |
| 139,767 | | Freddie Mac | | 5.50 | | | 9/1/17 | | | 147,934 |
| 170,201 | | Freddie Mac | | 5.50 | | | 4/1/19 | | | 180,441 |
| 72,697 | | Freddie Mac | | 5.50 | | | 10/1/19 | | | 77,704 |
| 134,013 | | Freddie Mac | | 5.50 | | | 12/1/20 | | | 143,254 |
| 116,650 | | Freddie Mac | | 5.50 | | | 1/1/21 | | | 124,716 |
| 228,895 | | Freddie Mac | | 5.50 | | | 3/1/21 | | | 248,565 |
| 122,803 | | Freddie Mac | | 5.50 | | | 3/1/21 | | | 133,118 |
| 85,045 | | Freddie Mac | | 5.50 | | | 10/1/21 | | | 90,895 |
| 52,509 | | Freddie Mac | | 6.00 | | | 8/1/16 | | | 53,900 |
| 87,979 | | Freddie Mac | | 6.00 | | | 9/1/23 | | | 99,110 |
| | | | | | | | | | |
| | | | |
| | | | | | | | | | 3,200,799 |
| | | | | | | | | | |
Federal National Mortgage Association - 3.8% | | | | | | |
| 288,571 | | Fannie Mae | | 2.75 | | | 11/1/17 | | | 298,764 |
| 1,000,000 | | Fannie Mae | | 2.78 | | | 12/1/17 | | | 1,033,940 |
| 359,084 | | Fannie Mae | | 3.00 | | | 8/1/21 | | | 373,898 |
| 378,150 | | Fannie Mae | | 3.50 | | | 4/1/21 | | | 398,165 |
| 158,750 | | Fannie Mae | | 3.50 | | | 5/1/21 | | | 167,154 |
| 143,421 | | Fannie Mae | | 3.50 | | | 10/1/21 | | | 151,022 |
| 573,666 | | Fannie Mae | | 3.98 | | | 4/1/18 | | | 612,747 |
| 84,881 | | Fannie Mae | | 4.00 | | | 3/1/26 | | | 90,587 |
| 55,075 | | Fannie Mae | | 4.00 | | | 10/1/31 | | | 58,886 |
| 411,817 | | Fannie Mae | | 5.00 | | | 1/1/20 | | | 436,397 |
| 121,571 | | Fannie Mae | | 6.00 | | | 5/1/23 | | | 128,960 |
| 49,322 | | Fannie Mae | | 6.50 | | | 2/1/19 | | | 55,830 |
| | | | | | | | | | |
| | | | |
| | | | | | | | | | 3,806,350 |
| | | | | | | | | | |
| | |
See accompanying notes to financial statements. |
SEPTEMBER 30, 2014 | | 15 |
|
|
|
SCHEDULE OF INVESTMENTS (Unaudited) September 30, 2014 Sit Quality Income Fund (Continued) |
| | | | | | | | | | |
Principal Amount ($) | | Name of Issuer | | Coupon
Rate (%) | | Maturity
Date | | | Fair Value ($) |
| | |
Government National Mortgage Association - 0.5% | | | | | | |
| 116,982 | | Ginnie Mae 1 | | 1.63 | | | 4/20/33 | | | 121,470 |
| 83,453 | | Ginnie Mae 1 | | 1.63 | | | 10/20/34 | | | 86,907 |
| 53,471 | | Ginnie Mae 1 | | 3.50 | | | 4/20/42 | | | 56,093 |
| 214,569 | | Ginnie Mae | | 5.00 | | | 9/15/24 | | | 229,492 |
| | | | | | | | | | |
| | | | |
| | | | | | | | | | 493,962 |
| | | | | | | | | | |
| | |
Total Mortgage Pass-Through Securities
(cost: $7,434,851) | | | | | | 7,501,111 |
| | | | | | | | | | |
| | |
Taxable Municipal Bonds - 6.7% | | | | | | |
| 795,000 | | Academica Charter Schools 4 | | 7.93 | | | 8/15/19 | | | 800,223 |
| 390,000 | | Cleveland OH Airport System Revenue | | 5.24 | | | 1/1/17 | | | 405,799 |
| 540,000 | | Inland Valley Development Agency Tax Allocation | | 2.75 | | | 9/1/18 | | | 538,952 |
| 500,000 | | La Paz County Industrial Development Authority | | 2.75 | | | 3/1/15 | | | 501,989 |
| 520,000 | | Milwaukee Redevelopment Authority | | 3.00 | | | 8/1/18 | | | 526,042 |
| 1,000,000 | | Sandoval Co. Incentive Payment Rev. Ref. | | 1.95 | | | 6/1/18 | | | 1,005,710 |
| 295,000 | | Skagit County Public Hospital District No. 1 | | 2.00 | | | 12/1/14 | | | 295,502 |
| 1,100,000 | | Skyway Concession Co., LLC 1, 4 | | 0.61 | | | 6/30/26 | | | 880,000 |
| 785,000 | | Texas Department of Housing & Community Affairs | | 4.80 | | | 7/1/19 | | | 810,332 |
| 1,000,000 | | Village Center Community Development District 4 | | 1.30 | | | 11/1/15 | | | 999,450 |
| | | | | | | | | | |
| | |
Total Taxable Municipal Bonds
(cost: $6,731,986) | | | | | | 6,763,999 |
| | | | | | | | | | |
| | |
U.S. Treasury / Federal Agency Securities - 36.5% | | | | | | |
| | |
Federal Farm Credit Banks - 0.1% | | | | | | |
| 100,000 | | Federal Farm Credit Banks 1 | | 0.18 | | | 11/3/14 | | | 100,009 |
| | | | | | | | | | |
| | |
Other Federal Agency Securities - 2.8% | | | | | | |
| 250,000 | | Ally Bank 12 | | 0.60 | | | 6/29/15 | | | 250,114 |
| 150,000 | | Bank of China, Ltd. 12 | | 0.55 | | | 8/6/15 | | | 149,952 |
| 100,000 | | Bank of China, Ltd. 12 | | 0.60 | | | 4/17/15 | | | 100,059 |
| 150,000 | | Discover Bank 12 | | 0.50 | | | 5/22/15 | | | 150,092 |
| 100,000 | | Discover Bank 12 | | 0.55 | | | 2/27/15 | | | 100,077 |
| 250,000 | | Firstbank Puerto Rico 12 | | 0.80 | | | 9/21/15 | | | 250,407 |
| 250,000 | | GE Capital Bank 12 | | 0.80 | | | 11/2/15 | | | 250,442 |
| 100,000 | | Goldman Sachs Bank 12 | | 0.70 | | | 2/6/15 | | | 100,084 |
| 250,000 | | Investors Bank/Short Hills 12 | | 0.65 | | | 2/25/16 | | | 249,439 |
| 675,000 | | Micron Semiconductor Asia Pte, Ltd. 12 | | 1.26 | | | 1/15/19 | | | 674,139 |
| 250,000 | | Sallie Mae Bank 12 | | 0.80 | | | 10/23/15 | | | 250,354 |
| 125,000 | | State Bank of India 12 | | 0.60 | | | 7/22/15 | | | 125,132 |
| 125,000 | | State Bank of India 12 | | 0.85 | | | 10/19/15 | | | 125,233 |
| | | | | | | | | | |
| | | | |
| | | | | | | | | | 2,775,524 |
| | | | | | | | | | |
| | |
U.S. Treasury Note - 33.6% | | | | | | |
| 9,350,000 | | U.S. Treasury Note 1 | | 0.08 | | | 4/30/16 | | | 9,354,797 |
| 4,200,000 | | U.S. Treasury Note | | 0.25 | | | 10/31/14 | | | 4,200,655 |
| 4,200,000 | | U.S. Treasury Note | | 0.25 | | | 11/30/14 | | | 4,201,310 |
| 8,000,000 | | U.S. Treasury Note | | 0.63 | | | 10/15/16 | | | 7,996,872 |
| 8,000,000 | | U.S. Treasury Note | | 1.00 | | | 10/31/16 | | | 8,056,872 |
| | | | | | | | | | |
| | | | |
| | | | | | | | | | 33,810,506 |
| | | | | | | | | | |
| | |
Total U.S. Treasury / Federal Agency Securities
(cost: $36,696,014) | | | | | | 36,686,039 |
| | | | | | | | | | |
| | |
See accompanying notes to financial statements. |
16 | | SIT MUTUAL FUNDS SEMI-ANNUAL REPORT |
| | | | | | | | | | |
| Contracts | | Name of Issuer | | | | | | Fair Value ($) | |
| | |
Put Options Purchased 10 - 0.0% | | | | | | |
| 30 | | U.S. Treasury 5 Year Future Put Options: $117.50 strike, November 2014 expiration | | | | | | | 3,281 | |
| | | | | | | | | | |
| | |
Total Put Options Purchased
(cost: $4,114) | | | | | | |
Total Investments in Securities - 105.8%
(cost: $106,294,532) | | | | | 106,362,891 | |
| | | | | | | | | | |
| | |
Call Options Written 10 - 0.0% | | | | | | |
| (40) | | U.S. Treasury 5 Year Future Call Options: $117.50 strike, November 2014 expiration | | | | | | | (34,688 | ) |
| | | | | | | | | | |
| | |
Total Call Options Written
(premiums received: $30,452) | | | | | | |
Other Assets and Liabilities, net - (5.8%) | | | | | (5,856,514 | ) |
| | | | | | | | | | |
| | |
Total Net Assets - 100.0% | | | | | $100,471,689 | |
| | | | | | | | | | |
| 1 | Variable rate security. Rate disclosed is as of September 30, 2014. |
| 4 | 144A Restricted Security. The total value of such securities as of September 30, 2014 was $4,664,396 and represented 4.6% of net assets. These securities have been determined to be liquid by the Adviser in accordance with guidelines established by the Board of Directors. |
| 12 | Certificate of Deposit. Investments up to $250,000 are insured by the Federal Deposit Insurance Corporation. |
| 10 | The amount of $500,000 in cash was segregated with the broker to cover margin requirements for derivative transactions as of September 30, 2014. |
| 14 | Step Coupon: A bond that pays an initial coupon rate for the first period and then a higher coupon rate for the following periods. Rate disclosed is as of September 30, 2014. |
Numeric footnotes not disclosed are not applicable to this Schedule of Investments.
Short futures contracts outstanding as of September 30, 2014 were as follows:
| | | | | | | | |
| Contracts | | Type | | Expiration Date | | Notional
Amount | | Unrealized
Appreciation |
280 | | U.S. Treasury 2 Year Futures 10 | | December 2014 | | $61,276,250 | | $20,537 |
| | |
See accompanying notes to financial statements. |
SEPTEMBER 30, 2014 | | 17 |
|
|
|
SCHEDULE OF INVESTMENTS (Unaudited) September 30, 2014 Sit Quality Income Fund (Continued) |
A summary of the levels for the Fund’s investments as of September 30, 2014 is as follows (see Note 2 - significant accounting policies in the notes to financial statements):
| | | | | | | | | | | | | | |
| | | Investment in Securities | |
| | | Level 1
Quoted
Price ($) | | | Level 2
Other Significant
Observable Inputs ($) | | | Level 3
Other Significant
Observable Inputs ($) | | Total ($) | |
| | | | |
Assets | | | | | | | | | | | | | | |
Asset-Backed Securities | | | — | | | | 12,300,488 | | | — | | | 12,300,488 | |
Collateralized Mortgage Obligations | | | — | | | | 14,599,539 | | | — | | | 14,599,539 | |
Corporate Bonds | | | — | | | | 27,862,837 | | | — | | | 27,862,837 | |
Foreign Government Bonds | | | — | | | | 645,597 | | | — | | | 645,597 | |
Mortgage Pass-Through Securities | | | — | | | | 7,501,111 | | | — | | | 7,501,111 | |
Taxable Municipal Bonds | | | — | | | | 6,763,999 | | | — | | | 6,763,999 | |
U.S. Treasury / Federal Agency Securities | | | — | | | | 36,686,039 | | | — | | | 36,686,039 | |
Put Options Purchased | | | 3,281 | | | | — | | | — | | | 3,281 | |
Futures | | | 20,537 | | | | — | | | — | | | 20,537 | |
| | | | |
| | | | |
| | | 23,818 | | | | 106,359,610 | | | — | | | 106,383,428 | |
| | | | |
Liabilities | | | | | | | | | | | | | | |
| | | | |
Call Options Written | | | (34,688) | | | | — | | | — | | | (34,688) | |
| | | | |
For the reporting period, there were no transfers between levels 1, 2 and 3.
| | |
See accompanying notes to financial statements. |
18 | | SIT MUTUAL FUNDS SEMI-ANNUAL REPORT |
[This page intentionally left blank.]
OBJECTIVE & STRATEGY
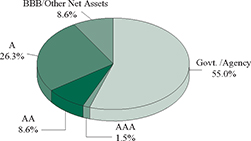
The objective of the Tax-Free Income Fund is to provide a high level of current income that is exempt from federal income tax, consistent with preservation of capital, by investing primarily in investment-grade municipal securities.
Such municipal securities generate interest income that is exempt from both federal regular income tax and federal alternative minimum tax. During normal market conditions, the Fund invests 100% of its net assets in such tax-exempt municipal securities.
The Sit Tax-Free Income Fund provided a return of +5.88% during the 6-month period ended September 30, 3014, which compared to a return of +2.08% for the benchmark Barclays 5-Year Municipal Index. The Fund’s 30-day SEC yield was 3.40%, which compared to a yield of 1.35% for the benchmark index. The Fund’s 12-month distribution rate was 3.89%.
Lower than average issuance volume, combined with demand from reinvestment and modestly positive mutual funds flows continued to be the main driver of performance for tax-exempt bonds during the period. Investors continued to reach for yield, as supply remained light. As a result, longer duration bonds outperformed shorter duration bonds as the yield curve flattened. Revenue bonds also generally outperformed general obligation bonds, and lower credit quality outperformed higher credit quality. These trends were evident in the Fund’s performance, which particularly benefitted from its longer duration positioning in addition to its holdings in non-rated securities as credit spreads narrowed. The Fund’s top performing sector was its general obligation holdings which primarily consisted of longer duration, convertible coupon local California school district issues. Of the top five industry sectors in which the Fund invests, representing 66% of the portfolio in aggregate, the multifamily housing, hospital and other revenue bond sectors provided the highest contributions to the Fund’s strong returns. Puerto Rico made headlines as the passage of the Recovery Act in Puerto Rico in June set in motion numerous ratings downgrades to below investment grade, however, the Fund has little (i.e., less than 0.5%) exposure to Puerto Rico credits and thus the impact on performance was negligible.
Our tax-exempt investment strategy remains focused on securities that provide a high level of interest income. In addition to security structure, we are maintaining our emphasis on revenue bonds, which continue to offer attractive incremental yield over most general obligation issues and have much less exposure to pressure from employee costs, such as pension and other post-employment benefits (OPEB) liabilities. We continue to be attracted to sectors with stable to growing demand fundamentals, (e.g., single-family housing, senior housing and hospitals with dominant market share). The Fund remains highly diversified both geographically and on an issue basis, to help manage credit risk.
Although the Fund’s portfolio duration has shortened, it remains longer than its benchmark. We believe that the Fund’s longer duration
HYPOTHETICAL GROWTH OF $10,000
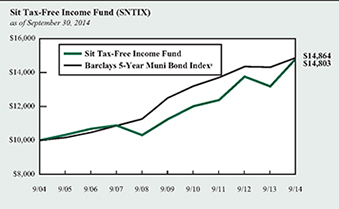
The chart above illustrates the total value of a hypothetical $10,000 investment in the Fund over the past 10 years (or for the life of the Fund if shorter) as compared to the performance of the Barclays 5-Year Municipal Bond Index. Past performance does not guarantee future results. Returns include the reinvestment of distributions. The chart does not reflect the deduction of taxes that a shareholder would pay on Fund distributions or the redemption of Fund shares.
1 The Barclays 5-Year Municipal Bond Index is the 5 year (4-6) component of the Municipal Bond Index, an unmanaged, rules-based, market-value-weighted index for the long-term tax-exempt bond market. The index includes bonds with a minimum credit rating of BBB. The returns include the reinvestment of income and do not include any transaction costs, management fees or other costs. It is not possible to invest directly in an index. This is the Fund’s primary index.
positioning will continue to be rewarded in the near term, particularly as the tax-exempt yield curve remains steeper than its longer term historical average. Relative yield valuations for intermediate and longer duration revenue bonds remain attractive, and continue to attract crossover buyers. We anticipate shortening the Fund’s duration closer to its benchmark as interest rates are expected to trend modestly higher next year. We continue to expect tax-exempt supply to remain light, as municipalities continue to seek fiscal discipline and shrink their balance sheets, helping to mitigate the downward pressure in prices as yields rise.
Michael C. Brilley
Debra A. Sit, CFA
Paul J. Jungquist, CFA
Senior Portfolio Managers
| | |
20 | | SIT MUTUAL FUNDS SEMI-ANNUAL REPORT |
COMPARATIVE RATES OF RETURNS
as of September 30, 2014
| | | | | | | | | | | | | | | |
| | | Sit
Tax-Free
Income
Fund | | Barclays
5-Year Muni
Bond Index1 | | Lipper
General
Muni. Bond
Fund Index2 |
| | | |
Six Months | | | | 5.88 | % | | | | 2.08 | % | | | | n/a | |
| | | |
One Year | | | | 12.44 | | | | | 3.96 | | | | | 9.52 | % |
| | | |
Five Years | | | | 5.67 | | | | | 3.54 | | | | | 5.05 | |
| | | |
Ten Years | | | | 4.00 | | | | | 4.04 | | | | | 4.54 | |
| | | |
Since Inception (9/29/88) | | | | 5.38 | | | | | 5.43 | | | | | 5.87 | |
Performance figures are historical and do not guarantee future results. Investment returns and principal value will vary, and you may have a gain or loss when you sell shares. Current performance may be lower or higher than the performance data quoted. Contact the Fund for performance data current to the most recent month-end. Returns include changes in share price as well as reinvestment of all dividends and capital gains and all fee waivers. Without the fee waivers total return and yield figures would have been lower. Returns do not reflect the deduction of taxes that a shareholder would pay on Fund distributions or the redemption of Fund shares. Management fees and administrative expenses are included in the Fund’s performance. Returns for periods greater than one year are compounded average annual rates of return.
1 The Barclays 5-Year Municipal Bond Index is the 5 year (4-6) component of the Municipal Bond Index, an unmanaged, rules-based, market-value-weighted index for the long-term tax-exempt bond market. The index includes bonds with a minimum credit rating of BBB. The returns include the reinvestment of income and do not include any transaction costs, management fees or other costs. It is not possible to invest directly in an index.
2 The Lipper returns are obtained from Lipper Analytical Services, Inc., a large independent evaluator of mutual funds.
FUND DIVERSIFICATION
| | | | |
| |
Single Family Mortgage | | | 19.2 | % |
Multifamily Mortgage | | | 17.7 | % |
Other Revenue | | | 12.1 | % |
Education/Student Loan | | | 10.2 | % |
Insured | | | 7.2 | % |
Hospital/Health Care | | | 6.2 | % |
Closed-End Mutual Funds | | | 6.1 | % |
General Obligation | | | 5.6 | % |
Sectors less than 5% | | | 8.0 | % |
Cash & Other Net Assets | | | 7.7 | % |
Based on total net assets as of September 30, 2014. Subject to change.
PORTFOLIO SUMMARY
| | |
| Net Asset Value 9/30/14: | | $ 9.52 Per Share |
| Net Asset Value 3/31/14: | | $ 9.16 Per Share |
| Total Net Assets: | | $ 159.1 Million |
| Average Maturity: | | 16.2 Years |
| Effective Duration 3: | | 5.9 Years |
3 Duration is a measure of estimated price sensitivity relative to changes in interest rates. Portfolios with longer durations are typically more sensitive to changes in interest rates. For example, if interest rates rise by 1%, the fair value of a security with an effective duration of 5 years would decrease by 5%, with all other factors being constant. The correlation between duration and price sensitivity is greater for securities rated investment-grade than it is for securities rated below investment-grade. Duration estimates are based on assumptions by the Adviser and are subject to a number of limitations. Effective duration is calculated based on historical price changes of securities held by the Fund, and therefore is a more accurate estimate of price sensitivity provided interest rates remain within their historical range.
QUALITY RATINGS (% of Total Net Assets)
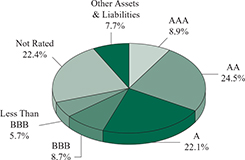
Lower of Moody’s, S&P, Fitch or Duff & Phelps ratings used.
Adviser’s Assessment of Non-Rated Securities:
| | | | | | | | | | | | |
AAA | | | 0.0 | % | | | | | | | | |
AA | | | 1.5 | | | | | | | | | |
A | | | 0.0 | | | | | | | | | |
BBB | | | 2.5 | | | | | | | | | |
BB | | | 12.8 | | | | | | | | | |
<BB | | | 5.6 | | | | | | | | | |
| | | | | | | | | | | | |
Total | | | 22.4 | % | | | | | | | | |
|
|
|
SCHEDULE OF INVESTMENTS (Unaudited) September 30, 2014 Sit Tax-Free Income Fund |
| | | | | | | | | | |
Principal
Amount ($) | | Name of Issuer | | Coupon
Rate (%) | | Maturity Date | | | Fair Value ($) |
| | |
Municipal Bonds - 86.2% | | | | | | |
| | |
Alabama - 0.4% | | | | | | |
| 400,000 | | Birmingham-Baptist Medical Centers Special Care Facs. Financing Auth. Rev. | | 5.00 | | | 11/15/30 | | | 402,628 |
| 285,000 | | Pell City Special Care Facs. Finance Rev. | | 5.00 | | | 12/1/39 | | | 301,687 |
| | | | | | | | | | |
| | | | |
| | | | | | | | | | 704,315 |
| | | | | | | | | | |
| | | |
Alaska - 2.2% | | | | | | | | |
| 750,000 | | AK Hsg. Finance Corp. Mtg. Rev. | | 4.13 | | | 12/1/37 | | | 765,540 |
| 640,000 | | AK Hsg. Finance Corp. Mtg. Rev. | | 4.25 | | | 12/1/40 | | | 654,906 |
| 500,000 | | AK Hsg. Finance Corp. Mtg. Rev. (GO of Corp. Insured) | | 4.50 | | | 12/1/35 | | | 518,880 |
| 250,000 | | AK Industrial Dev. & Export Auth. Rev. (Boys & Girls Home) 2, 5, 10 | | 5.50 | | | N/A | | | 112,471 |
| 250,000 | | AK Industrial Dev. & Export Auth. Rev. (GTR Fairbanks Community Hospital Foundation) | | 5.00 | | | 4/1/33 | | | 270,680 |
| 500,000 | | Koyukuk Health Facility Rev. (Tanana Chief’s Conf. Health Care) | | 7.00 | | | 10/1/23 | | | 554,970 |
| 550,000 | | North Slope Borough Service Area Rev. | | 5.25 | | | 6/30/34 | | | 604,725 |
| | | | | | | | | | |
| | | | |
| | | | | | | | | | 3,482,172 |
| | | | | | | | | | |
| | | |
Arizona - 2.1% | | | | | | | | |
| 893,734 | | AZ Health Facs. Auth. Rev. (New Arizona Family Proj.) | | 5.25 | | | 7/1/27 | | | 990,955 |
| 125,000 | | Flagstaff Industrial Dev. Auth. Rev. (Sr. Living Community Proj.) | | 5.50 | | | 7/1/22 | | | 125,998 |
| 700,000 | | Phoenix Industrial Dev. Auth. Education Rev. (Legacy Schools Proj.) 4 | | 4.75 | | | 7/1/19 | | | 722,477 |
| 5,000 | | Pima Co. Industrial Dev. Auth. Education Rev. (AZ Charter Schools Proj.) | | 6.70 | | | 7/1/21 | | | 5,017 |
| 170,000 | | Pima Co. Industrial Dev. Auth. Education Rev. (Choice Education & Dev. Corp. Proj.) | | 6.00 | | | 6/1/16 | | | 172,977 |
| 400,000 | | Pima Co. Industrial Dev. Auth. Education Rev. (Coral Academy Science Proj.) | | 6.38 | | | 12/1/18 | | | 421,356 |
| 365,000 | | Pima Co. Industrial Dev. Auth. Education Rev. (Tucson Country Day School Proj.) | | 5.00 | | | 6/1/22 | | | 366,420 |
| 500,000 | | Quechan Indian Tribe of Fort Yuma Rev. (Tribal Economic Dev.) | | 9.75 | | | 5/1/25 | | | 565,830 |
| | | | | | | | | | |
| | | | |
| | | | | | | | | | 3,371,030 |
| | | | | | | | | | |
| | | |
Arkansas - 0.3% | | | | | | | | |
| 460,000 | | Rogers Rev. (Sales & Use Tax) | | 4.13 | | | 11/1/31 | | | 490,079 |
| | | | | | | | | | |
| | | |
California - 9.9% | | | | | | | | |
| 500,000 | | Agua Caliente Band of Cahuilla Indians Rev. 4 | | 6.00 | | | 7/1/18 | | | 493,035 |
| 250,000 | | CA Finance Auth. Rev. (Mobile Home Park-Caritas Affordable Hsg.) | | 5.25 | | | 8/15/39 | | | 272,505 |
| 240,000 | | CA Hsg. Finance Agy. Home Mtg. Rev. | | 5.20 | | | 8/1/28 | | | 245,642 |
| 500,000 | | CA School Facs. Finance Auth. Rev. (Azusa Unified School District) (AGM Insured) 6 | | 6.00 | | | 8/1/29 | | | 553,460 |
| 250,000 | | CA Statewide Communities Dev. Auth. Rev. (Lancer Plaza Proj.) | | 5.13 | | | 11/1/23 | | | 265,465 |
| 500,000 | | CA Statewide Communities Dev. Auth. Rev. (Provident Group - Pomona Property) | | 5.60 | | | 1/15/36 | | | 511,600 |
| 100,000 | | CA Statewide Communities Dev. Auth. Rev. (Sunedison Huntington Beach Solar Proj.) | | 6.00 | | | 1/1/21 | | | 113,151 |
| 100,000 | | CA Statewide Communities Dev. Auth. Rev. C.O.P. (Internext Group) | | 5.38 | | | 4/1/30 | | | 100,279 |
| 400,000 | | Carlsbad Unified School District G.O. Capital Appreciation 6 | | 6.13 | | | 8/1/31 | | | 352,232 |
| 1,000,000 | | Colton Joint Unified School District G.O. (AGM Insured) 6 | | 5.80 | | | 8/1/35 | | | 764,060 |
| 250,000 | | Eden Township Hospital District C.O.P. | | 6.00 | | | 6/1/25 | | | 272,280 |
| 500,000 | | Encinitas Union School District G.O. Capital Appreciation 6 | | 6.75 | | | 8/1/35 | | | 429,630 |
| 500,000 | | Hartnell Community College G.O. 6 | | 7.00 | | | 8/1/34 | | | 399,920 |
| 1,250,000 | | Healdsburg Unified School District G.O. 6 | | 4.60 | | | 8/1/37 | | | 849,675 |
| 250,000 | | Imperial Community College District G.O. Capital Appreciation (AGM Insured) 6 | | 6.75 | | | 8/1/40 | | | 293,272 |
| 1,100,000 | | Los Alamitos Unified School District Capital Appreciation C.O.P. 6 | | 5.95 | | | 8/1/34 | | | 768,460 |
| 250,000 | | Marina Coast Water District Rev. | | 5.00 | | | 6/1/20 | | | 281,350 |
| 250,000 | | Martinez Unified School District G.O. 6 | | 6.13 | | | 8/1/35 | | | 321,028 |
| 1,000,000 | | Oak Grove School District G.O. 6 | | 6.96 | | | 6/1/41 | | | 185,240 |
| 500,000 | | Placentia-Yorba Linda Unified School District C.O.P. Capital Appreciation (AGM Insured) 6 | | 6.25 | | | 10/1/28 | | | 508,865 |
| 600,000 | | Redondo Beach School District G.O. 6 | | 6.38 | | | 8/1/34 | | | 651,366 |
| 750,000 | | Reef-Sunset Unified School District (BAM Insured) 6 | | 4.85 | | | 8/1/38 | | | 534,855 |
| 350,000 | | Ripon Unified School District G.O. (BAM Insured) 6 | | 4.50 | | | 8/1/30 | | | 299,453 |
| | |
See accompanying notes to financial statements. |
22 | | SIT MUTUAL FUNDS SEMI-ANNUAL REPORT |
| | | | | | | | | | |
Principal
Amount ($) | | Name of Issuer | | Coupon
Rate (%) | | Maturity Date | | | Fair Value ($) |
| | | | |
| 500,000 | | Sacramento Co. Water Financing Auth. Rev. (NATL-RE FGIC Insured) 1 | | 0.73 | | | 6/1/39 | | | 430,610 |
| 1,000,000 | | San Bernardino City Unified School District G.O. Capital Appreciation (NATL-RE Insured) 6 | | 4.72 | | | 8/1/29 | | | 504,410 |
| 90,000 | | San Bernardino Joint Powers Financing Auth. Rev. (City Hall Proj.) (NATL-RE Insured) | | 5.60 | | | 1/1/15 | | | 90,121 |
| 350,000 | | San Gabriel Unified School District (BAM Insured) 6 | | 5.10 | | | 8/1/33 | | | 365,050 |
| 400,000 | | San Jose Financing Auth. Rev. (Civic Center Garage Proj.) 9 | | 5.00 | | | 6/1/39 | | | 446,096 |
| 250,000 | | South Bayside Waste Management Auth. Rev. (Shoreway Environmental) | | 6.25 | | | 9/1/29 | | | 295,122 |
| 350,000 | | Southwest Community Finance Auth. Rev. (Riverside Co. Proj.) 9 | | 6.00 | | | 5/1/24 | | | 404,512 |
| 515,000 | | Sulphur Springs Union School District C.O.P. Capital Appreciation (AGM Insured) 6 | | 6.50 | | | 12/1/37 | | | 568,406 |
| 500,000 | | Sutter Butte Flood Agency (BAM Insured) | | 4.00 | | | 10/1/38 | | | 508,650 |
| 600,000 | | Tracy Joint Unified School District G.O. Capital Appreciation 6 | | 7.30 | | | 8/1/41 | | | 357,456 |
| 500,000 | | Tustin Unified School District G.O. Capital Appreciation 6 | | 6.00 | | | 8/1/28 | | | 414,905 |
| 2,000,000 | | Twin Rivers Unified School District (BAM Insured) 6 | | 6.25 | | | 8/1/34 | | | 663,940 |
| 1,000,000 | | Upland Unified School District G.O. Capital Appreciation 6 | | 7.00 | | | 8/1/41 | | | 904,170 |
| 500,000 | | Val Verde Unified School District G.O. Capital Appreciation (AGM Insured) 6 | | 6.13 | | | 8/1/34 | | | 390,130 |
| | | | | | | | | | |
| | | | |
| | | | | | | | | | 15,810,401 |
| | | | | | | | | | |
| | | |
Colorado - 1.9% | | | | | | | | |
| 250,000 | | CO Educational & Cultural Facs. Auth. Rev. (CO Springs Charter Academy Proj.) | | 5.60 | | | 7/1/34 | | | 269,958 |
| 400,000 | | CO Educational & Cultural Facs. Auth. Rev. Ref. (Charter School Aid Twin Peaks) | | 4.00 | | | 11/15/37 | | | 394,988 |
| 500,000 | | CO Educational & Cultural Facs. Auth. Rev. Ref. (Vail Mountain School Proj.) | | 6.00 | | | 5/1/30 | | | 530,075 |
| 280,000 | | CO Hsg. Finance Auth. Single Family Mtg. Rev. | | 5.50 | | | 11/1/29 | | | 289,814 |
| 625,000 | | CO Hsg. Finance Auth. Single Family Mtg. Rev. (FHA Insured) | | 5.00 | | | 11/1/34 | | | 653,312 |
| 500,000 | | East Morgan Co. Hospital District C.O.P. 9 | | 5.88 | | | 12/1/38 | | | 503,825 |
| 350,043 | | Lyons Rev. (Longmont Humane Society Proj.) | | 4.75 | | | 11/30/16 | | | 345,685 |
| | | | | | | | | | |
| | | | |
| | | | | | | | | | 2,987,657 |
| | | | | | | | | | |
| | | |
Connecticut - 1.7% | | | | | | | | |
| 1,000,000 | | CT Hsg. Finance Auth. Rev. | | 4.00 | | | 11/15/34 | | | 1,025,730 |
| 210,000 | | CT Hsg. Finance Auth. Rev. | | 5.15 | | | 11/15/34 | | | 218,129 |
| 500,000 | | CT Hsg. Finance Auth. Rev. | | 3.75 | | | 11/15/35 | | | 504,665 |
| 500,000 | | CT Hsg. Finance Auth. Rev. (GO of Auth.) | | 4.75 | | | 11/15/35 | | | 526,910 |
| 350,000 | | CT Hsg. Finance Auth. Rev. (GO of Auth.) | | 4.90 | | | 11/15/36 | | | 375,739 |
| | | | | | | | | | |
| | | | |
| | | | | | | | | | 2,651,173 |
| | | | | | | | | | |
| | |
Florida - 8.0% | | | | | | |
| 385,000 | | Alachua Co. Health Facs. Auth. Rev. (Oak Hammock University) | | 8.00 | | | 10/1/32 | | | 461,634 |
| 500,000 | | Bay Co. Educational Facs. Rev. (Bay Haven Charter) | | 5.25 | | | 9/1/30 | | | 513,010 |
| 410,000 | | Boynton Beach Rev. (Charter Schools Boynton Beach, Inc.) | | 6.25 | | | 6/1/27 | | | 246,012 |
| 335,000 | | Capital Trust Agy. Rev. (Golf Villas, Rivermill, and Village Square Apartments Proj.) 2, 5, 10 | | 4.75 | | | N/A | | | 182,575 |
| 1,000,000 | | Capital Trust Agy. Rev. (Golf Villas, Rivermill, and Village Square Apartments Proj.) 2, 5 | | 5.88 | | | 6/1/38 | | | 545,000 |
| 350,000 | | Collier Co. Industrial Dev. Auth. Rev. (Arlington of Naples Proj.) 4 | | 6.50 | | | 5/15/20 | | | 352,030 |
| 250,000 | | Collier Co. Industrial Dev. Auth. Rev. (Arlington of Naples Proj.) 4 | | 7.25 | | | 5/15/26 | | | 275,652 |
| 415,000 | | Collier Co. Industrial Dev. Auth. Rev. (NCH Healthcare System Proj.) | | 6.25 | | | 10/1/39 | | | 471,307 |
| 100,000 | | Fiddlers Creek Community Dev. District No. 2 Special Assessment Rev. 2, 5, 10 | | 5.75 | | | N/A | | | 52,077 |
| 400,000 | | FL Dev. Fin. Corp. (Renaissance Charter School Proj.) | | 6.38 | | | 12/15/25 | | | 422,364 |
| 240,000 | | FL Hsg. Finance Corp. (GNMA/FNMA Collateralized) | | 5.00 | | | 7/1/26 | | | 252,763 |
| 255,000 | | FL Hsg. Finance Corp. (GNMA/FNMA/FHLMC Collateralized) | | 5.00 | | | 7/1/39 | | | 272,468 |
| 535,000 | | Gramercy Farms Community Dev. District Special Assessment 6 | | 3.24 | | | 5/1/39 | | | 70,994 |
| 500,000 | | Lake Ashton Community Dev. District Cap. Improvement Special Assessment Rev. 2, 5, 10 | | 5.00 | | | N/A | | | 165,020 |
| 250,000 | | Lakewood Ranch Stewardship District Cap. Improvement Special Assessment Rev. (Country Club East Proj.) | | 6.70 | | | 5/1/33 | | | 276,238 |
| 500,000 | | Lakewood Ranch Stewardship District Cap. Improvement Special Assessment Rev. (Lakewood Center) | | 7.40 | | | 5/1/30 | | | 623,125 |
| 250,000 | | Lexington Oaks Community Dev. District Special Assessment Rev. | | 5.65 | | | 5/1/33 | | | 265,160 |
| 235,000 | | Long Lake Ranch Community Dev. District Special Assessment | | 5.63 | | | 5/1/24 | | | 238,816 |
| 500,000 | | Long Lake Ranch Community Dev. District Special Assessment | | 5.75 | | | 5/1/44 | | | 503,335 |
| | |
See accompanying notes to financial statements. |
SEPTEMBER 30, 2014 | | 23 |
|
|
|
SCHEDULE OF INVESTMENTS (Unaudited) September 30, 2014 Sit Tax-Free Income Fund (Continued) |
| | | | | | | | | | |
Principal Amount ($) | | Name of Issuer | | Coupon
Rate (%) | | Maturity
Date | | | Fair Value ($) |
| | | | |
| 250,000 | | Magnolia Creek Community Dev. District Rev. 2, 5, 10 | | 5.60 | | | N/A | | | 86,365 |
| 230,000 | | New River Community Dev. District Cap. Improvement Special Assessment Rev. 2, 5, 10 | | 5.00 | | | N/A | | | 2 |
| 110,000 | | New River Community Dev. District Cap. Improvement Special Assessment Rev. | | 5.00 | | | 5/1/15 | | | 109,268 |
| 275,000 | | New River Community Dev. District Cap. Improvement Special Assessment Rev. | | 5.00 | | | 5/1/18 | | | 221,265 |
| 350,000 | | New River Community Dev. District Cap. Improvement Special Assessment Rev. 6 | | 5.75 | | | 5/1/38 | | | 280,010 |
| 135,000 | | New River Community Dev. District Cap. Improvement Special Assessment Rev. | | 5.75 | | | 5/1/38 | | | 135,220 |
| 550,000 | | Orange Co. Health Facs. Auth. Rev. (Presbyterian Retirement Community Proj.) | | 5.00 | | | 8/1/34 | | | 596,194 |
| 250,000 | | Palm Beach Co. Health Facs. Auth. Rev. (Sinai Residences Boca Raton Proj.) | | 6.00 | | | 6/1/21 | | | 268,255 |
| 250,000 | | Palm Beach Co. Health Facs. Auth. Rev. (Sinai Residences Boca Raton Proj.) | | 6.25 | | | 6/1/23 | | | 269,375 |
| 500,000 | | Port St. Lucie Research Foundation Rev. (Vaccine Gene Therapy Inst.) | | 5.00 | | | 5/1/33 | | | 531,220 |
| 750,000 | | Sarasota Co. Health Facs. Auth. Retirement Rev. (Village on the Isle) | | 5.50 | | | 1/1/27 | | | 797,355 |
| 500,000 | | Seminole Tribe Special Obligation Rev. 4 | | 5.50 | | | 10/1/24 | | | 543,360 |
| 250,000 | | Seven Oaks Community Dev. District Special Assessment Rev. | | 5.50 | | | 5/1/33 | | | 260,845 |
| 250,000 | | Silverleaf Community Dev. District Special Assessment. | | 6.75 | | | 5/1/44 | | | 264,318 |
| 615,000 | | Tallahassee Health Facs. Rev. (Memorial Health Care Proj.) | | 6.38 | | | 12/1/30 | | | 616,937 |
| 295,000 | | Tolomato Community Dev. District Special Assessment 2, 5 | | 6.38 | | | 5/1/17 | | | 189,343 |
| 105,000 | | Tolomato Community Dev. District Special Assessment 2, 5 | | 6.38 | | | 5/1/17 | | | 1 |
| 65,000 | | Tolomato Community Dev. District Special Assessment | | 6.38 | | | 5/1/17 | | | 64,472 |
| 40,000 | | Tolomato Community Dev. District Special Assessment 6 | | 6.61 | | | 5/1/39 | | | 29,295 |
| 85,000 | | Tolomato Community Dev. District Special Assessment 6 | | 6.61 | | | 5/1/40 | | | 50,723 |
| 45,000 | | Tolomato Community Dev. District Special Assessment 6 | | 6.61 | | | 5/1/40 | | | 19,878 |
| 500,000 | | Viera East Community Dev. District Special Assessment Rev. | | 5.00 | | | 5/1/26 | | | 501,340 |
| 10,000 | | Waters Edge Community Dev. District Cap. Improvement Rev. | | 5.35 | | | 5/1/39 | | | 10,042 |
| 555,000 | | Waters Edge Community Dev. District Cap. Improvement Rev. 6 | | 6.60 | | | 5/1/39 | | | 342,590 |
| 250,000 | | Wiregrass Community Dev. District Special Assessment | | 5.38 | | | 5/1/35 | | | 250,588 |
| 450,000 | | Zephyr Ridge Community Dev. District Special Assessment 2, 5, 10 | | 5.25 | | | N/A | | | 177,183 |
| | | | | | | | | | |
| | | | |
| | | | | | | | | | 12,805,024 |
| | | | | | | | | | |
| | | |
Georgia - 2.6% | | | | | | | | |
| 200,000 | | Barnesville-Lamar County Ind. Dev. Auth. Rev. (Gordon College Property) | | 5.00 | | | 8/1/30 | | | 200,220 |
| 1,240,000 | | East Point Tax Allocation | | 8.00 | | | 2/1/26 | | | 1,243,162 |
| 1,280,000 | | GA Housing & Finance Authority Rev. | | 3.80 | | | 12/1/37 | | | 1,296,115 |
| 1,000,000 | | GA Housing & Finance Authority Rev. | | 4.00 | | | 12/1/37 | | | 1,018,070 |
| 300,000 | | GA State Environmental Loan Acquisition Corp. Rev. | | 5.13 | | | 2/15/31 | | | 336,177 |
| | | | | | | | | | |
| | | | |
| | | | | | | | | | 4,093,744 |
| | | | | | | | | | |
| | | |
Idaho - 1.0% | | | | | | | | |
| 500,000 | | ID Health Facs. Authority Rev. (Terraces Boise Proj.) | | 6.00 | | | 10/1/21 | | | 505,855 |
| 250,000 | | ID Health Facs. Authority Rev. (Terraces Boise Proj.) | | 7.00 | | | 10/1/24 | | | 265,125 |
| 250,000 | | ID Health Facs. Authority Rev. (Terraces Boise Proj.) | | 7.38 | | | 10/1/29 | | | 262,530 |
| 500,000 | | ID Hsg. & Fin. Assoc. Nonprofit Facs. Rev. (Idaho Arts Charter School Proj.) | | 5.75 | | | 12/1/32 | | | 525,545 |
| | | | | | | | | | |
| | | | |
| | | | | | | | | | 1,559,055 |
| | | | | | | | | | |
| | | |
Illinois - 7.4% | | | | | | | | |
| 500,000 | | Bellwood G.O. | | 5.88 | | | 12/1/27 | | | 490,755 |
| 500,000 | | Bureau Co. Township High School Dist. No. 502 G.O. (BAM Insured) | | 6.25 | | | 12/1/33 | | | 611,865 |
| 375,000 | | Chicago Board of Education G.O. | | 5.50 | | | 12/1/39 | | | 393,754 |
| 500,000 | | Chicago Midway Airport Rev. (Second Lien) | | 5.25 | | | 1/1/35 | | | 556,910 |
| 1,000,000 | | Dekalb, Kane & Lasalle Counties Comm. College Dist. No. 523 G.O. Capital Appreciation 6 | | 6.58 | | | 2/1/30 | | | 452,400 |
| 200,000 | | IL C.O.P. (NATL-RE Insured) | | 5.80 | | | 7/1/17 | | | 200,392 |
| 300,000 | | IL Fin. Auth. Rev. (Lutheran Home & Services) | | 5.50 | | | 5/15/27 | | | 320,763 |
| 750,000 | | IL Fin. Auth. Rev. (Noble Network Charter Schools) (ACA Insured) | | 5.00 | | | 9/1/27 | | | 761,152 |
| 465,000 | | IL Fin. Auth. Rev. (Peace Village) | | 5.25 | | | 8/15/23 | | | 482,335 |
| 500,000 | | IL Fin. Auth. Rev. (Rogers Park Montessori School Proj.) | | 5.00 | | | 2/1/24 | | | 501,815 |
| | |
See accompanying notes to financial statements. |
24 | | SIT MUTUAL FUNDS SEMI-ANNUAL REPORT |
| | | | | | | | | | |
Principal Amount ($) | | Name of Issuer | | Coupon
Rate (%) | | Maturity
Date | | | Fair Value ($) |
| | | | |
| 250,000 | | IL Fin. Auth. Rev. (Tabor Hills Living Proj.) | | 5.25 | | | 11/15/36 | | | 254,660 |
| 370,000 | | IL Fin. Auth. Rev. (UNO Charter School Network) | | 6.88 | | | 10/1/31 | | | 427,269 |
| 1,000,000 | | IL Fin. Auth. Sports Facs. Rev. (North Shore Ice Arena Proj.) | | 6.25 | | | 12/1/38 | | | 597,320 |
| 500,000 | | IL Fin. Auth. Sports Facs. Rev. (United Sports Organizations of Barrington Proj.) 2, 4, 5 | | 6.13 | | | 10/1/27 | | | 36,315 |
| 500,000 | | IL Fin. Auth. Sports Facs. Rev. (United Sports Organizations of Barrington Proj.) 2, 4, 5 | | 6.25 | | | 10/1/37 | | | 36,315 |
| 300,000 | | IL G.O. | | 5.25 | | | 2/1/31 | | | 324,345 |
| 250,000 | | IL G.O. | | 5.50 | | | 7/1/33 | | | 269,592 |
| 380,000 | | IL Housing Dev. Auth. (AMBAC GO of Authority Insured) | | 4.50 | | | 7/1/47 | | | 382,276 |
| 350,000 | | IL Housing Dev. Auth. Rev. (Evergreen Towers) | | 4.95 | | | 7/1/34 | | | 375,935 |
| 1,000,000 | | IL Sports Facilities Auth. Rev. (State Tax Supported) (AGM Insured) | | 5.25 | | | 6/15/31 | | | 1,116,750 |
| 250,000 | | Lake Co. Community Consolidated School District No. 50 Woodland G.O. | | 5.63 | | | 1/1/26 | | | 290,240 |
| 40,000 | | Lombard Public Facs. Corp. Rev. First Tier (Conference Center & Hotel Proj.) | | 6.38 | | | 1/1/15 | | | 23,934 |
| 1,000,000 | | Lombard Public Facs. Corp. Rev. First Tier (Conference Center & Hotel Proj.) 2, 5 | | 5.25 | | | 1/1/36 | | | 350,100 |
| 335,000 | | Macon & Moultrie Counties Community Unit School District No. 3 Mt Zion G.O. | | 5.50 | | | 12/1/41 | | | 388,858 |
| 250,000 | | Macon County School District No. 61 Decatur G.O. (AGM Insured) | | 5.25 | | | 1/1/37 | | | 272,752 |
| 1,921,000 | | Malta Tax Allocation Rev. 2, 5 | | 5.75 | | | 12/30/25 | | | 1,012,963 |
| 818,000 | | Manhattan Special Service Area Special Tax No. 07-6 (Groebe Farm-Stonegate) 2, 5 | | 5.75 | | | 3/1/22 | | | 159,944 |
| 545,000 | | Southwestern IL Dev. Auth. Tax Allocation Ref. (Local Govt. Program) | | 7.00 | | | 10/1/22 | | | 451,402 |
| 685,000 | | Westmont Park District G.O. 6 | | 6.03 | | | 12/1/32 | | | 276,603 |
| | | | | | | | | | |
| | | | |
| | | | | | | | | | 11,819,714 |
| | | | | | | | | | |
| | | |
Indiana - 2.9% | | | | | | | | |
| 700,000 | | Carmel Multifamily Hsg. Rev. (Barrington Carmel Proj.) | | 6.00 | | | 11/15/22 | | | 759,353 |
| 300,000 | | Damon Run Conservancy Dist. G.O. (St Intercept Insured) | | 6.10 | | | 7/1/25 | | | 342,609 |
| 375,000 | | Hammond Local Public Improvement Bond Bank | | 6.50 | | | 8/15/25 | | | 380,880 |
| 250,000 | | Hammond Local Public Improvement Bond Bank | | 6.50 | | | 8/15/30 | | | 253,388 |
| 275,000 | | IN Finance Auth. Rev. (BHI Senior Living) | | 5.88 | | | 11/15/41 | | | 305,200 |
| 400,000 | | IN Finance Auth. Rev. (BHI Senior Living) | | 6.00 | | | 11/15/41 | | | 447,968 |
| 500,000 | | IN Finance Auth. Rev. (Community Foundation of Northwest Indiana) | | 5.00 | | | 3/1/41 | | | 534,460 |
| 350,000 | | IN Finance Auth. Rev. (Educational Facility Indianapolis) | | 4.00 | | | 2/1/31 | | | 357,945 |
| 350,000 | | IN Finance Auth. Rev. (Greencroft Obligated Group) | | 6.50 | | | 11/15/33 | | | 392,150 |
| 300,000 | | IN Health & Educational Fac. Fin. Auth. Rev. (Clarian Health Obligation) | | 5.00 | | | 2/15/39 | | | 306,546 |
| 210,000 | | IN Health & Educational Fac. Fin. Auth. Rev. (Schneck Memorial Hospital) | | 5.25 | | | 2/15/30 | | | 216,684 |
| 250,000 | | St. Joseph Co. Health Facs. Rev. (Holy Cross Village) 1 | | 6.25 | | | 5/15/39 | | | 256,530 |
| 340,555 | | St. Joseph Co. Hospital Auth. Health Facs. Rev. (Madison Center) 2, 5 | | 5.25 | | | 2/15/28 | | | 28,062 |
| | | | | | | | | | |
| | | | |
| | | | | | | | | | 4,581,775 |
| | | | | | | | | | |
| | | |
Iowa - 0.5% | | | | | | | | |
| 500,000 | | IA Fin. Auth. Health Care Facs. Rev. (Genesis Health System) | | 5.50 | | | 7/1/33 | | | 576,435 |
| 250,000 | | IA Student Loan Liquidity Corp. Rev. | | 5.80 | | | 12/1/31 | | | 267,678 |
| | | | | | | | | | |
| | | | |
| | | | | | | | | | 844,113 |
| | | | | | | | | | |
| | | |
Kansas - 1.1% | | | | | | | | |
| 250,000 | | Wichita Health Care Facs. Rev. (Larksfield Place) | | 7.13 | | | 12/15/36 | | | 279,880 |
| 500,000 | | Wichita Health Care Facs. Rev. (Presbyterian Manors, Inc.) | | 5.00 | | | 5/15/29 | | | 503,870 |
| 500,000 | | Wichita Health Care Facs. Rev. (Presbyterian Manors, Inc.) | | 6.25 | | | 5/15/34 | | | 519,780 |
| 500,000 | | Wyandotte Co./Kansas City Board of Public Utility Rev. (Office Building Complex) (NATL-RE Insured) | | 5.00 | | | 5/1/21 | | | 501,925 |
| | | | | | | | | | |
| | | | |
| | | | | | | | | | 1,805,455 |
| | | | | | | | | | |
| | | |
Kentucky - 0.3% | | | | | | | | |
| 425,000 | | Pikeville Hospital Rev. Ref. (Pikeville Medical Center) | | 6.50 | | | 3/1/41 | | | 486,425 |
| | | | | | | | | | |
| | | |
Louisiana - 2.2% | | | | | | | | |
| 94,376 | | Denham Springs/Livingston Hsg. & Mtg. Finance Auth. Rev. (GNMA/FHLMC Collateralized) | | 5.00 | | | 11/1/40 | | | 95,995 |
| 365,000 | | Jefferson Parish Finance Auth. Single Family Mtg. Rev. (GNMA/FHLMC Collateralized) | | 5.00 | | | 6/1/38 | | | 380,272 |
| | |
See accompanying notes to financial statements. |
SEPTEMBER 30, 2014 | | 25 |
|
|
|
SCHEDULE OF INVESTMENTS (Unaudited) September 30, 2014 Sit Tax-Free Income Fund (Continued) |
| | | | | | | | | | |
Principal Amount ($) | | Name of Issuer | | Coupon
Rate (%) | | Maturity
Date | | | Fair Value ($) |
| | | | |
| 145,000 | | LA Hsg. Fin. Agy. Single Family Mtg. Rev. (Home Ownership Program) (GNMA/FHLMC Collateralized) | | 6.00 | | | 12/1/28 | | | 151,335 |
| 690,000 | | LA Hsg. Fin. Agy. Single Family Mtg. Rev. (Home Ownership Program) (GNMA/FHLMC Collateralized) | | 5.70 | | | 12/1/38 | | | 733,208 |
| 320,000 | | LA Hsg. Fin. Agy. Single Family Mtg. Rev. (Mtg. Backed Sec. Prog.) (GNMA/FHLMC Collateralized) | | 4.60 | | | 6/1/29 | | | 346,221 |
| 250,000 | | LA Public Facs. Auth. Rev. (Belle-Chase Educational Foundation Proj.) (NATL-RE Insured) | | 6.50 | | | 5/1/31 | | | 277,312 |
| 705,000 | | LA Public Facs. Auth. Rev. (Tulane Univ. Proj.) (NATL-RE Insured) 1 | | 0.86 | | | 2/15/36 | | | 617,580 |
| 500,000 | | LA Public Facs. Auth. Rev. (University of New Orleans Research) (AGM Insured) | | 4.00 | | | 9/1/35 | | | 504,065 |
| 250,000 | | LA Tobacco Settlement Financing Corp. Rev. | | 5.50 | | | 5/15/30 | | | 273,728 |
| 58,000 | | Lafayette Public Finance Auth. Single Family Mortgage-Backed Rev. (GNMA/FHLMC Collateralized) | | 5.35 | | | 1/1/41 | | | 59,339 |
| | | | | | | | | | |
| | | | |
| | | | | | | | | | 3,439,055 |
| | | | | | | | | | |
| | | |
Maine - 0.8% | | | | | | | | |
| 500,000 | | ME Health & Higher Educational Facs. Auth. Rev. (ME General Medical Center) | | 7.50 | | | 7/1/32 | | | 583,615 |
| 500,000 | | ME Hsg. Auth. Rev. | | 3.60 | | | 11/15/36 | | | 487,305 |
| 250,000 | | ME Hsg. Auth. Rev. | | 4.50 | | | 11/15/37 | | | 263,198 |
| | | | | | | | | | |
| | | | |
| | | | | | | | | | 1,334,118 |
| | | | | | | | | | |
| | | |
Maryland - 1.3% | | | | | | | | |
| 235,000 | | MD Community Dev. Administration Rev. | | 5.13 | | | 9/1/30 | | | 255,722 |
| 350,000 | | MD Community Dev. Administration Rev. | | 3.75 | | | 3/1/39 | | | 350,819 |
| 900,000 | | Montgomery Co. Housing Opportunities Commission Rev. | | 4.00 | | | 7/1/38 | | | 907,524 |
| 250,000 | | Westminster Rev. (Lutheran Village at Millers Grant, Inc.) | | 4.88 | | | 7/1/23 | | | 254,800 |
| 250,000 | | Westminster Rev. (Lutheran Village at Millers Grant, Inc.) | | 6.00 | | | 7/1/34 | | | 261,620 |
| | | | | | | | | | |
| | | | |
| | | | | | | | | | 2,030,485 |
| | | | | | | | | | |
| | | |
Massachusetts - 2.2% | | | | | | | | |
| 315,000 | | MA Education Finance Auth. Education Rev. | | 5.15 | | | 1/1/26 | | | 325,811 |
| 250,000 | | MA Housing Finance Agy. Rev. | | 4.75 | | | 6/1/35 | | | 265,225 |
| 1,250,000 | | MA Housing Finance Agy. Rev. | | 3.45 | | | 12/1/37 | | | 1,188,512 |
| 500,000 | | MA Housing Finance Agy. Rev. (FHA Insured) | | 5.30 | | | 12/1/38 | | | 542,945 |
| 1,250,000 | | MA Housing Finance Agy. Rev. (GNMA/FNMA/FHLMC Collateralized) | | 3.90 | | | 12/1/38 | | | 1,252,550 |
| | | | | | | | | | |
| | | | |
| | | | | | | | | | 3,575,043 |
| | | | | | | | | | |
| | | |
Michigan - 2.0% | | | | | | | | |
| 185,000 | | Allen Academy Rev. | | 5.25 | | | 6/1/17 | | | 188,395 |
| 975,000 | | MI Hospital Finance Auth. Rev. Ref. (Presbyterian Village) | | 5.25 | | | 11/15/25 | | | 976,180 |
| 250,000 | | MI Hsg. Dev. Auth. (GO of Authority Insured) | | 4.63 | | | 10/1/41 | | | 259,220 |
| 500,000 | | MI Public Education Facs. Auth. Ltd. Rev. Ref. (Nataki Talibah Proj.) (Q-SBLF Insured) | | 6.25 | | | 10/1/23 | | | 467,985 |
| 270,000 | | MI Public Education Facs. Auth. Rev. Ref. (Bradford Proj.) 4 | | 6.00 | | | 9/1/16 | | | 175,514 |
| 300,000 | | Oakland County Economic Development Corp. Rev. (Roman Catholic Archdiocese Proj.) | | 6.50 | | | 12/1/20 | | | 321,312 |
| 250,000 | | Universal Academy Michigan Public School Rev. | | 6.50 | | | 12/1/23 | | | 258,690 |
| 500,000 | | Wyoming Sewer District Rev. (NATL-RE Insured) | | 5.00 | | | 6/1/27 | | | 513,765 |
| | | | | | | | | | |
| | | | |
| | | | | | | | | | 3,161,061 |
| | | | | | | | | | |
| | | |
Minnesota - 1.6% | | | | | | | | |
| 1,862,044 | | Intermediate School District 287 Lease Rev. | | 5.30 | | | 11/1/32 | | | 1,890,198 |
| 245,000 | | MN Hsg. Fin. Agy. Mtg. Rev. (Mtg. Backed Securities Program) (GNMA/FNMA Collateralized) | | 4.40 | | | 7/1/32 | | | 257,248 |
| 435,000 | | MN Hsg. Fin. Agy. Residential Hsg. Rev. | | 5.10 | | | 1/1/40 | | | 460,713 |
| | | | | | | | | | |
| | | | |
| | | | | | | | | | 2,608,159 |
| | | | | | | | | | |
| | | |
Mississippi - 0.1% | | | | | | | | |
| 110,000 | | MS Home Corp. Single Family Mtg. Rev. (GNMA/FNMA/FHLMC Collateralized) | | 6.75 | | | 6/1/39 | | | 116,064 |
| | | | | | | | | | |
| | |
See accompanying notes to financial statements. |
26 | | SIT MUTUAL FUNDS SEMI-ANNUAL REPORT |
| | | | | | | | | | |
Principal Amount ($) | | Name of Issuer | | Coupon
Rate (%) | | Maturity
Date | | | Fair Value ($) |
| | |
Missouri - 0.8% | | | | | | |
| 500,000 | | Chillicothe Tax Increment Rev. (South U.S. 65 Proj.) | | 5.63 | | | 4/1/27 | | | 402,385 |
| 400,000 | | Kansas City Industrial Dev. Auth. Rev. (Kansas City Pkg. LLC) | | 5.45 | | | 9/1/23 | | | 424,512 |
| 320,000 | | Kirkwood Industrial Dev. Auth. Rev. (Aberdeen Heights) | | 8.00 | | | 5/15/21 | | | 377,002 |
| 473,793 | | Moberly Industrial Dev. Auth. (Annual Appropriation Proj.) 2, 5 | | 6.00 | | | 9/1/24 | | | 30,797 |
| | | | | | | | | | |
| | | | |
| | | | | | | | | | 1,234,696 |
| | | | | | | | | | |
| | | |
Montana - 0.8% | | | | | | | | |
| 440,000 | | MT Board of Housing Single Family Rev. (FHA Insured) | | 3.75 | | | 12/1/38 | | | 445,865 |
| 170,000 | | MT Board of Housing Single Family Rev. (GO of BRD Insured) | | 4.70 | | | 12/1/26 | | | 177,439 |
| 559,995 | | MT Facs. Finance Auth. Rev. (Great Falls Pre-Release Services Proj.) | | 5.08 | | | 4/1/21 | | | 616,353 |
| | | | | | | | | | |
| | | | |
| | | | | | | | | | 1,239,657 |
| | | | | | | | | | |
| | | |
Nebraska - 0.0% | | | | | | | | |
| 410,000 | | Mead Village Tax Allocation Rev. (E3 Biofuels - Mead LLC Proj.) 2, 5, 10 | | 5.13 | | | N/A | | | 61,499 |
| | | | | | | | | | |
| | | |
Nevada - 0.7% | | | | | | | | |
| 750,000 | | Las Vegas Redev. Agy. Tax Allocation Rev. | | 7.50 | | | 6/15/23 | | | 878,168 |
| 180,000 | | NV Hsg. Dev. Single Family Mtg. Program Mezzanine (GNMA/FNMA/FHLMC Collateralized) | | 5.10 | | | 10/1/40 | | | 189,524 |
| | | | | | | | | | |
| | | | |
| | | | | | | | | | 1,067,692 |
| | | | | | | | | | |
| | | |
New Hampshire - 0.8% | | | | | | | | |
| 890,000 | | Manchester Hsg. & Redev. Auth. Rev. (ACA Insured) | | 6.75 | | | 1/1/15 | | | 891,148 |
| 400,000 | | NH Health & Educ. Facs. Auth. Rev. (Wentworth Douglas Hospital) | | 6.00 | | | 1/1/34 | | | 443,144 |
| | | | | | | | | | |
| | | | |
| | | | | | | | | | 1,334,292 |
| | | | | | | | | | |
| | | |
New Jersey - 1.5% | | | | | | | | |
| 300,000 | | Burlington Co. Bridge Commission Rev. (The Evergreens Proj.) | | 5.63 | | | 1/1/38 | | | 304,101 |
| 450,000 | | NJ Economic Dev. Auth. Rev. Ref. (United Methodist Home Obligation) | | 5.00 | | | 7/1/34 | | | 473,751 |
| 120,000 | | NJ Higher Education Assistance Auth. Student Loan Rev. | | 5.00 | | | 12/1/28 | | | 130,252 |
| 505,000 | | NJ Hsg. & Mtg. Finance Agy. Rev. | | 5.05 | | | 10/1/39 | | | 530,260 |
| 550,000 | | NJ Hsg. & Mtg. Finance Agy. Rev. (Mciver Homes Hsg. Proj.) (FHLMC Collateralized) | | 3.60 | | | 1/1/30 | | | 554,510 |
| 400,000 | | NJ Hsg. & Mtg. Finance Agy. Single Family Mtg. Rev. | | 4.50 | | | 10/1/30 | | | 426,444 |
| | | | | | | | | | |
| | | | |
| | | | | | | | | | 2,419,318 |
| | | | | | | | | | |
| | | |
New Mexico - 1.4% | | | | | | | | |
| 460,000 | | NM Mtg. Fin. Auth. Single Family Mtg. Rev. (FHA Insured) | | 3.90 | | | 9/1/42 | | | 460,281 |
| 290,000 | | NM Mtg. Fin. Auth. Single Family Mtg. Rev. (GNMA/FNMA/FHLMC Collateralized) | | 4.80 | | | 9/1/29 | | | 308,296 |
| 265,000 | | NM Mtg. Fin. Auth. Single Family Mtg. Rev. (GNMA/FNMA/FHLMC Collateralized) | | 5.35 | | | 9/1/30 | | | 280,375 |
| 595,000 | | NM Mtg. Fin. Auth. Single Family Mtg. Rev. (GNMA/FNMA/FHLMC Collateralized) | | 5.25 | | | 9/1/34 | | | 629,094 |
| 485,000 | | NM Mtg. Fin. Auth. Single Family Mtg. Rev. (GNMA/FNMA/FHLMC Collateralized) | | 4.13 | | | 9/1/42 | | | 493,526 |
| | | | | | | | | | |
| | | | |
| | | | | | | | | | 2,171,572 |
| | | | | | | | | | |
| | | |
New York - 3.8% | | | | | | | | |
| 250,000 | | Albany Capital Resource Corp. Rev. (The College of Saint Rose) | | 5.63 | | | 7/1/31 | | | 278,668 |
| 350,000 | | Hempstead Town Local Development Corp. Rev. (Hofstra University Proj.) | | 4.00 | | | 7/1/33 | | | 362,558 |
| 250,000 | | New York City Housing Development Corp. Multifamily Mtg. Rev. | | 4.60 | | | 11/1/36 | | | 262,590 |
| 500,000 | | New York City Housing Development Corp. Rev. | | 3.80 | | | 11/1/37 | | | 501,295 |
| 750,000 | | New York City Municipal Water Finance Authority | | 5.00 | | | 6/15/38 | | | 845,182 |
| 500,000 | | NY Mortgage Agency Rev. | | 3.70 | | | 10/1/38 | | | 503,105 |
| 415,000 | | NY Mortgage Agency Rev. | | 4.13 | | | 10/1/40 | | | 427,085 |
| 200,000 | | NY Mortgage Agency Rev. | | 3.75 | | | 10/1/42 | | | 197,266 |
| 475,000 | | NY Mortgage Agency Rev. | | 4.75 | | | 10/1/42 | | | 499,942 |
| 200,000 | | NY State Dormitory Auth. Rev. Ref. (Miriam Osborne Memorial Home) | | 5.00 | | | 7/1/42 | | | 210,868 |
| 590,000 | | NY State Housing Finance Agency Rev. (Affordable Hsg. Proj.) | | 3.75 | | | 11/1/37 | | | 589,080 |
| | |
See accompanying notes to financial statements. |
SEPTEMBER 30, 2014 | | 27 |
|
|
|
SCHEDULE OF INVESTMENTS (Unaudited) September 30, 2014 Sit Tax-Free Income Fund (Continued) |
| | | | | | | | | | |
Principal Amount ($) | | Name of Issuer | | Coupon
Rate (%) | | Maturity
Date | | | Fair Value ($) |
| | | | |
| 400,000 | | NY State Housing Finance Agency Rev. (Affordable Hsg. Proj.) | | 4.88 | | | 11/1/42 | | | 425,712 |
| 1,000,000 | | NY State Housing Finance Agency Rev. (Affordable Hsg. Proj.) (SOYMNA Insured) | | 4.10 | | | 5/1/48 | | | 1,013,050 |
| | | | | | | | | | |
| | | | |
| | | | | | | | | | 6,116,401 |
| | | | | | | | | | |
| | | |
North Dakota - 0.3% | | | | | | | | |
| 435,000 | | ND Housing Finance Agency Rev. | | 5.00 | | | 7/1/33 | | | 476,499 |
| | | | | | | | | | |
| | | |
Ohio - 1.4% | | | | | | | | |
| 815,000 | | Cleveland-Cuyahoga Co. Port Auth. Dev. Rev. (St. Clarence Proj.) | | 6.00 | | | 5/1/21 | | | 815,375 |
| 651,900 | | Cuyahoga Co. Hsg. Mtg. Sr. Rev. (R H Myers Apts. Proj.) (GNMA Collateralized) | | 5.70 | | | 3/20/42 | | | 695,004 |
| 550,000 | | Lucas Co. Hospital Rev. (Promedica Health Care Proj.) | | 6.50 | | | 11/15/37 | | | 676,604 |
| | | | | | | | | | |
| | | | |
| | | | | | | | | | 2,186,983 |
| | | | | | | | | | |
| | | |
Oklahoma - 0.5% | | | | | | | | |
| 200,000 | | Citizen Potawatomi Nation Sr. Obligation Tax Rev. | | 6.50 | | | 9/1/16 | | | 196,512 |
| 525,000 | | Fort Sill Apache Tribe Economic Dev. Auth. 4 | | 8.50 | | | 8/25/26 | | | 609,047 |
| | | | | | | | | | |
| | | | |
| | | | | | | | | | 805,559 |
| | | | | | | | | | |
| | | |
Oregon - 1.3% | | | | | | | | |
| 350,000 | | Clackamas Co. Hsg. Auth. Rev. (Easton Ridge Apts. Proj.) | | 3.50 | | | 9/1/33 | | | 345,219 |
| 250,000 | | Forest Grove Rev. (Campus Improvement-Pacific Unv. Proj.) | | 5.25 | | | 5/1/34 | | | 279,980 |
| 485,000 | | OR Hsg. & Community Services Dept. Rev. (Single Family Mtg. Program) | | 4.00 | | | 7/1/38 | | | 491,450 |
| 350,000 | | Port of Morrow G.O. | | 4.00 | | | 6/1/32 | | | 337,498 |
| 315,000 | | Western Generation Agy. Rev. (Wauna Cogeneration Proj.) | | 5.00 | | | 1/1/21 | | | 323,480 |
| 300,000 | | Western Generation Agy. Rev. (Wauna Cogeneration Proj.) | | 5.00 | | | 1/1/21 | | | 301,788 |
| | | | | | | | | | |
| | | | |
| | | | | | | | | | 2,079,415 |
| | | | | | | | | | |
| | | |
Pennsylvania - 2.9% | | | | | | | | |
| 210,000 | | Allegheny Co. Industrial Dev. Auth. Charter School Rev. (Propel Charter-McKeesport) | | 5.90 | | | 8/15/26 | | | 223,747 |
| 480,000 | | Butler Co. General Authority Rev. (School District Proj.) (AGM GO of District) 1 | | 0.86 | | | 10/1/34 | | | 387,941 |
| 250,000 | | Central Bradford Progress Auth. Rev. (Guthrie Healthcare System) | | 5.50 | | | 12/1/31 | | | 294,448 |
| 250,000 | | Erie Co. Hospital Auth. Rev. (St. Vincent Health Center Proj.) | | 7.00 | | | 7/1/27 | | | 264,718 |
| 240,000 | | Lehigh Co. General Purpose Auth. Rev. (Saint Luke’s Bethlehem) 1 | | 1.18 | | | 8/15/42 | | | 186,924 |
| 500,000 | | Luzerne Co. G.O. (AGM Insured) | | 7.00 | | | 11/1/26 | | | 576,125 |
| 500,000 | | PA Hsg. Finance Agy. Rev. (GO of Agency Insured) | | 4.63 | | | 10/1/29 | | | 525,905 |
| 180,000 | | PA Hsg. Finance Agy. Single Family Mtg. Rev. (GO of Agency Insured) | | 4.75 | | | 10/1/39 | | | 187,209 |
| 500,000 | | PA Turnpike Commission Rev. Capital Appreciation 6 | | 5.13 | | | 12/1/35 | | | 510,765 |
| 1,250,000 | | PA Turnpike Commission Rev. Capital Appreciation 6 | | 5.00 | | | 12/1/38 | | | 1,138,138 |
| 250,000 | | Philadelphia Authority for Industrial Dev. Rev. (Tacony Academy Charter School Proj.) | | 6.13 | | | 6/15/23 | | | 266,008 |
| | | | | | | | | | |
| | | | |
| | | | | | | | | | 4,561,928 |
| | | | | | | | | | |
| | | |
Puerto Rico - 0.4% | | | | | | | | |
| 335,000 | | Puerto Rico Ind. Medical & Environmental Pollution Control Facs. Fing. Auth. Rev. (American Home Proj.) 1 | | 5.10 | | | 12/1/18 | | | 341,727 |
| 250,000 | | Puerto Rico Public Improvement G.O. (AGM Insured) | | 5.50 | | | 7/1/27 | | | 257,430 |
| | | | | | | | | | |
| | | | |
| | | | | | | | | | 599,157 |
| | | | | | | | | | |
| | | |
Rhode Island - 0.5% | | | | | | | | |
| 250,000 | | RI Health & Edl. Building Corp. Hosp. Fing. Rev. (Lifespan Obligation Group) (NATL-RE Insured) | | 5.25 | | | 5/15/26 | | | 250,540 |
| 230,000 | | RI Hsg. & Mortgage Finance Corp. Rev. | | 3.45 | | | 4/1/35 | | | 215,793 |
| 250,000 | | RI Hsg. & Mortgage Finance Corp. Rev. | | 3.90 | | | 10/1/37 | | | 247,375 |
| | | | | | | | | | |
| | | | |
| | | | | | | | | | 713,708 |
| | | | | | | | | | |
| | |
See accompanying notes to financial statements. |
28 | | SIT MUTUAL FUNDS SEMI-ANNUAL REPORT |
| | | | | | | | | | |
Principal Amount ($) | | Name of Issuer | | Coupon
Rate (%) | | Maturity
Date | | | Fair Value ($) |
| | | |
South Carolina - 0.8% | | | | | | | | |
| 370,000 | | SC Education Assistance Auth. Student Loan Rev. | | 5.10 | | | 10/1/29 | | | 398,009 |
| 76,190 | | SC Jobs Economic Dev. Auth. Health Care Facs. Rev. (Woodlands at Furman Proj.) 6 | | 0.04 | | | 11/15/47 | | | 3,038 |
| 250,000 | | SC Public Service Auth. Rev. (Santee Cooper) | | 5.00 | | | 12/1/38 | | | 276,632 |
| 500,000 | | SC Public Service Auth. Rev. (Santee Cooper) | | 5.75 | | | 12/1/43 | | | 587,565 |
| | | | | | | | | | |
| | | | |
| | | | | | | | | | 1,265,244 |
| | | | | | | | | | |
| | | |
Tennessee - 0.5% | | | | | | | | |
| 495,000 | | Metro Govt. Nashville & Davidson Co. Health & Education Facs. Rev. (Prestige Proj.) 2, 5 | | 7.50 | | | 12/20/40 | | | 297,000 |
| 1,850,000 | | Shelby Co. Health, Education & Hsg. Facs. Rev. (CME Memphis Apts. Proj.) 2, 5 | | 5.35 | | | 1/1/19 | | | 92,499 |
| 7,875,000 | | Shelby Co. Health, Education & Hsg. Facs. Rev. (CME Memphis Apts. Proj.) 2, 5 | | 5.55 | | | 1/1/29 | | | 393,750 |
| 1,630,000 | | Shelby Co. Health, Education & Hsg. Facs. Rev. (CME Memphis Apts. Proj.) 2, 5 | | 6.00 | | | 1/1/29 | | | 16 |
| | | | | | | | | | |
| | | | |
| | | | | | | | | | 783,265 |
| | | | | | | | | | |
| | | |
Texas - 6.1% | | | | | | | | |
| 975,000 | | Arlington Higher Education Finance Corp., Education Rev. (Arlington Classics Academy) | | 7.00 | | | 8/15/28 | | | 1,076,790 |
| 250,000 | | Bexar Co. Hsg. Fin. Corp. Rev. (Dymaxion & Marbach Park Apts. Proj.) (NATL-RE Insured) | | 6.10 | | | 8/1/30 | | | 250,945 |
| 1,000,000 | | Bexar Co. Rev. (Venue Proj.) | | 5.00 | | | 8/15/39 | | | 1,076,740 |
| 500,000 | | Dallas/Fort Worth International Airport Rev. (JT Improvement) | | 5.25 | | | 11/1/37 | | | 566,750 |
| 1,639,349 | | Galveston Co. Municipal Utility Dist. No. 52 BANS Series 2014A 10 | | 6.50 | | | N/A | | | 1,308,414 |
| 600,000 | | Harris Co. Cultural Education Facs. Finance Corp. Rev. (Space Center Houston Proj.) 4 | | 6.75 | | | 8/15/21 | | | 663,936 |
| 360,000 | | Harris Co. Housing Finance Corp. Rev. (FHA/VA/VEREX Mtgs.) 6 | | 10.34 | | | 10/15/15 | | | 320,260 |
| 500,000 | | New Hope Cultural Education Facs. Corp. Rev. (Collegiate Hsg. Corpus Christi) | | 5.00 | | | 4/1/34 | | | 516,035 |
| 500,000 | | Newark Cultural Education Facs. Finance Corp. Rev. (A.W. Brown-Fellowship Leadership) | | 6.00 | | | 8/15/32 | | | 518,205 |
| 400,000 | | Red River Health Facs. Dev. Corp. Rev. (MRC Crossings Proj.) | | 6.13 | | | 11/15/20 | | | 404,356 |
| 250,000 | | Red River Health Facs. Dev. Corp. Rev. (MRC Crossings Proj.) | | 7.50 | | | 11/15/34 | | | 275,528 |
| 300,000 | | Red River Health Facs. Dev. Corp. Rev. (Wichita Falls Retirement Foundation) | | 5.50 | | | 1/1/32 | | | 307,539 |
| 250,000 | | Tarrant Co. Cultural Education Facs. Fin. Rev. (Mirador Proj.) | | 7.75 | | | 11/15/19 | | | 246,250 |
| 100,000 | | Texas State Turnpike Auth. Rev. Capital Appreciation (AMBAC Insured) 6 | | 6.07 | | | 8/15/32 | | | 34,367 |
| 550,000 | | Texas State Turnpike Auth. Rev. Capital Appreciation (AMBAC Insured) 6 | | 6.08 | | | 8/15/33 | | | 177,722 |
| 250,000 | | Texas State Turnpike Auth. Rev. Capital Appreciation (AMBAC Insured) 6 | | 6.02 | | | 8/15/37 | | | 63,289 |
| 250,000 | | Travis Co. Health Facs. Dev. Corp. Rev. (Westminster Manor) | | 6.25 | | | 11/1/16 | | | 250,678 |
| 500,000 | | TX Grand Parkway Transportation Corp. Rev. 6 | | 5.50 | | | 10/1/35 | | | 364,375 |
| 300,000 | | TX Municipal Gas Acquisition & Supply Corp. II Rev. 1 | | 1.03 | | | 9/15/27 | | | 280,650 |
| 750,000 | | TX Private Activity Surface Transportation Corp. Rev. (LBJ Infrastructure) | | 7.50 | | | 6/30/33 | | | 930,338 |
| | | | | | | | | | |
| | | | |
| | | | | | | | | | 9,633,167 |
| | | | | | | | | | |
| | | |
Utah - 0.7% | | | | | | | | |
| 400,000 | | UT Charter School Finance Auth. Rev. (Entheos Academy) | | 6.50 | | | 10/15/33 | | | 426,668 |
| 230,000 | | UT Hsg. Corp. Single Family Mtg. Rev. | | 5.75 | | | 1/1/33 | | | 252,724 |
| 395,000 | | UT Hsg. Corp. Single Family Mtg. Rev. | | 4.60 | | | 7/1/34 | | | 414,501 |
| | | | | | | | | | |
| | | | |
| | | | | | | | | | 1,093,893 |
| | | | | | | | | | |
| | | |
Virginia - 2.7% | | | | | | | | |
| 500,000 | | Farms New Kent Community Dev. Auth. Special Assessment 2, 5 | | 5.13 | | | 3/1/36 | | | 267,505 |
| 525,000 | | VA Hsg. Dev. Auth. Rev. (Commonwealth Mtg.) | | 3.88 | | | 1/1/38 | | | 530,948 |
| 550,000 | | VA Hsg. Dev. Auth. Rev. (Commonwealth Mtg.) | | 4.80 | | | 7/1/38 | | | 595,138 |
| 500,000 | | VA Hsg. Dev. Auth. Rev. (Commonwealth Mtg.) | | 4.75 | | | 10/1/38 | | | 539,310 |
| 500,000 | | VA Hsg. Dev. Auth. Rev. (Commonwealth Mtg.) | | 4.75 | | | 10/1/38 | | | 539,310 |
| 500,000 | | VA Hsg. Dev. Auth. Rev. (Commonwealth Mtg.) | | 5.10 | | | 10/1/38 | | | 551,380 |
| 400,000 | | VA Hsg. Dev. Auth. Rev. (Rental Hsg. Proj.) | | 4.13 | | | 7/1/33 | | | 417,768 |
| 500,000 | | VA Hsg. Dev. Auth. Rev. (Rental Hsg. Proj.) | | 5.00 | | | 12/1/39 | | | 527,395 |
| 250,000 | | VA Hsg. Dev. Auth. Rev. (Rental Hsg. Proj.) (GO of Auth. Insured) | | 4.60 | | | 12/1/38 | | | 264,702 |
| | | | | | | | | | |
| | | | |
| | | | | | | | | | 4,233,456 |
| | | | | | | | | | |
| | |
See accompanying notes to financial statements. |
SEPTEMBER 30, 2014 | | 29 |
|
|
|
SCHEDULE OF INVESTMENTS (Unaudited) September 30, 2014 Sit Tax-Free Income Fund (Continued) |
| | | | | | | | | | |
Principal Amount ($)/
Quantity | | Name of Issuer | | Coupon
Rate (%) | | Maturity
Date | | | Fair Value ($) |
| | |
Washington - 2.3% | | | | | | |
| 275,000 | | Kalispel Tribe Indians Priority District Rev. | | 6.20 | | | 1/1/16 | | | 273,576 |
| 200,000 | | WA Hsg. Fin. Commission Multi Family Mtg. Rev. (Emerald Heights Proj.) | | 5.00 | | | 7/1/33 | | | 214,482 |
| 500,000 | | WA Hsg. Fin. Commission Multi Family Mtg. Rev. (GNMA/FNMA/FHLMC Collateralized) | | 3.50 | | | 12/1/33 | | | 501,750 |
| 400,000 | | WA Hsg. Fin. Commission Multi Family Mtg. Rev. (Non-profit Hsg.) | | 6.00 | | | 10/1/22 | | | 435,744 |
| 300,000 | | WA Hsg. Fin. Commission Multi Family Mtg. Rev. (Rockwood Retmnt Cmnyts Proj.) 4 | | 6.00 | | | 1/1/24 | | | 316,296 |
| 650,000 | | WA Hsg. Fin. Commission Multi Family Mtg. Rev. (Skyline at First Hill Proj.) | | 5.25 | | | 1/1/17 | | | 660,010 |
| 1,000,000 | | WA Hsg. Fin. Commission Multi Family Mtg. Rev. (Skyline at First Hill Proj.) | | 5.63 | | | 1/1/27 | | | 1,004,620 |
| 210,000 | | WA Hsg. Fin. Commission Single Family Mtg. Rev. (GNMA/FNMA Collateralized) | | 4.60 | | | 10/1/33 | | | 223,961 |
| | | | | | | | | | |
| | | | |
| | | | | | | | | | 3,630,439 |
| | | | | | | | | | |
| | | |
West Virginia - 0.2% | | | | | | | | |
| 250,000 | | WV Hsg. Dev. Fund Rev. | | 4.50 | | | 11/1/31 | | | 267,650 |
| | | | | | | | | | |
| | | |
Wisconsin - 1.7% | | | | | | | | |
| 250,000 | | WI General Fund Rev. Appropriation Rev. | | 6.00 | | | 5/1/27 | | | 298,928 |
| 500,000 | | WI Health & Education Facs. Auth. Rev. (Three Pillars Senior Living) | | 5.00 | | | 8/15/43 | | | 522,195 |
| 500,000 | | WI Public Finance Auth. Rev. (Glenridge Palmer Ranch Proj.) | | 8.25 | | | 6/1/46 | | | 583,695 |
| 310,000 | | WI Public Finance Auth. Rev. (Horizon Academy West Charter School) | | 5.25 | | | 9/1/22 | | | 311,383 |
| 500,000 | | WI Public Finance Auth. Rev. (Rose Villa Proj.) | | 5.00 | | | 11/15/24 | | | 516,015 |
| 500,000 | | WI Public Finance Auth. Rev. (Roseman University Health Sciences) | | 5.50 | | | 4/1/32 | | | 533,180 |
| | | | | | | | | | |
| | | | |
| | | | | | | | | | 2,765,396 |
| | | | | | | | | | |
| | | |
Wyoming - 1.6% | | | | | | | | |
| 650,000 | | WY Community Dev. Auth. Rev. | | 3.75 | | | 12/1/32 | | | 659,126 |
| 1,000,000 | | WY Community Dev. Auth. Rev. | | 4.25 | | | 12/1/37 | | | 1,032,410 |
| 415,000 | | WY Community Dev. Auth. Rev. | | 4.05 | | | 12/1/38 | | | 419,013 |
| 500,000 | | WY Community Dev. Auth. Rev. | | 4.05 | | | 12/1/39 | | | 506,485 |
| | | | | | | | | | |
| | | | |
| | | | | | | | | | 2,617,034 |
| | | | | | | | | | |
| | | |
Total Municipal Bonds
(cost: $149,373,463) | | | | | | | | 137,114,037 |
| | | | | | | | | | |
| | | |
Investment Companies - 6.1% | | | | | | | | |
| 54,383 | | BlackRock Long-Term Municipal Advantage Trust (BTA) | | | | | | | | 612,353 |
| 13,200 | | BlackRock Municipal Income Trust (BFK) | | | | | | | | 180,444 |
| 54,000 | | BlackRock MuniHoldings Florida Insured Fund (MFL) | | | | | | | | 750,600 |
| 7,000 | | BlackRock MuniHoldings Quality Fund II, Inc. (MUE) | | | | | | | | 92,959 |
| 10,000 | | BlackRock MuniHoldings Quality Fund, Inc. (MUS) | | | | | | | | 129,700 |
| 48,500 | | BlackRock MuniYield Florida Fund (MYF) | | | | | | | | 712,465 |
| 89,100 | | BlackRock MuniYield Insured Fund (MYI) | | | | | | | | 1,221,561 |
| 23,000 | | BlackRock MuniYield Michigan Insured Fund II (MYM) | | | | | | | | 288,190 |
| 193,000 | | Deutsche Municipal Income Trust (KTF) | | | | | | | | 2,545,670 |
| 18,400 | | Invesco Municipal Opportunity Trust (VMO) | | | | | | | | 230,552 |
| 35,700 | | Invesco Van Kampen Advantage Muni Income Trust (VKI) | | | | | | | | 406,266 |
| 36,123 | | Managed Duration Investment Grade Municipal Fund (MZF) | | | | | | | | 483,326 |
| 2,677 | | Nuveen Dividend Advantage Municipal Fund 3 (NZF) | | | | | | | | 36,595 |
| 12,091 | | Nuveen Dividend Advantage Municipal Income Fund (NVG) | | | | | | | | 170,604 |
| 5,645 | | Nuveen Municipal Advantage Fund, Inc. (NMA) | | | | | | | | 76,151 |
| 21,500 | | Nuveen Premier Municipal Income Fund (NPF) | | | | | | | | 289,175 |
| 114,332 | | Nuveen Premium Income Fund (NPM) | | | | | | | | 1,572,065 |
| | | | | | | | | | |
| | | |
Total Investment Companies
(cost: $9,246,415) | | | | | | | | 9,798,676 |
| | | | | | | | | | |
| | |
See accompanying notes to financial statements. |
30 | | SIT MUTUAL FUNDS SEMI-ANNUAL REPORT |
| | | | | | | | |
| Quantity | | Name of Issuer | | | | | | Fair Value ($) |
| | | |
Short-Term Securities - 6.5% | | | | | | |
| 10,347,075 | | Dreyfus Tax-Exempt Cash Management Fund, 0.004% | | | | | | |
Total Short-Term Securities
(cost: $10,347,075) | | | | | | 10,347,075 |
| | | | | | | | |
| | | |
Total Investments in Securities - 98.8%
(cost: $168,966,953) | | | | | | 157,259,788 |
Other Assets and Liabilities, net - 1.2% | | | | | | 1,839,613 |
| | | | | | | | |
| | | |
Total Net Assets - 100.0% | | | | | | $159,099,401 |
| | | | | | | | |
| 1 | Variable rate security. Rate disclosed is as of September 30, 2014. |
| 2 | Securities considered illiquid by the Investment Adviser. The total value of such securities as of September 30, 2014 was $4,276,802 and represented 2.7% of net assets. |
| 4 | 144A Restricted Security. The total value of such securities as of September 30, 2014 was $4,223,977 and represented 2.7% of net assets. These securities have been determined to be liquid by the Adviser in accordance with guidelines established by the Board of Directors. |
| 5 | The issuer is in default of certain debt covenants. Income is not being accrued. The total value of such securities as of September 30, 2014 was $4,276,802 and represented 2.7% of net assets. |
| 6 | Zero coupon or convertible capital appreciation bond, for which the rate disclosed is either the effective yield on purchase date or the coupon rate to be paid upon conversion to coupon paying, respectively. |
| 9 | Municipal Lease Security. The total value of such securities as of September 30, 2014 was $1,354,433 and represented 0.9% of net assets. These securities have been determined to be liquid by the Adviser in accordance with guidelines established by the Board of Directors. |
| 10 | Securities with a “N/A” maturity date have passed their stated maturity date and have pending restructuring arrangements. |
Numeric footnotes not disclosed are not applicable to this Schedule of Investments.
A summary of the levels for the Fund’s investments as of September 30, 2014 is as follows (See Note 2 - significant accounting policies in the financial statements):
| | | | | | | | | | | | | | | | |
| | | Investment in Securities | |
| | | Level 1 Quoted Price ($) | | | Level 2
Other significant
observable inputs ($) | | | Level 3 Significant
unobservable inputs ($) | | | Total ($) | |
| | | | |
Municipal Bonds | | | — | | | | 137,114,037 | | | | — | | | | 137,114,037 | |
Investment Companies | | | 9,798,676 | | | | — | | | | — | | | | 9,798,676 | |
Short-Term Securities | | | 10,347,075 | | | | — | | | | — | | | | 10,347,075 | |
| | | | |
| | | | |
Total: | | | 20,145,751 | | | | 137,114,037 | | | | — | | | | 157,259,788 | |
| | | | |
For the reporting period, there were no transfers between levels 1, 2 and 3.
| | |
See accompanying notes to financial statements. |
SEPTEMBER 30, 2014 | | 31 |
Sit Minnesota Tax-Free Income Fund
OBJECTIVE & STRATEGY
The investment objective of the Minnesota Tax-Free Income Fund is to provide a high level of current income exempt from federal regular income tax and Minnesota regular personal income tax as is consistent with the preservation of capital.
During normal market conditions, the Fund invests 100% of its net assets in municipal securities that generate interest income that is exempt from federal regular income tax and Minnesota regular personal income tax. The Fund anticipates that substantially all of its distributions to its shareholders will be exempt as such. For investors subject to the alternative minimum tax (“AMT”), up to 20% of the Fund’s income may be alternative minimum taxable income.
The Sit Minnesota Tax-Free Income Fund provided a return of +4.05% during the 6-month period ended September 30, 3014, which compared to a return of +2.08% for the Barclays 5-Year Municipal Index. The Fund’s 30-day SEC yield was 2.92%, which compared to a yield of 1.35% for the benchmark index. The Fund’s 12-month distribution rate was 3.77%.
Lower than average issuance volume in Minnesota, combined with demand from reinvestment and modestly positive mutual fund flows continued to be the main driver of performance for Minnesota tax-exempt bonds during the period. Investors continued to reach for yield, as supply remained light. As a result, longer duration bonds outperformed shorter duration bonds as the yield curve flattened. Revenue bonds also outperformed general obligation bonds, and lower credit quality outperformed higher credit quality. These trends were evident in the Fund’s performance, which particularly benefitted from its longer duration positioning in addition to its holdings in non-rated securities as credit spreads narrowed. Of the top five industry sectors in which the Fund invests, representing 72% of the portfolio in aggregate, all but the higher rated single family housing revenue bond sector contributed to the Fund’s strong returns. Puerto Rico made headlines as the passage of the Recovery Act in Puerto Rico in June set in motion numerous ratings downgrades to below investment grade, however, the Fund has little (i.e., less than 1.5%) exposure to Puerto Rico credits and thus the impact on performance was negligible.
Our tax-exempt investment strategy remains focused on securities that provide a high level of interest income. In addition to security structure, we are maintaining our emphasis on revenue bonds, which continue to offer attractive incremental yield over general obligation issues and have much less exposure to pressure from employee costs, such as pension and other post-employment benefits (OPEB) liabilities. We continue to be attracted to sectors with stable to growing demand fundamentals, (e.g., single-family housing, senior housing and hospitals with dominant market share). We remain focused on bonds rated A and below, as we believe there is room for credit spreads to modestly narrow further.
Although the Fund’s portfolio duration has shortened, it remains longer than its benchmark. We believe that the Fund’s longer duration positioning will continue to be rewarded in the near term, particularly as the tax-exempt yield curve remains steeper than its longer
HYPOTHETICAL GROWTH OF $10,000
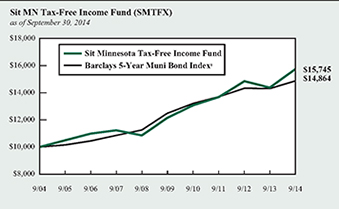
The chart above illustrates the total value of a hypothetical $10,000 investment in the Fund over the past 10 years (or for the life of the Fund if shorter) as compared to the performance of the Barclays 5-Year Municipal Bond Index. Past performance does not guarantee future results. Returns include the reinvestment of distributions. The chart does not reflect the deduction of taxes that a shareholder would pay on Fund distributions or the redemption of Fund shares.
1 The Barclays 5-Year Municipal Bond Index is the 5 year (4-6) component of the Municipal Bond Index, an unmanaged, rules-based, market-value-weighted index for the long-term tax-exempt bond market. The index includes bonds with a minimum credit rating of BBB. The returns include the reinvestment of income and do not include any transaction costs, management fees or other costs. It is not possible to invest directly in an index. This is the Fund’s primary index.
term historical average. Relative yield valuations for intermediate and longer duration revenue bonds remain attractive, and continue to attract crossover buyers. We continue to expect tax-exempt supply to remain light, as municipalities continue to seek fiscal discipline and shrink their balance sheets, helping to mitigate the downward pressure in prices as yields rise.
Michael C. Brilley
Debra A. Sit, CFA
Paul J. Jungquist, CFA
Senior Portfolio Managers
| | |
32 | | SIT MUTUAL FUNDS SEMI-ANNUAL REPORT |
COMPARATIVE RATES OF RETURNS
as of September 30, 2014
| | | | | | | | | | | | | | | |
| | | Sit
Minnesota
Tax-Free
Income Fund | | Barclays 5-Year
Muni. Bond
Index1 | | Lipper MN
Muni. Bond
Fund Index2 |
| | | |
Six Months | | | | 4.05 | % | | | | 2.08 | % | | | | n/a | |
| | | |
One Year | | | | 9.47 | | | | | 3.96 | | | | | 8.40 | % |
| | | |
Five Years | | | | 5.32 | | | | | 3.54 | | | | | 4.58 | |
| | | |
Ten Years | | | | 4.64 | | | | | 4.04 | | | | | 4.33 | |
| | | |
Since Inception (12/1/93) | | | | 4.98 | | | | | 4.70 | | | | | 4.73 | |
Performance figures are historical and do not guarantee future results. Investment returns and principal value will vary, and you may have a gain or loss when you sell shares. Current performance may be lower or higher than the performance data quoted. Contact the Fund for performance data current to the most recent month-end. Returns include changes in share price as well as reinvestment of all dividends and capital gains. Returns do not reflect the deduction of taxes that a shareholder would pay on Fund distributions or the redemption of Fund shares. Management fees and administrative expenses are included in the Fund’s performance. Returns for periods greater than one year are compounded average annual rates of return.
1 The Barclays 5-Year Municipal Bond Index is the 5 year (4-6) component of the Municipal Bond Index, an unmanaged, rules-based, market-value-weighted index made for the long-term tax-exempt bond market. The index includes bonds with a minimum credit rating of BBB. The returns include the reinvestment of income and do not include any transaction costs, management fees or other costs. It is not possible to invest directly in an index.
2 The Lipper returns are obtained from Lipper Analytical Services, Inc., a large independent evaluator of mutual funds.
FUND DIVERSIFICATION
| | | | |
Multifamily Mortgage | | | 21.5 | % |
Hospital/Health Care | | | 16.1 | % |
Single Family Mortgage | | | 15.0 | % |
Education/Student Loan | | | 11.3 | % |
Other Revenue Bonds | | | 7.7 | % |
Utility | | | 5.0 | % |
Sectors less than 5.0% | | | 16.5 | % |
Cash & Other Net Assets | | | 6.9 | % |
Based on total net assets as of September 30, 2014. Subject to change.
PORTFOLIO SUMMARY
| | |
| Net Asset Value 09/30/14: | | $ 10.49 Per Share |
| Net Asset Value 3/31/14: | | $ 10.26 Per Share |
| Total Net Assets: | | $ 394.5 Million |
| Average Maturity: | | 15.8 Years |
| Effective Duration 3: | | 4.7 Years |
3 Duration is a measure of estimated price sensitivity relative to changes in interest rates. Portfolios with longer durations are typically more sensitive to changes in interest rates. For example, if interest rates rise by 1%, the fair value of a security with an effective duration of 5 years would decrease by 5%, with all other factors being constant. The correlation between duration and price sensitivity is greater for securities rated investment-grade than it is for securities rated below investment-grade. Duration estimates are based on assumptions by the Adviser and are subject to a number of limitations. Effective duration is calculated based on historical price changes of securities held by the Fund, and therefore is a more accurate estimate of price sensitivity provided interest rates remain within their historical range.
QUALITY RATINGS (% of Total Net Assets)
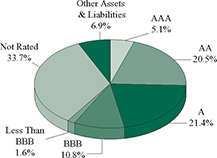
Lower of Moody’s, S&P, Fitch or Duff & Phelps ratings used.
Adviser’s Assessment of Non-Rated Securities:
| | | | | | |
AAA | | | 0.0% | | | |
AA | | | 2.2 | | | |
A | | | 0.8 | | | |
BBB | | | 8.8 | | | |
BB | | | 21.7 | | | |
<BB | | | 0.2 | | | |
| | | | | | |
Total | | | 33.7% | | | |
|
|
|
SCHEDULE OF INVESTMENTS (Unaudited) September 30, 2014 Sit Minnesota Tax-Free Income Fund |
| | | | | | | | | | |
Principal Amount ($) | | Name of Issuer | | Coupon
Rate (%) | | Maturity Date | | | Fair Value ($) |
| |
Municipal Bonds - 91.6% | | | |
| |
Education/Student Loan - 11.3% | | | |
| 295,000 | | Anoka Co. Charter School Lease Rev. | | 5.00 | | | 6/1/27 | | | 307,959 |
| 275,000 | | Anoka Co. Charter School Lease Rev. | | 5.00 | | | 6/1/32 | | | 282,560 |
| 1,035,000 | | Anoka Co. Charter School Lease Rev. | | 5.00 | | | 6/1/43 | | | 1,048,745 |
| 1,070,000 | | Brooklyn Park Lease Rev. (Prairie Seeds Academy Proj.) | | 8.00 | | | 3/1/20 | | | 1,160,971 |
| 1,280,000 | | Deephaven Charter School Lease Rev. (Eagle Ridge Academy Proj.) | | 5.13 | | | 7/1/33 | | | 1,340,096 |
| 2,500,000 | | Duluth Hsg. & Redev. Auth. Lease Rev. (Edison Academy) | | 5.00 | | | 11/1/21 | | | 2,659,275 |
| 400,000 | | Forest Lake Charter School Lease Rev. (Lake International Language Academy) | | 4.50 | | | 8/1/26 | | | 417,104 |
| 500,000 | | Forest Lake Charter School Lease Rev. (Lake International Language Academy) | | 5.50 | | | 8/1/36 | | | 541,420 |
| 750,000 | | Hugo Charter School Lease Rev. (Noble Academy Proj.) | | 5.00 | | | 7/1/29 | | | 795,712 |
| 1,000,000 | | Hugo Charter School Lease Rev. (Noble Academy Proj.) | | 5.00 | | | 7/1/34 | | | 1,040,660 |
| 6,237,847 | | Intermediate School District 287 Lease Rev. | | 5.30 | | | 11/1/32 | | | 6,332,163 |
| 1,000,000 | | Minneapolis Educational Fac. Lease Rev. (Seed/Harvest Preparatory Proj.) | | 6.25 | | | 3/1/21 | | | 1,010,980 |
| 600,000 | | MN Higher Education Fac. Auth. Rev. (Bethel Univ.) | | 5.50 | | | 5/1/22 | | | 622,626 |
| 160,000 | | MN Higher Education Fac. Auth. Rev. (Bethel Univ.) | | 5.50 | | | 5/1/23 | | | 165,597 |
| 1,000,000 | | MN Higher Education Fac. Auth. Rev. (Bethel Univ.) | | 5.50 | | | 5/1/37 | | | 1,026,820 |
| 956,901 | | MN Higher Education Fac. Auth. Rev. (College of St. Benedict) | | 4.49 | | | 10/1/16 | | | 970,011 |
| 400,000 | | MN Higher Education Fac. Auth. Rev. (College of St. Scholastica Inc.) | | 4.00 | | | 12/1/32 | | | 381,552 |
| 750,000 | | MN Higher Education Fac. Auth. Rev. (Hamline Univ.) | | 6.00 | | | 10/1/32 | | | 836,948 |
| 1,000,000 | | MN Higher Education Fac. Auth. Rev. (Hamline Univ.) | | 6.00 | | | 10/1/40 | | | 1,106,310 |
| 1,000,000 | | MN Higher Education Fac. Auth. Rev. (Macalester College) | | 3.00 | | | 5/1/32 | | | 980,960 |
| 500,000 | | MN Higher Education Fac. Auth. Rev. (Macalester College) | | 3.25 | | | 5/1/36 | | | 488,345 |
| 750,000 | | MN Higher Education Fac. Auth. Rev. (Macalester College-Seven-I) | | 5.00 | | | 6/1/35 | | | 866,092 |
| 1,400,000 | | MN Higher Education Fac. Auth. Rev. (St. Scholastica College) | | 5.00 | | | 12/1/27 | | | 1,466,696 |
| 1,800,000 | | MN Higher Education Fac. Auth. Rev. (St. Scholastica College) | | 6.30 | | | 12/1/40 | | | 2,026,368 |
| 1,250,000 | | MN Higher Education Fac. Auth. Rev. (Univ. of St. Thomas) | | 6.00 | | | 10/1/25 | | | 1,358,950 |
| 664,369 | | Olmsted Co. Hsg. & Redev. Auth. (Schaeffer Academy Proj.) | | 4.98 | | | 4/25/27 | | | 651,719 |
| 385,000 | | Ramsey Lease Rev. (Pact Charter School Proj.) | | 5.00 | | | 12/1/26 | | | 417,509 |
| 1,850,000 | | Ramsey Lease Rev. (Pact Charter School Proj.) | | 5.50 | | | 12/1/33 | | | 2,017,758 |
| 1,150,000 | | St Paul Hsg & Redev Auth. (St. Paul Conservatory for Performing Artists) | | 4.63 | | | 3/1/43 | | | 1,136,510 |
| 1,250,000 | | St Paul Hsg & Redev. Auth. (Higher Ground Academy Proj.) | | 4.25 | | | 12/1/23 | | | 1,284,712 |
| 1,500,000 | | St Paul Hsg & Redev. Auth. (Higher Ground Academy Proj.) | | 5.00 | | | 12/1/33 | | | 1,551,750 |
| 2,000,000 | | St Paul Hsg. & Redev. Auth. (Community of Peace Academy Proj.) | | 5.00 | | | 12/1/36 | | | 2,014,540 |
| 535,000 | | St. Paul Hsg. & Redev. Auth. (German Immersion School) | | 4.00 | | | 7/1/23 | | | 521,839 |
| 855,000 | | St. Paul Hsg. & Redev. Auth. (German Immersion School) | | 5.00 | | | 7/1/33 | | | 859,147 |
| 500,000 | | St. Paul Hsg. & Redev. Auth. (German Immersion School) | | 5.00 | | | 7/1/44 | | | 484,170 |
| 470,000 | | St. Paul Hsg. & Redev. Auth. Lease Rev. (Hmong Academy Proj.) | | 5.50 | | | 9/1/18 | | | 479,978 |
| 295,000 | | St. Paul Hsg. & Redev. Auth. Lease Rev. (Hmong College Preparatory Academy) | | 4.75 | | | 9/1/22 | | | 306,824 |
| 500,000 | | St. Paul Hsg. & Redev. Auth. Lease Rev. (Hmong College Preparatory Academy) | | 5.00 | | | 9/1/27 | | | 512,130 |
| 820,000 | | St. Paul Hsg. & Redev. Auth. Lease Rev. (Nova Classical Academy Proj.) | | 5.70 | | | 9/1/21 | | | 896,252 |
| 1,610,000 | | Victoria Private School Fac. Rev. (Holy Family Catholic High) | | 4.00 | | | 9/1/23 | | | 1,614,299 |
| 355,000 | | Woodbury Charter School Lease Rev. (MSA Building) | | 5.00 | | | 12/1/27 | | | 380,025 |
| 225,000 | | Woodbury Charter School Lease Rev. (MSA Building) | | 5.00 | | | 12/1/32 | | | 236,848 |
| | | | | | | | | | |
| | | | |
| | | | | | | | | | 44,600,930 |
| | | | | | | | | | |
| |
Escrowed To Maturity/Prerefunded - 2.4% | | | |
| 2,010,000 | | Minneapolis & St. Paul Metro Airport Commission Sub. Ref. (NATL-RE FGIC Insured) | | 5.00 | | | 1/1/22 | | | 2,034,622 |
| 3,500,000 | | Minneapolis & St. Paul Metro Airport Commission Sub. Rev. (AMBAC Insured) 8 | | 5.00 | | | 1/1/25 | | | 3,541,895 |
| 1,000,000 | | Sauk Rapids Health Care & Hsg. Facs. Rev. (Good Shepherd Lutheran Home Proj.) | | 6.75 | | | 1/1/24 | | | 1,075,450 |
| 1,000,000 | | Sauk Rapids Health Care & Hsg. Facs. Rev. (Good Shepherd Lutheran Home Proj.) | | 7.25 | | | 1/1/29 | | | 1,081,670 |
| 1,690,000 | | St. Paul Hsg. & Redev. Sales Tax Rev. Ref. (Civic Center) (AGM Insured) | | 7.10 | | | 11/1/23 | | | 1,855,874 |
| | | | | | | | | | |
| | | | |
| | | | | | | | | | 9,589,511 |
| | | | | | | | | | |
| | |
See accompanying notes to financial statements. |
34 | | SIT MUTUAL FUNDS SEMI-ANNUAL REPORT |
| | | | | | | | | | |
Principal Amount ($) | | Name of Issuer | | Coupon
Rate (%) | | Maturity Date | | | Fair Value ($) |
| | |
General Obligation - 1.6% | | | | | | |
| 1,000,000 | | Bemidji Sales Tax G.O. | | 5.00 | | | 2/1/34 | | | 1,112,150 |
| 1,350,000 | | Bemidji Sales Tax G.O. | | 6.00 | | | 2/1/41 | | | 1,589,720 |
| 550,000 | | Brooklyn Center Independent School District No. 286 (NATL-RE Insured) | | 4.50 | | | 2/1/31 | | | 568,095 |
| 650,000 | | Dakota Co. Community Dev. Agy. Sr. Hsg. Facs. G.O. | | 5.00 | | | 1/1/26 | | | 715,299 |
| 300,000 | | Forest Lake Independent School District No. 831 (AGM Insured) | | 5.00 | | | 2/1/19 | | | 304,683 |
| 1,000,000 | | Puerto Rico Public Improvement G.O. 11 | | 6.00 | | | 7/1/28 | | | 787,250 |
| 480,000 | | Watkins G.O. | | 4.00 | | | 1/1/34 | | | 483,600 |
| 735,000 | | Watkins G.O. | | 4.00 | | | 1/1/38 | | | 737,381 |
| | | | | | | | | | |
| | | | |
| | | | | | | | | | 6,298,178 |
| | | | | | | | | | |
| |
Hospital/Health Care - 16.1% | | | |
| 4,025,000 | | Breckenridge Rev. (Catholic Health Initiatives Proj.) | | 5.00 | | | 5/1/30 | | | 4,039,892 |
| 275,000 | | Carlton Health Care & Hsg. Fac. Rev. Ref. (Faith Care Center Proj.) | | 5.20 | | | 4/1/16 | | | 282,772 |
| 1,000,000 | | Center City Heath Care Facs. Rev. (Hazelden Betty Ford Foundation Proj.) | | 4.00 | | | 11/1/39 | | | 1,006,580 |
| 3,000,000 | | Center City Heath Care Facs. Rev. (Hazelden Betty Ford Foundation Proj.) | | 4.50 | | | 11/1/34 | | | 3,221,340 |
| 250,000 | | Center City Heath Care Facs. Rev. (Hazelden Betty Ford Foundation Proj.) | | 5.00 | | | 11/1/29 | | | 288,522 |
| 500,000 | | Center City Heath Care Facs. Rev. (Hazelden Betty Ford Foundation Proj.) | | 5.00 | | | 11/1/44 | | | 547,670 |
| 365,000 | | Cold Spring Health Care Facs. Rev. (Assumption Home, Inc. Proj.) | | 7.25 | | | 3/1/23 | | | 394,678 |
| 1,550,000 | | Douglas Co. Gross Health Care Facs. Rev. (Douglas Co. Hospital Proj.) | | 6.00 | | | 7/1/28 | | | 1,661,941 |
| 2,000,000 | | Duluth Economic Dev. Auth. Rev. (St. Lukes Hospital Oblig. Group) | | 4.75 | | | 6/15/22 | | | 2,159,100 |
| 1,600,000 | | Duluth Economic Dev. Auth. Rev. (St. Lukes Hospital Oblig. Group) | | 5.75 | | | 6/15/32 | | | 1,738,160 |
| 2,000,000 | | Duluth Economic Dev. Auth. Rev. (St. Lukes Hospital Oblig. Group) | | 6.00 | | | 6/15/39 | | | 2,178,480 |
| 1,000,000 | | Fergus Falls Health Care & Hsg. Fac. Rev. (Lake Region Healthcare Proj.) | | 5.15 | | | 8/1/35 | | | 1,023,480 |
| 1,860,000 | | Glencoe Health Care Fac. Rev. (Glencoe Regional Health Services Proj.) | | 4.00 | | | 4/1/31 | | | 1,893,815 |
| 1,350,000 | | Hayward Health Care Fac. Rev. (American Baptist Homes Midwest Proj.) | | 5.38 | | | 8/1/34 | | | 1,366,092 |
| 500,000 | | Hayward Health Care Fac. Rev. (American Baptist Homes Midwest Proj.) | | 5.75 | | | 2/1/44 | | | 507,270 |
| 780,000 | | Maple Grove Health Care Fac. Rev. (North Memorial Health Care Proj.) | | 5.00 | | | 9/1/29 | | | 788,143 |
| 1,200,000 | | Maple Grove Health Care System Rev. (Maple Grove Hospital Corp.) | | 5.25 | | | 5/1/25 | | | 1,249,344 |
| 255,000 | | Minneapolis Health Care Fac. Rev. (Augustana Chapel View Homes Proj.) | | 5.00 | | | 6/1/15 | | | 255,581 |
| 270,000 | | Minneapolis Health Care Fac. Rev. (Augustana Chapel View Homes Proj.) | | 5.10 | | | 6/1/16 | | | 270,580 |
| 105,000 | | Minneapolis Pooled Rev. (Care Choice Member Proj.) | | 5.75 | | | 4/1/19 | | | 105,133 |
| 1,705,000 | | Minneapolis Rev. Ref. (Walker Campus) | | 4.50 | | | 11/15/20 | | | 1,805,920 |
| 10,000 | | MN Agricultural & Economic Dev. Board Rev. (Fairview Health Care System Proj.) | | 6.38 | | | 11/15/22 | | | 10,047 |
| 130,000 | | MN Agricultural & Economic Dev. Board Rev. (Fairview Health Care System Proj.) | | 6.38 | | | 11/15/29 | | | 130,575 |
| 550,000 | | Moorhead Economic Dev. Auth. Rev. | | 4.60 | | | 9/1/25 | | | 551,012 |
| 1,500,000 | | Oak Park Heights Nursing Home Rev. (Boutwells Landing Care Center) | | 5.50 | | | 8/1/28 | | | 1,609,410 |
| 1,000,000 | | Oak Park Heights Nursing Home Rev. (Boutwells Landing Care Center) | | 6.00 | | | 8/1/36 | | | 1,079,540 |
| 575,000 | | Owatonna Senior Hsg. Rev. (Senior Living Proj.) | | 5.80 | | | 10/1/29 | | | 585,143 |
| 1,500,000 | | Rochester Health Care Facs. Rev. (Olmsted Medical Center Proj.) | | 5.88 | | | 7/1/30 | | | 1,685,745 |
| 1,000,000 | | Shakopee Health Care Facs. Rev. (St. Francis Regional Medical Center Proj.) | | 5.00 | | | 9/1/26 | | | 1,175,160 |
| 745,000 | | Shakopee Health Care Facs. Rev. (St. Francis Regional Medical Center Proj.) | | 5.00 | | | 9/1/28 | | | 858,188 |
| 325,000 | | Shakopee Health Care Facs. Rev. (St. Francis Regional Medical Center Proj.) | | 5.00 | | | 9/1/29 | | | 373,184 |
| 850,000 | | Shakopee Health Care Facs. Rev. (St. Francis Regional Medical Center Proj.) | | 5.00 | | | 9/1/34 | | | 949,254 |
| 1,225,000 | | St. Cloud Health Care Rev. (CentraCare Health System Proj.) (Assured Guaranty) | | 5.50 | | | 5/1/39 | | | 1,358,035 |
| 4,240,000 | | St. Cloud Health Care Rev. (CentraCare Health System) | | 5.00 | | | 5/1/25 | | | 4,333,704 |
| 2,000,000 | | St. Louis Park Health Care Facs. Rev. (Park Nicollet Health Proj.) | | 5.50 | | | 7/1/29 | | | 2,259,560 |
| 350,000 | | St. Paul Hsg. & Redev. Auth. Health Care Rev. (Gillette Childrens Specialty Proj.) | | 5.00 | | | 2/1/20 | | | 351,218 |
| 4,200,000 | | St. Paul Hsg. & Redev. Auth. Health Care Rev. (HealthPartners Oblig. Group Proj.) | | 5.25 | | | 5/15/36 | | | 4,397,400 |
| 525,000 | | St. Paul Hsg. & Redev. Auth. Health Care Rev. (Senior Episcopal Homes Proj.) | | 4.25 | | | 11/1/25 | | | 521,089 |
| 750,000 | | St. Paul Hsg. & Redev. Auth. Health Care Rev. (Senior Episcopal Homes Proj.) | | 4.75 | | | 11/1/31 | | | 750,360 |
| 260,000 | | St. Paul Hsg. & Redev. Auth. Health Care Rev. (Senior Episcopal Homes Proj.) | | 5.00 | | | 5/1/33 | | | 263,796 |
| 2,150,000 | | St. Paul Hsg. & Redev. Auth. Health Care Rev. (Senior Episcopal Homes Proj.) | | 5.00 | | | 5/1/38 | | | 2,157,353 |
| | |
See accompanying notes to financial statements. |
SEPTEMBER 30, 2014 | | 35 |
|
|
|
SCHEDULE OF INVESTMENTS (Unaudited) September 30, 2014 Sit Minnesota Tax-Free Income Fund (Continued) |
| | | | | | | | | | |
Principal Amount ($) | | Name of Issuer | | Coupon
Rate (%) | | Maturity Date | | | Fair Value ($) |
| | | | |
| 2,269,792 | | St. Paul Hsg. & Redev. Auth. Rev. (Nursing Home NTS-Episcopal) | | 5.63 | | | 10/1/33 | | | 2,316,278 |
| 2,500,000 | | Stillwater Health Care Rev. (Health System Obligation Proj.) | | 5.00 | | | 6/1/25 | | | 2,530,200 |
| 1,000,000 | | Victoria Health Care Facs. Rev. (Augustana Emerald Care LLC) | | 4.25 | | | 8/1/24 | | | 1,013,880 |
| 1,400,000 | | Victoria Health Care Facs. Rev. (Augustana Emerald Care LLC) | | 4.75 | | | 8/1/29 | | | 1,421,966 |
| 1,000,000 | | Victoria Health Care Facs. Rev. (Augustana Emerald Care LLC) | | 5.00 | | | 8/1/39 | | | 1,016,130 |
| 525,000 | | West St. Paul Health Care (Walker Thompson Hill) | | 6.75 | | | 9/1/31 | | | 560,243 |
| 1,300,000 | | Winsted Health Care Rev. (St. Mary’s Care Center Proj.) | | 6.00 | | | 9/1/25 | | | 1,328,652 |
| 1,250,000 | | Winsted Health Care Rev. (St. Mary’s Care Center Proj.) | | 6.50 | | | 9/1/34 | | | 1,281,025 |
| | | | | | | | | | |
| | | | |
| | | | | | | | | | 63,652,640 |
| | | | | | | | | | |
| |
Industrial/Pollution Control - 0.5% | | | |
| 1,020,000 | | St. Paul Port Auth. Solid Waste Disposal Rev. (Ecullet Proj.) 2, 5 | | 6.25 | | | 11/1/15 | | | 821,059 |
| 1,000,000 | | St. Paul Port Auth. Solid Waste Disposal Rev. (Gerdau St. Paul Steel Mill Proj.) 8 | | 4.50 | | | 10/1/37 | | | 983,800 |
| | | | | | | | | | |
| | | | |
| | | | | | | | | | 1,804,859 |
| | | | | | | | | | |
| |
Insured - 2.4% | | | |
| 500,000 | | Guam Power Auth. Rev. (AGM Insured) 11 | | 5.00 | | | 10/1/30 | | | 571,060 |
| 1,750,000 | | Minneapolis & St. Paul Metro Airport Commission Sub. Ref. (NATL-RE FGIC Insured) | | 5.00 | | | 1/1/25 | | | 1,905,522 |
| 2,750,000 | | Minneapolis & St. Paul Metro Airport Commission Sub. Rev. (NATL-RE FGIC Insured) | | 5.00 | | | 1/1/22 | | | 3,004,072 |
| 1,025,000 | | Minneapolis Health Care Facs. Rev. (Fairview Health Svcs.) (Assured Guaranty) | | 6.50 | | | 11/15/38 | | | 1,209,070 |
| 350,000 | | MN Governmental Agy. Fin. Group (Flex Terminal Prog.) (AGC Insured) | | 4.00 | | | 3/1/22 | | | 354,224 |
| 600,000 | | Puerto Rico Public Improvement G.O. (AGM Insured) 11 | | 5.13 | | | 7/1/30 | | | 599,946 |
| 1,000,000 | | Puerto Rico Public Improvement G.O. (AGM Insured) 11 | | 5.25 | | | 7/1/20 | | | 1,053,680 |
| 1,000,000 | | Puerto Rico Public Improvement G.O. (Assured Guaranty) 1, 11 | | 2.97 | | | 7/1/20 | | | 935,530 |
| | | | | | | | | | |
| | | | |
| | | | | | | | | | 9,633,104 |
| | | | | | | | | | |
| |
Multifamily Mortgage - 21.5% | | | |
| 785,000 | | Anoka Co. Hsg. & Redev. Rev. (Recovery Zone Fac.-Park River Estates) | | 6.50 | | | 11/1/25 | | | 807,632 |
| 250,000 | | Bloomington Hsg. Rev. Sr. (Gideon Pond Commons LLC) | | 5.25 | | | 6/1/21 | | | 261,105 |
| 300,000 | | Bloomington Hsg. Rev. Sr. (Gideon Pond Commons LLC) | | 5.25 | | | 12/1/21 | | | 312,453 |
| 375,000 | | Bloomington Hsg. Rev. Sr. (Gideon Pond Commons LLC) | | 5.38 | | | 6/1/22 | | | 392,738 |
| 385,000 | | Bloomington Hsg. Rev. Sr. (Gideon Pond Commons LLC) | | 5.38 | | | 12/1/22 | | | 402,564 |
| 1,000,000 | | Bloomington Hsg. Rev. Sr. (Gideon Pond Commons LLC) | | 6.00 | | | 12/1/30 | | | 1,046,480 |
| 895,000 | | Champlin Multifamily Hsg. Rev. (Champlin Drive Apts.) | | 6.00 | | | 1/1/27 | | | 947,823 |
| 750,000 | | Chisago Hsg. and Health Care Rev. (CDL Homes LLC) | | 6.00 | | | 8/1/33 | | | 815,265 |
| 1,000,000 | | Cloquet Hsg. Fac. Ref. (HADC Cloquet LLC Proj.) | | 5.00 | | | 8/1/38 | | | 1,023,170 |
| 620,000 | | Columbia Heights Multifamily & Health Care Fac. Rev. (Crest View Corp Proj.) | | 5.30 | | | 7/1/17 | | | 627,099 |
| 1,200,000 | | Coon Rapids Multifamily Hsg. Rev. (Margaret Place Apartments) | | 6.50 | | | 5/1/25 | | | 1,205,436 |
| 2,360,000 | | Cottage Grove Sr. Hsg. Rev. (PHS, Inc. Proj.) | | 5.00 | | | 12/1/31 | | | 2,361,817 |
| 3,680,000 | | Cottage Grove Sr. Hsg. Rev. (PHS, Inc. Proj.) | | 6.00 | | | 12/1/46 | | | 3,684,490 |
| 2,500,000 | | Crystal Multifamily Hsg. Rev. (Cavanagh Proj.) | | 5.25 | | | 6/1/31 | | | 2,539,225 |
| 1,345,000 | | Deephaven Hsg. & Healthcare Rev. (St. Therese Senior Living Proj.) | | 5.00 | | | 4/1/38 | | | 1,335,800 |
| 250,000 | | Inver Grove Heights Nursing Home Rev. Ref. (Presbyterian Homes) | | 5.38 | | | 10/1/26 | | | 250,172 |
| 1,315,000 | | Maplewood Multifamily Hsg. Rev. (Park Edge Apartments Proj.) 8 | | 6.50 | | | 5/1/29 | | | 1,315,605 |
| 2,765,000 | | Minneapolis & St. Paul Hsg. & Redev. Auth. Multifamily Hsg. Rev. (GNMA Collateralized) 8 | | 4.75 | | | 1/20/42 | | | 2,767,654 |
| 680,000 | | Minneapolis Hsg. Rev. (Keeler Apartments Proj.) | | 5.00 | | | 10/1/37 | | | 671,758 |
| 375,000 | | Minneapolis Multifamily Hsg. Rev. (Blaisdell Apartments Proj.) 8 | | 5.10 | | | 4/1/17 | | | 374,685 |
| 1,015,000 | | Minneapolis Multifamily Hsg. Rev. (Greenway Heights Family Housing) | | 5.75 | | | 7/15/31 | | | 1,090,952 |
| 100,000 | | Minneapolis Multifamily Hsg. Rev. (Seward Towers Proj.) (GNMA Collateralized) | | 5.00 | | | 5/20/36 | | | 101,324 |
| 780,000 | | Minnetonka Multifamily Hsg. Rev. Ref. (Archer Heights Apartments Proj.) (GNMA Collateralized) 8 | | 5.20 | | | 1/20/18 | | | 781,989 |
| 1,750,000 | | MN Hsg. Fin. Agy. Rental Hsg. 8 | | 5.10 | | | 8/1/47 | | | 1,759,555 |
| 1,000,000 | | MN Hsg. Fin. Agy. Rental Hsg. | | 5.20 | | | 8/1/43 | | | 1,068,560 |
| 250,000 | | MN Hsg. Fin. Agy. Rental Hsg. (GO of AGY. Insured) | | 5.05 | | | 8/1/31 | | | 269,362 |
| 2,560,000 | | MN Hsg. Fin. Agy. Rental Hsg. (GO of AGY. Insured) | | 5.25 | | | 8/1/40 | | | 2,734,566 |
| | |
See accompanying notes to financial statements. |
36 | | SIT MUTUAL FUNDS SEMI-ANNUAL REPORT |
| | | | | | | | | | |
Principal Amount ($) | | Name of Issuer | | Coupon
Rate (%) | | Maturity Date | | | Fair Value ($) |
| | | | |
| 1,760,000 | | MN Hsg. Fin. Agy. Rental Hsg. (GO of AGY. Insured) | | 5.45 | | | 8/1/41 | | | 1,933,290 |
| 1,065,000 | | MN Hsg. Fin. Agy. Residential Hsg. Rev. (GO of AGY. Insured) 8 | | 5.00 | | | 7/1/21 | | | 1,100,401 |
| 280,000 | | Moorhead Economic Dev. Auth. Rev. Ref. (EverCare Sr. Living LLC) | | 4.65 | | | 9/1/26 | | | 280,400 |
| 210,000 | | Moorhead Economic Dev. Auth. Rev. Ref. (EverCare Sr. Living LLC) | | 4.70 | | | 9/1/27 | | | 210,272 |
| 1,000,000 | | Moorhead Health Care Rev. Ref. (EverCare Sr. Living LLC) | | 5.00 | | | 9/1/32 | | | 981,390 |
| 250,000 | | Moorhead Health Care Rev. Ref. (EverCare Sr. Living LLC) | | 5.13 | | | 9/1/37 | | | 243,172 |
| 1,500,000 | | New Ulm Economic Dev. Auth. Rev. (HADC Ridgeway Proj.) | | 5.00 | | | 8/1/39 | | | 1,513,455 |
| 1,390,000 | | North Oaks Sr. Hsg. Rev. (Presbyterian Homes North Oaks Proj.) | | 5.63 | | | 10/1/17 | | | 1,502,757 |
| 1,000,000 | | North Oaks Sr. Hsg. Rev. (Presbyterian Homes North Oaks Proj.) | | 6.00 | | | 10/1/33 | | | 1,054,530 |
| 1,000,000 | | Oak Park Heights Hsg. Rev. (Oakgreen Commons Proj.) | | 6.00 | | | 8/1/25 | | | 1,078,300 |
| 1,000,000 | | Oak Park Heights Hsg. Rev. (Oakgreen Commons Proj.) | | 6.25 | | | 8/1/33 | | | 1,078,040 |
| 875,000 | | Oakdale Rev. (Sr. Hsg. Oak Meadows Proj.) | | 5.00 | | | 4/1/34 | | | 890,050 |
| 220,000 | | Richfield Sr. Hsg. Rev. Ref. (Richfield Sr. Hsg., Inc. Proj.) | | 5.00 | | | 12/1/15 | | | 224,323 |
| 430,000 | | Rochester Health Care & Hsg. Rev. (Samaritan Bethany, Inc. Proj.) | | 5.25 | | | 12/1/17 | | | 464,916 |
| 455,000 | | Rochester Health Care & Hsg. Rev. (Samaritan Bethany, Inc. Proj.) | | 5.50 | | | 12/1/18 | | | 502,820 |
| 475,000 | | Rochester Health Care & Hsg. Rev. (Samaritan Bethany, Inc. Proj.) | | 5.75 | | | 12/1/19 | | | 534,194 |
| 245,000 | | Rochester Health Care & Hsg. Rev. (The Homestead at Rochester) | | 6.38 | | | 12/1/33 | | | 267,724 |
| 2,500,000 | | Rochester Health Care & Hsg. Rev. (The Homestead at Rochester) | | 6.50 | | | 12/1/35 | | | 2,723,000 |
| 4,000,000 | | Rochester Multifamily Hsg. Rev. (Essex Place Apartments Proj.) (FHLMC) | | 3.75 | | | 6/1/29 | | | 4,148,440 |
| 2,200,000 | | Sartell Health Care & Hsg. Fac. Rev. (Country Manor Campus LLC Proj.) | | 4.00 | | | 9/1/20 | | | 2,262,260 |
| 1,135,000 | | Sartell Health Care & Hsg. Fac. Rev. (Country Manor Campus LLC Proj.) | | 5.25 | | | 9/1/27 | | | 1,189,605 |
| 100,000 | | Sartell Health Care & Hsg. Fac. Rev. (Country Manor Campus LLC Proj.) | | 5.25 | | | 9/1/30 | | | 103,164 |
| 2,150,000 | | Sartell Health Care & Hsg. Fac. Rev. (Country Manor Campus LLC Proj.) | | 5.30 | | | 9/1/37 | | | 2,192,462 |
| 1,705,000 | | Sauk Rapids Health Care & Hsg. Facs. Rev. (Good Shepherd Lutheran Home Proj.) | | 5.13 | | | 1/1/39 | | | 1,705,426 |
| 250,000 | | St. Anthony Multifamily Hsg. Rev. (Silver Lake Village Hsg.) | | 5.75 | | | 12/1/28 | | | 268,582 |
| 2,000,000 | | St. Anthony Multifamily Hsg. Rev. (Silver Lake Village Hsg.) | | 6.00 | | | 12/1/30 | | | 2,150,080 |
| 240,000 | | St. Paul Hsg. & Redev. Auth. Health Care Rev. (Carondelet Village Proj.) | | 5.13 | | | 2/1/22 | | | 248,858 |
| 275,000 | | St. Paul Hsg. & Redev. Auth. Health Care Rev. (Carondelet Village Proj.) | | 5.13 | | | 8/1/22 | | | 284,740 |
| 175,000 | | St. Paul Hsg. & Redev. Auth. Health Care Rev. (Carondelet Village Proj.) | | 5.38 | | | 2/1/24 | | | 181,396 |
| 150,000 | | St. Paul Hsg. & Redev. Auth. Health Care Rev. (Carondelet Village Proj.) | | 5.38 | | | 8/1/24 | | | 155,320 |
| 150,000 | | St. Paul Hsg. & Redev. Auth. Health Care Rev. (Carondelet Village Proj.) | | 5.50 | | | 2/1/25 | | | 155,410 |
| 3,000,000 | | St. Paul Hsg. & Redev. Auth. Health Care Rev. (Carondelet Village Proj.) | | 6.25 | | | 8/1/30 | | | 3,199,830 |
| 1,285,000 | | St. Paul Hsg. & Redev. Auth. Multifamily Housing Rev. (Marian Center Proj.) | | 5.20 | | | 11/1/22 | | | 1,294,368 |
| 1,000,000 | | St. Paul Hsg. & Redev. Auth. Multifamily Housing Rev. (Marian Center Proj.) | | 5.30 | | | 11/1/30 | | | 1,003,030 |
| 2,590,000 | | St. Paul Hsg. & Redev. Auth. Multifamily Housing Rev. (Marian Center Proj.) | | 5.38 | | | 5/1/43 | | | 2,594,274 |
| 4,840,000 | | St. Paul Hsg. & Redev. Auth. Multifamily Rev. Ref. (Univ. & Dale Proj.) (GNMA Collateralized) 8 | | 4.82 | | | 7/20/46 | | | 4,860,812 |
| 2,515,000 | | St. Paul Port Auth. Rev. (Energy Park Utility Company Proj.) 8 | | 5.70 | | | 8/1/36 | | | 2,610,620 |
| 275,000 | | Stillwater Multifamily Hsg. Rev. (Orleans Homes LP Proj.) 8 | | 5.00 | | | 2/1/17 | | | 281,658 |
| 730,000 | | Wayzata Sr. Hsg. Rev. (Folkestone Sr. Living Community) | | 5.20 | | | 5/1/25 | | | 796,678 |
| 790,000 | | Wayzata Sr. Hsg. Rev. (Folkestone Sr. Living Community) | | 5.25 | | | 11/1/26 | | | 860,500 |
| 1,250,000 | | Wayzata Sr. Hsg. Rev. (Folkestone Sr. Living Community) | | 5.50 | | | 11/1/32 | | | 1,352,500 |
| 800,000 | | Wayzata Sr. Hsg. Rev. (Folkestone Sr. Living Community) | | 5.75 | | | 11/1/39 | | | 867,048 |
| 2,610,000 | | Willmar Hsg. & Redev. Auth. Multifamily Rev. (Eagle Ridge Apartments) | | 4.63 | | | 4/1/30 | | | 2,582,960 |
| | | | | | | | | | |
| | | | |
| | | | | | | | | | 84,882,334 |
| | | | | | | | | | |
| |
Municipal Lease 9 - 4.6% | | | |
| 500,000 | | Anoka Co. Hsg. & Redev. Rev. | | 5.63 | | | 5/1/22 | | | 540,555 |
| 500,000 | | Anoka Co. Hsg. & Redev. Rev. | | 6.63 | | | 5/1/30 | | | 537,890 |
| 500,000 | | Anoka Co. Hsg. & Redev. Rev. | | 6.88 | | | 5/1/40 | | | 537,370 |
| 1,120,115 | | Carver Scott Co. Lease Purchase Agreement | | 5.00 | | | 8/4/20 | | | 1,128,583 |
| 1,030,000 | | Goodhue Co. Education District No 6051 Lease Rev. | | 5.00 | | | 2/1/34 | | | 1,146,884 |
| 1,500,000 | | Goodhue Co. Education District No 6051 Lease Rev. | | 5.00 | | | 2/1/39 | | | 1,650,195 |
| 3,000,000 | | MN General Fund Rev. (Appropriation) | | 3.00 | | | 3/1/30 | | | 2,867,310 |
| | |
See accompanying notes to financial statements. |
SEPTEMBER 30, 2014 | | 37 |
|
|
|
SCHEDULE OF INVESTMENTS (Unaudited) September 30, 2014 Sit Minnesota Tax-Free Income Fund (Continued) |
| | | | | | | | | | |
Principal Amount ($) | | Name of Issuer | | Coupon
Rate (%) | | Maturity Date | | | Fair Value ($) |
| | | | |
| 4,000,000 | | MN General Fund Rev. (Appropriation) | | 4.00 | | | 3/1/26 | | | 4,359,200 |
| 2,000,000 | | MN Hsg. Fin. Agy. Non-Profit Hsg. Rev. (St. Appropriation) | | 5.00 | | | 8/1/31 | | | 2,242,860 |
| 1,270,000 | | Virginia Hsg. & Redev. Auth. Health Care Fac. Lease Rev. | | 5.13 | | | 10/1/20 | | | 1,296,873 |
| 400,000 | | Virginia Hsg. & Redev. Auth. Health Care Fac. Lease Rev. | | 5.25 | | | 10/1/25 | | | 405,436 |
| 340,000 | | Virginia Hsg. & Redev. Auth. Health Care Fac. Lease Rev. | | 5.38 | | | 10/1/30 | | | 345,756 |
| 939,470 | | Winona School District 861 Lease Purchase | | 6.04 | | | 8/1/24 | | | 940,955 |
| | | | | | | | | | |
| | | | |
| | | | | | | | | | 17,999,867 |
| | | | | | | | | | |
| |
Other Revenue Bonds - 7.7% | | | |
| 765,000 | | Bloomington Port Auth. Recovery Zone Fac. Rev. (Radisson Blu MOA LLC) | | 6.25 | | | 12/1/16 | | | 785,158 |
| 510,000 | | Columbia Heights Economic Dev. Auth. Tax Increment Rev. (Huset Park Area Redev.) | | 5.20 | | | 2/15/22 | | | 512,331 |
| 588,345 | | Crystal Governmental Fac. Rev. | | 5.10 | | | 12/15/26 | | | 669,160 |
| 475,000 | | Minneapolis Community Dev. Agy. Limited Tax Common Bond Fund (Discount Steel) 8 | | 5.25 | | | 6/1/19 | | | 477,062 |
| 1,500,000 | | Minneapolis National Marrow Donor Program Rev. | | 4.88 | | | 8/1/25 | | | 1,556,715 |
| 400,000 | | Minneapolis Tax Increment Rev. (Grant Park Proj.) | | 5.35 | | | 2/1/30 | | | 400,012 |
| 155,000 | | Minneapolis Tax Increment Rev. Ref. (East River/Unocal Site Proj.) | | 5.10 | | | 2/1/17 | | | 156,552 |
| 240,000 | | Minneapolis Tax Increment Rev. Ref. (East River/Unocal Site Proj.) | | 5.20 | | | 2/1/21 | | | 241,390 |
| 1,000,000 | | MN Development Rev. Limited Tax Supported Comm. Board | | 6.00 | | | 12/1/40 | | | 1,139,370 |
| 2,000,000 | | MN Development Rev. Limited Tax Supported Comm. Board | | 6.25 | | | 12/1/30 | | | 2,363,520 |
| 1,175,000 | | Mound Hsg. & Redev. Auth. Tax Increment Rev. Ref. (Metroplain Proj.) | | 5.00 | | | 2/15/27 | | | 1,180,146 |
| 1,000,000 | | St. Louis Park Economic Dev. Auth. Tax Increment Rev. (Hoigaard Vlg.) | | 5.00 | | | 2/1/23 | | | 1,035,360 |
| 500,000 | | St. Paul Hsg. & Redev. Auth. Rev. (Jimmy Lee Recreation Center Proj.) | | 4.75 | | | 12/1/26 | | | 539,770 |
| 500,000 | | St. Paul Hsg. & Redev. Auth. Rev. (Jimmy Lee Recreation Center Proj.) | | 5.00 | | | 12/1/32 | | | 537,230 |
| 1,000,000 | | St. Paul Hsg. & Redev. Auth. Rev. (Ordway Center Performing Arts Proj.) | | 2.20 | | | 7/1/18 | | | 1,000,160 |
| 1,081,000 | | St. Paul Hsg. & Redev. Auth. Tax Increment Rev. (9th St. Lofts Proj.) | | 6.38 | | | 2/15/28 | | | 1,083,875 |
| 849,000 | | St. Paul Hsg. & Redev. Auth. Tax Increment Rev. (Drake Marble Proj.) | | 6.75 | | | 3/1/28 | | | 850,163 |
| 745,000 | | St. Paul Hsg. & Redev. Auth. Tax Increment Rev. (Emerald Gardens Proj.) | | 6.50 | | | 3/1/29 | | | 785,521 |
| 1,021,000 | | St. Paul Hsg. & Redev. Auth. Tax Increment Rev. (North Quadrant Owner Occupied Proj.) | | 7.00 | | | 2/15/28 | | | 1,026,044 |
| 858,000 | | St. Paul Hsg. & Redev. Auth. Tax Increment Rev. (North Quadrant Owner Occupied Proj.) | | 7.50 | | | 2/15/28 | | | 859,201 |
| 175,000 | | St. Paul Hsg. & Redev. Auth. Tax Increment Rev. (Upper Landing Proj.) | | 5.00 | | | 3/1/19 | | | 183,391 |
| 180,000 | | St. Paul Hsg. & Redev. Auth. Tax Increment Rev. (Upper Landing Proj.) | | 5.00 | | | 9/1/19 | | | 189,520 |
| 185,000 | | St. Paul Hsg. & Redev. Auth. Tax Increment Rev. (Upper Landing Proj.) | | 5.00 | | | 3/1/20 | | | 193,836 |
| 220,000 | | St. Paul Hsg. & Redev. Auth. Tax Increment Rev. (Upper Landing Proj.) | | 5.00 | | | 9/1/20 | | | 231,370 |
| 225,000 | | St. Paul Hsg. & Redev. Auth. Tax Increment Rev. (Upper Landing Proj.) | | 5.00 | | | 3/1/21 | | | 235,544 |
| 1,000,000 | | St. Paul Hsg. & Redev. Auth. Tax Increment Rev. (Upper Landing Proj.) | | 5.00 | | | 9/1/26 | | | 1,043,380 |
| 930,000 | | St. Paul Hsg. & Redev. Auth. Tax Increment Rev. (Upper Landing Proj.) | | 5.00 | | | 3/1/29 | | | 964,364 |
| 3,875,000 | | St. Paul Port Auth. Lease Rev. (Regions Hospital Parking Ramp Proj.) | | 5.00 | | | 8/1/36 | | | 3,898,366 |
| 3,000,000 | | St. Paul Port Auth. Rev. (Amherst H. Wilder Foundation) | | 5.00 | | | 12/1/36 | | | 3,258,030 |
| 715,000 | | St. Paul Recreational Facs. Gross Rev. (Highland National Proj.) | | 5.00 | | | 10/1/25 | | | 747,382 |
| 2,000,000 | | Virgin Islands Public Fin. Auth. (Gross Receipts Taxes Loan Note) 11 | | 5.00 | | | 10/1/42 | | | 2,161,420 |
| | | | | | | | | | |
| | | | |
| | | | | | | | | | 30,305,343 |
| | | | | | | | | | |
| |
Public Facilities - 0.3% | | | |
| 1,075,000 | | St. Paul Hsg. & Redev. Auth. Parking Rev. (Smith Ave. Proj.) | | 5.00 | | | 8/1/35 | | | 1,128,342 |
| | | | | | | | | | |
| |
Sales Tax Revenue - 1.5% | | | |
| 1,825,000 | | Guam Govt. Business Privilege Tax Rev. 11 | | 5.25 | | | 1/1/36 | | | 1,978,026 |
| 2,000,000 | | Hennepin Co. Sales Tax Rev. | | 4.75 | | | 12/15/37 | | | 2,201,720 |
| 900,000 | | Puerto Rico Sales Tax Financing Corp. Rev. 11 | | 5.00 | | | 8/1/26 | | | 727,236 |
| 1,500,000 | | Puerto Rico Sales Tax Financing Corp. Rev. 6, 11 | | 6.25 | | | 8/1/33 | | | 842,310 |
| | | | | | | | | | |
| | | | |
| | | | | | | | | | 5,749,292 |
| | | | | | | | | | |
| | |
See accompanying notes to financial statements. |
38 | | SIT MUTUAL FUNDS SEMI-ANNUAL REPORT |
| | | | | | | | | | |
Principal Amount ($) | | Name of Issuer | | Coupon
Rate (%) | | Maturity Date | | | Fair Value ($) |
| |
Single Family Mortgage - 15.0% | | | |
| 1,590,000 | | Dakota Co. Community Dev. Agy. Single Family Mtg. Rev. (GNMA) | | 4.45 | | | 12/1/32 | | | 1,705,498 |
| 880,000 | | Dakota Co. Community Dev. Agy. Single Family Mtg. Rev. (GNMA-FNMA-FHLMC) | | 4.63 | | | 12/1/30 | | | 934,190 |
| 1,080,000 | | Dakota Co. Community Dev. Agy. Single Family Mtg. Rev. (GNMA-FNMA-FHLMC) | | 4.88 | | | 12/1/33 | | | 1,161,713 |
| 263,206 | | Dakota Co. Community Dev. Agy. Single Family Mtg. Rev. (GNMA-FNMA-FHLMC) 8 | | 5.13 | | | 12/1/40 | | | 265,233 |
| 82,571 | | Dakota Co. Community Dev. Agy. Single Family Mtg. Rev. (GNMA-FNMA-FHLMC) 8 | | 5.15 | | | 12/1/38 | | | 85,261 |
| 493,962 | | Dakota Co. Community Dev. Agy. Single Family Mtg. Rev. (GNMA-FNMA-FHLMC) 8 | | 5.30 | | | 12/1/39 | | | 497,820 |
| 890,000 | | Minneapolis St. Paul Hsg. Fin. Board Single Family Mtg. Rev. (GNMA-FNMA) | | 4.45 | | | 12/1/27 | | | 955,566 |
| 34,782 | | Minneapolis St. Paul Hsg. Fin. Board Single Family Mtg. Rev. (GNMA-FNMA) 8 | | 5.00 | | | 12/1/38 | | | 35,094 |
| 25,014 | | Minneapolis St. Paul Hsg. Fin. Board Single Family Mtg. Rev. (GNMA-FNMA) | | 5.70 | | | 4/1/27 | | | 26,031 |
| 55,048 | | Minneapolis St. Paul Hsg. Fin. Board Single Family Mtg. Rev. (GNMA-FNMA-FHLMC) | | 5.10 | | | 4/1/27 | | | 55,352 |
| 526,530 | | Minneapolis St. Paul Hsg. Fin. Board Single Family Mtg. Rev. (GNMA-FNMA-FHLMC) 8 | | 5.25 | | | 12/1/40 | | | 541,094 |
| 267,807 | | Minneapolis St. Paul Hsg. Fin. Board Single Family Mtg. Rev. (GNMA-FNMA-FHLMC) | | 5.45 | | | 4/1/27 | | | 283,265 |
| 145,000 | | Minneapolis St. Paul Hsg. Fin. Board Single Family Mtg. Rev. (GNMA-FNMA-FHLMC) 8 | | 5.52 | | | 3/1/41 | | | 154,748 |
| 5,325,000 | | MN Hsg. Fin. Agy. Homeownership Fin. (GNMA-FNMA) | | 4.40 | | | 7/1/32 | | | 5,591,197 |
| 5,030,000 | | MN Hsg. Fin. Agy. Homeownership Fin. (GNMA-FNMA-FHLMC) | | 4.45 | | | 7/1/31 | | | 5,045,794 |
| 2,760,000 | | MN Hsg. Fin. Agy. Homeownership Fin. (GNMA-FNMA-FHLMC) | | 4.70 | | | 1/1/31 | | | 2,993,800 |
| 2,775,000 | | MN Hsg. Fin. Agy. Residential Hsg. Rev. | | 3.60 | | | 7/1/33 | | | 2,836,633 |
| 6,475,000 | | MN Hsg. Fin. Agy. Residential Hsg. Rev. | | 3.80 | | | 7/1/38 | | | 6,603,594 |
| 5,255,000 | | MN Hsg. Fin. Agy. Residential Hsg. Rev. | | 3.90 | | | 7/1/43 | | | 5,362,676 |
| 1,690,000 | | MN Hsg. Fin. Agy. Residential Hsg. Rev. 8 | | 4.65 | | | 7/1/22 | | | 1,741,156 |
| 4,600,000 | | MN Hsg. Fin. Agy. Residential Hsg. Rev. | | 5.10 | | | 1/1/40 | | | 4,871,906 |
| 2,400,000 | | MN Hsg. Fin. Agy. Residential Hsg. Rev. (GO of AGY. Insured) | | 3.63 | | | 7/1/25 | | | 2,505,840 |
| 3,115,000 | | MN Hsg. Fin. Agy. Residential Hsg. Rev. (GO of AGY. Insured) | | 3.90 | | | 7/1/30 | | | 3,240,690 |
| 480,000 | | MN Hsg. Fin. Agy. Residential Hsg. Rev. (GO of AGY. Insured) 8 | | 4.75 | | | 7/1/26 | | | 484,128 |
| 190,000 | | MN Hsg. Fin. Agy. Residential Hsg. Rev. (GO of AGY. Insured) 8 | | 5.10 | | | 7/1/31 | | | 192,077 |
| 1,655,000 | | MN Hsg. Fin. Agy. Residential Hsg. Rev. (GO of AGY. Insured) 8 | | 5.10 | | | 7/1/38 | | | 1,710,972 |
| 645,000 | | MN Hsg. Fin. Agy. Rev. (GNMA-FNMA Collateralized) | | 5.00 | | | 1/1/31 | | | 699,877 |
| 215,000 | | MN Hsg. Fin. Agy. Single Family Mtg. Rev. | | 4.90 | | | 7/1/29 | | | 228,876 |
| 355,000 | | MN Hsg. Fin. Agy. Single Family Mtg. Rev. | | 5.00 | | | 7/1/38 | | | 364,542 |
| 1,570,000 | | MN Hsg. Fin. Agy. Single Family Mtg. Rev. | | 5.05 | | | 7/1/34 | | | 1,664,545 |
| 260,000 | | MN Hsg. Fin. Agy. Single Family Mtg. Rev. 8 | | 5.10 | | | 7/1/20 | | | 260,486 |
| 120,000 | | MN Hsg. Fin. Agy. Single Family Mtg. Rev. | | 5.20 | | | 1/1/23 | | | 126,236 |
| 370,000 | | MN Hsg. Fin. Agy. Single Family Mtg. Rev. | | 5.90 | | | 7/1/28 | | | 384,567 |
| 690,000 | | MN Hsg. Fin. Agy. Single Family Mtg. Rev. (GO of AGY. Insured) 8 | | 4.75 | | | 7/1/27 | | | 704,153 |
| 1,900,000 | | MN Hsg. Fin. Agy. Single Family Mtg. Rev. (GO of AGY. Insured) 8 | | 4.80 | | | 7/1/26 | | | 1,930,514 |
| 1,115,000 | | MN Hsg. Fin. Agy. Single Family Mtg. Rev. (GO of AGY. Insured) 8 | | 5.15 | | | 7/1/28 | | | 1,154,806 |
| 1,090,000 | | MN Hsg. Fin. Agy. Single Family Mtg. Rev. (GO of AGY. Insured) 8 | | 5.25 | | | 7/1/33 | | | 1,121,675 |
| 330,000 | | MN Hsg. Fin. Agy. Single Family Mtg. Rev. (GO of AGY. Insured) 8 | | 5.50 | | | 7/1/28 | | | 337,874 |
| 365,000 | | MN Hsg. Fin. Agy. Single Family Mtg. Rev. (GO of AGY. Insured) 8 | | 5.65 | | | 7/1/33 | | | 380,717 |
| | | | | | | | | | |
| | | | |
| | | | | | | | | | 59,240,196 |
| | | | | | | | | | |
| |
Transportation - 1.7% | | | |
| 1,000,000 | | Minneapolis & St. Paul Metro Airport Commission Sub. Rev. | | 5.00 | | | 1/1/30 | | | 1,162,260 |
| 1,000,000 | | Minneapolis & St. Paul Metro Airport Commission Sub. Rev. | | 5.00 | | | 1/1/31 | | | 1,156,130 |
| 500,000 | | Minneapolis & St. Paul Metro Airport Commission Sub. Rev. | | 5.00 | | | 1/1/31 | | | 562,990 |
| 775,000 | | Minneapolis & St. Paul Metro Airport Commission Sub. Rev. | | 5.00 | | | 1/1/32 | | | 892,630 |
| 1,100,000 | | Minneapolis & St. Paul Metro Airport Commission Sub. Rev. | | 5.00 | | | 1/1/33 | | | 1,262,184 |
| 600,000 | | Minneapolis & St. Paul Metro Airport Commission Sub. Rev. | | 5.00 | | | 1/1/34 | | | 685,356 |
| 440,000 | | Minneapolis & St. Paul Metro Airport Commission Sub. Rev. | | 5.00 | | | 1/1/35 | | | 500,707 |
| 400,000 | | MN Valley Transit Auth. Proj. Rev. | | 4.50 | | | 6/1/26 | | | 425,704 |
| | | | | | | | | | |
| | | | |
| | | | | | | | | | 6,647,961 |
| | | | | | | | | | |
| | |
See accompanying notes to financial statements. |
SEPTEMBER 30, 2014 | | 39 |
|
|
|
SCHEDULE OF INVESTMENTS (Unaudited) September 30, 2014 Sit Minnesota Tax-Free Income Fund (Continued) |
| | | | | | | | | | |
Quantity/ Principal Amount ($) | | Name of Issuer | | Coupon
Rate (%) | | Maturity Date | | | Fair Value ($ |
| |
Utility - 5.0% | | | |
| 1,000,000 | | MN Municipal Power Agy. Electric Rev. | | 5.00 | | | 10/1/25 | | | 1,140,640 |
| 1,000,000 | | MN Municipal Power Agy. Electric Rev. | | 5.00 | | | 10/1/30 | | | 1,103,340 |
| 320,000 | | MN Municipal Power Agy. Electric Rev. | | 5.00 | | | 10/1/30 | | | 371,350 |
| 250,000 | | MN Municipal Power Agy. Electric Rev. | | 5.00 | | | 10/1/33 | | | 285,500 |
| 50,000 | | MN Municipal Power Agy. Electric Rev. | | 5.00 | | | 10/1/34 | | | 50,006 |
| 1,465,000 | | MN Municipal Power Agy. Electric Rev. | | 5.00 | | | 10/1/35 | | | 1,515,762 |
| 2,000,000 | | MN Municipal Power Agy. Electric Rev. | | 5.25 | | | 10/1/24 | | | 2,000,280 |
| 700,000 | | MN Municipal Power Agy. Electric Rev. | | 5.25 | | | 10/1/27 | | | 772,408 |
| 1,000,000 | | MN Municipal Power Agy. Electric Rev. | | 5.25 | | | 10/1/35 | | | 1,103,690 |
| 500,000 | | North Branch Electric System Rev. | | 5.75 | | | 8/1/28 | | | 523,450 |
| 695,000 | | Northern Municipal Power Agy. Electric Rev. | | 5.00 | | | 1/1/31 | | | 782,924 |
| 1,000,000 | | Puerto Rico Electric Power Auth. Rev. 11 | | 7.25 | | | 7/1/30 | | | 594,140 |
| 2,000,000 | | Southern MN Power Agy. Power Supply System Rev. | | 5.25 | | | 1/1/30 | | | 2,172,480 |
| 1,250,000 | | St. Paul Port Auth. Rev. (Energy Park Utility Company Proj.) 8 | | 5.45 | | | 8/1/28 | | | 1,297,500 |
| 1,690,000 | | Virgin Islands Water & Power Auth. Water System Rev. Ref. 11 | | 5.50 | | | 7/1/17 | | | 1,695,087 |
| 2,000,000 | | Western MN Municipal Power Agy. Rev. | | 3.00 | | | 1/1/28 | | | 2,005,820 |
| 1,000,000 | | Western MN Municipal Power Agy. Rev. | | 5.00 | | | 1/1/31 | | | 1,172,850 |
| 1,000,000 | | Western MN Municipal Power Agy. Rev. | | 5.00 | | | 1/1/36 | | | 1,148,310 |
| | | | | | | | | | |
| | | | |
| | | | | | | | | | 19,735,537 |
| | | | | | | | | | |
| | |
Total Municipal Bonds
(cost: $348,783,043) | | | | | | 361,268,094 |
| | | | | | | | | | |
| |
Investment Companies - 1.5% | | | |
| 293,300 | | Delaware Investments Minnesota Municipal Income Fund II (VMM) | | | | | | | | 3,956,617 |
| 43,696 | | First American Minnesota Municipal Income Fund II (MXN) | | | | | | | | 628,348 |
| 83,329 | | MN Municipal Income Portfolio (MXA) | | | | | | | | 1,291,600 |
| | | | | | | | | | |
| | |
Total Investment Companies
(cost: $6,179,897) | | | | | | 5,876,565 |
| | | | | | | | | | |
| | |
Total Investments in Securities - 93.1%
(cost: $354,962,940) | | | | | | 367,144,659 |
Other Assets and Liabilities, net - 6.9% | | | | | | 27,357,737 |
| | | | | | | | | | |
| | |
Total Net Assets - 100.0% | | | | | | $394,502,396 |
| | | | | | | | | | |
| 1 | Variable rate security. Rate disclosed is as of September 30, 2014. |
| 2 | Security considered illiquid by the Investment Adviser. The total value of such security as of September 30, 2014 was $821,059 and represented 0.2% of net assets. |
| 5 | The issuer is in default of certain debt covenants. Income is not being accrued. The total value of such security as of September 30, 2014 was $821,059 and represented 0.2% of net assets. |
| 6 | Zero coupon or convertible capital appreciation bond, for which the rate disclosed is either the effective yield on purchase date or the coupon rate to be paid upon conversion to coupon paying, respectively. |
| 8 | Securities the income from which is treated as a tax preference that is included in alternative minimum taxable income for purposes of computing federal alternative minimum tax (AMT). At September 30, 2014, 8.6% of net assets in the Fund was invested in such securities. |
| 9 | Municipal Lease Security. The total value of such securities as of September 30, 2014 was $17,999,867 and represented 4.6% of net assets. These securities have been determined to be liquid by the Adviser in accordance with guidelines established by the Board of Directors. |
| 11 | The Fund may invest in obligations issued by U.S. territories, for example Guam, Puerto Rico, and Virgin Islands. The total value of such securities as of September 30, 2014 was $11,945,685 and represented 3.0% of net assets. |
Numeric footnotes not disclosed are not applicable to this Schedule of Investments.
| | |
See accompanying notes to financial statements. |
40 | | SIT MUTUAL FUNDS SEMI-ANNUAL REPORT |
A summary of the levels for the Fund’s investments as of September 30, 2014 is as follows (see Note 2 - significant accounting policies in the notes to financial statements):
| | | | | | | | | | | | | | | | |
| | | Investment in Securities | |
| | | Level 1 | | | Level 2 | | | Level 3 | | | | |
| | | Quoted
Price ($) | | | Other significant
observable inputs ($) | | | Significant
unobservable inputs ($) | | | Total ($) | |
| | | | |
Municipal Bonds | | | — | | | | 361,268,094 | | | | — | | | | 361,268,094 | |
Investment Companies | | | 5,876,565 | | | | — | | | | — | | | | 5,876,565 | |
| | | | |
| | | | |
Total: | | | 5,876,565 | | | | 361,268,094 | | | | — | | | | 367,144,659 | |
| | | | |
For the reporting period, there were no transfers between levels 1, 2 and 3.
| | |
See accompanying notes to financial statements. |
SEPTEMBER 30, 2014 | | 41 |
|
|
|
STATEMENTS OF ASSETS AND LIABILITIES (Unaudited) September 30, 2014 |
| | | | | | | | | | | | | | | | |
| | | Sit U.S.
Government
Securities
Fund | | | Sit Quality
Income
Fund | | | Sit Tax-Free
Income
Fund | | | Sit Minnesota
Tax-Free
Income
Fund | |
| | | | |
ASSETS | | | | | | | | | | | | | | | | |
Investments in securities, at identified cost | | $ | 561,610,571 | | | $ | 106,294,532 | | | $ | 168,966,953 | | | $ | 354,962,940 | |
| | | | | | | | | | | | | | | | |
| | | | |
Investments in securities, at fair value - see accompanying schedule for detail | | $ | 566,347,811 | | | $ | 106,362,891 | | | $ | 157,259,788 | | | $ | 367,144,659 | |
Cash in bank on demand deposit | | | 28,541,975 | | | | 2,260,381 | | | | 3,914 | | | | 29,135,348 | |
Restricted cash | | | 17,000,000 | | | | 500,000 | | | | — | | | | — | |
Accrued interest and dividends receivable | | | 3,053,181 | | | | 606,754 | | | | 1,972,720 | | | | 4,740,602 | |
Receivable for investment securities sold | | | 25,344 | | | | — | | | | 155,877 | | | | — | |
Variation margin | | | — | | | | 20,537 | | | | — | | | | — | |
Other receivables | | | | | | | — | | | | — | | | | 15,000 | |
Receivable for Fund shares sold | | | 954,131 | | | | 355,918 | | | | 8,126 | | | | 536,841 | |
| | | | | | | | | | | | | | | | |
| | | | |
Total assets | | | 615,922,442 | | | | 110,106,481 | | | | 159,400,425 | | | | 401,572,450 | |
| | | | | | | | | | | | | | | | |
| | | | |
LIABILITIES | | | | | | | | | | | | | | | | |
Payable for investment securities purchased | | | 853,801 | | | | 1,000,036 | | | | — | | | | 5,864,614 | |
Payable for Fund shares redeemed | | | 1,237,536 | | | | 8,516,105 | | | | 113,716 | | | | 715,156 | |
Cash portion of dividends payable to shareholders | | | 49,513 | | | | 3,165 | | | | 83,394 | | | | 232,252 | |
Accrued investment management fees | | | 403,719 | | | | 80,798 | | | | 103,914 | | | | 258,032 | |
Outstanding options written, at fair value (premiums received $1,443,079 and $30,452, respectively) | | | 1,464,063 | | | | 34,688 | | | | — | | | | — | |
| | | | | | | | | | | | | | | | |
| | | | |
Total liabilities | | | 4,008,632 | | | | 9,634,792 | | | | 301,024 | | | | 7,070,054 | |
| | | | | | | | | | | | | | | | |
| | | | |
Net assets applicable to outstanding capital stock | | $ | 611,913,810 | | | $ | 100,471,689 | | | $ | 159,099,401 | | | $ | 394,502,396 | |
| | | | | | | | | | | | | | | | |
| | | | |
Net assets consist of: | | | | | | | | | | | | | | | | |
Capital (par value and paid-in surplus) | | $ | 615,054,445 | | | $ | 100,583,219 | | | $ | 195,500,504 | | | $ | 390,210,112 | |
Undistributed (distributions in excess of) net investment income | | | 105 | | | | 11 | | | | (772 | ) | | | 40,358 | |
Accumulated net realized gain (loss) from security transactions, written options and futures | | | (7,856,996 | ) | | | (196,201 | ) | | | (24,693,166 | ) | | | (7,929,793 | ) |
Unrealized appreciation (depreciation) on investments, written options and futures | | | 4,716,256 | | | | 84,660 | | | | (11,707,165 | ) | | | 12,181,719 | |
| | | | | | | | | | | | | | | | |
| | | | |
| | $ | 611,913,810 | | | $ | 100,471,689 | | | $ | 159,099,401 | | | $ | 394,502,396 | |
| | | | | | | | | | | | | | | | |
| | | | |
Outstanding shares | | | 55,397,472 | | | | 10,070,569 | | | | 16,713,516 | | | | 37,602,919 | |
| | | | | | | | | | | | | | | | |
| | | | |
Net asset value per share of outstanding capital stock | | | $11.05 | | | | $9.98 | | | | $9.52 | | | | $10.49 | |
| | | | | | | | | | | | | | | | |
| | |
See accompanying notes to financial statements. |
42 | | SIT MUTUAL FUNDS SEMI-ANNUAL REPORT |
|
|
|
STATEMENTS OF OPERATIONS (Unaudited) Six Months Ended September 30, 2014 |
| | | | | | | | | | | | | | | | |
| | | Sit U.S.
Government
Securities
Fund | | | Sit Quality
Income
Fund | | | Sit Tax-Free
Income
Fund | | | Sit Minnesota
Tax-Free
Income
Fund | |
| | | | |
Investment income: | | | | | | | | | | | | | | | | |
Income: | | | | | | | | | | | | | | | | |
Dividends | | | — | | | | — | | | | $301,032 | | | | $155,619 | |
Interest | | $ | 8,160,051 | | | $ | 851,725 | | | | 3,237,934 | | | | 8,013,338 | |
| | | | | | | | | | | | | | | | |
| | | | |
Total income | | | 8,160,051 | | | | 851,725 | | | | 3,538,966 | | | | 8,168,957 | |
| | | | | | | | | | | | | | | | |
| | | | |
Expenses (note 4): | | | | | | | | | | | | | | | | |
Investment management fee | | | 2,588,603 | | | | 469,235 | | | | 626,391 | | | | 1,517,454 | |
| | | | | | | | | | | | | | | | |
| | | | |
Total expenses | | | 2,588,603 | | | | 469,235 | | | | 626,391 | | | | 1,517,454 | |
| | | | | | | | | | | | | | | | |
| | | | |
Net investment income | | | 5,571,448 | | | | 382,490 | | | | 2,912,575 | | | | 6,651,503 | |
| | | | | | | | | | | | | | | | |
| | | | |
Realized and unrealized gain (loss): | | | | | | | | | | | | | | | | |
Net realized gain (loss) on investments | | | (3,755,351 | ) | | | 104,754 | | | | (401,151 | ) | | | (604,844 | ) |
Net realized gain (loss) on written options | | | 2,814,725 | | | | 87,027 | | | | — | | | | — | |
Net realized gain (loss) on futures | | | — | | | | (86,975 | ) | | | — | | | | — | |
| | | | |
Net change in unrealized appreciation (depreciation) on investments | | | 3,494,912 | | | | 47,643 | | | | 6,302,778 | | | | 9,049,505 | |
Net change in unrealized appreciation (depreciation) on written options | | | (2,024,727 | ) | | | (4,236 | ) | | | — | | | | — | |
Net change in unrealized appreciation (depreciation) on futures | | | — | | | | (72,408 | ) | | | — | | | | — | |
| | | | | | | | | | | | | | | | |
| | | | |
Net gain | | | 529,559 | | | | 75,805 | | | | 5,901,627 | | | | 8,444,661 | |
| | | | | | | | | | | | | | | | |
| | | | |
Net increase (decrease) in net assets resulting from operations | | $ | 6,101,007 | | | $ | 458,295 | | | $ | 8,814,202 | | | $ | 15,096,164 | |
| | | | | | | | | | | | | | | | |
| | |
See accompanying notes to financial statements. |
SEPTEMBER 30, 2014 | | 43 |
|
|
|
| STATEMENTS OF CHANGES IN NET ASSETS |
| | | | | | | | |
| | | Sit U.S. Government | |
| | | Securities Fund | |
| | | Six Months | | | Year | |
| | | Ended | | | Ended | |
| | | September 30, 2014 | | | March 31, | |
| | | (Unaudited) | | | 2014 | |
| | |
Operations: | | | | | | | | |
Net investment income | | | $5,571,448 | | | | $10,813,857 | |
Net realized gain (loss) on investments, written options and futures | | | (940,626) | | | | (2,445,209 | ) |
Net change in unrealized appreciation (depreciation) of investments, written options and futures | | | 1,470,185 | | | | (26,914,664 | ) |
| | | | | | | | |
| | |
Net increase (decrease) in net assets resulting from operations | | | 6,101,007 | | | | (18,546,016 | ) |
| | | | | | | | |
| | |
Distributions from: | | | | | | | | |
Net investment income | | | (5,531,592) | | | | (10,806,708 | ) |
| | | | | | | | |
Total distributions | | | (5,531,592) | | | | (10,806,708 | ) |
| | | | | | | | |
| | |
Capital share transactions: | | | | | | | | |
Proceeds from shares sold | | | 46,562,694 | | | | 204,383,543 | |
Reinvested distributions | | | 5,198,566 | | | | 10,072,964 | |
Payments for shares redeemed | | | (152,186,372) | | | | (993,393,329 | ) |
| | | | | | | | |
| | |
Increase (decrease) in net assets from capital transactions | | | (100,425,112) | | | | (778,936,822 | ) |
| | | | | | | | |
| | |
Total increase (decrease) in net assets | | | (99,855,697) | | | | (808,289,546 | ) |
| | |
Net assets: | | | | | | | | |
Beginning of period | | | 711,769,507 | | | | 1,520,059,053 | |
| | | | | | | | |
| | |
End of period * | | | $611,913,810 | | | | $711,769,507 | |
| | | | | | | | |
| | |
Capital transactions in shares: | | | | | | | | |
Sold | | | 4,213,904 | | | | 18,318,110 | |
Reinvested distributions | | | 470,959 | | | | 907,499 | |
Redeemed | | | (13,778,237) | | | | (89,264,019 | ) |
| | | | | | | | |
| | |
Net increase (decrease) | | | (9,093,374) | | | | (70,038,410 | ) |
| | | | | | | | |
| | |
* Includes undistributed (distributions in excess of) net investment income | | | $105 | | | | ($39,751 | ) |
| | |
See accompanying notes to financial statements. |
44 | | SIT MUTUAL FUNDS SEMI-ANNUAL REPORT |
| | | | | | | | | | | | | | | | | | | | | | |
Sit Quality
Income Fund | | | Sit Tax-Free
Income Fund | | | Sit Minnesota Tax-Free
Income Fund | |
Six Months
Ended
September 30, 2014
(Unaudited) | | | Year
Ended
March 31,
2014 | | | Six Months
Ended
September 30, 2014
(Unaudited) | | | Year
Ended
March 31,
2014 | | | Six Months
Ended
September 30, 2014
(Unaudited) | | | Year
Ended
March 31,
2014 | |
| | | | | |
| | | | | | | | | | | | | | | | | | | | | | |
| | $382,490 | | | | $540,589 | | | | $2,912,575 | | | | $6,532,036 | | | | $6,651,503 | | | | $14,630,322 | |
| | 104,806 | | | | (298,343 | ) | | | (401,151) | | | | (997,576 | ) | | | (604,844) | | | | (1,582,797 | ) |
| | | | | |
| | (29,001) | | | | 106,092 | | | | 6,302,778 | | | | (7,069,263 | ) | | | 9,049,505 | | | | (14,451,385 | ) |
| | | | | | | | | | | | | | | | | | | | | | |
| | | | | |
| | 458,295 | | | | 348,338 | | | | 8,814,202 | | | | (1,534,803 | ) | | | 15,096,164 | | | | (1,403,860 | ) |
| | | | | | | | | | | | | | | | | | | | | | |
| | | | | |
| | | | | | | | | | | | | | | | | | | | | | |
| | (382,490) | | | | (540,578 | ) | | | (2,912,575) | | | | (6,537,121 | ) | | | (6,651,503) | | | | (14,620,594 | ) |
| | | | | | | | | | | | | | | | | | | | | | |
| | (382,490) | | | | (540,578 | ) | | | (2,912,575) | | | | (6,537,121 | ) | | | (6,651,503) | | | | (14,620,594 | ) |
| | | | | | | | | | | | | | | | | | | | | | |
| | | | | |
| | | | | | | | | | | | | | | | | | | | | | |
| | 50,921,214 | | | | 133,622,057 | | | | 12,088,158 | | | | 25,342,854 | | | | 50,078,441 | | | | 88,007,700 | |
| | 356,705 | | | | 513,661 | | | | 2,419,445 | | | | 5,528,407 | | | | 5,275,857 | | | | 11,665,080 | |
| | (58,228,197) | | | | (31,718,921 | ) | | | (16,614,271) | | | | (42,975,264 | ) | | | (27,974,613) | | | | (141,114,996 | ) |
| | | | | | | | | | | | | | | | | | | | | | |
| | | | | |
| | (6,950,278) | | | | 102,416,797 | | | | (2,106,668) | | | | (12,104,003 | ) | | | 27,379,685 | | | | (41,442,216 | ) |
| | | | | | | | | | | | | | | | | | | | | | |
| | | | | |
| | (6,874,473) | | | | 102,224,557 | | | | 3,794,959 | | | | (20,175,927 | ) | | | 35,824,346 | | | | (57,466,670 | ) |
| | | | | |
| | | | | | | | | | | | | | | | | | | | | | |
| | 107,346,162 | | | | 5,121,605 | | | | 155,304,442 | | | | 175,480,369 | | | | 358,678,050 | | | | 416,144,720 | |
| | | | | | | | | | | | | | | | | | | | | | |
| | | | | |
| | $100,471,689 | | | | $107,346,162 | | | | $159,099,401 | | | | $155,304,442 | | | | $394,502,396 | | | | $358,678,050 | |
| | | | | | | | | | | | | | | | | | | | | | |
| | | | | |
| | | | | | | | | | | | | | | | | | | | | | |
| | 5,101,907 | | | | 13,387,023 | | | | 1,283,882 | | | | 2,763,230 | | | | 4,816,474 | | | | 8,594,504 | |
| | 35,742 | | | | 51,543 | | | | 256,450 | | | | 613,246 | | | | 505,807 | | | | 1,150,601 | |
| | (5,836,400) | | | | (3,180,886 | ) | | | (1,773,707) | | | | (4,769,456 | ) | | | (2,689,126) | | | | (13,949,311 | ) |
| | | | | | | | | | | | | | | | | | | | | | |
| | | | | |
| | (698,751) | | | | 10,257,680 | | | | (233,375) | | | | (1,392,980 | ) | | | 2,633,155 | | | | (4,204,206 | ) |
| | | | | | | | | | | | | | | | | | | | | | |
| | | | | |
| | $11 | | | | $11 | | | | ($772) | | | | ($772 | ) | | | $40,358 | | | | $40,358 | |
|
|
|
FINANCIAL HIGHLIGHTS Per share income and capital changes for a share outstanding throughout the period. See accompanying notes to financial statements. |
Sit U.S. Government Securities Fund
| | | | | | | | | | | | | | | | | | | | | | | | |
| |
| |
| Six Months Ended
September 30, 2014 |
| | | Years Ended March 31, | |
| | | (Unaudited) | | | | 2014 | | | | 2013 | | | | 2012 | | | | 2011 | | | | 2010 | |
| |
Net Asset Value: | | | | | | | | | | | | | | | | | | | | | | | | |
Beginning of period | | | $11.04 | | | | $11.30 | | | | $11.31 | | | | $11.29 | | | | $11.13 | | | | $10.84 | |
| | | | |
| | | | | | |
Operations: | | | | | | | | | | | | | | | | | | | | | | | | |
Net investment income 1 | | | 0.10 | | | | 0.12 | | | | 0.16 | | | | 0.31 | | | | 0.32 | | | | 0.44 | |
Net realized and unrealized gains (losses) on investments, written options and futures | | | — | | | | (0.26) | | | | — | | | | 0.02 | | | | 0.16 | | | | 0.29 | |
| | | | |
Total from operations | | | 0.10 | | | | (0.14) | | | | 0.16 | | | | 0.33 | | | | 0.48 | | | | 0.73 | |
| | | | |
| | | | | | |
Distributions from: | | | | | | | | | | | | | | | | | | | | | | | | |
Net investment income | | | (0.09) | | | | (0.12 | ) | | | (0.16 | ) | | | (0.31 | ) | | | (0.32 | ) | | | (0.44 | ) |
Return of capital | | | — | | | | — | | | | (0.01 | ) | | | — | | | | — | | | | — | |
Net realized gains | | | — | | | | — | | | | — | | | | — | | | | (— | )2 | | | — | |
| | | | |
Total Distributions | | | (0.09) | | | | (0.12 | ) | | | (0.17 | ) | | | (0.31 | ) | | | (0.32 | ) | | | (0.44 | ) |
| | | | |
| | | | | | |
Net Asset Value: | | | | | | | | | | | | | | | | | | | | | | | | |
End of period | | | $11.05 | | | | $11.04 | | | | $11.30 | | | | $11.31 | | | | $11.29 | | | | $11.13 | |
| | | | |
Total investment return 3 | | | 0.95% | | | | (1.21% | ) | | | 1.39% | | | | 2.98% | | | | 4.37% | | | | 6.88% | |
| | | | |
Net assets at end of period (000’s omitted) | | | $611,914 | | | | $711,770 | | | | $1,520,059 | | | | $1,504,154 | | | | $1,057,154 | | | | $768,720 | |
| | | | | | |
Ratios: 4, 5 | | | | | | | | | | | | | | | | | | | | | | | | |
Expenses (without waiver) | | | 0.80% | | | | 0.80% | | | | 0.80% | | | | 0.80% | | | | 0.81% | | | | 0.82% | |
Expenses (with waiver) | | | 0.80% | | | | 0.80% | | | | 0.80% | | | | 0.80% | | | | 0.75% | | | | 0.80% | |
Net investment income (with waiver) | | | 1.72% | | | | 1.06% | | | | 1.43% | | | | 2.73% | | | | 2.88% | | | | 3.85% | |
| | | | | | |
Portfolio turnover rate (excluding short-term securities) | | | 4.40%6 | | | | 4.13% | | | | 58.67% | | | | 33.82% | | | | 45.80% | | | | 66.89% | |
| 1 | The net investment income per share is based on average shares outstanding for the period. |
| 2 | Amount represents less than $0.01 per share. |
| 3 | Total investment return is based on the change in net asset value of a share during the period (not annualized) and assumes reinvestment of distributions at net asset value. |
| 4 | Ratios are annualized for periods less than one year. In addition to fees and expenses which the Fund bears directly, the Fund indirectly bears a pro rata share of the fees and expenses of the acquired funds in which it invests. Such indirect expenses are not included in the above reported expense ratios. |
| 5 | Effective November 1, 2010, total Fund expenses are calculated at 0.80% of average daily net assets. Prior to this date, expenses were calculated at a higher rate and the investment adviser voluntarily waived expenses that were otherwise payable by the Fund. |
| | |
46 | | SIT MUTUAL FUNDS SEMI-ANNUAL REPORT |
|
|
|
FINANCIAL HIGHLIGHTS Per share income and capital changes for a share outstanding throughout the period. See accompanying notes to financial statements. |
Sit Quality Income Fund
| | | | | | | | | | | | |
| |
| | | Six Months Ended
September 30, 2014
(Unaudited) | | | Year Ended
March 31, 2014 | | | Three
Months Ended
March 31, 2013 * | |
| |
Net Asset Value: | | | | | | | | | | | | |
Beginning of period | | | $9.97 | | | | $10.01 | | | | $10.00 | |
| | | | |
| | | |
Operations: | | | | | | | | | | | | |
Net investment income 1 | | | 0.04 | | | | 0.09 | | | | 0.03 | |
Net realized and unrealized gains (losses) on investments, written options and futures | | | 0.01 | | | | (0.04) | | | | 0.01 | |
| | | | |
Total from operations | | | 0.05 | | | | 0.05 | | | | 0.04 | |
| | | | |
| | | |
Distributions from: | | | | | | | | | | | | |
Net investment income | | | (0.04) | | | | (0.09) | | | | (0.03) | |
| | | | |
| | | |
Net Asset Value: | | | | | | | | | | | | |
End of period | | | $9.98 | | | | $9.97 | | | | $10.01 | |
| | | | |
Total investment return 2 | | | 0.47% | | | | 0.47% | | | | 0.38% | |
| | | | |
Net assets at end of period (000’s omitted) | | | $100,472 | | | | $107,346 | | | | $5,122 | |
| | | |
Ratios: 3 | | | | | | | | | | | | |
Expenses | | | 0.90% | | | | 0.90% | | | | 0.90% | |
Net investment income | | | 0.73% | | | | 0.80% | | | | 1.25% | |
| | | |
Portfolio turnover rate (excluding short-term securities) | | | 98.06%4 | | | | 81.19% | | | | 37.44%4 | |
| * | The Fund commenced investment operations on December 31, 2012. |
| 1 | The net investment income per share is based on average shares outstanding for the period. |
| 2 | Total investment return is based on the change in net asset value of a share during the period (not annualized) and assumes reinvestment of distributions at net asset value. |
| 3 | Ratios are annualized for periods less than one year. In addition to fees and expenses which the Fund bears directly, the Fund indirectly bears a pro rata share of the fees and expenses of the acquired funds in which it invests. Such indirect expenses are not included in the above reported expense ratios. |
|
|
|
FINANCIAL HIGHLIGHTS Per share income and capital changes for a share outstanding throughout the period. See accompanying notes to financial statements. |
Sit Tax-Free Income Fund
| | | | | | | | | | | | | | | | | | | | | | | | |
| |
| |
| Six Months Ended
September 30, 2014 |
| | | Years Ended March 31, | |
| | | (Unaudited) | | | | 2014 | | | | 2013 | | | | 2012 | | | | 2011 | | | | 2010 | |
| |
Net Asset Value: | | | | | | | | | | | | | | | | | | | | | | | | |
Beginning of period | | | $9.16 | | | | $9.57 | | | | $9.23 | | | | $8.52 | | | | $8.90 | | | | $7.93 | |
| | | | |
| | | | | | |
Operations: | | | | | | | | | | | | | | | | | | | | | | | | |
Net investment income 1 | | | 0.18 | | | | 0.38 | | | | 0.38 | | | | 0.41 | | | | 0.41 | | | | 0.41 | |
Net realized and unrealized gains (losses) on investments | | | 0.36 | | | | (0.41 | ) | | | 0.34 | | | | 0.71 | | | | (0.38 | ) | | | 0.97 | |
| | | | |
Total from operations | | | 0.54 | | | | (0.03 | ) | | | 0.72 | | | | 1.12 | | | | 0.03 | | | | 1.38 | |
| | | | |
| | | | | | |
Distributions from: | | | | | | | | | | | | | | | | | | | | | | | | |
Net investment income | | | (0.18) | | | | (0.38 | ) | | | (0.38 | ) | | | (0.41 | ) | | | (0.41 | ) | | | (0.41 | ) |
| | | | |
| | | | | | |
Net Asset Value: | | | | | | | | | | | | | | | | | | | | | | | | |
End of period | | | $9.52 | | | | $9.16 | | | | $9.57 | | | | $9.23 | | | | $8.52 | | | | $8.90 | |
| | | | |
Total investment return 2 | | | 5.88% | | | | (0.19% | ) | | | 7.92% | | | | 13.41% | | | | 0.26% | | | | 17.71% | |
| | | | |
Net assets at end of period (000’s omitted) | | | $159,099 | | | | $155,304 | | | | $175,480 | | | | $154,659 | | | | $140,371 | | | | $153,495 | |
| | | | | | |
Ratios: 3 | | | | | | | | | | | | | | | | | | | | | | | | |
Expenses | | | 0.80% | | | | 0.80% | | | | 0.80% | | | | 0.80% | | | | 0.80% | | | | 0.80% | |
Net investment income | | | 3.72% | | | | 4.17% | | | | 4.03% | | | | 4.62% | | | | 4.63% | | | | 4.79% | |
| | | | | | |
Portfolio turnover rate (excluding short-term securities) | | | 11.27%4 | | | | 28.32% | | | | 36.75% | | | | 37.18% | | | | 30.23% | | | | 27.30% | |
| 1 | The net investment income per share is based on average shares outstanding for the period. |
| 2 | Total investment return is based on the change in net asset value of a share during the period (not annualized) and assumes reinvestment of distributions at net asset value. |
| 3 | Ratios are annualized for periods less than one year. In addition to fees and expenses which the Fund bears directly, the Fund indirectly bears a pro rata share of the fees and expenses of the acquired funds in which it invests. Such indirect expenses are not included in the above reported expense ratios. |
| | |
48 | | SIT MUTUAL FUNDS SEMI-ANNUAL REPORT |
|
|
|
FINANCIAL HIGHLIGHTS Per share income and capital changes for a share outstanding throughout the period. See accompanying notes to financial statements. |
Sit Minnesota Tax-Free Income Fund
| | | | | | | | | | | | | | | | | | | | | | | | |
| |
| |
| Six Months Ended
September 30, 2014 |
| | | Years Ended March 31, | |
| | | (Unaudited) | | | | 2014 | | | | 2013 | | | | 2012 | | | | 2011 | | | | 2010 | |
| |
Net Asset Value: | | | | | | | | | | | | | | | | | | | | | | | | |
Beginning of period | | | $10.26 | | | | $10.62 | | | | $10.42 | | | | $9.67 | | | | $9.88 | | | | $8.97 | |
| | | | |
| | | | | | |
Operations: | | | | | | | | | | | | | | | | | | | | | | | | |
Net investment income 1 | | | 0.18 | | | | 0.40 | | | | 0.38 | | | | 0.44 | | | | 0.43 | | | | 0.43 | |
| | | | | | |
Net realized and unrealized gains (losses) on investments | | | 0.23 | | | | (0.36 | ) | | | 0.20 | | | | 0.75 | | | | (0.21 | ) | | | 0.91 | |
| | | | |
Total from operations | | | 0.41 | | | | 0.04 | | | | 0.58 | | | | 1.19 | | | | 0.22 | | | | 1.34 | |
| | | | |
| | | | | | |
Distributions from: | | | | | | | | | | | | | | | | | | | | | | | | |
Net investment income | | | (0.18) | | | | (0.40 | ) | | | (0.38 | ) | | | (0.44 | ) | | | (0.43 | ) | | | (0.43 | ) |
| | | | |
| | | | | | |
Net Asset Value: | | | | | | | | | | | | | | | | | | | | | | | | |
End of period | | | $10.49 | | | | $10.26 | | | | $10.62 | | | | $10.42 | | | | $9.67 | | | | $9.88 | |
| | | | |
Total investment return 2 | | | 4.05% | | | | 0.47% | | | | 5.61% | | | | 12.48% | | | | 2.22% | | | | 15.22% | |
| | | | |
Net assets at end of period (000’s omitted) | | | $394,502 | | | | $358,678 | | | | $416,145 | | | | $343,800 | | | | $289,105 | | | | $290,806 | |
| | | | | | |
Ratios: 3 | | | | | | | | | | | | | | | | | | | | | | | | |
Expenses | | | 0.80% | | | | 0.80% | | | | 0.80% | | | | 0.80% | | | | 0.80% | | | | 0.80% | |
Net investment income | | | 3.51% | | | | 3.91% | | | | 3.58% | | | | 4.32% | | | | 4.35% | | | | 4.52% | |
| | | | | | |
Portfolio turnover rate (excluding short-term securities) | | | 5.11%4 | | | | 20.53% | | | | 17.13% | | | | 15.06% | | | | 24.48% | | | | 11.46% | |
| 1 | The net investment income per share is based on average shares outstanding for the period. |
| 2 | Total investment return is based on the change in net asset value of a share during the period (not annualized) and assumes reinvestment of distributions at net asset value. |
| 3 | Ratios are annualized for periods less than one year. In addition to fees and expenses which the Fund bears directly, the Fund indirectly bears a pro rata share of the fees and expenses of the acquired funds in which it invests. Such indirect expenses are not included in the above reported expense ratios. |
|
|
|
NOTES TO FINANCIAL STATEMENTS (Unaudited) Six Months Ended September 30, 2014 |
The Sit Mutual Funds (the Funds) are no-load funds, and are registered under the Investment Company Act of 1940 (as amended) as diversified (except Minnesota Tax-Free Income Fund which is non-diversified), open-end management investment companies, or series thereof. The Sit Quality Income Fund, Sit Tax-Free Income Fund and Minnesota Tax-Free Income Fund are series funds of Sit Mutual Funds II, Inc. Each fund has 10 billion authorized shares of capital stock. Shares in the U.S. Government Securities Fund have a par value of $0.01, and shares in other funds have a par value of $0.001. This report covers the bond funds of the Sit Mutual Funds.
The investment objective for each of these Funds is as follows:
| | |
| Fund | | Investment Objective |
| U.S. Government Securities | | High level of current income and safety of principal. |
| Quality Income Fund | | High level of current income and safety of principal. |
| Tax-Free Income | | High level of current income that is exempt from federal income tax, consistent with the preservation of capital. |
| Minnesota Tax-Free Income | | High level of current income that is exempt from federal regular income tax and Minnesota regular personal income tax, consistent with the preservation of capital. |
| (2) | Significant Accounting Policies |
The Funds are investment companies and follow accounting and reporting guidance under Financial Accounting Standards Board (“FASB”) Accounting Standards Codification (“ASC”) Topic 946, “Financial Services-Investment Companies”. The following is a summary of significant accounting policies consistently followed by the Funds in the preparation of its financial statements in conformity with U.S. generally accepted accounting principles (“GAAP”).
Investments in Securities
Investment securities are carried at fair value based upon closing market quotations on the last business day of the period. Investments in securities traded on national or international securities exchanges are valued at the last reported sales price prior to the time when assets are valued. Securities traded on the over-the-counter market are valued at the last reported sales price or if the last sales price is not available, at the last reported bid price. The sale and bid prices or prices deemed best to reflect fair value quoted by dealers who make markets in these securities are obtained from independent pricing services. Consistent with the Funds’ valuation policies and procedures, the current fair value of certain fixed income securities is provided by an independent pricing service. Fixed income securities for which prices are not available from an independent pricing service but where an active market exists are valued using market quotations obtained from broker-dealers or quotation systems. Securities for which market quotations are not available, such as private placement securities, are valued at fair value according to methods selected in good faith by Sit Investment Associates, Inc. (the “Adviser”) and may include dealer-supplied valuations or other inputs and assumptions that pricing services would typically utilize. Short-term investments of sufficient credit quality with maturities of 60 days or less when acquired, or which subsequently are within 60 days of maturity, are valued at amortized cost, which approximates fair value. Option and future contracts entered into and held by the Funds are valued at the close of the securities and commodities exchange on which they are traded.
Security transactions are accounted for on the date the securities are purchased or sold. Gains and losses are calculated on the identified-cost basis. Interest, including level-yield amortization of long-term bond premium and discount, is recorded on the accrual basis. Dividends received from closed-end fund holdings are included in Dividend Income and distributions from capital gains, if any, are included in Net Realized Gain (Loss).
Delivery and payment for securities which have been purchased by the Funds on a forward commitment or when-issued basis can take place two weeks or more after the transaction date. During this period, such securities are subject to market fluctuations and may increase or decrease in value prior to delivery.
The Minnesota Tax-Free Income Fund concentrates its investments in Minnesota, and therefore may have more credit risk related to the economic conditions in the state of Minnesota than a portfolio with broader geographical diversification.
| | |
50 | | SIT MUTUAL FUNDS SEMI-ANNUAL REPORT |
Derivative Instruments
The Funds apply derivative instrument disclosure standards in order to enable investors to understand how and why the Funds use derivatives, how derivatives are accounted for, and how derivative instruments affect the Funds’ financial statements.
To hedge interest rate risk, the U.S. Government Securities Fund purchased put options and wrote call option contracts traded on a U.S. exchange. To hedge interest rate risk, the Quality Income Fund purchased put options, entered into futures contracts and wrote call options on these future contracts traded on a U.S. exchange. Risks of entering into futures contracts and purchasing and writing options include the possibility of an illiquid market and that a change in the value of the option may not correlate with changes in the value of the underlying securities.
The premiums paid for the options represent the cost of the investment and the options are valued daily at their closing price. The Funds recognize a realized gain or loss when the option is sold or expired. Option holdings within the Funds, which may include put options and call options, are subject to loss of value with the passage of time, and may experience a total loss of value upon expiration. With options, there is minimal counterparty risk to the Funds since they are exchange traded.
Upon entering into a futures contract, the Quality Income Fund is required to deposit either cash or securities in an amount (initial margin) equal to a certain percentage of the contract value. Subsequent payments (variation margin) are made or received by the Fund each day. The variation margin payments are equal to the daily changes in the contract value and are recorded as unrealized gains and losses. The Fund recognizes a realized gain or loss when the contract is closed or expired. With futures contracts, there is minimal counterparty risk to the Fund since futures are exchange traded and the exchange’s clearinghouse, as counterparty to all exchange-traded futures, guarantees the futures against default.
During the six months ended September 30, 2014, the average volume of derivative activity was as follows:
| | | | | | | | | | | | |
| | | Average
Cost | | | Average
Premium
Received | | | Average
Notional
Amount | |
| | | | |
U.S. Government Securities Fund | | | | | | | | | | | | |
Purchased put options | | | $825,906 | | | | — | | | | $4,266,667 | |
Written call options | | | — | | | | $2,311,785 | | | | 5,360,000 | |
| | | |
Quality Income Fund | | | | | | | | | | | | |
Purchased put options | | | $4,696 | | | | — | | | | $20,000 | |
Treasury futures | | | — | | | | — | | | | 63,608,958 | |
Written call options | | | — | | | | $12,784 | | | | 21,667 | |
The number of open option contracts and open futures contracts outstanding as of September 30, 2014 also serve as indicators of the volume of activity for the Funds throughout the period.
|
|
|
NOTES TO FINANCIAL STATEMENTS (Unaudited) Six Months Ended September 30, 2014 (Continued) |
Statement of Assets and Liabilities - Values of derivatives as of September 30, 2014
| | | | | | | | | | |
| | | Asset Derivatives Value | | Liability Derivatives Value |
Interest rate risk: | | | | | | | | | | |
U.S. Government Securities Fund | | | | | | | | | | |
Purchased put options | | | | $394,531 | 1 | | | | — | |
Written call options | | | | — | | | | | $1,464,063 | 2 |
| | |
Quality Income Fund | | | | | | | | | | |
Purchased put options | | | | $3,281 | 1 | | | | — | |
Treasury futures | | | | 20,537 | 3 | | | | — | |
Written call options | | | | — | | | | | $34,688 | 2 |
1 Statement of Assets and Liabilities location: Investments in securities, at fair value.
2Statement of Assets and Liabilities location: Outstanding options written, at fair value.
3Statement of Assets and Liabilities location: Variation margin receivable/payable. Includes cumulative appreciation(depreciation) of futures as reported in the
Schedule of Investments.
The effect of derivative instruments on the statement of operations for the six months ended September 30, 2014:
| | | | | | | | | | |
| | | Amount of Realized
Gain (Loss) on Derivatives 4 | | Change in Unrealized
Appreciation (Depreciation) on Derivatives 5 |
Interest rate risk: | | | | | | | | | | |
U.S. Government Securities Fund | | | | | | | | | | |
Purchased put options | | | | ($2,063,799 | ) | | | | ($1,244,529 | ) |
Written call options | | | | 2,814,725 | | | | | (2,024,727 | ) |
| | |
Quality Income Fund | | | | | | | | | | |
Purchased put options | | | | ($9,973 | ) | | | | ($833 | ) |
Written call options | | | | 87,027 | | | | | (4,236 | ) |
Treasury Futures | | | | (86,975 | ) | | | | (72,408 | ) |
4 Statement of Operations location: Net realized gain (loss) on investments, net realized gain (loss) on written options and net
realized gain (loss) on futures, respectively.
5 Statement of Operations location: Net change in unrealized appreciation (depreciation) on investments, net change in
unrealized appreciation (depreciation) on written options and net change in unrealized appreciation (depreciation) on futures,
respectively.
Transactions in written options for the six months ended September 30, 2014 were as follows:
| | | | | | | | | | |
| | | Number of
Contracts | | Premium |
U.S. Government Securities Fund | | | | | | | | | | |
Outstanding, March 31, 2014 | | | | 4,640 | | | | | $3,501,087 | |
Call options written | | | | 13,600 | | | | | 8,067,732 | |
Call options expired | | | | (2,000 | ) | | | | (271,220 | ) |
Call options closed | | | | (13,640 | ) | | | | (9,854,520 | ) |
| | |
Outstanding, September 30, 2014 | | | | 2,600 | | | | | $1,443,079 | |
| | |
52 | | SIT MUTUAL FUNDS SEMI-ANNUAL REPORT |
| | | | | | | | | | |
| | | Number of
Contracts | | Premium |
Quality Income Fund | | | | | | | | | | |
Outstanding, March 31, 2014 | | | | — | | | | | — | |
Call options written | | | | 365 | | | | $ | 193,983 | |
Call options expired | | | | — | | | | | — | |
Call options closed | | | | (325 | ) | | | | (163,531 | ) |
| | |
Outstanding, September 30, 2014 | | | | 40 | | | | $ | 30,452 | |
Fair Value Measurements
The inputs and valuations techniques used to measure fair value of the Funds’ net assets are summarized into three levels as described in the hierarchy below:
| | • | | Level 1 – quoted prices for active markets for identical securities. An active market for the security is a market in which transactions occur with sufficient frequency and volume to provide pricing information on an ongoing basis. A quoted price in an active market provides the most reliable evidence of fair value. |
| | • | | Level 2 – debt securities are valued based on evaluated prices received from independent pricing services or from dealers who make markets in such securities. For corporate bonds, U.S. government and government agency obligations, and municipal securities the pricing services utilize matrix pricing which considers yield or price of bonds of comparable quality, coupon, maturity, and type as well as dealer supplied prices. For asset-backed securities and mortgage-backed securities, the pricing services utilize matrix pricing which considers prepayment speed assumptions, attributes of the collateral, yield or price of bonds of comparable quality, coupon, maturity, and type as well as dealer supplied prices. All of these inputs are derived principally from or corroborated by observable market data. An adjustment to any observable input that is significant to the fair value may render the measurement a Level 3 measurement. |
| | • | | Level 3 – significant unobservable inputs, including the Adviser’s own assumptions in determining the fair value of investments. |
The inputs or methodology used for valuing securities are not necessarily an indication of the risk associated with investing in those securities.
The fair value of the Funds’ bonds are generally based on quotes received from brokers or independent pricing services. Bonds with quotes that are based on actual trades with a sufficient level of activity on or near the measurement date are classified as Level 2 assets.
At the end of each calendar quarter, management evaluates the Level 2 and 3 assets and liabilities for changes in liquidity, including but not limited to: whether a broker is willing to execute at the quoted price, the depth and consistency of prices from third party services, and the existence of contemporaneous, observable trades in the market. Additionally, management evaluates the Level 1 and 2 assets and liabilities on a quarterly basis for changes in listings or delistings on national exchanges. Due to the inherent uncertainty of determining the fair value of investments that do not have a readily available market value, the fair value of the Funds’ investments may fluctuate from period to period. Additionally, the fair value of investments may differ significantly from the values that would have been used had a ready market existed for such investments and may differ materially from the values the Fund may ultimately realize. Further, such investments may be subject to legal and other restrictions on resale or otherwise are less liquid than publicly traded securities.
A summary of the levels for the Funds’ investments as of September 30, 2014 is included with the Funds’ schedules of investments.
Federal Taxes
The Funds’ policy is to comply with the requirements of the Internal Revenue Code applicable to regulated investment companies and to distribute all of its taxable income to shareholders. The Funds have recorded in their financial statements the full benefit of their tax positions taken in connection with the Registered Investment Company (RIC) qualification and distribution requirements of the
|
|
|
NOTES TO FINANCIAL STATEMENTS (Unaudited) Six Months Ended September 30, 2014 (Continued) |
RIC. Therefore, no income tax provision is required. Also, in order to avoid the payment of any federal excise taxes, the Funds will distribute substantially all of their net investment income and net realized gains on a calendar year basis.
Management has analyzed the Funds’ tax positions taken in federal tax returns for all open tax years and has concluded that as of September 30, 2014, no provision for income tax would be required in the Funds’ financial statements. The Funds’ federal and state income and federal excise returns for the 2011, 2012, and 2013 tax years for which the applicable statutes of limitations have not expired remain subject to examination by the Internal Revenue Service and state departments of revenue.
At September 30, 2014, the gross unrealized appreciation (depreciation) on investments and cost of securities on a tax basis for federal income tax purposes were as follows:
| | | | | | | | | | | | | | | | | | | | |
| | | Unrealized
Appreciation | | Unrealized
Depreciation | | Net Unrealized
Appreciation (Depreciation) | | Cost of Securities
on a Tax Basis |
U.S. Government Securities | | | | $12,425,554 | | | | | ($7,688,314 | ) | | | | $4,737,240 | | | | | $561,610,571 | |
Quality Income | | | | 299,766 | | | | | (231,407 | ) | | | | 68,359 | | | | | 106,294,532 | |
Tax-Free Income | | | | 8,015,026 | | | | | (19,722,191 | ) | | | | (11,707,165 | ) | | | | 168,966,953 | |
Minnesota Tax-Free Income | | | | 14,406,794 | | | | | (2,225,075 | ) | | | | 12,181,719 | | | | | 354,962,940 | |
Net investment income and net realized gains may differ for financial statement and tax purposes. The character of distributions made during the year for net investment income or net realized gains may also differ from its ultimate characterization for tax purposes. The tax character of distributions paid during the fiscal years or period ended March 31, 2014 and 2013 were as follows:
| | | | | | | | | | | | | | | | | | | | |
| Year Ended March 31, 2014: | | | | | | | | |
| | | Ordinary Income | | Tax-Exempt
Income | | Long Term
Capital Gain | | Total |
U.S. Government Securities | | | | $10,762,504 | | | | | — | | | | | — | | | | | $10,762,504 | |
Quality Income | | | | 537,852 | | | | | — | | | | | — | | | | | 537,852 | |
Tax-Free Income* | | | | 132,476 | | | | | $6,404,645 | | | | | — | | | | | 6,537,121 | |
Minnesota Tax-Free Income* | | | | 101,933 | | | | | 14,518,661 | | | | | — | | | | | 14,620,594 | |
* 97.9% and 99.3% of dividends were derived from interest on tax-exempt securities, on the Tax-Free Income and Minnesota Tax-Free Income Funds, respectively. | |
| | | | | | | | | | | | | | | | | | | | | | | | | |
| Year or Period Ended March 31, 2013: | | |
| | | Ordinary Income | | Tax-Exempt
Income | | Long Term
Capital Gain | | Return of Capital | | Total |
U.S. Government Securities | | | | $24,620,957 | | | | | — | | | | | — | | | | | $899,593 | | | | | $25,520,550 | |
Quality Income | | | | 13,470 | | | | | — | | | | | — | | | | | — | | | | | 13,470 | |
Tax-Free Income* | | | | 75,807 | | | | | $6,859,570 | | | | | — | | | | | — | | | | | 6,935,377 | |
Minnesota Tax-Free Income* | | | | 62,713 | | | | | 13,462,345 | | | | | — | | | | | — | | | | | 13,525,058 | |
* 98.9% and 99.5% of dividends were derived from interest on tax-exempt securities, on the Tax-Free Income and Minnesota Tax-Free Income Funds, respectively. | |
As of March 31, 2014 the components of distributable earnings on a tax basis were as follows:
| | | | | | | | | | | | | | | | | | | | |
| | | Undistributed
Ordinary Income | | Undistributed
Tax-Exempt Income | | Accumulated
Gain (Loss) | | Unrealized
Appreciation
(Depreciation) |
U.S. Government Securities | | | | $51,353 | | | | | — | | | | | ($4,170,078 | ) | | | | $499,779 | |
Quality Income | | | | 3,676 | | | | | — | | | | | (204,962 | ) | | | | 20,073 | |
Tax-Free Income | | | | 917 | | | | | $82,202 | | | | | (24,313,234 | ) | | | | (17,988,724 | ) |
Minnesota Tax-Free Income | | | | — | | | | | 286,821 | | | | | (7,390,287 | ) | | | | 3,197,552 | |
| | |
54 | | SIT MUTUAL FUNDS SEMI-ANNUAL REPORT |
Net capital loss carryovers and late year losses, if any, as of March 31, 2014, are available to offset future realized capital gains and thereby reduce future capital gains distributions. Under the Regulated Investment Company Modernization Act of 2010 (“Act”), the Funds are permitted to carry forward capital losses incurred in taxable years beginning after December 22, 2010 for an unlimited period. Any losses incurred during those future taxable years will be required to be utilized prior to any losses incurred in pre-enactment taxable years. Additionally, post-enactment capital losses that are carried forward will retain their character as either short-term or long-term capital losses, and will not be considered exclusively short-term as under previous law.
The Funds’ first fiscal year end subject to the Modernization Act was March 31, 2012. The net capital loss carryovers and the expiration dates for capital losses carryover from pre-enactment taxable years and the late year losses deferred as of March 31, 2014, were as follows:
| | | | | | | | | | | | | | | | | | | | | | | | | | | | | | |
| | | Pre-Enactment | | Post-Enactment | | | | |
| | | Net Capital Loss | | Unlimited Period of Net | | Late Year | | Accumulated |
| | | Carryover Expiring in: | | Capital Loss Carryover | | Losses | | Capital and |
| | | 2015 | | 2016-2019 | | Short-Term | | Long-Term | | Deferred | | Other Losses |
U.S. Government Securities | | | | — | | | | | — | | | | | $4,170,078 | | | | | — | | | | | — | | | | | $4,170,078 | |
Quality Income | | | | — | | | | | — | | | | | 77,140 | | | | | $127,822 | | | | | — | | | | | 204,962 | |
Tax-Free Income | | | | — | | | | | $19,109,911 | | | | | 619,000 | | | | | 4,405,430 | | | | | $178,893 | | | | | 24,313,234 | |
Minnesota Tax-Free Income | | | | $774,842 | | | | | 5,024,269 | | | | | 664,551 | | | | | — | | | | | 926,625 | | | | | 7,390,287 | |
For the year ended March 31, 2014 , the Funds’ utilized capital losses and expired capital losses as follows:
| | | | | | | | | | |
| | | Utilized | | Expired |
U.S. Government Securities | | | | $1,543,618 | | | | | — | |
Quality Income | | | | 3,837 | | | | | — | |
Tax-Free Income | | | | 4,204,371 | | | | | — | |
Minnesota Tax-Free Income | | | | — | | | | | $1,709,459 | |
Distributions
Distributions to shareholders are recorded as of the close of business on the record date. Such distributions are payable in cash or reinvested in additional shares of the Funds’ capital stock. Distributions from net investment income are declared daily and paid monthly for the Funds. Distributions from net realized gains, if any, will be made annually for each of the Funds.
Use of Estimates
The preparation of financial statements in conformity with U.S. generally accepted accounting principles requires management to make certain estimates and assumptions that affect the reported amounts of assets and liabilities and disclosure of contingent assets and liabilities at the date of the financial statements and the reported results for the respective periods. Actual results could differ from those estimates.
Guarantees and Indemnifications
Under each Fund’s organizational documents, its officers and directors are indemnified against certain liabilities arising out of the performance of their duties to each Fund. In addition, certain of each Fund’s contracts with its service providers contain general indemnification clauses. Each Fund’s maximum exposure under these arrangements is unknown since the amount of any future claims that may be made against each Fund cannot be determined and each Fund has no historical basis for predicting the likelihood of any such claims.
|
|
|
NOTES TO FINANCIAL STATEMENTS (Unaudited) Six Months Ended September 30, 2014 (Continued) |
| (3) | Investment Security Transactions |
The cost of purchases of and proceeds from sales and maturities of investment securities, other than short-term securities, for the six months ended September 30, 2014, were as follows:
| | | | | | | | | | | | | | | | | | | | |
| | | Purchases | | Proceeds |
| | | U.S. Government | | Other | | U.S. Government | | Other |
U.S. Government Securities | | | | $26,964,998 | | | | | — | | | | | $144,774,919 | | | | | — | |
Quality Income | | | | 60,788,962 | | | | | $35,903,009 | | | | | 59,111,797 | | | | | $29,979,668 | |
Tax-Free Income | | | | — | | | | | 16,611,198 | | | | | — | | | | | 22,231,998 | |
Minnesota Tax-Free Income | | | | — | | | | | 39,349,904 | | | | | — | | | | | 17,928,529 | |
| (4) | Affiliated Fees and Transactions |
Investment Adviser
The Funds each have entered into an investment management agreement with Sit Investment Associates Inc. (SIA), under which SIA manages the Funds’ assets and provides research, statistical and advisory services, and pays related office rental, executive expenses and executive salaries. SIA also is obligated to pay all of the Funds’ expenses (excluding extraordinary expenses, stock transfer taxes, interest, brokerage commissions, and other transaction charges relating to investing activities). The fee for investment management and advisory services is based on the average daily net assets of the Funds at the annual rate of:
| | | | |
| | | Average Daily Net Assets | | |
U.S. Government Securities | | 0.80% | |
Quality Income | | 0.90% | |
Tax-Free Income | | 0.80% | |
Minnesota Tax-Free Income | | 0.80% | |
Transactions with affiliates
The investment adviser, affiliates of the investment adviser, directors and officers of the Funds as a whole owned the following shares as of September 30, 2014:
| | | | | | |
| | | Shares | | % Shares Outstanding | | |
U.S. Government Securities | | 1,146,912 | | 2.1 | |
Quality Income | | 5,808,134 | | 57.7 | |
Tax-Free Income | | 2,823,871 | | 16.9 | |
Minnesota Tax-Free Income | | 1,971,462 | | 5.2 | |
Management has evaluated the impact of all subsequent events on the Funds through the date the financial statements were issued, and has determined that there were no subsequent events that would require disclosure in or adjustments to the financial statements.
| | |
56 | | SIT MUTUAL FUNDS SEMI-ANNUAL REPORT |
EXPENSE EXAMPLE (Unaudited)
As a shareholder of the Funds, you incur two types of costs: (1) transaction costs, including redemption fees and (2) ongoing costs, including management fees; and other Fund expenses. This Example is intended to help you understand your ongoing costs (in dollars) of investing in the Funds and to compare these costs with the ongoing costs of investing in other mutual funds.
The Example is based on an investment of $1,000 invested at the beginning of the period and held for the entire period April 1, 2014 to September 30, 2014.
Actual Expenses
The first line of the following table provides information about actual account values and actual expenses. You may use the information in this line, together with the amount you invested, to estimate the expenses that you paid over the period. Simply divide your account value by $1,000 (for example, an $8,600 account value divided by $1,000 = 8.6), then multiply the result by the number in the first line under the heading entitled “Expenses Paid During Period” to estimate the expenses you paid on your account during this period.
Hypothetical Example for Comparison Purposes
The second line of the table provides information about hypothetical account values and hypothetical expenses based on the Fund’s actual expense ratio and an assumed rate of return of 5% per year before expenses, which is not the Fund’s actual return. The hypothetical account values and expenses may not be used to estimate the actual ending account balance or expenses you paid for the period. You may use this information to compare the ongoing costs of investing in the Fund and other funds. To do so, compare this 5% hypothetical example with the 5% hypothetical examples that appear in the shareholder reports of the other funds.
Please note that the expenses shown in the table are meant to highlight your ongoing costs only and do not reflect any transactional costs, such as redemption fees. Therefore, the second line of the table is useful in comparing ongoing costs only, and will not help you determine the relative total costs of owning different funds. In addition, if these transactional costs (redemption fees) were included, your costs would have been higher.
| | | | | | | | | | | | |
| | | Beginning
Account
Value
(4/1/14) | | | Ending
Account
Value
(9/30/14) | | | Expenses
Paid During
Period
(4/1/14-
9/30/14)* | |
U.S. Government Securities Fund | |
Actual | | | $1,000 | | | | $1,009.50 | | | | $4.03 | |
Hypothetical | | | $1,000 | | | | $1,021.06 | | | | $4.05 | |
| | | | | | | | | | | | | |
Quality Income Fund | |
Actual | | | $1,000 | | | | $1,004.70 | | | | $4.52 | |
Hypothetical | | | $1,000 | | | | $1,020.56 | | | | $4.56 | |
| | | | | | | | | | | | | |
Tax-Free Income Fund | |
Actual | | | $1,000 | | | | $1,058.80 | | | | $4.13 | |
Hypothetical | | | $1,000 | | | | $1,021.06 | | | | $4.05 | |
| | | | | | | | | | | | | |
Minnesota Tax-Free Income Fund | |
Actual | | | $1,000 | | | | $1,040.50 | | | | $4.09 | |
Hypothetical | | | $1,000 | | | | $1,021.06 | | | | $4.05 | |
*Expenses are equal to the Funds’ annualized expense ratio of 0.80% for the U.S. Government Securities, Tax-Free Income and Minnesota Tax-Free Funds; and 0.90% for the Quality Income Fund, multiplied by the average account value over the period, multiplied by 183/365 (to reflect the one-half year period.)
ADDITIONAL INFORMATION (Unaudited)
PROXY VOTING
Each Fund follows certain policies and procedures for voting proxies for securities held in each portfolio. A description of the Funds’ proxy voting policies and procedures is available without charge upon request by calling the Funds at 1-800-332-5580.
Information regarding how each Fund voted proxies relating to its portfolio securities during the most recent twelve-month period ended June 30 is available without charge upon request by calling the Funds at 1-800-332-5580, and is available on the U.S. Securities and Exchange Commission’s website at www.sec.gov.
AVAILABILITY OF QUARTERLY PORTFOLIO SCHEDULES
The Funds’ file their complete schedules of portfolio holdings with the U.S. Securities and Exchange Commission (SEC) for the first and third quarters of each fiscal year on Form N-Q. The Funds’ Form N-Qs are available without charge upon request by calling the Funds at 1-800-332-5580 and are available on the SEC’s website at www.sec.gov. In addition, the Funds’ Form N-Qs may be reviewed and copied at the SEC’s Public Reference Room in Washington, DC. Information on the operation of the Public Reference Room may be obtained by calling 1-202-551-8090.
| | |
58 | | SIT MUTUAL FUNDS SEMI-ANNUAL REPORT |
[This page intentionally left blank.]
[This page intentionally left blank.]
Item 2: Code of Ethics. Not applicable to Semi-Annual Report.
Item 3: Audit Committee Financial Expert. Not applicable to Semi-Annual Report.
Item 4: Principal Accountant Fees and Services. Not applicable to Semi-Annual Report.
Item 5: Audit Committee of Listed Registrants.
Not applicable to open-end investment companies.
Item 6: Schedule of Investments.
The schedule of investments is included as part of the report to shareholders filed under Item 1 of this Form.
Item 7: Disclosure of Proxy Voting Policies and Procedures for Closed-End Management Investment Companies.
Not applicable to open-end investment companies.
Item 8: Portfolio Managers of Closed-End Management Companies.
Not applicable to open-end investment companies.
Item 9: Purchases of Equity Securities by Closed-End Management Investment Company and Affiliated Purchasers.
Not applicable to open-end investment companies.
Item 10. Submission of Matters to a vote of Security Holders.
There have been no material changes to the procedures by which shareholders may recommend nominees to the registrant’s board of directors.
Item 11: Controls and Procedures -
(a) Based on their evaluation of the Registrant’s Disclosure Controls and Procedures as of a date within 90 days of the Filing Date, the Registrant’s Chairman and Treasurer have determined that the Disclosure Controls and Procedures (as defined in Rule 30a-2(c) under the Act) are designed to ensure that information required to be disclosed by the Registrant is recorded, processed, summarized and reported by the filing Date, and that information required to be disclosed in the report is communicated to the Registrant’s management, as appropriate, to allow timely decisions regarding required disclosure.
b) There were no changes in the Registrant’s internal control over financial reporting as defined in Rule 30a-3(d) under the Act) that occurred during the Registrant’s last fiscal half-year that has materially affected, or is reasonably likely to materially affect, the Registrant’s internal control over financial reporting.
Item 12: Exhibits:
(a) The following exhibits are attached to this Form N-CSR:
(2) A separate certification for each principal executive and principal financial officer of the registrant as required by Rule 30a-2(a) under the Act (17 CFR 270.30a-2) (certification required by Section 302 of the Sarbanes-Oxley Act of 2002).
(b) Certification required by Rule 30a-2(b) under the Act (certification required by Section 906 of the Sarbanes-Oxley Act of 2002).
SIGNATURES
Pursuant to the requirements of the Securities Exchange Act of 1934 and the Investment Company Act of 1940, the registrant has duly caused this report to be signed on its behalf by the undersigned, thereunto duly authorized.
SIT MUTUAL FUNDS II, INC.
| | | | | | | | |
| By (Signature and Title) | | /s/ Paul E. Rasmussen Paul E. Rasmussen Vice President, Treasurer | | |
| | | |
| | | |
| Date November 26, 2014 | | | | | | | | |
Pursuant to the requirements of the Securities Exchange Act of 1934 and the Investment Company Act of 1940, this report has been signed below by the following persons on behalf of the registrant and in the capacities and on the dates indicated.
| | | | | | | | |
| By (Signature and Title) | | /s/ Paul E. Rasmussen Paul E. Rasmussen Vice President, Treasurer | | |
| Date November 26, 2014 | | | | | | | | |
| | |
| By (Signature and Title) | | /s/ Roger J. Sit Roger J. Sit Chairman | | |
| Date November 26, 2014 | | | | | | | | |