UNITED STATES SECURITIES AND EXCHANGE COMMISSION
Washington, D.C. 20549
FORM N-CSR
----------
CERTIFIED SHAREHOLDER REPORT OF REGISTERED
MANAGEMENT INVESTMENT COMPANIES
Investment Company Act file number: 811-04033
----------
Sit Mutual Funds II, Inc.
(Exact name of registrant as specified in charter)
3300 IDS Center
80 South Eighth Street
Minneapolis, MN 55402
(Address of principal executive offices)
Paul E. Rasmussen, VP Treasurer
Sit Mutual Funds, Inc.
3300 IDS Center
80 South Eighth Street
Minneapolis, MN 55402
(Name and address of agent for service)
Copy to:
Mike Radmer, Esq.
Dorsey & Whitney
Suite 1500
50 South Sixth Street
Minneapolis, MN 55402-1498
Registrant’s telephone number, including area code:
(612) 332-3223
Date of fiscal year end: March 31, 2017
Date of reporting period: September 30, 2016
Item 1: Reports to Stockholders
Semi-Annual Report
September 30, 2016
U.S. Government Securities Fund
Quality Income Fund
Tax-Free Income Fund
Minnesota Tax-Free Income Fund
Sit Mutual Funds
|
|
Sit Mutual Funds BOND FUNDS SEMI-ANNUAL REPORT TABLE OF CONTENTS |
This document must be preceded or accompanied by a Prospectus.
CHAIRMAN’S LETTER
November 2, 2016
Dear fellow shareholders:
During the six month period ended September 30, 2016, U.S. fixed-income markets exhibited modest trading volatility with positive overall performance. The 30-year U.S. Treasury bond yielded 2.32% at the close of September, which was down 29 basis points from March. Short Treasury yields exhibited very little net movement over the six month period, so nearly all curve flattening coincided with rates moving down on the long end of the curve.
All taxable sectors posted positive returns for the six months ending September 30, 2016. Corporate bonds were the best performing sector, with lower quality bonds outperforming their higher rated counterparts, demonstrating an increase in investor confidence and return to a risk-on environment. Government Agency mortgage-backed securities modestly outperformed benefitting from a period of relatively stable prepayment.
The tax-exempt yield curve underwent a more significant flattening, as short yields increased and long yields decreased. AAA-rated, 30-year general obligation bonds yielded 2.31% at the end of September, 38 basis points lower than six months prior. Municipal bond fund flows posted 52 consecutive weeks of inflows through the end of September. These strong, positive inflows have helped to absorb the robust level of issuance in 2016 which has totaled an estimated $335 billion through September (6% increase from 2015). The 2016 calendar year is on pace to end at just under $440 billion of total issuance, and may end up at the highest annual level on record. Refunding bonds have made up over half of municipal bond issuance in 2016 and refunding activity is expected to continue to be strong in the near term, even if rates continue to rise modestly.
While the dual mandate of full employment and stable inflation continue to be the core focus of Federal Reserve policy, attention to global financial conditions has become more integral to the discussion. Domestically, the United States seems to be faring better than its global counterparts. Labor markets in the U.S. continue to post steady gains with the unemployment rate consistently at or below the symbolic 5% rate, while many inflation metrics are near the Fed’s 2% target figure.
Globally, central banks continue to closely monitor sluggish economic conditions in their regions. The Bank of Japan announced they will shift focus from expanding the monetary base to focus more on yield curve control. They plan to target short-term rates while keeping the 10-year government bond near zero. The European Central Bank did not expand its asset purchase program or cut rates further into negative territory at their September meeting, however growth forecasts for Europe were downgraded slightly from 1.7% to 1.6% for both 2017 and 2018. While the United Kingdom appears to have weathered the initial shock of the Brexit vote (to exit the European Union), uncertainty remains around the path and economic implications the exit will have going forward.
The challenges globally have tempered optimism surrounding improvements in the domestic economy, leading to a continued cautious
approach on interest rates from the Fed. Though employment gains and inflation metrics are improving towards their long-term targets, the Federal Open Markets Committee (FOMC) left the Federal Funds rate unchanged (0.25% to 0.50%) at the recent September meeting. Three officials dissented from the September decision compared to just one dissent at the July meeting.
Strategy
We expect domestic economic activity to remain healthy enough to warrant the Federal Reserve increasing the Fed Funds rate before year-end; however we expect them to refrain from doing so until after the November elections. Globally, while the imminent threat of repercussions from Brexit has subsided, concerns remain about slow economic growth, political pressures and the stability of some financial institutions. Market participants continue to struggle with negative interest rates in Europe and Japan and the continuation of large scale asset purchase programs by central banks. We continue to strategically position portfolios defensively within the current environment while maintaining an emphasis on liquidity to optimize tactical trading opportunities.
The U.S. Government Fund is positioned defensively against rising interest rates, with a focus on seasoned, high coupon agency mortgages. The income and principal stability exhibited by these securities continues to be a fundamental focus of the fund. The Sit Quality Income Fund also maintains a defensive position for increases in short-term rates. The combination of high quality assets and short duration make it an attractive vehicle for cash management purposes.
The tax-exempt fixed income strategy employed in managing both the Tax-Free Income Fund and the Minnesota Tax-Free Income Fund will continue to focus heavily on the use of high coupon bonds and bonds structured with call, sinking fund and prepayment provisions that provide regular cash flow. We believe that our investment strategy’s focus on income, which we believe is the primary source of return over longer periods of time, will continue to deliver relatively high levels of income compared to our benchmarks. We continue to focus on sectors and security structures that provide incremental yield, while using diversification to help manage credit risk.
We appreciate your continued interest in the Sit family of funds.
With best wishes,

Roger J. Sit
Chairman and President Sit Mutual Funds
| | |
2 | | SIT MUTUAL FUNDS SEMI-ANNUAL REPORT |
[This page intentionally left blank.]
|
Sit U.S. Government Securities Fund |
OBJECTIVE & STRATEGY
The objective of the U.S. Government Securities Fund is to provide high current income and safety of principal, which it seeks to attain by investing solely in debt obligations issued, guaranteed or insured by the U.S. government or its agencies or its instrumentalities.
Agency mortgage securities and U.S. Treasury securities are the principal holdings in the Fund. The mortgage securities that the Fund purchases consist of pass-through securities including those issued by Government National Mortgage Association (GNMA), Federal National Mortgage Association (FNMA), and Federal Home Loan Mortgage Corporation (FHLMC).
The Sit U.S. Government Securities Fund provided a return of +0.91% during the 6-month period ending September 30, 2016, compared to the return of the Bloomberg Barclays Intermediate Government Bond Index of +1.00%. The Fund’s 30-day SEC yield was 2.08% and its 12-month distribution rate was 1.74%.
During the 6-month period, the Fund benefitted from the consistent high level of income provided by its position in higher coupon government agency mortgages. The Fund uses Treasury options to reduce interest rate risk. While these positions had minimal impact on the Fund’s performance, the options were successful in providing stability to the Fund’s net asset value over the period. Below benchmark exposure to intermediate term Treasury bonds caused the Fund to underperform the benchmark as these bonds outperformed during the period. Short term interest rates rose modestly while intermediate and long term interest rates declined as the Federal Reserve delayed raising the Fed Funds rate. The market was anticipating several rate hikes at the beginning of the year, but only one rate hike by year-end is currently expected. This is primarily due to lower growth expectations both domestically and abroad. Uncertainty with respect to the timing and magnitude of future rate increases has resulted in significant volatility in bond prices. The use of options should continue to lessen the impact on the Fund’s net asset value.
As the Federal Reserve normalizes monetary policy by increasing the Fed Funds rate, we expect short term interest rates to continue to move higher, while longer term rates stay range bound. Below average long-term economic growth, low inflation expectations, and central banks abroad aggressively pursuing accommodative policies will likely prevent long-term interest rates from moving significantly higher, resulting in a flattening of the yield curve. The Fund’s high coupon mortgages should continue to produce an income advantage in this environment as prepayments are likely to remain stable or potentially slow.
We continue to position the Fund defensively against rising short-term interest rates. We continue to focus on seasoned, high coupon
HYPOTHETICAL GROWTH OF $10,000
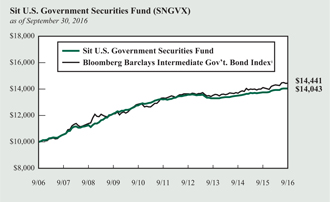
The chart above illustrates the total value of a hypothetical $10,000 investment in the Fund over the past 10 years (or for the life of the Fund if shorter) as compared to the performance of the Bloomberg Barclays Intermediate Government Bond Index. Past performance does not guarantee future results. Returns include the reinvestment of distributions. The chart does not reflect the deduction of taxes that a shareholder would pay on Fund distributions or the redemption of Fund shares.
1 The Bloomberg Barclays Intermediate Government Bond Index is a sub-index of the Bloomberg Barclays Government Bond Index covering issues with remaining maturities of between three and five years. The Bloomberg Barclays Government Bond Index is an index that measures the performance of all public U.S. government obligations with remaining maturities of one year or more. The returns include the reinvestment of income and do not include any transaction costs, management fees or other costs. It is not possible to invest directly in an index. This is the Fund’s primary index.
agency mortgage securities, as they provide a high level of income with relatively stable prices. This high level of income and stability of principal has been a fundamental focus of the Fund since its inception.
Michael C. Brilley Bryce A. Doty, CFA
Senior Portfolio Managers
Mark H. Book, CFA
Portfolio Manager
| | |
4 | | SIT MUTUAL FUNDS SEMI-ANNUAL REPORT |
COMPARATIVE RATES OF RETURNS
as of September 30, 2016
| | | | | | | | | | | | | | | |
| | | Sit U.S. | | Bloomberg | | Lipper |
| | | Government | | Barclays | | U.S. |
| | | Securities | | Inter. Gov’t | | Gov’t Fund |
| | | Fund | | Bond Index1 | | Index2 |
Six Months | | 0.91% | | 1.00% | | n/a |
One Year | | 2.13 | | 2.44 | | 3.56% |
Five Years | | 1.22 | | 1.62 | | 2.14 |
Ten Years | | 3.45 | | 3.74 | | 4.15 |
Since Inception (6/2/87) | | 5.54 | | 5.76 | | 5.63 |
Performance figures are historical and do not guarantee future results. Investment returns and principal value will vary, and you may have a gain or loss when you sell shares. Current performance may be lower or higher than the performance data quoted. Contact the Fund for performance data current to the most recent month-end. Returns include changes in share price as well as reinvestment of all dividends and capital gains and all fee waivers. Without the fee waivers total return and yield figures would have been lower. Returns do not reflect the deduction of taxes that a shareholder would pay on Fund distributions or the redemption of Fund shares. Management fees and administrative expenses are included in the Fund’s performance. Returns for periods greater than one year are compounded average annual rates of return.
1 The Bloomberg Barclays Intermediate Government Bond Index is a sub-index of the Bloomberg Barclays Government Bond Index covering issues with remaining maturities of between three and five years. The Bloomberg Barclays Government Bond Index is an index that measures the performance of all public U.S. government obligations with remaining maturities of one year or more. The returns include the reinvestment of income and do not include any transaction costs, management fees or other costs. It is not possible to invest directly in an index.
2 The Lipper returns are obtained from Lipper Analytical Services, Inc., a large independent evaluator of mutual funds.
FUND DIVERSIFICATION
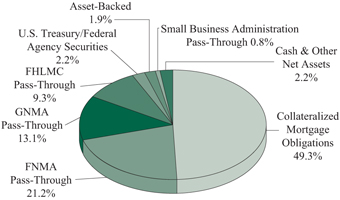
Based on total net assets as of September 30, 2016. Subject to change.
PORTFOLIO SUMMARY
| | | | |
Net Asset Value 9/30/16: | | $11.08 Per Share |
Net Asset Value 3/31/16: | | $11.07 Per Share |
Total Net Assets: | | $694.6 Million |
Effective Duration3: | | 1.4 Years |
3 Duration is a measure of estimated price sensitivity relative to changes in interest rates. Portfolios with longer durations are typically more sensitive to changes in interest rates. For example, if interest rates rise by 1%, the fair value of a security with an effective duration of 5 years would decrease by 5%, with all other factors being constant. The correlation between duration and price sensitivity is greater for securities rated investment-grade than it is for securities rated below investment-grade. Duration estimates are based on assumptions by the Adviser and are subject to a number of limitations. Effective duration is calculated based on historical price changes of securities held by the Fund, and therefore is a more accurate estimate of price sensitivity provided interest rates remain within their historical range.
ESTIMATED AVERAGE LIFE
| | | | |
| |
0-1 Year | | | 2.2% | |
1-5 Years | | | 95.2% | |
5-10 Years | | | 0.4% | |
10-20 Years | | | 0.7% | |
20+ Years | | | 1.5% | |
The table represents the Adviser’s estimates of the dollar weighted average life of the portfolio’s securities, which differ from their stated maturities. The Fund’s average stated maturity was 19.7 years as of September 30, 2016.
SCHEDULE OF INVESTMENTS (Unaudited)
September 30, 2016
Sit U.S. Government Securities Fund
| | | | | | | | | | | | |
| |
| | | | |
| Principal | | Coupon Rate | | | | | | | | |
| Amount ($) | | (%) | | Maturity Date | | | | | Fair Value ($) | |
| |
|
Mortgage Pass-Through Securities - 44.4% | |
Federal Home Loan Mortgage Corporation - 9.3% | |
| 371,952 | | 4.00 | | | 7/1/25 | | | | | | 394,695 | |
| 3,625,956 | | 5.00 | | | 5/1/42-9/1/43 | | | | | | 4,120,810 | |
| 211,752 | | 5.82 | | | 10/1/37 | | | | | | 239,986 | |
| 2,288,961 | | 6.00 | | | 7/1/38 | | | | | | 2,654,979 | |
| 50,414 | | 6.38 | | | 12/1/26-12/1/27 | | | | | | 57,556 | |
| 8,956,158 | | 6.50 | | | 11/1/27-11/1/38 | | | | | | 10,434,560 | |
| 346,293 | | 6.88 | | | 2/17/31 | | | | | | 408,503 | |
| 34,875,424 | | 7.00 | | | 8/1/27-3/1/39 | | | | | | 41,224,736 | |
| 49,106 | | 7.38 | | | 12/17/24 | | | | | | 54,165 | |
| 1,431,603 | | 7.50 | | | 1/1/31-10/1/38 | | | | | | 1,641,886 | |
| 65,058 | | 7.95 | | | 10/1/25-11/1/25 | | | | | | 65,711 | |
| 544,772 | | 8.00 | | | 5/1/31-1/1/37 | | | | | | 636,552 | |
| 1,770 | | 8.25 | | | 12/1/17 | | | | | | 1,774 | |
| 982,743 | | 8.50 | | | 10/1/19-3/1/31 | | | | | | 1,130,162 | |
| 777,206 | | 9.00 | | | 11/1/25-5/1/31 | | | | | | 839,128 | |
| 6,362 | | 9.25 | | | 2/1/18 | | | | | | 6,382 | |
| 121,803 | | 9.50 | | | 12/17/21 | | | | | | 127,847 | |
| 452,595 | | 10.00 | | | 9/1/20-7/1/30 | | | | | | 468,542 | |
| 27,507 | | 10.50 | | | 6/1/19 | | | | | | 29,328 | |
| 18,096 | | 11.00 | | | 8/25/20 | | | | | | 18,269 | |
| | | | | | | | | | | | |
| | | | |
| | | | | | | | | | | 64,555,571 | |
| | | | | | | | | | | | |
Federal National Mortgage Association - 21.2% | |
| 1,562 | | 2.95 | | | 3/1/19 | | | 1 | | | 1,613 | |
| 1,777,740 | | 5.50 | | | 12/1/32-6/1/33 | | | | | | 1,976,043 | |
| 740,126 | | 5.61 | | | 11/1/22 | | | | | | 740,374 | |
| 4,673,410 | | 5.69 | | | 10/1/48 | | | | | | 5,339,882 | |
| 1,014,633 | | 5.93 | | | 5/1/35 | | | | | | 1,223,818 | |
| 2,934,805 | | 5.96 | | | 6/1/28 | | | | | | 3,487,049 | |
| 12,754,206 | | 6.00 | | | 9/1/28-3/1/41 | | | | | | 14,690,017 | |
| 3,848,088 | | 6.14 | | | 11/1/43 | | | | | | 4,406,941 | |
| 451,171 | | 6.15 | | | 6/1/33 | | | 1 | | | 514,913 | |
| 45,886,679 | | 6.50 | | | 1/1/22-6/1/40 | | | | | | 53,644,157 | |
| 1,900,640 | | 6.75 | | | 6/1/32 | | | | | | 2,308,347 | |
| 2,130,446 | | 6.89 | | | 6/1/40 | | | | | | 2,458,796 | |
| 60,206 | | 6.95 | | | 8/1/21 | | | 1 | | | 60,124 | |
| 35,845,203 | | 7.00 | | | 6/1/17-9/1/47 | | | | | | 42,682,226 | |
| 4,231,265 | | 7.50 | | | 6/1/22-2/1/38 | | | | | | 5,061,401 | |
| 43,888 | | 7.69 | | | 7/20/30 | | | | | | 47,379 | |
| 2,237,864 | | 8.00 | | | 10/1/23-3/1/38 | | | | | | 2,637,145 | |
| 15,310 | | 8.06 | | | 7/20/28 | | | | | | 15,530 | |
| 185,117 | | 8.09 | | | 11/15/31 | | | | | | 218,212 | |
| 48,864 | | 8.33 | | | 7/15/20 | | | | | | 52,391 | |
| 2,324,673 | | 8.50 | | | 7/1/26-1/1/37 | | | | | | 2,764,005 | |
| 1,030,371 | | 9.00 | | | 9/1/24-2/1/38 | | | | | | 1,183,041 | |
| 44,601 | | 9.12 | | | 5/15/28 | | | | | | 49,348 | |
| 18,831 | | 9.18 | | | 3/15/22 | | | | | | 19,168 | |
| 809,500 | | 9.50 | | | 3/1/20-8/1/31 | | | | | | 932,775 | |
| 133,037 | | 9.60 | | | 8/20/25 | | | | | | 145,334 | |
| 346,363 | | 10.00 | | | 2/1/28-6/1/30 | | | | | | 407,628 | |
| | | | | | | | | | | | |
| |
| | | | |
| Principal | | Coupon Rate | | | | | | | | |
| Amount ($) | | (%) | | Maturity Date | | | | | Fair Value ($) | |
| |
| | | | |
| 5,323 | | 10.05 | | | 8/15/20 | | | | | | 5,424 | |
| 5,291 | | 10.47 | | | 7/15/20 | | | | | | 5,392 | |
| 30,636 | | 10.50 | | | 6/1/28 | | | | | | 31,783 | |
| | | | | | | | | | | | |
| | | | |
| | | | | | | | | | | 147,110,256 | |
| | | | | | | | | | | | |
Government National Mortgage Association - 13.1% | |
| 17,254,297 | | 4.00 | | | 12/15/24-12/20/31 | | | | | | 18,636,188 | |
| 2,081,525 | | 4.25 | | | 10/20/31-3/20/37 | | | | | | 2,262,593 | |
| 3,104,560 | | 4.75 | | | 9/20/31 | | | | | | 3,416,235 | |
| 1,953,353 | | 5.50 | | | 9/15/25-5/15/29 | | | | | | 2,219,742 | |
| 5,426,131 | | 5.75 | | | 2/15/29-10/20/31 | | | | | | 6,204,955 | |
| 1,407,716 | | 6.00 | | | 6/15/23-11/20/34 | | | | | | 1,609,217 | |
| 292,405 | | 6.20 | | | 3/15/32 | | | | | | 338,769 | |
| 1,505,236 | | 6.25 | | | 12/15/23-4/15/29 | | | | | | 1,739,832 | |
| 407,517 | | 6.35 | | | 4/20/30-6/20/31 | | | | | | 466,975 | |
| 237,924 | | 6.38 | | | 8/15/26-4/15/28 | | | | | | 273,774 | |
| 21,047,362 | | 6.50 | | | 11/15/23-4/20/43 | | | | | | 24,782,592 | |
| 316,741 | | 6.91 | | | 7/20/26-2/20/27 | | | | | | 348,285 | |
| 23,005,052 | | 7.00 | | | 5/15/24-1/20/39 | | | | | | 27,303,078 | |
| 116,356 | | 7.02 | | | 4/20/26 | | | | | | 123,770 | |
| 200,092 | | 7.10 | | | 5/20/25 | | | | | | 217,521 | |
| 114,286 | | 7.15 | | | 4/20/27 | | | | | | 122,010 | |
| 351,665 | | 7.50 | | | 1/20/38-3/15/39 | | | | | | 397,460 | |
| 416,705 | | 8.00 | | | 6/20/31 | | | | | | 529,800 | |
| | | | | | | | | | | | |
| | | | |
| | | | | | | | | | | 90,992,796 | |
| | | | | | | | | | | | |
|
Small Business Administration - 0.8% | |
| 4,981,065 | | 5.33 | | | 8/25/36-9/25/36 | | | | | | 5,532,644 | |
| | | | | | | | | | | | |
| | |
Total Mortgage Pass-Through Securities
(cost: $300,405,726) | | | | | | 308,191,267 | |
| | | | | | | | | | | | |
|
U.S. Treasury / Federal Agency Securities - 2.2% | |
| 6,000,000 | | 1.60 | | | 11/15/26 | | | 6 | | | 5,082,294 | |
| 19,700,000 | | 2.81 | | | 5/15/44 | | | 6 | | | 10,157,025 | |
| | | | | | | | | | | | |
| | |
Total U.S. Treasury / Federal Agency Securities
(cost: $14,095,656) | | | | | | 15,239,319 | |
| | | | | | | | | | | | |
|
Collateralized Mortgage Obligations - 49.3% | |
Federal Home Loan Mortgage Corporation - 14.4% | |
| 819,902 | | 5.00 | | | 2/15/23 | | | | | | 898,727 | |
| 2,592,697 | | 5.89 | | | 7/25/32 | | | 1 | | | 2,956,497 | |
| 7,870,858 | | 6.00 | | | 9/15/21-6/15/37 | | | | | | 8,983,364 | |
| 1,793,205 | | 6.00 | | | 1/15/33-9/15/36 | | | | | | 2,199,752 | |
| 72,960 | | 6.25 | | | 5/15/29 | | | | | | 79,904 | |
| 9,083,914 | | 6.50 | | | 12/15/21-8/15/45 | | | | | | 10,992,812 | |
| 18,839,924 | | 6.50 | | | 9/15/23-10/25/43 | | | 1 | | | 22,222,848 | |
| 52,798 | | 6.70 | | | 9/15/23 | | | | | | 59,245 | |
| 307,416 | | 6.95 | | | 3/15/28 | | | | | | 351,136 | |
| 29,359,835 | | 7.00 | | | 12/15/20-9/25/43 | | | | | | 33,036,925 | |
| 10,591,342 | | 7.50 | | | 10/15/21-9/25/43 | | | | | | 12,538,613 | |
| 1,836,199 | | 7.50 | | | 12/15/29-8/25/42 | | | 1 | | | 2,235,520 | |
| 2,191,192 | | 8.00 | | | 7/15/21-1/15/30 | | | | | | 2,513,996 | |
| 25,132 | | 8.25 | | | 6/15/22 | | | | | | 27,890 | |
| 103,521 | | 8.30 | | | 11/15/20 | | | | | | 112,488 | |
See accompanying notes to financial statements.
| | |
6 | | SIT MUTUAL FUNDS SEMI-ANNUAL REPORT |
| | | | | | | | | | | | |
| |
| | | | |
| Principal | | Coupon Rate | | | | | | | | |
| Amount ($) | | (%) | | Maturity Date | | | | | Fair Value ($) | |
| |
| | | | |
| 325,156 | | 8.50 | | | 10/15/22-3/15/32 | | | | | | 372,930 | |
| 46,077 | | 9.00 | | | 12/15/19 | | | | | | 47,985 | |
| 2,632 | | 9.15 | | | 10/15/20 | | | | | | 2,779 | |
| 65,295 | | 9.50 | | | 2/15/20 | | | | | | 68,958 | |
| | | | | | | | | | | | |
| | | | |
| | | | | | | | | | | 99,702,369 | |
| | | | | | | | | | | | |
Federal National Mortgage Association - 22.2% | |
| 472,284 | | 4.55 | | | 6/25/43 | | | | | | 515,798 | |
| 5,779,011 | | 5.50 | | | 6/25/33-6/25/40 | | | | | | 6,733,623 | |
| 2,238,392 | | 5.60 | | | 12/25/53 | | | 1 | | | 2,572,635 | |
| 1,483,490 | | 5.81 | | | 8/25/43 | | | | | | 1,724,287 | |
| 5,666,425 | | 6.00 | | | 5/25/35-5/25/36 | | | | | | 6,670,039 | |
| 2,533,607 | | 6.00 | | | 7/25/36 | | | | | | 2,905,665 | |
| 2,650,386 | | 6.05 | | | 2/25/44 | | | | | | 3,125,693 | |
| 3,179,674 | | 6.19 | | | 2/25/42 | | | 1 | | | 3,751,637 | |
| 475,594 | | 6.24 | | | 12/25/42 | | | 1 | | | 553,816 | |
| 2,602,433 | | 6.27 | | | 10/25/42 | | | 1 | | | 2,981,272 | |
| 2,141,564 | | 6.35 | | | 8/25/47 | | | 1 | | | 2,440,175 | |
| 1,015,904 | | 6.41 | | | 9/25/37 | | | 1 | | | 1,124,804 | |
| 12,903,074 | | 6.50 | | | 8/20/28-11/25/42 | | | | | | 14,508,519 | |
| 13,400,316 | | 6.50 | | | 6/25/32-7/25/44 | | | | | | 15,417,152 | |
| 603,057 | | 6.70 | | | 2/25/45 | | | 1 | | | 711,917 | |
| 8,438,126 | | 6.75 | | | 6/25/32-4/25/37 | | | | | | 9,577,089 | |
| 74,309 | | 6.85 | | | 12/18/27 | | | | | | 85,815 | |
| 962,987 | | 6.91 | | | 8/25/37 | | | 1 | | | 1,054,427 | |
| 18,796,239 | | 7.00 | | | 1/25/21-3/25/45 | | | | | | 22,157,398 | |
| 1,441,039 | | 7.00 | | | 4/25/24 | | | | | | 1,599,038 | |
| 34,152,508 | | 7.50 | | | 8/20/27-1/25/48 | | | 1 | | | 41,499,578 | |
| 986,841 | | 8.00 | | | 7/25/22-7/25/44 | | | | | | 1,135,746 | |
| 811,022 | | 8.13 | | | 11/25/37 | | | 1 | | | 984,020 | |
| 479,748 | | 8.23 | | | 11/25/37 | | | 1 | | | 550,841 | |
| 993,505 | | 8.50 | | | 1/25/21-6/25/30 | | | | | | 1,171,029 | |
| 46,496 | | 8.68 | | | 10/25/42 | | | 1 | | | 57,486 | |
| 17,210 | | 8.70 | | | 12/25/19 | | | | | | 18,501 | |
| 4,637 | | 8.75 | | | 9/25/20 | | | | | | 5,047 | |
| 27,622 | | 8.95 | | | 10/25/20 | | | | | | 29,938 | |
| 1,358,294 | | 9.00 | | | 7/25/19-10/25/30 | | | | | | 1,580,200 | |
| 3,694 | | 9.05 | | | 12/25/18 | | | | | | 3,756 | |
| 13,561 | | 9.25 | | | 1/25/20 | | | | | | 14,454 | |
| 389,164 | | 9.33 | | | 6/25/32 | | | 1 | | | 436,419 | |
| 621,062 | | 9.50 | | | 12/25/18-12/25/41 | | | | | | 732,999 | |
| 59,325 | | 9.60 | | | 3/25/20 | | | | | | 64,260 | |
| 3,914,715 | | 9.91 | | | 7/25/37-9/25/42 | | | 1 | | | 4,484,980 | |
| 769,669 | | 10.76 | | | 6/25/44 | | | 1 | | | 927,088 | |
| 58,482 | | 15.04 | | | 3/25/39 | | | 1 | | | 81,313 | |
| | | | | | | | | | | | |
| | | | |
| | | | | | | | | | | 153,988,454 | |
| | | | | | | | | | | | |
|
Government National Mortgage Association - 10.2% | |
| 500,000 | | 5.50 | | | 9/20/39 | | | | | | 610,260 | |
| 4,691,919 | | 5.51 | | | 11/20/45 | | | 1 | | | 5,307,097 | |
| 11,792,518 | | 5.62 | | | 4/20/40 | | | 1 | | | 13,578,771 | |
| 2,303,194 | | 5.87 | | | 11/20/43 | | | | | | 2,607,986 | |
| 3,904,000 | | 6.00 | | | 11/20/33 | | | | | | 4,519,747 | |
| | | | | | | | | | | | |
| |
| | | | |
| Principal | | Coupon Rate | | | | | | | | |
| Amount ($) | | (%) | | Maturity Date | | | | | Fair Value ($) | |
| |
| | | | |
| 4,213,368 | | 6.00 | | | 6/20/43-2/20/46 | | | | | | 4,820,972 | |
| 2,386,161 | | 6.13 | | | 1/20/39 | | | 1 | | | 2,800,187 | |
| 1,800,539 | | 6.25 | | | 10/20/40 | | | 1 | | | 2,065,354 | |
| 2,847,018 | | 6.28 | | | 12/20/42 | | | 1 | | | 3,397,654 | |
| 4,219,045 | | 6.30 | | | 12/20/40 | | | 1 | | | 4,863,269 | |
| 2,625,361 | | 6.38 | | | 5/20/43 | | | 1 | | | 3,060,697 | |
| 2,886,565 | | 6.50 | | | 6/20/32-2/20/37 | | | | | | 3,387,733 | |
| 1,208,639 | | 6.66 | | | 9/20/44 | | | 1 | | | 1,425,604 | |
| 898,090 | | 6.70 | | | 4/20/39 | | | 1 | | | 1,061,636 | |
| 176,548 | | 6.86 | | | 3/16/41 | | | 1 | | | 195,010 | |
| 2,514,714 | | 6.90 | | | 8/20/40 | | | 1 | | | 2,996,071 | |
| 1,215,363 | | 6.98 | | | 6/20/45 | | | 1 | | | 1,423,291 | |
| 3,498,859 | | 7.00 | | | 9/16/23-5/20/42 | | | | | | 3,743,975 | |
| 620,468 | | 7.17 | | | 12/20/33 | | | 1 | | | 738,728 | |
| 3,301,959 | | 7.37 | | | 8/20/38 | | | | | | 3,969,175 | |
| 91,400 | | 7.50 | | | 5/16/27 | | | | | | 104,978 | |
| 2,307,677 | | 7.54 | | | 7/20/44 | | | 1 | | | 2,692,338 | |
| 28,494 | | 8.50 | | | 2/20/32 | | | | | | 35,090 | |
| 1,366,153 | | 9.00 | | | 3/16/30 | | | | | | 1,658,808 | |
| | | | | | | | | | | | |
| | | | |
| | | | | | | | | | | 71,064,431 | |
| | | | | | | | | | | | |
|
Vendee Mortgage Trust - 2.5% | |
| 3,849,408 | | 6.50 | | | 8/15/31 | | | | | | 4,513,442 | |
| 1,908,507 | | 6.50 | | | 10/15/31 | | | | | | 2,296,121 | |
| 1,669,526 | | 6.75 | | | 2/15/26 | | | | | | 1,932,051 | |
| 1,731,965 | | 7.00 | | | 3/15/28 | | | | | | 2,078,521 | |
| 1,005,234 | | 7.25 | | | 9/15/22-9/15/25 | | | | | | 1,131,861 | |
| 2,984,378 | | 7.46 | | | 3/15/25 | | | 1 | | | 3,450,055 | |
| 1,555,067 | | 7.75 | | | 5/15/22-9/15/24 | | | | | | 1,770,702 | |
| 299,153 | | 8.00 | | | 2/15/25 | | | | | | 348,896 | |
| 156,071 | | 8.29 | | | 12/15/26 | | | | | | 187,593 | |
| | | | | | | | | | | | |
| | | | |
| | | | | | | | | | | 17,709,242 | |
| | | | | | | | | | | | |
| | |
Total Collateralized Mortgage Obligations
(cost: $334,539,584) | | | | | | 342,464,496 | |
| | | | | | | | | | | | |
|
Asset-Backed Securities - 1.9% | |
Federal Home Loan Mortgage Corporation - 0.3% | |
| 1,450 | | 6.09 | | | 9/25/29 | | | 1 | | | 1,448 | |
| 192,767 | | 6.28 | | | 10/27/31 | | | 14 | | | 220,054 | |
| 1,881,547 | | 7.16 | | | 7/25/29 | | | | | | 2,128,786 | |
| | | | | | | | | | | | |
| | | | |
| | | | | | | | | | | 2,350,288 | |
| | | | | | | | | | | | |
|
Federal National Mortgage Association - 0.5% | |
| 27,290 | | 0.87 | | | 11/25/32 | | | 1 | | | 26,669 | |
| 287,525 | | 4.75 | | | 10/25/33 | | | 14 | | | 309,868 | |
| 370,579 | | 4.99 | | | 9/26/33 | | | 14 | | | 418,379 | |
| 1,896,860 | | 5.68 | | | 2/25/33 | | | 14 | | | 2,104,760 | |
| 7,594 | | 6.47 | | | 10/25/31 | | | 14 | | | 7,698 | |
| 518,779 | | 6.59 | | | 10/25/31 | | | 14 | | | 563,077 | |
| 76,369 | | 6.64 | | | 5/25/32 | | | 1 | | | 79,811 | |
See accompanying notes to financial statements.
SCHEDULE OF INVESTMENTS (Unaudited)
September 30, 2016
Sit U.S. Government Securities Fund (Continued)
| | | | | | | | | | | | | | |
| |
| | | | |
| Principal | | Coupon Rate | | | | | | | | | |
| Amount ($) | | (%) | | Maturity Date | | | | | | Fair Value ($) | |
| |
| | | | |
| 2,508 | | 6.83 | | | 7/25/31 | 14 | | | | | | | 2,564 | |
| 11,844 | | 7.80 | | | 6/25/26 | 1 | | | | | | | 11,722 | |
| | | | |
| | | | | | | | | | | | | 3,524,548 | |
|
Small Business Administration - 1.1% | |
| 4,223,322 | | 5.87 | | | 7/1/28 | | | | | | | | 4,788,055 | |
| 955,120 | | 7.13 | | | 10/1/20 | | | | | | | | 1,002,228 | |
| 1,008,587 | | 7.33 | | | 8/1/20 | | | | | | | | 1,061,098 | |
| 576,331 | | 8.03 | | | 5/1/20 | | | | | | | | 607,769 | |
| | | | |
| | | | | | | | | | | | | 7,459,150 | |
| | |
Total Asset-Backed Securities
(cost: $12,998,250) | | | | | | | | 13,333,986 | |
|
Short-Term Securities - 0.3% | |
| 2,332,726 | | Fidelity Instl. Money Mkt. Govt. Fund, 0.27% | | | | | | | | | |
Total Short-Term Securities
(cost: $2,332,726) | | | | | | | | 2,332,726 | |
Total Investments in Securities - 98.1%
(cost: $664,371,942) | | | | | | | | 681,561,794 | |
Call Options Written 10 - (0.8%) | |
| (1,350) | | U.S. Treasury 2 Year Future | | | | | | | | | |
| | Call Options: $108.25 strike | | | | | | | | | |
| | December 2016 expiration | | | | | | | | (2,678,906 | ) |
| (875) | | U.S. Treasury 2 Year Future | | | | | | | | | |
| | Call Options: $108.38 strike | | | | | | | | | |
| | November 2016 expiration | | | | | | | | (1,503,906 | ) |
| (285) | | U.S. Treasury 5 Year Future | | | | | | | | | |
| | Call Options: $118.25 strike | | | | | | | | | |
| | December 2016 expiration | | | | | | | | (937,383 | ) |
| (340) | | U.S. Treasury 5 Year Future | | | | | | | | | |
| | Call Options: $119.00 strike | | | | | | | | | |
| | November 2016 expiration | | | | | | | | (857,969 | ) |
| | |
Total Call Options Written
(premiums received: $5,889,888) | | | | | | | | (5,978,164 | ) |
| | |
Other Assets and Liabilities, net - 2.7% | | | | | | | | 19,006,897 | |
| | |
Total Net Assets - 100.0% | | | | | | | $ | 694,590,527 | |
| 1 | | Variable rate security. Rate disclosed is as of September 30, 2016. |
| 6 | | Zero coupon or convertible capital appreciation bond, for which the rate disclosed is either the effective yield on purchase date or the coupon rate to be paid upon conversion to coupon paying, respectively. |
| 10 | | The amount of $14,000,000 in cash was segregated with the broker to cover margin requirements for derivative transactions as of September 30, 2016. |
| 14 | | Step Coupon: A bond that pays an initial coupon rate for the first period and then a higher coupon rate for the following periods. Rate disclosed is as of September 30, 2016. |
Numeric footnotes not disclosed are not applicable to this Schedule of Investments.
See accompanying notes to financial statements.
| | |
8 | | SIT MUTUAL FUNDS SEMI-ANNUAL REPORT |
For a detailed list of security holdings, refer to our company website at www.sitfunds.com.
A summary of the levels for the Fund’s investments as of September 30, 2016 is as follows (see Note 2 - significant accounting policies in the notes to financial statements):
| | | | | | | | | | | | | | | | |
| | | Investment in Securities | |
| | | Level 1 | | | Level 2 | | | Level 3 | | | | |
| | | Quoted | | | Other significant | | | Significant | | | | |
| | | Price ($) | | | observable inputs ($) | | | unobservable inputs ($) | | | Total ($) | |
Assets | | | | | | | | | | | | | | | | |
Mortgage Pass-Through Securities | | | — | | | | 308,191,267 | | | | — | | | | 308,191,267 | |
U.S. Treasury / Federal Agency Securities | | | — | | | | 15,239,319 | | | | — | | | | 15,239,319 | |
Collateralized Mortgage Obligations | | | — | | | | 342,464,496 | | | | — | | | | 342,464,496 | |
Asset-Backed Securities | | | — | | | | 13,333,986 | | | | — | | | | 13,333,986 | |
Short-Term Securities | | | 2,332,726 | | | | — | | | | — | | | | 2,332,726 | |
| | | | |
| | | 2,332,726 | | | | 679,229,068 | | | | — | | | | 681,561,794 | |
Liabilities | | | | | | | | | | | | | | | | |
Call Options Written | | | (5,978,164 | ) | | | — | | | | — | | | | (5,978,164 | ) |
For the reporting period, there were no transfers between levels 1, 2 and 3.
See accompanying notes to financial statements.
OBJECTIVE & STRATEGY
The objective of the Quality Income Fund is to provide high current income and safety of principal, which it seeks to attain by investing at least 80% of its assets in debt securities issued by the U.S. government and its agencies, debt securities issued by corporations, mortgage and other asset-backed securities. The Fund invests at least 50% of its assets in U.S. government debt securities, which are securities issued, guaranteed or insured by the U.S. government, its agencies or instrumentalities.
The Sit Quality Income Fund provided a return of +0.77% during the 6-month period ended September 30, 2016, compared to the return of the Bloomberg Barclays 1-3 year Government/Credit Bond Index of +0.69%. The Fund’s 30-day SEC yield was 1.16% and its 12-month distribution rate was 0.93%.
The primary goal of the Fund is to maintain a high credit quality portfolio with stable principal values, while generating a relatively high level of income. During the period, the Fund benefitted from the income advantage produced by its holdings in non-agency residential mortgage, corporate, and taxable municipal securities. Non-agency residential mortgages outperformed as higher home prices increased demand for these securities. Corporate bonds outperformed as spreads tightened (yields decreased relative to treasuries) during the period, with lower quality bonds outperforming by more. Taxable municipal securities also outperformed as higher tax revenues resulted in better balance sheets for many municipalities. Treasury yields ended the period little changed despite seeing a bit of volatility in the form of both higher rates (into the end of May) and lower rates (into the end of June) during the six months. For the six months, Treasury securities detracted from performance, as did the Treasury futures and options used for duration management. This is typical during periods of stable or declining interest rates, which was the case for much of the 6-month period.
Looking forward, we expect continued gains in employment and modest economic growth. We believe these factors make it more likely that the Federal Reserve may increase short-term rates in December 2016. This will likely cause the yield curve to flatten further, as short term yields are more correlated with the Fed Funds rate than are longer term yields. We have positioned the Fund defensively, in both credit quality and interest rate sensitivity to maximize return potential while preserving income. We focus on a mix of Treasury, agency and credit sectors that provide relatively high levels of income and stable prices.
| | |
Michael C. Brilley | | Mark H. Book, CFA |
Bryce A. Doty, CFA | | Chris M. Rasmussen, CFA |
Senior Portfolio Managers | | Portfolio Managers |
HYPOTHETICAL GROWTH OF $10,000
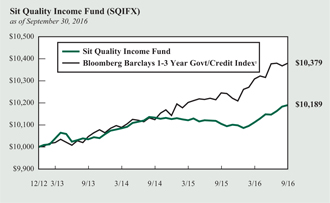
The chart above illustrates the total value of a hypothetical $10,000 investment in the Fund over the past 10 years (or for the life of the Fund if shorter) as compared to the performance of the Bloomberg Barclays 1-3 Year Government/Credit Index. Past performance does not guarantee future results. Returns include the reinvestment of distributions. The chart does not reflect the deduction of taxes that a shareholder would pay on Fund distributions or the redemption of Fund shares.
1 The Bloomberg Barclays 1-3 Year Government/Credit Index is an unmanaged index of Treasury or government agency securities and investment grade corporate debt securities with maturities of one to three years. The returns include the reinvestment of income and do not include any transaction costs, management fees or other costs. It is not possible to invest directly in an index.
| | |
10 | | SIT MUTUAL FUNDS SEMI-ANNUAL REPORT |
COMPARATIVE RATES OF RETURNS
as of September 30, 2016
| | | | | | | | | | | | | | | |
| | | Sit Quality
Income Fund | | Bloomberg
Barclays 1-3 Year
Government/Credit
Index1 | | Lipper
Short
Investment
Grade Bond
Index2 |
Six Months | | | | 0.77% | | | | | 0.69% | | | | | n/a | |
One Year | | | | 0.83 | | | | | 1.31 | | | | | 2.06 | % |
Since Inception (12/31/12) | | | | 0.50 | | | | | 1.00 | | | | | 1.20 | |
Performance figures are historical and do not guarantee future results. Investment returns and principal value will vary, and you may have a gain or loss when you sell shares. Current performance may be lower or higher than the performance data quoted. Contact the Fund for performance data current to the most recent month-end. Returns include changes in share price as well as reinvestment of all dividends and capital gains and all fee waivers. Without the fee waivers total return and yield figures would have been lower. Returns do not reflect the deduction of taxes that a shareholder would pay on Fund distributions or the redemption of Fund shares. Management fees and administrative expenses are included in the Fund’s performance. Returns for the periods greater than one year are compounded average annual rates of return.
1 The Bloomberg Barclays 1-3 Year Government/Credit Index is an unmanaged index of Treasury or government agency securities and investment grade corporate debt securities with maturities of one to three years. The returns include the reinvestment of income and do not include any transaction costs, management fees or other costs. It is not possible to invest directly in an index.
2 The Lipper returns are obtained from Lipper Analytical Services, Inc., a large independent evaluator of mutual funds.
FUND DIVERSIFICATION
| | | | |
| |
U.S. Treasury/Federal Agency Securities | | | 33.2% | |
Corporate Bonds | | | 16.0% | |
Mortgage Pass-Through (Agency) | | | 15.1% | |
Asset Backed (Non-Agency) | | | 14.6% | |
Taxable Municipal Bonds | | | 11.3% | |
Collateralized Mortgage Obligations (Non-Agency) | | | 7.6% | |
Other Net Assets | | | 2.2% | |
Based on total net assets as of September 30, 2016. Subject to change.
PORTFOLIO SUMMARY
| | |
Net Asset Value 9/30/16: | | $9.86 Per Share |
Net Asset Value 3/31/16: | | $9.83 Per Share |
Total Net Assets: | | $65.6 Million |
Average Maturity: | | 6.6 Years |
Effective Duration3: | | 1.0 Years |
3 Duration is a measure of estimated price sensitivity relative to changes in interest rates. Portfolios with longer durations are typically more sensitive to changes in interest rates. For example, if interest rates rise by 1%, the fair value of a security with an effective duration of 5 years would decrease by 5%, with all other factors being constant. The correlation between duration and price sensitivity is greater for securities rated investment-grade than it is for securities rated below investment-grade. Duration estimates are based on assumptions by the Adviser and are subject to a number of limitations. Effective duration is calculated based on historical price changes of securities held by the Fund, and therefore is a more accurate estimate of price sensitivity provided interest rates remain within their historical range.
QUALITY RATINGS (% of Total Net Assets)
Lower of Moody’s, S&P, Fitch or Duff & Phelps ratings used.
SCHEDULE OF INVESTMENTS (Unaudited)
September 30, 2016
Sit Quality Income Fund
| | | | | | | | | | | | | | |
| |
| | | | |
Principal Amount ($) | | Name of Issuer | | Coupon
Rate (%) | | | Maturity
Date | | | Fair Value ($) | |
| |
| | | |
Asset-Backed Securities - 14.6% | | | | | | | | | | | | |
Agency - 0.0% | | | | | | | | | | | | |
| 9,405 | | FNMA REMICS, Series 2001-W2, Class AS5 14 | | | 6.47 | | | | 10/25/31 | | | | 9,535 | |
| | | | | | | | | | | | | | |
| | | |
Non-Agency - 14.6% | | | | | | | | | | | | |
| 45,119 | | Ace Securities Corp. Home Equity Loan Trust, Series 2004-SD1, Class A1 1 | | | 1.02 | | | | 11/25/33 | | | | 45,061 | |
| 16,381 | | Aegis Asset Backed Securities Trust, Series 2004-2, Class A3 1 | | | 1.49 | | | | 6/25/34 | | | | 16,370 | |
| 271,297 | | Aegis Asset Backed Securities Trust, Series 2004-5, Class M1 1 | | | 1.50 | | | | 12/25/34 | | | | 270,221 | |
| 72,057 | | Aegis Asset Backed Securities Trust, Series 2005-2, Class M1 1 | | | 0.95 | | | | 6/25/35 | | | | 71,826 | |
| 35,521 | | Bayview Financial Mortgage Pass-Through Trust, Series 2006-B, Class 1A5 14 | | | 6.04 | | | | 4/28/36 | | | | 37,380 | |
| 562,329 | | Bear Stearns Asset Backed Securities I Trust, Series 2005-AQ2, Class A3 1 | | | 0.89 | | | | 9/25/35 | | | | 557,225 | |
| 474,148 | | Bear Stearns Asset Backed Securities Trust, Series 2005-SD2, Class 1A2 1 | | | 1.00 | | | | 3/25/35 | | | | 471,136 | |
| 30,534 | | Bear Stearns Asset Backed Securities Trust, Series 2005-SD2, Class 1A3 1 | | | 0.93 | | | | 3/25/35 | | | | 30,315 | |
| 102,684 | | Centex Home Equity Loan Trust, Series 2004-A, Class AF4 14 | | | 5.01 | | | | 8/25/32 | | | | 102,868 | |
| 310,000 | | Centex Home Equity Loan Trust, Series 2004-A, Class AF5 14 | | | 5.43 | | | | 1/25/34 | | | | 311,104 | |
| 96,455 | | Centex Home Equity Loan Trust, Series 2004-D, Class AF4 14 | | | 5.18 | | | | 6/25/32 | | | | 96,622 | |
| 109,538 | | Centex Home Equity Loan Trust, Series 2004-D, Class AF6 14 | | | 5.17 | | | | 9/25/34 | | | | 111,950 | |
| 38,567 | | CIT Home Equity Loan Trust, Series 2003-1, Class A4 14 | | | 4.43 | | | | 3/20/32 | | | | 38,642 | |
| 132,972 | | CIT Home Equity Loan Trust, Series 2003-1, Class A6 14 | | | 4.56 | | | | 10/20/32 | | | | 135,910 | |
| 216,907 | | Citifinancial Mortgage Securities, Inc., Series 2004-1, Class AF3 14 | | | 4.27 | | | | 4/25/34 | | | | 218,303 | |
| 207,075 | | Conseco Finance Home Equity Loan Trust, Series 2002-B, Class M1 1 | | | 2.27 | | | | 5/15/33 | | | | 206,646 | |
| 37,047 | | Conseco Financial Corp., Series 1997-3, Class A6 | | | 7.32 | | | | 3/15/28 | | | | 38,297 | |
| 3,608 | | Conseco Financial Corp., Series 1997-6, Class A6 | | | 6.90 | | | | 1/15/29 | | | | 3,603 | |
| 11,997 | | Conseco Financial Corp., Series 1997-6, Class A7 | | | 7.14 | | | | 1/15/29 | | | | 11,982 | |
| 31,997 | | Conseco Financial Corp., Series 1997-7, Class A7 1 | | | 6.96 | | | | 7/15/28 | | | | 32,406 | |
| 82,308 | | Conseco Financial Corp., Series 1998-1, Class A6 1 | | | 6.33 | | | | 11/1/29 | | | | 83,207 | |
| 358,516 | | Countrywide Asset-Backed Certificates, Series 2004-S1, Class A3 14 | | | 5.12 | | | | 2/25/35 | | | | 363,746 | |
| 363,621 | | First Alliance Mortgage Loan Trust, Series 1997-4, Class A2 14 | | | 7.63 | | | | 4/20/29 | | | | 368,365 | |
| 282,172 | | GSAMP Trust, Series 2004-FM1, Class M1 1 | | | 1.50 | | | | 11/25/33 | | | | 266,585 | |
| 272,414 | | HSBC Home Equity Loan Trust USA, Series 2007-2, Class A4 1 | | | 0.83 | | | | 7/20/36 | | | | 271,015 | |
| 59,355 | | Irwin Home Equity Loan Trust, Series 2002-1, Class 2M1 1 | | | 1.88 | | | | 2/25/29 | | | | 58,140 | |
| 191,326 | | Irwin Whole Loan Home Equity Trust, Series 2003-B, Class M 1 | | | 3.53 | | | | 11/25/32 | | | | 192,504 | |
| 795,543 | | Irwin Whole Loan Home Equity Trust, Series 2003-D, Class M1 1 | | | 1.62 | | | | 11/25/28 | | | | 780,241 | |
| 1,227,850 | | Irwin Whole Loan Home Equity Trust, Series 2005-A, Class M1 1 | | | 1.38 | | | | 6/25/34 | | | | 1,193,832 | |
| 56,120 | | Irwin Whole Loan Home Equity Trust, Series 2005-C, Class 1M2 14 | | | 6.25 | | | | 4/25/30 | | | | 56,284 | |
| 22,142 | | New Century Home Equity Loan Trust, Series 2003-5, Class AI7 1 | | | 5.15 | | | | 11/25/33 | | | | 22,639 | |
| 108,029 | | NovaStar Mortgage Funding Trust, Series 2004-2, Class M2 1 | | | 1.55 | | | | 9/25/34 | | | | 106,935 | |
| 16,542 | | Popular ABS Mortgage Pass-Through Trust, Series 2004-4, Class AF4 1 | | | 4.63 | | | | 9/25/34 | | | | 16,521 | |
| 37,144 | | Residential Asset Mortgage Products Trust, Series 2003-RZ5, Class A7 14 | | | 5.47 | | | | 9/25/33 | | | | 38,141 | |
| 34,212 | | Residential Asset Mortgage Products Trust, Series 2003-RZ3, Class A6 14 | | | 3.90 | | | | 3/25/33 | | | | 34,745 | |
| 6,950 | | Residential Asset Mortgage Products Trust, Series 2004-RS12, Class A16 | | | 4.55 | | | | 12/25/34 | | | | 6,997 | |
| 165,000 | | Residential Funding Mortgage Securities, Series 2006-HI1, Class M2 14 | | | 6.06 | | | | 2/25/36 | | | | 172,532 | |
| 1,000,000 | | Santander Drive Auto Receivables, Series Trust 2014-4, Class D | | | 3.10 | | | | 11/16/20 | | | | 1,025,361 | |
| 1,000,000 | | Santander Drive Auto Receivables, Series Trust 2015-1, Class C | | | 2.57 | | | | 4/15/21 | | | | 1,012,459 | |
| 700,000 | | Santander Drive Auto Receivables, Series Trust 2016-2, Class B | | | 2.08 | | | | 2/16/21 | | | | 705,011 | |
| | | | | | | | | | | | | | |
| | | | |
| | | | | | | | | | | | | 9,583,127 | |
| | | | | | | | | | | | | | |
| | | |
Total Asset-Backed Securities
(cost: $9,559,078) | | | | | | | | | | | 9,592,662 | |
| | | | | | | | | | | | | | |
See accompanying notes to financial statements.
| | |
12 | | SIT MUTUAL FUNDS SEMI-ANNUAL REPORT |
| | | | | | | | | | | | | | |
| |
| | | | |
Principal Amount ($) | | Name of Issuer | | Coupon
Rate (%) | | | Maturity Date | | | Fair Value ($) | |
| |
|
Collateralized Mortgage Obligations - 27.0% | |
Agency - 19.4% | | | | | | | | | | | | |
| 2,000,000 | | FHLMC Multifamily Structured Pass Through Certificates, Series K003, Class A4 | | | 5.05 | | | | 1/25/19 | | | | 2,147,248 | |
| 744,814 | | FHLMC Multifamily Structured Pass Through Certificates, Series K007, Class A1 | | | 3.34 | | | | 12/25/19 | | | | 752,279 | |
| 100,000 | | FHLMC Multifamily Structured Pass Through Certificates, Series K007, Class A2 | | | 4.22 | | | | 3/25/20 | | | | 108,682 | |
| 1,000,000 | | FHLMC Multifamily Structured Pass Through Certificates, Series K013, Class A2 | | | 3.97 | | | | 1/25/21 | | | | 1,096,643 | |
| 293,184 | | FHLMC Multifamily Structured Pass Through Certificates, Series K016, Class A1 | | | 2.06 | | | | 10/25/20 | | | | 297,078 | |
| 1,000,000 | | FHLMC Multifamily Structured Pass Through Certificates, Series K712, Class A2 | | | 1.87 | | | | 11/25/19 | | | | 1,015,713 | |
| 500,000 | | FHLMC Multifamily Structured Pass Through Certificates, Series K715, Class A2 | | | 2.86 | | | | 1/25/21 | | | | 527,374 | |
| 2,000,000 | | FHLMC Multifamily Structured Pass Through Certificates, Series K716, Class A2 | | | 3.13 | | | | 6/25/21 | | | | 2,138,366 | |
| 255,970 | | FHLMC Multifamily Structured Pass Through Certificates, Series KAIV, Class A1 | | | 2.97 | | | | 1/25/21 | | | | 264,691 | |
| 438,065 | | FHLMC REMICS, Series 3737, Class NA | | | 3.50 | | | | 6/15/25 | | | | 456,268 | |
| 745,698 | | FHLMC REMICS, Series 3817, Class GA | | | 3.50 | | | | 6/15/24 | | | | 759,222 | |
| 418,930 | | FNMA ACES, Series 2009-M1, Class A2 | | | 4.29 | | | | 7/25/19 | | | | 447,836 | |
| 124,051 | | FNMA REMICS, Series 2003-52, Class NA | | | 4.00 | | | | 6/25/23 | | | | 129,705 | |
| 156,152 | | FNMA REMICS, Series 2005-19, Class PA | | | 5.50 | | | | 7/25/34 | | | | 166,141 | |
| 38,310 | | FNMA REMICS, Series 2005-68, Class PC | | | 5.50 | | | | 7/25/35 | | | | 40,495 | |
| 146,045 | | FNMA REMICS, Series 2008-65, Class CD | | | 4.50 | | | | 8/25/23 | | | | 151,308 | |
| 635,055 | | FNMA REMICS, Series 2009-13, Class NX | | | 4.50 | | | | 3/25/24 | | | | 661,821 | |
| 116,858 | | FNMA REMICS, Series 2009-71, Class MB | | | 4.50 | | | | 9/25/24 | | | | 125,221 | |
| 90,545 | | FNMA REMICS, Series 2009-88, Class DA | | | 4.50 | | | | 10/25/20 | | | | 93,162 | |
| 47,205 | | FNMA REMICS, Series 2010-28, Class DA | | | 5.00 | | | | 9/25/28 | | | | 48,370 | |
| 115,489 | | FNMA REMICS, Series 2011-16, Class GE | | | 2.75 | | | | 3/25/26 | | | | 116,934 | |
| 178,622 | | FNMA REMICS, Series 2011-42, Class BJ | | | 3.00 | | | | 8/25/25 | | | | 181,138 | |
| 90,752 | | FNMA REMICS, Series 2011-46, Class A | | | 3.00 | | | | 5/25/24 | | | | 92,540 | |
| 71,256 | | FNMA REMICS, Series 2012-19, Class GH | | | 3.00 | | | | 11/25/30 | | | | 73,691 | |
| 473,224 | | FNMA REMICS, Series 2013-74, Class AD | | | 2.00 | | | | 7/25/23 | | | | 478,951 | |
| 138,891 | | GNMA, Series 2011-29, Class JA | | | 4.50 | | | | 4/20/40 | | | | 142,982 | |
| 172,565 | | Vendee Mortgage Trust, Series 1993-1, Class ZB | | | 7.25 | | | | 2/15/23 | | | | 193,480 | |
| | | | | | | | | | | | | | |
| | | | |
| | | | | | | | | | | | | 12,707,339 | |
| | | | | | | | | | | | | | |
Non-Agency - 7.6% | | | | | | | | | | | | |
| 182,986 | | BCAP, LLC Trust, Series 2010-RR6, Class 7A2 1, 4 | | | 6.00 | | | | 2/26/37 | | | | 183,886 | |
| 884,637 | | Bear Stearns Trust, Series 2004-10, Class 1A1 1 | | | 1.21 | | | | 9/25/34 | | | | 874,146 | |
| 1,283,499 | | CHL Mortgage Pass-Through Trust, Series 2003-56, Class 6A1 1 | | | 2.90 | | | | 12/25/33 | | | | 1,294,038 | |
| 33,935 | | Deutsche Mortgage Securities, Inc. Mortgage Loan Trust, Series 2004-1, Class 2A1 | | | 4.75 | | | | 10/25/18 | | | | 33,996 | |
| 125,746 | | Deutsche Mortgage Securities, Inc. Mortgage Loan Trust, Series 2004-1, Class 2A3 | | | 4.75 | | | | 10/25/18 | | | | 125,581 | |
| 78,738 | | GSR Mortgage Loan Trust, Series 2005-5F, Class 8A1 1 | | | 1.03 | | | | 6/25/35 | | | | 74,654 | |
| 15,703 | | Master Asset Securitization Trust, Series 2003-4, Class CA1 | | | 8.00 | | | | 5/25/18 | | | | 16,017 | |
| 86,046 | | MASTR Alternative Loan Trust, Series 2003-4, Class 2A1 | | | 6.25 | | | | 6/25/33 | | | | 89,578 | |
| 177,128 | | MASTR Alternative Loan Trust, Series 2003-5, Class 4A1 | | | 5.50 | | | | 7/25/33 | | | | 185,014 | |
| 246,255 | | MASTR Alternative Loan Trust, Series 2003-8, Class 3A1 | | | 5.50 | | | | 12/25/33 | | | | 256,494 | |
| 79,000 | | MASTR Asset Securitization Trust, Series 2005-2, Class 1A3 | | | 5.35 | | | | 11/25/35 | | | | 80,227 | |
| 133,402 | | Prime Mortgage Trust, Series 2004-CL1, Class 1A1 | | | 6.00 | | | | 2/25/34 | | | | 139,252 | |
| 9,886 | | RAAC Trust, Series 2004-SP3, Class AI5 1 | | | 4.89 | | | | 12/25/32 | | | | 10,026 | |
| 153,606 | | Sequoia Mortgage Trust, Series 2012-1, Class 2A1 1 | | | 3.47 | | | | 1/25/42 | | | | 158,238 | |
| 817,352 | | Sequoia Mortgage Trust, Series 2012-2, Class B1 1 | | | 4.26 | | | | 4/25/42 | | | | 859,398 | |
| 197,695 | | Structured Asset Securities, Corp. Mortgage Loan Trust, Series 2005-GEL3, Class M3 1 | | | 1.73 | | | | 6/25/35 | | | | 196,230 | |
| 258,365 | | Structured Asset Securities, Corp. Mortgage Pass-Through Certificates, Series 2003-22A, Class 3A 1 | | | 2.99 | | | | 6/25/33 | | | | 261,468 | |
See accompanying notes to financial statements.
SCHEDULE OF INVESTMENTS (Unaudited)
September 30, 2016
Sit Quality Income Fund (Continued)
| | | | | | | | | | | | | | |
| |
| | | | |
Principal Amount ($) | | Name of Issuer | | Coupon
Rate (%) | | | Maturity Date | | | Fair Value ($) | |
| |
| | | | |
| 98,431 | | WaMu Mortgage Pass Through Certificates, Series 2002-AR2 Class A 1 | | | 1.94 | | | | 2/27/34 | | | | 96,237 | |
| 57,666 | | WaMu Mortgage Pass Through Certificates, Series 2004-CB2, Class 7A | | | 5.50 | | | | 8/25/19 | | | | 58,463 | |
| | | | | | | | | | | | | | |
| | | | |
| | | | | | | | | | | | | 4,992,943 | |
| | | | | | | | | | | | | | |
Total Collateralized Mortgage Obligations
(cost: $17,637,725) | | | | | | | | | | | 17,700,282 | |
| | | | | | | | | | | | | | |
Corporate Bonds - 16.0% | | | | | | | | | | | | |
| 375,000 | | Air Lease Corp. | | | 2.13 | | | | 1/15/20 | | | | 374,220 | |
| 620,412 | | Aircraft Certificate Owner Trust 2003 4 | | | 7.00 | | | | 9/20/22 | | | | 657,636 | |
| 176,518 | | America West Airlines 1999-1 Pass Through Trust | | | 7.93 | | | | 1/2/19 | | | | 187,550 | |
| 78,859 | | American Airlines 2013-2 Class B Pass Through Trust 4 | | | 5.60 | | | | 7/15/20 | | | | 82,506 | |
| 500,000 | | American Financial Group, Inc. | | | 9.88 | | | | 6/15/19 | | | | 601,954 | |
| 350,000 | | Ameriprise Financial, Inc. | | | 5.30 | | | | 3/15/20 | | | | 389,818 | |
| 250,000 | | Ameriprise Financial, Inc. | | | 7.30 | | | | 6/28/19 | | | | 286,685 | |
| 375,000 | | Anheuser-Busch InBev Worldwide, Inc. | | | 7.75 | | | | 1/15/19 | | | | 426,600 | |
| 250,000 | | Burlington Northern Santa Fe, LLC | | | 8.13 | | | | 4/15/20 | | | | 305,468 | |
| 500,000 | | General Electric Co. | | | 5.50 | | | | 1/8/20 | | | | 564,953 | |
| 350,000 | | Kroger Co. | | | 1.50 | | | | 9/30/19 | | | | 349,413 | |
| 700,000 | | Lender Processing Services, Inc./Black Knight Lending Solutions, Inc. | | | 5.75 | | | | 4/15/23 | | | | 736,750 | |
| 1,000,000 | | Manufacturers & Traders Trust Co. (Subordinated) 1 | | | 5.63 | | | | 12/1/21 | | | | 982,286 | |
| 350,000 | | Mead Johnson Nutrition Co. | | | 4.90 | | | | 11/1/19 | | | | 384,213 | |
| 500,000 | | Nationwide Mutual Insurance Co. (Subordinated) 1, 4 | | | 3.14 | | | | 12/15/24 | | | | 490,014 | |
| 800,000 | | Prudential Financial, Inc. 1 | | | 3.76 | | | | 8/10/18 | | | | 824,800 | |
| 325,000 | | Santander Holdings USA, Inc. | | | 2.70 | | | | 5/24/19 | | | | 329,058 | |
| 500,000 | | SBA Tower Trust 4 | | | 2.24 | | | | 4/16/18 | | | | 501,529 | |
| 500,000 | | Ultramar Diamond Shamrock Corp. | | | 7.20 | | | | 10/15/17 | | | | 531,654 | |
| 500,000 | | United Parcel Service of America, Inc. | | | 8.38 | | | | 4/1/20 | | | | 615,876 | |
| 500,000 | | UnitedHealth Group, Inc. | | | 2.88 | | | | 12/15/21 | | | | 526,894 | |
| 318,791 | | Virgin Australia 2013-1A Trust 4 | | | 5.00 | | | | 10/23/23 | | | | 330,745 | |
| | | | | | | | | | | | | | |
| | | |
Total Corporate Bonds
(cost: $10,465,561) | | | | | | | | | | | 10,480,622 | |
| | | | | | | | | | | | | | |
Mortgage Pass-Through Securities - 15.1% | | | | | | | | | | | | |
Federal Home Loan Mortgage Corporation - 1.8% | | | | | | | | | | | | |
| 268,655 | | Freddie Mac | | | 3.00 | | | | 9/1/27 | | | | 283,294 | |
| 64,211 | | Freddie Mac | | | 3.50 | | | | 7/1/26 | | | | 68,438 | |
| 29,888 | | Freddie Mac | | | 4.50 | | | | 5/1/19 | | | | 30,651 | |
| 66,473 | | Freddie Mac | | | 4.50 | | | | 6/1/19 | | | | 68,248 | |
| 46,084 | | Freddie Mac | | | 4.50 | | | | 6/1/19 | | | | 47,286 | |
| 48,937 | | Freddie Mac | | | 4.50 | | | | 12/1/21 | | | | 51,069 | |
| 69,810 | | Freddie Mac | | | 4.50 | | | | 7/1/26 | | | | 72,992 | |
| 29,572 | | Freddie Mac | | | 5.00 | | | | 3/1/18 | | | | 30,378 | |
| 29,537 | | Freddie Mac | | | 5.00 | | | | 10/1/25 | | | | 32,707 | |
| 25,771 | | Freddie Mac | | | 5.50 | | | | 10/1/19 | | | | 26,681 | |
| 166,398 | | Freddie Mac | | | 5.50 | | | | 5/1/20 | | | | 173,688 | |
| 51,817 | | Freddie Mac | | | 5.50 | | | | 7/1/20 | | | | 53,885 | |
| 45,514 | | Freddie Mac | | | 5.50 | | | | 12/1/20 | | | | 47,259 | |
| 110,077 | | Freddie Mac | | | 5.50 | | | | 3/1/21 | | | | 116,834 | |
| 59,041 | | Freddie Mac | | | 5.50 | | | | 3/1/21 | | | | 62,912 | |
| 40,573 | | Freddie Mac | | | 6.00 | | | | 9/1/23 | | | | 46,282 | |
| | | | | | | | | | | | | | |
| | | | |
| | | | | | | | | | | | | 1,212,604 | |
| | | | | | | | | | | | | | |
See accompanying notes to financial statements.
| | |
14 | | SIT MUTUAL FUNDS SEMI-ANNUAL REPORT |
| | | | | | | | | | | | | | |
| |
| | | | |
Principal Amount ($) | | Name of Issuer | | Coupon
Rate (%) | | | Maturity Date | | | Fair Value ($) | |
| |
| | | |
Federal National Mortgage Association - 12.6% | | | | | | | | | | | | |
| 995,755 | | Fannie Mae | | | 2.50 | | | | 6/1/23 | | | | 1,032,333 | |
| 276,512 | | Fannie Mae | | | 2.75 | | | | 11/1/17 | | | | 279,454 | |
| 431,580 | | Fannie Mae | | | 3.00 | | | | 8/1/28 | | | | 453,558 | |
| 1,000,000 | | Fannie Mae | | | 3.15 | | | | 9/1/18 | | | | 1,034,200 | |
| 485,853 | | Fannie Mae | | | 3.18 | | | | 12/1/17 | | | | 486,051 | |
| 73,011 | | Fannie Mae | | | 3.50 | | | | 10/1/21 | | | | 76,954 | |
| 1,209,273 | | Fannie Mae | | | 3.50 | | | | 1/1/26 | | | | 1,275,849 | |
| 47,116 | | Fannie Mae | | | 4.00 | | | | 9/1/24 | | | | 50,031 | |
| 35,895 | | Fannie Mae | | | 4.00 | | | | 10/1/31 | | | | 38,880 | |
| 795,042 | | Fannie Mae | | | 4.44 | | | | 6/1/21 | | | | 866,971 | |
| 646,798 | | Fannie Mae | | | 4.71 | | | | 2/1/20 | | | | 700,133 | |
| 56,537 | | Fannie Mae | | | 5.00 | | | | 8/1/19 | | | | 58,722 | |
| 109,795 | | Fannie Mae | | | 5.00 | | | | 9/1/20 | | | | 115,661 | |
| 121,442 | | Fannie Mae | | | 5.14 | | | | 1/1/18 | | | | 125,323 | |
| 449,862 | | Fannie Mae | | | 5.36 | | | | 1/1/19 | | | | 486,857 | |
| 20,443 | | Fannie Mae | | | 5.50 | | | | 9/1/17 | | | | 20,665 | |
| 52,751 | | Fannie Mae | | | 5.50 | | | | 4/1/19 | | | | 54,456 | |
| 49,941 | | Fannie Mae | | | 5.50 | | | | 1/1/21 | | | | 52,477 | |
| 48,958 | | Fannie Mae | | | 5.50 | | | | 10/1/21 | | | | 51,005 | |
| 645,511 | | Fannie Mae | | | 5.60 | | | | 4/1/17 | | | | 646,269 | |
| 286,705 | | Fannie Mae | | | 6.00 | | | | 2/1/21 | | | | 308,646 | |
| 17,267 | | Fannie Mae | | | 6.50 | | | | 2/1/19 | | | | 19,889 | |
| | | | | | | | | | | | | | |
| | | | |
| | | | | | | | | | | | | 8,234,384 | |
| | | | | | | | | | | | | | |
Government National Mortgage Association - 0.7% | | | | | | | | | | | | |
| 84,632 | | Ginnie Mae 1 | | | 2.13 | | | | 4/20/33 | | | | 87,878 | |
| 23,149 | | Ginnie Mae 1 | | | 3.50 | | | | 4/20/42 | | | | 23,939 | |
| 127,906 | | Ginnie Mae | | | 5.00 | | | | 12/20/23 | | | | 134,041 | |
| 102,253 | | Ginnie Mae | | | 5.00 | | | | 9/15/24 | | | | 108,421 | |
| 116,073 | | Ginnie Mae | | | 5.00 | | | | 6/20/26 | | | | 124,642 | |
| | | | | | | | | | | | | | |
| | | | |
| | | | | | | | | | | | | 478,921 | |
| | | | | | | | | | | | | | |
Total Mortgage Pass-Through Securities
(cost: $9,816,811) | | | | | | | | | | | 9,925,909 | |
| | | | | | | | | | | | | | |
Taxable Municipal Bonds - 11.3% | | | | | | | | | | | | |
| 500,000 | | Albany Capital Resource Corp. | | | 1.45 | | | | 5/1/18 | | | | 499,895 | |
| 240,000 | | Arizona State University | | | 5.88 | | | | 7/1/36 | | | | 242,311 | |
| 1,025,000 | | Atlanta Downtown Development Authority 17 | | | 6.88 | | | | 2/1/21 | | | | 1,158,568 | |
| 600,000 | | Atlanta Urban Residential Finance Authority | | | 5.80 | | | | 12/1/27 | | | | 618,072 | |
| 250,000 | | Banning Redevelopment Agency Successor Agency | | | 1.90 | | | | 9/1/20 | | | | 249,887 | |
| 760,000 | | Colorado Housing & Finance Authority | | | 4.00 | | | | 11/1/31 | | | | 796,054 | |
| 290,000 | | Fuller Road Management Corp. | | | 5.40 | | | | 9/1/17 | | | | 291,128 | |
| 740,000 | | Iowa Finance Authority 17 | | | 1.77 | | | | 1/1/18 | | | | 743,101 | |
| 250,000 | | Massachusetts Educational Financing Authority | | | 4.00 | | | | 1/1/32 | | | | 262,622 | |
| 400,000 | | Multistate Liquidating Trust No. 1 4, 17 | | | 1.39 | | | | 12/15/18 | | | | 400,614 | |
| 250,000 | | NDSU Research & Technology Park, Inc. | | | 1.85 | | | | 5/1/20 | | | | 250,310 | |
| 305,000 | | Osceola Co. Industrial Development Authority | | | 2.25 | | | | 8/1/17 | | | | 306,244 | |
| 250,000 | | Pittsburgh School District | | | 6.04 | | | | 9/1/29 | | | | 276,040 | |
| 145,000 | | Rhode Island Housing & Mortgage Finance Corp. | | | 4.00 | | | | 10/1/39 | | | | 152,452 | |
| 380,000 | | South Carolina Jobs-Economic Development Authority | | | 2.04 | | | | 8/15/18 | | | | 380,821 | |
See accompanying notes to financial statements.
SCHEDULE OF INVESTMENTS (Unaudited)
September 30, 2016
Sit Quality Income Fund (Continued)
| | | | | | | | | | | | | | |
| |
Principal Amount ($)/ Contracts | | Name of Issuer | | Coupon
Rate (%) | | | Maturity Date | | | Fair Value ($) | |
| |
| | | | |
| 490,000 | | Texas Department of Housing & Community Affairs 17 | | | 4.80 | | | | 7/1/19 | | | | 499,805 | |
| 250,000 | | Town of Ledgeview WI | | | 2.75 | | | | 9/1/19 | | | | 257,297 | |
| | | | | | | | | | | | | | |
| | | |
Total Taxable Municipal Bonds
(cost: $7,375,630) | | | | | | | | | | | 7,385,221 | |
| | | | | | | | | | | | | | |
U.S. Treasury / Federal Agency Securities - 13.8% | | | | | | | | | | | | |
U.S. Treasury - 13.8% | | | | | | | | | | | | |
| 1,500,000 | | U.S. Treasury Bill 6 | | | 0.08 | | | | 10/20/16 | | | | 1,499,937 | |
| 5,000,000 | | U.S. Treasury Floating Rate Note 1 | | | 0.33 | | | | 7/31/17 | | | | 5,001,715 | |
| 500,000 | | U.S. Treasury Note | | | 0.75 | | | | 10/31/17 | | | | 500,352 | |
| 500,000 | | U.S. Treasury Note | | | 0.88 | | | | 6/15/17 | | | | 500,957 | |
| 1,500,000 | | U.S. Treasury Note | | | 1.25 | | | | 10/31/18 | | | | 1,513,593 | |
| | | | | | | | | | | | | | |
| | | | |
| | | | | | | | | | | | | 9,016,554 | |
| | | | | | | | | | | | | | |
Total U.S. Treasury / Federal Agency Securities
(cost: $9,013,226) | | | | | | | | | | | 9,016,554 | |
| | | | | | | | | | | | | | |
| | | |
Short-Term Securities - 2.2% | | | | | | | | | | | | |
| 1,468,343 | | Fidelity Instl. Money Mkt. Govt. Fund, 0.27% | | | | | | | | | | | | |
Total Short-Term Securities
(cost: $1,468,343) | | | | | | | | | | | 1,468,343 | |
| | | | | | | | | | | | | | |
| | | |
Total Investments in Securities - 100.0%
(cost: $65,336,374) | | | | | | | | | | | 65,569,593 | |
| | | | | | | | | | | | | | |
| | | |
Other Assets and Liabilities, net - 0.0% | | | | | | | | | | | (18,911 | ) |
| | | | | | | | | | | | | | |
| | | |
Total Net Assets - 100.0% | | | | | | | | | | | $65,550,682 | |
| | | | | | | | | | | | | | |
|
| |
| 1 | | Variable rate security. Rate disclosed is as of September 30, 2016. |
| 4 | | 144A Restricted Security. The total value of such securities as of September 30, 2016 was $2,646,930 and represented 4.0% of net assets. These securities have been determined to be liquid by the Adviser in accordance with guidelines established by the Board of Directors. |
| 6 | | Zero coupon or convertible capital appreciation bond, for which the rate disclosed is either the effective yield on purchase date or the coupon rate to be paid upon conversion to coupon paying, respectively. |
| 14 | | Step Coupon: A bond that pays an initial coupon rate for the first period and then a higher coupon rate for the following periods. Rate disclosed is as of September 30, 2016. |
| 17 | | Security that is either an absolute and unconditional obligation of the United States Government or is collateralized by securities, loans, or leases guaranteed by the U.S. Government or its agencies or instrumentalities. |
Numeric footnotes not disclosed are not applicable to this Schedule of Investments.
Short futures contracts outstanding as of September 30, 2016 were as follows:
| | | | | | | | | | | | |
| Contracts | | Type | | Expiration Date | | Notional
Amount | | | Unrealized
Depreciation | |
| |
Short Futures: | | | | | | | | | | | | |
80 | | U.S. Treasury 2 Year Futures 10 | | December 2016 | | $ | 17,477,504 | | | | $(1,619) | |
41 | | U.S. Treasury 5 Year Futures 10 | | December 2016 | | | 4,982,140 | | | | (6,897) | |
| | | | | | | | | | | | |
| | | | |
| | | | | | | | | | | $(8,516) | |
(10) The amount of $700,000 in cash was segregated with the broker to cover margin requirements for derivatives transactions as of September 30, 2016.
See accompanying notes to financial statements.
| | |
16 | | SIT MUTUAL FUNDS SEMI-ANNUAL REPORT |
A summary of the levels for the Fund’s investments as of September 30, 2016 is as follows (see Note 2 - significant accounting policies in the notes to financial statements):
| | | | | | | | | | | | | | | | |
| | | Investment in Securities | |
| | | | |
| | | Level 1 | | | Level 2 | | | Level 3 | | | | |
| | | Quoted | | | Other Significant | | | Other Significant | | | | |
| | | Price ($) | | | Observable Inputs ($) | | | Observable Inputs ($) | | | Total ($) | |
| | | | |
Assets | | | | | | | | | | | | | | | | |
Asset-Backed Securities | | | — | | | | 9,592,662 | | | | — | | | | 9,592,662 | |
Collateralized Mortgage Obligations | | | — | | | | 17,700,282 | | | | — | | | | 17,700,282 | |
Corporate Bonds | | | — | | | | 10,480,622 | | | | — | | | | 10,480,622 | |
Mortgage Pass-Through Securities | | | — | | | | 9,925,909 | | | | — | | | | 9,925,909 | |
Taxable Municipal Bonds | | | — | | | | 7,385,221 | | | | — | | | | 7,385,221 | |
U.S. Treasury / Federal Agency Securities | | | | | | | 9,016,554 | | | | — | | | | 9,016,554 | |
Short-Term Securities | | | 1,468,343 | | | | — | | | | — | | | | 1,468,343 | |
| | | | |
| | | 1,468,343 | | | | 64,101,250 | | | | — | | | | 65,569,593 | |
| | | | |
Liabilities | | | | | | | | | | | | | | | | |
Futures | | | (8,516 | ) | | | — | | | | — | | | | (8,516) | |
| | | | |
For the reporting period, there were no transfers between levels 1, 2 and 3.
See accompanying notes to financial statements.
OBJECTIVE & STRATEGY
The objective of the Tax-Free Income Fund is to provide a high level of current income that is exempt from federal income tax, consistent with preservation of capital, by investing primarily in investment-grade municipal securities.
Such municipal securities generate interest income that is exempt from both federal regular income tax and federal alternative minimum tax. During normal market conditions, the Fund invests 100% of its net assets in such tax-exempt municipal securities.
The Sit Tax-Free Income Fund provided a total return of +2.90% for the 6-month period ended September 30, 2016, outpacing the +1.14% return for its benchmark, the Bloomberg Barclays 5-Year Municipal Bond Index. The Fund’s 30-day SEC yield was 2.26%, which compared favorably to the yield of 1.31 % for the benchmark index. The Fund’s 12-month distribution rate was 3.35%.
Flows into tax-exempt bond funds have been strong and steady over the past year. As of September 28, 2016, net inflows into these funds hit the 52 consecutive week mark, which totaled approximately $59.3 billion. Further, these inflows have amounted to about $50.4 billion thus far in 2016, and $36.0 billion over the past six months. These strong inflows have persisted due to some combination of the tax-exempt nature of most municipal bonds, their historically favorable risk/return profile relative to other asset classes, and their reasonable yields relative to the incredibly low yielding environment across the globe (approximately $11 trillion of bonds worldwide had negative yields as of September 30). To be sure, these inflows into municipal bond funds have continued in spite of yields that remain historically low. The 30-year yield on a AAA-rated general obligation bond as of September 30, 2016 was 2.31%, down 38 basis points from six months earlier, and 51 basis points from the conclusion of last year, although it’s off its low of 1.93% in early July. Municipal bond issuance in September was $38.3 billion, bringing year-to-date total issuance to $336.6 billion, which is about 6% higher than the total over the same period last year, which ended as the 5th highest for annual issuance on record. $205 billion of the $336.6 billion issued, or 60.9%, have been refundings. These lower rates have also encouraged issuance of lower coupon bonds; indeed, the proportion of bonds issued with coupons less than or equal to 4.25% thus far in 2016 totals approximately 53%, versus an average of about 33% issued with like coupons from 2011 through 2015.
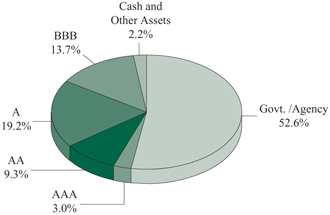
The strong outperformance for the Fund in the past 6-month period was driven by multiple forces. The largest contributor to the Fund’s relative performance has been a longer duration position than the Bloomberg Barclays 5-Year Municipal Bond Index. As long-term yields have experienced a net decline through the year, longer duration bonds have substantially outperformed the shorter end of the curve, all else equal. So although the Fund’s duration has shortened up over the past few years, it still stood at 5.5 years as of September 30, 2016, longer than the benchmark’s duration of 3.9 years. Additional support for the Fund’s performance has been its distribution within credit quality. As of the end of the period, the Fund held 20.7% and 23.5% of assets in A-rated and non-rated bonds, respectively.
As credit spreads have tightened over the past six and twelve month periods, lower rated bonds have generally outperformed their higher rated counterparts, providing a strong tailwind for the Fund. Strong
HYPOTHETICAL GROWTH OF $10,000
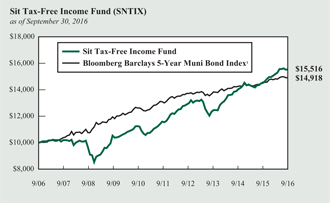
The chart above illustrates the total value of a hypothetical $10,000 investment in the Fund over the past 10 years (or for the life of the Fund if shorter) as compared to the performance of the Bloomberg Barclays 5-Year Municipal Bond Index. Past performance does not guarantee future results. Returns include the reinvestment of distributions. The chart does not reflect the deduction of taxes that a shareholder would pay on Fund distributions or the redemption of Fund shares.
1 The Bloomberg Barclays 5-Year Municipal Bond Index is the 5 year (4-6) component of the Municipal Bond Index, an unmanaged, rules-based, market-value-weighted index for the long-term tax-exempt bond market. The index includes bonds with a minimum credit rating of BBB. The returns include the reinvestment of income and do not include any transaction costs, management fees or other costs. It is not possible to invest directly in an index. This is the Fund’s primary index.
security selection within the Multi-Family Housing sector also contributed meaningfully to the period’s good performance; indeed, the broad Housing sector has actually underperformed the index, while holdings within the Fund have noticeably outperformed. Finally, the Fund’s focus on relatively higher coupon bonds has continued to provide a higher income return than the benchmark.
The Fund will continue to maintain a longer duration than the benchmark, although the spread between them may narrow further. The Fund’s emphasis on income as the chief source of total return has continued to reward shareholders over the long term, and positioning into higher income producing credits remains a priority. Focus on credit analysis will also continue as a key driver of opportunity to outperform. We remain diversified on a geographic and issuer basis in order to manage credit and liquidity risk, and we continue to believe the Fund is positioned to achieve attractive risk-adjusted returns going forward.
Michael C. Brilley
Paul J. Jungquist, CFA
Senior Portfolio Managers
| | |
18 | | SIT MUTUAL FUNDS SEMI-ANNUAL REPORT |
COMPARATIVE RATES OF RETURNS
| | | | | | | | | | | | | | | |
as of September 30, 2016 | |
| | | Sit
Tax-Free
Income
Fund | | Bloomberg
Barclays
5-Year Muni
Bond Index1 | | Lipper
General
Muni. Bond
Fund Index2 |
Six Months | | | | 2.90% | | | | | 1.14% | | | | | n/a | |
One Year | | | | 7.17 | | | | | 2.98 | | | | | 6.25% | |
Five Years | | | | 6.01 | | | | | 2.63 | | | | | 5.18 | |
Ten Years | | | | 4.49 | | | | | 4.08 | | | | | 4.58 | |
Since Inception (9/29/88) | | | | 5.40 | | | | | 5.21 | | | | | 5.78 | |
Performance figures are historical and do not guarantee future results. Investment returns and principal value will vary, and you may have a gain or loss when you sell shares. Current performance may be lower or higher than the performance data quoted. Contact the Fund for performance data current to the most recent month-end. Returns include changes in share price as well as reinvestment of all dividends and capital gains and all fee waivers. Without the fee waivers total return and yield figures would have been lower. Returns do not reflect the deduction of taxes that a shareholder would pay on Fund distributions or the redemption of Fund shares. Management fees and administrative expenses are included in the Fund’s performance. Returns for periods greater than one year are compounded average annual rates of return.
1 The Bloomberg Barclays 5-Year Municipal Bond Index is the 5 year (4-6) component of the Municipal Bond Index, an unmanaged, rules-based, market-value-weighted index for the long-term tax-exempt bond market. The index includes bonds with a minimum credit rating of BBB. The returns include the reinvestment of income and do not include any transaction costs, management fees or other costs. It is not possible to invest directly in an index.
2 The Lipper returns are obtained from Lipper Analytical Services, Inc., a large independent evaluator of mutual funds.
FUND DIVERSIFICATION
| | | | |
| |
Multi Family Mortgage | | | 22.5% | |
Single Family Mortgage | | | 21.7% | |
Other Revenue | | | 10.4% | |
Education/Student Loan | | | 7.7% | |
General Obligation | | | 6.9% | |
Insured | | | 6.1% | |
Investment Companies | | | 5.7% | |
Sectors less than 5% | | | 13.0% | |
Cash & Other Net Assets | | | 6.0% | |
Based on total net assets as of September 30, 2016. Subject to change.
PORTFOLIO SUMMARY
| | |
Net Asset Value 9/30/16: | | $9.92 Per Share |
Net Asset Value 3/31/16: | | $9.80 Per Share |
Total Net Assets: | | $161.8 Million |
Average Maturity: | | 17.1 Years |
Effective Duration3: | | 5.5 Years |
3 Duration is a measure of estimated price sensitivity relative to changes in interest rates. Portfolios with longer durations are typically more sensitive to changes in interest rates. For example, if interest rates rise by 1%, the fair value of a security with an effective duration of 5 years would decrease by 5%, with all other factors being constant. The correlation between duration and price sensitivity is greater for securities rated investment-grade than it is for securities rated below investment-grade. Duration estimates are based on assumptions by the Adviser and are subject to a number of limitations. Effective duration is calculated based on historical price changes of securities held by the Fund, and therefore is a more accurate estimate of price sensitivity provided interest rates remain within their historical range.
QUALITY RATINGS (% of Total Net Assets)
Lower of Moody’s, S&P, Fitch or Duff & Phelps ratings used.
Adviser’s Assessment of Non-Rated Securities:
| | |
AAA | | 0.0% |
AA | | 1.3 |
A | | 0.2 |
BBB | | 1.4 |
BB | | 16.7 |
<BB | | 3.9 |
Total | | 23.5% |
SCHEDULE OF INVESTMENTS (Unaudited)
September 30, 2016
Sit Tax-Free Income Fund
| | | | | | | | | | | | | | |
| |
| | | | |
Principal Amount ($) | | Name of Issuer | | Coupon
Rate (%) | | | Maturity Date | | | Fair Value ($) | |
| |
|
Municipal Bonds - 88.3% | |
Alaska - 2.1% | | | | | | | | | | | | |
| 750,000 | | AK Hsg. Finance Corp. Mtg. Rev. | | | 4.13 | | | | 12/1/37 | | | | 779,182 | |
| 640,000 | | AK Hsg. Finance Corp. Mtg. Rev. | | | 4.25 | | | | 12/1/40 | | | | 667,776 | |
| 500,000 | | AK Hsg. Finance Corp. Mtg. Rev. (G.O. of Corp. Insured) | | | 4.50 | | | | 12/1/35 | | | | 520,805 | |
| 500,000 | | AK Hsg. Finance Corp. Rev. (State Capital Proj.) | | | 4.00 | | | | 6/1/36 | | | | 539,090 | |
| 250,000 | | AK Industrial Dev. & Export Auth. Rev. (Boys & Girls Home) 2, 5, 15 | | | 5.50 | | | | N/A | | | | 27,470 | |
| 250,000 | | AK Industrial Dev. & Export Auth. Rev. (GTR Fairbanks Community Hospital Foundation) | | | 5.00 | | | | 4/1/33 | | | | 284,722 | |
| 550,000 | | North Slope Borough Service Area Rev. | | | 5.25 | | | | 6/30/34 | | | | 613,420 | |
| | | | | | | | | | | | | | |
| | | | |
| | | | | | | | | | | | | 3,432,465 | |
| | | | | | | | | | | | | | |
Arizona - 2.8% | | | | | | | | | | | | |
| 790,764 | | AZ Health Facs. Auth. Rev. (New Arizona Family Proj.) | | | 5.25 | | | | 7/1/27 | | | | 816,353 | |
| 320,000 | | Glendale Industrial Dev. & Auth. Rev. (Glencroft Retirement Community) | | | 4.25 | | | | 11/15/26 | | | | 318,685 | |
| 300,000 | | Glendale Industrial Dev. & Auth. Rev. (Glencroft Retirement Community) | | | 5.00 | | | | 11/15/36 | | | | 302,355 | |
| 250,000 | | Maricopa Co. Industrial Dev. Auth. Education Rev. (Horizon Community Learning Center) | | | 5.00 | | | | 7/1/35 | | | | 272,965 | |
| 400,000 | | Peoria Industrial Dev. Auth. Rev. (Sierra Winds Life Care Community) | | | 5.25 | | | | 11/15/29 | | | | 422,016 | |
| 1,500,000 | | Pima Co. Industrial Dev. Auth. Education Rev. (American Charter School Foundation) | | | 5.50 | | | | 7/1/26 | | | | 1,492,035 | |
| 300,000 | | Pima Co. Industrial Dev. Auth. Education Rev. (Coral Academy Science Proj.) | | | 6.38 | | | | 12/1/18 | | | | 312,300 | |
| 500,000 | | Quechan Indian Tribe of Fort Yuma Rev. (Tribal Economic Dev.) | | | 9.75 | | | | 5/1/25 | | | | 561,030 | |
| | | | | | | | | | | | | | |
| | | | |
| | | | | | | | | | | | | 4,497,739 | |
| | | | | | | | | | | | | | |
California - 9.4% | | | | | | | | | | | | |
| 100,000 | | Agua Caliente Band of Cahuilla Indians Rev. 4 | | | 6.00 | | | | 7/1/18 | | | | 100,058 | |
| 300,000 | | CA Health Facs. Finance Auth. Rev. (El Camino Hospital) | | | 5.00 | | | | 2/1/35 | | | | 353,394 | |
| 300,000 | | CA Municipal Finance Auth. Rev. (Creative Center Los Altos Proj.) 4 | | | 4.00 | | | | 11/1/36 | | | | 300,981 | |
| 500,000 | | CA School Facs. Finance Auth. Rev. (Azusa Unified School District) (AGM Insured) 6 | | | 6.00 | | | | 8/1/29 | | | | 673,565 | |
| 500,000 | | CA State G.O. | | | 4.00 | | | | 12/1/40 | | | | 550,820 | |
| 500,000 | | CA Statewide Communities Dev. Auth. Rev. (Provident Group - Pomona Property) | | | 5.60 | | | | 1/15/36 | | | | 562,710 | |
| 400,000 | | Carlsbad Unified School District G.O. Capital Appreciation 6 | | | 6.13 | | | | 8/1/31 | | | | 460,768 | |
| 1,000,000 | | Colton Joint Unified School District G.O. (AGM Insured) 6 | | | 5.80 | | | | 8/1/35 | | | | 974,110 | |
| 500,000 | | Encinitas Union School District G.O. Capital Appreciation 6 | | | 6.75 | | | | 8/1/35 | | | | 558,515 | |
| 500,000 | | Hartnell Community College G.O. 6 | | | 7.00 | | | | 8/1/34 | | | | 500,765 | |
| 1,250,000 | | Healdsburg Unified School District G.O. 6 | | | 4.60 | | | | 8/1/37 | | | | 1,058,937 | |
| 250,000 | | Imperial Community College District G.O. Capital Appreciation (AGM Insured) 6 | | | 6.75 | | | | 8/1/40 | | | | 334,815 | |
| 1,100,000 | | Los Alamitos Unified School District Capital Appreciation C.O.P. 6 | | | 5.95 | | | | 8/1/34 | | | | 1,002,826 | |
| 250,000 | | Martinez Unified School District G.O. 6 | | | 6.13 | | | | 8/1/35 | | | | 330,618 | |
| 500,000 | | Placentia-Yorba Linda Unified School District C.O.P. Capital Appreciation (AGM Insured) 6 | | | 6.25 | | | | 10/1/28 | | | | 584,945 | |
| 600,000 | | Redondo Beach School District G.O. 6 | | | 6.38 | | | | 8/1/34 | | | | 830,076 | |
| 750,000 | | Reef-Sunset Unified School District (BAM Insured) 6 | | | 4.85 | | | | 8/1/38 | | | | 685,598 | |
| 350,000 | | Ripon Unified School District G.O. (BAM Insured) 6 | | | 4.50 | | | | 8/1/30 | | | | 358,110 | |
| 500,000 | | Sacramento Co. Water Financing Auth. Rev. (NATL-RE FGIC Insured) 1 | | | 1.13 | | | | 6/1/39 | | | | 438,990 | |
| 400,000 | | San Jose Financing Auth. Rev. (Civic Center Garage Proj.) 9 | | | 5.00 | | | | 6/1/39 | | | | 470,468 | |
| 500,000 | | South Tahoe Joint Powers Financing Auth. Tax Allocation Ref. (South Tahoe Redev. Proj.) (AGM Insured) | | | 5.00 | | | | 10/1/30 | | | | 598,670 | |
| 350,000 | | Southwest Community Finance Auth. Rev. (Riverside Co. Proj.) 9 | | | 6.00 | | | | 5/1/24 | | | | 377,024 | |
| 450,000 | | Sulphur Springs Union School District C.O.P. (AGM Insured) 6 | | | 6.50 | | | | 12/1/37 | | | | 599,058 | |
| 600,000 | | Tracy Joint Unified School District G.O. Capital Appreciation 6 | | | 7.30 | | | | 8/1/41 | | | | 491,940 | |
| 500,000 | | Tustin Unified School District G.O. Capital Appreciation 6 | | | 6.00 | | | | 8/1/28 | | | | 510,860 | |
| 1,000,000 | | Upland Unified School District G.O. Capital Appreciation 6 | | | 7.00 | | | | 8/1/41 | | | | 1,055,730 | |
| 500,000 | | Val Verde Unified School District G.O. Capital Appreciation (AGM Insured) 6 | | | 6.13 | | | | 8/1/34 | | | | 509,005 | |
| | | | | | | | | | | | | | |
| | | | |
| | | | | | | | | | | | | 15,273,356 | |
| | | | | | | | | | | | | | |
See accompanying notes to financial statements.
| | |
20 | | SIT MUTUAL FUNDS SEMI-ANNUAL REPORT |
| | | | | | | | | | | | | | |
| |
| | | | |
Principal Amount ($) | | Name of Issuer | | Coupon
Rate (%) | | | Maturity
Date | | | Fair Value ($) | |
| |
| | | |
Colorado - 2.9% | | | | | | | | | | | | |
| 250,000 | | CO Educational & Cultural Facs. Auth. Rev. (CO Springs Charter Academy Proj.) | | | 5.60 | | | | 7/1/34 | | | | 272,895 | |
| 500,000 | | CO Educational & Cultural Facs. Auth. Rev. Ref. (Vail Mountain School Proj.) | | | 6.00 | | | | 5/1/30 | | | | 547,595 | |
| 800,000 | | CO Educational & Cultural Facs. Auth. Rev. Ref. (Windsor Charter Academy) 4 | | | 5.00 | | | | 9/1/36 | | | | 814,264 | |
| 190,000 | | CO Hsg. Finance Auth. Single Family Mtg. Rev. (FHA Insured) | | | 5.00 | | | | 11/1/34 | | | | 193,635 | |
| 500,000 | | Copperleaf Metro District No. 2 G.O. | | | 5.75 | | | | 12/1/45 | | | | 533,510 | |
| 500,000 | | Crystal Crossing Metro District G.O. | | | 5.25 | | | | 12/1/40 | | | | 511,655 | |
| 500,000 | | East Morgan Co. Hospital District C.O.P. 9 | | | 5.88 | | | | 12/1/38 | | | | 513,815 | |
| 500,000 | | Lambertson Farms Metro District No. 1 G.O. | | | 5.00 | | | | 12/15/25 | | | | 514,900 | |
| 250,000 | | Leyden Rock Metropolitan District No. 10 G.O. | | | 5.00 | | | | 12/1/45 | | | | 255,362 | |
| 500,000 | | Palisade Metropolitan District No. 2 G.O. | | | 5.00 | | | | 12/1/46 | | | | 508,350 | |
| | | | | | | | | | | | | | |
| | | | |
| | | | | | | | | | | | | 4,665,981 | |
| | | | | | | | | | | | | | |
Connecticut - 0.6% | | | | | | | | | | | | |
| 210,000 | | CT Hsg. Finance Auth. Rev. | | | 5.15 | | | | 11/15/34 | | | | 212,938 | |
| 500,000 | | CT Hsg. Finance Auth. Rev. | | | 3.75 | | | | 11/15/35 | | | | 520,020 | |
| 250,000 | | CT Hsg. Finance Auth. Rev. | | | 3.75 | | | | 11/15/40 | | | | 259,917 | |
| | | | | | | | | | | | | | |
| | | | |
| | | | | | | | | | | | | 992,875 | |
| | | | | | | | | | | | | | |
Florida - 11.2% | | | | | | | | | | | | |
| 385,000 | | Alachua Co. Health Facs. Auth. Rev. (Oak Hammock University) | | | 8.00 | | | | 10/1/32 | | | | 482,174 | |
| 250,000 | | Babcock Ranch Community Independent District Special Assessment | | | 5.00 | | | | 11/1/31 | | | | 255,855 | |
| 500,000 | | Bay Co. Educational Facs. Rev. (Bay Haven Charter) | | | 5.25 | | | | 9/1/30 | | | | 523,740 | |
| 225,000 | | Blackburn Creek Community Dev. District Special Assessment (Grand Palm Proj.) | | | 6.25 | | | | 5/1/35 | | | | 234,178 | |
| 250,000 | | Blackburn Creek Community Dev. District Special Assessment (Grand Palm Proj.) | | | 6.25 | | | | 5/1/45 | | | | 260,600 | |
| 550,000 | | Capital Trust Agency Rev. (Tallahassee Tapestry) 4 | | | 6.75 | | | | 12/1/35 | | | | 574,645 | |
| 250,000 | | Capital Trust Agency Rev. (Tuscan Gardens Senior Living Center) | | | 7.00 | | | | 4/1/35 | | | | 267,662 | |
| 350,000 | | Collier Co. Industrial Dev. Auth. Rev. (Arlington of Naples Proj.) 4 | | | 6.50 | | | | 5/15/20 | | | | 350,672 | |
| 250,000 | | Collier Co. Industrial Dev. Auth. Rev. (Arlington of Naples Proj.) 4 | | | 7.25 | | | | 5/15/26 | | | | 294,560 | |
| 415,000 | | Collier Co. Industrial Dev. Auth. Rev. (NCH Healthcare System Proj.) | | | 6.25 | | | | 10/1/39 | | | | 492,750 | |
| 100,000 | | Fiddlers Creek Community Dev. District No. 2 Special Assessment Rev. 2, 5, 15 | | | 5.75 | | | | N/A | | | | 59,963 | |
| 200,000 | | FL Hsg. Finance Corp. (GNMA/FNMA Collateralized) | | | 5.00 | | | | 7/1/26 | | | | 216,740 | |
| 220,000 | | FL Hsg. Finance Corp. (GNMA/FNMA/FHLMC Collateralized) | | | 5.00 | | | | 7/1/39 | | | | 235,081 | |
| 400,000 | | Florida Dev. Finance Corp. Rev. (Renaissance Charter School) | | | 6.00 | | | | 6/15/34 | | | | 420,072 | |
| 535,000 | | Gramercy Farms Community Dev. District Special Assessment 6 | | | 3.24 | | | | 5/1/39 | | | | 113,597 | |
| 350,000 | | Heritage Harbour North Community Dev. District Special Assessment | | | 5.00 | | | | 5/1/34 | | | | 380,646 | |
| 350,000 | | Lakewood Ranch Stewardship District Cap. Improvement Special Assessment Rev. | | | 4.25 | | | | 5/1/25 | | | | 370,380 | |
| 250,000 | | Lakewood Ranch Stewardship District Cap. Improvement Special Assessment Rev. (Country Club East Proj.) | | | 6.70 | | | | 5/1/33 | | | | 290,112 | |
| 400,000 | | Lakewood Ranch Stewardship District Cap. Improvement Special Assessment Rev. (Lakewood Center) | | | 7.40 | | | | 5/1/30 | | | | 481,144 | |
| 500,000 | | Lakewood Ranch Stewardship District Cap. Improvement Special Assessment Rev. (Lakewood Ranch) | | | 5.00 | | | | 5/1/36 | | | | 522,840 | |
| 250,000 | | Lexington Oaks Community Dev. District Special Assessment Rev. | | | 5.65 | | | | 5/1/33 | | | | 270,185 | |
| 400,000 | | Live Oak No. 2 Community Dev. District Special Assessment Rev. | | | 4.00 | | | | 5/1/35 | | | | 413,848 | |
| 235,000 | | Long Lake Ranch Community Dev. District Special Assessment | | | 5.63 | | | | 5/1/24 | | | | 246,358 | |
| 100,000 | | Long Lake Ranch Community Dev. District Special Assessment | | | 5.75 | | | | 5/1/44 | | | | 104,721 | |
| 250,000 | | Magnolia Creek Community Dev. District Rev. 2, 5, 15 | | | 5.60 | | | | N/A | | | | 52,425 | |
| 250,000 | | Marshall Creek Community Dev. District Cap. Improvement Special Assessment Rev. | | | 5.00 | | | | 5/1/32 | | | | 263,545 | |
| 1,400,000 | | Miami-Dade Co. Special Obligation Rev. | | | 4.00 | | | | 10/1/40 | | | | 1,535,436 | |
| 500,000 | | Miami-Dade Co. Transit Sales Tax Rev. | | | 5.00 | | | | 7/1/34 | | | | 598,570 | |
| 230,000 | | New River Community Dev. District Cap. Improvement Special Assessment Rev. 2, 5, 15 | | | 5.00 | | | | N/A | | | | 2 | |
| 500,000 | | Northern Palm Beach Co. Improvement District Special Assessment | | | 5.00 | | | | 8/1/29 | | | | 529,700 | |
| 550,000 | | Orange Co. Health Facs. Auth. Rev. (Presbyterian Retirement Community Proj.) | | | 5.00 | | | | 8/1/34 | | | | 631,664 | |
| 500,000 | | Orange Co. Health Facs. Auth. Rev. (Presbyterian Retirement Community Proj.) | | | 5.00 | | | | 8/1/35 | | | | 578,355 | |
| 960,000 | | Orange Co. Hsg. Finance Auth. Rev. (GNMA/FNMA/FHLMC Collateralized) | | | 3.55 | | | | 9/1/30 | | | | 1,023,466 | |
See accompanying notes to financial statements.
SCHEDULE OF INVESTMENTS (Unaudited)
September 30, 2016
Sit Tax-Free Income Fund (Continued)
| | | | | | | | | | | | | | |
| |
| | | | |
Principal Amount ($) | | Name of Issuer | | Coupon
Rate (%) | | | Maturity
Date | | | Fair Value ($) | |
| |
| | | | |
| 715,000 | | Orange Co. Hsg. Finance Auth. Rev. (GNMA/FNMA/FHLMC Collateralized) | | | 3.95 | | | | 3/1/40 | | | | 741,584 | |
| 500,000 | | Osceola Co. Industrial Dev. Auth. (Wells Charter School Proj.) | | | 4.00 | | | | 8/1/31 | | | | 534,585 | |
| 500,000 | | Port St. Lucie Research Foundation Rev. (Vaccine Gene Therapy Inst.) 9 | | | 5.00 | | | | 5/1/33 | | | | 506,855 | |
| 750,000 | | Sarasota Co. Health Facs. Auth. Retirement Rev. (Village on the Isle) | | | 5.50 | | | | 1/1/27 | | | | 780,292 | |
| 500,000 | | Seminole Tribe Special Obligation Rev. 4 | | | 5.50 | | | | 10/1/24 | | | | 518,940 | |
| 250,000 | | Seven Oaks Community Dev. District Special Assessment Rev. | | | 5.50 | | | | 5/1/33 | | | | 267,320 | |
| 185,000 | | Silverleaf Community Dev. District Special Assessment. | | | 6.75 | | | | 5/1/44 | | | | 201,173 | |
| 105,000 | | Tolomato Community Dev. District Special Assessment 2, 5 | | | 6.38 | | | | 5/1/17 | | | | 1 | |
| 30,000 | | Tolomato Community Dev. District Special Assessment | | | 6.38 | | | | 5/1/17 | | | | 30,033 | |
| 40,000 | | Tolomato Community Dev. District Special Assessment 6 | | | 6.61 | | | | 5/1/39 | | | | 32,328 | |
| 185,000 | | Tolomato Community Dev. District Special Assessment 6 | | | 6.61 | | | | 5/1/40 | | | | 115,658 | |
| 120,000 | | Tolomato Community Dev. District Special Assessment 2, 5 | | | 6.61 | | | | 5/1/40 | | | | 1 | |
| 110,000 | | Tolomato Community Dev. District Special Assessment 6 | | | 6.61 | | | | 5/1/40 | | | | 58,266 | |
| 85,000 | | Tolomato Community Dev. District Special Assessment 6 | | | 6.61 | | | | 5/1/40 | | | | 51,388 | |
| 45,000 | | Tolomato Community Dev. District Special Assessment 6 | | | 6.61 | | | | 5/1/40 | | | | 20,178 | |
| 250,000 | | Trout Creek Community Dev. District Cap. Improvement Special Assessment | | | 5.50 | | | | 5/1/35 | | | | 256,522 | |
| 9,000 | | Waters Edge Community Dev. District Cap. Improvement Rev. | | | 5.35 | | | | 5/1/39 | | | | 9,017 | |
| 375,000 | | Waters Edge Community Dev. District Cap. Improvement Rev. 6 | | | 6.60 | | | | 5/1/39 | | | | 374,981 | |
| 250,000 | | Wiregrass Community Dev. District Special Assessment | | | 5.38 | | | | 5/1/35 | | | | 261,710 | |
| 450,000 | | Zephyr Ridge Community Dev. District Special Assessment 2, 5, 15 | | | 5.25 | | | | N/A | | | | 224,928 | |
| | | | | | | | | | | | | | |
| | | | |
| | | | | | | | | | | | | 18,061,446 | |
| | | | | | | | | | | | | | |
Georgia - 2.7% | | | | | | | | | | | | |
| 200,000 | | Barnesville-Lamar County Ind. Dev. Auth. Rev. (Gordon College Property) | | | 5.00 | | | | 8/1/30 | | | | 200,600 | |
| 1,280,000 | | GA Housing & Finance Authority Rev. | | | 3.80 | | | | 12/1/37 | | | | 1,321,190 | |
| 1,000,000 | | GA Housing & Finance Authority Rev. | | | 4.00 | | | | 12/1/37 | | | | 1,041,680 | |
| 650,000 | | GA Housing & Finance Authority Rev. | | | 3.80 | | | | 12/1/40 | | | | 681,811 | |
| 485,000 | | GA Housing & Finance Authority Rev. | | | 3.80 | | | | 12/1/40 | | | | 499,419 | |
| 605,000 | | GA Housing & Finance Authority Rev. | | | 3.85 | | | | 12/1/41 | | | | 628,214 | |
| | | | | | | | | | | | | | |
| | | | |
| | | | | | | | | | | | | 4,372,914 | |
| | | | | | | | | | | | | | |
Guam - 0.3% | | | | | | | | | | | | |
| 400,000 | | Guam Government Limited Obligation Rev. | | | 5.00 | | | | 12/1/21 | | | | 461,480 | |
| | | | | | | | | | | | | | |
Idaho - 0.8% | | | | | | | | | | | | |
| 200,000 | | ID Health Facs. Authority Rev. (Terraces Boise Proj.) | | | 6.00 | | | | 10/1/21 | | | | 200,318 | |
| 250,000 | | ID Health Facs. Authority Rev. (Terraces Boise Proj.) | | | 7.00 | | | | 10/1/24 | | | | 281,155 | |
| 250,000 | | ID Health Facs. Authority Rev. (Terraces Boise Proj.) | | | 7.38 | | | | 10/1/29 | | | | 276,020 | |
| 500,000 | | ID Hsg. & Fin. Assoc. Nonprofit Facs. Rev. (Idaho Arts Charter School Proj.) | | | 5.75 | | | | 12/1/32 | | | | 567,850 | |
| | | | | | | | | | | | | | |
| | | | |
| | | | | | | | | | | | | 1,325,343 | |
| | | | | | | | | | | | | | |
Illinois - 6.4% | | | | | | | | | | | | |
| 500,000 | | Bellwood G.O. | | | 5.88 | | | | 12/1/27 | | | | 594,300 | |
| 500,000 | | Burbank Educational Facs. Rev. (Intercultural Montessori Language School) 4 | | | 6.00 | | | | 9/1/35 | | | | 527,505 | |
| 500,000 | | Bureau Co. Township High School Dist. No. 502 G.O. (BAM Insured) | | | 6.25 | | | | 12/1/33 | | | | 644,345 | |
| 500,000 | | Chicago Midway Airport Rev. (Second Lien) | | | 5.25 | | | | 1/1/35 | | | | 577,865 | |
| 250,000 | | Chicago Transit Auth. Sales Tax Rev. | | | 5.25 | | | | 12/1/30 | | | | 284,567 | |
| 95,000 | | IL C.O.P. (NATL-RE Insured) | | | 5.80 | | | | 7/1/17 | | | | 95,229 | |
| 250,000 | | IL Fin. Auth. Rev. | | | 4.50 | | | | 11/1/36 | | | | 263,502 | |
| 500,000 | | IL Fin. Auth. Rev. (Lifespace Communities) | | | 5.00 | | | | 5/15/35 | | | | 586,685 | |
| 500,000 | | IL Fin. Auth. Rev. (Rogers Park Montessori School Proj.) | | | 5.00 | | | | 2/1/24 | | | | 531,820 | |
| 250,000 | | IL Fin. Auth. Rev. (Tabor Hills Living Proj.) | | | 5.25 | | | | 11/15/36 | | | | 251,035 | |
| 1,000,000 | | IL Fin. Auth. Sports Facs. Rev. (North Shore Ice Arena Proj.) | | | 6.25 | | | | 12/1/38 | | | | 543,670 | |
| 250,000 | | IL G.O. | | | 5.50 | | | | 7/1/33 | | | | 282,875 | |
See accompanying notes to financial statements.
| | |
22 | | SIT MUTUAL FUNDS SEMI-ANNUAL REPORT |
| | | | | | | | | | | | | | |
| |
| | | | |
Principal Amount ($) | | Name of Issuer | | Coupon
Rate (%) | | | Maturity
Date | | | Fair Value ($) | |
| |
| | | | |
| 265,000 | | IL G.O. (AGM Insured) | | | 4.50 | | | | 9/1/20 | | | | 265,787 | |
| 500,000 | | IL G.O. (AMBAC Insured) | | | 5.00 | | | | 3/1/34 | | | | 509,525 | |
| 380,000 | | IL Housing Dev. Auth. (AMBAC G.O. of Authority Insured) | | | 4.50 | | | | 7/1/47 | | | | 380,996 | |
| 350,000 | | IL Housing Dev. Auth. Rev. (Evergreen Towers) | | | 4.95 | | | | 7/1/34 | | | | 383,355 | |
| 1,000,000 | | IL Sports Facilities Auth. Rev. (State Tax Supported) (AGM Insured) | | | 5.25 | | | | 6/15/31 | | | | 1,156,750 | |
| 250,000 | | Lake Co. Community Consolidated School District No. 50 Woodland G.O. | | | 5.63 | | | | 1/1/26 | | | | 289,862 | |
| 1,000,000 | | Lombard Public Facs. Corp. Rev. First Tier (Conference Center & Hotel Proj.) 2, 5 | | | 5.25 | | | | 1/1/36 | | | | 304,900 | |
| 335,000 | | Macon & Moultrie Counties Community Unit School District No. 3 Mt Zion G.O. | | | 5.50 | | | | 12/1/41 | | | | 398,399 | |
| 250,000 | | Macon County School District No. 61 Decatur G.O. (AGM Insured) | | | 5.25 | | | | 1/1/37 | | | | 280,678 | |
| 1,921,000 | | Malta Tax Allocation Rev. 2, 5 | | | 5.75 | | | | 12/30/25 | | | | 768,093 | |
| 818,000 | | Manhattan Special Service Area Special Tax No. 07-6 (Groebe Farm-Stonegate) 2, 5 | | | 5.75 | | | | 3/1/22 | | | | 147,044 | |
| 490,000 | | Southwestern IL Dev. Auth. Tax Allocation Ref. (Local Govt. Program) | | | 7.00 | | | | 10/1/22 | | | | 244,995 | |
| | | | | | | | | | | | | | |
| | | | |
| | | | | | | | | | | | | 10,313,782 | |
| | | | | | | | | | | | | | |
Indiana - 2.6% | | | | | | | | | | | | |
| 700,000 | | Carmel Multifamily Hsg. Rev. (Barrington Carmel Proj.) | | | 6.00 | | | | 11/15/22 | | | | 781,634 | |
| 300,000 | | Damon Run Conservancy Dist. G.O. (State Intercept Insured) | | | 6.10 | | | | 7/1/25 | | | | 332,307 | |
| 775,000 | | IN Finance Auth. Rev. (BHI Senior Living) | | | 5.88 | | | | 11/15/41 | | | | 907,192 | |
| 425,000 | | IN Finance Auth. Rev. (BHI Senior Living) | | | 6.00 | | | | 11/15/41 | | | | 501,151 | |
| 350,000 | | IN Finance Auth. Rev. (Greencroft Obligated Group) | | | 6.50 | | | | 11/15/33 | | | | 407,771 | |
| 500,000 | | IN Housing & Community Dev. Auth. Rev. (Hammond Assisted Living Proj.) | | | 5.75 | | | | 1/1/36 | | | | 510,150 | |
| 300,000 | | Merrillville Industry Economic Dev. Rev. (Belvedere Housing Proj.) | | | 5.75 | | | | 4/1/36 | | | | 305,271 | |
| 350,000 | | Richmond Hospital Auth. Rev. (Reid Hospital & Health Care) | | | 5.00 | | | | 1/1/35 | | | | 406,654 | |
| | | | | | | | | | | | | | |
| | | | |
| | | | | | | | | | | | | 4,152,130 | |
| | | | | | | | | | | | | | |
Iowa - 0.2% | | | | | | | | | | | | |
| 250,000 | | IA Student Loan Liquidity Corp. Rev. | | | 5.80 | | | | 12/1/31 | | | | 269,587 | |
| | | | | | | | | | | | | | |
Kansas - 0.7% | | | | | | | | | | | | |
| 300,000 | | Wichita Health Care Facs. Rev. (Kansas Masonic Home) | | | 5.25 | | | | 12/1/36 | | | | 318,180 | |
| 250,000 | | Wichita Health Care Facs. Rev. (Larksfield Place) | | | 7.13 | | | | 12/15/36 | | | | 287,258 | |
| 500,000 | | Wichita Health Care Facs. Rev. (Presbyterian Manors, Inc.) | | | 6.25 | | | | 5/15/34 | | | | 517,340 | |
| | | | | | | | | | | | | | |
| | | | |
| | | | | | | | | | | | | 1,122,778 | |
| | | | | | | | | | | | | | |
Kentucky - 0.3% | | | | | | | | | | | | |
| 425,000 | | Pikeville Hospital Rev. Ref. (Pikeville Medical Center) | | | 6.50 | | | | 3/1/41 | | | | 494,734 | |
| | | | | | | | | | | | | | |
Louisiana - 2.3% | | | | | | | | | | | | |
| 47,872 | | Denham Springs/Livingston Hsg. & Mtg. Finance Auth. Rev. (GNMA/FHLMC Collateralized) | | | 5.00 | | | | 11/1/40 | | | | 48,430 | |
| 265,000 | | Jefferson Parish Finance Auth. Single Family Mtg. Rev. (GNMA/FHLMC Collateralized) | | | 5.00 | | | | 6/1/38 | | | | 273,711 | |
| 105,000 | | LA Hsg. Fin. Agy. Single Family Mtg. Rev. (Home Ownership Program) (GNMA/FHLMC Collateralized) | | | 6.00 | | | | 12/1/28 | | | | 105,306 | |
| 335,000 | | LA Hsg. Fin. Agy. Single Family Mtg. Rev. (Home Ownership Program) (GNMA/FHLMC Collateralized) | | | 5.70 | | | | 12/1/38 | | | | 344,906 | |
| 220,000 | | LA Hsg. Fin. Agy. Single Family Mtg. Rev. (Mtg. Backed Sec. Prog.) (GNMA/FHLMC Collateralized) | | | 4.60 | | | | 6/1/29 | | | | 240,227 | |
| 500,000 | | LA Local Government Environmental Facilities & Community Development Auth. | | | 5.25 | | | | 11/15/25 | | | | 537,470 | |
| 500,000 | | LA Local Government Environmental Facilities & Community Development Auth. | | | 6.00 | | | | 11/15/30 | | | | 550,090 | |
| 300,000 | | LA Public Facs. Auth. Rev. | | | 5.00 | | | | 7/1/35 | | | | 352,689 | |
| 250,000 | | LA Public Facs. Auth. Rev. (Belle-Chase Educational Foundation Proj.) (NATL-RE Insured) | | | 6.50 | | | | 5/1/31 | | | | 288,960 | |
| 655,000 | | LA Public Facs. Auth. Rev. (Tulane Univ. Proj.) (NATL-RE Insured) 1 | | | 1.25 | | | | 2/15/36 | | | | 586,854 | |
| 24,000 | | Lafayette Public Finance Auth. Single Family Mortgage-Backed Rev. (GNMA/FHLMC Collateralized) | | | 5.35 | | | | 1/1/41 | | | | 24,392 | |
| 300,000 | | St. Tammany Parish Fin. Auth. Rev. (Christwood Proj.) | | | 5.25 | | | | 11/15/37 | | | | 318,510 | |
| | | | | | | | | | | | | | |
| | | | |
| | | | | | | | | | | | | 3,671,545 | |
| | | | | | | | | | | | | | |
Maine - 1.0% | | | | | | | | | | | | |
| 600,000 | | ME Hsg. Auth. Rev. | | | 4.00 | | | | 11/15/35 | | | | 636,732 | |
| 250,000 | | ME Hsg. Auth. Rev. | | | 4.50 | | | | 11/15/37 | | | | 267,795 | |
See accompanying notes to financial statements.
SCHEDULE OF INVESTMENTS (Unaudited)
September 30, 2016
Sit Tax-Free Income Fund (Continued)
| | | | | | | | | | | | | | |
| |
| | | | |
Principal Amount ($) | | Name of Issuer | | Coupon
Rate (%) | | | Maturity
Date | | | Fair Value ($) | |
| |
| | | | |
| 250,000 | | ME Hsg. Auth. Rev. | | | 3.55 | | | | 11/15/40 | | | | 255,875 | |
| 500,000 | | ME Hsg. Auth. Rev. | | | 3.85 | | | | 11/15/40 | | | | 520,865 | |
| | | | | | | | | | | | | | |
| | | | |
| | | | | | | | | | | | | 1,681,267 | |
| | | | | | | | | | | | | | |
Maryland - 0.7% | | | | | | | | | | | | |
| 200,000 | | MD Community Dev. Administration Rev. | | | 5.13 | | | | 9/1/30 | | | | 218,894 | |
| 350,000 | | MD Community Dev. Administration Rev. | | | 3.75 | | | | 3/1/39 | | | | 363,556 | |
| 500,000 | | Montgomery Co. Housing Opportunities Commission Rev. | | | 4.00 | | | | 7/1/38 | | | | 518,750 | |
| | | | | | | | | | | | | | |
| | | | |
| | | | | | | | | | | | | 1,101,200 | |
| | | | | | | | | | | | | | |
Massachusetts - 1.8% | | | | | | | | | | | | |
| 220,000 | | MA Education Finance Auth. Education Rev. | | | 5.15 | | | | 1/1/26 | | | | 231,319 | |
| 250,000 | | MA Housing Finance Agy. Rev. | | | 4.75 | | | | 6/1/35 | | | | 267,458 | |
| 500,000 | | MA Housing Finance Agy. Rev. | | | 3.75 | | | | 12/1/40 | | | | 513,025 | |
| 500,000 | | MA Housing Finance Agy. Rev. (FHA Insured) | | | 5.30 | | | | 12/1/38 | | | | 546,845 | |
| 1,250,000 | | MA Housing Finance Agy. Rev. (GNMA/FNMA/FHLMC Collateralized) | | | 3.90 | | | | 12/1/38 | | | | 1,305,000 | |
| | | | | | | | | | | | | | |
| | | | |
| | | | | | | | | | | | | 2,863,647 | |
| | | | | | | | | | | | | | |
Michigan - 2.5% | | | | | | | | | | | | |
| 250,000 | | MI Finance Auth. Rev. (Presbyterian Village) | | | 5.25 | | | | 11/15/35 | | | | 264,852 | |
| 250,000 | | MI Hsg. Dev. Auth. (G.O. of Authority Insured) | | | 4.63 | | | | 10/1/41 | | | | 264,608 | |
| 500,000 | | MI Hsg. Dev. Auth. Rev. | | | 3.35 | | | | 12/1/34 | | | | 501,620 | |
| 500,000 | | MI Hsg. Dev. Auth. Rev. | | | 4.10 | | | | 10/1/35 | | | | 529,375 | |
| 500,000 | | MI Hsg. Dev. Auth. Rev. | | | 3.70 | | | | 12/1/36 | | | | 520,525 | |
| 705,000 | | MI Hsg. Dev. Auth. Rev. | | | 3.95 | | | | 12/1/40 | | | | 729,992 | |
| 500,000 | | MI Hsg. Dev. Auth. Rev. | | | 3.70 | | | | 12/1/45 | | | | 504,015 | |
| 400,000 | | MI Public Education Facs. Auth. Ltd. Rev. Ref. (Nataki Talibah Proj.) (Q-SBLF Insured) 2, 5 | | | 6.25 | | | | 10/1/23 | | | | 119,948 | |
| 170,000 | | MI Public Education Facs. Auth. Rev. Ref. (Bradford Proj.) 2, 4, 15 | | | 6.00 | | | | N/A | | | | 161,497 | |
| 250,000 | | Taylor Brownfield Redevelopment Authority (NATL Insured) | | | 5.00 | | | | 5/1/32 | | | | 283,692 | |
| 230,000 | | Universal Academy Michigan Public School Rev. | | | 6.50 | | | | 12/1/23 | | | | 238,630 | |
| | | | | | | | | | | | | | |
| | | | |
| | | | | | | | | | | | | 4,118,754 | |
| | | | | | | | | | | | | | |
Minnesota - 1.4% | | | | | | | | | | | | |
| 1,736,148 | | Intermediate School District 287 Lease Rev. 9 | | | 5.30 | | | | 11/1/32 | | | | 1,742,919 | |
| 170,000 | | MN Hsg. Fin. Agy. Mtg. Rev. (Mtg. Backed Securities Program) (GNMA/FNMA Collateralized) | | | 4.40 | | | | 7/1/32 | | | | 183,646 | |
| 300,000 | | MN Hsg. Fin. Agy. Residential Hsg. Rev. | | | 5.10 | | | | 1/1/40 | | | | 315,213 | |
| | | | | | | | | | | | | | |
| | | | |
| | | | | | | | | | | | | 2,241,778 | |
| | | | | | | | | | | | | | |
Mississippi - 0.0% | | | | | | | | | | | | |
| 70,000 | | MS Home Corp. Single Family Mtg. Rev. (GNMA/FNMA/FHLMC Collateralized) | | | 6.75 | | | | 6/1/39 | | | | 73,171 | |
| | | | | | | | | | | | | | |
Missouri - 0.8% | | | | | | | | | | | | |
| 400,000 | | Kansas City Industrial Dev. Auth. Rev. (Kansas City Pkg. LLC) | | | 5.45 | | | | 9/1/23 | | | | 427,468 | |
| 500,000 | | Kansas City Industrial Dev. Auth. Rev. (United Methodist Retirement Home, Inc.) 4 | | | 5.75 | | | | 11/15/36 | | | | 515,385 | |
| 295,000 | | Kirkwood Industrial Dev. Auth. Rev. (Aberdeen Heights) | | | 8.00 | | | | 5/15/21 | | | | 331,064 | |
| | | | | | | | | | | | | | |
| | | | |
| | | | | | | | | | | | | 1,273,917 | |
| | | | | | | | | | | | | | |
Montana - 0.7% | | | | | | | | | | | | |
| 240,000 | | MT Board of Housing Single Family Rev. | | | 4.00 | | | | 12/1/38 | | | | 253,310 | |
| 340,000 | | MT Board of Housing Single Family Rev. (FHA Insured) | | | 3.75 | | | | 12/1/38 | | | | 354,059 | |
| 150,000 | | MT Board of Housing Single Family Rev. (G.O. of BRD Insured) | | | 4.70 | | | | 12/1/26 | | | | 162,852 | |
| 419,519 | | MT Facs. Finance Auth. Rev. (Great Falls Pre-Release Services Proj.) | | | 5.08 | | | | 4/1/21 | | | | 433,862 | |
| | | | | | | | | | | | | | |
| | | | |
| | | | | | | | | | | | | 1,204,083 | |
| | | | | | | | | | | | | | |
See accompanying notes to financial statements.
| | |
24 | | SIT MUTUAL FUNDS SEMI-ANNUAL REPORT |
| | | | | | | | | | | | | | |
| |
| | | | |
Principal Amount ($) | | Name of Issuer | | Coupon
Rate (%) | | | Maturity
Date | | | Fair Value ($) | |
| |
| | | |
Nebraska - 0.3% | | | | | | | | | | | | |
| 400,000 | | Douglas Co. Hospital Auth. No. 3 (Methodist Hospital) | | | 5.00 | | | | 11/1/30 | | | | 474,744 | |
| 410,000 | | Mead Village Tax Allocation Rev. (E3 Biofuels - Mead LLC Proj.) 2, 5, 15 | | | 5.13 | | | | N/A | | | | 9,738 | |
| | | | | | | | | | | | | | |
| | | | |
| | | | | | | | | | | | | 484,482 | |
| | | | | | | | | | | | | | |
Nevada - 0.5% | | | | | | | | | | | | |
| 700,000 | | Nevada Hsg. Division Rev. (GNMA/FNMA/FHLMC Collateralized) | | | 3.85 | | | | 10/1/39 | | | | 723,898 | |
| 105,000 | | NV Hsg. Dev. Single Family Mtg. Program Mezzanine (GNMA/FNMA/FHLMC Collateralized) | | | 5.10 | | | | 10/1/40 | | | | 109,633 | |
| | | | | | | | | | | | | | |
| | | | |
| | | | | | | | | | | | | 833,531 | |
| | | | | | | | | | | | | | |
New Hampshire - 0.3% | | | | | | | | | | | | |
| 400,000 | | NH Health & Educ. Facs. Auth. Rev. (Wentworth Douglas Hospital) | | | 6.00 | | | | 1/1/34 | | | | 465,260 | |
| | | | | | | | | | | | | | |
New Jersey - 0.9% | | | | | | | | | | | | |
| 35,000 | | NJ Higher Education Assistance Auth. Student Loan Rev. | | | 5.00 | | | | 12/1/28 | | | | 38,324 | |
| 370,000 | | NJ Hsg. & Mtg. Finance Agy. Rev. | | | 5.05 | | | | 10/1/39 | | | | 385,522 | |
| 550,000 | | NJ Hsg. & Mtg. Finance Agy. Rev. (Mciver Homes Hsg. Proj.) (FHLMC Collateralized) | | | 3.60 | | | | 1/1/30 | | | | 583,143 | |
| 400,000 | | NJ Hsg. & Mtg. Finance Agy. Single Family Mtg. Rev. | | | 4.50 | | | | 10/1/30 | | | | 432,120 | |
| | | | | | | | | | | | | | |
| | | | |
| | | | | | | | | | | | | 1,439,109 | |
| | | | | | | | | | | | | | |
New Mexico - 1.4% | | | | | | | | | | | | |
| 480,000 | | NM Mtg. Fin. Auth. Rev. | | | 3.80 | | | | 9/1/46 | | | | 495,720 | |
| 440,000 | | NM Mtg. Fin. Auth. Single Family Mtg. Rev. (FHA Insured) | | | 3.90 | | | | 9/1/42 | | | | 453,878 | |
| 230,000 | | NM Mtg. Fin. Auth. Single Family Mtg. Rev. (GNMA/FNMA/FHLMC Collateralized) | | | 4.80 | | | | 9/1/29 | | | | 239,738 | |
| 225,000 | | NM Mtg. Fin. Auth. Single Family Mtg. Rev. (GNMA/FNMA/FHLMC Collateralized) | | | 5.35 | | | | 9/1/30 | | | | 237,622 | |
| 465,000 | | NM Mtg. Fin. Auth. Single Family Mtg. Rev. (GNMA/FNMA/FHLMC Collateralized) | | | 5.25 | | | | 9/1/34 | | | | 490,942 | |
| 420,000 | | NM Mtg. Fin. Auth. Single Family Mtg. Rev. (GNMA/FNMA/FHLMC Collateralized) | | | 4.13 | | | | 9/1/42 | | | | 438,753 | |
| | | | | | | | | | | | | | |
| | | | |
| | | | | | | | | | | | | 2,356,653 | |
| | | | | | | | | | | | | | |
New York - 4.8% | | | | | | | | | | | | |
| 350,000 | | Hempstead Town Local Development Corp. Rev. (Hofstra University Proj.) | | | 4.00 | | | | 7/1/33 | | | | 380,156 | |
| 250,000 | | New York City Housing Development Corp. Multifamily Mtg. Rev. | | | 4.60 | | | | 11/1/36 | | | | 265,360 | |
| 250,000 | | New York City Housing Development Corp. Multifamily Mtg. Rev. | | | 3.30 | | | | 11/1/41 | | | | 249,992 | |
| 500,000 | | New York City Housing Development Corp. Rev. | | | 3.80 | | | | 11/1/37 | | | | 517,555 | |
| 750,000 | | New York City Municipal Water Finance Authority | | | 5.00 | | | | 6/15/38 | | | | 897,338 | |
| 500,000 | | NY Mortgage Agency Rev. | | | 3.75 | | | | 10/1/38 | | | | 514,915 | |
| 500,000 | | NY Mortgage Agency Rev. | | | 3.70 | | | | 10/1/38 | | | | 517,705 | |
| 500,000 | | NY Mortgage Agency Rev. | | | 3.80 | | | | 10/1/40 | | | | 516,830 | |
| 540,000 | | NY Mortgage Agency Rev. | | | 4.13 | | | | 10/1/40 | | | | 564,446 | |
| 200,000 | | NY Mortgage Agency Rev. | | | 3.75 | | | | 10/1/42 | | | | 204,394 | |
| 5,000 | | NY Mortgage Agency Rev. | | | 4.75 | | | | 10/1/42 | | | | 5,299 | |
| 200,000 | | NY State Dormitory Auth. Rev. Ref. (Miriam Osborne Memorial Home) | | | 5.00 | | | | 7/1/42 | | | | 212,280 | |
| 300,000 | | NY State Dormitory Auth. Rev. Ref. (N. Shore-Long Island Jewish Obligation) | | | 5.00 | | | | 5/1/33 | | | | 361,482 | |
| 590,000 | | NY State Housing Finance Agency Rev. (Affordable Hsg. Proj.) | | | 3.75 | | | | 11/1/37 | | | | 612,284 | |
| 400,000 | | NY State Housing Finance Agency Rev. (Affordable Hsg. Proj.) | | | 4.88 | | | | 11/1/42 | | | | 429,848 | |
| 500,000 | | NY State Housing Finance Agency Rev. (Affordable Hsg. Proj.) (FNMA/FHLMC Collateralized) | | | 3.65 | | | | 11/1/34 | | | | 523,625 | |
| 1,000,000�� | | NY State Housing Finance Agency Rev. (Affordable Hsg. Proj.) (SOYMNA Insured) | | | 4.10 | | | | 5/1/48 | | | | 1,041,000 | |
| | | | | | | | | | | | | | |
| | | | |
| | | | | | | | | | | | | 7,814,509 | |
| | | | | | | | | | | | | | |
North Dakota - 0.2% | | | | | | | | | | | | |
| 300,000 | | ND Maple-Steel Joint Water Resource District | | | 4.00 | | | | 5/1/30 | | | | 300,168 | |
| | | | | | | | | | | | | | |
See accompanying notes to financial statements.
SCHEDULE OF INVESTMENTS (Unaudited)
September 30, 2016
Sit Tax-Free Income Fund (Continued)
| | | | | | | | | | | | | | |
| |
| | | | |
Principal Amount ($) | | Name of Issuer | | Coupon
Rate (%) | | | Maturity
Date | | | Fair Value ($) | |
| |
| | | |
Ohio - 1.0% | | | | | | | | | | | | |
| 636,800 | | Cuyahoga Co. Hsg. Mtg. Sr. Rev. (R H Myers Apts. Proj.) (GNMA Collateralized) | | | 5.70 | | | | 3/20/42 | | | | 663,686 | |
| 400,000 | | Dayton-Montgomery County Port Auth. Rev. (Storypoint Troy Proj.) | | | 7.00 | | | | 1/15/40 | | | | 412,480 | |
| 500,000 | | Lucas Metro Hsg. Auth. | | | 5.00 | | | | 11/1/36 | | | | 550,970 | |
| | | | | | | | | | | | | | |
| | | | |
| | | | | | | | | | | | | 1,627,136 | |
| | | | | | | | | | | | | | |
Oklahoma - 0.4% | | | | | | | | | | | | |
| 525,000 | | Fort Sill Apache Tribe Economic Dev. Auth. 4 | | | 8.50 | | | | 8/25/26 | | | | 628,866 | |
| | | | | | | | | | | | | | |
Oregon - 1.9% | | | | | | | | | | | | |
| 350,000 | | Clackamas Co. Hsg. Auth. Rev. (Easton Ridge Apts. Proj.) | | | 3.50 | | | | 9/1/33 | | | | 359,936 | |
| 350,000 | | Coos Bay G.O. (XLCA Insured) | | | 4.20 | | | | 12/1/22 | | | | 352,142 | |
| 250,000 | | Forest Grove Rev. (Campus Improvement-Pacific Unv. Proj.) | | | 5.25 | | | | 5/1/34 | | | | 286,050 | |
| 455,000 | | OR Hsg. & Community Services Dept. Rev. (Single Family Mtg. Program) | | | 4.00 | | | | 7/1/38 | | | | 471,280 | |
| 1,000,000 | | OR State Ref G.O. (Veterans Welfare Service) | | | 3.90 | | | | 12/1/39 | | | | 1,060,290 | |
| 250,000 | | Polk Co. Hospital Fac. Auth. Rev. (Dallas Retirement Village Proj.) | | | 5.13 | | | | 7/1/35 | | | | 261,092 | |
| 350,000 | | Port of Morrow G.O. | | | 4.00 | | | | 6/1/32 | | | | 356,794 | |
| | | | | | | | | | | | | | |
| | | | |
| | | | | | | | | | | | | 3,147,584 | |
| | | | | | | | | | | | | | |
Pennsylvania - 2.8% | | | | | | | | | | | | |
| 170,000 | | Allegheny Co. Industrial Dev. Auth. Charter School Rev. (Propel Charter-McKeesport) | | | 5.90 | | | | 8/15/26 | | | | 184,696 | |
| 470,000 | | Butler Co. General Authority Rev. (School District Proj.) (AGM G.O. of District) 1 | | | 1.27 | | | | 10/1/34 | | | | 380,051 | |
| 250,000 | | Central Bradford Progress Auth. Rev. (Guthrie Healthcare System) | | | 5.50 | | | | 12/1/31 | | | | 294,107 | �� |
| 250,000 | | Erie Co. Hospital Auth. Rev. (St. Vincent Health Center Proj.) | | | 7.00 | | | | 7/1/27 | | | | 266,450 | |
| 225,000 | | Lehigh Co. General Purpose Auth. Rev. (Saint Luke’s Bethlehem) 1 | | | 1.57 | | | | 8/15/42 | | | | 171,747 | |
| 250,000 | | Moon Industrial Dev. Auth. Rev. (Baptist Homes Society Obligation) | | | 5.63 | | | | 7/1/30 | | | | 283,638 | |
| 500,000 | | PA Hsg. Finance Agy. Rev. | | | 4.05 | | | | 10/1/40 | | | | 531,420 | |
| 500,000 | | PA Hsg. Finance Agy. Rev. | | | 4.05 | | | | 10/1/40 | | | | 523,320 | |
| 500,000 | | PA Turnpike Commission Rev. Capital Appreciation 6 | | | 5.13 | | | | 12/1/35 | | | | 562,385 | |
| 1,250,000 | | PA Turnpike Commission Rev. Capital Appreciation 6 | | | 0.00 | | | | 12/1/38 | | | | 1,359,075 | |
| | | | | | | | | | | | | | |
| | | | |
| | | | | | | | | | | | | 4,556,889 | |
| | | | | | | | | | | | | | |
Puerto Rico - 0.2% | | | | | | | | | | | | |
| 335,000 | | Puerto Rico Ind. Medical & Environmental Pollution Control Facs. Fing. Auth. Rev. (American Home Proj.) | | | 5.10 | | | | 12/1/18 | | | | 344,290 | |
| | | | | | | | | | | | | | |
Rhode Island - 0.2% | | | | | | | | | | | | |
| 250,000 | | RI Hsg. & Mortgage Finance Corp. Rev. | | | 3.90 | | | | 10/1/37 | | | | 258,660 | |
| | | | | | | | | | | | | | |
South Carolina - 0.8% | | | | | | | | | | | | |
| 315,000 | | SC Education Assistance Auth. Student Loan Rev. | | | 5.10 | | | | 10/1/29 | | | | 336,899 | |
| 71,690 | | SC Jobs Economic Dev. Auth. Health Care Facs. Rev. (Woodlands at Furman Proj.) 6 | | | 0.04 | | | | 11/15/47 | | | | 8,007 | |
| 250,000 | | SC Public Service Auth. Rev. (Santee Cooper) | | | 5.00 | | | | 12/1/38 | | | | 291,655 | |
| 500,000 | | SC Public Service Auth. Rev. (Santee Cooper) | | | 5.75 | | | | 12/1/43 | | | | 620,460 | |
| | | | | | | | | | | | | | |
| | | | |
| | | | | | | | | | | | | 1,257,021 | |
| | | | | | | | | | | | | | |
Tennessee - 1.7% | | | | | | | | | | | | |
| 495,000 | | Metro Govt. Nashville & Davidson Co. Health & Education Facs. Rev. (Prestige Proj.) 2, 5 | | | 7.50 | | | | 12/20/40 | | | | 494,936 | |
| 1,850,000 | | Shelby Co. Health, Education & Hsg. Facs. Rev. (CME Memphis Apts. Proj.) 2, 5 | | | 5.35 | | | | 1/1/19 | | | | 46,158 | |
| 7,875,000 | | Shelby Co. Health, Education & Hsg. Facs. Rev. (CME Memphis Apts. Proj.) 2, 5 | | | 5.55 | | | | 1/1/29 | | | | 196,481 | |
| 1,630,000 | | Shelby Co. Health, Education & Hsg. Facs. Rev. (CME Memphis Apts. Proj.) 2, 5 | | | 6.00 | | | | 1/1/29 | | | | 16 | |
| 350,000 | | Shelby Co. Health, Education & Hsg. Facs. Rev. (Trezevant Manor Proj.) | | | 5.00 | | | | 9/1/37 | | | | 373,978 | |
| 700,000 | | TN Hsg. Dev. Agency. Rev. | | | 3.88 | | | | 7/1/35 | | | | 736,603 | |
| 430,000 | | TN Hsg. Dev. Agency. Rev. | | | 3.95 | | | | 7/1/35 | | | | 456,097 | |
| 400,000 | | TN Hsg. Dev. Agency. Rev. | | | 3.25 | | | | 7/1/41 | | | | 398,640 | |
| | | | | | | | | | | | | | |
| | | | |
| | | | | | | | | | | | | 2,702,909 | |
| | | | | | | | | | | | | | |
See accompanying notes to financial statements.
| | |
26 | | SIT MUTUAL FUNDS SEMI-ANNUAL REPORT |
| | | | | | | | | | | | | | |
| |
| | | | |
Principal Amount ($) | | Name of Issuer | | Coupon Rate (%) | | | Maturity Date | | | Fair Value ($) | |
| |
| | | |
Texas - 5.1% | | | | | | | | | | | | |
| 915,000 | | Arlington Higher Education Finance Corp., Education Rev. (Arlington Classics Academy) | | | 7.00 | | | | 8/15/28 | | | | 1,019,877 | |
| 200,000 | | Arlington Higher Education Finance Corp., Education Rev. (Leadership Prep School) | | | 5.00 | | | | 6/15/36 | | | | 204,358 | |
| 1,000,000 | | Bexar Co. Rev. (Venue Proj.) | | | 5.00 | | | | 8/15/39 | | | | 1,138,710 | |
| 500,000 | | Dallas/Fort Worth International Airport Rev. (JT Improvement) | | | 5.25 | | | | 11/1/37 | | | | 602,825 | |
| 1,745,617 | | Galveston Co. Municipal Utility Dist. No. 52 BANS Series 2016A 15 | | | 5.37 | | | | N/A | | | | 1,308,707 | |
| 600,000 | | Harris Co. Cultural Education Facs. Finance Corp. Rev. (Space Center Houston Proj.) | | | 6.75 | | | | 8/15/21 | | | | 654,756 | |
| 400,000 | | New Hope Cultural Education Facs. Corp. Rev. (Cardinal Bay, Inc.) | | | 5.00 | | | | 7/1/46 | | | | 459,168 | |
| 250,000 | | New Hope Cultural Education Facs. Corp. Rev. (NCCD-College Station Properties, LLC) | | | 5.00 | | | | 7/1/35 | | | | 281,865 | |
| 250,000 | | New Hope Cultural Education Facs. Corp. Rev. (Wesleyan Homes Inc. Proj.) | | | 5.50 | | | | 1/1/35 | | | | 271,725 | |
| 229,000 | | North Central Texas Health Facility Development Corp. (CC Young Memorial Home) | | | 5.38 | | | | 2/15/25 | | | | 229,057 | |
| 250,000 | | Red River Health Facs. Dev. Corp. Rev. (MRC Crossings Proj.) | | | 7.50 | | | | 11/15/34 | | | | 295,970 | |
| 500,000 | | Sugar Land Dev. Corp. Rev. (BAM Insured) | | | 5.00 | | | | 2/15/33 | | | | 578,330 | |
| 300,000 | | Tarrant County Cultural Education Facs. Finance Corp. Rev. (Air Force Villages Proj.) | | | 5.00 | | | | 5/15/37 | | | | 329,931 | |
| 300,000 | | Travis County Health Facs. Dev. Corp. Rev. (Longhorn Village Proj.) | | | 7.13 | | | | 1/1/46 | | | | 339,879 | |
| 500,000 | | TX Grand Parkway Transportation Corp. Rev. 6 | | | 5.50 | | | | 10/1/35 | | | | 468,845 | |
| | | | | | | | | | | | | | |
| | | | |
| | | | | | | | | | | | | 8,184,003 | |
| | | | | | | | | | | | | | |
Utah - 0.8% | | | | | | | | | | | | |
| 250,000 | | UT Charter School Finance Auth. Rev. (Spectrum Academy Proj.) 4 | | | 6.00 | | | | 4/15/45 | | | | 265,082 | |
| 185,000 | | UT Hsg. Corp. Single Family Mtg. Rev. | | | 5.75 | | | | 1/1/33 | | | | 188,818 | |
| 285,000 | | UT Hsg. Corp. Single Family Mtg. Rev. | | | 4.60 | | | | 7/1/34 | | | | 300,436 | |
| 500,000 | | UT Hsg. Corp. Single Family Mtg. Rev. (FHA Insured) | | | 4.00 | | | | 1/1/36 | | | | 537,190 | |
| | | | | | | | | | | | | | |
| | | | |
| | | | | | | | | | | | | 1,291,526 | |
| | | | | | | | | | | | | | |
Virginia - 2.7% | | | | | | | | | | | | |
| 500,000 | | Farms New Kent Community Dev. Auth. Special Assessment 2, 5 | | | 5.13 | | | | 3/1/36 | | | | 124,950 | |
| 250,000 | | VA Hsg. Dev. Auth. Rev. | | | 3.55 | | | | 5/1/41 | | | | 255,762 | |
| 525,000 | | VA Hsg. Dev. Auth. Rev. (Commonwealth Mtg.) | | | 3.88 | | | | 1/1/38 | | | | 543,926 | |
| 550,000 | | VA Hsg. Dev. Auth. Rev. (Commonwealth Mtg.) | | | 4.80 | | | | 7/1/38 | | | | 602,118 | |
| 500,000 | | VA Hsg. Dev. Auth. Rev. (Commonwealth Mtg.) | | | 4.75 | | | | 10/1/38 | | | | 544,585 | |
| 500,000 | | VA Hsg. Dev. Auth. Rev. (Commonwealth Mtg.) | | | 4.75 | | | | 10/1/38 | | | | 544,585 | |
| 500,000 | | VA Hsg. Dev. Auth. Rev. (Commonwealth Mtg.) | | | 5.10 | | | | 10/1/38 | | | | 554,100 | |
| 400,000 | | VA Hsg. Dev. Auth. Rev. (Rental Hsg. Proj.) | | | 4.13 | | | | 7/1/33 | | | | 426,408 | |
| 500,000 | | VA Hsg. Dev. Auth. Rev. (Rental Hsg. Proj.) | | | 5.00 | | | | 12/1/39 | | | | 536,670 | |
| 250,000 | | VA Hsg. Dev. Auth. Rev. (Rental Hsg. Proj.) (G.O. of Auth. Insured) | | | 4.60 | | | | 12/1/38 | | | | 265,255 | |
| | | | | | | | | | | | | | |
| | | | |
| | | | | | | | | | | | | 4,398,359 | |
| | | | | | | | | | | | | | |
Washington - 3.3% | | | | | | | | | | | | |
| 500,000 | | Pike Place Market Preservation Dev. Auth. Rev. | | | 5.00 | | | | 12/1/40 | | | | 579,625 | |
| 325,000 | | WA Hsg. Fin. Commission | | | 3.70 | | | | 12/1/33 | | | | 338,436 | |
| 250,000 | | WA Hsg. Fin. Commission Multi Family Mtg. Rev. (Bayview Manor Homes) 4 | | | 5.00 | | | | 7/1/31 | | | | 273,880 | |
| 750,000 | | WA Hsg. Fin. Commission Multi Family Mtg. Rev. (Bayview Manor Homes) 4 | | | 5.00 | | | | 7/1/36 | | | | 816,338 | |
| 500,000 | | WA Hsg. Fin. Commission Multi Family Mtg. Rev. (GNMA/FNMA/FHLMC Collateralized) | | | 3.50 | | | | 12/1/33 | | | | 517,965 | |
| 50,000 | | WA Hsg. Fin. Commission Multi Family Mtg. Rev. (Non-profit Hsg.) | | | 6.00 | | | | 10/1/22 | | | | 56,283 | |
| 145,000 | | WA Hsg. Fin. Commission Multi Family Mtg. Rev. (Skyline at First Hill Proj.) | | | 5.25 | | | | 1/1/17 | | | | 146,598 | |
| 1,700,000 | | WA Hsg. Fin. Commission Multi Family Mtg. Rev. (Skyline at First Hill Proj.) | | | 5.63 | | | | 1/1/27 | | | | 1,720,332 | |
| 300,000 | | WA Hsg. Fin. Commission Multi Family Mtg. Rev. (Wesley Homes Lea Hill Proj.) 4 | | | 5.00 | | | | 7/1/36 | | | | 321,756 | |
| 400,000 | | WA Hsg. Fin. Commission Rev. (Heron’s Key Senior Living) 4 | | | 6.50 | | | | 7/1/30 | | | | 425,308 | |
| 120,000 | | WA Hsg. Fin. Commission Single Family Mtg. Rev. (GNMA/FNMA Collateralized) | | | 4.60 | | | | 10/1/33 | | | | 124,333 | |
| | | | | | | | | | | | | | |
| | | | |
| | | | | | | | | | | | | 5,320,854 | |
| | | | | | | | | | | | | | |
See accompanying notes to financial statements.
SCHEDULE OF INVESTMENTS (Unaudited)
September 30, 2016
Sit Tax-Free Income Fund (Continued)
| | | | | | | | | | | | | | |
| |
Principal Amount ($)/ Quantity | | Name of Issuer | | Coupon Rate (%) | | | Maturity Date | | | Fair Value ($) | |
| |
| | | |
West Virginia - 0.9% | | | | | | | | | | | | |
| 215,000 | | WV Hsg. Dev. Fund Rev. | | | 4.50 | | | | 11/1/31 | | | | 223,202 | |
| 250,000 | | WV Hsg. Dev. Fund Rev. | | | 3.75 | | | | 11/1/32 | | | | 264,660 | |
| 550,000 | | WV Hsg. Dev. Fund Rev. | | | 3.80 | | | | 11/1/35 | | | | 575,460 | |
| 445,000 | | WV Hsg. Dev. Fund Rev. | | | 4.10 | | | | 11/1/45 | | | | 470,721 | |
| | | | | | | | | | | | | | |
| | | | |
| | | | | | | | | | | | | 1,534,043 | |
| | | | | | | | | | | | | | |
Wisconsin - 3.2% | | | | | | | | | | | | |
| 250,000 | | WI General Fund Rev. Appropriation Rev. | | | 6.00 | | | | 5/1/27 | | | | 281,855 | |
| 1,000,000 | | WI Health & Education Facs. Auth. Rev. (Three Pillars Senior Living) | | | 5.00 | | | | 8/15/43 | | | | 1,118,110 | |
| 500,000 | | WI Health & Educational Facs. Auth. Rev. (Aspirus, Inc. Obligation Group) | | | 5.00 | | | | 8/15/32 | | | | 582,815 | |
| 400,000 | | WI Health & Educational Facs. Auth. Rev. (Dickson Hollow Proj.) | | | 5.00 | | | | 10/1/29 | | | | 424,912 | |
| 250,000 | | WI Housing & Economic Dev. Auth. Rev. | | | 3.88 | | | | 11/1/35 | | | | 262,002 | |
| 500,000 | | WI Public Finance Auth. Rev. (Charter Educational Foundation Proj.) 4 | | | 5.00 | | | | 6/15/36 | | | | 503,790 | |
| 500,000 | | WI Public Finance Auth. Rev. (Glenridge Palmer Ranch Proj.) | | | 8.25 | | | | 6/1/46 | | | | 621,010 | |
| 500,000 | | WI Public Finance Auth. Rev. (Rose Villa Proj.) | | | 5.00 | | | | 11/15/24 | | | | 548,915 | |
| 250,000 | | WI Public Finance Auth. Rev. (Roseman University Health Sciences) | | | 5.00 | | | | 4/1/25 | | | | 264,728 | |
| 500,000 | | WI Public Finance Auth. Rev. (Roseman University Health Sciences) | | | 5.50 | | | | 4/1/32 | | | | 524,880 | |
| | | | | | | | | | | | | | |
| | | | |
| | | | | | | | | | | | | 5,133,017 | |
| | | | | | | | | | | | | | |
Wyoming - 0.7% | | | | | | | | | | | | |
| 650,000 | | WY Community Dev. Auth. Rev. | | | 3.75 | | | | 12/1/32 | | | | 680,615 | |
| 110,000 | | WY Community Dev. Auth. Rev. | | | 4.25 | | | | 12/1/37 | | | | 111,692 | |
| 325,000 | | WY Community Dev. Auth. Rev. | | | 4.05 | | | | 12/1/38 | | | | 339,232 | |
| | | | | | | | | | | | | | |
| | | | |
| | | | | | | | | | | | | 1,131,539 | |
| | | | | | | | | | | | | | |
Total Municipal Bonds
(cost: $149,364,618) | | | | | | | | | | | 142,876,380 | |
| | | | | | | | | | | | | | |
Investment Companies - 5.7% | | | | | | | | | | | | |
| 59,383 | | BlackRock Long-Term Municipal Advantage Trust (BTA) | | | | | | | | | | | 750,601 | |
| 54,000 | | BlackRock MuniHoldings Florida Insured Fund (MFL) | | | | | | | | | | | 862,920 | |
| 10,000 | | BlackRock MuniHoldings Quality Fund II, Inc. (MUE) | | | | | | | | | | | 147,700 | |
| 21,438 | | BlackRock MuniHoldings Quality Fund, Inc. (MUS) | | | | | | | | | | | 311,280 | |
| 71,171 | | BlackRock MuniYield Insured Fund (MYI) | | | | | | | | | | | 1,083,223 | |
| 21,538 | | BlackRock MuniYield Michigan Insured Fund (MIY) | | | | | | | | | | | 325,655 | |
| 100,415 | | Deutsche Municipal Income Trust (KTF) | | | | | | | | | | | 1,414,847 | |
| 18,400 | | Invesco Municipal Opportunity Trust (VMO) | | | | | | | | | | | 262,200 | |
| 15,000 | | Invesco Municipal Trust (VKQ) | | | | | | | | | | | 206,850 | |
| 25,000 | | Invesco Quality Municipal Income Trust (IQI) | | | | | | | | | | | 345,000 | |
| 40,200 | | Invesco Van Kampen Advantage Muni Income Trust (VKI) | | | | | | | | | | | 494,058 | |
| 15,000 | | Invesco Van Kampen Trust For Investment Grade Municipals (VGM) | | | | | | | | | | | 211,500 | |
| 36,123 | | Managed Duration Investment Grade Municipal Fund (MZF) | | | | | | | | | | | 518,726 | |
| 117,572 | | Nuveen AMT-Free Quality Municipal Income Fund (NEA) | | | | | | | | | | | 1,716,551 | |
| 21,173 | | Nuveen Quality Municipal Income Fund (NAD) | | | | | | | | | | | 319,077 | |
| 15,000 | | Putnam Municipal Opportunities Trust (PMO) | | | | | | | | | | | 200,100 | |
| | | | | | | | | | | | | | |
Total Investment Companies
(cost: $8,099,942) | | | | | | | | | | | 9,170,288 | |
| | | | | | | | | | | | | | |
See accompanying notes to financial statements.
| | |
28 | | SIT MUTUAL FUNDS SEMI-ANNUAL REPORT |
| | | | | | |
| |
| | |
| Quantity | | Name of Issuer | | Fair Value ($) | |
| |
| |
Short-Term Securities - 6.0% | | | | |
| 9,744,325 | | Dreyfus Tax-Exempt Cash Management Fund, 0.00% | | | | |
Total Short-Term Securities
(cost: $9,744,324) | | | 9,744,325 | |
| | | | | | |
| |
Total Investments in Securities - 100.0%
(cost: $167,208,884) | | | 161,790,993 | |
Other Assets and Liabilities, net - 0.0% | | | 3,022 | |
| | | | | | |
| |
Total Net Assets - 100.0% | | | $161,794,015 | |
| | | | | | |
| 1 | | Variable rate security. Rate disclosed is as of September 30, 2016. |
| 2 | | Securities considered illiquid by the Investment Adviser. The total value of such securities as of September 30, 2016 was $2,738,551 and represented 1.7% of net assets. |
| 4 | | 144A Restricted Security. The total value of such securities as of September 30, 2016 was $7,393,527 and represented 4.6% of net assets. These securities have been determined to be liquid by the Adviser in accordance with guidelines established by the Board of Directors. |
| 5 | | The issuer is in default of certain debt covenants. Income is not being accrued. The total value of such securities as of September 30, 2016 was $2,577,054 and represented 1.6% of net assets. |
| 6 | | Zero coupon or convertible capital appreciation bond, for which the rate disclosed is either the effective yield on purchase date or the coupon rate to be paid upon conversion to coupon paying, respectively. |
| 9 | | Municipal Lease Security. The total value of such securities as of September 30, 2016 was $3,611,081 and represented 2.2% of net assets. These securities have been determined to be liquid by the Adviser in accordance with guidelines established by the Board of Directors. |
| 15 | | Securities with a “N/A” maturity date have passed their stated maturity date and have pending restructuring arrangements. |
Numeric footnotes not disclosed are not applicable to this Schedule of Investments.
A summary of the levels for the Fund’s investments as of September 30, 2016 is as follows (see Note 2 - significant accounting policies in the notes to financial statements):
| | | | | | | | | | | | | | |
| | | | | | Investment in Securities | | | |
| | | Level 1 | | | Level 2 | | | Level 3 | | | |
| | | Quoted
Price ($) | | | Other significant observable inputs ($) | | | Significant unobservable inputs ($) | | Total ($) | |
Municipal Bonds | | | — | | | | 142,876,380 | | | — | | | 142,876,380 | |
Investment Companies | | | 9,170,288 | | | | — | | | — | | | 9,170,288 | |
Short-Term Securities | | | 9,744,325 | | | | — | | | — | | | 9,744,325 | |
| | | | |
Total: | | | 18,914,613 | | | | 142,876,380 | | | — | | | 161,790,993 | |
For the reporting period, there were no transfers between levels 1, 2 and 3.
See accompanying notes to financial statements.
|
Sit Minnesota Tax-Free Income Fund |
OBJECTIVE & STRATEGY
The investment objective of the Minnesota Tax-Free Income Fund is to provide a high level of current income exempt from federal regular income tax and Minnesota regular personal income tax as is consistent with the preservation of capital.
During normal market conditions, the Fund invests 100% of its net assets in municipal securities that generate interest income that is exempt from federal regular income tax and Minnesota regular personal income tax. The Fund anticipates that substantially all of its distributions to its shareholders will be exempt as such. For investors subject to the alternative minimum tax (“AMT”), up to 20% of the Fund’s income may be alternative minimum taxable income.
The Sit Minnesota Tax-Free Income Fund provided a total return of +2.43% for the 6-month period ended September 30, 2016, outpacing the +1.14% return for its benchmark, the Bloomberg Barclays 5-Year Municipal Bond Index. The Fund’s 30-day SEC yield was 1.88%, which compared favorably to the yield of 1.31% for the benchmark index. The Fund’s 12-month distribution rate was 3.07%.
Flows into tax-exempt bond funds have been strong and steady over the past year. As of September 28, 2016, net inflows into these funds hit the 52 consecutive week mark, which totaled approximately $59.3 billion. Further, these inflows have amounted to about $50.4 billion thus far in 2016, and $36.0 billion over the past six months. Relative to total assets, flows into Minnesota funds have been similar, with one year inflows into all municipal bond funds equating to about 8% of assets under management, whereas inflows into Minnesota municipal bond funds has been closer to about 7% of assets under management. These strong inflows have persisted due to some combination of the tax-exempt nature of most municipal bonds, their historically favorable risk/return profile relative to other asset classes, and their reasonable yields relative to the incredibly low yielding environment across the globe (approximately $11 trillion of bonds worldwide had negative yields as of September 30). To be sure, these inflows into municipal bond funds have continued in spite of yields that remain historically low. The 30-year yield on a AAA-rated general obligation bond as of September 30, 2016 was 2.31%, down 38 basis points from six months earlier, and 51 basis points from the conclusion of last year, although it’s off its low of 1.93% in early July. Municipal bond issuance in September was $38.3 billion, bringing year-to-date total issuance to $336.6 billion, which is about 6% higher than the total over the same period last year, which ended as the 5th highest for annual issuance on record. $205 billion of the $336.6 billion issued, or 60.9%, have been refundings. However, issuance of Minnesota bonds has been substantially lower. These lower rates have also encouraged issuance of lower coupon bonds; indeed, the proportion of bonds issued with coupons less than or equal to 4.25% thus far in 2016 totals approximately 53%, versus an average of about 33% issued with like coupons from 2011 through 2015. The combination of lack of Minnesota supply, low coupons, and high demand for Minnesota bonds has created a challenging investing environment for the Fund.
The strong outperformance for the Fund in the past 6-month period was driven by multiple forces. The largest contributor to the Fund’s relative performance has been a longer duration position than the Bloomberg Barclays 5-Year Municipal Bond Index. As long-term yields have experienced a net decline through the year, longer duration bonds have substantially outperformed the shorter end of the curve, all else equal. The Fund’s duration stood at 5.2 years as of September 30, 2016, longer than the benchmark’s duration of 3.9 years. Additional support for the Fund’s performance has been its distribution within credit quality. As of September 30, 2016, the Fund
HYPOTHETICAL GROWTH OF $10,000
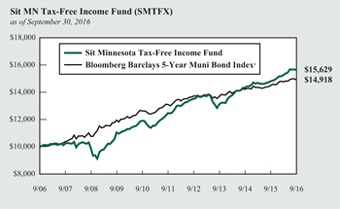
The chart above illustrates the total value of a hypothetical $10,000 investment in the Fund over the past 10 years (or for the life of the Fund if shorter) as compared to the performance of the Bloomberg Barclays 5-Year Municipal Bond Index. Past performance does not guarantee future results. Returns include the reinvestment of distributions. The chart does not reflect the deduction of taxes that a shareholder would pay on Fund distributions or the redemption of Fund shares.
1 The Bloomberg Barclays 5-Year Municipal Bond Index is the 5 year (4-6) component of the Municipal Bond Index, an unmanaged, rules-based, market-value-weighted index for the long-term tax-exempt bond market. The index includes bonds with a minimum credit rating of BBB. The returns include the reinvestment of income and do not include any transaction costs, management fees or other costs. It is not possible to invest directly in an index. This is the Fund’s primary index.
held 20.9% and 27.0% of assets in A-rated and non-rated bonds, respectively. As credit spreads have tightened over the past six and twelve month periods, lower rated bonds have generally outperformed their higher rated counterparts, providing a strong tailwind for the Fund. Strong security selection within the Multi-Family Housing, Healthcare, and Education sectors also contributed meaningfully to the period’s good performance.
Finally, the Fund’s focus on relatively higher coupon bonds has continued to provide a higher income return than the benchmark. The Fund will continue to maintain a longer duration than the benchmark. The Fund’s emphasis on income as the chief source of total return has continued to reward shareholders over the long term, and positioning into higher income producing credits remains a priority. Focus on credit analysis will also continue as a key driver of opportunity to outperform. We remain diversified on an industry and issuer basis in order to manage credit and liquidity risk, and we continue to believe the Fund is positioned to achieve attractive risk-adjusted returns going forward.
Michael C. Brilley Paul J. Jungquist, CFA
Senior Portfolio Managers
| | |
30 | | SIT MUTUAL FUNDS SEMI-ANNUAL REPORT |
COMPARATIVE RATES OF RETURNS
| | | | | | |
as of September 30, 2016 | | | | |
| | | Sit Minnesota Tax-Free Income Fund | | Bloomberg Barclays 5-Year Muni. Bond Index1 | | Lipper MN Muni. Bond Fund Index2 |
|
Six Months | | 2.43% | | 1.14% | | n/a |
One Year | | 5.57 | | 2.98 | | 4.90% |
Five Years | | 4.63 | | 2.63 | | 4.29 |
Ten Years | | 4.57 | | 4.08 | | 4.34 |
Since Inception (12/1/93) | | 4.93 | | 4.50 | | 4.67 |
|
Performance figures are historical and do not guarantee future results. Investment returns and principal value will vary, and you may have a gain or loss when you sell shares. Current performance may be lower or higher than the performance data quoted. Contact the Fund for performance data current to the most recent month-end. Returns include changes in share price as well as reinvestment of all dividends and capital gains. Returns do not reflect the deduction of taxes that a shareholder would pay on Fund distributions or the redemption of Fund shares. Management fees and administrative expenses are included in the Fund’s performance. Returns for periods greater than one year are compounded average annual rates of return.
1 The Bloomberg Barclays 5-Year Municipal Bond Index is the 5 year (4-6) component of the Municipal Bond Index, an unmanaged, rules-based, market-value-weighted index made for the long-term tax-exempt bond market. The index includes bonds with a minimum credit rating of BBB. The returns include the reinvestment of income and do not include any transaction costs, management fees or other costs. It is not possible to invest directly in an index.
2 The Lipper returns are obtained from Lipper Analytical Services, Inc., a large independent evaluator of mutual funds.
FUND DIVERSIFICATION
| | | | |
| | |
Multifamily Mortgage | | | 18.3% | |
Hospital / Health Care | | | 16.9% | |
Single Family Mortgage | | | 14.2% | |
Education/Student Loan | | | 13.0% | |
Municipal Lease | | | 8.3% | |
Other Revenue Bonds | | | 5.7% | |
Sectors less than 5.0% | | | 20.7% | |
Cash & Other Net Assets | | | 2.9% | |
Based on total net assets as of September 30, 2016. Subject to change.
PORTFOLIO SUMMARY
| | |
Net Asset Value 9/30/16: | | $10.73 Per Share |
Net Asset Value 3/31/16: | | $10.63 Per Share |
Total Net Assets: | | $573.4 Million |
Average Maturity: | | 15.6 Years |
Effective Duration3: | | 5.2 Years |
3 Duration is a measure of estimated price sensitivity relative to changes in interest rates. Portfolios with longer durations are typically more sensitive to changes in interest rates. For example, if interest rates rise by 1%, the fair value of a security with an effective duration of 5 years would decrease by 5%, with all other factors being constant. The correlation between duration and price sensitivity is greater for securities rated investment-grade than it is for securities rated below investment-grade. Duration estimates are based on assumptions by the Adviser and are subject to a number of limitations. Effective duration is calculated based on historical price changes of securities held by the Fund, and therefore is a more accurate estimate of price sensitivity provided interest rates remain within their historical range.
QUALITY RATINGS (% of Total Net Assets)
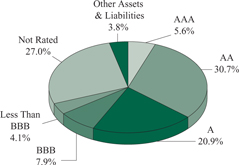
Lower of Moody’s, S&P, Fitch or Duff & Phelps ratings used.
Adviser’s Assessment of Non-Rated Securities:
| | | | |
AAA | | | 0.0% | |
AA | | | 1.0 | |
A | | | 0.3 | |
BBB | | | 7.0 | |
BB | | | 18.7 | |
<BB | | | 0.0 | |
Total | | | 27.0% | |
SCHEDULE OF INVESTMENTS (Unaudited)
September 30, 2016
Sit Minnesota Tax-Free Income Fund
| | | | | | | | | | | | | | |
| |
| | | | |
Principal
Amount ($) | | Name of Issuer | | Coupon
Rate (%) | | | Maturity Date | | | Fair Value ($) | |
| |
| | | |
Municipal Bonds - 95.8% | | | | | | | | | | | | |
Education/Student Loan - 13.0% | | | | | | | | | | | | |
| 295,000 | | Anoka Co. Charter School Lease Rev. | | | 5.00 | | | | 6/1/27 | | | | 321,172 | |
| 275,000 | | Anoka Co. Charter School Lease Rev. | | | 5.00 | | | | 6/1/32 | | | | 297,393 | |
| 2,435,000 | | Anoka Co. Charter School Lease Rev. | | | 5.00 | | | | 6/1/43 | | | | 2,613,631 | |
| 750,000 | | Baytown Township Rev. (St. Croix Prep) | | | 4.00 | | | | 8/1/36 | | | | 755,437 | |
| 750,000 | | Baytown Township Rev. (St. Croix Prep) | | | 4.00 | | | | 8/1/41 | | | | 752,392 | |
| 1,000,000 | | Baytown Township Rev. (St. Croix Prep) | | | 4.25 | | | | 8/1/46 | | | | 1,016,860 | |
| 530,000 | | Brooklyn Park Charter School Lease Rev. (Athlos Leadership Academy Proj.) | | | 5.25 | | | | 7/1/30 | | | | 549,144 | |
| 575,000 | | Cologne Charter School Lease Rev. (Cologne Academy Proj.) | | | 5.00 | | | | 7/1/29 | | | | 639,693 | |
| 500,000 | | Cologne Charter School Lease Rev. (Cologne Academy Proj.) | | | 5.00 | | | | 7/1/34 | | | | 546,960 | |
| 585,000 | | Deephaven Charter School Lease Rev. (Eagle Ridge Academy Proj.) | | | 5.25 | | | | 7/1/37 | | | | 647,168 | |
| 600,000 | | Deephaven Charter School Lease Rev. (Eagle Ridge Academy Proj.) | | | 5.25 | | | | 7/1/40 | | | | 662,352 | |
| 2,065,000 | | Duluth Hsg. & Redev. Auth. Lease Rev. (Edison Academy) | | | 5.00 | | | | 11/1/21 | | | | 2,188,838 | |
| 580,000 | | Forest Lake Charter School Lease Rev. (Lake International Language Academy) | | | 4.50 | | | | 8/1/26 | | | | 624,300 | |
| 500,000 | | Forest Lake Charter School Lease Rev. (Lake International Language Academy) | | | 5.50 | | | | 8/1/36 | | | | 551,285 | |
| 375,000 | | Ham Lake Charter School Lease Rev. (Davinci Academy Proj.) | | | 4.00 | | | | 7/1/28 | | | | 376,489 | |
| 625,000 | | Ham Lake Charter School Lease Rev. (Davinci Academy Proj.) | | | 5.00 | | | | 7/1/31 | | | | 672,406 | |
| 1,000,000 | | Ham Lake Charter School Lease Rev. (Davinci Academy Proj.) | | | 5.00 | | | | 7/1/36 | | | | 1,055,220 | |
| 460,000 | | Hugo Charter School Lease Rev. (Noble Academy Proj.) | | | 4.00 | | | | 7/1/21 | | | | 475,677 | |
| 750,000 | | Hugo Charter School Lease Rev. (Noble Academy Proj.) | | | 5.00 | | | | 7/1/29 | | | | 796,958 | |
| 1,000,000 | | Hugo Charter School Lease Rev. (Noble Academy Proj.) | | | 5.00 | | | | 7/1/34 | | | | 1,047,010 | |
| 500,000 | | Independence Charter School Lease Rev. (Beacon Academy Proj.) | | | 4.25 | | | | 7/1/26 | | | | 498,195 | |
| 750,000 | | Independence Charter School Lease Rev. (Beacon Academy Proj.) | | | 4.75 | | | | 7/1/31 | | | | 759,300 | |
| 1,200,000 | | Independence Charter School Lease Rev. (Beacon Academy Proj.) | | | 5.00 | | | | 7/1/36 | | | | 1,213,764 | |
| 1,590,000 | | Minneapolis Charter School Lease Rev. (Hiawatha Academy Proj.) | | | 4.00 | | | | 7/1/26 | | | | 1,601,432 | |
| 1,000,000 | | Minneapolis Educational Fac. Lease Rev. (Seed/Harvest Preparatory Proj.) | | | 6.25 | | | | 3/1/21 | | | | 1,002,990 | |
| 600,000 | | MN Higher Education Fac. Auth. Rev. (Bethel Univ.) | | | 5.50 | | | | 5/1/22 | | | | 608,670 | |
| 160,000 | | MN Higher Education Fac. Auth. Rev. (Bethel Univ.) | | | 5.50 | | | | 5/1/23 | | | | 162,302 | |
| 1,000,000 | | MN Higher Education Fac. Auth. Rev. (Bethel Univ.) | | | 5.50 | | | | 5/1/37 | | | | 1,011,820 | |
| 1,000,000 | | MN Higher Education Fac. Auth. Rev. (College of St. Benedict) | | | 4.00 | | | | 3/1/43 | | | | 1,073,010 | |
| 199,977 | | MN Higher Education Fac. Auth. Rev. (College of St. Benedict) | | | 4.49 | | | | 10/1/16 | | | | 199,983 | |
| 1,150,000 | | MN Higher Education Fac. Auth. Rev. (College of St. Benedict) | | | 5.00 | | | | 3/1/37 | | | | 1,356,092 | |
| 400,000 | | MN Higher Education Fac. Auth. Rev. (College of St. Scholastica Inc.) | | | 4.00 | | | | 12/1/32 | | | | 416,180 | |
| 750,000 | | MN Higher Education Fac. Auth. Rev. (Hamline Univ.) | | | 6.00 | | | | 10/1/32 | | | | 875,025 | |
| 1,000,000 | | MN Higher Education Fac. Auth. Rev. (Hamline Univ.) | | | 6.00 | | | | 10/1/40 | | | | 1,156,500 | |
| 1,000,000 | | MN Higher Education Fac. Auth. Rev. (Macalester College) | | | 3.00 | | | | 5/1/32 | | | | 1,024,580 | |
| 500,000 | | MN Higher Education Fac. Auth. Rev. (Macalester College) | | | 3.25 | | | | 5/1/36 | | | | 513,425 | |
| 750,000 | | MN Higher Education Fac. Auth. Rev. (Macalester College-Seven-I) | | | 5.00 | | | | 6/1/35 | | | | 845,370 | |
| 400,000 | | MN Higher Education Fac. Auth. Rev. (Minneapolis College of Art) | | | 3.00 | | | | 5/1/23 | | | | 421,452 | |
| 250,000 | | MN Higher Education Fac. Auth. Rev. (Minneapolis College of Art) | | | 4.00 | | | | 5/1/24 | | | | 275,352 | |
| 500,000 | | MN Higher Education Fac. Auth. Rev. (St. Olaf College) | | | 4.00 | | | | 10/1/32 | | | | 566,015 | |
| 500,000 | | MN Higher Education Fac. Auth. Rev. (St. Olaf College) | | | 4.00 | | | | 10/1/34 | | | | 563,185 | |
| 500,000 | | MN Higher Education Fac. Auth. Rev. (St. Olaf College) | | | 4.00 | | | | 10/1/35 | | | | 560,370 | |
| 345,000 | | MN Higher Education Fac. Auth. Rev. (St. Olaf College) | | | 5.00 | | | | 10/1/20 | | | | 345,041 | |
| 350,000 | | MN Higher Education Fac. Auth. Rev. (St. Olaf College) | | | 5.00 | | | | 12/1/30 | | | | 429,009 | |
| 1,500,000 | | MN Higher Education Fac. Auth. Rev. (St. Olaf College) | | | 5.00 | | | | 12/1/31 | | | | 1,830,285 | |
| 1,400,000 | | MN Higher Education Fac. Auth. Rev. (St. Scholastica College) | | | 5.00 | | | | 12/1/27 | | | | 1,442,910 | |
| 1,800,000 | | MN Higher Education Fac. Auth. Rev. (St. Scholastica College) | | | 6.30 | | | | 12/1/40 | | | | 2,010,024 | |
| 1,120,000 | | MN Higher Education Fac. Auth. Rev. (Univ. of St. Thomas) | | | 4.00 | | | | 4/1/17 | | | | 1,137,494 | |
| 750,000 | | MN Higher Education Fac. Auth. Rev. (Univ. of St. Thomas) | | | 4.00 | | | | 4/1/31 | | | | 848,018 | |
| 3,150,000 | | MN Higher Education Fac. Auth. Rev. (Univ. of St. Thomas) | | | 4.00 | | | | 4/1/39 | | | | 3,480,088 | |
| 750,000 | | MN Higher Education Fac. Auth. Rev. (Univ. of St. Thomas) | | | 5.00 | | | | 4/1/35 | | | | 896,512 | |
See accompanying notes to financial statements.
| | |
32 | | SIT MUTUAL FUNDS SEMI-ANNUAL REPORT |
| | | | | | | | | | | | | | |
| |
| | | | |
Principal Amount ($) | | Name of Issuer | | Coupon
Rate (%) | | | Maturity
Date | | | Fair Value ($) | |
| |
| | | | |
| 1,250,000 | | Moorhead Educational Fac. Rev. (Concordia College Corp. Proj.) | | | 5.00 | | | | 12/1/40 | | | | 1,451,238 | |
| 616,123 | | Olmsted Co. Hsg. & Redev. Auth. (Schaeffer Academy Proj.) | | | 4.98 | | | | 4/25/27 | | | | 652,647 | |
| 385,000 | | Ramsey Lease Rev. (Pact Charter School Proj.) | | | 5.00 | | | | 12/1/26 | | | | 417,378 | |
| 1,850,000 | | Ramsey Lease Rev. (Pact Charter School Proj.) | | | 5.50 | | | | 12/1/33 | | | | 2,021,662 | |
| 3,500,000 | | Rice Co. Educational Fac. Rev. (Shattuck-St. Mary’s School) | | | 5.00 | | | | 8/1/22 | | | | 3,774,785 | |
| 350,000 | | St. Cloud Charter School Lease Rev. (Stride Academy Proj.) | | | 3.00 | | | | 4/1/21 | | | | 350,392 | |
| 1,850,000 | | St. Cloud Charter School Lease Rev. (Stride Academy Proj.) | | | 5.00 | | | | 4/1/36 | | | | 1,915,102 | |
| 700,000 | | St. Paul Hsg. & Redev. Auth. | | | 5.00 | | | | 12/1/30 | | | | 778,743 | |
| 1,000,000 | | St. Paul Hsg. & Redev. Auth. | | | 5.00 | | | | 12/1/37 | | | | 1,089,410 | |
| 705,000 | | St. Paul Hsg. & Redev. Auth. | | | 5.00 | | | | 12/1/46 | | | | 763,621 | |
| 535,000 | | St. Paul Hsg. & Redev. Auth. (German Immersion School) | | | 4.00 | | | | 7/1/23 | | | | 555,180 | |
| 855,000 | | St. Paul Hsg. & Redev. Auth. (German Immersion School) | | | 5.00 | | | | 7/1/33 | | | | 909,267 | |
| 500,000 | | St. Paul Hsg. & Redev. Auth. (German Immersion School) | | | 5.00 | | | | 7/1/44 | | | | 527,185 | |
| 1,300,000 | | St. Paul Hsg. & Redev. Auth. (Higher Ground Academy Proj.) | | | 4.25 | | | | 12/1/23 | | | | 1,384,071 | |
| 1,500,000 | | St. Paul Hsg. & Redev. Auth. (Higher Ground Academy Proj.) | | | 5.00 | | | | 12/1/33 | | | | 1,602,345 | |
| 720,000 | | St. Paul Hsg. & Redev. Auth. (Hope Community Academy Proj.) | | | 4.50 | | | | 12/1/29 | | | | 777,118 | |
| 1,150,000 | | St. Paul Hsg. & Redev. Auth. (St. Paul Conservatory for Performing Artists) | | | 4.63 | | | | 3/1/43 | | | | 1,196,253 | |
| 1,610,000 | | St. Paul Hsg. & Redev. Auth. (Twin Cities Academy Proj.) | | | 4.00 | | | | 7/1/25 | | | | 1,682,530 | |
| 955,000 | | St. Paul Hsg. & Redev. Auth. (Twin Cities Academy Proj.) | | | 5.00 | | | | 7/1/35 | | | | 998,309 | |
| 205,000 | | St. Paul Hsg. & Redev. Auth. Lease Rev. (Hmong Academy Proj.) | | | 5.50 | | | | 9/1/18 | | | | 205,402 | |
| 295,000 | | St. Paul Hsg. & Redev. Auth. Lease Rev. (Hmong College Preparatory Academy) | | | 4.75 | | | | 9/1/22 | | | | 315,104 | |
| 500,000 | | St. Paul Hsg. & Redev. Auth. Lease Rev. (Hmong College Preparatory Academy) | | | 5.00 | | | | 9/1/27 | | | | 530,465 | |
| 620,000 | | St. Paul Hsg. & Redev. Auth. Lease Rev. (Nova Classical Academy Proj.) | | | 5.70 | | | | 9/1/21 | | | | 687,636 | |
| 1,000,000 | | University of Minnesota Rev. | | | 5.00 | | | | 4/1/41 | | | | 1,226,420 | |
| 1,610,000 | | Victoria Private School Fac. Rev. (Holy Family Catholic High) | | | 4.00 | | | | 9/1/23 | | | | 1,597,474 | |
| 510,000 | | Victoria Private School Fac. Rev. (Holy Family Catholic High) | | | 4.60 | | | | 9/1/29 | | | | 504,599 | |
| 355,000 | | Woodbury Charter School Lease Rev. (MSA Building) | | | 5.00 | | | | 12/1/27 | | | | 385,086 | |
| 225,000 | | Woodbury Charter School Lease Rev. (MSA Building) | | | 5.00 | | | | 12/1/32 | | | | 242,784 | |
| | | | | | | | | | | | | | |
| | | | |
| | | | | | | | | | | | | 74,256,984 | |
| | | | | | | | | | | | | | |
Escrowed To Maturity/Prerefunded - 3.0% | | | | | | | | | | | | |
| 905,000 | | Brooklyn Park Lease Rev. (Prairie Seeds Academy Proj.) | | | 8.00 | | | | 3/1/20 | | | | 949,942 | |
| 140,000 | | City of Minneapolis Rev. (Fairview Health Services) | | | 6.50 | | | | 11/15/38 | | | | 156,345 | |
| 545,000 | | County of Douglas, Rev. (Douglas County Hospital) | | | 6.00 | | | | 7/1/28 | | | | 593,118 | |
| 1,280,000 | | Deephaven Charter School Lease Rev. (Eagle Ridge Academy Proj.) | | | 5.13 | | | | 7/1/33 | | | | 1,560,832 | |
| 1,005,000 | | Douglas Co. Gross Health Care Facs. Rev. (Douglas Co. Hospital Proj.) | | | 6.00 | | | | 7/1/28 | | | | 1,093,731 | |
| 1,500,000 | | Minneapolis National Marrow Donor Program Rev. | | | 4.88 | | | | 8/1/25 | | | | 1,607,985 | |
| 1,250,000 | | MN Higher Education Fac. Auth. Rev. (Univ. of St. Thomas) | | | 6.00 | | | | 10/1/25 | | | | 1,250,188 | |
| 2,000,000 | | Southern MN Power Agy. Power Supply System Rev. | | | 5.25 | | | | 1/1/30 | | | | 2,192,620 | |
| 1,225,000 | | St. Cloud Health Care Rev. (CentraCare Health System Proj.) | | | 5.50 | | | | 5/1/39 | | | | 1,368,043 | |
| 2,000,000 | | St. Louis Park Health Care Facs. Rev. (Park Nicollet Health Proj.) | | | 5.50 | | | | 7/1/29 | | | | 2,248,980 | |
| 4,200,000 | | St. Paul Hsg. & Redev. Auth. Health Care Rev. (HealthPartners Oblig. Group Proj.) | | | 5.25 | | | | 5/15/36 | | | | 4,223,268 | |
| | | | | | | | | | | | | | |
| | | | |
| | | | | | | | | | | | | 17,245,052 | |
| | | | | | | | | | | | | | |
General Obligation - 4.5% | | | | | | | | | | | | |
| 1,000,000 | | Bemidji Sales Tax G.O. | | | 5.00 | | | | 2/1/34 | | | | 1,140,350 | |
| 1,350,000 | | Bemidji Sales Tax G.O. | | | 6.00 | | | | 2/1/41 | | | | 1,598,872 | |
| 5,000,000 | | Cloquet Independent School District No. 94 | | | 4.00 | | | | 2/1/36 | | | | 5,443,200 | |
| 600,000 | | Columbia Heights G.O. (Public Safety Center) | | | 4.50 | | | | 2/1/35 | | | | 625,098 | |
| 650,000 | | Dakota Co. Community Dev. Agy. Sr. Hsg. Facs. G.O. | | | 5.00 | | | | 1/1/26 | | | | 669,740 | |
| 400,000 | | Fridley Independent School District No. 14 | | | 4.00 | | | | 2/1/30 | | | | 455,748 | |
| 1,300,000 | | Glencoe-Silver Lake Independent School District No. 2859 | | | 4.00 | | | | 2/1/40 | | | | 1,425,359 | |
See accompanying notes to financial statements.
SCHEDULE OF INVESTMENTS (Unaudited)
September 30, 2016
Sit Minnesota Tax-Free Income Fund (Continued)
| | | | | | | | | | | | | | |
| |
| | | | |
Principal
Amount ($) | | Name of Issuer | | Coupon
Rate (%) | | | Maturity Date | | | Fair Value ($) | |
| |
| | | | |
| 685,000 | | Lakeville City G.O. | | | 2.00 | | | | 2/1/17 | | | | 687,877 | |
| 1,050,000 | | Minneapolis G.O. | | | 2.00 | | | | 12/1/16 | | | | 1,052,300 | |
| 750,000 | | Northland Independent School District No. 118 | | | 5.00 | | | | 2/1/17 | | | | 760,192 | |
| 500,000 | | Perham Independent School District No. 549 | | | 4.00 | | | | 2/1/29 | | | | 560,590 | |
| 1,000,000 | | Puerto Rico Public Improvement G.O. 2, 5, 11 | | | 6.00 | | | | 7/1/28 | | | | 626,250 | |
| 1,050,000 | | Robbinsdale Independent School District No. 281 | | | 4.00 | | | | 2/1/31 | | | | 1,186,374 | |
| 5,000,000 | | South Washington Co. Independent School District No. 833 | | | 4.00 | | | | 2/1/31 | | | | 5,674,400 | |
| 410,000 | | St. Cloud G.O. | | | 3.00 | | | | 2/1/17 | | | | 413,096 | |
| 400,000 | | St. Cloud Independent School District No. 742 | | | 4.00 | | | | 2/1/30 | | | | 453,904 | |
| 765,000 | | St. Francis Independent School District No. 15 | | | 3.00 | | | | 2/1/30 | | | | 793,083 | |
| 600,000 | | St. Francis Independent School District No. 15 | | | 3.00 | | | | 2/1/31 | | | | 617,544 | |
| 480,000 | | Watkins G.O. | | | 4.00 | | | | 1/1/34 | | | | 492,350 | |
| 735,000 | | Watkins G.O. | | | 4.00 | | | | 1/1/38 | | | | 752,772 | |
| 360,000 | | Waubun-Ogema-White Earth Independent School District No. 435 | | | 3.75 | | | | 2/1/18 | | | | 363,632 | |
| | | | | | | | | | | | | | |
| | | | |
| | | | | | | | | | | | | 25,792,731 | |
| | | | | | | | | | | | | | |
Hospital/Health Care - 16.9% | | | | | | | | | | | | |
| 1,135,000 | | Anoka Health Care and Hsg. Facs. Rev. | | | 5.38 | | | | 11/1/34 | | | | 1,233,291 | |
| 1,500,000 | | Anoka Health Care and Hsg. Facs. Rev. (Walker Methodist Plaza) | | | 5.25 | | | | 7/1/35 | | | | 1,540,170 | |
| 3,840,000 | | Breckenridge Rev. (Catholic Health Initiatives Proj.) | | | 5.00 | | | | 5/1/30 | | | | 3,853,171 | |
| 1,000,000 | | Center City Heath Care Facs. Rev. (Hazelden Betty Ford Foundation Proj.) | | | 4.00 | | | | 11/1/39 | | | | 1,077,270 | |
| 3,000,000 | | Center City Heath Care Facs. Rev. (Hazelden Betty Ford Foundation Proj.) | | | 4.50 | | | | 11/1/34 | | | | 3,420,240 | |
| 250,000 | | Center City Heath Care Facs. Rev. (Hazelden Betty Ford Foundation Proj.) | | | 5.00 | | | | 11/1/29 | | | | 301,965 | |
| 500,000 | | Center City Heath Care Facs. Rev. (Hazelden Betty Ford Foundation Proj.) | | | 5.00 | | | | 11/1/44 | | | | 579,485 | |
| 365,000 | | Cold Spring Health Care Facs. Rev. (Assumption Home, Inc. Proj.) | | | 7.25 | | | | 3/1/23 | | | | 371,384 | |
| 2,000,000 | | Dakota Co. Community Dev. Agy. (Sanctuary at W. St. Paul Proj.) | | | 5.75 | | | | 8/1/30 | | | | 2,093,480 | |
| 1,050,000 | | Dakota Co. Community Dev. Agy. (Sanctuary at W. St. Paul Proj.) | | | 6.00 | | | | 8/1/35 | | | | 1,092,452 | |
| 1,570,000 | | Duluth Economic Dev. Auth. Rev. (St. Lukes Hospital Oblig. Group) | | | 4.75 | | | | 6/15/22 | | | | 1,687,907 | |
| 1,600,000 | | Duluth Economic Dev. Auth. Rev. (St. Lukes Hospital Oblig. Group) | | | 5.75 | | | | 6/15/32 | | | | 1,808,560 | |
| 2,000,000 | | Duluth Economic Dev. Auth. Rev. (St. Lukes Hospital Oblig. Group) | | | 6.00 | | | | 6/15/39 | | | | 2,275,400 | |
| 1,000,000 | | Fergus Falls Health Care & Hsg. Fac. Rev. (Lake Region Healthcare Proj.) | | | 5.15 | | | | 8/1/35 | | | | 1,013,180 | |
| 2,110,000 | | Glencoe Health Care Fac. Rev. (Glencoe Regional Health Services Proj.) | | | 4.00 | | | | 4/1/31 | | | | 2,251,623 | |
| 1,350,000 | | Hayward Health Care Fac. Rev. (American Baptist Homes Midwest Proj.) | | | 5.38 | | | | 8/1/34 | | | | 1,419,633 | |
| 500,000 | | Hayward Health Care Fac. Rev. (American Baptist Homes Midwest Proj.) | | | 5.75 | | | | 2/1/44 | | | | 529,010 | |
| 1,900,000 | | Hayward Hsg. & Health Care Fac. Rev. (St. John Lutheran Home of Albert Lea Proj.) | | | 5.00 | | | | 10/1/34 | | | | 1,999,769 | |
| 1,200,000 | | Maple Grove Health Care System Rev. (Maple Grove Hospital Corp.) | | | 5.25 | | | | 5/1/25 | | | | 1,228,932 | |
| 200,000 | | Maple Grove Health Care System Rev. (Maple Grove Hospital Corp.) | | | 5.25 | | | | 5/1/28 | | | | 204,516 | |
| 1,275,000 | | Maple Grove Health Care System Rev. (Memorial Health Care) | | | 4.00 | | | | 9/1/35 | | | | 1,369,975 | |
| 4,590,000 | | Minneapolis Health Care System Rev. (Fairview Health Services) | | | 5.00 | | | | 11/15/34 | | | | 5,487,850 | |
| 70,000 | | Minneapolis Pooled Rev. (Care Choice Member Proj.) | | | 5.75 | | | | 4/1/19 | | | | 70,130 | |
| 1,705,000 | | Minneapolis Rev. Ref. (Walker Campus) | | | 4.50 | | | | 11/15/20 | | | | 1,827,436 | |
| 550,000 | | Moorhead Economic Dev. Auth. Rev. | | | 4.60 | | | | 9/1/25 | | | | 565,460 | |
| 500,000 | | New River Medical Center Rev. | | | 4.40 | | | | 12/1/16 | | | | 502,470 | |
| 1,500,000 | | Oak Park Heights Nursing Home Rev. (Boutwells Landing Care Center) | | | 5.50 | | | | 8/1/28 | | | | 1,673,190 | |
| 1,000,000 | | Oak Park Heights Nursing Home Rev. (Boutwells Landing Care Center) | | | 6.00 | | | | 8/1/36 | | | | 1,131,300 | |
| 750,000 | | Proctor Assisted Living Facs. Rev. (Golden Oaks Assisted Living) | | | 5.00 | | | | 12/1/36 | | | | 771,788 | |
| 9,250,000 | | Rochester Health Care Facs. Rev. (Mayo Clinic) | | | 5.00 | | | | 11/15/33 | | | | 12,434,498 | |
| 1,500,000 | | Rochester Health Care Facs. Rev. (Olmsted Medical Center Proj.) | | | 5.88 | | | | 7/1/30 | | | | 1,724,340 | |
| 1,000,000 | | Shakopee Health Care Facs. Rev. (St. Francis Regional Medical Center Proj.) | | | 5.00 | | | | 9/1/26 | | | | 1,224,980 | |
| 745,000 | | Shakopee Health Care Facs. Rev. (St. Francis Regional Medical Center Proj.) | | | 5.00 | | | | 9/1/28 | | | | 899,841 | |
| 325,000 | | Shakopee Health Care Facs. Rev. (St. Francis Regional Medical Center Proj.) | | | 5.00 | | | | 9/1/29 | | | | 390,192 | |
| 1,350,000 | | Shakopee Health Care Facs. Rev. (St. Francis Regional Medical Center Proj.) | | | 5.00 | | | | 9/1/34 | | | | 1,587,910 | |
See accompanying notes to financial statements.
| | |
34 | | SIT MUTUAL FUNDS SEMI-ANNUAL REPORT |
| | | | | | | | | | | | | | |
| |
| | | | |
Principal Amount ($) | | Name of Issuer | | Coupon
Rate (%) | | | Maturity Date | | | Fair Value ($) | |
| |
| | | | |
| 2,500,000 | | St. Cloud Health Care Rev. (CentraCare Health System Proj.) | | | 4.00 | | | | 5/1/37 | | | | 2,752,850 | |
| 3,750,000 | | St. Cloud Health Care Rev. (CentraCare Health System Proj.) | | | 5.00 | | | | 5/1/46 | | | | 4,474,088 | |
| 2,250,000 | | St. Louis Park Health Care Facs. Rev. (Mount Olivet Careview Home Health Proj.) 1 | | | 2.00 | | | | 6/1/41 | | | | 2,245,320 | |
| 1,315,000 | | St. Paul Hsg. & Redev. Auth. Health Care Rev. (Allina Health System Proj.) | | | 5.00 | | | | 11/15/16 | | | | 1,322,035 | |
| 1,000,000 | | St. Paul Hsg. & Redev. Auth. Health Care Rev. (HealthEast Care System Proj.) | | | 5.00 | | | | 11/15/26 | | | | 1,123,260 | |
| 1,000,000 | | St. Paul Hsg. & Redev. Auth. Health Care Rev. (HealthEast Care System Proj.) | | | 5.25 | | | | 11/15/28 | | | | 1,126,360 | |
| 1,000,000 | | St. Paul Hsg. & Redev. Auth. Health Care Rev. (HealthEast Care System Proj.) | | | 5.25 | | | | 11/15/35 | | | | 1,114,180 | |
| 4,800,000 | | St. Paul Hsg. & Redev. Auth. Health Care Rev. (HealthPartners Oblig. Group Proj.) | | | 5.00 | | | | 7/1/32 | | | | 5,758,800 | |
| 2,000,000 | | St. Paul Hsg. & Redev. Auth. Health Care Rev. (HealthPartners Oblig. Group Proj.) | | | 5.00 | | | | 7/1/33 | | | | 2,392,540 | |
| 525,000 | | St. Paul Hsg. & Redev. Auth. Health Care Rev. (Senior Episcopal Homes Proj.) | | | 4.25 | | | | 11/1/25 | | | | 542,892 | |
| 750,000 | | St. Paul Hsg. & Redev. Auth. Health Care Rev. (Senior Episcopal Homes Proj.) | | | 4.75 | | | | 11/1/31 | | | | 777,570 | |
| 260,000 | | St. Paul Hsg. & Redev. Auth. Health Care Rev. (Senior Episcopal Homes Proj.) | | | 5.00 | | | | 5/1/33 | | | | 278,177 | |
| 2,150,000 | | St. Paul Hsg. & Redev. Auth. Health Care Rev. (Senior Episcopal Homes Proj.) | | | 5.00 | | | | 5/1/38 | | | | 2,283,558 | |
| 500,000 | | St. Paul Hsg. & Redev. Auth. Health Care Rev. (Senior Episcopal Homes Proj.) | | | 5.15 | | | | 11/1/42 | | | | 522,340 | |
| 2,134,006 | | St. Paul Hsg. & Redev. Auth. Rev. (Nursing Home NTS-Episcopal) | | | 5.63 | | | | 10/1/33 | | | | 2,153,639 | |
| 1,000,000 | | Victoria Health Care Facs. Rev. (Augustana Emerald Care LLC) | | | 4.25 | | | | 8/1/24 | | | | 1,054,000 | |
| 1,450,000 | | Victoria Health Care Facs. Rev. (Augustana Emerald Care LLC) | | | 4.75 | | | | 8/1/29 | | | | 1,528,286 | |
| 1,000,000 | | Victoria Health Care Facs. Rev. (Augustana Emerald Care LLC) | | | 5.00 | | | | 8/1/39 | | | | 1,057,940 | |
| 525,000 | | West St. Paul Health Care (Walker Thompson Hill) | | | 6.75 | | | | 9/1/31 | | | | 559,099 | |
| 1,300,000 | | Winsted Health Care Rev. (St. Mary’s Care Center Proj.) 2, 5 | | | 6.00 | | | | 9/1/25 | | | | 1,040,000 | |
| 1,250,000 | | Winsted Health Care Rev. (St. Mary’s Care Center Proj.) 2, 5 | | | 6.50 | | | | 9/1/34 | | | | 1,000,000 | |
| | | | | | | | | | | | | | |
| | | | |
| | | | | | | | | | | | | 96,749,732 | |
| | | | | | | | | | | | | | |
| | | |
Industrial/Pollution Control - 0.2% | | | | | | | | | | | | |
| 1,000,000 | | St. Paul Port Auth. Solid Waste Disposal Rev. (Gerdau St. Paul Steel Mill Proj.) 8 | | | 4.50 | | | | 10/1/37 | | | | 894,350 | |
| | | | | | | | | | | | | | |
| | | |
Insured - 1.4% | | | | | | | | | | | | |
| 500,000 | | Guam Power Auth. Rev. (AGM Insured) 11 | | | 5.00 | | | | 10/1/30 | | | | 586,920 | |
| 200,000 | | Minneapolis & St. Paul Metro Airport Commission Sub. Rev. (NATL Insured) | | | 4.50 | | | | 1/1/32 | | | | 201,826 | |
| 2,750,000 | | Minneapolis & St. Paul Metro Airport Commission Sub. Rev. (NATL Insured) | | | 5.00 | | | | 1/1/22 | | | | 2,778,572 | |
| 1,750,000 | | Minneapolis & St. Paul Metro Airport Commission Sub. Rev. (NATL Insured) | | | 5.00 | | | | 1/1/25 | | | | 1,768,182 | |
| 885,000 | | Minneapolis Health Care System Rev. (Fairview Health Services) (AGC Insured) | | | 6.50 | | | | 11/15/38 | | | | 978,792 | |
| 75,000 | | MN Governmental Agy. Fin. Group (Flex Terminal Prog.) (AGC Insured) | | | 4.00 | | | | 3/1/20 | | | | 75,219 | |
| 90,000 | | MN Governmental Agy. Fin. Group (Flex Terminal Prog.) (AGC Insured) | | | 4.00 | | | | 3/1/22 | | | | 90,266 | |
| 600,000 | | Puerto Rico Public Improvement G.O. (AGM Insured) 11 | | | 5.13 | | | | 7/1/30 | | | | 600,930 | |
| 1,000,000 | | Virgin Islands Public Fin. Auth. (Gross Receipts Taxes Loan Note) (NATL Insured) 11 | | | 5.00 | | | | 10/1/23 | | | | 1,003,420 | |
| | | | | | | | | | | | | | |
| | | | |
| | | | | | | | | | | | | 8,084,127 | |
| | | | | | | | | | | | | | |
| | | |
Multifamily Mortgage - 18.3% | | | | | | | | | | | | |
| 785,000 | | Anoka Co. Hsg. & Redev. Rev. (Recovery Zone Fac.-Park River Estates) | | | 6.50 | | | | 11/1/25 | | | | 801,673 | |
| 500,000 | | Apple Valley Economic Dev. Auth. Rev. (Augustana Healthcare Center) | | | 3.90 | | | | 2/1/31 | | | | 506,475 | |
| 500,000 | | Apple Valley Economic Dev. Auth. Rev. (Augustana Healthcare Center) | | | 4.15 | | | | 2/1/36 | | | | 506,430 | |
| 750,000 | | Apple Valley Economic Dev. Auth. Rev. (Augustana Healthcare Center) | | | 4.40 | | | | 2/1/40 | | | | 759,570 | |
| 1,500,000 | | Blaine Senior Hsg. & Health Care Fac. Rev. (Crest View Senior Community Proj.) | | | 5.75 | | | | 7/1/35 | | | | 1,591,710 | |
| 250,000 | | Bloomington Hsg. Rev. Sr. (Gideon Pond Commons LLC) | | | 5.25 | | | | 6/1/21 | | | | 256,000 | |
| 300,000 | | Bloomington Hsg. Rev. Sr. (Gideon Pond Commons LLC) | | | 5.25 | | | | 12/1/21 | | | | 307,047 | |
| 375,000 | | Bloomington Hsg. Rev. Sr. (Gideon Pond Commons LLC) | | | 5.38 | | | | 6/1/22 | | | | 384,712 | |
| 385,000 | | Bloomington Hsg. Rev. Sr. (Gideon Pond Commons LLC) | | | 5.38 | | | | 12/1/22 | | | | 394,814 | |
| 1,000,000 | | Bloomington Hsg. Rev. Sr. (Gideon Pond Commons LLC) | | | 6.00 | | | | 12/1/30 | | | | 1,025,440 | |
| 795,000 | | Champlin Multifamily Hsg. Rev. (Champlin Drive Apts.) | | | 6.00 | | | | 1/1/27 | | | | 831,014 | |
| 750,000 | | Chisago Hsg. and Health Care Rev. (CDL Homes LLC) | | | 6.00 | | | | 8/1/33 | | | | 838,898 | |
| 1,020,000 | | Cloquet Hsg. Fac. Ref. (HADC Cloquet LLC Proj.) | | | 5.00 | | | | 8/1/38 | | | | 1,061,208 | |
| 1,000,000 | | Columbus Hsg. Rev. (Richfield Senior Hsg., Inc.) | | | 5.00 | | | | 1/1/34 | | | | 1,045,210 | |
| 1,000,000 | | Columbus Hsg. Rev. (Richfield Senior Hsg., Inc.) | | | 5.25 | | | | 1/1/40 | | | | 1,044,290 | |
See accompanying notes to financial statements.
SCHEDULE OF INVESTMENTS (Unaudited)
September 30, 2016
Sit Minnesota Tax-Free Income Fund (Continued)
| | | | | | | | | | | | |
| |
| | | | |
Principal
Amount ($) | | Name of Issuer | | Coupon
Rate (%) | | Maturity
Date | | | Fair Value ($) | |
| |
| | | | |
| 2,185,000 | | Cottage Grove Sr. Hsg. Rev. (PHS, Inc. Proj.) | | 5.00 | | | 12/1/31 | | | | 2,187,185 | |
| 3,605,000 | | Cottage Grove Sr. Hsg. Rev. (PHS, Inc. Proj.) | | 6.00 | | | 12/1/46 | | | | 3,611,525 | |
| 2,500,000 | | Crystal Multifamily Hsg. Rev. (Cavanagh Proj.) | | 5.25 | | | 6/1/31 | | | | 2,595,275 | |
| 3,500,000 | | Dakota Co. Community Dev. Agy. Multifamily Hsg. Rev. | | 4.00 | | | 1/1/42 | | | | 3,683,785 | |
| 750,000 | | Dakota Co. Community Dev. Agy. Multifamily Hsg. Rev. (Walker Highviews Hills LLC) | | 5.00 | | | 8/1/36 | | | | 777,195 | |
| 500,000 | | Dakota Co. Community Dev. Agy. Multifamily Hsg. Rev. (Walker Highviews Hills LLC) | | 5.00 | | | 8/1/51 | | | | 511,390 | |
| 1,345,000 | | Deephaven Hsg. & Healthcare Rev. (St. Therese Senior Living Proj.) | | 5.00 | | | 4/1/38 | | | | 1,411,914 | |
| 285,000 | | Ely Hsg. & Redev. Auth. | | 4.20 | | | 11/1/26 | | | | 285,855 | |
| 250,000 | | Inver Grove Heights Nursing Home Rev. Ref. (Presbyterian Homes) | | 5.38 | | | 10/1/26 | | | | 250,332 | |
| 1,210,000 | | Maplewood Multifamily Hsg. Rev. (Park Edge Apartments Proj.) 8 | | 6.50 | | | 5/1/29 | | | | 1,211,295 | |
| 2,765,000 | | Minneapolis & St. Paul Hsg. & Redev. Auth. Multifamily Hsg. Rev. (GNMA Collateralized) 8 | | 4.75 | | | 1/20/42 | | | | 2,767,516 | |
| 680,000 | | Minneapolis Hsg. Rev. (Keeler Apartments Proj.) | | 5.00 | | | 10/1/37 | | | | 684,291 | |
| 130,000 | | Minneapolis Multifamily Hsg. Rev. (Blaisdell Apartments Proj.) 8 | | 5.10 | | | 4/1/17 | | | | 130,108 | |
| 1,015,000 | | Minneapolis Multifamily Hsg. Rev. (Greenway Heights Family Housing) | | 5.75 | | | 7/15/31 | | | | 1,125,391 | |
| 375,000 | | Minneapolis Senior Hsg. & Health Care Rev. (Ecumen Mill City Quarter) | | 4.75 | | | 11/1/28 | | | | 395,910 | |
| 1,500,000 | | Minneapolis Senior Hsg. & Health Care Rev. (Ecumen Mill City Quarter) | | 5.00 | | | 11/1/35 | | | | 1,563,105 | |
| 350,000 | | Minnetonka Multifamily Hsg. Rev. Ref. (Archer Heights Apartments Proj.) (GNMA Collateralized) 8 | | 5.20 | | | 1/20/18 | | | | 350,970 | |
| 250,000 | | MN Hsg. Fin. Agy. Rental Hsg. (G.O. of AGY. Insured) | | 5.05 | | | 8/1/31 | | | | 275,578 | |
| 2,560,000 | | MN Hsg. Fin. Agy. Rental Hsg. (G.O. of AGY. Insured) | | 5.25 | | | 8/1/40 | | | | 2,731,725 | |
| 1,760,000 | | MN Hsg. Fin. Agy. Rental Hsg. (G.O. of AGY. Insured) | | 5.45 | | | 8/1/41 | | | | 1,934,381 | |
| 1,000,000 | | MN Hsg. Fin. Agy. Rental Hsg. Rev. | | 5.20 | | | 8/1/43 | | | | 1,115,380 | |
| 270,000 | | MN Hsg. Fin. Agy. Rev. | | 4.00 | | | 8/1/29 | | | | 303,996 | |
| 255,000 | | MN Hsg. Fin. Agy. Rev. | | 4.00 | | | 8/1/31 | | | | 282,165 | |
| 155,000 | | MN Hsg. Fin. Agy. Rev. | | 4.00 | | | 8/1/33 | | | | 170,998 | |
| 335,000 | | MN Hsg. Fin. Agy. Rev. | | 4.00 | | | 8/1/34 | | | | 367,364 | |
| 335,000 | | MN Hsg. Fin. Agy. Rev. | | 4.00 | | | 8/1/35 | | | | 366,815 | |
| 1,000,000 | | MN Hsg. Fin. Agy. Rev. (St. Appropriation) | | 5.00 | | | 8/1/33 | | | | 1,193,360 | |
| 2,000,000 | | MN Hsg. Fin. Agy. Rev. (St. Appropriation) | | 5.00 | | | 8/1/34 | | | | 2,378,820 | |
| 1,000,000 | | MN Hsg. Fin. Agy. Rev.(St. Appropriation) | | 5.00 | | | 8/1/35 | | | | 1,185,470 | |
| 280,000 | | Moorhead Economic Dev. Auth. Rev. Ref. (EverCare Sr. Living LLC) | | 4.65 | | | 9/1/26 | | | | 287,440 | |
| 210,000 | | Moorhead Economic Dev. Auth. Rev. Ref. (EverCare Sr. Living LLC) | | 4.70 | | | 9/1/27 | | | | 215,630 | |
| 1,000,000 | | Moorhead Health Care Rev. Ref. (EverCare Sr. Living LLC) | | 5.00 | | | 9/1/32 | | | | 1,030,060 | |
| 250,000 | | Moorhead Health Care Rev. Ref. (EverCare Sr. Living LLC) | | 5.13 | | | 9/1/37 | | | | 257,402 | |
| 1,500,000 | | New Ulm Economic Dev. Auth. Rev. (HADC Ridgeway Proj.) | | 5.00 | | | 8/1/39 | | | | 1,544,235 | |
| 620,000 | | North Oaks Sr. Hsg. Rev. (Presbyterian Homes North Oaks Proj.) | | 5.63 | | | 10/1/17 | | | | 640,448 | |
| 1,000,000 | | North Oaks Sr. Hsg. Rev. (Presbyterian Homes North Oaks Proj.) | | 6.00 | | | 10/1/33 | | | | 1,027,890 | |
| 1,000,000 | | Oak Park Heights Hsg. Rev. (Oakgreen Commons Proj.) | | 6.00 | | | 8/1/25 | | | | 1,090,840 | |
| 1,000,000 | | Oak Park Heights Hsg. Rev. (Oakgreen Commons Proj.) | | 6.25 | | | 8/1/33 | | | | 1,096,770 | |
| 875,000 | | Oakdale Rev. (Sr. Hsg. Oak Meadows Proj.) | | 5.00 | | | 4/1/34 | | | | 922,898 | |
| 1,950,000 | | Rochester Health Care & Hsg. Rev. (Homestead Rochester, Inc.) | | 5.00 | | | 12/1/30 | | | | 2,139,150 | |
| 1,000,000 | | Rochester Health Care & Hsg. Rev. (Homestead Rochester, Inc.) | | 5.00 | | | 12/1/49 | | | | 1,068,180 | |
| 430,000 | | Rochester Health Care & Hsg. Rev. (Samaritan Bethany, Inc. Proj.) | | 5.25 | | | 12/1/17 | | | | 446,164 | |
| 455,000 | | Rochester Health Care & Hsg. Rev. (Samaritan Bethany, Inc. Proj.) | | 5.50 | | | 12/1/18 | | | | 487,123 | |
| 475,000 | | Rochester Health Care & Hsg. Rev. (Samaritan Bethany, Inc. Proj.) | | 5.75 | | | 12/1/19 | | | | 525,260 | |
| 2,300,000 | | Rochester Health Care & Hsg. Rev. (Samaritan Bethany, Inc. Proj.) | | 7.38 | | | 12/1/41 | | | | 2,560,268 | |
| 720,000 | | Rochester Health Care & Hsg. Rev. (The Homestead at Rochester) | | 6.38 | | | 12/1/33 | | | | 828,770 | |
| 2,500,000 | | Rochester Health Care & Hsg. Rev. (The Homestead at Rochester) | | 6.50 | | | 12/1/35 | | | | 2,877,650 | |
| 4,000,000 | | Rochester Multifamily Hsg. Rev. (Essex Place Apartments Proj.) (FHLMC) | | 3.75 | | | 6/1/29 | | | | 4,273,440 | |
| 1,795,000 | | Sartell Health Care & Hsg. Fac. Rev. (Country Manor Campus LLC Proj.) | | 4.00 | | | 9/1/20 | | | | 1,885,989 | |
| 1,135,000 | | Sartell Health Care & Hsg. Fac. Rev. (Country Manor Campus LLC Proj.) | | 5.25 | | | 9/1/27 | | | | 1,235,584 | |
| 100,000 | | Sartell Health Care & Hsg. Fac. Rev. (Country Manor Campus LLC Proj.) | | 5.25 | | | 9/1/30 | | | | 108,004 | |
| 2,150,000 | | Sartell Health Care & Hsg. Fac. Rev. (Country Manor Campus LLC Proj.) | | 5.30 | | | 9/1/37 | | | | 2,325,784 | |
See accompanying notes to financial statements.
| | |
36 | | SIT MUTUAL FUNDS SEMI-ANNUAL REPORT |
| | | | | | | | | | | | |
| |
| | | | |
Principal
Amount ($) | | Name of Issuer | | Coupon
Rate (%) | | Maturity
Date | | | Fair
Value ($) | |
| |
| | | | |
| 1,705,000 | | Sauk Rapids Health Care & Hsg. Facs. Rev. (Good Shepherd Lutheran Home Proj.) | | 5.13 | | | 1/1/39 | | | | 1,767,659 | |
| 250,000 | | St. Anthony Multifamily Hsg. Rev. (Silver Lake Village Hsg.) | | 5.75 | | | 12/1/28 | | | | 275,710 | |
| 2,000,000 | | St. Anthony Multifamily Hsg. Rev. (Silver Lake Village Hsg.) | | 6.00 | | | 12/1/30 | | | | 2,219,440 | |
| 240,000 | | St. Paul Hsg. & Redev. Auth. Health Care Rev. (Carondelet Village Proj.) | | 5.13 | | | 2/1/22 | | | | 244,018 | |
| 275,000 | | St. Paul Hsg. & Redev. Auth. Health Care Rev. (Carondelet Village Proj.) | | 5.13 | | | 8/1/22 | | | | 279,524 | |
| 175,000 | | St. Paul Hsg. & Redev. Auth. Health Care Rev. (Carondelet Village Proj.) | | 5.38 | | | 2/1/24 | | | | 178,005 | |
| 150,000 | | St. Paul Hsg. & Redev. Auth. Health Care Rev. (Carondelet Village Proj.) | | 5.38 | | | 8/1/24 | | | | 152,502 | |
| 150,000 | | St. Paul Hsg. & Redev. Auth. Health Care Rev. (Carondelet Village Proj.) | | 5.50 | | | 2/1/25 | | | | 152,583 | |
| 3,000,000 | | St. Paul Hsg. & Redev. Auth. Health Care Rev. (Carondelet Village Proj.) | | 6.25 | | | 8/1/30 | | | | 3,075,630 | |
| 1,285,000 | | St. Paul Hsg. & Redev. Auth. Multifamily Housing Rev. (Marian Center Proj.) | | 5.20 | | | 11/1/22 | | | | 1,287,339 | |
| 1,000,000 | | St. Paul Hsg. & Redev. Auth. Multifamily Housing Rev. (Marian Center Proj.) | | 5.30 | | | 11/1/30 | | | | 1,001,200 | |
| 2,590,000 | | St. Paul Hsg. & Redev. Auth. Multifamily Housing Rev. (Marian Center Proj.) | | 5.38 | | | 5/1/43 | | | | 2,592,642 | |
| 4,710,000 | | St. Paul Hsg. & Redev. Auth. Multifamily Rev. Ref. (Univ. & Dale Proj.) (GNMA Collateralized) 8 | | 4.82 | | | 7/20/46 | | | | 4,714,993 | |
| 2,515,000 | | St. Paul Port Auth. Rev. (Energy Park Utility Company Proj.) 8 | | 5.70 | | | 8/1/36 | | | | 2,675,658 | |
| 95,000 | | Stillwater Multifamily Hsg. Rev. (Orleans Homes LP Proj.) 8 | | 5.00 | | | 2/1/17 | | | | 95,410 | |
| 500,000 | | Vergas Hsg. & Healthcare Facs. Rev. (CDL Homes Proj.) | | 4.00 | | | 8/1/31 | | | | 509,760 | |
| 1,000,000 | | Vergas Hsg. & Healthcare Facs. Rev. (CDL Homes Proj.) | | 4.25 | | | 8/1/43 | | | | 992,030 | |
| 730,000 | | Wayzata Sr. Hsg. Rev. (Folkestone Sr. Living Community) | | 5.20 | | | 5/1/25 | | | | 790,393 | |
| 790,000 | | Wayzata Sr. Hsg. Rev. (Folkestone Sr. Living Community) | | 5.25 | | | 11/1/26 | | | | 852,228 | |
| 1,250,000 | | Wayzata Sr. Hsg. Rev. (Folkestone Sr. Living Community) | | 5.50 | | | 11/1/32 | | | | 1,354,238 | |
| 1,135,000 | | Wayzata Sr. Hsg. Rev. (Folkestone Sr. Living Community) | | 5.75 | | | 11/1/39 | | | | 1,224,801 | |
| 2,610,000 | | Willmar Hsg. & Redev. Auth. Multifamily Rev. (Eagle Ridge Apartments) | | 4.63 | | | 4/1/30 | | | | 2,665,097 | |
| | | | | | | | | | | | |
| | | | |
| | | | | | | | | | | 105,179,424 | |
| | | | | | | | | | | | |
|
Municipal Lease 9 - 8.3% | |
| 500,000 | | Anoka Co. Hsg. & Redev. Rev. | | 5.63 | | | 5/1/22 | | | | 540,050 | |
| 500,000 | | Anoka Co. Hsg. & Redev. Rev. | | 6.63 | | | 5/1/30 | | | | 538,231 | |
| 500,000 | | Anoka Co. Hsg. & Redev. Rev. | | 6.88 | | | 5/1/40 | | | | 537,870 | |
| 500,000 | | Anoka-Hennepin Independent School District No. 11 Lease Rev. | | 3.75 | | | 2/1/35 | | | | 522,655 | |
| 600,000 | | Anoka-Hennepin Independent School District No. 11 Lease Rev. | | 4.00 | | | 2/1/41 | | | | 640,800 | |
| 1,100,000 | | Chaska Economic Dev. Auth. Lease Rev. | | 4.00 | | | 2/1/31 | | | | 1,241,086 | |
| 690,000 | | Chaska Economic Dev. Auth. Lease Rev. | | 4.00 | | | 2/1/33 | | | | 771,282 | |
| 500,000 | | Chaska Economic Dev. Auth. Lease Rev. | | 4.00 | | | 2/1/35 | | | | 553,725 | |
| 1,000,000 | | Duluth Independent School District No. 709 | | 4.00 | | | 2/1/27 | | | | 1,156,160 | |
| 1,300,000 | | Duluth Independent School District No. 709 | | 4.00 | | | 2/1/28 | | | | 1,479,816 | |
| 2,000,000 | | Duluth Independent School District No. 709 | | 5.00 | | | 2/1/25 | | | | 2,478,440 | |
| 2,000,000 | | Duluth Independent School District No. 709 | | 5.00 | | | 2/1/26 | | | | 2,513,100 | |
| 1,000,000 | | Golden Valley Hsg. & Redev. Auth. Rev. | | 4.00 | | | 2/1/30 | | | | 1,090,930 | |
| 500,000 | | Golden Valley Hsg. & Redev. Auth. Rev. | | 4.00 | | | 2/1/32 | | | | 542,010 | |
| 1,030,000 | | Goodhue Co. Education District No. 6051 Lease Rev. | | 5.00 | | | 2/1/34 | | | | 1,191,864 | |
| 1,500,000 | | Goodhue Co. Education District No. 6051 Lease Rev. | | 5.00 | | | 2/1/39 | | | | 1,716,345 | |
| 1,000,000 | | Guam Education Fin. Foundation 11 | | 5.00 | | | 10/1/21 | | | | 1,141,110 | |
| 1,730,000 | | Guam Education Fin. Foundation 11 | | 5.00 | | | 10/1/22 | | | | 2,013,149 | |
| 5,816,095 | | Intermediate School District No. 287 Lease Rev. | | 5.30 | | | 11/1/32 | | | | 5,838,778 | |
| 450,000 | | Minnetonka Independent School District No. 276 | | 4.00 | | | 3/1/30 | | | | 496,638 | |
| 340,000 | | Minnetonka Independent School District No. 276 | | 4.00 | | | 2/1/33 | | | | 365,571 | |
| 300,000 | | Minnetonka Independent School District No. 276 | | 4.00 | | | 3/1/33 | | | | 326,595 | |
| 400,000 | | Minnetonka Independent School District No. 276 | | 4.00 | | | 2/1/36 | | | | 427,680 | |
| 3,000,000 | | MN General Fund Rev. (Appropriation) | | 3.00 | | | 3/1/30 | | | | 3,070,950 | |
| 4,000,000 | | MN General Fund Rev. (Appropriation) | | 4.00 | | | 3/1/26 | | | | 4,484,720 | |
| 2,000,000 | | MN Hsg. Fin. Agy. Non-Profit Hsg. Rev. (St. Appropriation) | | 5.00 | | | 8/1/31 | | | | 2,290,120 | |
| 300,000 | | MN Hsg. Fin. Agy. Rev. (St. Appropriation) | | 5.00 | | | 8/1/35 | | | | 344,853 | |
See accompanying notes to financial statements.
SCHEDULE OF INVESTMENTS (Unaudited)
September 30, 2016
Sit Minnesota Tax-Free Income Fund (Continued)
| | | | | | | | | | | | |
| |
| | | | |
Principal
Amount ($) | | Name of Issuer | | Coupon
Rate (%) | | Maturity
Date | | | Fair Value ($) | |
| |
| | | | |
| 1,000,000 | | Northeastern Metropolitan Intermediate School District No. 916 | | 5.00 | | | 2/1/34 | | | | 1,181,260 | |
| 1,000,000 | | Osseo Independent School District No. 279 | | 4.00 | | | 2/1/28 | | | | 1,111,160 | |
| 1,000,000 | | Plymouth Intermediate District No. 287 | | 3.00 | | | 5/1/28 | | | | 1,048,420 | |
| 1,335,000 | | Plymouth Intermediate District No. 287 | | 3.00 | | | 5/1/32 | | | | 1,366,519 | |
| 500,000 | | Plymouth Intermediate District No. 287 | | 4.00 | | | 5/1/26 | | | | 574,705 | |
| 290,000 | | Plymouth Intermediate District No. 287 | | 4.00 | | | 5/1/27 | | | | 330,965 | |
| 300,000 | | Plymouth Intermediate District No. 287 | | 4.00 | | | 5/1/29 | | | | 337,623 | |
| 300,000 | | Plymouth Intermediate District No. 287 | | 4.00 | | | 5/1/30 | | | | 336,051 | |
| 470,000 | | Plymouth Intermediate District No. 287 | | 4.00 | | | 5/1/31 | | | | 524,163 | |
| 1,270,000 | | Virginia Hsg. & Redev. Auth. Health Care Fac. Lease Rev. | | 5.13 | | | 10/1/20 | | | | 1,273,696 | |
| 400,000 | | Virginia Hsg. & Redev. Auth. Health Care Fac. Lease Rev. | | 5.25 | | | 10/1/25 | | | | 401,032 | |
| 340,000 | | Virginia Hsg. & Redev. Auth. Health Care Fac. Lease Rev. | | 5.38 | | | 10/1/30 | | | | 340,806 | |
| 678,240 | | Winona School District 861 Lease Purchase | | 6.04 | | | 8/1/24 | | | | 679,746 | |
| | | | | | | | | | | | |
| | | | |
| | | | | | | | | | | 47,820,674 | |
| | | | | | | | | | | | |
|
Municipal Money Market - 0.9% | |
| 2,200,000 | | City of Minneapolis Rev. (Univ. Gateway Proj.) 1 | | 0.83 | | | 12/1/27 | | | | 2,200,000 | |
| 500,000 | | City of Minneapolis Rev. (Univ. Gateway Proj.) 1 | | 0.83 | | | 6/1/32 | | | | 500,000 | |
| 2,320,000 | | Minneapolis Hsg. Dev. Rev. (One Ten Grant Proj.) (FNMA) 1 | | 0.83 | | | 9/1/26 | | | | 2,320,000 | |
| | | | | | | | | | | | |
| | | | |
| | | | | | | | | | | 5,020,000 | |
| | | | | | | | | | | | |
|
Other Revenue Bonds - 5.7% | |
| 250,000 | | Bloomington Port Auth. Recovery Zone Fac. Rev. (Radisson Blu MOA LLC) | | 6.25 | | | 12/1/16 | | | | 250,717 | |
| 517,209 | | Crystal Governmental Fac. Rev. | | 5.10 | | | 12/15/26 | | | | 610,762 | |
| 290,000 | | Minneapolis Community Dev. Agy. Limited Tax Common Bond Fund (Discount Steel) 8 | | 5.25 | | | 6/1/19 | | | | 291,467 | |
| 110,000 | | Minneapolis Rev. (YMCA Greater Twin Cities Proj.) | | 4.00 | | | 6/1/27 | | | | 124,262 | |
| 165,000 | | Minneapolis Rev. (YMCA Greater Twin Cities Proj.) | | 4.00 | | | 6/1/29 | | | | 183,726 | |
| 125,000 | | Minneapolis Rev. (YMCA Greater Twin Cities Proj.) | | 4.00 | | | 6/1/30 | | | | 138,969 | |
| 250,000 | | Minneapolis Rev. (YMCA Greater Twin Cities Proj.) | | 4.00 | | | 6/1/31 | | | | 275,920 | |
| 215,000 | | Minneapolis Tax Increment Rev. | | 3.05 | | | 3/1/21 | | | | 220,824 | |
| 320,000 | | Minneapolis Tax Increment Rev. | | 3.50 | | | 3/1/23 | | | | 334,029 | |
| 170,000 | | Minneapolis Tax Increment Rev. | | 3.80 | | | 3/1/25 | | | | 177,885 | |
| 200,000 | | Minneapolis Tax Increment Rev. | | 4.00 | | | 3/1/27 | | | | 210,402 | |
| 260,000 | | Minneapolis Tax Increment Rev. | | 4.00 | | | 3/1/30 | | | | 267,410 | |
| 1,000,000 | | MN Development Rev. Limited Tax Supported Comm. Board | | 6.00 | | | 12/1/40 | | | | 1,171,860 | |
| 2,000,000 | | MN Development Rev. Limited Tax Supported Comm. Board | | 6.25 | | | 12/1/30 | | | | 2,363,320 | |
| 1,175,000 | | Mound Hsg. & Redev. Auth. Tax Increment Rev. Ref. (Metroplain Proj.) | | 5.00 | | | 2/15/27 | | | | 1,184,776 | |
| 3,500,000 | | Northeastern Metropolitan Intermediate School District No. 916 | | 4.00 | | | 2/1/38 | | | | 3,775,100 | |
| 1,000,000 | | St. Louis Park Economic Dev. Auth. Tax Increment Rev. (Hoigaard Vlg.) | | 5.00 | | | 2/1/23 | | | | 1,023,770 | |
| 500,000 | | St. Paul Hsg. & Redev. Auth. Rev. (Jimmy Lee Recreation Center Proj.) | | 4.75 | | | 12/1/26 | | | | 517,820 | |
| 500,000 | | St. Paul Hsg. & Redev. Auth. Rev. (Jimmy Lee Recreation Center Proj.) | | 5.00 | | | 12/1/32 | | | | 523,210 | |
| 550,000 | | St. Paul Hsg. & Redev. Auth. Rev. (Ordway Center Performing Arts Proj.) | | 2.20 | | | 7/1/18 | | | | 550,204 | |
| 1,043,000 | | St. Paul Hsg. & Redev. Auth. Tax Increment Rev. (9th St. Lofts Proj.) | | 6.38 | | | 2/15/28 | | | | 1,049,863 | |
| 698,000 | | St. Paul Hsg. & Redev. Auth. Tax Increment Rev. (Drake Marble Proj.) | | 6.75 | | | 3/1/28 | | | | 699,584 | |
| 745,000 | | St. Paul Hsg. & Redev. Auth. Tax Increment Rev. (Emerald Gardens Proj.) | | 6.50 | | | 3/1/29 | | | | 790,736 | |
| 972,000 | | St. Paul Hsg. & Redev. Auth. Tax Increment Rev. (North Quadrant Owner Occupied Proj.) | | 7.00 | | | 2/15/28 | | | | 980,622 | |
| 823,000 | | St. Paul Hsg. & Redev. Auth. Tax Increment Rev. (North Quadrant Owner Occupied Proj.) | | 7.50 | | | 2/15/28 | | | | 824,893 | |
| 175,000 | | St. Paul Hsg. & Redev. Auth. Tax Increment Rev. (Upper Landing Proj.) | | 5.00 | | | 3/1/19 | | | | 183,064 | |
| 180,000 | | St. Paul Hsg. & Redev. Auth. Tax Increment Rev. (Upper Landing Proj.) | | 5.00 | | | 9/1/19 | | | | 189,936 | |
| 185,000 | | St. Paul Hsg. & Redev. Auth. Tax Increment Rev. (Upper Landing Proj.) | | 5.00 | | | 3/1/20 | | | | 196,255 | |
| 220,000 | | St. Paul Hsg. & Redev. Auth. Tax Increment Rev. (Upper Landing Proj.) | | 5.00 | | | 9/1/20 | | | | 235,226 | |
| 225,000 | | St. Paul Hsg. & Redev. Auth. Tax Increment Rev. (Upper Landing Proj.) | | 5.00 | | | 3/1/21 | | | | 241,466 | |
| 1,000,000 | | St. Paul Hsg. & Redev. Auth. Tax Increment Rev. (Upper Landing Proj.) | | 5.00 | | | 9/1/26 | | | | 1,067,020 | |
See accompanying notes to financial statements.
| | |
38 | | SIT MUTUAL FUNDS SEMI-ANNUAL REPORT |
| | | | | | | | | | | | |
| |
| | | | |
Principal
Amount ($) | | Name of Issuer | | Coupon
Rate (%) | | Maturity
Date | | | Fair
Value ($) | |
| |
| | | | |
| 930,000 | | St. Paul Hsg. & Redev. Auth. Tax Increment Rev. (Upper Landing Proj.) | | 5.00 | | | 3/1/29 | | | | 987,669 | |
| 3,875,000 | | St. Paul Port Auth. Lease Rev. (Regions Hospital Parking Ramp Proj.) | | 5.00 | | | 8/1/36 | | | | 3,878,952 | |
| 3,000,000 | | St. Paul Port Auth. Rev. (Amherst H. Wilder Foundation) | | 5.00 | | | 12/1/36 | | | | 3,291,360 | |
| 715,000 | | St. Paul Recreational Facs. Gross Rev. (Highland National Proj.) | | 5.00 | | | 10/1/25 | | | | 717,138 | |
| 325,000 | | Swift Co. Hsg. & Redevelopment Auth. | | 3.20 | | | 2/1/33 | | | | 328,270 | |
| 500,000 | | Territory of Guam. Rev. 11 | | 5.00 | | | 12/1/46 | | | | 584,680 | |
| 2,000,000 | | Virgin Islands Public Fin. Auth. (Gross Receipts Taxes Loan Note) 11 | | 5.00 | | | 10/1/42 | | | | 1,957,280 | |
| | | | | | | | | | | | |
| | | | |
| | | | | | | | | | | 32,400,447 | |
| | | | | | | | | | | | |
|
Public Facilities - 0.4% | |
| 1,250,000 | | Lakeville Hsg. & Redev. Auth. Parking Rev. (Ice Arena. Proj.) | | 4.00 | | | 2/1/32 | | | | 1,392,012 | |
| 1,075,000 | | St. Paul Hsg. & Redev. Auth. Parking Rev. (Smith Ave. Proj.) | | 5.00 | | | 8/1/35 | | | | 1,089,362 | |
| | | | | | | | | | | | |
| | | | |
| | | | | | | | | | | 2,481,374 | |
| | | | | | | | | | | | |
|
Sales Tax Revenue - 2.4% | |
| 2,000,000 | | American Samoa Economic Development Authority Rev. 11 | | 6.25 | | | 9/1/29 | | | | 2,071,020 | |
| 2,750,000 | | Guam Govt. Business Privilege Tax Rev. 11 | | 5.00 | | | 11/15/35 | | | | 3,178,972 | |
| 1,825,000 | | Guam Govt. Business Privilege Tax Rev. 11 | | 5.25 | | | 1/1/36 | | | | 2,023,104 | |
| 2,000,000 | | Hennepin Co. Sales Tax Rev. | | 4.75 | | | 12/15/37 | | | | 2,095,120 | |
| 900,000 | | Puerto Rico Sales Tax Financing Corp. Rev. 11 | | 5.00 | | | 8/1/26 | | | | 471,600 | |
| 1,500,000 | | Puerto Rico Sales Tax Financing Corp. Rev. 6, 11 | | 6.25 | | | 8/1/33 | | | | 479,775 | |
| 1,500,000 | | St. Paul Sales Tax Rev. | | 5.00 | | | 11/1/29 | | | | 1,819,230 | |
| 1,400,000 | | St. Paul Sales Tax Rev. | | 5.00 | | | 11/1/31 | | | | 1,684,312 | |
| | | | | | | | | | | | |
| | | | |
| | | | | | | | | | | 13,823,133 | |
| | | | | | | | | | | | |
|
Single Family Mortgage - 14.2% | |
| 1,360,000 | | Dakota Co. Community Dev. Agy. Single Family Mtg. Rev. (GNMA) | | 4.45 | | | 12/1/32 | | | | 1,466,814 | |
| 630,000 | | Dakota Co. Community Dev. Agy. Single Family Mtg. Rev. (GNMA-FNMA-FHLMC) | | 4.63 | | | 12/1/30 | | | | 671,624 | |
| 875,000 | | Dakota Co. Community Dev. Agy. Single Family Mtg. Rev. (GNMA-FNMA-FHLMC) | | 4.88 | | | 12/1/33 | | | | 942,375 | |
| 139,838 | | Dakota Co. Community Dev. Agy. Single Family Mtg. Rev. (GNMA-FNMA-FHLMC) 8 | | 5.13 | | | 12/1/40 | | | | 140,599 | |
| 26,376 | | Dakota Co. Community Dev. Agy. Single Family Mtg. Rev. (GNMA-FNMA-FHLMC) 8 | | 5.15 | | | 12/1/38 | | | | 26,991 | |
| 181,027 | | Dakota Co. Community Dev. Agy. Single Family Mtg. Rev. (GNMA-FNMA-FHLMC) 8 | | 5.30 | | | 12/1/39 | | | | 186,776 | |
| 565,000 | | Minneapolis St. Paul Hsg. Fin. Board Single Family Mtg. Rev. (GNMA-FNMA) | | 4.45 | | | 12/1/27 | | | | 614,957 | |
| 9,174 | | Minneapolis St. Paul Hsg. Fin. Board Single Family Mtg. Rev. (GNMA-FNMA) 8 | | 5.00 | | | 12/1/38 | | | | 9,177 | |
| 157,286 | | Minneapolis St. Paul Hsg. Fin. Board Single Family Mtg. Rev. (GNMA-FNMA-FHLMC) 8 | | 5.25 | | | 12/1/40 | | | | 157,967 | |
| 7,414 | | Minneapolis St. Paul Hsg. Fin. Board Single Family Mtg. Rev. (GNMA-FNMA-FHLMC) | | 5.45 | | | 4/1/27 | | | | 7,415 | |
| 70,000 | | Minneapolis St. Paul Hsg. Fin. Board Single Family Mtg. Rev. (GNMA-FNMA-FHLMC) 8 | | 5.52 | | | 3/1/41 | | | | 74,056 | |
| 4,470,000 | | MN Hsg. Fin. Agy. Homeownership Fin. (GNMA-FNMA) | | 4.40 | | | 7/1/32 | | | | 4,828,807 | |
| 4,175,000 | | MN Hsg. Fin. Agy. Homeownership Fin. (GNMA-FNMA-FHLMC) | | 4.45 | | | 7/1/31 | | | | 4,471,717 | |
| 2,340,000 | | MN Hsg. Fin. Agy. Homeownership Fin. (GNMA-FNMA-FHLMC) | | 4.70 | | | 1/1/31 | | | | 2,548,447 | |
| 1,500,000 | | MN Hsg. Fin. Agy. Residential Hsg. Rev. 8 | | 3.20 | | | 1/1/33 | | | | 1,521,735 | |
| 1,870,000 | | MN Hsg. Fin. Agy. Residential Hsg. Rev. | | 3.30 | | | 7/1/29 | | | | 1,980,124 | |
| 3,725,000 | | MN Hsg. Fin. Agy. Residential Hsg. Rev. | | 5.10 | | | 1/1/40 | | | | 3,913,895 | |
| 2,035,000 | | MN Hsg. Fin. Agy. Residential Hsg. Rev. (G.O. of AGY. Insured) | | 3.63 | | | 7/1/25 | | | | 2,193,832 | |
| 2,650,000 | | MN Hsg. Fin. Agy. Residential Hsg. Rev. (G.O. of AGY. Insured) | | 3.90 | | | 7/1/30 | | | | 2,802,004 | |
| 1,530,000 | | MN Hsg. Fin. Agy. Residential Hsg. Rev. (G.O. of AGY. Insured) 8 | | 5.10 | | | 7/1/38 | | | | 1,536,395 | |
| 2,650,000 | | MN Hsg. Fin. Agy. Residential Hsg. Rev. (GNMA-FNMA-FHLMC) 8 | | 3.10 | | | 7/1/31 | | | | 2,703,000 | |
| 4,680,000 | | MN Hsg. Fin. Agy. Residential Hsg. Rev. (GNMA-FNMA-FHLMC) | | 3.10 | | | 7/1/35 | | | | 4,694,134 | |
| 2,600,000 | | MN Hsg. Fin. Agy. Residential Hsg. Rev. (GNMA-FNMA-FHLMC) | | 3.15 | | | 1/1/37 | | | | 2,611,804 | |
| 2,145,000 | | MN Hsg. Fin. Agy. Residential Hsg. Rev. (GNMA-FNMA-FHLMC) | | 3.35 | | | 7/1/29 | | | | 2,221,255 | |
| 9,685,000 | | MN Hsg. Fin. Agy. Residential Hsg. Rev. (GNMA-FNMA-FHLMC) | | 3.50 | | | 1/1/32 | | | | 10,154,238 | |
| 7,385,000 | | MN Hsg. Fin. Agy. Residential Hsg. Rev. (GNMA-FNMA-FHLMC) | | 3.60 | | | 7/1/31 | | | | 7,795,089 | |
| 2,735,000 | | MN Hsg. Fin. Agy. Residential Hsg. Rev. (GNMA-FNMA-FHLMC) | | 3.60 | | | 7/1/33 | | | | 2,850,034 | |
See accompanying notes to financial statements.
SCHEDULE OF INVESTMENTS (Unaudited)
September 30, 2016
Sit Minnesota Tax-Free Income Fund (Continued)
| | | | | | | | | | | | |
| |
| | | | |
Principal
Amount ($) | | Name of Issuer | | Coupon
Rate (%) | | Maturity
Date | | | Fair
Value ($) | |
| |
| | | | |
| 6,185,000 | | MN Hsg. Fin. Agy. Residential Hsg. Rev. (GNMA-FNMA-FHLMC) | | 3.80 | | | 7/1/38 | | | | 6,425,596 | |
| 5,580,000 | | MN Hsg. Fin. Agy. Residential Hsg. Rev. (GNMA-FNMA-FHLMC) | | 3.90 | | | 7/1/43 | | | | 5,735,738 | |
| 555,000 | | MN Hsg. Fin. Agy. Rev. (GNMA-FNMA Collateralized) | | 5.00 | | | 1/1/31 | | | | 596,742 | |
| 500,000 | | MN Hsg. Fin. Agy. Rev. (GNMA-FNMA-FHLMC) | | 3.10 | | | 7/1/26 | | | | 521,520 | |
| 1,810,000 | | MN Hsg. Fin. Agy. Rev. (GNMA-FNMA-FHLMC) 8 | | 4.00 | | | 1/1/41 | | | | 1,947,506 | |
| 100,000 | | MN Hsg. Fin. Agy. Single Family Mtg. Rev. | | 4.90 | | | 7/1/29 | | | | 106,477 | |
| 1,265,000 | | MN Hsg. Fin. Agy. Single Family Mtg. Rev. | | 5.05 | | | 7/1/34 | | | | 1,332,627 | |
| 65,000 | | MN Hsg. Fin. Agy. Single Family Mtg. Rev. 8 | | 5.10 | | | 7/1/20 | | | | 65,163 | |
| 45,000 | | MN Hsg. Fin. Agy. Single Family Mtg. Rev. | | 5.20 | | | 1/1/23 | | | | 46,930 | |
| 705,000 | | MN Hsg. Fin. Agy. Single Family Mtg. Rev. (G.O. of AGY. Insured) 8 | | 5.15 | | | 7/1/28 | | | | 716,273 | |
| 730,000 | | MN Hsg. Fin. Agy. Single Family Mtg. Rev. (G.O. of AGY. Insured) 8 | | 5.25 | | | 7/1/33 | | | | 740,242 | |
| 150,000 | | MN Hsg. Fin. Agy. Single Family Mtg. Rev. (G.O. of AGY. Insured) 8 | | 5.50 | | | 7/1/28 | | | | 152,356 | |
| 180,000 | | MN Hsg. Fin. Agy. Single Family Mtg. Rev. (G.O. of AGY. Insured) 8 | | 5.65 | | | 7/1/33 | | | | 186,874 | |
| | | | | | | | | | | | |
| | | | |
| | | | | | | | | | | 81,699,305 | |
| | | | | | | | | | | | |
|
Transportation - 2.5% | |
| 300,000 | | Minneapolis & St. Paul Metro Airport Commission Sub. Rev. | | 4.50 | | | 1/1/32 | | | | 302,739 | |
| 750,000 | | Minneapolis & St. Paul Metro Airport Commission Sub. Rev. | | 5.00 | | | 1/1/24 | | | | 757,792 | |
| 1,000,000 | | Minneapolis & St. Paul Metro Airport Commission Sub. Rev. | | 5.00 | | | 1/1/30 | | | | 1,260,700 | |
| 1,000,000 | | Minneapolis & St. Paul Metro Airport Commission Sub. Rev. | | 5.00 | | | 1/1/30 | | | | 1,197,840 | |
| 2,000,000 | | Minneapolis & St. Paul Metro Airport Commission Sub. Rev. | | 5.00 | | | 1/1/31 | | | | 2,513,020 | |
| 1,000,000 | | Minneapolis & St. Paul Metro Airport Commission Sub. Rev. | | 5.00 | | | 1/1/31 | | | | 1,193,380 | |
| 500,000 | | Minneapolis & St. Paul Metro Airport Commission Sub. Rev. | | 5.00 | | | 1/1/31 | | | | 581,470 | |
| 2,000,000 | | Minneapolis & St. Paul Metro Airport Commission Sub. Rev. | | 5.00 | | | 1/1/32 | | | | 2,504,680 | |
| 775,000 | | Minneapolis & St. Paul Metro Airport Commission Sub. Rev. | | 5.00 | | | 1/1/32 | | | | 922,002 | |
| 1,100,000 | | Minneapolis & St. Paul Metro Airport Commission Sub. Rev. | | 5.00 | | | 1/1/33 | | | | 1,304,589 | |
| 600,000 | | Minneapolis & St. Paul Metro Airport Commission Sub. Rev. | | 5.00 | | | 1/1/34 | | | | 709,386 | |
| 440,000 | | Minneapolis & St. Paul Metro Airport Commission Sub. Rev. | | 5.00 | | | 1/1/35 | | | | 518,927 | |
| 400,000 | | MN Valley Transit Auth. Proj. Rev. | | 4.50 | | | 6/1/26 | | | | 431,680 | |
| | | | | | | | | | | | |
| | | | |
| | | | | | | | | | | 14,198,205 | |
| | | | | | | | | | | | |
|
Utility - 4.1% | |
| 2,000,000 | | Guam Govt. Waterworks Auth. Rev. 11 | | 5.00 | | | 1/1/46 | | | | 2,304,900 | |
| 1,000,000 | | MN Hsg. Fin. Agy. Rev. (Ace Rental Hsg.) | | 0.85 | | | 2/1/18 | | | | 996,950 | |
| 500,000 | | MN Municipal Power Agy. Electric Rev. | | 4.00 | | | 10/1/31 | | | | 550,660 | |
| 1,250,000 | | MN Municipal Power Agy. Electric Rev. | | 4.00 | | | 10/1/32 | | | | 1,370,025 | |
| 1,155,000 | | MN Municipal Power Agy. Electric Rev. | | 4.00 | | | 10/1/33 | | | | 1,254,619 | |
| 1,000,000 | | MN Municipal Power Agy. Electric Rev. | | 5.00 | | | 10/1/25 | | | | 1,128,930 | |
| 500,000 | | MN Municipal Power Agy. Electric Rev. | | 5.00 | | | 10/1/29 | | | | 605,175 | |
| 1,000,000 | | MN Municipal Power Agy. Electric Rev. | | 5.00 | | | 10/1/30 | | | | 1,130,590 | |
| 500,000 | | MN Municipal Power Agy. Electric Rev. | | 5.00 | | | 10/1/30 | | | | 602,215 | |
| 320,000 | | MN Municipal Power Agy. Electric Rev. | | 5.00 | | | 10/1/30 | | | | 385,418 | |
| 250,000 | | MN Municipal Power Agy. Electric Rev. | | 5.00 | | | 10/1/33 | | | | 297,875 | |
| 700,000 | | MN Municipal Power Agy. Electric Rev. | | 5.25 | | | 10/1/27 | | | | 727,188 | |
| 1,000,000 | | MN Municipal Power Agy. Electric Rev. | | 5.25 | | | 10/1/35 | | | | 1,133,800 | |
| 500,000 | | North Branch Electric System Rev. | | 5.75 | | | 8/1/28 | | | | 501,490 | |
| 520,000 | | Northern Municipal Power Agy. Electric Rev. | | 5.00 | | | 1/1/30 | | | | 638,830 | |
| 695,000 | | Northern Municipal Power Agy. Electric Rev. | | 5.00 | | | 1/1/31 | | | | 804,998 | |
| 1,000,000 | | Southern Minnesota Municipal Power Agency | | 5.00 | | | 1/1/41 | | | | 1,197,120 | |
| 1,250,000 | | St. Paul Port Auth. Rev. (Energy Park Utility Company Proj.) 8 | | 5.45 | | | 8/1/28 | | | | 1,331,725 | |
| 590,000 | | Virgin Islands Water & Power Auth. Water System Rev. Ref. 11 | | 5.50 | | | 7/1/17 | | | | 590,761 | |
| 2,000,000 | | Western MN Municipal Power Agy. Rev. | | 3.00 | | | 1/1/28 | | | | 2,095,340 | |
| 1,000,000 | | Western MN Municipal Power Agy. Rev. | | 5.00 | | | 1/1/31 | | | | 1,200,820 | |
See accompanying notes to financial statements.
| | |
40 | | SIT MUTUAL FUNDS SEMI-ANNUAL REPORT |
| | | | | | | | | | | | |
| |
Principal
Amount ($)/
Quantity | | Name of Issuer | | Coupon
Rate (%) | | Maturity
Date | | | Fair Value ($) | |
| |
| | | | |
| 600,000 | | Western MN Municipal Power Agy. Rev. | | 5.00 | | | 1/1/35 | | | | 727,068 | |
| 1,750,000 | | Western MN Municipal Power Agy. Rev. | | 5.00 | | | 1/1/36 | | | | 2,070,338 | |
| | | | | | | | | | | | |
| | | | |
| | | | | | | | | | | 23,646,835 | |
| | | | | | | | | | | | |
| | | |
Total Municipal Bonds
(cost: $526,555,712) | | | | | | | | | 549,292,373 | |
| | | | | | | | | | | | |
|
Investment Companies - 1.3% | |
| 334,436 | | Delaware Investments Minnesota Municipal Income Fund II (VMM) | | | | | | | | | 4,999,818 | |
| 144,128 | | Nuveen Minnesota Municipal Income Fund (NMS) | | | | | | | | | 2,549,632 | |
| | | | | | | | | | | | |
| | | |
Total Investment Companies
(cost: $7,044,064) | | | | | | | | | 7,549,450 | |
| | | | | | | | | | | | |
| | | |
Total Investments in Securities - 97.1%
(cost: $533,599,776) | | | | | | | | | 556,841,823 | |
Other Assets and Liabilities, net - 2.9% | | | | | | | | | 16,529,776 | |
| | | | | | | | | | | | |
| | | |
Total Net Assets - 100.0% | | | | | | | | | $573,371,599 | |
| | | | | | | | | | | | |
| 1 | Variable rate security. Rate disclosed is as of September 30, 2016. |
| 2 | Security considered illiquid by the Investment Adviser. The total value of such securities as of September 30, 2016 was $2,666,250 and represented 0.5% of net assets. |
| 5 | The issuer is in default of certain debt covenants. Income is not being accrued. The total value of such securities as of September 30, 2016 was $2,666,250 and represented 0.5% of net assets. |
| 6 | Zero coupon or convertible capital appreciation bond, for which the rate disclosed is either the effective yield on purchase date or the coupon rate to be paid upon conversion to coupon paying, respectively. |
| 8 | Securities the income from which is treated as a tax preference that is included in alternative minimum taxable income for purposes of computing federal alternative minimum tax (AMT). At September 30, 2016, 4.3% of net assets in the Fund was invested in such securities. |
| 9 | Municipal Lease Security. The total value of such securities as of September 30, 2016 was $47,820,674 and represented 8.3% of net assets. These securities have been determined to be liquid by the Adviser in accordance with guidelines established by the Board of Directors. |
| 11 | The Fund may invest in obligations issued by U.S. territories, for example Guam, Puerto Rico, and Virgin Islands. The total value of such securities as of September 30, 2016 was $19,633,871 and represented 3.4% of net assets. |
Numeric footnotes not disclosed are not applicable to this Schedule of Investments.
A summary of the levels for the Fund’s investments as of September 30, 2016 is as follows (see Note 2 - significant accounting policies in the notes to financial statements):
| | | | | | | | | | | | | | |
| | | Investment in Securities | |
| | | | |
| | | Level 1 Quoted
Price ($) | | | Level 2
Other significant
observable inputs ($) | | | Level 3 Significant
unobservable inputs ($) | | Total ($) | |
| | | | |
Municipal Bonds | | | — | | | | 549,292,373 | | | — | | | 549,292,373 | |
Investment Companies | | | 7,549,450 | | | | — | | | — | | | 7,549,450 | |
| | | | |
| | | | |
Total: | | | 7,549,450 | | | | 549,292,373 | | | — | | | 556,841,823 | |
| | | | |
For the reporting period, there were no transfers between levels 1, 2 and 3.
See accompanying notes to financial statements.
STATEMENTS OF ASSETS AND LIABILITIES (Unaudited)
September 30, 2016
| | | | | | | | | | | | | | | | |
| | | Sit U.S.
Government
Securities
Fund | | | Sit Quality
Income
Fund | | | Sit Tax-Free
Income
Fund | | | Sit Minnesota
Tax-Free
Income
Fund | |
ASSETS | | | | | | | | | | | | | | | | |
Investments in securities, at identified cost | | | $664,371,942 | | | | $65,336,374 | | | | $167,208,884 | | | | $533,599,776 | |
| | | | | | | | | | | | | | | | |
| | | | |
Investments in securities, at fair value - see accompanying schedule for detail | | | $681,561,794 | | | | $65,569,593 | | | | $161,790,993 | | | | $556,841,823 | |
Cash in bank on demand deposit | | | 2,130,174 | | | | — | | | | 3,461 | | | | 30,666,166 | |
Restricted cash | | | 14,000,000 | | | | 700,000 | | | | — | | | | — | |
Accrued interest and dividends receivable | | | 3,250,757 | | | | 316,425 | | | | 1,872,715 | | | | 6,389,348 | |
Receivable for investment securities sold | | | 46,385 | | | | — | | | | — | | | | — | |
Other receivables | | | 524 | | | | — | | | | 24,000 | | | | 9,000 | |
Receivable for Fund shares sold | | | 2,566,152 | | | | 406 | | | | 73,103 | | | | 763,038 | |
| | | | | | | | | | | | | | | | |
| | | | |
Total assets | | | 703,555,786 | | | | 66,586,424 | | | | 163,764,272 | | | | 594,669,375 | |
| | | | | | | | | | | | | | | | |
| | | | |
LIABILITIES | | | | | | | | | | | | | | | | |
Disbursements in excess of cash balances | | | — | | | | 1,389 | | | | — | | | | — | |
Payable for investment securities purchased | | | 1,512,986 | | | | 973,490 | | | | 1,730,138 | | | | 20,366,500 | |
Payable for Fund shares redeemed | | | 996,061 | | | | 73 | | | | 62,097 | | | | 362,392 | |
Cash portion of dividends payable to shareholders | | | 26,089 | | | | 1,977 | | | | 71,580 | | | | 195,138 | |
Variation margin on futures contracts | | | — | | | | 8,516 | | | | — | | | | — | |
Accrued investment management fees | | | 451,959 | | | | 50,297 | | | | 106,442 | | | | 373,746 | |
Outstanding options written, at fair value (premiums received $5,889,888) | | | 5,978,164 | | | | — | | | | — | | | | — | |
| | | | | | | | | | | | | | | | |
| | | | |
Total liabilities | | | 8,965,259 | | | | 1,035,742 | | | | 1,970,257 | | | | 21,297,776 | |
| | | | | | | | | | | | | | | | |
| | | | |
Net assets applicable to outstanding capital stock | | | $694,590,527 | | | | $65,550,682 | | | | $161,794,015 | | | | $573,371,599 | |
| | | | | | | | | | | | | | | | |
| | | | |
Net assets consist of: | | | | | | | | | | | | | | | | |
Capital (par value and paid-in surplus) | | | $695,905,611 | | | | $66,935,109 | | | | $189,202,228 | | | | $557,244,270 | |
Undistributed (distributions in excess of) net investment income | | | 702 | | | | 486 | | | | (4,991 | ) | | | (12,738 | ) |
Accumulated net realized gain (loss) from security transactions, written options and futures | | | (18,417,362 | ) | | | (1,609,616 | ) | | | (21,985,331 | ) | | | (7,101,980 | ) |
Unrealized appreciation (depreciation) on investments, written options and futures | | | 17,101,576 | | | | 224,703 | | | | (5,417,891 | ) | | | 23,242,047 | |
| | | | | | | | | | | | | | | | |
| | | $694,590,527 | | | | $65,550,682 | | | | $161,794,015 | | | | $573,371,599 | |
| | | | | | | | | | | | | | | | |
| | | | |
Outstanding shares | | | 62,704,512 | | | | 6,647,518 | | | | 16,309,374 | | | | 53,449,119 | |
| | | | | | | | | | | | | | | | |
| | | | |
Net asset value per share of outstanding capital stock | | | $11.08 | | | | $9.86 | | | | $9.92 | | | | $10.73 | |
| | | | | | | | | | | | | | | | |
See accompanying notes to financial statements.
| | |
42 | | SIT MUTUAL FUNDS SEMI-ANNUAL REPORT |
STATEMENTS OF OPERATIONS (Unaudited)
Six Months Ended September 30, 2016
| | | | | | | | | | | | | | | | |
| | | Sit U.S. | | | | | | | | | Sit Minnesota | |
| | | Government | | | Sit Quality | | | Sit Tax-Free | | | Tax-Free | |
| | | Securities | | | Income | | | Income | | | Income | |
| | | Fund | | | Fund | | | Fund | | | Fund | |
Investment income: | | | | | | | | | | | | | | | | |
Income: | | | | | | | | | | | | | | | | |
Dividends | | | — | | | | — | | | | $249,004 | | | | $156,003 | |
Interest | | | $8,222,194 | | | $ | 569,911 | | | | 3,014,659 | | | | 10,025,780 | |
| | | | | | | | | | | | | | | | |
| | | | |
Total income | | | 8,222,194 | | | | 569,911 | | | | 3,263,663 | | | | 10,181,783 | |
| | | | | | | | | | | | | | | | |
| | | | |
Expenses (note 4): | | | | | | | | | | | | | | | | |
Investment management fee | | | 2,721,887 | | | | 282,213 | | | | 641,370 | | | | 2,187,315 | |
| | | | | | | | | | | | | | | | |
| | | | |
Total expenses | | | 2,721,887 | | | | 282,213 | | | | 641,370 | | | | 2,187,315 | |
| | | | | | | | | | | | | | | | |
| | | | |
Net investment income | | | 5,500,307 | | | | 287,698 | | | | 2,622,293 | | | | 7,994,468 | |
| | | | | | | | | | | | | | | | |
| | | | |
Realized and unrealized gain (loss): | | | | | | | | | | | | | | | | |
Net realized gain (loss) on investments | | | 347,597 | | | | 58,980 | | | | 584,169 | | | | 10,493 | |
Net realized gain (loss) on written options | | | (1,438,276 | ) | | | — | | | | — | | | | — | |
Net realized gain (loss) on futures | | | — | | | | (86,682 | ) | | | — | | | | — | |
| | | | |
Net change in unrealized appreciation (depreciation) on investments | | | 375,786 | | | | 197,085 | | | | 1,347,812 | | | | 4,495,191 | |
Net change in unrealized appreciation (depreciation) on written options | | | 1,261,329 | | | | — | | | | — | | | | — | |
Net change in unrealized appreciation (depreciation) on futures | | | — | | | | 43,908 | | | | — | | | | — | |
| | | | | | | | | | | | | | | | |
| | | | |
Net gain (loss) | | | 546,436 | | | | 213,291 | | | | 1,931,981 | | | | 4,505,684 | |
| | | | | | | | | | | | | | | | |
| | | | |
Net increase (decrease) in net assets resulting from operations | | | $6,046,743 | | | $ | 500,989 | | | $ | 4,554,274 | | | $ | 12,500,152 | |
| | | | | | | | | | | | | | | | |
See accompanying notes to financial statements.
STATEMENTS OF CHANGES IN NET ASSETS
| | | | | | | | |
| | | Sit U.S. Government | |
| | | Securities Fund | |
| | | Six Months | | | Year | |
| | | Ended | | | Ended | |
| | | September 30, 2016 | | | March 31, | |
| | | (Unaudited) | | | 2016 | |
Operations: | | | | | | | | |
Net investment income | | | $5,500,307 | | | | $10,922,813 | |
Net realized gain (loss) on investments, written options and futures | | | (1,090,679) | | | | (6,899,422 | ) |
Net change in unrealized appreciation (depreciation) of investments, written options and futures | | | 1,637,115 | | | | 5,850,345 | |
| | | | | | | | |
| | |
Net increase (decrease) in net assets resulting from operations | | | 6,046,743 | | | | 9,873,736 | |
| | | | | | | | |
| | |
Distributions from: | | | | | | | | |
Net investment income | | | (5,500,307) | | | | (10,922,716 | ) |
| | | | | | | | |
Total distributions | | | (5,500,307) | | | | (10,922,716 | ) |
| | | | | | | | |
| | |
Capital share transactions: | | | | | | | | |
Proceeds from shares sold | | | 128,789,037 | | | | 293,668,159 | |
Reinvested distributions | | | 5,288,188 | | | | 10,413,329 | |
Payments for shares redeemed | | | (103,709,502) | | | | (226,566,424 | ) |
| | | | | | | | |
| | |
Increase (decrease) in net assets from capital transactions | | | 30,367,723 | | | | 77,515,064 | |
| | | | | | | | |
| | |
Total increase (decrease) in net assets | | | 30,914,159 | | | | 76,466,084 | |
| | |
Net assets: | | | | | | | | |
Beginning of period | | | 663,676,368 | | | | 587,210,284 | |
| | | | | | | | |
End of period * | | | $694,590,527 | | | | $663,676,368 | |
| | | | | | | | |
| | |
Capital transactions in shares: | | | | | | | | |
Sold | | | 11,618,295 | | | | 26,575,075 | |
Reinvested distributions | | | 477,439 | | | | 943,031 | |
Redeemed | | | (9,356,833) | | | | (20,507,129 | ) |
| | | | | | | | |
| | |
Net increase (decrease) | | | 2,738,901 | | | | 7,010,977 | |
| | | | | | | | |
| | |
* Includes undistributed (distributions in excess of) net investment income | | | $702 | | | | $702 | |
See accompanying notes to financial statements.
| | |
44 | | SIT MUTUAL FUNDS SEMI-ANNUAL REPORT |
| | | | | | | | | | | | | | | | | | | | | | |
| | | | | | | | | | | | | | | | | | | | | | |
Sit Quality
Income Fund | | | Sit Tax-Free
Income Fund | | | Sit Minnesota Tax-Free
Income Fund | |
| | | | | |
| Six Months | | | Year | | | Six Months | | | Year | | | Six Months | | | Year | |
| Ended | | | Ended | | | Ended | | | Ended | | | Ended | | | Ended | |
| September 30, 2016 | | | March 31, | | | September 30, 2016 | | | March 31, | | | September 30, 2016 | | | March 31, | |
| (Unaudited) | | | 2016 | | | (Unaudited) | | | 2016 | | | (Unaudited) | | | 2016 | |
| | | | | | | | | | | | | | | | | | | | | | |
| | $287,698 | | | | $798,771 | | | | $2,622,293 | | | | $5,573,066 | | | | $7,994,468 | | | | $14,985,361 | |
| | (27,702) | | | | (855,777 | ) | | | 584,169 | | | | (961,157 | ) | | | 10,493 | | | | (154,714 | ) |
| | | | | |
| | 240,993 | | | | (27,385 | ) | | | 1,347,812 | | | | 2,664,372 | | | | 4,495,191 | | | | 3,733,575 | |
| | | | | | | | | | | | | | | | | | | | | | |
| | | | | |
| | 500,989 | | | | (84,391 | ) | | | 4,554,274 | | | | 7,276,281 | | | | 12,500,152 | | | | 18,564,222 | |
| | | | | | | | | | | | | | | | | | | | | | |
| | | | | |
| | | | | | | | | | | | | | | | | | | | | | |
| | (287,536) | | | | (798,771 | ) | | | (2,622,293) | | | | (5,568,398 | ) | | | (7,994,468) | | | | (14,967,354 | ) |
| | | | | | | | | | | | | | | | | | | | | | |
| | (287,536) | | | | (798,771 | ) | | | (2,622,293) | | | | (5,568,398 | ) | | | (7,994,468) | | | | (14,967,354 | ) |
| | | | | | | | | | | | | | | | | | | | | | |
| | | | | |
| | | | | | | | | | | | | | | | | | | | | | |
| | 29,527,593 | | | | 79,196,051 | | | | 11,151,666 | | | | 25,202,505 | | | | 87,544,792 | | | | 146,439,663 | |
| | 269,528 | | | | 739,247 | | | | 2,180,753 | | | | 4,635,837 | | | | 6,792,349 | | | | 12,530,119 | |
| | (31,339,432) | | | | (136,590,268 | ) | | | (10,360,371) | | | | (39,806,557 | ) | | | (33,680,182) | | | | (91,240,718 | ) |
| | | | | | | | | | | | | | | | | | | | | | |
| | | | | |
| | (1,542,311) | | | | (56,654,970 | ) | | | 2,972,048 | | | | (9,968,215 | ) | | | 60,656,959 | | | | 67,729,064 | |
| | | | | | | | | | | | | | | | | | | | | | |
| | | | | |
| | (1,328,858) | | | | (57,538,132 | ) | | | 4,904,029 | | | | (8,260,332 | ) | | | 65,162,643 | | | | 71,325,932 | |
| | | | | |
| | | | | | | | | | | | | | | | | | | | | | |
| | 66,879,540 | | | | 124,417,672 | | | | 156,889,986 | | | | 165,150,318 | | | | 508,208,956 | | | | 436,883,024 | |
| | | | | | | | | | | | | | | | | | | | | | |
| | $65,550,682 | | | | $66,879,540 | | | | $161,794,015 | | | | $156,889,986 | | | | $573,371,599 | | | | $508,208,956 | |
| | | | | | | | | | | | | | | | | | | | | | |
| | | | | |
| | | | | | | | | | | | | | | | | | | | | | |
| | 2,999,120 | | | | 8,003,261 | | | | 1,119,392 | | | | 2,617,597 | | | | 8,154,045 | | | | 13,931,659 | |
| | 27,364 | | | | 74,844 | | | | 219,335 | | | | 482,272 | | | | 631,643 | | | | 1,192,155 | |
| | (3,184,731) | | | | (13,789,907 | ) | | | (1,043,897) | | | | (4,138,627 | ) | | | (3,133,654) | | | | (8,674,963 | ) |
| | | | | | | | | | | | | | | | | | | | | | |
| | | | | |
| | (158,247) | | | | (5,711,802 | ) | | | 294,830 | | | | (1,038,758 | ) | | | 5,652,034 | | | | 6,448,851 | |
| | | | | | | | | | | | | | | | | | | | | | |
| | | | | |
| | $486 | | | | $324 | | | | ($4,991) | | | | ($4,991 | ) | | | ($12,738) | | | | ($12,738 | ) |
FINANCIAL HIGHLIGHTS
Per share income and capital changes for a share outstanding throughout the period. See accompanying notes to financial statements.
| | | | | | | | | | | | | | | | | | | | | | | | |
Sit U.S. Government Securities Fund | |
| | | Six Months Ended
September 30, 2016 | | | Year Ended March 31, | |
| | | (Unaudited) | | | 2016 | | | 2015 | | | 2014 | | | 2013 | | | 2012 | |
| | | | | | |
Net Asset Value: | | | | | | | | | | | | | | | | | | | | | | | | |
Beginning of period | | | $11.07 | | | | $11.09 | | | | $11.04 | | | | $11.30 | | | | $11.31 | | | | $11.29 | |
| | | | | | |
Operations: | | | | | | | | | | | | | | | | | | | | | | | | |
Net investment income 1 | | | 0.09 | | | | 0.20 | | | | 0.21 | | | | 0.12 | | | | 0.16 | | | | 0.31 | |
Net realized and unrealized gains (losses) on investments, written options and futures | | | 0.01 | | | | (0.02 | ) | | | 0.05 | | | | (0.26 | ) | | | — | | | | 0.02 | |
| | | | | | |
Total from operations | | | 0.10 | | | | 0.18 | | | | 0.26 | | | | (0.14 | ) | | | 0.16 | | | | 0.33 | |
| | | | | | |
Distributions from: | | | | | | | | | | | | | | | | | | | | | | | | |
Net investment income | | | (0.09) | | | | (0.20 | ) | | | (0.21 | ) | | | (0.12 | ) | | | (0.16 | ) | | | (0.31 | ) |
Return of capital | | | — | | | | — | | | | — | | | | — | | | | (0.01 | ) | | | — | |
| | | | | | |
Total Distributions | | | (0.09) | | | | (0.20 | ) | | | (0.21 | ) | | | (0.12 | ) | | | (0.17 | ) | | | (0.31 | ) |
| | | | | | |
Net Asset Value: | | | | | | | | | | | | | | | | | | | | | | | | |
End of period | | | $11.08 | | | | $11.07 | | | | $11.09 | | | | $11.04 | | | | $11.30 | | | | $11.31 | |
| | | | | | |
Total investment return 2 | | | 0.91% | | | | 1.63% | | | | 2.37% | | | | (1.21% | ) | | | 1.39% | | | | 2.98% | |
| | | | | | |
Net assets at end of period (000’s omitted) | | | $694,591 | | | | $663,676 | | | | $587,210 | | | | $711,770 | | | | $1,520,059 | | | | $1,504,154 | |
| | | | | | |
Ratios: 3 | | | | | | | | | | | | | | | | | | | | | | | | |
Expenses | | | 0.80% | | | | 0.80% | | | | 0.80% | | | | 0.80% | | | | 0.80% | | | | 0.80% | |
Net investment income | | | 1.62% | | | | 1.81% | | | | 1.89% | | | | 1.06% | | | | 1.43% | | | | 2.73% | |
| | | | | | |
Portfolio turnover rate (excluding short-term securities) | | | 14.96%4 | | | | 28.65% | | | | 13.71% | | | | 4.13% | | | | 58.67% | | | | 33.82% | |
| 1 | The net investment income per share is based on average shares outstanding for the period. |
| 2 | Total investment return is based on the change in net asset value of a share during the period (not annualized) and assumes reinvestment of distributions at net asset value. |
| 3 | Ratios are annualized for periods less than one year. In addition to fees and expenses which the Fund bears directly, the Fund indirectly bears a pro rata share of the fees and expenses of the acquired funds in which it invests. Such indirect expenses are not included in the above reported expense ratios. |
| | |
46 | | SIT MUTUAL FUNDS SEMI-ANNUAL REPORT |
FINANCIAL HIGHLIGHTS
Per share income and capital changes for a share outstanding throughout the period. See accompanying notes to financial statements.
| | | | | | | | | | | | | | | | | | | | | | | | | |
Sit Quality Income Fund | |
| | | Six Months Ended
September 30, 2015
(Unaudited) | | Year Ended
March 31, 2016 | | Year Ended
March 31, 2015 | | Year Ended
March 31, 2014 | | Three
Months Ended
March 31, 2013 * |
| | | | | |
Net Asset Value: | | | | | | | | | | | | | | | | | | | | | | | | | |
Beginning of period | | | | $9.83 | | | | | $9.94 | | | | | $9.97 | | | | | $10.01 | | | | | $10.00 | |
| | | | | |
Operations: | | | | | | | | | | | | | | | | | | | | | | | | | |
Net investment income 1 | | | | 0.05 | | | | | 0.10 | | | | | 0.06 | | | | | 0.09 | | | | | 0.03 | |
Net realized and unrealized gains (losses) on investments, written options and futures | | | | 0.03 | | | | | (0.11 | ) | | | | (0.03 | ) | | | | (0.04 | ) | | | | 0.01 | |
| | | | | |
Total from operations | | | | 0.08 | | | | | (0.01 | ) | | | | 0.03 | | | | | 0.05 | | | | | 0.04 | |
| | | | | |
Distributions from: | | | | | | | | | | | | | | | | | | | | | | | | | |
Net investment income | | | | (0.05 | ) | | | | (0.10 | ) | | | | (0.06 | ) | | | | (0.09 | ) | | | | (0.03 | ) |
| | | | | |
Net Asset Value: | | | | | | | | | | | | | | | | | | | | | | | | | |
End of period | | | | $9.86 | | | | | $9.83 | | | | | $9.94 | | | | | $9.97 | | | | | $10.01 | |
| | | | | |
Total investment return 2 | | | | 0.77% | | | | | (0.10% | ) | | | | 0.36% | | | | | 0.47% | | | | | 0.38% | |
| | | | | |
Net assets at end of period (000’s omitted) | | | | $65,551 | | | | | $66,880 | | | | | $124,418 | | | | | $107,346 | | | | | $5,122 | |
| | | | | |
Ratios: 3 | | | | | | | | | | | | | | | | | | | | | | | | | |
Expenses | | | | 0.90% | | | | | 0.90% | | | | | 0.90% | | | | | 0.90% | | | | | 0.90% | |
Net investment income | | | | 0.92% | | | | | 1.02% | | | | | 0.63% | | | | | 0.80% | | | | | 1.25% | |
| | | | | |
Portfolio turnover rate (excluding short-term securities) | | | | 48.37%4 | | | | | 90.38% | | | | | 241.64% | | | | | 81.19% | | | | | 37.44%4 | |
| * | The Fund commenced investment operations on December 31, 2012. |
| 1 | The net investment income per share is based on average shares outstanding for the period. |
| 2 | Total investment return is based on the change in net asset value of a share during the period (not annualized) and assumes reinvestment of distributions at net asset value. |
| 3 | Ratios are annualized for periods less than one year. In addition to fees and expenses which the Fund bears directly, the Fund indirectly bears a pro rata share of the fees and expenses of the acquired funds in which it invests. Such indirect expenses are not included in the above reported expense ratios. |
FINANCIAL HIGHLIGHTS
Per share income and capital changes for a share outstanding throughout the period. See accompanying notes to financial statements.
| | | | | | | | | | | | | | | | | | | | | | | | |
Sit Tax-Free Income Fund | | | | | | | | | | | | | | | | | | | | | | | | |
| |
| | | Six Months Ended
September 30, 2016 | | | Years Ended March 31, | |
| | | (Unaudited) | | | 2016 | | | 2015 | | | 2014 | | | 2013 | | | 2012 | |
| |
| | | | | | |
Net Asset Value: | | | | | | | | | | | | | | | | | | | | | | | | |
Beginning of period | | | $9.80 | | | | $9.68 | | | | $9.16 | | | | $9.57 | | | | $9.23 | | | | $8.52 | |
| | | | |
| | | | | | |
Operations: | | | | | | | | | | | | | | | | | | | | | | | | |
Net investment income 1 | | | 0.16 | | | | 0.33 | | | | 0.37 | | | | 0.38 | | | | 0.38 | | | | 0.41 | |
Net realized and unrealized gains (losses) on investments | | | 0.12 | | | | 0.12 | | | | 0.52 | | | | (0.41 | ) | | | 0.34 | | | | 0.71 | |
| | | | |
| | | | | | |
Total from operations | | | 0.28 | | | | 0.45 | | | | 0.89 | | | | (0.03 | ) | | | 0.72 | | | | 1.12 | |
| | | | |
| | | | | | |
Distributions from: | | | | | | | | | | | | | | | | | | | | | | | | |
Net investment income | | | (0.16) | | | | (0.33 | ) | | | (0.37 | ) | | | (0.38 | ) | | | (0.38 | ) | | | (0.41 | ) |
| | | | |
| | | | | | |
Net Asset Value: | | | | | | | | | | | | | | | | | | | | | | | | |
End of period | | | $9.92 | | | | $9.80 | | | | $9.68 | | | | $9.16 | | | | $9.57 | | | | $9.23 | |
| | | | |
| | | | | | |
Total investment return 2 | | | 2.90% | | | | 4.78% | | | | 9.81% | | | | (0.19% | ) | | | 7.92% | | | | 13.41% | |
| | | | |
| | | | | | |
Net assets at end of period (000’s omitted) | | | $161,794 | | | | $156,890 | | | | $165,150 | | | | $155,304 | | | | $175,480 | | | | $154,659 | |
| | | | | | |
Ratios: 3 | | | | | | | | | | | | | | | | | | | | | | | | |
Expenses | | | 0.80% | | | | 0.80% | | | | 0.80% | | | | 0.80% | | | | 0.80% | | | | 0.80% | |
Net investment income | | | 3.27% | | | | 3.45% | | | | 3.86% | | | | 4.17% | | | | 4.03% | | | | 4.62% | |
| | | | | | |
Portfolio turnover rate (excluding short-term securities) | | | 10.39%4 | | | | 23.11% | | | | 31.14% | | | | 28.32% | | | | 36.75% | | | | 37.18% | |
| 1 | The net investment income per share is based on average shares outstanding for the period. |
| 2 | Total investment return is based on the change in net asset value of a share during the period (not annualized) and assumes reinvestment of distributions at net asset value. |
| 3 | Ratios are annualized for periods less than one year. In addition to fees and expenses which the Fund bears directly, the Fund indirectly bears a pro rata share of the fees and expenses of the acquired funds in which it invests. Such indirect expenses are not included in the above reported expense ratios. |
| | |
48 | | SIT MUTUAL FUNDS SEMI-ANNUAL REPORT |
FINANCIAL HIGHLIGHTS
Per share income and capital changes for a share outstanding throughout the period. See accompanying notes to financial statements.
| | | | | | | | | | | | | | | | | | | | | | | | |
Sit Minnesota Tax-Free Income Fund | |
| |
| | | Six Months Ended
September 30, 2016 | | | Years Ended March 31, | |
| | | (Unaudited) | | | 2016 | | | 2015 | | | 2014 | | | 2013 | | | 2012 | |
| |
| | | | | | |
Net Asset Value: | | | | | | | | | | | | | | | | | | | | | | | | |
Beginning of period | | | $10.63 | | | | $10.57 | | | | $10.26 | | | | $10.62 | | | | $10.42 | | | | $9.67 | |
| | | | |
| | | | | | |
Operations: | | | | | | | | | | | | | | | | | | | | | | | | |
Net investment income 1 | | | 0.16 | | | | 0.34 | | | | 0.36 | | | | 0.40 | | | | 0.38 | | | | 0.44 | |
Net realized and unrealized gains (losses) on investments | | | 0.10 | | | | 0.06 | | | | 0.31 | | | | (0.36 | ) | | | 0.20 | | | | 0.75 | |
| | | | |
| | | | | | |
Total from operations | | | 0.26 | | | | 0.40 | | | | 0.67 | | | | 0.04 | | | | 0.58 | | | | 1.19 | |
| | | | |
| | | | | | |
Distributions from: | | | | | | | | | | | | | | | | | | | | | | | | |
Net investment income | | | (0.16) | | | | (0.34 | ) | | | (0.36 | ) | | | (0.40 | ) | | | (0.38 | ) | | | (0.44 | ) |
| | | | |
| | | | | | |
Net Asset Value: | | | | | | | | | | | | | | | | | | | | | | | | |
End of period | | | $10.73 | | | | $10.63 | | | | $10.57 | | | | $10.26 | | | | $10.62 | | | | $10.42 | |
| | | | |
| | | | | | |
Total investment return 2 | | | 2.43% | | | | 3.89% | | | | 6.62% | | | | 0.47% | | | | 5.61% | | | | 12.48% | |
| | | | |
| | | | | | |
Net assets at end of period (000’s omitted) | | | $573,372 | | | | $508,209 | | | | $436,883 | | | | $358,678 | | | | $416,145 | | | | $343,800 | |
| | | | | | |
Ratios: 3 | | | | | | | | | | | | | | | | | | | | | | | | |
Expenses | | | 0.80% | | | | 0.80% | | | | 0.80% | | | | 0.80% | | | | 0.80% | | | | 0.80% | |
Net investment income | | | 2.92% | | | | 3.25% | | | | 3.43% | | | | 3.91% | | | | 3.58% | | | | 4.32% | |
| | | | | | |
Portfolio turnover rate (excluding short-term securities) | | | 2.95%4 | | | | 10.45% | | | | 9.68% | | | | 20.53% | | | | 17.13% | | | | 15.06% | |
| 1 | The net investment income per share is based on average shares outstanding for the period. |
| 2 | Total investment return is based on the change in net asset value of a share during the period (not annualized) and assumes reinvestment of distributions at net asset value. |
| 3 | Ratios are annualized for periods less than one year. In addition to fees and expenses which the Fund bears directly, the Fund indirectly bears a pro rata share of the fees and expenses of the acquired funds in which it invests. Such indirect expenses are not included in the above reported expense ratios. |
NOTES TO FINANCIAL STATEMENTS (Unaudited)
Six Months Ended September 30, 2016
The Sit Mutual Funds (the Funds) are no-load funds, and are registered under the Investment Company Act of 1940 (as amended) as diversified (except Minnesota Tax-Free Income Fund which is non-diversified), open-end management investment companies, or series thereof. The Sit Quality Income Fund, Sit Tax-Free Income Fund and Minnesota Tax-Free Income Fund are series funds of Sit Mutual Funds II, Inc. Each fund has 10 billion authorized shares of capital stock. Shares in the U.S. Government Securities Fund have a par value of $0.01, and shares in other funds have a par value of $0.001. This report covers the bond funds of the Sit Mutual Funds.
The investment objective for each of these Funds is as follows:
| | |
| Fund | | Investment Objective |
|
U.S. Government Securities | | High level of current income and safety of principal. |
Quality Income Fund | | High level of current income and safety of principal. |
Tax-Free Income | | High level of current income that is exempt from federal income tax, consistent with the preservation of capital. |
Minnesota Tax-Free Income | | High level of current income that is exempt from federal regular income tax and Minnesota regular personal income tax, consistent with the preservation of capital. |
| (2) | Significant Accounting Policies |
The Funds are investment companies and follow accounting and reporting guidance under Financial Accounting Standards Board (“FASB”) Accounting Standards Codification (“ASC”) Topic 946, “Financial Services-Investment Companies”. The following is a summary of significant accounting policies consistently followed by the Funds in the preparation of their financial statements in conformity with U.S. generally accepted accounting principles (“GAAP”).
Investments in Securities
Investment securities are carried at fair value based upon closing market quotations on the last business day of the period. Investments in securities traded on national or international securities exchanges are valued at the last reported sales price prior to the time when assets are valued. Securities traded on the over-the-counter market are valued at the last reported sales price or if the last sales price is not available, at the last reported bid price. The sale and bid prices or prices deemed best to reflect fair value quoted by dealers who make markets in these securities are obtained from independent pricing services. Consistent with the Funds’ valuation policies and procedures, the current fair value of certain fixed income securities is provided by an independent pricing service. Fixed income securities for which prices are not available from an independent pricing service but where an active market exists are valued using market quotations obtained from broker-dealers or quotation systems. Securities for which market quotations are not available, such as private placement securities, are valued at fair value according to methods selected in good faith by Sit Investment Associates, Inc. (the “Adviser”) and may include dealer-supplied valuations or other inputs and assumptions that pricing services would typically utilize. Short-term investments of sufficient credit quality with maturities of 60 days or less when acquired, or which subsequently are within 60 days of maturity, are valued at amortized cost, which approximates fair value. Option and future contracts entered into and held by the Funds are valued at the close of the securities and commodities exchange on which they are traded.
Security transactions are accounted for on the date the securities are purchased or sold. Gains and losses are calculated on the identified-cost basis. Interest, including level-yield amortization of long-term bond premium and discount, is recorded on the accrual basis. Dividends received from closed-end fund holdings are included in Dividend Income and distributions from capital gains, if any, are included in Net Realized Gain (Loss).
Delivery and payment for securities which have been purchased by the Funds on a forward commitment or when-issued basis can take place two weeks or more after the transaction date. During this period, such securities are subject to market fluctuations and may increase or decrease in value prior to delivery.
The Minnesota Tax-Free Income Fund concentrates its investments in Minnesota, and therefore may have more credit risk related to the economic conditions in the state of Minnesota than a portfolio with broader geographical diversification.
| | |
50 | | SIT MUTUAL FUNDS SEMI-ANNUAL REPORT |
Derivative Instruments
The Funds apply derivative instrument disclosure standards in order to enable investors to understand how and why the Funds use derivatives, how derivatives are accounted for, and how derivative instruments affect the Funds’ financial statements.
To hedge interest rate risk, the U.S. Government Securities Fund wrote call option contracts traded on a U.S. exchange. To hedge interest rate risk, the Quality Income Fund entered into futures contracts traded on a U.S. exchange. Risks of entering into futures contracts and writing options include the possibility of an illiquid market and that a change in the value of the option may not correlate with changes in the value of the underlying securities.
The premiums paid for the options represent the cost of the investment and the options are valued daily at their closing price. The Funds recognize a realized gain or loss when the option is sold or expired. Option holdings within the Funds, which may include put options and call options, are subject to loss of value with the passage of time, and may experience a total loss of value upon expiration. With options, there is minimal counterparty risk to the Funds since they are exchange traded.
Upon entering into a futures contract, the Quality Income Fund is required to deposit either cash or securities in an amount (initial margin) equal to a certain percentage of the contract value. Subsequent payments (variation margin) are made or received by the Fund each day. The variation margin payments are equal to the daily changes in the contract value and are recorded as unrealized gains and losses. The Fund recognizes a realized gain or loss when the contract is closed or expired. With futures contracts, there is minimal counterparty risk to the Fund since futures are exchange traded and the exchange’s clearinghouse, as counterparty to all exchange-traded futures, guarantees the futures against default.
During the six months ended September 30, 2016, the average volume of derivative activity, calculated on a quarterly basis, was as follows:
| | | | | | | | | | | | |
| | | Average
Cost | | | Average Premium Received | | | Average
Notional
Amount | |
| | | | |
U.S. Government Securities Fund | | | | | | | | | | | | |
Written call options | | | — | | | | $5,147,640 | | | | $642,608,182 | |
| | | |
Quality Income Fund | | | | | | | | | | | | |
Treasury futures | | | — | | | | — | | | | $28,574,219 | |
The number of open option contracts and open futures contracts outstanding as of September 30, 2016 also serve as indicators of the volume of activity for the Funds throughout the period.
NOTES TO FINANCIAL STATEMENTS (Unaudited)
Six Months Ended September 30, 2016 (Continued)
Statement of Assets and Liabilities - Values of derivatives as of September 30, 2016
| | | | | | | | |
| | | Asset Derivatives Value | | | Liability Derivatives Value | |
| | | | |
Interest rate risk: | | | | | | | | |
U.S. Government Securities Fund | | | | | | | | |
Written Call Options | | | — | | | | $5,978,164 1 | |
| | |
Quality Income Fund | | | | | | | | |
Treasury futures | | | — | | | | $8,516 2 | |
| | |
1Statement of Assets and Liabilities location: Outstanding options written, at fair value. 2Statement of Assets and Liabilities location: Variation margin receivable/payable. Includes cumulative appreciation(depreciation) of futures as reported in the Schedule of Investments. | | |
The effect of derivative instruments on the statement of operations for the six months ended September 30, 2016:
| | | | | | | | |
| | | Amount of Realized
Gain (Loss) on Derivatives 4 | | | Change in Unrealized
Appreciation (Depreciation) on Derivatives 5 | |
| | | | |
Interest rate risk: | | | | | | | | |
U.S. Government Securities Fund | | | | | | | | |
Written call options | | | ($1,438,276) | | | | $1,261,329 | |
| | |
Quality Income Fund | | | | | | | | |
Treasury Futures | | | ($86,682) | | | | $43,908 | |
| | |
4Statement of Operations location: Net realized gain (loss) on investments, net realized gain (loss) on written options and net realized gain (loss) on futures, respectively. 5Statement of Operations location: Net change in unrealized appreciation (depreciation) on investments, net change in unrealized appreciation (depreciation) on written options and net change in unrealized appreciation (depreciation) on futures, respectively. | | |
Transactions in written options for the six months ended September 30, 2016 were as follows:
| | | | | | | | |
| | | Number of
Contracts | | | Premium | |
| | | | |
U.S. Government Securities Fund | | | | | | | | |
Outstanding, March 31, 2016 | | | 3,200 | | | | $3,310,942 | |
Call options written | | | 10,541 | | | | 18,640,681 | |
Call options closed | | | (10,891) | | | | (16,061,735 | ) |
| | | | |
Outstanding, September 30, 2016 | | | 2,850 �� | | | | $5,889,888 | |
| | | | |
| | |
52 | | SIT MUTUAL FUNDS SEMI-ANNUAL REPORT |
Fair Value Measurements
The inputs and valuation techniques used to measure fair value of the Funds’ net assets are summarized into three levels as described in the hierarchy below:
| | • | | Level 1 – quoted prices in active markets for identical securities. An active market for the security is a market in which transactions occur with sufficient frequency and volume to provide pricing information on an ongoing basis. A quoted price in an active market provides the most reliable evidence of fair value. |
| | • | | Level 2 – debt securities are valued based on evaluated prices received from independent pricing services or from dealers who make markets in such securities. For corporate bonds, U.S. government and government agency obligations, and municipal securities the pricing services utilize matrix pricing which considers yield or price of bonds of comparable quality, coupon, maturity, and type as well as dealer supplied prices. For asset-backed securities and mortgage-backed securities, the pricing services utilize matrix pricing which considers prepayment speed assumptions, attributes of the collateral, yield or price of bonds of comparable quality, coupon, maturity, and type as well as dealer supplied prices. All of these inputs are derived principally from or corroborated by observable market data. An adjustment to any observable input that is significant to the fair value may render the measurement a Level 3 measurement. |
| | • | | Level 3 – significant unobservable inputs, including the Adviser’s own assumptions in determining the fair value of investments. |
The inputs or methodology used for valuing securities are not necessarily an indication of the risk associated with investing in those securities.
The fair value of the Funds’ bonds are generally based on quotes received from brokers or independent pricing services. Bonds with quotes that are based on actual trades with a sufficient level of activity on or near the measurement date are classified as Level 2 assets.
At the end of each calendar quarter, management evaluates the Level 2 and 3 assets and liabilities for changes in liquidity, including but not limited to: whether a broker is willing to execute at the quoted price, the depth and consistency of prices from third party services, and the existence of contemporaneous, observable trades in the market. Additionally, management evaluates the Level 1 and 2 assets and liabilities on a quarterly basis for changes in listings or delistings on national exchanges. Due to the inherent uncertainty of determining the fair value of investments that do not have a readily available market value, the fair value of the Funds’ investments may fluctuate from period to period. Additionally, the fair value of investments may differ significantly from the values that would have been used had a ready market existed for such investments and may differ materially from the values the Fund may ultimately realize. Further, such investments may be subject to legal and other restrictions on resale or otherwise are less liquid than publicly traded securities.
A summary of the levels for the Funds’ investments as of September 30, 2016 is included with the Funds’ schedules of investments.
Federal Taxes
The Funds’ policy is to comply with the requirements of the Internal Revenue Code applicable to regulated investment companies and to distribute all of their taxable income to shareholders. The Funds have recorded in their financial statements the full benefit of their tax positions taken in connection with the Registered Investment Company (RIC) qualification and distribution requirements of the Internal Revenue Code. Therefore, no income tax provision is required. Also, in order to avoid the payment of any federal excise taxes, the Funds will distribute substantially all of their net investment income and net realized gains on a calendar year basis.
Management has analyzed the Funds’ tax positions taken in federal tax returns for all open tax years and has concluded that as of September 30, 2016, no provision for income tax would be required in the Funds’ financial statements. The Funds’ federal and state income and federal excise returns for the 2013, 2014, and 2015 tax years for which the applicable statutes of limitations have not expired remain subject to examination by the Internal Revenue Service and state departments of revenue.
NOTES TO FINANCIAL STATEMENTS (Unaudited)
Six Months Ended September 30, 2016 (Continued)
At September 30, 2016, the gross unrealized appreciation (depreciation) on investments and cost of securities on a tax basis for federal income tax purposes were as follows:
| | | | | | | | | | | | | | | | |
| | | Unrealized
Appreciation | | | Unrealized
Depreciation | | | Net Unrealized
Appreciation (Depreciation) | | | Cost of Securities
on a Tax Basis | |
| | | | |
U.S. Government Securities | | | $19,165,240 | | | | ($1,975,388) | | | | $17,189,852 | | | | $664,371,942 | |
Quality Income | | | 349,977 | | | | (116,758) | | | | 233,219 | | | | 65,336,374 | |
Tax-Free Income | | | 12,071,049 | | | | (17,488,940) | | | | (5,417,891) | | | | 167,208,884 | |
Minnesota Tax-Free Income | | | 25,457,821 | | | | (2,215,774) | | | | 23,242,047 | | | | 533,599,776 | |
Net investment income and net realized gains may differ for financial statement and tax purposes. The character of distributions made during the year for net investment income or net realized gains may also differ from its ultimate characterization for tax purposes. The tax character of distributions paid during the fiscal years ended March 31, 2016 and 2015 were as follows:
| | | | | | | | | | | | | | | | |
Year Ended March 31, 2016: | | | | | | | | | | | | | | | | |
| | | | |
| | | Ordinary Income | | | Tax-Exempt
Income | | | Long Term
Capital Gain | | | Total | |
| | | | |
U.S. Government Securities | | | $10,944,000 | | | | — | | | | — | | | | $10,944,000 | |
Quality Income | | | 799,171 | | | | — | | | | — | | | | 799,171 | |
Tax-Free Income* | | | 44,863 | | | | $5,535,455 | | | | — | | | | 5,580,318 | |
Minnesota Tax-Free Income* | | | 29,957 | | | | 14,937,262 | | | | — | | | | 14,967,219 | |
* 99.2% and 99.8% of dividends were derived from interest on tax-exempt securities, on the Tax-Free Income and Minnesota Tax-Free Income Funds, respectively. | |
| | | | |
Year Ended March 31, 2015: | | | | | | | | | | | | | | | | |
| | | | |
| | | Ordinary Income | | | Tax-Exempt
Income | | | Long Term
Capital Gain | | | Total | |
| | | | |
U.S. Government Securities | | | $11,708,730 | | | | — | | | | — | | | | $11,708,730 | |
Quality Income | | | 849,014 | | | | — | | | | — | | | | 849,014 | |
Tax-Free Income* | | | 59,463 | | | | $6,095,161 | | | | — | | | | 6,154,624 | |
Minnesota Tax-Free Income* | | | 56,423 | | | | 13,651,571 | | | | — | | | | 13,707,994 | |
* 99.0% and 99.6% of dividends were derived from interest on tax-exempt securities, on the Tax-Free Income and Minnesota Tax-Free Income Funds, respectively. | |
As of March 31, 2016 the components of distributable earnings on a tax basis were as follows:
| | | | | | | | | | | | | | | | | | |
| | | Undistributed
Ordinary Income | | | Undistributed
Tax-Exempt Income | | | Accumulated
Gain (Loss) | | | Unrealized
Appreciation
(Depreciation) | | | |
| | | | | |
U.S. Government Securities | | | $38,136 | | | | — | | | | ($18,282,471) | | | | $16,814,066 | | |
Quality Income | | | 2,417 | | | | — | | | | (1,626,366) | | | | 35,387 | | |
Tax-Free Income | | | — | | | | $70,473 | | | | (22,595,836) | | | | (6,739,367) | | |
Minnesota Tax-Free Income | | | — | | | | 195,838 | | | | (7,177,538) | | | | 18,811,921 | | |
Net capital loss carryovers and late year losses, if any, as of March 31, 2016, are available to offset future realized capital gains and thereby reduce future capital gains distributions. Under the Regulated Investment Company Modernization Act of 2010 (“Act”), the Funds are permitted to carry forward capital losses incurred in taxable years beginning after December 22, 2010 for an unlimited period. Any losses incurred during those future taxable years will be required to be utilized prior to any losses incurred in pre-enactment taxable years. Additionally, post-enactment capital losses that are carried forward will retain their character as either short-term or long-term capital losses, and will not be considered exclusively short-term as under previous law.
| | |
54 | | SIT MUTUAL FUNDS SEMI-ANNUAL REPORT |
The Funds’ first fiscal year end subject to the Modernization Act was March 31, 2012. The net capital loss carryovers and the expiration dates for capital losses carryover from pre-enactment taxable years and the late year losses deferred as of March 31, 2016, were as follows:
| | | | | | | | | | | | | | | | | | | | | | |
| | | Pre-Enactment Net Capital Loss Carryover Expiring in: | | | Post-Enactment Unlimited Period of Net Capital Loss Carryover | | | Late Year
Losses Deferred | | Accumulated
Capital and Other Losses | |
| | | | | | |
| | | 2017 | | | 2018-2019 | | | Short-Term | | | Long-Term | | | |
| | | | |
U.S. Government Securities | | | — | | | | — | | | | $9,163,334 | | | | $9,119,137 | | | — | | | $18,282,471 | |
Quality Income | | | — | | | | — | | | | 670,834 | | | | 955,532 | | | — | | | 1,626,366 | |
Tax-Free Income | | | $7,759,043 | | | | $8,723,671 | | | | 179,394 | | | | 5,933,728 | | | — | | | 22,595,836 | |
Minnesota Tax-Free Income | | | 1,488,606 | | | | 3,535,663 | | | | 896,040 | | | | 1,257,229 | | | — | | | 7,177,538 | |
For the year ended March 31, 2016, the Funds’ utilized capital losses and expired capital losses as follows:
| | | | | | |
| | | Utilized | | Expired | | |
| | | |
Tax-Free Income | | $— | | $2,627,197 | |
Distributions
Distributions to shareholders are recorded as of the close of business on the record date. Such distributions are payable in cash or reinvested in additional shares of the Funds’ capital stock. Distributions from net investment income are declared daily and paid monthly for the Funds. Distributions from net realized gains, if any, will be made annually for each of the Funds.
Use of Estimates
The preparation of financial statements in conformity with U.S. generally accepted accounting principles requires management to make certain estimates and assumptions that affect the reported amounts of assets and liabilities and disclosure of contingent assets and liabilities at the date of the financial statements and the reported results for the respective periods. Actual results could differ from those estimates.
Guarantees and Indemnifications
Under each Fund’s organizational documents, its officers and directors are indemnified against certain liabilities arising out of the performance of their duties to each Fund. In addition, certain of each Fund’s contracts with its service providers contain general indemnification clauses. Each Fund’s maximum exposure under these arrangements is unknown since the amount of any future claims that may be made against each Fund cannot be determined and each Fund has no historical basis for predicting the likelihood of any such claims.
NOTES TO FINANCIAL STATEMENTS (Unaudited)
Six Months Ended September 30, 2016 (Continued)
| (3) | Investment Security Transactions |
The cost of purchases and proceeds from sales and maturities of investment securities, other than short-term securities, for the six months ended September 30, 2016, were as follows:
| | | | | | | | | | | | | | | | |
| | | Purchases | | | Proceeds | |
| | | | |
| | | U.S. Government | | | Other | | | U.S. Government | | | Other | |
| | | | |
U.S. Government Securities | | | $140,462,920 | | | | — | | | | $98,769,400 | | | | — | |
Quality Income | | | 14,230,591 | | | | $13,655,421 | | | | 22,467,664 | | | | $12,595,157 | |
Tax-Free Income | | | — | | | | 15,560,153 | | | | — | | | | 18,492,450 | |
Minnesota Tax-Free Income | | | — | | | | 87,096,406 | | | | — | | | | 15,194,190 | |
| (4) | Affiliated Fees and Transactions |
Investment Adviser
The Funds each have entered into an investment management agreement with Sit Investment Associates Inc. (SIA), under which SIA manages the Funds’ assets and provides research, statistical and advisory services, and pays related office rental, executive expenses and executive salaries. SIA also is obligated to pay all of the Funds’ expenses (excluding extraordinary expenses, stock transfer taxes, interest, brokerage commissions, and other transaction charges relating to investing activities). The fee for investment management and advisory services is based on the average daily net assets of the Funds at the annual rate of:
| | | | |
| | | Average Daily Net Assets | | |
U.S. Government Securities | | 0.80% | |
Quality Income | | 0.90% | |
Tax-Free Income | | 0.80% | |
Minnesota Tax-Free Income | | 0.80% | |
Transactions with affiliates
The investment adviser, affiliates of the investment adviser, directors and officers of the Funds as a whole owned the following shares as of September 30, 2016:
| | | | | | | | |
| | | Shares | | | % Shares Outstanding | | |
| | | | |
U.S. Government Securities | | | 1,037,576 | | | 1.7 | |
Quality Income | | | 5,057,939 | | | 76.1 | |
Tax-Free Income | | | 2,681,295 | | | 16.4 | |
Minnesota Tax-Free Income | | | 1,944,670 | | | 3.6 | |
Management has evaluated the impact of all subsequent events on the Funds through the date the financial statements were issued, and has determined that there were no subsequent events that would require disclosure in or adjustments to the financial statements.
| | |
56 | | SIT MUTUAL FUNDS SEMI-ANNUAL REPORT |
EXPENSE EXAMPLE (Unaudited)
As a shareholder of the Funds, you incur two types of costs: (1) transaction costs, including redemption fees and (2) ongoing costs, including management fees; and other Fund expenses. This Example is intended to help you understand your ongoing costs (in dollars) of investing in the Funds and to compare these costs with the ongoing costs of investing in other mutual funds.
The Example is based on an investment of $1,000 invested at the beginning of the period and held for the entire period April 1, 2016 to September 30, 2016.
Actual Expenses
The first line of the following table provides information about actual account values and actual expenses. You may use the information in this line, together with the amount you invested, to estimate the expenses that you paid over the period. Simply divide your account value by $1,000 (for example, an $8,600 account value divided by $1,000 = 8.6), then multiply the result by the number in the first line under the heading entitled “Expenses Paid During Period” to estimate the expenses you paid on your account during this period.
Hypothetical Example for Comparison Purposes
The second line of the table provides information about hypothetical account values and hypothetical expenses based on the Fund’s actual expense ratio and an assumed rate of return of 5% per year before expenses, which is not the Fund’s actual return. The hypothetical account values and expenses may not be used to estimate the actual ending account balance or expenses you paid for the period. You may use this information to compare the ongoing costs of investing in the Fund and other funds. To do so, compare this 5% hypothetical example with the 5% hypothetical examples that appear in the shareholder reports of the other funds.
Please note that the expenses shown in the table are meant to highlight your ongoing costs only and do not reflect any transactional costs, such as redemption fees. Therefore, the second line of the table is useful in comparing ongoing costs only, and will not help you determine the relative total costs of owning different funds. In addition, if these transactional costs (redemption fees) were included, your costs would have been higher.
| | | | | | |
| | | Beginning
Account
Value
(4/1/16) | | Ending
Account
Value
(9/30/16) | | Expenses Paid During Period
(4/1/16- 9/30/16)* |
|
U.S. Government Securities Fund |
|
Actual | | $1,000 | | $1,009.10 | | $4.03 |
Hypothetical | | $1,000 | | $1,021.06 | | $4.05 |
| | | | | | |
|
Quality Income Fund |
|
Actual | | $1,000 | | $1,007.70 | | $4.53 |
Hypothetical | | $1,000 | | $1,020.56 | | $4.56 |
| | | | | | |
|
Tax-Free Income Fund |
|
Actual | | $1,000 | | $1,029.00 | | $4.07 |
Hypothetical | | $1,000 | | $1,021.06 | | $4.05 |
| | | | | | |
|
Minnesota Tax-Free Income Fund |
|
Actual | | $1,000 | | $1,024.30 | | $4.06 |
Hypothetical | | $1,000 | | $1,021.06 | | $4.05 |
|
*Expenses are equal to the Funds’ annualized expense ratio of 0.80% for the U.S. Government Securities, Tax-Free Income and Minnesota Tax-Free Funds; and 0.90% for the Quality Income Fund, multiplied by the average account value over the period, multiplied by 183/365 (to reflect the one-half year period.)
ADDITIONAL INFORMATION (Unaudited)
PROXY VOTING
Each Fund follows certain policies and procedures for voting proxies for securities held in each portfolio. A description of the Funds’ proxy voting policies and procedures is available without charge upon request by calling the Funds at 1-800-332-5580.
Information regarding how each Fund voted proxies relating to its portfolio securities during the most recent twelve-month period ended June 30 is available without charge upon request by calling the Funds at 1-800-332-5580, and is available on the U.S. Securities and Exchange Commission’s website at www.sec.gov.
AVAILABILITY OF QUARTERLY PORTFOLIO SCHEDULES
The Funds’ file their complete schedules of portfolio holdings with the U.S. Securities and Exchange Commission (SEC) for the first and third quarters of each fiscal year on Form N-Q. The Funds’ Form N-Qs are available without charge upon request by calling the Funds at 1-800-332-5580 and are available on the SEC’s website at www.sec.gov. In addition, the Funds’ Form N-Qs may be reviewed and copied at the SEC’s Public Reference Room in Washington, DC. Information on the operation of the Public Reference Room may be obtained by calling 1-202-551-8090.
| | |
58 | | SIT MUTUAL FUNDS SEMI-ANNUAL REPORT |
[This page intentionally left blank.]
[This page intentionally left blank.]
Semi-Annual Report
September 30, 2016
INVESTMENT ADVISER
Sit Investment Associates, Inc.
80 S. Eighth Street
Suite 3300
Minneapolis, MN 55402
CUSTODIAN
The Bank Of New York Mellon
One Wall Street
New York, NY 10286
TRANSFER AGENT AND
DISBURSING AGENT
BNY Mellon Investment Servicing (US) Inc.
4400 Computer Drive
Westborough, MA 01581
INDEPENDENT REGISTERED PUBLIC
ACCOUNTING FIRM
KPMG LLP
Minneapolis, MN
GENERAL COUNSEL
Dorsey & Whitney LLP
Minneapolis, MN
Sit Mutual Funds
1-800-332-5580 www.sitfunds.com
Sit Bond 9-2016
Item 2: Code of Ethics. Not applicable to Semi-Annual Report.
Item 3: Audit Committee Financial Expert. Not applicable to Semi-Annual Report.
Item 4: Principal Accountant Fees and Services. Not applicable to Semi-Annual Report.
Item 5: Audit Committee of Listed Registrants.
Not applicable to open-end investment companies.
Item 6: Schedule of Investments.
The schedule of investments is included as part of the report to shareholders filed under Item 1 of this Form.
Item 7: Disclosure of Proxy Voting Policies and Procedures for Closed-End Management Investment Companies.
Not applicable to open-end investment companies.
Item 8: Portfolio Managers of Closed-End Management Companies.
Not applicable to open-end investment companies.
Item 9: Purchases of Equity Securities by Closed-End Management Investment Company and Affiliated Purchasers.
Not applicable to open-end investment companies.
Item 10. Submission of Matters to a vote of Security Holders.
There have been no material changes to the procedures by which shareholders may recommend nominees to the registrant’s board of directors.
Item 11: Controls and Procedures -
(a) Based on their evaluation of the Registrant’s Disclosure Controls and Procedures as of a date within 90 days of the Filing Date, the Registrant’s Chairman and Treasurer have determined that the Disclosure Controls and Procedures (as defined in Rule 30a-2(c) under the Act) are designed to ensure that information required to be disclosed by the Registrant is recorded, processed, summarized and reported by the filing Date, and that information required to be disclosed in the report is communicated to the Registrant’s management, as appropriate, to allow timely decisions regarding required disclosure.
b) There were no changes in the Registrant’s internal control over financial reporting as defined in Rule 30a-3(d) under the Act) that occurred during the Registrant’s last fiscal half-year that has materially affected, or is reasonably likely to materially affect, the Registrant’s internal control over financial reporting.
Item 12: Exhibits:
(a) The following exhibits are attached to this Form N-CSR:
(2) A separate certification for each principal executive and principal financial officer of the registrant as required by Rule 30a-2(a) under the Act (17 CFR 270.30a-2) (certification required by Section 302 of the Sarbanes-Oxley Act of 2002).
(b) Certification required by Rule 30a-2(b) under the Act (certification required by Section 906 of the Sarbanes-Oxley Act of 2002).
SIGNATURES
Pursuant to the requirements of the Securities Exchange Act of 1934 and the Investment Company Act of 1940, the registrant has duly caused this report to be signed on its behalf by the undersigned, thereunto duly authorized.
| | | | | | |
| SIT MUTUAL FUNDS II, INC. | | | | | | |
| | | |
By (Signature and Title) | | /s/ Paul E. Rasmussen | | | | |
| | Paul E. Rasmussen | | | | |
| | Vice President, Treasurer | | | | |
Date November 25, 2016
Pursuant to the requirements of the Securities Exchange Act of 1934 and the Investment Company Act of 1940, this report has been signed below by the following persons on behalf of the registrant and in the capacities and on the dates indicated.
| | | | | | |
By (Signature and Title) | | /s/ Paul E. Rasmussen | | | | |
| | Paul E. Rasmussen | | | | |
| | Vice President, Treasurer | | | | |
Date November 25, 2016
| | | | | | |
By (Signature and Title) | | /s/ Roger J. Sit | | | | |
| | Roger J. Sit | | | | |
| | Chairman | | | | |
Date November 25, 2016