UNITED STATES SECURITIES AND EXCHANGE COMMISSION
Washington, D.C. 20549
FORM N-CSR
----------
CERTIFIED SHAREHOLDER REPORT OF REGISTERED
MANAGEMENT INVESTMENT COMPANIES
Investment Company Act file number: 811-04033
----------
Sit Mutual Funds II, Inc.
(Exact name of registrant as specified in charter)
3300 IDS Center
80 South Eighth Street
Minneapolis, MN 55402
(Address of principal executive offices)
Paul E. Rasmussen, VP & Treasurer
Sit Mutual Funds, Inc.
3300 IDS Center
80 South Eighth Street
Minneapolis, MN 55402
(Name and address of agent for service)
Copy to:
Mike Radmer, Esq.
Dorsey & Whitney
Suite 1500
50 South Sixth Street
Minneapolis, MN 55402-1498
Registrant’s telephone number, including area code:
(612) 332-3223
Date of fiscal year end: March 31, 2018
Date of reporting period: September 30, 2018
Item 1: Reports to Stockholders

|
|
Sit Mutual Funds BOND FUNDS SEMI-ANNUAL REPORT TABLE OF CONTENTS |
This document must be preceded or accompanied by a Prospectus.
CHAIRMAN’S LETTER
October 22, 2018
Dear fellow shareholders:
During the six month period ended September 30, 2018, U.S. Treasury yields rose and the yield curve flattened meaningfully as actions by the Federal Reserve pushed short-term Treasury yields higher. Two-Year Treasury yields ended September at 2.82%, an increase of 55 basis points from the end of March. Yields for longer-term bonds rose less as inflation expectations remained relatively stable. The 30-year Treasury yield rose only 23 basis points from March 31 to end the period at 3.21%.
Yield Curve Flattening
The yield curve flattened 32 basis points during the period with the difference between the yield on the 30-year Treasury and 2-year treasury at just 38 basis points as of September 30, 2018. Short-term yields have been rising at a much faster pace than long-term yields due to the Federal Reserve (Fed) raising its target Fed Funds Rate, the contraction of the Fed’s balance sheet, and increased issuance of short maturity Treasury securities by the Treasury. To demonstrate how unusual this is note that the average steepness between the 2-year and 30-year Treasury bonds has been 193 basis points over the last 5 years.
The Fed raised its target range for the Fed Funds Rate twice during the six months ending September 30, 2018, and is on pace for four increases during 2018. At the most recent meeting in September, the Fed raised the upper end of the target range to 2.25%. The Fed Funds Rate is the rate at which banks lend excess reserves to other banks on an overnight basis. The Fed sets the target rate, which in turn is highly correlated with other short-term interest rates in fixed income markets. Both increases in the target rate were anticipated by the markets and were announced after FOMC meetings that had scheduled press conferences. Acknowledging that market participants deemed only FOMC meetings with scheduled press conferences as “live” for any shift in monetary policy, in January 2019, Fed Chairman Powell will begin hosting a press conference after each FOMC meeting instead of the current schedule of every other meeting.
The Federal Reserve’s balance sheet normalization program is also pressuring short-term rates higher as the Fed is no longer the dominant buyer of newly issued Treasury securities. The Federal Reserve began reducing its balance sheet in October 2017 as it began to remove the $2.5 trillion of excess reserves in the banking system through capping the reinvestment of principal payments received from its portfolio. The cumulative reduction of $295 billion since normalization began last year must be purchased in the market by other buyers. Since over 70% of the Treasuries purchased by the Fed had maturities of 7 years or less, short term yields must rise to entice buyers to fill the void.
Increased issuance of shorter maturity Treasury securities by the Treasury to finance the Federal budget deficit has exacerbated the supply/demand imbalance. The preliminary estimate by the Congressional Budget Office (CBO) for the fiscal 2018 budget deficit was $782 billion, $973 billion for fiscal 2019 and $1.0 trillion for fiscal 2020. In late 2017, the Treasury announced that skewing future issuance towards shorter maturity securities would lead to an opti-
mal mix of its debt portfolio. The result is an increased supply of short-term bonds, further pressuring short-term yields higher.
The movement higher for longer maturity yields was more subdued than that of shorter maturity yields during the six months ending September 30, 2018 due to both a temporary increase in demand for longer maturity bonds by pension plans and relatively stable inflation expectations. A provision in the Tax Cuts and Jobs Act of 2017 allowed pension plans to make a 2017 plan-year pension contribution by September 15, 2018 and receive the old 35% tax deduction instead of the 21% rate that became effective in 2018. Since pension plans have long dated liabilities, they typically purchase long maturity bonds in order to match cash flows and mitigate interest rate risk. The impact of this temporary increase in demand became evident as the yield on long-term bonds spiked higher once the deadline passed.
Domestic Developments
The U.S. economy is firing on all cylinders thanks, in large part, to pro growth fiscal policies. The combination of tax cuts and deregulation has contributed to a notable acceleration in U.S. economic growth; real GDP growth is on pace to possibly exceed 3.0% in 2018 versus an average annual growth rate of only 2.2% over the prior 5-year period. Inflation as measured by the year over year change in U.S. Personal Consumption Expenditures (PCE) has been hovering near 2.0% during the six month period ending September 30, 2018. However, the outlook for future inflation has been moving up over the last few months as expectations for higher wages increase and businesses pass higher input costs through to consumers.
The labor market is tight with the unemployment rate at a decades’ low of just 3.7% with labor shortages becoming increasingly obvious. The number of job openings currently exceeds the number of unemployed and over half of businesses state that there are few or no qualified applicants.
Earlier this year, President Trump escalated his international trade strategy with the goal of achieving fairer trade and lower tariffs overall. The United States, Mexico and Canada have agreed to replace the twenty-four year old North American Free Trade Agreement (NAFTA) with a more modernized pact known as the United States Mexico Canada Agreement (USMCA). We believe there will be more successes on trade because, generally speaking, our trading partners need us more than we need them.
Using China as an example, in 2017, the United States imported $523 billion of goods and services from China while only exporting $188 billion to China. China’s currency manipulation, tariffs, and treatment of intellectual property are seen as unfair trade practices by the United States and the rest of the world. The Trump administration is seeking a long-term shift in trade policy by China in order to close the trade deficit and make trade more fair for the United States overall. Although a prolonged conflict may be looming, the United States is much better positioned to weather a trade battle given its strong economy and lower reliance on international trade.
| | |
2 | | SIT MUTUAL FUNDS SEMI-ANNUAL REPORT |
Strategy
We anticipate the Fed to raise the target Fed Funds Rate an additional 0.25% at the current pace of every other FOMC meeting (once per quarter) until the target rate reaches a neutral rate of 3.0% next June. With the target Fed Funds Rate at neutral, or the rate that is seen as neither stimulative nor restrictive, the Fed can shift its emphasis to accelerating balance sheet normalization in order to reduce excess reserves in the banking system. The mechanism by which the Fed is setting the Fed Funds Rate is through paying banks interest on their excess reserves on deposit at the Fed (IOER). The IOER rate is currently set just below the top end of the target range for the Fed Funds Rate, currently 2.20%. Congress gave the Fed authority to pay banks interest on their excess reserves during the financial crisis, however, it never intended for the tool to be used as it is now for monetary policy. With excess reserves currently at $1.8 trillion, billions of dollars are being transferred from taxpayers to pay banks interest each year. Combined with the disincentive to lend created by the IOER, the Fed will be politically motivated to shrink its balance sheet and with it, excess reserves, as quickly as possible.
We expect the short end of the yield curve to continue to rise as the Fed raises the target Fed Funds Rate and contract its balance sheet in conjunction with the Treasury emphasizing the issuance of more short-term bonds to finance the deficit. We also expect the long-end of the yield curve to rise due to increasing inflationary pressures in the economy, particularly from the tight labor market. These forces may create a V-shaped yield curve with a low point around the 6- to 8-year part of the curve. We do not see this partial inversion of the yield curve as an indicator of a looming recession as economic activity is robust.
We have positioned the Funds to be resilient in the face of rising interest rates through defensive yield curve positioning and emphasizing income. The U.S. Government Securities Fund remains focused on seasoned, high coupon agency-backed mortgages which should continue to provide long-term income stability and principal preservation. The Sit Quality Income Fund continues to focus on shorter than benchmark duration securities using a combination of government securities, corporate bonds, and taxable municipal securities, including floating rate securities.
The tax-exempt fixed income strategy for both the Tax-Free Income Fund and Minnesota Tax-Free Income Fund will continue to focus heavily on the use of high coupon bonds and bonds structured with put, call, sinking fund, and prepayment provisions that provide regular cash flow. Our investment strategy focuses on income, which is the primary source of returns over longer periods of time. We believe that this will continue to deliver positive relative performance. We continue to focus on sectors and security structures that provide incremental yield, while using diversification to mitigate credit risk.
We appreciate your continued interest in the Sit family of funds.
With best wishes,

Roger J. Sit
Chairman and President Sit Mutual Funds
|
Sit U.S. Government Securities Fund |
OBJECTIVE & STRATEGY
The objective of the U.S. Government Securities Fund is to provide high current income and safety of principal, which it seeks to attain by investing solely in debt obligations issued, guaranteed or insured by the U.S. government or its agencies or its instrumentalities. Agency mortgage securities and U.S. Treasury securities are the principal holdings in the Fund. The mortgage securities that the Fund purchases consist of pass-through securities including those issued by Government National Mortgage Association (GNMA), Federal National Mortgage Association (FNMA), and Federal Home Loan Mortgage Corporation (FHLMC).
The Sit U.S. Government Securities Fund provided a return of +0.71% during the 6-month period ending September 30, 2018, compared to the return of the Bloomberg Barclays Intermediate Government Bond Index of -0.05%. The Fund’s 30-day SEC yield was 2.98% and its 12-month distribution rate was 1.92%.
During the 6-month period, the Fund benefited from the consistent relatively high level of income provided by its holdings in higher coupon government agency mortgages. The Fund reduces interest rate risk by using futures and options on Treasury securities. The use of futures and options was successful in providing stability to the Fund’s net asset value and contributed positively to the return. The Federal Reserve hiked the Fed Funds rate two times over the 6-month period as it continued to normalize monetary policy. In addition, the Federal Reserve allowed its balance sheet to shrink by up to $40 billion per month during the third quarter, and will increase that amount to up to $50 billion in October. The normalization coupled with a strong economic environment, caused treasury rates to rise across all maturities with short term rates outpacing long term rates. Federal Reserve Chairman Jerome Powell indicated that beginning in January 2019, the Federal Reserve will begin hosting a press conference after each Federal Open Market Committee meeting instead of every other meeting. Market participants had dismissed monetary policy shifts on non-press conference meetings, and with the additional press conferences the Federal Reserve can react more nimbly to incoming market data. We expect the Federal Reserve to maintain a methodical approach for normalizing its balance sheet and gradually raising interest rates over time until it reaches a neutral rate, which is expected to be around 3.00%. The Fund’s high coupon mortgages should continue to produce an income advantage in this environment as prepayments are likely to remain stable or potentially slow.
We continue to position the Fund defensively against rising short-term interest rates while maintaining the Fund’s focus on seasoned,
HYPOTHETICAL GROWTH OF $10,000
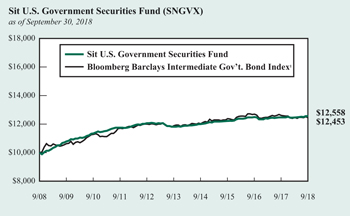
The chart above illustrates the total value of a hypothetical $10,000 investment in the Fund over the past 10 years (or for the life of the Fund if shorter) as compared to the performance of the Bloomberg Barclays Intermediate Government Bond Index. Past performance does not guarantee future results. Returns include the reinvestment of distributions. The chart does not reflect the deduction of taxes that a shareholder would pay on Fund distributions or the redemption of Fund shares.
1 The Bloomberg Barclays Intermediate Government Bond Index is a sub-index of the Bloomberg Barclays Government Bond Index covering issues with remaining maturities of between three and five years. The Bloomberg Barclays Government Bond Index is an index that measures the performance of all public U.S. government obligations with remaining maturities of one year or more. The returns include the reinvestment of income and do not include any transaction costs, management fees or other costs. It is not possible to invest directly in an index. This is the Fund’s primary index.
high coupon agency mortgage securities which provide a high level of income with relatively stable prices. This high level of income and stability of principal has been a fundamental focus of the Fund since its inception.
Michael C. Brilley Bryce A. Doty, CFA
Senior Portfolio Managers
Mark H. Book, CFA
Portfolio Manager
| | |
4 | | SIT MUTUAL FUNDS SEMI-ANNUAL REPORT |
COMPARATIVE RATES OF RETURNS
as of September 30, 2018
| | | | | | | | | | | | |
| | | Sit U.S. | | | Bloomberg | | | Lipper | |
| | | Government | | | Barclays | | | U.S. | |
| | | Securities | | | Inter. Gov’t | | | Gov’t Fund | |
| | | Fund | | | Bond Index1 | | | Index2 | |
Six Months | | | 0.71% | | | | -0.05% | | | | n/a | |
One Year | | | 0.81 | | | | -1.18 | | | | -1.28% | |
Five Years | | | 1.22 | | | | 0.93 | | | | 1.62 | |
Ten Years | | | 2.30 | | | | 2.22 | | | | 3.05 | |
Since Inception (6/2/87) | | | 5.19 | | | | 5.32 | | | | 5.19 | |
Performance figures are historical and do not guarantee future results. Investment returns and principal value will vary, and you may have a gain or loss when you sell shares. Current performance may be lower or higher than the performance data quoted. Contact the Fund for performance data current to the most recent month-end. Returns include changes in share price as well as reinvestment of all dividends and capital gains and all fee waivers. Without the fee waivers total return and yield figures would have been lower. Returns do not reflect the deduction of taxes that a shareholder would pay on Fund distributions or the redemption of Fund shares. Management fees and administrative expenses are included in the Fund’s performance. Returns for periods greater than one year are compounded average annual rates of return.
1 The Bloomberg Barclays Intermediate Government Bond Index is a sub-index of the Bloomberg Barclays Government Bond Index covering issues with remaining maturities of between three and five years. The Bloomberg Barclays Government Bond Index is an index that measures the performance of all public U.S. government obligations with remaining maturities of one year or more. The returns include the reinvestment of income and do not include any transaction costs, management fees or other costs. It is not possible to invest directly in an index.
2 The Lipper returns are obtained from Lipper Analytical Services, Inc., a large independent evaluator of mutual funds.
FUND DIVERSIFICATION
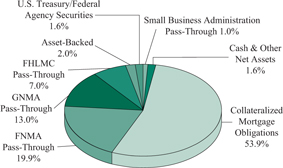
Based on total net assets as of September 30, 2018. Subject to change.
PORTFOLIO SUMMARY
| | | | |
Net Asset Value 9/30/18: | | $10.77 Per Share |
Net Asset Value 3/31/18: | | $10.80 Per Share |
Total Net Assets: | | $472.9 Million |
Effective Duration3: | | 2.1 Years |
3 Duration is a measure of estimated price sensitivity relative to changes in interest rates. Portfolios with longer durations are typically more sensitive to changes in interest rates. For example, if interest rates rise by 1%, the fair value of a security with an effective duration of 5 years would decrease by 5%, with all other factors being constant. The correlation between duration and price sensitivity is greater for securities rated investment-grade than it is for securities rated below investment-grade. Duration estimates are based on assumptions by the Adviser and are subject to a number of limitations. Effective duration is calculated based on historical price changes of securities held by the Fund, and therefore is a more accurate estimate of price sensitivity provided interest rates remain within their historical range.
ESTIMATED AVERAGE LIFE
| | | | |
0-1 Year | | | 1.6 | % |
1-5 Years | | | 96.0 | |
5-10 Years | | | 2.4 | |
The table represents the Adviser’s estimates of the dollar weighted average life of the portfolio’s securities, which differ from their stated maturities. The Fund’s average stated maturity was 18.4 years as of September 30, 2018.
SCHEDULE OF INVESTMENTS (Unaudited)
September 30, 2018
Sit U.S. Government Securities Fund
| | | | | | | | | | | | |
| |
Principal
Amount ($) | | Coupon Rate (%) | | Maturity Date | | | | | Fair
Value ($) | |
| |
Mortgage Pass-Through Securities - 40.9% | |
Federal Home Loan Mortgage Corporation - 7.0% | |
| 203,086 | | 4.00 | | | 7/1/25 | | | | | | 207,825 | |
| 1,132,648 | | 5.00 | | | 5/1/42 | | | | | | 1,216,768 | |
| 1,233,727 | | 5.00 | | | 9/1/43 | | | | | | 1,329,945 | |
| 54,984 | | 5.82 | | | 10/1/37 | | | | | | 59,297 | |
| 731,983 | | 6.50 | | | 11/1/27 | | | | | | 809,773 | |
| 562,405 | | 6.50 | | | 12/1/34 | | | | | | 616,991 | |
| 2,193,126 | | 6.50 | | | 11/1/35 | | | | | | 2,426,196 | |
| 255,844 | | 6.88 | | | 2/17/31 | | | | | | 280,355 | |
| 68,677 | | 7.00 | | | 8/1/27 | | | | | | 70,647 | |
| 25,235 | | 7.00 | | | 10/1/27 | | | | | | 25,334 | |
| 1,054,264 | | 7.00 | | | 4/1/28 | | | | | | 1,130,135 | |
| 8,327,040 | | 7.00 | | | 12/1/31 | | | | | | 9,161,206 | |
| 516,076 | | 7.00 | | | 2/1/37 | | | | | | 558,525 | |
| 6,750,527 | | 7.00 | | | 10/1/37 | | | | | | 7,789,882 | |
| 3,060,625 | | 7.00 | | | 10/1/38 | | | | | | 3,480,854 | |
| 734,963 | | 7.00 | | | 1/1/39 | | | | | | 828,487 | |
| 88,756 | | 7.38 | | | 12/17/24 | | | | | | 93,119 | |
| 111,208 | | 7.50 | | | 1/1/31 | | | | | | 114,669 | |
| 621,641 | | 7.50 | | | 1/1/32 | | | | | | 686,848 | |
| 390,597 | | 7.50 | | | 8/1/32 | | | | | | 413,909 | |
| 61,364 | | 7.50 | | | 10/1/38 | | | | | | 64,948 | |
| 13,284 | | 7.95 | | | 10/1/25 | | | | | | 13,314 | |
| 16,102 | | 7.95 | | | 11/1/25 | | | | | | 16,136 | |
| 77,784 | | 8.00 | | | 5/1/31 | | | | | | 82,494 | |
| 76,722 | | 8.00 | | | 11/1/36 | | | | | | 85,807 | |
| 157,010 | | 8.00 | | | 1/1/37 | | | | | | 182,100 | |
| 233,032 | | 8.50 | | | 12/1/21 | | | | | | 243,667 | |
| 195,217 | | 8.50 | | | 6/20/27 | | | | | | 219,312 | |
| 42,549 | | 8.50 | | | 12/1/29 | | | | | | 45,579 | |
| 114,835 | | 8.50 | | | 3/1/31 | | | | | | 128,502 | |
| 16,719 | | 9.00 | | | 11/1/25 | | | | | | 17,033 | |
| 50,569 | | 9.00 | | | 3/20/27 | | | | | | 50,811 | |
| 157,232 | | 9.00 | | | 2/17/31 | | | | | | 156,479 | |
| 139,275 | | 9.00 | | | 5/1/31 | | | | | | 152,140 | |
| 37,650 | | 9.50 | | | 12/17/21 | | | | | | 37,408 | |
| 6,722 | | 10.00 | | | 9/1/20 | | | | | | 6,757 | |
| 11,754 | | 10.00 | | | 3/1/21 | | | | | | 11,823 | |
| 46,251 | | 10.00 | | | 3/17/25 | | | | | | 46,124 | |
| 12,245 | | 10.00 | | | 3/25/25 | | | | | | 12,209 | |
| 32,079 | | 10.00 | | | 7/1/30 | | | | | | 32,692 | |
| 6,262 | | 10.50 | | | 6/1/19 | | | | | | 6,289 | |
| 1,709 | | 11.00 | | | 8/25/20 | | | | | | 1,721 | |
| | | | | | | | | | | | |
| | | | |
| | | | | | | | | | | 32,914,110 | |
| | | | | | | | | | | | |
| | | | | | | | | | | | |
| |
Principal
Amount ($) | | Coupon Rate (%) | | Maturity Date | | | | | Fair
Value ($) | |
| |
|
Federal National Mortgage Association - 19.9% | |
| 5,805,893 | | 4.50 | | | 4/1/48 | | | | | | 6,080,714 | |
| 854,039 | | 5.50 | | | 12/1/32 | | | | | | 898,001 | |
| 419,133 | | 5.50 | | | 6/1/33 | | | | | | 438,432 | |
| 126,846 | | 5.61 | | | 11/1/22 | | | | | | 126,793 | |
| 953,131 | | 5.93 | | | 5/1/35 | | | | | | 987,307 | |
| 2,838,918 | | 5.96 | | | 6/1/28 | | | | | | 3,165,737 | |
| 769,371 | | 6.00 | | | 11/1/34 | | | | | | 847,133 | |
| 194,404 | | 6.00 | | | 5/1/37 | | | | | | 210,266 | |
| 99,240 | | 6.00 | | | 9/1/37 | | | | | | 104,100 | |
| 260,590 | | 6.00 | | | 11/1/37 | | | | | | 269,278 | |
| 2,435,682 | | 6.00 | | | 4/1/38 | | | | | | 2,680,218 | |
| 2,609,764 | | 6.00 | | | 3/1/41 | | | | | | 2,873,600 | |
| 8,072,799 | | 6.00 | | | 5/1/41 | | | | | | 8,884,108 | |
| 2,516,305 | | 6.09 | | | 11/1/43 | | | | | | 2,709,866 | |
| 17,350 | | 6.50 | | | 1/1/22 | | | | | | 17,667 | |
| 2,170,413 | | 6.50 | | | 2/1/29 | | | | | | 2,379,511 | |
| 359,051 | | 6.50 | | | 3/1/29 | | | | | | 375,334 | |
| 5,313,837 | | 6.50 | | | 12/1/30 | | | | | | 5,841,836 | |
| 397,949 | | 6.50 | | | 6/1/31 | | | | | | 437,037 | |
| 65,806 | | 6.50 | | | 8/1/34 | | | | | | 69,897 | |
| 1,123,255 | | 6.50 | | | 12/1/36 | | | | | | 1,231,470 | |
| 313,986 | | 6.50 | | | 1/1/39 | | | | | | 328,603 | |
| 5,773,003 | | 6.50 | | | 4/1/39 | | | | | | 6,386,924 | |
| 5,233,434 | | 6.50 | | | 6/1/40 | | | | | | 5,851,442 | |
| 1,903,270 | | 6.50 | | | 9/1/40 | | | | | | 2,172,452 | |
| 1,370,589 | | 6.75 | | | 6/1/32 | | | | | | 1,532,931 | |
| 35,460 | | 1 Mo. Libor + 2.28, 6.95% | | | 8/1/21 | | | 1 | | | 34,619 | |
| 1,331,598 | | 6.95 | | | 6/1/40 | | | | | | 1,444,374 | |
| 100,985 | | 7.00 | | | 9/1/21 | | | | | | 102,703 | |
| 112,990 | | 7.00 | | | 3/1/22 | | | | | | 116,570 | |
| 155,068 | | 7.00 | | | 6/1/22 | | | | | | 160,092 | |
| 62,180 | | 7.00 | | | 1/1/24 | | | | | | 64,594 | |
| 39,531 | | 7.00 | | | 2/1/26 | | | | | | 41,053 | |
| 90,544 | | 7.00 | | | 9/1/27 | | | | | | 94,217 | |
| 46,950 | | 7.00 | | | 10/1/27 | | | | | | 49,454 | |
| 215,916 | | 7.00 | | | 11/1/27 | | | | | | 235,750 | |
| 41,564 | | 7.00 | | | 1/1/28 | | | | | | 43,739 | |
| 43,174 | | 7.00 | | | 10/1/32 | | | | | | 46,182 | |
| 5,358,450 | | 7.00 | | | 12/1/32 | | | | | | 6,085,368 | |
| 104,768 | | 7.00 | | | 7/1/33 | | | | | | 112,873 | |
| 3,138,596 | | 7.00 | | | 12/1/33 | | | | | | 3,544,545 | |
| 137,467 | | 7.00 | | | 7/1/34 | | | | | | 151,954 | |
| 670,985 | | 7.00 | | | 3/1/37 | | | | | | 763,795 | |
| 1,005,751 | | 7.00 | | | 10/1/37 | | | | | | 1,126,473 | |
| 40,044 | | 7.00 | | | 12/1/37 | | | | | | 42,409 | |
| 776,431 | | 7.00 | | | 11/1/38 | | | | | | 905,846 | |
| 8,252,717 | | 7.00 | | | 3/1/39 | | | | | | 9,459,438 | |
| 935,125 | | 7.00 | | | 5/1/39 | | | | | | 1,054,300 | |
| 1,904,925 | | 7.00 | | | 1/1/40 | | | | | | 2,153,489 | |
| 642,503 | | 7.00 | | | 9/1/47 | | | | | | 686,838 | |
| 39,504 | | 7.50 | | | 6/1/22 | | | | | | 40,718 | |
| 20,043 | | 7.50 | | | 8/1/22 | | | | | | 20,368 | |
See accompanying notes to financial statements.
| | |
6 | | SIT MUTUAL FUNDS SEMI-ANNUAL REPORT |
| | | | | | | | | | | | |
| |
Principal
Amount ($) | | Coupon Rate (%) | | Maturity Date | | | | | Fair Value ($) | |
| |
| 36,346 | | 7.50 | | | 12/1/22 | | | | | | 37,064 | |
| 39,771 | | 7.50 | | | 3/1/23 | | | | | | 40,206 | |
| 201,904 | | 7.50 | | | 4/1/32 | | | | | | 218,223 | |
| 10,794 | | 7.50 | | | 8/1/32 | | | | | | 10,965 | |
| 107,228 | | 7.50 | | | 1/1/34 | | | | | | 115,129 | |
| 1,117,908 | | 7.50 | | | 10/1/37 | | | | | | 1,304,015 | |
| 2,020,115 | | 7.50 | | | 11/1/38 | | | | | | 2,294,004 | |
| 23,864 | | 7.61 | | | 7/20/30 | | | | | | 24,080 | |
| 77,479 | | 8.00 | | | 10/1/23 | | | | | | 79,803 | |
| 287,920 | | 8.00 | | | 6/1/25 | | | | | | 304,468 | |
| 8,646 | | 8.00 | | | 7/20/28 | | | | | | 8,719 | |
| 114,927 | | 8.00 | | | 2/1/31 | | | | | | 128,136 | |
| 97,953 | | 8.00 | | | 1/1/32 | | | | | | 106,796 | |
| 348,694 | | 8.00 | | | 11/1/37 | | | | | | 389,394 | |
| 370,403 | | 8.00 | | | 3/1/38 | | | | | | 427,652 | |
| 122,786 | | 8.08 | | | 11/15/31 | | | | | | 134,670 | |
| 8,357 | | 8.33 | | | 7/15/20 | | | | | | 8,500 | |
| 90,105 | | 8.50 | | | 11/1/26 | | | | | | 94,094 | |
| 114,415 | | 8.50 | | | 3/1/28 | | | | | | 124,848 | |
| 76,052 | | 8.50 | | | 10/1/28 | | | | | | 85,827 | |
| 39,103 | | 8.50 | | | 11/1/28 | | | | | | 42,756 | |
| 234,125 | | 8.50 | | | 4/1/29 | | | | | | 256,921 | |
| 50,341 | | 8.50 | | | 10/1/29 | | | | | | 50,786 | |
| 110,966 | | 8.50 | | | 7/1/30 | | | | | | 123,145 | |
| 72,914 | | 8.50 | | | 8/1/30 | | | | | | 85,529 | |
| 266,936 | | 8.50 | | | 4/1/32 | | | | | | 312,756 | |
| 360,836 | | 8.50 | | | 1/1/37 | | | | | | 407,375 | |
| 25,746 | | 9.00 | | | 9/1/24 | | | | | | 26,003 | |
| 14,146 | | 9.00 | | | 6/15/25 | | | | | | 14,347 | |
| 55,035 | | 9.00 | | | 6/1/30 | | | | | | 59,598 | |
| 48,155 | | 9.00 | | | 7/1/30 | | | | | | 49,462 | |
| 35,264 | | 9.00 | | | 10/1/30 | | | | | | 38,325 | |
| 177,558 | | 9.00 | | | 2/1/31 | | | | | | 199,495 | |
| 22,382 | | 9.00 | | | 7/1/31 | | | | | | 22,436 | |
| 71,639 | | 9.00 | | | 10/1/31 | | | | | | 81,896 | |
| 80,503 | | 9.00 | | | 8/1/37 | | | | | | 89,122 | |
| 24,191 | | 9.00 | | | 1/1/38 | | | | | | 24,387 | |
| 188,669 | | 9.00 | | | 2/1/38 | | | | | | 206,404 | |
| 30,299 | | 9.01 | | | 5/15/28 | | | | | | 30,922 | |
| 24,181 | | 9.08 | | | 8/20/25 | | | | | | 24,623 | |
| 10,009 | | 9.24 | | | 3/15/22 | | | | | | 10,129 | |
| 17,323 | | 9.50 | | | 3/1/20 | | | | | | 17,621 | |
| 21,539 | | 9.50 | | | 7/1/20 | | | | | | 22,112 | |
| 511 | | 9.50 | | | 12/15/20 | | | | | | 516 | |
| 1,356 | | 9.50 | | | 4/15/21 | | | | | | 1,401 | |
| 25,505 | | 9.50 | | | 8/1/24 | | | | | | 25,806 | |
| 9,734 | | 9.50 | | | 5/1/27 | | | | | | 9,736 | |
| 178,402 | | 9.50 | | | 5/1/29 | | | | | | 201,840 | |
| 40,573 | | 9.50 | | | 4/1/30 | | | | | | 45,074 | |
| 168,056 | | 9.50 | | | 8/1/31 | | | | | | 187,987 | |
| 1,855 | | 10.00 | | | 8/15/20 | | | | | | 1,875 | |
| 53,820 | | 10.00 | | | 2/1/28 | | | | | | 59,143 | |
| 161,220 | | 10.00 | | | 6/1/30 | | | | | | 181,614 | |
| | | | | | | | | | | | |
| |
Principal
Amount ($) | | Coupon Rate (%) | | Maturity Date | | | | | Fair Value ($) | |
| |
| 5,338 | | 10.50 | | | 6/1/28 | | | | | | 5,355 | |
| 654 | | 10.94 | | | 7/15/20 | | | | | | 659 | |
| | | | | | | | | | | | |
| | | | |
| | | | | | | | | | | 94,336,167 | |
| | | | | | | | | | | | |
| |
Government National Mortgage Association - 13.0% | | | | |
| 270,699 | | 4.00 | | | 12/15/24 | | | | | | 276,026 | |
| 714,394 | | 4.00 | | | 10/20/30 | | | | | | 732,884 | |
| 11,369,378 | | 4.00 | | | 8/20/31 | | | | | | 11,663,579 | |
| 1,007,779 | | 4.00 | | | 12/20/31 | | | | | | 1,033,900 | |
| 942,342 | | 4.25 | | | 10/20/31 | | | | | | 976,853 | |
| 525,772 | | 4.25 | | | 3/20/37 | | | | | | 545,071 | |
| 2,533,267 | | 4.75 | | | 9/20/31 | | | | | | 2,679,131 | |
| 98,196 | | 5.50 | | | 9/15/25 | | | | | | 104,734 | |
| 1,329,490 | | 5.50 | | | 5/15/29 | | | | | | 1,418,322 | |
| 3,030,597 | | 5.75 | | | 2/15/29 | | | | | | 3,256,980 | |
| 963,864 | | 5.75 | | | 10/20/31 | | | | | | 1,042,996 | |
| 676,987 | | 6.00 | | | 9/15/33 | | | | | | 735,895 | |
| 2,155,468 | | 6.00 | | | 12/15/40 | | | | | | 2,328,826 | |
| 548,485 | | 6.00 | | | 2/20/47 | | | | | | 588,013 | |
| 5,495,192 | | 6.00 | | | 7/20/47 | | | | | | 5,878,045 | |
| 87,533 | | 6.25 | | | 12/15/23 | | | | | | 95,601 | |
| 974,586 | | 6.25 | | | 4/15/29 | | | | | | 1,064,820 | |
| 186,614 | | 6.50 | | | 11/15/23 | | | | | | 195,174 | |
| 345,405 | | 6.50 | | | 4/15/24 | | | | | | 362,010 | |
| 1,113,956 | | 6.50 | | | 2/20/28 | | | | | | 1,233,388 | |
| 656,900 | | 6.50 | | | 2/20/29 | | | | | | 696,045 | |
| 1,274,851 | | 6.50 | | | 11/20/29 | | | | | | 1,409,869 | |
| 4,064,598 | | 6.50 | | | 2/15/35 | | | | | | 4,494,219 | |
| 17,569 | | 6.50 | | | 12/20/38 | | | | | | 17,967 | |
| 393,273 | | 6.50 | | | 1/20/39 | | | | | | 438,120 | |
| 291,769 | | 6.50 | | | 2/20/39 | | | | | | 327,912 | |
| 442,461 | | 6.50 | | | 4/20/39 | | | | | | 484,868 | |
| 653,018 | | 6.50 | | | 6/20/39 | | | | | | 724,276 | |
| 926,485 | | 6.50 | | | 8/20/39 | | | | | | 1,031,548 | |
| 598,578 | | 6.50 | | | 4/20/43 | | | | | | 662,832 | |
| 6,502,220 | | 7.00 | | | 8/15/29 | | | | | | 7,230,015 | |
| 6,747,566 | | 7.00 | | | 10/15/29 | | | | | | 7,517,734 | |
| | | | | | | | | | | | |
| | | | |
| | | | | | | | | | | 61,247,653 | |
| | | | | | | | | | | | |
| |
Small Business Administration - 1.0% | | | | |
| 1,509,925 | | 5.33 | | | 8/25/36 | | | | | | 1,557,382 | |
| 3,303,443 | | 5.33 | | | 9/25/36 | | | | | | 3,399,859 | |
| | | | | | | | | | | | |
| | | | |
| | | | | | | | | | | 4,957,241 | |
| | | | | | | | | | | | |
| |
Total Mortgage Pass-Through Securities
(cost: $196,795,073) | | | 193,455,171 | |
| | | | | | | | | | | | |
| |
U.S. Treasury / Federal Agency Securities - 1.6% | | | | |
United States Treasury Strip Principal: | | | | | | | | | | |
| 10,000,000 | | 2.91 | | | 11/15/27 | | | 6 | | | 7,589,681 | |
| | | | | | | | | | | | |
| |
Total U.S. Treasury / Federal Agency Securities
(cost: $7,682,118) | | | | |
See accompanying notes to financial statements.
SCHEDULE OF INVESTMENTS (Unaudited)
September 30, 2018
Sit U.S. Government Securities Fund (Continued)
| | | | | | | | | | | | |
| |
Principal
Amount ($) | | Coupon Rate (%) | | Maturity Date | | | | | Fair Value ($) | |
| |
Collateralized Mortgage Obligations - 53.9% | |
Federal Home Loan Mortgage Corporation - 13.8% | |
| 670,809 | | 5.00 | | | 2/15/23 | | | | | | 694,876 | |
| 2,097,278 | | 5.54 | | | 7/25/32 | | | 1 | | | 2,201,075 | |
| 672,292 | | 5.55 | | | 5/15/38 | | | 1 | | | 711,023 | |
| 7,471 | | 6.00 | | | 9/15/21 | | | | | | 7,654 | |
| 1,683,081 | | 6.00 | | | 1/15/33 | | | | | | 1,867,223 | |
| 3,034,100 | | 6.00 | | | 9/15/42 | | | | | | 3,350,761 | |
| 42,129 | | 6.25 | | | 5/15/29 | | | | | | 44,688 | |
| 10,167 | | 6.50 | | | 12/15/21 | | | | | | 10,177 | |
| 193,082 | | 6.50 | | | 9/15/23 | | | | | | 203,260 | |
| 72,880 | | 6.50 | | | 3/15/24 | | | | | | 77,389 | |
| 24,043 | | 6.50 | | | 2/15/30 | | | | | | 26,629 | |
| 1,285,386 | | 6.50 | | | 8/15/31 | | | | | | 1,436,847 | |
| 422,431 | | 6.50 | | | 1/15/32 | | | | | | 469,646 | |
| 97,113 | | 6.50 | | | 3/15/32 | | | | | | 107,250 | |
| 527,121 | | 6.50 | | | 6/25/32 | | | | | | 570,506 | |
| 162,437 | | 6.50 | | | 7/15/32 | | | | | | 175,591 | |
| 7,010,537 | | 6.50 | | | 5/15/33 | | | | | | 7,699,101 | |
| 1,179,655 | | 6.50 | | | 5/15/35 | | | | | | 1,307,379 | |
| 671,634 | | 6.50 | | | 8/15/39 | | | | | | 746,176 | |
| 757,642 | | 6.50 | | | 2/25/43 | | | | | | 848,662 | |
| 700,184 | | 6.50 | | | 3/25/43 | | | | | | 770,275 | |
| 837,916 | | 6.50 | | | 7/25/43 | | | | | | 934,048 | |
| 642,690 | | 6.50 | | | 9/25/43 | | | 1 | | | 713,549 | |
| 719,994 | | 6.50 | | | 10/25/43 | | | | | | 818,130 | |
| 5,876,207 | | 6.50 | | | 8/15/45 | | | | | | 6,732,955 | |
| 26,381 | | 6.70 | | | 9/15/23 | | | | | | 27,972 | |
| 207,451 | | 6.95 | | | 3/15/28 | | | | | | 223,452 | |
| 65 | | 7.00 | | | 12/15/20 | | | | | | 65 | |
| 3,747 | | 7.00 | | | 3/15/21 | | | | | | 3,797 | |
| 40,185 | | 7.00 | | | 10/15/22 | | | | | | 42,072 | |
| 11,666 | | 7.00 | | | 11/15/22 | | | | | | 12,157 | |
| 405,095 | | 7.00 | | | 3/25/23 | | | | | | 422,408 | |
| 16,699 | | 7.00 | | | 4/15/23 | | | | | | 17,574 | |
| 71,205 | | 7.00 | | | 7/15/23 | | | | | | 74,977 | |
| 112,817 | | 7.00 | | | 1/15/24 | | | | | | 119,781 | |
| 92,976 | | 7.00 | | | 3/15/24 | | | | | | 98,364 | |
| 123,389 | | 7.00 | | | 8/15/25 | | | | | | 132,315 | |
| 112,534 | | 7.00 | | | 9/15/26 | | | | | | 121,293 | |
| 174,257 | | 7.00 | | | 6/15/29 | | | | | | 190,477 | |
| 1,401,337 | | 7.00 | | | 8/15/29 | | | | | | 1,473,829 | |
| 514,477 | | 7.00 | | | 10/20/29 | | | | | | 574,087 | |
| 1,058,582 | | 7.00 | | | 11/15/29 | | | | | | 1,096,791 | |
| 2,485,250 | | 7.00 | | | 12/15/29 | | | | | | 2,554,491 | |
| 146,817 | | 7.00 | | | 1/15/30 | | | | | | 161,962 | |
| 331,791 | | 7.00 | | | 10/15/30 | | | | | | 370,436 | |
| 186,483 | | 7.00 | | | 7/15/31 | | | | | | 205,487 | |
| 144,639 | | 7.00 | | | 4/15/32 | | | | | | 157,640 | |
| 787,280 | | 7.00 | | | 5/15/32 | | | | | | 874,185 | |
| 4,254,636 | | 7.00 | | | 8/15/41 | | | | | | 4,569,317 | |
| 2,498,465 | | 7.00 | | | 2/25/43 | | | | | | 2,791,094 | |
| 891,940 | | 7.00 | | | 3/25/43 | | | | | | 985,344 | |
| | | | | | | | | | | | |
| |
Principal
Amount ($) | | Coupon Rate (%) | | Maturity Date | | | | | Fair Value ($) | |
| |
| 1,027,503 | | 7.00 | | | 7/25/43 | | | | | | 1,168,379 | |
| 2,045,044 | | 7.00 | | | 9/25/43 | | | | | | 2,323,246 | |
| 38,607 | | 7.50 | | | 10/15/21 | | | | | | 40,047 | |
| 104,931 | | 7.50 | | | 7/15/22 | | | | | | 109,555 | |
| 181,368 | | 7.50 | | | 3/15/23 | | | | | | 191,725 | |
| 647,807 | | 7.50 | | | 4/15/23 | | | | | | 686,913 | |
| 79,687 | | 7.50 | | | 9/20/26 | | | | | | 88,052 | |
| 375,223 | | 7.50 | | | 3/15/28 | | | | | | 416,137 | |
| 444,705 | | 7.50 | | | 9/15/29 | | | | | | 498,464 | |
| 188,247 | | 7.50 | | | 12/15/29 | | | | | | 207,480 | |
| 264,480 | | 7.50 | | | 6/15/30 | | | | | | 297,744 | |
| 290,293 | | 7.50 | | | 8/15/30 | | | | | | 319,809 | |
| 514,402 | | 7.50 | | | 9/15/30 | | | | | | 583,027 | |
| 144,023 | | 7.50 | | | 11/15/30 | | | | | | 160,685 | |
| 3,391,300 | | 7.50 | | | 6/15/34 | | | | | | 3,869,052 | |
| 1,328,792 | | 7.50 | | | 8/25/42 | | | 1 | | | 1,529,500 | |
| 1,010,379 | | 7.50 | | | 9/25/43 | | | | | | 1,142,048 | |
| 52,063 | | 8.00 | | | 7/15/21 | | | | | | 52,857 | |
| 728,322 | | 8.00 | | | 2/15/23 | | | | | | 773,042 | |
| 54,147 | | 8.00 | | | 4/25/24 | | | | | | 57,812 | |
| 170,588 | | 8.00 | | | 2/15/27 | | | | | | 190,695 | |
| 190,174 | | 8.00 | | | 11/20/29 | | | | | | 215,170 | |
| 250,040 | | 8.00 | | | 1/15/30 | | | | | | 284,270 | |
| 13,057 | | 8.25 | | | 6/15/22 | | | | | | 13,914 | |
| 33,312 | | 8.30 | | | 11/15/20 | | | | | | 34,611 | |
| 12,367 | | 8.50 | | | 10/15/22 | | | | | | 12,684 | |
| 140,725 | | 8.50 | | | 3/15/25 | | | | | | 156,326 | |
| 36,825 | | 8.50 | | | 3/15/32 | | | | | | 40,826 | |
| 502 | | 9.15 | | | 10/15/20 | | | | | | 516 | |
| 5,135 | | 9.50 | | | 2/15/20 | | | | | | 5,158 | |
| | | | | | | | | | | | |
| | | | |
| | | | | | | | | | | 65,295,981 | |
| | | | | | | | | | | | |
|
Federal National Mortgage Association - 25.4% | |
| 886,988 | | 3.70 | | | 8/25/43 | | | 1 | | | 897,239 | |
| 372,149 | | 4.55 | | | 6/25/43 | | | | | | 381,549 | |
| 1,028,547 | | 5.00 | | | 6/25/43 | | | | | | 1,064,298 | |
| 835,311 | | 5.36 | | | 6/25/42 | | | | | | 885,314 | |
| 579,350 | | 5.50 | | | 9/25/33 | | | | | | 608,972 | |
| 4,376,580 | | 5.50 | | | 6/25/40 | | | | | | 4,794,070 | |
| 1,611,645 | | 5.59 | | | 12/25/53 | | | 1 | | | 1,754,275 | |
| 1,081,697 | | 5.81 | | | 8/25/43 | | | | | | 1,138,478 | |
| 1,158,140 | | 5.93 | | | 12/25/42 | | | 1 | | | 1,249,068 | |
| 2,470,496 | | 6.00 | | | 5/25/30 | | | | | | 2,682,922 | |
| 3,300,303 | | 6.00 | | | 5/25/36 | | | | | | 3,627,303 | |
| 2,823,384 | | 6.00 | | | 11/25/43 | | | | | | 3,047,618 | |
| 290,107 | | 6.00 | | | 8/25/45 | | | | | | 312,288 | |
| 3,687,466 | | 6.00 | | | 2/25/48 | | | | | | 4,155,294 | |
| 2,014,560 | | 6.05 | | | 2/25/44 | | | | | | 2,238,331 | |
| 1,295,503 | | 6.34 | | | 8/25/47 | | | 1 | | | 1,371,970 | |
| 339,587 | | 6.50 | | | 8/20/28 | | | | | | 355,905 | |
| 178,276 | | 6.50 | | | 3/25/32 | | | | | | 196,077 | |
| 436,031 | | 6.50 | | | 6/25/32 | | | | | | 481,942 | |
| 354,845 | | 6.50 | | | 7/25/36 | | | | | | 397,631 | |
| 146,702 | | 6.50 | | | 9/25/36 | | | | | | 157,528 | |
See accompanying notes to financial statements.
| | |
8 | | SIT MUTUAL FUNDS SEMI-ANNUAL REPORT |
| | | | | | | | | | | | |
| |
Principal
Amount ($) | | Coupon Rate (%) | | Maturity Date | | | | | Fair Value ($) | |
| |
| 316,905 | | 6.50 | | | 3/25/42 | | | | | | 346,541 | |
| 2,028,134 | | 6.50 | | | 5/25/42 | | | | | | 2,217,591 | |
| 6,044,929 | | 6.50 | | | 7/25/42 | | | | | | 6,637,016 | |
| 428,441 | | 6.50 | | | 9/25/42 | | | | | | 468,897 | |
| 920,703 | | 6.50 | | | 11/25/42 | | | | | | 1,002,280 | |
| 4,748,812 | | 6.50 | | | 7/25/44 | | | | | | 5,166,994 | |
| 572,553 | | 6.58 | | | 9/25/37 | | | 1 | | | 610,066 | |
| 1,056,187 | | 6.66 | | | 7/25/37 | | | 1 | | | 974,645 | |
| 401,202 | | 6.68 | | | 2/25/45 | | | 1 | | | 447,582 | |
| 4,387,447 | | 6.75 | | | 6/25/32 | | | | | | 4,881,139 | |
| 750,432 | | 6.75 | | | 4/25/37 | | | | | | 811,388 | |
| 111,257 | | 6.85 | | | 12/18/27 | | | | | | 120,839 | |
| 2,849 | | 7.00 | | | 1/25/21 | | | | | | 2,914 | |
| 11,802 | | 7.00 | | | 7/25/22 | | | | | | 12,278 | |
| 23,237 | | 7.00 | | | 11/25/22 | | | | | | 24,405 | |
| 43,477 | | 7.00 | | | 12/25/22 | | | | | | 46,086 | |
| 30,511 | | 7.00 | | | 6/25/23 | | | | | | 31,983 | |
| 842,261 | | 7.00 | | | 4/25/24 | | | | | | 886,170 | |
| 271,189 | | 7.00 | | | 9/18/27 | | | | | | 294,214 | |
| 4,990,785 | | 7.00 | | | 5/25/31 | | | | | | 5,558,830 | |
| 403,882 | | 7.00 | | | 9/25/40 | | | | | | 460,773 | |
| 614,547 | | 7.00 | | | 10/25/41 | | | | | | 674,436 | |
| 359,386 | | 7.00 | | | 11/25/41 | | | | | | 404,739 | |
| 2,259,252 | | 7.00 | | | 12/25/41 | | | | | | 2,532,034 | |
| 1,206,656 | | 7.00 | | | 1/25/42 | | | | | | 1,339,391 | |
| 1,291,493 | | 7.00 | | | 7/25/42 | | | | | | 1,438,050 | |
| 2,089,949 | | 7.00 | | | 10/25/42 | | | 1 | | | 2,236,571 | |
| 3,243,111 | | 7.00 | | | 2/25/44 | | | | | | 3,601,066 | |
| 154,739 | | 7.00 | | | 8/25/44 | | | | | | 173,100 | |
| 544,743 | | 7.04 | | | 8/25/37 | | | 1 | | | 562,422 | |
| 45,290 | | 7.50 | | | 8/20/27 | | | | | | 49,911 | |
| 306,113 | | 7.50 | | | 10/25/40 | | | | | | 337,127 | |
| 854,852 | | 7.50 | | | 11/25/40 | | | | | | 937,236 | |
| 330,755 | | 7.50 | | | 2/25/41 | | | | | | 371,325 | |
| 915,340 | | 7.50 | | | 6/19/41 | | | 1 | | | 1,013,536 | |
| 1,987,225 | | 7.50 | | | 7/25/41 | | | | | | 2,242,972 | |
| 1,352,883 | | 7.50 | | | 8/25/41 | | | | | | 1,525,902 | |
| 4,020,558 | | 7.50 | | | 10/25/41 | | | | | | 4,645,501 | |
| 327,161 | | 7.50 | | | 11/25/41 | | | | | | 370,129 | |
| 663,370 | | 7.50 | | | 1/25/42 | | | | | | 747,837 | |
| 3,192,205 | | 7.50 | | | 2/25/42 | | | 1 | | | 3,431,598 | |
| 4,422,919 | | 7.50 | | | 5/25/42 | | | | | | 5,052,801 | |
| 492,344 | | 7.50 | | | 6/25/42 | | | | | | 547,729 | |
| 3,974,755 | | 7.50 | | | 8/25/42 | | | 1 | | | 4,557,339 | |
| 1,465,907 | | 7.50 | | | 2/25/44 | | | | | | 1,665,993 | |
| 917,674 | | 7.50 | | | 3/25/44 | | | | | | 1,004,478 | |
| 1,024,185 | | 7.50 | | | 5/25/44 | | | | | | 1,170,153 | |
| 69,012 | | 7.50 | | | 10/25/44 | | | | | | 77,305 | |
| 6,310,039 | | 7.50 | | | 1/25/48 | | | | | | 7,173,323 | |
| 63,807 | | 8.00 | | | 7/25/22 | | | | | | 67,480 | |
| 74,463 | | 8.00 | | | 7/18/27 | | | | | | 82,344 | |
| 616,754 | | 8.00 | | | 7/25/44 | | | | | | 690,682 | |
| | | | | | | | | | | | |
| |
Principal
Amount ($) | | Coupon Rate (%) | | Maturity Date | | | | | Fair Value ($) | |
| |
| 871,248 | | 8.02 | | | 11/25/37 | | | 1 | | | 991,013 | |
| 467,963 | | 8.13 | | | 11/25/37 | | | 1 | | | 532,572 | |
| 65,401 | | 8.25 | | | 10/25/42 | | | 1 | | | 77,975 | |
| 18,567 | | 8.50 | | | 1/25/21 | | | | | | 18,812 | |
| 12,167 | | 8.50 | | | 9/25/21 | | | | | | 12,642 | |
| 18,272 | | 8.50 | | | 1/25/25 | | | | | | 19,903 | |
| 716,720 | | 8.50 | | | 6/25/30 | | | | | | 819,592 | |
| 5,016 | | 8.70 | | | 12/25/19 | | | | | | 5,118 | |
| 944 | | 8.75 | | | 9/25/20 | | | | | | 980 | |
| 8,054 | | 8.95 | | | 10/25/20 | | | | | | 8,372 | |
| 471 | | 9.00 | | | 7/25/19 | | | | | | 471 | |
| 3,731 | | 9.00 | | | 12/25/19 | | | | | | 3,812 | |
| 577 | | 9.00 | | | 3/25/20 | | | | | | 593 | |
| 19,621 | | 9.00 | | | 5/25/20 | | | | | | 20,276 | |
| 1,398 | | 9.00 | | | 6/25/20 | | | | | | 1,447 | |
| 1,155 | | 9.00 | | | 7/25/20 | | | | | | 1,193 | |
| 4,343 | | 9.00 | | | 9/25/20 | | | | | | 4,527 | |
| 4,908 | | 9.00 | | | 10/25/20 | | | | | | 5,098 | |
| 65,310 | | 9.00 | | | 1/25/21 | | | | | | 68,223 | |
| 12,790 | | 9.00 | | | 8/25/22 | | | | | | 13,867 | |
| 93,335 | | 9.00 | | | 11/25/28 | | | | | | 103,394 | |
| 505,029 | | 9.00 | | | 6/25/30 | | | | | | 595,718 | |
| 87,588 | | 9.00 | | | 10/25/30 | | | | | | 103,085 | |
| 1,855 | | 9.25 | | | 1/25/20 | | | | | | 1,880 | |
| 197,703 | | 9.34 | | | 6/25/32 | | | 1 | | | 220,017 | |
| 5,763 | | 9.50 | | | 3/25/20 | | | | | | 5,953 | |
| 826 | | 9.50 | | | 4/25/20 | | | | | | 850 | |
| 8,188 | | 9.50 | | | 11/25/20 | | | | | | 8,544 | |
| 108,743 | | 9.50 | | | 11/25/31 | | | | | | 123,980 | |
| 302,387 | | 9.50 | | | 12/25/41 | | | | | | 352,726 | |
| 13,348 | | 9.60 | | | 3/25/20 | | | | | | 13,733 | |
| 1,508,088 | | 10.63 | | | 9/25/42 | | | 1 | | | 1,874,266 | |
| 484,076 | | 11.10 | | | 6/25/44 | | | 1 | | | 538,727 | |
| 26,096 | | 22.45 | | | 3/25/39 | | | 1 | | | 35,066 | |
| | | | | | | | | | | | |
| | | | |
| | | | | | | | | | | 120,109,638 | |
| | | | | | | | | | | | |
|
Government National Mortgage Association - 12.4% | |
| 500,000 | | 5.50 | | | 9/20/39 | | | | | | 562,844 | |
| 3,660,361 | | 5.53 | | | 11/20/45 | | | 1 | | | 3,943,862 | |
| 7,772,801 | | 5.67 | | | 4/20/40 | | | 1 | | | 8,525,000 | |
| 1,140,481 | | 5.99 | | | 11/20/43 | | | 1 | | | 1,228,158 | |
| 263,926 | | 6.00 | | | 12/16/29 | | | | | | 283,585 | |
| 2,855,691 | | 6.00 | | | 11/20/33 | | | | | | 3,083,854 | |
| 483,524 | | 6.00 | | | 12/20/35 | | | | | | 533,843 | |
| 529,291 | | 6.00 | | | 3/20/42 | | | | | | 577,606 | |
| 1,064,989 | | 6.00 | | | 6/20/43 | | | | | | 1,145,544 | |
| 1,469,685 | | 6.00 | | | 2/20/46 | | | | | | 1,622,843 | |
| 2,928,049 | | 6.13 | | | 1/20/39 | | | 1 | | | 3,262,635 | |
| 1,420,088 | | 6.13 | | | 10/20/40 | | | 1 | | | 1,558,569 | |
| 2,603,749 | | 6.28 | | | 12/20/40 | | | 1 | | | 2,860,450 | |
| 3,800,555 | | 6.28 | | | 12/20/42 | | | 1 | | | 4,276,581 | |
| 645,795 | | 6.40 | | | 4/20/37 | | | 1 | | | 703,875 | |
| 385,902 | | 6.50 | | | 5/16/32 | | | | | | 426,413 | |
| 1,575,460 | | 6.50 | | | 7/20/32 | | | | | | 1,664,551 | |
See accompanying notes to financial statements.
SCHEDULE OF INVESTMENTS (Unaudited)
September 30, 2018
Sit U.S. Government Securities Fund (Continued)
| | | | | | | | | | | | |
| |
Principal Amount ($) | | Coupon Rate (%) | | Maturity Date | | | | | Fair Value ($) | |
| |
| | | | |
| 327,653 | | 6.50 | | | 9/16/38 | | | | | | 357,608 | |
| 3,456,532 | | 6.51 | | | 6/20/41 | | | 1 | | | 3,836,587 | |
| 1,133,915 | | 6.55 | | | 7/20/39 | | | 1 | | | 1,266,905 | |
| 1,792,387 | | 6.65 | | | 9/20/44 | | | 1 | | | 2,009,062 | |
| 646,389 | | 6.66 | | | 4/20/39 | | | 1 | | | 727,645 | |
| 169,766 | | 6.85 | | | 3/16/41 | | | 1 | | | 179,554 | |
| 1,681,399 | | 6.90 | | | 8/20/40 | | | 1 | | | 1,905,913 | |
| 1,157,598 | | 6.98 | | | 6/20/45 | | | 1 | | | 1,295,018 | |
| 769,593 | | 7.00 | | | 6/20/26 | | | | | | 769,701 | |
| 191,460 | | 7.00 | | | 9/16/33 | | | | | | 216,223 | |
| 671,731 | | 7.00 | | | 5/20/42 | | | | | | 748,928 | |
| 1,088,839 | | 7.14 | | | 12/20/33 | | | 1 | | | 1,221,123 | |
| 2,261,928 | | 7.29 | | | 8/20/38 | | | 1 | | | 2,523,517 | |
| 821,526 | | 7.49 | | | 7/16/24 | | | | | | 913,252 | |
| 2,968,469 | | 7.49 | | | 7/20/44 | | | 1 | | | 3,321,226 | |
| 65,928 | | 7.50 | | | 5/16/27 | | | | | | 65,861 | |
| 899,831 | | 9.00 | | | 3/16/30 | | | | | | 899,716 | |
| | | | | | | | | | | | |
| | | | |
| | | | | | | | | | | 58,518,052 | |
| | | | | | | | | | | | |
| |
Vendee Mortgage Trust - 2.3% | | | | |
| 2,739,664 | | 6.50 | | | 8/15/31 | | | | | | 3,027,588 | |
| 1,294,448 | | 6.50 | | | 10/15/31 | | | | | | 1,427,856 | |
| 1,106,025 | | 6.75 | | | 2/15/26 | | | | | | 1,201,851 | |
| 1,825,650 | | 6.78 | | | 3/15/25 | | | 1 | | | 2,007,416 | |
| 1,167,109 | | 7.00 | | | 3/15/28 | | | | | | 1,281,318 | |
| 212,976 | | 7.25 | | | 9/15/22 | | | | | | 217,461 | |
| 416,115 | | 7.25 | | | 9/15/25 | | | | | | 453,795 | |
| 327,579 | | 7.75 | | | 5/15/22 | | | | | | 344,712 | |
| 568,832 | | 7.75 | | | 9/15/24 | | | | | | 611,209 | |
| 198,163 | | 8.00 | | | 2/15/25 | | | | | | 219,108 | |
| 120,425 | | 8.29 | | | 12/15/26 | | | | | | 133,285 | |
| | | | | | | | | | | | |
| | | | |
| | | | | | | | | | | 10,925,599 | |
| | | | | | | | | | | | |
| | |
Total Collateralized Mortgage Obligations
(cost: $259,394,004) | | | | | | 254,849,270 | |
| | | | | | | | | | | | |
| | | |
Asset-Backed Securities - 2.0% | | | | | | | | | | |
| | |
Federal Home Loan Mortgage Corporation - 0.3% | | | | | | | |
| 800 | | 6.09 | | | 9/25/29 | | | 1 | | | 777 | |
| 1,415,633 | | 7.16 | | | 7/25/29 | | | | | | 1,527,187 | |
| | | | | | | | | | | | |
| | | | |
| | | | | | | | | | | 1,527,964 | |
| | | | | | | | | | | | |
| | |
Federal National Mortgage Association - 0.5% | | | | | | | |
| 18,200 | | 1 Mo. Libor + 0.34, 2.56% | | | 11/25/32 | | | 1 | | | 17,821 | |
| 538,984 | | 4.68 | | | 9/26/33 | | | 14 | | | 584,791 | |
| 177,883 | | 5.00 | | | 10/25/33 | | | 14 | | | 178,946 | |
| 1,214,951 | | 5.75 | | | 2/25/33 | | | 14 | | | 1,241,154 | |
| 4,605 | | 6.47 | | | 10/25/31 | | | 14 | | | 4,756 | |
| 23,242 | | 6.50 | | | 5/25/32 | | | 14 | | | 23,463 | |
| 267,090 | | 6.59 | | | 10/25/31 | | | 14 | | | 282,206 | |
| 1,582 | | 6.83 | | | 7/25/31 | | | 14 | | | 1,562 | |
| 9,114 | | 7.80 | | | 6/25/26 | | | 1 | | | 10,041 | |
| | | | | | | | | | | | |
| | | | |
| | | | | | | | | | | 2,344,740 | |
| | | | | | | | | | | | |
| | | | | | | | | | | | |
| |
Principal Amount ($) | | Coupon Rate (%) | | Maturity Date | | | | | Fair Value ($) | |
| |
| | |
Small Business Administration - 1.2% | | | | | | | |
| 2,319,629 | | 5.87 | | | 7/1/28 | | | | | | 2,431,700 | |
| 1,944,504 | | 6.02 | | | 8/1/28 | | | | | | 2,053,010 | |
| 353,275 | | 7.13 | | | 10/1/20 | | | | | | 357,624 | |
| 281,848 | | 7.33 | | | 8/1/20 | | | | | | 286,562 | |
| 255,255 | | 8.03 | | | 5/1/20 | | | | | | 259,791 | |
| | | | | | | | | | | | |
| | | | |
| | | | | | | | | | | 5,388,687 | |
| | | | | | | | | | | | |
| | | |
Total Asset-Backed Securities
(cost: $9,337,995) | | | | | | | | | 9,261,391 | |
| | | | | | | | | | | | |
| | | |
Total Investments in Securities - 98.4%
(cost: $473,209,190) | | | | | | | | | 465,155,513 | |
| | | | | | | | | | | | |
Call Options Written 10, 19 - (0.1%)
(premiums received: $402,038) | | | | | | | | | (255,859 | ) |
| |
Other Assets and Liabilities, net - 1.7% | | | 8,045,824 | |
| | | | | | | | | | | | |
| |
Total Net Assets - 100.0% | | $ | 472,945,478 | |
| | | | | | | | | | | | |
| | | | |
| | | | | | | | | | | | | |
| 1 | | Variable rate security. Rate disclosed is as of September 30, 2018. Certain variable rate securities are not based on a published reference rate and spread but are determined by the issuer or agent and are based on current market conditions, or, for mortgage-backed securities, are impacted by the individual mortgages which are paying off over time. These securities do not indicate a reference rate and spread in their descriptions. |
| 6 | | Zero coupon or convertible capital appreciation bond, for which the rate disclosed is either the effective yield on purchase date or the coupon rate to be paid upon conversion to coupon paying, respectively. |
| 10 | | The amount of $6,000,000 in cash was segregated with the broker to cover margin requirements for derivative transactions as of September 30, 2018. |
| 14 | | Step Coupon: A bond that pays an initial coupon rate for the first period and then a higher coupon rate for the following periods. Rate disclosed is as of September 30, 2018. |
Numeric footnotes not disclosed are not applicable to this Schedule of Investments.
See accompanying notes to financial statements.
| | |
10 | | SIT MUTUAL FUNDS SEMI-ANNUAL REPORT |
| (19) | Options outstanding as of September 30, 2018 were as follows: |
| | | | | | | | | | | | | | | | | | | | | | | | | | | | |
| | | | | | Exercise | | | Expiration | | | | | | Notional | | | Cost/ | | | | |
| Description | | Contracts | | | Price ($) | | | Date | | | Counterparty | | | Amount ($) | | | Premiums ($) | | | Value ($) | |
| |
| | | | | |
Call Options Written - U.S. Treasury Futures: | | | | | | | | | | | | | | | | | | | | | |
5-Year | | | (750) | | | | 112.75 | | | | November 2018 | | | | Societe Generale | | | | 84,562,500 | | | | (196,912 | ) | | | (99,609 | ) |
2-Year | | | (1,000) | | | | 105.38 | | | | November 2018 | | | | Societe Generale | | | | 210,750,000 | | | | (205,126 | ) | | | (156,250 | ) |
| | | | | | | | | | | | | | | | | | | | | | | | |
| | | | | | | |
| | | | | | | | | | | | | | | | | | | | | | | (402,038 | ) | | | (255,859 | ) |
A summary of the levels for the Fund’s investments as of September 30, 2018 is as follows (see Note 2 - significant accounting policies in the notes to financial statements):
| | | | | | | | | | | | | | | | |
| | | Investment in Securities | |
| | | Level 1 | | | Level 2 | | | Level 3 | | | | |
| | | Quoted
Price ($) | | | Other significant
observable inputs ($) | | | Significant
unobservable inputs ($) | | | Total ($) | |
| | | | |
Assets | | | | | | | | | | | | | | | | |
Mortgage Pass-Through Securities | | | — | | | | 193,455,171 | | | | — | | | | 193,455,171 | |
U.S. Treasury / Federal Agency Securities | | | — | | | | 7,589,681 | | | | — | | | | 7,589,681 | |
Collateralized Mortgage Obligations | | | — | | | | 254,849,270 | | | | — | | | | 254,849,270 | |
Asset-Backed Securities | | | — | | | | 9,261,391 | | | | — | | | | 9,261,391 | |
| | | | |
| | | | |
| | | — | | | | 465,155,513 | | | | — | | | | 465,155,513 | |
| | | | |
| | | | |
Liabilities | | | | | | | | | | | | | | | | |
Call Options Written | | | (255,859 | ) | | | — | | | | — | | | | (255,859) | |
| | | | |
For the reporting period, there were no transfers between levels 1, 2 and 3.
See accompanying notes to financial statements.
OBJECTIVE & STRATEGY
The objective of the Quality Income Fund is to provide high current income and safety of principal, which it seeks to attain by investing at least 80% of its assets in debt securities issued by the U.S. government and its agencies, debt securities issued by corporations and, mortgage and other asset-backed securities. The Fund invests at least 50% of its assets in U.S. government debt securities, which are securities issued, guaranteed or insured by the U.S. government, its agencies or instrumentalities.
The Sit Quality Income Fund provided a return of +0.82% during the 6-month period ending September 30, 2018, compared to the return of the Bloomberg Barclays 1-3 Year Government/Credit Bond Index of +0.61%. The Fund’s 30-day SEC yield was 2.33% and its 12-month distribution rate was 1.61%.
The primary goal of the Fund is to maintain a high credit quality portfolio with stable principal values, while generating a relatively high level of income. During the period, the Fund benefited from the income advantage produced by its holdings in non-agency residential mortgage, corporate, and taxable municipal securities. Non-agency residential mortgages outperformed as higher home prices increased demand for these securities. Taxable municipal securities underperformed as the income advantage was not enough to offset the price weakness due to the securities’ longer duration. Corporate securities outperformed as the Fund invests in several floating rate securities which saw increases in coupon payments. The Fund reduces interest rate risk by using futures and options on Treasury securities. The use of futures and options was successful in providing stability to the Fund’s net asset value and contributed positively to the return.
The Federal Reserve hiked the Fed Funds rate two times over the 6-month period as it continued to normalize monetary policy. The Federal Reserve’s balance sheet has been declining as it has allowed up to $40 billion to roll off each month in the third quarter. Treasury yields rose across the curve with short-term rates outpacing long term rates. We expect this trend to continue as the Federal Reserve continues to reduce the balance sheet and increase the Fed Funds rate to a more neutral rate, which is anticipated to be around 3.00%. We expect the Federal Reserve to maintain a methodical approach for normalizing its balance sheet and gradually raising interest rates over time.
HYPOTHETICAL GROWTH OF $10,000

The chart above illustrates the total value of a hypothetical $10,000 investment in the Fund over the past 10 years (or for the life of the Fund if shorter) as compared to the performance of the Bloomberg Barclays 1-3 Year Government/Credit Index. Past performance does not guarantee future results. Returns include the reinvestment of distributions. The chart does not reflect the deduction of taxes that a shareholder would pay on Fund distributions or the redemption of Fund shares.
1 The Bloomberg Barclays 1-3 Year Government/Credit Index is an unmanaged index of Treasury or government agency securities and investment grade corporate debt securities with maturities of one to three years. The returns include the reinvestment of income and do not include any transaction costs, management fees or other costs. It is not possible to invest directly in an index. This is the Fund’s primary index.
We have positioned the Fund defensively, in both credit quality and interest rate sensitivity to maximize return potential while preserving principal. We focus on a mix of Treasury, agency and credit sectors that provide relatively high levels of income and stable prices.
| | |
Michael C. Brilley | | Mark H. Book, CFA |
Bryce A. Doty, CFA | | Chris M. Rasmussen, CFA |
Senior Portfolio Managers | | Portfolio Managers |
| | |
12 | | SIT MUTUAL FUNDS SEMI-ANNUAL REPORT |
COMPARATIVE RATES OF RETURNS
as of September 30, 2018
| | | | | | | | |
| | | Sit
Quality
Income Fund | | | Bloomberg
Barclays
1-3 Year
Government/Credit
Index1 | | Lipper
Short
Investment
Grade Bond
Index2 |
Six Months | | | 0.82% | | | 0.61% | | n/a |
One Year | | | 0.90 | | | 0.20 | | 0.77% |
Five Years | | | 0.65 | | | 0.83 | | 1.29 |
Since Inception
(12/31/12) | | | 0.63 | | | 0.80 | | 1.17 |
Performance figures are historical and do not guarantee future results. Investment returns and principal value will vary, and you may have a gain or loss when you sell shares. Current performance may be lower or higher than the performance data quoted. Contact the Fund for performance data current to the most recent month-end. Returns include changes in share price as well as reinvestment of all dividends and capital gains and all fee waivers. Without the fee waivers total return and yield figures would have been lower. Returns do not reflect the deduction of taxes that a shareholder would pay on Fund distributions or the redemption of Fund shares. Management fees and administrative expenses are included in the Fund’s performance. Returns for the periods greater than one year are compounded average annual rates of return.
1 The Bloomberg Barclays 1-3 Year Government/Credit Index is an unmanaged index of Treasury or government agency securities and investment grade corporate debt securities with maturities of one to three years. The returns include the reinvestment of income and do not include any transaction costs, management fees or other costs. It is not possible to invest directly in an index.
2 The Lipper returns are obtained from Lipper Analytical Services, Inc., a large independent evaluator of mutual funds.
FUND DIVERSIFICATION
| | | | |
| |
U.S. Treasury/Federal Agency Securities | | | 41.0 | % |
Mortgage Pass-Through (Agency) | | | 14.8 | |
Asset-Backed (Non-Agency) | | | 14.0 | |
Corporate Bonds | | | 13.7 | |
Taxable Municipal Bonds | | | 7.3 | |
Collateralized Mortgage Obligations (Non-Agency) | | | 7.0 | |
Other Net Assets | | | 2.2 | |
Based on total net assets as of September 30, 2018. Subject to change.
PORTFOLIO SUMMARY
| | |
Net Asset Value 9/30/18: | | $9.77 Per Share |
Net Asset Value 3/31/18: | | $9.78 Per Share |
Total Net Assets: | | $81.3 Million |
Average Maturity: | | 9.6 Years |
Effective Duration3: | | 0.9 Years |
3 Duration is a measure of estimated price sensitivity relative to changes in interest rates. Portfolios with longer durations are typically more sensitive to changes in interest rates. For example, if interest rates rise by 1%, the fair value of a security with an effective duration of 5 years would decrease by 5%, with all other factors being constant. The correlation between duration and price sensitivity is greater for securities rated investment-grade than it is for securities rated below investment-grade. Duration estimates are based on assumptions by the Adviser and are subject to a number of limitations. Effective duration is calculated based on historical price changes of securities held by the Fund, and therefore is a more accurate estimate of price sensitivity provided interest rates remain within their historical range.
QUALITY RATINGS (% of Total Net Assets)
|
| Lower of Moody’s, S&P, Fitch or Duff & Phelps ratings used. |
SCHEDULE OF INVESTMENTS (Unaudited)
September 30, 2018
Sit Quality Income Fund
| | | | | | | | | | | | | | | | | | | | | | | | | |
| | | | | |
| Name of Issuer | | Principal Amount ($) | | Coupon Rate (%) | | Maturity Date | | Fair Value ($) | | |
| | | | | |
Asset-Backed Securities - 15.9% | | | | | | | | | | | | | | | | | | | | | | |
Agency - 1.9% | | | | | | | | | | | | | | | | | | | | | | |
| FNMA Grantor Trust, Series 2004-T5, Class A11 1 | | | | 761,784 | | | 2.56 | | | | 5/28/35 | | | | | 743,527 | | | | | | |
| FNMA REMICS, Series 2001-W2, Class AS5 14 | | | | 5,703 | | | 6.47 | | | | 10/25/31 | | | | | 5,890 | | | | | | |
| Small Business Administration, Series 2000-20D | | | | 57,602 | | | 7.47 | | | | 4/1/20 | | | | | 58,430 | | | | | | |
| Small Business Administration, Series 2006-20D, Class 1 | | | | 332,442 | | | 5.64 | | | | 4/1/26 | | | | | 342,854 | | | | | | |
| Small Business Administration, Series 2007-20B, Class 1 | | | | 173,666 | | | 5.49 | | | | 2/1/27 | | | | | 179,552 | | | | | | |
| Small Business Administration, Series 2007-20J, Class 1 | | | | 220,159 | | | 5.57 | | | | 10/1/27 | | | | | 227,301 | | | | | | |
| | | | | | | | | | | | | | | | | | | | | | |
| | | | | |
| | | | | | | | | | | | | | | | 1,557,554 | | | | | | |
| | | | | | | | | | | | | | | | | | | | | | |
Non-Agency - 14.0% | | | | | | | | | | | |
| Aegis Asset Backed Securities Corp., Series 2003-2, Class M1, 1 Mo. Libor + 1.13% 1 | | | | 747,206 | | | 3.34 | | | | 11/25/33 | | | | | 744,874 | | | | | | |
| Bayview Opportunity Master Fund, Series 2017-SPL5, Class A 1, 4 | | | | 473,486 | | | 3.50 | | | | 6/28/57 | | | | | 470,523 | | | | | | |
| Bear Stearns Asset Backed Securities I Trust, Series 2005-AQ2, Class A3, 1 Mo. Libor + 0.36% 1 | | | | 172,521 | | | 2.58 | | | | 9/25/35 | | | | | 172,578 | | | | | | |
| Bear Stearns Asset Backed Securities Trust, Series 2005-SD2, Class 1A2, 1 Mo. Libor + 0.47% 1 | | | | 1,313 | | | 2.69 | | | | 3/25/35 | | | | | 1,313 | | | | | | |
| Centex Home Equity Loan Trust, Series 2004-A, Class AF4 14 | | | | 102,684 | | | 5.01 | | | | 8/25/32 | | | | | 103,970 | | | | | | |
| Centex Home Equity Loan Trust, Series 2004-A, Class AF5 14 | | | | 310,000 | | | 5.43 | | | | 1/25/34 | | | | | 315,991 | | | | | | |
| Centex Home Equity Loan Trust, Series 2004-D, Class AF6 14 | | | | 13,752 | | | 5.17 | | | | 9/25/34 | | | | | 13,916 | | | | | | |
| CIT Home Equity Loan Trust, Series 2003-1, Class A6 14 | | | | 9,335 | | | 4.56 | | | | 10/20/32 | | | | | 9,404 | | | | | | |
| Countrywide Asset-Backed Certificates, Series 2004-S1, Class A3 14 | | | | 182,244 | | | 5.12 | | | | 2/25/35 | | | | | 183,122 | | | | | | |
| Credit Acceptance Auto Loan Trust, Series 2018-2A, Class B 4 | | | | 500,000 | | | 3.94 | | | | 7/15/27 | | | | | 498,868 | | | | | | |
| Credit Suisse First Boston Mortgage Securities Corp. Series 2005-AGE1, Class M3, 1 Mo. Libor + 0.65% 1 | | | | 257,774 | | | 2.87 | | | | 2/25/32 | | | | | 256,680 | | | | | | |
| Discover Card Execution Note Trust, Series 2017-A5, Class A5, 1 Mo. Libor + 0.60% 1 | | | | 700,000 | | | 2.76 | | | | 12/15/26 | | | | | 705,786 | | | | | | |
| Fairway Outdoor Funding, LLC, Series 2012-1A, Class A2 4 | | | | 498,795 | | | 4.21 | | | | 10/15/42 | | | | | 499,598 | | | | | | |
| First Alliance Mortgage Loan Trust, Series 1997-4, Class A2 14 | | | | 292,605 | | | 7.63 | | | | 4/20/29 | | | | | 295,185 | | | | | | |
| GSAMP Trust, Series 2004-FM1, Class M1, 1 Mo. Libor + 0.98% 1 | | | | 213,942 | | | 3.19 | | | | 11/25/33 | | | | | 211,445 | | | | | | |
| Hertz Vehicle Financing II LP, Series 2018-1A, Class A 4 | | | | 750,000 | | | 3.29 | | | | 2/25/24 | | | | | 729,431 | | | | | | |
| IrwinWhole Loan Home Equity Trust, Series 2003-B, Class M, 1 Mo. Libor + 2.00% 1 | | | | 63,235 | | | 4.22 | | | | 11/25/32 | | | | | 63,266 | | | | | | |
| Irwin Whole Loan Home Equity Trust, Series 2005-A, Class M1, 1 Mo. Libor + 0.86% 1 | | | | 667,868 | | | 3.07 | | | | 6/25/34 | | | | | 664,998 | | | | | | |
| Mill City Mortgage Loan Trust, Series 2017-3, Class A1 1, 4 | | | | 404,468 | | | 2.75 | | | | 1/25/61 | | | | | 395,048 | | | | | | |
| New Century Home Equity Loan Trust, Series 2003-5, Class AI7 1 | | | | 5,851 | | | 5.10 | | | | 11/25/33 | | | | | 5,971 | | | | | | |
| New Residential Mortgage Loan Trust, Series 2017-6A, Class A1 1, 4 | | | | 241,594 | | | 4.00 | | | | 8/27/57 | | | | | 242,327 | | | | | | |
| New Residential Mortgage Trust, 2018-1A, Class A1A 1, 4 | | | | 482,622 | | | 4.00 | | | | 12/25/57 | | | | | 484,735 | | | | | | |
| NovaStar Mortgage Funding Trust, Series 2004-2, Class M2, 1 Mo. Libor + 1.02% 1 | | | | 44,812 | | | 3.24 | | | | 9/25/34 | | | | | 44,840 | | | | | | |
| OSCAR US Funding Trust VI, LLC, Series 2017-1A, Class A3 4 | | | | 1,000,000 | | | 2.82 | | | | 6/10/21 | | | | | 996,140 | | | | | | |
| OSCAR US Funding Trust VI, LLC, Series 2017-1A, Class A4 4 | | | | 940,000 | | | 3.30 | | | | 5/10/24 | | | | | 935,375 | | | | | | |
| OSCAR US Funding Trust VII, LLC, Series 2017-2A, Class A3 4 | | | | 780,000 | | | 2.45 | | | | 12/10/21 | | | | | 768,834 | | | | | | |
| OSCAR US Funding Trust VIII, LLC, Series 2018-1A, Class A2B, 1 Mo. Libor + 0.49% 1, 4 | | | | 950,370 | | | 2.62 | | | | 4/12/21 | | | | | 950,807 | | | | | | |
| OSCAR US Funding Trust, Series 2014-1A, Class A4 4 | | | | 98,538 | | | 2.55 | | | | 12/15/21 | | | | | 98,348 | | | | | | |
| RAAC Trust, Series 2006-RP2, Class A, 1 Mo. Libor + 0.25% 1, 4 | | | | 13,349 | | | 2.47 | | | | 2/25/37 | | | | | 13,344 | | | | | | |
| World Omni Auto Receivables Trust, Series 2018-A, Class B | | | | 500,000 | | | 2.89 | | | | 4/15/25 | | | | | 492,357 | | | | | | |
| | | | | | | | | | | | | | | | | | | | | | |
| | | | | |
| | | | | | | | | | | | | | | | 11,369,074 | | | | | | |
| | | | | | | | | | | | | | | | | | | | | | |
| | | | |
Total Asset-Backed Securities
(cost: $13,030,999) | | | | | | | | | | | | 12,926,628 | | | | | | |
| | | | | | | | | | | | | | | | | | | | | | |
Collateralized Mortgage Obligations - 31.7% | | | | | | | | | | | | | | | | | | |
Agency - 24.7% | | | | | | | | | | | | | | | | | | | | | | |
| FHLMC Multifamily Structured Pass Through Certificates, Series K007, Class A2 | | | | 98,503 | | | 4.22 | | | | 3/25/20 | | | | | 99,823 | | | | | | |
| FHLMC Multifamily Structured Pass Through Certificates, Series K716, Class A2 | | | | 2,000,000 | | | 3.13 | | | | 6/25/21 | | | | | 1,996,855 | | | | | | |
| FHLMC Multifamily Structured Pass Through Certificates, Series K727, Class A2 | | | | 293,000 | | | 2.95 | | | | 7/25/24 | | | | | 287,558 | | | | | | |
| FHLMC Multifamily Structured Pass Through Certificates, Series K728, Class A2 1 | | | | 2,000,000 | | | 3.06 | | | | 8/25/24 | | | | | 1,973,551 | | | | | | |
| FHLMC Multifamily Structured Pass Through Certificates, Series K729, Class A2 | | | | 1,500,000 | | | 3.14 | | | | 10/25/24 | | | | | 1,483,751 | | | | | | |
See accompanying notes to financial statements.
| | |
14 | | SIT MUTUAL FUNDS SEMI-ANNUAL REPORT |
| | | | | | | | | | | | | | |
| | | | |
| Name of Issuer | | Principal Amount ($) | | | Coupon Rate (%) | | Maturity Date | | | Fair Value ($) | |
| FHLMC Multifamily Structured Pass Through Certificates, Series K730, Class A2 | | | 1,500,000 | | | 3.59 | | | 1/25/25 | | | | 1,519,032 | |
| FHLMC REMICS, Series 2528, Class KM | | | 48,870 | | | 5.50 | | | 11/15/22 | | | | 50,796 | |
| FHLMC REMICS, Series 3104, Class BY | | | 154,567 | | | 5.50 | | | 1/15/26 | | | | 163,379 | |
| FHLMC REMICS, Series 3614, Class QA | | | 156,411 | | | 4.00 | | | 5/15/24 | | | | 156,823 | |
| FHLMC REMICS, Series 3806, Class JA | | | 405,230 | | | 3.50 | | | 2/15/26 | | | | 405,520 | |
| FHLMC REMICS, Series 4759, Class NA | | | 963,251 | | | 3.00 | | | 8/15/44 | | | | 945,378 | |
| FHLMC REMICS, Series 4776, Class QG | | | 973,380 | | | 3.00 | | | 9/15/42 | | | | 955,779 | |
| FNMA ACES, Series 2009-M1, Class A2 | | | 265,429 | | | 4.29 | | | 7/25/19 | | �� | | 265,974 | |
| FNMA ACES, Series 2013-M14, Class A2 1 | | | 333,029 | | | 3.33 | | | 10/25/23 | | | | 334,573 | |
| FNMA ACES, Series 2013-M9, Class A2 1 | | | 1,222,131 | | | 2.39 | | | 1/25/23 | | | | 1,179,956 | |
| FNMA Grantor Trust, Series 2004-T1, Class 2A 1 | | | 637,225 | | | 3.70 | | | 8/25/43 | | | | 644,590 | |
| FNMA REMICS, Series 2003-52, Class NA | | | 61,917 | | | 4.00 | | | 6/25/23 | | | | 62,624 | |
| FNMA REMICS, Series 2005-19, Class PA | | | 55,414 | | | 5.50 | | | 7/25/34 | | | | 56,351 | |
| FNMA REMICS, Series 2005-68, Class PC | | | 12,462 | | | 5.50 | | | 7/25/35 | | | | 12,664 | |
| FNMA REMICS, Series 2008-65, Class CD | | | 35,215 | | | 4.50 | | | 8/25/23 | | | | 35,422 | |
| FNMA REMICS, Series 2009-13, Class NX | | | 160,250 | | | 4.50 | | | 3/25/24 | | | | 161,276 | |
| FNMA REMICS, Series 2009-71, Class MB | | | 57,551 | | | 4.50 | | | 9/25/24 | | | | 59,271 | |
| FNMA REMICS, Series 2009-88, Class DA | | | 10,365 | | | 4.50 | | | 10/25/20 | | | | 10,395 | |
| FNMA REMICS, Series 2011-16, Class GE | | | 2,272 | | | 2.75 | | | 3/25/26 | | | | 2,266 | |
| FNMA REMICS, Series 2011-46, Class A | | | 8,178 | | | 3.00 | | | 5/25/24 | | | | 8,169 | |
| FNMA REMICS, Series 2012-19, Class GH | | | 40,550 | | | 3.00 | | | 11/25/30 | | | | 40,414 | |
| FNMA REMICS, Series 2013-74, Class AD | | | 227,949 | | | 2.00 | | | 7/25/23 | | | | 223,573 | |
| FNMA REMICS, Series 2017-97, Class DP | | | 1,124,443 | | | 3.50 | | | 10/25/46 | | | | 1,113,156 | |
| FNMA REMICS, Series 2018-1, Class TE | | | 774,149 | | | 3.50 | | | 3/25/44 | | | | 771,084 | |
| FNMA REMICS, Series 2018-25, Class AG | | | 809,699 | | | 3.50 | | | 4/25/47 | | | | 806,342 | |
| FREMF Multifamily Aggregation Risk Transfer Trust, Series 2017-KT01, Class A, 1 Mo. Libor + 0.32% 1 | | | 1,000,000 | | | 2.53 | | | 2/25/20 | | | | 1,001,400 | |
| FRESB Mortgage Trust, Series 2018-SB45, Class A5H, 1 Mo. Libor + 2.96% 1 | | | 995,293 | | | 2.96 | | | 11/25/37 | | | | 983,394 | |
| FRESB Mortgage Trust, Series 2018-SB46, Class A5H, 1 Mo. Libor + 2.89% 1 | | | 895,344 | | | 2.89 | | | 12/25/37 | | | | 880,980 | |
| GNMA, Series 2011-29, Class JA | | | 26,314 | | | 4.50 | | | 4/20/40 | | | | 26,469 | |
| NCUA Guaranteed Notes Trust, Series 2010-R1, Class 1A, 1 Mo. Libor + 0.45% 1 | | | 215,216 | | | 2.53 | | | 10/7/20 | | | | 215,881 | |
| NCUA Guaranteed Notes Trust, Series 2010-R3, Class 2A, 1 Mo. Libor + 0.56% 1 | | | 1,033,363 | | | 2.68 | | | 12/8/20 | | | | 1,038,462 | |
| Vendee Mortgage Trust, Series 1993-1, Class ZB | | | 93,161 | | | 7.25 | | | 2/15/23 | | | | 99,583 | |
| | | | | | | | | | | | | | |
| | | | | | | | | | | | | 20,072,514 | |
| | | | | | | | | | | | | | |
Non-Agency - 7.0% | | | | | |
| COLT Mortgage Loan Trust, Series 2017-1, Class A1 1, 4 | | | 201,263 | | | 2.61 | | | 5/27/47 | | | | 199,714 | |
| COLT Mortgage Loan Trust, Series 2017-2, Class A2A 1, 4 | | | 270,248 | | | 2.57 | | | 10/25/47 | | | | 268,532 | |
| COMM Mortgage Trust, Series 2014-CR21, Class A1 | | | 168,664 | | | 1.49 | | | 12/10/47 | | | | 167,746 | |
| GSR Mortgage Loan Trust, Series 2005-5F, Class 8A1, 1 Mo. Libor + 0.50% 1 | | | 47,340 | | | 2.72 | | | 6/25/35 | | | | 45,210 | |
| MASTR Adjustable Rate Mortgages Trust, Series 2004-13, Class 3A1 1 | | | 251,393 | | | 4.42 | | | 11/21/34 | | | | 258,312 | |
| MASTR Alternative Loan Trust, Series 2003-4, Class 2A1 | | | 76,266 | | | 6.25 | | | 6/25/33 | | | | 79,228 | |
| MASTR Alternative Loan Trust, Series 2003-5, Class 4A1 | | | 114,832 | | | 5.50 | | | 7/25/33 | | | | 119,813 | |
| MASTR Alternative Loan Trust, Series 2003-8, Class 3A1 | | | 119,960 | | | 5.50 | | | 12/25/33 | | | | 123,496 | |
| MASTR Asset Securitization Trust, Series 2005-2, Class 1A3 | | | 46,000 | | | 5.35 | | | 11/25/35 | | | | 47,962 | |
| New Residential Mortgage Loan Trust, Series 2017-2A, Class A4 1, 4 | | | 681,787 | | | 4.00 | | | 3/25/57 | | | | 681,227 | |
| New Residential Mortgage Loan Trust, Series 2017-3A, Class A1 1, 4 | | | 743,849 | | | 4.00 | | | 4/25/57 | | | | 747,011 | |
| New Residential Mortgage Loan Trust, Series 2017-5A, Class A1, 1 Mo. Libor + 1.50% 1, 4 | | | 356,799 | | | 3.72 | | | 6/25/57 | | | | 365,885 | |
| Prime Mortgage Trust, Series 2004-CL1, Class 1A1 | | | 80,756 | | | 6.00 | | | 2/25/34 | | | | 85,107 | |
| RAAC Trust, Series 2004-SP3, Class AI5 1 | | | 1,392 | | | 4.89 | | | 12/25/32 | | | | 1,409 | |
| Sequoia Mortgage Trust, Series 2012-1, Class 2A1 1 | | | 49,895 | | | 3.47 | | | 1/25/42 | | | | 48,972 | |
| Sequoia Mortgage Trust, Series 2012-1, Class B1 1 | | | 473,601 | | | 4.28 | | | 1/25/42 | | | | 472,970 | |
| Sequoia Mortgage Trust, Series 2012-2, Class B1 1 | | | 686,649 | | | 4.23 | | | 4/25/42 | | | | 691,775 | |
See accompanying notes to financial statements.
SCHEDULE OF INVESTMENTS (Unaudited)
September 30, 2018
Sit Quality Income Fund (Continued)
| | | | | | | | | | | | | | | | | | | |
| | | | |
| Name of Issuer | | Principal
Amount ($) | | Coupon Rate (%) | | Maturity Date | | Fair Value ($) |
| | | | | |
| Sequoia Mortgage Trust, Series 2017-4, Class A4 1, 4 | | 402,699 | | | | 3.50 | | | | | 7/25/47 | | | | | 397,807 | | | |
| Sequoia Mortgage Trust, Series 2018-3, Class A4 1, 4 | | 704,661 | | | | 3.50 | | | | | 3/25/48 | | | | | 693,202 | | | |
| Structured Asset Securities, Corp. Mtg Pass-Through Certificates, Series 2003-22A, Class 3A 1 | | 104,978 | | | | 4.42 | | | | | 6/25/33 | | | | | 106,361 | | | |
| WaMu Mortgage Pass Through Certificates, Series 2002-AR2 Class A, US FED + 1.25% 1 | | 79,781 | | | | 2.27 | | | | | 2/27/34 | | | | | 78,752 | | | |
| WaMu Mortgage Pass Through Certificates, Series 2004-CB2, Class 7A | | 7,245 | | | | 5.50 | | | | | 8/25/19 | | | | | 7,259 | | | |
| | | | | | | | | | | | | | | | | | | |
| | | | | |
| | | | | | | | | | | | | | | | 5,687,750 | | | |
| | | | | | | | | | | | | | | | | | | |
| | | | | |
Total Collateralized Mortgage Obligations
(cost: $26,096,181) | | | | | | | | | | | | | | | | 25,760,264 | | | |
| | | | | | | | | | | | | | | | | | | |
| | | | | |
Corporate Bonds - 13.7% | | | | | | | | | | | | | | | | | | | |
| Anheuser-Busch InBev Finance, Inc. | | 750,000 | | | | 3.70 | | | | | 2/1/24 | | | | | 747,735 | | | |
| Assured Guaranty US Holdings, Inc. | | 250,000 | | | | 5.00 | | | | | 7/1/24 | | | | | 257,741 | | | |
| Athene Global Funding, 3 Mo. Libor + 1.23% 1, 4 | | 500,000 | | | | 3.63 | | | | | 7/1/22 | | | | | 509,068 | | | |
| Bank of America Corp., 3 Mo. Libor + 0.79% 1 | | 750,000 | | | | 3.11 | | | | | 3/5/24 | | | | | 749,508 | | | |
| Caterpillar Financial Services Corp., 3 Mo. Libor + 0.28% 1 | | 400,000 | | | | 2.60 | | | | | 9/7/21 | | | | | 400,342 | | | |
| Citigroup, Inc., 3 Mo. Libor + 1.02% 1 | | 750,000 | | | | 3.34 | | | | | 6/1/24 | | | | | 753,601 | | | |
| Doric Nimrod Air Finance Alpha 2012-1 Trust 4 | | 332,244 | | | | 5.13 | | | | | 11/30/22 | | | | | 337,235 | | | |
| Equinor ASA | | 800,000 | | | | 2.45 | | | | | 1/17/23 | | | | | 770,638 | | | |
| Goldman Sachs Group, Inc., 3 Mo. Libor + 1.00% 1 | | 150,000 | | | | 3.34 | | | | | 7/24/23 | | | | | 151,590 | | | |
| Hawaiian Airlines Pass Through Certificates, Series 2013-1, Class A | | 748,932 | | | | 3.90 | | | | | 1/15/26 | | | | | 735,825 | | | |
| HSBC Holdings, PLC, 3 Mo. Libor + 1.00% 1 | | 700,000 | | | | 3.32 | | | | | 5/18/24 | | | | | 698,758 | | | |
| JPMorgan Chase & Co., 3 Mo. Libor + 0.73% 1 | | 783,000 | | | | 3.08 | | | | | 4/23/24 | | | | | 779,470 | | | |
| Manufacturers & Traders Trust Co. (Subordinated), 3 Mo. Libor + 0.64% 1 | | 800,000 | | | | 2.96 | | | | | 12/1/21 | | | | | 798,109 | | | |
| Massachusetts Mutual Life Insurance Co. (Subordinated) 4 | | 700,000 | | | | 7.50 | | | | | 3/1/24 | | | | | 809,837 | | | |
| Nationwide Mutual Insurance Co. (Subordinated), 3 Mo. Libor + 2.29% 1, 4 | | 625,000 | | | | 4.62 | | | | | 12/15/24 | | | | | 625,009 | | | |
| United Airlines 2013-1 Class A Pass Through Trust | | 742,300 | | | | 4.30 | | | | | 2/15/27 | | | | | 756,276 | | | |
| United Community Bank (Subordinated), 3 Mo. Libor + 2.12% 1 | | 500,000 | | | | 4.50 | | | | | 1/30/28 | | | | | 491,404 | | | |
| US Airways 2013-1 Class A Pass Through Trust | | 743,675 | | | | 3.95 | | | | | 11/15/25 | | | | | 736,611 | | | |
| | | | | | | | | | | | | | | | | | | |
| | | | | |
Total Corporate Bonds
(cost: $11,207,100) | | | | | | | | | | | | | | | | 11,108,757 | | | |
| | | | | | | | | | | | | | | | | | | |
| | | | | |
Mortgage Pass-Through Securities - 14.8% | | | | | | | | | | | | | | | | | | | |
Federal Home Loan Mortgage Corporation - 1.1% | | | | | | | | | | | | | | | | | | | |
| Freddie Mac | | 175,084 | | | | 3.00 | | | | | 9/1/27 | | | | | 173,795 | | | |
| Freddie Mac | | 38,283 | | | | 3.50 | | | | | 7/1/26 | | | | | 38,504 | | | |
| Freddie Mac | | 243,676 | | | | 4.00 | | | | | 7/1/26 | | | | | 249,792 | | | |
| Freddie Mac | | 252,540 | | | | 4.00 | | | | | 1/1/27 | | | | | 258,853 | | | |
| Freddie Mac | | 4,031 | | | | 4.50 | | | | | 5/1/19 | | | | | 4,081 | | | |
| Freddie Mac | | 9,130 | | | | 4.50 | | | | | 6/1/19 | | | | | 9,244 | | | |
| Freddie Mac | | 6,024 | | | | 4.50 | | | | | 6/1/19 | | | | | 6,099 | | | |
| Freddie Mac | | 47,388 | | | | 4.50 | | | | | 12/1/21 | | | | | 48,006 | | | |
| Freddie Mac | | 17,368 | | | | 4.50 | | | | | 7/1/26 | | | | | 17,652 | | | |
| Freddie Mac | | 10,471 | | | | 5.00 | | | | | 7/1/19 | | | | | 10,644 | | | |
| Freddie Mac | | 17,545 | | | | 5.00 | | | | | 10/1/25 | | | | | 18,424 | | | |
| Freddie Mac | | 2,609 | | | | 5.50 | | | | | 10/1/19 | | | | | 2,620 | | | |
| Freddie Mac | | 30,566 | | | | 5.50 | | | | | 5/1/20 | | | | | 30,796 | | | |
| Freddie Mac | | 7,006 | | | | 5.50 | | | | | 7/1/20 | | | | | 7,050 | | | |
| Freddie Mac | | 6,056 | | | | 5.50 | | | | | 12/1/20 | | | | | 6,090 | | | |
| Freddie Mac | | 32,194 | | | | 5.50 | | | | | 3/1/21 | | | | | 32,660 | | | |
| Freddie Mac | | 21,435 | | | | 5.50 | | | | | 3/1/21 | | | | | 21,836 | | | |
| | | | | | | | | | | | | | | | | | | |
| | | | | |
| | | | | | | | | | | | | | | | 936,146 | | | |
| | | | | | | | | | | | | | | | | | | |
See accompanying notes to financial statements.
| | |
16 | | SIT MUTUAL FUNDS SEMI-ANNUAL REPORT |
| | | | | | | | | | | | | | | | | | | |
| | | | | |
| Name of Issuer | | Principal
Amount ($) | | Coupon Rate (%) | | Maturity Date | | Fair Value ($) |
Federal National Mortgage Association - 9.3% | | | | | | | | | | | | | | | | | | | |
| Fannie Mae | | 509,098 | | | | 2.50 | | | | | 6/1/23 | | | | | 502,591 | | | |
| Fannie Mae | | 982,174 | | | | 2.61 | | | | | 2/1/23 | | | | | 958,716 | | | |
| Fannie Mae | | 897,968 | | | | 2.70 | | | | | 4/1/23 | | | | | 874,693 | | | |
| Fannie Mae | | 701,279 | | | | 2.72 | | | | | 12/1/22 | | | | | 684,798 | | | |
| Fannie Mae | | 988,866 | | | | 2.77 | | | | | 11/1/23 | | | | | 963,177 | | | |
| Fannie Mae | | 283,539 | | | | 3.00 | | | | | 8/1/28 | | | | | 281,756 | | | |
| Fannie Mae | | 716,625 | | | | 3.50 | | | | | 1/1/26 | | | | | 720,659 | | | |
| Fannie Mae | | 274,071 | | | | 3.93 | | | | | 5/1/24 | | | | | 279,603 | | | |
| Fannie Mae | | 21,944 | | | | 4.00 | | | | | 9/1/24 | | | | | 22,396 | | | |
| Fannie Mae | | 160,530 | | | | 4.00 | | | | | 6/1/25 | | | | | 163,901 | | | |
| Fannie Mae | | 23,963 | | | | 4.00 | | | | | 10/1/31 | | | | | 24,386 | | | |
| Fannie Mae | | 509,625 | | | | 4.44 | | | | | 6/1/21 | | | | | 519,798 | | | |
| Fannie Mae | | 150,157 | | | | 4.50 | | | | | 4/1/25 | | | | | 155,816 | | | |
| Fannie Mae | | 248,938 | | | | 4.73 | | | | | 2/1/20 | | | | | 251,158 | | | |
| Fannie Mae | | 9,820 | | | | 5.00 | | | | | 8/1/19 | | | | | 10,116 | | | |
| Fannie Mae | | 48,958 | | | | 5.00 | | | | | 9/1/20 | | | | | 50,494 | | | |
| Fannie Mae | | 1,067,821 | | | | 5.44 | | | | | 1/1/19 | | | | | 1,065,914 | | | |
| Fannie Mae | | 1,072 | | | | 5.50 | | | | | 4/1/19 | | | | | 1,071 | | | |
| Fannie Mae | | 11,233 | | | | 5.50 | | | | | 1/1/21 | | | | | 11,369 | | | |
| Fannie Mae | | 7,542 | | | | 5.50 | | | | | 10/1/21 | | | | | 7,635 | | | |
| Fannie Mae | | 843 | | | | 6.50 | | | | | 2/1/19 | | | | | 924 | | | |
| | | | | | | | | | | | | | | | | | | |
| | | | | |
| | | | | | | | | | | | | | | | 7,550,971 | | | |
| | | | | | | | | | | | | | | | | | | |
| | | | | |
Government National Mortgage Association - 0.3% | | | | | | | | | | | | | | | | | | | |
| Ginnie Mae, US Treasury + 1.50% 1 | | 54,102 | | | | 3.63 | | | | | 4/20/33 | | | | | 56,003 | | | |
| Ginnie Mae, US Treasury + 1.50% 1 | | 11,315 | | | | 3.63 | | | | | 4/20/42 | | | | | 11,576 | | | |
| Ginnie Mae | | 47,154 | | | | 5.00 | | | | | 12/20/23 | | | | | 49,637 | | | |
| Ginnie Mae | | 29,670 | | | | 5.00 | | | | | 9/15/24 | | | | | 30,946 | | | |
| Ginnie Mae | | 55,982 | | | | 5.00 | | | | | 6/20/26 | | | | | 60,510 | | | |
| | | | | | | | | | | | | | | | | | | |
| | | | | |
| | | | | | | | | | | | | | | | 208,672 | | | |
| | | | | | | | | | | | | | | | | | | |
| | | | | |
Other Federal Agency Securities - 4.1% | | | | | | | | | | | | | | | | | | | |
| Small Business Administration Pools, PRIME - 2.50% 1 | | 680,196 | | | | 2.50 | | | | | 5/25/43 | | | | | 681,534 | | | |
| Small Business Administration Pools, PRIME + 0.78% 1 | | 651,658 | | | | 5.78 | | | | | 3/25/30 | | | | | 715,611 | | | |
| Small Business Administration Pools, PRIME + 0.80% 1 | | 1,805,925 | | | | 5.80 | | | | | 2/25/28 | | | | | 1,969,792 | | | |
| | | | | | | | | | | | | | | | | | | |
| | | | | |
| | | | | | | | | | | | | | | | 3,366,937 | | | |
| | | | | | | | | | | | | | | | | | | |
| | | | | |
Total Mortgage Pass-Through Securities
(cost: $12,277,664) | | | | | | | | | | | | | | | | 12,062,726 | | | |
| | | | | | | | | | | | | | | | | | | |
| | | | | |
Taxable Municipal Bonds - 7.3% | | | | | | | | | | | | | | | | | | | |
| Atlanta Downtown Development Authority 17 | | 635,000 | | | | 6.88 | | | | | 2/1/21 | | | | | 666,623 | | | |
| Berks County Industrial Development Authority | | 395,000 | | | | 3.20 | | | | | 5/15/21 | | | | | 393,981 | | | |
| City of Wilkes-Barre PA 17 | | 1,000,000 | | | | 3.24 | | | | | 11/15/21 | | | | | 998,650 | | | |
| Colorado Housing & Finance Authority | | 15,000 | | | | 4.00 | | | | | 11/1/31 | | | | | 15,152 | | | |
| Kentucky Higher Education Student Loan Corp. | | 800,000 | | | | 3.92 | | | | | 6/1/32 | | | | | 775,424 | | | |
| Massachusetts Educational Financing Authority | | 470,000 | | | | 4.00 | | | | | 1/1/32 | | | | | 477,327 | | | |
| Massachusetts Educational Financing Authority | | 750,000 | | | | 4.41 | | | | | 7/1/34 | | | | | 745,223 | | | |
| Multistate Liquidating Trust No. 1 4, 17 | | 100,000 | | | | 1.39 | | | | | 12/15/18 | | | | | 99,720 | | | |
| New Hampshire Housing Finance Authority | | 565,000 | | | | 4.22 | | | | | 7/1/29 | | | | | 562,378 | | | |
| New Hampshire Housing Finance Authority | | 255,000 | | | | 4.00 | | | | | 7/1/35 | | | | | 256,716 | | | |
| New Hampshire Housing Finance Authority | | 20,000 | | | | 4.00 | | | | | 1/1/37 | | | | | 20,140 | | | |
| Rhode Island Housing & Mortgage Finance Corp. | | 80,000 | | | | 4.00 | | | | | 10/1/39 | | | | | 80,535 | | | |
| South Dakota Housing Development Authority | | 340,000 | | | | 3.50 | | | | | 11/1/41 | | | | | 338,086 | | | |
See accompanying notes to financial statements.
SCHEDULE OF INVESTMENTS (Unaudited)
September 30, 2018
Sit Quality Income Fund (Continued)
| | | | | | | | | | | | | | | | |
| | | | |
| Name of Issuer | | Principal
Amount ($) | | | Coupon
Rate (%) | | | Maturity
Date | | | Fair Value ($) | |
| | | | |
| Tennessee Housing Development Agency | | | 130,000 | | | | 3.50 | | | | 7/1/31 | | | | 129,848 | |
| Texas Department of Housing & Community Affairs 17 | | | 155,000 | | | | 4.80 | | | | 7/1/19 | | | | 155,332 | |
| Town of Mammoth Lakes CA | | | 225,000 | | | | 2.75 | | | | 10/1/22 | | | | 218,259 | |
| | | | | | | | | | | | | | | | |
| | | | |
Total Taxable Municipal Bonds
(cost: $6,047,781) | | | | | | | | | | | | | | | 5,933,394 | |
| | | | | | | | | | | | | | | | |
U.S. Treasury / Federal Agency Securities - 14.4% | | | | | | | | | | | | | | | | |
Federal Agency Issues - 0.9% | | | | | | | | | | | | | | | | |
| Federal Agricultural Mortgage Corp., 3 Mo. Libor + 0.37% 1 | | | 250,000 | | | | 2.70 | | | | 3/9/23 | | | | 252,823 | |
| Pershing Road Development Co., LLC, 3 Mo. Libor + 0.40% 1, 4 | | | 425,000 | | | | 2.73 | | | | 9/15/21 | | | | 422,875 | |
| | | | | | | | | | | | | | | | |
| | | | |
| | | | | | | | | | | | | | | 675,698 | |
| | | | | | | | | | | | | | | | |
U.S. Treasury - 13.5% | | | | | | | | | | | | | | | | |
| U.S. Treasury Bill 6 | | | 3,000,000 | | | | 2.04 | | | | 10/11/18 | | | | 2,998,295 | |
| U.S. Treasury Floating Rate Note, 3 Mo. Libor + 0.03% 1 | | | 4,000,000 | | | | 2.22 | | | | 4/30/20 | | | | 4,000,399 | |
| U.S. Treasury Floating Rate Note, 3 Mo. Libor + 0.04% 1 | | | 4,000,000 | | | | 2.23 | | | | 7/31/20 | | | | 3,999,739 | |
| | | | | | | | | | | | | | | | |
| | | | |
| | | | | | | | | | | | | | | 10,998,433 | |
| | | | | | | | | | | | | | | | |
Total U.S. Treasury / Federal Agency Securities
(cost: $11,673,485) | | | | | | | | | | | | | | | 11,674,131 | |
| | | | | | | | | | | | | | | | |
Short-Term Securities - 9.3% | | | | | | | | | | | | | | | | |
| Fidelity Inst. Money Mkt. Gvt. Fund, 1.95% | | | 7,599,284 | | | | | | | | | | | | 7,599,284 | |
| | | | | | | | | | | | | | | | |
(cost: $7,599,284) | | | | | | | | | | | | | | | | |
Total Investments in Securities - 107.1% | | | | | | | | | | | | | | | | |
(cost: $87,932,494) | | | | | | | | | | | | | | | 87,065,184 | |
| | | | | | | | | | | | | | | | |
Call Options Written 10, 19 - 0.0% | | | | | | | | | | | | | | | | |
| (premiums received: $14,621) | | | | | | | | | | | | | | | (10,938 | ) |
| | | | |
Other Assets and Liabilities, net - (7.1%) | | | | | | | | | | | | | | | (5,740,978 | ) |
| | | | | | | | | | | | | | | | |
| | | | |
Total Net Assets - 100.0% | | | | | | | | | | | | | | $ | 81,313,268 | |
| | | | | | | | | | | | | | | | |
| 1 | | Variable rate security. Rate disclosed is as of September 30, 2018. Certain variable rate securities are not based on a published reference rate and spread but are determined by the issuer or agent and are based on current market conditions, or, for mortgage-backed securities, are impacted by the individual mortgages which are paying off over time. These securities do not indicate a reference rate and spread in their descriptions. |
| 4 | | 144A Restricted Security. The total value of such securities as of September 30, 2018 was $13,240,500 and represented 16.3% of net assets. These securities have been determined to be liquid by the Adviser in accordance with guidelines established by the Board of Directors. |
| 6 | | Zero coupon or convertible capital appreciation bond, for which the rate disclosed is either the effective yield on purchase date or the coupon rate to be paid upon conversion to coupon paying, respectively. |
| 10 | | The amount of $800,000 in cash was segregated with the broker to cover margin requirements for derivative transactions as of September 30, 2018. |
| 14 | | Step Coupon: A bond that pays an initial coupon rate for the first period and then a higher coupon rate for the following periods. Rate disclosed is as of September 30, 2018. |
| 17 | | Security that is either an absolute and unconditional obligation of the United States Government or is collateralized by securities, loans, or leases guaranteed by the U.S. Government or its agencies or instrumentalities. |
Numeric footnotes not disclosed are not applicable to this Schedule of Investments.
See accompanying notes to financial statements.
| | |
18 | | SIT MUTUAL FUNDS SEMI-ANNUAL REPORT |
(19) Options outstanding as of September 30, 2018 were as follows:
| | | | | | | | | | | | | | | | | | | | |
| Description | | Contracts | | Exercise
Price ($) | | Expiration
Date | | Counterparty | | Notional
Amount ($) | | | Cost/
Premiums ($) | | | Value ($) | |
Call Options Written - U.S. Treasury Futures: | | | | | | | | | | | | |
2-Year | | (70) | | 105.38 | | November 2018 | | Societe Generale | | | 14,752,500 | | | | (14,621) | | | | (10,938) | |
Short futures contracts outstanding as of September 30, 2018 were as follows:
| | | | | | | | | | | | | | | | | | | | | | | | | |
| Type | | Contracts | | Expiration
Date | | Notional
Amount ($) | | | | Value/ Unrealized
Appreciation
(Depreciation) ($) |
| | | | | |
Short Futures: 10 | | | | | | | | | | | | | | | | | | | | | | | | | |
U.S. Treasury 5-Year | | | | 174 | | | | | December 2018 | | | | | 19,570,922 | | | | | | | | | | 169,347 | |
U.S. Treasury 2-Year | | | | 57 | | | | | December 2018 | | | | | 12,011,859 | | | | | | | | | | 37,319 | |
| | | | | |
| | | | | | | | | | | | | | | | | | | | | | | | 206,666 | |
| 10 | | The amount of $800,000 in cash was segregated with the broker to cover margin requirements for derivative transactions as of September 30, 2018. |
A summary of the levels for the Fund’s investments as of September 30, 2018 is as follows (see Note 2 - significant accounting policies in the notes to financial statements):
| | | | | | | | | | | | | | | | |
| | | | | | Investment in Securities | |
| | | | |
| | | Level 1 | | | Level 2 | | | Level 3 | | | | |
| | | Quoted | | | Other Significant | | | Other Significant | | | | |
| | | Price ($) | | | Observable Inputs ($) | | | Observable Inputs ($) | | | Total ($) | |
| | | | |
Assets | | | | | | | | | | | | | | | | |
Asset-Backed Securities | | | — | | | | 12,926,628 | | | | — | | | | 12,926,628 | |
Collateralized Mortgage Obligations | | | — | | | | 25,760,264 | | | | — | | | | 25,760,264 | |
Corporate Bonds | | | — | | | | 11,108,757 | | | | — | | | | 11,108,757 | |
Mortgage Pass-Through Securities | | | — | | | | 12,062,726 | | | | — | | | | 12,062,726 | |
Taxable Municipal Bonds | | | — | | | | 5,933,394 | | | | — | | | | 5,933,394 | |
U.S. Treasury/ Federal Agency Securities | | | — | | | | 11,674,131 | | | | — | | | | 11,674,131 | |
Short-Term Securities | | | 7,599,284 | | | | — | | | | — | | | | 7,599,284 | |
Futures | | | 206,666 | | | | — | | | | — | | | | 206,666 | |
| | | | |
| | | 7,805,950 | | | | 79,465,900 | | | | — | | | | 87,271,850 | |
| | | | |
Liabilities | | | | | | | | | | | | | | | | |
Call Options Written | | | (10,938 | ) | | | — | | | | — | | | | (10,938) | |
| | | | |
For the reporting period, there were no transfers between levels 1, 2 and 3.
See accompanying notes to financial statements.
OBJECTIVE & STRATEGY
The objective of the Tax-Free Income Fund is to provide a high level of current income that is exempt from federal income tax, consistent with preservation of capital, by investing primarily in investment-grade municipal securities.
Such municipal securities generate interest income that is exempt from both federal regular income tax and federal alternative minimum tax. During normal market conditions, the Fund invests 100% of its net assets in such tax-exempt municipal securities.
The Sit Tax-Free Income Fund provided a return of +0.46% for the 6-month period ending September 30, 2018. The return for its bench-mark, the Bloomberg Barclays 5-year Municipal Bond Index, was +0.67%. The Fund’s 30-day SEC yield was 2.92%, compared to the yield of 2.40% for the benchmark index. The Taxable Equivalent Yield of the Fund was 4.93% assuming a federal tax rate of 40.8%.
Over the last 6 months, the 5-year benchmark Index benefited from superior total returns compared with the long end of the municipal market. The Fund’s barbell approach, which emphasizes a combination of shorter and longer duration bonds, is poised to outdistance the Index over the long haul. The returns of the Fund were slightly better than the benchmark in the prior two quarters than in the last quarter, which ended with an uptick in interest rates. The Housing sector, where the Fund has a significant weighting, was generally on pace with the Index. The Fund’s broader distribution of credit quality was not a major influence in the period, as the prior out performance of lower rated credits moderated in recent months. Overall, tax-exempt bond performance compares favorably to that of Treasury bonds over the last 6 months of -0.34% for the 5-year Treasury, -1.37% for the 10-year, and -2.77% for the 30-year. As we continue to foresee moderately rising interest rates due to Fed increases as well as the contraction of its balance sheet, we have maintained our hedge on the portfolio using U.S. Treasury futures to shorten duration. The net effect of the hedge for the 6-month period was to add 27 basis points to the return of the Fund.
Light supply of new bond issuance has been supportive of the tax-exempt municipal market most of this year. Long-term 2018Q3 municipal bond issuance was $84.2 billion, 8.7% below the 2017Q3. That brings 2018YTD volume to $249.4 billion, 14.9% below the same period in 2017. Lighter issuance volume in 2018 has been anticipated in the wake of federal tax law changes that eliminated tax-exempt advance refundings. Final 2018 new issuance should come in well below the $436 billion in 2017, which was boosted by a surge late last year ahead of the tax reform bill. While pure refunding activity declined to a very low 17.8% of the primary market, “new money” issuance has been robust, and is the most since 2010. Moderate supply has been supportive of the market as we enter what is customarily the strongest period for tax-exempt bond issuance. Municipal mutual funds experienced mainly positive inflows until September.
HYPOTHETICAL GROWTH OF $10,000
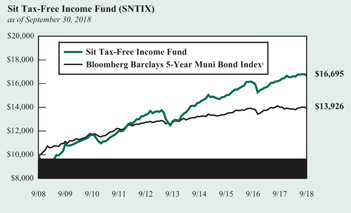
The chart above illustrates the total value of a hypothetical $10,000 investment in the Fund over the past 10 years (or for the life of the Fund if shorter) as compared to the performance of the Bloomberg Barclays 5-Year Municipal Bond Index. Past performance does not guarantee future results. Returns include the reinvestment of distributions. The chart does not reflect the deduction of taxes that a shareholder would pay on Fund distributions or the redemption of Fund shares.
1 The Bloomberg Barclays 5-Year Municipal Bond Index is the 5 year (4-6) component of the Municipal Bond Index, an unmanaged, rules-based, market-value-weighted index for the long-term tax-exempt bond market. The index includes bonds with a minimum credit rating of BBB. The returns include the reinvestment of income and do not include any transaction costs, management fees or other costs. It is not possible to invest directly in an index. This is the Fund’s primary index.
The Fund’s core strategy has not changed. We will continue to emphasize income as the primary source of returns, and will add to higher coupon bonds when available. We will also focus deeply on credit analysis to take advantage of opportunities as they arise.
We remain diversified on an industry and issuer basis in order to manage credit and liquidity risk, and we continue to believe the Fund is Positioned to achieve attractive risk-adjusted returns going forward.
Michael C.Brilley
Paul J. Jungquist, CFA
Senior Portfolio Managers
| | |
20 | | SIT MUTUAL FUNDS SEMI-ANNUAL REPORT |
COMPARATIVE RATES OF RETURNS
| | | | | | | | | | | | | | | |
as of September 30, 2018 | |
| | | Sit
Tax-Free
Income
Fund | | Bloomberg
Barclays
5-Year Muni
Bond Index1 | | Lipper
General
Muni. Bond
Fund Index2 |
Six Months | | | | 0.46% | | | | | 0.67% | | | | | n/a | |
One Year | | | | 2.68 | | | | | -0.60 | | | | | 0.98% | |
Five Years | | | | 5.48 | | | | | 1.85 | | | | | 4.10 | |
Ten Years | | | | 5.26 | | | | | 3.37 | | | | | 5.06 | |
Since Inception (9/29/88) | | | | 5.17 | | | | | 4.88 | | | | | 5.45 | |
Performance figures are historical and do not guarantee future results. Investment returns and principal value will vary, and you may have a gain or loss when you sell shares. Current performance may be lower or higher than the performance data quoted. Contact the Fund for performance data current to the most recent month-end. Returns include changes in share price as well as reinvestment of all dividends and capital gains and all fee waivers. Without the fee waivers total return and yield figures would have been lower. Returns do not reflect the deduction of taxes that a shareholder would pay on Fund distributions or the redemption of Fund shares. Management fees and administrative expenses are included in the Fund’s performance. Returns for periods greater than one year are compounded average annual rates of return.
1 The Bloomberg Barclays 5-Year Municipal Bond Index is the 5 year (4-6) component of the Municipal Bond Index, an unmanaged, rules-based, market-value-weighted index for the long-term tax-exempt bond market. The index includes bonds with a minimum credit rating of BBB. The returns include the reinvestment of income and do not include any transaction costs, management fees or other costs. It is not possible to invest directly in an index.
2 The Lipper returns are obtained from Lipper Analytical Services, Inc., a large independent evaluator of mutual funds.
FUND DIVERSIFICATION
| | | | |
| |
Single Family Mortgage | | | 24.9% | |
Multi Family Mortgage | | | 23.1 | |
Other Revenue | | | 8.4 | |
Insured | | | 7.3 | |
Education/Student Loan | | | 6.8 | |
General Obligation | | | 6.1 | |
Hospital/Health Care | | | 5.1 | |
Sectors less than 5% | | | 11.9 | |
Cash & Other Net Assets | | | 6.4 | |
Based on total net assets as of September 30, 2018. Subject to change.
PORTFOLIO SUMMARY
| | |
Net Asset Value 9/30/18: | | $9.55 Per Share |
Net Asset Value 3/31/18: | | $9.66 Per Share |
Total Net Assets: | | $217.7 Million |
Average Maturity: | | 17.4 Years |
Effective Duration3: | | 4.2 Years |
3 Duration is a measure of estimated price sensitivity relative to changes in interest rates. Portfolios with longer durations are typically more sensitive to changes in interest rates. For example, if interest rates rise by 1%, the fair value of a security with an effective duration of 5 years would decrease by 5%, with all other factors being constant. The correlation between duration and price sensitivity is greater for securities rated investment-grade than it is for securities rated below investment-grade. Duration estimates are based on assumptions by the Adviser and are subject to a number of limitations. Effective duration is calculated based on historical price changes of securities held by the Fund, and therefore is a more accurate estimate of price sensitivity provided interest rates remain within their historical range.
QUALITY RATINGS (% of Total Net Assets)
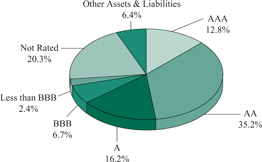
Lower of Moody’s, S&P, Fitch or Duff & Phelps ratings used.
Adviser’s Assessment of Non-Rated Securities
| | |
AAA | | 0.0% |
AA | | 0.1 |
A | | 0.0 |
BBB | | 0.8 |
BB | | 16.5 |
<BB | | 2.9 |
Total | | 20.3% |
SCHEDULE OF INVESTMENTS (Unaudited)
September 30, 2018
Sit Tax-Free Income Fund
| | | | | | | | | | | | | | | | | | | | | | |
| | | | | | | | | | | | | | | | | | | | | | | |
| | | | |
| Name of Issuer | | Principal Amount ($) | | Coupon
Rate (%) | | Maturity Date | | Fair Value ($) |
| | | | | |
Municipal Bonds - 90.0% | | | | | | | | | | | | | | | | | | | | | | |
Alabama - 0.2% | | | | | | | | | | | | | | | | | | | | | | |
Pell City Special Care Facs. Finance Auth. Rev. (Noland Health Services, Inc.) | | | | 500,000 | | | | | 5.00 | | | | | 12/1/31 | | | | | 534,475 | | | |
| | | | | | | | | | | | | | | | | | | | | | |
| | | | | |
Alaska - 1.1% | | | | | | | | | | | | | | | | | | | | | | |
AK Hsg. Finance Corp. Mtg. Rev. | | | | 640,000 | | | | | 4.13 | | | | | 12/1/37 | | | | | 645,517 | | | |
AK Hsg. Finance Corp. Mtg. Rev. | | | | 550,000 | | | | | 4.25 | | | | | 12/1/40 | | | | | 555,775 | | | |
AK Hsg. Finance Corp. Mtg. Rev. (G.O. of Corp. Insured) | | | | 500,000 | | | | | 4.50 | | | | | 12/1/35 | | | | | 504,720 | | | |
AK Hsg. Finance Corp. Rev. (State Capital Proj.) | | | | 500,000 | | | | | 4.00 | | | | | 6/1/36 | | | | | 513,230 | | | |
AK Industrial Dev. & Export Auth. Rev. (Boys & Girls Home) 2, 5, 15 | | | | 250,000 | | | | | 5.50 | | | | | N/A | | | | | 16,875 | | | |
AK Industrial Dev. & Export Auth. Rev. (GTR Fairbanks Community Hospital Foundation) | | | | 250,000 | | | | | 5.00 | | | | | 4/1/33 | | | | | 266,872 | | | |
| | | | | | | | | | | | | | | | | | | | | | |
| | | | | |
| | | | | | | | | | | | | | | | | | | 2,502,989 | | | |
| | | | | | | | | | | | | | | | | | | | | | |
| | | | | |
Arizona - 2.3% | | | | | | | | | | | | | | | | | | | | | | |
AZ Industrial Dev. Auth. Rev. (Bridgewater Avondale Proj.) | | | | 500,000 | | | | | 5.38 | | | | | 1/1/38 | | | | | 483,945 | | | |
Glendale Industrial Dev. & Auth. Rev. (Beatitudes Campus Proj.) | | | | 300,000 | | | | | 5.00 | | | | | 11/15/36 | | | | | 305,037 | | | |
Glendale Industrial Dev. & Auth. Rev. (Glencroft Retirement Community) | | | | 300,000 | | | | | 5.00 | | | | | 11/15/36 | | | | | 300,381 | | | |
La Paz Co. Industrial Dev. Auth. (Charter School Solutions Harmony Public Proj.) | | | | 750,000 | | | | | 5.00 | | | | | 2/15/48 | | | | | 784,800 | | | |
Maricopa Co. Industrial Dev. Auth. Education Rev. (Horizon Community Learning Center) | | | | 300,000 | | | | | 5.00 | | | | | 7/1/35 | | | | | 308,316 | | | |
Maricopa Co. Industrial Dev. Auth. Rev. (Christian Care Surprise Inc.) 4 | | | | 250,000 | | | | | 5.75 | | | | | 1/1/36 | | | | | 250,462 | | | |
Peoria Industrial Dev. Auth. Rev. (Sierra Winds Life Care Community) | | | | 400,000 | | | | | 5.25 | | | | | 11/15/29 | | | | | 402,680 | | | |
Phoenix City Industrial Dev. Auth. Rev. (Great Hearts Academies Proj.) | | | | 250,000 | | | | | 6.30 | | | | | 7/1/42 | | | | | 277,665 | | | |
Phoenix City Industrial Dev. Auth. Rev. (Vista College Preparatory Proj.) | | | | 400,000 | | | | | 4.13 | | | | | 7/1/38 | | | | | 399,176 | | | |
Pima Co. Industrial Dev. Auth. Education Rev. (American Leadership Academy Proj.) 4 | | | | 370,000 | | | | | 4.75 | | | | | 6/15/37 | | | | | 369,519 | | | |
Pima Co. Industrial Dev. Auth. Education Rev. (Coral Academy Science Proj.) | | | | 160,000 | | | | | 6.38 | | | | | 12/1/18 | | | | | 160,242 | | | |
Quechan Indian Tribe of Fort Yuma Rev. (Tribal Economic Dev.) | | | | 415,000 | | | | | 9.75 | | | | | 5/1/25 | | | | | 461,061 | | | |
Tempe Industrial Dev. Auth. Rev. (Mirabella at ASU Proj.) 4 | | | | 500,000 | | | | | 4.70 | | | | | 10/1/24 | | | | | 505,515 | | | |
| | | | | | | | | | | | | | | | | | | | | | |
| | | | | |
| | | | | | | | | | | | | | | | | | | 5,008,799 | | | |
| | | | | | | | | | | | | | | | | | | | | | |
| | | | | |
Arkansas - 0.2% | | | | | | | | | | | | | | | | | | | | | | |
Springdale City Sales & Use Tax Rev. Ref. (BAM Insured) | | | | 500,000 | | | | | 3.60 | | | | | 4/1/41 | | | | | 474,075 | | | |
| | | | | | | | | | | | | | | | | | | | | | |
| | | | | |
California - 6.7% | | | | | | | | | | | | | | | | | | | | | | |
CA Infrastructure & Econ. Dev. Rev. (Dept. of Social Services) (AMBAC G.O. of Authority Insured) 9 | | | | 500,000 | | | | | 5.00 | | | | | 12/1/18 | | | | | 501,245 | | | |
CA School Facs. Finance Auth. Rev. (Azusa Unified School District) (AGM Insured) 6 | | | | 500,000 | | | | | 6.00 | | | | | 8/1/29 | | | | | 614,550 | | | |
CA State G.O. | | | | 500,000 | | | | | 4.00 | | | | | 12/1/40 | | | | | 507,905 | | | |
Carlsbad Unified School District G.O. Capital Appreciation 6 | | | | 400,000 | | | | | 6.00 | | | | | 8/1/31 | | | | | 439,748 | | | |
Colton Joint Unified School District G.O. (AGM Insured) 6 | | | | 1,000,000 | | | | | 6.00 | | | | | 8/1/35 | | | | | 987,120 | | | |
Encinitas Union School District G.O. Capital Appreciation 6 | | | | 500,000 | | | | | 7.00 | | | | | 8/1/35 | | | | | 556,950 | | | |
Hartnell Community College G.O. 6 | | | | 500,000 | | | | | 7.00 | | | | | 8/1/34 | | | | | 524,130 | | | |
Healdsburg Unified School District G.O. 6 | | | | 1,250,000 | | | | | 5.00 | | | | | 8/1/37 | | | | | 1,115,725 | | | |
Imperial Community College District G.O. Capital Appreciation (AGM Insured) 6 | | | | 250,000 | | | | | 6.75 | | | | | 8/1/40 | | | | | 320,488 | | | |
Los Alamitos Unified School District Capital Appreciation C.O.P. 6 | | | | 1,100,000 | | | | | 6.00 | | | | | 8/1/34 | | | | | 1,011,901 | | | |
Martinez Unified School District G.O. 6 | | | | 250,000 | | | | | 6.13 | | | | | 8/1/35 | | | | | 304,480 | | | |
Placentia-Yorba Linda Unified School District C.O.P. Capital Appreciation (AGM Insured) 6 | | | | 500,000 | | | | | 6.25 | | | | | 10/1/28 | | | | | 561,210 | | | |
Redondo Beach School District G.O. 6 | | | | 600,000 | | | | | 6.38 | | | | | 8/1/34 | | | | | 753,702 | | | |
Reef-Sunset Unified School District (BAM Insured) 6 | | | | 750,000 | | | | | 5.00 | | | | | 8/1/38 | | | | | 700,080 | | | |
Ripon Unified School District G.O. (BAM Insured) 6 | | | | 270,000 | | | | | 4.50 | | | | | 8/1/30 | | | | | 294,035 | | | |
Ripon Unified School District G.O. (BAM Insured) 6 | | | | 80,000 | | | | | 4.50 | | | | | 8/1/30 | | | | | 85,505 | | | |
Sacramento Co. Water Financing Auth. Rev. (NATL-RE FGIC Insured) 1 | | | | 500,000 | | | | | 2.13 | | | | | 6/1/39 | | | | | 457,815 | | | |
San Jose Financing Auth. Rev. (Civic Center Garage Proj.) 9 | | | | 400,000 | | | | | 5.00 | | | | | 6/1/39 | | | | | 440,232 | | | |
San Jose G.O. Capital Appreciation (Libraries Parks and Public Safety Proj.) (NATL Insured) | | | | 500,000 | | | | | 5.00 | | | | | 9/1/32 | | | | | 501,130 | | | |
South Tahoe Joint Powers Financing Auth. Tax Allocation Ref. (South Tahoe Redev. Proj.) (AGM Insured) | | | | 500,000 | | | | | 5.00 | | | | | 10/1/30 | | | | | 554,225 | | | |
Sulphur Springs Union School District C.O.P. (AGM Insured) 6 | | | | 450,000 | | | | | 6.50 | | | | | 12/1/37 | | | | | 549,531 | | | |
See accompanying notes to financial statements.
| | |
22 | | SIT MUTUAL FUNDS SEMI-ANNUAL REPORT |
| | | | | | | | | | | | | | | | | | | | | | |
| | | | | | | | | | | | | | | | | | | | | | | |
| | | | |
| Name of Issuer | | Principal Amount ($) | | Coupon
Rate (%) | | Maturity Date | | Fair Value ($) |
| | | | | |
Tracy Joint Unified School District G.O. Capital Appreciation 6 | | | | 600,000 | | | | | 7.00 | | | | | 8/1/41 | | | | | 495,744 | | | |
Tustin Unified School District G.O. Capital Appreciation 6 | | | | 500,000 | | | | | 6.00 | | | | | 8/1/28 | | | | | 530,185 | | | |
Upland Unified School District G.O. Capital Appreciation 6 | | | | 1,000,000 | | | | | 7.00 | | | | | 8/1/41 | | | | | 1,156,460 | | | |
Val Verde Unified School District G.O. Capital Appreciation (AGM Insured) 6 | | | | 500,000 | | | | | 6.00 | | | | | 8/1/34 | | | | | 521,890 | | | |
| | | | | | | | | | | | | | | | | | | | | | |
| | | | | |
| | | | | | | | | | | | | | | | | | | 14,485,986 | | | |
| | | | | | | | | | | | | | | | | | | | | | |
| | | | | |
Colorado - 2.4% | | | | | | | | | | | | | | | | | | | | | | |
Buffalo Highlands Metropolitan District G.O. | | | | 350,000 | | | | | 5.25 | | | | | 12/1/38 | | | | | 347,823 | | | |
CO Educational & Cultural Facs. Auth. Rev. (CO Springs Charter Academy Proj.) | | | | 250,000 | | | | | 5.60 | | | | | 7/1/34 | | | | | 257,608 | | | |
CO Educational & Cultural Facs. Auth. Rev. Ref. (Windsor Charter Academy) 4 | | | | 800,000 | | | | | 5.00 | | | | | 9/1/36 | | | | | 799,024 | | | |
Copperleaf Metro District No. 2 G.O. | | | | 500,000 | | | | | 5.75 | | | | | 12/1/45 | | | | | 523,320 | | | |
Crystal Crossing Metro District G.O. | | | | 500,000 | | | | | 5.25 | | | | | 12/1/40 | | | | | 500,555 | | | |
East Morgan Co. Hospital District C.O.P. 9 | | | | 500,000 | | | | | 5.88 | | | | | 12/1/38 | | | | | 503,555 | | | |
Lambertson Farms Metro District No. 1 G.O. | | | | 500,000 | | | | | 5.00 | | | | | 12/15/25 | | | | | 495,495 | | | |
Leyden Rock Metropolitan District No. 10 G.O. | | | | 250,000 | | | | | 5.00 | | | | | 12/1/45 | | | | | 254,360 | | | |
Palisade Metropolitan District No. 2 G.O. | | | | 500,000 | | | | | 5.00 | | | | | 12/1/46 | | | | | 500,230 | | | |
St. Vrain Lakes Metropolitan District No. 2 G.O. | | | | 500,000 | | | | | 5.00 | | | | | 12/1/37 | | | | | 488,515 | | | |
Tallman Gulch Metropolitan District G.O. | | | | 500,000 | | | | | 5.25 | | | | | 12/1/47 | | | | | 485,435 | | | |
| | | | | | | | | | | | | | | | | | | | | | |
| | | | | |
| | | | | | | | | | | | | | | | | | | 5,155,920 | | | |
| | | | | | | | | | | | | | | | | | | | | | |
| | | | | |
Connecticut - 1.0% | | | | | | | | | | | | | | | | | | | | | | |
CT Hsg. Finance Auth. Rev. | | | | 500,000 | | | | | 3.75 | | | | | 11/15/35 | | | | | 502,590 | | | |
CT Hsg. Finance Auth. Rev. | | | | 550,000 | | | | | 3.88 | | | | | 11/15/35 | | | | | 560,549 | | | |
CT Hsg. Finance Auth. Rev. | | | | 250,000 | | | | | 3.75 | | | | | 11/15/40 | | | | | 248,875 | | | |
CT Hsg. Finance Auth. Rev. 9 | | | | 505,000 | | | | | 4.25 | | | | | 6/15/43 | | | | | 492,143 | | | |
CT Hsg. Finance Auth. Rev. 9 | | | | 455,000 | | | | | 4.30 | | | | | 6/15/48 | | | | | 442,324 | | | |
| | | | | | | | | | | | | | | | | | | | | | |
| | | | | |
| | | | | | | | | | | | | | | | | | | 2,246,481 | | | |
| | | | | | | | | | | | | | | | | | | | | | |
| | | | | |
District of Columbia - 0.4% | | | | | | | | | | | | | | | | | | | | | | |
District of Columbia Hsg. Finance Agency Rev. (Multi-Family Dev. Program) | | | | 600,000 | | | | | 4.05 | | | | | 9/1/43 | | | | | 601,680 | | | |
District of Columbia Rev. (Ingleside Rock Creek Proj.) | | | | 250,000 | | | | | 5.00 | | | | | 7/1/37 | | | | | 260,225 | | | |
| | | | | | | | | | | | | | | | | | | | | | |
| | | | | |
| | | | | | | | | | | | | | | | | | | 861,905 | | | |
| | | | | | | | | | | | | | | | | | | | | | |
| | | | | |
Florida - 10.2% | | | | | | | | | | | | | | | | | | | | | | |
Alachua Co. Health Facs. Auth. Rev. (Oak Hammock University) | | | | 385,000 | | | | | 8.00 | | | | | 10/1/32 | | | | | 441,002 | | | |
Arborwood Community Dev. District Special Assessment (AGM Insured) | | | | 750,000 | | | | | 3.50 | | | | | 5/1/32 | | | | | 720,120 | | | |
Babcock Ranch Community Independent District Special Assessment | | | | 250,000 | | | | | 5.00 | | | | | 11/1/31 | | | | | 252,215 | | | |
Bay Co. Educational Facs. Rev. (Bay Haven Charter) | | | | 455,000 | | | | | 5.25 | | | | | 9/1/30 | | | | | 468,495 | | | |
Blackburn Creek Community Dev. District Special Assessment (Grand Palm Proj.) | | | | 200,000 | | | | | 6.25 | | | | | 5/1/35 | | | | | 205,412 | | | |
Capital Trust Agency Rev. (Elim Senior Housing, Inc.) 4 | | | | 250,000 | | | | | 5.00 | | | | | 8/1/27 | | | | | 247,698 | | | |
Capital Trust Agency Rev. (Elim Senior Housing, Inc.) 4 | | | | 250,000 | | | | | 5.38 | | | | | 8/1/32 | | | | | 247,698 | | | |
Capital Trust Agency Rev. (River City Educational Services, Inc. Proj.) | | | | 500,000 | | | | | 5.38 | | | | | 2/1/35 | | | | | 488,020 | | | |
Capital Trust Agency Rev. (Tallahassee Tapestry) 4 | | | | 550,000 | | | | | 6.75 | | | | | 12/1/35 | | | | | 565,625 | | | |
Capital Trust Agency Rev. (Tapestry Walden Senior Hsg. Proj.) 4 | | | | 250,000 | | | | | 6.75 | | | | | 7/1/37 | | | | | 257,445 | | | |
Capital Trust Agency Rev. (Tuscan Gardens Senior Living Center) | | | | 250,000 | | | | | 7.00 | | | | | 4/1/35 | | | | | 248,792 | | | |
Capital Trust Agency Rev. (University Bridge LLC Student Housing Proj.) 4 | | | | 500,000 | | | | | 5.25 | | | | | 12/1/43 | | | | | 503,685 | | | |
Celebration Pointe Community Dev. District Special Assessment Rev. 4 | | | | 250,000 | | | | | 5.00 | | | | | 5/1/32 | | | | | 263,278 | | | |
Collier Co. Industrial Dev. Auth. Rev. (Arlington of Naples Proj.) 4 | | | | 250,000 | | | | | 7.25 | | | | | 5/15/26 | | | | | 248,005 | | | |
Collier Co. Industrial Dev. Auth. Rev. (Arlington of Naples Proj.) 4 | | | | 750,000 | | | | | 8.13 | | | | | 5/15/44 | | | | | 738,330 | | | |
Collier Co. Industrial Dev. Auth. Rev. (NCH Healthcare System Proj.) | | | | 415,000 | | | | | 6.25 | | | | | 10/1/39 | | | | | 451,396 | | | |
Durbin Crossing Community Dev. District Special Assessment (AGM Insured) | | | | 520,000 | | | | | 5.00 | | | | | 5/1/32 | | | | | 574,527 | | | |
Fiddlers Creek Community Dev. District No. 2 Special Assessment Rev. 2, 5, 15 | | | | 100,000 | | | | | 5.75 | | | | | N/A | | | | | 63,000 | | | |
FL Hsg. Finance Corp. (GNMA/FNMA Collateralized) | | | | 105,000 | | | | | 5.00 | | | | | 7/1/26 | | | | | 108,001 | | | |
See accompanying notes to financial statements.
SCHEDULE OF INVESTMENTS (Unaudited)
September 30, 2018
Sit Tax-Free Income Fund (Continued)
| | | | | | | | | | | | | | | | | | | | | | |
| | | | | | | | | | | | | | | | | | | | |
| | | | |
| Name of Issuer | | Principal Amount ($) | | Coupon
Rate (%) | | Maturity Date | | Fair Value ($) |
| | | | | |
FL Hsg. Finance Corp. (GNMA/FNMA/FHLMC Collateralized) | | 155,000 | | 5.00 | | | | 7/1/39 | | | | | 157,071 | | | |
FL Hsg. Finance Corp. (GNMA/FNMA/FHLMC Collateralized) | | 500,000 | | 3.80 | | | | 7/1/47 | | | | | 474,785 | | | |
Florida Dev. Finance Corp. Rev. (Renaissance Charter School) | | 400,000 | | 6.00 | | | | 6/15/34 | | | | | 417,964 | | | |
Gramercy Farms Community Dev. District Special Assessment 6 | | 517,637 | | 3.00 | | | | 5/1/39 | | | | | 248,466 | | | |
Heritage Harbour North Community Dev. District Special Assessment | | 235,000 | | 5.00 | | | | 5/1/34 | | | | | 249,857 | | | |
Lakewood Ranch Stewardship District Cap. Improvement Special Assessment Rev. | | 345,000 | | 4.25 | | | | 5/1/25 | | | | | 348,798 | | | |
Lakewood Ranch Stewardship District Cap. Improvement Special Assessment Rev. (Country Club East Proj.) | | 250,000 | | 6.70 | | | | 5/1/33 | | | | | 269,525 | | | |
Lakewood Ranch Stewardship District Cap. Improvement Special Assessment Rev. (Lakewood Center) | | 300,000 | | 7.40 | | | | 5/1/30 | | | | | 332,454 | | | |
Lakewood Ranch Stewardship District Cap. Improvement Special Assessment Rev. (Lakewood National) | | 300,000 | | 5.25 | | | | 5/1/37 | | | | | 314,553 | | | |
Lakewood Ranch Stewardship District Cap. Improvement Special Assessment Rev. (Lakewood Ranch) | | 400,000 | | 5.00 | | | | 5/1/36 | | | | | 412,192 | | | |
Lakewood Ranch Stewardship District Cap. Improvement Special Assessment Rev. (Northeast Sector Proj.) | | 300,000 | | 5.00 | | | | 5/1/38 | | | | | 294,840 | | | |
Lakewood Ranch Stewardship District Cap. Improvement Special Assessment Rev. (Webb Proj.) 4 | | 320,000 | | 5.00 | | | | 5/1/37 | | | | | 330,352 | | | |
Lee Co. Industrial Dev. Auth. Rev. (Preserve Proj.) 4 | | 315,000 | | 5.38 | | | | 12/1/32 | | | | | 316,899 | | | |
Lee Co. Industrial Dev. Auth. Rev. (Preserve Proj.) 4 | | 300,000 | | 5.75 | | | | 12/1/52 | | | | | 303,594 | | | |
Lexington Oaks Community Dev. District Special Assessment Rev. | | 245,000 | | 5.65 | | | | 5/1/33 | | | | | 252,171 | | | |
Live Oak No. 2 Community Dev. District Special Assessment Rev. | | 400,000 | | 4.00 | | | | 5/1/35 | | | | | 377,644 | | | |
Long Lake Ranch Community Dev. District Special Assessment | | 110,000 | | 5.63 | | | | 5/1/24 | | | | | 112,831 | | | |
Long Lake Ranch Community Dev. District Special Assessment | | 500,000 | | 4.63 | | | | 5/1/36 | | | | | 490,835 | | | |
Long Lake Ranch Community Dev. District Special Assessment | | 465,000 | | 5.00 | | | | 5/1/38 | | | | | 459,829 | | | |
Magnolia Creek Community Dev. District Rev. 2, 5, 15 | | 250,000 | | 5.60 | | | | N/A | | | | | 56,250 | | | |
Marshall Creek Community Dev. District Cap. Improvement Special Assessment Rev. | | 250,000 | | 5.00 | | | | 5/1/32 | | | | | 251,660 | | | |
Miami-Dade Co. Transit Sales Tax Rev. | | 500,000 | | 5.00 | | | | 7/1/34 | | | | | 555,805 | | | |
New River Community Dev. District Cap. Improvement Special Assessment Rev. 2, 5, 15 | | 230,000 | | 5.00 | | | | N/A | | | | | 2 | | | |
Northern Palm Beach Co. Improvement District Special Assessment | | 500,000 | | 5.00 | | | | 8/1/29 | | | | | 522,835 | | | |
Northern Palm Beach Co. Improvement District Special Assessment | | 250,000 | | 5.00 | | | | 8/1/37 | | | | | 261,050 | | | |
Orange Co. Health Facs. Auth. Rev. (Presbyterian Retirement Community Proj.) | | 550,000 | | 5.00 | | | | 8/1/34 | | | | | 587,164 | | | |
Orange Co. Health Facs. Auth. Rev. (Presbyterian Retirement Community Proj.) | | 500,000 | | 5.00 | | | | 8/1/35 | | | | | 537,330 | | | |
Orange Co. Health Facs. Auth. Rev. (Presbyterian Retirement Community Proj.) | | 250,000 | | 5.00 | | | | 8/1/41 | | | | | 268,442 | | | |
Orange Co. Hsg. Finance Auth. Rev. (GNMA/FNMA/FHLMC Collateralized) | | 725,000 | | 3.55 | | | | 9/1/30 | | | | | 736,992 | | | |
Orange Co. Hsg.Finance Auth. Rev. (GNMA/FNMA/FHLMC Collateralized) | | 530,000 | | 3.95 | | | | 3/1/40 | | | | | 529,226 | | | |
Orange Co. Hsg. Finance Auth. Rev. (GNMA/FNMA/FHLMC Collateralized) | | 490,000 | | 3.75 | | | | 9/1/47 | | | | | 465,877 | | | |
Orange Co. Hsg. Finance Auth. Rev. (GNMA/FNMA/FHLMC Collateralized) | | 460,000 | | 4.00 | | | | 9/1/48 | | | | | 482,140 | | | |
Orlando Tourist Dev. Rev. (Senior Lien Tourist Dev.) (AGM Insured) | | 250,000 | | 5.00 | | | | 11/1/38 | | | | | 276,082 | | | |
Palm Beach Co. Health Facs. Auth. Rev. (ACTS Retirement-Life Community, Inc.) | | 500,000 | | 5.00 | | | | 11/15/32 | | | | | 547,410 | | | |
Port St. Lucie Research Foundation Rev. (Vaccine Gene Therapy Inst.) 9 | | 500,000 | | 5.00 | | | | 5/1/33 | | | | | 510,260 | | | |
Seven Oaks Community Dev. District Special Assessment Rev | | 250,000 | | 5.50 | | | | 5/1/33 | | | | | 259,608 | | | |
Silverleaf Community Dev. District Special Assessment | | 15,000 | | 6.75 | | | | 5/1/44 | | | | | 15,786 | | | |
Tolomato Community Dev. District Special Assessment 2, 5 | | 120,000 | | 6.61 | | | | 5/1/40 | | | | | 1 | | | |
Tolomato Community Dev. District Special Assessment 6 | | 185,000 | | 7.00 | | | | 5/1/40 | | | | | 147,341 | | | |
Tolomato Community Dev. District Special Assessment 6 | | 110,000 | | 7.00 | | | | 5/1/40 | | | | | 72,080 | | | |
Tolomato Community Dev. District Special Assessment 6 | | 85,000 | | 7.00 | | | | 5/1/40 | | | | | 82,281 | | | |
Tolomato Community Dev. District Special Assessment 6 | | 45,000 | | 7.00 | | | | 5/1/40 | | | | | 36,504 | | | |
Tolomato Community Dev. District Special Assessment (AGM Insured) | | 500,000 | | 3.75 | | | | 5/1/40 | | | | | 473,020 | | | |
Trout Creek Community Dev. District Special Assessment | | 300,000 | | 5.38 | | | | 5/1/38 | | | | | 299,625 | | | |
Waters Edge Community Dev. District Cap. Improvement Rev. | | 9,000 | | 5.35 | | | | 5/1/39 | | | | | 8,663 | | | |
Waters Edge Community Dev. District Cap. Improvement Rev. 6 | | 225,000 | | 6.60 | | | | 5/1/39 | | | | | 224,230 | | | |
Wiregrass Community Dev. District Special Assessment | | 245,000 | | 5.38 | | | | 5/1/35 | | | | | 255,949 | | | |
Zephyr Ridge Community Dev. District Special Assessment 2, 5, 15 | | 450,000 | | 5.25 | | | | N/A | | | | | 378,000 | | | |
| | | | | | | | | | | | | | | | |
| | | | | |
| | | | | | | | | | | | | 22,099,017 | | | |
| | | | | | | | | | | | | | | | |
See accompanying notes to financial statements.
| | |
24 | | SIT MUTUAL FUNDS SEMI-ANNUAL REPORT |
| | | | | | | | | | | | | | | | |
| | | | | | | | | | | | | | |
| | | | | |
| Name of Issuer | | Principal
Amount ($) | | | Coupon
Rate (%) | | Maturity
Date | | | Fair Value ($) |
| | |
Georgia - 4.1% | | | | | | | |
| Atlanta Dev. Auth. Senior Health Care Facs. Rev. (GA Proton Treatment Center) | | | 250,000 | | | 6.00 | | | 1/1/23 | | | | 246,575 | | | |
| Atlanta Dev. Auth. Senior Health Care Facs. Rev. (GA Proton Treatment Center) | | | 250,000 | | | 6.50 | | | 1/1/29 | | | | 243,420 | | | |
| GA Housing & Finance Authority Rev. | | | 1,280,000 | | | 3.80 | | | 12/1/37 | | | | 1,276,493 | | | |
| GA Housing & Finance Authority Rev. | | | 1,000,000 | | | 4.00 | | | 12/1/37 | | | | 1,008,540 | | | |
| GA Housing & Finance Authority Rev. | | | 500,000 | | | 3.85 | | | 12/1/38 | | | | 497,200 | | | |
| GA Housing & Finance Authority Rev. | | | 500,000 | | | 4.00 | | | 12/1/39 | | | | 504,585 | | | |
| GA Housing & Finance Authority Rev. | | | 650,000 | | | 3.80 | | | 12/1/40 | | | | 634,725 | | | |
| GA Housing & Finance Authority Rev. | | | 485,000 �� | | | 3.80 | | | 12/1/40 | | | | 480,674 | | | |
| GA Housing & Finance Authority Rev. | | | 605,000 | | | 3.85 | | | 12/1/41 | | | | 598,569 | | | |
| GA Housing & Finance Authority Rev. | | | 1,000,000 | | | 3.55 | | | 12/1/42 | | | | 944,010 | | | |
| GA Housing & Finance Authority Rev. | | | 540,000 | | | 3.95 | | | 12/1/43 | | | | 537,419 | | | |
| GA Housing & Finance Authority Rev. | | | 600,000 | | | 4.00 | | | 12/1/48 | | | | 583,560 | | | |
| GA Tax Allocation (Beltline Proj.) | | | 500,000 | | | 5.00 | | | 1/1/30 | | | | 515,110 | | | |
| Gainesville Hospital Auth. Rev. (Northeast Georgia Health System, Inc. Proj.) | | | 500,000 | | | 5.00 | | | 2/15/37 | | | | 556,670 | | | |
| Glynn-Brunswick Memorial Hospital Auth. Rev. (Southeast Georgia Health System Proj.) | | | 350,000 | | | 5.00 | | | 8/1/47 | | | | 375,536 | | | |
| | | | | | | | | | | | | | | | |
| | | | | |
| | | | | | | | | | | | | 9,003,086 | | | |
| | | | | | | | | | | | | | | | |
Idaho - 0.9% | | | | | | | |
| ID Health Facs. Authority Rev. (Terraces Boise Proj.) | | | 475,000 | | | 7.00 | | | 10/1/24 | | | | 521,645 | | | |
| ID Health Facs. Authority Rev. (Terraces Boise Proj.) | | | 250,000 | | | 7.38 | | | 10/1/29 | | | | 273,005 | | | |
| ID Health Facs. Authority Rev. (Terraces Boise Proj.) | | | 500,000 | | | 8.00 | | | 10/1/44 | | | | 559,340 | | | |
| ID Hsg. & Fin. Assoc. Nonprofit Facs. Rev. (Idaho Arts Charter School Proj.) | | | 465,000 | | | 5.75 | | | 12/1/32 | | | | 499,959 | | | |
| | | | | | | | | | | | | | | | |
| | | | | |
| | | | | | | | | | | | | 1,853,949 | | | |
| | | | | | | | | | | | | | | | |
Illinois - 7.3% | | | | | | | |
| Bellwood G.O. | | | 500,000 | | | 5.88 | | | 12/1/27 | | | | 557,305 | | | |
| Bolingbrook Special Tax (AGM Insured) | | | 1,000,000 | | | 4.00 | | | 3/1/30 | | | | 1,027,330 | | | |
| Burbank Educational Facs. Rev. (Intercultural Montessori Language School) 4 | | | 500,000 | | | 6.00 | | | 9/1/35 | | | | 520,600 | | | |
| Bureau Co. Township High School Dist. No. 502 G.O. (BAM Insured) | | | 500,000 | | | 6.25 | | | 12/1/33 | | | | 595,625 | | | |
| Chicago Heights G.O. (NATL-RE Insured) | | | 500,000 | | | 4.50 | | | 12/1/29 | | | | 522,065 | | | |
| Chicago Midway Airport Rev. (Second Lien) | | | 500,000 | | | 5.25 | | | 1/1/35 | | | | 543,900 | | | |
| Chicago Park Dist. G.O (Limited Tax) | | | 1,000,000 | | | 5.00 | | | 1/1/28 | | | | 1,089,290 | | | |
| Chicago Transit Auth. Sales Tax Rev. | | | 250,000 | | | 5.25 | | | 12/1/30 | | | | 266,225 | | | |
| IL Educational Facs. Auth. Rev. | | | 250,000 | | | 4.50 | | | 11/1/36 | | | | 255,325 | | | |
| IL Educational Facs. Auth. Rev. (Field Museum of Natural History) | | | 500,000 | | | 3.90 | | | 11/1/36 | | | | 484,200 | | | |
| IL Fin. Auth. Rev. (Admiral Lake Proj.) | | | 300,000 | | | 5.13 | | | 5/15/38 | | | | 295,422 | | | |
| IL Fin. Auth. Rev. (Christian Homes, Inc.) | | | 500,000 | | | 5.00 | | | 5/15/36 | | | | 519,875 | | | |
| IL Fin. Auth. Rev. (Lifespace Communities) | | | 500,000 | | | 5.00 | | | 5/15/35 | | | | 524,650 | | | |
| IL Fin. Auth. Rev. (Lifespace Communities) | | | 500,000 | | | 5.00 | | | 5/15/45 | | | | 518,785 | | | |
| IL Fin. Auth. Rev. (Rogers Park Montessori School Proj.) | | | 300,000 | | | 5.00 | | | 2/1/24 | | | | 308,451 | | | |
| IL Fin. Auth. Sports Facs. Rev. (North Shore Ice Arena Proj.) | | | 1,000,000 | | | 6.25 | | | 12/1/38 | | | | 718,010 | | | |
| IL G.O. | | | 250,000 | | | 5.50 | | | 7/1/33 | | | | 266,052 | | | |
| IL G.O. (AGM Insured) | | | 500,000 | | | 4.00 | | | 2/1/30 | | | | 512,090 | | | |
| IL Housing Dev. Auth. Rev. (Evergreen Towers) | | | 350,000 | | | 4.95 | | | 7/1/34 | | | | 368,557 | | | |
| IL Housing Dev. Auth. Rev. (GNMA/FNMA/FHLMC Collateralized) | | | 450,000 | | | 3.88 | | | 4/1/41 | | | | 443,678 | | | |
| IL Housing Dev. Auth. Rev. (GNMA/FNMA/FHLMC Collateralized) | | | 395,000 | | | 4.00 | | | 10/1/48 | | | | 413,533 | | | |
| IL Sports Facilities Auth. Rev. (State Tax Supported) (AGM Insured) | | | 1,000,000 | | | 5.25 | | | 6/15/31 | | | | 1,087,550 | | | |
| La Salle & Bureau Counties Township High School Dist. No. 120 LaSalle-Peru G.O. (BAM Insured) | | | 250,000 | | | 5.00 | | | 12/1/31 | | | | 279,618 | | | |
| Lake Co. Community Consolidated School District No. 50 Woodland G.O. | | | 250,000 | | | 5.63 | | | 1/1/26 | | | | 269,752 | | | |
| Macon & Moultrie Counties Community Unit School District No. 3 Mt Zion G.O. | | | 335,000 | | | 5.50 | | | 12/1/41 | | | | 366,882 | | | |
| Macon County School District No. 61 Decatur G.O. (AGM Insured) | | | 250,000 | | | 5.25 | | | 1/1/37 | | | | 264,135 | | | |
| Macoupin Sangamon & Montgomery Counties Community Unit School District G.O. (AGM Insured) | | | 990,000 | | | 4.25 | | | 12/1/35 | | | | 1,012,532 | | | |
See accompanying notes to financial statements.
SCHEDULE OF INVESTMENTS (Unaudited)
September 30, 2018
Sit Tax-Free Income Fund (Continued)
| | | | | | | | | | | | | | | | | | | | | | |
| | | | |
| Name of Issuer | | Principal
Amount ($) | | Coupon
Rate (%) | | Maturity
Date | | Fair Value ($) |
| | | | | |
Malta Tax Allocation Rev. 2, 5 | | | | 1,921,000 | | | | | 5.75 | | | | | 12/30/25 | | | | | 614,720 | | | |
Metropolitan Pier & Exposition Auth. Rev. (McCormick Place Expansion Proj.) 6 | | | | 500,000 | | | | | 5.00 | | | | | 12/15/37 | | | | | 275,640 | | | |
Metropolitan Pier & Exposition Auth. Rev. (McCormick Place Expansion Proj.) | | | | 250,000 | | | | | 5.00 | | | | | 6/15/57 | | | | | 263,948 | | | |
Southwestern IL Dev. Auth. Tax Allocation Ref. (Local Govt. Program) | | | | 440,000 | | | | | 7.00 | | | | | 10/1/22 | | | | | 255,200 | | | |
Upper Illinois River Valley Dev. Auth. Rev. (Cambridge Lakes Learning Center) 4 | | | | 250,000 | | | | | 4.00 | | | | | 12/1/22 | | | | | 245,475 | | | |
Upper Illinois River Valley Dev. Auth. Rev. (Cambridge Lakes Learning Center) 4 | | | | 250,000 | | | | | 5.25 | | | | | 12/1/37 | | | | | 250,522 | | | |
| | | | | | | | | | | | | | | | | | | | | | |
| | | | | |
| | | | | | | | | | | | | | | | | | | 15,936,942 | | | |
| | | | | | | | | | | | | | | | | | | | | | |
| | | | | |
Indiana - 2.1% | | | | | | | | | | | | | | | | | | | | | | |
Carmel Multifamily Hsg. Rev. (Barrington Carmel Proj.) | | | | 600,000 | | | | | 6.00 | | | | | 11/15/22 | | | | | 601,686 | | | |
Damon Run Conservancy Dist. G.O. (State Intercept Insured) | | | | 300,000 | | | | | 6.10 | | | | | 7/1/25 | | | | | 309,111 | | | |
Evansville Hsg. Rev. (Silver Birch Evansville Proj.) | | | | 250,000 | | | | | 5.45 | | | | | 1/1/38 | | | | | 244,730 | | | |
IN Finance Auth. Rev. (BHI Senior Living) | | | | 775,000 | | | | | 5.88 | | | | | 11/15/41 | | | | | 864,009 | | | |
IN Finance Auth. Rev. (BHI Senior Living) | | | | 425,000 | | | | | 6.00 | | | | | 11/15/41 | | | | | 477,352 | | | |
IN Finance Auth. Rev. (Greencroft Obligated Group) | | | | 350,000 | | | | | 6.50 | | | | | 11/15/33 | | | | | 384,181 | | | |
IN Housing & Community Dev. Auth. Rev. (Hammond Assisted Living Proj.) | | | | 500,000 | | | | | 5.75 | | | | | 1/1/36 | | | | | 472,270 | | | |
Merrillville Industry Economic Dev. Rev. (Belvedere Housing Proj.) | | | | 300,000 | | | | | 5.75 | | | | | 4/1/36 | | | | | 280,548 | | | |
Mishawaka Multifamily Hsg. Rev. (Silver Birch Mishawaka Proj.) 4 | | | | 500,000 | | | | | 5.38 | | | | | 1/1/38 | | | | | 485,085 | | | |
Richmond Hospital Auth. Rev. (Reid Hospital & Health Care) | | | | 350,000 | | | | | 5.00 | | | | | 1/1/35 | | | | | 378,192 | | | |
| | | | | | | | | | | | | | | | | | | | | | |
| | | | | |
| | | | | | | | | | | | | | | | | | | 4,497,164 | | | |
| | | | | | | | | | | | | | | | | | | | | | |
| | | | | |
Iowa - 0.4% | | | | | | | | | | | | | | | | | | | | | | |
IA Fin. Auth. Rev. (Lifespace Communities, Inc.) | | | | 650,000 | | | | | 5.00 | | | | | 5/15/36 | | | | | 680,128 | | | |
IA Student Loan Liquidity Corp. Rev. | | | | 250,000 | | | | | 5.80 | | | | | 12/1/31 | | | | | 258,548 | | | |
| | | | | | | | | | | | | | | | | | | | | | |
| | | | | |
| | | | | | | | | | | | | | | | | | | 938,676 | | | |
| | | | | | | | | | | | | | | | | | | | | | |
| | | | | |
Kansas - 0.4% | | | | | | | | | | | | | | | | | | | | | | |
Wichita Health Care Facs. Rev. (Kansas Masonic Home) | | | | 300,000 | | | | | 5.25 | | | | | 12/1/36 | | | | | 311,679 | | | |
Wichita Health Care Facs. Rev. (Presbyterian Manors, Inc.) | | | | 500,000 | | | | | 6.25 | | | | | 5/15/34 | | | | | 500,765 | | | |
| | | | | | | | | | | | | | | | | | | | | | |
| | | | | |
| | | | | | | | | | | | | | | | | | | 812,444 | | | |
| | | | | | | | | | | | | | | | | | | | | | |
| | | | | |
Kentucky - 0.2% | | | | | | | | | | | | | | | | | | | | | | |
| | | | | |
Pikeville Hospital Rev. Ref. (Pikeville Medical Center) | | | | 425,000 | | | | | 6.50 | | | | | 3/1/41 | | | | | 455,987 | | | |
| | | | | | | | | | | | | | | | | | | | | | |
| | | | | |
Louisiana - 1.5% | | | | | | | | | | | | | | | | | | | | | | |
Denham Springs/Livingston Hsg. & Mtg. Finance Auth. Rev. (GNMA/FHLMC Collateralized) | | | | 25,048 | | | | | 5.00 | | | | | 11/1/40 | | | | | 25,052 | | | |
LA Hsg. Fin. Agy. Single Family Mtg. Rev. (Home Ownership Program) (GNMA/FHLMC Collateralized) | | | | 85,000 | | | | | 6.00 | | | | | 12/1/28 | | | | | 85,234 | | | |
LA Hsg. Fin. Agy. Single Family Mtg. Rev. (Mtg. Backed Sec. Prog.) (GNMA/FHLMC Collateralized) | | | | 170,000 | | | | | 4.60 | | | | | 6/1/29 | | | | | 174,666 | | | |
LA Local Government Environmental Facilities & Community Development Auth. | | | | 500,000 | | | | | 5.25 | | | | | 11/15/25 | | | | | 530,170 | | | |
LA Local Government Environmental Facilities & Community Development Auth. | | | | 500,000 | | | | | 6.00 | | | | | 11/15/30 | | | | | 549,055 | | | |
LA Local Government Environmental Facilities & Community Development Auth. Rev. 4 | | | | 300,000 | | | | | 5.65 | | | | | 11/1/37 | | | | | 305,289 | | | |
LA Public Facs. Auth. Rev. (Belle-Chase Educational Foundation Proj.) (NATL-RE Insured) | | | | 250,000 | | | | | 6.50 | | | | | 5/1/31 | | | | | 262,725 | | | |
LA Public Facs. Auth. Rev. (Franciscan Missionaries Health System Proj.) | | | | 300,000 | | | | | 5.00 | | | | | 7/1/35 | | | | | 327,762 | | | |
LA Public Facs. Auth. Rev. (Tulane Univ. Proj.) (NATL-RE Insured) 1 | | | | 620,000 | | | | | 2.25 | | | | | 2/15/36 | | | | | 588,374 | | | |
St. Tammany Parish Fin. Auth. Rev. (Christwood Proj.) | | | | 300,000 | | | | | 5.25 | | | | | 11/15/37 | | | | | 316,497 | | | |
| | | | | | | | | | | | | | | | | | | | | | |
| | | | | |
| | | | | | | | | | | | | | | | | | | 3,164,824 | | | |
| | | | | | | | | | | | | | | | | | | | | | |
| | | | | |
Maine - 0.9% | | | | | | | | | | | | | | | | | | | | | | |
ME Hsg. Auth. Rev. | | | | 600,000 | | | | | 4.00 | | | | | 11/15/35 | | | | | 605,172 | | | |
ME Hsg. Auth. Rev. | | | | 500,000 | | | | | 4.00 | | | | | 11/15/37 | | | | | 500,310 | | | |
ME Hsg. Auth. Rev. | | | | 205,000 | | | | | 4.50 | | | | | 11/15/37 | | | | | 210,574 | | | |
ME Hsg. Auth. Rev. | | | | 250,000 | | | | | 3.55 | | | | | 11/15/40 | | | | | 236,040 | | | |
ME Hsg. Auth. Rev. | | | | 500,000 | | | | | 3.85 | | | | | 11/15/40 | | | | | 482,625 | | | |
| | | | | | | | | | | | | | | | | | | | | | |
| | | | | |
| | | | | | | | | | | | | | | | | | | 2,034,721 | | | |
| | | | | | | | | | | | | | | | | | | | | | |
See accompanying notes to financial statements.
| | |
26 | | SIT MUTUAL FUNDS SEMI-ANNUAL REPORT |
| | | | | | | | | | | | | | | | | | | | | | | | | |
| | | | |
| Name of Issuer | | Principal
Amount ($) | | Coupon
Rate (%) | | Maturity
Date | | Fair Value ($) |
| | | | | |
Maryland - 0.5% | | | | | | | | | | | | | | | | | | | | | | | | | |
MD Community Dev. Administration Rev. | | | | 350,000 | | | | | 3.75 | | | | | 3/1/39 | | | | | 351,183 | | | | | | |
MD Community Dev. Administration Rev. | | | | 350,000 | | | | | 4.20 | | | | | 7/1/46 | | | | | 352,516 | | | | | | |
Montgomery Co. Housing Opportunities Commission Rev. | | | | 405,000 | | | | | 4.00 | | | | | 7/1/38 | | | | | 406,798 | | | | | | |
| | | | | | | | | | | | | | | | | | | | | | | | | |
| | | | | |
| | | | | | | | | | | | | | | | | | | 1,110,497 | | | | | | |
| | | | | | | | | | | | | | | | | | | | | | | | | |
| | | | | |
Massachusetts - 2.2% | | | | | | | | | | | | | | | | | | | | | | | | | |
Dedham Municipal Purpose Loan. G.O. (NATL Insured) | | | | 480,000 | | | | | 4.00 | | | | | 10/15/24 | | | | | 480,869 | | | | | | |
Ipswich Muncipal Purpose Loan G.O. (AGM Insured) | | | | 500,000 | | | | | 4.00 | | | | | 6/1/25 | | | | | 500,670 | | | | | | |
MA Dev. Finance Agy. Rev. (Newbridge on the Charles, Inc.) 4 | | | | 300,000 | | | | | 5.00 | | | | | 10/1/47 | | | | | 316,677 | | | | | | |
MA Education Finance Auth. Education Rev. | | | | 135,000 | | | | | 5.15 | | | | | 1/1/26 | | | | | 137,754 | | | | | | |
MA Housing Finance Agy. Rev. | | | | 250,000 | | | | | 4.75 | | | | | 6/1/35 | | | | | 260,265 | | | | | | |
MA Housing Finance Agy. Rev. | | | | 500,000 | | | | | 3.75 | | | | | 12/1/40 | | | | | 493,305 | | | | | | |
MA Housing Finance Agy. Rev. | | | | 900,000 | | | | | 3.85 | | | | | 12/1/47 | | | | | 854,541 | | | | | | |
MA Housing Finance Agy. Rev. (FHA Insured) | | | | 500,000 | | | | | 5.30 | | | | | 12/1/38 | | | | | 518,015 | | | | | | |
MA Housing Finance Agy. Rev. (GNMA/FNMA/FHLMC Collateralized) | | | | 270,000 | | | | | 3.90 | | | | | 12/1/38 | | | | | 270,092 | | | | | | |
Northbridge Muncipal Purpose Loan G.O (AGM Insured) | | | | 500,000 | | | | | 4.00 | | | | | 6/15/25 | | | | | 500,515 | | | | | | |
Rowley Land Acquisition Loan G.O (AGM Insured) | | | | 360,000 | | | | | 4.00 | | | | | 5/1/27 | | | | | 360,371 | | | | | | |
| | | | | | | | | | | | | | | | | | | | | | | | | |
| | | | | |
| | | | | | | | | | | | | | | | | | | 4,693,074 | | | | | | |
| | | | | | | | | | | | | | | | | | | | | | | | | |
| | | | | |
Michigan - 2.3% | | | | | | | | | | | | | | | | | | | | | | | | | |
MI Finance Auth. Rev. (Presbyterian Village) | | | | 250,000 | | | | | 5.25 | | | | | 11/15/35 | | | | | 256,702 | | | | | | |
MI Hsg. Dev. Auth. (G.O. of Authority Insured) | | | | 250,000 | | | | | 4.63 | | | | | 10/1/41 | | | | | 254,970 | | | | | | |
MI Hsg. Dev. Auth. Rev. | | | | 500,000 | | | | | 4.10 | | | | | 10/1/35 | | | | | 509,320 | | | | | | |
MI Hsg. Dev. Auth. Rev. | | | | 500,000 | | | | | 3.70 | | | | | 12/1/36 | | | | | 494,760 | | | | | | |
MI Hsg. Dev. Auth. Rev. | | | | 705,000 | | | | | 3.95 | | | | | 12/1/40 | | | | | 707,460 | | | | | | |
MI Hsg. Dev. Auth. Rev. | | | | 300,000 | | | | | 3.75 | | | | | 10/1/42 | | | | | 284,499 | | | | | | |
MI Hsg. Dev. Auth. Rev. | | | | 750,000 | | | | | 4.00 | | | | | 10/1/43 | | | | | 748,822 | | | | | | |
MI Hsg. Dev. Auth. Rev. | | | | 330,000 | | | | | 3.70 | | | | | 12/1/45 | | | | | 318,991 | | | | | | |
Muskegon Heights Water Supply Rev. (NATL Insured) | | | | 510,000 | | | | | 4.15 | | | | | 11/1/23 | | | | | 510,632 | | | | | | |
Muskegon Heights Water Supply Rev. (NATL Insured) | | | | 425,000 | | | | | 4.20 | | | | | 11/1/24 | | | | | 425,518 | | | | | | |
Taylor Brownfield Redevelopment Authority (NATL Insured) | | | | 250,000 | | | | | 5.00 | | | | | 5/1/32 | | | | | 268,198 | | | | | | |
Universal Academy Michigan Public School Rev. | | | | 185,000 | | | | | 6.50 | | | | | 12/1/23 | | | | | 188,134 | | | | | | |
| | | | | | | | | | | | | | | | | | | | | | | | | |
| | | | | |
| | | | | | | | | | | | | | | | | | | 4,968,006 | | | | | | |
| | | | | | | | | | | | | | | | | | | | | | | | | |
| | | | | |
Minnesota - 0.6% | | | | | | | | | | | | | | | | | | | | | | | | | |
Apple Valley City Rev. (Senior Living, LLC Proj.) | | | | 500,000 | | | | | 5.00 | | | | | 1/1/47 | | | | | 510,315 | | | | | | |
MN Hsg. Fin. Agy. Mtg. Rev. (Mtg. Backed Securities Program) (GNMA/FNMA Collateralized) | | | | 110,000 | | | | | 4.40 | | | | | 7/1/32 | | | | | 112,287 | | | | | | |
MN Hsg. Fin. Agy. Residential Hsg. Rev. | | | | 160,000 | | | | | 5.10 | | | | | 1/1/40 | | | | | 161,402 | | | | | | |
Rochester City Rev. (Math & Science Academy Proj.) | | | | 500,000 | | | | | 5.13 | | | | | 9/1/38 | | | | | 490,800 | | | | | | |
| | | | | | | | | | | | | | | | | | | | | | | | | |
| | | | | |
| | | | | | | | | | | | | | | | | | | 1,274,804 | | | | | | |
| | | | | | | | | | | | | | | | | | | | | | | | | |
| | | | | |
Mississippi - 0.2% | | | | | | | | | | | | | | | | | | | | | | | | | |
MS Home Corp. Single Family Mtg. Rev. (GNMA/FNMA/FHLMC Collateralized) | | | | 470,000 | | | | | 4.00 | | | | | 12/1/43 | | | | | 488,579 | | | | | | |
| | | | | | | | | | | | | | | | | | | | | | | | | |
| | | | | |
Missouri - 0.6% | | | | | | | | | | | | | | | | | | | | | | | | | |
Kansas City Industrial Dev. Auth. Rev. (Kansas City Pkg. LLC) | | | | 200,000 | | | | | 5.45 | | | | | 9/1/23 | | | | | 205,434 | | | | | | |
Kansas City Industrial Dev. Auth. Rev. (United Methodist Retirement Home, Inc.) 4 | | | | 500,000 | | | | | 5.75 | | | | | 11/15/36 | | | | | 473,595 | | | | | | |
MO Hsg. Dev. Commission Rev. (GNMA/FNMA/FHLMC Collateralized) | | | | 750,000 | | | | | 3.80 | | | | | 11/1/48 | | | | | 725,152 | | | | | | |
| | | | | | | | | | | | | | | | | | | | | | | | | |
| | | | | |
| | | | | | | | | | | | | | | | | | | 1,404,181 | | | | | | |
| | | | | | | | | | | | | | | | | | | | | | | | | |
| | | | | |
Montana - 0.5% | | | | | | | | | | | | | | | | | | | | | | | | | |
Forsyth Pollution Control Rev. | | | | 250,000 | | | | | 5.00 | | | | | 5/1/33 | | | | | 263,838 | | | | | | |
MT Board of Housing Single Family Rev. | | | | 205,000 | | | | | 4.00 | | | | | 12/1/38 | | | | | 210,225 | | | | | | |
MT Board of Housing Single Family Rev. (FHA Insured) | | | | 280,000 | | | | | 3.75 | | | | | 12/1/38 | | | | | 282,355 | | | | | | |
See accompanying notes to financial statements.
SCHEDULE OF INVESTMENTS (Unaudited)
September 30, 2018
Sit Tax-Free Income Fund (Continued)
| | | | | | | | | | | | | | | | | | | | | | |
| | | | |
| Name of Issuer | | Principal
Amount ($) | | Coupon
Rate (%) | | Maturity
Date | | Fair Value ($) |
| | | | | |
MT Board of Housing Single Family Rev. (G.O. of BRD Insured) | | | | 95,000 | | | | | 4.70 | | | | | 12/1/26 | | | | | 97,638 | | | |
MT Facs. Finance Auth. Rev. (Great Falls Pre-Release Services Proj.) | | | | 264,217 | | | | | 5.08 | | | | | 4/1/21 | | | | | 267,026 | | | |
| | | | | | | | | | | | | | | | | | | | | | |
| | | | | |
| | | | | | | | | | | | | | | | | | | 1,121,082 | | | |
| | | | | | | | | | | | | | | | | | | | | | |
| | | | | |
Nebraska - 0.4% | | | | | | | | | | | | | | | | | | | | | | |
Douglas Co. Hospital Auth. No. 3 (Methodist Hospital) | | | | 400,000 | | | | | 5.00 | | | | | 11/1/30 | | | | | 445,284 | | | |
Mead Village Tax Allocation Rev. (E3 Biofuels - Mead LLC Proj.) 2, 5, 15 | | | | 410,000 | | | | | 5.13 | | | | | N/A | | | | | 38,130 | | | |
Nebraska Investment Fin. Auth. Rev. (GNMA/FNMA/FHLMC Collateralized) | | | | 310,000 | | | | | 3.75 | | | | | 9/1/35 | | | | | 306,544 | | | |
| | | | | | | | | | | | | | | | | | | | | | |
| | | | | |
| | | | | | | | | | | | | | | | | | | 789,958 | | | |
| | | | | | | | | | | | | | | | | | | | | | |
| | | | | |
Nevada - 0.6% | | | | | | | | | | | | | | | | | | | | | | |
City of North Las Vegas (Special Northern Beltway Commercial Area) 4 | | | | 400,000 | | | | | 4.00 | | | | | 12/1/27 | | | | | 386,556 | | | |
City of North Las Vegas (Special Northern Beltway Commercial Area) 4 | | | | 400,000 | | | | | 5.00 | | | | | 12/1/37 | | | | | 395,328 | | | |
Nevada Hsg. Division Rev. (GNMA/FNMA/FHLMC Collateralized) | | | | 460,000 | | | | | 3.85 | | | | | 10/1/39 | | | | | 460,621 | | | |
NV Hsg. Dev. Single Family Mtg. Program Mezzanine (GNMA/FNMA/FHLMC Collateralized) | | | | 35,000 | | | | | 5.10 | | | | | 10/1/40 | | | | | 35,317 | | | |
| | | | | | | | | | | | | | | | | | | | | | |
| | | | | |
| | | | | | | | | | | | | | | | | | | 1,277,822 | | | |
| | | | | | | | | | | | | | | | | | | | | | |
| | | | | |
New Hampshire - 0.5% | | | | | | | | | | | | | | | | | | | | | | |
NH Health & Educ. Facs. Auth. Rev. (Wentworth Douglas Hospital) | | | | 400,000 | | | | | 6.00 | | | | | 1/1/34 | | | | | 433,500 | | | |
NH Hsg. Fin. Agy. Rev. (Cimarron, Whittier Falls & Mars) (FHA Insured) | | | | 725,000 | | | | | 4.00 | | | | | 7/1/52 | | | | | 705,309 | | | |
| | | | | | | | | | | | | | | | | | | | | | |
| | | | | |
| | | | | | | | | | | | | | | | | | | 1,138,809 | | | |
| | | | | | | | | | | | | | | | | | | | | | |
| | | | | |
New Jersey - 2.4% | | | | | | | | | | | | | | | | | | | | | | |
NJ Economic Dev. Auth. Rev. (North Star Academy Charter School Newark) | | | | 250,000 | | | | | 5.00 | | | | | 7/15/47 | | | | | 264,740 | | | |
NJ Economic Dev. Auth. Rev. (State Government Buildings Proj.) 9 | | | | 500,000 | | | | | 5.00 | | | | | 6/15/42 | | | | | 531,420 | | | |
NJ Higher Education Assistance Auth. Student Loan Rev. | | | | 5,000 | | | | | 5.00 | | | | | 12/1/28 | | | | | 5,200 | | | |
NJ Hsg. & Mtg. Finance Agy. Rev. | | | | 265,000 | | | | | 5.05 | | | | | 10/1/39 | | | | | 266,200 | | | |
NJ Hsg. & Mtg. Finance Agy. Rev. | | | | 750,000 | | | | | 3.95 | | | | | 11/1/43 | | | | | 742,905 | | | |
NJ Hsg. & Mtg. Finance Agy. Rev. (Mciver Homes Hsg. Proj.) (FHLMC Collateralized) | | | | 550,000 | | | | | 3.60 | | | | | 1/1/30 | | | | | 555,484 | | | |
NJ Hsg. & Mtg. Finance Agy. Single Family Mtg. Rev. | | | | 350,000 | | | | | 4.50 | | | | | 10/1/30 | | | | | 360,882 | | | |
NJ Hsg. & Mtg. Finance Agy. Single Family Mtg. Rev. | | | | 1,000,000 | | | | | 3.75 | | | | | 10/1/35 | | | | | 985,150 | | | |
NJ Hsg. & Mtg. Finance Agy. Single Family Mtg. Rev. | | | | 700,000 | | | | | 4.50 | | | | | 10/1/48 | | | | | 746,088 | | | |
NJ Transportation Trust Fund Auth. Rev. (Transportation System) | | | | 400,000 | | | | | 5.88 | | | | | 12/15/38 | | | | | 403,184 | | | |
Tobacco Settlement Financing Corp. Rev. | | | | 300,000 | | | | | 5.00 | | | | | 6/1/46 | | | | | 316,203 | | | |
| | | | | | | | | | | | | | | | | | | | | | |
| | | | | |
| | | | | | | | | | | | | | | | | | | 5,177,456 | | | |
| | | | | | | | | | | | | | | | | | | | | | |
| | | | | |
New Mexico - 1.8% | | | | | | | | | | | | | | | | | | | | | | |
NM Mtg. Fin. Auth. Single Family Mtg. Rev. (FHA Insured) | | | | 355,000 | | | | | 3.90 | | | | | 9/1/42 | | | | | 355,217 | | | |
NM Mtg. Fin. Auth. Single Family Mtg. Rev. (GNMA/FNMA/FHLMC Collateralized) | | | | 185,000 | | | | | 4.80 | | | | | 9/1/29 | | | | | 186,306 | | | |
NM Mtg. Fin. Auth. Single Family Mtg. Rev. (GNMA/FNMA/FHLMC Collateralized) | | | | 185,000 | | | | | 5.35 | | | | | 9/1/30 | | | | | 186,180 | | | |
NM Mtg. Fin. Auth. Single Family Mtg. Rev. (GNMA/FNMA/FHLMC Collateralized) | | | | 420,000 | | | | | 5.25 | | | | | 9/1/34 | | | | | 425,149 | | | |
NM Mtg. Fin. Auth. Single Family Mtg. Rev. (GNMA/FNMA/FHLMC Collateralized) | | | | 350,000 | | | | | 4.13 | | | | | 9/1/42 | | | | | 353,938 | | | |
NM Mtg. Fin. Auth. Single Family Mtg. Rev. (GNMA/FNMA/FHLMC Collateralized) | | | | 750,000 | | | | | 3.85 | | | | | 7/1/43 | | | | | 733,545 | | | |
NM Mtg. Fin. Auth. Single Family Mtg. Rev. (GNMA/FNMA/FHLMC Collateralized) | | | | 500,000 | | | | | 3.85 | | | | | 7/1/43 | | | | | 489,030 | | | |
NM Mtg. Fin. Auth. Single Family Mtg. Rev. (GNMA/FNMA/FHLMC Collateralized) | | | | 440,000 | | | | | 3.80 | | | | | 9/1/46 | | | | | 428,160 | | | |
NM Mtg. Fin. Auth. Single Family Mtg. Rev. (GNMA/FNMA/FHLMC Collateralized) | | | | 845,000 | | | | | 4.00 | | | | | 7/1/48 | | | | | 815,011 | | | |
| | | | | | | | | | | | | | | | | | | | | | |
| | | | | |
| | | | | | | | | | | | | | | | | | | 3,972,536 | | | |
| | | | | | | | | | | | | | | | | | | | | | |
| | | | | |
New York - 4.0% | | | | | | | | | | | | | | | | | | | | | | |
Hempstead Town Local Development Corp. Rev. (Hofstra University Proj.) | | | | 350,000 | | | | | 4.00 | | | | | 7/1/33 | | | | | 358,656 | | | |
New York City Housing Development Corp. Multifamily Mtg. Rev. | | | | 250,000 | | | | | 4.60 | | | | | 11/1/36 | | | | | 258,975 | | | |
New York City Housing Development Corp. Multifamily Mtg. Rev. | | | | 300,000 | | | | | 4.05 | | | | | 11/1/41 | | | | | 301,092 | | | |
New York City Housing Development Corp. Multifamily Mtg. Rev. | | | | 300,000 | | | | | 3.85 | | | | | 11/1/42 | | | | | 290,820 | | | |
New York City Housing Development Corp. Multifamily Mtg. Rev. | | | | 650,000 | | | | | 3.65 | | | | | 11/1/47 | | | | | 616,447 | | | |
See accompanying notes to financial statements.
| | |
28 | | SIT MUTUAL FUNDS SEMI-ANNUAL REPORT |
| | | | | | | | | | | | | | | | | | |
| | | | |
| Name of Issuer | | Principal
Amount ($) | | | Coupon
Rate (%) | | | Maturity
Date | | | Fair Value ($) |
| | | | | |
New York City Housing Development Corp. Rev. | | | 500,000 | | | | 3.80 | | | | 11/1/37 | | | | 500,650 | | | |
New York City Municipal Water Finance Authority | | | 750,000 | | | | 5.00 | | | | 6/15/38 | | | | 822,202 | | | |
NY Mortgage Agency Rev. | | | 500,000 | | | | 3.70 | | | | 10/1/38 | | | | 495,115 | | | |
NY Mortgage Agency Rev. | | | 500,000 | | | | 3.75 | | | | 10/1/38 | | | | 497,215 | | | |
NY Mortgage Agency Rev. | | | 500,000 | | | | 3.80 | | | | 10/1/40 | | | | 490,485 | | | |
NY Mortgage Agency Rev. | | | 200,000 | | | | 3.75 | | | | 10/1/42 | | | | 194,440 | | | |
NY Mortgage Agency Rev. | | | 750,000 | | | | 3.80 | | | | 10/1/48 | | | | 722,662 | | | |
NY State Dormitory Auth. Rev. Ref. (Miriam Osborne Memorial Home) | | | 500,000 | | | | 5.00 | | | | 7/1/42 | | | | 507,795 | | | |
NY State Dormitory Auth. Rev. Ref. (N. Shore-Long Island Jewish Obligation) | | | 300,000 | | | | 5.00 | | | | 5/1/33 | | | | 333,123 | | | |
NY State Housing Finance Agency Rev. (Affordable Hsg. Proj.) | | | 590,000 | | | | 3.75 | | | | 11/1/37 | | | | 590,773 | | | |
NY State Housing Finance Agency Rev. (Affordable Hsg. Proj.) | | | 400,000 | | | | 4.88 | | | | 11/1/42 | | | | 411,556 | | | |
NY State Housing Finance Agency Rev. (Affordable Hsg. Proj.) (FNMA/FHLMC Collateralized) | | | 500,000 | | | | 3.65 | | | | 11/1/34 | | | | 502,500 | | | |
NY State Housing Finance Agency Rev. (Affordable Hsg. Proj.) (GNMA/FNMA/FHLMC Collateralized) | | | 500,000 | | | | 3.95 | | | | 11/1/37 | | | | 504,560 | | | |
NY State Housing Finance Agency Rev. (GNMA/FNMA/FHLMC Collateralized) | | | 250,000 | | | | 4.10 | | | | 11/1/41 | | | | 254,070 | | | |
| | | | | | | | | | | | | | | | | | |
| | | | | |
| | | | | | | | | | | | | | | 8,653,136 | | | |
| | | | | | | | | | | | | | | | | | |
| | | | | |
North Carolina - 1.2% | | | | | | | | | | | | | | | | | | |
NC Housing Finance Agency Rev. | | | 650,000 | | | | 3.85 | | | | 7/1/37 | | | | 649,110 | | | |
NC Housing Finance Agency Rev. | | | 300,000 | | | | 3.95 | | | | 1/1/41 | | | | 297,351 | | | |
NC Housing Finance Agency Rev. | | | 15,000 | | | | 3.60 | | | | 7/1/41 | | | | 15,000 | | | |
NC Housing Finance Agency Rev. | | | 1,200,000 | | | | 4.00 | | | | 7/1/47 | | | | 1,251,168 | | | |
NC Housing Finance Agency Rev. (GNMA/FNMA/FHLMC Collateralized) | | | 500,000 | | | | 4.00 | | | | 1/1/48 | | | | 499,120 | | | |
| | | | | | | | | | | | | | | | | | |
| | | | | |
| | | | | | | | | | | | | | | 2,711,749 | | | |
| | | | | | | | | | | | | | | | | | |
| | | | | |
North Dakota - 0.2% | | | | | | | | | | | | | | | | | | |
ND Housing Finance Agency Rev. | | | 495,000 | | | | 4.00 | | | | 7/1/48 | | | | 517,537 | | | |
| | | | | | | | | | | | | | | | | | |
| | | | | |
Ohio - 1.7% | | | | | | | | | | | | | | | | | | |
Cuyahoga Co. Hsg. Mtg. Sr. Rev. (R H Myers Apts. Proj.) (GNMA Collateralized) | | | 636,800 | | | | 5.70 | | | | 3/20/42 | | | | 644,620 | | | |
Dayton-Montgomery County Port Auth. Rev. (Storypoint Troy Proj.) | | | 400,000 | | | | 7.00 | | | | 1/15/40 | | | | 414,088 | | | |
Lake Co. Port & Economic Dev. Auth. Rev. (Tapestry Wickliffe Proj.) 4 | | | 250,000 | | | | 6.50 | | | | 12/1/37 | | | | 259,580 | | | |
Lucas Metro Hsg. Auth. | | | 500,000 | | | | 5.00 | | | | 11/1/36 | | | | 519,605 | | | |
OH Housing Finance Agency Rev. (GNMA/FNMA Collateralized) | | | 450,000 | | | | 4.05 | | | | 3/1/37 | | | | 460,220 | | | |
OH Housing Finance Agency Rev. (GNMA/FNMA/FHLMC Collateralized) | | | 465,000 | | | | 3.35 | | | | 9/1/39 | | | | 437,784 | | | |
OH Housing Finance Agency Rev. (GNMA/FNMA/FHLMC Collateralized) | | | 1,000,000 | | | | 4.00 | | | | 9/1/48 | | | | 1,000,720 | | | |
| | | | | | | | | | | | | | | | | | |
| | | | | |
| | | | | | | | | | | | | | | 3,736,617 | | | |
| | | | | | | | | | | | | | | | | | |
| | | | | |
Oklahoma - 0.3% | | | | | | | | | | | | | | | | | | |
Fort Sill Apache Tribe Economic Dev. Auth. 4 | | | 505,000 | | | | 8.50 | | | | 8/25/26 | | | | 579,225 | | | |
| | | | | | | | | | | | | | | | | | |
| | | | | |
Oregon - 2.1% | | | | | | | | | | | | | | | | | | |
Clackamas Co. Hospital Fac. Auth. Rev. (Willamette View Proj.) | | | 460,000 | | | | 5.00 | | | | 11/15/52 | | | | 486,905 | | | |
Clackamas Co. Hsg. Auth. Rev. (Easton Ridge Apts. Proj.) | | | 350,000 | | | | 3.50 | | | | 9/1/33 | | | | 350,133 | | | |
Deschutes Co. G.O. (AGC Insured) | | | 635,000 | | | | 4.45 | | | | 6/1/28 | | | | 636,099 | | | |
Forest Grove Rev. (Campus Improvement-Pacific Unv. Proj.) | | | 250,000 | | | | 5.25 | | | | 5/1/34 | | | | 266,330 | | | |
Marion Co. School District No.1 Gervais G.O. | | | 500,000 | | | | 4.00 | | | | 6/1/33 | | | | 500,320 | | | |
OR Hsg. & Community Services Dept. Rev. (Single Family Mtg. Program) | | | 290,000 | | | | 3.75 | | | | 7/1/35 | | | | 288,915 | | | |
OR Hsg. & Community Services Dept. Rev. (Single Family Mtg. Program) | | | 400,000 | | | | 4.00 | | | | 7/1/38 | | | | 401,376 | | | |
OR Hsg. & Community Services Dept. Rev. (Single Family Mtg. Program) | | | 470,000 | | | | 3.75 | | | | 7/1/48 | | | | 452,817 | | | |
OR State Ref G.O. (Veterans Welfare Service) | | | 1,000,000 | | | | 3.90 | | | | 12/1/39 | | | | 1,013,510 | | | |
Polk Co. Hospital Fac. Auth. Rev. (Dallas Retirement Village Proj.) | | | 250,000 | | | | 5.13 | | | | 7/1/35 | | | | 257,230 | | | |
| | | | | | | | | | | | | | | | | | |
| | | | | |
| | | | | | | | | | | | | | | 4,653,635 | | | |
| | | | | | | | | | | | | | | | | | |
See accompanying notes to financial statements.
SCHEDULE OF INVESTMENTS (Unaudited)
September 30, 2018
Sit Tax-Free Income Fund (Continued)
| | | | | | | | | | | | | | | | | | | | | | |
| | | | |
| Name of Issuer | | Principal
Amount ($) | | Coupon
Rate (%) | | Maturity
Date | | Fair Value ($) |
| | | | | |
Pennsylvania - 3.8% | | | | | | | | | | | | | | | | | | | | | | |
Allegheny Co. Industrial Dev. Auth. Charter School Rev. (Propel Charter-McKeesport) | | | | 145,000 | | | | | 5.90 | | | | | 8/15/26 | | | | | 150,773 | | | |
Butler Co. General Authority Rev. (School District Proj.) (AGM G.O. of District) 1 | | | | 465,000 | | | | | 2.27 | | | | | 10/1/34 | | | | | 435,398 | | | |
Central Bradford Progress Auth. Rev. (Guthrie Healthcare System) | | | | 250,000 | | | | | 5.50 | | | | | 12/1/31 | | | | | 274,430 | | | |
Commonwealth Financing Auth. Rev. (Tobacco Master Settlement Payment) (AGM Insured) | | | | 350,000 | | | | | 4.00 | | | | | 6/1/39 | | | | | 349,982 | | | |
Dauphin Co. General Auth. Rev. (Harrisburg University Science Technology) 4 | | | | 400,000 | | | | | 4.00 | | | | | 10/15/22 | | | | | 400,632 | | | |
Erie Co. Hospital Auth. Rev. (St. Vincent Health Center Proj.) | | | | 250,000 | | | | | 7.00 | | | | | 7/1/27 | | | | | 270,942 | | | |
PA Higher Educational Facs. Auth. Rev. (La Salle University) | | | | 280,000 | | | | | 5.00 | | | | | 5/1/42 | | | | | 291,399 | | | |
PA Hsg. Finance Agy. Rev. | | | | 500,000 | | | | | 3.90 | | | | | 10/1/36 | | | | | 504,860 | | | |
PA Hsg. Finance Agy. Rev. | | | | 530,000 | | | | | 3.95 | | | | | 10/1/38 | | | | | 530,382 | | | |
PA Hsg. Finance Agy. Rev. | | | | 500,000 | | | | | 4.05 | | | | | 10/1/40 | | | | | 504,510 | | | |
PA Hsg. Finance Agy. Rev. | | | | 500,000 | | | | | 4.05 | | | | | 10/1/40 | | | | | 503,125 | | | |
PA Hsg. Finance Agy. Rev. | | | | 825,000 | | | | | 3.65 | | | | | 10/1/42 | | | | | 794,294 | | | |
PA Hsg. Finance Agy. Rev. | | | | 250,000 | | | | | 4.00 | | | | | 10/1/42 | | | | | 250,170 | | | |
PA Hsg. Finance Agy. Rev. | | | | 590,000 | | | | | 4.15 | | | | | 10/1/45 | | | | | 594,053 | | | |
PA Hsg. Finance Agy. Rev. | | | | 225,000 | | | | | 4.00 | | | | | 10/1/46 | | | | | 234,439 | | | |
PA Turnpike Commission Rev. Capital Appreciation 6 | | | | 500,000 | | | | | 5.13 | | | | | 12/1/35 | | | | | 532,805 | | | |
PA Turnpike Commission Rev. Capital Appreciation 6 | | | | 1,250,000 | | | | | 4.00 | | | | | 12/1/38 | | | | | 1,345,562 | | | |
Philadelphia Industrial Dev. Auth. Rev. (Charter School Proj.) | | | | 250,000 | | | | | 5.63 | | | | | 8/1/36 | | | | | 253,852 | | | |
| | | | | | | | | | | | | | | | | | | | | | |
| | | | | |
| | | | | | | | | | | | | | | | | | | 8,221,608 | | | |
| | | | | | | | | | | | | | | | | | | | | | |
| | | | | |
Rhode Island - 0.1% | | | | | | | | | | | | | | | | | | | | | | |
RI Hsg. & Mortgage Finance Corp. Rev. | | | | 250,000 | | | | | 3.90 | | | | | 10/1/37 | | | | | 250,368 | | | |
| | | | | | | | | | | | | | | | | | | | | | |
South Carolina - 1.0% | | | | | | | | | | | | | | | | | | | | | | |
SC Education Assistance Auth. Student Loan Rev. | | | | 230,000 | | | | | 5.10 | | | | | 10/1/29 | | | | | 234,641 | | | |
SC Public Service Auth. Rev. (Santee Cooper) | | | | 250,000 | | | | | 5.00 | | | | | 12/1/38 | | | | | 263,582 | | | |
SC Public Service Auth. Rev. (Santee Cooper) | | | | 500,000 | | | | | 5.75 | | | | | 12/1/43 | | | | | 583,520 | | | |
SC State Hsg. Finance & Dev. Auth. Rev. | | | | 1,035,000 | | | | | 4.00 | | | | | 1/1/47 | | | | | 1,010,947 | | | |
| | | | | | | | | | | | | | | | | | | | | | |
| | | | | |
| | | | | | | | | | | | | | | | | | | 2,092,690 | | | |
| | | | | | | | | | | | | | | | | | | | | | |
| | | | | |
South Dakota - 0.3% | | | | | | | | | | | | | | | | | | | | | | |
SD Health & Educational Facs. Auth. Rev. (Westhills Village Retirement Community) | | | | 500,000 | | | | | 5.00 | | | | | 9/1/40 | | | | | 546,735 | | | |
| | | | | | | | | | | | | | | | | | | | | | |
| | | | | |
Tennessee - 2.9% | | | | | | | | | | | | | | | | | | | | | | |
Franklin Health & Education Facs. Board Rev. (Provision Cares Proton Therapy Center) 4 | | | | 500,000 | | | | | 6.50 | | | | | 6/1/27 | | | | | 503,205 | | | |
Shelby Co. Health, Education & Hsg. Facs. Rev. (CME Memphis Apts. Proj.) 2, 5 | | | | 1,850,000 | | | | | 5.35 | | | | | 1/1/19 | | | | | 4,625 | | | |
Shelby Co. Health, Education & Hsg. Facs. Rev. (CME Memphis Apts. Proj.) 2, 5 | | | | 7,875,000 | | | | | 5.55 | | | | | 1/1/29 | | | | | 19,688 | | | |
Shelby Co. Health, Education & Hsg. Facs. Rev. (CME Memphis Apts. Proj.) 2, 5 | | | | 1,630,000 | | | | | 6.00 | | | | | 1/1/29 | | | | | 16 | | | |
Shelby Co. Health, Education & Hsg. Facs. Rev. (Trezevant Manor Proj.) 4 | | | | 350,000 | | | | | 5.00 | | | | | 9/1/37 | | | | | 320,708 | | | |
TN Hsg. Dev. Agency. Rev. | | | | 495,000 | | | | | 3.60 | | | | | 1/1/31 | | | | | 500,098 | | | |
TN Hsg. Dev. Agency. Rev. | | | | 640,000 | | | | | 3.88 | | | | | 7/1/35 | | | | | 646,170 | | | |
TN Hsg. Dev. Agency. Rev. | | | | 375,000 | | | | | 3.95 | | | | | 7/1/35 | | | | | 382,268 | | | |
TN Hsg. Dev. Agency. Rev. | | | | 665,000 | | | | | 3.70 | | | | | 7/1/36 | | | | | 665,864 | | | |
TN Hsg. Dev. Agency. Rev. | | | | 730,000 | | | | | 4.00 | | | | | 7/1/39 | | | | | 739,198 | | | |
TN Hsg. Dev. Agency. Rev. | | | | 500,000 | | | | | 3.85 | | | | | 7/1/42 | | | | | 497,665 | | | |
TN Hsg. Dev. Agency. Rev. | | | | 500,000 | | | | | 3.90 | | | | | 7/1/42 | | | | | 492,355 | | | |
TN Hsg. Dev. Agency. Rev. | | | | 535,000 | | | | | 3.65 | | | | | 7/1/47 | | | | | 507,544 | | | |
TN Hsg. Dev. Agency. Rev. | | | | 1,000,000 | | | | | 3.95 | | | | | 1/1/49 | | | | | 972,390 | | | |
| | | | | | | | | | | | | | | | | | | | | | |
| | | | | |
| | | | | | | | | | | | | | | | | | | 6,251,794 | | | |
| | | | | | | | | | | | | | | | | | | | | | |
| | | | | |
Texas - 5.1% | | | | | | | | | | | | | | | | | | | | | | |
Arlington Higher Education Finance Corp., Education Rev. (Arlington Classics Academy) | | | | 845,000 | | | | | 7.00 | | | | | 8/15/28 | | | | | 901,184 | | | |
Arlington Higher Education Finance Corp., Education Rev. (Leadership Prep School) | | | | 200,000 | | | | | 5.00 | | | | | 6/15/36 | | | | | 201,542 | | | |
Arlington Special Tax (BAM Insured) | | | | 350,000 | | | | | 5.00 | | | | | 2/15/41 | | | | | 379,729 | | | |
See accompanying notes to financial statements.
| | |
30 | | SIT MUTUAL FUNDS SEMI-ANNUAL REPORT |
| | | | | | | | | | | | | | | | | | | | | | |
| | | | |
| Name of Issuer | | Principal
Amount ($) | | Coupon
Rate (%) | | Maturity
Date | | Fair Value ($) |
| | | | | |
Bexar Co. Rev. (Venue Proj.) | | | | 1,000,000 | | | | | 5.00 | | | | | 8/15/39 | | | | | 1,074,030 | | | |
Dallas/Fort Worth International Airport Rev. (JT Improvement) | | | | 500,000 | | | | | 5.25 | | | | | 11/1/37 | | | | | 553,630 | | | |
Harris Co. Cultural Education Facs. Finance Corp. Rev. (Brazos Presbyterian Homes, Inc. Proj.) | | | | 500,000 | | | | | 5.00 | | | | | 1/1/37 | | | | | 526,895 | | | |
Harris Co. Cultural Education Facs. Finance Corp. Rev. (Space Center Houston Proj.) | | | | 600,000 | | | | | 6.75 | | | | | 8/15/21 | | | | | 624,906 | | | |
Harris-Fort Bend Counties Municipal Utilities Dist. No. 5 G.O. (AGC Insured) | | | | 300,000 | | | | | 4.88 | | | | | 4/1/25 | | | | | 300,681 | | | |
New Hope Cultural Education Facs. Corp. Rev. (Cardinal Bay, Inc.) | | | | 400,000 | | | | | 5.00 | | | | | 7/1/46 | | | | | 433,604 | | | |
New Hope Cultural Education Facs. Corp. Rev. (Jubilee Academic Center) 4 | | | | 250,000 | | | | | 5.00 | | | | | 8/15/36 | | | | | 250,648 | | | |
New Hope Cultural Education Facs. Corp. Rev. (Legacy Preparatory Charter Academy) 4 | | | | 500,000 | | | | | 6.00 | | | | | 8/15/37 | | | | | 516,595 | | | |
New Hope Cultural Education Facs. Corp. Rev. (Presbyterian Village North Proj.) | | | | 500,000 | | | | | 5.00 | | | | | 10/1/34 | | | | | 504,280 | | | |
New Hope Cultural Education Facs. Corp. Rev. (Wesleyan Homes Inc. Proj.) | | | | 250,000 | | | | | 5.50 | | | | | 1/1/35 | | | | | 265,000 | | | |
North Central Texas Health Facility Development Corp. (CC Young Memorial Home) | | | | 185,000 | | | | | 5.38 | | | | | 2/15/25 | | | | | 185,115 | | | |
Red River Health Facs. Dev. Corp. Rev. (MRC Crossings Proj.) | | | | 250,000 | | | | | 7.50 | | | | | 11/15/34 | | | | | 282,160 | | | |
Sugar Land Dev. Corp. Rev. (BAM Insured) | | | | 500,000 | | | | | 5.00 | | | | | 2/15/33 | | | | | 543,425 | | | |
Tarrant County Cultural Education Facs. Finance Corp. Rev. (Buckingham Senior Living Community, Inc.) | | | | 500,000 | | | | | 5.63 | | | | | 11/15/27 | | | | | 423,275 | | | |
Tarrant County Cultural Education Facs. Finance Corp. Rev. (Buckner Retirement Service) | | | | 500,000 | | | | | 5.00 | | | | | 11/15/37 | | | | | 530,025 | | | |
Tarrant County Cultural Education Facs. Finance Corp. Rev. (Buckner Senior Living Ventana Proj.) | | | | 250,000 | | | | | 5.63 | | | | | 11/15/24 | | | | | 253,625 | | | |
Tarrant County Cultural Education Facs. Finance Corp. Rev. (Buckner Senior Living Ventana Proj.) | | | | 500,000 | | | | | 6.63 | | | | | 11/15/37 | | | | | 546,775 | | | |
Travis County Health Facs. Dev. Corp. Rev. (Longhorn Village Proj.) | | | | 300,000 | | | | | 7.13 | | | | | 1/1/46 | | | | | 332,487 | | | |
Travis County Health Facs. Dev. Corp. Rev. (Longhorn Village Proj.) 1 | | | | 425,000 | | | | | 5.25 | | | | | 1/1/47 | | | | | 445,918 | | | |
TX Department of Housing & Community Affairs (GNMA Collateralized) | | | | 500,000 | | | | | 4.13 | | | | | 9/1/38 | | | | | 504,635 | | | |
TX Grand Parkway Transportation Corp. Rev. 6 | | | | 500,000 | | | | | 6.00 | | | | | 10/1/35 | | | | | 469,465 | | | |
| | | | | | | | | | | | | | | | | | | | | | |
| | | | | |
| | | | | | | | | | | | | | | | | | | 11,049,629 | | | |
| | | | | | | | | | | | | | | | | | | | | | |
| | | | | |
Utah - 0.9% | | | | | | | | | | | | | | | | | | | | | | |
UT Charter School Finance Auth. Rev. (Academy Science Proj.) 4 | | | | 625,000 | | | | | 4.65 | | | | | 7/15/33 | | | | | 610,581 | | | |
UT Charter School Finance Auth. Rev. (Spectrum Academy Proj.) 4 | | | | 250,000 | | | | | 6.00 | | | | | 4/15/45 | | | | | 257,108 | | | |
UT Hsg. Corp. Single Family Mtg. Rev. | | | | 55,000 | | | | | 5.75 | | | | | 1/1/33 | | | | | 55,999 | | | |
UT Hsg. Corp. Single Family Mtg. Rev. | | | | 105,000 | | | | | 4.60 | | | | | 7/1/34 | | | | | 106,722 | | | |
UT Hsg. Corp. Single Family Mtg. Rev. (FHA Insured) | | | | 385,000 | | | | | 4.00 | | | | | 1/1/36 | | | | | 386,937 | | | |
West Valley City Municipal Building Auth. Rev. (AGM Insured) | | | | 400,000 | | | | | 5.00 | | | | | 2/1/39 | | | | | 442,708 | | | |
| | | | | | | | | | | | | | | | | | | | | | |
| | | | | |
| | | | | | | | | | | | | | | | | | | 1,860,055 | | | |
| | | | | | | | | | | | | | | | | | | | | | |
| | | | | |
Vermont - 0.2% | | | | | | | | | | | | | | | | | | | | | | |
VT Hsg. Fin. Agy. Rev. (GNMA/FNMA/FHLMC Collateralized) | | | | 500,000 | | | | | 3.50 | | | | | 5/1/38 | | | | | 481,415 | | | |
| | | | | | | | | | | | | | | | | | | | | | |
| | | | | |
Virginia - 1.4% | | | | | | | | | | | | | | | | | | | | | | |
VA Hsg. Dev. Auth. Rev. | | | | 250,000 | | | | | 3.55 | | | | | 5/1/41 | | | | | 239,112 | | | |
VA Hsg. Dev. Auth. Rev. (Commonwealth Mtg.) | | | | 1,000,000 | | | | | 3.63 | | | | | 1/1/31 | | | | | 1,007,600 | | | |
VA Hsg. Dev. Auth. Rev. (Commonwealth Mtg.) | | | | 525,000 | | | | | 3.88 | | | | | 1/1/38 | | | | | 527,609 | | | |
VA Hsg. Dev. Auth. Rev. (Commonwealth Mtg.) | | | | 190,000 | | | | | 4.75 | | | | | 10/1/38 | | | | | 190,462 | | | |
VA Hsg. Dev. Auth. Rev. (Rental Hsg. Proj.) | | | | 400,000 | | | | | 4.13 | | | | | 7/1/33 | | | | | 411,680 | | | |
VA Hsg. Dev. Auth. Rev. (Rental Hsg. Proj.) | | | | 500,000 | | | | | 5.00 | | | | | 12/1/39 | | | | | 507,965 | | | |
VA Hsg. Dev. Auth. Rev. (Rental Hsg. Proj.) (G.O. of Auth. Insured) | | | | 250,000 | | | | | 4.60 | | | | | 12/1/38 | | | | | 255,725 | | | |
| | | | | | | | | | | | | | | | | | | | | | |
| | | | | |
| | | | | | | | | | | | | | | | | | | 3,140,153 | | | |
| | | | | | | | | | | | | | | | | | | | | | |
| | | | | |
Washington - 2.5% | | | | | | | | | | | | | | | | | | | | | | |
Kalispel Tribe of Indians Rev. 4 | | | | 300,000 | | | | | 5.25 | | | | | 1/1/38 | | | | | 308,835 | | | |
King County Hsg. Auth. Rev. | | | | 500,000 | | | | | 3.75 | | | | | 5/1/36 | | | | | 484,315 | | | |
Pike Place Market Preservation Dev. Auth. Rev. | | | | 500,000 | | | | | 5.00 | | | | | 12/1/40 | | | | | 548,465 | | | |
Seattle Hsg. Auth. Rev. | | | | 500,000 | | | | | 3.85 | | | | | 12/1/47 | | | | | 478,825 | | | |
Vancouver Hsg. Auth. Rev. | | | | 500,000 | | | | | 3.75 | | | | | 8/1/34 | | | | | 497,615 | | | |
WA Hsg. Fin. Commission Multi Family Mtg. Rev. (Bayview Manor Homes) 4 | | | | 250,000 | | | | | 5.00 | | | | | 7/1/31 | | | | | 260,575 | | | |
WA Hsg. Fin. Commission Multi Family Mtg. Rev. (Bayview Manor Homes) 4 | | | | 750,000 | | | | | 5.00 | | | | | 7/1/36 | | | | | 773,258 | | | |
See accompanying notes to financial statements.
SCHEDULE OF INVESTMENTS (Unaudited)
September 30, 2018
Sit Tax-Free Income Fund (Continued)
| | | | | | | | | | | | | | | | | | | | | | |
| | | | |
| Name of Issuer | | Principal Amount ($) | | Coupon
Rate (%) | | Maturity Date | | Fair Value ($) |
WA Hsg. Fin. Commission Multi Family Mtg. Rev. (Horizon House Proj.) 4 | | | | 500,000 | | | | | 5.00 | | | | | 1/1/38 | | | | | 542,625 | | | |
WA Hsg. Fin. Commission Multi Family Mtg. Rev. (Wesley Homes Lea Hill Proj.) 4 | | | | 300,000 | | | | | 5.00 | | | | | 7/1/36 | | | | | 308,712 | | | |
WA Hsg. Fin. Commission Rev. (Heron’s Key Senior Living) 4 | | | | 400,000 | | | | | 6.50 | | | | | 7/1/30 | | | | | 429,468 | | | |
WA Hsg. Fin. Commission Single Family Mtg. Rev. (GNMA/FNMA/FHLMC Collateralized) | | | | 65,000 | | | | | 4.60 | | | | | 10/1/33 | | | | | 65,638 | | | |
WA Hsg. Fin. Commission Single Family Mtg. Rev. (GNMA/FNMA/FHLMC Collateralized) | | | | 245,000 | | | | | 3.80 | | | | | 12/1/45 | | | | | 239,701 | | | |
WA Hsg. Fin. Commission Single Family Mtg. Rev. (GNMA/FNMA/FHLMC Collateralized) | | | | 490,000 | | | | | 4.00 | | | | | 12/1/47 | | | | | 508,992 | | | |
| | | | | | | | | | | | | | | | | | | | | | |
| | | | | | | | | | | | | | | | | | | 5,447,024 | | | |
| | | | | | | | | | | | | | | | | | | | | | |
| | | | | |
West Virginia - 0.6% | | | | | | | | | | | | | | | | | | | | | | |
WV Hsg. Dev. Fund Rev. | | | | 250,000 | | | | | 3.75 | | | | | 11/1/32 | | | | | 253,802 | | | |
WV Hsg. Dev. Fund Rev. | | | | 335,000 | | | | | 3.80 | | | | | 11/1/35 | | | | | 339,412 | | | |
WV Hsg. Dev. Fund Rev. | | | | 500,000 | | | | | 4.00 | | | | | 11/1/37 | | | | | 505,205 | | | |
WV Hsg. Dev. Fund Rev. | | | | 195,000 | | | | | 4.10 | | | | | 11/1/45 | | | | | 197,510 | | | |
| | | | | | | | | | | | | | | | | | | | | | |
| | | | | | | | | | | | | | | | | | | 1,295,929 | | | |
| | | | | | | | | | | | | | | | | | | | | | |
| | | | | |
Wisconsin - 6.0% | | | | | | | | | | | | | | | | | | | | | | |
Brookfield City G.O. | | | | 25,000 | | | | | 3.85 | | | | | 12/1/24 | | | | | 25,070 | | | |
Brookfield City G.O. | | | | 425,000 | | | | | 3.90 | | | | | 12/1/25 | | | | | 426,237 | | | |
WI Health & Education Facs. Auth. Rev. (Medical College) | | | | 1,000,000 | | | | | 5.25 | | | | | 12/1/35 | | | | | 1,006,490 | | | |
WI Health & Education Facs. Auth. Rev. (PHW Oconomowoc, Inc. Proj.) | | | | 1,000,000 | | | | | 5.13 | | | | | 10/1/48 | | | | | 985,680 | | | |
WI Health & Education Facs. Auth. Rev. (Rogers Memorial Hospital) | | | | 700,000 | | | | | 4.40 | | | | | 7/1/38 | | | | | 701,848 | | | |
WI Health & Education Facs. Auth. Rev. (St. John’s Communities, Inc. Proj.) | | | | 500,000 | | | | | 5.00 | | | | | 9/15/40 | | | | | 519,975 | | | |
WI Health & Education Facs. Auth. Rev. (Three Pillars Senior Living) | | | | 1,000,000 | | | | | 5.00 | | | | | 8/15/43 | | | | | 1,055,120 | | | |
WI Health & Educational Facs. Auth. Rev. (Aspirus, Inc. Obligation Group) | | | | 500,000 | | | | | 5.00 | | | | | 8/15/32 | | | | | 552,380 | | | |
WI Health & Educational Facs. Auth. Rev. (Benevolent Corp. Cedar Community) | | | | 300,000 | | | | | 5.00 | | | | | 6/1/37 | | | | | 309,258 | | | |
WI Health & Educational Facs. Auth. Rev. (Froedtert Health, Inc. Obligated Group) | | | | 500,000 | | | | | 5.00 | | | | | 4/1/35 | | | | | 560,570 | | | |
WI Health & Educational Facs. Auth. Rev. (Marshfield Clinic Health System) | | | | 850,000 | | | | | 5.00 | | | | | 2/15/47 | | | | | 908,046 | | | |
WI Housing & Economic Dev. Auth. Rev. | | | | 250,000 | | | | | 3.88 | | | | | 11/1/35 | | | | | 251,365 | | | |
WI Housing & Economic Dev. Auth. Rev. | | | | 560,000 | | | | | 3.90 | | | | | 11/1/42 | | | | | 557,385 | | | |
WI Housing & Economic Dev. Auth. Rev. | | | | 500,000 | | | | | 4.15 | | | | | 5/1/55 | | | | | 485,325 | | | |
WI Public Finance Auth. Rev. (Delray Beach Radiation Therapy) 4 | | | | 750,000 | | | | | 6.25 | | | | | 11/1/28 | | | | | 755,618 | | | |
WI Public Finance Auth. Rev. (Glenridge Palmer Ranch Proj.) 4 | | | | 500,000 | | | | | 8.25 | | | | | 6/1/46 | | | | | 567,060 | | | |
WI Public Finance Auth. Rev. (Lombard Public Facilities Corp.) 2, 4, 6 | | | | 16,520 | | | | | 9.00 | | | | | 1/1/46 | | | | | 514 | | | |
WI Public Finance Auth. Rev. (Lombard Public Facilities Corp.) 2, 4, 6 | | | | 16,287 | | | | | 9.00 | | | | | 1/1/47 | | | | | 505 | | | |
WI Public Finance Auth. Rev. (Lombard Public Facilities Corp.) 2, 4, 6 | | | | 447 | | | | | 12.00 | | | | | 1/1/47 | | | | | 14 | | | |
WI Public Finance Auth. Rev. (Lombard Public Facilities Corp.) 2, 4, 6 | | | | 16,171 | | | | | 9.00 | | | | | 1/1/48 | | | | | 500 | | | |
WI Public Finance Auth. Rev. (Lombard Public Facilities Corp.) 2, 4, 6 | | | | 390 | | | | | 12.00 | | | | | 1/1/48 | | | | | 12 | | | |
WI Public Finance Auth. Rev. (Lombard Public Facilities Corp.) 2, 4, 6 | | | | 16,055 | | | | | 9.00 | | | | | 1/1/49 | | | | | 494 | | | |
WI Public Finance Auth. Rev. (Lombard Public Facilities Corp.) 2, 4, 6 | | | | 384 | | | | | 11.00 | | | | | 1/1/49 | | | | | 12 | | | |
WI Public Finance Auth. Rev. (Lombard Public Facilities Corp.) 2, 4, 6 | | | | 15,822 | | | | | 9.00 | | | | | 1/1/50 | | | | | 486 | | | |
WI Public Finance Auth. Rev. (Lombard Public Facilities Corp.) 2, 4, 6 | | | | 372 | | | | | 11.00 | | | | | 1/1/50 | | | | | 11 | | | |
WI Public Finance Auth. Rev. (Lombard Public Facilities Corp.) 2, 4, 6 | | | | 17,334 | | | | | 9.00 | | | | | 1/1/51 | | | | | 530 | | | |
WI Public Finance Auth. Rev. (Lombard Public Facilities Corp.) 2, 4, 6 | | | | 365 | | | | | 11.00 | | | | | 1/1/51 | | | | | 11 | | | |
WI Public Finance Auth. Rev. (Lombard Public Facilities Corp.) 1, 2, 4 | | | | 451,406 | | | | | 3.75 | | | | | 7/1/51 | | | | | 431,720 | | | |
WI Public Finance Auth. Rev. (Lombard Public Facilities Corp.) 2, 4, 6 | | | | 17,218 | | | | | 9.00 | | | | | 1/1/52 | | | | | 525 | | | |
WI Public Finance Auth. Rev. (Lombard Public Facilities Corp.) 2, 4, 6 | | | | 475 | | | | | 10.00 | | | | | 1/1/52 | | | | | 14 | | | |
WI Public Finance Auth. Rev. (Lombard Public Facilities Corp.) 2, 4, 6 | | | | 16,985 | | | | | 9.00 | | | | | 1/1/53 | | | | | 517 | | | |
WI Public Finance Auth. Rev. (Lombard Public Facilities Corp.) 2, 4, 6 | | | | 469 | | | | | 10.00 | | | | | 1/1/53 | | | | | 14 | | | |
WI Public Finance Auth. Rev. (Lombard Public Facilities Corp.) 2, 4, 6 | | | | 16,869 | | | | | 9.00 | | | | | 1/1/54 | | | | | 512 | | | |
WI Public Finance Auth. Rev. (Lombard Public Facilities Corp.) 2, 4, 6 | | | | 453 | | | | | 10.00 | | | | | 1/1/54 | | | | | 14 | | | |
WI Public Finance Auth. Rev. (Lombard Public Facilities Corp.) 2, 4, 6 | | | | 16,636 | | | | | 9.00 | | | | | 1/1/55 | | | | | 504 | | | |
WI Public Finance Auth. Rev. (Lombard Public Facilities Corp.) 2, 4, 6 | | | | 444 | | | | | 9.00 | | | | | 1/1/55 | | | | | 13 | | | |
WI Public Finance Auth. Rev. (Lombard Public Facilities Corp.) 2, 4, 6 | | | | 16,404 | | | | | 9.00 | | | | | 1/1/56 | | | | | 495 | | | |
See accompanying notes to financial statements.
| | |
32 | | SIT MUTUAL FUNDS SEMI-ANNUAL REPORT |
| | | | | | | | | | | | | | | | | | | | | | |
| Name of Issuer | | Principal Amount ($)/ Quantity | | Coupon
Rate (%) | | Maturity Date | | Fair Value ($) |
WI Public Finance Auth. Rev. (Lombard Public Facilities Corp.) 2, 4, 6 | | | | 434 | | | | | 9.00 | | | | | 1/1/56 | | | | | 13 | | | |
WI Public Finance Auth. Rev. (Lombard Public Facilities Corp.) 2, 4 | | | | 21,092 | | | | | 5.50 | | | | | 7/1/56 | | | | | 20,728 | | | |
WI Public Finance Auth. Rev. (Lombard Public Facilities Corp.) 2, 4, 6 | | | | 16,287 | | | | | 9.00 | | | | | 1/1/57 | | | | | 491 | | | |
WI Public Finance Auth. Rev. (Lombard Public Facilities Corp.) 2, 4, 6 | | | | 481 | | | | | 9.00 | | | | | 1/1/57 | | | | | 14 | | | |
WI Public Finance Auth. Rev. (Lombard Public Facilities Corp.) 2, 4, 6 | | | | 16,055 | | | | | 9.00 | | | | | 1/1/58 | | | | | 482 | | | |
WI Public Finance Auth. Rev. (Lombard Public Facilities Corp.) 2, 4, 6 | | | | 469 | | | | | 9.00 | | | | | 1/1/58 | | | | | 14 | | | |
WI Public Finance Auth. Rev. (Lombard Public Facilities Corp.) 2, 4, 6 | | | | 15,938 | | | | | 9.00 | | | | | 1/1/59 | | | | | 478 | | | |
WI Public Finance Auth. Rev. (Lombard Public Facilities Corp.) 2, 4, 6 | | | | 456 | | | | | 9.00 | | | | | 1/1/59 | | | | | 14 | | | |
WI Public Finance Auth. Rev. (Lombard Public Facilities Corp.) 2, 4, 6 | | | | 447 | | | | | 8.00 | | | | | 1/1/60 | | | | | 13 | | | |
WI Public Finance Auth. Rev. (Lombard Public Facilities Corp.) 2, 4, 6 | | | | 15,822 | | | | | 9.00 | | | | | 1/1/60 | | | | | 473 | | | |
WI Public Finance Auth. Rev. (Lombard Public Facilities Corp.) 2, 4, 6 | | | | 440 | | | | | 8.00 | | | | | 1/1/61 | | | | | 13 | | | |
WI Public Finance Auth. Rev. (Lombard Public Facilities Corp.) 2, 4, 6 | | | | 15,589 | | | | | 9.00 | | | | | 1/1/61 | | | | | 465 | | | |
WI Public Finance Auth. Rev. (Lombard Public Facilities Corp.) 2, 4, 6 | | | | 428 | | | | | 8.00 | | | | | 1/1/62 | | | | | 13 | | | |
WI Public Finance Auth. Rev. (Lombard Public Facilities Corp.) 2, 4, 6 | | | | 15,473 | | | | | 9.00 | | | | | 1/1/62 | | | | | 461 | | | |
WI Public Finance Auth. Rev. (Lombard Public Facilities Corp.) 2, 4, 6 | | | | 419 | | | | | 8.00 | | | | | 1/1/63 | | | | | 12 | | | |
WI Public Finance Auth. Rev. (Lombard Public Facilities Corp.) 2, 4, 6 | | | | 15,240 | | | | | 9.00 | | | | | 1/1/63 | | | | | 453 | | | |
WI Public Finance Auth. Rev. (Lombard Public Facilities Corp.) 2, 4, 6 | | | | 409 | | | | | 8.00 | | | | | 1/1/64 | | | | | 12 | | | |
WI Public Finance Auth. Rev. (Lombard Public Facilities Corp.) 2, 4, 6 | | | | 15,124 | | | | | 9.00 | | | | | 1/1/64 | | | | | 448 | | | |
WI Public Finance Auth. Rev. (Lombard Public Facilities Corp.) 2, 4, 6 | | | | 403 | | | | | 7.00 | | | | | 1/1/65 | | | | | 12 | | | |
WI Public Finance Auth. Rev. (Lombard Public Facilities Corp.) 2, 4, 6 | | | | 15,008 | | | | | 9.00 | | | | | 1/1/65 | | | | | 444 | | | |
WI Public Finance Auth. Rev. (Lombard Public Facilities Corp.) 2, 4, 6 | | | | 434 | | | | | 7.00 | | | | | 1/1/66 | | | | | 13 | | | |
WI Public Finance Auth. Rev. (Lombard Public Facilities Corp.) 2, 4, 6 | | | | 14,775 | | | | | 9.00 | | | | | 1/1/66 | | | | | 436 | | | |
WI Public Finance Auth. Rev. (Lombard Public Facilities Corp.) 2, 4, 6 | | | | 5,235 | | | | | 7.00 | | | | | 1/1/67 | | | | | 154 | | | |
WI Public Finance Auth. Rev. (Lombard Public Facilities Corp.) 2, 4, 6 | | | | 192,429 | | | | | 9.00 | | | | | 1/1/67 | | | | | 5,671 | | | |
WI Public Finance Auth. Rev. (MD Proton Treatment Center) 4 | | | | 500,000 | | | | | 6.13 | | | | | 1/1/33 | | | | | 509,660 | | | |
WI Public Finance Auth. Rev. (Mountain Island Charter School) | | | | 820,000 | | | | | 5.00 | | | | | 7/1/37 | | | | | 846,412 | | | |
WI Public Finance Auth. Rev. (Rose Villa Proj.) 4 | | | | 450,000 | | | | | 5.00 | | | | | 11/15/24 | | | | | 479,727 | | | |
WI Public Finance Auth. Rev. (Roseman University Health Sciences) | | | | 250,000 | | | | | 5.00 | | | | | 4/1/25 | | | | | 263,952 | | | |
WI Public Finance Auth. Rev. (Roseman University Health Sciences) | | | | 500,000 | | | | | 5.50 | | | | | 4/1/32 | | | | | 532,200 | | | |
WI State Rev. | | | | 225,000 | | | | | 6.00 | | | | | 5/1/27 | | | | | 230,258 | | | |
| | | | | | | | | | | | | | | | | | | | | | |
| | | | | | | | | | | | | | | | | | | 12,998,380 | | | |
| | | | | | | | | | | | | | | | | | | | | | |
| | | | | |
Wyoming - 0.8% | | | | | | | | | | | | | | | | | | | | | | |
WY Community Dev. Auth. Rev. | | | | 505,000 | | | | | 3.75 | | | | | 12/1/32 | | | | | 511,989 | | | |
WY Community Dev. Auth. Rev. | | | | 50,000 | | | | | 4.25 | | | | | 12/1/37 | | | | | 50,078 | | | |
WY Community Dev. Auth. Rev. | | | | 1,000,000 | | | | | 3.90 | | | | | 12/1/38 | | | | | 1,000,690 | | | |
WY Community Dev. Auth. Rev. | | | | 285,000 | | | | | 4.05 | | | | | 12/1/38 | | | | | 286,841 | | | |
| | | | | | | | | | | | | | | | | | | | | | |
| | | | | | | | | | | | | | | | | | | 1,849,598 | | | |
| | | | | | | | | | | | | | | | | | | | | | |
| | | | | |
Total Municipal Bonds
(cost: $206,822,487) | | | | | | | | | | | | | | | | | | | 195,821,521 | | | |
| | | | | | | | | | | | | | | | | | | | | | |
| | | | | |
Investment Companies - 3.6% | | | | | | | | | | | | | | | | | | | | | | |
BlackRock Long-Term Municipal Advantage Trust (BTA) | | | | 59,383 | | | | | | | | | | | | | | | 669,840 | | | |
BlackRock MuniEnhanced Fund, Inc. (MEN) | | | | 18,500 | | | | | | | | | | | | | | | 186,295 | | | |
BlackRock MuniHoldings Florida Insured Fund (MFL) | | | | 58,500 | | | | | | | | | | | | | | | 732,420 | | | |
BlackRock MuniHoldings Fund II, Inc. (MUH) | | | | 36,000 | | | | | | | | | | | | | | | 480,240 | | | |
BlackRock MuniHoldings Quality Fund II, Inc. (MUE) | | | | 20,000 | | | | | | | | | | | | | | | 241,200 | | | |
BlackRock MuniHoldings Quality Fund, Inc. (MUS) | | | | 21,438 | | | | | | | | | | | | | | | 247,823 | | | |
BlackRock MuniYield Insured Fund (MYI) | | | | 71,171 | | | | | | | | | | | | | | | 859,746 | | | |
BlackRock MuniYield Michigan Insured Fund (MIY) | | | | 21,538 | | | | | | | | | | | | | | | 267,071 | | | |
DWS Municipal, Income Trust (KTF) | | | | 50,436 | | | | | | | | | | | | | | | 529,074 | | | |
Invesco Municipal Opportunity Trust (VMO) | | | | 38,400 | | | | | | | | | | | | | | | 439,296 | | | |
Invesco Municipal Trust (VKQ) | | | | 25,000 | | | | | | | | | | | | | | | 288,500 | | | |
See accompanying notes to financial statements.
SCHEDULE OF INVESTMENTS (Unaudited)
September 30, 2018
Sit Tax-Free Income Fund (Continued)
| | | | | | | | | | | | | | |
| | | | |
| Name of Issuer | | Quantity | | | | | | Fair Value ($) | | | |
| Invesco Quality Municipal Income Trust (IQI) | | | 25,000 | | | | | | | | 289,500 | | | |
| Invesco Van Kampen Advantage Muni Income Trust (VKI) | | | 40,200 | | | | | | | | 423,708 | | | |
| Invesco Van Kampen Trust For Investment Grade Municipals (VGM) | | | 25,000 | | | | | | | | 297,000 | | | |
| Nuveen AMT-Free Quality Municipal Income Fund (NEA) | | | 117,572 | | | | | | | | 1,488,462 | | | |
| Nuveen Quality Municipal Income Fund (NAD) | | | 21,173 | | | | | | | | 270,803 | | | |
| Putnam Municipal Opportunities Trust (PMO) | | | 15,000 | | | | | | | | 171,300 | | | |
| | | | | | | | | | | | | | |
| | | | |
Total Investment Companies
(cost: $8,484,543) | | | | | | | | | | | 7,882,278 | | | |
| | | | | | | | | | | | | | |
| | | |
Total Investments in Securities - 93.6%
(cost: $215,307,030) | | | | | | | | | | | 203,703,799 |
| Other Assets and Liabilities, net - 6.4% | | | | | | | | | | | 13,981,266 |
| | | | | | | | | | | |
| | | |
| Total Net Assets - 100.0% | | | | | | | | | | | $217,685,065 |
| | | | | | | | | | | |
| 1 | | Variable rate security. Rate disclosed is as of September 30, 2018. Certain variable rate securities are not based on a published reference rate and spread but are determined by the issuer or agent and are based on current market conditions, or, for mortgage-backed securities, are impacted by the individual mortgages which are paying off over time. These securities do not indicate a reference rate and spread in their descriptions. |
| 2 | | Securities considered illiquid by the Investment Adviser. The total value of such securities as of September 30, 2018 was $1,660,051 and represented 0.8% of net assets. |
| 4 | | 144A Restricted Security. The total value of such securities as of September 30, 2018 was $18,428,820 and represented 8.5% of net assets. These securities have been determined to be liquid by the Adviser in accordance with guidelines established by the Board of Directors. |
| 5 | | The issuer is in default of interest or principal payments, or other debt covenants. Income is not being accrued. The total value of such securities as of September 30, 2018 was $1,191,307 and represented 0.5% of net assets. |
| 6 | | Zero coupon or convertible capital appreciation bond, for which the rate disclosed is either the effective yield on purchase date or the coupon rate to be paid upon conversion to coupon paying, respectively. |
| 9 | | Municipal Lease Security. The total value of such securities as of September 30, 2018 was $3,421,179 and represented 1.6% of net assets. These securities have been determined to be liquid by the Adviser in accordance with guidelines established by the Board of Directors. |
| 15 | | Securities with a “N/A” maturity date have passed their stated maturity date and have pending restructuring arrangements. |
Numeric footnotes not disclosed are not applicable to this Schedule of Investments.
Short futures contracts outstanding as of September 30, 2018 were as follows:
| | | | | | | | | | | | | | | | | | | | |
| Type | | Contracts | | | Expiration
Date | | | Notional
Amount ($) | | | | | | Value/ Unrealized
Appreciation
Depreciation ($) | |
Short Futures: 10 | | | | | | | | | | | | | | | | | | | | |
U.S. Treasury 2-Year | | | 162 | | | | December 2018 | | | | (34,138,970) | | | | | | | | 120,993 | |
U.S. Treasury 10-Year | | | 149 | | | | December 2018 | | | | (17,698,406) | | | | | | | | 255,606 | |
U.S. Treasury 5-Year | | | 147 | | | | December 2018 | | | | (16,534,054) | | | | | | | | 159,832 | |
U.S. Treasury Long Bond | | | 15 | | | | December 2018 | | | | (2,107,500) | | | | | | | | 63,700 | |
| | | | | |
| | | | | | | | | | | | | | | | | | | 600,131 | |
| 10 | | The amount of $2,000,000 in cash was segregated with the broker to cover margin requirements for derivative transactions as of September 30, 2018. |
See accompanying notes to financial statements.
| | |
34 | | SIT MUTUAL FUNDS SEMI-ANNUAL REPORT |
A summary of the levels for the Fund’s investments as of September 30, 2018 is as follows (see Note 2 - significant accounting policies in the notes to financial statements):
| | | | | | | | | | | | | | |
| | | | | | Investment in Securities | | | |
| | | Level 1 | | | Level 2 | | | Level 3 | | | |
| | | Quoted
Price ($) | | | Other significant observable inputs ($) | | | Significant unobservable inputs ($) | | Total ($) | |
Assets | | | | | | | | | | | | | | |
Municipal Bonds | | | — | | | | 195,821,521 | | | — | | | 195,821,521 | |
Investment Companies | | | 7,882,278 | | | | — | | | — | | | 7,882,278 | |
Futures | | | 600,131 | | | | — | | | — | | | 600,131 | |
| | | 8,482,409 | | | | 195,821,521 | | | — | | | 204,303,930 | |
For the reporting period,there were no transfers between levels 1, 2 and 3.
See accompanying notes to financial statements.
|
Sit Minnesota Tax-Free Income Fund |
OBJECTIVE & STRATEGY
The investment objective of the Minnesota Tax-Free Income Fund is to provide a high level of current income exempt from federal regular income tax and Minnesota regular personal income tax as is consistent with the preservation of capital.
During normal market conditions, the Fund invests 100% of its net assets in municipal securities that generate interest income that is exempt from federal regular income tax and Minnesota regular personal income tax. The Fund anticipates that substantially all of its distributions to its shareholders will be exempt as such. For investors subject to the alternative minimum tax (“AMT”), up to 20% of the Fund’s income may be alternative minimum taxable income.
The Sit Minnesota Tax-Free Income Fund provided a return of +0.78% for the 6-month period ending September 30, 2018. That surpassed the return for its benchmark, the Bloomberg Barclays 5-year Municipal Bond Index, which was +0.67%. The Fund’s 30-day SEC yield was 2.89%, compared to the yield of 2.40% for the benchmark index. The Taxable Equivalent Yield of the Fund was 5.86% assuming the highest federal and state tax rates for individuals.
Minnesota’s state general obligation bond rating was upgraded to AAA by Standard & Poor’s Corp. in July, after 11 years at AA+. The State has benefited from ongoing economic expansion and revenue growth that have allowed it to build up reserves, creating a strong buffer for future revenue declines. Minnesota also enacted new pension funding and benefit reforms in 2018.
Over the last 6 months, the 5-year benchmark Index benefited from superior total returns compared with the long end of the municipal market. The Fund’s barbell approach, which emphasizes a combination of shorter and longer duration bonds, is poised to outdistance the Index over the long haul. Security selection in the Housing, Health Care and Education sectors, where the Fund has significant weightings, was strong. The Fund’s broad distribution of credit quality helped differentiate its return, although the prior outperformance of lower rated credits moderated in recent months. Overall, tax-exempt municipal performance compares favorably to that of Treasury bonds over the last 6 months of -0.34% for the 5-year Treasury, -1.37% for the 10-year, and -.2.77% for the 30-year. As we continue to foresee moderately rising interest rates due to Fed increases as well as contraction of its balance sheet, we have maintained our hedge on the portfolio using U.S. Treasury futures to shorten duration. The net effect of the hedge for the 6-month period was to add 13 basis points to the return of the Fund.
Bond Issuance by Minnesota issuers for the first nine months of 2018 of $5.2 billion is 1.6% above last year’s comparable total. This contrasts with overall 2018YTD municipal market volume, for which long-term bond issuance was 14.9% below the same period in 2017. Lighter overall municipal bond issuance in 2018 has been anticipated in the wake of federal tax law changes that eliminated tax-exempt advance refundings. Final 2018 new issuance should come in well below the $436 billion in 2017, which was boosted by a surge late last year ahead of the tax reform bill. While pure refunding activ-
HYPOTHETICAL GROWTH OF $10,000
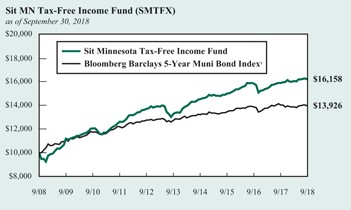
The chart above illustrates the total value of a hypothetical $10,000 investment in the Fund over the past 10 years (or for the life of the Fund if shorter) as compared to the performance of the Bloomberg Barclays 5-Year Municipal Bond Index. Past performance does not guarantee future results. Returns include the reinvestment of distributions. The chart does not reflect the deduction of taxes that a shareholder would pay on Fund distributions or the redemption of Fund shares.
1 The Bloomberg Barclays 5-Year Municipal Bond Index is the 5 year (4-6) component of the Municipal Bond Index, an unmanaged, rules-based, market-value-weighted index for the long-term tax-exempt bond market. The index includes bonds with a minimum credit rating of BBB. The returns include the reinvestment of income and do not include any transaction costs, management fees or other costs. It is not possible to invest directly in an index. This is the Fund’s primary index.
ity declined to a very low 17.8% of the primary market, “new money” issuance has been robust, and is the most since 2010. Municipal mutual funds experienced mainly positive inflows until September.
The Fund’s core strategy has not changed. We will continue to emphasize income as the primary source of returns, and will add to higher coupon bonds when available. We will also focus deeply on credit analysis to take advantage of opportunities as they arise. We remain diversified on an industry and issuer basis in order to manage credit liquidity risk, and we continue to believe the Fund is positioned to achieve attractive risk-adjusted returns going forward.
Michael C. Brilley
Paul J. Jungquist, CFA
Senior Portfolio Managers
| | |
36 | | SIT MUTUAL FUNDS SEMI-ANNUAL REPORT |
COMPARATIVE RATES OF RETURNS
| | | | | | |
| | | |
| as of September 30, 2018 | | | | |
| | | Sit
Minnesota
Tax-Free
Income Fund | | Bloomberg
Barclays
5-Year
Muni. Bond
Index1 | | Lipper MN
Muni. Bond
Fund Index2 |
|
Six Months | | 0.78% | | 0.67% | | n/a |
One Year | | 1.82 | | -0.60 | | 0.39% |
Five Years | | 4.06 | | 1.85 | | 3.44 |
Ten Years | | 4.92 | | 3.37 | | 4.47 |
Since Inception (12/1/93) | | 4.62 | | 4.15 | | 4.32 |
Performance figures are historical and do not guarantee future results. Investment returns and principal value will vary, and you may have a gain or loss when you sell shares. Current performance may be lower or higher than the performance data quoted. Contact the Fund for performance data current to the most recent month-end. Returns include changes in share price as well as reinvestment of all dividends and capital gains. Returns do not reflect the deduction of taxes that a shareholder would pay on Fund distributions or the redemption of Fund shares. Management fees and administrative expenses are included in the Fund’s performance. Returns for periods greater than one year are compounded average annual rates of return.
1 The Bloomberg Barclays 5-Year Municipal Bond Index is the 5 year (4-6) component of the Municipal Bond Index, an unmanaged, rules-based, market-value-weighted index made for the long-term tax-exempt bond market. The index includes bonds with a minimum credit rating of BBB. The returns include the reinvestment of income and do not include any transaction costs, management fees or other costs. It is not possible to invest directly in an index.
2 The Lipper returns are obtained from Lipper Analytical Services, Inc., a large independent evaluator of mutual funds.
FUND DIVERSIFICATION
| | | | |
| | |
Multifamily Mortgage | | | 20.2% | |
Single Family Mortgage | | | 17.8 | |
Hospital/Health Care | | | 16.4 | |
Education/Student Loan | | | 12.9 | |
General Obligation | | | 7.0 | |
Municipal Lease | | | 6.4 | |
Sectors less than 5.0% | | | 17.2 | |
Cash & Other Net Assets | | | 2.1 | |
Based on total net assets as of September 30, 2018. Subject to change.
PORTFOLIO SUMMARY
| | |
Net Asset Value 9/3018: | | $10.31 Per Share |
Net Asset Value 3/31/18: | | $10.39 Per Share |
Total Net Assets: | | $575.7 Million |
Average Maturity: | | 16.4 Years |
Effective Duration3: | | 4.7 Years |
3 Duration is a measure of estimated price sensitivity relative to changes in interest rates. Portfolios with longer durations are typically more sensitive to changes in interest rates. For example, if interest rates rise by 1%, the fair value of a security with an effective duration of 5 years would decrease by 5%, with all other factors being constant. The correlation between duration and price sensitivity is greater for securities rated investment-grade than it is for securities rated below investment-grade. Duration estimates are based on assumptions by the Adviser and are subject to a number of limitations. Effective duration is calculated based on historical price changes of securities held by the Fund, and therefore is a more accurate estimate of price sensitivity provided interest rates remain within their historical range.
QUALITY RATINGS (% of Total Net Assets)
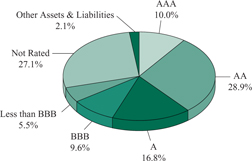
Lower of Moody’s, S&P, Fitch or Duff & Phelps ratings used.
Adviser’s Assessment of Non-Rated Securities:
| | | | |
A | | | 1.7% | |
BBB | | | 4.1 | |
BB | | | 19.9 | |
<BB | | | 1.4 | |
Total | | | 27.1% | |
SCHEDULE OF INVESTMENTS (Unaudited)
September 30, 2018
Sit Minnesota Tax-Free Income Fund
| | | | | | | | | | | | | | | | | | | | | | |
| | | | | | | | | | | |
| | | | | |
| Name of Issuer | | Principal
Amount ($) | | Coupon Rate (%) | | Maturity
Date | | Fair
Value ($) | | |
| | | | | |
Municipal Bonds - 96.9% | | | | | | | | | | | | | | | | | | | | | | |
Education/Student Loan - 12.9% | | | | | | | | | | | | | | | | | | | | | | |
| Baytown Township Rev. (St. Croix Prep) | | | | 1,000,000 | | | | | 4.00 | | | | | 8/1/36 | | | | | 943,780 | | | |
| Baytown Township Rev. (St. Croix Prep) | | | | 1,250,000 | | | | | 4.00 | | | | | 8/1/41 | | | | | 1,144,625 | | | |
| Baytown Township Rev. (St. Croix Prep) | | | | 1,000,000 | | | | | 4.25 | | | | | 8/1/46 | | | | | 937,860 | | | |
| Bethel Charter School Lease Rev. (Spectrum High School Proj.) | | | | 500,000 | | | | | 3.50 | | | | | 7/1/27 | | | | | 487,450 | | | |
| Bethel Charter School Lease Rev. (Spectrum High School Proj.) | | | | 900,000 | | | | | 4.00 | | | | | 7/1/32 | | | | | 891,504 | | | |
| Bethel Charter School Lease Rev. (Spectrum High School Proj.) | | | | 1,100,000 | | | | | 4.00 | | | | | 7/1/37 | | | | | 1,059,135 | | | |
| Bethel Charter School Lease Rev. (Spectrum High School Proj.) | | | | 1,500,000 | | | | | 4.25 | | | | | 7/1/47 | | | | | 1,453,485 | | | |
| Brooklyn Park Charter School Lease Rev. (Athlos Leadership Academy Proj.) | | | | 605,000 | | | | | 5.25 | | | | | 7/1/30 | | | | | 613,524 | | | |
| Cologne Charter School Lease Rev. (Cologne Academy Proj.) | | | | 285,000 | | | | | 4.00 | | | | | 7/1/21 | | | | | 289,138 | | | |
| Cologne Charter School Lease Rev. (Cologne Academy Proj.) | | | | 295,000 | | | | | 4.00 | | | | | 7/1/22 | | | | | 299,608 | | | |
| Cologne Charter School Lease Rev. (Cologne Academy Proj.) | | | | 575,000 | | | | | 5.00 | | | | | 7/1/29 | | | | | 602,491 | | | |
| Cologne Charter School Lease Rev. (Cologne Academy Proj.) | | | | 500,000 | | | | | 5.00 | | | | | 7/1/34 | | | | | 512,035 | | | |
| Deephaven Charter School Lease Rev. (Eagle Ridge Academy Proj.) | | | | 585,000 | | | | | 5.25 | | | | | 7/1/37 | | | | | 611,629 | | | |
| Deephaven Charter School Lease Rev. (Eagle Ridge Academy Proj.) | | | | 600,000 | | | | | 5.25 | | | | | 7/1/40 | | | | | 625,182 | | | |
| Duluth Hsg. & Redev. Auth. Lease Rev. (Edison Academy) | | | | 1,445,000 | | | | | 5.00 | | | | | 11/1/21 | | | | | 1,475,374 | | | |
| Forest Lake Charter School Lease Rev. (Lake International Language Academy) | | | | 580,000 | | | | | 4.50 | | | | | 8/1/26 | | | | | 597,661 | | | |
| Forest Lake Charter School Lease Rev. (Lake International Language Academy) | | | | 750,000 | | | | | 5.50 | | | | | 8/1/36 | | | | | 789,982 | | | |
| Ham Lake Charter School Lease Rev. (Davinci Academy Proj.) | | | | 625,000 | | | | | 5.00 | | | | | 7/1/31 | | | | | 637,825 | | | |
| Ham Lake Charter School Lease Rev. (Davinci Academy Proj.) | | | | 1,000,000 | | | | | 5.00 | | | | | 7/1/36 | | | | | 1,008,870 | | | |
| Ham Lake Charter School Lease Rev. (Parnassus Prep. Sch. Proj.) | | | | 1,000,000 | | | | | 4.00 | | | | | 11/1/26 | | | | | 989,090 | | | |
| Ham Lake Charter School Lease Rev. (Parnassus Prep. Sch. Proj.) | | | | 2,720,000 | | | | | 5.00 | | | | | 11/1/36 | | | | | 2,777,909 | | | |
| Hugo Charter School Lease Rev. (Noble Academy Proj.) | | | | 460,000 | | | | | 4.00 | | | | | 7/1/21 | | | | | 469,343 | | | |
| Hugo Charter School Lease Rev. (Noble Academy Proj.) | | | | 750,000 | | | | | 5.00 | | | | | 7/1/29 | | | | | 785,378 | | | |
| Hugo Charter School Lease Rev. (Noble Academy Proj.) | | | | 1,000,000 | | | | | 5.00 | | | | | 7/1/34 | | | | | 1,033,700 | | | |
| Independence Charter School Lease Rev. (Beacon Academy Proj.) | | | | 500,000 | | | | | 4.25 | | | | | 7/1/26 | | | | | 493,800 | | | |
| Independence Charter School Lease Rev. (Beacon Academy Proj.) | | | | 750,000 | | | | | 4.75 | | | | | 7/1/31 | | | | | 746,400 | | | |
| Independence Charter School Lease Rev. (Beacon Academy Proj.) | | | | 1,200,000 | | | | | 5.00 | | | | | 7/1/36 | | | | | 1,192,932 | | | |
| Minneapolis Charter School Lease Rev. (Hiawatha Academy Proj.) | | | | 975,000 | | | | | 4.00 | | | | | 7/1/26 | | | | | 961,535 | | | |
| Minneapolis Educational Fac. Lease Rev. (Seed/Harvest Preparatory Proj.) 4 | | | | 775,000 | | | | | 6.25 | | | | | 3/1/21 | | | | | 689,285 | | | |
| Minneapolis School Lease Rev. (Twin Cities International School) 4 | | | | 1,000,000 | | | | | 4.25 | | | | | 12/1/27 | | | | | 971,100 | | | |
| Minneapolis School Lease Rev. (Twin Cities International School) 4 | | | | 1,000,000 | | | | | 5.00 | | | | | 12/1/37 | | | | | 954,830 | | | |
| MN Higher Education Fac. Auth. Rev. (Bethel Univ.) | | | | 1,200,000 | | | | | 5.00 | | | | | 5/1/37 | | | | | 1,287,576 | | | |
| MN Higher Education Fac. Auth. Rev. (Bethel Univ.) | | | | 1,000,000 | | | | | 5.00 | | | | | 5/1/47 | | | | | 1,061,550 | | | |
| MN Higher Education Fac. Auth. Rev. (College of St. Benedict) | | | | 400,000 | | | | | 4.00 | | | | | 3/1/36 | | | | | 403,428 | | | |
| MN Higher Education Fac. Auth.Rev. (College of St. Benedict) | | | | 1,000,000 | | | | | 4.00 | | | | | 3/1/43 | | | | | 992,260 | | | |
| MN Higher Education Fac. Auth.Rev. (College of St. Benedict) | | | | 1,150,000 | | | | | 5.00 | | | | | 3/1/37 | | | | | 1,250,786 | | | |
| MN Higher Education Fac. Auth. Rev. (Gustavus Adolphus College) | | | | 1,250,000 | | | | | 4.00 | | | | | 10/1/41 | | | | | 1,266,038 | | | |
| MN Higher Education Fac. Auth. Rev. (Macalester College) | | | | 360,000 | | | | | 3.00 | | | | | 5/1/32 | | | | | 352,505 | | | |
| MN Higher Education Fac. Auth. Rev. (St. Olaf College) | | | | 500,000 | | | | | 4.00 | | | | | 10/1/32 | | | | | 526,945 | | | |
| MN Higher Education Fac. Auth. Rev. (St. Olaf College) | | | | 500,000 | | | | | 4.00 | | | | | 10/1/34 | | | | | 523,350 | | | |
| MN Higher Education Fac. Auth. Rev. (St. Olaf College) | | | | 500,000 | | | | | 4.00 | | | | | 10/1/35 | | | | | 521,565 | | | |
| MN Higher Education Fac. Auth. Rev. (St. Scholastica College) | | | | 1,400,000 | | | | | 5.00 | | | | | 12/1/27 | | | | | 1,402,380 | | | |
| MN Higher Education Fac. Auth. Rev. (St. Scholastica College) | | | | 1,800,000 | | | | | 6.30 | | | | | 12/1/40 | | | | | 1,863,360 | | | |
| MN Higher Education Fac. Auth. Rev. (Univ. of St. Thomas) | | | | 400,000 | | | | | 4.00 | | | | | 10/1/35 | | | | | 412,824 | | | |
| MN Higher Education Fac. Auth. Rev. (Univ. of St. Thomas) | | | | 500,000 | | | | | 4.00 | | | | | 10/1/37 | | | | | 511,775 | | | |
| MN Higher Education Fac. Auth. Rev. (Univ. of St. Thomas) | | | | 3,150,000 | | | | | 4.00 | | | | | 4/1/39 | | | | | 3,215,520 | | | |
| MN Higher Education Fac. Auth. Rev. (Univ. of St. Thomas) | | | | 750,000 | | | | | 5.00 | | | | | 4/1/35 | | | | | 836,182 | | | |
| Moorhead Educational Fac. Rev. (Concordia College Corp. Proj.) | | | | 1,250,000 | | | | | 5.00 | | | | | 12/1/40 | | | | | 1,349,750 | | | |
| Olmsted Co. Hsg. & Redev. Auth. Rev. (Schaeffer Academy Proj.) | | | | 562,892 | | | | | 4.98 | | | | | 4/25/27 | | | | | 562,892 | | | |
| Ramsey Lease Rev. (Pact Charter School Proj.) | | | | 385,000 | | | | | 5.00 | | | | | 12/1/26 | | | | | 399,796 | | | |
| Ramsey Lease Rev. (Pact Charter School Proj.) | | | | 1,850,000 | | | | | 5.50 | | | | | 12/1/33 | | | | | 1,921,003 | | | |
See accompanying notes to financial statements.
| | |
38 | | SIT MUTUAL FUNDS SEMI-ANNUAL REPORT |
| | | | | | | | | | | | | | | | | | | | | | |
| | | | |
| Name of Issuer | | Principal
Amount ($) | | Coupon
Rate (%) | | Maturity
Date | | Fair
Value ($) |
| | | | | |
Rice Co. Educational Fac. Rev. (Shattuck-St. Mary’s School) 4 | | | | 3,500,000 | | | | | 5.00 | | | | | 8/1/22 | | | | | 3,668,420 | | | |
Rochester Rev. (Math & Science Academy) | | | | 1,430,000 | | | | | 5.13 | | | | | 9/1/38 | | | | | 1,403,688 | | | |
Savage Charter School Lease Rev. (Aspen Academy) | | | | 500,000 | | | | | 4.00 | | | | | 10/1/26 | | | | | 463,935 | | | |
Savage Charter School Lease Rev. (Aspen Academy) | | | | 1,000,000 | | | | | 4.75 | | | | | 10/1/31 | | | | | 938,070 | | | |
St. Cloud Charter School Lease Rev. (Stride Academy Proj.) | | | | 350,000 | | | | | 3.00 | | | | | 4/1/21 | | | | | 225,390 | | | |
St. Cloud Charter School Lease Rev. (Stride Academy Proj.) | | | | 1,850,000 | | | | | 5.00 | | | | | 4/1/36 | | | | | 1,101,176 | | | |
St. Paul Hsg. & Redev, Auth. Rev. (Hmong College Preparatory Academy Proj.) | | | | 1,000,000 | | | | | 5.25 | | | | | 9/1/31 | | | | | 1,040,650 | | | |
St. Paul Hsg. & Redev, Auth. Rev. (Metro Deaf School Proj.) 4 | | | | 700,000 | | | | | 5.00 | | | | | 6/15/38 | | | | | 703,906 | | | |
St. Paul Hsg. & Redev, Auth. Rev. (Nova Classical Academy Proj.) | | | | 600,000 | | | | | 4.00 | | | | | 9/1/36 | | | | | 580,572 | | | |
St. Paul Hsg. & Redev. Auth. | | | | 700,000 | | | | | 5.00 | | | | | 12/1/30 | | | | | 750,113 | | | |
St. Paul Hsg. & Redev. Auth. | | | | 1,000,000 | | | | | 5.00 | | | | | 12/1/37 | | | | | 1,047,420 | | | |
St. Paul Hsg. & Redev. Auth. | | | | 705,000 | | | | | 5.00 | | | | | 12/1/46 | | | | | 718,050 | | | |
St. Paul Hsg. & Redev. Auth. (German Immersion School) | | | | 450,000 | | | | | 4.00 | | | | | 7/1/23 | | | | | 455,810 | | | |
St. Paul Hsg. & Redev. Auth. (German Immersion School) | | | | 855,000 | | | | | 5.00 | | | | | 7/1/33 | | | | | 871,202 | | | |
St. Paul Hsg. & Redev. Auth. (German Immersion School) | | | | 500,000 | | | | | 5.00 | | | | | 7/1/44 | | | | | 503,110 | | | |
St. Paul Hsg. & Redev. Auth. (Higher Ground Academy Proj.) | | | | 1,300,000 | | | | | 4.25 | | | | | 12/1/23 | | | | | 1,334,879 | | | |
St. Paul Hsg. & Redev. Auth. (Higher Ground Academy Proj.) | | | | 1,500,000 | | | | | 5.00 | | | | | 12/1/33 | | | | | 1,555,185 | | | |
St. Paul Hsg. & Redev. Auth. (Higher Ground Academy Proj.) | | | | 390,000 | | | | | 5.13 | | | | | 12/1/38 | | | | | 403,478 | | | |
St. Paul Hsg. & Redev. Auth. (Hope Community Academy Proj.) | | | | 720,000 | | | | | 4.50 | | | | | 12/1/29 | | | | | 718,085 | | | |
St. Paul Hsg. & Redev. Auth. (St. Paul Conservatory for Performing Artists) | | | | 1,135,000 | | | | | 4.63 | | | | | 3/1/43 | | | | | 1,049,716 | | | |
St. Paul Hsg. & Redev. Auth. (Twin Cities Academy Proj.) | | | | 1,600,000 | | | | | 4.00 | | | | | 7/1/25 | | | | | 1,622,624 | | | |
St. Paul Hsg. & Redev. Auth. (Twin Cities Academy Proj.) | | | | 955,000 | | | | | 5.00 | | | | | 7/1/35 | | | | | 974,654 | | | |
St. Paul Hsg. & Redev. Auth. Lease Rev. (Hmong College Preparatory Academy) | | | | 295,000 | | | | | 4.75 | | | | | 9/1/22 | | | | | 302,313 | | | |
St. Paul Hsg. & Redev. Auth. Lease Rev. (Hmong College Preparatory Academy) | | | | 500,000 | | | | | 5.00 | | | | | 9/1/27 | | | | | 510,400 | | | |
St. Paul Hsg. & Redev. Auth. Lease Rev. (Nova Classical Academy Proj.) | | | | 390,000 | | | | | 5.70 | | | | | 9/1/21 | | | | | 410,502 | | | |
University of Minnesota Rev. | | | | 1,000,000 | | | | | 5.00 | | | | | 4/1/41 | | | | | 1,118,430 | | | |
Victoria Private School Fac. Rev. (Holy Family Catholic High) | | | | 1,610,000 | | | | | 4.00 | | | | | 9/1/23 | | | | | 1,597,909 | | | |
Woodbury Charter School Lease Rev. (MSA Building) | | | | 355,000 | | | | | 5.00 | | | | | 12/1/27 | | | | | 375,256 | | | |
Woodbury Charter School Lease Rev. (MSA Building) | | | | 225,000 | | | | | 5.00 | | | | | 12/1/32 | | | | | 235,897 | | | |
| | | | | | | | | | | | | | | | | | | | | | |
| | | | | |
| | | | | | | | | | | | | | | | | | | 74,388,785 | | | |
| | | | | | | | | | | | | | | | | | | | | | |
| | | | | |
Escrowed To Maturity/Prerefunded - 3.5% | | | | | | | | | | | | | | | | | | | | | | |
Anoka Co. Charter School Lease Rev. | | | | 295,000 | | | | | 5.00 | | | | | 6/1/27 | | | | | 314,759 | | | |
Anoka Co. Charter School Lease Rev. | | | | 2,435,000 | | | | | 5.00 | | | | | 6/1/43 | | | | | 2,598,096 | | | |
Bemidji Sales Tax G.O. | | | | 1,000,000 | | | | | 5.00 | | | | | 2/1/34 | | | | | 1,066,540 | | | |
Bemidji Sales Tax G.O. | | | | 1,350,000 | | | | | 6.00 | | | | | 2/1/41 | | | | | 1,470,379 | | | |
Deephaven Charter School Lease Rev. (Eagle Ridge Academy Proj.) | | | | 1,280,000 | | | | | 5.13 | | | | | 7/1/33 | | | | | 1,441,075 | | | |
MN Higher Education Fac. Auth. Rev. (Hamline Univ.) | | | | 750,000 | | | | | 6.00 | | | | | 10/1/32 | | | | | 832,920 | | | |
MN Higher Education Fac. Auth. Rev. (Hamline Univ.) | | | | 1,000,000 | | | | | 6.00 | | | | | 10/1/40 | | | | | 1,110,560 | | | |
Oak Park Heights Hsg. Rev. (Oakgreen Commons Proj.) | | | | 1,000,000 | | | | | 6.00 | | | | | 8/1/25 | | | | | 1,068,710 | | | |
Oak Park Heights Hsg. Rev. (Oakgreen Commons Proj.) | | | | 1,000,000 | | | | | 6.25 | | | | | 8/1/33 | | | | | 1,091,450 | | | |
Rochester Health Care & Hsg. Rev. (Samaritan Bethany, Inc. Proj.) | | | | 475,000 | | | | | 5.75 | | | | | 12/1/19 | | | | | 494,646 | | | |
Rochester Health Care & Hsg. Rev. (Samaritan Bethany, Inc. Proj.) | | | | 2,515,000 | | | | | 7.38 | | | | | 12/1/41 | | | | | 2,667,258 | | | |
St. Louis Park Health Care Facs. Rev. (Park Nicollet Health Proj.) | | | | 2,000,000 | | | | | 5.50 | | | | | 7/1/29 | | | | | 2,050,980 | | | |
St. Paul Hsg. & Redev. Auth. Rev. (HealthEast Care System Proj.) | | | | 1,000,000 | | | | | 5.00 | | | | | 11/15/26 | | | | | 1,059,570 | | | |
St. Paul Hsg. & Redev. Auth. Rev. (HealthEast Care System Proj.) | | | | 1,000,000 | | | | | 5.25 | | | | | 11/15/28 | | | | | 1,064,730 | | | |
St. Paul Hsg. & Redev. Auth. Rev. (HealthEast Care System Proj.) | | | | 1,000,000 | | | | | 5.25 | | | | | 11/15/35 | | | | | 1,064,730 | | | |
West St. Paul Health Care (Walker Thompson Hill) | | | | 525,000 | | | | | 6.75 | | | | | 9/1/31 | | | | | 546,824 | | | |
| | | | | | | | | | | | | | | | | | | | | | |
| | | | | |
| | | | | | | | | | | | | | | | | | | 19,943,227 | | | |
| | | | | | | | | | | | | | | | | | | | | | |
| | | | | |
General Obligation - 7.0% | | | | | | | | | | | | | | | | | | | | | | |
Brainerd Independent School District No. 181 | | | | 4,000,000 | | | | | 4.00 | | | | | 2/1/43 | | | | | 4,056,520 | | | |
Brooklyn Center Independent School District No. 286 | | | | 4,000,000 | | | | | 4.00 | | | | | 2/1/40 | | | | | 4,047,920 | | | |
See accompanying notes to financial statements.
SCHEDULE OF INVESTMENTS (Unaudited)
September 30, 2018
Sit Minnesota Tax-Free Income Fund (Continued)
| | | | | | | | | | | | | | | | | | | | | | |
| | | | |
| Name of Issuer | | Principal Amount ($) | | Coupon
Rate (%) | | Maturity Date | | Fair Value ($) |
| | | | | |
Cloquet Independent School District No. 94 | | | | 5,000,000 | | | | | 4.00 | | | | | 2/1/36 | | | | | 5,103,600 | | | |
Deer River G.O. | | | | 500,000 | | | | | 4.00 | | | | | 2/1/48 | | | | | 502,190 | | | |
Fridley Independent School District No. 14 | | | | 400,000 | | | | | 4.00 | | | | | 2/1/30 | | | | | 420,480 | | | |
Glencoe-Silver Lake Independent School District No. 2859 | | | | 1,300,000 | | | | | 4.00 | | | | | 2/1/40 | | | | | 1,326,936 | | | |
Morrison Co. Education District No. 6979 | | | | 1,000,000 | | | | | 4.50 | | | | | 2/1/34 | | | | | 1,017,030 | | | |
Richfield Independent School District No. 280 | | | | 6,000,000 | | | | | 4.00 | | | | | 2/1/37 | | | | | 6,175,560 | | | |
Robbinsdale Independent School District No. 281 | | | | 1,050,000 | | | | | 4.00 | | | | | 2/1/31 | | | | | 1,103,288 | | | |
Roseville Independent School District No. 623 | | | | 930,000 | | | | | 4.00 | | | | | 2/1/35 | | | | | 965,359 | | | |
Roseville Independent School District No. 623 | | | | 795,000 | | | | | 4.00 | | | | | 2/1/36 | | | | | 822,316 | | | |
Roseville Independent School District No. 623 | | | | 4,100,000 | | | | | 4.00 | | | | | 2/1/37 | | | | | 4,222,918 | | | |
South Washington Co. Independent School District No. 833 | | | | 5,000,000 | | | | | 4.00 | | | | | 2/1/31 | | | | | 5,262,700 | | | |
St. Cloud Independent School District No. 742 | | | | 400,000 | | | | | 4.00 | | | | | 2/1/30 | | | | | 425,744 | | | |
St. Cloud Independent School District No. 742 | | | | 1,000,000 | | | | | 4.00 | | | | | 2/1/37 | | | | | 1,032,040 | | | |
St. Francis Independent School District No. 15 | | | | 550,000 | | | | | 4.00 | | | | | 2/1/35 | | | | | 563,612 | | | |
St. Francis Independent School District No. 15 | | | | 750,000 | | | | | 4.00 | | | | | 2/1/36 | | | | | 767,040 | | | |
St. Michael-Albertville Independent School District No. 885 | | | | 500,000 | | | | | 4.00 | | | | | 2/1/30 | | | | | 529,290 | | | |
United Hospital District Health Care Facs. G.O (Lake Wood Health System) | | | | 1,005,000 | | | | | 5.00 | | | | | 12/1/30 | | | | | 1,114,213 | | | |
Watkins G.O. | | | | 735,000 | | | | | 4.00 | | | | | 1/1/38 | | | | | 741,564 | | | |
| | | | | | | | | | | | | | | | | | | | | | |
| | | | | |
| | | | | | | | | | | | | | | | | | | 40,200,320 | | | |
| | | | | | | | | | | | | | | | | | | | | | |
| | | | | |
Hospital/Health Care - 16.4% | | | | | | | | | | | | | | | | | | | | | | |
Anoka Health Care and Hsg. Facs. Rev. | | | | 1,135,000 | | | | | 5.38 | | | | | 11/1/34 | | | | | 1,193,430 | | | |
Anoka Health Care and Hsg. Facs. Rev. (Walker Methodist Plaza) | | | | 1,500,000 | | | | | 5.25 | | | | | 7/1/35 | | | | | 1,501,740 | | | |
Breckenridge Rev. (Catholic Health Initiatives Proj.) | | | | 3,480,000 | | | | | 5.00 | | | | | 5/1/30 | | | | | 3,516,088 | | | |
Center City Heath Care Facs. Rev. (Hazelden Betty Ford Foundation Proj.) | | | | 3,000,000 | | | | | 4.50 | | | | | 11/1/34 | | | | | 3,141,180 | | | |
Center City Heath Care Facs. Rev. (Hazelden Betty Ford Foundation Proj.) | | | | 500,000 | | | | | 4.75 | | | | | 11/1/31 | | | | | 510,135 | | | |
Center City Heath Care Facs. Rev. (Hazelden Betty Ford Foundation Proj.) | | | | 250,000 | | | | | 5.00 | | | | | 11/1/29 | | | | | 277,010 | | | |
Center City Heath Care Facs. Rev. (Hazelden Betty Ford Foundation Proj.) | | | | 500,000 | | | | | 5.00 | | | | | 11/1/44 | | | | | 544,170 | | | |
Chippewa Co. Rev. (Monte Video Hospital Proj.) | | | | 2,000,000 | | | | | 4.00 | | | | | 3/1/32 | | | | | 1,995,820 | | | |
Crookston Health Care Facs. Rev. (Riverview Health Care Proj.) | | | | 250,000 | | | | | 3.30 | | | | | 5/1/25 | | | | | 243,630 | | | |
Crookston Health Care Facs. Rev. (Riverview Health Care Proj.) | | | | 1,000,000 | | | | | 4.00 | | | | | 5/1/32 | | | | | 960,390 | | | |
Dakota Co. Community Dev. Agy. (Sanctuary at W. St. Paul Proj.) | | | | 2,000,000 | | | | | 5.75 | | | | | 8/1/30 | | | | | 1,949,640 | | | |
Dakota Co. Community Dev. Agy. (Sanctuary at W. St. Paul Proj.) | | | | 1,050,000 | | | | | 6.00 | | | | | 8/1/35 | | | | | 1,035,688 | | | |
Duluth Economic Dev. Auth. Rev. (St. Lukes Hospital Oblig. Group) | | | | 1,095,000 | | | | | 4.75 | | | | | 6/15/22 | | | | | 1,104,975 | | | |
Duluth Economic Dev. Auth. Rev. (St. Lukes Hospital Oblig. Group) | | | | 1,600,000 | | | | | 5.75 | | | | | 6/15/32 | | | | | 1,725,072 | | | |
Duluth Economic Dev. Auth.Rev. (St. Lukes Hospital Oblig. Group) | | | | 2,000,000 | | | | | 6.00 | | | | | 6/15/39 | | | | | 2,175,740 | | | |
Fergus Falls Health Care & Hsg. Fac. Rev. (Lake Region Healthcare Proj.) | | | | 1,000,000 | | | | | 5.15 | | | | | 8/1/35 | | | | | 1,000,630 | | | |
Glencoe Health Care Fac. Rev. (Glencoe Regional Health Services Proj.) | | | | 2,110,000 | | | | | 4.00 | | | | | 4/1/31 | | | | | 2,136,818 | | | |
Hayward Health Care Fac. Rev. (American Baptist Homes Midwest Proj.) | | | | 1,350,000 | | | | | 5.38 | | | | | 8/1/34 | | | | | 1,357,600 | | | |
Hayward Health Care Fac. Rev. (American Baptist Homes Midwest Proj.) | | | | 500,000 | | | | | 5.75 | | | | | 2/1/44 | | | | | 508,110 | | | |
Hayward Hsg. & Health Care Fac. Rev. (St. John Lutheran Home of Albert Lea Proj.) | | | | 1,900,000 | | | | | 5.00 | | | | | 10/1/34 | | | | | 1,934,447 | | | |
Maple Grove Health Care System Rev. (Maple Grove Hospital Corp.) | | | | 3,500,000 | | | | | 4.00 | | | | | 5/1/37 | | | | | 3,472,700 | | | |
Maple Grove Health Care System Rev. (Maple Grove Hospital Corp.) | | | | 325,000 | | | | | 5.00 | | | | | 5/1/32 | | | | | 361,621 | | | |
Maple Grove Health Care System Rev. (Memorial Health Care) | | | | 1,275,000 | | | | | 4.00 | | | | | 9/1/35 | | | | | 1,281,860 | | | |
Minneapolis Health Care System Rev. (Fairview Health Services) | | | | 1,000,000 | | | | | 4.00 | | | | | 11/15/37 | | | | | 1,004,930 | | | |
Minneapolis Health Care System Rev. (Fairview Health Services) | | | | 1,000,000 | | | | | 4.00 | | | | | 11/15/38 | | | | | 1,002,440 | | | |
Minneapolis Health Care System Rev. (Fairview Health Services) | | | | 2,590,000 | | | | | 5.00 | | | | | 11/15/34 | | | | | 2,889,870 | | | |
Minneapolis Health Care System Rev. (Fairview Health Services) | | | | 2,500,000 | | | | | 5.00 | | | | | 11/15/49 | | | | | 2,738,550 | | | |
Minneapolis Pooled Rev. (Care Choice Member Proj.) | | | | 20,000 | | | | | 5.75 | | | | | 4/1/19 | | | | | 19,973 | | | |
Minneapolis Rev. Ref. (Walker Campus) | | | | 1,705,000 | | | | | 4.50 | | | | | 11/15/20 | | | | | 1,741,572 | | | |
Moorhead Economic Dev. Auth. Rev. | | | | 550,000 | | | | | 4.60 | | | | | 9/1/25 | | | | | 557,524 | | | |
Oak Park Heights Nursing Home Rev. (Boutwells Landing Care Center) | | | | 1,500,000 | | | | | 5.50 | | | | | 8/1/28 | | | | | 1,570,335 | | | |
Oak Park Heights Nursing Home Rev. (Boutwells Landing Care Center) | | | | 1,000,000 | | | | | 6.00 | | | | | 8/1/36 | | | | | 1,053,760 | | | |
See accompanying notes to financial statements.
| | |
40 | | SIT MUTUAL FUNDS SEMI-ANNUAL REPORT |
| | | | | | | | | | | | | | | | | | | | | | |
| | | | | | | | | | | |
| | | | |
| Name of Issuer | | Principal Amount ($) | | Coupon
Rate (%) | | Maturity Date | | Fair Value ($) |
Rochester Health Care Facs. Rev. (Mayo Clinic) | | | | 5,000,000 | | | | | 4.00 | | | | | 11/15/48 | | | | | 5,051,500 | | | |
Rochester Health Care Facs. Rev. (Mayo Clinic) | | | | 5,000,000 | | | | | 5.00 | | | | | 11/15/33 | | | | | 6,072,000 | | | |
Rochester Health Care Facs. Rev. (Olmsted Medical Center Proj.) | | | | 1,500,000 | | | | | 5.88 | | | | | 7/1/30 | | | | | 1,586,745 | | | |
Shakopee Health Care Facs. Rev. (St. Francis Regional Medical Center Proj.) | | | | 745,000 | | | | | 5.00 | | | | | 9/1/28 | | | | | 817,556 | | | |
Shakopee Health Care Facs. Rev. (St. Francis Regional Medical Center Proj.) | | | | 1,350,000 | | | | | 5.00 | | | | | 9/1/34 | | | | | 1,455,800 | | | |
St. Cloud Health Care Rev. (CentraCare Health System Proj.) | | | | 2,500,000 | | | | | 4.00 | | | | | 5/1/37 | | | | | 2,565,775 | | | |
St. Cloud Health Care Rev. (CentraCare Health System Proj.) | | | | 3,750,000 | | | | | 5.00 | | | | | 5/1/46 | | | | | 4,090,275 | | | |
St. Louis Park Health Care Facs. Rev. (Mount Olivet Careview Home Health Proj.) 1 | | | | 2,250,000 | | | | | 4.60 | | | | | 6/1/41 | | | | | 2,262,870 | | | |
St. Paul Hsg. & Redev. Auth. Health Care Rev. (Fairview Health Services Proj.) | | | | 750,000 | | | | | 4.00 | | | | | 11/15/35 | | | | | 759,712 | | | |
St. Paul Hsg. & Redev. Auth. Health Care Rev. (Fairview Health Services Proj.) | | | | 4,000,000 | | | | | 4.00 | | | | | 11/15/43 | | | | | 3,993,560 | | | |
St. Paul Hsg. & Redev. Auth. Health Care Rev. (Fairview Health Services Proj.) | | | | 1,000,000 | | | | | 5.00 | | | | | 11/15/47 | | | | | 1,090,100 | | | |
St. Paul Hsg. & Redev. Auth. Health Care Rev. (HealthPartners Oblig. Group Proj.) | | | | 4,800,000 | | | | | 5.00 | | | | | 7/1/32 | | | | | 5,351,184 | | | |
St. Paul Hsg. & Redev. Auth. Health Care Rev. (HealthPartners Oblig. Group Proj.) | | | | 2,000,000 | | | | | 5.00 | | | | | 7/1/33 | | | | | 2,212,980 | | | |
St. Paul Hsg. & Redev. Auth. Health Care Rev. (Senior Episcopal Homes Proj.) | | | | 525,000 | | | | | 4.25 | | | | | 11/1/25 | | | | | 518,978 | | | |
St. Paul Hsg. & Redev. Auth. Health Care Rev. (Senior Episcopal Homes Proj.) | | | | 750,000 | | | | | 4.75 | | | | | 11/1/31 | | | | | 745,642 | | | |
St. Paul Hsg. & Redev. Auth. Health Care Rev. (Senior Episcopal Homes Proj.) | | | | 2,150,000 | | | | | 5.00 | | | | | 5/1/38 | | | | | 2,144,582 | | | |
St. Paul Hsg. & Redev. Auth. Health Care Rev. (Senior Episcopal Homes Proj.) | | | | 500,000 | | | | | 5.15 | | | | | 11/1/42 | | | | | 500,465 | | | |
St. Paul Hsg. & Redev. Auth. Rev. (Nursing Home NTS-Episcopal) | | | | 1,981,246 | | | | | 5.63 | | | | | 10/1/33 | | | | | 1,983,743 | | | |
Victoria Health Care Facs. Rev. (Augustana Emerald Care LLC) | | | | 1,000,000 | | | | | 4.25 | | | | | 8/1/24 | | | | | 1,018,380 | | | |
Victoria Health Care Facs. Rev. (Augustana Emerald Care LLC) | | | | 1,450,000 | | | | | 4.75 | | | | | 8/1/29 | | | | | 1,476,419 | | | |
West St. Paul Hsg. & Health Care Rev. (Walker Westwood Ridge Camp) | | | | 1,000,000 | | | | | 5.00 | | | | | 11/1/37 | | | | | 1,032,440 | | | |
Winsted Health Care Rev. (St. Mary’s Care Center Proj.) 2, 5 | | | | 1,071,148 | | | | | 6.00 | | | | | 9/1/25 | | | | | 749,803 | | | |
Winsted Health Care Rev. (St. Mary’s Care Center Proj.) 2, 5 | | | | 1,029,950 | | | | | 6.50 | | | | | 9/1/34 | | | | | 720,965 | | | |
| | | | | | | | | | | | | | | | | | | | | | |
| | | | | |
| | | | | | | | | | | | | | | | | | | 94,708,922 | | | |
| | | | | | | | | | | | | | | | | | | | | | |
| | | | | |
Industrial/Pollution Control - 0.5% | | | | | | | | | | | | | | | | | | | | | | |
St. Paul Port Auth. Rev. 8 | | | | 1,000,000 | | | | | 4.00 | | | | | 10/1/40 | | | | | 994,210 | | | |
St. Paul Port Auth. Rev. | | | | 1,000,000 | | | | | 4.00 | | | | | 10/1/42 | | | | | 1,013,600 | | | |
St. Paul Port Auth. Solid Waste Disposal Rev. (Gerdau St. Paul Steel Mill Proj.) 4, 8 | | | | 1,000,000 | | | | | 4.50 | | | | | 10/1/37 | | | | | 924,110 | | | |
| | | | | | | | | | | | | | | | | | | | | | |
| | | | | |
| | | | | | | | | | | | | | | | | | | 2,931,920 | | | |
| | | | | | | | | | | | | | | | | | | | | | |
| | | | | |
Insured - 0.6% | | | | | | | | | | | | | | | | | | | | | | |
Guam Power Auth. Rev. (AGM Insured) 11 | | | | 500,000 | | | | | 5.00 | | | | | 10/1/30 | | | | | 545,480 | | | |
Hibbing G.O. (AGM Insured) | | | | 485,000 | | | | | 4.10 | | | | | 2/1/28 | | | | | 485,708 | | | |
Minneapolis Health Care System Rev. (Fairview Health Services) (AGC Insured) | | | | 885,000 | | | | | 6.50 | | | | | 11/15/38 | | | | | 889,903 | | | |
MN Governmental Agy. Fin. Group (Flex Terminal Prog.) (AGC Insured) | | | | 75,000 | | | | | 4.00 | | | | | 3/1/20 | | | | | 75,104 | | | |
MN Governmental Agy. Fin. Group (Flex Terminal Prog.) (AGC Insured) | | | | 90,000 | | | | | 4.00 | | | | | 3/1/22 | | | | | 90,099 | | | |
Puerto Rico Public Improvement G.O. (AGM Insured) 11 | | | | 600,000 | | | | | 5.13 | | | | | 7/1/30 | | | | | 623,142 | | | |
Virgin Islands Public Fin. Auth. (Gross Receipts Taxes Loan Note) (NATL Insured) 11 | | | | 1,000,000 | | | | | 5.00 | | | | | 10/1/23 | | | | | 1,002,370 | | | |
| | | | | | | | | | | | | | | | | | | | | | |
| | | | | |
| | | | | | | | | | | | | | | | | | | 3,711,806 | | | |
| | | | | | | | | | | | | | | | | | | | | | |
| | | | | |
Multifamily Mortgage - 20.2% | | | | | | | | | | | | | | | | | | | | | | |
Anoka Hsg. Rev. (Homestead at Anoka, Inc. Proj.) | | | | 1,000,000 | | | | | 4.75 | | | | | 11/1/35 | | | | | 1,023,680 | | | |
Anoka Hsg. Rev. (Homestead at Anoka, Inc. Proj.) | | | | 1,000,000 | | | | | 5.50 | | | | | 11/1/46 | | | | | 1,069,210 | | | |
Apple Valley Economic Dev. Auth. Rev. (Augustana Healthcare Center) | | | | 500,000 | | | | | 3.90 | | | | | 2/1/31 | | | | | 491,800 | | | |
Apple Valley Economic Dev. Auth. Rev. (Augustana Healthcare Center) | | | | 500,000 | | | | | 4.15 | | | | | 2/1/36 | | | | | 491,480 | | | |
Apple Valley Senior Hsg. Rev. (Presbyterian Homes) | | | | 1,000,000 | | | | | 5.00 | | | | | 9/1/43 | | | | | 1,054,290 | | | |
Apple Valley Senior Living Rev. (Senior Living LLC Proj.) | | | | 500,000 | | | | | 4.00 | | | | | 1/1/25 | | | | | 510,055 | | | |
Apple Valley Senior Living Rev. (Senior Living LLC Proj.) | | | | 1,000,000 | | | | | 4.00 | | | | | 1/1/30 | | | | | 1,015,790 | | | |
Apple Valley Senior Living Rev. (Senior Living LLC Proj.) | | | | 1,500,000 | | | | | 4.25 | | | | | 1/1/37 | | | | | 1,517,625 | | | |
Apple Valley Senior Living Rev. (Senior Living LLC Proj.) | | | | 3,000,000 | | | | | 5.00 | | | | | 1/1/47 | | | | | 3,061,890 | | | |
Apple Valley Senior Living Rev. (Senior Living LLC Proj.) | | | | 1,860,000 | | | | | 6.75 | | | | | 1/1/27 | | | | | 1,853,936 | | | |
Apple Valley Senior Living Rev. (Senior Living LLC Proj.) | | | | 1,000,000 | | | | | 7.00 | | | | | 1/1/37 | | | | | 984,690 | | | |
Bethel Rev. (Grandview Christian Home Proj.) | | | | 3,000,000 | | | | | 5.00 | | | | | 10/1/41 | | | | | 3,073,470 | | | |
See accompanying notes to financial statements.
SCHEDULE OF INVESTMENTS (Unaudited)
September 30, 2018
Sit Minnesota Tax-Free Income Fund (Continued)
| | | | | | | | | | | | | | | | | | | | | | |
| | | | | | | | | | | |
| | | | |
| Name of Issuer | | Principal Amount ($) | | Coupon
Rate (%) | | Maturity Date | | Fair Value ($) |
Blaine Senior Hsg. & Health Care Fac. Rev. (Crest View Senior Community Proj.) | | | | 1,500,000 | | | | | 5.75 | | | | | 7/1/35 | | | | | 1,436,145 | | | |
Cambridge Hsg. & Health Care Facs. Rev. (Walker Methodist Levande, LLC Proj.) | | | | 1,250,000 | | | | | 5.13 | | | | | 3/1/39 | | | | | 1,275,825 | | | |
Champlin Multifamily Hsg. Rev. (Champlin Drive Apts.) | | | | 685,000 | | | | | 6.00 | | | | | 1/1/27 | | | | | 699,508 | | | |
Chisago Hsg. and Health Care Rev. (CDL Homes LLC) | | | | 750,000 | | | | | 6.00 | | | | | 8/1/33 | | | | | 810,803 | | | |
City of Otsego Rev. (Riverview Landing Proj.) | | | | 1,500,000 | | | | | 5.00 | | | | | 10/1/42 | | | | | 1,539,825 | | | |
Cloquet Hsg. Fac. Ref. (HADC Cloquet LLC Proj.) | | | | 1,020,000 | | | | | 5.00 | | | | | 8/1/38 | | | | | 1,030,914 | | | |
Columbus Hsg. Rev. (Richfield Senior Hsg., Inc.) | | | | 1,000,000 | | | | | 5.00 | | | | | 1/1/34 | | | | | 1,022,170 | | | |
Columbus Hsg. Rev. (Richfield Senior Hsg., Inc.) | | | | 1,000,000 | | | | | 5.25 | | | | | 1/1/40 | | | | | 1,026,300 | | | |
Crystal Multifamily Hsg. Rev. (Cavanagh Proj.) | | | | 2,500,000 | | | | | 5.25 | | | | | 6/1/31 | | | | | 2,499,800 | | | |
Dakota Co. Community Dev. Agy. (Glen at Valley Creek Proj.) | | | | 1,400,000 | | | | | 4.50 | | | | | 8/1/36 | | | | | 1,374,660 | | | |
Dakota Co. Community Dev. Agy. Multifamily Hsg. Rev. | | | | 3,500,000 | | | | | 4.00 | | | | | 1/1/42 | | | | | 3,543,505 | | | |
Dakota Co. Community Dev. Agy. Multifamily Hsg. Rev. (Walker Highviews Hills LLC) 4 | | | �� | 750,000 | | | | | 5.00 | | | | | 8/1/36 | | | | | 757,755 | | | |
Dakota Co. Community Dev. Agy. Multifamily Hsg. Rev. (Walker Highviews Hills LLC) 4 | | | | 500,000 | | | | | 5.00 | | | | | 8/1/51 | | | | | 501,345 | | | |
Deephaven Hsg. & Healthcare Rev. (St. Therese Senior Living Proj.) | | | | 1,345,000 | | | | | 5.00 | | | | | 4/1/38 | | | | | 1,345,538 | | | |
Fridley Multifamily Hsg. Rev. (Village Green Apartments Proj.) | | | | 3,500,000 | | | | | 3.75 | | | | | 11/1/34 | | | | | 3,500,000 | | | |
Independence Health Care Facs. Rev. (Augustana Chapel View Home) | | | | 250,000 | | | | | 4.00 | | | | | 12/1/32 | | | | | 246,002 | | | |
Minneapolis & St. Paul Hsg. & Redev. Auth. Multifamily Hsg. Rev. (GNMA Collateralized) 8 | | | | 2,765,000 | | | | | 4.75 | | | | | 1/20/42 | | | | | 2,766,078 | | | |
Minneapolis Multifamily Hsg. Rev. (Greenway Heights Family Housing) | | | | 1,015,000 | | | | | 5.75 | | | | | 7/15/31 | | | | | 1,061,893 | | | |
Minneapolis Senior Hsg. & Health Care Rev. (Ecumen Mill City Quarter) | | | | 375,000 | | | | | 4.75 | | | | | 11/1/28 | | | | | 384,758 | | | |
Minneapolis Senior Hsg. & Health Care Rev. (Ecumen Mill City Quarter) | | | | 1,500,000 | | | | | 5.00 | | | | | 11/1/35 | | | | | 1,531,305 | | | |
Minneapolis Student Hsg. Rev. (Riverton Community Housing Proj.) 4 | | | | 1,000,000 | | | | | 4.75 | | | | | 8/1/43 | | | | | 1,014,970 | | | |
Minneapolis Student Hsg. Rev. (Riverton Community Housing Proj.) 4 | | | | 500,000 | | | | | 5.00 | | | | | 8/1/53 | | | | | 510,685 | | | |
MN Hsg. Fin. Agy. Rental Hsg. (G.O. of AGY. Insured) | | | | 250,000 | | | | | 5.05 | | | | | 8/1/31 | | | | | 261,512 | | | |
MN Hsg. Fin. Agy. Rental Hsg. (G.O. of AGY. Insured) | | | | 2,560,000 | | | | | 5.25 | | | | | 8/1/40 | | | | | 2,593,203 | | | |
MN Hsg. Fin. Agy. Rental Hsg. (G.O. of AGY. Insured) | | | | 1,760,000 | | | | | 5.45 | | | | | 8/1/41 | | | | | 1,837,616 | | | |
MN Hsg. Fin. Agy. Rental Hsg. Rev. | | | | 1,000,000 | | | | | 5.20 | | | | | 8/1/43 | | | | | 1,057,130 | | | |
MN Hsg. Fin. Agy. Rev. | | | | 270,000 | | | | | 4.00 | | | | | 8/1/29 | | | | | 282,641 | | | |
MN Hsg. Fin. Agy. Rev. | | | | 255,000 | | | | | 4.00 | | | | | 8/1/31 | | | | | 264,562 | | | |
MN Hsg. Fin. Agy. Rev. | | | | 335,000 | | | | | 4.00 | | | | | 8/1/34 | | | | | 344,058 | | | |
MN Hsg. Fin. Agy. Rev. | | | | 335,000 | | | | | 4.00 | | | | | 8/1/35 | | | | | 343,037 | | | |
MN Hsg. Fin. Agy. Rev. (State Appropriation) | | | | 250,000 | | | | | 4.00 | | | | | 8/1/33 | | | | | 263,498 | | | |
MN Hsg. Fin. Agy. Rev. (State Appropriation) | | | | 1,000,000 | | | | | 5.00 | | | | | 8/1/33 | | | | | 1,118,700 | | | |
MN Hsg. Fin. Agy. Rev. (State Appropriation) | | | | 2,000,000 | | | | | 5.00 | | | | | 8/1/34 | | | | | 2,235,100 | | | |
MN Hsg. Fin. Agy. Rev. (State Appropriation) | | | | 1,000,000 | | | | | 5.00 | | | | | 8/1/35 | | | | | 1,116,410 | | | |
Moorhead Economic Dev. Auth. Rev. Ref. (EverCare Sr. Living LLC) | | | | 280,000 | | | | | 4.65 | | | | | 9/1/26 | | | | | 283,055 | | | |
Moorhead Health Care Rev. Ref. (EverCare Sr. Living LLC) | | | | 1,000,000 | | | | | 5.00 | | | | | 9/1/32 | | | | | 1,009,030 | | | |
Moorhead Health Care Rev. Ref. (EverCare Sr. Living LLC) | | | | 250,000 | | | | | 5.13 | | | | | 9/1/37 | | | | | 252,278 | | | |
New Ulm Economic Dev. Auth. Rev. (HADC Ridgeway Proj.) | | | | 1,500,000 | | | | | 5.00 | | | | | 8/1/39 | | | | | 1,525,500 | | | |
North Oaks Senior Hsg. Rev. (Waverly Gardens Proj.) | | | | 2,000,000 | | | | | 4.00 | | | | | 10/1/33 | | | | | 1,995,520 | | | |
North Oaks Senior Hsg. Rev. (Waverly Gardens Proj.) | | | | 1,500,000 | | | | | 5.00 | | | | | 10/1/35 | | | | | 1,620,510 | | | |
North Oaks Senior Hsg. Rev. (Waverly Gardens Proj.) | | | | 1,000,000 | | | | | 5.00 | | | | | 10/1/47 | | | | | 1,066,460 | | | |
Oakdale Rev. (Sr. Hsg. Oak Meadows Proj.) | | | | 875,000 | | | | | 5.00 | | | | | 4/1/34 | | | | | 881,528 | | | |
Rochester Health Care & Hsg. Rev. (Homestead Rochester, Inc.) | | | | 1,950,000 | | | | | 5.00 | | | | | 12/1/30 | | | | | 2,049,236 | | | |
Rochester Health Care & Hsg. Rev. (Homestead Rochester, Inc.) | | | | 1,325,000 | | | | | 5.00 | | | | | 12/1/49 | | | | | 1,363,478 | | | |
Rochester Health Care & Hsg. Rev. (Samaritan Bethany, Inc. Proj.) | | | | 1,000,000 | | | | | 5.00 | | | | | 8/1/37 | | | | | 1,030,840 | | | |
Rochester Health Care & Hsg. Rev. (The Homestead at Rochester) | | | | 720,000 | | | | | 6.38 | | | | | 12/1/33 | | | | | 799,020 | | | |
Rochester Health Care & Hsg. Rev. (The Homestead at Rochester) | | | | 2,500,000 | | | | | 6.50 | | | | | 12/1/35 | | | | | 2,780,200 | | | |
Rochester Multifamily Hsg. Rev. (Essex Place Apartments Proj.) (FHLMC) | | | | 4,000,000 | | | | | 3.75 | | | | | 6/1/29 | | | | | 4,086,480 | | | |
Sartell Health Care & Hsg. Fac. Rev. (Country Manor Campus LLC Proj.) | | | | 930,000 | | | | | 4.00 | | | | | 9/1/20 | | | | | 954,273 | | | |
Sartell Health Care & Hsg. Fac. Rev. (Country Manor Campus LLC Proj.) | | | | 850,000 | | | | | 5.00 | | | | | 9/1/42 | | | | | 914,498 | | | |
Sartell Health Care & Hsg. Fac. Rev. (Country Manor Campus LLC Proj.) | | | | 1,135,000 | | | | | 5.25 | | | | | 9/1/27 | | | | | 1,231,237 | | | |
Sartell Health Care & Hsg. Fac. Rev. (Country Manor Campus LLC Proj.) | | | | 2,150,000 | | | | | 5.30 | | | | | 9/1/37 | | | | | 2,320,237 | | | |
Sauk Rapids Health Care & Hsg. Facs. Rev. (Good Shepherd Lutheran Home Proj.) | | | | 1,705,000 | | | | | 5.13 | | | | | 1/1/39 | | | | | 1,731,172 | | | |
See accompanying notes to financial statements.
| | |
42 | | SIT MUTUAL FUNDS SEMI-ANNUAL REPORT |
| | | | | | | | | | | | | | | | | | | | | | | | |
| | | | | | | | | | | | | |
| | | | |
| Name of Issuer | | Principal Amount ($) | | Coupon
Rate (%) | | Maturity Date | | Fair Value ($) |
St. Anthony Multifamily Hsg. Rev. (Silver Lake Village Hsg.) | | | | 250,000 | | | | | 5.75 | | | | | 12/1/28 | | | | | 263,330 | | | | | |
St. Anthony Multifamily Hsg. Rev. (Silver Lake Village Hsg.) | | | | 2,000,000 | | | | | 6.00 | | | | | 12/1/30 | | | | | 2,112,460 | | | | | |
St. Paul Hsg. & Redev. Auth. (Pioneer Press Apts. Proj.) 1, 4 | | | | 5,000,000 | | | | | 3.38 | | | | | 5/1/21 | | | | | 4,925,450 | | | | | |
St. Paul Hsg. & Redev. Auth. Health Care Rev. (Carondelet Village Proj.) | | | | 2,620,000 | | | | | 4.25 | | | | | 12/1/27 | | | | | 2,687,701 | | | | | |
St. Paul Hsg. & Redev. Auth. Health Care Rev. (Carondelet Village Proj.) | | | | 2,400,000 | | | | | 5.00 | | | | | 12/1/47 | | | | | 2,541,624 | | | | | |
St. Paul Hsg. & Redev. Auth. Multifamily Housing Rev. (Marian Center Proj.) | | | | 1,175,000 | | | | | 5.20 | | | | | 11/1/22 | | | | | 1,175,212 | | | | | |
St. Paul Hsg. & Redev. Auth. Multifamily Housing Rev. (Marian Center Proj.) | | | | 1,000,000 | | | | | 5.30 | | | | | 11/1/30 | | | | | 972,160 | | | | | |
St. Paul Hsg. & Redev. Auth. Multifamily Housing Rev. (Marian Center Proj.) | | | | 2,590,000 | | | | | 5.38 | | | | | 5/1/43 | | | | | 2,433,745 | | | | | |
St. Paul Park Health Care Facs. Rev (Presbyterian Homes Interlu Proj.) | | | | 1,000,000 | | | | | 5.00 | | | | | 5/1/43 | | | | | 1,048,480 | | | | | |
St. Paul Park Hsg. Rev. (Buffalo Senior Housing Proj.) | | | | 1,115,000 | | | | | 5.00 | | | | | 10/1/38 | | | | | 1,137,412 | | | | | |
St. Paul Park Senior Hsg. Rev. (Presbyterian Homes Bloomin Proj.) | | | | 1,000,000 | | | | | 5.00 | | | | | 9/1/42 | | | | | 1,080,030 | | | | | |
St. Paul Port Auth. Rev. (Energy Park Utility Company Proj.) 8 | | | | 2,515,000 | | | | | 5.70 | | | | | 8/1/36 | | | | | 2,564,948 | | | | | |
St. Peter Hsg. & Health Care Fac. Rev. (Ecumen Second Century & Owatonna Senior Living Proj.) | | | | 700,000 | | | | | 5.00 | | | | | 3/1/40 | | | | | 720,223 | | | | | |
Vergas Hsg. & Healthcare Facs. Rev. (CDL Homes Proj.) | | | | 1,000,000 | | | | | 4.25 | | | | | 8/1/43 | | | | | 970,070 | | | | | |
Wayzata Sr. Hsg. Rev. (Folkestone Sr. Living Community) | | | | 730,000 | | | | | 5.20 | | | | | 5/1/25 | | | | | 757,704 | | | | | |
Wayzata Sr. Hsg. Rev. (Folkestone Sr. Living Community) | | | | 1,250,000 | | | | | 5.50 | | | | | 11/1/32 | | | | | 1,288,562 | | | | | |
Wayzata Sr. Hsg. Rev. (Folkestone Sr. Living Community) | | | | 1,135,000 | | | | | 5.75 | | | | | 11/1/39 | | | | | 1,170,696 | | | | | |
Willmar Hsg. & Redev. Auth. Multifamily Rev. (Eagle Ridge Apartments) | | | | 2,610,000 | | | | | 4.63 | | | | | 4/1/30 | | | | | 2,531,857 | | | | | |
| | | | | | | | | | | | | | | | | | | | | | | | |
| | | | | | |
| | | | | | | | | | | | | | | | | | | 116,021,383 | | | | | |
| | | | | | | | | | | | | | | | | | | | | | | | |
Municipal Lease 9 - 6.4% | | | | | | | | | | | | | | | | | | | | | | | | |
Anoka Co. Hsg. & Redev. Rev. | | | | 415,000 | | | | | 5.63 | | | | | 5/1/22 | | | | | 421,271 | | | | | |
Anoka Co. Hsg. & Redev. Rev. | | | | 500,000 | | | | | 6.63 | | | | | 5/1/30 | | | | | 511,180 | | | | | |
Anoka Co. Hsg. & Redev. Rev. | | | | 500,000 | | | | | 6.88 | | | | | 5/1/40 | | | | | 510,620 | | | | | |
Anoka-Hennepin Independent School District No. 11 Lease Rev. | | | | 500,000 | | | | | 3.75 | | | | | 2/1/35 | | | | | 501,570 | | | | | |
Anoka-Hennepin Independent School District No. 11 Lease Rev. | | | | 600,000 | | | | | 4.00 | | | | | 2/1/41 | | | | | 607,596 | | | | | |
Chaska Economic Dev. Auth. Lease Rev. | | | | 1,100,000 | | | | | 4.00 | | | | | 2/1/31 | | | | | 1,148,741 | | | | | |
Chaska Economic Dev. Auth. Lease Rev. | | | | 690,000 | | | | | 4.00 | | | | | 2/1/33 | | | | | 714,971 | | | | | |
Chaska Economic Dev. Auth. Lease Rev. | | | | 500,000 | | | | | 4.00 | | | | | 2/1/35 | | | | | 515,790 | | | | | |
Duluth Independent School District No. 709 | | | | 1,000,000 | | | | | 4.00 | | | | | 2/1/27 | | | | | 1,057,900 | | | | | |
Duluth Independent School District No. 709 | | | | 1,300,000 | | | | | 4.00 | | | | | 2/1/28 | | | | | 1,367,431 | | | | | |
Duluth Independent School District No. 709 | | | | 2,000,000 | | | | | 5.00 | | | | | 2/1/25 | | | | | 2,243,700 | | | | | |
Duluth Independent School District No. 709 | | | | 785,000 | | | | | 5.13 | | | | | 3/1/29 | | | | | 795,535 | | | | | |
Golden Valley Hsg. & Redev. Auth. Rev. | | | | 1,000,000 | | | | | 4.00 | | | | | 2/1/30 | | | | | 1,029,480 | | | | | |
Golden Valley Hsg. & Redev. Auth. Rev. | | | | 500,000 | | | | | 4.00 | | | | | 2/1/32 | | | | | 513,265 | | | | | |
Goodhue Co. Education District No. 6051 Lease Rev. | | | | 1,030,000 | | | | | 5.00 | | | | | 2/1/34 | | | | | 1,116,479 | | | | | |
Goodhue Co. Education District No. 6051 Lease Rev. | | | | 1,500,000 | | | | | 5.00 | | | | | 2/1/39 | | | | | 1,603,215 | | | | | |
Guam Education Fin. Foundation 11 | | | | 1,000,000 | | | | | 5.00 | | | | | 10/1/21 | | | | | 1,069,970 | | | | | |
Guam Education Fin. Foundation 11 | | | | 1,730,000 | | | | | 5.00 | | | | | 10/1/22 | | | | | 1,879,126 | | | | | |
Minnetonka Independent School District No. 276 | | | | 450,000 | | | | | 4.00 | | | | | 3/1/30 | | | | | 469,386 | | | | | |
Minnetonka Independent School District No. 276 | | | | 340,000 | | | | | 4.00 | | | | | 2/1/33 | | | | | 346,902 | | | | | |
Minnetonka Independent School District No. 276 | | | | 300,000 | | | | | 4.00 | | | | | 3/1/33 | | | | | 308,718 | | | | | |
Minnetonka Independent School District No. 276 | | | | 400,000 | | | | | 4.00 | | | | | 2/1/36 | | | | | 405,064 | | | | | |
Minnetonka Independent School District No. 276 | | | | 500,000 | | | | | 4.50 | | | | | 1/1/41 | | | | | 520,350 | | | | | |
MN Hsg. Fin. Agy. Hsg. Infrastructure (State Appropriation) | | | | 1,000,000 | | | | | 3.88 | | | | | 8/1/38 | | | | | 992,430 | | | | | |
MN Hsg. Fin. Agy. Hsg. Infrastructure (State Appropriation) | | | | 1,040,000 | | | | | 4.00 | | | | | 8/1/36 | | | | | 1,061,174 | | | | | |
MN Hsg. Fin. Agy. Hsg. Infrastructure (State Appropriation) | | | | 580,000 | | | | | 4.00 | | | | | 8/1/37 | | | | | 587,992 | | | | | |
MN Hsg. Fin. Agy. Hsg. Infrastructure (State Appropriation) | | | | 945,000 | | | | | 4.00 | | | | | 8/1/40 | | | | | 951,842 | | | | | |
MN Hsg. Fin. Agy. Non-Profit Hsg. Rev. (State Appropriation) | | | | 2,000,000 | | | | | 5.00 | | | | | 8/1/31 | | | | | 2,147,660 | | | | | |
MN Hsg. Fin. Agy. Rev. (State Appropriation) | | | | 300,000 | | | | | 5.00 | | | | | 8/1/35 | | | | | 331,329 | | | | | |
Northeastern Metropolitan Intermediate School District No. 916 | | | | 1,000,000 | | | | | 5.00 | | | | | 2/1/34 | | | | | 1,109,020 | | | | | |
Osseo Independent School District No. 279 | | | | 1,000,000 | | | | | 4.00 | | | | | 2/1/28 | | | | | 1,048,390 | | | | | |
Plymouth Intermediate District No. 287 | | | | 1,285,000 | | | | | 3.00 | | | | | 5/1/32 | | | | | 1,204,186 | | | | | |
See accompanying notes to financial statements.
SCHEDULE OF INVESTMENTS (Unaudited)
September 30, 2018
Sit Minnesota Tax-Free Income Fund (Continued)
| | | | | | | | | | | | | | | | | | | | | | |
| | | | | | | | | | | |
| | | | |
| Name of Issuer | | Principal Amount ($) | | Coupon
Rate (%) | | Maturity Date | | Fair Value ($) |
Plymouth Intermediate District No. 287 | | | | 500,000 | | | | | 4.00 | | | | | 5/1/26 | | | | | 536,445 | | | |
Plymouth Intermediate District No. 287 | | | | 300,000 | | | | | 4.00 | | | | | 5/1/29 | | | | | 315,042 | | | |
Plymouth Intermediate District No. 287 | | | | 300,000 | | | | | 4.00 | | | | | 5/1/30 | | | | | 313,407 | | | |
Plymouth Intermediate District No. 287 | | | | 470,000 | | | | | 4.00 | | | | | 5/1/31 | | | | | 488,462 | | | |
Plymouth Intermediate District No. 287 | | | | 600,000 | | | | | 4.00 | | | | | 2/1/37 | | | | | 620,178 | | | |
Southern Plains Education Cooperative No. 915 | | | | 1,215,000 | | | | | 4.00 | | | | | 2/1/37 | | | | | 1,175,026 | | | |
Southern Plains Education Cooperative No. 915 | | | | 1,000,000 | | | | | 4.50 | | | | | 2/1/39 | | | | | 1,019,390 | | | |
St. Cloud Independent School District No. 742 | | | | 750,000 | | | | | 4.00 | | | | | 2/1/38 | | | | | 747,968 | | | |
Waconia Independent School District No. 110 | | | | 500,000 | | | | | 5.00 | | | | | 2/1/37 | | | | | 550,580 | | | |
Winona School District 861 Lease Purchase | | | | 384,501 | | | | | 6.04 | | | | | 8/1/24 | | | | | 385,182 | | | |
Worthington Independent School District No. 518 | | | | 1,400,000 | | | | | 4.00 | | | | | 2/1/45 | | | | | 1,408,792 | | | |
| | | | | | | | | | | | | | | | | | | | | | |
| | | | | |
| | | | | | | | | | | | | | | | | | | 36,652,755 | | | |
| | | | | | | | | | | | | | | | | | | | | | |
Municipal Money Market - 0.9% | | | | | | | | | | | | | | | | | | | | | | |
City of Minneapolis Hsg. Dev. Rev. (One Ten Grant Proj.) 1 | | | | 2,300,000 | | | | | 1.52 | | | | | 9/1/26 | | | | | 2,300,000 | | | |
City of Minneapolis Rev. (Univ. Gateway Proj.) 1 | | | | 2,200,000 | | | | | 1.52 | | | | | 12/1/27 | | | | | 2,200,000 | | | |
City of Minneapolis Rev. (Univ. Gateway Proj.) 1 | | | | 500,000 | | | | | 1.52 | | | | | 6/1/32 | | | | | 500,000 | | | |
| | | | | | | | | | | | | | | | | | | | | | |
| | | | | |
| | | | | | | | | | | | | | | | | | | 5,000,000 | | | |
| | | | | | | | | | | | | | | | | | | | | | |
Other Revenue Bonds - 4.9% | | | | | | | | | | | | | | | | | | | | | | |
Crystal Governmental Fac. Rev. | | | | 438,543 | | | | | 5.10 | | | | | 12/15/26 | | | | | 438,604 | | | |
Minneapolis Community Dev. Agy. Limited Tax Common Bond Fund (Discount Steel) 8 | | | | 80,000 | | | | | 5.25 | | | | | 6/1/19 | | | | | 80,386 | | | |
Minneapolis Rev. (YMCA Greater Twin Cities Proj.) | | | | 165,000 | | | | | 4.00 | | | | | 6/1/29 | | | | | 172,758 | | | |
Minneapolis Rev. (YMCA Greater Twin Cities Proj.) | | | | 125,000 | | | | | 4.00 | | | | | 6/1/30 | | | | | 130,104 | | | |
Minneapolis Rev. (YMCA Greater Twin Cities Proj.) | | | | 250,000 | | | | | 4.00 | | | | | 6/1/31 | | | | | 258,670 | | | |
Minneapolis Tax Increment Rev. | | | | 215,000 | | | | | 3.05 | | | | | 3/1/21 | | | | | 216,092 | | | |
Minneapolis Tax Increment Rev. | | | | 320,000 | | | | | 3.50 | | | | | 3/1/23 | | | | | 324,445 | | | |
Minneapolis Tax Increment Rev. | | | | 170,000 | | | | | 3.80 | | | | | 3/1/25 | | | | | 172,343 | | | |
Minneapolis Tax Increment Rev. | | | | 200,000 | | | | | 4.00 | | | | | 3/1/27 | | | | | 203,028 | | | |
Minneapolis Tax Increment Rev. | | | | 260,000 | | | | | 4.00 | | | | | 3/1/30 | | | | | 261,352 | | | |
MN Development Rev. Limited Tax Supported Comm. Board | | | | 1,000,000 | | | | | 6.00 | | | | | 12/1/40 | | | | | 1,077,850 | | | |
MN Development Rev. Limited Tax Supported Comm. Board | | | | 2,000,000 | | | | | 6.25 | | | | | 12/1/30 | | | | | 2,166,640 | | | |
Mound Hsg. & Redev. Auth. Tax Increment Rev. Ref. (Metroplain Proj.) | | | | 960,000 | | | | | 5.00 | | | | | 2/15/27 | | | | | 953,472 | | | |
Northeastern Metropolitan Intermediate School District No. 916 | | | | 4,500,000 | | | | | 4.00 | | | | | 2/1/38 | | | | | 4,560,165 | | | |
St. Louis Park Economic Dev. Auth. Tax Increment Rev. (Hoigaard Vlg.) | | | | 925,000 | | | | | 5.00 | | | | | 2/1/23 | | | | | 925,379 | | | |
St. Paul Hsg. & Redev. Auth. Tax Increment Rev. (9th St. Lofts Proj.) | | | | 890,000 | | | | | 6.38 | | | | | 2/15/28 | | | | | 893,177 | | | |
St. Paul Hsg. & Redev. Auth. Tax Increment Rev. (Drake Marble Proj.) | | | | 534,000 | | | | | 6.75 | | | | | 3/1/28 | | | | | 534,283 | | | |
St. Paul Hsg. & Redev. Auth. Tax Increment Rev. (Emerald Gardens Proj.) | | | | 740,000 | | | | | 6.50 | | | | | 3/1/29 | | | | | 753,616 | | | |
St. Paul Hsg. & Redev. Auth. Tax Increment Rev. (North Quadrant Owner Occupied Proj.) | | | | 929,000 | | | | | 7.00 | | | | | 2/15/28 | | | | | 934,500 | | | |
St. Paul Hsg. & Redev. Auth. Tax Increment Rev. (North Quadrant Owner Occupied Proj.) | | | | 770,000 | | | | | 7.50 | | | | | 2/15/28 | | | | | 770,770 | | | |
St. Paul Hsg. & Redev. Auth. Tax Increment Rev. (Upper Landing Proj.) | | | | 175,000 | | | | | 5.00 | | | | | 3/1/19 | | | | | 176,974 | | | |
St. Paul Hsg. & Redev. Auth. Tax Increment Rev. (Upper Landing Proj.) | | | | 180,000 | | | | | 5.00 | | | | | 9/1/19 | | | | | 184,383 | | | |
St. Paul Hsg. & Redev. Auth. Tax Increment Rev. (Upper Landing Proj.) | | | | 185,000 | | | | | 5.00 | | | | | 3/1/20 | | | | | 191,697 | | | |
St. Paul Hsg. & Redev. Auth. Tax Increment Rev. (Upper Landing Proj.) | | | | 220,000 | | | | | 5.00 | | | | | 9/1/20 | | | | | 230,296 | | | |
St. Paul Hsg. & Redev. Auth. Tax Increment Rev. (Upper Landing Proj.) | | | | 225,000 | | | | | 5.00 | | | | | 3/1/21 | | | | | 236,169 | | | |
St. Paul Hsg. & Redev. Auth. Tax Increment Rev. (Upper Landing Proj.) | | | | 1,000,000 | | | | | 5.00 | | | | | 9/1/26 | | | | | 1,037,690 | | | |
St. Paul Hsg. & Redev. Auth. Tax Increment Rev. (Upper Landing Proj.) | | | | 930,000 | | | | | 5.00 | | | | | 3/1/29 | | | | | 961,257 | | | |
St. Paul Port Auth. Lease Rev. (Regions Hospital Parking Ramp Proj.) | | | | 3,875,000 | | | | | 5.00 | | | | | 8/1/36 | | | | | 3,880,658 | | | |
St. Paul Port Auth. Rev. (Amherst H. Wilder Foundation) | | | | 3,000,000 | | | | | 5.00 | | | | | 12/1/36 | | | | | 3,111,900 | | | |
Territory of Guam. Rev. 11 | | | | 500,000 | | | | | 5.00 | | | | | 12/1/46 | | | | | 541,020 | | | |
Virgin Islands Public Fin. Auth. (Gross Receipts Taxes Loan Note) 11 | | | | 2,000,000 | | | | | 5.00 | | | | | 10/1/42 | | | | | 1,885,000 | | | |
| | | | | | | | | | | | | | | | | | | | | | |
| | | | | | | | | | | | | | | | | | | 28,264,678 | | | |
| | | | | | | | | | | | | | | | | | | | | | |
See accompanying notes to financial statements.
| | |
44 | | SIT MUTUAL FUNDS SEMI-ANNUAL REPORT |
| | | | | | | | | | | | | | | | | | | | | | |
| | | | | | | | | | | |
| | | | |
| Name of Issuer | | Principal
Amount ($) | | Coupon
Rate (%) | | Maturity
Date | | Fair Value ($) |
| | | | | |
Public Facilities - 0.2% | | | | | | | | | | | | | | | | | | | | | | |
Lakeville Hsg. & Redev. Auth. Parking Rev. (Ice Arena. Proj.) | | | | 1,250,000 | | | | | 4.00 | | | | | 2/1/32 | | | | | 1,299,900 | | | |
| | | | | | | | | | | | | | | | | | | | | | |
Sales Tax Revenue - 1.1% | | | | | | | | | | | | | | | | | | | | | | |
American Samoa Economic Development Authority Rev. 11 | | | | 2,000,000 | | | | | 6.25 | | | | | 9/1/29 | | | | | 1,941,480 | | | |
Guam Govt. Business Privilege Tax Rev. 11 | | | | 2,750,000 | | | | | 5.00 | | | | | 11/15/35 | | | | | 2,973,630 | | | |
St. Paul Sales Tax Rev. | | | | 1,400,000 | | | | | 5.00 | | | | | 11/1/31 | | | | | 1,563,604 | | | |
| | | | | | | | | | | | | | | | | | | | | | |
| | | | | |
| | | | | | | | | | | | | | | | | | | 6,478,714 | | | |
| | | | | | | | | | | | | | | | | | | | | | |
Single Family Mortgage - 17.8% | | | | | | | | | | | | | | | | | | | | | | |
Dakota Co. Community Dev. Agy. Single Family Mtg. Rev. (GNMA) | | | | 1,060,000 | | | | | 4.45 | | | | | 12/1/32 | | | | | 1,086,352 | | | |
Dakota Co. Community Dev. Agy. Single Family Mtg. Rev. (GNMA-FNMA-FHLMC) | | | | 370,000 | | | | | 4.63 | | | | | 12/1/30 | | | | | 377,378 | | | |
Dakota Co. Community Dev. Agy. Single Family Mtg. Rev. (GNMA-FNMA-FHLMC) | | | | 620,000 | | | | | 4.88 | | | | | 12/1/33 | | | | | 635,481 | | | |
Dakota Co. Community Dev. Agy. Single Family Mtg. Rev. (GNMA-FNMA-FHLMC) 8 | | | | 66,675 | | | | | 5.13 | | | | | 12/1/40 | | | | | 66,696 | | | |
Dakota Co. Community Dev. Agy. Single Family Mtg. Rev. (GNMA-FNMA-FHLMC) 8 | | | | 6,573 | | | | | 5.15 | | | | | 12/1/38 | | | | | 6,573 | | | |
Dakota Co. Community Dev. Agy. Single Family Mtg. Rev. (GNMA-FNMA-FHLMC) 8 | | | | 50,228 | | | | | 5.30 | | | | | 12/1/39 | | | | | 50,284 | | | |
Minneapolis St. Paul Hsg. Fin. Board Single Family Mtg. Rev. (GNMA-FNMA) | | | | 375,000 | | | | | 4.45 | | | | | 12/1/27 | | | | | 386,216 | | | |
Minneapolis St. Paul Hsg. Fin. Board Single Family Mtg. Rev. (GNMA-FNMA) 8 | | | | 4,780 | | | | | 5.00 | | | | | 12/1/38 | | | | | 4,787 | | | |
Minneapolis St. Paul Hsg. Fin. Board Single Family Mtg. Rev. (GNMA-FNMA-FHLMC) 8 | | | | 73,758 | | | | | 5.25 | | | | | 12/1/40 | | | | | 73,873 | | | |
MN Hsg. Fin. Agy. Homeownership Fin. (GNMA-FNMA) | | | | 3,380,000 | | | | | 4.40 | | | | | 7/1/32 | | | | | 3,450,270 | | | |
MN Hsg. Fin. Agy. Homeownership Fin. (GNMA-FNMA-FHLMC) | | | | 4,942,723 | | | | | 3.30 | | | | | 3/1/48 | | | | | 4,874,810 | | | |
MN Hsg. Fin. Agy. Homeownership Fin. (GNMA-FNMA-FHLMC) | | | | 3,978,562 | | | | | 3.30 | | | | | 5/1/48 | | | | | 3,924,095 | | | |
MN Hsg. Fin. Agy. Homeownership Fin. (GNMA-FNMA-FHLMC) | | | | 1,500,000 | | | | | 3.45 | | | | | 9/1/48 | | | | | 1,479,780 | | | |
MN Hsg. Fin. Agy. Homeownership Fin. (GNMA-FNMA-FHLMC) | | | | 2,870,000 | | | | | 4.45 | | | | | 7/1/31 | | | | | 2,948,265 | | | |
MN Hsg. Fin. Agy. Homeownership Fin. (GNMA-FNMA-FHLMC) | | | | 1,565,000 | | | | | 4.70 | | | | | 1/1/31 | | | | | 1,609,462 | | | |
MN Hsg. Fin. Agy. Residential Hsg. Rev. 8 | | | | 1,085,000 | | | | | 3.20 | | | | | 1/1/33 | | | | | 1,036,924 | | | |
MN Hsg. Fin. Agy. Residential Hsg. Rev. | | | | 2,275,000 | | | | | 3.30 | | | | | 7/1/29 | | | | | 2,277,662 | | | |
MN Hsg. Fin. Agy. Residential Hsg. Rev. | | | | 2,780,000 | | | | | 5.10 | | | | | 1/1/40 | | | | | 2,804,353 | | | |
MN Hsg. Fin. Agy. Residential Hsg. Rev. (G.O. of AGY. Insured) | | | | 1,615,000 | | | | | 3.63 | | | | | 7/1/25 | | | | | 1,625,481 | | | |
MN Hsg. Fin. Agy. Residential Hsg. Rev. (G.O. of AGY. Insured) | | | | 2,100,000 | | | | | 3.90 | | | | | 7/1/30 | | | | | 2,134,524 | | | |
MN Hsg. Fin. Agy. Residential Hsg. Rev. (GNMA-FNMA-FHLMC) 8 | | | | 2,055,000 | | | | | 3.10 | | | | | 7/1/31 | | | | | 1,987,452 | | | |
MN Hsg. Fin. Agy. Residential Hsg. Rev. (GNMA-FNMA-FHLMC) | | | | 6,385,000 | | | | | 3.10 | | | | | 7/1/35 | | | | | 6,032,101 | | | |
MN Hsg. Fin. Agy. Residential Hsg. Rev. (GNMA-FNMA-FHLMC) | | | | 2,010,000 | | | | | 3.15 | | | | | 1/1/37 | | | | | 1,845,542 | | | |
MN Hsg. Fin. Agy. Residential Hsg. Rev. (GNMA-FNMA-FHLMC) 8 | | | | 1,390,000 | | | | | 3.20 | | | | | 7/1/30 | | | | | 1,335,776 | | | |
MN Hsg. Fin. Agy. Residential Hsg. Rev. (GNMA-FNMA-FHLMC) 8 | | | | 975,000 | | | | | 3.30 | | | | | 1/1/30 | | | | | 936,741 | | | |
MN Hsg. Fin. Agy. Residential Hsg. Rev. (GNMA-FNMA-FHLMC) | | | | 7,225,000 | | | | | 3.30 | | | | | 1/1/34 | | | | | 7,088,664 | | | |
MN Hsg. Fin. Agy. Residential Hsg. Rev. (GNMA-FNMA-FHLMC) | | | | 1,720,000 | | | | | 3.35 | | | | | 7/1/29 | | | | | 1,726,364 | | | |
MN Hsg. Fin. Agy. Residential Hsg. Rev. (GNMA-FNMA-FHLMC) | | | | 1,645,000 | | | | | 3.40 | | | | | 7/1/38 | | | | | 1,554,114 | | | |
MN Hsg. Fin. Agy. Residential Hsg. Rev. (GNMA-FNMA-FHLMC) | | | | 7,845,000 | | | | | 3.50 | | | | | 1/1/32 | | | | | 7,901,719 | | | |
MN Hsg. Fin. Agy. Residential Hsg. Rev. (GNMA-FNMA-FHLMC) | | | | 5,455,000 | | | | | 3.60 | | | | | 7/1/31 | | | | | 5,513,696 | | | |
MN Hsg. Fin. Agy. Residential Hsg. Rev. (GNMA-FNMA-FHLMC) | | | | 2,425,000 | | | | | 3.60 | | | | | 7/1/33 | | | | | 2,429,656 | | | |
MN Hsg. Fin. Agy. Residential Hsg. Rev. (GNMA-FNMA-FHLMC) 8 | | | | 2,500,000 | | | | | 3.63 | | | | | 7/1/32 | | | | | 2,453,375 | | | |
MN Hsg. Fin. Agy. Residential Hsg. Rev. (GNMA-FNMA-FHLMC) | | | | 5,000,000 | | | | | 3.65 | | | | | 7/1/37 | | | | | 4,847,600 | | | |
MN Hsg. Fin. Agy. Residential Hsg. Rev. (GNMA-FNMA-FHLMC) | | | | 5,470,000 | | | | | 3.80 | | | | | 7/1/38 | | | | | 5,499,647 | | | |
MN Hsg. Fin. Agy. Residential Hsg. Rev. (GNMA-FNMA-FHLMC) | | | | 4,985,000 | | | | | 3.90 | | | | | 7/1/43 | | | | | 4,914,612 | | | |
MN Hsg. Fin. Agy. Residential Hsg. Rev. (GNMA-FNMA-FHLMC) | | | | 320,000 | | | | | 4.00 | | | | | 7/1/40 | | | | | 325,750 | | | |
MN Hsg. Fin. Agy. Residential Hsg. Rev. (GNMA-FNMA-FHLMC) | | | | 1,840,000 | | | | | 4.00 | | | | | 1/1/48 | | | | | 1,919,562 | | | |
MN Hsg. Fin. Agy. Residential Hsg. Rev. (GNMA-FNMA-FHLMC) | | | | 3,850,000 | | | | | 4.00 | | | | | 7/1/48 | | | | | 4,035,416 | | | |
MN Hsg. Fin. Agy. Rev. (GNMA-FNMA Collateralized) | | | | 480,000 | | | | | 5.00 | | | | | 1/1/31 | | | | | 499,272 | | | |
MN Hsg. Fin. Agy. Rev. (GNMA-FNMA FHLMC) | | | | 4,030,000 | | | | | 3.70 | | | | | 1/1/31 | | | | | 4,109,512 | | | |
MN Hsg. Fin. Agy. Rev. (GNMA-FNMA FHLMC) | | | | 1,660,000 | | | | | 4.00 | | | | | 1/1/47 | | | | | 1,717,320 | | | |
MN Hsg. Fin. Agy. Rev. (GNMA-FNMA-FHLMC) | | | | 405,000 | | | | | 3.10 | | | | | 7/1/26 | | | | | 406,567 | | | |
MN Hsg. Fin. Agy. Rev. (GNMA-FNMA-FHLMC) 8 | | | | 1,320,000 | | | | | 4.00 | | | | | 1/1/41 | | | | | 1,359,019 | | | |
See accompanying notes to financial statements.
SCHEDULE OF INVESTMENTS (Unaudited)
September 30, 2018
Sit Minnesota Tax-Free Income Fund (Continued)
| | | | | | | | | | | | | | | | | | | | | | |
| | | | | | | | | | | |
| | | | |
Name of Issuer | | Principal
Amount ($)/
Quantity | | Coupon
Rate (%) | | Maturity
Date | | Fair Value ($) |
MN Hsg. Fin. Agy. Single Family Mtg. Rev. | | | | 35,000 | | | | | 4.90 | | | | | 7/1/29 | | | | | 35,406 | | | |
MN Hsg. Fin. Agy. Single Family Mtg. Rev. | | | | 955,000 | | | | | 5.05 | | | | | 7/1/34 | | | | | 964,082 | | | |
| | | | | | | | | | | | | | | | | | | | | | |
| | | | | |
| | | | | | | | | | | | | | | | | | | 102,292,231 | | | |
| | | | | | | | | | | | | | | | | | | | | | |
| | | | | |
Transportation - 0.3% | | | | | | | | | | | | | | | | | | | | | | |
Minneapolis & St. Paul Metro Airport Commission Sub. Rev. | | | | 1,100,000 | | | | | 5.00 | | | | | 1/1/33 | | | | | 1,208,834 | | | |
Minneapolis & St. Paul Metro Airport Commission Sub. Rev. | | | | 600,000 | | | | | 5.00 | | | | | 1/1/34 | | | | | 658,140 | | | |
| | | | | | | | | | | | | | | | | | | | | | |
| | | | | |
| | | | | | | | | | | | | | | | | | | 1,866,974 | | | |
| | | | | | | | | | | | | | | | | | | | | | |
| | | | | |
Utility - 4.2% | | | | | | | | | | | | | | | | | | | | | | |
Guam Govt. Waterworks Auth. Rev. 11 | | | | 2,000,000 | | | | | 5.00 | | | | | 1/1/46 | | | | | 2,147,140 | | | |
MN Municipal Power Agy. Electric Rev. | | | | 500,000 | | | | | 4.00 | | | | | 10/1/31 | | | | | 518,075 | | | |
MN Municipal Power Agy. Electric Rev. | | | | 1,250,000 | | | | | 4.00 | | | | | 10/1/32 | | | | | 1,292,438 | | | |
MN Municipal Power Agy. Electric Rev. | | | | 1,155,000 | | | | | 4.00 | | | | | 10/1/33 | | | | | 1,185,365 | | | |
MN Municipal Power Agy. Electric Rev. | | | | 500,000 | | | | | 5.00 | | | | | 10/1/29 | | | | | 564,165 | | | |
MN Municipal Power Agy. Electric Rev. | | | | 1,000,000 | | | | | 5.00 | | | | | 10/1/30 | | | | | 1,053,410 | | | |
MN Municipal Power Agy. Electric Rev. | | | | 500,000 | | | | | 5.00 | | | | | 10/1/30 | | | | | 563,280 | | | |
MN Municipal Power Agy. Electric Rev. | | | | 1,000,000 | | | | | 5.25 | | | | | 10/1/35 | | | | | 1,056,660 | | | |
Northern Municipal Power Agy. Electric Rev. | | | | 695,000 | | | | | 5.00 | | | | | 1/1/31 | | | | | 748,862 | | | |
Rochester Electric Utility Rev. | | | | 500,000 | | | | | 5.00 | | | | | 12/1/42 | | | | | 559,995 | | | |
Southern Minnesota Municipal Power Agency | | | | 1,000,000 | | | | | 5.00 | | | | | 1/1/41 | | | | | 1,103,310 | | | |
St. Paul Hsg. & Redev. Auth. | | | | 900,000 | | | | | 3.38 | | | | | 10/1/37 | | | | | 838,161 | | | |
St. Paul Hsg. & Redev. Auth. | | | | 880,000 | | | | | 4.00 | | | | | 10/1/31 | | | | | 915,086 | | | |
St. Paul Hsg. & Redev. Auth. | | | | 650,000 | | | | | 4.00 | | | | | 10/1/33 | | | | | 670,338 | | | |
St. Paul Hsg. & Redev. Auth. | | | | 800,000 | | | | | 4.00 | | | | | 10/1/37 | | | | | 810,880 | | | |
St. Paul Port Auth. Rev. (Energy Park Utility Company Proj.) 8 | | | | 1,250,000 | | | | | 5.45 | | | | | 8/1/28 | | | | | 1,279,788 | | | |
Western MN Municipal Power Agy. Rev. | | | | 1,000,000 | | | | | 5.00 | | | | | 1/1/31 | | | | | 1,119,580 | | | |
Western MN Municipal Power Agy. Rev. | | | | 600,000 | | | | | 5.00 | | | | | 1/1/35 | | | | | 674,286 | | | |
Western MN Municipal Power Agy. Rev. | | | | 1,750,000 | | | | | 5.00 | | | | | 1/1/36 | | | | | 1,944,722 | | | |
Western MN Municipal Power Agy. Rev. | | | | 4,725,000 | | | | | 5.00 | | | | | 1/1/46 | | | | | 5,187,672 | | | |
| | | | | | | | | | | | | | | | | | | | | | |
| | | | | |
| | | | | | | | | | | | | | | | | | | 24,233,213 | | | |
| | | | | | | | | | | | | | | | | | | | | | |
| | | | | |
Total Municipal Bonds
(cost: $558,387,264) | | | | | | | | | | | | | | | | | | | 557,994,828 | | | |
| | | | | | | | | | | | | | | | | | | | | | |
| | | | | |
Investment Companies - 1.0% | | | | | | | | | | | | | | | | | | | | | | |
Delaware Investments Minnesota Municipal Income Fund II (VMM) | | | | 334,436 | | | | | | | | | | | | | | | 3,979,788 | | | |
Nuveen Minnesota Municipal Income Fund (NMS) | | | | 144,128 | | | | | | | | | | | | | | | 1,826,102 | | | |
| | | | | | | | | | | | | | | | | | | | | | |
| | | | | |
Total Investment Companies
(cost: $7,044,059) | | | | | | | | | | | | | | | | | | | 5,805,890 | | | |
| | | | | | | | | | | | | | | | | | | | | | |
| | | | | |
Total Investments in Securities - 97.9%
(cost: $565,431,323) | | | | | | | | | | | | | | | | | | | 563,800,718 | | | |
Other Assets and Liabilities, net - 2.1% | | | | | | | | | | | | | | | | | | | 11,877,562 | | | |
| | | | | | | | | | | | | | | | | | | | | | |
| | | | | |
Total Net Assets - 100.0% | | | | | | | | | | | | | | | | | | | $575,678,280 | | | |
| | | | | | | | | | | | | | | | | | | | | | |
See accompanying notes to financial statements.
| | |
46 | | SIT MUTUAL FUNDS SEMI-ANNUAL REPORT |
| 1 | | Variable rate security. Rate disclosed is as of September 30, 2018. Certain variable rate securities are not based on a published reference rate and spread but are determined by the issuer or agent and are based on current market conditions, or, for mortgage-backed securities, are impacted by the individual mortgages which are paying off over time. These securities do not indicate a reference rate and spread in their descriptions. |
| 2 | | Security considered illiquid by the Investment Adviser. The total value of such securities as of September 30, 2018 was $1,470,768 and represented 0.3% of net assets. |
| 4 | | 144A Restricted Security. The total value of such securities as of September 30, 2018 was $15,621,856 and represented 2.7% of net assets. These securities have been determined to be liquid by the Adviser in accordance with guidelines established by the Board of Directors. |
| 5 | | The issuer is in default of interest or principal payments, or other debt covenants. Income is not being accrued. The total value of such securities as of September 30, 2018 was $1,470,768 and represented 0.3% of net assets. |
| 8 | | Securities the income from which is treated as a tax preference that is included in alternative minimum taxable income for purposes of computing federal alternative minimum tax (AMT). At September 30, 2018, 3.1% of net assets in the Fund was invested in such securities. |
| 9 | | Municipal Lease Security. The total value of such securities as of September 30, 2018 was $36,652,755 and represented 6.4% of net assets. These securities have been determined to be liquid by the Adviser in accordance with guidelines established by the Board of Directors. |
| 11 | | The Fund may invest in obligations issued by U.S. territories, for example Guam, Puerto Rico, and Virgin Islands. The total value of such securities as of September 30, 2018 was $14,608,358 and represented 2.5% of net assets. |
Numeric footnotes not disclosed are not applicable to this Schedule of Investments.
Short futures contracts outstanding as of September 30, 2018 were as follows:
| | | | | | | | | | | | | | | | | | | | |
| Type | | Contracts | | | Expiration
Date | | | Notional
Amount ($) | | | | | | Value/
Unrealized
Appreciation
(Depreciation) ($) | |
| | | | | |
Short Futures: 10 | | | | | | | | | | | | | | | | | | | | |
U.S. Treasury 2-Year | | | 159 | | | | December 2018 | | | | 33,506,766 | | | | | | | | 118,753 | |
U.S. Treasury 10-Year | | | 146 | | | | December 2018 | | | | 17,342,063 | | | | | | | | 250,460 | |
U.S. Treasury 5-Year | | | 145 | | | | December 2018 | | | | 16,309,101 | | | | | | | | 157,657 | |
U.S. Treasury Long Bond | | | 15 | | | | December 2018 | | | | 2,107,500 | | | | | | | | 63,700 | |
| | | | | |
| | | | | | | | | | | | | | | | | | | 590,570 | |
| 10 | | The amount of $3,000,000 in cash was segregated with the broker to cover margin requirements for derivative transactions as of September 30, 2018. |
A summary of the levels for the Fund’s investments as of September 30, 2018 is as follows (see Note 2 - significant accounting policies in the notes to financial statements):
| | | | | | | | | | | | | | | | |
| | | Investment in Securities | |
| | | | |
| | | Level 1 Quoted
Price ($) | | | Level 2
Other significant
observable inputs ($) | | | Level 3 Significant
unobservable inputs ($) | | | Total ($) | |
| | | | |
Assets | | | | | | | | | | | | | | | | |
Municipal Bonds | | | — | | | | 557,994,828 | | | | — | | | | 557,994,828 | |
Investment Companies | | | 5,805,890 | | | | — | | | | — | | | | 5,805,890 | |
Futures | | | 590,570 | | | | — | | | | — | | | | 590,570 | |
| | | | |
| | | | |
| | | 6,396,460 | | | | 557,994,828 | | | | — | | | | 564,391,288 | |
| | | | |
For the reporting period, there were no transfers between levels 1, 2 and 3.
See accompanying notes to financial statements.
STATEMENTS OF ASSETS AND LIABILITIES (Unaudited)
September 30, 2018
| | | | | | | | | | | | | | | | |
| | | Sit U.S.
Government
Securities
Fund | | | Sit Quality
Income
Fund | | | Sit Tax-Free
Income
Fund | | | Sit Minnesota
Tax-Free
Income
Fund | |
| | | | |
ASSETS | | | | | | | | | | | | | | | | |
Investments in securities, at identified cost | | $ | 473,209,190 | | | $ | 87,932,494 | | | $ | 215,307,030 | | | $ | 565,431,323 | |
| | | | | | | | | | | | | | | | |
| | | | |
Investments in securities, at fair value - see accompanying schedule for detail | | $ | 465,155,513 | | | $ | 87,065,184 | | | $ | 203,703,799 | | | $ | 563,800,718 | |
Cash in bank on demand deposit | | | 544,907 | | | | — | | | | 9,775,525 | | | | 16,391,588 | |
Restricted cash | | | 6,000,000 | | | | 800,000 | | | | 2,000,000 | | | | 3,000,000 | |
Accrued interest and dividends receivable | | | 2,185,200 | | | | 315,814 | | | | 2,490,071 | | | | 6,434,849 | |
Receivable for investment securities sold | | | 318,052 | | | | 49,039 | | | | — | | | | — | |
Variation margin on futures contracts | | | — | | | | 206,666 | | | | 601,640 | | | | 590,570 | |
Other receivables | | | — | | | | — | | | | — | | | | 3,000 | |
Receivable for Fund shares sold | | | 241,226 | | | | — | | | | 519,251 | | | | 1,852,697 | |
| | | | | | | | | | | | | | | | |
| | | | |
Total assets | | | 474,444,898 | | | | 88,436,703 | | | | 219,090,286 | | | | 592,073,422 | |
| | | | | | | | | | | | | | | | |
| | | | |
LIABILITIES | | | | | | | | | | | | | | | | |
Disbursements in excess of cash balances | | | — | | | | 22,634 | | | | — | | | | — | |
Payable for investment securities purchased | | | — | | | | 7,013,352 | | | | 901,599 | | | | 14,881,520 | |
Payable for Fund shares redeemed | | | 902,729 | | | | 14,388 | | | | 266,181 | | | | 950,234 | |
Cash portion of dividends payable to shareholders | | | 48,327 | | | | 8,859 | | | | 103,800 | | | | 209,649 | |
Accrued investment management fees | | | 292,505 | | | | 53,264 | | | | 133,641 | | | | 353,739 | |
Outstanding options written, at fair value (premiums received $402,038, $14,621) | | | 255,859 | | | | 10,938 | | | | — | | | | — | |
| | | | | | | | | | | | | | | | |
| | | | |
Total liabilities | | | 1,499,420 | | | | 7,123,435 | | | | 1,405,221 | | | | 16,395,142 | |
| | | | | | | | | | | | | | | | |
| | | | |
Net assets applicable to outstanding capital stock | | $ | 472,945,478 | | | $ | 81,313,268 | | | $ | 217,685,065 | | | $ | 575,678,280 | |
| | | | | | | | | | | | | | | | |
| | | | |
Net assets consist of: | | | | | | | | | | | | | | | | |
Capital (par value and paid-in surplus) | | $ | 492,379,076 | | | $ | 83,379,714 | | | $ | 237,574,190 | | | $ | 577,670,112 | |
Undistributed (distributions in excess of) net investment income | | | (14 | ) | | | (497 | ) | | | 1,237 | | | | — | |
Accumulated net realized gain (loss) from security transactions, written options and futures | | | (11,526,086 | ) | | | (1,408,988 | ) | | | (8,887,263 | ) | | | (951,797 | ) |
Unrealized appreciation (depreciation) on investments, written options and futures | | | (7,907,498 | ) | | | (656,961 | ) | | | (11,003,099 | ) | | | (1,040,035 | ) |
| | | | | | | | | | | | | | | | |
| | | | |
| | $ | 472,945,478 | | | $ | 81,313,268 | | | $ | 217,685,065 | | | $ | 575,678,280 | |
| | | | | | | | | | | | | | | | |
| | | | |
Outstanding shares | | | 43,931,014 | | | | 8,323,270 | | | | 22,796,971 | | | | 55,854,310 | |
| | | | | | | | | | | | | | | | |
| | | | |
Net asset value per share of outstanding capital stock | | | $10.77 | | | | $9.77 | | | | $9.55 | | | | $10.31 | |
| | | | | | | | | | | | | | | | |
See accompanying notes to financial statements.
| | |
48 | | SIT MUTUAL FUNDS SEMI-ANNUAL REPORT |
STATEMENTS OF OPERATIONS (Unaudited)
Six Months Ended September 30, 2018
| | | | | | | | | | | | | | | | |
| | | Sit U.S. | | | | | | | | | Sit Minnesota | |
| | | Government | | | Sit Quality | | | Sit Tax-Free | | | Tax-Free | |
| | | Securities | | | Income | | | Income | | | Income | |
| | | Fund | | | Fund | | | Fund | | | Fund | |
| | | | |
Investment income: | | | | | | | | | | | | | | | | |
Income: | | | | | | | | | | | | | | | | |
Dividends | | | — | | | | — | | | | $209,349 | | | | $123,675 | |
Interest | | | $6,818,006 | | | $ | 1,032,008 | | | | 3,970,730 | | | | 10,805,003 | |
| | | | | | | | | | | | | | | | |
| | | | |
Total income | | | 6,818,006 | | | | 1,032,008 | | | | 4,180,079 | | | | 10,928,678 | |
| | | | | | | | | | | | | | | | |
| | | | |
Expenses (note 4): | | | | | | | | | | | | | | | | |
Investment management fee | | | 1,982,188 | | | | 338,624 | | | | 824,931 | | | | 2,243,513 | |
| | | | | | | | | | | | | | | | |
| | | | |
Total expenses | | | 1,982,188 | | | | 338,624 | | | | 824,931 | | | | 2,243,513 | |
| | | | | | | | | | | | | | | | |
| | | | |
Net investment income | | | 4,835,818 | | | | 693,384 | | | | 3,355,148 | | | | 8,685,165 | |
| | | | | | | | | | | | | | | | |
| | | | |
Realized and unrealized gain (loss): | | | | | | | | | | | | | | | | |
Net realized gain (loss) on investments | | | (350,554 | ) | | | (340,025 | ) | | | (979,618 | ) | | | (732,157 | ) |
Net realized gain (loss) on written options | | | 1,563,025 | | | | 26,626 | | | | — | | | | — | |
Net realized gain (loss) on futures | | | — | | | | 27,326 | | | | (282,615 | ) | | | (150,484 | ) |
| | | | |
Net change in unrealized appreciation (depreciation) on investments | | | (3,208,542 | ) | | | (118,011 | ) | | | (2,065,011 | ) | | | (4,866,626 | ) |
Net change in unrealized appreciation (depreciation) on written options | | | 447,853 | | | | 3,683 | | | | — | | | | — | |
Net change in unrealized appreciation (depreciation) on futures | | | — | | | | 325,850 | | | | 873,694 | | | | 1,033,562 | |
| | | | | | | | | | | | | | | | |
| | | | |
Net gain (loss) | | | (1,548,218 | ) | | | (74,551 | ) | | | (2,453,550 | ) | | | (4,715,705 | ) |
| | | | | | | | | | | | | | | | |
| | | | |
Net increase (decrease) in net assets resulting from operations | | | $3,287,600 | | | | $618,833 | | | | $901,598 | | | | $3,969,460 | |
| | | | | | | | | | | | | | | | |
See accompanying notes to financial statements.
STATEMENTS OF CHANGES IN NET ASSETS
| | | | | | | | |
| | | Sit U.S. Government |
| | | Securities Fund |
| | | Six Months | | Year | |
| | | Ended | | Ended | |
| | | September 30, 2018 | | March 31, | |
| | | (Unaudited) | | 2018 | |
Operations: | | | | | | | | |
Net investment income. | | | $4,835,818 | | | | $10,154,053 | |
Net realized gain (loss) on investments, written options and futures | | | 1,212,471 | | | | 1,619,622 | |
Net change in unrealized appreciation (depreciation) of investments, written options and futures. | | | (2,760,689 | ) | | | (7,251,930 | ) |
| | | | | | | | |
| | |
Net increase (decrease) in net assets resulting from operations | | | 3,287,600 | | | | 4,521,745 | |
| | | | | | | | |
| | |
Distributions from: | | | | | | | | |
Net investment income | | | (4,835,832 | ) | | | (10,154,053 | ) |
| | | | | | | | |
| | |
Total distributions | | | (4,835,832 | ) | | | (10,154,053 | ) |
| | | | | | | | |
| | |
Capital share transactions: | | | | | | | | |
Proceeds from shares sold | | | 43,632,491 | | | | 132,808,397 | |
Reinvested distributions | | | 4,650,108 | | | | 9,667,291 | |
Payments for shares redeemed | | | (101,537,336 | ) | | | (252,398,673 | ) |
| | | | | | | | |
| | |
Increase (decrease) in net assets from capital transactions | | | (53,254,737 | ) | | | (109,922,985 | ) |
| | | | | | | | |
| | |
Total increase (decrease) in net assets | | | (54,802,969 | ) | | | (115,555,293 | ) |
| | |
Net assets: | | | | | | | | |
Beginning of period | | | 527,748,447 | | | | 643,303,740 | |
| | | | | | | | |
| | |
End of period * | | | $472,945,478 | | | | $527,748,447 | |
| | | | | | | | |
| | |
Capital transactions in shares: | | | | | | | | |
Sold | | | 4,046,724 | | | | 12,188,543 | |
Reinvested distributions | | | 431,668 | | | | 889,177 | |
Redeemed | | | (9,419,489 | ) | | | (23,199,596 | ) |
| | | | | | | | |
| | |
Net increase (decrease) | | | (4,941,097 | ) | | | (10,121,876 | ) |
| | | | | | | | |
| | |
* Includes undistributed (distributions in excess of) net investment income | | | ($14 | ) | | | — | |
See accompanying notes to financial statements.
| | |
50 | | SIT MUTUAL FUNDS SEMI-ANNUAL REPORT |
| | | | | | | | | | | | | | | | | | | | | | |
| | | | | | | | | | | | | | | | | | | | | | |
Sit Quality
Income Fund | | | Sit Tax-Free
Income Fund | | | Sit Minnesota Tax-Free
Income Fund | |
| | | | | |
| Six Months | | | Year | | | Six Months | | | Year | | | Six Months | | | Year | |
| Ended | | | Ended | | | Ended | | | Ended | | | Ended | | | Ended | |
| September 30, 2018 | | | March 31, | | | September 30, 2018 | | | March 31, | | | September 30, 2018 | | | March 31, | |
| (Unaudited) | | | 2018 | | | (Unaudited) | | | 2018 | | | (Unaudited) | | | 2018 | |
| | | | | | | | | | | | | | | | | | | | | | |
| | $693,384 | | | | $985,779 | | | | $3,355,148 | | | | $7,138,637 | | | | $8,685,165 | | | | $16,474,457 | |
| | (286,073) | | | | 333,632 | | | | (1,262,233) | | | | 592,104 | | | | (882,641) | | | | 1,956,145 | |
| | | | | |
| | 211,522 | | | | (752,564 | ) | | | (1,191,317) | | | | 2,228,796 | | | | (3,833,064) | | | | 3,216,286 | |
| | | | | | | | | | | | | | | | | | | | | | |
| | | | | |
| | 618,833 | | | | 566,847 | | | | 901,598 | | | | 9,959,537 | | | | 3,969,460 | | | | 21,646,888 | |
| | | | | | | | | | | | | | | | | | | | | | |
| | | | | |
| | | | | | | | | | | | | | | | | | | | | | |
| | (693,764) | | | | (985,896 | ) | | | (3,351,843) | | | | (7,143,190 | ) | | | (8,689,487) | | | | (16,459,459 | ) |
| | | | | | | | | | | | | | | | | | | | | | |
| | | | | |
| | (693,764) | | | | (985,896 | ) | | | (3,351,843) | | | | (7,143,190 | ) | | | (8,689,487) | | | | (16,459,459 | ) |
| | | | | | | | | | | | | | | | | | | | | | |
| | | | | |
| | | | | | | | | | | | | | | | | | | | | | |
| | 32,048,859 | | | | 51,183,608 | | | | 44,076,197 | | | | 55,698,315 | | | | 64,068,156 | | | | 116,133,884 | |
| | 666,469 | | | | 949,395 | | | | 2,767,345 | | | | 6,064,679 | | | | 7,482,146 | | | | 14,116,257 | |
| | (25,869,561) | | | | (51,032,358 | ) | | | (22,726,634) | | | | (29,006,204 | ) | | | (42,314,511) | | | | (114,096,206 | ) |
| | | | | | | | | | | | | | | | | | | | | | |
| | | | | |
| | 6,845,767 | | | | 1,100,645 | | | | 24,116,908 | | | | 32,756,790 | | | | 29,235,791 | | | | 16,153,935 | |
| | | | | | | | | | | | | | | | | | | | | | |
| | | | | |
| | 6,770,836 | | | | 681,596 | | | | 21,666,663 | | | | 35,573,137 | | | | 24,515,764 | | | | 21,341,364 | |
| | | | | |
| | | | | | | | | | | | | | | | | | | | | | |
| | 74,542,432 | | | | 73,860,836 | | | | 196,018,402 | | | | 160,445,265 | | | | 551,162,516 | | | | 529,821,152 | |
| | | | | | | | | | | | | | | | | | | | | | |
| | | | | |
| | $81,313,268 | | | | $74,542,432 | | | | $217,685,065 | | | | $196,018,402 | | | | $575,678,280 | | | | $551,162,516 | |
| | | | | | | | | | | | | | | | | | | | | | |
| | | | | |
| | | | | | | | | | | | | | | | | | | | | | |
| | 3,280,280 | | | | 5,202,564 | | | | 4,572,687 | | | | 5,760,763 | | | | 6,170,689 | | | | 11,124,647 | |
| | 68,241 | | | | 96,609 | | | | 287,408 | | | | 628,951 | | | | 721,159 | | | | 1,353,797 | |
| | (2,647,867) | | | | (5,188,246 | ) | | | (2,359,025) | | | | (3,005,135 | ) | | | (4,079,113) | | | | (10,933,655 | ) |
| | | | | | | | | | | | | | | | | | | | | | |
| | | | | |
| | 700,654 | | | | 110,927 | | | | 2,501,070 | | | | 3,384,579 | | | | 2,812,735 | | | | 1,544,789 | |
| | | | | | | | | | | | | | | | | | | | | | |
| | | | | |
| | ($497) | | | | ($117 | ) | | | $1,237 | | | | ($2,068 | ) | | | — | | | | $4,322 | |
FINANCIAL HIGHLIGHTS
Per share income and capital changes for a share outstanding throughout the period. See accompanying notes to financial statements.
| | | | | | | | | | | | | | | | | | | | | | | | |
| Sit U.S. Government Securities Fund | | | | | | | | | | | | | | | | | | | | | |
| |
| | | Six Months Ended
September 30, 2018 | | | Year Ended March 31, | |
| | | (Unaudited) | | | 2018 | | | 2017 | | | 2016 | | | 2015 | | | 2014 | |
| |
| | | | | | |
Net Asset Value: | | | | | | | | | | | | | | | | | | | | | | | | |
Beginning of period | | | $10.80 | | | | $10.90 | | | | $11.07 | | | | $11.09 | | | | $11.04 | | | | $11.30 | |
| | | | |
| | | | | | |
Operations: | | | | | | | | | | | | | | | | | | | | | | | | |
Net investment income 1 | | | 0.10 | | | | 0.18 | | | | 0.17 | | | | 0.20 | | | | 0.21 | | | | 0.12 | |
Net realized and unrealized gains (losses) on investments, written options and futures | | | (0.02) | | | | (0.10) | | | | (0.17) | | | | (0.02) | | | | 0.05 | | | | (0.26) | |
| | | | |
| | | | | | |
Total from operations | | | 0.08 | | | | 0.08 | | | | — | | | | 0.18 | | | | 0.26 | | | | (0.14) | |
| | | | |
| | | | | | |
Distributions from: | | | | | | | | | | | | | | | | | | | | | | | | |
Net investment income | | | (0.11) | | | | (0.18) | | | | (0.17) | | | | (0.20) | | | | (0.21) | | | | (0.12) | |
| | | | |
| | | | | | |
Net Asset Value: | | | | | | | | | | | | | | | | | | | | | | | | |
End of period | | | $10.77 | | | | $10.80 | | | | $10.90 | | | | $11.07 | | | | $11.09 | | | | $11.04 | |
| | | | |
| | | | | | |
Total investment return 2 | | | 0.71% | | | | 0.76% | | | | 0.02% | | | | 1.63% | | | | 2.37% | | | | (1.21%) | |
| | | | |
Net assets at end of period (000’s omitted) | | | $472,945 | | | | $527,748 | | | | $643,304 | | | | $663,676 | | | | $587,210 | | | | $711,770 | |
| | | | | | |
Ratios: 3 | | | | | | | | | | | | | | | | | | | | | | | | |
Expenses | | | 0.80% | | | | 0.80% | | | | 0.80% | | | | 0.80% | | | | 0.80% | | | | 0.80% | |
Net investment income | | | 1.95% | | | | 1.68% | | | | 1.57% | | | | 1.81% | | | | 1.89% | | | | 1.06% | |
| | | | | | |
Portfolio turnover rate (excluding short-term securities) | | | 8.83%4 | | | | 14.68% | | | | 29.00% | | | | 28.65% | | | | 13.71% | | | | 4.13% | |
| 1 | The net investment income per share is based on average shares outstanding for the period. |
| 2 | Total investment return is based on the change in net asset value of a share during the period (not annualized) and assumes reinvestment of distributions at net asset value. |
| 3 | Ratios are annualized for periods less than one year. In addition to fees and expenses which the Fund bears directly, the Fund indirectly bears a pro rata share of the fees and expenses of the acquired funds in which it invests. Such indirect expenses are not included in the above reported expense ratios. |
| | |
52 | | SIT MUTUAL FUNDS SEMI-ANNUAL REPORT |
FINANCIAL HIGHLIGHTS
Per share income and capital changes for a share outstanding throughout the period. See accompanying notes to financial statements.
| | | | | | | | | | | | | | | | | | | | | | | | |
| Sit Quality Income Fund | | | | | | | | | | | | | | | | | | | | | |
| |
| | | Six Months Ended
September 30, 2018 | | | Years Ended March 31, | |
| | | (Unaudited) | | | 2018 | | | 2017 | | | 2016 | | | 2015 | | | 2014 | |
| |
| | | | | | |
Net Asset Value: | | | | | | | | | | | | | | | | | | | | | | | | |
Beginning of period | | | $9.78 | | | | $9.83 | | | | $9.83 | | | | $9.94 | | | | $9.97 | | | | $10.01 | |
| | | | |
| | | | | | |
Operations: | | | | | | | | | | | | | | | | | | | | | | | | |
Net investment income 1 | | | 0.09 | | | | 0.13 | | | | 0.09 | | | | 0.10 | | | | 0.06 | | | | 0.09 | |
Net realized and unrealized gains (losses) on investments, written options and futures | | | (0.01) | | | | (0.05 | ) | | | — | | | | (0.11 | ) | | | (0.03 | ) | | | (0.04 | ) |
| | | | |
| | | | | | |
Total from operations | | | 0.08 | | | | 0.08 | | | | 0.09 | | | | (0.01 | ) | | | 0.03 | | | | 0.05 | |
| | | | |
| | | | | | |
Distributions from: | | | | | | | | | | | | | | | | | | | | | | | | |
Net investment income | | | (0.09) | | | | (0.13 | ) | | | (0.09 | ) | | | (0.10 | ) | | | (0.06 | ) | | | (0.09 | ) |
| | | | |
| | | | | | |
Net Asset Value: | | | | | | | | | | | | | | | | | | | | | | | | |
End of period | | | $9.77 | | | | $9.78 | | | | $9.83 | | | | $9.83 | | | | $9.94 | | | | $9.97 | |
| | | | |
| | | | | | |
Total investment return 2 | | | 0.82% | | | | 0.79% | | | | 0.91% | | | | (0.10% | ) | | | 0.36% | | | | 0.47% | |
| | | | |
Net assets at end of period (000’s omitted) | | | $81,313 | | | | $74,542 | | | | $73,861 | | | | $66,880 | | | | $124,418 | | | | $107,346 | |
| | | | | | |
Ratios: 3 | | | | | | | | | | | | | | | | | | | | | | | | |
Expenses | | | 0.90% | | | | 0.90% | | | | 0.90% | | | | 0.90% | | | | 0.90% | | | | 0.90% | |
Net investment income | | | 1.84% | | | | 1.31% | | | | 0.91% | | | | 1.02% | | | | 0.63% | | | | 0.80% | |
| | | | | | |
Portfolio turnover rate (excluding short-term securities) | | | 40.08%4 | | | | 81.14% | | | | 84.03% | | | | 90.38% | | | | 241.64% | | | | 81.19% | |
| 1 | The net investment income per share is based on average shares outstanding for the period. |
| 2 | Total investment return is based on the change in net asset value of a share during the period (not annualized) and assumes reinvestment of distributions at net asset value. |
| 3 | Ratios are annualized for periods less than one year. In addition to fees and expenses which the Fund bears directly, the Fund indirectly bears a pro rata share of the fees and expenses of the acquired funds in which it invests. Such indirect expenses are not included in the above reported expense ratios. |
FINANCIAL HIGHLIGHTS
Per share income and capital changes for a share outstanding throughout the period. See accompanying notes to financial statements.
| | | | | | | | | | | | | | | | | | | | | | | | |
| Sit Tax-Free Income Fund | | | | | | | | | | | | | | | | | | | | | |
| |
| | | Six Months Ended
September 30, 2018 | | | Years Ended March 31, | |
| | | (Unaudited) | | | 2018 | | | 2017 | | | 2016 | | | 2015 | | | 2014 | |
| |
| | | | | | |
Net Asset Value: | | | | | | | | | | | | | | | | | | | | | | | | |
Beginning of period | | | $9.66 | | | | $9.49 | | | | $9.80 | | | | $9.68 | | | | $9.16 | | | | $9.57 | |
| | | | |
| | | | | | |
Operations: | | | | | | | | | | | | | | | | | | | | | | | | |
Net investment income 1 | | | 0.16 | | | | 0.39 | | | | 0.35 | | | | 0.33 | | | | 0.37 | | | | 0.38 | |
Net realized and unrealized gains (losses) on investments and futures | | | (0.11) | | | | 0.17 | | | | (0.31 | ) | | | 0.12 | | | | 0.52 | | | | (0.41 | ) |
| | | | |
| | | | | | |
Total from operations | | | 0.05 | | | | 0.56 | | | | 0.04 | | | | 0.45 | | | | 0.89 | | | | (0.03 | ) |
| | | | |
| | | | | | |
Distributions from: | | | | | | | | | | | | | | | | | | | | | | | | |
Net investment income | | | (0.16) | | | | (0.39 | ) | | | (0.35 | ) | | | (0.33 | ) | | | (0.37 | ) | | | (0.38 | ) |
| | | | |
| | | | | | |
Net Asset Value: | | | | | | | | | | | | | | | | | | | | | | | | |
End of period | | | $9.55 | | | | $9.66 | | | | $9.49 | | | | $9.80 | | | | $9.68 | | | | $9.16 | |
| | | | |
| | | | | | |
Total investment return 2 | | | 0.46% | | | | 6.00% | | | | 0.37% | | | | 4.78% | | | | 9.81% | | | | (0.19% | ) |
| | | | |
Net assets at end of period (000’s omitted) | | | $217,685 | | | | $196,018 | | | | $160,445 | | | | $156,890 | | | | $165,150 | | | | $155,304 | |
| | | | | | |
Ratios: 3 | | | | | | | | | | | | | | | | | | | | | | | | |
Expenses | | | 0.80% | | | | 0.80% | | | | 0.80% | | | | 0.80% | | | | 0.80% | | | | 0.80% | |
Net investment income | | | 3.25% | | | | 4.03% | | | | 3.58% | | | | 3.45% | | | | 3.86% | | | | 4.17% | |
| | | | | | |
Portfolio turnover rate (excluding short-term securities) | | | 5.60%4 | | | | 15.72% | | | | 25.41% | | | | 23.11% | | | | 31.14% | | | | 28.32% | |
| 1 | The net investment income per share is based on average shares outstanding for the period. |
| 2 | Total investment return is based on the change in net asset value of a share during the period (not annualized) and assumes reinvestment of distributions at net asset value. |
| 3 | Ratios are annualized for periods less than one year. In addition to fees and expenses which the Fund bears directly, the Fund indirectly bears a pro rata share of the fees and expenses of the acquired funds in which it invests. Such indirect expenses are not included in the above reported expense ratios. |
| | |
54 | | SIT MUTUAL FUNDS SEMI-ANNUAL REPORT |
FINANCIAL HIGHLIGHTS
Per share income and capital changes for a share outstanding throughout the period. See accompanying notes to financial statements.
| | | | | | | | | | | | | | | | | | | | | | | | |
| Sit Minnesota Tax-Free Income Fund | | | | | | | | | | | | | | | | | | | | | |
| |
| | | Six Months Ended
September 30, 2018 | | | Years Ended March 31, | |
| | | (Unaudited) | | | 2018 | | | 2017 | | | 2016 | | | 2015 | | | 2014 | |
| |
| | | | | | |
Net Asset Value: | | | | | | | | | | | | | | | | | | | | | | | | |
Beginning of period | | | $10.39 | | | | $10.29 | | | | $10.63 | | | | $10.57 | | | | $10.26 | | | | $10.62 | |
| | | | |
| | | | | | |
Operations: | | | | | | | | | | | | | | | | | | | | | | | | |
Net investment income 1 | | | 0.16 | | | | 0.32 | | | | 0.32 | | | | 0.34 | | | | 0.36 | | | | 0.40 | |
Net realized and unrealized gains (losses) on investments and futures | | | (0.08) | | | | 0.10 | | | | (0.34 | ) | | | 0.06 | | | | 0.31 | | | | (0.36 | ) |
| | | | |
| | | | | | |
Total from operations | | | 0.08 | | | | 0.42 | | | | (0.02 | ) | | | 0.40 | | | | 0.67 | | | | 0.04 | |
| | | | |
| | | | | | |
Distributions from: | | | | | | | | | | | | | | | | | | | | | | | | |
Net investment income | | | (0.16) | | | | (0.32 | ) | | | (0.32 | ) | | | (0.34 | ) | | | (0.36 | ) | | | (0.40 | ) |
| | | | |
| | | | | | |
Net Asset Value: | | | | | | | | | | | | | | | | | | | | | | | | |
End of period | | | $10.31 | | | | $10.39 | | | | $10.29 | | | | $10.63 | | | | $10.57 | | | | $10.26 | |
| | | | |
| | | | | | |
Total investment return 2 | | | 0.78% | | | | 4.08% | | | | (0.19% | ) | | | 3.89% | | | | 6.62% | | | | 0.47% | |
| | | | |
Net assets at end of period (000’s omitted) | | | $575,678 | | | | $551,163 | | | | $529,821 | | | | $508,209 | | | | $436,883 | | | | $358,678 | |
| | | | | | |
Ratios: 3 | | | | | | | | | | | | | | | | | | | | | | | | |
Expenses | | | 0.80% | | | | 0.80% | | | | 0.80% | | | | 0.80% | | | | 0.80% | | | | 0.80% | |
Net investment income | | | 3.10% | | | | 3.05% | | | | 3.06% | | | | 3.25% | | | | 3.43% | | | | 3.91% | |
| | | | | | |
Portfolio turnover rate (excluding short-term securities) | | | 3.50%4 | | | | 12.97% | | | | 16.18% | | | | 10.45% | | | | 9.68% | | | | 20.53% | |
| 1 | The net investment income per share is based on average shares outstanding for the period. |
| 2 | Total investment return is based on the change in net asset value of a share during the period (not annualized) and assumes reinvestment of distributions at net asset value. |
| 3 | Ratios are annualized for periods less than one year. In addition to fees and expenses which the Fund bears directly, the Fund indirectly bears a pro rata share of the fees and expenses of the acquired funds in which it invests. Such indirect expenses are not included in the above reported expense ratios. |
NOTES TO FINANCIAL STATEMENTS (Unaudited)
Six Months Ended September 30, 2018
The Sit Mutual Funds (the Funds) are no-load funds, and are registered under the Investment Company Act of 1940 (as amended) as diversified (except Minnesota Tax-Free Income Fund which is non-diversified), open-end management investment companies, or series thereof. The Sit Quality Income Fund, Sit Tax-Free Income Fund and Minnesota Tax-Free Income Fund are series funds of Sit Mutual Funds II, Inc. Each fund has 10 billion authorized shares of capital stock. Shares in the U.S. Government Securities Fund have a par value of $0.01, and shares in other funds have a par value of $0.001. This report covers the bond funds of the Sit Mutual Funds.
The investment objective for each of these Funds is as follows:
| | |
| Fund | | Investment Objective |
|
U.S. Government Securities | | High level of current income and safety of principal. |
Quality Income Fund | | High level of current income and safety of principal. |
Tax-Free Income | | High level of current income that is exempt from federal income tax, consistent |
| | with the preservation of capital. |
Minnesota Tax-Free Income | | High level of current income that is exempt from federal regular income tax and |
| | Minnesota regular personal income tax, consistent with the preservation of capital. |
| (2) | Significant Accounting Policies |
The Funds are investment companies and follow accounting and reporting guidance under Financial Accounting Standards Board (“FASB”) Accounting Standards Codification (“ASC”) Topic 946, “Financial Services-Investment Companies”. The following is a summary of significant accounting policies consistently followed by the Funds in the preparation of their financial statements in conformity with U.S. generally accepted accounting principles (“GAAP”).
Investments in Securities
Investment securities are carried at fair value based upon closing market quotations on the last business day of the period. Investments in securities traded on national or international securities exchanges are valued at the last reported sales price prior to the time when assets are valued. Equity securities traded on the over-the-counter market are valued at the last reported sales price or if the last sales price is not available, at the last reported bid price. The sale and bid prices or prices deemed best to reflect fair value quoted by dealers who make markets in these securities are obtained from independent pricing services. Consistent with the Funds’ valuation policies and procedures, the current fair value of certain fixed income securities is provided by an independent pricing service. Fixed income securities for which prices are not available from an independent pricing service but where an active market exists are valued using market quotations obtained from broker-dealers or quotation systems. Securities for which market quotations are not available, such as private placement securities, are valued at fair value according to methods selected in good faith by Sit Investment Associates, Inc. (the “Adviser”) and may include dealer-supplied valuations or other inputs and assumptions that pricing services would typically utilize. Short-term investments of sufficient credit quality with maturities of 60 days or less when acquired, or which subsequently are within 60 days of maturity, are valued at amortized cost, which approximates fair value. Option and future contracts entered into and held by the Funds are valued at the close of the securities and commodities exchange on which they are traded.
Security transactions are accounted for on the date the securities are purchased or sold. Gains and losses are calculated on the identified-cost basis. Interest, including level-yield amortization of long-term bond premium and discount, is recorded on the accrual basis. Dividends received from closed-end fund holdings are included in Dividend Income and distributions from capital gains, if any, are included in Net Realized Gain (Loss).
Delivery and payment for securities which have been purchased by the Funds on a forward commitment or when-issued basis can take place two weeks or more after the transaction date. During this period, such securities are subject to market fluctuations and may increase or decrease in value prior to delivery.
The Minnesota Tax-Free Income Fund concentrates its investments in Minnesota, and therefore may have more credit risk related to the economic conditions in the state of Minnesota than a portfolio with broader geographical diversification.
| | |
56 | | SIT MUTUAL FUNDS SEMI-ANNUAL REPORT |
Derivative Instruments
The Funds apply derivative instrument disclosure standards in order to enable investors to understand how and why the Funds use derivatives, how derivatives are accounted for, and how derivative instruments affect the Funds’ financial statements.
To hedge interest rate risk, the Funds used Treasury options and futures traded on a U.S. exchange. Risks of entering into futures and options contracts include the possibility of an illiquid market and that a change in the value of the option may not correlate with changes in the value of the underlying securities.
The premiums paid for the options represent the cost of the investment and the options are valued daily at their closing price. The Funds recognize a realized gain or loss when the option is sold or expired. Option holdings within the Funds, which may include put options and call options, are subject to loss of value with the passage of time, and may experience a total loss of value upon expiration. With options, there is minimal counterparty risk to the Funds since they are exchange traded.
Upon entering into a futures contract, a Fund is required to deposit either cash or securities in an amount (initial margin) equal to a certain percentage of the contract value. Subsequent payments (variation margin) are made or received by the Fund each day. The variation margin payments are equal to the daily changes in the contract value and are recorded as unrealized gains and losses. The Fund recognizes a realized gain or loss when the contract is closed or expired. With futures contracts, there is minimal counterparty risk to the Fund since futures are exchange traded and the exchange’s clearinghouse, as counterparty to all exchange-traded futures, guarantees the futures against default.
During the six months ended September 30, 2018, the average volume of derivative activity, calculated on a quarterly basis, was as follows:
| | | | | | | | | | | | |
| | | Average
Cost | | | Average
Premium
Received | | | Average
Notional
Amount | |
U.S. Government Securities Fund | | | | | | | | | | | | |
Purchased put options | | | $512,930 | | | | — | | | | $106,513,500 | |
Written call options | | | — | | | | $580,671 | | | | 220,209,503 | |
| | | |
Quality Income Fund | | | | | | | | | | | | |
Written Call options | | | — | | | | 4,874 | | | | 4,917,500 | |
Treasury futures | | | — | | | | — | | | | 33,025,914 | |
| | | |
Tax-Free Income Fund | | | | | | | | | | | | |
Treasury futures | | | — | | | | — | | | | 54,263,097 | |
| | | |
Minnesota Tax-Free Income Fund | | | | | | | | | | | | |
Treasury futures | | | — | | | | — | | | | 63,212,583 | |
The number of open option contracts and open futures contracts outstanding as of September 30, 2018 also serve as indicators of the volume of activity for the Funds throughout the period.
NOTES TO FINANCIAL STATEMENTS (Unaudited)
Six Months Ended September 30, 2018 (Continued)
Statement of Assets and Liabilities - Values of derivatives as of September 30, 2018
| | | | | | | | |
| | | Asset Derivatives Value | | | Liability Derivatives Value | |
| | | | |
Interest rate risk: | | | | | | | | |
U.S. Government Securities Fund | | | | | | | | |
Written Call Options | | | — | | | | $255,859 1 | |
| | |
Quality Income Fund | | | | | | | | |
Written Call Options | | | — | | | | 10,938 1 | |
Treasury futures | | | $206,666 2 | | | | | |
| | |
Tax-Free Income Fund | | | | | | | | |
Treasury futures | | | 600,131 2 | | | | — | |
| | |
Minnesota Tax-Free Income Fund | | | | | | | | |
Treasury futures | | | 590,570 2 | | | | — | |
|
1Statement of Assets and Liabilities location: Outstanding options written, at fair value. 2Statement of Assets and Liabilities location: Variation margin receivable/payable. Includes cumulative appreciation (depreciation) of futures as reported in the Schedule of Investments. |
The effect of derivative instruments on the statement of operations for the six months ended September 30, 2018:
| | | | | | | | |
| | | Amount of Realized
Gain (Loss) on Derivatives 3 | | | Change in Unrealized
Appreciation (Depreciation) on Derivatives 4 | |
| | | | |
Interest rate risk: | | | | | | | | |
U.S. Government Securities Fund | | | | | | | | |
Purchased put options | | | $470,307 | | | | $320,625 | |
Written call options | | | 1,563,025 | | | | 447,853 | |
| | |
Quality Income Fund | | | | | | | | |
Written call options | | | 26,626 | | | | 3,683 | |
Treasury Futures | | | 27,326 | | | | 325,850 | |
| | |
Tax-Free Income Fund | | | | | | | | |
Treasury Futures | | | (282,615) | | | | 873,694 | |
| | |
Minnesota Tax-Free Income Fund | | | | | | | | |
Treasury Futures | | | (150,484) | | | | 1,033,562 | |
|
3Statement of Operations location: Net realized gain (loss) on investments, net realized gain (loss) on written options and net realized gain (loss) on futures, respectively. 4Statement of Operations location: Net change in unrealized appreciation (depreciation) on investments, net change in unrealized appreciation (depreciation) on written options and net change in unrealized appreciation (depreciation) on futures, respectively. |
| | |
58 | | SIT MUTUAL FUNDS SEMI-ANNUAL REPORT |
Fair Value Measurements
The inputs and valuation techniques used to measure fair value of the Funds’ net assets are summarized into three levels as described in the hierarchy below:
| | • | | Level 1 – quoted prices in active markets for identical securities. An active market for the security is a market in which transactions occur with sufficient frequency and volume to provide pricing information on an ongoing basis. A quoted price in an active market provides the most reliable evidence of fair value. |
| | • | | Level 2 – debt securities are valued based on evaluated prices received from independent pricing services or from dealers who make markets in such securities. For corporate bonds, U.S. government and government agency obligations, and municipal securities the pricing services utilize matrix pricing which considers yield or price of bonds of comparable quality, coupon, maturity, and type as well as dealer supplied prices. For asset-backed securities and mortgage-backed securities, the pricing services utilize matrix pricing which considers prepayment speed assumptions, attributes of the collateral, yield or price of bonds of comparable quality, coupon, maturity, and type as well as dealer supplied prices. All of these inputs are derived principally from or corroborated by observable market data. An adjustment to any observable input that is significant to the fair value may render the measurement a Level 3 measurement. |
| | • | | Level 3 – significant unobservable inputs, including the Adviser’s own assumptions in determining the fair value of investments. |
The inputs or methodology used for valuing securities are not necessarily an indication of the risk associated with investing in those securities.
At the end of each calendar quarter, management evaluates the Level 2 and 3 assets and liabilities for changes in liquidity, including but not limited to: whether a broker is willing to execute at the quoted price, the depth and consistency of prices from third party services, and the existence of contemporaneous, observable trades in the market. Additionally, management evaluates the Level 1 and 2 assets and liabilities on a quarterly basis for changes in listings or delistings on national exchanges. Due to the inherent uncertainty of determining the fair value of investments that do not have a readily available market value, the fair value of the Funds’ investments may fluctuate from period to period. Additionally, the fair value of investments may differ significantly from the values that would have been used had a ready market existed for such investments and may differ materially from the values the Fund may ultimately realize. Further, such investments may be subject to legal and other restrictions on resale or otherwise are less liquid than publicly traded securities.
A summary of the levels for the Funds’ investments as of September 30, 2018 is included with the Funds’ schedules of investments.
Federal Taxes
The Funds’ policy is to comply with the requirements of the Internal Revenue Code applicable to regulated investment companies and to distribute all of their taxable income to shareholders. The Funds have recorded in their financial statements the full benefit of their tax positions taken in connection with the Registered Investment Company (RIC) qualification and distribution requirements of the Internal Revenue Code. Therefore, no income tax provision is required. Also, in order to avoid the payment of any federal excise taxes, the Funds will distribute substantially all of their net investment income and net realized gains on a calendar year basis.
Management has analyzed the Funds’ tax positions taken in federal tax returns for all open tax years and has concluded that as of September 30, 2018, no provision for income tax would be required in the Funds’ financial statements. The Funds’ federal and state income and federal excise tax returns remain subject to examination by the Internal Revenue Service and state departments of revenue until such time as the applicable statute of limitations for audit has expired. For example, U.S. tax returns are generally subject to audit for three years from the date they are filed.
NOTES TO FINANCIAL STATEMENTS (Unaudited)
Six Months Ended September 30, 2018 (Continued)
At September 30, 2018, the gross unrealized appreciation (depreciation) on investments and cost of investments on a tax basis for federal income tax purposes were as follows:
| | | | | | | | | | | | | | | | | | | | |
| | | Unrealized Appreciation | | Unrealized Depreciation | | Net Unrealized Appreciation
(Depreciation) | | Cost (Proceeds) of Investments on a Tax Basis |
| | | | | |
U.S. Government Securities - Investments | | | | $3,194,550 | | | | | ($11,248,227) | | | | | ($8,053,677) | | | | | $473,209,190 | |
Quality Income - Investments | | | | 66,529 | | | | | (933,839) | | | | | (867,310) | | | | | 87,932,494 | |
Tax-Free Income - Investments | | | | 5,134,006 | | | | | (16,737,237) | | | | | (11,603,231) | | | | | 215,307,030 | |
Minnesota Tax-Free Income - Investments | | | | 7,735,476 | | | | | (9,366,081) | | | | | (1,630,605) | | | | | 565,431,323 | |
Net investment income and net realized gains may differ for financial statement and tax purposes. The character of distributions made
during the year for net investment income or net realized gains may also differ from its ultimate characterization for tax purposes. The tax character of distributions paid during the fiscal years ended March 31, 2018 and 2017 were as follows:
| | | | | | | | | | | | | | | | |
Year Ended March 31, 2018: | | | | | | | | | | | | | |
| | | | |
| | | Ordinary Income | | | Tax-Exempt
Income | | | Long Term
Capital Gain | | | Total | |
| | | | |
U.S. Government Securities | | | $10,036,925 | | | | — | | | | — | | | | $10,036,925 | |
Quality Income | | | 979,607 | | | | — | | | | — | | | | 979,607 | |
Tax-Free Income* | | | 357,688 | | | | $6,755,280 | | | | — | | | | 7,112,968 | |
Minnesota Tax-Free Income* | | | 43,477 | | | | 16,314,954 | | | | — | | | | 16,358,431 | |
* 95.0% and 99.7% of dividends were derived from interest on tax-exempt securities for the Tax-Free Income and Minnesota Tax-Free Income Funds, respectively. | |
| | | | |
Year Ended March 31, 2017: | | | | | | | | | | | | | | | | |
| | | | |
| | | Ordinary Income | | | Tax-Exempt
Income | | | Long Term
Capital Gain | | | Total | |
| | | | |
U.S. Government Securities | | | $10,596,109 | | | | — | | | | — | | | | $10,596,109 | |
Quality Income | | | 599,299 | | | | — | | | | — | | | | 599,299 | |
Tax-Free Income* | | | 44,040 | | | | $5,591,828 | | | | — | | | | 5,635,868 | |
Minnesota Tax-Free Income* | | | 23,297 | | | | 16,486,767 | | | | — | | | | 16,510,064 | |
* 99.2% and 99.9% of dividends were derived from interest on tax-exempt securities for the Tax-Free Income and Minnesota Tax-Free Income Funds, respectively. | |
As of March 31, the components of distributable earnings on a tax basis were as follows:
| | | | | | | | | | | | | | | | | | | | |
| | | Undistributed
Ordinary Income | | | Undistributed
Tax-Exempt Income | | | Accumulated
Gain (Loss) | | | Unrealized
Appreciation (Depreciation) | | | | |
| | | | |
U.S. Government Securities | | | $145,211 | | | | — | | | | ($13,289,160) | | | | ($4,542,687) | | | | | |
Quality Income | | | 8,471 | | | | — | | | | (1,241,221) | | | | (750,177) | | | | | |
Tax-Free Income | | | — | | | | $103,847 | | | | (7,904,808) | | | | (9,532,004) | | | | | |
Minnesota Tax-Free Income | | | — | | | | 295,831 | | | | (575,026) | | | | 3,298,899 | | | | | |
| | |
60 | | SIT MUTUAL FUNDS SEMI-ANNUAL REPORT |
Net capital loss carryovers and late year losses, if any, as of March 31, 2018, are available to offset future realized capital gains and thereby reduce future capital gains distributions. The Funds are permitted to carry forward capital losses for an unlimited period. Capital losses that are carried forward retain their character as either short-term or long-term capital losses. The net capital loss carryovers and the expiration dates for capital loss carryovers from pre-enactment taxable years and the late year losses deferred as of March 31, 2018, were as follows:
| | | | | | | | | | | | | | | | | | | | |
| | | Pre-Enactment Net Capital Loss
Carryover Expiring in: | | | Unlimited Period of Net Capital Loss Carryover | | | Late Year
Losses Deferred | | Accumulated
Capital and Other Losses | |
| | | |
| | | 2018 | | 2019 | | | Short-Term | | | Long-Term | |
| | | |
U.S. Government Securities | | — | | | — | | | | $7,579,310 | | | | $5,709,850 | | | — | | | $13,289,160 | |
Quality Income | | — | | | — | | | | 545,294 | | | | 695,927 | | | — | | | 1,241,221 | |
Tax-Free Income | | — | | | $2,401,634 | | | | 61,848 | | | | 5,441,326 | | | — | | | 7,904,808 | |
Minnesota Tax-Free Income | | — | | | — | | | | 575,026 | | | | — | | | — | | | 575,026 | |
For the year ended March 31, 2018, the Funds’ utilized capital losses and expired capital losses as follows:
| | | | | | | | | | | | | | | | | | | | | | | | |
| | | Utilized | | | | | | Expired | | | | | | | | | | |
| | | | | | | | | | | | | | | | |
U.S. Government Securities | | | $2,813,612 | | | | | | | | — | | | | | | | | | | | | | |
Quality Income | | | 264,984 | | | | | | | | — | | | | | | | | | | | | | |
Tax-Free Income | | | 361,962 | | | | | | | | $6,322,037 | | | | | | | | | | | | | |
Minnesota Tax-Free Income | | | 1,521,985 | | | | | | | | 3,535,663 | | | | | | | | | | | | | |
Distributions
Distributions to shareholders are recorded as of the close of business on the record date. Such distributions are payable in cash or reinvested in additional shares of the Funds’ capital stock. Distributions from net investment income are declared daily and paid monthly for the Funds. Distributions from net realized gains, if any, will be made annually for each of the Funds.
Use of Estimates
The preparation of financial statements in conformity with U.S. generally accepted accounting principles requires management to make certain estimates and assumptions that affect the reported amounts of assets and liabilities and disclosure of contingent assets and liabilities at the date of the financial statements and the reported results for the respective periods. Actual results could differ from those estimates.
Guarantees and Indemnifications
Under each Fund’s organizational documents, its officers and directors are indemnified against certain liabilities arising out of the performance of their duties to each Fund. In addition, certain of each Fund’s contracts with its service providers contain general indemnification clauses. Each Fund’s maximum exposure under these arrangements is unknown since the amount of any future claims that may be made against each Fund cannot be determined and each Fund has no historical basis for predicting the likelihood of any such claims.
| (3) | Investment Security Transactions |
The cost of purchases and proceeds from sales and maturities of investment securities, other than short-term securities, for the six months ended September 30, 2018, were as follows:
| | | | | | | | | | | | | | | | |
| | | Purchases | | | Proceeds | |
| | | | |
| | | U.S. Government | | | Other | | | U.S. Government | | | Other | |
| | | | |
U.S. Government Securities | | | $42,875,333 | | | | — | | | | $72,823,606 | | | | — | |
Quality Income | | | 18,715,086 | | | | $14,519,371 | | | | 11,967,554 | | | | $16,556,301 | |
Tax-Free Income | | | 34,671,612 | | | | — | | | | 10,818,654 | | | | — | |
Minnesota Tax-Free Income | | | — | | | | 56,565,671 | | | | — | | | | 19,207,124 | |
NOTES TO FINANCIAL STATEMENTS (Unaudited)
Six Months Ended September 30, 2018 (Continued)
| (4) | Affiliated Fees and Transactions |
Investment Adviser
The Funds each have entered into an investment management agreement with Sit Investment Associates Inc. (SIA), under which SIA manages the Funds’ assets and provides research, statistical and advisory services, and pays related office rental, executive expenses and executive salaries. SIA also is obligated to pay all of the Funds’ expenses (excluding extraordinary expenses, stock transfer taxes, interest, brokerage commissions, and other transaction charges relating to investing activities). The fee for investment management and advisory services is based on the average daily net assets of the Funds at the annual rate of:
| | | | |
| | | Average Daily Net Assets | | |
U.S. Government Securities | | 0.80% |
Quality Income | | 0.90% |
Tax-Free Income | | 0.80% |
Minnesota Tax-Free Income | | 0.80% |
Transactions with affiliates
The investment adviser, affiliates of the investment adviser, directors and officers of the Funds as a whole owned the following shares as of September 30, 2018:
| | | | | | |
| | | Shares | | | % Shares Outstanding |
| | | |
U.S. Government Securities | | | 830,872 | | | 1.9 |
Quality Income | | | 6,108,042 | | | 73.4 |
Tax-Free Income | | | 1,773,513 | | | 7.8 |
Minnesota Tax-Free Income | | | 2,179,358 | | | 3.9 |
| | |
62 | | SIT MUTUAL FUNDS SEMI-ANNUAL REPORT |
EXPENSE EXAMPLE (Unaudited)
As a shareholder of the Funds, you incur two types of costs: (1) transaction costs, including redemption fees and (2) ongoing costs, including management fees; and other Fund expenses. This Example is intended to help you understand your ongoing costs (in dollars) of investing in the Funds and to compare these costs with the ongoing costs of investing in other mutual funds.
The Example is based on an investment of $1,000 invested at the beginning of the period and held for the entire period April 1, 2018 to September 30, 2018.
Actual Expenses
The first line of the following table provides information about actual account values and actual expenses. You may use the information in this line, together with the amount you invested, to estimate the expenses that you paid over the period. Simply divide your account value by $1,000 (for example, an $8,600 account value divided by $1,000 = 8.6), then multiply the result by the number in the first line under the heading entitled “Expenses Paid During Period” to estimate the expenses you paid on your account during this period.
Hypothetical Example for Comparison Purposes
The second line of the table provides information about hypothetical account values and hypothetical expenses based on the Fund’s actual expense ratio and an assumed rate of return of 5% per year before expenses, which is not the Fund’s actual return. The hypothetical account values and expenses may not be used to estimate the actual ending account balance or expenses you paid for the period. You may use this information to compare the ongoing costs of investing in the Fund and other funds. To do so, compare this 5% hypothetical example with the 5% hypothetical examples that appear in the shareholder reports of the other funds.
Please note that the expenses shown in the table are meant to highlight your ongoing costs only and do not reflect any transactional costs, such as redemption fees. Therefore, the second line of the table is useful in comparing ongoing costs only, and will not help you determine the relative total costs of owning different funds. In addition, if these transactional costs (redemption fees) were included, your costs would have been higher.
| | | | | | |
| | | Beginning
Account
Value
(4/1/18) | | Ending
Account
Value
(9/30/18) | | Expenses
Paid During
Period
(4/1/18-
9/30/18)* |
|
U.S. Government Securities Fund |
|
Actual | | $1,000 | | $1,007.10 | | $4.03 |
Hypothetical | | $1,000 | | $1,021.06 | | $4.05 |
| | | | | | |
|
Quality Income Fund |
|
Actual | | $1,000 | | $1,008.20 | | $4.53 |
Hypothetical | | $1,000 | | $1,020.56 | | $4.56 |
| | | | | | |
|
Tax-Free Income Fund |
|
Actual | | $1,000 | | $1,004.60 | | $4.02 |
Hypothetical | | $1,000 | | $1,021.06 | | $4.05 |
| | | | | | |
|
Minnesota Tax-Free Income Fund |
|
Actual | | $1,000 | | $1,007.80 | | $4.03 |
Hypothetical | | $1,000 | | $1,021.06 | | $4.05 |
|
*Expenses are equal to the Funds’ annualized expense ratio of 0.80% for the U.S. Government Securities, Tax-Free Income and Minnesota Tax-Free Funds; and 0.90% for the Quality Income Fund, multiplied by the average account value over the period, multiplied by 183/365 (to reflect the one-half year period.)
ADDITIONAL INFORMATION (Unaudited)
PROXY VOTING
Each Fund follows certain policies and procedures for voting proxies for securities held in each portfolio. A description of the Funds’ proxy voting policies and procedures is available without charge upon request by calling the Funds at 1-800-332-5580.
Information regarding how each Fund voted proxies relating to its portfolio securities during the most recent twelve-month period ended June 30 is available without charge upon request by calling the Funds at 1-800-332-5580, and is available on the U.S. Securities and Exchange Commission’s website at www.sec.gov.
AVAILABILITY OF QUARTERLY PORTFOLIO SCHEDULES
The Funds’ file their complete schedules of portfolio holdings with the U.S. Securities and Exchange Commission (SEC) for the first and third quarters of each fiscal year on Form N-Q. The Funds’ Form N-Qs are available without charge upon request by calling the Funds at 1-800-332-5580 and are available on the SEC’s website at www.sec.gov. In addition, the Funds’ Form N-Qs may be reviewed and copied at the SEC’s Public Reference Room in Washington, DC. Information on the operation of the Public Reference Room may be obtained by calling 1-202-551-8090.
| | |
64 | | SIT MUTUAL FUNDS SEMI-ANNUAL REPORT |
Item 2: Code of Ethics.
Not applicable to Semi-Annual Report.
Item 3: Audit Committee Financial Expert.
Not applicable to Semi-Annual Report.
Item 4: Principal Accountant Fees and Services.
Not applicable to Semi-Annual Report.
Item 5: Audit Committee of Listed Registrants.
Not applicable to open-end investment companies.
Item 6: Schedule of Investments.
The schedule of investments is included as part of the report to shareholders filed under Item 1 of this Form.
Item 7: Disclosure of Proxy Voting Policies and Procedures for Closed-End Management Investment Companies.
Not applicable to open-end investment companies.
Item 8: Portfolio Managers of Closed-End Management Companies.
Not applicable to open-end investment companies.
Item 9: Purchases of Equity Securities by Closed-End Management Investment Company and Affiliated Purchasers.
Not applicable to open-end investment companies.
Item 10. Submission of Matters to a vote of Security Holders.
There have been no material changes to the procedures by which shareholders may recommend nominees to the registrant’s board of directors.
Item 11: Controls and Procedures -
(a) Based on their evaluation of the Registrant’s Disclosure Controls and Procedures as of a date within 90 days of the Filing Date, the Registrant’s Chairman and Treasurer have determined that the Disclosure Controls and Procedures (as defined in Rule 30a-2(c) under the Act) are designed to ensure that information required to be disclosed by the Registrant is recorded, processed, summarized and reported by the filing Date, and that information required to be disclosed in the report is communicated to the Registrant’s management, as appropriate, to allow timely decisions regarding required disclosure.
b) There were no changes in the Registrant’s internal control over financial reporting as defined in Rule 30a-3(d) under the Act) that occurred during the Registrant’s last fiscal half-year that has materially affected, or is reasonably likely to materially affect, the Registrant’s internal control over financial reporting.
Item 12: Exhibits:
(a) The following exhibits are attached to this Form N-CSR:
(2) A separate certification for each principal executive and principal financial officer of the registrant as required by Rule 30a-2(a) under the Act (17 CFR 270.30a-2) (certification required by Section 302 of the Sarbanes-Oxley Act of 2002).
(b) Certification required by Rule 30a-2(b) under the Act (certification required by Section 906 of the Sarbanes-Oxley Act of 2002).
SIGNATURES
Pursuant to the requirements of the Securities Exchange Act of 1934 and the Investment Company Act of 1940, the registrant has duly caused this report to be signed on its behalf by the undersigned, thereunto duly authorized.
| | |
| SIT MUTUAL FUNDS II, INC. |
| |
| By: | | /s/ Paul E. Rasmussen |
| | Paul E. Rasmussen |
| | Vice President, Treasurer |
Date: November 21, 2018
Pursuant to the requirements of the Securities Exchange Act of 1934 and the Investment Company Act of 1940, this report has been signed below by the following persons on behalf of the registrant and in the capacities and on the dates indicated.
| | |
| By: | | /s/ Paul E. Rasmussen |
| | Paul E. Rasmussen |
| | Vice President, Treasurer |
Date: November 21, 2018
| | |
| By: | | /s/ Roger J. Sit |
| | Roger J. Sit |
| | Chairman |
Date: November 21, 2018