UNITED STATES
SECURITIES AND EXCHANGE COMMISSION
Washington, D.C. 20549
FORM N-CSR
CERTIFIED SHAREHOLDER REPORT OF REGISTERED
MANAGEMENT INVESTMENT COMPANIES
Investment Company Act file number: 811-04033
Sit Mutual Funds II, Inc.
(Exact name of registrant as specified in charter)
3300 IDS Center
80 South Eighth Street
Minneapolis, MN 55402
(Address of principal executive offices)
Paul E. Rasmussen, VP & Treasurer
Sit Mutual Funds, Inc.
3300 IDS Center
80 South Eighth Street
Minneapolis, MN 55402
(Name and address of agent for service)
Registrant’s telephone number, including area code: (612) 332-3223
Date of fiscal year end: March 31, 2021
Date of reporting period: September 30, 2021
Item 1: Reports to Stockholders
| | |
Sit Mutual Funds BOND FUNDS SEMI-ANNUAL REPORT TABLE OF CONTENTS | | |
This document must be preceded or accompanied by a Prospectus.
CHAIRMAN’S LETTER
November 3, 2021
Dear fellow shareholders:
The six-month period ending September 30, 2021, showcased continued resilience in the financial markets as the world looks to distance itself further from the dark days of early-2020. However, the fourth wave of Covid-19 infections, product shortages, rising prices in several critical sectors (food, energy, housing), and the end of federal aid contributed to a slowing of confidence and created headwinds for economic growth. As a result, third-quarter real U.S. GDP growth appears to be approximately 2 percent, much lower than forecast. However, we expect a higher growth rate in the coming months.
Boosted by federal stimulus checks, consumer spending has bounced back from its Covid-induced recession low in April 2020 and is now exceeding pre-pandemic measures. Although we expect demand for goods to normalize into 2022, inventory restocking and elevated backlogs should sustain strong levels of manufacturing activity. As global vaccinations continue to increase (7 billion doses administered) and Covid-19 fears recede, pent up demand for services should continue to help drive above-trend GDP growth over the next year.
A proposed fiscal 2022 reconciliation package that entails $3.5 trillion in added spending over ten years, partially offset by higher taxes, is mired in intra-Party politics. We suspect a figure closer to $2 trillion or less is needed to satisfy moderates. In the meantime, the Senate’s $1 trillion bipartisan infrastructure bill may languish in the House until Congress can compromise on a reconciliation package. While the bill’s specifics are yet to be determined, higher personal and corporate taxes are important aspects for financial markets, as investors attempt to assess the impact on earnings.
As we continue to monitor impacts from global supply chain constraints, near-term labor shortages, the evolution of Covid-19 variants, Federal Reserve taper timeline, potential tax increases, the infrastructure spending bill, and political brinksmanship surrounding debt ceiling and spending bill deadlines, the next several months are shaping up to be quite the soap opera.
Guiding Light
At the November Federal Reserve meeting the Fed formally announced its intent to taper asset purchases. Though the timeline is not set in stone, the expected pace of purchases will decline from $120 billion per month of mortgages and U.S. Treasuries by $15 billion per month ending in the middle of 2022.
Though most expected this announcement, the pace at which the program will be wound down is quicker than some projected. As a result, in recent weeks the yield on 30-year U.S. Treasury bonds rose to over 2.0 percent, with 10-year U.S. Treasury bonds moving above 1.5 percent.
The core PCE Price Index, the Federal Reserve’s preferred measure of inflation, reached +3.6 percent (YOY) in June, the highest reading since the early 1990s. Financial market participants have widely expected elevated inflation given low year-over-year base comparisons and disruptions due to the pandemic, but many also expected this effect to be transitory. However, supply chain bottlenecks have persisted in part due to the resurgence of Covid-19 worldwide. As the holiday season approaches, there does not appear to be any short-term relief to these supply chain constraints, which could lead to higher inflation levels for longer.
While the Fed continues its focus on unwinding the asset purchase program, we do not anticipate any interest rate hikes until the program is concluded. Fed fund futures currently imply a 70 percent probability of one or more 25 basis point rate increases by the end of 2022. Finally, two regional Fed presidents resigned following an inquiry into personal trading activities. Although not the most likely scenario in our view, these vacancies could potentially impact Powell’s chances for reappointment in February 2022. If Powell is not reappointed, the trajectory of both the asset taper and path of interest rates could potentially change going forward.
As the World Turns
The input shortages that have cascaded across global supply chains started to show some signs of easing in late spring, per the ISM Report on Business. Yet, since then, the more contagious Delta variant of Covid-19 has spread worldwide, intensifying supply shortages and inflationary pressures.
Export-heavy countries in Southeast Asia enacted measures to control large outbreaks, resulting in production shortfalls and shipping delays. In August, a two-week partial closure of China’s third-busiest shipping port to quarantine workers also contributed to a backup in container ships and a spike in freight costs. In addition, record-high imports from Asia are now clogging West Coast ports, with snarls across the logistics ecosystem.
The 19-country Euro Area economy weathered the late summer wave of coronavirus infections relatively well, as world-leading vaccination rates precluded the need for wholesale lockdowns. Still, the rapid spread of the Delta variant of the coronavirus worldwide is intensifying global supply chain woes, eroding confidence, and impeding economic activity in the near term.
The U.S. economy initially experienced demand-pull inflation in mid-2020 due to government stimulus for consumers and financial markets, but supply chain issues along with a spike in Unit Labor Costs, has transformed this into cost-push inflation. Development of the latter may maintain pressure on inflation through the first half of 2022.
| | | | |
| | | | |
2 | | | SIT MUTUAL FUNDS SEMI-ANNUAL REPORT | |
Though companies with pricing power are increasing prices to make up for higher costs, we expect this to recede next year as increased taxes and a decline in consumer savings likely hinders demand. However, we expect inflation to remain above the Fed’s +2.0 percent long-term target well into 2022.
Strategy
We expect heightened volatility in the markets over the coming months. Third quarter earnings often disappoint, however with consumer demand and corporate pricing power, we expect earnings to be strong leading to increased unrealized gains in investor portfolios. The market is concerned about higher taxes next year and some investors are likely to sell portfolio positions in the fourth quarter to lock in lower tax rates on capital gains. This activity will lead to higher market volatility and overall lower prices as sellers drive down markets. This may cause some investors to panic, leading to prices dropping further. Weaker markets may lead to bad policy decisions (delay in tapering, additional stimulus, etc), though this uncertainty will lead to attractive buying opportunities in early 2022.
In our taxable fixed income strategies, we maintain durations near or below the Funds’ respective benchmarks, as we believe the ongoing worldwide rollout of Covid-19 vaccines and their efficacy against known variants will improve global economic activity, pushing interest rates higher over time. If anything, we expect supply constraints to hold back global growth more than lingering pandemic fears, as we expect global demand to outpace even the rapidly increasing global supply of goods. We continue to emphasize holdings in cyclical industries where appropriate, as we expect industries such as airlines and leisure to disproportionally benefit as the global economy emerges from the pandemic. Although the debt ceiling debate provides a near-term distraction, we do not anticipate the U.S. government will default and may trade opportunistically on any dislocation. We expect longer maturity interest rates to be volatile in the coming months, as expectations for a Fed response to elevated levels of inflation change. We plan to take advantage of shifting investor sentiment tactically. Also, we have modestly increased the portfolios’ liquidity to take advantage of potential opportunities provided by tax-motivated selling in the fourth quarter. The income advantage should continue to help performance, with yields well above benchmarks across most of the strategies we manage.
The outlook for tax-exempt rates and, ultimately, performance continues to be heavily impacted by macro factors, including inflation, monetary policy, and fiscal policy. Municipals are likely to track Treasuries with one exception, municipal demand will likely increase further if Congress raises tax rates to fund increased government spending. This nuance suggests that tax-exempt yield
increases may continue to lag Treasuries. We plan to maintain duration near current levels and view diversification as a vital component of managing portfolio risk. As always, we look to opportunistically add to our income advantage as this is a primary driver of performance over an investing cycle.
With best wishes,

Roger J. Sit
Chairman and President Sit Mutual Funds
|
|
| |
Sit U.S. Government Securities Fund - Class S and Class Y |
OBJECTIVE & STRATEGY
The objective of the U.S. Government Securities Fund is to provide high current income and safety of principal, which it seeks to attain by investing solely in debt obligations issued, guaranteed or insured by the U.S. government or its agencies or its instrumentalities. Agency mortgage securities and U.S. Treasury securities are the principal holdings in the Fund. The mortgage securities that the Fund purchases consist of pass-through securities including those issued by Government National Mortgage Association (GNMA), Federal National mortgage Association (FNMA) and Federal Home Loan Mortgage Corporation (FHLMC).
Fund Performance
The Sit U.S. Government Securities Fund (Class S) provided a return of -0.18% during the 6-month period ending September 30, 2021, compared to the return of the Bloomberg Intermediate Government Bond Index of +0.61%. The Fund’s 30-day SEC yield was 1.94% and its 12-month distribution rate was 1.03%.
Factors that Influenced the Fund’s Performance
During the 6-month period, the Fund benefitted from the consistent relatively high level of income provided by its holdings in higher coupon government agency mortgages. U.S. Treasury securities were mixed with shorter to intermediate treasuries increasing in yield while longer maturities decreased in yield. The Fund underperformed in this environment as the income produced from the high coupon mortgage securities was not enough to offset the negative price performance. In addition, the Fund continued to experience relatively stable prepayment rates as the mortgage holdings are generally well seasoned and have been through many refinancing cycles. The Fund reduces interest rate risk by using futures and options on Treasury securities. The use of futures and options is to provide stability to the Fund’s net asset value. However, the cost detracted from overall return.
Outlook and Positioning
Since the beginning of 2021, COVID-19 cases began to stabilize and even decrease going into the summer. Cases then began to accelerate towards the later part of summer as the Delta variant gained its foothold. Despite the increase in cases, consumers demand continued to increase causing demand-pull inflationary pressures. As the reopening of the economy continues, bottlenecks and labor shortages have impeded on economic growth. The subsequent supply chain issues have resulted in a cost-push inflationary environment. Companies have realized they have more pricing power and will likely pass on any increase in input costs directly to the consumer. Supply chain constraints are unlikely to be resolved until next year. The additional unemployment benefits set to expire in September will likely bolster employment once pent-up savings begin to dwindle which could alleviate supply chain issues. The Federal Reserve continued to buoy the market by keeping the Fed Funds rate at 0-0.25% and continuing its ongoing asset purchase program, albeit at a declining pace. The Federal Reserve will begin tapering its purchase program in November of 2021, expecting to conclude by the middle of 2022. The reduction in asset purchases will be systematic and predict-
HYPOTHETICAL GROWTH OF $10,000
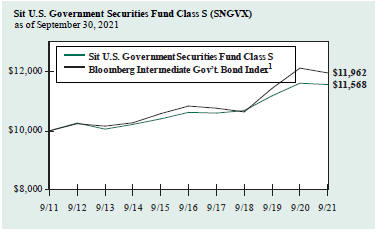
The chart above illustrates the total value of a hypothetical $10,000 investment in the Fund over the past 10 years (or for the life of the Fund if shorter) as compared to the performance of the Bloomberg Intermediate Government Bond Index. Past performance does not guarantee future results. Returns include the reinvestment of distributions. The chart does not reflect the deduction of taxes that a shareholder would pay on Fund distributions or the redemption of Fund shares.
1 The Bloomberg Intermediate Government Bond Index is a sub-index of the Bloomberg Government Bond Index covering issues with remaining maturities of between three and five years. The Bloomberg Government Bond Index is an index that measures the performance of all public U.S. government obligations with remaining maturities of one year or more. The returns include the reinvestment of income and do not include any transaction costs, management fees or other costs. It is not possible to invest directly in an index. This is the Fund’s primary index.
able, however, we expect heightened volatility as the market digests this change. The Fund’s high coupon mortgages should continue to produce an income advantage in this environment as prepayments are likely to remain stable.
We continue to position the Fund opportunistically as concerns regarding inflationary pressures and cases of the COVID-19 virus wane while maintaining the Fund’s focus on seasoned, high coupon agency mortgage securities which provide a high level of income with relatively stable prices. This high level of income and stability of principal has been a fundamental focus of the Fund since its inception.
| | |
Bryce A. Doty, CFA | | Mark H. Book, CFA |
Senior Portfolio Manager | | Portfolio Manager |
| | |
|
| | |
4 | | SIT MUTUAL FUNDS SEMI-ANNUAL REPORT |
COMPARATIVE RATES OF RETURNS
as of September 30, 2021
| | | | | | | | | | | | | | | | | | | | |
| | | Sit U.S. Government | | | | |
| | | Securities Fund | | | | |
| | | | | | | Bloomberg | | |
| | | | | | | Intermediate | | Lipper |
| | | Class S | | Class Y | | Gov’t. Bond | | U.S. Gov’t |
| | | | | | | Index1 | | Fund Index2 |
Six Month | | | | -0.18 | % | | | | -0.05 | % | | | | 0.61 | % | | | | n/a | |
One Year | | | | -0.40 | | | | | -0.13 | | | | | -1.33 | | | | | 4.64 | % |
Five Year | | | | 1.72 | | | | | n/a | | | | | 1.99 | | | | | 3.51 | |
Ten Year | | | | 1.47 | | | | | n/a | | | | | 1.81 | | | | | 4.34 | |
| Since Inception-Class S (6/2/87) | | | | 4.97 | | | | | n/a | | | | | 5.20 | | | | | 5.15 | |
Since Inception-Class Y (1/1/20) | | | | n/a | | | | | 2.21 | | | | | 2.57 | | | | | n/a | |
| | | | | | | | | | | | | | | | | | | | |
Performance figures are historical and do not guarantee future results. Investment returns and principal value will vary, and you may have a gain or loss when you sell shares. Current performance may be lower or higher than the performance data quoted. Contact the Fund for performance data current to the most recent month-end. Returns include changes in share price as well as reinvestment of all dividends and capital gains and all fee waivers. Without the fee waivers total return and yield figures would have been lower. Returns do not reflect the deduction of taxes that a shareholder would pay on Fund distributions or the redemption of Fund shares. Management fees and administrative expenses are included in the Fund’s performance. Returns for periods greater than one year are compounded average annual rates of return.
1 The Bloomberg Intermediate Government Bond Index is a sub-index of the Bloomberg Government Bond Index covering issues with remaining maturities of between three and five years. The Bloomberg Government Bond Index is an index that measures the performance of all public U.S. government obligations with remaining maturities of one year or more. The returns include the reinvestment of income and do not include any transaction costs, management fees or other costs. It is not possible to invest directly in an index.
2 The Lipper returns are obtained from Lipper Analytical Services, Inc., a large independent evaluator of mutual funds.
FUND DIVERSIFICATION
| | | | | |
Collateralized Mortgage Obligations | | | | 56.8 | % |
U.S. Treasury / Federal Agency Securities | | | | 15.7 | |
Federal National Mortgage Association | | | | 13.5 | |
Government National Mortgage Association | | | | 8.0 | |
Federal Home Loan Mortgage Corporation | | | | 3.1 | |
Asset-Backed Securities | | | | 1.2 | |
Small Business Administration | | | | 0.4 | |
Other Net Assets | | | | 1.3 | |
|
Based on total net assets as of September 30, 2021. Subject to change. | |
PORTFOLIO SUMMARY
| | |
Class S: | | |
Net Asset Value 09/30/21: | | $11.09 Per Share |
Net Asset Value 03/31/21: | | $11.17 Per Share |
Total Net Assets: | | $376.7 Million |
| |
Class Y: | | |
Net Asset Value 09/30/21: | | $11.09 Per Share |
Net Asset Value 03/31/21: | | $11.17 Per Share |
Total Net Assets: | | $139.1 Million |
| |
Effective Duration 3 : | | 2.3 Years |
3 Duration is a measure of estimated price sensitivity relative to changes in interest rates. Portfolios with longer durations are typically more sensitive to changes in interest rates. For example, if interest rates rise by 1%, the fair value of a security with an effective duration of 5 years would decrease by 5%, with all other factors being constant. The correlation between duration and price sensitivity is greater for securities rated investment-grade than it is for securities rated below investment-grade. Duration estimates are based on assumptions by the Adviser and are subject to a number of limitations. Effective duration is calculated based on historical price changes of securities held by the Fund, and therefore is a more accurate estimate of price sensitivity provided interest rates remain within their historical range.
ESTIMATED AVERAGE LIFE
| | | | |
0-1 Year | | | 1.2 | % |
1-5 Years | | | 89.0 | |
5-10 Years | | | 8.2 | |
10-20 Years | | | 1.2 | |
20+ Years | | | 0.4 | |
| | | | |
The table represents the Adviser’s estimates of the dollar weighted average life of the portfolio’s securities, which differ from their stated maturities. The Fund’s average stated maturity was 18.7 years as of September 30, 2021.
SCHEDULE OF INVESTMENTS (Unaudited)
September 30, 2021
Sit U.S. Government Securities Fund
| | | | | | | | | | |
Principal
Amount ($) | | Coupon Rate (%) | | Maturity
Date | | | Fair Value ($) | |
| |
Mortgage Pass-Through Securities - 25.0% | | | | | |
| |
Federal Home Loan Mortgage Corporation - 3.1% | | | | | |
406,551 | | 3.00 | | | 1/1/44 | | | | 443,230 | |
57,315 | | 4.00 | | | 7/1/25 | | | | 60,720 | |
505,019 | | 5.00 | | | 5/1/42 | | | | 558,186 | |
1,227,603 | | 5.50 | | | 8/1/49 | | | | 1,424,187 | |
49,488 | | 5.82 | | | 10/1/37 | | | | 55,510 | |
262,479 | | 6.50 | | | 12/1/34 | | | | 292,770 | |
153,832 | | 6.88 | | | 2/17/31 | | | | 172,659 | |
37,521 | | 7.00 | | | 8/1/27 | | | | 37,939 | |
412,220 | | 7.00 | | | 4/1/28 | | | | 446,795 | |
2,958,317 | | 7.00 | | | 12/1/31 | | | | 3,354,598 | |
421,224 | | 7.00 | | | 2/1/37 | | | | 473,193 | |
256,048 | | 7.00 | | | 4/1/37 | | | | 301,873 | |
3,943,058 | | 7.00 | | | 10/1/37 | | | | 4,558,196 | |
2,183,238 | | 7.00 | | | 10/1/38 | | | | 2,567,049 | |
25,080 | | 7.38 | | | 12/17/24 | | | | 25,365 | |
49,051 | | 7.50 | | | 1/1/31 | | | | 50,147 | |
278,565 | | 7.50 | | | 1/1/32 | | | | 321,146 | |
199,880 | | 7.50 | | | 8/1/32 | | | | 218,285 | |
6,201 | | 7.95 | | | 10/1/25 | | | | 6,228 | |
15,805 | | 8.00 | | | 5/1/31 | | | | 15,873 | |
52,729 | | 8.00 | | | 11/1/36 | | | | 61,796 | |
86,295 | | 8.00 | | | 1/1/37 | | | | 103,041 | |
5,286 | | 8.50 | | | 12/1/21 | | | | 5,305 | |
78,387 | | 8.50 | | | 6/20/27 | | | | 88,049 | |
16,935 | | 8.50 | | | 12/1/29 | | | | 18,394 | |
68,159 | | 8.50 | | | 3/1/31 | | | | 77,737 | |
14,394 | | 9.00 | | | 3/20/27 | | | | 14,482 | |
35,659 | | 9.00 | | | 2/17/31 | | | | 35,769 | |
25,366 | | 9.00 | | | 5/1/31 | | | | 25,689 | |
4 | | 10.00 | | | 3/17/25 | | | | 4 | |
960 | | 10.00 | | | 7/1/30 | | | | 964 | |
| | | | | | | | | | |
| | | | | | | | | 15,815,179 | |
| | | | | | | | | | |
Federal National Mortgage Association - 13.5% | | | | | |
3,100,000 | | 2.48 | | | 2/1/35 | | | | 3,259,173 | |
3,100,000 | | 2.68 | | | 2/1/35 | | | | 3,293,038 | |
2,418,021 | | 4.50 | | | 4/1/48 | | | | 2,640,435 | |
1,280,242 | | 5.00 | | | 9/1/43 | | | | 1,474,331 | |
9,736,637 | | 5.00 | | | 2/1/49 | | | | 11,160,611 | |
519,521 | | 5.00 | | | 6/1/51 | | | | 598,252 | |
358,357 | | 5.50 | | | 6/1/33 | | | | 394,997 | |
4,406,944 | | 5.50 | | | 12/1/41 | | | | 5,200,062 | |
2,757,214 | | 5.50 | | | 1/1/49 | | | | 3,213,989 | |
1,739,230 | | 5.50 | | | 5/1/49 | | | | 1,954,122 | |
850,604 | | 5.50 | | | 4/1/50 | | | | 951,186 | |
845,368 | | 5.93 | | | 5/1/35 | | | | 845,078 | |
401,664 | | 6.00 | | | 11/1/34 | | | | 472,558 | |
136,125 | | 6.00 | | | 5/1/37 | | | | 153,746 | |
53,962 | | 6.00 | | | 9/1/37 | | | | 58,707 | |
1,397,293 | | 6.00 | | | 4/1/38 | | | | 1,651,669 | |
404,497 | | 6.00 | | | 2/1/40 | | | | 467,254 | |
4,307,631 | | 6.00 | | | 5/1/41 | | | | 5,079,207 | |
261 | | 6.50 | | | 1/1/22 | | | | 262 | |
979,323 | | 6.50 | | | 2/1/29 | | | | 1,100,258 | |
134,346 | | 6.50 | | | 3/1/29 | | | | 143,947 | |
2,626,393 | | 6.50 | | | 12/1/30 | | | | 2,968,333 | |
143,626 | | 6.50 | | | 6/1/31 | | | | 162,492 | |
334,762 | | 6.50 | | | 4/1/32 | | | | 377,967 | |
49,911 | | 6.50 | | | 8/1/34 | | | | 55,949 | |
| | | | | | | | | | |
Principal
Amount ($) | | Coupon Rate (%) | | Maturity
Date | | | Fair Value ($) | |
330,961 | | 6.50 | | | 11/1/34 | | | | 370,757 | |
704,792 | | 6.50 | | | 12/1/36 | | | | 803,248 | |
165,853 | | 6.50 | | | 1/1/39 | | | | 180,635 | |
1,307,944 | | 6.50 | | | 6/1/40 | | | | 1,511,830 | |
885,665 | | 6.75 | | | 6/1/32 | | | | 1,035,211 | |
680,653 | | 6.87 | | | 6/1/40 | | | | 777,839 | |
4,453 | | 7.00 | | | 3/1/22 | | | | 4,469 | |
9,463 | | 7.00 | | | 6/1/22 | | | | 9,563 | |
2,943 | | 7.00 | | | 1/1/24 | | | | 2,958 | |
18,104 | | 7.00 | | | 2/1/26 | | | | 19,276 | |
50,722 | | 7.00 | | | 9/1/27 | | | | 54,544 | |
24,355 | | 7.00 | | | 10/1/27 | | | | 26,222 | |
103,820 | | 7.00 | | | 11/1/27 | | | | 114,086 | |
23,957 | | 7.00 | | | 1/1/28 | | | | 25,897 | |
18,509 | | 7.00 | | | 10/1/32 | | | | 20,199 | |
2,887,044 | | 7.00 | | | 12/1/32 | | | | 3,424,708 | |
81,345 | | 7.00 | | | 7/1/33 | | | | 91,370 | |
85,921 | | 7.00 | | | 7/1/34 | | | | 97,030 | |
10,679 | | 7.00 | | | 12/1/37 | | | | 11,955 | |
1,659,972 | | 7.00 | | | 3/1/39 | | | | 1,995,927 | |
3,621,701 | | 7.00 | | | 1/1/40 | | | | 4,181,359 | |
453,682 | | 7.00 | | | 9/1/47 | | | | 487,621 | |
1,072 | | 7.50 | | | 6/1/22 | | | | 1,078 | |
4,048 | | 7.50 | | | 12/1/22 | | | | 4,079 | |
9,676 | | 7.50 | | | 3/1/23 | | | | 9,771 | |
92,585 | | 7.50 | | | 4/1/32 | | | | 103,308 | |
128,663 | | 7.50 | | | 1/1/34 | | | | 145,334 | |
2,584,010 | | 7.50 | | | 10/1/38 | | | | 3,032,760 | |
1,116,676 | | 7.50 | | | 11/1/38 | | | | 1,318,149 | |
8,465 | | 7.68 | | | 7/20/30 | | | | 8,580 | |
4,430 | | 7.96 | | | 8/20/25 | | | | 4,485 | |
101,207 | | 8.00 | | | 6/1/25 | | | | 107,516 | |
4,050 | | 8.00 | | | 7/20/28 | | | | 4,101 | |
60,466 | | 8.00 | | | 2/1/31 | | | | 69,187 | |
124,409 | | 8.00 | | | 1/1/32 | | | | 136,540 | |
53,555 | | 8.00 | | | 11/1/37 | | | | 63,509 | |
287,969 | | 8.00 | | | 3/1/38 | | | | 348,495 | |
54,312 | | 8.13 | | | 11/15/31 | | | | 61,149 | |
61,713 | | 8.50 | | | 11/1/26 | | | | 64,552 | |
44,856 | | 8.50 | | | 3/1/28 | | | | 46,034 | |
30,131 | | 8.50 | | | 10/1/28 | | | | 33,590 | |
110,343 | | 8.50 | | | 4/1/29 | | | | 123,448 | |
33,423 | | 8.50 | | | 10/1/29 | | | | 33,555 | |
58,645 | | 8.50 | | | 7/1/30 | | | | 68,055 | |
41,075 | | 8.50 | | | 8/1/30 | | | | 49,329 | |
140,358 | | 8.50 | | | 4/1/32 | | | | 170,808 | |
147,683 | | 8.50 | | | 1/1/37 | | | | 169,296 | |
1,726 | | 9.00 | | | 6/15/25 | | | | 1,750 | |
17,829 | | 9.00 | | | 6/1/30 | | | | 18,158 | |
8,891 | | 9.00 | | | 10/1/30 | | | | 9,700 | |
68,306 | | 9.00 | | | 2/1/31 | | | | 71,017 | |
18,960 | | 9.00 | | | 7/1/31 | | | | 19,033 | |
25,655 | | 9.00 | | | 10/1/31 | | | | 29,600 | |
59,797 | | 9.00 | | | 8/1/37 | | | | 62,754 | |
156,567 | | 9.00 | | | 2/1/38 | | | | 172,079 | |
20,298 | | 9.00 | | | 5/15/28 | | | | 20,617 | |
14,315 | | 9.50 | | | 8/1/24 | | | | 14,468 | |
98,838 | | 9.50 | | | 5/1/29 | | | | 112,206 | |
12,469 | | 9.50 | | | 4/1/30 | | | | 13,688 | |
72,176 | | 9.50 | | | 8/1/31 | | | | 80,375 | |
22,528 | | 10.00 | | | 2/1/28 | | | | 22,874 | |
| | | | |
See accompanying notes to financial statements. | | | | |
| | |
6 | | | SIT MUTUAL FUNDS SEMI-ANNUAL REPORT | |
| | | | | | | | | | |
Principal
Amount ($) | | Coupon Rate (%) | | Maturity
Date | | | Fair Value ($) | |
75,439 | | 10.00 | | | 6/1/30 | | | | 85,018 | |
| | | | | | | | | | |
| | | | | | | | | 69,834,372 | |
| | | | | | | | | | |
Government National Mortgage Association - 8.0% | | | | | |
94,202 | | 4.00 | | | 12/15/24 | | | | 99,691 | |
395,749 | | 4.00 | | | 10/20/30 | | | | 435,521 | |
7,164,926 | | 4.00 | | | 8/20/31 | | | | 7,766,302 | |
746,925 | | 4.00 | | | 12/20/31 | | | | 822,399 | |
564,175 | | 4.25 | | | 10/20/31 | | | | 619,500 | |
332,916 | | 4.25 | | | 3/20/37 | | | | 359,707 | |
1,709,632 | | 4.75 | | | 9/20/31 | | | | 1,914,899 | |
6,007,636 | | 5.00 | | | 12/15/45 | | | | 7,084,252 | |
1,048,150 | | 5.00 | | | 7/20/49 | | | | 1,133,216 | |
61,388 | | 5.50 | | | 9/15/25 | | | | 65,205 | |
740,088 | | 5.50 | | | 5/15/29 | | | | 834,320 | |
1,699,946 | | 5.75 | | | 2/15/29 | | | | 1,896,440 | |
593,667 | | 5.75 | | | 10/20/31 | | | | 668,204 | |
375,313 | | 6.00 | | | 9/15/33 | | | | 417,343 | |
251,540 | | 6.00 | | | 2/20/47 | | | | 294,752 | |
2,514,539 | | 6.00 | | | 7/20/47 | | | | 2,934,254 | |
22,803 | | 6.25 | | | 12/15/23 | | | | 23,587 | |
537,077 | | 6.25 | | | 4/15/29 | | | | 597,587 | |
51,110 | | 6.50 | | | 11/15/23 | | | | 53,163 | |
161,901 | | 6.50 | | | 4/15/24 | | | | 169,052 | |
584,728 | | 6.50 | | | 2/20/28 | | | | 655,070 | |
222,808 | | 6.50 | | | 2/20/29 | | | | 239,685 | |
383,252 | | 6.50 | | | 7/20/34 | | | | 457,167 | |
2,050,099 | | 6.50 | | | 2/15/35 | | | | 2,349,010 | |
16,241 | | 6.50 | | | 12/20/38 | | | | 17,583 | |
210,655 | | 6.50 | | | 1/20/39 | | | | 246,784 | |
112,010 | | 6.50 | | | 2/20/39 | | | | 133,424 | |
242,639 | | 6.50 | | | 4/20/39 | | | | 283,107 | |
268,031 | | 6.50 | | | 6/20/39 | | | | 308,308 | |
457,113 | | 6.50 | | | 8/20/39 | | | | 536,257 | |
275,376 | | 6.50 | | | 4/20/43 | | | | 325,649 | |
3,031,247 | | 7.00 | | | 8/15/29 | | | | 3,459,267 | |
3,204,795 | | 7.00 | | | 10/15/29 | | | | 3,660,846 | |
187,661 | | 7.00 | | | 10/15/36 | | | | 210,138 | |
| | | | | | | | | | |
| | | | | | | | | 41,071,689 | |
| | | | | | | | | | |
Small Business Administration - 0.4% | | | | | |
1,314,799 | | 5.33 | | | 8/25/36 | | | | 1,425,008 | |
671,315 | | 5.33 | | | 9/25/36 | | | | 727,788 | |
| | | | | | | | | | |
| | | | | | | | | 2,152,796 | |
| | | | | | | | | | |
Total Mortgage Pass-Through Securities | | | | 128,874,036 | |
| | | | | | | | | | |
(cost: $125,204,127) | | | | | |
| |
U.S. Treasury / Federal Agency Securities - 15.7% | | | | | |
U.S. Treasury Bonds: | | | | | |
1,900,000 | | 2.00 | | | 2/15/50 | | | | 1,861,332 | |
U.S. Treasury Inflation Indexed Bonds: | | | | | |
35,777,885 | | 0.13 | | | 1/15/23 | | | | 36,987,718 | |
U.S. Treasury Note: | | | | | |
18,850,000 | | 1.25 | | | 8/15/31 | | | | 18,369,914 | |
15,000,000 | | 1.63 | | | 5/15/31 | | | | 15,157,031 | |
U.S. Treasury Strip Principal: | | | | | |
9,800,000 | | 1.05 | | | 5/15/30 | 6 | | | 8,649,482 | |
| | | | | | | | | | |
Total U.S. Treasury / Federal Agency Securities | | | | 81,025,477 | |
| | | | | | | | | | |
(cost: $82,145,320) | | | | | |
| | | | | | | | | | |
Principal
Amount ($) | | Coupon Rate (%) | | Maturity
Date | | | Fair Value ($) | |
| |
Collateralized Mortgage Obligations - 56.8% | | | | | |
| |
Federal Home Loan Mortgage Corporation - 10.2% | | | | | |
90,837 | | 5.00 | | | 2/15/23 | | | | 92,189 | |
3,372,257 | | 5.00 | | | 11/25/50 | | | | 3,929,160 | |
884,006 | | 5.00 | | | 11/25/50 | 1 | | | 1,022,756 | |
5,975,547 | | 5.50 | | | 6/25/51 | | | | 7,038,062 | |
352,322 | | 5.53 | | | 5/15/38 | 1 | | | 386,802 | |
1,675,128 | | 6.00 | | | 1/15/33 | | | | 1,943,361 | |
1,730,326 | | 6.00 | | | 5/15/36 | | | | 2,011,774 | |
1,663,357 | | 6.00 | | | 9/15/42 | | | | 1,922,316 | |
17,549 | | 6.25 | | | 5/15/29 | | | | 18,542 | |
45,800 | | 6.50 | | | 9/15/23 | | | | 47,977 | |
20,700 | | 6.50 | | | 3/15/24 | | | | 21,910 | |
331,055 | | 6.50 | | | 7/15/27 | | | | 372,332 | |
339,919 | | 6.50 | | | 2/15/28 | | | | 377,773 | |
408,866 | | 6.50 | | | 3/15/29 | | | | 461,963 | |
11,434 | | 6.50 | | | 2/15/30 | | | | 12,858 | |
335,982 | | 6.50 | | | 1/15/31 | | | | 380,832 | |
675,588 | | 6.50 | | | 8/15/31 | | | | 770,031 | |
140,906 | | 6.50 | | | 1/15/32 | | | | 162,068 | |
53,053 | | 6.50 | | | 3/15/32 | | | | 61,449 | |
340,811 | | 6.50 | | | 6/25/32 | | | | 397,453 | |
175,258 | | 6.50 | | | 7/15/32 | | | | 202,816 | |
3,799,407 | | 6.50 | | | 5/15/33 | | | | 4,465,651 | |
725,640 | | 6.50 | | | 5/15/35 | | | | 863,237 | |
399,186 | | 6.50 | | | 8/15/39 | | | | 472,708 | |
760,007 | | 6.50 | | | 2/25/43 | | | | 896,679 | |
474,916 | | 6.50 | | | 3/25/43 | | | | 555,618 | |
626,495 | | 6.50 | | | 7/25/43 | | | | 757,480 | |
563,567 | | 6.50 | | | 10/25/43 | | | | 653,609 | |
2,272,185 | | 6.50 | | | 8/15/45 | | | | 2,691,177 | |
477,415 | | 6.50 | | | 2/15/49 | | | | 539,440 | |
6,504 | | 6.70 | | | 9/15/23 | | | | 6,812 | |
374,311 | | 6.75 | | | 3/15/28 | | | | 422,686 | |
342,187 | | 6.95 | | | 3/15/28 | | | | 384,109 | |
6,659 | | 7.00 | | | 10/15/22 | | | | 6,773 | |
1,590 | | 7.00 | | | 11/15/22 | | | | 1,624 | |
45,479 | | 7.00 | | | 3/25/23 | | | | 46,531 | |
3,291 | | 7.00 | | | 4/15/23 | | | | 3,407 | |
16,268 | | 7.00 | | | 7/15/23 | | | | 17,001 | |
46,945 | | 7.00 | | | 1/15/24 | | | | 49,417 | |
23,574 | | 7.00 | | | 3/15/24 | | | | 24,785 | |
48,729 | | 7.00 | | | 8/15/25 | | | | 52,926 | |
39,670 | | 7.00 | | | 9/15/26 | | | | 43,557 | |
88,887 | | 7.00 | | | 6/15/29 | | | | 101,307 | |
223,742 | | 7.00 | | | 8/15/29 | | | | 256,896 | |
283,273 | | 7.00 | | | 10/20/29 | | | | 325,899 | |
47,535 | | 7.00 | | | 1/15/30 | | | | 55,575 | |
158,491 | | 7.00 | | | 10/15/30 | | | | 187,427 | |
117,385 | | 7.00 | | | 7/15/31 | | | | 137,245 | |
60,520 | | 7.00 | | | 4/15/32 | | | | 68,595 | |
398,744 | | 7.00 | | | 5/15/32 | | | | 472,035 | |
2,120,763 | | 7.00 | | | 8/15/41 | | | | 2,496,464 | |
3,224,458 | | 7.00 | | | 2/25/43 | | | | 3,846,423 | |
599,849 | | 7.00 | | | 3/25/43 | | | | 706,811 | |
827,223 | | 7.00 | | | 7/25/43 | | | | 996,062 | |
715,467 | | 7.00 | | | 3/15/49 | | | | 835,999 | |
94 | | 7.50 | | | 10/15/21 | | | | 94 | |
5,448 | | 7.50 | | | 7/15/22 | | | | 5,510 | |
29,525 | | 7.50 | | | 3/15/23 | | | | 30,603 | |
129,146 | | 7.50 | | | 4/15/23 | | | | 134,014 | |
| | | | |
See accompanying notes to financial statements. | | | | |
| | |
SEPTEMBER 30, 2021 | | | 7 | |
SCHEDULE OF INVESTMENTS (Unaudited)
September 30, 2021
Sit U.S. Government Securities Fund (Continued)
| | | | | | | | | | |
Principal
Amount ($) | | Coupon Rate (%) | | Maturity
Date | | | Fair Value ($) | |
30,723 | | 7.50 | | | 9/20/26 | | | | 34,357 | |
149,890 | | 7.50 | | | 3/15/28 | | | | 171,586 | |
245,562 | | 7.50 | | | 9/15/29 | | | | 288,726 | |
80,194 | | 7.50 | | | 12/15/29 | | | | 91,673 | |
143,347 | | 7.50 | | | 6/15/30 | | | | 169,115 | |
219,744 | | 7.50 | | | 8/15/30 | | | | 257,008 | |
342,648 | | 7.50 | | | 9/15/30 | | | | 408,006 | |
78,257 | | 7.50 | | | 11/15/30 | | | | 91,488 | |
2,184,104 | | 7.50 | | | 6/15/34 | | | | 2,674,394 | |
1,264,560 | | 7.50 | | | 8/25/42 | 1 | | | 1,623,894 | |
716,300 | | 7.50 | | | 9/25/43 | | | | 835,290 | |
137,790 | | 8.00 | | | 2/15/23 | | | | 143,094 | |
15,744 | | 8.00 | | | 4/25/24 | | | | 16,476 | |
88,056 | | 8.00 | | | 2/15/27 | | | | 100,277 | |
107,564 | | 8.00 | | | 11/20/29 | | | | 125,721 | |
121,091 | | 8.00 | | | 1/15/30 | | | | 142,710 | |
1,211 | | 8.25 | | | 6/15/22 | | | | 1,235 | |
62,293 | | 8.50 | | | 3/15/25 | | | | 69,148 | |
20,789 | | 8.50 | | | 3/15/32 | | | | 24,874 | |
| | | | | | | | | | |
| | | | | | | | | 52,515,682 | |
| | | | | | | | | | |
Federal National Mortgage Association - 15.7% | | | | | |
450,683 | | 1.53 | | | 7/25/37 | 1 | | | 447,186 | |
457,516 | | 3.03 | | | 8/25/43 | 1 | | | 483,604 | |
198,496 | | 4.55 | | | 6/25/43 | | | | 218,101 | |
1,990,067 | | 5.00 | | | 7/25/40 | | | | 2,244,597 | |
378,515 | | 5.00 | | | 11/25/41 | | | | 426,176 | |
576,832 | | 5.00 | | | 6/25/43 | | | | 638,165 | |
2,382,632 | | 5.00 | | | 11/25/50 | | | | 2,734,976 | |
3,081,952 | | 5.00 | | | 12/25/50 | | | | 3,578,058 | |
2,180,451 | | 5.28 | | | 2/25/42 | 1 | | | 2,398,544 | |
564,303 | | 5.36 | | | 6/25/42 | | | | 642,279 | |
1,404,154 | | 5.38 | | | 10/25/42 | 1 | | | 1,614,300 | |
662,681 | | 5.50 | | | 9/25/33 | | | | 751,496 | |
3,174,244 | | 5.50 | | | 6/25/40 | | | | 3,605,928 | |
2,498,603 | | 5.57 | | | 12/25/42 | 1 | | | 2,751,331 | |
942,366 | | 5.62 | | | 12/25/53 | 1 | | | 1,103,454 | |
663,203 | | 5.81 | | | 8/25/43 | | | | 746,039 | |
1,088,189 | | 6.00 | | | 5/25/30 | | | | 1,226,884 | |
1,859,244 | | 6.00 | | | 5/25/36 | | | | 2,193,935 | |
240,000 | | 6.00 | | | 6/25/36 | | | | 278,330 | |
1,851,531 | | 6.00 | | | 11/25/43 | | | | 2,126,182 | |
864,006 | | 6.00 | | | 9/25/46 | | | | 968,619 | |
1,325,023 | | 6.00 | | | 2/25/48 | | | | 1,512,187 | |
977,929 | | 6.30 | | | 8/25/47 | 1 | | | 1,108,090 | |
177,946 | | 6.50 | | | 8/20/28 | | | | 195,051 | |
1,043,360 | | 6.50 | | | 1/25/32 | | | | 1,223,736 | |
153,340 | | 6.50 | | | 3/25/32 | | | | 179,548 | |
251,760 | | 6.50 | | | 6/25/32 | | | | 292,410 | |
201,232 | | 6.50 | | | 7/25/36 | | | | 239,051 | |
57,760 | | 6.50 | | | 9/25/36 | | | | 68,250 | |
1,733,888 | | 6.50 | | | 11/25/41 | | | | 1,982,975 | |
221,562 | | 6.50 | | | 3/25/42 | | | | 251,065 | |
1,071,067 | | 6.50 | | | 5/25/42 | | | | 1,280,045 | |
3,457,564 | | 6.50 | | | 7/25/42 | | | | 3,751,643 | |
252,605 | | 6.50 | | | 9/25/42 | | | | 292,300 | |
619,177 | | 6.50 | | | 11/25/42 | | | | 705,682 | |
540,668 | | 6.50 | | | 7/25/44 | | | | 560,117 | |
220,258 | | 6.51 | | | 2/25/45 | 1 | | | 259,635 | |
313,975 | | 6.63 | | | 9/25/37 | 1 | | | 382,982 | |
2,215,136 | | 6.75 | | | 6/25/32 | | | | 2,624,238 | |
478,259 | | 6.75 | | | 4/25/37 | | | | 520,976 | |
| | | | | | | | | | |
Principal
Amount ($) | | Coupon Rate (%) | | Maturity
Date | | | Fair Value ($) | |
54,622 | | 6.85 | | | 12/18/27 | | | | 60,235 | |
319,837 | | 6.89 | | | 8/25/37 | 1 | | | 353,651 | |
580 | | 7.00 | | | 7/25/22 | | | | 587 | |
3,959 | | 7.00 | | | 11/25/22 | | | | 4,065 | |
4,008 | | 7.00 | | | 12/25/22 | | | | 4,093 | |
5,348 | | 7.00 | | | 6/25/23 | | | | 5,568 | |
215,807 | | 7.00 | | | 4/25/24 | | | | 226,392 | |
117,645 | | 7.00 | | | 9/18/27 | | | | 131,974 | |
1,497,759 | | 7.00 | | | 5/25/31 | | | | 1,592,807 | |
1,061,696 | | 7.00 | | | 12/25/33 | | | | 1,242,640 | |
104,247 | | 7.00 | | | 9/25/40 | | | | 121,378 | |
397,057 | | 7.00 | | | 10/25/41 | | | | 451,975 | |
161,051 | | 7.00 | | | 11/25/41 | | | | 194,074 | |
281,620 | | 7.00 | | | 12/25/41 | | | | 329,298 | |
877,103 | | 7.00 | | | 7/25/42 | | | | 1,045,074 | |
1,768,515 | | 7.00 | | | 2/25/44 | | | | 2,076,236 | |
92,977 | | 7.00 | | | 8/25/44 | | | | 110,777 | |
22,230 | | 7.50 | | | 8/20/27 | | | | 25,113 | |
186,710 | | 7.50 | | | 10/25/40 | | | | 208,726 | |
1,326,090 | | 7.50 | | | 11/25/40 | | | | 1,409,518 | |
689,068 | | 7.50 | | | 6/19/41 | 1 | | | 807,510 | |
1,271,157 | | 7.50 | | | 7/25/41 | | | | 1,511,445 | |
755,385 | | 7.50 | | | 8/25/41 | | | | 869,504 | |
249,593 | | 7.50 | | | 11/25/41 | | | | 301,527 | |
469,476 | | 7.50 | | | 1/25/42 | | | | 557,668 | |
3,157,444 | | 7.50 | | | 5/25/42 | | | | 3,775,513 | |
286,016 | | 7.50 | | | 6/25/42 | | | | 338,932 | |
2,895,829 | | 7.50 | | | 8/25/42 | 1 | | | 3,555,317 | |
984,301 | | 7.50 | | | 2/25/44 | | | | 1,160,536 | |
473,911 | | 7.50 | | | 3/25/44 | | | | 548,601 | |
668,791 | | 7.50 | | | 5/25/44 | | | | 812,662 | |
43,253 | | 7.50 | | | 10/25/44 | | | | 51,859 | |
3,887,757 | | 7.50 | | | 1/25/48 | | | | 4,681,788 | |
5,586 | | 8.00 | | | 7/25/22 | | | | 5,694 | |
31,346 | | 8.00 | | | 7/18/27 | | | | 35,083 | |
316,042 | | 8.00 | | | 7/25/44 | | | | 364,160 | |
437,111 | | 8.00 | | | 11/25/37 | 1 | | | 518,967 | |
227,764 | | 8.11 | | | 11/25/37 | 1 | | | 271,090 | |
37,821 | | 8.28 | | | 10/25/42 | 1 | | | 46,140 | |
5,070 | | 8.50 | | | 1/25/25 | | | | 5,536 | |
384,862 | | 8.50 | | | 6/25/30 | | | | 461,716 | |
1,674 | | 9.00 | | | 8/25/22 | | | | 1,722 | |
40,444 | | 9.00 | | | 11/25/28 | | | | 46,976 | |
254,564 | | 9.00 | | | 6/25/30 | | | | 311,396 | |
47,626 | | 9.00 | | | 10/25/30 | | | | 58,138 | |
70,341 | | 9.43 | | | 6/25/32 | 1 | | | 81,975 | |
61,746 | | 9.50 | | | 11/25/31 | | | | 75,068 | |
190,774 | | 9.50 | | | 12/25/41 | | | | 230,733 | |
249,850 | | 11.04 | | | 6/25/44 | 1 | | | 284,535 | |
852,617 | | 11.37 | | | 9/25/42 | 1 | | | 1,102,639 | |
13,825 | | 22.48 | | | 3/25/39 | 1 | | | 21,092 | |
| | | | | | | | | | |
| | | | | | | | | 81,097,868 | |
| | | | | | | | | | |
Government National Mortgage Association - 29.9% | | | | | |
5,756,476 | | 4.88 | | | 4/20/51 | 1 | | | 6,559,928 | |
3,544,595 | | 5.00 | | | 12/20/50 | | | | 4,118,967 | |
24,144,431 | | 5.00 | | | 2/20/51 | | | | 28,241,632 | |
2,486,482 | | 5.02 | | | 8/20/51 | 1 | | | 2,848,677 | |
2,717,399 | | 5.06 | | | 7/20/51 | 1 | | | 3,122,655 | |
2,059,625 | | 5.19 | | | 5/20/51 | 1 | | | 2,383,744 | |
500,000 | | 5.50 | | | 9/20/39 | | | | 583,773 | |
7,745,198 | | 5.50 | | | 10/20/50 | | | | 9,126,682 | |
| | | | |
See accompanying notes to financial statements. | | | | |
| | |
8 | | | SIT MUTUAL FUNDS SEMI-ANNUAL REPORT | |
| | | | | | | | | | |
Principal
Amount ($) | | Coupon Rate (%) | | Maturity
Date | | | Fair Value ($) | |
2,233,636 | | 5.50 | | | 11/20/50 | | | | 2,625,847 | |
3,844,531 | | 5.50 | | | 1/20/51 | | | | 4,625,974 | |
18,478,162 | | 5.50 | | | 5/20/51 | | | | 21,647,019 | |
2,656,113 | | 5.50 | | | 6/20/51 | | | | 3,037,332 | |
12,738,865 | | 5.50 | | | 7/20/51 | | | | 15,012,602 | |
314,074 | | 5.54 | | | 4/20/48 | 1 | | | 357,287 | |
4,349,600 | | 5.59 | | | 4/20/40 | 1 | | | 5,031,206 | |
4,643,859 | | 5.81 | | | 3/20/45 | 1 | | | 5,355,388 | |
9,546,271 | | 5.90 | | | 2/20/51 | 1 | | | 11,433,193 | |
778,526 | | 5.95 | | | 10/20/40 | 1 | | | 908,622 | |
418,926 | | 5.99 | | | 11/20/43 | 1 | | | 484,538 | |
1,553,679 | | 6.00 | | | 11/20/33 | | | | 1,686,700 | |
458,971 | | 6.00 | | | 12/20/35 | | | | 525,997 | |
289,929 | | 6.00 | | | 3/20/42 | | | | 338,727 | |
441,724 | | 6.00 | | | 3/20/48 | | | | 500,394 | |
2,663,757 | | 6.00 | | | 3/20/49 | | | | 2,969,280 | |
805,481 | | 6.00 | | | 5/20/49 | | | | 893,448 | |
1,735,846 | | 6.13 | | | 1/20/39 | 1 | | | 2,059,122 | |
326,913 | | 6.43 | | | 4/20/37 | 1 | | | 360,775 | |
1,631,203 | | 6.48 | | | 6/20/41 | 1 | | | 1,900,464 | |
1,051,418 | | 6.50 | | | 7/20/32 | | | | 1,049,542 | |
1,069,304 | | 6.50 | | | 2/20/37 | | | | 1,199,252 | |
215,910 | | 6.50 | | | 9/16/38 | | | | 241,297 | |
2,152,358 | | 6.50 | | | 8/20/48 | | | | 2,482,397 | |
985,614 | | 6.50 | | | 10/20/48 | | | | 1,116,959 | |
1,659,687 | | 6.50 | | | 1/20/49 | | | | 1,854,728 | |
559,683 | | 6.57 | | | 7/20/39 | 1 | | | 652,069 | |
445,534 | | 6.65 | | | 4/20/39 | 1 | | | 525,154 | |
829,691 | | 6.87 | | | 8/20/40 | 1 | | | 967,220 | |
447,245 | | 6.99 | | | 6/20/45 | 1 | | | 513,467 | |
117,804 | | 7.00 | | | 9/16/33 | | | | 129,479 | |
318,346 | | 7.00 | | | 5/20/42 | | | | 377,113 | |
953,265 | | 7.00 | | | 10/20/48 | | | | 1,051,504 | |
902,128 | | 7.11 | | | 12/20/38 | 1 | | | 1,055,639 | |
542,239 | | 7.13 | | | 12/20/33 | 1 | | | 628,081 | |
1,291,171 | | 7.31 | | | 8/20/38 | 1 | | | 1,516,953 | |
| | | | | | | | | | |
| | | | | | | | | 154,100,827 | |
| | | | | | | | | | |
Vendee Mortgage Trust - 1.0% | | | | | |
994,446 | | 6.08 | | | 3/15/25 | 1 | | | 1,133,697 | |
1,478,204 | | 6.50 | | | 8/15/31 | | | | 1,650,517 | |
720,547 | | 6.50 | | | 10/15/31 | | | | 844,813 | |
505,649 | | 6.75 | | | 2/15/26 | | | | 562,811 | |
579,524 | | 7.00 | | | 3/15/28 | | | | 640,004 | |
30,281 | | 7.25 | | | 9/15/22 | | | | 30,731 | |
151,119 | | 7.25 | | | 9/15/25 | | | | 166,586 | |
89,439 | | 7.75 | | | 5/15/22 | | | | 90,707 | |
190,488 | | 7.75 | | | 9/15/24 | | | | 205,291 | |
76,157 | | 8.00 | | | 2/15/25 | | | | 81,751 | |
62,477 | | 8.29 | | | 12/15/26 | | | | 70,208 | |
| | | | | | | | | | |
| | | | | | | | | 5,477,116 | |
| | | | | | | | | | |
Total Collateralized Mortgage Obligations | | | | 293,191,493 | |
| | | | | | | | | | |
(cost: $288,088,842) | | | | | |
| |
Asset-Backed Securities - 1.2% | | | | | |
|
Federal Home Loan Mortgage Corporation - 0.2% | |
398 | | 6.09 | | | 9/25/29 | 1 | | | 400 | |
707,555 | | 7.16 | | | 7/25/29 | | | | 813,186 | |
| | | | | | | | | | |
| | | | | | | | | 813,586 | |
| | | | | | | | | | |
|
Federal National Mortgage Association - 0.6% | |
12,079 | | 1 Mo. Libor + 0.17%, 0.40 | | | 11/25/32 | 1 | | | 11,843 | |
| | | | | | | | | | |
Principal
Amount ($) | | Coupon Rate (%) | | Maturity
Date | | | Fair Value ($) | |
527,002 | | 4.40 | | | 11/25/33 | 14 | | | 585,564 | |
302,495 | | 4.67 | | | 9/26/33 | 14 | | | 337,418 | |
107,404 | | 4.80 | | | 10/25/33 | 14 | | | 120,967 | |
1,717,914 | | 5.73 | | | 2/25/33 | 14 | | | 1,976,603 | |
3,632 | | 6.00 | | | 5/25/32 | 14 | | | 3,919 | |
81,687 | | 6.09 | | | 10/25/31 | 14 | | | 87,125 | |
3,730 | | 7.80 | | | 6/25/26 | 1 | | | 4,125 | |
| | | | | | | | | | |
| | | | | | | | | 3,127,564 | |
| | | | | | | | | | |
Small Business Administration - 0.4% | | | | | |
212,087 | | 5.78 | | | 8/1/27 | | | | 232,456 | |
952,847 | | 5.87 | | | 7/1/28 | | | | 1,050,104 | |
818,427 | | 6.02 | | | 8/1/28 | | | | 909,473 | |
| | | | | | | | | | |
| | | | | | | | | 2,192,033 | |
| | | | | | | | | | |
Total Asset-Backed Securities | | | | 6,133,183 | |
| | | | | | | | | | |
(cost: $5,627,198) | | | | | | | | |
| |
Put Options Purchased 19- 0.1% | | | | 632,813 | |
| | | | | | | | | | |
(cost: $328,977) | | | | | | | | |
| | | | | | | | | | |
| Quantity | | Name of Issuer | | | | | Fair Value ($) | |
| |
Short-Term Securities - 0.8% | | | | | |
4,158,579 | | Fidelity Inst. Money Mkt. Gvt. Fund, 0.01% | | | | 4,158,579 | |
| | | | | | | | | | |
(cost: $4,158,579) | | | | | |
| |
Total Investments in Securities - 99.6% | | | | | |
(cost: $505,553,043) | | | | 514,015,581 | |
| | | | | | | | | | |
| |
Other Assets and Liabilities - 0.4% | | | | 1,808,442 | |
| | | | | | | | | | |
| |
Total Net Assets - 100.0% | | | | $515,824,023 | |
| | | | | | | | | | |
| 1 | Variable rate security. Rate disclosed is as of September 30, 2021. Certain variable rate securities are not based on a published reference rate and spread but are determined by the issuer or agent and are based on current market conditions, or, for mortgage-backed securities, are impacted by the individual mortgages which are paying off over time. These securities do not indicate a reference rate and spread in their descriptions. |
| 6 | Zero coupon or convertible capital appreciation bond, for which the rate disclosed is either the effective yield on purchase date or the coupon rate to be paid upon conversion to coupon paying. |
| 14 | Step Coupon: A bond that pays a coupon rate that increases on a specified date(s). Rate disclosed is as of September 30, 2021. |
Numeric footnotes not disclosed are not applicable to this Schedule of Investments.
| | | | |
See accompanying notes to financial statements. | | | | |
| | |
SEPTEMBER 30, 2021 | | | 9 | |
SCHEDULE OF INVESTMENTS (Unaudited)
September 30, 2021
Sit U.S. Government Securities Fund (Continued)
| 19 | Options outstanding as of September 30, 2021 were as follows: |
| | | | | | | | | | | | | | | | | | | | | | | | |
| | | | | | Exercise | | | Expiration | | | | Notional | | | Cost/ | | | | |
| Description | | Contracts | | | Price ($) | | | Date | | Counterparty | | Amount ($) | | | Premiums ($) | | | Value ($) | |
| | |
Put Options Purchased - U.S. Treasury Futures: | | | | | | | | | |
| 10-Year | | | 300 | | | | 133.50 | | | November 2021 | | StoneX Financial, Inc. | | | 40,050,000 | | | | 328,977 | | | | 632,813 | |
A summary of the levels for the Fund’s investments as of September 30, 2021 is as follows (see Note 2 - significant accounting policies in the notes to financial statements):
| | | | | | | | | | | | | | |
| | | Investment in Securities | |
| | | Level 1 | | | Level 2 | | | Level 3 | | | |
| | | Quoted | | | Other significant | | | Significant | | | |
| | | Prices ($) | | | observable inputs ($) | | | unobservable inputs ($) | | Total ($) | |
Mortgage Pass-Through Securities | | | — | | | | 128,874,036 | | | — | | | 128,874,036 | |
U.S. Treasury / Federal Agency Securities | | | — | | | | 81,025,477 | | | — | | | 81,025,477 | |
Collateralized Mortgage Obligations | | | — | | | | 293,191,493 | | | — | | | 293,191,493 | |
Asset-Backed Securities | | | — | | | | 6,133,183 | | | — | | | 6,133,183 | |
Put Options Purchased | | | 632,813 | | | | — | | | — | | | 632,813 | |
Short-Term Securities | | | 4,158,579 | | | | — | | | — | | | 4,158,579 | |
| Total: | | | 4,791,392 | | | | 509,224,189 | | | — | | | 514,015,581 | |
There were no transfers into or out of level 3 during the reporting period.
| | | | |
See accompanying notes to financial statements. | | | | |
| | |
10 | | | SIT MUTUAL FUNDS SEMI-ANNUAL REPORT | |
[This page is intentionally left blank.]
OBJECTIVE & STRATEGY
The objective of the Quality Income Fund is to provide high current income and safety of principal, which it seeks to attain by investing at least 80% of its assets in debt securities issued by the U.S. government and its agencies, debt securities issued by corporations, and mortgage and other asset-backed securities. The Fund invests at least 50% of its assets in U.S. government debt securities, which are securities issued, guaranteed or insured by the U.S. government, its agencies or instrumentalities.
Fund Performance
The Sit Quality Income Fund provided a return of +1.07% during the 6-month period ending September 30, 2021, compared to the return of the Bloomberg 1-3 Year Government/Credit Bond Index of +0.13%. The Fund’s 30-day SEC yield was 1.26% and its 12-month distribution rate was 1.33%.
Factors that Influenced the Fund’s Performance
The primary goal of the Fund is to maintain a high credit quality portfolio with stable principal values, while generating a relatively high level of income. During the 6-month period, the Fund benefitted from the income advantage produced by its holdings in residential mortgages, corporate, and taxable municipal securities. The Fund reduces interest rate risk by using futures and options on Treasury securities. The use of futures and options was effective in providing stability to the Fund’s net asset value, however, detracted from overall return. Corporate securities experienced a positive return for the Fund, as prices on these securities rebounded as the economy continues to improve. The Fund’s treasury holdings outperformed the benchmark as the securities held by the Fund were generally inflation protected securities which benefitted from higher-than-expected inflation measures. The Fund’s collateralized mortgage obligations and asset-backed securities outperformed as the income advantage was enough to offset slight acceleration in prepayment speeds. Agency mortgage-backed securities outperformed due to the strong income advantage relative to the benchmark. Taxable municipal securities outperformed as these securities tend to be longer in duration and yields on longer term treasury securities declined over the period providing positive price performance.
Outlook and Positioning
Since the beginning of 2021, COVID-19 cases began to stabilize and even decrease going into the summer. Cases then began to accelerate towards the later part of summer as the Delta variant gained its foothold. Despite the increase in cases, consumers demand continued to increase causing demand-pull inflationary pressures. As the reopening of the economy continues, bottlenecks and labor shortages have impeded economic growth. The subsequent supply chain issues have resulted in a cost-push inflationary environment. Companies have realized they have more pricing power and will likely pass on any increase in input costs directly to the consumer. Supply chain constraints are unlikely to be resolved until next year. The additional unemployment benefits set
HYPOTHETICAL GROWTH OF $10,000
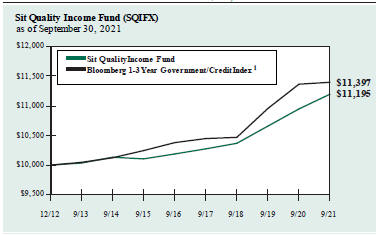
The chart above illustrates the total value of a hypothetical $10,000 investment in the Fund over the past 10 years as compared to the performance of the Bloomberg 1-3 Year Government/Credit Index. Past performance does not guarantee future results. Returns include the reinvestment of distributions. The chart does not reflect the deduction of taxes that a shareholder would pay on Fund distributions or the redemption of Fund shares.
1 The Bloomberg 1-3 Year Government/Credit Index is an unmanaged index of Treasury or government agency securities and investment grade corporate debt securities with maturities of one to three years. The returns include the reinvestment of income and do not include any transaction costs, management fees or other costs. It is not possible to invest directly in an index. This is the Fund’s primary index.
to expire in September will likely bolster employment once pent-up savings begin to dwindle which could alleviate supply chain issues. The Federal Reserve continued to buoy the market by keeping the Fed Funds rate at 0-0.25% and continuing its ongoing asset purchase program, albeit at a declining pace. The Federal Reserve will begin tapering its purchase program in November of 2021, expecting to conclude by the middle of 2022. The reduction in asset purchases will be systematic and predictable, however, we expect heightened volatility as the market digests this change.
We have positioned the Fund opportunistically in terms of credit quality and defensively with respect to an inflationary environment in order to maximize return potential while preserving principal. We focus on a mix of Treasury, agency and credit sectors that provide relatively high levels of income and stable prices.
| | |
| Bryce A. Doty, CFA | | Chris M. Rasmussen, CFA |
| Senior Portfolio Manager | | Mark H. Book, CFA |
| | Portfolio Managers |
| | |
| |
12 | | SIT MUTUAL FUNDS SEMI-ANNUAL REPORT |
COMPARATIVE RATES OF RETURNS
| | | | | | |
as of September 30, 2021 | | |
| | | | | Bloomberg | | Lipper Short |
| | | | | 1-3 Year | | Investment |
| | | Sit Quality | | Government/ | | Grade Bond |
| | | Income Fund | | Credit Index1 | | Index2 |
| | | |
Six Months | | 1.07% | | 0.13% | | n/a |
One Year | | 2.25 | | 0.30 | | 1.64% |
Five Year | | 1.90 | | 1.89 | | 2.42 |
Since Inception
(12/31/12) | | 1.30 | | 1.51 | | 1.90 |
Performance figures are historical and do not guarantee future results. Investment returns and principal value will vary, and you may have a gain or loss when you sell shares. Current performance may be lower or higher than the performance data quoted. Contact the Fund for performance data current to the most recent month-end. Returns include changes in share price as well as reinvestment of all dividends and capital gains and all fee waivers. Without the fee waivers total return and yield figures would have been lower. Returns do not reflect the deduction of taxes that a shareholder would pay on Fund distributions or the redemption of Fund shares. Management fees and administrative expenses are included in the Fund’s performance. Returns for periods greater than one year are compounded average annual rates of return.
1 The Bloomberg 1-3 Year Government/Credit Index is an unmanaged index of Treasury or government agency securities and investment grade corporate debt securities with maturities of one to three years. The returns include the reinvestment of income and do not include any transaction costs, management fees or other costs. It is not possible to invest directly in an index.
2 The Lipper returns are obtained from Lipper Analytical Services, Inc., a large independent evaluator of mutual funds.
FUND DIVERSIFICATION
| | | | |
| |
U.S. Treasury / Federal Agency Securities | | | 32.2 | % |
Corporate Bonds | | | 27.0 | |
Mortgage Pass-Through Securities | | | 19.2 | |
Taxable Municipal Bonds | | | 8.4 | |
Collateralized Mortgage Obligations - Non Agency | | | 4.8 | |
Asset-Backed Securities - Non Agency | | | 3.0 | |
Other Net Assets | | | 5.4 | |
Based on total net assets as of September 30, 2021. Subject to change.
PORTFOLIO SUMMARY
| | |
Net Asset Value 09/30/21: | | $10.06 Per Share |
Net Asset Value 03/31/21: | | $10.04 Per Share |
Total Net Assets: | | $124.3 Million |
Average Maturity: | | 8.0 Years |
Effective Duration: 3 | | 1.7 Years |
3 Duration is a measure of estimated price sensitivity relative to changes in interest rates. Portfolios with longer durations are typically more sensitive to changes in interest rates. For example, if interest rates rise by 1%, the fair value of a security with an effective duration of 5 years would decrease by 5%, with all other factors being constant. The correlation between duration and price sensitivity is greater for securities rated investment-grade than it is for securities rated below investment-grade. Duration estimates are based on assumptions by the Adviser and are subject to a number of limitations. Effective duration is calculated based on historical price changes of securities held by the Fund, and therefore is a more accurate estimate of price sensitivity provided interest rates remain within their historical range.
QUALITY RATING (% of Total Net Assets)
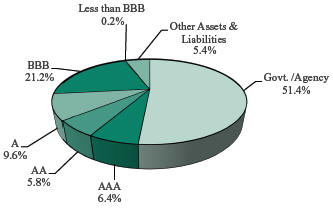
Lower of Moody’s, S&P, Fitch or Duff & Phelps ratings used.
SCHEDULE OF INVESTMENTS (Unaudited)
September 30, 2021
Sit Quality Income Fund
| | | | | | | | | | | | | | | | |
| | | | | |
| Name of Issuer | | Principal
Amount ($) | | | Coupon
Rate (%) | | | Maturity
Date | | | Fair Value ($) | |
| | | | |
Asset-Backed Securities - 3.7% | | | | | | | | | | | | | | | | |
| | | | |
Agency - 0.7% | | | | | | | | | | | | | | | | |
FNMA Grantor Trust, Series 2004-T5, Class A11 1 | | | 501,251 | | | | 0.66 | | | | 5/28/35 | | | | 495,967 | |
Small Business Administration, Series 2006-20D, Class 1 | | | 123,165 | | | | 5.64 | | | | 4/1/26 | | | | 132,398 | |
Small Business Administration, Series 2007-20B, Class 1 | | | 99,210 | | | | 5.49 | | | | 2/1/27 | | | | 107,046 | |
Small Business Administration, Series 2007-20J, Class 1 | | | 182,634 | | | | 5.57 | | | | 10/1/27 | | | | 199,378 | |
| | | | | | | | | | | | | | | | |
| | | | |
| | | | | | | | | | | | | | | 934,789 | |
| | | | | | | | | | | | | | | | |
Non-Agency - 3.0% | | | | | | | | | | | | | | | | |
ACE Securities Corp. Manufactured Housing Trust, Series 2003-MH1, Class M2 1, 4 | | | 499,642 | | | | 6.50 | | | | 8/15/30 | | | | 520,626 | |
Bayview Opportunity Master Fund, Series 2017-SPL5, Class A 1, 4 | | | 204,812 | | | | 3.50 | | | | 6/28/57 | | | | 209,140 | |
Centex Home Equity Loan Trust, Series 2004-A, Class AF4 14 | | | 102,684 | | | | 5.01 | | | | 8/25/32 | | | | 105,325 | |
Centex Home Equity Loan Trust, Series 2004-A, Class AF5 14 | | | 310,000 | | | | 5.43 | | | | 1/25/34 | | | | 311,885 | |
Home Equity Mortgage Loan Asset-Backed Trust, Series 2003-A, Class AV2, 1 Mo. Libor + 0.86% 1 | | | 227,088 | | | | 0.95 | | | | 10/25/33 | | | | 226,010 | |
Mill City Mortgage Loan Trust, Series 2017-3, Class A1 1, 4 | | | 142,404 | | | | 2.75 | | | | 1/25/61 | | | | 144,713 | |
OSCAR US Funding Trust IX, LLC, Series 2018-2A, Class A4 4 | | | 455,385 | | | | 3.63 | | | | 9/10/25 | | | | 465,208 | |
Towd Point Mortgage Trust, Series 2019-MH1, Class A2 1, 4 | | | 800,000 | | | | 3.00 | | | | 11/25/58 | | | | 820,404 | |
Towd Point Mortgage Trust, Series 2019-SJ3, Class A1 1, 4 | | | 206,604 | | | | 3.00 | | | | 11/25/59 | | | | 207,003 | |
Towd Point Mortgage Trust, Series 2020-MH1, Class A1A 1, 4 | | | 663,767 | | | | 2.18 | | | | 2/25/60 | | | | 667,874 | |
| | | | | | | | | | | | | | | | |
| | | | |
| | | | | | | | | | | | | | | 3,678,188 | |
| | | | | | | | | | | | | | | | |
| | | | |
Total Asset-Backed Securities
(cost: $4,579,985) | | | | | | | | | | | | | | | 4,612,977 | |
| | | | | | | | | | | | | | | | |
| | | | |
Collateralized Mortgage Obligations - 8.2% | | | | | | | | | | | | | | | | |
| | | | |
Agency - 3.4% | | | | | | | | | | | | | | | | |
FHLMC REMICS, Series 2528, Class KM | | | 6,730 | | | | 5.50 | | | | 11/15/22 | | | | 6,855 | |
FHLMC REMICS, Series 3104, Class BY | | | 62,219 | | | | 5.50 | | | | 1/15/26 | | | | 66,561 | |
FHLMC REMICS, Series 3806, Class JA | | | 107,748 | | | | 3.50 | | | | 2/15/26 | | | | 111,498 | |
FHLMC REMICS, Series 4246, Class PT | | | 327,311 | | | | 6.50 | | | | 2/15/36 | | | | 384,438 | |
FHLMC REMICS, Series 4759, Class NA | | | 238,903 | | | | 3.00 | | | | 8/15/44 | | | | 243,131 | |
FHLMC REMICS, Series 4776, Class QG | | | 9,419 | | | | 3.00 | | | | 9/15/42 | | | | 9,417 | |
FHLMC Structured Pass-Through Certificates, Series T-60, Class 1A2 | | | 641,341 | | | | 7.00 | | | | 3/25/44 | | | | 749,622 | |
FNMA Grantor Trust, Series 2004-T1, Class 2A 1 | | | 328,687 | | | | 3.03 | | | | 8/25/43 | | | | 347,429 | |
FNMA REMICS, Series 2003-52, Class NA | | | 2,800 | | | | 4.00 | | | | 6/25/23 | | | | 2,807 | |
FNMA REMICS, Series 2009-13, Class NX | | | 271 | | | | 4.50 | | | | 3/25/24 | | | | 276 | |
FNMA REMICS, Series 2009-71, Class MB | | | 9,065 | | | | 4.50 | | | | 9/25/24 | | | | 9,266 | |
FNMA REMICS, Series 2012-19, Class GH | | | 3,711 | | | | 3.00 | | | | 11/25/30 | | | | 3,741 | |
FNMA REMICS, Series 2013-74, Class AD | | | 28,025 | | | | 2.00 | | | | 7/25/23 | | | | 28,206 | |
FNMA REMICS, Series 2017-97, Class DP | | | 97,308 | | | | 3.50 | | | | 10/25/46 | | | | 98,490 | |
FNMA REMICS, Series 2018-1, Class TE | | | 111,107 | | | | 3.50 | | | | 3/25/44 | | | | 113,328 | |
FNMA REMICS, Series 2018-25, Class AG | | | 287,833 | | | | 3.50 | | | | 4/25/47 | | | | 300,131 | |
FRESB Mortgage Trust, Series 2018-SB45, Class A5H 1 | | | 619,310 | | | | 2.96 | | | | 11/25/37 | | | | 630,337 | |
FRESB Mortgage Trust, Series 2018-SB46, Class A5H 1 | | | 751,595 | | | | 2.89 | | | | 12/25/37 | | | | 769,845 | |
Seasoned Credit Risk Transfer Trust, Series 2019-4, Class M55D | | | 341,461 | | | | 4.00 | | | | 2/25/59 | | | | 371,763 | |
Vendee Mortgage Trust, Series 1993-1, Class ZB | | | 14,887 | | | | 7.25 | | | | 2/15/23 | | | | 15,419 | |
| | | | | | | | | | | | | | | | |
| | | | |
| | | | | | | | | | | | | | | 4,262,560 | |
| | | | | | | | | | | | | | | | |
Non-Agency - 4.8% | | | | | | | | | | | | | | | | |
JP Morgan Mortgage Trust, Series 2020-8, Class A4 1, 4 | | | 102,894 | | | | 3.00 | | | | 3/25/51 | | | | 103,535 | |
JP Morgan Mortgage Trust, Series 2021-1, Class A4 1, 4 | | | 800,898 | | | | 2.50 | | | | 6/25/51 | | | | 811,754 | |
JP Morgan Mortgage Trust, Series 2021-12, Class A4 1, 4 | | | 600,000 | | | | 2.50 | | | | 2/25/52 | | | | 610,031 | |
JP Morgan Mortgage Trust, Series 2021-6, Class A4 1, 4 | | | 1,398,477 | | | | 2.50 | | | | 10/25/51 | | | | 1,423,551 | |
JP Morgan Mortgage Trust, Series 2021-7, Class A4 1, 4 | | | 616,473 | | | | 2.50 | | | | 11/25/51 | | | | 627,542 | |
New Residential Mortgage Loan Trust, Series 2017-2A, Class A4 1, 4 | | | 337,620 | | | | 4.00 | | | | 3/25/57 | | | | 358,571 | |
New Residential Mortgage Loan Trust, Series 2017-3A, Class A1 1, 4 | | | 358,484 | | | | 4.00 | | | | 4/25/57 | | | | 384,139 | |
New Residential Mortgage Loan Trust, Series 2017-5A, Class A1, 1 Mo. Libor + 1.50% 1, 4 | | | 126,861 | | | | 1.59 | | | | 6/25/57 | | | | 127,649 | |
New Residential Mortgage Loan Trust, Series 2018-1A, Class A1A 1, 4 | | | 253,697 | | | | 4.00 | | | | 12/25/57 | | | | 270,717 | |
New Residential Mortgage Loan Trust, Series 2018-4A, Class A1S, 1 Mo. Libor + 0.75% 1, 4 | | | 364,634 | | | | 0.84 | | | | 1/25/48 | | | | 365,174 | |
Sequoia Mortgage Trust, Series 2020-2, Class A4 1, 4 | | | 132,832 | | | | 3.50 | | | | 3/25/50 | | | | 133,499 | |
| | | | |
See accompanying notes to financial statements. | | | | |
| | |
14 | | | SIT MUTUAL FUNDS SEMI-ANNUAL REPORT | |
| | | | | | | | | | | | | | | | |
| | | | | |
| Name of Issuer | | Principal Amount ($) | | | Coupon
Rate (%) | | | Maturity
Date | | | Fair Value ($) | |
Sequoia Mortgage Trust, Series 2020-4, Class A5 1, 4 | | | 398,056 | | | | 2.50 | | | | 11/25/50 | | | | 408,677 | |
Wells Fargo Mortgaged Backed Securities Trust, Series 2020-5, Class A3 1, 4 | | | 360,195 | | | | 2.50 | | | | 9/25/50 | | | | 364,064 | |
| | | | | | | | | | | | | | | | |
| | | | |
| | | | | | | | | | | | | | | 5,988,903 | |
| | | | | | | | | | | | | | | | |
| | | | |
Total Collateralized Mortgage Obligations
(cost: $10,161,693) | | | | | | | | | | | | | | | 10,251,463 | |
| | | | | | | | | | | | | | | | |
| | | | |
Corporate Bonds - 27.0% | | | | | | | | | | | | | | | | |
Alaska Airlines 2020-1 Class A Pass Through Trust 4 | | | 207,363 | | | | 4.80 | | | | 8/15/27 | | | | 230,823 | |
Alaska Airlines 2020-1 Class B Pass Through Trust 4 | | | 808,157 | | | | 8.00 | | | | 8/15/25 | | | | 909,123 | |
American Equity Investment Life Holding Co. | | | 950,000 | | | | 5.00 | | | | 6/15/27 | | | | 1,093,571 | |
Bank of America Corp. 1 | | | 1,100,000 | | | | 1.73 | | | | 7/22/27 | | | | 1,104,379 | |
Bank OZK (Subordinated) 1 | | | 1,000,000 | | | | 2.75 | | | | 10/1/31 | | | | 1,001,129 | |
BGC Partners, Inc. | | | 900,000 | | | | 4.38 | | | | 12/15/25 | | | | 971,557 | |
Brighthouse Financial, Inc. | | | 500,000 | | | | 3.70 | | | | 6/22/27 | | | | 547,421 | |
British Airways 2020-1 Class B Pass Through Trust 4 | | | 390,360 | | | | 8.38 | | | | 11/15/28 | | | | 458,217 | |
Broadcom Corp./Broadcom Cayman Finance, Ltd. | | | 850,000 | | | | 3.88 | | | | 1/15/27 | | | | 934,086 | |
Cabot Corp. | | | 850,000 | | | | 3.40 | | | | 9/15/26 | | | | 905,728 | |
Canadian Natural Resources, Ltd. | | | 1,000,000 | | | | 3.85 | | | | 6/1/27 | | | | 1,093,214 | |
Cigna Corp. | | | 350,000 | | | | 7.88 | | | | 5/15/27 | | | | 465,521 | |
Continental Airlines 2012-1 Class A Pass Through Trust | | | 212,188 | | | | 4.15 | | | | 4/11/24 | | | | 224,038 | |
CVS Pass-Through Trust Series 2009 4 | | | 262,769 | | | | 8.35 | | | | 7/10/31 | | | | 341,678 | |
Delta Air Lines 2015-1 Class A Pass Through Trust | | | 554,348 | | | | 3.88 | | | | 7/30/27 | | | | 578,363 | |
Delta Air Lines 2015-1 Class AA Pass Through Trust | | | 369,561 | | | | 3.63 | | | | 7/30/27 | | | | 395,931 | |
Delta Air Lines 2019-1 Class A Pass Through Trust | | | 306,000 | | | | 3.40 | | | | 4/25/24 | | | | 313,866 | |
Delta Air Lines, Inc./SkyMiles 4 | | | 750,000 | | | | 4.75 | | | | 10/20/28 | | | | 836,181 | |
Doric Nimrod Air Finance Alpha 2012-1 Trust 4 | | | 197,116 | | | | 5.13 | | | | 11/30/22 | | | | 196,557 | |
Duke Energy Florida Project Finance, LLC | | | 359,579 | | | | 1.73 | | | | 9/1/22 | | | | 361,981 | |
Duke Energy Florida Project Finance, LLC | | | 569,000 | | | | 2.54 | | | | 9/1/29 | | | | 589,342 | |
El Paso Natural Gas Co., LLC | | | 500,000 | | | | 7.50 | | | | 11/15/26 | | | | 627,567 | |
Equinor ASA | | | 224,000 | | | | 7.15 | | | | 11/15/25 | | | | 274,883 | |
Expedia Group, Inc. | | | 1,000,000 | | | | 4.63 | | | | 8/1/27 | | | | 1,133,335 | |
General Motors Financial Co., Inc. | | | 1,000,000 | | | | 2.70 | | | | 8/20/27 | | | | 1,037,400 | |
JetBlue 2019-1 Class B Pass Through Trust | | | 888,677 | | | | 8.00 | | | | 11/15/27 | | | | 1,039,829 | |
JPMorgan Chase & Co., 3 Mo. Libor + 0.80% 1 | | | 900,000 | | | | 1.00 | | | | 5/10/23 | | | | 905,844 | |
Liberty Mutual Insurance Co. (Subordinated) 4 | | | 700,000 | | | | 8.50 | | | | 5/15/25 | | | | 862,204 | |
Marathon Oil Corp. | | | 1,000,000 | | | | 4.40 | | | | 7/15/27 | | | | 1,122,731 | |
Mercury General Corp. | | | 1,000,000 | | | | 4.40 | | | | 3/15/27 | | | | 1,120,682 | |
Metropolitan Life Insurance Co. (Subordinated) 4 | | | 750,000 | | | | 7.80 | | | | 11/1/25 | | | | 926,252 | |
Minnesota Life Insurance Co. (Subordinated) 4 | | | 925,000 | | | | 8.25 | | | | 9/15/25 | | | | 1,144,737 | |
Nationwide Mutual Insurance Co. (Subordinated), 3 Mo. Libor + 2.29% 1, 4 | | | 1,100,000 | | | | 2.41 | | | | 12/15/24 | | | | 1,101,294 | |
Prudential Insurance Co. of America (Subordinated) 4 | | | 615,000 | | | | 8.30 | | | | 7/1/25 | | | | 760,234 | |
RenaissanceRe Finance, Inc. | | | 725,000 | | | | 3.45 | | | | 7/1/27 | | | | 787,972 | |
Ross Stores, Inc. | | | 833,000 | | | | 4.70 | | | | 4/15/27 | | | | 955,372 | |
Southwest Airlines Co. | | | 1,000,000 | | | | 5.13 | | | | 6/15/27 | | | | 1,168,912 | |
TIAA FSB Holdings, Inc. (Subordinated) | | | 780,000 | | | | 5.75 | | | | 7/2/25 | | | | 834,713 | |
Tosco Corp. | | | 500,000 | | | | 7.80 | | | | 1/1/27 | | | | 642,205 | |
Tyco Intl. Finance | | | 1,000,000 | | | | 3.90 | | | | 2/14/26 | | | | 1,075,319 | |
United Airlines 2013-1 Class A Pass Through Trust | | | 195,888 | | | | 4.30 | | | | 8/15/25 | | | | 210,238 | |
United Airlines 2014-1 Class A Pass Through Trust | | | 937,362 | | | | 4.00 | | | | 4/11/26 | | | | 989,136 | |
United Airlines 2016-2 Class AA Pass Through Trust | | | 142,622 | | | | 2.88 | | | | 10/7/28 | | | | 144,308 | |
Valero Energy Partners LP | | | 1,000,000 | | | | 4.38 | | | | 12/15/26 | | | | 1,118,893 | |
| | | | | | | | | | | | | | | | |
| | | | |
Total Corporate Bonds
(cost: $33,149,429) | | | | | | | | | | | | | | | 33,536,766 | |
| | | | | | | | | | | | | | | | |
| | | | |
Mortgage Pass-Through Securities - 19.2% | | | | | | | | | | | | | | | | |
| | | | |
Federal Home Loan Mortgage Corporation - 5.1% | | | | | | | | | | | | | | | | |
Freddie Mac | | | 405,758 | | | | 2.00 | | | | 11/1/31 | | | | 419,344 | |
Freddie Mac | | | 518,191 | | | | 2.00 | | | | 8/1/32 | | | | 535,464 | |
Freddie Mac | | | 71,258 | | | | 3.00 | | | | 9/1/27 | | | | 75,535 | |
| | | | |
See accompanying notes to financial statements. | | | | |
| | |
SEPTEMBER 30, 2021 | | | 15 | |
SCHEDULE OF INVESTMENTS (Unaudited)
September 30, 2021
Sit Quality Income Fund (Continued)
| | | | | | | | | | | | | | | | |
| | | | | |
| Name of Issuer | | Principal
Amount ($) | | | Coupon
Rate (%) | | | Maturity
Date | | | Fair Value ($) | |
Freddie Mac | | | 766,807 | | | | 3.00 | | | | 1/1/35 | | | | 818,513 | |
Freddie Mac | | | 1,724,270 | | | | 3.00 | | | | 1/1/36 | | | | 1,843,037 | |
Freddie Mac | | | 14,422 | | | | 3.50 | | | | 7/1/26 | | | | 15,400 | |
Freddie Mac | | | 989,660 | | | | 3.50 | | | | 8/1/31 | | | | 1,073,688 | |
Freddie Mac | | | 388,969 | | | | 3.50 | | | | 9/1/32 | | | | 417,014 | |
Freddie Mac | | | 97,163 | | | | 4.00 | | | | 7/1/26 | | | | 103,320 | |
Freddie Mac | | | 97,886 | | | | 4.00 | | | | 1/1/27 | | | | 104,031 | |
Freddie Mac | | | 3,410 | | | | 4.50 | | | | 7/1/26 | | | | 3,573 | |
Freddie Mac | | | 410,243 | | | | 4.50 | | | | 10/1/34 | | | | 447,336 | |
Freddie Mac | | | 6,139 | | | | 5.00 | | | | 10/1/25 | | | | 6,744 | |
Freddie Mac | | | 353,285 | | | | 5.00 | | | | 5/1/28 | | | | 388,273 | |
| | | | | | | | | | | | | | | | |
| | | | |
| | | | | | | | | | | | | | | 6,251,272 | |
| | | | | | | | | | | | | | | | |
| | | | |
Federal National Mortgage Association - 12.2% | | | | | | | | | | | | | | | | |
Fannie Mae | | | 1,227,339 | | | | 2.35 | | | | 5/1/23 | | | | 1,253,897 | |
Fannie Mae | | | 1,946,682 | | | | 2.50 | | | | 6/1/31 | | | | 2,043,145 | |
Fannie Mae | | | 728,061 | | | | 2.50 | | | | 2/1/35 | | | | 762,341 | |
Fannie Mae | | | 108,999 | | | | 3.00 | | | | 8/1/28 | | | | 114,676 | |
Fannie Mae | | | 603,674 | | | | 3.00 | | | | 9/1/32 | | | | 642,257 | |
Fannie Mae | | | 627,999 | | | | 3.00 | | | | 4/1/40 | | | | 669,953 | |
Fannie Mae | | | 1,477,534 | | | | 3.00 | | | | 6/1/40 | | | | 1,588,531 | |
Fannie Mae | | | 238,620 | | | | 3.50 | | | | 1/1/26 | | | | 254,712 | |
Fannie Mae | | | 655,806 | | | | 3.50 | | | | 2/1/32 | | | | 697,092 | |
Fannie Mae | | | 1,514,074 | | | | 3.50 | | | | 8/1/33 | | | | 1,640,924 | |
Fannie Mae | | | 574,085 | | | | 3.50 | | | | 5/1/35 | | | | 619,727 | |
Fannie Mae | | | 7,233 | | | | 4.00 | | | | 9/1/24 | | | | 7,658 | |
Fannie Mae | | | 51,646 | | | | 4.00 | | | | 6/1/25 | | | | 54,741 | |
Fannie Mae | | | 11,521 | | | | 4.00 | | | | 10/1/31 | | | | 12,513 | |
Fannie Mae | | | 799,871 | | | | 4.00 | | | | 10/1/34 | | | | 847,168 | |
Fannie Mae | | | 2,337,402 | | | | 4.00 | | | | 1/1/39 | | | | 2,583,793 | |
Fannie Mae | | | 38,864 | | | | 4.50 | | | | 4/1/25 | | | | 40,829 | |
Fannie Mae | | | 544,605 | | | | 5.50 | | | | 8/1/40 | | | | 652,931 | |
Fannie Mae | | | 713,269 | | | | 5.50 | | | | 2/1/42 | | | | 829,537 | |
| | | | | | | | | | | | | | | | |
| | | | |
| | | | | | | | | | | | | | | 15,316,425 | |
| | | | | | | | | | | | | | | | |
| | | | |
Government National Mortgage Association - 0.5% | | | | | | | | | | | | | | | | |
Ginnie Mae, US Treasury + 1.50% 1 | | | 23,590 | | | | 1.88 | | | | 4/20/33 | | | | 24,545 | |
Ginnie Mae, US Treasury + 1.50% 1 | | | 5,405 | | | | 1.88 | | | | 4/20/42 | | | | 5,629 | |
Ginnie Mae | | | 2,660 | | | | 5.00 | | | | 12/20/23 | | | | 2,749 | |
Ginnie Mae | | | 3,602 | | | | 5.00 | | | | 9/15/24 | | | | 3,722 | |
Ginnie Mae | | | 18,069 | | | | 5.00 | | | | 6/20/26 | | | | 19,503 | |
Ginnie Mae | | | 503,888 | | | | 6.00 | | | | 7/20/37 | | | | 587,983 | |
| | | | | | | | | | | | | | | | |
| | | | |
| | | | | | | | | | | | | | | 644,131 | |
| | | | | | | | | | | | | | | | |
| | | | |
Other Federal Agency Securities - 1.4% | | | | | | | | | | | | | | | | |
Small Business Administration Pools, PRIME - 2.50% 1 | | | 454,636 | | | | 0.75 | | | | 5/25/43 | | | | 463,336 | |
Small Business Administration Pools, PRIME + 0.79% 1 | | | 853,235 | | | | 4.04 | | | | 2/25/28 | | | | 902,629 | |
Small Business Administration Pools, PRIME + 0.81% 1 | | | 287,050 | | | | 4.06 | | | | 3/25/30 | | | | 308,323 | |
| | | | | | | | | | | | | | | | |
| | | | |
| | | | | | | | | | | | | | | 1,674,288 | |
| | | | | | | | | | | | | | | | |
| | | | |
Total Mortgage Pass-Through Securities
(cost: $23,678,316) | | | | | | | | | | | | | | | 23,886,116 | |
| | | | | | | | | | | | | | | | |
| | | | |
Taxable Municipal Bonds - 8.4% | | | | | | | | | | | | | | | | |
Borough of Naugatuck CT G.O. | | | 190,000 | | | | 1.40 | | | | 9/15/27 | | | | 188,837 | |
Chino, CA Public Financing Authority | | | 215,000 | | | | 1.70 | | | | 9/1/26 | | | | 218,857 | |
City of Cleveland OH | | | 125,000 | | | | 1.28 | | | | 10/1/26 | | | | 124,334 | |
City of Cleveland OH | | | 325,000 | | | | 1.61 | | | | 10/1/27 | | | | 324,727 | |
City of Encinitas CA | | | 500,000 | | | | 1.45 | | | | 9/1/27 | | | | 492,415 | |
Colorado Housing & Finance Authority | | | 5,000 | | | | 4.00 | | | | 11/1/31 | | | | 5,151 | |
County of Yamhill OR | | | 500,000 | | | | 4.50 | | | | 10/1/30 | | | | 546,415 | |
Florida Capital Projects Finance Authority | | | 1,000,000 | | | | 4.00 | | | | 10/1/24 | | | | 995,800 | |
| | | | |
See accompanying notes to financial statements. | | | | |
| | |
16 | | | SIT MUTUAL FUNDS SEMI-ANNUAL REPORT | |
| | | | | | | | | | | | | | | | |
| | | | | |
| Name of Issuer | | Principal Amount ($) | | | Coupon
Rate (%) | | | Maturity
Date | | | Fair Value ($) | |
Illinois Finance Authority | | | 500,000 | | | | 3.25 | | | | 5/15/27 | | | | 496,970 | |
Jersey City, NJ G.O. | | | 335,000 | | | | 1.13 | | | | 9/1/26 | | | | 328,776 | |
Kansas City Industrial Development Authority | | | 500,000 | | | | 1.75 | | | | 3/1/26 | | | | 501,570 | |
Massachusetts Educational Financing Authority | | | 215,000 | | | | 4.00 | | | | 1/1/32 | | | | 221,358 | |
Massachusetts Educational Financing Authority | | | 390,000 | | | | 4.41 | | | | 7/1/34 | | | | 423,883 | |
Michigan State Housing Development Authority | | | 500,000 | | | | 2.90 | | | | 6/1/52 | | | | 489,105 | |
New Hampshire Housing Finance Authority | | | 165,000 | | | | 4.00 | | | | 7/1/35 | | | | 169,128 | |
New Jersey Economic Development Authority | | | 365,000 | | | | 4.43 | | | | 12/1/21 | | | | 366,011 | |
New Jersey Turnpike Authority 4 | | | 1,000,000 | | | | 3.22 | | | | 1/1/35 | | | | 1,042,530 | |
New York Liberty Development Corp. 9 | | | 450,000 | | | | 1.41 | | | | 11/15/26 | | | | 445,154 | |
Pueblo County, CO C.O.P. 9 | | | 700,000 | | | | 1.07 | | | | 9/15/26 | | | | 687,687 | |
Riverside County Infrastructure Financing Authority 9 | | | 1,000,000 | | | | 1.77 | | | | 11/1/27 | | | | 1,000,430 | |
St. Charles, LA Parish School District No. 1 | | | 250,000 | | | | 2.00 | | | | 3/1/27 | | | | 255,922 | |
Tennessee Housing Development Agency | | | 35,000 | | | | 3.50 | | | | 7/1/31 | | | | 35,810 | |
Wisconsin Housing & Economic Development Authority 8 | | | 485,000 | | | | 3.50 | | | | 3/1/46 | | | | 510,371 | |
Wisconsin Public Finance Authority (Statler Hilton) 6 | | | 355,000 | | | | 3.50 | | | | 12/15/27 | | | | 278,110 | |
Zachary Community School District No. 1 | | | 285,000 | | | | 2.00 | | | | 3/1/27 | | | | 293,399 | |
| | | | | | | | | | | | | | | | |
| | | | |
Total Taxable Municipal Bonds
(cost: $10,396,305) | | | | | | | | | | | | | | | 10,442,750 | |
| | | | | | | | | | | | | | | | |
| | | | |
U.S. Treasury / Federal Agency Securities - 28.1% | | | | | | | | | | | | | | | | |
| | | | |
Federal Agency Issues - 2.2% | | | | | | | | | | | | | | | | |
Federal Agricultural Mortgage Corp., 3 Mo. Libor + 0.37% 1 | | | 250,000 | | | | 0.49 | | | | 3/9/23 | | | | 251,140 | |
Pershing Road Development Co., LLC, 3 Mo. Libor + 0.40% 1, 4 | | | 1,834,124 | | | | 0.52 | | | | 9/1/26 | | | | 1,762,970 | |
U.S. Department of Housing and Urban Development | | | 690,000 | | | | 4.28 | | | | 8/1/27 | | | | 698,508 | |
| | | | | | | | | | | | | | | | |
| | | | |
| | | | | | | | | | | | | | | 2,712,618 | |
| | | | | | | | | | | | | | | | |
| | | | |
U.S. Treasury - 25.9% | | | | | | | | | | | | | | | | |
U.S. Treasury Bill 6 | | | 2,500,000 | | | | 0.05 | | | | 11/4/21 | | | | 2,499,856 | |
U.S. Treasury Inflation Indexed Bonds | | | 11,225,700 | | | | 0.13 | | | | 4/15/22 | | | | 11,382,100 | |
U.S. Treasury Inflation Indexed Bonds | | | 3,086,616 | | | | 0.13 | | | | 7/15/22 | | | | 3,160,928 | |
U.S. Treasury Inflation Indexed Bonds | | | 13,696,129 | | | | 0.13 | | | | 1/15/23 | | | | 14,159,265 | |
U.S. Treasury Inflation Indexed Bonds | | | 951,228 | | | | 0.13 | | | | 4/15/25 | | | | 1,020,464 | |
| | | | | | | | | | | | | | | | |
| | | | |
| | | | | | | | | | | | | | | 32,222,613 | |
| | | | | | | | | | | | | | | | |
| | | | |
Total U.S. Treasury / Federal Agency Securities
(cost: $34,872,829) | | | | | | | | | | | | | | | 34,935,231 | |
| | | | | | | | | | | | | | | | |
| | | | |
Short-Term Securities - 7.6% | | | | | | | | | | | | | | | | |
Fidelity Inst. Money Mkt. Gvt. Fund, 0.01
(cost: $9,420,295) | | | 9,420,295 | | | | | | | | | | | | 9,420,295 | |
| | | | | | | | | | | | | | | | |
| | | | |
Total Investments in Securities - 102.2%
(cost: $126,258,852) | | | | | | | | | | | | | | | 127,085,598 | |
| | | | | | | | | | | | | | | | |
| | | | |
Call Options Written 19 - (0.0%)
(Premium received: $15,324) | | | | | | | | | | | | | | | (1,938 | ) |
| | | | |
Other Assets and Liabilities, net - (2.2)% | | | | | | | | | | | | | | | (2,770,616 | ) |
| | | | | | | | | | | | | | | | |
| | | | |
Total Net Assets - 100.0% | | | | | | | | | | | | | | $ | 124,313,044 | |
| | | | | | | | | | | | | | | | |
| | | | |
See accompanying notes to financial statements. | | | | |
| | |
SEPTEMBER 30, 2021 | | | 17 | |
SCHEDULE OF INVESTMENTS (Unaudited)
September 30, 2021
Sit Quality Income Fund (Continued)
| 1 | Variable rate security. Rate disclosed is as of September 30, 2021. Certain variable rate securities are not based on a published reference rate and spread but are determined by the issuer or agent and are based on current market conditions, or, for mortgage-backed securities, are impacted by the individual mortgages which are paying off over time. These securities do not indicate a reference rate and spread in their descriptions. |
| 4 | 144A Restricted Security. The total value of such securities as of September 30, 2021 was $19,596,671 and represented 15.8% of net assets. These securities have been determined to be liquid by the Adviser in accordance with guidelines established by the Board of Directors. |
| 6 | Zero coupon or convertible capital appreciation bond, for which the rate disclosed is either the effective yield on purchase date or the coupon rate to be paid upon conversion to coupon paying. |
| 8 | Securities the income from which is treated as a tax preference that is included in alternative minimum taxable income for purposes of computing federal alternative minimum tax (AMT). At September 30, 2021, 0.4% of net assets in the Fund was invested in such securities. |
| 9 | Municipal Lease Security. The total value of such securities as of September 30, 2021 was $2,133,271 and represented 1.7% of net assets. These securities have been determined to be liquid by the Adviser in accordance with guidelines established by the Board of Directors. |
| 14 | Step Coupon: A bond that pays a coupon rate that increases on a specified date(s). Rate disclosed is as of September 30, 2021. |
Numeric footnotes not disclosed are not applicable to this Schedule of Investments.
19 Options outstanding as of September 30, 2021 were as follows:
| | | | | | | | | | | | | | | | | | | | | | | | | | |
| Description | | Contracts | | | Strike Price ($) | | Expiration
Date | | | Counterparty | | | Notional Amount ($) | | | Cost/ Premiums ($) | | | Value ($) | |
Call Options Written - U.S. Treasury Futures: | | | | | | | | | | | | | | | | | | | | |
| | | | | | | |
5-Year | | | 62 | | | 123.75 | | | October 2021 | | | | StoneX Financial, Inc. | | | | 7,672,500 | | | | (15,324) | | | | (1,938) | |
Short futures contracts outstanding as of September 30, 2021 were as follows:
| | | | | | | | | | | | | | | | |
| | | | | | | | | | | | Value/ | |
| | | | | | | | | | | | Unrealized | |
| | | | | | Expiration | | | Notional | | | Appreciation | |
| Type | | Contracts | | | Date | | | Amount ($) | | | (Depreciation) ($) | |
| | | | |
Short Futures: 10 | | | | | | | | | | | | | | | | |
U.S. Treasury 5-Year | | | 105 | | | | December 2021 | | | | (12,887,930) | | | | 98,780 | |
U.S. Treasury 2-Year | | | 90 | | | | December 2021 | | | | (19,804,922) | | | | 13,792 | |
| | | | | | | | | | | | | | | | |
| | | | | | | | | | | | | | | 112,572 | |
| | | | | | | | | | | | | | | | |
| 10 | The amount of $500,000 in cash was segregated with the broker to cover margin requirements for derivative transactions as of September 30, 2021. |
| | | | |
See accompanying notes to financial statements. | | | | |
| | |
18 | | | SIT MUTUAL FUNDS SEMI-ANNUAL REPORT | |
A summary of the levels for the Fund’s investments as of September 30, 2021 is as follows (see Note 2 - significant accounting policies in the notes to financial statements):
| | | | | | | | | | | | | | | | |
| | | Investment in Securities | |
| | | Level 1 | | | Level 2 | | | Level 3 | | | | |
| | | Quoted | | | Other significant | | | Significant | | | | |
| | | Prices ($) | | | observable inputs ($) | | | unobservable inputs ($) | | | Total ($) | |
Assets | | | | | | | | | | | | | | | | |
Asset-Backed Securities | | | — | | | | 4,612,977 | | | | — | | | | 4,612,977 | |
Collateralized Mortgage Obligations | | | — | | | | 10,251,463 | | | | — | | | | 10,251,463 | |
Corporate Bonds | | | — | | | | 33,536,766 | | | | — | | | | 33,536,766 | |
Mortgage Pass-Through Securities | | | — | | | | 23,886,116 | | | | — | | | | 23,886,116 | |
Taxable Municipal Bonds | | | — | | | | 10,442,750 | | | | — | | | | 10,442,750 | |
U.S. Treasury / Federal Agency Securities | | | — | | | | 34,935,231 | | | | — | | | | 34,935,231 | |
Short-Term Securities | | | 9,420,295 | | | | — | | | | — | | | | 9,420,295 | |
Futures | | | 112,572 | | | | — | | | | — | | | | 112,572 | |
Total: | | | 9,532,867 | | | | 117,665,303 | | | | — | | | | 127,198,170 | |
Liabilities | | | | | | | | | | | | | | | | |
Call Options Written | | | (1,938 | ) | | | — | | | | — | | | | (1,938 | ) |
There were no transfers into or out of level 3 during the reporting period.
| | | | |
See accompanying notes to financial statements. | | | | |
| | |
SEPTEMBER 30, 2021 | | | 19 | |
|
|
| |
Sit Tax-Free Income Fund - Class S and Class Y |
OBJECTIVE & STRATEGY
The objective of the Tax-Free Income Fund is to provide a high level of current income that is exempt from federal income tax, consistent with preservation of capital, by investing primarily in investment-grade municipal securities. Such municipal securities generate interest income that is exempt from both federal regular income tax and federal alternative minimum tax. During normal market conditions, the Fund invests 100% of its net assets in such tax-exempt municipal securities.
Fund Performance
The Sit Tax-Free Income Fund (Class S) provided a return of +1.73% during the 6-month period ending September 30, 2021, compared to the return of the Bloomberg 5-Year Municipal Bond Index of +0.61%. The Fund’s 30-day SEC yield was 1.55%, and its 12-month distribution rate was 2.76%.
Factors that Influenced the Fund’s Performance
The tax-exempt yield curve flattened modestly during the period, as yields on shorter bonds increased slightly, and yields on longer bonds decreased modestly. Specifically, short-term yields increased by approximately five basis points, while long-term yields decreased by nearly ten basis points. Tax-exempt fund flows were strongly positive throughout the period, and are on track for a record year in 2021. Municipal issuance was down modestly versus the prior year for the period. The proportion of taxable and refunding issuance was also down versus the prior year period, which tended to dampen the impact on net tax-exempt supply. Credit spreads continued to tighten over the period, as investors continued to reach for yield in the low rate environment.
The Fund benefitted from its longer than benchmark duration, as the Fund’s longer duration bonds contributed favorably to performance during the six-month period. The Fund began hedging interest rate risk using U.S. Treasury Futures again in late April. The hedge was a slight drag on performance but did not change the favorable duration impact. The Fund also benefitted from its substantial allocation to bonds in the ‘A’ rating category and below, as they significantly outperformed the highest quality bonds. The non-rated bonds in the portfolio also contributed favorably to performance, as they significantly outperformed the rated portion of the portfolio. The Fund benefitted from its positions in the multi-family mortgage revenue bonds, other revenue bonds, education/student loan revenue bonds, and closed-end funds. Conversely, the Fund’s meaningful weighting to single family mortgage revenue bonds modestly underperformed the benchmark return.
Outlook and Positioning
Most state and local government issuers ultimately had minimal budget impacts from the pandemic related economic slowdown. Moreover, the federal stimulus funding provided over the last eighteen months generally reduced their need to issue debt this year. Other municipal issuers, such as mass transportation and conference centers, were hard hit and remain depressed. Senior living facilities, healthcare facilities, and higher education were also negatively impacted but have benefited meaningfully from stimulus programs, and are recovering operationally. Demand for tax-exempt income has been strong. Should President
HYPOTHETICAL GROWTH OF $10,000
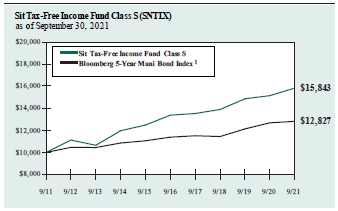
The chart above illustrates the total value of a hypothetical $10,000 investment in the Fund over the past 10 years as compared to the performance of the Bloomberg 5-Year Municipal Bond Index. Past performance does not guarantee future results. Returns include the reinvestment of distributions. The chart does not reflect the deduction of taxes that a shareholder would pay on Fund distributions or the redemption of Fund shares.
1 The Bloomberg 5-Year Municipal Bond Index is the 5 year (4-6) component of the Municipal Bond Index, an unmanaged, rules-based, market-value-weighted index for the long-term tax-exempt bond market. The index includes bonds with a minimum credit rating of BBB. The returns include the reinvestment of income and do not include any transaction costs, management fees or other costs. It is not possible to invest directly in an index. This is the Fund’s primary index.
Biden’s Build Back Better Plan be passed into law, it has the potential to increase demand for tax-exempt bonds further, particularly if any final bill includes a meaningful increase to individual or corporate taxes as currently being discussed in Congress.
The Fund continues to emphasize income as the primary driver of return over the long-run and maintains a significant yield advantage over the benchmark in this regard. The Fund’s longer than benchmark duration, significant weighting to housing issues, and meaningful position in non-rated credits contribute to this income advantage. The Fund’s interest rate hedge with U.S. Treasury Futures allows it to benefit from this yield advantage in longer-term municipals, while positioning for a modest increase in the general level of interest rates. The Fund remains diversified on both an issuer and a geographic basis to manage credit risk, and we believe the Fund is positioned to achieve attractive risk-adjusted returns in the future.
Paul J. Jungquist, CFA
Senior Portfolio Manager
| | |
|
| | |
20 | | SIT MUTUAL FUNDS SEMI-ANNUAL REPORT |
COMPARATIVE RATES OF RETURNS
as of September 30, 2021
| | | | | | | | | | | | | | | | |
| | | Sit Tax-Free Income
Fund | | | | | | | |
| | | Class S | | | Class Y | | | Bloomberg
5-Year Muni
Bond Index1 | | | Lipper
General
Muni Bond
Fund Index2 | |
Six Month | | | 1.73% | | | | n/a | | | | 0.61% | | | | n/a | |
| One Year | | | 4.48 | | | | n/a | | | | 1.08 | | | | 3.77% | |
| Five Year | | | 3.42 | | | | n/a | | | | 2.41 | | | | 4.39 | |
| Ten Year | | | 4.71 | | | | n/a | | | | 2.52 | | | | 4.11 | |
| Since Inception-Class S (9/29/88) | | | 5.10 | | | | n/a | | | | 4.78 | | | | 5.43 | |
| Since Inception-Class Y (6/1/21) | | | n/a | | | | 0.08 | | | | 0.15 | | | | n/a | |
Performance figures are historical and do not guarantee future results. Investment returns and principal value will vary, and you may have a gain or loss when you sell shares. Current performance may be lower or higher than the performance data quoted. Contact the Fund for performance data current to the most recent month-end. Returns include changes in share price as well as reinvestment of all dividends and capital gains. Returns do not reflect the deduction of taxes that a shareholder would pay on Fund distributions or the redemption of Fund shares. Management fees and administrative expenses are included in the Fund’s performance. Returns for periods greater than one year are compounded average annual rates of return.
1 The Bloomberg 5-Year Municipal Bond Index is the 5 year (4-6) component of the Municipal Bond Index, an unmanaged, rules-based, market-value weighted index for the long-term tax-exempt bond market. The index includes bonds with a minimum credit rating of BBB. The returns include the reinvestment of income and do not include any transaction costs, management fees or other costs. It is not possible to invest directly in an index.
2 The Lipper returns are obtained from Lipper Analytical Services, Inc., a large independent evaluator of mutual funds.
FUND DIVERSIFICATION
| | | | |
Multifamily Mortgage | | | 26.6% | |
Single Family Mortgage | | | 18.6 | |
Other Revenue Bonds | | | 13.8 | |
Education/Student Loan | | | 10.3 | |
Insured | | | 5.3 | |
General Obligation | | | 5.2 | |
Investment Companies | | | 5.2 | |
Sector less than 5% | | | 11.7 | |
Cash & Other Net Assets | | | 3.3 | |
Based on total net assets as of September 30, 2021. Subject to change.
PORTFOLIO SUMMARY
| | |
Class S: | | |
Net Asset Value 09/30/21: | | $9.95 Per Share |
Net Asset Value 03/31/21: | | $9.91 Per Share |
Total Net Assets: | | $209.3 Million |
Class Y: | | |
Net Asset Value 09/30/21: | | $9.95 Per Share |
Net Asset Value 06/01/21: 3 | | $10.04 Per Share |
Total Net Assets: | | $176.7 Million |
Average Maturity: | | 20.5 Years |
Effective Duration: 4 | | 4.3 Years |
3 The inception date of Class Y Shares was June 1, 2021.
4 Duration is a measure of estimated price sensitivity relative to changes in interest rates. Portfolios with longer durations are typically more sensitive to changes in interest rates. For example, if interest rates rise by 1%, the fair value of a security with an effective duration of 5 years would decrease by 5%, with all other factors being constant. The correlation between duration and price sensitivity is greater for securities rated investment-grade than it is for securities rated below investment-grade. Duration estimates are based on assumptions by the Adviser and are subject to a number of limitations. Effective duration is calculated based on historical price changes of securities held by the Fund, and therefore is a more accurate estimate of price sensitivity provided interest rates remain within their historical range.
QUALITY RATINGS (% of Total Net Assets)
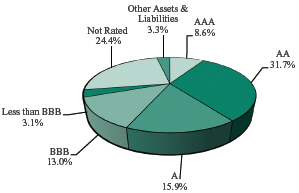
Lower of Moody’s, S&P, Fitch or Duff & Phelps ratings used.
Adviser’s Assessment of Non-Rated Securities
| | | | |
AAA | | | 0.1% | |
AA | | | 0.2 | |
BBB | | | 1.2 | |
BB | | | 20.2 | |
<BB | | | 2.7 | |
| | | | |
Total | | | 24.4% | |
SCHEDULE OF INVESTMENTS (Unaudited)
September 30, 2021
Sit Tax-Free Income Fund
| | | | | | | | | | | | | | | | | | | | |
| Name of Issuer | | Principal
Amount ($) | | Coupon
Rate (%) | | Maturity
Date | | Fair
Value ($) |
| | | | |
Municipal Bonds - 91.5% | | | | | | | | | | | | | | | | | | | | |
| | | | |
Alabama - 0.4% | | | | | | | | | | | | | | | | | | | | |
Clio Water & Sewer Rev. (AGM Insured) | | | | 340,000 | | | | | 3.10 | | | | | 1/1/33 | | | | | 340,717 | |
Mobile Co. Limited Obligation Warrants Rev. (Gomesa Proj.) 4 | | | | 500,000 | | | | | 4.00 | | | | | 11/1/45 | | | | | 540,455 | |
Pell City Special Care Facs. Finance Auth. Rev. (Noland Health Services, Inc.) | | | | 500,000 | | | | | 5.00 | | | | | 12/1/31 | | | | | 503,825 | |
| | | | | | | | | | | | | | | | | | | | |
| | | | |
| | | | | | | | | | | | | | | | | | | 1,384,997 | |
| | | | | | | | | | | | | | | | | | | | |
Alaska - 0.3% | | | | | | | | | | | | | | | | | | | | |
AK Hsg. Finance Corp. Rev. (State Capital Proj.) | | | | 500,000 | | | | | 4.00 | | | | | 6/1/36 | | | | | 541,340 | |
AK Industrial Dev. & Export Auth. Rev. (Boys & Girls Home) 2, 5,15 | | | | 250,000 | | | | | 5.50 | | | | | N/A | | | | | 10,313 | |
AK Industrial Dev. & Export Auth. Rev. (GTR Fairbanks Community Hospital Foundation) | | | | 250,000 | | | | | 5.00 | | | | | 4/1/33 | | | | | 263,427 | |
AK Industrial Dev. & Export Auth. Rev. (Tanana Chiefs Conference Proj.) | | | | 300,000 | | | | | 4.00 | | | | | 10/1/49 | | | | | 333,255 | |
| | | | | | | | | | | | | | | | | | | | |
| | | | |
| | | | | | | | | | | | | | | | | | | 1,148,335 | |
| | | | | | | | | | | | | | | | | | | | |
Arizona - 2.6% | | | | | | | | | | | | | | | | | | | | |
AZ Health Facs. Auth. Rev. (Scottsdale Lincoln Hospital Proj.) 1 | | | | 250,000 | | | | | 4.00 | | | | | 12/1/39 | | | | | 250,210 | |
AZ Industrial Dev. Auth. Rev. (Legacy Cares, Inc. Proj.) 4 | | | | 750,000 | | | | | 6.75 | | | | | 7/1/30 | | | | | 860,168 | |
AZ Industrial Dev. Auth. Rev. (Legacy Cares, Inc. Proj.) 4 | | | | 100,000 | | | | | 5.50 | | | | | 7/1/31 | | | | | 108,070 | |
AZ Industrial Dev. Auth. Rev. (Legacy Cares, Inc. Proj.) 4 | | | | 750,000 | | | | | 7.75 | | | | | 7/1/50 | | | | | 891,165 | |
AZ Industrial Dev. Auth. Rev. (Legacy Cares, Inc. Proj.) 4 | | | | 200,000 | | | | | 6.00 | | | | | 7/1/51 | | | | | 219,018 | |
AZ Industrial Dev. Auth. Rev. (Pinecrest Academy Horizon) 4 | | | | 500,000 | | | | | 5.75 | | | | | 7/15/38 | | | | | 580,600 | |
AZ Industrial Dev. Auth. Rev. (Social Bond Equitable School Revolving Fund) | | | | 500,000 | | | | | 4.00 | | | | | 11/1/45 | | | | | 564,855 | |
Glendale Industrial Dev. & Auth. Rev. (Beatitudes Campus Proj.) | | | | 300,000 | | | | | 5.00 | | | | | 11/15/36 | | | | | 322,533 | |
La Paz Co. Industrial Dev. Auth. (Charter School Solutions Harmony Public Proj.) | | | | 750,000 | | | | | 5.00 | | | | | 2/15/48 | | | | | 860,107 | |
Maricopa Co. Industrial Dev. Auth. Education Rev. (Horizon Community Learning Center) | | | | 300,000 | | | | | 5.00 | | | | | 7/1/35 | | | | | 328,683 | |
Maricopa Co. Industrial Dev. Auth. Rev. (Legacy Traditional School Proj.) | | | | 500,000 | | | | | 4.00 | | | | | 7/1/50 | | | | | 555,320 | |
Maricopa Co. Industrial Dev. Auth. Rev. (Paradise School Proj.) | | | | 1,000,000 | | | | | 4.00 | | | | | 7/1/54 | | | | | 1,124,970 | |
Phoenix City Industrial Dev. Auth. Rev. (Northwest Christian School Proj.) 4 | | | | 600,000 | | | | | 5.00 | | | | | 9/1/45 | | | | | 670,782 | |
Phoenix City Industrial Dev. Auth. Rev. (Vista College Preparatory Proj.) | | | | 400,000 | | | | | 4.13 | | | | | 7/1/38 | | | | | 443,716 | |
Pima Co. Industrial Dev. Auth. Education Rev. (American Leadership Academy Proj.) 4 | | | | 1,000,000 | | | | | 5.38 | | | | | 6/15/35 | | | | | 1,083,210 | |
Pima Co. Industrial Dev. Auth. Education Rev. (American Leadership Academy Proj.) 4 | | | | 370,000 | | | | | 4.75 | | | | | 6/15/37 | | | | | 374,059 | |
Quechan Indian Tribe of Fort Yuma Rev. (Tribal Economic Dev.) | | | | 275,000 | | | | | 9.75 | | | | | 5/1/25 | | | | | 281,394 | |
Tempe Industrial Dev. Auth. Rev. (Mirabella at ASU Proj.) 4 | | | | 500,000 | | | | | 4.70 | | | | | 10/1/24 | | | | | 500,325 | |
| | | | | | | | | | | | | | | | | | | | |
| | | | |
| | | | | | | | | | | | | | | | | | | 10,019,185 | |
| | | | | | | | | | | | | | | | | | | | |
Arkansas - 0.6% | | | | | | | | | | | | | | | | | | | | |
Mountain Home City Sales & Use Tax Rev. | | | | 500,000 | | | | | 2.00 | | | | | 9/1/38 | | | | | 491,415 | |
Rogers City Rev. | | | | 1,000,000 | | | | | 3.88 | | | | | 11/1/39 | | | | | 1,124,190 | |
Springdale City Sales & Use Tax Rev. Ref. (BAM Insured) | | | | 500,000 | | | | | 3.60 | | | | | 4/1/41 | | | | | 519,460 | |
| | | | | | | | | | | | | | | | | | | | |
| | | | |
| | | | | | | | | | | | | | | | | | | 2,135,065 | |
| | | | | | | | | | | | | | | | | | | | |
California - 4.3% | | | | | | | | | | | | | | | | | | | | |
CA Health Facs. Financing Auth. Rev. (On Lok Senior Health Services) | | | | 500,000 | | | | | 5.00 | | | | | 8/1/50 | | | | | 607,540 | |
CA Public Finance Auth. Rev. (Enso Village Proj.) 4 | | | | 350,000 | | | | | 3.13 | | | | | 5/15/29 | | | | | 354,543 | |
CA Public Finance Auth. Rev. (Green Bond-Enso Village Proj.) 4 | | | | 500,000 | | | | | 5.00 | | | | | 11/15/46 | | | | | 572,350 | |
CA Public Finance Auth. Rev. (Green Bond-Enso Village Proj.) 4 | | | | 250,000 | | | | | 5.00 | | | | | 11/15/56 | | | | | 284,822 | |
CA School Facs. Finance Auth. Rev. (Azusa Unified School District) (AGM Insured) 6 | | | | 500,000 | | | | | 6.00 | | | | | 8/1/29 | | | | | 623,695 | |
Carlsbad Unified School District G.O. Capital Appreciation 6 | | | | 400,000 | | | | | 6.13 | | | | | 8/1/31 | | | | | 554,508 | |
Colton Joint Unified School District G.O. (AGM Insured) 6 | | | | 1,000,000 | | | | | 5.80 | | | | | 8/1/35 | | | | | 1,251,370 | |
Encinitas Union School District G.O. Capital Appreciation 6 | | | | 500,000 | | | | | 7.00 | | | | | 8/1/35 | | | | | 713,280 | |
Hartnell Community College G.O. 6 | | | | 500,000 | | | | | 7.00 | | | | | 8/1/34 | | | | | 619,750 | |
Healdsburg Unified School District G.O. 6 | | | | 1,250,000 | | | | | 5.00 | | | | | 8/1/37 | | | | | 1,380,425 | |
Imperial Community College District G.O. Capital Appreciation (AGM Insured) 6 | | | | 250,000 | | | | | 6.75 | | | | | 8/1/40 | | | | | 308,262 | |
Los Alamitos Unified School District Capital Appreciation C.O.P. 6 | | | | 1,100,000 | | | | | 6.00 | | | | | 8/1/34 | | | | | 1,257,773 | |
Martinez Unified School District G.O. 6 | | | | 250,000 | | | | | 6.13 | | | | | 8/1/35 | | | | | 291,088 | |
| | | | |
See accompanying notes to financial statements. | | | | |
| | |
22 | | | SIT MUTUAL FUNDS SEMI-ANNUAL REPORT | |
| | | | | | | | | | | | | | | | | | | | |
| Name of Issuer | | Principal
Amount ($) | | Coupon
Rate (%) | | Maturity
Date | | Fair
Value ($) |
Orange Co. Community Facs. District No. 2017-1 Special Assessment (Village of Esencia) | | | | 500,000 | | | | | 4.00 | | | | | 8/15/45 | | | | | 563,920 | |
Placentia-Yorba Linda Unified School District C.O.P. Capital Appreciation (AGM Insured) 6 | | | | 500,000 | | | | | 6.25 | | | | | 10/1/28 | | | | | 500,000 | |
Redondo Beach School District G.O. 6 | | | | 600,000 | | | | | 6.38 | | | | | 8/1/34 | | | | | 757,446 | |
Reef-Sunset Unified School District (BAM Insured) 6 | | | | 750,000 | | | | | 4.85 | | | | | 8/1/38 | | | | | 861,180 | |
Ripon Unified School District G.O. (BAM Insured) 6 | | | | 270,000 | | | | | 4.50 | | | | | 8/1/30 | | | | | 289,975 | |
Ripon Unified School District G.O. (BAM Insured) 6 | | | | 80,000 | | | | | 4.50 | | | | | 8/1/30 | | | | | 85,752 | |
Sacramento Co. Water Financing Auth. Rev. (NATL-RE FGIC Insured) 1 | | | | 500,000 | | | | | 0.65 | | | | | 6/1/39 | | | | | 496,865 | |
San Jose Financing Auth. Rev. (Civic Center Garage Proj.) 9 | | | | 400,000 | | | | | 5.00 | | | | | 6/1/39 | | | | | 426,752 | |
South Tahoe Joint Powers Financing Auth. Tax Allocation Ref. (South Tahoe Redev. Proj.) (AGM Insured) | | | | 500,000 | | | | | 5.00 | | | | | 10/1/30 | | | | | 556,410 | |
Sulphur Springs Union School Dist. C.O.P. (AGM Insured) 6 | | | | 245,000 | | | | | 6.50 | | | | | 12/1/37 | | | | | 300,826 | |
Sulphur Springs Union School Dist. C.O.P. (AGM Insured) 6 | | | | 205,000 | | | | | 6.50 | | | | | 12/1/37 | | | | | 254,118 | |
Tracy Joint Unified School District G.O. Capital Appreciation 6 | | | | 600,000 | | | | | 7.00 | | | | | 8/1/41 | | | | | 661,674 | |
Upland Unified School District G.O. Capital Appreciation 6 | | | | 1,000,000 | | | | | 7.00 | | | | | 8/1/41 | | | | | 1,242,260 | |
Val Verde Unified School District G.O. Capital Appreciation (AGM Insured) 6 | | | | 500,000 | | | | | 6.00 | | | | | 8/1/34 | | | | | 669,640 | |
| | | | | | | | | | | | | | | | | | | | |
| | | | |
| | | | | | | | | | | | | | | | | | | 16,486,224 | |
| | | | | | | | | | | | | | | | | | | | |
Colorado - 5.1% | | | | | | | | | | | | | | | | | | | | |
Baseline Metropolitan District No. 1 G.O. | | | | 280,000 | | | | | 5.00 | | | | | 12/1/51 | | | | | 298,222 | |
Brighton Crossing Metropolitan District No. 6 G.O. | | | | 515,000 | | | | | 5.00 | | | | | 12/1/40 | | | | | 568,931 | |
Broadway Station Metropolitan District No. 2 G.O. | | | | 750,000 | | | | | 5.13 | | | | | 12/1/48 | | | | | 812,400 | |
Broadway Station Metropolitan District No. 3 G.O. | | | | 500,000 | | | | | 5.00 | | | | | 12/1/49 | | | | | 545,025 | |
Buffalo Highlands Metropolitan District G.O. | | | | 350,000 | | | | | 5.25 | | | | | 12/1/38 | | | | | 374,129 | |
Chambers Highpoint Metropolitan District No. 2 G.O. | | | | 515,000 | | | | | 5.00 | | | | | 12/1/41 | | | | | 545,122 | |
CO Educational & Cultural Facs. Auth. Rev. (CO Springs Charter Academy Proj.) | | | | 250,000 | | | | | 5.60 | | | | | 7/1/34 | | | | | 250,903 | |
CO Health Facs. Auth. Rev. (Covenant Living Community) | | | | 500,000 | | | | | 4.00 | | | | | 12/1/50 | | | | | 566,425 | |
CO Health Facs. Auth. Rev. (Covenant Retirement Community) | | | | 650,000 | | | | | 5.00 | | | | | 12/1/48 | | | | | 754,026 | |
Copperleaf Metro District No. 4 G.O. | | | | 750,000 | | | | | 5.00 | | | | | 12/1/49 | | | | | 810,120 | |
Creekwalk Marketplace Business Improvement District Rev. 4 | | | | 500,000 | | | | | 5.50 | | | | | 12/1/39 | | | | | 555,130 | |
Crystal Crossing Metro District G.O. | | | | 500,000 | | | | | 5.25 | | | | | 12/1/40 | | | | | 540,540 | |
Denver 9th Avenue Metropolitan District No. 2 G.O. | | | | 500,000 | | | | | 5.00 | | | | | 12/1/48 | | | | | 533,430 | |
Denver City & County Housing Auth. Rev. (Sustainability Bonds - Thrive Proj.) | | | | 500,000 | | | | | 2.05 | | | | | 2/1/39 | | | | | 487,420 | |
DIATC Metropolitan District G.O. 4 | | | | 500,000 | | | | | 5.00 | | | | | 12/1/49 | | | | | 537,010 | |
Green Valley Ranch East Metropolitan District No. 6 G.O. | | | | 1,000,000 | | | | | 5.88 | | | | | 12/1/50 | | | | | 1,101,700 | |
Haskins Station Metropolitan District G.O. | | | | 500,000 | | | | | 5.00 | | | | | 12/1/49 | | | | | 536,280 | |
Hunters Overlook Metropolitan District No. 5 G.O. | | | | 500,000 | | | | | 5.00 | | | | | 12/1/49 | | | | | 545,425 | |
Johnstown Village Metropolitan District No. 2. G.O. | | | | 500,000 | | | | | 5.00 | | | | | 12/1/50 | | | | | 540,540 | |
Lambertson Farms Metro District No. 1 G.O. | | | | 500,000 | | | | | 5.00 | | | | | 12/15/25 | | | | | 473,660 | |
Legato Community Auth. Rev. | | | | 500,000 | | | | | 5.00 | | | | | 12/1/51 | | | | | 538,405 | |
Leyden Rock Metropolitan District No. 10 G.O. | | | | 250,000 | | | | | 5.00 | | | | | 12/1/45 | | | | | 259,390 | |
Mirabelle Metropolitan District. No. 2 G.O. | | | | 500,000 | | | | | 5.00 | | | | | 12/1/49 | | | | | 538,220 | |
Painted Prairie Public Improvement Auth. Rev. | | | | 500,000 | | | | | 5.00 | | | | | 12/1/39 | | | | | 545,945 | |
Palisade Metropolitan District No. 2 G.O. | | | | 500,000 | | | | | 5.00 | | | | | 12/1/46 | | | | | 516,245 | |
Peak Metropolitan District No. 1 G.O. 4 | | | | 500,000 | | | | | 5.00 | | | | | 12/1/41 | | | | | 548,445 | |
Peak Metropolitan District No. 1 G.O. 4 | | | | 500,000 | | | | | 5.00 | | | | | 12/1/51 | | | | | 545,405 | |
Reunion Metropolitan District Rev. | | | | 600,000 | | | | | 3.63 | | | | | 12/1/44 | | | | | 582,558 | |
St. Vrain Lakes Metropolitan District No. 2 G.O. | | | | 500,000 | | | | | 5.00 | | | | | 12/1/37 | | | | | 529,575 | |
STC Metropolitan District No. 2 G.O. | | | | 500,000 | | | | | 5.00 | | | | | 12/1/49 | | | | | 542,595 | |
Thompson Crossing Metropolitan District No. 4 G.O. | | | | 500,000 | | | | | 5.00 | | | | | 12/1/49 | | | | | 536,865 | |
Transport Metropolitan District No. 3 G.O. | | | | 750,000 | | | | | 5.00 | | | | | 12/1/51 | | | | | 830,355 | |
Vauxmont Metropolitan District G.O. (AGM Insured) | | | | 500,000 | | | | | 3.25 | | | | | 12/15/50 | | | | | 538,545 | |
Wild Plum Metropolitan District G.O. | | | | 595,000 | | | | | 5.00 | | | | | 12/1/49 | | | | | 644,468 | |
Windler Public Improvement Auth. Rev. | | | | 500,000 | | | | | 4.00 | | | | | 12/1/41 | | | | | 495,875 | |
| | | | | | | | | | | | | | | | | | | | |
| | | | |
| | | | | | | | | | | | | | | | | | | 19,569,329 | |
| | | | | | | | | | | | | | | | | | | | |
| | | | |
See accompanying notes to financial statements. | | | | |
| | |
SEPTEMBER 30, 2021 | | | 23 | |
SCHEDULE OF INVESTMENTS (Unaudited)
September 30, 2021
Sit Tax-Free Income Fund (Continued)
| | | | | | | | | | | | | | | | | | | | |
| Name of Issuer | | Principal
Amount ($) | | Coupon
Rate (%) | | Maturity
Date | | Fair
Value ($) |
Connecticut - 1.0% | | | | | | | | | | | | | | | | | | | | |
CT Health & Educational Facs. Auth. Rev. 4 | | | | 250,000 | | | | | 3.25 | | | | | 1/1/27 | | | | | 254,612 | |
CT Health & Educational Facs. Auth. Rev. 4 | | | | 250,000 | | | | | 5.00 | | | | | 1/1/55 | | | | | 276,178 | |
CT Hsg. Finance Auth. Rev. | | | | 100,000 | | | | | 3.88 | | | | | 11/15/35 | | | | | 101,168 | |
CT Hsg. Finance Auth. Rev. 9 | | | | 505,000 | | | | | 4.25 | | | | | 6/15/43 | | | | | 568,913 | |
CT Hsg. Finance Auth. Rev. | | | | 1,000,000 | | | | | 3.85 | | | | | 5/15/45 | | | | | 1,024,970 | |
CT Hsg. Finance Auth. Rev. | | | | 865,000 | | | | | 2.55 | | | | | 6/15/46 | | | | | 851,290 | |
CT Hsg. Finance Auth. Rev. 9 | | | | 455,000 | | | | | 4.30 | | | | | 6/15/48 | | | | | 507,862 | |
Steel Point Infrastructure Improvement District Rev. (Steelpointe Harbor Proj.) | | | | 350,000 | | | | | 4.00 | | | | | 4/1/51 | | | | | 356,293 | |
| | | | | | | | | | | | | | | | | | | | |
| | | | |
| | | | | | | | | | | | | | | | | | | 3,941,286 | |
| | | | | | | | | | | | | | | | | | | | |
District of Columbia - 0.7% | | | | | | | | | | | | | | | | | | | | |
District of Columbia Hsg. Finance Agency Rev. (FHA Insured) | | | | 1,500,000 | | | | | 2.50 | | | | | 3/1/42 | | | | | 1,493,265 | |
District of Columbia Hsg. Finance Agency Rev. (Multi-Family Dev. Program) | | | | 600,000 | | | | | 4.05 | | | | | 9/1/43 | | | | | 672,348 | |
District of Columbia Rev. (Ingleside Rock Creek Proj.) | | | | 500,000 | | | | | 5.00 | | | | | 7/1/37 | | | | | 538,545 | |
| | | | | | | | | | | | | | | | | | | | |
| | | | |
| | | | | | | | | | | | | | | | | | | 2,704,158 | |
| | | | | | | | | | | | | | | | | | | | |
Florida - 12.6% | | | | | | | | | | | | | | | | | | | | |
Alachua Co. Health Facs. Auth. Rev. (Oak Hammock University) | | | | 385,000 | | | | | 8.00 | | | | | 10/1/32 | | | | | 412,685 | |
Artisan Lakes East Community Dev. District Special Assessment | | | | 450,000 | | | | | 4.00 | | | | | 5/1/51 | | | | | 470,399 | |
Atlantic Beach, Rev. (Fleet Landing Proj.) | | | | 750,000 | | | | | 3.00 | | | | | 11/15/23 | | | | | 751,147 | |
Ave Maria Stewardship Community District Special Assessment. (AGM Insured) | | | | 295,000 | | | | | 3.00 | | | | | 5/1/38 | | | | | 314,538 | |
Blackburn Creek Community Dev. District Special Assessment (Grand Palm Proj.) | | | | 200,000 | | | | | 6.25 | | | | | 5/1/35 | | | | | 225,686 | |
Capital Trust Agency Rev. (Academir Charter Schools, Inc. Proj.) 4 | | | | 250,000 | | | | | 4.00 | | | | | 7/1/51 | | | | | 268,565 | |
Capital Trust Agency Rev. (Academir Charter Schools, Inc. Proj.) 4 | | | | 250,000 | | | | | 4.00 | | | | | 7/1/56 | | | | | 266,400 | |
Capital Trust Agency Rev. (Imagine School at North Manate, Inc. Proj.) 4 | | | | 325,000 | | | | | 5.00 | | | | | 6/1/41 | | | | | 369,496 | |
Capital Trust Agency Rev. (Lutz Preparatory School, Inc. Proj.) | | | | 300,000 | | | | | 4.00 | | | | | 6/1/41 | | | | | 335,259 | |
Capital Trust Agency Rev. (River City Educational Services, Inc. Proj.) | | | | 500,000 | | | | | 5.38 | | | | | 2/1/35 | | | | | 527,330 | |
Capital Trust Agency Rev. (River City Educational Services, Inc. Proj.) | | | | 300,000 | | | | | 5.63 | | | | | 2/1/45 | | | | | 315,906 | |
Capital Trust Agency Rev. (Tallahassee Tapestry) 2, 4, 5 | | | | 550,000 | | | | | 6.75 | | | | | 12/1/35 | | | | | 176,000 | |
Capital Trust Agency Rev. (Tapestry Walden Senior Hsg. Proj.) 2, 4, 5 | | | | 250,000 | | | | | 6.75 | | | | | 7/1/37 | | | | | 76,250 | |
Capital Trust Agency Rev. (Tuscan Gardens Senior Living Center) 2, 5 | | | | 250,000 | | | | | 7.00 | | | | | 4/1/35 | | | | | 138,235 | |
Capital Trust Agency Rev. (University Bridge LLC Student Housing Proj.) 4 | | | | 500,000 | | | | | 5.25 | | | | | 12/1/43 | | | | | 583,175 | |
Celebration Pointe Community Dev. District Special Assessment Rev. 4 | | | | 240,000 | | | | | 5.00 | | | | | 5/1/32 | | | | | 264,209 | |
CFM Community Dev. District Special Assessment | | | | 500,000 | | | | | 4.00 | | | | | 5/1/51 | | | | | 518,115 | |
Collier Co. Industrial Dev. Auth. Rev. (Arlington of Naples Proj.) 2, 4, 5 | | | | 250,000 | | | | | 7.25 | | | | | 5/15/26 | | | | | 170,000 | |
Collier Co. Industrial Dev. Auth. Rev. (Arlington of Naples Proj.) 2, 4, 5 | | | | 750,000 | | | | | 8.13 | | | | | 5/15/44 | | | | | 510,000 | |
County of Hillsborough Utility Rev. | | | | 1,000,000 | | | | | 2.50 | | | | | 8/1/51 | | | | | 966,620 | |
Durbin Crossing Community Dev. District Special Assessment (AGM Insured) | | | | 520,000 | | | | | 5.00 | | | | | 5/1/32 | | | | | 630,032 | |
Entrada Community Dev. District Special Assessment Rev. 4 | | | | 400,000 | | | | | 4.00 | | | | | 5/1/52 | | | | | 418,132 | |
Escambia Co. Housing Finance Auth. Rev. (Multi-County Program) | | | | 575,000 | | | | | 3.75 | | | | | 10/1/49 | | | | | 609,339 | |
Fishhawk Ranch Community Dev. District Special Assessment (AGM Insured) | | | | 500,000 | | | | | 3.00 | | | | | 11/1/41 | | | | | 527,220 | |
FL Dev. Finance Corp. Rev. (Discovery High School Proj.) 4 | | | | 500,000 | | | | | 5.00 | | | | | 6/1/40 | | | | | 553,160 | |
FL Dev. Finance Corp. Rev. (Green Bond-Brightline Proj.) 4 | | | | 650,000 | | | | | 7.38 | | | | | 1/1/49 | | | | | 707,330 | |
FL Dev. Finance Corp. Rev. (Mayflower Retirement Community) 4 | | | | 330,000 | | | | | 2.38 | | | | | 6/1/27 | | | | | 326,967 | |
FL Dev. Finance Corp. Rev. (The Glenride on Palmer Ranch Proj.) | | | | 650,000 | | | | | 5.00 | | | | | 6/1/51 | | | | | 740,071 | |
FL Higher Educational Facs. Financial Auth. Rev. (Rollins College Proj.) | | | | 1,000,000 | | | | | 4.00 | | | | | 12/1/50 | | | | | 1,140,220 | |
FL Hsg. Finance Corp. (GNMA/FNMA/FHLMC Collateralized) | | | | 570,000 | | | | | 4.20 | | | | | 1/1/45 | | | | | 615,247 | |
FL Hsg. Finance Corp. (GNMA/FNMA/FHLMC Collateralized) | | | | 360,000 | | | | | 3.30 | | | | | 7/1/49 | | | | | 371,304 | |
FL Hsg. Finance Corp. (GNMA/FNMA/FHLMC Collateralized) | | | | 945,000 | | | | | 2.75 | | | | | 7/1/50 | | | | | 951,984 | |
FL Hsg. Finance Corp. (GNMA/FNMA/FHLMC Collateralized) | | | | 1,500,000 | | | | | 2.30 | | | | | 1/1/52 | | | | | 1,429,560 | |
FRERC Community Dev. District Special Assessment | | | | 1,000,000 | | | | | 5.38 | | | | | 11/1/40 | | | | | 1,070,200 | |
Gramercy Farms Community Dev. District Special Assessment 6 | | | | 330,000 | | | | | 3.20 | | | | | 5/1/39 | | | | | 171,600 | |
Grande Pines Community Dev. District Special Assessment | | | | 635,000 | | | | | 4.00 | | | | | 5/1/51 | | | | | 648,170 | |
| | | | |
See accompanying notes to financial statements. | | | | |
| | |
24 | | | SIT MUTUAL FUNDS SEMI-ANNUAL REPORT | |
| | | | | | | | | | | | | | | | | | | | |
| Name of Issuer | | Principal
Amount ($) | | Coupon
Rate (%) | | Maturity
Date | | Fair
Value ($) |
Harbor Bay Community Dev. District Special Assessment | | | | 295,000 | | | | | 4.10 | | | | | 5/1/48 | | | | | 315,762 | |
Heritage Harbour North Community Dev. District Special Assessment | | | | 200,000 | | | | | 5.00 | | | | | 5/1/34 | | | | | 231,134 | |
Hollywood Beach Community Dev. District Special Assessment (Public Parking Facilities Proj.) | | | | 500,000 | | | | | 4.00 | | | | | 10/1/45 | | | | | 570,405 | |
Lake Co. Educational Project. Rev. (Imagine South Lake Charter School Proj.) 4 | | | | 550,000 | | | | | 5.00 | | | | | 1/15/39 | | | | | 617,683 | |
Lake Co. Retirement Project. Rev. (Lakeside at Waterman Village Proj.) | | | | 500,000 | | | | | 5.75 | | | | | 8/15/50 | | | | | 566,230 | |
Lakes of Sarasota Community Dev. District Special Assessment | | | | 300,000 | | | | | 3.88 | | | | | 5/1/31 | | | | | 301,305 | |
Lakes of Sarasota Community Dev. District Special Assessment | | | | 500,000 | | | | | 4.13 | | | | | 5/1/31 | | | | | 505,710 | |
Lakes of Sarasota Community Dev. District Special Assessment | | | | 265,000 | | | | | 4.10 | | | | | 5/1/51 | | | | | 269,619 | |
Lakewood Ranch Stewardship District Cap. Improvement Special Assessment Rev. | | | | 100,000 | | | | | 4.25 | | | | | 5/1/25 | | | | | 104,412 | |
Lakewood Ranch Stewardship District Cap. Improvement Special Assessment Rev. (Azario Proj.) | | | | 520,000 | | | | | 3.75 | | | | | 5/1/40 | | | | | 544,378 | |
Lakewood Ranch Stewardship District Cap. Improvement Special Assessment Rev. (Azario Proj.) | | | | 580,000 | | | | | 4.00 | | | | | 5/1/40 | | | | | 621,244 | |
Lakewood Ranch Stewardship District Cap. Improvement Special Assessment Rev. (Country Club East Proj.) | | | | 100,000 | | | | | 6.70 | | | | | 5/1/33 | | | | | 105,378 | |
Lakewood Ranch Stewardship District Cap. Improvement Special Assessment Rev. (Lakewood National) | | | | 300,000 | | | | | 5.25 | | | | | 5/1/37 | | | | | 335,223 | |
Lakewood Ranch Stewardship District Cap. Improvement Special Assessment Rev. (Lakewood Ranch) | | | | 400,000 | | | | | 5.00 | | | | | 5/1/36 | | | | | 435,780 | |
Lakewood Ranch Stewardship District Cap. Improvement Special Assessment Rev. (Lorraine Lakes Proj.) 4 | | | | 500,000 | | | | | 3.63 | | | | | 5/1/40 | | | | | 518,860 | |
Lakewood Ranch Stewardship District Cap. Improvement Special Assessment Rev. (NE Sector Proj.) | | | | 300,000 | | | | | 5.00 | | | | | 5/1/38 | | | | | 334,092 | |
Lakewood Ranch Stewardship District Cap. Improvement Special Assessment Rev. (NE Sector Proj.) | | | | 550,000 | | | | | 5.30 | | | | | 5/1/39 | | | | | 631,516 | |
Lakewood Ranch Stewardship District Cap. Improvement Special Assessment Rev. (NE Sector Proj.) 4 | | | | 485,000 | | | | | 3.75 | | | | | 5/1/40 | | | | | 507,077 | |
Lakewood Ranch Stewardship District Cap. Improvement Special Assessment Rev. (Sweetwater Proj.) | | | | 490,000 | | | | | 3.10 | | | | | 5/1/41 | | | | | 477,324 | |
Lakewood Ranch Stewardship District Cap. Improvement Special Assessment Rev. (Webb Proj.) 4 | | | | 320,000 | | | | | 5.00 | | | | | 5/1/37 | | | | | 354,355 | |
Lakewood Ranch Stewardship District Special Assessment (Lake Club Phase 4 Proj.) | | | | 425,000 | | | | | 4.50 | | | | | 5/1/49 | | | | | 462,009 | |
Live Oak No. 2 Community Dev. District Special Assessment | | | | 400,000 | | | | | 4.00 | | | | | 5/1/35 | | | | | 436,436 | |
LT Ranch Community Dev. District Special Assessment | | | | 500,000 | | | | | 4.00 | | | | | 5/1/40 | | | | | 529,920 | |
Magnolia Creek Community Dev. District Rev. 2, 5,15 | | | | 250,000 | | | | | 5.60 | | | | | N/A | | | | | 58,125 | |
Marshall Creek Community Dev. District Cap. Improvement Special Assessment Rev. | | | | 250,000 | | | | | 5.00 | | | | | 5/1/32 | | | | | 264,672 | |
Miami-Dade Co. Transit Sales Tax Rev. | | | | 500,000 | | | | | 5.00 | | | | | 7/1/34 | | | | | 578,595 | |
New River Community Dev. District Cap. Improvement Special Assessment Rev. 2, 5,15 | | | | 230,000 | | | | | 5.00 | | | | | N/A | | | | | 2 | |
North River Ranch Community Dev. District Cap. Improvement Special Assessment Rev. | | | | 550,000 | | | | | 4.20 | | | | | 5/1/35 | | | | | 567,583 | |
Northern Palm Beach Co. Improvement District Special Assessment | | | | 500,000 | | | | | 5.00 | | | | | 8/1/29 | | | | | 539,020 | |
Northern Palm Beach Co. Improvement District Special Assessment | | | | 250,000 | | | | | 5.00 | | | | | 8/1/37 | | | | | 284,400 | |
Orange Co. Health Facs. Auth. Rev. (Presbyterian Retirement Community Proj.) | | | | 550,000 | | | | | 5.00 | | | | | 8/1/34 | | | | | 608,036 | |
Orange Co. Health Facs. Auth. Rev. (Presbyterian Retirement Community Proj.) | | | | 500,000 | | | | | 5.00 | | | | | 8/1/35 | | | | | 570,280 | |
Orange Co. Health Facs. Auth. Rev. (Presbyterian Retirement Community Proj.) | | | | 250,000 | | | | | 5.00 | | | | | 8/1/41 | | | | | 273,800 | |
Orange Co. Hsg. Finance Auth. Rev. (GNMA/FNMA/FHLMC Collateralized) | | | | 40,000 | | | | | 3.95 | | | | | 3/1/40 | | | | | 40,452 | |
Orange Co. Hsg. Finance Auth. Rev. (GNMA/FNMA/FHLMC Collateralized) | | | | 285,000 | | | | | 4.00 | | | | | 9/1/48 | | | | | 312,790 | |
Orlando Tourist Dev. Rev. (Senior Lien Tourist Dev.) (AGM Insured) | | | | 250,000 | | | | | 5.00 | | | | | 11/1/38 | | | | | 302,862 | |
Palm Beach Co. Health Facs. Auth. Rev. (ACTS Retirement-Life Community, Inc.) | | | | 500,000 | | | | | 5.00 | | | | | 11/15/32 | | | | | 592,325 | |
Palm Beach Co. Health Facs. Auth. Rev. (Lifespace Communities, Inc.) | | | | 500,000 | | | | | 4.00 | | | | | 5/15/53 | | | | | 547,970 | |
Palm Beach Co. Health Facs. Auth. Rev. (Sinai Residences Boca Raton Proj.) | | | | 600,000 | | | | | 7.25 | | | | | 6/1/34 | | | | | 631,986 | |
Palm Beach Co. Health Facs. Auth. Rev. (Sinai Residences Boca Raton Proj.) | | | | 690,000 | | | | | 7.50 | | | | | 6/1/49 | | | | | 726,729 | |
Palm Beach Co. Health Facs. Auth. Rev. (Toby & Leon Cooperman Sinai Residences of Boca Raton) | | | | 500,000 | | | | | 5.00 | | | | | 6/1/55 | | | | | 539,090 | |
Parker Road Community Dev. District Special Assessment | | | | 500,000 | | | | | 4.10 | | | | | 5/1/50 | | | | | 524,685 | |
Parkview at Long Lake Ranch Community Dev. District Special Assessment | | | | 270,000 | | | | | 4.00 | | | | | 5/1/51 | | | | | 281,343 | |
Pinellas Co. Industrial Dev. Auth. Rev. | | | | 500,000 | | | | | 5.00 | | | | | 7/1/39 | | | | | 568,230 | |
Pompano Beach, Rev. (John Knox Village Proj.) | | | | 1,250,000 | | | | | 4.00 | | | | | 9/1/50 | | | | | 1,347,800 | |
River Landing Community Dev. District Special Assessment | | | | 500,000 | | | | | 4.25 | | | | | 11/1/35 | | | | | 502,620 | |
Sandridge Community Dev. District Special Assessment | | | | 500,000 | | | | | 3.88 | | | | | 5/1/41 | | | | | 506,585 | |
Sawyers Landing Community Dev. District Special Assessment Rev. | | | | 590,000 | | | | | 3.25 | | | | | 5/1/26 | | | | | 600,620 | |
Sawyers Landing Community Dev. District Special Assessment Rev. | | | | 500,000 | | | | | 4.13 | | | | | 5/1/41 | | | | | 522,325 | |
Sawyers Landing Community Dev. District Special Assessment Rev. | | | | 1,250,000 | | | | | 4.25 | | | | | 5/1/53 | | | | | 1,297,812 | |
Seminole County Industrial Dev. Auth. Rev. (Galileo Schools For Gifted Learning Proj.) 4 | | | | 705,000 | | | | | 4.00 | | | | | 6/15/56 | | | | | 769,493 | |
Southern Groves Community Dev. District No. 5 Special Assessment | | | | 500,000 | | | | | 4.00 | | | | | 5/1/30 | | | | | 535,585 | |
Southern Groves Community Dev. District No. 5 Special Assessment | | | | 285,000 | | | | | 4.00 | | | | | 5/1/48 | | | | | 297,916 | |
| | | | |
See accompanying notes to financial statements. | | | | |
| | |
SEPTEMBER 30, 2021 | | | 25 | |
SCHEDULE OF INVESTMENTS (Unaudited)
September 30, 2021
Sit Tax-Free Income Fund (Continued)
| | | | | | | | | | | | | | | | | | | | |
| Name of Issuer | | Principal
Amount ($) | | Coupon
Rate (%) | | Maturity
Date | | Fair
Value ($) |
St. Johns Co. Industrial Dev. Auth. Rev. (Presbyterian Retirement Communities Obligated Group Proj.) | | | | 1,000,000 | | | | | 4.00 | | | | | 8/1/55 | | | | | 1,123,200 | |
Tolomato Community Dev. District Special Assessment | | | | 500,000 | | | | | 4.25 | | | | | 5/1/37 | | | | | 549,135 | |
Tolomato Community Dev. District Special Assessment 2, 5 | | | | 120,000 | | | | | 6.61 | | | | | 5/1/40 | | | | | 1 | |
Tolomato Community Dev. District Special Assessment 6 | | | | 45,000 | | | | | 7.00 | | | | | 5/1/40 | | | | | 39,967 | |
Tolomato Community Dev. District Special Assessment 6 | | | | 185,000 | | | | | 7.00 | | | | | 5/1/40 | | | | | 184,573 | |
Tolomato Community Dev. District Special Assessment 6 | | | | 110,000 | | | | | 7.00 | | | | | 5/1/40 | | | | | 85,038 | |
Tolomato Community Dev. District Special Assessment (AGM Insured) | | | | 500,000 | | | | | 3.75 | | | | | 5/1/40 | | | | | 550,575 | |
Tradition Community Dev. District No. 9 Special Assessment | | | | 645,000 | | | | | 4.00 | | | | | 5/1/52 | | | | | 673,167 | |
Trout Creek Community Dev. District Special Assessment | | | | 300,000 | | | | | 5.38 | | | | | 5/1/38 | | | | | 335,313 | |
Trout Creek Community Dev. District Special Assessment | | | | 250,000 | | | | | 4.00 | | | | | 5/1/40 | | | | | 261,260 | |
University Park Recreation District Special Assessment (BAM Insured) | | | | 750,000 | | | | | 3.50 | | | | | 5/1/50 | | | | | 816,390 | |
Waters Edge Community Dev. District Cap. Improvement Rev. | | | | 9,000 | | | | | 5.35 | | | | | 5/1/39 | | | | | 9,009 | |
Waters Edge Community Dev. District Cap. Improvement Rev. 6 | | | | 115,000 | | | | | 6.60 | | | | | 5/1/39 | | | | | 115,815 | |
Wiregrass Community Dev. District Special Assessment | | | | 240,000 | | | | | 5.38 | | | | | 5/1/35 | | | | | 260,208 | |
Zephyr Ridge Community Dev. District Special Assessment 2, 5,15 | | | | 450,000 | | | | | 5.25 | | | | | N/A | | | | | 198,000 | |
| | | | | | | | | | | | | | | | | | | | |
| | | | |
| | | | | | | | | | | | | | | | | | | 48,741,785 | |
| | | | | | | | | | | | | | | | | | | | |
Georgia - 2.4% | | | | | | | | | | | | | | | | | | | | |
Burke Co. Dev. Auth. Rev. (Georgia Transmission Corp. Vogtle Proj.) 14 | | | | 740,000 | | | | | 2.75 | | | | | 1/1/52 | | | | | 739,556 | |
Clarke Co. Hospital Auth. Rev. (Piedmont Healthcare) | | | | 350,000 | | | | | 5.00 | | | | | 7/1/46 | | | | | 405,377 | |
Cobb Co. Dev. Auth. Rev. (Presbyterian Village Proj.) 4 | | | | 650,000 | | | | | 5.00 | | | | | 12/1/39 | | | | | 674,642 | |
Fulton Co. Dev. Auth. Rev. (Woodruff Arts Center) | | | | 500,000 | | | | | 5.00 | | | | | 3/15/44 | | | | | 593,160 | |
GA Housing & Finance Authority Rev. | | | | 1,280,000 | | | | | 3.80 | | | | | 12/1/37 | | | | | 1,304,166 | |
GA Housing & Finance Authority Rev. | | | | 590,000 | | | | | 4.00 | | | | | 12/1/37 | | | | | 591,988 | |
GA Housing & Finance Authority Rev. | | | | 455,000 | | | | | 3.85 | | | | | 12/1/38 | | | | | 483,715 | |
GA Housing & Finance Authority Rev. | | | | 650,000 | | | | | 3.80 | | | | | 12/1/40 | | | | | 680,862 | |
GA Housing & Finance Authority Rev. | | | | 605,000 | | | | | 3.85 | | | | | 12/1/41 | | | | | 615,424 | |
GA Housing & Finance Authority Rev. | | | | 960,000 | | | | | 3.50 | | | | | 12/1/46 | | | | | 995,059 | |
GA Housing & Finance Authority Rev. | | | | 490,000 | | | | | 4.00 | | | | | 12/1/48 | | | | | 510,364 | |
GA Tax Allocation (Beltline Proj.) | | | | 500,000 | | | | | 5.00 | | | | | 1/1/30 | | | | | 501,725 | |
Gainesville Hospital Auth. Rev. (Northeast Georgia Health System, Inc. Proj.) | | | | 500,000 | | | | | 5.00 | | | | | 2/15/37 | | | | | 590,465 | |
Glynn-Brunswick Memorial Hospital Auth. Rev. (Southeast Georgia Health System Proj.) | | | | 350,000 | | | | | 5.00 | | | | | 8/1/47 | | | | | 410,379 | |
| | | | | | | | | | | | | | | | | | | | |
| | | | |
| | | | | | | | | | | | | | | | | | | 9,096,882 | |
| | | | | | | | | | | | | | | | | | | | |
Idaho - 0.3% | | | | | | | | | | | | | | | | | | | | |
ID Health Facs. Authority Rev. (Terraces Boise Proj.) | | | | 290,000 | | | | | 7.00 | | | | | 10/1/24 | | | | | 252,019 | |
ID Health Facs. Authority Rev. (Terraces Boise Proj.) | | | | 250,000 | | | | | 7.38 | | | | | 10/1/29 | | | | | 214,467 | |
ID Health Facs. Authority Rev. (Terraces Boise Proj.) | | | | 500,000 | | | | | 8.00 | | | | | 10/1/44 | | | | | 427,070 | |
ID Hsg. & Fin. Assoc. Nonprofit Facs. Rev. (Idaho Arts Charter School Proj.) | | | | 335,000 | | | | | 5.75 | | | | | 12/1/32 | | | | | 354,447 | |
| | | | | | | | | | | | | | | | | | | | |
| | | | |
| | | | | | | | | | | | | | | | | | | 1,248,003 | |
| | | | | | | | | | | | | | | | | | | | |
Illinois - 6.0% | | | | | | | | | | | | | | | | | | | | |
Bellwood Village G.O. | | | | 500,000 | | | | | 5.88 | | | | | 12/1/27 | | | | | 532,810 | |
Bolingbrook Special Tax (AGM Insured) | | | | 998,000 | | | | | 4.00 | | | | | 3/1/30 | | | | | 1,142,171 | |
Burbank Educational Facs. Rev. (Intercultural Montessori Language School) 4 | | | | 500,000 | | | | | 6.00 | | | | | 9/1/35 | | | | | 546,225 | |
Bureau Co. Township High School Dist. No. 502 G.O. (BAM Insured) | | | | 500,000 | | | | | 6.25 | | | | | 12/1/33 | | | | | 563,255 | |
Chicago Heights G.O. (NATL-RE Insured) | | | | 500,000 | | | | | 4.50 | | | | | 12/1/29 | | | | | 560,370 | |
Chicago Midway Airport Rev. (Second Lien) | | | | 500,000 | | | | | 5.25 | | | | | 1/1/35 | | | | | 529,235 | |
Chicago Park Dist. G.O. (BAM Insured) | | | | 500,000 | | | | | 4.00 | | | | | 1/1/42 | | | | | 575,695 | |
Chicago Park Dist. G.O. (Limited Tax) | | | | 1,000,000 | | | | | 5.00 | | | | | 1/1/28 | | | | | 1,087,210 | |
Evanston Educational Facs. Rev. (Roycemore School) 4 | | | | 250,000 | | | | | 4.00 | | | | | 4/1/32 | | | | | 252,095 | |
IL Educational Facs. Auth. Rev. | | | | 250,000 | | | | | 4.50 | | | | | 11/1/36 | | | | | 277,085 | |
IL Educational Facs. Auth. Rev. (Field Museum of Natural History) | | | | 500,000 | | | | | 3.90 | | | | | 11/1/36 | | | | | 571,360 | |
IL Fin. Auth. Rev. (Admiral Lake Proj.) | | | | 670,000 | | | | | 5.13 | | | | | 5/15/38 | | | | | 706,622 | |
IL Fin. Auth. Rev. (Christian Homes, Inc.) | | | | 500,000 | | | | | 5.00 | | | | | 5/15/36 | | | | | 565,550 | |
| | | | |
See accompanying notes to financial statements. | | | | |
| | |
26 | | | SIT MUTUAL FUNDS SEMI-ANNUAL REPORT | |
| | | | | | | | | | | | | | | | | | | | |
| Name of Issuer | | Principal
Amount ($) | | Coupon
Rate (%) | | Maturity
Date | | Fair
Value ($) |
IL Fin. Auth. Rev. (Edward Elmhurst Healthcare) | | | | 1,000,000 | | | | | 5.00 | | | | | 1/1/44 | | | | | 1,186,360 | |
IL Fin. Auth. Rev. (Lifespace Communities) | | | | 500,000 | | | | | 5.00 | | | | | 5/15/35 | | | | | 557,025 | |
IL Fin. Auth. Rev. (Lifespace Communities) | | | | 1,000,000 | | | | | 5.00 | | | | | 5/15/45 | | | | | 1,100,390 | |
IL Fin. Auth. Rev. (Rogers Park Montessori School Proj.) | | | | 100,000 | | | | | 5.00 | | | | | 2/1/24 | | | | | 103,390 | |
IL Fin. Auth. Rev. (Westminster Village) | | | | 500,000 | | | | | 5.25 | | | | | 5/1/38 | | | | | 530,460 | |
IL Fin. Auth. Sports Facs. Rev. (North Shore Ice Arena Proj.) | | | | 1,000,000 | | | | | 6.25 | | | | | 12/1/38 | | | | | 696,570 | |
IL G.O. | | | | 250,000 | | | | | 5.50 | | | | | 7/1/33 | | | | | 267,425 | |
IL G.O. (AGM Insured) | | | | 500,000 | | | | | 4.00 | | | | | 2/1/30 | | | | | 568,240 | |
IL Housing Dev. Auth. Rev. | | | | 500,000 | | | | | 5.38 | | | | | 12/1/28 | | | | | 505,535 | |
IL Housing Dev. Auth. Rev. (FHA Insured) | | | | 1,500,000 | | | | | 3.00 | | | | | 7/1/61 | | | | | 1,509,990 | |
IL Housing Dev. Auth. Rev. (GNMA/FNMA/FHLMC Collateralized) | | | | 155,000 | | | | | 3.88 | | | | | 4/1/41 | | | | | 165,222 | |
IL Housing Dev. Auth. Rev. (GNMA/FNMA/FHLMC Collateralized) | | | | 1,000,000 | | | | | 2.38 | | | | | 10/1/42 | | | | | 971,970 | |
IL Housing Dev. Auth. Rev. (GNMA/FNMA/FHLMC Collateralized) | | | | 240,000 | | | | | 4.00 | | | | | 10/1/48 | | | | | 262,058 | |
IL Rev. | | | | 500,000 | | | | | 5.00 | | | | | 6/15/33 | | | | | 607,690 | |
IL Sports Facilities Auth. Rev. (State Tax Supported) (AGM Insured) | | | | 1,000,000 | | | | | 5.25 | | | | | 6/15/31 | | | | | 1,100,280 | |
La Salle & Bureau Counties Township High School Dist. No. 120 LaSalle-Peru G.O. (BAM Insured) | | | | 250,000 | | | | | 5.00 | | | | | 12/1/31 | | | | | 302,898 | |
Macon & Moultrie Counties Community Unit School District No. 3 Mt Zion G.O. | | | | 335,000 | | | | | 5.50 | | | | | 12/1/41 | | | | | 372,986 | |
Macoupin Sangamon & Montgomery Counties Community Unit School District G.O. (AGM Insured) | | | | 990,000 | | | | | 4.25 | | | | | 12/1/35 | | | | | 1,064,745 | |
Malta Tax Allocation Rev. 2, 5 | | | | 1,921,000 | | | | | 5.75 | | | | | 12/30/25 | | | | | 672,350 | |
Metropolitan Pier & Exposition Auth. Rev. (McCormick Place Expansion Proj.) | | | | 250,000 | | | | | 5.00 | | | | | 6/15/57 | | | | | 292,762 | |
Richton Park Public Library District G.O. | | | | 250,000 | | | | | 4.50 | | | | | 12/15/32 | | | | | 261,528 | |
Southwestern IL Dev. Auth. Tax Allocation Ref. (Local Govt. Program) 2 | | | | 360,000 | | | | | 7.00 | | | | | 10/1/22 | | | | | 208,800 | |
University of Illinois (AGM Insured) | | | | 1,000,000 | | | | | 4.13 | | | | | 4/1/48 | | | | | 1,130,680 | |
Upper Illinois River Valley Dev. Auth. Rev. (Cambridge Lakes Learning Center) 4 | | | | 140,000 | | | | | 4.00 | | | | | 12/1/22 | | | | | 141,424 | |
Upper Illinois River Valley Dev. Auth. Rev. (Cambridge Lakes Learning Center) 4 | | | | 250,000 | | | | | 5.25 | | | | | 12/1/37 | | | | | 269,448 | |
Upper Illinois River Valley Dev. Auth. Rev. (Prairie Crossing Charter) 4 | | | | 250,000 | | | | | 5.00 | | | | | 1/1/45 | | | | | 263,512 | |
| | | | | | | | | | | | | | | | | | | | |
| | | | |
| | | | | | | | | | | | | | | | | | | 23,023,421 | |
| | | | | | | | | | | | | | | | | | | | |
Indiana - 1.0% | | | | | | | | | | | | | | | | | | | | |
IN Finance Auth. Rev. (BHI Senior Living) | | | | 500,000 | | | | | 4.00 | | | | | 11/15/41 | | | | | 576,475 | |
IN Finance Auth. Rev. (BHI Senior Living) | | | | 775,000 | | | | | 5.88 | | | | | 11/15/41 | | | | | 867,372 | |
IN Finance Auth. Rev. (BHI Senior Living) | | | | 425,000 | | | | | 6.00 | | | | | 11/15/41 | | | | | 476,485 | |
IN Finance Auth. Rev. (BHI Senior Living) | | | | 170,000 | | | | | 5.25 | | | | | 11/15/46 | | | | | 195,449 | |
IN Finance Auth. Rev. (Greencroft Obligated Group) | | | | 350,000 | | | | | 6.50 | | | | | 11/15/33 | | | | | 379,165 | |
IN Housing & Community Dev. Auth. Rev. (Hammond Assisted Living Proj.) | | | | 500,000 | | | | | 5.75 | | | | | 1/1/36 | | | | | 514,815 | |
Merrillville Industry Economic Dev. Rev. (Belvedere Housing Proj.) | | | | 300,000 | | | | | 5.75 | | | | | 4/1/36 | | | | | 312,372 | |
Richmond Hospital Auth. Rev. (Reid Hospital & Health Care) | | | | 350,000 | | | | | 5.00 | | | | | 1/1/35 | | | | | 386,880 | |
| | | | | | | | | | | | | | | | | | | | |
| | | | |
| | | | | | | | | | | | | | | | | | | 3,709,013 | |
| | | | | | | | | | | | | | | | | | | | |
Iowa - 0.8% | | | | | | | | | | | | | | | | | | | | |
IA Fin. Auth. Rev. (Lifespace Communities, Inc.) | | | | 650,000 | | | | | 5.00 | | | | | 5/15/36 | | | | | 740,441 | |
IA Fin. Auth. Rev. (Lifespace Communities, Inc.) | | | | 565,000 | | | | | 5.00 | | | | | 5/15/47 | | | | | 634,563 | |
IA Fin. Auth. Rev. (Lifespace Communities, Inc.) | | | | 500,000 | | | | | 4.00 | | | | | 5/15/53 | | | | | 550,390 | |
IA Fin. Auth. Rev. (Lifespace Communities, Inc.) | | | | 530,000 | | | | | 4.00 | | | | | 5/15/55 | | | | | 580,313 | |
IA Higher Education Loan Auth. Rev. (Simpson College Proj.) | | | | 500,000 | | | | | 5.00 | | | | | 11/1/30 | | | | | 561,090 | |
| | | | | | | | | | | | | | | | | | | | |
| | | | |
| | | | | | | | | | | | | | | | | | | 3,066,797 | |
| | | | | | | | | | | | | | | | | | | | |
Louisiana - 1.5% | | | | | | | | | | | | | | | | | | | | |
Denham Springs/Livingston Hsg. & Mtg. Finance Auth. Rev. (GNMA/FHLMC Collateralized) | | | | 8,813 | | | | | 5.00 | | | | | 11/1/40 | | | | | 8,960 | |
LA Hsg. Fin. Agy. Single Family Mtg. Rev. (Home Ownership Prog.)(GNMA/FHLMC Collateralized) | | | | 470,000 | | | | | 2.50 | | | | | 12/1/45 | | | | | 472,585 | |
LA Local Government Environmental Facilities & Community Development Auth. | | | | 500,000 | | | | | 5.25 | | | | | 11/15/25 | | | | | 532,065 | |
LA Local Government Environmental Facilities & Community Development Auth. | | | | 500,000 | | | | | 6.00 | | | | | 11/15/30 | | | | | 554,560 | |
LA Local Government Environmental Facilities & Community Development Auth. Rev. 4 | | | | 300,000 | | | | | 5.65 | | | | | 11/1/37 | | | | | 358,134 | |
LA Local Government Environmental Facilities & Community Development Auth. Rev. 4 | | | | 500,000 | | | | | 5.00 | | | | | 7/1/39 | | | | | 529,900 | |
LA Local Government Environmental Facilities & Community Development Auth. Rev. 4 | | | | 300,000 | | | | | 5.50 | | | | | 11/1/39 | | | | | 341,493 | |
| | | | |
See accompanying notes to financial statements. | | | | |
| | |
SEPTEMBER 30, 2021 | | | 27 | |
SCHEDULE OF INVESTMENTS (Unaudited)
September 30, 2021
Sit Tax-Free Income Fund (Continued)
| | | | | | | | | | | | | | | | | | | | |
| Name of Issuer | | Principal
Amount ($) | | Coupon
Rate (%) | | Maturity
Date | | Fair
Value ($) |
LA Local Government Environmental Facilities & Community Development Auth. Rev. 4 | | | | 500,000 | | | | | 4.00 | | | | | 11/1/44 | | | | | 539,705 | |
LA Local Government Environmental Facilities & Community Development Auth. Rev. 4 | | | | 495,000 | | | | | 4.40 | | | | | 11/1/44 | | | | | 544,168 | |
LA Local Government Environmental Facilities & Community Development Auth. Rev. 4 | | | | 750,000 | | | | | 4.00 | | | | | 11/1/46 | | | | | 816,630 | |
LA Public Facs. Auth. Rev. (Franciscan Missionaries Health System Proj.) | | | | 300,000 | | | | | 5.00 | | | | | 7/1/35 | | | | | 342,021 | |
LA Public Facs. Auth. Rev. (Tulane Univ. Proj.) (NATL-RE Insured) 1 | | | | 545,000 | | | | | 0.78 | | | | | 2/15/36 | | | | | 542,281 | |
St. Tammany Parish Fin. Auth. Rev. (Christwood Proj.) | | | | 300,000 | | | | | 5.25 | | | | | 11/15/37 | | | | | 324,090 | |
| | | | | | | | | | | | | | | | | | | | |
| | | | |
| | | | | | | | | | | | | | | | | | | 5,906,592 | |
| | | | | | | | | | | | | | | | | | | | |
Maine - 0.1% | | | | | | | | | | | | | | | | | | | | |
ME Hsg. Auth. Rev. | | | | 310,000 | | | | | 3.85 | | | | | 11/15/40 | | | | | 323,392 | |
| | | | | | | | | | | | | | | | | | | | |
| | | | |
Maryland - 0.2% | | | | | | | | | | | | | | | | | | | | |
MD Community Dev. Administration Rev. | | | | 350,000 | | | | | 4.20 | | | | | 7/1/46 | | | | | 377,125 | |
Montgomery Co. Housing Opportunities Commission Rev. | | | | 250,000 | | | | | 4.00 | | | | | 7/1/38 | | | | | 251,650 | |
| | | | | | | | | | | | | | | | | | | | |
| | | | |
| | | | | | | | | | | | | | | | | | | 628,775 | |
| | | | | | | | | | | | | | | | | | | | |
Massachusetts - 3.4% | | | | | | | | | | | | | | | | | | | | |
Dedham Municipal Purpose Loan. G.O. (NATL Insured) | | | | 480,000 | | | | | 4.00 | | | | | 10/15/24 | | | | | 481,406 | |
MA Dev. Finance Agy. Rev. | | | | 890,000 | | | | | 5.00 | | | | | 7/1/44 | | | | | 1,063,408 | |
MA Dev. Finance Agy. Rev. (Atrius Health Issue) | | | | 1,375,000 | | | | | 4.00 | | | | | 6/1/49 | | | | | 1,532,781 | |
MA Dev. Finance Agy. Rev. (FNMA Collateralized) | | | | 1,500,000 | | | | | 2.30 | | | | | 1/1/42 | | | | | 1,452,750 | |
MA Dev. Finance Agy. Rev. (Newbridge on the Charles, Inc.) 4 | | | | 300,000 | | | | | 5.00 | | | | | 10/1/47 | | | | | 325,644 | |
MA Dev. Finance Agy. Rev. (Orchard Cove, Inc.) | | | | 400,000 | | | | | 5.00 | | | | | 10/1/49 | | | | | 446,240 | |
MA Education Finance Auth. Education Rev. | | | | 485,000 | | | | | 3.63 | | | | | 7/1/34 | | | | | 507,790 | |
MA Education Finance Auth. Education Rev. | | | | 1,000,000 | | | | | 2.63 | | | | | 7/1/36 | | | | | 1,027,140 | |
MA Education Finance Auth. Education Rev. | | | | 875,000 | | | | | 3.75 | | | | | 7/1/48 | | | | | 912,363 | |
MA Education Finance Auth. Education Rev. | | | | 1,000,000 | | | | | 3.00 | | | | | 7/1/51 | | | | | 991,630 | |
MA Housing Finance Agy. Rev. | | | | 250,000 | | | | | 4.75 | | | | | 6/1/35 | | | | | 250,368 | |
MA Housing Finance Agy. Rev. | | | | 500,000 | | | | | 4.00 | | | | | 12/1/38 | | | | | 556,390 | |
MA Housing Finance Agy. Rev. | | | | 500,000 | | | | | 3.75 | | | | | 12/1/40 | | | | | 528,440 | |
MA Housing Finance Agy. Rev. | | | | 500,000 | | | | | 2.40 | | | | | 6/1/44 | | | | | 494,235 | |
MA Housing Finance Agy. Rev. | | | | 900,000 | | | | | 3.85 | | | | | 12/1/47 | | | | | 963,567 | |
MA Housing Finance Agy. Rev. | | | | 500,000 | | | | | 2.80 | | | | | 6/1/63 | | | | | 488,795 | |
MA Housing Finance Agy. Rev. (FHA Insured) | | | | 355,000 | | | | | 5.30 | | | | | 12/1/38 | | | | | 355,841 | |
Northbridge Municipal Purpose Loan G.O. (AGM Insured) | | | | 500,000 | | | | | 4.00 | | | | | 6/15/25 | | | | | 501,465 | |
Rowley Land Acquisition Loan G.O. (AGM Insured) | | | | 360,000 | | | | | 4.00 | | | | | 5/1/27 | | | | | 361,055 | |
| | | | | | | | | | | | | | | | | | | | |
| | | | |
| | | | | | | | | | | | | | | | | | | 13,241,308 | |
| | | | | | | | | | | | | | | | | | | | |
Michigan - 4.3% | | | | | | | | | | | | | | | | | | | | |
Chandler Park Academy Rev. | | | | 85,000 | | | | | 5.00 | | | | | 11/1/22 | | | | | 85,178 | |
City of Allen Park G.O. (BAM Insured) | | | | 300,000 | | | | | 3.25 | | | | | 5/1/34 | | | | | 330,198 | |
City of Kalamazoo Economic Dev. Corp. Rev. (Revel Creek Proj.) | | | | 500,000 | | | | | 5.00 | | | | | 5/15/43 | | | | | 565,380 | |
MI Finance Auth. Rev. (Presbyterian Village) | | | | 250,000 | | | | | 5.25 | | | | | 11/15/35 | | | | | 270,500 | |
MI Hsg. Dev. Auth. (G.O. of Authority Insured) | | | | 250,000 | | | | | 4.63 | | | | | 10/1/41 | | | | | 255,457 | |
MI Hsg. Dev. Auth. Rev. | | | | 500,000 | | | | | 4.10 | | | | | 10/1/35 | | | | | 533,340 | |
MI Hsg. Dev. Auth. Rev. | | | | 160,000 | | | | | 3.70 | | | | | 12/1/36 | | | | | 164,451 | |
MI Hsg. Dev. Auth. Rev. | | | | 300,000 | | | | | 3.75 | | | | | 10/1/42 | | | | | 319,698 | |
MI Hsg. Dev. Auth. Rev. | | | | 750,000 | | | | | 4.00 | | | | | 10/1/43 | | | | | 816,323 | |
MI Hsg. Dev. Auth. Rev. | | | | 530,000 | | | | | 4.00 | | | | | 6/1/49 | | | | | 556,585 | |
MI Hsg. Dev. Auth. Rev. | | | | 500,000 | | | | | 3.35 | | | | | 10/1/49 | | | | | 523,720 | |
MI Hsg. Dev. Auth. Rev. | | | | 1,000,000 | | | | | 3.15 | | | | | 6/1/50 | | | | | 1,036,780 | |
MI Hsg. Dev. Auth. Rev. | | | | 2,000,000 | | | | | 2.75 | | | | | 6/1/51 | | | | | 2,024,200 | |
MI Hsg. Dev. Auth. Rev. | | | | 3,500,000 | | | | | 2.50 | | | | | 6/1/52 | | | | | 3,276,000 | |
MI Hsg. Dev. Auth. Rev. | | | | 1,750,000 | | | | | 3.50 | | | | | 10/1/54 | | | | | 1,847,475 | |
MI Hsg. Dev. Auth. Rev. | | | | 1,000,000 | | | | | 2.70 | | | | | 10/1/56 | | | | | 972,810 | |
MI Public Educational Facs. Auth. Rev. (Chandler Park Academy) | | | | 260,000 | | | | | 6.35 | | | | | 11/1/28 | | | | | 260,564 | |
| | | | |
See accompanying notes to financial statements. | | | | |
| | |
28 | | | SIT MUTUAL FUNDS SEMI-ANNUAL REPORT | |
| | | | | | | | | | | | | | | | | | | | |
| Name of Issuer | | Principal
Amount ($) | | Coupon
Rate (%) | | Maturity
Date | | Fair
Value ($) |
MI Strategic Fund. Rev. (United Methodist Retirement Facs.) | | | | 415,000 | | | | | 5.00 | | | | | 11/15/49 | | | | | 473,735 | |
Muskegon Heights Water Supply Rev. (NATL Insured) | | | | 165,000 | | | | | 4.15 | | | | | 11/1/23 | | | | | 165,492 | |
Muskegon Heights Water Supply Rev. (NATL Insured) | | | | 135,000 | | | | | 4.20 | | | | | 11/1/24 | | | | | 135,406 | |
Richfield Public School Academy Rev. | | | | 1,060,000 | | | | | 4.00 | | | | | 9/1/36 | | | | | 1,086,468 | |
Taylor Brownfield Redevelopment Authority (NATL Insured) | | | | 250,000 | | | | | 5.00 | | | | | 5/1/32 | | | | | 278,105 | |
Universal Academy Michigan Public School Rev. | | | | 105,000 | | | | | 6.50 | | | | | 12/1/23 | | | | | 108,138 | |
Universal Academy Michigan Public School Rev. | | | | 350,000 | | | | | 4.00 | | | | | 12/1/40 | | | | | 383,257 | |
| | | | | | | | | | | | | | | | | | | | |
| | | | |
| | | | | | | | | | | | | | | | | | | 16,469,260 | |
| | | | | | | | | | | | | | | | | | | | |
Minnesota - 0.1% | | | | | | | | | | | | | | | | | | | | |
Apple Valley Rev. (Senior Living, LLC Proj.) | | | | 475,000 | | | | | 5.00 | | | | | 1/1/47 | | | | | 360,402 | |
| | | | | | | | | | | | | | | | | | | | |
| | | | |
Mississippi - 0.7% | | | | | | | | | | | | | | | | | | | | |
MS Development Bank Rev. (Green Bond-Hancock County) 4 | | | | 1,000,000 | | | | | 4.55 | | | | | 11/1/39 | | | | | 1,118,400 | |
MS Development Bank Rev. (Jackson Co. Gomesa Proj.) 4 | | | | 500,000 | | | | | 3.63 | | | | | 11/1/36 | | | | | 493,975 | |
MS Gaming Tax Rev. | | | | 740,000 | | | | | 4.00 | | | | | 10/15/38 | | | | | 844,887 | |
MS Home Corp. Single Family Mtg. Rev. (GNMA/FNMA/FHLMC Collateralized) | | | | 245,000 | | | | | 4.00 | | | | | 12/1/43 | | | | | 262,062 | |
| | | | | | | | | | | | | | | | | | | | |
| | | | |
| | | | | | | | | | | | | | | | | | | 2,719,324 | |
| | | | | | | | | | | | | | | | | | | | |
Missouri - 1.6% | | | | | | | | | | | | | | | | | | | | |
Joplin Industrial Dev. Auth. Rev. (32nd Street Place Community Improvement Dist. Proj.) | | | | 250,000 | | | | | 3.50 | | | | | 11/1/40 | | | | | 250,772 | |
Kansas City Industrial Dev. Auth. Rev. (United Methodist Retirement Home, Inc.) 2, 4, 5 | | | | 500,000 | | | | | 5.75 | | | | | 11/15/36 | | | | | 260,000 | |
Lees Summit Industrial Dev. Auth. Rev. (John Knox Village Proj.) | | | | 370,000 | | | | | 5.00 | | | | | 8/15/32 | | | | | 415,702 | |
MO Health & Education Facs. Auth. Rev. (Lutheran Senior Services) | | | | 500,000 | | | | | 4.00 | | | | | 2/1/33 | | | | | 575,160 | |
MO Health & Education Facs. Auth. Rev. (Lutheran Senior Services) | | | | 775,000 | | | | | 4.00 | | | | | 2/1/42 | | | | | 871,666 | |
MO Health & Education Facs. Auth. Rev. (Lutheran Senior Services) | | | | 1,000,000 | | | | | 4.00 | | | | | 2/1/48 | | | | | 1,116,110 | |
MO Hsg. Dev. Commission Rev. (GNMA/FNMA/FHLMC Collateralized) | | | | 750,000 | | | | | 2.20 | | | | | 11/1/46 | | | | | 701,903 | |
MO Hsg. Dev. Commission Rev. (GNMA/FNMA/FHLMC Collateralized) | | | | 495,000 | | | | | 3.80 | | | | | 11/1/48 | | | | | 528,447 | |
MO Hsg. Dev. Commission Rev. (GNMA/FNMA/FHLMC Collateralized) | | | | 405,000 | | | | | 3.35 | | | | | 11/1/49 | | | | | 425,756 | |
MO Hsg. Dev. Commission Rev. (GNMA/FNMA/FHLMC Collateralized) | | | | 485,000 | | | | | 2.50 | | | | | 5/1/50 | | | | | 487,212 | |
MO Hsg. Dev. Commission Rev. (GNMA/FNMA/FHLMC Collateralized) | | | | 500,000 | | | | | 2.40 | | | | | 11/1/51 | | | | | 485,050 | |
| | | | | | | | | | | | | | | | | | | | |
| | | | |
| | | | | | | | | | | | | | | | | | | 6,117,778 | |
| | | | | | | | | | | | | | | | | | | | |
Montana - 0.4% | | | | | | | | | | | | | | | | | | | | |
Gallatin Co., G.O. | | | | 360,000 | | | | | 3.00 | | | | | 7/1/25 | | | | | 360,771 | |
MT Board of Housing Single Family Rev. | | | | 160,000 | | | | | 4.00 | | | | | 12/1/38 | | | | | 169,363 | |
MT Board of Housing Single Family Rev. | | | | 500,000 | | | | | 2.40 | | | | | 12/1/45 | | | | | 504,040 | |
MT Board of Housing Single Family Rev. (BRD Insured) | | | | 420,000 | | | | | 4.00 | | | | | 6/1/45 | | | | | 454,675 | |
MT Board of Housing Single Family Rev. (FHA Insured) | | | | 225,000 | | | | | 3.75 | | | | | 12/1/38 | | | | | 228,040 | |
| | | | | | | | | | | | | | | | | | | | |
| | | | |
| | | | | | | | | | | | | | | | | | | 1,716,889 | |
| | | | | | | | | | | | | | | | | | | | |
Nebraska - 0.3% | | | | | | | | | | | | | | | | | | | | |
Douglas Co. Hospital Auth. No. 2 Rev. (Children Hospital Obligation) | | | | 500,000 | | | | | 4.00 | | | | | 11/15/50 | | | | | 573,790 | |
Douglas Co. Hospital Auth. No. 3 Rev. (Methodist Hospital) | | | | 400,000 | | | | | 5.00 | | | | | 11/1/30 | | | | | 463,168 | |
Mead Village Tax Allocation Rev. (E3 Biofuels - Mead LLC Proj.) 2, 5,15 | | | | 410,000 | | | | | 5.13 | | | | | N/A | | | | | 17,015 | |
Nebraska Investment Fin. Auth. Rev. (GNMA/FNMA/FHLMC Collateralized) | | | | 85,000 | | | | | 3.05 | | | | | 9/1/42 | | | | | 87,373 | |
| | | | | | | | | | | | | | | | | | | | |
| | | | |
| | | | | | | | | | | | | | | | | | | 1,141,346 | |
| | | | | | | | | | | | | | | | | | | | |
Nevada - 0.8% | | | | | | | | | | | | | | | | | | | | |
City of Las Vegas Special Improvement District No. 815 | | | | 500,000 | | | | | 5.00 | | | | | 12/1/49 | | | | | 579,275 | |
City of North Las Vegas (Special Northern Beltway Commercial Area) 4 | | | | 335,000 | | | | | 4.00 | | | | | 12/1/27 | | | | | 364,312 | |
City of North Las Vegas (Special Northern Beltway Commercial Area) 4 | | | | 340,000 | | | | | 5.00 | | | | | 12/1/37 | | | | | 386,281 | |
NV Hsg. Division Rev. (GNMA/FNMA/FHLMC Collateralized) | | | | 220,000 | | | | | 3.85 | | | | | 10/1/39 | | | | | 224,789 | |
NV Hsg. Division Rev. (GNMA/FNMA/FHLMC Collateralized) | | | | 555,000 | | | | | 3.35 | | | | | 10/1/49 | | | | | 580,608 | |
NV Hsg. Division Rev. (GNMA/FNMA/FHLMC Collateralized) | | | | 630,000 | | | | | 3.40 | | | | | 10/1/49 | | | | | 661,891 | |
NV Hsg. Division Rev. (GNMA/FNMA/FHLMC Collateralized) | | | | 500,000 | | | | | 2.45 | | | | | 10/1/51 | | | | | 485,180 | |
| | | | | | | | | | | | | | | | | | | | |
| | | | |
| | | | | | | | | | | | | | | | | | | 3,282,336 | |
| | | | | | | | | | | | | | | | | | | | |
| | | | |
See accompanying notes to financial statements. | | | | |
| | |
SEPTEMBER 30, 2021 | | | 29 | |
SCHEDULE OF INVESTMENTS (Unaudited)
September 30, 2021
Sit Tax-Free Income Fund (Continued)
| | | | | | | | | | | | | | | | | | | | |
| Name of Issuer | | Principal
Amount ($) | | Coupon
Rate (%) | | Maturity
Date | | Fair
Value ($) |
New Hampshire - 0.9% | | | | | | | | | | | | | | | | | | | | |
NH Business Finance Auth. Rev. (Springpoint Senior Living Proj.) | | | | 650,000 | | | | | 4.00 | | | | | 1/1/41 | | | | | 708,194 | |
NH Business Finance Auth. Rev. (The Vista Proj.) 4 | | | | 310,000 | | | | | 5.25 | | | | | 7/1/39 | | | | | 324,468 | |
NH Business Finance Auth. Rev. (The Vista Proj.) 4 | | | | 500,000 | | | | | 5.63 | | | | | 7/1/46 | | | | | 527,600 | |
NH Hsg. Fin. Auth. Rev. (Cimarron, Whittier Falls & Mars) (FHA Insured) | | | | 725,000 | | | | | 4.00 | | | | | 7/1/52 | | | | | 777,990 | |
NH Hsg. Fin. Auth. Rev. (FHA Insured) | | | | 500,000 | | | | | 2.60 | | | | | 7/1/51 | | | | | 493,565 | |
NH Hsg. Fin. Auth. Rev. (FHA Insured) | | | | 500,000 | | | | | 2.85 | | | | | 7/1/61 | | | | | 492,625 | |
| | | | | | | | | | | | | | | | | | | | |
| | | | |
| | | | | | | | | | | | | | | | | | | 3,324,442 | |
| | | | | | | | | | | | | | | | | | | | |
New Jersey - 3.1% | | | | | | | | | | | | | | | | | | | | |
NJ Economic Dev. Auth. Rev. 9 | | | | 500,000 | | | | | 4.00 | | | | | 6/15/50 | | | | | 571,520 | |
NJ Economic Dev. Auth. Rev. (North Star Academy Charter School Newark) | | | | 250,000 | | | | | 5.00 | | | | | 7/15/47 | | | | | 285,013 | |
NJ Economic Dev. Auth. Rev. (State Government Buildings Proj.) 9 | | | | 500,000 | | | | | 5.00 | | | | | 6/15/42 | | | | | 601,445 | |
NJ Economic Dev. Auth. Rev. (State Housing Proj.) 9 | | | | 250,000 | | | | | 5.00 | | | | | 6/15/37 | | | | | 308,553 | |
NJ Economic Dev. Auth. Rev. (State Housing Proj.) 9 | | | | 500,000 | | | | | 5.00 | | | | | 6/15/43 | | | | | 611,670 | |
NJ Higher Education Student Assistance Auth. Rev. | | | | 1,250,000 | | | | | 3.50 | | | | | 12/1/39 | | | | | 1,329,500 | |
NJ Higher Education Student Assistance Auth. Rev. | | | | 1,000,000 | | | | | 4.25 | | | | | 12/1/50 | | | | | 1,050,150 | |
NJ Hsg. & Mtg. Finance Agy. Rev. | | | | 750,000 | | | | | 3.95 | | | | | 11/1/43 | | | | | 815,947 | |
NJ Hsg. & Mtg. Finance Agy. Rev. | | | | 500,000 | | | | | 2.63 | | | | | 11/1/56 | | | | | 497,970 | |
NJ Hsg. & Mtg. Finance Agy. Rev. (Mciver Homes Hsg. Proj.) (FHLMC Collateralized) | | | | 550,000 | | | | | 3.60 | | | | | 1/1/30 | | | | | 566,671 | |
NJ Hsg. & Mtg. Finance Agy. Single Family Mtg. Rev. | | | | 880,000 | | | | | 3.75 | | | | | 10/1/35 | | | | | 952,635 | |
NJ Hsg. & Mtg. Finance Agy. Single Family Mtg. Rev. | | | | 750,000 | | | | | 2.30 | | | | | 10/1/46 | | | | | 702,555 | |
NJ Hsg. & Mtg. Finance Agy. Single Family Mtg. Rev. | | | | 490,000 | | | | | 4.50 | | | | | 10/1/48 | | | | | 550,059 | |
NJ Hsg. & Mtg. Finance Agy. Single Family Mtg. Rev. | | | | 460,000 | | | | | 4.00 | | | | | 4/1/49 | | | | | 493,309 | |
NJ Hsg. & Mtg. Finance Agy. Single Family Mtg. Rev. | | | | 955,000 | | | | | 2.45 | | | | | 10/1/50 | | | | | 948,410 | |
NJ Transportation Trust Fund Auth. Rev. 9 | | | | 500,000 | | | | | 4.00 | | | | | 12/15/39 | | | | | 574,470 | |
NJ Transportation Trust Fund Auth. Rev. 9 | | | | 500,000 | | | | | 5.25 | | | | | 6/15/43 | | | | | 621,635 | |
Tobacco Settlement Financing Corp. Rev. | | | | 300,000 | | | | | 5.00 | | | | | 6/1/46 | | | | | 351,543 | |
| | | | | | | | | | | | | | | | | | | | |
| | | | |
| | | | | | | | | | | | | | | | | | | 11,833,055 | |
| | | | | | | | | | | | | | | | | | | | |
New Mexico - 1.4% | | | | | | | | | | | | | | | | | | | | |
Las Vegas NM Gross Receipts Tax Rev. | | | | 410,000 | | | | | 4.00 | | | | | 6/1/28 | | | | | 419,356 | |
NM Mtg. Fin. Auth. Single Family Mtg. Rev. (GNMA/FNMA/FHLMC Collateralized) | | | | 270,000 | | | | | 3.90 | | | | | 9/1/42 | | | | | 271,563 | |
NM Mtg. Fin. Auth. Single Family Mtg. Rev. (GNMA/FNMA/FHLMC Collateralized) | | | | 215,000 | | | | | 4.13 | | | | | 9/1/42 | | | | | 216,440 | |
NM Mtg. Fin. Auth. Single Family Mtg. Rev. (GNMA/FNMA/FHLMC Collateralized) | | | | 635,000 | | | | | 3.85 | | | | | 7/1/43 | | | | | 671,627 | |
NM Mtg. Fin. Auth. Single Family Mtg. Rev. (GNMA/FNMA/FHLMC Collateralized) | | | | 390,000 | | | | | 3.85 | | | | | 7/1/43 | | | | | 419,363 | |
NM Mtg. Fin. Auth. Single Family Mtg. Rev. (GNMA/FNMA/FHLMC Collateralized) | | | | 320,000 | | | | | 3.80 | | | | | 9/1/46 | | | | | 331,725 | |
NM Mtg. Fin. Auth. Single Family Mtg. Rev. (GNMA/FNMA/FHLMC Collateralized) | | | | 665,000 | | | | | 4.00 | | | | | 7/1/48 | | | | | 714,702 | |
NM Mtg. Fin. Auth. Single Family Mtg. Rev. (GNMA/FNMA/FHLMC Collateralized) | | | | 940,000 | | | | | 3.35 | | | | | 7/1/49 | | | | | 981,595 | |
NM Mtg. Fin. Auth. Single Family Mtg. Rev. (GNMA/FNMA/FHLMC Collateralized) | | | | 410,000 | | | | | 4.00 | | | | | 7/1/49 | | | | | 441,763 | |
NM Mtg. Fin. Auth. Single Family Mtg. Rev. (GNMA/FNMA/FHLMC Collateralized) | | | | 500,000 | | | | | 3.00 | | | | | 7/1/50 | | | | | 513,805 | |
NM Mtg. Fin. Auth. Single Family Mtg. Rev. (GNMA/FNMA/FHLMC Collateralized) | | | | 500,000 | | | | | 2.35 | | | | | 7/1/51 | | | | | 473,930 | |
| | | | | | | | | | | | | | | | | | | | |
| | | | |
| | | | | | | | | | | | | | | | | | | 5,455,869 | |
| | | | | | | | | | | | | | | | | | | | |
New York - 5.6% | | | | | | | | | | | | | | | | | | | | |
Brookhaven Local Dev. Corp. Rev. (Jefferson’s Ferry Proj.) | | | | 675,000 | | | | | 4.00 | | | | | 11/1/45 | | | | | 754,832 | |
Buffalo & Erie Co. Industrial Land Dev. Corp. Rev. (D’Youville College Proj.) | | | | 500,000 | | | | | 4.00 | | | | | 11/1/40 | | | | | 569,915 | |
Hempstead Town Local Development Corp. Rev. (Hofstra University Proj.) | | | | 350,000 | | | | | 4.00 | | | | | 7/1/33 | | | | | 366,769 | |
New York City Housing Development Corp. Multifamily Mtg. Rev. | | | | 300,000 | | | | | 4.05 | | | | | 11/1/41 | | | | | 324,060 | |
New York City Housing Development Corp. Multifamily Mtg. Rev. | | | | 300,000 | | | | | 3.85 | | | | | 11/1/42 | | | | | 321,870 | |
New York City Housing Development Corp. Multifamily Mtg. Rev. | | | | 500,000 | | | | | 2.63 | | | | | 8/1/45 | | | | | 497,735 | |
New York City Housing Development Corp. Multifamily Mtg. Rev. | | | | 650,000 | | | | | 3.65 | | | | | 11/1/47 | | | | | 683,352 | |
New York City Housing Development Corp. Multifamily Mtg. Rev. | | | | 500,000 | | | | | 3.95 | | | | | 11/1/49 | | | | | 540,240 | |
New York City Housing Development Corp. Multifamily Mtg. Rev. | | | | 500,000 | | | | | 2.80 | | | | | 2/1/50 | | | | | 504,810 | |
New York City Housing Development Corp. Multifamily Mtg. Rev. | | | | 1,000,000 | | | | | 3.00 | | | | | 11/1/55 | | | | | 1,018,990 | |
| | | | |
See accompanying notes to financial statements. | | | | |
| | |
30 | | | SIT MUTUAL FUNDS SEMI-ANNUAL REPORT | |
| | | | | | | | | | | | | | | | | | | | |
| Name of Issuer | | Principal
Amount ($) | | Coupon
Rate (%) | | Maturity
Date | | Fair
Value ($) |
New York City Housing Development Corp. Multifamily Mtg. Rev. | | | | 1,500,000 | | | | | 2.60 | | | | | 11/1/56 | | | | | 1,475,220 | |
New York City Housing Development Corp. Multifamily Mtg. Rev. | | | | 1,000,000 | | | | | 2.80 | | | | | 11/1/60 | | | | | 1,001,770 | |
New York City Housing Development Corp. Rev. | | | | 500,000 | | | | | 3.80 | | | | | 11/1/37 | | | | | 504,400 | |
New York City Municipal Water Finance Authority | | | | 750,000 | | | | | 5.00 | | | | | 6/15/38 | | | | | 807,892 | |
New York Transportation Dev. Corp. Rev. (John F. Kennedy International Airport Proj.) | | | | 300,000 | | | | | 4.00 | | | | | 12/1/40 | | | | | 339,381 | |
New York Transportation Dev. Corp. Rev. (Laguardia Airport Proj.) | | | | 750,000 | | | | | 4.00 | | | | | 10/1/30 | | | | | 875,565 | |
NY Monroe Co. Industrial Development Corp. Rev. (St. Ann’s Community Proj.) | | | | 705,000 | | | | | 4.00 | | | | | 1/1/30 | | | | | 774,464 | |
NY Mortgage Agency Rev. | | | | 95,000 | | | | | 3.75 | | | | | 10/1/42 | | | | | 95,642 | |
NY Mortgage Agency Rev. | | | | 1,230,000 | | | | | 3.80 | | | | | 10/1/48 | | | | | 1,299,237 | |
NY State Dormitory Auth. Rev. Ref. (N. Shore-Long Island Jewish Obligation) | | | | 300,000 | | | | | 5.00 | | | | | 5/1/33 | | | | | 343,539 | |
NY State Housing Finance Agency Rev. | | | | 500,000 | | | | | 2.75 | | | | | 11/1/45 | | | | | 506,470 | |
NY State Housing Finance Agency Rev. | | | | 1,000,000 | | | | | 2.60 | | | | | 11/1/46 | | | | | 968,060 | |
NY State Housing Finance Agency Rev. | | | | 1,000,000 | | | | | 2.75 | | | | | 11/1/56 | | | | | 955,870 | |
NY State Housing Finance Agency Rev. (Affordable Hsg. Proj.) | | | | 590,000 | | | | | 3.75 | | | | | 11/1/37 | | | | | 596,006 | |
NY State Housing Finance Agency Rev. (Affordable Hsg. Proj.) | | | | 400,000 | | | | | 4.88 | | | | | 11/1/42 | | | | | 400,740 | |
NY State Housing Finance Agency Rev. (Affordable Hsg. Proj.) (FNMA/FHLMC Collateralized) | | | | 500,000 | | | | | 3.65 | | | | | 11/1/34 | | | | | 522,020 | |
NY State Housing Finance Agency Rev. (Affordable Hsg. Proj.) (GNMA/FNMA/FHLMC Collateralized) | | | | 500,000 | | | | | 3.95 | | | | | 11/1/37 | | | | | 538,360 | |
NY State Housing Finance Agency Rev. (GNMA/FNMA/FHLMC Collateralized) | | | | 250,000 | | | | | 4.10 | | | | | 11/1/41 | | | | | 269,197 | |
NY State Mortgage Agency Rev. | | | | 750,000 | | | | | 2.20 | | | | | 4/1/36 | | | | | 741,855 | |
NY State Mortgage Agency Rev. | | | | 1,000,000 | | | | | 2.50 | | | | | 10/1/46 | | | | | 985,760 | |
NY State Mortgage Agency Rev. | | | | 1,700,000 | | | | | 2.55 | | | | | 4/1/50 | | | | | 1,658,316 | |
Western Regional Off-Track Betting Corp. Rev. 4 | | | | 500,000 | | | | | 4.13 | | | | | 12/1/41 | | | | | 493,560 | |
| | | | | | | | | | | | | | | | | | | | |
| | | | |
| | | | | | | | | | | | | | | | | | | 21,735,897 | |
| | | | | | | | | | | | | | | | | | | | |
| | | | |
North Carolina - 1.4% | | | | | | | | | | | | | | | | | | | | |
Mecklenburg Co. Rev. (Little Rock Apts) | | | | 65,000 | | | | | 5.15 | | | | | 1/1/22 | | | | | 65,541 | |
Mecklenburg Co. Rev. (Little Rock Apts) | | | | 510,000 | | | | | 5.38 | | | | | 1/1/36 | | | | | 514,932 | |
NC Education Assistance Auth. Senior Bond-Student Loan Rev. | | | | 405,000 | | | | | 3.13 | | | | | 6/1/39 | | | | | 409,362 | |
NC Housing Finance Agency Rev. | | | | 245,000 | | | | | 3.95 | | | | | 1/1/41 | | | | | 263,331 | |
NC Housing Finance Agency Rev. | | | | 625,000 | | | | | 4.00 | | | | | 7/1/47 | | | | | 673,537 | |
NC Housing Finance Agency Rev. (GNMA/FNMA/FHLMC Collateralized) | | | | 1,000,000 | | | | | 2.40 | | | | | 7/1/44 | | | | | 974,790 | |
NC Housing Finance Agency Rev. (GNMA/FNMA/FHLMC Collateralized) | | | | 385,000 | | | | | 4.00 | | | | | 1/1/48 | | | | | 412,701 | |
NC Housing Finance Agency Rev. (GNMA/FNMA/FHLMC Collateralized) | | | | 910,000 | | | | | 3.63 | | | | | 7/1/49 | | | | | 964,227 | |
NC Medical Care Comm. Rev. (Salemtowne Proj.) | | | | 400,000 | | | | | 5.00 | | | | | 10/1/38 | | | | | 444,236 | |
University of North Carolina School of the Arts | | | | 500,000 | | | | | 3.25 | | | | | 2/1/46 | | | | | 530,040 | |
| | | | | | | | | | | | | | | | | | | | |
| | | | |
| | | | | | | | | | | | | | | | | | | 5,252,697 | |
| | | | | | | | | | | | | | | | | | | | |
| | | | |
North Dakota - 0.6% | | | | | | | | | | | | | | | | | | | | |
ND Housing Finance Agency Rev. | | | | 290,000 | | | | | 3.85 | | | | | 1/1/42 | | | | | 310,100 | |
ND Housing Finance Agency Rev. | | | | 1,000,000 | | | | | 2.35 | | | | | 7/1/44 | | | | | 981,490 | |
ND Housing Finance Agency Rev. | | | | 1,000,000 | | | | | 2.50 | | | | | 7/1/44 | | | | | 1,009,910 | |
| | | | | | | | | | | | | | | | | | | | |
| | | | |
| | | | | | | | | | | | | | | | | | | 2,301,500 | |
| | | | | | | | | | | | | | | | | | | | |
| | | | |
Ohio - 2.9% | | | | | | | | | | | | | | | | | | | | |
Butler Co. Port Auth. Rev. | | | | 640,000 | | | | | 5.00 | | | | | 12/1/34 | | | | | 641,594 | |
Cleveland-Cuyahoga County Port Auth. Rev. (Cleveland Museum of Natural History Proj.) | | | | 500,000 | | | | | 4.00 | | | | | 7/1/46 | | | | | 577,680 | |
Cleveland-Cuyahoga County Port Auth. Tax Allocation (Flats East Bank Proj.) 4 | | | | 500,000 | | | | | 4.00 | | | | | 12/1/55 | | | | | 523,375 | |
Cleveland-Cuyahoga County Port Auth. Tax Allocation (Flats East Bank Proj.) 4 | | | | 500,000 | | | | | 4.50 | | | | | 12/1/55 | | | | | 529,370 | |
Columbus-Franklin Co. Finance Auth. Rev. (Beulah Park Phase 1 Proj.) | | | | 840,000 | | | | | 4.00 | | | | | 5/15/49 | | | | | 928,477 | |
Franklin Co. Health Care Facs. Rev. (Ohio Living Communities) | | | | 1,000,000 | | | | | 4.00 | | | | | 7/1/45 | | | | | 1,120,700 | |
Lake Co. Port & Economic Dev. Auth. Rev. (Tapestry Wickliffe Proj.) 2, 4, 5 | | | | 250,000 | | | | | 6.50 | | | | | 12/1/37 | | | | | 88,750 | |
Liberty Community Infrastructure Financing Auth. Special Assessment | | | | 500,000 | | | | | 3.13 | | | | | 12/1/46 | | | | | 527,175 | |
Lucas Metro Hsg. Auth. | | | | 500,000 | | | | | 5.00 | | | | | 11/1/36 | | | | | 547,755 | |
OH Higher Educational Facs. Commission Rev. (Tiffin University Proj.) | | | | 1,045,000 | | | | | 4.00 | | | | | 11/1/49 | | | | | 1,074,532 | |
OH Housing Finance Agency Rev. | | | | 705,000 | | | | | 3.35 | | | | | 9/1/49 | | | | | 738,071 | |
| | | | |
See accompanying notes to financial statements. | | | | |
| | |
SEPTEMBER 30, 2021 | | | 31 | |
SCHEDULE OF INVESTMENTS (Unaudited)
September 30, 2021
Sit Tax-Free Income Fund (Continued)
| | | | | | | | | | | | | | | | | | | | |
| Name of Issuer | | Principal
Amount ($) | | Coupon
Rate (%) | | Maturity
Date | | Fair
Value ($) |
OH Housing Finance Agency Rev. | | | | 1,990,000 | | | | | 2.45 | | | | | 9/1/51 | | | | | 1,927,056 | |
OH Housing Finance Agency Rev. (GNMA/FNMA Collateralized) | | | | 270,000 | | | | | 4.05 | | | | | 3/1/37 | | | | | 291,487 | |
OH Housing Finance Agency Rev. (GNMA/FNMA/FHLMC Collateralized) | | | | 305,000 | | | | | 3.35 | | | | | 9/1/39 | | | | | 317,996 | |
OH Housing Finance Agency Rev. (GNMA/FNMA/FHLMC Collateralized) | | | | 525,000 | | | | | 4.00 | | | | | 9/1/48 | | | | | 559,356 | |
OH Housing Finance Agency Rev. (GNMA/FNMA/FHLMC Collateralized) | | | | 455,000 | | | | | 4.00 | | | | | 3/1/49 | | | | | 490,954 | |
Port of Greater Cincinnati Dev. Auth. Rev. (St. Xavier High School, Inc. Proj.) | | | | 400,000 | | | | | 4.00 | | | | | 4/1/40 | | | | | 460,676 | |
| | | | | | | | | | | | | | | | | | | | |
| | | | |
| | | | | | | | | | | | | | | | | | | 11,345,004 | |
| | | | | | | | | | | | | | | | | | | | |
| | | | |
Oklahoma - 0.3% | | | | | | | | | | | | | | | | | | | | |
| | | | |
Oklahoma Dev. Finance Auth. Rev. (Oklahoma City University Proj.) | | | | 1,000,000 | | | | | 5.00 | | | | | 8/1/49 | | | | | 1,174,060 | |
| | | | | | | | | | | | | | | | | | | | |
| | | | |
Oregon - 1.7% | | | | | | | | | | | | | | | | | | | | |
Clackamas Co. Hospital Facs. Auth. Rev. (Rose Villa Proj.) | | | | 500,000 | | | | | 5.38 | | | | | 11/15/55 | | | | | 552,000 | |
Clackamas Co. Hsg. Auth. Rev. (Easton Ridge Apts. Proj.) | | | | 350,000 | | | | | 3.50 | | | | | 9/1/33 | | | | | 356,573 | |
Forest Grove Rev. (Campus Improvement-Pacific Unv. Proj.) | | | | 250,000 | | | | | 5.25 | | | | | 5/1/34 | | | | | 256,032 | |
Marion Co. School District No.1 Gervais G.O. | | | | 500,000 | | | | | 4.00 | | | | | 6/1/33 | | | | | 500,930 | |
OR Hsg. & Community Services Dept. Rev. | | | | 225,000 | | | | | 3.80 | | | | | 7/1/34 | | | | | 245,939 | |
OR Hsg. & Community Services Dept. Rev. (Single Family Mtg. Program) | | | | 115,000 | | | | | 3.75 | | | | | 7/1/35 | | | | | 115,000 | |
OR Hsg. & Community Services Dept. Rev. (Single Family Mtg. Program) | | | | 345,000 | | | | | 4.00 | | | | | 7/1/38 | | | | | 350,920 | |
OR Hsg. & Community Services Dept. Rev. (Single Family Mtg. Program) | | | | 500,000 | | | | | 2.35 | | | | | 1/1/44 | | | | | 504,355 | |
OR Hsg. & Community Services Dept. Rev. (Single Family Mtg. Program) | | | | 500,000 | | | | | 2.38 | | | | | 1/1/45 | | | | | 483,810 | |
OR Hsg. & Community Services Dept. Rev. (Single Family Mtg. Program) | | | | 360,000 | | | | | 3.75 | | | | | 7/1/48 | | | | | 379,422 | |
OR State Ref G.O. (Veterans Welfare Service) | | | | 1,000,000 | | | | | 3.90 | | | | | 12/1/39 | | | | | 1,035,490 | |
Polk Co. Hospital Fac. Auth. Rev. (Dallas Retirement Village Proj.) | | | | 1,000,000 | | | | | 4.00 | | | | | 7/1/24 | | | | | 1,000,560 | |
Polk Co. Hospital Fac. Auth. Rev. (Dallas Retirement Village Proj.) | | | | 500,000 | | | | | 5.13 | | | | | 7/1/55 | | | | | 518,695 | |
Yamhill County Hospital Auth. Rev. (Friendsview) | | | | 350,000 | | | | | 5.00 | | | | | 11/15/56 | | | | | 404,254 | |
| | | | | | | | | | | | | | | | | | | | |
| | | | |
| | | | | | | | | | | | | | | | | | | 6,703,980 | |
| | | | | | | | | | | | | | | | | | | | |
| | | | |
Pennsylvania - 2.5% | | | | | | | | | | | | | | | | | | | | |
Allegheny Co. Industrial Dev. Auth. Charter School Rev. (Propel Charter-McKeesport) | | | | 100,000 | | | | | 5.90 | | | | | 8/15/26 | | | | | 100,307 | |
Butler Co. General Authority Rev. (School District Proj.) (AGM G.O. of District) 1 | | | | 465,000 | | | | | 0.80 | | | | | 10/1/34 | | | | | 452,068 | |
Chester Co. Health & Education Fac. Auth. Rev. (The Devereux Foundation) | | | | 475,000 | | | | | 3.00 | | | | | 11/1/30 | | | | | 499,510 | |
Commonwealth Financing Auth. Rev. (Tobacco Master Settlement Payment) (AGM Insured) | | | | 350,000 | | | | | 4.00 | | | | | 6/1/39 | | | | | 397,030 | |
Dauphin Co. General Auth. Rev. (Harrisburg University Science Technology) 4 | | | | 200,000 | | | | | 4.00 | | | | | 10/15/22 | | | | | 201,926 | |
PA Higher Educational Assistance Agy. Rev. | | | | 500,000 | | | | | 2.63 | | | | | 6/1/42 | | | | | 498,150 | |
PA Higher Educational Facs. Auth. Rev. (La Salle University) | | | | 280,000 | | | | | 5.00 | | | | | 5/1/42 | | | | | 285,712 | |
PA Hsg. Finance Agy. Rev. | | | | 795,000 | | | | | 3.65 | | | | | 10/1/42 | | | | | 824,924 | |
PA Hsg. Finance Agy. Rev. | | | | 500,000 | | | | | 3.00 | | | | | 10/1/46 | | | | | 511,495 | |
PA Hsg. Finance Agy. Rev. | | | | 120,000 | | | | | 4.00 | | | | | 10/1/46 | | | | | 128,882 | |
PA Hsg. Finance Agy. Rev. | | | | 60,000 | | | | | 4.00 | | | | | 10/1/47 | | | | | 60,000 | |
PA Hsg. Finance Agy. Rev. | | | | 1,000,000 | | | | | 3.40 | | | | | 10/1/49 | | | | | 1,044,110 | |
PA Hsg. Finance Agy. Rev. | | | | 1,000,000 | | | | | 2.55 | | | | | 10/1/51 | | | | | 970,740 | |
PA Turnpike Commission Rev. Capital Appreciation 6 | | | | 1,250,000 | | | | | 5.00 | | | | | 12/1/38 | | | | | 1,542,875 | |
Philadelphia Industrial Dev. Auth. Rev. (Alliance for Progress Charter School Proj.) | | | | 635,000 | | | | | 5.00 | | | | | 6/15/49 | | | | | 681,869 | |
Philadelphia Industrial Dev. Auth. Rev. (Charter School Proj.) | | | | 350,000 | | | | | 5.63 | | | | | 8/1/36 | | | | | 391,136 | |
Southcentral General Auth. Rev. (York College of Pennsylvania) | | | | 500,000 | | | | | 4.00 | | | | | 11/1/37 | | | | | 579,525 | |
West Cornwall Township Municipal Auth. Rev. (Lebanon Valley Brethren Home Proj.) | | | | 525,000 | | | | | 4.00 | | | | | 11/15/46 | | | | | 598,505 | |
| | | | | | | | | | | | | | | | | | | | |
| | | | |
| | | | | | | | | | | | | | | | | | | 9,768,764 | |
| | | | | | | | | | | | | | | | | | | | |
| | | | |
Rhode Island - 0.4% | | | | | | | | | | | | | | | | | | | | |
RI Hsg. & Mortgage Finance Corp. Rev. | | | | 250,000 | | | | | 3.90 | | | | | 10/1/37 | | | | | 254,545 | |
RI Hsg. & Mortgage Finance Corp. Rev. | | | | 500,000 | | | | | 2.80 | | | | | 4/1/45 | | | | | 498,235 | |
RI Student Loan Auth. Rev. | | | | 750,000 | | | | | 3.63 | | | | | 12/1/37 | | | | | 777,960 | |
| | | | | | | | | | | | | | | | | | | | |
| | | | |
| | | | | | | | | | | | | | | | | | | 1,530,740 | |
| | | | | | | | | | | | | | | | | | | | |
| | | | |
See accompanying notes to financial statements. | | | | |
| | |
32 | | | SIT MUTUAL FUNDS SEMI-ANNUAL REPORT | |
| | | | | | | | | | | | | | | | | | | | |
| Name of Issuer | | Principal
Amount ($) | | Coupon
Rate (%) | | Maturity
Date | | Fair
Value ($) |
| | | | |
South Carolina - 1.0% | | | | | | | | | | | | | | | | | | | | |
Berkeley Co. Nexton Improvement District Special Assessment | | | | 350,000 | | | | | 4.25 | | | | | 11/1/40 | | | | | 391,261 | |
SC Education Assistance Auth. Student Loan Rev. | | | | 80,000 | | | | | 5.10 | | | | | 10/1/29 | | | | | 80,037 | |
SC Jobs-Economic Dev. Auth. Rev. (Bishop Gadsden Episcopal Retirement Community) | | | | 500,000 | | | | | 4.00 | | | | | 4/1/54 | | | | | 541,060 | |
SC Jobs-Economic Dev. Auth. Rev. (Bon Secours Mercy Health, Inc.) | | | | 750,000 | | | | | 4.00 | | | | | 12/1/44 | | | | | 868,268 | |
SC Jobs-Economic Dev. Auth. Rev. (Kiawah Life Plan Village, Inc. Proj.) 4 | | | | 500,000 | | | | | 8.75 | | | | | 7/1/25 | | | | | 505,100 | |
SC Public Service Auth. Rev. (Santee Cooper) | | | | 250,000 | | | | | 5.00 | | | | | 12/1/38 | | | | | 276,990 | |
SC Public Service Auth. Rev. (Santee Cooper) | | | | 500,000 | | | | | 5.75 | | | | | 12/1/43 | | | | | 558,805 | |
SC State Hsg. Finance & Dev. Auth. Rev. | | | | 490,000 | | | | | 3.05 | | | | | 7/1/45 | | | | | 507,429 | |
| | | | | | | | | | | | | | | | | | | | |
| | | | |
| | | | | | | | | | | | | | | | | | | 3,728,950 | |
| | | | | | | | | | | | | | | | | | | | |
| | | | |
South Dakota - 0.1% | | | | | | | | | | | | | | | | | | | | |
| | | | |
SD Health & Educational Facs. Auth. Rev. (Westhills Village Retirement Community) | | | | 500,000 | | | | | 5.00 | | | | | 9/1/40 | | | | | 567,905 | |
| | | | | | | | | | | | | | | | | | | | |
| | | | |
Tennessee - 2.6% | | | | | | | | | | | | | | | | | | | | |
Franklin Health & Education Facs. Board Rev. (Provision Cares Proton Therapy Center) 2, 4, 5 | | | | 500,000 | | | | | 6.50 | | | | | 6/1/27 | | | | | 150,000 | |
Metropolitan Govt. Nashville & Davidson County Health & Edu. Facs. Board Rev. (Blakford at Green Hills) | | | | 895,000 | | | | | 4.00 | | | | | 11/1/45 | | | | | 952,772 | |
Nashville Metropolitan Dev. & Hsg. Agency Tax Allocation 4 | | | | 300,000 | | | | | 5.13 | | | | | 6/1/36 | | | | | 341,895 | |
Shelby Co. Health, Education & Hsg. Facs. Rev. (CME Memphis Apts. Proj.) 2, 5,15 | | | | 1,850,000 | | | | | 5.35 | | | | | N/A | | | | | 4,625 | |
Shelby Co. Health, Education & Hsg. Facs. Rev. (CME Memphis Apts. Proj.) 2, 5 | | | | 7,875,000 | | | | | 5.55 | | | | | 1/1/29 | | | | | 19,687 | |
Shelby Co. Health, Education & Hsg. Facs. Rev. (CME Memphis Apts. Proj.) 2, 5 | | | | 1,630,000 | | | | | 6.00 | | | | | 1/1/29 | | | | | 16 | |
Shelby Co. Health, Education & Hsg. Facs. Rev. (The Farms at Bailey Station Proj.) | | | | 650,000 | | | | | 5.50 | | | | | 10/1/39 | | | | | 695,474 | |
TN Hsg. Dev. Agency. Rev. | | | | 270,000 | | | | | 3.60 | | | | | 1/1/31 | | | | | 275,640 | |
TN Hsg. Dev. Agency. Rev. | | | | 330,000 | | | | | 3.88 | | | | | 7/1/35 | | | | | 344,982 | |
TN Hsg. Dev. Agency. Rev. | | | | 160,000 | | | | | 3.95 | | | | | 7/1/35 | | | | | 167,517 | |
TN Hsg. Dev. Agency. Rev. | | | | 345,000 | | | | | 4.00 | | | | | 7/1/39 | | | | | 366,331 | |
TN Hsg. Dev. Agency. Rev. | | | | 390,000 | | | | | 3.85 | | | | | 7/1/42 | | | | | 417,374 | |
TN Hsg. Dev. Agency. Rev. | | | | 380,000 | | | | | 3.90 | | | | | 7/1/42 | | | | | 411,491 | |
TN Hsg. Dev. Agency. Rev. | | | | 875,000 | | | | | 4.00 | | | | | 7/1/44 | | | | | 918,487 | |
TN Hsg. Dev. Agency. Rev. | | | | 1,000,000 | | | | | 2.55 | | | | | 1/1/45 | | | | | 1,009,060 | |
TN Hsg. Dev. Agency. Rev. | | | | 750,000 | | | | | 2.38 | | | | | 7/1/46 | | | | | 722,318 | |
TN Hsg. Dev. Agency. Rev. | | | | 850,000 | | | | | 3.95 | | | | | 1/1/49 | | | | | 891,336 | |
TN Hsg. Dev. Agency. Rev. | | | | 1,260,000 | | | | | 4.05 | | | | | 1/1/49 | | | | | 1,364,341 | |
TN Hsg. Dev. Agency. Rev. | | | | 1,000,000 | | | | | 2.50 | | | | | 7/1/51 | | | | | 970,690 | |
| | | | | | | | | | | | | | | | | | | | |
| | | | |
| | | | | | | | | | | | | | | | | | | 10,024,036 | |
| | | | | | | | | | | | | | | | | | | | |
| | | | |
Texas - 6.5% | | | | | | | | | | | | | | | | | | | | |
Arlington Higher Education Finance Corp., Education Rev. (Leadership Prep School) | | | | 200,000 | | | | | 5.00 | | | | | 6/15/36 | | | | | 200,500 | |
Arlington Higher Education Finance Corp., Education Rev. (Ninos, Inc.) | | | | 350,000 | | | | | 2.38 | | | | | 8/15/51 | | | | | 321,174 | |
Arlington Higher Education Finance Corp., Education Rev. (Pineywoods Community Academy) | | | | 750,000 | | | | | 2.38 | | | | | 8/15/51 | | | | | 688,230 | |
Arlington Special Tax (BAM Insured) | | | | 350,000 | | | | | 5.00 | | | | | 2/15/41 | | | | | 389,337 | |
Brazos Higher Education Auth., Inc. Rev. (Subordinate Student Loan) | | | | 1,000,000 | | | | | 3.00 | | | | | 4/1/40 | | | | | 943,460 | |
Central Texas Regional Mobility Auth. Rev. | | | | 500,000 | | | | | 4.00 | | | | | 1/1/45 | | | | | 563,045 | |
Central Texas Regional Mobility Auth. Rev. | | | | 500,000 | | | | | 4.00 | | | | | 1/1/50 | | | | | 562,130 | |
Cypress Hill Municipal Utility Dist. No. 1 G.O. (AGM Insured) | | | | 1,000,000 | | | | | 4.00 | | | | | 9/1/34 | | | | | 1,029,880 | |
Dallas/Fort Worth International Airport Rev. (JT Improvement) | | | | 500,000 | | | | | 5.25 | | | | | 11/1/37 | | | | | 548,845 | |
Danbury Higher Education Auth. Education Rev. (Golden Rule Schools) | | | | 650,000 | | | | | 5.13 | | | | | 8/15/49 | | | | | 663,046 | |
Edinburg Economic Dev. Corp. Rev. | | | | 225,000 | | | | | 3.00 | | | | | 8/15/31 | | | | | 221,400 | |
Edinburg Economic Dev. Corp. Rev. | | | | 500,000 | | | | | 3.25 | | | | | 8/15/41 | | | | | 475,985 | |
El Paso Co. Hospital District G.O. | | | | 825,000 | | | | | 5.00 | | | | | 8/15/43 | | | | | 883,765 | |
Grand Parkway Transportation Corp. Rev. (Grand Parkway System) (BAM Insured) | | | | 1,000,000 | | | | | 3.00 | | | | | 10/1/50 | | | | | 1,053,440 | |
Hale Center Education Facs. Corp. Rev. (Wayland Baptist University Proj.) | | | | 500,000 | | | | | 5.00 | | | | | 3/1/35 | | | | | 504,930 | |
Harris Co. Cultural Education Facs. Finance Corp. Rev. (Brazos Presbyterian Homes, Inc. Proj.) | | | | 500,000 | | | | | 5.00 | | | | | 1/1/37 | | | | | 554,480 | |
Houston Higher Education Finance Corp. (Cosmos Foundation) | | | | 480,000 | | | | | 5.00 | | | | | 2/15/32 | | | | | 486,221 | |
Houston Higher Education Finance Corp. (Houston Baptist University Proj.) | | | | 500,000 | | | | | 3.38 | | | | | 10/1/37 | | | | | 500,145 | |
| | | | |
See accompanying notes to financial statements. | | | | |
| | |
SEPTEMBER 30, 2021 | | | 33 | |
SCHEDULE OF INVESTMENTS (Unaudited)
September 30, 2021
Sit Tax-Free Income Fund (Continued)
| | | | | | | | | | | | | | | | | | | | |
| Name of Issuer | | Principal
Amount ($) | | Coupon
Rate (%) | | Maturity
Date | | Fair
Value ($) |
| | | | |
Meadowhill Regional Municipal Utility Dist. G.O. (AGM Insured) | | | | 500,000 | | | | | 4.00 | | | | | 10/1/35 | | | | | 515,935 | |
New Hope Cultural Education Fac. Corp. Rev. (Cardinal Bay) | | | | 260,000 | | | | | 4.00 | | | | | 7/1/23 | | | | | 254,259 | |
New Hope Cultural Education Fac. Corp. Rev. (Cardinal Bay) | | | | 460,000 | | | | | 4.00 | | | | | 7/1/26 | | | | | 427,510 | |
New Hope Cultural Education Facs. Corp. Rev. (Beta Academy) 4 | | | | 425,000 | | | | | 5.00 | | | | | 8/15/39 | | | | | 446,233 | |
New Hope Cultural Education Facs. Corp. Rev. (Flower Mound Campus Proj.) 9 | | | | 495,000 | | | | | 3.75 | | | | | 6/1/28 | | | | | 505,113 | |
New Hope Cultural Education Facs. Corp. Rev. (Flower Mound Campus Proj.) 9 | | | | 500,000 | | | | | 4.00 | | | | | 6/1/32 | | | | | 511,005 | |
New Hope Cultural Education Facs. Corp. Rev. (Jubilee Academic Center) 4 | | | | 250,000 | | | | | 5.00 | | | | | 8/15/36 | | | | | 250,540 | |
New Hope Cultural Education Facs. Corp. Rev. (Presbyterian Village North Proj.) | | | | 500,000 | | | | | 5.00 | | | | | 10/1/34 | | | | | 547,280 | |
New Hope Cultural Education Facs. Corp. Rev. (Wesleyan Homes, Inc. Proj.) | | | | 250,000 | | | | | 5.50 | | | | | 1/1/35 | | | | | 263,220 | |
New Hope Cultural Education Facs. Finance Corp. Rev. (Presbyterian Village North Proj.) | | | | 350,000 | | | | | 5.25 | | | | | 10/1/49 | | | | | 381,636 | |
New Hope Cultural Education Facs. Finance Corp. Rev. (Wesleyan Homes, Inc. Proj.) | | | | 750,000 | | | | | 5.00 | | | | | 1/1/55 | | | | | 779,482 | |
New Hope Cultural Education Facs. Finance Corp. Rev. (Westminster Proj.) | | | | 500,000 | | | | | 4.00 | | | | | 11/1/49 | | | | | 561,895 | |
Newark Higher Education Finance Corp. Rev. (Austin Achieve Public School) | | | | 100,000 | | | | | 5.00 | | | | | 6/15/37 | | | | | 103,284 | |
Newark Higher Education Finance Corp. Rev. (Austin Achieve Public School) | | | | 1,000,000 | | | | | 5.00 | | | | | 6/15/42 | | | | | 1,032,840 | |
North Central Texas Health Facility Development Corp. (CC Young Memorial Home) 5 | | | | 204,000 | | | | | 5.38 | | | | | 2/15/25 | | | | | 142,800 | |
Parkway Utility Dist. G.O. (BAM Insured) | | | | 500,000 | | | | | 3.63 | | | | | 3/1/35 | | | | | 500,935 | |
Parkway Utility Dist. G.O. (Waterworks and Sewer System) (BAM Insured) | | | | 275,000 | | | | | 4.00 | | | | | 3/1/33 | | | | | 278,732 | |
Red River Health Facs. Dev. Corp. Rev. (MRC Crossings Proj.) | | | | 250,000 | | | | | 7.50 | | | | | 11/15/34 | | | | | 275,517 | |
Sugar Land Dev. Corp. Rev. (BAM Insured) | | | | 500,000 | | | | | 5.00 | | | | | 2/15/33 | | | | | 530,435 | |
Tarrant Co. Cultural Education Facs. Finance Corp. Rev. (Buckingham Senior Living Community, Inc.) 2, 5 | | | | 500,000 | | | | | 5.63 | | | | | 11/15/27 | | | | | 285,000 | |
Tarrant Co. Cultural Education Facs. Finance Corp. Rev. (Buckner Retirement Service) | | | | 500,000 | | | | | 5.00 | | | | | 11/15/37 | | | | | 593,230 | |
Tarrant Co. Cultural Education Facs. Finance Corp. Rev. (Buckner Senior Living Ventana Proj.) | | | | 120,000 | | | | | 5.63 | | | | | 11/15/24 | | | | | 120,227 | |
TX Department of Housing & Community Affairs (GNMA Collateralized) | | | | 460,000 | | | | | 4.13 | | | | | 9/1/38 | | | | | 496,294 | |
TX Department of Housing & Community Affairs (GNMA Collateralized) | | | | 1,100,000 | | | | | 3.63 | | | | | 9/1/44 | | | | | 1,179,013 | |
TX Department of Housing & Community Affairs (GNMA Collateralized) | | | | 500,000 | | | | | 3.00 | | | | | 9/1/45 | | | | | 520,220 | |
TX Department of Housing & Community Affairs (GNMA Collateralized) | | | | 1,000,000 | | | | | 2.50 | | | | | 7/1/51 | | | | | 995,230 | |
TX Department of Housing & Community Affairs (GNMA Collateralized) | | | | 750,000 | | | | | 2.35 | | | | | 9/1/51 | | | | | 735,285 | |
TX Grand Parkway Transportation Corp. Rev. 6 | | | | 500,000 | | | | | 6.00 | | | | | 10/1/35 | | | | | 578,495 | |
TX State Affordable Hsg. Corp. Rev. (Heroes Home Loan Program) (GNMA Collateralized) | | | | 630,000 | | | | | 4.00 | | | | | 3/1/50 | | | | | 655,786 | |
| | | | | | | | | | | | | | | | | | | | |
| | | | |
| | | | | | | | | | | | | | | | | | | 25,057,444 | |
| | | | | | | | | | | | | | | | | | | | |
Utah - 0.8% | | | | | | | | | | | | | | | | | | | | |
Black Desert Public Infrastructure District G.O. 4 | | | | 500,000 | | | | | 4.00 | | | | | 3/1/51 | | | | | 500,560 | |
Military Installation Dev. Auth. Rev. | | | | 400,000 | | | | | 4.00 | | | | | 6/1/41 | | | | | 407,596 | |
Military Installation Dev. Auth. Rev. | | | | 1,000,000 | | | | | 4.00 | | | | | 6/1/52 | | | | | 1,009,430 | |
ROAM Public Infrastructure District No. 1 G.O. 4 | | | | 500,000 | | | | | 4.25 | | | | | 3/1/51 | | | | | 486,625 | |
UT Hsg. Corp. Single Family Mtg. Rev. | | | | 25,000 | | | | | 5.75 | | | | | 1/1/33 | | | | | 25,054 | |
UT Hsg. Corp. Single Family Mtg. Rev. | | | | 45,000 | | | | | 4.60 | | | | | 7/1/34 | | | | | 45,056 | |
UT Hsg. Corp. Single Family Mtg. Rev. (FHA Insured) | | | | 195,000 | | | | | 4.00 | | | | | 1/1/36 | | | | | 203,954 | |
West Valley City Municipal Building Auth. Rev. (AGM Insured) | | | | 400,000 | | | | | 5.00 | | | | | 2/1/39 | | | | | 468,348 | |
| | | | | | | | | | | | | | | | | | | | |
| | | | |
| | | | | | | | | | | | | | | | | | | 3,146,623 | |
| | | | | | | | | | | | | | | | | | | | |
Vermont - 0.2% | | | | | | | | | | | | | | | | | | | | |
Vermont Economic Dev. Auth. Mtg. Rev. (Wake Robin Corporation Proj.) | | | | 500,000 | | | | | 4.00 | | | | | 5/1/45 | | | | | 536,020 | |
VT Hsg. Fin. Agy. Rev. (GNMA/FNMA/FHLMC Collateralized) | | | | 250,000 | | | | | 3.50 | | | | | 5/1/38 | | | | | 262,560 | |
| | | | | | | | | | | | | | | | | | | | |
| | | | |
| | | | | | | | | | | | | | | | | | | 798,580 | |
| | | | | | | | | | | | | | | | | | | | |
Virginia - 0.3% | | | | | | | | | | | | | | | | | | | | |
James City Co. Economic Dev. Auth. Rev. | | | | 350,000 | | | | | 4.00 | | | | | 6/1/47 | | | | | 376,778 | |
VA Hsg. Dev. Auth. Rev. (GNMA/FNMA/FHLMC Collateralized) | | | | 500,000 | | | | | 2.45 | | | | | 11/1/45 | | | | | 501,065 | |
VA Hsg. Dev. Auth. Rev. (Rental Hsg. Proj.) | | | | 400,000 | | | | | 4.13 | | | | | 7/1/33 | | | | | 412,056 | |
| | | | | | | | | | | | | | | | | | | | |
| | | | |
| | | | | | | | | | | | | | | | | | | 1,289,899 | |
| | | | | | | | | | | | | | | | | | | | |
Washington - 2.6% | | | | | | | | | | | | | | | | | | | | |
Kalispel Tribe of Indians Rev. 4 | | | | 300,000 | | | | | 5.25 | | | | | 1/1/38 | | | | | 355,512 | |
King Co. Hsg. Auth. Rev. | | | | 1,000,000 | | | | | 3.00 | | | | | 11/1/39 | | | | | 1,060,730 | |
| | | | |
See accompanying notes to financial statements. | | | | |
| | |
34 | | | SIT MUTUAL FUNDS SEMI-ANNUAL REPORT | |
| | | | | | | | | | | | | | | | | | | | |
| Name of Issuer | | Principal
Amount ($) | | Coupon
Rate (%) | | Maturity
Date | | Fair
Value ($) |
| | | | |
King Co. Hsg. Auth. Rev. | | | | 500,000 | | | | | 2.38 | | | | | 10/1/41 | | | | | 487,840 | |
King Co. Hsg. Auth. Rev. (Bellevue Manor and Abbey Ridge) | | | | 750,000 | | | | | 3.00 | | | | | 8/1/40 | | | | | 790,170 | |
Pike Place Market Preservation Dev. Auth. Rev. | | | | 500,000 | | | | | 5.00 | | | | | 12/1/40 | | | | | 538,515 | |
Seattle Hsg. Auth. Rev. (Hinoki Apartments Proj.) | | | | 500,000 | | | | | 3.00 | | | | | 6/1/52 | | | | | 513,340 | |
Seattle Hsg. Auth. Rev. (Lam Bow Apartments Proj.) | | | | 500,000 | | | | | 2.38 | | | | | 6/1/41 | | | | | 487,230 | |
Snohomish Co. Hsg. Auth. Rev. | | | | 500,000 | | | | | 4.00 | | | | | 4/1/44 | | | | | 547,135 | |
Vancouver Hsg. Auth. Rev. | | | | 500,000 | | | | | 3.75 | | | | | 8/1/34 | | | | | 540,830 | |
Vancouver Hsg. Auth. Rev. (Anthem Park & Columbia Hsg. Proj.) | | | | 1,000,000 | | | | | 3.00 | | | | | 6/1/38 | | | | | 1,051,330 | |
Vancouver Hsg. Auth. Rev. (Van Vista Plaza Proj.) | | | | 1,000,000 | | | | | 3.30 | | | | | 12/1/51 | | | | | 1,051,680 | |
WA Hsg. Fin. Commission Multi Family Mtg. Rev. (Bayview Manor Homes) 4 | | | | 250,000 | | | | | 5.00 | | | | | 7/1/31 | | | | | 263,108 | |
WA Hsg. Fin. Commission Multi Family Mtg. Rev. (Bayview Manor Homes) 4 | | | | 1,000,000 | | | | | 5.00 | | | | | 7/1/36 | | | | | 1,046,270 | |
WA Hsg. Fin. Commission Multi Family Mtg. Rev. (Horizon House Proj.) 4 | | | | 500,000 | | | | | 5.00 | | | | | 1/1/38 | | | | | 573,645 | |
WA Hsg. Fin. Commission Multi Family Mtg. Rev. (Transforming Age Proj.) 4 | | | | 500,000 | | | | | 5.00 | | | | | 1/1/44 | | | | | 562,370 | |
WA Hsg. Fin. Commission Multi Family Mtg. Rev. (Wesley Homes Lea Hill Proj.) 4 | | | | 300,000 | | | | | 5.00 | | | | | 7/1/36 | | | | | 327,291 | |
| | | | | | | | | | | | | | | | | | | | |
| | | | |
| | | | | | | | | | | | | | | | | | | 10,196,996 | |
| | | | | | | | | | | | | | | | | | | | |
West Virginia - 0.6% | | | | | | | | | | | | | | | | | | | | |
WV Hsg. Dev. Fund Rev. | | | | 250,000 | | | | | 3.75 | | | | | 11/1/32 | | | | | 263,745 | |
WV Hsg. Dev. Fund Rev. | | | | 1,005,000 | | | | | 2.75 | | | | | 11/1/45 | | | | | 1,027,773 | |
WV Hsg. Dev. Fund Rev. | | | | 1,005,000 | | | | | 2.50 | | | | | 11/1/51 | | | | | 985,594 | |
| | | | | | | | | | | | | | | | | | | | |
| | | | |
| | | | | | | | | | | | | | | | | | | 2,277,112 | |
| | | | | | | | | | | | | | | | | | | | |
Wisconsin - 4.4% | | | | | | | | | | | | | | | | | | | | |
Public Finance Auth. Rev. (Appalachian Regional Healthcare System Obligated Group) | | | | 500,000 | | | | | 4.00 | | | | | 7/1/46 | | | | | 569,600 | |
Public Finance Auth. Rev. (Presbyterian Villages of Michigan) 4 | | | | 895,000 | | | | | 4.75 | | | | | 11/15/53 | | | | | 946,955 | |
WI Health & Education Facs. Auth. Rev. (Medical College) | | | | 870,000 | | | | | 5.25 | | | | | 12/1/35 | | | | | 873,306 | |
WI Health & Education Facs. Auth. Rev. (PHW Oconomowoc, Inc. Proj.) | | | | 500,000 | | | | | 5.13 | | | | | 10/1/48 | | | | | 517,945 | |
WI Health & Education Facs. Auth. Rev. (St. John’s Communities, Inc. Proj.) | | | | 500,000 | | | | | 5.00 | | | | | 9/15/40 | | | | | 532,060 | |
WI Health & Education Facs. Auth. Rev. (St. John’s Communities, Inc. Proj.) | | | | 500,000 | | | | | 5.00 | | | | | 9/15/45 | | | | | 530,375 | |
WI Health & Educational Facs. Auth. Rev. (Aspirus, Inc. Obligation Group) | | | | 500,000 | | | | | 5.00 | | | | | 8/15/32 | | | | | 564,090 | |
WI Health & Educational Facs. Auth. Rev. (Benevolent Corp. Cedar Community) | | | | 300,000 | | | | | 5.00 | | | | | 6/1/37 | | | | | 329,916 | |
WI Health & Educational Facs. Auth. Rev. (Froedtert Health, Inc. Obligated Group) | | | | 500,000 | | | | | 5.00 | | | | | 4/1/35 | | | | | 596,025 | |
WI Health & Educational Facs. Auth. Rev. (St. Camillus Health System, Inc.) | | | | 745,000 | | | | | 5.00 | | | | | 11/1/27 | | | | | 859,335 | |
WI Health & Educational Facs. Auth. Rev. (St. Camillus Health System, Inc.) | | | | 350,000 | | | | | 5.00 | | | | | 11/1/46 | | | | | 390,156 | |
WI Health & Educational Facs. Auth. Rev. (Three Pillars Senior Living Communities) | | | | 920,000 | | | | | 5.00 | | | | | 8/15/43 | | | | | 1,001,208 | |
WI Housing & Economic Dev. Auth. Rev. | | | | 250,000 | | | | | 3.88 | | | | | 11/1/35 | | | | | 265,613 | |
WI Housing & Economic Dev. Auth. Rev. | | | | 560,000 | | | | | 3.90 | | | | | 11/1/42 | | | | | 601,614 | |
WI Housing & Economic Dev. Auth. Rev. | | | | 1,500,000 | | | | | 4.15 | | | | | 5/1/55 | | | | | 1,607,415 | |
WI Housing & Economic Dev. Auth. Rev. | | | | 1,500,000 | | | | | 2.70 | | | | | 11/1/56 | | | | | 1,468,980 | |
WI Housing & Economic Dev. Auth. Rev. | | | | 500,000 | | | | | 3.38 | | | | | 5/1/57 | | | | | 520,195 | |
WI Public Finance Auth. Rev. (ACTS Retirement-Life Community, Inc.) | | | | 600,000 | | | | | 4.00 | | | | | 11/15/37 | | | | | 697,950 | |
WI Public Finance Auth. Rev. (Carmelite System, Inc.) | | | | 500,000 | | | | | 5.00 | | | | | 1/1/45 | | | | | 590,900 | |
WI Public Finance Auth. Rev. (Coral Academy of Science Reno) 4 | | | | 700,000 | | | | | 5.00 | | | | | 6/1/39 | | | | | 762,440 | |
WI Public Finance Auth. Rev. (Delray Beach Radiation Therapy) 4 | | | | 750,000 | | | | | 6.25 | | | | | 11/1/28 | | | | | 774,030 | |
WI Public Finance Auth. Rev. (Lombard Public Facilities Corp.) 2, 4, 6 | | | | 16,520 | | | | | 9.00 | | | | | 1/1/46 | | | | | 526 | |
WI Public Finance Auth. Rev. (Lombard Public Facilities Corp.) 2, 4, 6 | | | | 16,287 | | | | | 9.00 | | | | | 1/1/47 | | | | | 499 | |
WI Public Finance Auth. Rev. (Lombard Public Facilities Corp.) 2, 4, 6 | | | | 447 | | | | | 12.00 | | | | | 1/1/47 | | | | | 14 | |
WI Public Finance Auth. Rev. (Lombard Public Facilities Corp.) 2, 4, 6 | | | | 16,171 | | | | | 9.00 | | | | | 1/1/48 | | | | | 486 | |
WI Public Finance Auth. Rev. (Lombard Public Facilities Corp.) 2, 4, 6 | | | | 390 | | | | | 12.00 | | | | | 1/1/48 | | | | | 12 | |
WI Public Finance Auth. Rev. (Lombard Public Facilities Corp.) 2, 4, 6 | | | | 16,055 | | | | | 9.00 | | | | | 1/1/49 | | | | | 472 | |
WI Public Finance Auth. Rev. (Lombard Public Facilities Corp.) 2, 4, 6 | | | | 384 | | | | | 11.00 | | | | | 1/1/49 | | | | | 11 | |
WI Public Finance Auth. Rev. (Lombard Public Facilities Corp.) 2, 4, 6 | | | | 15,822 | | | | | 9.00 | | | | | 1/1/50 | | | | | 447 | |
WI Public Finance Auth. Rev. (Lombard Public Facilities Corp.) 2, 4, 6 | | | | 372 | | | | | 11.00 | | | | | 1/1/50 | | | | | 11 | |
WI Public Finance Auth. Rev. (Lombard Public Facilities Corp.) 2, 4, 6 | | | | 17,334 | | | | | 9.00 | | | | | 1/1/51 | | | | | 480 | |
| | | | |
See accompanying notes to financial statements. | | | | |
| | |
SEPTEMBER 30, 2021 | | | 35 | |
SCHEDULE OF INVESTMENTS (Unaudited)
September 30, 2021
Sit Tax-Free Income Fund (Continued)
| | | | | | | | | | | | | | | | | | | | |
| Name of Issuer | | Principal
Amount ($) | | Coupon
Rate (%) | | Maturity
Date | | Fair
Value ($) |
| | | | |
WI Public Finance Auth. Rev. (Lombard Public Facilities Corp.) 2, 4, 6 | | | | 365 | | | | | 11.00 | | | | | 1/1/51 | | | | | 10 | |
WI Public Finance Auth. Rev. (Lombard Public Facilities Corp.) 1, 2, 4, 5 | | | | 446,246 | | | | | 3.75 | | | | | 7/1/51 | | | | | 298,146 | |
WI Public Finance Auth. Rev. (Lombard Public Facilities Corp.) 2, 4, 6 | | | | 17,218 | | | | | 9.00 | | | | | 1/1/52 | | | | | 458 | |
WI Public Finance Auth. Rev. (Lombard Public Facilities Corp.) 2, 4, 6 | | | | 475 | | | | | 10.00 | | | | | 1/1/52 | | | | | 13 | |
WI Public Finance Auth. Rev. (Lombard Public Facilities Corp.) 2, 4, 6 | | | | 16,985 | | | | | 9.00 | | | | | 1/1/53 | | | | | 443 | |
WI Public Finance Auth. Rev. (Lombard Public Facilities Corp.) 2, 4, 6 | | | | 469 | | | | | 10.00 | | | | | 1/1/53 | | | | | 12 | |
WI Public Finance Auth. Rev. (Lombard Public Facilities Corp.) 2, 4, 6 | | | | 16,869 | | | | | 9.00 | | | | | 1/1/54 | | | | | 427 | |
WI Public Finance Auth. Rev. (Lombard Public Facilities Corp.) 2, 4, 6 | | | | 453 | | | | | 10.00 | | | | | 1/1/54 | | | | | 11 | |
WI Public Finance Auth. Rev. (Lombard Public Facilities Corp.) 2, 4, 6 | | | | 16,636 | | | | | 9.00 | | | | | 1/1/55 | | | | | 412 | |
WI Public Finance Auth. Rev. (Lombard Public Facilities Corp.) 2, 4, 6 | | | | 444 | | | | | 9.00 | | | | | 1/1/55 | | | | | 11 | |
WI Public Finance Auth. Rev. (Lombard Public Facilities Corp.) 2, 4, 6 | | | | 434 | | | | | 9.00 | | | | | 1/1/56 | | | | | 11 | |
WI Public Finance Auth. Rev. (Lombard Public Facilities Corp.) 2, 4, 6 | | | | 16,404 | | | | | 9.00 | | | | | 1/1/56 | | | | | 399 | |
WI Public Finance Auth. Rev. (Lombard Public Facilities Corp.) 2, 4, 5 | | | | 22,407 | | | | | 5.50 | | | | | 7/1/56 | | | | | 16,965 | |
WI Public Finance Auth. Rev. (Lombard Public Facilities Corp.) 2, 4, 6 | | | | 481 | | | | | 9.00 | | | | | 1/1/57 | | | | | 11 | |
WI Public Finance Auth. Rev. (Lombard Public Facilities Corp.) 2, 4, 6 | | | | 16,287 | | | | | 9.00 | | | | | 1/1/57 | | | | | 386 | |
WI Public Finance Auth. Rev. (Lombard Public Facilities Corp.) 2, 4, 6 | | | | 469 | | | | | 9.00 | | | | | 1/1/58 | | | | | 11 | |
WI Public Finance Auth. Rev. (Lombard Public Facilities Corp.) 2, 4, 6 | | | | 16,055 | | | | | 9.00 | | | | | 1/1/58 | | | | | 371 | |
WI Public Finance Auth. Rev. (Lombard Public Facilities Corp.) 2, 4, 6 | | | | 15,938 | | | | | 9.00 | | | | | 1/1/59 | | | | | 361 | |
WI Public Finance Auth. Rev. (Lombard Public Facilities Corp.) 2, 4, 6 | | | | 456 | | | | | 9.00 | | | | | 1/1/59 | | | | | 10 | |
WI Public Finance Auth. Rev. (Lombard Public Facilities Corp.) 2, 4, 6 | | | | 447 | | | | | 8.00 | | | | | 1/1/60 | | | | | 10 | |
WI Public Finance Auth. Rev. (Lombard Public Facilities Corp.) 2, 4, 6 | | | | 15,822 | | | | | 9.00 | | | | | 1/1/60 | | | | | 347 | |
WI Public Finance Auth. Rev. (Lombard Public Facilities Corp.) 2, 4, 6 | | | | 440 | | | | | 8.00 | | | | | 1/1/61 | | | | | 9 | |
WI Public Finance Auth. Rev. (Lombard Public Facilities Corp.) 2, 4, 6 | | | | 15,589 | | | | | 9.00 | | | | | 1/1/61 | | | | | 332 | |
WI Public Finance Auth. Rev. (Lombard Public Facilities Corp.) 2, 4, 6 | | | | 428 | | | | | 8.00 | | | | | 1/1/62 | | | | | 9 | |
WI Public Finance Auth. Rev. (Lombard Public Facilities Corp.) 2, 4, 6 | | | | 15,473 | | | | | 9.00 | | | | | 1/1/62 | | | | | 322 | |
WI Public Finance Auth. Rev. (Lombard Public Facilities Corp.) 2, 4, 6 | | | | 419 | | | | | 8.00 | | | | | 1/1/63 | | | | | 9 | |
WI Public Finance Auth. Rev. (Lombard Public Facilities Corp.) 2, 4, 6 | | | | 15,240 | | | | | 9.00 | | | | | 1/1/63 | | | | | 310 | |
WI Public Finance Auth. Rev. (Lombard Public Facilities Corp.) 2, 4, 6 | | | | 409 | | | | | 8.00 | | | | | 1/1/64 | | | | | 8 | |
WI Public Finance Auth. Rev. (Lombard Public Facilities Corp.) 2, 4, 6 | | | | 15,124 | | | | | 9.00 | | | | | 1/1/64 | | | | | 302 | |
WI Public Finance Auth. Rev. (Lombard Public Facilities Corp.) 2, 4, 6 | | | | 403 | | | | | 7.00 | | | | | 1/1/65 | | | | | 8 | |
WI Public Finance Auth. Rev. (Lombard Public Facilities Corp.) 2, 4, 6 | | | | 15,008 | | | | | 9.00 | | | | | 1/1/65 | | | | | 290 | |
WI Public Finance Auth. Rev. (Lombard Public Facilities Corp.) 2, 4, 6 | | | | 434 | | | | | 7.00 | | | | | 1/1/66 | | | | | 8 | |
WI Public Finance Auth. Rev. (Lombard Public Facilities Corp.) 2, 4, 6 | | | | 14,775 | | | | | 9.00 | | | | | 1/1/66 | | | | | 272 | |
WI Public Finance Auth. Rev. (Lombard Public Facilities Corp.) 2, 4, 6 | | | | 5,235 | | | | | 5.00 | | | | | 1/1/67 | | | | | 90 | |
WI Public Finance Auth. Rev. (Lombard Public Facilities Corp.) 2, 4, 6 | | | | 192,429 | | | | | 9.00 | | | | | 1/1/67 | | | | | 3,292 | |
WI Public Finance Auth. Rev. (MD Proton Treatment Center) 4 | | | | 500,000 | | | | | 6.13 | | | | | 1/1/33 | | | | | 410,550 | |
WI Public Finance Auth. Rev. (MN College of Osteopathic Medicine) 2, 4, 5 | | | | 7,608 | | | | | 5.50 | | | | | 12/1/48 | | | | | 3,804 | |
WI Public Finance Auth. Rev. (North Carolina Leadership Academy) 4 | | | | 410,000 | | | | | 5.00 | | | | | 6/15/39 | | | | | 446,785 | |
WI Public Finance Auth. Rev. (Roseman University Health Sciences) | | | | 135,000 | | | | | 5.00 | | | | | 4/1/25 | | | | | 145,341 | |
WI Public Finance Auth. Rev. (Roseman University Health Sciences) | | | | 500,000 | | | | | 5.50 | | | | | 4/1/32 | | | | | 510,730 | |
WI Public Finance Auth. Rev. (Southminster) 4 | | | | 250,000 | | | | | 5.00 | | | | | 10/1/43 | | | | | 275,435 | |
| | | | | | | | | | | | | | | | | | | | |
| | | | |
| | | | | | | | | | | | | | | | | | | 17,119,797 | |
| | | | | | | | | | | | | | | | | | | | |
Wyoming - 0.1% | | | | | | | | | | | | | | | | | | | | |
WY Community Dev. Auth. Rev. | | | | 280,000 | | | | | 4.05 | | | | | 12/1/38 | | | | | 284,530 | |
| | | | | | | | | | | | | | | | | | | | |
| | | | |
Total Municipal Bonds (Cost: $353,053,302) | | | | | | | | | | | | | | | | | | | 353,099,762 | |
| | | | | | | | | | | | | | | | | | | | |
| | | | |
Investment Companies - 5.2% | | | | | | | | | | | | | | | | | | | | |
BlackRock Long-Term Municipal Advantage Trust (BTA) | | | | 59,383 | | | | | | | | | | | | | | | 802,858 | |
BlackRock MuniHoldings Florida Insured Fund (MFL) | | | | 85,398 | | | | | | | | | | | | | | | 1,239,979 | |
BlackRock MuniHoldings Fund, Inc. (MHD) | | | | 81,102 | | | | | | | | | | | | | | | 1,327,640 | |
BlackRock MuniHoldings Quality Fund II, Inc. (MUE) | | | | 57,814 | | | | | | | | | | | | | | | 797,833 | |
BlackRock MuniYield Insured Fund (MYI) | | | | 71,171 | | | | | | | | | | | | | | | 1,044,790 | |
BlackRock MuniYield Michigan Insured Fund (MIY) | | | | 21,538 | | | | | | | | | | | | | | | 333,193 | |
| | | | |
See accompanying notes to financial statements. | | | | |
| | |
36 | | | SIT MUTUAL FUNDS SEMI-ANNUAL REPORT | |
| | | | | | | | | | | | | | | | | | | | |
| Name of Issuer | | Principal
Amount ($) | | Coupon
Rate (%) | | Maturity
Date | | Fair
Value ($) |
| | | | |
BlackRock MuniYield Quality Fund, Inc. (MQY) | | | | 24,512 | | | | | | | | | | | | | | | 397,094 | |
BNY Mellon Strategic Municipal Bond Fund, Inc. (DSM) | | | | 35,000 | | | | | | | | | | | | | | | 279,300 | |
DWS Municipal Income Trust (KTF) | | | | 93,236 | | | | | | | | | | | | | | | 1,109,508 | |
DWS Strategic Municipal Income Trust (KSM) | | | | 29,351 | | | | | | | | | | | | | | | 360,724 | |
Eaton Vance Municipal Bond Fund (EIM) | | | | 5,360 | | | | | | | | | | | | | | | 71,717 | |
Invesco Municipal Opportunity Trust (VMO) | | | | 67,520 | | | | | | | | | | | | | | | 924,349 | |
Invesco Municipal Trust (VKQ) | | | | 76,872 | | | | | | | | | | | | | | | 1,030,085 | |
Invesco Pennsylvania Value Municipal Income Trust (VPV) | | | | 31,500 | | | | | | | | | | | | | | | 417,690 | |
Invesco Quality Municipal Income Trust (IQI) | | | | 91,114 | | | | | | | | | | | | | | | 1,200,883 | |
Invesco Value Municipal Income Trust (IIM) | | | | 45,799 | | | | | | | | | | | | | | | 746,982 | |
Invesco Van Kampen Advantage Muni Income Trust (VKI) | | | | 111,341 | | | | | | | | | | | | | | | 1,386,195 | |
Invesco Van Kampen Trust For Investment Grade Municipals (VGM) | | | | 66,847 | | | | | | | | | | | | | | | 915,135 | |
Nuveen AMT-Free Quality Municipal Income Fund (NEA) | | | | 163,972 | | | | | | | | | | | | | | | 2,490,735 | |
Nuveen Dividend Advantage Municipal Income Fund (NVG) | | | | 20,000 | | | | | | | | | | | | | | | 343,000 | |
Nuveen Pennsylvania Quality Municipal Income Fund (NQP) | | | | 5,000 | | | | | | | | | | | | | | | 73,950 | |
Nuveen Quality Municipal Income Fund (NAD) | | | | 163,973 | | | | | | | | | | | | | | | 2,561,258 | |
| | | | | | | | | | | | | | | | | | | | |
| | | | |
Total Investment Companies (cost: $18,172,420) | | | | | | | | | | | | | | | | | | | 19,854,898 | |
| | | | | | | | | | | | | | | | | | | | |
| | | | |
Total Investments in Securities - 96.7% (cost: $371,225,722) | | | | | | | | | | | | | | | | | | | 372,954,660 | |
| | | | | | | | | | | | | | | | | | | | |
| | | | |
Other Assets and Liabilities, net - 3.3% | | | | | | | | | | | | | | | | | | | 13,005,922 | |
| | | | | | | | | | | | | | | | | | | | |
| | | | |
Total Net Assets - 100.0% | | | | | | | | | | | | | | | | | | | $385,960,582 | |
| | | | | | | | | | | | | | | | | | | | |
| 1 | Variable rate security. Rate disclosed is as of September 30, 2021. Certain variable rate securities are not based on a published reference rate and spread but are determined by the issuer or agent and are based on current market conditions, or, for mortgage-backed securities, are impacted by the individual mortgages which are paying off over time. These securities do not indicate a reference rate and spread in their descriptions. |
| 2 | Security considered illiquid by the Investment Adviser. The total value of such securities as of September 30, 2021 was $3,374,017 and represented 0.9% of net assets. |
| 4 | 144A Restricted Security. The total value of such securities as of September 30, 2021 was $37,884,728 and represented 9.8% of net assets. These securities have been determined to be liquid by the Adviser in accordance with guidelines established by the Board of Directors. |
| 5 | The issuer is in default of interest or principal payments, or other debt covenants. Income is not being accrued. The total value of such securities as of September 30, 2021 was $3,296,084 and represented 0.9% of net assets. |
| 6 | Zero coupon or convertible capital appreciation bond, for which the rate disclosed is either the effective yield on purchase date or the coupon rate to be paid upon conversion to coupon paying. |
| 9 | Municipal Lease Security. The total value of such securities as of September 30, 2021 was $5,808,938 and represented 1.5% of net assets. These securities have been determined to be liquid by the Adviser in accordance with guidelines established by the Board of Directors. |
| 14 | Step Coupon: A bond that pays a coupon rate that increases on a specified date(s). Rate disclosed is as of September 30, 2021. |
| 15 | Securities with a “N/A” maturity date have passed their stated maturity date and have pending restructuring arrangements. |
Numeric footnotes not disclosed are not applicable to this Schedule of Investments.
Short futures contracts outstanding as of September 30, 2021 were as follows:
| | | | | | | | | | | | | | | | |
| Type | | Contracts | | | Expiration
Date | | | Notional
Amount ($) | | | Value/ Unrealized Appreciation
(Depreciation) ($) | |
Short Futures: 10 | | | | | | | | | | | | | | | | |
U.S. Treasury Long Bond | | | 60 | | | | December 2021 | | | | (9,553,125 | ) | | | 249,778 | |
U.S. Treasury 2-Year | | | 87 | | | | December 2021 | | | | (19,144,758 | ) | | | 24,702 | |
U.S. Treasury 5-Year | | | 140 | | | | December 2021 | | | | (17,183,906 | ) | | | 143,679 | |
U.S. Treasury 10-Year | | | 181 | | | | December 2021 | | | | (23,821,298 | ) | | | 354,476 | |
| | | | | | | | | | | | | | | | |
| | | | |
| | | | | | | | | | | | | | | 772,635 | |
| | | | | | | | | | | | | | | | |
| 10 | The amount of $1,600,000 in cash was segregated with the broker to cover margin requirements for derivative transactions as of September 30, 2021. |
| | | | |
See accompanying notes to financial statements. | | | | |
| | |
SEPTEMBER 30, 2021 | | | 37 | |
SCHEDULE OF INVESTMENTS (Unaudited)
September 30, 2021
Sit Tax-Free Income Fund (Continued)
A summary of the levels for the Fund’s investments as of September 30, 2021 is as follows (see Note 2 - significant accounting policies in the notes to financial statements):
| | | | | | | | | | | | |
| | | | | | Investment in Securities | | |
| | | Level 1 | | | Level 2 | | | Level 3 | | |
| | | Quoted | | | Other significant | | | Significant | | |
| | | Prices ($) | | | observable inputs ($) | | | unobservable inputs ($) | | Total ($) |
Municipal Bonds | | | — | | | | 353,099,762 | | | — | | 353,099,762 |
Investment Companies | | | 19,854,898 | | | | — | | | — | | 19,854,898 |
Futures | | | 772,635 | | | | — | | | — | | 772,635 |
Total: | | | 20,627,533 | | | | 353,099,762 | | | — | | 373,727,295 |
There were no transfers into or out of level 3 during the reporting period.
| | | | |
See accompanying notes to financial statements. | | | | |
| | |
38 | | | SIT MUTUAL FUNDS SEMI-ANNUAL REPORT | |
[This page is intentionally left blank.]
|
|
| |
Sit Minnesota Tax-Free Income Fund |
OBJECTIVE & STRATEGY
The investment objective of the Minnesota Tax-Free Income Fund is to provide a high level of current income exempt from federal regular income tax and Minnesota regular personal income tax as is consistent with the preservation of capital.
During normal market conditions, the Fund invests 100% of its net assets in municipal securities that generate interest income that is exempt from federal regular income tax and Minnesota regular personal income tax. The Fund anticipates that substantially all of its distributions to its shareholders will be exempt as such. For investors subject to the alternative minimum tax (“AMT”), up to 20% of the Fund’s income may be alternative minimum taxable income.
Fund Performance
The Sit Minnesota Tax-Free Income Fund provided a return of +1.55% during the 6-month period ending September 30, 2021, compared to the return of the Bloomberg 5-Year Municipal Bond Index of +0.61%. The Fund’s 30-day SEC yield was 1.61%, and its 12-month distribution rate was 2.59%.
Factors that Influenced the Fund’s Performance
The tax-exempt yield curve flattened modestly during the period, as yields on shorter bonds increased slightly, and yields on longer bonds decreased modestly. Specifically, short-term yields increased by approximately five basis points, while long-term yields decreased by nearly ten basis points. Tax-exempt fund flows were strongly positive throughout the period, and are on track for a record year in 2021. Municipal issuance was down modestly versus the prior year for the period. The proportion of taxable and refunding issuance was also down versus the prior year period, which tended to dampen the impact on net tax-exempt supply. Minnesota tax-exempt issuance has not only followed this trend in 2021 on an absolute basis but is also down on a relative basis when compared to other states. Credit spreads continued to tighten over the period, as investors continued to reach for yield in the low rate environment.
The Fund benefitted from its longer than benchmark duration, as the Fund’s longer duration bonds contributed favorably to performance during the six-month period. The Fund also benefitted from its substantial allocation to bonds in the ‘A’ rating category and below, as they significantly outperformed the highest quality bonds. The non-rated bonds in the portfolio also contributed favorably to performance, as they significantly outperformed the rated portion of the portfolio. The Fund benefitted from its positions in the multi-family mortgage revenue bonds, education/student loan revenue bonds, and hospital/health-care revenue bonds. Conversely, the Fund’s meaningful weighting to single family mortgage revenue bonds modestly underperformed the benchmark return.
Outlook and Positioning
Most state and local government issuers, including the State of Minnesota, ultimately had minimal budget impacts from the pandemic related economic slowdown. Moreover, the federal stimulus funding provided over the last eighteen months generally reduced their need to issue debt this year. Other municipal issuers, such as mass transportation and conference centers, were hard hit and remain depressed. Senior living
HYPOTHETICAL GROWTH OF $10,000
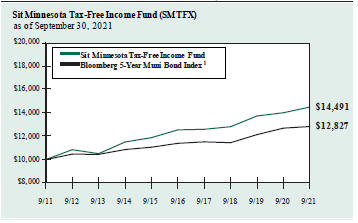
The chart above illustrates the total value of a hypothetical $10,000 investment in the Fund over the past 10 years (or for the life of the Fund if shorter) as compared to the performance of the Bloomberg 5-Year Municipal Bond Index. Past performance does not guarantee future results. Returns include the reinvestment of distributions. The chart does not reflect the deduction of taxes that a shareholder would pay on Fund distributions or the redemption of Fund shares.
1 The Bloomberg 5-Year Municipal Bond Index is the 5 year (4-6) component of the Municipal Bond Index, an unmanaged, rules-based, market-value-weighted index for the long-term tax-exempt bond market. The index includes bonds with a minimum credit rating of BBB. The returns include the reinvestment of income and do not include any transaction costs, management fees or other costs. It is not possible to invest directly in an index. This is the Fund’s primary index.
facilities, healthcare facilities, and higher education were also negatively impacted but have benefited meaningfully from stimulus programs, and are recovering operationally. Demand for tax-exempt income has been strong. Should President Biden’s Build Back Better Plan be passed into law, it has the potential to increase demand for tax-exempt bonds further, particularly if any final bill includes a meaningful increase to individual or corporate taxes as currently being discussed in Congress.
The Fund continues to emphasize income as the primary driver of return over the long-run and maintains a significant yield advantage over the benchmark in this regard. The Fund’s longer than benchmark duration, significant weighting to housing issues, and meaningful position in non-rated credits contribute to this income advantage. We believe the Fund is positioned to achieve attractive risk-adjusted returns in the future.
Paul J. Jungquist, CFA
Senior Portfolio Manager
| | |
|
| | |
40 | | SIT MUTUAL FUNDS SEMI-ANNUAL REPORT |
COMPARATIVE RATES OF RETURNS
as of September 30, 2021
| | | | | | | | | | | | | | | |
| | | Sit Minnesota
Tax-Free Income
Fund | | Bloomberg
5-Year Muni
Bond Index1 | | Lipper MN
Muni. Bond
Fund Index2 |
Six Months | | | | 1.55 | % | | | | 0.61 | % | | | | n/a | |
One Year | | | | 3.40 | | | | | 1.08 | | | | | 2.36 | % |
Five Year | | | | 2.93 | | | | | 2.41 | | | | | 2.65 | |
Ten Years | | | | 3.78 | | | | | 2.52 | | | | | 3.47 | |
Since Inception (12/1/93) | | | | 4.57 | | | | | 4.12 | | | | | 4.30 | |
Performance figures are historical and do not guarantee future results. Investment returns and principal value will vary, and you may have a gain or loss when you sell shares. Current performance may be lower or higher than the performance data quoted. Contact the Fund for performance data current to the most recent month-end. Returns include changes in share price as well as reinvestment of all dividends and capital gains. Returns do not reflect the deduction of taxes that a shareholder would pay on Fund distributions or the redemption of Fund shares. Management fees and administrative expenses are included in the Fund’s performance. Returns for periods greater than one year are compounded average annual rates of return.
1 The Bloomberg 5-Year Municipal Bond Index is the 5 year (4-6) component of the Municipal Bond Index, unmanaged rules-based, market-value-weighted index for the long-term tax-exempt bond market. The index includes bonds with a minimum credit rating of BBB. The returns include the reinvestment of income and do not include any transaction costs, management fees or other costs. It is not possible to invest directly in an index.
2 The Lipper returns are obtained from Lipper Analytical Services, Inc., a large independent evaluator of mutual funds.
FUND DIVERSIFICATION
| | | | |
| |
Multifamily Mortgage | | | 19.2 | % |
Single Family Mortgage | | | 17.7 | |
Education/Student Loan | | | 14.6 | |
Hospital/Health Care | | | 14.1 | |
General Obligation | | | 13.1 | |
Municipal Lease | | | 6.7 | |
Sector less than 5% | | | 13.4 | |
Cash & Other Net Assets | | | 1.2 | |
Based on total net assets as of September 30, 2021, Subject to change.
PORTFOLIO SUMMARY
| | |
Net Asset Value 09/30/21: | | $10.71 Per Share |
Net Asset Value 03/31/21: | | $10.68 Per Share |
Total Net Assets: | | $724.0 Million |
Average Maturity: | | 17.3 Years |
Effective Duration: 3 | | 4.6 Years |
3 Duration is a measure of estimated price sensitivity relative to changes in interest rates. Portfolios with longer durations are typically more sensitive to changes in interest rates. For example, if interest rates rise by 1%, the fair value of a security with an effective duration of 5 years would decrease by 5%, with all other factors being constant. The correlation between duration and price sensitivity is greater for securities rated investment-grade than it is for securities rated below investment-grade. Duration estimates are based on assumptions by the Adviser and are subject to a number of limitations. Effective duration is calculated based on historical price changes of securities held by the Fund, and therefore is a more accurate estimate of price sensitivity provided interest rates remain within their historical range.
QUALITY RATINGS (% of Total Net Assets)

Lower of Moody’s, S&P, Fitch or Duff & Phelps ratings used.
Adviser’s Assessment of Non-Rated Securities
| | | | |
A | | | 1.2 | % |
BBB | | | 4.8 | |
BB | | | 17.5 | |
<BB | | | 1.3 | |
| | | | |
Total | | | 24.8 | % |
SCHEDULE OF INVESTMENTS (Unaudited)
September 30, 2021
Sit Minnesota Tax-Free Income Fund
| | | | | | | | | | | | | | | | |
| Name of Issuer | | Principal
Amount ($) | | | Coupon
Rate (%) | | | Maturity
Date | | | Fair
Value ($) | |
| | | | |
Municipal Bonds - 97.8% | | | | | | | | | | | | | | | | |
Education/Student Loan - 14.6% | | | | | | | | | | | | | | | | |
Baytown Township Rev. (St. Croix Prep) | | | 1,000,000 | | | | 4.00 | | | | 8/1/36 | | | | 1,064,000 | |
Baytown Township Rev. (St. Croix Prep) | | | 1,250,000 | | | | 4.00 | | | | 8/1/41 | | | | 1,317,788 | |
Baytown Township Rev. (St. Croix Prep) | | | 1,935,000 | | | | 4.25 | | | | 8/1/46 | | | | 2,049,068 | |
Bethel Charter School Lease Rev. (Spectrum High School Proj.) | | | 440,000 | | | | 3.50 | | | | 7/1/27 | | | | 463,540 | |
Bethel Charter School Lease Rev. (Spectrum High School Proj.) | | | 900,000 | | | | 4.00 | | | | 7/1/32 | | | | 971,046 | |
Bethel Charter School Lease Rev. (Spectrum High School Proj.) | | | 1,100,000 | | | | 4.00 | | | | 7/1/37 | | | | 1,179,002 | |
Bethel Charter School Lease Rev. (Spectrum High School Proj.) | | | 1,750,000 | | | | 4.25 | | | | 7/1/47 | | | | 1,872,308 | |
Brooklyn Park Charter School Lease Rev. (Athlos Leadership Academy Proj.) | | | 605,000 | | | | 5.25 | | | | 7/1/30 | | | | 650,811 | |
Cologne Charter School Lease Rev. (Cologne Academy Proj.) | | | 295,000 | | | | 4.00 | | | | 7/1/22 | | | | 300,941 | |
Cologne Charter School Lease Rev. (Cologne Academy Proj.) | | | 320,000 | | | | 4.00 | | | | 7/1/24 | | | | 341,136 | |
Cologne Charter School Lease Rev. (Cologne Academy Proj.) | | | 575,000 | | | | 5.00 | | | | 7/1/29 | | | | 618,700 | |
Cologne Charter School Lease Rev. (Cologne Academy Proj.) | | | 500,000 | | | | 5.00 | | | | 7/1/34 | | | | 532,630 | |
Deephaven Charter School Lease Rev. (Eagle Ridge Academy Proj.) | | | 855,000 | | | | 5.25 | | | | 7/1/37 | | | | 952,051 | |
Deephaven Charter School Lease Rev. (Eagle Ridge Academy Proj.) | | | 600,000 | | | | 5.25 | | | | 7/1/40 | | | | 665,136 | |
Deephaven Charter School Lease Rev. (Eagle Ridge Academy Proj.) | | | 1,000,000 | | | | 5.50 | | | | 7/1/50 | | | | 1,109,120 | |
Forest Lake Charter School Lease Rev. (Lake International Language Academy) | | | 495,000 | | | | 4.50 | | | | 8/1/26 | | | | 516,983 | |
Forest Lake Charter School Lease Rev. (Lake International Language Academy) | | | 1,000,000 | | | | 5.00 | | | | 8/1/36 | | | | 1,136,780 | |
Forest Lake Charter School Lease Rev. (Lake International Language Academy) | | | 850,000 | | | | 5.50 | | | | 8/1/36 | | | | 887,595 | |
Ham Lake Charter School Lease Rev. (Davinci Academy Proj.) | | | 875,000 | | | | 5.00 | | | | 7/1/31 | | | | 953,829 | |
Ham Lake Charter School Lease Rev. (Davinci Academy Proj.) | | | 1,000,000 | | | | 5.00 | | | | 7/1/36 | | | | 1,083,370 | |
Ham Lake Charter School Lease Rev. (Parnassus Prep. Sch. Proj.) | | | 1,000,000 | | | | 4.00 | | | | 11/1/26 | | | | 1,061,470 | |
Ham Lake Charter School Lease Rev. (Parnassus Prep. Sch. Proj.) | | | 2,720,000 | | | | 5.00 | | | | 11/1/36 | | | | 3,028,421 | |
Hugo Charter School Lease Rev. (Noble Academy Proj.) | | | 750,000 | | | | 5.00 | | | | 7/1/29 | | | | 799,148 | |
Hugo Charter School Lease Rev. (Noble Academy Proj.) | | | 1,000,000 | | | | 5.00 | | | | 7/1/34 | | | | 1,056,810 | |
Independence Charter School Lease Rev. (Beacon Academy Proj.) | | | 375,000 | | | | 4.25 | | | | 7/1/26 | | | | 398,629 | |
Independence Charter School Lease Rev. (Beacon Academy Proj.) | | | 750,000 | | | | 4.75 | | | | 7/1/31 | | | | 793,620 | |
Independence Charter School Lease Rev. (Beacon Academy Proj.) | | | 1,200,000 | | | | 5.00 | | | | 7/1/36 | | | | 1,260,804 | |
Independence Charter School Lease Rev. (Global Academy Proj.) | | | 1,500,000 | | | | 4.00 | | | | 7/1/41 | | | | 1,661,895 | |
Minneapolis Charter School Lease Rev. (Hiawatha Academy Proj.) | | | 725,000 | | | | 4.00 | | | | 7/1/26 | | | | 765,187 | |
Minneapolis School Lease Rev. (Friendship Academy of the Arts) 4 | | | 585,000 | | | | 4.00 | | | | 12/1/31 | | | | 607,300 | |
Minneapolis School Lease Rev. (Friendship Academy of the Arts) 4 | | | 1,385,000 | | | | 5.25 | | | | 12/1/43 | | | | 1,491,908 | |
Minneapolis School Lease Rev. (Twin Cities International School) 4 | | | 1,000,000 | | | | 4.25 | | | | 12/1/27 | | | | 1,108,310 | |
Minneapolis School Lease Rev. (Twin Cities International School) 4 | | | 1,000,000 | | | | 5.00 | | | | 12/1/37 | | | | 1,117,610 | |
MN Higher Education Fac. Auth. Rev. (Augsburg College) | | | 3,275,000 | | | | 4.25 | | | | 5/1/40 | | | | 3,276,376 | |
MN Higher Education Fac. Auth. Rev. (Bethel Univ.) | | | 1,200,000 | | | | 5.00 | | | | 5/1/37 | | | | 1,340,760 | |
MN Higher Education Fac. Auth. Rev. (Bethel Univ.) | | | 3,500,000 | | | | 5.00 | | | | 5/1/47 | | | | 3,862,460 | |
MN Higher Education Fac. Auth. Rev. (College of St. Benedict) | | | 1,900,000 | | | | 5.00 | | | | 3/1/37 | | | | 2,163,568 | |
MN Higher Education Fac. Auth. Rev. (College of St. Benedict) | | | 1,000,000 | | | | 4.00 | | | | 3/1/43 | | | | 1,080,620 | |
MN Higher Education Fac. Auth. Rev. (College of St. Scholastica) | | | 1,100,000 | | | | 4.00 | | | | 12/1/40 | | | | 1,246,674 | |
MN Higher Education Fac. Auth. Rev. (Gustavus Adolphus College) | | | 1,250,000 | | | | 4.00 | | | | 10/1/41 | | | | 1,394,175 | |
MN Higher Education Fac. Auth. Rev. (Macalester College) | | | 300,000 | | | | 3.00 | | | | 3/1/43 | | | | 322,242 | |
MN Higher Education Fac. Auth. Rev. (St. Johns Univ.) | | | 500,000 | | | | 3.00 | | | | 10/1/37 | | | | 543,170 | |
MN Higher Education Fac. Auth. Rev. (St. Johns Univ.) | | | 250,000 | | | | 3.00 | | | | 10/1/38 | | | | 270,880 | |
MN Higher Education Fac. Auth. Rev. (St. Olaf College) | | | 500,000 | | | | 4.00 | | | | 10/1/32 | | | | 565,645 | |
MN Higher Education Fac. Auth. Rev. (St. Olaf College) | | | 500,000 | | | | 4.00 | | | | 10/1/34 | | | | 563,305 | |
MN Higher Education Fac. Auth. Rev. (St. Olaf College) | | | 500,000 | | | | 4.00 | | | | 10/1/35 | | | | 562,705 | |
MN Higher Education Fac. Auth. Rev. (Univ. of St. Thomas) | | | 750,000 | | | | 5.00 | | | | 4/1/35 | | | | 864,353 | |
MN Higher Education Fac. Auth. Rev. (Univ. of St. Thomas) | | | 500,000 | | | | 4.00 | | | | 10/1/37 | | | | 566,815 | |
MN Higher Education Fac. Auth. Rev. (Univ. of St. Thomas) | | | 3,150,000 | | | | 4.00 | | | | 4/1/39 | | | | 3,464,055 | |
MN Higher Education Fac. Auth. Rev. (Univ. of St. Thomas) | | | 850,000 | | | | 5.00 | | | | 10/1/40 | | | | 1,051,271 | |
MN Higher Education Fac. Auth. Rev. (Univ. of St. Thomas) | | | 750,000 | | | | 4.00 | | | | 10/1/41 | | | | 860,828 | |
MN Higher Education Fac. Auth. Rev. (Univ. of St. Thomas) | | | 4,000,000 | | | | 4.00 | | | | 10/1/44 | | | | 4,560,680 | |
MN Office of Higher Education Rev. 8 | | | 3,500,000 | | | | 2.65 | | | | 11/1/38 | | | | 3,574,655 | |
MN Office of Higher Education Rev. 8 | | | 5,000,000 | | | | 4.00 | | | | 11/1/37 | | | | 5,258,500 | |
Moorhead Educational Fac. Rev. (Concordia College Corp. Proj.) | | | 1,250,000 | | | | 5.00 | | | | 12/1/40 | | | | 1,383,337 | |
Olmsted Co. Hsg. & Redev. Auth. Rev. (Schaeffer Academy Proj.) | | | 472,559 | | | | 4.98 | | | | 4/25/27 | | | | 472,918 | |
Ramsey Lease Rev. (Pact Charter School Proj.) | | | 385,000 | | | | 5.00 | | | | 12/1/26 | | | | 387,325 | |
Ramsey Lease Rev. (Pact Charter School Proj.) | | | 1,850,000 | | | | 5.50 | | | | 12/1/33 | | | | 1,860,693 | |
| | | | |
See accompanying notes to financial statements. | | | | |
| | |
42 | | | SIT MUTUAL FUNDS SEMI-ANNUAL REPORT | |
| | | | | | | | | | | | | | | | |
| Name of Issuer | | Principal
Amount ($) | | | Coupon
Rate (%) | | | Maturity
Date | | | Fair
Value ($) | |
Savage Charter School Lease Rev. (Aspen Academy) | | | 500,000 | | | | 4.00 | | | | 10/1/26 | | | | 525,800 | |
Savage Charter School Lease Rev. (Aspen Academy) | | | 1,000,000 | | | | 4.75 | | | | 10/1/31 | | | | 1,082,970 | |
St. Cloud Charter School Lease Rev. (Stride Academy Proj.) | | | 1,850,000 | | | | 5.00 | | | | 4/1/36 | | | | 1,723,404 | |
St. Paul Hsg. & Redev. Auth. | | | 700,000 | | | | 5.00 | | | | 12/1/30 | | | | 775,446 | |
St. Paul Hsg. & Redev. Auth. | | | 1,150,000 | | | | 5.00 | | | | 12/1/37 | | | | 1,263,631 | |
St. Paul Hsg. & Redev. Auth. | | | 705,000 | | | | 5.00 | | | | 12/1/46 | | | | 767,646 | |
St. Paul Hsg. & Redev. Auth. (German Immersion School) | | | 205,000 | | | | 4.00 | | | | 7/1/23 | | | | 211,371 | |
St. Paul Hsg. & Redev. Auth. (German Immersion School) | | | 855,000 | | | | 5.00 | | | | 7/1/33 | | | | 892,808 | |
St. Paul Hsg. & Redev. Auth. (German Immersion School) | | | 500,000 | | | | 5.00 | | | | 7/1/44 | | | | 518,200 | |
St. Paul Hsg. & Redev. Auth. (Higher Ground Academy Proj.) | | | 815,000 | | | | 4.25 | | | | 12/1/23 | | | | 841,846 | |
St. Paul Hsg. & Redev. Auth. (Higher Ground Academy Proj.) | | | 1,500,000 | | | | 5.00 | | | | 12/1/33 | | | | 1,548,480 | |
St. Paul Hsg. & Redev. Auth. (Higher Ground Academy Proj.) | | | 390,000 | | | | 5.13 | | | | 12/1/38 | | | | 402,332 | |
St. Paul Hsg. & Redev. Auth. (Hope Community Academy Proj.) | | | 720,000 | | | | 4.50 | | | | 12/1/29 | | | | 747,655 | |
St. Paul Hsg. & Redev. Auth. (Hope Community Academy Proj.) | | | 730,000 | | | | 3.88 | | | | 12/1/30 | | | | 750,973 | |
St. Paul Hsg. & Redev. Auth. (Hope Community Academy Proj.) | | | 500,000 | | | | 5.00 | | | | 12/1/45 | | | | 538,395 | |
St. Paul Hsg. & Redev. Auth. (Math & Science Academy) 4 | | | 1,000,000 | | | | 3.00 | | | | 6/1/31 | | | | 976,950 | |
St. Paul Hsg. & Redev. Auth. (Math & Science Academy) 4 | | | 1,225,000 | | | | 4.00 | | | | 6/1/51 | | | | 1,216,511 | |
St. Paul Hsg. & Redev. Auth. (Nova Classical Academy Proj.) | | | 350,000 | | | | 2.00 | | | | 9/1/26 | | | | 346,272 | |
St. Paul Hsg. & Redev. Auth. (Nova Classical Academy Proj.) | | | 350,000 | | | | 4.00 | | | | 9/1/31 | | | | 371,448 | |
St. Paul Hsg. & Redev. Auth. (St. Paul Conservatory for Performing Artists) | | | 1,135,000 | | | | 4.63 | | | | 3/1/43 | | | | 1,156,122 | |
St. Paul Hsg. & Redev. Auth. (Twin Cities Academy Proj.) | | | 965,000 | | | | 4.00 | | | | 7/1/25 | | | | 1,017,882 | |
St. Paul Hsg. & Redev. Auth. (Twin Cities Academy Proj.) | | | 955,000 | | | | 5.00 | | | | 7/1/35 | | | | 1,028,392 | |
St. Paul Hsg. & Redev. Auth. (Twin Cities German Immersion School) | | | 555,000 | | | | 5.00 | | | | 7/1/49 | | | | 621,223 | |
St. Paul Hsg. & Redev. Auth. (Twin Cities German Immersion School) | | | 870,000 | | | | 5.00 | | | | 7/1/55 | | | | 968,919 | |
St. Paul Hsg. & Redev. Auth. Rev. (Community of Peace Academy Proj.) | | | 600,000 | | | | 4.00 | | | | 12/1/39 | | | | 679,008 | |
St. Paul Hsg. & Redev. Auth. Rev. (Community of Peace Academy Proj.) | | | 1,000,000 | | | | 4.00 | | | | 12/1/49 | | | | 1,111,350 | |
St. Paul Hsg. & Redev. Auth. Rev. (Hmong College Preparatory Academy Proj.) | | | 1,000,000 | | | | 5.25 | | | | 9/1/31 | | | | 1,152,720 | |
St. Paul Hsg. & Redev. Auth. Rev. (Metro Deaf School Proj.) 4 | | | 700,000 | | | | 5.00 | | | | 6/15/38 | | | | 755,237 | |
St. Paul Hsg. & Redev. Auth. Rev. (Nova Classical Academy Proj.) | | | 600,000 | | | | 4.00 | | | | 9/1/36 | | | | 632,586 | |
St. Paul Hsg. & Redev. Auth. Rev. (Nova Classical Academy Proj.) | | | 1,000,000 | | | | 4.13 | | | | 9/1/47 | | | | 1,048,850 | |
University of Minnesota Rev. | | | 1,000,000 | | | | 5.00 | | | | 4/1/41 | | | | 1,174,750 | |
Victoria Private School Fac. Rev. (Holy Family Catholic High) | | | 1,090,000 | | | | 4.00 | | | | 9/1/23 | | | | 1,081,280 | |
Woodbury Charter School Lease Rev. | | | 500,000 | | | | 3.00 | | | | 12/1/30 | | | | 526,365 | |
Woodbury Charter School Lease Rev. | | | 400,000 | | | | 4.00 | | | | 12/1/40 | | | | 434,984 | |
Woodbury Charter School Lease Rev. | | | 555,000 | | | | 4.00 | | | | 12/1/50 | | | | 598,490 | |
Woodbury Charter School Lease Rev. (Woodbury Leadership Proj.) | | | 660,000 | | | | 4.00 | | | | 7/1/51 | | | | 711,315 | |
| | | | | | | | | | | | | | | | |
| | | | |
| | | | | | | | | | | | | | | 105,516,567 | |
| | | | | | | | | | | | | | | | |
Escrowed To Maturity/Prerefunded - 2.0% | | | | | | | | | | | | | | | | |
Deephaven Charter School Lease Rev. (Eagle Ridge Academy Proj.) | | | 1,280,000 | | | | 5.13 | | | | 7/1/33 | | | | 1,384,845 | |
Goodhue Co. Education District No. 6051 Lease Rev. | | | 1,030,000 | | | | 5.00 | | | | 2/1/34 | | | | 1,140,035 | |
Goodhue Co. Education District No. 6051 Lease Rev. | | | 1,500,000 | | | | 5.00 | | | | 2/1/39 | | | | 1,660,245 | |
MN Higher Education Fac. Auth. Rev. (Hamline Univ.) | | | 750,000 | | | | 6.00 | | | | 10/1/32 | | | | 750,000 | |
MN Higher Education Fac. Auth. Rev. (Hamline Univ.) | | | 1,000,000 | | | | 6.00 | | | | 10/1/40 | | | | 1,000,000 | |
Rice Co. Educational Fac. Rev. (Shattuck-St. Mary’s School) 4 | | | 3,300,000 | | | | 5.00 | | | | 8/1/22 | | | | 3,429,624 | |
Western MN Municipal Power Agy. Rev. | | | 4,725,000 | | | | 5.00 | | | | 1/1/46 | | | | 5,222,967 | |
| | | | | | | | | | | | | | | | |
| | | | |
| | | | | | | | | | | | | | | 14,587,716 | |
| | | | | | | | | | | | | | | | |
General Obligation - 13.1% | | | | | | | | | | | | | | | | |
Anoka-Hennepin Independent School District No. 11 | | | 3,850,000 | | | | 3.00 | | | | 2/1/45 | | | | 4,058,670 | |
Apple Valley G.O. | | | 365,000 | | | | 2.00 | | | | 12/15/41 | | | | 354,262 | |
Brainerd Independent School District No. 181 | | | 1,000,000 | | | | 4.00 | | | | 2/1/42 | | | | 1,117,780 | |
Brainerd Independent School District No. 181 | | | 4,000,000 | | | | 4.00 | | | | 2/1/43 | | | | 4,465,040 | |
Brooklyn Center Independent School District No. 286 | | | 4,000,000 | | | | 4.00 | | | | 2/1/40 | | | | 4,487,000 | |
Cloquet Independent School District No. 94 | | | 4,250,000 | | | | 4.00 | | | | 2/1/36 | | | | 4,633,988 | |
Duluth Independent School District No. 709 6 | | | 1,325,000 | | | | 1.90 | | | | 2/1/31 | | | | 1,089,163 | |
Duluth Independent School District No. 709 6 | | | 1,080,000 | | | | 2.03 | | | | 2/1/32 | | | | 857,390 | |
Duluth Independent School District No. 709 6 | | | 1,075,000 | | | | 2.15 | | | | 2/1/33 | | | | 823,998 | |
Elk River Independent School District No. 728 | | | 7,000,000 | | | | 3.00 | | | | 2/1/40 | | | | 7,519,470 | |
Fosston Independent School District No. 601 | | | 250,000 | | | | 4.00 | | | | 2/1/36 | | | | 278,088 | |
Fosston Independent School District No. 601 | | | 1,000,000 | | | | 4.00 | | | | 2/1/38 | | | | 1,109,110 | |
| | | | |
See accompanying notes to financial statements. | | | | |
| | |
SEPTEMBER 30, 2021 | | | 43 | |
SCHEDULE OF INVESTMENTS (Unaudited)
September 30, 2021
Sit Minnesota Tax-Free Income Fund (Continued)
| | | | | | | | | | | | | | | | |
| Name of Issuer | | Principal
Amount ($) | | | Coupon
Rate (%) | | | Maturity
Date | | | Fair
Value ($) | |
Itasca G.O. | | | 2,500,000 | | | | 2.38 | | | | 2/1/45 | | | | 2,453,400 | |
Itasca G.O. | | | 4,000,000 | | | | 2.50 | | | | 2/1/50 | | | | 3,964,960 | |
Lakeville Independent School District No. 194 | | | 500,000 | | | | 2.00 | | | | 2/1/37 | | | | 489,060 | |
Litchfield G.O. | | | 230,000 | | | | 4.00 | | | | 2/1/33 | | | | 232,486 | |
Long Prairie G.O. 8 | | | 750,000 | | | | 4.00 | | | | 2/1/37 | | | | 803,828 | |
Madison Lake G.O. | | | 590,000 | | | | 2.13 | | | | 2/1/42 | | | | 575,344 | |
Minneapolis Capital Improvement | | | 4,000,000 | | | | 4.00 | | | | 12/1/43 | | | | 4,525,080 | |
Minneapolis Capital Improvement | | | 2,000,000 | | | | 4.00 | | | | 12/1/46 | | | | 2,253,880 | |
Minneapolis G.O. | | | 5,000,000 | | | | 3.00 | | | | 12/1/42 | | | | 5,355,900 | |
Minneapolis Special School District No. 1 | | | 1,000,000 | | | | 4.00 | | | | 2/1/40 | | | | 1,164,880 | |
Minnetonka Independent School District No. 276 | | | 1,900,000 | | | | 5.00 | | | | 2/1/41 | | | | 2,138,564 | |
Moorhead G.O. | | | 160,000 | | | | 3.00 | | | | 2/1/23 | | | | 161,426 | |
Morrison Co. Education District No. 6979 | | | 1,000,000 | | | | 4.50 | | | | 2/1/34 | | | | 1,043,540 | |
North Mankato G.O. | | | 1,000,000 | | | | 2.00 | | | | 2/1/37 | | | | 979,400 | |
North Mankato G.O. | | | 700,000 | | | | 2.00 | | | | 2/1/38 | | | | 681,695 | |
Owatonna Independent School District No. 761 | | | 750,000 | | | | 2.13 | | | | 2/1/40 | | | | 735,435 | |
Richfield Independent School District No. 280 | | | 6,000,000 | | | | 4.00 | | | | 2/1/37 | | | | 6,729,360 | |
Robbinsdale Independent School District No. 281 | | | 1,000,000 | | | | 2.25 | | | | 2/1/41 | | | | 987,480 | |
Roseau Independent School District No. 682 | | | 750,000 | | | | 2.25 | | | | 2/1/46 | | | | 721,605 | |
Roseville Independent School District No. 623 | | | 930,000 | | | | 4.00 | | | | 2/1/35 | | | | 1,045,246 | |
Roseville Independent School District No. 623 | | | 4,895,000 | | | | 4.00 | | | | 2/1/36 | | | | 5,487,393 | |
South Washington Co. Independent School District No. 833 | | | 5,000,000 | | | | 4.00 | | | | 2/1/31 | | | | 5,614,550 | |
Springfield Independent School District No. 85 | | | 750,000 | | | | 2.00 | | | | 2/1/39 | | | | 718,432 | |
Springfield Independent School District No. 85 | | | 500,000 | | | | 2.00 | | | | 2/1/40 | | | | 467,065 | |
St. Cloud G.O. | | | 1,090,000 | | | | 2.00 | | | | 2/1/41 | | | | 1,057,365 | |
St. Cloud G.O. | | | 560,000 | | | | 2.00 | | | | 2/1/42 | | | | 537,410 | |
St. Francis Independent School District No. 15 | | | 550,000 | | | | 4.00 | | | | 2/1/35 | | | | 571,175 | |
St. Francis Independent School District No. 15 | | | 750,000 | | | | 4.00 | | | | 2/1/36 | | | | 778,335 | |
St. Paul Independent School District No. 625 | | | 2,475,000 | | | | 2.00 | | | | 2/1/40 | | | | 2,380,702 | |
State of Minnesota G.O. | | | 5,550,000 | | | | 2.00 | | | | 9/1/41 | | | | 5,406,199 | |
United Hospital District Health Care Facs. G.O (Lake Wood Health System) | | | 1,005,000 | | | | 5.00 | | | | 12/1/30 | | | | 1,193,639 | |
Worthington Independent School District No. 518 | | | 1,000,000 | | | | 3.00 | | | | 2/1/37 | | | | 1,060,050 | |
Worthington Independent School District No. 518 | | | 500,000 | | | | 3.00 | | | | 2/1/40 | | | | 527,950 | |
Zumbrota-Mazeppa Independent School District No. 2805 | | | 1,500,000 | | | | 2.50 | | | | 2/1/44 | | | | 1,508,145 | |
| | | | | | | | | | | | | | | | |
| | | | |
| | | | | | | | | | | | | | | 95,144,938 | |
| | | | | | | | | | | | | | | | |
Hospital/Health Care - 14.1% | | | | | | | | | | | | | | | | |
Anoka Health Care and Hsg. Facs. Rev. | | | 1,135,000 | | | | 5.38 | | | | 11/1/34 | | | | 1,210,829 | |
Anoka Health Care and Hsg. Facs. Rev. (Walker Methodist Plaza) | | | 1,500,000 | | | | 5.25 | | | | 7/1/35 | | | | 1,514,595 | |
Center City Heath Care Facs. Rev. (Hazelden Betty Ford Foundation Proj.) | | | 250,000 | | | | 5.00 | | | | 11/1/29 | | | | 277,013 | |
Center City Heath Care Facs. Rev. (Hazelden Betty Ford Foundation Proj.) | | | 3,000,000 | | | | 4.50 | | | | 11/1/34 | | | | 3,244,740 | |
Center City Heath Care Facs. Rev. (Hazelden Betty Ford Foundation Proj.) | | | 500,000 | | | | 5.00 | | | | 11/1/44 | | | | 542,600 | |
Chatfield Health Care and Hsg. Facs. Rev. (Chosen Valley Care Center) | | | 350,000 | | | | 4.00 | | | | 9/1/39 | | | | 345,142 | |
Chatfield Health Care and Hsg. Facs. Rev. (Chosen Valley Care Center) | | | 500,000 | | | | 5.00 | | | | 9/1/44 | | | | 521,920 | |
Chatfield Health Care and Hsg. Facs. Rev. (Chosen Valley Care Center) | | | 1,225,000 | | | | 5.00 | | | | 9/1/52 | | | | 1,267,581 | |
Chippewa Co. Rev. (Monte Video Hospital Proj.) | | | 2,000,000 | | | | 4.00 | | | | 3/1/32 | | | | 2,109,740 | |
Crookston Health Care Facs. Rev. (Riverview Health Care Proj.) | | | 1,000,000 | | | | 4.00 | | | | 5/1/32 | | | | 1,002,800 | |
Crookston Health Care Facs. Rev. (Riverview Health Care Proj.) | | | 1,000,000 | | | | 5.00 | | | | 5/1/34 | | | | 1,038,060 | |
Crookston Health Care Facs. Rev. (Riverview Health Care Proj.) | | | 1,000,000 | | | | 5.00 | | | | 5/1/38 | | | | 1,037,300 | |
Dakota Co. Community Dev. Agy. (Sanctuary at W. St. Paul Proj.) | | | 1,700,000 | | | | 5.75 | | | | 8/1/30 | | | | 1,362,958 | |
Dakota Co. Community Dev. Agy. (Sanctuary at W. St. Paul Proj.) | | | 1,050,000 | | | | 6.00 | | | | 8/1/35 | | | | 837,008 | |
Duluth Economic Dev. Auth. Rev. (Benedictine Health System) | | | 360,000 | | | | 3.00 | | | | 7/1/26 | | | | 379,732 | |
Duluth Economic Dev. Auth. Rev. (Benedictine Health System) | | | 1,625,000 | | | | 4.00 | | | | 7/1/31 | | | | 1,777,067 | |
Duluth Economic Dev. Auth. Rev. (St. Luke Hospital of Duluth) | | | 170,000 | | | | 4.00 | | | | 6/15/35 | | | | 196,848 | |
Duluth Economic Dev. Auth. Rev. (St. Luke Hospital of Duluth) | | | 400,000 | | | | 4.00 | | | | 6/15/35 | | | | 454,160 | |
Duluth Economic Dev. Auth. Rev. (St. Luke Hospital of Duluth) | | | 170,000 | | | | 4.00 | | | | 6/15/36 | | | | 196,450 | |
Duluth Economic Dev. Auth. Rev. (St. Luke Hospital of Duluth) | | | 375,000 | | | | 4.00 | | | | 6/15/36 | | | | 425,242 | |
Duluth Economic Dev. Auth. Rev. (St. Luke Hospital of Duluth) | | | 350,000 | | | | 4.00 | | | | 6/15/37 | | | | 396,554 | |
Duluth Economic Dev. Auth. Rev. (St. Luke Hospital of Duluth) | | | 170,000 | | | | 4.00 | | | | 6/15/37 | | | | 195,969 | |
Duluth Economic Dev. Auth. Rev. (St. Luke Hospital of Duluth) | | | 375,000 | | | | 4.00 | | | | 6/15/38 | | | | 423,330 | |
Duluth Economic Dev. Auth. Rev. (St. Luke Hospital of Duluth) | | | 150,000 | | | | 4.00 | | | | 6/15/38 | | | | 172,591 | |
| | | | |
See accompanying notes to financial statements. | | | | |
| | |
44 | | | SIT MUTUAL FUNDS SEMI-ANNUAL REPORT | |
| | | | | | | | | | | | | | | | |
| Name of Issuer | | Principal
Amount ($) | | | Coupon
Rate (%) | | | Maturity
Date | | | Fair
Value ($) | |
Duluth Economic Dev. Auth. Rev. (St. Luke Hospital of Duluth) | | | 225,000 | | | | 4.00 | | | | 6/15/39 | | | | 253,040 | |
Duluth Economic Dev. Auth. Rev. (St. Luke Hospital of Duluth) | | | 150,000 | | | | 4.00 | | | | 6/15/39 | | | | 171,967 | |
Duluth Economic Dev. Auth. Rev. (St. Luke Hospital of Duluth) | | | 850,000 | | | | 3.00 | | | | 6/15/44 | | | | 863,124 | |
Duluth Economic Dev. Auth. Rev. (St. Lukes Hospital Oblig. Group) | | | 295,000 | | | | 4.75 | | | | 6/15/22 | | | | 303,198 | |
Duluth Economic Dev. Auth. Rev. (St. Lukes Hospital Oblig. Group) | | | 1,600,000 | | | | 5.75 | | | | 6/15/32 | | | | 1,648,368 | |
Duluth Economic Dev. Auth. Rev. (St. Lukes Hospital Oblig. Group) | | | 2,000,000 | | | | 6.00 | | | | 6/15/39 | | | | 2,058,500 | |
Glencoe Health Care Fac. Rev. (Glencoe Regional Health Services Proj.) | | | 2,110,000 | | | | 4.00 | | | | 4/1/31 | | | | 2,128,948 | |
Hayward Hsg. & Health Care Fac. Rev. (St. John Lutheran Home of Albert Lea Proj.) | | | 1,900,000 | | | | 5.00 | | | | 10/1/34 | | | | 1,917,309 | |
Maple Grove Health Care System Rev. (Maple Grove Hospital Corp.) | | | 825,000 | | | | 5.00 | | | | 5/1/32 | | | | 979,894 | |
Maple Grove Health Care System Rev. (Maple Grove Hospital Corp.) | | | 4,175,000 | | | | 4.00 | | | | 5/1/37 | | | | 4,651,034 | |
Maple Grove Health Care System Rev. (Memorial Health Care) | | | 1,375,000 | | | | 4.00 | | | | 9/1/35 | | | | 1,492,521 | |
Minneapolis Health Care System Rev. (Fairview Health Services) | | | 2,590,000 | | | | 5.00 | | | | 11/15/34 | | | | 2,985,208 | |
Minneapolis Health Care System Rev. (Fairview Health Services) | | | 3,000,000 | | | | 4.00 | | | | 11/15/37 | | | | 3,400,530 | |
Minneapolis Health Care System Rev. (Fairview Health Services) | | | 1,000,000 | | | | 4.00 | | | | 11/15/38 | | | | 1,133,310 | |
Minneapolis Health Care System Rev. (Fairview Health Services) | | | 2,500,000 | | | | 5.00 | | | | 11/15/49 | | | | 3,007,200 | |
Moorhead Economic Dev. Auth. Rev. | | | 550,000 | | | | 4.60 | | | | 9/1/25 | | | | 550,105 | |
Oak Park Heights Nursing Home Rev. (Boutwells Landing Care Center) | | | 1,500,000 | | | | 5.50 | | | | 8/1/28 | | | | 1,532,745 | |
Oak Park Heights Nursing Home Rev. (Boutwells Landing Care Center) | | | 1,000,000 | | | | 6.00 | | | | 8/1/36 | | | | 1,026,800 | |
Rochester Health Care Facs. Rev. (Mayo Clinic) | | | 5,000,000 | | | | 5.00 | | | | 11/15/33 | | | | 7,048,300 | |
Rochester Health Care Facs. Rev. (Mayo Clinic) | | | 7,500,000 | | | | 4.00 | | | | 11/15/48 | | | | 8,534,175 | |
Shakopee Health Care Facs. Rev. (St. Francis Regional Medical Center Proj.) | | | 745,000 | | | | 5.00 | | | | 9/1/28 | | | | 816,378 | |
Shakopee Health Care Facs. Rev. (St. Francis Regional Medical Center Proj.) | | | 1,350,000 | | | | 5.00 | | | | 9/1/34 | | | | 1,451,803 | |
St. Cloud Health Care Rev. (CentraCare Health System Proj.) | | | 2,500,000 | | | | 4.00 | | | | 5/1/37 | | | | 2,783,700 | |
St. Cloud Health Care Rev. (CentraCare Health System Proj.) | | | 3,750,000 | | | | 5.00 | | | | 5/1/46 | | | | 4,383,900 | |
St. Cloud Health Care Rev. (CentraCare Health System Proj.) | | | 500,000 | | | | 5.00 | | | | 5/1/48 | | | | 607,275 | |
St. Cloud Health Care Rev. (CentraCare Health System Proj.) | | | 500,000 | | | | 4.00 | | | | 5/1/49 | | | | 564,955 | |
St. Louis Park Health Care Facs. Rev. (Mount Olivet Careview Home Health Proj.) 1 | | | 2,250,000 | | | | 4.60 | | | | 6/1/41 | | | | 2,268,630 | |
St. Paul Hsg. & Redev. Auth. (Episcopal Homes Oblig. Group) | | | 1,000,000 | | | | 4.00 | | | | 11/1/42 | | | | 1,019,120 | |
St. Paul Hsg. & Redev. Auth. Health Care Rev. (Fairview Health Services Proj.) | | | 750,000 | | | | 4.00 | | | | 11/15/35 | | | | 855,120 | |
St. Paul Hsg. & Redev. Auth. Health Care Rev. (Fairview Health Services Proj.) | | | 4,000,000 | | | | 4.00 | | | | 11/15/43 | | | | 4,520,560 | |
St. Paul Hsg. & Redev. Auth. Health Care Rev. (Fairview Health Services Proj.) | | | 1,000,000 | | | | 5.00 | | | | 11/15/47 | | | | 1,195,280 | |
St. Paul Hsg. & Redev. Auth. Health Care Rev. (HealthPartners Oblig. Group Proj.) | | | 4,800,000 | | | | 5.00 | | | | 7/1/32 | | | | 5,558,352 | |
St. Paul Hsg. & Redev. Auth. Health Care Rev. (HealthPartners Oblig. Group Proj.) | | | 2,000,000 | | | | 5.00 | | | | 7/1/33 | | | | 2,313,560 | |
St. Paul Hsg. & Redev. Auth. Health Care Rev. (Senior Episcopal Homes Proj.) | | | 525,000 | | | | 4.25 | | | | 11/1/25 | | | | 526,586 | |
St. Paul Hsg. & Redev. Auth. Health Care Rev. (Senior Episcopal Homes Proj.) | | | 750,000 | | | | 4.75 | | | | 11/1/31 | | | | 752,550 | |
St. Paul Hsg. & Redev. Auth. Health Care Rev. (Senior Episcopal Homes Proj.) | | | 2,150,000 | | | | 5.00 | | | | 5/1/38 | | | | 2,212,931 | |
St. Paul Hsg. & Redev. Auth. Health Care Rev. (Senior Episcopal Homes Proj.) | | | 500,000 | | | | 5.15 | | | | 11/1/42 | | | | 501,850 | |
St. Paul Hsg. & Redev. Auth. Rev. (Nursing Home NTS-Episcopal) | | | 1,717,389 | | | | 5.63 | | | | 10/1/33 | | | | 1,734,322 | |
Victoria Health Care Facs. Rev. (Augustana Emerald Care LLC) | | | 625,000 | | | | 4.25 | | | | 8/1/24 | | | | 625,300 | |
West St. Paul Hsg. & Health Care Rev. (Walker Westwood Ridge Camp) | | | 1,000,000 | | | | 5.00 | | | | 11/1/37 | | | | 1,034,180 | |
| | | | | | | | | | | | | | | | |
| | | | |
| | | | | | | | | | | | | | | 102,342,857 | |
| | | | | | | | | | | | | | | | |
Industrial/Pollution Control - 0.6% | | | | | | | | | | | | | | | | |
International Falls Rev. (Boise Cascade Corp. Proj.) | | | 1,000,000 | | | | 5.65 | | | | 12/1/22 | | | | 1,001,280 | |
St. Paul Port Auth. Rev. 8 | | | 1,000,000 | | | | 4.00 | | | | 10/1/40 | | | | 1,089,670 | |
St. Paul Port Auth. Rev. | | | 1,000,000 | | | | 4.00 | | | | 10/1/42 | | | | 1,098,860 | |
St. Paul Port Auth. Solid Waste Disposal Rev. (Gerdau St. Paul Steel Mill Proj.) 4, 8 | | | 1,000,000 | | | | 4.50 | | | | 10/1/37 | | | | 1,016,010 | |
| | | | | | | | | | | | | | | | |
| | | | |
| | | | | | | | | | | | | | | 4,205,820 | |
| | | | | | | | | | | | | | | | |
Insured - 0.3% | | | | | | | | | | | | | | | | |
Guam Power Auth. Rev. (AGM Insured) 11 | | | 500,000 | | | | 5.00 | | | | 10/1/30 | | | | 520,535 | |
MN Governmental Agy. Fin. Group (Flex Terminal Prog.) (AGC Insured) | | | 55,000 | | | | 4.00 | | | | 3/1/22 | | | | 55,128 | |
Puerto Rico Public Improvement G.O. (AGM Insured) 11 | | | 750,000 | | | | 5.13 | | | | 7/1/30 | | | | 756,090 | |
Virgin Islands Public Fin. Auth. (Gross Receipts Taxes Loan Note) (NATL Insured) 11 | | | 1,000,000 | | | | 5.00 | | | | 10/1/23 | | | | 1,015,820 | |
| | | | | | | | | | | | | | | | |
| | | | |
| | | | | | | | | | | | | | | 2,347,573 | |
| | | | | | | | | | | | | | | | |
Multifamily Mortgage - 19.2% | | | | | | | | | | | | | | | | |
Anoka Hsg. Rev. (Homestead at Anoka, Inc. Proj.) | | | 315,000 | | | | 4.00 | | | | 11/1/21 | | | | 315,343 | |
Anoka Hsg. Rev. (Homestead at Anoka, Inc. Proj.) | | | 1,000,000 | | | | 4.75 | | | | 11/1/35 | | | | 1,071,920 | |
Anoka Hsg. Rev. (Homestead at Anoka, Inc. Proj.) | | | 1,000,000 | | | | 5.50 | | | | 11/1/46 | | | | 1,087,840 | |
Apple Valley Economic Dev. Auth. Rev. (Augustana Healthcare Center) | | | 500,000 | | | | 3.90 | | | | 2/1/31 | | | | 496,115 | |
Apple Valley Economic Dev. Auth. Rev. (Augustana Healthcare Center) | | | 500,000 | | | | 4.15 | | | | 2/1/36 | | | | 493,065 | |
| | | | |
See accompanying notes to financial statements. | | | | |
| | |
SEPTEMBER 30, 2021 | | | 45 | |
SCHEDULE OF INVESTMENTS (Unaudited)
September 30, 2021
Sit Minnesota Tax-Free Income Fund (Continued)
| | | | | | | | | | | | | | | | |
| Name of Issuer | | Principal
Amount ($) | | | Coupon
Rate (%) | | | Maturity
Date | | | Fair
Value ($) | |
Apple Valley Rev. (Orchard Path Phase II Proj.) | | | 260,000 | | | | 4.00 | | | | 9/1/30 | | | | 287,841 | |
Apple Valley Rev. (Orchard Path Phase II Proj.) | | | 300,000 | | | | 4.00 | | | | 9/1/36 | | | | 326,895 | |
Apple Valley Rev. (Orchard Path Phase II Proj.) | | | 440,000 | | | | 4.00 | | | | 9/1/41 | | | | 474,166 | |
Apple Valley Rev. (Orchard Path Phase II Proj.) | | | 830,000 | | | | 4.00 | | | | 9/1/51 | | | | 877,791 | |
Apple Valley Rev. (Orchard Path Phase II Proj.) | | | 750,000 | | | | 4.00 | | | | 9/1/61 | | | | 784,575 | |
Apple Valley Senior Hsg. Rev. (Orchard Path Proj.) | | | 2,000,000 | | | | 5.00 | | | | 9/1/58 | | | | 2,089,620 | |
Apple Valley Senior Hsg. Rev. (Presbyterian Homes) | | | 1,500,000 | | | | 5.00 | | | | 9/1/43 | | | | 1,575,780 | |
Apple Valley Senior Living Rev. (Senior Living LLC Proj.) | | | 1,045,000 | | | | 4.00 | | | | 1/1/25 | | | | 1,045,575 | |
Apple Valley Senior Living Rev. (Senior Living LLC Proj.) | | | 475,000 | | | | 4.00 | | | | 1/1/25 | | | | 452,851 | |
Apple Valley Senior Living Rev. (Senior Living LLC Proj.) | | | 1,175,000 | | | | 4.00 | | | | 1/1/26 | | | | 1,175,223 | |
Apple Valley Senior Living Rev. (Senior Living LLC Proj.) | | | 1,290,000 | | | | 6.75 | | | | 1/1/27 | | | | 1,174,055 | |
Apple Valley Senior Living Rev. (Senior Living LLC Proj.) | | | 950,000 | | | | 4.00 | | | | 1/1/30 | | | | 925,832 | |
Apple Valley Senior Living Rev. (Senior Living LLC Proj.) | | | 1,430,000 | | | | 4.25 | | | | 1/1/37 | | | | 1,380,064 | |
Apple Valley Senior Living Rev. (Senior Living LLC Proj.) | | | 950,000 | | | | 7.00 | | | | 1/1/37 | | | | 761,207 | |
Apple Valley Senior Living Rev. (Senior Living LLC Proj.) | | | 2,640,000 | | | | 4.38 | | | | 1/1/47 | | | | 2,469,324 | |
Apple Valley Senior Living Rev. (Senior Living LLC Proj.) | | | 2,850,000 | | | | 5.00 | | | | 1/1/47 | | | | 2,162,409 | |
Bethel Rev. (Grandview Christian Home Proj.) | | | 3,000,000 | | | | 5.00 | | | | 10/1/41 | | | | 3,173,790 | |
Blaine Senior Hsg. & Health Care Fac. Rev. (Crest View Senior Community Proj.) | | | 1,630,000 | | | | 5.13 | | | | 7/1/25 | | | | 1,617,025 | |
Blaine Senior Hsg. & Health Care Fac. Rev. (Crest View Senior Community Proj.) | | | 1,645,000 | | | | 5.75 | | | | 7/1/35 | | | | 1,579,940 | |
Blaine Senior Hsg. & Health Care Fac. Rev. (Crest View Senior Community Proj.) | | | 2,000,000 | | | | 6.13 | | | | 7/1/45 | | | | 1,928,340 | |
Cambridge Hsg. & Health Care Facs. Rev. (Walker Methodist Levande, LLC Proj.) | | | 1,250,000 | | | | 5.13 | | | | 3/1/39 | | | | 1,346,563 | |
Champlin Multifamily Hsg. Rev. (Champlin Drive Apts.) | | | 495,000 | | | | 6.00 | | | | 1/1/27 | | | | 496,049 | |
Chisago Hsg. and Health Care Rev. (CDL Homes LLC) | | | 750,000 | | | | 6.00 | | | | 8/1/33 | | | | 787,170 | |
Cloquet Rev. (HADC Cloquet, LLC Proj.) | | | 180,000 | | | | 2.20 | | | | 8/1/28 | | | | 175,826 | |
Cloquet Rev. (HADC Cloquet, LLC Proj.) | | | 250,000 | | | | 2.60 | | | | 8/1/30 | | | | 244,765 | |
Cloquet Rev. (HADC Cloquet, LLC Proj.) | | | 200,000 | | | | 2.80 | | | | 8/1/31 | | | | 195,444 | |
Cloquet Rev. (HADC Cloquet, LLC Proj.) | | | 200,000 | | | | 3.20 | | | | 8/1/34 | | | | 194,442 | |
Cloquet Rev. (HADC Cloquet, LLC Proj.) | | | 500,000 | | | | 4.00 | | | | 8/1/41 | | | | 506,665 | |
Cloquet Rev. (HADC Cloquet, LLC Proj.) | | | 500,000 | | | | 4.00 | | | | 8/1/48 | | | | 498,345 | |
Columbus Hsg. Rev. (Richfield Senior Hsg., Inc.) | | | 1,000,000 | | | | 5.00 | | | | 1/1/34 | | | | 986,420 | |
Columbus Hsg. Rev. (Richfield Senior Hsg., Inc.) | | | 1,000,000 | | | | 5.25 | | | | 1/1/40 | | | | 995,270 | |
Crystal Multifamily Hsg. Rev. (Cavanagh Proj.) | | | 2,500,000 | | | | 5.25 | | | | 6/1/31 | | | | 2,502,200 | |
Dakota Co. Community Dev. Agy. (Glen at Valley Creek Proj.) | | | 1,400,000 | | | | 4.50 | | | | 8/1/36 | | | | 1,446,438 | |
Dakota Co. Community Dev. Agy. Multifamily Hsg. Rev. | | | 3,500,000 | | | | 4.00 | | | | 1/1/42 | | | | 3,605,910 | |
Dakota Co. Community Dev. Agy. Multifamily Hsg. Rev. (The Quill Proj.) 4 | | | 2,500,000 | | | | 3.55 | | | | 4/1/39 | | | | 2,461,500 | |
Dakota Co. Community Dev. Agy. Multifamily Hsg. Rev. (Walker Highviews Hills LLC) 4 | | | 750,000 | | | | 5.00 | | | | 8/1/36 | | | | 764,880 | |
Dakota Co. Community Dev. Agy. Multifamily Hsg. Rev. (Walker Highviews Hills LLC) 4 | | | 500,000 | | | | 5.00 | | | | 8/1/51 | | | | 508,680 | |
Deephaven Hsg. & Healthcare Rev. (St. Therese Senior Living Proj.) | | | 1,345,000 | | | | 5.00 | | | | 4/1/38 | | | | 1,363,305 | |
Fridley Multifamily Hsg. Rev. (Village Green Apartments Proj.) | | | 3,386,384 | | | | 3.75 | | | | 11/1/34 | | | | 3,873,787 | |
Hayward Health Care Fac. Rev. (American Baptist Homes Midwest Proj.) | | | 1,350,000 | | | | 5.38 | | | | 8/1/34 | | | | 1,362,015 | |
Hayward Health Care Fac. Rev. (American Baptist Homes Midwest Proj.) | | | 500,000 | | | | 5.75 | | | | 2/1/44 | | | | 506,310 | |
Independence Health Care Facs. Rev. (Augustana Chapel View Home) | | | 250,000 | | | | 4.00 | | | | 12/1/32 | | | | 250,748 | |
Maple Plain Senior Hsg. Health Care Rev. (Haven Home Inc Proj.) | | | 1,000,000 | | | | 4.25 | | | | 7/1/39 | | | | 1,032,870 | |
Maple Plain Senior Hsg. Health Care Rev. (Haven Home Inc Proj.) | | | 500,000 | | | | 5.00 | | | | 7/1/39 | | | | 536,670 | |
Maple Plain Senior Hsg. Health Care Rev. (Haven Home Inc Proj.) | | | 1,000,000 | | | | 4.45 | | | | 7/1/44 | | | | 1,036,850 | |
Maple Plain Senior Hsg. Health Care Rev. (Haven Home Inc Proj.) | | | 1,000,000 | | | | 5.00 | | | | 7/1/49 | | | | 1,062,410 | |
Minneapolis & St. Paul Hsg. & Redev. Auth. Multifamily Hsg. Rev. (GNMA Collateralized) 8 | | | 2,765,000 | | | | 4.75 | | | | 1/20/42 | | | | 2,769,341 | |
Minneapolis Multifamily Hsg. Rev. (14th & Central LLLP Proj.) (FNMA Collateralized) | | | 5,000,000 | | | | 2.35 | | | | 2/1/38 | | | | 5,066,200 | |
Minneapolis Multifamily Hsg. Rev. (Greenway Heights Family Housing) | | | 1,015,000 | | | | 5.75 | | | | 7/15/31 | | | | 1,049,398 | |
Minneapolis Senior Hsg. & Health Care Rev. (Ecumen Mill City Quarter) | | | 375,000 | | | | 4.75 | | | | 11/1/28 | | | | 379,755 | |
Minneapolis Senior Hsg. & Health Care Rev. (Ecumen Mill City Quarter) | | | 1,500,000 | | | | 5.00 | | | | 11/1/35 | | | | 1,518,735 | |
Minneapolis Student Hsg. Rev. (Riverton Community Housing Proj.) 4 | | | 1,000,000 | | | | 4.75 | | | | 8/1/43 | | | | 1,054,480 | |
Minneapolis Student Hsg. Rev. (Riverton Community Housing Proj.) 4 | | | 500,000 | | | | 5.00 | | | | 8/1/53 | | | | 529,745 | |
Minnetonka MF Hsg. Rev. (Elmbrooke & Golden Valley Townhome Proj.) (FNMA Collateralized) | | | 1,900,438 | | | | 3.00 | | | | 11/1/34 | | | | 2,013,020 | |
MN Hsg. Fin. Agy. Rental Hsg. Rev. | | | 1,000,000 | | | | 5.20 | | | | 8/1/43 | | | | 1,051,020 | |
Moorhead Economic Dev. Auth. Rev. Ref. (EverCare Sr. Living LLC) | | | 280,000 | | | | 4.65 | | | | 9/1/26 | | | | 280,034 | |
Moorhead Health Care Rev. Ref. (EverCare Sr. Living LLC) | | | 1,000,000 | | | | 5.00 | | | | 9/1/32 | | | | 1,000,130 | |
Moorhead Health Care Rev. Ref. (EverCare Sr. Living LLC) | | | 250,000 | | | | 5.13 | | | | 9/1/37 | | | | 250,020 | |
New Ulm Economic Dev. Auth. Rev. (HADC Ridgeway Proj.) | | | 1,500,000 | | | | 5.00 | | | | 8/1/39 | | | | 1,502,895 | |
North Oaks Rev. (Waverly Gardens Proj.) | | | 150,000 | | | | 4.25 | | | | 10/1/41 | | | | 161,164 | |
North Oaks Senior Hsg. Rev. (Waverly Gardens Proj.) | | | 2,000,000 | | | | 4.00 | | | | 10/1/33 | | | | 2,161,200 | |
| | | | |
See accompanying notes to financial statements. | | | | |
| | |
46 | | | SIT MUTUAL FUNDS SEMI-ANNUAL REPORT | |
| | | | | | | | | | | | | | | | |
| Name of Issuer | | Principal
Amount ($) | | | Coupon
Rate (%) | | | Maturity
Date | | | Fair
Value ($) | |
North Oaks Senior Hsg. Rev. (Waverly Gardens Proj.) | | | 1,500,000 | | | | 5.00 | | | | 10/1/35 | | | | 1,661,550 | |
North Oaks Senior Hsg. Rev. (Waverly Gardens Proj.) | | | 1,000,000 | | | | 5.00 | | | | 10/1/47 | | | | 1,097,830 | |
Otsego Rev. (Riverview Landing Proj.) | | | 1,500,000 | | | | 5.00 | | | | 10/1/42 | | | | 1,538,055 | |
Rochester Health Care & Hsg. Rev. (Homestead Rochester, Inc.) | | | 1,950,000 | | | | 5.00 | | | | 12/1/30 | | | | 2,053,623 | |
Rochester Health Care & Hsg. Rev. (Homestead Rochester, Inc.) | | | 1,325,000 | | | | 5.00 | | | | 12/1/49 | | | | 1,354,044 | |
Rochester Health Care & Hsg. Rev. (Samaritan Bethany, Inc. Proj.) | | | 1,000,000 | | | | 5.00 | | | | 8/1/37 | | | | 1,056,150 | |
Rochester Health Care & Hsg. Rev. (Samaritan Bethany, Inc. Proj.) | | | 1,800,000 | | | | 5.00 | | | | 8/1/48 | | | | 1,881,342 | |
Rochester Health Care & Hsg. Rev. (The Homestead at Rochester) | | | 720,000 | | | | 6.38 | | | | 12/1/33 | | | | 768,506 | |
Rochester Health Care & Hsg. Rev. (The Homestead at Rochester) | | | 2,500,000 | | | | 6.50 | | | | 12/1/35 | | | | 2,667,875 | |
Rochester Health Care & Hsg. Rev. (The Homestead at Rochester) | | | 250,000 | | | | 6.88 | | | | 12/1/48 | | | | 266,732 | |
Rochester Multifamily Hsg. Rev. (Essex Place Apartments Proj.) (FHLMC) | | | 4,000,000 | | | | 3.75 | | | | 6/1/29 | | | | 4,055,520 | |
Sartell Health Care & Hsg. Fac. Rev. (Country Manor Campus LLC Proj.) | | | 1,135,000 | | | | 5.25 | | | | 9/1/27 | | | | 1,154,091 | |
Sartell Health Care & Hsg. Fac. Rev. (Country Manor Campus LLC Proj.) | | | 1,000,000 | | | | 5.25 | | | | 9/1/30 | | | | 1,014,130 | |
Sartell Health Care & Hsg. Fac. Rev. (Country Manor Campus LLC Proj.) | | | 2,150,000 | | | | 5.30 | | | | 9/1/37 | | | | 2,202,761 | |
Sartell Health Care & Hsg. Fac. Rev. (Country Manor Campus LLC Proj.) | | | 1,275,000 | | | | 5.00 | | | | 9/1/42 | | | | 1,334,619 | |
Sauk Rapids Health Care & Hsg. Facs. Rev. (Good Shepherd Lutheran Home Proj.) | | | 1,705,000 | | | | 5.13 | | | | 1/1/39 | | | | 1,715,759 | |
St. Anthony Multifamily Hsg. Rev. (Silver Lake Village Hsg.) | | | 250,000 | | | | 5.75 | | | | 12/1/28 | | | | 263,500 | |
St. Anthony Multifamily Hsg. Rev. (Silver Lake Village Hsg.) | | | 2,000,000 | | | | 6.00 | | | | 12/1/30 | | | | 2,107,120 | |
St. Joseph Senior Hsg. & Health Care Rev. (Woodcrest of Country Manor Proj.) | | | 750,000 | | | | 4.25 | | | | 7/1/39 | | | | 727,208 | |
St. Joseph Senior Hsg. & Health Care Rev. (Woodcrest of Country Manor Proj.) | | | 1,125,000 | | | | 4.25 | | | | 7/1/44 | | | | 1,062,169 | |
St. Joseph Senior Hsg. & Health Care Rev. (Woodcrest of Country Manor Proj.) | | | 1,500,000 | | | | 5.00 | | | | 7/1/55 | | | | 1,523,265 | |
St. Louis Park Rev. (Roitenberg Family Assisted) | | | 620,000 | | | | 4.63 | | | | 8/15/44 | | | | 641,123 | |
St. Paul Hsg. & Redev. Auth. Health Care Rev. (Carondelet Village Proj.) | | | 3,965,000 | | | | 4.25 | | | | 12/1/27 | | | | 4,265,071 | |
St. Paul Hsg. & Redev. Auth. Health Care Rev. (Carondelet Village Proj.) | | | 2,400,000 | | | | 5.00 | | | | 12/1/47 | | | | 2,659,560 | |
St. Paul Hsg. & Redev. Auth. Multifamily Housing Rev. (Marian Center Proj.) | | | 420,000 | | | | 5.20 | | | | 11/1/22 | | | | 420,689 | |
St. Paul Hsg. & Redev. Auth. Multifamily Housing Rev. (Marian Center Proj.) | | | 1,000,000 | | | | 5.30 | | | | 11/1/30 | | | | 1,001,030 | |
St. Paul Hsg. & Redev. Auth. Multifamily Housing Rev. (Marian Center Proj.) | | | 2,590,000 | | | | 5.38 | | | | 5/1/43 | | | | 2,591,554 | |
St. Paul Park Health Care Facs. Rev (Presbyterian Homes Interlu Proj.) | | | 1,000,000 | | | | 5.00 | | | | 5/1/43 | | | | 1,057,420 | |
St. Paul Park Hsg. Rev. (Buffalo Senior Housing Proj.) | | | 1,115,000 | | | | 5.00 | | | | 10/1/38 | | | | 1,134,334 | |
St. Paul Park Senior Hsg. Rev. (Presbyterian Homes Bloomin Proj.) | | | 1,000,000 | | | | 5.00 | | | | 9/1/42 | | | | 1,063,890 | |
St. Paul Port Auth. Rev. (Energy Park Utility Company Proj.) 8 | | | 2,515,000 | | | | 5.70 | | | | 8/1/36 | | | | 2,563,414 | |
St. Peter Hsg. & Health Care Fac. Rev. (Ecumen Second Century & Owatonna Senior Living Proj.) | | | 875,000 | | | | 5.00 | | | | 3/1/40 | | | | 913,658 | |
Vergas Hsg. & Healthcare Facs. Rev. (CDL Homes Proj.) | | | 1,000,000 | | | | 4.25 | | | | 8/1/43 | | �� | | 1,018,610 | |
Vergas Rev. (CDL Homes Proj.) | | | 235,000 | | | | 4.00 | | | | 8/1/25 | | | | 242,682 | |
Wayzata Senior Hsg. Rev. (Folkestone Senior Living Community) | | | 1,500,000 | | | | 4.00 | | | | 8/1/44 | | | | 1,564,110 | |
Wayzata Senior Hsg. Rev. (Folkestone Senior Living Community) | | | 1,000,000 | | | | 5.00 | | | | 8/1/49 | | | | 1,070,430 | |
Wayzata Senior Hsg. Rev. (Folkestone Senior Living Community) | | | 2,750,000 | | | | 5.00 | | | | 8/1/54 | | | | 2,935,927 | |
West St. Paul Hsg. & Health Care Rev. (Walker Westwood Ridge Camp) | | | 250,000 | | | | 5.00 | | | | 11/1/49 | | | | 255,158 | |
Willmar Hsg. & Redev. Auth. Multifamily Rev. (Eagle Ridge Apartments) | | | 2,610,000 | | | | 4.63 | | | | 4/1/30 | | | | 2,641,294 | |
| | | | | | | | | | | | | | | | |
| | | | |
| | | | | | | | | | | | | | | 138,801,058 | |
| | | | | | | | | | | | | | | | |
Municipal Lease - 6.7% 9 | | | | | | | | | | | | | | | | |
Anoka-Hennepin Independent School District No. 11 Lease Rev. | | | 600,000 | | | | 4.00 | | | | 2/1/41 | | | | 623,844 | |
Chaska Economic Dev. Auth. Lease Rev. | | | 1,100,000 | | | | 4.00 | | | | 2/1/31 | | | | 1,208,284 | |
Chaska Economic Dev. Auth. Lease Rev. | | | 500,000 | | | | 4.00 | | | | 2/1/35 | | | | 546,090 | |
Duluth Independent School District No. 709 | | | 245,000 | | | | 3.00 | | | | 3/1/22 | | | | 246,022 | |
Duluth Independent School District No. 709 | | | 1,875,000 | | | | 2.60 | | | | 3/1/28 | | | | 1,889,700 | |
Duluth Independent School District No. 709 | | | 920,000 | | | | 3.00 | | | | 3/1/32 | | | | 923,717 | |
Duluth Independent School District No. 709 | | | 1,000,000 | | | | 4.00 | | | | 2/1/27 | | | | 1,136,780 | |
Duluth Independent School District No. 709 | | | 750,000 | | | | 4.20 | | | | 3/1/34 | | | | 794,985 | |
Golden Valley Hsg. & Redev. Auth. Rev. | | | 1,000,000 | | | | 4.00 | | | | 2/1/30 | | | | 1,072,550 | |
Golden Valley Hsg. & Redev. Auth. Rev. | | | 500,000 | | | | 4.00 | | | | 2/1/32 | | | | 534,520 | |
Guam Education Fin. Foundation 11 | | | 1,000,000 | | | | 5.00 | | | | 10/1/21 | | | | 1,000,000 | |
Guam Education Fin. Foundation 11 | | | 1,730,000 | | | | 5.00 | | | | 10/1/22 | | | | 1,785,066 | |
Hibbing Independent School District No. 701 | | | 2,000,000 | | | | 3.00 | | | | 3/1/41 | | | | 2,133,280 | |
Lake Agassiz Education Cooperative No. 0397-52 | | | 645,000 | | | | 2.50 | | | | 2/1/32 | | | | 636,983 | |
Lake Agassiz Education Cooperative No. 0397-52 | | | 365,000 | | | | 2.75 | | | | 2/1/36 | | | | 362,065 | |
Minnetonka Independent School District No. 276 | | | 340,000 | | | | 4.00 | | | | 2/1/33 | | | | 357,085 | |
Minnetonka Independent School District No. 276 | | | 400,000 | | | | 4.00 | | | | 2/1/36 | | | | 420,100 | |
Minnetonka Independent School District No. 276 | | | 300,000 | | | | 4.00 | | | | 3/1/33 | | | | 329,175 | |
Minnetonka Independent School District No. 276 | | | 500,000 | | | | 3.00 | | | | 7/1/50 | | | | 520,665 | |
| | | | |
See accompanying notes to financial statements. | | | | |
| | |
SEPTEMBER 30, 2021 | | | 47 | |
SCHEDULE OF INVESTMENTS (Unaudited)
September 30, 2021
Sit Minnesota Tax-Free Income Fund (Continued)
| | | | | | | | | | | | | | | | |
| Name of Issuer | | Principal
Amount ($) | | | Coupon
Rate (%) | | | Maturity
Date | | | Fair
Value ($) | |
Minnetonka Independent School District No. 276 | | | 1,410,000 | | | | 2.25 | | | | 2/1/44 | | | | 1,355,574 | |
Minnetonka Independent School District No. 276 | | | 500,000 | | | | 4.50 | | | | 1/1/41 | | | | 549,100 | |
Minnetonka Independent School District No. 276 | | | 1,000,000 | | | | 2.13 | | | | 2/1/41 | | | | 960,680 | |
Minnetonka Independent School District No. 276 | | | 750,000 | | | | 2.38 | | | | 7/1/51 | | | | 716,265 | |
MN Hsg. Fin. Agy. Hsg. Infrastructure (State Appropriation) | | | 1,040,000 | | | | 4.00 | | | | 8/1/36 | | | | 1,204,507 | |
MN Hsg. Fin. Agy. Hsg. Infrastructure (State Appropriation) | | | 580,000 | | | | 4.00 | | | | 8/1/37 | | | | 668,496 | |
MN Hsg. Fin. Agy. Hsg. Infrastructure (State Appropriation) | | | 750,000 | | | | 3.88 | | | | 8/1/38 | | | | 824,130 | |
MN Hsg. Fin. Agy. Hsg. Infrastructure (State Appropriation) | | | 945,000 | | | | 4.00 | | | | 8/1/40 | | | | 1,080,230 | |
MN Hsg. Fin. Agy. Rev. | | | 255,000 | | | | 4.00 | | | | 8/1/31 | | | | 283,496 | |
MN Hsg. Fin. Agy. Rev. | | | 335,000 | | | | 4.00 | | | | 8/1/34 | | | | 370,624 | |
MN Hsg. Fin. Agy. Rev. | | | 335,000 | | | | 4.00 | | | | 8/1/35 | | | | 370,269 | |
MN Hsg. Fin. Agy. Rev. | | | 515,000 | | | | 4.00 | | | | 8/1/39 | | | | 595,072 | |
MN Hsg. Fin. Agy. Rev. | | | 535,000 | | | | 4.00 | | | | 8/1/40 | | | | 616,534 | |
MN Hsg. Fin. Agy. Rev. | | | 815,000 | | | | 4.00 | | | | 8/1/41 | | | | 937,552 | |
MN Hsg. Fin. Agy. Rev. (State Appropriation) | | | 2,000,000 | | | | 5.00 | | | | 8/1/34 | | | | 2,246,980 | |
MN Hsg. Fin. Agy. Rev. (State Appropriation) | | | 1,000,000 | | | | 5.00 | | | | 8/1/35 | | | | 1,121,990 | |
MN Hsg. Fin. Agy. Rev. (State Appropriation) | | | 300,000 | | | | 5.00 | | | | 8/1/35 | | | | 324,459 | |
MN Hsg. Finance Agency Rev. | | | 405,000 | | | | 3.00 | | | | 8/1/38 | | | | 438,263 | |
MN Hsg. Finance Agency Rev. | | | 435,000 | | | | 3.00 | | | | 8/1/39 | | | | 468,543 | |
MN Hsg. Finance Agency Rev. | | | 1,000,000 | | | | 3.00 | | | | 8/1/43 | | | | 1,062,450 | |
MN Hsg. Finance Agency Rev. (State Appropriation) | | | 290,000 | | | | 3.00 | | | | 8/1/38 | | | | 313,551 | |
MN State Armory Building Commission Rev. | | | 1,900,000 | | | | 3.00 | | | | 6/1/38 | | | | 2,052,304 | |
MN State Armory Building Commission Rev. | | | 750,000 | | | | 3.00 | | | | 6/1/41 | | | | 799,657 | |
Northeastern Metropolitan Intermediate School District No. 916 | | | 1,000,000 | | | | 5.00 | | | | 2/1/34 | | | | 1,132,570 | |
Osseo Independent School District No. 279 | | | 1,000,000 | | | | 4.00 | | | | 2/1/28 | | | | 1,075,660 | |
Pine Island Independent School District No. 255 | | | 525,000 | | | | 2.00 | | | | 2/1/40 | | | | 516,658 | |
Pine Island Independent School District No. 255 | | | 1,110,000 | | | | 2.20 | | | | 2/1/44 | | | | 1,093,250 | |
Pine Island Independent School District No. 255 | | | 895,000 | | | | 2.25 | | | | 2/1/47 | | | | 869,492 | |
Plymouth Intermediate District No. 287 | | | 600,000 | | | | 4.00 | | | | 2/1/37 | | | | 661,638 | |
Plymouth Intermediate District No. 287 | | | 470,000 | | | | 4.00 | | | | 5/1/31 | | | | 513,348 | |
Plymouth Intermediate District No. 287 | | | 535,000 | | | | 3.00 | | | | 5/1/32 | | | | 562,852 | |
Rochester Economic Dev. Auth. Rev. | | | 1,000,000 | | | | 2.13 | | | | 2/1/38 | | | | 990,930 | |
Southern Plains Education Cooperative No. 915 | | | 1,215,000 | | | | 4.00 | | | | 2/1/37 | | | | 1,301,168 | |
Southern Plains Education Cooperative No. 915 | | | 1,000,000 | | | | 4.50 | | | | 2/1/39 | | | | 1,088,080 | |
St. Cloud Independent School District No. 742 | | | 750,000 | | | | 4.00 | | | | 2/1/38 | | | | 794,738 | |
Waconia Independent School District No. 110 | | | 500,000 | | | | 5.00 | | | | 2/1/37 | | | | 555,330 | |
Winona School District No. 861 Lease Purchase | | | 142,315 | | | | 6.04 | | | | 8/1/24 | | | | 142,491 | |
Wright Co. | | | 1,350,000 | | | | 3.00 | | | | 12/1/39 | | | | 1,453,693 | |
| | | | | | | | | | | | | | | | |
| | | | |
| | | | | | | | | | | | | | | 48,633,535 | |
| | | | | | | | | | | | | | | | |
Municipal Money Market - 2.6% 1 | | | | | | | | | | | | | | | | |
City of Minneapolis Rev. (Univ. Gateway Proj.) | | | 6,200,000 | | | | 0.06 | | | | 12/1/27 | | | | 6,200,000 | |
City of Minneapolis St. Paul Hsg. & Redev. Auth. Rev. (Allina Health) | | | 2,455,000 | | | | 0.05 | | | | 11/15/34 | | | | 2,455,000 | |
City of Rochester Rev. (Mayo Clinic) | | | 10,000,000 | | | | 0.03 | | | | 11/15/38 | | | | 10,000,000 | |
| | | | | | | | | | | | | | | | |
| | | | |
| | | | | | | | | | | | | | | 18,655,000 | |
| | | | | | | | | | | | | | | | |
Other Revenue Bonds - 3.3% | | | | | | | | | | | | | | | | |
Center City Heath Care Facs. Rev. (Hazelden Betty Ford Foundation Proj.) | | | 1,000,000 | | | | 4.00 | | | | 11/1/41 | | | | 1,129,970 | |
Crystal Governmental Fac. Rev. | | | 305,711 | | | | 5.10 | | | | 12/15/26 | | | | 299,477 | |
Milaca Rev. (Edina Headquarters Proj.) | | | 250,000 | | | | 5.00 | | | | 2/1/44 | | | | 252,547 | |
Minneapolis Rev. (YMCA Greater Twin Cities Proj.) | | | 165,000 | | | | 4.00 | | | | 6/1/29 | | | | 178,316 | |
Minneapolis Rev. (YMCA Greater Twin Cities Proj.) | | | 125,000 | | | | 4.00 | | | | 6/1/30 | | | | 134,178 | |
Minneapolis Rev. (YMCA Greater Twin Cities Proj.) | | | 250,000 | | | | 4.00 | | | | 6/1/31 | | | | 266,915 | |
Minneapolis Tax Increment Rev. | | | 320,000 | | | | 3.50 | | | | 3/1/23 | | | | 326,694 | |
Minneapolis Tax Increment Rev. | | | 170,000 | | | | 3.80 | | | | 3/1/25 | | | | 173,947 | |
Minneapolis Tax Increment Rev. | | | 200,000 | | | | 4.00 | | | | 3/1/27 | | | | 204,738 | |
Minneapolis Tax Increment Rev. | | | 260,000 | | | | 4.00 | | | | 3/1/30 | | | | 265,070 | |
MN Development Rev. Limited Tax Supported Comm. Board | | | 2,000,000 | | | | 6.25 | | | | 12/1/30 | | | | 2,018,800 | |
MN Development Rev. Limited Tax Supported Comm. Board | | | 1,300,000 | | | | 6.00 | | | | 12/1/40 | | | | 1,311,700 | |
Mound Hsg. & Redev. Auth. Tax Increment Rev. Ref. (Metroplain Proj.) | | | 536,000 | | | | 5.00 | | | | 2/15/27 | | | | 538,487 | |
Northeastern Metropolitan Intermediate School District No. 916 | | | 4,500,000 | | | | 4.00 | | | | 2/1/38 | | | | 4,804,290 | |
| | | | |
See accompanying notes to financial statements. | | | | |
| | |
48 | | | SIT MUTUAL FUNDS SEMI-ANNUAL REPORT | |
| | | | | | | | | | | | | | | | |
| Name of Issuer | | Principal
Amount ($) | | | Coupon
Rate (%) | | | Maturity
Date | | | Fair
Value ($) | |
St. Louis Park Economic Dev. Auth. Tax Increment Rev. (Hoigaard Vlg.) | | | 375,000 | | | | 5.00 | | | | 2/1/23 | | | | 375,503 | |
St. Paul Hsg. & Redev. Auth. Rev. (Amherst H Wilder Foundation Proj.) | | | 1,750,000 | | | | 5.00 | | | | 12/1/36 | | | | 2,087,120 | |
St. Paul Hsg. & Redev. Auth. Tax Increment Rev. (9th St. Lofts Proj.) | | | 619,000 | | | | 6.38 | | | | 2/15/28 | | | | 623,593 | |
St. Paul Hsg. & Redev. Auth. Tax Increment Rev. (Drake Marble Proj.) | | | 200,000 | | | | 6.75 | | | | 3/1/28 | | | | 200,176 | |
St. Paul Hsg. & Redev. Auth. Tax Increment Rev. (Emerald Gardens Proj.) | | | 660,000 | | | | 6.50 | | | | 3/1/29 | | | | 661,221 | |
St. Paul Hsg. & Redev. Auth. Tax Increment Rev. (North Quadrant Owner Occupied Proj.) | | | 805,000 | | | | 7.00 | | | | 2/15/28 | | | | 812,672 | |
St. Paul Hsg. & Redev. Auth. Tax Increment Rev. (North Quadrant Owner Occupied Proj.) | | | 568,000 | | | | 7.50 | | | | 2/15/28 | | | | 569,005 | |
St. Paul Port Auth. Lease Rev. (Regions Hospital Parking Ramp Proj.) | | | 3,875,000 | | | | 5.00 | | | | 8/1/36 | | | | 3,879,069 | |
Territory of Guam. Rev. 11 | | | 500,000 | | | | 5.00 | | | | 12/1/46 | | | | 569,535 | |
Virgin Islands Public Fin. Auth. (Gross Receipts Taxes Loan Note) 11 | | | 2,000,000 | | | | 5.00 | | | | 10/1/42 | | | | 1,924,120 | |
| | | | | | | | | | | | | | | | |
| | | | |
| | | | | | | | | | | | | | | 23,607,143 | |
| | | | | | | | | | | | | | | | |
Public Facilities - 0.2% | | | | | | | | | | | | | | | | |
Lakeville Hsg. & Redev. Auth. Parking Rev. (Ice Arena. Proj.) | | | 1,250,000 | | | | 4.00 | | | | 2/1/32 | | | | 1,382,688 | |
| | | | | | | | | | | | | | | | |
Sales Tax Revenue - 1.0% | | | | | | | | | | | | | | | | |
American Samoa Economic Development Authority Rev. 11, 4 | | | 500,000 | | | | 6.00 | | | | 9/1/23 | | | | 524,195 | |
American Samoa Economic Development Authority Rev. 11 | | | 2,000,000 | | | | 6.25 | | | | 9/1/29 | | | | 2,330,600 | |
Guam Govt. Business Privilege Tax Rev. 11 | | | 2,750,000 | | | | 5.00 | | | | 11/15/35 | | | | 3,110,772 | |
St. Paul Sales Tax Rev. | | | 1,400,000 | | | | 5.00 | | | | 11/1/31 | | | | 1,588,650 | |
| | | | | | | | | | | | | | | | |
| | | | |
| | | | | | | | | | | | | | | 7,554,217 | |
| | | | | | | | | | | | | | | | |
Single Family Mortgage - 17.7% | | | | | | | | | | | | | | | | |
Dakota Co. Community Dev. Agy. Single Family Mtg. Rev. (GNMA) | | | 640,000 | | | | 4.45 | | | | 12/1/32 | | | | 640,307 | |
Dakota Co. Community Dev. Agy. Single Family Mtg. Rev. (GNMA-FNMA-FHLMC) | | | 150,000 | | | | 4.63 | | | | 12/1/30 | | | | 150,117 | |
Dakota Co. Community Dev. Agy. Single Family Mtg. Rev. (GNMA-FNMA-FHLMC) | | | 385,000 | | | | 4.88 | | | | 12/1/33 | | | | 385,320 | |
Dakota Co. Community Dev. Agy. Single Family Mtg. Rev. (GNMA-FNMA-FHLMC) 8 | | | 4,814 | | | | 5.13 | | | | 12/1/40 | | | | 4,819 | |
Minneapolis St. Paul Hsg. Fin. Board Single Family Mtg. Rev. (GNMA-FNMA) | | | 210,000 | | | | 4.45 | | | | 12/1/27 | | | | 210,132 | |
Minneapolis St. Paul Hsg. Fin. Board Single Family Mtg. Rev. (GNMA-FNMA) 8 | | | 92 | | | | 5.00 | | | | 12/1/38 | | | | 92 | |
MN Hsg. Fin. Agy. Homeownership Fin. | | | 1,651,086 | | | | 2.35 | | | | 6/1/50 | | | | 1,700,322 | |
MN Hsg. Fin. Agy. Homeownership Fin. | | | 7,500,000 | | | | 2.25 | | | | 7/1/41 | | | | 7,334,475 | |
MN Hsg. Fin. Agy. Homeownership Fin. | | | 7,000,000 | | | | 2.40 | | | | 7/1/46 | | | | 6,823,670 | |
MN Hsg. Fin. Agy. Homeownership Fin. (GNMA-FNMA-FHLMC) | | | 3,495,000 | | | | 2.45 | | | | 7/1/45 | | | | 3,482,034 | |
MN Hsg. Fin. Agy. Homeownership Fin. (GNMA-FNMA-FHLMC) | | | 5,200,000 | | | | 2.45 | | | | 7/1/46 | | | | 5,144,932 | |
MN Hsg. Fin. Agy. Homeownership Fin. (GNMA-FNMA-FHLMC) | | | 2,631,513 | | | | 3.30 | | | | 3/1/48 | | | | 2,717,853 | |
MN Hsg. Fin. Agy. Homeownership Fin. (GNMA-FNMA-FHLMC) | | | 2,354,489 | | | | 3.30 | | | | 5/1/48 | | | | 2,433,058 | |
MN Hsg. Fin. Agy. Homeownership Fin. (GNMA-FNMA-FHLMC) | | | 875,835 | | | | 3.75 | | | | 11/1/48 | | | | 919,740 | |
MN Hsg. Fin. Agy. Homeownership Fin. (GNMA-FNMA-FHLMC) | | | 858,584 | | | | 3.60 | | | | 1/1/49 | | | | 891,184 | |
MN Hsg. Fin. Agy. Homeownership Fin. (GNMA-FNMA-FHLMC) | | | 953,686 | | | | 3.45 | | | | 3/1/49 | | | | 987,436 | |
MN Hsg. Fin. Agy. Homeownership Fin. (GNMA-FNMA-FHLMC) | | | 1,301,275 | | | | 3.15 | | | | 6/1/49 | | | | 1,339,480 | |
MN Hsg. Fin. Agy. Homeownership Fin. (GNMA-FNMA-FHLMC) | | | 1,480,329 | | | | 2.47 | | | | 1/1/50 | | | | 1,507,774 | |
MN Hsg. Fin. Agy. Homeownership Fin. (GNMA-FNMA-FHLMC) | | | 9,525,000 | | | | 2.55 | | | | 1/1/51 | | | | 9,480,328 | |
MN Hsg. Fin. Agy. Homeownership Fin. (GNMA-FNMA-FHLMC) | | | 4,475,000 | | | | 2.50 | | | | 7/1/51 | | | | 4,407,472 | |
MN Hsg. Fin. Agy. Homeownership Fin. (GNMA-FNMA-FHLMC) | | | 1,345,000 | | | | 1.60 | | | | 1/1/30 | | | | 1,341,597 | |
MN Hsg. Fin. Agy. Homeownership Fin. (GNMA-FNMA-FHLMC) | | | 1,200,000 | | | | 1.65 | | | | 7/1/30 | | | | 1,196,484 | |
MN Hsg. Fin. Agy. Homeownership Fin. (GNMA-FNMA-FHLMC) | | | 500,000 | | | | 2.38 | | | | 7/1/46 | | | | 490,545 | |
MN Hsg. Fin. Agy. Homeownership Fin. (GNMA-FNMA-FHLMC) | | | 10,000,000 | | | | 2.45 | | | | 1/1/52 | | | | 9,701,700 | |
MN Hsg. Fin. Agy. Homeownership Fin. (GNMA-FNMA-FHLMC) | | | 4,250,000 | | | | 2.40 | | | | 1/1/35 | | | | 4,405,040 | |
MN Hsg. Fin. Agy. Residential Hsg. Rev. | | | 165,000 | | | | 3.30 | | | | 7/1/29 | | | | 169,533 | |
MN Hsg. Fin. Agy. Residential Hsg. Rev. (G.O. of AGY. Insured) | | | 670,000 | | | | 3.63 | | | | 7/1/25 | | | | 673,645 | |
MN Hsg. Fin. Agy. Residential Hsg. Rev. (G.O. of AGY. Insured) | | | 875,000 | | | | 3.90 | | | | 7/1/30 | | | | 879,323 | |
MN Hsg. Fin. Agy. Residential Hsg. Rev. (GNMA-FNMA-FHLMC) | | | 1,025,000 | | | | 3.35 | | | | 7/1/29 | | | | 1,058,302 | |
MN Hsg. Fin. Agy. Residential Hsg. Rev. (GNMA-FNMA-FHLMC) 8 | | | 275,000 | | | | 3.30 | | | | 1/1/30 | | | | 282,554 | |
MN Hsg. Fin. Agy. Residential Hsg. Rev. (GNMA-FNMA-FHLMC) | | | 950,000 | | | | 3.60 | | | | 7/1/31 | | | | 972,239 | |
MN Hsg. Fin. Agy. Residential Hsg. Rev. (GNMA-FNMA-FHLMC) | | | 4,705,000 | | | | 3.50 | | | | 1/1/32 | | | | 4,870,428 | |
MN Hsg. Fin. Agy. Residential Hsg. Rev. (GNMA-FNMA-FHLMC) | | | 1,720,000 | | | | 3.60 | | | | 7/1/33 | | | | 1,751,132 | |
MN Hsg. Fin. Agy. Residential Hsg. Rev. (GNMA-FNMA-FHLMC) | | | 1,450,000 | | | | 3.30 | | | | 1/1/34 | | | | 1,489,831 | |
MN Hsg. Fin. Agy. Residential Hsg. Rev. (GNMA-FNMA-FHLMC) | | | 1,965,000 | | | | 2.45 | | | | 7/1/34 | | | | 2,041,203 | |
MN Hsg. Fin. Agy. Residential Hsg. Rev. (GNMA-FNMA-FHLMC) | | | 460,000 | | | | 3.10 | | | | 7/1/35 | | | | 463,905 | |
MN Hsg. Fin. Agy. Residential Hsg. Rev. (GNMA-FNMA-FHLMC) | | | 510,000 | | | | 3.15 | | | | 1/1/37 | | | | 519,134 | |
MN Hsg. Fin. Agy. Residential Hsg. Rev. (GNMA-FNMA-FHLMC) | | | 140,000 | | | | 3.40 | | | | 7/1/38 | | | | 140,871 | |
MN Hsg. Fin. Agy. Residential Hsg. Rev. (GNMA-FNMA-FHLMC) | | | 3,877,000 | | | | 3.80 | | | | 7/1/38 | | | | 3,947,057 | |
| | | | |
See accompanying notes to financial statements. | | | | |
| | |
SEPTEMBER 30, 2021 | | | 49 | |
SCHEDULE OF INVESTMENTS (Unaudited)
September 30, 2021
Sit Minnesota Tax-Free Income Fund (Continued)
| | | | | | | | | | | | | | | | |
| Name of Issuer | | Principal
Amount ($) | | | Coupon
Rate (%) | | | Maturity
Date | | | Fair Value ($) | |
MN Hsg. Fin. Agy. Residential Hsg. Rev. (GNMA-FNMA-FHLMC) | | | 6,290,000 | | | | 2.55 | | | | 7/1/39 | | | | 6,446,810 | |
MN Hsg. Fin. Agy. Residential Hsg. Rev. (GNMA-FNMA-FHLMC) | | | 3,505,000 | | | | 3.90 | | | | 7/1/43 | | | | 3,569,562 | |
MN Hsg. Fin. Agy. Residential Hsg. Rev. (GNMA-FNMA-FHLMC) | | | 3,565,000 | | | | 2.80 | | | | 1/1/44 | | | | 3,715,015 | |
MN Hsg. Fin. Agy. Residential Hsg. Rev. (GNMA-FNMA-FHLMC) | | | 3,250,000 | | | | 2.70 | | | | 7/1/44 | | | | 3,340,090 | |
MN Hsg. Fin. Agy. Residential Hsg. Rev. (GNMA-FNMA-FHLMC) | | | 4,605,000 | | | | 2.75 | | | | 7/1/44 | | | | 4,727,954 | |
MN Hsg. Fin. Agy. Residential Hsg. Rev. (GNMA-FNMA-FHLMC) | | | 1,110,000 | | | | 4.00 | | | | 1/1/48 | | | | 1,204,516 | |
MN Hsg. Fin. Agy. Residential Hsg. Rev. (GNMA-FNMA-FHLMC) | | | 30,000 | | | | 4.00 | | | | 7/1/48 | | | | 32,386 | |
MN Hsg. Fin. Agy. Residential Hsg. Rev. (GNMA-FNMA-FHLMC) | | | 2,785,000 | | | | 3.75 | | | | 1/1/50 | | | | 3,047,013 | |
MN Hsg. Fin. Agy. Rev. | | | 3,385,000 | | | | 2.00 | | | | 7/1/40 | | | | 3,278,948 | |
MN Hsg. Fin. Agy. Rev. | | | 4,125,000 | | | | 2.15 | | | | 7/1/45 | | | | 3,960,413 | |
MN Hsg. Fin. Agy. Rev. | | | 6,645,000 | | | | 2.20 | | | | 1/1/51 | | | | 6,309,162 | |
MN Hsg. Fin. Agy. Rev. (GNMA-FNMA FHLMC) | | | 455,000 | | | | 3.70 | | | | 1/1/31 | | | | 457,807 | |
MN Hsg. Fin. Agy. Rev. (GNMA-FNMA FHLMC) | | | 715,000 | | | | 4.00 | | | | 1/1/47 | | | | 759,909 | |
MN Hsg. Fin. Agy. Rev. (GNMA-FNMA-FHLMC) 8 | | | 550,000 | | | | 4.00 | | | | 1/1/41 | | | | 574,013 | |
| | | | | | | | | | | | | | | | |
| | | | |
| | | | | | | | | | | | | | | 128,378,666 | |
| | | | | | | | | | | | | | | | |
Transportation - 0.3% | | | | | | | | | | | | | | | | |
Minneapolis & St. Paul Metro Airport Commission Sub. Rev. | | | 1,100,000 | | | | 5.00 | | | | 1/1/33 | | | | 1,209,538 | |
Minneapolis & St. Paul Metro Airport Commission Sub. Rev. | | | 600,000 | | | | 5.00 | | | | 1/1/34 | | | | 659,040 | |
| | | | | | | | | | | | | | | | |
| | | | |
| | | | | | | | | | | | | | | 1,868,578 | |
| | | | | | | | | | | | | | | | |
Utility - 2.1% | | | | | | | | | | | | | | | | |
Guam Govt. Waterworks Auth. Rev. 11 | | | 2,000,000 | | | | 5.00 | | | | 1/1/46 | | | | 2,235,700 | |
MN Municipal Power Agy. Electric Rev. | | | 500,000 | | | | 4.00 | | | | 10/1/31 | | | | 542,190 | |
MN Municipal Power Agy. Electric Rev. | | | 1,250,000 | | | | 4.00 | | | | 10/1/32 | | | | 1,353,825 | |
MN Municipal Power Agy. Electric Rev. | | | 1,155,000 | | | | 4.00 | | | | 10/1/33 | | | | 1,249,329 | |
Northern Municipal Power Agy. Electric Rev. | | | 695,000 | | | | 5.00 | | | | 1/1/31 | | | | 733,128 | |
Rochester Electric Utility Rev. | | | 500,000 | | | | 5.00 | | | | 12/1/42 | | | | 591,895 | |
Southern Minnesota Municipal Power Agency | | | 1,000,000 | | | | 5.00 | | | | 1/1/41 | | | | 1,157,770 | |
St. Paul Hsg. & Redev. Auth. | | | 650,000 | | | | 4.00 | | | | 10/1/33 | | | | 729,222 | |
St. Paul Hsg. & Redev. Auth. | | | 900,000 | | | | 3.38 | | | | 10/1/37 | | | | 957,573 | |
St. Paul Hsg. & Redev. Auth. | | | 800,000 | | | | 4.00 | | | | 10/1/37 | | | | 889,512 | |
St. Paul Port Auth. Rev. 8 | | | 1,000,000 | | | | 4.00 | | | | 10/1/40 | | | | 1,089,670 | |
St. Paul Port Auth. Rev. | | | 550,000 | | | | 4.00 | | | | 10/1/41 | | | | 605,588 | |
St. Paul Port Auth. Rev. (Energy Park Utility Company Proj.) 8 | | | 1,250,000 | | | | 5.45 | | | | 8/1/28 | | | | 1,275,500 | |
St. Paul Sewer Rev. | | | 1,220,000 | | | | 2.00 | | | | 12/1/41 | | | | 1,162,965 | |
Western MN Municipal Power Agy. Rev. | | | 600,000 | | | | 5.00 | | | | 1/1/35 | | | | 700,896 | |
| | | | | | | | | | | | | | | | |
| | | | |
| | | | | | | | | | | | | | | 15,274,763 | |
| | | | | | | | | | | | | | | | |
| | | | |
Total Municipal Bonds
(cost: $686,502,031) | | | | | | | | | | | | | | | 708,301,119 | |
| | | | | | | | | | | | | | | | |
| | | | |
Investment Companies - 1.0% | | | | | | | | | | | | | | | | |
Delaware Investments Minnesota Municipal Income Fund II (VMM) | | | 334,436 | | | | | | | | | | | | 4,742,302 | |
Nuveen Minnesota Quality Municipal Income Fund (NMS) | | | 159,408 | | | | | | | | | | | | 2,550,528 | |
| | | | | | | | | | | | | | | | |
| | | | |
Total Investment Companies
(cost: $7,237,879) | | | | | | | | | | | | | | | 7,292,830 | |
| | | | | | | | | | | | | | | | |
| | | | |
Total Investments in Securities - 98.8%
(cost: $693,739,910) | | | | | | | | | | | | | | | 715,593,949 | |
| | | | | | | | | | | | | | | | |
| | | | |
Other Assets and Liabilities, net - 1.2% | | | | | | | | | | | | | | | 8,356,743 | |
| | | | | | | | | | | | | | | | |
| | | | |
Total Net Assets - 100.0% | | | | | | | | | | | | | | | $723,950,692 | |
| | | | | | | | | | | | | | | | |
| | | | |
See accompanying notes to financial statements. | | | | |
| | |
50 | | | SIT MUTUAL FUNDS SEMI-ANNUAL REPORT | |
| 1 | Variable rate security. Rate disclosed is as of September 30, 2021. Certain variable rate securities are not based on a published reference rate and spread but are determined by the issuer or agent and are based on current market conditions, or, for mortgage-backed securities, are impacted by the individual mortgages which are paying off over time. These securities do not indicate a reference rate and spread in their descriptions. |
| 4 | 144A Restricted Security. The total value of such securities as of September 30, 2021 was $17,562,940 and represented 2.4% of net assets. These securities have been determined to be liquid by the Adviser in accordance with guidelines established by the Board of Directors. |
| 6 | Zero coupon or convertible capital appreciation bond, for which the rate disclosed is either the effective yield on purchase date or the coupon rate to be paid upon conversion to coupon paying. |
| 8 | Securities the income from which is treated as a tax preference that is included in alternative minimum taxable income for purposes of computing federal alternative minimum tax (AMT). At September 30, 2021, 2.8% of net assets in the Fund was invested in such securities. |
| 9 | Municipal Lease Security. The total value of such securities as of September 30, 2021 was $48,633,535 and represented 6.7% of net assets. These securities have been determined to be liquid by the Adviser in accordance with guidelines established by the Board of Directors. |
| 11 | The Fund may invest in obligations issued by U.S. territories, for example Guam, Puerto Rico, and Virgin Islands. The total value of such securities as of September 30, 2021 was $15,772,433 and represented 2.2% of net assets. |
Numeric footnotes not disclosed are not applicable to this Schedule of Investments.
A summary of the levels for the Fund’s investments as of September 30, 2021 is as follows (see Note 2 -significant accounting policies in the notes to financial statements):
| | | | | | | | | | | | | | |
| | | Investment in Securities | |
| | | Level 1
Quoted
Prices ($) | | | Level 2
Other significant
observable inputs ($) | | Level 3
Significant
unobservable inputs ($) | | Total ($) | |
Municipal Bonds | | | — | | | | 708,301,119 | | | — | | | 708,301,119 | |
Investment Companies | | | 7,292,830 | | | | — | | | — | | | 7,292,830 | |
Total: | | | 7,292,830 | | | | 708,301,119 | | | — | | | 715,593,949 | |
There were no transfers into or out of level 3 during the reporting period.
| | | | |
See accompanying notes to financial statements. | | | | |
| | |
SEPTEMBER 30, 2021 | | | 51 | |
STATEMENTS OF ASSETS AND LIABILITIES (Unaudited)
September 30, 2021
| | | | | | | | | | | | | | | | |
| | | Sit U.S.
Government
Securities
Fund | | | Sit Quality
Income
Fund | | | Sit Tax-Free
Income
Fund | | | Sit
Minnesota
Tax-Free
Income
Fund | |
ASSETS | | | | | | | | | | | | | | | | |
Investments in securities, at identified cost | | | $505,553,043 | | | | $126,258,852 | | | | $371,225,722 | | | | $693,739,910 | |
| | | | | | | | | | | | | | | | |
| | | | |
Investments in securities, at fair value - see accompanying schedule for detail | | | $514,015,581 | | | | $127,085,598 | | | | $372,954,660 | | | | $715,593,949 | |
Cash in bank on demand deposit | | | — | | | | — | | | | 10,882,225 | | | | 4,562,156 | |
Cash collateral held at broker | | | — | | | | 500,000 | | | | 1,600,000 | | | | — | |
Accrued interest and dividends receivable | | | 1,963,288 | | | | 528,138 | | | | 3,988,314 | | | | 6,953,986 | |
Receivable for investment securities sold | | | 7,296 | | | | 55,646 | | | | — | | | | 5,600,129 | |
Variation margin on futures contracts | | | — | | | | 156,829 | | | | 773,571 | | | | — | |
Receivable for Fund shares sold | | | 935,272 | | | | 195,767 | | | | 295,389 | | | | 1,376,010 | |
| | | | | | | | | | | | | | | | |
| | | | |
Total assets | | | 516,921,437 | | | | 128,521,978 | | | | 390,494,159 | | | | 734,086,230 | |
| | | | | | | | | | | | | | | | |
| | | | |
LIABILITIES | | | | | | | | | | | | | | | | |
Payable for investment securities purchased | | | — | | | | 4,098,503 | | | | 1,380,162 | | | | 8,843,653 | |
Payable for Fund shares redeemed | | | 730,735 | | | | 15,983 | | | | 2,588,635 | | | | 681,729 | |
Cash portion of dividends payable to shareholders | | | 54,600 | | | | 3,623 | | | | 344,611 | | | | 131,435 | |
Accrued supervisory and administrative fees | | | 226,897 | | | | 59,258 | | | | 156,067 | | | | 359,041 | |
Accrued investment management fees | | | 85,182 | | | | 29,629 | | | | 64,102 | | | | 119,680 | |
Outstanding options written, at fair value (premiums received $15,324) | | | — | | | | 1,938 | | | | — | | | | — | |
| | | | | | | | | | | | | | | | |
| | | | |
Total liabilities | | | 1,097,414 | | | | 4,208,934 | | | | 4,533,577 | | | | 10,135,538 | |
| | | | | | | | | | | | | | | | |
| | | | |
Net assets applicable to outstanding capital stock | | | $515,824,023 | | | | $124,313,044 | | | | $385,960,582 | | | | $723,950,692 | |
| | | | | | | | | | | | | | | | |
| | | | |
Net assets consist of: | | | | | | | | | | | | | | | | |
Capital (par value and paid-in surplus) | | | $524,212,066 | | | | $123,632,611 | | | | $394,049,992 | | | | $704,855,271 | |
| Total distributable earnings (loss), including unrealized appreciation (depreciation) | | | (8,388,043) | | | | 680,433 | | | | (8,089,410) | | | | 19,095,421 | |
| | | | | | | | | | | | | | | | |
| | | | |
| | | $515,824,023 | | | | $124,313,044 | | | | $385,960,582 | | | | $723,950,692 | |
| | | | | | | | | | | | | | | | |
Outstanding shares: | | | | | | | | | | | | | | | | |
Class S Shares (Class S)* | | | 33,960,601 | | | | 12,357,879 | | | | 21,035,451 | | | | 67,585,908 | |
| | | | | | | | | | | | | | | | |
Class Y Shares (Class Y)* | | | 12,547,508 | | | | — | | | | 17,759,973 | | | | — | |
| | | | | | | | | | | | | | | | |
| | | | |
Net assets applicable to outstanding shares: | | | | | | | | | | | | | | | | |
Net Assets (Class S)* | | | $376,690,809 | | | | $124,313,044 | | | | $209,276,656 | | | | $723,950,692 | |
| | | | | | | | | | | | | | | | |
Net Assets (Class Y)* | | | 139,133,214 | | | | — | | | | 176,683,926 | | | | — | |
| | | | | | | | | | | | | | | | |
| | | | |
Net asset value per share of outstanding capital stock: | | | | | | | | | | | | | | | | |
Net Assets Value (Class S)* | | | $11.09 | | | | $10.06 | | | | $9.95 | | | | $10.71 | |
| | | | | | | | | | | | | | | | |
Net Assets Value (Class Y)* | | | 11.09 | | | | — | | | | 9.95 | | | | — | |
| | | | | | | | | | | | | | | | |
* Sit U.S. Government Securities Fund and Sit Tax-Free Income Fund offers multiple share classes (S and Y). All other Funds offer a single share class.
| | | | |
See accompanying notes to financial statements. | | | | |
| | |
52 | | | SIT MUTUAL FUNDS SEMI-ANNUAL REPORT | |
STATEMENTS OF OPERATIONS (Unaudited)
Six Months Ended September 30, 2021
| | | | | | | | | | | | | | | | |
| | | Sit U.S.
Government
Securities
Fund | | | Sit Quality
Income
Fund | | | Sit Tax-Free
Income
Fund | | | Sit
Minnesota
Tax-Free
Income
Fund | |
Investment income: | | | | | | | | | | | | | | | | |
Income: | | | | | | | | | | | | | | | | |
Dividends | | | — | | | | — | | | | $448,272 | | | | $118,773 | |
Interest | | | $4,941,789 | | | | $1,484,056 | | | | 5,954,561 | | | | 11,605,129 | |
| | | | | | | | | | | | | | | | |
| | | | |
Total income | | | 4,941,789 | | | | 1,484,056 | | | | 6,402,833 | | | | 11,723,902 | |
| | | | | | | | | | | | | | | | |
Expenses (note 4): | | | | | | | | | | | | | | | | |
Investment management fee | | | 527,295 | | | | 259,028 | | | | 660,651 | | | | 1,263,530 | |
Supervisory and administrative fee | | | 1,409,132 | | | | 250,802 | | | | 699,465 | | | | 1,577,486 | |
| | | | | | | | | | | | | | | | |
| | | | |
Total expenses | | | 1,936,427 | | | | 509,830 | | | | 1,360,116 | | | | 2,841,016 | |
| | | | | | | | | | | | | | | | |
| | | | |
Net investment income | | | 3,005,362 | | | | 974,226 | | | | 5,042,717 | | | | 8,882,886 | |
| | | | | | | | | | | | | | | | |
Realized and unrealized gain (loss): | | | | | | | | | | | | | | | | |
Net realized gain (loss) on investments | | | (814,312) | | | | 360,643 | | | | 96,162 | | | | 473,127 | |
Net realized gain (loss) on written options | | | 307,989 | | | | 149,018 | | | | — | | | | — | |
Net realized gain (loss) on futures | | | — | | | | (194,855) | | | | (1,211,361) | | | | — | |
| | | | |
Net change in unrealized appreciation (depreciation) on investments | | | (3,178,157) | | | | (52,428) | | | | 1,321,292 | | | | 1,277,658 | |
Net change in unrealized appreciation (depreciation) on written options | | | — | | | | (33,878) | | | | — | | | | — | |
Net change in unrealized appreciation (depreciation) on futures | | | — | | | | 12,067 | | | | 772,635 | | | | — | |
| | | | |
Net gain (loss) | | | (3,684,480) | | | | 240,567 | | | | 978,728 | | | | 1,750,785 | |
| | | | | | | | | | | | | | | | |
| | | | |
Net increase (decrease) in net assets resulting from operations | | | ($679,118) | | | | $1,214,793 | | | | $6,021,445 | | | | $10,633,671 | |
| | | | | | | | | | | | | | | | |
| | | | |
| See accompanying notes to financial statements. | |
| | |
SEPTEMBER 30, 2021 | | | 53 | |
STATEMENTS OF CHANGES IN NET ASSETS
| | | | | | | | |
| | | Sit U.S. Government
Securities Fund | |
| | | Six Months
Ended
September 30, 2021
(Unaudited) | | | Year
Ended
March 31, 2021 | |
Operations: | | | | | | | | |
Net investment income | | | $3,005,362 | | | | $5,957,142 | |
Net realized gain (loss) on investments, written options and futures | | | (506,323) | | | | 1,420,937 | |
Net change in unrealized appreciation (depreciation) of investments, written options and futures | | | (3,178,157) | | | | (5,331,616) | |
| | | | | | | | |
| | |
Net increase (decrease) in net assets resulting from operations | | | (679,118) | | | | 2,046,463 | |
| | | | | | | | |
| | |
Distributions from: | | | | | | | | |
Net investment income and net realized gains | | | | | | | | |
Common shares (Class S) | | | (2,080,013) | | | | (5,228,287) | |
Common shares (Class Y) | | | (925,365) | | | | (728,814) | |
| | | | | | | | |
| | |
Total distributions | | | (3,005,378) | | | | (5,957,101) | |
| | | | | | | | |
| | |
Capital share transactions: | | | | | | | | |
Proceeds from shares sold | | | | | | | | |
Class S Shares | | | 55,328,064 | | | | 175,900,447 | |
Class Y Shares | | | 22,884,710 | | | | 132,909,586 | |
Reinvested distributions | | | | | | | | |
Class S Shares | | | 1,981,014 | | | | 4,972,098 | |
Class Y Shares | | | 581,592 | | | | 639,672 | |
Payments for shares redeemed | | | | | | | | |
Class S Shares | | | (76,789,967) | | | | (183,858,762) | |
Class Y Shares | | | (11,746,209) | | | | (17,452,406) | |
| | | | | | | | |
| | |
Increase (decrease) in net assets from capital transactions | | | (7,760,796) | | | | 113,110,635 | |
| | | | | | | | |
| | |
Total increase (decrease) in net assets | | | (11,445,292) | | | | 109,199,997 | |
| | |
Net assets: | | | | | | | | |
Beginning of period | | | 527,269,315 | | | | 418,069,318 | |
| | | | | | | | |
| | |
End of period | | | $515,824,023 | | | | $527,269,315 | |
| | | | | | | | |
| | |
Capital transactions in shares: | | | | | | | | |
Sold | | | | | | | | |
Class S Shares | | | 4,946,419 | | | | 15,622,198 | |
Class Y Shares | | | 2,043,027 | | | | 11,836,082 | |
Reinvested distributions | | | | | | | | |
Class S Shares | | | 177,425 | | | | 442,475 | |
Class Y Shares | | | 52,100 | | | | 57,057 | |
Redeemed | | | | | | | | |
Class S Shares | | | (6,860,121) | | | | (16,345,293) | |
Class Y Shares | | | (1,048,343) | | | | (1,554,866) | |
| | | | | | | | |
| | |
Net increase (decrease) | | | (689,493) | | | | 10,057,653 | |
| | | | | | | | |
| | | | |
See accompanying notes to financial statements. | | | | |
| | |
54 | | | SIT MUTUAL FUNDS SEMI-ANNUAL REPORT | |
| | | | | | | | | | | | | | | | | | | | | | | | | | | | |
Sit Quality
Income Fund | | Sit Tax-Free
Income Fund | | Minnesota Tax-Free
Income Fund |
| | | | | |
| Six Months | | | | Six Months | | | | Six Months | | |
| Ended | | Year | | Ended | | Year | | Ended | | Year |
| September 30, 2021 | | Ended | | September 30, 2021 | | Ended | | September 30, 2021 | | Ended |
| (Unaudited) | | March 31, 2021 | | (Unaudited) | | March 31, 2021 | | (Unaudited) | | March 31, 2021 |
| | | | | |
| | | $974,226 | | | | | $1,043,505 | | | | | $5,042,717 | | | | | $9,527,207 | | | | | $8,882,886 | | | | | $18,437,711 | |
| | | 314,806 | | | | | 1,017,781 | | | | | (1,115,199) | | | | | (151,568) | | | | | 473,127 | | | | | (756,912) | |
| | | (74,239) | | | | | 1,045,651 | | | | | 2,093,927 | | | | | 11,721,222 | | | | | 1,277,658 | | | | | 19,096,672 | |
| | | | | | | | | | | | | | | | | | | | | | | | | | | | | |
| | | | | |
| | | 1,214,793 | | | | | 3,106,937 | | | | | 6,021,445 | | | | | 21,096,861 | | | | | 10,633,671 | | | | | 36,777,471 | |
| | | | | | | | | | | | | | | | | | | | | | | | | | | | | |
| | | | | |
| | | (974,227) | | | | | (1,043,484) | | | | | (3,483,638) | | | | | (9,527,607) | | | | | (8,882,886) | | | | | (18,437,904) | |
| | | — | | | | | — | | | | | (1,559,079) | | | | | — | | | | | — | | | | | — | |
| | | | | | | | | | | | | | | | | | | | | | | | | | | | | |
| | | | | |
| | | (974,227) | | | | | (1,043,484) | | | | | (5,042,717) | | | | | (9,527,607) | | | | | (8,882,886) | | | | | (18,437,904) | |
| | | | | | | | | | | | | | | | | | | | | | | | | | | | | |
| | | | | |
| | | 32,413,179 | | | | | 39,380,433 | | | | | 41,330,600 | | | | | 88,915,647 | | | | | 78,540,642 | | | | | 136,016,186 | |
| | | — | | | | | — | | | | | 184,951,620 | | | | | — | | | | | — | | | | | — | |
| | | | | |
| | | 946,933 | | | | | 1,004,721 | | | | | 2,700,886 | | | | | 6,204,641 | | | | | 8,003,684 | | | | | 16,170,025 | |
| | | — | | | | | — | | | | | 382,171 | | | | | — | | | | | — | | | | | — | |
| | | | | |
| | | (18,082,111) | | | | | (23,927,160) | | | | | (185,786,392) | | | | | (71,755,723) | | | | | (44,645,454) | | | | | (132,247,052) | |
| | | — | | | | | — | | | | | (6,826,669) | | | | | — | | | | | — | | | | | — | |
| | | | | | | | | | | | | | | | | | | | | | | | | | | | | |
| | | | | |
| | | 15,278,001 | | | | | 16,457,994 | | | | | 36,752,216 | | | | | 23,364,565 | | | | | 41,898,872 | | | | | 19,939,159 | |
| | | | | | | | | | | | | | | | | | | | | | | | | | | | | |
| | | | | |
| | | 15,518,567 | | | | | 18,521,447 | | | | | 37,730,944 | | | | | 34,933,819 | | | | | 43,649,657 | | | | | 38,278,726 | |
| | | | | |
| | | 108,794,477 | | | | | 90,273,030 | | | | | 348,229,638 | | | | | 313,295,819 | | | | | 680,301,035 | | | | | 642,022,309 | |
| | | | | | | | | | | | | | | | | | | | | | | | | | | | | |
| | | | | |
| | | $124,313,044 | | | | | $108,794,477 | | | | | $385,960,582 | | | | | $348,229,638 | | | | | $723,950,692 | | | | | $680,301,035 | |
| | | | | | | | | | | | | | | | | | | | | | | | | | | | | |
| | | | | |
| | | 3,220,606 | | | | | 3,946,193 | | | | | 40,005,682 | | | | | 9,124,175 | | | | | 7,270,367 | | | | | 12,839,133 | |
| | | — | | | | | — | | | | | 18,400,539 | | | | | — | | | | | — | | | | | — | |
| | | | | |
| | | 94,036 | | | | | 100,768 | | | | | 269,218 | | | | | 634,570 | | | | | 741,629 | | | | | 1,528,730 | |
| | | — | | | | | — | | | | | 38,062 | | | | | — | | | | | — | | | | | — | |
| | | | | |
| | | (1,797,016) | | | | | (2,395,722) | | | | | (54,379,454) | | | | | (7,401,245) | | | | | (4,135,655) | | | | | (12,581,578) | |
| | | — | | | | | — | | | | | (678,628) | | | | | — | | | | | — | | | | | — | |
| | | | | | | | | | | | | | | | | | | | | | | | | | | | | |
| | | | | |
| | | 1,517,626 | | | | | 1,651,239 | | | | | 3,655,419 | | | | | 2,357,500 | | | | | 3,876,341 | | | | | 1,786,285 | |
| | | | | | | | | | | | | | | | | | | | | | | | | | | | | |
FINANCIAL HIGHLIGHTS
Per share income and capital changes for a share outstanding throughout the period. See accompanying notes to financial statements.
| | | | | | | | | | | | | | | | | | | | | | | | | | | | | | | | | | | |
| Sit U.S. Government Securities Fund | | | | | | | | | | | | | | | | | | | | | | | | | | | | | | | |
| | | | | |
| Class S | | Six Months Ended September 30, 2021, | | | | Year Ended March 31, | | | | |
| | | (Unaudited) | | 2021 | | 2020 | | 2019 | | 2018 | | 2017 | | |
| | | | | | | |
Net Asset Value: | | | | | | | | | | | | | | | | | | | | | | | | | | | | | | | | | | | |
Beginning of period | | | | $11.17 | | | | | $11.26 | | | | | $10.92 | | | | | $10.80 | | | | | $10.90 | | | | | $11.07 | | | | | | |
| | | | | | | |
Operations: | | | | | | | | | | | | | | | | | | | | | | | | | | | | | | | | | | | |
Net investment income 1 | | | | 0.06 | | | | | 0.14 | | | | | 0.22 | | | | | 0.23 | | | | | 0.18 | | | | | 0.17 | | | | | | |
Net realized and unrealized gains (losses) on investments, written options and futures | | | | (0.08 | ) | | | | (0.09 | ) | | | | 0.34 | | | | | 0.12 | | | | | (0.10 | ) | | | | (0.17 | ) | | | | | |
| | | | | | | |
Total from operations | | | | (0.02 | ) | | | | 0.05 | | | | | 0.56 | | | | | 0.35 | | | | | 0.08 | | | | | – | | | | | | |
Distributions from: | | | | | | | | | | | | | | | | | | | | | | | | | | | | | | | | | | | |
Net investment income | | | | (0.06 | ) | | | | (0.14 | ) | | | | (0.22 | ) | | | | (0.23 | ) | | | | (0.18 | ) | | | | (0.17 | ) | | | | | |
| | | | | | | |
Net Asset Value | | | | | | | | | | | | | | | | | | | | | | | | | | | | | | | | | | | |
End of period | | | | $11.09 | | | | | $11.17 | | | | | $11.26 | | | | | $10.92 | | | | | $10.80 | | | | | $10.90 | | | | | | |
| | | | | | | |
Total investment return 2 | | | | (0.18 | %) | | | | 0.44 | % | | | | 5.25 | % | | | | 3.31 | % | | | | 0.76 | % | | | | 0.02 | % | | | | | |
| | | | | | | |
Net assets at end of period (000’s omitted) | | | | $376,691 | | | | | $398,821 | | | | | $404,985 | | | | | $427,314 | | | | | $527,748 | | | | | $643,304 | | | | | | |
| | | | | | | |
Ratios: 3 | | | | | | | | | | | | | | | | | | | | | | | | | | | | | | | | | | | |
Expenses | | | | 0.80 | % | | | | 0.80 | % | | | | 0.80 | % | | | | 0.80 | % | | | | 0.80 | % | | | | 0.80 | % | | | | | |
Net investment income | | | | 1.07 | % | | | | 1.25 | % | | | | 2.06 | % | | | | 2.13 | % | | | | 1.68 | % | | | | 1.57 | % | | | | | |
| | | | | | | |
Portfolio turnover rate (excluding short-term securities) | | | | 18.43 | %4 | | | | 39.29 | % | | | | 29.91 | % | | | | 14.88 | % | | | | 14.68 | % | | | | 29.00 | % | | | | | |
| 1 | The net investment income per share is based on average shares outstanding for the period. |
| 2 | Total investment return is based on the change in net asset value of a share during the period (not annualized) and assumes reinvestment of distributions at net asset value. |
| 3 | Ratios are annualized for periods less than one year. In addition to fees and expenses which the Fund bears directly, the Fund indirectly bears a pro rata share of the fees and expenses of the acquired funds in which it invests. Such indirect expenses are not included in the above reported expense ratios. |
| | | | |
| | | | |
| | |
56 | | | SIT MUTUAL FUNDS SEMI-ANNUAL REPORT | |
FINANCIAL HIGHLIGHTS
Per share income and capital changes for a share outstanding throughout the period. See accompanying notes to financial statements.
Sit U.S. Government Securities Fund
| | | | | | | | | | | | | | | |
| | | |
| Class Y | | Six Months Ended
September 30, 2021,
(Unaudited) | | Year Ended
March 31, 2021 | | Period Ended
March 31, 2020 1 |
| | | |
Net Asset Value: | | | | | | | | | | | | | | | |
Beginning of period | | | | $11.17 | | | | | $11.26 | | | | | $10.97 | |
| | | |
Operations: | | | | | | | | | | | | | | | |
Net investment income 2 | | | | 0.07 | | | | | 0.17 | | | | | 0.06 | |
Net realized and unrealized gains (losses) on investments, written options and futures | | | | (0.08 | ) | | | | (0.09 | ) | | | | 0.29 | |
| | | |
Total from operations | | | | (0.01 | ) | | | | 0.08 | | | | | 0.35 | |
Distributions from: | | | | | | | | | | | | | | | |
Net investment income | | | | (0.07 | ) | | | | (0.17 | ) | | | | (0.06 | ) |
| | | |
Net Asset Value | | | | | | | | | | | | | | | |
End of period | | | | $11.09 | | | | | $11.17 | | | | | $11.26 | |
| | | |
Total investment return 3 | | | | (0.05 | %) | | | | 0.72 | % | | | | 3.20 | % |
| | | |
Net assets at end of period (000’s omitted) | | | | $139,133 | | | | | $128,449 | | | | | $13,085 | |
| | | |
Ratios: 4 | | | | | | | | | | | | | | | |
Expenses | | | | 0.55 | % | | | | 0.55 | % | | | | 0.55 | %5 |
Net investment income | | | | 1.32 | % | | | | 1.44 | % | | | | 2.19 | % |
| | | |
Portfolio turnover rate (excluding short-term securities) | | | | 18.43 | %6 | | | | 39.29 | % | | | | 29.91 | % |
| 1 | The inception date of Class Y shares was January 1, 2020. |
| 2 | The net investment income per share is based on average shares outstanding for the period. |
| 3 | Total investment return is based on the change in net asset value of a share during the period (not annualized) and assumes reinvestment of distributions at net asset value. |
| 4 | Ratios are annualized for periods less than one year. In addition to fees and expenses which the Fund bears directly, the Fund indirectly bears a pro rata share of the fees and expenses of the acquired funds in which it invests. Such indirect expenses are not included in the above reported expense ratios. |
| 5 | Sit U.S. Government Securities Fund Class Y shares were first issued on January 1, 2020, and therefore the fees presented reflect the fees provided for in the Investment Management Agreement and Supervision and Administration Agreement. |
FINANCIAL HIGHLIGHTS
Per share income and capital changes for a share outstanding throughout the period. See accompanying notes to financial statements.
Sit Quality Income Fund
| | | | | | | | | | | | | | | | | | | | | | | | | | | | | | | | | | | |
| | | Six Months Ended | | Year Ended March 31, | | |
| | | September 30, 2021, | | | | | | | | | | | | |
| | | (Unaudited) | | 2021 | | 2020 | | 2019 | | 2018 | | 2017 | | |
| | | | | | | |
Net Asset Value: | | | | | | | | | | | | | | | | | | | | | | | | | | | | | | | | | | | |
Beginning of period | | | | $10.04 | | | | | $9.82 | | | | | $9.80 | | | | | $9.78 | | | | | $9.83 | | | | | $9.83 | | | | | | |
| | | | | | | |
Operations: | | | | | | | | | | | | | | | | | | | | | | | | | | | | | | | | | | | |
Net investment income 1 | | | | 0.09 | | | | | 0.10 | | | | | 0.18 | | | | | 0.19 | | | | | 0.13 | | | | | 0.09 | | | | | | |
Net realized and unrealized gains (losses) on investments, written options and futures | | | | 0.02 | | | | | 0.22 | | | | | 0.02 | | | | | 0.02 | | | | | (0.05 | ) | | | | — | | | | | | |
| | | | | | | |
Total from operations | | | | 0.11 | | | | | 0.32 | | | | | 0.20 | | | | | 0.21 | | | | | 0.08 | | | | | 0.09 | | | | | | |
Distributions from: | | | | | | | | | | | | | | | | | | | | | | | | | | | | | | | | | | | |
Net investment income | | | | (0.09 | ) | | | | (0.10 | ) | | | | (0.18 | ) | | | | (0.19 | ) | | | | (0.13 | ) | | | | (0.09 | ) | | | | | |
| | | | | | | |
Net Asset Value | | | | | | | | | | | | | | | | | | | | | | | | | | | | | | | | | | | |
End of period | | | | $10.06 | | | | | $10.04 | | | | | $9.82 | | | | | $9.80 | | | | | $9.78 | | | | | $9.83 | | | | | | |
| | | | | | | |
Total investment return 2 | | | | 1.07 | % | | | | 3.32 | % | | | | 2.04 | % | | | | 2.17 | % | | | | 0.79 | % | | | | 0.91 | % | | | | | |
| | | | | | | |
Net assets at end of period (000’s omitted) | | | | $124,313 | | | | | $108,794 | | | | | $90,273 | | | | | $82,287 | | | | | $74,542 | | | | | $73,861 | | | | | | |
| | | | | | | |
Ratios: 3 | | | | | | | | | | | | | | | | | | | | | | | | | | | | | | | | | | | |
Expenses | | | | 0.90 | % | | | | 0.90 | % | | | | 0.90 | % | | | | 0.90 | % | | | | 0.90 | % | | | | 0.90 | % | | | | | |
Net investment income | | | | 1.72 | % | | | | 1.05 | % | | | | 1.80 | % | | | | 1.96 | % | | | | 1.31 | % | | | | 0.91 | % | | | | | |
| | | | | | | |
Portfolio turnover rate (excluding short-term securities) | | | | 29.74 | %4 | | | | 77.96 | % | | | | 117.52 | % | | | | 68.93 | % | | | | 81.14 | % | | | | 84.03 | % | | | | | |
| 1 | The net investment income per share is based on average shares outstanding for the period. |
| 2 | Total investment return is based on the change in net asset value of a share during the period (not annualized) and assumes reinvestment of distributions at net asset value. |
| 3 | Ratios are annualized for periods less than one year. In addition to fees and expenses which the Fund bears directly, the Fund indirectly bears a pro rata share of the fees and expenses of the acquired funds in which it invests. Such indirect expenses are not included in the above reported expense ratios. |
| | | | |
| | | | |
| | |
58 | | | SIT MUTUAL FUNDS SEMI-ANNUAL REPORT | |
FINANCIAL HIGHLIGHTS
Per share income and capital changes for a share outstanding throughout the period. See accompanying notes to financial statements.
Sit Tax-Free Income Fund
| | | | | | | | | | | | | | | | | | | | | | | | | | | | | | | | | | | |
| Class S | | Six Months Ended | | Year Ended March 31, | | |
| | September 30, 2021, | | | | | | | | | | | | |
| | | (Unaudited) | | 2021 | | 2020 | | 2019 | | 2018 | | 2017 | | |
| | | | | | | |
Net Asset Value: | | | | | | | | | | | | | | | | | | | | | | | | | | | | | | | | | | | |
Beginning of period | | | | $9.91 | | | | | $9.56 | | | | | $9.69 | | | | | $9.66 | | | | | $9.49 | | | | | $9.80 | | | | | | |
| | | | | | | |
Operations: | | | | | | | | | | | | | | | | | | | | | | | | | | | | | | | | | | | |
Net investment income 1 | | | | 0.13 | | | | | 0.29 | | | | | 0.29 | | | | | 0.32 | | | | | 0.39 | | | | | 0.35 | | | | | | |
Net realized and unrealized gains (losses) on investments and futures | | | | 0.04 | | | | | 0.35 | | | | | (0.13 | ) | | | | 0.03 | | | | | 0.17 | | | | | (0.31 | ) | | | | | |
| | | | | | | |
Total from operations | | | | 0.17 | | | | | 0.64 | | | | | 0.16 | | | | | 0.35 | | | | | 0.56 | | | | | 0.04 | | | | | | |
Distributions from: | | | | | | | | | | | | | | | | | | | | | | | | | | | | | | | | | | | |
Net investment income | | | | (0.13 | ) | | | | (0.29 | ) | | | | (0.29 | ) | | | | (0.32 | ) | | | | (0.39 | ) | | | | (0.35 | ) | | | | | |
| | | | | | | |
Net Asset Value | | | | | | | | | | | | | | | | | | | | | | | | | | | | | | | | | | | |
End of period | | | | $9.95 | | | | | $9.91 | | | | | $9.56 | | | | | $9.69 | | | | | $9.66 | | | | | $9.49 | | | | | | |
| | | | | | | |
Total investment return 2 | | | | 1.73 | % | | | | 6.73 | % | | | | 1.66 | % | | | | 3.67 | % | | | | 6.00 | % | | | | 0.37 | % | | | | | |
| | | | | | | |
Net assets at end of period (000’s omitted) | | | | $209,277 | | | | | $348,230 | | | | | $313,296 | | | | | $247,351 | | | | | $196,018 | | | | | $160,445 | | | | | | |
| | | | | | | |
Ratios: 3 | | | | | | | | | | | | | | | | | | | | | | | | | | | | | | | | | | | |
Expenses | | | | 0.80 | % | | | | 0.80 | % | | | | 0.80 | % | | | | 0.80 | % | | | | 0.80 | % | | | | 0.80 | % | | | | | |
Net investment income | | | | 2.62 | % | | | | 2.92 | % | | | | 2.95 | % | | | | 3.37 | % | | | | 4.03 | % | | | | 3.58 | %0 | | | | | |
| | | | | | | |
Portfolio turnover rate (excluding short-term securities) | | | | 8.53 | %4 | | | | 21.22 | % | | | | 14.33 | % | | | | 13.80 | % | | | | 15.72 | % | | | | 25.41 | % | | | | | |
| 1 | The net investment income per share is based on average shares outstanding for the period. |
| 2 | Total investment return is based on the change in net asset value of a share during the period (not annualized) and assumes reinvestment of distributions at net asset value. |
| 3 | Ratios are annualized for periods less than one year. In addition to fees and expenses which the Fund bears directly, the Fund indirectly bears a pro rata share of the fees and expenses of the acquired funds in which it invests. Such indirect expenses are not included in the above reported expense ratios. |
FINANCIAL HIGHLIGHTS
Per share income and capital changes for a share outstanding throughout the period. See accompanying notes to financial statements.
| | | | | | | | | | |
Sit Tax-Free Income Fund | | | | | | | | | | |
| |
| Class Y | | Period Ended |
| | | September 30, 2021 1 |
| | |
Net Asset Value: | | | | | | | | | | |
Beginning of period | | | | $10.04 | | | | | | |
| | |
Operations: | | | | | | | | | | |
Net investment income 2 | | | | 0.10 | | | | | | |
Net realized and unrealized losses on investments and futures | | | | (0.09 | ) | | | | | |
| | |
Total from operations | | | | 0.01 | | | | | | |
Distributions from: | | | | | | | | | | |
Net investment income | | | | (0.10 | ) | | | | | |
| | |
Net Asset Value | | | | | | | | | | |
End of period | | | | $9.95 | | | | | | |
| | |
Total investment return 3 | | | | 0.08 | % | | | | | |
| | |
Net assets at end of period (000’s omitted) | | | | $176,684 | | | | | | |
| | |
Ratios: 4 | | | | | | | | | | |
Expenses | | | | 0.55 | %5 | | | | | |
Net investment income | | | | 2.91 | % | | | | | |
| | |
Portfolio turnover rate (excluding short-term securities) | | | | 8.53 | %6 | | | | | |
| 1 | The inception date of Class Y shares was June 1, 2021. |
| 2 | The net investment income per share is based on average shares outstanding for the period. |
| 3 | Total investment return is based on the change in net asset value of a share during the period (not annualized) and assumes reinvestment of distributions at net asset value. |
| 4 | Ratios are annualized for periods less than one year. In addition to fees and expenses which the Fund bears directly, the Fund indirectly bears a pro rata share of the fees and expenses of the acquired funds in which it invests. Such indirect expenses are not included in the above reported expense ratios. |
| 5 | Sit Tax-Free Income Class Y shares were first issued on June 1, 2021, and therefore the fees presented reflect the fees provided for in the Investment Management Agreement and Supervision and Administration Agreement. |
| | | | |
| | | | |
| | |
60 | | | SIT MUTUAL FUNDS SEMI-ANNUAL REPORT | |
FINANCIAL HIGHLIGHTS
Per share income and capital changes for a share outstanding throughout the period. See accompanying notes to financial statements.
| | | | | | | | | | | | | | | | | | | | | | | | | | | | | | | | | | | |
Sit Minnesota Tax-Free Income Fund | | | | | | | | | | | | | | | | | | | | | | | | | | | | | | | | | | | |
| | | |
| | | Six Months Ended | | Year Ended March 31, | | |
| | | September 30, 2021, | | | | | | | | | | | | |
| | | (Unaudited) | | 2021 | | 2020 | | 2019 | | 2018 | | 2017 | | |
| | | | | | | |
Net Asset Value: | | | | | | | | | | | | | | | | | | | | | | | | | | | | | | | | | | | |
Beginning of period | | | | $10.68 | | | | | $10.37 | | | | | $10.49 | | | | | $10.39 | | | | | $10.29 | | | | | $10.63 | | | | | | |
| | | | | | | |
Operations: | | | | | | | | | | | | | | | | | | | | | | | | | | | | | | | | | | | |
Net investment income 1 | | | | 0.14 | | | | | 0.30 | | | | | 0.30 | | | | | 0.32 | | | | | 0.32 | | | | | 0.32 | | | | | | |
Net realized and unrealized gains
(losses) on investments and futures | | | | 0.03 | | | | | 0.31 | | | | | (0.12 | ) | | | | 0.10 | | | | | 0.10 | | | | | (0.34 | ) | | | | | |
| | | | | | | |
Total from operations | | | | 0.17 | | | | | 0.61 | | | | | 0.18 | | | | | 0.42 | | | | | 0.42 | | | | | (0.02 | ) | | | | | |
Distributions from: | | | | | | | | | | | | | | | | | �� | | | | | | | | | | | | | | | | | | |
Net investment income | | | | (0.14 | ) | | | | (0.30 | ) | | | | (0.30 | ) | | | | (0.32 | ) | | | | (0.32 | ) | | | | (0.32 | ) | | | | | |
| | | | | | | |
Net Asset Value | | | | | | | | | | | | | | | | | | | | | | | | | | | | | | | | | | | |
End of period | | | | $10.71 | | | | | $10.68 | | | | | $10.37 | | | | | $10.49 | | | | | $10.39 | | | | | $10.29 | | | | | | |
| | | | | | | |
Total investment return 2 | | | | 1.55 | % | | | | 5.94 | % | | | | 1.46 | % | | | | 4.15 | % | | | | 4.08 | % | | | | (0.19 | %) | | | | | |
| | | | | | | |
Net assets at end of period (000’s omitted) | | | | $723,951 | | | | | $680,301 | | | | | $642,022 | | | | | $617,766 | | | | | $551,163 | | | | | $529,821 | | | | | | |
| | | | | | | |
Ratios: 3 | | | | | | | | | | | | | | | | | | | | | | | | | | | | | | | | | | | |
Expenses | | | | 0.80 | % | | | | 0.80 | % | | | | 0.80 | % | | | | 0.80 | % | | | | 0.80 | % | | | | 0.80 | % | | | | | |
Net investment income | | | | 2.50 | % | | | | 2.83 | % | | | | 2.80 | % | | | | 3.12 | % | | | | 3.05 | % | | | | 3.06 | % | | | | | |
| | | | | | | |
Portfolio turnover rate (excluding short-term securities) | | | | 6.36 | %4 | | | | 12.04 | % | | | | 10.05 | % | | | | 9.25 | % | | | | 12.97 | % | | | | 16.18 | % | | | | | |
| 1 | The net investment income per share is based on average shares outstanding for the period. |
| 2 | Total investment return is based on the change in net asset value of a share during the period (not annualized) and assumes reinvestment of distributions at net asset value. |
| 3 | Ratios are annualized for periods less than one year. In addition to fees and expenses which the Fund bears directly, the Fund indirectly bears a pro rata share of the fees and expenses of the acquired funds in which it invests. Such indirect expenses are not included in the above reported expense ratios. |
NOTES TO FINANCIAL STATEMENTS (Unaudited)
Six Months Ended September 30, 2021
(1) Organization
The Sit Mutual Funds (the Funds) are no-load funds, and are registered under the Investment Company Act of 1940 (as amended) as diversified (except Minnesota Tax-Free Income Fund which is non-diversified), open-end management investment companies, or series thereof. The Sit Quality Income Fund, Sit Tax-Free Income Fund and Minnesota Tax-Free Income Fund are series funds of Sit Mutual Funds II, Inc. Each fund has 10 billion authorized shares of capital stock. Shares in the U.S. Government Securities Fund have a par value of $0.01, and shares in other funds have a par value of $0.001. This report covers the bond funds of the Sit Mutual Funds.
The investment objective for each Fund is as follows:
| | |
| Fund | | Investment Objective |
U.S. Government Securities Fund | | High current income and safety of principal. |
| |
Quality Income Fund | | High current income and safety of principal. |
| |
Tax-Free Income Fund | | High current income that is exempt from federal income tax, consistent with the preservation of capital. |
| |
Minnesota Tax-Free Income Fund | | High current income that is exempt from federal regular income tax and Minnesota regular personal income tax, consistent with the preservation of capital. |
The U.S. Government Securities Fund and Tax-Free Income Fund offer Class S and Class Y shares. Both classes of shares have identical voting, dividend and liquidation rights. Income, expenses (other than class specific expenses) and realized and unrealized gains or losses on investments are allocated to each class of shares based upon its relative net assets.
(2) Significant Accounting Policies
The Funds are investment companies and follow accounting and reporting guidance under Financial Accounting Standards Board (“FASB”) Accounting Standards Codification (“ASC”) Topic 946, “Financial Services-Investment Companies”. The following is a summary of significant accounting policies consistently followed by the Funds in the preparation of their financial statements in conformity with U.S. generally accepted accounting principles (“GAAP”).
Investments in Securities
Investment securities are carried at fair value based upon closing market quotations on the last business day of the period. Investments in securities traded on national or international securities exchanges are valued at the last reported sales price prior to the time when assets are valued. Equity securities traded on the over-the-counter market are valued at the last reported sales price or if the last sales price is not available, at the last reported bid price. The sale and bid prices or prices deemed best to reflect fair value quoted by dealers who make markets in these securities are obtained from independent pricing services. Consistent with the Funds’ valuation policies and procedures, the current fair value of certain fixed income securities is provided by an independent pricing service. Fixed income securities for which prices are not available from an independent pricing service but where an active market exists are valued using market quotations obtained from broker-dealers or quotation systems. Securities for which market quotations are not available, such as private placement securities, are valued at fair value according to methods selected in good faith by Sit Investment Associates, Inc. (the “Adviser”) and may include dealer-supplied valuations or other inputs and assumptions that pricing services would typically utilize. Short-term investments of sufficient credit quality with maturities of 60 days or less when acquired, or which subsequently are within 60 days of maturity, are valued at amortized cost, which approximates fair value. Options and futures contracts entered into and held by the Funds are valued at the close of the securities and commodities exchange on which they are traded.
Security transactions are accounted for on the date the securities are purchased or sold. Gains and losses are calculated on the identified cost basis. Interest, including level-yield amortization of long-term bond premium and discount, is recorded on the accrual basis. Dividends received from closed-end fund holdings are included in Dividend Income and distributions from capital gains, if any, are included in Net Realized Gain (Loss).
| | | | |
| | | | |
| | |
62 | | | SIT MUTUAL FUNDS SEMI-ANNUAL REPORT | |
Delivery and payment for securities which have been purchased by the Funds on a forward commitment or when-issued basis can take place two weeks or more after the transaction date. During this period, such securities are subject to market fluctuations and may increase or decrease in value prior to delivery.
The Minnesota Tax-Free Income Fund concentrates its investments in Minnesota, and therefore may have more credit risk related to the economic conditions in the state of Minnesota than a portfolio with broader geographical diversification.
Derivative Instruments
The Funds apply derivative instrument disclosure standards in order to enable investors to understand how and why the Funds use derivatives, how derivatives are accounted for, and how derivative instruments affect the Funds’ financial statements.
To hedge interest rate risk, the Funds used Treasury options and futures traded on a U.S. exchange. Risks of entering into futures and options contracts include the possibility of an illiquid market and that a change in the value of the option may not correlate with changes in the value of the underlying securities.
The premiums paid for the options represent the cost of the investment and the options are valued daily at their closing price. The Funds recognize a realized gain or loss when the option is sold or expired. Option holdings within the Funds, which may include put options and call options, are subject to loss of value with the passage of time, and may experience a total loss of value upon expiration. With options, there is minimal counterparty risk to the Funds since they are exchange traded.
Upon entering into a futures contract, a Fund is required to deposit either cash or securities in an amount (initial margin) equal to a certain percentage of the contract value. Subsequent payments (variation margin) are made or received by the Fund each day. The variation margin payments are equal to the daily changes in the contract value and are recorded as unrealized gains and losses. The Fund recognizes a realized gain or loss when the contract is closed or expired. With futures contracts, there is minimal counterparty risk to the Fund since futures are exchange traded and the exchange’s clearinghouse, as counterparty to all exchange-traded futures, guarantees the futures against default.
During the six months ended September 30, 2021, the average volume of derivative activity, calculated on a quarterly basis, was as follows:
| | | | | | | | | | | | |
| | | Average
Cost | | | Average
Premium
Received | | | Average
Notional
Amount | |
U.S. Government Securities Fund | | | | | | | | | | | | |
Purchased put options | | $ | 570,507 | | | | — | | | $ | 93,095,333 | |
Quality Income Fund | | | | | | | | | | | | |
Written call options | | | — | | | | $38,800 | | | | 10,296,833 | |
Treasury futures - short | | | — | | | | — | | | | 40,957,464 | |
Tax-Free Income Fund | | | | | | | | | | | | |
Treasury futures - short | | | — | | | | — | | | | 40,993,639 | |
The number of open option contracts and open futures contracts outstanding as of September 30, 2021 also serve as indicators of the volume of activity for the Funds throughout the period.
NOTES TO FINANCIAL STATEMENTS (Unaudited)
Six Months Ended September 30, 2021 (Continued)
Statement of Assets and Liabilities – Values of derivatives as of September 30, 2021:
| | | | | | | | | | |
| | | Asset Derivatives Value | | | | Liability Derivatives Value |
Interest rate risk: | | | | | | | | | | |
Quality Income Fund | | | | | | | | | | |
Written call options | | | — | | | | | | $1,938 | 2 |
Treasury futures | | | $156,829 | 1 | | | | | — | |
Tax-Free Income Fund | | | | | | | | | | |
Treasury futures | | | 773,571 | 1 | | | | | — | |
| | 1 | Statement of Assets and Liabilities location: Variation margin receivable/payable. Includes cumulative appreciation (depreciation) of futures as reported in the Schedule of Investments. | |
| | 2 | Statement of Assets and Liabilities location: Outstanding options written, at fair value. | |
The effect of derivative instruments on the statement of operations for the six months ended September 30, 2021:
| | | | | | | | |
| | | Amount of Realized | | Change in Unrealized |
| | | Gain (Loss) on | | Appreciation (Depreciation) on |
| | | Derivatives 3 | | Derivatives 4 |
Interest rate risk: | | | | | | | | |
U.S. Government Securities Fund | | | | | | | | |
Purchased put options | | | ($1,657,864 | ) | | | $212,244 | |
Written call options | | | 307,989 | | | | — | |
Quality Income Fund | | | | | | | | |
Written call options | | | 149,018 | | | | (33,878 | ) |
Treasury futures | | | (194,855 | ) | | | 12,067 | |
Tax-Free Income Fund | | | | | | | | |
Treasury futures | | | (1,211,361 | ) | | | 772,635 | |
| | 3 | Statement of Operations location: Net realized gain (loss) on investments, net realized gain (loss) on written options and net realized gain (loss) on futures, respectively. | |
| | 4 | Statement of Operations location: Net change in unrealized appreciation (depreciation) on investments, net change in unrealized appreciation (depreciation) on written options and net change in unrealized appreciation (depreciation) on futures, respectively. | |
Fair Value Measurements
The inputs and valuation techniques used to measure fair value of the Funds’ net assets are summarized into three levels as described in the hierarchy below:
• Level 1 – quoted prices in active markets for identical securities. An active market for the security is a market in which transactions occur with sufficient frequency and volume to provide pricing information on an ongoing basis. A quoted price in an active market provides the most reliable evidence of fair value.
• Level 2 – debt securities are valued based on evaluated prices received from independent pricing services or from dealers who make markets in such securities. For corporate bonds, U.S. government and government agency obligations, and municipal securities the pricing services utilize matrix pricing which considers yield or price of bonds of comparable quality, coupon, maturity, and type as well as dealer supplied prices. For asset-backed securities and mortgage-backed securities, the pricing services utilize matrix pricing which considers prepayment speed assumptions, attributes of the collateral, yield or price of bonds of comparable quality, coupon, maturity, and type as well as dealer supplied prices. All of these inputs are derived principally from or corroborated by observable market data. An adjustment to any observable input that is significant to the fair value may render the measurement a Level 3 measurement.
| | | | |
| | | | |
| | |
64 | | | SIT MUTUAL FUNDS SEMI-ANNUAL REPORT | |
• Level 3 – significant unobservable inputs, including the Adviser’s own assumptions in determining the fair value of investments.
The inputs or methodology used for valuing securities are not necessarily an indication of the risk associated with investing in those securities.
At the end of each calendar quarter, management evaluates the Level 2 and 3 assets and liabilities for changes in liquidity, including but not limited to: whether a broker is willing to execute at the quoted price, the depth and consistency of prices from third party services, and the existence of contemporaneous, observable trades in the market. Additionally, management evaluates the Level 1 and 2 assets and liabilities on a quarterly basis for changes in listings or delistings on national exchanges. Due to the inherent uncertainty of determining the fair value of investments that do not have a readily available market value, the fair value of the Funds’ investments may fluctuate from period to period. Additionally, the fair value of investments may differ significantly from the values that would have been used had a ready market existed for such investments and may differ materially from the values the Fund may ultimately realize. Further, such investments may be subject to legal and other restrictions on resale or otherwise are less liquid than publicly traded securities.
A summary of the levels for the Funds’ investments as of September 30, 2021 is included with the Funds’ schedules of investments.
Federal Taxes
The Funds’ policy is to comply with the requirements of the Internal Revenue Code applicable to regulated investment companies and to distribute all of their taxable income to shareholders. The Funds have recorded in their financial statements the full benefit of their tax positions taken in connection with the Registered Investment Company (RIC) qualification and distribution requirements of the Internal Revenue Code. Therefore, no income tax provision is required. Also, in order to avoid the payment of any federal excise taxes, the Funds will distribute substantially all of their net investment income and net realized gains on a calendar year basis.
Management has analyzed the Funds’ tax positions taken in federal tax returns for all open tax years and has concluded that as of September 30, 2021, no provision for income tax would be required in the Funds’ financial statements. The Funds’ federal and state income and federal excise tax returns remain subject to examination by the Internal Revenue Service and state departments of revenue until such time as the applicable statute of limitations for audit has expired. For example, U.S. tax returns are generally subject to audit for three years from the date they are filed.
At September 30, 2021, the gross unrealized appreciation (depreciation) on investments and cost of securities on a tax basis for federal income tax purposes were as follows:
| | | | | | | | | | | | | | | | |
| | | Unrealized Appreciation | | | Unrealized Depreciation | | | Net Unrealized Appreciation (Depreciation) | | | Cost (Proceeds) of Investments on a Tax Basis | |
U.S. Government Securities Fund - Investments | | | $12,101,424 | | | | ($3,638,886 | ) | | | $8,462,538 | | | | $505,553,043 | |
Quality Income Fund - Investments | | | 1,166,732 | | | | (339,986 | ) | | | 826,746 | | | | 126,258,852 | |
Tax-Free Income Fund - Investments | | | 20,049,953 | | | | (18,321,015 | ) | | | 1,728,938 | | | | 371,225,722 | |
Minnesota Tax-Free Income Fund - Investments | | | 26,944,167 | | | | (5,090,128 | ) | | | 21,854,039 | | | | 693,739,910 | |
Net investment income and net realized gains may differ for financial statement and tax purposes. The character of distributions made during the year from net investment income or net realized gains may also differ from its ultimate characterization for tax purposes. The tax character of distributions paid during the fiscal years ended March 31, 2021 and 2020 was as follows:
NOTES TO FINANCIAL STATEMENTS (Unaudited)
Six Months Ended September 30, 2021 (Continued)
| | | | | | | | | | | | | | | | |
Year Ended March 31, 2021: | |
| | | Ordinary Income | | | Tax-Exempt
Income | | | Long Term
Capital Gain | | | Total | |
U.S. Government Securities | | | $5,957,101 | | | | — | | | | — | | | | $5,957,101 | |
Quality Income | | | 1,043,484 | | | | — | | | | — | | | | 1,043,484 | |
Tax-Free Income* | | | 74,376 | | | | $9,453,231 | | | | — | | | | 9,527,607 | |
Minnesota Tax-Free Income* | | | 13,344 | | | | 18,424,560 | | | | — | | | | 18,437,904 | |
*99.2% and 99.9% of dividends were derived from interest on tax-exempt securities for the Tax-Free Income and Minnesota Tax-Free Income Funds, respectively.
| | | | | | | | | | | | | | | | |
Year Ended March 31, 2020: | |
| | | Ordinary Income | | | Tax-Exempt
Income | | | Long Term
Capital Gain | | | Total | |
U.S. Government Securities | | | $8,592,078 | | | | — | | | | — | | | | $8,592,078 | |
Quality Income | | | 1,540,562 | | | | — | | | | — | | | | 1,540,562 | |
Tax-Free Income* | | | 51,791 | | | | $8,593,961 | | | | — | | | | 8,645,752 | |
Minnesota Tax-Free Income* | | | 21,281 | | | | 18,749,227 | | | | — | | | | 18,770,508 | |
*99.4% and 99.9% of dividends were derived from interest on tax-exempt securities for the Tax-Free Income and Minnesota Tax-Free Income Funds, respectively.
As of March 31, 2021, the components of distributable earnings on a tax basis were as follows:
| | | | | | | | | | | | | | | | |
| | | Undistributed
Ordinary
Income | | | Undistributed
Tax-Exempt
Income | | | Accumulated
Gain (Loss) | | | Unrealized
Appreciation
(Depreciation) | |
U.S. Government Securities | | | $86,304 | | | | — | | | | ($16,252,613 | ) | | | $11,549,103 | |
Quality Income | | | 2,200 | | | | — | | | | 401,278 | | | | 877,773 | |
Tax-Free Income | | | — | | | | $316,861 | | | | (9,475,083 | ) | | | 402,438 | |
Minnesota Tax-Free Income | | | — | | | | 140,643 | | | | (3,276,482 | ) | | | 20,666,938 | |
Net capital loss carryovers and late year losses, if any, as of March 31, 2021, are available to offset future realized capital gains and thereby reduce future capital gains distributions. The Funds are permitted to carry forward capital losses for an unlimited period. Capital losses that are carried forward retain their character as either short-term or long-term capital losses. The net capital loss carryovers and the late year losses deferred as of March 31, 2021, were as follows:
| | | | | | | | | | | | | | | | |
| | | Unlimited Period of Net | | | Late Year | | | Accumulated | |
| | | Capital Loss Carryover | | | Losses | | | Capital and | |
| | | Short-Term | | | Long-Term | | | Deferred | | | Other Losses | |
U.S. Government Securities | | | $7,890,798 | | | | $8,361,815 | | | | — | | | | $16,252,613 | |
Quality Income | | | — | | | | 401,278 | | | | — | | | | 401,278 | |
Tax-Free Income | | | 1,632,309 | | | | 7,842,774 | | | | — | | | | 9,475,083 | |
Minnesota Tax-Free Income | | | 1,444,330 | | | | 1,832,152 | | | | — | | | | 3,276,482 | |
For the year ended March 31, 2021, the Funds’ utilized capital losses and expired capital losses as follows:
| | | | | | | | |
| | | Utilized | | | Expired | |
U.S. Government Securities | | | $1,243,344 | | | | — | |
Quality Income | | | 1,143,549 | | | | — | |
| | | | |
| | | | |
| | |
66 | | | SIT MUTUAL FUNDS SEMI-ANNUAL REPORT | |
Distributions
Distributions to shareholders are recorded as of the close of business on the record date. Such distributions are payable in cash or reinvested in additional shares of the Funds’ capital stock. Distributions from net investment income are declared daily and paid monthly for the Funds. Distributions from net realized gains, if any, will be made annually for each of the Funds.
Use of Estimates
The preparation of financial statements in conformity with U.S. generally accepted accounting principles requires management to make certain estimates and assumptions that affect the reported amounts of assets and liabilities and disclosure of contingent assets and liabilities at the date of the financial statements and the reported results for the respective periods. Actual results could differ from those estimates.
Guarantees and Indemnifications
Under each Fund’s organizational documents, its officers and directors are indemnified against certain liability arising out of the performance of their duties to each Fund. In addition, certain of each Fund’s contracts with its service providers contain general indemnification clauses. Each Fund’s maximum exposure under these arrangements is unknown since the amount of any future claims that may be made against each Fund cannot be determined and each Fund has no historical basis for predicting the likelihood of any such claims.
| (3) | Investment Security Transactions |
The cost of purchases and proceeds from sales and maturities of investment securities, other than short-term securities, for the six months ended September 30, 2021, were as follows:
| | | | | | | | | | | | | | | | |
| | | Purchases | | | Proceeds | |
| | | U.S. Government | | | Other | | | U.S. Government | | | Other | |
U.S. Government Securities | | | $121,361,508 | | | | — | | | | $92,783,761 | | | | $859,960 | |
Quality Income | | | 10,686,856 | | | | $25,983,749 | | | | 9,106,602 | | | | 22,640,046 | |
Tax-Free Income | | | — | | | | 67,991,504 | | | | — | | | | 30,224,433 | |
Minnesota Tax-Free Income | | | — | | | | 106,005,991 | | | | — | | | | 43,203,169 | |
NOTES TO FINANCIAL STATEMENTS (Unaudited)
Six Months Ended September 30, 2021 (Continued)
(4) Affiliated Fees and Transactions
Investment Adviser
The Funds each have entered into an investment management agreement with Sit Investment Associates Inc., under which SIA manages the Funds’ assets and provides research, statistical and advisory services, and pays related office rental, executive expenses and executive salaries. In addition, the Funds have entered into separate supervision and administration agreements with SIA. SIA also is obligated to pay all of the Funds’ expenses (excluding extraordinary expenses, stock transfer taxes, interest, brokerage commissions, and other transaction charges relating to investing activities). The fees charged to each Fund by SIA are based on the average daily net assets of the Funds at the annual rate of:
| | | | | | |
| | | Advisory
Fees | | Supervisory and
Administrative Fees | | Total
Management Fees |
U.S. Government Securities Class S | | 0.20% | | 0.60% | | 0.80% |
U.S. Government Securities Class Y | | 0.20% | | 0.35% | | 0.55% |
Quality Income 1 | | 0.30% | | 0.60% | | 0.90% |
Tax-Free Income Class S 1 | | 0.20% | | 0.60% | | 0.80% |
Tax-Free Income Class Y 2 | | 0.20% | | 0.35% | | 0.55% |
Minnesota Tax-Free Income 1 | | 0.20% | | 0.60% | | 0.80% |
| 1 | The supervisory and administrative fee was effective June 1, 2021. Prior to June 1, 2021, the advisory fee and total management fee was 0.90%, 0.80%, and 0.80% for Quality Income, Tax-Free Income and Minnesota Tax-Free Income, respectively. |
| 2 | Sit Tax-Free Income Fund Class Y shares were first issued on June 1, 2021, and therefore the fees presented reflect the fees provided for in the Investment Management Agreement and Supervision and Administration Agreement. |
Transactions with affiliates
The Adviser, affiliates of the Adviser, directors and officers of the Funds as a whole owned the following shares as of September 30, 2021:
| | | | | | | | | | | | |
| | | | | | Shares | | % Shares Outstanding | |
U.S. Government Securities Class S | | | | | | | 132,304 | | | | 0.4 | |
U.S. Government Securities Class Y | | | | | | | 1,100,252 | | | | 8.8 | |
Quality Income | | | | | | | 9,137,709 | | | | 73.9 | |
Tax-Free Income Class S | | | | | | | 314,792 | | | | 1.5 | |
Tax-Free Income Class Y | | | | | | | 666,858 | | | | 3.8 | |
Minnesota Tax-Free Income | | | | | | | 1,850,552 | | | | 2.7 | |
| | | | |
| | | | |
| | |
68 | | | SIT MUTUAL FUNDS SEMI-ANNUAL REPORT | |
EXPENSE EXAMPLE (Unaudited)
As a shareholder of the Funds, you incur two types of costs: (1) transaction costs, including redemption fees and (2) ongoing costs, including management fees; and other Fund expenses. This Example is intended to help you understand your ongoing costs (in dollars) of investing in the Funds and to compare these costs with the ongoing costs of investing in other mutual funds.
The Example is based on an investment of $1,000 invested at the beginning of the period and held for the entire period April 1, 2021 to September 30, 2021.
Actual Expenses
The first line of the following table provides information about actual account values and actual expenses. You may use the information in this line, together with the amount you invested, to estimate the expenses that you paid over the period. Simply divide your account value by $1,000 (for example, an $8,600 account value divided by $1,000 = 8.6), then multiply the result by the number in the first line under the heading entitled “Expenses Paid During Period” to estimate the expenses you paid on your account during this period.
Hypothetical Example for Comparison Purposes
The second line of the table provides information about hypothetical account values and hypothetical expenses based on the Fund’s actual expense ratio and an assumed rate of return of 5% per year before expenses, which is not the Fund’s actual return. The hypothetical account values and expenses may not be used to estimate the actual ending account balance or expenses you paid for the period. You may use this information to compare the ongoing costs of investing in the Fund and other funds. To do so, compare this 5% hypothetical example with the 5% hypothetical examples that appear in the shareholder reports of the other funds.
Please note that the expenses shown in the table are meant to highlight your ongoing costs only and do not reflect any transactional costs, such as redemption fees. Therefore, the second line of the table is useful in comparing ongoing costs only, and will not help you determine the relative total costs of owning different funds. In addition, if these transactional costs (redemption fees) were included, your costs would have been higher.
| | | | | | | | | | | | |
| | | Beginning
Account
Value
(4/1/21) | | | Ending
Account
Value
(9/30/21) | | | Expenses Paid During
Period
(4/1/21-
9/30/21)* | |
|
| U.S. Government Securities Fund | |
Actual | | | | | | | | | | | | |
Class S | | | $1,000 | | | | $998.20 | | | | $4.01 | |
Class Y | | | $1,000 | | | | $999.50 | | | | $2.76 | |
Hypothetical | | | | | | | | | | | | |
Class S | | | $1,000 | | | | $1,021.06 | | | | $4.05 | |
Class Y | | | $1,000 | | | | $1,022.31 | | | | $2.79 | |
| |
| Quality Income Fund | |
Actual | | | $1,000 | | | | $1,010.70 | | | | $4.54 | |
Hypothetical | | | $1,000 | | | | $1,020.56 | | | | $4.56 | |
| |
| Tax-Free Income Fund | |
Actual | | | | | | | | | | | | |
Class S | | | $1,000 | | | | $1,017.30 | | | | $4.05 | |
Class Y ** | | | $1,000 | | | | $1,000.80 | | | | $1.84 | |
Hypothetical | | | | | | | | | | | | |
Class S | | | $1,000 | | | | $1,021.06 | | | | $4.05 | |
Class Y *** | | | $1,000 | | | | $1,022.31 | | | | $1.86 | |
| |
| Minnesota Tax-Free Income Fund | |
Actual | | | $1,000 | | | | $1,015.50 | | | | $4.04 | |
Hypothetical | | | $1,000 | | | | $1,021.06 | | | | $4.05 | |
| | | | | | | | | | | | | |
| * | Expenses are equal to the Funds’ annualized expense ratios of 0.80% for the U.S. Government Securities, Class S, Tax-Free Income, Class S, and Minnesota Tax-Free Funds; 0.55% for the U.S. Government Securities, Class Y; and 0.90% for the Quality Income Fund, multiplied by the average account value over the period, multiplied by 183/365 (to reflect the one-half year period.) |
| ** | Expenses are equal to the Tax-Free Income Fund’s, Class Y annualized expense ratio of 0.55%, multiplied by the average account value over the period, multiplied by 122/365 (to reflect the one-quarter year period.) |
| *** | Expenses are as if the Tax-Free Income Fund’s, Class Y had been in existence since April 1, 2021, and are equal to the Tax-Free Income Fund’s, Class Y annualized expense ratio of 0.55%, multiplied by the average account value over the period, multiplied by 183/365 (to reflect the one-half year period.) |
ADDITIONAL INFORMATION
PROXY VOTING
A description of the policies and procedures that Sit Investment uses to vote proxies related to the Funds’ portfolio securities is set forth in the Funds’ Statement of Additional Information, which is available on the Funds’ website at www.sitfunds.com, without charge by calling 800-332-5580 and on the Securities and Exchange Commission’s (SEC) website at www.sec.gov. The Funds’ proxy voting record is available without charge by calling 800-332-5580 and on the SEC’s website at www.sec.gov no later than August 31 for the prior 12 months ending June.
QUARTERLY SCHEDULE OF INVESTMENTS SCHEDULES
Each Fund files a complete schedule of investments with the SEC for the first and third quarters of each fiscal year on Form N-PORT. The Funds’ Form N-PORT is available on the SEC’s website at www.sec.gov. Each Fund’s complete schedule of investments, as filed on Form N-PORT, is also available on its website at www.sitfunds.com, or without charge by calling 800-332-5580.
| | | | |
| | | | |
| | |
70 | | | SIT MUTUAL FUNDS SEMI-ANNUAL REPORT | |
[This page is intentionally left blank.]
[This page is intentionally left blank.]
| | | | |
| | | | |
| | |
72 | | | SIT MUTUAL FUNDS SEMI-ANNUAL REPORT | |
Item 2: Code of Ethics.
Not applicable to Semi-Annual Report.
Item 3: Audit Committee Financial Expert.
Not applicable to Semi-Annual Report.
Item 4: Principal Accountant Fees and Services.
Not applicable to Semi-Annual Report.
Item 5: Audit Committee of Listed Registrants.
Not applicable to open-end investment companies.
Item 6: Schedule of Investments.
The schedule of investments is included as part of the report to shareholders filed under Item 1 of this Form.
Item 7: Disclosure of Proxy Voting Policies and Procedures for Closed-End Management Investment Companies.
Not applicable to open-end investment companies.
Item 8: Portfolio Managers of Closed-End Management Companies.
Not applicable to open-end investment companies.
Item 9: Purchases of Equity Securities by Closed-End Management Investment Company and Affiliated Purchasers.
Not applicable to open-end investment companies.
Item 10. Submission of Matters to a vote of Security Holders.
There have been no material changes to the procedures by which shareholders may recommend nominees to the registrant’s board of directors.
Item 11: Controls and Procedures -
(a) Based on their evaluation of the Registrant’s Disclosure Controls and Procedures as of a date within 90 days of the Filing Date, the Registrant’s Chairman and Treasurer have determined that the Disclosure Controls and Procedures (as defined in Rule 30a-2(c) under the Act) are designed to ensure that information required to be disclosed by the Registrant is recorded, processed, summarized and reported by the filing Date, and that information required to be disclosed in the report is communicated to the Registrant’s management, as appropriate, to allow timely decisions regarding required disclosure.
b) There were no changes in the Registrant’s internal control over financial reporting as defined in Rule 30a-3(d) under the Act) that occurred during the Registrant’s last fiscal half-year that has materially affected, or is reasonably likely to materially affect, the Registrant’s internal control over financial reporting.
Item 12: Disclosure of Securities Lending Activities for Closed-End Management Investment Companies.
Not applicable to open-end investment companies.
Item 13: Exhibits:
(a) The following exhibits are attached to this Form N-CSR:
(2) A separate certification for each principal executive and principal financial officer of the registrant as required by Rule 30a-2(a) under the Act (17 CFR 270.30a-2) (certification required by Section 302 of the Sarbanes-Oxley Act of 2002).
(b) Certification required by Rule 30a-2(b) under the Act (certification required by Section 906 of the Sarbanes-Oxley Act of 2002).
SIGNATURES
Pursuant to the requirements of the Securities Exchange Act of 1934 and the Investment Company Act of 1940, the registrant has duly caused this report to be signed on its behalf by the undersigned, thereunto duly authorized.
| | |
| SIT MUTUAL FUNDS II, INC. |
| |
| By: �� | | /s/ Paul E. Rasmussen |
| | Paul E. Rasmussen |
| | Vice President, Treasurer |
Date: November 19, 2021
Pursuant to the requirements of the Securities Exchange Act of 1934 and the Investment Company Act of 1940, this report has been signed below by the following persons on behalf of the registrant and in the capacities and on the dates indicated.
| | |
| By: | | /s/ Paul E. Rasmussen |
| | Paul E. Rasmussen |
| | Vice President, Treasurer |
Date: November 19, 2021
| | |
| By: | | /s/ Roger J. Sit |
| | Roger J. Sit |
| | Chairman |
Date: November 19, 2021