UNITED STATES
SECURITIES AND EXCHANGE COMMISSION
Washington, D.C. 20549
FORM N-CSR
CERTIFIED SHAREHOLDER REPORT OF REGISTERED
MANAGEMENT INVESTMENT COMPANIES
Investment Company Act file number: 811-04033
Sit Mutual Funds II, Inc.
(Exact name of registrant as specified in charter)
3300 IDS Center
80 South Eighth Street
Minneapolis, MN 55402
(Address of principal executive offices)
Paul E. Rasmussen, VP & Treasurer
Sit Mutual Funds, Inc.
3300 IDS Center
80 South Eighth Street
Minneapolis, MN 55402
(Name and address of agent for service)
Registrant’s telephone number, including area code: (612) 332-3223
Date of fiscal year end:March 31, 2022
Date of reporting period: September 30, 2022
Item 1: Reports to Stockholders

Semi-Annual Report
September 30, 2022
U.S. Government Securities Fund
Quality Income Fund
Tax-Free Income Fund
Minnesota Tax-Free Income Fund
Sit Mutual Funds
Sit Mutual Funds
BOND FUNDS SEMI-ANNUAL REPORT
TABLE OF CONTENTS
This document must be preceded or accompanied by a Prospectus.
CHAIRMAN’S LETTER
November 4, 2022
Dear Fellow Shareholders:
The Federal Reserve (the Fed) and inflation took center stage for the semi-annual period ended September 30th, 2022 as elevated inflation and the most hawkish monetary policy in decades drove sharp declines in bond and stock prices. As measured by the Bloomberg Aggregate Bond Index, the broad bond market returned -9.2% for the period, while the S&P 500® stock index returned -20.2%. The $6.3 trillion of fiscal stimulus and $5 trillion of monetary stimulus after the onset of the pandemic caused inflation to spike. This resulted in higher yields and for the Fed to finally reverse its stimulative stance and raise rates aggressively. The Fed’s quicker-than-expected increase in the Fed Funds rate spurred a dramatic shift higher in interest rates across all maturities. For example, the yield for the 2-year maturity Treasury increased 1.94% to 4.28%, while the yield for the 30-year maturity Treasury increased 1.33% to 3.78%.
Inflation
Inflation has been broad-based, with energy, food, and housing making notable contributions. The rate of change in consumer prices peaked in June, when the non-seasonally adjusted CPI reported a 9.1% year-over-year increase. The less volatile core CPI (excludes energy and foods) most recently showed a 6.3% year-over-year increase in prices. We believe the supply-demand gap caused by a lack of production factors, notably labor, has been the primary driver of inflation. Employers find it challenging to fill vacant positions, resulting in a widespread reduction in service hours and order backlogs. In fact, according to the JOLTs survey, the number of job openings has exceeded 11 million since late 2021. An elevated level of savings that was accumulated by individuals from the various pandemic-era fiscal stimulus payments has kept the labor participation rate below pre-pandemic levels. However, the national savings rate has fallen below the long-run average in recent months, and the labor participation rate has ticked up. China’s strict Covid-19 policies also worsened the supply-demand imbalance, adding even more pressure to the prices of goods. The two-month lockdown in Shanghai that ended in June was particularly disruptive to international trade.
Swings in oil and natural gas prices throughout the period had an outsized impact on prices overall due to the relative importance of energy costs for transportation and the production of goods. Russia’s invasion of Ukraine and the ensuing raft of sanctions levied against Russia by the international community, combined with OPEC member countries’ inability and/or unwillingness to increase production, resulted in surging oil prices. After peaking in June, oil prices and motor vehicle fuel prices have returned to March levels. However, the weaponization of natural gas supplies from Russia to Europe spurred a second resurgence over the summer, and prices remain elevated.
Monetary Policy
The Fed raised the target for the Fed Funds rate at each of the four meetings during the period for a total rate increase of 2.75% as it combats inflation. The lower bound of the range for the Fed Funds target rate now stands at 3.00%, and the Fed has indicated that more rate hikes are to be expected as monetary policy has only just become restrictive. Additionally, the Fed has embarked on quantitative tightening as it has begun shrinking its balance sheet. Combating inflation will be difficult for the Fed, with the main driver of inflation being labor shortage-induced supply chain issues, not easy money. However, the Fed has reiterated that it will be undeterred in bringing the year-over-year change in core-PCE rate of inflation down to 2.0%. The Fed prefers this measure of inflation, which has been greater than 4.0% since October 2021.
The Fed’s interest rate increases, which have been at the quickest pace in 40 years, have inverted the yield curve, spooked equity investors, and increased volatility across all asset classes. The Fed’s strategy for solving the supply-demand mismatch that is pushing up prices is to eliminate some of the demand for goods and services through slowing economic activity. The short end of the yield curve has shifted up as the Fed has signaled that more rate hikes are coming and it intends to keep rates elevated through 2023, however fears that the Fed may push the economy into a deep recession have muted the rise in long-term rates. As such, the 2-year Treasury has the highest yield across the curve and is 0.45% higher than the 10-year Treasury. Recession fears are not unfounded as real-GDP growth has already been negative for the first and second quarters of 2022. As economists, investors, politicians, and market pundits debate the definition of ‘recession,’ the reality is Americans are suffering from higher consumer prices, declining real wages, and the very rapid rise in mortgage rates.
Balance Sheet Reduction
The Fed’s aggressive balance sheet reduction has contributed to the spike in interest rates and market turmoil in the latest quarter. Since June, the Fed’s security holdings have been reduced by approximately $228 billion, with $85 billion in September alone. Although anticipated mortgage prepayments depend on the future path of interest rates, under its current plans, the Fed would force the market to absorb an estimated $850 billion in the first year of normalization. For historical context, the previous attempt at balance sheet normalization that ended in 2019 saw a reduction of only $295 billion in the first 12 months; and that was after waiting 35 months from the last asset purchase.
| | |
| | |
| 2 | | SIT MUTUAL FUNDS SEMI-ANNUAL REPORT |
In June, the Fed began to reduce its nearly $9.0 trillion balance sheet by forgoing reinvestment of a portion of the principal payments received each month from its Treasury and mortgage-backed securities (MBS) holdings. The Fed’s holdings of these securities had ballooned to $8.4 trillion from a pre-pandemic level of $3.8 trillion as the Fed absorbed the bond issuance required to finance the various pandemic-related fiscal stimulus packages.
The Fed set an initial pace of balance sheet reduction at $47.5 billion per month for June through August, with a monthly reduction cap of $30.0 billion for Treasuries and $17.5 billion for MBS. The reduction caps doubled to $60.0 billion and $35.0 billion in September, respectively. However, principal payments received by the Fed will fall short of the caps, particularly for its MBS holdings, where prepayments have plummeted due to the rise in mortgage rates. The shortfall in principal received from maturing Treasuries will be filled with a reduction in T-bill holdings. The Fed may consider outright sales of MBS in the future to fill the shortfall, but for now, it goes unfilled. Ultimately, the Fed would like to reduce the MBS on its balance sheet to zero.
Outlook & Strategy
The Fed will ultimately be able to claim victory over inflation but doing so by reducing demand will have high economic costs. The Fed is determined to keep rates at a restrictive level in order to eliminate jobs in the economy and eventually reduce enough demand and, consequently, supply to bring inflation down to its target. We believe that the Fed will ultimately achieve its inflation goal. However, the probability of avoiding a recession declines as the Fed becomes more entrenched in its strategy. A fiscal approach of promoting pro-growth policies could also quell the elevated level of inflation by closing the supply-demand gap through increasing supply. For instance, measures encouraging individuals to return to the labor force would have far fewer economic costs. However, the current period of stagflation is likely to continue through the first half of 2023 as real economic growth remains near zero and inflation continues to be elevated.
The Fed embarking on balance sheet normalization has weighed on agency mortgage-backed securities (MBS) as the largest buyer (the Fed) of these securities since the beginning of the pandemic has entirely exited the market, forcing private investors to fill the void. The resulting higher yields and wider credit spreads for these securities have increased their relative attractiveness. For the Sit Quality Income Fund, we rotated out of Treasury Inflation Protected Securities (TIPS) and into agency MBS and callable federal agency notes to lock in higher relative yields for these high-quality securities. We also traded out of the TIPS in the Sit U.S. Government Securities Fund and continue to emphasize seasoned high-coupon mortgages
that we believe will provide an income advantage over the long term. Our focus on generating a high level of income while investing in high-quality securities and maintaining a conservative interest rate position should drive outperformance versus the benchmarks for these Funds.
The historic surge in yields presents attractive investment opportunities in the current market. High-quality tax-exempt municipal bonds are now available at yields not seen in many years. Where feasible, we will de-emphasize low-coupon bonds and swap into bonds with higher coupons, boosting income for many years ahead. Municipal bond credits should fare relatively well in a recessionary downturn. Short and intermediate-duration bonds are now at yields close to those of longer-term bonds but with far less interest rate sensitivity. Undervalued deep-discount single-family housing bonds that should have significant prepayment calls at par are also attractive. We believe our emphasis on tax-exempt income over short-term gains will differentiate our performance.
In conclusion, investors should maintain a diversified portfolio of stocks and bonds underpinned by strong fundamentals to help manage risk in this challenging market. We appreciate your continued interest in the Sit family of funds. Please see our complete Outlook and Strategy research paper at www.sitfunds.com.
With best wishes,

Roger J. Sit
Chairman and President Sit Mutual Funds
Sit U.S. Government Securities Fund - Class S and Class Y
OBJECTIVE & STRATEGY
The objective of the U.S. Government Securities Fund is to provide high current income and safety of principal, which it seeks to attain by investing solely in debt obligations issued, guaranteed or insured by the U.S. government or its agencies or its instrumentalities. Agency mortgage securities and U.S. Treasury securities are the principal holdings in the Fund. The mortgage securities that the Fund purchases consist of pass-through securities including those issued by Government National Mortgage Association (GNMA), Federal National Mortgage Association (FNMA) and Federal Home Loan Mortgage Corporation (FHLMC).
Fund Performance
The Sit U.S. Government Securities Fund (Class S) provided a return of -3.40% during the 6-month period ended September 30, 2022, compared to the return of the Bloomberg Intermediate Government Bond Index of -4.66%. The Fund’s 30-day SEC yield was 3.07% and its 12-month distribution rate was 1.43%.
Factors that Influenced the Fund’s Performance
During the 6-month period, the Fund benefited from the consistent relatively high level of income provided by its holdings in higher coupon government agency mortgages. Yields on U.S. Treasury securities were higher across all maturities. The Fund reduces interest rate risk by us-ing options on Treasury securities. The use of options was effective in providing stability to the Fund’s net asset value and was able to partially offset the negative price performance as it relates to the increase in U.S. Treasury yields. In addition, the Fund continued to experience relatively stable prepayment rates as the mortgage holdings are generally well seasoned and have been through many refinancing cycles. The Fund’s opportunistic holdings in Treasury Inflation Protected Securities benefited performance as the economy experienced higher than expected inflation metrics. The Fund’s longer collateralized mortgage obligations detracted from performance as the duration of these securities is longer than the benchmark as yields rose.
Outlook and Positioning
The Federal Reserve had its hands full to start the period with respect to inflation. What previously had been coined ‘transitory’ inflation, had evolved into a much bigger issue than the Fed had previously thought. Inflation had not only become a serious issue domestically but globally as well due to the ongoing war in Ukraine and supply chain disruptions. To combat inflation, the Fed embarked on a restrictive monetary policy which had arguably not been seen in 40 years. The 6-month period started with the Federal Funds upper bound target rate at 0.50% and ended at 3.25%, even higher than the most recent peak of 2.50% prior to the Covid-19 virus taking root. Additionally, credit sensitive sectors saw increased volatility as the Fed began to unwind its nearly $9.0 trillion balance sheet. The Fed will undoubtedly win its war on inflation, but at serious costs to economic activity. The market has begun to price in a recessionary environment, but now is grappling with how long and severe the recession will be Another headwind for the economy is the rapidly rising mortgage rate.
HYPOTHETICAL GROWTH OF $10,000
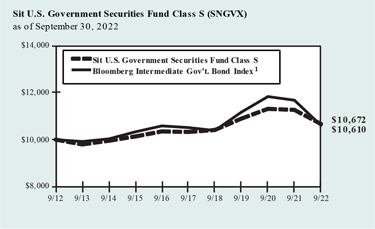
The chart above illustrates the total value of a hypothetical $10,000 investment in the Fund over the past 10 years (or for the life of the Fund if shorter) as compared to the performance of the Bloomberg Intermediate Government Bond Index. Past performance does not guarantee future results. Returns include the reinvestment of distributions. The chart does not reflect the deduction of taxes that a shareholder would pay on Fund distributions or the redemption of Fund shares.
| 1 | The Bloomberg Intermediate Government Bond Index is a sub-index of the Bloomberg Government Bond Index covering issues with remaining maturities of between three and five years. The Bloomberg Government Bond Index is an index that measures the performance of all public U.S. government obligations with remaining maturities of one year or more. The returns include the reinvestment of income and do not include any transaction costs, management fees or other costs. It is not possible to invest directly in an index. This is the Fund’s primary index. |
Mortgage rates are over 7% causing housing affordability to be very low. Prepayments across all coupons have slowed and we expect will continue to decrease as housing turnover and refinancings have grinded to a halt.
We continue to position the Fund defensively as it relates to interest rates. We continue to favor shorter duration securities as we expect the Fed will overshoot and potentially be forced to cut short-term interest rates as early as next year. The Fund’s focus on seasoned, high coupon agency mortgage securities provide a high level of income with relatively stable prices. This high level of income and stability of principal has been a fundamental focus of the Fund since its inception.
| | |
| Bryce A. Doty, CFA | | Mark H. Book, CFA |
| Senior Portfolio Manager | | Portfolio Manager |
| | |
| | |
| 4 | | SIT MUTUAL FUNDS SEMI-ANNUAL REPORT |
COMPARATIVE RATES OF RETURNS
as of September 30, 2022
| | | | | | | | | | | | | | | | |
| | | Sit U.S. Government | | | | | | | |
| | | Securities Fund | | | | | | | |
| | | Class S | | | Class Y | | | Bloomberg
Intermediate
Gov’t. Bond
Index1 | | | Lipper U.S.
Gov’t Fund
Index2 | |
Six Month | | | -3.40 | % | | | -3.31 | % | | | -4.66 | % | | | n/a | |
One Year | | | -5.31 | | | | -5.12 | | | | -9.18 | | | | -13.49 | % |
Five Year | | | 0.66 | | | | n/a | | | | 0.18 | | | | -0.42 | |
Ten Year | | | 0.65 | | | | n/a | | | | 0.59 | | | | 0.40 | |
Since Inception-Class S (6/2/87) | | | 4.67 | | | | n/a | | | | 4.76 | | | | 4.57 | |
Since Inception-Class Y (1/1/20) | | | n/a | | | | -0.52 | | | | -1.87 | | | | -3.34 | |
Performance figures are historical and do not guarantee future results. Investment returns and principal value will vary, and you may have a gain or loss when you sell shares. Current performance may be lower or higher than the performance data quoted. Contact the Fund for performance data current to the most recent month-end. Returns include changes in share price as well as reinvestment of all dividends and capital gains and all fee waivers. Without the fee waivers total return and yield figures would have been lower. Returns do not reflect the deduction of taxes that a shareholder would pay on Fund distributions or the redemption of Fund shares. Management fees and administrative expenses are included in the Fund’s performance. Returns for periods greater than one year are compounded average annual rates of return.
| 1 | The Bloomberg Intermediate Government Bond Index is a sub-index of the Bloomberg Government Bond Index covering issues with remaining maturities of between three and five years. The Bloomberg Government Bond Index is an index that measures the performance of all public U.S. government obligations with remaining maturities of one year or more. The returns include the reinvestment of income and do not include any transaction costs, management fees or other costs. It is not possible to invest directly in an index. |
| 2 | The Lipper returns are obtained from Lipper Analytical Services, Inc., a large independent evaluator of mutual funds. |
FUND DIVERSIFICATION
| | | | |
Collateralized Mortgage Obligations | | | 64.3 | % |
Federal National Mortgage Association | | | 13.9 | |
Government National Mortgage Association | | | 12.1 | |
Federal Home Loan Mortgage Corporation | | | 5.2 | |
Asset-Backed Securities | | | 0.9 | |
U.S. Treasury / Federal Agency Securities | | | 0.8 | |
Small Business Administration | | | 0.5 | |
Other Net Assets | | | 2.3 | |
Based on net assets as of September 30, 2022.
PORTFOLIO SUMMARY
| | | | | | |
Class S: | | | | | | |
Net Asset Value 9/30/22: | | $ | 10.35 | | | Per Share |
Net Asset Value 3/31/22: | | $ | 10.83 | | | Per Share |
Net Assets: | | $ | 299.9 | | | Million |
| | |
Class Y: | | | | | | |
Net Asset Value 9/30/22: | | $ | 10.35 | | | Per Share |
Net Asset Value 3/31/22: | | $ | 10.83 | | | Per Share |
Net Assets: | | $ | 110.0 | | | Million |
| | |
Effective Duration:3 | | | 2.2 | | | Years |
| 3 | Duration is a measure of estimated price sensitivity relative to changes in interest rates. Portfolios with longer durations are typically more sensitive to changes in interest rates. For example, if interest rates rise by 1%, the fair value of a security with an effective duration of 5 years would decrease by 5%, with all other factors being constant. The correlation between duration and price sensitivity is greater for securities rated investment-grade than it is for securities rated below investment-grade. Duration estimates are based on assumptions by Sit Investment Associates, Inc. (the “Adviser”) and are subject to a number of limitations. Effective duration is calculated based on historical price changes of securities held by the Fund, and therefore is a more accurate estimate of price sensitivity provided interest rates remain within their historical range. |
ESTIMATED AVERAGE LIFE
| | | | |
0-1 Year | | | 2.3 | % |
1-5 Years | | | 96.4 | |
5-10 Years | | | 0.1 | |
10-20 Years | | | 1.2 | |
The table represents the Adviser’s estimates of the dollar weighted average life of the portfolio’s securities, which differ from their stated maturities. The Fund’s average stated maturity was 22.3 years as of September 30, 2022.
SCHEDULE OF INVESTMENTS (Unaudited)
September 30, 2022
Sit U.S. Government Securities Fund
| | | | | | | | | | | | | | |
Principal
Amount ($) | | | Coupon Rate (%) | | | Maturity
Date | | | Fair
Value ($) | |
| Mortgage Pass-Through Securities -
31.7% |
| | | | |
| | Federal Home Loan Mortgage Corporation - 5.2% | |
| | 345,954 | | | | 3.00 | | | | 1/1/44 | | | | 311,299 | |
| | 30,318 | | | | 4.00 | | | | 7/1/25 | | | | 29,406 | |
| | 7,967,583 | | | | 4.50 | | | | 9/1/52 | | | | 7,614,088 | |
| | 322,424 | | | | 5.00 | | | | 5/1/42 | | | | 319,914 | |
| | 2,439,284 | | | | 5.00 | | | | 6/1/52 | | | | 2,351,287 | |
| | 1,014,421 | | | | 5.50 | | | | 8/1/49 | | | | 1,039,105 | |
| | 47,417 | | | | 5.82 | | | | 10/1/37 | | | | 47,981 | |
| | 248,786 | | | | 6.50 | | | | 12/1/34 | | | | 252,455 | |
| | 180,585 | | | | 6.88 | | | | 2/17/31 | | | | 184,880 | |
| | 25,457 | | | | 7.00 | | | | 8/1/27 | | | | 25,490 | |
| | 284,426 | | | | 7.00 | | | | 4/1/28 | | | | 287,980 | |
| | 2,151,029 | | | | 7.00 | | | | 12/1/31 | | | | 2,234,449 | |
| | 351,833 | | | | 7.00 | | | | 2/1/37 | | | | 353,905 | |
| | 229,775 | | | | 7.00 | | | | 4/1/37 | | | | 245,165 | |
| | 3,149,319 | | | | 7.00 | | | | 10/1/37 | | | | 3,308,496 | |
| | 1,707,549 | | | | 7.00 | | | | 10/1/38 | | | | 1,832,084 | |
| | 8,715 | | | | 7.38 | | | | 12/17/24 | | | | 8,709 | |
| | 23,300 | | | | 7.50 | | | | 1/1/31 | | | | 23,313 | |
| | 220,783 | | | | 7.50 | | | | 1/1/32 | | | | 231,342 | |
| | 175,356 | | | | 7.50 | | | | 8/1/32 | | | | 178,398 | |
| | 3,407 | | | | 7.95 | | | | 10/1/25 | | | | 3,410 | |
| | 10,356 | | | | 8.00 | | | | 5/1/31 | | | | 10,366 | |
| | 41,543 | | | | 8.00 | | | | 11/1/36 | | | | 44,115 | |
| | 79,808 | | | | 8.00 | | | | 1/1/37 | | | | 85,150 | |
| | 49,226 | | | | 8.50 | | | | 6/20/27 | | | | 51,293 | |
| | 9,910 | | | | 8.50 | | | | 12/1/29 | | | | 10,119 | |
| | 60,174 | | | | 8.50 | | | | 3/1/31 | | | | 63,085 | |
| | 7,829 | | | | 9.00 | | | | 3/20/27 | | | | 7,843 | |
| | 21,719 | | | | 9.00 | | | | 2/17/31 | | | | 21,510 | |
| | 10,429 | | | | 9.00 | | | | 5/1/31 | | | | 10,464 | |
| | 631 | | | | 10.00 | | | | 7/1/30 | | | | 631 | |
| | | | | | | | | | | | | | |
| | | | | | | | | | | | | 21,187,732 | |
| | | | | | | | | | | | | | |
| | Federal National Mortgage Association - 13.9% | |
| | 3,100,000 | | | | 2.48 | | | | 2/1/35 | | | | 2,484,128 | |
| | 3,100,000 | | | | 2.68 | | | | 2/1/35 | | | | 2,539,325 | |
| | 1,650,580 | | | | 4.50 | | | | 4/1/48 | | | | 1,604,555 | |
| | 5,246,928 | | | | 4.50 | | | | 7/1/52 | | | | 5,014,139 | |
| | 5,322,594 | | | | 4.50 | | | | 9/1/52 | | | | 5,086,448 | |
| | 1,000,302 | | | | 5.00 | | | | 9/1/43 | | | | 1,025,738 | |
| | 7,415,345 | | | | 5.00 | | | | 2/1/49 | | | | 7,413,548 | |
| | 392,690 | | | | 5.00 | | | | 6/1/51 | | | | 404,283 | |
| | 1,849,804 | | | | 5.00 | | | | 7/1/52 | | | | 1,780,045 | |
| | 335,078 | | | | 5.50 | | | | 6/1/33 | | | | 337,137 | |
| | 3,480,305 | | | | 5.50 | | | | 12/1/41 | | | | 3,649,403 | |
| | 1,824,963 | | | | 5.50 | | | | 1/1/49 | | | | 1,878,518 | |
| | 986,079 | | | | 5.50 | | | | 5/1/49 | | | | 990,751 | |
| | 510,702 | | | | 5.50 | | | | 4/1/50 | | | | 514,768 | |
| | 804,769 | | | | 5.93 | | | | 5/1/35 | | | | 802,986 | |
| | 308,115 | | | | 6.00 | | | | 11/1/34 | | | | 320,712 | |
| | 143,104 | | | | 6.00 | | | | 1/1/36 | | | | 148,500 | |
| | 61,071 | | | | 6.00 | | | | 5/1/37 | | | | 62,106 | |
| | 49,384 | | | | 6.00 | | | | 9/1/37 | | | | 49,330 | |
| | 1,170,019 | | | | 6.00 | | | | 4/1/38 | | | | 1,230,348 | |
| | 391,160 | | | | 6.00 | | | | 2/1/40 | | | | 404,373 | |
| | 3,231,893 | | | | 6.00 | | | | 5/1/41 | | | | 3,394,391 | |
| | 2,245,046 | | | | 6.00 | | | | 7/1/52 | | | | 2,296,722 | |
| | 717,218 | | | | 6.50 | | | | 2/1/29 | | | | 738,936 | |
| | 99,735 | | | | 6.50 | | | | 3/1/29 | | | | 99,387 | |
| | | | | | | | | | | | | | |
Principal
Amount ($) | | | Coupon Rate (%) | | | Maturity
Date | | | Fair
Value ($) | |
| | 105,292 | | | | 6.50 | | | | 6/1/31 | | | | 107,293 | |
| | 46,459 | | | | 6.50 | | | | 8/1/34 | | | | 47,136 | |
| | 76,054 | | | | 6.50 | | | | 11/1/34 | | | | 76,226 | |
| | 157,643 | | | | 6.50 | | | | 1/1/39 | | | | 157,262 | |
| | 315,124 | | | | 6.50 | | | | 6/1/40 | | | | 329,522 | |
| | 708,530 | | | | 6.75 | | | | 6/1/32 | | | | 743,445 | |
| | 501,572 | | | | 6.84 | | | | 6/1/40 | | | | 518,960 | |
| | 13,088 | | | | 7.00 | | | | 2/1/26 | | | | 13,196 | |
| | 37,398 | | | | 7.00 | | | | 9/1/27 | | | | 37,796 | |
| | 19,289 | | | | 7.00 | | | | 10/1/27 | | | | 19,506 | |
| | 79,268 | | | | 7.00 | | | | 11/1/27 | | | | 80,607 | |
| | 18,053 | | | | 7.00 | | | | 1/1/28 | | | | 18,255 | |
| | 13,922 | | | | 7.00 | | | | 10/1/32 | | | | 14,178 | |
| | 2,305,535 | | | | 7.00 | | | | 12/1/32 | | | | 2,467,702 | |
| | 72,294 | | | | 7.00 | | | | 7/1/33 | | | | 74,233 | |
| | 55,689 | | | | 7.00 | | | | 7/1/34 | | | | 57,172 | |
| | 10,329 | | | | 7.00 | | | | 12/1/37 | | | | 10,512 | |
| | 2,780,372 | | | | 7.00 | | | | 1/1/40 | | | | 2,912,953 | |
| | 443,615 | | | | 7.00 | | | | 9/1/47 | | | | 430,015 | |
| | 602 | | | | 7.50 | | | | 12/1/22 | | | | 601 | |
| | 37,663 | | | | 7.50 | | | | 4/1/32 | | | | 37,925 | |
| | 112,581 | | | | 7.50 | | | | 1/1/34 | | | | 116,377 | |
| | 1,970,660 | | | | 7.50 | | | | 10/1/38 | | | | 2,089,697 | |
| | 835,110 | | | | 7.50 | | | | 11/1/38 | | | | 889,841 | |
| | 5,737 | | | | 7.81 | | | | 7/20/30 | | | | 5,759 | |
| | 2,854 | | | | 7.99 | | | | 8/20/25 | | | | 2,861 | |
| | 53,548 | | | | 8.00 | | | | 6/1/25 | | | | 54,270 | |
| | 2,713 | | | | 8.00 | | | | 7/20/28 | | | | 2,720 | |
| | 42,868 | | | | 8.00 | | | | 2/1/31 | | | | 44,615 | |
| | 91,377 | | | | 8.00 | | | | 1/1/32 | | | | 93,957 | |
| | 49,332 | | | | 8.00 | | | | 11/1/37 | | | | 52,384 | |
| | 276,550 | | | | 8.00 | | | | 3/1/38 | | | | 297,623 | |
| | 40,614 | | | | 8.17 | | | | 11/15/31 | | | | 42,573 | |
| | 50,495 | | | | 8.50 | | | | 11/1/26 | | | | 51,142 | |
| | 37,693 | | | | 8.50 | | | | 3/1/28 | | | | 37,865 | |
| | 19,861 | | | | 8.50 | | | | 10/1/28 | | | | 20,584 | |
| | 60,126 | | | | 8.50 | | | | 4/1/29 | | | | 62,154 | |
| | 26,295 | | | | 8.50 | | | | 10/1/29 | | | | 26,292 | |
| | 52,477 | | | | 8.50 | | | | 7/1/30 | | | | 55,349 | |
| | 32,988 | | | | 8.50 | | | | 8/1/30 | | | | 35,409 | |
| | 115,347 | | | | 8.50 | | | | 4/1/32 | | | | 126,075 | |
| | 70,910 | | | | 8.50 | | | | 1/1/37 | | | | 71,900 | |
| | 1,181 | | | | 9.00 | | | | 6/15/25 | | | | 1,185 | |
| | 16,979 | | | | 9.00 | | | | 5/15/28 | | | | 17,031 | |
| | 11,884 | | | | 9.00 | | | | 6/1/30 | | | | 11,934 | |
| | 5,731 | | | | 9.00 | | | | 10/1/30 | | | | 5,793 | |
| | 63,146 | | | | 9.00 | | | | 2/1/31 | | | | 63,852 | |
| | 17,592 | | | | 9.00 | | | | 7/1/31 | | | | 17,586 | |
| | 20,703 | | | | 9.00 | | | | 10/1/31 | | | | 21,742 | |
| | 53,591 | | | | 9.00 | | | | 8/1/37 | | | | 54,413 | |
| | 152,270 | | | | 9.00 | | | | 2/1/38 | | | | 157,607 | |
| | 9,777 | | | | 9.50 | | | | 8/1/24 | | | | 9,793 | |
| | 61,382 | | | | 9.50 | | | | 5/1/29 | | | | 64,113 | |
| | 6,875 | | | | 9.50 | | | | 4/1/30 | | | | 7,099 | |
| | 26,319 | | | | 9.50 | | | | 8/1/31 | | | | 26,471 | |
| | 11,679 | | | | 10.00 | | | | 2/1/28 | | | | 11,679 | |
| | 62,154 | | | | 10.00 | | | | 6/1/30 | | | | 65,234 | |
| | | | | | | | | | | | | | |
| | | | | | | | | | | | | 57,140,051 | |
| | | | | | | | | | | | | | |
| | Government National Mortgage Association - 12.1% | |
| | 62,678 | | | | 4.00 | | | | 12/15/24 | | | | 61,259 | |
| | 322,289 | | | | 4.00 | | | | 10/20/30 | | | | 314,591 | |
| | |
| |
| See accompanying notes to financial statements. | | |
| | |
| 6 | | SIT MUTUAL FUNDS SEMI-ANNUAL REPORT |
| | | | | | | | | | | | | | |
Principal
Amount ($) | | | Coupon Rate (%) | | | Maturity
Date | | | Fair
Value ($) | |
| | 5,990,607 | | | | 4.00 | | | | 8/20/31 | | | | 5,749,751 | |
| | 608,162 | | | | 4.00 | | | | 12/20/31 | | | | 598,589 | |
| | 465,616 | | | | 4.25 | | | | 10/20/31 | | | | 460,952 | |
| | 313,486 | | | | 4.25 | | | | 3/20/37 | | | | 304,678 | |
| | 1,492,395 | | | | 4.75 | | | | 9/20/31 | | | | 1,518,776 | |
| | 5,129,392 | | | | 5.00 | | | | 12/15/45 | | | | 5,377,704 | |
| | 342,545 | | | | 5.00 | | | | 7/20/49 | | | | 337,385 | |
| | 38,957 | | | | 5.50 | | | | 9/15/25 | | | | 37,501 | |
| | 502,179 | | | | 5.50 | | | | 5/15/29 | | | | 516,296 | |
| | 453,942 | | | | 5.50 | | | | 7/20/37 | | | | 479,101 | |
| | 668,447 | | | | 5.50 | | | | 7/20/62 | | | | 673,977 | |
| | 11,992,270 | | | | 5.50 | | | | 8/20/62 | | | | 12,091,506 | |
| | 1,317,295 | | | | 5.75 | | | | 2/15/29 | | | | 1,337,958 | |
| | 513,371 | | | | 5.75 | | | | 10/20/31 | | | | 526,735 | |
| | 334,792 | | | | 6.00 | | | | 9/15/33 | | | | 341,028 | |
| | 172,160 | | | | 6.00 | | | | 2/20/47 | | | | 184,764 | |
| | 1,937,469 | | | | 6.00 | | | | 7/20/47 | | | | 2,079,322 | |
| | 8,771,258 | | | | 6.00 | | | | 8/20/62 | | | | 8,952,540 | |
| | 9,724 | | | | 6.25 | | | | 12/15/23 | | | | 9,268 | |
| | 431,604 | | | | 6.25 | | | | 4/15/29 | | | | 442,744 | |
| | 19,286 | | | | 6.50 | | | | 11/15/23 | | | | 19,313 | |
| | 58,350 | | | | 6.50 | | | | 4/15/24 | | | | 58,421 | |
| | 468,232 | | | | 6.50 | | | | 2/20/28 | | | | 480,929 | |
| | 180,461 | | | | 6.50 | | | | 2/20/29 | | | | 180,881 | |
| | 304,668 | | | | 6.50 | | | | 7/20/34 | | | | 319,528 | |
| | 15,732 | | | | 6.50 | | | | 12/20/38 | | | | 15,653 | |
| | 171,742 | | | | 6.50 | | | | 1/20/39 | | | | 179,902 | |
| | 90,212 | | | | 6.50 | | | | 2/20/39 | | | | 95,126 | |
| | 209,581 | | | | 6.50 | | | | 4/20/39 | | | | 221,471 | |
| | 194,260 | | | | 6.50 | | | | 6/20/39 | | | | 205,216 | |
| | 388,659 | | | | 6.50 | | | | 8/20/39 | | | | 410,822 | |
| | 216,267 | | | | 6.50 | | | | 4/20/43 | | | | 223,887 | |
| | 2,144,548 | | | | 7.00 | | | | 8/15/29 | | | | 2,234,621 | |
| | 2,371,700 | | | | 7.00 | | | | 10/15/29 | | | | 2,471,263 | |
| | 107,326 | | | | 7.00 | | | | 10/15/36 | | | | 107,726 | |
| | | | | | | | | | | | | | |
| | | | | | | | | | | | | 49,621,184 | |
| | | | | | | | | | | | | | |
| | Small Business Administration - 0.5% | |
| | 1,254,974 | | | | 5.33 | | | | 8/25/36 | | | | 1,196,338 | |
| | 641,016 | | | | 5.33 | | | | 9/25/36 | | | | 611,206 | |
| | | | | | | | | | | | | | |
| | | | | | | | | | | | | 1,807,544 | |
| | | | | | | | | | | | | | |
| Total Mortgage Pass-Through Securities
(cost: $138,513,939) |
| | | 129,756,511 | |
| | | | | | | | | | | | | | |
| | U.S. Treasury / Federal Agency Securities - 0.8% | |
| | U.S. Treasury Notes: | | | | | | | | | |
| | 3,625,000 | | | | 0.50 | | | | 3/31/25 | | | | 3,307,813 | |
| | | | | | | | | | | | | | |
| Total U.S. Treasury / Federal Agency
Securities
(cost: $3,368,903) |
| | | 3,307,813 | |
| | | | | | | | | | | | | | |
| | Collateralized Mortgage Obligations - 64.3% | |
| | Federal Home Loan Mortgage Corporation - 11.4% | |
| | 794,445 | | | | 4.81 | | | | 7/25/32 | 1 | | | 760,728 | |
| | 13,982 | | | | 5.00 | | | | 2/15/23 | | | | 13,949 | |
| | 2,765,846 | | | | 5.00 | | | | 11/25/50 | | | | 2,834,034 | |
| | 5,055,975 | | | | 5.00 | | | | 11/25/50 | 1 | | | 4,976,667 | |
| | 5,249,768 | | | | 5.50 | | | | 6/25/51 | | | | 5,504,640 | |
| | 310,078 | | | | 5.53 | | | | 5/15/38 | 1 | | | 299,503 | |
| | 1,194,100 | | | | 6.00 | | | | 1/15/33 | | | | 1,237,236 | |
| | 1,312,300 | | | | 6.00 | | | | 5/15/36 | | | | 1,354,779 | |
| | 1,125,838 | | | | 6.00 | | | | 9/15/42 | | | | 1,151,350 | |
| | | | | | | | | | | | | | |
Principal
Amount ($) | | | Coupon Rate (%) | | | Maturity
Date | | | Fair
Value ($) | |
| | 2,992,126 | | | | 6.00 | | | | 9/25/52 | | | | 3,114,057 | |
| | 11,599 | | | | 6.25 | | | | 5/15/29 | | | | 11,606 | |
| | 15,341 | | | | 6.50 | | | | 9/15/23 | | | | 15,455 | |
| | 8,944 | | | | 6.50 | | | | 3/15/24 | | | | 9,044 | |
| | 225,687 | | | | 6.50 | | | | 7/15/27 | | | | 233,304 | |
| | 202,597 | | | | 6.50 | | | | 2/15/28 | | | | 207,749 | |
| | 318,143 | | | | 6.50 | | | | 3/15/29 | | | | 327,798 | |
| | 8,783 | | | | 6.50 | | | | 2/15/30 | | | | 8,989 | |
| | 250,749 | | | | 6.50 | | | | 1/15/31 | | | | 258,980 | |
| | 493,327 | | | | 6.50 | | | | 8/15/31 | | | | 506,662 | |
| | 128,572 | | | | 6.50 | | | | 1/15/32 | | | | 132,950 | |
| | 45,091 | | | | 6.50 | | | | 3/15/32 | | | | 47,107 | |
| | 299,911 | | | | 6.50 | | | | 6/25/32 | | | | 308,582 | |
| | 136,652 | | | | 6.50 | | | | 7/15/32 | | | | 142,618 | |
| | 3,055,545 | | | | 6.50 | | | | 5/15/33 | | | | 3,184,350 | |
| | 670,697 | | | | 6.50 | | | | 5/15/35 | | | | 710,699 | |
| | 311,672 | | | | 6.50 | | | | 8/15/39 | | | | 325,436 | |
| | 901,374 | | | | 6.50 | | | | 2/25/43 | | | | 948,611 | |
| | 385,609 | | | | 6.50 | | | | 3/25/43 | | | | 405,429 | |
| | 537,141 | | | | 6.50 | | | | 7/25/43 | | | | 560,700 | |
| | 726,446 | | | | 6.50 | | | | 10/25/43 | | | | 735,487 | |
| | 268,805 | | | | 6.50 | | | | 11/15/43 | | | | 283,262 | |
| | 1,700,703 | | | | 6.50 | | | | 8/15/45 | | | | 1,836,900 | |
| | 281,593 | | | | 6.50 | | | | 2/15/49 | | | | 293,973 | |
| | 2,096 | | | | 6.70 | | | | 9/15/23 | | | | 2,105 | |
| | 276,449 | | | | 6.75 | | | | 3/15/28 | | | | 286,644 | |
| | 246,351 | | | | 6.95 | | | | 3/15/28 | | | | 254,316 | |
| | 39 | | | | 7.00 | | | | 11/15/22 | | | | 39 | |
| | 3,487 | | | | 7.00 | | | | 3/25/23 | | | | 3,486 | |
| | 772 | | | | 7.00 | | | | 4/15/23 | | | | 774 | |
| | 5,104 | | | | 7.00 | | | | 7/15/23 | | | | 5,140 | |
| | 19,862 | | | | 7.00 | | | | 1/15/24 | | | | 20,023 | |
| | 10,592 | | | | 7.00 | | | | 3/15/24 | | | | 10,668 | |
| | 8,793 | | | | 7.00 | | | | 8/15/25 | | | | 8,954 | |
| | 24,607 | | | | 7.00 | | | | 9/15/26 | | | | 25,197 | |
| | 61,529 | | | | 7.00 | | | | 6/15/29 | | | | 64,292 | |
| | 164,951 | | | | 7.00 | | | | 8/15/29 | | | | 172,415 | |
| | 211,204 | | | | 7.00 | | | | 10/20/29 | | | | 222,122 | |
| | 36,233 | | | | 7.00 | | | | 1/15/30 | | | | 38,326 | |
| | 108,624 | | | | 7.00 | | | | 10/15/30 | | | | 115,076 | |
| | 96,657 | | | | 7.00 | | | | 7/15/31 | | | | 101,803 | |
| | 44,868 | | | | 7.00 | | | | 4/15/32 | | | | 46,667 | |
| | 335,439 | | | | 7.00 | | | | 5/15/32 | | | | 356,613 | |
| | 1,631,867 | | | | 7.00 | | | | 8/15/41 | | | | 1,679,485 | |
| | 2,963,092 | | | | 7.00 | | | | 2/25/43 | | | | 3,056,340 | |
| | 514,899 | | | | 7.00 | | | | 3/25/43 | | | | 545,755 | |
| | 733,011 | | | | 7.00 | | | | 7/25/43 | | | | 779,000 | |
| | 522,230 | | | | 7.00 | | | | 3/15/49 | | | | 547,952 | |
| | 5,132 | | | | 7.50 | | | | 3/15/23 | | | | 5,154 | |
| | 26,621 | | | | 7.50 | | | | 4/15/23 | | | | 26,737 | |
| | 18,311 | | | | 7.50 | | | | 9/20/26 | | | | 18,917 | |
| | 105,375 | | | | 7.50 | | | | 3/15/28 | | | | 110,493 | |
| | 194,316 | | | | 7.50 | | | | 9/15/29 | | | | 206,548 | |
| | 55,130 | | | | 7.50 | | | | 12/15/29 | | | | 57,841 | |
| | 114,377 | | | | 7.50 | | | | 6/15/30 | | | | 121,637 | |
| | 186,950 | | | | 7.50 | | | | 8/15/30 | | | | 197,723 | |
| | 201,396 | | | | 7.50 | | | | 9/15/30 | | | | 216,047 | |
| | 63,384 | | | | 7.50 | | | | 11/15/30 | | | | 67,326 | |
| | 1,863,643 | | | | 7.50 | | | | 6/15/34 | | | | 2,038,706 | |
| | 397,162 | | | | 7.50 | | | | 2/25/42 | | | | 408,085 | |
| | 1,167,799 | | | | 7.50 | | | | 8/25/42 | 1 | | | 1,168,562 | |
| | |
| |
| See accompanying notes to financial statements. | | |
| | |
| SEPTEMBER 30, 2022 | | 7 |
SCHEDULE OF INVESTMENTS (Unaudited)
September 30, 2022
Sit U.S. Government Securities Fund (Continued)
| | | | | | | | | | | | | | |
Principal
Amount ($) | | | Coupon Rate (%) | | | Maturity
Date | | | Fair
Value ($) | |
| | 653,104 | | | | 7.50 | | | | 9/25/43 | | | | 671,489 | |
| | 21,095 | | | | 8.00 | | | | 2/15/23 | | | | 21,152 | |
| | 3,499 | | | | 8.00 | | | | 4/25/24 | | | | 3,537 | |
| | 60,015 | | | | 8.00 | | | | 2/15/27 | | | | 63,165 | |
| | 85,612 | | | | 8.00 | | | | 11/20/29 | | | | 91,051 | |
| | 92,038 | | | | 8.00 | | | | 1/15/30 | | | | 98,751 | |
| | 37,937 | | | | 8.50 | | | | 3/15/25 | | | | 39,461 | |
| | 16,360 | | | | 8.50 | | | | 3/15/32 | | | | 17,656 | |
| | | | | | | | | | | | | | |
| | | | | | | | | | | | | 46,735,864 | |
| | | | | | | | | | | | | | |
| | Federal National Mortgage Association - 18.7% | |
| | 269,472 | | | | 1.90 | | | | 7/25/37 | 1 | | | 240,901 | |
| | 1,657,000 | | | | 3.00 | | | | 7/25/40 | | | | 1,634,539 | |
| | 382,778 | | | | 3.10 | | | | 8/25/43 | 1 | | | 358,808 | |
| | 9,874,793 | | | | 3.25 | | | | 9/25/52 | | | | 9,194,100 | |
| | 170,640 | | | | 4.55 | | | | 6/25/43 | | | | 166,211 | |
| | 1,817,586 | | | | 4.95 | | | | 2/25/42 | 1 | | | 1,776,201 | |
| | 1,965,405 | | | | 5.00 | | | | 7/25/33 | | | | 1,973,250 | |
| | 1,545,409 | | | | 5.00 | | | | 7/25/40 | | | | 1,475,807 | |
| | 290,510 | | | | 5.00 | | | | 11/25/41 | | | | 290,355 | |
| | 484,004 | | | | 5.00 | | | | 6/25/43 | | | | 476,991 | |
| | 1,998,029 | | | | 5.00 | | | | 11/25/50 | | | | 1,972,329 | |
| | 3,727,765 | | | | 5.00 | | | | 12/25/50 | | | | 3,807,245 | |
| | 1,221,264 | | | | 5.11 | | | | 10/25/42 | 1 | | | 1,246,377 | |
| | 2,177,229 | | | | 5.33 | | | | 12/25/42 | 1 | | | 2,120,323 | |
| | 525,205 | | | | 5.36 | | | | 6/25/42 | | | | 527,168 | |
| | 565,951 | | | | 5.50 | | | | 9/25/33 | | | | 575,648 | |
| | 2,660,209 | | | | 5.50 | | | | 6/25/40 | | | | 2,621,257 | |
| | 744,543 | | | | 5.63 | | | | 12/25/53 | 1 | | | 771,698 | |
| | 565,435 | | | | 5.81 | | | | 8/25/43 | | | | 562,978 | |
| | 739,095 | | | | 6.00 | | | | 5/25/30 | | | | 755,292 | |
| | 127,260 | | | | 6.00 | | | | 11/25/32 | | | | 131,069 | |
| | 245,146 | | | | 6.00 | | | | 7/25/33 | | | | 253,368 | |
| | 1,451,736 | | | | 6.00 | | | | 5/25/36 | | | | 1,503,895 | |
| | 191,905 | | | | 6.00 | | | | 6/25/36 | | | | 197,853 | |
| | 729,274 | | | | 6.00 | | | | 10/25/36 | | | | 757,717 | |
| | 1,591,147 | | | | 6.00 | | | | 11/25/43 | | | | 1,617,696 | |
| | 662,849 | | | | 6.00 | | | | 9/25/46 | | | | 658,908 | |
| | 836,294 | | | | 6.00 | | | | 2/25/48 | | | | 870,585 | |
| | 196,295 | | | | 6.00 | | | | 12/25/49 | | | | 200,107 | |
| | 767,488 | | | | 6.32 | | | | 8/25/47 | 1 | | | 769,615 | |
| | 975,584 | | | | 6.43 | | | | 9/25/37 | 1 | | | 1,020,663 | |
| | 132,831 | | | | 6.50 | | | | 8/20/28 | | | | 134,338 | |
| | 796,145 | | | | 6.50 | | | | 1/25/32 | | | | 826,467 | |
| | 122,205 | | | | 6.50 | | | | 3/25/32 | | | | 125,615 | |
| | 206,924 | | | | 6.50 | | | | 6/25/32 | | | | 215,684 | |
| | 170,171 | | | | 6.50 | | | | 7/25/36 | | | | 179,492 | |
| | 38,530 | | | | 6.50 | | | | 9/25/36 | | | | 40,325 | |
| | 1,505,669 | | | | 6.50 | | | | 11/25/41 | | | | 1,550,025 | |
| | 167,855 | | | | 6.50 | | | | 3/25/42 | | | | 171,703 | |
| | 822,818 | | | | 6.50 | | | | 5/25/42 | | | | 861,031 | |
| | 1,861,907 | | | | 6.50 | | | | 7/25/42 | | | | 1,895,982 | |
| | 214,785 | | | | 6.50 | | | | 9/25/42 | | | | 220,884 | |
| | 520,983 | | | | 6.50 | | | | 11/25/42 | | | | 542,935 | |
| | 2,414,163 | | | | 6.50 | | | | 12/25/43 | | | | 2,496,643 | |
| | 138,862 | | | | 6.50 | | | | 7/25/44 | | | | 139,966 | |
| | 166,832 | | | | 6.53 | | | | 2/25/45 | 1 | | | 175,823 | |
| | 277,119 | | | | 6.63 | | | | 9/25/37 | 1 | | | 297,297 | |
| | 1,501,045 | | | | 6.75 | | | | 6/25/32 | | | | 1,590,634 | |
| | 383,210 | | | | 6.75 | | | | 4/25/37 | | | | 388,169 | |
| | 281,816 | | | | 6.81 | | | | 8/25/37 | 1 | | | 272,932 | |
| | 36,489 | | | | 6.85 | | | | 12/18/27 | | | | 36,979 | |
| | | | | | | | | | | | | | |
Principal
Amount ($) | | | Coupon Rate (%) | | | Maturity
Date | | | Fair
Value ($) | |
| | 351 | | | | 7.00 | | | | 11/25/22 | | | | 347 | |
| | 1,804 | | | | 7.00 | | | | 6/25/23 | | | | 1,814 | |
| | 91,251 | | | | 7.00 | | | | 4/25/24 | | | | 91,665 | |
| | 80,991 | | | | 7.00 | | | | 9/18/27 | | | | 84,033 | |
| | 848,507 | | | | 7.00 | | | | 5/25/31 | | | | 853,494 | |
| | 1,046,513 | | | | 7.00 | | | | 12/25/33 | | | | 1,104,336 | |
| | 64,819 | | | | 7.00 | | | | 9/25/40 | | | | 67,873 | |
| | 317,854 | | | | 7.00 | | | | 10/25/41 | | | | 329,721 | |
| | 117,207 | | | | 7.00 | | | | 11/25/41 | | | | 125,066 | |
| | 234,085 | | | | 7.00 | | | | 12/25/41 | | | | 245,926 | |
| | 769,745 | | | | 7.00 | | | | 7/25/42 | | | | 810,976 | |
| | 1,619,137 | | | | 7.00 | | | | 2/25/44 | | | | 1,703,705 | |
| | 71,040 | | | | 7.00 | | | | 8/25/44 | | | | 75,061 | |
| | 16,225 | | | | 7.50 | | | | 8/20/27 | | | | 16,854 | |
| | 160,459 | | | | 7.50 | | | | 10/25/40 | | | | 164,846 | |
| | 1,109,224 | | | | 7.50 | | | | 11/25/40 | | | | 1,105,393 | |
| | 621,857 | | | | 7.50 | | | | 6/19/41 | 1 | | | 640,990 | |
| | 1,073,105 | | | | 7.50 | | | | 7/25/41 | | | | 1,076,630 | |
| | 601,308 | | | | 7.50 | | | | 8/25/41 | | | | 624,355 | |
| | 212,843 | | | | 7.50 | | | | 11/25/41 | | | | 230,149 | |
| | 384,407 | | | | 7.50 | | | | 1/25/42 | | | | 408,632 | |
| | 2,746,727 | | | | 7.50 | | | | 5/25/42 | | | | 2,924,756 | |
| | 258,970 | | | | 7.50 | | | | 6/25/42 | | | | 274,281 | |
| | 2,506,192 | | | | 7.50 | | | | 8/25/42 | 1 | | | 2,720,583 | |
| | 845,283 | | | | 7.50 | | | | 2/25/44 | | | | 896,539 | |
| | 357,553 | | | | 7.50 | | | | 3/25/44 | | | | 375,922 | |
| | 550,661 | | | | 7.50 | | | | 5/25/44 | | | | 595,038 | |
| | 36,435 | | | | 7.50 | | | | 10/25/44 | | | | 38,849 | |
| | 3,499,991 | | | | 7.50 | | | | 1/25/48 | | | | 3,758,447 | |
| | 17,233 | | | | 8.00 | | | | 7/18/27 | | | | 17,983 | |
| | 264,372 | | | | 8.00 | | | | 7/25/44 | | | | 274,552 | |
| | 323,115 | | | | 8.01 | | | | 11/25/37 | 1 | | | 347,238 | |
| | 163,543 | | | | 8.12 | | | | 11/25/37 | 1 | | | 175,847 | |
| | 32,553 | | | | 8.24 | | | | 10/25/42 | 1 | | | 35,197 | |
| | 2,897 | | | | 8.50 | | | | 1/25/25 | | | | 2,978 | |
| | 289,636 | | | | 8.50 | | | | 6/25/30 | | | | 315,330 | |
| | 31,982 | | | | 9.00 | | | | 11/25/28 | | | | 34,052 | |
| | 227,801 | | | | 9.00 | | | | 6/25/30 | | | | 251,760 | |
| | 42,083 | | | | 9.00 | | | | 10/25/30 | | | | 46,448 | |
| | 49,206 | | | | 9.44 | | | | 6/25/32 | 1 | | | 53,518 | |
| | 51,349 | | | | 9.50 | | | | 11/25/31 | | | | 56,595 | |
| | 164,319 | | | | 9.50 | | | | 12/25/41 | | | | 178,782 | |
| | 190,889 | | | | 9.61 | | | | 6/25/44 | 1 | | | 193,137 | |
| | 704,225 | | | | 11.30 | | | | 9/25/42 | 1 | | | 813,294 | |
| | 11,096 | | | | 22.29 | | | | 3/25/39 | 1 | | | 15,608 | |
| | | | | | | | | | | | | | |
| | | | | | | | | | | | | 76,850,478 | |
| | | | | | | | | | | | | | |
| | Government National Mortgage Association - 33.2% | |
| | 2,005,483 | | | | 4.73 | | | | 5/20/51 | 1 | | | 2,007,896 | |
| | 2,469,319 | | | | 4.76 | | | | 5/20/51 | 1 | | | 2,478,683 | |
| | 4,866,111 | | | | 4.84 | | | | 8/20/51 | 1 | | | 4,854,607 | |
| | 4,051,014 | | | | 4.88 | | | | 4/20/51 | 1 | | | 4,037,314 | |
| | 2,417,282 | | | | 4.91 | | | | 7/20/51 | 1 | | | 2,401,720 | |
| | 3,073,274 | | | | 5.00 | | | | 12/20/50 | | | | 3,112,585 | |
| | 3,705,871 | | | | 5.00 | | | | 1/20/51 | | | | 3,761,485 | |
| | 19,374,563 | | | | 5.00 | | | | 2/20/51 | | | | 19,660,821 | |
| | 3,629,679 | | | | 5.00 | | | | 2/20/51 | 1 | | | 3,708,948 | |
| | 498,288 | | | | 5.50 | | | | 9/20/39 | | | | 513,747 | |
| | 7,827,789 | | | | 5.50 | | | | 10/20/50 | | | | 7,994,246 | |
| | 1,842,064 | | | | 5.50 | | | | 11/20/50 | | | | 1,939,022 | |
| | 3,226,601 | | | | 5.50 | | | | 1/20/51 | | | | 3,353,109 | |
| | 12,693,982 | | | | 5.50 | | | | 5/20/51 | | | | 13,225,491 | |
| | |
| |
| See accompanying notes to financial statements. | | |
| | |
| 8 | | SIT MUTUAL FUNDS SEMI-ANNUAL REPORT |
| | | | | | | | | | | | | | |
Principal
Amount ($) | | | Coupon Rate (%) | | | Maturity
Date | | | Fair
Value ($) | |
| | 7,686,579 | | | | 5.50 | | | | 6/20/51 | | | | 7,941,316 | |
| | 13,673,908 | | | | 5.50 | | | | 7/20/51 | | | | 14,099,836 | |
| | 5,720,126 | | | | 5.50 | | | | 11/20/51 | | | | 5,896,230 | |
| | 241,863 | | | | 5.53 | | | | 4/20/48 | 1 | | | 243,565 | |
| | 3,424,702 | | | | 5.59 | | | | 4/20/40 | 1 | | | 3,505,325 | |
| | 3,710,760 | | | | 5.80 | | | | 3/20/45 | 1 | | | 3,775,700 | |
| | 8,011,902 | | | | 5.84 | | | | 2/20/51 | 1 | | | 8,541,842 | |
| | 595,388 | | | | 5.95 | | | | 10/20/40 | 1 | | | 617,304 | |
| | 343,535 | | | | 5.99 | | | | 11/20/43 | 1 | | | 357,172 | |
| | 1,207,336 | | | | 6.00 | | | | 11/20/33 | | | | 1,244,765 | |
| | 371,517 | | | | 6.00 | | | | 12/20/35 | | | | 384,910 | |
| | 233,478 | | | | 6.00 | | | | 3/20/42 | | | | 242,430 | |
| | 306,771 | | | | 6.00 | | | | 3/20/48 | | | | 315,762 | |
| | 1,446,393 | | | | 6.00 | | | | 3/20/49 | | | | 1,464,556 | |
| | 449,433 | | | | 6.00 | | | | 5/20/49 | | | | 451,986 | |
| | 1,447,091 | | | | 6.13 | | | | 1/20/39 | 1 | | | 1,509,367 | |
| | 1,223,147 | | | | 6.44 | | | | 6/20/41 | 1 | | | 1,274,991 | |
| | 243,364 | | | | 6.46 | | | | 4/20/37 | 1 | | | 249,131 | |
| | 903,753 | | | | 6.50 | | | | 7/20/32 | | | | 900,849 | |
| | 886,695 | | | | 6.50 | | | | 2/20/37 | | | | 917,329 | |
| | 171,089 | | | | 6.50 | | | | 9/16/38 | | | | 175,966 | |
| | 1,476,958 | | | | 6.50 | | | | 8/20/48 | | | | 1,548,467 | |
| | 632,809 | | | | 6.50 | | | | 10/20/48 | | | | 657,881 | |
| | 1,033,382 | | | | 6.50 | | | | 1/20/49 | | | | 1,049,800 | |
| | 406,868 | | | | 6.54 | | | | 7/20/39 | 1 | | | 424,069 | |
| | 377,527 | | | | 6.64 | | | | 4/20/39 | 1 | | | 396,142 | |
| | 615,349 | | | | 6.84 | | | | 8/20/40 | 1 | | | 647,826 | |
| | 298,968 | | | | 7.00 | | | | 6/20/45 | 1 | | | 313,260 | |
| | 90,487 | | | | 7.00 | | | | 9/16/33 | | | | 92,222 | |
| | 239,715 | | | | 7.00 | | | | 5/20/42 | | | | 253,960 | |
| | 599,518 | | | | 7.00 | | | | 10/20/48 | | | | 632,634 | |
| | 368,033 | | | | 7.08 | | | | 2/20/45 | 1 | | | 396,192 | |
| | 761,273 | | | | 7.09 | | | | 12/20/38 | 1 | | | 806,797 | |
| | 405,074 | | | | 7.14 | | | | 12/20/33 | 1 | | | 425,650 | |
| | 1,015,041 | | | | 7.32 | | | | 8/20/38 | 1 | | | 1,079,158 | |
| | | | | | | | | | | | | | |
| | | | | | | | | | | | | 135,884,064 | |
| | | | | | | | | | | | | | |
| | Vendee Mortgage Trust - 1.0% | | | | | |
| | 838,271 | | | | 6.01 | | | | 3/15/25 | 1 | | | 853,572 | |
| | 375,081 | | | | 6.50 | | | | 2/15/24 | | | | 377,549 | |
| | 1,111,421 | | | | 6.50 | | | | 8/15/31 | | | | 1,106,099 | |
| | 545,166 | | | | 6.50 | | | | 10/15/31 | | | | 566,731 | |
| | 364,873 | | | | 6.75 | | | | 2/15/26 | | | | 375,059 | |
| | 432,939 | | | | 7.00 | | | | 3/15/28 | | | | 437,464 | |
| | 96,332 | | | | 7.25 | | | | 9/15/25 | | | | 99,089 | |
| | 235,323 | | | | 7.50 | | | | 2/15/27 | | | | 242,462 | |
| | 96,296 | | | | 7.75 | | | | 9/15/24 | | | | 97,944 | |
| | 45,504 | | | | 8.00 | | | | 2/15/25 | | | | 46,113 | |
| | 47,227 | | | | 8.29 | | | | 12/15/26 | | | | 48,658 | |
| | | | | | | | | | | | | | |
| | | | | | | | | | | | | 4,250,740 | |
| | | | | | | | | | | | | | |
| Total Collateralized Mortgage Obligations
(cost: $288,380,490) |
| | | 263,721,146 | |
| | | | | | | | | | | | | | |
| | Asset-Backed Securities - 0.9% | |
| | Federal Home Loan Mortgage Corporation - 0.1% | |
| | 302 | | | | 6.09 | | | | 9/25/29 | 1 | | | 293 | |
| | 567,083 | | | | 7.16 | | | | 7/25/29 | | | | 585,312 | |
| | | | | | | | | | | | | | |
| | | | | | | | | | | | | 585,605 | |
| | | | | | | | | | | | | | |
| | Federal National Mortgage Association - 0.5% | |
| | 8,625 | | | | 1 Mo. Libor + 0.17 | %, 2.70 | | | 11/25/32 | 1 | | | 8,474 | |
| | | | | | | | | | | | | | |
Principal
Amount ($) | | | Coupon Rate (%) | | | Maturity
Date | | | Fair
Value ($) | |
| | 372,322 | | | | 4.40 | | | | 11/25/33 | 14 | | | 351,273 | |
| | 302,495 | | | | 4.51 | | | | 9/26/33 | 14 | | | 291,064 | |
| | 90,642 | | | | 4.83 | | | | 10/25/33 | 14 | | | 91,080 | |
| | 1,360,279 | | | | 5.71 | | | | 2/25/33 | 14 | | | 1,310,861 | |
| | 1,800 | | | | 6.00 | | | | 5/25/32 | 14 | | | 1,742 | |
| | 50,819 | | | | 6.09 | | | | 10/25/31 | 14 | | | 51,584 | |
| | 2,312 | | | | 7.79 | | |
| 6/25/26
| 1
| | | 2,364 | |
| | | | | | | | | | | | | | |
| | | | | | | | | | | | | 2,108,442 | |
| | | | | | | | | | | | | | |
| | Small Business Administration - 0.3% | | | | | |
| | 122,969 | | | | 5.78 | | | | 8/1/27 | | | | 121,829 | |
| | 542,232 | | | | 5.87 | | | | 7/1/28 | | | | 536,065 | |
| | 508,661 | | | | 6.02 | | | | 8/1/28 | | | | 505,846 | |
| | | | | | | | | | | | | | |
| | | | | | | | | | | | | 1,163,740 | |
| | | | | | | | | | | | | | |
| Total Asset-Backed Securities
(cost: $4,038,165) |
| | | 3,857,787 | |
| | | | | | | | | | | | | | |
| Put Options Purchased 19 - 1.0%
(cost: $1,449,573) |
| | | 4,045,703 | |
| | | | | | | | | | | | | | |
| | |
Quantity | | | Name of Issuer | | | Fair
Value ($) | |
| | Short-Term Securities - 2.5% | | | | | |
| | 10,053,821 | | |
| Fidelity Inst. Money
Mkt. Gvt. Fund, 2.74% |
| | | 10,053,821 | |
| | | | | | | | | | | | | | |
| | (cost: $10,053,821) | | | | | | | | | |
| Total Investments in Securities - 101.2%
(cost: $445,804,891) |
| | | 414,742,781 | |
| | | | | | | | | | | | | | |
| | Other Assets and Liabilities - (1.2)% | | | | (4,835,079 | ) |
| | | | | | | | | | | | | | |
| | Net Assets - 100.0% | | | | | | | $ | 409,907,702 | |
| | | | | | | | | | | | | | |
| 1 | Variable rate security. Rate disclosed is as of September 30, 2022. Certain variable rate securities are not based on a published reference rate and spread but are determined by the issuer or agent and are based on current market conditions, or, for mortgage-backed securities, are impacted by the individual mortgages which are paying off over time. These securities do not indicate a reference rate and spread in their descriptions. |
| 14 | Step Coupon: A bond that pays a coupon rate that increases on a specified date(s). Rate disclosed is as of September 30, 2022. |
Numeric footnotes not disclosed are not applicable to this Schedule of Investments.
| | |
| |
| See accompanying notes to financial statements. | | |
| | |
| SEPTEMBER 30, 2022 | | 9 |
SCHEDULE OF INVESTMENTS (Unaudited)
September 30, 2022
Sit U.S. Government Securities Fund (Continued)
| 19 | Options outstanding as of September 30, 2022 were as follows: |
| | | | | | | | | | | | | | | | | | | | | | | | | | | | |
Description | | Contracts | | | Exercise
Price ($) | | | Expiration
Date | | | Counterparty | | | Notional
Amount ($) | | | Cost/
Premiums ($) | | | Value ($) | |
Put Options Purchased - U.S. Treasury Futures: | |
5-Year | | | 550 | | | | 110.00 | | | | November 2022 | | | | StoneX Financial, Inc. | | | | 60,500,000 | | | | 422,531 | | | | 1,508,203 | |
5-Year | | | 800 | | | | 110.50 | | | | November 2022 | | | | StoneX Financial, Inc. | | | | 88,400,000 | | | | 1,027,042 | | | | 2,537,500 | |
| | | | | | | | | | | | | | | | | | | | | | | | | | | | |
Total | | | | | | | | | | | | | | | | | | | 148,900,000 | | | | 1,449,573 | | | | 4,045,703 | |
| | | | | | | | | | | | | | | | | | | | | | | | | | | | |
A summary of the levels for the Fund’s investments as of September 30, 2022 is as follows (see Note 2 - significant accounting policies in the notes to financial statements):
| | | | | | | | | | | | | | | | |
| | | Investment in Securities | |
| | | Level 1
Quoted
Prices ($) | | | Level 2
Other significant
observable inputs ($) | | | Level 3
Significant
unobservable inputs ($) | | | Total ($) | |
Mortgage Pass-Through Securities | | | — | | | | 129,756,511 | | | | — | | | | 129,756,511 | |
U.S. Treasury / Federal Agency Securities | | | — | | | | 3,307,813 | | | | — | | | | 3,307,813 | |
Collateralized Mortgage Obligations | | | — | | | | 263,721,146 | | | | — | | | | 263,721,146 | |
Asset-Backed Securities | | | — | | | | 3,857,787 | | | | — | | | | 3,857,787 | |
Put Options Purchased | | | 4,045,703 | | | | — | | | | — | | | | 4,045,703 | |
Short-Term Securities | | | 10,053,821 | | | | — | | | | — | | | | 10,053,821 | |
| | | | | | | | | | | | | | | | |
Total: | | | 14,099,524 | | | | 400,643,257 | | | | — | | | | 414,742,781 | |
| | | | | | | | | | | | | | | | |
There were no transfers into or out of level 3 during the reporting period.
| | |
| |
| See accompanying notes to financial statements. | | |
| | |
| 10 | | SIT MUTUAL FUNDS SEMI-ANNUAL REPORT |
[This page is intentionally left blank.]
Sit Quality Income Fund - Class S and Class Y
OBJECTIVE & STRATEGY
The objective of the Quality Income Fund is to provide high current income and safety of principal, which it seeks to attain by investing at least 80% of its assets in debt securities issued by the U.S. government and its agencies, debt securities issued by corporations, and mortgage and other asset-backed securities. The Fund invests at least 50% of its assets in U.S. government debt securities, which are securities issued, guaranteed or insured by the U.S. government, its agencies or instrumentalities.
Fund Performance
The Sit Quality Income Fund (Class S) provided a return of -2.05% during the 6-month period ended September 30, 2022, compared to the return of the Bloomberg 1-3 Year Government/Credit Bond Index of -2.10%. The Fund’s 30-day SEC yield was 2.75% and its 12-month distribution rate was 2.03%.
Factors that Influenced the Fund’s Performance
The primary goal of the Fund is to maintain a high credit quality portfolio with stable principal values, while generating a relatively high level of income. Yields of U.S. Treasury securities were higher across all maturities for the 6-month period causing large price declines across most sectors. The Fund’s strong income advantage was able to partially offset some of the price declines but not all. The Fund reduces interest rate risk by using futures and options on Treasury securities. The use of futures and options was effective in providing stability to the Fund’s net asset value and provided a positive return. The Fund’s U.S. Treasury holdings outperformed the benchmark as the securities held by the Fund were generally inflation protected securities which benefited from higher-than-expected inflation measures. The Fund’s allocation to corporate securities, mortgage-backed securities, and taxable municipal securities underperformed the benchmark due to larger increases in yield relative to U.S. Treasury securities.
Outlook and Positioning
The Federal Reserve had its hands full to start the period with respect to inflation. What previously had been coined ‘transitory’ inflation, had evolved into a much bigger issue than the Fed had previously thought. Inflation had not only become a serious issue domestically but globally as well due to the ongoing war in Ukraine and supply chain disruptions. To combat inflation, the Fed embarked on a restrictive monetary policy which had arguably not been seen in 40 years. The 6-month period started with the Federal Funds upper bound target rate at 0.50% and ended at 3.25%, even higher than the most recent peak of 2.50% prior to the Covid-19 virus taking root. Additionally, credit sensitive sectors saw increased volatility as the Fed began to unwind its nearly $9.0 trillion balance sheet. The Fed will undoubtedly win its war on inflation, but at serious costs to economic activity. The market has begun to price in a recessionary environment, but now is grappling with how long and severe the recession will be.
HYPOTHETICAL GROWTH OF $10,000
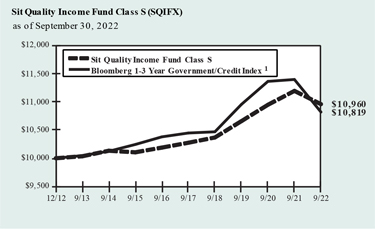
The chart above illustrates the total value of a hypothetical $10,000 investment in the Fund over the past 10 years as compared to the performance of the Bloomberg 1-3 Year Government/Credit Index. Past performance does not guarantee future results. Returns include the reinvestment of distributions. The chart does not reflect the deduction of taxes that a shareholder would pay on Fund distributions or the redemption of Fund shares.
| 1 | The Bloomberg 1-3 Year Government/Credit Index is an unmanaged index of Treasury or government agency securities and investment grade corporate debt securities with maturities of one to three years. The returns include the reinvestment of income and do not include any transaction costs, management fees or other costs. It is not possible to invest directly in an index. This is the Fund’s primary index. |
Another headwind for the economy is the rapidly rising mortgage rate. Mortgage rates are over 7% causing housing affordability to be very low. Prepayments across all coupons have slowed and we expect will continue to decrease as housing turnover and refinancings have grinded to a halt.
We have positioned the Fund defensively in terms of credit quality and interest rates. We continue to favor shorter duration securities as we expect the Fed will overshoot and potentially be forced to cut short-term interest rates as early as next year. We focus on a mix of Treasury, agency and credit sectors that provide relatively high levels of income and stable prices.
| | |
| Bryce A. Doty, CFA | | Chris M. Rasmussen, CFA |
| Senior Portfolio Manager | | Mark H. Book, CFA |
| | Portfolio Managers |
| | |
| |
| | |
| | |
| 12 | | SIT MUTUAL FUNDS SEMI-ANNUAL REPORT |
COMPARATIVE RATES OF RETURNS
as of September 30, 2022
| | | | | | | | | | | | | | | | |
| | | Sit Quality | | | | | | | |
| | | Income Fund | | | | | | | |
| | | Class S | | | Class Y | | | Bloomberg
1-3 Year
Government/
Credit Index1 | | | Lipper Short
Investment
Grade Bond
Index2 | |
Six Month | | | -2.05 | % | | | -1.71 | % | | | -2.10 | % | | | n/a | |
One Year | | | -2.09 | | | | n/a | | | | -5.07 | | | | -5.54 | % |
Five Year | | | 1.30 | | | | n/a | | | | 0.70 | | | | 0.97 | |
Since Inception-Class S (12/31/12) | | | 0.94 | | | | n/a | | | | 0.81 | | | | 1.11 | |
Since Inception-Class Y (3/31/22) | | | n/a | | | | -1.71 | | | | -2.10 | | | | n/a | |
Performance figures are historical and do not guarantee future results. Investment returns and principal value will vary, and you may have a gain or loss when you sell shares. Current performance may be lower or higher than the performance data quoted. Contact the Fund for performance data current to the most recent month-end. Returns include changes in share price as well as reinvestment of all dividends and capital gains and all fee waivers. Without the fee waivers total return and yield figures would have been lower. Returns do not reflect the deduction of taxes that a shareholder would pay on Fund distributions or the redemption of Fund shares. Management fees and administrative expenses are included in the Fund’s performance. Returns for periods greater than one year are compounded average annual rates of return.
| 1 | The Bloomberg 1-3 Year Government/Credit Index is an unmanaged index of Treasury or government agency securities and investment grade corporate debt securities with maturities of one to three years. The returns include the reinvestment of income and do not include any transaction costs, management fees or other costs. It is not possible to invest directly in an index. |
| 2 | The Lipper returns are obtained from Lipper Analytical Services, Inc., a large independent evaluator of mutual funds. |
FUND DIVERSIFICATION
| | | | |
U.S. Treasury / Federal Agency Securities | | | 27.6 | % |
Mortgage Pass-Through Securities | | | 23.0 | |
Corporate Bonds | | | 22.4 | |
Taxable Municipal Bonds | | | 19.2 | |
Collateralized Mortgage Obligations - Non Agency | | | 4.7 | |
Asset-Backed Securities - Non Agency | | | 1.4 | |
Based on net assets as of September 30, 2022.
PORTFOLIO SUMMARY
| | | | | | |
Class S: | | | | | | |
Net Asset Value 9/30/22: | | $ | 9.65 | | | Per Share |
Net Asset Value 3/31/22: | | $ | 9.98 | | | Per Share |
Net Assets: | | $ | 58.8 | | | Million |
| | |
Class Y: | | | | | | |
Net Asset Value 9/30/22: | | $ | 9.66 | | | Per Share |
Net Asset Value 3/31/22:3 | | $ | 9.97 | | | Per Share |
Net Assets: | | $ | 80.6 | | | Million |
Average Maturity | | | 8.7 | | | Years |
Effective Duration:4 | | | 1.8 | | | Years |
| 3 | The inception date of Class Y Shares was March 31, 2022. |
| 4 | Duration is a measure of estimated price sensitivity relative to changes in interest rates. |
Portfolios with longer durations are typically more sensitive to changes in interest rates. For example, if interest rates rise by 1%, the fair value of a security with an effective duration of 5 years would decrease by 5%, with all other factors being constant. The correlation between duration and price sensitivity is greater for securities rated investment-grade than it is for securities rated below investment-grade. Duration estimates are based on assumptions by the Adviser and are subject to a number of limitations. Effective duration is calculated based on historical price changes of securities held by the Fund, and therefore is a more accurate estimate of price sensitivity provided interest rates remain within their historical range.
QUALITY RATING (% of Net Assets)
Lower of Moody’s, S&P, Fitch or Duff & Phelps ratings used.
SCHEDULE OF INVESTMENTS (Unaudited)
September 30, 2022
Sit Quality Income Fund
| | | | | | | | | | | | | | | | |
Name of Issuer | | Principal
Amount ($) | | | Coupon
Rate (%) | | | Maturity
Date | | | Fair
Value ($) | |
Asset-Backed Securities - 1.9% | | | | | | | | | | | | | | | | |
Agency - 0.5% | | | | | | | | | | | | | | | | |
FNMA Grantor Trust, Series 2004-T5, Class A11 1 | | | 426,068 | | | | 3.02 | | | | 5/28/35 | | | | 402,697 | |
Small Business Administration, Series 2006-20D, Class 1 | | | 80,732 | | | | 5.64 | | | | 4/1/26 | | | | 80,082 | |
Small Business Administration, Series 2007-20B, Class 1 | | | 64,930 | | | | 5.49 | | | | 2/1/27 | | | | 63,734 | |
Small Business Administration, Series 2007-20J, Class 1 | | | 127,303 | | | | 5.57 | | | | 10/1/27 | | | | 126,100 | |
| | | | | | | | | | | | | | | | |
| | | | | | | | | | | | | | | 672,613 | |
| | | | | | | | | | | | | | | | |
Non-Agency - 1.4% | | | | | | | | | | | | | | | | |
Centex Home Equity Loan Trust, Series 2004-A, Class AF4 14 | | | 102,684 | | | | 5.01 | | | | 8/25/32 | | | | 96,732 | |
Centex Home Equity Loan Trust, Series 2004-A, Class AF5 14 | | | 310,000 | | | | 5.43 | | | | 1/25/34 | | | | 270,317 | |
Home Equity Mortgage Loan Asset-Backed Trust, Series 2003-A, Class AV2, 1 Mo. Libor + 0.86% 1 | | | 114,890 | | | | 3.94 | | | | 10/25/33 | | | | 113,124 | |
Mill City Mortgage Loan Trust, Series 2017-3, Class A1 1, 4 | | | 73,922 | | | | 2.75 | | | | 1/25/61 | | | | 72,764 | |
OSCAR US Funding Trust IX, LLC, Series 2018-2A, Class A4 4 | | | 143,415 | | | | 3.63 | | | | 9/10/25 | | | | 143,124 | |
Towd Point Mortgage Trust, Series 2019-MH1, Class A2 1, 4 | | | 800,000 | | | | 3.00 | | | | 11/25/58 | | | | 758,635 | |
Towd Point Mortgage Trust, Series 2020-MH1, Class A1A 1, 4 | | | 495,052 | | | | 2.18 | | | | 2/25/60 | | | | 458,994 | |
| | | | | | | | | | | | | | | | |
| | | | | | | | | | | | | | | 1,913,690 | |
| | | | | | | | | | | | | | | | |
Total Asset-Backed Securities
(cost: $2,754,612) | | | | | | | | | | | | | | | 2,586,303 | |
| | | | | | | | | | | | | | | | |
Collateralized Mortgage Obligations - 13.3% | | | | | | | | | | | | | | | | |
Agency - 8.6% | | | | | | | | | | | | | | | | |
FHLMC REMICS, Series 2528, Class KM | | | 384 | | | | 5.50 | | | | 11/15/22 | | | | 384 | |
FHLMC REMICS, Series 3104, Class BY | | | 39,634 | | | | 5.50 | | | | 1/15/26 | | | | 39,846 | |
FHLMC REMICS, Series 3806, Class JA | | | 52,554 | | | | 3.50 | | | | 2/15/26 | | | | 52,133 | |
FHLMC REMICS, Series 3982, Class LA | | | 758,864 | | | | 2.50 | | | | 12/15/39 | | | | 742,810 | |
FHLMC REMICS, Series 4210, Class AD | | | 668,576 | | | | 4.00 | | | | 3/15/40 | | | | 665,866 | |
FHLMC REMICS, Series 4246, Class PT | | | 251,493 | | | | 6.50 | | | | 2/15/36 | | | | 263,925 | |
FHLMC REMICS, Series 4390, Class CA | | | 1,091,470 | | | | 3.50 | | | | 6/15/50 | | | | 1,076,285 | |
FHLMC REMICS, Series 4523, Class VB | | | 3,099,473 | | | | 3.50 | | | | 8/15/34 | | | | 3,084,205 | |
FHLMC REMICS, Series 4759, Class NA | | | 81,028 | | | | 3.00 | | | | 8/15/44 | | | | 79,754 | |
FHLMC REMICS, Series 5252, Class BT | | | 997,375 | | | | 6.00 | | | | 9/25/52 | | | | 1,038,019 | |
FHLMC Structured Pass-Through Certificates, Series T-60, Class 1A2 | | | 563,674 | | | | 7.00 | | | | 3/25/44 | | | | 566,173 | |
FNMA Grantor Trust, Series 2004-T1, Class 2A 1 | | | 274,994 | | | | 3.10 | | | | 8/25/43 | | | | 257,773 | |
FNMA REMICS, Series 2009-13, Class NX | | | 51 | | | | 4.50 | | | | 3/25/24 | | | | 51 | |
FNMA REMICS, Series 2009-71, Class MB | | | 1,840 | | | | 4.50 | | | | 9/25/24 | | | | 1,837 | |
FNMA REMICS, Series 2011-146, Class LX | | | 1,570,849 | | | | 3.50 | | | | 10/25/40 | | | | 1,534,083 | |
FNMA REMICS, Series 2013-74, Class AD | | | 3,242 | | | | 2.00 | | | | 7/25/23 | | | | 3,224 | |
FNMA REMICS, Series 2017-97, Class DP | | | 26,005 | | | | 3.50 | | | | 10/25/46 | | | | 25,285 | |
FNMA REMICS, Series 2018-25, Class AG | | | 200,421 | | | | 3.50 | | | | 4/25/47 | | | | 192,246 | |
Freddie Mac Multifamily Structured Pass-Through Certificates, Series K723, Class A2 | | | 1,217,166 | | | | 2.45 | | | | 8/25/23 | | | | 1,198,094 | |
FRESB Mortgage Trust, Series 2018-SB45, Class A5H 1 | | | 255,060 | | | | 2.96 | | | | 11/25/37 | | | | 254,084 | |
FRESB Mortgage Trust, Series 2018-SB46, Class A5H 1 | | | 623,194 | | | | 2.89 | | | | 12/25/37 | | | | 621,053 | |
Seasoned Credit Risk Transfer Trust, Series 2019-4, Class M55D | | | 273,549 | | | | 4.00 | | | | 2/25/59 | | | | 261,661 | |
Vendee Mortgage Trust, Series 1993-1, Class ZB | | | 3,970 | | | | 7.25 | | | | 2/15/23 | | | | 3,978 | |
| | | | | | | | | | | | | | | | |
| | | | | | | | | | | | | | | 11,962,769 | |
| | | | | | | | | | | | | | | | |
Non-Agency - 4.7% | | | | | | | | | | | | | | | | |
JP Morgan Mortgage Trust, Series 2021-1, Class A4 1, 4 | | | 576,627 | | | | 2.50 | | | | 6/25/51 | | | | 502,251 | |
JP Morgan Mortgage Trust, Series 2021-13, Class A4 1, 4 | | | 835,074 | | | | 2.50 | | | | 4/25/52 | | | | 717,185 | |
JP Morgan Mortgage Trust, Series 2021-6, Class A4 1, 4 | | | 1,514,541 | | | | 2.50 | | | | 10/25/51 | | | | 1,300,730 | |
JP Morgan Mortgage Trust, Series 2021-7, Class A4 1, 4 | | | 523,789 | | | | 2.50 | | | | 11/25/51 | | | | 450,630 | |
JP Morgan Mortgage Trust, Series 2022-1, Class A11 1, 4 | | | 2,362,091 | | | | 3.03 | | | | 7/25/52 | | | | 2,191,118 | |
New Residential Mortgage Loan Trust, Series 2017-2A, Class A4 1, 4 | | | 247,144 | | | | 4.00 | | | | 3/25/57 | | | | 232,615 | |
New Residential Mortgage Loan Trust, Series 2017-3A, Class A1 1, 4 | | | 262,640 | | | | 4.00 | | | | 4/25/57 | | | | 249,321 | |
New Residential Mortgage Loan Trust, Series 2017-5A, Class A1, 1 Mo. Libor + 1.50% 1, 4 | | | 89,237 | | | | 4.58 | | | | 6/25/57 | | | | 88,032 | |
New Residential Mortgage Loan Trust, Series 2018-1A, Class A1A 1, 4 | | | 192,478 | | | | 4.00 | | | | 12/25/57 | | | | 182,989 | |
New Residential Mortgage Loan Trust, Series 2018-4A, Class A1S, 1 Mo. Libor + 0.75% 1, 4 | | | 256,520 | | | | 3.19 | | | | 1/25/48 | | | | 248,251 | |
| | |
| |
| See accompanying notes to financial statements. | | |
| | |
| 14 | | SIT MUTUAL FUNDS SEMI-ANNUAL REPORT |
| | | | | | | | | | | | | | | | |
Name of Issuer | | Principal
Amount ($) | | | Coupon
Rate (%) | | | Maturity
Date | | | Fair
Value ($) | |
Sequoia Mortgage Trust, Series 2020-4, Class A5 1, 4 | | | 273,482 | | | | 2.50 | | | | 11/25/50 | | | | 248,145 | |
Wells Fargo Mortgaged Backed Securities Trust, Series 2020-5, Class A3 1, 4 | | | 251,158 | | | | 2.50 | | | | 9/25/50 | | | | 218,056 | |
| | | | | | | | | | | | | | | | |
| | | | | | | | | | | | | | | 6,629,323 | |
| | | | | | | | | | | | | | | | |
Total Collateralized Mortgage Obligations
(cost: $19,666,537) | | | | | | | | | | | | | | | 18,592,092 | |
| | | | | | | | | | | | | | | | |
Corporate Bonds - 22.4% | | | | | | | | | | | | | | | | |
American Equity Investment Life Holding Co. | | | 1,450,000 | | | | 5.00 | | | | 6/15/27 | | | | 1,376,241 | |
Bank of America Corp. 1 | | | 1,000,000 | | | | 3.34 | | | | 5/28/24 | | | | 980,050 | |
BGC Partners, Inc. | | | 900,000 | | | | 4.38 | | | | 12/15/25 | | | | 840,749 | |
British Airways 2020-1 Class B Pass Through Trust 4 | | | 340,401 | | | | 8.38 | | | | 11/15/28 | | | | 344,208 | |
Brown & Brown, Inc. | | | 600,000 | | | | 4.20 | | | | 9/15/24 | | | | 588,198 | |
Cabot Corp. | | | 680,000 | | | | 3.40 | | | | 9/15/26 | | | | 627,022 | |
Cadence Bank (Subordinated), 3 Mo. Libor + 3.03% 1 | | | 1,200,000 | | | | 4.75 | | | | 6/30/29 | | | | 1,160,404 | |
Canadian Natural Resources, Ltd. | | | 1,000,000 | | | | 3.85 | | | | 6/1/27 | | | | 921,587 | |
CenterState Bank Corp. (Subordinated) 1 | | | 650,000 | | | | 5.75 | | | | 6/1/30 | | | | 639,150 | |
CVS Pass-Through Trust Series 2009 4 | | | 870,349 | | | | 8.35 | | | | 7/10/31 | | | | 941,230 | |
Delta Air Lines 2015-1 Class AA Pass Through Trust | | | 347,646 | | | | 3.63 | | | | 7/30/27 | | | | 313,282 | |
DTE Energy Co. 14 | | | 577,000 | | | | 4.22 | | | | 11/1/24 | | | | 565,708 | |
Duke Energy Florida Project Finance, LLC | | | 1,172,734 | | | | 2.54 | | | | 9/1/29 | | | | 1,063,629 | |
El Paso Natural Gas Co., LLC | | | 500,000 | | | | 7.50 | | | | 11/15/26 | | | | 532,075 | |
Equinor ASA | | | 224,000 | | | | 7.15 | | | | 11/15/25 | | | | 236,966 | |
F&G Global Funding 4 | | | 900,000 | | | | 0.90 | | | | 9/20/24 | | | | 819,111 | |
F&G Global Funding 4 | | | 600,000 | | | | 5.15 | | | | 7/7/25 | | | | 587,907 | |
Fairfax US, Inc. 4 | | | 600,000 | | | | 4.88 | | | | 8/13/24 | | | | 587,536 | |
First Midwest Bancorp, Inc. (Subordinated) | | | 1,250,000 | | | | 5.88 | | | | 9/29/26 | | | | 1,254,704 | |
First-Citizens Bank & Trust Co. (Subordinated) 1 | | | 1,250,000 | | | | 4.13 | | | | 11/13/29 | | | | 1,177,110 | |
Hyundai Capital America 4 | | | 895,000 | | | | 2.38 | | | | 10/15/27 | | | | 747,783 | |
JetBlue 2019-1 Class B Pass Through Trust | | | 777,354 | | | | 8.00 | | | | 11/15/27 | | | | 762,877 | |
Liberty Mutual Insurance Co. (Subordinated) 4 | | | 500,000 | | | | 8.50 | | | | 5/15/25 | | | | 522,209 | |
M&T Bank Corp. (Subordinated) | | | 450,000 | | | | 4.00 | | | | 7/15/24 | | | | 443,679 | |
Metropolitan Life Insurance Co. (Subordinated) 4 | | | 750,000 | | | | 7.80 | | | | 11/1/25 | | | | 802,095 | |
Minnesota Life Insurance Co. (Subordinated) 4 | | | 925,000 | | | | 8.25 | | | | 9/15/25 | | | | 980,926 | |
Nationwide Mutual Insurance Co. (Subordinated), 3 Mo. Libor + 2.29% 1, 4 | | | 1,300,000 | | | | 5.58 | | | | 12/15/24 | | | | 1,300,151 | |
Old Republic International Corp. | | | 1,338,000 | | | | 4.88 | | | | 10/1/24 | | | | 1,335,957 | |
Orange & Rockland Utilities, Inc. | | | 700,000 | | | | 6.50 | | | | 12/1/27 | | | | 730,724 | |
Reliant Bancorp, Inc. (Subordinated) 1 | | | 1,250,000 | | | | 5.13 | | | | 12/15/29 | | | | 1,203,061 | |
SC Johnson & Son, Inc. 4 | | | 700,000 | | | | 6.75 | | | | 2/15/28 | | | | 748,382 | |
TIAA FSB Holdings, Inc. (Subordinated) | | | 1,455,000 | | | | 5.75 | | | | 7/2/25 | | | | 1,438,613 | |
Tosco Corp. | | | 740,000 | | | | 7.80 | | | | 1/1/27 | | | | 803,913 | |
Tyco Intl. Finance | | | 1,000,000 | | | | 3.90 | | | | 2/14/26 | | | | 918,906 | |
United Airlines 2014-1 Class A Pass Through Trust | | | 861,758 | | | | 4.00 | | | | 4/11/26 | | | | 787,935 | |
United Financial Bancorp, Inc. (Subordinated) | | | 300,000 | | | | 5.75 | | | | 10/1/24 | | | | 295,234 | |
VeriSign, Inc. | | | 550,000 | | | | 4.75 | | | | 7/15/27 | | | | 529,338 | |
West Loop BC (Subordinated), 3 Mo. Libor + 1.87 1 | | | 1,300,000 | | | | 4.00 | | | | 12/1/27 | | | | 1,294,640 | |
| | | | | | | | | | | | | | | | |
Total Corporate Bonds
(cost: $33,890,871) | | | | | | | | | | | | | | | 31,203,290 | |
| | | | | | | | | | | | | | | | |
Mortgage Pass-Through Securities - 23.0% | | | | | | | | | | | | | | | | |
Federal Home Loan Mortgage Corporation - 7.4% | | | | | | | | | | | | | | | | |
Freddie Mac | | | 315,586 | | | | 2.00 | | | | 11/1/31 | | | | 282,714 | |
Freddie Mac | | | 401,548 | | | | 2.00 | | | | 8/1/32 | | | | 360,166 | |
Freddie Mac | | | 2,970,889 | | | | 2.50 | | | | 8/1/30 | | | | 2,759,837 | |
Freddie Mac | | | 47,503 | | | | 3.00 | | | | 9/1/27 | | | | 46,044 | |
Freddie Mac | | | 2,915,000 | | | | 3.00 | | | | 4/1/33 | | | | 2,733,771 | |
Freddie Mac | | | 503,021 | | | | 3.00 | | | | 1/1/35 | | | | 469,010 | |
Freddie Mac | | | 1,416,762 | | | | 3.00 | | | | 1/1/36 | | | | 1,306,113 | |
Freddie Mac | | | 9,215 | | | | 3.50 | | | | 7/1/26 | | | | 8,785 | |
| | |
| |
| See accompanying notes to financial statements. | | |
| | |
| SEPTEMBER 30, 2022 | | 15 |
SCHEDULE OF INVESTMENTS (Unaudited)
September 30, 2022
Sit Quality Income Fund (Continued)
| | | | | | | | | | | | | | | | |
Name of Issuer | | Principal
Amount ($) | | | Coupon
Rate (%) | | | Maturity
Date | | | Fair
Value ($) | |
Freddie Mac | | | 729,032 | | | | 3.50 | | | | 8/1/31 | | | | 695,457 | |
Freddie Mac | | | 272,387 | | | | 3.50 | | | | 9/1/32 | | | | 258,989 | |
Freddie Mac | | | 63,621 | | | | 4.00 | | | | 7/1/26 | | | | 61,845 | |
Freddie Mac | | | 62,950 | | | | 4.00 | | | | 1/1/27 | | | | 61,210 | |
Freddie Mac | | | 680,733 | | | | 4.00 | | | | 4/1/29 | | | | 664,618 | |
Freddie Mac | | | 140,896 | | | | 4.00 | | | | 10/1/31 | | | | 134,560 | |
Freddie Mac | | | 1,879 | | | | 4.50 | | | | 7/1/26 | | | | 1,850 | |
Freddie Mac | | | 301,270 | | | | 4.50 | | | | 10/1/34 | | | | 291,620 | |
Freddie Mac | | | 3,982 | | | | 5.00 | | | | 10/1/25 | | | | 3,914 | |
Freddie Mac | | | 264,735 | | | | 5.00 | | | | 5/1/28 | | | | 259,868 | |
| | | | | | | | | | | | | | | | |
| | | | | | | | | | | | | | | 10,400,371 | |
| | | | | | | | | | | | | | | | |
Federal National Mortgage Association - 13.2% | | | | | | | | | | | | | | | | |
Fannie Mae | | | 1,189,606 | | | | 2.35 | | | | 5/1/23 | | | | 1,184,581 | |
Fannie Mae | | | 1,462,205 | | | | 2.50 | | | | 6/1/31 | | | | 1,358,159 | |
Fannie Mae | | | 443,421 | | | | 2.50 | | | | 2/1/35 | | | | 403,821 | |
Fannie Mae | | | 70,494 | | | | 3.00 | | | | 8/1/28 | | | | 66,955 | |
Fannie Mae | | | 463,907 | | | | 3.00 | | | | 9/1/32 | | | | 427,797 | |
Fannie Mae | | | 505,042 | | | | 3.00 | | | | 4/1/40 | | | | 440,620 | |
Fannie Mae | | | 1,276,442 | | | | 3.00 | | | | 6/1/40 | | | | 1,157,686 | |
Fannie Mae | | | 144,212 | | | | 3.50 | | | | 1/1/26 | | | | 137,141 | |
Fannie Mae | | | 496,453 | | | | 3.50 | | | | 2/1/32 | | | | 468,459 | |
Fannie Mae | | | 1,192,305 | | | | 3.50 | | | | 8/1/33 | | | | 1,119,062 | |
Fannie Mae | | | 430,749 | | | | 3.50 | | | | 5/1/35 | | | | 404,358 | |
Fannie Mae | | | 467,544 | | | | 3.50 | | | | 11/1/38 | | | | 440,197 | |
Fannie Mae | | | 2,644 | | | | 4.00 | | | | 9/1/24 | | | | 2,564 | |
Fannie Mae | | | 31,076 | | | | 4.00 | | | | 6/1/25 | | | | 30,116 | |
Fannie Mae | | | 8,728 | | | | 4.00 | | | | 10/1/31 | | | | 8,329 | |
Fannie Mae | | | 521,100 | | | | 4.00 | | | | 10/1/34 | | | | 506,332 | |
Fannie Mae | | | 1,855,354 | | | | 4.00 | | | | 1/1/39 | | | | 1,811,582 | |
Fannie Mae | | | 19,518 | | | | 4.50 | | | | 4/1/25 | | | | 19,201 | |
Fannie Mae | | | 2,500,000 | | | | 4.50 | | | | 3/1/29 | | | | 2,458,317 | |
Fannie Mae | | | 121,851 | | | | 4.50 | | | | 7/1/31 | | | | 117,767 | |
Fannie Mae | | | 2,509,117 | | | | 4.50 | | | | 4/1/39 | | | | 2,455,708 | |
Fannie Mae | | | 457,852 | | | | 5.50 | | | | 8/1/40 | | | | 480,206 | |
Fannie Mae | | | 555,198 | | | | 5.50 | | | | 2/1/42 | | | | 574,014 | |
Fannie Mae | | | 2,145,405 | | | | 6.00 | | | | 9/1/29 | | | | 2,180,096 | |
| | | | | | | | | | | | | | | | |
| | | | | | | | | | | | | | | 18,253,068 | |
| | | | | | | | | | | | | | | | |
Government National Mortgage Association - 1.6% | | | | | | | | | | | | | | | | |
Ginnie Mae, US Treasury + 1.50% 1 | | | 19,673 | | | | 2.88 | | | | 4/20/33 | | | | 19,516 | |
Ginnie Mae, US Treasury + 1.50% 1 | | | 4,492 | | | | 2.88 | | | | 4/20/42 | | | | 4,487 | |
Ginnie Mae | | | 1,904,251 | | | | 4.00 | | | | 7/20/26 | | | | 1,842,720 | |
Ginnie Mae | | | 956 | | | | 5.00 | | | | 12/20/23 | | | | 959 | |
Ginnie Mae | | | 1,270 | | | | 5.00 | | | | 9/15/24 | | | | 1,274 | |
Ginnie Mae | | | 10,017 | | | | 5.00 | | | | 6/20/26 | | | | 10,135 | |
Ginnie Mae | | | 403,658 | | | | 6.00 | | | | 7/20/37 | | | | 433,452 | |
| | | | | | | | | | | | | | | | |
| | | | | | | | | | | | | | | 2,312,543 | |
| | | | | | | | | | | | | | | | |
Other Federal Agency Securities - 0.8% | | | | | | | | | | | | | | | | |
Small Business Administration Pools, PRIME - 2.50% 1 | | | 290,775 | | | | 2.25 | | | | 5/25/43 | | | | 290,705 | |
Small Business Administration Pools, PRIME + 0.81% 1 | | | 205,295 | | | | 5.56 | | | | 3/25/30 | | | | 218,135 | |
Small Business Administration Pools, PRIME + 0.82% 1 | | | 527,514 | | | | 5.57 | | | | 2/25/28 | | | | 554,141 | |
| | | | | | | | | | | | | | | | |
| | | | | | | | | | | | | | | 1,062,981 | |
| | | | | | | | | | | | | | | | |
Total Mortgage Pass-Through Securities
(cost: $34,201,788) | | | | | | | | | | | | | | | 32,028,963 | |
| | | | | | | | | | | | | | | | |
Taxable Municipal Bonds - 19.2% | | | | | | | | | | | | | | | | |
Anaheim Housing & Public Improvements Authority | | | 1,000,000 | | | | 2.94 | | | | 10/1/24 | | | | 965,270 | |
Borough of Naugatuck CT G.O. | | | 190,000 | | | | 1.40 | | | | 9/15/27 | | | | 161,346 | |
| | |
| |
| See accompanying notes to financial statements. | | |
| | |
| 16 | | SIT MUTUAL FUNDS SEMI-ANNUAL REPORT |
| | | | | | | | | | | | | | | | |
Name of Issuer | | Principal
Amount ($) | | | Coupon
Rate (%) | | | Maturity
Date | | | Fair
Value ($) | |
California Municipal Finance Authority | | | 725,000 | | | | 2.19 | | | | 11/15/26 | | | | 657,611 | |
Cape Girardeau School District No. 63 | | | 1,000,000 | | | | 5.35 | | | | 3/1/27 | | | | 1,010,813 | |
Charleston County School District | | | 640,000 | | | | 1.05 | | | | 9/15/26 | | | | 597,178 | |
Chino, CA Public Financing Authority | | | 215,000 | | | | 1.70 | | | | 9/1/26 | | | | 190,526 | |
City of Cleveland OH | | | 125,000 | | | | 1.28 | | | | 10/1/26 | | | | 107,870 | |
City of Encinitas CA | | | 500,000 | | | | 1.45 | | | | 9/1/27 | | | | 424,530 | |
City of Kansas MO 9 | | | 1,245,000 | | | | 3.27 | | | | 4/1/25 | | | | 1,195,835 | |
Clark County School District Finance Corp. | | | 1,000,000 | | | | 5.20 | | | | 6/1/26 | | | | 1,019,850 | |
Colorado Housing & Finance Authority | | | 5,000 | | | | 4.00 | | | | 11/1/31 | | | | 4,981 | |
Columbus Metropolitan Housing Authority | | | 1,000,000 | | | | 1.25 | | | | 11/1/24 | | | | 930,590 | |
Commonwealth of Massachusetts | | | 1,500,000 | | | | 4.11 | | | | 7/15/31 | | | | 1,439,010 | |
County of Cook IL | | | 1,200,000 | | | | 5.79 | | | | 11/15/29 | | | | 1,239,876 | |
County of Yamhill OR | | | 455,000 | | | | 4.50 | | | | 10/1/30 | | | | 438,597 | |
District of Columbia 9 | | | 1,000,000 | | | | 3.85 | | | | 2/28/25 | | | | 960,630 | |
Duluth Independent School District No. 709 | | | 250,000 | | | | 2.00 | | | | 2/1/24 | | | | 242,028 | |
Florida Capital Projects Finance Authority | | | 800,000 | | | | 4.00 | | | | 10/1/24 | | | | 768,120 | |
Jersey City, NJ G.O. | | | 335,000 | | | | 1.13 | | | | 9/1/26 | | | | 289,185 | |
Kansas City Industrial Development Authority | | | 500,000 | | | | 1.75 | | | | 3/1/26 | | | | 452,390 | |
Kentucky Higher Education Student Loan Corp. | | | 1,000,000 | | | | 2.52 | | | | 6/1/35 | | | | 879,340 | |
Louisiana Local Government Environmental Facilities & Community Development Authority | | | 1,500,000 | | | | 3.62 | | | | 2/1/29 | | | | 1,454,550 | |
Maryland Community Development Administration | | | 315,000 | | | | 3.95 | | | | 3/1/27 | | | | 303,326 | |
Maryland Community Development Administration | | | 500,000 | | | | 4.40 | | | | 3/1/53 | | | | 483,950 | |
Massachusetts Educational Financing Authority | | | 120,000 | | | | 4.00 | | | | 1/1/32 | | | | 114,713 | |
Massachusetts Educational Financing Authority | | | 205,000 | | | | 4.41 | | | | 7/1/34 | | | | 199,965 | |
Massachusetts Educational Financing Authority | | | 1,000,000 | | | | 2.64 | | | | 7/1/37 | | | | 882,100 | |
Michigan State Housing Development Authority | | | 500,000 | | | | 2.90 | | | | 6/1/52 | | | | 464,865 | |
Minnesota Housing Finance Agency | | | 275,000 | | | | 4.17 | | | | 1/1/25 | | | | 271,780 | |
Mount Diablo Unified School District | | | 1,000,000 | | | | 5.55 | | | | 8/1/27 | | | | 1,017,794 | |
New Hampshire Housing Finance Authority | | | 45,000 | | | | 4.00 | | | | 7/1/35 | | | | 44,992 | |
New Mexico Educational Assistance Foundation | | | 1,000,000 | | | | 2.11 | | | | 9/1/51 | | | | 944,430 | |
New York Liberty Development Corp. 9 | | | 450,000 | | | | 1.41 | | | | 11/15/26 | | | | 391,486 | |
North Dakota Housing Finance Agency | | | 565,000 | | | | 2.86 | | | | 7/1/24 | | | | 548,078 | |
Oklahoma Development Finance Authority | | | 500,000 | | | | 3.88 | | | | 5/1/37 | | | | 477,985 | |
Oklahoma Development Finance Authority | | | 1,000,000 | | | | 4.14 | | | | 12/1/33 | | | | 964,540 | |
Redondo Beach Community Financing Authority 9 | | | 750,000 | | | | 1.60 | | | | 5/1/27 | | | | 640,898 | |
South Dakota Housing Development Authority | | | 1,000,000 | | | | 5.46 | | | | 5/1/53 | | | | 1,004,220 | |
St. Charles Parish School District No. 1 | | | 250,000 | | | | 2.00 | | | | 3/1/27 | | | | 223,045 | |
State Public School Building Authority | | | 1,000,000 | | | | 5.00 | | | | 9/15/27 | | | | 1,001,800 | |
Tennessee Housing Development Agency | | | 10,000 | | | | 3.50 | | | | 7/1/31 | | | | 9,958 | |
Warm Springs Reservation Confederated Tribe 4 | | | 760,000 | | | | 2.02 | | | | 11/1/25 | | | | 699,185 | |
Wisconsin Housing & Economic Development Authority 8 | | | 335,000 | | | | 3.50 | | | | 3/1/46 | | | | 330,216 | |
Zachary Community School District No. 1 | | | 285,000 | | | | 2.00 | | | | 3/1/27 | | | | 254,796 | |
| | | | | | | | | | | | | | | | |
Total Taxable Municipal Bonds
(cost: $28,291,136) | | | | | | | | | | | | | | | 26,704,248 | |
| | | | | | | | | | | | | | | | |
U.S. Treasury / Federal Agency Securities - 18.5% | | | | | | | | | | | | | | | | |
Federal Agency Issues - 10.4% | | | | | | | | | | | | | | | | |
Federal Agricultural Mortgage Corp., 3 Mo. Libor + 0.37% 1 | | | 250,000 | | | | 3.56 | | | | 3/9/23 | | | | 250,163 | |
Federal Home Loan Banks | | | 1,100,000 | | | | 4.00 | | | | 8/28/25 | | | | 1,085,082 | |
Federal Home Loan Banks | | | 2,800,000 | | | | 4.13 | | | | 8/28/25 | | | | 2,773,602 | |
Federal Home Loan Mortgage Corp. | | | 3,000,000 | | | | 4.05 | | | | 7/21/25 | | | | 2,959,000 | |
Federal Home Loan Mortgage Corp. | | | 4,200,000 | | | | 4.63 | | | | 9/29/25 | | | | 4,206,518 | |
Federal National Mortgage Association | | | 2,800,000 | | | | 4.13 | | | | 8/28/25 | | | | 2,763,352 | |
U.S. Department of Housing and Urban Development | | | 530,000 | | | | 4.28 | | | | 8/1/27 | | | | 530,069 | |
| | | | | | | | | | | | | | | | |
| | | | | | | | | | | | | | | 14,567,786 | |
| | | | | | | | | | | | | | | | |
U.S. Treasury - 8.1% | | | | | | | | | | | | | | | | |
U.S. Treasury Bill 6 | | | 2,900,000 | | | | 2.33 | | | | 10/27/22 | | | | 2,895,153 | |
| | |
| |
| See accompanying notes to financial statements. | | |
| | |
| SEPTEMBER 30, 2022 | | 17 |
SCHEDULE OF INVESTMENTS (Unaudited)
September 30, 2022
Sit Quality Income Fund (Continued)
| | | | | | | | | | | | | | | | |
Name of Issuer | | Principal
Amount ($) | | | Coupon
Rate (%) | | | Maturity
Date | | | Fair
Value ($) | |
U.S. Treasury Bill 6 | | | 7,200,000 | | | | 3.86 | | | | 9/7/23 | | | | 6,940,462 | |
U.S. Treasury Notes | | | 1,550,000 | | | | 0.50 | | | | 3/31/25 | | | | 1,414,375 | |
| | | | | | | | | | | | | | | | |
| | | | | | | | | | | | | | | 11,249,990 | |
| | | | | | | | | | | | | | | | |
Total U.S. Treasury / Federal Agency Securities
(cost: $25,962,058) | | | | | | | | | | | | | | | 25,817,776 | |
| | | | | | | | | | | | | | | | |
Name of Issuer | | Quantity | | | | | | | | | Fair
Value ($) | |
Short-Term Securities - 6.3% | | | | | | | | | | | | | | | | |
Fidelity Inst. Money Mkt. Gvt. Fund, 2.74
(cost: $8,843,609) | | | 8,843,609 | | | | | | | | | | | | 8,843,609 | |
| | | | | | | | | | | | | | | | |
Total Investments in Securities - 104.6%
(cost: $153,610,611) | | | | | | | | | | | | | | | 145,776,281 | |
| | | | | | | | | | | | | | | | |
Other Assets and Liabilities, net - (4.6)% | | | | | | | | | | | | | | | (6,423,085 | ) |
| | | | | | | | | | | | | | | | |
Net Assets - 100.0% | | | | | | | | | | | | | | $ | 139,353,196 | |
| | | | | | | | | | | | | | | | |
| 1 | Variable rate security. Rate disclosed is as of September 30, 2022. Certain variable rate securities are not based on a published reference rate and spread but are determined by the issuer or agent and are based on current market conditions, or, for mortgage-backed securities, are impacted by the individual mortgages which are paying off over time. These securities do not indicate a reference rate and spread in their descriptions. |
| 4 | 144A Restricted Security. The total value of such securities as of September 30, 2022 was $17,143,563 and represented 12.3% of net assets. These securities have been determined to be liquid by the Adviser in accordance with guidelines established by the Board of Directors. |
| 6 | Zero coupon or convertible capital appreciation bond, for which the rate disclosed is either the effective yield on purchase date or the coupon rate to be paid upon conversion to coupon paying. |
| 8 | Securities the income from which is treated as a tax preference that is included in alternative minimum taxable income for purposes of computing federal alternative minimum tax (AMT). At September 30, 2022, 0.2% of net assets in the Fund was invested in such securities. |
| 9 | Municipal Lease Security. The total value of such securities as of September 30, 2022 was $3,188,849 and represented 2.3% of net assets. These securities have been determined to be liquid by the Adviser in accordance with guidelines established by the Board of Directors. |
| 14 | Step Coupon: A bond that pays a coupon rate that increases on a specified date(s). Rate disclosed is as of September 30, 2022. |
Numeric footnotes not disclosed are not applicable to this Schedule of Investments.
Short futures contracts outstanding as of September 30, 2022 were as follows:
| | | | | | | | | | | | | | | | |
Type | | Contracts | | | Expiration
Date | | | Notional
Amount ($) | | | Value/
Unrealized
Appreciation
(Depreciation) ($) | |
Short Futures: 10 | | | | | | | | | | | | | | | | |
U.S. Treasury 5-Year | | | 189 | | | | December 2022 | | | | (20,318,976 | ) | | | 407,226 | |
| 10 | The amount of $400,000 in cash was segregated with the broker to cover margin requirements for derivative transactions as of September 30, 2022. |
| | |
| |
| See accompanying notes to financial statements. | | |
| | |
| 18 | | SIT MUTUAL FUNDS SEMI-ANNUAL REPORT |
A summary of the levels for the Fund’s investments as of September 30, 2022 is as follows (see Note 2 - significant accounting policies in the notes to financial statements):
| | | | | | | | | | | | | | | | |
| | | Investment in Securities | |
| | | Level 1
Quoted
Prices ($) | | | Level 2
Other significant
observable inputs ($) | | | Level 3
Significant
unobservable inputs ($) | | | Total ($) | |
Asset-Backed Securities | | | — | | | | 2,586,303 | | | | — | | | | 2,586,303 | |
Collateralized Mortgage Obligations | | | — | | | | 18,592,092 | | | | — | | | | 18,592,092 | |
Corporate Bonds | | | — | | | | 31,203,290 | | | | — | | | | 31,203,290 | |
Mortgage Pass-Through Securities | | | — | | | | 32,028,963 | | | | — | | | | 32,028,963 | |
Taxable Municipal Bonds | | | — | | | | 26,704,248 | | | | — | | | | 26,704,248 | |
U.S. Treasury / Federal Agency Securities | | | — | | | | 25,817,776 | | | | — | | | | 25,817,776 | |
Short-Term Securities | | | 8,843,609 | | | | — | | | | — | | | | 8,843,609 | |
Futures | | | 407,226 | | | | — | | | | — | | | | 407,226 | |
| | | | | | | | | | | | | | | | |
Total: | | | 9,250,835 | | | | 136,932,672 | | | | — | | | | 146,183,507 | |
| | | | | | | | | | | | | | | | |
There were no transfers into or out of level 3 during the reporting period.
| | |
| |
| See accompanying notes to financial statements. | | |
| | |
| SEPTEMBER 30, 2022 | | 19 |
Sit Tax-Free Income Fund - Class S and Class Y
OBJECTIVE & STRATEGY
The objective of the Sit Tax-Free Income Fund is to provide a high level of current income that is exempt from federal income tax, consistent with preservation of capital, by investing primarily in investment-grade municipal securities. Such municipal securities generate interest income that is exempt from both federal regular income tax and federal alternative minimum tax. During normal market conditions, the Fund invests 100% of its net assets in such tax-exempt municipal securities.
Fund Performance
The Sit Tax-Free Income Fund (Class S) provided a return of -8.60% during the 6-month period ended September 30, 2022, compared to the return of the Bloomberg 5-Year Municipal Bond Index of -3.12%. The Fund’s 30-day SEC yield was 3.37%, and its 12-month distribution rate was 2.88%.
Factors that Influenced the Fund’s Performance
Interest rates in general and yields on tax-exempt bonds in particular increased dramatically during the period. Specifically, Municipal Market Data (MMD) AAA General Obligation yields rose by roughly 110 to 140 basis points. Moreover, shorter-term and longer-term bond yields increased more than intermediate-term bond yields. Longer duration bonds performed worst during the period. In addition, lower coupon bond performance was worse than higher coupon bond performance, as the duration of lower coupon bonds increased markedly when their market prices fell below par. Tax-exempt mutual funds experienced heavy outflows during the period and have already reached a record in dollar terms during 2022. Municipal issuance was also down, and the comparable 6-month period was the lightest since 2019. Credit spreads widened during the period.
The Fund was hurt by its barbelled positioning, as the Fund’s longer duration bonds dramatically underperformed during the six-month period. However, the Funds’ interest rate hedge in U.S. Treasury Futures partially offset the negative impact of the barbell. The Fund was also negatively impacted by a significant concentration of lower coupon bonds in the portfolio. The non-rated bonds in the portfolio outperformed the rated bonds in the portfolio, likely due to higher coupons, but both segments underperformed the benchmark return. Most of the industry groups in the Fund contributed negatively to performance, especially the Fund’s positions in multi-family mortgage revenue bonds, single family mortgage revenue bonds, other revenue bonds, education/student loan revenue bonds, and closed-end funds. Conversely, the Fund’s small weighting in escrowed to maturity/pre-refunded bonds contributed favorably to performance.
Outlook and Positioning
Municipal credit remains strong in general, and the volatility experienced thus far in 2022 has almost exclusively been interest rate driven. We are mindful that the economy is experiencing stubbornly high inflation, and some municipal issuers, particularly healthcare and senior living issuers, are experiencing significant increases in operating costs. Moreover, income tax collections may be down in some states next year, especially from capital gains. Although we are watching credits and industries for negative trends, we are confident that the vast majority of municipal credits remain fundamentally strong.
HYPOTHETICAL GROWTH OF $10,000

The chart above illustrates the total value of a hypothetical $10,000 investment in the Fund over the past 10 years as compared to the performance of the Bloomberg 5-Year Municipal Bond Index. Past performance does not guarantee future results. Returns include the reinvestment of distributions. The chart does not reflect the deduction of taxes that a shareholder would pay on Fund distributions or the redemption of Fund shares.
| 1 | The Bloomberg 5-Year Municipal Bond Index is the 5 year (4-6) component of the Bloomberg Municipal Bond Index, an unmanaged, rules-based, market-value-weighted index for the long-term tax-exempt bond market. The index includes bonds with a minimum credit rating of BBB. The returns include the reinvestment of income and do not include any transaction costs, management fees or other costs. It is not possible to invest directly in an index. This is the Fund’s primary index. |
The Fund emphasizes income as the primary driver of return over the long run and maintains a significant yield advantage over the benchmark. We continue to hedge the Fund’s duration with U.S. Treasury Futures, although the cost of hedging has increased this year. We are organically shortening the Fund’s duration and may reduce or eliminate the hedge if our interest rate outlook changes. The Fund’s longer than benchmark duration, position in non-rated issues, emphasis on revenue bonds, and focus on bond structures with attractive prepayment characteristics all contribute to this yield advantage. The Fund remains diversified on both an issuer and a geographic basis to manage credit risk. This year has been challenging, but we believe our actions to reposition the portfolio and its yield advantage over the benchmark have positioned it to achieve attractive risk-adjusted returns in the future.
| | |
| Paul J. Jungquist, CFA | | Todd S. Emerson, CFA |
| Senior Portfolio Manager | | Kevin P. O’Brien, CFA |
| | Portfolio Managers |
| | |
| | |
| 20 | | SIT MUTUAL FUNDS SEMI-ANNUAL REPORT |
COMPARATIVE RATES OF RETURNS
as of September 30, 2022
| | | | | | | | | | | | | | | | |
| | | Sit Tax-Free Income
Fund | | | | | | | |
| | | Class S | | | Class Y | | | Bloomberg
5-Year Muni
Bond Index1 | | | Lipper
General
Muni Bond
Fund Index2 | |
Six Month | | | -8.60 | % | | | -8.49 | % | | | -3.12 | % | | | n/a | |
One Year | | | -14.31 | | | | -14.10 | | | | -8.03 | | | | -13.31 | % |
Five Year | | | 0.04 | | | | n/a | | | | 0.48 | | | | 0.43 | |
Ten Year | | | 2.01 | | | | n/a | | | | 1.20 | | | | 1.82 | |
Since Inception-Class S (9/29/88) | | | 4.47 | | | | n/a | | | | 4.38 | | | | 4.83 | |
Since Inception-Class Y (6/1/21) | | | n/a | | | | -10.71 | | | | -5.97 | | | | -10.20 | |
Performance figures are historical and do not guarantee future results. Investment returns and principal value will vary, and you may have a gain or loss when you sell shares. Current performance may be lower or higher than the performance data quoted. Contact the Fund for performance data current to the most recent month-end. Returns include changes in share price as well as reinvestment of all dividends and capital gains. Returns do not reflect the deduction of taxes that a shareholder would pay on Fund distributions or the redemption of Fund shares. Management fees and administrative expenses are included in the Fund’s performance. Returns for periods greater than one year are compounded average annual rates of return.
| 1 | The Bloomberg 5-Year Municipal Bond Index is the 5 year (4-6) component of the Bloomberg Municipal Bond Index, unmanaged rules-based, market-value-weighted index for the long-term tax-exempt bond market. The index includes bonds with a minimum credit rating of BBB. The returns include the reinvestment of income and do not include any transaction costs, management fees or other costs. It is not possible to invest directly in an index. |
| 2 | The Lipper returns are obtained from Lipper Analytical Services, Inc., a large independent evaluator of mutual funds. |
FUND DIVERSIFICATION
| | | | |
Multifamily Mortgage | | | 24.4 | % |
Single Family Mortgage | | | 22.6 | |
Other Revenue Bonds | | | 16.3 | |
Education/Student Loan | | | 6.3 | |
Sectors less than 5% | | | 19.1 | |
Cash & Other Net Assets | | | 11.3 | |
Based on net assets as of September 30, 2022.
PORTFOLIO SUMMARY
| | | | | | | | |
Class S: | | | | | | | | |
Net Asset Value 9/30/22: | | $ | 8.28 | | | | Per Share | |
Net Asset Value 3/31/22: | | $ | 9.20 | | | | Per Share | |
Net Assets: | | $ | 145.5 | | | | Million | |
Class Y: | | | | | | | | |
Net Asset Value 9/30/22: | | $ | 8.28 | | | | Per Share | |
Net Asset Value 3/31/22: | | $ | 9.20 | | | | Per Share | |
Net Assets: | | $ | 112.5 | | | | Million | |
| | |
Average Maturity | | | 17.5 | | | | Years | |
Effective Duration:3 | | | 4.2 | | | | Years | |
| 3 | Duration is a measure of estimated price sensitivity relative to changes in interest rates. Portfolios with longer durations are typically more sensitive to changes in interest rates. For example, if interest rates rise by 1%, the fair value of a security with an effective duration of 5 years would decrease by 5%, with all other factors being constant. The correlation between duration and price sensitivity is greater for securities rated investment-grade than it is for securities rated below investment-grade. Duration estimates are based on assumptions by the Adviser and are subject to a number of limitations. Effective duration is calculated based on historical price changes of securities held by the Fund, and therefore is a more accurate estimate of price sensitivity provided interest rates remain within their historical range. |
QUALITY RATINGS (% of Net Assets)
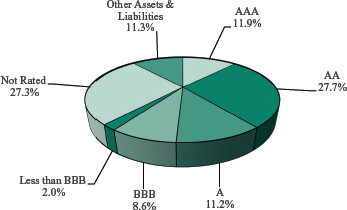
Lower of Moody’s, S&P, Fitch or Duff & Phelps ratings used.
| | | | |
Adviser’s Assessment of Non-Rated Securities | | | |
AA | | | 0.2 | % |
A | | | 0.2 | |
BBB | | | 1.8 | |
BB | | | 20.9 | |
<BB | | | 4.2 | |
| | | | |
Total | | | 27.3 | % |
SCHEDULE OF INVESTMENTS (Unaudited)
September 30, 2022
Sit Tax-Free Income Fund
| | | | | | | | | | | | | | | | |
Name of Issuer | | Principal
Amount ($) | | | Coupon
Rate (%) | | | Maturity
Date | | | Fair
Value ($) | |
Municipal Bonds - 84.9% | | | | | | | | | | | | | | | | |
Alabama - 0.3% | | | | | | | | | | | | | | | | |
Mobile Co. Limited Obligation Warrants Rev. (Gomesa Proj.) 4 | | | 500,000 | | | | 4.00 | | | | 11/1/45 | | | | 367,890 | |
Stadium Trace Village Improvement District Rev. | | | 485,000 | | | | 3.63 | | | | 3/1/36 | | | | 363,959 | |
| | | | | | | | | | | | | | | | |
| | | | | | | | | | | | | | | 731,849 | |
| | | | | | | | | | | | | | | | |
Alaska - 0.2% | | | | | | | | | | | | | | | | |
AK Industrial Dev. & Export Auth. Rev. (Boys & Girls Home) 2, 5, 15 | | | 250,000 | | | | 5.50 | | | | N/A | | | | 5,000 | |
AK Industrial Dev. & Export Auth. Rev. (GTR Fairbanks Community Hospital Foundation) | | | 250,000 | | | | 5.00 | | | | 4/1/33 | | | | 250,203 | |
AK Industrial Dev. & Export Auth. Rev. (Tanana Chiefs Conference Proj.) | | | 300,000 | | | | 4.00 | | | | 10/1/49 | | | | 247,266 | |
| | | | | | | | | | | | | | | | |
| | | | | | | | | | | | | | | 502,469 | |
| | | | | | | | | | | | | | | | |
Arizona - 0.8% | | | | | | | | | | | | | | | | |
AZ Industrial Dev. Auth. Rev. (Legacy Cares, Inc. Proj.) 4 | | | 750,000 | | | | 6.75 | | | | 7/1/30 | | | | 712,245 | |
AZ Industrial Dev. Auth. Rev. (Legacy Cares, Inc. Proj.) 4 | | | 100,000 | | | | 5.50 | | | | 7/1/31 | | | | 86,405 | |
AZ Industrial Dev. Auth. Rev. (Legacy Cares, Inc. Proj.) 4 | | | 750,000 | | | | 7.75 | | | | 7/1/50 | | | | 723,428 | |
AZ Industrial Dev. Auth. Rev. (Legacy Cares, Inc. Proj.) 4 | | | 200,000 | | | | 6.00 | | | | 7/1/51 | | | | 153,768 | |
Tempe Industrial Dev. Auth. Rev. (Mirabella at ASU Proj.) 4 | | | 380,000 | | | | 4.70 | | | | 10/1/24 | | | | 367,680 | |
| | | | | | | | | | | | | | | | |
| | | | | | | | | | | | | | | 2,043,526 | |
| | | | | | | | | | | | | | | | |
Arkansas - 0.1% | | | | | | | | | | | | | | | | |
Mountain Home City Sales & Use Tax Rev. | | | 490,000 | | | | 2.00 | | | | 9/1/38 | | | | 326,350 | |
| | | | | | | | | | | | | | | | |
California - 4.2% | | | | | | | | | | | | | | | | |
CA Health Facs. Financing Auth. Rev. (On Lok Senior Health Services) | | | 500,000 | | | | 5.00 | | | | 8/1/50 | | | | 496,515 | |
CA Municipal Finance Auth. Rev. (Caritas Proj.) | | | 250,000 | | | | 4.00 | | | | 8/15/56 | | | | 190,060 | |
CA Public Finance Auth. Rev. (Enso Village Proj.) 4 | | | 350,000 | | | | 3.13 | | | | 5/15/29 | | | | 302,473 | |
CA Public Finance Auth. Rev. (Green Bond-Enso Village Proj.) 4 | | | 500,000 | | | | 5.00 | | | | 11/15/46 | | | | 416,670 | |
CA Public Finance Auth. Rev. (Green Bond-Enso Village Proj.) 4 | | | 250,000 | | | | 5.00 | | | | 11/15/56 | | | | 199,652 | |
Colton Joint Unified School District G.O. (AGM Insured) 6 | | | 1,000,000 | | | | 5.80 | | | | 8/1/35 | | | | 1,094,200 | |
Encinitas Union School District G.O. Capital Appreciation 6 | | | 500,000 | | | | 6.75 | | | | 8/1/35 | | | | 608,060 | |
Healdsburg Unified School District G.O. 6 | | | 1,250,000 | | | | 4.60 | | | | 8/1/37 | | | | 1,270,450 | |
Imperial Community College District G.O. Capital Appreciation (AGM Insured) 6 | | | 250,000 | | | | 6.75 | | | | 8/1/40 | | | | 273,063 | |
Los Alamitos Unified School District Capital Appreciation C.O.P. 6 | | | 1,100,000 | | | | 6.00 | | | | 8/1/34 | | | | 1,090,870 | |
Martinez Unified School District G.O. 6 | | | 250,000 | | | | 6.13 | | | | 8/1/35 | | | | 263,165 | |
Orange Co. Community Facs. District No. 2017-1 Special Assessment (Village of Esencia) | | | 500,000 | | | | 4.00 | | | | 8/15/45 | | | | 406,245 | |
Redondo Beach School District G.O. 6 | | | 600,000 | | | | 6.38 | | | | 8/1/34 | | | | 668,538 | |
Sacramento Co. Water Financing Auth. Rev. (NATL-RE FGIC Insured) 1 | | | 500,000 | | | | 2.64 | | | | 6/1/39 | | | | 428,965 | |
San Jose Financing Auth. Rev. (Civic Center Garage Proj.) 9 | | | 400,000 | | | | 5.00 | | | | 6/1/39 | | | | 404,832 | |
Sulphur Springs Union School Dist. C.O.P. (AGM Insured) 6 | | | 245,000 | | | | 6.50 | | | | 12/1/37 | | | | 265,862 | |
Sulphur Springs Union School Dist. C.O.P. (AGM Insured) 6 | | | 205,000 | | | | 6.50 | | | | 12/1/37 | | | | 224,791 | |
Tracy Joint Unified School District G.O. Capital Appreciation 6 | | | 600,000 | | | | 7.00 | | | | 8/1/41 | | | | 553,746 | |
Upland Unified School District G.O. Capital Appreciation 6 | | | 1,000,000 | | | | 7.00 | | | | 8/1/41 | | | | 1,098,090 | |
Val Verde Unified School District G.O. Capital Appreciation (AGM Insured) 6 | | | 500,000 | | | | 6.13 | | | | 8/1/34 | | | | 571,735 | |
| | | | | | | | | | | | | | | | |
| | | | | | | | | | | | | | | 10,827,982 | |
| | | | | | | | | | | | | | | | |
Colorado - 3.7% | | | | | | | | | | | | | | | | |
Baseline Metropolitan District No. 1 G.O. | | | 280,000 | | | | 5.00 | | | | 12/1/51 | | | | 228,474 | |
Brighton Crossing Metropolitan District No. 6 G.O. | | | 515,000 | | | | 5.00 | | | | 12/1/40 | | | | 453,277 | |
Buffalo Highlands Metropolitan District G.O. | | | 350,000 | | | | 5.25 | | | | 12/1/38 | | | | 326,599 | |
Chambers Highpoint Metropolitan District No. 2 G.O. | | | 515,000 | | | | 5.00 | | | | 12/1/41 | | | | 447,499 | |
| | |
| |
| See accompanying notes to financial statements. | | |
| | |
| 22 | | SIT MUTUAL FUNDS SEMI-ANNUAL REPORT |
| | | | | | | | | | | | | | | | |
Name of Issuer | | Principal
Amount ($) | | | Coupon
Rate (%) | | | Maturity
Date | | | Fair
Value ($) | |
CO Educational & Cultural Facs. Auth. Rev. (CO Springs Charter Academy Proj.) | | | 250,000 | | | | 5.60 | | | | 7/1/34 | | | | 250,193 | |
CO Health Facs. Auth. Rev. (Aberdeen Ridge) | | | 400,000 | | | | 3.50 | | | | 5/15/30 | | | | 352,128 | |
CO Health Facs. Auth. Rev. (Aberdeen Ridge) | | | 415,000 | | | | 5.00 | | | | 5/15/44 | | | | 339,084 | |
CO Health Facs. Auth. Rev. (Aberdeen Ridge) | | | 850,000 | | | | 5.00 | | | | 5/15/58 | | | | 637,662 | |
CO Health Facs. Auth. Rev. (Covenant Retirement Community) | | | 650,000 | | | | 5.00 | | | | 12/1/48 | | | | 602,647 | |
Colliers Hill Metro District No. 2 G.O. | | | 600,000 | | | | 6.00 | | | | 12/15/47 | | | | 481,284 | |
Crossroads Metropolitan District No. 1 G.O. | | | 500,000 | | | | 6.50 | | | | 12/1/51 | | | | 455,535 | |
Denver City & County Housing Auth. Rev. (Sustainability Bonds - Thrive Proj.) | | | 500,000 | | | | 2.05 | | | | 2/1/39 | | | | 341,780 | |
Green Valley Ranch East Metropolitan District No. 6 G.O. | | | 1,000,000 | | | | 5.88 | | | | 12/1/50 | | | | 885,690 | |
Haskins Station Metropolitan District G.O. | | | 500,000 | | | | 5.00 | | | | 12/1/49 | | | | 425,670 | |
Lambertson Farms Metro District No. 1 G.O. | | | 500,000 | | | | 5.00 | | | | 12/15/25 | | | | 446,285 | |
Raindance Metropolitan District No. 2 G.O. | | | 330,000 | | | | 5.00 | | | | 12/1/39 | | | | 301,386 | |
Reunion Metropolitan District Rev. | | | 600,000 | | | | 3.63 | | | | 12/1/44 | | | | 408,882 | |
Rudolph Farms Metropolitan District No. 6 G.O. | | | 500,000 | | | | 6.50 | | | | 6/1/52 | | | | 463,600 | |
Sky Ranch Community Auth. Board Rev. | | | 500,000 | | | | 5.75 | | | | 12/1/52 | | | | 443,455 | |
Thompson Crossing Metropolitan District No. 4 G.O. | | | 500,000 | | | | 5.00 | | | | 12/1/49 | | | | 431,740 | |
Tree Farm Metropolitan District G.O. 4 | | | 500,000 | | | | 4.50 | | | | 12/1/41 | | | | 380,895 | |
Windler Public Improvement Auth. Rev. | | | 500,000 | | | | 4.00 | | | | 12/1/41 | | | | 342,215 | |
| | | | | | | | | | | | | | | | |
| | | | | | | | | | | | | | | 9,445,980 | |
| | | | | | | | | | | | | | | | |
Connecticut - 0.6% | | | | | | | | | | | | | | | | |
CT Health & Educational Facs. Auth. Rev. 4 | | | 250,000 | | | | 3.25 | | | | 1/1/27 | | | | 236,470 | |
CT Health & Educational Facs. Auth. Rev. 4 | | | 250,000 | | | | 5.00 | | | | 1/1/55 | | | | 223,615 | |
CT Hsg. Finance Auth. Rev. | | | 100,000 | | | | 3.88 | | | | 11/15/35 | | | | 97,158 | |
CT Hsg. Finance Auth. Rev. | | | 865,000 | | | | 2.55 | | | | 6/15/46 | | | | 610,275 | |
Steel Point Infrastructure Improvement District Rev. (Steelpointe Harbor Proj.) 4 | | | 350,000 | | | | 4.00 | | | | 4/1/51 | | | | 269,496 | |
| | | | | | | | | | | | | | | | |
| | | | | | | | | | | | | | | 1,437,014 | |
| | | | | | | | | | | | | | | | |
District of Columbia - 0.6% | | | | | | | | | | | | | | | | |
District of Columbia Hsg. Finance Agency Rev. (FHA Insured) | | | 1,500,000 | | | | 2.50 | | | | 3/1/42 | | | | 1,033,260 | |
District of Columbia Hsg. Finance Agency Rev. (Multi-Family Dev. Program) | | | 600,000 | | | | 4.05 | | | | 9/1/43 | | | | 540,102 | |
| | | | | | | | | | | | | | | | |
| | | | | | | | | | | | | | | 1,573,362 | |
| | | | | | | | | | | | | | | | |
Florida - 14.0% | | | | | | | | | | | | | | | | |
Artisan Lakes East Community Dev. District Special Assessment | | | 450,000 | | | | 4.00 | | | | 5/1/51 | | | | 351,477 | |
Blackburn Creek Community Dev. District Special Assessment (Grand Palm Proj.) | | | 150,000 | | | | 6.25 | | | | 5/1/35 | | | | 153,696 | |
Capital Trust Agency Rev. (River City Educational Services, Inc. Proj.) | | | 500,000 | | | | 5.38 | | | | 2/1/35 | | | | 513,430 | |
Capital Trust Agency Rev. (River City Educational Services, Inc. Proj.) | | | 300,000 | | | | 5.63 | | | | 2/1/45 | | | | 308,298 | |
Capital Trust Agency Rev. (Tallahassee Tapestry) 2, 4, 5 | | | 550,000 | | | | 6.75 | | | | 12/1/35 | | | | 176,000 | |
Capital Trust Agency Rev. (Tapestry Walden Senior Hsg. Proj.) 2, 4, 5 | | | 250,000 | | | | 6.75 | | | | 7/1/37 | | | | 65,000 | |
Capital Trust Agency Rev. (Tuscan Gardens Senior Living Center) 2, 5 | | | 250,000 | | | | 7.00 | | | | 4/1/35 | | | | 181,875 | |
Celebration Pointe Community Dev. District Special Assessment Rev. 4 | | | 240,000 | | | | 5.00 | | | | 5/1/32 | | | | 240,058 | |
CFM Community Dev. District Special Assessment | | | 500,000 | | | | 4.00 | | | | 5/1/51 | | | | 390,155 | |
Cobblestone Community Dev. District Special Assessment 4 | | | 630,000 | | | | 4.20 | | | | 5/1/42 | | | | 541,391 | |
Collier Co. Industrial Dev. Auth. Rev. (Arlington of Naples Proj.) 2, 4, 5 | | | 250,000 | | | | 7.25 | | | | 5/15/26 | | | | 160,000 | |
Collier Co. Industrial Dev. Auth. Rev. (Arlington of Naples Proj.) 2, 4, 5 | | | 750,000 | | | | 8.13 | | | | 5/15/44 | | | | 480,000 | |
Elevation Pointe Community Dev. District Special Assessment | | | 500,000 | | | | 4.40 | | | | 5/1/32 | | | | 471,190 | |
Entrada Community Dev. District Special Assessment Rev. 4 | | | 400,000 | | | | 4.00 | | | | 5/1/52 | | | | 310,332 | |
Escambia Co. Housing Finance Auth. Rev. (Multi-County Program) | | | 420,000 | | | | 3.75 | | | | 10/1/49 | | | | 408,278 | |
| | |
| |
| See accompanying notes to financial statements. | | |
| | |
| SEPTEMBER 30, 2022 | | 23 |
SCHEDULE OF INVESTMENTS (Unaudited)
September 30, 2022
Sit Tax-Free Income Fund (Continued)
| | | | | | | | | | | | | | | | |
Name of Issuer | | Principal
Amount ($) | | | Coupon
Rate (%) | | | Maturity
Date | | | Fair
Value ($) | |
FL Dev. Finance Corp. Rev. (Discovery High School Proj.) 4 | | | 500,000 | | | | 5.00 | | | | 6/1/40 | | | | 444,965 | |
FL Dev. Finance Corp. Rev. (Green Bond-Brightline Proj.) 4 | | | 650,000 | | | | 7.38 | | | | 1/1/49 | | | | 560,014 | |
FL Dev. Finance Corp. Rev. (Green Bond-Brightline Proj.) 1, 4 | | | 500,000 | | | | 7.25 | | | | 7/1/57 | | | | 488,020 | |
FL Dev. Finance Corp. Rev. (Jensen Dunes Proj.) 4 | | | 500,000 | | | | 5.00 | | | | 11/15/30 | | | | 439,695 | |
FL Dev. Finance Corp. Rev. (Mayflower Retirement Community) 4 | | | 330,000 | | | | 2.38 | | | | 6/1/27 | | | | 291,730 | |
FL Dev. Finance Corp. Rev. (The Glenride on Palmer Ranch Proj.) | | | 650,000 | | | | 5.00 | | | | 6/1/51 | | | | 516,873 | |
FL Hsg. Finance Corp. (GNMA/FNMA/FHLMC Collateralized) | | | 319,000 | | | | 4.20 | | | | 1/1/45 | | | | 316,346 | |
FL Hsg. Finance Corp. (GNMA/FNMA/FHLMC Collateralized) | | | 790,000 | | | | 5.05 | | | | 7/1/47 | | | | 789,139 | |
FL Hsg. Finance Corp. (GNMA/FNMA/FHLMC Collateralized) | | | 255,000 | | | | 3.30 | | | | 7/1/49 | | | | 245,488 | |
FL Hsg. Finance Corp. (GNMA/FNMA/FHLMC Collateralized) | | | 745,000 | | | | 2.75 | | | | 7/1/50 | | | | 598,533 | |
FL Hsg. Finance Corp. (GNMA/FNMA/FHLMC Collateralized) | | | 1,405,000 | | | | 2.30 | | | | 1/1/52 | | | | 872,927 | |
FL Hsg. Finance Corp. (GNMA/FNMA/FHLMC Collateralized) | | | 500,000 | | | | 4.55 | | | | 7/1/52 | | | | 452,790 | |
FRERC Community Dev. District Special Assessment | | | 1,000,000 | | | | 5.38 | | | | 11/1/40 | | | | 935,250 | |
Gramercy Farms Community Dev. District Special Assessment 6 | | | 300,000 | | | | 3.24 | | | | 5/1/39 | | | | 156,000 | |
Grande Pines Community Dev. District Special Assessment | | | 635,000 | | | | 4.00 | | | | 5/1/51 | | | | 494,506 | |
Harbor Bay Community Dev. District Special Assessment | | | 295,000 | | | | 4.10 | | | | 5/1/48 | | | | 240,266 | |
Heritage Harbour North Community Dev. District Special Assessment | | | 200,000 | | | | 5.00 | | | | 5/1/34 | | | | 199,570 | |
Hyde Park Community Dev. District No. 1 Special Assessment | | | 500,000 | | | | 4.00 | | | | 5/1/52 | | | | 387,415 | |
Lake Co. Retirement Project. Rev. (Lakeside at Waterman Village Proj.) | | | 500,000 | | | | 5.75 | | | | 8/15/50 | | | | 428,655 | |
Lakes of Sarasota Community Dev. District Special Assessment | | | 300,000 | | | | 3.88 | | | | 5/1/31 | | | | 270,780 | |
Lakes of Sarasota Community Dev. District Special Assessment | | | 500,000 | | | | 4.13 | | | | 5/1/31 | | | | 456,040 | |
Lakes of Sarasota Community Dev. District Special Assessment | | | 265,000 | | | | 4.10 | | | | 5/1/51 | | | | 211,239 | |
Lakewood Ranch Stewardship District Cap. Improvement Special Assessment Rev. | | | 100,000 | | | | 4.25 | | | | 5/1/25 | | | | 99,496 | |
Lakewood Ranch Stewardship District Cap. Improvement Special Assessment Rev. (Azario Proj.) | | | 520,000 | | | | 3.75 | | | | 5/1/40 | | | | 413,920 | |
Lakewood Ranch Stewardship District Cap. Improvement Special Assessment Rev. (Azario Proj.) | | | 580,000 | | | | 4.00 | | | | 5/1/40 | | | | 496,173 | |
Lakewood Ranch Stewardship District Cap. Improvement Special Assessment Rev. (Country Club East Proj.) | | | 100,000 | | | | 6.70 | | | | 5/1/33 | | | | 100,861 | |
Lakewood Ranch Stewardship District Cap. Improvement Special Assessment Rev. (Lakewood National) | | | 300,000 | | | | 5.25 | | | | 5/1/37 | | | | 298,776 | |
Lakewood Ranch Stewardship District Cap. Improvement Special Assessment Rev. (Lakewood Ranch) | | | 400,000 | | | | 5.00 | | | | 5/1/36 | | | | 393,572 | |
Lakewood Ranch Stewardship District Cap. Improvement Special Assessment Rev. (Lakewood Ranch) | | | 430,000 | | | | 3.00 | | | | 5/1/41 | | | | 311,948 | |
Lakewood Ranch Stewardship District Cap. Improvement Special Assessment Rev. (Lorraine Lakes Proj.) 4 | | | 500,000 | | | | 3.63 | | | | 5/1/40 | | | | 391,460 | |
Lakewood Ranch Stewardship District Cap. Improvement Special Assessment Rev. (NE Sector Proj.) | | | 300,000 | | | | 5.00 | | | | 5/1/38 | | | | 292,161 | |
Lakewood Ranch Stewardship District Cap. Improvement Special Assessment Rev. (NE Sector Proj.) | | | 550,000 | | | | 5.30 | | | | 5/1/39 | | | | 543,999 | |
Lakewood Ranch Stewardship District Cap. Improvement Special Assessment Rev. (NE Sector Proj.) 4 | | | 485,000 | | | | 3.75 | | | | 5/1/40 | | | | 386,623 | |
Lakewood Ranch Stewardship District Cap. Improvement Special Assessment Rev. (Sweetwater Proj.) | | | 490,000 | | | | 3.10 | | | | 5/1/41 | | | | 348,253 | |
Lakewood Ranch Stewardship District Cap. Improvement Special Assessment Rev. (Webb Proj.) 4 | | | 320,000 | | | | 5.00 | | | | 5/1/37 | | | | 313,181 | |
Lakewood Ranch Stewardship District Special Assessment (Lake Club Phase 4 Proj.) | | | 340,000 | | | | 4.50 | | | | 5/1/49 | | | | 293,978 | |
Laurel Road Community Dev. District Special Assessment | | | 700,000 | | | | 3.13 | | | | 5/1/31 | | | | 590,093 | |
LT Ranch Community Dev. District Special Assessment | | | 500,000 | | | | 4.00 | | | | 5/1/40 | | | | 428,375 | |
Marshall Creek Community Dev. District Cap. Improvement Special Assessment Rev. | | | 250,000 | | | | 5.00 | | | | 5/1/32 | | | | 246,527 | |
Meadow View at Twin Creeks Community Dev. District Special Assessment | | | 225,000 | | | | 3.75 | | | | 5/1/52 | | | | 163,089 | |
Meadow View at Twin Creeks Community Dev. District Special Assessment | | | 245,000 | | | | 4.00 | | | | 5/1/52 | | | | 189,988 | |
New River Community Dev. District Cap. Improvement Special Assessment Rev. 2, 5,15 | | | 230,000 | | | | 5.00 | | | | N/A | | | | 2 | |
North River Ranch Community Dev. District Cap. Improvement Special Assessment Rev. | | | 550,000 | | | | 4.20 | | | | 5/1/35 | | | | 495,896 | |
Northern Palm Beach Co. Improvement District Special Assessment | | | 500,000 | | | | 5.00 | | | | 8/1/29 | | | | 504,410 | |
Northern Palm Beach Co. Improvement District Special Assessment | | | 250,000 | | | | 5.00 | | | | 8/1/37 | | | | 250,192 | |
Orange Co. Health Facs. Auth. Rev. (Presbyterian Retirement Community Proj.) | | | 550,000 | | | | 5.00 | | | | 8/1/34 | | | | 556,204 | |
| | |
| |
| See accompanying notes to financial statements. | | |
| | |
| 24 | | SIT MUTUAL FUNDS SEMI-ANNUAL REPORT |
| | | | | | | | | | | | | | | | |
Name of Issuer | | Principal
Amount ($) | | | Coupon
Rate (%) | | | Maturity
Date | | | Fair
Value ($) | |
Orange Co. Health Facs. Auth. Rev. (Presbyterian Retirement Community Proj.) | | | 500,000 | | | | 5.00 | | | | 8/1/35 | | | | 507,995 | |
Orange Co. Health Facs. Auth. Rev. (Presbyterian Retirement Community Proj.) | | | 250,000 | | | | 5.00 | | | | 8/1/41 | | | | 259,240 | |
Orange Co. Hsg. Finance Auth. Rev. (GNMA/FNMA/FHLMC Collateralized) | | | 220,000 | | | | 4.00 | | | | 9/1/48 | | | | 217,455 | |
Orlando Tourist Dev. Rev. (Senior Lien Tourist Dev.) (AGM Insured) | | | 250,000 | | | | 5.00 | | | | 11/1/38 | | | | 261,880 | |
Palm Beach Co. Health Facs. Auth. Rev. (ACTS Retirement-Life Community, Inc.) | | | 500,000 | | | | 5.00 | | | | 11/15/32 | | | | 507,765 | |
Palm Beach Co. Health Facs. Auth. Rev. (Green Cay Life Plan Village Proj.) 4 | | | 500,000 | | | | 11.50 | | | | 7/1/27 | | | | 483,270 | |
Palm Beach Co. Health Facs. Auth. Rev. (Lifespace Communities, Inc.) | | | 500,000 | | | | 4.00 | | | | 5/15/53 | | | | 339,225 | |
Palm Beach Co. Health Facs. Auth. Rev. (Toby & Leon Cooperman Sinai Residences of Boca Raton) | | | 500,000 | | | | 4.00 | | | | 6/1/41 | | | | 390,500 | |
Palm Coast Park Community Dev. District Special Assessment | | | 500,000 | | | | 4.00 | | | | 5/1/52 | | | | 388,600 | |
Parker Road Community Dev. District Special Assessment | | | 500,000 | | | | 4.10 | | | | 5/1/50 | | | | 399,615 | |
Parkview at Long Lake Ranch Community Dev. District Special Assessment | | | 270,000 | | | | 4.00 | | | | 5/1/51 | | | | 210,886 | |
Pinellas Co. Industrial Dev. Auth. Rev. | | | 500,000 | | | | 5.00 | | | | 7/1/39 | | | | 472,305 | |
Pompano Beach Rev. (John Knox Village Proj.) | | | 1,000,000 | | | | 5.00 | | | | 9/1/44 | | | | 970,160 | |
River Landing Community Dev. District Special Assessment | | | 440,000 | | | | 4.25 | | | | 11/1/35 | | | | 387,297 | |
Rolling Hills Community Dev. District Special Assessment | | | 250,000 | | | | 3.65 | | | | 5/1/32 | | | | 209,750 | |
Sandridge Community Dev. District Special Assessment | | | 500,000 | | | | 3.88 | | | | 5/1/41 | | | | 394,750 | |
Sawyers Landing Community Dev. District Special Assessment Rev. | | | 590,000 | | | | 3.25 | | | | 5/1/26 | | | | 550,517 | |
Sawyers Landing Community Dev. District Special Assessment Rev. | | | 500,000 | | | | 4.13 | | | | 5/1/41 | | | | 429,440 | |
Sawyers Landing Community Dev. District Special Assessment Rev. | | | 1,250,000 | | | | 4.25 | | | | 5/1/53 | | | | 1,015,375 | |
Southern Groves Community Dev. District No. 5 Special Assessment | | | 500,000 | | | | 4.00 | | | | 5/1/30 | | | | 470,335 | |
Southern Groves Community Dev. District No. 5 Special Assessment | | | 285,000 | | | | 4.00 | | | | 5/1/48 | | | | 226,663 | |
St. Johns Co. Industrial Dev. Auth. Rev. (Presbyterian Retirement Communities Obligated Group Proj.) | | | 1,000,000 | | | | 4.00 | | | | 8/1/55 | | | | 816,840 | |
Sunbridge Stewardship District Special Assessment (Weslyn Park Proj.) | | | 350,000 | | | | 5.20 | | | | 5/1/42 | | | | 322,521 | |
Tolomato Community Dev. District Special Assessment | | | 500,000 | | | | 4.25 | | | | 5/1/37 | | | | 453,920 | |
Tolomato Community Dev. District Special Assessment 2, 5 | | | 120,000 | | | | 6.61 | | | | 5/1/40 | | | | 1 | |
Tolomato Community Dev. District Special Assessment 6 | | | 110,000 | | | | 7.00 | | | | 5/1/40 | | | | 95,631 | |
Tradition Community Dev. District No. 9 Special Assessment | | | 645,000 | | | | 4.00 | | | | 5/1/52 | | | | 500,172 | |
Trout Creek Community Dev. District Special Assessment | | | 300,000 | | | | 5.38 | | | | 5/1/38 | | | | 296,277 | |
Trout Creek Community Dev. District Special Assessment | | | 250,000 | | | | 4.00 | | | | 5/1/40 | | | | 212,903 | |
University Park Recreation District Special Assessment (BAM Insured) | | | 750,000 | | | | 3.50 | | | | 5/1/50 | | | | 578,437 | |
Viera Stewardship District Special Assessment | | | 250,000 | | | | 4.00 | | | | 5/1/53 | | | | 193,223 | |
Windward at Lakewood Ranch Community Dev. District Special Assessment | | | 450,000 | | | | 4.25 | | | | 5/1/52 | | | | 365,467 | |
Wiregrass Community Dev. District Special Assessment | | | 240,000 | | | | 5.38 | | | | 5/1/35 | | | | 241,627 | |
Zephyr Ridge Community Dev. District Special Assessment 2, 5,15 | | | 450,000 | | | | 5.25 | | | | N/A | | | | 189,000 | |
| | | | | | | | | | | | | | | | |
| | | | | | | | | | | | | | | 36,015,640 | |
| | | | | | | | | | | | | | | | |
Georgia - 2.5% | | | | | | | | | | | | | | | | |
Burke Co. Dev. Auth. Rev. (Georgia Transmission Corp. Vogtle Proj.) 14 | | | 740,000 | | | | 2.75 | | | | 1/1/52 | | | | 454,819 | |
Clarke Co. Hospital Auth. Rev. (Piedmont Healthcare) | | | 350,000 | | | | 5.00 | | | | 7/1/46 | | | | 347,847 | |
Cobb Co. Dev. Auth. Rev. (Presbyterian Village Proj.) 4 | | | 650,000 | | | | 5.00 | | | | 12/1/39 | | | | 559,026 | |
Fulton Co. Dev. Auth. Rev. (Woodruff Arts Center) | | | 500,000 | | | | 5.00 | | | | 3/15/44 | | | | 511,325 | |
GA Housing & Finance Authority Rev. | | | 425,000 | | | | 3.80 | | | | 12/1/37 | | | | 398,319 | |
GA Housing & Finance Authority Rev. | | | 90,000 | | | | 3.85 | | | | 12/1/38 | | | | 87,591 | |
GA Housing & Finance Authority Rev. | | | 355,000 | | | | 3.80 | | | | 12/1/40 | | | | 346,157 | |
GA Housing & Finance Authority Rev. | | | 595,000 | | | | 3.85 | | | | 12/1/41 | | | | 541,045 | |
GA Housing & Finance Authority Rev. | | | 900,000 | | | | 3.50 | | | | 12/1/46 | | | | 733,239 | |
GA Housing & Finance Authority Rev. | | | 490,000 | | | | 4.00 | | | | 12/1/48 | | | | 478,152 | |
| | |
| |
| See accompanying notes to financial statements. | | |
| | |
| SEPTEMBER 30, 2022 | | 25 |
SCHEDULE OF INVESTMENTS (Unaudited)
September 30, 2022
Sit Tax-Free Income Fund (Continued)
| | | | | | | | | | | | | | | | |
Name of Issuer | | Principal
Amount ($) | | | Coupon
Rate (%) | | | Maturity
Date | | | Fair
Value ($) | |
GA Tax Allocation (Beltline Proj.) | | | 500,000 | | | | 5.00 | | | | 1/1/30 | | | | 500,485 | |
Gainesville & Hall Co. Dev. Auth. Rev. (Lanier Christian Academy, inc. Proj.) 4 | | | 640,000 | | | | 6.25 | | | | 9/1/44 | | | | 574,720 | |
Gainesville Hospital Auth. Rev. (Northeast Georgia Health System, Inc. Proj.) | | | 500,000 | | | | 5.00 | | | | 2/15/37 | | | | 513,355 | |
Glynn-Brunswick Memorial Hospital Auth. Rev. (Southeast Georgia Health System Proj.) | | | 350,000 | | | | 5.00 | | | | 8/1/47 | | | | 329,714 | |
| | | | | | | | | | | | | | | | |
| | | | | | | | | | | | | | | 6,375,794 | |
| | | | | | | | | | | | | | | | |
Idaho - 0.5% | | | | | | | | | | | | | | | | |
ID Health Facs. Authority Rev. (Terraces Boise Proj.) | | | 100,000 | | | | 8.00 | | | | 10/1/28 | | | | 92,046 | |
ID Health Facs. Authority Rev. (Terraces Boise Proj.) | | | 290,000 | | | | 3.80 | | | | 10/1/31 | | | | 245,076 | |
ID Health Facs. Authority Rev. (Terraces Boise Proj.) | | | 250,000 | | | | 4.00 | | | | 10/1/33 | | | | 205,585 | |
ID Health Facs. Authority Rev. (Terraces Boise Proj.) | | | 500,000 | | | | 4.50 | | | | 10/1/50 | | | | 358,850 | |
Spring Valley Community Infrastructure District. No. 1 Special Assessment 4 | | | 500,000 | | | | 3.75 | | | | 9/1/51 | | | | 351,170 | |
| | | | | | | | | | | | | | | | |
| | | | | | | | | | | | | | | 1,252,727 | |
| | | | | | | | | | | | | | | | |
Illinois - 4.5% | | | | | | | | | | | | | | | | |
Bolingbrook Special Tax (AGM Insured) | | | 998,000 | | | | 4.00 | | | | 3/1/30 | | | | 988,180 | |
Burbank Educational Facs. Rev. (Intercultural Montessori Language School) 4 | | | 500,000 | | | | 6.00 | | | | 9/1/35 | | | | 495,980 | |
Bureau Co. Township High School Dist. No. 502 G.O. (BAM Insured) | | | 500,000 | | | | 6.25 | | | | 12/1/33 | | | | 517,475 | |
Chicago Midway Airport Rev. (Second Lien) | | | 500,000 | | | | 5.25 | | | | 1/1/35 | | | | 501,255 | |
Chicago O’Hare International Airport Rev. (Senior Lien) | | | 500,000 | | | | 5.50 | | | | 1/1/53 | | | | 522,035 | |
IL Fin. Auth. Rev. (Admiral Lake Proj.) | | | 670,000 | | | | 5.13 | | | | 5/15/38 | | | | 512,738 | |
IL Fin. Auth. Rev. (Christian Homes, Inc.) | | | 500,000 | | | | 5.00 | | | | 5/15/36 | | | | 452,600 | |
IL Fin. Auth. Rev. (Edward Elmhurst Healthcare) | | | 1,000,000 | | | | 5.00 | | | | 1/1/44 | | | | 1,079,790 | |
IL Fin. Auth. Rev. (Lifespace Communities) | | | 500,000 | | | | 5.00 | | | | 5/15/35 | | | | 470,500 | |
IL Fin. Auth. Rev. (Lifespace Communities) | | | 1,000,000 | | | | 5.00 | | | | 5/15/45 | | | | 882,670 | |
IL Fin. Auth. Rev. (Rogers Park Montessori School Proj.) | | | 100,000 | | | | 5.00 | | | | 2/1/24 | | | | 100,058 | |
IL Fin. Auth. Rev. (Westminster Village) | | | 500,000 | | | | 5.25 | | | | 5/1/38 | | | | 443,355 | |
IL Fin. Auth. Sports Facs. Rev. (North Shore Ice Arena Proj.) | | | 1,000,000 | | | | 6.25 | | | | 12/1/38 | | | | 630,020 | |
IL G.O. | | | 250,000 | | | | 5.50 | | | | 7/1/33 | | | | 251,192 | |
IL Housing Dev. Auth. Rev. | | | 500,000 | | | | 5.38 | | | | 12/1/28 | | | | 504,630 | |
IL Housing Dev. Auth. Rev. (GNMA/FNMA/FHLMC Collateralized) | | | 190,000 | | | | 4.00 | | | | 10/1/48 | | | | 188,193 | |
IL Rev. | | | 500,000 | | | | 5.00 | | | | 6/15/33 | | | | 512,405 | |
IL Sports Facilities Auth. Rev. (State Tax Supported) (AGM Insured) | | | 1,000,000 | | | | 5.25 | | | | 6/15/31 | | | | 1,022,450 | |
Macon & Moultrie Counties Community Unit School District No. 3 Mt Zion G.O. | | | 335,000 | | | | 5.50 | | | | 12/1/41 | | | | 343,951 | |
Malta Tax Allocation Rev. 2, 5 | | | 1,921,000 | | | | 5.75 | | | | 12/30/25 | | | | 480,250 | |
Richton Park Public Library District G.O. | | | 250,000 | | | | 4.50 | | | | 12/15/32 | | | | 250,515 | |
Southwestern IL Dev. Auth. Tax Allocation Ref. (Local Govt. Program) 2 | | | 325,000 | | | | 7.00 | | | | 10/1/34 | | | | 48,750 | |
Upper Illinois River Valley Dev. Auth. Rev. (Cambridge Lakes Learning Center) 4 | | | 140,000 | | | | 4.00 | | | | 12/1/22 | | | | 139,765 | |
Upper Illinois River Valley Dev. Auth. Rev. (Cambridge Lakes Learning Center) 4 | | | 250,000 | | | | 5.25 | | | | 12/1/37 | | | | 228,227 | |
| | | | | | | | | | | | | | | | |
| | | | | | | | | | | | | | | 11,566,984 | |
| | | | | | | | | | | | | | | | |
Indiana - 1.1% | | | | | | | | | | | | | | | | |
IN Finance Auth. Rev. (BHI Senior Living) | | | 500,000 | | | | 4.00 | | | | 11/15/41 | | | | 392,915 | |
IN Finance Auth. Rev. (BHI Senior Living) | | | 775,000 | | | | 5.88 | | | | 11/15/41 | | | | 794,421 | |
IN Finance Auth. Rev. (BHI Senior Living) | | | 170,000 | | | | 5.25 | | | | 11/15/46 | | | | 163,254 | |
IN Finance Auth. Rev. (Greencroft Obligated Group) | | | 350,000 | | | | 6.50 | | | | 11/15/33 | | | | 361,757 | |
IN Housing & Community Dev. Auth. Rev. (Hammond Assisted Living Proj.) | | | 500,000 | | | | 5.75 | | | | 1/1/36 | | | | 422,810 | |
Merrillville Industry Economic Dev. Rev. (Belvedere Housing Proj.) | | | 300,000 | | | | 5.75 | | | | 4/1/36 | | | | 257,514 | |
| | |
| |
| See accompanying notes to financial statements. | | |
| | |
| 26 | | SIT MUTUAL FUNDS SEMI-ANNUAL REPORT |
| | | | | | | | | | | | | | | | |
Name of Issuer | | Principal
Amount ($) | | | Coupon
Rate (%) | | | Maturity
Date | | | Fair
Value ($) | |
Richmond Hospital Auth. Rev. (Reid Hospital & Health Care) | | | 350,000 | | | | 5.00 | | | | 1/1/35 | | | | 352,604 | |
| | | | | | | | | | | | | | | | |
| | | | | | | | | | | | | | | 2,745,275 | |
| | | | | | | | | | | | | | | | |
Iowa - 1.1% | | | | | | | | | | | | | | | | |
IA Fin. Auth. Rev. (Lifespace Communities, Inc.) | | | 650,000 | | | | 5.00 | | | | 5/15/36 | | | | 604,942 | |
IA Fin. Auth. Rev. (Lifespace Communities, Inc.) | | | 565,000 | | | | 5.00 | | | | 5/15/47 | | | | 489,516 | |
IA Fin. Auth. Rev. (Lifespace Communities, Inc.) | | | 750,000 | | | | 5.00 | | | | 5/15/48 | | | | 646,807 | |
IA Fin. Auth. Rev. (Lifespace Communities, Inc.) | | | 500,000 | | | | 4.00 | | | | 5/15/53 | | | | 339,225 | |
IA Fin. Auth. Rev. (Lifespace Communities, Inc.) | | | 530,000 | | | | 4.00 | | | | 5/15/55 | | | | 355,095 | |
IA Higher Education Loan Auth. Rev. (Simpson College Proj.) | | | 500,000 | | | | 5.00 | | | | 11/1/30 | | | | 484,485 | |
| | | | | | | | | | | | | | | | |
| | | | | | | | | | | | | | | 2,920,070 | |
| | | | | | | | | | | | | | | | |
Kansas - 0.2% | | | | | | | | | | | | | | | | |
Wyandotte County Unified Government (Village East Proj.) 4 | | | 500,000 | | | | 5.25 | | | | 9/1/35 | | | | 464,990 | |
| | | | | | | | | | | | | | | | |
Louisiana - 1.9% | | | | | | | | | | | | | | | | |
Denham Springs/Livingston Hsg. & Mtg. Finance Auth. Rev. (GNMA/FHLMC Collateralized) | | | 8,215 | | | | 5.00 | | | | 11/1/40 | | | | 7,969 | |
LA Hsg. Corp. Rev. (Home Ownership Prog.) (GNMA/FHLMC Collateralized) | | | 750,000 | | | | 2.55 | | | | 12/1/46 | | | | 495,195 | |
LA Hsg. Fin. Agy. Single Family Mtg. Rev. (Home Ownership Prog.) (GNMA/FHLMC Collateralized) | | | 425,000 | | | | 2.50 | | | | 12/1/45 | | | | 365,436 | |
LA Local Government Environmental Facilities & Community Development Auth. | | | 500,000 | | | | 5.25 | | | | 11/15/25 | | | | 493,210 | |
LA Local Government Environmental Facilities & Community Development Auth. | | | 500,000 | | | | 6.00 | | | | 11/15/30 | | | | 498,055 | |
LA Local Government Environmental Facilities & Community Development Auth. Rev. 4 | | | 300,000 | | | | 5.65 | | | | 11/1/37 | | | | 300,441 | |
LA Local Government Environmental Facilities & Community Development Auth. Rev. 4 | | | 500,000 | | | | 5.00 | | | | 7/1/39 | | | | 406,060 | |
LA Local Government Environmental Facilities & Community Development Auth. Rev. 4 | | | 300,000 | | | | 5.50 | | | | 11/1/39 | | | | 292,530 | |
LA Local Government Environmental Facilities & Community Development Auth. Rev. 4 | | | 500,000 | | | | 4.00 | | | | 11/1/44 | | | | 372,060 | |
LA Local Government Environmental Facilities & Community Development Auth. Rev. 4 | | | 495,000 | | | | 4.40 | | | | 11/1/44 | | | | 402,420 | |
LA Local Government Environmental Facilities & Community Development Auth. Rev. 4 | | | 750,000 | | | | 4.00 | | | | 11/1/46 | | | | 534,758 | |
LA Public Facs. Auth. Rev. (Franciscan Missionaries Health System Proj.) | | | 300,000 | | | | 5.00 | | | | 7/1/35 | | | | 303,366 | |
LA Public Facs. Auth. Rev. (Tulane Univ. Proj.) (NATL-RE Insured) 1 | | | 520,000 | | | | 2.65 | | | | 2/15/36 | | | | 511,831 | |
| | | | | | | | | | | | | | | | |
| | | | | | | | | | | | | | | 4,983,331 | |
| | | | | | | | | | | | | | | | |
Maine - 0.1% | | | | | | | | | | | | | | | | |
ME State Hsg. Auth. Rev. | | | 310,000 | | | | 3.85 | | | | 11/15/40 | | | | 302,854 | |
| | | | | | | | | | | | | | | | |
Maryland - 0.3% | | | | | | | | | | | | | | | | |
MD Community Dev. Administration Rev. | | | 500,000 | | | | 2.55 | | | | 9/1/44 | | | | 335,995 | |
MD Community Dev. Administration Rev. | | | 350,000 | | | | 4.20 | | | | 7/1/46 | | | | 311,129 | |
Montgomery Co. Housing Opportunities Commission Rev. | | | 245,000 | | | | 4.00 | | | | 7/1/38 | | | | 217,611 | |
| | | | | | | | | | | | | | | | |
| | | | | | | | | | | | | | | 864,735 | |
| | | | | | | | | | | | | | | | |
Massachusetts - 2.9% | | | | | | | | | | | | | | | | |
MA Dev. Finance Agy. Rev. (Atrius Health Issue) | | | 1,375,000 | | | | 4.00 | | | | 6/1/49 | | | | 1,418,560 | |
MA Dev. Finance Agy. Rev. (FNMA Collateralized) | | | 1,500,000 | | | | 2.30 | | | | 1/1/42 | | | | 1,063,035 | |
MA Dev. Finance Agy. Rev. (Newbridge on the Charles, Inc.) 4 | | | 300,000 | | | | 5.00 | | | | 10/1/47 | | | | 305,697 | |
MA Dev. Finance Agy. Rev. (Orchard Cove, Inc.) | | | 400,000 | | | | 5.00 | | | | 10/1/49 | | | | 390,160 | |
MA Education Finance Auth. Education Rev. | | | 90,000 | | | | 3.63 | | | | 7/1/34 | | | | 85,822 | |
MA Education Finance Auth. Education Rev. | | | 185,000 | | | | 2.63 | | | | 7/1/36 | | | | 160,824 | |
MA Education Finance Auth. Education Rev. | | | 875,000 | | | | 3.75 | | | | 7/1/48 | | | | 669,436 | |
MA Education Finance Auth. Education Rev. | | | 1,000,000 | | | | 3.00 | | | | 7/1/51 | | | | 642,600 | |
MA Housing Finance Agy. Rev. | | | 250,000 | | | | 4.75 | | | | 6/1/35 | | | | 249,870 | |
MA Housing Finance Agy. Rev. | | | 500,000 | | | | 4.00 | | | | 12/1/38 | | | | 462,980 | |
MA Housing Finance Agy. Rev. | | | 500,000 | | | | 3.75 | | | | 12/1/40 | | | | 430,420 | |
| | |
| |
| See accompanying notes to financial statements. | | |
| | |
| SEPTEMBER 30, 2022 | | 27 |
SCHEDULE OF INVESTMENTS (Unaudited)
September 30, 2022
Sit Tax-Free Income Fund (Continued)
| | | | | | | | | | | | | | | | |
Name of Issuer | | Principal
Amount ($) | | | Coupon
Rate (%) | | | Maturity
Date | | | Fair
Value ($) | |
MA Housing Finance Agy. Rev. | | | 900,000 | | | | 3.85 | | | | 12/1/47 | | | | 736,281 | |
Northbridge Municipal Purpose Loan G.O. (AGM Insured) | | | 500,000 | | | | 4.00 | | | | 6/15/25 | | | | 500,295 | |
Rowley Land Acquisition Loan G.O. (AGM Insured) | | | 360,000 | | | | 4.00 | | | | 5/1/27 | | | | 360,213 | |
| | | | | | | | | | | | | | | | |
| | | | | | | | | | | | | | | 7,476,193 | |
| | | | | | | | | | | | | | | | |
Michigan - 3.8% | | | | | | | | | | | | | | | | |
Chandler Park Academy Rev. | | | 40,000 | | | | 5.00 | | | | 11/1/22 | | | | 39,991 | |
City of Allen Park G.O. (BAM Insured) | | | 300,000 | | | | 3.25 | | | | 5/1/34 | | | | 277,887 | |
City of Kalamazoo Economic Dev. Corp. Rev. (Revel Creek Proj.) | | | 500,000 | | | | 5.00 | | | | 5/15/43 | | | | 424,490 | |
MI Finance Auth. Rev. (Holly Academy Proj.) | | | 500,000 | | | | 3.00 | | | | 12/1/31 | | | | 404,995 | |
MI Finance Auth. Rev. (Madison Academy Proj.) | | | 350,000 | | | | 4.25 | | | | 12/1/39 | | | | 264,180 | |
MI Hsg. Dev. Auth. Rev. | | | 500,000 | | | | 4.10 | | | | 10/1/35 | | | | 475,080 | |
MI Hsg. Dev. Auth. Rev. | | | 300,000 | | | | 3.75 | | | | 10/1/42 | | | | 257,049 | |
MI Hsg. Dev. Auth. Rev. | | | 750,000 | | | | 4.00 | | | | 10/1/43 | | | | 652,110 | |
MI Hsg. Dev. Auth. Rev. | | | 500,000 | | | | 3.35 | | | | 10/1/49 | | | | 377,400 | |
MI Hsg. Dev. Auth. Rev. | | | 415,000 | | | | 3.15 | | | | 6/1/50 | | | | 385,460 | |
MI Hsg. Dev. Auth. Rev. | | | 2,000,000 | | | | 2.75 | | | | 6/1/51 | | | | 1,310,660 | |
MI Hsg. Dev. Auth. Rev. | | | 3,500,000 | | | | 2.50 | | | | 6/1/52 | | | | 2,099,825 | |
MI Hsg. Dev. Auth. Rev. | | | 1,750,000 | | | | 3.50 | | | | 10/1/54 | | | | 1,314,215 | |
MI Public Educational Facs. Auth. Rev. (Chandler Park Academy) | | | 235,000 | | | | 6.35 | | | | 11/1/28 | | | | 235,052 | |
MI Strategic Fund. Rev. (United Methodist Retirement Facs.) | | | 415,000 | | | | 5.00 | | | | 11/15/49 | | | | 352,385 | |
Muskegon Heights Water Supply Rev. (NATL Insured) | | | 165,000 | | | | 4.15 | | | | 11/1/23 | | | | 165,137 | |
Muskegon Heights Water Supply Rev. (NATL Insured) | | | 135,000 | | | | 4.20 | | | | 11/1/24 | | | | 135,097 | |
Taylor Brownfield Redevelopment Authority (NATL Insured) | | | 250,000 | | | | 5.00 | | | | 5/1/32 | | | | 256,027 | |
Universal Academy Michigan Public School Rev. | | | 350,000 | | | | 4.00 | | | | 12/1/40 | | | | 294,438 | |
| | | | | | | | | | | | | | | | |
| | | | | | | | | | | | | | | 9,721,478 | |
| | | | | | | | | | | | | | | | |
Minnesota - 0.1% | | | | | | | | | | | | | | | | |
Apple Valley Rev. (Senior Living, LLC Proj.) | | | 475,000 | | | | 5.00 | | | | 1/1/47 | | | | 273,353 | |
| | | | | | | | | | | | | | | | |
Mississippi - 0.8% | | | | | | | | | | | | | | | | |
MS Development Bank Rev. (Green Bond-Hancock County) 4 | | | 1,000,000 | | | | 4.55 | | | | 11/1/39 | | | | 872,510 | |
MS Development Bank Rev. (Jackson Co. Gomesa Proj.) 4 | | | 500,000 | | | | 3.63 | | | | 11/1/36 | | | | 388,590 | |
MS Home Corp. Single Family Mtg. Rev. (GNMA/FNMA/FHLMC Collateralized) | | | 1,000,000 | | | | 2.55 | | | | 6/1/42 | | | | 712,700 | |
MS Home Corp. Single Family Mtg. Rev. (GNMA/FNMA/FHLMC Collateralized) | | | 180,000 | | | | 4.00 | | | | 12/1/43 | | | | 178,610 | |
| | | | | | | | | | | | | | | | |
| | | | | | | | | | | | | | | 2,152,410 | |
| | | | | | | | | | | | | | | | |
Missouri - 1.1% | | | | | | | | | | | | | | | | |
Joplin Industrial Dev. Auth. Rev. (32nd Street Place Community Improvement Dist. Proj.) | | | 225,000 | | | | 3.50 | | | | 11/1/40 | | | | 182,491 | |
Kansas City Industrial Dev. Auth. Rev. (United Methodist Retirement Home, Inc.) 2, 5 | | | 118,010 | | | | 2.00 | | | | 11/15/46 | | | | 5,577 | |
Kansas City Industrial Dev. Auth. Rev. (United Methodist Retirement Home, Inc.) | | | 264,421 | | | | 5.00 | | | | 11/15/46 | | | | 198,281 | |
MO Health & Education Facs. Auth. Rev. (Lutheran Senior Services) | | | 775,000 | | | | 4.00 | | | | 2/1/42 | | | | 615,629 | |
MO Health & Education Facs. Auth. Rev. (Lutheran Senior Services) | | | 1,000,000 | | | | 4.00 | | | | 2/1/48 | | | | 748,560 | |
MO Hsg. Dev. Commission Rev. (GNMA/FNMA/FHLMC Collateralized) | | | 375,000 | | | | 3.80 | | | | 11/1/48 | | | | 363,840 | |
MO Hsg. Dev. Commission Rev. (GNMA/FNMA/FHLMC Collateralized) | | | 310,000 | | | | 3.35 | | | | 11/1/49 | | | | 269,917 | |
MO Hsg. Dev. Commission Rev. (GNMA/FNMA/FHLMC Collateralized) | | | 445,000 | | | | 2.50 | | | | 5/1/50 | | | | 293,180 | |
MO Hsg. Dev. Commission Rev. (GNMA/FNMA/FHLMC Collateralized) | | | 355,000 | | | | 2.40 | | | | 11/1/51 | | | | 283,052 | |
| | | | | | | | | | | | | | | | |
| | | | | | | | | | | | | | | 2,960,527 | |
| | | | | | | | | | | | | | | | |
Montana - 0.4% | | | | | | | | | | | | | | | | |
MT Board of Housing Single Family Rev. | | | 70,000 | | | | 4.00 | | | | 12/1/38 | | | | 68,970 | |
| | |
| |
| See accompanying notes to financial statements. | | |
| | |
| 28 | | SIT MUTUAL FUNDS SEMI-ANNUAL REPORT |
| | | | | | | | | | | | | | | | |
Name of Issuer | | Principal
Amount ($) | | | Coupon
Rate (%) | | | Maturity
Date | | | Fair
Value ($) | |
MT Board of Housing Single Family Rev. | | | 475,000 | | | | 2.40 | | | | 12/1/45 | | | | 308,569 | |
MT Board of Housing Single Family Rev. | | | 500,000 | | | | 4.55 | | | | 6/1/52 | | | | 451,320 | |
MT Board of Housing Single Family Rev. (BRD Insured) | | | 240,000 | | | | 4.00 | | | | 6/1/45 | | | | 236,638 | |
| | | | | | | | | | | | | | | | |
| | | | | | | | | | | | | | | 1,065,497 | |
| | | | | | | | | | | | | | | | |
Nebraska - 0.0% | | | | | | | | | | | | | | | | |
Mead Village Tax Allocation Rev. (E3 Biofuels - Mead LLC Proj.) 2, 5,15 | | | 410,000 | | | | 5.13 | | | | N/A | | | | 17,015 | |
Nebraska Investment Fin. Auth. Rev. (GNMA/FNMA/FHLMC Collateralized) | | | 80,000 | | | | 3.05 | | | | 9/1/42 | | | | 77,307 | |
| | | | | | | | | | | | | | | | |
| | | | | | | | | | | | | | | 94,322 | |
| | | | | | | | | | | | | | | | |
Nevada - 1.0% | | | | | | | | | | | | | | | | |
City of Las Vegas Special Improvement District No. 815 | | | 500,000 | | | | 5.00 | | | | 12/1/49 | | | | 460,955 | |
City of North Las Vegas (Special Northern Beltway Commercial Area) 4 | | | 340,000 | | | | 5.00 | | | | 12/1/37 | | | | 339,136 | |
NV Hsg. Division Rev. (GNMA/FNMA/FHLMC Collateralized) | | | 750,000 | | | | 2.60 | | | | 4/1/46 | | | | 496,208 | |
NV Hsg. Division Rev. (GNMA/FNMA/FHLMC Collateralized) | | | 450,000 | | | | 3.35 | | | | 10/1/49 | | | | 437,157 | |
NV Hsg. Division Rev. (GNMA/FNMA/FHLMC Collateralized) | | | 490,000 | | | | 3.40 | | | | 10/1/49 | | | | 476,486 | |
NV Hsg. Division Rev. (GNMA/FNMA/FHLMC Collateralized) | | | 495,000 | | | | 2.45 | | | | 10/1/51 | | | | 323,487 | |
| | | | | | | | | | | | | | | | |
| | | | | | | | | | | | | | | 2,533,429 | |
| | | | | | | | | | | | | | | | |
New Hampshire - 0.2% | | | | | | | | | | | | | | | | |
NH Hsg. Fin. Auth. Rev. (Cimarron, Whittier Falls & Mars) (FHA Insured) | | | 725,000 | | | | 4.00 | | | | 7/1/52 | | | | 618,933 | |
| | | | | | | | | | | | | | | | |
New Jersey - 3.4% | | | | | | | | | | | | | | | | |
NJ Economic Dev. Auth. Rev. 9 | | | 500,000 | | | | 4.00 | | | | 6/15/50 | | | | 412,830 | |
NJ Economic Dev. Auth. Rev. (North Star Academy Charter School Newark) | | | 250,000 | | | | 5.00 | | | | 7/15/47 | | | | 236,170 | |
NJ Economic Dev. Auth. Rev. (State Government Buildings Proj.) 9 | | | 500,000 | | | | 5.00 | | | | 6/15/42 | | | | 495,060 | |
NJ Higher Education Student Assistance Auth. Rev. | | | 1,055,000 | | | | 3.50 | | | | 12/1/39 | | | | 966,401 | |
NJ Higher Education Student Assistance Auth. Rev. | | | 1,000,000 | | | | 4.25 | | | | 12/1/50 | | | | 824,900 | |
NJ Hsg. & Mtg. Finance Agy. Rev. (Mciver Homes Hsg. Proj.) (FHLMC Collateralized) | | | 550,000 | | | | 3.60 | | | | 1/1/30 | | | | 529,920 | |
NJ Hsg. & Mtg. Finance Agy. Single Family Mtg. Rev. | | | 795,000 | | | | 3.75 | | | | 10/1/35 | | | | 749,343 | |
NJ Hsg. & Mtg. Finance Agy. Single Family Mtg. Rev. | | | 2,000,000 | | | | 4.50 | | | | 10/1/42 | | | | 1,938,580 | |
NJ Hsg. & Mtg. Finance Agy. Single Family Mtg. Rev. | | | 750,000 | | | | 2.30 | | | | 10/1/46 | | | | 494,775 | |
NJ Hsg. & Mtg. Finance Agy. Single Family Mtg. Rev. | | | 400,000 | | | | 4.50 | | | | 10/1/48 | | | | 399,680 | |
NJ Hsg. & Mtg. Finance Agy. Single Family Mtg. Rev. | | | 435,000 | | | | 4.00 | | | | 4/1/49 | | | | 365,426 | |
NJ Hsg. & Mtg. Finance Agy. Single Family Mtg. Rev. | | | 855,000 | | | | 2.45 | | | | 10/1/50 | | | | 596,072 | |
NJ Transportation Trust Fund Auth. Rev. 9 | | | 500,000 | | | | 5.25 | | | | 6/15/43 | | | | 505,430 | |
Tobacco Settlement Financing Corp. Rev. | | | 300,000 | | | | 5.00 | | | | 6/1/46 | | | | 276,162 | |
| | | | | | | | | | | | | | | | |
| | | | | | | | | | | | | | | 8,790,749 | |
| | | | | | | | | | | | | | | | |
New Mexico - 2.2% | | | | | | | | | | | | | | | | |
Las Vegas NM Gross Receipts Tax Rev. | | | 410,000 | | | | 4.00 | | | | 6/1/28 | | | | 410,197 | |
NM Mtg. Fin. Auth. Single Family Mtg. Rev. (GNMA/FNMA/FHLMC Collateralized) | | | 315,000 | | | | 3.85 | | | | 7/1/43 | | | | 303,276 | |
NM Mtg. Fin. Auth. Single Family Mtg. Rev. (GNMA/FNMA/FHLMC Collateralized) | | | 500,000 | | | | 3.85 | | | | 7/1/43 | | | | 477,520 | |
NM Mtg. Fin. Auth. Single Family Mtg. Rev. (GNMA/FNMA/FHLMC Collateralized) | | | 260,000 | | | | 3.80 | | | | 9/1/46 | | | | 251,787 | |
NM Mtg. Fin. Auth. Single Family Mtg. Rev. (GNMA/FNMA/FHLMC Collateralized) | | | 1,000,000 | | | | 3.95 | | | | 9/1/47 | | | | 839,140 | |
NM Mtg. Fin. Auth. Single Family Mtg. Rev. (GNMA/FNMA/FHLMC Collateralized) | | | 510,000 | | | | 4.00 | | | | 7/1/48 | | | | 481,603 | |
NM Mtg. Fin. Auth. Single Family Mtg. Rev. (GNMA/FNMA/FHLMC Collateralized) | | | 720,000 | | | | 3.35 | | | | 7/1/49 | | | | 548,575 | |
NM Mtg. Fin. Auth. Single Family Mtg. Rev. (GNMA/FNMA/FHLMC Collateralized) | | | 305,000 | | | | 4.00 | | | | 7/1/49 | | | | 294,779 | |
NM Mtg. Fin. Auth. Single Family Mtg. Rev. (GNMA/FNMA/FHLMC Collateralized) | | | 465,000 | | | | 3.00 | | | | 7/1/50 | | | | 335,879 | |
NM Mtg. Fin. Auth. Single Family Mtg. Rev. (GNMA/FNMA/FHLMC Collateralized) | | | 495,000 | | | | 2.35 | | | | 7/1/51 | | | | 316,364 | |
NM Mtg. Fin. Auth. Single Family Mtg. Rev. (GNMA/FNMA/FHLMC Collateralized) | | | 980,000 | | | | 2.63 | | | | 7/1/51 | | | | 645,536 | |
| | |
| |
| See accompanying notes to financial statements. | | |
| | |
| SEPTEMBER 30, 2022 | | 29 |
SCHEDULE OF INVESTMENTS (Unaudited)
September 30, 2022
Sit Tax-Free Income Fund (Continued)
| | | | | | | | | | | | | | | | |
Name of Issuer | | Principal
Amount ($) | | | Coupon
Rate (%) | | | Maturity
Date | | | Fair
Value ($) | |
NM Mtg. Fin. Auth. Single Family Mtg. Rev. (GNMA/FNMA/FHLMC Collateralized) | | | 985,000 | | | | 2.80 | | | | 9/1/52 | | | | 645,559 | |
| | | | | | | | | | | | | | | | |
| | | | | | | | | | | | | | | 5,550,215 | |
| | | | | | | | | | | | | | | | |
New York - 5.1% | | | | | | | | | | | | | | | | |
Brookhaven Local Dev. Corp. Rev. (Jefferson’s Ferry Proj.) | | | 675,000 | | | | 4.00 | | | | 11/1/45 | | | | 556,578 | |
Hempstead Town Local Development Corp. Rev. (Hofstra University Proj.) | | | 350,000 | | | | 4.00 | | | | 7/1/33 | | | | 350,199 | |
New York City Housing Development Corp. Multifamily Mtg. Rev. | | | 300,000 | | | | 4.05 | | | | 11/1/41 | | | | 265,389 | |
New York City Housing Development Corp. Multifamily Mtg. Rev. | | | 300,000 | | | | 3.85 | | | | 11/1/42 | | | | 253,908 | |
New York City Housing Development Corp. Multifamily Mtg. Rev. | | | 500,000 | | | | 2.63 | | | | 8/1/45 | | | | 331,040 | |
New York City Housing Development Corp. Multifamily Mtg. Rev. | | | 500,000 | | | | 3.95 | | | | 11/1/49 | | | | 408,590 | |
New York City Housing Development Corp. Multifamily Mtg. Rev. | | | 500,000 | | | | 2.80 | | | | 2/1/50 | | | | 317,115 | |
New York City Housing Development Corp. Multifamily Mtg. Rev. | | | 1,000,000 | | | | 2.60 | | | | 11/1/56 | | | | 582,210 | |
New York City Housing Development Corp. Multifamily Mtg. Rev. | | | 1,000,000 | | | | 2.80 | | | | 11/1/60 | | | | 598,880 | |
New York City Municipal Water Finance Authority | | | 750,000 | | | | 5.00 | | | | 6/15/38 | | | | 755,670 | |
New York Transportation Dev. Corp. Rev. (Laguardia Airport Proj.) | | | 750,000 | | | | 4.00 | | | | 10/1/30 | | | | 702,960 | |
NY Monroe Co. Industrial Development Corp. Rev. (St. Ann’s Community Proj.) | | | 660,000 | | | | 4.00 | | | | 1/1/30 | | | | 576,609 | |
NY Mortgage Agency Rev. | | | 905,000 | | | | 3.80 | | | | 10/1/48 | | | | 837,632 | |
NY State Dormitory Auth. Rev. Ref. (N. Shore-Long Island Jewish Obligation) | | | 300,000 | | | | 5.00 | | | | 5/1/33 | | | | 303,213 | |
NY State Housing Finance Agency Rev. | | | 500,000 | | | | 2.85 | | | | 11/1/51 | | | | 334,145 | |
NY State Housing Finance Agency Rev. (Affordable Hsg. Proj.) | | | 590,000 | | | | 3.75 | | | | 11/1/37 | | | | 519,967 | |
NY State Housing Finance Agency Rev. (Affordable Hsg. Proj.) (GNMA/FNMA/FHLMC Collateralized) | | | 500,000 | | | | 3.95 | | | | 11/1/37 | | | | 451,240 | |
NY State Housing Finance Agency Rev. (GNMA/FNMA/FHLMC Collateralized) | | | 250,000 | | | | 4.10 | | | | 11/1/41 | | | | 230,797 | |
NY State Mortgage Agency Rev. | | | 580,000 | | | | 2.20 | | | | 4/1/36 | | | | 430,256 | |
NY State Mortgage Agency Rev. | | | 1,000,000 | | | | 2.45 | | | | 10/1/45 | | | | 637,420 | |
NY State Mortgage Agency Rev. | | | 980,000 | | | | 2.50 | | | | 10/1/46 | | | | 621,212 | |
NY State Mortgage Agency Rev. | | | 1,490,000 | | | | 3.30 | | | | 10/1/47 | | | | 1,122,611 | |
NY State Mortgage Agency Rev. | | | 1,625,000 | | | | 2.55 | | | | 4/1/50 | | | | 994,305 | |
Westchester Co. Local Dev. Corp. Rev. (Purchase Senior Learning Community Inc. Proj.) 4 | | | 350,000 | | | | 3.60 | | | | 7/1/29 | | | | 307,464 | |
Westchester Co. Local Dev. Corp. Rev. (Purchase Senior Learning Community Inc. Proj.) 4 | | | 350,000 | | | | 5.00 | | | | 7/1/46 | | | | 278,331 | |
Western Regional Off-Track Betting Corp. Rev. 4 | | | 500,000 | | | | 4.13 | | | | 12/1/41 | | | | 368,255 | |
| | | | | | | | | | | | | | | | |
| | | | | | | | | | | | | | | 13,135,996 | |
| | | | | | | | | | | | | | | | |
North Carolina - 1.3% | | | | | | | | | | | | | | | | |
Mecklenburg Co. Rev. (Little Rock Apts) | | | 495,000 | | | | 5.38 | | | | 1/1/36 | | | | 495,649 | |
NC Education Assistance Auth. Senior Bond-Student Loan Rev. | | | 255,000 | | | | 3.13 | | | | 6/1/39 | | | | 223,140 | |
NC Housing Finance Agency Rev. | | | 180,000 | | | | 3.95 | | | | 1/1/41 | | | | 175,631 | |
NC Housing Finance Agency Rev. | | | 515,000 | | | | 4.00 | | | | 7/1/47 | | | | 510,484 | |
NC Housing Finance Agency Rev. (GNMA/FNMA/FHLMC Collateralized) | | | 1,000,000 | | | | 3.60 | | | | 1/1/46 | | | | 815,450 | |
NC Housing Finance Agency Rev. (GNMA/FNMA/FHLMC Collateralized) | | | 95,000 | | | | 4.00 | | | | 1/1/48 | | | | 91,197 | |
NC Housing Finance Agency Rev. (GNMA/FNMA/FHLMC Collateralized) | | | 695,000 | | | | 3.63 | | | | 7/1/49 | | | | 557,640 | |
NC Medical Care Comm. Rev. (Salemtowne Proj.) | | | 400,000 | | | | 5.00 | | | | 10/1/38 | | | | 369,684 | |
| | | | | | | | | | | | | | | | |
| | | | | | | | | | | | | | | 3,238,875 | |
| | | | | | | | | | | | | | | | |
North Dakota - 0.7% | | | | | | | | | | | | | | | | |
ND Housing Finance Agency Rev. | | | 175,000 | | | | 3.85 | | | | 1/1/42 | | | | 172,030 | |
ND Housing Finance Agency Rev. | | | 500,000 | | | | 3.65 | | | | 7/1/42 | | | | 419,825 | |
ND Housing Finance Agency Rev. | | | 980,000 | | | | 2.50 | | | | 7/1/44 | | | | 678,885 | |
ND Housing Finance Agency Rev. | | | 500,000 | | | | 4.00 | | | | 1/1/53 | | | | 488,580 | |
| | | | | | | | | | | | | | | | |
| | | | | | | | | | | | | | | 1,759,320 | |
| | | | | | | | | | | | | | | | |
| | |
| |
| See accompanying notes to financial statements. | | |
| | |
| 30 | | SIT MUTUAL FUNDS SEMI-ANNUAL REPORT |
| | | | | | | | | | | | | | | | |
Name of Issuer | | Principal
Amount ($) | | | Coupon
Rate (%) | | | Maturity
Date | | | Fair
Value ($) | |
Ohio - 3.0% | | | | | | | | | | | | | | | | |
Cleveland-Cuyahoga County Port Auth. Rev. (Cleveland Museum of Natural History Proj.) | | | 500,000 | | | | 4.00 | | | | 7/1/46 | | | | 423,430 | |
Cleveland-Cuyahoga County Port Auth. Tax Allocation (Flats East Bank Proj.) 4 | | | 500,000 | | | | 4.50 | | | | 12/1/55 | | | | 378,150 | |
Columbus-Franklin Co. Finance Auth. Rev. (Beulah Park Phase 1 Proj.) | | | 840,000 | | | | 4.00 | | | | 5/15/49 | | | | 729,767 | |
Franklin Co. Health Care Facs. Rev. (Ohio Living Communities) | | | 1,000,000 | | | | 4.00 | | | | 7/1/45 | | | | 820,120 | |
Lake Co. Port & Economic Dev. Auth. Rev. (Tapestry Wickliffe Proj.) 2, 4, 5 | | | 250,000 | | | | 6.50 | | | | 12/1/37 | | | | 75,000 | |
Lucas Metro Hsg. Auth. | | | 500,000 | | | | 5.00 | | | | 11/1/36 | | | | 505,080 | |
OH Housing Finance Agency Rev. | | | 1,835,000 | | | | 2.45 | | | | 9/1/51 | | | | 1,189,172 | |
OH Housing Finance Agency Rev. (GNMA/FNMA Collateralized) | | | 200,000 | | | | 4.05 | | | | 3/1/37 | | | | 193,572 | |
OH Housing Finance Agency Rev. (GNMA/FNMA/FHLMC Collateralized) | | | 255,000 | | | | 3.35 | | | | 9/1/39 | | | | 245,149 | |
OH Housing Finance Agency Rev. (GNMA/FNMA/FHLMC Collateralized) | | | 1,990,000 | | | | 2.85 | | | | 9/1/46 | | | | 1,400,463 | |
OH Housing Finance Agency Rev. (GNMA/FNMA/FHLMC Collateralized) | | | 500,000 | | | | 4.55 | | | | 9/1/47 | | | | 457,435 | |
OH Housing Finance Agency Rev. (GNMA/FNMA/FHLMC Collateralized) | | | 350,000 | | | | 4.00 | | | | 9/1/48 | | | | 339,699 | |
OH Housing Finance Agency Rev. (GNMA/FNMA/FHLMC Collateralized) | | | 320,000 | | | | 4.00 | | | | 3/1/49 | | | | 306,627 | |
OH Housing Finance Agency Rev. (GNMA/FNMA/FHLMC Collateralized) | | | 980,000 | | | | 2.75 | | | | 9/1/51 | | | | 646,486 | |
| | | | | | | | | | | | | | | | |
| | | | | | | | | | | | | | | 7,710,150 | |
| | | | | | | | | | | | | | | | |
Oregon - 1.5% | | | | | | | | | | | | | | | | |
Clackamas Co. Hsg. Auth. Rev. (Easton Ridge Apts. Proj.) | | | 350,000 | | | | 3.50 | | | | 9/1/33 | | | | 324,236 | |
OR Hsg. & Community Services Dept. Rev. (Single Family Mtg. Program) | | | 130,000 | | | | 3.80 | | | | 7/1/34 | | | | 126,602 | |
OR Hsg. & Community Services Dept. Rev. (Single Family Mtg. Program) | | | 260,000 | | | | 4.00 | | | | 7/1/38 | | | | 237,011 | |
OR Hsg. & Community Services Dept. Rev. (Single Family Mtg. Program) | | | 500,000 | | | | 3.70 | | | | 1/1/42 | | | | 424,130 | |
OR Hsg. & Community Services Dept. Rev. (Single Family Mtg. Program) | | | 500,000 | | | | 2.35 | | | | 1/1/44 | | | | 338,490 | |
OR Hsg. & Community Services Dept. Rev. (Single Family Mtg. Program) | | | 1,000,000 | | | | 2.38 | | | | 1/1/45 | | | | 659,020 | |
OR Hsg. & Community Services Dept. Rev. (Single Family Mtg. Program) | | | 280,000 | | | | 3.75 | | | | 7/1/48 | | | | 269,755 | |
OR State Ref G.O. (Veterans Welfare Service) | | | 1,000,000 | | | | 3.90 | | | | 12/1/39 | | | | 932,730 | |
Polk Co. Hospital Fac. Auth. Rev. (Dallas Retirement Village Proj.) | | | 500,000 | | | | 5.13 | | | | 7/1/55 | | | | 404,355 | |
Yamhill County Hospital Auth. Rev. (Friendsview) | | | 350,000 | | | | 5.00 | | | | 11/15/56 | | | | 271,306 | |
| | | | | | | | | | | | | | | | |
| | | | | | | | | | | | | | | 3,987,635 | |
| | | | | | | | | | | | | | | | |
Pennsylvania - 1.8% | | | | | | | | | | | | | | | | |
Butler Co. General Authority Rev. (School District Proj.) (AGM G.O. of District) 1 | | | 465,000 | | | | 3.21 | | | | 10/1/34 | | | | 438,709 | |
Chester Co. Health & Education Fac. Auth. Rev. (The Devereux Foundation) | | | 475,000 | | | | 3.00 | | | | 11/1/30 | | | | 426,783 | |
Dauphin Co. General Auth. Rev. (Harrisburg University Science Technology) 4 | | | 100,000 | | | | 4.00 | | | | 10/15/22 | | | | 99,987 | |
PA Higher Educational Assistance Agy. Rev. | | | 455,000 | | | | 2.63 | | | | 6/1/42 | | | | 345,472 | |
PA Higher Educational Facs. Auth. Rev. (La Salle University) | | | 280,000 | | | | 5.00 | | | | 5/1/42 | | | | 241,055 | |
PA Hsg. Finance Agy. Rev. | | | 500,000 | | | | 3.00 | | | | 10/1/46 | | | | 353,750 | |
PA Hsg. Finance Agy. Rev. | | | 95,000 | | | | 4.00 | | | | 10/1/46 | | | | 94,368 | |
PA Hsg. Finance Agy. Rev. | | | 1,000,000 | | | | 2.55 | | | | 10/1/51 | | | | 607,060 | |
PA Turnpike Commission Rev. Capital Appreciation 6 | | | 1,250,000 | | | | 5.00 | | | | 12/1/38 | | | | 1,289,550 | |
Philadelphia Industrial Dev. Auth. Rev. (Charter School Proj.) | | | 350,000 | | | | 5.63 | | | | 8/1/36 | | | | 350,623 | |
West Cornwall Township Municipal Auth. Rev. (Lebanon Valley Brethren Home Proj.) | | | 525,000 | | | | 4.00 | | | | 11/15/46 | | | | 428,353 | |
| | | | | | | | | | | | | | | | |
| | | | | | | | | | | | | | | 4,675,710 | |
| | | | | | | | | | | | | | | | |
Rhode Island - 0.3% | | | | | | | | | | | | | | | | |
RI Hsg. & Mortgage Finance Corp. Rev. | | | 500,000 | | | | 2.80 | | | | 4/1/45 | | | | 349,170 | |
RI Student Loan Auth. Rev. | | | 595,000 | | | | 3.63 | | | | 12/1/37 | | | | 548,055 | |
| | | | | | | | | | | | | | | | |
| | | | | | | | | | | | | | | 897,225 | |
| | | | | | | | | | | | | | | | |
| | |
| |
| See accompanying notes to financial statements. | | |
| | |
| SEPTEMBER 30, 2022 | | 31 |
SCHEDULE OF INVESTMENTS (Unaudited)
September 30, 2022
Sit Tax-Free Income Fund (Continued)
| | | | | | | | | | | | | | | | |
Name of Issuer | | Principal
Amount ($) | | | Coupon
Rate (%) | | | Maturity
Date | | | Fair
Value ($) | |
South Carolina - 1.0% | | | | | | | | | | | | | | | | |
Berkeley Co. Nexton Improvement District Special Assessment | | | 350,000 | | | | 4.25 | | | | 11/1/40 | | | | 311,112 | |
SC Jobs-Economic Dev. Auth. Rev. (Bishop Gadsden Episcopal Retirement Community) | | | 500,000 | | | | 4.00 | | | | 4/1/54 | | | | 342,830 | |
SC Jobs-Economic Dev. Auth. Rev. (Kiawah Life Plan Village, Inc. Proj.) 4 | | | 500,000 | | | | 8.75 | | | | 7/1/25 | | | | 503,420 | |
SC Public Service Auth. Rev. | | | 250,000 | | | | 5.00 | | | | 12/1/38 | | | | 250,350 | |
SC Public Service Auth. Rev. (Santee Cooper) | | | 500,000 | | | | 5.75 | | | | 12/1/43 | | | | 514,480 | |
SC State Hsg. Finance & Dev. Auth. Rev. | | | 460,000 | | | | 3.05 | | | | 7/1/45 | | | | 335,312 | |
SC State Hsg. Finance & Dev. Auth. Rev. | | | 500,000 | | | | 4.40 | | | | 7/1/52 | | | | 438,810 | |
| | | | | | | | | | | | | | | | |
| | | | | | | | | | | | | | | 2,696,314 | |
| | | | | | | | | | | | | | | | |
South Dakota - 0.5% | | | | | | | | | | | | | | | | |
SD Health & Educational Facs. Auth. Rev. (Westhills Village Retirement Community) | | | 500,000 | | | | 5.00 | | | | 9/1/40 | | | | 504,260 | |
SD Housing Dev. Auth. Rev. | | | 1,000,000 | | | | 2.50 | | | | 11/1/42 | | | | 707,840 | |
| | | | | | | | | | | | | | | | |
| | | | | | | | | | | | | | | 1,212,100 | |
| | | | | | | | | | | | | | | | |
Tennessee - 3.2% | | | | | | | | | | | | | | | | |
Franklin Health & Education Facs. Board Rev. (Provision Cares Proton Therapy Center) 2, 4, 5 | | | 500,000 | | | | 6.50 | | | | 6/1/27 | | | | 135,000 | |
Metropolitan Govt. Nashville & Davidson County Health & Edu. Facs. Board Rev. (Blakford at Green Hills) | | | 895,000 | | | | 4.00 | | | | 11/1/45 | | | | 707,802 | |
Nashville Metropolitan Dev. & Hsg. Agency Tax Allocation 4 | | | 300,000 | | | | 5.13 | | | | 6/1/36 | | | | 299,541 | |
Shelby Co. Health, Education & Hsg. Facs. Rev. (CME Memphis Apts. Proj.) 2, 5,15 | | | 1,850,000 | | | | 5.35 | | | | N/A | | | | 18 | |
Shelby Co. Health, Education & Hsg. Facs. Rev. (CME Memphis Apts. Proj.) 2, 5 | | | 7,875,000 | | | | 5.55 | | | | 1/1/29 | | | | 79 | |
Shelby Co. Health, Education & Hsg. Facs. Rev. (CME Memphis Apts. Proj.) 2, 5 | | | 1,630,000 | | | | 6.00 | | | | 1/1/29 | | | | 16 | |
Shelby Co. Health, Education & Hsg. Facs. Rev. (The Farms at Bailey Station Proj.) | | | 650,000 | | | | 5.50 | | | | 10/1/39 | | | | 591,175 | |
TN Hsg. Dev. Agency Rev. | | | 435,000 | | | | 2.55 | | | | 7/1/46 | | | | 295,569 | |
TN Hsg. Dev. Agency Rev. | | | 730,000 | | | | 5.05 | | | | 7/1/48 | | | | 728,955 | |
TN Hsg. Dev. Agency. Rev. | | | 225,000 | | | | 3.60 | | | | 1/1/31 | | | | 217,105 | |
TN Hsg. Dev. Agency. Rev. | | | 175,000 | | | | 3.88 | | | | 7/1/35 | | | | 167,237 | |
TN Hsg. Dev. Agency. Rev. | | | 95,000 | | | | 3.95 | | | | 7/1/35 | | | | 93,127 | |
TN Hsg. Dev. Agency. Rev. | | | 135,000 | | | | 4.00 | | | | 7/1/39 | | | | 133,858 | |
TN Hsg. Dev. Agency. Rev. | | | 260,000 | | | | 3.85 | | | | 7/1/42 | | | | 248,945 | |
TN Hsg. Dev. Agency. Rev. | | | 240,000 | | | | 3.90 | | | | 7/1/42 | | | | 229,603 | |
TN Hsg. Dev. Agency. Rev. | | | 605,000 | | | | 4.00 | | | | 7/1/44 | | | | 593,039 | |
TN Hsg. Dev. Agency. Rev. | | | 870,000 | | | | 2.55 | | | | 1/1/45 | | | | 603,058 | |
TN Hsg. Dev. Agency. Rev. | | | 1,500,000 | | | | 2.38 | | | | 7/1/46 | | | | 974,415 | |
TN Hsg. Dev. Agency. Rev. | | | 630,000 | | | | 3.95 | | | | 1/1/49 | | | | 604,794 | |
TN Hsg. Dev. Agency. Rev. | | | 875,000 | | | | 4.05 | | | | 1/1/49 | | | | 856,187 | |
TN Hsg. Dev. Agency. Rev. | | | 1,000,000 | | | | 2.50 | | | | 7/1/51 | | | | 655,670 | |
| | | | | | | | | | | | | | | | |
| | | | | | | | | | | | | | | 8,135,193 | |
| | | | | | | | | | | | | | | | |
Texas - 5.7% | | | | | | | | | | | | | | | | |
Arlington Higher Education Finance Corp., Education Rev. (Pineywoods Community Academy) | | | 750,000 | | | | 2.38 | | | | 8/15/51 | | | | 428,182 | |
Brazos Higher Education Auth., Inc. Rev. (Subordinate Student Loan) | | | 1,000,000 | | | | 3.00 | | | | 4/1/40 | | | | 709,990 | |
Dallas/Fort Worth International Airport Rev. (JT Improvement) | | | 500,000 | | | | 5.25 | | | | 11/1/37 | | | | 505,335 | |
Danbury Higher Education Auth. Education Rev. (Golden Rule Schools) | | | 650,000 | | | | 5.13 | | | | 8/15/49 | | | | 604,071 | |
Edinburg Economic Dev. Corp. Rev. | | | 225,000 | | | | 3.00 | | | | 8/15/31 | | | | 186,082 | |
Edinburg Economic Dev. Corp. Rev. | | | 500,000 | | | | 3.25 | | | | 8/15/41 | | | | 362,300 | |
Harris Co. Cultural Education Facs. Finance Corp. Rev. (Brazos Presbyterian Homes, Inc. Proj.) | | | 500,000 | | | | 5.00 | | | | 1/1/37 | | | | 452,525 | |
New Hope Cultural Education Fac. Corp. Rev. (Cardinal Bay) | | | 260,000 | | | | 4.00 | | | | 7/1/23 | | | | 143,000 | |
New Hope Cultural Education Fac. Corp. Rev. (Cardinal Bay) | | | 460,000 | | | | 4.00 | | | | 7/1/26 | | | | 253,000 | |
| | |
| |
| See accompanying notes to financial statements. | | |
| | |
| 32 | | SIT MUTUAL FUNDS SEMI-ANNUAL REPORT |
| | | | | | | | | | | | | | | | |
Name of Issuer | | Principal
Amount ($) | | | Coupon
Rate (%) | | | Maturity
Date | | | Fair
Value ($) | |
New Hope Cultural Education Facs. Corp. Rev. (Beta Academy) 4 | | | 425,000 | | | | 5.00 | | | | 8/15/39 | | | | 394,311 | |
New Hope Cultural Education Facs. Corp. Rev. (Presbyterian Village North Proj.) | | | 500,000 | | | | 5.00 | | | | 10/1/34 | | | | 452,505 | |
New Hope Cultural Education Facs. Corp. Rev. (Wesleyan Homes, Inc. Proj.) | | | 250,000 | | | | 5.50 | | | | 1/1/35 | | | | 225,760 | |
New Hope Cultural Education Facs. Finance Corp. Rev. (Buckingham Senior Living Community, Inc.) 1 | | | 504,581 | | | | 2.00 | | | | 11/15/61 | | | | 244,192 | |
New Hope Cultural Education Facs. Finance Corp. Rev. (Cityscape Schools, Inc.) 4 | | | 670,000 | | | | 5.00 | | | | 8/15/51 | | | | 598,230 | |
New Hope Cultural Education Facs. Finance Corp. Rev. (Presbyterian Village North Proj.) | | | 350,000 | | | | 5.25 | | | | 10/1/49 | | | | 295,830 | |
New Hope Cultural Education Facs. Finance Corp. Rev. (Wesleyan Homes, Inc. Proj.) | | | 750,000 | | | | 5.00 | | | | 1/1/55 | | | | 538,440 | |
New Hope Cultural Education Facs. Finance Corp. Rev. (Westminster Proj.) | | | 500,000 | | | | 4.00 | | | | 11/1/49 | | | | 385,695 | |
New Hope Cultural Education Facs. Finance Corp. Rev. (Windhaven Proj.) | | | 500,000 | | | | 5.50 | | | | 10/1/27 | | | | 483,500 | |
New Hope Cultural Education Facs. Finance Corp. Rev. (Windhaven Proj.) | | | 500,000 | | | | 6.50 | | | | 10/1/33 | | | | 478,465 | |
North Central Texas Health Facility Development Corp. (CC Young Memorial Home) 5 | | | 204,000 | | | | 5.38 | | | | 2/15/25 | | | | 132,600 | |
Red River Health Facs. Dev. Corp. Rev. (MRC Crossings Proj.) | | | 250,000 | | | | 7.50 | | | | 11/15/34 | | | | 270,683 | |
San Antonio Education Facs. Corp. Rev. (Hallmark University Proj.) | | | 290,000 | | | | 5.00 | | | | 10/1/41 | | | | 245,734 | |
Sugar Land Dev. Corp. Rev. (BAM Insured) | | | 500,000 | | | | 5.00 | | | | 2/15/33 | | | | 501,580 | |
Tarrant Co. Cultural Education Facs. Finance Corp. Rev. (Buckner Retirement Service) | | | 500,000 | | | | 5.00 | | | | 11/15/37 | | | | 508,075 | |
TX Department of Housing & Community Affairs (GNMA Collateralized) | | | 335,000 | | | | 4.13 | | | | 9/1/38 | | | | 329,168 | |
TX Department of Housing & Community Affairs (GNMA Collateralized) | | | 975,000 | | | | 3.63 | | | | 9/1/44 | | | | 860,945 | |
TX Department of Housing & Community Affairs (GNMA Collateralized) | | | 500,000 | | | | 3.00 | | | | 9/1/45 | | | | 366,625 | |
TX Department of Housing & Community Affairs (GNMA Collateralized) | | | 985,000 | | | | 2.50 | | | | 7/1/51 | | | | 658,886 | |
TX Department of Housing & Community Affairs (GNMA Collateralized) | | | 2,500,000 | | | | 3.13 | | | | 1/1/52 | | | | 1,755,575 | |
TX Department of Housing & Community Affairs (GNMA Collateralized) | | | 500,000 | | | | 5.50 | | | | 9/1/52 | | | | 523,920 | |
TX Grand Parkway Transportation Corp. Rev. 6 | | | 500,000 | | | | 6.00 | | | | 10/1/35 | | | | 514,110 | |
TX State Affordable Hsg. Corp. Rev. (Heroes Home Loan Program) (GNMA Collateralized) | | | 355,000 | | | | 4.00 | | | | 3/1/50 | | | | 352,355 | |
| | | | | | | | | | | | | | | | |
| | | | | | | | | | | | | | | 14,761,669 | |
| | | | | | | | | | | | | | | | |
Utah - 1.0% | | | | | | | | | | | | | | | | |
Black Desert Public Infrastructure District G.O. 4 | | | 500,000 | | | | 4.00 | | | | 3/1/51 | | | | 352,605 | |
Military Installation Dev. Auth. Rev. | | | 400,000 | | | | 4.00 | | | | 6/1/41 | | | | 304,856 | |
Military Installation Dev. Auth. Rev. | | | 1,000,000 | | | | 4.00 | | | | 6/1/52 | | | | 691,840 | |
UT Charter School Finance Auth. Rev. (Mountain Sunrise Academy) 4 | | | 515,000 | | | | 3.50 | | | | 12/15/31 | | | | 419,864 | |
UT Hospital Auth. Rev. (IHC Health Services, Inc.) | | | 500,000 | | | | 5.00 | | | | 5/15/45 | | | | 500,650 | |
UT Hsg. Corp. Single Family Mtg. Rev. | | | 15,000 | | | | 5.75 | | | | 1/1/33 | | | | 15,016 | |
UT Hsg. Corp. Single Family Mtg. Rev. | | | 25,000 | | | | 4.60 | | | | 7/1/34 | | | | 25,006 | |
UT Hsg. Corp. Single Family Mtg. Rev. (FHA Insured) | | | 185,000 | | | | 4.00 | | | | 1/1/36 | | | | 182,743 | |
| | | | | | | | | | | | | | | | |
| | | | | | | | | | | | | | | 2,492,580 | |
| | | | | | | | | | | | | | | | |
Vermont - 0.1% | | | | | | | | | | | | | | | | |
Vermont Economic Dev. Auth. Mtg. Rev. (Wake Robin Corporation Proj.) | | | 500,000 | | | | 4.00 | | | | 5/1/45 | | | | 361,485 | |
| | | | | | | | | | | | | | | | |
Virginia - 0.4% | | | | | | | | | | | | | | | | |
VA Hsg. Dev. Auth. Rev. (Rental Hsg. Proj.) | | | 400,000 | | | | 4.13 | | | | 7/1/33 | | | | 396,596 | |
VA Hsg. Dev. Auth. Rev. (Rental Hsg. Proj.) | | | 500,000 | | | | 5.35 | | | | 10/1/43 | | | | 501,865 | |
| | | | | | | | | | | | | | | | |
| | | | | | | | | | | | | | | 898,461 | |
| | | | | | | | | | | | | | | | |
Washington - 2.2% | | | | | | | | | | | | | | | | |
Kalispel Tribe of Indians Rev. 4 | | | 300,000 | | | | 5.25 | | | | 1/1/38 | | | | 313,464 | |
King Co. Hsg. Auth. Rev. | | | 1,000,000 | | | | 3.00 | | | | 11/1/39 | | | | 780,400 | |
King Co. Hsg. Auth. Rev. (Bellevue Manor and Abbey Ridge) | | | 750,000 | | | | 3.00 | | | | 8/1/40 | | | | 551,385 | |
Pike Place Market Preservation Dev. Auth. Rev. | | | 500,000 | | | | 5.00 | | | | 12/1/40 | | | | 502,915 | |
Seattle Hsg. Auth. Rev. (Lam Bow Apartments Proj.) | | | 500,000 | | | | 2.38 | | | | 6/1/41 | | | | 342,195 | |
| | |
| |
| See accompanying notes to financial statements. | | |
| | |
| SEPTEMBER 30, 2022 | | 33 |
SCHEDULE OF INVESTMENTS (Unaudited)
September 30, 2022
Sit Tax-Free Income Fund (Continued)
| | | | | | | | | | | | | | | | |
Name of Issuer | | Principal
Amount ($) | | | Coupon
Rate (%) | | | Maturity
Date | | | Fair
Value ($) | |
Snohomish Co. Hsg. Auth. Rev. | | | 500,000 | | | | 4.00 | | | | 4/1/44 | | | | 429,300 | |
Vancouver Hsg. Auth. Rev. | | | 470,000 | | | | 3.75 | | | | 8/1/34 | | | | 432,767 | |
Vancouver Hsg. Auth. Rev. (Anthem Park & Columbia Hsg. Proj.) | | | 1,000,000 | | | | 3.00 | | | | 6/1/38 | | | | 793,280 | |
WA Hsg. Fin. Commission Multi Family Mtg. Rev. (Bayview Manor Homes) 4 | | | 1,000,000 | | | | 5.00 | | | | 7/1/36 | | | | 870,700 | |
WA Hsg. Fin. Commission Multi Family Mtg. Rev. (Horizon House Proj.) 4 | | | 500,000 | | | | 5.00 | | | | 1/1/38 | | | | 502,015 | |
WA Hsg. Fin. Commission Multi Family Mtg. Rev. (Wesley Homes Lea Hill Proj.) 4 | | | 300,000 | | | | 5.00 | | | | 7/1/36 | | | | 268,533 | |
| | | | | | | | | | | | | | | | |
| | | | | | | | | | | | | | | 5,786,954 | |
| | | | | | | | | | | | | | | | |
West Virginia - 0.5% | | | | | | | | | | | | | | | | |
WV Hsg. Dev. Fund Rev. | | | 1,005,000 | | | | 2.75 | | | | 11/1/45 | | | | 718,112 | |
WV Hsg. Dev. Fund Rev. | | | 955,000 | | | | 2.50 | | | | 11/1/51 | | | | 614,304 | |
| | | | | | | | | | | | | | | | |
| | | | | | | | | | | | | | | 1,332,416 | |
| | | | | | | | | | | | | | | | |
Wisconsin - 3.9% | | | | | | | | | | | | | | | | |
Public Finance Auth. Rev. (Grand Hyatt San Antonio Hotel Acquisition Proj.) | | | 500,000 | | | | 5.00 | | | | 2/1/52 | | | | 441,095 | |
Public Finance Auth. Rev. (Grand Hyatt San Antonio Hotel Acquisition Proj.) 4 | | | 500,000 | | | | 6.00 | | | | 2/1/62 | | | | 450,745 | |
Public Finance Auth. Rev. (Presbyterian Villages of Michigan) 4 | | | 895,000 | | | | 4.75 | | | | 11/15/53 | | | | 668,896 | |
WI Health & Education Facs. Auth. Rev. (PHW Oconomowoc, Inc. Proj.) | | | 500,000 | | | | 5.13 | | | | 10/1/48 | | | | 424,775 | |
WI Health & Education Facs. Auth. Rev. (St. John’s Communities, Inc. Proj.) | | | 500,000 | | | | 5.00 | | | | 9/15/45 | | | | 507,780 | |
WI Health & Educational Facs. Auth. Rev. (Benevolent Corp. Cedar Community) | | | 300,000 | | | | 5.00 | | | | 6/1/37 | | | | 277,050 | |
WI Health & Educational Facs. Auth. Rev. (Benevolent Corp. Cedar Community) | | | 500,000 | | | | 5.00 | | | | 6/1/41 | | | | 449,985 | |
WI Health & Educational Facs. Auth. Rev. (Hope Christian Schools) | | | 615,000 | | | | 3.00 | | | | 12/1/31 | | | | 498,144 | |
WI Health & Educational Facs. Auth. Rev. (St. Camillus Health System, Inc.) | | | 745,000 | | | | 5.00 | | | | 11/1/27 | | | | 728,342 | |
WI Health & Educational Facs. Auth. Rev. (St. Camillus Health System, Inc.) | | | 350,000 | | | | 5.00 | | | | 11/1/46 | | | | 288,733 | |
WI Housing & Economic Dev. Auth. Rev. | | | 250,000 | | | | 3.88 | | | | 11/1/35 | | | | 239,060 | |
WI Housing & Economic Dev. Auth. Rev. | | | 1,500,000 | | | | 4.15 | | | | 5/1/55 | | | | 1,323,600 | |
WI Public Finance Auth. Rev. (Carmelite System, Inc.) | | | 500,000 | | | | 5.00 | | | | 1/1/45 | | | | 479,235 | |
WI Public Finance Auth. Rev. (Coral Academy of Science Reno) 4 | | | 335,000 | | | | 5.38 | | | | 6/1/37 | | | | 314,743 | |
WI Public Finance Auth. Rev. (Coral Academy of Science Reno) 4 | | | 700,000 | | | | 5.00 | | | | 6/1/39 | | | | 621,446 | |
WI Public Finance Auth. Rev. (Delray Beach Radiation Therapy) 4 | | | 750,000 | | | | 6.25 | | | | 11/1/28 | | | | 631,987 | |
WI Public Finance Auth. Rev. (Lombard Public Facilities Corp.) 2, 4, 6 | | | 16,520 | | | | 9.00 | | | | 1/1/46 | | | | 355 | |
WI Public Finance Auth. Rev. (Lombard Public Facilities Corp.) 2, 4, 6 | | | 16,287 | | | | 9.00 | | | | 1/1/47 | | | | 327 | |
WI Public Finance Auth. Rev. (Lombard Public Facilities Corp.) 2, 4, 6 | | | 447 | | | | 12.00 | | | | 1/1/47 | | | | 9 | |
WI Public Finance Auth. Rev. (Lombard Public Facilities Corp.) 2, 4, 6 | | | 16,171 | | | | 9.00 | | | | 1/1/48 | | | | 310 | |
WI Public Finance Auth. Rev. (Lombard Public Facilities Corp.) 2, 4, 6 | | | 390 | | | | 12.00 | | | | 1/1/48 | | | | 7 | |
WI Public Finance Auth. Rev. (Lombard Public Facilities Corp.) 2, 4, 6 | | | 16,055 | | | | 9.00 | | | | 1/1/49 | | | | 292 | |
WI Public Finance Auth. Rev. (Lombard Public Facilities Corp.) 2, 4, 6 | | | 384 | | | | 11.00 | | | | 1/1/49 | | | | 7 | |
WI Public Finance Auth. Rev. (Lombard Public Facilities Corp.) 2, 4, 6 | | | 15,822 | | | | 9.00 | | | | 1/1/50 | | | | 269 | |
WI Public Finance Auth. Rev. (Lombard Public Facilities Corp.) 2, 4, 6 | | | 372 | | | | 11.00 | | | | 1/1/50 | | | | 6 | |
WI Public Finance Auth. Rev. (Lombard Public Facilities Corp.) 2, 4, 6 | | | 17,334 | | | | 9.00 | | | | 1/1/51 | | | | 281 | |
WI Public Finance Auth. Rev. (Lombard Public Facilities Corp.) 2, 4, 6 | | | 365 | | | | 11.00 | | | | 1/1/51 | | | | 6 | |
WI Public Finance Auth. Rev. (Lombard Public Facilities Corp.) 1, 2, 4, 5 | | | 446,246 | | | | 3.75 | | | | 7/1/51 | | | | 210,012 | |
WI Public Finance Auth. Rev. (Lombard Public Facilities Corp.) 2, 4, 6 | | | 17,218 | | | | 9.00 | | | | 1/1/52 | | | | 261 | |
WI Public Finance Auth. Rev. (Lombard Public Facilities Corp.) 2, 4, 6 | | | 475 | | | | 10.00 | | | | 1/1/52 | | | | 7 | |
WI Public Finance Auth. Rev. (Lombard Public Facilities Corp.) 2, 4, 6 | | | 16,985 | | | | 9.00 | | | | 1/1/53 | | | | 246 | |
WI Public Finance Auth. Rev. (Lombard Public Facilities Corp.) 2, 4, 6 | | | 469 | | | | 10.00 | | | | 1/1/53 | | | | 7 | |
WI Public Finance Auth. Rev. (Lombard Public Facilities Corp.) 2, 4, 6 | | | 16,869 | | | | 9.00 | | | | 1/1/54 | | | | 231 | |
WI Public Finance Auth. Rev. (Lombard Public Facilities Corp.) 2, 4, 6 | | | 453 | | | | 10.00 | | | | 1/1/54 | | | | 6 | |
| | |
| |
| See accompanying notes to financial statements. | | |
| | |
| 34 | | SIT MUTUAL FUNDS SEMI-ANNUAL REPORT |
| | | | | | | | | | | | | | | | |
Name of Issuer | | Principal
Amount ($) | | | Coupon
Rate (%) | | | Maturity
Date | | | Fair
Value ($) | |
WI Public Finance Auth. Rev. (Lombard Public Facilities Corp.) 2, 4, 6 | | | 444 | | | | 9.00 | | | | 1/1/55 | | | | 6 | |
WI Public Finance Auth. Rev. (Lombard Public Facilities Corp.) 2, 4, 6 | | | 16,636 | | | | 9.00 | | | | 1/1/55 | | | | 216 | |
WI Public Finance Auth. Rev. (Lombard Public Facilities Corp.) 2, 4, 6 | | | 434 | | | | 9.00 | | | | 1/1/56 | | | | 5 | |
WI Public Finance Auth. Rev. (Lombard Public Facilities Corp.) 2, 4, 6 | | | 16,404 | | | | 9.00 | | | | 1/1/56 | | | | 204 | |
WI Public Finance Auth. Rev. (Lombard Public Facilities Corp.) 2, 4, 5 | | | 23,656 | | | | 5.50 | | | | 7/1/56 | | | | 13,457 | |
WI Public Finance Auth. Rev. (Lombard Public Facilities Corp.) 2, 4, 6 | | | 481 | | | | 9.00 | | | | 1/1/57 | | | | 6 | |
WI Public Finance Auth. Rev. (Lombard Public Facilities Corp.) 2, 4, 6 | | | 16,287 | | | | 9.00 | | | | 1/1/57 | | | | 192 | |
WI Public Finance Auth. Rev. (Lombard Public Facilities Corp.) 2, 4, 6 | | | 469 | | | | 9.00 | | | | 1/1/58 | | | | 5 | |
WI Public Finance Auth. Rev. (Lombard Public Facilities Corp.) 2, 4, 6 | | | 16,055 | | | | 9.00 | | | | 1/1/58 | | | | 180 | |
WI Public Finance Auth. Rev. (Lombard Public Facilities Corp.) 2, 4, 6 | | | 456 | | | | 9.00 | | | | 1/1/59 | | | | 5 | |
WI Public Finance Auth. Rev. (Lombard Public Facilities Corp.) 2, 4, 6 | | | 15,938 | | | | 9.00 | | | | 1/1/59 | | | | 171 | |
WI Public Finance Auth. Rev. (Lombard Public Facilities Corp.) 2, 4, 6 | | | 447 | | | | 8.00 | | | | 1/1/60 | | | | 5 | |
WI Public Finance Auth. Rev. (Lombard Public Facilities Corp.) 2, 4, 6 | | | 15,822 | | | | 9.00 | | | | 1/1/60 | | | | 160 | |
WI Public Finance Auth. Rev. (Lombard Public Facilities Corp.) 2, 4, 6 | | | 440 | | | | 8.00 | | | | 1/1/61 | | | | 4 | |
WI Public Finance Auth. Rev. (Lombard Public Facilities Corp.) 2, 4, 6 | | | 15,589 | | | | 9.00 | | | | 1/1/61 | | | | 149 | |
WI Public Finance Auth. Rev. (Lombard Public Facilities Corp.) 2, 4, 6 | | | 428 | | | | 8.00 | | | | 1/1/62 | | | | 4 | |
WI Public Finance Auth. Rev. (Lombard Public Facilities Corp.) 2, 4, 6 | | | 15,473 | | | | 9.00 | | | | 1/1/62 | | | | 140 | |
WI Public Finance Auth. Rev. (Lombard Public Facilities Corp.) 2, 4, 6 | | | 419 | | | | 8.00 | | | | 1/1/63 | | | | 4 | |
WI Public Finance Auth. Rev. (Lombard Public Facilities Corp.) 2, 4, 6 | | | 15,240 | | | | 9.00 | | | | 1/1/63 | | | | 132 | |
WI Public Finance Auth. Rev. (Lombard Public Facilities Corp.) 2, 4, 6 | | | 409 | | | | 8.00 | | | | 1/1/64 | | | | 3 | |
WI Public Finance Auth. Rev. (Lombard Public Facilities Corp.) 2, 4, 6 | | | 15,124 | | | | 9.00 | | | | 1/1/64 | | | | 125 | |
WI Public Finance Auth. Rev. (Lombard Public Facilities Corp.) 2, 4, 6 | | | 403 | | | | 7.00 | | | | 1/1/65 | | | | 3 | |
WI Public Finance Auth. Rev. (Lombard Public Facilities Corp.) 2, 4, 6 | | | 15,008 | | | | 9.00 | | | | 1/1/65 | | | | 117 | |
WI Public Finance Auth. Rev. (Lombard Public Facilities Corp.) 2, 4, 6 | | | 434 | | | | 7.00 | | | | 1/1/66 | | | | 3 | |
WI Public Finance Auth. Rev. (Lombard Public Facilities Corp.) 2, 4, 6 | | | 14,775 | | | | 9.00 | | | | 1/1/66 | | | | 107 | |
WI Public Finance Auth. Rev. (Lombard Public Facilities Corp.) 2, 4, 6 | | | 5,235 | | | | 5.00 | | | | 1/1/67 | | | | 34 | |
WI Public Finance Auth. Rev. (Lombard Public Facilities Corp.) 2, 4, 6 | | | 192,429 | | | | 9.00 | | | | 1/1/67 | | | | 1,264 | |
WI Public Finance Auth. Rev. (MD Proton Treatment Center) 4 | | | 500,000 | | | | 6.13 | | | | 1/1/33 | | | | 307,500 | |
WI Public Finance Auth. Rev. (MN College of Osteopathic Medicine) 2, 4, 5 | | | 7,608 | | | | 5.50 | | | | 12/1/48 | | | | 2,358 | |
WI Public Finance Auth. Rev. (North Carolina Leadership Academy) 4 | | | 410,000 | | | | 5.00 | | | | 6/15/39 | | | | 376,827 | |
WI Public Finance Auth. Rev. (Roseman University Health Sciences) | | | 135,000 | | | | 5.00 | | | | 4/1/25 | | | | 135,468 | |
WI Public Finance Auth. Rev. (Searstone CCRC Project) 4 | | | 750,000 | | | | 3.00 | | | | 6/1/28 | | | | 653,183 | |
| | | | | | | | | | | | | | | | |
| | | | | | | | | | | | | | | 10,050,292 | |
| | | | | | | | | | | | | | | | |
Wyoming - 0.1% | | | | | | | | | | | | | | | | |
WY Community Dev. Auth. Rev. | | | 280,000 | | | | 4.05 | | | | 12/1/38 | | | | 274,929 | |
| | | | | | | | | | | | | | | | |
Total Municipal Bonds
(Cost: $276,396,663) | | | | | | | | | | | | | | | 219,025,342 | |
| | | | | | | | | | | | | | | | |
| | | | |
| | | Quantity | | | | | | | | | | |
Investment Companies - 3.8% | | | | | | | | | | | | | | | | |
BlackRock Municipal Income Fund, Inc. (MUI) | | | 52,666 | | | | | | | | | | | | 571,953 | |
BlackRock MuniHoldings Fund, Inc. (MHD) | | | 51,519 | | | | | | | | | | | | 579,589 | |
BlackRock MuniHoldings Quality Fund II, Inc. (MUE) | | | 45,777 | | | | | | | | | | | | 444,952 | |
BlackRock MuniYield Quality Fund III, Inc. (MYI) | | | 48,671 | | | | | | | | | | | | 507,639 | |
BNY Mellon Strategic Municipal Bond Fund, Inc. (DSM) | | | 12,028 | | | | | | | | | | | | 68,079 | |
| | |
| |
| See accompanying notes to financial statements. | | |
| | |
| SEPTEMBER 30, 2022 | | 35 |
SCHEDULE OF INVESTMENTS (Unaudited)
September 30, 2022
Sit Tax-Free Income Fund (Continued)
| | | | | | | | | | | | | | | | |
Name of Issuer | | Quantity | | | | | | | | | Fair
Value ($) | |
DWS Municipal Income Trust (KTF) | | | 93,236 | | | | | | | | | | | | 775,724 | |
DWS Strategic Municipal Income Trust (KSM) | | | 29,351 | | | | | | | | | | | | 232,166 | |
Invesco Advantage Municipal Income Trust II (VKI) | | | 62,289 | | | | | | | | | | | | 505,787 | |
Invesco Municipal Opportunity Trust (VMO) | | | 62,240 | | | | | | | | | | | | 567,006 | |
Invesco Municipal Trust (VKQ) | | | 76,872 | | | | | | | | | | | | 702,610 | |
Invesco Pennsylvania Value Municipal Income Trust (VPV) | | | 31,500 | | | | | | | | | | | | 304,038 | |
Invesco Quality Municipal Income Trust (IQI) | | | 91,114 | | | | | | | | | | | | 831,871 | |
Invesco Trust for Investment Grade Municipals (VGM) | | | 66,447 | | | | | | | | | | | | 621,944 | |
Nuveen AMT-Free Municipal Credit Income Fund (NVG) | | | 17,623 | | | | | | | | | | | | 205,660 | |
Nuveen AMT-Free Quality Municipal Income Fund (NEA) | | | 163,972 | | | | | | | | | | | | 1,738,103 | |
Nuveen Quality Municipal Income Fund (NAD) | | | 101,846 | | | | | | | | | | | | 1,120,306 | |
| | | | | | | | | | | | | | | | |
Total Investment Companies
(cost: $12,991,957) | | | | | | | | | | | | | | | 9,777,427 | |
| | | | | | | | | | | | | | | | |
Total Investments in Securities - 88.7%
(cost: $289,388,620) | | | | | | | | | | | | | | | 228,802,769 | |
| | | | | | | | | | | | | | | | |
Other Assets and Liabilities, net - 11.3% | | | | | | | | | | | | | | | 29,213,813 | |
| | | | | | | | | | | | | | | | |
Net Assets - 100.0% | | | | | | | | | | | | | | $ | 258,016,582 | |
| | | | | | | | | | | | | | | | |
| 1 | Variable rate security. Rate disclosed is as of September 30, 2022. Certain variable rate securities are not based on a published reference rate and spread but are determined by the issuer or agent and are based on current market conditions, or, for mortgage-backed securities, are impacted by the individual mortgages which are paying off over time. These securities do not indicate a reference rate and spread in their descriptions. |
| 2 | Security considered illiquid by the Investment Adviser. The total value of such securities as of September 30, 2022 was $2,250,283 and represented 0.9% of net assets. |
| 4 | 144A Restricted Security. The total value of such securities as of September 30, 2022 was $27,662,401 and represented 10.7% of net assets. These securities have been determined to be liquid by the Adviser in accordance with guidelines established by the Board of Directors. |
| 5 | The issuer is in default of interest or principal payments, or other debt covenants. Income is not being accrued. The total value of such securities as of September 30, 2022 was $2,328,262 and represented 0.9% of net assets. |
| 6 | Zero coupon or convertible capital appreciation bond, for which the rate disclosed is either the effective yield on purchase date or the coupon rate to be paid upon conversion to coupon paying. |
| 9 | Municipal Lease Security. The total value of such securities as of September 30, 2022 was $1,818,152 and represented 0.7% of net assets. These securities have been determined to be liquid by the Adviser in accordance with guidelines established by the Board of Directors. |
| 14 | Step Coupon: A bond that pays a coupon rate that increases on a specified date(s). Rate disclosed is as of September 30, 2022. |
| 15 | Securities with a “N/A” maturity date have passed their stated maturity date and have pending restructuring arrangements. |
Numeric footnotes not disclosed are not applicable to this Schedule of Investments.
Short futures contracts outstanding as of September 30, 2022 were as follows:
| | | | | | | | | | | | | | | | |
Type | | Contracts | | | Expiration Date | | | Notional
Amount ($) | | | Value/
Unrealized
Appreciation
(Depreciation)($) | |
Short Futures: 10 | | | | | | | | | | | | | | | | |
U.S. Treasury Long Bond | | | 79 | | | | December 2022 | | | | (9,986,094 | ) | | | 835,430 | |
U.S. Treasury 2-Year | | | 145 | | | | December 2022 | | | | (29,781,641 | ) | | | 483,999 | |
U.S. Treasury 5-Year | | | 261 | | | | December 2022 | | | | (28,059,538 | ) | | | 1,004,973 | |
U.S. Treasury 10-Year | | | 432 | | | | December 2022 | | | | (48,411,000 | ) | | | 2,452,438 | |
| | | | | | | | | | | | | | | | |
| | | | | | | | | | | | | | | 4,776,840 | |
| | | | | | | | | | | | | | | | |
| 10 | The amount of $7,000,000 in cash was segregated with the broker to cover margin requirements for derivative transactions as of September 30, 2022. |
| | |
| |
| See accompanying notes to financial statements. | | |
| | |
| 36 | | SIT MUTUAL FUNDS SEMI-ANNUAL REPORT |
A summary of the levels for the Fund’s investments as of September 30, 2022 is as follows (see Note 2 - significant accounting policies in the notes to financial statements):
| | | | | | | | | | | | | | | | |
| | | Investment in Securities | |
| | | Level 1
Quoted
Prices ($) | | | Level 2
Other significant
observable inputs ($) | | | Level 3
Significant
unobservable inputs ($) | | | Total ($) | |
Municipal Bonds | | | — | | | | 219,025,342 | | | | — | | | | 219,025,342 | |
Investment Companies | | | 9,777,427 | | | | — | | | | — | | | | 9,777,427 | |
Futures | | | 4,776,840 | | | | — | | | | — | | | | 4,776,840 | |
| | | | | | | | | | | | | | | | |
Total: | | | 14,554,267 | | | | 219,025,342 | | | | — | | | | 233,579,609 | |
| | | | | | | | | | | | | | | | |
There were no transfers into or out of level 3 during the reporting period.
| | |
| |
| See accompanying notes to financial statements. | | |
| | |
| SEPTEMBER 30, 2022 | | 37 |
Sit Minnesota Tax-Free Income Fund
OBJECTIVE & STRATEGY
The investment objective of the Sit Minnesota Tax-Free Income Fund is to provide a high level of current income exempt from federal regular income tax and Minnesota regular personal income tax as is consistent with the preservation of capital.
During normal market conditions, the Fund invests 100% of its net assets in municipal securities that generate interest income that is exempt from federal regular income tax and Minnesota regular personal income tax. The Fund anticipates that substantially all of its distributions to its shareholders will be exempt as such. For investors subject to the alternative minimum tax (“AMT”), up to 20% of the Fund’s income may be alternative minimum taxable income.
Fund Performance
The Sit Minnesota Tax-Free Income Fund provided a return of -7.74% during the 6-month period ended September 30, 2022, compared to the return of the Bloomberg 5-Year Municipal Bond Index of -3.12%. The Fund’s 30-day SEC yield was 3.34%, and its 12-month distribution rate was 2.63%.
Factors that Influenced the Fund’s Performance
Interest rates in general and yields on tax-exempt bonds in particular increased dramatically during the period. Specifically, Municipal Market Data (MMD) AAA General Obligation yields rose by roughly 110 to 140 basis points. Moreover, shorter-term and longer-term bond yields increased more than intermediate-term bond yields. Longer duration bonds performed worst during the period. In addition, lower coupon bond performance was worse than higher coupon bond performance, as the duration of lower coupon bonds increased markedly when their market prices fell below par. Tax-exempt mutual funds experienced heavy outflows during the period and have already reached a record in dollar terms during 2022. Municipal issuance was also down, and the comparable 6-month period was the lightest since 2019. Nationwide, municipal issuance was down, however, Minnesota issuance increased versus last year.
The Fund was hurt by its barbelled positioning, as the Fund’s longer duration bonds dramatically underperformed during the six-month period. However, the Funds’ interest rate hedge in U.S. Treasury Futures partially offset the negative impact of the barbell. The Fund was also negatively impacted by a significant concentration of lower coupon bonds in the portfolio. The non-rated bonds in the portfolio outperformed the rated bonds in the portfolio, likely due to higher coupons, but both segments underperformed the benchmark return. Most of the industry groups in the Fund contributed negatively to performance, especially the Fund’s positions in single family mortgage revenue bonds, general obligation bonds, education/student loan revenue bonds, and hospital/healthcare revenue bonds. Conversely, the Funds’ small weighting in escrowed to maturity/pre-refunded bonds contributed favorably to performance.
Outlook and Positioning
Municipal credit remains strong in general, and the volatility experienced thus far in 2022 has almost exclusively been interest rate driven. We are mindful that the economy is experiencing stubbornly high inflation, and some municipal issuers, particularly healthcare and senior living issuers, are experiencing significant increases in operating costs. Moreover, income tax collections may be down in Minnesota next year, especially from capital gains. Fortunately, the State of Minnesota will benefit from the record budget surplus it recorded in its most recent budget cycle. Regardless, we are watching credits and industries for negative trends and are confident that the vast majority of municipal credits remain fundamentally strong.
HYPOTHETICAL GROWTH OF $10,000

The chart above illustrates the total value of a hypothetical $10,000 investment in the Fund over the past 10 years (or for the life of the Fund if shorter) as compared to the performance of the Bloomberg 5-Year Municipal Bond Index. Past performance does not guarantee future results. Returns include the reinvestment of distributions. The chart does not reflect the deduction of taxes that a shareholder would pay on Fund distributions or the redemption of Fund shares.
1 The Bloomberg 5-Year Municipal Bond Index is the 5 year (4-6) component of the Bloomberg Municipal Bond Index, an unmanaged, rules-based, market-value-weighted index for the long-term tax-exempt bond market. The index includes bonds with a minimum credit rating of BBB. The returns include the reinvestment of income and do not include any transaction costs, management fees or other costs. It is not possible to invest directly in an index. This is the Fund’s primary index.
The Fund emphasizes income as the primary driver of return over the long run and maintains a significant yield advantage over the benchmark in this regard. We continue to hedge the Fund’s duration with U.S. Treasury Futures, although the cost of hedging has increased this year. We are organically shortening the Fund’s duration and may reduce or eliminate the hedge if our interest rate outlook changes. The Fund’s longer than benchmark duration, position in non-rated issues, emphasis on revenue bonds, and focus on bond structures with attractive prepayment characteristics all contribute to this yield advantage. The Fund also remains diversified on an issuer basis to manage credit risk. This year has been challenging, but we believe the Fund’s yield advantage over the benchmark have positioned it to achieve attractive risk-adjusted returns in the future.
| | | | |
| Paul J. Jungquist, CFA | | Todd S. Emerson, CFA | | |
| Senior Portfolio Manager | | Kevin P. O’Brien, CFA | | |
| | Portfolio Managers | | |
| | |
| | |
| 38 | | SIT MUTUAL FUNDS SEMI-ANNUAL REPORT |
COMPARATIVE RATES OF RETURNS
as of September 30, 2022
| | | | | | | | | | | | |
| | | Sit Minnesota
Tax-Free Income
Fund | | | Bloomberg
5-Year Muni
Bond Index1 | | | Lipper MN
Muni. Bond
Fund Index2 | |
Six Month | | | -7.74 | % | | | -3.12 | % | | | n/a | |
One Year | | | -13.29 | | | | -8.03 | | | | -11.88 | % |
Five Year | | | -0.04 | | | | 0.48 | | | | -0.02 | |
Ten Year | | | 1.48 | | | | 1.20 | | | | 1.37 | |
Since Inception (12/1/93) | | | 3.89 | | | | 3.67 | | | | 3.70 | |
Performance figures are historical and do not guarantee future results. Investment returns and principal value will vary, and you may have a gain or loss when you sell shares. Current performance may be lower or higher than the performance data quoted. Contact the Fund for performance data current to the most recent month-end. Returns include changes in share price as well as reinvestment of all dividends and capital gains. Returns do not reflect the deduction of taxes that a shareholder would pay on Fund distributions or the redemption of Fund shares. Management fees and administrative expenses are included in the Fund’s performance. Returns for periods greater than one year are compounded average annual rates of return.
| 1 | The Bloomberg 5-Year Municipal Bond Index is the 5 year (4-6) component of the Bloomberg Municipal Bond Index, unmanaged rules-based, market-value-weighted index for the long-term tax-exempt bond market. The index includes bonds with a minimum credit rating of BBB. The returns include the reinvestment of income and do not include any transaction costs, management fees or other costs. It is not possible to invest directly in an index. |
| 2 | The Lipper returns are obtained from Lipper Analytical Services, Inc., a large independent evaluator of mutual funds. |
FUND DIVERSIFICATION
| | | | |
Single Family Mortgage | | | 21.8 | % |
Multifamily Mortgage | | | 19.2 | |
Education/Student Loan | | | 15.8 | |
Hospital/Health Care | | | 12.1 | |
General Obligation | | | 11.4 | |
Sectors less than 5% | | | 14.2 | |
Cash & Other Net Assets | | | 5.5 | |
Based on net assets as of September 30, 2022.
PORTFOLIO SUMMARY
| | | | | | |
Net Asset Value 9/30/22: | | $ | 9.04 | | | Per Share |
Net Asset Value 3/31/22: | | $ | 9.94 | | | Per Share |
Net Assets: | | $ | 489.7 | | | Million |
Average Maturity | | | 16.3 | | | Years |
Effective Duration: 3 | | | 5.1 | | | Years |
| 3 | Duration is a measure of estimated price sensitivity relative to changes in interest rates. Portfolios with longer durations are typically more sensitive to changes in interest rates. For example, if interest rates rise by 1%, the fair value of a security with an effective duration of 5 years would decrease by 5%, with all other factors being constant. The correlation between duration and price sensitivity is greater for securities rated investment-grade than it is for securities rated below investment-grade. Duration estimates are based on assumptions by the Adviser and are subject to a number of limitations. Effective duration is calculated based on historical price changes of securities held by the Fund, and therefore is a more accurate estimate of price sensitivity provided interest rates remain within their historical range. |
QUALITY RATINGS (% of Net Assets)

Lower of Moody’s, S&P, Fitch or Duff & Phelps ratings used.
| | | | |
| Adviser’s Assessment of Non-Rated Securities | | | |
A | | | 0.8 | % |
BBB | | | 6.2 | |
BB | | | 13.4 | |
<BB | | | 1.5 | |
| | | | |
Total | | | 21.9 | % |
SCHEDULE OF INVESTMENTS (Unaudited)
September 30, 2022
Sit Minnesota Tax-Free Income Fund
| | | | | | | | | | | | | | | | |
Name of Issuer | | Principal
Amount ($) | | | Coupon
Rate (%) | | | Maturity
Date | | | Fair
Value ($) | |
| | | | |
Municipal Bonds - 94.2% | | | | | | | | | | | | | | | | |
Education/Student Loan - 15.8% | | | | | | | | | | | | | | | | |
| | | | |
Baytown Township Rev. (St. Croix Prep) | | | 1,000,000 | | | | 4.00 | | | | 8/1/36 | | | | 825,460 | |
Bethel Charter School Lease Rev. (Spectrum High School Proj.) | | | 900,000 | | | | 4.00 | | | | 7/1/32 | | | | 799,164 | |
Bethel Charter School Lease Rev. (Spectrum High School Proj.) | | | 1,100,000 | | | | 4.00 | | | | 7/1/37 | | | | 917,048 | |
Bethel Charter School Lease Rev. (Spectrum High School Proj.) | | | 1,750,000 | | | | 4.25 | | | | 7/1/47 | | | | 1,376,567 | |
Brooklyn Park Charter School Lease Rev. (Athlos Leadership Academy Proj.) | | | 605,000 | | | | 5.25 | | | | 7/1/30 | | | | 560,539 | |
Cologne Charter School Lease Rev. (Cologne Academy Proj.) | | | 320,000 | | | | 4.00 | | | | 7/1/24 | | | | 315,542 | |
Cologne Charter School Lease Rev. (Cologne Academy Proj.) | | | 575,000 | | | | 5.00 | | | | 7/1/29 | | | | 568,479 | |
Cologne Charter School Lease Rev. (Cologne Academy Proj.) | | | 500,000 | | | | 5.00 | | | | 7/1/34 | | | | 476,875 | |
Deephaven Charter School Lease Rev. (Eagle Ridge Academy Proj.) | | | 855,000 | | | | 5.25 | | | | 7/1/37 | | | | 836,053 | |
Deephaven Charter School Lease Rev. (Eagle Ridge Academy Proj.) | | | 600,000 | | | | 5.25 | | | | 7/1/40 | | | | 578,478 | |
Deephaven Charter School Lease Rev. (Eagle Ridge Academy Proj.) | | | 1,000,000 | | | | 5.50 | | | | 7/1/50 | | | | 961,430 | |
Duluth Hsg. & Redevelopment Auth. Rev. (Public School Academy Proj.) | | | 1,100,000 | | | | 5.00 | | | | 11/1/38 | | | | 1,007,677 | |
Duluth Hsg. & Redevelopment Auth. Rev. (Public School Academy Proj.) | | | 350,000 | | | | 5.00 | | | | 11/1/48 | | | | 301,259 | |
Forest Lake Charter School Lease Rev. (Lake International Language Academy) | | | 405,000 | | | | 4.50 | | | | 8/1/26 | | | | 400,772 | |
Forest Lake Charter School Lease Rev. (Lake International Language Academy) | | | 1,000,000 | | | | 5.00 | | | | 8/1/36 | | | | 951,020 | |
Forest Lake Charter School Lease Rev. (Lake International Language Academy) | | | 850,000 | | | | 5.50 | | | | 8/1/36 | | | | 851,241 | |
Ham Lake Charter School Lease Rev. (Davinci Academy Proj.) | | | 875,000 | | | | 5.00 | | | | 7/1/31 | | | | 857,342 | |
Ham Lake Charter School Lease Rev. (Davinci Academy Proj.) | | | 1,000,000 | | | | 5.00 | | | | 7/1/36 | | | | 944,760 | |
Ham Lake Charter School Lease Rev. (Parnassus Prep. Sch. Proj.) | | | 1,000,000 | | | | 4.00 | | | | 11/1/26 | | | | 958,880 | |
Ham Lake Charter School Lease Rev. (Parnassus Prep. Sch. Proj.) | | | 2,720,000 | | | | 5.00 | | | | 11/1/36 | | | | 2,562,376 | |
Hugo Charter School Lease Rev. (Noble Academy Proj.) | | | 750,000 | | | | 5.00 | | | | 7/1/29 | | | | 744,015 | |
Hugo Charter School Lease Rev. (Noble Academy Proj.) | | | 1,000,000 | | | | 5.00 | | | | 7/1/34 | | | | 959,580 | |
Independence Charter School Lease Rev. (Beacon Academy Proj.) | | | 305,000 | | | | 4.25 | | | | 7/1/26 | | | | 291,745 | |
Independence Charter School Lease Rev. (Beacon Academy Proj.) | | | 750,000 | | | | 4.75 | | | | 7/1/31 | | | | 690,713 | |
Independence Charter School Lease Rev. (Beacon Academy Proj.) | | | 1,200,000 | | | | 5.00 | | | | 7/1/36 | | | | 1,044,840 | |
Independence Charter School Lease Rev. (Paladin High School Proj.) | | | 225,000 | | | | 3.25 | | | | 6/1/31 | | | | 182,610 | |
Independence Charter School Lease Rev. (Paladin High School Proj.) | | | 1,410,000 | | | | 4.00 | | | | 6/1/51 | | | | 940,822 | |
Minneapolis School Lease Rev. (Friendship Academy of the Arts) 4 | | | 585,000 | | | | 4.00 | | | | 12/1/31 | | | | 510,196 | |
Minneapolis School Lease Rev. (Friendship Academy of the Arts) 4 | | | 1,385,000 | | | | 5.25 | | | | 12/1/43 | | | | 1,197,319 | |
Minneapolis School Lease Rev. (Twin Cities International School) 4 | | | 1,000,000 | | | | 4.25 | | | | 12/1/27 | | | | 964,440 | |
Minneapolis School Lease Rev. (Twin Cities International School) 4 | | | 1,000,000 | | | | 5.00 | | | | 12/1/37 | | | | 947,970 | |
MN Higher Education Fac. Auth. Rev. (Augsburg College) | | | 3,195,000 | | | | 4.25 | | | | 5/1/40 | | | | 2,613,798 | |
MN Higher Education Fac. Auth. Rev. (Bethel Univ.) | | | 1,200,000 | | | | 5.00 | | | | 5/1/37 | | | | 1,144,044 | |
MN Higher Education Fac. Auth. Rev. (Bethel Univ.) | | | 3,500,000 | | | | 5.00 | | | | 5/1/47 | | | | 3,173,660 | |
MN Higher Education Fac. Auth. Rev. (College of St. Benedict) | | | 1,900,000 | | | | 5.00 | | | | 3/1/37 | | | | 1,934,409 | |
MN Higher Education Fac. Auth. Rev. (Gustavus Adolphus College) | | | 1,250,000 | | | | 4.00 | | | | 10/1/41 | | | | 1,076,313 | |
MN Higher Education Fac. Auth. Rev. (Macalester College) | | | 300,000 | | | | 3.00 | | | | 3/1/43 | | | | 221,955 | |
MN Higher Education Fac. Auth. Rev. (Univ. of St. Thomas) | | | 2,000,000 | | | | 5.00 | | | | 10/1/47 | | | | 2,017,400 | |
MN Higher Education Fac. Auth. Rev. (Univ. of St. Thomas) | | | 4,000,000 | | | | 5.00 | | | | 10/1/47 | | | | 4,034,800 | |
MN Higher Education Fac. Auth. Rev. (Univ. of St. Thomas) | | | 750,000 | | | | 5.00 | | | | 4/1/35 | | | | 771,990 | |
MN Higher Education Fac. Auth. Rev. (Univ. of St. Thomas) | | | 3,150,000 | | | | 4.00 | | | | 4/1/39 | | | | 2,763,400 | |
MN Higher Education Fac. Auth. Rev. (Univ. of St. Thomas) | | | 850,000 | | | | 5.00 | | | | 10/1/40 | | | | 867,722 | |
MN Higher Education Fac. Auth. Rev. (Univ. of St. Thomas) | | | 750,000 | | | | 4.00 | | | | 10/1/41 | | | | 656,310 | |
MN Higher Education Fac. Auth. Rev. (Univ. of St. Thomas) | | | 4,000,000 | | | | 4.00 | | | | 10/1/44 | | | | 3,405,120 | |
| | |
| |
| See accompanying notes to financial statements. | | |
| | |
| 40 | | SIT MUTUAL FUNDS SEMI-ANNUAL REPORT |
| | | | | | | | | | | | | | | | |
Name of Issuer | | Principal
Amount ($) | | | Coupon
Rate (%) | | | Maturity
Date | | | Fair
Value ($) | |
| | | | |
MN Office of Higher Education Rev. 8 | | | 2,820,000 | | | | 2.65 | | | | 11/1/38 | | | | 2,198,162 | |
MN Office of Higher Education Rev. 8 | | | 2,375,000 | | | | 4.00 | | | | 11/1/37 | | | | 2,315,577 | |
Moorhead Educational Fac. Rev. (Concordia College Corp. Proj.) | | | 1,250,000 | | | | 5.00 | | | | 12/1/40 | | | | 1,256,900 | |
Ramsey Lease Rev. (Pact Charter School Proj.) | | | 385,000 | | | | 5.00 | | | | 12/1/26 | | | | 385,239 | |
Ramsey Lease Rev. (Pact Charter School Proj.) | | | 1,850,000 | | | | 5.50 | | | | 12/1/33 | | | | 1,851,443 | |
Savage Charter School Lease Rev. (Aspen Academy) | | | 500,000 | | | | 4.00 | | | | 10/1/26 | | | | 482,455 | |
Savage Charter School Lease Rev. (Aspen Academy) | | | 1,000,000 | | | | 4.75 | | | | 10/1/31 | | | | 950,070 | |
St. Cloud Charter School Lease Rev. (Stride Academy Proj.) | | | 1,850,000 | | | | 5.00 | | | | 4/1/36 | | | | 1,413,437 | |
St. Paul Hsg. & Redev. Auth. | | | 700,000 | | | | 5.00 | | | | 12/1/30 | | | | 705,222 | |
St. Paul Hsg. & Redev. Auth. | | | 1,150,000 | | | | 5.00 | | | | 12/1/37 | | | | 1,150,610 | |
St. Paul Hsg. & Redev. Auth. | | | 705,000 | | | | 5.00 | | | | 12/1/46 | | | | 672,246 | |
St. Paul Hsg. & Redev. Auth. (German Immersion School) | | | 95,000 | | | | 4.00 | | | | 7/1/23 | | | | 94,379 | |
St. Paul Hsg. & Redev. Auth. (German Immersion School) | | | 855,000 | | | | 5.00 | | | | 7/1/33 | | | | 822,604 | |
St. Paul Hsg. & Redev. Auth. (German Immersion School) | | | 500,000 | | | | 5.00 | | | | 7/1/44 | | | | 445,785 | |
St. Paul Hsg. & Redev. Auth. (Higher Ground Academy Proj.) | | | 555,000 | | | | 4.25 | | | | 12/1/23 | | | | 553,346 | |
St. Paul Hsg. & Redev. Auth. (Higher Ground Academy Proj.) | | | 1,500,000 | | | | 5.00 | | | | 12/1/33 | | | | 1,459,095 | |
St. Paul Hsg. & Redev. Auth. (Higher Ground Academy Proj.) | | | 390,000 | | | | 5.13 | | | | 12/1/38 | | | | 372,477 | |
St. Paul Hsg. & Redev. Auth. (Hope Community Academy Proj.) | | | 720,000 | | | | 4.50 | | | | 12/1/29 | | | | 642,355 | |
St. Paul Hsg. & Redev. Auth. (Math & Science Academy) 4 | | | 1,000,000 | | | | 3.00 | | | | 6/1/31 | | | | 812,050 | |
St. Paul Hsg. & Redev. Auth. (Math & Science Academy) 4 | | | 1,225,000 | | | | 4.00 | | | | 6/1/51 | | | | 812,775 | |
St. Paul Hsg. & Redev. Auth. (Nova Classical Academy Proj.) | | | 325,000 | | | | 2.00 | | | | 9/1/26 | | | | 291,086 | |
St. Paul Hsg. & Redev. Auth. (Nova Classical Academy Proj.) | | | 350,000 | | | | 4.00 | | | | 9/1/31 | | | | 325,307 | |
St. Paul Hsg. & Redev. Auth. (St. Paul Conservatory for Performing Artists) | | | 1,135,000 | | | | 4.63 | | | | 3/1/43 | | | | 943,321 | |
St. Paul Hsg. & Redev. Auth. (Twin Cities Academy Proj.) | | | 735,000 | | | | 4.00 | | | | 7/1/25 | | | | 715,971 | |
St. Paul Hsg. & Redev. Auth. (Twin Cities Academy Proj.) | | | 955,000 | | | | 5.00 | | | | 7/1/35 | | | | 904,882 | |
St. Paul Hsg. & Redev. Auth. (Twin Cities German Immersion School) | | | 555,000 | | | | 5.00 | | | | 7/1/49 | | | | 483,472 | |
St. Paul Hsg. & Redev. Auth. Rev. (Community of Peace Academy Proj.) | | | 600,000 | | | | 4.00 | | | | 12/1/39 | | | | 505,266 | |
St. Paul Hsg. & Redev. Auth. Rev. (Community of Peace Academy Proj.) | | | 1,000,000 | | | | 4.00 | | | | 12/1/49 | | | | 771,270 | |
St. Paul Hsg. & Redev. Auth. Rev. (Metro Deaf School Proj.) 4 | | | 700,000 | | | | 5.00 | | | | 6/15/38 | | | | 651,609 | |
St. Paul Hsg. & Redev. Auth. Rev. (Nova Classical Academy Proj.) | | | 600,000 | | | | 4.00 | | | | 9/1/36 | | | | 507,030 | |
St. Paul Hsg. & Redev. Auth. Rev. (Nova Classical Academy Proj.) | | | 1,000,000 | | | | 4.13 | | | | 9/1/47 | | | | 769,790 | |
Woodbury Charter School Lease Rev. | | | 500,000 | | | | 3.00 | | | | 12/1/30 | | | | 432,755 | |
Woodbury Charter School Lease Rev. | | | 400,000 | | | | 4.00 | | | | 12/1/40 | | | | 333,756 | |
Woodbury Charter School Lease Rev. | | | 555,000 | | | | 4.00 | | | | 12/1/50 | | | | 425,591 | |
| | | | | | | | | | | | | | | | |
| | | | | | | | | | | | | | | 77,663,466 | |
| | | | | | | | | | | | | | | | |
Escrowed To Maturity/Prerefunded - 1.8% | | | | | | | | | | | | | | | | |
| | | | |
Goodhue Co. Education District No. 6051 Lease Rev. | | | 1,030,000 | | | | 5.00 | | | | 2/1/34 | | | | 1,052,680 | |
Goodhue Co. Education District No. 6051 Lease Rev. | | | 1,500,000 | | | | 5.00 | | | | 2/1/39 | | | | 1,533,030 | |
Lakeville Hsg. & Redev. Auth. Parking Rev. (Ice Arena. Proj.) | | | 1,250,000 | | | | 4.00 | | | | 2/1/32 | | | | 1,276,525 | |
Western MN Municipal Power Agy. Rev. | | | 4,725,000 | | | | 5.00 | | | | 1/1/46 | | | | 4,828,525 | |
| | | | | | | | | | | | | | | | |
| | | | | | | | | | | | | | | 8,690,760 | |
| | | | | | | | | | | | | | | | |
General Obligation - 11.4% | | | | | | | | | | | | | | | | |
| | | | |
Anoka-Hennepin Independent School District No. 11 | | | 3,850,000 | | | | 3.00 | | | | 2/1/45 | | | | 2,961,689 | |
Apple Valley G.O. | | | 365,000 | | | | 2.00 | | | | 12/15/41 | | | | 220,778 | |
Blooming Prairie Independent School District No. 756 | | | 1,300,000 | | | | 2.25 | | | | 2/1/45 | | | | 778,765 | |
| | |
| |
| See accompanying notes to financial statements. | | |
| | |
| SEPTEMBER 30, 2022 | | 41 |
SCHEDULE OF INVESTMENTS (Unaudited)
September 30, 2022
Sit Minnesota Tax-Free Income Fund (Continued)
| | | | | | | | | | | | | | | | |
Name of Issuer | | Principal
Amount ($) | | | Coupon
Rate (%) | | | Maturity
Date | | | Fair
Value ($) | |
| | | | |
Brooklyn Center Independent School District No. 286 | | | 4,000,000 | | | | 4.00 | | | | 2/1/40 | | | | 3,762,320 | |
Duluth Independent School District No. 709 6 | | | 1,325,000 | | | | 1.90 | | | | 2/1/31 | | | | 914,687 | |
Duluth Independent School District No. 709 6 | | | 1,080,000 | | | | 2.03 | | | | 2/1/32 | | | | 705,596 | |
Duluth Independent School District No. 709 6 | | | 1,075,000 | | | | 2.15 | | | | 2/1/33 | | | | 663,640 | |
Elk River Independent School District No. 728 | | | 5,000,000 | | | | 3.00 | | | | 2/1/40 | | | | 3,773,250 | |
Itasca County Independent School District No. 318 | | | 4,050,000 | | | | 2.00 | | | | 2/1/39 | | | | 2,607,188 | |
Itasca County Independent School District No. 318 | | | 4,250,000 | | | | 2.00 | | | | 2/1/40 | | | | 2,679,328 | |
Itasca G.O. | | | 2,500,000 | | | | 2.38 | | | | 2/1/45 | | | | 1,541,000 | |
Itasca G.O. | | | 4,000,000 | | | | 2.50 | | | | 2/1/50 | | | | 2,429,840 | |
Lakeville Independent School District No. 194 | | | 500,000 | | | | 2.00 | | | | 2/1/37 | | | | 338,780 | |
Madison Lake G.O. | | | 590,000 | | | | 2.13 | | | | 2/1/42 | | | | 380,556 | |
Minneapolis Capital Improvement | | | 2,000,000 | | | | 4.00 | | | | 12/1/46 | | | | 1,804,120 | |
Minneapolis G.O. | | | 5,000,000 | | | | 3.00 | | | | 12/1/42 | | | | 3,920,000 | |
Minnetonka Independent School District No. 276 | | | 1,900,000 | | | | 5.00 | | | | 2/1/41 | | | | 1,953,941 | |
Moorhead G.O. | | | 605,000 | | | | 2.00 | | | | 2/1/38 | | | | 407,268 | |
Moorhead G.O. | | | 365,000 | | | | 2.13 | | | | 2/1/40 | | | | 241,239 | |
Moorhead G.O. | | | 370,000 | | | | 2.13 | | | | 2/1/41 | | | | 240,126 | |
Moorhead G.O. | | | 510,000 | | | | 2.13 | | | | 2/1/42 | | | | 324,600 | |
Morrison Co. Education District No. 6979 | | | 1,000,000 | | | | 4.50 | | | | 2/1/34 | | | | 1,000,590 | |
North Mankato G.O. | | | 1,000,000 | | | | 2.00 | | | | 2/1/37 | | | | 674,910 | |
North Mankato G.O. | | | 550,000 | | | | 2.00 | | | | 2/1/38 | | | | 362,368 | |
Norwood Young America Independent School District No. 108 | | | 2,000,000 | | | | 2.13 | | | | 2/1/41 | | | | 1,267,020 | |
Norwood Young America Independent School District No. 108 | | | 1,400,000 | | | | 2.13 | | | | 2/1/42 | | | | 867,510 | |
Norwood Young America Independent School District No. 108 | | | 1,500,000 | | | | 2.25 | | | | 2/1/45 | | | | 911,280 | |
Owatonna Independent School District No. 761 | | | 750,000 | | | | 2.13 | | | | 2/1/40 | | | | 484,808 | |
Richfield Independent School District No. 280 | | | 6,000,000 | | | | 4.00 | | | | 2/1/37 | | | | 5,865,000 | |
Robbinsdale Independent School District No. 281 | | | 1,000,000 | | | | 2.25 | | | | 2/1/41 | | | | 651,020 | |
Roseau Independent School District No. 682 | | | 750,000 | | | | 2.25 | | | | 2/1/46 | | | | 448,410 | |
Sauk Centre Independent School District No. 743 | | | 1,000,000 | | | | 2.00 | | | | 2/1/39 | | | | 647,630 | |
Sauk Centre Independent School District No. 743 | | | 1,000,000 | | | | 2.00 | | | | 2/1/40 | | | | 634,670 | |
Springfield Independent School District No. 85 | | | 750,000 | | | | 2.00 | | | | 2/1/39 | | | | 477,982 | |
Springfield Independent School District No. 85 | | | 500,000 | | | | 2.00 | | | | 2/1/40 | | | | 312,935 | |
St. Cloud G.O. | | | 1,090,000 | | | | 2.00 | | | | 2/1/41 | | | | 729,548 | |
St. Cloud G.O. | | | 560,000 | | | | 2.00 | | | | 2/1/42 | | | | 365,053 | |
St. Paul Independent School District No. 625 | | | 2,475,000 | | | | 2.00 | | | | 2/1/40 | | | | 1,551,503 | |
State of Minnesota G.O. | | | 5,550,000 | | | | 2.00 | | | | 9/1/41 | | | | 3,470,359 | |
United Hospital District Health Care Facs. G.O (Lake Wood Health System) | | | 1,005,000 | | | | 5.00 | | | | 12/1/30 | | | | 1,031,482 | |
Worthington Independent School District No. 518 | | | 500,000 | | | | 3.00 | | | | 2/1/40 | | | | 412,525 | |
Zumbrota-Mazeppa Independent School District No. 2805 | | | 1,500,000 | | | | 2.50 | | | | 2/1/44 | | | | 1,008,285 | |
| | | | | | | | | | | | | | | | |
| | | | | | | | | | | | | | | 55,823,599 | |
| | | | | | | | | | | | | | | | |
Hospital/Health Care - 12.1% | | | | | | | | | | | | | | | | |
| | | | |
Anoka Health Care and Hsg. Facs. Rev. | | | 1,135,000 | | | | 5.38 | | | | 11/1/34 | | | | 1,075,549 | |
Center City Heath Care Facs. Rev. (Hazelden Betty Ford Foundation Proj.) | | | 250,000 | | | | 5.00 | | | | 11/1/29 | | | | 253,727 | |
Center City Heath Care Facs. Rev. (Hazelden Betty Ford Foundation Proj.) | | | 500,000 | | | | 5.00 | | | | 11/1/44 | | | | 502,125 | |
Chatfield Health Care and Hsg. Facs. Rev. (Chosen Valley Care Center) | | | 1,225,000 | | | | 5.00 | | | | 9/1/52 | | | | 926,982 | |
Chippewa Co. Rev. (Monte Video Hospital Proj.) | | | 2,000,000 | | | | 4.00 | | | | 3/1/32 | | | | 1,852,400 | |
| | |
| |
| See accompanying notes to financial statements. | | |
| | |
| 42 | | SIT MUTUAL FUNDS SEMI-ANNUAL REPORT |
| | | | | | | | | | | | | | | | |
Name of Issuer | | Principal
Amount ($) | | | Coupon
Rate (%) | | | Maturity
Date | | | Fair
Value ($) | |
| | | | |
Crookston Health Care Facs. Rev. (Riverview Health Care Proj.) | | | 1,000,000 | | | | 4.00 | | | | 5/1/32 | | | | 887,090 | |
Dakota Co. Community Dev. Agy. (Sanctuary at W. St. Paul Proj.) | | | 1,400,000 | | | | 5.75 | | | | 8/1/30 | | | | 1,120,084 | |
Dakota Co. Community Dev. Agy. (Sanctuary at W. St. Paul Proj.) | | | 1,050,000 | | | | 6.00 | | | | 8/1/35 | | | | 803,187 | |
Duluth Economic Dev. Auth. Rev. (St. Luke Hospital of Duluth) | | | 400,000 | | | | 4.00 | | | | 6/15/35 | | | | 351,140 | |
Duluth Economic Dev. Auth. Rev. (St. Luke Hospital of Duluth) | | | 170,000 | | | | 4.00 | | | | 6/15/35 | | | | 149,234 | |
Duluth Economic Dev. Auth. Rev. (St. Luke Hospital of Duluth) | | | 170,000 | | | | 4.00 | | | | 6/15/36 | | | | 147,446 | |
Duluth Economic Dev. Auth. Rev. (St. Luke Hospital of Duluth) | | | 375,000 | | | | 4.00 | | | | 6/15/36 | | | | 325,249 | |
Duluth Economic Dev. Auth. Rev. (St. Luke Hospital of Duluth) | | | 350,000 | | | | 4.00 | | | | 6/15/37 | | | | 299,415 | |
Duluth Economic Dev. Auth. Rev. (St. Luke Hospital of Duluth) | | | 170,000 | | | | 4.00 | | | | 6/15/37 | | | | 145,430 | |
Duluth Economic Dev. Auth. Rev. (St. Luke Hospital of Duluth) | | | 375,000 | | | | 4.00 | | | | 6/15/38 | | | | 316,459 | |
Duluth Economic Dev. Auth. Rev. (St. Luke Hospital of Duluth) | | | 150,000 | | | | 4.00 | | | | 6/15/38 | | | | 126,583 | |
Duluth Economic Dev. Auth. Rev. (St. Luke Hospital of Duluth) | | | 225,000 | | | | 4.00 | | | | 6/15/39 | | | | 187,445 | |
Duluth Economic Dev. Auth. Rev. (St. Luke Hospital of Duluth) | | | 150,000 | | | | 4.00 | | | | 6/15/39 | | | | 124,963 | |
Duluth Economic Dev. Auth. Rev. (St. Luke Hospital of Duluth) | | | 850,000 | | | | 3.00 | | | | 6/15/44 | | | | 538,169 | |
Hayward Hsg. & Health Care Fac. Rev. (St. John Lutheran Home of Albert Lea Proj.) | | | 1,900,000 | | | | 5.00 | | | | 10/1/34 | | | | 1,442,822 | |
Maple Grove Health Care System Rev. (Maple Grove Hospital Corp.) | | | 825,000 | | | | 5.00 | | | | 5/1/32 | | | | 837,037 | |
Maple Grove Health Care System Rev. (Maple Grove Hospital Corp.) | | | 4,175,000 | | | | 4.00 | | | | 5/1/37 | | | | 3,568,957 | |
Minneapolis Health Care System Rev. (Fairview Health Services) | | | 2,590,000 | | | | 5.00 | | | | 11/15/34 | | | | 2,619,630 | |
Minneapolis Health Care System Rev. (Fairview Health Services) | | | 2,500,000 | | | | 5.00 | | | | 11/15/49 | | | | 2,463,975 | |
Moorhead Economic Dev. Auth. Rev. | | | 550,000 | | | | 4.60 | | | | 9/1/25 | | | | 528,000 | |
Oak Park Heights Nursing Home Rev. (Boutwells Landing Care Center) | | | 1,500,000 | | | | 5.50 | | | | 8/1/28 | | | | 1,424,580 | |
Oak Park Heights Nursing Home Rev. (Boutwells Landing Care Center) | | | 1,000,000 | | | | 6.00 | | | | 8/1/36 | | | | 917,170 | |
Puerto Rico Industrial Tourist Educational Medical & Environmental Ctl. Facs. Fin. Auth. Rev. 11 | | | 175,000 | | | | 4.00 | | | | 7/1/37 | | | | 146,368 | |
Puerto Rico Industrial Tourist Educational Medical & Environmental Ctl. Facs. Fin. Auth. Rev. 11 | | | 200,000 | | | | 4.00 | | | | 7/1/39 | | | | 164,178 | |
Puerto Rico Industrial Tourist Educational Medical & Environmental Ctl. Facs. Fin. Auth. Rev. 11 | | | 220,000 | | | | 4.00 | | | | 7/1/41 | | | | 177,533 | |
Rochester Health Care Facs. Rev. (Mayo Clinic) | | | 5,000,000 | | | | 5.00 | | | | 11/15/33 | | | | 5,545,800 | |
Rochester Health Care Facs. Rev. (Mayo Clinic) | | | 7,500,000 | | | | 4.00 | | | | 11/15/48 | | | | 6,524,250 | |
Rochester Health Care Facs. Rev. (Mayo Clinic) | | | 1,300,000 | | | | 4.00 | | | | 11/15/39 | | | | 1,228,461 | |
Shakopee Health Care Facs. Rev. (St. Francis Regional Medical Center Proj.) | | | 745,000 | | | | 5.00 | | | | 9/1/28 | | | | 754,774 | |
St. Cloud Health Care Rev. (CentraCare Health System Proj.) | | | 3,750,000 | | | | 5.00 | | | | 5/1/46 | | | | 3,727,163 | |
St. Cloud Health Care Rev. (CentraCare Health System Proj.) | | | 500,000 | | | | 5.00 | | | | 5/1/48 | | | | 497,155 | |
St. Cloud Health Care Rev. (CentraCare Health System Proj.) | | | 500,000 | | | | 4.00 | | | | 5/1/49 | | | | 421,595 | |
St. Louis Park Health Care Facs. Rev. (Mount Olivet Careview Home Health Proj.) 1 | | | 2,250,000 | | | | 4.60 | | | | 6/1/41 | | | | 1,795,635 | |
St. Paul Hsg. & Redev. Auth. Health Care Rev. (Fairview Health Services Proj.) | | | 750,000 | | | | 4.00 | | | | 11/15/35 | | | | 691,658 | |
St. Paul Hsg. & Redev. Auth. Health Care Rev. (Fairview Health Services Proj.) | | | 4,000,000 | | | | 4.00 | | | | 11/15/43 | | | | 3,455,800 | |
St. Paul Hsg. & Redev. Auth. Health Care Rev. (Fairview Health Services Proj.) | | | 1,000,000 | | | | 5.00 | | | | 11/15/47 | | | | 987,650 | |
St. Paul Hsg. & Redev. Auth. Health Care Rev. (HealthPartners Oblig. Group Proj.) | | | 4,800,000 | | | | 5.00 | | | | 7/1/32 | | | | 4,891,824 | |
St. Paul Hsg. & Redev. Auth. Health Care Rev. (HealthPartners Oblig. Group Proj.) | | | 2,000,000 | | | | 5.00 | | | | 7/1/33 | | | | 2,035,000 | |
St. Paul Hsg. & Redev. Auth. Health Care Rev. (Senior Episcopal Homes Proj.) | | | 2,150,000 | | | | 5.00 | | | | 5/1/38 | | | | 1,900,428 | |
Victoria Health Care Facs. Rev. (Augustana Emerald Care LLC) | | | 425,000 | | | | 4.25 | | | | 8/1/24 | | | | 411,086 | |
| | | | | | | | | | | | | | | | |
| | | | | | | | | | | | | | | 59,291,206 | |
| | | | | | | | | | | | | | | | |
Industrial/Pollution Control - 0.6% | | | | | | | | | | | | | | | | |
| | | | |
St. Paul Port Auth. Rev. 8 | | | 1,000,000 | | | | 4.00 | | | | 10/1/40 | | | | 919,590 | |
St. Paul Port Auth. Rev. | | | 1,000,000 | | | | 4.00 | | | | 10/1/42 | | | | 899,640 | |
St. Paul Port Auth. Solid Waste Disposal Rev. (Gerdau St. Paul Steel Mill Proj.) 4, 8 | | | 1,000,000 | | | | 4.50 | | | | 10/1/37 | | | | 926,360 | |
| | | | | | | | | | | | | | | | |
| | | | | | | | | | | | | | | 2,745,590 | |
| | | | | | | | | | | | | | | | |
| | |
| |
| See accompanying notes to financial statements. | | |
| | |
| SEPTEMBER 30, 2022 | | 43 |
SCHEDULE OF INVESTMENTS (Unaudited)
September 30, 2022
Sit Minnesota Tax-Free Income Fund (Continued)
| | | | | | | | | | | | | | | | |
Name of Issuer | | Principal
Amount ($) | | | Coupon
Rate (%) | | | Maturity
Date | | | Fair
Value ($) | |
Insured - 0.2% | | | | | | | | | | | | | | | | |
Luverne Electric Rev. | | | 500,000 | | | | 3.00 | | | | 12/1/47 | | | | 351,055 | |
Luverne Electric Rev. | | | 800,000 | | | | 3.00 | | | | 12/1/51 | | | | 540,880 | |
| | | | | | | | | | | | | | | | |
| | | | | | | | | | | | | | | 891,935 | |
| | | | | | | | | | | | | | | | |
Multifamily Mortgage - 19.2% | | | | | | | | | | | | | | | | |
Anoka Hsg. Rev. (Homestead at Anoka, Inc. Proj.) | | | 1,000,000 | | | | 5.50 | | | | 11/1/46 | | | | 901,480 | |
Apple Valley Economic Dev. Auth. Rev. (Augustana Healthcare Center) | | | 500,000 | | | | 3.90 | | | | 2/1/31 | | | | 413,415 | |
Apple Valley Economic Dev. Auth. Rev. (Augustana Healthcare Center) | | | 500,000 | | | | 4.15 | | | | 2/1/36 | | | | 380,660 | |
Apple Valley Rev. (Orchard Path Phase II Proj.) | | | 260,000 | | | | 4.00 | | | | 9/1/30 | | | | 239,333 | |
Apple Valley Rev. (Orchard Path Phase II Proj.) | | | 300,000 | | | | 4.00 | | | | 9/1/36 | | | | 256,113 | |
Apple Valley Rev. (Orchard Path Phase II Proj.) | | | 440,000 | | | | 4.00 | | | | 9/1/41 | | | | 355,410 | |
Apple Valley Rev. (Orchard Path Phase II Proj.) | | | 830,000 | | | | 4.00 | | | | 9/1/51 | | | | 614,275 | |
Apple Valley Rev. (Orchard Path Phase II Proj.) | | | 750,000 | | | | 4.00 | | | | 9/1/61 | | | | 530,130 | |
Apple Valley Senior Hsg. Rev. (Orchard Path Proj.) | | | 2,000,000 | | | | 5.00 | | | | 9/1/58 | | | | 1,775,840 | |
Apple Valley Senior Hsg. Rev. (Presbyterian Homes) | | | 1,500,000 | | | | 5.00 | | | | 9/1/43 | | | | 1,403,865 | |
Apple Valley Senior Living Rev. (Senior Living LLC Proj.) | | | 475,000 | | | | 4.00 | | | | 1/1/25 | | | | 434,302 | |
Apple Valley Senior Living Rev. (Senior Living LLC Proj.) | | | 1,045,000 | | | | 4.00 | | | | 1/1/25 | | | | 990,179 | |
Apple Valley Senior Living Rev. (Senior Living LLC Proj.) | | | 1,175,000 | | | | 4.00 | | | | 1/1/26 | | | | 1,085,430 | |
Apple Valley Senior Living Rev. (Senior Living LLC Proj.) | | | 1,100,000 | | | | 6.75 | | | | 1/1/27 | | | | 943,272 | |
Apple Valley Senior Living Rev. (Senior Living LLC Proj.) | | | 950,000 | | | | 4.00 | | | | 1/1/30 | | | | 784,444 | |
Apple Valley Senior Living Rev. (Senior Living LLC Proj.) | | | 1,430,000 | | | | 4.25 | | | | 1/1/37 | | | | 1,045,544 | |
Apple Valley Senior Living Rev. (Senior Living LLC Proj.) | | | 950,000 | | | | 7.00 | | | | 1/1/37 | | | | 648,650 | |
Apple Valley Senior Living Rev. (Senior Living LLC Proj.) | | | 2,640,000 | | | | 4.38 | | | | 1/1/47 | | | | 1,709,426 | |
Apple Valley Senior Living Rev. (Senior Living LLC Proj.) | | | 2,850,000 | | | | 5.00 | | | | 1/1/47 | | | | 1,640,118 | |
Bethel Rev. (Grandview Christian Home Proj.) | | | 3,000,000 | | | | 5.00 | | | | 10/1/41 | | | | 2,583,420 | |
Blaine Senior Hsg. & Health Care Fac. Rev. (Crest View Senior Community Proj.) | | | 1,250,000 | | | | 5.13 | | | | 7/1/25 | | | | 1,046,325 | |
Blaine Senior Hsg. & Health Care Fac. Rev. (Crest View Senior Community Proj.) | | | 1,645,000 | | | | 5.75 | | | | 7/1/35 | | | | 1,019,078 | |
Blaine Senior Hsg. & Health Care Fac. Rev. (Crest View Senior Community Proj.) | | | 2,000,000 | | | | 6.13 | | | | 7/1/45 | | | | 1,218,940 | |
Champlin Multifamily Hsg. Rev. (Champlin Drive Apts.) | | | 425,000 | | | | 6.00 | | | | 1/1/27 | | | | 425,034 | |
Chisago Hsg. and Health Care Rev. (CDL Homes LLC) | | | 750,000 | | | | 6.00 | | | | 8/1/33 | | | | 752,490 | |
Cloquet Rev. (HADC Cloquet, LLC Proj.) | | | 180,000 | | | | 2.20 | | | | 8/1/28 | | | | 148,898 | |
Cloquet Rev. (HADC Cloquet, LLC Proj.) | | | 250,000 | | | | 2.60 | | | | 8/1/30 | | | | 197,655 | |
Cloquet Rev. (HADC Cloquet, LLC Proj.) | | | 200,000 | | | | 2.80 | | | | 8/1/31 | | | | 155,112 | |
Cloquet Rev. (HADC Cloquet, LLC Proj.) | | | 200,000 | | | | 3.20 | | | | 8/1/34 | | | | 147,328 | |
Cloquet Rev. (HADC Cloquet, LLC Proj.) | | | 500,000 | | | | 4.00 | | | | 8/1/41 | | | | 362,295 | |
Cloquet Rev. (HADC Cloquet, LLC Proj.) | | | 500,000 | | | | 4.00 | | | | 8/1/48 | | | | 332,935 | |
Dakota Co. Community Dev. Agy. Multifamily Hsg. Rev. | | | 3,500,000 | | | | 4.00 | | | | 1/1/42 | | | | 3,213,420 | |
Dakota Co. Community Dev. Agy. Multifamily Hsg. Rev. (The Quill Proj.) 4 | | | 2,500,000 | | | | 3.55 | | | | 4/1/39 | | | | 1,762,475 | |
Dakota Co. Community Dev. Agy. Multifamily Hsg. Rev. (Walker Highviews Hills LLC) 4 | | | 750,000 | | | | 5.00 | | | | 8/1/36 | | | | 719,565 | |
Dakota Co. Community Dev. Agy. Multifamily Hsg. Rev. (Walker Highviews Hills LLC) 4 | | | 500,000 | | | | 5.00 | | | | 8/1/51 | | | | 449,405 | |
Fridley Multifamily Hsg. Rev. (Village Green Apartments Proj.) | | | 3,345,889 | | | | 3.75 | | | | 11/1/34 | | | | 3,103,781 | |
Hayward Health Care Fac. Rev. (American Baptist Homes Midwest Proj.) | | | 1,350,000 | | | | 5.38 | | | | 8/1/34 | | | | 1,159,771 | |
Hayward Health Care Fac. Rev. (American Baptist Homes Midwest Proj.) | | | 500,000 | | | | 5.75 | | | | 2/1/44 | | | | 409,825 | |
Independence Health Care Facs. Rev. (Augustana Chapel View Home) | | | 250,000 | | | | 4.00 | | | | 12/1/32 | | | | 207,815 | |
Lauderdale Multifamily Hsg. Rev. (The Fern Senior Affordable Housing Proj.) | | | 2,000,000 | | | | 5.13 | | | | 1/1/40 | | | | 1,860,080 | |
| | |
| |
| See accompanying notes to financial statements. | | |
| | |
| 44 | | SIT MUTUAL FUNDS SEMI-ANNUAL REPORT |
| | | | | | | | | | | | | | | | |
Name of Issuer | | Principal
Amount ($) | | | Coupon
Rate (%) | | | Maturity
Date | | | Fair
Value ($) | |
Maple Plain Senior Hsg. Health Care Rev. (Haven Home Inc Proj.) | | | 500,000 | | | | 5.00 | | | | 7/1/39 | | | | 454,970 | |
Minneapolis & St. Paul Hsg. & Redev. Auth. Multifamily Hsg. Rev. (GNMA Collateralized) 8 | | | 2,765,000 | | | | 4.75 | | | | 1/20/42 | | | | 2,747,746 | |
Minneapolis Multifamily Hsg. Rev. (14th & Central LLLP Proj.) (FNMA Collateralized) | | | 5,000,000 | | | | 2.35 | | | | 2/1/38 | | | | 3,940,900 | |
Minneapolis Multifamily Hsg. Rev. (Greenway Heights Family Housing) | | | 1,015,000 | | | | 5.75 | | | | 7/15/31 | | | | 995,735 | |
Minneapolis Senior Hsg. & Health Care Rev. (Ecumen Mill City Quarter) | | | 375,000 | | | | 4.75 | | | | 11/1/28 | | | | 355,796 | |
Minneapolis Senior Hsg. & Health Care Rev. (Ecumen Mill City Quarter) | | | 1,500,000 | | | | 5.00 | | | | 11/1/35 | | | | 1,362,795 | |
Minneapolis Senior Hsg. & Health Care Rev. (Ecumen Mill City Quarter) | | | 1,090,000 | | | | 4.00 | | | | 11/1/25 | | | | 1,041,015 | |
Minnetonka MF Hsg. Rev. (Elmbrooke & Golden Valley Townhome Proj.) (FNMA Collateralized) | | | 1,873,957 | | | | 3.00 | | | | 11/1/34 | | | | 1,623,522 | |
MN Hsg. Fin. Agy. Rental Hsg. Rev. | | | 1,000,000 | | | | 5.20 | | | | 8/1/43 | | | | 1,005,280 | |
Moorhead Economic Dev. Auth. Rev. Ref. (EverCare Sr. Living LLC) | | | 280,000 | | | | 4.65 | | | | 9/1/26 | | | | 265,401 | |
Moorhead Health Care Rev. Ref. (EverCare Sr. Living LLC) | | | 1,000,000 | | | | 5.00 | | | | 9/1/32 | | | | 883,570 | |
Moorhead Health Care Rev. Ref. (EverCare Sr. Living LLC) | | | 250,000 | | | | 5.13 | | | | 9/1/37 | | | | 211,543 | |
New Ulm Economic Dev. Auth. Rev. (HADC Ridgeway Proj.) | | | 1,500,000 | | | | 5.00 | | | | 8/1/39 | | | | 1,189,605 | |
North Oaks Rev. (Waverly Gardens Proj.) | | | 150,000 | | | | 4.25 | | | | 10/1/41 | | | | 135,451 | |
North Oaks Senior Hsg. Rev. (Waverly Gardens Proj.) | | | 2,000,000 | | | | 4.00 | | | | 10/1/33 | | | | 1,869,420 | |
North Oaks Senior Hsg. Rev. (Waverly Gardens Proj.) | | | 1,500,000 | | | | 5.00 | | | | 10/1/35 | | | | 1,509,150 | |
North Oaks Senior Hsg. Rev. (Waverly Gardens Proj.) | | | 1,000,000 | | | | 5.00 | | | | 10/1/47 | | | | 979,040 | |
Otsego Rev. (Riverview Landing Proj.) | | | 1,500,000 | | | | 5.00 | | | | 10/1/42 | | | | 1,264,980 | |
Rochester Health Care & Hsg. Rev. (Homestead Rochester, Inc.) | | | 1,950,000 | | | | 5.00 | | | | 12/1/30 | | | | 1,807,650 | |
Rochester Health Care & Hsg. Rev. (The Homestead at Rochester) | | | 720,000 | | | | 6.38 | | | | 12/1/33 | | | | 725,782 | |
Rochester Health Care & Hsg. Rev. (The Homestead at Rochester) | | | 2,500,000 | | | | 6.50 | | | | 12/1/35 | | | | 2,521,850 | |
Rochester Health Care & Hsg. Rev. (The Homestead at Rochester) | | | 250,000 | | | | 6.88 | | | | 12/1/48 | | | | 252,635 | |
Rochester Multifamily Hsg. Rev. (Essex Place Apartments Proj.) (FHLMC) | | | 4,000,000 | | | | 3.75 | | | | 6/1/29 | | | | 3,969,000 | |
Sartell Health Care & Hsg. Fac. Rev. (Country Manor Campus LLC Proj.) | | | 2,150,000 | | | | 5.30 | | | | 9/1/37 | | | | 2,000,919 | |
Sartell Health Care & Hsg. Fac. Rev. (Country Manor Campus LLC Proj.) | | | 500,000 | | | | 5.00 | | | | 9/1/35 | | | | 457,170 | |
Sauk Rapids Health Care & Hsg. Facs. Rev. (Good Shepherd Lutheran Home Proj.) | | | 1,705,000 | | | | 5.13 | | | | 1/1/39 | | | | 1,462,583 | |
St. Anthony Multifamily Hsg. Rev. (Silver Lake Village Hsg.) | | | 250,000 | | | | 5.75 | | | | 12/1/28 | | | | 252,850 | |
St. Anthony Multifamily Hsg. Rev. (Silver Lake Village Hsg.) | | | 2,000,000 | | | | 6.00 | | | | 12/1/30 | | | | 2,024,260 | |
St. Joseph Senior Hsg. & Health Care Rev. (Woodcrest of Country Manor Proj.) | | | 750,000 | | | | 4.25 | | | | 7/1/39 | | | | 592,942 | |
St. Joseph Senior Hsg. & Health Care Rev. (Woodcrest of Country Manor Proj.) | | | 1,500,000 | | | | 5.00 | | | | 7/1/55 | | | | 1,196,325 | |
St. Paul Hsg. & Redev. Auth. Health Care Rev. (Carondelet Village Proj.) | | | 3,475,000 | | | | 4.25 | | | | 12/1/27 | | | | 3,339,232 | |
St. Paul Hsg. & Redev. Auth. Health Care Rev. (Carondelet Village Proj.) | | | 2,400,000 | | | | 5.00 | | | | 12/1/47 | | | | 2,310,072 | |
St. Paul Hsg. & Redev. Auth. Multifamily Housing Rev. (Marian Center Proj.) | | | 145,000 | | | | 5.20 | | | | 11/1/22 | | | | 144,923 | |
St. Paul Hsg. & Redev. Auth. Multifamily Housing Rev. (Marian Center Proj.) | | | 1,000,000 | | | | 5.30 | | | | 11/1/30 | | | | 931,410 | |
St. Paul Hsg. & Redev. Auth. Multifamily Housing Rev. (Marian Center Proj.) | | | 2,590,000 | | | | 5.38 | | | | 5/1/43 | | | | 2,161,666 | |
St. Paul Park Health Care Facs. Rev (Presbyterian Homes Interlu Proj.) | | | 1,000,000 | | | | 5.00 | | | | 5/1/43 | | | | 916,910 | |
St. Paul Park Senior Hsg. Rev. (Presbyterian Homes Bloomin Proj.) | | | 1,000,000 | | | | 5.00 | | | | 9/1/42 | | | | 957,390 | |
St. Peter Hsg. & Health Care Fac. Rev. (Ecumen Second Century & Owatonna Senior Living Proj.) | | | 875,000 | | | | 5.00 | | | | 3/1/40 | | | | 801,561 | |
Vergas Hsg. & Healthcare Facs. Rev. (CDL Homes Proj.) | | | 1,000,000 | | | | 4.25 | | | | 8/1/43 | | | | 762,030 | |
Vergas Rev. (CDL Homes Proj.) | | | 235,000 | | | | 4.00 | | | | 8/1/25 | | | | 225,995 | |
Wayzata Senior Hsg. Rev. (Folkestone Senior Living Community) | | | 1,500,000 | | | | 4.00 | | | | 8/1/44 | | | | 1,209,450 | |
Wayzata Senior Hsg. Rev. (Folkestone Senior Living Community) | | | 1,000,000 | | | | 5.00 | | | | 8/1/49 | | | | 931,540 | |
Wayzata Senior Hsg. Rev. (Folkestone Senior Living Community) | | | 2,750,000 | | | | 5.00 | | | | 8/1/54 | | | | 2,509,733 | |
West St. Paul Hsg. & Health Care Rev. (Walker Westwood Ridge Camp) | | | 250,000 | | | | 5.00 | | | | 11/1/49 | | | | 209,150 | |
| | | | | | | | | | | | | | | | |
| | | | | | | | | | | | | | | 93,938,480 | |
| | | | | | | | | | | | | | | | |
| | |
| |
| See accompanying notes to financial statements. | | |
| | |
| SEPTEMBER 30, 2022 | | 45 |
SCHEDULE OF INVESTMENTS (Unaudited)
September 30, 2022
Sit Minnesota Tax-Free Income Fund (Continued)
| | | | | | | | | | | | | | | | |
Name of Issuer | | Principal
Amount ($) | | | Coupon
Rate (%) | | | Maturity
Date | | | Fair
Value ($) | |
Municipal Lease - 4.2% 9 | | | | | | | | | | | | | | | | |
Duluth Independent School District No. 709 | | | 1,875,000 | | | | 2.60 | | | | 3/1/28 | | | | 1,678,837 | |
Duluth Independent School District No. 709 | | | 920,000 | | | | 3.00 | | | | 3/1/32 | | | | 767,216 | |
Golden Valley Hsg. & Redev. Auth. Rev. | | | 500,000 | | | | 4.00 | | | | 2/1/32 | | | | 503,775 | |
Guam Education Fin. Foundation 11 | | | 1,730,000 | | | | 5.00 | | | | 10/1/22 | | | | 1,730,000 | |
Hibbing Independent School District No. 701 | | | 2,000,000 | | | | 3.00 | | | | 3/1/41 | | | | 1,522,560 | |
Lake Agassiz Education Cooperative No. 0397-52 | | | 645,000 | | | | 2.50 | | | | 2/1/32 | | | | 501,932 | |
Lake Agassiz Education Cooperative No. 0397-52 | | | 365,000 | | | | 2.75 | | | | 2/1/36 | | | | 268,903 | |
Minnetonka Independent School District No. 276 | | | 400,000 | | | | 3.00 | | | | 3/1/42 | | | | 308,132 | |
Minnetonka Independent School District No. 276 | | | 500,000 | | | | 3.00 | | | | 7/1/50 | | | | 363,245 | |
Minnetonka Independent School District No. 276 | | | 1,410,000 | | | | 2.25 | | | | 2/1/44 | | | | 860,072 | |
Minnetonka Independent School District No. 276 | | | 1,000,000 | | | | 2.13 | | | | 2/1/41 | | | | 629,700 | |
Minnetonka Independent School District No. 276 | | | 750,000 | | | | 2.38 | | | | 7/1/51 | | | | 447,885 | |
MN Hsg. Fin. Agy. Rev. | | | 405,000 | | | | 3.00 | | | | 8/1/38 | | | | 320,687 | |
MN Hsg. Fin. Agy. Rev. | | | 435,000 | | | | 3.00 | | | | 8/1/39 | | | | 338,256 | |
MN Hsg. Fin. Agy. Rev. | | | 1,000,000 | | | | 3.00 | | | | 8/1/43 | | | | 733,270 | |
MN Hsg. Fin. Agy. Rev. (State Appropriation) | | | 290,000 | | | | 3.00 | | | | 8/1/38 | | | | 229,628 | |
MN Hsg. Fin. Agy. Rev. (State Appropriation) | | | 2,000,000 | | | | 5.00 | | | | 8/1/34 | | | | 2,044,980 | |
MN State Armory Building Commission Rev. | | | 1,900,000 | | | | 3.00 | | | | 6/1/38 | | | | 1,569,609 | |
Northeastern Metropolitan Intermediate School District No. 916 | | | 1,000,000 | | | | 5.00 | | | | 2/1/34 | | | | 1,031,540 | |
Pine Island Independent School District No. 255 | | | 525,000 | | | | 2.00 | | | | 2/1/40 | | | | 350,506 | |
Pine Island Independent School District No. 255 | | | 1,110,000 | | | | 2.20 | | | | 2/1/44 | | | | 712,209 | |
Pine Island Independent School District No. 255 | | | 895,000 | | | | 2.25 | | | | 2/1/47 | | | | 551,517 | |
Plymouth Intermediate District No. 287 | | | 600,000 | | | | 4.00 | | | | 2/1/37 | | | | 557,208 | |
Rochester Economic Dev. Auth. Rev. | | | 750,000 | | | | 2.13 | | | | 2/1/38 | | | | 543,615 | |
Shakopee Independent School Dist. No. 720 | | | 500,000 | | | | 2.00 | | | | 2/1/31 | | | | 401,925 | |
Southern Plains Education Cooperative No. 915 | | | 1,000,000 | | | | 4.50 | | | | 2/1/39 | | | | 949,410 | |
Waconia Independent School District No. 110 | | | 500,000 | | | | 5.00 | | | | 2/1/37 | | | | 508,720 | |
Winona School District No. 861 Lease Purchase | | | 97,630 | | | | 6.04 | | | | 8/1/24 | | | | 97,754 | |
| | | | | | | | | | | | | | | | |
| | | | | | | | | | | | | | | 20,523,091 | |
| | | | | | | | | | | | | | | | |
Other Revenue Bonds - 3.3% | | | | | | | | | | | | | | | | |
Crystal Governmental Fac. Rev. | | | 256,399 | | | | 5.10 | | | | 12/15/26 | | | | 226,575 | |
Minneapolis Tax Increment Rev. | | | 320,000 | | | | 3.50 | | | | 3/1/23 | | | | 318,314 | |
Minneapolis Tax Increment Rev. | | | 170,000 | | | | 3.80 | | | | 3/1/25 | | | | 165,653 | |
Minneapolis Tax Increment Rev. | | | 200,000 | | | | 4.00 | | | | 3/1/27 | | | | 195,302 | |
Minneapolis Tax Increment Rev. | | | 260,000 | | | | 4.00 | | | | 3/1/30 | | | | 245,718 | |
Mound Hsg. & Redev. Auth. Tax Increment Rev. Ref. (Metroplain Proj.) | | | 431,000 | | | | 5.00 | | | | 2/15/27 | | | | 411,454 | |
Northeastern Metropolitan Intermediate School District No. 916 | | | 4,500,000 | | | | 4.00 | | | | 2/1/38 | | | | 4,197,555 | |
St. Louis Park Economic Dev. Auth. Tax Increment Rev. (Hoigaard Vlg.) | | | 175,000 | | | | 5.00 | | | | 2/1/23 | | | | 174,561 | |
St. Paul Hsg. & Redev. Auth. Rev. (Amherst H Wilder Foundation Proj.) | | | 1,750,000 | | | | 5.00 | | | | 12/1/36 | | | | 1,739,343 | |
St. Paul Hsg. & Redev. Auth. Tax Increment Rev. (9th St. Lofts Proj.) | | | 564,000 | | | | 6.38 | | | | 2/15/28 | | | | 552,201 | |
St. Paul Hsg. & Redev. Auth. Tax Increment Rev. (Emerald Gardens Proj.) | | | 610,000 | | | | 6.50 | | | | 3/1/29 | | | | 610,006 | |
St. Paul Hsg. & Redev. Auth. Tax Increment Rev. (North Quadrant Owner Occupied Proj.) | | | 774,000 | | | | 7.00 | | | | 2/15/28 | | | | 774,542 | |
St. Paul Hsg. & Redev. Auth. Tax Increment Rev. (North Quadrant Owner Occupied Proj.) | | | 532,000 | | | | 7.50 | | | | 2/15/28 | | | | 531,941 | |
St. Paul Port Auth. Lease Rev. (Regions Hospital Parking Ramp Proj.) | | | 3,695,000 | | | | 5.00 | | | | 8/1/36 | | | | 3,695,185 | |
| | |
| |
| See accompanying notes to financial statements. | | |
| | |
| 46 | | SIT MUTUAL FUNDS SEMI-ANNUAL REPORT |
| | | | | | | | | | | | | | | | |
Name of Issuer | | Principal
Amount ($) | | | Coupon
Rate (%) | | | Maturity
Date | | | Fair
Value ($) | |
Territory of Guam. Rev. 11 | | | 500,000 | | | | 5.00 | | | | 12/1/46 | | | | 456,390 | |
Virgin Islands Public Fin. Auth. (Gross Receipts Taxes Loan Note) 11 | | | 2,000,000 | | | | 5.00 | | | | 10/1/42 | | | | 1,754,980 | |
| | | | | | | | | | | | | | | | |
| | | | | | | | | | | | | | | 16,049,720 | |
| | | | | | | | | | | | | | | | |
Sales Tax Revenue - 1.3% | | | | | | | | | | | | | | | | |
American Samoa Economic Development Authority Rev. 11, 4 | | | 300,000 | | | | 6.00 | | | | 9/1/23 | | | | 301,068 | |
American Samoa Economic Development Authority Rev. 11 | | | 2,000,000 | | | | 6.25 | | | | 9/1/29 | | | | 2,105,400 | |
Guam Govt. Business Privilege Tax Rev. 11 | | | 2,750,000 | | | | 5.00 | | | | 11/15/35 | | | | 2,621,685 | |
St. Paul Sales Tax Rev. | | | 1,400,000 | | | | 5.00 | | | | 11/1/31 | | | | 1,441,426 | |
| | | | | | | | | | | | | | | | |
| | | | | | | | | | | | | | | 6,469,579 | |
| | | | | | | | | | | | | | | | |
Single Family Mortgage - 21.8% | | | | | | | | | | | | | | | | |
Dakota Co. Community Dev. Agy. Single Family Mtg. Rev. (GNMA) | | | 555,000 | | | | 4.45 | | | | 12/1/32 | | | | 555,022 | |
Dakota Co. Community Dev. Agy. Single Family Mtg. Rev. (GNMA) | | | 60,000 | | | | 4.63 | | | | 12/1/30 | | | | 60,020 | |
Dakota Co. Community Dev. Agy. Single Family Mtg. Rev. (GNMA-FNMA-FHLMC) | | | 315,000 | | | | 4.88 | | | | 12/1/33 | | | | 315,120 | |
Minneapolis St. Paul Hsg. Fin. Board Single Family Mtg. Rev. (GNMA-FNMA) | | | 115,000 | | | | 4.45 | | | | 12/1/27 | | | | 115,008 | |
MN Hsg. Fin. Agy. Homeownership Fin. | | | 7,305,000 | | | | 2.25 | | | | 7/1/41 | | | | 5,205,105 | |
MN Hsg. Fin. Agy. Homeownership Fin. | | | 8,280,000 | | | | 2.40 | | | | 7/1/46 | | | | 5,587,095 | |
MN Hsg. Fin. Agy. Homeownership Fin. (GNMA-FNMA-FHLMC) | | | 3,150,000 | | | | 2.45 | | | | 7/1/45 | | | | 2,671,609 | |
MN Hsg. Fin. Agy. Homeownership Fin. (GNMA-FNMA-FHLMC) | | | 4,985,000 | | | | 2.45 | | | | 7/1/46 | | | | 3,455,303 | |
MN Hsg. Fin. Agy. Homeownership Fin. (GNMA-FNMA-FHLMC) | | | 1,873,926 | | | | 3.30 | | | | 3/1/48 | | | | 1,786,433 | |
MN Hsg. Fin. Agy. Homeownership Fin. (GNMA-FNMA-FHLMC) | | | 1,842,517 | | | | 3.30 | | | | 5/1/48 | | | | 1,772,612 | |
MN Hsg. Fin. Agy. Homeownership Fin. (GNMA-FNMA-FHLMC) | | | 608,445 | | | | 3.75 | | | | 11/1/48 | | | | 587,022 | |
MN Hsg. Fin. Agy. Homeownership Fin. (GNMA-FNMA-FHLMC) | | | 582,627 | | | | 3.60 | | | | 1/1/49 | | | | 559,882 | |
MN Hsg. Fin. Agy. Homeownership Fin. (GNMA-FNMA-FHLMC) | | | 629,316 | | | | 3.45 | | | | 3/1/49 | | | | 602,337 | |
MN Hsg. Fin. Agy. Homeownership Fin. (GNMA-FNMA-FHLMC) | | | 1,000,980 | | | | 3.15 | | | | 6/1/49 | | | | 950,411 | |
MN Hsg. Fin. Agy. Homeownership Fin. (GNMA-FNMA-FHLMC) | | | 1,143,457 | | | | 2.47 | | | | 1/1/50 | | | | 1,057,434 | |
MN Hsg. Fin. Agy. Homeownership Fin. (GNMA-FNMA-FHLMC) | | | 8,645,000 | | | | 2.55 | | | | 1/1/51 | | | | 7,154,343 | |
MN Hsg. Fin. Agy. Homeownership Fin. (GNMA-FNMA-FHLMC) | | | 4,290,000 | | | | 2.50 | | | | 7/1/51 | | | | 2,843,455 | |
MN Hsg. Fin. Agy. Homeownership Fin. (GNMA-FNMA-FHLMC) | | | 1,135,000 | | | | 1.65 | | | | 7/1/30 | | | | 953,809 | |
MN Hsg. Fin. Agy. Homeownership Fin. (GNMA-FNMA-FHLMC) | | | 480,000 | | | | 2.38 | | | | 7/1/46 | | | | 322,181 | |
MN Hsg. Fin. Agy. Homeownership Fin. (GNMA-FNMA-FHLMC) | | | 9,445,000 | | | | 2.45 | | | | 1/1/52 | | | | 6,037,055 | |
MN Hsg. Fin. Agy. Homeownership Fin. (GNMA-FNMA-FHLMC) | | | 3,520,000 | | | | 2.40 | | | | 1/1/35 | | | | 3,105,766 | |
MN Hsg. Fin. Agy. Homeownership Fin. (GNMA-FNMA-FHLMC) | | | 2,545,000 | | | | 2.75 | | | | 7/1/42 | | | | 1,836,955 | |
MN Hsg. Fin. Agy. Homeownership Fin. (GNMA-FNMA-FHLMC) | | | 1,270,000 | | | | 2.90 | | | | 1/1/45 | | | | 926,567 | |
MN Hsg. Fin. Agy. Homeownership Fin. (GNMA-FNMA-FHLMC) | | | 575,000 | | | | 2.70 | | | | 7/1/33 | | | | 491,401 | |
MN Hsg. Fin. Agy. Homeownership Fin. (GNMA-FNMA-FHLMC) | | | 255,000 | | | | 2.75 | | | | 1/1/34 | | | | 217,092 | |
MN Hsg. Fin. Agy. Homeownership Fin. (GNMA-FNMA-FHLMC) | | | 2,310,000 | | | | 3.00 | | | | 7/1/43 | | | | 1,739,291 | |
MN Hsg. Fin. Agy. Residential Hsg. Rev. (GNMA-FNMA-FHLMC) | | | 3,995,000 | | | | 3.50 | | | | 1/1/32 | | | | 3,913,462 | |
MN Hsg. Fin. Agy. Residential Hsg. Rev. (GNMA-FNMA-FHLMC) | | | 1,535,000 | | | | 3.60 | | | | 7/1/33 | | | | 1,398,185 | |
MN Hsg. Fin. Agy. Residential Hsg. Rev. (GNMA-FNMA-FHLMC) | | | 1,340,000 | | | | 2.45 | | | | 7/1/34 | | | | 1,229,102 | |
MN Hsg. Fin. Agy. Residential Hsg. Rev. (GNMA-FNMA-FHLMC) | | | 3,467,000 | | | | 3.80 | | | | 7/1/38 | | | | 3,066,908 | |
MN Hsg. Fin. Agy. Residential Hsg. Rev. (GNMA-FNMA-FHLMC) | | | 4,290,000 | | | | 2.55 | | | | 7/1/39 | | | | 3,915,183 | |
MN Hsg. Fin. Agy. Residential Hsg. Rev. (GNMA-FNMA-FHLMC) | | | 3,140,000 | | | | 3.90 | | | | 7/1/43 | | | | 2,692,581 | |
MN Hsg. Fin. Agy. Residential Hsg. Rev. (GNMA-FNMA-FHLMC) | | | 2,950,000 | | | | 2.80 | | | | 1/1/44 | | | | 2,522,692 | |
MN Hsg. Fin. Agy. Residential Hsg. Rev. (GNMA-FNMA-FHLMC) | | | 2,840,000 | | | | 2.70 | | | | 7/1/44 | | | | 2,059,114 | |
MN Hsg. Fin. Agy. Residential Hsg. Rev. (GNMA-FNMA-FHLMC) | | | 3,135,000 | | | | 2.75 | | | | 7/1/44 | | | | 2,891,599 | |
| | |
| |
| See accompanying notes to financial statements. | | |
| | |
| SEPTEMBER 30, 2022 | | 47 |
SCHEDULE OF INVESTMENTS (Unaudited)
September 30, 2022
Sit Minnesota Tax-Free Income Fund (Continued)
| | | | | | | | | | | | | | | | |
Name of Issuer | | Principal
Amount ($) | | | Coupon
Rate (%) | | | Maturity
Date | | | Fair
Value ($) | |
MN Hsg. Fin. Agy. Residential Hsg. Rev. (GNMA-FNMA-FHLMC) | | | 855,000 | | | | 4.00 | | | | 1/1/48 | | | | 845,561 | |
MN Hsg. Fin. Agy. Residential Hsg. Rev. (GNMA-FNMA-FHLMC) | | | 2,310,000 | | | | 3.75 | | | | 1/1/50 | | | | 2,263,754 | |
MN Hsg. Fin. Agy. Rev. 8 | | | 500,000 | | | | 2.30 | | | | 7/1/32 | | | | 410,480 | |
MN Hsg. Fin. Agy. Rev. 8 | | | 1,590,000 | | | | 2.35 | | | | 1/1/33 | | | | 1,296,804 | |
MN Hsg. Fin. Agy. Rev. 8 | | | 1,040,000 | | | | 2.40 | | | | 7/1/33 | | | | 838,958 | |
MN Hsg. Fin. Agy. Rev. | | | 3,888,948 | | | | 2.05 | | | | 12/1/51 | | | | 3,559,593 | |
MN Hsg. Fin. Agy. Rev. | | | 3,165,000 | | | | 2.00 | | | | 7/1/40 | | | | 2,199,675 | |
MN Hsg. Fin. Agy. Rev. | | | 3,850,000 | | | | 2.15 | | | | 7/1/45 | | | | 2,482,518 | |
MN Hsg. Fin. Agy. Rev. | | | 6,205,000 | | | | 2.20 | | | | 1/1/51 | | | | 3,874,588 | |
MN Hsg. Fin. Agy. Rev. | | | 9,405,000 | | | | 2.35 | | | | 7/1/41 | | | | 6,916,813 | |
MN Hsg. Fin. Agy. Rev. | | | 5,605,000 | | | | 2.55 | | | | 1/1/46 | | | | 4,017,216 | |
MN Hsg. Fin. Agy. Rev. | | | 2,500,000 | | | | 5.00 | | | | 7/1/53 | | | | 2,547,975 | |
MN Hsg. Fin. Agy. Rev. (GNMA-FNMA-FHLMC) | | | 490,000 | | | | 4.00 | | | | 1/1/47 | | | | 486,737 | |
MN Hsg. Fin. Agy. Rev. (GNMA-FNMA-FHLMC) 8 | | | 325,000 | | | | 4.00 | | | | 1/1/41 | | | | 323,485 | |
| | | | | | | | | | | | | | | | |
| | | | | | | | | | | | | | | 106,661,311 | |
| | | | | | | | | | | | | | | | |
Transportation - 0.8% | | | | | | | | | | | | | | | | |
Minneapolis & St. Paul Metro Airport Commission Sub. Rev. 8 | | | 1,000,000 | | | | 5.00 | | | | 1/1/47 | | | | 989,220 | |
Minneapolis & St. Paul Metro Airport Commission Sub. Rev. 8 | | | 500,000 | | | | 5.25 | | | | 1/1/47 | | | | 506,265 | |
Minneapolis & St. Paul Metro Airport Commission Sub. Rev. | | | 1,100,000 | | | | 5.00 | | | | 1/1/33 | | | | 1,113,112 | |
Minneapolis & St. Paul Metro Airport Commission Sub. Rev. | | | 600,000 | | | | 5.00 | | | | 1/1/34 | | | | 606,474 | |
Minneapolis & St. Paul Metro Airport Commission Sub. Rev. | | | 1,000,000 | | | | 4.25 | | | | 1/1/52 | | | | 887,600 | |
| | | | | | | | | | | | | | | | |
| | | | | | | | | | | | | | | 4,102,671 | |
| | | | | | | | | | | | | | | | |
Utility - 1.7% | | | | | | | | | | | | | | | | |
Guam Govt. Waterworks Auth. Rev. 11 | | | 2,000,000 | | | | 5.00 | | | | 1/1/46 | | | | 2,015,160 | |
Rochester Electric Utility Rev. | | | 500,000 | | | | 5.00 | | | | 12/1/42 | | | | 521,610 | |
Southern Minnesota Municipal Power Agency | | | 1,000,000 | | | | 5.00 | | | | 1/1/41 | | | | 1,042,170 | |
St. Paul Hsg. & Redev. Auth. | | | 650,000 | | | | 4.00 | | | | 10/1/33 | | | | 640,114 | |
St. Paul Hsg. & Redev. Auth. | | | 900,000 | | | | 3.38 | | | | 10/1/37 | | | | 760,023 | |
St. Paul Port Auth. Rev. 8 | | | 1,000,000 | | | | 4.00 | | | | 10/1/40 | | | | 919,590 | |
St. Paul Sewer Rev. | | | 1,220,000 | | | | 2.00 | | | | 12/1/41 | | | | 742,138 | |
Western MN Municipal Power Agy. Rev. | | | 500,000 | | | | 5.00 | | | | 1/1/24 | | | | 510,515 | |
Western MN Municipal Power Agy. Rev. | | | 550,000 | | | | 5.00 | | | | 1/1/25 | | | | 569,867 | |
Western MN Municipal Power Agy. Rev. | | | 600,000 | | | | 5.00 | | | | 1/1/35 | | | | 624,180 | |
| | | | | | | | | | | | | | | | |
| | | | | | | | | | | | | | | 8,345,367 | |
| | | | | | | | | | | | | | | | |
Total Municipal Bonds
(cost: $550,842,930) | | | | | | | | | | | | | | | 461,196,775 | |
| | | | | | | | | | | | | | | | |
| | |
| |
| See accompanying notes to financial statements. | | |
| | |
| 48 | | SIT MUTUAL FUNDS SEMI-ANNUAL REPORT |
| | | | | | | | | | | | |
| | | | | | | | | Fair | |
Name of Issuer | | Quantity | | | | | | Value ($) | |
Investment Companies - 0.3% | | | | | | | | | | | | |
Nuveen Minnesota Quality Municipal Income Fund (NMS) | | | 135,710 | | | | | | | | 1,632,591 | |
| | | | | | | | | | | | |
Total Investment Companies
(cost: $1,873,272) | | | | | | | | | | | 1,632,591 | |
| | | | | | | | | | | | |
Total Investments in Securities - 94.5%
(cost: $552,716,202) | | | | | | | | | | | 462,829,366 | |
| | | | | | | | | | | | |
Other Assets and Liabilities, net - 5.5% | | | | | | | | | | | 26,911,711 | |
| | | | | | | | | | | | |
Net Assets - 100.0% | | | | | | | | | | $ | 489,741,077 | |
| | | | | | | | | | | | |
| 1 | Variable rate security. Rate disclosed is as of September 30, 2022. Certain variable rate securities are not based on a published reference rate and spread but are determined by the issuer or agent and are based on current market conditions, or, for mortgage-backed securities, are impacted by the individual mortgages which are paying off over time. These securities do not indicate a reference rate and spread in their descriptions. |
| 4 | 144A Restricted Security. The total value of such securities as of September 30, 2022 was $10,055,232 and represented 2.1% of net assets. These securities have been determined to be liquid by the Adviser in accordance with guidelines established by the Board of Directors. |
| 6 | Zero coupon or convertible capital appreciation bond, for which the rate disclosed is either the effective yield on purchase date or the coupon rate to be paid upon conversion to coupon paying. |
| 8 | Securities the income from which is treated as a tax preference that is included in alternative minimum taxable income for purposes of computing federal alternative minimum tax (AMT). At September 30, 2022, 2.9% of net assets in the Fund was invested in such securities. |
| 9 | Municipal Lease Security. The total value of such securities as of September 30, 2022 was $20,523,091 and represented 4.2% of net assets. These securities have been determined to be liquid by the Adviser in accordance with guidelines established by the Board of Directors. |
| 11 | The Fund may invest in obligations issued by U.S. territories, for example Guam, Puerto Rico, and Virgin Islands. The total value of such securities as of September 30, 2022 was $11,472,762 and represented 2.3% of net assets. |
Numeric footnotes not disclosed are not applicable to this Schedule of Investments.
Short futures contracts outstanding as of September 30, 2022 were as follows:
| | | | | | | | | | | | | | | | |
Type | | Contracts | | | Expiration
Date | | | Notional
Amount ($) | | | Value/
Unrealized
Appreciation
(Depreciation) ($) | |
Short Futures: 10 | | | | | | | | | | | | | | | | |
U.S. Treasury Long Bond | | | 112 | | | | December 2022 | | | | (14,157,500 | ) | | | 1,184,408 | |
U.S. Treasury 2-Year | | | 207 | | | | December 2022 | | | | (42,515,860 | ) | | | 690,950 | |
U.S. Treasury 5-Year | | | 371 | | | | December 2022 | | | | (39,885,397 | ) | | | 1,428,524 | |
U.S. Treasury 10-Year | | | 614 | | | | December 2022 | | | | (68,806,375 | ) | | | 3,485,641 | |
| | | | | | | | | | | | | | | | |
| | | | | | | | | | | | | | | 6,789,523 | |
| | | | | | | | | | | | | | | | |
| 10 | The amount of $6,000,000 in cash was segregated with the broker to cover margin requirements for derivative transactions as of September 30, 2022. |
A summary of the levels for the Fund’s investments as of September 30, 2022 is as follows (see Note 2 - significant accounting policies in the notes to financial statements):
| | | | | | | | | | | | | | | | |
| | | Investment in Securities | |
| | | Level 1
Quoted
Prices ($) | | | Level 2
Other significant
observable inputs ($) | | | Level 3
Significant
unobservable inputs ($) | | | Total ($) | |
Municipal Bonds | | | — | | | | 461,196,775 | | | | — | | | | 461,196,775 | |
Investment Companies | | | 1,632,591 | | | | — | | | | — | | | | 1,632,591 | |
Futures | | | 6,789,523 | | | | — | | | | — | | | | 6,789,523 | |
| | | | | | | | | | | | | | | | |
Total: | | | 8,422,114 | | | | 461,196,775 | | | | — | | | | 469,618,889 | |
| | | | | | | | | | | | | | | | |
There were no transfers into or out of level 3 during the reporting period.
| | |
| |
| See accompanying notes to financial statements. | | |
| | |
| SEPTEMBER 30, 2022 | | 49 |
STATEMENTS OF ASSETS AND LIABILITIES (Unaudited)
September 30, 2022
| | | | | | | | | | | | | | | | |
| | | Sit U.S.
Government
Securities
Fund | | | Sit Quality
Income
Fund | | | Sit Tax-Free
Income
Fund | | | Sit
Minnesota
Tax-Free
Income
Fund | |
ASSETS | | | | | | | | | | | | | | | | |
Investments in securities, at identified cost | | $ | 445,804,891 | | | $ | 153,610,611 | | | $ | 289,388,620 | | | $ | 552,716,202 | |
| | | | | | | | | | | | | | | | |
Investments in securities, at fair value - see accompanying schedule for detail | | $ | 414,742,781 | | | $ | 145,776,281 | | | $ | 228,802,769 | | | $ | 462,829,366 | |
Cash in bank on demand deposit | | | 7 | | | | — | | | | 16,571,451 | | | | 17,248,182 | |
Cash collateral held at broker | | | — | | | | 400,000 | | | | 7,000,000 | | | | 6,000,000 | |
Accrued interest and dividends receivable | | | 1,850,399 | | | | 816,903 | | | | 3,225,188 | | | | 5,557,541 | |
Receivable for investment securities sold | | | 7,695 | | | | 3,068,129 | | | | 354,892 | | | | — | |
Variation margin on futures contracts | | | — | | | | 407,731 | | | | 4,778,674 | | | | 6,792,131 | |
Receivable for Fund shares sold | | | 263,168 | | | | 48,107 | | | | 131,915 | | | | 1,011,286 | |
| | | | | | | | | | | | | | | | |
Total assets | | | 416,864,050 | | | | 150,517,151 | | | | 260,864,889 | | | | 499,438,506 | |
| | | | | | | | | | | | | | | | |
LIABILITIES | | | | | | | | | | | | | | | | |
Disbursements in excess of cash balances | | | — | | | | 1,156 | | | | — | | | | — | |
Payable for investment securities purchased | | | 4,243,963 | | | | 11,013,282 | | | | 2,052,655 | | | | 1,080,331 | |
Payable for Fund shares redeemed | | | 2,431,270 | | | | 72,229 | | | | 395,030 | | | | 8,144,705 | |
Cash portion of dividends payable to shareholders | | | 30,234 | | | | 100 | | | | 250,893 | | | | 134,341 | |
Accrued supervisory and administrative fees | | | 182,350 | | | | 53,645 | | | | 106,393 | | | | 253,539 | |
Accrued investment management fees | | | 68,531 | | | | 23,543 | | | | 43,336 | | | | 84,513 | |
| | | | | | | | | | | | | | | | |
Total liabilities | | | 6,956,348 | | | | 11,163,955 | | | | 2,848,307 | | | | 9,697,429 | |
| | | | | | | | | | | | | | | | |
Net assets applicable to outstanding capital stock | | $ | 409,907,702 | | | $ | 139,353,196 | | | $ | 258,016,582 | | | $ | 489,741,077 | |
| | | | | | | | | | | | | | | | |
Net assets consist of: | | | | | | | | | | | | | | | | |
Capital (par value and paid-in surplus) | | $ | 447,809,222 | | | $ | 144,448,680 | | | $ | 327,971,553 | | | $ | 575,430,136 | |
Total distributable earnings (loss), including unrealized appreciation (depreciation) | | | (37,901,520 | ) | | | (5,095,484 | ) | | | (69,954,971 | ) | | | (85,689,059 | ) |
| | | | | | | | | | | | | | | | |
| | $ | 409,907,702 | | | $ | 139,353,196 | | | $ | 258,016,582 | | | $ | 489,741,077 | |
| | | | | | | | | | | | | | | | |
Outstanding shares: | | | | | | | | | | | | | | | | |
Class S Shares (Class S)* | | | 28,967,590 | | | | 6,092,491 | | | | 17,565,449 | | | | 54,183,813 | |
| | | | | | | | | | | | | | | | |
Class Y Shares (Class Y)* | | | 10,629,980 | | | | 8,344,610 | | | | 13,589,799 | | | | — | |
| | | | | | | | | | | | | | | | |
Net assets applicable to outstanding shares: | | | | | | | | | | | | | | | | |
Net Assets (Class S)* | | $ | 299,897,200 | | | $ | 58,764,630 | | | $ | 145,479,853 | | | $ | 489,741,077 | |
| | | | | | | | | | | | | | | | |
Net Assets (Class Y)* | | | 110,010,502 | | | | 80,588,566 | | | | 112,536,729 | | | | — | |
| | | | | | | | | | | | | | | | |
Net asset value per share of outstanding capital stock: | | | | | | | | | | | | | | | | |
Net Assets Value (Class S)* | | $ | 10.35 | | | $ | 9.65 | | | $ | 8.28 | | | $ | 9.04 | |
| | | | | | | | | | | | | | | | |
Net Assets Value (Class Y)* | | | 10.35 | | | | 9.66 | | | | 8.28 | | | | — | |
| | | | | | | | | | | | | | | | |
| * | Sit U.S. Government Securities Fund, Sit Quality Income Fund and Sit Tax-Free Income Fund offer multiple share classes (S and Y). Sit Minnesota Tax Free Income Fund offers a single share class. |
| | |
| |
| See accompanying notes to financial statements. | | |
| | |
| 50 | | SIT MUTUAL FUNDS SEMI-ANNUAL REPORT |
STATEMENTS OF OPERATIONS (Unaudited)
Six Months Ended September 30, 2022
| | | | | | | | | | | | | | | | |
| | | Sit U.S.
Government
Securities
Fund | | | Sit Quality
Income
Fund | | | Sit Tax-Free
Income
Fund | | | Sit
Minnesota
Tax-Free
Income
Fund | |
Investment income: | | | | | | | | | | | | | | | | |
Income: | | | | | | | | | | | | | | | | |
Dividends | | | — | | | | — | | | $ | 353,536 | | | $ | 44,352 | |
Interest | | $ | 6,028,101 | | | $ | 2,637,816 | | | | 5,421,149 | | | | 10,004,065 | |
| | | | | | | | | | | | | | | | |
Total income | | | 6,028,101 | | | | 2,637,816 | | | | 5,774,685 | | | | 10,048,417 | |
| | | | | | | | | | | | | | | | |
Expenses (note 4): | | | | | | | | | | | | | | | | |
Investment management fee | | | 420,826 | | | | 175,434 | | | | 298,674 | | | | 551,537 | |
Supervisory and administrative fee | | | 1,122,879 | | | | 328,429 | | | | 723,832 | | | | 1,654,611 | |
| | | | | | | | | | | | | | | | |
Total expenses | | | 1,543,705 | | | | 503,863 | | | | 1,022,506 | | | | 2,206,148 | |
| | | | | | | | | | | | | | | | |
Less fees and expenses waived by investment adviser | | | — | | | | (28,561 | ) | | | — | | | | — | |
| | | | | | | | | | | | | | | | |
Total net expenses | | | 1,543,705 | | | | 475,302 | | | | 1,022,506 | | | | 2,206,148 | |
| | | | | | | | | | | | | | | | |
Net investment income | | | 4,484,396 | | | | 2,162,514 | | | | 4,752,179 | | | | 7,842,269 | |
| | | | | | | | | | | | | | | | |
Realized and unrealized gain (loss): | | | | | | | | | | | | | | | | |
Net realized gain (loss) on investments | | | 2,792,025 | | | | (1,950,730 | ) | | | (11,009,973 | ) | | | (4,180,787 | ) |
Net realized gain (loss) on written options | | | 715,880 | | | | — | | | | — | | | | — | |
Net realized gain (loss) on futures | | | — | | | | 2,374,345 | | | | 4,190,017 | | | | 4,883,611 | |
Net change in unrealized appreciation (depreciation) on investments | | | (22,592,601 | ) | | | (4,788,502 | ) | | | (28,874,535 | ) | | | (58,365,271 | ) |
Net change in unrealized appreciation (depreciation) on futures | | | — | | | | (354,245 | ) | | | 3,047,586 | | | | 4,772,664 | |
| | | | | | | | | | | | | | | | |
Net gain (loss) | | | (19,084,696 | ) | | | (4,719,132 | ) | | | (32,646,905 | ) | | | (52,889,783 | ) |
| | | | | | | | | | | | | | | | |
Net increase (decrease) in net assets resulting from operations | | ($ | 14,600,300 | ) | | ($ | 2,556,618 | ) | | ($ | 27,894,726 | ) | | ($ | 45,047,514 | ) |
| | | | | | | | | | | | | | | | |
| | |
|
| See accompanying notes to financial statements. |
| | |
| SEPTEMBER 30, 2022 | | 51 |
STATEMENTS OF CHANGES IN NET ASSETS
| | | | | | | | |
| | | Sit U.S. Government
Securities Fund | |
| | | Six Months Ended
September 30, 2022
(Unaudited) | | | Year
Ended
March 31, 2022 | |
Operations: | | | | | | | | |
Net investment income | | $ | 4,484,396 | | | $ | 4,763,191 | |
Net realized gain (loss) on investments, written options and futures | | | 3,507,905 | | | | 5,997,591 | |
Net change in unrealized depreciation of investments, written options and futures | | | (22,592,601 | ) | | | (20,110,204 | ) |
| | | | | | | | |
Net increase (decrease) in net assets resulting from operations | | | (14,600,300 | ) | | | (9,349,422 | ) |
| | | | | | | | |
Distributions from: | | | | | | | | |
Net investment income and net realized gains | | | | | | | | |
Common shares (Class S) | | | (3,182,879 | ) | | | (3,318,866 | ) |
Common shares (Class Y) | | | (1,299,723 | ) | | | (1,446,783 | ) |
| | | | | | | | |
Total distributions | | | (4,482,602 | ) | | | (4,765,649 | ) |
| | | | | | | | |
Capital share transactions: | | | | | | | | |
Proceeds from shares sold | | | | | | | | |
Class S Shares | | | 40,523,255 | | | | 94,149,154 | |
Class Y Shares | | | 31,524,278 | | | | 60,860,914 | |
Reinvested distributions | | | | | | | | |
Class S Shares | | | 3,009,411 | | | | 3,155,336 | |
Class Y Shares | | | 1,299,723 | | | | 1,049,359 | |
Payments for shares redeemed | | | | | | | | |
Class S Shares | | | (48,101,585 | ) | | | (167,125,867 | ) |
Class Y Shares | | | (27,008,920 | ) | | | (77,498,698 | ) |
| | | | | | | | |
Increase (decrease) in net assets from capital transactions | | | 1,246,162 | | | | (85,409,802 | ) |
| | | | | | | | |
Total increase (decrease) in net assets | | | (17,836,740 | ) | | | (99,524,873 | ) |
Net assets: | | | | | | | | |
Beginning of period | | | 427,744,442 | | | | 527,269,315 | |
| | | | | | | | |
End of period | | $ | 409,907,702 | | | $ | 427,744,442 | |
| | | | | | | | |
Capital transactions in shares: | | | | | | | | |
Sold | | | | | | | | |
Class S Shares | | | 3,799,423 | | | | 8,477,904 | |
Class Y Shares | | | 2,945,708 | | | | 5,514,051 | |
Reinvested distributions | | | | | | | | |
Class S Shares | | | 282,719 | | | | 284,711 | |
Class Y Shares | | | 122,114 | | | | 94,858 | |
Redeemed | | | | | | | | |
Class S Shares | | | (4,505,044 | ) | | | (15,069,001 | ) |
Class Y Shares | | | (2,529,415 | ) | | | (7,018,060 | ) |
| | | | | | | | |
Net increase (decrease) | | | 115,505 | | | | (7,715,537 | ) |
| | | | | | | | |
| | |
| |
| See accompanying notes to financial statements. | | |
| | |
| 52 | | SIT MUTUAL FUNDS SEMI-ANNUAL REPORT |
| | | | | | | | | | | | | | | | | | | | | | |
Sit Quality
Income Fund | | | Sit Tax-Free
Income Fund | | | Minnesota Tax-Free
Income Fund | |
Six Months Ended
September 30, 2022
(Unaudited) | | | Year
Ended
March 31, 2022 | | | Six Months Ended
September 30, 2022
(Unaudited) | | | Year
Ended
March 31, 2022 | | | Six Months Ended
September 30, 2022
(Unaudited) | | | Year
Ended
March 31, 2022 | |
| | | | | | | | | | | | | | | | | | | | | | |
| $ | 2,162,514 | | | $ | 1,815,111 | | | $ | 4,752,179 | | | $ | 10,550,598 | | | $ | 7,842,269 | | | $ | 17,846,151 | |
| | 423,615 | | | | 2,625,512 | | | | (6,819,956 | ) | | | 2,149,277 | | | | 702,824 | | | | (62,787 | ) |
| | (5,142,747) | | | | (3,311,300 | ) | | | (25,826,949 | ) | | | (30,389,708 | ) | | | (53,592,607 | ) | | | (50,081,087 | ) |
| | | | | | | | | | | | | | | | | | | | | | |
| | (2,556,618) | | | | 1,129,323 | | | | (27,894,726 | ) | | | (17,689,833 | ) | | | (45,047,514 | ) | | | (32,297,723 | ) |
| | | | | | | | | | | | | | | | | | | | | | |
| | | | | | | | | | | | | | | | | | | | | | |
| | | | | | | | | | | | | | | | | | | | | | |
| | (771,580) | | | | (1,945,396 | ) | | | (2,466,765 | ) | | | (6,316,370 | ) | | | (7,842,200 | ) | | | (17,846,258 | ) |
| | (1,391,080) | | | | — | | | | (2,285,606 | ) | | | (4,233,533 | ) | | | — | | | | — | |
| | | | | | | | | | | | | | | | | | | | | | |
| | (2,162,660) | | | | (1,945,396 | ) | | | (4,752,371 | ) | | | (10,549,903 | ) | | | (7,842,200 | ) | | | (17,846,258 | ) |
| | | | | | | | | | | | | | | | | | | | | | |
| | | | | | | | | | | | | | | | | | | | | | |
| | | | | | | | | | | | | | | | | | | | | | |
| | 65,262,845 | | | | 64,599,814 | | | | 30,214,342 | | | | 67,395,789 | | | | 84,171,541 | | | | 147,871,319 | |
| | 105,678,988 | | | | — | | | | 15,950,061 | | | | 200,935,048 | | | | — | | | | — | |
| | | | | | | | | | | | | | | | | | | | | | |
| | 747,768 | | | | 1,906,030 | | | | 2,233,491 | | | | 5,278,259 | | | | 7,011,156 | | | | 16,148,317 | |
| | 1,390,687 | | | | — | | | | 682,435 | | | | 1,079,989 | | | | — | | | | — | |
| | | | | | | | | | | | | | | | | | | | | | |
| | (140,543,171) | | | | (39,238,702 | ) | | | (54,839,857 | ) | | | (223,085,440 | ) | | | (176,715,759 | ) | | | (166,012,837 | ) |
| | (23,710,189) | | | | — | | | | (57,990,156 | ) | | | (17,180,184 | ) | | | — | | | | — | |
| | | | | | | | | | | | | | | | | | | | | | |
| | 8,826,928 | | | | 27,267,142 | | | | (63,749,684 | ) | | | 34,423,461 | | | | (85,533,062 | ) | | | (1,993,201 | ) |
| | | | | | | | | | | | | | | | | | | | | | |
| | 4,107,650 | | | | 26,451,069 | | | | (96,396,781 | ) | | | 6,183,725 | | | | (138,422,776 | ) | | | (52,137,182 | ) |
| | | | | | | | | | | | | | | | | | | | | | |
| | 135,245,546 | | | | 108,794,477 | | | | 354,413,363 | | | | 348,229,638 | | | | 628,163,853 | | | | 680,301,035 | |
| | | | | | | | | | | | | | | | | | | | | | |
| $ | 139,353,196 | | | $ | 135,245,546 | | | $ | 258,016,582 | | | $ | 354,413,363 | | | $ | 489,741,077 | | | $ | 628,163,853 | |
| | | | | | | | | | | | | | | | | | | | | | |
| | | | | | | | | | | | | | | | | | | | | | |
| | | | | | | | | | | | | | | | | | | | | | |
| | 6,624,368 | | | | 19,950,192 | | | | 3,456,769 | | | | 42,641,846 | | | | 8,811,274 | | | | 13,815,355 | |
| | 10,610,323 | | | | — | | | | 1,813,012 | | | | 20,032,205 | | | | — | | | | — | |
| | | | | | | | | | | | | | | | | | | | | | |
| | 76,177 | | | | 189,776 | | | | 257,678 | | | | 534,205 | | | | 738,408 | | | | 1,519,493 | |
| | 141,353 | | | | — | | | | 78,732 | | | | 109,927 | | | | — | | | | — | |
| | | | | | | | | | | | | | | | | | | | | | |
| | (14,163,157) | | | | (17,425,118 | ) | | | (6,266,021 | ) | | | (58,199,033 | ) | | | (18,544,228 | ) | | | (15,866,056 | ) |
| | (2,407,066) | | | | — | | | | (6,693,537 | ) | | | (1,750,540 | ) | | | — | | | | — | |
| | | | | | | | | | | | | | | | | | | | | | |
| | 881,998 | | | | 2,714,850 | | | | (7,353,367 | ) | | | 3,368,610 | | | | (8,994,546 | ) | | | (531,208 | ) |
| | | | | | | | | | | | | | | | | | | | | | |
FINANCIAL HIGHLIGHTS
Per share income and capital changes for a share outstanding throughout the period. See accompanying notes to financial statements.
Sit U.S. Government Securities Fund
| | | | | | | | | | | | | | | | | | | | | | | | |
| | | Six Months Ended
September 30, 2022
(Unaudited) | | | Year Ended March 31, | |
Class S | | 2022 | | | 2021 | | | 2020 | | | 2019 | | | 2018 | |
Net Asset Value: | | | | | | | | | | | | | | | | | | | | | | | | |
Beginning of period | | $ | 10.83 | | | $ | 11.17 | | | $ | 11.26 | | | $ | 10.92 | | | $ | 10.80 | | | $ | 10.90 | |
| | | | | | | | | | | | | | | | | | | | | | | | |
Operations: | | | | | | | | | | | | | | | | | | | | | | | | |
Net investment income 1 | | | 0.11 | | | | 0.10 | | | | 0.14 | | | | 0.22 | | | | 0.23 | | | | 0.18 | |
Net realized and unrealized gains (losses) on investments and written options | | | (0.48 | ) | | | (0.34 | ) | | | (0.09 | ) | | | 0.34 | | | | 0.12 | | | | (0.10 | ) |
| | | | | | | | | | | | | | | | | | | | | | | | |
Total from operations | | | (0.37 | ) | | | (0.24 | ) | | | 0.05 | | | | 0.56 | | | | 0.35 | | | | 0.08 | |
| | | | | | | | | | | | | | | | | | | | | | | | |
Distributions from: | | | | | | | | | | | | | | | | | | | | | | | | |
Net investment income | | | (0.11 | ) | | | (0.10 | ) | | | (0.14 | ) | | | (0.22 | ) | | | (0.23 | ) | | | (0.18 | ) |
| | | | | | | | | | | | | | | | | | | | | | | | |
Net Asset Value | | | | | | | | | | | | | | | | | | | | | | | | |
End of period | | $ | 10.35 | | | $ | 10.83 | | | $ | 11.17 | | | $ | 11.26 | | | $ | 10.92 | | | $ | 10.80 | |
| | | | | | | | | | | | | | | | | | | | | | | | |
Total investment return 2 | | | (3.40 | %) | | | (2.16 | %) | | | 0.44 | % | | | 5.25 | % | | | 3.31 | % | | | 0.76 | % |
| | | | | | | | | | | | | | | | | | | | | | | | |
Net assets at end of period (000’s omitted) | | $ | 299,897 | | | $ | 318,439 | | | $ | 398,821 | | | $ | 404,985 | | | $ | 427,314 | | | $ | 527,748 | |
| | | | | | |
Ratios: 3 | | | | | | | | | | | | | | | | | | | | | | | | |
Expenses | | | 0.80 | % | | | 0.80 | % | | | 0.80 | % | | | 0.80 | % | | | 0.80 | % | | | 0.80 | % |
Net investment income | | | 2.06 | % | | | 0.90 | % | | | 1.25 | % | | | 2.06 | % | | | 2.13 | % | | | 1.68 | % |
Portfolio turnover rate (excluding short-term securities) | | | 34.04 | %4 | | | 40.96 | % | | | 39.29 | % | | | 29.91 | % | | | 14.88 | % | | | 14.68 | % |
| 1 | The net investment income per share is based on average shares outstanding for the period. |
| 2 | Total investment return is based on the change in net asset value of a share during the period (not annualized) and assumes reinvestment of distributions at net asset value. |
| 3 | Ratios are annualized for periods less than one year. In addition to fees and expenses which the Fund bears directly, the Fund indirectly bears a pro rata share of the fees and expenses of the acquired funds in which it invests. Such indirect expenses are not included in the above reported expense ratios. |
| | |
| | |
| 54 | | SIT MUTUAL FUNDS SEMI-ANNUAL REPORT |
FINANCIAL HIGHLIGHTS
Per share income and capital changes for a share outstanding throughout the period. See accompanying notes to financial statements.
Sit U.S. Government Securities Fund
| | | | | | | | | | | | | | | | |
| | | Six Months Ended
September 30, 2022
(Unaudited) | | | Year Ended March 31, | | | | |
Class Y | | 2022 | | | 2021 | | | Period Ended
March 31, 2020 1 | |
Net Asset Value: | | | | | | | | | | | | | | | | |
Beginning of period | | $ | 10.83 | | | $ | 11.17 | | | $ | 11.26 | | | $ | 10.97 | |
| | | | | | | | | | | | | | | | |
Operations: | | | | | | | | | | | | | | | | |
Net investment income 2 | | | 0.12 | | | | 0.13 | | | | 0.17 | | | | 0.06 | |
Net realized and unrealized gains (losses) on investments and written options | | | (0.48 | ) | | | (0.34 | ) | | | (0.09 | ) | | | 0.29 | |
| | | | | | | | | | | | | | | | |
Total from operations | | | (0.36 | ) | | | (0.21 | ) | | | 0.08 | | | | 0.35 | |
| | | | | | | | | | | | | | | | |
Distributions from: | | | | | | | | | | | | | | | | |
Net investment income | | | (0.12 | ) | | | (0.13 | ) | | | (0.17 | ) | | | (0.06 | ) |
| | | | | | | | | | | | | | | | |
Net Asset Value | | | | | | | | | | | | | | | | |
End of period | | $ | 10.35 | | | $ | 10.83 | | | $ | 11.17 | | | $ | 11.26 | |
| | | | | | | | | | | | | | | | |
Total investment return 3 | | | (3.31 | %) | | | (1.91 | %) | | | 0.72 | % | | | 3.20 | % |
| | | | | | | | | | | | | | | | |
Net assets at end of period (000’s omitted) | | $ | 110,011 | | | $ | 109,305 | | | $ | 128,449 | | | $ | 13,085 | |
| | | | |
Ratios: 4 | | | | | | | | | | | | | | | | |
Expenses | | | 0.55 | % | | | 0.55 | % | | | 0.55 | % | | | 0.55 | % |
Net investment income | | | 2.32 | % | | | 1.14 | % | | | 1.44 | % | | | 2.19 | % |
Portfolio turnover rate (excluding short-term securities) | | | 34.04 | %5 | | | 40.96 | % | | | 39.29 | % | | | 29.91 | % |
| 1 | The inception date of Class Y shares was January 1, 2020. |
| 2 | The net investment income per share is based on average shares outstanding for the period. |
| 3 | Total investment return is based on the change in net asset value of a share during the period (not annualized) and assumes reinvestment of distributions at net asset value. |
| 4 | Ratios are annualized for periods less than one year. In addition to fees and expenses which the Fund bears directly, the Fund indirectly bears a pro rata share of the fees and expenses of the acquired funds in which it invests. Such indirect expenses are not included in the above reported expense ratios. |
FINANCIAL HIGHLIGHTS
Per share income and capital changes for a share outstanding throughout the period. See accompanying notes to financial statements.
Sit Quality Income Fund
| | | | | | | | | | | | | | | | | | | | | | | | |
| | | Six Months Ended
September 30, 2022
(Unaudited) | | | Year Ended March 31, | |
Class S | | 2022 | | | 2021 | | | 2020 | | | 2019 | | | 2018 | |
Net Asset Value: | | | | | | | | | | | | | | | | | | | | | | | | |
Beginning of period | | $ | 9.98 | | | $ | 10.04 | | | $ | 9.82 | | | $ | 9.80 | | | $ | 9.78 | | | $ | 9.83 | |
| | | | | | | | | | | | | | | | | | | | | | | | |
Operations: | | | | | | | | | | | | | | | | | | | | | | | | |
Net investment income 1 | | | 0.13 | | | | 0.15 | | | | 0.10 | | | | 0.18 | | | | 0.19 | | | | 0.13 | |
Net realized and unrealized gains (losses) on investments, written options and futures | | | (0.32 | ) | | | (0.05 | ) | | | 0.22 | | | | 0.02 | | | | 0.02 | | | | (0.05 | ) |
| | | | | | | | | | | | | | | | | | | | | | | | |
Total from operations | | | (0.19 | ) | | | 0.10 | | | | 0.32 | | | | 0.20 | | | | 0.21 | | | | 0.08 | |
| | | | | | | | | | | | | | | | | | | | | | | | |
Distributions from: | | | | | | | | | | | | | | | | | | | | | | | | |
Net investment income | | | (0.14 | ) | | | (0.15 | ) | | | (0.10 | ) | | | (0.18 | ) | | | (0.19 | ) | | | (0.13 | ) |
From net realized gains | | | — | | | | (0.01 | ) | | | — | | | | — | | | | — | | | | — | |
| | | | | | | | | | | | | | | | | | | | | | | | |
Total distributions | | | (0.14 | ) | | | (0.16 | ) | | | (0.10 | ) | | | (0.18 | ) | | | (0.19 | ) | | | (0.13 | ) |
| | | | | | | | | | | | | | | | | | | | | | | | |
Net Asset Value | | | | | | | | | | | | | | | | | | | | | | | | |
End of period | | $ | 9.65 | | | $ | 9.98 | | | $ | 10.04 | | | $ | 9.82 | | | $ | 9.80 | | | $ | 9.78 | |
| | | | | | | | | | | | | | | | | | | | | | | | |
Total investment return 2 | | | (2.05 | %) | | | 0.92 | % | | | 3.32 | % | | | 2.04 | % | | | 2.17 | % | | | 0.79 | % |
| | | | | | | | | | | | | | | | | | | | | | | | |
Net assets at end of period (000’s omitted) | | $ | 58,765 | | | $ | 135,246 | | | $ | 108,794 | | | $ | 90,273 | | | $ | 82,287 | | | $ | 74,542 | |
| | | | | | |
Ratios: 3 | | | | | | | | | | | | | | | | | | | | | | | | |
Expenses (without waiver) | | | 0.90 | %4 | | | 0.90 | % | | | 0.90 | % | | | 0.90 | % | | | 0.90 | % | | | 0.90 | % |
Expenses (with waiver) | | | 0.80 | %4 | | | — | | | | — | | | | — | | | | — | | | | — | |
Net investment income (without waiver) | | | 2.60 | % | | | 1.51 | % | | | 1.05 | % | | | 1.80 | % | | | 1.96 | % | | | 1.31 | % |
Net investment income (with waiver) | | | 2.70 | % | | | — | | | | — | | | | — | | | | — | | | | — | |
Portfolio turnover rate (excluding short-term securities) | | | 58.89 | %5 | | | 63.03 | % | | | 77.96 | % | | | 117.52 | % | | | 68.93 | % | | | 81.14 | % |
| 1 | The net investment income per share is based on average shares outstanding for the period. |
| 2 | Total investment return is based on the change in net asset value of a share during the period (not annualized) and assumes reinvestment of distributions at net asset value. |
| 3 | Ratios are annualized for periods less than one year. In addition to fees and expenses which the Fund bears directly, the Fund indirectly bears a pro rata share of the fees and expenses of the acquired funds in which it invests. Such indirect expenses are not included in the above reported expense ratios. |
| 4 | Total Fund expenses are limited to 0.90% of average daily net assets. However, during the period above, the investment adviser voluntarily absorbed expenses that were otherwise payable by the Fund. |
| | |
| | |
| 56 | | SIT MUTUAL FUNDS SEMI-ANNUAL REPORT |
FINANCIAL HIGHLIGHTS
Per share income and capital changes for a share outstanding throughout the period. See accompanying notes to financial statements.
Sit Quality Income Fund
| | | | |
Class Y | | Period Ended
September 30, 2022 1 | |
Net Asset Value: | | | | |
Beginning of period | | $ | 9.97 | |
| | | | |
Operations: | | | | |
Net investment income 2 | | | 0.15 | |
Net realized and unrealized losses on investments, written options and futures | | | (0.31 | ) |
| | | | |
Total from operations | | | (0.16 | ) |
| | | | |
Distributions from: | | | | |
Net investment income | | | (0.15 | ) |
| | | | |
Net Asset Value | | | | |
End of period | | $ | 9.66 | |
| | | | |
Total investment return 3 | | | (1.71 | %) |
| | | | |
Net assets at end of period (000’s omitted) | | $ | 80,589 | |
| |
Ratios: 4 | | | | |
Expenses | | | 0.55 | % |
Net investment income | | | 3.10 | % |
Portfolio turnover rate (excluding short-term securities) | | | 58.89 | %5 |
| 1 | The inception date of Class Y shares was March 31, 2022. |
| 2 | The net investment income per share is based on average shares outstanding for the period. |
| 3 | Total investment return is based on the change in net asset value of a share during the period (not annualized) and assumes reinvestment of distributions at net asset value. |
| 4 | Ratios are annualized for periods less than one year. In addition to fees and expenses which the Fund bears directly, the Fund indirectly bears a pro rata share of the fees and expenses of the acquired funds in which it invests. Such indirect expenses are not included in the above reported expense ratios. |
FINANCIAL HIGHLIGHTS
Per share income and capital changes for a share outstanding throughout the period. See accompanying notes to financial statements.
Sit Tax-Free Income Fund
| | | | | | | | | | | | | | | | | | | | | | | | |
Class S | | Six Months Ended
September 30, 2022
(Unaudited) | | | Year Ended March 31, | |
| | 2022 | | | 2021 | | | 2020 | | | 2019 | | | 2018 | |
Net Asset Value: | | | | | | | | | | | | | | | | | | | | | | | | |
Beginning of period | | $ | 9.20 | | | $ | 9.91 | | | $ | 9.56 | | | $ | 9.69 | | | $ | 9.66 | | | $ | 9.49 | |
| | | | | | | | | | | | | | | | | | | | | | | | |
Operations: | | | | | | | | | | | | | | | | | | | | | | | | |
Net investment income 1 | | | 0.13 | | | | 0.27 | | | | 0.29 | | | | 0.29 | | | | 0.32 | | | | 0.39 | |
Net realized and unrealized gains (losses) on investments and futures | | | (0.92 | ) | | | (0.71 | ) | | | 0.35 | | | | (0.13 | ) | | | 0.03 | | | | 0.17 | |
| | | | | | | | | | | | | | | | | | | | | | | | |
Total from operations | | | (0.79 | ) | | | (0.44 | ) | | | 0.64 | | | | 0.16 | | | | 0.35 | | | | 0.56 | |
| | | | | | | | | | | | | | | | | | | | | | | | |
Distributions from: | | | | | | | | | | | | | | | | | | | | | | | | |
Net investment income | | | (0.13 | ) | | | (0.27 | ) | | | (0.29 | ) | | | (0.29 | ) | | | (0.32 | ) | | | (0.39 | ) |
| | | | | | | | | | | | | | | | | | | | | | | | |
Net Asset Value | | | | | | | | | | | | | | | | | | | | | | | | |
End of period | | $ | 8.28 | | | $ | 9.20 | | | $ | 9.91 | | | $ | 9.56 | | | $ | 9.69 | | | $ | 9.66 | |
| | | | | | | | | | | | | | | | | | | | | | | | |
Total investment return 2 | | | (8.60 | %) | | | (4.62 | %) | | | 6.73 | % | | | 1.66 | % | | | 3.67 | % | | | 6.00 | % |
| | | | | | | | | | | | | | | | | | | | | | | | |
Net assets at end of period (000’s omitted) | | $ | 145,480 | | | $ | 185,151 | | | $ | 348,230 | | | $ | 313,296 | | | $ | 247,351 | | | $ | 196,018 | |
| | | | | | |
Ratios: 3 | | | | | | | | | | | | | | | | | | | | | | | | |
Expenses | | | 0.80 | % | | | 0.80 | % | | | 0.80 | % | | | 0.80 | % | | | 0.80 | % | | | 0.80 | % |
Net investment income | | | 3.07 | % | | | 2.68 | % | | | 2.92 | % | | | 2.95 | % | | | 3.37 | % | | | 4.03 | % |
Portfolio turnover rate (excluding short-term securities) | | | 6.15 | %4 | | | 20.78 | % | | | 21.22 | % | | | 14.33 | % | | | 13.80 | % | | | 15.72 | % |
| 1 | The net investment income per share is based on average shares outstanding for the period. |
| 2 | Total investment return is based on the change in net asset value of a share during the period (not annualized) and assumes reinvestment of distributions at net asset value. |
| 3 | Ratios are annualized for periods less than one year. In addition to fees and expenses which the Fund bears directly, the Fund indirectly bears a pro rata share of the fees and expenses of the acquired funds in which it invests. Such indirect expenses are not included in the above reported expense ratios. |
| | |
| | |
| 58 | | SIT MUTUAL FUNDS SEMI-ANNUAL REPORT |
FINANCIAL HIGHLIGHTS
Per share income and capital changes for a share outstanding throughout the period. See accompanying notes to financial statements.
Sit Tax-Free Income Fund
| | | | | | | | |
Class Y | | Six Months Ended
September 30, 2022
(Unaudited) | | | Period Ended
March 31, 2022 1 | |
Net Asset Value: | | | | | | | | |
Beginning of period | | $ | 9.20 | | | $ | 10.04 | |
| | | | | | | | |
Operations: | | | | | | | | |
Net investment income 2 | | | 0.15 | | | | 0.24 | |
Net realized and unrealized losses on investments and futures | | | (0.93 | ) | | | (0.84 | ) |
| | | | | | | | |
Total from operations | | | (0.78 | ) | | | (0.60 | ) |
| | | | | | | | |
Distributions from: | | | | | | | | |
Net investment income | | | (0.14 | ) | | | (0.24 | ) |
| | | | | | | | |
Net Asset Value | | | | | | | | |
End of period | | $ | 8.28 | | | $ | 9.20 | |
| | | | | | | | |
Total investment return 3 | | | (8.49 | %) | | | (6.06 | %) |
| | | | | | | | |
Net assets at end of period (000’s omitted) | | $ | 112,537 | | | $ | 169,263 | |
| | |
Ratios: 4 | | | | | | | | |
Expenses | | | 0.55 | % | | | 0.55 | % |
Net investment income | | | 3.32 | % | | | 3.57 | % |
Portfolio turnover rate (excluding short-term securities) | | | 6.15 | %5 | | | 20.78 | % |
| 1 | The inception date of Class Y shares was June 1, 2021. |
| 2 | The net investment income per share is based on average shares outstanding for the period. |
| 3 | Total investment return is based on the change in net asset value of a share during the period (not annualized) and assumes reinvestment of distributions at net asset value. |
| 4 | Ratios are annualized for periods less than one year. In addition to fees and expenses which the Fund bears directly, the Fund indirectly bears a pro rata share of the fees and expenses of the acquired funds in which it invests. Such indirect expenses are not included in the above reported expense ratios. |
FINANCIAL HIGHLIGHTS
Per share income and capital changes for a share outstanding throughout the period. See accompanying notes to financial statements.
Sit Minnesota Tax-Free Income Fund
| | | | | | | | | | | | | | | | | | | | | | | | |
| | | Six Months Ended
September 30, 2022
(Unaudited) | | | Year Ended March 31, | |
| | | 2022 | | | 2021 | | | 2020 | | | 2019 | | | 2018 | |
Net Asset Value: | | | | | | | | | | | | | | | | | | | | | | | | |
Beginning of period | | $ | 9.94 | | | $ | 10.68 | | | $ | 10.37 | | | $ | 10.49 | | | $ | 10.39 | | | $ | 10.29 | |
| | | | | | | | | | | | | | | | | | | | | | | | |
Operations: | | | | | | | | | | | | | | | | | | | | | | | | |
Net investment income 1 | | | 0.14 | | | | 0.27 | | | | 0.30 | | | | 0.30 | | | | 0.32 | | | | 0.32 | |
Net realized and unrealized gains (losses) on investments and futures | | | (0.90 | ) | | | (0.74 | ) | | | 0.31 | | | | (0.12 | ) | | | 0.10 | | | | 0.10 | |
| | | | | | | | | | | | | | | | | | | | | | | | |
Total from operations | | | (0.76 | ) | | | (0.47 | ) | | | 0.61 | | | | 0.18 | | | | 0.42 | | | | 0.42 | |
| | | | | | | | | | | | | | | | | | | | | | | | |
Distributions from: | | | | | | | | | | | | | | | | | | | | | | | | |
Net investment income | | | (0.14 | ) | | | (0.27 | ) | | | (0.30 | ) | | | (0.30 | ) | | | (0.32 | ) | | | (0.32 | ) |
| | | | | | | | | | | | | | | | | | | | | | | | |
Net Asset Value | | | | | | | | | | | | | | | | | | | | | | | | |
End of period | | $ | 9.04 | | | $ | 9.94 | | | $ | 10.68 | | | $ | 10.37 | | | $ | 10.49 | | | $ | 10.39 | |
| | | | | | | | | | | | | | | | | | | | | | | | |
Total investment return 2 | | | (7.74 | %) | | | (4.56 | %) | | | 5.94 | % | | | 1.46 | % | | | 4.15 | % | | | 4.08 | % |
| | | | | | | | | | | | | | | | | | | | | | | | |
Net assets at end of period (000’s omitted) | | $ | 489,741 | | | $ | 628,164 | | | $ | 680,301 | | | $ | 642,022 | | | $ | 617,766 | | | $ | 551,163 | |
| | | | | | |
Ratios: 3 | | | | | | | | | | | | | | | | | | | | | | | | |
Expenses | | | 0.80 | % | | | 0.80 | % | | | 0.80 | % | | | 0.80 | % | | | 0.80 | % | | | 0.80 | % |
Net investment income | | | 2.84 | % | | | 2.50 | % | | | 2.83 | % | | | 2.80 | % | | | 3.12 | % | | | 3.05 | % |
Portfolio turnover rate (excluding short-term securities) | | | 3.03 | %4 | | | 20.82 | % | | | 12.04 | % | | | 10.05 | % | | | 9.25 | % | | | 12.97 | % |
| 1 | The net investment income per share is based on average shares outstanding for the period. |
| 2 | Total investment return is based on the change in net asset value of a share during the period (not annualized) and assumes reinvestment of distributions at net asset value. |
| 3 | Ratios are annualized for periods less than one year. In addition to fees and expenses which the Fund bears directly, the Fund indirectly bears a pro rata share of the fees and expenses of the acquired funds in which it invests. Such indirect expenses are not included in the above reported expense ratios. |
| | |
| | |
| 60 | | SIT MUTUAL FUNDS SEMI-ANNUAL REPORT |
[This page is intentionally left blank.]
NOTES TO FINANCIAL STATEMENTS (Unaudited)
Six Months Ended September 30, 2022
The Sit Mutual Funds covered by this report are Sit U.S. Government Securities Fund, Sit Quality Income Fund, Sit Tax-Free Income Fund and Sit Minnesota Tax-Free Income Fund (each a “Fund” and collectively, the “Funds”). The Funds are no-load funds, and are registered under the Investment Company Act of 1940 (as amended) as diversified (except Sit Minnesota Tax-Free Income Fund which is non-diversified), open-end management investment companies, or series thereof. The Sit Quality Income Fund, Sit Tax-Free Income Fund and Sit Minnesota Tax-Free Income Fund are series funds of Sit Mutual Funds II, Inc. Each Fund has 10 billion authorized shares of capital stock. Shares in the Sit U.S. Government Securities Fund have a par value of $0.01, and shares in other Funds have a par value of $0.001. This report covers the bond funds of the Sit Mutual Funds.
The investment objective for each Fund is as follows:
| | |
Fund | | Investment Objective |
| U.S. Government Securities Fund | | High current income and safety of principal. |
| Quality Income Fund | | High current income and safety of principal. |
| Tax-Free Income Fund | | High current income that is exempt from federal income tax, consistent with the preservation of capital. |
| Minnesota Tax-Free Income Fund | | High current income that is exempt from federal regular income tax and Minnesota regular personal income tax, consistent with the preservation of capital. |
The U.S. Government Securities Fund, Quality Income Fund and Tax-Free Income Fund offer Class S and Class Y shares. Both classes of shares have identical voting, dividend and liquidation rights. Income, expenses (other than class specific expenses) and realized and unrealized gains or losses on investments are allocated to each class of shares based upon its relative net assets.
| (2) | Significant Accounting Policies |
The Funds are investment companies and follow accounting and reporting guidance under Financial Accounting Standards Board (“FASB”) Accounting Standards Codification (“ASC”) Topic 946, “Financial Services-Investment Companies”. The following is a summary of significant accounting policies consistently followed by the Funds in the preparation of their financial statements in conformity with U.S. generally accepted accounting principles (“GAAP”).
Investments in Securities
Investment securities are carried at fair value based upon closing market quotations on the last business day of the period. Investments in securities traded on national or international securities exchanges are valued at the last reported sales price prior to the time when assets are valued. Equity securities traded on the over-the-counter market are valued at the last reported sales price or if the last sales price is not available, at the last reported bid price. The sale and bid prices or prices deemed best to reflect fair value quoted by dealers who make markets in these securities are obtained from independent pricing services. Consistent with the Funds’ valuation policies and procedures, the current fair value of certain fixed income securities is provided by an independent pricing service. Fixed income securities for which prices are not available from an independent pricing service but where an active market exists are valued using market quotations obtained from broker-dealers or quotation systems. Securities for which market quotations are not available, such as private placement securities, are valued at fair value according to methods selected in good faith by Sit Investment Associates, Inc. (the “Adviser” or “SIA”) and may include dealer-supplied valuations or other inputs and assumptions that pricing services would typically utilize. Short-term investments of sufficient credit quality with maturities of 60 days or less when acquired, or which subsequently are within 60 days of maturity, are valued at amortized cost, which approximates fair value. Options and futures contracts entered into and held by the Funds are valued at the close of the securities and commodities exchange on which they are traded.
Security transactions are accounted for on the date the securities are purchased or sold. Gains and losses are calculated on the identified cost basis. Interest, including level-yield amortization of long-term bond premium and discount, is recorded on the accrual basis. Amortization of long-term bond premium and discount is calculated using the effective interest rate method. Dividends received from closed-end fund holdings are included in Dividend Income and distributions from capital gains, if any, are included in Net Realized Gain (Loss).
| | |
| | |
| 62 | | SIT MUTUAL FUNDS SEMI-ANNUAL REPORT |
Delivery and payment for securities which have been purchased by the Funds on a forward commitment or when-issued basis can take place two weeks or more after the transaction date. During this period, such securities are subject to market fluctuations and may increase or decrease in value prior to delivery.
The Minnesota Tax-Free Income Fund concentrates its investments in Minnesota, and therefore may have more credit risk related to the economic conditions in the state of Minnesota than a portfolio with broader geographical diversification.
Derivative Instruments
The Funds apply derivative instrument disclosure standards in order to enable investors to understand how and why the Funds use derivatives, how derivatives are accounted for, and how derivative instruments affect the Funds’ financial statements.
To hedge interest rate risk, the Funds used Treasury options and futures traded on a U.S. exchange. Risks of entering into futures and options contracts include the possibility of an illiquid market and that a change in the value of the option may not correlate with changes in the value of the underlying securities.
The premiums paid for the options represent the cost of the investment and the options are valued daily at their closing price. The Funds recognize a realized gain or loss when the option is sold or expired. Option holdings within the Funds, which may include put options and call options, are subject to loss of value with the passage of time, and may experience a total loss of value upon expiration. With options, there is minimal counterparty risk to the Funds since they are exchange traded.
Upon entering into a futures contract, a Fund is required to deposit either cash or securities in an amount (initial margin) equal to a certain percentage of the contract value. Subsequent payments (variation margin) are made or received by the Fund each day. The variation margin payments are equal to the daily changes in the contract value and are recorded as unrealized gains and losses. The Fund recognizes a realized gain or loss when the contract is closed or expired. With futures contracts, there is minimal counterparty risk to the Fund since futures are exchange traded and the exchange’s clearinghouse, as counterparty to all exchange-traded futures, guarantees the futures against default.
During the six months ended September 30, 2022, the average volume of derivative activity, calculated on a quarterly basis, was as follows:
| | | | | | | | | | | | |
| | | Average
Cost | | | Average
Premium
Received | | | Average
Notional
Amount | |
U.S. Government Securities Fund | | | | | | | | | | | | |
Purchased put options | | $ | 1,618,534 | | | $ | 3,388,255 | | | $ | 143,837,333 | |
Written call options | | | 420,741 | | | | 228,021 | | | | 44,233,333 | |
Quality Income Fund | | | | | | | | | | | | |
Treasury futures - short | | | — | | | | — | | | | 29,656,857 | |
Tax-Free Income Fund | | | | | | | | | | | | |
Treasury futures - short | | | — | | | | — | | | | 120,801,940 | |
Minnesota Tax-Free Income Fund | | | | | | | | | | | | |
Treasury futures - short | | | — | | | | — | | | | 138,477,793 | |
The number of open option contracts and open futures contracts outstanding as of September 30, 2022 also serve as indicators of the volume of activity for the Funds throughout the period.
NOTES TO FINANCIAL STATEMENTS (Unaudited)
Six Months Ended September 30, 2022 (Continued)
Statement of Assets and Liabilities – Values of derivatives as of September 30, 2022:
| | | | | | | | |
| | | Asset
Derivatives
Value | | | Liability
Derivatives
Value | |
Interest rate risk: | | | | | | | | |
U.S. Government Securities Fund | | | | | | | | |
Put Options Purchased | | $ | 4,045,703 | 1 | | | — | |
Quality Income Fund | | | | | | | | |
Treasury futures | | | 407,731 | 2 | | | — | |
Tax-Free Income Fund | | | | | | | | |
Treasury futures | | | 4,778,674 | 2 | | | — | |
Minnesota Tax-Free Income Fund | | | | | | | | |
Treasury futures | | | 6,792,131 | 2 | | | — | |
| 1 | Statement of Assets and Liabilities location: Investments in Securities, at fair value. |
| 2 | Statement of Assets and Liabilities location: Variation margin receivable/payable. Includes cumulative appreciation (depreciation) of futures as reported in the Schedule of Investments. |
The effect of derivative instruments on the Statement of Operations for the six months ended September 30, 2022:
| | | | | | | | |
| | | Amount of Realized
Gain (Loss) on
Derivatives 3 | | | Change in Unrealized
Appreciation (Depreciation) on
Derivatives 4 | |
Interest rate risk: | | | | | | | | |
U.S. Government Securities Fund | | | | | | | | |
Purchased put options | | $ | 5,147,706 | | | | ($359,000 | ) |
Written call options | | | 715,880 | | | | — | |
Quality Income Fund | | | | | | | | |
Purchased put options | | | (18,134 | ) | | | — | |
Treasury futures | | | 2,374,345 | | | | (354,245 | ) |
Tax-Free Income Fund | | | | | | | | |
Treasury futures | | | 4,190,017 | | | | 3,047,586 | |
Minnesota Tax-Free Income Fund | | | | | | | | |
Treasury futures | | | 4,883,611 | | | | 4,772,664 | |
| 3 | Statement of Operations location: Net realized gain (loss) on investments, net realized gain (loss) on written options and net realized gain (loss) on futures, respectively. |
| 4 | Statement of Operations location: Net change in unrealized appreciation (depreciation) on investments, net change in unrealized appreciation (depreciation) on written options and net change in unrealized appreciation (depreciation) on futures, respectively. |
Fair Value Measurements
The inputs and valuation techniques used to measure fair value of the Funds’ net assets are summarized into three levels as described in the hierarchy below:
| • | | Level 1 – quoted prices in active markets for identical securities. An active market for the security is a market in which transactions occur with sufficient frequency and volume to provide pricing information on an ongoing basis. A quoted price in an active market provides the most reliable evidence of fair value. |
| • | | Level 2 – debt securities are valued based on evaluated prices received from independent pricing services or from dealers who make markets in such securities. For corporate bonds, U.S. government and government agency obligations, and municipal securities the pricing services utilize matrix pricing which considers yield or price of bonds of comparable quality, coupon, maturity, and type as well as dealer |
| | |
| | |
| 64 | | SIT MUTUAL FUNDS SEMI-ANNUAL REPORT |
supplied prices. For asset-backed securities and mortgage-backed securities, the pricing services utilize matrix pricing which considers prepayment speed assumptions, attributes of the collateral, yield or price of bonds of comparable quality, coupon, maturity, and type as well as dealer supplied prices. All of these inputs are derived principally from or corroborated by observable market data. An adjustment to any observable input that is significant to the fair value may render the measurement a Level 3 measurement.
| • | | Level 3 – significant unobservable inputs, including the Adviser’s own assumptions in determining the fair value of investments. |
The inputs or methodology used for valuing securities are not necessarily an indication of the risk associated with investing in those securities.
At the end of each calendar quarter, management evaluates the Level 2 and 3 assets and liabilities for changes in liquidity, including but not limited to: whether a broker is willing to execute at the quoted price, the depth and consistency of prices from third party services, and the existence of contemporaneous, observable trades in the market. Additionally, management evaluates the Level 1 and 2 assets and liabilities on a quarterly basis for changes in listings or delistings on national exchanges. Due to the inherent uncertainty of determining the fair value of investments that do not have a readily available market value, the fair value of the Funds’ investments may fluctuate from period to period. Additionally, the fair value of investments may differ significantly from the values that would have been used had a ready market existed for such investments and may differ materially from the values the Fund may ultimately realize. Further, such investments may be subject to legal and other restrictions on resale or otherwise are less liquid than publicly traded securities.
A summary of the levels for the Funds’ investments as of September 30, 2022 is included with the Funds’ schedules of investments.
Federal Taxes
The Funds’ policy is to comply with the requirements of the Internal Revenue Code applicable to regulated investment companies and to distribute all of their taxable income to shareholders. The Funds have recorded in their financial statements the full benefit of their tax positions taken in connection with the Registered Investment Company (RIC) qualification and distribution requirements of the Internal Revenue Code. Therefore, no income tax provision is required. Also, in order to avoid the payment of any federal excise taxes, the Funds will distribute substantially all of their net investment income and net realized gains on a calendar year basis.
Management has analyzed the Funds’ tax positions taken in federal tax returns for all open tax years and has concluded that as of September 30, 2022, no provision for income tax would be required in the Funds’ financial statements. The Funds’ federal and state income and federal excise tax returns remain subject to examination by the Internal Revenue Service and state departments of revenue until such time as the applicable statute of limitations for audit has expired. For example, U.S. tax returns are generally subject to audit for three years from the date they are filed.
At September 30, 2022, the gross unrealized appreciation (depreciation) on investments and cost of investments on a tax basis for federal income tax purposes were as follows:
| | | | | | | | | | | | | | | | |
| | | Unrealized
Appreciation | | | Unrealized
Depreciation | | | Net Unrealized
Appreciation
(Depreciation) | | | Cost (Proceeds)
of Investments
on a Tax Basis | |
U.S. Government Securities Fund - Investments | | $ | 2,847,165 | | | | ($33,909,275 | ) | | | ($31,062,110 | ) | | $ | 445,804,891 | |
Quality Income Fund - Investments | | | 36,790 | | | | (7,871,120 | ) | | | (7,834,330 | ) | | | 153,610,611 | |
Tax-Free Income Fund - Investments | | | 1,073,552 | | | | (61,659,403 | ) | | | (60,585,851 | ) | | | 289,388,620 | |
Minnesota Tax-Free Income Fund - Investments | | | 552,288 | | | | (90,439,124 | ) | | | (89,886,836 | ) | | | 552,716,202 | |
NOTES TO FINANCIAL STATEMENTS (Unaudited)
Six Months Ended September 30, 2022 (Continued)
Net investment income and net realized gains may differ for financial statement and tax purposes. The character of distributions made during the year from net investment income or net realized gains may also differ from its ultimate characterization for tax purposes. The tax character of distributions paid during the fiscal years ended March 31, 2022 and 2021 was as follows:
| | | | | | | | | | | | | | | | |
| Year Ended March 31, 2022: | | | | | | | | | | | | |
| | | | |
| | | Ordinary
Income | | | Tax-Exempt
Income | | | Long Term
Capital Gain | | | Total | |
U.S. Government Securities Fund | | $ | 4,765,649 | | | | — | | | | — | | | $ | 4,765,649 | |
Quality Income Fund | | | 1,945,396 | | | | — | | | | — | | | | 1,945,396 | |
Tax-Free Income Fund* | | | 39,318 | | | $ | 10,510,585 | | | | — | | | | 10,549,903 | |
Minnesota Tax-Free Income Fund* | | | 18,163 | | | | 17,828,095 | | | | — | | | | 17,846,258 | |
| * | 99.6% and 99.9% of dividends were derived from interest on tax-exempt securities for the Tax-Free Income and Minnesota Tax-Free Income Funds, respectively. |
| | | | | | | | | | | | | | | | |
| | | | |
| Year Ended March 31, 2021: | | | | | | | | | | | | | | | | |
| | | | |
| | | Ordinary
Income | | | Tax-Exempt
Income | | | Long Term
Capital Gain | | | Total | |
U.S. Government Securities Fund | | $ | 5,957,101 | | | | — | | | | — | | | $ | 5,957,101 | |
Quality Income Fund | | | 1,043,484 | | | | — | | | | — | | | | 1,043,484 | |
Tax-Free Income Fund* | | | 74,376 | | | $ | 9,453,231 | | | | — | | | | 9,527,607 | |
Minnesota Tax-Free Income Fund* | | | 13,344 | | | | 18,424,560 | | | | — | | | | 18,437,904 | |
| * | 99.2% and 99.9% of dividends were derived from interest on tax-exempt securities for the Tax-Free Income and Minnesota Tax-Free Income Funds, respectively. |
As of March 31, 2022, the components of distributable earnings on a tax basis were as follows:
| | | | | | | | | | | | | | | | |
| | | Undistributed
Ordinary
Income | | | Undistributed
Tax-Exempt
Income | | | Undistributed
Long-Term
Capital Gains | | | Unrealized
Appreciation
(Depreciation) | |
U.S. Government Securities Fund | | $ | 15,193 | | | | — | | | | — | | | | ($11,424,639 | ) |
Quality Income Fund | | | 773,386 | | | | — | | | $ | 1,898,889 | | | | (3,046,741 | ) |
Tax-Free Income Fund | | | — | | | $ | 409,245 | | | | — | | | | (31,723,022 | ) |
Minnesota Tax-Free Income Fund | | | — | | | | 83,235 | | | | — | | | | (31,416,963 | ) |
Net capital loss carryovers and late year losses, if any, as of March 31, 2022, are available to offset future realized capital gains and thereby reduce future capital gains distributions. The Funds are permitted to carry forward capital losses for an unlimited period. Capital losses that are carried forward retain their character as either short-term or long-term capital losses. The net capital loss carryovers and the late year losses deferred as of March 31, 2022, were as follows:
| | | | | | | | | | | | | | | | |
| | | Unlimited Period of Net
Capital Loss Carryover | | | Late Year
Losses
Deferred | | | Accumulated
Capital and
Other Losses | |
| | | Short-Term | | | Long-Term | |
U.S. Government Securities Fund | | $ | 4,494,197 | | | $ | 2,897,287 | | | | — | | | $ | 7,391,484 | |
Tax-Free Income Fund | | | 541,918 | | | | 5,054,634 | | | | — | | | | 5,596,552 | |
Minnesota Tax-Free Income Fund | | | 1,322,405 | | | | — | | | | — | | | | 1,322,405 | |
| | |
| | |
| 66 | | SIT MUTUAL FUNDS SEMI-ANNUAL REPORT |
For the year ended March 31, 2022, the Funds’ utilized capital losses and expired capital losses as follows:
| | | | | | | | |
| | | Utilized | | | Expired | |
U.S. Government Securities Fund | | $ | 8,861,129 | | | | — | |
Quality Income Fund | | | 401,278 | | | | — | |
Tax-Free Income Fund | | | 3,878,531 | | | | — | |
Minnesota Tax-Free Income Fund | | | 1,954,077 | | | | — | |
Distributions
Distributions to shareholders are recorded as of the close of business on the record date. Such distributions are payable in cash or reinvested in additional shares of the Funds’ capital stock. Distributions from net investment income are declared daily and paid monthly for the Funds. Distributions from net realized gains, if any, will be made annually for each of the Funds.
Use of Estimates
The preparation of financial statements in conformity with U.S. generally accepted accounting principles requires management to make certain estimates and assumptions that affect the reported amounts of assets and liabilities and disclosure of contingent assets and liabilities at the date of the financial statements and the reported results for the respective periods. Actual results could differ from those estimates.
Guarantees and Indemnifications
Under each Fund’s organizational documents, its officers and directors are indemnified against certain liability arising out of the performance of their duties to each Fund. In addition, certain of each Fund’s contracts with its service providers contain general indemnification clauses. Each Fund’s maximum exposure under these arrangements is unknown since the amount of any future claims that may be made against each Fund cannot be determined and each Fund has no historical basis for predicting the likelihood of any such claims.
| (3) | Investment Security Transactions |
The cost of purchases and proceeds from sales and maturities of investment securities, other than short-term securities, for the six months ended September 30, 2022, were as follows:
| | | | | | | | | | | | | | | | |
| | | Purchases | | | Proceeds | |
| | | U.S. Government | | | Other | | | U.S. Government | | | Other | |
U.S. Government Securities Fund | | $ | 166,203,916 | | | | — | | | $ | 132,939,851 | | | $ | 817,752 | |
Quality Income Fund | | | 23,985,425 | | | $ | 54,913,761 | | | | 19,658,701 | | | | 53,413,191 | |
Tax-Free Income Fund | | | — | | | | 17,080,543 | | | | — | | | | 88,281,004 | |
Minnesota Tax-Free Income Fund | | | — | | | | 16,077,314 | | | | — | | | | 109,882,756 | |
NOTES TO FINANCIAL STATEMENTS (Unaudited)
Six Months Ended September 30, 2022 (Continued)
| (4) | Affiliated Fees and Transactions |
Investment Adviser
The Funds each have entered into an investment management agreement with Sit Investment Associates Inc., under which SIA manages the Funds’ assets and provides research, statistical and advisory services, and pays related office rental, executive expenses and executive salaries. In addition, the Funds have entered into separate supervision and administration agreements with SIA. SIA also is obligated to pay all of the Funds’ expenses (excluding extraordinary expenses, stock transfer taxes, interest, brokerage commissions, and other transaction charges relating to investing activities). The fees charged to each Fund by SIA are based on the average daily net assets of the Funds at the annual rate of:
| | | | | | | | | | | | |
| | | Advisory
Fees | | | Supervisory and
Administrative Fees | | | Total
Management Fees | |
U.S. Government Securities Fund Class S | | | 0.20 | % | | | 0.60 | % | | | 0.80 | % |
U.S. Government Securities Fund Class Y | | | 0.20 | % | | | 0.35 | % | | | 0.55 | % |
Quality Income Fund Class S1 | | | 0.20 | % | | | 0.60 | % | | | 0.80 | % |
Quality Income Fund Class Y2 | | | 0.20 | % | | | 0.35 | % | | | 0.55 | % |
Tax-Free Income Fund Class S | | | 0.20 | % | | | 0.60 | % | | | 0.80 | % |
Tax-Free Income Fund Class Y | | | 0.20 | % | | | 0.35 | % | | | 0.55 | % |
Minnesota Tax-Free Income Fund | | | 0.20 | % | | | 0.60 | % | | | 0.80 | % |
| 1 | Effective April 1, 2022, the advisory fee for Sit Quality Income Fund was voluntarily reduced from 0.30% to 0.20%; the fees presented reflect the fees net of the Adviser’s voluntary fee waiver. |
| 2 | Sit Quality Income Fund Class Y shares were first issued on March 31, 2022, and therefore the fees presented reflect the fees provided for in the Investment Management Agreement and Supervision and Administration Agreement. |
Transactions with affiliates
The Adviser, affiliates of the Adviser, directors and officers of the Funds as a whole owned the following shares as of September 30, 2022:
| | | | | | | | |
| | | Shares | | | % Shares
Outstanding | |
U.S. Government Securities Fund Class S | | | 224,953 | | | | 0.8 | |
U.S. Government Securities Fund Class Y | | | 1,110,070 | | | | 10.4 | |
Quality Income Fund Class S | | | 2,252,016 | | | | 37.0 | |
Quality Income Fund Class Y | | | 7,548,932 | | | | 90.5 | |
Tax-Free Income Fund Class S | | | 324,249 | | | | 1.8 | |
Tax-Free Income Fund Class Y | | | 607,550 | | | | 4.5 | |
Minnesota Tax-Free Income Fund | | | 1,907,879 | | | | 3.5 | |
Effective November 30, 2021, the Funds, together with the 10 equity Sit Mutual Funds managed by SIA, are borrowers in a $20 million credit facility (Credit Facility) maturing November 29, 2022. The Credit Facility provides a source of funds to the Funds for temporary and emergency purposes, including the ability to meet future unanticipated or unusually large redemption requests. Under the terms of the Credit Facility, each Fund shall pay interest charged on any borrowings made by the Fund. During the six months ended September 30, 2022, the Funds did not use the Credit Facility.
| | |
| | |
| 68 | | SIT MUTUAL FUNDS SEMI-ANNUAL REPORT |
EXPENSE EXAMPLE (Unaudited)
As a shareholder of the Funds, you incur two types of costs: (1) transaction costs, including redemption fees and (2) ongoing costs, including management fees; and other Fund expenses. This Example is intended to help you understand your ongoing costs (in dollars) of investing in the Funds and to compare these costs with the ongoing costs of investing in other mutual funds.
The Example is based on an investment of $1,000 invested at the beginning of the period and held for the entire period April 1, 2022 to September 30, 2022.
Actual Expenses
The first line of the following table provides information about actual account values and actual expenses. You may use the information in this line, together with the amount you invested, to estimate the expenses that you paid over the period. Simply divide your account value by $1,000 (for example, an $8,600 account value divided by $1,000 = 8.6), then multiply the result by the number in the first line under the heading entitled “Expenses Paid During Period” to estimate the expenses you paid on your account during this period.
Hypothetical Example for Comparison Purposes
The second line of the table provides information about hypothetical account values and hypothetical expenses based on the Fund’s actual expense ratio and an assumed rate of return of 5% per year before expenses, which is not the Fund’s actual return. The hypothetical account values and expenses may not be used to estimate the actual ending account balance or expenses you paid for the period. You may use this information to compare the ongoing costs of investing in the Fund and other funds. To do so, compare this 5% hypothetical example with the 5% hypothetical examples that appear in the shareholder reports of the other funds.
Please note that the expenses shown in the table are meant to highlight your ongoing costs only and do not reflect any transactional costs, such as redemption fees. Therefore, the second line of the table is useful in comparing ongoing costs only, and will not help you determine the relative total costs of owning different funds. In addition, if these transactional costs (redemption fees) were included, your costs would have been higher.
| | | | | | | | | | | | |
| | | Beginning
Account
Value
(4/1/22) | | | Ending
Account
Value
(9/30/22) | | | Expenses
Paid
During
Period
(4/1/22-
9/30/22)* | |
| | | | | | | | | | |
| | | U.S. Government Securities Fund | |
Actual | | | | | | | | | | | | |
Class S | | $ | 1,000 | | | $ | 966.00 | | | $ | 3.94 | |
Class Y | | $ | 1,000 | | | $ | 966.90 | | | $ | 2.71 | |
Hypothetical | | | | | | | | | | | | |
Class S | | $ | 1,000 | | | $ | 1,021.06 | | | $ | 4.05 | |
Class Y | | $ | 1,000 | | | $ | 1,022.31 | | | $ | 2.79 | |
| |
| | | Quality Income Fund | |
Actual | | | | | | | | | | | | |
Class S | | $ | 1,000 | | | $ | 979.50 | | | $ | 3.97 | |
Class Y | | $ | 1,000 | | | $ | 982.90 | | | $ | 2.73 | |
Hypothetical | | | | | | | | | | | | |
Class S | | $ | 1,000 | | | $ | 1,021.06 | | | $ | 4.05 | |
Class Y | | $ | 1,000 | | | $ | 1,022.31 | | | $ | 2.79 | |
| |
| | | Tax-Free Income Fund | |
Actual | | | | | | | | | | | | |
Class S | | $ | 1,000 | | | $ | 914.00 | | | $ | 3.84 | |
Class Y | | $ | 1,000 | | | $ | 915.10 | | | $ | 2.64 | |
Hypothetical | | | | | | | | | | | | |
Class S | | $ | 1,000 | | | $ | 1,021.06 | | | $ | 4.05 | |
Class Y | | $ | 1,000 | | | $ | 1,022.31 | | | $ | 2.79 | |
| |
| | | Minnesota Tax-Free Income Fund | |
Actual | | $ | 1,000 | | | $ | 922.60 | | | $ | 3.86 | |
Hypothetical | | $ | 1,000 | | | $ | 1,021.06 | | | $ | 4.05 | |
| * | Expenses are equal to the Funds’ annualized expense ratios of 0.80% for the Class S shares and the Minnesota Tax Free Fund; 0.55% for the Class Y shares, multiplied by the average account value over the period, multiplied by 183/365 (to reflect the one-half year period.) |
ADDITIONAL INFORMATION (Unaudited)
PROXY VOTING
A description of the policies and procedures that the Adviser uses to vote proxies related to the Funds’ portfolio securities is set forth in the Funds’ Statement of Additional Information, which is available on the Funds’ website at www.sitfunds.com, without charge by calling 800-332-5580 and on the Securities and Exchange Commission’s (SEC) website at www.sec.gov. The Funds’ proxy voting record is available without charge by calling 800-332-5580 and on the SEC’s website at www.sec.gov no later than August 31 for the prior 12 months ending June.
QUARTERLY SCHEDULES OF INVESTMENTS
Each Fund files a complete schedule of investments with the SEC for the first and third quarters of each fiscal year on Form N-PORT. The Funds’ Form N-PORT is available on the SEC’s website at www.sec.gov. Each Fund’s complete schedule of investments, as filed on Form N-PORT, is also available on its website at www.sitfunds.com, or without charge by calling 800-332-5580.
| | |
| | |
| 70 | | SIT MUTUAL FUNDS SEMI-ANNUAL REPORT |
[This page is intentionally left blank.]
[This page is intentionally left blank.]
| | |
| | |
| 72 | | SIT MUTUAL FUNDS SEMI-ANNUAL REPORT |
Semi-Annual Report
September 30, 2022
INVESTMENT ADVISER
INDEPENDENT REGISTERED PUBLIC
Sit Investment Associates, Inc.
ACCOUNTING FIRM
80 S. Eighth Street
KPMG LLP
Suite 3300
Minneapolis, MN
Minneapolis, MN 55402
GENERAL COUNSEL
CUSTODIAN
Faegre Drinker Biddle & Reath LLP
The Bank Of New York Mellon
Minneapolis, MN
111 Sanders Creek Parkway
Syracuse, NY 13057
TRANSFER AGENT AND
DISBURSING AGENT
BNY Mellon Investment Servicing (US) Inc.
4400 Computer Drive
Westborough, MA 01581
Sit Mutual Funds
1-800-332-5580 www.sitfunds.com
SIT BOND 9-2022
Item 2: Code of Ethics.
Not applicable to Semi-Annual Report.
Item 3: Audit Committee Financial Expert.
Not applicable to Semi-Annual Report.
Item 4: Principal Accountant Fees and Services.
Not applicable to Semi-Annual Report.
Item 5: Audit Committee of Listed Registrants.
Not applicable to open-end investment companies.
Item 6: Schedule of Investments.
The schedule of investments is included as part of the report to shareholders filed under Item 1 of this Form.
Item 7: Disclosure of Proxy Voting Policies and Procedures for Closed-End Management Investment Companies.
Not applicable to open-end investment companies.
Item 8: Portfolio Managers of Closed-End Management Companies.
Not applicable to open-end investment companies.
Item 9: Purchases of Equity Securities by Closed-End Management Investment Company and Affiliated Purchasers.
Not applicable to open-end investment companies.
Item 10. Submission of Matters to a vote of Security Holders.
There have been no material changes to the procedures by which shareholders may recommend nominees to the registrant’s board of directors.
Item 11: Controls and Procedures -
(a) Based on their evaluation of the Registrant’s Disclosure Controls and Procedures as of a date within 90 days of the Filing Date, the Registrant’s Chairman and Treasurer have determined that the Disclosure Controls and Procedures (as defined in Rule 30a-2(c) under the Act) are designed to ensure that information required to be disclosed by the Registrant is recorded, processed, summarized and reported by the filing Date, and that information required to be disclosed in the report is communicated to the Registrant’s management, as appropriate, to allow timely decisions regarding required disclosure.
b) There were no changes in the Registrant’s internal control over financial reporting as defined in Rule 30a-3(d) under the Act) that occurred during the Registrant’s last fiscal half-year that has materially affected, or is reasonably likely to materially affect, the Registrant’s internal control over financial reporting.
Item 12: Disclosure of Securities Lending Activities for Closed-End Management Investment Companies.
Not applicable to open-end investment companies.
Item 13: Exhibits:
| (a) | The following exhibits are attached to this Form N-CSR: |
SIGNATURES
Pursuant to the requirements of the Securities Exchange Act of 1934 and the Investment Company Act of 1940, the registrant has duly caused this report to be signed on its behalf by the undersigned, thereunto duly authorized.
| | |
| SIT MUTUAL FUNDS II, INC. |
| |
| By: | | /s/ Paul E. Rasmussen |
| | Paul E. Rasmussen |
| | Vice President, Treasurer |
|
| Date: November 18, 2022 |
Pursuant to the requirements of the Securities Exchange Act of 1934 and the Investment Company Act of 1940, this report has been signed below by the following persons on behalf of the registrant and in the capacities and on the dates indicated.
| | |
| By: | | /s/ Paul E. Rasmussen |
| | Paul E. Rasmussen |
| | Vice President, Treasurer |
|
| Date: November 18, 2022 |
| |
| By: | | /s/ Roger J. Sit |
| | Roger J. Sit |
| | Chairman |
|
| Date: November 18, 2022 |