UNITED STATES SECURITIES AND EXCHANGE COMMISSION
Washington, D.C. 20549
FORMN-CSR
----------
CERTIFIED SHAREHOLDER REPORT OF REGISTERED
MANAGEMENT INVESTMENT COMPANIES
Investment Company Act file number:811-04033
---------
Sit Mutual Funds II, Inc.
(Exact name of registrant as specified in charter)
3300 IDS Center
80 South Eighth Street
Minneapolis, MN 55402
(Address of principal executive offices)
Paul E. Rasmussen, VP & Treasurer
Sit Mutual Funds, Inc.
3300 IDS Center
80 South Eighth Street
Minneapolis, MN 55402
(Name and address of agent for service)
Copy to:
Mike Radmer, Esq.
Dorsey & Whitney
Suite 1500
50 South Sixth Street
Minneapolis, MN 55402-1498
Registrant’s telephone number, including area code:
(612)332-3223
Date of fiscal year end: March 31, 2019
Date of reporting period: September 30, 2019
Item 1: Reports to Stockholders
|
|
Sit Mutual Funds BOND FUNDS SEMI-ANNUAL REPORT TABLE OF CONTENTS |
This document must be preceded or accompanied by a Prospectus.
CHAIRMAN’S LETTER
October 30, 2019
Dear fellow shareholders:
During the six month period ended September 30, 2019, U.S. Treasury yields declined and the yield curve flattened as fears regarding the health of the global economy resulted in investors seeking the relative safety of Treasury Bonds.2-year Treasury yields ended September at 1.62%, a decrease of 63 basis points from the end of March. Yields for longer-term bonds dropped even more as expectations for future inflation waned. The30-year Treasury yield declined 70 bps from March 31 to end the period at 2.11%.
The yield curve maintained its checkmark shape throughout the period with the 5-year Treasury being at the lowest point along the curve at a yield of 1.54% as of September 30, 2019. The yield curve inverted in late March 2019 with the10-year Treasury yield dropping below the yield of 3-month Treasury bill. The yield curve remained inverted for much of the period and finished with the10-year Treasury yield lower than3-month Treasury bill yield by 0.16%. This is the first time since prior to last decade’s financial crisis that the yield curve has been inverted. Many economists, analysts, and market pundits have been claiming that a U.S. recession is being signaled by the current inversion despite their questionable approach to justify their claims. However, with the U.S. economy on solid footing, particularly with regard to the consumer, and unemployment at a50-year low, the inversion of the yield curve is more likely driven by high demand for longer maturity U.S. Treasury bonds due to negative yields in Japan and Europe, Brexit fears, and potential supply chain disruptions due to the global trade wars.
Accommodative Monetary Policy
The U.S. Federal Reserve (Fed) lowered its target range for the federal funds rate by 50 basis points during the period with 25 basis point cuts at both the July and September FOMC meetings, to the current target range of 1.75 to 2.00%. In addition, the Fed stopped reducing its balance sheet to maintain a permanently higher level of excess reserves. The Fed undertook these actions to mitigate the potential risk to the domestic economy caused by the global slowdown which is at least partially attributable to the protracted trade war with China.
Trade War
The stealing of intellectual property by the Chinese government and corporations and the open manipulation of its currency by China’s central bank has been giving China an unfair advantage over its trading partners. President Trump has settled into a protracted and escalating trade war with China in an attempt to force China to adhere to fairer trade practices.
Announcements of threats and/or actions taken by either President Trump or the Chinese government are escalating the trade war on a near weekly basis. Official communication from the White House, Chinese authorities, or President Trump’s Twitter account cause gyrations in the stock and bond markets as hopes for a trade deal rise and fall with each new message. Markets experienced increased volatility throughout August as President Trump escalated the trade war in the aftermath of the late July cut in the target range for the federal funds rate. Fed Chair Powell stated that international trade
tensions were one of his primary concerns and that an escalation in the trade war could sway his outlook enough to prompt future rate cuts. Disappointed that rates were not cut further, President Trump delivered the escalation just one day later by announcing that an additional $300 million in Chinese goods would be subject to a 10% tariff beginning September 1, 2019. The Chinese retaliated by manipulating the value of their currency lower and announcing the suspension of any U.S. agriculture imports. These new tariffs announced by President Trump followed the May 10, 2019 implementation of a 25% tariff on $250 million of Chinese imports.
Domestic Economy
The U.S. domestic economy continues to be resilient in the face of a spike in trade uncertainty and a global industrial downturn. U.S. real GDP grew by 2.0% in the second quarter of 2019 and the Atlanta Fed is estimating that GDP grew by 1.8% in the third quarter. Although U.S. business confidence and capital investment have declined, consumer spending has so far been relatively unscathed, buoyed by a tight labor market, rising wage growth, and improving household net worth. The growth of the economy is largely reliant on consumer spending, which has remained strong with year over year wage growth near or in excess of 3.0%, as measured by the Bureau of Labor Statistics’ U.S. Average Hourly Earnings report.
Outlook
Despite a strong domestic economy and an unemployment rate at a50-year low of just 3.5%, we still expect the Fed to cut interest rates further. Although previous rate cuts were in response to concerns over international trade, future rate cuts will be to combat the lack of liquidity in the overnight bank lending markets that came to light in the wake of the bombings of oil processing facilities in Saudi Arabia in September. To help ensure the smooth functioning of the banking system, the Fed is likely to continue to lower the target range for the federal funds rate and further reduce the interest rate it pays on the bloated excess reserve balance at the Fed.
We believe that the Fed’s policy tool of paying banks interest on their excess reserves is the main rationale for the large excess reserve balance at the Fed, and why that cash has not been a source of liquidity in the overnight funding markets. On the surface it appears that the banking system is awash in reserves due to the $1.4 trillion balance of excess reserves. However, a large portion of these reserves are concentrated at a few very large banks that are happy to earn risk free interest from the Fed at an above market rate. In fact, in times of stress, it is even more likely that banks with excess reserves would prefer to earn a guaranteed rate at the Fed in lieu of lending to another bank. Lowering the federal funds rate and taking other actions that would increase demand for Treasury bills, such as reducing the interest paid on excess reserves, capping the balance of reserves on which interest is paid or forcing the banks with large reserve balances to post Treasury bills at the Fed instead of depositing cash would result in there-steepening of the yield curve and smoother functioning of the banking system.
| | |
2 | | SIT MUTUAL FUNDS SEMI-ANNUAL REPORT |
Further trade negotiations are likely to continue to cause bouts of volatility across the capital markets well into 2020. We do not believe that a comprehensive trade deal will be reached in the near term; but President Trump is likely to seek a resolution prior to the 2020 elections. However, even without a resolution, the United States is able to weather a protracted trade war due to its low reliance on international trade. In fact, the Congressional Budget Office projects the existing high level of tariffs may only reduce GDP by 0.3% through 2020, and just 0.1% over the long term. These economic effects are small because imported goods subject to tariffs account for less than 2% of all goods and services purchased in the United States. Supply chain disruptions are likely to affect the economy in the near term, as businesses adjust to the changing international trade landscape. When reached, a comprehensive trade deal is likely to push longer maturity yields higher as global growth concerns subside and inflationary pressures increase.
The Sit U.S. Government Securities Fund remains focused on seasoned, high coupon agency-backed mortgages which should continue to provide long-term income stability and principal preservation. The Sit Quality Income Fund continues to focus on a combination of government securities, corporate bonds, asset-backed securities, and taxable municipal bonds.
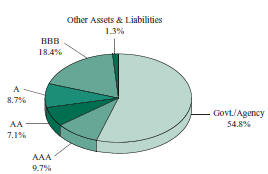
Thetax-exempt fixed income strategy for both the SitTax-Free Income Fund and the Sit MinnesotaTax-Free Income Fund will continue to focus heavily on the use of premium coupon bonds and bonds structured with, call, sinking fund, and prepayment provisions that provide regular cash flow. Our investment strategy focuses on income, which is the primary source of returns over longer periods of time. We believe that this will continue to deliver positive relative performance. We continue to focus on sectors and security structures that provide incremental yield, while using diversification to mitigate credit risk.
We appreciate your continued interest in the Sit family of funds.
With best wishes,

Roger J. Sit
Chairman and President Sit Mutual Funds
|
Sit U.S. Government Securities Fund |
OBJECTIVE & STRATEGY
The objective of the U.S. Government Securities Fund is to provide high current income and safety of principal, which it seeks to attain by investing solely in debt obligations issued, guaranteed or insured by the U.S. government or its agencies or its instrumentalities.
Agency mortgage securities and U.S. Treasury securities are the principal holdings in the Fund. The mortgage securities that the Fund purchases consist of pass-through securities including those issued by Government National Mortgage Association (GNMA), Federal National Mortgage Association (FNMA), and Federal Home Loan Mortgage Corporation (FHLMC).
Fund Performance
The Sit U.S. Government Securities Fund provided a return of +2.05% during the6-month period ending September 30, 2019, compared to the return of the Bloomberg Barclays Intermediate Government Bond Index of +3.55%. The Fund’s30-day SEC yield was 2.63% and its12-month distribution rate was 2.28%.
Factors that Influenced the Fund’s Performance
During the6-month period, the Fund benefited from the consistent relatively high level of income provided by its holdings in higher coupon government agency mortgages. Yields on U.S. Treasuries decreased resulting in prices of the government agency mortgage holdings to increase. However, due to market expectations of future elevated prepayment speeds, prices on mortgage securities under-performed relative to the benchmark. Despite declining mortgage rates, the Fund continues to experience stable prepayment rates as the mortgage holdings are generally well seasoned and have been through many refinancing cycles. The Fund reduces interest rate risk by using futures and options on Treasury securities. The use of futures and options was effective in providing stability to the Fund’s net asset value, however, detracted from the return. The Federal Reserve cut the federal funds rate twice over the6-month period as the global outlook worsened and trade issues intensified. Despite the worsened global outlook, the U.S. economy continues to grow at a solid rate with unemployment at a50-year low.
Outlook and Positioning
Although the U.S. economy appears to be strong, there are significant headwinds that still remain. The escalating trade war with China continues to be at the forefront. In addition, the repercussions of the attacks on Saudi Arabia’s oil fields continue to develop. Ongoing support of the overnight lending markets by the Federal Reserve is being monitored closely as rates jumped to as high as 10% annually after the attacks. Other headwinds include Brexit, the U.S. presidential election, and impeachment proceedings. We expect interest rates to remain lower until global concerns wane or positive developments to headwinds occur. The Fund’s high coupon mortgages should
HYPOTHETICAL GROWTH OF $10,000
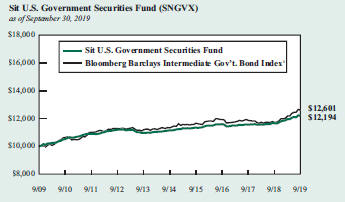
The chart above illustrates the total value of a hypothetical $10,000 investment in the Fund over the past 10 years (or for the life of the Fund if shorter) as compared to the performance of the Bloomberg Barclays Intermediate Government Bond Index. Past performance does not guarantee future results. Returns include the reinvestment of distributions. The chart does not reflect the deduction of taxes that a shareholder would pay on Fund distributions or the redemption of Fund shares.
1 The Bloomberg Barclays Intermediate Government Bond Index is asub-index of the Bloomberg Barclays Government Bond Index covering issues with remaining maturities of between three and five years. The Bloomberg Barclays Government Bond Index is an index that measures the performance of all public U.S. government obligations with remaining maturities of one year or more. The returns include the reinvestment of income and do not include any transaction costs, management fees or other costs. It is not possible to invest directly in an index. This is the Fund’s primary index.
continue to produce an income advantage in this environment as prepayments are likely to remain stable.
We continue to position the Fund defensively against rising short-term interest rates while maintaining the Fund’s focus on seasoned, high coupon agency mortgage securities which provide a high level of income with relatively stable prices. This high level of income and stability of principal has been a fundamental focus of the Fund since its inception.
| | |
| Bryce A. Doty, CFA | | Mark H. Book, CFA |
Senior Portfolio Manager | | Portfolio Manager |
| | |
4 | | SIT MUTUAL FUNDS SEMI-ANNUAL REPORT |
COMPARATIVE RATES OF RETURNS
as of September 30, 2019
| | | | | | | | | | | | | | | |
| | | Sit U.S. | | Bloomberg | | Lipper |
| | | Government | | Barclays | | U.S. |
| | | Securities | | Inter. Gov’t | | Gov’t Fund |
| | | Fund | | Bond Index1 | | Index2 |
| | | |
Six Months | | | | 2.05 | % | | | | 3.55 | % | | | | n/a | |
One Year | | | | 4.68 | | | | | 7.52 | | | | | 9.75 | % |
Five Years | | | | 1.83 | | | | | 2.18 | | | | | 2.81 | |
Ten Years | | | | 2.00 | | | | | 2.34 | | | | | 3.17 | |
Since Inception (6/2/87) | | | | 5.18 | | | | | 5.38 | | | | | 5.33 | |
Performance figures are historical and do not guarantee future results. Investment returns and principal value will vary, and you may have a gain or loss when you sell shares. Current performance may be lower or higher than the performance data quoted. Contact the Fund for performance data current to the most recentmonth-end. Returns include changes in share price as well as reinvestment of all dividends and capital gains and all fee waivers. Without the fee waivers total return and yield figures would have been lower. Returns do not reflect the deduction of taxes that a shareholder would pay on Fund distributions or the redemption of Fund shares. Management fees and administrative expenses are included in the Fund’s performance. Returns for periods greater than one year are compounded average annual rates of return.
1 The Bloomberg Barclays Intermediate Government Bond Index is asub-index of the Bloomberg Barclays Government Bond Index covering issues with remaining maturities of between three and five years. The Bloomberg Barclays Government Bond Index is an index that measures the performance of all public U.S. government obligations with remaining maturities of one year or more. The returns include the reinvestment of income and do not include any transaction costs, management fees or other costs. It is not possible to invest directly in an index.
2 The Lipper returns are obtained from Lipper Analytical Services, Inc., a large independent evaluator of mutual funds.
FUND DIVERSIFICATION
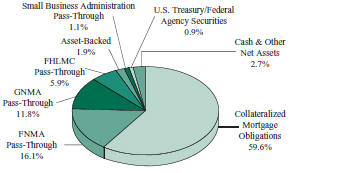
Based on total net assets as of September 30, 2019. Subject to change.
PORTFOLIO SUMMARY
| | |
Net Asset Value 9/30/19: | | $11.02 Per Share |
Net Asset Value 3/31/19: | | $10.92 Per Share |
Total Net Assets: | | $420.9 Million |
Effective Duration3: | | 2.7 Years |
3 Duration is a measure of estimated price sensitivity relative to changes in interest rates. Portfolios with longer durations are typically more sensitive to changes in interest rates. For example, if interest rates rise by 1%, the fair value of a security with an effective duration of 5 years would decrease by 5%, with all other factors being constant. The correlation between duration and price sensitivity is greater for securities rated investment-grade than it is for securities rated below investment-grade. Duration estimates are based on assumptions by the Adviser and are subject to a number of limitations. Effective duration is calculated based on historical price changes of securities held by the Fund, and therefore is a more accurate estimate of price sensitivity provided interest rates remain within their historical range.
ESTIMATED AVERAGE LIFE
| | | | |
0-1 Year | | | 2.7 | % |
1-5 Years | | | 95.6 | |
5-10 Years | | | 0.9 | |
20+ Years | | | 0.8 | |
The table represents the Adviser’s estimates of the dollar weighted average life of the portfolio’s securities, which differ from their stated maturities. The Fund’s average stated maturity was 18.4 years as of September 30, 2019.
SCHEDULE OF INVESTMENTS (Unaudited)
September 30, 2019
Sit U.S. Government Securities Fund
| | | | | | | | | | | | |
Principal
Amount ($) | | Coupon Rate (%) | | Maturity
Date | | | | | Fair
Value ($) | |
|
Mortgage Pass-Through Securities - 34.9% | |
Federal Home Loan Mortgage Corporation - 5.9% | |
| 156,039 | | 4.00 | | | 7/1/25 | | | | | | 162,593 | |
| 956,078 | | 5.00 | | | 5/1/42 | | | | | | 1,043,268 | |
| 1,206,893 | | 5.00 | | | 9/1/43 | | | | | | 1,319,257 | |
| 53,282 | | 5.82 | | | 10/1/37 | | | | | | 58,606 | |
| 418,904 | | 6.50 | | | 12/1/34 | | | | | | 476,070 | |
| 1,820,927 | | 6.50 | | | 11/1/35 | | | | | | 2,059,945 | |
| 207,314 | | 6.88 | | | 2/17/31 | | | | | | 234,078 | |
| 59,010 | | 7.00 | | | 8/1/27 | | | | | | 61,082 | |
| 775,193 | | 7.00 | | | 4/1/28 | | | | | | 835,047 | |
| 4,839,111 | | 7.00 | | | 12/1/31 | | | | | | 5,444,337 | |
| 501,538 | | 7.00 | | | 2/1/37 | | | | | | 561,288 | |
| 407,881 | | 7.00 | | | 4/1/37 | | | | | | 466,930 | |
| 5,646,047 | | 7.00 | | | 10/1/37 | | | | | | 6,664,846 | |
| 2,863,905 | | 7.00 | | | 10/1/38 | | | | | | 3,341,896 | |
| 69,822 | | 7.38 | | | 12/17/24 | | | | | | 73,267 | |
| 92,708 | | 7.50 | | | 1/1/31 | | | | | | 95,723 | |
| 508,786 | | 7.50 | | | 1/1/32 | | | | | | 578,011 | |
| 297,212 | | 7.50 | | | 8/1/32 | | | | | | 320,825 | |
| 11,123 | | 7.95 | | | 10/1/25 | | | | | | 11,146 | |
| 11,280 | | 7.95 | | | 11/1/25 | | | | | | 11,302 | |
| 64,427 | | 8.00 | | | 5/1/31 | | | | | | 69,398 | |
| 63,246 | | 8.00 | | | 11/1/36 | | | | | | 72,872 | |
| 121,995 | | 8.00 | | | 1/1/37 | | | | | | 140,025 | |
| 125,483 | | 8.50 | | | 12/1/21 | | | | | | 130,334 | |
| 143,894 | | 8.50 | | | 6/20/27 | | | | | | 164,947 | |
| 33,415 | | 8.50 | | | 12/1/29 | | | | | | 36,296 | |
| 94,553 | | 8.50 | | | 3/1/31 | | | | | | 108,141 | |
| 13,815 | | 9.00 | | | 11/1/25 | | | | | | 13,996 | |
| 37,583 | | 9.00 | | | 3/20/27 | | | | | | 37,770 | |
| 99,536 | | 9.00 | | | 2/17/31 | | | | | | 102,004 | |
| 95,085 | | 9.00 | | | 5/1/31 | | | | | | 106,357 | |
| 14,402 | | 9.50 | | | 12/17/21 | | | | | | 14,406 | |
| 1,615 | | 10.00 | | | 9/1/20 | | | | | | 1,618 | |
| 3,071 | | 10.00 | | | 3/1/21 | | | | | | 3,084 | |
| 13,113 | | 10.00 | | | 3/17/25 | | | | | | 13,128 | |
| 1,225 | | 10.00 | | | 3/25/25 | | | | | | 1,241 | |
| 12,905 | | 10.00 | | | 7/1/30 | | | | | | 13,026 | |
| 317 | | 11.00 | | | 8/25/20 | | | | | | 319 | |
| | | | | | | | | | | | |
| | | | |
| | | | | | | | | | | 24,848,479 | |
| | | | | | | | | | | | |
| | | | | | | | | | | | |
Principal
Amount ($) | | Coupon Rate (%) | | Maturity
Date | | | | | Fair
Value ($) | |
|
Federal National Mortgage Association - 16.1% | |
| 5,406,675 | | 4.50 | | | 4/1/48 | | | | | | 5,801,026 | |
| 876,615 | | 5.00 | | | 6/1/51 | | | | | | 971,169 | |
| 400,203 | | 5.50 | | | 6/1/33 | | | | | | 432,146 | |
| 15,683 | | 5.61 | | | 11/1/22 | | | | | | 15,676 | |
| 919,407 | | 5.93 | | | 5/1/35 | | | | | | 938,397 | |
| 634,244 | | 6.00 | | | 11/1/34 | | | | | | 729,447 | |
| 187,697 | | 6.00 | | | 5/1/37 | | | | | | 211,158 | |
| 94,159 | | 6.00 | | | 9/1/37 | | | | | | 103,536 | |
| 250,682 | | 6.00 | | | 11/1/37 | | | | | | 264,136 | |
| 2,015,452 | | 6.00 | | | 4/1/38 | | | | | | 2,319,827 | |
| 469,999 | | 6.00 | | | 2/1/40 | | | | | | 530,902 | |
| 6,598,499 | | 6.00 | | | 5/1/41 | | | | | | 7,592,959 | |
| 2,193,745 | | 6.05 | | | 11/1/43 | | | | | | 2,468,045 | |
| 11,666 | | 6.50 | | | 1/1/22 | | | | | | 11,728 | |
| 1,734,941 | | 6.50 | | | 2/1/29 | | | | | | 1,932,900 | |
| 292,337 | | 6.50 | | | 3/1/29 | | | | | | 315,226 | |
| 4,314,493 | | 6.50 | | | 12/1/30 | | | | | | 4,833,335 | |
| 312,455 | | 6.50 | | | 6/1/31 | | | | | | 352,699 | |
| 413,076 | | 6.50 | | | 4/1/32 | | | | | | 464,244 | |
| 61,788 | | 6.50 | | | 8/1/34 | | | | | | 68,139 | |
| 386,767 | | 6.50 | | | 11/1/34 | | | | | | 428,759 | |
| 997,847 | | 6.50 | | | 12/1/36 | | | | | | 1,146,772 | |
| 302,948 | | 6.50 | | | 1/1/39 | | | | | | 339,802 | |
| 3,318,803 | | 6.50 | | | 6/1/40 | | | | | | 3,842,300 | |
| 1,574,609 | | 6.50 | | | 9/1/40 | | | | | | 1,785,624 | |
| 1,091,314 | | 6.75 | | | 6/1/32 | | | | | | 1,249,892 | |
| 1,079,427 | | 6.90 | | | 6/1/40 | | | | | | 1,224,480 | |
| 22,613 | | 1 Mo. Libor + 2.26, 6.95% | | | 8/1/21 | | | 1 | | | 22,240 | |
| 18,966 | | 7.00 | | | 9/1/21 | | | | | | 19,379 | |
| 68,613 | | 7.00 | | | 3/1/22 | | | | | | 70,544 | |
| 85,919 | | 7.00 | | | 6/1/22 | | | | | | 88,101 | |
| 50,644 | | 7.00 | | | 1/1/24 | | | | | | 53,014 | |
| 31,893 | | 7.00 | | | 2/1/26 | | | | | | 33,650 | |
| 75,620 | | 7.00 | | | 9/1/27 | | | | | | 80,716 | |
| 43,028 | | 7.00 | | | 10/1/27 | | | | | | 46,360 | |
| 191,888 | | 7.00 | | | 11/1/27 | | | | | | 213,784 | |
| 37,183 | | 7.00 | | | 1/1/28 | | | | | | 39,939 | |
| 36,038 | | 7.00 | | | 10/1/32 | | | | | | 39,146 | |
| 4,411,929 | | 7.00 | | | 12/1/32 | | | | | | 5,129,764 | |
| 97,540 | | 7.00 | | | 7/1/33 | | | | | | 108,452 | |
| 119,386 | | 7.00 | | | 7/1/34 | | | | | | 135,895 | |
| 11,305 | | 7.00 | | | 12/1/37 | | | | | | 12,364 | |
| 2,416,013 | | 7.00 | | | 3/1/39 | | | | | | 2,887,360 | |
| 5,512,419 | | 7.00 | | | 1/1/40 | | | | | | 6,396,592 | |
| 594,646 | | 7.00 | | | 9/1/47 | | | | | | 634,597 | |
| 21,620 | | 7.50 | | | 6/1/22 | | | | | | 22,192 | |
| 4,899 | | 7.50 | | | 8/1/22 | | | | | | 4,916 | |
| 26,578 | | 7.50 | | | 12/1/22 | | | | | | 26,740 | |
| 31,765 | | 7.50 | | | 3/1/23 | | | | | | 32,017 | |
| 186,900 | | 7.50 | | | 4/1/32 | | | | | | 211,782 | |
| 10,382 | | 7.50 | | | 8/1/32 | | | | | | 10,611 | |
| 189,415 | | 7.50 | | | 1/1/34 | | | | | | 210,732 | |
See accompanying notes to financial statements.
| | |
6 | | SIT MUTUAL FUNDS SEMI-ANNUAL REPORT |
| | | | | | | | | | | | |
Principal
Amount ($) | | Coupon Rate (%) | | Maturity
Date | | | | | Fair
Value ($) | |
| | | | |
| 3,977,948 | | 7.50 | | | 10/1/38 | | | | | | 4,780,712 | |
| 1,723,287 | | 7.50 | | | 11/1/38 | | | | | | 2,024,333 | |
| 17,047 | | 7.57 | | | 7/20/30 | | | | | | 17,192 | |
| 59,870 | | 8.00 | | | 10/1/23 | | | | | | 61,523 | |
| 199,546 | | 8.00 | | | 6/1/25 | | | | | | 212,606 | |
| 7,254 | | 8.00 | | | 7/20/28 | | | | | | 7,323 | |
| 95,018 | | 8.00 | | | 2/1/31 | | | | | | 109,066 | |
| 279,263 | | 8.00 | | | 1/1/32 | | | | | | 309,517 | |
| 208,337 | | 8.00 | | | 11/1/37 | | | | | | 244,627 | |
| 326,351 | | 8.00 | | | 3/1/38 | | | | | | 394,097 | |
| 99,285 | | 8.09 | | | 11/15/31 | | | | | | 111,371 | |
| 514 | | 8.33 | | | 7/15/20 | | | | | | 515 | |
| 81,523 | | 8.50 | | | 11/1/26 | | | | | | 85,353 | |
| 102,186 | | 8.50 | | | 3/1/28 | | | | | | 114,006 | |
| 59,831 | | 8.50 | | | 10/1/28 | | | | | | 68,408 | |
| 23,642 | | 8.50 | | | 11/1/28 | | | | | | 26,129 | |
| 191,021 | | 8.50 | | | 4/1/29 | | | | | | 214,607 | |
| 45,412 | | 8.50 | | | 10/1/29 | | | | | | 45,831 | |
| 83,816 | | 8.50 | | | 7/1/30 | | | | | | 96,734 | |
| 61,388 | | 8.50 | | | 8/1/30 | | | | | | 74,234 | |
| 221,823 | | 8.50 | | | 4/1/32 | | | | | | 268,717 | |
| 261,536 | | 8.50 | | | 1/1/37 | | | | | | 303,242 | |
| 12,818 | | 8.59 | | | 8/20/25 | | | | | | 12,960 | |
| 18,326 | | 9.00 | | | 9/1/24 | | | | | | 18,507 | |
| 9,627 | | 9.00 | | | 6/15/25 | | | | | | 9,743 | |
| 27,036 | | 9.00 | | | 5/15/28 | | | | | | 27,497 | |
| 42,526 | | 9.00 | | | 6/1/30 | | | | | | 46,644 | |
| 97 | | 9.00 | | | 7/1/30 | | | | | | 97 | |
| 24,045 | | 9.00 | | | 10/1/30 | | | | | | 26,171 | |
| 123,289 | | 9.00 | | | 2/1/31 | | | | | | 133,005 | |
| 21,345 | | 9.00 | | | 7/1/31 | | | | | | 21,396 | |
| 40,606 | | 9.00 | | | 10/1/31 | | | | | | 47,127 | |
| 70,483 | | 9.00 | | | 8/1/37 | | | | | | 73,789 | |
| 23,777 | | 9.00 | | | 1/1/38 | | | | | | 23,975 | |
| 164,024 | | 9.00 | | | 2/1/38 | | | | | | 179,025 | |
| 6,017 | | 9.24 | | | 3/15/22 | | | | | | 6,086 | |
| 800 | | 9.50 | | | 3/1/20 | | | | | | 801 | |
| 4,809 | | 9.50 | | | 7/1/20 | | | | | | 4,830 | |
| 154 | | 9.50 | | | 12/15/20 | | | | | | 155 | |
| 395 | | 9.50 | | | 4/15/21 | | | | | | 398 | |
| 22,140 | | 9.50 | | | 8/1/24 | | | | | | 22,474 | |
| 141,590 | | 9.50 | | | 5/1/29 | | | | | | 162,222 | |
| 28,437 | | 9.50 | | | 4/1/30 | | | | | | 31,977 | |
| 146,137 | | 9.50 | | | 8/1/31 | | | | | | 167,565 | |
| 132 | | 10.00 | | | 8/15/20 | | | | | | 132 | |
| 31,947 | | 10.00 | | | 2/1/28 | | | | | | 32,515 | |
| 104,545 | | 10.00 | | | 6/1/30 | | | | | | 118,889 | |
| 2,812 | | 10.50 | | | 6/1/28 | | | | | | 2,819 | |
| | | | | | | | | | | | |
| | | | |
| | | | | | | | | | | 67,646,153 | |
| | | | | | | | | | | | |
| | | | | | | | | | | | |
Principal
Amount ($) | | Coupon Rate (%) | | Maturity
Date | | | | | Fair
Value ($) | |
| |
Government National Mortgage Association - 11.8% | | | | |
| 170,027 | | 4.00 | | | 12/15/24 | | | | | | 176,816 | |
| 616,298 | | 4.00 | | | 10/20/30 | | | | | | 646,139 | |
| 9,940,836 | | 4.00 | | | 8/20/31 | | | | | | 10,422,385 | |
| 954,573 | | 4.00 | | | 12/20/31 | | | | | | 1,000,873 | |
| 764,477 | | 4.25 | | | 10/20/31 | | | | | | 805,592 | |
| 490,000 | | 4.25 | | | 3/20/37 | | | | | | 515,987 | |
| 2,225,173 | | 4.75 | | | 9/20/31 | | | | | | 2,376,324 | |
| 87,099 | | 5.50 | | | 9/15/25 | | | | | | 93,490 | |
| 1,149,728 | | 5.50 | | | 5/15/29 | | | | | | 1,233,843 | |
| 2,571,505 | | 5.75 | | | 2/15/29 | | | | | | 2,803,891 | |
| 864,605 | | 5.75 | | | 10/20/31 | | | | | | 951,354 | |
| 585,541 | | 6.00 | | | 9/15/33 | | | | | | 650,817 | |
| 449,860 | | 6.00 | | | 2/20/47 | | | | | | 518,190 | |
| 4,325,128 | | 6.00 | | | 7/20/47 | | | | | | 4,864,010 | |
| 69,390 | | 6.25 | | | 12/15/23 | | | | | | 75,892 | |
| 836,804 | | 6.25 | | | 4/15/29 | | | | | | 928,096 | |
| 127,576 | | 6.50 | | | 11/15/23 | | | | | | 134,766 | |
| 534,750 | | 6.50 | | | 4/15/24 | | | | | | 563,758 | |
| 959,491 | | 6.50 | | | 2/20/28 | | | | | | 1,079,055 | |
| 539,924 | | 6.50 | | | 2/20/29 | | | | | | 586,487 | |
| 3,354,313 | | 6.50 | | | 2/15/35 | | | | | | 3,813,733 | |
| 17,157 | | 6.50 | | | 12/20/38 | | | | | | 18,055 | |
| 349,762 | | 6.50 | | | 1/20/39 | | | | | | 398,793 | |
| 218,089 | | 6.50 | | | 2/20/39 | | | | | | 252,086 | |
| 385,406 | | 6.50 | | | 4/20/39 | | | | | | 440,368 | |
| 483,537 | | 6.50 | | | 6/20/39 | | | | | | 551,416 | |
| 707,375 | | 6.50 | | | 8/20/39 | | | | | | 808,217 | |
| 489,788 | | 6.50 | | | 4/20/43 | | | | | | 560,540 | |
| 5,219,894 | | 7.00 | | | 8/15/29 | | | | | | 5,921,601 | |
| 5,487,153 | | 7.00 | | | 10/15/29 | | | | | | 6,252,556 | |
| 282,113 | | 7.00 | | | 10/15/36 | | | | | | 326,927 | |
| | | | | | | | | | | | |
| | | | |
| | | | | | | | | | | 49,772,057 | |
| | | | | | | | | | | | |
Small Business Administration - 1.1% | | | | |
| 1,457,753 | | 5.33 | | | 8/25/36 | | | | | | 1,593,816 | |
| 2,888,393 | | 5.33 | | | 9/25/36 | | | | | | 3,151,716 | |
| | | | | | | | | | | | |
| | | | |
| | | | | | | | | | | 4,745,532 | |
| | | | | | | | | | | | |
| |
Total Mortgage Pass-Through Securities
(cost: $144,681,609) | | | 147,012,221 | |
| | | | | | | | | | | | |
| |
U.S. Treasury / Federal Agency Securities - 0.9% | | | | |
U.S. Treasury Note: | | | | | | | | | | |
| 1,000,000 | | 1.63 | | | 8/15/29 | | | | | | 995,391 | |
United States Treasury Strip Principal: | | | | | | | | | | |
| 3,300,000 | | 2.91 | | | 11/15/27 | | | 6 | | | 2,894,272 | |
| | | | | | | | | | | | |
| |
Total U.S. Treasury / Federal Agency Securities
(cost: $3,589,656) | | | 3,889,663 | |
| | | | | | | | | | | | |
See accompanying notes to financial statements.
SCHEDULE OF INVESTMENTS (Unaudited)
September 30, 2019
Sit U.S. Government Securities Fund (Continued)
| | | | | | | | | | | | |
Principal
Amount ($) | | Coupon Rate (%) | | Maturity
Date | | | | | Fair
Value ($) | |
|
Collateralized Mortgage Obligations - 59.6% | |
Federal Home Loan Mortgage Corporation - 15.9% | |
| 456,130 | | 5.00 | | | 2/15/23 | | | | | | 472,924 | |
| 1,874,242 | | 5.41 | | | 7/25/32 | | | 1 | | | 2,074,687 | |
| 528,987 | | 5.51 | | | 5/15/38 | | | 1 | | | 569,639 | |
| 3,792 | | 6.00 | | | 9/15/21 | | | | | | 3,880 | |
| 1,786,890 | | 6.00 | | | 1/15/33 | | | | | | 2,134,751 | |
| 1,717,232 | | 6.00 | | | 5/15/36 | | | | | | 1,983,174 | |
| 3,812,650 | | 6.00 | | | 9/15/42 | | | | | | 4,357,501 | |
| 34,427 | | 6.25 | | | 5/15/29 | | | | | | 37,331 | |
| 131,728 | | 6.50 | | | 9/15/23 | | | | | | 139,903 | |
| 55,289 | | 6.50 | | | 3/15/24 | | | | | | 59,326 | |
| 18,397 | | 6.50 | | | 2/15/30 | | | | | | 20,493 | |
| 1,101,862 | | 6.50 | | | 8/15/31 | | | | | | 1,250,883 | |
| 187,490 | | 6.50 | | | 1/15/32 | | | | | | 209,634 | |
| 80,264 | | 6.50 | | | 3/15/32 | | | | | | 89,390 | |
| 467,898 | | 6.50 | | | 6/25/32 | | | | | | 532,553 | |
| 232,001 | | 6.50 | | | 7/15/32 | | | | | | 263,868 | |
| 5,801,103 | | 6.50 | | | 5/15/33 | | | | | | 6,677,591 | |
| 963,764 | | 6.50 | | | 5/15/35 | | | | | | 1,131,467 | |
| 568,470 | | 6.50 | | | 8/15/39 | | | | | | 657,334 | |
| 810,956 | | 6.50 | | | 2/25/43 | | | | | | 974,555 | |
| 618,461 | | 6.50 | | | 3/25/43 | | | | | | 705,212 | |
| 735,551 | | 6.50 | | | 7/25/43 | | | | | | 875,264 | |
| 641,996 | | 6.50 | | | 10/25/43 | | | | | | 770,143 | |
| 5,046,265 | | 6.50 | | | 8/15/45 | | | | | | 6,124,733 | |
| 1,856,392 | | 6.50 | | | 2/15/49 | | | | | | 2,130,086 | |
| 19,034 | | 6.70 | | | 9/15/23 | | | | | | 20,305 | |
| 524,127 | | 6.95 | | | 3/15/28 | | | | | | 582,872 | |
| 30,783 | | 7.00 | | | 10/15/22 | | | | | | 32,221 | |
| 7,946 | | 7.00 | | | 11/15/22 | | | | | | 8,290 | |
| 258,383 | | 7.00 | | | 3/25/23 | | | | | | 269,945 | |
| 11,354 | | 7.00 | | | 4/15/23 | | | | | | 11,984 | |
| 49,694 | | 7.00 | | | 7/15/23 | | | | | | 52,987 | |
| 116,976 | | 7.00 | | | 1/15/24 | | | | | | 125,204 | |
| 65,572 | | 7.00 | | | 3/15/24 | | | | | | 69,969 | |
| 88,937 | | 7.00 | | | 8/15/25 | | | | | | 97,420 | |
| 81,723 | | 7.00 | | | 9/15/26 | | | | | | 89,930 | |
| 135,029 | | 7.00 | | | 6/15/29 | | | | | | 152,753 | |
| 891,053 | | 7.00 | | | 8/15/29 | | | | | | 954,257 | |
| 435,963 | | 7.00 | | | 10/20/29 | | | | | | 502,040 | |
| 554,387 | | 7.00 | | | 11/15/29 | | | | | | 565,991 | |
| 1,346,023 | | 7.00 | | | 12/15/29 | | | | | | 1,372,262 | |
| 104,803 | | 7.00 | | | 1/15/30 | | | | | | 120,640 | |
| 275,620 | | 7.00 | | | 10/15/30 | | | | | | 321,880 | |
| 159,019 | | 7.00 | | | 7/15/31 | | | | | | 183,086 | |
| 110,162 | | 7.00 | | | 4/15/32 | | | | | | 124,368 | |
| 623,987 | | 7.00 | | | 5/15/32 | | | | | | 726,896 | |
| 3,716,321 | | 7.00 | | | 8/15/41 | | | | | | 4,248,867 | |
| 3,758,368 | | 7.00 | | | 2/25/43 | | | | | | 4,483,562 | |
| 787,029 | | 7.00 | | | 3/25/43 | | | | | | 901,558 | |
| 924,191 | | 7.00 | | | 7/25/43 | | | | | | 1,121,730 | |
| 1,790,818 | | 7.00 | | | 9/25/43 | | | | | | 2,081,727 | |
| | | | | | | | | | | | |
Principal
Amount ($) | | Coupon Rate (%) | | Maturity
Date | | | | | Fair
Value ($) | |
| | | | |
| 2,713,431 | | 7.00 | | | 3/15/49 | | | | | | 3,111,107 | |
| 14,692 | | 7.50 | | | 10/15/21 | | | | | | 15,154 | |
| 61,115 | | 7.50 | | | 7/15/22 | | | | | | 63,588 | |
| 117,874 | | 7.50 | | | 3/15/23 | | | | | | 124,974 | |
| 434,957 | | 7.50 | | | 4/15/23 | | | | | | 461,242 | |
| 61,190 | | 7.50 | | | 9/20/26 | | | | | | 69,096 | |
| 300,285 | | 7.50 | | | 3/15/28 | | | | | | 343,203 | |
| 375,184 | | 7.50 | | | 9/15/29 | | | | | | 437,512 | |
| 148,431 | | 7.50 | | | 12/15/29 | | | | | | 168,766 | |
| 229,690 | | 7.50 | | | 6/15/30 | | | | | | 269,385 | |
| 323,140 | | 7.50 | | | 8/15/30 | | | | �� | | 371,802 | |
| 507,337 | | 7.50 | | | 9/15/30 | | | | | | 599,881 | |
| 122,325 | | 7.50 | | | 11/15/30 | | | | | | 142,090 | |
| 2,963,226 | | 7.50 | | | 6/15/34 | | | | | | 3,560,571 | |
| 1,200,330 | | 7.50 | | | 8/25/42 | | | 1 | | | 1,508,502 | |
| 888,919 | | 7.50 | | | 9/25/43 | | | | | | 1,040,340 | |
| 26,355 | | 8.00 | | | 7/15/21 | | | | | | 26,749 | |
| 463,799 | | 8.00 | | | 2/15/23 | | | | | | 493,725 | |
| 33,672 | | 8.00 | | | 4/25/24 | | | | | | 35,950 | |
| 142,070 | | 8.00 | | | 2/15/27 | | | | | | 162,351 | |
| 154,571 | | 8.00 | | | 11/20/29 | | | | | | 180,280 | |
| 197,858 | | 8.00 | | | 1/15/30 | | | | | | 231,464 | |
| 8,520 | | 8.25 | | | 6/15/22 | | | | | | 9,035 | |
| 13,523 | | 8.30 | | | 11/15/20 | | | | | | 13,865 | |
| 2,253 | | 8.50 | | | 10/15/22 | | | | | | 2,268 | |
| 117,427 | | 8.50 | | | 3/15/25 | | | | | | 132,372 | |
| 31,979 | | 8.50 | | | 3/15/32 | | | | | | 36,991 | |
| 43 | | 9.15 | | | 10/15/20 | | | | | | 43 | |
| | | | | | | | | | | | |
| | | | |
| | | | | | | | | | | 67,081,372 | |
| | | | | | | | | | | | |
Federal National Mortgage Association - 24.0% | |
| 778,529 | | 3.82 | | | 7/25/37 | | | 1 | | | 751,138 | |
| 672,430 | | 3.95 | | | 8/25/43 | | | 1 | | | 690,579 | |
| 270,945 | | 4.55 | | | 6/25/43 | | | | | | 292,232 | |
| 768,221 | | 5.00 | | | 6/25/43 | | | | | | 834,120 | |
| 726,101 | | 5.36 | | | 6/25/42 | | | | | | 810,975 | |
| 1,048,010 | | 5.50 | | | 9/25/33 | | | | | | 1,162,413 | |
| 4,623,453 | | 5.50 | | | 6/25/40 | | | | | | 5,260,421 | |
| 1,351,349 | | 5.56 | | | 12/25/53 | | | 1 | | | 1,551,890 | |
| 2,882,561 | | 5.70 | | | 2/25/42 | | | 1 | | | 3,134,265 | |
| 1,816,904 | | 5.70 | | | 10/25/42 | | | 1 | | | 2,045,904 | |
| 869,647 | | 5.81 | | | 8/25/43 | | | | | | 963,471 | |
| 1,027,557 | | 5.82 | | | 12/25/42 | | | 1 | | | 1,140,935 | |
| 2,004,608 | | 6.00 | | | 5/25/30 | | | | | | 2,260,342 | |
| 2,947,020 | | 6.00 | | | 5/25/36 | | | | | | 3,453,118 | |
| 202,685 | | 6.00 | | | 6/25/36 | | | | | | 248,430 | |
| 2,528,394 | | 6.00 | | | 11/25/43 | | | | | | 2,869,509 | |
| 791,412 | | 6.00 | | | 9/25/46 | | | | | | 872,205 | |
| 3,129,522 | | 6.00 | | | 2/25/48 | | | | | | 3,715,228 | |
| 1,296,634 | | 6.31 | | | 8/25/47 | | | 1 | | | 1,448,160 | |
| 286,948 | | 6.50 | | | 8/20/28 | | | | | | 309,618 | |
| 170,085 | | 6.50 | | | 3/25/32 | | | | | | 197,881 | |
| 410,729 | | 6.50 | | | 6/25/32 | | | | | | 471,213 | |
| 310,364 | | 6.50 | | | 7/25/36 | | | | | | 358,392 | |
See accompanying notes to financial statements.
| | |
8 | | SIT MUTUAL FUNDS SEMI-ANNUAL REPORT |
| | | | | | | | | | | | |
Principal
Amount ($) | | Coupon Rate (%) | | Maturity
Date | | | | | Fair
Value ($) | |
| | | | |
| 113,075 | | 6.50 | | | 9/25/36 | | | | | | 127,718 | |
| 260,554 | | 6.50 | | | 3/25/42 | | | | | | 295,920 | |
| 1,663,319 | | 6.50 | | | 5/25/42 | | | | | | 1,931,983 | |
| 4,457,487 | | 6.50 | | | 7/25/42 | | | | | | 5,036,243 | |
| 321,702 | | 6.50 | | | 9/25/42 | | | | | | 367,894 | |
| 821,352 | | 6.50 | | | 11/25/42 | | | | | | 920,180 | |
| 3,905,010 | | 6.50 | | | 7/25/44 | | | | | | 4,388,779 | |
| 467,904 | | 6.53 | | | 9/25/37 | | | 1 | | | 531,619 | |
| 338,827 | | 6.63 | | | 2/25/45 | | | 1 | | | 396,638 | |
| 3,558,003 | | 6.75 | | | 6/25/32 | | | | | | 4,157,876 | |
| 643,901 | | 6.75 | | | 4/25/37 | | | | | | 713,848 | |
| 91,643 | | 6.85 | | | 12/18/27 | | | | | | 102,650 | |
| 460,050 | | 6.91 | | | 8/25/37 | | | 1 | | | 497,271 | |
| 1,014 | | 7.00 | | | 1/25/21 | | | | | | 1,029 | |
| 7,618 | | 7.00 | | | 7/25/22 | | | | | | 7,901 | |
| 14,324 | | 7.00 | | | 11/25/22 | | | | | | 15,054 | |
| 27,172 | | 7.00 | | | 12/25/22 | | | | | | 28,655 | |
| 21,173 | | 7.00 | | | 6/25/23 | | | | | | 22,288 | |
| 616,095 | | 7.00 | | | 4/25/24 | | | | | | 654,437 | |
| 192,249 | | 7.00 | | | 9/18/27 | | | | | | 214,693 | |
| 4,137,546 | | 7.00 | | | 5/25/31 | | | | | | 4,666,612 | |
| 1,417,874 | | 7.00 | | | 12/25/33 | | | | | | 1,630,382 | |
| 312,933 | | 7.00 | | | 9/25/40 | | | | | | 372,758 | |
| 580,705 | | 7.00 | | | 10/25/41 | | | | | | 656,988 | |
| 283,121 | | 7.00 | | | 11/25/41 | | | | | | 335,683 | |
| 375,469 | | 7.00 | | | 12/25/41 | | | | | | 430,338 | |
| 1,065,015 | | 7.00 | | | 1/25/42 | | | | | | 1,230,005 | |
| 1,075,180 | | 7.00 | | | 7/25/42 | | | | | | 1,259,705 | |
| 2,607,518 | | 7.00 | | | 2/25/44 | | | | | | 3,010,436 | |
| 125,250 | | 7.00 | | | 8/25/44 | | | | | | 146,835 | |
| 36,962 | | 7.50 | | | 8/20/27 | | | | | | 41,887 | |
| 258,378 | | 7.50 | | | 10/25/40 | | | | | | 295,476 | |
| 737,482 | | 7.50 | | | 11/25/40 | | | | | | 823,901 | |
| 851,905 | | 7.50 | | | 6/19/41 | | | 1 | | | 992,888 | |
| 1,728,725 | | 7.50 | | | 7/25/41 | | | | | | 2,025,574 | |
| 1,025,955 | | 7.50 | | | 8/25/41 | | | | | | 1,203,394 | |
| 302,824 | | 7.50 | | | 11/25/41 | | | | | | 357,854 | |
| 584,981 | | 7.50 | | | 1/25/42 | | | | | | 686,327 | |
| 3,896,538 | | 7.50 | | | 5/25/42 | | | | | | 4,661,498 | |
| 420,392 | | 7.50 | | | 6/25/42 | | | | | | 488,622 | |
| 3,583,014 | | 7.50 | | | 8/25/42 | | | 1 | | | 4,325,428 | |
| 1,254,364 | | 7.50 | | | 2/25/44 | | | | | | 1,478,019 | |
| 741,596 | | 7.50 | | | 3/25/44 | | | | | | 846,385 | |
| 833,287 | | 7.50 | | | 5/25/44 | | | | | | 994,940 | |
| 59,884 | | 7.50 | | | 10/25/44 | | | | | | 70,345 | |
| 5,522,147 | | 7.50 | | | 1/25/48 | | | | | | 6,566,144 | |
| 704,429 | | 7.99 | | | 11/25/37 | | | 1 | | | 831,254 | |
| 40,421 | | 8.00 | | | 7/25/22 | | | | | | 42,598 | |
| 61,835 | | 8.00 | | | 7/18/27 | | | | | | 69,685 | |
| 515,985 | | 8.00 | | | 7/25/44 | | | | | | 600,606 | |
| 372,537 | | 8.09 | | | 11/25/37 | | | 1 | | | 439,871 | |
| 6,100 | | 8.50 | | | 1/25/21 | | | | | | 6,144 | |
| | | | | | | | | | | | |
Principal
Amount ($) | | Coupon Rate (%) | | Maturity
Date | | | | | Fair
Value ($) | |
| | | | |
| 5,866 | | 8.50 | | | 9/25/21 | | | | | | 6,027 | |
| 14,600 | | 8.50 | | | 1/25/25 | | | | | | 16,163 | |
| 594,032 | | 8.50 | | | 6/25/30 | | | | | | 703,312 | |
| 50,611 | | 8.55 | | | 10/25/42 | | | 1 | | | 61,411 | |
| 157 | | 8.70 | | | 12/25/19 | | | | | | 157 | |
| 378 | | 8.75 | | | 9/25/20 | | | | | | 385 | |
| 2,776 | | 8.95 | | | 10/25/20 | | | | | | 2,835 | |
| 303 | | 9.00 | | | 12/25/19 | | | | | | 303 | |
| 46 | | 9.00 | | | 3/25/20 | | | | | | 46 | |
| 4,861 | | 9.00 | | | 5/25/20 | | | | | | 4,915 | |
| 327 | | 9.00 | | | 6/25/20 | | | | | | 332 | |
| 282 | | 9.00 | | | 7/25/20 | | | | | | 286 | |
| 1,891 | | 9.00 | | | 9/25/20 | | | | | | 1,930 | |
| 1,456 | | 9.00 | | | 10/25/20 | | | | | | 1,490 | |
| 27,582 | | 9.00 | | | 1/25/21 | | | | | | 28,341 | |
| 6,530 | | 9.00 | | | 8/25/22 | | | | | | 6,999 | |
| 67,500 | | 9.00 | | | 11/25/28 | | | | | | 76,825 | |
| 425,244 | | 9.00 | | | 6/25/30 | | | | | | 521,155 | |
| 76,619 | | 9.00 | | | 10/25/30 | | | | | | 93,438 | |
| 139,553 | | 9.38 | | | 6/25/32 | | | 1 | | | 159,276 | |
| 851 | | 9.50 | | | 3/25/20 | | | | | | 858 | |
| 97 | | 9.50 | | | 4/25/20 | | | | | | 98 | |
| 2,364 | | 9.50 | | | 11/25/20 | | | | | | 2,420 | |
| 86,182 | | 9.50 | | | 11/25/31 | | | | | | 102,995 | |
| 252,253 | | 9.50 | | | 12/25/41 | | | | | | 301,241 | |
| 1,340 | | 9.60 | | | 3/25/20 | | | | | | 1,349 | |
| 1,145,280 | | 11.34 | | | 9/25/42 | | | 1 | | | 1,482,234 | |
| 383,845 | | 11.38 | | | 6/25/44 | | | 1 | | | 440,950 | |
| 22,412 | | 21.14 | | | 3/25/39 | | | 1 | | | 34,842 | |
| | | | | | | | | | | | |
| | | | |
| | | | | | | | | | | 100,896,310 | |
| | | | | | | | | | | | |
Government National Mortgage Association - 17.5% | |
| 500,000 | | 5.50 | | | 9/20/39 | | | | | | 609,882 | |
| 3,150,670 | | 5.53 | | | 11/20/45 | | | 1 | | | 3,595,763 | |
| 6,419,211 | | 5.64 | | | 4/20/40 | | | 1 | | | 7,434,196 | |
| 866,642 | | 5.99 | | | 11/20/43 | | | 1 | | | 983,440 | |
| 2,449,032 | | 6.00 | | | 11/20/33 | | | | | | 2,734,576 | |
| 702,085 | | 6.00 | | | 12/20/35 | | | | | | 805,706 | |
| 452,686 | | 6.00 | | | 3/20/42 | | | | | | 516,000 | |
| 7,651,191 | | 6.00 | | | 3/20/49 | | | | | | 8,628,735 | |
| 4,957,659 | | 6.00 | | | 5/20/49 | | | | | | 5,600,794 | |
| 1,197,990 | | 6.07 | | | 10/20/40 | | | 1 | | | 1,371,563 | |
| 2,644,500 | | 6.13 | | | 1/20/39 | | | 1 | | | 3,107,784 | |
| 539,145 | | 6.40 | | | 4/20/37 | | | 1 | | | 606,466 | |
| 2,796,434 | | 6.48 | | | 6/20/41 | | | 1 | | | 3,213,954 | |
| 317,705 | | 6.50 | | | 5/16/32 | | | | | | 319,624 | |
| 1,358,790 | | 6.50 | | | 7/20/32 | | | | | | 1,360,343 | |
| 561,047 | | 6.50 | | | 2/20/37 | | | | | | 636,813 | |
| 253,958 | | 6.50 | | | 9/16/38 | | | | | | 285,436 | |
| 4,525,523 | | 6.50 | | | 8/20/48 | | | | | | 5,388,269 | |
| 4,872,010 | | 6.50 | | | 1/20/49 | | | | | | 5,620,977 | |
| 894,315 | | 6.58 | | | 7/20/39 | | | 1 | | | 1,033,304 | |
| 597,570 | | 6.65 | | | 4/20/39 | | | 1 | | | 701,120 | |
See accompanying notes to financial statements.
SCHEDULE OF INVESTMENTS (Unaudited)
September 30, 2019
Sit U.S. Government Securities Fund (Continued)
| | | | | | | | | | | | |
Principal
Amount ($) | | Coupon Rate (%) | | Maturity
Date | | | | | Fair
Value ($) | |
| | | | |
| 1,777,230 | | 6.65 | | | 9/20/44 | | | 1 | | | 2,070,000 | |
| 1,395,998 | | 6.90 | | | 8/20/40 | | | 1 | | | 1,634,948 | |
| 896,940 | | 6.99 | | | 6/20/45 | | | 1 | | | 1,034,039 | |
| 603,886 | | 7.00 | | | 6/20/26 | | | | | | 603,833 | |
| 162,057 | | 7.00 | | | 9/16/33 | | | | | | 186,572 | |
| 526,023 | | 7.00 | | | 5/20/42 | | | | | | 607,247 | |
| 2,904,840 | | 7.00 | | | 10/20/48 | | | | | | 3,369,776 | |
| 887,719 | | 7.15 | | | 12/20/33 | | | 1 | | | 1,014,647 | |
| 1,948,586 | | 7.30 | | | 8/20/38 | | | 1 | | | 2,255,631 | |
| 4,796,360 | | 7.45 | | | 7/20/44 | | | 1 | | | 5,520,426 | |
| 623,836 | | 7.49 | | | 7/16/24 | | | | | | 706,727 | |
| 57,274 | | 7.50 | | | 5/16/27 | | | | | | 57,204 | |
| | | | | | | | | | | | |
| | | | |
| | | | | | | | | | | 73,615,795 | |
| | | | | | | | | | | | |
Vendee Mortgage Trust - 2.2% | | | | |
| 2,264,453 | | 6.50 | | | 8/15/31 | | | | | | 2,632,580 | |
| 1,074,869 | | 6.50 | | | 10/15/31 | | | | | | 1,246,699 | |
| 1,472,279 | | 6.55 | | | 3/15/25 | | | 1 | | | 1,670,676 | |
| 880,487 | | 6.75 | | | 2/15/26 | | | | | | 980,784 | |
| 964,924 | | 7.00 | | | 3/15/28 | | | | | | 1,093,412 | |
| 147,501 | | 7.25 | | | 9/15/22 | | | | | | 151,703 | |
| 319,341 | | 7.25 | | | 9/15/25 | | | | | | 354,640 | |
| 517,938 | | 7.75 | | | 5/15/22 | | | | | | 543,683 | |
| 402,772 | | 7.75 | | | 9/15/24 | | | | | | 439,122 | |
| 154,128 | | 8.00 | | | 2/15/25 | | | | | | 172,385 | |
| 98,681 | | 8.29 | | | 12/15/26 | | | | | | 111,775 | |
| | | | | | | | | | | | |
| | | | |
| | | | | | | | | | | 9,397,459 | |
| | | | | | | | | | | | |
| | |
Total Collateralized Mortgage Obligations
(cost: $244,627,284) | | | | | | 250,990,936 | |
| | | | | | | | | | | | |
| | | |
Asset-Backed Securities - 1.9% | | | | | | | | | | |
Federal Home Loan Mortgage Corporation - 0.3% | | | | | | | |
| 568 | | 6.09 | | | 9/25/29 | | | 1 | | | 561 | |
| 1,194,396 | | 7.16 | | | 7/25/29 | | | | | | 1,346,634 | |
| | | | | | | | | | | | |
| | | | |
| | | | | | | | | | | 1,347,195 | |
| | | | | | | | | | | | |
Federal National Mortgage Association - 0.5% | | | | | | | |
| 15,204 | | 1 Mo. Libor + 0.34, 2.57% | | | 11/25/32 | | | 1 | | | 14,897 | |
| 465,846 | | 4.68 | | | 9/26/33 | | | 14 | | | 523,895 | |
| 158,594 | | 4.69 | | | 10/25/33 | | | 14 | | | 165,512 | |
| 1,028,120 | | 5.68 | | | 2/25/33 | | | 14 | | | 1,110,318 | |
| 2,884 | | 6.47 | | | 10/25/31 | | | 14 | | | 2,960 | |
| 13,117 | | 6.48 | | | 5/25/32 | | | 14 | | | 13,831 | |
| 163,772 | | 6.59 | | | 10/25/31 | | | 14 | | | 173,007 | |
| 1,027 | | 6.83 | | | 7/25/31 | | | 14 | | | 1,028 | |
| 7,698 | | 7.80 | | | 6/25/26 | | | 1 | | | 8,718 | |
| | | | | | | | | | | | |
| | | | |
| | | | | | | | | | | 2,014,166 | |
| | | | | | | | | | | | |
| | | | | | | | | | | | |
Principal
Amount ($) | | Coupon Rate (%) | | Maturity
Date | | | | | Fair
Value ($) | |
| | |
Small Business Administration - 1.1% | | | | | | | |
| 412,462 | | 5.78 | | | 8/1/27 | | | | | | 445,183 | |
| 1,770,089 | | 5.87 | | | 7/1/28 | | | | | | 1,927,217 | |
| 1,482,993 | | 6.02 | | | 8/1/28 | | | | | | 1,617,984 | |
| 187,390 | | 7.13 | | | 10/1/20 | | | | | | 188,885 | |
| 123,130 | | 7.33 | | | 8/1/20 | | | | | | 124,545 | |
| 121,686 | | 8.03 | | | 5/1/20 | | | | | | 122,684 | |
| | | | | | | | | | | | |
| | | | |
| | | | | | | | | | | 4,426,498 | |
| | | | | | | | | | | | |
| | | |
Total Asset-Backed Securities
(cost: $7,480,642) | | | | | | | | | 7,787,859 | |
| | | | | | | | | | | | |
| | | | |
| | | | | | | | | | | | |
| Quantity | | Name of Issuer | | | | | | | Fair Value ($) | |
| | | |
Short-Term Securities - 2.3% | | | | | | | | | | |
| 9,657,958 | | Fidelity Inst. Money Mkt. Gvt. Fund, 1.86% | | | | | | 9,657,958 | |
| | | | | | | | | | | | |
| |
(cost: $9,657,958) | | | | |
Total Investments in Securities - 99.6%
(cost: $410,037,149) | | | | | | | | | 419,338,637 | |
| | | | | | | | | | | | |
| |
Other Assets and Liabilities, net - 0.4% | | | 1,535,832 | |
| | | | | | | | | | | | |
| |
Total Net Assets - 100.0% | | $ | 420,874,469 | |
| | | | | | | | | | | | |
| | | | |
| | | | | | | | | | | | | |
| 1 | | Variable rate security. Rate disclosed is as of September 30, 2019. Certain variable rate securities are not based on a published reference rate and spread but are determined by the issuer or agent and are based on current market conditions, or, for mortgage-backed securities, are impacted by the individual mortgages which are paying off over time. These securities do not indicate a reference rate and spread in their descriptions. |
| 6 | | Zero coupon or convertible capital appreciation bond, for which the rate disclosed is either the effective yield on purchase date or the coupon rate to be paid upon conversion to coupon paying. |
| 14 | | Step Coupon: A bond that pays a coupon rate that increases on a specified date(s). Rate disclosed is as of September 30, 2019. |
Numeric footnotes not disclosed are not applicable to this Schedule of Investments.
See accompanying notes to financial statements.
| | |
10 | | SIT MUTUAL FUNDS SEMI-ANNUAL REPORT |
A summary of the levels for the Fund’s investments as of September 30, 2019 is as follows (see Note 2 - significant accounting policies in the notes to financial statements):
| | | | | | | | | | | | | | | | | | | | |
| | | Investment in Securities |
| | | Level 1 | | Level 2 | | Level 3 | | |
| | | Quoted
Price ($) | | Other significant
observable inputs ($) | | Significant
unobservable inputs ($) | | Total ($) |
| | | | | |
Assets | | | | | | | | | | | | | | | | | | | | |
Mortgage Pass-Through Securities | | | | — | | | | | 147,012,221 | | | | | — | | | | | 147,012,221 | |
U.S. Treasury / Federal Agency Securities | | | | — | | | | | 3,889,663 | | | | | — | | | | | 3,889,663 | |
Collateralized Mortgage Obligations | | | | — | | | | | 250,990,936 | | | | | — | | | | | 250,990,936 | |
Asset-Backed Securities | | | | — | | | | | 7,787,859 | | | | | — | | | | | 7,787,859 | |
Short-Term Securities | | | | 9,657,958 | | | | | — | | | | | — | | | | | 9,657,958 | |
| | | | | |
| | | | |
| | | | 9,657,958 | | | | | 409,680,679 | | | | | — | | | | | 419,338,637 | |
| | | | | |
There were no transfers into or out of level 3 during the reporting period.
See accompanying notes to financial statements.
OBJECTIVE & STRATEGY
The objective of the Quality Income Fund is to provide high current income and safety of principal, which it seeks to attain by investing at least 80% of its assets in debt securities issued by the U.S. government and its agencies, debt securities issued by corporations, and mortgage and other asset-backed securities. The Fund invests at least 50% of its assets in U.S. government debt securities, which are securities issued, guaranteed or insured by the U.S. government, its agencies or instrumentalities.
Fund Performance
The Sit Quality Income Fund provided a return of +1.44% during the6-month period ending September 30, 2019, compared to the return of the Barclays1-3 Year Government/Credit Bond Index of +2.19%. The Fund’s30-day SEC yield was 1.74% and its12-month distribution rate was 2.05%.
Factors that Influenced the Fund’s Performance
The primary goal of the Fund is to maintain a high credit quality portfolio with stable principal values, while generating a relatively high level of income. During the6-month period, the Fund benefited from the income advantage produced by its holdings in residential mortgages, corporate, and taxable municipal securities. The Fund reduces interest rate risk by using futures and options on Treasury securities. The use of futures and options was effective in providing stability to the Fund’s net asset value, however, detracted from the return. Agency mortgage-backed securities underperformed as lower interest rates caused prepayments to accelerate. Although the Fund underperformed during the6-month period, several sectors outperformed the benchmark.Non-agency residential mortgages outperformed as the strong price appreciation more than offset an increase in prepayments. Taxable municipal securities outperformed as the strong income return and longer duration performed well in the interest rate environment. Corporate securities outperformed as spreads narrowed modestly.
Outlook and Positioning
The Federal Reserve cut interest rates twice over the6-month period which represented the first decrease in the federal funds rate since 2008. The U.S. economy continues to be strong, but global growth concerns as well as an escalating trade war with China caused the Federal Reserve to be cautions and cut rates. Other headwinds include the attack on Saudi Arabian oil fields which caused overnight lending rates to skyrocket to 10% annually. As a result, the Federal Reserve has had to inject liquidity daily to support the overnight lending market. Additional concerns include the upcoming U.S. election, developments surrounding the impeachment proceedings, and concerns
HYPOTHETICAL GROWTH OF $10,000
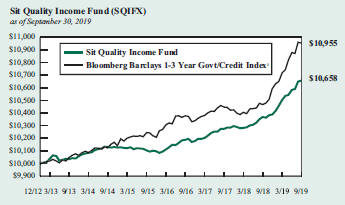
The chart above illustrates the total value of a hypothetical $10,000 investment in the Fund over the past 10 years (or for the life of the Fund if shorter) as compared to the performance of the Bloomberg Barclays1-3 Year Government/Credit Index. Past performance does not guarantee future results. Returns include the reinvestment of distributions. The chart does not reflect the deduction of taxes that a shareholder would pay on Fund distributions or the redemption of Fund shares.
1 The Bloomberg Barclays1-3 Year Government/Credit Index is an unmanaged index of Treasury or government agency securities and investment grade corporate debt securities with maturities of one to three years. The returns include the reinvestment of income and do not include any transaction costs, management fees or other costs. It is not possible to invest directly in an index. This is the Fund’s primary index.
over Brexit. Positive headlines regarding these issues could cause interest rates to increase, but as it stands, the market expects further federal funds rate cuts which will likely cause interest rates to decline.
We have positioned the Fund defensively, in both credit quality and interest rate sensitivity to maximize return potential while preserving principal. We focus on a mix of Treasury, agency and credit sectors that provide relatively high levels of income and stable prices.
| | |
Bryce A. Doty, CFA | | Chris M. Rasmussen, CFA |
Senior Portfolio Manager | | Mark H. Book, CFA |
| | Portfolio Managers |
| | |
12 | | SIT MUTUAL FUNDS SEMI-ANNUAL REPORT |
COMPARATIVE RATES OF RETURNS
as of September 30, 2019
| | | | | | | | |
| | | Sit Quality
Income Fund | | | Bloomberg
Barclays
1-3 Year
Government/Credit
Index1 | | Lipper
Short
Investment
Grade Bond
Index2 |
| | | |
Six Months | | | 1.44% | | | 2.19% | | n/a |
One Year | | | 2.80 | | | 4.64 | | 4.46% |
Five Years | | | 1.02 | | | 1.59 | | 1.87 |
Since Inception
(12/31/12) | | | 0.95 | | | 1.36 | | 1.65 |
Performance figures are historical and do not guarantee future results. Investment returns and principal value will vary, and you may have a gain or loss when you sell shares. Current performance may be lower or higher than the performance data quoted. Contact the Fund for performance data current to the most recentmonth-end. Returns include changes in share price as well as reinvestment of all dividends and capital gains and all fee waivers. Without the fee waivers total return and yield figures would have been lower. Returns do not reflect the deduction of taxes that a shareholder would pay on Fund distributions or the redemption of Fund shares. Management fees and administrative expenses are included in the Fund’s performance. Returns for the periods greater than one year are compounded average annual rates of return.
1 The Bloomberg Barclays1-3 Year Government/Credit Index is an unmanaged index of Treasury or government agency securities and investment grade corporate debt securities with maturities of one to three years. The returns include the reinvestment of income and do not include any transaction costs, management fees or other costs. It is not possible to invest directly in an index.
2 The Lipper returns are obtained from Lipper Analytical Services, Inc., a large independent evaluator of mutual funds.
FUND DIVERSIFICATION
| | | | |
U.S. Treasury/Federal Agency Securities | | | 45.5 | % |
Corporate Bonds | | | 24.6 | |
Asset-Backed(Non-Agency) | | | 8.0 | |
Mortgage Pass-Through (Agency) | | | 7.3 | |
Taxable Municipal Bonds | | | 6.7 | |
Collateralized Mortgage Obligations(Non-Agency) | | | 6.6 | |
Other Net Assets | | | 1.3 | |
Based on total net assets as of September 30, 2019. Subject to change.
PORTFOLIO SUMMARY
| | |
Net Asset Value 9/30/19: | | $9.84 Per Share |
Net Asset Value 3/31/19: | | $9.80 Per Share |
Total Net Assets: | | $86.6 Million |
Average Maturity: | | 8.1 Years |
Effective Duration3: | | 1.3 Years |
3 Duration is a measure of estimated price sensitivity relative to changes in interest rates. Portfolios with longer durations are typically more sensitive to changes in interest rates. For example, if interest rates rise by 1%, the fair value of a security with an effective duration of 5 years would decrease by 5%, with all other factors being constant. The correlation between duration and price sensitivity is greater for securities rated investment-grade than it is for securities rated below investment-grade. Duration estimates are based on assumptions by the Adviser and are subject to a number of limitations. Effective duration is calculated based on historical price changes of securities held by the Fund, and therefore is a more accurate estimate of price sensitivity provided interest rates remain within their historical range.
QUALITY RATINGS (% of Total Net Assets)
Lower of Moody’s, S&P, Fitch or Duff & Phelps ratings used.
SCHEDULE OF INVESTMENTS (Unaudited)
September 30, 2019
Sit Quality Income Fund
| | | | | | | | | | | | | | | | |
| | | | | | |
| Name of Issuer | | Principal Amount ($) | | | Coupon Rate (%) | | Maturity Date | | | Fair Value ($) | | | |
| | | | | |
Asset-Backed Securities - 9.7% | | | | | | | | | | | | | | | | |
Agency - 1.7% | | | | | | | | | | | | | | | | |
| FNMA Grantor Trust, Series2004-T5, Class A111 | | | 661,074 | | | 2.73 | | | 5/28/35 | | | | 650,348 | | | |
| FNMA REMICS, Series2001-W2, Class AS514 | | | 3,572 | | | 6.47 | | | 10/25/31 | | | | 3,666 | | | |
| Small Business Administration, Series2000-20D | | | 25,669 | | | 7.47 | | | 4/1/20 | | | | 25,806 | | | |
| Small Business Administration, Series2006-20D, Class 1 | | | 258,694 | | | 5.64 | | | 4/1/26 | | | | 275,527 | | | |
| Small Business Administration, Series2007-20B, Class 1 | | | 181,898 | | | 5.49 | | | 2/1/27 | | | | 194,969 | | | |
| Small Business Administration, Series2007-20J, Class 1 | | | 300,355 | | | 5.57 | | | 10/1/27 | | | | 318,693 | | | |
| | | | | | | | | | | | | | | | |
| | | | | |
| | | | | | | | | | | | | 1,469,009 | | | |
| | | | | | | | | | | | | | | | |
Non-Agency - 8.0% | | | | | | | |
| ACE Securities Corp. Manufactured Housing Trust, Series2003-MH1, Class M21,4 | | | 499,642 | | | 6.50 | | | 8/15/30 | | | | 537,601 | | | |
| Aegis Asset Backed Securities Corp., Series2003-2, Class M1, 1 Mo. Libor + 1.13%1 | | | 747,206 | | | 3.14 | | | 11/25/33 | | | | 746,851 | | | |
| Bayview Opportunity Master Fund, Series 2017-SPL5, Class A1,4 | | | 377,760 | | | 3.50 | | | 6/28/57 | | | | 384,167 | | | |
| Bear Stearns Asset Backed Securities I Trust, Series2005-AQ2, Class A3, 1 Mo. Libor + 0.36%1 | | | 8,605 | | | 2.38 | | | 9/25/35 | | | | 8,697 | | | |
| Centex Home Equity Loan Trust, Series2004-A, Class AF414 | | | 102,684 | | | 5.01 | | | 8/25/32 | | | | 107,880 | | | |
| Centex Home Equity Loan Trust, Series2004-A, Class AF514 | | | 310,000 | | | 5.43 | | | 1/25/34 | | | | 318,148 | | | |
| Centex Home Equity Loan Trust, Series2004-D, Class AF614 | | | 2,636 | | | 5.17 | | | 9/25/34 | | | | 2,662 | | | |
| CIT Home Equity Loan Trust, Series2003-1, Class A614 | | | 1,477 | | | 4.56 | | | 10/20/32 | | | | 1,480 | | | |
| Countrywide Asset-Backed Certificates, Series2004-S1, Class A314 | | | 107,830 | | | 5.12 | | | 2/25/35 | | | | 107,716 | | | |
| Credit Acceptance Auto Loan Trust, Series2018-2A, Class B4 | | | 500,000 | | | 3.94 | | | 7/15/27 | | | | 514,418 | | | |
| GSAMP Trust, Series2004-FM1, Class M1, 1 Mo. Libor + 0.98%1 | | | 188,316 | | | 2.99 | | | 11/25/33 | | | | 187,370 | | | |
Home Equity Mortgage Loan Asset-Backed Trust, Series2003-A, Class AV2, 1 Mo. Libor + 0.86% 1 | | | 345,402 | | | 2.88 | | | 10/25/33 | | | | 344,147 | | | |
| Irwin Whole Loan Home Equity Trust, Series2005-A, Class M1, 1 Mo. Libor + 0.86%1 | | | 127,668 | | | 2.87 | | | 6/25/34 | | | | 127,615 | | | |
| Mill City Mortgage Loan Trust, Series2017-3, Class A11,4 | | | 318,438 | | | 2.75 | | | 1/25/61 | | | | 319,662 | | | |
| New Century Home Equity Loan Trust, Series2003-5, Class AI71 | | | 3,768 | | | 5.05 | | | 11/25/33 | | | | 3,853 | | | |
| NovaStar Mortgage Funding Trust, Series2004-2, Class M2, 1 Mo. Libor + 1.02%1 | | | 44,812 | | | 3.04 | | | 9/25/34 | | | | 45,415 | | | |
| OSCAR US Funding Trust IX, LLC, Series2018-2A, Class A44 | | | 500,000 | | | 3.63 | | | 9/10/25 | | | | 518,210 | | | |
| OSCAR US Funding Trust VI, LLC, Series2017-1A, Class A34 | | | 516,050 | | | 2.82 | | | 6/10/21 | | | | 516,597 | | | |
| OSCAR US Funding Trust VI, LLC, Series2017-1A, Class A44 | | | 940,000 | | | 3.30 | | | 5/10/24 | | | | 952,415 | | | |
| OSCAR US Funding Trust VIII, LLC, Series2018-1A, Class A2A4 | | | 96,908 | | | 2.91 | | | 4/12/21 | | | | 97,003 | | | |
| OSCAR US Funding Trust VIII, LLC, Series2018-1A, Class A2B, 1 Mo. Libor + 0.49%1,4 | | | 276,880 | | | 2.54 | | | 4/12/21 | | | | 276,956 | | | |
| Towd Point Mortgage Trust, Series2019-MH1, Class A21,4 | | | 800,000 | | | 3.00 | | | 11/25/58 | | | | 808,506 | | | |
| | | | | | | | | | | | | | | | |
| | | | | |
| | | | | | | | | | | | | 6,927,369 | | | |
| | | | | | | | | | | | | | | | |
| | | | |
Total Asset-Backed Securities
(cost: $8,349,132) | | | | | | | | | | 8,396,378 | | | |
| | | | | | | | | | | | | | | | |
| | | | |
| Collateralized Mortgage Obligations - 17.8% | | | | | | | | | | | | | |
Agency - 11.2% | | | | | | | | | | | | | | | | |
| FHLMC Multifamily Structured Pass Through Certificates, Series K007, Class A2 | | | 93,153 | | | 4.22 | | | 3/25/20 | | | | 93,399 | | | |
| FHLMC REMICS, Series 2528, Class KM | | | 31,544 | | | 5.50 | | | 11/15/22 | | | | 32,515 | | | |
| FHLMC REMICS, Series 3104, Class BY | | | 117,602 | | | 5.50 | | | 1/15/26 | | | | 126,478 | | | |
| FHLMC REMICS, Series 3806, Class JA | | | 295,773 | | | 3.50 | | | 2/15/26 | | | | 301,992 | | | |
| FHLMC REMICS, Series 4759, Class NA | | | 868,863 | | | 3.00 | | | 8/15/44 | | | | 883,608 | | | |
| FHLMC REMICS, Series 4776, Class QG | | | 884,647 | | | 3.00 | | | 9/15/42 | | | | 892,531 | | | |
| FNMA Grantor Trust, Series2004-T1, Class 2A1 | | | 483,084 | | | 3.95 | | | 8/25/43 | | | | 496,122 | | | |
| FNMA REMICS, Series2003-52, Class NA | | | 39,311 | | | 4.00 | | | 6/25/23 | | | | 39,790 | | | |
| FNMA REMICS, Series2005-19, Class PA | | | 19,421 | | | 5.50 | | | 7/25/34 | | | | 19,555 | | | |
| FNMA REMICS, Series2005-68, Class PC | | | 5,272 | | | 5.50 | | | 7/25/35 | | | | 5,328 | | | |
| FNMA REMICS, Series2008-65, Class CD | | | 5,713 | | | 4.50 | | | 8/25/23 | | | | 5,713 | | | |
| FNMA REMICS, Series2009-13, Class NX | | | 31,176 | | | 4.50 | | | 3/25/24 | | | | 31,193 | | | |
| FNMA REMICS, Series2009-71, Class MB | | | 38,312 | | | 4.50 | | | 9/25/24 | | | | 39,844 | | | |
See accompanying notes to financial statements.
| | |
14 | | SIT MUTUAL FUNDS SEMI-ANNUAL REPORT |
| | | | | | | | | | | | | | | | |
| | | | | | |
| Name of Issuer | | Principal Amount ($) | | | Coupon Rate (%) | | Maturity Date | | | Fair Value ($) | | | |
| | | | | |
| FNMA REMICS, Series2009-88, Class DA | | | 1,196 | | | 4.50 | | | 10/25/20 | | | | 1,198 | | | |
| FNMA REMICS, Series2012-19, Class GH | | | 30,748 | | | 3.00 | | | 11/25/30 | | | | 31,199 | | | |
| FNMA REMICS, Series2013-74, Class AD | | | 140,159 | | | 2.00 | | | 7/25/23 | | | | 139,670 | | | |
| FNMA REMICS, Series2017-97, Class DP | | | 1,024,877 | | | 3.50 | | | 10/25/46 | | | | 1,062,440 | | | |
| FNMA REMICS, Series2018-1, Class TE | | | 611,713 | | | 3.50 | | | 3/25/44 | | | | 625,146 | | | |
| FNMA REMICS, Series2018-25, Class AG | | | 688,701 | | | 3.50 | | | 4/25/47 | | | | 706,970 | | | |
FREMF Multifamily Aggregation Risk Transfer Trust, Series 2017-KT01, Class A, 1 Mo. Libor + 0.32%1 | | | 1,000,000 | | | 2.36 | | | 2/25/20 | | | | 999,985 | | | |
| FRESB Mortgage Trust, Series 2018-SB45, Class A5H, 1 Mo. Libor + 2.96%1 | | | 894,223 | | | 2.96 | | | 11/25/37 | | | | 916,879 | | | |
| FRESB Mortgage Trust, Series 2018-SB46, Class A5H, 1 Mo. Libor + 2.89%1 | | | 877,479 | | | 2.89 | | | 12/25/37 | | | | 894,085 | | | |
| GNMA, Series2011-29, Class JA | | | 2,048 | | | 4.50 | | | 4/20/40 | | | | 2,046 | | | |
| NCUA Guaranteed Notes Trust, Series2010-R1, Class 1A, 1 Mo. Libor + 0.45%1 | | | 267,011 | | | 2.45 | | | 10/7/20 | | | | 267,127 | | | |
| NCUA Guaranteed Notes Trust, Series2010-R3, Class 2A, 1 Mo. Libor + 0.56%1 | | | 994,036 | | | 2.62 | | | 12/8/20 | | | | 995,505 | | | |
| Vendee Mortgage Trust, Series1993-1, Class ZB | | | 60,841 | | | 7.25 | | | 2/15/23 | | | | 65,024 | | | |
| | | | | | | | | | | | | | | | |
| | | | | |
| | | | | | | | | | | | | 9,675,342 | | | |
| | | | | | | | | | | | | | | | |
| Non-Agency - 6.6% | | | | | | | | | | | | | | | | |
| COLT Mortgage Loan Trust, Series2019-1, Class A11,4 | | | 398,737 | | | 3.71 | | | 3/25/49 | | | | 404,350 | | | |
| GSR Mortgage Loan Trust, Series2005-5F, Class 8A1, 1 Mo. Libor + 0.50%1 | | | 38,966 | | | 2.52 | | | 6/25/35 | | | | 36,793 | | | |
| JPMorgan Mortgage Trust, Series2019-1, Class A61,4 | | | 394,318 | | | 4.00 | | | 5/25/49 | | | | 395,841 | | | |
| MASTR Adjustable Rate Mortgages Trust, Series2004-13, Class 3A11 | | | 175,203 | | | 4.73 | | | 11/21/34 | | | | 179,918 | | | |
| MASTR Alternative Loan Trust, Series2003-4, Class 2A1 | | | 69,159 | | | 6.25 | | | 6/25/33 | | | | 74,204 | | | |
| MASTR Alternative Loan Trust, Series2003-5, Class 4A1 | | | 96,227 | | | 5.50 | | | 7/25/33 | | | | 103,089 | | | |
| MASTR Alternative Loan Trust, Series2003-8, Class 3A1 | | | 93,179 | | | 5.50 | | | 12/25/33 | | | | 95,998 | | | |
| MASTR Asset Securitization Trust, Series2005-2, Class 1A3 | | | 37,000 | | | 5.35 | | | 11/25/35 | | | | 38,218 | | | |
| New Residential Mortgage Loan Trust, Series2017-2A, Class A41,4 | | | 562,748 | | | 4.00 | | | 3/25/57 | | | | 578,508 | | | |
| New Residential Mortgage Loan Trust, Series2017-3A, Class A11,4 | | | 598,439 | | | 4.00 | | | 4/25/57 | | | | 620,062 | | | |
| New Residential Mortgage Loan Trust, Series2017-5A, Class A1, 1 Mo. Libor + 1.50%1,4 | | | 260,117 | | | 3.52 | | | 6/25/57 | | | | 263,929 | | | |
| New Residential Mortgage Loan Trust, Series2018-1A, Class A1A1,4 | | | 403,610 | | | 4.00 | | | 12/25/57 | | | | 418,623 | | | |
| New Residential Mortgage Loan Trust, Series2018-4A, Class A1S, 1 Mo. Libor + 0.75%1,4 | | | 712,308 | | | 2.77 | | | 1/25/48 | | | | 710,193 | | | |
| Prime Mortgage Trust, Series2004-CL1, Class 1A1 | | | 68,927 | | | 6.00 | | | 2/25/34 | | | | 73,497 | | | |
| RAAC Trust, Series2004-SP3, Class AI51 | | | 352 | | | 4.89 | | | 12/25/32 | | | | 358 | | | |
| Sequoia Mortgage Trust, Series2012-2, Class B11 | | | 613,552 | | | 4.21 | | | 4/25/42 | | | | 638,889 | | | |
| Sequoia Mortgage Trust, Series2017-4, Class A41,4 | | | 331,019 | | | 3.50 | | | 7/25/47 | | | | 336,773 | | | |
| Sequoia Mortgage Trust, Series2018-3, Class A41,4 | | | 592,837 | | | 3.50 | | | 3/25/48 | | | | 601,661 | | | |
| Structured Asset Securities, Corp. Mtg Pass-Through Certificates, Series2003-22A, Class 3A1 | | | 63,748 | | | 4.65 | | | 6/25/33 | | | | 65,442 | | | |
| WaMu Mortgage Pass Through Certificates, Series2002-AR2 Class A, US FED + 1.25%1 | | | 66,410 | | | 2.41 | | | 2/27/34 | | | | 66,220 | | | |
| | | | | | | | | | | | | | | | |
| | | | | |
| | | | | | | | | | | | | 5,702,566 | | | |
| | | | | | | | | | | | | | | | |
| | | | |
Total Collateralized Mortgage Obligations
(cost: $15,193,998) | | | | | | | | | | 15,377,908 | | | |
| | | | | | | | | | | | | | | | |
| | | | | |
Corporate Bonds - 24.6% | | | | | | | | | | | | | | | | |
| Anheuser-Busch InBev Worldwide, Inc. | | | 750,000 | | | 4.15 | | | 1/23/25 | | | | 819,147 | | | |
| Arrow Electronics, Inc. | | | 1,000,000 | | | 4.00 | | | 4/1/25 | | | | 1,042,349 | | | |
| Booking Holdings | | | 800,000 | | | 3.65 | | | 3/15/25 | | | | 852,704 | | | |
| Brown & Brown, Inc. | | | 1,000,000 | | | 4.20 | | | 9/15/24 | | | | 1,058,095 | | | |
| Cantor Fitzgerald LP4 | | | 1,000,000 | | | 4.88 | | | 5/1/24 | | | | 1,055,626 | | | |
| Comcast Corp. | | | 400,000 | | | 3.38 | | | 2/15/25 | | | | 421,778 | | | |
| CommonSpirit Health | | | 400,000 | | | 2.95 | | | 11/1/22 | | | | 407,143 | | | |
| Credit Suisse Group Funding Guernsey, Ltd.4 | | | 400,000 | | | 3.75 | | | 3/26/25 | | | | 420,107 | | | |
| CVS Health Corp. | | | 900,000 | | | 4.10 | | | 3/25/25 | | | | 961,618 | | | |
| Delta Air Lines2015-1 Class A Pass Through Trust | | | 620,096 | | | 3.88 | | | 7/30/27 | | | | 661,378 | | | |
| Doric Nimrod Air Finance Alpha2012-1 Trust4 | | | 438,220 | | | 5.13 | | | 11/30/22 | | | | 445,241 | | | |
See accompanying notes to financial statements.
SCHEDULE OF INVESTMENTS (Unaudited)
September 30, 2019
Sit Quality Income Fund (Continued)
| | | | | | | | | | | | | | | | |
| | | | | | |
| Name of Issuer | | Principal Amount ($) | | Coupon Rate (%) | | Maturity Date | | Fair Value ($) | | | |
| | | | | |
Duke Energy Florida, LLC | | | 1,000,000 | | | 1.73 | | | 9/1/22 | | | | 992,612 | | | |
Equifax, Inc., 3 Mo. Libor + 0.87%1 | | | 800,000 | | | 3.03 | | | 8/15/21 | | | | 799,627 | | | |
Hawaiian Airlines Pass Through Certificates, Series2013-1, Class A | | | 700,251 | | | 3.90 | | | 1/15/26 | | | | 714,326 | | | |
HSBC Holdings, PLC, 3 Mo. Libor + 1.00%1 | | | 700,000 | | | 3.12 | | | 5/18/24 | | | | 702,776 | | | |
Kraft Heinz Foods Co.4 | | | 684,000 | | | 4.88 | | | 2/15/25 | | | | 704,162 | | | |
Liberty Mutual Insurance Co. (Subordinated)4 | | | 700,000 | | | 8.50 | | | 5/15/25 | | | | 874,543 | | | |
Manufacturers & Traders Trust Co. (Subordinated), 3 Mo. Libor + 0.64%1 | | | 900,000 | | | 2.78 | | | 12/1/21 | | | | 899,376 | | | |
Marathon Petroleum Corp. | | | 650,000 | | | 5.38 | | | 10/1/22 | | | | 658,137 | | | |
Nationwide Mutual Insurance Co. (Subordinated), 3 Mo. Libor + 2.29%1,4 | | | 725,000 | | | 4.41 | | | 12/15/24 | | | | 722,185 | | | |
Prudential Insurance Co. of America (Subordinated)4 | | | 400,000 | | | 8.30 | | | 7/1/25 | | | | 517,261 | | | |
RenaissanceRe Finance, Inc. | | | 500,000 | | | 3.70 | | | 4/1/25 | | | | 523,200 | | | |
Sherwin-Williams Co. | | | 800,000 | | | 3.30 | | | 2/1/25 | | | | 817,114 | | | |
Silversea Cruise Finance, Ltd.4 | | | 800,000 | | | 7.25 | | | 2/1/25 | | | | 854,400 | | | |
TCF National Bank (Subordinated), 3 Mo. Libor + 2.38%1 | | | 750,000 | | | 4.13 | | | 7/2/29 | | | | 754,126 | | | |
United Airlines2013-1 Class A Pass Through Trust | | | 820,386 | | | 4.30 | | | 8/15/25 | | | | 886,099 | | | |
US Airways2012-2 Class A Pass Through Trust | | | 155,507 | | | 4.63 | | | 6/3/25 | | | | 168,030 | | | |
US Airways2013-1 Class A Pass Through Trust | | | 687,296 | | | 3.95 | | | 11/15/25 | | | | 723,710 | | | |
XLIT, Ltd. | | | 750,000 | | | 4.45 | | | 3/31/25 | | | | 814,502 | | | |
| | | | | | | | | | | | | | | | |
| | | | |
Total Corporate Bonds
(cost: $20,862,429) | | | | | | | | | | 21,271,372 | | | |
| | | | | | | | | | | | | | | | |
| | | | | |
Mortgage Pass-Through Securities - 7.3% | | | | | | | | | | | | | | | | |
Federal Home Loan Mortgage Corporation - 0.7% | | | | | | | | | | | | | | | | |
Freddie Mac | | | 138,337 | | | 3.00 | | | 9/1/27 | | | | 142,293 | | | |
Freddie Mac | | | 29,324 | | | 3.50 | | | 7/1/26 | | | | 30,549 | | | |
Freddie Mac | | | 187,512 | | | 4.00 | | | 7/1/26 | | | | 197,080 | | | |
Freddie Mac | | | 201,704 | | | 4.00 | | | 1/1/27 | | | | 212,636 | | | |
Freddie Mac | | | 11,090 | | | 4.50 | | | 12/1/21 | | | | 11,428 | | | |
Freddie Mac | | | 9,275 | | | 4.50 | | | 7/1/26 | | | | 9,576 | | | |
Freddie Mac | | | 13,446 | | | 5.00 | | | 10/1/25 | | | | 14,386 | | | |
Freddie Mac | | | 1,567 | | | 5.50 | | | 5/1/20 | | | | 1,570 | | | |
Freddie Mac | | | 491 | | | 5.50 | | | 7/1/20 | | | | 491 | | | |
Freddie Mac | | | 573 | | | 5.50 | | | 12/1/20 | | | | 573 | | | |
Freddie Mac | | | 10,561 | | | 5.50 | | | 3/1/21 | | | | 10,632 | | | |
Freddie Mac | | | 9,081 | | | 5.50 | | | 3/1/21 | | | | 9,196 | | | |
| | | | | | | | | | | | | | | | |
| | | | | |
| | | | | | | | | | | | | 640,410 | | | |
| | | | | | | | | | | | | | | | |
Federal National Mortgage Association - 3.2% | | | | | | | | | | | | | | | | |
Fannie Mae | | | 336,587 | | | 2.50 | | | 6/1/23 | | | | 339,492 | | | |
Fannie Mae | | | 228,364 | | | 3.00 | | | 8/1/28 | | | | 234,521 | | | |
Fannie Mae | | | 1,330,792 | | | 3.23 | | | 11/1/20 | | | | 1,336,289 | | | |
Fannie Mae | | | 546,972 | | | 3.50 | | | 1/1/26 | | | | 565,476 | | | |
Fannie Mae | | | 15,839 | | | 4.00 | | | 9/1/24 | | | | 16,473 | | | |
Fannie Mae | | | 119,212 | | | 4.00 | | | 6/1/25 | | | | 124,283 | | | |
Fannie Mae | | | 20,368 | | | 4.00 | | | 10/1/31 | | | | 21,573 | | | |
Fannie Mae | | | 102,784 | | | 4.50 | | | 4/1/25 | | | | 108,096 | | | |
Fannie Mae | | | 33,973 | | | 4.73 | | | 2/1/20 | | | | 33,973 | | | |
Fannie Mae | | | 18,986 | | | 5.00 | | | 9/1/20 | | | | 19,583 | | | |
See accompanying notes to financial statements.
| | |
16 | | SIT MUTUAL FUNDS SEMI-ANNUAL REPORT |
| | | | | | | | | | | | | | | | |
| | | | | | |
| Name of Issuer | | Principal Amount ($) | | Coupon Rate (%) | | Maturity Date | | Fair Value ($) | | | |
| | | | | |
Fannie Mae | | | 2,065 | | | 5.50 | | | 1/1/21 | | | | 2,072 | | | |
Fannie Mae | | | 1,517 | | | 5.50 | | | 10/1/21 | | | | 1,524 | | | |
| | | | | | | | | | | | | | | | |
| | | | | |
| | | | | | | | | | | | | 2,803,355 | | | |
| | | | | | | | | | | | | | | | |
Government National Mortgage Association - 0.2% | | | | | | | | | | | | | | | | |
Ginnie Mae, US Treasury + 1.50%1 | | | 36,920 | | | 3.88 | | | 4/20/33 | | | | 38,429 | | | |
Ginnie Mae, US Treasury + 1.50%1 | | | 8,545 | | | 3.88 | | | 4/20/42 | | | | 8,802 | | | |
Ginnie Mae | | | 22,471 | | | 5.00 | | | 12/20/23 | | | | 23,917 | | | |
Ginnie Mae | | | 14,451 | | | 5.00 | | | 9/15/24 | | | | 15,024 | | | |
Ginnie Mae | | | 41,240 | | | 5.00 | | | 6/20/26 | | | | 45,076 | | | |
| | | | | | | | | | | | | | | | |
| | | | | |
| | | | | | | | | | | | | 131,248 | | | |
| | | | | | | | | | | | | | | | |
Other Federal Agency Securities - 3.2% | | | | | | | | | | | | | | | | |
Small Business Administration Pools, PRIME - 2.50%1 | | | 660,928 | | | 3.00 | | | 5/25/43 | | | | 661,926 | | | |
Small Business Administration Pools, PRIME + 0.78%1 | | | 508,998 | | | 6.28 | | | 3/25/30 | | | | 552,146 | | | |
Small Business Administration Pools, PRIME + 0.79%1 | | | 1,449,254 | | | 6.29 | | | 2/25/28 | | | | 1,563,536 | | | |
| | | | | | | | | | | | | | | | |
| | | | | |
| | | | | | | | | | | | | 2,777,608 | | | |
| | | | | | | | | | | | | | | | |
| | | | | |
Total Mortgage Pass-Through Securities
(cost: $6,341,293) | | | | | | | | | | | | | 6,352,621 | | | |
| | | | | | | | | | | | | | | | |
| | | | | |
Taxable Municipal Bonds - 6.7% | | | | | | | | | | | | | | | | |
Atlanta Downtown Development Authority17 | | | 435,000 | | | 6.88 | | | 2/1/21 | | | | 452,896 | | | |
Berks County Industrial Development Authority | | | 270,000 | | | 3.20 | | | 5/15/21 | | | | 270,945 | | | |
Century Housing Corp. | | | 500,000 | | | 3.82 | | | 11/1/20 | | | | 506,086 | | | |
City of Wilkes-Barre PA17 | | | 1,000,000 | | | 3.24 | | | 11/15/21 | | | | 1,028,270 | | | |
City of Worcester MA17 | | | 250,000 | | | 6.75 | | | 11/1/34 | | | | 263,050 | | | |
Colorado Housing & Finance Authority | | | 10,000 | | | 4.00 | | | 11/1/31 | | | | 10,251 | | | |
Kentucky Higher Education Student Loan Corp. | | | 1,000,000 | | | 3.92 | | | 6/1/32 | | | | 1,076,850 | | | |
Massachusetts Educational Financing Authority | | | 480,000 | | | 4.00 | | | 1/1/32 | | | | 499,934 | | | |
Massachusetts Educational Financing Authority | | | 750,000 | | | 4.41 | | | 7/1/34 | | | | 809,948 | | | |
New Hampshire Housing Finance Authority | | | 420,000 | | | 4.00 | | | 7/1/35 | | | | 428,009 | | | |
New Hampshire Housing Finance Authority | | | 10,000 | | | 4.00 | | | 1/1/37 | | | | 10,301 | | | |
New Jersey Economic Development Authority | | | 365,000 | | | 4.43 | | | 12/1/21 | | | | 374,756 | | | |
Tennessee Housing Development Agency | | | 95,000 | | | 3.50 | | | 7/1/31 | | | | 96,224 | | | |
| | | | | | | | | | | | | | | | |
| | | | | |
Total Taxable Municipal Bonds
(cost: $5,685,346) | | | | | | | | | | | | | 5,827,520 | | | |
| | | | | | | | | | | | | | | | |
| | | | | |
U.S. Treasury / Federal Agency Securities - 32.6% | | | | | | | | | | | | | | | | |
Federal Agency Issues - 1.6% | | | | | | | | | | | | | | | | |
Federal Agricultural Mortgage Corp., 3 Mo. Libor + 0.37%1 | | | 250,000 | | | 2.47 | | | 3/9/23 | | | | 252,227 | | | |
Pershing Road Development Co., LLC, 3 Mo. Libor + 0.40%1,4 | | | 300,000 | | | 2.53 | | | 9/15/21 | | | | 300,000 | | | |
U.S. Department of Housing and Urban Development | | | 800,000 | | | 4.28 | | | 8/1/27 | | | | 816,152 | | | |
| | | | | | | | | | | | | | | | |
| | | | | |
| | | | | | | | | | | | | 1,368,379 | | | |
| | | | | | | | | | | | | | | | |
U.S. Treasury - 31.0% | | | | | | | | | | | | | | | | |
U.S. Treasury Bill6 | | | 1,000,000 | | | 1.86 | | | 10/10/19 | | | | 999,535 | | | |
U.S. Treasury Bill6 | | | 5,000,000 | | | 1.95 | | | 11/7/19 | | | | 4,990,020 | | | |
U.S. Treasury Bill6 | | | 7,000,000 | | | 1.95 | | | 11/29/19 | | | | 6,977,773 | | | |
U.S. Treasury Floating Rate Note, 3 Mo. Libor + 0.04%1 | | | 2,500,000 | | | 1.89 | | | 7/31/20 | | | | 2,497,466 | | | |
U.S. Treasury Floating Rate Note, 3 Mo. Libor + 0.05%1 | | | 4,000,000 | | | 1.89 | | | 10/31/20 | | | | 3,993,698 | | | |
U.S. Treasury Inflation Indexed Bonds | | | 1,764,000 | | | 0.38 | | | 7/15/23 | | | | 1,773,924 | | | |
See accompanying notes to financial statements.
SCHEDULE OF INVESTMENTS (Unaudited)
September 30, 2019
Sit Quality Income Fund (Continued)
| | | | | | | | | | | | | | | | | | |
| | | | | | |
| Name of Issuer | | Principal Amount ($) | | Coupon Rate (%) | | | Maturity Date | | Fair Value ($) | | | |
| | | | | |
U.S. Treasury Note | | | 1,500,000 | | | | 1.50 | | | | 8/31/21 | | | | 1,495,605 | | | |
U.S. Treasury Note | | | 4,000,000 | | | | 2.25 | | | | 11/15/24 | | | | 4,130,781 | | | |
| | | | | | | | | | | | | | | | | | |
| | | | | |
| | | | | | | | | | | | | | | 26,858,802 | | | |
| | | | | | | | | | | | | | | | | | |
| | | | | |
Total U.S. Treasury / Federal Agency Securities
(cost: $28,065,050) | | | | | | | | | | | | | | | 28,227,181 | | | |
| | | | | | | | | | | | | | | | | | |
| | | | | |
Short-Term Securities - 1.1% | | | | | | | | | | | | | | | | | | |
Fidelity Inst. Money Mkt. Gvt. Fund, 1.86% | | | 952,249 | | | | | | | | | | | | 952,249 | | | |
| | | | | | | | | | | | | | | | | | |
| | | | | |
(cost: $952,249) | | | | | | | | | | | | | | | | | | |
Total Investments in Securities - 99.8%
(cost: $85,449,497) | | | | | | | | | | | | | | | 86,405,229 | | | |
| | | | | | | | | | | | | | | | | | |
| | | | | |
Other Assets and Liabilities, net - 0.2% | | | | | | | | | | | | | | | 203,650 | | | |
| | | | | | | | | | | | | | | | | | |
| | | | | |
Total Net Assets - 100.0% | | | | | | | | | | | | | | | $86,608,879 | | | |
| | | | | | | | | | | | | | | | | | |
| 1 | | Variable rate security. Rate disclosed is as of September 30, 2019. Certain variable rate securities are not based on a published reference rate and spread but are determined by the issuer or agent and are based on current market conditions, or, for mortgage-backed securities, are impacted by the individual mortgages which are paying off over time. These securities do not indicate a reference rate and spread in their descriptions. |
| 4 | | 144A Restricted Security. The total value of such securities as of September 30, 2019 was $15,149,000 and represented 17.5% of net assets. These securities have been determined to be liquid by the Adviser in accordance with guidelines established by the Board of Directors. |
| 6 | | Zero coupon or convertible capital appreciation bond, for which the rate disclosed is either the effective yield on purchase date or the coupon rate to be paid upon conversion to coupon paying. |
| 14 | | Step Coupon: A bond that pays a coupon rate that increases on a specified date(s). Rate disclosed is as of September 30, 2019. |
| 17 | | Security that is either an absolute and unconditional obligation of the United States Government or is collateralized by securities, loans, or leases guaranteed by the U.S. Government or its agencies or instrumentalities. |
Numeric footnotes not disclosed are not applicable to this Schedule of Investments.
See accompanying notes to financial statements.
| | |
18 | | SIT MUTUAL FUNDS SEMI-ANNUAL REPORT |
Short futures contracts outstanding as of September 30, 2019 were as follows:
| | | | | | | | | | | | | | | | | | | | | | | | | |
| Type | | Contracts | | Expiration
Date | | Notional
Amount ($) | | | | Value/ Unrealized
Appreciation
(Depreciation) ($) |
| | | | | |
Short Futures:10 | | | | | | | | | | | | | | | | | | | | | | | | | |
U.S. Treasury5-Year | | | | 133 | | | | | December 2019 | | | | | (15,846,743 | ) | | | | | | | | | 91,709 | |
U.S. Treasury2-Year | | | | 30 | | | | | December 2019 | | | | | (6,465,000 | ) | | | | | | | | | 20,811 | |
| | | | | |
| | | | | | | | | | | | | | | | | | | | | | | | 112,520 | |
| 10 | | The amount of $500,000 in cash was segregated with the broker to cover margin requirements for derivative transactions as of September 30, 2019. |
A summary of the levels for the Fund’s investments as of September 30, 2019 is as follows (see Note 2 - significant accounting policies in the notes to financial statements):
| | | | | | | | | | | | | | | | |
| | | | | | Investment in Securities | |
| | | | |
| | | Level 1 | | | Level 2 | | | Level 3 | | | | |
| | | Quoted | | | Other Significant | | | Other Significant | | | | |
| | | Price ($) | | | Observable Inputs ($) | | | Observable Inputs ($) | | | Total ($) | |
| | | | |
Assets | | | | | | | | | | | | | | | | |
Asset-Backed Securities | | | — | | | | 8,396,378 | | | | — | | | | 8,396,378 | |
Collateralized Mortgage Obligations | | | — | | | | 15,377,908 | | | | — | | | | 15,377,908 | |
Corporate Bonds | | | — | | | | 21,271,372 | | | | — | | | | 21,271,372 | |
Mortgage Pass-Through Securities | | | — | | | | 6,352,621 | | | | — | | | | 6,352,621 | |
Taxable Municipal Bonds | | | — | | | | 5,827,520 | | | | — | | | | 5,827,520 | |
U.S. Treasury / Federal Agency Securities | | | — | | | | 28,227,181 | | | | — | | | | 28,227,181 | |
Short-Term Securities | | | 952,249 | | | | — | | | | — | | | | 952,249 | |
Futures | | | 112,520 | | | | — | | | | — | | | | 112,520 | |
| | | | |
| | | | |
| | | 1,064,769 | | | | 85,452,980 | | | | — | | | | 86,517,749 | |
| | | | |
There were no transfers into or out of level 3 during the reporting period.
See accompanying notes to financial statements.
OBJECTIVE & STRATEGY
The objective of theTax-Free Income Fund is to provide a high level of current income that is exempt from federal income tax, consistent with preservation of capital, by investing primarily in investment-grade municipal securities.
Such municipal securities generate interest income that is exempt from both federal regular income tax and federal alternative minimum tax. During normal market conditions, the Fund invests 100% of its net assets in suchtax-exempt municipal securities.
Fund Performance
The SitTax-Free Income Fund provided a return of +3.67% during the six months ending September 30, 2019, compared to the return of the Bloomberg Barclays5-Year Municipal Bond Index of +2.21%. As of September 30, 2019, the Fund’s30-day SEC yield was 2.03%, compared to a yield of 1.50% for the benchmark index, and the Fund’s12-month distribution rate was 3.26%.
Factors that influenced the Fund’s Performance
Thetax-exempt yield curve shifted lower and flattened during the pastsix-months, as longer yields fell most. Yields for10-30 year maturities fell approximately45-60 basis points, while yields for2-5 year maturities fell approximately25-35 basis points. Credit spreads fortax-exempt bonds also tightened over the last six months, particularly forA-rated credits and below.Tax-exempt fund flows remained strong throughout 2019, totaling $69 billion through the beginning of October, already the highest annual total on record since data collection began in 1992. Municipal issuance in the first nine months of 2019, totaling $275 billion, was slightly stronger than the $253 billion issued in the same period in 2018 and easily absorbed by the market.
The Fund benefited from its significant allocation to longer bonds relative to its benchmark over the last six months, as longer bonds outperformed shorter bonds. Specifically, over 80% of the Fund’s bonds had a duration of 4 years or longer and outperformed the benchmark return. Conversely, the Fund’s hedge in U.S. Treasury futures partially offset this excess return, as Treasury yields decreased approximately90-140 basis points over the last six months. Nearly all sectors in the Fund outperformed the benchmark, with the most significant performance contributions resulting from single-family mortgage revenue bonds, multi-family mortgage revenue bonds, other revenue bonds,closed-end funds, and education/student loan revenue bonds. In terms of quality, the Fund maintained an average credit quality ofsingle-A and benefited from a significant allocation, more than 80% of the Fund, to bonds with AA to BB credit quality, as such bonds tended to outperform both the highest and lowest-rated bonds.
Outlook and Positioning
The Fund continues to emphasize income as the primary driver of returns over an interest rate cycle. We will continue to focus on higher-yielding revenue bond sectors,non-rated bonds, and bonds with call
HYPOTHETICAL GROWTH OF $10,000
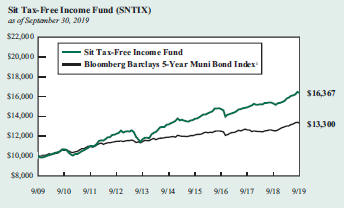
The chart above illustrates the total value of a hypothetical $10,000 investment in the Fund over the past 10 years (or for the life of the Fund if shorter) as compared to the performance of the Bloomberg Barclays5-Year Municipal Bond Index. Past performance does not guarantee future results. Returns include the reinvestment of distributions. The chart does not reflect the deduction of taxes that a shareholder would pay on Fund distributions or the redemption of Fund shares.
1 The Bloomberg Barclays5-Year Municipal Bond Index is the 5 year(4-6) component of the Municipal Bond Index, an unmanaged, rules-based, market-value-weighted index for the long-termtax-exempt bond market. The index includes bonds with a minimum credit rating of BBB. The returns include the reinvestment of income and do not include any transaction costs, management fees or other costs. It is not possible to invest directly in an index. This is the Fund’s primary index.
or redemption provisions that present attractive relative yields to average life estimates. Housing-related sectors remain a meaningful percentage of the Fund, totaling nearly 50% of Fund assets, and continue to present an attractive relative value. Similarly, over 20% of the Fund remains invested innon-rated bonds, which also possess an attractive income advantage.
We continue to hedge the Fund��s duration using U.S. Treasury bond futures to maintain duration modestly longer than the benchmark. The Fund’s unhedged duration is longer than its benchmark to benefit from the modestly steepertax-exempt yield curve relative to Treasuries. We continue to monitor this dynamic and may modify our hedge going forward if conditions change. We remain diversified on a geographic and issuer basis to manage credit risk within the Fund and believe the Fund remains well-positioned for the current environment.
Paul J. Jungquist, CFA
Senior Portfolio Manager
| | |
20 | | SIT MUTUAL FUNDS SEMI-ANNUAL REPORT |
COMPARATIVE RATES OF RETURNS
as of September 30, 2019
| | | | | | | | | | | | | | | |
| | | Sit | | Bloomberg | | Lipper |
| | | Tax-Free | | Barclays | | General |
| | | Income | | 5-Year Muni | | Muni. Bond |
| | | Fund | | Bond Index1 | | Fund Index2 |
| | | |
Six Months | | | | 3.67 | % | | | | 2.21 | % | | | | n/a | |
One Year | | | | 6.98 | | | | | 6.02 | | | | | 8.50 | % |
Five Years | | | | 4.44 | | | | | 2.25 | | | | | 3.90 | |
Ten Years | | | | 5.05 | | | | | 2.89 | | | | | 4.48 | |
Since Inception (9/29/88) | | | | 5.22 | | | | | 4.91 | | | | | 5.55 | |
Performance figures are historical and do not guarantee future results. Investment returns and principal value will vary, and you may have a gain or loss when you sell shares. Current performance may be lower or higher than the performance data quoted. Contact the Fund for performance data current to the most recentmonth-end. Returns include changes in share price as well as reinvestment of all dividends and capital gains and all fee waivers. Without the fee waivers total return and yield figures would have been lower. Returns do not reflect the deduction of taxes that a shareholder would pay on Fund distributions or the redemption of Fund shares. Management fees and administrative expenses are included in the Fund’s performance. Returns for periods greater than one year are compounded average annual rates of return.
1 The Bloomberg Barclays5-Year Municipal Bond Index is the 5 year(4-6) component of the Municipal Bond Index, an unmanaged, rules-based, market-value-weighted index for the long-termtax-exempt bond market. The index includes bonds with a minimum credit rating of BBB. The returns include the reinvestment of income and do not include any transaction costs, management fees or other costs. It is not possible to invest directly in an index.
2 The Lipper returns are obtained from Lipper Analytical Services, Inc., a large independent evaluator of mutual funds.
FUND DIVERSIFICATION
| | | | |
| |
Single Family Mortgage | | | 26.1 | % |
Multi Family Mortgage | | | 20.4 | |
Other Revenue | | | 9.8 | |
Education/Student Loan | | | 6.9 | |
Insured | | | 6.5 | |
General Obligation | | | 6.1 | |
Sectors less than 5% | | | 15.7 | |
Cash & Other Net Assets | | | 8.5 | |
Based on total net assets as of September 30, 2019. Subject to change.
PORTFOLIO SUMMARY
| | |
Net Asset Value 9/30/19: | | $9.89 Per Share |
Net Asset Value 3/31/19: | | $9.69 Per Share |
Total Net Assets: | | $292.7 Million |
Average Maturity: | | 19.2 Years |
Effective Duration3: | | 4.5 Years |
3 Duration is a measure of estimated price sensitivity relative to changes in interest rates. Portfolios with longer durations are typically more sensitive to changes in interest rates. For example, if interest rates rise by 1%, the fair value of a security with an effective duration of 5 years would decrease by 5%, with all other factors being constant. The correlation between duration and price sensitivity is greater for securities rated investment-grade than it is for securities rated below investment-grade. Duration estimates are based on assumptions by the Adviser and are subject to a number of limitations. Effective duration is calculated based on historical price changes of securities held by the Fund, and therefore is a more accurate estimate of price sensitivity provided interest rates remain within their historical range.
QUALITY RATINGS (% of Total Net Assets)
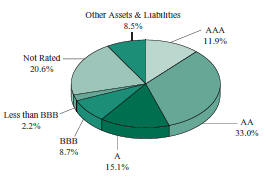
Lower of Moody’s, S&P, Fitch or Duff & Phelps ratings used.
Adviser’s Assessment of Non-Rated Securities
| | | | |
AAA | | | 0.0 | % |
AA | | | 0.1 | |
A | | | 0.0 | |
BBB | | | 0.8 | |
BB | | | 15.9 | |
<BB | | | 3.8 | |
| | | | |
Total | | | 20.6 | % |
SCHEDULE OF INVESTMENTS (Unaudited)
September 30, 2019
SitTax-Free Income Fund
| | | | | | | | | | | | | | | | | | | | | | | | | |
| | | | | |
| Name of Issuer | | Principal
Amount ($) | | Coupon
Rate (%) | | Maturity
Date | | Fair Value ($) |
| | | | | |
Municipal Bonds - 87.5% | | | | | | | | | | | | | | | | | | | | | | | | | |
Alabama - 0.2% | | | | | | | | | | | | | | | | | | | | | | | | | |
Pell City Special Care Facs. Finance Auth. Rev. (Noland Health Services, Inc.) | | | | 500,000 | | | | | 5.00 | | | | | 12/1/31 | | | | | 533,155 | | | | | | |
| | | | | | | | | | | | | | | | | | | | | | | | | |
| | | | | |
Alaska - 0.8% | | | | | | | | | | | | | | | | | | | | | | | | | |
AK Hsg. Finance Corp. Mtg. Rev. | | | | 545,000 | | | | | 4.13 | | | | | 12/1/37 | | | | | 560,222 | | | | | | |
AK Hsg. Finance Corp. Mtg. Rev. (G.O. of Corp. Insured) | | | | 500,000 | | | | | 4.50 | | | | | 12/1/35 | | | | | 501,680 | | | | | | |
AK Hsg. Finance Corp. Rev. (State Capital Proj.) | | | | 500,000 | | | | | 4.00 | | | | | 6/1/36 | | | | | 545,955 | | | | | | |
AK Industrial Dev. & Export Auth. Rev. (Boys & Girls Home)2,5, 15 | | | | 250,000 | | | | | 5.50 | | | | | N/A | | | | | 12,500 | | | | | | |
AK Industrial Dev. & Export Auth. Rev. (GTR Fairbanks Community Hospital Foundation) | | | | 250,000 | | | | | 5.00 | | | | | 4/1/33 | | | | | 271,620 | | | | | | |
AK Industrial Dev. & Export Auth. Rev. (Tanana Chiefs Conference Proj.) | | | | 300,000 | | | | | 4.00 | | | | | 10/1/49 | | | | | 322,080 | | | | | | |
| | | | | | | | | | | | | | | | | | | | | | | | | |
| | | | | |
| | | | | | | | | | | | | | | | | | | 2,214,057 | | | | | | |
| | | | | | | | | | | | | | | | | | | | | | | | | |
Arizona - 2.4% | | | | | | | | | | | | | | | | | | | | | | | | | |
AZ Health Facs. Auth. Rev. (Scottsdale Lincoln Hospital Proj.)1 | | | | 250,000 | | | | | 2.75 | | | | | 12/1/39 | | | | | 250,095 | | | | | | |
AZ Industrial Dev. Auth. Rev. (Bridgewater Avondale Proj.) | | | | 500,000 | | | | | 5.38 | | | | | 1/1/38 | | | | | 519,575 | | | | | | |
AZ Industrial Dev. Auth. Rev. (Pinecrest Academy Horizon)4 | | | | 500,000 | | | | | 5.75 | | | | | 7/15/38 | | | | | 569,020 | | | | | | |
Glendale Industrial Dev. & Auth. Rev. (Beatitudes Campus Proj.) | | | | 300,000 | | | | | 5.00 | | | | | 11/15/36 | | | | | 324,897 | | | | | | |
Glendale Industrial Dev. & Auth. Rev. (Glencroft Retirement Community) | | | | 400,000 | | | | | 5.00 | | | | | 11/15/36 | | | | | 426,852 | | | | | | |
La Paz Co. Industrial Dev. Auth. (Charter School Solutions Harmony Public Proj.) | | | | 750,000 | | | | | 5.00 | | | | | 2/15/48 | | | | | 855,420 | | | | | | |
Maricopa Co. Industrial Dev. Auth. Education Rev. (Horizon Community Learning Center) | | | | 300,000 | | | | | 5.00 | | | | | 7/1/35 | | | | | 325,311 | | | | | | |
Maricopa Co. Industrial Dev. Auth. Rev. (Christian Care Surprise Inc.)4 | | | | 250,000 | | | | | 5.75 | | | | | 1/1/36 | | | | | 265,315 | | | | | | |
Peoria Industrial Dev. Auth. Rev. (Sierra Winds Life Care Community) | | | | 400,000 | | | | | 5.25 | | | | | 11/15/29 | | | | | 407,880 | | | | | | |
Phoenix City Industrial Dev. Auth. Rev. (Great Hearts Academies Proj.) | | | | 250,000 | | | | | 6.30 | | | | | 7/1/42 | | | | | 271,338 | | | | | | |
Phoenix City Industrial Dev. Auth. Rev. (Vista College Preparatory Proj.) | | | | 400,000 | | | | | 4.13 | | | | | 7/1/38 | | | | | 440,888 | | | | | | |
Pima Co. Industrial Dev. Auth. Education Rev. (American Leadership Academy Proj.)4 | | | | 1,000,000 | | | | | 5.38 | | | | | 6/15/35 | | | | | 1,099,920 | | | | | | |
Pima Co. Industrial Dev. Auth. Education Rev. (American Leadership Academy Proj.)4 | | | | 370,000 | | | | | 4.75 | | | | | 6/15/37 | | | | | 381,233 | | | | | | |
Quechan Indian Tribe of Fort Yuma Rev. (Tribal Economic Dev.) | | | | 370,000 | | | | | 9.75 | | | | | 5/1/25 | | | | | 406,016 | | | | | | |
Tempe Industrial Dev. Auth. Rev. (Mirabella at ASU Proj.)4 | | | | 500,000 | | | | | 4.70 | | | | | 10/1/24 | | | | | 512,725 | | | | | | |
| | | | | | | | | | | | | | | | | | | | | | | | | |
| | | | | |
| | | | | | | | | | | | | | | | | | | 7,056,485 | | | | | | |
| | | | | | | | | | | | | | | | | | | | | | | | | |
Arkansas - 0.5% | | | | | | | | | | | | | | | | | | | | | | | | | |
Rogers City Rev. | | | | 1,000,000 | | | | | 3.88 | | | | | 11/1/39 | | | | | 1,079,950 | | | | | | |
Springdale City Sales & Use Tax Rev. Ref. (BAM Insured) | | | | 500,000 | | | | | 3.60 | | | | | 4/1/41 | | | | | 518,010 | | | | | | |
| | | | | | | | | | | | | | | | | | | | | | | | | |
| | | | | |
| | | | | | | | | | | | | | | | | | | 1,597,960 | | | | | | |
| | | | | | | | | | | | | | | | | | | | | | | | | |
California - 5.1% | | | | | | | | | | | | | | | | | | | | | | | | | |
CA School Facs. Finance Auth. Rev. (Azusa Unified School District) (AGM Insured)6 | | | | 500,000 | | | | | 6.00 | | | | | 8/1/29 | | | | | 649,100 | | | | | | |
CA State G.O. | | | | 500,000 | | | | | 4.00 | | | | | 12/1/40 | | | | | 535,535 | | | | | | |
Carlsbad Unified School District G.O. Capital Appreciation6 | | | | 400,000 | | | | | 6.00 | | | | | 8/1/31 | | | | | 505,272 | | | | | | |
Colton Joint Unified School District G.O. (AGM Insured)6 | | | | 1,000,000 | | | | | 6.00 | | | | | 8/1/35 | | | | | 1,121,410 | | | | | | |
Encinitas Union School District G.O. Capital Appreciation6 | | | | 500,000 | | | | | 7.00 | | | | | 8/1/35 | | | | | 658,040 | | | | | | |
Hartnell Community College G.O.6 | | | | 500,000 | | | | | 7.00 | | | | | 8/1/34 | | | | | 583,125 | | | | | | |
Healdsburg Unified School District G.O.6 | | | | 1,250,000 | | | | | 5.00 | | | | | 8/1/37 | | | | | 1,259,388 | | | | | | |
Imperial Community College District G.O. Capital Appreciation (AGM Insured)6 | | | | 250,000 | | | | | 6.75 | | | | | 8/1/40 | | | | | 329,058 | | | | | | |
Los Alamitos Unified School District Capital Appreciation C.O.P.6 | | | | 1,100,000 | | | | | 6.00 | | | | | 8/1/34 | | | | | 1,171,621 | | | | | | |
Martinez Unified School District G.O.6 | | | | 250,000 | | | | | 6.13 | | | | | 8/1/35 | | | | | 309,070 | | | | | | |
Morongo Band of Mission Indians Rev.4 | | | | 300,000 | | | | | 5.00 | | | | | 10/1/42 | | | | | 338,922 | | | | | | |
Placentia-Yorba Linda Unified School District C.O.P. Capital Appreciation (AGM Insured)6 | | | | 500,000 | | | | | 6.25 | | | | | 10/1/28 | | | | | 550,020 | | | | | | |
Redondo Beach School District G.O.6 | | | | 600,000 | | | | | 6.38 | | | | | 8/1/34 | | | | | 790,878 | | | | | | |
Reef-Sunset Unified School District (BAM Insured)6 | | | | 750,000 | | | | | 5.00 | | | | | 8/1/38 | | | | | 788,805 | | | | | | |
Ripon Unified School District G.O. (BAM Insured)6 | | | | 270,000 | | | | | 4.50 | | | | | 8/1/30 | | | | | 304,881 | | | | | | |
Ripon Unified School District G.O. (BAM Insured)6 | | | | 80,000 | | | | | 4.50 | | | | | 8/1/30 | | | | | 88,186 | | | | | | |
Sacramento Co. Water Financing Auth. Rev.(NATL-RE FGIC Insured)1 | | | | 500,000 | | | | | 2.00 | | | | | 6/1/39 | | | | | 462,400 | | | | | | |
See accompanying notes to financial statements.
| | |
22 | | SIT MUTUAL FUNDS SEMI-ANNUAL REPORT |
| | | | | | | | | | | | | | | | | | | | | | | | | |
| | | | | |
| Name of Issuer | | Principal
Amount ($) | | Coupon
Rate (%) | | Maturity
Date | | Fair Value ($) |
| | | | | |
San Jose Financing Auth. Rev. (Civic Center Garage Proj.)9 | | | | 400,000 | | | | | 5.00 | | | | | 6/1/39 | | | | | 450,196 | | | | | | |
South Tahoe Joint Powers Financing Auth. Tax Allocation Ref. (South Tahoe Redev. Proj.) (AGM Insured) | | | | 500,000 | | | | | 5.00 | | | | | 10/1/30 | | | | | 579,050 | | | | | | |
Sulphur Springs Union School District C.O.P. (AGM Insured)6 | | | | 450,000 | | | | | 6.50 | | | | | 12/1/37 | | | | | 570,429 | | | | | | |
Tracy Joint Unified School District G.O. Capital Appreciation6 | | | | 600,000 | | | | | 7.00 | | | | | 8/1/41 | | | | | 600,108 | | | | | | |
Tustin Unified School District G.O. Capital Appreciation6 | | | | 500,000 | | | | | 6.00 | | | | | 8/1/28 | | | | | 544,080 | | | | | | |
Upland Unified School District G.O. Capital Appreciation6 | | | | 1,000,000 | | | | | 7.00 | | | | | 8/1/41 | | | | | 1,260,110 | | | | | | |
Val Verde Unified School District G.O. Capital Appreciation (AGM Insured)6 | | | | 500,000 | | | | | 6.00 | | | | | 8/1/34 | | | | | 615,795 | | | | | | |
| | | | | | | | | | | | | | | | | | | | | | | | | |
| | | | | |
| | | | | | | | | | | | | | | | | | | 15,065,479 | | | | | | |
| | | | | | | | | | | | | | | | | | | | | | | | | |
Colorado - 3.9% | | | | | | | | | | | | | | | | | | | | | | | | | |
Aerotropolis Regional Transportation Auth. Rev. | | | | 400,000 | | | | | 5.00 | | | | | 12/1/51 | | | | | 413,344 | | | | | | |
Broadway Station Metropolitan District No. 2 G.O. | | | | 750,000 | | | | | 5.13 | | | | | 12/1/48 | | | | | 793,507 | | | | | | |
Buffalo Highlands Metropolitan District G.O. | | | | 350,000 | | | | | 5.25 | | | | | 12/1/38 | | | | | 366,380 | | | | | | |
CO Educational & Cultural Facs. Auth. Rev. (CO Springs Charter Academy Proj.) | | | | 250,000 | | | | | 5.60 | | | | | 7/1/34 | | | | | 255,352 | | | | | | |
CO Educational & Cultural Facs. Auth. Rev. Ref. (Windsor Charter Academy)4 | | | | 800,000 | | | | | 5.00 | | | | | 9/1/36 | | | | | 815,752 | | | | | | |
CO Health Facs. Auth. Rev. (Covenant Retirement Community) | | | | 650,000 | | | | | 5.00 | | | | | 12/1/48 | | | | | 752,694 | | | | | | |
CO Science and Technology Park Metropolitan District No. 1 Rev. | | | | 500,000 | | | | | 5.00 | | | | | 12/1/33 | | | | | 534,655 | | | | | | |
Copperleaf Metro District No. 2 G.O. | | | | 500,000 | | | | | 5.75 | | | | | 12/1/45 | | | | | 524,385 | | | | | | |
Creekwalk Marketplace Business Improvement District Rev.4 | | | | 500,000 | | | | | 5.50 | | | | | 12/1/39 | | | | | 509,315 | | | | | | |
Crystal Crossing Metro District G.O. | | | | 500,000 | | | | | 5.25 | | | | | 12/1/40 | | | | | 524,920 | | | | | | |
Denver 9th Avenue Metropolitan District No. 2 G.O | | | | 500,000 | | | | | 5.00 | | | | | 12/1/48 | | | | | 527,345 | | | | | | |
Denver Urban Renewal Auth. Tax Allocation4 | | | | 500,000 | | | | | 5.25 | | | | | 12/1/39 | | | | | 535,045 | | | | | | |
DIATC Metropolitan District G.O.4 | | | | 500,000 | | | | | 5.00 | | | | | 12/1/49 | | | | | 530,830 | | | | | | |
East Morgan Co. Hospital District C.O.P.9 | | | | 500,000 | | | | | 5.88 | | | | | 12/1/38 | | | | | 501,550 | | | | | | |
Hunters Overlook Metropolitan District No. 5 G.O. | | | | 500,000 | | | | | 5.00 | | | | | 12/1/49 | | | | | 529,785 | | | | | | |
Lambertson Farms Metro District No. 1 G.O. | | | | 500,000 | | | | | 5.00 | | | | | 12/15/25 | | | | | 516,715 | | | | | | |
Leyden Rock Metropolitan District No. 10 G.O. | | | | 250,000 | | | | | 5.00 | | | | | 12/1/45 | | | | | 262,545 | | | | | | |
Palisade Metropolitan District No. 2 G.O. | | | | 500,000 | | | | | 5.00 | | | | | 12/1/46 | | | | | 518,195 | | | | | | |
St. Vrain Lakes Metropolitan District No. 2 G.O. | | | | 500,000 | | | | | 5.00 | | | | | 12/1/37 | | | | | 526,210 | | | | | | |
Tallman Gulch Metropolitan District G.O. | | | | 500,000 | | | | | 5.25 | | | | | 12/1/47 | | | | | 514,805 | | | | | | |
Thompson Crossing Metropolitan District No. 4 G.O. | | | | 500,000 | | | | | 5.00 | | | | | 12/1/49 | | | | | 532,570 | | | | | | |
Velocity Metropolitan District No. 3 G.O. | | | | 500,000 | | | | | 5.38 | | | | | 12/1/39 | | | | | 533,615 | | | | | | |
| | | | | | | | | | | | | | | | | | | | | | | | | |
| | | | | |
| | | | | | | | | | | | | | | | | | | 11,519,514 | | | | | | |
| | | | | | | | | | | | | | | | | | | | | | | | | |
Connecticut - 0.9% | | | | | | | | | | | | | | | | | | | | | | | | | |
CT Hsg. Finance Auth. Rev. | | | | 550,000 | | | | | 3.88 | | | | | 11/15/35 | | | | | 592,598 | | | | | | |
CT Hsg. Finance Auth. Rev.9 | | | | 505,000 | | | | | 4.25 | | | | | 6/15/43 | | | | | 547,930 | | | | | | |
CT Hsg. Finance Auth. Rev. | | | | 1,000,000 | | | | | 3.85 | | | | | 5/15/45 | | | | | 1,038,730 | | | | | | |
CT Hsg. Finance Auth. Rev.9 | | | | 455,000 | | | | | 4.30 | | | | | 6/15/48 | | | | | 493,220 | | | | | | |
| | | | | | | | | | | | | | | | | | | | | | | | | |
| | | | | |
| | | | | | | | | | | | | | | | | | | 2,672,478 | | | | | | |
| | | | | | | | | | | | | | | | | | | | | | | | | |
District of Columbia - 0.4% | | | | | | | | | | | | | | | | | | | | | | | | | |
District of Columbia Hsg. Finance Agency Rev. (Multi-Family Dev. Program) | | | | 600,000 | | | | | 4.05 | | | | | 9/1/43 | | | | | 653,202 | | | | | | |
District of Columbia Rev. (Ingleside Rock Creek Proj.) | | | | 500,000 | | | | | 5.00 | | | | | 7/1/37 | | | | | 540,865 | | | | | | |
| | | | | | | | | | | | | | | | | | | | | | | | | |
| | | | | |
| | | | | | | | | | | | | | | | | | | 1,194,067 | | | | | | |
| | | | | | | | | | | | | | | | | | | | | | | | | |
Florida - 8.8% | | | | | | | | | | | | | | | | | | | | | | | | | |
Alachua Co. Health Facs. Auth. Rev. (Oak Hammock University) | | | | 385,000 | | | | | 8.00 | | | | | 10/1/32 | | | | | 437,749 | | | | | | |
Alta Lakes Community Dev. District Special Assessment | | | | 500,000 | | | | | 4.40 | | | | | 5/1/39 | | | | | 510,975 | | | | | | |
Ave Maria Stewardship Community District Special Assessment. (AGM Insured) | | | | 300,000 | | | | | 3.00 | | | | | 5/1/38 | | | | | 305,670 | | | | | | |
Bay Co. Educational Facs. Rev. (Bay Haven Charter) | | | | 430,000 | | | | | 5.25 | | | | | 9/1/30 | | | | | 441,507 | | | | | | |
Blackburn Creek Community Dev. District Special Assessment (Grand Palm Proj.) | | | | 200,000 | | | | | 6.25 | | | | | 5/1/35 | | | | | 219,970 | | | | | | |
Capital Trust Agency Rev. (Elim Senior Housing, Inc.)4 | | | | 250,000 | | | | | 5.00 | | | | | 8/1/27 | | | | | 258,885 | | | | | | |
Capital Trust Agency Rev. (Elim Senior Housing, Inc.)4 | | | | 250,000 | | | | | 5.38 | | | | | 8/1/32 | | | | | 262,100 | | | | | | |
See accompanying notes to financial statements.
SCHEDULE OF INVESTMENTS (Unaudited)
September 30, 2019
SitTax-Free Income Fund (Continued)
| | | | | | | | | | | | | | | | | | | | | | |
| | | | | |
| Name of Issuer | | Principal
Amount ($) | | Coupon
Rate (%) | | Maturity
Date | | Fair Value ($) |
| | | | | |
Capital Trust Agency Rev. (River City Educational Services, Inc. Proj.) | | | | 500,000 | | | | | 5.38 | | | | | 2/1/35 | | | | | 519,775 | | | |
Capital Trust Agency Rev. (Tallahassee Tapestry)4 | | | | 550,000 | | | | | 6.75 | | | | | 12/1/35 | | | | | 570,361 | | | |
Capital Trust Agency Rev. (Tapestry Walden Senior Hsg. Proj.)4 | | | | 250,000 | | | | | 6.75 | | | | | 7/1/37 | | | | | 266,388 | | | |
Capital Trust Agency Rev. (Tuscan Gardens Senior Living Center) | | | | 250,000 | | | | | 7.00 | | | | | 4/1/35 | | | | | 253,287 | | | |
Capital Trust Agency Rev. (University Bridge LLC Student Housing Proj.)4 | | | | 500,000 | | | | | 5.25 | | | | | 12/1/43 | | | | | 530,960 | | | |
Celebration Pointe Community Dev. District Special Assessment Rev.4 | | | | 250,000 | | | | | 5.00 | | | | | 5/1/32 | | | | | 272,955 | | | |
Collier Co. Industrial Dev. Auth. Rev. (Arlington of Naples Proj.)4 | | | | 250,000 | | | | | 7.25 | | | | | 5/15/26 | | | | | 238,758 | | | |
Collier Co. Industrial Dev. Auth. Rev. (Arlington of Naples Proj.)4 | | | | 750,000 | | | | | 8.13 | | | | | 5/15/44 | | | | | 718,515 | | | |
Collier Co. Industrial Dev. Auth. Rev. (NCH Healthcare System Proj.) | | | | 415,000 | | | | | 6.25 | | | | | 10/1/39 | | | | | 442,676 | | | |
Dowden West Community Dev. District Special Assessment4 | | | | 360,000 | | | | | 5.40 | | | | | 5/1/39 | | | | | 386,428 | | | |
Durbin Crossing Community Dev. District Special Assessment (AGM Insured) | | | | 520,000 | | | | | 5.00 | | | | | 5/1/32 | | | | | 631,608 | | | |
Escambia Co. Housing Finance Auth. Rev. (Multi-County Program) | | | | 990,000 | | | | | 3.75 | | | | | 10/1/49 | | | | | 1,041,262 | | | |
Fiddlers Creek Community Dev. District No. 2 Special Assessment Rev.2, 5,15 | | | | 100,000 | | | | | 5.75 | | | | | N/A | | | | | 63,000 | | | |
FL Hsg. Finance Corp. (GNMA/FNMA Collateralized) | | | | 80,000 | | | | | 5.00 | | | | | 7/1/26 | | | | | 80,942 | | | |
FL Hsg. Finance Corp. (GNMA/FNMA/FHLMC Collateralized) | | | | 1,000,000 | | | | | 4.20 | | | | | 1/1/45 | | | | | 1,099,280 | | | |
FL Hsg. Finance Corp. (GNMA/FNMA/FHLMC Collateralized) | | | | 500,000 | | | | | 3.30 | | | | | 7/1/49 | | | | | 514,065 | | | |
Gramercy Farms Community Dev. District Special Assessment6 | | | | 420,000 | | | | | 3.24 | | | | | 5/1/39 | | | | | 201,600 | | | |
Harbor Bay Community Dev. District Special Assessment | | | | 350,000 | | | | | 4.10 | | | | | 5/1/48 | | | | | 345,345 | | | |
Heritage Harbour North Community Dev. District Special Assessment | | | | 200,000 | | | | | 5.00 | | | | | 5/1/34 | | | | | 221,434 | | | |
Lake Co. Educational Project. Rev. (Imagine South Lake Charter School Proj.)4 | | | | 550,000 | | | | | 5.00 | | | | | 1/15/39 | | | | | 599,731 | | | |
Lakewood Ranch Stewardship District Cap. Improvement Special Assessment Rev. | | | | 250,000 | | | | | 4.25 | | | | | 5/1/25 | | | | | 258,852 | | | |
Lakewood Ranch Stewardship District Cap. Improvement Special Assessment Rev. (Country Club East Proj.) | | | | 150,000 | | | | | 6.70 | | | | | 5/1/33 | | | | | 163,485 | | | |
Lakewood Ranch Stewardship District Cap. Improvement Special Assessment Rev. (Lakewood Center) | | | | 200,000 | | | | | 7.40 | | | | | 5/1/30 | | | | | 215,738 | | | |
Lakewood Ranch Stewardship District Cap. Improvement Special Assessment Rev. (Lakewood National) | | | | 300,000 | | | | | 5.25 | | | | | 5/1/37 | | | | | 329,859 | | | |
Lakewood Ranch Stewardship District Cap. Improvement Special Assessment Rev. (Lakewood Ranch) | | | | 400,000 | | | | | 5.00 | | | | | 5/1/36 | | | | | 424,804 | | | |
Lakewood Ranch Stewardship District Cap. Improvement Special Assessment Rev. (NE Sector Proj.) | | | | 300,000 | | | | | 5.00 | | | | | 5/1/38 | | | | | 318,444 | | | |
Lakewood Ranch Stewardship District Cap. Improvement Special Assessment Rev. (NE Sector Proj.)4 | | | | 550,000 | | | | | 5.30 | | | | | 5/1/39 | | | | | 600,017 | | | |
Lakewood Ranch Stewardship District Cap. Improvement Special Assessment Rev. (Webb Proj.)4 | | | | 320,000 | | | | | 5.00 | | | | | 5/1/37 | | | | | 343,334 | | | |
Lakewood Ranch Stewardship District Special Assessment (Lake Club Phase 4 Proj.) | | | | 500,000 | | | | | 4.50 | | | | | 5/1/49 | | | | | 515,575 | | | |
Lee Co. Industrial Dev. Auth. Rev. (Shell Point/Waterside Health Proj.) | | | | 400,000 | | | | | 5.00 | | | | | 11/15/49 | | | | | 463,232 | | | |
Lexington Oaks Community Dev. District Special Assessment Rev. | | | | 240,000 | | | | | 5.65 | | | | | 5/1/33 | | | | | 250,373 | | | |
Live Oak No. 2 Community Dev. District Special Assessment Rev. | | | | 400,000 | | | | | 4.00 | | | | | 5/1/35 | | | | | 420,720 | | | |
Long Lake Ranch Community Dev. District Special Assessment | | | | 110,000 | | | | | 5.63 | | | | | 5/1/24 | | | | | 114,182 | | | |
Long Lake Ranch Community Dev. District Special Assessment | | | | 500,000 | | | | | 4.63 | | | | | 5/1/36 | | | | | 520,245 | | | |
Long Lake Ranch Community Dev. District Special Assessment | | | | 435,000 | | | | | 5.00 | | | | | 5/1/38 | | | | | 460,482 | | | |
Magnolia Creek Community Dev. District Rev.2,5, 15 | | | | 250,000 | | | | | 5.60 | | | | | N/A | | | | | 45,000 | | | |
Marshall Creek Community Dev. District Cap. Improvement Special Assessment Rev. | | | | 250,000 | | | | | 5.00 | | | | | 5/1/32 | | | | | 259,598 | | | |
Miami-Dade Co. Transit Sales Tax Rev. | | | | 500,000 | | | | | 5.00 | | | | | 7/1/34 | | | | | 586,380 | | | |
New River Community Dev. District Cap. Improvement Special Assessment Rev.2,5, 15 | | | | 230,000 | | | | | 5.00 | | | | | N/A | | | | | 2 | | | |
Northern Palm Beach Co. Improvement District Special Assessment | | | | 500,000 | | | | | 5.00 | | | | | 8/1/29 | | | | | 539,265 | | | |
Northern Palm Beach Co. Improvement District Special Assessment | | | | 250,000 | | | | | 5.00 | | | | | 8/1/37 | | | | | 271,375 | | | |
Orange Co. Health Facs. Auth. Rev. (Presbyterian Retirement Community Proj.) | | | | 550,000 | | | | | 5.00 | | | | | 8/1/34 | | | | | 612,090 | | | |
Orange Co. Health Facs. Auth. Rev. (Presbyterian Retirement Community Proj.) | | | | 500,000 | | | | | 5.00 | | | | | 8/1/35 | | | | | 566,480 | | | |
Orange Co. Health Facs. Auth. Rev. (Presbyterian Retirement Community Proj.) | | | | 250,000 | | | | | 5.00 | | | | | 8/1/41 | | | | | 276,838 | | | |
Orange Co. Hsg. Finance Auth. Rev. (GNMA/FNMA/FHLMC Collateralized) | | | | 470,000 | | | | | 3.95 | | | | | 3/1/40 | | | | | 495,089 | | | |
Orange Co. Hsg. Finance Auth. Rev. (GNMA/FNMA/FHLMC Collateralized) | | | | 405,000 | | | | | 4.00 | | | | | 9/1/48 | | | | | 438,032 | | | |
Orlando Tourist Dev. Rev. (Senior Lien Tourist Dev.) (AGM Insured) | | | | 250,000 | | | | | 5.00 | | | | | 11/1/38 | | | | | 301,572 | | | |
Palm Beach Co. Health Facs. Auth. Rev. (ACTS Retirement-Life Community, Inc.) | | | | 500,000 | | | | | 5.00 | | | | | 11/15/32 | | | | | 588,415 | | | |
Pinellas Co. Industrial Dev. Auth. Rev. | | | | 500,000 | | | | | 5.00 | | | | | 7/1/39 | | | | | 582,570 | | | |
Port St. Lucie Research Foundation Rev. (Vaccine Gene Therapy Inst.) | | | | 500,000 | | | | | 5.00 | | | | | 5/1/33 | | | | | 510,275 | | | |
Seven Oaks Community Dev. District Special Assessment Rev | | | | 250,000 | | | | | 5.50 | | | | | 5/1/33 | | | | | 262,965 | | | |
Tolomato Community Dev. District Special Assessment | | | | 500,000 | | | | | 4.25 | | | | | 5/1/37 | | | | | 511,475 | | | |
See accompanying notes to financial statements.
| | |
24 | | SIT MUTUAL FUNDS SEMI-ANNUAL REPORT |
| | | | | | | | | | | | | | | | | | | | | | |
| | | | | |
| Name of Issuer | | Principal
Amount ($) | | Coupon
Rate (%) | | Maturity
Date | | Fair Value ($) |
| | | | | |
Tolomato Community Dev. District Special Assessment2, 5 | | | | 120,000 | | | | | 6.61 | | | | | 5/1/40 | | | | | 1 | | | |
Tolomato Community Dev. District Special Assessment6 | | | | 185,000 | | | | | 7.00 | | | | | 5/1/40 | | | | | 157,729 | | | |
Tolomato Community Dev. District Special Assessment6 | | | | 110,000 | | | | | 7.00 | | | | | 5/1/40 | | | | | 77,226 | | | |
Tolomato Community Dev. District Special Assessment6 | | | | 45,000 | | | | | 7.00 | | | | | 5/1/40 | | | | | 38,701 | | | |
Tolomato Community Dev. District Special Assessment (AGM Insured) | | | | 500,000 | | | | | 3.75 | | | | | 5/1/40 | | | | | 534,225 | | | |
Trout Creek Community Dev. District Special Assessment | | | | 300,000 | | | | | 5.38 | | | | | 5/1/38 | | | | | 322,710 | | | |
Waters Edge Community Dev. District Cap. Improvement Rev. | | | | 9,000 | | | | | 5.35 | | | | | 5/1/39 | | | | | 9,003 | | | |
Waters Edge Community Dev. District Cap. Improvement Rev.6 | | | | 165,000 | | | | | 6.60 | | | | | 5/1/39 | | | | | 166,244 | | | |
Wiregrass Community Dev. District Special Assessment | | | | 245,000 | | | | | 5.38 | | | | | 5/1/35 | | | | | 264,375 | | | |
Zephyr Ridge Community Dev. District Special Assessment2,5, 15 | | | | 450,000 | | | | | 5.25 | | | | | N/A | | | | | 378,000 | | | |
| | | | | | | | | | | | | | | | | | | | | | |
| | | | | |
| | | | | | | | | | | | | | | | | | | 25,630,203 | | | |
| | | | | | | | | | | | | | | | | | | | | | |
Georgia - 3.8% | | | | | | | | | | | | | | | | | | | | | | |
Fulton Co. Dev. Auth. Rev. (Woodruff Arts Center) | | | | 500,000 | | | | | 5.00 | | | | | 3/15/44 | | | | | 609,395 | | | |
GA Housing & Finance Authority Rev. | | | | 1,280,000 | | | | | 3.80 | | | | | 12/1/37 | | | | | 1,327,091 | | | |
GA Housing & Finance Authority Rev. | | | | 1,000,000 | | | | | 4.00 | | | | | 12/1/37 | | | | | 1,028,160 | | | |
GA Housing & Finance Authority Rev. | | | | 465,000 | | | | | 3.85 | | | | | 12/1/38 | | | | | 504,744 | | | |
GA Housing & Finance Authority Rev. | | | | 340,000 | | | | | 4.00 | | | | | 12/1/39 | | | | | 367,163 | | | |
GA Housing & Finance Authority Rev. | | | | 650,000 | | | | | 3.80 | | | | | 12/1/40 | | | | | 685,451 | | | |
GA Housing & Finance Authority Rev. | | | | 605,000 | | | | | 3.85 | | | | | 12/1/41 | | | | | 625,909 | | | |
GA Housing & Finance Authority Rev. | | | | 540,000 | | | | | 3.95 | | | | | 12/1/43 | | | | | 582,741 | | | |
GA Housing & Finance Authority Rev. | | | | 1,000,000 | | | | | 3.50 | | | | | 12/1/46 | | | | | 1,042,630 | | | |
GA Housing & Finance Authority Rev. | | | | 600,000 | | | | | 4.00 | | | | | 12/1/48 | | | | | 644,028 | | | |
GA Housing & Finance Authority Rev. | | | | 1,100,000 | | | | | 4.20 | | | | | 12/1/48 | | | | | 1,203,774 | | | |
GA Housing & Finance Authority Rev. | | | | 1,000,000 | | | | | 3.25 | | | | | 12/1/49 | | | | | 1,012,790 | | | |
GA Tax Allocation (Beltline Proj.) | | | | 500,000 | | | | | 5.00 | | | | | 1/1/30 | | | | | 504,600 | | | |
Gainesville Hospital Auth. Rev. (Northeast Georgia Health System, Inc. Proj.) | | | | 500,000 | | | | | 5.00 | | | | | 2/15/37 | | | | | 598,395 | | | |
Glynn-Brunswick Memorial Hospital Auth. Rev. (Southeast Georgia Health System Proj.) | | | | 350,000 | | | | | 5.00 | | | | | 8/1/47 | | | | | 406,119 | | | |
| | | | | | | | | | | | | | | | | | | | | | |
| | | | | |
| | | | | | | | | | | | | | | | | | | 11,142,990 | | | |
| | | | | | | | | | | | | | | | | | | | | | |
Idaho - 0.6% | | | | | | | | | | | | | | | | | | | | | | |
ID Health Facs. Authority Rev. (Terraces Boise Proj.) | | | | 475,000 | | | | | 7.00 | | | | | 10/1/24 | | | | | 527,169 | | | |
ID Health Facs. Authority Rev. (Terraces Boise Proj.) | | | | 250,000 | | | | | 7.38 | | | | | 10/1/29 | | | | | 276,550 | | | |
ID Health Facs. Authority Rev. (Terraces Boise Proj.) | | | | 500,000 | | | | | 8.00 | | | | | 10/1/44 | | | | | 564,430 | | | |
ID Hsg. & Fin. Assoc. Nonprofit Facs. Rev. (Idaho Arts Charter School Proj.) | | | | 425,000 | | | | | 5.75 | | | | | 12/1/32 | | | | | 462,630 | | | |
| | | | | | | | | | | | | | | | | | | | | | |
| | | | | |
| | | | | | | | | | | | | | | | | | | 1,830,779 | | | |
| | | | | | | | | | | | | | | | | | | | | | |
Illinois - 7.0% | | | | | | | | | | | | | | | | | | | | | | |
Bellwood G.O. | | | | 500,000 | | | | | 5.88 | | | | | 12/1/27 | | | | | 561,925 | | | |
Bolingbrook Special Tax (AGM Insured) | | | | 998,000 | | | | | 4.00 | | | | | 3/1/30 | | | | | 1,110,814 | | | |
Burbank Educational Facs. Rev. (Intercultural Montessori Language School)4 | | | | 500,000 | | | | | 6.00 | | | | | 9/1/35 | | | | | 557,195 | | | |
Bureau Co. Township High School Dist. No. 502 G.O. (BAM Insured) | | | | 500,000 | | | | | 6.25 | | | | | 12/1/33 | | | | | 599,765 | | | |
Chicago Heights G.O.(NATL-RE Insured) | | | | 500,000 | | | | | 4.50 | | | | | 12/1/29 | | | | | 548,245 | | | |
Chicago Midway Airport Rev. (Second Lien) | | | | 500,000 | | | | | 5.25 | | | | | 1/1/35 | | | | | 553,760 | | | |
Chicago Park Dist. G.O (Limited Tax) | | | | 1,000,000 | | | | | 5.00 | | | | | 1/1/28 | | | | | 1,119,570 | | | |
Chicago Transit Auth. Sales Tax Rev. | | | | 250,000 | | | | | 5.25 | | | | | 12/1/30 | | | | | 267,185 | | | |
IL Educational Facs. Auth. Rev. | | | | 250,000 | | | | | 4.50 | | | | | 11/1/36 | | | | | 270,145 | | | |
IL Educational Facs. Auth. Rev. (Field Museum of Natural History) | | | | 500,000 | | | | | 3.90 | | | | | 11/1/36 | | | | | 546,455 | | | |
IL Fin. Auth. Rev. (Admiral Lake Proj.) | | | | 670,000 | | | | | 5.13 | | | | | 5/15/38 | | | | | 704,666 | | | |
IL Fin. Auth. Rev. (Christian Homes, Inc.) | | | | 500,000 | | | | | 5.00 | | | | | 5/15/36 | | | | | 539,355 | | | |
IL Fin. Auth. Rev. (Edward Elmhurst Healthcare) | | | | 1,000,000 | | | | | 5.00 | | | | | 1/1/44 | | | | | 1,148,560 | | | |
IL Fin. Auth. Rev. (Lifespace Communities) | | | | 500,000 | | | | | 5.00 | | | | | 5/15/35 | | | | | 559,180 | | | |
IL Fin. Auth. Rev. (Lifespace Communities) | | | | 500,000 | | | | | 5.00 | | | | | 5/15/45 | | | | | 550,625 | | | |
See accompanying notes to financial statements.
SCHEDULE OF INVESTMENTS (Unaudited)
September 30, 2019
SitTax-Free Income Fund (Continued)
| | | | | | | | | | | | | | | | | | | | | | | | | |
| | | | | |
| Name of Issuer | | Principal
Amount ($) | | Coupon
Rate (%) | | Maturity
Date | | Fair Value ($) |
| | | | | |
IL Fin. Auth. Rev. (Rogers Park Montessori School Proj.) | | | | 200,000 | | | | | 5.00 | | | | | 2/1/24 | | | | | 208,950 | | | | | | |
IL Fin. Auth. Rev. (Westminster Village) | | | | 500,000 | | | | | 5.25 | | | | | 5/1/38 | | | | | 545,635 | | | | | | |
IL Fin. Auth. Sports Facs. Rev. (North Shore Ice Arena Proj.) | | | | 1,000,000 | | | | | 6.25 | | | | | 12/1/38 | | | | | 723,060 | | | | | | |
IL G.O. | | | | 250,000 | | | | | 5.50 | | | | | 7/1/33 | | | | | 272,622 | | | | | | |
IL G.O. (AGM Insured) | | | | 500,000 | | | | | 4.00 | | | | | 2/1/30 | | | | | 552,215 | | | | | | |
IL Housing Dev. Auth. Rev. (GNMA/FNMA/FHLMC Collateralized) | | | | 450,000 | | | | | 3.88 | | | | | 4/1/41 | | | | | 481,468 | | | | | | |
IL Housing Dev. Auth. Rev. (GNMA/FNMA/FHLMC Collateralized) | | | | 375,000 | | | | | 4.00 | | | | | 10/1/48 | | | | | 403,928 | | | | | | |
IL Rev. | | | | 500,000 | | | | | 5.00 | | | | | 6/15/33 | | | | | 575,850 | | | | | | |
IL Sports Facilities Auth. Rev. (State Tax Supported) (AGM Insured) | | | | 1,000,000 | | | | | 5.25 | | | | | 6/15/31 | | | | | 1,132,240 | | | | | | |
Johnson Co. School Dist. No. 55 Vienna G.O. (AGM Insured) | | | | 500,000 | | | | | 5.40 | | | | | 12/1/27 | | | | | 503,000 | | | | | | |
La Salle & Bureau Counties Township High School Dist. No. 120 LaSalle-Peru G.O. (BAM Insured) | | | | 250,000 | | | | | 5.00 | | | | | 12/1/31 | | | | | 298,478 | | | | | | |
Lake Co. Community Consolidated School District No. 50 Woodland G.O. | | | | 250,000 | | | | | 5.63 | | | | | 1/1/26 | | | | | 263,232 | | | | | | |
Macon & Moultrie Counties Community Unit School District No. 3 Mt Zion G.O. | | | | 335,000 | | | | | 5.50 | | | | | 12/1/41 | | | | | 374,855 | | | | | | |
Macon Co. School District No. 61 Decatur G.O. (AGM Insured) | | | | 250,000 | | | | | 5.25 | | | | | 1/1/37 | | | | | 260,722 | | | | | | |
Macoupin Sangamon & Montgomery Counties Community Unit School District G.O. (AGM Insured) | | | | 990,000 | | | | | 4.25 | | | | | 12/1/35 | | | | | 1,054,677 | | | | | | |
Madison Counties Community College District No. 536 G.O. (Lewis & Clark Cmnty. College) | | | | 345,000 | | | | | 5.00 | | | | | 5/1/29 | | | | | 351,679 | | | | | | |
Malta Tax Allocation Rev.2, 5 | | | | 1,921,000 | | | | | 5.75 | | | | | 12/30/25 | | | | | 614,720 | | | | | | |
Metropolitan Pier & Exposition Auth. Rev. (McCormick Place Expansion Proj.) | | | | 250,000 | | | | | 5.00 | | | | | 6/15/57 | | | | | 277,655 | | | | | | |
Southwestern IL Dev. Auth. Tax Allocation Ref. (Local Govt. Program)2 | | | | 415,000 | | | | | 7.00 | | | | | 10/1/22 | | | | | 240,700 | | | | | | |
University of Illinois (AGM Insured) | | | | 1,000,000 | | | | | 4.13 | | | | | 4/1/48 | | | | | 1,102,500 | | | | | | |
Upper Illinois River Valley Dev. Auth. Rev. (Cambridge Lakes Learning Center)4 | | | | 250,000 | | | | | 4.00 | | | | | 12/1/22 | | | | | 252,085 | | | | | | |
Upper Illinois River Valley Dev. Auth. Rev. (Cambridge Lakes Learning Center)4 | | | | 250,000 | | | | | 5.25 | | | | | 12/1/37 | | | | | 269,935 | | | | | | |
| | | | | | | | | | | | | | | | | | | | | | | | | |
| | | | | |
| | | | | | | | | | | | | | | | | | | 20,397,651 | | | | | | |
| | | | | | | | | | | | | | | | | | | | | | | | | |
Indiana - 1.4% | | | | | | | | | | | | | | | | | | | | | | | | | |
Carmel Multifamily Hsg. Rev. (Barrington Carmel Proj.)2,5 | | | | 495,000 | | | | | 6.00 | | | | | 11/15/22 | | | | | 29,700 | | | | | | |
Damon Run Conservancy Dist. G.O. (State Intercept Insured) | | | | 300,000 | | | | | 6.10 | | | | | 7/1/25 | | | | | 301,251 | | | | | | |
Evansville Hsg. Rev. (Silver Birch Evansville Proj.) | | | | 250,000 | | | | | 5.45 | | | | | 1/1/38 | | | | | 264,252 | | | | | | |
IN Finance Auth. Rev. (BHI Senior Living) | | | | 775,000 | | | | | 5.88 | | | | | 11/15/41 | | | | | 876,393 | | | | | | |
IN Finance Auth. Rev. (BHI Senior Living) | | | | 425,000 | | | | | 6.00 | | | | | 11/15/41 | | | | | 483,561 | | | | | | |
IN Finance Auth. Rev. (Greencroft Obligated Group) | | | | 350,000 | | | | | 6.50 | | | | | 11/15/33 | | | | | 397,848 | | | | | | |
IN Housing & Community Dev. Auth. Rev. (Hammond Assisted Living Proj.) | | | | 500,000 | | | | | 5.75 | | | | | 1/1/36 | | | | | 511,980 | | | | | | |
Merrillville Industry Economic Dev. Rev. (Belvedere Housing Proj.) | | | | 300,000 | | | | | 5.75 | | | | | 4/1/36 | | | | | 301,128 | | | | | | |
Mishawaka Multifamily Hsg. Rev. (Silver Birch Mishawaka Proj.)4 | | | | 500,000 | | | | | 5.38 | | | | | 1/1/38 | | | | | 519,350 | | | | | | |
Richmond Hospital Auth. Rev. (Reid Hospital & Health Care) | | | | 350,000 | | | | | 5.00 | | | | | 1/1/35 | | | | | 397,187 | | | | | | |
| | | | | | | | | | | | | | | | | | | | | | | | | |
| | | | | |
| | | | | | | | | | | | | | | | | | | 4,082,650 | | | | | | |
| | | | | | | | | | | | | | | | | | | | | | | | | |
Iowa - 0.9% | | | | | | | | | | | | | | | | | | | | | | | | | |
IA Fin. Auth. Rev. (Lifespace Communities, Inc.) | | | | 650,000 | | | | | 5.00 | | | | | 5/15/36 | | | | | 737,516 | | | | | | |
IA Fin. Auth. Rev. (Lifespace Communities, Inc.) | | | | 500,000 | | | | | 5.00 | | | | | 5/15/47 | | | | | 558,035 | | | | | | |
IA Student Loan Liquidity Corp. Rev. | | | | 250,000 | | | | | 5.80 | | | | | 12/1/31 | | | | | 251,722 | | | | | | |
North Polk Community School District G.O. (AGM Insured) | | | | 1,000,000 | | | | | 4.00 | | | | | 6/1/31 | | | | | 1,017,130 | | | | | | |
| | | | | | | | | | | | | | | | | | | | | | | | | |
| | | | | |
| | | | | | | | | | | | | | | | | | | 2,564,403 | | | | | | |
| | | | | | | | | | | | | | | | | | | | | | | | | |
Kansas - 0.3% | | | | | | | | | | | | | | | | | | | | | | | | | |
Wichita Health Care Facs. Rev. (Kansas Masonic Home) | | | | 300,000 | | | | | 5.25 | | | | | 12/1/36 | | | | | 327,828 | | | | | | |
Wichita Health Care Facs. Rev. (Presbyterian Manors, Inc.) | | | | 500,000 | | | | | 6.25 | | | | | 5/15/34 | | | | | 500,610 | | | | | | |
| | | | | | | | | | | | | | | | | | | | | | | | | |
| | | | | |
| | | | | | | | | | | | | | | | | | | 828,438 | | | | | | |
| | | | | | | | | | | | | | | | | | | | | | | | | |
Kentucky - 0.2% | | | | | | | | | | | | | | | | | | | | | | | | | |
Pikeville Hospital Rev. Ref. (Pikeville Medical Center) | | | | 425,000 | | | | | 6.50 | | | | | 3/1/41 | | | | | 448,031 | | | | | | |
| | | | | | | | | | | | | | | | | | | | | | | | | |
See accompanying notes to financial statements.
| | |
26 | | SIT MUTUAL FUNDS SEMI-ANNUAL REPORT |
| | | | | | | | | | | | | | | | | | | | | | | | | |
| | | | | |
| Name of Issuer | | Principal
Amount ($) | | Coupon
Rate (%) | | Maturity
Date | | Fair Value ($) |
| | | | | |
Louisiana - 1.8% | | | | | | | | | | | | | | | | | | | | | | | | | |
Denham Springs/Livingston Hsg. & Mtg. Finance Auth. Rev. (GNMA/FHLMC Collateralized) | | | | 21,654 | | | | | 5.00 | | | | | 11/1/40 | | | | | 21,702 | | | | | | |
LA Hsg. Fin. Agy. Single Family Mtg. Rev. (Mtg. Backed Sec. Prog.) (GNMA/FHLMC Collateralized) | | | | 105,000 | | | | | 4.60 | | | | | 6/1/29 | | | | | 108,204 | | | | | | |
LA Local Government Environmental Facilities & Community Development Auth. | | | | 500,000 | | | | | 5.25 | | | | | 11/15/25 | | | | | 540,410 | | | | | | |
LA Local Government Environmental Facilities & Community Development Auth. | | | | 500,000 | | | | | 6.00 | | | | | 11/15/30 | | | | | 563,020 | | | | | | |
LA Local Government Environmental Facilities & Community Development Auth. Rev.4 | | | | 300,000 | | | | | 5.65 | | | | | 11/1/37 | | | | | 337,371 | | | | | | |
LA Local Government Environmental Facilities & Community Development Auth. Rev.4 | | | | 500,000 | | | | | 5.00 | | | | | 7/1/39 | | | | | 549,320 | | | | | | |
LA Local Government Environmental Facilities & Community Development Auth. Rev.4 | | | | 300,000 | | | | | 5.50 | | | | | 11/1/39 | | | | | 323,385 | | | | | | |
LA Local Government Environmental Facilities & Community Development Auth. Rev.4 | | | | 500,000 | | | | | 4.00 | | | | | 11/1/44 | | | | | 500,600 | | | | | | |
LA Local Government Environmental Facilities & Community Development Auth. Rev.4 | | | | 495,000 | | | | | 4.40 | | | | | 11/1/44 | | | | | 505,123 | | | | | | |
LA Public Facs. Auth. Rev. (Belle-Chase Educational Foundation Proj.)(NATL-RE Insured) | | | | 510,000 | | | | | 6.50 | | | | | 5/1/31 | | | | | 534,582 | | | | | | |
LA Public Facs. Auth. Rev. (Franciscan Missionaries Health System Proj.) | | | | 300,000 | | | | | 5.00 | | | | | 7/1/35 | | | | | 344,250 | | | | | | |
LA Public Facs. Auth. Rev. (Tulane Univ. Proj.)(NATL-RE Insured)1 | | | | 595,000 | | | | | 2.15 | | | | | 2/15/36 | | | | | 574,871 | | | | | | |
St. Tammany Parish Fin. Auth. Rev. (Christwood Proj.) | | | | 300,000 | | | | | 5.25 | | | | | 11/15/37 | | | | | 329,265 | | | | | | |
| | | | | | | | | | | | | | | | | | | | | | | | | |
| | | | | |
| | | | | | | | | | | | | | | | | | | 5,232,103 | | | | | | |
| | | | | | | | | | | | | | | | | | | | | | | | | |
Maine - 1.3% | | | | | | | | | | | | | | | | | | | | | | | | | |
ME Hsg. Auth. Rev. | | | | 600,000 | | | | | 4.00 | | | | | 11/15/35 | | | | | 639,330 | | | | | | |
ME Hsg. Auth. Rev. | | | | 500,000 | | | | | 4.00 | | | | | 11/15/37 | | | | | 538,850 | | | | | | |
ME Hsg. Auth. Rev. | | | | 105,000 | | | | | 4.50 | | | | | 11/15/37 | | | | | 110,552 | | | | | | |
ME Hsg. Auth. Rev. | | | | 750,000 | | | | | 4.13 | | | | | 11/15/38 | | | | | 831,038 | | | | | | |
ME Hsg. Auth. Rev. | | | | 500,000 | | | | | 3.85 | | | | | 11/15/40 | | | | | 526,805 | | | | | | |
ME Hsg. Auth. Rev. | | | | 500,000 | | | | | 3.10 | | | | | 11/15/44 | | | | | 499,235 | | | | | | |
ME Hsg. Auth. Rev. | | | | 500,000 | | | | | 4.25 | | | | | 11/15/48 | | | | | 548,555 | | | | | | |
| | | | | | | | | | | | | | | | | | | | | | | | | |
| | | | | |
| | | | | | | | | | | | | | | | | | | 3,694,365 | | | | | | |
| | | | | | | | | | | | | | | | | | | | | | | | | |
Maryland - 0.5% | | | | | | | | | | | | | | | | | | | | | | | | | |
MD Community Dev. Administration Rev. | | | | 350,000 | | | | | 4.10 | | | | | 9/1/38 | | | | | 382,242 | | | | | | |
MD Community Dev. Administration Rev. | | | | 350,000 | | | | | 3.75 | | | | | 3/1/39 | | | | | 364,308 | | | | | | |
MD Community Dev. Administration Rev. | | | | 350,000 | | | | | 4.20 | | | | | 7/1/46 | | | | | 380,460 | | | | | | |
Montgomery Co. Housing Opportunities Commission Rev. | | | | 405,000 | | | | | 4.00 | | | | | 7/1/38 | | | | | 411,569 | | | | | | |
| | | | | | | | | | | | | | | | | | | | | | | | | |
| | | | | |
| | | | | | | | | | | | | | | | | | | 1,538,579 | | | | | | |
| | | | | | | | | | | | | | | | | | | | | | | | | |
| | | | | |
Massachusetts - 3.1% | | | | | | | | | | | | | | | | | | | | | | | | | |
Dedham Municipal Purpose Loan. G.O. (NATL Insured) | | | | 480,000 | | | | | 4.00 | | | | | 10/15/24 | | | | | 481,056 | | | | | | |
Ipswich Municipal Purpose Loan G.O. (AGM Insured) | | | | 500,000 | | | | | 4.00 | | | | | 6/1/25 | | | | | 501,060 | | | | | | |
MA Dev. Finance Agy. Rev. | | | | 890,000 | | | | | 5.00 | | | | | 7/1/44 | | | | | 1,059,429 | | | | | | |
MA Dev. Finance Agy. Rev. (Atrius Health Issue) | | | | 1,375,000 | | | | | 4.00 | | | | | 6/1/49 | | | | | 1,475,072 | | | | | | |
MA Dev. Finance Agy. Rev. (Newbridge on the Charles, Inc.)4 | | | | 300,000 | | | | | 5.00 | | | | | 10/1/47 | | | | | 330,702 | | | | | | |
MA Dev. Finance Agy. Rev. (Orchard Cove, Inc.) | | | | 400,000 | | | | | 5.00 | | | | | 10/1/49 | | | | | 451,132 | | | | | | |
MA Education Finance Auth. Education Rev. | | | | 75,000 | | | | | 5.15 | | | | | 1/1/26 | | | | | 75,724 | | | | | | |
MA Housing Finance Agy. Rev. | | | | 250,000 | | | | | 4.75 | | | | | 6/1/35 | | | | | 261,542 | | | | | | |
MA Housing Finance Agy. Rev. | | | | 500,000 | | | | | 4.00 | | | | | 12/1/38 | | | | | 551,490 | | | | | | |
MA Housing Finance Agy. Rev. | | | | 500,000 | | | | | 3.75 | | | | | 12/1/40 | | | | | 523,825 | | | | | | |
MA Housing Finance Agy. Rev. | | | | 900,000 | | | | | 3.85 | | | | | 12/1/47 | | | | | 959,175 | | | | | | |
MA Housing Finance Agy. Rev. | | | | 825,000 | | | | | 3.60 | | | | | 12/1/59 | | | | | 854,320 | | | | | | |
MA Housing Finance Agy. Rev. (FHA Insured) | | | | 500,000 | | | | | 5.30 | | | | | 12/1/38 | | | | | 511,510 | | | | | | |
MA Housing Finance Agy. Rev. (GNMA/FNMA/FHLMC Collateralized) | | | | 270,000 | | | | | 3.90 | | | | | 12/1/38 | | | | | 275,438 | | | | | | |
Northbridge Municipal Purpose Loan G.O (AGM Insured) | | | | 500,000 | | | | | 4.00 | | | | | 6/15/25 | | | | | 501,020 | | | | | | |
Rowley Land Acquisition Loan G.O (AGM Insured) | | | | 360,000 | | | | | 4.00 | | | | | 5/1/27 | | | | | 360,770 | | | | | | |
| | | | | | | | | | | | | | | | | | | | | | | | | |
| | | | | |
| | | | | | | | | | | | | | | | | | | 9,173,265 | | | | | | |
| | | | | | | | | | | | | | | | | | | | | | | | | |
See accompanying notes to financial statements.
SCHEDULE OF INVESTMENTS (Unaudited)
September 30, 2019
SitTax-Free Income Fund (Continued)
| | | | | | | | | | | | | | | | | | | | | | | | | |
| | | | | |
| Name of Issuer | | Principal
Amount ($) | | Coupon
Rate (%) | | Maturity
Date | | Fair Value ($) |
| | | | | |
Michigan - 2.8% | | | | | | | | | | | | | | | | | | | | | | | | | |
Chandler Park Academy Rev. | | | | 170,000 | | | | | 5.00 | | | | | 11/1/22 | | | | | 170,275 | | | | | | |
City of Allen Park G.O. (BAM Insured) | | | | 300,000 | | | | | 3.25 | | | | | 5/1/34 | | | | | 310,971 | | | | | | |
MI Finance Auth. Rev. (Presbyterian Village) | | | | 250,000 | | | | | 5.25 | | | | | 11/15/35 | | | | | 269,152 | | | | | | |
MI Hsg. Dev. Auth. (G.O. of Authority Insured) | | | | 250,000 | | | | | 4.63 | | | | | 10/1/41 | | | | | 260,570 | | | | | | |
MI Hsg. Dev. Auth. Rev. | | | | 500,000 | | | | | 4.10 | | | | | 10/1/35 | | | | | 534,485 | | | | | | |
MI Hsg. Dev. Auth. Rev. | | | | 500,000 | | | | | 3.70 | | | | | 12/1/36 | | | | | 530,485 | | | | | | |
MI Hsg. Dev. Auth. Rev. | | | | 1,500,000 | | | | | 4.13 | | | | | 12/1/38 | | | | | 1,650,795 | | | | | | |
MI Hsg. Dev. Auth. Rev. | | | | 300,000 | | | | | 3.75 | | | | | 10/1/42 | | | | | 317,016 | | | | | | |
MI Hsg. Dev. Auth. Rev. | | | | 750,000 | | | | | 4.00 | | | | | 10/1/43 | | | | | 810,022 | | | | | | |
MI Hsg. Dev. Auth. Rev. | | | | 1,000,000 | | | | | 4.00 | | | | | 6/1/49 | | | | | 1,076,450 | | | | | | |
MI Hsg. Dev. Auth. Rev. | | | | 1,000,000 | | | | | 3.50 | | | | | 10/1/54 | | | | | 1,024,360 | | | | | | |
MI Public Educational Facs. Auth. Rev. (Chandler Park Academy) | | | | 300,000 | | | | | 6.35 | | | | | 11/1/28 | | | | | 300,636 | | | | | | |
MI Strategic Fund. Rev. (United Methodist Retirement Facs.) | | | | 300,000 | | | | | 5.00 | | | | | 11/15/49 | | | | | 345,525 | | | | | | |
Muskegon Heights Water Supply Rev. (NATL Insured) | | | | 165,000 | | | | | 4.15 | | | | | 11/1/23 | | | | | 165,337 | | | | | | |
Muskegon Heights Water Supply Rev. (NATL Insured) | | | | 135,000 | | | | | 4.20 | | | | | 11/1/24 | | | | | 135,286 | | | | | | |
Taylor Brownfield Redevelopment Authority (NATL Insured) | | | | 250,000 | | | | | 5.00 | | | | | 5/1/32 | | | | | 279,628 | | | | | | |
Universal Academy Michigan Public School Rev. | | | | 160,000 | | | | | 6.50 | | | | | 12/1/23 | | | | | 165,746 | | | | | | |
| | | | | | | | | | | | | | | | | | | | | | | | | |
| | | | | |
| | | | | | | | | | | | | | | | | | | 8,346,739 | | | | | | |
| | | | | | | | | | | | | | | | | | | | | | | | | |
Minnesota - 0.4% | | | | | | | | | | | | | | | | | | | | | | | | | |
Apple Valley Rev. (Senior Living, LLC Proj.) | | | | 500,000 | | | | | 5.00 | | | | | 1/1/47 | | | | | 507,130 | | | | | | |
MN Hsg. Fin. Agy. Mtg. Rev. (Mtg. Backed Securities Program) (GNMA/FNMA Collateralized) | | | | 95,000 | | | | | 4.40 | | | | | 7/1/32 | | | | | 96,042 | | | | | | |
Rochester City Rev. (Math & Science Academy Proj.) | | | | 500,000 | | | | | 5.13 | | | | | 9/1/38 | | | | | 523,280 | | | | | | |
| | | | | | | | | | | | | | | | | | | | | | | | | |
| | | | | |
| | | | | | | | | | | | | | | | | | | 1,126,452 | | | | | | |
| | | | | | | | | | | | | | | | | | | | | | | | | |
Mississippi - 0.8% | | | | | | | | | | | | | | | | | | | | | | | | | |
MS Development Bank Rev. (Green Bond-Hancock County)4 | | | | 1,000,000 | | | | | 4.55 | | | | | 11/1/39 | | | | | 1,038,420 | | | | | | |
MS Gaming Tax Rev. | | | | 740,000 | | | | | 4.00 | | | | | 10/15/38 | | | | | 818,048 | | | | | | |
MS Home Corp. Single Family Mtg. Rev. (GNMA/FNMA/FHLMC Collateralized) | | | | 410,000 | | | | | 4.00 | | | | | 12/1/43 | | | | | 436,322 | | | | | | |
| | | | | | | | | | | | | | | | | | | | | | | | | |
| | | | | |
| | | | | | | | | | | | | | | | | | | 2,292,790 | | | | | | |
| | | | | | | | | | | | | | | | | | | | | | | | | |
Missouri - 1.0% | | | | | | | | | | | | | | | | | | | | | | | | | |
Kansas City Industrial Dev. Auth. Rev. (Kansas City Pkg. LLC) | | | | 200,000 | | | | | 5.45 | | | | | 9/1/23 | | | | | 203,742 | | | | | | |
Kansas City Industrial Dev. Auth. Rev. (United Methodist Retirement Home, Inc.)2,4, 5 | | | | 500,000 | | | | | 5.75 | | | | | 11/15/36 | | | | | 459,630 | | | | | | |
MO Health & Education Facs. Auth. Rev. (Lutheran Senior Services) | | | | 1,000,000 | | | | | 4.00 | | | | | 2/1/48 | | | | | 1,056,080 | | | | | | |
MO Hsg. Dev. Commission Rev. (GNMA/FNMA/FHLMC Collateralized) | | | | 720,000 | | | | | 3.80 | | | | | 11/1/48 | | | | | 770,515 | | | | | | |
MO Hsg. Dev. Commission Rev. (GNMA/FNMA/FHLMC Collateralized) | | | | 500,000 | | | | | 3.35 | | | | | 11/1/49 | | | | | 515,530 | | | | | | |
| | | | | | | | | | | | | | | | | | | | | | | | | |
| | | | | |
| | | | | | | | | | | | | | | | | | | 3,005,497 | | | | | | |
| | | | | | | | | | | | | | | | | | | | | | | | | |
Montana - 0.5% | | | | | | | | | | | | | | | | | | | | | | | | | |
Forsyth Pollution Control Rev. | | | | 250,000 | | | | | 5.00 | | | | | 5/1/33 | | | | | 258,620 | | | | | | |
MT Board of Housing Single Family Rev. | | | | 205,000 | | | | | 4.00 | | | | | 12/1/38 | | | | | 219,887 | | | | | | |
MT Board of Housing Single Family Rev. (BRD Insured) | | | | 500,000 | | | | | 4.00 | | | | | 6/1/45 | | | | | 543,165 | | | | | | |
MT Board of Housing Single Family Rev. (FHA Insured) | | | | 270,000 | | | | | 3.75 | | | | | 12/1/38 | | | | | 277,193 | | | | | | |
MT Board of Housing Single Family Rev. (G.O. of BRD Insured) | | | | 90,000 | | | | | 4.70 | | | | | 12/1/26 | | | | | 91,235 | | | | | | |
MT Facs. Finance Auth. Rev. (Great FallsPre-Release Services Proj.) | | | | 180,524 | | | | | 5.08 | | | | | 4/1/21 | | | | | 183,597 | | | | | | |
| | | | | | | | | | | | | | | | | | | | | | | | | |
| | | | | |
| | | | | | | | | | | | | | | | | | | 1,573,697 | | | | | | |
| | | | | | | | | | | | | | | | | | | | | | | | | |
Nebraska - 0.3% | | | | | | | | | | | | | | | | | | | | | | | | | |
Douglas Co. Hospital Auth. No. 3 (Methodist Hospital) | | | | 400,000 | | | | | 5.00 | | | | | 11/1/30 | | | | | 468,812 | | | | | | |
Mead Village Tax Allocation Rev. (E3 Biofuels - Mead LLC Proj.)2,5, 15 | | | | 410,000 | | | | | 5.13 | | | | | N/A | | | | | 17,015 | | | | | | |
Nebraska Investment Fin. Auth. Rev. (GNMA/FNMA/FHLMC Collateralized) | | | | 310,000 | | | | | 3.75 | | | | | 9/1/35 | | | | | 334,211 | | | | | | |
| | | | | | | | | | | | | | | | | | | | | | | | | |
| | | | | |
| | | | | | | | | | | | | | | | | | | 820,038 | | | | | | |
| | | | | | | | | | | | | | | | | | | | | | | | | |
See accompanying notes to financial statements.
| | |
28 | | SIT MUTUAL FUNDS SEMI-ANNUAL REPORT |
| | | | | | | | | | | | | | | | | | | | | | | | | |
| | | | | |
| Name of Issuer | | Principal
Amount ($) | | Coupon
Rate (%) | | Maturity
Date | | Fair Value ($) |
| | | | | |
Nevada - 1.1% | | | | | | | | | | | | | | | | | | | | | | | | | |
City of North Las Vegas (Special Northern Beltway Commercial Area)4 | | | | 375,000 | | | | | 4.00 | | | | | 12/1/27 | | | | | 391,316 | | | | | | |
City of North Las Vegas (Special Northern Beltway Commercial Area)4 | | | | 380,000 | | | | | 5.00 | | | | | 12/1/37 | | | | | 414,591 | | | | | | |
NV Hsg. Division Rev. (GNMA/FNMA/FHLMC Collateralized) | | | | 345,000 | | | | | 3.85 | | | | | 10/1/39 | | | | | 359,307 | | | | | | |
NV Hsg. Division Rev. (GNMA/FNMA/FHLMC Collateralized) | | | | 1,000,000 | | | | | 3.35 | | | | | 10/1/49 | | | | | 1,018,990 | | | | | | |
NV Hsg. Division Rev. (GNMA/FNMA/FHLMC Collateralized) | | | | 1,000,000 | | | | | 3.40 | | | | | 10/1/49 | | | | | 1,022,890 | | | | | | |
| | | | | | | | | | | | | | | | | | | | | | | | | |
| | | | | |
| | | | | | | | | | | | | | | | | | | 3,207,094 | | | | | | |
| | | | | | | | | | | | | | | | | | | | | | | | | |
New Hampshire - 0.7% | | | | | | | | | | | | | | | | | | | | | | | | | |
NH Business Finance Auth. Rev. (The Vista Proj.)4 | | | | 310,000 | | | | | 5.25 | | | | | 7/1/39 | | | | | 336,772 | | | | | | |
NH Business Finance Auth. Rev. (The Vista Proj.)4 | | | | 500,000 | | | | | 5.63 | | | | | 7/1/46 | | | | | 548,365 | | | | | | |
NH Health & Educ. Facs. Auth. Rev. (Wentworth Douglas Hospital) | | | | 400,000 | | | | | 6.00 | | | | | 1/1/34 | | | | | 422,968 | | | | | | |
NH Hsg. Fin. Agy. Rev. (Cimarron, Whittier Falls & Mars) (FHA Insured) | | | | 725,000 | | | | | 4.00 | | | | | 7/1/52 | | | | | 771,204 | | | | | | |
| | | | | | | | | | | | | | | | | | | | | | | | | |
| | | | | |
| | | | | | | | | | | | | | | | | | | 2,079,309 | | | | | | |
| | | | | | | | | | | | | | | | | | | | | | | | | |
New Jersey - 2.3% | | | | | | | | | | | | | | | | | | | | | | | | | |
NJ Economic Dev. Auth. Rev. (North Star Academy Charter School Newark) | | | | 250,000 | | | | | 5.00 | | | | | 7/15/47 | | | | | 284,065 | | | | | | |
NJ Economic Dev. Auth. Rev. (State Government Buildings Proj.)9 | | | | 500,000 | | | | | 5.00 | | | | | 6/15/42 | | | | | 568,560 | | | | | | |
NJ Economic Dev. Auth. Rev. (State Housing Proj.)9 | | | | 250,000 | | | | | 5.00 | | | | | 6/15/37 | | | | | 291,022 | | | | | | |
NJ Economic Dev. Auth. Rev. (State Housing Proj.)9 | | | | 500,000 | | | | | 5.00 | | | | | 6/15/43 | | | | | 572,680 | | | | | | |
NJ Higher Education Assistance Auth. Student Loan Rev. | | | | 5,000 | | | | | 5.00 | | | | | 12/1/28 | | | | | 5,167 | | | | | | |
NJ Hsg. & Mtg. Finance Agy. Rev. | | | | 750,000 | | | | | 3.95 | | | | | 11/1/43 | | | | | 803,340 | | | | | | |
NJ Hsg. & Mtg. Finance Agy. Rev. (Mciver Homes Hsg. Proj.) (FHLMC Collateralized) | | | | 550,000 | | | | | 3.60 | | | | | 1/1/30 | | | | | 576,521 | | | | | | |
NJ Hsg. & Mtg. Finance Agy. Single Family Mtg. Rev. | | | | 340,000 | | | | | 4.50 | | | | | 10/1/30 | | | | | 355,759 | | | | | | |
NJ Hsg. & Mtg. Finance Agy. Single Family Mtg. Rev. | | | | 980,000 | | | | | 3.75 | | | | | 10/1/35 | | | | | 1,053,686 | | | | | | |
NJ Hsg. & Mtg. Finance Agy. Single Family Mtg. Rev. | | | | 655,000 | | | | | 4.50 | | | | | 10/1/48 | | | | | 724,843 | | | | | | |
NJ Hsg. & Mtg. Finance Agy. Single Family Mtg. Rev. | | | | 500,000 | | | | | 4.00 | | | | | 4/1/49 | | | | | 538,860 | | | | | | |
NJ Transportation Trust Fund Auth. Rev.9 | | | | 500,000 | | | | | 5.25 | | | | | 6/15/43 | | | | | 586,080 | | | | | | |
Tobacco Settlement Financing Corp. Rev. | | | | 300,000 | | | | | 5.00 | | | | | 6/1/46 | | | | | 330,537 | | | | | | |
| | | | | | | | | | | | | | | | | | | | | | | | | |
| | | | | |
| | | | | | | | | | | | | | | | | | | 6,691,120 | | | | | | |
| | | | | | | | | | | | | | | | | | | | | | | | | |
New Mexico - 1.7% | | | | | | | | | | | | | | | | | | | | | | | | | |
NM Mtg. Fin. Auth. Single Family Mtg. Rev. (FHA Insured) | | | | 350,000 | | | | | 3.90 | | | | | 9/1/42 | | | | | 359,429 | | | | | | |
NM Mtg. Fin. Auth. Single Family Mtg. Rev. (GNMA/FNMA/FHLMC Collateralized) | | | | 335,000 | | | | | 4.13 | | | | | 9/1/42 | | | | | 346,805 | | | | | | |
NM Mtg. Fin. Auth. Single Family Mtg. Rev. (GNMA/FNMA/FHLMC Collateralized) | | | | 745,000 | | | | | 3.85 | | | | | 7/1/43 | | | | | 791,793 | | | | | | |
NM Mtg. Fin. Auth. Single Family Mtg. Rev. (GNMA/FNMA/FHLMC Collateralized) | | | | 495,000 | | | | | 3.85 | | | | | 7/1/43 | | | | | 526,091 | | | | | | |
NM Mtg. Fin. Auth. Single Family Mtg. Rev. (GNMA/FNMA/FHLMC Collateralized) | | | | 425,000 | | | | | 3.80 | | | | | 9/1/46 | | | | | 442,102 | | | | | | |
NMMtg. Fin. Auth. Single Family Mtg. Rev. (GNMA/FNMA/FHLMC Collateralized) | | | | 845,000 | | | | | 4.00 | | | | | 7/1/48 | | | | | 909,676 | | | | | | |
NM Mtg. Fin. Auth. Single Family Mtg. Rev. (GNMA/FNMA/FHLMC Collateralized) | | | | 1,000,000 | | | | | 3.35 | | | | | 7/1/49 | | | | | 1,031,920 | | | | | | |
NM Mtg. Fin. Auth. Single Family Mtg. Rev. (GNMA/FNMA/FHLMC Collateralized) | | | | 500,000 | | | | | 4.00 | | | | | 7/1/49 | | | | | 545,735 | | | | | | |
| | | | | | | | | | | | | | | | | | | | | | | | | |
| | | | | |
| | | | | | | | | | | | | | | | | | | 4,953,551 | | | | | | |
| | | | | | | | | | | | | | | | | | | | | | | | | |
New York - 3.3% | | | | | | | | | | | | | | | | | | | | | | | | | |
Hempstead Town Local Development Corp. Rev. (Hofstra University Proj.) | | | | 350,000 | | | | | 4.00 | | | | | 7/1/33 | | | | | 372,519 | | | | | | |
New York City Housing Development Corp. Multifamily Mtg. Rev. | | | | 250,000 | | | | | 4.60 | | | | | 11/1/36 | | | | | 260,708 | | | | | | |
New York City Housing Development Corp. Multifamily Mtg. Rev. | | | | 300,000 | | | | | 4.05 | | | | | 11/1/41 | | | | | 321,690 | | | | | | |
New York City Housing Development Corp. Multifamily Mtg. Rev. | | | | 300,000 | | | | | 3.85 | | | | | 11/1/42 | | | | | 317,757 | | | | | | |
New York City Housing Development Corp. Multifamily Mtg. Rev. | | | | 650,000 | | | | | 3.65 | | | | | 11/1/47 | | | | | 676,416 | | | | | | |
New York City Housing Development Corp. Multifamily Mtg. Rev. | | | | 500,000 | | | | | 3.95 | | | | | 11/1/49 | | | | | 533,160 | | | | | | |
New York City Housing Development Corp. Rev. | | | | 500,000 | | | | | 3.80 | | | | | 11/1/37 | | | | | 514,895 | | | | | | |
New York City Municipal Water Finance Authority | | | | 750,000 | | | | | 5.00 | | | | | 6/15/38 | | | | | 837,360 | | | | | | |
NY Mortgage Agency Rev. | | | | 175,000 | | | | | 3.75 | | | | | 10/1/42 | | | | | 178,516 | | | | | | |
NY Mortgage Agency Rev. | | | | 500,000 | | | | | 4.20 | | | | | 10/1/43 | | | | | 548,615 | | | | | | |
NY Mortgage Agency Rev. | | | | 1,315,000 | | | | | 3.80 | | | | | 10/1/48 | | | | | 1,384,143 | | | | | | |
See accompanying notes to financial statements.
SCHEDULE OF INVESTMENTS (Unaudited)
September 30, 2019
SitTax-Free Income Fund (Continued)
| | | | | | | | | | | | | | | | | | | | | | | | | |
| | | | | |
| Name of Issuer | | Principal
Amount ($) | | Coupon
Rate (%) | | Maturity
Date | | Fair Value ($) |
| | | | | |
NY State Dormitory Auth. Rev. Ref. (N. Shore-Long Island Jewish Obligation) | | | | 300,000 | | | | | 5.00 | | | | | 5/1/33 | | | | | 354,660 | | | | | | |
NY State Housing Finance Agency Rev. (Affordable Hsg. Proj.) | | | | 590,000 | | | | | 3.75 | | | | | 11/1/37 | | | | | 605,954 | | | | | | |
NY State Housing Finance Agency Rev. (Affordable Hsg. Proj.) | | | | 400,000 | | | | | 4.88 | | | | | 11/1/42 | | | | | 418,124 | | | | | | |
NY State Housing Finance Agency Rev. (Affordable Hsg. Proj.) (FNMA/FHLMC Collateralized) | | | | 500,000 | | | | | 3.65 | | | | | 11/1/34 | | | | | 522,665 | | | | | | |
NY State Housing Finance Agency Rev. (Affordable Hsg. Proj.) (GNMA/FNMA/FHLMC Collateralized) | | | | 500,000 | | | | | 3.95 | | | | | 11/1/37 | | | | | 536,875 | | | | | | |
NY State Housing Finance Agency Rev. (GNMA/FNMA/FHLMC Collateralized) | | | | 250,000 | | | | | 4.10 | | | | | 11/1/41 | | | | | 271,750 | | | | | | |
NY State Mortgage Agency Rev. | | | | 1,000,000 | | | | | 2.95 | | | | | 10/1/49 | | | | | 1,000,290 | | | | | | |
| | | | | | | | | | | | | | | | | | | | | | | | | |
| | | | | |
| | | | | | | | | | | | | | | | | | | 9,656,097 | | | | | | |
| | | | | | | | | | | | | | | | | | | | | | | | | |
North Carolina - 1.8% | | | | | | | | | | | | | | | | | | | | | | | | | |
NC Housing Finance Agency Rev. | | | | 650,000 | | | | | 3.85 | | | | | 7/1/37 | | | | | 700,102 | | | | | | |
NC Housing Finance Agency Rev. | | | | 300,000 | | | | | 3.95 | | | | | 1/1/41 | | | | | 320,133 | | | | | | |
NC Housing Finance Agency Rev. | | | | 1,060,000 | | | | | 4.00 | | | | | 7/1/47 | | | | | 1,131,741 | | | | | | |
NC Housing Finance Agency Rev. (GNMA/FNMA/FHLMC Collateralized) | | | | 1,000,000 | | | | | 4.10 | | | | | 1/1/41 | | | | | 1,100,880 | | | | | | |
NC Housing Finance Agency Rev. (GNMA/FNMA/FHLMC Collateralized) | | | | 495,000 | | | | | 4.00 | | | | | 1/1/48 | | | | | 532,189 | | | | | | |
NC Housing Finance Agency Rev. (GNMA/FNMA/FHLMC Collateralized) | | | | 1,000,000 | | | | | 3.63 | | | | | 7/1/49 | | | | | 1,051,470 | | | | | | |
NC Medical Care Comm. Rev. (Salemtowne Proj.) | | | | 400,000 | | | | | 5.00 | | | | | 10/1/38 | | | | | 438,968 | | | | | | |
| | | | | | | | | | | | | | | | | | | | | | | | | |
| | | | | |
| | | | | | | | | | | | | | | | | | | 5,275,483 | | | | | | |
| | | | | | | | | | | | | | | | | | | | | | | | | |
North Dakota - 0.4% | | | | | | | | | | | | | | | | | | | | | | | | | |
ND Housing Finance Agency Rev. | | | | 550,000 | | | | | 3.85 | | | | | 1/1/42 | | | | | 586,636 | | | | | | |
ND Housing Finance Agency Rev. | | | | 460,000 | | | | | 4.00 | | | | | 7/1/48 | | | | | 493,980 | | | | | | |
| | | | | | | | | | | | | | | | | | | | | | | | | |
| | | | | |
| | | | | | | | | | | | | | | | | | | 1,080,616 | | | | | | |
| | | | | | | | | | | | | | | | | | | | | | | | | |
Ohio - 1.7% | | | | | | | | | | | | | | | | | | | | | | | | | |
Dayton-Montgomery Co. Port Auth. Rev. (Storypoint Troy Proj.) | | | | 400,000 | | | | | 7.00 | | | | | 1/15/40 | | | | | 412,916 | | | | | | |
Lake Co. Port & Economic Dev. Auth. Rev. (Tapestry Wickliffe Proj.)4 | | | | 250,000 | | | | | 6.50 | | | | | 12/1/37 | | | | | 261,725 | | | | | | |
Lucas Metro Hsg. Auth. | | | | 500,000 | | | | | 5.00 | | | | | 11/1/36 | | | | | 553,800 | | | | | | |
OH Housing Finance Agency Rev. | | | | 1,000,000 | | | | | 3.35 | | | | | 9/1/49 | | | | | 1,028,350 | | | | | | |
OH Housing Finance Agency Rev. (GNMA/FNMA Collateralized) | | | | 440,000 | | | | | 4.05 | | | | | 3/1/37 | | | | | 465,925 | | | | | | |
OH Housing Finance Agency Rev. (GNMA/FNMA/FHLMC Collateralized) | | | | 450,000 | | | | | 3.35 | | | | | 9/1/39 | | | | | 465,016 | | | | | | |
OH Housing Finance Agency Rev. (GNMA/FNMA/FHLMC Collateralized) | | | | 995,000 | | | | | 4.00 | | | | | 9/1/48 | | | | | 1,066,789 | | | | | | |
OH Housing Finance Agency Rev. (GNMA/FNMA/FHLMC Collateralized) | | | | 750,000 | | | | | 4.00 | | | | | 3/1/49 | | | | | 810,165 | | | | | | |
| | | | | | | | | | | | | | | | | | | | | | | | | |
| | | | | |
| | | | | | | | | | | | | | | | | | | 5,064,686 | | | | | | |
| | | | | | | | | | | | | | | | | | | | | | | | | |
Oklahoma - 0.3% | | | | | | | | | | | | | | | | | | | | | | | | | |
Fort Sill Apache Tribe Economic Dev. Auth.4 | | | | 460,000 | | | | | 8.50 | | | | | 8/25/26 | | | | | 510,632 | | | | | | |
Sallisaw Municipal Auth. Rev. (AGM Insured) | | | | 500,000 | | | | | 4.45 | | | | | 1/1/28 | | | | | 502,800 | | | | | | |
| | | | | | | | | | | | | | | | | | | | | | | | | |
| | | | | |
| | | | | | | | | | | | | | | | | | | 1,013,432 | | | | | | |
| | | | | | | | | | | | | | | | | | | | | | | | | |
Oregon - 1.7% | | | | | | | | | | | | | | | | | | | | | | | | | |
Clackamas Co. Hospital Fac. Auth. Rev. (Willamette View Proj.) | | | | 460,000 | | | | | 5.00 | | | | | 11/15/52 | | | | | 522,132 | | | | | | |
Clackamas Co. Hsg. Auth. Rev. (Easton Ridge Apts. Proj.) | | | | 350,000 | | | | | 3.50 | | | | | 9/1/33 | | | | | 361,196 | | | | | | |
Forest Grove Rev. (Campus Improvement-Pacific Unv. Proj.) | | | | 250,000 | | | | | 5.25 | | | | | 5/1/34 | | | | | 268,418 | | | | | | |
Marion Co. School District No. 1 Gervais G.O. | | | | 500,000 | | | | | 4.00 | | | | | 6/1/33 | | | | | 500,880 | | | | | | |
OR Hsg. & Community Services Dept. Rev. | | | | 250,000 | | | | | 3.80 | | | | | 7/1/34 | | | | | 271,360 | | | | | | |
OR Hsg. & Community Services Dept. Rev. (Single Family Mtg. Program) | | | | 275,000 | | | | | 3.75 | | | | | 7/1/35 | | | | | 291,316 | | | | | | |
OR Hsg. & Community Services Dept. Rev. (Single Family Mtg. Program) | | | | 390,000 | | | | | 4.00 | | | | | 7/1/38 | | | | | 398,206 | | | | | | |
OR Hsg. & Community Services Dept. Rev. (Single Family Mtg. Program) | | | | 460,000 | | | | | 3.75 | | | | | 7/1/48 | | | | | 481,776 | | | | | | |
OR State Ref G.O. (Veterans Welfare Service) | | | | 1,000,000 | | | | | 3.90 | | | | | 12/1/39 | | | | | 1,045,230 | | | | | | |
Polk Co. Hospital Fac. Auth. Rev. (Dallas Retirement Village Proj.) | | | | 740,000 | | | | | 5.13 | | | | | 7/1/35 | | | | | 768,453 | | | | | | |
| | | | | | | | | | | | | | | | | | | | | | | | | |
| | | | | |
| | | | | | | | | | | | | | | | | | | 4,908,967 | | | | | | |
| | | | | | | | | | | | | | | | | | | | | | | | | |
See accompanying notes to financial statements.
| | |
30 | | SIT MUTUAL FUNDS SEMI-ANNUAL REPORT |
| | | | | | | | | | | | | | | | | | | | | | | | | |
| | | | | |
| Name of Issuer | | Principal
Amount ($) | | Coupon
Rate (%) | | Maturity
Date | | Fair Value ($) |
| | | | | |
Pennsylvania - 4.1% | | | | | | | | | | | | | | | | | | | | | | | | | |
Allegheny Co. Industrial Dev. Auth. Charter School Rev. (Propel Charter-McKeesport) | | | | 130,000 | | | | | 5.90 | | | | | 8/15/26 | | | | | 134,090 | | | | | | |
Butler Co. General Authority Rev. (School District Proj.) (AGM G.O. of District)1 | | | | 465,000 | | | | | 2.25 | | | | | 10/1/34 | | | | | 445,200 | | | | | | |
Central Bradford Progress Auth. Rev. (Guthrie Healthcare System) | | | | 250,000 | | | | | 5.50 | | | | | 12/1/31 | | | | | 268,498 | | | | | | |
Commonwealth Financing Auth. Rev. (Tobacco Master Settlement Payment) (AGM Insured) | | | | 350,000 | | | | | 4.00 | | | | | 6/1/39 | | | | | 387,866 | | | | | | |
Dauphin Co. General Auth. Rev. (Harrisburg University Science Technology)4 | | | | 400,000 | | | | | 4.00 | | | | | 10/15/22 | | | | | 407,512 | | | | | | |
Erie Co. Hospital Auth. Rev. (St. Vincent Health Center Proj.) | | | | 250,000 | | | | | 7.00 | | | | | 7/1/27 | | | | | 260,382 | | | | | | |
PA Higher Educational Facs. Auth. Rev. (La Salle University) | | | | 280,000 | | | | | 5.00 | | | | | 5/1/42 | | | | | 296,514 | | | | | | |
PA Hsg. Finance Agy. Rev. | | | | 500,000 | | | | | 3.90 | | | | | 10/1/36 | | | | | 539,150 | | | | | | |
PA Hsg. Finance Agy. Rev. | | | | 530,000 | | | | | 3.95 | | | | | 10/1/38 | | | | | 572,199 | | | | | | |
PA Hsg. Finance Agy. Rev. | | | | 500,000 | | | | | 4.05 | | | | | 10/1/40 | | | | | 530,915 | | | | | | |
PA Hsg. Finance Agy. Rev. | | | | 500,000 | | | | | 4.05 | | | | | 10/1/40 | | | | | 528,295 | | | | | | |
PA Hsg. Finance Agy. Rev. | | | | 825,000 | | | | | 3.65 | | | | | 10/1/42 | | | | | 864,988 | | | | | | |
PA Hsg. Finance Agy. Rev. | | | | 250,000 | | | | | 4.00 | | | | | 10/1/42 | | | | | 267,628 | | | | | | |
PA Hsg. Finance Agy. Rev. | | | | 600,000 | | | | | 3.00 | | | | | 10/1/46 | | | | | 602,328 | | | | | | |
PA Hsg. Finance Agy. Rev. | | | | 195,000 | | | | | 4.00 | | | | | 10/1/46 | | | | | 207,841 | | | | | | |
PA Hsg. Finance Agy. Rev. | | | | 500,000 | | | | | 4.00 | | | | | 10/1/47 | | | | | 536,595 | | | | | | |
PA Hsg. Finance Agy. Rev. | | | | 1,000,000 | | | | | 3.40 | | | | | 10/1/49 | | | | | 1,031,620 | | | | | | |
PA Turnpike Commission Rev. Capital Appreciation6 | | | | 500,000 | | | | | 5.13 | | | | | 12/1/35 | | | | | 522,130 | | | | | | |
PA Turnpike Commission Rev. Capital Appreciation6 | | | | 1,250,000 | | | | | 5.00 | | | | | 12/1/38 | | | | | 1,521,412 | | | | | | |
Palmerton Area School District G.O. | | | | 500,000 | | | | | 4.00 | | | | | 8/15/35 | | | | | 513,680 | | | | | | |
Philadelphia Industrial Dev. Auth. Rev. (Alliance for Progress Charter School Proj.) | | | | 635,000 | | | | | 5.00 | | | | | 6/15/49 | | | | | 671,963 | | | | | | |
Philadelphia Industrial Dev. Auth. Rev. (Charter School Proj.) | | | | 250,000 | | | | | 5.63 | | | | | 8/1/36 | | | | | 265,158 | | | | | | |
Upper Uwchlan Township G.O. | | | | 500,000 | | | | | 4.00 | | | | | 12/1/39 | | | | | 501,660 | | | | | | |
| | | | | | | | | | | | | | | | | | | | | | | | | |
| | | | | |
| | | | | | | | | | | | | | | | | | | 11,877,624 | | | | | | |
| | | | | | | | | | | | | | | | | | | | | | | | | |
Rhode Island - 0.1% | | | | | | | | | | | | | | | | | | | | | | | | | |
RI Hsg. & Mortgage Finance Corp. Rev. | | | | 250,000 | | | | | 3.90 | | | | | 10/1/37 | | | | | 258,468 | | | | | | |
| | | | | | | | | | | | | | | | | | | | | | | | | |
| | | | | |
South Carolina - 0.7% | | | | | | | | | | | | | | | | | | | | | | | | | |
SC Education Assistance Auth. Student Loan Rev. | | | | 185,000 | | | | | 5.10 | | | | | 10/1/29 | | | | | 185,102 | | | | | | |
SC Public Service Auth. Rev. (Santee Cooper) | | | | 250,000 | | | | | 5.00 | | | | | 12/1/38 | | | | | 281,902 | | | | | | |
SC Public Service Auth. Rev. (Santee Cooper) | | | | 500,000 | | | | | 5.75 | | | | | 12/1/43 | | | | | 588,775 | | | | | | |
SC State Hsg. Finance & Dev. Auth. Rev. | | | | 1,035,000 | | | | | 4.00 | | | | | 1/1/47 | | | | | 1,105,960 | | | | | | |
| | | | | | | | | | | | | | | | | | | | | | | | | |
| | | | | |
| | | | | | | | | | | | | | | | | | | 2,161,739 | | | | | | |
| | | | | | | | | | | | | | | | | | | | | | | | | |
South Dakota - 0.2% | | | | | | | | | | | | | | | | | | | | | | | | | |
SD Health & Educational Facs. Auth. Rev. (Westhills Village Retirement Community) | | | | 500,000 | | | | | 5.00 | | | | | 9/1/40 | | | | | 581,140 | | | | | | |
| | | | | | | | | | | | | | | | | | | | | | | | | |
| | | | | |
Tennessee - 3.1% | | | | | | | | | | | | | | | | | | | | | | | | | |
Franklin Health & Education Facs. Board Rev. (Provision Cares Proton Therapy Center)4 | | | | 500,000 | | | | | 6.50 | | | | | 6/1/27 | | | | | 527,925 | | | | | | |
Nashville Metropolitan Dev. & Hsg. Agency Tax Allocation4 | | | | 300,000 | | | | | 5.13 | | | | | 6/1/36 | | | | | 331,662 | | | | | | |
Shelby Co. Health, Education & Hsg. Facs. Rev. (CME Memphis Apts. Proj.)2,5, 15 | | | | 1,850,000 | | | | | 5.35 | | | | | N/A | | | | | 4,625 | | | | | | |
Shelby Co. Health, Education & Hsg. Facs. Rev. (CME Memphis Apts. Proj.)2, 5 | | | | 7,875,000 | | | | | 5.55 | | | | | 1/1/29 | | | | | 19,688 | | | | | | |
Shelby Co. Health, Education & Hsg. Facs. Rev. (CME Memphis Apts. Proj.)2,5 | | | | 1,630,000 | | | | | 6.00 | | | | | 1/1/29 | | | | | 16 | | | | | | |
TN Hsg. Dev. Agency Rev. | | | | 1,250,000 | | | | | 2.95 | | | | | 7/1/49 | | | | | 1,244,400 | | | | | | |
TN Hsg. Dev. Agency. Rev. | | | | 400,000 | | | | | 3.60 | | | | | 1/1/31 | | | | | 407,664 | | | | | | |
TN Hsg. Dev. Agency. Rev. | | | | 535,000 | | | | | 3.88 | | | | | 7/1/35 | | | | | 567,458 | | | | | | |
TN Hsg. Dev. Agency. Rev. | | | | 280,000 | | | | | 3.95 | | | | | 7/1/35 | | | | | 298,010 | | | | | | |
TN Hsg. Dev. Agency. Rev. | | | | 680,000 | | | | | 4.00 | | | | | 7/1/39 | | | | | 738,562 | | | | | | |
TN Hsg. Dev. Agency. Rev. | | | | 490,000 | | | | | 3.85 | | | | | 7/1/42 | | | | | 523,315 | | | | | | |
TN Hsg. Dev. Agency. Rev. | | | | 495,000 | | | | | 3.90 | | �� | | | 7/1/42 | | | | | 530,363 | | | | | | |
TN Hsg. Dev. Agency. Rev. | | | | 1,000,000 | | | | | 4.00 | | | | | 7/1/44 | | | | | 1,088,990 | | | | | | |
See accompanying notes to financial statements.
SCHEDULE OF INVESTMENTS (Unaudited)
September 30, 2019
SitTax-Free Income Fund (Continued)
| | | | | | | | | | | | | | | | | | | | | | | | | |
| | | | | |
| Name of Issuer | | Principal
Amount ($) | | Coupon
Rate (%) | | Maturity
Date | | Fair Value ($) |
| | | | | |
TN Hsg. Dev. Agency. Rev. | | | | 1,000,000 | | | | | 3.95 | | | | | 1/1/49 | | | | | 1,066,980 | | | | | | |
TN Hsg. Dev. Agency. Rev. | | | | 1,595,000 | | | | | 4.05 | | | | | 1/1/49 | | | | | 1,707,448 | | | | | | |
| | | | | | | | | | | | | | | | | | | | | | | | | |
| | | | | |
| | | | | | | | | | | | | | | | | | | 9,057,106 | | | | | | |
| | | | | | | | | | | | | | | | | | | | | | | | | |
Texas - 5.6% | | | | | | | | | | | | | | | | | | | | | | | | | |
Arlington Higher Education Finance Corp., Education Rev. (Arlington Classics Academy) | | | | 805,000 | | | | | 7.00 | | | | | 8/15/28 | | | | | 843,157 | | | | | | |
Arlington Higher Education Finance Corp., Education Rev. (Leadership Prep School) | | | | 200,000 | | | | | 5.00 | | | | | 6/15/36 | | | | | 204,808 | | | | | | |
Arlington Special Tax (BAM Insured) | | | | 350,000 | | | | | 5.00 | | | | | 2/15/41 | | | | | 393,190 | | | | | | |
Bexar Co. Rev. (Venue Proj.) | | | | 1,000,000 | | | | | 5.00 | | | | | 8/15/39 | | | | | 1,092,510 | | | | | | |
Dallas/Fort Worth International Airport Rev. (JT Improvement) | | | | 500,000 | | | | | 5.25 | | | | | 11/1/37 | | | | | 568,120 | | | | | | |
El Paso County Hospital District G.O. | | | | 825,000 | | | | | 5.00 | | | | | 8/15/43 | | | | | 882,024 | | | | | | |
Fort Bend Co. Municipal Utility District No. 25 G.O. (AGM Insured) | | | | 350,000 | | | | | 5.00 | | | | | 10/1/38 | | | | | 350,000 | | | | | | |
Harris Co. Cultural Education Facs. Finance Corp. Rev. (Brazos Presbyterian Homes, Inc. Proj.) | | | | 500,000 | | | | | 5.00 | | | | | 1/1/37 | | | | | 551,600 | | | | | | |
Huffman Independent School District G.O. | | | | 955,000 | | | | | 4.00 | | | | | 2/15/28 | | | | | 964,092 | | | | | | |
New Hope Cultural Education Facs. Corp. Rev. (Beta Academy)4 | | | | 425,000 | | | | | 5.00 | | | | | 8/15/39 | | | | | 451,342 | | | | | | |
New Hope Cultural Education Facs. Corp. Rev. (Cardinal Bay, Inc.) | | | | 400,000 | | | | | 5.00 | | | | | 7/1/46 | | | | | 442,084 | | | | | | |
New Hope Cultural Education Facs. Corp. Rev. (Jubilee Academic Center)4 | | | | 250,000 | | | | | 5.00 | | | | | 8/15/36 | | | | | 256,855 | | | | | | |
New Hope Cultural Education Facs. Corp. Rev. (Legacy Preparatory Charter Academy)4 | | | | 500,000 | | | | | 6.00 | | | | | 8/15/37 | | | | | 539,900 | | | | | | |
New Hope Cultural Education Facs. Corp. Rev. (Presbyterian Village North Proj.) | | | | 500,000 | | | | | 5.00 | | | | | 10/1/34 | | | | | 555,905 | | | | | | |
New Hope Cultural Education Facs. Corp. Rev. (Wesleyan Homes Inc. Proj.) | | | | 250,000 | | | | | 5.50 | | | | | 1/1/35 | | | | | 271,890 | | | | | | |
North Central Texas Health Facility Development Corp. (CC Young Memorial Home) | | | | 242,000 | | | | | 5.38 | | | | | 2/15/25 | | | | | 242,358 | | | | | | |
North Mission Glen Municipal Utility District, G.O. (AGM Insured) | | | | 575,000 | | | | | 4.00 | | | | | 9/1/32 | | | | | 586,954 | | | | | | |
Red River Health Facs. Dev. Corp. Rev. (MRC Crossings Proj.) | | | | 250,000 | | | | | 7.50 | | | | | 11/15/34 | | | | | 296,355 | | | | | | |
Sheldon Independent School District G.O. | | | | 360,000 | | | | | 4.00 | | | | | 2/15/27 | | | | | 363,762 | | | | | | |
Sugar Land Dev. Corp. Rev. (BAM Insured) | | | | 500,000 | | | | | 5.00 | | | | | 2/15/33 | | | | | 550,600 | | | | | | |
Tarrant Co. Cultural Education Facs. Finance Corp. Rev. (Buckingham Senior Living Community, Inc.)2, 5 | | | | 500,000 | | | | | 5.63 | | | | | 11/15/27 | | | | | 350,000 | | | | | | |
Tarrant Co. Cultural Education Facs. Finance Corp. Rev. (Buckner Retirement Service) | | | | 500,000 | | | | | 5.00 | | | | | 11/15/37 | | | | | 580,975 | | | | | | |
Tarrant Co. Cultural Education Facs. Finance Corp. Rev. (Buckner Senior Living Ventana Proj.) | | | | 250,000 | | | | | 5.63 | | | | | 11/15/24 | | | | | 250,705 | | | | | | |
Tarrant Co. Cultural Education Facs. Finance Corp. Rev. (Buckner Senior Living Ventana Proj.) | | | | 500,000 | | | | | 6.63 | | | | | 11/15/37 | | | | | 580,100 | | | | | | |
Travis Co. Health Facs. Dev. Corp. Rev. (Longhorn Village Proj.) | | | | 300,000 | | | | | 7.13 | | | | | 1/1/46 | | | | | 320,997 | | | | | | |
TX Department of Housing & Community Affairs (GNMA Collateralized) | | | | 500,000 | | | | | 4.13 | | | | | 9/1/38 | | | | | 548,430 | | | | | | |
TX Department of Housing & Community Affairs (GNMA Collateralized) | | | | 1,100,000 | | | | | 3.63 | | | | | 9/1/44 | | | | | 1,172,413 | | | | | | |
TX Grand Parkway Transportation Corp. Rev.6 | | | | 500,000 | | | | | 6.00 | | | | | 10/1/35 | | | | | 539,280 | | | | | | |
TX State Affordable Hsg. Corp. Rev. (Heroes Home Loan Program) (GNMA Collateralized) | | | | 550,000 | | | | | 3.00 | | | | | 3/1/35 | | | | | 564,316 | | | | | | |
TX State Affordable Hsg. Corp. Rev. (Heroes Home Loan Program) (GNMA Collateralized) | | | | 1,000,000 | | | | | 4.00 | | | | | 3/1/50 | | | | | 1,082,270 | | | | | | |
| | | | | | | | | | | | | | | | | | | | | | | | | |
| | | | | |
| | | | | | | | | | | | | | | | | | | 16,396,992 | | | | | | |
| | | | | | | | | | | | | | | | | | | | | | | | | |
Utah - 0.7% | | | | | | | | | | | | | | | | | | | | | | | | | |
UT Charter School Finance Auth. Rev. (Academy Sciences Proj.)4 | | | | 625,000 | | | | | 4.65 | | | | | 7/15/33 | | | | | 636,750 | | | | | | |
UT Charter School Finance Auth. Rev. (Spectrum Academy Proj.)4 | | | | 500,000 | | | | | 6.00 | | | | | 4/15/45 | | | | | 505,400 | | | | | | |
UT Hsg. Corp. Single Family Mtg. Rev. | | | | 45,000 | | | | | 5.75 | | | | | 1/1/33 | | | | | 45,382 | | | | | | |
UT Hsg. Corp. Single Family Mtg. Rev. | | | | 85,000 | | | | | 4.60 | | | | | 7/1/34 | | | | | 86,380 | | | | | | |
UT Hsg. Corp. Single Family Mtg. Rev. (FHA Insured) | | | | 345,000 | | | | | 4.00 | | | | | 1/1/36 | | | | | 367,446 | | | | | | |
West Valley City Municipal Building Auth. Rev. (AGM Insured) | | | | 400,000 | | | | | 5.00 | | | | | 2/1/39 | | | | | 474,924 | | | | | | |
| | | | | | | | | | | | | | | | | | | | | | | | | |
| | | | | |
| | | | | | | | | | | | | | | | | | | 2,116,282 | | | | | | |
| | | | | | | | | | | | | | | | | | | | | | | | | |
Vermont - 0.2% | | | | | | | | | | | | | | | | | | | | | | | | | |
VT Hsg. Fin. Agy. Rev. (GNMA/FNMA/FHLMC Collateralized) | | | | 500,000 | | | | | 3.50 | | | | | 5/1/38 | | | | | 522,535 | | | | | | |
| | | | | | | | | | | | | | | | | | | | | | | | | |
| | | | | |
Virginia - 0.8% | | | | | | | | | | | | | | | | | | | | | | | | | |
VA Hsg. Dev. Auth. Rev. (Commonwealth Mtg.) | | | | 1,000,000 | | | | | 3.63 | | | | | 1/1/31 | | | | | 1,039,870 | | | | | | |
VA Hsg. Dev. Auth. Rev. (Commonwealth Mtg.) | | | | 525,000 | | | | | 3.88 | | | | | 1/1/38 | | | | | 545,207 | | | | | | |
See accompanying notes to financial statements.
| | |
32 | | SIT MUTUAL FUNDS SEMI-ANNUAL REPORT |
| | | | | | | | | | | | | | | | | | | | | | | | | |
| | | | | |
| Name of Issuer | | Principal
Amount ($) | | Coupon
Rate (%) | | Maturity
Date | | Fair Value ($) |
| | | | | |
VA Hsg. Dev. Auth. Rev. (Rental Hsg. Proj.) | | | | 400,000 | | | | | 4.13 | | | | | 7/1/33 | | | | | 424,368 | | | | | | |
VA Hsg. Dev. Auth. Rev. (Rental Hsg. Proj.) (G.O. of Auth. Insured) | | | | 250,000 | | | | | 4.60 | | | | | 12/1/38 | | | | | 256,788 | | | | | | |
| | | | | | | | | | | | | | | | | | | | | | | | | |
| | | | | |
| | | | | | | | | | | | | | | | | | | 2,266,233 | | | | | | |
| | | | | | | | | | | | | | | | | | | | | | | | | |
Washington - 2.1% | | | | | | | | | | | | | | | | | | | | | | | | | |
Chelan Co. Public Utility District No. 1 Rev. | | | | 1,000,000 | | | | | 5.00 | | | | | 7/1/29 | | | | | 1,002,820 | | | | | | |
Kalispel Tribe of Indians Rev.4 | | | | 300,000 | | | | | 5.25 | | | | | 1/1/38 | | | | | 333,225 | | | | | | |
Pike Place Market Preservation Dev. Auth. Rev. | | | | 500,000 | | | | | 5.00 | | | | | 12/1/40 | | | | | 582,690 | | | | | | |
Snohomish County Hsg. Auth. Rev. | | | | 500,000 | | | | | 4.00 | | | | | 4/1/44 | | | | | 539,775 | | | | | | |
Vancouver Hsg. Auth. Rev. | | | | 500,000 | | | | | 3.75 | | | | | 8/1/34 | | | | | 538,020 | | | | | | |
WA Hsg. Fin. Commission Multi Family Mtg. Rev. (Bayview Manor Homes)4 | | | | 250,000 | | | | | 5.00 | | | | | 7/1/31 | | | | | 276,300 | | | | | | |
WA Hsg. Fin. Commission Multi Family Mtg. Rev. (Bayview Manor Homes)4 | | | | 750,000 | | | | | 5.00 | | | | | 7/1/36 | | | | | 820,140 | | | | | | |
WA Hsg. Fin. Commission Multi Family Mtg. Rev. (Horizon House Proj.)4 | | | | 500,000 | | | | | 5.00 | | | | | 1/1/38 | | | | | 567,520 | | | | | | |
WA Hsg. Fin. Commission Multi Family Mtg. Rev. (Transforming Age Proj.)4 | | | | 500,000 | | | | | 5.00 | | | | | 1/1/44 | | | | | 547,020 | | | | | | |
WA Hsg. Fin. Commission Multi Family Mtg. Rev. (Wesley Homes Lea Hill Proj.)4 | | | | 300,000 | | | | | 5.00 | | | | | 7/1/36 | | | | | 325,881 | | | | | | |
WA Hsg. Fin. Commission Single Family Mtg. Rev. (GNMA/FNMA/FHLMC Collateralized) | | | | 60,000 | | | | | 4.60 | | | | | 10/1/33 | | | | | 62,172 | | | | | | |
WA Hsg. Fin. Commission Single Family Mtg. Rev. (GNMA/FNMA/FHLMC Collateralized) | | | | 470,000 | | | | | 4.00 | | | | | 12/1/47 | | | | | 494,445 | | | | | | |
| | | | | | | | | | | | | | | | | | | | | | | | | |
| | | | | |
| | | | | | | | | | | | | | | | | | | 6,090,008 | | | | | | |
| | | | | | | | | | | | | | | | | | | | | | | | | |
West Virginia - 0.4% | | | | | | | | | | | | | | | | | | | | | | | | | |
WV Hsg. Dev. Fund Rev. | | | | 250,000 | | | | | 3.75 | | | | | 11/1/32 | | | | | 266,268 | | | | | | |
WV Hsg. Dev. Fund Rev. | | | | 285,000 | | | | | 3.80 | | | | | 11/1/35 | | | | | 297,671 | | | | | | |
WV Hsg. Dev. Fund Rev. | | | | 500,000 | | | | | 4.00 | | | | | 11/1/37 | | | | | 539,310 | | | | | | |
WV Hsg. Dev. Fund Rev. | | | | 135,000 | | | | | 4.10 | | | | | 11/1/45 | | | | | 142,769 | | | | | | |
| | | | | | | | | | | | | | | | | | | | | | | | | |
| | | | | |
| | | | | | | | | | | | | | | | | | | 1,246,018 | | | | | | |
| | | | | | | | | | | | | | | | | | | | | | | | | |
Wisconsin - 4.3% | | | | | | | | | | | | | | | | | | | | | | | | | |
WI Health & Education Facs. Auth. Rev. (Medical College) | | | | 870,000 | | | | | 5.25 | | | | | 12/1/35 | | | | | 873,254 | | | | | | |
WI Health & Education Facs. Auth. Rev. (PHW Oconomowoc, Inc. Proj.) | | | | 1,000,000 | | | | | 5.13 | | | | | 10/1/48 | | | | | 1,071,710 | | | | | | |
WI Health & Education Facs. Auth. Rev. (St. John’s Communities, Inc. Proj.) | | | | 500,000 | | | | | 5.00 | | | | | 9/15/40 | | | | | 527,455 | | | | | | |
WI Health & Education Facs. Auth. Rev. (Three Pillars Senior Living) | | | | 1,000,000 | | | | | 5.00 | | | | | 8/15/43 | | | | | 1,088,550 | | | | | | |
WI Health & Educational Facs. Auth. Rev. (Aspirus, Inc. Obligation Group) | | | | 500,000 | | | | | 5.00 | | | | | 8/15/32 | | | | | 575,330 | | | | | | |
WI Health & Educational Facs. Auth. Rev. (Benevolent Corp. Cedar Community) | | | | 300,000 | | | | | 5.00 | | | | | 6/1/37 | | | | | 325,125 | | | | | | |
WI Health & Educational Facs. Auth. Rev. (Froedtert Health, Inc. Obligated Group) | | | | 500,000 | | | | | 5.00 | | | | | 4/1/35 | | | | | 598,970 | | | | | | |
WI Housing & Economic Dev. Auth. Rev. | | | | 250,000 | | | | | 3.88 | | | | | 11/1/35 | | | | | 265,900 | | | | | | |
WI Housing & Economic Dev. Auth. Rev. | | | | 560,000 | | | | | 3.90 | | | | | 11/1/42 | | | | | 596,635 | | | | | | |
WI Housing & Economic Dev. Auth. Rev. | | | | 1,500,000 | | | | | 4.15 | | | | | 5/1/55 | | | | | 1,605,090 | | | | | | |
WI Public Finance Auth. Rev. (Delray Beach Radiation Therapy)4 | | | | 750,000 | | | | | 6.25 | | | | | 11/1/28 | | | | | 845,408 | | | | | | |
WI Public Finance Auth. Rev. (Glenridge Palmer Ranch Proj.)4 | | | | 500,000 | | | | | 8.25 | | | | | 6/1/46 | | | | | 552,215 | | | | | | |
WI Public Finance Auth. Rev. (Lombard Public Facilities Corp.)2,4, 6 | | | | 16,520 | | | | | 9.00 | | | | | 1/1/46 | | | | | 583 | | | | | | |
WI Public Finance Auth. Rev. (Lombard Public Facilities Corp.)2,4, 6 | | | | 16,287 | | | | | 9.00 | | | | | 1/1/47 | | | | | 571 | | | | | | |
WI Public Finance Auth. Rev. (Lombard Public Facilities Corp.)2,4, 6 | | | | 447 | | | | | 12.00 | | | | | 1/1/47 | | | | | 16 | | | | | | |
WI Public Finance Auth. Rev. (Lombard Public Facilities Corp.)2,4, 6 | | | | 16,171 | | | | | 9.00 | | | | | 1/1/48 | | | | | 563 | | | | | | |
WI Public Finance Auth. Rev. (Lombard Public Facilities Corp.)2,4, 6 | | | | 390 | | | | | 12.00 | | | | | 1/1/48 | | | | | 14 | | | | | | |
WI Public Finance Auth. Rev. (Lombard Public Facilities Corp.)2,4, 6 | | | | 16,055 | | | | | 9.00 | | | | | 1/1/49 | | | | | 555 | | | | | | |
WI Public Finance Auth. Rev. (Lombard Public Facilities Corp.)2,4, 6 | | | | 384 | | | | | 11.00 | | | | | 1/1/49 | | | | | 13 | | | | | | |
WI Public Finance Auth. Rev. (Lombard Public Facilities Corp.)2,4, 6 | | | | 15,822 | | | | | 9.00 | | | | | 1/1/50 | | | | | 543 | | | | | | |
WI Public Finance Auth. Rev. (Lombard Public Facilities Corp.)2,4, 6 | | | | 372 | | | | | 11.00 | | | | | 1/1/50 | | | | | 13 | | | | | | |
WI Public Finance Auth. Rev. (Lombard Public Facilities Corp.)2,4, 6 | | | | 17,334 | | | | | 9.00 | | | | | 1/1/51 | | | | | 591 | | | | | | |
WI Public Finance Auth. Rev. (Lombard Public Facilities Corp.)2,4, 6 | | | | 365 | | | | | 11.00 | | | | | 1/1/51 | | | | | 12 | | | | | | |
WI Public Finance Auth. Rev. (Lombard Public Facilities Corp.)1,2, 4 | | | | 451,406 | | | | | 3.75 | | | | | 7/1/51 | | | | | 405,218 | | | | | | |
WI Public Finance Auth. Rev. (Lombard Public Facilities Corp.)2,4, 6 | | | | 17,218 | | | | | 9.00 | | | | | 1/1/52 | | | | | 584 | | | | | | |
WI Public Finance Auth. Rev. (Lombard Public Facilities Corp.)2,4, 6 | | | | 475 | | | | | 10.00 | | | | | 1/1/52 | | | | | 16 | | | | | | |
WI Public Finance Auth. Rev. (Lombard Public Facilities Corp.)2,4, 6 | | | | 16,985 | | | | | 9.00 | | | | | 1/1/53 | | | | | 572 | | | | | | |
See accompanying notes to financial statements.
SCHEDULE OF INVESTMENTS (Unaudited)
September 30, 2019
SitTax-Free Income Fund (Continued)
| | | | | | | | | | | | | | | | | | | | | | | | | |
| Name of Issuer | | Principal Amount ($)/ Quantity | | Coupon Rate (%) | | Maturity
Date | | Fair Value ($) |
| | | | | |
WI Public Finance Auth. Rev. (Lombard Public Facilities Corp.)2,4, 6 | | | | 469 | | | | | 10.00 | | | | | 1/1/53 | | | | | 16 | | | | | | |
WI Public Finance Auth. Rev. (Lombard Public Facilities Corp.)2,4, 6 | | | | 16,869 | | | | | 9.00 | | | | | 1/1/54 | | | | | 565 | | | | | | |
WI Public Finance Auth. Rev. (Lombard Public Facilities Corp.)2,4, 6 | | | | 453 | | | | | 10.00 | | | | | 1/1/54 | | | | | 15 | | | | | | |
WI Public Finance Auth. Rev. (Lombard Public Facilities Corp.)2,4, 6 | | | | 16,636 | | | | | 9.00 | | | | | 1/1/55 | | | | | 554 | | | | | | |
WI Public Finance Auth. Rev. (Lombard Public Facilities Corp.)2,4, 6 | | | | 444 | | | | | 9.00 | | | | | 1/1/55 | | | | | 15 | | | | | | |
WI Public Finance Auth. Rev. (Lombard Public Facilities Corp.)2,4, 6 | | | | 16,404 | | | | | 9.00 | | | | | 1/1/56 | | | | | 544 | | | | | | |
WI Public Finance Auth. Rev. (Lombard Public Facilities Corp.)2,4, 6 | | | | 434 | | | | | 9.00 | | | | | 1/1/56 | | | | | 14 | | | | | | |
WI Public Finance Auth. Rev. (Lombard Public Facilities Corp.)2,4 | | | | 21,561 | | | | | 5.50 | | | | | 7/1/56 | | | | | 20,923 | | | | | | |
WI Public Finance Auth. Rev. (Lombard Public Facilities Corp.)2,4, 6 | | | | 16,287 | | | | | 9.00 | | | | | 1/1/57 | | | | | 538 | | | | | | |
WI Public Finance Auth. Rev. (Lombard Public Facilities Corp.)2,4, 6 | | | | 481 | | | | | 9.00 | | | | | 1/1/57 | | | | | 16 | | | | | | |
WI Public Finance Auth. Rev. (Lombard Public Facilities Corp.)2,4, 6 | | | | 16,055 | | | | | 9.00 | | | | | 1/1/58 | | | | | 527 | | | | | | |
WI Public Finance Auth. Rev. (Lombard Public Facilities Corp.)2,4, 6 | | | | 469 | | | | | 9.00 | | | | | 1/1/58 | | | | | 15 | | | | | | |
WI Public Finance Auth. Rev. (Lombard Public Facilities Corp.)2,4, 6 | | | | 15,938 | | | | | 9.00 | | | | | 1/1/59 | | | | | 521 | | | | | | |
WI Public Finance Auth. Rev. (Lombard Public Facilities Corp.)2,4, 6 | | | | 456 | | | | | 9.00 | | | | | 1/1/59 | | | | | 15 | | | | | | |
WI Public Finance Auth. Rev. (Lombard Public Facilities Corp.)2,4, 6 | | | | 447 | | | | | 8.00 | | | | | 1/1/60 | | | | | 15 | | | | | | |
WI Public Finance Auth. Rev. (Lombard Public Facilities Corp.)2,4, 6 | | | | 15,822 | | | | | 9.00 | | | | | 1/1/60 | | | | | 515 | | | | | | |
WI Public Finance Auth. Rev. (Lombard Public Facilities Corp.)2,4, 6 | | | | 440 | | | | | 8.00 | | | | | 1/1/61 | | | | | 14 | | | | | | |
WI Public Finance Auth. Rev. (Lombard Public Facilities Corp.)2,4, 6 | | | | 15,589 | | | | | 9.00 | | | | | 1/1/61 | | | | | 506 | | | | | | |
WI Public Finance Auth. Rev. (Lombard Public Facilities Corp.)2,4, 6 | | | | 428 | | | | | 8.00 | | | | | 1/1/62 | | | | | 14 | | | | | | |
WI Public Finance Auth. Rev. (Lombard Public Facilities Corp.)2,4, 6 | | | | 15,473 | | | | | 9.00 | | | | | 1/1/62 | | | | | 500 | | | | | | |
WI Public Finance Auth. Rev. (Lombard Public Facilities Corp.)2,4, 6 | | | | 419 | | | | | 8.00 | | | | | 1/1/63 | | | | | 13 | | | | | | |
WI Public Finance Auth. Rev. (Lombard Public Facilities Corp.)2,4, 6 | | | | 15,240 | | | | | 9.00 | | | | | 1/1/63 | | | | | 490 | | | | | | |
WI Public Finance Auth. Rev. (Lombard Public Facilities Corp.)2,4, 6 | | | | 409 | | | | | 8.00 | | | | | 1/1/64 | | | | | 13 | | | | | | |
WI Public Finance Auth. Rev. (Lombard Public Facilities Corp.)2,4, 6 | | | | 15,124 | | | | | 9.00 | | | | | 1/1/64 | | | | | 485 | | | | | | |
WI Public Finance Auth. Rev. (Lombard Public Facilities Corp.)2,4, 6 | | | | 403 | | | | | 7.00 | | | | | 1/1/65 | | | | | 13 | | | | | | |
WI Public Finance Auth. Rev. (Lombard Public Facilities Corp.)2,4, 6 | | | | 15,008 | | | | | 9.00 | | | | | 1/1/65 | | | | | 479 | | | | | | |
WI Public Finance Auth. Rev. (Lombard Public Facilities Corp.)2,4, 6 | | | | 434 | | | | | 7.00 | | | | | 1/1/66 | | | | | 14 | | | | | | |
WI Public Finance Auth. Rev. (Lombard Public Facilities Corp.)2,4, 6 | | | | 14,775 | | | | | 9.00 | | | | | 1/1/66 | | | | | 470 | | | | | | |
WI Public Finance Auth. Rev. (Lombard Public Facilities Corp.)2,4, 6 | | | | 5,235 | | | | | 7.00 | | | | | 1/1/67 | | | | | 166 | | | | | | |
WI Public Finance Auth. Rev. (Lombard Public Facilities Corp.)2,4, 6 | | | | 192,429 | | | | | 9.00 | | | | | 1/1/67 | | | | | 6,100 | | | | | | |
WI Public Finance Auth. Rev. (MD Proton Treatment Center)4 | | | | 500,000 | | | | | 6.13 | | | | | 1/1/33 | | | | | 530,760 | | | | | | |
WI Public Finance Auth. Rev. (MN College of Osteopathic Medicine)4 | | | | 250,000 | | | | | 5.50 | | | | | 12/1/48 | | | | | 246,450 | | | | | | |
WI Public Finance Auth. Rev. (Mountain Island Charter School) | | | | 820,000 | | | | | 5.00 | | | | | 7/1/37 | | | | | 896,104 | | | | | | |
WI Public Finance Auth. Rev. (North Carolina Leadership Academy)4 | | | | 410,000 | | | | | 5.00 | | | | | 6/15/39 | | | | | 437,974 | | | | | | |
WI Public Finance Auth. Rev. (Rose Villa Proj.)4 | | | | 450,000 | | | | | 5.00 | | | | | 11/15/24 | | | | | 472,437 | | | | | | |
WI Public Finance Auth. Rev. (Roseman University Health Sciences) | | | | 240,000 | | | | | 5.00 | | | | | 4/1/25 | | | | | 256,723 | | | | | | |
WI Public Finance Auth. Rev. (Roseman University Health Sciences) | | | | 500,000 | | | | | 5.50 | | | | | 4/1/32 | | | | | 528,995 | | | | | | |
| | | | | | | | | | | | | | | | | | | | | | | | | |
| | | | | |
| | | | | | | | | | | | | | | | | | | 12,739,034 | | | | | | |
| | | | | | | | | | | | | | | | | | | | | | | | | |
Wyoming - 0.5% | | | | | | | | | | | | | | | | | | | | | | | | | |
WY Community Dev. Auth. Rev. | | | | 265,000 | | | | | 3.75 | | | | | 12/1/32 | | | | | 273,133 | | | | | | |
WY Community Dev. Auth. Rev. | | | | 810,000 | | | | | 3.90 | | | | | 12/1/38 | | | | | 864,602 | | | | | | |
WY Community Dev. Auth. Rev. | | | | 285,000 | | | | | 4.05 | | | | | 12/1/38 | | | | | 293,265 | | | | | | |
| | | | | | | | | | | | | | | | | | | | | | | | | |
| | | | | |
| | | | | | | | | | | | | | | | | | | 1,431,000 | | | | | | |
| | | | | | | | | | | | | | | | | | | | | | | | | |
| | | | | |
Total Municipal Bonds
(cost: $255,485,833) | | | | | | | | | | | | | | | | | | | 256,256,399 | | | | | | |
| | | | | | | | | | | | | | | | | | | | | | | | | |
| | | | | |
Investment Companies - 4.0% | | | | | | | | | | | | | | | | | | | | | | | | | |
BlackRock Long-Term Municipal Advantage Trust (BTA) | | | | 59,383 | | | | | | | | | | 749,413 | | | | | | |
BlackRock Municipal Income Investment Quality Trust (BAF) | | | | 28,500 | | | | | | | | | | 409,260 | | | | | | |
BlackRock MuniEnhanced Fund, Inc. (MEN) | | | | 24,000 | | | | | | | | | | 272,160 | | | | | | |
See accompanying notes to financial statements.
| | |
34 | | SIT MUTUAL FUNDS SEMI-ANNUAL REPORT |
| | | | | | | | | | | | | | | | | | | | | | | | | |
| | | | | |
| Name of Issuer | | Quantity | | | | | | Fair Value ($) |
| | | | | |
BlackRock MuniHoldings Florida Insured Fund (MFL) | | | | 85,398 | | | | | | | | | | | | | | | 1,155,435 | | | | | | |
BlackRock MuniHoldings Fund II, Inc. (MUH) | | | | 36,000 | | | | | | | | | | | | | | | 542,880 | | | | | | |
BlackRock MuniHoldings Quality Fund II, Inc. (MUE) | | | | 39,714 | | | | | | | | | | | | | | | 507,148 | | | | | | |
BlackRock MuniHoldings Quality Fund, Inc. (MUS) | | | | 36,338 | | | | | | | | | | | | | | | 464,763 | | | | | | |
BlackRock MuniYield Insured Fund (MYI) | | | | 71,171 | | | | | | | | | | | | | | | 965,790 | | | | | | |
BlackRock MuniYield Michigan Insured Fund (MIY) | | | | 21,538 | | | | | | | | | | | | | | | 302,609 | | | | | | |
DWS Municipal, Income Trust (KTF) | | | | 76,036 | | | | | | | | | | | | | | | 881,257 | | | | | | |
Invesco Municipal Opportunity Trust (VMO) | | | | 38,400 | | | | | | | | | | | | | | | 480,384 | | | | | | |
Invesco Municipal Trust (VKQ) | | | | 25,000 | | | | | | | | | | | | | | | 315,250 | | | | | | |
Invesco Quality Municipal Income Trust (IQI) | | | | 50,200 | | | | | | | | | | | | | | | 642,058 | | | | | | |
Invesco Van Kampen Advantage Muni Income Trust (VKI) | | | | 40,200 | | | | | | | | | | | | | | | 451,848 | | | | | | |
Invesco Van Kampen Trust For Investment Grade Municipals (VGM) | | | | 25,000 | | | | | | | | | | | | | | | 321,750 | | | | | | |
NuveenAMT-Free Quality Municipal Income Fund (NEA) | | | | 135,172 | | | | | | | | | | | | | | | 1,934,311 | | | | | | |
Nuveen Quality Municipal Income Fund (NAD) | | | | 74,173 | | | | | | | | | | | | | | | 1,065,124 | | | | | | |
Putnam Municipal Opportunities Trust (PMO) | | | | 15,000 | | | | | | | | | | | | | | | 196,050 | | | | | | |
| | | | | | | | | | | | | | | | | | | | | | | | | |
| | | | | |
Total Investment Companies
(cost: $11,303,277) | | | | | | | | | | | | | | | | | | | 11,657,490 | | | | | | |
| | | | | | | | | | | | | | | | | | | | | | | | | |
| | | | | |
Total Investments in Securities - 91.5%
(cost: $266,789,110) | | | | | | | | | | | | | | | | | | | 267,913,889 | | | | | | |
Other Assets and Liabilities, net - 8.5% | | | | | | | | | | | | | | | | | | | 24,822,208 | | | | | | |
| | | | | | | | | | | | | | | | | | | | | | | | | |
| | | | | |
Total Net Assets - 100.0% | | | | | | | | | | | | | | | | | | $ | 292,736,097 | | | | | | |
| | | | | | | | | | | | | | | | | | | | | | | | | |
| | | | | | | | | | | | | | | | | | | | | | | | | |
| 1 | | Variable rate security. Rate disclosed is as of September 30, 2019. Certain variable rate securities are not based on a published reference rate and spread but are determined by the issuer or agent and are based on current market conditions, or, for mortgage-backed securities, are impacted by the individual mortgages which are paying off over time. These securities do not indicate a reference rate and spread in their descriptions. |
| 2 | | Securities considered illiquid by the Investment Adviser. The total value of such securities as of September 30, 2019 was $2,678,546 and represented 0.9% of net assets. |
| 4 | | 144A Restricted Security. The total value of such securities as of September 30, 2019 was $28,769,651 and represented 9.8% of net assets. These securities have been determined to be liquid by the Adviser in accordance with guidelines established by the Board of Directors. |
| 5 | | The issuer is in default of interest or principal payments, or other debt covenants. Income is not being accrued. The total value of such securities as of September 30, 2019 was $1,993,897 and represented 0.7% of net assets. |
| 6 | | Zero coupon or convertible capital appreciation bond, for which the rate disclosed is either the effective yield on purchase date or the coupon rate to be paid upon conversion to coupon paying. |
| 9 | | Municipal Lease Security. The total value of such securities as of September 30, 2019 was $4,011,238 and represented 1.4% of net assets. These securities have been determined to be liquid by the Adviser in accordance with guidelines established by the Board of Directors. |
| 15 | | Securities with a “N/A” maturity date have passed their stated maturity date and have pending restructuring arrangements. |
Numeric footnotes not disclosed are not applicable to this Schedule of Investments.
See accompanying notes to financial statements.
SCHEDULE OF INVESTMENTS (Unaudited)
September 30, 2019
SitTax-Free Income Fund (Continued)
Short futures contracts outstanding as of September 30, 2019 were as follows:
| | | | | | | | | | | | | | | | |
| | | | | | | | | | | | Value/ | |
| | | | | | | | | | | | Unrealized | |
| | | | | | Expiration | | | Notional | | | Appreciation | |
| Type | | Contracts | | | Date | | | Amount ($) | | | Depreciation ($) | |
| | | | |
Short Futures:10 | | | | | | | | | | | | | | | | |
U.S. Treasury10-Year | | | 87 | | | | December 2019 | | | | (11,337,188 | ) | | | 96,232 | |
U.S. Treasury5-Year | | | 72 | | | | December 2019 | | | | (8,578,688 | ) | | | 52,084 | |
U.S. Treasury Long Bond | | | 36 | | | | December 2019 | | | | (5,843,250 | ) | | | 67,662 | |
| | | | |
| | | | | | | | | | | | | | | 215,978 | |
| 10 | The amount of $3,000,000 in cash was segregated with the broker to cover margin requirements for derivative transactions as of September 30, 2019. |
A summary of the levels for the Fund’s investments as of September 30, 2019 is as follows (see Note 2 - significant accounting policies in the notes to financial statements):
| | | | | | | | | | | | | | | | | | | | |
| | | Investment in Securities |
| | | | | |
| | | Level 1 | | Level 2 | | Level 3 | | |
| | | Quoted | | Other significant | | Significant | | |
| | | Price ($) | | observable inputs ($) | | unobservable inputs ($) | | Total ($) |
| | | | | |
Assets | | | | | | | | | | | | | | | | | | | | |
Municipal Bonds | | | | — | | | | | 256,256,399 | | | | | — | | | | | 256,256,399 | |
Investment Companies | | | | 11,657,490 | | | | | — | | | | | — | | | | | 11,657,490 | |
Futures | | | | 215,978 | | | | | — | | | | | — | | | | | 215,978 | |
| | | | | |
| | | | |
| | | | 11,873,468 | | | | | 256,256,399 | | | | | — | | | | | 268,129,867 | |
| | | | | |
There were no transfers into or out of level 3 during the reporting period.
See accompanying notes to financial statements.
| | |
36 | | SIT MUTUAL FUNDS SEMI-ANNUAL REPORT |
[This page intentionally left blank.]
|
Sit MinnesotaTax-Free Income Fund |
OBJECTIVE & STRATEGY
The investment objective of the MinnesotaTax-Free Income Fund is to provide a high level of current income exempt from federal regular income tax and Minnesota regular personal income tax as is consistent with the preservation of capital.
During normal market conditions, the Fund invests 100% of its net assets in municipal securities that generate interest income that is exempt from federal regular income tax and Minnesota regular personal income tax. The Fund anticipates that substantially all of its distributions to its shareholders will be exempt as such. For investors subject to the alternative minimum tax (“AMT”), up to 20% of the Fund’s income may be alternative minimum taxable income.
Fund Performance
The Sit MinnesotaTax-Free Income Fund provided a return of +3.66% during the six months ending September 30, 2019, compared to the return of the Bloomberg Barclays5-Year Bond Index of +2.21%. The Fund’s30-day SEC yield was 1.88%, compared to a yield of 1.50% for the benchmark index, and the Fund’s12-month distribution rate was 2.99%.
Factors that Influenced the Fund’s Performance
Thetax-exempt yield curve shifted lower and flattened during the pastsix-months, as longer yields fell most. Yields for10-30 year maturities fell approximately45-60 basis points, while yields for2-5 year maturities fell approximately25-35 basis points. Credit spreads fortax-exempt bonds also tightened over the last six months, particularly forA-rated credits and below.Tax-exempt fund flows remained strong throughout 2019, totaling $69 billion through the beginning of October, already the highest annual total on record since data collection began in 1992. Municipal issuance in the first nine months of 2019, totaling $275 billion, was slightly stronger than the $253 billion issued in the same period in 2018 and easily absorbed by the market. Access to attractive Minnesota-exempt issues has been a bit challenging. Minnesota-exempt issuanceyear-to-date is down modestly versus the same period last year. Also, high yield funds often competed with specialty state funds fornon-rated and high-yield issues, and school district bonds and other high-grade issues often possessed unappealing combinations of structure and yield. Fortunately, strong Minnesota-exempt housing issuance offset some of these challenges.
The Fund benefited from its significant allocation to longer bonds relative to its benchmark over the last six months, as longer bonds outperformed shorter bonds. Specifically, over 75% of the Fund’s bonds had a duration of 4 years or longer and outperformed the benchmark return. Conversely, the Fund had a negligible loss on our hedge in U.S. Treasury futures before we stopped hedging the Fund’s duration in May. Nearly all sectors in the Fund outperformed the benchmark, with the most significant performance contributions resulting from education/student loan revenue bonds, hospital/healthcare revenue bonds, multi-family mortgage revenue bonds, general obligation bonds, and single-family mortgage revenue bonds. In terms of quality, the Fund maintained an average credit quality ofsingle-A and benefited from a significant allocation, nearly 90% of the Fund, to bonds with AA or lower credit quality, as such bonds tended to outperform the highest-rated bonds.
HYPOTHETICAL GROWTH OF $10,000
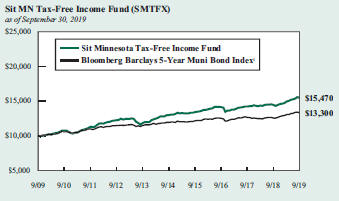
The chart above illustrates the total value of a hypothetical $10,000 investment in the Fund over the past 10 years (or for the life of the Fund if shorter) as compared to the performance of the Bloomberg Barclays5-Year Municipal Bond Index. Past performance does not guarantee future results. Returns include the reinvestment of distributions. The chart does not reflect the deduction of taxes that a shareholder would pay on Fund distributions or the redemption of Fund shares.
1 The Bloomberg Barclays5-Year Municipal Bond Index is the 5 year(4-6) component of the Municipal Bond Index, an unmanaged, rules-based, market-value-weighted index for the long-termtax-exempt bond market. The index includes bonds with a minimum credit rating of BBB. The returns include the reinvestment of income and do not include any transaction costs, management fees or other costs. It is not possible to invest directly in an index. This is the Fund’s primary index.
Outlook and Positioning
The Fund continues to emphasize income as the primary driver of returns over an interest rate cycle. We will continue to focus on higher-yielding revenue bond sectors,non-rated bonds, and bonds with call or redemption provisions that present attractive relative yields to average life estimates. Housing-related sectors remain a meaningful percentage of the Fund, totaling nearly 40% of Fund assets, and continue to present an attractive relative value. Similarly, roughly 25% of the Fund remains invested innon-rated bonds, which also possess an attractive income advantage and have been rated by the Adviser. Although we are not currently hedging the Fund’s duration, we may reinstate the hedge if conditions in the Fund or market change. We remain diversified on an issuer basis to manage credit risk within the Fund and believe the Fund remains well-positioned for the current environment.
Paul J. Jungquist, CFA
Senior Portfolio Manager
| | |
38 | | SIT MUTUAL FUNDS SEMI-ANNUAL REPORT |
COMPARATIVE RATES OF RETURNS
| | | | | | |
| | | |
| as of September 30, 2019 | | | | |
| | | Sit
Minnesota
Tax-Free
Income Fund | | Bloomberg
Barclays
5-Year
Muni. Bond
Index1 | | Lipper MN
Muni. Bond
Fund Index2 |
|
| | | |
Six Months | | 3.66% | | 2.21% | | n/a |
One Year | | 7.13 | | 6.02 | | 7.56% |
Five Years | | 3.61 | | 2.25 | | 3.27 |
Ten Years | | 4.46 | | 2.89 | | 3.93 |
Since Inception (12/1/93) | | 4.72 | | 4.22 | | 4.45 |
Performance figures are historical and do not guarantee future results. Investment returns and principal value will vary, and you may have a gain or loss when you sell shares. Current performance may be lower or higher than the performance data quoted. Contact the Fund for performance data current to the most recentmonth-end. Returns include changes in share price as well as reinvestment of all dividends and capital gains. Returns do not reflect the deduction of taxes that a shareholder would pay on Fund distributions or the redemption of Fund shares. Management fees and administrative expenses are included in the Fund’s performance. Returns for periods greater than one year are compounded average annual rates of return.
1 The Bloomberg Barclays5-Year Municipal Bond Index is the 5 year(4-6) component of the Municipal Bond Index, an unmanaged, rules-based, market-value-weighted index made for the long-termtax-exempt bond market. The index includes bonds with a minimum credit rating of BBB. The returns include the reinvestment of income and do not include any transaction costs, management fees or other costs. It is not possible to invest directly in an index.
2 The Lipper returns are obtained from Lipper Analytical Services, Inc., a large independent evaluator of mutual funds.
FUND DIVERSIFICATION
| | | | |
| | |
Multifamily Mortgage | | | 20.0 | % |
Single Family Mortgage | | | 18.6 | |
Hospital/Health Care | | | 15.0 | |
Education/Student Loan | | | 14.0 | |
General Obligation | | | 8.4 | |
Sectors less than 5.0% | | | 19.5 | |
Cash & Other Net Assets | | | 4.5 | |
Based on total net assets as of September 30, 2019. Subject to change.
PORTFOLIO SUMMARY
| | |
| | |
Net Asset Value 9/30/19: | | $10.72 Per Share |
Net Asset Value 3/31/19: | | $10.49 Per Share |
Total Net Assets: | | $676.1 Million |
Average Maturity: | | 16.5 Years |
Effective Duration3: | | 4.6 Years |
3 Duration is a measure of estimated price sensitivity relative to changes in interest rates. Portfolios with longer durations are typically more sensitive to changes in interest rates. For example, if interest rates rise by 1%, the fair value of a security with an effective duration of 5 years would decrease by 5%, with all other factors being constant. The correlation between duration and price sensitivity is greater for securities rated investment-grade than it is for securities rated below investment-grade. Duration estimates are based on assumptions by the Adviser and are subject to a number of limitations. Effective duration is calculated based on historical price changes of securities held by the Fund, and therefore is a more accurate estimate of price sensitivity provided interest rates remain within their historical range.
QUALITY RATINGS (% of Total Net Assets)
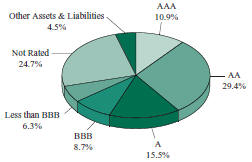
Lower of Moody’s, S&P, Fitch or Duff & Phelps ratings used
Adviser’s Assessment ofNon-Rated Securities:
| | | | |
A | | | 1.3 | % |
BBB | | | 5.1 | |
BB | | | 16.8 | |
<BB | | | 1.5 | |
| | | | |
Total | | | 24.7 | % |
SCHEDULE OF INVESTMENTS (Unaudited)
September 30, 2019
Sit MinnesotaTax-Free Income Fund
| | | | | | | | | | | | | | | | | | | | | | |
| | | | | |
| Name of Issuer | | Principal
Amount ($) | | Coupon
Rate (%) | | Maturity
Date | | Fair Value ($) |
| | | | | |
Municipal Bonds - 94.5% | | | | | | | | | | | | | | | | | | | | | | |
Education/Student Loan - 14.0% | | | | | | | | | | | | | | | | | | | | | | |
Baytown Township Rev. (St. Croix Prep) | | | | 1,000,000 | | | | | 4.00 | | | | | 8/1/36 | | | | | 1,028,270 | | | |
Baytown Township Rev. (St. Croix Prep) | | | | 1,250,000 | | | | | 4.00 | | | | | 8/1/41 | | | | | 1,270,138 | | | |
Baytown Township Rev. (St. Croix Prep) | | | | 1,000,000 | | | | | 4.25 | | | | | 8/1/46 | | | | | 1,026,800 | | | |
Bethel Charter School Lease Rev. (Spectrum High School Proj.) | | | | 500,000 | | | | | 3.50 | | | | | 7/1/27 | | | | | 520,795 | | | |
Bethel Charter School Lease Rev. (Spectrum High School Proj.) | | | | 900,000 | | | | | 4.00 | | | | | 7/1/32 | | | | | 959,922 | | | |
Bethel Charter School Lease Rev. (Spectrum High School Proj.) | | | | 1,100,000 | | | | | 4.00 | | | | | 7/1/37 | | | | | 1,157,409 | | | |
Bethel Charter School Lease Rev. (Spectrum High School Proj.) | | | | 1,500,000 | | | | | 4.25 | | | | | 7/1/47 | | | | | 1,578,645 | | | |
Brooklyn Park Charter School Lease Rev. (Athlos Leadership Academy Proj.) | | | | 605,000 | | | | | 5.25 | | | | | 7/1/30 | | | | | 651,168 | | | |
Cologne Charter School Lease Rev. (Cologne Academy Proj.) | | | | 285,000 | | | | | 4.00 | | | | | 7/1/21 | | | | | 291,273 | | | |
Cologne Charter School Lease Rev. (Cologne Academy Proj.) | | | | 295,000 | | | | | 4.00 | | | | | 7/1/22 | | | | | 304,526 | | | |
Cologne Charter School Lease Rev. (Cologne Academy Proj.) | | | | 575,000 | | | | | 5.00 | | | | | 7/1/29 | | | | | 622,328 | | | |
Cologne Charter School Lease Rev. (Cologne Academy Proj.) | | | | 500,000 | | | | | 5.00 | | | | | 7/1/34 | | | | | 533,870 | | | |
Deephaven Charter School Lease Rev. (Eagle Ridge Academy Proj.) | | | | 585,000 | | | | | 5.25 | | | | | 7/1/37 | | | | | 638,802 | | | |
Deephaven Charter School Lease Rev. (Eagle Ridge Academy Proj.) | | | | 600,000 | | | | | 5.25 | | | | | 7/1/40 | | | | | 652,248 | | | |
Deephaven Charter School Lease Rev. (Eagle Ridge Academy Proj.) | | | | 1,000,000 | | | | | 5.50 | | | | | 7/1/50 | | | | | 1,092,800 | | | |
Forest Lake Charter School Lease Rev. (Lake International Language Academy) | | | | 580,000 | | | | | 4.50 | | | | | 8/1/26 | | | | | 617,190 | | | |
Forest Lake Charter School Lease Rev. (Lake International Language Academy) | | | | 1,000,000 | | | | | 5.00 | | | | | 8/1/36 | | | | | 1,106,970 | | | |
Forest Lake Charter School Lease Rev. (Lake International Language Academy) | | | | 750,000 | | | | | 5.50 | | | | | 8/1/36 | | | | | 805,755 | | | |
Ham Lake Charter School Lease Rev. (Davinci Academy Proj.) | | | | 625,000 | | | | | 5.00 | | | | | 7/1/31 | | | | | 672,250 | | | |
Ham Lake Charter School Lease Rev. (Davinci Academy Proj.) | | | | 1,000,000 | | | | | 5.00 | | | | | 7/1/36 | | | | | 1,066,090 | | | |
Ham Lake Charter School Lease Rev. (Parnassus Prep. Sch. Proj.) | | | | 1,000,000 | | | | | 4.00 | | | | | 11/1/26 | | | | | 1,052,900 | | | |
Ham Lake Charter School Lease Rev. (Parnassus Prep. Sch. Proj.) | | | | 2,720,000 | | | | | 5.00 | | | | | 11/1/36 | | | | | 2,936,648 | | | |
Hugo Charter School Lease Rev. (Noble Academy Proj.) | | | | 460,000 | | | | | 4.00 | | | | | 7/1/21 | | | | | 470,759 | | | |
Hugo Charter School Lease Rev. (Noble Academy Proj.) | | | | 750,000 | | | | | 5.00 | | | | | 7/1/29 | | | | | 804,885 | | | |
Hugo Charter School Lease Rev. (Noble Academy Proj.) | | | | 1,000,000 | | | | | 5.00 | | | | | 7/1/34 | | | | | 1,062,330 | | | |
Independence Charter School Lease Rev. (Beacon Academy Proj.) | | | | 495,000 | | | | | 4.25 | | | | | 7/1/26 | | | | | 513,196 | | | |
Independence Charter School Lease Rev. (Beacon Academy Proj.) | | | | 750,000 | | | | | 4.75 | | | | | 7/1/31 | | | | | 784,290 | | | |
Independence Charter School Lease Rev. (Beacon Academy Proj.) | | | | 1,200,000 | | | | | 5.00 | | | | | 7/1/36 | | | | | 1,255,824 | | | |
Minneapolis Charter School Lease Rev. (Hiawatha Academy Proj.) | | | | 875,000 | | | | | 4.00 | | | | | 7/1/26 | | | | | 908,434 | | | |
Minneapolis Educational Fac. Lease Rev. (Seed/Harvest Preparatory Proj.)4 | | | | 525,000 | | | | | 6.25 | | | | | 3/1/21 | | | | | 491,101 | | | |
Minneapolis School Lease Rev. (Twin Cities International School)4 | | | | 1,000,000 | | | | | 4.25 | | | | | 12/1/27 | | | | | 1,031,290 | | | |
Minneapolis School Lease Rev. (Twin Cities International School)4 | | | | 1,000,000 | | | | | 5.00 | | | | | 12/1/37 | | | | | 1,027,590 | | | |
MN Higher Education Fac. Auth. Rev. (Bethel Univ.) | | | | 1,200,000 | | | | | 5.00 | | | | | 5/1/37 | | | | | 1,392,156 | | | |
MN Higher Education Fac. Auth. Rev. (Bethel Univ.) | | | | 3,500,000 | | | | | 5.00 | | | | | 5/1/47 | | | | | 3,994,550 | | | |
MN Higher Education Fac. Auth. Rev. (College of St. Benedict) | | | | 1,000,000 | | | | | 4.00 | | | | | 3/1/43 | | | | | 1,054,970 | | | |
MN Higher Education Fac. Auth. Rev. (College of St. Benedict) | | | | 1,900,000 | | | | | 5.00 | | | | | 3/1/37 | | | | | 2,175,595 | | | |
MN Higher Education Fac. Auth. Rev. (College of St. Scholastica) | | | | 1,100,000 | | | | | 4.00 | | | | | 12/1/40 | | | | | 1,214,708 | | | |
MN Higher Education Fac. Auth. Rev. (Gustavus Adolphus College) | | | | 1,250,000 | | | | | 4.00 | | | | | 10/1/41 | | | | | 1,371,975 | | | |
MN Higher Education Fac. Auth. Rev. (St. Olaf College) | | | | 500,000 | | | | | 4.00 | | | | | 10/1/32 | | | | | 565,000 | | | |
MN Higher Education Fac. Auth. Rev. (St. Olaf College) | | | | 500,000 | | | | | 4.00 | | | | | 10/1/34 | | | | | 562,540 | | | |
MN Higher Education Fac. Auth. Rev. (St. Olaf College) | | | | 500,000 | | | | | 4.00 | | | | | 10/1/35 | | | | | 561,920 | | | |
MN Higher Education Fac. Auth. Rev. (St. Scholastica College) | | | | 1,800,000 | | | | | 6.30 | | | | | 12/1/40 | | | | | 1,814,508 | | | |
MN Higher Education Fac. Auth. Rev. (Univ. of St. Thomas) | | | | 400,000 | | | | | 4.00 | | | | | 10/1/35 | | | | | 449,772 | | | |
MN Higher Education Fac. Auth. Rev. (Univ. of St. Thomas) | | | | 500,000 | | | | | 4.00 | | | | | 10/1/37 | | | | | 558,840 | | | |
MN Higher Education Fac. Auth. Rev. (Univ. of St. Thomas) | | | | 3,150,000 | | | | | 4.00 | | | | | 4/1/39 | | | | | 3,453,124 | | | |
MN Higher Education Fac. Auth. Rev. (Univ. of St. Thomas) | | | | 750,000 | | | | | 4.00 | | | | | 10/1/41 | | | | | 856,200 | | | |
MN Higher Education Fac. Auth. Rev. (Univ. of St. Thomas) | | | | 2,750,000 | | | | | 4.00 | | | | | 10/1/44 | | | | | 3,108,545 | | | |
MN Higher Education Fac. Auth. Rev. (Univ. of St. Thomas) | | | | 750,000 | | | �� | | 5.00 | | | | | 4/1/35 | | | | | 886,972 | | | |
MN Office of Higher Education Rev.8 | | | | 5,000,000 | | | | | 4.00 | | | | | 11/1/37 | | | | | 5,416,900 | | | |
MN State Colleges and Universities Rev. | | | | 510,000 | | | | | 4.00 | | | | | 10/1/35 | | | | | 546,088 | | | |
Moorhead Educational Fac. Rev. (Concordia College Corp. Proj.) | | | | 1,250,000 | | | | | 5.00 | | | | | 12/1/40 | | | | | 1,391,700 | | | |
See accompanying notes to financial statements.
| | |
40 | | SIT MUTUAL FUNDS SEMI-ANNUAL REPORT |
| | | | | | | | | | | | | | | | | | | | | | |
| | | | | |
| Name of Issuer | | Principal
Amount ($) | | Coupon
Rate (%) | | Maturity
Date | | Fair Value ($) |
| | | | | |
Olmsted Co. Hsg. & Redev. Auth. Rev. (Schaeffer Academy Proj.) | | | | 534,249 | | | | | 4.98 | | | | | 4/25/27 | | | | | 534,617 | | | |
Ramsey Lease Rev. (Pact Charter School Proj.) | | | | 385,000 | | | | | 5.00 | | | | | 12/1/26 | | | | | 406,029 | | | |
Ramsey Lease Rev. (Pact Charter School Proj.) | | | | 1,850,000 | | | | | 5.50 | | | | | 12/1/33 | | | | | 1,957,485 | | | |
Rice Co. Educational Fac. Rev.(Shattuck-St. Mary’s School)4 | | | | 3,400,000 | | | | | 5.00 | | | | | 8/1/22 | | | | | 3,580,030 | | | |
Rochester Rev. (Math & Science Academy) | | | | 1,430,000 | | | | | 5.13 | | | | | 9/1/38 | | | | | 1,496,581 | | | |
Savage Charter School Lease Rev. (Aspen Academy) | | | | 500,000 | | | | | 4.00 | | | | | 10/1/26 | | | | | 498,190 | | | |
Savage Charter School Lease Rev. (Aspen Academy) | | | | 1,000,000 | | | | | 4.75 | | | | | 10/1/31 | | | | | 1,020,880 | | | |
St. Cloud Charter School Lease Rev. (Stride Academy Proj.)2 | | | | 350,000 | | | | | 3.00 | | | | | 4/1/21 | | | | | 238,000 | | | |
St. Cloud Charter School Lease Rev. (Stride Academy Proj.)2 | | | | 1,850,000 | | | | | 5.00 | | | | | 4/1/36 | | | | | 1,253,042 | | | |
St. Paul Hsg. & Redev. Auth. | | | | 700,000 | | | | | 5.00 | | | | | 12/1/30 | | | | | 781,480 | | | |
St. Paul Hsg. & Redev. Auth. | | | | 1,000,000 | | | | | 5.00 | | | | | 12/1/37 | | | | | 1,102,480 | | | |
St. Paul Hsg. & Redev. Auth. | | | | 705,000 | | | | | 5.00 | | | | | 12/1/46 | | | | | 768,330 | | | |
St. Paul Hsg. & Redev. Auth. (German Immersion School) | | | | 360,000 | | | | | 4.00 | | | | | 7/1/23 | | | | | 369,270 | | | |
St. Paul Hsg. & Redev. Auth. (German Immersion School) | | | | 855,000 | | | | | 5.00 | | | | | 7/1/33 | | | | | 912,636 | | | |
St. Paul Hsg. & Redev. Auth. (German Immersion School) | | | | 500,000 | | | | | 5.00 | | | | | 7/1/44 | | | | | 527,360 | | | |
St. Paul Hsg. & Redev. Auth. (Higher Ground Academy Proj.) | | | | 1,300,000 | | | | | 4.25 | | | | | 12/1/23 | | | | | 1,334,346 | | | |
St. Paul Hsg. & Redev. Auth. (Higher Ground Academy Proj.) | | | | 1,500,000 | | | | | 5.00 | | | | | 12/1/33 | | | | | 1,573,875 | | | |
St. Paul Hsg. & Redev. Auth. (Higher Ground Academy Proj.) | | | | 390,000 | | | | | 5.13 | | | | | 12/1/38 | | | | | 408,190 | | | |
St. Paul Hsg. & Redev. Auth. (Hope Community Academy Proj.) | | | | 720,000 | | | | | 4.50 | | | | | 12/1/29 | | | | | 758,938 | | | |
St. Paul Hsg. & Redev. Auth. (St. Paul Conservatory for Performing Artists) | | | | 1,135,000 | | | | | 4.63 | | | | | 3/1/43 | | | | | 1,144,046 | | | |
St. Paul Hsg. & Redev. Auth. (Twin Cities Academy Proj.) | | | | 1,395,000 | | | | | 4.00 | | | | | 7/1/25 | | | | | 1,442,821 | | | |
St. Paul Hsg. & Redev. Auth. (Twin Cities Academy Proj.) | | | | 955,000 | | | | | 5.00 | | | | | 7/1/35 | | | | | 1,022,270 | | | |
St. Paul Hsg. & Redev. Auth. (Twin Cities German Immersion School) | | | | 555,000 | | | | | 5.00 | | | | | 7/1/49 | | | | | 614,318 | | | |
St. Paul Hsg. & Redev. Auth. (Twin Cities German Immersion School) | | | | 870,000 | | | | | 5.00 | | | | | 7/1/55 | | | | | 956,765 | | | |
St. Paul Hsg. & Redev. Auth. Lease Rev. (Hmong College Preparatory Academy) | | | | 285,000 | | | | | 4.75 | | | | | 9/1/22 | | | | | 292,544 | | | |
St. Paul Hsg. & Redev. Auth. Lease Rev. (Hmong College Preparatory Academy) | | | | 500,000 | | | | | 5.00 | | | | | 9/1/27 | | | | | 513,845 | | | |
St. Paul Hsg. & Redev. Auth. Lease Rev. (Nova Classical Academy Proj.) | | | | 270,000 | | | | | 5.70 | | | | | 9/1/21 | | | | | 282,328 | | | |
St. Paul Hsg. & Redev. Auth. Rev. (Community of Peace Academy Proj.) | | | | 600,000 | | | | | 4.00 | | | | | 12/1/39 | | | | | 634,806 | | | |
St. Paul Hsg. & Redev. Auth. Rev. (Community of Peace Academy Proj.) | | | | 1,000,000 | | | | | 4.00 | | | | | 12/1/49 | | | | | 1,040,840 | | | |
St. Paul Hsg. & Redev. Auth. Rev. (Hmong College Preparatory Academy Proj.) | | | | 1,000,000 | | | | | 5.25 | | | | | 9/1/31 | | | | | 1,110,500 | | | |
St. Paul Hsg. & Redev. Auth. Rev. (Metro Deaf School Proj.)4 | | | | 700,000 | | | | | 5.00 | | | | | 6/15/38 | | | | | 731,346 | | | |
St. Paul Hsg. & Redev. Auth. Rev. (Nova Classical Academy Proj.) | | | | 600,000 | | | | | 4.00 | | | | | 9/1/36 | | | | | 630,678 | | | |
St. Paul Hsg. & Redev. Auth. Rev. (Nova Classical Academy Proj.) | | | | 1,000,000 | | | | | 4.13 | | | | | 9/1/47 | | | | | 1,041,550 | | | |
University of Minnesota Rev. | | | | 1,000,000 | | | | | 5.00 | | | | | 4/1/41 | | | | | 1,187,750 | | | |
Victoria Private School Fac. Rev. (Holy Family Catholic High) | | | | 1,610,000 | | | | | 4.00 | | | | | 9/1/23 | | | | | 1,633,409 | | | |
Woodbury Charter School Lease Rev. (MSA Building) | | | | 355,000 | | | | | 5.00 | | | | | 12/1/27 | | | | | 373,577 | | | |
Woodbury Charter School Lease Rev. (MSA Building) | | | | 225,000 | | | | | 5.00 | | | | | 12/1/32 | | | | | 235,604 | | | |
| | | | | | | | | | | | | | | | | | | | | | |
| | | | | |
| | | | | | | | | | | | | | | | | | | 94,723,315 | | | |
| | | | | | | | | | | | | | | | | | | | | | |
Escrowed To Maturity/Prerefunded - 2.5% | | | | | | | | | | | | | | | | | | | | | | |
Anoka Co. Charter School Lease Rev. | | | | 295,000 | | | | | 5.00 | | | | | 6/1/27 | | | | | 307,974 | | | |
Anoka Co. Charter School Lease Rev. | | | | 2,435,000 | | | | | 5.00 | | | | | 6/1/43 | | | | | 2,542,091 | | | |
Bemidji Sales Tax G.O. | | | | 1,000,000 | | | | | 5.00 | | | | | 2/1/34 | | | | | 1,048,900 | | | |
Bemidji Sales Tax G.O. | | | | 1,350,000 | | | | | 6.00 | | | | | 2/1/41 | | | | | 1,433,592 | | | |
Deephaven Charter School Lease Rev. (Eagle Ridge Academy Proj.) | | | | 1,280,000 | | | | | 5.13 | | | | | 7/1/33 | | | | | 1,456,461 | | | |
MN Higher Education Fac. Auth. Rev. (Hamline Univ.) | | | | 750,000 | | | | | 6.00 | | | | | 10/1/32 | | | | | 818,648 | | | |
MN Higher Education Fac. Auth. Rev. (Hamline Univ.) | | | | 1,000,000 | | | | | 6.00 | | | | | 10/1/40 | | | | | 1,091,530 | | | |
Oak Park Heights Hsg. Rev. (Oakgreen Commons Proj.) | | | | 1,000,000 | | | | | 6.00 | | | | | 8/1/25 | | | | | 1,037,910 | | | |
Oak Park Heights Hsg. Rev. (Oakgreen Commons Proj.) | | | | 1,000,000 | | | | | 6.25 | | | | | 8/1/33 | | | | | 1,059,310 | | | |
Rochester Health Care & Hsg. Rev. (Samaritan Bethany, Inc. Proj.) | | | | 475,000 | | | | | 5.75 | | | | | 12/1/19 | | | | | 478,334 | | | |
Rochester Health Care & Hsg. Rev. (Samaritan Bethany, Inc. Proj.) | | | | 2,515,000 | | | | | 7.38 | | | | | 12/1/41 | | | | | 2,539,270 | | | |
See accompanying notes to financial statements.
SCHEDULE OF INVESTMENTS (Unaudited)
September 30, 2019
Sit MinnesotaTax-Free Income Fund (Continued)
| | | | | | | | | | | | | | | | | | | | | | |
| | | | | |
| Name of Issuer | | Principal
Amount ($) | | Coupon
Rate (%) | | Maturity
Date | | Fair Value ($) |
| | | | | |
St. Paul Hsg. & Redev. Auth. Rev. (HealthEast Care System Proj.) | | | | 1,000,000 | | | | | 5.00 | | | | | 11/15/26 | | | | | 1,040,630 | | | |
St. Paul Hsg. & Redev. Auth. Rev. (HealthEast Care System Proj.) | | | | 1,000,000 | | | | | 5.25 | | | | | 11/15/28 | | | | | 1,043,400 | | | |
St. Paul Hsg. & Redev. Auth. Rev. (HealthEast Care System Proj.) | | | | 1,000,000 | | | | | 5.25 | | | | | 11/15/35 | | | | | 1,043,400 | | | |
| | | | | | | | | | | | | | | | | | | | | | |
| | | | | |
| | | | | | | | | | | | | | | | | | | 16,941,450 | | | |
| | | | | | | | | | | | | | | | | | | | | | |
General Obligation - 8.4% | | | | | | | | | | | | | | | | | | | | | | |
Brainerd Independent School District No. 181 | | | | 1,000,000 | | | | | 4.00 | | | | | 2/1/42 | | | | | 1,106,530 | | | |
Brainerd Independent School District No. 181 | | | | 4,000,000 | | | | | 4.00 | | | | | 2/1/43 | | | | | 4,417,080 | | | |
Brooklyn Center Independent School District No. 286 | | | | 4,000,000 | | | | | 4.00 | | | | | 2/1/40 | | | | | 4,380,560 | | | |
Cloquet Independent School District No. 94 | | | | 5,000,000 | | | | | 4.00 | | | | | 2/1/36 | | | | | 5,424,000 | | | |
Deer River G.O. | | | | 500,000 | | | | | 4.00 | | | | | 2/1/48 | | | | | 539,975 | | | |
Fosston Independent School District No. 601 | | | | 1,000,000 | | | | | 4.00 | | | | | 2/1/36 | | | | | 1,112,680 | | | |
Fosston Independent School District No. 601 | | | | 1,000,000 | | | | | 4.00 | | | | | 2/1/38 | | | | | 1,104,190 | | | |
Fridley Independent School District No. 14 | | | | 400,000 | | | | | 4.00 | | | | | 2/1/30 | | | | | 452,028 | | | |
Glencoe-Silver Lake Independent School District No. 2859 | | | | 1,300,000 | | | | | 4.00 | | | | | 2/1/40 | | | | | 1,407,016 | | | |
Inver Grove Heights Independent School District No. 199 | | | | 520,000 | | | | | 4.00 | | | | | 2/1/25 | | | | | 524,534 | | | |
Long Prairie G.O.8 | | | | 750,000 | | | | | 4.00 | | | | | 2/1/37 | | | | | 805,432 | | | |
Minneapolis Capital Improvement | | | | 4,000,000 | | | | | 4.00 | | | | | 12/1/43 | | | | | 4,450,840 | | | |
Minneapolis Capital Improvement | | | | 2,000,000 | | | | | 4.00 | | | | | 12/1/46 | | | | | 2,221,520 | | | |
Minnetonka Independent School District No. 276 | | | | 1,900,000 | | | | | 5.00 | | | | | 2/1/41 | | | | | 2,178,711 | | | |
Morrison Co. Education District No. 6979 | | | | 1,000,000 | | | | | 4.50 | | | | | 2/1/34 | | | | | 1,045,230 | | | |
Mounds View Independent School District No. 621 | | | | 500,000 | | | | | 4.00 | | | | | 2/1/24 | | | | | 503,980 | | | |
Pine City Crossover G.O. | | | | 500,000 | | | | | 3.25 | | | | | 2/1/28 | | | | | 500,590 | | | |
Richfield Independent School District No. 280 | | | | 6,000,000 | | | | | 4.00 | | | | | 2/1/37 | | | | | 6,684,000 | | | |
Robbinsdale Independent School District No. 281 | | | | 375,000 | | | | | 4.00 | | | | | 2/1/21 | | | | | 378,409 | | | |
Robbinsdale Independent School District No. 281 | | | | 1,050,000 | | | | | 4.00 | | | | | 2/1/31 | | | | | 1,163,673 | | | |
Roseville Independent School District No. 623 | | | | 930,000 | | | | | 4.00 | | | | | 2/1/35 | | | | | 1,041,191 | | | |
Roseville Independent School District No. 623 | | | | 4,895,000 | | | | | 4.00 | | | | | 2/1/36 | | | | | 5,467,274 | | | |
South Washington Co. Independent School District No. 833 | | | | 5,000,000 | | | | | 4.00 | | | | | 2/1/31 | | | | | 5,637,100 | | | |
St. Cloud Independent School District No. 742 | | | | 1,000,000 | | | | | 4.00 | | | | | 2/1/37 | | | | | 1,105,140 | | | |
St. Francis Independent School District No. 15 | | | | 550,000 | | | | | 4.00 | | | | | 2/1/35 | | | | | 583,192 | | | |
St. Francis Independent School District No. 15 | | | | 750,000 | | | | | 4.00 | | | | | 2/1/36 | | | | | 794,348 | | | |
St. Michael-Albertville Independent School District No. 885 | | | | 500,000 | | | | | 4.00 | | | | | 2/1/30 | | | | | 567,915 | | | |
United Hospital District Health Care Facs. G.O (Lake Wood Health System) | | | | 1,005,000 | | | | | 5.00 | | | | | 12/1/30 | | | | | 1,193,659 | | | |
| | | | | | | | | | | | | | | | | | | | | | |
| | | | | |
| | | | | | | | | | | | | | | | | | | 56,790,797 | | | |
| | | | | | | | | | | | | | | | | | | | | | |
Hospital/Health Care - 15.0% | | | | | | | | | | | | | | | | | | | | | | |
Anoka Health Care and Hsg. Facs. Rev. | | | | 1,135,000 | | | | | 5.38 | | | | | 11/1/34 | | | | | 1,231,032 | | | |
Anoka Health Care and Hsg. Facs. Rev. (Walker Methodist Plaza) | | | | 1,500,000 | | | | | 5.25 | | | | | 7/1/35 | | | | | 1,536,735 | | | |
Center City Heath Care Facs. Rev. (Hazelden Betty Ford Foundation Proj.) | | | | 3,000,000 | | | | | 4.50 | | | | | 11/1/34 | | | | | 3,293,010 | | | |
Center City Heath Care Facs. Rev. (Hazelden Betty Ford Foundation Proj.) | | | | 500,000 | | | | | 4.75 | | | | | 11/1/31 | | | | | 501,365 | | | |
Center City Heath Care Facs. Rev. (Hazelden Betty Ford Foundation Proj.) | | | | 250,000 | | | | | 5.00 | | | | | 11/1/29 | | | | | 284,635 | | | |
Center City Heath Care Facs. Rev. (Hazelden Betty Ford Foundation Proj.) | | | | 500,000 | | | | | 5.00 | | | | | 11/1/44 | | | | | 555,045 | | | |
Chippewa Co. Rev. (Monte Video Hospital Proj.) | | | | 2,000,000 | | | | | 4.00 | | | | | 3/1/32 | | | | | 2,148,000 | | | |
Crookston Health Care Facs. Rev. (Riverview Health Care Proj.) | | | | 1,000,000 | | | | | 4.00 | | | | | 5/1/32 | | | | | 1,039,980 | | | |
Crookston Health Care Facs. Rev. (Riverview Health Care Proj.) | | | | 1,000,000 | | | | | 5.00 | | | | | 5/1/34 | | | | | 1,127,000 | | | |
Crookston Health Care Facs. Rev. (Riverview Health Care Proj.) | | | | 1,000,000 | | | | | 5.00 | | | | | 5/1/38 | | | | | 1,107,970 | | | |
Dakota Co. Community Dev. Agy. (Sanctuary at W. St. Paul Proj.) | | | | 1,900,000 | | | | | 5.75 | | | | | 8/1/30 | | | | | 1,957,874 | | | |
Dakota Co. Community Dev. Agy. (Sanctuary at W. St. Paul Proj.) | | | | 1,050,000 | | | | | 6.00 | | | | | 8/1/35 | | | | | 1,083,128 | | | |
Duluth Economic Dev. Auth. Rev. (St. Lukes Hospital Oblig. Group) | | | | 840,000 | | | | | 4.75 | | | | | 6/15/22 | | | | | 859,463 | | | |
Duluth Economic Dev. Auth. Rev. (St. Lukes Hospital Oblig. Group) | | | | 1,600,000 | | | | | 5.75 | | | | | 6/15/32 | | | | | 1,748,336 | | | |
Duluth Economic Dev. Auth. Rev. (St. Lukes Hospital Oblig. Group) | | | | 2,000,000 | | | | | 6.00 | | | | | 6/15/39 | | | | | 2,203,920 | | | |
Glencoe Health Care Fac. Rev. (Glencoe Regional Health Services Proj.) | | | | 2,110,000 | | | | | 4.00 | | | | | 4/1/31 | | | | | 2,196,742 | | | |
See accompanying notes to financial statements.
| | |
42 | | SIT MUTUAL FUNDS SEMI-ANNUAL REPORT |
| | | | | | | | | | | | | | | | | | | | | | |
| | | | | |
| Name of Issuer | | Principal
Amount ($) | | Coupon
Rate (%) | | Maturity
Date | | Fair Value ($) |
| | | | | |
Hayward Health Care Fac. Rev. (American Baptist Homes Midwest Proj.) | | | | 1,350,000 | | | | | 5.38 | | | | | 8/1/34 | | | | | 1,413,814 | | | |
Hayward Health Care Fac. Rev. (American Baptist Homes Midwest Proj.) | | | | 500,000 | | | | | 5.75 | | | | | 2/1/44 | | | | | 525,280 | | | |
Hayward Hsg. & Health Care Fac. Rev. (St. John Lutheran Home of Albert Lea Proj.) | | | | 1,900,000 | | | | | 5.00 | | | | | 10/1/34 | | | | | 1,960,952 | | | |
Maple Grove Health Care System Rev. (Maple Grove Hospital Corp.) | | | | 3,500,000 | | | | | 4.00 | | | | | 5/1/37 | | | | | 3,834,145 | | | |
Maple Grove Health Care System Rev. (Maple Grove Hospital Corp.) | | | | 325,000 | | | | | 5.00 | | | | | 5/1/32 | | | | | 389,685 | | | |
Maple Grove Health Care System Rev. (Memorial Health Care) | | | | 1,275,000 | | | | | 4.00 | | | | | 9/1/35 | | | | | 1,379,856 | | | |
Minneapolis Health Care System Rev. (Fairview Health Services) | | | | 3,000,000 | | | | | 4.00 | | | | | 11/15/37 | | | | | 3,370,200 | | | |
Minneapolis Health Care System Rev. (Fairview Health Services) | | | | 1,000,000 | | | | | 4.00 | | | | | 11/15/38 | | | | | 1,120,700 | | | |
Minneapolis Health Care System Rev. (Fairview Health Services) | | | | 2,590,000 | | | | | 5.00 | | | | | 11/15/34 | | | | | 3,042,680 | | | |
Minneapolis Health Care System Rev. (Fairview Health Services) | | | | 2,500,000 | | | | | 5.00 | | | | | 11/15/49 | | | | | 2,998,275 | | | |
Minneapolis Rev. Ref. (Walker Campus) | | | | 1,160,000 | | | | | 4.50 | | | | | 11/15/20 | | | | | 1,181,298 | | | |
Moorhead Economic Dev. Auth. Rev. | | | | 550,000 | | | | | 4.60 | | | | | 9/1/25 | | | | | 556,369 | | | |
Oak Park Heights Nursing Home Rev. (Boutwells Landing Care Center) | | | | 1,500,000 | | | | | 5.50 | | | | | 8/1/28 | | | | | 1,616,085 | | | |
Oak Park Heights Nursing Home Rev. (Boutwells Landing Care Center) | | | | 1,000,000 | | | | | 6.00 | | | | | 8/1/36 | | | | | 1,085,100 | | | |
Rochester Health Care Facs. Rev. (Mayo Clinic) | | | | 7,500,000 | | | | | 4.00 | | | | | 11/15/48 | | | | | 8,433,450 | | | |
Rochester Health Care Facs. Rev. (Mayo Clinic) | | | | 5,000,000 | | | | | 5.00 | | | | | 11/15/33 | | | | | 6,999,550 | | | |
Rochester Health Care Facs. Rev. (Olmsted Medical Center Proj.) | | | | 1,500,000 | | | | | 5.88 | | | | | 7/1/30 | | | | | 1,545,690 | | | |
Shakopee Health Care Facs. Rev. (St. Francis Regional Medical Center Proj.) | | | | 745,000 | | | | | 5.00 | | | | | 9/1/28 | | | | | 853,979 | | | |
Shakopee Health Care Facs. Rev. (St. Francis Regional Medical Center Proj.) | | | | 1,350,000 | | | | | 5.00 | | | | | 9/1/34 | | | | | 1,514,619 | | | |
St. Cloud Health Care Rev. (CentraCare Health System Proj.) | | | | 2,500,000 | | | | | 4.00 | | | | | 5/1/37 | | | | | 2,749,500 | | | |
St. Cloud Health Care Rev. (CentraCare Health System Proj.) | | | | 500,000 | | | | | 4.00 | | | | | 5/1/49 | | | | | 553,200 | | | |
St. Cloud Health Care Rev. (CentraCare Health System Proj.) | | | | 3,750,000 | | | | | 5.00 | | | | | 5/1/46 | | | | | 4,376,662 | | | |
St. Cloud Health Care Rev. (CentraCare Health System Proj.) | | | | 500,000 | | | | | 5.00 | | | | | 5/1/48 | | | | | 609,010 | | | |
St. Louis Park Health Care Facs. Rev. (Mount Olivet Careview Home Health Proj.)1 | | | | 2,250,000 | | | | | 4.60 | | | | | 6/1/41 | | | | | 2,361,735 | | | |
St. Paul Hsg. & Redev. Auth. Health Care Rev. (Fairview Health Services Proj.) | | | | 750,000 | | | | | 4.00 | | | | | 11/15/35 | | | | | 841,395 | | | |
St. Paul Hsg. & Redev. Auth. Health Care Rev. (Fairview Health Services Proj.) | | | | 4,000,000 | | | | | 4.00 | | | | | 11/15/43 | | | | | 4,399,880 | | | |
St. Paul Hsg. & Redev. Auth. Health Care Rev. (Fairview Health Services Proj.) | | | | 1,000,000 | | | | | 5.00 | | | | | 11/15/47 | | | | | 1,189,350 | | | |
St. Paul Hsg. & Redev. Auth. Health Care Rev. (HealthPartners Oblig. Group Proj.) | | | | 4,800,000 | | | | | 5.00 | | | | | 7/1/32 | | | | | 5,533,248 | | | |
St. Paul Hsg. & Redev. Auth. Health Care Rev. (HealthPartners Oblig. Group Proj.) | | | | 2,000,000 | | | | | 5.00 | | | | | 7/1/33 | | | | | 2,295,940 | | | |
St. Paul Hsg. & Redev. Auth. Health Care Rev. (Senior Episcopal Homes Proj.) | | | | 525,000 | | | | | 4.25 | | | | | 11/1/25 | | | | | 527,630 | | | |
St. Paul Hsg. & Redev. Auth. Health Care Rev. (Senior Episcopal Homes Proj.) | | | | 750,000 | | | | | 4.75 | | | | | 11/1/31 | | | | | 754,920 | | | |
St. Paul Hsg. & Redev. Auth. Health Care Rev. (Senior Episcopal Homes Proj.) | | | | 2,150,000 | | | | | 5.00 | | | | | 5/1/38 | | | | | 2,219,552 | | | |
St. Paul Hsg. & Redev. Auth. Health Care Rev. (Senior Episcopal Homes Proj.) | | | | 500,000 | | | | | 5.15 | | | | | 11/1/42 | | | | | 503,790 | | | |
St. Paul Hsg. & Redev. Auth. Rev. (Nursing HomeNTS-Episcopal) | | | | 1,897,923 | | | | | 5.63 | | | | | 10/1/33 | | | | | 1,906,577 | | | |
Victoria Health Care Facs. Rev. (Augustana Emerald Care LLC) | | | | 1,000,000 | | | | | 4.25 | | | | | 8/1/24 | | | | | 1,028,190 | | | |
West St. Paul Hsg. & Health Care Rev. (Walker Westwood Ridge Camp) | | | | 1,000,000 | | | | | 5.00 | | | | | 11/1/37 | | | | | 1,077,510 | | | |
Winsted Health Care Rev. (St. Mary’s Care Center Proj.)2, 5 | | | | 1,071,148 | | | | | 6.00 | | | | | 9/1/25 | | | | | 749,803 | | | |
Winsted Health Care Rev. (St. Mary’s Care Center Proj.)2,5 | | | | 1,029,950 | | | | | 6.50 | | | | | 9/1/34 | | | | | 720,965 | | | |
| | | | | | | | | | | | | | | | | | | | | | |
| | | | | |
| | | | | | | | | | | | | | | | | | | 101,094,819 | | | |
| | | | | | | | | | | | | | | | | | | | | | |
Industrial/Pollution Control - 0.5% | | | | | | | | | | | | | | | | | | | | | | |
International Falls Rev. (Boise Cascade Corp. Proj.) | | | | 405,000 | | | | | 5.65 | | | | | 12/1/22 | | | | | 411,099 | | | |
St. Paul Port Auth. Rev.8 | | | | 1,000,000 | | | | | 4.00 | | | | | 10/1/40 | | | | | 1,087,860 | | | |
St. Paul Port Auth. Rev. | | | | 1,000,000 | | | | | 4.00 | | | | | 10/1/42 | | | | | 1,102,010 | | | |
St. Paul Port Auth. Solid Waste Disposal Rev. (Gerdau St. Paul Steel Mill Proj.)4,8 | | | | 1,000,000 | | | | | 4.50 | | | | | 10/1/37 | | | | | 1,012,580 | | | |
| | | | | | | | | | | | | | | | | | | | | | |
| | | | | |
| | | | | | | | | | | | | | | | | | | 3,613,549 | | | |
| | | | | | | | | | | | | | | | | | | | | | |
Insured - 0.4% | | | | | | | | | | | | | | | | | | | | | | |
Guam Power Auth. Rev. (AGM Insured)11 | | | | 500,000 | | | | | 5.00 | | | | | 10/1/30 | | | | | 548,975 | | | |
MN Governmental Agy. Fin. Group (Flex Terminal Prog.) (AGC Insured) | | | | 75,000 | | | | | 4.00 | | | | | 3/1/20 | | | | | 75,148 | | | |
MN Governmental Agy. Fin. Group (Flex Terminal Prog.) (AGC Insured) | | | | 90,000 | | | | | 4.00 | | | | | 3/1/22 | | | | | 90,157 | | | |
See accompanying notes to financial statements.
SCHEDULE OF INVESTMENTS (Unaudited)
September 30, 2019
Sit MinnesotaTax-Free Income Fund (Continued)
| | | | | | | | | | | | | | | | | | | | | | |
| | | | | |
| Name of Issuer | | Principal
Amount ($) | | Coupon
Rate (%) | | Maturity
Date | | Fair Value ($) |
| | | | | |
Puerto Rico Public Improvement G.O. (AGM Insured)11 | | | | 750,000 | | | | | 5.13 | | | | | 7/1/30 | | | | | 772,492 | | | |
Virgin Islands Public Fin. Auth. (Gross Receipts Taxes Loan Note) (NATL Insured)11 | | | | 1,000,000 | | | | | 5.00 | | | | | 10/1/23 | | | | | 1,017,330 | | | |
| | | | | | | | | | | | | | | | | | | | | | |
| | | | | |
| | | | | | | | | | | | | | | | | | | 2,504,102 | | | |
| | | | | | | | | | | | | | | | | | | | | | |
Multifamily Mortgage - 20.0% | | | | | | | | | | | | | | | | | | | | | | |
Anoka Hsg. Rev. (Homestead at Anoka, Inc. Proj.) | | | | 1,000,000 | | | | | 4.75 | | | | | 11/1/35 | | | | | 1,075,530 | | | |
Anoka Hsg. Rev. (Homestead at Anoka, Inc. Proj.) | | | | 1,000,000 | | | | | 5.50 | | | | | 11/1/46 | | | | | 1,105,570 | | | |
Apple Valley Economic Dev. Auth. Rev. (Augustana Healthcare Center) | | | | 500,000 | | | | | 3.90 | | | | | 2/1/31 | | | | | 507,220 | | | |
Apple Valley Economic Dev. Auth. Rev. (Augustana Healthcare Center) | | | | 500,000 | | | | | 4.15 | | | | | 2/1/36 | | | | | 506,300 | | | |
Apple Valley Senior Hsg. Rev. (Presbyterian Homes) | | | | 1,500,000 | | | | | 5.00 | | | | | 9/1/43 | | | | | 1,622,145 | | | |
Apple Valley Senior Living Rev. (Senior Living LLC Proj.) | | | | 1,100,000 | | | | | 4.00 | | | | | 1/1/25 | | | | | 1,119,470 | | | |
Apple Valley Senior Living Rev. (Senior Living LLC Proj.) | | | | 500,000 | | | | | 4.00 | | | | | 1/1/25 | | | | | 505,165 | | | |
Apple Valley Senior Living Rev. (Senior Living LLC Proj.) | | | | 1,235,000 | | | | | 4.00 | | | | | 1/1/26 | | | | | 1,255,674 | | | |
Apple Valley Senior Living Rev. (Senior Living LLC Proj.) | | | | 1,000,000 | | | | | 4.00 | | | | | 1/1/30 | | | | | 1,011,750 | | | |
Apple Valley Senior Living Rev. (Senior Living LLC Proj.) | | | | 660,000 | | | | | 4.13 | | | | | 1/1/28 | | | | | 666,534 | | | |
Apple Valley Senior Living Rev. (Senior Living LLC Proj.) | | | | 1,500,000 | | | | | 4.25 | | | | | 1/1/37 | | | | | 1,516,065 | | | |
Apple Valley Senior Living Rev. (Senior Living LLC Proj.) | | | | 2,775,000 | | | | | 4.38 | | | | | 1/1/47 | | | | | 2,797,949 | | | |
Apple Valley Senior Living Rev. (Senior Living LLC Proj.) | | | | 3,000,000 | | | | | 5.00 | | | | | 1/1/47 | | | | | 3,042,780 | | | |
Apple Valley Senior Living Rev. (Senior Living LLC Proj.) | | | | 1,700,000 | | | | | 6.75 | | | | | 1/1/27 | | | | | 1,735,071 | | | |
Apple Valley Senior Living Rev. (Senior Living LLC Proj.) | | | | 1,000,000 | | | | | 7.00 | | | | | 1/1/37 | | | | | 1,027,240 | | | |
Bethel Rev. (Grandview Christian Home Proj.) | | | | 3,000,000 | | | | | 5.00 | | | | | 10/1/41 | | | | | 3,185,280 | | | |
Blaine Senior Hsg. & Health Care Fac. Rev. (Crest View Senior Community Proj.) | | | | 540,000 | | | | | 5.13 | | | | | 7/1/25 | | | | | 548,413 | | | |
Blaine Senior Hsg. & Health Care Fac. Rev. (Crest View Senior Community Proj.) | | | | 1,500,000 | | | | | 5.75 | | | | | 7/1/35 | | | | | 1,528,470 | | | |
Cambridge Hsg. & Health Care Facs. Rev. (Walker Methodist Levande, LLC Proj.) | | | | 1,250,000 | | | | | 5.13 | | | | | 3/1/39 | | | | | 1,364,250 | | | |
Champlin Multifamily Hsg. Rev. (Champlin Drive Apts.) | | | | 625,000 | | | | | 6.00 | | | | | 1/1/27 | | | | | 628,888 | | | |
Chisago Hsg. and Health Care Rev. (CDL Homes LLC) | | | | 750,000 | | | | | 6.00 | | | | | 8/1/33 | | | | | 820,568 | | | |
City of Otsego Rev. (Riverview Landing Proj.) | | | | 1,500,000 | | | | | 5.00 | | | | | 10/1/42 | | | | | 1,594,965 | | | |
Cloquet Hsg. Fac. Ref. (HADC Cloquet LLC Proj.) | | | | 1,020,000 | | | | | 5.00 | | | | | 8/1/38 | | | | | 1,039,584 | | | |
Columbus Hsg. Rev. (Richfield Senior Hsg., Inc.) | | | | 1,000,000 | | | | | 5.00 | | | | | 1/1/34 | | | | | 1,013,670 | | | |
Columbus Hsg. Rev. (Richfield Senior Hsg., Inc.) | | | | 1,000,000 | | | | | 5.25 | | | | | 1/1/40 | | | | | 1,011,210 | | | |
Crystal Multifamily Hsg. Rev. (Cavanagh Proj.) | | | | 2,500,000 | | | | | 5.25 | | | | | 6/1/31 | | | | | 2,567,275 | | | |
Dakota Co. Community Dev. Agy. (Glen at Valley Creek Proj.) | | | | 1,400,000 | | | | | 4.50 | | | | | 8/1/36 | | | | | 1,455,804 | | | |
Dakota Co. Community Dev. Agy. Multifamily Hsg. Rev. | | | | 3,500,000 | | | | | 4.00 | | | | | 1/1/42 | | | | | 3,684,625 | | | |
Dakota Co. Community Dev. Agy. Multifamily Hsg. Rev. (Walker Highviews Hills LLC)4 | | | | 750,000 | | | | | 5.00 | | | | | 8/1/36 | | | | | 782,498 | | | |
Dakota Co. Community Dev. Agy. Multifamily Hsg. Rev. (Walker Highviews Hills LLC)4 | | | | 500,000 | | | | | 5.00 | | | | | 8/1/51 | | | | | 517,020 | | | |
Deephaven Hsg. & Healthcare Rev. (St. Therese Senior Living Proj.) | | | | 1,345,000 | | | | | 5.00 | | | | | 4/1/38 | | | | | 1,375,263 | | | |
Fridley Multifamily Hsg. Rev. (Village Green Apartments Proj.) | | | | 3,467,952 | | | | | 3.75 | | | | | 11/1/34 | | | | | 3,877,205 | | | |
Independence Health Care Facs. Rev. (Augustana Chapel View Home) | | | | 250,000 | | | | | 4.00 | | | | | 12/1/32 | | | | | 255,208 | | | |
Maple Plain Senior Hsg. Health Care Rev. (Haven Home Inc Proj.) | | | | 1,000,000 | | | | | 4.25 | | | | | 7/1/39 | | | | | 1,025,180 | | | |
Maple Plain Senior Hsg. Health Care Rev. (Haven Home Inc Proj.) | | | | 1,000,000 | | | | | 4.45 | | | | | 7/1/44 | | | | | 1,024,980 | | | |
Maple Plain Senior Hsg. Health Care Rev. (Haven Home Inc Proj.) | | | | 500,000 | | | | | 5.00 | | | | | 7/1/39 | | | | | 538,205 | | | |
Maple Plain Senior Hsg. Health Care Rev. (Haven Home Inc Proj.) | | | | 1,000,000 | | | | | 5.00 | | | | | 7/1/49 | | | | | 1,073,720 | | | |
Minneapolis & St. Paul Hsg. & Redev. Auth. Multifamily Hsg. Rev. (GNMA Collateralized)8 | | | | 2,765,000 | | | | | 4.75 | | | | | 1/20/42 | | | | | 2,768,871 | | | |
Minneapolis Multifamily Hsg. Rev. (Greenway Heights Family Housing) | | | | 1,015,000 | | | | | 5.75 | | | | | 7/15/31 | | | | | 1,080,072 | | | |
Minneapolis Senior Hsg. & Health Care Rev. (Ecumen Mill City Quarter) | | | | 375,000 | | | | | 4.75 | | | | | 11/1/28 | | | | | 395,678 | | | |
Minneapolis Senior Hsg. & Health Care Rev. (Ecumen Mill City Quarter) | | | | 1,500,000 | | | | | 5.00 | | | | | 11/1/35 | | | | | 1,579,185 | | | |
Minneapolis Student Hsg. Rev. (Riverton Community Housing Proj.)4 | | | | 1,000,000 | | | | | 4.75 | | | | | 8/1/43 | | | | | 1,060,960 | | | |
Minneapolis Student Hsg. Rev. (Riverton Community Housing Proj.)4 | | | | 500,000 | | | | | 5.00 | | | | | 8/1/53 | | | | | 532,730 | | | |
Minnetonka MF Hsg. Rev. (Elmbrooke & Golden Valley Townhome Proj.) (FNMA Collateralized) | | | | 1,954,272 | | | | | 3.00 | | | | | 11/1/34 | | | | | 2,042,312 | | | |
MN Hsg. Fin. Agy. Rental Hsg. (G.O. of AGY. Insured) | | | | 250,000 | | | | | 5.05 | | | | | 8/1/31 | | | | | 263,050 | | | |
MN Hsg. Fin. Agy. Rental Hsg. (G.O. of AGY. Insured) | | | | 2,560,000 | | | | | 5.25 | | | | | 8/1/40 | | | | | 2,615,450 | | | |
MN Hsg. Fin. Agy. Rental Hsg. (G.O. of AGY. Insured) | | | | 1,760,000 | | | | | 5.45 | | | | | 8/1/41 | | | | | 1,849,250 | | | |
MN Hsg. Fin. Agy. Rental Hsg. Rev. | | | | 1,000,000 | | | | | 5.20 | | | | | 8/1/43 | | | | | 1,090,780 | | | |
See accompanying notes to financial statements.
| | |
44 | | SIT MUTUAL FUNDS SEMI-ANNUAL REPORT |
| | | | | | | | | | | | | | | | | | | | | | |
| | | | | |
| Name of Issuer | | Principal
Amount ($) | | Coupon
Rate (%) | | Maturity
Date | | Fair Value ($) |
| | | | | |
MN Hsg. Fin. Agy. Rev. | | | | 270,000 | | | | | 4.00 | | | | | 8/1/29 | | | | | 302,643 | | | |
MN Hsg. Fin. Agy. Rev. | | | | 255,000 | | | | | 4.00 | | | | | 8/1/31 | | | | | 284,032 | | | |
MN Hsg. Fin. Agy. Rev. | | | | 335,000 | | | | | 4.00 | | | | | 8/1/34 | | | | | 370,848 | | | |
MN Hsg. Fin. Agy. Rev. | | | | 335,000 | | | | | 4.00 | | | | | 8/1/35 | | | | | 370,098 | | | |
MN Hsg. Fin. Agy. Rev. | | | | 515,000 | | | | | 4.00 | | | | | 8/1/39 | | | | | 581,842 | | | |
MN Hsg. Fin. Agy. Rev. | | | | 535,000 | | | | | 4.00 | | | | | 8/1/40 | | | | | 602,924 | | | |
MN Hsg. Fin. Agy. Rev. | | | | 815,000 | | | | | 4.00 | | | | | 8/1/41 | | | | | 915,392 | | | |
MN Hsg. Fin. Agy. Rev. (State Appropriation) | | | | 250,000 | | | | | 4.00 | | | | | 8/1/33 | | | | | 286,002 | | | |
MN Hsg. Fin. Agy. Rev. (State Appropriation) | | | | 2,000,000 | | | | | 5.00 | | | | | 8/1/34 | | | | | 2,315,500 | | | |
MN Hsg. Fin. Agy. Rev. (State Appropriation) | | | | 1,000,000 | | | | | 5.00 | | | | | 8/1/35 | | | | | 1,156,310 | | | |
Moorhead Economic Dev. Auth. Rev. Ref. (EverCare Sr. Living LLC) | | | | 280,000 | | | | | 4.65 | | | | | 9/1/26 | | | | | 283,016 | | | |
Moorhead Health Care Rev. Ref. (EverCare Sr. Living LLC) | | | | 1,000,000 | | | | | 5.00 | | | | | 9/1/32 | | | | | 1,010,560 | | | |
Moorhead Health Care Rev. Ref. (EverCare Sr. Living LLC) | | | | 250,000 | | | | | 5.13 | | | | | 9/1/37 | | | | | 252,490 | | | |
New Ulm Economic Dev. Auth. Rev. (HADC Ridgeway Proj.) | | | | 1,500,000 | | | | | 5.00 | | | | | 8/1/39 | | | | | 1,544,955 | | | |
North Oaks Senior Hsg. Rev. (Waverly Gardens Proj.) | | | | 2,000,000 | | | | | 4.00 | | | | | 10/1/33 | | | | | 2,117,620 | | | |
North Oaks Senior Hsg. Rev. (Waverly Gardens Proj.) | | | | 1,500,000 | | | | | 5.00 | | | | | 10/1/35 | | | | | 1,674,525 | | | |
North Oaks Senior Hsg. Rev. (Waverly Gardens Proj.) | | | | 1,000,000 | | | | | 5.00 | | | | | 10/1/47 | | | | | 1,100,070 | | | |
Oakdale Rev. (Sr. Hsg. Oak Meadows Proj.) | | | | 875,000 | | | | | 5.00 | | | | | 4/1/34 | | | | | 889,630 | | | |
Red Wing Senior Hsg. Rev. (Deer Crest Proj.) | | | | 325,000 | | | | | 5.00 | | | | | 11/1/27 | | | | | 335,706 | | | |
Red Wing Senior Hsg. Rev. (Deer Crest Proj.) | | | | 330,000 | | | | | 5.00 | | | | | 11/1/32 | | | | | 340,438 | | | |
Red Wing Senior Hsg. Rev. (Deer Crest Proj.) | | | | 500,000 | | | | | 5.00 | | | | | 11/1/42 | | | | | 515,115 | | | |
Rochester Health Care & Hsg. Rev. (Homestead Rochester, Inc.) | | | | 1,950,000 | | | | | 5.00 | | | | | 12/1/30 | | | | | 2,055,495 | | | |
Rochester Health Care & Hsg. Rev. (Homestead Rochester, Inc.) | | | | 1,325,000 | | | | | 5.00 | | | | | 12/1/49 | | | | | 1,365,267 | | | |
Rochester Health Care & Hsg. Rev. (Samaritan Bethany, Inc. Proj.) | | | | 1,000,000 | | | | | 5.00 | | | | | 8/1/37 | | | | | 1,071,900 | | | |
Rochester Health Care & Hsg. Rev. (Samaritan Bethany, Inc. Proj.) | | | | 800,000 | | | | | 5.00 | | | | | 8/1/48 | | | | | 848,024 | | | |
Rochester Health Care & Hsg. Rev. (The Homestead at Rochester) | | | | 720,000 | | | | | 6.38 | | | | | 12/1/33 | | | | | 783,792 | | | |
Rochester Health Care & Hsg. Rev. (The Homestead at Rochester) | | | | 2,500,000 | | | | | 6.50 | | | | | 12/1/35 | | | | | 2,726,350 | | | |
Rochester Health Care & Hsg. Rev. (The Homestead at Rochester) | | | | 250,000 | | | | | 6.88 | | | | | 12/1/48 | | | | | 273,090 | | | |
Rochester Multifamily Hsg. Rev. (Essex Place Apartments Proj.) ( FHLMC) | | | | 4,000,000 | | | | | 3.75 | | | | | 6/1/29 | | | | | 4,172,480 | | | |
Sartell Health Care & Hsg. Fac. Rev. (Country Manor Campus LLC Proj.) | | | | 475,000 | | | | | 4.00 | | | | | 9/1/20 | | | | | 485,778 | | | |
Sartell Health Care & Hsg. Fac. Rev. (Country Manor Campus LLC Proj.) | | | | 850,000 | | | | | 5.00 | | | | | 9/1/42 | | | | | 948,642 | | | |
Sartell Health Care & Hsg. Fac. Rev. (Country Manor Campus LLC Proj.) | | | | 1,135,000 | | | | | 5.25 | | | | | 9/1/27 | | | | | 1,231,827 | | | |
Sartell Health Care & Hsg. Fac. Rev. (Country Manor Campus LLC Proj.) | | | | 2,150,000 | | | | | 5.30 | | | | | 9/1/37 | | | | | 2,348,724 | | | |
Sauk Rapids Health Care & Hsg. Facs. Rev. (Good Shepherd Lutheran Home Proj.) | | | | 1,705,000 | | | | | 5.13 | | | | | 1/1/39 | | | | | 1,760,668 | | | |
St. Anthony Multifamily Hsg. Rev. (Silver Lake Village Hsg.) | | | | 250,000 | | | | | 5.75 | | | | | 12/1/28 | | | | | 274,145 | | | |
St. Anthony Multifamily Hsg. Rev. (Silver Lake Village Hsg.) | | | | 2,000,000 | | | | | 6.00 | | | | | 12/1/30 | | | | | 2,200,000 | | | |
St. Joseph Senior Hsg. & Health Care Rev. (Woodcrest of Country Manor Proj.) | | | | 750,000 | | | | | 4.25 | | | | | 7/1/39 | | | | | 761,400 | | | |
St. Joseph Senior Hsg. & Health Care Rev. (Woodcrest of Country Manor Proj.) | | | | 1,125,000 | | | | | 4.25 | | | | | 7/1/44 | | | | | 1,132,155 | | | |
St. Joseph Senior Hsg. & Health Care Rev. (Woodcrest of Country Manor Proj.) | | | | 1,500,000 | | | | | 5.00 | | | | | 7/1/55 | | | | | 1,577,880 | | | |
St. Paul Hsg. & Redev. Auth. (Pioneer Press Apts. Proj.)1,4 | | | | 1,500,000 | | | | | 3.38 | | | | | 5/1/21 | | | | | 1,500,075 | | | |
St. Paul Hsg. & Redev. Auth. Health Care Rev. (Carondelet Village Proj.) | | | | 2,415,000 | | | | | 4.25 | | | | | 12/1/27 | | | | | 2,582,046 | | | |
St. Paul Hsg. & Redev. Auth. Health Care Rev. (Carondelet Village Proj.) | | | | 2,400,000 | | | | | 5.00 | | | | | 12/1/47 | | | | | 2,642,352 | | | |
St. Paul Hsg. & Redev. Auth. Multifamily Housing Rev. (Marian Center Proj.) | | | | 935,000 | | | | | 5.20 | | | | | 11/1/22 | | | | | 935,935 | | | |
St. Paul Hsg. & Redev. Auth. Multifamily Housing Rev. (Marian Center Proj.) | | | | 1,000,000 | | | | | 5.30 | | | | | 11/1/30 | | | | | 1,000,580 | | | |
St. Paul Hsg. & Redev. Auth. Multifamily Housing Rev. (Marian Center Proj.) | | | | 2,590,000 | | | | | 5.38 | | | | | 5/1/43 | | | | | 2,590,673 | | | |
St. Paul Park Health Care Facs. Rev (Presbyterian Homes Interlu Proj.) | | | | 1,000,000 | | | | | 5.00 | | | | | 5/1/43 | | | | | 1,068,750 | | | |
St. Paul Park Hsg. Rev. (Buffalo Senior Housing Proj.) | | | | 1,115,000 | | | | | 5.00 | | | | | 10/1/38 | | | | | 1,175,756 | | | |
St. Paul Park Senior Hsg. Rev. (Presbyterian Homes Bloomin Proj.) | | | | 1,000,000 | | | | | 5.00 | | | | | 9/1/42 | | | | | 1,097,430 | | | |
St. Paul Port Auth. Rev. (Energy Park Utility Company Proj.)8 | | | | 2,515,000 | | | | | 5.70 | | | | | 8/1/36 | | | | | 2,598,423 | | | |
St. Peter Hsg. & Health Care Fac. Rev. (Ecumen Second Century & Owatonna Senior Living Proj.) | | | | 700,000 | | | | | 5.00 | | | | | 3/1/40 | | | | | 734,153 | | | |
Vergas Hsg. & Healthcare Facs. Rev. (CDL Homes Proj.) | | | | 1,000,000 | | | | | 4.25 | | | | | 8/1/43 | | | | | 1,024,530 | | | |
Wayzata Senior Hsg. Rev. (Folkestone Senior Living Community) | | | | 1,500,000 | | | | | 4.00 | | | | | 8/1/44 | | | | | 1,552,545 | | | |
Wayzata Senior Hsg. Rev. (Folkestone Senior Living Community) | | | | 1,000,000 | | | | | 5.00 | | | | | 8/1/49 | | | | | 1,100,400 | | | |
See accompanying notes to financial statements.
SCHEDULE OF INVESTMENTS (Unaudited)
September 30, 2019
Sit MinnesotaTax-Free Income Fund (Continued)
| | | | | | | | | | | | | | | | | | | | | | |
| | | | | |
| Name of Issuer | | Principal
Amount ($) | | Coupon
Rate (%) | | Maturity
Date | | Fair Value ($) |
| | | | | |
Wayzata Senior Hsg. Rev. (Folkestone Senior Living Community) | | | | 1,750,000 | | | | | 5.00 | | | | | 8/1/54 | | | | | 1,921,552 | | | |
Willmar Hsg. & Redev. Auth. Multifamily Rev. (Eagle Ridge Apartments) | | | | 2,610,000 | | | | | 4.63 | | | | | 4/1/30 | | | | | 2,643,199 | | | |
| | | | | | | | | | | | | | | | | | | | | | |
| | | | | |
| | | | | | | | | | | | | | | | | | | 135,120,814 | | | |
| | | | | | | | | | | | | | | | | | | | | | |
Municipal Lease9- 4.9% | | | | | | | | | | | | | | | | | | | | | | |
Anoka Co. Hsg. & Redev. Rev. | | | | 320,000 | | | | | 5.63 | | | | | 5/1/22 | | | | | 323,533 | | | |
Anoka Co. Hsg. & Redev. Rev. | | | | 500,000 | | | | | 6.63 | | | | | 5/1/30 | | | | | 508,070 | | | |
Anoka Co. Hsg. & Redev. Rev. | | | | 500,000 | | | | | 6.88 | | | | | 5/1/40 | | | | | 507,755 | | | |
Anoka-Hennepin Independent School District No. 11 Lease Rev. | | | | 600,000 | | | | | 4.00 | | | | | 2/1/41 | | | | | 626,268 | | | |
Chaska Economic Dev. Auth. Lease Rev. | | | | 1,100,000 | | | | | 4.00 | | | | | 2/1/31 | | | | | 1,212,618 | | | |
Chaska Economic Dev. Auth. Lease Rev. | | | | 690,000 | | | | | 4.00 | | | | | 2/1/33 | | | | | 755,074 | | | |
Chaska Economic Dev. Auth. Lease Rev. | | | | 500,000 | | | | | 4.00 | | | | | 2/1/35 | | | | | 545,730 | | | |
Duluth Independent School District No. 709 | | | | 1,000,000 | | | | | 4.00 | | | | | 2/1/27 | | | | | 1,117,640 | | | |
Duluth Independent School District No. 709 | | | | 750,000 | | | | | 4.20 | | | | | 3/1/34 | | | | | 801,180 | | | |
Duluth Independent School District No. 709 | | | | 2,000,000 | | | | | 5.00 | | | | | 2/1/25 | | | | | 2,337,520 | | | |
Duluth Independent School District No. 709 | | | | 785,000 | | | | | 5.13 | | | | | 3/1/29 | | | | | 796,555 | | | |
Golden Valley Hsg. & Redev. Auth. Rev. | | | | 1,000,000 | | | | | 4.00 | | | | | 2/1/30 | | | | | 1,085,350 | | | |
Golden Valley Hsg. & Redev. Auth. Rev. | | | | 500,000 | | | | | 4.00 | | | | | 2/1/32 | | | | | 540,190 | | | |
Goodhue Co. Education District No. 6051 Lease Rev. | | | | 1,030,000 | | | | | 5.00 | | | | | 2/1/34 | | | | | 1,156,989 | | | |
Goodhue Co. Education District No. 6051 Lease Rev. | | | | 1,500,000 | | | | | 5.00 | | | | | 2/1/39 | | | | | 1,666,185 | | | |
Guam Education Fin. Foundation11 | | | | 1,000,000 | | | | | 5.00 | | | | | 10/1/21 | | | | | 1,052,060 | | | |
Guam Education Fin. Foundation11 | | | | 1,730,000 | | | | | 5.00 | | | | | 10/1/22 | | | | | 1,862,933 | | | |
Minnetonka Independent School District No. 276 | | | | 450,000 | | | | | 4.00 | | | | | 3/1/30 | | | | | 499,846 | | | |
Minnetonka Independent School District No. 276 | | | | 340,000 | | | | | 4.00 | | | | | 2/1/33 | | | | | 361,920 | | | |
Minnetonka Independent School District No. 276 | | | | 300,000 | | | | | 4.00 | | | | | 3/1/33 | | | | | 330,774 | | | |
Minnetonka Independent School District No. 276 | | | | 400,000 | | | | | 4.00 | | | | | 2/1/36 | | | | | 424,316 | | | |
Minnetonka Independent School District No. 276 | | | | 500,000 | | | | | 4.50 | | | | | 1/1/41 | | | | | 554,705 | | | |
MN Hsg. Fin. Agy. Hsg. Infrastructure (State Appropriation) | | | | 750,000 | | | | | 3.88 | | | | | 8/1/38 | | | | | 819,322 | | | |
MN Hsg. Fin. Agy. Hsg. Infrastructure (State Appropriation) | | | | 1,040,000 | | | | | 4.00 | | | | | 8/1/36 | | | | | 1,158,768 | | | |
MN Hsg. Fin. Agy. Hsg. Infrastructure (State Appropriation) | | | | 580,000 | | | | | 4.00 | | | | | 8/1/37 | | | | | 643,835 | | | |
MN Hsg. Fin. Agy. Hsg. Infrastructure (State Appropriation) | | | | 945,000 | | | | | 4.00 | | | | | 8/1/40 | | | | | 1,032,167 | | | |
MN Hsg. Fin. Agy. Rev. (State Appropriation) | | | | 300,000 | | | | | 5.00 | | | | | 8/1/35 | | | | | 336,309 | | | |
Northeastern Metropolitan Intermediate School District No. 916 | | | | 1,000,000 | | | | | 5.00 | | | | | 2/1/34 | | | | | 1,160,150 | | | |
Osseo Independent School District No. 279 | | | | 1,000,000 | | | | | 4.00 | | | | | 2/1/28 | | | | | 1,093,750 | | | |
Plymouth Intermediate District No. 287 | | | | 1,285,000 | | | | | 3.00 | | | | | 5/1/32 | | | | | 1,330,386 | | | |
Plymouth Intermediate District No. 287 | | | | 470,000 | | | | | 4.00 | | | | | 5/1/31 | | | | | 516,488 | | | |
Plymouth Intermediate District No. 287 | | | | 600,000 | | | | | 4.00 | | | | | 2/1/37 | | | | | 666,690 | | | |
Southern Plains Education Cooperative No. 915 | | | | 1,215,000 | | | | | 4.00 | | | | | 2/1/37 | | | | | 1,229,143 | | | |
Southern Plains Education Cooperative No. 915 | | | | 1,000,000 | | | | | 4.50 | | | | | 2/1/39 | | | | | 1,032,930 | | | |
St. Cloud Independent School District No. 742 | | | | 750,000 | | | | | 4.00 | | | | | 2/1/38 | | | | | 810,232 | | | |
Waconia Independent School District No. 110 | | | | 500,000 | | | | | 5.00 | | | | | 2/1/37 | | | | | 577,370 | | | |
Winona School District No. 861 Lease Purchase | | | | 224,196 | | | | | 6.04 | | | | | 8/1/24 | | | | | 224,740 | | | |
Worthington Independent School District No. 518 | | | | 1,400,000 | | | | | 4.00 | | | | | 2/1/45 | | | | | 1,509,270 | | | |
| | | | | | | | | | | | | | | | | | | | | | |
| | | | | |
| | | | | | | | | | | | | | | | | | | 33,208,761 | | | |
| | | | | | | | | | | | | | | | | | | | | | |
Municipal Money Market - 1.1% | | | | | | | | | | | | | | | | | | | | | | |
City of Minneapolis Hsg. Dev. Rev. (One Ten Grant Proj.)1 | | | | 4,720,000 | | | | | 1.57 | | | | | 9/1/26 | | | | | 4,720,000 | | | |
City of Minneapolis Rev. (Univ. Gateway Proj.)1 | | | | 2,200,000 | | | | | 1.60 | | | | | 12/1/27 | | | | | 2,200,000 | | | |
City of Minneapolis Rev. (Univ. Gateway Proj.)1 | | | | 500,000 | | | | | 1.60 | | | | | 6/1/32 | | | | | 500,000 | | | |
| | | | | | | | | | | | | | | | | | | | | | |
| | | | | |
| | | | | | | | | | | | | | | | | | | 7,420,000 | | | |
| | | | | | | | | | | | | | | | | | | | | | |
Other Revenue Bonds - 4.2% | | | | | | | | | | | | | | | | | | | | | | |
Center City Heath Care Facs. Rev. (Hazelden Betty Ford Foundation Proj.) | | | | 1,000,000 | | | | | 4.00 | | | | | 11/1/41 | | | | | 1,106,790 | | | |
Crystal Governmental Fac. Rev. | | | | 397,193 | | | | | 5.10 | | | | | 12/15/26 | | | | | 397,777 | | | |
See accompanying notes to financial statements.
| | |
46 | | SIT MUTUAL FUNDS SEMI-ANNUAL REPORT |
| | | | | | | | | | | | | | | | | | | | | | |
| | | | | |
| Name of Issuer | | Principal
Amount ($) | | Coupon
Rate (%) | | Maturity
Date | | Fair Value ($) |
| | | | | |
Milaca Rev. (Edina Headquarters Proj.) | | | | 250,000 | | | | | 5.00 | | | | | 2/1/44 | | | | | 256,435 | | | |
Minneapolis Rev. (YMCA Greater Twin Cities Proj.) | | | | 165,000 | | | | | 4.00 | | | | | 6/1/29 | | | | | 182,805 | | | |
Minneapolis Rev. (YMCA Greater Twin Cities Proj.) | | | | 125,000 | | | | | 4.00 | | | | | 6/1/30 | | | | | 138,002 | | | |
Minneapolis Rev. (YMCA Greater Twin Cities Proj.) | | | | 250,000 | | | | | 4.00 | | | | | 6/1/31 | | | | | 275,038 | | | |
Minneapolis Tax Increment Rev. | | | | 320,000 | | | | | 3.50 | | | | | 3/1/23 | | | | | 330,192 | | | |
Minneapolis Tax Increment Rev. | | | | 170,000 | | | | | 3.80 | | | | | 3/1/25 | | | | | 176,057 | | | |
Minneapolis Tax Increment Rev. | | | | 200,000 | | | | | 4.00 | | | | | 3/1/27 | | | | | 207,494 | | | |
Minneapolis Tax Increment Rev. | | | | 260,000 | | | | | 4.00 | | | | | 3/1/30 | | | | | 268,286 | | | |
MN Development Rev. Limited Tax Supported Comm. Board | | | | 1,000,000 | | | | | 6.00 | | | | | 12/1/40 | | | | | 1,051,630 | | | |
MN Development Rev. Limited Tax Supported Comm. Board | | | | 2,000,000 | | | | | 6.25 | | | | | 12/1/30 | | | | | 2,109,000 | | | |
Mound Hsg. & Redev. Auth. Tax Increment Rev. Ref. (Metroplain Proj.) | | | | 788,000 | | | | | 5.00 | | | | | 2/15/27 | | | | | 789,608 | | | |
Northeastern Metropolitan Intermediate School District No. 916 | | | | 4,500,000 | | | | | 4.00 | | | | | 2/1/38 | | | | | 4,861,395 | | | |
St. Louis Park Economic Dev. Auth. Tax Increment Rev. (Hoigaard Vlg.) | | | | 775,000 | | | | | 5.00 | | | | | 2/1/23 | | | | | 775,790 | | | |
St. Paul Hsg. & Redev. Auth. Tax Increment Rev. (9th St. Lofts Proj.) | | | | 820,000 | | | | | 6.38 | | | | | 2/15/28 | | | | | 825,248 | | | |
St. Paul Hsg. & Redev. Auth. Tax Increment Rev. (Drake Marble Proj.) | | | | 372,000 | | | | | 6.75 | | | | | 3/1/28 | | | | | 372,339 | | | |
St. Paul Hsg. & Redev. Auth. Tax Increment Rev. (Emerald Gardens Proj.) | | | | 720,000 | | | | | 6.50 | | | | | 3/1/29 | | | | | 726,516 | | | |
St. Paul Hsg. & Redev. Auth. Tax Increment Rev. (North Quadrant Owner Occupied Proj.) | | | | 916,000 | | | | | 7.00 | | | | | 2/15/28 | | | | | 924,024 | | | |
St. Paul Hsg. & Redev. Auth. Tax Increment Rev. (North Quadrant Owner Occupied Proj.) | | | | 716,000 | | | | | 7.50 | | | | | 2/15/28 | | | | | 717,181 | | | |
St. Paul Hsg. & Redev. Auth. Tax Increment Rev. (Upper Landing Proj.) | | | | 185,000 | | | | | 5.00 | | | | | 3/1/20 | | | | | 186,770 | | | |
St. Paul Hsg. & Redev. Auth. Tax Increment Rev. (Upper Landing Proj.) | | | | 220,000 | | | | | 5.00 | | | | | 9/1/20 | | | | | 224,552 | | | |
St. Paul Hsg. & Redev. Auth. Tax Increment Rev. (Upper Landing Proj.) | | | | 225,000 | | | | | 5.00 | | | | | 3/1/21 | | | | | 231,530 | | | |
St. Paul Hsg. & Redev. Auth. Tax Increment Rev. (Upper Landing Proj.) | | | | 1,000,000 | | | | | 5.00 | | | | | 9/1/26 | | | | | 1,027,440 | | | |
St. Paul Hsg. & Redev. Auth. Tax Increment Rev. (Upper Landing Proj.) | | | | 930,000 | | | | | 5.00 | | | | | 3/1/29 | | | | | 954,598 | | | |
St. Paul Port Auth. Lease Rev. (Regions Hospital Parking Ramp Proj.) | | | | 3,875,000 | | | | | 5.00 | | | | | 8/1/36 | | | | | 3,883,060 | | | |
St. Paul Port Auth. Rev. (Amherst H. Wilder Foundation) | | | | 3,000,000 | | | | | 5.00 | | | | | 12/1/36 | | | | | 3,042,090 | | | |
Territory of Guam. Rev.11 | | | | 500,000 | | | | | 5.00 | | | | | 12/1/46 | | | | | 560,485 | | | |
Virgin Islands Public Fin. Auth. (Gross Receipts Taxes Loan Note)11 | | | | 2,000,000 | | | | | 5.00 | | | | | 10/1/42 | | | | | 1,965,000 | | | |
| | | | | | | | | | | | | | | | | | | | | | |
| | | | | |
| | | | | | | | | | | | | | | | | | | 28,567,132 | | | |
| | | | | | | | | | | | | | | | | | | | | | |
Public Facilities - 0.2% | | | | | | | | | | | | | | | | | | | | | | |
Lakeville Hsg. & Redev. Auth. Parking Rev. (Ice Arena. Proj.) | | | | 1,250,000 | | | | | 4.00 | | | | | 2/1/32 | | | | | 1,388,475 | | | |
| | | | | | | | | | | | | | | | | | | | | | |
| | | | | |
Sales Tax Revenue - 1.2% | | | | | | | | | | | | | | | | | | | | | | |
American Samoa Economic Development Authority Rev.4,11 | | | | 900,000 | | | | | 6.00 | | | | | 9/1/23 | | | | | 935,703 | | | |
American Samoa Economic Development Authority Rev.11 | | | | 2,000,000 | | | | | 6.25 | | | | | 9/1/29 | | | | | 2,134,340 | | | |
Guam Govt. Business Privilege Tax Rev.11 | | | | 2,750,000 | | | | | 5.00 | | | | | 11/15/35 | | | | | 3,087,535 | | | |
St. Paul Sales Tax Rev. | | | | 1,400,000 | | | | | 5.00 | | | | | 11/1/31 | | | | | 1,627,710 | | | |
| | | | | | | | | | | | | | | | | | | | | | |
| | | | | |
| | | | | | | | | | | | | | | | | | | 7,785,288 | | | |
| | | | | | | | | | | | | | | | | | | | | | |
Single Family Mortgage - 18.6% | | | | | | | | | | | | | | | | | | | | | | |
Dakota Co. Community Dev. Agy. Single Family Mtg. Rev. (GNMA) | | | | 1,035,000 | | | | | 4.45 | | | | | 12/1/32 | | | | | 1,054,986 | | | |
Dakota Co. Community Dev. Agy. Single Family Mtg. Rev. (GNMA-FNMA-FHLMC) | | | | 335,000 | | | | | 4.63 | | | | | 12/1/30 | | | | | 341,727 | | | |
Dakota Co. Community Dev. Agy. Single Family Mtg. Rev. (GNMA-FNMA-FHLMC) | | | | 570,000 | | | | | 4.88 | | | | | 12/1/33 | | | | | 578,772 | | | |
Dakota Co. Community Dev. Agy. Single Family Mtg. Rev. (GNMA-FNMA-FHLMC)8 | | | | 51,342 | | | | | 5.13 | | | | | 12/1/40 | | | | | 51,509 | | | |
Dakota Co. Community Dev. Agy. Single Family Mtg. Rev. (GNMA-FNMA-FHLMC)8 | | | | 37,394 | | | | | 5.30 | | | | | 12/1/39 | | | | | 37,425 | | | |
Minneapolis St. Paul Hsg. Fin. Board Single Family Mtg. Rev. (GNMA-FNMA) | | | | 375,000 | | | | | 4.45 | | | | | 12/1/27 | | | | | 390,349 | | | |
Minneapolis St. Paul Hsg. Fin. Board Single Family Mtg. Rev. (GNMA-FNMA)8 | | | | 4,373 | | | | | 5.00 | | | | | 12/1/38 | | | | | 4,376 | | | |
Minneapolis St. Paul Hsg. Fin. Board Single Family Mtg. Rev. (GNMA-FNMA-FHLMC)8 | | | | 41,767 | | | | | 5.25 | | | | | 12/1/40 | | | | | 41,912 | | | |
MN Hsg. Fin. Agy. Homeownership Fin. (GNMA-FNMA) | | | | 3,190,000 | | | | | 4.40 | | | | | 7/1/32 | | | | | 3,224,994 | | | |
MN Hsg. Fin. Agy. Homeownership Fin. (GNMA-FNMA-FHLMC) | | | | 2,466,237 | | | | | 3.15 | | | | | 6/1/49 | | | | | 2,519,730 | | | |
MN Hsg. Fin. Agy. Homeownership Fin. (GNMA-FNMA-FHLMC) | | | | 4,643,349 | | | | | 3.30 | | | | | 3/1/48 | | | | | 4,768,952 | | | |
MN Hsg. Fin. Agy. Homeownership Fin. (GNMA-FNMA-FHLMC) | | | | 3,769,386 | | | | | 3.30 | | | | | 5/1/48 | | | | | 3,871,348 | | | |
MN Hsg. Fin. Agy. Homeownership Fin. (GNMA-FNMA-FHLMC) | | | | 1,951,828 | | | | | 3.45 | | | | | 3/1/49 | | | | | 2,029,433 | | | |
MN Hsg. Fin. Agy. Homeownership Fin. (GNMA-FNMA-FHLMC) | | | | 1,912,465 | | | | | 3.60 | | | | | 1/1/49 | | | | | 1,980,778 | | | |
See accompanying notes to financial statements.
SCHEDULE OF INVESTMENTS (Unaudited)
September 30, 2019
Sit MinnesotaTax-Free Income Fund (Continued)
| | | | | | | | | | | | | | | | | | | | | | |
| | | | | |
| Name of Issuer | | Principal
Amount ($) | | Coupon
Rate (%) | | Maturity
Date | | Fair Value ($) |
| | | | | |
MN Hsg. Fin. Agy. Homeownership Fin. (GNMA-FNMA-FHLMC) | | | | 1,728,876 | | | | | 3.75 | | | | | 11/1/48 | | | | | 1,798,601 | | | |
MN Hsg. Fin. Agy. Homeownership Fin. (GNMA-FNMA-FHLMC) | | | | 2,620,000 | | | | | 4.45 | | | | | 7/1/31 | | | | | 2,697,631 | | | |
MN Hsg. Fin. Agy. Homeownership Fin. (GNMA-FNMA-FHLMC) | | | | 1,365,000 | | | | | 4.70 | | | | | 1/1/31 | | | | | 1,377,694 | | | |
MN Hsg. Fin. Agy. Residential Hsg. Rev.8 | | | | 980,000 | | | | | 3.20 | | | | | 1/1/33 | | | | | 1,019,327 | | | |
MN Hsg. Fin. Agy. Residential Hsg. Rev. | | | | 1,895,000 | | | | | 3.30 | | | | | 7/1/29 | | | | | 2,013,096 | | | |
MN Hsg. Fin. Agy. Residential Hsg. Rev. (G.O. of AGY. Insured) | | | | 1,450,000 | | | | | 3.63 | | | | | 7/1/25 | | | | | 1,472,924 | | | |
MN Hsg. Fin. Agy. Residential Hsg. Rev. (G.O. of AGY. Insured) | | | | 1,885,000 | | | | | 3.90 | | | | | 7/1/30 | | | | | 1,949,297 | | | |
MN Hsg. Fin. Agy. Residential Hsg. Rev. (GNMA-FNMA-FHLMC) | | | | 3,110,000 | | | | | 2.45 | | | | | 7/1/34 | | | | | 3,056,881 | | | |
MN Hsg. Fin. Agy. Residential Hsg. Rev. (GNMA-FNMA-FHLMC) | | | | 10,000,000 | | | | | 2.55 | | | | | 7/1/39 | | | | | 9,817,100 | | | |
MN Hsg. Fin. Agy. Residential Hsg. Rev. (GNMA-FNMA-FHLMC) | | | | 7,315,000 | | | | | 2.75 | | | | | 7/1/44 | | | | | 7,168,627 | | | |
MN Hsg. Fin. Agy. Residential Hsg. Rev. (GNMA-FNMA-FHLMC)8 | | | | 1,850,000 | | | | | 3.10 | | | | | 7/1/31 | | | | | 1,923,020 | | | |
MN Hsg. Fin. Agy. Residential Hsg. Rev. (GNMA-FNMA-FHLMC) | | | | 5,765,000 | | | | | 3.10 | | | | | 7/1/35 | | | | | 5,980,611 | | | |
MN Hsg. Fin. Agy. Residential Hsg. Rev. (GNMA-FNMA-FHLMC) | | | | 1,815,000 | | | | | 3.15 | | | | | 1/1/37 | | | | | 1,870,249 | | | |
MN Hsg. Fin. Agy. Residential Hsg. Rev. (GNMA-FNMA-FHLMC)8 | | | | 1,185,000 | | | | | 3.20 | | | | | 7/1/30 | | | | | 1,198,616 | | | |
MN Hsg. Fin. Agy. Residential Hsg. Rev. (GNMA-FNMA-FHLMC)8 | | | | 1,280,000 | | | | | 3.30 | | | | | 1/1/30 | | | | | 1,346,573 | | | |
MN Hsg. Fin. Agy. Residential Hsg. Rev. (GNMA-FNMA-FHLMC) | | | | 1,000,000 | | | | | 3.30 | | | | | 7/1/33 | | | | | 1,065,640 | | | |
MN Hsg. Fin. Agy. Residential Hsg. Rev. (GNMA-FNMA-FHLMC) | | | | 6,715,000 | | | | | 3.30 | | | | | 1/1/34 | | | | | 7,101,515 | | | |
MN Hsg. Fin. Agy. Residential Hsg. Rev. (GNMA-FNMA-FHLMC) | | | | 1,605,000 | | | | | 3.35 | | | | | 7/1/29 | | | | | 1,634,901 | | | |
MN Hsg. Fin. Agy. Residential Hsg. Rev. (GNMA-FNMA-FHLMC) | | | | 1,395,000 | | | | | 3.40 | | | | | 7/1/38 | | | | | 1,462,699 | | | |
MN Hsg. Fin. Agy. Residential Hsg. Rev. (GNMA-FNMA-FHLMC) | | | | 7,320,000 | | | | | 3.50 | | | | | 1/1/32 | | | | | 7,663,454 | | | |
MN Hsg. Fin. Agy. Residential Hsg. Rev. (GNMA-FNMA-FHLMC) | | | | 4,780,000 | | | | | 3.60 | | | | | 7/1/31 | | | | | 4,943,476 | | | |
MN Hsg. Fin. Agy. Residential Hsg. Rev. (GNMA-FNMA-FHLMC) | | | | 2,210,000 | | | | | 3.60 | | | | | 7/1/33 | | | | | 2,295,748 | | | |
MN Hsg. Fin. Agy. Residential Hsg. Rev. (GNMA-FNMA-FHLMC)8 | | | | 2,200,000 | | | | | 3.63 | | | | | 7/1/32 | | | | | 2,339,942 | | | |
MN Hsg. Fin. Agy. Residential Hsg. Rev. (GNMA-FNMA-FHLMC) | | | | 4,400,000 | | | | | 3.65 | | | | | 7/1/37 | | | | | 4,705,404 | | | |
MN Hsg. Fin. Agy. Residential Hsg. Rev. (GNMA-FNMA-FHLMC) | | | | 3,000,000 | | | | | 3.75 | | | | | 1/1/50 | | | | | 3,266,130 | | | |
MN Hsg. Fin. Agy. Residential Hsg. Rev. (GNMA-FNMA-FHLMC) | | | | 990,000 | | | | | 3.80 | | | | | 1/1/33 | | | | | 1,084,822 | | | |
MN Hsg. Fin. Agy. Residential Hsg. Rev. (GNMA-FNMA-FHLMC) | | | | 4,975,000 | | | | | 3.80 | | | | | 7/1/38 | | | | | 5,151,911 | | | |
MN Hsg. Fin. Agy. Residential Hsg. Rev. (GNMA-FNMA-FHLMC) | | | | 4,510,000 | | | | | 3.90 | | | | | 7/1/43 | | | | | 4,657,567 | | | |
MN Hsg. Fin. Agy. Residential Hsg. Rev. (GNMA-FNMA-FHLMC) | | | | 180,000 | | | | | 4.00 | | | | | 7/1/40 | | | | | 183,598 | | | |
MN Hsg. Fin. Agy. Residential Hsg. Rev. (GNMA-FNMA-FHLMC) | | | | 1,660,000 | | | | | 4.00 | | | | | 1/1/48 | | | | | 1,780,450 | | | |
MN Hsg. Fin. Agy. Residential Hsg. Rev. (GNMA-FNMA-FHLMC) | | | | 3,605,000 | | | | | 4.00 | | | | | 7/1/48 | | | | | 3,900,790 | | | |
MN Hsg. Fin. Agy. Rev. (GNMA-FNMA Collateralized) | | | | 460,000 | | | | | 5.00 | | | | | 1/1/31 | | | | | 472,880 | | | |
MN Hsg. Fin. Agy. Rev. (GNMA-FNMA FHLMC) | | | | 3,635,000 | | | | | 3.70 | | | | | 1/1/31 | | | | | 3,931,180 | | | |
MN Hsg. Fin. Agy. Rev. (GNMA-FNMA FHLMC) | | | | 1,320,000 | | | | | 4.00 | | | | | 1/1/47 | | | | | 1,393,445 | | | |
MN Hsg. Fin. Agy. Rev. (GNMA-FNMA-FHLMC) | | | | 380,000 | | | | | 3.10 | | | | | 7/1/26 | | | | | 386,882 | | | |
MN Hsg. Fin. Agy. Rev. (GNMA-FNMA-FHLMC)8 | | | | 1,035,000 | | | | | 4.00 | | | | | 1/1/41 | | | | | 1,083,076 | | | |
| | | | | | | | | | | | | | | | | | | | | | |
| | | | | |
| | | | | | | | | | | | | | | | | | | 126,092,048 | | | |
| | | | | | | | | | | | | | | | | | | | | | |
Transportation - 0.3% | | | | | | | | | | | | | | | | | | | | | | |
Minneapolis & St. Paul Metro Airport Commission Sub. Rev. | | | | 1,100,000 | | | | | 5.00 | | | | | 1/1/33 | | | | | 1,244,947 | | | |
Minneapolis & St. Paul Metro Airport Commission Sub. Rev. | | | | 600,000 | | | | | 5.00 | | | | | 1/1/34 | | | | | 678,012 | | | |
| | | | | | | | | | | | | | | | | | | | | | |
| | | | | |
| | | | | | | | | | | | | | | | | | | 1,922,959 | | | |
| | | | | | | | | | | | | | | | | | | | | | |
Utility - 3.2% | | | | | | | | | | | | | | | | | | | | | | |
Guam Govt. Waterworks Auth. Rev.11 | | | | 2,000,000 | | | | | 5.00 | | | | | 1/1/46 | | | | | 2,256,020 | | | |
MN Municipal Power Agy. Electric Rev. | | | | 500,000 | | | | | 4.00 | | | | | 10/1/31 | | | | | 545,205 | | | |
MN Municipal Power Agy. Electric Rev. | | | | 1,250,000 | | | | | 4.00 | | | | | 10/1/32 | | | | | 1,359,650 | | | |
MN Municipal Power Agy. Electric Rev. | | | | 1,155,000 | | | | | 4.00 | | | | | 10/1/33 | | | | | 1,252,413 | | | |
MN Municipal Power Agy. Electric Rev. | | | | 1,000,000 | | | | | 5.25 | | | | | 10/1/35 | | | | | 1,036,980 | | | |
Northern Municipal Power Agy. Electric Rev. | | | | 695,000 | | | | | 5.00 | | | | | 1/1/31 | | | | | 765,237 | | | |
Rochester Electric Utility Rev. | | | | 500,000 | | | | | 5.00 | | | | | 12/1/42 | | | | | 594,720 | | | |
Southern Minnesota Municipal Power Agency | | | | 1,000,000 | | | | | 5.00 | | | | | 1/1/41 | | | | | 1,166,670 | | | |
St. Paul Hsg. & Redev. Auth. | | | | 900,000 | | | | | 3.38 | | | | | 10/1/37 | | | | | 944,388 | | | |
See accompanying notes to financial statements.
| | |
48 | | SIT MUTUAL FUNDS SEMI-ANNUAL REPORT |
| | | | | | | | | | | | | | | | | | | | | | |
| Name of Issuer | | Principal
Amount ($)/ Quantity | | Coupon
Rate (%) | | Maturity
Date | | Fair Value ($) |
| | | | | |
St. Paul Hsg. & Redev. Auth. | | | | 880,000 | | | | | 4.00 | | | | | 10/1/31 | | | | | 984,922 | | | |
St. Paul Hsg. & Redev. Auth. | | | | 650,000 | | | | | 4.00 | | | | | 10/1/33 | | | | | 722,858 | | | |
St. Paul Hsg. & Redev. Auth. | | | | 800,000 | | | | | 4.00 | | | | | 10/1/37 | | | | | 877,032 | | | |
St. Paul Port Auth. Rev. (Energy Park Utility Company Proj.)8 | | | | 1,250,000 | | | | | 5.45 | | | | | 8/1/28 | | | | | 1,292,988 | | | |
Western MN Municipal Power Agy. Rev. | | | | 600,000 | | | | | 5.00 | | | | | 1/1/35 | | | | | 713,340 | | | |
Western MN Municipal Power Agy. Rev. | | | | 1,750,000 | | | | | 5.00 | | | | | 1/1/36 | | | | | 1,988,158 | | | |
Western MN Municipal Power Agy. Rev. | | | | 4,725,000 | | | | | 5.00 | | | | | 1/1/46 | | | | | 5,336,935 | | | |
| | | | | | | | | | | | | | | | | | | | | | |
| | | | | |
| | | | | | | | | | | | | | | | | | | 21,837,516 | | | |
| | | | | | | | | | | | | | | | | | | | | | |
| | | | | |
Total Municipal Bonds
(cost: $613,193,164) | | | | | | | | | | | | | | | | | | | 639,011,025 | | | |
| | | | | | | | | | | | | | | | | | | | | | |
| | | | | |
Investment Companies - 1.0% | | | | | | | | | | | | | | | | | | | | | | |
Delaware Investments Minnesota Municipal Income Fund II (VMM) | | | | 334,436 | | | | | | | | | | | | | | | 4,382,784 | | | |
Nuveen Minnesota Municipal Income Fund (NMS) | | | | 159,408 | | | | | | | | | | | | | | | 2,279,534 | | | |
| | | | | | | | | | | | | | | | | | | | | | |
| | | | | |
Total Investment Companies
(cost: $7,237,880) | | | | | | | | | | | | | | | | | | | 6,662,318 | | | |
| | | | | | | | | | | | | | | | | | | | | | |
| | | | | |
Total Investments in Securities - 95.5%
(cost: $620,431,044) | | | | | | | | | | | | | | | | | | | 645,673,343 | | | |
Other Assets and Liabilities, net - 4.5% | | | | | | | | | | | | | | | | | | | 30,406,827 | | | |
| | | | | | | | | | | | | | | | | | | | | | |
| | | | | |
Total Net Assets - 100.0% | | | | | | | | | | | | | | | | | | | $676,080,170 | | | |
| | | | | | | | | | | | | | | | | | | | | | |
| 1 | | Variable rate security. Rate disclosed is as of September 30, 2019. Certain variable rate securities are not based on a published reference rate and spread but are determined by the issuer or agent and are based on current market conditions, or, for mortgage-backed securities, are impacted by the individual mortgages which are paying off over time. These securities do not indicate a reference rate and spread in their descriptions. |
| 2 | | Security considered illiquid by the Investment Adviser. The total value of such securities as of September 30, 2019 was $2,961,810 and represented 0.4% of net assets. |
| 4 | | 144A Restricted Security. The total value of such securities as of September 30, 2019 was $13,202,923 and represented 2.0% of net assets. These securities have been determined to be liquid by the Adviser in accordance with guidelines established by the Board of Directors. |
| 5 | | The issuer is in default of interest or principal payments, or other debt covenants. Income is not being accrued. The total value of such securities as of September 30, 2019 was $1,470,768 and represented 0.2% of net assets. |
| 8 | | Securities the income from which is treated as a tax preference that is included in alternative minimum taxable income for purposes of computing federal alternative minimum tax (AMT). At September 30, 2019, 3.6% of net assets in the Fund was invested in such securities. |
| 9 | | Municipal Lease Security. The total value of such securities as of September 30, 2019 was $33,208,761 and represented 4.9% of net assets. These securities have been determined to be liquid by the Adviser in accordance with guidelines established by the Board of Directors. |
| 11 | | The Fund may invest in obligations issued by U.S. territories, for example Guam, Puerto Rico, and Virgin Islands. The total value of such securities as of September 30, 2019 was $16,192,873 and represented 2.4% of net assets. |
Numeric footnotes not disclosed are not applicable to this Schedule of Investments.
See accompanying notes to financial statements.
SCHEDULE OF INVESTMENTS (Unaudited)
September 30, 2019
Sit MinnesotaTax-Free Income Fund (Continued)
A summary of the levels for the Fund’s investments as of September 30, 2019 is as follows (see Note 2 - significant accounting policies in the notes to financial statements):
| | | | | | | | | | | | | | | | |
| | | Investment in Securities | |
| | | Level 1 Quoted
Price ($) | | | Level 2 Other significant
observable inputs ($) | | | Level 3 Significant
unobservable inputs ($) | | | Total ($) | |
| | | | |
Assets | | | | | | | | | | | | | | | | |
Municipal Bonds | | | — | | | | 639,011,025 | | | | — | | | | 639,011,025 | |
Investment Companies | | | 6,662,318 | | | | — | | | | — | | | | 6,662,318 | |
| | | | |
| | | | |
| | | 6,662,318 | | | | 639,011,025 | | | | — | | | | 645,673,343 | |
| | | | |
There were no transfers into or out of level 3 during the reporting period.
See accompanying notes to financial statements.
| | |
50 | | SIT MUTUAL FUNDS SEMI-ANNUAL REPORT |
[This page intentionally left blank.]
STATEMENTS OF ASSETS AND LIABILITIES (Unaudited)
September 30, 2019
| | | | | | | | | | | | | | | | | | | | |
| | | Sit U.S. | | | | | | Sit Minnesota |
| | | Government | | Sit Quality | | SitTax-Free | | Tax-Free |
| | | Securities | | Income | | Income | | Income |
| | | Fund | | Fund | | Fund | | Fund |
| | | | |
ASSETS | | | | | | | | | | | | | | | | | | | | |
Investments in securities, at identified cost | | | $ | 410,037,149 | | | | $ | 85,449,497 | | | | $ | 266,789,110 | | | | $ | 620,431,044 | |
| | | | | | | | | | | | | | | | | | | | |
| | | | |
Investments in securities, at fair value - see accompanying schedule for detail | | | $ | 419,338,637 | | | | $ | 86,405,229 | | | | $ | 267,913,889 | | | | $ | 645,673,343 | |
Cash in bank on demand deposit | | | | — | | | | | — | | | | | 20,547,946 | | | | | 24,629,762 | |
Cash collateral held at broker | | | | — | | | | | 500,000 | | | | | 3,000,000 | | | | | — | |
Accrued interest and dividends receivable | | | | 1,971,163 | | | | | 435,572 | | | | | 3,161,233 | | | | | 6,953,601 | |
Receivable for investment securities sold | | | | 14,274 | | | | | 45,018 | | | | | — | | | | | — | |
Variation margin on futures contracts | | | | — | | | | | 112,520 | | | | | 215,978 | | | | | — | |
Other receivables | | | | — | | | | | — | | | | | — | | | | | 1,500 | |
Receivable for Fund shares sold | | | | 1,001,374 | | | | | 162,183 | | | | | 2,408,934 | | | | | 450,311 | |
| | | | | | | | | | | | | | | | | | | | |
| | | | |
Total assets | | | | 422,325,448 | | | | | 87,660,522 | | | | | 297,247,980 | | | | | 677,708,517 | |
| | | | | | | | | | | | | | | | | | | | |
| | | | |
LIABILITIES | | | | | | | | | | | | | | | | | | | | |
Disbursements in excess of cash balances | | | | 85,194 | | | | | 41,734 | | | | | — | | | | | — | |
Payable for investment securities purchased | | | | 538,854 | | | | | 810,639 | | | | | 3,904,292 | | | | | — | |
Payable for Fund shares redeemed | | | | 500,405 | | | | | 125,162 | | | | | 248,142 | | | | | 990,057 | |
Cash portion of dividends payable to shareholders | | | | 49,990 | | | | | 11,436 | | | | | 171,062 | | | | | 194,165 | |
Accrued investment management fees | | | | 276,536 | | | | | 62,672 | | | | | 188,387 | | | | | 444,125 | |
| | | | | | | | | | | | | | | | | | | | |
| | | | |
Total liabilities | | | | 1,450,979 | | | | | 1,051,643 | | | | | 4,511,883 | | | | | 1,628,347 | |
| | | | | | | | | | | | | | | | | | | | |
| | | | |
Net assets applicable to outstanding capital stock | | | $ | 420,874,469 | | | | $ | 86,608,879 | | | | $ | 292,736,097 | | | | $ | 676,080,170 | |
| | | | | | | | | | | | | | | | | | | | |
| | | | |
Net assets consist of: | | | | | | | | | | | | | | | | | | | | |
Capital (par value andpaid-in surplus) | �� | | $ | 430,213,990 | | | | $ | 88,079,138 | | | | $ | 301,180,571 | | | | $ | 653,330,660 | |
Total distributable earnings (loss), including unrealized appreciation (depreciation) | | | | (9,339,521 | ) | | | | (1,470,259 | ) | | | | (8,444,474 | ) | | | | 22,749,510 | |
| | | | | | | | | | | | | | | | | | | | |
| | | $ | 420,874,469 | | | | $ | 86,608,879 | | | | $ | 292,736,097 | | | | $ | 676,080,170 | |
| | | | | | | | | | | | | | | | | | | | |
| | | | |
Outstanding shares | | | | 38,192,150 | | | | | 8,801,588 | | | | | 29,594,124 | | | | | 63,060,832 | |
| | | | | | | | | | | | | | | | | | | | |
| | | | |
Net asset value per share of outstanding capital stock | | | | $11.02 | | | | | $9.84 | | | | | $9.89 | | | | | $10.72 | |
| | | | | | | | | | | | | | | | | | | | |
See accompanying notes to financial statements.
| | |
52 | | SIT MUTUAL FUNDS SEMI-ANNUAL REPORT |
STATEMENTS OF OPERATIONS (Unaudited)
Six Months Ended September 30, 2019
| | | | | | | | | | | | | | | | | | | | |
| | | Sit U.S. | | | | | | Sit Minnesota |
| | | Government | | Sit Quality | | SitTax-Free | | Tax-Free |
| | | Securities | | Income | | Income | | Income |
| | | Fund | | Fund | | Fund | | Fund |
| | | | |
Investment income: | | | | | | | | | | | | | | | | | | | | |
Income: | | | | | | | | | | | | | | | | | | | | |
Dividends | | | | — | | | | | — | | | | | $228,470 | | | | | $122,114 | |
Interest | | | | $6,328,419 | | | | | $1,211,837 | | | | | 4,880,993 | | | | | 11,715,344 | |
| | | | | | | | | | | | | | | | | | | | |
| | | | |
Total income | | | | 6,328,419 | | | | | 1,211,837 | | | | | 5,109,463 | | | | | 11,837,458 | |
| | | | | | | | | | | | | | | | | | | | |
| | | | |
Expenses (note 4): | | | | | | | | | | | | | | | | | | | | |
Investment management fee | | | | 1,695,799 | | | | | 372,481 | | | | | 1,071,479 | | | | | 2,607,797 | |
| | | | | | | | | | | | | | | | | | | | |
| | | | |
Total expenses | | | | 1,695,799 | | | | | 372,481 | | | | | 1,071,479 | | | | | 2,607,797 | |
| | | | | | | | | | | | | | | | | | | | |
| | | | |
Net investment income | | | | 4,632,620 | | | | | 839,356 | | | | | 4,037,984 | | | | | 9,229,661 | |
| | | | | | | | | | | | | | | | | | | | |
| | | | |
Realized and unrealized gain (loss): | | | | | | | | | | | | | | | | | | | | |
Net realized gain (loss) on investments | | | | 537,117 | | | | | 331,196 | | | | | 154,293 | | | | | 95,616 | |
Net realized gain (loss) on written options | | | | (3,127,018 | ) | | | | (788,149 | ) | | | | — | | | | | — | |
Net realized gain (loss) on futures | | | | — | | | | | (131,273 | ) | | | | (2,081,113 | ) | | | | (437,577 | ) |
| | | | |
Net change in unrealized appreciation (depreciation) on investments | | | | 6,633,065 | | | | | 681,422 | | | | | 6,500,926 | | | | | 14,434,318 | |
Net change in unrealized appreciation (depreciation) on written options | | | | — | | | | | 143,039 | | | | | — | | | | | — | |
Net change in unrealized appreciation (depreciation) on futures | | | | — | | | | | 112,520 | | | | | 833,771 | | | | | 291,937 | |
| | | | | | | | | | | | | | | | | | | | |
| | | | |
Net gain (loss) | | | | 4,043,164 | | | | | 348,755 | | | | | 5,407,877 | | | | | 14,384,294 | |
| | | | | | | | | | | | | | | | | | | | |
| | | | |
Net increase (decrease) in net assets resulting from operations | | | | $8,675,784 | | | | | $1,188,111 | | | | | $9,445,861 | | | | | $23,613,955 | |
| | | | | | | | | | | | | | | | | | | | |
See accompanying notes to financial statements.
STATEMENTS OF CHANGES IN NET ASSETS
| | | | | | | | |
| | | Sit U.S. Government | |
| | | Securities Fund | |
| | | Six Months | | | Year | |
| | | Ended | | | Ended | |
| | | September 30, 2019 | | | March 31, | |
| | | (Unaudited) | | | 2019 | |
Operations: | | | | | | | | |
Net investment income | | | $4,632,620 | | | | $10,090,189 | |
Net realized gain (loss) on investments, written options and futures | | | (2,589,901) | | | | (3,280,832 | ) |
Net change in unrealized appreciation (depreciation) of investments, written options and futures | | | 6,633,065 | | | | 7,815,232 | |
| | | | | | | | |
| | |
Net increase (decrease) in net assets resulting from operations | | | 8,675,784 | | | | 14,624,589 | |
| | | | | | | | |
| | |
Distributions from: | | | | | | | | |
Net investment income and net realized gains | | | (4,754,728) | | | | (9,999,800 | ) |
| | | | | | | | |
| | |
Total distributions | | | (4,754,728) | | | | (9,999,800 | ) |
| | | | | | | | |
| | |
Capital share transactions: | | | | | | | | |
Proceeds from shares sold | | | 38,437,458 | | | | 89,008,596 | |
Reinvested distributions | | | 4,408,731 | | | | 9,446,690 | |
Payments for shares redeemed | | | (53,206,664) | | | | (203,514,634 | ) |
| | | | | | | | |
| | |
Increase (decrease) in net assets from capital transactions | | | (10,360,475) | | | | (105,059,348 | ) |
| | | | | | | | |
| | |
Total increase (decrease) in net assets | | | (6,439,419) | | | | (100,434,559 | ) |
| | |
Net assets: | | | | | | | | |
Beginning of period | | | 427,313,888 | | | | 527,748,447 | |
| | | | | | | | |
| | |
End of period | | | $420,874,469 | | | | $427,313,888 | |
| | | | | | | | |
| | |
Capital transactions in shares: | | | | | | | | |
Sold | | | 3,497,631 | | | | 8,232,091 | |
Reinvested distributions | | | 401,428 | | | | 874,500 | |
Redeemed | | | (4,845,235) | | | | (18,840,376 | ) |
| | | | | | | | |
| | |
Net increase (decrease) | | | (946,176) | | | | (9,733,785 | ) |
| | | | | | | | |
See accompanying notes to financial statements.
| | |
54 | | SIT MUTUAL FUNDS SEMI-ANNUAL REPORT |
| | | | | | | | | | | | | | | | | | | | | | |
Sit Quality
Income Fund | | | SitTax-Free
Income Fund | | | Sit MinnesotaTax-Free
Income Fund | |
| | | | | |
| Six Months | | | Year | | | Six Months | | | Year | | | Six Months | | | Year | |
| Ended | | | Ended | | | Ended | | | Ended | | | Ended | | | Ended | |
| September 30, 2019 | | | March 31, | | | September 30, 2019 | | | March 31, | | | September 30, 2019 | | | March 31, | |
| (Unaudited) | | | 2019 | | | (Unaudited) | | | 2019 | | | (Unaudited) | | | 2019 | |
| | | | | | | | | | | | | | | | | | | | | | |
| | $839,356 | | | | $1,552,824 | | | | $4,037,984 | | | | $7,353,842 | | | | $9,229,661 | | | | $17,874,654 | |
| | (588,226) | | | | (827,188 | ) | | | (1,926,820) | | | | (2,635,016 | ) | | | (341,961) | | | | (2,081,682 | ) |
| | | | | |
| | 936,981 | | | | 999,754 | | | | 7,334,697 | | | | 3,817,842 | | | | 14,726,255 | | | | 7,723,015 | |
| | | | | | | | | | | | | | | | | | | | | | |
| | | | | |
| | 1,188,111 | | | | 1,725,390 | | | | 9,445,861 | | | | 8,536,668 | | | | 23,613,955 | | | | 23,515,987 | |
| | | | | | | | | | | | | | | | | | | | | | |
| | | | | |
| | | | | | | | | | | | | | | | | | | | | | |
| | (849,419) | | | | (1,542,826 | ) | | | (4,168,768) | | | | (7,220,989 | ) | | | (9,328,144) | | | | (17,780,483 | ) |
| | | | | | | | | | | | | | | | | | | | | | |
| | | | | |
| | (849,419) | | | | (1,542,826 | ) | | | (4,168,768) | | | | (7,220,989 | ) | | | (9,328,144) | | | | (17,780,483 | ) |
| | | | | | | | | | | | | | | | | | | | | | |
| | | | | |
| | | | | | | | | | | | | | | | | | | | | | |
| | 25,545,535 | | | | 50,682,279 | | | | 59,295,290 | | | | 89,073,224 | | | | 92,470,885 | | | | 166,504,993 | |
| | 778,871 | | | | 1,451,693 | | | | 3,229,048 | | | | 5,808,755 | | | | 8,130,942 | | | | 15,266,867 | |
| | (22,341,198) | | | | (44,571,989 | ) | | | (22,416,182) | | | | (44,865,212 | ) | | | (56,573,280) | | | | (120,904,068 | ) |
| | | | | | | | | | | | | | | | | | | | | | |
| | | | | |
| | | | | | | | | | | | | | | | | | | | | | |
| | 3,983,208 | | | | 7,561,983 | | | | 40,108,156 | | | | 50,016,767 | | | | 44,028,547 | | | | 60,867,792 | |
| | | | | | | | | | | | | | | | | | | | | | |
| | | | | |
| | 4,321,900 | | | | 7,744,547 | | | | 45,385,249 | | | | 51,332,446 | | | | 58,314,358 | | | | 66,603,296 | |
| | | | | |
| | | | | | | | | | | | | | | | | | | | | | |
| | 82,286,979 | | | | 74,542,432 | | | | 247,350,848 | | | | 196,018,402 | | | | 617,765,812 | | | | 551,162,516 | |
| | | | | | | | | | | | | | | | | | | | | | |
| | | | | |
| | $86,608,879 | | | | $82,286,979 | | | | $292,736,097 | | | | $247,350,848 | | | | $676,080,170 | | | | $617,765,812 | |
| | | | | | | | | | | | | | | | | | | | | | |
| | | | | |
| | | | | | | | | | | | | | | | | | | | | | |
| | 2,601,968 | | | | 5,192,415 | | | | 6,036,559 | | | | 9,296,735 | | | | 8,711,990 | | | | 16,120,183 | |
| | 79,310 | | | | 148,699 | | | | 328,520 | | | | 606,282 | | | | 763,587 | | | | 1,475,949 | |
| | (2,276,051) | | | | (4,567,369 | ) | | | (2,285,227) | | | | (4,684,646 | ) | | | (5,325,127) | | | | (11,727,325 | ) |
| | | | | | | | | | | | | | | | | | | | | | |
| | | | | |
| | 405,227 | | | | 773,745 | | | | 4,079,852 | | | | 5,218,371 | | | | 4,150,450 | | | | 5,868,807 | |
| | | | | | | | | | | | | | | | | | | | | | |
FINANCIAL HIGHLIGHTS
Per share income and capital changes for a share outstanding throughout the period. See accompanying notes to financial statements.
| | | | | | | | | | | | | | | | | | | | | | | | |
| Sit U.S. Government Securities Fund | | | | | | | | | | | | | | | | | | | | | |
| |
| | | Six Months Ended
September 30, 2019 | | | Year Ended March 31, | |
| | | (Unaudited) | | | 2019 | | | 2018 | | | 2017 | | | 2016 | | | 2015 |
| |
| | | | | | |
Net Asset Value: | | | | | | | | | | | | | | | | | | | | | | | | |
Beginning of period | | | $10.92 | | | | $10.80 | | | | $10.90 | | | | $11.07 | | | | $11.09 | | | | $11.04 | |
| | | | |
| | | | | | |
Operations: | | | | | | | | | | | | | | | | | | | | | | | | |
Net investment income1 | | | 0.12 | | | | 0.23 | | | | 0.18 | | | | 0.17 | | | | 0.20 | | | | 0.21 | |
Net realized and unrealized gains (losses) on investments, written options and futures | | | 0.10 | | | | 0.12 | | | | (0.10) | | | | (0.17 | ) | | | (0.02 | ) | | | 0.05 | |
| | | | |
| | | | | | |
Total from operations | | | 0.22 | | | | 0.35 | | | | 0.08 | | | | — | | | | 0.18 | | | | 0.26 | |
| | | | |
| | | | | | |
Distributions from: | | | | | | | | | | | | | | | | | | | | | | | | |
Net investment income | | | (0.12) | | | | (0.23) | | | | (0.18) | | | | (0.17 | ) | | | (0.20 | ) | | | (0.21) | |
| | | | |
| | | | | | |
Net Asset Value: | | | | | | | | | | | | | | | | | | | | | | | | |
End of period | | | $11.02 | | | | $10.92 | | | | $10.80 | | | | $10.90 | | | | $11.07 | | | | $11.09 | |
| | | | |
| | | | | | |
Total investment return2 | | | 2.05% | | | | 3.31% | | | | 0.76% | | | | 0.02% | | | | 1.63% | | | | 2.37% | |
| | | | |
| | | | | | |
Net assets at end of period (000’s omitted) | | | $420,874 | | | | $427,314 | | | | $527,748 | | | | $643,304 | | | | $663,676 | | | | $587,210 | |
| | | | | | |
Ratios:3 | | | | | | | | | | | | | | | | | | | | | | | | |
Expenses | | | 0.80% | | | | 0.80% | | | | 0.80% | | | | 0.80% | | | | 0.80% | | | | 0.80% | |
Net investment income | | | 2.19% | | | | 2.13% | | | | 1.68% | | | | 1.57% | | | | 1.81% | | | | 1.89% | |
| | | | | | |
Portfolio turnover rate (excluding short-term securities) | | | 10.89%4 | | | | 14.88% | | | | 14.68% | | | | 29.00% | | | | 28.65% | | | | 13.71% | |
| 1 | | The net investment income per share is based on average shares outstanding for the period. |
| 2 | | Total investment return is based on the change in net asset value of a share during the period (not annualized) and assumes reinvestment of distributions at net asset value. |
| 3 | | Ratios are annualized for periods less than one year. In addition to fees and expenses which the Fund bears directly, the Fund indirectly bears a pro rata share of the fees and expenses of the acquired funds in which it invests. Such indirect expenses are not included in the above reported expense ratios. |
| | |
56 | | SIT MUTUAL FUNDS SEMI-ANNUAL REPORT |
FINANCIAL HIGHLIGHTS
Per share income and capital changes for a share outstanding throughout the period. See accompanying notes to financial statements.
| | | | | | | | | | | | | | | | | | | | | | | | |
Sit Quality Income Fund | | | | | | | | | | | | | | | | | | | | | |
| |
| | | Six Months Ended | | | | | | | | | | | | | | | | |
| | | September 30, 2019 | | | | | | Years Ended March 31, | | | | |
| | | (Unaudited) | | | 2019 | | | 2018 | | | 2017 | | | 2016 | | | 2015 | |
| |
| | | | | | |
Net Asset Value: | | | | | | | | | | | | | | | | | | | | | | | | |
Beginning of period | | | $9.80 | | | | $9.78 | | | | $9.83 | | | | $9.83 | | | | $9.94 | | | | $9.97 | |
| | | | |
| | | | | | |
Operations: | | | | | | | | | | | | | | | | | | | | | | | | |
Net investment income1 | | | 0.10 | | | | 0.19 | | | | 0.13 | | | | 0.09 | | | | 0.10 | | | | 0.06 | |
Net realized and unrealized gains (losses) on investments, written options and futures | | | 0.04 | | | | 0.02 | | | | (0.05 | ) | | | — | | | | (0.11 | ) | | | (0.03 | ) |
| | | | |
| | | | | | |
Total from operations | | | 0.14 | | | | 0.21 | | | | 0.08 | | | | 0.09 | | | | (0.01 | ) | | | 0.03 | |
| | | | |
| | | | | | |
Distributions from: | | | | | | | | | | | | | | | | | | | | | | | | |
Net investment income | | | (0.10) | | | | (0.19 | ) | | | (0.13 | ) | | | (0.09 | ) | | | (0.10 | ) | | | (0.06 | ) |
| | | | |
| | | | | | |
Net Asset Value: | | | | | | | | | | | | | | | | | | | | | | | | |
End of period | | | $9.84 | | | | $9.80 | | | | $9.78 | | | | $9.83 | | | | $9.83 | | | | $9.94 | |
| | | | |
| | | | | | |
Total investment return2 | | | 1.44% | | | | 2.17% | | | | 0.79% | | | | 0.91% | | | | (0.10% | ) | | | 0.36% | |
| | | | |
| | | | | | |
Net assets at end of period (000’s omitted) | | | $86,609 | | | | $82,287 | | | | $74,542 | | | | $73,861 | | | | $66,880 | | | | $124,418 | |
| | | | | | |
Ratios:3 | | | | | | | | | | | | | | | | | | | | | | | | |
Expenses | | | 0.90% | | | | 0.90% | | | | 0.90% | | | | 0.90% | | | | 0.90% | | | | 0.90% | |
Net investment income | | | 2.03% | | | | 1.96% | | | | 1.31% | | | | 0.91% | | | | 1.02% | | | | 0.63% | |
| | | | | | |
Portfolio turnover rate (excluding short-term securities) | | | 35.06%4 | | | | 68.93% | | | | 81.14% | | | | 84.03% | | | | 90.38% | | | | 241.64% | |
| 1 | | The net investment income per share is based on average shares outstanding for the period. |
| 2 | | Total investment return is based on the change in net asset value of a share during the period (not annualized) and assumes reinvestment of distributions at net asset value. |
| 3 | | Ratios are annualized for periods less than one year. In addition to fees and expenses which the Fund bears directly, the Fund indirectly bears a pro rata share of the fees and expenses of the acquired funds in which it invests. Such indirect expenses are not included in the above reported expense ratios. |
FINANCIAL HIGHLIGHTS
Per share income and capital changes for a share outstanding throughout the period. See accompanying notes to financial statements.
| | | | | | | | | | | | | | | | | | | | | | | | |
| SitTax-Free Income Fund | | | | | | | | | | | | | | | | | | | | | |
| |
| | | Six Months Ended
September 30, 2019 | | | Years Ended March 31, | |
| | | (Unaudited) | | | 2019 | | | 2018 | | | 2017 | | | 2016 | | | 2015 | |
| |
| | | | | | |
Net Asset Value: | | | | | | | | | | | | | | | | | | | | | | | | |
Beginning of period | | | $9.69 | | | | $9.66 | | | | $9.49 | | | | $9.80 | | | | $9.68 | | | | $9.16 | |
| | | | |
| | | | | | |
Operations: | | | | | | | | | | | | | | | | | | | | | | | | |
Net investment income1 | | | 0.15 | | | | 0.32 | | | | 0.39 | | | | 0.35 | | | | 0.33 | | | | 0.37 | |
Net realized and unrealized gains (losses) on investments and futures | | | 0.20 | | | | 0.03 | | | | 0.17 | | | | (0.31 | ) | | | 0.12 | | | | 0.52 | |
| | | | |
| | | | | | |
Total from operations | | | 0.35 | | | | 0.35 | | | | 0.56 | | | | 0.04 | | | | 0.45 | | | | 0.89 | |
| | | | |
| | | | | | |
Distributions from: | | | | | | | | | | | | | | | | | | | | | | | | |
Net investment income | | | (0.15) | | | | (0.32 | ) | | | (0.39 | ) | | | (0.35 | ) | | | (0.33 | ) | | | (0.37 | ) |
| | | | |
| | | | | | |
Net Asset Value: | | | | | | | | | | | | | | | | | | | | | | | | |
End of period | | | $9.89 | | | | $9.69 | | | | $9.66 | | | | $9.49 | | | | $9.80 | | | | $9.68 | |
| | | | |
| | | | | | |
Total investment return2 | | | 3.67% | | | | 3.67% | | | | 6.00% | | | | 0.37% | | | | 4.78% | | | | 9.81% | |
| | | | |
| | | | | | |
Net assets at end of period (000’s omitted) | | | $292,736 | | | | $247,351 | | | | $196,018 | | | | $160,445 | | | | $156,890 | | | | $165,150 | |
| | | | | | |
Ratios:3 | | | | | | | | | | | | | | | | | | | | | | | | |
Expenses | | | 0.80% | | | | 0.80% | | | | 0.80% | | | | 0.80% | | | | 0.80% | | | | 0.80% | |
Net investment income | | | 3.01% | | | | 3.37% | | | | 4.03% | | | | 3.58% | | | | 3.45% | | | | 3.86% | |
| | | | | | |
Portfolio turnover rate (excluding short-term securities) | | | 5.95%4 | | | | 13.80% | | | | 15.72% | | | | 25.41% | | | | 23.11% | | | | 31.14% | |
| 1 | | The net investment income per share is based on average shares outstanding for the period. |
| 2 | | Total investment return is based on the change in net asset value of a share during the period (not annualized) and assumes reinvestment of distributions at net asset value. |
| 3 | | Ratios are annualized for periods less than one year. In addition to fees and expenses which the Fund bears directly, the Fund indirectly bears a pro rata share of the fees and expenses of the acquired funds in which it invests. Such indirect expenses are not included in the above reported expense ratios. |
| | |
58 | | SIT MUTUAL FUNDS SEMI-ANNUAL REPORT |
FINANCIAL HIGHLIGHTS
Per share income and capital changes for a share outstanding throughout the period. See accompanying notes to financial statements.
| | | | | | | | | | | | | | | | | | | | | | | | |
| Sit MinnesotaTax-Free Income Fund | | | | | | | | | | | | | | | | | | | | | |
| |
| | | Six Months Ended
September 30, 2019 | | | Years Ended March 31, | |
| | | (Unaudited) | | | 2019 | | | 2018 | | | 2017 | | | 2016 | | | 2015 | |
| |
| | | | | | |
Net Asset Value: | | | | | | | | | | | | | | | | | | | | | | | | |
Beginning of period | | | $10.49 | | | | $10.39 | | | | $10.29 | | | | $10.63 | | | | $10.57 | | | | $10.26 | |
| | | | |
| | | | | | |
Operations: | | | | | | | | | | | | | | | | | | | | | | | | |
Net investment income1 | | | 0.15 | | | | 0.32 | | | | 0.32 | | | | 0.32 | | | | 0.34 | | | | 0.36 | |
Net realized and unrealized gains (losses) on investments and futures | | | 0.23 | | | | 0.10 | | | | 0.10 | | | | (0.34 | ) | | | 0.06 | | | | 0.31 | |
| | | | |
| | | | | | |
Total from operations | | | 0.38 | | | | 0.42 | | | | 0.42 | | | | (0.02 | ) | | | 0.40 | | | | 0.67 | |
| | | | |
| | | | | | |
Distributions from: | | | | | | | | | | | | | | | | | | | | | | | | |
Net investment income | | | (0.15) | | | | (0.32 | ) | | | (0.32 | ) | | | (0.32 | ) | | | (0.34 | ) | | | (0.36 | ) |
| | | | |
| | | | | | |
Net Asset Value: | | | | | | | | | | | | | | | | | | | | | | | | |
End of period | | | $10.72 | | | | $10.49 | | | | $10.39 | | | | $10.29 | | | | $10.63 | | | | $10.57 | |
| | | | |
| | | | | | |
Total investment return2 | | | 3.66% | | | | 4.15% | | | | 4.08% | | | | (0.19% | ) | | | 3.89% | | | | 6.62% | |
| | | | |
| | | | | | |
Net assets at end of period (000’s omitted) | | | $676,080 | | | | $617,766 | | | | $551,163 | | | | $529,821 | | | | $508,209 | | | | $436,883 | |
| | | | | | |
Ratios:3 | | | | | | | | | | | | | | | | | | | | | | | | |
Expenses | | | 0.80% | | | | 0.80% | | | | 0.80% | | | | 0.80% | | | | 0.80% | | | | 0.80% | |
Net investment income | | | 2.83% | | | | 3.12% | | | | 3.05% | | | | 3.06% | | | | 3.25% | | | | 3.43% | |
| | | | | | |
Portfolio turnover rate (excluding short-term securities) | | | 3.81%4 | | | | 9.25% | | | | 12.97% | | | | 16.18% | | | | 10.45% | | | | 9.68% | |
| 1 | | The net investment income per share is based on average shares outstanding for the period. |
| 2 | | Total investment return is based on the change in net asset value of a share during the period (not annualized) and assumes reinvestment of distributions at net asset value. |
| 3 | | Ratios are annualized for periods less than one year. In addition to fees and expenses which the Fund bears directly, the Fund indirectly bears a pro rata share of the fees and expenses of the acquired funds in which it invests. Such indirect expenses are not included in the above reported expense ratios. |
NOTES TO FINANCIAL STATEMENTS (Unaudited)
Six Months Ended September 30, 2019
The Sit Mutual Funds (the Funds) areno-load funds, and are registered under the Investment Company Act of 1940 (as amended) as diversified (except MinnesotaTax-Free Income Fund which isnon-diversified),open-end management investment companies, or series thereof. The Sit Quality Income Fund, SitTax-Free Income Fund and MinnesotaTax-Free Income Fund are series funds of Sit Mutual Funds II, Inc. Each fund has 10 billion authorized shares of capital stock. Shares in the U.S. Government Securities Fund have a par value of $0.01, and shares in other funds have a par value of $0.001. This report covers the bond funds of the Sit Mutual Funds.
The investment objective for each Fund is as follows:
| | |
| Fund | | Investment Objective |
|
U.S. Government Securities | | High level of current income and safety of principal. |
Quality Income Fund | | High level of current income and safety of principal. |
Tax-Free Income | | High level of current income that is exempt from federal income tax, consistent |
| | with the preservation of capital. |
MinnesotaTax-Free Income | | High level of current income that is exempt from federal regular income tax and |
| | Minnesota regular personal income tax, consistent with the preservation of capital. |
| (2) | Significant Accounting Policies |
The Funds are investment companies and follow accounting and reporting guidance under Financial Accounting Standards Board (“FASB”) Accounting Standards Codification (“ASC”) Topic 946, “Financial Services-Investment Companies”. The following is a summary of significant accounting policies consistently followed by the Funds in the preparation of their financial statements in conformity with U.S. generally accepted accounting principles (“GAAP”).
Investments in Securities
Investment securities are carried at fair value based upon closing market quotations on the last business day of the period. Investments in securities traded on national or international securities exchanges are valued at the last reported sales price prior to the time when assets are valued. Equity securities traded on theover-the-counter market are valued at the last reported sales price or if the last sales price is not available, at the last reported bid price. The sale and bid prices or prices deemed best to reflect fair value quoted by dealers who make markets in these securities are obtained from independent pricing services. Consistent with the Funds’ valuation policies and procedures, the current fair value of certain fixed income securities is provided by an independent pricing service. Fixed income securities for which prices are not available from an independent pricing service but where an active market exists are valued using market quotations obtained from broker-dealers or quotation systems. Securities for which market quotations are not available, such as private placement securities, are valued at fair value according to methods selected in good faith by Sit Investment Associates, Inc. (the “Adviser”) and may include dealer-supplied valuations or other inputs and assumptions that pricing services would typically utilize. Short-term investments of sufficient credit quality with maturities of 60 days or less when acquired, or which subsequently are within 60 days of maturity, are valued at amortized cost, which approximates fair value. Options and futures contracts entered into and held by the Funds are valued at the close of the securities and commodities exchange on which they are traded.
Security transactions are accounted for on the date the securities are purchased or sold. Gains and losses are calculated on the identified-cost basis. Interest, including level-yield amortization of long-term bond premium and discount, is recorded on the accrual basis. Dividends received fromclosed-end fund holdings are included in Dividend Income and distributions from capital gains, if any, are included in Net Realized Gain (Loss).
Delivery and payment for securities which have been purchased by the Funds on a forward commitment or when-issued basis can take place two weeks or more after the transaction date. During this period, such securities are subject to market fluctuations and may increase or decrease in value prior to delivery.
The MinnesotaTax-Free Income Fund concentrates its investments in Minnesota, and therefore may have more credit risk related to the economic conditions in the state of Minnesota than a portfolio with broader geographical diversification.
| | |
60 | | SIT MUTUAL FUNDS SEMI-ANNUAL REPORT |
Derivative Instruments
The Funds apply derivative instrument disclosure standards in order to enable investors to understand how and why the Funds use derivatives, how derivatives are accounted for, and how derivative instruments affect the Funds’ financial statements.
To hedge interest rate risk, the Funds used Treasury options and futures traded on a U.S. exchange. Risks of entering into futures and options contracts include the possibility of an illiquid market and that a change in the value of the option may not correlate with changes in the value of the underlying securities.
The premiums paid for the options represent the cost of the investment and the options are valued daily at their closing price. The Funds recognize a realized gain or loss when the option is sold or expired. Option holdings within the Funds, which may include put options and call options, are subject to loss of value with the passage of time, and may experience a total loss of value upon expiration. With options, there is minimal counterparty risk to the Funds since they are exchange traded.
Upon entering into a futures contract, a Fund is required to deposit either cash or securities in an amount (initial margin) equal to a certain percentage of the contract value. Subsequent payments (variation margin) are made or received by the Fund each day. The variation margin payments are equal to the daily changes in the contract value and are recorded as unrealized gains and losses. The Fund recognizes a realized gain or loss when the contract is closed or expired. With futures contracts, there is minimal counterparty risk to the Fund since futures are exchange traded and the exchange’s clearinghouse, as counterparty to all exchange-traded futures, guarantees the futures against default.
During the six months ended September 30, 2019, the average volume of derivative activity, calculated on a quarterly basis (monthly for U.S. Government Securities Fund), was as follows:
| | | | | | | | | | | | |
| | | Average
Premium
Received | | | | | | Average
Notional
Amount | |
U.S. Government Securities Fund | | | | | | | | | | | | |
Purchased put options | | | $50,833 | | | | | | | | $12,776,786 | |
Written call options | | | 386,233 | | | | | | | | 66,297,857 | |
| | | |
Quality Income Fund | | | | | | | | | | | | |
Written call options | | | 49,651 | | | | | | | | 11,461,667 | |
Treasury futures - short | | | — | | | | | | | | 13,857,071 | |
| | | |
Tax-Free Income Fund | | | | | | | | | | | | |
Treasury futures - short | | | — | | | | | | | | 34,371,901 | |
| | | |
MinnesotaTax-Free Income Fund | | | | | | | | | | | | |
Treasury futures - short | | | — | | | | | | | | 8,309,620 | |
The number of open option contracts and open futures contracts outstanding as of September 30, 2019 also serve as indicators
of the volume of activity for the Funds throughout the period.
NOTES TO FINANCIAL STATEMENTS (Unaudited)
Six Months Ended September 30, 2019 (Continued)
Statement of Assets and Liabilities - Values of derivatives as of September 30, 2019
| | | | | | | | | | |
| | | Asset Derivatives Value | | Liability Derivatives Value |
Interest rate risk: | | | | | | | | | | |
| | |
Quality Income Fund | | | | | | | | | | |
Treasury futures | | | | $112,520 | 1 | | | | — | |
| | |
Tax-Free Income Fund | | | | | | | | | | |
Treasury futures | | | | 215,978 | 1 | | | | — | |
1Statement of Assets and Liabilities location: Variation margin receivable/payable. Includes cumulative appreciation (depreciation) of futures as reported
in the Schedule of Investments.
The effect of derivative instruments on the statement of operations for the six months ended September 30, 2019:
| | | | | | | | | | |
| | | Amount of Realized
Gain (Loss) on Derivatives 2 | | Change in Unrealized
Appreciation (Depreciation) on Derivatives 3 |
Interest rate risk: | | | | | | | | | | |
| | |
U.S. Government Securities Fund | | | | | | | | | | |
Purchased put options | | | | $96,251 | | | | | — | |
Written call options | | | | (3,127,018 | ) | | | | — | |
| | |
Quality Income Fund | | | | | | | | | | |
Written call options | | | | (788,149 | ) | | | | $143,039 | |
Treasury futures | | | | (131,273 | ) | | | | 112,520 | |
| | |
Tax-Free Income Fund | | | | | | | | | | |
Treasury futures | | | | (2,081,113 | ) | | | | 833,771 | |
| | |
MinnesotaTax-Free Income Fund | | | | | | | | | | |
Treasury futures | | | | (437,577 | ) | | | | 291,937 | |
2Statement of Operations location: Net realized gain (loss) on investments, net realized gain (loss) on written options and net realized gain (loss)
on futures, respectively.
3Statement of Operations location: Net change in unrealized appreciation (depreciation) on investments, net change in unrealized appreciation
(depreciation) on written options and net change in unrealized appreciation (depreciation) on futures, respectively.
| | |
62 | | SIT MUTUAL FUNDS SEMI-ANNUAL REPORT |
Fair Value Measurements
The inputs and valuation techniques used to measure fair value of the Funds’ net assets are summarized into three levels as described in the hierarchy below:
| | • | | Level 1 – quoted prices in active markets for identical securities. An active market for the security is a market in which transactions occur with sufficient frequency and volume to provide pricing information on an ongoing basis. A quoted price in an active market provides the most reliable evidence of fair value. |
| | • | | Level 2 – debt securities are valued based on evaluated prices received from independent pricing services or from dealers who make markets in such securities. For corporate bonds, U.S. government and government agency obligations, and municipal securities the pricing services utilize matrix pricing which considers yield or price of bonds of comparable quality, coupon, maturity, and type as well as dealer supplied prices. For asset-backed securities and mortgage-backed securities, the pricing services utilize matrix pricing which considers prepayment speed assumptions, attributes of the collateral, yield or price of bonds of comparable quality, coupon, maturity, and type as well as dealer supplied prices. All of these inputs are derived principally from or corroborated by observable market data. An adjustment to any observable input that is significant to the fair value may render the measurement a Level 3 measurement. |
| | • | | Level 3 – significant unobservable inputs, including the Adviser’s own assumptions in determining the fair value of investments. |
The inputs or methodology used for valuing securities are not necessarily an indication of the risk associated with investing in those securities.
At the end of each calendar quarter, management evaluates the Level 2 and 3 assets and liabilities for changes in liquidity, including but not limited to: whether a broker is willing to execute at the quoted price, the depth and consistency of prices from third party services, and the existence of contemporaneous, observable trades in the market. Additionally, management evaluates the Level 1 and 2 assets and liabilities on a quarterly basis for changes in listings or delistings on national exchanges. Due to the inherent uncertainty of determining the fair value of investments that do not have a readily available market value, the fair value of the Funds’ investments may fluctuate from period to period. Additionally, the fair value of investments may differ significantly from the values that would have been used had a ready market existed for such investments and may differ materially from the values the Fund may ultimately realize. Further, such investments may be subject to legal and other restrictions on resale or otherwise are less liquid than publicly traded securities.
A summary of the levels for the Funds’ investments as of September 30, 2019 is included with the Funds’ schedules of investments.
Federal Taxes
The Funds’ policy is to comply with the requirements of the Internal Revenue Code applicable to regulated investment companies and to distribute all of their taxable income to shareholders. The Funds have recorded in their financial statements the full benefit of their tax positions taken in connection with the Registered Investment Company (RIC) qualification and distribution requirements of the Internal Revenue Code. Therefore, no income tax provision is required. Also, in order to avoid the payment of any federal excise taxes, the Funds will distribute substantially all of their net investment income and net realized gains on a calendar year basis.
Management has analyzed the Funds’ tax positions taken in federal tax returns for all open tax years and has concluded that as of September 30, 2019, no provision for income tax would be required in the Funds’ financial statements. The Funds’ federal and state income and federal excise tax returns remain subject to examination by the Internal Revenue Service and state departments of revenue until such time as the applicable statute of limitations for audit has expired. For example, U.S. tax returns are generally subject to audit for three years from the date they are filed.
NOTES TO FINANCIAL STATEMENTS (Unaudited)
Six Months Ended September 30, 2019 (Continued)
At September 30, 2019, the gross unrealized appreciation (depreciation) on investments and cost of investments on a tax basis for federal income tax purposes were as follows:
| | | | | | | | | | | | | | | | |
| | | Unrealized Appreciation | | Unrealized Depreciation | | Net Unrealized Appreciation
(Depreciation) | | Cost (Proceeds) of Investments on a Tax Basis |
| | | | |
U.S. Government Securities - Investments | | | $10,505,956 | | | | ($1,204,468) | | | | $9,301,488 | | | | $410,037,149 | |
Quality Income - Investments | | | 1,034,909 | | | | (79,177) | | | | 955,732 | | | | 85,449,497 | |
Tax-Free Income - Investments | | | 16,042,551 | | | | (14,917,772) | | | | 1,124,779 | | | | 266,789,110 | |
MinnesotaTax-Free Income - Investments | | | 27,938,471 | | | | (2,696,172) | | | | 25,242,299 | | | | 620,431,044 | |
Net investment income and net realized gains may differ for financial statement and tax purposes. The character of distributions made during the year from net investment income or net realized gains may also differ from its ultimate characterization for tax purposes. The tax character of distributions paid during the fiscal years ended March 31, 2019 and 2018 were as follows:
| | | | | | | | | | | | | | | | |
Year Ended March 31, 2019: | | | | | | | | | | | | | |
| | | | |
| | | Ordinary Income | | | Tax-Exempt
Income | | | Long Term
Capital Gain | | | Total | |
| | | | |
U.S. Government Securities | | | $10,088,083 | | | | — | | | | — | | | | $10,088,083 | |
Quality Income | | | 1,541,309 | | | | — | | | | — | | | | 1,541,309 | |
Tax-Free Income* | | | 155,254 | | | | $7,037,416 | | | | — | | | | 7,192,670 | |
MinnesotaTax-Free Income* | | | 43,587 | | | | 17,831,078 | | | | — | | | | 17,874,665 | |
* 97.8% and 99.8% of dividends were derived from interest ontax-exempt securities for theTax-Free Income and MinnesotaTax-Free Income Funds, respectively. | |
| | | | |
Year Ended March 31, 2018: | | | | | | | | | | | | | | | | |
| | | | |
| | | Ordinary Income | | | Tax-Exempt
Income | | | Long Term
Capital Gain | | | Total | |
| | | | |
U.S. Government Securities | | | $10,036,925 | | | | — | | | | — | | | | $10,036,925 | |
Quality Income | | | 979,607 | | | | — | | | | — | | | | 979,607 | |
Tax-Free Income* | | | 357,688 | | | | $6,755,280 | | | | — | | | | 7,112,968 | |
MinnesotaTax-Free Income* | | | 43,477 | | | | 16,314,954 | | | | — | | | | 16,358,431 | |
* 95.0% and 99.7% of dividends were derived from interest ontax-exempt securities for theTax-Free Income and MinnesotaTax-Free Income Funds, respectively. | |
As of March 31, 2019 the components of distributable earnings on a tax basis were as follows:
| | | | | | | | | | | | | | | | | | | | | | | | | | | | | | | |
| | | Undistributed
Ordinary Income | | | | Undistributed
Tax-Exempt Income | | | | Accumulated
Gain (Loss) | | | | Unrealized
Appreciation (Depreciation) | | |
U.S. Government Securities | | | | $147,317 | | | | | | | — | | | | | | | ($15,811,773) | | | | | | | $2,668,423 | |
Quality Income | | | | 19,986 | | | | | | | — | | | | | | | (2,050,372) | | | | | | | 272,777 | |
Tax-Free Income | | | | — | | | | | | | $264,134 | | | | | | | (8,482,403) | | | | | | | (5,369,064) | |
Minnesota Tax-Free Income | | | | — | | | | | | | 283,413 | | | | | | | (2,503,945) | | | | | | | 10,881,246 | |
| | |
64 | | SIT MUTUAL FUNDS SEMI-ANNUAL REPORT |
Net capital loss carryovers and late year losses, if any, as of March 31, 2019, are available to offset future realized capital gains and thereby reduce future capital gains distributions. The Funds are permitted to carry forward capital losses for an unlimited period. Capital losses that are carried forward retain their character as either short-term or long-term capital losses. The net capital loss carryovers and the late year losses deferred as of March 31, 2019, were as follows:
| | | | | | | | | | | | | | |
| | | Unlimited Period of Net
Capital Loss Carryover | | Late Year
Losses | | Accumulated
Capital and | |
| | | | | | | | | | |
| | | Short-Term | | Long-Term | | Deferred | | Other Losses | |
| | | | |
U.S. Government Securities | | | $8,122,223 | | | | $7,689,550 | | | — | | | $15,811,773 | |
Quality Income | | | 1,077,553 | | | | 972,819 | | | — | | | 2,050,372 | |
Tax-Free Income | | | 813,905 | | | | 7,668,498 | | | — | | | 8,482,403 | |
MinnesotaTax-Free Income | | | 1,235,782 | | | | 1,268,163 | | | — | | | 2,503,945 | |
For the year ended March 31, 2019, the Funds’ utilized capital losses and expired capital losses as follows:
| | | | | | | | | | | | | | |
| | | Utilized | | | | | Expired | | | | | |
Tax-Free Income | | — | | | | | | $ | 2,401,634 | |
Distributions
Distributions to shareholders are recorded as of the close of business on the record date. Such distributions are payable in cash or reinvested in additional shares of the Funds’ capital stock. Distributions from net investment income are declared daily and paid monthly for the Funds. Distributions from net realized gains, if any, will be made annually for each of the Funds.
Use of Estimates
The preparation of financial statements in conformity with U.S. generally accepted accounting principles requires management to make certain estimates and assumptions that affect the reported amounts of assets and liabilities and disclosure of contingent assets and liabilities at the date of the financial statements and the reported results for the respective periods. Actual results could differ from those estimates.
Guarantees and Indemnifications
Under each Fund’s organizational documents, its officers and directors are indemnified against certain liabilities arising out of the performance of their duties to each Fund. In addition, certain of each Fund’s contracts with its service providers contain general indemnification clauses. Each Fund’s maximum exposure under these arrangements is unknown since the amount of any future claims that may be made against each Fund cannot be determined and each Fund has no historical basis for predicting the likelihood of any such claims.
| (3) | Investment Security Transactions |
The cost of purchases and proceeds from sales and maturities of investment securities, other than short-term securities, for the six months ended September 30, 2019, were as follows:
| | | | | | | | | | | | | | | | |
| | | Purchases | | | Proceeds | |
| | | | |
| | | U.S. Government | | | Other | | | U.S. Government | | | Other | |
| | | | |
U.S. Government Securities | | | $45,083,000 | | | | — | | | | $52,044,975 | | | | — | |
Quality Income | | | 5,583,423 | | | | $20,171,638 | | | | 14,806,462 | | | | $19,381,716 | |
Tax-Free Income | | | — | | | | 43,411,588 | | | | — | | | | 14,874,269 | |
MinnesotaTax-Free Income | | | — | | | | 70,596,190 | | | | — | | | | 23,396,465 | |
NOTES TO FINANCIAL STATEMENTS (Unaudited)
Six Months Ended September 30, 2019 (Continued)
| (4) | Affiliated Fees and Transactions |
Investment Adviser
The Funds each have entered into an investment management agreement with Sit Investment Associates Inc. (SIA),under which SIA manages the Funds’ assets and provides research, statistical and advisory services, and pays related office rental, executive expenses and executive salaries. SIA also is obligated to pay all of the Funds’ expenses (excluding extraordinary expenses, stock transfer taxes, interest, brokerage commissions, and other transaction charges relating to investing activities). The fee for investment management and advisory services is based on the average daily net assets of the Funds at the annual rate of:
| | | | |
| | | Average Daily Net Assets | | |
U.S. Government Securities | | 0.80% |
Quality Income | | 0.90% |
Tax-Free Income | | 0.80% |
MinnesotaTax-Free Income | | 0.80% |
Transactions with affiliates
The investment adviser, affiliates of the investment adviser, directors and officers of the Funds as a whole owned the following shares as of September 30, 2019:
| | | | | | |
| | | Shares | | | % Shares Outstanding |
| | | |
U.S. Government Securities | | | 850,319 | | | 2.2 |
Quality Income | | | 6,547,991 | | | 74.4 |
Tax-Free Income | | | 1,277,665 | | | 4.3 |
MinnesotaTax-Free Income | | | 1,991,687 | | | 3.2 |
| | |
66 | | SIT MUTUAL FUNDS SEMI-ANNUAL REPORT |
EXPENSE EXAMPLE (Unaudited)
As a shareholder of the Funds, you incur two types of costs: (1) transaction costs, including redemption fees and (2) ongoing costs, including management fees; and other Fund expenses. This Example is intended to help you understand your ongoing costs (in dollars) of investing in the Funds and to compare these costs with the ongoing costs of investing in other mutual funds.
The Example is based on an investment of $1,000 invested at the beginning of the period and held for the entire period April 1, 2019 to September 30, 2019.
Actual Expenses
The first line of the following table provides information about actual account values and actual expenses. You may use the information in this line, together with the amount you invested, to estimate the expenses that you paid over the period. Simply divide your account value by $1,000 (for example, an $8,600 account value divided by $1,000 = 8.6), then multiply the result by the number in the first line under the heading entitled “Expenses Paid During Period” to estimate the expenses you paid on your account during this period.
Hypothetical Example for Comparison Purposes
The second line of the table provides information about hypothetical account values and hypothetical expenses based on the Fund’s actual expense ratio and an assumed rate of return of 5% per year before expenses, which is not the Fund’s actual return. The hypothetical account values and expenses may not be used to estimate the actual ending account balance or expenses you paid for the period. You may use this information to compare the ongoing costs of investing in the Fund and other funds. To do so, compare this 5% hypothetical example with the 5% hypothetical examples that appear in the shareholder reports of the other funds.
Please note that the expenses shown in the table are meant to highlight your ongoing costs only and do not reflect any transactional costs, such as redemption fees. Therefore, the second line of the table is useful in comparing ongoing costs only, and will not help you determine the relative total costs of owning different funds. In addition, if these transactional costs (redemption fees) were included, your costs would have been higher.
| | | | | | |
| | | Beginning
Account
Value
(4/1/19) | | Ending
Account
Value
(9/30/19) | | Expenses
Paid During
Period
(4/1/19-
9/30/19)* |
|
| U.S. Government Securities Fund |
|
Actual | | $1,000 | | $1,020.50 | | $4.04 |
Hypothetical | | $1,000 | | $1,021.00 | | $4.04 |
| | | | | | |
|
Quality Income Fund |
|
Actual | | $1,000 | | $1,014.40 | | $4.53 |
Hypothetical | | $1,000 | | $1,020.50 | | $4.55 |
| | | | | | |
|
Tax-Free Income Fund |
|
Actual | | $1,000 | | $1,036.70 | | $4.07 |
Hypothetical | | $1,000 | | $1,021.00 | | $4.04 |
| | | | | | |
|
MinnesotaTax-Free Income Fund |
|
Actual | | $1,000 | | $1,036.60 | | $4.07 |
Hypothetical | | $1,000 | | $1,021.00 | | $4.04 |
*Expenses are equal to the Funds’ annualized expense ratio of 0.80% for the U.S. Government Securities,Tax-Free Income and MinnesotaTax-Free Funds; and 0.90% for the Quality Income Fund, multiplied by the average account value over the period, multiplied by 183/366 (to reflect theone-half year period.)
ADDITIONAL INFORMATION (Unaudited)
PROXY VOTING
A description of the policies and procedures that Sit Investment uses to vote proxies related to the Funds’ portfolio securities is set forth in the Funds’ Statement of Additional Information, which is available on the Funds’ website at www.sitfunds.com, without charge by calling800-332-5580 and on the Securities and Exchange Commission’s (SEC) website at www.sec.gov. The Funds’ proxy voting record is available without charge by calling800-332-5580 and on the SEC’s website at www.sec.gov no later than August 31 for the prior 12 months ending June.
QUARTERLY SCHEDULE OF INVESTMENTS
Each Fund files a complete schedule of investments with the SEC for the first and third quarters of each fiscal year on FormN-PORT. The Funds’ FormN-PORT is available on the SEC’s website at www.sec.gov. Each Fund’s complete schedule of investments, as filed on FormN-PORT, is also available on its website at www.sitfunds.com, or without charge by calling800-332-5580.
| | |
68 | | SIT MUTUAL FUNDS SEMI-ANNUAL REPORT |
Item 2: Code of Ethics.
Not applicable to Semi-Annual Report.
Item 3: Audit Committee Financial Expert.
Not applicable to Semi-Annual Report.
Item 4: Principal Accountant Fees and Services.
Not applicable to Semi-Annual Report.
Item 5: Audit Committee of Listed Registrants.
Not applicable toopen-end investment companies.
Item 6: Schedule of Investments.
The schedule of investments is included as part of the report to shareholders filed under Item 1 of this Form.
Item 7: Disclosure of Proxy Voting Policies and Procedures forClosed-End Management Investment Companies.
Not applicable toopen-end investment companies.
Item 8: Portfolio Managers ofClosed-End Management Companies.
Not applicable toopen-end investment companies.
Item 9: Purchases of Equity Securities byClosed-End Management Investment Company and Affiliated Purchasers.
Not applicable toopen-end investment companies.
Item 10. Submission of Matters to a vote of Security Holders.
There have been no material changes to the procedures by which shareholders may recommend nominees to the registrant’s board of directors.
Item 11: Controls and Procedures -
(a) Based on their evaluation of the Registrant’s Disclosure Controls and Procedures as of a date within 90 days of the Filing Date, the Registrant’s Chairman and Treasurer have determined that the Disclosure Controls and Procedures (as defined in Rule30a-2(c) under the Act) are designed to ensure that information required to be disclosed by the Registrant is recorded, processed, summarized and reported by the filing Date, and that information required to be disclosed in the report is communicated to the Registrant’s management, as appropriate, to allow timely decisions regarding required disclosure.
b) There were no changes in the Registrant’s internal control over financial reporting as defined in Rule30a-3(d) under the Act) that occurred during the Registrant’s last fiscal half-year that has materially affected, or is reasonably likely to materially affect, the Registrant’s internal control over financial reporting.
Item 12: Disclosure of Securities Lending Activities forClosed-End Management Investment Companies.
Not applicable toopen-end investment companies.
Item 13: Exhibits:
(a) The following exhibits are attached to this FormN-CSR:
(2) A separate certification for each principal executive and principal financial officer of the registrant as required by Rule30a-2(a) under the Act (17 CFR270.30a-2) (certification required by Section 302 of the Sarbanes-Oxley Act of 2002).
(b) Certification required by Rule30a-2(b) under the Act (certification required by Section 906 of the Sarbanes-Oxley Act of 2002).
SIGNATURES
Pursuant to the requirements of the Securities Exchange Act of 1934 and the Investment Company Act of 1940, the registrant has duly caused this report to be signed on its behalf by the undersigned, thereunto duly authorized.
| | |
| SIT MUTUAL FUNDS II, INC. |
| |
| By: | | /s/ Paul E. Rasmussen |
| | Paul E. Rasmussen |
| | Vice President, Treasurer |
|
| Date: November 22, 2019 |
Pursuant to the requirements of the Securities Exchange Act of 1934 and the Investment Company Act of 1940, this report has been signed below by the following persons on behalf of the registrant and in the capacities and on the dates indicated.
| | |
| By: | | /s/ Paul E. Rasmussen |
| | Paul E. Rasmussen |
| | Vice President, Treasurer |
|
| Date: November 22, 2019 |
| |
| By: | | /s/ Roger J. Sit |
| | Roger J. Sit |
| | Chairman |
|
| Date: November 22, 2019 |