UNITED STATES
SECURITIES AND EXCHANGE COMMISSION
Washington, D.C. 20549
FORM N-CSR
CERTIFIED SHAREHOLDER REPORT OF REGISTERED
MANAGEMENT INVESTMENT COMPANIES
Investment Company Act file number: 811-04033
Sit Mutual Funds II, Inc.
(Exact name of registrant as specified in charter)
3300 IDS Center
80 South Eighth Street
Minneapolis, MN 55402
(Address of principal executive offices)
Paul E. Rasmussen, VP Treasurer
Sit Mutual Funds, Inc.
3300 IDS Center
80 South Eighth Street
Minneapolis, MN 55402
(Name and address of agent for service)
Copy to:
Mike Radmer, Esq.
Dorsey & Whitney
Suite 1500
50 South Sixth Street
Minneapolis, MN 55402-1498
Registrant’s telephone number, including area code:
(612) 334-5888
Date of fiscal year end: March 31, 2011
Date of reporting period: March 31, 2011
| Item 1: | Reports to Stockholders |

|
Sit Mutual Funds BOND FUNDS ANNUAL REPORT TABLE OF CONTENTS |
This document must be preceded or accompanied by a Prospectus.
CHAIRMAN’S LETTER
Year Ended March 31, 2011
Dear fellow shareholders:
U.S. fixed-income markets performed well over the first half of the last year, but significant and conflicting forces challenged the markets during the latter half of the year. Some of these forces included: improving economic conditions in the U.S. economy; a massive increase in the money supply as a result of the Federal Reserve’s second round of quantitative easing (QE2); a sovereign debt crisis in Europe; political instability in the Middle East; and fiscal concerns at all levels of government in the U.S.
Taxable bond yields increased and the yield curve steepened during the last six months, with short-term yields remaining at historic lows and longer-term U.S. Treasury yields increasing. Specifically, the one-year maturity U.S.Treasury bill yield increased 2 basis points to 0.27%, while the 30-year U.S. Treasury bond yield increased 82 basis points to 4.51%. Most taxable bond sectors experienced negative returns over the last six months, but still delivered strong returns over the last year. Commercial mortgage-backed securities and home equity securities were the strongest sectors for both the six-month and one-year time periods. Lower quality bonds outperformed higher quality bonds during the last six and twelve months. In terms of duration, longer bonds outperformed shorter bonds during the last year; however, this trend reversed during the last six-months with shorter duration outperforming longer duration bonds.
Tax-exempt bond yields showed a similar pattern of increased yields and more pronounced yield curve steepening during the six-month period. The one-year Municipal Market Data (MMD) AAA GO increased 2 basis points to 0.30%, while the 30-year MMD AAA GO increased 110 basis points to 4.80%. The sharp rise in yields that began in the fourth quarter of 2010 continued through mid-January before settling at lower levels in February and March. The slowing pace of mutual fund redemptions, combined with the lowest quarterly issuance volume since the first quarter of 2000 and the entrance of taxable crossover buyers, helped stabilize the market recently. The Barclays Five-year Municipal Bond Index produced a total return of -1.0% and +3.2% for the six-month and one-year periods ended March 31, respectively. Among revenue bonds, housing and resource recovery bonds led the six-month and one-year periods. Intermediate duration bonds outperformed shorter and longer duration over the last year while shorter duration bonds outperformed over the last six-months.
U.S. economic activity is at a new high after recovering from the severe contraction of activity resulting from the financial crisis. The final estimate fourth quarter 2010 real GDP growth was revised up to +3.1% from the previous estimate of +2.8%. Impressively, year-over-year changes in real GDP components have actually been remarkably steady in the +2.5 to +3.0% range over the past four quarters.
The nonfarm payroll report, released on April 1st, revealed that 216,000 jobs were created in March, compared with the consensus expectation of 190,000 jobs. Even more notably, private sector payrolls grew by 564,000 in the first quarter, which is the highest level since the first quarter of 2006 and marked the fifth consecutive quarterly
increase. The unemployment rate drifted downward to 8.8%, compared to 9.8% as recently as November. The full one percentage point decline in four months is the steepest reduction over such a period since January 1984. However, the labor participation rate, which had been in a moderate downtrend since 2000 and had accelerated with the recession, has yet to show improvement and remains at 64.2% vs. 66.0% at the beginning of the recession and 67.3% in early 2000.
Inflation, as measured by the headline Consumer Price Index for All Urban Consumers (CPI), increased +0.5% from the January level or +2.1% year-over-year in February. Not surprisingly, energy costs continued to rise, up +3.4% from January. Core CPI, which excludes the volatile food and energy components, increased +0.2%, slightly ahead of the +0.1% consensus estimate. While inflation is clearly increasing, much of the rise has been caused by food and energy commodities, which will be “transitory,” according to a recent FOMC statement. Nonetheless, investors are clearly beginning to sharpen their focus on inflation expectations.
Through the first five months of fiscal year 2011, the federal budget deficit stands at $641 billion, approximately $10 billion less than the comparable period last year. Furthermore, the Congressional Budget Office (CBO) estimates that the fiscal 2011 deficit will be $1.48 trillion versus a 2010 deficit of $1.29 trillion. Despite all of the news grabbing headlines from Washington surrounding the debate on the budget, none of the current proposals from Congress will meaningfully change the budget outlook for 2011.
The Federal Reserve’s U.S. trade-weighted major currencies dollar index declined -1.6% in March from the February level and -5.8% on a year-over-year basis. The dollar is very near the all-time lows that were reached in early 2008. Given the fiscal difficulties the U.S. faces over both the near and long term, we do not expect a sustained rally in the dollar, but there may be short-term, technically driven rallies.
We expect the current economic recovery to continue at a subpar pace. Consumer spending continues to be subdued, as improvements in employment have been measureable but slow. Two significant problems remaining in the U.S. economy are high unemployment and a weak housing market. Significant job creation is naturally one of the last things to occur in any economic recovery. In a general economic cycle, recessions cause corporations to lose money, followed by workforce reductions and bankruptcies until the surviving companies are once again profitable. But after a few quarters of stable operations and profits, corporations will risk hiring people and expand their businesses. We believe the moderate economic growth should continue to create jobs but the process will be long, slow and erratic.
Likewise, the very weak housing market has begun to stabilize even though a full recovery will take considerable time. While home prices are near their lows, year-over-year home price comparisons are distorted because last year’s home prices were artificially inflated
| | |
| | | |
2 | | SIT MUTUAL FUNDS ANNUAL REPORT |
by the home buyer tax credit that expired in April of 2010. One of our preferred housing data points is the trend in unsold housing inventory. We like to include homes that are also in foreclosure (often referred to as “shadow inventory”) and properties owned by borrowers that are more than 60 days delinquent on their mortgage. This measure of total housing inventory has steadily declined for 15 months and we expect this trend to continue.
The rapid deterioration of the federal deficit and, to a lesser degree, state and local budgets remain challenging to the economy. The Federal Reserve’s aggressive money printing program is already distorting financial markets (the real challenge will come when the Fed tries to reverse the process). The normal threat of rising inflation that comes with an expanding economy is heightened by the Fed’s 30% increase in the money supply over the past three years. Recent external factors will likely continue to slow the recovery both globally and in the U.S., namely: continuing issues surrounding the European sovereign debt crisis; unrest in the Middle East; and the earthquake in Japan. The revolutions in the Middle East will have unpredictable outcomes. Japan’s earthquake, tsunami, and nuclear crisis have disrupted the lives of everyone in the country and many companies around the world, but we expect the extraordinary culture and work ethic of the Japanese to help them recover from this terrible tragedy. While the effect on the Japanese people will be long term, we expect the effects on the world economy to be more limited.
As Japan recovers from the massive earthquake, employment improves, and housing stabilizes, there will be little to stop the gradual rising trend in interest rates. Treasury yields for most 5 to 10-year maturities have already risen by a full percentage point since last November, when the Fed announced their intention to print $600 billion by “purchasing” U.S. Treasury bonds. Shifting from recovery mode to a phase of economic expansion, accompanied by high unemployment, a weak housing market, the Japanese earthquake, and the fact that the U.S. is waging multiple wars simultaneously all serve to create multiple opposing pressures on the direction of interest rates. Wars, natural disasters, weak housing markets, and high unemployment tend to push rates lower. Improving economic growth, printing money, and rising inflation expectations tend to push rates higher. We believe the effects of the latter will eventually outweigh those of the former.
Our current taxable bond strategy continues to be underweighting U.S. Treasury bonds and investing in securities that will minimize the negative effects of rising interest rates (if not directly benefit).
Examples include variable rate securities; short average life bonds with high levels of principal repayments 2 to 3 years from now; inflation-linked securities; and short duration, high-coupon, government agency mortgage securities. We have also been able to maintain portfolio yields at levels more than 1% higher than their benchmarks.
Our tax-exempt strategy continues to favor revenue bonds over general obligation bonds with significant weightings in A or BBB rated tax-exempt credits. Tax-exempt bond yields remain quite high relative to taxable bond yields, particularly for intermediate and longer duration bonds. Specifically, the ratio of MMD AAA GO to U.S. Treasuries ended the year at 107% for 30-year bonds and 84% for 10-year bonds versus longer-term averages of 90% and 82%, respectively. Furthermore, yield spreads between AAA and A or BBB tax-exempts also remain quite high. We expect yield ratios between tax-exempts and taxables to decline and quality spreads to narrow as tax-exempt supply normalizes and as credit concerns lessen as state and local bond issuers make progress in moving towards balanced budgets. The slope of the tax-exempt municipal yield curve, as measured by the MMD AAA general obligation curve, steepened markedly over the year to 448 basis points from 385 basis points at the end of last March, placing it at the high end of the range experienced over the last 30 years. As a result, although inflation expectations are increasing modestly, we continue to position municipal portfolios modestly longer than their benchmarks.
All portfolios continue to emphasize high levels of current income and diversification to manage risk. Thank you for your continued interest in the Sit family of mutual funds.
With best wishes,

Roger J. Sit
Chairman and President
Sit Mutual Funds
|
|
Sit U.S. Government Securities Fund |
OBJECTIVE & STRATEGY
The objective of the U.S. Government Securities Fund is to provide high current income and safety of principal, which it seeks to attain by investing solely in debt obligations issued, guaranteed or insured by the U.S. government or its agencies or its instrumentalities.
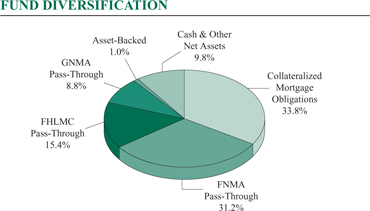
Agency mortgage securities and U.S. Treasury securities are the principal holdings in the Fund. The mortgage securities that the Fund purchases consist of pass-through securities including those issued by Government National Mortgage Association (GNMA), Federal National Mortgage Asociation (FNMA), and Federal Home Loan Mortgage Corporation (FHLMC).
The Sit U.S. Government Securities Fund provided a return of +4.37% during the fiscal year ended March 31, 2011, compared to the return of the Barclays Capital Intermediate Government Bond Index of +3.83%. The Fund’s 30-day SEC yield was 3.25% and its 12-month distribution rate was 2.83%.
During the twelve-month period, the Fund benefited from its holdings in older, high-coupon, agency mortgage pass-through securities and collateralized mortgage obligations, which provide a meaningful income advantage in excess of 2% relative to the benchmark. The Fund’s positions in U.S. Treasury securities provided a slight positive return, as a flight to quality spurred by international geopolitical concerns was only partially offset by investor inflation fears. The Federal housing agencies completed a buyout operation of delinquent loans that had built up throughout the crisis years that detracted from returns. Since the completion of this one-time purchase event, normal buyouts have returned to historical levels. The Fund’s modest cash position hurt relative performance due to the very low levels of interest rates currently available on cash-equivalent investments.
In the first quarter of 2011, the Treasury released a proposal offering various long-term options for the future of the housing market. As the current role of the Federal housing agencies evolves, we expect there will continue to be government sponsorship of the housing market into the foreseeable future and we expect the viability of our strategy to continue.
Economic activity in the U.S. is at a new high after finally recovering from the severe contraction of activity resulting from the financial crisis. While the economic outlook continues to improve, head-winds still remain. An improving but still high unemployment rate, a weak housing market, revolutions in the Middle East, natural catastrophes and fiscal issues at home, all present challenges in the year ahead. We continue to believe that the inflationary environment likely to result from the Federal Reserve’s massive monetary stimulus plan is likely to push interest rates higher. In order to minimize the negative effects of a rising interest rate environment, we are maintaining an underweight to the U.S. Treasury sector. We also continue to focus on older, high-coupon, agency mortgage pass-through
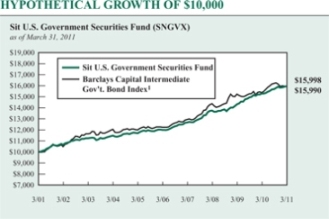
The chart above illustrates the total value of a hypothetical $10,000 investment in the Fund over the past 10 years (or for the life of the Fund if shorter) as compared to the performance of the Barclays Capital Intermediate Government Bond Index. Past performance does not guarantee future results. Returns include the reinvestment of distributions. The chart does not reflect the deduction of taxes that a shareholder would pay on Fund distributions or the redemption of Fund shares.
1 The Barclays Capital Intermediate Government Bond Index is a sub-index of the Barclays Capital Government Bond Index covering issues with remaining maturities of between three and five years. The Barclays Capital Government Bond Index is an index that measures the performance of all public U.S. government obligations with remaining maturities of one year or more. The returns include the reinvestment of income and do not include any transaction costs, management fees or other costs. It is not possible to invest directly in an index.
securities, as these continue to provide high levels of income with relatively stable prices, especially compared to the low absolute levels of shorter term interest rates available from other investment alternatives. This high level of income and principal stability has been and continues to be a fundamental focus of the Fund since its inception.
Michael C. Brilley
Bryce A. Doty, CFA
Senior Portfolio Managers
Mark H. Book, CFA
Portfolio Manager
| | |
| | | |
4 | | SIT MUTUAL FUNDS ANNUAL REPORT |
COMPARATIVE RATES OF RETURNS
| | | | | | | | | | | | |
as of March 31, 2011 | |
| | | Sit U.S. Government Securities Fund | | | Barclays Capital Inter. Gov’t Bond Index1 | | | Lipper U.S. Gov’t Fund Index2 | |
| One Year | | | 4.37 | % | | | 3.83 | % | | | 4.66 | % |
| Five Years | | | 5.91 | | | | 5.48 | | | | 5.17 | |
| Ten Years | | | 4.81 | | | | 4.81 | | | | 4.66 | |
| Since Inception (6/2/87) | | | 6.50 | | | | 6.54 | | | | 6.14 | |
Performance figures are historical and do not guarantee future results. Investment returns and principal value will vary, and you may have a gain or loss when you sell shares. Current performance may be lower or higher than the performance data quoted. Contact the Fund for performance data current to the most recent month-end. Returns include changes in share price as well as reinvestment of all dividends and capital gains and all fee waivers. Without the fee waivers total return and yield figures would have been lower. Returns do not reflect the deduction of taxes that a shareholder would pay on Fund distributions or the redemption of Fund shares. Management fees and administrative expenses are included in the Fund’s performance. Returns for periods greater than one year are compounded average annual rates of return.
1 The Barclays Capital Intermediate Government Bond Index is a sub-index of the Barclays Capital Government Bond Index covering issues with remaining maturities of between three and five years. The Barclays Capital Government Bond Index is an index that measures the performance of all public U.S. government obligations with remaining maturities of one year or more. The returns include the reinvestment of income and do not include any transaction costs, management fees or other costs. It is not possible to invest directly in an index.
2 The Lipper returns are obtained from Lipper Analytical Services, Inc., a large independent evaluator of mutual funds.
Based on total assets as of March 31, 2011. Subject to change
PORTFOLIO SUMMARY
| | |
Net Asset Value 3/31/11: | | $11.29 Per Share |
Net Asset Value 3/31/10: | | $11.13 Per Share |
Total Net Assets: | | $1,057.2 Million |
30-day SEC Yield 3: | | 3.25% |
12-month Distribution Rate 3: | | 2.83% |
Effective Duration 4: | | 1.5 Years |
3 The SEC Yield reflects the rate at which the Fund is earning income on its current portfolio of securities, while the distribution rate reflects the Fund’s past dividends paid to shareholders based on the net investment income distributed and the average NAV during the past 12 months. Accordingly, the Fund’s SEC yield and distribution rate may differ.
4 Duration is a measure of estimated price sensitivity relative to changes in interest rates. Portfolios with longer durations are typically more sensitive to changes in interest rates. For example, if interest rates rise by 1%, the market value of a security with an effective duration of 5 years would decrease by 5%, with all other factors being constant. The correlation between duration and price sensitivity is greater for securities rated investment-grade than it is for securities rated below investment-grade. Duration estimates are based on assumptions by the Adviser and are subject to a number of limitations. Effective duration is calculated based on historical price changes of securities held by the Fund, and therefore is a more accurate estimate of price sensitivity provided interest rates remain within their historical range.
ESTIMATED AVERAGE LIFE
| | | | |
| |
0-1 Year | | | 9.8 | % |
1-5 Years | | | 89.0 | % |
5-10 Years | | | 1.2 | % |
10-20 Years | | | 0.0 | % |
20+ Years | | | 0.0 | % |
The Adviser’s estimates of the dollar weighted average life of the portfolio’s securities, which differ from their stated maturities. The Fund’s average stated maturity was 20.1 years as of March 31, 2011.
SCHEDULE OF INVESTMENTS
March 31, 2011
Sit U.S. Government Securities Fund
| | | | | | | | |
| | | | | |
Principal Amount ($) | | Coupon Rate (%) | | Maturity Date | | | | Fair Value ($) |
Mortgage Pass-Through Securities - 55.4% | | | | |
Federal Home Loan Mortgage Corporation - 15.4% |
222,952 | | 5.50 | | 8/1/17-3/1/33 | | | | 239,494 |
334,300 | | 6.38 | | 12/1/26-12/1/27 | | | | 375,116 |
18,351,977 | | 6.50 | | 4/1/28-10/1/36 | | | | 20,569,112 |
1,005,715 | | 6.88 | | 2/17/31 | | | | 1,152,837 |
50,260 | | 7.00 | | 2/1/16 | | | | 51,080 |
49,134,314 | | 7.00 | | 4/1/28-1/1/39 | | | | 56,162,312 |
164,257 | | 7.38 | | 12/17/24 | | | | 189,400 |
54,705,490 | | 7.50 | | 9/1/26-10/1/38 | | | | 63,137,345 |
163,193 | | 7.95 | | 10/1/25-11/1/25 | | | | 191,682 |
2,291,457 | | 8.00 | | 5/1/17-1/1/37 | | | | 2,666,267 |
33,859 | | 8.25 | | 12/1/17 | | | | 38,347 |
3,666,961 | | 8.50 | | 5/1/16-8/1/36 | | | | 4,333,221 |
53,090 | | 9.00 | | 11/1/15 | | | | 60,502 |
6,566,816 | | 9.00 | | 10/1/16-11/1/36 | | | | 7,735,088 |
126,328 | | 9.25 | | 6/1/16-3/1/19 | | | | 135,619 |
712,810 | | 9.50 | | 10/1/16-12/17/21 | | | | 829,454 |
96,518 | | 9.75 | | 12/1/16-12/1/17 | | | | 104,461 |
2,723,099 | | 10.00 | | 9/1/20-7/1/30 | | | | 3,088,560 |
17,578 | | 10.25 | | 2/1/17 | | | | 17,646 |
12,487 | | 10.50 | | 10/1/13 | | | | 13,304 |
123,540 | | 10.50 | | 6/1/19 | | | | 139,186 |
842,845 | | 11.00 | | 9/17/16-8/15/20 | | | | 936,285 |
9,233 | | 13.00 | | 5/1/17 | | | | 11,026 |
| | | | | | | | |
| | | | | | | | 162,177,344 |
| | | | | | | | |
Federal National Mortgage Association - 31.2% |
13,942,535 | | 4.00 | | 1/1/41 | | | | 13,734,294 |
71,306 | | 5.76 | | 3/1/33 | | | | 77,660 |
10,913 | | 5.99 | | 3/1/19 | | 1 | | 11,625 |
1,934,443 | | 6.00 | | 9/1/28-9/1/37 | | | | 2,118,440 |
588,611 | | 6.15 | | 8/1/36 | | 1 | | 588,844 |
404,562 | | 6.20 | | 11/1/27 | | | | 456,088 |
124,215 | | 6.35 | | 10/1/30 | | | | 140,555 |
78,259 | | 6.49 | | 2/1/32 | | | | 88,482 |
20,091,882 | | 6.50 | | 1/1/22-8/1/37 | | | | 22,629,726 |
1,384,968 | | 6.74 | | 12/1/15 | | | | 1,513,214 |
195,338 | | 6.91 | | 11/1/26-8/1/27 | | | | 225,549 |
257,754 | | 6.95 | | 8/1/21 | | 1 | | 268,512 |
138,432,547 | | 7.00 | | 6/1/17-1/1/40 | | | | 159,361,477 |
210,267 | | 7.45 | | 6/1/16 | | | | 211,943 |
299,410 | | 7.50 | | 11/1/12 | | | | 315,590 |
69,584,227 | | 7.50 | | 6/1/22-4/1/38 | | | | 80,013,541 |
188,220 | | 7.62 | | 12/1/16 | | | | 192,633 |
395,715 | | 7.95 | | 9/15/20 | | | | 454,176 |
10,637,223 | | 8.00 | | 4/1/16-3/1/38 | | | | 12,418,757 |
548,112 | | 8.17 | | 11/15/31 | | | | 651,162 |
12,458 | | 8.25 | | 4/1/22 | | | | 13,501 |
269,220 | | 8.33 | | 7/15/20 | | | | 315,051 |
163,099 | | 8.38 | | 7/20/28 | | | | 187,749 |
1,360,745 | | 8.45 | | 3/15/32 | | | | 1,630,098 |
127,790 | | 8.46 | | 9/15/30 | | | | 149,144 |
| | | | | | |
| | | | |
Principal Amount ($) | | Coupon Rate (%) | | Maturity Date | | Fair Value ($) |
92,307 | | 8.50 | | 9/1/12 | | 97,327 |
200,943 | | 8.50 | | 2/1/16 | | 220,316 |
13,348,098 | | 8.50 | | 9/1/17-12/1/37 | | 15,581,098 |
216,712 | | 8.59 | | 7/20/30 | | 253,442 |
51,906 | | 8.87 | | 12/15/25 | | 61,267 |
7,066,867 | | 9.00 | | 10/1/19-2/1/38 | | 8,271,590 |
112,512 | | 9.25 | | 10/1/16-2/1/17 | | 126,718 |
128,119 | | 9.40 | | 5/15/28 | | 152,898 |
4,030,358 | | 9.50 | | 11/1/18-8/1/31 | | 4,680,191 |
418,187 | | 9.55 | | 8/20/25 | | 474,533 |
15,141 | | 9.75 | | 1/15/13 | | 16,271 |
184,043 | | 9.75 | | 10/1/21-4/1/25 | | 203,605 |
15,328 | | 10.00 | | 7/1/13 | | 15,565 |
136,510 | | 10.00 | | 2/1/15 | | 149,441 |
219,650 | | 10.00 | | 3/1/15 | | 242,206 |
819,920 | | 10.00 | | 11/1/16-6/1/30 | | 930,742 |
142,390 | | 10.16 | | 7/15/20 | | 157,747 |
150,896 | | 10.18 | | 7/1/20 | | 168,317 |
21,094 | | 10.25 | | 8/15/13 | | 22,700 |
15,796 | | 10.50 | | 5/1/15 | | 15,885 |
78,865 | | 10.50 | | 6/1/15 | | 87,807 |
202,425 | | 10.50 | | 12/1/17-6/1/28 | | 232,520 |
83,947 | | 11.27 | | 8/15/20 | | 94,712 |
36,983 | | 11.57 | | 12/15/26 | | 42,280 |
| | | | | | |
| | | | | | 330,066,989 |
| | | | | | |
Government National Mortgage Association - 8.8% |
1,253,280 | | 5.45 | | 7/15/27 | | 1,335,524 |
303,165 | | 5.50 | | 9/15/25 | | 331,658 |
3,704,540 | | 5.61 | | 11/15/34 | | 3,966,530 |
409,572 | | 5.76 | | 3/20/33-5/20/33 | | 446,134 |
7,936,733 | | 5.85 | | 12/15/30 | | 8,405,673 |
390,463 | | 6.00 | | 9/15/18-11/20/28 | | 427,829 |
76,686 | | 6.05 | | 3/20/33 | | 84,043 |
8,904,912 | | 6.09 | | 3/15/41-7/15/41 | | 9,412,968 |
2,868,220 | | 6.15 | | 1/15/42 | | 2,953,160 |
1,031,348 | | 6.20 | | 3/15/32 | | 1,151,887 |
52,583 | | 6.25 | | 5/15/13 | | 56,032 |
415,193 | | 6.25 | | 12/15/23-1/15/24 | | 471,103 |
5,875,721 | | 6.35 | | 4/20/30-11/20/31 | | 6,335,677 |
499,674 | | 6.38 | | 8/15/26-4/15/28 | | 562,945 |
343,364 | | 6.49 | | 11/20/31-6/20/32 | | 376,611 |
27,034,221 | | 6.50 | | 4/15/24-2/15/41 | | 30,133,783 |
112,812 | | 6.57 | | 9/20/32-3/20/33 | | 127,972 |
45,863 | | 6.75 | | 9/15/15 | | 50,492 |
302,498 | | 6.75 | | 8/15/28-6/15/29 | | 346,791 |
886,218 | | 6.91 | | 7/20/26-2/20/27 | | 1,015,944 |
54,159 | | 6.93 | | 2/20/25 | | 62,018 |
1,580,559 | | 7.00 | | 6/20/38-2/20/39 | | 1,793,393 |
161,772 | | 7.02 | | 4/20/26 | | 184,294 |
271,822 | | 7.05 | | 2/15/23-4/20/27 | | 310,112 |
779,558 | | 7.10 | | 5/20/25 | | 890,785 |
| | |
See accompanying notes to financial statements. | | |
6 | | SIT MUTUAL FUNDS ANNUAL REPORT |
| | | | | | | | |
| | | | | |
Principal Amount ($) | | Coupon Rate (%) | | Maturity Date | | | | Fair Value ($) |
| | | | |
315,530 | | 7.15 | | 12/20/26-4/20/27 | | | | 361,126 |
152,246 | | 7.25 | | 5/15/29-6/15/29 | | | | 175,818 |
51,722 | | 7.27 | | 7/20/22 | | | | 59,025 |
55,937 | | 7.38 | | 1/15/29 | | | | 64,817 |
4,801,401 | | 7.50 | | 5/15/16-3/15/39 | | | | 5,540,825 |
21,931 | | 7.55 | | 10/20/22 | | | | 25,169 |
2,666,545 | | 7.60 | | 12/15/33 | | | | 2,831,478 |
95,223 | | 7.63 | | 12/15/29 | | | | 110,747 |
64,872 | | 7.65 | | 7/20/22 | | | | 74,661 |
380,561 | | 7.75 | | 6/15/20-11/15/20 | | | | 436,139 |
47,148 | | 7.90 | | 1/20/21 | | | | 52,722 |
766,521 | | 7.95 | | 2/15/20-3/20/27 | | | | 891,636 |
468,649 | | 7.99 | | 2/20/21-6/20/22 | | | | 540,383 |
121,567 | | 8.00 | | 10/15/14 | | | | 133,591 |
7,145,831 | | 8.00 | | 5/15/16-9/15/31 | | | | 8,364,833 |
399,668 | | 8.10 | | 5/20/19-7/20/20 | | | | 451,468 |
5,082 | | 8.25 | | 12/15/11 | | | | 5,250 |
13,337 | | 8.25 | | 8/15/15 | | | | 14,932 |
306,884 | | 8.25 | | 4/15/19-2/15/20 | | | | 350,797 |
33,220 | | 8.38 | | 10/15/19 | | | | 38,465 |
166,958 | | 8.40 | | 2/15/19-2/15/20 | | | | 193,941 |
4,367 | | 8.50 | | 1/15/12 | | | | 4,651 |
23,201 | | 8.50 | | 4/15/15 | | | | 26,078 |
326,759 | | 8.50 | | 9/15/16-12/20/26 | | | | 384,649 |
35,482 | | 8.60 | | 6/15/18 | | | | 40,971 |
29,490 | | 8.63 | | 10/15/18 | | | | 33,459 |
18,138 | | 8.75 | | 11/15/11 | | | | 18,929 |
1,522 | | 9.00 | | 6/15/11 | | | | 1,589 |
1,892 | | 9.00 | | 8/15/11 | | | | 1,908 |
5,431 | | 9.00 | | 9/15/11 | | | | 5,672 |
3,290 | | 9.00 | | 9/15/11 | | | | 3,436 |
32,330 | | 9.00 | | 1/15/17-7/15/17 | | | | 37,457 |
17,217 | | 9.10 | | 5/15/18 | | | | 20,076 |
9,179 | | 9.50 | | 3/20/16 | | | | 10,509 |
147,527 | | 9.50 | | 11/20/16-8/20/19 | | | | 172,951 |
2,444 | | 9.75 | | 11/15/12 | | | | 2,658 |
222,496 | | 10.00 | | 11/15/17-6/15/21 | | | | 258,234 |
368,545 | | 10.50 | | 2/15/20-8/15/21 | | | | 412,762 |
17,995 | | 11.50 | | 8/15/18 | | | | 19,195 |
| | | | | | | | |
| | | | | | | | 93,406,365 |
| | | | | | | | |
Total Mortgage Pass-Through Securities
(cost: $564,902,639) | | | | 585,650,698 |
| | | | | | | | |
| | |
Collateralized Mortgage Obligations - 33.8% | | | | |
Federal Home Loan Mortgage Corporation - 8.3% |
112,019 | | 5.40 | | 3/25/44 | | 1 | | 116,903 |
203,887 | | 5.50 | | 2/15/34 | | | | 212,208 |
223,588 | | 6.00 | | 9/15/21-6/15/28 | | | | 233,538 |
4,448,275 | | 6.50 | | 9/15/23-10/25/43 | | | | 4,939,902 |
330,499 | | 6.50 | | 9/25/43 | | 1 | | 371,855 |
| | | | | | | | |
| | | | | |
Principal Amount ($) | | Coupon Rate (%) | | Maturity Date | | | | Fair Value ($) |
147,133 | | 6.70 | | 9/15/23 | | | | 162,186 |
365,005 | | 6.95 | | 3/15/28 | | | | 368,954 |
42,819,926 | | 7.00 | | 12/15/20-3/25/43 | | | | 47,426,663 |
19,972,256 | | 7.50 | | 6/15/17-9/25/43 | | | | 23,047,437 |
5,955,086 | | 8.00 | | 3/15/21-1/15/30 | | | | 6,726,231 |
96,325 | | 8.25 | | 6/15/22 | | | | 108,976 |
555,901 | | 8.30 | | 11/15/20 | | | | 627,316 |
1,014,987 | | 8.50 | | 10/15/22-3/15/32 | | | | 1,151,697 |
12,184 | | 9.15 | | 10/15/20 | | | | 13,484 |
1,551,216 | | 9.50 | | 2/15/20-2/25/42 | | | | 1,806,973 |
129,221 | | 10.00 | | 6/15/20 | | | | 148,328 |
| | | | | | | | |
| | | | | | | | 87,462,651 |
| | | | | | | | |
Federal National Mortgage Association - 15.5% |
655,430 | | 5.50 | | 1/25/37 | | | | 679,152 |
1,773,088 | | 6.50 | | 12/25/23-12/25/42 | | | | 1,981,113 |
301,134 | | 6.51 | | 3/25/29 | | 1 | | 337,212 |
6,448,237 | | 6.75 | | 4/25/37 | | | | 7,468,872 |
41,266 | | 6.85 | | 12/18/27 | | | | 45,652 |
31,327,220 | | 7.00 | | 1/25/21-8/25/44 | | | | 34,769,969 |
1,553,004 | | 7.00 | | 6/25/42 | | | | 1,726,340 |
2,501,261 | | 7.12 | | 6/17/40 | | 1 | | 2,800,798 |
945,576 | | 7.13 | | 1/17/37 | | 1 | | 945,145 |
46,915,323 | | 7.50 | | 8/20/27-1/25/48 | | | | 52,643,561 |
15,105,464 | | 7.50 | | 6/19/30-12/25/42 | | 1 | | 17,350,288 |
11,674,329 | | 7.62 | | 7/25/37 | | 1 | | 12,884,029 |
21,455 | | 7.70 | | 3/25/23 | | | | 24,102 |
554,395 | | 8.00 | | 7/25/22-7/25/44 | | | | 651,242 |
8,599,176 | | 8.50 | | 1/25/21-10/25/30 | | | | 9,920,007 |
23,619 | | 8.70 | | 12/25/19 | | | | 25,938 |
1,771,867 | | 8.71 | | 11/25/37 | | 1 | | 2,093,696 |
33,048 | | 8.75 | | 9/25/20 | | | | 36,400 |
102,093 | | 8.95 | | 10/25/20 | | | | 115,757 |
1,865,596 | | 8.95 | | 11/25/37 | | 1 | | 2,110,153 |
3,775,683 | | 9.00 | | 7/25/19-6/25/30 | | | | 4,275,013 |
65,362 | | 9.05 | | 12/25/18 | | | | 72,913 |
2,980,091 | | 9.05 | | 2/25/44 | | 1 | | 3,683,206 |
81,297 | | 9.25 | | 1/25/20 | | | | 92,415 |
4,044,328 | | 9.50 | | 12/25/18-12/25/41 | | | | 5,014,015 |
1,548,166 | | 9.51 | | 6/25/32 | | 1 | | 1,766,946 |
170,685 | | 9.60 | | 3/25/20 | | | | 195,529 |
| | | | | | | | |
| | | | | | | | 163,709,463 |
| | | | | | | | |
Government National Mortgage Association - 5.7% | | | | |
46,536,322 | | 7.00 | | 9/16/23-6/20/40 | | | | 52,423,679 |
401,406 | | 7.50 | | 6/20/26-5/16/27 | | | | 455,115 |
4,365,981 | | 8.00 | | 10/16/29-3/16/30 | | | | 4,989,794 |
1,944,311 | | 8.50 | | 9/20/30-2/20/32 | | | | 1,959,720 |
| | | | | | | | |
| | | | | | | | 59,828,308 |
| | | | | | | | |
Vendee Mortgage Trust - 4.3% | | | | |
1,041,756 | | 6.00 | | 2/15/30 | | | | 1,099,433 |
| | |
See accompanying notes to financial statements. | | |
MARCH 31, 2011 | | 7 |
SCHEDULE OF INVESTMENTS
March 31, 2011
Sit U.S. Government Securities Fund (Continued)
| | | | | | | | |
Principal Amount ($)/ Contracts/Quantity | | Coupon Rate (%) | | Maturity Date | | | | Fair Value ($) |
| | | | |
23,531,350 | | 6.50 | | 1/15/29-8/15/31 | | | | 27,244,891 |
3,365,144 | | 7.00 | | 3/15/28 | | | | 3,849,817 |
646,659 | | 7.25 | | 9/15/25 | | | | 722,311 |
3,752,109 | | 7.75 | | 5/15/22-9/15/24 | | | | 4,275,592 |
6,864,372 | | 8.11 | | 3/15/25 | | 1 | | 8,516,112 |
273,181 | | 8.29 | | 12/15/26 | | | | 319,572 |
| | | | | | | | |
| | | | | | | | 46,027,728 |
| | | | | | | | |
Total Collateralized Mortgage Obligations (cost: $350,525,989) | | | | 357,028,150 |
| | | | | | | | |
Asset-Backed Securities - 1.0% | | | | |
Federal Home Loan Mortgage Corporation - 0.7% |
99,414 | | 6.09 | | 9/25/29 | | 1 | | 106,257 |
250,000 | | 6.28 | | 10/27/31 | | | | 278,444 |
551,964 | | 7.00 | | 11/25/30 | | | | 569,921 |
4,308,166 | | 7.15 | | 9/25/28 | | | | 4,821,107 |
1,410,070 | | 7.27 | | 8/25/28 | | 1 | | 1,492,031 |
| | | | | | | | |
| | | | | | | | 7,267,760 |
| | | | | | | | |
Federal National Mortgage Association - 0.3% |
112,003 | | 0.69 | | 11/25/32 | | 1 | | 107,841 |
99,035 | | 5.41 | | 9/26/33 | | | | 97,085 |
156,776 | | 5.75 | | 2/25/33 | | | | 146,824 |
480,541 | | 6.47 | | 10/25/31 | | | | 488,467 |
923,432 | | 6.50 | | 5/25/32 | | | | 994,036 |
851,527 | | 6.59 | | 10/25/31 | | | | 956,962 |
236,161 | | 6.83 | | 7/25/31 | | | | 239,003 |
137,971 | | 7.80 | | 6/25/26 | | 1 | | 137,876 |
| | | | | | | | |
| | | | | | | | 3,168,094 |
| | | | | | | | |
Total Asset-Backed Securities
(cost: $10,155,642) | | | | 10,435,854 |
| | | | | | | | |
Put Options Purchased 10 - 0.0% | | | | |
1,000 | | U.S. Treasury 5 Year Future
Put Options: $117 strike
May 2011 expiration | | | | |
Total Put Options Purchased
(cost: $629,980) | | | | 648,438 |
| | | | | | | | |
| | | |
Short-Term Securities - 10.3% | | | | | | |
17,250,098 | | Dreyfus Gov’t Cash Mgmt. Fund, 0.004% | | 17,250,098 |
10,000,000 | | FHLB, A.D.N. 0.05%, 4/1/11 6 | | | | 10,000,000 |
5,000,000 | | FHLB, A.D.N. 0.05%, 4/4/11 6 | | | | 4,999,979 |
6,600,000 | | FHLB, A.D.N. 0.05%, 4/5/11 6 | | | | 6,599,963 |
10,000,000 | | FHLB, A.D.N. 0.07%, 4/6/11 6 | | | | 9,999,903 |
10,000,000 | | FHLB, A.D.N. 0.07%, 4/8/11 6 | | | | 9,999,864 |
6,000,000 | | FHLB, A.D.N. 0.08%, 4/13/11 6 | | | | 5,999,840 |
3,350,000 | | FHLMC, A.D.N. 0.07%, 4/4/11 6 | | | | 3,349,980 |
1,000,000 | | FHLMC, A.D.N. 0.07%, 4/5/11 6 | | | | 999,992 |
10,000,000 | | U.S. Treasury Bill, 0.02%, 4/14/11 6 | | | | 9,999,930 |
20,000,000 | | U.S. Treasury Bill, 0.04%, 4/28/11 6 | | | | 19,999,392 |
| | | | | | | | |
| | | | | |
Quantity/ Contracts | | Coupon Rate (%) | | Maturity Date | | | | Fair Value ($) |
| | | |
10,000,000 | | U.S. Treasury Bill, 0.14%, 4/28/11 6 | | | | 9,999,186 |
| | | | | | | | |
| | |
Total Short-Term Securities
(cost: $109,197,873) | | | | 109,198,127 |
| | | | | | | | |
Total Investments in Securities - 100.5%
(cost: $1,035,412,123) | | | | 1,062,961,267 |
| | | | | | | | |
| | |
Call Options Written 10 - 0.0% | | | | |
750 | | U.S. Treasury 2 Year Future
Call Options: $109.25 strike
May 2011 expiration | | | | |
Total Call Options Written
(premiums received: $300,953) | | | | (105,470) |
| | | | | | | | |
| | |
Other Assets and Liabilities, net - (0.5%) | | | | (5,701,975) |
| | | | | | | | |
| | | |
Total Net Assets - 100.0% | | | | | | $1,057,153,822 |
| | | | | | | | |
| 1 | Variable rate security. Rate disclosed is as of March 31, 2011. |
| 6 | Zero coupon security. Rate disclosed is the effective yield on purchase date. |
| 10 | The amount of $2,700,000 in cash was segregated with the broker to cover put options purchased and call options written as of March 31, 2011. |
Numeric footnotes not disclosed are not applicable to this Schedule of Investments.
| | |
See accompanying notes to financial statements. | | |
8 | | SIT MUTUAL FUNDS ANNUAL REPORT |
For a complete list of security holdings refer to our company website at www.sitfunds.com.
A summary of the inputs used to value the Fund’s net assets as of March 31, 2011 is as follows (see note 2 - significant accounting policies in the notes to financial statements):
| | | | | | | | | | | | | | | | |
| | | Investment in Securities | |
| | | Level 1
Quoted
Price ($) | | | Level 2
Other significant
observable inputs ($) | | | Level 3 Significant
unobservable inputs ($) | | | Total ($) | |
Assets | | | | | | | | | | | | | | | | |
Collateralized Mortgage Obligations | | | — | | | | 357,028,150 | | | | — | | | | 357,028,150 | |
Mortgage Pass-Through Securities | | | — | | | | 585,650,698 | | | | — | | | | 585,650,698 | |
Asset-Backed Securities | | | — | | | | 10,435,854 | | | | — | | | | 10,435,854 | |
Short-Term Securities | | | 17,250,098 | | | | 91,948,029 | | | | — | | | | 109,198,127 | |
Put Options Purchased | | | 648,438 | | | | — | | | | — | | | | 648,438 | |
| | | 17,898,536 | | | | 1,045,062,731 | | | | — | | | | 1,062,961,267 | |
Liabilities | | | | | | | | | | | | | | | | |
Call Options Written | | | (105,470 | ) | | | — | | | | — | | | | (105,470 | ) |
| | |
See accompanying notes to financial statements. | | |
MARCH 31, 2011 | | 9 |
OBJECTIVE & STRATEGY
The objective of the Tax-Free Income Fund is to provide a high level of current income that is exempt from federal income tax, consistent with preservation of capital, by investing primarily in investment-grade municipal securities.
Such municipal securities generate interest income that is exempt from both federal regular income tax and federal alternative minimum tax. During normal market conditions, the Fund invests 100% of its net assets in such tax-exempt municipal securities.
The Sit Tax-Free Income Fund provided a return of +0.26% for the fiscal year ended March 31, 2011, compared to a return of +3.25% for the Barclays Capital 5-Year Municipal Bond Index. The Fund’s 30 day SEC yield was 5.76% as of March 31, 2011.
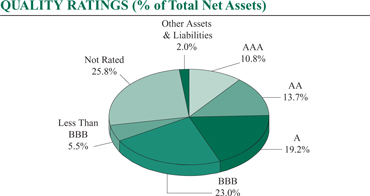
During the last 12 months, tax-exempt yield levels were stable for maturities of four years or less, but rose on longer maturities. Yields on five-year maturity bonds increased by 0.10%, while the longest maturity yields rose by 0.63%. Yields rose across all bond rating categories of the Barclays Municipal Index, with a smaller increase of 0.29% for AAA-rated bonds compared to a 0.58% rise for A-rated bonds and a 0.66% rise for Baa-rated issues. The larger rise in yields for lower rated bonds reflected fears of higher possible levels of municipal defaults forecasted by several prominent analysts in the fourth quarter of 2010. While we expect there will be some municipal defaults in 2011, we do not expect a substantial increase in the number of defaults compared to prior years. Furthermore, we believe that the increase in defaults is more likely to occur among general obligation bonds than revenue bonds, with the latter improving in quality as the economy continues to recover.
The Fund’s underperformance over the past twelve months was primarily attributable to market value declines for A-rated bonds and longer duration holdings. The five largest sectors in which the Fund invests each account for more than 10% of the Fund’s investments; while all of those sectors underperformed the Barclay’s 5-Year Municipal Bond Index, only the Multi-Family sector underperformed by more than 2%. The credit quality of the Fund’s investments improved modestly compared to a year ago, as non-rated holdings were reduced by more than 5%, and all four investment grades had higher weightings than a year earlier. The Fund is highly diversified with over 300 security holdings across 44 states and two territories as of March 31, 2011. The Fund’s average duration of 6.4 years was longer than the Barclays Capital Municipal 5-Year Bond Index’s duration, which negatively affected the Fund’s relative return.
Looking forward, we expect yield spreads for A and BBB issues as well as non-rated bonds to narrow over the coming year from their current historically wide levels. We expect state and local governments to make substantial progress in balancing their budgets
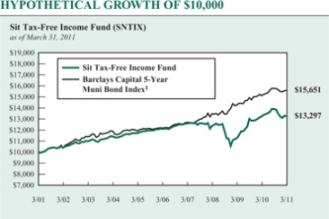
The chart above illustrates the total value of a hypothetical $10,000 investment in the Fund over the past 10 years (or for the life of the Fund if shorter) as compared to the performance of the Barclays Capital 5-Year Municipal Bond Index. Past performance does not guarantee future results. Returns include the reinvestment of distributions. The chart does not reflect the deduction of taxes that a shareholder would pay on Fund distributions or the redemption of Fund shares.
1 The Barclays Capital 5-Year Municipal Bond Index is the 5 year (4-6) component of the Municipal Bond Index, an unmanaged, rules-based, market-value-weighted index for the long-term tax-exempt bond market. The index includes bonds with a minimum credit rating of BBB. The returns include the reinvestment of income and do not include any transaction costs, management fees or other costs. It is not possible to invest directly in an index.
as they cut expenditures and see improved revenue streams as the economy continues to grow at a moderate pace of +2.5% to +3%. We also believe the Fund’s 5.76% 30-day SEC yield represents attractive value in this low inflation environment.
Michael C. Brilley
Debra A. Sit, CFA
Paul J. Jungquist, CFA
Senior Portfolio Managers
| | |
| | | |
10 | | SIT MUTUAL FUNDS ANNUAL REPORT |
COMPARATIVE RATES OF RETURNS
| | | | | | |
| as of March 31, 2011 |
| | | Sit
Tax-Free
Income
Fund | | Barclays
Capital
5-Year Muni
Bond Index1 | | Lipper
General
Muni. Bond
Fund Index2 |
One Year | | 0.26% | | 3.25% | | 0.12% |
Five Years | | 1.85 | | 5.13 | | 2.95 |
Ten Years | | 2.89 | | 4.58 | | 3.89 |
Since Inception (9/29/88) | | 5.03 | | 5.70 | | 5.66 |
| | | | | | | |
Performance figures are historical and do not guarantee future results. Investment returns and principal value will vary, and you may have a gain or loss when you sell shares. Current performance may be lower or higher than the performance data quoted. Contact the Fund for performance data current to the most recent month-end. Returns include changes in share price as well as reinvestment of all dividends and capital gains and all fee waivers. Without the fee waivers total return and yield figures would have been lower. Returns do not reflect the deduction of taxes that a shareholder would pay on Fund distributions or the redemption of Fund shares. Management fees and administrative expenses are included in the Fund’s performance. Returns for periods greater than one year are compounded average annual rates of return.
1 The Barclays Capital 5-Year Municipal Bond Index is the 5 year (4-6) component of the Municipal Bond Index, an unmanaged, rules-based, market-value-weighted index for the long-term tax-exempt bond market. The index includes bonds with a minimum credit rating of BBB. The returns include the reinvestment of income and do not include any transaction costs, management fees or other costs. It is not possible to invest directly in an index.
2 The Lipper returns are obtained from Lipper Analytical Services, Inc., a large independent evaluator of mutual funds.
FUND DIVERSIFICATION
| | | | |
Other Revenue | | | 17.5% | |
Hospital/Health Care | | | 15.6% | |
Education/Student Loan | | | 14.0% | |
Single Family Mortgage | | | 11.9% | |
Multifamily Mortgage | | | 11.1% | |
Closed-End Mutual Funds | | | 6.9% | |
Sectors less than 5% | | | 21.0% | |
Cash & Other Net Assets | | | 2.0% | |
| | | | | |
Based on total net assets as of March 31, 2011. Subject to change.
PORTFOLIO SUMMARY
| | | | |
Net Asset Value 3/31/11: | | $8.52 Per Share | | |
Net Asset Value 3/31/10: | | $8.90 Per Share | | |
Total Net Assets: | | $140.4 Million | | |
30-day SEC Yield 3: | | 5.76% | | |
Tax Equivalent Yield 4: | | 8.86% | | |
12-month Distribution Rate 3: | | 4.63% | | |
Average Maturity: | | 16.1 Years | | |
Effective Duration 5: | | 6.4 Years | | |
3 The SEC Yield reflects the rate at which the Fund is earning income on its current portfolio of securities, while the distribution rate reflects the Fund’s past dividends paid to shareholders based on the net investment income distributed and the average NAV during the past 12 months. Accordingly, the Fund’s SEC yield and distribution rate may differ.
4 The tax-equivalent yield is based on an assumed tax rate of 35.0%.
5 Duration is a measure of estimated price sensitivity relative to changes in interest rates. Portfolios with longer durations are typically more sensitive to changes in interest rates. For example, if interest rates rise by 1%, the market value of a security with an effective duration of 5 years would decrease by 5%, with all other factors being constant. The correlation between duration and price sensitivity is greater for securities rated investment-grade than it is for securities rated below investment-grade. Duration estimates are based on assumptions by the Adviser and are subject to a number of limitations. Effective duration is calculated based on historical price changes of securities held by the Fund, and therefore is a more accurate estimate of price sensitivity provided interest rates remain within their historical range.
Lower of Moody’s, S&P, Fitch or Duff & Phelps ratings used.
Adviser’s Assessment of Non-Rated Securities:
| | | | |
AAA | | | 0.5% | |
AA | | | 2.0 | |
A | | | 0.5 | |
BBB | | | 6.4 | |
BB | | | 11.2 | |
<BB | | | 5.2 | |
| | | | |
Total | | | 25.8% | |
SCHEDULE OF INVESTMENTS
March 31, 2011
Sit Tax-Free Income Fund
| | | | | | | | | | | | | | | | |
Principal
Amount ($) | | | Name of Issuer | | Coupon
Rate (%) | | | Maturity
Date | | | Fair Value ($) | |
| | Municipal Bonds - 91.1% | | | | | | | | | | | | |
| Alabama - 0.4% | | | | | | | | | | | | |
| | 380,000 | | | ASMS Public Education Building Rev. (ASMSF LLC Proj.) (AMBAC Insured) 9 | | | 4.38 | | | | 9/1/26 | | | | 360,707 | |
| | 215,000 | | | Birmingham-Southern College Private Education Building Rev. | | | 5.35 | | | | 12/1/19 | | | | 167,780 | |
| | | | | | | | | | | | | | | | |
| | | | | | | | | | | | | | | 528,487 | |
| | | | | | | | | | | | | | | | |
| Alaska - 0.3% | | | | | | | | | | | | |
| | 500,000 | | | AK Hsg. Finance Corp. Mtg. Rev. (GO of Corp. Insured) | | | 4.50 | | | | 12/1/35 | | | | 461,425 | |
| | | | | | | | | | | | | | | | |
| Arizona - 2.9% | | | | | | | | | | | | |
| | 1,049,893 | | | AZ Health Facs. Auth. Rev. (New Arizona Family Proj.) | | | 5.25 | | | | 7/1/27 | | | | 842,833 | |
| | 250,000 | | | Festival Ranch Community Facs. District G.O. | | | 6.25 | | | | 7/15/24 | | | | 246,758 | |
| | 225,000 | | | Flagstaff Industrial Dev. Auth. Rev. (Sr. Living Community Proj.) | | | 5.50 | | | | 7/1/22 | | | | 198,194 | |
| | 495,000 | | | Pima Co. Industrial Dev. Auth. Education Rev. (AZ Charter Schools Proj.) | | | 5.00 | | | | 7/1/26 | | | | 390,857 | |
| | 450,000 | | | Pima Co. Industrial Dev. Auth. Education Rev. (Center For Academic Success Proj.) 4 | | | 5.38 | | | | 7/1/22 | | | | 397,822 | |
| | 490,000 | | | Pima Co. Industrial Dev. Auth. Education Rev. (Choice Education & Dev. Corp. Proj.) | | | 6.00 | | | | 6/1/16 | | | | 473,105 | |
| | 250,000 | | | Pima Co. Industrial Dev. Auth. Education Rev. (Coral Academy Science Proj.) | | | 6.38 | | | | 12/1/18 | | | | 244,140 | |
| | 250,000 | | | Pima Co. Industrial Dev. Auth. Education Rev. (Noah Webster Basic School Proj.) | | | 5.25 | | | | 12/15/16 | | | | 246,712 | |
| | 400,000 | | | Pima Co. Industrial Dev. Auth. Education Rev. (Tucson Country Day School Proj.) | | | 5.00 | | | | 6/1/22 | | | | 342,016 | |
| | 500,000 | | | Quail Creek Community Facs. District G.O. | | | 5.15 | | | | 7/15/16 | | | | 480,410 | |
| | 150,000 | | | Westpark Community Facs. District G.O. | | | 4.90 | | | | 7/15/16 | | | | 142,824 | |
| | | | | | | | | | | | | | | | |
| | | | | | | | | | | | | | | 4,005,671 | |
| | | | | | | | | | | | | | | | |
| California - 10.5% | | | | | | | | | | | | |
| | 500,000 | | | Agua Caliente Band of Cahuilla Indians Rev. 4 | | | 6.00 | | | | 7/1/18 | | | | 471,475 | |
| | 250,000 | | | Alameda Corridor Transportation Auth. Rev. Capital Appreciation (AMBAC Insured) 6 | | | 6.71 | | | | 10/1/24 | | | | 201,903 | |
| | 250,000 | | | Alameda Corridor Transportation Auth. Rev. Sr. Lien (NATL-RE Insured) | | | 5.25 | | | | 10/1/21 | | | | 241,392 | |
| | 340,000 | | | CA Co. Tobacco Securitization Agy. Rev. (Golden Gate Tobacco Proj.) | | | 4.50 | | | | 6/1/21 | | | | 285,012 | |
| | 500,000 | | | CA Co. Tobacco Securitization Agy. Rev. (Golden Gate Tobacco Proj.) | | | 5.00 | | | | 6/1/36 | | | | 331,415 | |
| | 350,000 | | | CA Community Hsg. Fin. Agy. Lease Rev. Pass Thru Obligation | | | 4.85 | | | | 11/1/12 | | | | 171,728 | |
| | 600,000 | | | CA Finance Auth. Education Rev. (American Heritage Education Foundation Proj.) | | | 5.25 | | | | 6/1/26 | | | | 490,146 | |
| | 250,000 | | | CA Finance Auth. Rev. (Kern Regional Center Proj.) 9 | | | 6.88 | | | | 5/1/25 | | | | 257,910 | |
| | 250,000 | | | CA Finance Auth. Rev. (Literacy First Proj.) | | | 5.50 | | | | 9/1/22 | | | | 226,122 | |
| | 495,000 | | | CA Govt. Finance Auth. Lease Rev. (Placer Co. Transportation Proj.) | | | 6.00 | | | | 12/1/28 | | | | 495,554 | |
| | 250,000 | | | CA Hsg. Finance Agy. Home Mtg. Rev. | | | 5.20 | | | | 8/1/28 | | | | 242,130 | |
| | 250,000 | | | CA Hsg. Finance Agy. Home Mtg. Rev. | | | 5.50 | | | | 8/1/38 | | | | 230,145 | |
| | 500,000 | | | CA Infrastructure & Economic Dev. Bank Rev. | | | 6.00 | | | | 2/1/30 | | | | 515,100 | |
| | 500,000 | | | CA School Facs. Finance Auth. Rev. (Azusa Unified School District) (AGM Insured) 6 | | | 6.00 | | | | 8/1/29 | | | | 348,720 | |
| | 580,000 | | | CA Statewide Communities Dev. Auth. Multifamily Rev. (Orange Tree Proj.) (GNMA Collateral) | | | 6.15 | | | | 11/20/36 | | | | 650,435 | |
| | 500,000 | | | CA Statewide Communities Dev. Auth. Rev. (Lancer Education Student Hsg. Proj.) | | | 5.40 | | | | 6/1/17 | | | | 481,690 | |
| | 350,000 | | | CA Statewide Communities Dev. Auth. Rev. (Sunedison Huntington Beach Solar Proj.) | | | 6.00 | | | | 1/1/21 | | | | 342,968 | |
| | 510,000 | | | CA Statewide Communities Dev. Auth. Rev. (Sunedison Irvine School District) | | | 5.25 | | | | 1/1/16 | | | | 503,222 | |
| | 250,000 | | | CA Statewide Communities Dev. Auth. School Facs. Rev. (Aspire Public Schools) | | | 5.00 | | | | 7/1/20 | | | | 233,942 | |
| | 450,000 | | | CA Statewide Communities Dev. Auth. Special Tax (Orinda Proj.) | | | 6.00 | | | | 9/1/29 | | | | 373,784 | |
| | 1,000,000 | | | Colton Joint Unified School District (AGM Insured) 6 | | | 5.80 | | | | 8/1/35 | | | | 431,600 | |
| | 500,000 | | | Hartnell Community College G.O. 6 | | | 7.00 | | | | 8/1/34 | | | | 236,295 | |
| | 500,000 | | | Hawthorne School District C.O.P. (AGM Insured) 6 | | | 6.00 | | | | 12/1/29 | | | | 383,230 | |
| | 250,000 | | | Imperial Community College District G.O. Capital Appreciation (AGM Insured) 6 | | | 0.97 | | | | 8/1/40 | | | | 188,573 | |
| | 500,000 | | | Lemon Grove Community Dev. Agency Tax Allocation (Redev. Proj.) | | | 5.15 | | | | 8/1/25 | | | | 441,455 | |
| | 215,000 | | | Lindsay-Strathmore Irrigation District C.O.P. 9 | | | 4.50 | | | | 8/1/30 | | | | 176,876 | |
| | 250,000 | | | Los Angeles Unified School District C.O.P. (Administration Building Proj.) (AMBAC Insured) 9 | | | 5.00 | | | | 10/1/31 | | | | 219,130 | |
| | 560,000 | | | Manteca Unified School District Capital Appreciation C.O.P. (NATL-RE Insured) 6 | | | 7.55 | | | | 9/15/25 | | | | 199,360 | |
| | 250,000 | | | Marina Coast Water District Rev. | | | 5.00 | | | | 6/1/20 | | | | 249,582 | |
| | |
See accompanying notes to financial statements. | | |
12 | | SIT MUTUAL FUNDS ANNUAL REPORT |
| | | | | | | | | | | | | | |
Principal
Amount ($) | | | Name of Issuer | | Coupon
Rate (%) | | Maturity
Date | | | Fair Value ($) | |
| | 500,000 | | | Northern CA Gas Auth. No. 1 Rev. 1 | | 0.92 | | | 7/1/27 | | | | 352,395 | |
| | 650,000 | | | Poway Unified School District (AMBAC Insured) | | 5.00 | | | 9/15/31 | | | | 576,778 | |
| | 600,000 | | | Redondo Beach School District G.O. 6 | | 6.38 | | | 8/1/34 | | | | 427,644 | |
| | 500,000 | | | Richmond Community Redev. Agy. Tax Allocation | | 6.00 | | | 9/1/30 | | | | 486,020 | |
| | 500,000 | | | Riverside Co. Redev. Agy. Tax Allocation (Interstate 215 Corridor) | | 6.00 | | | 10/1/25 | | | | 475,850 | |
| | 500,000 | | | Sacramento Co. Water Financing Auth. Rev. (NATL-RE FGIC Insured) 1 | | 0.78 | | | 6/1/39 | | | | 302,160 | |
| | 1,000,000 | | | San Bernardino City Unified School District G.O. Capital Appreciation (NATL-RE Insured) 6 | | 4.72 | | | 8/1/29 | | | | 267,900 | |
| | 250,000 | | | San Joaquin Hills Toll Road Rev. Ref. (NATL-RE Insured) | | 5.25 | | | 1/15/30 | | | | 178,963 | |
| | 385,000 | | | Santa Rosa Rancheria Tachi Yokut Tribe Enterprise Rev. 4 | | 4.88 | | | 3/1/16 | | | | 350,612 | |
| | 350,000 | | | Southwest Community Finance Auth. Rev. (Riverside Co. Proj.) 9 | | 6.00 | | | 5/1/24 | | | | 367,602 | |
| | 500,000 | | | Tustin Unified School District G.O. Capital Appreciation 6 | | 6.05 | | | 8/1/28 | | | | 291,675 | |
| | 400,000 | | | Upland C.O.P. (San Antonio Community Hospital Proj.) | | 6.38 | | | 1/1/32 | | | | 397,900 | |
| | 500,000 | | | Val Verde Unified School District G.O. Capital Appreciation (AGM Insured) 6 | | 6.13 | | | 8/1/34 | | | | 225,805 | |
| | 250,000 | | | Vallejo City Unified School District Special Tax (Community Facilities District No. 2) (XLCA Insured) | | 4.15 | | | 9/1/31 | | | | 162,963 | |
| | 500,000 | | | Westminster School District G.O. 6 | | 5.37 | | | 8/1/24 | | | | 214,805 | |
| | | | | | | | | | | | | | |
| | | | | | | | | | | | | 14,699,966 | |
| | | | | | | | | | | | | | |
| Colorado - 3.6% | | | | | | | | | | |
| | 250,000 | | | CO Education & Cultural Facs. Auth. Rev. (CO Springs Charter Academy Proj.) | | 5.60 | | | 7/1/34 | | | | 225,110 | |
| | 500,000 | | | CO Education & Cultural Facs. Auth. Rev. Ref. (Vail Mountain School Proj.) | | 6.00 | | | 5/1/30 | | | | 466,650 | |
| | 425,000 | | | CO Hsg. Finance Auth. Single Family Mtg. Rev. | | 5.50 | | | 11/1/29 | | | | 432,892 | |
| | 625,000 | | | CO Hsg. Finance Auth. Single Family Mtg. Rev. (FHA Insured) | | 5.00 | | | 11/1/34 | | | | 627,569 | |
| | 1,000,000 | | | Compark Business Campus Metro District G.O. (Radian Insured) | | 5.75 | | | 12/1/27 | | | | 812,880 | |
| | 965,000 | | | Denver Health & Hospital Auth. Healthcare Rev. 1 | | 1.31 | | | 12/1/33 | | | | 628,659 | |
| | 500,000 | | | Kremmling Memorial Hospital District C.O.P. | | 6.00 | | | 12/1/22 | | | | 471,920 | |
| | 654,593 | | | Lyons Rev. (Longmont Humane Society Proj.) | | 4.75 | | | 11/30/16 | | | | 591,379 | |
| | 500,000 | | | Regional Transportation District Private Activity Rev. (Denver Trans. Partners) | | 6.00 | | | 1/15/34 | | | | 459,880 | |
| | 350,000 | | | University of Colorado Hospital Auth. (AMBAC Insured) | | 5.00 | | | 11/15/29 | | | | 315,766 | |
| | | | | | | | | | | | | | |
| | | | | | | | | | | | | 5,032,705 | |
| | | | | | | | | | | | | | |
| Connecticut - 1.4% | | | | | | | | | | |
| | 100,000 | | | CT Dev. Auth. First Mtg. Gross Rev. (Church Homes, Inc.) | | 5.70 | | | 4/1/12 | | | | 100,161 | |
| | 300,000 | | | CT Hsg. Finance Auth. Rev. | | 5.15 | | | 11/15/34 | | | | 299,169 | |
| | 500,000 | | | CT Hsg. Finance Auth. Rev. (GO of Auth.) | | 4.75 | | | 11/15/35 | | | | 467,610 | |
| | 500,000 | | | Hamden Facs. Rev. (Whitney Center Proj.) | | 6.13 | | | 1/1/14 | | | | 501,170 | |
| | 500,000 | | | Harbor Point Infrastructure Improvement District Special Obligation Rev. Tax Allocation | | 7.00 | | | 4/1/22 | | | | 510,695 | |
| | 300,000 | | | Mashantucket Western Pequot Tribe Sub. Special Rev. 2, 4, 5 | | 5.75 | | | 9/1/18 | | | | 113,970 | |
| | | | | | | | | | | | | | |
| | | | | | | | | | | | | 1,992,775 | |
| | | | | | | | | | | | | | |
| Delaware - 0.2% | | | | | | | | | | |
| | 500,000 | | | Millsboro Special Obligation Rev. (Plantation Lakes Dev. District) | | 5.45 | | | 7/1/36 | | | | 331,585 | |
| | | | | | | | | | | | | | |
| Florida - 6.1% | | | | | | | | | | |
| | 500,000 | | | Bay Co. Educational Facs. Rev. (Bay Haven Charter) | | 5.25 | | | 9/1/30 | | | | 384,615 | |
| | 1,000,000 | | | Capital Trust Agy. Rev. (American Opportunity Proj.) | | 5.88 | | | 6/1/38 | | | | 319,750 | |
| | 335,000 | | | Capital Trust Agy. Rev. (Golf Villas, Rivermill, and Village Square Apartments Proj.) | | 4.75 | | | 6/1/13 | | | | 107,116 | |
| | 415,000 | | | Collier County Industrial Dev. Auth. Rev. (NCH Healthcare System Proj.) | | 6.25 | | | 10/1/39 | | | | 407,957 | |
| | 400,000 | | | Connerton West Community Dev. District Cap. Improvement Special Assessment Rev. (Pasco Co.) 2, 5 | | 5.13 | | | 5/1/16 | | | | 159,880 | |
| | 100,000 | | | Fiddlers Creek Community Dev. District No. 2 Special Assessment Rev. 2, 5 | | 5.75 | | | 5/1/13 | | | | 31,880 | |
| | 250,000 | | | Florida Gulf Coast University Fin. Corp. Rev. (Hsg. Acquisition Proj.) | | 5.00 | | | 2/1/31 | | | | 232,152 | |
| | 250,000 | | | Florida Higher Educational Facs. Fin. Auth. Rev. (Bethune-Cookman University) | | 5.38 | | | 7/1/32 | | | | 240,635 | |
| | 300,000 | | | Florida Hsg. Finance Corp. (FHLMC Collateralized) | | 5.05 | | | 1/1/27 | | | | 299,460 | |
| | 250,000 | | | Florida Hsg. Finance Corp. (GNMA/FNMA Collateralized) | | 5.00 | | | 7/1/26 | | | | 253,122 | |
| | 40,000 | | | Forest Creek Community Dev. District Capital Improvement Special Assessment Rev. 2, 5 | | 7.00 | | | 11/1/13 | | | | 38,431 | |
| | |
See accompanying notes to financial statements. | | |
MARCH 31, 2011 | | 13 |
SCHEDULE OF INVESTMENTS
March 31, 2011
Sit Tax-Free Income Fund (Continued)
| | | | | | | | | | | | | | | | |
Principal
Amount ($) | | | Name of Issuer | | Coupon
Rate (%) | | | Maturity
Date | | | Fair
Value ($) | |
| | 250,000 | | | Gramercy Farms Community Dev. District Special Assessment 2, 5 | | | 5.10 | | | | 5/1/14 | | | | 109,600 | |
| | 80,000 | | | Highlands Co. Health Facs. Auth. Rev. (Adventist Health) | | | 5.00 | | | | 11/15/30 | | | | 74,503 | |
| | 500,000 | | | Highlands Co. Health Facs. Auth. Rev. (Adventist Health) 1 | | | 5.00 | | | | 11/15/31 | | | | 461,250 | |
| | 445,000 | | | Jacksonville Economic Dev. Commission Health Care Facs. Rev. Ref. | | | 6.00 | | | | 9/1/17 | | | | 442,873 | |
| | 500,000 | | | Lake Ashton Community Dev. District Cap. Improvement Special Assessment Rev. 2, 5 | | | 5.00 | | | | 11/1/11 | | | | 179,500 | |
| | 1,000,000 | | | Lee Co. Industrial Dev. Auth. Health Care Facs. Rev. (Lee Charter Foundation) | | | 5.25 | | | | 6/15/27 | | | | 802,060 | |
| | 250,000 | | | Magnolia Creek Community Dev. District Rev. 2, 5 | | | 5.60 | | | | 5/1/14 | | | | 119,825 | |
| | 265,000 | | | Miami-Dade Co. Special Obligation (NATL-RE Insured) 6 | | | 5.44 | | | | 10/1/33 | | | | 50,119 | |
| | 250,000 | | | Naples Hospital Rev. (Naples Community Hospital, Inc. Proj.) (NATL-RE Insured) | | | 5.50 | | | | 10/1/26 | | | | 238,648 | |
| | 230,000 | | | New River Community Dev. District Cap. Improvement Special Assessment Rev. 2, 5 | | | 5.00 | | | | 5/1/13 | | | | 2 | |
| | 135,000 | | | New River Community Dev. District Cap. Improvement Special Assessment Rev. 6 | | | 1.96 | | | | 5/1/15 | | | | 108,340 | |
| | 275,000 | | | New River Community Dev. District Cap. Improvement Special Assessment Rev. 6 | | | 1.85 | | | | 5/1/18 | | | | 107,330 | |
| | 140,000 | | | New River Community Dev. District Cap. Improvement Special Assessment Rev. 6 | | | 0.40 | | | | 5/1/38 | | | | 78,072 | |
| | 350,000 | | | New River Community Dev. District Cap. Improvement Special Assessment Rev. 6 | | | 0.80 | | | | 5/1/38 | | | | 122,017 | |
| | 10,000 | | | Parklands Lee Community Dev. District Special Assessment 2, 5 | | | 5.13 | | | | 5/1/11 | | | | 4,943 | |
| | 750,000 | | | Riverwood Estates Community Dev. District Special Assessment 2, 5 | | | 5.00 | | | | 5/1/13 | | | | 128,625 | |
| | 750,000 | | | Sarasota Co. Health Facs. Auth. Retirement Rev. Ref. (Village on the Isle) | | | 5.50 | | | | 1/1/27 | | | | 648,075 | |
| | 500,000 | | | Seminole Tribe Special Obligation Rev. 4 | | | 5.50 | | | | 10/1/24 | | | | 439,830 | |
| | 600,000 | | | Tallahassee Health Facs. Rev. (Memorial Health Care Proj.) | | | 6.38 | | | | 12/1/30 | | | | 592,326 | |
| | 750,000 | | | Tolomato Community Dev. District Special Assessment 2, 5 | | | 6.38 | | | | 5/1/17 | | | | 562,605 | |
| | 650,000 | | | Waters Edge Community Dev. District Cap. Improvement Special Assessment Rev. 2, 5 | | | 5.00 | | | | 11/1/12 | | | | 285,545 | |
| | 500,000 | | | Waterset North Community Dev. District Special Assessment Rev. 2, 5 | | | 6.55 | | | | 11/1/15 | | | | 305,340 | |
| | 50,000 | | | West Villages Improvement District Special Assessment Rev. (Unit of Dev. No. 3) 2, 5 | | | 5.50 | | | | 5/1/37 | | | | 22,055 | |
| | 450,000 | | | Zephyr Ridge Community Dev. District Special Assessment Rev. 2, 5 | | | 5.25 | | | | 5/1/13 | | | | 178,335 | |
| | | | | | | | | | | | | | | | |
| | | | | | | | | | | | | | | 8,536,816 | |
| | | | | | | | | | | | | | | | |
| Georgia - 2.2% | | | | | | | | | | | | |
| | 250,000 | | | Atlanta Airport General Rev. Ref. (NATL-RE FGIC Insured) | | | 5.75 | | | | 1/1/20 | | | | 252,080 | |
| | 1,355,000 | | | East Point Tax Allocation | | | 8.00 | | | | 2/1/26 | | | | 1,357,805 | |
| | 225,000 | | | Gainesville & Hall Co. Development Auth. Rev. | | | 6.38 | | | | 11/15/29 | | | | 226,534 | |
| | 300,000 | | | Georgia State Environmental Loan Acquisition Corp. Rev. | | | 5.13 | | | | 2/15/31 | | | | 301,947 | |
| | 750,000 | | | Georgia State Environmental Loan Acquisition Corp. Rev. | | | 5.13 | | | | 3/15/31 | | | | 743,025 | |
| | 250,000 | | | Medical Center Hospital Auth. Rev. Ref. (Spring Harbor Green Island Proj.) | | | 5.25 | | | | 7/1/27 | | | | 204,128 | |
| | | | | | | | | | | | | | | | |
| | | | | | | | | | | | | | | 3,085,519 | |
| | | | | | | | | | | | | | | | |
| Guam - 0.3% | | | | | | | | | | | | |
| | 450,000 | | | Northern Mariana Islands Commonwealth G.O. | | | 5.00 | | | | 10/1/22 | | | | 366,309 | |
| | | | | | | | | | | | | | | | |
| Idaho - 0.7% | | | | | | | | | | | | |
| | 320,000 | | | ID Hsg. & Fin. Assoc. Nonprofit Facs. Rev. (Compass Public Charter School Proj.) | | | 5.50 | | | | 7/1/30 | | | | 257,245 | |
| | 250,000 | | | ID Hsg. & Fin. Assoc. Nonprofit Facs. Rev. (Idaho Arts Charter School Proj.) | | | 5.50 | | | | 12/1/18 | | | | 241,938 | |
| | 250,000 | | | ID Hsg. & Fin. Assoc. Nonprofit Facs. Rev. (Liberty Charter School Proj.) | | | 5.50 | | | | 6/1/21 | | | | 233,880 | |
| | 250,000 | | | ID Hsg. & Fin. Assoc. Nonprofit Facs. Rev. (Victory Charter School Proj.) | | | 5.63 | | | | 7/1/21 | | | | 230,620 | |
| | | | | | | | | | | | | | | | |
| | | | | | | | | | | | | | | 963,683 | |
| | | | | | | | | | | | | | | | |
| Illinois - 8.0% | | | | | | | | | | | | |
| | 10,000 | | | Chicago Metro Hsg. Dev. Corp. Mtg. Rev. Ref. (Section 8) (FHA Insured) | | | 6.85 | | | | 7/1/22 | | | | 10,016 | |
| | 500,000 | | | Harvey Ref. & Improvement G.O. | | | 5.50 | | | | 12/1/27 | | | | 390,575 | |
| | 500,000 | | | IL Dev. Ref. Auth. Rev. Ref. (Chicago Charter School Foundation Proj.) | | | 5.00 | | | | 12/1/36 | | | | 391,890 | |
| | 250,000 | | | IL Fin. Auth. Rev. | | | 6.00 | | | | 10/1/24 | | | | 244,580 | |
| | 250,000 | | | IL Fin. Auth. Rev. (DePaul University) | | | 6.00 | | | | 10/1/32 | | | | 252,245 | |
| | 250,000 | | | IL Fin. Auth. Rev. (Local Government PG-Metro. Proj.) | | | 5.00 | | | | 12/1/24 | | | | 235,105 | |
| | 500,000 | | | IL Fin. Auth. Rev. (Luther Hillside Village Proj.) | | | 5.25 | | | | 2/1/37 | | | | 412,520 | |
| | |
See accompanying notes to financial statements. | | |
14 | | SIT MUTUAL FUNDS ANNUAL REPORT |
| | | | | | | | | | | | | | | | |
Principal
Amount ($) | | | Name of Issuer | | Coupon
Rate (%) | | | Maturity
Date | | | Fair Value ($) | |
| | 395,000 | | | IL Fin. Auth. Rev. (TEMPS-50-The Admiral at the Lake Proj.) | | | 6.00 | | | | 5/15/17 | | | | 383,379 | |
| | 1,000,000 | | | IL Fin. Auth. Sports Facs. Rev. (North Shore Ice Arena Proj.) | | | 6.25 | | | | 12/1/38 | | | | 697,160 | |
| | 500,000 | | | IL Fin. Auth. Sports Facs. Rev. (United Sports Organizations of Barrington Proj.) 2, 4, 5 | | | 6.13 | | | | 10/1/27 | | | | 99,825 | |
| | 500,000 | | | IL Fin. Auth. Sports Facs. Rev. (United Sports Organizations of Barrington Proj.) 2, 4, 5 | | | 6.25 | | | | 10/1/37 | | | | 99,540 | |
| | 210,000 | | | IL Health Facs. Auth. Rev. (Ingalls Health System Proj.) (NATL-RE Insured) | | | 6.25 | | | | 5/15/14 | | | | 207,154 | |
| | 250,000 | | | Lake County Community Consolidated School District No. 50 Woodland G.O. | | | 5.63 | | | | 1/1/26 | | | | 257,542 | |
| | 115,000 | | | Lombard Public Facs. Corp. Rev. First Tier (Conference Center & Hotel Proj.) | | | 6.38 | | | | 1/1/15 | | | | 76,696 | |
| | 1,925,000 | | | Lombard Public Facs. Corp. Rev. First Tier (Conference Center & Hotel Proj.) | | | 5.25 | | | | 1/1/36 | | | | 1,303,398 | |
| | 550,000 | | | Lombard Public Facs. Corp. Rev. First Tier (Conference Center & Hotel Proj.) (ACA Insured) | | | 5.50 | | | | 1/1/25 | | | | 364,832 | |
| | 2,000,000 | | | Malta Tax Allocation Rev. | | | 5.75 | | | | 12/30/25 | | | | 1,233,580 | |
| | 818,000 | | | Manhattan Special Service Area Special Tax No. 07-6 (Groebe Farm-Stonegate) 2, 5 | | | 5.75 | | | | 3/1/22 | | | | 326,873 | |
| | 310,000 | | | Northern Illinios University Rev. (Auxiliary Facs.) (AGM Insured) | | | 5.50 | | | | 4/1/26 | | | | 314,393 | |
| | 500,000 | | | Railsplitter Tobacco Settlement Auth. Rev. | | | 6.25 | | | | 6/1/24 | | | | 499,500 | |
| | 2,475,000 | | | Southwestern IL Dev. Auth. Rev. (Anderson Hospital Proj.) | | | 5.63 | | | | 8/15/29 | | | | 2,266,778 | |
| | 445,000 | | | Southwestern IL Dev. Auth. Rev. (Village of Sauget Proj.) | | | 5.63 | | | | 11/1/26 | | | | 298,889 | |
| | 650,000 | | | Southwestern IL Dev. Auth. Tax Allocation Ref. (Local Govt. Program) | | | 7.00 | | | | 10/1/22 | | | | 597,148 | |
| | 280,000 | | | St. Clair County Township High School District No. 203 O’Fallon G.O. (AMBAC Insured) | | | 5.75 | | | | 12/1/26 | | | | 286,661 | |
| | | | | | | | | | | | | | | | |
| | | | | | | | | | | | | | | 11,250,279 | |
| | | | | | | | | | | | | | | | |
| Indiana - 2.1% | | | | | | | | | | | | |
| | 220,000 | | | Crown Point Economic Dev. Rev. (Wittenberg Village Proj.) | | | 6.50 | | | | 11/15/13 | | | | 217,796 | |
| | 300,000 | | | Damon Run Conservancy Dist. G.O. (St Intercept Insured) | | | 6.10 | | | | 7/1/25 | | | | 298,836 | |
| | 100,000 | | | Elkhart Co. Hospital Auth. Rev. (Elkhart General Hospital Proj.) (AMBAC-TCRS Insured) | | | 5.25 | | | | 8/15/28 | | | | 93,091 | |
| | 400,000 | | | Hammond Public Improvement Board Rev. | | | 6.50 | | | | 8/15/25 | | | | 404,192 | |
| | 500,000 | | | IN Finance Auth. Hospital Rev. (Floyd Memorial Hospital & Health Proj.) | | | 5.13 | | | | 3/1/30 | | | | 459,365 | |
| | 250,000 | | | IN Finance Auth. Rev. (Drexel Foundation Education Facs. Proj.) | | | 6.00 | | | | 10/1/21 | | | | 240,228 | |
| | 360,000 | | | IN Health Facs. Fin. Auth. Hospital Rev. (Community Foundation Northwest IN) | | | 6.38 | | | | 8/1/21 | | | | 364,810 | |
| | 305,000 | | | IN Health Facs. Fin. Auth. Hospital Rev. (Community Hospital of Anderson Proj.) | | | 6.00 | | | | 1/1/23 | | | | 305,180 | |
| | 60,000 | | | IN Health Facs. Fin. Auth. Hospital Rev. (Community Hospital of Anderson Proj.) (NATL-RE Insured) | | | 6.00 | | | | 1/1/14 | | | | 60,148 | |
| | 400,000 | | | St. Joseph Co. Hospital Auth. Health Facs. Rev. (Madison Center) 2, 5 | | | 5.25 | | | | 2/15/28 | | | | 73,960 | |
| | 500,000 | | | Vigo Co. Hospital Auth. Rev. (Union Hospital, Inc. Proj.) 4 | | | 5.50 | | | | 9/1/27 | | | | 400,815 | |
| | | | | | | | | | | | | | | | |
| | | | | | | | | | | | | | | 2,918,421 | |
| | | | | | | | | | | | | | | | |
| Iowa - 1.0% | | | | | | | | | | | | |
| | 410,000 | | | IA Finance Auth. Sr. Hsg. Rev. Ref. (Walnut Ridge Proj.) | | | 5.00 | | | | 12/1/14 | | | | 359,681 | |
| | 500,000 | | | IA Finance Auth. Sr. Living Facs. Rev. (Deerfield Retirement Community, Inc.) | | | 5.00 | | | | 11/15/21 | | | | 369,975 | |
| | 500,000 | | | IA Student Loan Liquidity Corp. Rev. | | | 5.25 | | | | 12/1/24 | | | | 496,255 | |
| | 250,000 | | | Iowa Student Loan Liquidity Corp. Rev. | | | 5.80 | | | | 12/1/31 | | | | 233,998 | |
| | | | | | | | | | | | | | | | |
| | | | | | | | | | | | | | | 1,459,909 | |
| | | | | | | | | | | | | | | | |
| Kansas - 0.5% | | | | | | | | | | | | |
| | 500,000 | | | Overland Park Transportation Dev. District Sales Tax Rev. (Oak Park Mall Proj.) | | | 5.90 | | | | 4/1/32 | | | | 491,150 | |
| | 500,000 | | | Wyandotte Co. Govt. Special Obligation Rev. 6 | | | 6.07 | | | | 6/1/21 | | | | 269,005 | |
| | | | | | | | | | | | | | | | |
| | | | | | | | | | | | | | | 760,155 | |
| | | | | | | | | | | | | | | | |
| Kentucky - 0.2% | | | | | | | | | | | | |
| | 350,000 | | | Kentucky Economic Development Fin. Auth. Rev. | | | 6.63 | | | | 10/1/28 | | | | 351,760 | |
| | | | | | | | | | | | | | | | |
| Louisiana - 2.8% | | | | | | | | | | | | |
| | 267,696 | | | Denham Springs/Livingston Hsg. & Mtg. Finance Auth. Rev. | | | 5.00 | | | | 11/1/40 | | | | 270,518 | |
| | 1,055,000 | | | Jefferson Parish Finance Auth. Single Family Mtg. Rev. | | | 5.00 | | | | 6/1/38 | | | | 1,036,464 | |
| | 1,680,000 | | | LA Hsg. Fin. Agy. Single Family Mtg. Rev. | | | 5.70 | | | | 12/1/38 | | | | 1,774,147 | |
| | 185,000 | | | LA Hsg. Fin. Agy. Single Family Mtg. Rev. (Home Ownership Program) | | | 6.00 | | | | 12/1/28 | | | | 192,835 | |
| | 750,000 | | | LA Public Facs. Auth. Rev. Ref. (Tulane Univ. Proj.) (NATL-RE Insured) 1 | | | 0.91 | | | | 2/15/36 | | | | 514,102 | |
| | |
See accompanying notes to financial statements. | | |
MARCH 31, 2011 | | 15 |
SCHEDULE OF INVESTMENTS
March 31, 2011
Sit Tax-Free Income Fund (Continued)
| | | | | | | | | | | | | | |
Principal Amount ($) | | Name of Issuer | | Coupon Rate (%) | | | Maturity Date | | | Fair Value ($) | |
| 114,000 | | Lafayette Public Finance Auth. Single Family Mortgage-Backed Rev. | | | 5.35 | | | | 1/1/41 | | | | 117,203 | |
| | | | | | | | | | | | | | |
| | | | | | | | | | | | | 3,905,269 | |
| | | | | | | | | | | | | | |
Maine - 0.3% | | | | | | | | | | | | |
| 360,000 | | ME Education Auth. Student Loan Rev. (Assured Guaranty) | | | 5.63 | | | | 12/1/27 | | | | 363,841 | |
| | | | | | | | | | | | | | |
Maryland - 0.3% | | | | | | | | | | | | |
| 515,000 | | MD Health & Higher Education Facs. Auth. Rev. (Patterson Park School) | | | 5.75 | | | | 7/1/30 | | | | 453,854 | |
| | | | | | | | | | | | | | |
Massachusetts - 1.0% | | | | | | | | | | | | |
| 350,000 | | MA Dev. Fin. Agy. Rev. (Foxborough Regional Charter School) | | | 6.38 | | | | 7/1/30 | | | | 341,257 | |
| 110,000 | | MA Development Finance Agency Facs. Rev. | | | 6.25 | | | | 6/1/14 | | | | 107,573 | |
| 480,000 | | MA Education Finance Auth. Education Rev. | | | 5.15 | | | | 1/1/26 | | | | 481,973 | |
| 240,000 | | MA Education Finance Auth. Education Rev. | | | 5.25 | | | | 1/1/28 | | | | 236,563 | |
| 250,000 | | MA Health & Educational Facilities Auth. Rev. | | | 6.00 | | | | 7/1/22 | | | | 253,428 | |
| | | | | | | | | | | | | | |
| | | | | | | | | | | | | 1,420,794 | |
| | | | | | | | | | | | | | |
Michigan - 2.5% | | | | | | | | | | | | |
| 470,000 | | Flint Hospital Building Auth. Rev. (Hurley Medical Center) | | | 6.00 | | | | 7/1/20 | | | | 436,517 | |
| 250,000 | | MI Finance Auth. Ltd. Obligation Rev. (Public School Academy-University Learning Proj.) | | | 6.25 | | | | 11/1/20 | | | | 246,450 | |
| 250,000 | | MI Hospital Finance Auth. Rev. (Mid-Michigan Obligation Group Proj.) | | | 6.13 | | | | 6/1/34 | | | | 252,290 | |
| 500,000 | | MI Hospital Finance Auth. Rev. Ref. (Mclaren Health Care Proj.) (NATL-RE-IBC Insured) | | | 5.00 | | | | 6/1/28 | | | | 459,900 | |
| 115,000 | | MI Public Education Facs. Auth. Ltd. Rev. Ref. (Black River School Proj.) | | | 5.13 | | | | 9/1/11 | | | | 115,524 | |
| 500,000 | | MI Public Education Facs. Auth. Ltd. Rev. Ref. (Nataki Talibah Proj.) (Q-SBLF Insured) | | | 6.25 | | | | 10/1/23 | | | | 422,220 | |
| 500,000 | | MI Public Education Facs. Auth. Ltd. Rev. Ref. (Richfield Public School Proj.) | | | 5.00 | | | | 9/1/22 | | | | 425,400 | |
| 650,000 | | MI Public Education Facs. Auth. Rev. Ref. (Bradford Proj.) 4 | | | 6.00 | | | | 9/1/16 | | | | 653,536 | |
| 220,000 | | MI Strategic Fund Rev. (Detroit Edison Pollution Control Proj.) | | | 5.45 | | | | 9/1/29 | | | | 220,004 | |
| 345,000 | | MI Tobacco Settlement Finance Auth. Sr. Rev. | | | 5.13 | | | | 6/1/22 | | | | 272,612 | |
| | | | | | | | | | | | | | |
| | | | | | | | | | | | | 3,504,453 | |
| | | | | | | | | | | | | | |
Minnesota - 2.4% | | | | | | | | | | | | |
| 2,053,048 | | Intermediate School District 287 Lease Rev. | | | 5.30 | | | | 11/1/32 | | | | 1,877,882 | |
| 500,000 | | Minneapolis Mulitfamily Hsg. Rev. (Riverside Plaza) | | | 6.00 | | | | 11/1/13 | | | | 496,325 | |
| 585,000 | | MN Hsg. Fin. Agy. Residential Hsg. Rev. | | | 5.10 | | | | 1/1/40 | | | | 566,941 | |
| 571,157 | | St. Paul Hsg. & Redev. Auth. Rev. (Nursing Home NTS-Episcopal) | | | 5.63 | | | | 10/1/33 | | | | 478,350 | |
| | | | | | | | | | | | | | |
| | | | | | | | | | | | | 3,419,498 | |
| | | | | | | | | | | | | | |
Mississippi - 0.4% | | | | | | | | | | | | |
| 185,000 | | MS Home Corp. Single Family Mtg. Rev. (GNMA/FNMA/FHLMC Collateralized) | | | 5.60 | | | | 6/1/38 | | | | 197,132 | |
| 290,000 | | MS Home Corp. Single Family Mtg. Rev. (GNMA/FNMA/FHLMC Collateralized) | | | 6.75 | | | | 6/1/39 | | | | 315,662 | |
| | | | | | | | | | | | | | |
| | | | | | | | | | | | | 512,794 | |
| | | | | | | | | | | | | | |
Missouri - 4.4% | | | | | | | | | | | | |
| 500,000 | | Chillicothe Tax Increment Rev. (South U.S. 65 Proj.) | | | 5.63 | | | | 4/1/27 | | | | 402,735 | |
| 480,000 | | Community Memorial Hospital District Rev. | | | 6.68 | | | | 12/1/34 | | | | 472,104 | |
| 250,000 | | Independence 39th St. Transportation District Rev. Ref. & Improvement | | | 6.88 | | | | 9/1/32 | | | | 221,372 | |
| 1,000,000 | | Joplin Industrial Dev. Auth. Rev. Ref. (Christian Homes, Inc. Proj.) | | | 5.50 | | | | 5/15/17 | | | | 1,000,960 | |
| 500,000 | | Kansas City Industrial Dev. Auth. Multifamily Hsg. Rev. (Grand Blvd. Lofts) | | | 5.00 | | | | 1/1/12 | | | | 499,815 | |
| 500,000 | | Kansas City Industrial Dev. Auth. Rev. (Kansas City Pkg. LLC) | | | 5.45 | | | | 9/1/23 | | | | 466,595 | |
| 500,000 | | Kirkwood Industrial Dev. Auth. Retirement Community Rev. (Aberdeen Heights) | | | 7.00 | | | | 11/15/15 | | | | 497,420 | |
| 750,000 | | Lakeside 370 Levee District Improvement Special Tax | | | 7.00 | | | | 4/1/28 | | | | 670,125 | |
| 500,000 | | Meadows Transportation Development Dist. Rev. | | | 5.40 | | | | 5/1/35 | | | | 453,755 | |
| 400,000 | | MO Health & Education Facs. Auth. Education Facs. Rev. (Riverside Horizons) (ACA Insured) | | | 4.50 | | | | 5/1/27 | | | | 378,060 | |
| 250,000 | | MO Health & Educational Facs. Auth. (Senior Living Facs.-Lutheran Senior) | | | 5.38 | | | | 2/1/35 | | | | 213,980 | |
| | |
See accompanying notes to financial statements. | | |
16 | | SIT MUTUAL FUNDS ANNUAL REPORT |
| | | | | | | | | | | | |
Principal
Amount ($) | | Name of Issuer | | Coupon Rate (%) | | Maturity Date | | | Fair Value ($) | |
| 500,000 | | Moberly Industrial Dev. Auth. (Annual Appropriation Proj.) | | 6.00 | | | 9/1/24 | | | | 493,320 | |
| 400,000 | | Saline County Industrial Dev. Auth. Health Facs. Rev. (John Fitzgibbon Memorial Hospital) | | 5.00 | | | 12/1/20 | | | | 380,520 | |
| | | | | | | | | | | | |
| | | | | | | | | | | 6,150,761 | |
| | | | | | | | | | | | |
Montana - 0.6% | | | | | | | | | | |
| 774,335 | | MT Facs. Finance Auth. Rev. (Great Falls Pre-Release Services Proj.) | | 5.08 | | | 4/1/21 | | | | 813,369 | |
| | | | | | | | | | | | |
Nebraska - 0.4% | | | | | | | | | | |
| 410,000 | | Mead Village Tax Allocation Rev. (E3 Biofuels - Mead LLC Proj.) 2, 5 | | 5.13 | | | 7/1/12 | | | | 289,833 | |
| 250,000 | | Nebraska Investment Fin. Auth. Single Family Hsg. Rev. (GNMA/FNMA/FHLMC Collateralized) | | 5.90 | | | 9/1/36 | | | | 256,152 | |
| | | | | | | | | | | | |
| | | | | | | | | | | 545,985 | |
| | | | | | | | | | | | |
Nevada - 2.5% | | | | | | | | | | |
| 250,000 | | Clark Co. Economic Dev. Rev. (Alexander Dawson School Proj.) | | 5.38 | | | 5/15/33 | | | | 236,240 | |
| 415,000 | | Clark Co. Improvement Special Assessment (Summerlin Proj.) | | 4.85 | | | 2/1/17 | | | | 371,832 | |
| 600,000 | | Las Vegas Paiute Tribe Rev. (ACA Insured) | | 6.63 | | | 11/1/17 | | | | 467,238 | |
| 750,000 | | Las Vegas Redev. Agy. Tax Allocation Rev. | | 7.50 | | | 6/15/23 | | | | 827,588 | |
| 495,000 | | NV Hsg. Dev. Single Family Mtg. Program Mezzanine (GNMA/FNMA/FHLMC Collateralized) | | 5.10 | | | 10/1/40 | | | | 478,878 | |
| 500,000 | | Sparks Redev. Agy. Tax Increment Rev. (Redev. Area No. 1 Proj.) | | 5.00 | | | 1/15/22 | | | | 457,275 | |
| 500,000 | | Sparks Redev. Agy. Tax Increment Rev. (Redev. Area No. 2 Proj.) | | 6.40 | | | 6/1/20 | | | | 481,525 | |
| 250,000 | | Sparks Tourism Improvement District No. 1 Sr. Sales Tax Rev. 4 | | 6.50 | | | 6/15/20 | | | | 225,252 | |
| | | | | | | | | | | | |
| | | | | | | | | | | 3,545,828 | |
| | | | | | | | | | | | |
New Hampshire - 0.9% | | | | | | | | | | |
| 890,000 | | Manchester Hsg. & Redev. Auth. Rev. (ACA Insured) | | 6.75 | | | 1/1/15 | | | | 845,883 | |
| 200,000 | | Manchester Hsg. & Redev. Auth. Rev. (Radian-IBCC ACA Insured) 6 | | 5.25 | | | 1/1/19 | | | | 98,580 | |
| 400,000 | | NH Health & Educ. Facs. Auth. Rev. (Wentworth Douglas Hosipital) | | 6.00 | | | 1/1/34 | | | | 387,428 | |
| | | | | | | | | | | | |
| | | | | | | | | | | 1,331,891 | |
| | | | | | | | | | | | |
New Jersey - 1.6% | | | | | | | | | | |
| 750,000 | | NJ Higher Education Assistance Auth. Student Loan Rev. | | 5.00 | | | 6/1/27 | | | | 767,685 | |
| 250,000 | | NJ Higher Education Assistance Auth. Student Loan Rev. | | 5.00 | | | 12/1/28 | | | | 234,892 | |
| 250,000 | | NJ Higher Education Assistance Auth. Student Loan Rev. | | 4.75 | | | 12/1/29 | | | | 245,848 | |
| 965,000 | | NJ Hsg. & Mtg. Finance Agy. Rev. | | 5.05 | | | 10/1/39 | | | | 933,859 | |
| | | | | | | | | | | | |
| | | | | | | | | | | 2,182,284 | |
| | | | | | | | | | | | |
New Mexico - 1.5% | | | | | | | | | | |
| 290,000 | | NM Mtg. Fin. Auth. Forward Mortgage-Backed (GNMA/FNMA Collateralized) | | 6.95 | | | 1/1/26 | | | | 291,781 | |
| 475,000 | | NM Mtg. Fin. Auth. Single Family Mtg. Rev. (GNMA/FNMA/FHLMC Collateralized) | | 4.80 | | | 9/1/29 | | | | 454,808 | |
| 465,000 | | NM Mtg. Fin. Auth. Single Family Mtg. Rev. (GNMA/FNMA/FHLMC Collateralized) | | 5.35 | | | 9/1/30 | | | | 467,599 | |
| 930,000 | | NM Mtg. Fin. Auth. Single Family Mtg. Rev. (GNMA/FNMA/FHLMC Collateralized) | | 5.25 | | | 9/1/34 | | | | 932,344 | |
| | | | | | | | | | | | |
| | | | | | | | | | | 2,146,532 | |
| | | | | | | | | | | | |
New York - 0.6% | | | | | | | | | | |
| 250,000 | | Chautauqua County Capital Resource Corp. Rev. (Women’s Christian Assn. Proj.) | | 6.75 | | | 11/15/16 | | | | 244,845 | |
| 650,000 | | Ulster Co. Industrial Dev. Agy. Civic Facs. Rev. | | 5.25 | | | 9/15/16 | | | | 599,950 | |
| | | | | | | | | | | | |
| | | | | | | | | | | 844,795 | |
| | | | | | | | | | | | |
North Carolina - 0.5% | | | | | | | | | | |
| 750,000 | | Buncome Co. Proj. Dev. Finance Rev. (Woodfin Downtown Corridor Dev.) | | 6.75 | | | 8/1/24 | | | | 641,572 | |
| | | | | | | | | | | | |
North Dakota - 0.3% | | | | | | | | | | |
| 455,000 | | North Dakota Hsg. Fin. Agy. Rev. (GO of Agency Insured) | | 4.75 | | | 7/1/30 | | | | 428,665 | |
| | | | | | | | | | | | |
Ohio - 1.9% | | | | | | | | | | |
| 425,000 | | Buckeye Tobacco Settlement Finance Auth. Asset-Backed Sr. Rev. | | 5.13 | | | 6/1/24 | | | | 323,157 | |
| | |
See accompanying notes to financial statements. | | |
MARCH 31, 2011 | | 17 |
SCHEDULE OF INVESTMENTS
March 31, 2011
Sit Tax-Free Income Fund (Continued)
| | | | | | | | | | | | |
Principal
Amount ($) | | Name of Issuer | | Coupon
Rate (%) | | Maturity
Date | | | Fair
Value ($) | |
| 730,000 | | Cleveland-Cuyahoga Co. Port Auth. Dev. Rev. (St. Clarence Proj.) | | 6.00 | | | 5/1/21 | | | | 628,829 | |
| 724,100 | | Cuyahoga Co. Hsg. Mtg. Sr. Rev. (R H Myers Apts. Proj.) (GNMA Collateralized) | | 5.70 | | | 3/20/42 | | | | 739,415 | |
| 250,000 | | Erie Co. Hospital Facs. Rev. (Firelands Regional Medical Center Proj.) | | 5.63 | | | 8/15/32 | | | | 217,378 | |
| 550,000 | | Lucas Co. Hospital Rev. (Promedica Health Care Proj.) | | 6.50 | | | 11/15/37 | | | | 569,574 | |
| 155,000 | | OH Hsg. Finance Agy. Residential Mtg. Rev. (GNMA/FNMA/FHLMC Collateralized) | | 5.45 | | | 9/1/33 | | | | 156,504 | |
| | | | | | | | | | | | |
| | | | | | | | | | | 2,634,857 | |
| | | | | | | | | | | | |
Oklahoma - 0.3% | | | | | | | | | | |
| 500,000 | | Citizen Potawatomi Nation Sr. Obligation Tax Rev. | | 6.50 | | | 9/1/16 | | | | 473,030 | |
| | | | | | | | | | | | |
Oregon - 0.5% | | | | | | | | | | |
| 200,000 | | OR G.O. (Veterans Welfare Proj.) | | 5.25 | | | 10/1/42 | | | | 195,482 | |
| 595,000 | | Western Generation Agy. Rev. (Wauna Cogeneration) | | 5.00 | | | 1/1/21 | | | | 524,891 | |
| | | | | | | | | | | | |
| | | | | | | | | | | 720,373 | |
| | | | | | | | | | | | |
Pennsylvania - 3.6% | | | | | | | | | | |
| 250,000 | | Allegheny Co. Industrial Dev. Auth. Charter School Rev. (Propel Charter-McKeesport) | | 5.90 | | | 8/15/26 | | | | 217,955 | |
| 490,000 | | Butler Co. General Auth. Rev. (Butler Area School District Proj.) (AGM GO Of District Insured) 1 | | 0.90 | | | 10/1/34 | | | | 288,605 | |
| 250,000 | | Erie Co. Hospital Auth. Rev. (St. Vincent Health Center Proj.) | | 7.00 | | | 7/1/27 | | | | 242,890 | |
| 600,000 | | Geisinger Auth. Health System Rev. (Geisinger Health System Proj.) 1 | | 0.97 | | | 5/1/37 | | | | 384,420 | |
| 250,000 | | Lehigh Co. General Purpose Auth. Rev. (Saint Luke’s Bethlehem) 1 | | 1.23 | | | 8/15/42 | | | | 146,333 | |
| 500,000 | | Luzerne Co. G.O. (FSA Insured) | | 7.00 | | | 11/1/26 | | | | 543,960 | |
| 500,000 | | PA Economic Dev. Fin. Auth. Health Systems Rev. (Albert Einstein Health Care) | | 6.25 | | | 10/15/23 | | | | 518,030 | |
| 300,000 | | PA Hsg. Finance Agy. Rev. | | 5.00 | | | 10/1/25 | | | | 301,353 | |
| 500,000 | | PA Hsg. Finance Agy. Rev. (GO of Agency Insured) | | 4.63 | | | 10/1/29 | | | | 467,230 | |
| 500,000 | | PA Hsg. Finance Agy. Single Family Mtg. Rev. | | 4.75 | | | 10/1/28 | | | | 475,565 | |
| 250,000 | | PA Hsg. Finance Agy. Single Family Mtg. Rev. | | 4.75 | | | 10/1/39 | | | | 231,628 | |
| 500,000 | | PA Turnpike Commission Rev. Capital Appreciation 6 | | 5.13 | | | 12/1/35 | | | | 336,065 | |
| 500,000 | | PA Turnpike Commission Rev. Capital Appreciation 6 | | 5.73 | | | 12/1/38 | | | | 334,315 | |
| 500,000 | | PA Turnpike Commission Rev. Capital Appreciation (AGM Insured) 6 | | 6.25 | | | 6/1/33 | | | | 386,125 | |
| 160,000 | | Philadelphia Hospital & Higher Education Facs. Auth. Hospital Rev. (Temple Univ. Hospital) | | 6.63 | | | 11/15/23 | | | | 160,029 | |
| | | | | | | | | | | | |
| | | | | | | | | | | 5,034,503 | |
| | | | | | | | | | | | |
Puerto Rico - 1.4% | | | | | | | | | | |
| 500,000 | | Puerto Rico Electric Power Auth. Rev. Ref. 1 | | 0.88 | | | 7/1/25 | | | | 358,955 | |
| 500,000 | | Puerto Rico Highways & Transportation Auth. Rev. Ref. (AMBAC Insured) 1 | | 0.73 | | | 7/1/45 | | | | 270,305 | |
| 500,000 | | Puerto Rico Public Improvement G.O. | | 5.75 | | | 7/1/36 | | | | 462,445 | |
| 250,000 | | Puerto Rico Public Improvement G.O. (AGM Insured) | | 5.50 | | | 7/1/27 | | | | 251,142 | |
| 300,000 | | Puerto Rico Sales Tax Financing Corp. Rev. | | 6.00 | | | 8/1/39 | | | | 295,629 | |
| 500,000 | | Puerto Rico Sales Tax Financing Corp. Rev. 1 | | 1.13 | | | 8/1/57 | | | | 275,105 | |
| | | | | | | | | | | | |
| | | | | | | | | | | 1,913,581 | |
| | | | | | | | | | | | |
Rhode Island - 1.1% | | | | | | | | | | |
| 565,000 | | RI Health & Education Building Corp. Rev. (Steere House Proj.) | | 5.80 | | | 7/1/20 | | | | 528,518 | |
| 500,000 | | RI Hsg. & Mtg. Finance Corp. Rev. (Home Ownership Opportunity Proj.) | | 5.63 | | | 10/1/38 | | | | 507,940 | |
| 500,000 | | RI Student Loan Auth. Sr. Rev. | | 5.75 | | | 12/1/27 | | | | 491,545 | |
| | | | | | | | | | | | |
| | | | | | | | | | | 1,528,003 | |
| | | | | | | | | | | | |
South Carolina - 0.4% | | | | | | | | | | |
| 430,000 | | SC Education Assistance Auth. Student Loan Rev. | | 5.10 | | | 10/1/29 | | | | 423,425 | |
| 250,000 | | SC Jobs Economic Dev. Auth. Health Care Facs. Rev. (Woodlands at Furman Proj.) 2, 5 | | 5.15 | | | 11/15/42 | | | | 122,525 | |
| | | | | | | | | | | | |
| | | | | | | | | | | 545,950 | |
| | | | | | | | | | | | |
Tennessee - 1.3% | | | | | | | | | | |
| 495,000 | | Metro Govt. Nashville & Davidson Co. Health & Education Facs. Rev. (Prestige Proj.) 2, 5 | | 7.50 | | | 12/20/40 | | | | 284,348 | |
| | |
See accompanying notes to financial statements. | | |
18 | | SIT MUTUAL FUNDS ANNUAL REPORT |
| | | | | | | | | | | | |
Principal
Amount ($) | | Name of Issuer | | Coupon
Rate (%) | | Maturity Date | | | Fair
Value ($) | |
240,000 | | Metro Govt. Nashville & Davidson Co. Industrial Dev. Board Rev. (GNMA Collateralized) | | 6.63 | | | 3/20/36 | | | | 247,370 | |
| 250,000 | | Metro Govt. Nashville & Davidson Co. Industrial Dev. Board Rev. Escrowed to Maturity | | 9.75 | | | 2/15/15 | | | | 277,900 | |
| 1,850,000 | | Shelby Co. Health, Education & Hsg. Facs. Rev. (CME Memphis Apts. Proj.) 2, 5 | | 5.35 | | | 1/1/19 | | | | 201,687 | |
| 7,875,000 | | Shelby Co. Health, Education & Hsg. Facs. Rev. (CME Memphis Apts. Proj.) 2, 5 | | 5.55 | | | 1/1/29 | | | | 780,649 | |
| 1,630,000 | | Shelby Co. Health, Education & Hsg. Facs. Rev. (CME Memphis Apts. Proj.) 2, 5 | | 6.00 | | | 1/1/29 | | | | 16 | |
| 1,000,000 | | Shelby Co. Health, Education & Hsg. Facs. Rev. (Eastwood Park Apts. Proj.) 2, 5 | | 6.40 | | | 9/1/25 | | | | 48,400 | |
| 405,000 | | Shelby Co. Health, Education & Hsg. Facs. Rev. (Eastwood Park Apts. Proj.) 2, 5, 6 | | 7.50 | | | 9/1/25 | | | | 4 | |
| | | | | | | | | | | | |
| | | | | | | | | | | 1,840,374 | |
| | | | | | | | | | | | |
Texas - 8.4% | | | | | | | | | | |
| 500,000 | | Arlington Higher Education Finance Corp., Education Rev. (Arlington Classics Academy) | | 7.00 | | | 8/15/28 | | | | 476,345 | |
| 85,000 | | Bexar Co. Hsg. Fin. Corp. Rev. (Dublin Kingswood & Waterford Apts.) | | 7.50 | | | 12/1/14 | | | | 79,351 | |
| 250,000 | | Bexar Co. Hsg. Fin. Corp. Rev. (Dymaxion & Marbach Park Apts. Proj.) (NATL-RE Insured) | | 6.10 | | | 8/1/30 | | | | 215,910 | |
| 540,000 | | Bexar Co. Hsg. Fin. Corp. Rev. (Honey Creek Apartments Proj.) 2, 5 | | 8.00 | | | 4/1/30 | | | | 234,306 | |
| 440,000 | | Bexar Co. Hsg. Fin. Corp. Rev. (Waterford Proj.) | | 6.50 | | | 12/1/21 | | | | 397,025 | |
| 400,000 | | Central TX Regional Mobility Auth. Rev. | | 5.75 | | | 1/1/25 | | | | 393,252 | |
| 250,000 | | Clifton Higher Education Finance Corp. Education Rev. (Uplift Education Proj.) | | 6.00 | | | 12/1/30 | | | | 216,085 | |
| 1,902,000 | | Dallas Hsg. Finance Corp. Multifamily Mtg. Rev. (Towne Center Apts.) (GNMA Collateralized) | | 6.75 | | | 10/20/32 | | | | 1,941,733 | |
| 186,389 | | El Paso Hsg. Finance Corp. Single Family Mtg. Rev. (GNMA Collateralized) | | 6.18 | | | 4/1/33 | | | | 195,064 | |
| 1,327,160 | | Galveston Co. Municipal Utility District No. 52 | | 6.16 | | | 3/1/11 | | | | 1,060,134 | |
| 500,000 | | Harris Co. Cultural Education Facs. Finance Corp. Rev. (Space Center Houston Proj.) 4 | | 6.75 | | | 8/15/21 | | | | 495,180 | |
| 100,000 | | Harris Co. Special Rev. Sr. Lien (Houston Sports Auth. Proj.) (NATL-RE Insured) | | 5.00 | | | 11/15/28 | | | | 78,557 | |
| 410,000 | | La Vernia Higher Education Finance Corp. Rev. (Friends Life Proj.) | | 6.00 | | | 2/15/18 | | | | 397,204 | |
| 750,000 | | North TX Tollway Auth. Rev. Ref. | | 6.13 | | | 1/1/31 | | | | 756,818 | |
| 305,000 | | Richardson Hospital Auth. Rev. Ref. (Baylor/Richardson Proj.) | | 5.63 | | | 12/1/28 | | | | 275,693 | |
| 265,000 | | Rio Grande Valley Health Facs. Dev. Corp. Hospital Rev. (Valley Baptist) (NATL-RE Insured) | | 6.40 | | | 8/1/12 | | | | 265,299 | |
| 500,000 | | Tarrant Co. Cultural Education Facs. Fin. Rev. (C.C. Young Memorial Home Proj.) | | 6.50 | | | 2/15/14 | | | | 480,415 | |
| 490,000 | | Tarrant Co. Cultural Education Facs. Fin. Rev. (Crossroads Apts. Proj.) 2, 5 | | 7.25 | | | 12/1/36 | | | | 5 | |
| 250,000 | | Tarrant Co. Cultural Education Facs. Fin. Rev. (Mirador Proj.) | | 7.75 | | | 11/15/19 | | | | 248,728 | |
| 500,000 | | Tarrant Co. Cultural Education Facs. Fin. Rev. (Sr. Living Center Proj.) | | 6.50 | | | 11/15/14 | | | | 491,445 | |
| 250,000 | | Travis Co. Health Facs. Dev. Corp. Rev. (Westminster Manor) | | 6.25 | | | 11/1/16 | | | | 244,472 | |
| 500,000 | | TX Municipal Gas Acquisition & Supply Corp. I Sr. Lien Rev. 1 | | 1.66 | | | 12/15/26 | | | | 356,570 | |
| 300,000 | | TX Municipal Gas Acquisition & Supply Corp. II Rev. 1 | | 1.08 | | | 9/15/27 | | | | 217,218 | |
| 750,000 | | TX Private Activity Surface Transportation Corp. Rev. (LBJ Infrastructure) | | 7.50 | | | 6/30/33 | | | | 792,345 | |
| 250,000 | | TX Public Finance Auth. Charter School Finance Corp. Rev. (Cosmos Foundation, Inc.) | | 6.00 | | | 2/15/30 | | | | 229,885 | |
| 500,000 | | TX Public Finance Auth. Charter School Finance Corp. Rev. (Idea Public School) (ACA Insured) | | 5.00 | | | 8/15/30 | | | | 421,395 | |
| 800,000 | | TX Public Finance Auth. Charter School Finance Corp. Rev. (Kipp, Inc. Proj.) (ACA Insured) | | 5.00 | | | 2/15/28 | | | | 699,616 | |
| 195,000 | | TX Public Property Finance Corp. Mental Health & Mental Retardation Rev. | | 6.20 | | | 9/1/16 | | | | 196,260 | |
| | | | | | | | | | | | |
| | | | | | | | | | | 11,856,310 | |
| | | | | | | | | | | | |
Utah - 1.2% | | | | | | | | | | |
| 250,000 | | Provo Charter School Rev. (Freedom Academy Foundation) | | 5.50 | | | 6/15/37 | | | | 176,043 | |
| 857,000 | | UT Assoc. Municipal Power System Rev. | | 5.00 | | | 5/1/27 | | | | 677,647 | |
| 300,000 | | Utah Hsg. Corp. Single Family Mtg. Rev. | | 5.75 | | | 1/1/33 | | | | 303,765 | |
| 500,000 | | Utah Hsg. Corp. Single Family Mtg. Rev. | | 4.60 | | | 7/1/34 | | | | 464,215 | |
| | | | | | | | | | | | |
| | | | | | | | | | | 1,621,670 | |
| | | | | | | | | | | | |
Virginia - 1.8% | | | | | | | | | | |
| 500,000 | | Farms New Kent Community Dev. Auth. Special Assessment | | 5.13 | | | 3/1/36 | | | | 293,270 | |
| 1,500,000 | | VA Hsg. Dev. Auth. Commonwealth Mtg. Rev. (NATL-RE GO of Authority Insured) | | 5.38 | | | 7/1/36 | | | | 1,500,615 | |
| 250,000 | | VA Hsg. Dev. Auth. Rev. (GO of Authority Insured) | | 6.25 | | | 7/1/31 | | | | 257,448 | |
| 500,000 | | VA Hsg. Dev. Auth. Rev. (Rental Hsg. Proj.) | | 5.00 | | | 12/1/39 | | | | 484,570 | |
| | | | | | | | | | | | |
| | | | | | | | | | | 2,535,903 | |
| | | | | | | | | | | | |
| | |
See accompanying notes to financial statements. | | |
MARCH 31, 2011 | | 19 |
SCHEDULE OF INVESTMENTS
March 31, 2011
Sit Tax-Free Income Fund (Continued)
| | | | | | | | | | | | |
Principal Amount ($)/ Quantity | | Name of Issuer | | Coupon
Rate (%) | | Maturity
Date | | | Fair Value ($) | |
Washington - 1.6% | | | | | | | | | | |
| 665,000 | | Kalispel Tribe Indians Priority District Rev. | | 6.20 | | | 1/1/16 | | | | 611,773 | |
| 250,000 | | Skagit County Public Hospital Dist. No. 1 Rev. (Skagit Valley Hospital) | | 6.00 | | | 12/1/30 | | | | 242,680 | |
| 500,000 | | WA Health Care Facs. Auth. Rev. (Swedish Health Services Proj.) | | 6.50 | | | 11/15/27 | | | | 518,475 | |
| 980,000 | | WA Hsg. Finance Commission Nonprofit Rev. (Skyline at First Hill Proj.) | | 5.10 | | | 1/1/13 | | | | 918,035 | |
| | | | | | | | | | | | |
| | | | | | | | | | | 2,290,963 | |
| | | | | | | | | | | | |
West Virginia - 1.0% | | | | | | | | | | |
| 1,350,000 | | Pleasants Co. Pollution Control Rev. (Monongahela Power Co.) (AMBAC Insured) | | 6.15 | | | 5/1/15 | | | | 1,351,876 | |
| | | | | | | | | | | | |
Wisconsin - 3.2% | | | | | | | | | | |
| 250,000 | | WI General Fund Rev. Appropriation Rev. | | 6.00 | | | 5/1/27 | | | | 275,165 | |
| 960,000 | | WI Health & Education Facs. Auth. Rev. (Aurora Health Care Proj.) | | 5.60 | | | 2/15/29 | | | | 926,323 | |
| 250,000 | | WI Health & Education Facs. Auth. Rev. (Aurora Health Care Proj.) | | 6.40 | | | 4/15/33 | | | | 252,075 | |
| 495,000 | | WI Health & Education Facs. Auth. Rev. (Aurora Health Care Proj.) (ACA-CBI Insured) | | 5.63 | | | 11/15/32 | | | | 485,402 | |
| 300,000 | | WI Health & Education Facs. Auth. Rev. (Aurora Medical Group Proj.) (AGM Insured) | | 5.75 | | | 11/15/25 | | | | 300,180 | |
| 500,000 | | WI Health & Education Facs. Auth. Rev. (Beaver Dam Community Hospital, Inc.) | | 6.75 | | | 8/15/34 | | | | 473,330 | |
| 900,000 | | WI Health & Education Facs. Auth. Rev. (Divine Savior, Inc. Proj.) (ACA-CBI Insured) | | 5.70 | | | 6/1/28 | | | | 838,395 | |
| 500,000 | | WI Health & Education Facs. Auth. Rev. (Ministry Health Care, Inc.) | | 5.50 | | | 8/15/30 | | | | 494,100 | |
| 200,000 | | WI Health & Education Facs. Auth. Rev. (Synergy Health, Inc. Proj.) | | 6.00 | | | 11/15/23 | | | | 204,736 | |
| 250,000 | | WI Health & Education Facs. Auth. Rev. (Synergy Health, Inc. Proj.) | | 6.00 | | | 11/15/32 | | | | 251,052 | |
| | | | | | | | | | | | |
| | | | | | | | | | | 4,500,758 | |
| | | | | | | | | | | | |
Total Municipal Bonds
(cost: $158,457,611) | | | | | | | | | 127,805,801 | |
| | | | | | | | | | | | |
Closed-End Mutual Funds - 6.9% | | | | | | | | | | |
| 45,400 | | BlackRock Long-Term Municipal Advantage Trust (BTA) | | | | | | | | | 464,443 | |
| 33,800 | | BlackRock MuniHoldings Florida Insured Fund (MFL) | | | | | | | | | 434,330 | |
| 54,500 | | BlackRock MuniYield Florida Fund (MYF) | | | | | | | | | 686,700 | |
| 66,500 | | BlackRock MuniYield Insured Fund (MYI) | | | | | | | | | 801,325 | |
| 23,700 | | BlackRock MuniYield Michigan Insured Fund (MIY) | | | | | | | | | 308,574 | |
| 23,000 | | BlackRock MuniYield Michigan Insured Fund II (MYM) | | | | | | | | | 275,080 | |
| 208,600 | | DWS Municipal Income Trust (KTF) | | | | | | | | | 2,430,190 | |
| 12,390 | | Eaton Vance National Municipal Income Trust (FEV) | | | | | | | | | 145,583 | |
| 31,200 | | Invesco PA Value Muni Income Trust (VPV) | | | | | | | | | 402,168 | |
| 17,300 | | Invesco Quality Muni (IQT) | | | | | | | | | 208,292 | |
| 9,100 | | Invesco Select Sector Muni Trust (VKL) | | | | | | | | | 103,285 | |
| 36,800 | | Invesco Van Kampen Advantage Muni Income Trust (VKI) | | | | | | | | | 414,736 | |
| 25,889 | | Invesco Van Kampen Trust for Investment Grade Municipals (VGM) | | | | | | | | | 347,948 | |
| 25,923 | | Managed Duration Investment Grade (MZF) | | | | | | | | | 340,887 | |
| 11,700 | | Nuveen Michigan Premium Income Municipal Fund (NMP) | | | | | | | | | 148,590 | |
| 21,500 | | Nuveen Premier Municipal Income Fund (NPF) | | | | | | | | | 272,620 | |
| 81,332 | | Nuveen Premium Income Fund (NPM) | | | | | | | | | 1,058,944 | |
| 77,011 | | Putnam Municipal Opportunities Trust (PMO) | | | | | | | | | 834,799 | |
| | | | | | | | | | | | |
Total Closed-End Mutual Funds
(cost: $9,836,206) | | | | | | | | | 9,678,494 | |
| | | | | | | | | | | | |
Short-Term Securities - 2.4% | | | | | | | | | | |
| 3,385,277 | | Dreyfus Tax-Exempt Cash Management Fund, 0.07% | | | | | | | | | | |
Total Short-Term Securities
(cost: $3,385,277) | | | | | | | | | 3,385,277 | |
| | | | | | | | | | | | |
| | |
See accompanying notes to financial statements. | | |
20 | | SIT MUTUAL FUNDS ANNUAL REPORT |
| | | | |
| | | Fair Value ($) | |
Total Investments in Securities - 100.4%
(cost: $171,679,094) | | | 140,869,572 | |
Other Assets and Liabilities, net - (0.4%) | | | (498,525 | ) |
| | | | |
Total Net Assets - 100.0% | | $ | 140,371,047 | |
| | | | |
| 1 | Variable rate security. Rate disclosed is as of March 31, 2011. |
| 2 | Securities considered illiquid by the Investment Adviser. The total value of such securities as of March 31, 2011 was $4,802,507 and represented 3.4% of net assets. |
| 4 | 144A Restricted Security. The total value of such securities as of March 31, 2011 was $3,747,857 and represented 2.7% of net assets. These securities have been determined to be liquid by the Adviser in accordance with guidelines established by the Board of Directors. |
| 5 | The issuer is in default of certain debt covenants. Income is not being accrued. The total value of such securities as of March 31, 2011 was $4,802,507 and represented 3.4% of net assets. |
| 6 | Zero coupon security. Rate disclosed is the effective yield on purchase date. |
| 9 | Municipal Lease Security. The total value of such securities as of March 31, 2011 was $1,382,225 and represented 1.0% of net assets. These securities have been determined to be liquid by the Adviser in accordance with guidelines established by the Board of Directors. |
Numeric footnotes not disclosed are not applicable to this Schedule of Investments.
A summary of the inputs used to value the Fund’s net assets as of March 31, 2011 is as follows (see Note 2 - significant accounting policies in the notes to financial statements):
| | | | | | | | | | | | | | | | |
| | | Investment in Securities | |
| | | | |
| | | Level 1 Quoted Price ($) | | | Level 2 Other significant
observable inputs ($) | | | Level 3 Significant unobservable inputs ($) | | | Total ($) | |
| | | | |
Short-Term Securities | | | 3,385,277 | | | | — | | | | — | | | | 3,385,277 | |
Closed-End Mutual Funds | | | 9,678,494 | | | | — | | | | — | | | | 9,678,494 | |
Municipal Bonds | | | — | | | | 127,805,801 | | | | — | | | | 127,805,801 | |
| | | | |
Total: | | | 13,063,771 | | | | 127,805,801 | | | | — | | | | 140,869,572 | |
| | | | |
| | |
See accompanying notes to financial statements. | | |
MARCH 31, 2011 | | 21 |
|
|
Sit Minnesota Tax-Free Income Fund |
OBJECTIVE & STRATEGY
The investment objective of the Minnesota Tax-Free Income Fund is to provide a high level of current income exempt from federal regular income tax and Minnesota regular personal income tax as is consistent with the preservation of capital.
During normal market conditions, the Fund invests 100% of its net assets in municipal securities that generate interest income that is exempt from federal regular income tax and Minnesota regular personal income tax. The Fund anticipates that substantially all of its distributions to its shareholders will be exempt as such. For investors subject to the alternative minimum tax (“AMT”), up to 20% of the Fund’s income may be alternative minimum taxable income.
The Sit Minnesota Tax-Free Income Fund provided investors a return of +2.22% for the fiscal year ended March 31, 2011, compared to a return of +3.25% for the Barclays Capital 5-Year Municipal Bond Index. The Fund’s 30-day SEC yield was 4.83% as of March 31, 2011.
During the last 12 months, tax-exempt yield levels were stable for maturities of four years or less but rose on longer maturities. Yields on five-year maturity bonds increased by 0.10%, while the longest maturities rose by 0.63%. Yields rose across all bond rating categories of the Barclays Municipal Index, with a smaller increase of 0.29% for AAA-rated bonds compared to a 0.58% rise for A-rated bonds and a 0.66% rise for Baa-rated issues. The larger rise in yields for lower rated bonds reflected fears of possible higher levels of municipal defaults forecasted by several prominent analysts in the fourth quarter of 2010. While we expect there will be some municipal defaults in 2011, we do not expect a substantial increase in the number of defaults compared to prior years. Furthermore, we believe that the increase in defaults is more likely to occur among general obligation bonds than revenue bonds, with the latter improving in quality as the economy continues to recover.
The Fund’s underperformance over the past twelve months was primarily attributable to the Fund’s longer-than-benchmark duration. The Fund’s longer duration investments experienced larger declines in market value than the Fund’s shorter duration investments. Credit quality did not play an important role in relative returns, as non-rated bonds earned modestly higher returns than rated bonds, and there were no substantial differences in returns between different rating categories of rated bonds. Returns from various market sectors did not vary substantially; the Other Revenue sector earned the highest returns, and only the Education sector underperformed by more than 1% compared to the Barclays Capital 5-Year Municipal Bond Index’s returns. The Fund is highly diversified with over 300 security holdings. The Fund’s duration of 5.7 years was longer than the Index’s duration.
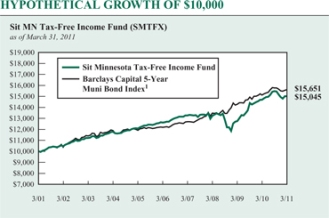
The chart above illustrates the total value of a hypothetical $10,000 investment in the Fund over the past 10 years (or for the life of the Fund if shorter) as compared to the performance of the Barclays Capital 5-Year Municipal Bond Index. Past performance does not guarantee future results. Returns include the reinvestment of distributions. The chart does not reflect the deduction of taxes that a shareholder would pay on Fund distributions or the redemption of Fund shares.
1 The Barclays Capital 5-Year Municipal Bond Index is the 5 year (4-6) component of the Municipal Bond Index, an unmanaged, rules-based, market-value-weighted index for the long-term tax-exempt bond market. The index includes bonds with a minimum credit rating of BBB. The returns include the reinvestment of income and do not include any transaction costs, management fees or other costs. It is not possible to invest directly in an index.
Looking forward, we expect yield spreads for A and BBB issues as well as non-rated bonds to narrow over the coming year from their current historically wide levels. We expect Minnesota state and local governments to make substantial progress in balancing their budgets as they cut expenditures and see improved revenue streams as the economy continues to grow at a moderate pace of +2.5% to +3%. We also believe the Fund’s 4.83% 30-day SEC yield represents attractive value in this low inflation environment.
Michael C. Brilley
Debra A. Sit, CFA
Paul J. Jungquist, CFA
Senior Portfolio Managers
| | |
| | | |
22 | | SIT MUTUAL FUNDS ANNUAL REPORT |
| | | | | | | | | | | | |
| COMPARATIVE RATES OF RETURNS | |
as of March 31, 2011 | |
| | | Sit Minnesota Tax-Free Income Fund | | | Barclays Capital 5-Year Muni. Bond Index1 | | | Lipper MN Muni. Bond
Fund Index2 | |
One Year | | | 2.22 | % | | | 3.25 | % | | | 1.27 | % |
Five Years | | | 3.55 | | | | 5.13 | | | | 3.47 | |
Ten Years | | | 4.17 | | | | 4.58 | | | | 4.09 | |
Since Inception (12/1/93) | | | 4.70 | | | | 4.90 | | | | 4.47 | |
Performance figures are historical and do not guarantee future results. Investment returns and principal value will vary, and you may have a gain or loss when you sell shares. Current performance may be lower or higher than the performance data quoted. Contact the Fund for performance data current to the most recent month-end. Returns include changes in share price as well as reinvestment of all dividends and capital gains. Returns do not reflect the deduction of taxes that a shareholder would pay on Fund distributions or the redemption of Fund shares. Management fees and administrative expenses are included in the Fund’s performance. Returns for periods greater than one year are compounded average annual rates of return.
1 The Barclays Capital 5-Year Municipal Bond Index is the 5 year (4-6) component of the Municipal Bond Index, an unmanaged, rules-based, market-value-weighted index made for the long-term tax-exempt bond market. The index includes bonds with a minimum credit rating of BBB. The returns include the reinvestment of income and do not include any transaction costs, management fees or other costs. It is not possible to invest directly in an index.
2 The Lipper returns are obtained from Lipper Analytical Services, Inc., a large independent evaluator of mutual funds.
| | | | |
| FUND DIVERSIFICATION | | | | |
| |
Multifamily Mortgage | | | 19.8 | % |
Hospital/Health Care | | | 18.6 | % |
Single Family Mortgage | | | 12.6 | % |
Education/Student Loan | | | 11.6 | % |
Other Revenue | | | 9.5 | % |
Utility | | | 6.8 | % |
Sectors less than 6.0% | | | 18.3 | % |
Cash & Other Net Assets | | | 2.8 | % |
Based on total net assets as of March 31, 2011. Subject to change.
| | |
PORTFOLIO SUMMARY |
| |
Net Asset Value 3/31/11: | | $9.67 Per Share |
Net Asset Value 3/31/10: | | $9.88 Per Share |
Total Net Assets: | | $289.1 Million |
30-day SEC Yield 3: | | 4.83% |
Tax Equivalent Yield 4: | | 8.06% |
12-month Distribution Rate 3: | | 4.36% |
Average Maturity: | | 16.3 Years |
Effective Duration 5: | | 5.7 Years |
3 The SEC Yield reflects the rate at which the Fund is earning income on its current portfolio of securities, while the distribution rate reflects the Fund’s past dividends paid to shareholders based on the net investment income distributed and the average NAV during the past 12 months. Accordingly, the Fund’s SEC yield and distribution rate may differ.
4 The tax-equivalent yield is based on an assumed federal tax rate of 35.0% and a Minnesota tax rate of 7.85%, for an effective combined tax rate of 40.1%.
5 Duration is a measure of estimated price sensitivity relative to changes in interest rates. Portfolios with longer durations are typically more sensitive to changes in interest rates. For example, if interest rates rise by 1%, the market value of a security with an effective duration of 5 years would decrease by 5%, with all other factors being constant. The correlation between duration and price sensitivity is greater for securities rated investment-grade than it is for securities rated below investment-grade. Duration estimates are based on assumptions by the Adviser and are subject to a number of limitations. Effective duration is calculated based on historical price changes of securities held by the Fund, and therefore is a more accurate estimate of price sensitivity provided interest rates remain within their historical range.
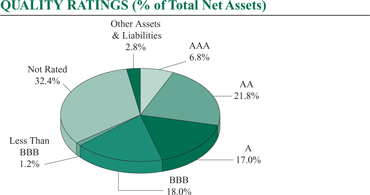
Lower of Moody’s, S&P, Fitch or Duff & Phelps ratings used.
Adviser’s Assessment of Non-Rated Securities:
| | | | | | |
AAA | | | | 0.0% | | |
AA | | | | 2.6 | | |
A | | | | 3.3 | | |
BBB | | | | 12.8 | | |
BB | | | | 13.1 | | |
<BB | | | | 0.6 | | |
Total | | | | 32.4% | | |
SCHEDULE OF INVESTMENTS
March 31, 2011
Sit Minnesota Tax-Free Income Fund
| | | | | | | | | | | | | | |
Principal
Amount ($) | | Name of Issuer | | Coupon
Rate (%) | | | Maturity Date | | | Fair Value ($) | |
| | | |
Municipal Bonds - 96.5% | | | | | | | | | | | | |
Education/Student Loan - 11.6% | | | | | | | | | | | | |
| 1,070,000 | | Brooklyn Park Lease Rev. (Prairie Seeds Academy Proj.) | | | 8.00 | | | | 3/1/20 | | | | 1,140,620 | |
| 2,500,000 | | Duluth Hsg. & Redev. Auth. Lease Rev. (Public Schools Academy) | | | 5.00 | | | | 11/1/21 | | | | 2,228,425 | |
| 6,877,709 | | Intermediate School District 287 Lease Rev. | | | 5.30 | | | | 11/1/32 | | | | 6,290,903 | |
| 775,000 | | Minneapolis Educational Fac. Lease Rev. (Seed/Harvest Preparatory Proj.) (LOC-U.S. Bank) | | | 5.13 | | | | 1/1/16 | | | | 547,692 | |
| 875,000 | | Minneapolis Educational Fac. Lease Rev. (Seed/Harvest Preparatory Proj.) (LOC-U.S. Bank) | | | 6.25 | | | | 1/1/21 | | | | 608,160 | |
| 910,000 | | MN Higher Education Fac. Auth. Rev. (Bethel Univ.) | | | 5.50 | | | | 5/1/14 | | | | 934,306 | |
| 600,000 | | MN Higher Education Fac. Auth. Rev. (Bethel Univ.) | | | 5.50 | | | | 5/1/22 | | | | 583,968 | |
| 160,000 | | MN Higher Education Fac. Auth. Rev. (Bethel Univ.) | | | 5.50 | | | | 5/1/23 | | | | 153,582 | |
| 1,000,000 | | MN Higher Education Fac. Auth. Rev. (Bethel Univ.) | | | 5.50 | | | | 5/1/37 | | | | 865,020 | |
| 2,129,957 | | MN Higher Education Fac. Auth. Rev. (College of St. Benedict) | | | 4.49 | | | | 10/1/16 | | | | 2,143,141 | |
| 1,827,033 | | MN Higher Education Fac. Auth. Rev. (College of St. Catherine) | | | 4.75 | | | | 4/26/27 | | | | 1,687,886 | |
| 500,000 | | MN Higher Education Fac. Auth. Rev. (Hamline Univ.) | | | 5.00 | | | | 10/1/29 | | | | 480,175 | |
| 750,000 | | MN Higher Education Fac. Auth. Rev. (Hamline Univ.) | | | 6.00 | | | | 10/1/32 | | | | 753,480 | |
| 1,000,000 | | MN Higher Education Fac. Auth. Rev. (Hamline Univ.) | | | 6.00 | | | | 10/1/40 | | | | 979,690 | |
| 750,000 | | MN Higher Education Fac. Auth. Rev. (Macalester College-Seven-I) | | | 5.00 | | | | 6/1/35 | | | | 751,042 | |
| 1,400,000 | | MN Higher Education Fac. Auth. Rev. (St. Scholastica College) | | | 5.00 | | | | 12/1/27 | | | | 1,302,462 | |
| 1,800,000 | | MN Higher Education Fac. Auth. Rev. (St. Scholastica College) | | | 6.30 | | | | 12/1/40 | | | | 1,818,216 | |
| 250,000 | | MN Higher Education Fac. Auth. Rev. (St. Scholastica College-H) | | | 5.13 | | | | 12/1/40 | | | | 228,855 | |
| 500,000 | | MN Higher Education Fac. Auth. Rev. (St. Scholastica College-H) | | | 5.25 | | | | 12/1/35 | | | | 475,430 | |
| 1,250,000 | | MN Higher Education Fac. Auth. Rev. (Univ. of St. Thomas) | | | 6.00 | | | | 10/1/25 | | | | 1,314,362 | |
| 216,043 | | MN Higher Education Fac. Auth. Rev. Lease Rev. (Concordia Univ.) | | | 5.25 | | | | 4/25/14 | | | | 218,428 | |
| 2,500,000 | | MN Office of Higher Education Rev. (Suppl. Student Loan Prog.) | | | 5.00 | | | | 11/1/29 | | | | 2,423,400 | |
| 738,184 | | Olmsted Co. Hsg. & Redev. Auth. (Schaeffer Academy Proj.) | | | 4.98 | | | | 4/25/27 | | | | 561,470 | |
| 340,000 | | Pine City Lease Rev. (Lakes International Language Academy Proj.) | | | 5.75 | | | | 5/1/16 | | | | 336,304 | |
| 300,000 | | Pine City Lease Rev. (Lakes International Language Academy Proj.) | | | 6.00 | | | | 5/1/26 | | | | 259,740 | |
| 320,000 | | Ramsey Lease Rev. (Pact Charter School Proj.) | | | 5.65 | | | | 12/1/13 | | | | 323,930 | |
| 685,000 | | St. Paul Hsg. & Redev. Auth. Lease Rev. (Community of Peace Academy Proj.) | | | 4.35 | | | | 12/1/12 | | | | 692,878 | |
| 600,000 | | St. Paul Hsg. & Redev. Auth. Lease Rev. (Community of Peace Academy Proj.) | | | 4.35 | | | | 12/1/14 | | | | 593,586 | |
| 1,500,000 | | St. Paul Hsg. & Redev. Auth. Lease Rev. (Community of Peace Academy Proj.) | | | 5.00 | | | | 12/1/18 | | | | 1,414,935 | |
| 605,000 | | St. Paul Hsg. & Redev. Auth. Lease Rev. (Hmong Academy Proj.) | | | 5.50 | | | | 9/1/18 | | | | 573,891 | |
| 255,000 | | St. Paul Hsg. & Redev. Auth. Lease Rev. (New Spirit Charter School Proj.) | | | 6.50 | | | | 12/1/12 | | | | 262,543 | |
| 500,000 | | St. Paul Hsg. & Redev. Auth. Rev. Ref. (St. Paul Academy & Summit School) | | | 5.00 | | | | 10/1/24 | | | | 512,540 | |
| 100,000 | | Victoria Private School Fac. Rev. (Holy Family Catholic High School Proj.) | | | 5.20 | | | | 9/1/11 | | | | 100,142 | |
| | | | | | | | | | | | | | |
| | | | | | | | | | | | | 33,561,202 | |
| | | | | | | | | | | | | | |
General Obligation - 3.3% | | | | | | | | | | | | |
| 1,000,000 | | Bemidji Sales Tax G.O. | | | 5.00 | | | | 2/1/34 | | | | 1,024,130 | |
| 1,350,000 | | Bemidji Sales Tax G.O. | | | 6.00 | | | | 2/1/41 | | | | 1,480,140 | |
| 650,000 | | Dakota Co. Community Dev. Agy. Sr. Hsg. Facs. G.O. | | | 5.00 | | | | 1/1/26 | | | | 669,272 | |
| 500,000 | | Northern Mariana Islands Commonwealth G.O. 11 | | | 5.00 | | | | 10/1/22 | | | | 407,010 | |
| 1,000,000 | | Puerto Rico Public Improvement G.O. 11 | | | 5.75 | | | | 7/1/36 | | | | 924,890 | |
| 1,000,000 | | Puerto Rico Public Improvement G.O. 11 | | | 6.00 | | | | 7/1/28 | | | | 1,009,030 | |
| 4,000,000 | | Puerto Rico Public Improvement G.O. 11 | | | 6.50 | | | | 7/1/40 | | | | 4,059,240 | |
| 100,000 | | St. Paul Street Improvement Special Assessment G.O. | | | 5.30 | | | | 3/1/12 | | | | 100,387 | |
| | | | | | | | | | | | | | |
| | | | | | | | | | | | | 9,674,099 | |
| | | | | | | | | | | | | | |
Hospital/Health Care - 18.6% | | | | | | | | | | | | |
| 1,500,000 | | Bemidji Health Care Facs. Rev. (North Country Health Services Proj.) (Radian Insured) | | | 5.00 | | | | 9/1/24 | | | | 1,434,900 | |
| 4,025,000 | | Breckenridge Rev. (Catholic Health Initiatives Proj.) | | | 5.00 | | | | 5/1/30 | | | | 3,966,436 | |
| 400,000 | | Carlton Health Care & Hsg. Fac. Rev. Ref. (Faith Care Center Proj.) | | | 5.20 | | | | 4/1/16 | | | | 389,372 | |
| | |
See accompanying notes to financial statements. | | |
24 | | SIT MUTUAL FUNDS ANNUAL REPORT |
| | | | | | | | | | | | | | |
Principal
Amount ($) | | Name of Issuer | | Coupon
Rate (%) | | | Maturity Date | | | Fair Value ($) | |
| | | | |
| 365,000 | | Cold Spring Health Care Facs. Rev. (Assumption Home, Inc. Proj.) | | | 7.25 | | | | 3/1/23 | | | | 374,110 | |
| 10,000 | | Crookston Nursing Home & Multifamily Hsg. Rev. (Villa St. Vincent Proj.) | | | 5.50 | | | | 9/1/11 | | | | 9,994 | |
| 405,000 | | Detroit Lakes Hsg. & Health Facs. Rev. Ref. (CDL Homes Proj.) | | | 2.14 | | | | 8/1/34 | | | | 405,028 | |
| 1,500,000 | | Detroit Lakes Hsg. Rev. Ref. (Mankato Lutheran Proj.) | | | 2.39 | | | | 8/1/34 | | | | 1,466,880 | |
| 1,500,000 | | Douglas Co. Gross Health Care Facs. Rev. (Douglas Co. Hospital Proj.) | | | 6.00 | | | | 7/1/28 | | | | 1,485,540 | |
| 135,000 | | Duluth Economic Dev. Auth. Health Care Fac. Rev. (St. Luke’s Hospital Proj.) | | | 6.00 | | | | 6/15/12 | | | | 135,343 | |
| 916,641 | | Duluth Hsg. & Redev. Auth. Sr. Hsg. (Lakeshore Proj.) | | | 4.00 | | | | 8/20/34 | | | | 884,852 | |
| 750,253 | | Duluth Sr. Hsg. Loan Participation (Lakeshore Proj.) 1 | | | 4.50 | | | | 12/20/35 | | | | 705,801 | |
| 590,000 | | Elk River Rev. (Care Choice Member Proj.) | | | 5.60 | | | | 8/1/13 | | | | 586,395 | |
| 1,925,000 | | Glencoe Health Care Fac. Rev. (Glencoe Regional Health Services Proj.) | | | 5.00 | | | | 4/1/25 | | | | 1,784,841 | |
| 125,000 | | Hastings Health Care Fac. Rev. (Augustana Home of Hastings Proj.) | | | 5.30 | | | | 11/1/11 | | | | 123,910 | |
| 135,000 | | Hastings Health Care Fac. Rev. (Augustana Home of Hastings Proj.) | | | 5.40 | | | | 11/1/12 | | | | 133,546 | |
| 970,000 | | Hastings Health Care Fac. Rev. (Regina Medical Center) (ACA Insured) | | | 5.25 | | | | 9/15/18 | | | | 965,247 | |
| 705,000 | | Hastings Health Care Fac. Rev. (Regina Medical Center) (ACA Insured) | | | 5.30 | | | | 9/15/28 | | | | 599,137 | |
| 275,000 | | Inver Grove Heights Nursing Home Rev. Ref. (Presbyterian Homes Care) | | | 5.00 | | | | 10/1/11 | | | | 275,470 | |
| 780,000 | | Maple Grove Health Care Fac. Rev. (North Memorial Health Care Proj.) | | | 5.00 | | | | 9/1/29 | | | | 704,192 | |
| 1,200,000 | | Maple Grove Health Care System Rev. (Maple Grove Hospital Corp.) | | | 5.25 | | | | 5/1/25 | | | | 1,160,868 | |
| 1,500,000 | | Maple Grove Health Care System Rev. (Maple Grove Hospital Corp.) | | | 5.25 | | | | 5/1/28 | | | | 1,409,685 | |
| 600,000 | | Minneapolis & St. Paul Hsg. & Redev. Auth. Rev. (Health Partners) | | | 5.88 | | | | 12/1/29 | | | | 598,260 | |
| 255,000 | | Minneapolis Health Care Fac. Rev. (Augustana Chapel View Homes Proj.) | | | 5.00 | | | | 6/1/15 | | | | 242,635 | |
| 270,000 | | Minneapolis Health Care Fac. Rev. (Augustana Chapel View Homes Proj.) | | | 5.10 | | | | 6/1/16 | | | | 255,647 | |
| 1,470,000 | | Minneapolis Health Care Fac. Rev. (Jones-Harrison Residence Proj.) | | | 5.40 | | | | 10/1/25 | | | | 1,286,309 | |
| 1,000,000 | | Minneapolis Hsg. & Health Care Facs. Rev. Ref. (Providence Proj.) | | | 5.50 | | | | 10/1/14 | | | | 949,400 | |
| 200,000 | | Minneapolis Hsg. Fac. Rev. (Augustana Chapel View Homes Proj.) | | | 5.50 | | | | 6/1/27 | | | | 168,648 | |
| 500,000 | | Minneapolis Hsg. Fac. Rev. (Augustana Chapel View Homes Proj.) | | | 5.75 | | | | 1/1/19 | | | | 474,045 | |
| 530,000 | | Minneapolis Hsg. Fac. Rev. (Augustana Chapel View Homes Proj.) | | | 5.80 | | | | 1/1/24 | | | | 468,780 | |
| 180,000 | | Minneapolis Pooled Rev. (Care Choice Member Proj.) | | | 5.75 | | | | 4/1/19 | | | | 163,165 | |
| 405,000 | | MN Agricultural & Economic Dev. Board Rev. (Evangelical Lutheran Good Samaritan Society Proj.) | | | 6.55 | | | | 8/1/16 | | | | 413,910 | |
| 1,330,000 | | MN Agricultural & Economic Dev. Board Rev. (Evangelical Lutheran Good Samaritan Society Proj.) | | | 6.63 | | | | 8/1/25 | | | | 1,348,301 | |
| 10,000 | | MN Agricultural & Economic Dev. Board Rev. (Fairview Health Care System Proj.) | | | 6.38 | | | | 11/15/22 | | | | 10,071 | |
| 130,000 | | MN Agricultural & Economic Dev. Board Rev. (Fairview Health Care System Proj.) | | | 6.38 | | | | 11/15/29 | | | | 130,337 | |
| 150,000 | | New Hope Health Care Facs. Rev. (MN Masonic Home North Ridge Proj.) | | | 5.60 | | | | 3/1/12 | | | | 149,294 | |
| 920,000 | | New Hope Health Care Facs. Rev. (MN Masonic Home North Ridge Proj.) | | | 5.88 | | | | 3/1/29 | | | | 778,449 | |
| 1,175,000 | | New Hope Health Care Facs. Rev. (MN Masonic Home North Ridge Proj.) | | | 5.90 | | | | 3/1/19 | | | | 1,092,386 | |
| 100,000 | | Rochester Health Care Facs. Rev. (Mayo Clinic Proj.) | | | 5.00 | | | | 11/15/36 | | | | 98,292 | |
| 500,000 | | Rochester Health Care Facs. Rev. (Olmsted Medical Center Proj.) | | | 5.13 | | | | 7/1/20 | | | | 495,965 | |
| 1,500,000 | | Rochester Health Care Facs. Rev. (Olmsted Medical Center Proj.) | | | 5.88 | | | | 7/1/30 | | | | 1,421,310 | |
| 1,020,000 | | Sartell Health Care & Hsg. Facs. Rev. (Foundation for Healthcare Proj.) | | | 6.63 | | | | 9/1/29 | | | | 974,284 | |
| 1,000,000 | | Sauk Rapids Health Care & Hsg. Facs. Rev. (Good Shepherd Lutheran Home Proj.) | | | 6.75 | | | | 1/1/24 | | | | 983,120 | |
| 1,000,000 | | Sauk Rapids Health Care & Hsg. Facs. Rev. (Good Shepherd Lutheran Home Proj.) | | | 7.25 | | | | 1/1/29 | | | | 999,840 | |
| 125,000 | | Shakopee Health Care Facs. Rev. (St. Francis Regional Medical Center Proj.) | | | 5.10 | | | | 9/1/25 | | | | 118,950 | |
| 3,475,000 | | Shakopee Health Care Facs. Rev. (St. Francis Regional Medical Center Proj.) | | | 5.25 | | | | 9/1/34 | | | | 3,105,190 | |
| 4,000,000 | | St. Cloud Health Care Rev. (CentraCare Health System) | | | 5.00 | | | | 5/1/25 | | | | 3,961,160 | |
| 2,000,000 | | St. Louis Park Health Care Facs. Rev. (Park Nicollet Health Proj.) | | | 5.50 | | | | 7/1/29 | | | | 1,898,280 | |
| 160,000 | | St. Paul Hsg. & Redev. Auth. Health Care Rev. (Gillette Childrens Hospital Proj.) | | | 5.00 | | | | 2/1/15 | | | | 163,632 | |
| 350,000 | | St. Paul Hsg. & Redev. Auth. Health Care Rev. (Gillette Childrens Specialty Proj.) | | | 5.00 | | | | 2/1/20 | | | | 353,416 | |
| 500,000 | | St. Paul Hsg. & Redev. Auth. Health Care Rev. (Gillette Childrens Specialty Proj.) | | | 5.00 | | | | 2/1/21 | | | | 502,785 | |
| 500,000 | | St. Paul Hsg. & Redev. Auth. Health Care Rev. (HealthPartners Oblig. Group Proj.) | | | 5.25 | | | | 5/15/36 | | | | 441,030 | |
| 135,000 | | St. Paul Hsg. & Redev. Auth. Health Care Rev. (Model Cities Health Center) | | | 6.50 | | | | 11/1/11 | | | | 134,792 | |
| 60,000 | | St. Paul Hsg. & Redev. Auth. Health Care Rev. (Regions Hospital Proj.) | | | 5.00 | | | | 5/15/11 | | | | 60,164 | |
| 1,365,000 | | St. Paul Hsg. & Redev. Auth. Health Care Rev. (Regions Hospital Proj.) | | | 5.20 | | | | 5/15/13 | | | | 1,368,030 | |
| 2,070,000 | | St. Paul Hsg. & Redev. Auth. Health Care Rev. (Regions Hospital Proj.) | | | 5.25 | | | | 5/15/18 | | | | 2,071,263 | |
| | |
See accompanying notes to financial statements. | | |
MARCH 31, 2011 | | 25 |
SCHEDULE OF INVESTMENTS
March 31, 2011
Sit Minnesota Tax-Free Income Fund (Continued)
| | | | | | | | | | | | |
Principal
Amount ($) | | Name of Issuer | | Coupon
Rate (%) | | Maturity Date | | | Fair Value ($) | |
| | | | |
| 1,903,858 | | St. Paul Hsg. & Redev. Auth. Rev. (Nursing Home NTS-Episcopal) | | 5.63 | | | 10/1/33 | | | | 1,594,500 | |
| 50,000 | | St. Paul Hsg. & Redev. Auth. Rev. (Regions Hospital Proj.) | | 5.30 | | | 5/15/28 | | | | 46,944 | |
| 1,210,000 | | St. Paul Hsg. & Redev. Auth. Rev. Ref. (Franciscan Health Community) | | 7.00 | | | 7/1/21 | | | | 1,209,843 | |
| 2,500,000 | | Stillwater Health Care Rev. (Health System Obligation Proj.) | | 5.00 | | | 6/1/25 | | | | 2,378,375 | |
| 920,000 | | Stillwater Health Care Rev. (Health System Obligation Proj.) | | 5.00 | | | 6/1/35 | | | | 795,975 | |
| 1,300,000 | | Winsted Health Care Rev. (St. Mary’s Care Center Proj.) | | 6.00 | | | 9/1/25 | | | | 1,153,919 | |
| | | | | | | | | | | | |
| | | | | | | | | | | 53,862,243 | |
| | | | | | | | | | | | |
| Industrial/Pollution Control - 2.5% | | | | | | | | | | |
| 2,250,000 | | Moorhead Rev. (Amer. Crystal Sugar Co. Recovery Zone Fac.) | | 5.65 | | | 6/1/27 | | | | 2,175,772 | |
| 500,000 | | Otter Tail Co. Rev. Sub. (Otter Tail Proj.) 2, 5, 8 | | 7.50 | | | 11/1/19 | | | | 123,955 | |
| 505,000 | | Owatonna Industrial Dev. Rev. (Slidell, Inc. Proj.) 2, 5, 8 | | 8.48 | | | 5/1/17 | | | | 252,500 | |
| 890,000 | | Puerto Rico Childrens Trust Fund Tobacco Settlement Rev. 11 | | 5.38 | | | 5/15/33 | | | | 782,764 | |
| 2,000,000 | | St. Paul Port Auth. Solid Waste Disposal Rev. (Ecullet Proj.) | | 6.25 | | | 11/1/15 | | | | 2,024,440 | |
| 1,035,000 | | Virgin Islands Tobacco Settlement Financing Corp. Asset-Backed Rev. 11 | | 5.00 | | | 5/15/21 | | | | 948,412 | |
| 980,000 | | White Earth Band of Chippewa Indians Rev. (ACA Insured) | | 7.00 | | | 12/1/11 | | | | 997,669 | |
| | | | | | | | | | | | |
| | | | | | | | | | | 7,305,512 | |
| | | | | | | | | | | | |
| Insured - 5.1% | | | | | | | | | | |
| 2,000,000 | | Guam Power Auth. Rev. (AGM Insured) 11 | | 5.00 | | | 10/1/37 | | | | 1,750,600 | |
| 500,000 | | Minneapolis & St. Paul Hsg. & Redev. Rev. (Children’s Hospital) (AGM Insured) | | 5.00 | | | 8/15/34 | | | | 464,200 | |
| 1,750,000 | | Minneapolis & St. Paul Metro Airport Commission Rev. (NATL-RE FGIC Insured) | | 5.00 | | | 1/1/25 | | | | 1,753,325 | |
| 2,010,000 | | Minneapolis & St. Paul Metro Airport Commission Rev. Ref. (NATL-RE FGIC Insured) | | 5.00 | | | 1/1/22 | | | | 2,058,119 | |
| 1,000,000 | | Minneapolis Health Care Facs. Rev. (Fairview Health Svcs.) (Assured Guaranty) | | 6.50 | | | 11/15/38 | | | | 1,047,560 | |
| 350,000 | | Plymouth Health Facs. Rev. (West Health Proj.) (AGM Insured) | | 6.13 | | | 6/1/24 | | | | 350,287 | |
| 600,000 | | Puerto Rico Electric Power Auth. Rev. Ref. (AGM Insured) 1, 11 | | 0.72 | | | 7/1/29 | | | | 407,814 | |
| 160,000 | | Puerto Rico Industrial, Tourist, Education, Medical & Envir. Control Facs. Rev. (NATL-RE Insured)11 | | 6.25 | | | 7/1/16 | | | | 160,525 | |
| 1,000,000 | | Puerto Rico Public Improvement G.O. (AGM Insured) 11 | | 5.13 | | | 7/1/30 | | | | 942,140 | |
| 1,000,000 | | Puerto Rico Public Improvement G.O. (AGM Insured) 11 | | 5.25 | | | 7/1/20 | | | | 1,034,730 | |
| 500,000 | | Puerto Rico Public Improvement G.O. (AGM Insured) 11 | | 5.50 | | | 7/1/27 | | | | 502,285 | |
| 1,000,000 | | Puerto Rico Public Improvement G.O. (Assured Guaranty) 1, 11 | | 2.19 | | | 7/1/20 | | | | 832,210 | |
| 1,000,000 | | St. Cloud Health Care Rev. (CentraCare Health System Proj.) (Assured Guaranty) | | 5.50 | | | 5/1/39 | | | | 985,460 | |
| 2,010,000 | | St. Paul Hsg. & Redev. Sales Tax Rev. Ref. (Civic Center) (AGM Insured) | | 7.10 | | | 11/1/23 | | | | 2,333,027 | |
| | | | | | | | | | | | |
| | | | | | | | | | | 14,622,282 | |
| | | | | | | | | | | | |
| Multifamily Mortgage - 19.8% | | | | | | | | | | |
| 785,000 | | Anoka Co. Hsg. & Redev. Rev. (Recovery Zone Fac.-Park River Estates) | | 6.50 | | | 11/1/25 | | | | 761,254 | |
| 250,000 | | Bloomington Hsg. Rev. Sr. (Gideon Pond Commons LLC) | | 5.25 | | | 6/1/21 | | | | 239,880 | |
| 300,000 | | Bloomington Hsg. Rev. Sr. (Gideon Pond Commons LLC) | | 5.25 | | | 12/1/21 | | | | 286,848 | |
| 375,000 | | Bloomington Hsg. Rev. Sr. (Gideon Pond Commons LLC) | | 5.38 | | | 6/1/22 | | | | 362,062 | |
| 385,000 | | Bloomington Hsg. Rev. Sr. (Gideon Pond Commons LLC) | | 5.38 | | | 12/1/22 | | | | 370,982 | |
| 1,000,000 | | Bloomington Hsg. Rev. Sr. (Gideon Pond Commons LLC) | | 6.00 | | | 12/1/30 | | | | 939,560 | |
| 2,635,000 | | Carver Co. Hsg. & Redev. Gross Rev. & Limited Tax Ref. (Lake Grace Apartments Proj.) | | 6.00 | | | 7/1/28 | | | | 2,646,805 | |
| 1,000,000 | | Champlin Multifamily Hsg. Rev. (Champlin Drive Apts.) | | 6.00 | | | 1/1/27 | | | | 965,360 | |
| 355,000 | | Chaska Multifamily Hsg. Rev. (West Suburban Hsg. Partners Proj.) 8 | | 5.38 | | | 9/1/14 | | | | 347,502 | |
| 500,000 | | Cloquet Hsg. Fac. Rev. Ref. (HADC Cloquet LLC Proj.) | | 5.50 | | | 8/1/25 | | | | 416,875 | |
| 100,000 | | Columbia Heights Multifamily & Health Care Fac. Rev. (Crest View Corp Proj.) | | 5.30 | | | 7/1/17 | | | | 88,075 | |
| 700,000 | | Coon Rapids Multifamily Hsg. Rev. Ref. (Margaret Place Apartments) | | 6.50 | | | 5/1/25 | | | | 691,698 | |
| 545,000 | | Coon Rapids Senior Hsg. Rev. Ref. (Epiphany Sr. Citizens Hsg. Corp. Proj.) | | 5.80 | | | 11/1/15 | | | | 528,585 | |
| 2,565,000 | | Cottage Grove Sr. Hsg. Rev. (PHS, Inc. Proj.) | | 5.00 | | | 12/1/31 | | | | 2,018,091 | |
| 71,000 | | Eden Prairie Multifamily Hsg. Rev. Ref. (Rolling Hills Proj.) | | 9.00 | | | 4/1/43 | | | | 71,000 | |
| 470,000 | | Eden Prairie Multifamily Hsg. Rev. Ref. (Rolling Hills Proj.) (GNMA Collateralized) | | 6.00 | | | 8/20/21 | | | | 495,676 | |
| 675,000 | | Eden Prairie Multifamily Hsg. Rev. Ref. (Rolling Hills Proj.) (GNMA Collateralized) | | 6.15 | | | 8/20/31 | | | | 710,255 | |
| | |
See accompanying notes to financial statements. | | |
26 | | SIT MUTUAL FUNDS ANNUAL REPORT |
| | | | | | | | | | | | | | |
Principal
Amount ($) | | Name of Issuer | | Coupon
Rate (%) | | | Maturity Date | | | Fair Value ($) | |
| | | | |
| 1,635,000 | | Eden Prairie Multifamily Hsg. Rev. Ref. (Rolling Hills Proj.) (GNMA Collateralized) | | | 6.20 | | | | 2/20/43 | | | | 1,719,660 | |
| 100,000 | | Eveleth Multifamily Hsg. Rev. Sr. (Manor House Woodland Proj.) | | | 5.00 | | | | 10/1/11 | | | | 100,215 | |
| 155,000 | | Eveleth Multifamily Hsg. Rev. Sr. (Manor House Woodland Proj.) | | | 5.10 | | | | 10/1/12 | | | | 153,419 | |
| 165,000 | | Eveleth Multifamily Hsg. Rev. Sr. (Manor House Woodland Proj.) | | | 5.15 | | | | 10/1/13 | | | | 161,342 | |
| 300,000 | | Fairmont Hsg. Fac. Rev. (Goldfinch Estates-GEAC Proj.) | �� | | 5.75 | | | | 10/1/17 | | | | 275,325 | |
| 290,000 | | Fairmont Hsg. Fac. Rev. (Goldfinch Estates-GEAC Proj.) | | | 6.00 | | | | 10/1/21 | | | | 260,913 | |
| 275,000 | | Fairmont Hsg. Fac. Rev. (Homestead-GEAC Proj.) | | | 6.63 | | | | 10/1/11 | | | | 274,799 | |
| 295,000 | | Fairmont Hsg. Fac. Rev. (Homestead-GEAC Proj.) | | | 6.88 | | | | 10/1/14 | | | | 290,256 | |
| 695,000 | | Golden Valley Rev. (Covenant Retirement Communities Proj.) | | | 5.50 | | | | 12/1/25 | | | | 629,976 | |
| 2,000,000 | | Golden Valley Rev. (Covenant Retirement Communities Proj.) | | | 5.50 | | | | 12/1/29 | | | | 1,746,280 | |
| 1,660,000 | | Grand Rapids Hsg. & Redev. Auth. (Lakeshore Place & Forest Park West Apartments Proj.) | | | 5.30 | | | | 10/1/29 | | | | 1,483,476 | |
| 245,000 | | Inver Grove Heights Nursing Home Rev. Ref. (Presbyterian Homes) | | | 5.50 | | | | 10/1/33 | | | | 204,146 | |
| 1,295,000 | | Lake Crystal Hsg. Rev. (Ecumen-Second Century Proj.) | | | 5.63 | | | | 9/1/28 | | | | 1,189,173 | |
| 1,400,000 | | Maplewood Multifamily Hsg. Rev. (Park Edge Apartments Proj.) 8 | | | 6.50 | | | | 5/1/29 | | | | 1,253,630 | |
| 2,765,000 | | Minneapolis & St. Paul Hsg. & Redev. Auth. Multifamily Hsg. Rev. (GNMA Collateralized) 8 | | | 4.75 | | | | 1/20/42 | | | | 2,425,320 | |
| 3,500,000 | | Minneapolis Mulitfamily Hsg. Rev. (Riverside Plaza) | | | 6.00 | | | | 11/1/13 | | | | 3,474,275 | |
| 790,000 | | Minneapolis Multifamily Hsg. Rev. (Blaisdell Apartments Proj.) 8 | | | 5.10 | | | | 4/1/17 | | | | 738,895 | |
| 300,000 | | Minneapolis Multifamily Hsg. Rev. (Garr Scott Loft Proj.) (LOC U.S. Bank) 8 | | | 5.95 | | | | 5/1/30 | | | | 300,375 | |
| 350,000 | | Minnetonka Multifamily Hsg. Rev. Ref. (Archer Heights Apartments Proj.) (GNMA Collateralized) 8 | | | 5.10 | | | | 7/20/13 | | | | 352,314 | |
| 975,000 | | Minnetonka Multifamily Hsg. Rev. Ref. (Archer Heights Apartments Proj.) (GNMA Collateralized) 8 | | | 5.20 | | | | 1/20/18 | | | | 977,204 | |
| 1,750,000 | | MN Hsg. Fin. Agy. Rental Hsg. 8 | | | 5.10 | | | | 8/1/47 | | | | 1,555,260 | |
| 85,000 | | MN Hsg. Fin. Agy. Rental Hsg. (GO of AGY. Insured) 8 | | | 4.88 | | | | 8/1/24 | | | | 82,679 | |
| 250,000 | | MN Hsg. Fin. Agy. Rental Hsg. (GO of AGY. Insured) | | | 5.05 | | | | 8/1/31 | | | | 249,100 | |
| 2,560,000 | | MN Hsg. Fin. Agy. Rental Hsg. (GO of AGY. Insured) | | | 5.25 | | | | 8/1/40 | | | | 2,481,613 | |
| 125,000 | | MN Hsg. Fin. Agy. Rental Hsg. (GO of AGY. Insured) 8 | | | 5.45 | | | | 8/1/11 | | | | 125,386 | |
| 1,660,000 | | MN Hsg. Fin. Agy. Rental Hsg. (GO of AGY. Insured) | | | 5.45 | | | | 8/1/41 | | | | 1,654,489 | |
| 1,320,000 | | MN Hsg. Fin. Agy. Residential Hsg. Rev. (GO of AGY. Insured) 8 | | | 5.00 | | | | 7/1/21 | | | | 1,327,102 | |
| 500,000 | | North Oaks Sr. Hsg. Rev. (Presbyterian Homes North Oaks Proj.) | | | 5.25 | | | | 10/1/13 | | | | 497,460 | |
| 1,565,000 | | North Oaks Sr. Hsg. Rev. (Presbyterian Homes North Oaks Proj.) | | | 5.63 | | | | 10/1/17 | | | | 1,545,359 | |
| 500,000 | | North Oaks Sr. Hsg. Rev. (Presbyterian Homes North Oaks Proj.) | | | 5.75 | | | | 10/1/22 | | | | 475,385 | |
| 110,000 | | Norwood Young America Economic Dev. Auth. Govt. Rev. (Harbor at Peace Village) | | | 5.35 | | | | 8/1/15 | | | | 110,582 | |
| 200,000 | | Norwood Young America Economic Dev. Auth. Govt. Rev. (Harbor at Peace Village) | | | 5.63 | | | | 8/1/20 | | | | 189,080 | |
| 550,000 | | Norwood Young America Economic Dev. Auth. Govt. Rev. (Harbor at Peace Village) | | | 5.75 | | | | 8/1/25 | | | | 497,118 | |
| 250,000 | | Norwood Young America Economic Dev. Auth. Govt. Rev. (Harbor at Peace Village) | | | 6.00 | | | | 8/1/31 | | | | 222,085 | |
| 1,000,000 | | Oak Park Heights Hsg. Rev. (Oakgreen Commons Proj.) | | | 6.00 | | | | 8/1/25 | | | | 895,330 | |
| 310,000 | | Oakdale Multifamily Sr. Hsg. Rev. Ref. (Oak Meadows Proj.) | | | 5.00 | | | | 4/1/12 | | | | 310,239 | |
| 370,000 | | Oronoco Multifamily Hsg. Rev. Ref. (Wedum Shorewood Campus Proj.) | | | 4.70 | | | | 6/1/11 | | | | 369,985 | |
| 500,000 | | Richfield Sr. Hsg. Rev. Ref. (Richfield Sr. Hsg., Inc. Proj.) | | | 5.00 | | | | 12/1/15 | | | | 473,255 | |
| 430,000 | | Rochester Health Care & Hsg. Rev. (Samaritan Bethany, Inc. Proj.) | | | 5.25 | | | | 12/1/17 | | | | 413,823 | |
| 455,000 | | Rochester Health Care & Hsg. Rev. (Samaritan Bethany, Inc. Proj.) | | | 5.50 | | | | 12/1/18 | | | | 436,290 | |
| 475,000 | | Rochester Health Care & Hsg. Rev. (Samaritan Bethany, Inc. Proj.) | | | 5.75 | | | | 12/1/19 | | | | 453,744 | |
| 250,000 | | Rochester Health Care & Hsg. Rev. (Samaritan Bethany, Inc. Proj.) (Gty. Agmt. Samaritan Bethany) | | | 7.38 | | | | 12/1/41 | | | | 245,938 | |
| 2,800,000 | | Rochester Multifamily Rev. Ref. (Weatherstone Townhomes Apartments Proj.) 8 | | | 6.38 | | | | 9/1/37 | | | | 3,046,260 | |
| 600,000 | | St. Cloud Hsg. & Redev. Auth. Multifamily Hsg. Rev. Ref. (Northway Manor Apts. Proj.) (HUD Sect. 8) | | | 5.35 | | | | 12/1/18 | | | | 526,380 | |
| 1,195,000 | | St. Cloud Hsg. & Redev. Auth. Multifamily Rev. (Germain Towers Proj.) (HUD Section 8) | | | 5.90 | | | | 9/1/20 | | | | 1,029,660 | |
| 240,000 | | St. Paul Hsg. & Redev. Auth. Health Care Rev. (Carondelet Village Proj.) | | | 5.13 | | | | 2/1/22 | | | | 225,394 | |
| 275,000 | | St. Paul Hsg. & Redev. Auth. Health Care Rev. (Carondelet Village Proj.) | | | 5.13 | | | | 8/1/22 | | | | 259,672 | |
| 175,000 | | St. Paul Hsg. & Redev. Auth. Health Care Rev. (Carondelet Village Proj.) | | | 5.38 | | | | 2/1/24 | | | | 163,819 | |
| 150,000 | | St. Paul Hsg. & Redev. Auth. Health Care Rev. (Carondelet Village Proj.) | | | 5.38 | | | | 8/1/24 | | | | 140,238 | |
| 150,000 | | St. Paul Hsg. & Redev. Auth. Health Care Rev. (Carondelet Village Proj.) | | | 5.50 | | | | 2/1/25 | | | | 139,932 | |
| 3,000,000 | | St. Paul Hsg. & Redev. Auth. Health Care Rev. (Carondelet Village Proj.) | | | 6.25 | | | | 8/1/30 | | | | 2,966,550 | |
| 140,000 | | St. Paul Hsg. & Redev. Auth. Multifamily Ref. Rev. (Sun Cliffe Apts. Proj.) (GNMA Collat. FHA Insd.) | | | 5.88 | | | | 7/1/15 | | | | 140,347 | |
| | |
See accompanying notes to financial statements. | | |
MARCH 31, 2011 | | 27 |
SCHEDULE OF INVESTMENTS
March 31, 2011
Sit Minnesota Tax-Free Income Fund (Continued)
| | | | | | | | | | | | | | |
| | | | | |
Principal
Amount ($) | | Name of Issuer | | Coupon
Rate (%) | | | Maturity
Date | | | Fair Value ($) | |
1,000,000 | | St. Paul Hsg. & Redev. Auth. Multifamily Ref. Rev. Ref. (Series Center Proj.) | | | 5.20 | | | | 11/1/22 | | | | 858,260 | |
400,000 | | St. Paul Hsg. & Redev. Auth. Rev. (Rossy & Richard Schaller Proj.) | | | 5.15 | | | | 10/1/42 | | | | 292,976 | |
525,000 | | Stillwater Multifamily Hsg. Rev. (Orleans Homes LP Proj.) 8 | | | 5.00 | | | | 2/1/17 | | | | 500,178 | |
120,000 | | Victoria Sr. Hsg. Rev. (Chanhassen, Inc. Proj.) | | | 5.50 | | | | 8/1/18 | | | | 111,817 | |
580,000 | | Washington Co. Hsg. & Redev. Auth. Govt. Hsg. Rev. Ref. (Briar Pond Apartments Proj.) (GNMA Collat.) | | | 5.50 | | | | 2/20/14 | | | | 580,255 | |
695,000 | | Washington Co. Hsg. & Redev. Auth. Govt. Hsg. Rev. Ref. (Woodland Park Apartments Proj.) (CNTY Gty.) | | | 4.70 | | | | 10/1/26 | | | | 687,459 | |
705,000 | | Willmar Hsg. & Redev. Auth. Multifamily Rev. (Copperleaf) | | | 8.00 | | | | 3/15/41 | | | | 677,949 | |
250,000 | | Woodbury Economic Dev. Auth. Sr. Hsg. Rev. (Summerhouse) | | | 5.75 | | | | 6/1/41 | | | | 206,110 | |
| | | | | | | | | | | | | | |
| | | | | | | | | | | | | 57,116,059 | |
| | | | | | | | | | | | | | |
Municipal Lease 9 - 2.9% | | | | | | | | | | | | |
500,000 | | Anoka Co. Hsg. & Redev. Rev. | | | 5.63 | | | | 5/1/22 | | | | 479,100 | |
500,000 | | Anoka Co. Hsg. & Redev. Rev. | | | 6.63 | | | | 5/1/30 | | | | 474,345 | |
500,000 | | Anoka Co. Hsg. & Redev. Rev. | | | 6.88 | | | | 5/1/40 | | | | 472,175 | |
1,631,272 | | Carver Scott Co. Lease Purchase Agreement | | | 5.00 | | | | 8/4/20 | | �� | | 1,425,846 | |
46,000 | | Hennepin Co. Hsg. & Redev. Auth. Rev. | | | 5.70 | | | | 8/1/13 | | | | 46,142 | |
289,327 | | Intermediate School District 287 Lease Rev. | | | 4.78 | | | | 3/15/13 | | | | 290,592 | |
2,000,000 | | MN Hsg. Fin. Agy. Non-Profit Hsg. Rev. (St. Appropriation) | | | 5.00 | | | | 8/1/31 | | | | 2,004,660 | |
1,250,000 | | Virginia Hsg. & Redev. Auth. Health Care Fac. Lease Rev. | | | 5.13 | | | | 10/1/20 | | | | 1,256,225 | |
400,000 | | Virginia Hsg. & Redev. Auth. Health Care Fac. Lease Rev. | | | 5.25 | | | | 10/1/25 | | | | 380,696 | |
245,000 | | Virginia Hsg. & Redev. Auth. Health Care Fac. Lease Rev. | | | 5.38 | | | | 10/1/30 | | | | 225,427 | |
1,378,393 | | Winona School District 861 Lease Purchase | | | 6.04 | | | | 8/1/24 | | | | 1,378,132 | |
| | | | | | | | | | | | | | |
| | | | | | | | | | | | | 8,433,340 | |
| | | | | | | | | | | | | | |
Other Revenue Bonds - 9.5% | | | | | | | | | | | | |
510,000 | | Columbia Heights Economic Dev. Auth. Tax Increment Rev. (Huset Park Area Redev.) | | | 5.20 | | | | 2/15/22 | | | | 411,295 | |
696,842 | | Crystal Governmental Fac. Rev. | | | 5.10 | | | | 12/15/26 | | | | 535,662 | |
400,000 | | Guam Govt. Section 30 Limited Obligation Rev. 11 | | | 5.38 | | | | 12/1/24 | | | | 384,984 | |
230,000 | | McLeod Co. Commercial Dev. Rev. (Southwest MN Foundation) | | | 5.13 | | | | 12/1/31 | | | | 211,685 | |
475,000 | | Minneapolis Community Dev. Agy. Limited Tax Common Bond Fund (Discount Steel) 8 | | | 5.25 | | | | 6/1/19 | | | | 475,290 | |
20,000 | | Minneapolis Community Dev. Agy. Limited Tax Common Bond Fund (LOC U.S. Bank) | | | 6.00 | | | | 6/1/11 | | | | 20,158 | |
400,000 | | Minneapolis Tax Increment Rev. (Grant Park Proj.) | | | 5.00 | | | | 2/1/16 | | | | 395,248 | |
245,000 | | Minneapolis Tax Increment Rev. Ref. (East River/Unocal Site Proj.) | | | 5.10 | | | | 2/1/17 | | | | 237,229 | |
240,000 | | Minneapolis Tax Increment Rev. Ref. (East River/Unocal Site Proj.) | | | 5.20 | | | | 2/1/21 | | | | 214,001 | |
315,000 | | Minneapolis Tax Increment Rev. Ref. (St. Anthony Falls Proj.) | | | 4.50 | | | | 2/1/13 | | | | 312,146 | |
125,000 | | Minneapolis Tax Increment Rev. Ref. (St. Anthony Falls Proj.) | | | 4.80 | | | | 2/1/13 | | | | 124,620 | |
1,000,000 | | MN Development Rev. Limited Tax Supported Comm. Board | | | 6.00 | | | | 12/1/40 | | | | 967,650 | |
2,000,000 | | MN Development Rev. Limited Tax Supported Comm. Board | | | 6.25 | | | | 12/1/30 | | | | 2,077,680 | |
1,190,000 | | Mound Hsg. & Redev. Auth. Tax Increment Rev. Ref. (Metroplain Proj.) | | | 5.00 | | | | 2/15/27 | | | | 1,045,879 | |
280,000 | | Puerto Rico Infrastucture Financing Auth. Special Tax Rev. Ref. (AMBAC Insured) 6, 11 | | | 8.40 | | | | 7/1/28 | | | | 85,478 | |
500,000 | | St. Anthony Hsg. & Redev. Auth. Tax Increment Rev. (Silver Lake Village Hsg.) | | | 4.75 | | | | 2/1/17 | | | | 473,345 | |
500,000 | | St. Anthony Hsg. & Redev. Auth. Tax Increment Rev. (Silver Lake Village Hsg.) | | | 4.90 | | | | 2/1/22 | | | | 416,915 | |
1,000,000 | | St. Louis Park Economic Dev. Auth. Tax Increment Rev. (Hoigaard Vlg.) | | | 5.00 | | | | 2/1/23 | | | | 922,190 | |
500,000 | | St. Paul Hsg. & Redev. Auth. Rev. (Jimmy Lee Recreation Center Proj.) | | | 4.75 | | | | 12/1/26 | | | | 501,100 | |
500,000 | | St. Paul Hsg. & Redev. Auth. Rev. (Jimmy Lee Recreation Center Proj.) | | | 5.00 | | | | 12/1/32 | | | | 482,645 | |
1,195,000 | | St. Paul Hsg. & Redev. Auth. Tax Increment Rev. (9th St. Lofts Proj.) | | | 6.38 | | | | 2/15/28 | | | | 972,192 | |
1,093,000 | | St. Paul Hsg. & Redev. Auth. Tax Increment Rev. (Drake Marble Proj.) | | | 6.75 | | | | 3/1/28 | | | | 984,203 | |
480,000 | | St. Paul Hsg. & Redev. Auth. Tax Increment Rev. (Emerald Gardens Proj.) | | | 5.00 | | | | 3/1/15 | | | | 478,598 | |
785,000 | | St. Paul Hsg. & Redev. Auth. Tax Increment Rev. (Emerald Gardens Proj.) | �� | | 6.50 | | | | 3/1/29 | | | | 717,608 | |
1,075,000 | | St. Paul Hsg. & Redev. Auth. Tax Increment Rev. (North Quadrant Owner Occupied Proj.) | | | 7.00 | | | | 2/15/28 | | | | 934,304 | |
947,000 | | St. Paul Hsg. & Redev. Auth. Tax Increment Rev. (North Quadrant Owner Occupied Proj.) | | | 7.50 | | | | 2/15/28 | | | | 862,802 | |
2,967,000 | | St. Paul Hsg. & Redev. Auth. Tax Increment Rev. (Upper Landing Proj.) | | | 6.80 | | | | 3/1/29 | | | | 2,701,483 | |
| | |
See accompanying notes to financial statements. | | |
28 | | SIT MUTUAL FUNDS ANNUAL REPORT |
| | | | | | | | | | | | | | |
| | | | | |
Principal
Amount ($) | | Name of Issuer | | Coupon
Rate (%) | | | Maturity
Date | | | Fair Value ($) | |
1,832,000 | | St. Paul Hsg. & Redev. Auth. Tax Increment Rev. (Upper Landing Proj.) | | | 6.90 | | | | 3/1/29 | | | | 1,685,678 | |
100,000 | | St. Paul Hsg. & Redev. Auth. Tax Increment Rev. (US Bank Operations Center Proj.) | | | 5.70 | | | | 8/1/12 | | | | 100,098 | |
750,000 | | St. Paul Hsg. & Redev. Auth. Tax Increment Rev. (US Bank Operations Center Proj.) | | | 6.13 | | | | 8/1/19 | | | | 723,645 | |
390,000 | | St. Paul Port Auth. Lease Rev. (Regions Hospital Parking Ramp Proj.) | | | 5.00 | | | | 8/1/11 | | | | 392,145 | |
805,000 | | St. Paul Port Auth. Lease Rev. (Regions Hospital Parking Ramp Proj.) | | | 5.00 | | | | 8/1/21 | | | | 779,691 | |
2,525,000 | | St. Paul Port Auth. Lease Rev. (Regions Hospital Parking Ramp Proj.) | | | 5.00 | | | | 8/1/36 | | | | 2,062,723 | |
2,000,000 | | St. Paul Port Auth. Rev. (Amherst H. Wilder Fndtn.-3) | | | 5.00 | | | | 12/1/36 | | | | 1,744,320 | |
715,000 | | St. Paul Recreational Facs. Gross Rev. (Highland National Proj.) | | | 5.00 | | | | 10/1/25 | | | | 733,604 | |
300,000 | | Steele Co. Health Care Fac. Gross Rev. Ref. Crossover | | | 5.00 | | | | 6/1/30 | | | | 274,698 | |
1,000,000 | | Virgin Islands Public Finance Auth. Rev. (Diago Proj.) 11 | | | 6.63 | | | | 10/1/29 | | | | 1,033,550 | |
125,000 | | Virgin Islands Public Finance Auth. Sr. Lien Rev. 11 | | | 5.25 | | | | 10/1/21 | | | | 126,592 | |
| | | | | | | | | | | | | | |
| | | | | | | | | | | | | 27,603,134 | |
| | | | | | | | | | | | | | |
Public Facilities - 0.5% | | | | | | | | | | | | |
50,000 | | MN Agricultural Society State Fair Rev. | | | 5.00 | | | | 9/15/20 | | | | 50,574 | |
255,000 | | Spring Grove Economic Dev. Auth. Public Proj. Rev. | | | 5.00 | | | | 2/1/16 | | | | 255,181 | |
125,000 | | Spring Grove Economic Dev. Auth. Public Proj. Rev. | | | 5.10 | | | | 2/1/18 | | | | 125,029 | |
1,075,000 | | St. Paul Hsg. & Redev. Auth. Parking Rev. (Smith Ave. Proj.) | | | 5.00 | | | | 8/1/35 | | | | 980,475 | |
| | | | | | | | | | | | | | |
| | | | | | | | | | | | | 1,411,259 | |
| | | | | | | | | | | | | | |
Sales Tax Revenue - 1.1% | | | | | | | | | | | | |
500,000 | | Puerto Rico Sales Tax Financing Corp. Rev. 11 | | | 6.00 | | | | 8/1/39 | | | | 492,715 | |
1,250,000 | | Puerto Rico Sales Tax Financing Corp. Rev. 6, 11 | | | 6.13 | | | | 8/1/29 | | | | 850,250 | |
1,500,000 | | Puerto Rico Sales Tax Financing Corp. Rev. 6, 11 | | | 6.25 | | | | 8/1/33 | | | | 1,020,060 | |
1,000,000 | | Puerto Rico Sales Tax Financing Corp. Rev. 6, 11 | | | 6.75 | | | | 8/1/32 | | | | 800,690 | |
| | | | | | | | | | | | | | |
| | | | | | | | | | | | | 3,163,715 | |
| | | | | | | | | | | | | | |
Single Family Mortgage - 12.6% | | | | | | | | | | | | |
1,000,000 | | Dakota Co. Community Dev. Agy. Single Family Mtg. Rev. (GNMA Collateralized) | | | 4.63 | | | | 12/1/30 | | | | 928,480 | |
1,306,553 | | Dakota Co. Community Dev. Agy. Single Family Mtg. Rev. (GNMA-FNMA-FHLMC) 8 | | | 5.13 | | | | 12/1/40 | | | | 1,350,087 | |
278,242 | | Dakota Co. Community Dev. Agy. Single Family Mtg. Rev. (GNMA-FNMA-FHLMC) 8 | | | 5.15 | | | | 12/1/38 | | | | 283,846 | |
1,754,242 | | Dakota Co. Community Dev. Agy. Single Family Mtg. Rev. (GNMA-FNMA-FHLMC) 8 | | | 5.30 | | | | 12/1/39 | | | | 1,825,640 | |
250,578 | | Minneapolis St. Paul Hsg. Fin. Board Single Family Mtg. Rev. (GNMA-FNMA) 8 | | | 5.00 | | | | 12/1/38 | | | | 230,116 | |
268,071 | | Minneapolis St. Paul Hsg. Fin. Board Single Family Mtg. Rev. (GNMA-FNMA) | | | 5.70 | | | | 4/1/27 | | | | 280,306 | |
664,183 | | Minneapolis St. Paul Hsg. Fin. Board Single Family Mtg. Rev. (GNMA-FNMA-FHLMC) | | | 5.10 | | | | 4/1/27 | | | | 694,204 | |
2,767,786 | | Minneapolis St. Paul Hsg. Fin. Board Single Family Mtg. Rev. (GNMA-FNMA-FHLMC) 8 | | | 5.25 | | | | 12/1/40 | | | | 2,874,623 | |
1,249,282 | | Minneapolis St. Paul Hsg. Fin. Board Single Family Mtg. Rev. (GNMA-FNMA-FHLMC) | | | 5.45 | | | | 4/1/27 | | | | 1,304,088 | |
620,000 | | Minneapolis St. Paul Hsg. Fin. Board Single Family Mtg. Rev. (GNMA-FNMA-FHLMC) 8 | | | 5.52 | | | | 3/1/41 | | | | 638,123 | |
6,060,000 | | MN Hsg. Fin. Agy. Residential Hsg. Rev. | | | 5.10 | | | | 1/1/40 | | | | 5,872,928 | |
750,000 | | MN Hsg. Fin. Agy. Rev. (GNMA-FNMA Collateralized) | | | 5.00 | | | | 1/1/31 | | | | 751,732 | |
1,605,000 | | MN Hsg. Fin. Agy. Single Family Mtg. Rev. | | | 5.00 | | | | 7/1/38 | | | | 1,609,654 | |
1,945,000 | | MN Hsg. Fin. Agy. Single Family Mtg. Rev. | | | 5.05 | | | | 7/1/34 | | | | 1,900,615 | |
435,000 | | MN Hsg. Fin. Agy. Single Family Mtg. Rev. 8 | | | 5.10 | | | | 7/1/20 | | | | 437,371 | |
320,000 | | MN Hsg. Fin. Agy. Single Family Mtg. Rev. | | | 5.20 | | | | 1/1/23 | | | | 330,704 | |
45,000 | | MN Hsg. Fin. Agy. Single Family Mtg. Rev. | | | 5.30 | | | | 7/1/11 | | | | 45,263 | |
85,000 | | MN Hsg. Fin. Agy. Single Family Mtg. Rev. | | | 5.45 | | | | 1/1/17 | | | | 85,835 | |
35,000 | | MN Hsg. Fin. Agy. Single Family Mtg. Rev. | | | 5.70 | | | | 1/1/17 | | | | 35,356 | |
305,000 | | MN Hsg. Fin. Agy. Single Family Mtg. Rev. 8 | | | 5.85 | | | | 7/1/19 | | | | 306,153 | |
1,285,000 | | MN Hsg. Fin. Agy. Single Family Mtg. Rev. | | | 5.90 | | | | 7/1/28 | | | | 1,308,348 | |
1,730,000 | | MN Hsg. Fin. Agy. Single Family Mtg. Rev. 8 | | | 6.00 | | | | 7/1/22 | | | | 1,754,220 | |
1,000,000 | | MN Hsg. Fin. Agy. Single Family Mtg. Rev. (GO of AGY. Insured) 8 | | | 4.75 | | | | 7/1/27 | | | | 939,460 | |
1,950,000 | | MN Hsg. Fin. Agy. Single Family Mtg. Rev. (GO of AGY. Insured) 8 | | | 4.80 | | | | 7/1/26 | | | | 1,881,360 | |
690,000 | | MN Hsg. Fin. Agy. Single Family Mtg. Rev. (GO of AGY. Insured) | | | 5.00 | | | | 1/1/20 | | | | 691,504 | |
| | |
See accompanying notes to financial statements. | | |
MARCH 31, 2011 | | 29 |
SCHEDULE OF INVESTMENTS
March 31, 2011
Sit Minnesota Tax-Free Income Fund (Continued)
| | | | | | | | | | | | | | |
| | | | | |
Principal
Amount ($) | | Name of Issuer | | Coupon
Rate (%) | | | Maturity
Date | | | Fair Value ($) | |
965,000 | | MN Hsg. Fin. Agy. Single Family Mtg. Rev. (GO of AGY. Insured) 8 | �� | | 5.00 | | | | 1/1/37 | | | | 1,000,473 | |
1,870,000 | | MN Hsg. Fin. Agy. Single Family Mtg. Rev. (GO of AGY. Insured) 8 | | | 5.15 | | | | 7/1/28 | | | | 1,816,780 | |
1,865,000 | | MN Hsg. Fin. Agy. Single Family Mtg. Rev. (GO of AGY. Insured) 8 | | | 5.25 | | | | 7/1/33 | | | | 1,777,811 | |
1,285,000 | | MN Hsg. Fin. Agy. Single Family Mtg. Rev. (GO of AGY. Insured) 8 | | | 5.50 | | | | 7/1/28 | | | | 1,289,909 | |
175,000 | | MN Hsg. Fin. Agy. Single Family Mtg. Rev. (GO of AGY. Insured) | | | 5.60 | | | | 7/1/13 | | | | 175,530 | |
1,360,000 | | MN Hsg. Fin. Agy. Single Family Mtg. Rev. (GO of AGY. Insured) 8 | | | 5.65 | | | | 7/1/33 | | | | 1,363,726 | |
175,000 | | MN Hsg. Fin. Agy. Single Family Mtg. Rev. (GO of AGY. Insured) | | | 5.90 | | | | 7/1/25 | | | | 175,108 | |
15,000 | | MN Hsg. Fin. Agy. Single Family Mtg. Rev. (GO of AGY. Insured) 8 | | | 5.90 | | | | 7/1/29 | | | | 15,064 | |
25,000 | | MN Hsg. Fin. Agy. Single Family Mtg. Rev. (GO of AGY. Insured) | | | 6.00 | | | | 1/1/16 | | | | 25,058 | |
325,000 | | MN Hsg. Fin. Agy. Single Family Mtg. Rev. (NATL-RE Insured) | | | 5.35 | | | | 7/1/17 | | | | 337,061 | |
| | | | | | | | | | | | | | |
| | | | | | | | | | | | | 36,336,536 | |
| | | | | | | | | | | | | | |
Transportation - 2.2% | | | | | | | | | | | | |
2,500,000 | | Minneapolis & St. Paul Metro Airport Commission Rev. Ref. 8 | | | 5.00 | | | | 1/1/22 | | | | 2,561,125 | |
3,500,000 | | Minneapolis & St. Paul Metro Airport Commission Sub. Rev. (AMBAC Insured) 8 | | | 5.00 | | | | 1/1/25 | | | | 3,262,000 | |
1,000,000 | | Puerto Rico Highways & Transportation Auth. Rev. Ref. (AMBAC Insured) 1, 11 | | | 0.73 | | | | 7/1/45 | | | | 540,610 | |
| | | | | | | | | | | | | | |
| | | | | | | | | | | | | 6,363,735 | |
| | | | | | | | | | | | | | |
Utility - 6.8% | | | | | | | | | | | | |
1,000,000 | | Chaska Electric Rev. Ref. (Generating Facs. Proj.) | | | 5.25 | | | | 10/1/25 | | | | 1,018,420 | |
1,465,000 | | MN Municipal Power Agy. Electric Rev. | | | 5.00 | | | | 10/1/35 | | | | 1,393,537 | |
2,000,000 | | MN Municipal Power Agy. Electric Rev. | | | 5.00 | | | | 10/1/25 | | | | 2,013,540 | |
1,000,000 | | MN Municipal Power Agy. Electric Rev. | | | 5.00 | | | | 10/1/30 | | | | 962,630 | |
1,000,000 | | MN Municipal Power Agy. Electric Rev. | | | 5.25 | | | | 10/1/35 | | | | 937,220 | |
700,000 | | MN Municipal Power Agy. Electric Rev. | | | 5.25 | | | | 10/1/27 | | | | 716,233 | |
2,000,000 | | MN Municipal Power Agy. Electric Rev. | | | 5.25 | | | | 10/1/24 | | | | 2,053,280 | |
500,000 | | North Branch Electric System Rev. | | | 5.75 | | | | 8/1/28 | | | | 510,295 | |
885,000 | | Puerto Rico Electric Power Auth. Rev. 11 | | | 5.00 | | | | 7/1/21 | | | | 887,053 | |
2,000,000 | | Puerto Rico Electric Power Auth. Rev. (NATL-RE FGIC Insured) 11 | | | 5.00 | | | | 7/1/22 | | | | 1,984,560 | |
1,250,000 | | Puerto Rico Electric Power Auth. Rev. Ref. 1, 11 | | | 0.88 | | | | 7/1/25 | | | | 897,388 | |
2,000,000 | | Southern MN Power Agy. Power Supply System Rev. | | | 5.25 | | | | 1/1/30 | | | | 2,045,820 | |
3,450,000 | | Southern MN Power Agy. Power Supply System Rev. (NATL-RE Insured) 1 | | | 1.72 | | | | 1/1/13 | | | | 3,422,228 | |
780,000 | | Virgin Islands Water & Power Auth. Water System Rev. Ref. 11 | | | 5.50 | | | | 7/1/17 | | | | 780,881 | |
| | | | | | | | | | | | | | |
| | | | | | | | | | | | | 19,623,085 | |
| | | | | | | | | | | | | | |
Total Municipal Bonds
(cost: $290,518,623) | | | | | | | | | | | 279,076,201 | |
| | | | | | | | | | | | | | |
| | |
See accompanying notes to financial statements. | | |
30 | | SIT MUTUAL FUNDS ANNUAL REPORT |
| | | | | | |
| | | |
| Quantity | | Name of Issuer | | Fair Value ($) | |
Closed-End Mutual Funds - 0.7% | | | | |
37,696 | | First American Minnesota Municipal Income Fund II (MXN) | | | 536,414 | |
112,998 | | MN Municipal Income Portfolio (MXA) | | | 1,644,121 | |
| | | | | | |
Total Closed-End Mutual Funds
(cost: $2,006,620) | | | 2,180,535 | |
| | | | | | |
| |
Short-Term Securities - 1.9% | | | | |
5,367,910 | | Wells Fargo Advantage Minnesota Money Market Fund, 0.01% | | | | |
Total Short-Term Securities
(cost: $5,367,910) | | | 5,367,910 | |
| | | | | | |
Total Investments in Securities - 99.1%
(cost: $297,893,153) | | | 286,624,646 | |
Other Assets and Liabilities, net - 0.9% | | | 2,480,575 | |
| | | | | | |
| |
Total Net Assets - 100.0% | | $ | 289,105,221 | |
| | | | | | |
| 1 | Variable rate security. Rate disclosed is as of March 31, 2011. |
| 2 | Securities considered illiquid by the Investment Adviser. The total value of such securities as of March 31, 2011 was $376,455 and represented 0.1% of net assets. |
| 5 | The issuer is in default of certain debt covenants. Income is not being accrued. The total value of such securities as of March 31, 2011 was $376,455 and represented 0.1% of net assets. |
| 6 | Zero coupon security. Rate disclosed is the effective yield on purchase date. |
| 8 | Securities the income from which is treated as a tax preference that is included in alternative minimum taxable income for purposes of computing federal alternative minimum tax (AMT). At March 31, 2011, 13.7% of net assets in the Fund was invested in such securities. |
| 9 | Municipal Lease Security. The total value of such securities as of March 31, 2011 was $8,433,340 and represented 2.9% of net assets. These securities have been determined to be liquid by the Adviser in accordance with guidelines established by the Board of Directors. |
| 11 | The Fund may invest in obligations issued by U.S. territories, for example Guam, Puerto Rico, and Virgin Islands. The total value of such securities as of March 31, 2011 was $23,646,461 and represented 8.2% of net assets. |
Numeric footnotes not disclosed are not applicable to this Schedule of Investments.
A summary of the inputs used to value the Fund’s net assets as of March 31, 2011 is as follows (see Note 2 - significant accounting policies in the notes to financial statements):
| | | | | | | | | | | | | | |
| | | | | | Investment in Securities | | | |
| | | Level 1 Quoted
Price ($) | | | Level 2 Other significant observable inputs ($) | | | Level 3 Significant unobservable inputs ($) | | Total ($) | |
Short-Term Securities | | | 5,367,910 | | | | — | | | — | | | 5,367,910 | |
Closed-End Mutual Funds | | | 2,180,535 | | | | — | | | — | | | 2,180,535 | |
Municipal Bonds | | | — | | | | 279,076,201 | | | — | | | 279,076,201 | |
Total: | | | 7,548,445 | | | | 279,076,201 | | | — | | | 286,624,646 | |
| | |
See accompanying notes to financial statements. | | |
MARCH 31, 2011 | | 31 |
STATEMENTS OF ASSETS AND LIABILITIES
March 31, 2011
| | | | | | | | | | | | |
| | | Sit U.S.
Government
Securities
Fund | | | Sit Tax-Free
Income
Fund | | | Sit Minnesota
Tax-Free
Income
Fund | |
ASSETS | | | | | | | | | | | | |
Investments in securities, at identified cost | | | $1,035,412,123 | | | | $171,679,094 | | | | $297,893,153 | |
| | | | | | | | | | | | |
| | | |
Investments in securities, at fair value - see accompanyingschedule for detail | | | $1,062,961,267 | | | | $140,869,572 | | | | $286,624,646 | |
Cash in bank on demand deposit | | | — | | | | — | | | | 769,652 | |
Restricted cash | | | 2,700,000 | | | | — | | | | — | |
Accrued interest and dividends receivable | | | 5,054,570 | | | | 1,998,754 | | | | 4,097,387 | |
Receivable for principal paydowns | | | 22,249 | | | | — | | | | — | |
Other receivables | | | — | | | | 16,750 | | | | 25,500 | |
Receivable for Fund shares sold | | | 4,947,399 | | | | 750 | | | | 563,378 | |
| | | | | | | | | | | | |
| | | |
Total assets | | | 1,075,685,485 | | | | 142,885,826 | | | | 292,080,563 | |
| | | | | | | | | | | | |
| | | |
LIABILITIES | | | | | | | | | | | | |
Disbursements in excess of cash balances | | | 7,638,957 | | | | 304,626 | | | | — | |
Payable for investment securities purchased | | | 7,535,336 | | | | 1,837,288 | | | | 1,823,232 | |
Payable for Fund shares redeemed | | | 2,463,077 | | | | 149,688 | | | | 718,849 | |
Cash portion of dividends payable to shareholders | | | 91,359 | | | | 127,221 | | | | 237,870 | |
Accrued investment management fees | | | 697,464 | | | | 95,956 | | | | 195,391 | |
Outstanding options written, at fair value (premiums received $300,953) | | | 105,470 | | | | — | | | | — | |
| | | | | | | | | | | | |
Total liabilities | | | 18,531,663 | | | | 2,514,779 | | | | 2,975,342 | |
| | | | | | | | | | | | |
| | | |
Net assets applicable to outstanding capital stock | | | $1,057,153,822 | | | | $140,371,047 | | | | $289,105,221 | |
| | | | | | | | | | | | |
| | | |
Net assets consist of: | | | | | | | | | | | | |
Capital (par value and paid-in surplus) | | | $1,030,294,299 | | | | $197,285,941 | | | | $308,600,803 | |
Undistributed (distributions in excess of) net investment income | | | — | | | | (11,447 | ) | | | (64,122) | |
Accumulated net realized gain (loss) from security transactions and written options | | | (885,104 | ) | | | (26,093,925 | ) | | | (8,162,953 | ) |
Unrealized appreciation (depreciation) on investments and written options | | | 27,744,627 | | | | (30,809,522 | ) | | | (11,268,507 | ) |
| | | | | | | | | | | | |
| | | $1,057,153,822 | | | | $140,371,047 | | | | $289,105,221 | |
| | | | | | | | | | | | |
| | | |
Outstanding shares | | | 93,663,519 | | | | 16,468,981 | | | | 29,883,381 | |
| | | | | | | | | | | | |
| | | |
Net asset value per share of outstanding capital stock | | | $11.29 | | | | $8.52 | | | | $9.67 | |
| | | | | | | | | | | | |
| | |
See accompanying notes to financial statements. | | |
32 | | SIT MUTUAL FUNDS ANNUAL REPORT |
STATEMENTS OF OPERATIONS
Year Ended March 31, 2011
| | | | | | | | | | | | |
| | | Sit U.S.
Government
Securities
Fund | | | Sit Tax-Free
Income
Fund | | | Sit Minnesota
Tax-Free
Income
Fund | |
Investment income: | | | | | | | | | | | | |
Income: | | | | | | | | | | | | |
Dividends | | | — | | | | $692,059 | | | | $144,227 | |
Interest | | | $33,985,637 | | | | 7,616,357 | | | | 15,057,268 | |
| | | | | | | | | | | | |
Total income | | | 33,985,637 | | | | 8,308,416 | | | | 15,201,495 | |
| | | | | | | | | | | | |
| | | |
Expenses (note 4): | | | | | | | | | | | | |
Investment management fee | | | 7,562,331 | | | | 1,224,871 | | | | 2,359,218 | |
| | | | | | | | | | | | |
Total expenses | | | 7,562,331 | | | | 1,224,871 | | | | 2,359,218 | |
| | | | | | | | | | | | |
Less fees and expenses waived by investment adviser. | | | (560,246 | ) | | | — | | | | — | |
| | | | | | | | | | | | |
Total net expenses | | | 7,002,085 | | | | 1,224,871 | | | | 2,359,218 | |
| | | | | | | | | | | | |
| | | |
Net investment income | | | 26,983,552 | | | | 7,083,545 | | | | 12,842,277 | |
| | | | | | | | | | | | |
| | | |
Realized and unrealized gain (loss): | | | | | | | | | | | | |
Net realized gain (loss) on investments | | | 2,101,930 | | | | (2,343,339 | ) | | | 687,582 | |
Net realized gain (loss) on written options | | | (1,116,707 | ) | | | — | | | | — | |
| | | |
Net change in unrealized appreciation (depreciation) on investments | | | 12,398,281 | | | | (4,402,244 | ) | | | (7,031,522 | ) |
Net change in unrealized appreciation (depreciation) on written options | | | 195,483 | | | | — | | | | — | |
| | | | | | | | | | | | |
| | | |
Net gain (loss) | | | 13,578,987 | | | | (6,745,583 | ) | | | (6,343,940 | ) |
| | | | | | | | | | | | |
| | | |
Net increase (decrease) in net assets resulting from operations | | | $40,562,539 | | | | $337,962 | | | | $6,498,337 | |
| | | | | | | | | | | | |
| | |
See accompanying notes to financial statements. | | |
MARCH 31, 2011 | | 33 |
STATEMENTS OF CHANGES IN NET ASSETS
| | | | | | | | |
| | | Sit U.S. Government
Securities Fund | |
| | | Year
Ended
March 31,
2011 | | | Year
Ended
March 31,
2010 | |
Operations: | | | | | | | | |
Net investment income | | | $26,983,552 | | | | $20,847,075 | |
Net realized gain (loss) on investments and written options | | | 985,223 | | | | 1,211,894 | |
Net change in unrealized appreciation (depreciation) of investments and written options | | | 12,593,764 | | | | 11,215,967 | |
| | | | | | | | |
| | |
Net increase (decrease) in net assets resulting from operations | | | 40,562,539 | | | | 33,274,936 | |
| | | | | | | | |
| | |
Distributions from: | | | | | | | | |
Net investment income | | | (26,943,488 | ) | | | (20,847,075 | ) |
Net realized gains on investments | | | (327,896 | ) | | | — | |
| | | | | | | | |
| | |
Total distributions | | | (27,271,384 | ) | | | (20,847,075 | ) |
| | | | | | | | |
| | |
Capital share transactions: | | | | | | | | |
Proceeds from shares sold | | | 777,577,419 | | | | 639,424,752 | |
Reinvested distributions | | | 27,608,283 | | | | 20,634,489 | |
Payments for shares redeemed | | | (530,043,200 | ) | | | (294,396,778 | ) |
| | | | | | | | |
| | |
Increase (decrease) in net assets from capital transactions | | | 275,142,502 | | | | 365,662,463 | |
| | | | | | | | |
| | |
Total increase (decrease) in net assets | | | 288,433,657 | | | | 378,090,324 | |
| | |
Net assets: | | | | | | | | |
Beginning of period | | | 768,720,165 | | | | 390,629,841 | |
| | | | | | | | |
End of period * | | | $1,057,153,822 | | | | $768,720,165 | |
| | | | | | | | |
| | |
Capital transactions in shares: | | | | | | | | |
Sold | | | 69,266,689 | | | | 57,843,581 | |
Reinvested distributions | | | 2,451,775 | | | | 1,873,419 | |
Redeemed | | | (47,134,441 | ) | | | (26,674,510 | ) |
| | | | | | | | |
| | |
Net increase (decrease) | | | 24,584,023 | | | | 33,042,490 | |
| | | | | | | | |
* Includes undistributed (distributions in excess of) net investment income | | | $— | | | | ($40,064 | ) |
| | |
See accompanying notes to financial statements. | | |
34 | | SIT MUTUAL FUNDS ANNUAL REPORT |
| | | | | | | | | | | | | | |
Sit Tax-Free
Income Fund | | | Sit Minnesota Tax-Free
Income Fund | |
Year
Ended
March 31,
2011 | | | Year
Ended
March 31,
2010 | | | Year
Ended
March 31,
2011 | | | Year
Ended
March 31,
2010 | |
| | | | | | | | | | | | | | |
| | $7,083,545 | | | | $7,118,383 | | | | $12,842,277 | | | | $12,201,424 | |
| | (2,343,339 | ) | | | (3,457,582 | ) | | | 687,582 | | | | (162,527 | ) |
| | | |
| | (4,402,244 | ) | | | 20,199,958 | | | | (7,031,522 | ) | | | 25,366,293 | |
| | | | | | | | | | | | | | | |
| | | |
| | 337,962 | | | | 23,860,759 | | | | 6,498,337 | | | | 37,405,190 | |
| | | | | | | | | | | | | | | |
| | | |
| | | | | | | | | | | | | | |
| | (7,083,545 | ) | | | (7,118,383 | ) | | | (12,842,277 | ) | | | (12,192,570 | ) |
| | — | | | | — | | | | — | | | | — | |
| | | | | | | | | | | | | | | |
| | | |
| | (7,083,545 | ) | | | (7,118,383 | ) | | | (12,842,277 | ) | | | (12,192,570 | ) |
| | | | | | | | | | | | | | | |
| | | |
| | | | | | | | | | | | | | | |
| | 21,999,747 | | | | 26,169,711 | | | | 76,051,309 | | | | 61,824,061 | |
| | 5,952,935 | | | | 5,683,304 | | | | 10,917,966 | | | | 9,569,010 | |
| | (34,330,959 | ) | | | (33,880,998 | ) | | | (82,326,152 | ) | | | (49,923,087 | ) |
| | | | | | | | | | | | | | | |
| | | |
| | (6,378,277 | ) | | | (2,027,983 | ) | | | 4,643,123 | | | | 21,469,984 | |
| | | | | | | | | | | | | | | |
| | | |
| | (13,123,860 | ) | | | 14,714,393 | | | | (1,700,817 | ) | | | 46,682,604 | |
| | | |
| | | | | | | | | | | | | | | |
| | 153,494,907 | | | | 138,780,514 | | | | 290,806,038 | | | | 244,123,434 | |
| | | | | | | | | | | | | | | |
| | $140,371,047 | | | | $153,494,907 | | | | $289,105,221 | | | | $290,806,038 | |
| | | | | | | | | | | | | | | |
| | | |
| | | | | | | | | | | | | | | |
| | 2,463,769 | | | | 3,016,955 | | | | 7,686,681 | | | | 6,414,784 | |
| | 672,009 | | | | 667,682 | | | | 1,100,769 | | | | 1,004,735 | |
| | (3,915,103 | ) | | | (3,939,909 | ) | | | (8,338,982 | ) | | | (5,194,472 | ) |
| | | | | | | | | | | | | | | |
| | | |
| | (779,325 | ) | | | (255,272 | ) | | | 448,468 | | | | 2,225,047 | |
| | | | | | | | | | | | | | | |
| | ($11,447 | ) | | | $— | | | | ($64,122 | ) | | | $— | |
FINANCIAL HIGHLIGHTS
Per share income and capital changes for a share outstanding throughout the period.
Sit U.S. Government Securities Fund
| | | | | | | | | | | | | | | | | | | | |
| | | Years Ended March 31, | |
| | | 2011 | | | 2010 | | | 2009 | | | 2008 | | | 2007 | |
Net Asset Value: | | | | | | | | | | | | | | | | | | | | |
Beginning of period | | | $11.13 | | | | $10.84 | | | | $10.92 | | | | $10.56 | | | | $10.45 | |
| | | | |
Operations: | | | | | | | | | | | | | | | | | | | | |
Net investment income 1 | | | 0.32 | | | | 0.44 | | | | 0.52 | | | | 0.50 | | | | 0.48 | |
Net realized and unrealized gains (losses) on investments and written options | | | 0.16 | | | | 0.29 | | | | (0.08 | ) | | | 0.36 | | | | 0.11 | |
| | | | |
Total from operations | | | 0.48 | | | | 0.73 | | | | 0.44 | | | | 0.86 | | | | 0.59 | |
| | | | |
Distributions from: | | | | | | | | | | | | | | | | | | | | |
Net investment income | | | (0.32 | ) | | | (0.44 | ) | | | (0.52 | ) | | | (0.50 | ) | | | (0.48 | ) |
Net realized gains | | | ( — | )2 | | | — | | | | — | | | | — | | | | — | |
| | | | |
Total Distributions | | | (0.32 | ) | | | (0.44 | ) | | | (0.52 | ) | | | (0.50 | ) | | | (0.48 | ) |
| | | | |
Net Asset Value: | | | | | | | | | | | | | | | | | | | | |
End of period | | | $11.29 | | | | $11.13 | | | | $10.84 | | | | $10.92 | | | | $10.56 | |
| | | | |
Total investment return 3 | | | 4.37% | | | | 6.88% | | | | 4.18% | | | | 8.37% | | | | 5.81% | |
| | | | |
Net assets at end of period (000’s omitted) | | | $1,057,154 | | | | $768,720 | | | | $390,630 | | | | $254,677 | | | | $198,378 | |
| | | | | |
Ratios: 4 | | | | | | | | | | | | | | | | | | | | |
Expenses (without waiver) 5 | | | 0.81% | | | | 0.82% | | | | 0.83% | | | | 0.85% | | | | 0.85% | |
Expenses (with waiver) 5 | | | 0.75% | | | | 0.80% | | | | 0.80% | | | | 0.80% | | | | 0.80% | |
Net investment income (with waiver) | | | 2.88% | | | | 3.85% | | | | 4.87% | | | | 4.66% | | | | 4.61% | |
| | | | | |
Portfolio turnover rate (excluding short-term securities) | | | 45.80% | | | | 66.89% | | | | 59.63% | | | | 67.42% | | | | 43.98% | |
| 1 | The net investment income per share is based on average shares outstanding for the period. |
| 2 | Amount represents less than $0.01 per share. |
| 3 | Total investment return is based on the change in net asset value of a share during the period and assumes reinvestment of distributions at net asset value. |
| 4 | The ratio information is calculated based on average daily net assets. Effective November 1, 2010, total Fund expenses are calculated at 0.80% of average daily net assets. Prior to this date, expenses were calculated at a higher rate. However, during all of the periods above, the investment adviser voluntarily waived expenses that were otherwise payable by the Fund. |
| 5 | In addition to fees and expenses which the Fund bears directly, the Fund indirectly bears a pro rata share of the fees and expenses of the acquired funds in which it invests. Such indirect expenses are not included in the above reported expense ratios. |
| | |
| | | |
36 | | SIT MUTUAL FUNDS ANNUAL REPORT |
FINANCIAL HIGHLIGHTS
Per share income and capital changes for a share outstanding throughout the period.
Sit Tax-Free Income Fund
| | | | | | | | | | | | | | | | | | | | |
| | | Years Ended March 31, | |
| | | 2011 | | | 2010 | | | 2009 | | | 2008 | | | 2007 | |
Net Asset Value: | | | | | | | | | | | | | | | | | | | | |
Beginning of period. | | | $8.90 | | | | $7.93 | | | | $9.16 | | | | $9.72 | | | | $9.72 | |
| | | | |
Operations: | | | | | | | | | | | | | | | | | | | | |
Net investment income 1 | | | 0.41 | | | | 0.41 | | | | 0.41 | | | | 0.40 | | | | 0.38 | |
Net realized and unrealized gains (losses) on investments | | | (0.38 | ) | | | 0.97 | | | | (1.23 | ) | | | (0.56 | ) | | | — | |
| | | | |
Total from operations | | | 0.03 | | | | 1.38 | | | | (0.82 | ) | | | (0.16 | ) | | | 0.38 | |
| | | | |
Distributions from: | | | | | | | | | | | | | | | | | | | | |
Net investment income | | | (0.41 | ) | | | (0.41 | ) | | | (0.41 | ) | | | (0.40 | ) | | | (0.38 | ) |
| | | | |
Net Asset Value: | | | | | | | | | | | | | | | | | | | | |
End of period | | | $8.52 | | | | $8.90 | | | | $7.93 | | | | $9.16 | | | | $9.72 | |
| | | | |
Total investment return 2 | | | 0.26% | | | | 17.71% | | | | (9.14% | ) | | | (1.72% | ) | | | 4.00% | |
| | | | |
Net assets at end of period (000’s omitted) | | | $140,371 | | | | $153,495 | | | | $138,781 | | | | $322,590 | | | | $377,549 | |
| | | | | |
Ratios: 3 | | | | | | | | | | | | | | | | | | | | |
Expenses (without waiver) 4 | | | 0.80% | | | | 0.80% | | | | 0.80% | | | | 0.80% | | | | 0.80% | |
Expenses (with waiver) 4 | | | 0.80% | | | | 0.80% | | | | 0.79% | | | | 0.77% | | | | 0.77% | |
Net investment income (with waiver) | | | 4.63% | | | | 4.79% | | | | 4.63% | | | | 4.18% | | | | 3.93% | |
| | | | | |
Portfolio turnover rate (excluding short-term securities) | | | 30.23% | | | | 27.30% | | | | 18.51% | | | | 42.93% | | | | 50.67% | |
| 1 | The net investment income per share is based on average shares outstanding for the period. |
| 2 | Total investment return is based on the change in net asset value of a share during the period and assumes reinvestment of distributions at net asset value. |
| 3 | The ratio information is calculated based on average daily net assets. Total Fund expenses are limited to 0.80% of average daily net assets. However, during the periods above, the investment adviser voluntarily absorbed expenses that were otherwise payable by the Fund. |
| 4 | In addition to fees and expenses which the Fund bears directly, the Fund indirectly bears a pro rata share of the fees and expenses of the acquired funds in which it invests. Such indirect expenses are not included in the above reported expense ratios. |
FINANCIAL HIGHLIGHTS
Per share income and capital changes for a share outstanding throughout the period.
Sit Minnesota Tax-Free Income Fund
| | | | | | | | | | | | | | | | | | | | |
| | | Years Ended March 31, | |
| | | 2011 | | | 2010 | | | 2009 | | | 2008 | | | 2007 | |
Net Asset Value: | | | | | | | | | | | | | | | | | | | | |
Beginning of period | | | $9.88 | | | | $8.97 | | | | $9.76 | | | | $10.21 | | | | $10.12 | |
| | | | |
Operations: | | | | | | | | | | | | | | | | | | | | |
Net investment income 1 | | | 0.43 | | | | 0.43 | | | | 0.43 | | | | 0.43 | | | | 0.42 | |
Net realized and unrealized gains (losses) on investments | | | (0.21 | ) | | | 0.91 | | | | (0.79 | ) | | | (0.45 | ) | | | 0.09 | |
| | | | |
Total from operations | | | 0.22 | | | | 1.34 | | | | (0.36 | ) | | | (0.02 | ) | | | 0.51 | |
| | | | |
Distributions from: | | | | | | | | | | | | | | | | | | | | |
Net investment income | | | (0.43 | ) | | | (0.43 | ) | | | (0.43 | ) | | | (0.43 | ) | | | (0.42 | ) |
| | | | |
Net Asset Value: | | | | | | | | | | | | | | | | | | | | |
End of period | | | $9.67 | | | | $9.88 | | | | $8.97 | | | | $9.76 | | | | $10.21 | |
| | | | |
Total investment return 2 | | | 2.22% | | | | 15.22% | | | | (3.67% | ) | | | (0.25% | ) | | | 5.17% | |
| | | | |
Net assets at end of period (000’s omitted) | | | $289,105 | | | | $290,806 | | | | $244,123 | | | | $307,738 | | | | $288,922 | |
| | | | | |
Ratios: 3 | | | | | | | | | | | | | | | | | | | | |
Expenses 4 | | | 0.80% | | | | 0.80% | | | | 0.80% | | | | 0.80% | | | | 0.80% | |
Net investment income | | | 4.35% | | | | 4.52% | | | | 4.65% | | | | 4.25% | | | | 4.17% | |
| | | | | |
Portfolio turnover rate (excluding short-term securities) | | | 24.48% | | | | 11.46% | | | | 15.68% | | | | 37.48% | | | | 28.42% | |
| 1 | The net investment income per share is based on average shares outstanding for the period. |
| 2 | Total investment return is based on the change in net asset value of a share during the period and assumes reinvestment of distributions at net asset value. |
| 3 | The ratio information is calculated based on average daily net assets. |
| 4 | In addition to fees and expenses which the Fund bears directly, the Fund indirectly bears a pro rata share of the fees and expenses of the acquired funds in which it invests. Such indirect expenses are not included in the above reported expense ratios. |
| | |
| | | |
38 | | SIT MUTUAL FUNDS ANNUAL REPORT |
[This page intentionally left blank.]
NOTES TO FINANCIAL STATEMENTS
Year Ended March 31, 2011
The Sit Mutual Funds (the Funds) are no-load funds, and are registered under the Investment Company Act of 1940 (as amended) as diversified (except Minnesota Tax-Free Income Fund which is non-diversified), open-end management investment companies, or series thereof. The Sit Minnesota Tax-Free Income Fund and the Sit Tax-Free Income Fund are series funds of Sit Mutual Funds II, Inc. Each fund has 10 billion authorized shares of capital stock. Shares in the U.S. Government Securities Fund have a par value of $0.01, and shares in other funds have a par value of $0.001. This report covers three of the bond funds of the Sit Mutual Funds.
The investment objective for each of these Funds is as follows:
| | |
| Fund | | Investment Objective |
U.S. Government Securities | | High level of current income and safety of principal. |
Tax-Free Income | | High level of current income that is exempt from federal income tax, consistent with the preservation of capital. |
Minnesota Tax-Free Income | | High level of current income that is exempt from federal regular income tax and Minnesota regular personal income tax, consistent with the preservation of capital. |
| (2) | Significant Accounting Policies |
Investments in Securities
Investment securities are carried at fair value based upon closing market quotations on the last business day of the period. Investments in securities traded on national or international securities exchanges are valued at the last reported sales price prior to the time when assets are valued. Securities traded on the over-the-counter market are valued at the last reported sales price or if the last sales price is not available, at the last reported bid price. The current fair value of certain fixed income securities is provided by an independent pricing service. Fixed income securities for which prices are not available from an independent pricing service but where an active market exists are valued using market quotations obtained from broker-dealers or quotation systems. Securities for which market quotations are not available, such as private placement securities, are valued at fair value according to methods selected in good faith by the Adviser and may include dealer-supplied valuations. Short-term investments of sufficient credit quality with maturities of 60 days or less when acquired, or which subsequently are within 60 days of maturity, are valued at amortized cost, which approximates fair value. Option and future contracts entered into and held by the Funds are valued at the close of the securities and commodities exchange on which they are traded.
Security transactions are accounted for on the date the securities are purchased or sold. Gains and losses are calculated on the identified-cost basis. Interest, including level-yield amortization of long-term bond premium and discount, is recorded on the accrual basis. Dividends received from closed-end fund holdings are included in Dividend Income and distributions from capital gains, if any, are included in Net Realized Gain (Loss).
Delivery and payment for securities which have been purchased by the Funds on a forward commitment or when-issued basis can take place two weeks or more after the transaction date. During this period, such securities are subject to market fluctuations and may increase or decrease in value prior to delivery.
The Minnesota Tax-Free Income Fund concentrates its investments in Minnesota, and therefore may have more credit risk related to the economic conditions in the state of Minnesota than a portfolio with broader geographical diversification.
Derivative Instruments
The Funds apply derivative instrument disclosure standards in order to enable investors to understand how and why the Funds use derivatives, how derivatives are accounted for, and how derivative instruments affect the Funds’ financial statements.
To hedge interest rate risk, the U.S. Government Securities Fund purchased put option and wrote call option contracts traded on a U.S. exchange. Risks of purchasing and writing options include the possibility of an illiquid market and that a change in the value of the option may not correlate with changes in the value of the underlying securities.
| | |
| | | |
40 | | SIT MUTUAL FUNDS ANNUAL REPORT |
NOTES TO FINANCIAL STATEMENTS
Year Ended March 31, 2011 (Continued)
The premiums paid for the options represent the cost of the investment and the options are valued daily at their closing price. The Funds recognize a realized gain or loss when the option is sold or expired. Option holdings within the Funds, which may include put options and call options, are subject to loss of value with the passage of time, and may experience a total loss of value upon expiration. With options, there is minimal counterparty risk to the Funds since they are exchange traded. During the year ended March 31, 2011, the average cost for purchased options and premium received in the U.S. Government Securities Fund for written options were $378,215 and $277,087, respectively. The number of open option contracts outstanding as of March 31, 2011 and the amounts of realized gain (loss) and changes in unrealized appreciation (depreciation), as disclosed below, also serve as indicators of the volume of activity for the Fund throughout the year.
Balance Sheet – Values of derivatives as of March 31, 2011
U.S. Government Securities Fund
| | | | | | | | |
| | | Asset Derivatives Value 1 | | | Liability Derivatives Value 2 | |
Interest rate risk: | | | | | | | | |
Purchased put options | | | $648,438 | | | | — | |
Written call options | | | — | | | | $105,470 | |
| | 1 | Statement of Assets and Liabilities location: Investments in securities, at fair value. |
| | 2 | Statement of Assets and Liabilities location: Outstanding options written, at fair value. |
The effect of derivative instruments on the statement of operations for the year ended March 31, 2011:
U.S. Government Securities Fund
| | | | | | | | |
| | | Amount of Realized Gain (Loss) on Derivatives 3 | | | Change in Unrealized Appreciation (Depreciation) on Derivatives 4 | |
Interest rate risk: | | | | | | | | |
Purchased put options | | | ($919,032) | | | | $18,458 | |
Written call options | | | (1,116,707) | | | | 195,483 | |
| | 3 | Statement of Operations location: Net realized gain (loss) on investments for purchased options and net realized gain (loss) on written options. |
| | 4 | Statement of Operations location: Net change in unrealized appreciation (depreciation) on investments for purchased options and net change in unrealized appreciation (depreciation) on written options. |
Transactions in written options for the year ended March 31, 2011 were as follows:
| | | | | | | | | | |
| | | Number of Contracts | | | | Premium | | | | |
Outstanding, March 31, 2010 | | — | | | | — | | | |
Call options written | | 7,800 | | | | $2,813,718 | | | |
Call options expired | | (1,700) | | | | (378,983) | | | |
Call options closed | | (5,350) | | | | (2,133,782) | | | |
Outstanding, March 31, 2011 | | 750 | | | | $300,953 | | | |
Fair Value Measurements
The inputs and valuations techniques used to measure fair value of the Funds’ net assets are summarized into three levels as described in the hierarchy below:
| | • | | Level 1 – quoted prices for active markets for identical securities. An active market for the security is a market in which transactions occur with sufficient frequency and volume to provide pricing information on an ongoing basis. A quoted price in an active market provides the most reliable evidence of fair value. |
NOTES TO FINANCIAL STATEMENTS
Year Ended March 31, 2011 (Continued)
| | • | | Level 2 – debt securities are valued based on evaluated prices received from independent pricing services or from dealers who make markets in such securities. For corporate bonds, U.S. government and government agency obligations, and municipal securities the pricing services utilize matrix pricing which considers yield or price of bonds of comparable quality, coupon, maturity, and type as well as dealer supplied prices. For asset-backed securities and mortgage-backed securities, the pricing services utilize matrix pricing which considers prepayment speed assumptions, attributes of the collateral, yield or price of bonds of comparable quality, coupon, maturity, and type as well as dealer supplied prices. All of these inputs are derived principally from or corroborated by observable market data. An adjustment to any observable input that is significant to the fair value may render the measurement a Level 3 measurement. |
| | • | | Level 3 – significant unobservable inputs, including the Adviser’s own assumptions in determining the fair value of investments. |
The inputs or methodology used for valuing securities are not necessarily an indication of the risk associated with investing in those securities.
The fair value of the Fund’s bonds are generally based on quotes received from brokers or independent pricing services. Bonds with quotes that are based on actual trades with a sufficient level of activity on or near the measurement date are classified as Level 2 assets.
At the end of each calendar quarter, management evaluates the Level 2 and 3 assets and liabilities for changes in liquidity, including but not limited to: whether a broker is willing to execute at the quoted price, the depth and consistency of prices from third party services, and the existence of contemporaneous, observable trades in the market. Additionally, management evaluates the Level 1 and 2 assets and liabilities on a quarterly basis for changes in listings or delistings on national exchanges. Due to the inherent uncertainty of determining the fair value of investments that do not have a readily available market value, the fair value of the Fund’s investments may fluctuate from period to period. Additionally, the fair value of investments may differ significantly from the values that would have been used had a ready market existed for such investments and may differ materially from the values the Fund may ultimately realize. Further, such investments may be subject to legal and other restrictions on resale or otherwise are less liquid than publicly traded securities.
For the year ended March 31, 2011, there were no transfers between Levels 1, 2 and 3.
A summary of the levels for the Funds’ investments as of March 31, 2011 is included with the Funds’ schedules of investments.
Federal Taxes
The Funds’ policy is to comply with the requirements of the Internal Revenue Code applicable to regulated investment companies and to distribute all of its taxable income to shareholders. The Funds have recorded in their financial statements the full benefit of their tax positions taken in connection with the RIC qualification and distribution requirements of the RIC. Therefore, no income tax provision is required. Also, in order to avoid the payment of any federal excise taxes, the Funds will distribute substantially all of their net investment income and net realized gains on a calendar year basis.
Management has analyzed the Funds’ tax positions taken in federal tax returns for all open tax years and has concluded that as of March 31, 2011, no provision for income tax would be required in the Funds’financial statements. The Funds’federal and state income and federal excise returns for the 2008, 2009, and 2010 tax years for which the applicable statutes of limitations have not expired remain subject to examination by the Internal Revenue Service and state departments of revenue.
At March 31, 2011, the gross unrealized appreciation (depreciation) on investments and cost of securities on a tax basis for federal income tax purposes were as follows:
| | | | | | | | | | | | | | |
| | | Unrealized
Appreciation | | | Unrealized
Depreciation | | | Net Unrealized Appreciation (Depreciation) | | Cost of Securities on a Tax Basis | |
U.S. Government Securities | | | $30,861,394 | | | | ($3,312,250) | | | $27,549,144 | | | $1,035,412,123 | |
Tax-Free Income | | | 813,617 | | | | (31,593,651) | | | (30,780,034) | | | 171,649,606 | |
| | |
| | | |
42 | | SIT MUTUAL FUNDS ANNUAL REPORT |
NOTES TO FINANCIAL STATEMENTS
Year Ended March 31, 2011 (Continued)
| | | | | | | | | | |
| | | Unrealized
Appreciation | | Unrealized
Depreciation | | | Net Unrealized Appreciation (Depreciation) | | Cost of Securities on a Tax Basis |
Minnesota Tax-Free Income | | 2,367,939 | | | (13,491,679 | ) | | (11,123,740) | | 297,748,386 |
Net investment income and net realized gains may differ for financial statement and tax purposes. The character of distributions made during the year for net investment income or net realized gains may also differ from its ultimate characterization for tax purposes. The tax character of distributions paid during the fiscal years ended March 31, 2011 and 2010 were as follows:
| | | | | | | | | | | | | | | | |
Year Ended March 31, 2011: | | | | | | | | | | | | | | | | |
| | | Ordinary Income | | | Tax-Exempt Income | | | Long Term
Capital Gain | | | Total | |
U.S. Government Securities | | | $26,999,851 | | | | — | | | | $271,533 | | | | $27,271,384 | |
Tax-Free Income* | | | 49,497 | | | | $7,034,048 | | | | — | | | | 7,083,545 | |
Minnesota Tax-Free Income* | | | 29,469 | | | | 12,812,808 | | | | — | | | | 12,842,277 | |
* 99.3% and 99.8% of dividends were derived from interest on tax-exempt securities, on the Tax-Free Income and Minnesota Tax-Free Income Funds, respectively.
| | | | | | | | | | | | | | | | |
Year Ended March 31, 2010: | | | | | | | | | | | | | | | | |
| | | Ordinary Income | | | Tax-Exempt
Income | | | Long Term
Capital Gain | | | Total | |
U.S. Government Securities | | | $20,847,075 | | | | — | | | | — | | | | $20,847,075 | |
Tax-Free Income | | | — | | | | $7,118,383 | | | | — | | | | 7,118,383 | |
Minnesota Tax-Free Income | | | — | | | | 12,192,570 | | | | — | | | | 12,192,570 | |
As of March 31, 2011, the components of distributable earnings on a tax basis were as follows:
| | | | | | | | | | | | |
| | | Undistributed
Ordinary
Income | | | Undistributed
Tax-Exempt Income | | | Accumulated
Gain (Loss) | | Unrealized
Appreciation
(Depreciation) |
U.S. Government Securities | | | $91,359 | | | | — | | | ($671,163) | | $27,530,686 |
Tax-Free Income | | | — | | | | $115,774 | | | (26,123,413) | | (30,780,034) |
Minnesota Tax-Free Income | | | — | | | | 173,748 | | | (8,307,720) | | (11,123,740) |
On the statement of assets and liabilities for the Tax-Free Income Fund, as a result of permanent book-to-tax differences, reclassification adjustments of $11,447, $36,250 and $24,803 were made to decrease undistributed net investment income, increase accumulated net realized gain (loss), and decrease additional paid-in capital, respectively, to account for market discount accretion adjustments. In the Minnesota Tax-Free Income Fund, adjustments of $64,122, $662,621 and $598,499 were made to decrease undistributed net investment income, increase accumulated net realized gain (loss), and decrease additional paid-in capital, respectively, to account for market discount accretion adjustments and capital loss carryforwards expiring.
Net capital loss carryovers and post-October capital losses, if any, as of March 31, 2011, are available to offset future realized capital gains and thereby reduce future capital gains distributions. The net capital loss carryovers and the post-October capital losses deferred as of March 31, 2011, were as follows:
| | | | | | | | | | | | | | | | | | | | |
| | | Capital Loss Carryover
Expiring in: | | | Net Capital | | | Post-October
Capital Loss | | | Accumulated
Capital and | |
| | | 2012 | | | 2013-2018 | | | Loss Carryover | | | Deferral | | | Other Losses | |
U.S. Government Securities | | | — | | | | — | | | | — | | | | $671,163 | | | | $671,163 | |
Tax-Free Income | | | $1,461,177 | | | | $22,851,389 | | | | $24,312,566 | | | | 1,810,847 | | | | 26,123,413 | |
Minnesota Tax-Free Income | | | 403,028 | | | | 7,904,692 | | | | 8,307,720 | | | | — | | | | 8,307,720 | |
NOTES TO FINANCIAL STATEMENTS
Year Ended March 31, 2011 (Continued)
The Regulated Investment Company Modernization Act of 2010 (“Act”) was enacted on December 22, 2010. In general, the provisions of the Act will be effective for Funds with fiscal years ending after December 22, 2011. Under the Act, a Fund will be permitted to carry forward capital losses for an unlimited period. However, any losses incurred during those future taxable years will be required to be utilized prior to the losses incurred in pre-enactment taxable years. As a result of this ordering rule, pre-enactment capital loss carry forwards may be more likely to expire unused. Additionally, post-enactment capital losses that are carried forward will retain their character as either short-term or long-term capital losses, and will not be considered exclusively short-term as under previous law.
Distributions
Distributions to shareholders are recorded as of the close of business on the record date. Such distributions are payable in cash or reinvested in additional shares of the Funds’ capital stock. Distributions from net investment income are declared daily and paid monthly for the Funds. Distributions from net realized gains, if any, will be made annually for each of the Funds.
Use of Estimates
The preparation of financial statements in conformity with U.S. generally accepted accounting principles requires management to make certain estimates and assumptions that affect the reported amounts of assets and liabilities and disclosure of contingent assets and liabilities at the date of the financial statements and the reported results. Actual results could differ from those estimates.
Guarantees and Indemnifications
Under each Fund’s organizational documents, its officers and directors are indemnified against certain liabilities arising out of the performance of their duties to each Fund. In addition, certain of each Fund’s contracts with its service providers contain general indemnification clauses. Each Fund’s maximum exposure under these arrangements is unknown since the amount of any future claims that may be made against each Fund cannot be determined and each Fund has no historical basis for predicting the likelihood of any such claims.
| (3) | Investment Security Transactions |
The cost of purchases of and proceeds from sales and maturities of investment securities, other than short-term securities, for the year ended March 31, 2011, were as follows:
| | | | | | | | |
| | | Purchases | | | Proceeds | |
U.S. Government Securities | | $ | 604,900,013 | | | $ | 409,533,864 | |
Tax-Free Income | | | 44,864,301 | | | | 49,425,916 | |
Minnesota Tax-Free Income | | | 79,825,163 | | | | 69,777,819 | |
| (4) | Affiliated Fees and Transactions |
Investment Adviser
The Funds each have entered into an investment management agreement with Sit Investment Associates Inc. (SIA), under which SIA manages the Funds’ assets and provides research, statistical and advisory services, and pays related office rental, executive expenses and executive salaries. SIA also is obligated to pay all of the Funds’ expenses (excluding extraordinary expenses, stock transfer taxes, interest, brokerage commissions, and other transaction charges relating to investing activities). The fee for investment management and advisory services is based on the average daily net assets of the Funds at the annual rate of:
| | | | |
| | | Average Daily Net Assets | | |
U.S. Government Securities | | 0.80%* | |
Tax-Free Income | | 0.80%** | |
Minnesota Tax-Free Income | | 0.80% | |
* Prior to November 1, 2010, the investment management fee for the U.S. Government Securities Fund was charged at a higher rate. During the period October 1, 1993, through October 31, 2010, the Adviser voluntarily agreed to limit the flat monthly fee (and, thereby, all Fund expenses, except extraordinary expenses, interest, brokerage commissions and other transaction charges not payable by the Adviser) of the U.S. Government Securities Fund to an annual rate of 0.80% of the Fund’s average daily net assets. In addition,
| | |
| | | |
44 | | SIT MUTUAL FUNDS ANNUAL REPORT |
NOTES TO FINANCIAL STATEMENTS
Year Ended March 31, 2011 (Continued)
in February 2010, Federal National Mortgage Association (FNMA) and Federal Home Loan Mortgage Corp. (FHLMC) announced programs to purchase delinquent mortgage loans from their guaranteed securities during March and April, 2010. These purchases caused the U.S. Government Securities Fund to incur losses recorded as a reduction of income. In response and to offset part of the losses, the Adviser voluntarily waived an additional portion of its management fee in April, 2010.
** For the period October 1, 1993, through December 31, 2011, the Adviser has voluntarily agreed to limit the flat monthly fee (and, thereby, all Fund expenses, except extraordinary expenses, interest, brokerage commissions and other transaction charges not payable by the Adviser) of the Tax-Free Income Fund to an annual rate of 0.70% of the Fund’s average daily net assets in excess of $250 million and 0.60% of the Fund’s average daily net assets in excess of $500 million. After December 31, 2011, this voluntary fee waiver will be discontinued by the Adviser.
Transactions with affiliates
The investment adviser, affiliates of the investment adviser, directors and officers of the Funds as a whole owned the following shares as of March 31, 2011:
| | | | | | |
| | | Shares | | | % Shares Outstanding |
U.S. Government Securities | | | 1,871,297 | | | 2.0 |
Tax-Free Income | | | 1,411,291 | | | 8.6 |
Minnesota Tax-Free Income | | | 2,417,171 | | | 8.1 |
Management has evaluated the impact of all subsequent events on the Funds through the date the financial statements were issued, and has determined that there were no subsequent events that would require disclosure in or adjustments to the financial statements.
REPORT OF INDEPENDENT REGISTERED PUBLIC ACCOUNTING FIRM
The Board of Directors and Shareholders:
Sit U.S. Government Securities Fund, Inc.
Sit Mutual Funds II, Inc.
We have audited the accompanying statements of assets and liabilities, including the schedules of investments, of Sit U.S. Government Securities Fund, Inc., Sit Tax-Free Income Fund (a series of Sit Mutual Funds II, Inc.), and Sit Minnesota Tax-Free Income Fund (a series of Sit Mutual Funds II, Inc.) (the “Funds”), as of March 31, 2011, and the related statements of operations for the year then ended, the statements of changes in net assets for each of the years in the two-year period then ended, and the financial highlights for each of the years in the five-year period then ended. These financial statements and financial highlights are the responsibility of the Funds’ management. Our responsibility is to express an opinion on these financial statements and financial highlights based on our audits.
We conducted our audits in accordance with auditing standards of the Public Company Accounting Oversight Board (United States). Those standards require that we plan and perform the audit to obtain reasonable assurance about whether the financial statements and financial highlights are free of material misstatement. An audit includes examining, on a test basis, evidence supporting the amounts and disclosures in the financial statements. Our procedures included confirmation of securities owned as of March 31, 2011, by correspondence with the custodian and brokers or by other appropriate auditing procedures. An audit also includes assessing the accounting principles used and significant estimates made by management, as well as evaluating the overall financial statement presentation. We believe that our audits provide a reasonable basis for our opinion.
In our opinion, the financial statements and financial highlights referred to above present fairly, in all material respects, the financial position of Sit U.S. Government Securities Fund, Sit Tax-Free Income Fund, and Sit Minnesota Tax-Free Income Fund as of March 31, 2011, and the results of their operations for the year then ended, the changes in their net assets for each of the years in the two-year period then ended, and their financial highlights for each of the years in the five-year period then ended, in conformity with U.S. generally accepted accounting principles.
KPMG LLP
Minneapolis, Minnesota
May 19, 2011
| | |
| | | |
46 | | SIT MUTUAL FUNDS ANNUAL REPORT |
EXPENSE EXAMPLE (Unaudited)
As a shareholder of the Funds, you incur two types of costs: (1) transaction costs, including redemption fees and (2) ongoing costs, including management fees; and other Fund expenses. This Example is intended to help you understand your ongoing costs (in dollars) of investing in the Funds and to compare these costs with the ongoing costs of investing in other mutual funds.
The Example is based on an investment of $1,000 invested at the beginning of the period and held for the entire period October 1, 2010 to March 31, 2011.
Actual Expenses
The first line of the table below provides information about actual account values and actual expenses. You may use the information in this line, together with the amount you invested, to estimate the expenses that you paid over the period. Simply divide your account value by $1,000 (for example, an $8,600 account value divided by $1,000 = 8.6), then multiply the result by the number in the first line under the heading entitled “Expenses Paid During Period” to estimate the expenses you paid on your account during this period.
Hypothetical Example for Comparison Purposes
The second line of the table below provides information about hypothetical account values and hypothetical expenses based on the Fund’s actual expense ratio and an assumed rate of return of 5% per year before expenses, which is not the Fund’s actual return. The hypothetical account values and expenses may not be used to estimate the actual ending account balance or expenses you paid for the period. You may use this information to compare the ongoing costs of investing in the Fund and other funds. To do so, compare this 5% hypothetical example with the 5% hypothetical examples that appear in the shareholder reports of the other funds.
Please note that the expenses shown in the table are meant to highlight your ongoing costs only and do not reflect any transactional costs, such as redemption fees. Therefore, the second line of the table is useful in comparing ongoing costs only, and will not help you determine the relative total costs of owning different funds. In addition, if these transactional costs (redemption fees) were included, your costs would have been higher.
| | | | | | | | |
| | | Beginning
Account
Value
(10/1/10) | | Ending
Account
Value
(3/31/11) | | | Expenses
Paid During
Period*
(10/1/10-
3/31/11) |
| U.S. Government Securities Fund |
Actual | | $1,000 | | $ | 1,043.70 | | | $4.08 |
Hypothetical | | $1,000 | | $ | 1,020.94 | | | $4.03 |
| Tax-Free Income Fund |
Actual | | $1,000 | | $ | 1,002.60 | | | $3.99 |
Hypothetical | | $1,000 | | $ | 1,020.94 | | | $4.03 |
| Minnesota Tax-Free Income Fund |
Actual | | $1,000 | | $ | 1,022.20 | | | $4.03 |
Hypothetical | | $1,000 | | $ | 1,020.94 | | | $4.03 |
*Expenses are equal to the Fund’s annualized expense ratio of 0.80% for the U.S. Government Securities Fund, the Tax-Free Income Fund and Minnesota Tax-Free Income Fund, multiplied by the average account value over the period, multiplied by 182/365 (to reflect the one-half year period.)
FEDERAL TAX INFORMATION (Unaudited)
Sit Bond Funds
For corporate shareholders, the percentage of investment income (dividend income and short-term gains, if any), for each of the Funds that qualify for the dividends-received deductions for the period of April 1, 2010 to March 31, 2011 is as follows:
| | |
| Fund | | Percentage |
U.S. Government Securities Fund | | 0.0% |
Tax-Free Income Fund | | 0.0 |
Minnseota Tax-Free Income Fund | | 0.0 |
For the year ended March 31, 2011, certain dividends paid by the Funds may be subject to a maximum tax rate of 15%, as provided by the Jobs and Growth Tax Relief Reconciliation Act of 2003. Of the distributions made by the following Funds, the corresponding percentages represent the amount of each distribution which may qualify for the 15% dividend income tax rate.
| | |
| Fund | | Percentage |
U.S. Government Securities Fund | | 0.0% |
Tax-Free Income Fund | | 0.0 |
Minnseota Tax-Free Income Fund | | 0.0 |
The following Funds designated the listed amounts as long-term capital gain dividends during the year ended March 31, 2011. Distributable long-term gains are based on net realized long term gains determined on a tax basis and may differ from such amounts for financial reporting purposes.
| | | | |
| Fund | | Amount | |
U.S. Government Securities Fund | | $ | 271,533 | |
Tax-Free Income Fund | | | — | |
Minnesota Tax-Free Income Fund | | | — | |
For the year ended March 31, 2011, 99.3% and 99.8% of dividends were derived from interest on tax-exempt securities for the Tax-Free Income Fund and Minnesota Tax-Free Income Fund, respectively. This portion of exempt-interest dividends is exempt from federal taxes and should not be included in shareholders’gross income. Exempt-interest dividends may be subject to state and local taxes. Each shareholder should consult a tax adviser about reporting this income for state and local tax purposes.
| | |
| | | |
48 | | SIT MUTUAL FUNDS ANNUAL REPORT |
[This page intentionally left blank.]
INFORMATION ABOUT DIRECTORS AND OFFICERS (Unaudited)
The Sit Mutual Funds are a family of no-load mutual funds. The bond funds described in this Annual Report are the Sit U.S. Government Securities Fund, Sit Tax-Free Income Fund, and Sit Minnesota Tax-Free Income Fund (the “Funds” or individually, a “Fund”). The Sit U.S. Government Securities Fund, and the corporate issuer of the Sit Tax-Free Income Fund and the Sit Minnesota Tax-Free Income Fund have a Board of Directors and officers. Pursuant to Minnesota law, the Boards of Directors are responsible for the management of the Funds and the establishment of the Funds’ policies. The officers of the Funds manage the day-to-day operation of the Funds. Information pertaining to the directors and officers of the Funds is set forth below. The business address, unless otherwise noted below, is that of the Funds’ investment adviser – 3300 IDS Center, 80 South Eighth Street, Minneapolis, Minnesota 55402. The Boards have a separate Audit Committee. The Bond Funds’ SAI has additional information about the Fund’s directors and is available without charge upon request by calling the Sit Funds at 800-332-5580.
| | | | | | | | |
Name, Age, and Position with the Fund | | Term of Office (1) and Length of Time Served | | Principal Occupation(s) During Past Five Years | | Number of Funds in Fund Complex Overseen by Director | | Other Directorships Held by Director (3) |
INTERESTED DIRECTORS: | | | | | | |
Roger J. Sit (2) Age: 49 Chairman and President | | Chairman since 10/08; Officer since 1998. | | Chairman, President, CEO and Global CIO of Sit Investment Associates, Inc. (the “Adviser”); Chairman and CEO of Sit Investment Fixed Income Advisors, Inc. (“SF”); Chairman of SIA Securities Corp. (the “Distributor”). | | 12 | | None. |
William E. Frenzel (2) Age: 82 Director | | Director since 1991 or the Fund’s inception if later. | | Guest Scholar at The Brookings Institution and member of several government policy committees, foundations and organizations; Director of the Adviser; Director of SF. | | 12 | | None. |
INDEPENDENT DIRECTORS: | | | | | | |
John P. Fagan Age: 80 Director | | Director since 2006 or the Fund’s inception, if later. | | Honorary member of Board of St. Joseph’s College in Rensselar, Indiana. | | 12 | | None. |
Sidney L. Jones Age: 77 Director | | Director since 1993 or the Fund’s inception, if later: Director from 1988 to 1989. | | Lecturer, Washington Campus Consortium of 17 Universities. | | 12 | | None. |
Bruce C. Lueck Age: 70 Director | | Director since 2004 or the Fund’s inception, if later. | | Consultant for Zephyr Management, L.P. (investment management) and committee member of several investment funds and foundations. | | 12 | | None. |
Donald W. Phillips Age: 62 Director | | Director of the International Fund since 1993, and since 1990 or the Fund’s inception if later for all other Funds. | | Chairman and CEO of WP Global Partners Inc., 7/05 to present; CEO and CIO of WestLB Asset Management (USA) LLC, 4/00 to 4/05. | | 12 | | None. |
Barry N. Winslow Age: 63 Director | | Director since 2010. | | Vice-Chairman of TCF Financial Corporation, 7/08 to present; COO 2006 to 2007; President of the national charter 2001-2006. | | 12 | | TCF Financial Corporation. |
| | |
| | | |
50 | | SIT MUTUAL FUNDS ANNUAL REPORT |
| | | | | | | | |
Name, Age, and Position with the Fund | | Term of Office (1) and Length of Time Served | | Principal Occupation(s) During Past Five Years | | Number of Funds in Fund Complex Overseen by Director | | Other Directorships Held by Director (3) |
OFFICERS: |
Mark H. Book Age: 47 Vice President – Investments of U.S. Govt. Fund only | | Officer since 2002; Re-Elected by the Boards annually. | | Vice President and Portfolio Manager of SF. | | N/A | | N/A |
Kelly K. Boston Age: 42 Assistant Secretary & Assistant Treasurer | | Officer since 2000; Re-Elected by the Boards annually. | | Staff Attorney of the Adviser; Secretary of the Distributor. | | N/A | | N/A |
Michael C. Brilley Age: 65 Senior Vice President | | Officer since 1985; Re-Elected by the Boards annually. | | Senior Vice President and Senior Fixed Income Officer of the Adviser; Director and President and Chief Fixed-Income Officer of SF. | | N/A | | N/A |
Bryce A. Doty Age: 44 Vice President - Investments of U.S. Govt. Fund only. | | Officer since 1996; Re-Elected by the Boards annually. | | Senior Vice President and Senior Portfolio Manager of SF. | | N/A | | N/A |
Paul J. Junquist Age: 49 Vice President - Investments of Tax-Free & MN Tax-Free Funds only. | | Officer since 1996; Re-Elected by the Boards annually. | | Vice President and Portfolio Manager of SF. | | N/A | | N/A |
Michael J. Radmer 50 S. 6th Street Minneapolis, MN 55401 Age: 65 Secretary | | Officer since 1984; Re-Elected by the Boards annually. | | Partner of the Funds’ general counsel, Dorsey & Whitney, LLP. | | N/A | | N/A |
Paul E. Rasmussen Age: 50 Vice President, Treasurer & Chief Compliance Officer | | Officer since 1994; Re-Elected by the Boards annually. | | Vice President, Secretary, Controller and Chief Compliance Officer of the Adviser; Vice President, Secretary, and Chief Compliance Officer of SF; President and Treasurer of the Distributor. | | N/A | | N/A |
Carla J. Rose Age: 44 Vice President, Assistant Secretary & Assistant Treasurer | | Officer since 2000; Re-Elected by the Boards annually. | | Vice President, Administration & Deputy Controller of the Adviser; Vice President, Controller, Treasurer & Assistant Secretary of SF; Vice President and Assistant Secretary of the Distributor. | | N/A | | N/A |
Debra A. Sit (3) Age: 50 Vice President - Investments | | Officer since 1994; Re-Elected by the Boards annually. | | Vice President – Bond Investments of the Adviser; Senior Vice President, Senior Portfolio Manager of SF. | | N/A | | N/A |
| 1 | Directors serve until their death, resignation, removal or the next shareholder meeting at which election of directors is an agenda item and a successor is duly elected and qualified. |
| 2 | Directors who are deemed to be “interested persons” of the Funds as that term is defined by the Investment Company Act of 1940. Mr. Sit is considered an “interested person” because he is a director and shareholder of Sit Investment Associates, Inc., the Fund’s investment adviser. Mr. Frenzel is deemed to be an interested person because he is a director and shareholder of the Fund’s investment adviser. |
| 3 | Includes only directorships of companies required to report under the Securities Exchange Act of 1934 (i.e., public companies) or other investment companies registered under the 1940 Act. |
ADDITIONAL INFORMATION (Unaudited)
PROXY VOTING
Each fund follows certain policies and procedures for voting proxies for securities held in each portfolio. A description of the Funds’ proxy voting policies and procedures is available without charge upon request by calling the Funds at 1-800-332-5580.
Information regarding how each Fund voted proxies relating to its portfolio securities during the most recent twelve-month period ended June 30 is available without charge upon request by calling the Funds at 1-800-332-5580, and is available on the U.S. Securities and Exchange Commission’s website at www.sec.gov.
AVAILABILITY OF QUARTERLY PORTFOLIO SCHEDULES
The Funds’ file their complete schedules of portfolio holdings with the U.S. Securities and Exchange Commission (SEC) for the first and third quarters of each fiscal year on Form N-Q. The Funds’ Form N-Qs are available without charge upon request by calling the Funds at 1-800-332-5580 and are available on the SEC’s website at www.sec.gov. In addition, the Funds’ Form N-Qs may be reviewed and copied at the SEC’s Public Reference Room in Washington, DC. Information on the operation of the Public Reference Room may be obtained by calling 1-202-551-8090.
RE-APPROVAL OF INVESTMENT MANAGEMENT AGREEMENTS
At their joint meeting held on October 25, 2010 the Boards of Directors of the Sit Mutual Funds unanimously approved the continuation for another one year period the investment management agreements entered into by and between Sit Investment Associates, Inc. (“SIA”) and Sit Mutual Funds II, Inc. dated November 1, 1992; and Sit U.S. Government Securities Fund, Inc. dated November 1, 1992 (the “Agreements”).
The Boards approved the Agreements after a lengthy discussion and consideration of various factors relating to both the Boards’ selection of SIA as the investment adviser and the Boards’ approval of the fees to be paid under the Agreements.
Investment Adviser Criteria. The Directors began their analysis by discussing their criteria for determining the quality of an investment adviser. The Directors’ noted that their analysis is similar to that used by institutional investors in evaluating and selecting investment advisers. The Directors discussed several factors used to determine the overall quality of an investment adviser and the nature, extent and quality of the services performed by SIA, including the following:
Investment Philosophy and Process. The Directors considered SIA’s philosophy of managing assets. With respect to fixed income securities, SIA stresses the consistent attainment of superior risk-adjusted returns using a conservative investment management approach that identifies pricing anomalies in the market and management of portfolio duration.
With respect to fixed income securities, SIA seeks investment grade securities with a special emphasis on interest income and significant stability of principal value. SIA’s style seeks to avoid excessive return volatility and generate consistent results over an economic cycle. The Directors noted that the Bond Funds’ objectives are to seek high current income. The Directors reviewed the Bond Funds’ characteristics, and noted that SIA has consistently managed the Bond Funds in this style. The Directors noted that since the Bond Funds emphasize income, they may at times not rank highly in total return comparisons with other funds during certain periods.
The Directors discussed SIA’s consistent and well-defined investment process. With respect to fixed income securities, the portfolio managers are responsible for implementing the strategy set forth in the Chief Fixed Income Officer’s duration targets and the Chief Investment Officer’s interest rate projections.
Investment Professionals. The Directors discussed the experience, knowledge and organizational stability of SIA and its investment professionals. The Directors noted that SIA’s senior professionals are actively involved in the investment process and have significant investment industry experience.
| | |
| | | |
52 | | SIT MUTUAL FUNDS ANNUAL REPORT |
The Directors discussed the depth of SIA’s investment staff. The Directors noted that SIA has over 30 investment professionals. Given the investment products offered by SIA and the assets under management, the Directors determined that SIA’s investment staff is well positioned to meet the current needs of its clients, including the Funds, and to accommodate growth in the number of clients and assets under management for the near future. The Directors concluded that the depth of the investment staff, and in particular senior management and investment analysts, is actually greater than the Funds currently require at their present asset size. The Directors noted that SIA has the resources of a $9.8 billion investment firm working for the benefit of the Fund shareholders.
Investment Performance. The Directors reviewed and discussed the Funds’ investment performance on an absolute and comparable basis for various periods as discussed below. The Directors noted that the investment performance of the Funds has generally been competitive with indices and other funds with similar investment styles as the Funds, such as fixed income funds seeking to maximize income.
Corporate Culture. The Directors discussed SIA’s corporate values to operate under the highest ethical and professional standards. SIA’s culture is set and practiced by senior management who insist that all professionals exhibit honesty and integrity. The Board noted that the firm’s values are evident in all of the services provided to the Funds.
Review of Specific Factors. The Directors continued their analysis by reviewing specific information on SIA and the Funds and specific terms of the Agreements, including the following.
Investment Performance. The Directors reviewed investment performance of each Fund for 1 month, 3 months, 6 months, year-to-date, 1 year, 5 years (as applicable), 10 years (as applicable) and since inception, both on an absolute basis and on a comparative basis to indices and mutual funds within the same investment categories. As noted above, the Directors concluded that the investment performance of the Funds has been competitive in relation to their stated objectives and strategies on a comparable basis with funds with similar objectives and strategies.
Fees and Expenses. The Directors noted that the Funds pay SIA a monthly fee and SIA is responsible for all of the Funds’ expenses except interest, brokerage commissions and transaction charges and certain extraordinary expenses. The Directors reviewed fees paid in prior years and the fees to be paid under the Agreements, both before and after the voluntary waiver of fees by SIA with respect to the Tax-Free Income Fund and U.S. Government Fund. The Directors noted that under the Agreements, the fees paid with respect to the U.S. Government Fund and the Tax-Free Income Fund (at its current asset level) will be equal to the fees paid previously net of the voluntary waiver of fees by SIA, and SIA will discontinue its voluntary waiver of fees with respect to both Funds as of December 31, 2010.
The Directors reviewed the average and median expense ratios of mutual funds within the same investment category for each Fund. The Directors noted that each Fund’s total expense ratio compares favorably to the total expense ratios of other no-load funds within the Fund’s Morningstar category, and are lower than the average total expense ratio for the full Morningstar category. The Directors concluded that the fees paid by the Funds are reasonable and appropriate.
The Directors reviewed the extent to which the fees to be paid under the Agreements by each Fund may be affected by an increase in the Fund’s assets, which included reviewing each Fund’s current and historical assets and the likelihood and magnitude of future increases in the Fund’s assets. The Directors agreed that it is appropriate that the Funds benefit from improved economies of scale as the Funds’ assets increase. However, the Directors concluded that given the limited size of the Funds, negotiating a graduated fee structure is unnecessary since it is unlikely that the size of the Funds will increase enough to justify a graduated fee schedule within the near future.
The Directors reviewed the expenses paid by SIA relating to the operations of the Funds, and SIA’s income with respect to the management of the Funds for the past two calendar years. The Directors concluded that the expenses paid were appropriate.
The Directors reviewed SIA’s investment advisory fee schedule for investment management services provided to other clients. The Directors compared the services provided to the Funds and other clients of SIA, and recognized that the Funds’ expenses are borne by SIA. The Directors concluded that the fees paid by the Funds in relation to the fees paid by other SIA clients were appropriate and reasonable. The Directors also concluded that SIA’s profit margin with respect to the management of the Funds was appropriate.
ADDITIONAL INFORMATION (Unaudited) (Continued)
The Directors discussed the extent to which SIA receives benefits from the relationship with the Funds such as soft dollar arrangements by which brokers provide research services to SIA as a result of brokerage generated by the Funds. The Board concluded that any benefits SIA receives from its relationship with the Funds are well within industry norms and are reflected in the amount of the fees paid by the Funds to SIA and are appropriate and reasonable.
Non-Advisory Services. The Directors considered the quality of non-advisory services which SIA provides to the Funds (and their shareholders) and the quality and depth of SIA’s non-investment personnel who provide such services. Directors concluded that the level of such services and the quality and depth of such personnel are consistent with industry standards.
Finally, the Directors considered the compliance staff and the regulatory history of SIA and the Funds, and concluded that both are consistent with industry standards.
Based on these conclusions, without any single conclusion being dispositive, the Directors determined that renewal of the Agreements was in the interest of each Fund and its shareholders.
| | |
| | | |
54 | | SIT MUTUAL FUNDS ANNUAL REPORT |
[This page intentionally left blank.]
[This page intentionally left blank.]

|
Sit Mutual Funds HIGH INCOME MUNICIPAL BOND FUND ANNUAL REPORT TABLE OF CONTENTS |
This document must be preceded or accompanied by a Prospectus.
CHAIRMAN’S LETTER
Year Ended March 31, 2011
Dear fellow shareholders:
U.S. fixed-income markets performed well over the first half of the last year, but significant and conflicting forces challenged the markets during the latter half of the year. Some of these forces included: improving economic conditions in the U.S. economy; a massive increase in the money supply as a result of the Federal Reserve’s second round of quantitative easing (QE2); a sovereign debt crisis in Europe; political instability in the Middle East; and fiscal concerns at all levels of government in the U.S.
Taxable bond yields increased and the yield curve steepened during the last six months, with short-term yields remaining at historic lows and longer-term U.S. Treasury yields increasing. Specifically, the one-year maturity U.S.Treasury bill yield increased 2 basis points to 0.27%, while the 30-year U.S. Treasury bond yield increased 82 basis points to 4.51%. Most taxable bond sectors experienced negative returns over the last six months, but still delivered strong returns over the last year. Commercial mortgage-backed securities and home equity securities were the strongest sectors for both the six-month and one-year time periods. Lower quality bonds outperformed higher quality bonds during the last six and twelve months. In terms of duration, longer bonds outperformed shorter bonds during the last year; however, this trend reversed during the last six-months with shorter duration outperforming longer duration bonds.
Tax-exempt bond yields showed a similar pattern of increased yields and more pronounced yield curve steepening during the six-month period. The one-year Municipal Market Data (MMD) AAA GO increased 2 basis points to 0.30%, while the 30-year MMD AAA GO increased 110 basis points to 4.80%. The sharp rise in yields that began in the fourth quarter of 2010 continued through mid-January before settling at lower levels in February and March. The slowing pace of mutual fund redemptions, combined with the lowest quarterly issuance volume since the first quarter of 2000 and the entrance of taxable crossover buyers, helped stabilize the market recently. The Barclays Five-year Municipal Bond Index produced a total return of -1.0% and +3.2% for the six-month and one-year periods ended March 31, respectively. Among revenue bonds, housing and resource recovery bonds led the six-month and one-year periods. Intermediate duration bonds outperformed shorter and longer duration over the last year while shorter duration bonds outperformed over the last six-months.
U.S. economic activity is at a new high after recovering from the severe contraction of activity resulting from the financial crisis. The final estimate fourth quarter 2010 real GDP growth was revised up to +3.1% from the previous estimate of +2.8%. Impressively, year-over-year changes in real GDP components have actually been remarkably steady in the +2.5 to +3.0% range over the past four quarters.
The nonfarm payroll report, released on April 1st, revealed that 216,000 jobs were created in March, compared with the consensus expectation of 190,000 jobs. Even more notably, private sector payrolls grew by 564,000 in the first quarter, which is the highest level since the first quarter of 2006 and marked the fifth consecutive quarterly increase. The unemployment rate drifted downward to 8.8%, compared to 9.8% as recently as November. The full one percentage point decline in four months is the steepest reduction over such a period since January 1984. However, the labor participation rate, which had been in a moderate downtrend since 2000 and had accelerated with the recession, has yet to show improvement and remains at 64.2% vs. 66.0% at the beginning of the recession and 67.3% in early 2000.
Inflation, as measured by the headline Consumer Price Index for All Urban Consumers (CPI), increased +0.5% from the January level or +2.1% year-over-year in February. Not surprisingly, energy costs continued to rise, up +3.4% from January. Core CPI, which excludes the volatile food and energy components, increased +0.2%, slightly ahead of the +0.1% consensus estimate. While inflation is clearly increasing, much of the rise has been caused by food and energy commodities, which will be “transitory,” according to a recent FOMC statement. Nonetheless, investors are clearly beginning to sharpen their focus on inflation expectations.
Through the first five months of fiscal year 2011, the federal budget deficit stands at $641 billion, approximately $10 billion less than the comparable period last year. Furthermore, the Congressional Budget Office (CBO) estimates that the fiscal 2011 deficit will be $1.48 trillion versus a 2010 deficit of $1.29 trillion. Despite all of the news grabbing headlines from Washington surrounding the debate on the budget, none of the current proposals from Congress will meaningfully change the budget outlook for 2011.
The Federal Reserve’s U.S. trade-weighted major currencies dollar index declined -1.6% in March from the February level and -5.8% on a year-over-year basis. The dollar is very near the all-time lows that were reached in early 2008. Given the fiscal difficulties the U.S. faces over both the near and long term, we do not expect a sustained rally in the dollar, but there may be short-term, technically driven rallies.
We expect the current economic recovery to continue at a subpar pace. Consumer spending continues to be subdued, as improvements in employment have been measureable but slow. Two significant problems remaining in the U.S. economy are high unemployment and a weak housing market. Significant job creation is naturally one of the last things to occur in any economic recovery. In a general economic cycle, recessions cause corporations to lose money, followed by workforce reductions and bankruptcies until the surviving companies are once again profitable. But after a few quarters of stable operations and profits, corporations will risk hiring people and
| | |
| | | |
2 | | SIT MUTUAL FUNDS ANNUAL REPORT |
expand their businesses. We believe the moderate economic growth should continue to create jobs but the process will be long, slow and erratic.
Likewise, the very weak housing market has begun to stabilize even though a full recovery will take considerable time. While home prices are near their lows, year-over-year home price comparisons are distorted because last year’s home prices were artificially inflated by the home buyer tax credit that expired in April of 2010. One of our preferred housing data points is the trend in unsold housing inventory. We like to include homes that are also in foreclosure (often referred to as “shadow inventory”) and properties owned by borrowers that are more than 60 days delinquent on their mortgage. This measure of total housing inventory has steadily declined for 15 months and we expect this trend to continue.
The rapid deterioration of the federal deficit and, to a lesser degree, state and local budgets remain challenging to the economy. The Federal Reserve’s aggressive money printing program is already distorting financial markets (the real challenge will come when the Fed tries to reverse the process). The normal threat of rising inflation that comes with an expanding economy is heightened by the Fed’s 30% increase in the money supply over the past three years. Recent external factors will likely continue to slow the recovery both globally and in the U.S., namely: continuing issues surrounding the European sovereign debt crisis; unrest in the Middle East; and the earthquake in Japan. The revolutions in the Middle East will have unpredictable outcomes. Japan’s earthquake, tsunami, and nuclear crisis have disrupted the lives of everyone in the country and many companies around the world, but we expect the extraordinary culture and work ethic of the Japanese to help them recover from this terrible tragedy. While the effect on the Japanese people will be long term, we expect the effects on the world economy to be more limited.
As Japan recovers from the massive earthquake, employment improves, and housing stabilizes, there will be little to stop the gradual rising trend in interest rates. Treasury yields for most 5 to 10-year maturities have already risen by a full percentage point since last November, when the Fed announced their intention to print $600 billion by “purchasing” U.S. Treasury bonds. Shifting from recovery mode to a phase of economic expansion, accompanied by high unemployment, a weak housing market, the Japanese earthquake, and the fact that the U.S. is waging multiple wars simultaneously all serve to create multiple opposing pressures on the direction of interest rates. Wars, natural disasters, weak housing markets, and high unemployment tend to push rates lower. Improving economic growth, printing money, and rising inflation expectations tend
to push rates higher. We believe the effects of the latter will eventually outweigh those of the former.
Our current taxable bond strategy continues to be underweighting U.S. Treasury bonds and investing in securities that will minimize the negative effects of rising interest rates (if not directly benefit). Examples include variable rate securities; short average life bonds with high levels of principal repayments 2 to 3 years from now; inflation-linked securities; and short duration, high-coupon, government agency mortgage securities. We have also been able to maintain portfolio yields at levels more than 1% higher than their benchmarks.
Our tax-exempt strategy continues to favor revenue bonds over general obligation bonds with significant weightings in A or BBB rated tax-exempt credits. Tax-exempt bond yields remain quite high relative to taxable bond yields, particularly for intermediate and longer duration bonds. Specifically, the ratio of MMD AAA GO to U.S. Treasuries ended the year at 107% for 30-year bonds and 84% for 10-year bonds versus longer-term averages of 90% and 82%, respectively. Furthermore, yield spreads between AAA and A or BBB tax-exempts also remain quite high. We expect yield ratios between tax-exempts and taxables to decline and quality spreads to narrow as tax-exempt supply normalizes and as credit concerns lessen as state and local bond issuers make progress in moving towards balanced budgets. The slope of the tax-exempt municipal yield curve, as measured by the MMD AAA general obligation curve, steepened markedly over the year to 448 basis points from 385 basis points at the end of last March, placing it at the high end of the range experienced over the last 30 years. As a result, although inflation expectations are increasing modestly, we continue to position municipal portfolios modestly longer than their benchmarks.
All portfolios continue to emphasize high levels of current income and diversification to manage risk. Thank you for your continued interest in the Sit family of mutual funds.
With best wishes,

Roger J. Sit
Chairman and President
Sit Mutual Funds
|
|
Sit High Income Municipal Bond Fund |
OBJECTIVE & STRATEGY
The Fund seeks high current income that is exempt from federal regular income tax. The Fund seeks to achieve its objective by investing primarily in municipal securities that generate interest income that is exempt from regular federal income tax. During normal market conditions, the Fund invests 100% (and, as a fundamental policy, no less than 80%) of its net assets in such tax-exempt municipal securities.
The Fund provided investors with a -0.15% total return for the fiscal year ended March 31, 2011 compared to a +1.61% return for the Barclays Municipal Bond Index. As of March 31, 2011, the Fund’s 30-day SEC yield was 4.08%, and its 12-month distribution rate was 4.92%.
The tax-exempt bond yield curve has steepened considerably over the past twelve months, with short-term rates relatively unchanged at very low levels, while long-term yields rose almost 100 basis points, mainly due to record mutual fund outflows beginning in November 2010, very heavy supply in the fourth quarter of 2010, and the announcement and implementation of additional quantitative easing (QE2), also beginning in November 2010. Spreads widened considerably for lower-rated and non-rated credits during the period. Specifically, spreads widened by over 50 basis points for A-rated credits and over 100 basis points for BBB-rated credits. Much of the spread widening was a result of investors’ reduced appetite for risk, perhaps resulting from predictions of extremely elevated levels of defaults for municipal bonds (a prediction we do not subscribe to, and which has not been borne out thus far in 2011), not weakening credit fundamentals. The Fed is likely on the sidelines in terms of interest rate policy until late 2011 or early 2012. The Fed will need to see sustainable positive growth, a significantly improving employment picture and/or a fanning of inflation to start to raise short-term interest rates. We expect positive but subpar growth, modestly improving employment and moderate but slowly increasing inflation during the remainder of 2011. The Fund’s net asset value fell during this volatile period, falling from $8.72 at March 31, 2010 to $8.29 at March 31, 2011. The Fund experienced a substantial decrease in net assets over the period to approximately $35 million, down from $70 million.
The Fund’s most significant investments during the period were in the other revenue (primarily tax increment financing and land-secured) sector (15%), the multi-family housing (primarily senior living) sector (12%), the education (primarily charter schools) sector (11%), and the healthcare (primarily hospitals) sector (9%). The Fund expects to maintain significant weightings in these sectors over the near term.
HYPOTHETICAL GROWTH OF $10,000
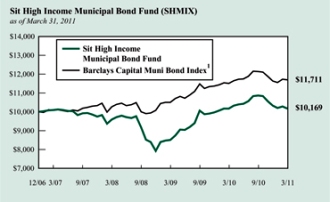
The chart above illustrates the total value of a hypothetical $10,000 investment in the Fund over the past 10 years (or for the life of the Fund if shorter) as compared to the performance of the Barclays Capital Municipal Bond Index. Past performance does not guarantee future results. Returns include the reinvestment of distributions. The chart does not reflect the deduction of taxes that a shareholder would pay on Fund distributions or the redemption of Fund shares.
1 The Barclays Capital Municipal Bond Index is an unmanaged, rules-based, market-value-weighted index for the long-term tax-exempt bond market. The index includes bonds with a minimum credit rating of BBB. The returns include the reinvestment of income and do not include any transaction costs, management fees or other costs. It is not possible to invest directly in an index.
The Fund also maintained a significant cash equivalents position (13%) at March 31 due to the significant amount of redemptions it has been experiencing and may experience going forward. We have shortened the Fund’s average life duration to 6.1 years from 6.3 years during the period. Duration may continue to come down if the Fund continues to shrink.
Michael C. Brilley
Debra A. Sit, CFA
Paul J. Jungquist, CFA
Portfolio Managers
| | |
| | | |
4 | | SIT MUTUAL FUNDS ANNUAL REPORT |
COMPARATIVE RATES OF RETURN
as of March 31 , 2011
| | | | | | |
| | | One Year | | Three Year | | Since Inception (12/31/06) |
Sit High Income Municipal Bond Fund | | -0.15% | | 1.95% | | 0.40% |
Barclays Capital Muni Bond Index 1 | | 1.61 | | 4.46 | | 3.79 |
Barclays Capital High Yield Muni Bond Index/5 Yr 2 | | 6.68 | | 3.93 | | 3.10 |
Composite Index 3 | | 4.14 | | 4.26 | | 3.49 |
Performance figures are historical and do not guarantee future results. Investment returns and principal value will vary, and you may have a gain or loss when you sell shares. Current performance may be lower or higher than the performance data quoted. Contact the Fund for performance data current to the most recent month-end. Returns include changes in share price as well as reinvestment of all dividends and capital gains. Returns do not reflect the deduction of the 2% redemption fee imposed if shares are redeemed or exchanged within 30 calendar days from their date of purchase. If imposed, the fee would reduce the performance quoted. Returns do not reflect the deduction of taxes that a shareholder would pay on Fund distributions or the redemption of Fund shares. Management fees and administrative expenses are included in the Fund’s performance. Returns for periods greater than one year are compounded average annual rates of return.
1 The Barclays Capital Municipal Bond Index is an unmanaged, rules-based, market-value-weighted index for the long-term tax-exempt bond market. The index includes investment grade bonds with a minimum credit rating of BBB. The returns include the reinvestment of income and do not include any transaction costs, management fees or other costs. It is not possible to invest directly in an index.
2 The Barclays Capital 5-Year High Yield Municipal Bond Index is the 5 year (4-6) component of the High-Yield Municipal Bond Index, an unmanaged, rules-based, market-value-weighted index made up of bonds that are non-investment grade, unrated, or rated below BB+.The returns include the reinvestment of income and do not include any transaction costs, management fees or other costs. It is not possible to invest directly in an index.
3 A composite index comprised of 50% Barclays Capital Municipal Bond Index and 50% Barclays Capital 5-Year High-Yield Municipal Bond Index.
FUND DIVERSIFICATION
| | | | |
Other Revenue | | | 15.0 | % |
Insured | | | 12.4 | % |
Multifamily Mortgage Revenue | | | 12.1 | % |
Education/Student Loan | | | 11.2 | % |
Hospital/Health Care | | | 9.0 | % |
Sectors less than 5.0% | | | 27.3 | % |
Cash & other net assets | | | 13.0 | % |
Based on total net assets as of March 31, 2011. Subject to change.
PORTFOLIO SUMMARY
| | |
Net Asset Value 3/31/11: | | $8.29 Per Share |
Net Asset Value 3/31/10: | | $8.72 Per Share |
Total Net Assets: | | $35.3 Million |
30-day SEC Yield 4: | | 4.08% |
Tax Equivalent Yield 5: | | 6.28% |
12-month Distribution Rate 4: | | 4.92% |
Average Maturity: | | 13.0 Years |
Effective Duration 6: | | 6.1 Years |
4 The SEC Yield reflects the rate at which the Fund is earning income on its current portfolio of securities, while the distribution rate reflects the Fund’s past dividends paid to shareholders based on the net investment income distributed and the average NAV during the past 12 months. Accordingly, the Fund’s SEC yield and distribution rate may differ.
5 The tax-equivalent yield is based on an assumed tax rate of 35.0%.
6 Duration is a measure of estimated price sensitivity relative to changes in interest rates. Portfolios with longer durations are typically more sensitive to changes in interest rates. For example, if interest rates rise by 1%, the market value of a security with an effective duration of 5 years would decrease by 5%, with all other factors being constant. The correlation between duration and price sensitivity is greater for securities rated investment-grade than it is for securities rated below investment-grade. Duration estimates are based on assumptions by the Adviser and are subject to a number of limitations. Effective duration is calculated based on historical price changes of securities held by the Fund, and therefore is a more accurate estimate of price sensitivity provided interest rates remain within their historical range.
QUALITY RATINGS (% of Total Net Assets)

| | | | |
Adviser’s Assessment of Non-Rated Securities: |
AAA | | 0.0% | | |
AA | | 0.0 | | |
A | | 2.3 | | |
BBB | | 5.6 | | |
BB | | 8.2 | | |
<BB | | 2.2 | | |
| | | | |
Total | | 18.3% | | |
SCHEDULE OF INVESTMENTS
March 31, 2011
Sit High Income Municipal Bond Fund
| | | | | | | | | | | | | | |
Principal
Amount ($) | | Name of Issuer | | Coupon Rate (%) | | | Maturity
Date | | | Fair Value ($) | |
|
Municipal Bonds - 82.1% | |
Alabama - 0.9% | | | | | | | | | | | | |
| 300,000 | | Bessemer Medical Clinic Rev. (Bessemer Carraway) (NATL-RE Insured) | | | 7.25 | | | | 4/1/15 | | | | 300,816 | |
| | | | | | | | | | | | | | |
Alaska - 1.0% | | | | | | | | | | | | |
| 250,000 | | AK Industrial Dev. & Export Rev. (Boys & Girls Home) | | | 5.50 | | | | 12/1/12 | | | | 200,000 | |
| 150,000 | | Matanuska-Susitna Boro C.O.P (Animal Care) 9 | | | 5.75 | | | | 3/1/23 | | | | 153,354 | |
| | | | | | | | | | | | | | |
| | | | | | | | | | | | | 353,354 | |
| | | | | | | | | | | | | | |
Arizona - 6.2% | | | | | | | | | | | | |
| 1,000,000 | | Goodyear McDowell Rd. Comm. Corridor Improvement Dist. Special Assessment (AMBAC Insured) | | | 5.25 | | | | 1/1/32 | | | | 924,950 | |
| 250,000 | | Pima Co. Industrial Dev. Auth. Education Rev. (AZ Charter Schools Proj.) | | | 6.75 | | | | 7/1/31 | | | | 230,225 | |
| 90,000 | | Pima Co. Industrial Dev. Auth. Education Rev. (Center For Academic Success Proj.) 4 | | | 5.38 | | | | 7/1/22 | | | | 79,565 | |
| 250,000 | | Pima Co. Industrial Dev. Auth. Education Rev. (Coral Academy Science Proj.) | | | 6.38 | | | | 12/1/18 | | | | 244,140 | |
| 250,000 | | Pima Co. Industrial Dev. Auth. Education Rev. (Tucson Country Day School Proj.) | | | 5.00 | | | | 6/1/22 | | | | 213,760 | |
| 505,000 | | Southside Community Special Assessment Rev. (Prescott Valley) | | | 6.13 | | | | 7/1/18 | | | | 475,225 | |
| | | | | | | | | | | | | | |
| | | | | | | | | | | | | 2,167,865 | |
| | | | | | | | | | | | | | |
California - 19.3% | | | | | | | | | | | | |
| 250,000 | | Agua Caliente Band of Cahuilla Indians Rev. 4 | | | 6.00 | | | | 7/1/18 | | | | 235,738 | |
| 250,000 | | CA Finance Auth. Rev. (Kern Regional Center Proj.) 9 | | | 6.88 | | | | 5/1/25 | | | | 257,910 | |
| 250,000 | | CA Finance Auth. Rev. (Literacy First Proj.) | | | 5.50 | | | | 9/1/22 | | | | 226,122 | |
| 250,000 | | CA Health Facs. Finance Auth. Rev. (Sutter Health) (NATL-RE Insured) | | | 5.38 | | | | 8/15/30 | | | | 235,222 | |
| 500,000 | | CA Housing Finance Agency Rev. (Non Ace-Mortgage) | | | 5.45 | | | | 8/1/33 | | | | 474,010 | |
| 250,000 | | CA Hsg. Finance Agy. Home Mtg. Rev. | | | 5.20 | | | | 8/1/28 | | | | 242,130 | |
| 400,000 | | CA Municipal Finance Auth. Educational Fac. Rev. (King/Chavez) | | | 8.00 | | | | 10/1/22 | | | | 440,636 | |
| 250,000 | | CA Municipal Finance Auth. Rev. Sr. Living (Pilgrim Place Claremont) (CA MTG Insured) | | | 5.88 | | | | 5/15/29 | | | | 249,428 | |
| 250,000 | | CA School Facs. Finance Auth. Rev. (Azusa Unified School District) (AGM Insured) 6 | | | 6.00 | | | | 8/1/29 | | | | 174,360 | |
| 350,000 | | CA Statewide Communities Dev. Auth. Rev. (American Baptist) | | | 5.75 | | | | 10/1/25 | | | | 329,500 | |
| 250,000 | | El Paso De Robles Redevelopment Agency Tax Allocation | | | 6.38 | | | | 7/1/33 | | | | 253,728 | |
| 245,000 | | Foothill/Eastern Corridor Agy. Toll Road Rev. Ref. 6 | | | 9.65 | | | | 1/15/22 | | | | 104,020 | |
| 500,000 | | Hartnell Community College G.O. 6 | | | 7.00 | | | | 8/1/34 | | | | 236,295 | |
| 395,000 | | Hawthorne School District G.O. (1997 Election) (NATL-RE Insured) 6 | | | 6.70 | | | | 11/1/26 | | | | 130,397 | |
| 300,000 | | Kern Public Services Fin. Auth. Lease Rev. (County Services Fac. Proj.) 9 | | | 5.25 | | | | 3/1/27 | | | | 284,778 | |
| 1,000,000 | | La Mirada Redevelopment Agency Tax Allocation (Merged Proj.) (NATL-RE Insured) 6 | | | 6.70 | | | | 8/15/27 | | | | 317,580 | |
| 250,000 | | Lancaster Redev. Agy. Tax Allocation (Redev. Projs.) | | | 6.00 | | | | 8/1/24 | | | | 218,132 | |
| 300,000 | | Los Angeles Unified School District C.O.P. (Administration Building Proj.) (AMBAC Insured) 9 | | | 5.00 | | | | 10/1/31 | | | | 262,956 | |
| 150,000 | | Mill Valley C.O.P. (The Redwoods) (NATL-RE IBC CA MTG Insured) | | | 5.75 | | | | 12/1/20 | | | | 150,486 | |
| 250,000 | | Palmdale Community Redev. Agy. Tax Allocation (AMBAC Insured) 6 | | | 6.95 | | | | 12/1/20 | | | | 137,412 | |
| 250,000 | | Richmond Joint Powers Lease Rev. (Point Potrero) | | | 6.25 | | | | 7/1/24 | | | | 262,580 | |
| 200,000 | | Riverside Co. Asset Leasing Rev. (Riverside Co. Hospital) (NATL-RE Insured) 6, 9 | | | 6.60 | | | | 6/1/24 | | | | 77,890 | |
| 250,000 | | Rohnert Park Community Dev. Tax Allocation (NATL-RE Insured) 6 | | | 7.75 | | | | 8/1/30 | | | | 58,483 | |
| 250,000 | | San Gorgonio Health Care G.O. (Election 2006) | | | 7.00 | | | | 8/1/27 | | | | 265,142 | |
| 250,000 | | South Bayside Waste Management Rev. (Shoreway Environmental Center) | | | 6.25 | | | | 9/1/29 | | | | 258,740 | |
| 350,000 | | Sulphur Springs Union School District C.O.P. Capital Appreciation (AGM Insured) 6 | | | 6.50 | | | | 12/1/37 | | | | 253,890 | |
| 500,000 | | Tustin Unified School District G.O. Capital Appreciation 6 | | | 6.05 | | | | 8/1/28 | | | | 291,675 | |
| 500,000 | | Val Verde Unified School District G.O. Capital Appreciation (AGM Insured) 6 | | | 6.13 | | | | 8/1/34 | | | | 225,805 | |
| 235,000 | | Vallejo City Unified School District Special Tax (Community Facilities District No. 2) (XLCA Insured) | | | 4.15 | | | | 9/1/31 | | | | 153,185 | |
| | | | | | | | | | | | | | |
| | | | | | | | | | | | | 6,808,230 | |
| | | | | | | | | | | | | | |
Colorado - 1.4% | | | | | | | | | | | | |
| 250,000 | | CO Education & Cultural Facs. Auth. Rev. (CO Springs Charter Academy Proj.) | | | 5.60 | | | | 7/1/34 | | | | 225,110 | |
| 1,000,000 | | E-470 Public Highway Auth. Rev. Capital Appreciation (NATL-RE Insured) 6 | | | 6.20 | | | | 9/1/28 | | | | 272,770 | |
| | | | | | | | | | | | | | |
| | | | | | | | | | | | | 497,880 | |
| | | | | | | | | | | | | | |
| | |
See accompanying notes to financial statements. | | |
6 | | SIT MUTUAL FUNDS ANNUAL REPORT |
| | | | | | | | | | | | | | |
Principal
Amount ($) | | Name of Issuer | | Coupon
Rate (%) | | | Maturity
Date | | | Fair
Value ($) | |
Florida - 1.3% | | | | | | | | | | | | |
| 100,000 | | Connerton West Community Dev. District Cap. Improvement Special Assessment Rev. (Pasco Co.) 2, 5 | | | 5.13 | | | | 5/1/16 | | | | 39,970 | |
| 250,000 | | Gramercy Farms Community Dev. District Special Assessment 2, 5 | | | 5.10 | | | | 5/1/14 | | | | 109,600 | |
| 150,000 | | Highlands Co. Health Facs. Auth. Rev. (Adventist Health) 1 | | | 5.00 | | | | 11/15/31 | | | | 138,375 | |
| 400,000 | | Miami-Dade Co. Special Obligation Rev. Ref. Sub. (NATL-RE Insured) 6 | | | 7.01 | | | | 10/1/24 | | | | 161,276 | |
| 25,000 | | Waters Edge Community Dev. District Cap. Improvement Special Assessment Rev. 2, 5 | | | 5.00 | | | | 11/1/12 | | | | 10,983 | |
| | | | | | | | | | | | | | |
| | | | | | | | | | | | | 460,204 | |
| | | | | | | | | | | | | | |
Georgia - 2.1% | | | | | | | | | | | | |
| 150,000 | | Atlanta Tax Allocation (Eastside Proj.) | | | 5.60 | | | | 1/1/30 | | | | 137,446 | |
| 500,000 | | Gainesville & Hall Co. Development Auth. Rev. | | | 6.38 | | | | 11/15/29 | | | | 503,410 | |
| 100,000 | | Medical Center Hospital Auth. Rev. Ref. (Spring Harbor Green Island Proj.) | | | 5.25 | | | | 7/1/27 | | | | 81,651 | |
| | | | | | | | | | | | | | |
| | | | | | | | | | | | | 722,507 | |
| | | | | | | | | | | | | | |
Hawaii - 1.0% | | | | | | | | | | | | |
| 350,000 | | Hawaii State Dept. of Budget & Fin. Special Purpose Rev. (Kahala Nui Proj.) | | | 8.00 | | | | 11/15/33 | | | | 365,250 | |
| | | | | | | | | | | | | | |
Idaho - 2.1% | | | | | | | | | | | | |
| 300,000 | | ID Hsg. & Fin. Assoc. Economic Dev. Rev. (TDF Facs. Proj. Recovery Zone Facs.) | | | 6.50 | | | | 2/1/26 | | | | 299,964 | |
| 250,000 | | ID Hsg. & Fin. Assoc. Nonprofit Facs. Rev. (Compass Public Charter School Proj.) | | | 5.50 | | | | 7/1/30 | | | | 200,972 | |
| 150,000 | | ID Hsg. & Fin. Assoc. Nonprofit Facs. Rev. (Liberty Charter School Proj.) | | | 5.50 | | | | 6/1/21 | | | | 140,328 | |
| 100,000 | | ID Hsg. & Fin. Assoc. Nonprofit Facs. Rev. (North Star Charter School) | | | 9.00 | | | | 7/1/21 | | | | 110,443 | |
| | | | | | | | | | | | | | |
| | | | | | | | | | | | | 751,707 | |
| | | | | | | | | | | | | | |
Illinois - 7.5% | | | | | | | | | | | | |
| 320,000 | | Cook Co. School District No. 148 Rev. (Dolton) | | | 5.50 | | | | 12/1/27 | | | | 294,717 | |
| 210,000 | | IL Dev. Fin. Auth. Rev. (Provena Health) (NATL-RE Insured) | | | 5.13 | | | | 5/15/23 | | | | 197,942 | |
| 170,000 | | IL Fin. Auth. Rev. (Community Rehab. Providers Facs.) | | | 4.20 | | | | 7/1/11 | | | | 169,199 | |
| 150,000 | | IL Fin. Auth. Rev. (Elmhurst Memorial) | | | 5.63 | | | | 1/1/37 | | | | 127,574 | |
| 205,000 | | IL Fin. Auth. Rev. (International Ice Center) 2, 5 | | | 7.00 | | | | 12/1/35 | | | | 18,382 | |
| 250,000 | | IL Fin. Auth. Rev. (Noble Network Charter School) (ACA Insured) | | | 5.00 | | | | 9/1/27 | | | | 186,922 | |
| 250,000 | | IL Fin. Auth. Rev. (Rush Univ. Medical Center) | | | 6.38 | | | | 11/1/29 | | | | 255,438 | |
| 100,000 | | IL Fin. Auth. Rev. (Wesleyan Univ.) (CIFG Insured) | | | 4.20 | | | | 9/1/20 | | | | 89,871 | |
| 200,000 | | IL Fin. Auth. Sports Facs. Rev. (North Shore Ice Arena Proj.) | | | 6.25 | | | | 12/1/38 | | | | 139,432 | |
| 150,000 | | IL Health Facs. Auth. Rev. (Centegra Health Sys.) (AMBAC-TCRS Insured) | | | 5.25 | | | | 9/1/24 | | | | 136,502 | |
| 100,000 | | IL Health Facs. Auth. Rev. Ref. (Sinai Health) (FHA Insured) | | | 5.00 | | | | 8/15/24 | | | | 100,661 | |
| 100,000 | | Lake Co. Community School District #3 G.O. (Beach Park) (AMBAC Insured) 6 | | | 6.47 | | | | 2/1/19 | | | | 71,983 | |
| 82,000 | | Manhattan Special Service Area Special Tax No. 07-6 (Groebe Farm-Stonegate) 2, 5 | | | 5.75 | | | | 3/1/22 | | | | 32,767 | |
| 500,000 | | Railsplitter Tobacco Settlement Auth. Rev. | | | 6.25 | | | | 6/1/24 | | | | 499,500 | |
| 500,000 | | Winnebago & Stephenson Co. G.O. (School District 321) (NATL-RE FGIC Insured) 6 | | | 5.25 | | | | 1/1/19 | | | | 339,195 | |
| | | | | | | | | | | | | | |
| | | | | | | | | | | | | 2,660,085 | |
| | | | | | | | | | | | | | |
Indiana - 2.3% | | | | | | | | | | | | |
| 370,000 | | East Chicago Redev. Tax Allocation (Harborside) | | | 5.50 | | | | 1/15/16 | | | | 373,704 | |
| 250,000 | | Hammond Public Improvement Board Rev. | | | 6.50 | | | | 8/15/25 | | | | 252,620 | |
| 100,000 | | Richmond Hospital Auth. Rev. (Reid Hospital) | | | 6.50 | | | | 1/1/29 | | | | 105,264 | |
| 150,000 | | St. Joseph Co. Hospital Auth. Health Facs. Rev. (Madison Center) 2, 5 | | | 5.80 | | | | 2/15/24 | | | | 27,735 | |
| 250,000 | | St. Joseph Co. Hospital Auth. Health Facs. Rev. (Madison Center) 2, 5 | | | 5.25 | | | | 2/15/28 | | | | 46,225 | |
| | | | | | | | | | | | | | |
| | | | | | | | | | | | | 805,548 | |
| | | | | | | | | | | | | | |
Iowa - 0.6% | | | | | | | | | | | | |
| 100,000 | | IA Finance Auth. Sr. Living Facs. Rev. (Deerfield Retirement Community, Inc.) | | | 5.00 | | | | 11/15/21 | | | | 73,995 | |
| 200,000 | | IA Finance Auth. Sr. Living Facs. Rev. (Deerfield Retirement Community, Inc.) | | | 5.50 | | | | 11/15/27 | | | | 139,540 | |
| | | | | | | | | | | | | | |
| | | | | | | | | | | | | 213,535 | |
| | | | | | | | | | | | | | |
| | |
See accompanying notes to financial statements. | | |
MARCH 31, 2011 | | 7 |
SCHEDULE OF INVESTMENTS
March 31, 2011
Sit High Income Municipal Bond Fund (Continued)
| | | | | | | | | | | | | | |
Principal
Amount ($) | | Name of Issuer | | Coupon
Rate (%) | | | Maturity
Date | | | Fair Value ($) | |
Louisiana - 1.3% | | | | | | | | | | | | |
| 195,000 | | LA Local Govt. Rev. (Capital Projects & Equipment Acquisition) (ACA Insured) | | | 6.55 | | | | 9/1/25 | | | | 195,203 | |
| 250,000 | | LA Public Facs. Auth. Hospital Rev. | | | 6.75 | | | | 7/1/39 | | | | 256,152 | |
| | | | | | | | | | | | | | |
| | | | | | | | | | | | | 451,355 | |
| | | | | | | | | | | | | | |
Maine - 0.4% | | | | | | | | | | | | |
| 150,000 | | ME Education Auth. Student Loan Rev. (Assured Guaranty) | | | 5.63 | | | | 12/1/27 | | | | 151,600 | |
| | | | | | | | | | | | | | |
Michigan - 2.6% | | | | | | | | | | | | |
| 345,000 | | Advanced Technology Academy Public School Rev. | | | 6.00 | | | | 11/1/28 | | | | 298,804 | |
| 100,000 | | Detroit Sewage Disposal System Rev. Ref. Second Lien (NATL-RE Insured) | | | 5.50 | | | | 7/1/22 | | | | 103,992 | |
| 200,000 | | MI Public Education Facs. Auth. Rev. Ref. (Bradford Academy) | | | 8.00 | | | | 9/1/21 | | | | 214,978 | |
| 155,000 | | MI Public Education Facs. Auth. Rev. Ref. (Bradford Proj.) 4 | | | 6.00 | | | | 9/1/16 | | | | 155,843 | |
| 150,000 | | MI Strategic Fund Rev. Ref. (Detroit Edison) (XLCA-ICR Insured) | | | 5.45 | | | | 9/1/29 | | | | 150,003 | |
| | | | | | | | | | | | | | |
| | | | | | | | | | | | | 923,620 | |
| | | | | | | | | | | | | | |
Minnesota - 2.9% | | | | | | | | | | | | |
| 500,000 | | Minneapolis Mulitfamily Hsg. Rev. (Riverside Plaza) | | | 6.00 | | | | 11/1/13 | | | | 496,325 | |
| 400,000 | | St. Paul Port Auth. Solid Waste Disposal Rev. (Ecullet Proj.) | | | 6.25 | | | | 11/1/15 | | | | 404,888 | |
| 115,000 | | White Earth Band of Chippewa Indians Rev. (ACA Insured) | | | 7.00 | | | | 12/1/11 | | | | 117,073 | |
| | | | | | | | | | | | | | |
| | | | | | | | | | | | | 1,018,286 | |
| | | | | | | | | | | | | | |
Missouri - 2.8% | | | | | | | | | | | | |
| 500,000 | | Kansas City Industrial Dev. Auth. Multifamily Hsg. Rev. (Grand Blvd. Lofts) | | | 5.00 | | | | 1/1/12 | | | | 499,815 | |
| 250,000 | | Kirkwood Industrial Dev. Auth. Retirement Community Rev. | | | 8.00 | | | | 5/15/21 | | | | 255,638 | |
| 250,000 | | MO Health & Educational Facs. Auth. (Senior Living Facs.-Lutheran Senior) | | | 5.38 | | | | 2/1/35 | | | | 213,980 | |
| | | | | | | | | | | | | | |
| | | | | | | | | | | | | 969,433 | |
| | | | | | | | | | | | | | |
Nebraska - 0.7% | | | | | | | | | | | | |
| 250,000 | | Nebraska Investment Fin. Auth. Single Family Hsg. Rev. (GNMA/FNMA/FHLMC Collateralized) | | | 5.90 | | | | 9/1/36 | | | | 256,152 | |
| | | | | | | | | | | | | | |
Nevada - 1.7% | | | | | | | | | | | | |
| 200,000 | | Mesquite Redev. Agy. Tax Allocation Rev. | | | 6.00 | | | | 6/1/15 | | | | 211,670 | |
| 300,000 | | Sparks Tourism Improvement District No. 1 Sr. Sales Tax Rev. 4 | | | 6.50 | | | | 6/15/20 | | | | 270,303 | |
| 150,000 | | Sparks Tourism Improvement District No. 1 Sr. Sales Tax Rev. 4 | | | 6.75 | | | | 6/15/28 | | | | 123,086 | |
| | | | | | | | | | | | | | |
| | | | | | | | | | | | | 605,059 | |
| | | | | | | | | | | | | | |
New Hampshire - 0.4% | | | | | | | | | | | | |
| 600,000 | | Manchester Hsg. & Redev. Auth. Rev. (ACA Insured) 6 | | | 7.60 | | | | 1/1/27 | | | | 130,194 | |
| | | | | | | | | | | | | | |
North Dakota - 0.7% | | | | | | | | | | | | |
| 250,000 | | ND Hsg. Fin. Agency (Home Mtge. Fin.) (GO of AGY. Insured) | | | 5.05 | | | | 7/1/40 | | | | 235,438 | |
| | | | | | | | | | | | | | |
Ohio - 2.3% | | | | | | | | | | | | |
| 138,500 | | Cuyahoga Co. Hsg. Mtg. Sr. Rev. (R H Myers Apts. Proj.) (GNMA Collateralized) | | | 5.70 | | | | 3/20/42 | | | | 141,429 | |
| 205,000 | | Hamilton Co. Healthcare Rev. Ref. (Life Enriching) | | | 5.00 | | | | 1/1/27 | | | | 177,128 | |
| 150,000 | | Ross Co. Hospital Rev. Ref. (Adena Health System) | | | 5.75 | | | | 12/1/28 | | | | 149,656 | |
| 250,000 | | Toledo-Lucas Co. Special Assessment Rev. (Crocker Park) | | | 5.38 | | | | 12/1/35 | | | | 197,915 | |
| 170,000 | | Toledo-Lucas Co. Special Assessment Rev. (Town Square) | | | 5.40 | | | | 11/1/36 | | | | 126,859 | |
| | | | | | | | | | | | | | |
| | | | | | | | | | | | | 792,987 | |
| | | | | | | | | | | | | | |
Oregon - 1.3% | | | | | | | | | | | | |
| 200,000 | | Redmond Airport Rev. | | | 5.50 | | | | 6/1/24 | | | | 195,230 | |
| 300,000 | | Western Generation Agy. Rev. (Wauna Cogeneration) | | | 5.00 | | | | 1/1/21 | | | | 267,447 | |
| | | | | | | | | | | | | | |
| | | | | | | | | | | | | 462,677 | |
| | | | | | | | | | | | | | |
| | |
See accompanying notes to financial statements. | | |
8 | | SIT MUTUAL FUNDS ANNUAL REPORT |
| | | | | | | | | | | | | | |
Principal
Amount ($) | | Name of Issuer | | Coupon
Rate (%) | | | Maturity
Date | | | Fair Value ($) | |
Pennsylvania - 3.6% | | | | | | | | | | | | |
| 250,000 | | Erie Co. Hospital Auth. Rev. (St. Vincent Health Center Proj.) | | | 7.00 | | | | 7/1/27 | | | | 242,890 | |
| 500,000 | | Luzerne Co. G.O. (FSA Insured) | | | 7.00 | | | | 11/1/26 | | | | 543,960 | |
| 500,000 | | PA Turnpike Commission Rev. Capital Appreciation (AGM Insured) 6 | | | 6.25 | | | | 6/1/33 | | | | 386,125 | |
| 100,000 | | Quakertown General Auth. Health Rev. (Lifequest) (GNMA Collateralized) | | | 6.05 | | | | 7/20/24 | | | | 103,413 | |
| | | | | | | | | | | | | | |
| | | | | | | | | | | | | 1,276,388 | |
| | | | | | | | | | | | | | |
Puerto Rico - 1.0% | | | | | | | | | | | | |
| 500,000 | | Puerto Rico Sales Tax Financing Corp. Rev. 6 | | | 6.13 | | | | 8/1/29 | | | | 340,100 | |
| | | | | | | | | | | | | | |
Rhode Island - 0.5% | | | | | | | | | | | | |
| 200,000 | | RI Hsg. & Mtge. Fin. Corp. (Multifamily Dev.) | | | 5.63 | | | | 10/1/40 | | | | 192,086 | |
| | | | | | | | | | | | | | |
Tennessee - 0.8% | | | | | | | | | | | | |
| 250,000 | | Metro Govt. Nashville & Davidson Co. Industrial Dev. Board Rev. Escrowed to Maturity | | | 9.75 | | | | 2/15/15 | | | | 277,900 | |
| | | | | | | | | | | | | | |
Texas - 8.4% | | | | | | | | | | | | |
| 350,000 | | Arlington Higher Education Finance Corp., Education Rev. (Arlington Classics Academy) | | | 7.00 | | | | 8/15/28 | | | | 333,442 | |
| 500,000 | | Bexar Co. Hsg. Fin. Corp. Rev. (American Opportunity) (NATL-RE Insured) | | | 5.70 | | | | 1/1/21 | | | | 454,560 | |
| 100,000 | | Bexar Co. Hsg. Fin. Corp. Rev. (American Opportunity) (NATL-RE Insured) | | | 5.80 | | | | 1/1/31 | | | | 82,615 | |
| 150,000 | | Bexar Co. Hsg. Fin. Corp. Rev. (Dymaxion & Marbach Park Apts. Proj.) (NATL-RE Insured) | | | 6.10 | | | | 8/1/30 | | | | 129,546 | |
| 300,000 | | Brazos Co. Health Facs. Development Corp. Rev. (Franciscan Services Corp.) | | | 5.38 | | | | 1/1/32 | | | | 270,648 | |
| 250,000 | | Clifton Higher Education Finance Corp. Education Rev. (Uplift Education Proj.) | | | 6.00 | | | | 12/1/30 | | | | 216,085 | |
| 95,000 | | Clifton Higher Education Rev. Ref. (Tejano Center Community) | | | 7.75 | | | | 2/15/18 | | | | 106,424 | |
| 162,877 | | Galveston Co. Municipal Utilities Bond Anticipation Notes Rev. | | | 6.16 | | | | 9/1/11 | | | | 130,106 | |
| 55,000 | | Harris Co. Hsg. Fin. Corp. Multi Family Hsg. Rev. Sr. Lien (Windsor Hsg. Found.) Escrowed to Maturity | | | 6.30 | | | | 6/1/25 | | | | 55,237 | |
| 350,000 | | Houston Hotel Occupancy Tax & Special Rev. (AMBAC Insured) 6 | | | 6.34 | | | | 9/1/23 | | | | 159,702 | |
| 185,000 | | Rio Grande Valley Health Facs. Dev. Corp. Hospital Rev. (Valley Baptist) (NATL-RE Insured) | | | 6.40 | | | | 8/1/12 | | | | 185,209 | |
| 250,000 | | Tarrant Co. Cultural Education Facs. Fin. Rev. (Mirador Proj.) | | | 7.75 | | | | 11/15/19 | | | | 248,728 | |
| 395,000 | | Tom Green Co. Hsg. Finance Corp. Mtg. Rev. 6 | | | 28.62 | | | | 3/1/16 | | | | 68,193 | |
| 500,000 | | TX Private Activity Surface Transportation Corp. Rev. (LBJ Infrastructure) | | | 7.50 | | | | 6/30/33 | | | | 528,230 | |
| | | | | | | | | | | | | | |
| | | | | | | | | | | | | 2,968,725 | |
| | | | | | | | | | | | | | |
Utah - 0.8% | | | | | | | | | | | | |
| 200,000 | | Provo Charter School Rev. (Freedom Academy Foundation) | | | 5.50 | | | | 6/15/37 | | | | 140,834 | |
| 200,000 | | UT Associated Municipal Power System Rev. | | | 5.00 | | | | 5/1/27 | | | | 157,214 | |
| | | | | | | | | | | | | | |
| | | | | | | | | | | | | 298,048 | |
| | | | | | | | | | | | | | |
Virginia - 0.7% | | | | | | | | | | | | |
| 245,000 | | VA Housing Development Auth. Commonwealth Mortgage Rev. (G.O. of Auth. Insured) | | | 6.00 | | | | 7/1/25 | | | | 257,899 | |
| | | | | | | | | | | | | | |
Washington - 2.1% | | | | | | | | | | | | |
| 500,000 | | WA Health Care Auth. Rev. (Seattle Cancer Care) | | | 7.13 | | | | 3/1/29 | | | | 533,380 | |
| 100,000 | | WA Hsg. Finance Commission Nonprofit Rev. (Skyline at First Hill Proj.) | | | 5.10 | | | | 1/1/13 | | | | 93,677 | |
| 150,000 | | WA Hsg. Finance Commission Nonprofit Rev. (Skyline at First Hill Proj.) | | | 5.25 | | | | 1/1/17 | | | | 121,766 | |
| | | | | | | | | | | | | | |
| | | | | | | | | | | | | 748,823 | |
| | | | | | | | | | | | | | |
Wisconsin - 1.4% | | | | | | | | | | | | |
| 110,000 | | Milwaukee Redev. Auth. Rev. (Academy of Learning) | | | 5.50 | | | | 8/1/22 | | | | 92,128 | |
| 290,000 | | WI Health & Education Facs. Auth. Rev. (Aurora Health Care Proj.) | | | 6.40 | | | | 4/15/33 | | | | 292,407 | |
| 100,000 | | WI Health & Education Facs. Auth. Rev. Ref. (Three Pillars) | | | 5.75 | | | | 8/15/26 | | | | 95,993 | |
| | | | | | | | | | | | | | |
| | | | | | | | | | | | | 480,528 | |
| | | | | | | | | | | | | | |
Total Municipal Bonds
(cost: $30,650,005) | | | | | | | | | | | 28,944,279 | |
| | | | | | | | | | | | | | |
| | |
See accompanying notes to financial statements. | | |
MARCH 31, 2011 | | 9 |
SCHEDULE OF INVESTMENTS
March 31, 2011
Sit High Income Municipal Bond Fund (Continued)
| | | | | | |
| Quantity | | Name of Issuer | | Fair Value ($) | |
Closed-End Mutual Funds - 4.9% | |
| 40,000 | | BlackRock Long-Term Municipal Advantage Trust (BTA) | | | 409,200 | |
| 35,000 | | DWS Municipal Income Trust (KTF) | | | 407,750 | |
| 26,000 | | Invesco Van Kampen Advantage Muni Income Trust (VKI) | | | 293,020 | |
| 19,700 | | Invesco Van Kampen Trust for Investment Grade Municipals (VGM) | | | 264,768 | |
| 75,000 | | MFS High Income Municipal Trust (CXE) | | | 353,250 | |
| | | | | | |
| |
Total Closed-End Mutual Funds
(cost: $1,666,894) | | | 1,727,988 | |
| | | | | | |
|
Short-Term Securities - 12.0% | |
| 4,237,180 | | Dreyfus Tax-Exempt Cash Management Fund, 0.07% | | | | |
Total Short-Term Securities
(cost: $4,237,180) | | | 4,237,180 | |
| | | | | | |
| |
Total Investments in Securities - 99.0%
(cost: $36,554,079) | | | 34,909,447 | |
Other Assets and Liabilities, net - 1.0% | | | 359,916 | |
| | | | | | |
| |
Total Net Assets - 100.0% | | $ | 35,269,363 | |
| | | | | | |
| 1 | Variable rate security. Rate disclosed is as of March 31, 2011. |
| 2 | Securities considered illiquid by the Investment Adviser. The total value of such securities as of March 31, 2011 was $285,662 and represented 0.8% of net assets. |
| 4 | 144A Restricted Security. The total value of such securities as of March 31, 2011 was $864,535 and represented 2.5% of net assets. These securities have have been determined to be liquid by the Adviser in accordance with guidelines established by the Board of Directors. |
| 5 | The issuer is in default of certain debt covenants. Income is not being accrued. The total value of such securities as of March 31, 2011 was $285,662 and represented 0.8% of net assets. |
| 6 | Zero coupon security. Rate disclosed is the effective yield on purchase date. |
| 9 | Municipal Lease Security. The total value of such securities as of March 31, 2011 was $1,036,888 and represented 2.9% of net assets. These securities have been determined to be liquid by the Adviser in accordance with guidelines established by the Board of Directors. |
Numeric footnotes not disclosed are not applicable to this Schedule of Investments.
A summary of the inputs used to value the Fund’s net assets as of March 31, 2011 is as follows (see Note 2 - significant accounting policies in the notes to financial statements):
| | | | | | | | | | | | | | |
| | | Investment in Securities | |
| | | Level 1
Quoted
Price ($) | | | Level 2
Other significant
observable inputs ($) | | | Level 3
Significant
unobservable inputs ($) | | Total ($) | |
Short-Term Securities | | | 4,237,180 | | | | — | | | — | | | 4,237,180 | |
Closed-End Mutual Funds | | | 1,727,988 | | | | — | | | — | | | 1,727,988 | |
Municipal Bonds | | | — | | | | 28,944,279 | | | — | | | 28,944,279 | |
| | | | |
Total: | | | 5,965,168 | | | | 28,944,279 | | | — | | | 34,909,447 | |
| | | | |
| | |
See accompanying notes to financial statements. | | |
10 | | SIT MUTUAL FUNDS ANNUAL REPORT |
STATEMENT OF ASSETS AND LIABILITIES
March 31, 2011
Sit High Income Municipal Bond Fund
| | | | |
ASSETS | | | | |
Investments in securities, at identified cost | | | $36,554,079 | |
| | | | |
| |
Investments in securities, at fair value - see accompanying schedule for detail | | | $34,909,447 | |
Cash in bank on demand deposit | | | 8,540 | |
Accrued interest and dividends receivable | | | 432,768 | |
Receivable for investment securities sold | | | 264,165 | |
Other receivables | | | 625 | |
| | | | |
| |
Total assets | | | 35,615,545 | |
| | | | |
| |
LIABILITIES | | | | |
Payable for Fund shares redeemed | | | 265,678 | |
Cash portion of dividends payable to shareholders | | | 32,790 | |
Accrued investment management fees | | | 47,714 | |
| | | | |
| |
Total liabilities | | | 346,182 | |
| | | | |
| |
Net assets applicable to outstanding capital stock | | | $35,269,363 | |
| | | | |
| |
Net assets consist of: | | | | |
Capital (par value and paid-in surplus) | | | $40,920,788 | |
Undistributed (distributions in excess of) net investment income | | | (26,700 | ) |
Accumulated net realized gain (loss) from security transactions | | | (3,980,093 | ) |
Unrealized appreciation (depreciation) on investments | | | (1,644,632 | ) |
| | | | |
| | | $35,269,363 | |
| | | | |
| |
Outstanding shares | | | 4,253,180 | |
| | | | |
| |
Net asset value per share of outstanding capital stock | | | $8.29 | |
| | | | |
| | |
See accompanying notes to financial statements. | | |
MARCH 31, 2011 | | 11 |
STATEMENT OF OPERATIONS
Year Ended March 31, 2011
Sit High Income Municipal Bond Fund
| | | | |
| |
Investment income: | | | | |
Income: | | | | |
Dividends | | | $150,317 | |
Interest | | | 4,337,290 | |
| | | | |
Total income | | | 4,487,607 | |
| | | | |
| |
Expenses (note 4): | | | | |
Investment management fees | | | 460,274 | |
Regulatory expenses | | | 45,971 | |
Fund administration services | | | 135,889 | |
Custodian fees | | | 6,084 | |
| | | | |
Total expenses | | | 648,218 | |
| | | | |
| |
Net investment income | | | 3,839,389 | |
| | | | |
| |
Realized and unrealized gain (loss) on investments: | | | | |
Net realized gain (loss) on investments | | | (2,977,190 | ) |
| |
Net change in unrealized appreciation (depreciation) on investments | | | (959,664 | ) |
| | | | |
| |
Net gain (loss) on investments | | | (3,936,854 | ) |
| | | | |
| |
Net increase (decrease) in net assets resulting from operations | | | ($97,465 | ) |
| | | | |
| | |
See accompanying notes to financial statements. | | |
12 | | SIT MUTUAL FUNDS ANNUAL REPORT |
STATEMENTS OF CHANGES IN NET ASSETS
Sit High Income Municipal Bond Fund
| | | | | | | | |
| | | Year
Ended
March 31,
2011 | | | Year
Ended
March 31,
2010 | |
Operations: | | | | | | | | |
Net investment income | | | $3,839,389 | | | | $2,758,525 | |
Net realized gain (loss) on investments | | | (2,977,190 | ) | | | (55,259 | ) |
Net change in unrealized appreciation (depreciation) of investments | | | (959,664 | ) | | | 6,248,944 | |
| | | | | | | | |
| | |
Net increase (decrease) in net assets resulting from operations | | | (97,465 | ) | | | 8,952,210 | |
| | | | | | | | |
| | |
Distributions from: | | | | | | | | |
Net investment income | | | (3,839,389 | ) | | | (2,758,525 | ) |
Net realized gains on investments | | | — | | | | — | |
| | | | | | | | |
| | |
Total distributions | | | (3,839,389 | ) | | | (2,758,525 | ) |
| | | | | | | | |
| | |
Capital share transactions: | | | | | | | | |
Proceeds from shares sold | | | 28,013,514 | | | | 34,802,159 | |
Reinvested distributions | | | 3,683,596 | | | | 2,315,720 | |
Payments for shares redeemed | | | (62,394,317 | ) | | | (7,110,442 | ) |
| | | | | | | | |
| | |
Increase (decrease) in net assets from capital transactions | | | (30,697,207 | ) | | | 30,007,437 | |
| | | | | | | | |
| | |
Total increase (decrease) in net assets | | | (34,634,061 | ) | | | 36,201,122 | |
| | |
Net assets: | | | | | | | | |
Beginning of period | | | 69,903,424 | | | | 33,702,302 | |
| | | | | | | | |
End of period * | | | $35,269,363 | | | | $69,903,424 | |
| | | | | | | | |
| | |
Capital transactions in shares: | | | | | | | | |
Sold | | | 3,188,268 | | | | 4,166,672 | |
Reinvested distributions | | | 420,099 | | | | 275,269 | |
Redeemed | | | (7,370,426 | ) | | | (824,541 | ) |
| | | | | | | | |
| | |
Net increase (decrease) | | | (3,762,059 | ) | | | 3,617,400 | |
| | | | | | | | |
* includes undistributed (distributions in excess of) net investment income. | | | ($26,700 | ) | | | $— | |
| | |
See accompanying notes to financial statements. | | |
MARCH 31, 2011 | | 13 |
FINANCIAL HIGHLIGHTS
Per share income and capital changes for a share outstanding throughout the period.
Sit High Income Municipal Bond Fund
| | | | | | | | | | | | | | | | | | | | |
| | | Year Ended March 31, | | | Three Months Ended March 31, 1 | |
| | | 2011 | | | 2010 | | | 2009 | | | 2008 | | | 2007 | |
Net Asset Value: | | | | | | | | | | | | | | | | | | | | |
Beginning of period | | | $8.72 | | | | $7.66 | | | | $9.12 | | | | $10.01 | | | | $10.00 | |
Operations: | | | | | | | | | | | | | | | | | | | | |
Net investment income 2 | | | 0.43 | | | | 0.43 | | | | 0.44 | | | | 0.41 | | | | 0.08 | |
Net realized and unrealized gains (losses) on investments | | | (0.43 | ) | | | 1.06 | | | | (1.46 | ) | | | (0.89 | ) | | | 0.01 | |
Total from operations | | | — | | | | 1.49 | | | | (1.02 | ) | | | (0.48 | ) | | | 0.09 | |
Distributions from: | | | | | | | | | | | | | | | | | | | | |
Net investment income | | | (0.43 | ) | | | (0.43 | ) | | | (0.44 | ) | | | (0.41 | ) | | | (0.08 | ) |
Net Asset Value: | | | | | | | | | | | | | | | | | | | | |
End of period | | | $8.29 | | | | $8.72 | | | | $7.66 | | | | $9.12 | | | | $10.01 | |
Total investment return 3 | | | (0.15% | ) | | | 19.84% | | | | (11.45% | ) | | | (4.89% | ) | | | 0.90% | |
Net assets at end of period (000’s omitted) | | | $35,269 | | | | $69,903 | | | | $33,702 | | | | $24,777 | | | | $9,480 | |
| | | | | |
Ratios: 4 | | | | | | | | | | | | | | | | | | | | |
Expenses (without waiver) 5 | | | 0.84% | | | | 0.91% | | | | 0.93% | | | | 1.14% | | | | 4.69% | |
Expenses (with waiver) 5 | | | n/a | | | | n/a | | | | 0.85% | | | | 0.85% | | | | 0.85% | |
Net investment income (with waiver) | | | 5.00% | | | | 5.13% | | | | 5.26% | | | | 4.30% | | | | 3.18% | |
| | | | | |
Portfolio turnover rate (excluding short-term securities) | | | 43.42% | | | | 24.20% | | | | 29.27% | | | | 19.38% | | | | 0.00% | |
| 1 | Fund commenced operations on December 31, 2006. |
| 2 | The net investment income per share is based on average shares outstanding for the period. |
| 3 | Total investment return is based on the change in net asset value of a share during the period and assumes reinvestment of distributions at net asset value. |
| 4 | The ratio information is calculated based on average daily net assets (annualized). Prior to March 31, 2009, total Fund expenses were limited to 0.85% of average daily net assets. During those periods, the investment adviser voluntarily absorbed expenses that were otherwise payable by the Fund. |
| 5 | In addition to fees and expenses which the Fund bears directly, the Fund indirectly bears a pro rata share of the fees and expenses of the acquired funds in which it invests. Such indirect expenses are not included in the above reported expense ratios. |
| | |
| | | |
14 | | SIT MUTUAL FUNDS ANNUAL REPORT |
NOTES TO FINANCIAL STATEMENTS
Year Ended March 31, 2011
The Sit High Income Municipal Bond Fund (the Fund) is a no-load fund, and is registered under the Investment Company Act of 1940 (as amended) as a diversified, open-end management investment company, or series thereof. The Fund is a series fund of Sit Mutual Funds II, Inc. The Fund has 10 billion authorized shares of capital stock that have a par value of $0.001. The Fund’s objective is to seek high current income that is exempt from federal regular income tax.
| (2) | Significant Accounting Policies |
Short-Term Trading (Redemption) Fees
The Fund charges a redemption fee equal to 2.00% of the proceeds on shares held for less than 30 calendar days. The fee is retained by the Fund for the benefit of its long-term shareholders and accounted for as an addition to paid-in capital.
Investments in Securities
Investment securities are carried at fair value based upon closing market quotations on the last business day of the period. Investments in securities traded on national or international securities exchanges are valued at the last reported sales price prior to the time when assets are valued. Securities traded on the over-the-counter market are valued at the last reported sales price or if the last sales price is not available, at the last reported bid price. The current fair value of certain fixed income securities is provided by an independent pricing service. Fixed income securities for which prices are not available from an independent pricing service but where an active market exists are valued using market quotations obtained from broker-dealers or quotation systems. Securities for which market quotations are not available, such as private placement securities, are valued at fair value according to methods selected in good faith by the Adviser and may include dealer-supplied valuations. Short-term investments of sufficient credit quality with maturities of 60 days or less when acquired, or which subsequently are within 60 days of maturity, are valued at amortized cost, which approximates fair value. Option and future contracts entered into and held by the Funds are valued at the close of the securities and commodities exchange on which they are traded.
Security transactions are accounted for on the date the securities are purchased or sold. Gains and losses are calculated on the identified cost basis. Interest, including level-yield amortization of long-term bond premium and discount, is recorded on the accrual basis.
Delivery and payment for securities which have been purchased by the Fund on a forward commitment or when-issued basis can take place two weeks or more after the transaction date. During this period, such securities are subject to market fluctuations and may increase or decrease in value prior to delivery.
Fair Value Measurements
The inputs and valuations techniques used to measure fair value of the Fund’s net assets are summarized into three levels as described in the hierarchy below:
| | • | | Level 1 – quoted prices for active markets for identical securities. An active market for the security is a market in which transactions occur with sufficient frequency and volume to provide pricing information on an ongoing basis. A quoted price in an active market provides the most reliable evidence of fair value. |
| | • | | Level 2 – debt securities are valued based on evaluated prices received from independent pricing services or from dealers who make markets in such securities. For corporate bonds, U.S. government and government agency obligations, and municipal securities the pricing services utilize matrix pricing which considers yield or price of bonds of comparable quality, coupon, maturity, and type as well as dealer supplied prices. For asset-backed securities and mortgage-backed securities, the pricing services utilize matrix pricing which considers prepayment speed assumptions, attributes of the collateral, yield or price of bonds of comparable quality, coupon, maturity, and type as well as dealer supplied prices. All of these inputs are derived principally from or corroborated by observable market data. An adjustment to any observable input that is significant to the fair value may render the measurement a Level 3 measurement. |
| | • | | Level 3 – significant unobservable inputs, including the Adviser’s own assumptions in determining the fair value of investments. |
NOTES TO FINANCIAL STATEMENTS
Year Ended March 31, 2011 (Continued)
The inputs or methodology used for valuing securities are not necessarily an indication of the risk associated with investing in those securities.
The fair value of the Fund’s bonds are generally based on quotes received from brokers of independent pricing services. Bonds with quotes that are based on actual trades with a sufficient level of activity on or near the measurement date are classified as Level 2 assets.
At the end of each calendar quarter, management evaluates the Level 2 and 3 assets and liabilities for changes in liquidity, including but not limited to: whether a broker is willing to execute at the quoted price, the depth and consistency of prices from third party services, and the existence of contemporaneous, observable trades in the market. Additionally, management evaluates the Level 1 and 2 assets and liabilities on a quarterly basis for changes in listings or delistings on national exchanges. Due to the inherent uncertainty of determining the fair value of investments that do not have a readily available market value, the fair value of the Fund’s investments may fluctuate from period to period. Additionally, the fair value of investments may differ significantly from the values that would have been used had a ready market existed for such investments and may differ materially from the values the Fund may ultimately realize. Further, such investments may be subject to legal and other restrictions on resale or otherwise less liquid than publicly traded securities.
For the period ended March 31, 2011, there were no transfers between Levels 1, 2 and 3.
A summary of the levels for the Fund’s investments as of March 31, 2011 is included with the Fund’s schedule of investments.
Federal Taxes
The Fund’s policy is to comply with the requirements of the Internal Revenue Code applicable to regulated investment companies and to distribute all of its taxable income to shareholders. The Fund has recorded in its financial statements the full benefit of its tax positions taken in connection with the RIC qualification and distribution requirements of the RIC. Therefore, no income tax provision is required. Also, in order to avoid the payment of any federal excise taxes, the Fund will distribute substantially all of its net investment income and net realized gains on a calendar year basis.
Management has analyzed the Fund’s tax positions taken in federal tax returns for all open tax years and has concluded that as of March 31, 2011, no provision for income tax would be required in the Fund’s financial statements. The Fund’s federal and state income and federal excise returns for the 2008, 2009 and 2010 tax years for which the applicable statutes of limitations have not expired remain subject to examination by the Internal Revenue Service and state departments of revenue.
At March 31, 2011, the gross unrealized appreciation (depreciation) on investments and cost of securities on a tax basis for federal income tax purposes are identical to book and are as follows:
| | | | | | | | |
| | | Unrealized
Appreciation | | Unrealized
Depreciation | | Net Unrealized
Depreciation | | Cost of Securities
on a Tax Basis |
| | $604,436 | | ($2,244,083) | | ($1,639,647) | | $36,549,094 |
Net investment income and net realized gains may differ for financial statement and tax purposes. The character of distributions made during the year for net investment income or net realized gains may also differ from its ultimate characterization for tax purposes. The tax character of distributions paid during the fiscal years ended March 31, 2011 and 2010 were as follows:
| | | | | | | | |
| | | Ordinary Income | | Tax-Exempt
Income | | Long Term
Capital Gain | | Total |
Year ended March 31, 2011 | | $200,729 | | $3,638,660 | | — | | $3,839,389 |
Year ended March 31, 2010 | | — | | 2,758,525 | | — | | 2,758,525 |
| | |
| | | |
16 | | SIT MUTUAL FUNDS ANNUAL REPORT |
NOTES TO FINANCIAL STATEMENTS
Year Ended March 31, 2011 (Continued)
As of March 31, 2011, the components of distributable earnings on a tax basis were as follows:
| | | | | | | | |
Undistributed
Ordinary Income | | Undistributed
Tax Exempt
Income | | Accumulated
Gain (Loss) | | Unrealized Appreciation (Depreciation) | | |
| — | | $6,090 | | ($3,985,078) | | ($1,639,647) | | |
On the statement of assets and liabilities, as a result of permanent book-to-tax differences, reclassification adjustments of $26,700 were made to decrease undistributed net investment income, $47,527 to increase accumulated net realized gain (loss) and $20,827 to decrease paid-in capital to account for the market discount accretion adjustment.
Net capital loss carryovers and post-October capital losses, if any, as of March 31, 2011, are available to offset future realized capital gains and thereby reduce future capital gains distributions. The net capital loss carryovers and the post-October capital losses deferred as of March 31, 2011 for the Fund, were as follows:
| | | | | | | | | | | | |
| | | Net Capital
Loss | | Post-October
Capital Loss | | Accumulated
Capital and | | |
Capital Loss Carryover Expiring in: | | | | |
| 2016 | | 2017 | | 2018 | | Carryover | | Deferral | | Other Losses | | |
| — | | — | | $646,751 | | $646,751 | | $3,338,327 | | $3,985,078 | | |
The Regulated Investment Company Modernization Act of 2010 (“Act”) was enacted on December 22, 2010. In general, the provisions of the Act will be effective for Funds with fiscal years ending after December 22, 2011. Under the Act, a Fund will be permitted to carry forward capital losses for an unlimited period. However, any losses incurred during those future taxable years will be required to be utilized prior to the losses incurred in pre-enactment taxable years. As a result of this ordering rule, pre-enactment capital loss carry forwards may be more likely to expire unused. Additionally, post-enactment capital losses that are carried forward will retain their character as either short-term or long-term capital losses, and will not be considered exclusively short-term as under previous law.
Distributions
Distributions to shareholders are recorded as of the close of business on the record date. Such distributions are payable in cash or reinvested in additional shares of the Fund’s capital stock. Distributions from net investment income are declared daily and paid monthly for the Fund. Distributions from net realized gains, if any, will be made annually for the Fund.
Use of Estimates
The preparation of financial statements in conformity with U.S. generally accepted accounting principles requires management to make certain estimates and assumptions that affect the reported amounts of assets and liabilities and disclosure of contingent assets and liabilities at the date of the financial statements and the reported results. Actual results could differ from those estimates.
Guarantees and Indemnifications
Under the Fund’s organizational documents, its officers and directors are indemnified against certain liabilities arising out of the performance of their duties to the Fund. In addition, certain of the Fund’s contracts with its service providers contain general indemnification clauses. The Fund’s maximum exposure under these arrangements is unknown since the amount of any future claims that may be made against the Fund cannot be determined and the Fund has no historical basis for predicting the likelihood of any such claims.
| (3) | Investment Security Transactions |
The cost of purchases of and proceeds from sales and maturities of investment securities, other than short-term securities, for the year ended March 31, 2011, were as follows:
| | | | | | |
| | | Purchases | | Proceeds | | |
| | $31,175,349 | | $65,902,356 | | |
NOTES TO FINANCIAL STATEMENTS
Year Ended March 31, 2011 (Continued)
| (4) | Affiliated Fees and Transactions |
Investment Adviser
The Fund has entered into an investment management agreement with Sit Investment Associates Inc. (SIA), under which SIA manages the Fund’s assets and provides research, statistical and advisory services, and pays related office rental, executive expenses and executive salaries. The fee for investment management and advisory services is based on the average daily net assets of the Fund at the annual rate of 0.60%. The Fund is obligated to pay all of its other operating expenses (including, but not limited to, custody, regulatory, and fund administration fees).
Transactions with affiliates
The investment adviser, affiliates of the investment adviser, directors and officers of the Fund as a whole owned 26,950 shares of the Fund as of March 31, 2011, which represented 0.6% of all shares outstanding.
Management has evaluated the impact of all subsequent events on the Fund through the date the financial statements were issued and has determined that there was the following subsequent event:
Since March 31, 2011, the Fund has continued to experience significant redemptions. As of May 16, 2011, total net assets in the Fund were approximately $18.0 million.
| | |
| | | |
18 | | SIT MUTUAL FUNDS ANNUAL REPORT |
REPORT OF INDEPENDENT REGISTERED PUBLIC ACCOUNTING FIRM
The Board of Directors and Shareholders:
Sit Mutual Funds II, Inc.
We have audited the accompanying statement of assets and liabilities, including the schedule of investments, of Sit High Income Municipal Bond Fund (a series of Sit Mutual Funds II, Inc.) (the “Fund”), as of March 31, 2011, and the related statement of operations for the year then ended, the statements of changes in net assets for each of the years in the two-year period then ended, and the financial highlights for each of the years in the four-year period then ended and the period from December 31, 2006 (commencement of operations) to March 31, 2007. These financial statements and financial highlights are the responsibility of the Fund’s management. Our responsibility is to express an opinion on these financial statements and financial highlights based on our audits.
We conducted our audits in accordance with auditing standards of the Public Company Accounting Oversight Board (United States). Those standards require that we plan and perform the audit to obtain reasonable assurance about whether the financial statements and financial highlights are free of material misstatement. An audit includes examining, on a test basis, evidence supporting the amounts and disclosures in the financial statements. Our procedures included confirmation of securities owned as of March 31, 2011, by correspondence with the custodian and brokers or by other appropriate auditing procedures. An audit also includes assessing the accounting principles used and significant estimates made by management, as well as evaluating the overall financial statement presentation. We believe that our audits provide a reasonable basis for our opinion.
In our opinion, the financial statements and financial highlights referred to above present fairly, in all material respects, the financial position of Sit High Income Municipal Bond Fund as of March 31, 2011, and the results of its operations for the year then ended, the changes in its net assets for each of the years in the two-year period then ended, and its financial highlights for each of the years in the four-year period then ended and the period from December 31, 2006 (commencement of operations) to March 31, 2007, in conformity with U.S. generally accepted accounting principles.
KPMG LLP
Minneapolis, Minnesota
May 19, 2011
EXPENSE EXAMPLE (Unaudited)
As a shareholder of the Fund, you incur two types of costs: (1) transaction costs, including redemption fees and (2) ongoing costs, including management fees; and other Fund expenses. This Example is intended to help you understand your ongoing costs (in dollars) of investing in the Fund and to compare these costs with the ongoing costs of investing in other mutual funds.
The Example is based on an investment of $1,000 invested at the beginning of the period and held for the entire period October 1, 2010 to March 31, 2011.
Actual Expenses
The first line of the table below provides information about actual account values and actual expenses. You may use the information in this line, together with the amount you invested, to estimate the expenses that you paid over the period. Simply divide your account value by $1,000 (for example, an $8,600 account value divided by $1,000 = 8.6), then multiply the result by the number in the first line under the heading entitled “Expenses Paid During Period” to estimate the expenses you paid on your account during this period.
Hypothetical Example for Comparison Purposes
The second line of the table below provides information about hypothetical account values and hypothetical expenses based on the Fund’s actual expense ratio and an assumed rate of return of 5% per year before expenses, which is not the Fund’s actual return. The hypothetical account values and expenses may not be used to estimate the actual ending account balance or expenses you paid for the period. You may use this information to compare the ongoing costs of investing in the Fund and other funds. To do so, compare this 5% hypothetical example with the 5% hypothetical examples that appear in the shareholder reports of the other funds.
Please note that the expenses shown in the table are meant to highlight your ongoing costs only and do not reflect any transactional costs, such as redemption fees. Therefore, the second line of the table is useful in comparing ongoing costs only, and will not help you determine the relative total costs of owning different funds. In addition, if these transactional costs (redemption fees) were included, your costs would have been higher.
| | | | | | |
| Sit High Income Muni Bond Fund | | Beginning
Account Value
(10/1/10) | | Ending
Account Value
(3/31/11) | | Expenses Paid
During Period*
(10/1/10 - 3/31/11) |
| Actual | | $1,000 | | $ 998.50 | | $4.24 |
| Hypothetical (5% return before expenses) | | $1,000 | | $1,020.69 | | $4.28 |
*Expenses are equal to the Fund’s annualized expense ratio of 0.85%, multiplied by the average account value over the period, multiplied by 182/365 (to reflect the one-half year period.)
| | |
| | | |
20 | | SIT MUTUAL FUNDS ANNUAL REPORT |
FEDERAL TAX INFORMATION (Unaudited)
Sit High Income Municipal Bond Fund
For corporate shareholders, the percentage of investment income (dividend income and short-term gains, if any), for the Fund that qualify for the dividends-received deductions for the period of April 1, 2010 to March 31, 2011 is 0.0%.
For the year ended March 31, 2011, certain dividends paid by the Fund may be subject to a maximum tax rate of 15%, as provided by the Jobs and Growth Tax Relief Reconciliation Act of 2003. Of the distributions made by the Fund, 0.0% qualify for the 15% dividend income tax rate.
For the year ended March 31, 2011, 94.8% of dividends were derived from interest on tax-exempt securities. This portion of exempt-interest dividends is exempt from federal taxes and should not be included in shareholders’ gross income. Exempt-interest dividends may be subject to state and local taxes. Each shareholder should consult a tax adviser about reporting this income for state and local tax purposes.
INFORMATION ABOUT DIRECTORS AND OFFICERS (Unaudited)
Sit High Income Municipal Bond Fund
The Sit Mutual Funds are a family of no-load mutual funds. The Sit High Income Municipal Bond Fund is described in this Annual Report. The corporate issuer of the Sit High Income Municipal Bond Fund has a Board of Directors and officers. Pursuant to Minnesota law, the Board of Directors are responsible for the management of the Fund and the establishment of the Fund’s policies. The officers of the Fund manage the day-to-day operation of the Fund. Information pertaining to the directors and officers of the Fund is set forth below. The business address, unless otherwise noted below, is that of the Fund’s investment adviser – 3300 IDS Center, 80 South Eighth Street, Minneapolis, Minnesota 55402. The Board has a separate Audit Committee. The SAI has additional information about the Fund’s directors and is available without charge upon request by calling the Sit Funds at 800-332-5580.
| | | | | | | | |
Name, Age, and Position with the Fund | | Term of Office (1) and Length of Time Served | | Principal Occupation(s) During Past Five Years | | Number of Funds in Fund Complex Overseen by Director | | Other Directorships Held by Director (3) |
| INTERESTED DIRECTORS: |
Roger J. Sit (2) Age: 49 Chairman and President | | Chairman since 10/08; Officer since 1998. | | Chairman , President, CEO and Global CIO of Sit Investment Associates, Inc. (the “Adviser”); Chairman and CEO of Sit Investment Fixed Income Advisors, Inc. (“SF”); Chairman of SIA Securities Corp. (the “Distributor”). | | 12 | | None. |
William E. Frenzel (2) Age: 82 Director | | Director since 1991 or the Fund’s inception if later. | | Guest Scholar at The Brookings Institution and member of several government policy committees, foundations and organizations; Director of the Adviser; Director of SF. | | 12 | | None. |
| INDEPENDENT DIRECTORS: |
John P. Fagan Age: 80 Director | | Director since 2006 or the Fund’s inception, if later. | | Honorary member of Board of St. Joseph’s College in Rensselar, Indiana. | | 12 | | None. |
Sidney L. Jones Age: 77 Director | | Director since 1993 or the Fund’s inception, if later: Director from 1988 to 1989. | | Lecturer, Washington Campus Consortium of 17 Universities. | | 12 | | None. |
Bruce C. Lueck Age: 70 Director | | Director since 2004 or the Fund’s inception, if later. | | Consultant for Zephyr Management, L.P. (investment management) and committee member of several investment funds and foundations. | | 12 | | None. |
Donald W. Phillips Age: 62 Director | | Director of the International Fund since1993, and since 1990 or the Fund’s inception if later for all other Funds. | | Chairman and CEO of WP Global Partners Inc., 7/05 to present; CEO and CIO of WestLB Asset Management (USA) LLC, 4/00 to 4/05. | | 12 | | None. |
Barry N. Winslow Age: 63 Director | | Director since 2010. | | Vice-Chairman of TCF Financial Corporation, 7/08 to present; COO 2006 to 2007; President of the national charter 2001-2006. | | 12 | | TCF Financial Corporation |
| | |
| | | |
22 | | SIT MUTUAL FUNDS ANNUAL REPORT |
| | | | | | | | |
Name, Age, and Position with the Fund | | Term of Office (1) and Length of Time Served | | Principal Occupation(s) During Past Five Years | | Number of Funds in Fund Complex Overseen by Director | | Other Directorships
Held by Director (3) |
OFFICERS: |
Mark H. Book Age: 47 Vice President – Investments of U.S. Govt. Fund only | | Officer since 2002; Re-Elected by the Boards annually. | | Vice President and Portfolio Manager of SF. | | N/A | | N/A |
Kelly K. Boston Age: 42 Assistant Secretary & Assistant Treasurer | | Officer since 2000; Re-Elected by the Boards annually. | | Staff Attorney of the Adviser; Secretary of the Distributor. | | N/A | | N/A |
Michael C. Brilley Age: 65 Senior Vice President | | Officer since 1985; Re-Elected by the Boards annually. | | Senior Vice President and Senior Fixed Income Officer of the Adviser; Director, President and Chief Fixed-Income Officer of SF. | | N/A | | N/A |
Bryce A. Doty Age: 44 Vice President - Investments of U.S. Govt. Fund only. | | Officer since 1996; Re-Elected by the Boardsannually. | | Senior Vice President and Senior Portfolio Manager of SF. | | N/A | | N/A |
Paul J. Junquist Age: 49 Vice President - Investments | | Officer since 1996; Re-Elected by the Boards annually. | | Vice President and Portfolio Manager of SF. | | N/A | | N/A |
Michael J. Radmer 50 S. 6th Street Minneapolis, MN 55401 Age: 65 Secretary | | Officer since 1984; Re-Elected by the Boards annually. | | Partner of the Funds’ general counsel, Dorsey & Whitney, LLP. | | N/A | | N/A |
Paul E. Rasmussen Age: 50 Vice President, Treasurer & Chief Compliance Officer | | Officer since 1994; Re-Elected by the Boards annually. | | Vice President, Secretary, Controller and Chief Compliance Officer of the Adviser; Vice President, Secretary, and Chief Compliance Officer of SF; President and Treasurer of the Distributor. | | N/A | | N/A |
Carla J. Rose Age: 44 Vice President, Assistant Secretary & Assistant Treasurer | | Officer since 2000; Re-Elected by the Boards annually. | | Vice President, Administration & Deputy Controller of the Adviser; Vice President, Controller, Treasurer & Assistant Secretary of SF; Vice President and Assistant Secretary of the Distributor. | | N/A | | N/A |
Debra A. Sit (3) Age: 50 Vice President - Investments | | Officer since 1994; Re-Elected by the Boards annually. | | Vice President – Bond Investments of the Adviser; Senior Vice President, Assistant Treasurer and Assistant Secretary of SF; Assistant Treasurer and Assistant Secretary of Sit/Kim. | | N/A | | N/A |
| (1) | Directors serve until their death, resignation, removal or the next shareholder meeting at which election of directors is an agenda item and a successor is duly elected and qualified. |
| (2) | Directors who are deemed to be “interested persons” of the Funds as that term is defined by the Investment Company Act of 1940. Mr. Sit is considered an “interested person” because he is a director and shareholder of Sit Investment Associates, Inc., the Fund’s investment adviser. Mr. Frenzel is deemed to be an interested person because he is a director and shareholder of the Fund’s investment adviser. |
| (3) | Includes only directorships of companies required to report under the Securities Exchange Act of 1934 (i.e., public companies) or other investment companies registered under the 1940 Act. |
ADDITIONAL INFORMATION (Unaudited)
PROXY VOTING
Each fund follows certain policies and procedures for voting proxies for securities held in each portfolio. A description of the Funds’ proxy voting policies and procedures is available without charge upon request by calling the Funds at 1-800-332-5580.
Information regarding how each Fund voted proxies relating to its portfolio securities during the most recent twelve-month period ended June 30 is available without charge upon request by calling the Funds at 1-800-332-5580, and is available on the U.S. Securities and Exchange Commission’s website at www.sec.gov.
AVAILABILITY OF QUARTERLY PORTFOLIO SCHEDULES
The Funds’ file their complete schedules of portfolio holdings with the U.S. Securities and Exchange Commission (SEC) for the first and third quarters of each fiscal year on Form N-Q. The Funds’ Form N-Qs are available without charge upon request by calling the Funds at 1-800-332-5580 and are available on the SEC’s website at www.sec.gov. In addition, the Funds’ Form N-Qs may be reviewed and copied at the SEC’s Public Reference Room in Washington, DC. Information on the operation of the Public Reference Room may be obtained by calling 1-202-551-8090.
RE-APPROVAL OF INVESTMENT MANAGEMENT AGREEMENT.
At their meeting held on October 25, 2010 the Board of Directors of Sit Mutual Funds II, Inc. unanimously approved the investment management agreement entered into by and between Sit Investment Associates, Inc. (“SIA”) and Sit Mutual Funds II, Inc. (the “Agreement”) with respect to the management of the Fund. The Board approved the Agreement after a lengthy discussion and consideration of various factors relating to both the Board’s selection of SIA as the investment adviser and the Board’s approval of the fee to be paid under the Agreement.
Investment Adviser Criteria. The Directors began their analysis by discussing their criteria for determining the quality of an investment adviser. The Directors’ noted that their analysis is similar to that used by institutional investors in evaluating and selecting investment advisers. The Directors discussed several factors used to determine the overall quality of an investment adviser and the nature, extent and quality of the services performed by SIA, including the following:
Investment Philosophy and Process. The Directors considered SIA’s philosophy of managing assets. With respect to fixed income securities generally, SIA stresses the consistent attainment of superior risk-adjusted returns using a conservative investment management approach that identifies pricing anomalies in the market and management of portfolio duration. SIA seeks securities with a special emphasis on interest income and significant stability of principal value. SIA’s style seeks to avoid excessive return volatility and generate consistent results over an economic cycle. The Directors noted that the Fund invests primarily in municipal securities that are not rated by a nationally recognized statistical rating organization, and may invest up to 60% of its assets in municipal securities rated below investment-grade.
The Directors discussed SIA’s consistent and well-defined investment process. The fixed income portfolio managers are responsible for implementing the strategy set forth in the Chief Fixed Income Officer’s duration targets and the Chief Investment Officer’s interest rate projections.
Investment Professionals. The Directors discussed the experience, knowledge and organizational stability of SIA and its investment professionals. The Directors noted that SIA’s senior professionals are actively involved in the investment process and have significant investment industry experience.
The Directors discussed the depth of SIA’s investment staff. The Directors noted that SIA has over 30 investment professionals. Given the investment products offered by SIA and the assets under management, the Directors determined that SIA’s investment staff is well positioned to meet the current needs of its clients, including the Fund, and to accommodate growth in the number of clients and assets under management for the near future. The Directors concluded that the depth of the investment staff, and in particular senior management and investment analysts, is actually greater than the Fund currently requires at its present asset size. The Directors noted that SIA has the resources of a $9.8 billion investment firm working for the benefit of the Fund shareholders.
| | |
| | | |
24 | | SIT MUTUAL FUNDS ANNUAL REPORT |
Investment Performance. The Directors reviewed and discussed the Fund’s investment performance along with each of the Sit Mutual Funds’ investment performance on an absolute and comparable basis for the various periods discussed below. The Directors noted that the investment performance of the Funds has generally been competitive with indices and other funds with similar investment styles as the Sit Funds, such as fixed income funds seeking to maximize income.
Corporate Culture. The Directors discussed SIA’s corporate values to operate under the highest ethical and professional standards. SIA’s culture is set and practiced by senior management who insist that all professionals exhibit honesty and integrity. The Board noted that the firm’s values are evident in all of the services provided to the Fund.
Review of Specific Factors. The Directors continued their analysis by reviewing specific information on SIA and the Fund and specific terms of the Agreement, including the following.
Investment Performance. The Directors reviewed the investment performance of each of the Sit Mutual Funds for 1 month, 3 months, 6 months, year-to-date, 1 year, 5 years (as applicable), 10 years (as applicable) and since inception, both on an absolute basis and on a comparative basis to indices and mutual funds within the same investment categories. As noted above, the Directors concluded that the investment performance of the Sit Funds have been competitive in relation to their stated objectives and strategies on a comparable basis with funds with similar objectives and strategies.
Fees and Expenses. The Directors noted that the Fund will pay SIA a fee for its services equal to .60% per year of the Fund’s average daily net assets, and that the Fund shall bear all of its expenses. The Directors reviewed the average and median expense ratios of mutual funds within the same investment category of the Fund. The Directors noted that the Fund’s estimated total expense ratio based on projected level of total fund assets compares favorably to the total expense ratios of other no-load funds within the Fund’s Morningstar category. The Directors concluded that the fee set for the Fund is reasonable and appropriate.
The Directors discussed the anticipated benefit SIA will receive from the relationship with the Fund. The Board concluded that any benefits SIA receives from its relationship with the Fund are well within industry norms and are reflected in the amount of the fees paid by the Fund to SIA and are appropriate and reasonable.
Non-Advisory Services. The Directors considered the quality of non-advisory services which SIA provides to its active and operating Funds in the Sit Mutual Fund Family of Funds (and its shareholders) and the quality and depth of SIA’s non-investment personnel who provide such services. Directors concluded that the level of such services and the quality and depth of such personnel are consistent with industry standards.
Finally, the Directors considered the compliance staff and the regulatory history of SIA, and concluded that both are consistent with industry standards.
Based on these conclusions, without any single conclusion being dispositive, the Directors determined that renewal of the Agreements was in the interest of each Fund and its shareholders.
[This page intentionally left blank.]
[This page intentionally left blank.]
[This page intentionally left blank.]

The registrant has adopted a code of ethics that applies to the registrant’s principal executive officer, principal financial officer, principal accounting officer, and persons performing similar functions. The registrant has not made any amendment to its code of ethics during the period covered by this report which must be described herein pursuant to Item 2. The registrant has not granted any waivers from any provisions of the code of ethics during the period covered by this report.
A copy of the registrant’s code of ethics is available without charge upon request by calling the registrant at 612-334-5888 or
1-800-332-5580, or by mail at Sit Mutual Funds, 3300 IDS Center, 80 South Eighth Street, Minneapolis, MN 55402.
| Item 3: | Audit Committee Financial Expert. |
The registrant’s Board of Directors has determined that Mr. John P. Fagan, Mr. Sidney L. Jones, Mr. Bruce C. Lueck, Mr. Donald W. Phillips, and Mr. Barry N. Winslow are audit committee financial experts serving on its audit committee. Mr. Fagan, Mr. Jones, Mr. Lueck, Mr. Phillips, and Mr. Winslow are independent for purposes of this item.
| Item 4: | Principal Accountant Fees and Services. |
(a) – (d) Aggregate fees billed to the registrant for the last two fiscal years for professional services rendered by the registrant’s principal accountant were as follows:
| | | | | | | | | | | | | | | | | | | | | | | | | | | | | | | | |
| | | 2011 | | | 2010 | |
| | | Audit
Fees | | | Audit
Related | | | Tax
Fees | | | Other
Fees | | | Audit
Fees | | | Audit
Related | | | Tax
Fees | | | Other
Fees | |
Fiscal year ended March 31 | | | | | | | | | | | | | | | | | | | | | | | | | | | | | | | | |
Sit Mutual Funds II, Inc. | | | | | | | | | | | | | | | | | | | | | | | | | | | | | | | | |
Sit Tax-Free Income Fund (series A) | | | 25,700 | | | | 0 | | | | 3,825 | | | | 0 | | | | 25,200 | | | | 0 | | | | 5,200 | | | | 0 | |
Sit Minnesota Tax-Free Income Fund (series B) | | | 20,400 | | | | 0 | | | | 3,825 | | | | 0 | | | | 20,000 | | | | 0 | | | | 5,200 | | | | 0 | |
Sit High Income Municipal Bond Fund (series D) | | | 15,400 | | | | 0 | | | | 3,825 | | | | 0 | | | | 15,100 | | | | 0 | | | | 5,200 | | | | 0 | |
| | | | | | | | | | | | | | | | | | | | | | | | | | | | | | | | |
Total Mutual Funds II, Inc. | | | 61,500 | | | | 0 | | | | 11,475 | | | | 0 | | | | 60,300 | | | | 0 | | | | 15,600 | | | | 0 | |
Audit fees include amounts related to the audit of the registrant’s annual financial statements and services normally provided by the accountant in connection with statutory and regulatory filings. Audit-related fees include amounts reasonably related to the performance of the audit of the registrant’s financial statements, and/or are traditionally performed by the auditor. Tax fees include amounts related to tax compliance, tax planning, and tax advice.
(e) (1) The Audit Committee is required to pre-approve audit and non-audit services performed for the registrant by the independent auditor in order to assure that the provision of such services does not impair the auditor’s independence. The audit committee also is required to pre-approve certain non-audit services performed by the registrant’s independent auditor for the registrant’s investment adviser and certain of the adviser’s affiliates if the services relate directly to the operations and financial reporting of the registrant. Services to be provided by the auditor must receive general pre-approval or specific pre-approval by the audit committee. Any proposed services exceeding pre-approved cost levels will require separate pre-approval by the audit committee.
The audit committee may delegate pre-approval authority to the audit committee chairman. The chairman shall report any pre-approval decisions to the audit committee at its next scheduled meeting. The audit committee does not delegate its responsibility to pre-approve services performed by the independent auditor to management.
(2) No services included in (b) – (d) were approved pursuant to paragraph (c)(7)(i)(C) of Rule 2-01 of Regulation S-X.
(f) Not applicable.
(g) The aggregate fees billed for the most recent fiscal year and the preceding fiscal year by the registrant’s principal accountant for non-audit services rendered to the registrant, its investment adviser, and any entity controlling, controlled by, or under common control with the investment adviser that provides ongoing services to the registrant were $4,000 and $4,000 respectively.
(h) The registrant’s audit committee has determined that the provision of non-audit services rendered to the registrant’s investment adviser, and any entity controlling, controlled by, or under common control with the investment adviser that provides ongoing services to the registrant, that were not pre-approved pursuant to paragraph (c)(7)(ii) of Rule 2-01 of Regulation S-X is considered compatible with maintaining the principal accountant’s independence.
| Item 5: | Audit Committee of Listed Registrants. |
Not applicable to open-end investment companies.
| Item 6: | Schedule of Investments. |
The schedule of investments is included as part of the report to shareholders filed under Item 1 of this Form.
| Item 7: | Disclosure of Proxy Voting Policies and Procedures for Closed-End Management Investment Companies. |
Not applicable to open-end investment companies.
| Item 8: | Portfolio Managers of Closed-End Management Investments Companies. |
Not applicable to open-end investment companies.
| Item 9: | Purchases of Equity Securities by Closed-End Management Investment Company and Affiliated Purchasers. |
Not applicable to open-end investment companies.
| Item 10. | Submission of Matters to a vote of Security Holders. |
There have been no material changes to the procedures by which shareholders may recommend nominees to the registrant’s board of directors.
| Item 11: | Controls and Procedures - |
(a) Based on their evaluation of the Registrant’s Disclosure Controls and Procedures as of a date within 90 days of the Filing Date, the Registrant’s Chairman and Treasurer have determined that the Disclosure Controls and Procedures (as defined in
Rule 30a-2(c) under the Act) are designed to ensure that information required to be disclosed by the Registrant is recorded, processed, summarized and reported by the filing Date, and that information required to be disclosed in the report is communicated to the Registrant’s management, as appropriate, to allow timely decisions regarding required disclosure.
(b) There were no significant changes in the Registrant’s internal controls or in other factors that could significantly affect these controls subsequent to the date of their evaluation, and there were no corrective actions with regard to significant deficiencies and material weaknesses.
(a) The following exhibits are attached to this Form N-CSR:
(2) A separate certification for each principal executive and principal financial officer of the registrant as required by Rule 30a-2(a) under the Act (17 CFR 270.30a-2) (certification required by Section 302 of the Sarbanes-Oxley Act of 2002).
(b) Certification required by Rule 30a-2(b) under the Act (certification required by Section 906 of the Sarbanes-Oxley Act of 2002).
SIGNATURES
Pursuant to the requirements of the Securities Exchange Act of 1934 and the Investment Company Act of 1940, the registrant has duly caused this report to be signed on its behalf by the undersigned, thereunto duly authorized.
| | |
SIT MUTUAL FUNDS II, INC. |
| |
| By (Signature and Title)* | | /S/ PAUL E. RASMUSSEN |
| | Paul E. Rasmussen Vice President, Treasurer |
Date May 27, 2011
Pursuant to the requirements of the Securities Exchange Act of 1934 and the Investment Company Act of 1940, this report has been signed below by the following persons on behalf of the registrant and in the capacities and on the dates indicated.
| | |
| |
| By (Signature and Title) | | /S/ PAUL E. RASMUSSEN |
| | Paul E. Rasmussen Vice President, Treasurer |
Date May 27, 2011
| | |
| |
| By (Signature and Title) | | /S/ ROGER J. SIT |
| | Roger J. Sit Chairman |
Date May 27, 2011