SIT MUTUAL FUNDS II, INC.
UNITED STATES SECURITIES AND EXCHANGE COMMISSION
Washington, D.C. 20549
FORM N-CSR
CERTIFIED SHAREHOLDER REPORT OF REGISTERED
MANAGEMENT INVESTMENT COMPANIES
Investment Company Act file number: 811-04033
Sit Mutual Funds II, Inc.
(Exact name of registrant as specified in charter)
3300 IDS Center
80 South Eighth Street
Minneapolis, MN 55402
(Address of principal executive offices)
Paul E. Rasmussen, VP Treasurer
Sit Mutual Funds, Inc.
3300 IDS Center
80 South Eighth Street
Minneapolis, MN 55402
(Name and address of agent for service)
Copy to:
Mike Radmer, Esq.
Dorsey & Whitney
Suite 1500
50 South Sixth Street
Minneapolis, MN 55402-1498
Registrant’s telephone number, including area code:
(612) 332-3223
Date of fiscal year end: March 31, 2013
Date of reporting period: March 31, 2013
| Item 1: | Reports to Stockholders |

|
Sit Mutual Funds BOND FUNDS ANNUAL REPORT TABLE OF CONTENTS |
This document must be preceded or accompanied by a Prospectus.
CHAIRMAN’S LETTER
May 6, 2013
Dear fellow shareholders:
U.S. fixed income markets continued to exhibit strong performance over the 12-month period ended March 31, 2013. The Sit family of fixed income funds performed well in this environment. A new fund, the Sit Quality Income Fund, was launched on December 31, 2012 and represents an option for diversification by providing a balanced focus between corporate and U.S. government debt while maintaining a short duration. We are excited about the addition of a new investment option for our mutual fund investors and have included our first review of this fund later in this document.
Treasury yields were volatile during the year, with the 30-year Treasury bond peaking at 3.44% last April before reaching an historic low of 2.45% last July and ultimately settling at 3.10% or down 23 basis points for the year by the end of March. Intermediate maturity Treasury yields exhibited a similar pattern, albeit somewhat more pronounced. The 7 to 10-year range of Treasury bonds demonstrated the largest decrease in yields for the year, down 40 and 36 basis points, respectively. Yields for the shortest maturity Treasuries were generally unchanged. Continued quantitative easing efforts by the U.S. Federal Reserve have kept interest rates at low absolute levels, while domestic and global events, whether they are economic, fiscal, political, or other in nature have caused volatility around these low absolute levels.
Beyond Treasury bonds, corporate bonds, particularly financial companies, performed exceptionally well during the year. Other positive trends in the taxable market included outperformance by longer duration and more credit sensitive bonds. Tax-exempt yields reached historic lows in December of 2012 before increasing modestly during the first quarter of 2013. The tax-exempt yield curve flattened over the course of the last year, as long-term bond yields declined 30-35 basis points while shorter maturities generally changed by 10 basis points or less.
Global
The problems in Europe returned to the headlines earlier this year as Cyprus became the latest country to face a crisis. The recent actions in Cyprus represented a new chapter in Europe’s financial crisis in that bank depositors throughout a country were forced to sacrifice a portion of their savings in an attempt to recapitalize a banking system. More broadly in Europe, the region continues to be in a mild recession with an estimated regional growth rate of -0.5% for 2012.
In Asia, Japan’s new Prime Minister continues to implement pro-growth policies in an attempt to boost economic activity and end deflation through coordinated monetary, fiscal, and private sector actions or incentives. Japan’s central bank recently implemented a new round of quantitative easing that exceeds current quantitative easing efforts by the U.S. Federal Reserve, when expressed as a percentage of GDP. Perhaps most ominous in Asia is the recent tension on the Korean Peninsula. It seems probable that North Korean leader Kim Jong-un’s latest threats are merely an attempt to solidify his
domestic leadership position. However, such threats never go unnoticed, and are another reminder of the many tense geo-political situations in the world.
Collectively, economic challenges and tense global situations continue to provide an impetus for investors to seek out safe havens for their investment capital. U.S. Treasury bonds have benefitted from this flight to quality. Further, as global situations remain fluid and sentiment is subject to rapid change, the resulting risk-on versus risk-off trades create modest volatility in Treasury yields, which often correlate with other fixed income assets.
Domestic
Economic growth improved during the first quarter of 2013 to a 2.5% annual rate after slowing to +0.4% in the fourth quarter of 2012. The housing market is finally contributing positively to growth again and seems to exhibit some robustness at least for the near term. The unemployment rate declined to 7.6% as of March, a significant reduction from the recession peak of 10.1% in October of 2009. However, the decreased unemployment rate’s positive impact is somewhat offset by the labor participation rate falling to a 34-year low of 63.3%, continuing a secular downtrend that began in 2000. Inflation remains contained at +1.5% on a year-over-year basis as of March, which is in line with the long term goals of the U.S. Federal Reserve.
The political environment in Washington, D.C. remains difficult. The fiscal cliff negotiations at year’s end were tense and resulted in a last minute compromise that fell well short of a grand bargain. The end result increased the payroll tax rate back to its normal level, increased income tax rates for the highest earners, and limited the amount of income tax deductions for a larger set of high earners. In addition, while the fiscal cliff agreement delayed sequestration cuts for two months, the spending cuts did take effect at the beginning of March. When combined with the new Medicare tax on investment income implemented with the Patient Protection and Affordable Care Act, there are clearly some new headwinds for the economy as it continues its recovery. Further, the gridlock and disagreement in Washington seems likely to continue, with no solution in sight for longer-term entitlement deficits.
Federal Reserve
The U.S. Federal Reserve continues to execute its third round of quantitative easing or asset purchases. These purchases consist of $85 billion new purchases per month of longer-term Treasury bonds and mortgage-backed securities, in addition to continuing to reinvest principal payments from existing holdings. When combined with reinvested principal, total purchases represent over $100 billion monthly of monthly demand. The purchase of $100+ billion on a monthly basis represents a sizable investment and should limit rate increases for intermediate to long-term fixed income securities while in place. The minutes from the Federal Reserve’s March meeting indicated
| | |
2 | | SIT MUTUAL FUNDS ANNUAL REPORT |
that the majority of the committee anticipated slowing the pace of these asset purchases in mid-2013. However, the March Employment Report was released since that meeting and demonstrated weaker job growth than expected with an increase in non-farm payrolls of 88 thousand versus 190 thousand expected. As a result, more recent conventional wisdom suggests quantitative easing will not be reduced as soon as anticipated.
Looking past any removal of or adjustment to quantitative easing policies, we expect the Federal Reserve to remain highly accommodative for a considerable amount of time after assets purchases are finished and the economy recovers. They continue to seek unemployment below 6.5% before taking any tightening action and remain committed to long-run inflation of 2%. Furthermore, their current projections do not suggest any such tightening action before 2015.
Strategy Summary
Our U.S. Government Securities Fund continues to emphasize seasoned, high coupon agency mortgage securities, which provide high levels of income at relatively stable price levels. The income produced by these mortgages remains particularly attractive given the low level of short interest rates and other investment opportunities. High current income and price stability have been a core focus of our U.S. Government Securities Fund since its inception. Our new Quality Income Fund adds the dimension of corporate bonds, and tends to focus on shorter duration taxable securities that possess attrac-
tive relative yields to Treasuries. We believe the taxable Funds’ durations, credit qualities, and income advantage have them well positioned for the current environment.
The tax-exempt fixed-income strategy employed in both the Sit Tax-Free Income Fund and the Sit Minnesota Tax-Free Income Fund continues to emphasize bond structures with put, call, sinking fund and prepayment provisions that provide regular cash flow. We believe this strategy of emphasizing securities with shorter expected average lives should help stabilize prices when yields do begin to increase. Our strategy continues to emphasize income, as we believe that a bond’s yield on both an absolute and a relative basis provides the best indicator of long-term value. We believe the tax-exempt Funds’ industry weightings, credit qualities, and durations have them well positioned for the current environment.
We appreciate your continued interest in the Sit family of funds.
With best wishes,

Roger J. Sit
Chairman and President
Sit Mutual Funds
|
Sit U.S. Government Securities Fund |
OBJECTIVE & STRATEGY
The objective of the U.S. Government Securities Fund is to provide high current income and safety of principal, which it seeks to attain by investing solely in debt obligations issued, guaranteed or insured by the U.S. government or its agencies or its instrumentalities.
Agency mortgage securities and U.S. Treasury securities are the principal holdings in the Fund. The mortgage securities that the Fund purchases consist of pass-through securities including those issued by Government National Mortgage Association (GNMA), Federal National Mortgage Asociation (FNMA), and Federal Home Loan Mortgage Corporation (FHLMC).
The Sit U.S. Government Securities Fund provided a total return of +1.39% during the fiscal year ended March 31, 2013, compared to the total return of the Barclays Intermediate Government Bond Index of +2.26%. As of March 31, 2013, the Fund’s 30-day SEC yield was 1.06% and its 12-month distribution rate was 1.47%.
During the twelve-month period, the Fund benefitted from the income advantage produced by its holdings in older, high coupon, government agency mortgage pass through securities and collateralized mortgage obligations. While the Fund’s holdings of U.S. Government bonds provided meaningful return on an absolute basis, an underweight position in the U.S. Treasury sector, relative to the benchmark, negatively impacted the Fund’s performance. Prices of U.S. Treasury bonds rose as domestic fiscal uncertainty and global economic concerns produced higher demand for U.S. government obligations, which was partially offset by increased inflation fears due to additional asset purchases by the Federal Reserve.
The Federal Reserve continued to provide economic stimulus through accommodative policy initiatives. In the third quarter of 2012, the Federal Reserve announced they would purchase $40 billion of recently originated mortgages every month, in addition to reinvesting payments from their current mortgage holdings (commonly referred to as Quantitative Easing or QE). The mortgage purchase program has been popularly referred to as “QE Infinity” as there are no constraints regarding amounts or timeline, which had accompanied all prior purchase programs. The Fund does not invest in mortgages that are likely to be included in the Federal Reserve’s purchase activity. The Federal Reserve announced in the fourth quarter plans to also purchase $45 billion of longer-term Treasury securities.
The government continues to engineer a myriad of mortgage modification and refinancing programs for homeowners. The mortgages held in the Fund have experienced modestly elevated refinancing activity, which has temporarily reduced the income advantage. Concerns regarding the expansion of refinancing programs caused the prices of the mortgages to generally underperform relative to comparable maturity U.S. Treasuries. We anticipate these programs have merely pulled forward refinancing and modification activity and have not changed the overall long-term projections for the strategy.
Stronger than expected economic data and a healing housing market offset sequestration fears and lifted market optimism during the first quarter. Some market participants are commenting that a reduction in government spending due to the sequester is good for the
HYPOTHETICAL GROWTH OF $10.000
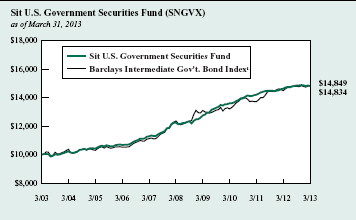
The chart above illustrates the total value of a hypothetical $10,000 investment in the Fund over the past 10 years (or for the life of the Fund if shorter) as compared to the performance of the Barclays Intermediate Government Bond Index. Past performance does not guarantee future results. Returns include the reinvestment of distributions. The chart does not reflect the deduction of taxes that a shareholder would pay on Fund distributions or the redemption of Fund shares.
1 The Barclays Intermediate Government Bond Index is a sub-index of the Barclays Government Bond Index covering issues with remaining maturities of between three and five years. The Barclays Government Bond Index is an index that measures the performance of all public U.S. government obligations with remaining maturities of one year or more. The returns include the reinvestment of income and do not include any transaction costs, management fees or other costs. It is not possible to invest directly in an index. This is the Fund’s primary index.
economy and market confidence. We expect sustained albeit slow domestic growth going forward. Continued uncertainty surrounding the fiscal problems in Europe and the fragile nature of the budding domestic recovery is likely to encourage the Fed to remain accommodative through year-end. As such we are maintaining our underweight position to the U.S. Treasury sector, as we expect the accommodative policy to drive inflation higher in the intermediate term, and, in turn, U.S. Treasury bond prices lower. We continue to focus on older, high coupon government agency mortgage pass through securities, as they provide high levels of income with relatively stable prices. This high level of income and principal stability continues to be the Fund’s focus, as has consistently been the case since the Fund’s inception.
Michael C. Brilley Bryce A. Doty, CFA
Senior Portfolio Managers
Mark H. Book, CFA
Portfolio Manager
| | |
4 | | SIT MUTUAL FUNDS ANNUAL REPORT |
COMPARATIVE RATES OF RETURNS
as of March 31, 2013
| | | | | | | | | | | | | | | |
| | | Sit U.S. Government Securities Fund | | Barclays Inter. Gov’t Bond Index1 | | Lipper U.S. Gov’t Fund Index2 |
| | | |
| | | |
| | | |
One Year | | | | 1.39 | % | | | | 2.26 | % | | | | 3.17 | % |
Five Years | | | | 3.95 | | | | | 3.70 | | | | | 4.83 | |
Ten Years | | | | 4.03 | | | | | 4.02 | | | | | 4.33 | |
Since Inception (6/2/87) | | | | 6.16 | | | | | 6.33 | | | | | 6.11 | |
Performance figures are historical and do not guarantee future results. Investment returns and principal value will vary, and you may have a gain or loss when you sell shares. Current performance may be lower or higher than the performance data quoted. Contact the Fund for performance data current to the most recent month-end. Returns include changes in share price as well as reinvestment of all dividends and capital gains and all fee waivers. Without the fee waivers total return and yield figures would have been lower. Returns do not reflect the deduction of taxes that a shareholder would pay on Fund distributions or the redemption of Fund shares. Management fees and administrative expenses are included in the Fund’s performance. Returns for periods greater than one year are compounded average annual rates of return.
1 The Barclays Intermediate Government Bond Index is a sub-index of the Barclays Government Bond Index covering issues with remaining maturities of between three and five years. The Barclays Government Bond Index is an index that measures the performance of all public U.S. government obligations with remaining maturities of one year or more. The returns include the reinvestment of income and do not include any transaction costs, management fees or other costs. It is not possible to invest directly in an index.
2 The Lipper returns are obtained from Lipper Analytical Services, Inc., a large independent evaluator of mutual funds.
FUND DIVERSIFICATION
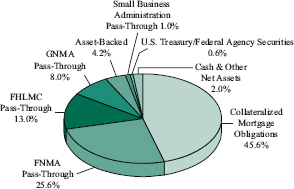
Based on total net assets as of March 31, 2013. Subject to change.
PORTFOLIO SUMMARY
| | |
Net Asset Value 3/31/13: | | $11.30 Per Share |
Net Asset Value 3/31/12: | | $11.31 Per Share |
Total Net Assets: | | $1,520.1 Million |
30-day SEC Yield 3: | | 1.06% |
12-month Distribution Rate 3: | | 1.47% |
Effective Duration 4: | | 1.9 Years |
3 The SEC Yield reflects the rate at which the Fund is earning income on its current portfolio of securities, while the distribution rate reflects the Fund’s past dividends paid to shareholders based on the net investment income distributed and the average NAV during the past 12 months. Accordingly, the Fund’s SEC yield and distribution rate may differ.
4 Duration is a measure of estimated price sensitivity relative to changes in interest rates. Portfolios with longer durations are typically more sensitive to changes in interest rates. For example, if interest rates rise by 1%, the fair value of a security with an effective duration of 5 years would decrease by 5%, with all other factors being constant. The correlation between duration and price sensitivity is greater for securities rated investment-grade than it is for securities rated below investment-grade. Duration estimates are based on assumptions by the Adviser and are subject to a number of limitations. Effective duration is calculated based on historical price changes of securities held by the Fund, and therefore is a more accurate estimate of price sensitivity provided interest rates remain within their historical range.
ESTIMATED AVERAGE LIFE
| | | | |
0-1 Year | | | 2.4 | % |
1-5 Years | | | 97.3 | % |
5-10 Years | | | 0.3 | % |
10-20 Years | | | 0.0 | % |
20+ Years | | | 0.0 | % |
The table represents the Adviser’s estimates of the dollar weighted average life of the portfolio’s securities, which differ from their stated maturities. The Fund’s average stated maturity was 21.7 years as of March 31, 2013.
SCHEDULE OF INVESTMENTS
March 31, 2013
Sit U.S. Government Securities Fund
| | | | | | | | | | | | |
Principal Amount ($) | | Coupon Rate (%) | | | Maturity Date | | | Fair Value ($) | |
| | | |
Mortgage Pass-Through Securities - 47.6% | |
Federal Home Loan Mortgage Corporation - 13.0% | |
30,697,276 | | | 3.00 | | | | 4/1/27 | | | | 32,221,822 | |
1,059,486 | | | 4.00 | | | | 7/1/25 | | | | 1,126,024 | |
204,101 | | | 5.50 | | | | 8/1/17-3/1/33 | | | | 222,508 | |
649,772 | | | 5.82 | | | | 10/1/37 | | | | 704,162 | |
232,232 | | | 6.38 | | | | 12/1/26-12/1/27 | | | | 265,005 | |
26,314,868 | | | 6.50 | | | | 11/1/27-9/1/39 | | | | 29,710,080 | |
734,652 | | | 6.88 | | | | 2/17/31 | | | | 848,185 | |
81,396,277 | | | 7.00 | | | | 2/1/16-1/1/39 | | | | 95,195,519 | |
99,808 | | | 7.38 | | | | 12/17/24 | | | | 107,641 | |
20,791,871 | | | 7.50 | | | | 7/1/30-10/1/38 | | | | 24,921,187 | |
143,278 | | | 7.95 | | | | 10/1/25-11/1/25 | | | | 162,246 | |
1,157,592 | | | 8.00 | | | | 5/1/17-1/1/37 | | | | 1,342,078 | |
24,310 | | | 8.25 | | | | 12/1/17 | | | | 25,250 | |
3,063,989 | | | 8.50 | | | | 5/1/16-8/1/36 | | | | 3,650,398 | |
4,275,505 | | | 9.00 | | | | 11/1/15-11/1/36 | | | | 5,049,072 | |
83,327 | | | 9.25 | | | | 6/1/16-3/1/19 | | | | 85,088 | |
490,055 | | | 9.50 | | | | 10/1/16-12/17/21 | | | | 561,640 | |
41,684 | | | 9.75 | | | | 12/1/16-12/1/17 | | | | 43,306 | |
1,698,707 | | | 10.00 | | | | 9/1/20-7/1/30 | | | | 1,987,017 | |
6,617 | | | 10.25 | | | | 2/1/17 | | | | 6,638 | |
86,467 | | | 10.50 | | | | 10/1/13-6/1/19 | | | | 99,609 | |
126,923 | | | 11.00 | | | | 8/25/20 | | | | 137,125 | |
828 | | | 13.00 | | | | 5/1/17 | | | | 833 | |
| | | | | | | | | | | | |
| | | | | | | | | | | 198,472,433 | |
| | | | | | | | | | | | |
Federal National Mortgage Association - 25.6% | |
15,784,695 | | | 3.00 | | | | 10/1/32 | | | | 16,510,132 | |
6,432 | | | 4.49 | | | | 3/1/19 | 1 | | | 6,701 | |
1,811,034 | | | 5.50 | | | | 12/1/32 | | | | 1,981,591 | |
4,306,009 | | | 5.61 | | | | 11/1/22 | | | | 4,921,627 | |
68,019 | | | 5.76 | | | | 3/1/33 | | | | 75,755 | |
4,826,844 | | | 5.81 | | | | 12/1/19-1/1/29 | | | | 5,660,120 | |
1,200,093 | | | 5.92 | | | | 1/1/35 | | | | 1,301,594 | |
3,725,732 | | | 5.94 | | | | 7/1/27 | | | | 4,415,124 | |
5,191,638 | | | 5.96 | | | | 11/1/27-6/1/28 | | | | 5,934,728 | |
4,990,243 | | | 6.00 | | | | 9/1/28-10/1/39 | | | | 5,479,495 | |
1,785,790 | | | 6.15 | | | | 6/1/28 | | | | 2,051,068 | |
486,662 | | | 6.15 | | | | 6/1/33 | 1 | | | 522,296 | |
148,113 | | | 6.20 | | | | 11/1/27 | | | | 167,597 | |
3,965,851 | | | 6.21 | | | | 12/1/29 | | | | 4,672,180 | |
2,514,667 | | | 6.34 | | | | 4/1/28 | | | | 2,830,887 | |
3,632,429 | | | 6.35 | | | | 2/1/25-10/1/30 | | | | 4,114,522 | |
1,808,919 | | | 6.45 | | | | 11/1/24 | | | | 2,087,533 | |
3,922,499 | | | 6.47 | | | | 10/15/28 | | | | 4,550,433 | |
67,165,031 | | | 6.50 | | | | 1/1/22-6/1/40 | | | | 76,255,825 | |
1,451,088 | | | 6.65 | | | | 1/1/28 | | | | 1,692,512 | |
4,205,427 | | | 6.74 | | | | 7/1/29 | | | | 5,162,101 | |
174,954 | | | 6.91 | | | | 11/1/26-8/1/27 | | | | 199,663 | |
3,211,421 | | | 6.94 | | | | 7/1/29 | | | | 3,936,845 | |
160,973 | | | 6.95 | | | | 8/1/21 | 1 | | | 169,798 | |
133,214,715 | | | 7.00 | | | | 6/1/17-1/1/40 | | | | 156,396,713 | |
| | | | | | | | | | | | |
Principal Amount ($) | | Coupon Rate (%) | | | Maturity Date | | | Fair Value ($) | |
| | | |
2,770,561 | | | 7.19 | | | | 2/1/31 | | | | 3,520,009 | |
36,582,729 | | | 7.50 | | | | 6/1/22-4/1/38 | | | | 43,460,619 | |
104,600 | | | 7.62 | | | | 12/1/16 | | | | 105,241 | |
272,184 | | | 7.95 | | | | 9/15/20 | | | | 310,596 | |
9,819,391 | | | 8.00 | | | | 4/1/16-3/1/38 | | | | 11,865,830 | |
378,237 | | | 8.11 | | | | 11/15/31 | | | | 459,501 | |
10,043 | | | 8.25 | | | | 4/1/22 | | | | 10,245 | |
164,918 | | | 8.33 | | | | 7/15/20 | | | | 189,954 | |
140,476 | | | 8.42 | | | | 7/20/30 | | | | 151,268 | |
916,852 | | | 8.46 | | | | 3/15/32 | | | | 1,097,841 | |
109,406 | | | 8.48 | | | | 7/20/28 | | | | 116,419 | |
5,273,881 | | | 8.50 | | | | 2/1/16-1/1/37 | | | | 6,403,463 | |
32,316 | | | 8.74 | | | | 12/15/25 | | | | 34,759 | |
4,779,052 | | | 9.00 | | | | 10/1/19-2/1/38 | | | | 5,731,352 | |
64,659 | | | 9.25 | | | | 10/1/16-2/1/17 | | | | 68,554 | |
93,280 | | | 9.33 | | | | 5/15/28 | | | | 99,950 | |
2,685,539 | | | 9.50 | | | | 11/1/18-8/1/31 | | | | 3,115,776 | |
236,599 | | | 9.74 | | | | 8/20/25 | | | | 278,244 | |
100,206 | | | 9.75 | | | | 10/1/21-4/1/25 | | | | 114,613 | |
75,252 | | | 9.78 | | | | 7/15/20 | | | | 79,460 | |
659,439 | | | 10.00 | | | | 2/1/15-6/1/30 | | | | 773,250 | |
52,751 | | | 10.18 | | | | 7/1/20 | | | | 55,706 | |
162,252 | | | 10.50 | | | | 5/1/15-6/1/28 | | | | 188,303 | |
34,514 | | | 10.51 | | | | 8/15/20 | | | | 35,049 | |
13,444 | | | 10.72 | | | | 12/15/26 | | | | 13,514 | |
| | | | | | | | | | | | |
| | | | | | | | | | | 389,376,356 | |
| | | | | | | | | | | | |
Government National Mortgage Association - 8.0% | |
24,361,128 | | | 4.00 | | | | 12/15/24-12/20/31 | | | | 27,000,453 | |
4,535,756 | | | 4.75 | | | | 9/20/31 | | | | 4,918,897 | |
6,417,308 | | | 5.40 | | | | 10/15/43 | | | | 6,556,336 | |
211,020 | | | 5.50 | | | | 9/15/25 | | | | 231,175 | |
3,694,785 | | | 5.67 | | | | 4/15/42 | | | | 3,844,075 | |
1,560,944 | | | 5.75 | | | | 10/20/31 | | | | 1,742,269 | |
175,535 | | | 5.76 | | | | 3/20/33-5/20/33 | | | | 193,698 | |
2,074,940 | | | 5.95 | | | | 3/15/37 | | | | 2,210,386 | |
2,747,346 | | | 6.00 | | | | 9/15/18-11/20/34 | | | | 3,110,027 | |
657,739 | | | 6.20 | | | | 3/15/32 | | | | 747,952 | |
2,784,402 | | | 6.25 | | | | 12/15/23-4/15/29 | | | | 3,201,539 | |
1,674,544 | | | 6.35 | | | | 4/20/30-11/20/31 | | | | 1,904,913 | |
446,914 | | | 6.38 | | | | 8/15/26-4/15/28 | | | | 504,871 | |
236,550 | | | 6.49 | | | | 11/20/31-6/20/32 | | | | 267,323 | |
33,193,418 | | | 6.50 | | | | 11/15/23-7/20/42 | | | | 38,710,313 | |
106,336 | | | 6.57 | | | | 9/20/32-3/20/33 | | | | 122,403 | |
78,133 | | | 6.58 | | | | 2/20/28 | | | | 91,850 | |
691,994 | | | 6.75 | | | | 9/15/15-6/15/29 | | | | 755,305 | |
612,584 | | | 6.91 | | | | 7/20/26-2/20/27 | | | | 724,578 | |
11,417,639 | | | 7.00 | | | | 5/15/24-1/20/39 | | | | 13,267,259 | |
148,069 | | | 7.02 | | | | 4/20/26 | | | | 175,305 | |
158,840 | | | 7.05 | | | | 2/15/23-4/20/27 | | | | 188,368 | |
479,985 | | | 7.10 | | | | 5/20/25 | | | | 566,894 | |
265,711 | | | 7.15 | | | | 3/20/27-4/20/27 | | | | 317,376 | |
143,576 | | | 7.25 | | | | 5/15/29-6/15/29 | | | | 172,305 | |
See accompanying notes to financial statements.
| | |
6 | | SIT MUTUAL FUNDS ANNUAL REPORT |
| | | | | | | | | | | | |
Principal Amount ($) | | Coupon Rate (%) | | | Maturity Date | | | Fair Value ($) | |
| | | |
44,473 | | | 7.27 | | | | 7/20/22 | | | | 51,734 | |
2,629,359 | | | 7.50 | | | | 12/15/23-3/15/39 | | | | 3,062,548 | |
31,822 | | | 7.63 | | | | 12/15/29 | | | | 32,308 | |
52,638 | | | 7.65 | | | | 7/20/22 | | | | 59,567 | |
290,045 | | | 7.75 | | | | 6/15/20-11/15/20 | | | | 319,765 | |
30,692 | | | 7.90 | | | | 1/20/21 | | | | 30,923 | |
551,960 | | | 7.95 | | | | 2/15/20-3/20/27 | | | | 589,856 | |
357,398 | | | 7.99 | | | | 2/20/21-6/20/22 | | | | 393,704 | |
3,178,365 | | | 8.00 | | | | 10/15/14-8/20/33 | | | | 3,758,470 | |
241,620 | | | 8.10 | | | | 5/20/19-1/20/20 | | | | 258,606 | |
182,396 | | | 8.25 | | | | 8/15/15-2/15/20 | | | | 201,588 | |
107,514 | | | 8.40 | | | | 2/15/19-2/15/20 | | | | 109,450 | |
209,563 | | | 8.50 | | | | 4/15/15-12/20/26 | | | | 240,282 | |
25,873 | | | 8.60 | | | | 6/15/18 | | | | 25,979 | |
17,143 | | | 8.63 | | | | 10/15/18 | | | | 18,877 | |
92,244 | | | 9.00 | | | | 1/15/17-12/15/20 | | | | 107,849 | |
13,472 | | | 9.10 | | | | 5/15/18 | | | | 15,289 | |
113,380 | | | 9.50 | | | | 11/20/16-8/20/19 | | | | 126,988 | |
159,332 | | | 10.00 | | | | 2/15/19-6/15/21 | | | | 179,976 | |
221,461 | | | 10.50 | | | | 2/15/20-8/15/21 | | | | 251,736 | |
1,668 | | | 11.50 | | | | 8/15/18 | | | | 1,678 | |
| | | | | | | | | | | | |
| | | | | | | | | | | 121,363,043 | |
| | | | | | | | | | | | |
Small Business Administration - 1.0% | |
5,000,000 | | | 4.33 | | | | 1/25/38 | | | | 5,476,562 | |
8,586,282 | | | 5.33 | | | | 8/25/36-9/25/36 | | | | 9,645,199 | |
| | | | | | | | | | | | |
| | | | | | | | | | | 15,121,761 | |
| | | | | | | | | | | | |
Total Mortgage Pass-Through Securities
(cost: $704,875,257) | | | | 724,333,593 | |
| | | | | | | | | | | | |
| | | | | | | | | | | | |
U.S. Treasury / Federal Agency Securities - 0.6% | |
Federal National Mortgage Association: | |
5,000,000 | | | 2.50 | | | | 11/19/32 | 1 | | | 4,941,869 | |
MSN 41079 and 41084, Ltd.: | |
3,923,786 | | | 1.63 | | | | 12/14/24 | | | | 3,935,212 | |
| | | | | | | | | | | | |
Total U.S. Treasury / Federal Agency Securities
(cost: $8,916,290) | | | | 8,877,081 | |
| | | | | | | | | | | | |
Collateralized Mortgage Obligations - 45.6% Federal Home Loan Mortgage Corporation - 9.2% | |
|
52,506 | | | 4.98 | | | | 3/25/44 | 1 | | | 53,218 | |
4,036,515 | | | 6.00 | | | | 9/15/21-5/15/36 | | | | 4,536,675 | |
11,128,275 | | | 6.50 | | | | 9/15/23-10/25/43 | | | | 12,753,583 | |
1,145,523 | | | 6.50 | | | | 9/25/43 | 1 | | | 1,302,503 | |
103,826 | | | 6.70 | | | | 9/15/23 | | | | 116,974 | |
235,355 | | | 6.95 | | | | 3/15/28 | | | | 273,289 | |
78,566,852 | | | 7.00 | | | | 12/15/20-9/25/43 | | | | 88,813,320 | |
19,888,736 | | | 7.50 | | | | 10/15/21-9/25/43 | | | | 23,865,678 | |
4,020,866 | | | 8.00 | | | | 3/15/21-1/15/30 | | | | 4,658,119 | |
60,671 | | | 8.25 | | | | 6/15/22 | | | | 69,882 | |
331,420 | | | 8.30 | | | | 11/15/20 | | | | 376,955 | |
| | | | | | | | | | | | | | | |
Principal Amount ($) | | Coupon Rate (%) | | Maturity Date | | Fair Value ($) |
| | | |
| | | |
690,539 | | | | 8.50 | | | | | 10/15/22-3/15/32 | | | | | 801,742 | |
360,831 | | | | 9.00 | | | | | 12/15/19 | | | | | 404,145 | |
8,673 | | | | 9.15 | | | | | 10/15/20 | | | | | 9,548 | |
1,788,635 | | | | 9.50 | | | | | 2/15/20-2/25/42 | | | | | 2,138,691 | |
| | | | | | | | | | | | | | | |
| | | | | | | | | | | | | | 140,174,322 | |
| | | | | | | | | | | | | | | |
Federal National Mortgage Association - 28.2% | |
9,248,396 | | | | 4.00 | | | | | 10/25/22 | | | | | 9,602,665 | |
13,727,364 | | | | 4.50 | | | | | 6/25/21 | | | | | 14,716,462 | |
39,230,318 | | | | 6.00 | | | | | 12/25/31-5/25/42 | | | | | 39,647,001 | |
3,900,582 | | | | 6.43 | | | | | 9/25/37 | 1 | | | | 4,489,874 | |
75,904,256 | | | | 6.50 | | | | | 12/25/23-2/25/43 | | | | | 87,479,333 | |
1,271,128 | | | | 6.59 | | | | | 6/25/42 | 1 | | | | 1,441,624 | |
191,021 | | | | 6.63 | | | | | 3/25/29 | 1 | | | | 219,356 | |
21,871,830 | | | | 6.75 | | | | | 6/25/32-4/25/37 | | | | | 24,908,457 | |
4,948,028 | | | | 6.77 | | | | | 10/25/42 | 1 | | | | 5,798,599 | |
28,908 | | | | 6.85 | | | | | 12/18/27 | | | | | 33,374 | |
702,606 | | | | 6.88 | | | | | 12/25/42 | 1 | | | | 839,861 | |
4,982,897 | | | | 6.90 | | | | | 2/25/42 | 1 | | | | 5,808,524 | |
63,752,439 | | | | 7.00 | | | | | 1/25/21-3/25/45 | | | | | 74,952,636 | |
3,347,346 | | | | 7.05 | | | | | 8/25/37 | 1 | | | | 3,865,535 | |
1,738,423 | | | | 7.06 | | | | | 6/25/42 | 1 | | | | 2,091,442 | |
3,922,723 | | | | 7.18 | | | | | 10/25/42 | 1 | | | | 4,657,829 | |
71,133,714 | | | | 7.50 | | | | | 8/20/27-1/25/48 | | | | | 82,941,960 | |
1,281,810 | | | | 7.50 | | | | | 6/19/30 | 1 | | | | 1,554,491 | |
32,349 | | | | 7.70 | | | | | 3/25/23 | | | | | 37,217 | |
1,774,341 | | | | 8.00 | | | | | 7/25/22-7/25/44 | | | | | 2,118,632 | |
1,193,327 | | | | 8.42 | | | | | 11/25/37 | 1 | | | | 1,431,037 | |
16,954,619 | | | | 8.50 | | | | | 1/25/21-10/25/30 | | | | | 20,254,173 | |
1,138,282 | | | | 8.53 | | | | | 11/25/37 | 1 | | | | 1,312,082 | |
16,513 | | | | 8.70 | | | | | 12/25/19 | | | | | 18,766 | |
20,753 | | | | 8.75 | | | | | 9/25/20 | | | | | 22,700 | |
6,632,186 | | | | 8.82 | | | | | 7/25/37 | 1 | | | | 7,399,139 | |
91,339 | | | | 8.95 | | | | | 10/25/20 | | | | | 104,183 | |
2,741,190 | | | | 9.00 | | | | | 7/25/19-10/25/30 | | | | | 3,217,697 | |
35,997 | | | | 9.05 | | | | | 12/25/18 | | | | | 39,475 | |
69,717 | | | | 9.18 | | | | | 10/25/42 | 1 | | | | 85,701 | |
45,502 | | | | 9.25 | | | | | 1/25/20 | | | | | 51,847 | |
999,698 | | | | 9.41 | | | | | 6/25/32 | 1 | | | | 1,151,629 | |
3,497,371 | | | | 9.50 | | | | | 12/25/18-12/25/41 | | | | | 4,351,057 | |
2,052,243 | | | | 9.58 | | | | | 2/25/44 | 1 | | | | 2,504,502 | |
114,575 | | | | 9.60 | | | | | 3/25/20 | | | | | 132,011 | |
13,076,772 | | | | 10.00 | | | | | 12/25/31-5/25/42 | | | | | 13,364,373 | |
3,032,360 | | | | 10.25 | | | | | 9/25/42 | 1 | | | | 3,908,964 | |
1,531,395 | | | | 11.36 | | | | | 6/25/44 | 1 | | | | 1,895,174 | |
229,451 | | | | 11.65 | | | | | 3/25/39 | 1 | | | | 271,441 | |
| | | | | | | | | | | | | | | |
| | | | | | | | | | | | | | 428,720,823 | |
| | | | | | | | | | | | | | | |
Government National Mortgage Association - 4.9% | |
15,689,120 | | | | 4.82 | | | | | 1/20/42 | 1 | | | | 17,665,573 | |
4,992,456 | | | | 5.53 | | | | | 7/20/40 | 1 | | | | 5,710,051 | |
1,895,672 | | | | 6.00 | | | | | 11/20/33 | | | | | 2,181,233 | |
See accompanying notes to financial statements.
SCHEDULE OF INVESTMENTS
March 31, 2013
Sit U.S. Government Securities Fund (Continued)
| | | | | | | | | | |
Principal Amount ($) | | Coupon Rate
(%) | | | Maturity Date | | | Fair Value ($) |
844,254 | | | 6.50 | | | | 9/20/28-3/20/31 | | | 990,256 |
981,311 | | | 6.95 | | | | 3/16/41 | 1 | | 1,025,028 |
38,289,675 | | | 7.00 | | | | 9/16/23-5/20/42 | | | 43,313,274 |
173,424 | | | 7.50 | | | | 5/16/27 | | | 210,958 |
2,061,725 | | | 8.00 | | | | 10/16/29-1/16/30 | | | 2,404,106 |
50,210 | | | 8.50 | | | | 2/20/32 | | | 63,870 |
| | | | | | | | | | |
| | | | | | | | | | 73,564,349 |
| | | | | | | | | | |
Vendee Mortgage Trust - 3.3% |
9,016,146 | | | 3.75 | | | | 12/15/33 | | | 9,654,841 |
528,706 | | | 6.00 | | | | 2/15/30 | | | 549,800 |
18,684,128 | | | 6.50 | | | | 1/15/29-8/15/31 | | | 22,291,207 |
2,800,621 | | | 7.00 | | | | 3/15/28 | | | 3,332,501 |
363,448 | | | 7.01 | | | | 7/15/30 | 1 | | 429,414 |
1,763,765 | | | 7.25 | | | | 9/15/22-9/15/25 | | | 1,998,818 |
924,864 | | | 7.50 | | | | 6/15/30 | | | 1,060,120 |
2,969,992 | | | 7.75 | | | | 5/15/22-9/15/24 | | | 3,442,460 |
5,416,335 | | | 7.95 | | | | 3/15/25 | 1 | | 6,481,902 |
524,114 | | | 8.00 | | | | 2/15/25 | | | 611,845 |
197,469 | | | 8.29 | | | | 12/15/26 | | | 233,306 |
| | | | | | | | | | |
| | | | | | | | | | 50,086,214 |
| | | | | | | | | | |
Total Collateralized Mortgage Obligations
(cost: $681,619,121) | | | 692,545,708 |
| | | | | | | | | | |
Asset-Backed Securities - 4.2% | | | |
Federal Home Loan Mortgage Corporation - 0.5% |
22,422 | | | 6.09 | | | | 9/25/29 | 1 | | 22,744 |
250,000 | | | 6.28 | | | | 10/27/31 | 1 | | 280,778 |
283,755 | | | 7.00 | | | | 11/25/30 | 1 | | 293,115 |
3,531,182 | | | 7.15 | | | | 9/25/28 | 1 | | 3,921,876 |
2,698,502 | | | 7.16 | | | | 7/25/29 | | | 2,808,177 |
| | | | | | | | | | |
| | | | | | | | | | 7,326,690 |
| | | | | | | | | | |
Federal National Mortgage Association - 0.2% |
85,569 | | | 0.54 | | | | 11/25/32 | 1 | | 79,198 |
494,042 | | | 4.70 | | | | 10/25/33 | 1 | | 494,953 |
422,275 | | | 5.41 | | | | 9/26/33 | 1 | | 449,910 |
156,686 | | | 5.75 | | | | 2/25/33 | 1 | | 167,881 |
256,876 | | | 6.47 | | | | 10/25/31 | 1 | | 268,379 |
1,817,462 | | | 6.59 | | | | 10/25/31-5/25/32 | 1 | | 1,979,920 |
126,316 | | | 6.83 | | | | 7/25/31 | 1 | | 132,853 |
48,868 | | | 7.80 | | | | 6/25/26 | 1 | | 48,912 |
| | | | | | | | | | |
| | | | | | | | | | 3,622,006 |
| | | | | | | | | | |
| | | | | | | | | |
Principal Amount($)/ Contracts | | Coupon Rate (%) | | Maturity Date | | Fair Value ($) |
|
Small Business Administration - 3.5% |
5,000,000 | | 2.22 | | | | 3/1/33 | | | 5,060,814 |
5,000,000 | | 2.35 | | | | 3/10/23 | | | 4,999,999 |
3,790,020 | | 5.49 | | | | 5/1/28 | | | 4,389,992 |
3,803,993 | | 5.57 | | | | 10/1/27 | | | 4,393,851 |
12,942,843 | | 5.87 | | | | 7/1/28 | | | 15,182,469 |
553,171 | | 6.02 | | | | 8/1/28 | | | 645,040 |
3,121,539 | | 6.77 | | | | 11/1/28 | | | 3,693,300 |
4,128,762 | | 7.13 | | | | 10/1/20 | | | 4,598,614 |
4,813,196 | | 7.33 | | | | 8/1/20 | | | 5,407,520 |
3,675,393 | | 8.03 | | | | 5/1/20 | | | 4,155,378 |
| | | | | | | | | |
| | | | | | | | | 52,526,977 |
| | | | | | | | | |
Total Asset-Backed Securities
(cost: $63,089,763) | | | 63,475,673 |
| | | | | | | | | |
|
Put Options Purchased 10 - 0.0% |
600 | | U.S. Treasury 5 Year Future Put Options: $123.50 strike May 2013 expiration | | | |
Total Put Options Purchased
(cost: $171,738) | | | 51,563 |
| | | | | | | | | |
Total Investments in Securities - 98.0%
(cost: $1,458,672,169) | | | 1,489,283,618 |
| | | | | | | | | |
Call Options Written 10 - (0.1%) | | | |
(1,000) | | U.S. Treasury 2 Year Future Call Options: $110.13 strike May 2013 expiration | | | (218,750) |
(1,200) | | U.S. Treasury 5 Year Future Call Options: $123.50 strike May 2013 expiration | | | (768,750) |
| | | | | | | | | |
Total Call Options Written
(premiums received: $536,786) | | | (987,500) |
| | | | | | | | | |
| |
Other Assets and Liabilities, net - 2.1% | | | 31,762,935 |
| | | | | | | | | |
Total Net Assets - 100.0% | | | $1,520,059,053 |
| | | | | | | | | |
| 1 | Variable rate security. Rate disclosed is as of March 31, 2013. |
| 10 | The amount of $2,000,000 in cash was segregated with the broker to cover put options purchased and call options written as of March 31, 2013. |
Numeric footnotes not disclosed are not applicable to this Schedule of Investments.
| | |
See accompanying notes to financial statements. |
8 | | SIT MUTUAL FUNDS ANNUAL REPORT |
For a detailed list of security holdings, refer to our company website at www.sitfunds.com.
A summary of the levels for the Fund’s investments as of March 31, 2013 is as follows (See Note 2 - significant accounting policies in the notes to financial statements):
| | | | | | | | | | | | | | | | | | | | |
| | | Investment in Securities |
| | | Level 1
Quoted
Price ($) | | Level 2
Other significant
observable inputs ($) | | Level 3 Significant
unobservable inputs ($) | | Total ($) |
| | | | | |
Assets | | | | | | | | | | | | | | | | | | | | |
Mortgage Pass-Through Securities | | | | — | | | | | 724,333,593 | | | | | — | | | | | 724,333,593 | |
U.S. Treasury / Federal Agency Securities | | | | — | | | | | 8,877,081 | | | | | — | | | | | 8,877,081 | |
Collateralized Mortgage Obligations | | | | — | | | | | 692,545,708 | | | | | — | | | | | 692,545,708 | |
Asset-Backed Securities | | | | — | | | | | 63,475,673 | | | | | — | | | | | 63,475,673 | |
Put Options Purchased | | | | 51,563 | | | | | — | | | | | — | | | | | 51,563 | |
| | | | | |
| | | | 51,563 | | | | | 1,489,232,055 | | | | | — | | | | | 1,489,283,618 | |
| | | | | |
Liabilities | | | | | | | | | | | | | | | | | | | | |
Call Options Written | | | | (987,500 | ) | | | | — | | | | | — | | | | | (987,500 | ) |
| | | | | |
For the reporting period, there were no transfers between levels 1, 2 and 3.
| | |
See accompanying notes to financial statements. | | |
MARCH 31, 2013 | | 9 |
OBJECTIVE & STRATEGY
The objective of the Quality Income Fund is to provide high current income and safety of principal, which it seeks to attain by investing at least 80% of its assets in debt securities issued by the U.S. government and its agencies, debt securities issued by corporations, mortgage and other asset-backed securities. The Fund invests at least 50% of its assets in U.S. government debt securities, which are securities issued, guaranteed or insured by the U.S. government, its agencies or instrumentalities.
The Sit Quality Income Fund provided a total return of +0.38% during the 3-month period ended March 31, 2013, compared to the total return of the Barclays 1-3 year Government/Credit Bond Index of +0.20%. As of March 31, 2013, the Fund’s 30-day SEC yield was 1.36%.
The inception date of the Fund was December 31, 2012, making the quarter our first reporting period. The initial cash was invested timely, allowing the Fund to earn relatively strong income for the quarter. The goal of the Fund is to maintain a high credit quality portfolio and stable principal values, while generating a relatively high level of income.
During the initial 3-month period, the Fund’s income advantage was primarily produced by its holdings in non-agency residential mortgage and corporate securities. Improvements in employment figures and housing metrics during the first quarter benefitted the credit markets, and the Fund’s overweight exposure to these sectors, relative to the benchmark index, contributed meaningfully to return. The Fund’s holdings in agency mortgages also contributed positively to performance primarily due to the income generated by these securities. In an effort to maintain price stability, we incorporate futures and options to offset interest rate risk. This component of the Fund can have a negative impact on performance in periods of stable or falling interest rates, as experienced in this reporting period.Although U.S. Treasuries provided positive return on an absolute basis, it was the weakest performing sector. Thus, the Fund’s underweight position in U.S. Treasury securities further benefitted performance.
Stronger than expected economic data and a healing housing market offset fears of the sequestration effect and lifted market optimism during the first quarter. In fact, some market participants are commenting that a reduction in government spending due to the sequester is good for the economy and market confidence. We expect sustained albeit slow domestic growth going forward. Continued uncertainty surrounding the fiscal problems in Europe and the fragile nature of the budding domestic recovery is likely to encourage the Fed to remain accommodative through year-end. As such we are maintaining our underweight position to the U.S. Treasury sector, as we expect the accommodative policy to drive inflation higher and, in turn, U.S. Treasury bond prices lower, in the intermediate term. A lack of
HYPOTHETICAL GROWTH OF $10,000
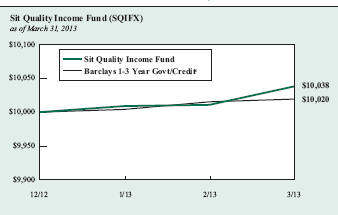
The chart above illustrates the total value of a hypothetical $10,000 investment in the Fund over the past 10 years (or for the life of the Fund if shorter) as compared to the performance of the Barclays 1-3 Year Government/Credit Index. Past performance does not guarantee future results. Returns include the reinvestment of distributions. The chart does not reflect the deduction of taxes that a shareholder would pay on Fund distributions or the redemption of Fund shares.
1 The Barclays U.S. 1-3 Year Government/Credit Index is an unmanaged index of Treasury or government agency securities and investment grade corporate debt securities with maturities of one to three years. The returns include the reinvestment of income and do not include any transaction costs, management fees or other costs. It is not possible to invest directly in an index.
bi-partisanship in Congress has left little chance for an improvement in the federal budget situation. As such we continue to invest in higher rated sectors that should out-perform in the event of further federal government ratings downgrades. We focus on a mix of Treasury, agency and credit sectors that provide relatively high levels of income and stable prices. The dual goals of income and principal stability are the primary objectives of the Fund.
Michael C. Brilley
Bryce A. Doty, CFA
Senior Portfolio Managers
Mark H. Book, CFA
Chris M. Rasmussen, CFA
Portfolio Managers
| | |
10 | | SIT MUTUAL FUNDS ANNUAL REPORT |
COMPARATIVE RATES OF RETURNS
as of March 31, 2013
| | | | | | |
| | | Sit Quality Income Fund | | Barclays U.S. 1-3 Year Government/Credit Index1 | | Lipper Short Investment Grade Bond Index2 |
| | | |
Since Inception
(12/31/12) | | 0.38% | | 0.20% | | 0.41% |
Performance figures are historical and do not guarantee future results. Investment returns and principal value will vary, and you may have a gain or loss when you sell shares. Current performance may be lower or higher than the performance data quoted. Contact the Fund for performance data current to the most recent month-end. Returns include changes in share price as well as reinvestment of all dividends and capital gains and all fee waivers. Without the fee waivers total return and yield figures would have been lower. Returns do not reflect the deduction of taxes that a shareholder would pay on Fund distributions or the redemption of Fund shares. Management fees and administrative expenses are included in the Fund’s performance.
1 The Barclays U.S. 1-3 Year Government/Credit Index is an unmanaged index of Treasury or government agency securities and investment grade corporate debt securities with maturities of one to three years. The returns include the reinvestment of income and do not include any transaction costs, management fees or other costs. It is not possible to invest directly in an index.
2 The Lipper returns are obtained from Lipper Analytical Services, Inc., a large independent evaluator of mutual funds.
FUND DIVERSIFICATION
| | | | |
U.S. Treasury/Federal Agency Securities | | | 29.0 | % |
Mortgage Pass-Through (Agency) | | | 21.3 | % |
Corporate Bonds | | | 14.6 | % |
Asset Backed | | | 14.5 | % |
Collateralized Mortgage Obligations (Non-Agency) | | | 13.4 | % |
Taxable Municipal | | | 5.7 | % |
Cash & Other Net Assets | | | 1.5 | % |
Based on total net assets as of March 31, 2013. Subject to change.
PORTFOLIO SUMMARY
| | |
Net Asset Value 3/31/13: | | $ 10.01 Per Share |
Net Asset Value 12/31/12 3: | | $ 10.00 Per Share |
Total Net Assets: | | $ 5.1 Million |
30-day SEC Yield 4: | | 1.36% |
Average Maturity: | | 11.5 Years |
Effective Duration 5: | | 1.4 Years |
3 Inception date of the Fund.
4 The SEC Yield reflects the rate at which the Fund is earning income on its current portfolio of securities, while the distribution rate reflects the Fund’s past dividends paid to shareholders based on the net investment income distributed and the average NAV during the past 12 months. Accordingly, the Fund’s SEC yield and distribution rate may differ.
5 Duration is a measure of estimated price sensitivity relative to changes in interest rates. Portfolios with longer durations are typically more sensitive to changes in interest rates. For example, if interest rates rise by 1%, the fair value of a security with an effective duration of 5 years would decrease by 5%, with all other factors being constant. The correlation between duration and price sensitivity is greater for securities rated investment-grade than it is for securities rated below investment-grade. Duration estimates are based on assumptions by the Adviser and are subject to a number of limitations. Effective duration is calculated based on historical price changes of securities held by the Fund, and therefore is a more accurate estimate of price sensitivity provided interest rates remain within their historical range.
QUALITY RATINGS (% of Total Net Assets)
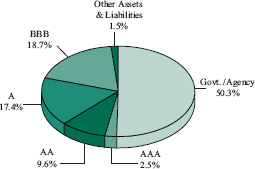
Lower of Moody’s, S&P, Fitch or Duff & Phelps ratings used.
SCHEDULE OF INVESTMENTS
March 31, 2013
Sit Quality Income Fund
| | | | | | | | | | | | |
Principal
Amount ($) | | Name of Issuer | | Coupon
Rate (%) | | Maturity Date | | | Fair
Value ($) | |
Asset-Backed Securities - 14.5% | | | | | | | | |
94,544 | | Bayview Financial Mortgage Pass-Through Trust, Series 2005-D, Class AF3 1 | | 5.50 | | | 12/28/35 | | | | 96,038 | |
155,000 | | Centex Home Equity Loan Trust, Series 2004-A, Class AF5 1 | | 5.43 | | | 1/25/34 | | | | 158,810 | |
83,426 | | Conseco Financial Corp., Series 1996-4, Class A6 | | 7.40 | | | 6/15/27 | | | | 86,773 | |
176,992 | | Countrywide Asset-Backed Certificates, Series 2004-S1, Class A3 1 | | 5.12 | | | 2/25/35 | | | | 181,713 | |
46,901 | | Deutsche Financial Capital Securitization LLC, Series 1998-1, Class A4 | | 6.38 | | | 4/15/28 | | | | 47,211 | |
45,949 | | Residential Funding Mortgage Securities II Home Loan Trust, Series 1999-HI1, Class A6 1 | | 7.58 | | | 9/25/29 | | | | 47,299 | |
122,687 | | Wells Fargo Home Equity Asset-Backed Securities Trust, Series 2004-2, Class AI6 1 | | 5.00 | | | 10/25/34 | | | | 126,239 | |
| | | | | | | | | | | | |
Total Asset-Backed Securities
(cost: $742,206) | | | | | | | | | 744,083 | |
| | | | | | | | | | | | |
Collateralized Mortgage Obligations - 18.0% | | | | | | | | | | |
92,843 | | Alternative Loan Trust, Series 2003-20CB, Class 1A2 | | 5.50 | | | 10/25/33 | | | | 95,736 | |
114,176 | | Banc of America Mortgage Trust, Series 2004-3, Class 1A26 | | 5.50 | | | 4/25/34 | | | | 116,083 | |
165,474 | | Chase Mortgage Finance Trust, Series 2003-S14, Class 3A10 | | 5.50 | | | 1/25/34 | | | | 169,908 | |
119,694 | | FNMA REMICS, Series 2007-100, Class ND | | 5.75 | | | 10/25/35 | | | | 125,399 | |
97,885 | | GNMA, Series 2013-26, Class PT 1 | | 4.82 | | | 1/20/42 | | | | 110,216 | |
115,225 | | MASTR Alternative Loan Trust, Series 2003-4, Class 2A1 | | 6.25 | | | 6/25/33 | | | | 120,095 | |
48,670 | | PHH Mortgage Trust, Series 2008-CIM2, Class 5A1 | | 6.00 | | | 7/25/38 | | | | 50,130 | |
135,223 | | Structured Asset Sec Corp. Mortgage Pass Through Certificates, Series 2003-16, Class A2 | | 4.75 | | | 6/25/33 | | | | 136,626 | |
| | | | | | | | | | | | |
Total Collateralized Mortgage Obligations
(cost: $921,605) | | | | | | | | | 924,193 | |
| | | | | | | | | | | | |
Corporate Bonds - 20.4% | | | | | | | | | | |
Federal Agency Issues - 5.8% | | | | | | | | | | |
100,000 | | Discover Bank 12 | | 0.55 | | | 2/27/15 | | | | 99,672 | |
100,000 | | Fifth Third Bank 12 | | 0.40 | | | 2/27/14 | | | | 99,845 | |
100,000 | | Goldman Sachs Bank 12 | | 0.70 | | | 2/6/15 | | | | 99,776 | |
| | | | | | | | | | | | |
| | | | | | | | | | | 299,293 | |
| | | | | | | | | | | | |
Finance - 5.9% | | | | | | | | | | |
100,000 | | Bank of Oklahoma 1 | | 0.98 | | | 5/15/17 | | | | 98,250 | |
50,000 | | BNY Institutional Capital Trust A 4 | | 7.78 | | | 12/1/26 | | | | 50,982 | |
50,000 | | Chittenden Corp. 1 | | 0.98 | | | 2/14/17 | | | | 48,222 | |
50,000 | | Comerica Bank | | 8.38 | | | 7/15/24 | | | | 54,111 | |
50,000 | | Security Benefit Life Insurance Co. 4 | | 8.75 | | | 5/15/16 | | | | 52,293 | |
| | | | | | | | | | | | |
| | | | | | | | | | | 303,858 | |
| | | | | | | | | | | | |
Industrial - 4.0% | | | | | | | | | | |
100,000 | | General Electric Capital Corp. 1 | | 1.04 | | | 8/11/15 | | | | 100,633 | |
95,880 | | Northwest Airlines 1999-2 Class A Pass Through Trust | | 7.58 | | | 3/1/19 | | | | 103,550 | |
| | | | | | | | | | | | |
| | | | | | | | | | | 204,183 | |
| | | | | | | | | | | | |
Transportation - 1.8% | | | | | | | | | | |
41,506 | | Continental Airlines 2009-1 Pass Through Trust | | 9.00 | | | 7/8/16 | | | | 47,992 | |
37,124 | | United Airlines 2009-2A Pass Through Trust | | 9.75 | | | 1/15/17 | | | | 43,063 | |
| | | | | | | | | | | | |
| | | | | | | | | | | 91,055 | |
| | | | | | | | | | | | |
Utilities - 1.0% | | | | | | | | | | |
50,000 | | Entergy Arkansas, Inc. | | 5.90 | | | 6/1/33 | | | | 50,336 | |
| | | | | | | | | | | | |
Yankees - 1.9% | | | | | | | | | | |
90,000 | | Alterra USA Holdings, Ltd. 4 | | 7.20 | | | 4/14/17 | | | | 94,617 | |
| | | | | | | | | | | | |
Total Corporate Bonds
(cost: $1,041,011) | | | | | | | | | 1,043,342 | |
| | | | | | | | | | | | |
See accompanying notes to financial statements.
| | |
12 | | SIT MUTUAL FUNDS ANNUAL REPORT |
| | | | | | | | | | | | |
Principal
Amount ($) | | Name of Issuer | | Coupon
Rate (%) | | Maturity Date | | | Fair
Value ($) | |
Mortgage Pass-Through Securities - 21.3% | | | | | | | | |
Federal Home Loan Mortgage Corporation - 8.1% | | | | | | | | |
145,553 | | Freddie Mac | | 3.50 | | | 7/1/26 | | | | 155,763 | |
82,613 | | Freddie Mac | | 5.00 | | | 10/1/25 | | | | 89,941 | |
149,808 | | Freddie Mac | | 6.00 | | | 9/1/23 | | | | 168,054 | |
| | | | | | | | | | | | |
| | | | | | | | | | | 413,758 | |
| | | | | | | | | | | | |
Federal National Mortgage Association - 9.1% | | | | | | | | | | |
133,008 | | Fannie Mae | | 4.00 | | | 3/1/26 | | | | 142,353 | |
141,579 | | Fannie Mae | | 4.00 | | | 4/1/31 | | | | 152,048 | |
74,794 | | Fannie Mae | | 4.00 | | | 10/1/31 | | | | 80,324 | |
83,151 | | Fannie Mae | | 6.50 | | | 2/1/19 | | | | 92,463 | |
| | | | | | | | | | | | |
| | | | | | | | | | | 467,188 | |
| | | | | | | | | | | | |
Government National Mortgage Association - 4.1% | | | | | | | | | | |
102,502 | | Ginnie Mae 1 | | 1.63 | | | 10/20/34 | | | | 107,369 | |
95,572 | | Ginnie Mae 1 | | 3.50 | | | 4/20/42 | | | | 101,894 | |
| | | | | | | | | | | | |
| | | | | | | | | | | 209,263 | |
| | | | | | | | | | | | |
Total Mortgage Pass-Through Securities
(cost: $1,088,204) | | | | | | | | | 1,090,209 | |
| | | | | | | | | | | | |
Taxable Municipal Bonds - 5.7% | | | | | | | | | | |
100,000 | | Academica Charter Schools 4 | | 7.18 | | | 8/15/13 | | | | 99,345 | |
50,000 | | Mashantucket Western Pequot Tribe 4 | | 6.57 | | | 9/1/13 | | | | 49,485 | |
100,000 | | OH Economic Dev. Rev. (Ohio Enterprise) | | 6.00 | | | 12/1/13 | | | | 100,569 | |
50,000 | | Skyway Concession Co. LLC 1, 4 | | 0.56 | | | 6/30/17 | | | | 44,750 | |
| | | | | | | | | | | | |
| | | | | | | | | | | 294,149 | |
| | | | | | | | | | | | |
Total Taxable Municipal Bonds
(cost: $294,340) | | | | | | | | | 294,149 | |
| | | | | | | | | | | | |
U.S. Treasury / Federal Agency Securities - 18.6% | | | | | | | | | | |
Federal Farm Credit Banks - 3.9% | | | | | | | | | | |
100,000 | | Federal Farm Credit Banks | | 0.16 | | | 5/12/14 | | | | 99,997 | |
100,000 | | Federal Farm Credit Banks | | 0.22 | | | 11/3/14 | | | | 100,057 | |
| | | | | | | | | | | | |
| | | | | | | | | | | 200,054 | |
| | | | | | | | | | | | |
U.S. Treasury Note - 14.7% | | | | | | | | | | |
400,000 | | U.S. Treasury Note | | 0.13 | | | 12/31/13 | | | | 399,938 | |
150,000 | | U.S. Treasury Note | | 0.25 | | | 12/15/15 | | | | 149,684 | |
200,000 | | U.S. Treasury Note | | 0.63 | | | 7/15/14 | | | | 201,086 | |
| | | | | | | | | | | | |
| | | | | | | | | | | 750,708 | |
| | | | | | | | | | | | |
Total U.S. Treasury / Federal Agency Securities
(cost: $950,630) | | | | | | | | | 950,762 | |
| | | | | | | | | | | | |
Total Investments in Securities - 98.5%
(cost: $5,037,996) | | | | | | | | | 5,046,738 | |
| | | | | | | | | | | | |
See accompanying notes to financial statements.
SCHEDULE OF INVESTMENTS
March 31, 2013
Sit Quality Income Fund (Continued)
| | | | |
Contracts | | Fair
Value ($) | |
| |
Call Options Written 13 - 0.0% | | | | |
(4) U.S. Treasury 2 Year Future Call Options: $110.13 strike May 2013 expiration | | | (1,062 | ) |
| | | | |
Total Call Options Written
(premiums received: $858) | | | (1,062 | ) |
| | | | |
Other Assets and Liabilities, net - 1.5% | | | 75,929 | |
| | | | |
Total Net Assets - 100.0% | | $ | 5,121,605 | |
| | | | |
| | | | | |
| 1 | Variable rate security. Rate disclosed is as of March 31, 2013. |
| 4 | 144A Restricted Security. The total value of such securities as of March 31, 2013 was $391,472 and represented 7.6% of net assets. These securities have been determined to be liquid by the Adviser in accordance with guidelines established by the Board of Directors. |
| 12 | Certificate of Deposit. Investments up to $250,000 are insured by the Federal Deposit Insurance Corporation. |
| 13 | The amount of $5,000 in cash was segregated with the broker to cover futures and call options written as of March 31, 2013. |
Numeric footnotes not disclosed are not applicable to this Schedule of Investments.
Short futures contracts outstanding as of March 31, 2013 were as follows:
| | | | | | | | |
| Contracts | | Type | | Expiration
Date | | Notional
Amount | | Unrealized
(Depreciation) |
5 | | U.S. Treasury 2 Year Futures 13 | | June 2013 | | $1,102,266 | | $(969) |
A summary of the levels for the Fund’s investments as of March 31, 2013 is as follows (See Note 2 - significant accounting policies in the notes to financial statements):
| | | | | | | | | | | | | | | | | |
| | | Investment in Securities |
| | | Level 1
Quoted
Price ($) | | Level 2
Other Significant
Observable Inputs ($) | | Level 3
Other Significant
Observable Inputs ($) | | Total ($) |
Assets | | | | | | | | | | | | | | |
Asset-Backed Securities | | — | | | | 744,083 | | | — | | | | 744,083 | |
Collateralized Mortgage
Obligations | | — | | | | 924,193 | | | — | | | | 924,193 | |
Corporate Bonds | | — | | | | 1,043,342 | | | — | | | | 1,043,342 | |
Mortgage Pass-Through
Securities | | — | | | | 1,090,209 | | | — | | | | 1,090,209 | |
Taxable Municipal Bonds | | — | | | | 294,149 | | | — | | | | 294,149 | |
U.S. Treasury / Federal | | | | | | | | | | | | | | |
Agency | | | | | | | | | | | | | | |
Securities | | — | | | | 950,762 | | | — | | | | 950,762 | |
| | — | | | | 5,046,738 | | | — | | | | 5,046,738 | |
Liabilities | | | | | | | | | | | | | | |
Call Options Written | | (1,062) | | | | — | | | — | | | | (1,062 | ) |
Futures | | (969) | | | | — | | | — | | | | (969 | ) |
| | (2,031) | | | | — | | | — | | | | (2,031 | ) |
For the reporting period, there were no transfers between levels 1, 2 and 3.
See accompanying notes to financial statements.
| | |
14 | | SIT MUTUAL FUNDS ANNUAL REPORT |
[This page intentionally left blank.]
OBJECTIVE & STRATEGY
The objective of the Tax-Free Income Fund is to provide a high level of current income that is exempt from federal income tax, consistent with preservation of capital, by investing primarily in investment-grade municipal securities.
Such municipal securities generate interest income that is exempt from both federal regular income tax and federal alternative minimum tax. During normal market conditions, the Fund invests 100% of its net assets in such tax-exempt municipal securities.
The Sit Tax-Free Income Fund provided a total return of +7.92% during the fiscal year ended March 31, 2013, compared with a total return of +3.22% for the Barclay’s 5-Year Municipal Bond Index. As of March 31, 2013, the Fund’s 30-day SEC yield was 3.92% and its 12-month distribution rate was 4.01%.
All but the very shortest of tax-exempt municipal bonds ultimately ended the fiscal year lower in yield. The curve also continued to flatten as yields on the long end declined more than shorter and intermediate yields. In the back half of the 2012 calendar year, tax-exempt yields reached record low levels before rising in December. In January, yields declined before rising again through February and March, ending the quarter slightly higher. In addition, credit spreads between high-grade municipal bonds and lower investment grade credits also experienced steady narrowing during the fiscal year.
The Fund’s outperformance during this period was primarily due to the portfolio’s duration, overall credit mix and security selection. The Fund benefitted from a longer duration relative to the benchmark. Over the last twelve months, longer bonds outperformed shorter bonds for the entire length of the curve. The Fund has also continued to benefit from exposure to bonds rated A and BBB. Bonds rated AAA and AA experienced slight underperformance, as did those rated BB and below. Sector exposures also benefitted the overall performance of the Fund and security selection led to outperformance in every major sector held. Health care, housing and education, which combine to comprise over 50% of the Fund, all had strong outperformance. General Obligation bonds, which are underweight in the Fund, underperformed within the overall benchmark during the fiscal year. However, due to better security selection, the General Obligation credits in the Fund achieved better than double the performance of the Barclay’s General Obligation Bond Index.
The Fund continues to maintain its duration longer than its benchmark with a significant weighting in intermediate and longer-term bonds. The Fund will look to shorten its duration as the broader economic recovery shows signs of surer footing in the future. Credit spreads, though narrower, still offer some opportunities based on historical comparisons. We also believe there continue to be solid prospects for finding attractive yields amongst A and BBB rated
HYPOTHETICAL GROWTH OF $10,000
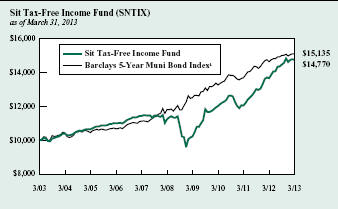
The chart above illustrates the total value of a hypothetical $10,000 investment in the Fund over the past 10 years (or for the life of the Fund if shorter) as compared to the performance of the Barclays 5-Year Municipal Bond Index. Past performance does not guarantee future results. Returns include the reinvestment of distributions. The chart does not reflect the deduction of taxes that a shareholder would pay on Fund distributions or the redemption of Fund shares.
1 The Barclays 5-Year Municipal Bond Index is the 5 year (4-6) component of the Municipal Bond Index, an unmanaged, rules-based, market-value-weighted index for the long-term tax-exempt bond market. The index includes bonds with a minimum credit rating of BBB. The returns include the reinvestment of income and do not include any transaction costs, management fees or other costs. It is not possible to invest directly in an index. This is the Fund’s primary index.
investment grade credits. Even after an extended period of strong returns and the low level of absolute yields at present, we believe the Fund’s duration, credit quality and industry weightings have it well positioned to provide attractive relative yield in the current economic and interest rate environment. As always, our strategy continues to emphasize income, which we believe is the primary driver of return over the long run. Diversification remains a key factor in managing risk.
Michael C. Brilley
Debra A. Sit, CFA
Paul J. Jungquist, CFA
Senior Portfolio Managers
| | |
16 | | SIT MUTUAL FUNDS ANNUAL REPORT |
COMPARATIVE RATES OF RETURNS
as of March 31, 2013
| | | | | | | | | | | | | | | |
| | | Sit
Tax-Free
Income
Fund | | Barclays
5-Year Muni
Bond Index1 | | Lipper
General
Muni. Bond
Fund Index2 |
One Year | | | | 7.92 | % | | | | 3.22 | % | | | | 6.81 | % |
Five Years | | | | 5.59 | | | | | 5.05 | | | | | 6.19 | |
Ten Years | | | | 3.98 | | | | | 4.23 | | | | | 4.82 | |
Since Inception(9/29/88) | | | | 5.48 | | | | | 5.64 | | | | | 6.04 | |
Performance figures are historical and do not guarantee future results. Investment returns and principal value will vary, and you may have a gain or loss when you sell shares. Current performance may be lower or higher than the performance data quoted. Contact the Fund for performance data current to the most recent month-end. Returns include changes in share price as well as reinvestment of all dividends and capital gains and all fee waivers. Without the fee waivers total return and yield figures would have been lower. Returns do not reflect the deduction of taxes that a shareholder would pay on Fund distributions or the redemption of Fund shares. Management fees and administrative expenses are included in the Fund’s performance. Returns for periods greater than one year are compounded average annual rates of return.
1 The Barclays 5-Year Municipal Bond Index is the 5 year (4-6) component of the Municipal Bond Index, an unmanaged, rules-based, market-value-weighted index for the long-term tax-exempt bond market. The index includes bonds with a minimum credit rating of BBB. The returns include the reinvestment of income and do not include any transaction costs, management fees or other costs. It is not possible to invest directly in an index.
2 The Lipper returns are obtained from Lipper Analytical Services, Inc., a large independent evaluator of mutual funds.
FUND DIVERSIFICATION
| | | | |
Single Family Mortgage. | | | 19.9 | % |
Multifamily Mortgage | | | 15.7 | % |
Other Revenue | | | 14.4 | % |
Education/Student Loan | | | 10.8 | % |
Hospital/Health Care | | | 8.1 | % |
General Obligation | | | 6.6 | % |
Insured | | | 5.9 | % |
Closed-End Mutual Funds | | | 5.8 | % |
Sectors less than 5%. | | | 10.1 | % |
Cash & Other Net Assets | | | 2.7 | % |
Based on total net assets as of March 31, 2013. Subject to change.
PORTFOLIO SUMMARY
| | |
Net Asset Value 3/31/13: | | $ 9.57 Per Share |
Net Asset Value 3/31/12: | | $ 9.23 Per Share |
Total Net Assets: | | $ 175.5 Million |
30-day SEC Yield 3: | | 3.92% |
Tax Equivalent Yield 4: | | 6.93% |
12-month Distribution Rate 3: | | 4.01% |
Average Maturity: | | 17.8 Years |
Effective Duration 5: | | 6.1 Years |
3 The SEC Yield reflects the rate at which the Fund is earning income on its current portfolio of securities, while the distribution rate reflects the Fund’s past dividends paid to shareholders based on the net investment income distributed and the average NAV during the past 12 months. Accordingly, the Fund’s SEC yield and distribution rate may differ.
4 The tax-equivalent yield is based on an assumed tax rate of 43.4%.
5 Duration is a measure of estimated price sensitivity relative to changes in interest rates. Portfolios with longer durations are typically more sensitive to changes in interest rates. For example, if interest rates rise by 1%, the fair value of a security with an effective duration of 5 years would decrease by 5%, with all other factors being constant. The correlation between duration and price sensitivity is greater for securities rated investment-grade than it is for securities rated below investment-grade. Duration estimates are based on assumptions by the Adviser and are subject to a number of limitations. Effective duration is calculated based on historical price changes of securities held by the Fund, and therefore is a more accurate estimate of price sensitivity provided interest rates remain within their historical range.
QUALITY RATINGS (% of Total Net Assets)
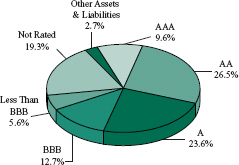
Lower of Moody’s, S&P, Fitch or Duff & Phelps ratings used.
Adviser’s Assessment of Non-Rated Securities:
| | | | | | |
AAA | | | 0.0 | % | | |
AA | | | 1.5 | | |
A | | | 0.7 | | |
BBB | | | 4.1 | | |
BB | | | 7.9 | | |
<BB | | | 5.1 | | |
| | | | | |
Total | | | 19.3 | % | | |
SCHEDULE OF INVESTMENTS
March 31, 2013
Sit Tax-Free Income Fund
| | | | | | | | | | | | |
Principal Amount ($) | | Name of Issuer | | Coupon
Rate (%) | | Maturity Date | | | Fair Value ($) | |
Municipal Bonds - 91.5% | | | | | | | | | | |
Alabama - 0.5% | | | | | | | | | | |
785,000 | | Pell City Special Care Facs. Finance Rev. | | 5.00 | | | 12/1/39 | | | | 843,208 | |
| | | | | | | | | | | | |
Alaska - 0.9% | | | | | | | | | | |
415,000 | | AK Hsg. Finance Corp. Mtg. Rev. | | 4.25 | | | 12/1/40 | | | | 426,529 | |
500,000 | | AK Hsg. Finance Corp. Mtg. Rev. (GO of Corp. Insured) | | 4.50 | | | 12/1/35 | | | | 525,860 | |
250,000 | | AK Industrial Dev. & Export Auth. Rev. (Boys & Girls Home) 2, 5, 10 | | 5.50 | | | N/A | | | | 109,988 | |
500,000 | | Koyukuk Health Facility Rev. (Tanana Chief’s Conf. Health Care) | | 7.00 | | | 10/1/23 | | | | 561,460 | |
| | | | | | | | | | | | |
| | | | | | | | | | | 1,623,837 | |
| | | | | | | | | | | | |
Arizona - 3.0% | | | | | | | | | | |
964,183 | | AZ Health Facs. Auth. Rev. (New Arizona Family Proj.) | | 5.25 | | | 7/1/27 | | | | 1,032,785 | |
250,000 | | Festival Ranch Community Facs. District G.O. | | 6.25 | | | 7/15/24 | | | | 272,338 | |
175,000 | | Flagstaff Industrial Dev. Auth. Rev. (Sr. Living Community Proj.) | | 5.50 | | | 7/1/22 | | | | 176,850 | |
850,000 | | Phoenix Industrial Development Authority | | 5.25 | | | 6/1/34 | | | | 940,508 | |
300,000 | | Pima Co. Industrial Dev. Auth. Education Rev. (AZ Charter Schools Proj.) | | 6.70 | | | 7/1/21 | | | | 300,867 | |
250,000 | | Pima Co. Industrial Dev. Auth. Education Rev. (AZ Charter Schools Proj.) | | 6.75 | | | 7/1/31 | | | | 250,490 | |
345,000 | | Pima Co. Industrial Dev. Auth. Education Rev. (Choice Education & Dev. Corp. Proj.) | | 6.00 | | | 6/1/16 | | | | 349,430 | |
500,000 | | Pima Co. Industrial Dev. Auth. Education Rev. (Coral Academy Science Proj.) | | 6.38 | | | 12/1/18 | | | | 522,020 | |
400,000 | | Pima Co. Industrial Dev. Auth. Education Rev. (Tucson Country Day School Proj.) | | 5.00 | | | 6/1/22 | | | | 403,268 | |
500,000 | | Quail Creek Community Facs. District G.O. | | 5.15 | | | 7/15/16 | | | | 514,700 | |
500,000 | | Quechan Indian Tribe of Fort Yuma Rev. (Tribal Economic Dev.) | | 9.75 | | | 5/1/25 | | | | 535,755 | |
| | | | | | | | | | | | |
| | | | | | | | | | | 5,299,011 | |
| | | | | | | | | | | | |
Arkansas - 0.3% | | | | | | | | | | |
460,000 | | Rogers Rev. (Sales & Use Tax) | | 4.13 | | | 11/1/31 | | | | 495,673 | |
| | | | | | | | | | | | |
California - 11.7% | | | | | | | | | | |
350,000 | | Acalanes Union High School District G.O. 6 | | 6.55 | | | 8/1/39 | | | | 228,725 | |
500,000 | | Agua Caliente Band of Cahuilla Indians Rev. 4 | | 6.00 | | | 7/1/18 | | | | 488,565 | |
326,137 | | CA Community Hsg. Fin. Agy. Lease Rev. Pass Thru Obligation 2, 5, 10 | | 4.85 | | | N/A | | | | 9,067 | |
250,000 | | CA Finance Auth. Rev. (Kern Regional Center Proj.) 9 | | 6.88 | | | 5/1/25 | | | | 297,472 | |
350,000 | | CA Finance Auth. Rev. (Literacy First Proj.) | | 5.50 | | | 9/1/22 | | | | 368,039 | |
495,000 | | CA Govt. Finance Auth. Lease Rev. (Placer Co. Transportation Proj.) | | 6.00 | | | 12/1/28 | | | | 502,326 | |
240,000 | | CA Hsg. Finance Agy. Home Mtg. Rev. | | 5.20 | | | 8/1/28 | | | | 248,657 | |
175,000 | | CA Hsg. Finance Agy. Home Mtg. Rev. | | 5.50 | | | 8/1/38 | | | | 177,875 | |
500,000 | | CA Infrastructure & Economic Dev. Bank Rev. | | 6.00 | | | 2/1/30 | | | | 538,930 | |
500,000 | | CA School Facs. Finance Auth. Rev. (Azusa Unified School District) (AGM Insured) 6 | | 6.00 | | | 8/1/29 | | | | 476,235 | |
250,000 | | CA Statewide Communities Dev. Auth. Multifamily Rev. (Bel Mar Apts. Proj.) (FNMA Collateral) | | 4.70 | | | 7/15/32 | | | | 275,018 | |
220,000 | | CA Statewide Communities Dev. Auth. Rev. (Sunedison Huntington Beach Solar Proj.) | | 6.00 | | | 1/1/21 | | | | 236,810 | |
500,000 | | CA Statewide Communities Dev. Auth. Rev. (Sunedison Irvine School District) | | 5.25 | | | 1/1/16 | | | | 506,740 | |
500,000 | | CA Statewide Communities Dev. Auth. Rev. C.O.P. (Internext Group) | | 5.38 | | | 4/1/30 | | | | 500,655 | |
400,000 | | Carlsbad Unified School District G.O. Capital Appreciation 6 | | 6.13 | | | 8/1/31 | | | | 326,056 | |
2,300,000 | | Ceres Unified School District G.O. Capital Appreciation (NATL-RE FGIC Insured) 6 | | 5.91 | | | 8/1/27 | | | | 998,890 | |
1,000,000 | | Colton Joint Unified School District G.O. (AGM Insured) 6 | | 5.80 | | | 8/1/35 | | | | 709,890 | |
250,000 | | Earlimart School District G.O. (AGM Insured) | | 5.00 | | | 8/1/37 | | | | 272,982 | |
250,000 | | Eden Township Hospital District C.O.P. | | 6.00 | | | 6/1/25 | | | | 277,970 | |
500,000 | | Encinitas Union School District G.O. Capital Appreciation 6 | | 6.75 | | | 8/1/35 | | | | 422,320 | |
1,000,000 | | Glendale Unified School District G.O. Capital Appreciation 6 | | 6.22 | | | 9/1/27 | | | | 485,460 | |
500,000 | | Hartnell Community College G.O. 6 | | 7.00 | | | 8/1/34 | | | | 369,950 | |
1,045,000 | | Hayward Unified School District G.O. Capital Appreciation (AGM Insured) 6 | | 5.48 | | | 8/1/33 | | | | 382,376 | |
1,250,000 | | Healdsburg Unified School District G.O. 6 | | 4.60 | | | 8/1/37 | | | | 770,888 | |
250,000 | | Imperial Community College District G.O. Capital Appreciation (AGM Insured) 6 | | 6.75 | | | 8/1/40 | | | | 254,308 | |
See accompanying notes to financial statements.
| | |
18 | | SIT MUTUAL FUNDS ANNUAL REPORT |
| | | | | | | | | | | | |
Principal
Amount ($) | | Name of Issuer | | Coupon Rate (%) | | Maturity
Date | | | Fair Value ($) | |
1,100,000 | | Los Alamitos Unified School District Capital Appreciation C.O.P. 6 | | 5.95 | | | 8/1/34 | | | | 666,699 | |
250,000 | | Marina Coast Water District Rev. | | 5.00 | | | 6/1/20 | | | | 284,680 | |
250,000 | | Martinez Unified School District G.O. 6 | | 6.13 | | | 8/1/35 | | | | 278,248 | |
250,000 | | Northern Inyo Co. Local Hospital District Rev. | | 5.00 | | | 12/1/29 | | | | 256,012 | |
1,000,000 | | Oak Grove School District G.O. 6 | | 6.96 | | | 6/1/41 | | | | 171,870 | |
2,100,000 | | Pittsburg CA Unified School District Rev. Capital Appreciation (AGM GO of District Insured) 6 | | 7.12 | | | 9/1/29 | | | | 839,286 | |
500,000 | | Placentia-Yorba Linda Unified School District C.O.P. Capital Appreciation (AGM Insured) 6 | | 6.25 | | | 10/1/28 | | | | 468,820 | |
600,000 | | Redondo Beach School District G.O. 6 | | 6.38 | | | 8/1/34 | | | | 606,198 | |
750,000 | | Reef-Sunset Unified School District 6 | | 4.85 | | | 8/1/38 | | | | 496,958 | |
250,000 | | Richmond Joint Powers Fin. Auth. Rev. (Point Potrero) | | 6.25 | | | 7/1/24 | | | | 292,458 | |
350,000 | | Ripon Unified School District G.O. 6 | | 4.50 | | | 8/1/30 | | | | 277,018 | |
1,000,000 | | Robla School District G.O. (AGM Insured) 6 | | 6.51 | | | 8/1/36 | | | | 305,870 | |
325,000 | | Rocklin Unified School District G.O. Capital Appreciation (NATL-RE-FGIC Insured) 6 | | 1.00 | | | 8/1/21 | | | | 211,357 | |
500,000 | | Sacramento Co. Water Financing Auth. Rev. (NATL-RE FGIC Insured) 1 | | 0.76 | | | 6/1/39 | | | | 444,145 | |
1,000,000 | | San Bernardino City Unified School District G.O. Capital Appreciation (NATL-RE Insured) 6 | | 4.72 | | | 8/1/29 | | | | 420,780 | |
170,000 | | San Bernardino Joint Powers Financing Auth. Rev. (City Hall Proj.) (NATL-RE Insured) | | 5.60 | | | 1/1/15 | | | | 166,896 | |
250,000 | | South Bayside Waste Management Auth. Rev. (Shoreway Environmental) | | 6.25 | | | 9/1/29 | | | | 288,002 | |
500,000 | | Southern Kern Unified School District G.O. (AGM Insured) 6 | | 4.50 | | | 11/1/31 | | | | 525,690 | |
350,000 | | Southwest Community Finance Auth. Rev. (Riverside Co. Proj.) 9 | | 6.00 | | | 5/1/24 | | | | 412,948 | |
515,000 | | Sulphur Springs Union School District C.O.P. Capital Appreciation (AGM Insured) 6 | | 6.50 | | | 12/1/37 | | | | 533,973 | |
755,000 | | Sutter Union High School District G.O. Capital Appreciation 6 | | 7.25 | | | 8/1/33 | | | | 234,835 | |
600,000 | | Tracy Joint Unified School District G.O. Capital Appreciation 6 | | 7.30 | | | 8/1/41 | | | | 327,618 | |
500,000 | | Tustin Unified School District G.O. Capital Appreciation 6 | | 6.00 | | | 8/1/28 | | | | 388,385 | |
500,000 | | Val Verde Unified School District G.O. Capital Appreciation (AGM Insured) 6 | | 6.13 | | | 8/1/34 | | | | 349,790 | |
400,000 | | Walnut Public Financing Auth. Tax Allocation (AMBAC Insured) | | 5.38 | | | 9/1/22 | | | | 400,944 | |
300,000 | | West Contra Costa Healthcare District C.O.P. | | 6.00 | | | 7/1/32 | | | | 350,556 | |
500,000 | | Westminster School District G.O. 6 | | 5.37 | | | 8/1/24 | | | | 327,415 | |
| | | | | | | | | | | | |
| | | | | | | | | | | 20,453,655 | |
| | | | | | | | | | | | |
Colorado - 1.6% | | | | | | | | | | |
250,000 | | CO Education & Cultural Facs. Auth. Rev. (CO Springs Charter Academy Proj.) | | 5.60 | | | 7/1/34 | | | | 265,180 | |
500,000 | | CO Education & Cultural Facs. Auth. Rev. Ref. (Vail Mountain School Proj.) | | 6.00 | | | 5/1/30 | | | | 540,045 | |
575,000 | | CO Hsg. Finance Auth. Multifamily Rev. | | 3.90 | | | 10/1/42 | | | | 580,008 | |
370,000 | | CO Hsg. Finance Auth. Single Family Mtg. Rev. | | 5.50 | | | 11/1/29 | | | | 383,509 | |
625,000 | | CO Hsg. Finance Auth. Single Family Mtg. Rev. (FHA Insured) | | 5.00 | | | 11/1/34 | | | | 651,756 | |
456,305 | | Lyons Rev. (Longmont Humane Society Proj.) | | 4.75 | | | 11/30/16 | | | | 459,910 | |
| | | | | | | | | | | | |
| | | | | | | | | | | 2,880,408 | |
| | | | | | | | | | | | |
Connecticut - 2.8% | | | | | | | | | | |
500,000 | | CT Health & Educational Fac. Auth. Rev. (Stamford Hospital) | | 5.13 | | | 7/1/35 | | | | 548,000 | |
1,000,000 | | CT Hsg. Finance Auth. Rev. | | 4.00 | | | 11/15/34 | | | | 1,027,940 | |
210,000 | | CT Hsg. Finance Auth. Rev. | | 5.15 | | | 11/15/34 | | | | 223,810 | |
500,000 | | CT Hsg. Finance Auth. Rev. | | 3.40 | | | 11/15/42 | | | | 480,710 | |
1,000,000 | | CT Hsg. Finance Auth. Rev. | | 3.65 | | | 11/15/47 | | | | 969,150 | |
500,000 | | CT Hsg. Finance Auth. Rev. (GO of Auth.) | | 3.75 | | | 11/15/35 | | | | 505,230 | |
500,000 | | CT Hsg. Finance Auth. Rev. (GO of Auth.) | | 4.75 | | | 11/15/35 | | | | 537,905 | |
425,000 | | CT Hsg. Finance Auth. Rev. (GO of Auth.) | | 4.90 | | | 11/15/36 | | | | 465,634 | |
117,850 | | Hamden Facs. Rev. (Whitney Center Proj.) | | 6.13 | | | 1/1/14 | | | | 118,011 | |
| | | | | | | | | | | | |
| | | | | | | | | | | 4,876,390 | |
| | | | | | | | | | | | |
Delaware - 0.1% | | | | | | | | | | |
310,000 | | Millsboro Special Obligation Rev. (Plantation Lakes Dev. District) | | 5.45 | | | 7/1/36 | | | | 241,642 | |
| | | | | | | | | | | | |
See accompanying notes to financial statements.
SCHEDULE OF INVESTMENTS
March 31, 2013
Sit Tax-Free Income Fund (Continued)
| | | | | | | | | | | | |
Principal Amount ($) | | Name of Issuer | | Coupon
Rate (%) | | Maturity Date | | | Fair Value ($) | |
Florida - 7.8% | | | | | | | | | | |
385,000 | | Alachua County Health Facs. Auth. Rev. (Oak Hammock University) | | 8.00 | | | 10/1/32 | | | | 469,461 | |
500,000 | | Alachua County Health Facs. Auth. Rev. (Terraces Bonita Springs District) | | 7.13 | | | 11/15/16 | | | | 505,060 | |
500,000 | | Bay Co. Educational Facs. Rev. (Bay Haven Charter) | | 5.25 | | | 9/1/30 | | | | 518,955 | |
410,000 | | Boynton Beach Rev. (Charter Schools Boynton Beach, Inc.) | | 6.25 | | | 6/1/27 | | | | 422,944 | |
335,000 | | Capital Trust Agy. Rev. (Golf Villas, Rivermill, and Village Square Apartments Proj.) 2, 5 | | 4.75 | | | 6/1/13 | | | | 190,900 | |
1,000,000 | | Capital Trust Agy. Rev. (Golf Villas, Rivermill, and Village Square Apartments Proj.) 2, 5 | | 5.88 | | | 6/1/38 | | | | 569,850 | |
415,000 | | Collier Co. Industrial Dev. Auth. Rev. (NCH Healthcare System Proj.) | | 6.25 | | | 10/1/39 | | | | 482,770 | |
250,000 | | Colonial Country Club Community Development District | | 3.75 | | | 5/1/25 | | | | 248,455 | |
250,000 | | Double Branch Community Development District | | 4.00 | | | 5/1/25 | | | | 246,620 | |
250,000 | | Double Branch Community Development District | | 4.13 | | | 5/1/31 | | | | 240,118 | |
100,000 | | Fiddlers Creek Community Dev. District No. 2 Special Assessment Rev. 2, 5 | | 5.75 | | | 5/1/13 | | | | 52,541 | |
500,000 | | FL Governmental Utility Auth. Rev. | | 5.00 | | | 10/1/37 | | | | 541,280 | |
245,000 | | FL Hsg. Finance Corp. (GNMA/FNMA Collateralized) | | 5.00 | | | 7/1/26 | | | | 264,081 | |
305,000 | | FL Hsg. Finance Corp. (GNMA/FNMA/FHLMC Collateralized) | | 5.00 | | | 7/1/39 | | | | 327,451 | |
250,000 | | FL Mid-Bay Bridge Authority 6 | | 6.95 | | | 10/1/21 | | | | 145,512 | |
15,000 | | Forest Creek Community Dev. District Capital Improvement Special Assessment Rev. 2, 5 | | 7.00 | | | 11/1/13 | | | | 14,898 | |
135,000 | | Gramercy Farms Community Dev. District Special Assessment 2, 5 | | 5.10 | | | 5/1/14 | | | | 1 | |
535,000 | | Gramercy Farms Community Dev. District Special Assessment 6 | | 3.24 | | | 5/1/39 | | | | 76,366 | |
500,000 | | Highlands Co. Health Facs. Auth. Rev. (Adventist Health) 1 | | 5.00 | | | 11/15/31 | | | | 537,505 | |
500,000 | | Lake Ashton Community Dev. District Cap. Improvement Special Assessment Rev. 2, 5, 10 | | 5.00 | | | N/A | | | | 171,030 | |
500,000 | | Lakewood Ranch Stewardship District Cap. Improvement Special Assesment Rev. (Lakewood Center) | | 7.40 | | | 5/1/30 | | | | 561,685 | |
250,000 | | Lexington Oaks Community Dev. District Special Assessment Rev. | | 5.65 | | | 5/1/33 | | | | 269,992 | |
250,000 | | Magnolia Creek Community Dev. District Rev. 2, 5 | | 5.60 | | | 5/1/14 | | | | 87,528 | |
750,000 | | Mediterra South Community Dev. District Special Assessment | | 5.10 | | | 5/1/31 | | | | 770,002 | |
500,000 | | Miami-Dade Co. Rev. (AGM Insured) | | 5.00 | | | 10/1/35 | | | | 552,125 | |
230,000 | | New River Community Dev. District Cap. Improvement Special Assessment Rev. 2, 5 | | 5.00 | | | 5/1/13 | | | | 2 | |
135,000 | | New River Community Dev. District Cap. Improvement Special Assessment Rev. | | 5.00 | | | 5/1/15 | | | | 123,711 | |
275,000 | | New River Community Dev. District Cap. Improvement Special Assessment Rev. 6 | | 1.85 | | | 5/1/18 | | | | 130,586 | |
350,000 | | New River Community Dev. District Cap. Improvement Special Assessment Rev. 6 | | 5.75 | | | 5/1/38 | | | | 151,606 | |
140,000 | | New River Community Dev. District Cap. Improvement Special Assessment Rev. | | 5.75 | | | 5/1/38 | | | | 109,718 | |
350,000 | | North Sumter Co. Utility Dependent District Rev. | | 5.00 | | | 10/1/32 | | | | 359,706 | |
750,000 | | Sarasota Co. Health Facs. Auth. Retirement Rev. Ref. (Village on the Isle) | | 5.50 | | | 1/1/27 | | | | 801,270 | |
500,000 | | Seminole Tribe Special Obligation Rev. 4 | | 5.50 | | | 10/1/24 | | | | 545,945 | |
250,000 | | Seven Oaks Community Dev. District Special Assessment Rev. | | 5.50 | | | 5/1/33 | | | | 265,028 | |
1,000,000 | | St. Petersburg Public Utility Rev. | | 4.00 | | | 10/1/42 | | | | 1,001,570 | |
600,000 | | Tallahassee Health Facs. Rev. (Memorial Health Care Proj.) | | 6.38 | | | 12/1/30 | | | | 609,732 | |
295,000 | | Tolomato Community Dev. District Special Assessment 2, 5 | | 6.38 | | | 5/1/17 | | | | 143,860 | |
110,000 | | Tolomato Community Dev. District Special Assessment | | 6.38 | | | 5/1/17 | | | | 107,197 | |
105,000 | | Tolomato Community Dev. District Special Assessment 2, 5 | | 6.38 | | | 5/1/17 | | | | 1 | |
10,000 | | Tolomato Community Dev. District Special Assessment 2, 5 | | 6.38 | | | 5/1/17 | | | | 5,661 | |
40,000 | | Tolomato Community Dev. District Special Assessment 6 | | 6.61 | | | 5/1/39 | | | | 28,665 | |
85,000 | | Tolomato Community Dev. District Special Assessment 6 | | 6.61 | | | 5/1/40 | | | | 48,935 | |
45,000 | | Tolomato Community Dev. District Special Assessment 6 | | 6.61 | | | 5/1/40 | | | | 19,058 | |
500,000 | | Viera East Community Dev. District Special Assessment Rev. Ref. | | 5.00 | | | 5/1/26 | | | | 498,885 | |
10,000 | | Waters Edge Community Dev. District Cap. Improvement Rev. | | 5.35 | | | 5/1/39 | | | | 10,064 | |
680,000 | | Waters Edge Community Dev. District Cap. Improvement Rev. 6 | | 6.60 | | | 5/1/39 | | | | 319,614 | |
50,000 | | West Villages Improvement District Special Assessment Rev. (Unit of Dev. No. 3) 2, 5 | | 5.50 | | | 5/1/37 | | | | 22,377 | |
450,000 | | Zephyr Ridge Community Dev. District Special Assessment Rev. 2, 5 | | 5.25 | | | 5/1/13 | | | | 179,276 | |
| | | | | | | | | | | | |
| | | | | | | | | | | 13,749,597 | |
| | | | | | | | | | | | |
Georgia - 2.9% | | | | | | | | | | |
250,000 | | Atlanta Water and Wastewater Rev. (NATL-RE Insured) | | 5.00 | | | 11/1/39 | | | | 250,748 | |
See accompanying notes to financial statements.
| | |
20 | | SIT MUTUAL FUNDS ANNUAL REPORT |
| | | | | | | | | | | | |
Principal
Amount ($) | | Name of Issuer | | Coupon
Rate (%) | | Maturity
Date | | | Fair Value ($) | |
1,290,000 | | East Point Tax Allocation | | 8.00 | | | 2/1/26 | | | | 1,292,103 | |
1,280,000 | | GA Housing & Finance Authority Rev. | | 3.80 | | | 12/1/37 | | | | 1,275,878 | |
1,000,000 | | GA Housing & Finance Authority Rev. | | 4.00 | | | 12/1/37 | | | | 1,035,580 | |
300,000 | | GA State Environmental Loan Acquisition Corp. Rev. | | 5.13 | | | 2/15/31 | | | | 341,502 | |
750,000 | | GA State Environmental Loan Acquisition Corp. Rev. | | 5.13 | | | 3/15/31 | | | | 852,510 | |
| | | | | | | | | | | | |
| | | | | | | | | | | 5,048,321 | |
| | | | | | | | | | | | |
Guam - 0.2% | | | | | | | | | | |
420,000 | | Northern Mariana Islands Commonwealth G.O. | | 5.00 | | | 10/1/22 | | | | 375,833 | |
| | | | | | | | | | | | |
Hawaii - 0.2% | | | | | | | | | | |
250,000 | | HI State Dept. of Budget & Fin. Rev. (Kahala Nui Proj.) | | 5.25 | | | 11/15/37 | | | | 267,740 | |
| | | | | | | | | | | | |
Idaho - 0.6% | | | | | | | | | | |
570,000 | | ID Hsg. & Fin. Assoc. Nonprofit Facs. Rev. (Compass Public Charter School Proj.) | | 5.50 | | | 7/1/30 | | | | 584,683 | |
500,000 | | ID Hsg. & Fin. Assoc. Nonprofit Facs. Rev. (Idaho Arts Charter School Proj.) | | 5.75 | | | 12/1/32 | | | | 528,840 | |
| | | | | | | | | | | | |
| | | | | | | | | | | 1,113,523 | |
| | | | | | | | | | | | |
Illinois - 6.2% | | | | | | | | | | |
500,000 | | Bellwood G.O. | | 5.88 | | | 12/1/27 | | | | 488,670 | |
375,000 | | Chicago Board of Education G.O. | | 5.50 | | | 12/1/39 | | | | 424,976 | |
1,000,000 | | Dekalb, Kane & Lasalle Counties Comm. College Dist. No. 523 G.O. Capital Appreciation 6 | | 6.58 | | | 2/1/30 | | | | 426,040 | |
250,000 | | Harvey Ref. & Improvement G.O. | | 5.50 | | | 12/1/27 | | | | 245,782 | |
265,000 | | IL C.O.P. (NATL-RE Insured) | | 5.80 | | | 7/1/17 | | | | 265,411 | |
500,000 | | IL Fin. Auth. Rev. (Lake Forest College) | | 5.75 | | | 10/1/32 | | | | 545,490 | |
300,000 | | IL Fin. Auth. Rev. (Lutheran Home & Services) | | 5.50 | | | 5/15/27 | | | | 317,862 | |
750,000 | | IL Fin. Auth. Rev. (Noble Network Charter Schools) (ACA Insured) | | 5.00 | | | 9/1/27 | | | | 751,148 | |
240,000 | | IL Fin. Auth. Rev. (TEMPS-50-The Admiral at the Lake Proj.) | | 6.00 | | | 5/15/17 | | | | 240,259 | |
375,000 | | IL Fin. Auth. Rev. (UNO Charter School Network) | | 6.88 | | | 10/1/31 | | | | 429,026 | |
1,000,000 | | IL Fin. Auth. Sports Facs. Rev. (North Shore Ice Arena Proj.) | | 6.25 | | | 12/1/38 | | | | 543,780 | |
500,000 | | IL Fin. Auth. Sports Facs. Rev. (United Sports Organizations of Barrington Proj.) 2, 5 | | 6.13 | | | 10/1/27 | | | | 29,759 | |
500,000 | | IL Fin. Auth. Sports Facs. Rev. (United Sports Organizations of Barrington Proj.) 2, 5 | | 6.25 | | | 10/1/37 | | | | 29,759 | |
250,000 | | IL G.O. (NATL-RE Insured) | | 4.75 | | | 10/1/27 | | | | 250,732 | |
380,000 | | IL Housing Dev. Auth. (AMBAC GO of Authority Insured) | | 4.50 | | | 7/1/47 | | | | 382,702 | |
500,000 | | IL Sports Facs. Auth. (AMBAC Insured) | | 5.00 | | | 6/15/32 | | | | 501,300 | |
250,000 | | Lake Co. Community Consolidated School District No. 50 Woodland G.O. | | 5.63 | | | 1/1/26 | | | | 297,780 | |
80,000 | | Lombard Public Facs. Corp. Rev. First Tier (Conference Center & Hotel Proj.) | | 6.38 | | | 1/1/15 | | | | 66,211 | |
1,000,000 | | Lombard Public Facs. Corp. Rev. First Tier (Conference Center & Hotel Proj.) | | 5.25 | | | 1/1/36 | | | | 456,450 | |
550,000 | | Lombard Public Facs. Corp. Rev. First Tier (Conference Center & Hotel Proj.) (ACA Insured) | | 5.50 | | | 1/1/25 | | | | 361,960 | |
250,000 | | Macon County School District No. 61 Decatur G.O. (AGM Insured) | | 5.25 | | | 1/1/37 | | | | 279,308 | |
1,921,000 | | Malta Tax Allocation Rev. | | 5.75 | | | 12/30/25 | | | | 1,244,597 | |
818,000 | | Manhattan Special Service Area Special Tax No. 07-6 (Groebe Farm-Stonegate) 2, 5 | | 5.75 | | | 3/1/22 | | | | 163,600 | |
310,000 | | Northern Illinios University Rev. (Auxiliary Facs.) (AGM Insured) | | 5.50 | | | 4/1/26 | | | | 346,909 | |
400,000 | | Southwestern IL Dev. Auth. Rev. (Village of Sauget Proj.) | | 5.63 | | | 11/1/26 | | | | 337,848 | |
590,000 | | Southwestern IL Dev. Auth. Tax Allocation Ref. (Local Govt. Program) | | 7.00 | | | 10/1/22 | | | | 612,874 | |
350,000 | | Springfield Electric Rev. (NATL-RE Insured) | | 5.00 | | | 3/1/35 | | | | 362,201 | |
1,000,000 | | Village of Bolingbrook G.O. (NATL-RE FGIC Insured) 6 | | 6.22 | | | 1/1/36 | | | | 245,840 | |
250,000 | | West Chicago Park District G.O (AGM Insured) | | 5.25 | | | 12/1/29 | | | | 273,575 | |
| | | | | | | | | | | | |
| | | | | | | | | | | 10,921,849 | |
| | | | | | | | | | | | |
Indiana - 2.9% | | | | | | | | | | |
700,000 | | Carmel Multifamily Hsg. Rev. (Barrington Carmel Proj.) | | 6.00 | | | 11/15/22 | | | | 735,994 | |
300,000 | | Damon Run Conservancy Dist. G.O. (St Intercept Insured) | | 6.10 | | | 7/1/25 | | | | 330,627 | |
370,000 | | East Chicago Redev. Commission Tax Allocation (Harborside Redev. Proj.) | | 5.50 | | | 1/15/16 | | | | 371,887 | |
See accompanying notes to financial statements.
SCHEDULE OF INVESTMENTS
March 31, 2013
Sit Tax-Free Income Fund (Continued)
| | | | | | | | | | | | |
Principal Amount ($) | | Name of Issuer | | Coupon
Rate (%) | | Maturity Date | | | Fair Value ($) | |
100,000 | | Elkhart Co. Hospital Auth. Rev. (Elkhart General Hospital Proj.) (AMBAC-TCRS Insured) | | 5.25 | | | 8/15/28 | | | | 100,159 | |
400,000 | | Hammond Local Public Improvement Bond Bank | | 6.50 | | | 8/15/25 | | | | 416,048 | |
250,000 | | Hammond Local Public Improvement Bond Bank | | 6.50 | | | 8/15/30 | | | | 259,210 | |
300,000 | | IN Finance Auth. Rev. (BHI Senior Living) | | 5.50 | | | 11/15/26 | | | | 337,800 | |
500,000 | | IN Finance Auth. Rev. (Community Foundation of Northwest Indiana) | | 5.00 | | | 3/1/41 | | | | 532,565 | |
295,000 | | IN Finance Auth. Rev. (Parkview Health System) | | 5.75 | | | 5/1/31 | | | | 338,613 | |
350,000 | | IN Health & Educational Fac. Fin. Auth. Rev. (Schneck Memorial Hospital Proj.) | | 5.25 | | | 2/15/30 | | | | 361,872 | |
1,000,000 | | Mt. Vernon School Building Corp. Rev. (State Aid Withholding) | | 5.00 | | | 1/15/37 | | | | 1,049,270 | |
250,000 | | St. Joseph Co. Health Facs. Rev. (Holy Cross Village) 1 | | 6.25 | | | 5/15/39 | | | | 259,485 | |
340,555 | | St. Joseph Co. Hospital Auth. Health Facs. Rev. (Madison Center) 2, 5 | | 5.25 | | | 2/15/28 | | | | 40,904 | |
| | | | | | | | | | | | |
| | | | | | | | | | | 5,134,434 | |
| | | | | | | | | | | | |
Iowa - 0.4% | | | | | | | | | | |
250,000 | | IA Student Loan Liquidity Corp. Rev. | | 5.80 | | | 12/1/31 | | | | 271,240 | |
225,000 | | Mason City Community School District Rev. | | 5.00 | | | 7/1/29 | | | | 241,326 | |
250,000 | | Waterloo Community School District Rev. | | 5.00 | | | 7/1/29 | | | | 269,008 | |
| | | | | | | | | | | | |
| | | | | | | | | | | 781,574 | |
| | | | | | | | | | | | |
Kansas - 0.3% | | | | | | | | | | |
500,000 | | Wyandotte Co./Kansas City Board of Public Utility Rev. (Office Building Complex) (NATL-RE Insured) | | 5.00 | | | 5/1/21 | | | | 501,840 | |
| | | | | | | | | | | | |
Kentucky - 0.4% | | | | | | | | | | |
200,000 | | KY Hsg. Corp. Rev. Ref. | | 4.75 | | | 7/1/35 | | | | 214,050 | |
425,000 | | Pikeville Hospital Rev. Ref. (Pikeville Medical Center) | | 6.50 | | | 3/1/41 | | | | 501,283 | |
| | | | | | | | | | | | |
| | | | | | | | | | | 715,333 | |
| | | | | | | | | | | | |
Louisiana - 2.2% | | | | | | | | | | |
164,730 | | Denham Springs/Livingston Hsg. & Mtg. Finance Auth. Rev. | | 5.00 | | | 11/1/40 | | | | 165,756 | |
660,000 | | Jefferson Parish Finance Auth. Single Family Mtg. Rev. | | 5.00 | | | 6/1/38 | | | | 690,188 | |
155,000 | | LA Hsg. Fin. Agy. Single Family Mtg. Rev. (Home Ownership Program) | | 6.00 | | | 12/1/28 | | | | 165,252 | |
1,105,000 | | LA Hsg. Fin. Agy. Single Family Mtg. Rev. (Home Ownership Program) | | 5.70 | | | 12/1/38 | | | | 1,176,250 | |
385,000 | | LA Hsg. Fin. Agy. Single Family Mtg. Rev. (Mtg. Backed Securities Program) | | 4.60 | | | 6/1/29 | | | | 426,699 | |
250,000 | | LA Public Facs. Auth. Rev. (Belle-Chase Educational Foundation Proj.) (NATL-RE Insured) | | 6.50 | | | 5/1/31 | | | | 290,020 | |
725,000 | | LA Public Facs. Auth. Rev. (Tulane Univ. Proj.) (NATL-RE Insured) 1 | | 0.89 | | | 2/15/36 | | | | 645,206 | |
255,000 | | LA University & Agricultural & Mechanical College Rev. (Health Sciences Center Proj.) (NATL-RE Insured) | | 6.20 | | | 5/1/20 | | | | 256,125 | |
84,000 | | Lafayette Public Finance Auth. Single Family Mortgage-Backed Rev. | | 5.35 | | | 1/1/41 | | | | 87,780 | |
| | | | | | | | | | | | |
| | | | | | | | | | | 3,903,276 | |
| | | | | | | | | | | | |
Maine - 0.6% | | | | | | | | | | |
500,000 | | ME Health & Higher Educational Facs. Auth. Rev. (ME General Medical Center) | | 7.50 | | | 7/1/32 | | | | 636,555 | |
500,000 | | ME Hsg. Auth. Rev. | | 3.60 | | | 11/15/36 | | | | 494,485 | |
| | | | | | | | | | | | |
| | | | | | | | | | | 1,131,040 | |
| | | | | | | | | | | | |
Maryland - 0.3% | | | | | | | | | | |
235,000 | | MD Community Dev. Administration Rev. | | 5.13 | | | 9/1/30 | | | | 263,642 | |
450,000 | | Montgomery County Housing Opportunites Commission Single Family Mtg. Rev. 6 | | 5.62 | | | 7/1/28 | | | | 192,632 | |
| | | | | | | | | | | | |
| | | | | | | | | | | 456,274 | |
| | | | | | | | | | | | |
Massachusetts - 2.5% | | | | | | | | | | |
70,000 | | MA Development Finance Agency Facs. Rev. 2, 5 | | 6.25 | | | 6/1/14 | | | | 35,001 | |
400,000 | | MA Education Finance Auth. Education Rev. | | 5.15 | | | 1/1/26 | | | | 449,116 | |
250,000 | | MA Housing Finance Agy. Rev. | | 3.50 | | | 12/1/31 | | | | 254,312 | |
400,000 | | MA Housing Finance Agy. Rev. | | 4.05 | | | 12/1/32 | | | | 415,412 | |
250,000 | | MA Housing Finance Agy. Rev. | | 4.75 | | | 6/1/35 | | | | 269,458 | |
| | |
| See accompanying notes to financial statements. |
22 | | SIT MUTUAL FUNDS ANNUAL REPORT |
| | | | | | | | | | | | |
Principal Amount ($) | | Name of Issuer | | Coupon
Rate (%) | | Maturity
Date | | | Fair Value ($) | |
1,250,000 | | MA Housing Finance Agy. Rev. | | 3.45 | | | 12/1/37 | | | | 1,218,662 | |
500,000 | | MA Housing Finance Agy. Rev. (FHA Insured) | | 5.30 | | | 12/1/38 | | | | 539,840 | |
1,250,000 | | MA Housing Finance Agy. Rev. (GNMA/FNMA/FHLMC Collateralized) | | 3.90 | | | 12/1/38 | | | | 1,252,150 | |
| | | | | | | | | | | | |
| | | | | | | | | | | 4,433,951 | |
| | | | | | | | | | | | |
Michigan - 1.9% | | | | | | | | | | |
250,000 | | Allen Academy Rev. | | 5.25 | | | 6/1/17 | | | | 251,002 | |
975,000 | | MI Hospital Finance Auth. Rev. Ref. (Presbyterian Village) | | 5.25 | | | 11/15/25 | | | | 986,086 | |
250,000 | | MI Hsg. Dev. Auth. (GO of Authority Insured) | | 4.63 | | | 10/1/41 | | | | 263,850 | |
500,000 | | MI Public Education Facs. Auth. Ltd. Rev. Ref. (Nataki Talibah Proj.) (Q-SBLF Insured) | | 6.25 | | | 10/1/23 | | | | 503,500 | |
465,000 | | MI Public Education Facs. Auth. Rev. Ref. (Bradford Proj.) 4 | | 6.00 | | | 9/1/16 | | | | 424,615 | |
335,000 | | MI Tobacco Settlement Finance Auth. Sr. Rev. | | 5.13 | | | 6/1/22 | | | | 312,501 | |
300,000 | | Oakland County Economic Development Corp. Rev. (Roman Catholic Archdiocese Proj.) | | 6.50 | | | 12/1/20 | | | | 319,320 | |
250,000 | | Saline Economic Dev. Corp. Rev. (Evangelical Homes Proj.) | | 5.25 | | | 6/1/32 | | | | 250,702 | |
| | | | | | | | | | | | |
| | | | | | | | | | | 3,311,576 | |
| | | | | | | | | | | | |
Minnesota - 1.9% | | | | | | | | | | |
1,948,196 | | Intermediate School District 287 Lease Rev. | | 5.30 | | | 11/1/32 | | | | 2,039,060 | |
400,000 | | Minneapolis Mulitfamily Hsg. Rev. (Riverside Plaza) | | 6.00 | | | 11/1/13 | | | | 400,400 | |
290,000 | | MN Hsg. Fin. Agy. Mtg. Rev. (Mtg. Backed Securities Program) (GNMA/FNMA Collateralized) | | 4.40 | | | 7/1/32 | | | | 320,421 | |
510,000 | | MN Hsg. Fin. Agy. Residential Hsg. Rev. | | 5.10 | | | 1/1/40 | | | | 546,649 | |
| | | | | | | | | | | | |
| | | | | | | | | | | 3,306,530 | |
| | | | | | | | | | | | |
Mississippi - 0.5% | | | | | | | | | | |
500,000 | | D’Iberville Tax Increment Rev. (Gult Coast Promenade Proj.) | | 4.75 | | | 4/1/33 | | | | 514,700 | |
120,000 | | MS Home Corp. Single Family Mtg. Rev. (GNMA/FNMA/FHLMC Collateralized) | | 5.60 | | | 6/1/38 | | | | 123,667 | |
170,000 | | MS Home Corp. Single Family Mtg. Rev. (GNMA/FNMA/FHLMC Collateralized) | | 6.75 | | | 6/1/39 | | | | 175,704 | |
| | | | | | | | | | | | |
| | | | | | | | | | | 814,071 | |
| | | | | | | | | | | | |
Missouri - 1.5% | | | | | | | | | | |
500,000 | | Chillicothe Tax Increment Rev. (South U.S. 65 Proj.) | | 5.63 | | | 4/1/27 | | | | 461,890 | |
480,000 | | Community Memorial Hospital District Rev. | | 6.68 | | | 12/1/34 | | | | 455,770 | |
250,000 | | Independence 39th St. Transportation District Rev. Ref. & Improvement | | 6.88 | | | 9/1/32 | | | | 259,285 | |
500,000 | | Kansas City Industrial Dev. Auth. Rev. (Kansas City Pkg. LLC) | | 5.45 | | | 9/1/23 | | | | 534,235 | |
275,000 | | Kirkwood Industrial Dev. Auth. Rev. (Aberdeen Heights) | | 8.00 | | | 5/15/21 | | | | 311,008 | |
473,793 | | Moberly Industrial Dev. Auth. (Annual Appropriation Proj.) 2, 5 | | 6.00 | | | 9/1/24 | | | | 28,423 | |
250,000 | | St. Louis Co. Industrial Dev. Auth. Rev. (Nazareth Living Center) | | 5.88 | | | 8/15/32 | | | | 255,585 | |
250,000 | | St. Louis Co. Industrial Dev. Auth. Rev. Ref. (Friendship Village Sunset Hills) | | 5.00 | | | 9/1/32 | | | | 265,828 | |
| | | | | | | | | | | | |
| | | | | | | | | | | 2,572,024 | |
| | | | | | | | | | | | |
Montana - 0.5% | | | | | | | | | | |
175,000 | | MT Board of Housing Single Family Rev. (GO of BRD Insured) | | 4.70 | | | 12/1/26 | | | | 187,196 | |
656,479 | | MT Facs. Finance Auth. Rev. (Great Falls Pre-Release Services Proj.) | | 5.08 | | | 4/1/21 | | | | 732,014 | |
| | | | | | | | | | | | |
| | | | | | | | | | | 919,210 | |
| | | | | | | | | | | | |
Nebraska - 0.1% | | | | | | | | | | |
410,000 | | Mead Village Tax Allocation Rev. (E3 Biofuels - Mead LLC Proj.) 2, 5, 10 | | 5.13 | | | N/A | | | | 192,532 | |
| | | | | | | | | | | | |
Nevada - 1.4% | | | | | | | | | | |
250,000 | | Clark Co. Economic Dev. Rev. (Alexander Dawson School Proj.) | | 5.38 | | | 5/15/33 | | | | 251,292 | |
750,000 | | Las Vegas Redev. Agy. Tax Allocation Rev. | | 7.50 | | | 6/15/23 | | | | 855,022 | |
380,000 | | NV Hsg. Dev. Single Family Mtg. Program Mezzanine (GNMA/FNMA/FHLMC Collateralized) | | 5.10 | | | 10/1/40 | | | | 408,257 | |
500,000 | | Sparks Redev. Agy. Tax Increment Rev. (Redev. Area No. 1 Proj.) | | 5.00 | | | 1/15/22 | | | | 524,795 | |
420,000 | | Sparks Redev. Agy. Tax Increment Rev. (Redev. Area No. 2 Proj.) | | 6.40 | | | 6/1/20 | | | | 447,863 | |
| | | | | | | | | | | | |
| | | | | | | | | | | 2,487,229 | |
| | | | | | | | | | | | |
See accompanying notes to financial statements.
SCHEDULE OF INVESTMENTS
March 31, 2013
Sit Tax-Free Income Fund (Continued)
| | | | | | | | | | | | |
Principal
Amount ($) | | Name of Issuer | | Coupon
Rate (%) | | Maturity Date | | | Fair Value ($) | |
New Hampshire - 0.8% | | | | | | | | | | |
890,000 | | Manchester Hsg. & Redev. Auth. Rev. (ACA Insured) | | 6.75 | | | 1/1/15 | | | | 886,253 | |
400,000 | | NH Health & Educ. Facs. Auth. Rev. (Wentworth Douglas Hospital) | | 6.00 | | | 1/1/34 | | | | 455,452 | |
| | | | | | | | | | | | |
| | | | | | | | | | | 1,341,705 | |
| | | | | | | | | | | | |
New Jersey - 0.9% | | | | | | | | | | |
205,000 | | NJ Economic Dev. Auth. Rev. Ref. (Harrogate Inc.) | | 5.75 | | | 12/1/16 | | | | 205,258 | |
235,000 | | NJ Higher Education Assistance Auth. Student Loan Rev. | | 5.00 | | | 12/1/28 | | | | 258,037 | |
665,000 | | NJ Hsg. & Mtg. Finance Agy. Rev. | | 5.05 | | | 10/1/39 | | | | 712,820 | |
400,000 | | NJ Hsg. & Mtg. Finance Agy. Single Family Mtg. Rev. | | 4.50 | | | 10/1/30 | | | | 433,808 | |
| | | | | | | | | | | | |
| | | | | | | | | | | 1,609,923 | |
| | | | | | | | | | | | |
New Mexico - 1.5% | | | | | | | | | | |
365,000 | | NM Mtg. Fin. Auth. Single Family Mtg. Rev. (GNMA/FNMA/FHLMC Collateralized) | | 4.80 | | | 9/1/29 | | | | 397,781 | |
325,000 | | NM Mtg. Fin. Auth. Single Family Mtg. Rev. (GNMA/FNMA/FHLMC Collateralized) | | 5.35 | | | 9/1/30 | | | | 345,267 | |
715,000 | | NM Mtg. Fin. Auth. Single Family Mtg. Rev. (GNMA/FNMA/FHLMC Collateralized) | | 5.25 | | | 9/1/34 | | | | 761,797 | |
510,000 | | NM Mtg. Fin. Auth. Single Family Mtg. Rev. (GNMA/FNMA/FHLMC Collateralized) | | 3.90 | | | 9/1/42 | | | | 520,016 | |
540,000 | | NM Mtg. Fin. Auth. Single Family Mtg. Rev. (GNMA/FNMA/FHLMC Collateralized) | | 4.13 | | | 9/1/42 | | | | 561,881 | |
| | | | | | | | | | | | |
| | | | | | | | | | | 2,586,742 | |
| | | | | | | | | | | | |
New York - 4.4% | | | | | | | | | | |
250,000 | | Albany Capital Resource Corp. Rev. (The College of Saint Rose) | | 5.63 | | | 7/1/31 | | | | 278,315 | |
500,000 | | New York City Housing Development Corp. | | 4.20 | | | 5/1/37 | | | | 518,615 | |
250,000 | | New York City Housing Development Corp. Multifamily Mtg. Rev. | | 4.60 | | | 11/1/36 | | | | 267,588 | |
500,000 | | New York City Housing Development Corp. Rev. | | 3.80 | | | 11/1/37 | | | | 500,370 | |
750,000 | | New York City Municipal Water Finance Authority | | 5.00 | | | 6/15/38 | | | | 853,478 | |
500,000 | | NY Mortgage Agency Rev. | | 3.70 | | | 10/1/38 | | | | 502,430 | |
500,000 | | NY Mortgage Agency Rev. | | 4.13 | | | 10/1/40 | | | | 516,755 | |
200,000 | | NY Mortgage Agency Rev. | | 3.75 | | | 10/1/42 | | | | 201,676 | |
495,000 | | NY Mortgage Agency Rev. | | 4.75 | | | 10/1/42 | | | | 522,309 | |
210,000 | | NY State Dormitory Auth. Rev. (N. Y. Medical College) (NATL-RE FGIC Insured) | | 4.75 | | | 7/1/27 | | | | 210,586 | |
200,000 | | NY State Dormitory Auth. Rev. Ref. (Miriam Osborne Memorial Home) | | 5.00 | | | 7/1/42 | | | | 213,130 | |
590,000 | | NY State Housing Finance Agency Rev. (Affordable Hsg. Proj.) | | 3.75 | | | 11/1/37 | | | | 596,797 | |
400,000 | | NY State Housing Finance Agency Rev. (Affordable Hsg. Proj.) | | 4.88 | | | 11/1/42 | | | | 433,084 | |
880,000 | | NY State Housing Finance Agency Rev. (Affordable Hsg. Proj.) | | 3.85 | | | 11/1/44 | | | | 860,746 | |
1,000,000 | | NY State Housing Finance Agency Rev. (Affordable Hsg. Proj.) | | 4.10 | | | 5/1/48 | | | | 988,400 | |
300,000 | | Westchester Co. Local Dev. Corp. Rev. (Kendal on Hudson Proj.) | | 5.00 | | | 1/1/34 | | | | 322,161 | |
| | | | | | | | | | | | |
| | | | | | | | | | | 7,786,440 | |
| | | | | | | | | | | | |
North Dakota - 0.7% | | | | | | | | | | |
910,000 | | North Dakota Hsg. Fin. Agy. Rev. | | 3.60 | | | 7/1/32 | | | | 919,264 | |
335,000 | | North Dakota Hsg. Fin. Agy. Rev. (GO of Agency Insured) | | 4.75 | | | 7/1/30 | | | | 354,323 | |
| | | | | | | | | | | | |
| | | | | | | | | | | 1,273,587 | |
| | | | | | | | | | | | |
Ohio - 1.9% | | | | | | | | | | |
425,000 | | Buckeye Tobacco Settlement Finance Auth. Asset-Backed Sr. Rev. | | 5.13 | | | 6/1/24 | | | | 390,770 | |
815,000 | | Cleveland-Cuyahoga Co. Port Auth. Dev. Rev. (St. Clarence Proj.) | | 6.00 | | | 5/1/21 | | | | 816,989 | |
694,700 | | Cuyahoga Co. Hsg. Mtg. Sr. Rev. (R H Myers Apts. Proj.) (GNMA Collateralized) | | 5.70 | | | 3/20/42 | | | | 758,737 | |
550,000 | | Lucas Co. Hospital Rev. (Promedica Health Care Proj.) | | 6.50 | | | 11/15/37 | | | | 685,438 | |
500,000 | | Middleburg Heights Hospital Rev. (Southwest General Health Center Proj.) | | 5.00 | | | 8/1/47 | | | | 540,250 | |
100,000 | | OH Hsg. Finance Agy. Residential Mtg. Rev. (GNMA/FNMA/FHLMC Collateralized) | | 5.45 | | | 9/1/33 | | | | 103,475 | |
| | | | | | | | | | | | |
| | | | | | | | | | | 3,295,659 | |
| | | | | | | | | | | | |
Oklahoma - 0.8% | | | | | | | | | | |
400,000 | | Citizen Potawatomi Nation Sr. Obligation Tax Rev. | | 6.50 | | | 9/1/16 | | | | 395,188 | |
See accompanying notes to financial statements.
| | |
| 24 | | SIT MUTUAL FUNDS ANNUAL REPORT |
| | | | | | | | | | | | |
Principal Amount ($) | | Name of Issuer | | Coupon
Rate (%) | | Maturity Date | | | Fair
Value ($) | |
525,000 | | Fort Sill Apache Tribe Economic Dev. Auth. 4 | | 8.50 | | | 8/25/26 | | | | 575,410 | |
400,000 | | Oklahoma Co. Finance Auth. Rev. (Epworth Villa Proj.) | | 5.13 | | | 4/1/42 | | | | 408,184 | |
| | | | | | | | | | | | |
| | | | | | | | | | | 1,378,782 | |
| | | | | | | | | | | | |
Oregon - 0.6% | | | | | | | | | | |
350,000 | | Clackamas Co. Hsg. Auth. Rev. (Easton Ridge Apts. Proj.) | | 3.50 | | | 9/1/33 | | | | 343,469 | |
315,000 | | Western Generation Agy. Rev. (Wauna Cogeneration Proj.) | | 5.00 | | | 1/1/21 | | | | 316,002 | |
300,000 | | Western Generation Agy. Rev. (Wauna Cogeneration) | | 5.00 | | | 1/1/21 | | | | 300,366 | |
| | | | | | | | | | | | |
| | | | | | | | | | | 959,837 | |
| | | | | | | | | | | | |
Pennsylvania - 3.8% | | | | | | | | | | |
300,000 | | Allegheny Co. Hospital Dev. Auth. Rev. (South Hills Health) | | 5.13 | | | 5/1/25 | | | | 300,099 | |
235,000 | | Allegheny Co. Industrial Dev. Auth. Charter School Rev. (Propel Charter-McKeesport) | | 5.90 | | | 8/15/26 | | | | 249,843 | |
480,000 | | Butler Co. General Authority Rev. (School District Proj.) (AGM GO of District) 1 | | 0.91 | | | 10/1/34 | | | | 392,050 | |
250,000 | | Central Bradford Progress Auth. Rev. (Guthrie Healthcare System) | | 5.50 | | | 12/1/31 | | | | 291,800 | |
250,000 | | Erie Co. Hospital Auth. Rev. (St. Vincent Health Center Proj.) | | 7.00 | | | 7/1/27 | | | | 275,068 | |
600,000 | | Geisinger Auth. Health System Rev. (Geisinger Health System Proj.) 1 | | 0.97 | | | 5/1/37 | | | | 507,672 | |
250,000 | | Lehigh Co. General Purpose Auth. Rev. (Saint Luke’s Bethlehem) 1 | | 1.21 | | | 8/15/42 | | | | 205,045 | |
500,000 | | Luzerne Co. G.O. (FSA Insured) | | 7.00 | | | 11/1/26 | | | | 596,775 | |
280,000 | | PA Higher Educational Facs. Auth. Rev. (AICUP Financing Program) | | 5.38 | | | 5/1/42 | | | | 294,263 | |
500,000 | | PA Housing Finance Agy. Single Family Mtg. Rev. | | 4.85 | | | 10/1/37 | | | | 536,670 | |
300,000 | | PA Hsg. Finance Agy. Rev. | | 5.00 | | | 10/1/25 | | | | 326,595 | |
370,000 | | PA Hsg. Finance Agy. Rev. | | 3.65 | | | 10/1/37 | | | | 366,444 | |
500,000 | | PA Hsg. Finance Agy. Rev. (GO of Agency Insured) | | 4.63 | | | 10/1/29 | | | | 529,130 | |
500,000 | | PA Hsg. Finance Agy. Single Family Mtg. Rev. | | 4.75 | | | 10/1/28 | | | | 546,435 | |
195,000 | | PA Hsg. Finance Agy. Single Family Mtg. Rev. | | 4.75 | | | 10/1/39 | | | | 200,676 | |
500,000 | | PA Turnpike Commission Rev. Capital Appreciation 6 | | 5.13 | | | 12/1/35 | | | | 470,145 | |
500,000 | | PA Turnpike Commission Rev. Capital Appreciation (AGM Insured) 6 | | 6.25 | | | 6/1/33 | | | | 525,415 | |
| | | | | | | | | | | | |
| | | | | | | | | | | 6,614,125 | |
| | | | | | | | | | | | |
Puerto Rico - 1.7% | | | | | | | | | | |
500,000 | | Puerto Rico Electric Power Auth. Rev. 1 | | 0.89 | | | 7/1/25 | | | | 398,465 | |
285,000 | | Puerto Rico Ind. Medical & Enviromental Pollution Control Facs. Fing. Auth. Rev. (American Home Proj.)1 | | 5.10 | | | 12/1/18 | | | | 286,131 | |
775,000 | | Puerto Rico Public Improvement G.O. | | 5.50 | | | 7/1/39 | | | | 746,806 | |
250,000 | | Puerto Rico Public Improvement G.O. (AGM Insured) | | 5.50 | | | 7/1/27 | | | | 263,540 | |
350,000 | | Puerto Rico Public Improvement G.O. (AGM Insured) | | 5.00 | | | 7/1/35 | | | | 348,576 | |
300,000 | | Puerto Rico Sales Tax Financing Corp. Rev. | | 6.00 | | | 8/1/39 | | | | 324,150 | |
250,000 | | Puerto Rico Sales Tax Financing Corp. Rev. | | 5.25 | | | 8/1/40 | | | | 262,728 | |
500,000 | | Puerto Rico Sales Tax Financing Corp. Rev. 1 | | 1.13 | | | 8/1/57 | | | | 359,935 | |
| | | | | | | | | | | | |
| | | | | | | | | | | 2,990,331 | |
| | | | | | | | | | | | |
Rhode Island - 0.7% | | | | | | | | | | |
500,000 | | RI Hsg. & Mortgage Finance Corp. Rev. | | 4.00 | | | 10/1/28 | | | | 513,455 | |
500,000 | | RI Hsg. & Mortgage Finance Corp. Rev. | | 3.45 | | | 4/1/35 | | | | 490,905 | |
250,000 | | RI Hsg. & Mortgage Finance Corp. Rev. | | 3.90 | | | 10/1/37 | | | | 250,000 | |
| | | | | | | | | | | | |
| | | | | | | | | | | 1,254,360 | |
| | | | | | | | | | | | |
South Carolina - 0.5% | | | | | | | | | | |
250,000 | | Coastal Carolina University Rev. | | 3.50 | | | 6/1/40 | | | | 237,430 | |
410,000 | | SC Education Assistance Auth. Student Loan Rev. | | 5.10 | | | 10/1/29 | | | | 447,634 | |
76,190 | | SC Jobs Economic Dev. Auth. Health Care Facs. Rev. (Woodlands at Furman Proj.) 6 | | 0.40 | | | 11/15/47 | | | | 76 | |
177,778 | | SC Jobs Economic Dev. Auth. Health Care Facs. Rev. (Woodlands at Furman Proj.) | | 6.00 | | | 11/15/47 | | | | 115,737 | |
| | | | | | | | | | | | |
| | | | | | | | | | | 800,877 | |
| | | | | | | | | | | | |
See accompanying notes to financial statements.
SCHEDULE OF INVESTMENTS
March 31, 2013
Sit Tax-Free Income Fund (Continued)
| | | | | | | | | | | | |
Principal
Amount ($) | | Name of Issuer | | Coupon
Rate (%) | | Maturity
Date | | | Fair
Value ($) | |
South Dakota - 0.2% | | | | | | | | | | |
250,000 | | SD Health & Educational Facs. Auth. Rev. | | 5.00 | | | 9/1/32 | | | | 263,125 | |
| | | | | | | | | | | | |
Tennessee - 1.6% | | | | | | | | | | |
250,000 | | Johnson City Health & Educational Facs. Board Rev. (Appalachian Christian Village) | | 5.00 | | | 2/15/34 | | | | 256,855 | |
495,000 | | Metro Govt. Nashville & Davidson Co. Health & Education Facs. Rev. (Prestige Proj.) 2, 5 | | 7.50 | | | 12/20/40 | | | | 272,171 | |
1,850,000 | | Shelby Co. Health, Education & Hsg. Facs. Rev. (CME Memphis Apts. Proj.) 2, 5 | | 5.35 | | | 1/1/19 | | | | 184,815 | |
7,875,000 | | Shelby Co. Health, Education & Hsg. Facs. Rev. (CME Memphis Apts. Proj.) 2, 5 | | 5.55 | | | 1/1/29 | | | | 786,712 | |
1,630,000 | | Shelby Co. Health, Education & Hsg. Facs. Rev. (CME Memphis Apts. Proj.) 2, 5 | | 6.00 | | | 1/1/29 | | | | 16 | |
500,000 | | Tennessee Housing Dev. Agy. Rev. | | 3.30 | | | 1/1/31 | | | | 494,015 | |
205,000 | | Tennessee Housing Dev. Agy. Rev. | | 4.20 | | | 7/1/42 | | | | 211,205 | |
650,000 | | Tennessee Housing Dev. Agy. Rev. | | 3.80 | | | 7/1/43 | | | | 643,045 | |
| | | | | | | | | | | | |
| | | | | | | | | | | 2,848,834 | |
| | | | | | | | | | | | |
Texas - 6.5% | | | | | | | | | | |
1,000,000 | | Arlington Higher Education Finance Corp., Education Rev. (Arlington Classics Academy) | | 7.00 | | | 8/15/28 | | | | 1,081,100 | |
45,000 | | Bexar Co. Hsg. Fin. Corp. Rev. (Dublin Kingswood & Waterford Apts.) | | 7.50 | | | 12/1/14 | | | | 42,322 | |
250,000 | | Bexar Co. Hsg. Fin. Corp. Rev. (Dymaxion & Marbach Park Apts. Proj.) (NATL-RE Insured) | | 6.10 | | | 8/1/30 | | | | 252,468 | |
540,000 | | Bexar Co. Hsg. Fin. Corp. Rev. (Honey Creek Apartments Proj.) 2, 5 | | 8.00 | | | 4/1/30 | | | | 237,535 | |
405,000 | | Bexar Co. Hsg. Fin. Corp. Rev. (Waterford Proj.) | | 6.50 | | | 12/1/21 | | | | 394,762 | |
1,000,000 | | Bexar Co. Rev. (Venue Proj.) | | 5.00 | | | 8/15/39 | | | | 1,105,540 | |
500,000 | | Brazos Co. Health Facs. Dev. Corp. Rev. | | 5.38 | | | 1/1/32 | | | | 507,030 | |
1,465,449 | | Galveston Co. Municipal Utility 10 | | 6.01 | | | N/A | | | | 1,172,359 | |
600,000 | | Harris Co. Cultural Education Facs. Finance Corp. Rev. (Space Center Houston Proj.) 4 | | 6.75 | | | 8/15/21 | | | | 671,292 | |
545,000 | | Harris Co. Housing Finance Corp. Rev. (FHA/VA/VEREX Mtgs.) 6 | | 10.34 | | | 10/15/15 | | | | 409,431 | |
240,000 | | Houston Hotel Occupancy Rev. Ref. | | 5.25 | | | 9/1/29 | | | | 263,791 | |
500,000 | | Houston Hotel Occupancy Rev. Ref. (Convention & Entertainment Facs.) | | 5.00 | | | 9/1/30 | | | | 507,775 | |
500,000 | | Newark Cultural Education Facs. Finance Corp. Rev. (A.W. Brown-Fellowship Leadership) | | 6.00 | | | 8/15/32 | | | | 525,655 | |
300,000 | | Red River Health Facs. Dev. Corp. Rev. (Wichita Falls Retirement Foundation) | | 5.50 | | | 1/1/32 | | | | 309,864 | |
240,000 | | Tarrant Co. Cultural Education Facs. Fin. Rev. (Air Force Village) | | 5.75 | | | 11/15/19 | | | | 277,378 | |
250,000 | | Tarrant Co. Cultural Education Facs. Fin. Rev. (Mirador Proj.) | | 7.75 | | | 11/15/19 | | | | 289,825 | |
250,000 | | Texas State Turnpike Auth. Rev. Capital Appreciation (AMBAC Insured) 6 | | 6.02 | | | 8/15/37 | | | | 58,612 | |
400,000 | | Travis Co. Health Facs. Dev. Corp. Rev. (First Mortgage - Longhorn Village Proj.) | | 5.50 | | | 1/1/17 | | | | 400,240 | |
500,000 | | Travis Co. Health Facs. Dev. Corp. Rev. (First Mortgage - Longhorn Village Proj.) | | 6.00 | | | 1/1/22 | | | | 521,010 | |
250,000 | | Travis Co. Health Facs. Dev. Corp. Rev. (Westminster Manor) | | 6.25 | | | 11/1/16 | | | | 254,788 | |
500,000 | | TX Municipal Gas Acquisition & Supply Corp. I Sr. Lien Rev. 1 | | 1.64 | | | 12/15/26 | | | | 429,415 | |
300,000 | | TX Municipal Gas Acquisition & Supply Corp. II Rev. 1 | | 1.06 | | | 9/15/27 | | | | 256,749 | |
750,000 | | TX Private Activity Surface Transportation Corp. Rev. (LBJ Infrastructure) | | 7.50 | | | 6/30/33 | | | | 939,338 | |
500,000 | | West Travis Co. Public Utility Agy. Rev. | | 5.00 | | | 8/15/25 | | | | 507,650 | |
| | | | | | | | | | | | |
| | | | | | | | | | | 11,415,929 | |
| | | | | | | | | | | | |
Utah - 1.8% | | | | | | | | | | |
500,000 | | Salt Lake Co. Hsg Auth. Rev. (Liberty Village Apts Proj.) (FHLMC Collateralized) | | 3.38 | | | 8/1/28 | | | | 503,535 | |
332,000 | | UT Assoc. Municipal Power System Rev. | | 4.75 | | | 5/1/22 | | | | 332,046 | |
857,000 | | UT Assoc. Municipal Power System Rev. | | 5.00 | | | 5/1/27 | | | | 857,197 | |
285,000 | | UT Hsg. Corp. Single Family Mtg. Rev. | | 5.75 | | | 1/1/33 | | | | 323,250 | |
500,000 | | UT Hsg. Corp. Single Family Mtg. Rev. | | 4.60 | | | 7/1/34 | | | | 538,615 | |
500,000 | | UT Hsg. Corp. Single Family Mtg. Rev. (State Street Plaza Proj.) (FHLMC Collateralized) | | 4.10 | | | 7/1/30 | | | | 531,665 | |
| | | | | | | | | | | | |
| | | | | | | | | | | 3,086,308 | |
| | | | | | | | | | | | |
Virginia - 1.7% | | | | | | | | | | |
500,000 | | Farms New Kent Community Dev. Auth. Special Assessment | | 5.13 | | | 3/1/36 | | | | 294,355 | |
275,000 | | Loudoun Co. Industrial Dev. Auth. Rev. (Falcons Landing) | | 6.00 | | | 8/1/28 | | | | 294,088 | |
750,000 | | VA Hsg. Dev. Auth. Rev. (Commonwealth Mtg.) | | 3.88 | | | 1/1/38 | | | | 750,000 | |
See accompanying notes to financial statements.
| | |
| 26 | | SIT MUTUAL FUNDS ANNUAL REPORT |
| | | | | | | | | | | | |
Principal Amount ($)/ Quantity | | Name of Issuer | | Coupon
Rate (%) | | Maturity
Date | | | Fair Value ($) | |
230,000 | | VA Hsg. Dev. Auth. Rev. (GO of Authority Insured) | | 6.25 | | | 7/1/31 | | | | 262,554 | |
375,000 | | VA Hsg. Dev. Auth. Rev. (GO of Authority Insured) | | 3.75 | | | 3/1/34 | | | | 376,526 | |
250,000 | | VA Hsg. Dev. Auth. Rev. (Rental Hsg. Proj.) | | 4.60 | | | 12/1/38 | | | | 267,072 | |
250,000 | | VA Hsg. Dev. Auth. Rev. (Rental Hsg. Proj.) | | 4.80 | | | 10/1/39 | | | | 265,800 | |
500,000 | | VA Hsg. Dev. Auth. Rev. (Rental Hsg. Proj.) | | 5.00 | | | 12/1/39 | | | | 539,000 | |
| | | | | | | | | | | | |
| | | | | | | | | | | 3,049,395 | |
| | | | | | | | | | | | |
Washington - 2.1% | | | | | | | | | | |
485,000 | | Grant Co. Public Hospital District No. 1 | | 5.25 | | | 9/1/13 | | | | 486,266 | |
390,000 | | Kalispel Tribe Indians Priority District Rev. | | 6.20 | | | 1/1/16 | | | | 387,465 | |
200,000 | | WA Hsg. Fin. Commission Multi Family Mtg. Rev. (Emerald Heights Proj.) | | 5.00 | | | 7/1/33 | | | | 220,756 | |
500,000 | | WA Hsg. Fin. Commission Multi Family Mtg. Rev. (GNMA/FNMA/FHLMC Collateralized) | | 3.50 | | | 12/1/33 | | | | 496,340 | |
300,000 | | WA Hsg. Fin. Commission Multi Family Mtg. Rev. (Non-profit Hsg.) | | 5.00 | | | 10/1/17 | | | | 300,597 | |
400,000 | | WA Hsg. Fin. Commission Multi Family Mtg. Rev. (Non-profit Hsg.) | | 6.00 | | | 10/1/22 | | | | 406,072 | |
600,000 | | WA Hsg. Fin. Commission Multi Family Mtg. Rev. (Quilceda Creeks Apt. Proj.) (FREDDIE MAC Insured) | | 3.50 | | | 7/1/30 | | | | 609,486 | |
420,000 | | WA Hsg. Fin. Commission Multi Family Mtg. Rev. (Skyline at First Hill Proj.) | | 5.25 | | | 1/1/17 | | | | 428,568 | |
300,000 | | WA Hsg. Fin. Commission Single Family Mtg. Rev. (GNMA/FNMA Collateralized) | | 4.60 | | | 10/1/33 | | | | 326,370 | |
| | | | | | | | | | | | |
| | | | | | | | | | | 3,661,920 | |
| | | | | | | | | | | | |
Wisconsin - 1.9% | | | | | | | | | | |
250,000 | | WI General Fund Rev. Appropriation Rev. | | 6.00 | | | 5/1/27 | | | | 306,918 | |
250,000 | | WI Health & Education Facs. Auth. Rev. (Aurora Health Care Proj.) | | 6.40 | | | 4/15/33 | | | | 250,600 | |
500,000 | | WI Health & Education Facs. Auth. Rev. (Beaver Dam Community Hospital, Inc.) | | 6.75 | | | 8/15/34 | | | | 511,695 | |
200,000 | | WI Public Finance Auth. Rev. (Glenridge Palmer Ranch Proj.) | | 7.00 | | | 6/1/20 | | | | 229,298 | |
500,000 | | WI Public Finance Auth. Rev. (Glenridge Palmer Ranch Proj.) | | 8.25 | | | 6/1/46 | | | | 599,590 | |
340,000 | | WI Public Finance Auth. Rev. (Horizon Academy West Charter School) | | 5.25 | | | 9/1/22 | | | | 341,493 | |
250,000 | | WI Public Finance Auth. Rev. (Roseman University Health Sciences) | | 5.00 | | | 4/1/22 | | | | 257,678 | |
500,000 | | WI Public Finance Auth. Rev. (Roseman University Health Sciences) | | 5.50 | | | 4/1/32 | | | | 514,665 | |
350,000 | | Wisconsin Health & Educational Facs. Auth. Rev. (Upland Hills Health Inc.) | | 5.00 | | | 5/15/36 | | | | 357,808 | |
| | | | | | | | | | | | |
| | | | | | | | | | | 3,369,745 | |
| | | | | | | | | | | | |
Wyoming - 1.2% | | | | | | | | | | |
650,000 | | WY Community Dev. Auth. Rev. | | 3.75 | | | 12/1/32 | | | | 651,547 | |
1,000,000 | | WY Community Dev. Auth. Rev. | | 4.25 | | | 12/1/37 | | | | 1,026,990 | |
500,000 | | WY Community Dev. Auth. Rev. | | 4.05 | | | 12/1/38 | | | | 500,615 | |
| | | | | | | | | | | | |
| | | | | | | | | | | 2,179,152 | |
| | | | | | | | | | | | |
Total Municipal Bonds
(cost: $173,140,147) | | | | 160,618,357 | |
| | | | | | | | | | | | |
|
Closed-End Mutual Funds - 5.8% | |
45,400 | | BlackRock Long-Term Municipal Advantage Trust (BTA) | | | | | | | | | 557,512 | |
13,800 | | BlackRock MuniHoldings Florida Insured Fund (MFL) | | | | | | | | | 214,452 | |
47,500 | | BlackRock MuniYield Florida Fund (MYF) | | | | | | | | | 780,425 | |
70,100 | | BlackRock MuniYield Insured Fund (MYI) | | | | | | | | | 1,069,726 | |
8,491 | | BlackRock MuniYield Michigan Insured Fund (MIY) | | | | | | | | | 129,912 | |
23,000 | | BlackRock MuniYield Michigan Insured Fund II (MYM) | | | | | | | | | 323,610 | |
208,600 | | DWS Municipal Income Trust (KTF) | | | | | | | | | 3,064,334 | |
31,200 | | Invesco PA Value Muni Income Trust (VPV) | | | | | | | | | 462,384 | |
8,250 | | Invesco Quality Municipal Income Trust (IQI) | | | | | | | | | 109,883 | |
35,700 | | Invesco Van Kampen Advantage Muni Income Trust (VKI) | | | | | | | | | 455,532 | |
32,389 | | Invesco Van Kampen Trust for Investment Grade Municipals (VGM) | | | | | | | | | 481,624 | |
25,923 | | Managed Duration Investment Grade (MZF) | | | | | | | | | 408,806 | |
4,825 | | Nuveen Michigan Quality Income Municipal Fund (NUM) | | | | | | | | | 73,101 | |
See accompanying notes to financial statements.
SCHEDULE OF INVESTMENTS
March 31, 2013
Sit Tax-Free Income Fund (Continued)
| | | | | | | | | | |
| Quantity | | Name of Issuer | | | | | | Fair
Value($) | |
21,500 | | Nuveen Premier Municipal Income Fund (NPF) | | | | | | | 317,555 | |
114,332 | | Nuveen Premium Income Fund (NPM) | | | | | | | 1,712,693 | |
| | | | | | | | | | |
| |
Total Closed-End Mutual Funds
(cost: $8,580,439) | | | 10,161,549 | |
| | | | | | | | | | |
|
Short-Term Securities - 2.0% | |
3,508,865 | | Dreyfus Tax-Exempt Cash Management Fund, 0.004% | | | | | | | | |
Total Short-Term Securities
(cost: $3,508,865) | | | 3,508,865 | |
| | | | | | | | | | |
| |
Total Investments in Securities - 99.3%
(cost: $185,229,451) | | | 174,288,771 | |
Other Assets and Liabilities, net - 0.7% | | | 1,191,598 | |
| | | | | | | | | | |
| |
Total Net Assets - 100.0% | | $ | 175,480,369 | |
| | | | | | | | | | |
| 1 | Variable rate security. Rate disclosed is as of March 31, 2013. |
| 2 | Securities considered illiquid by the Investment Adviser. The total value of such securities as of March 31, 2013 was $3,558,207 and represented 2.0% of net assets. |
| 4 | 144A Restricted Security. The total value of such securities as of March 31, 2013 was $2,705,827 and represented 1.5% of net assets. These securities have been determined to be liquid by the Adviser in accordance with guidelines established by the Board of Directors. |
| 5 | The issuer is in default of certain debt covenants. Income is not being accrued. The total value of such securities as of March 31, 2013 was $3,558,207 and represented 2.0% of net assets. |
| 6 | Zero coupon or convertible capital appreciation bond, for which the rate disclosed is either the effective yield on purchase date or the coupon rate to be paid upon conversion to coupon paying, respectively. |
| 9 | Municipal Lease Security. The total value of such securities as of March 31, 2013 was $710,420 and represented 0.4% of net assets. These securities have been determined to be liquid by the Adviser in accordance with guidelines established by the Board of Directors. |
| 10 | Securities with a “N/A” maturity date have passed their stated maturity date and have pending restructuring arrangements. |
Numeric footnotes not disclosed are not applicable to this Schedule of Investments.
A summary of the levels for the Fund’s investments as of March 31, 2013 is as follows (See Note 2 - Significant accounting policies in the notes to financial statements):
| | | | | | | | | | | | | | |
| | | Investment in Securities | |
| | | Level 1
Quoted
Price ($) | | | Level 2
Other significant
observable inputs ($) | | | Level 3
Significant
unobservable inputs ($) | | Total ($) | |
Short-Term Securities | | | 3,508,865 | | | | — | | | — | | | 3,508,865 | |
Closed-End Mutual Funds | | | 10,161,549 | | | | — | | | — | | | 10,161,549 | |
Municipal Bonds | | | — | | | | 160,618,357 | | | — | | | 160,618,357 | |
Total: | | | 13,670,414 | | | | 160,618,357 | | | — | | | 174,288,771 | |
For the reporting period, there were no transfers between levels 1, 2 and 3.
See accompanying notes to financial statements.
| | |
| 28 | | SIT MUTUAL FUNDS ANNUAL REPORT |
[This page intentionally left blank.]
|
Sit Minnesota Tax-Free Income Fund |
OBJECTIVE & STRATEGY
The investment objective of the Minnesota Tax-Free Income Fund is to provide a high level of current income exempt from federal regular income tax and Minnesota regular personal income tax as is consistent with the preservation of capital.
During normal market conditions, the Fund invests 100% of its net assets in municipal securities that generate interest income that is exempt from federal regular income tax and Minnesota regular personal income tax. The Fund anticipates that substantially all of its distributions to its shareholders will be exempt as such. For investors subject to the alternative minimum tax (“AMT”), up to 20% of the Fund’s income may be alternative minimum taxable income.
The Sit Minnesota Tax-Free Income Fund provided a total return of +5.61% during the fiscal year ended March 31, 2013, compared with a total return of +3.22% for the Barclay’s 5-Year Municipal Bond Index.As of March 31, 2013, the Fund’s 30-day SEC yield was 3.39% and its 12-month distribution rate was 3.30%.
All but the very shortest of tax-exempt municipal bonds ultimately ended the fiscal year lower in yield. The curve also continued to flatten as yields on the long end declined more than shorter and intermediate yields. In the back half of the 2012 calendar year, tax-exempt yields reached record low levels before rising in December. In January, yields declined before rising again through February and March, ending the quarter slightly higher. In addition, credit spreads between high-grade municipal bonds and lower investment grade credits also experienced steady narrowing during the fiscal year.
Minnesota continues to enjoy a better fiscal and economic situation than much of the country. Because of the more solid footing and generally higher credit ratings, Minnesota municipal bonds have historically been less volatile compared to larger issuance states like California and Illinois. The lack of volatility in prior periods actually led to an underperformance of 81 basis points during the current fiscal year when comparing Minnesota to other states.
The Fund’s outperformance over the fiscal year was due to the portfolio’s duration, overall credit mix and sector exposure. The Fund benefitted from having a longer duration relative to its benchmark. The Fund has also continued to benefit from exposure to A and BBB rated bonds, which outperformed as credit spreads narrowed. Sector exposures also contributed to the Fund’s overall performance and security selection within the portfolio led to outperformance in every major sector held. Health care, housing and education, which in aggregate comprised just under 60% of the Fund at year end, all had strong outperformance. General Obligation bonds, which are underweighted in the Fund at less than 3% of holdings, underperformed within the benchmark and the Fund during the fiscal year.
The Fund continues to maintain its duration longer than its benchmark with a significant weighting in intermediate and longer-term bonds. The Fund slightly shortened its duration over the year and plans to continue to do so. Credit spreads, though narrower, still offer some opportunities based on a historical comparisons.
HYPOTHETICAL GROWTH OF $10,000

The chart above illustrates the total value of a hypothetical $10,000 investment in the Fund over the past 10 years (or for the life of the Fund if shorter) as compared to the performance of the Barclays 5-Year Municipal Bond Index. Past performance does not guarantee future results. Returns include the reinvestment of distributions. The chart does not reflect the deduction of taxes that a shareholder would pay on Fund distributions or the redemption of Fund shares.
1 The Barclays 5-Year Municipal Bond Index is the 5 year (4-6) component of the Municipal Bond Index, an unmanaged, rules-based, market-value-weighted index for the long-term tax-exempt bond market. The index includes bonds with a minimum credit rating of BBB. The returns include the reinvestment of income and do not include any transaction costs, management fees or other costs. It is not possible to invest directly in an index. This is the Fund’s primary index.
We also believe there continue to be solid prospects for finding attractive yields amongst A and BBB rated investment grade credits, while good purchases of carefully selected non-rated bonds can also be made. Even after an extended period of strong returns and the low level of absolute yields at present, we believe the Fund’s duration, credit quality and industry weightings have it well positioned to provide attractive relative yield in the current economic and interest rate environment. As always, our strategy continues to emphasize income, which we believe is the primary driver of return over the long run. Diversification remains a key factor in managing risk.
Michael C. Brilley
Debra A. Sit, CFA
Paul J. Jungquist, CFA
Senior Portfolio Managers
| | |
30 | | SIT MUTUAL FUNDS ANNUAL REPORT |
COMPARATIVE RATES OF RETURNS
as of March 31, 2013
| | | | | | |
| | | Sit
Minnesota
Tax-Free
Income Fund | | Barclays 5-Year
Muni. Bond
Index1 | | Lipper MN
Muni. Bond
Fund Index2 |
One Year | | 5.61% | | 3.22% | | 4.92% |
Five Years | | 6.15 | | 5.05 | | 5.74 |
Ten Years | | 4.76 | | 4.23 | | 4.53 |
Since Inception
(12/1/93) | | 5.14 | | 4.91 | | 4.87 |
Performance figures are historical and do not guarantee future results. Investment returns and principal value will vary, and you may have a gain or loss when you sell shares. Current performance may be lower or higher than the performance data quoted. Contact the Fund for performance data current to the most recent month-end. Returns include changes in share price as well as reinvestment of all dividends and capital gains. Returns do not reflect the deduction of taxes that a shareholder would pay on Fund distributions or the redemption of Fund shares. Management fees and administrative expenses are included in the Fund’s performance. Returns for periods greater than one year are compounded average annual rates of return.
1 The Barclays 5-Year Municipal Bond Index is the 5 year (4-6) component of the Municipal Bond Index, an unmanaged, rules-based, market-value-weighted index made for the long-term tax-exempt bond market. The index includes bonds with a minimum credit rating of BBB. The returns include the reinvestment of income and do not include any transaction costs, management fees or other costs. It is not possible to invest directly in an index.
2 The Lipper returns are obtained from Lipper Analytical Services, Inc., a large independent evaluator of mutual funds.
FUND DIVERSIFICATION
| | | | |
Multifamily Mortgage | | | 17.8 | % |
Hospital/Health Care | | | 17.1 | % |
Single Family Mortgage | | | 13.4 | % |
Education/Student Loan | | | 11.2 | % |
Other Revenue | | | 8.4 | % |
Utility | | | 5.0 | % |
Sectors less than 5.0% | | | 16.3 | % |
Cash & Other Net Assets | | | 10.8 | % |
Based on total net assets as of March 31, 2013. Subject to change.
PORTFOLIO SUMMARY
| | |
Net Asset Value 3/31/13: | | $ 10.62 Per Share |
Net Asset Value 3/31/12: | | $ 10.42 Per Share |
Total Net Assets: | | $ 416.1 Million |
30-day SEC Yield 3: | | 3.39% |
Tax Equivalent Yield 4: | | 6.50% |
12-month Distribution Rate 3: | | 3.30% |
Average Maturity: | | 14.5 Years |
Effective Duration 5: | | 4.1 Years |
3 The SEC Yield reflects the rate at which the Fund is earning income on its current portfolio of securities, while the distribution rate reflects the Fund’s past dividends paid to shareholders based on the net investment income distributed and the average NAV during the past 12 months. Accordingly, the Fund’s SEC yield and distribution rate may differ.
4 The tax-equivalent yield is based on an assumed federal tax rate of 43.4% and a Minnesota tax rate of 7.85%, for an effective combined tax rate of 47.8%.
5 Duration is a measure of estimated price sensitivity relative to changes in interest rates. Portfolios with longer durations are typically more sensitive to changes in interest rates. For example, if interest rates rise by 1%, the fair value of a security with an effective duration of 5 years would decrease by 5%, with all other factors being constant. The correlation between duration and price sensitivity is greater for securities rated investment-grade than it is for securities rated below investment-grade. Duration estimates are based on assumptions by the Adviser and are subject to a number of limitations. Effective duration is calculated based on historical price changes of securities held by the Fund, and therefore is a more accurate estimate of price sensitivity provided interest rates remain within their historical range.
QUALITY RATINGS (% of Total Net Assets)
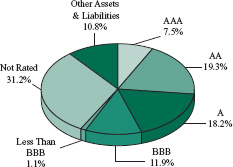
Lower of Moody’s, S&P, Fitch or Duff & Phelps ratings used.
Adviser’s Assessment of Non-Rated Securities:
| | | | | | |
AAA | | | 0.0 | % | | |
AA | | | 1.7 | | |
A | | | 1.8 | | |
BBB | | | 10.0 | | |
BB | | | 17.5 | | |
<BB | | | 0.2 | | |
| | | | | |
Total | | | 31.2 | % | | |
SCHEDULE OF INVESTMENTS
March 31, 2013
Sit Minnesota Tax-Free Income Fund
| | | | | | | | | | | | |
Principal Amount ($) | | Name of Issuer | | Coupon
Rate (%) | | Maturity Date | | | Fair Value ($) | |
Municipal Bonds - 87.9% | | | | | | | | | | |
Education/Student Loan - 11.2% | | | | | | | | |
295,000 | | Anoka Co. Charter School Lease Rev. | | 5.00 | | | 6/1/27 | | | | 310,204 | |
275,000 | | Anoka Co. Charter School Lease Rev. | | 5.00 | | | 6/1/32 | | | | 284,138 | |
1,035,000 | | Anoka Co. Charter School Lease Rev. | | 5.00 | | | 6/1/43 | | | | 1,046,313 | |
1,070,000 | | Brooklyn Park Lease Rev. (Prairie Seeds Academy Proj.) | | 8.00 | | | 3/1/20 | | | | 1,188,930 | |
2,500,000 | | Duluth Hsg. & Redev. Auth. Lease Rev. (Public Schools Academy) | | 5.00 | | | 11/1/21 | | | | 2,620,475 | |
6,526,458 | | Intermediate School District 287 Lease Rev. | | 5.30 | | | 11/1/32 | | | | 6,830,852 | |
420,000 | | Minneapolis Educational Fac. Lease Rev. (Seed/Harvest Preparatory Proj.) (LOC-U.S. Bank) | | 5.13 | | | 1/1/16 | | | | 343,354 | |
875,000 | | Minneapolis Educational Fac. Lease Rev. (Seed/Harvest Preparatory Proj.) (LOC-U.S. Bank) | | 6.25 | | | 1/1/21 | | | | 662,471 | |
910,000 | | MN Higher Education Fac. Auth. Rev. (Bethel Univ.) | | 5.50 | | | 5/1/14 | | | | 930,275 | |
600,000 | | MN Higher Education Fac. Auth. Rev. (Bethel Univ.) | | 5.50 | | | 5/1/22 | | | | 636,894 | |
160,000 | | MN Higher Education Fac. Auth. Rev. (Bethel Univ.) | | 5.50 | | | 5/1/23 | | | | 169,341 | |
1,000,000 | | MN Higher Education Fac. Auth. Rev. (Bethel Univ.) | | 5.50 | | | 5/1/37 | | | | 1,043,400 | |
1,482,049 | | MN Higher Education Fac. Auth. Rev. (College of St. Benedict) | | 4.49 | | | 10/1/16 | | | | 1,513,290 | |
250,000 | | MN Higher Education Fac. Auth. Rev. (College of St. Benedict) | | 5.13 | | | 3/1/36 | | | | 264,378 | |
400,000 | | MN Higher Education Fac. Auth. Rev. (College of St. Scholastica Inc.) | | 4.00 | | | 12/1/32 | | | | 407,060 | |
750,000 | | MN Higher Education Fac. Auth. Rev. (Hamline Univ.) | | 6.00 | | | 10/1/32 | | | | 882,712 | |
1,000,000 | | MN Higher Education Fac. Auth. Rev. (Hamline Univ.) | | 6.00 | | | 10/1/40 | | | | 1,150,810 | |
1,000,000 | | MN Higher Education Fac. Auth. Rev. (Macalester College) | | 3.00 | | | 5/1/32 | | | | 974,930 | |
500,000 | | MN Higher Education Fac. Auth. Rev. (Macalester College) | | 3.25 | | | 5/1/36 | | | | 483,075 | |
310,000 | | MN Higher Education Fac. Auth. Rev. (Macalester College) | | 4.00 | | | 5/1/43 | | | | 320,391 | |
750,000 | | MN Higher Education Fac. Auth. Rev. (Macalester College-Seven-I) | | 5.00 | | | 6/1/35 | | | | 852,375 | |
435,000 | | MN Higher Education Fac. Auth. Rev. (St. Catherine Univ.) | | 5.00 | | | 10/1/32 | | | | 484,038 | |
1,400,000 | | MN Higher Education Fac. Auth. Rev. (St. Scholastica College) | | 5.00 | | | 12/1/27 | | | | 1,489,768 | |
1,800,000 | | MN Higher Education Fac. Auth. Rev. (St. Scholastica College) | | 6.30 | | | 12/1/40 | | | | 2,053,890 | |
500,000 | | MN Higher Education Fac. Auth. Rev. (St. Scholastica College-H) | | 5.25 | | | 12/1/35 | | | | 544,205 | |
565,000 | | MN Higher Education Fac. Auth. Rev. (Univ. of St. Thomas) | | 4.00 | | | 4/1/27 | | | | 615,833 | |
1,250,000 | | MN Higher Education Fac. Auth. Rev. (Univ. of St. Thomas) | | 6.00 | | | 10/1/25 | | | | 1,413,412 | |
93,008 | | MN Higher Education Fac. Auth. Rev. Lease Rev. (Concordia Univ.) | | 5.25 | | | 4/25/14 | | | | 94,340 | |
2,500,000 | | MN Office of Higher Education Rev. (Suppl. Student Loan Prog.) | | 5.00 | | | 11/1/29 | | | | 2,772,650 | |
697,565 | | Olmsted Co. Hsg. & Redev. Auth. (Schaeffer Academy Proj.) | | 4.98 | | | 4/25/27 | | | | 639,360 | |
440,000 | | Pine City Lease Rev. (Lakes International Language Academy Proj.) | | 5.75 | | | 5/1/16 | | | | 454,159 | |
830,000 | | Pine City Lease Rev. (Lakes International Language Academy Proj.) | | 6.00 | | | 5/1/26 | | | | 848,218 | |
110,000 | | Ramsey Lease Rev. (Pact Charter School Proj.) | | 5.65 | | | 12/1/13 | | | | 110,979 | |
1,650,000 | | Ramsey Lease Rev. (Pact Charter School Proj.) | | 6.50 | | | 12/1/22 | | | | 1,710,819 | |
1,150,000 | | St. Paul Hsg. & Redev. Auth. (St. Paul Conservatory for Performing Artists) | | 4.63 | | | 3/1/43 | | | | 1,128,932 | |
1,500,000 | | St. Paul Hsg. & Redev. Auth. Lease Rev. (Community of Peace Academy Proj.) | | 5.00 | | | 12/1/18 | | | | 1,544,910 | |
600,000 | | St. Paul Hsg. & Redev. Auth. Lease Rev. (Hmong Academy Proj.) | | 5.50 | | | 9/1/18 | | | | 621,462 | |
295,000 | | St. Paul Hsg. & Redev. Auth. Lease Rev. (Hmong College Preparatory Academy) | | 4.75 | | | 9/1/22 | | | | 298,794 | |
500,000 | | St. Paul Hsg. & Redev. Auth. Lease Rev. (Hmong College Preparatory Academy) | | 5.00 | | | 9/1/27 | | | | 504,095 | |
1,000,000 | | St. Paul Hsg. & Redev. Auth. Lease Rev. (Hmong College Preparatory Academy) | | 5.25 | | | 9/1/32 | | | | 1,011,820 | |
600,000 | | St. Paul Hsg. & Redev. Auth. Lease Rev. (Nova Classical Academy Proj.) | | 5.70 | | | 9/1/21 | | | | 654,396 | |
500,000 | | St. Paul Hsg. & Redev. Auth. Rev. Ref. (St. Paul Academy & Summit School) | | 5.00 | | | 10/1/24 | | | | 545,220 | |
200,000 | | St. Paul Hsg. & Redev. Auth. Rev. Ref. (St. Paul Conservatory for Performing Artists) | | 3.20 | | | 3/1/20 | | | | 199,750 | |
1,000,000 | | University of Minnesota College and Univ. Rev. | | 4.00 | | | 2/1/24 | | | | 1,153,320 | |
1,610,000 | | Victoria Private School Fac. Rev. (Holy Family Catholic High) | | 4.00 | | | 9/1/23 | | | | 1,623,830 | |
215,000 | | Woodbury Charter School Lease Rev. (MSA Building) | | 5.00 | | | 12/1/27 | | | | 226,432 | |
225,000 | | Woodbury Charter School Lease Rev. (MSA Building) | | 5.00 | | | 12/1/32 | | | | 232,643 | |
See accompanying notes to financial statements.
| | |
32 | | SIT MUTUAL FUNDS ANNUAL REPORT |
| | | | | | | | | | | | | | |
Principal
Amount ($) | | Name of Issuer | | Coupon
Rate (%) | | | Maturity
Date | | | Fair Value ($) | |
885,000 | | Woodbury Charter School Lease Rev. (MSA Building) | | | 5.00 | | | | 12/1/43 | | | | 894,416 | |
| | | | | | | | | | | | | | |
| | | | | | | | | | | | | 46,787,359 | |
| | | | | | | | | | | | | | |
General Obligation - 2.4% | |
1,000,000 | | Bemidji Sales Tax G.O. | | | 5.00 | | | | 2/1/34 | | | | 1,145,560 | |
1,350,000 | | Bemidji Sales Tax G.O. | | | 6.00 | | | | 2/1/41 | | | | 1,644,772 | |
150,000 | | Buffalo Capital Appreciation Water & Sewer G.O. 6 | | | 5.05 | | | | 10/1/28 | | | | 68,388 | |
650,000 | | Dakota Co. Community Dev. Agy. Sr. Hsg. Facs. G.O. | | | 5.00 | | | | 1/1/26 | | | | 733,161 | |
490,000 | | Northern Mariana Islands Commonwealth G.O. 11 | | | 5.00 | | | | 10/1/22 | | | | 438,472 | |
1,000,000 | | Puerto Rico Public Improvement G.O. 11 | | | 5.50 | | | | 7/1/39 | | | | 963,620 | |
1,000,000 | | Puerto Rico Public Improvement G.O. 11 | | | 5.75 | | | | 7/1/36 | | | | 1,007,080 | |
1,000,000 | | Puerto Rico Public Improvement G.O. 11 | | | 6.00 | | | | 7/1/28 | | | | 1,035,410 | |
1,500,000 | | Puerto Rico Public Improvement G.O. 11 | | | 6.50 | | | | 7/1/40 | | | | 1,611,705 | |
480,000 | | Watkins G.O. | | | 4.00 | | | | 1/1/34 | | | | 487,085 | |
735,000 | | Watkins G.O. | | | 4.00 | | | | 1/1/38 | | | | 741,909 | |
| | | | | | | | | | | | | | |
| | | | | | | | | | | | | 9,877,162 | |
| | | | | | | | | | | | | | |
Hospital/Health Care - 17.1% | |
4,025,000 | | Breckenridge Rev. (Catholic Health Initiatives Proj.) | | | 5.00 | | | | 5/1/30 | | | | 4,180,928 | |
400,000 | | Carlton Health Care & Hsg. Fac. Rev. Ref. (Faith Care Center Proj.) | | | 5.20 | | | | 4/1/16 | | | | 413,272 | |
365,000 | | Cold Spring Health Care Facs. Rev. (Assumption Home, Inc. Proj.) | | | 7.25 | | | | 3/1/23 | | | | 398,332 | |
1,000,000 | | Cuyuna Range Hosp. Dist. Health Facs. Rev. | | | 5.20 | | | | 6/1/25 | | | | 1,012,340 | |
390,000 | | Detroit Lakes Hsg. & Health Facs. Rev. Ref. (CDL Homes Proj.) 1 | | | 2.14 | | | | 8/1/34 | | | | 390,905 | |
1,500,000 | | Detroit Lakes Hsg. Rev. Ref. (Mankato Lutheran Proj.) 1 | | | 2.39 | | | | 8/1/34 | | | | 1,497,225 | |
1,550,000 | | Douglas Co. Gross Health Care Facs. Rev. (Douglas Co. Hospital Proj.) | | | 6.00 | | | | 7/1/28 | | | | 1,703,295 | |
2,000,000 | | Duluth Economic Dev. Auth. Rev. (St. Lukes Hospital Oblig. Group) | | | 4.75 | | | | 6/15/22 | | | | 2,061,600 | |
1,600,000 | | Duluth Economic Dev. Auth. Rev. (St. Lukes Hospital Oblig. Group) | | | 5.75 | | | | 6/15/32 | | | | 1,703,408 | |
2,500,000 | | Duluth Economic Dev. Auth. Rev. (St. Lukes Hospital Oblig. Group) | | | 6.00 | | | | 6/15/39 | | | | 2,690,200 | |
80,000 | | Elk River Rev. (Care Choice Member Proj.) | | | 5.60 | | | | 8/1/13 | | | | 80,040 | |
820,000 | | Glencoe Health Care Fac. Rev. (Glencoe Regional Health Services Proj.) | | | 4.00 | | | | 4/1/23 | | | | 867,888 | |
200,000 | | Glencoe Health Care Fac. Rev. (Glencoe Regional Health Services Proj.) | | | 4.00 | | | | 4/1/26 | | | | 207,200 | |
375,000 | | Glencoe Health Care Fac. Rev. (Glencoe Regional Health Services Proj.) | | | 4.00 | | | | 4/1/27 | | | | 384,855 | |
1,400,000 | | Glencoe Health Care Fac. Rev. (Glencoe Regional Health Services Proj.) | | | 4.00 | | | | 4/1/31 | | | | 1,414,784 | |
1,925,000 | | Glencoe Health Care Fac. Rev. (Glencoe Regional Health Services Proj.) | | | 5.00 | | | | 4/1/25 | | | | 1,945,001 | |
970,000 | | Hastings Health Care Fac. Rev. (Regina Medical Center) (ACA Insured) | | | 5.25 | | | | 9/15/18 | | | | 971,804 | |
755,000 | | Hastings Health Care Fac. Rev. (Regina Medical Center) (ACA Insured) | | | 5.30 | | | | 9/15/28 | | | | 755,498 | |
780,000 | | Maple Grove Health Care Fac. Rev. (North Memorial Health Care Proj.) | | | 5.00 | | | | 9/1/29 | | | | 794,758 | |
1,200,000 | | Maple Grove Health Care System Rev. (Maple Grove Hospital Corp.) | | | 5.25 | | | | 5/1/25 | | | | 1,270,596 | |
1,500,000 | | Maple Grove Health Care System Rev. (Maple Grove Hospital Corp.) | | | 5.25 | | | | 5/1/28 | | | | 1,576,425 | |
600,000 | | Minneapolis & St. Paul Hsg. & Redev. Auth. Rev. (Health Partners) | | | 5.88 | | | | 12/1/29 | | | | 619,338 | |
255,000 | | Minneapolis Health Care Fac. Rev. (Augustana Chapel View Homes Proj.) | | | 5.00 | | | | 6/1/15 | | | | 255,247 | |
270,000 | | Minneapolis Health Care Fac. Rev. (Augustana Chapel View Homes Proj.) | | | 5.10 | | | | 6/1/16 | | | | 270,256 | |
1,470,000 | | Minneapolis Health Care Fac. Rev. (Jones-Harrison Residence Proj.) | | | 5.40 | | | | 10/1/25 | | | | 1,485,406 | |
675,000 | | Minneapolis Hsg. & Health Care Facs. Rev. Ref. (Providence Proj.) | | | 5.50 | | | | 10/1/14 | | | | 697,478 | |
225,000 | | Minneapolis Hsg. Fac. Rev. (Augustana Chapel View Homes Proj.) | | | 5.50 | | | | 6/1/27 | | | | 224,998 | |
105,000 | | Minneapolis Pooled Rev. (Care Choice Member Proj.) | | | 5.75 | | | | 4/1/19 | | | | 105,043 | |
2,705,000 | | Minneapolis Rev. Ref. (Walker Campus) | | | 4.50 | | | | 11/15/20 | | | | 2,800,270 | |
1,100,000 | | Minneapolis Rev. Ref. (Walker Campus) | | | 5.00 | | | | 11/15/24 | | | | 1,151,304 | |
10,000 | | MN Agricultural & Economic Dev. Board Rev. (Fairview Health Care System Proj.) | | | 6.38 | | | | 11/15/22 | | | | 10,043 | |
130,000 | | MN Agricultural & Economic Dev. Board Rev. (Fairview Health Care System Proj.) | | | 6.38 | | | | 11/15/29 | | | | 130,516 | |
550,000 | | Moorhead Economic Dev. Auth. Rev. | | | 4.60 | | | | 9/1/25 | | | | 549,620 | |
1,300,000 | | New Hope Health Care Facs. Rev. (MN Masonic Home North Ridge Proj.) | | | 5.88 | | | | 3/1/29 | | | | 1,300,663 | |
1,175,000 | | New Hope Health Care Facs. Rev. (MN Masonic Home North Ridge Proj.) | | | 5.90 | | | | 3/1/19 | | | | 1,176,375 | |
See accompanying notes to financial statements
SCHEDULE OF INVESTMENTS
March 31, 2013
Sit Minnesota Tax-Free Income Fund (Continued)
| | | | | | | | | | |
Principal
Amount ($) | | Name of Issuer | | Coupon
Rate (%) | | Maturity
Date | | | Fair Value ($) |
575,000 | | Owatonna Senior Hsg. Rev. (Sr. Living Proj.) | | 5.80 | | | 10/1/29 | | | 609,615 |
1,500,000 | | Rochester Health Care Facs. Rev. (Olmsted Medical Center Proj.) | | 5.88 | | | 7/1/30 | | | 1,638,030 |
1,000,000 | | Sauk Rapids Health Care & Hsg. Facs. Rev. (Good Shepherd Lutheran Home Proj.) | | 6.75 | | | 1/1/24 | | | 1,071,340 |
1,000,000 | | Sauk Rapids Health Care & Hsg. Facs. Rev. (Good Shepherd Lutheran Home Proj.) | | 7.25 | | | 1/1/29 | | | 1,064,080 |
3,475,000 | | Shakopee Health Care Facs. Rev. (St. Francis Regional Medical Center Proj.) | | 5.25 | | | 9/1/34 | | | 3,525,318 |
1,000,000 | | St. Cloud Health Care Rev. (CentraCare Health System Proj.) (Assured Guaranty) | | 5.50 | | | 5/1/39 | | | 1,097,730 |
4,200,000 | | St. Cloud Health Care Rev. (CentraCare Health System) | | 5.00 | | | 5/1/25 | | | 4,472,286 |
2,000,000 | | St. Louis Park Health Care Facs. Rev. (Park Nicollet Health Proj.) | | 5.50 | | | 7/1/29 | | | 2,226,520 |
350,000 | | St. Paul Hsg. & Redev. Auth. Health Care Rev. (Gillette Childrens Specialty Proj.) | | 5.00 | | | 2/1/20 | | | 360,234 |
500,000 | | St. Paul Hsg. & Redev. Auth. Health Care Rev. (Gillette Childrens Specialty Proj.) | | 5.00 | | | 2/1/21 | | | 513,895 |
4,200,000 | | St. Paul Hsg. & Redev. Auth. Health Care Rev. (HealthPartners Oblig. Group Proj.) | | 5.25 | | | 5/15/36 | | | 4,385,682 |
700,000 | | St. Paul Hsg. & Redev. Auth. Health Care Rev. (Regions Hospital Proj.) | | 5.20 | | | 5/15/13 | | | 702,604 |
2,120,000 | | St. Paul Hsg. & Redev. Auth. Health Care Rev. (Regions Hospital Proj.) | | 5.25 | | | 5/15/18 | | | 2,125,597 |
525,000 | | St. Paul Hsg. & Redev. Auth. Health Care Rev. (Senior Episcopal Homes Proj.) | | 4.25 | | | 11/1/25 | | | 520,684 |
750,000 | | St. Paul Hsg. & Redev. Auth. Health Care Rev. (Senior Episcopal Homes Proj.) | | 4.75 | | | 11/1/31 | | | 753,292 |
2,363,917 | | St. Paul Hsg. & Redev. Auth. Rev. (Nursing Home NTS-Episcopal) | | 5.63 | | | 10/1/33 | | | 2,431,643 |
50,000 | | St. Paul Hsg. & Redev. Auth. Rev. (Regions Hospital Proj.) | | 5.30 | | | 5/15/28 | | | 50,056 |
2,500,000 | | Stillwater Health Care Rev. (Health System Obligation Proj.) | | 5.00 | | | 6/1/25 | | | 2,576,800 |
525,000 | | West St. Paul Health Care (Walker Thompson Hill) | | 6.75 | | | 9/1/31 | | | 573,426 |
500,000 | | Winona Health Care Facs. Rev. (Winona Health Obligation) | | 5.00 | | | 7/1/34 | | | 522,315 |
1,300,000 | | Winsted Health Care Rev. (St. Mary’s Care Center Proj.) | | 6.00 | | | 9/1/25 | | | 1,366,755 |
1,250,000 | | Winsted Health Care Rev. (St. Mary’s Care Center Proj.) | | 6.50 | | | 9/1/34 | | | 1,312,938 |
| | | | | | | | | | |
| | | | | | | | | | 70,997,751 |
| | | | | | | | | | |
Industrial/Pollution Control - 1.2% |
2,250,000 | | Moorhead Rev. (Amer. Crystal Sugar Co. Recovery Zone Fac.) | | 5.65 | | | 6/1/27 | | | 2,515,118 |
100,000 | | Seaway Port Auth. (Duluth Cargill Incorporate Proj.) | | 4.20 | | | 5/1/13 | | | 100,321 |
1,420,000 | | St. Paul Port Auth. Solid Waste Disposal Rev. (Ecullet Proj.) | | 6.25 | | | 11/1/15 | | | 1,493,201 |
1,000,000 | | St. Paul Port Auth. Solid Waste Disposal Rev. (Gerdau St. Paul Steel Mill Proj.) 8 | | 4.50 | | | 10/1/37 | | | 1,005,770 |
| | | | | | | | | | |
| | | | | | | | | | 5,114,410 |
| | | | | | | | | | |
Insured - 2.0% |
500,000 | | Guam Power Auth. Rev. (AGM Insured) 11 | | 5.00 | | | 10/1/30 | | | 566,705 |
500,000 | | Minneapolis & St. Paul Hsg. & Redev. Rev. (Children’s Hospital) (AGM Insured) | | 5.00 | | | 8/15/34 | | | 543,310 |
1,025,000 | | Minneapolis Health Care Facs. Rev. (Fairview Health Svcs.) (Assured Guaranty) | | 6.50 | | | 11/15/38 | | | 1,251,894 |
415,000 | | MN Governmental Agy. Fin. Group (Flex Terminal Prog.) (AGC Insured) | | 4.00 | | | 3/1/21 | | | 428,143 |
350,000 | | MN Governmental Agy. Fin. Group (Flex Terminal Prog.) (AGC Insured) | | 4.00 | | | 3/1/22 | | | 360,213 |
260,000 | | MN Governmental Agy. Fin. Group (Flex Terminal Prog.) (AGC Insured) | | 4.25 | | | 3/1/23 | | | 275,756 |
600,000 | | Puerto Rico Public Improvement G.O. (AGM Insured) 11 | | 5.13 | | | 7/1/30 | | | 600,084 |
1,000,000 | | Puerto Rico Public Improvement G.O. (AGM Insured) 11 | | 5.25 | | | 7/1/20 | | | 1,109,570 |
1,000,000 | | Puerto Rico Public Improvement G.O. (Assured Guaranty) 1, 11 | | 3.18 | | | 7/1/20 | | | 1,013,610 |
1,800,000 | | St. Paul Hsg. & Redev. Sales Tax Rev. Ref. (Civic Center) (AGM Insured) | | 7.10 | | | 11/1/23 | | | 2,105,838 |
| | | | | | | | | | |
| | | | | | | | | | 8,255,123 |
| | | | | | | | | | |
Multifamily Mortgage - 17.8% |
785,000 | | Anoka Co. Hsg. & Redev. Rev. (Recovery Zone Fac.-Park River Estates) | | 6.50 | | | 11/1/25 | | | 837,948 |
250,000 | | Bloomington Hsg. Rev. Sr. (Gideon Pond Commons LLC) | | 5.25 | | | 6/1/21 | | | 265,422 |
300,000 | | Bloomington Hsg. Rev. Sr. (Gideon Pond Commons LLC) | | 5.25 | | | 12/1/21 | | | 317,784 |
375,000 | | Bloomington Hsg. Rev. Sr. (Gideon Pond Commons LLC) | | 5.38 | | | 6/1/22 | | | 399,465 |
385,000 | | Bloomington Hsg. Rev. Sr. (Gideon Pond Commons LLC) | | 5.38 | | | 12/1/22 | | | 409,186 |
1,000,000 | | Bloomington Hsg. Rev. Sr. (Gideon Pond Commons LLC) | | 6.00 | | | 12/1/30 | | | 1,067,740 |
80,000 | | Cambridge Hsg. & Health Care Facs. Rev. (Grandview West Proj.) | | 5.50 | | | 10/1/13 | | | 80,158 |
500,000 | | Cambridge Hsg. & Health Care Facs. Rev. (Grandview West Proj.) | | 5.80 | | | 10/1/18 | | | 500,665 |
1,000,000 | | Cambridge Hsg. & Health Care Facs. Rev. (Grandview West Proj.) | | 6.00 | | | 10/1/28 | | | 1,000,800 |
See accompanying notes to financial statements.
| | |
34 | | SIT MUTUAL FUNDS ANNUAL REPORT |
| | | | | | | | | | |
Principal Amount ($) | | Name of Issuer | | Coupon
Rate (%) | | Maturity
Date | | | Fair Value ($) |
940,000 | | Champlin Multifamily Hsg. Rev. (Champlin Drive Apts.) | | 6.00 | | | 1/1/27 | | | 1,002,811 |
165,000 | | Chaska Multifamily Hsg. Rev. (West Suburban Hsg. Partners Proj.) 8 | | 5.38 | | | 9/1/14 | | | 164,490 |
500,000 | | Cloquet Hsg. Fac. Rev. Ref. (HADC Cloquet LLC Proj.) | | 5.50 | | | 8/1/25 | | | 500,750 |
250,000 | | Columbia Heights Multifamily & Health Care Fac. Rev. (Crest View Corp Proj.) | | 5.30 | | | 7/1/17 | | | 239,595 |
2,700,000 | | Coon Rapids Multifamily Hsg. Rev. (Miss View Apartments Proj.) (GNMA Collateralized) 8 | | 4.95 | | | 10/20/41 | | | 2,739,393 |
1,200,000 | | Coon Rapids Multifamily Hsg. Rev. Ref. (Margaret Place Apartments) | | 6.50 | | | 5/1/25 | | | 1,200,720 |
2,490,000 | | Cottage Grove Sr. Hsg. Rev. (PHS, Inc. Proj.) | | 5.00 | | | 12/1/31 | | | 2,507,505 |
2,305,000 | | Cottage Grove Sr. Hsg. Rev. (PHS, Inc. Proj.) | | 6.00 | | | 12/1/46 | | | 2,342,341 |
165,000 | | Eveleth Multifamily Hsg. Rev. Sr. (Manor House Woodland Proj.) | | 5.15 | | | 10/1/13 | | | 164,511 |
1,660,000 | | Grand Rapids Hsg. & Redev. Auth. (Lakeshore Place & Forest Park West Apartments Proj.) | | 5.30 | | | 10/1/29 | | | 1,660,548 |
250,000 | | Inver Grove Heights Nursing Home Rev. Ref. (Presbyterian Homes) | | 5.38 | | | 10/1/26 | | | 253,245 |
245,000 | | Inver Grove Heights Nursing Home Rev. Ref. (Presbyterian Homes) | | 5.50 | | | 10/1/33 | | | 247,768 |
1,380,000 | | Maplewood Multifamily Hsg. Rev. (Park Edge Apartments Proj.) 8 | | 6.50 | | | 5/1/29 | | | 1,380,428 |
2,765,000 | | Minneapolis & St. Paul Hsg. & Redev. Auth. Multifamily Hsg. Rev. (GNMA Collateralized) 8 | | 4.75 | | | 1/20/42 | | | 2,801,222 |
680,000 | | Minneapolis Hsg. Rev. (Keeler Apartments Proj.) | | 5.00 | | | 10/1/37 | | | 671,480 |
4,300,000 | | Minneapolis Mulitfamily Hsg. Rev. (Riverside Plaza) | | 6.00 | | | 11/1/13 | | | 4,304,300 |
595,000 | | Minneapolis Multifamily Hsg. Rev. (Blaisdell Apartments Proj.) 8 | | 5.10 | | | 4/1/17 | | | 590,538 |
290,000 | | Minneapolis Multifamily Hsg. Rev. (Garr Scott Loft Proj.) (LOC U.S. Bank) 1, 8 | | 5.95 | | | 5/1/30 | | | 290,925 |
75,000 | | Minnetonka Multifamily Hsg. Rev. Ref. (Archer Heights Apartments Proj.) (GNMA Collateralized) 8 | | 5.10 | | | 7/20/13 | | | 75,224 |
975,000 | | Minnetonka Multifamily Hsg. Rev. Ref. (Archer Heights Apartments Proj.) (GNMA Collateralized) 8 | | 5.20 | | | 1/20/18 | | | 977,174 |
1,750,000 | | MN Hsg. Fin. Agy. Rental Hsg. 8 | | 5.10 | | | 8/1/47 | | | 1,787,380 |
85,000 | | MN Hsg. Fin. Agy. Rental Hsg. (GO of AGY. Insured) 8 | | 4.88 | | | 8/1/24 | | | 85,390 |
250,000 | | MN Hsg. Fin. Agy. Rental Hsg. (GO of AGY. Insured) | | 5.05 | | | 8/1/31 | | | 277,620 |
2,560,000 | | MN Hsg. Fin. Agy. Rental Hsg. (GO of AGY. Insured) | | 5.25 | | | 8/1/40 | | | 2,790,605 |
1,660,000 | | MN Hsg. Fin. Agy. Rental Hsg. (GO of AGY. Insured) | | 5.45 | | | 8/1/41 | | | 1,852,892 |
1,170,000 | | MN Hsg. Fin. Agy. Residential Hsg. Rev. (GO of AGY. Insured) 8 | | 5.00 | | | 7/1/21 | | | 1,230,501 |
485,000 | | Moorhead Economic Dev. Auth. Rev. Ref. (EverCare Sr. Living LLC) | | 4.55 | | | 9/1/24 | | | 486,290 |
280,000 | | Moorhead Economic Dev. Auth. Rev. Ref. (EverCare Sr. Living LLC) | | 4.65 | | | 9/1/26 | | | 279,297 |
210,000 | | Moorhead Economic Dev. Auth. Rev. Ref. (EverCare Sr. Living LLC) | | 4.70 | | | 9/1/27 | | | 209,687 |
1,000,000 | | Moorhead Health Care Rev. Ref. (EverCare Sr. Living LLC) | | 5.00 | | | 9/1/32 | | | 1,008,600 |
250,000 | | Moorhead Health Care Rev. Ref. (EverCare Sr. Living LLC) | | 5.13 | | | 9/1/37 | | | 251,262 |
500,000 | | North Oaks Sr. Hsg. Rev. (Presbyterian Homes North Oaks Proj.) | | 5.25 | | | 10/1/13 | | | 505,010 |
1,565,000 | | North Oaks Sr. Hsg. Rev. (Presbyterian Homes North Oaks Proj.) | | 5.63 | | | 10/1/17 | | | 1,702,923 |
650,000 | | North Oaks Sr. Hsg. Rev. (Presbyterian Homes North Oaks Proj.) | | 5.75 | | | 10/1/22 | | | 699,134 |
1,000,000 | | North Oaks Sr. Hsg. Rev. (Presbyterian Homes North Oaks Proj.) | | 6.00 | | | 10/1/33 | | | 1,060,380 |
1,000,000 | | Oak Park Heights Hsg. Rev. (Oakgreen Commons Proj.) | | 6.00 | | | 8/1/25 | | | 1,059,480 |
605,000 | | Oakdale Rev. (Sr. Hsg. Oak Meadows Proj.) | | 4.00 | | | 4/1/22 | | | 593,330 |
150,000 | | Oakdale Rev. (Sr. Hsg. Oak Meadows Proj.) | | 4.25 | | | 4/1/23 | | | 147,956 |
260,000 | | Oakdale Rev. (Sr. Hsg. Oak Meadows Proj.) | | 4.25 | | | 4/1/25 | | | 252,374 |
875,000 | | Oakdale Rev. (Sr. Hsg. Oak Meadows Proj.) | | 5.00 | | | 4/1/34 | | | 884,196 |
430,000 | | Red Wing Sr. Hsg. Rev. (Deer Crest Proj.) | | 5.00 | | | 11/1/27 | | | 452,417 |
330,000 | | Red Wing Sr. Hsg. Rev. (Deer Crest Proj.) | | 5.00 | | | 11/1/32 | | | 336,029 |
1,000,000 | | Red Wing Sr. Hsg. Rev. (Deer Crest Proj.) | | 5.00 | | | 11/1/42 | | | 996,890 |
320,000 | | Richfield Sr. Hsg. Rev. Ref. (Richfield Sr. Hsg., Inc. Proj.) | | 5.00 | | | 12/1/15 | | | 318,083 |
430,000 | | Rochester Health Care & Hsg. Rev. (Samaritan Bethany, Inc. Proj.) | | 5.25 | | | 12/1/17 | | | 454,850 |
455,000 | | Rochester Health Care & Hsg. Rev. (Samaritan Bethany, Inc. Proj.) | | 5.50 | | | 12/1/18 | | | 488,361 |
475,000 | | Rochester Health Care & Hsg. Rev. (Samaritan Bethany, Inc. Proj.) | | 5.75 | | | 12/1/19 | | | 517,874 |
250,000 | | Rochester Health Care & Hsg. Rev. (Samaritan Bethany, Inc. Proj.) (Gty. Agmt. Samaritan Bethany) | | 7.38 | | | 12/1/41 | | | 280,280 |
4,000,000 | | Rochester Multifamily Hsg. Rev. (Essex Place Apartments Proj.) (FHLMC) | | 3.75 | | | 6/1/29 | | | 4,202,840 |
2,200,000 | | Sartell Health Care & Hsg. Fac. Rev. (Country Manor Campus LLC Proj.) | | 4.00 | | | 9/1/20 | | | 2,205,984 |
1,135,000 | | Sartell Health Care & Hsg. Fac. Rev. (Country Manor Campus LLC Proj.) | | 5.25 | | | 9/1/27 | | | 1,179,425 |
1,400,000 | | Sauk Rapids Health Care & Hsg. Facs. Rev. (Good Shepherd Lutheran Home Proj.) | | 5.13 | | | 1/1/39 | | | 1,387,036 |
See accompanying notes to financial statements.
SCHEDULE OF INVESTMENTS
March 31, 2013
Sit Minnesota Tax-Free Income Fund (Continued)
| | | | | | | | | | |
Principal
Amount ($) | | Name of Issuer | | Coupon
Rate (%) | | Maturity
Date | | | Fair
Value ($) |
240,000 | | St. Paul Hsg. & Redev. Auth. Health Care Rev. (Carondelet Village Proj.) | | 5.13 | | | 2/1/22 | | | 251,441 |
275,000 | | St. Paul Hsg. & Redev. Auth. Health Care Rev. (Carondelet Village Proj.) | | 5.13 | | | 8/1/22 | | | 287,493 |
175,000 | | St. Paul Hsg. & Redev. Auth. Health Care Rev. (Carondelet Village Proj.) | | 5.38 | | | 2/1/24 | | | 183,031 |
150,000 | | St. Paul Hsg. & Redev. Auth. Health Care Rev. (Carondelet Village Proj.) | | 5.38 | | | 8/1/24 | | | 156,672 |
150,000 | | St. Paul Hsg. & Redev. Auth. Health Care Rev. (Carondelet Village Proj.) | | 5.50 | | | 2/1/25 | | | 156,802 |
3,000,000 | | St. Paul Hsg. & Redev. Auth. Health Care Rev. (Carondelet Village Proj.) | | 6.25 | | | 8/1/30 | | | 3,219,420 |
1,285,000 | | St. Paul Hsg. & Redev. Auth. Multifamily Rev. Ref. (Series Center Proj.) | | 5.20 | | | 11/1/22 | | | 1,297,747 |
2,970,000 | | St. Paul Hsg. & Redev. Auth. Multifamily Rev. Ref. (Univ. & Dale Proj.) (GNMA Collateralized) 8 | | 4.82 | | | 7/20/46 | | | 3,065,456 |
360,000 | | Stillwater Multifamily Hsg. Rev. (Orleans Homes LP Proj.) 8 | | 5.00 | | | 2/1/17 | | | 368,816 |
120,000 | | Victoria Sr. Hsg. Rev. (Chanhassen, Inc. Proj.) | | 5.50 | | | 8/1/18 | | | 120,085 |
2,000,000 | | Wayzata Sr. Hsg. Rev. (Folkestone Sr. Living Community) | | 4.88 | | | 5/1/19 | | | 2,018,940 |
730,000 | | Wayzata Sr. Hsg. Rev. (Folkestone Sr. Living Community) | | 5.20 | | | 5/1/25 | | | 779,822 |
770,000 | | Wayzata Sr. Hsg. Rev. (Folkestone Sr. Living Community) | | 5.25 | | | 5/1/26 | | | 821,682 |
790,000 | | Wayzata Sr. Hsg. Rev. (Folkestone Sr. Living Community) | | 5.25 | | | 11/1/26 | | | 843,025 |
1,250,000 | | Wayzata Sr. Hsg. Rev. (Folkestone Sr. Living Community) | | 5.50 | | | 11/1/32 | | | 1,326,975 |
120,000 | | Willmar Hsg. & Redev. Auth. Multifamily Rev. (Copperleaf) | | 8.00 | | | 3/15/41 | | | 120,672 |
250,000 | | Woodbury Economic Dev. Auth. Sr. Hsg. Rev. (Summerhouse) | | 5.75 | | | 6/1/41 | | | 253,215 |
| | | | | | | | | | |
| | | | | | | | | | 74,249,806 |
| | | | | | | | | | |
Municipal Lease 9 - 4.3% | | | | | | | | |
500,000 | | Anoka Co. Hsg. & Redev. Rev. | | 5.63 | | | 5/1/22 | | | 551,180 |
500,000 | | Anoka Co. Hsg. & Redev. Rev. | | 6.63 | | | 5/1/30 | | | 549,390 |
500,000 | | Anoka Co. Hsg. & Redev. Rev. | | 6.88 | | | 5/1/40 | | | 548,960 |
1,342,699 | | Carver Scott Co. Lease Purchase Agreement | | 5.00 | | | 8/4/20 | | | 1,374,427 |
9,000 | | Hennepin Co. Hsg. & Redev. Auth. Rev. | | 5.70 | | | 8/1/13 | | | 9,037 |
3,000,000 | | MN General Fund Rev. (Appropriation) | | 3.00 | | | 3/1/30 | | | 2,887,740 |
4,000,000 | | MN General Fund Rev. (Appropriation) | | 4.00 | | | 3/1/26 | | | 4,425,640 |
2,000,000 | | MN Hsg. Fin. Agy. Non-Profit Hsg. Rev. (St. Appropriation) | | 5.00 | | | 8/1/31 | | | 2,246,080 |
1,725,000 | | St. Paul Port Auth. Lease Rev. (Office Building) | | 5.25 | | | 12/1/27 | | | 1,731,520 |
150,000 | | St. Paul Port Auth. Lease Rev. (Office Building) | | 5.25 | | | 12/1/27 | | | 150,567 |
1,250,000 | | Virginia Hsg. & Redev. Auth. Health Care Fac. Lease Rev. | | 5.13 | | | 10/1/20 | | | 1,317,900 |
400,000 | | Virginia Hsg. & Redev. Auth. Health Care Fac. Lease Rev. | | 5.25 | | | 10/1/25 | | | 413,604 |
340,000 | | Virginia Hsg. & Redev. Auth. Health Care Fac. Lease Rev. | | 5.38 | | | 10/1/30 | | | 354,185 |
1,171,787 | | Winona School District 861 Lease Purchase | | 6.04 | | | 8/1/24 | | | 1,173,557 |
| | | | | | | | | | |
| | | | | | | | | | 17,733,787 |
| | | | | | | | | | |
Other Revenue Bonds - 8.4% | | | | | | | | |
1,030,000 | | Bloomington Port Auth. Recovery Zone Fac. Rev. (Radisson Blu MOA LLC) | | 6.25 | | | 12/1/16 | | | 1,083,581 |
510,000 | | Columbia Heights Economic Dev. Auth. Tax Increment Rev. (Huset Park Area Redev.) | | 5.20 | | | 2/15/22 | | | 486,509 |
637,191 | | Crystal Governmental Fac. Rev. | | 5.10 | | | 12/15/26 | | | 727,137 |
1,000,000 | | Guam Govt. Hotel Occupancy Tax Rev. 11 | | 6.00 | | | 11/1/26 | | | 1,163,560 |
230,000 | | McLeod Co. Commercial Dev. Rev. (Southwest MN Foundation) | | 5.13 | | | 12/1/31 | | | 238,381 |
475,000 | | Minneapolis Community Dev. Agy. Limited Tax Common Bond Fund (Discount Steel) 8 | | 5.25 | | | 6/1/19 | | | 476,966 |
1,500,000 | | Minneapolis National Marrow Donor Program Rev. | | 4.88 | | | 8/1/25 | | | 1,555,035 |
250,000 | | Minneapolis Tax Increment Rev. (Grant Park Proj.) | | 5.00 | | | 2/1/16 | | | 253,198 |
200,000 | | Minneapolis Tax Increment Rev. Ref. (East River/Unocal Site Proj.) | | 5.10 | | | 2/1/17 | | | 204,550 |
240,000 | | Minneapolis Tax Increment Rev. Ref. (East River/Unocal Site Proj.) | | 5.20 | | | 2/1/21 | | | 241,901 |
1,000,000 | | MN Development Rev. Limited Tax Supported Comm. Board | | 6.00 | | | 12/1/40 | | | 1,158,910 |
2,000,000 | | MN Development Rev. Limited Tax Supported Comm. Board | | 6.25 | | | 12/1/30 | | | 2,416,640 |
1,175,000 | | Mound Hsg. & Redev. Auth. Tax Increment Rev. Ref. (Metroplain Proj.) | | 5.00 | | | 2/15/27 | | | 1,178,502 |
280,000 | | Puerto Rico Infrastucture Financing Auth. Special Tax Rev. Ref. (AMBAC Insured) 6, 11 | | 8.40 | | | 7/1/28 | | | 114,114 |
425,000 | | St. Anthony Hsg. & Redev. Auth. Tax Increment Rev. (Silver Lake Village Hsg.) | | 4.75 | | | 2/1/17 | | | 428,821 |
See accompanying notes to financial statements.
| | |
36 | | SIT MUTUAL FUNDS ANNUAL REPORT |
| | | | | | | | | | |
Principal Amount ($) | | Name of Issuer | | Coupon
Rate (%) | | Maturity
Date | | | Fair Value ($) |
500,000 | | St. Anthony Hsg. & Redev. Auth. Tax Increment Rev. (Silver Lake Village Hsg.) | | 4.90 | | | 2/1/22 | | | 500,720 |
1,000,000 | | St. Louis Park Economic Dev. Auth. Tax Increment Rev. (Hoigaard Vlg.) | | 5.00 | | | 2/1/23 | | | 1,045,450 |
500,000 | | St. Paul Hsg. & Redev. Auth. Rev. (Jimmy Lee Recreation Center Proj.) | | 4.75 | | | 12/1/26 | | | 542,220 |
500,000 | | St. Paul Hsg. & Redev. Auth. Rev. (Jimmy Lee Recreation Center Proj.) | | 5.00 | | | 12/1/32 | | | 533,840 |
400,000 | | St. Paul Hsg. & Redev. Auth. Rev. (Ordway Center Performing Arts Proj.) | | 0.95 | | | 7/1/13 | | | 400,252 |
100,000 | | St. Paul Hsg. & Redev. Auth. Rev. (Ordway Center Performing Arts Proj.) | | 1.95 | | | 7/1/16 | | | 100,039 |
1,000,000 | | St. Paul Hsg. & Redev. Auth. Rev. (Ordway Center Performing Arts Proj.) | | 2.20 | | | 7/1/18 | | | 999,490 |
1,113,000 | | St. Paul Hsg. & Redev. Auth. Tax Increment Rev. (9th St. Lofts Proj.) | | 6.38 | | | 2/15/28 | | | 1,098,709 |
935,000 | | St. Paul Hsg. & Redev. Auth. Tax Increment Rev. (Drake Marble Proj.) | | 6.75 | | | 3/1/28 | | | 935,561 |
255,000 | | St. Paul Hsg. & Redev. Auth. Tax Increment Rev. (Emerald Gardens Proj.) | | 5.00 | | | 3/1/15 | | | 260,773 |
755,000 | | St. Paul Hsg. & Redev. Auth. Tax Increment Rev. (Emerald Gardens Proj.) | | 6.50 | | | 3/1/29 | | | 805,109 |
1,043,000 | | St. Paul Hsg. & Redev. Auth. Tax Increment Rev. (North Quadrant Owner Occupied Proj.) | | 7.00 | | | 2/15/28 | | | 1,044,690 |
892,000 | | St. Paul Hsg. & Redev. Auth. Tax Increment Rev. (North Quadrant Owner Occupied Proj.) | | 7.50 | | | 2/15/28 | | | 892,563 |
180,000 | | St. Paul Hsg. & Redev. Auth. Tax Increment Rev. (Upper Landing Proj.) | | 5.00 | | | 3/1/14 | | | 184,653 |
145,000 | | St. Paul Hsg. & Redev. Auth. Tax Increment Rev. (Upper Landing Proj.) | | 5.00 | | | 3/1/15 | | | 151,323 |
105,000 | | St. Paul Hsg. & Redev. Auth. Tax Increment Rev. (Upper Landing Proj.) | | 5.00 | | | 3/1/16 | | | 110,355 |
160,000 | | St. Paul Hsg. & Redev. Auth. Tax Increment Rev. (Upper Landing Proj.) | | 5.00 | | | 3/1/17 | | | 169,267 |
175,000 | | St. Paul Hsg. & Redev. Auth. Tax Increment Rev. (Upper Landing Proj.) | | 5.00 | | | 3/1/19 | | | 185,948 |
180,000 | | St. Paul Hsg. & Redev. Auth. Tax Increment Rev. (Upper Landing Proj.) | | 5.00 | | | 9/1/19 | | | 192,100 |
185,000 | | St. Paul Hsg. & Redev. Auth. Tax Increment Rev. (Upper Landing Proj.) | | 5.00 | | | 3/1/20 | | | 195,974 |
220,000 | | St. Paul Hsg. & Redev. Auth. Tax Increment Rev. (Upper Landing Proj.) | | 5.00 | | | 9/1/20 | | | 233,860 |
225,000 | | St. Paul Hsg. & Redev. Auth. Tax Increment Rev. (Upper Landing Proj.) | | 5.00 | | | 3/1/21 | | | 237,640 |
230,000 | | St. Paul Hsg. & Redev. Auth. Tax Increment Rev. (Upper Landing Proj.) | | 5.00 | | | 9/1/21 | | | 243,604 |
135,000 | | St. Paul Hsg. & Redev. Auth. Tax Increment Rev. (Upper Landing Proj.) | | 5.00 | | | 3/1/22 | | | 142,348 |
245,000 | | St. Paul Hsg. & Redev. Auth. Tax Increment Rev. (Upper Landing Proj.) | | 5.00 | | | 9/1/22 | | | 258,335 |
1,000,000 | | St. Paul Hsg. & Redev. Auth. Tax Increment Rev. (Upper Landing Proj.) | | 5.00 | | | 9/1/26 | | | 1,050,640 |
930,000 | | St. Paul Hsg. & Redev. Auth. Tax Increment Rev. (Upper Landing Proj.) | | 5.00 | | | 3/1/29 | | | 970,092 |
805,000 | | St. Paul Port Auth. Lease Rev. (Regions Hospital Parking Ramp Proj.) | | 5.00 | | | 8/1/21 | | | 846,675 |
2,525,000 | | St. Paul Port Auth. Lease Rev. (Regions Hospital Parking Ramp Proj.) | | 5.00 | | | 8/1/36 | | | 2,556,588 |
3,000,000 | | St. Paul Port Auth. Rev. (Amherst H. Wilder Fndtn.-3) | | 5.00 | | | 12/1/36 | | | 3,343,170 |
715,000 | | St. Paul Recreational Facs. Gross Rev. (Highland National Proj.) | | 5.00 | | | 10/1/25 | | | 783,054 |
300,000 | | Steele Co. Health Care Fac. Gross Rev. Ref. Crossover | | 5.00 | | | 6/1/30 | | | 303,771 |
2,000,000 | | Virgin Islands Public Fin. Auth. (Gross Receipts Taxes Loan Note) 11 | | 5.00 | | | 10/1/42 | | | 2,109,920 |
| | | | | | | | | | |
| | | | | | | | | | 35,156,538 |
| | | | | | | | | | |
Public Facilities - 0.3% | | | | | | | | |
1,075,000 | | St. Paul Hsg. & Redev. Auth. Parking Rev. (Smith Ave. Proj.) | | 5.00 | | | 8/1/35 | | | 1,170,922 |
| | | | | | | | | | |
Sales Tax Revenue - 1.2% | | | | | | | | |
2,000,000 | | Hennepin Co. Sales Tax Rev. | | 4.75 | | | 12/15/37 | | | 2,220,560 |
500,000 | | Puerto Rico Sales Tax Financing Corp. Rev. 11 | | 6.00 | | | 8/1/39 | | | 540,250 |
1,500,000 | | Puerto Rico Sales Tax Financing Corp. Rev. 6, 11 | | 6.25 | | | 8/1/33 | | | 1,179,045 |
1,000,000 | | Virgin Islands Public Fin. Auth. (Gross Receipts Taxes Loan Note) 11 | | 5.00 | | | 10/1/32 | | | 1,100,040 |
| | | | | | | | | | |
| | | | | | | | | | 5,039,895 |
| | | | | | | | | | |
Single Family Mortgage - 13.4% | | | | | | | | |
1,820,000 | | Dakota Co. Community Dev. Agy. Single Family Mtg. Rev. (GNMA) | | 4.45 | | | 12/1/32 | | | 1,986,548 |
915,000 | | Dakota Co. Community Dev. Agy. Single Family Mtg. Rev. (GNMA-FNMA-FHLMC) | | 4.63 | | | 12/1/30 | | | 990,030 |
1,155,000 | | Dakota Co. Community Dev. Agy. Single Family Mtg. Rev. (GNMA-FNMA-FHLMC) | | 4.88 | | | 12/1/33 | | | 1,270,823 |
636,061 | | Dakota Co. Community Dev. Agy. Single Family Mtg. Rev. (GNMA-FNMA-FHLMC) 8 | | 5.13 | | | 12/1/40 | | | 668,533 |
217,924 | | Dakota Co. Community Dev. Agy. Single Family Mtg. Rev. (GNMA-FNMA-FHLMC) 8 | | 5.15 | | | 12/1/38 | | | 225,233 |
996,347 | | Dakota Co. Community Dev. Agy. Single Family Mtg. Rev. (GNMA-FNMA-FHLMC) 8 | | 5.30 | | | 12/1/39 | | | 1,037,088 |
920,000 | | Minneapolis St. Paul Hsg. Fin. Board Single Family Mtg. Rev. (GNMA-FNMA) | | 4.45 | | | 12/1/27 | | | 1,016,122 |
See accompanying notes to financial statements.
SCHEDULE OF INVESTMENTS
March 31, 2013
Sit Minnesota Tax-Free Income Fund (Continued)
| | | | | | | | | | |
Principal Amount ($) | | Name of Issuer | | Coupon
Rate (%) | | Maturity
Date | | | Fair Value ($) |
105,643 | | Minneapolis St. Paul Hsg. Fin. Board Single Family Mtg. Rev. (GNMA-FNMA) 8 | | 5.00 | | | 12/1/38 | | | 108,649 |
123,502 | | Minneapolis St. Paul Hsg. Fin. Board Single Family Mtg. Rev. (GNMA-FNMA) | | 5.70 | | | 4/1/27 | | | 128,748 |
289,744 | | Minneapolis St. Paul Hsg. Fin. Board Single Family Mtg. Rev. (GNMA-FNMA-FHLMC) | | 5.10 | | | 4/1/27 | | | 303,643 |
1,296,679 | | Minneapolis St. Paul Hsg. Fin. Board Single Family Mtg. Rev. (GNMA-FNMA-FHLMC) 8 | | 5.25 | | | 12/1/40 | | | 1,370,447 |
715,562 | | Minneapolis St. Paul Hsg. Fin. Board Single Family Mtg. Rev. (GNMA-FNMA-FHLMC) | | 5.45 | | | 4/1/27 | | | 758,152 |
275,000 | | Minneapolis St. Paul Hsg. Fin. Board Single Family Mtg. Rev. (GNMA-FNMA-FHLMC) 8 | | 5.52 | | | 3/1/41 | | | 294,552 |
5,840,000 | | MN Hsg. Fin. Agy. Homeownership Fin. (GNMA-FNMA) | | 4.40 | | | 7/1/32 | | | 6,452,616 |
5,455,000 | | MN Hsg. Fin. Agy. Homeownership Fin. (GNMA-FNMA-FHLMC) | | 4.45 | | | 7/1/31 | | | 6,048,449 |
2,870,000 | | MN Hsg. Fin. Agy. Homeownership Fin. (GNMA-FNMA-FHLMC) | | 4.70 | | | 1/1/31 | | | 3,091,162 |
1,990,000 | | MN Hsg. Fin. Agy. Residential Hsg. Rev. 8 | | 4.65 | | | 7/1/22 | | | 2,091,112 |
5,285,000 | | MN Hsg. Fin. Agy. Residential Hsg. Rev. | | 5.10 | | | 1/1/40 | | | 5,664,780 |
2,750,000 | | MN Hsg. Fin. Agy. Residential Hsg. Rev. (GO of AGY. Insured) | | 3.63 | | | 7/1/25 | | | 2,908,592 |
460,000 | | MN Hsg. Fin. Agy. Residential Hsg. Rev. (GO of AGY. Insured) | | 3.85 | | | 1/1/29 | | | 481,519 |
3,585,000 | | MN Hsg. Fin. Agy. Residential Hsg. Rev. (GO of AGY. Insured) | | 3.90 | | | 7/1/30 | | | 3,820,391 |
1,970,000 | | MN Hsg. Fin. Agy. Residential Hsg. Rev. (GO of AGY. Insured) 8 | | 5.10 | | | 7/1/38 | | | 2,100,059 |
710,000 | | MN Hsg. Fin. Agy. Rev. (GNMA-FNMA Collateralized) | | 5.00 | | | 1/1/31 | | | 769,342 |
180,000 | | MN Hsg. Fin. Agy. Single Family Mtg. Rev. | | 4.90 | | | 7/1/29 | | | 196,794 |
880,000 | | MN Hsg. Fin. Agy. Single Family Mtg. Rev. | | 5.00 | | | 7/1/38 | | | 925,399 |
1,710,000 | | MN Hsg. Fin. Agy. Single Family Mtg. Rev. | | 5.05 | | | 7/1/34 | | | 1,847,228 |
260,000 | | MN Hsg. Fin. Agy. Single Family Mtg. Rev. 8 | | 5.10 | | | 7/1/20 | | | 260,452 |
220,000 | | MN Hsg. Fin. Agy. Single Family Mtg. Rev. | | 5.20 | | | 1/1/23 | | | 232,452 |
795,000 | | MN Hsg. Fin. Agy. Single Family Mtg. Rev. | | 5.90 | | | 7/1/28 | | | 867,521 |
820,000 | | MN Hsg. Fin. Agy. Single Family Mtg. Rev. (GO of AGY. Insured) 8 | | 4.75 | | | 7/1/27 | | | 853,833 |
1,975,000 | | MN Hsg. Fin. Agy. Single Family Mtg. Rev. (GO of AGY. Insured) 8 | | 4.80 | | | 7/1/26 | | | 2,047,008 |
425,000 | | MN Hsg. Fin. Agy. Single Family Mtg. Rev. (GO of AGY. Insured) 8 | | 5.00 | | | 1/1/37 | | | 441,618 |
1,360,000 | | MN Hsg. Fin. Agy. Single Family Mtg. Rev. (GO of AGY. Insured) 8 | | 5.15 | | | 7/1/28 | | | 1,432,570 |
1,380,000 | | MN Hsg. Fin. Agy. Single Family Mtg. Rev. (GO of AGY. Insured) 8 | | 5.25 | | | 7/1/33 | | | 1,452,919 |
720,000 | | MN Hsg. Fin. Agy. Single Family Mtg. Rev. (GO of AGY. Insured) 8 | | 5.50 | | | 7/1/28 | | | 738,014 |
825,000 | | MN Hsg. Fin. Agy. Single Family Mtg. Rev. (GO of AGY. Insured) 8 | | 5.65 | | | 7/1/33 | | | 867,174 |
| | | | | | | | | | |
| | | | | | | | | | 55,749,572 |
| | | | | | | | | | |
Transportation - 3.6% | | | | | | | | |
2,500,000 | | Minneapolis & St. Paul Metro Airport Commission Rev. Ref. 8 | | 5.00 | | | 1/1/22 | | | 2,863,825 |
2,010,000 | | Minneapolis & St. Paul Metro Airport Commission Rev. Ref. (NATL-RE FGIC Insured) | | 5.00 | | | 1/1/22 | | | 2,146,841 |
1,750,000 | | Minneapolis & St. Paul Metro Airport Commission Rev. Ref. (NATL-RE FGIC Insured) | | 5.00 | | | 1/1/25 | | | 1,966,825 |
500,000 | | Minneapolis & St. Paul Metro Airport Commission Sub. Rev. | | 5.00 | | | 1/1/30 | | | 571,530 |
500,000 | | Minneapolis & St. Paul Metro Airport Commission Sub. Rev. | | 5.00 | | | 1/1/31 | | | 570,295 |
3,500,000 | | Minneapolis & St. Paul Metro Airport Commission Sub. Rev. (AMBAC Insured) 8 | | 5.00 | | | 1/1/25 | | | 3,712,975 |
2,750,000 | | Minneapolis & St. Paul Metro Airport Commission Sub. Rev. (NATL-RE FGIC Insured) | | 5.00 | | | 1/1/22 | | | 3,125,238 |
| | | | | | | | | | |
| | | | | | | | | | 14,957,529 |
| | | | | | | | | | |
Utility - 5.0% | | | | | | | | |
1,000,000 | | Central MN Municipal Power Agy. Electric Rev. (Southeast Twin Cities Transmission Proj.) | | 5.00 | | | 1/1/42 | | | 1,102,730 |
1,000,000 | | Chaska Electric Rev. Ref. (Generating Facs. Proj.) | | 5.25 | | | 10/1/25 | | | 1,105,540 |
2,000,000 | | MN Municipal Power Agy. Electric Rev. | | 5.00 | | | 10/1/25 | | | 2,283,000 |
1,000,000 | | MN Municipal Power Agy. Electric Rev. | | 5.00 | | | 10/1/30 | | | 1,112,240 |
50,000 | | MN Municipal Power Agy. Electric Rev. | | 5.00 | | | 10/1/34 | | | 52,800 |
1,465,000 | | MN Municipal Power Agy. Electric Rev. | | 5.00 | | | 10/1/35 | | | 1,571,623 |
2,000,000 | | MN Municipal Power Agy. Electric Rev. | | 5.25 | | | 10/1/24 | | | 2,136,200 |
700,000 | | MN Municipal Power Agy. Electric Rev. | | 5.25 | | | 10/1/27 | | | 796,964 |
1,000,000 | | MN Municipal Power Agy. Electric Rev. | | 5.25 | | | 10/1/35 | | | 1,113,970 |
500,000 | | North Branch Electric System Rev. | | 5.75 | | | 8/1/28 | | | 539,915 |
500,000 | | Puerto Rico Aqueduct & Sewer Auth. Rev. 11 | | 5.75 | | | 7/1/37 | | | 494,790 |
See accompanying notes to financial statements.
| | |
38 | | SIT MUTUAL FUNDS ANNUAL REPORT |
| | | | | | | | | | |
Quantity/ Principal Amount ($) | | Name of Issuer | | Coupon Rate (%) | | Maturity
Date | | | Fair Value ($) |
1,250,000 | | Puerto Rico Electric Power Auth. Rev. Ref. 1, 11 | | 0.87 | | | 7/1/25 | | | 996,162 |
2,000,000 | | Southern MN Power Agy. Power Supply System Rev. | | 5.25 | | | 1/1/30 | | | 2,232,900 |
1,000,000 | | St. Paul Port Auth. Rev. (Energy Park Utility Company Proj.) 8 | | 5.45 | | | 8/1/28 | | | 1,035,080 |
1,265,000 | | St. Paul Port Auth. Rev. (Energy Park Utility Company Proj.) 8 | | 5.70 | | | 8/1/36 | | | 1,315,220 |
780,000 | | Virgin Islands Water & Power Auth. Water System Rev. Ref. 11 | | 5.50 | | | 7/1/17 | | | 781,849 |
2,000,000 | | Western MN Municipal Power Agy. Rev. | | 3.00 | | | 1/1/28 | | | 1,968,240 |
| | | | | | | | | | |
| | | | | | | | | | 20,639,223 |
| | | | | | | | | | |
Total Municipal Bonds
(cost: $348,728,344) | | | | | | 365,729,077 |
| | | | | | | | | | |
| | | |
Closed-End Mutual Funds - 1.3% | | | | | | | | |
183,100 | | Delaware Investments Minnesota Municipal Income Fund II (VMM) | | | | | | | | 2,861,853 |
37,696 | | First American Minnesota Municipal Income Fund II (MXN) | | | | | | | | 608,790 |
111,197 | | MN Municipal Income Portfolio (MXA) | | | | | | | | 1,921,484 |
| | | | | | | | | | |
| | | |
Total Closed-End Mutual Funds
(cost: $4,809,261) | | | | | | | | 5,392,127 |
| | | | | | | | | | |
| | | |
Short-Term Securities - 3.8% | | | | | | | | |
8,850,000 | | Minneapolis & St. Paul Hsg. & Redev. Auth. Rev. (Allina Health) 1 | | 0.12 | | | 11/15/34 | | | 8,850,000 |
1,975,000 | | Minneapolis Hsg. Dev. Rev. (One Ten Grant Proj.) (FNMA) 1 | | 0.14 | | | 9/1/26 | | | 1,975,000 |
5,000,000 | | Rochester Health Care Facs. Rev. (Mayo Foundation) 1 | | 0.12 | | | 8/15/32 | | | 5,000,000 |
| | | | | | | | | | |
| | | |
Total Short-Term Securities
(cost: $15,825,000) | | | | | | | | 15,825,000 |
| | | | | | | | | | |
| | | |
Total Investments in Securities - 93.0%
(cost: $369,362,605) | | | | | | | | 386,946,204 |
Other Assets and Liabilities, net - 7.0% | | | | | | | | 29,198,516 |
| | | | | | | | | | |
| | | |
Total Net Assets - 100.0% | | | | | | | | $416,144,720 |
| | | | | | | | | | |
| 1 | Variable rate security. Rate disclosed is as of March 31, 2013. |
| 6 | Zero coupon or convertible capital appreciation bond, for which the rate disclosed is either the effective yield on purchase date or the coupon rate to be paid upon conversion to coupon paying, respectively. |
| 8 | Securities the income from which is treated as a tax preference that is included in alternative minimum taxable income for purposes of computing federal alternative minimum tax (AMT). At March 31, 2013, 10.1% of net assets in the Fund was invested in such securities. |
| 9 | Municipal Lease Security. The total value of such securities as of March 31, 2013 was $17,733,787 and represented 4.3% of net assets. These securities have been determined to be liquid by the Adviser in accordance with guidelines established by the Board of Directors. |
| 11 | The Fund may invest in obligations issued by U.S. territories, for example Guam, Puerto Rico, and Virgin Islands. The total value of such securities as of March 31, 2013 was $16,825,986 and represented 4.0% of net assets. |
| Numeric | footnotes not disclosed are not applicable to this Schedule of Investments. |
See accompanying notes to financial statements.
SCHEDULE OF INVESTMENTS
March 31, 2013
Sit Minnesota Tax-Free Income Fund (Continued)
A summary of the levels for the Fund’s investments as of March 31, 2013 is as follows (See Note 2 -significant accounting policies in the notes to financial statements):
| | | | | | | | | | | | |
| | | Investment in Securities |
| | | Level 1 | | | Level 2 | | | Level 3 | | |
| | | Quoted
Price ($) | | | Other significant
observable inputs ($) | | | Significant
unobservable inputs ($) | | Total ($) |
Short-Term Securities | | | — | | | | 15,825,000 | | | — | | 15,825,000 |
Closed-End Mutual Funds | | | 5,392,127 | | | | — | | | — | | 5,392,127 |
Municipal Bonds | | | — | | | | 365,729,077 | | | — | | 365,729,077 |
| | | | |
Total: | | | 5,392,127 | | | | 381,554,077 | | | — | | 386,946,204 |
For the reporting period, there were no transfers between levels 1, 2 and 3.
See accompanying notes to financial statements.
| | |
40 | | SIT MUTUAL FUNDS ANNUAL REPORT |
[This page intentionally left blank.]
STATEMENTS OF ASSETS AND LIABILITIES
March 31, 2013
| | | | | | | | | | | | | | | | |
| | | Sit U.S.
Government
Securities
Fund | | | Sit Quality
Income
Fund | | | Sit Tax-Free
Income
Fund | | | Sit Minnesota
Tax-Free
Income
Fund | |
ASSETS | | | | | | | | | | | | | | | | |
Investments in securities, at identified cost | | | $1,458,672,169 | | | | $5,037,996 | | | | $185,229,451 | | | | $369,362,605 | |
| | | | | | | | | | | | | | | | |
| | | | |
Investments in securities, at fair value - see accompanying schedule for detail | | | $1,489,283,618 | | | | $5,046,738 | | | | $174,288,771 | | | | $386,946,204 | |
Cash in bank on demand deposit | | | 28,152,051 | | | | 148,004 | | | | 63,577 | | | | 25,654,867 | |
Restricted cash | | | 2,000,000 | | | | 5,000 | | | | — | | | | — | |
Accrued interest and dividends receivable | | | 7,811,063 | | | | 23,334 | | | | 2,151,411 | | | | 5,138,134 | |
Receivable for investment securities sold | | | — | | | | — | | | | 2,268,338 | | | | — | |
Receivable for principal paydowns | | | 37,518 | | | | — | | | | — | | | | — | |
Other receivables | | | — | | | | — | | | | — | | | | 13,853 | |
Receivable for Fund shares sold. | | | 3,385,772 | | | | — | | | | 42,974 | | | | 1,406,168 | |
| | | | | | | | | | | | | | | | |
| | | | |
Total assets | | | 1,530,670,022 | | | | 5,223,076 | | | | 178,815,071 | | | | 419,159,226 | |
| | | | | | | | | | | | | | | | |
| | | | |
LIABILITIES | | | | | | | | | | | | | | | | |
Payable for investment securities purchased | | | 4,250,536 | | | | 94,698 | | | | 2,973,960 | | | | 1,656,191 | |
Payable for Fund shares redeemed | | | 4,259,908 | | | | — | | | | 99,469 | | | | 743,784 | |
Cash portion of dividends payable to shareholders | | | 46,900 | | | | 939 | | | | 141,714 | | | | 334,254 | |
Variation margin | | | — | | | | 969 | | | | — | | | | — | |
Accrued investment management fees | | | 1,066,125 | | | | 3,803 | | | | 119,559 | | | | 280,277 | |
Outstanding options written, at fair value (premiums received $536,786 and $858, respectively) | | | 987,500 | | | | 1,062 | | | | — | | | | — | |
| | | | | | | | | | | | | | | | |
| | | | |
Total liabilities | | | 10,610,969 | | | | 101,471 | | | | 3,334,702 | | | | 3,014,506 | |
| | | | | | | | | | | | | | | | |
| | | | |
Net assets applicable to outstanding capital stock | | | $1,520,059,053 | | | | $5,121,605 | | | | $175,480,369 | | | | $416,144,720 | |
| | | | | | | | | | | | | | | | |
| | | | |
Net assets consist of: | | | | | | | | | | | | | | | | |
Capital (par value and paid-in surplus) | | | $1,494,416,379 | | | | $5,116,700 | | | | $209,711,175 | | | | $405,982,102 | |
Undistributed (distributions in excess of) net investment income | | | (46,900 | ) | | | — | | | | 4,597 | | | | (11,337 | ) |
Accumulated net realized gain (loss) from security transactions,written options and futures. | | | (4,471,161 | ) | | | (2,664 | ) | | | (23,294,723 | ) | | | (7,409,644 | ) |
Unrealized appreciation (depreciation) on investments, written options and futures | | | 30,160,735 | | | | 7,569 | | | | (10,940,680 | ) | | | 17,583,599 | |
| | | | | | | | | | | | | | | | |
| | | $1,520,059,053 | | | | $5,121,605 | | | | $175,480,369 | | | | $416,144,720 | |
| | | | | | | | | | | | | | | | |
| | | | |
Outstanding shares | | | 134,529,256 | | | | 511,640 | | | | 18,339,871 | | | | 39,173,970 | |
| | | | | | | | | | | | | | | | |
| | | | |
Net asset value per share of outstanding capital stock | | | $11.30 | | | | $10.01 | | | | $9.57 | | | | $10.62 | |
| | | | | | | | | | | | | | | | |
See accompanying notes to financial statements.
| | |
42 | | SIT MUTUAL FUNDS ANNUAL REPORT |
STATEMENTS OF OPERATIONS
Year or Period Ended March 31, 2013
| | | | | | | | | | | | | | | | |
| | | Sit U.S.
Government
Securities
Fund | | | Sit Quality
Income
Fund 1 | | | Sit Tax-Free
Income
Fund | | | Sit Minnesota
Tax-Free
Income
Fund | |
Investment income: | | | | | | | | | | | | | | | | |
Income: | | | | | | | | | | | | | | | | |
Dividends | | | — | | | | — | | | | $674,384 | | | | $164,682 | |
Interest | | | $38,380,985 | | | | $24,749 | | | | 7,628,735 | | | | 16,405,764 | |
| | | | | | | | | | | | | | | | |
Total income | | | 38,380,985 | | | | 24,749 | | | | 8,303,119 | | | | 16,570,446 | |
| | | | | | | | | | | | | | | | |
| | | | |
Expenses (note 4): | | | | | | | | | | | | | | | | |
Investment management fee | | | 13,760,028 | | | | 10,340 | | | | 1,374,171 | | | | 3,025,484 | |
| | | | | | | | | | | | | | | | |
Total expenses | | | 13,760,028 | | | | 10,340 | | | | 1,374,171 | | | | 3,025,484 | |
| | | | | | | | | | | | | | | | |
| | | | |
Net investment income | | | 24,620,957 | | | | 14,409 | | | | 6,928,948 | | | | 13,544,962 | |
| | | | | | | | | | | | | | | | |
| | | | |
Realized and unrealized gain (loss): | | | | | | | | | | | | | | | | |
Net realized gain (loss) on investments | | | (1,409,227 | ) | | | (2,542 | ) | | | (322,605 | ) | | | 378,680 | |
Net realized gain (loss) on written options | | | (218,151 | ) | | | 159 | | | | — | | | | — | |
Net realized gain (loss) on futures | | | — | | | | (281 | ) | | | — | | | | — | |
| | | | |
Net change in unrealized appreciation (depreciation) on investments | | | 324,785 | | | | 8,742 | | | | 6,123,415 | | | | 6,281,372 | |
Net change in unrealized appreciation (depreciation) on written options | | | (359,749 | ) | | | (204 | ) | | | — | | | | — | |
Net change in unrealized appreciation (depreciation) on futures | | | — | | | | (969 | ) | | | — | | | | — | |
| | | | | | | | | | | | | | | | |
| | | | |
Net gain (loss) | | | (1,662,342 | ) | | | 4,905 | | | | 5,800,810 | | | | 6,660,052 | |
| | | | | | | | | | | | | | | | |
| | | | |
Net increase (decrease) in net assets resulting from operations | | | $22,958,615 | | | | $19,314 | | | | $12,729,758 | | | | $20,205,014 | |
| | | | | | | | | | | | | | | | |
| 1 | The Fund commenced investment operations on December 31, 2012. |
See accompanying notes to financial statements.
STATEMENTS OF CHANGES IN NET ASSETS
| | | | | | | | |
| | | Sit U.S. Government
Securities Fund | |
| | | Year
Ended
March 31,
2013 | | | Year
Ended
March 31,
2012 | |
Operations: | | | | | | | | |
Net investment income | | | $24,620,957 | | | | $36,722,603 | |
Net realized gain (loss) on investments, written options and futures | | | (1,627,378 | ) | | | (1,958,679 | ) |
Net change in unrealized appreciation (depreciation) of investments, written options and futures | | | (34,964 | ) | | | 2,451,072 | |
| | | | | | | | |
| | |
Net increase (decrease) in net assets resulting from operations | | | 22,958,615 | | | | 37,214,996 | |
| | | | | | | | |
| | |
Distributions from: | | | | | | | | |
Net investment income | | | (24,572,827 | ) | | | (36,820,960 | ) |
Return of capital | | | (899,593 | ) | | | — | |
| | | | | | | | |
Total distributions | | | (25,472,420 | ) | | | (36,820,960 | ) |
| | | | | | | | |
| | |
Capital share transactions: | | | | | | | | |
Proceeds from shares sold | | | 1,038,042,856 | | | | 1,318,167,314 | |
Reinvested distributions | | | 24,175,094 | | | | 35,123,932 | |
Payments for shares redeemed | | | (1,043,799,295 | ) | | | (906,684,901 | ) |
| | | | | | | | |
| | |
Increase (decrease) in net assets from capital transactions | | | 18,418,655 | | | | 446,606,345 | |
| | | | | | | | |
| | |
Total increase (decrease) in net assets | | | 15,904,850 | | | | 447,000,381 | |
| | |
Net assets: | | | | | | | | |
Beginning of period | | | 1,504,154,203 | | | | 1,057,153,822 | |
| | | | | | | | |
End of period * | | | $1,520,059,053 | | | | $1,504,154,203 | |
| | | | | | | | |
| | |
Capital transactions in shares: | | | | | | | | |
Sold | | | 91,393,593 | | | | 116,325,137 | |
Reinvested distributions | | | 2,128,853 | | | | 3,102,575 | |
Redeemed | | | (91,991,808 | ) | | | (80,092,613 | ) |
| | | | | | | | |
| | |
Net increase (decrease) | | | 1,530,638 | | | | 39,335,099 | |
| | | | | | | | |
* Includes undistributed (distributions in excess of) net investment income | | | ($46,900 | ) | | | ($95,030 | ) |
| 1 | The Fund commenced investment operations on December 31, 2012. |
See accompanying notes to financial statements.
| | |
44 | | SIT MUTUAL FUNDS ANNUAL REPORT |
| | | | | | | | | | | | | | | | | | |
Sit Quality
Income Fund | | | Sit Tax-Free
Income Fund | | | Sit Minnesota Tax-Free
Income Fund | |
Three Months
Ended
March 31,
2013 1 | | | Year
Ended
March 31,
2013 | | | Year
Ended
March 31,
2012 | | | Year
Ended
March 31,
2013 | | | Year
Ended
March 31,
2012 | |
| | | | | | | | | | | | | | | | | | | |
| | $14,409 | | | | $6,928,948 | | | | $6,787,389 | | | | $13,544,962 | | | | $13,371,060 | |
| | (2,664 | ) | | | (322,605 | ) | | | (2,069,714 | ) | | | 378,680 | | | | (217,285 | ) |
| | | | |
| | 7,569 | | | | 6,123,415 | | | | 13,745,427 | | | | 6,281,372 | | | | 22,570,734 | |
| | | | | | | | | | | | | | | | | | |
| | | | |
| | 19,314 | | | | 12,729,758 | | | | 18,463,102 | | | | 20,205,014 | | | | 35,724,509 | |
| | | | | | | | | | | | | | | | | | |
| | | | | | | | | | | | | | | | | | | |
| | | | |
| | (14,409 | ) | | | (6,935,377 | ) | | | (6,775,942 | ) | | | (13,525,058 | ) | | | (13,341,328 | ) |
| | — | | | | — | | | | — | | | | — | | | | — | |
| | | | | | | | | | | | | | | | | | |
| | (14,409 | ) | | | (6,935,377 | ) | | | (6,775,942 | ) | | | (13,525,058 | ) | | | (13,341,328 | ) |
| | | | | | | | | | | | | | | | | | |
| | | | |
| | | | | | | | | | | | | | | | | | | |
| | 5,103,230 | | | | 52,350,817 | | | | 21,411,960 | | | | 131,737,549 | | | | 90,943,436 | |
| | 13,470 | | | | 5,748,024 | | | | 5,261,111 | | | | 10,558,334 | | | | 10,364,131 | |
| | — | | | | (43,072,241 | ) | | | (24,071,890 | ) | | | (76,630,712 | ) | | | (68,996,376 | ) |
| | | | | | | | | | | | | | | | | | |
| | | | |
| | 5,116,700 | | | | 15,026,600 | | | | 2,601,181 | | | | 65,665,171 | | | | 32,311,191 | |
| | | | | | | | | | | | | | | | | | |
| | | | |
| | 5,121,605 | | | | 20,820,981 | | | | 14,288,341 | | | | 72,345,127 | | | | 54,694,372 | |
| | | | |
| | | | | | | | | | | | | | | | | | | |
| | — | | | | 154,659,388 | | | | 140,371,047 | | | | 343,799,593 | | | | 289,105,221 | |
| | | | | | | | | | | | | | | | | | |
| | $5,121,605 | | | | $175,480,369 | | | | $154,659,388 | | | | $416,144,720 | | | | $343,799,593 | |
| | | | | | | | | | | | | | | | | | |
| | | | |
| | | | | | | | | | | | | | | | | | | |
| | 510,293 | | | | 5,510,054 | | | | 2,401,193 | | | | 12,394,907 | | | | 8,935,602 | |
| | 1,347 | | | | 601,779 | | | | 587,524 | | | | 993,393 | | | | 1,020,103 | |
| | — | | | | (4,519,822 | ) | | | (2,709,838 | ) | | | (7,215,943 | ) | | | (6,837,473 | ) |
| | | | | | | | | | | | | | | | | | |
| | | | |
| | 511,640 | | | | 1,592,011 | | | | 278,879 | | | | 6,172,357 | | | | 3,118,232 | |
| | | | | | | | | | | | | | | | | | |
| | — | | | | $4,597 | | | | $6,429 | | | | ($11,337 | ) | | | ($19,904 | ) |
FINANCIAL HIGHLIGHTS
Per share income and capital changes for a share outstanding throughout the period. See accompanying notes to financial statements.
Sit U.S. Government Securities Fund
| | | | | | | | | | | | | | | | | | | | |
| | | Years Ended March 31, | |
| | | 2013 | | | 2012 | | | 2011 | | | 2010 | | | 2009 | |
Net Asset Value: | | | | | | | | | | | | | | | | | | | | |
Beginning of period | | | $11.31 | | | | $11.29 | | | | $11.13 | | | | $10.84 | | | | $10.92 | |
| | | | |
Operations: | | | | | | | | | | | | | | | | | | | | |
Net investment income 1 | | | 0.16 | | | | 0.31 | | | | 0.32 | | | | 0.44 | | | | 0.52 | |
Net realized and unrealized gains (losses)on investments and written options | | | — | | | | 0.02 | | | | 0.16 | | | | 0.29 | | | | (0.08 | ) |
| | | | |
Total from operations | | | 0.16 | | | | 0.33 | | | | 0.48 | | | | 0.73 | | | | 0.44 | |
| | | | |
Distributions from: | | | | | | | | | | | | | | | | | | | | |
Net investment income | | | (0.16 | ) | | | (0.31 | ) | | | (0.32 | ) | | | (0.44 | ) | | | (0.52 | ) |
Return of capital | | | (0.01 | ) | | | — | | | | — | | | | — | | | | — | |
Net realized gains | | | — | | | | — | | | | (— | )2 | | | — | | | | — | |
| | | | |
Total Distributions | | | (0.17 | ) | | | (0.31 | ) | | | (0.32 | ) | | | (0.44 | ) | | | (0.52 | ) |
| | | | |
Net Asset Value: | | | | | | | | | | | | | | | | | | | | |
End of period | | | $11.30 | | | | $11.31 | | | | $11.29 | | | | $11.13 | | | | $10.84 | |
| | | | |
Total investment return 3 | | | 1.39% | | | | 2.98% | | | | 4.37% | | | | 6.88% | | | | 4.18% | |
| | | | |
Net assets at end of period (000’s omitted) | | | $1,520,059 | | | | $1,504,154 | | | | $1,057,154 | | | | $768,720 | | | | $390,630 | |
| | | | | |
Ratios: 4 | | | | | | | | | | | | | | | | | | | | |
Expenses (without waiver) 5 | | | 0.80% | | | | 0.80% | | | | 0.81% | | | | 0.82% | | | | 0.83% | |
Expenses (with waiver) 5 | | | 0.80% | | | | 0.80% | | | | 0.75% | | | | 0.80% | | | | 0.80% | |
Net investment income (with waiver) | | | 1.43% | | | | 2.73% | | | | 2.88% | | | | 3.85% | | | | 4.87% | |
| | | | | |
Portfolio turnover rate (excluding short-term securities) | | | 58.67% | | | | 33.82% | | | | 45.80% | | | | 66.89% | | | | 59.63% | |
| 1 | The net investment income per share is based on average shares outstanding for the period. |
| 2 | Amount represents less than $0.01 per share. |
| 3 | Total investment return is based on the change in net asset value of a share during the period (not annualized) and assumes reinvestment of distributions at net asset value. |
| 4 | The ratio information is calculated based on average daily net assets (annualized). Effective November 1, 2010, total Fund expenses are calculated at 0.80% of average daily net assets. Prior to this date, expenses were calculated at a higher rate and the investment adviser voluntarily waived expenses that were otherwise payable by the Fund. |
| 5 | Ratios are annualized for periods less than one year. In addition to fees and expenses which the Fund bears directly, the Fund indirectly bears a pro rata share of the fees and expenses of the acquired funds in which it invests. Such indirect expenses are not included in the above reported expense ratios. |
| | |
46 | | SIT MUTUAL FUNDS ANNUAL REPORT |
FINANCIAL HIGHLIGHTS
Per share income and capital changes for a share outstanding throughout the period. See accompanying notes to financial statements.
Sit Quality Income Fund
| | | | |
| | | Three
Months Ended
March 31,
2013 * | |
Net Asset Value: | | | | |
Beginning of period | | | $10.00 | |
| | | | |
Operations: | | | | |
Net investment income 1 | | | 0.03 | |
Net realized and unrealized gains (losses) on investments | | | 0.01 | |
| | | | |
Total from operations | | | 0.04 | |
| | | | |
Distributions from: | | | | |
Net investment income | | | (0.03 | ) |
| | | | |
Net Asset Value: | | | | |
End of period | | | $10.01 | |
| | | | |
Total investment return 2 | | | 0.38% | |
| | | | |
Net assets at end of period (000’s omitted) | | | $5,122 | |
| |
Ratios: 3 | | | | |
Expenses 4 | | | 0.90% | |
Net investment income | | | 1.25% | |
| |
Portfolio turnover rate (excluding short-term securities) | | | 37.44% | 5 |
| * | The Fund commenced investment operations on December 31, 2012. |
| 1 | The net investment income per share is based on average shares outstanding for the period. |
| 2 | Total investment return is based on the change in net asset value of a share during the period (not annualized) and assumes reinvestment of distributions at net asset value. |
| 3 | The ratio information is calculated based on average daily net assets (annualized). |
| 4 | Ratios are annualized for periods less than one year. In addition to fees and expenses which the Fund bears directly, the Fund indirectly bears a pro rata share of the fees and expenses of the acquired funds in which it invests. Such indirect expenses are not included in the above reported expense ratios. |
FINANCIAL HIGHLIGHTS
Per share income and capital changes for a share outstanding throughout the period. See accompanying notes to financial statements.
Sit Tax-Free Income Fund
| | | | | | | | | | | | | | | | | | | | |
| | | Years Ended March 31, | |
| | | 2013 | | | 2012 | | | 2011 | | | 2010 | | | 2009 | |
Net Asset Value: | | | | | | | | | | | | | | | | | | | | |
Beginning of period. | | | $9.23 | | | | $8.52 | | | | $8.90 | | | | $7.93 | | | | $9.16 | |
| | | | |
Operations: | | | | | | | | | | | | | | | | | | | | |
Net investment income 1 | | | 0.38 | | | | 0.41 | | | | 0.41 | | | | 0.41 | | | | 0.41 | |
Net realized and unrealized gains (losses)on investments | | | 0.34 | | | | 0.71 | | | | (0.38 | ) | | | 0.97 | | | | (1.23 | ) |
| | | | |
Total from operations | | | 0.72 | | | | 1.12 | | | | 0.03 | | | | 1.38 | | | | (0.82 | ) |
| | | | |
Distributions from: | | | | | | | | | | | | | | | | | | | | |
Net investment income | | | (0.38 | ) | | | (0.41 | ) | | | (0.41 | ) | | | (0.41 | ) | | | (0.41 | ) |
| | | | |
Net Asset Value: | | | | | | | | | | | | | | | | | | | | |
End of period | | | $9.57 | | | | $9.23 | | | | $8.52 | | | | $8.90 | | | | $7.93 | |
| | | | |
Total investment return 2 | | | 7.92% | | | | 13.41% | | | | 0.26% | | | | 17.71% | | | | (9.14% | ) |
| | | | |
Net assets at end of period (000’s omitted) | | | $175,480 | | | | $154,659 | | | | $140,371 | | | | $153,495 | | | | $138,781 | |
| | | | | |
Ratios: 3 | | | | | | | | | | | | | | | | | | | | |
Expenses (without waiver) 4 | | | 0.80% | | | | 0.80% | | | | 0.80% | | | | 0.80% | | | | 0.80% | |
Expenses (with waiver) 4 | | | 0.80% | | | | 0.80% | | | | 0.80% | | | | 0.80% | | | | 0.79% | |
Net investment income (with waiver) | | | 4.03% | | | | 4.62% | | | | 4.63% | | | | 4.79% | | | | 4.63% | |
| | | | | |
Portfolio turnover rate (excluding short-term securities) | | | 36.75% | | | | 37.18% | | | | 30.23% | | | | 27.30% | | | | 18.51% | |
| 1 | The net investment income per share is based on average shares outstanding for the period. |
| 2 | Total investment return is based on the change in net asset value of a share during the period (not annualized) and assumes reinvestment of distributions at net asset value. |
| 3 | The ratio information is calculated based on average daily net assets (annualized). Total Fund expenses are limited to 0.80% of average daily net assets. However, during the periods above, the investment adviser voluntarily absorbed expenses that were otherwise payable by the Fund. |
| 4 | Ratios are annualized for periods less than one year. In addition to fees and expenses which the Fund bears directly, the Fund indirectly bears a pro rata share of the fees and expenses of the acquired funds in which it invests. Such indirect expenses are not included in the above reported expense ratios. |
| | |
48 | | SIT MUTUAL FUNDS ANNUAL REPORT |
FINANCIAL HIGHLIGHTS
Per share income and capital changes for a share outstanding throughout the period. See accompanying notes to financial statements.
Sit Minnesota Tax-Free Income Fund
| | | | | | | | | | | | | | | | | | | | |
| | | Years Ended March 31, | |
| | | 2013 | | | 2012 | | | 2011 | | | 2010 | | | 2009 | |
Net Asset Value: | | | | | | | | | | | | | | | | | | | | |
Beginning of period. | | | $10.42 | | | | $9.67 | | | | $9.88 | | | | $8.97 | | | | $9.76 | |
| | | | |
Operations: | | | | | | | | | | | | | | | | | | | | |
Net investment income 1 | | | 0.38 | | | | 0.44 | | | | 0.43 | | | | 0.43 | | | | 0.43 | |
Net realized and unrealized gains (losses)on investments | | | 0.20 | | | | 0.75 | | | | (0.21 | ) | | | 0.91 | | | | (0.79 | ) |
| | | | |
Total from operations | | | 0.58 | | | | 1.19 | | | | 0.22 | | | | 1.34 | | | | (0.36 | ) |
| | | | |
Distributions from: | | | | | | | | | | | | | | | | | | | | |
Net investment income | | | (0.38 | ) | | | (0.44 | ) | | | (0.43 | ) | | | (0.43 | ) | | | (0.43 | ) |
| | | | |
Net Asset Value: | | | | | | | | | | | | | | | | | | | | |
End of period | | | $10.62 | | | | $10.42 | | | | $9.67 | | | | $9.88 | | | | $8.97 | |
| | | | |
Total investment return 2 | | | 5.61% | | | | 12.48% | | | | 2.22% | | | | 15.22% | | | | (3.67% | ) |
| | | | |
Net assets at end of period (000’s omitted) | | | $416,145 | | | | $343,800 | | | | $289,105 | | | | $290,806 | | | | $244,123 | |
| | | | | |
Ratios: 3 | | | | | | | | | | | | | | | | | | | | |
Expenses 4 | | | 0.80% | | | | 0.80% | | | | 0.80% | | | | 0.80% | | | | 0.80% | |
Net investment income | | | 3.58% | | | | 4.32% | | | | 4.35% | | | | 4.52% | | | | 4.65% | |
| | | | | |
Portfolio turnover rate (excluding short-term securities) | | | 17.13% | | | | 15.06% | | | | 24.48% | | | | 11.46% | | | | 15.68% | |
| 1 | The net investment income per share is based on average shares outstanding for the period. |
| 2 | Total investment return is based on the change in net asset value of a share during the period (not annualized) and assumes reinvestment of distributions at net asset value. |
| 3 | The ratio information is calculated based on average daily net assets (annualized). |
| 4 | Ratios are annualized for periods less than one year. In addition to fees and expenses which the Fund bears directly, the Fund indirectly bears a pro rata share of the fees and expenses of the acquired funds in which it invests. Such indirect expenses are not included in the above reported expense ratios. |
NOTES TO FINANCIAL STATEMENTS
Year or Period Ended March 31, 2013
The Sit Mutual Funds (the Funds) are no-load funds, and are registered under the Investment Company Act of 1940 (as amended) as diversified (except Minnesota Tax-Free Income Fund which is non-diversified), open-end management investment companies, or series thereof. The Sit Quality Income Fund, Sit Tax-Free Income Fund and Minnesota Tax-Free Income Fund are series funds of Sit Mutual Funds II, Inc. Each fund has 10 billion authorized shares of capital stock. Shares in the U.S. Government Securities Fund have a par value of $0.01, and shares in other funds have a par value of $0.001. This report covers the bond funds of the Sit Mutual Funds.
The investment objective for each of these Funds is as follows:
| | |
| Fund | | Investment Objective |
U.S. Government Securities | | High level of current income and safety of principal. |
Quality Income Fund | | High level of current income and safety of principal. |
Tax-Free Income | | High level of current income that is exempt from federal income tax, consistent |
| | with the preservation of capital. |
Minnesota Tax-Free Income | | High level of current income that is exempt from federal regular income tax and Minnesota regular personal income tax, consistent with the preservation of capital. |
| (2) | Significant Accounting Policies |
Investments in Securities
Investment securities are carried at fair value based upon closing market quotations on the last business day of the period. Investments in securities traded on national or international securities exchanges are valued at the last reported sales price prior to the time when assets are valued. Securities traded on the over-the-counter market are valued at the last reported sales price or if the last sales price is not available, at the last reported bid price. The sale and bid prices or prices deemend best to reflect fair value quoted by dealers who make markets in these securities are obtained from independent pricing services. Consistent with the Funds’ valuation policies and procedures, the current fair value of certain fixed income securities is provided by an independent pricing service. Fixed income securities for which prices are not available from an independent pricing service but where an active market exists are valued using market quotations obtained from broker-dealers or quotation systems. Securities for which market quotations are not available, such as private placement securities, are valued at fair value according to methods selected in good faith by Sit Investment Associates, Inc. (the “Adviser”) and may include dealer-supplied valuations or other inputs and assumptions that pricing services would typically utilize. Short-term investments of sufficient credit quality with maturities of 60 days or less when acquired, or which subsequently are within 60 days of maturity, are valued at amortized cost, which approximates fair value. Option and future contracts entered into and held by the Funds are valued at the close of the securities and commodities exchange on which they are traded.
Security transactions are accounted for on the date the securities are purchased or sold. Gains and losses are calculated on the identified-cost basis. Interest, including level-yield amortization of long-term bond premium and discount, is recorded on the accrual basis. Dividends received from closed-end fund holdings are included in Dividend Income and distributions from capital gains, if any, are included in Net Realized Gain (Loss).
Delivery and payment for securities which have been purchased by the Funds on a forward commitment or when-issued basis can take place two weeks or more after the transaction date. During this period, such securities are subject to market fluctuations and may increase or decrease in value prior to delivery.
The Minnesota Tax-Free Income Fund concentrates its investments in Minnesota, and therefore may have more credit risk related to the economic conditions in the state of Minnesota than a portfolio with broader geographical diversification.
Derivative Instruments
The Funds apply derivative instrument disclosure standards in order to enable investors to understand how and why the Funds use derivatives, how derivatives are accounted for, and how derivative instruments affect the Funds’ financial statements.
| | |
50 | | SIT MUTUAL FUNDS ANNUAL REPORT |
NOTES TO FINANCIAL STATEMENTS
Year or Period Ended March 31, 2013 (Continued)
To hedge interest rate risk, the U.S. Government Securities Fund purchased put options and wrote call option contracts traded on a U.S. exchange. To hedge interest rate risk, the Quality Income Fund entered into futures contracts and wrote call options on these future contracts traded on a U.S. exchange. Risks of entering into futures contracts and purchasing and writing options include the possibility of an illiquid market and that a change in the value of the option may not correlate with changes in the value of the underlying securities.
The premiums paid for the options represent the cost of the investment and the options are valued daily at their closing price. The Funds recognize a realized gain or loss when the option is sold or expired. Option holdings within the Funds, which may include put options and call options, are subject to loss of value with the passage of time, and may experience a total loss of value upon expiration. With options, there is minimal counterparty risk to the Funds since they are exchange traded.
Upon entering into a futures contract, the Quality Income Fund is required to deposit either cash or securities in an amount (initial margin) equal to a certain percentage of the contract value. Subsequent payments (variation margin) are made or received by the Fund each day. The variation margin payments are equal to the daily changes in the contract value and are recorded as unrealized gains and losses. The Fund recognizes a realized gain or loss when the contract is closed or expired. With futures contracts, there is minimal counterparty risk to the Fund since futures are exchange traded and the exchange’s clearinghouse, as counterparty to all exchange-traded futures, guarantees the futures against default.
During the year or period ended March 31, 2013, the average volume of derivative activity was as follows:
| | | | | | | | | | | | |
| | | Average
Cost | | | Average
Premium
Received | | | Average
Notional
Amount | |
U.S. Government Securities Fund | | | | | | | | | | | | |
Purchased Put Options | | $ | 91,595 | | | | — | | | $ | 260,000 | |
Written Call Options | | | — | | | $ | 223,504 | | | | 2,360,000 | |
Quality Income Fund* | | | | | | | | | | | | |
Treasury Futures | | | — | | | | — | | | $ | 1,029,443 | |
Written Call Options | | | — | | | $ | 667 | | | | 5,333 | |
*Inception date of the Fund is December 31, 2012. Average volume of derivative activity is calculated monthly.
The number of open option contracts and open futures contracts outstanding as of March 31, 2013 also serve as indicators of the volume of activity for the Funds throughout the period.
Statement of Assets and Liabilities - Values of derivatives as of March 31, 2013
| | | | | | | | | | |
| | | Asset Derivatives Value 1 | | Liability Derivatives Value |
Interest rate risk: | | | | | | | | | | |
U.S. Government Securities Fund | | | | | | | | | | |
Purchased put options | | | | $51,563 | | | | | — | |
Written call options | | | | — | | | | | $987,500 | 2 |
| | |
Quality Income Fund | | | | | | | | | | |
Treasury Futures | | | | — | | | | | $969 | 3 |
Written call options | | | | — | | | | | 1,062 | 2 |
1Statement of Assets and Liabilities location: Investments in securities, at fair value.
2Statement of Assets and Liabilities location: Outstanding options written, at fair value.
3Statement of Assets and Liabilities location: Variation margin receivable/payable. Includes cumulative appreciation (depreciation) of futures as reported in the Schedule of Investments.
NOTES TO FINANCIAL STATEMENTS
Year or Period Ended March 31, 2013 (Continued)
The effect of derivative instruments on the statement of operations for the year or period ended March 31, 2013:
| | | | | | | | | | |
| | | Amount of Realized
Gain (Loss) on Derivatives 4 | | Change in Unrealized Appreciation (Depreciation) on Derivatives 5 |
Interest rate risk: | | | | | | | | | | |
U.S. Government Securities Fund | | | | | | | | | | |
Purchased put options | | | | ($563,082 | ) | | | | ($21,437 | ) |
Written call options | | | | (218,151 | ) | | | | (359,749 | ) |
| | |
Quality Income Fund | | | | | | | | | | |
Index Futures | | | | ($281 | ) | | | | ($969 | ) |
Written call options | | | | 159 | | | | | (204 | ) |
| | 4 | Statement of Operations location: Net realized gain (loss) on investments, net realized gain (loss) on written options and net realized gain (loss) on futures, respectively. |
| | 5 | Statement of Operations location: Net change in unrealized appreciation (depreciation) on investments, net change in unrealized appreciation (depreciation) on written options and net change in unrealized appreciation (depreciation) on futures, respectively. |
Transactions in written options for the year or period ended March 31, 2013 were as follows:
| | | | | | | | | | |
| | | Number of
Contracts | | Premium |
U.S. Government Securities Fund | | | | | | | | | | |
Outstanding, March 31, 2012 | | | | 800 | | | | | $96,536 | |
Call options written | | | | 15,150 | | | | | 3,032,047 | |
Call options expired | | | | — | | | | | — | |
Call options closed | | | | (13,750 | ) | | | | (2,591,797 | ) |
Outstanding, March 31, 2013 | | | | 2,200 | | | | | $536,786 | |
| | |
Quality Income Fund | | | | | | | | | | |
Outstanding, March 31, 2012 | | | | — | | | | | — | |
Call options written | | | | 8 | | | | | $1,339 | |
Call options expired | | | | (2 | ) | | | | (240 | ) |
Call options closed | | | | (2 | ) | | | | (241 | ) |
Outstanding, March 31, 2013 | | | | 4 | | | | | $858 | |
Fair Value Measurements
The inputs and valuations techniques used to measure fair value of the Funds’ net assets are summarized into three levels as described in the hierarchy below:
| | • | | Level 1 – quoted prices for active markets for identical securities. An active market for the security is a market in which transactions occur with sufficient frequency and volume to provide pricing information on an ongoing basis. A quoted price in an active market provides the most reliable evidence of fair value. |
| | • | | Level 2 – debt securities are valued based on evaluated prices received from independent pricing services or from dealers who make markets in such securities. For corporate bonds, U.S. government and government agency obligations, and municipal securities the pricing services utilize matrix pricing which considers yield or price of bonds of comparable quality, coupon, maturity, and type as |
| | |
52 | | SIT MUTUAL FUNDS ANNUAL REPORT |
NOTES TO FINANCIAL STATEMENTS
Year or Period Ended March 31, 2013 (Continued)
| | well as dealer supplied prices. For asset-backed securities and mortgage-backed securities, the pricing services utilize matrix pricing which considers prepayment speed assumptions, attributes of the collateral, yield or price of bonds of comparable quality, coupon, maturity, and type as well as dealer supplied prices. All of these inputs are derived principally from or corroborated by observable market data. An adjustment to any observable input that is significant to the fair value may render the measurement a Level 3 measurement. |
| | • | | Level 3 – significant unobservable inputs, including the Adviser’s own assumptions in determining the fair value of investments. |
The inputs or methodology used for valuing securities are not necessarily an indication of the risk associated with investing in those securities.
The fair value of the Funds’ bonds are generally based on quotes received from brokers or independent pricing services. Bonds with quotes that are based on actual trades with a sufficient level of activity on or near the measurement date are classified as Level 2 assets.
At the end of each calendar quarter, management evaluates the Level 2 and 3 assets and liabilities for changes in liquidity, including but not limited to: whether a broker is willing to execute at the quoted price, the depth and consistency of prices from third party services, and the existence of contemporaneous, observable trades in the market. Additionally, management evaluates the Level 1 and 2 assets and liabilities on a quarterly basis for changes in listings or delistings on national exchanges. Due to the inherent uncertainty of determining the fair value of investments that do not have a readily available market value, the fair value of the Funds’ investments may fluctuate from period to period. Additionally, the fair value of investments may differ significantly from the values that would have been used had a ready market existed for such investments and may differ materially from the values the Fund may ultimately realize. Further, such investments may be subject to legal and other restrictions on resale or otherwise are less liquid than publicly traded securities.
A summary of the levels for the Funds’ investments as of March 31, 2013 is included with the Funds’ schedules of investments.
Federal Taxes
The Funds’ policy is to comply with the requirements of the Internal Revenue Code applicable to regulated investment companies and to distribute all of its taxable income to shareholders. The Funds have recorded in their financial statements the full benefit of their tax positions taken in connection with the Registered Investment Company (RIC) qualification and distribution requirements of the RIC. Therefore, no income tax provision is required. Also, in order to avoid the payment of any federal excise taxes, the Funds will distribute substantially all of their net investment income and net realized gains on a calendar year basis.
Management has analyzed the Funds’ tax positions taken in federal tax returns for all open tax years and has concluded that as of March 31, 2013, no provision for income tax would be required in the Funds’financial statements. The Funds’federal and state income and federal excise returns for the 2010, 2011, and 2012 tax years for which the applicable statutes of limitations have not expired remain subject to examination by the Internal Revenue Service and state departments of revenue.
At March 31, 2013, the gross unrealized appreciation (depreciation) on investments and cost of securities on a tax basis for federal income tax purposes were as follows:
| | | | | | | | | | | | | | | | | | | | |
| | | Unrealized
Appreciation | | Unrealized
Depreciation | | Net Unrealized
Appreciation (Depreciation) | | Cost of Securities
on a Tax Basis |
U.S. Government Securities | | | | $39,457,948 | | | | | ($8,726,323 | ) | | | | $30,731,625 | | | | | $1,458,551,993 | |
Quality Income | | | | 14,307 | | | | | (5,565 | ) | | | | 8,742 | | | | | 5,037,996 | |
Tax-Free Income | | | | 9,546,424 | | | | | (20,467,545 | ) | | | | (10,921,121 | ) | | | | 185,209,892 | |
Minnesota Tax-Free Income | | | | 19,089,034 | | | | | (1,387,073 | ) | | | | 17,701,961 | | | | | 369,244,243 | |
NOTES TO FINANCIAL STATEMENTS
Year or Period Ended March 31, 2013 (Continued)
Net investment income and net realized gains may differ for financial statement and tax purposes. The character of distributions made during the year for net investment income or net realized gains may also differ from its ultimate characterization for tax purposes. The tax character of distributions paid during the fiscal years or period ended March 31, 2013 and 2012 were as follows:
Year or Period Ended March 31, 2013:
| | | | | | | | | | | | | | | | | | | | |
| | | Ordinary Income | | | Tax-Exempt
Income | | | Long Term
Capital Gain | | | Return of Capital | | | Total | |
U.S. Government Securities | | $ | 24,620,957 | | | | — | | | | — | | | $ | 899,593 | | | $ | 25,520,550 | |
Quality Income | | | 13,470 | | | | — | | | | — | | | | — | | | | 13,470 | |
Tax-Free Income* | | | 75,807 | | | $ | 6,859,570 | | | | — | | | | — | | | | 6,935,377 | |
Minnesota Tax-Free Income* | | | 62,713 | | | | 13,462,345 | | | | — | | | | — | | | | 13,525,058 | |
*98.9% and 99.5% of dividends were derived from interest on tax-exempt securities, on the Tax-Free Income and Minnesota Tax-Free Income Funds, respectively.
Year Ended March 31, 2012:
| | | | | | | | | | | | | | | | |
| | | Ordinary Income | | | Tax-Exempt
Income | | | Long Term
Capital Gain | | | Total | |
U.S. Government Securities | | $ | 36,820,960 | | | | — | | | | — | | | $ | 36,820,960 | |
Tax-Free Income* | | | 83,152 | | | $ | 6,692,790 | | | | — | | | | 6,775,942 | |
Minnesota Tax-Free Income* | | | 83,224 | | | | 13,258,104 | | | | — | | | | 13,341,328 | |
* 98.8% and 99.4% of dividends were derived from interest on tax-exempt securities, on the Tax-Free Income and Minnesota Tax-Free Income Funds, respectively.
As of March 31, 2013 the components of distributable earnings on a tax basis were as follows:
| | | | | | | | | | | | | | | | |
| | | Undistributed
Ordinary Income | | | Undistributed
Tax-Exempt Income | | | Accumulated
Gain (Loss) | | | Unrealized
Appreciation
(Depreciation) | |
U.S. Government Securities | | | — | | | | — | | | ($ | 5,042,051 | ) | | $ | 30,731,625 | |
Quality Income | | $ | 939 | | | | — | | | | (3,837 | ) | | | 8,742 | |
Tax-Free Income | | | — | | | $ | 146,311 | | | | (23,314,282 | ) | | | (10,921,121 | ) |
Minnesota Tax-Free Income | | | — | | | | 322,917 | | | | (7,528,006 | ) | | | 17,701,961 | |
On the statement of assets and liabilities, as a result of permanent book-to-tax differences, reclassification adjustments were made to the following capital accounts:
| | | | | | | | | | | | |
| | | Undistributed
Net Investment
Income | | | Accumulated
Net Realized
Gain (Loss) | | | Additional
Paid-in Capital | |
Tax-Free Income | | $ | 4,597 | | | $ | 3,736,773 | | | ($ | 3,741,370 | ) |
Minnesota Tax-Free Income | | | (11,337 | ) | | | 203,385 | | | | (192,048 | ) |
These differences were primarily attributable to market discount accretion adjustments and capital loss carryforwards expiring.
Net capital loss carryovers and late year losses, if any, as of March 31, 2013, are available to offset future realized capital gains and thereby reduce future capital gains distributions. Under the Regulated Investment Company Modernization Act of 2010 (“Act”), the Funds’ are permitted to carry forward capital losses incurred in taxable years beginning after December 22, 2010 for an unlimited period. Any losses incurred during those future taxable years will be required to be utilized prior to any losses incurred in pre-enactment taxable years. Additionally, post-enactment capital losses that are carried forward will retain their character as either short-term or long-term capital losses, and will not be considered exclusively short-term as under previous law. The Funds’ first fiscal year
| | |
54 | | SIT MUTUAL FUNDS ANNUAL REPORT |
NOTES TO FINANCIAL STATEMENTS
Year or Period Ended March 31, 2013 (Continued)
end subject to the Modernization Act was March 31, 2012. The net capital loss carryovers and the expiration dates for capital losses carryover from pre-enactment taxable years and the late year losses deferred as of March 31, 2013, were as follows:
| | | | | | | | | | | | | | | | | | | | | | | | |
| | | Pre-Enactment Net Capital Loss
Carryover Expiring in: | | | Post-Enactment Unlimited Period of Net Capital Loss Carryover | | | Late Year
Losses Deferred | | | Accumulated
Capital and Other Losses | |
| | | 2014 | | | 2015-2019 | | | Short-Term | | | Long-Term | | | |
| | | | | | | | | | | | | | | | | | | | | | | | | |
U.S. Government Securities | | | — | | | | — | | | | $1,543,618 | | | | — | | | | $3,498,433 | | | | $5,042,051 | |
Quality Income | | | — | | | | — | | | | 3,060 | | | | $777 | | | | — | | | | 3,837 | |
Tax-Free Income | | | — | | | | $19,109,911 | | | | — | | | | 4,204,371 | | | | — | | | | 23,314,282 | |
Minnesota Tax-Free Income | | | $1,709,459 | | | | 5,799,111 | | | | — | | | | — | | | | 19,436 | | | | 7,528,006 | |
For the year ended March 31, 2013, the Funds’ utilized capital losses and expired capital losses as follows:
| | | | | | | | | | |
| | | Utilized | | | Expiring In | | Expired | |
Tax-Free Income | | | — | | | 2013 | | | $3,741,370 | |
Minnesota Tax-Free Income | | | $204,074 | | | 2013 | | | 192,048 | |
Distributions
Distributions to shareholders are recorded as of the close of business on the record date. Such distributions are payable in cash or reinvested in additional shares of the Funds’ capital stock. Distributions from net investment income are declared daily and paid monthly for the Funds. Distributions from net realized gains, if any, will be made annually for each of the Funds.
Use of Estimates
The preparation of financial statements in conformity with U.S. generally accepted accounting principles requires management to make certain estimates and assumptions that affect the reported amounts of assets and liabilities and disclosure of contingent assets and liabilities at the date of the financial statements and the reported results for the respective periods. Actual results could differ from those estimates.
Guarantees and Indemnifications
Under each Fund’s organizational documents, its officers and directors are indemnified against certain liabilities arising out of the performance of their duties to each Fund. In addition, certain of each Fund’s contracts with its service providers contain general indemnification clauses. Each Fund’s maximum exposure under these arrangements is unknown since the amount of any future claims that may be made against each Fund cannot be determined and each Fund has no historical basis for predicting the likelihood of any such claims.
| (3) | Investment Security Transactions |
The cost of purchases of and proceeds from sales and maturities of investment securities, other than short-term securities, for the year or period ended March 31, 2013, were as follows:
| | | | | | | | | | | | | | | | |
| | | Purchases | | | Proceeds | |
| | | U.S. Government | | | Other | | | U.S. Government | | | Other | |
U.S. Government Securities | | | $1,057,705,273 | | | | — | | | | $969,139,438 | | | | — | |
Quality Income | | | 2,822,328 | | | | $3,820,215 | | | | 742,063 | | | | $1,046,787 | |
Tax-Free Income | | | — | | | | 76,377,223 | | | | — | | | | 60,797,678 | |
Minnesota Tax-Free Income | | | — | | | | 120,809,489 | | | | — | | | | 60,627,102 | |
NOTES TO FINANCIAL STATEMENTS
Year or Period Ended March 31, 2013 (Continued)
| (4) | Affiliated Fees and Transactions |
Investment Adviser
The Funds each have entered into an investment management agreement with Sit Investment Associates Inc. (SIA), under which SIA manages the Funds’ assets and provides research, statistical and advisory services, and pays related office rental, executive expenses and executive salaries. SIA also is obligated to pay all of the Funds’ expenses (excluding extraordinary expenses, stock transfer taxes, interest, brokerage commissions, and other transaction charges relating to investing activities). The fee for investment management and advisory services is based on the average daily net assets of the Funds at the annual rate of:
| | | | | |
| | | Average Daily Net Assets |
U.S. Government Securities | | | | 0.80 | % |
Quality Income | | | | 0.90 | % |
Tax-Free Income | | | | 0.80 | % |
Minnesota Tax-Free Income | | | | 0.80 | % |
Transactions with affiliates
The investment adviser, affiliates of the investment adviser, directors and officers of the Funds as a whole owned the following shares as of March 31, 2013:
| | | | | | | | | | |
| | | Shares | | % Shares Outstanding |
U.S. Government Securities | | | | 4,757,797 | | | | | 3.5 | |
Quality Income | | | | 467,764 | | | | | 91.4 | |
Tax-Free Income | | | | 3,091,489 | | | | | 16.9 | |
Minnesota Tax-Free Income | | | | 2,793,849 | | | | | 7.1 | |
Management has evaluated the impact of all subsequent events on the Funds through the date the financial statements were issued, and has determined that there were no subsequent events that would require disclosure in or adjustments to the financial statements.
| | |
56 | | SIT MUTUAL FUNDS ANNUAL REPORT |
REPORT OF INDEPENDENT REGISTERED PUBLIC ACCOUNTING FIRM
The Board of Directors and Shareholders:
Sit U.S. Government Securities Fund, Inc.
Sit Mutual Funds II, Inc.
We have audited the accompanying statements of assets and liabilities of Sit U.S. Government Securities Fund, Inc., and Sit Quality Income Fund, Sit Tax-Free Income Fund, and Sit Minnesota Tax-Free Income Fund (each a series of Sit Mutual Funds II, Inc.) (collectively, the “Funds”), including the schedules of investments, as of March 31, 2013, and the related statements of operations for the year or period then ended, the statements of changes in net assets for each of the years or period in the two-year period then ended, and the financial highlights for each of the years or period in the five-year period then ended. These financial statements and financial highlights are the responsibility of the Funds’ management. Our responsibility is to express an opinion on these financial statements and financial highlights based on our audits.
We conducted our audits in accordance with the standards of the Public Company Accounting Oversight Board (United States). Those standards require that we plan and perform the audit to obtain reasonable assurance about whether the financial statements and financial highlights are free of material misstatement. An audit includes examining, on a test basis, evidence supporting the amounts and disclosures in the financial statements. Our procedures included confirmation of securities owned as of March 31, 2013, by correspondence with the custodian and brokers or by performing other appropriate auditing procedures. An audit also includes assessing the accounting principles used and significant estimates made by management, as well as evaluating the overall financial statement presentation. We believe that our audits provide a reasonable basis for our opinion.
In our opinion, the financial statements and financial highlights referred to above present fairly, in all material respects, the financial position of Sit U.S. Government Securities Fund, Sit Quality Income Fund, Sit Tax-Free Income Fund, and Sit Minnesota Tax-Free Income Fund as of March 31, 2013, and the results of their operations for the year or period then ended, the changes in their net assets for each of the years or period in the two-year period then ended, and their financial highlights for each of the years or period in the five-year period then ended, in conformity with U.S. generally accepted accounting principles.
KPMG LLP
Minneapolis, Minnesota
May 20, 2013
EXPENSE EXAMPLE (Unaudited)
As a shareholder of the Funds, you incur two types of costs: (1) transaction costs, including redemption fees and (2) ongoing costs, including management fees; and other Fund expenses. This Example is intended to help you understand your ongoing costs (in dollars) of investing in the Funds and to compare these costs with the ongoing costs of investing in other mutual funds.
The Example is based on an investment of $1,000 invested at the beginning of the period and held for the entire period October 1, 2012 to March 31, 2013.
Actual Expenses
The first line of the following table provides information about actual account values and actual expenses. You may use the information in this line, together with the amount you invested, to estimate the expenses that you paid over the period. Simply divide your account value by $1,000 (for example, an $8,600 account value divided by $1,000 = 8.6), then multiply the result by the number in the first line under the heading entitled “Expenses Paid During Period” to estimate the expenses you paid on your account during this period.
Hypothetical Example for Comparison Purposes
The second line of the table provides information about hypothetical account values and hypothetical expenses based on the Fund’s actual expense ratio and an assumed rate of return of 5% per year before expenses, which is not the Fund’s actual return. The hypothetical account values and expenses may not be used to estimate the actual ending account balance or expenses you paid for the period. You may use this information to compare the ongoing costs of investing in the Fund and other funds. To do so, compare this 5% hypothetical example with the 5% hypothetical examples that appear in the shareholder reports of the other funds.
Please note that the expenses shown in the table are meant to highlight your ongoing costs only and do not reflect any transactional costs, such as redemption fees. Therefore, the second line of the table is useful in comparing ongoing costs only, and will not help you determine the relative total costs of owning different funds. In addition, if these transactional costs (redemption fees) were included, your costs would have been higher.
| | | | | | | | | | | | |
| | | Beginning
Account
Value
(10/1/12) | | | Ending
Account
Value
(3/31/13) | | | Expenses
Paid During
Period
(10/1/12-
3/31/13) | |
| U.S. Government Securities Fund* | |
Actual | | | $1,000 | | | | $998.00 | | | | $3.99 | |
Hypothetical | | | $1,000 | | | | $1,020.94 | | | | $4.03 | |
| |
| Quality Income Fund** | |
Actual | | | $1,000 | | | | $1,003.80 | | | | $2.17 | |
Hypothetical | | | $1,000 | | | | $1,020.44 | | | | $2.19 | |
| |
| Tax-Free Income Fund* | |
Actual | | | $1,000 | | | | $1,018.70 | | | | $4.03 | |
Hypothetical | | | $1,000 | | | | $1,020.94 | | | | $4.03 | |
| |
| Minnesota Tax-Free Income Fund* | |
Actual | | | $1,000 | | | | $1,014.60 | | | | $4.02 | |
Hypothetical | | | $1,000 | | | | $1,020.94 | | | | $4.03 | |
*Expenses are equal to the Funds’ annualized expense ratio of 0.80% multiplied by the average account value over the period, multiplied by 182/365 (to reflect the one-half year period.)
**Expenses are equal to the Quality Income Fund’s annual expense ratio of 0.90% multiplied by the average account value over the period, multiplied by 88/365 (to reflect the one-quarter year period.)
| | |
58 | | SIT MUTUAL FUNDS ANNUAL REPORT |
FEDERAL TAX INFORMATION (Unaudited)
Sit Bond Funds
For corporate shareholders, the percentage of investment income (dividend income and short-term gains, if any), for each of the Funds that qualify for the dividends-received deductions for the period ofApril 1, 2012 to March 31, 2013 is as follows:
| | | | |
Fund | | Percentage | |
U.S. Government Securities Fund | | | 0.0 | % |
Quality Income Fund | | | 0.0 | |
Tax-Free Income Fund | | | 0.0 | |
Minnseota Tax-Free Income Fund | | | 0.0 | |
For the year ended March 31, 2013, certain dividends paid by the Funds may be subject to a maximum tax rate of 15%, as provided by the Jobs and Growth Tax Relief Reconciliation Act of 2003. Of the distributions made by the following Funds, the corresponding percentages represent the amount of each distribution which may qualify for the 15% dividend income tax rate.
| | | | |
Fund | | Percentage | |
U.S. Government Securities Fund | | | 0.0 | % |
Quality Income Fund | | | 0.0 | |
Tax-Free Income Fund | | | 0.0 | |
Minnseota Tax-Free Income Fund | | | 0.0 | |
The following Funds designated the listed amounts as
long-term capital gain dividends during the year ended March 31, 2013. Distributable long-term gains are based on net realized long term gains determined on a tax basis and may differ from such amounts for financial reporting purposes.
| | | | |
Fund | | Amount | |
U.S. Government Securities Fund | | | $— | |
Quality Income Fund | | | — | |
Tax-Free Income Fund | | | — | |
Minnesota Tax-Free Income Fund | | | — | |
For the year ended March 31, 2013, 98.9% and 99.5% of dividends were derived from interest on tax-exempt securities for the Tax-Free Income Fund and Minnesota Tax-Free Income Fund, respectively. This portion of exempt-interest dividends is exempt from federal taxes and should not be included in shareholders’gross income. Exempt-interest dividends may be subject to state and local taxes. Each shareholder should consult a tax adviser about reporting this income for state and local tax purposes.
INFORMATION ABOUT DIRECTORS AND OFFICERS (Unaudited)
The Sit Mutual Funds are a family of no-load mutual funds. The bond funds described in this Annual Report are the Sit U.S. Government Securities Fund, Sit Quality Income Fund, Sit Tax-Free Income Fund and the Sit Minnesota Tax-Free Income Fund (the “Funds” or individually, a “Fund”). The Sit U.S. Government Securities Fund, and the corporate issuer of the Sit Quality Income Fund, the Sit Tax-Free Income Fund and Sit Minnesota Tax-Free Income Fund have a Board of Directors and officers. Pursuant to Minnesota law, the Boards of Directors are responsible for the management of the Funds and the establishment of the Funds’ policies. The officers of the Funds manage the day-to-day operation of the Funds. Information pertaining to the directors and officers of the Funds is set forth below. The business address, unless otherwise noted below, is that of the Funds’ investment adviser – 3300 IDS Center, 80 South Eighth Street, Minne-apolis, Minnesota 55402. The Boards have a separate Audit Committee. The Bond Funds’ SAI has additional information about the Fund’s directors and is available without charge upon request by calling the Sit Funds at
800-332-5580.
| | | | | | | | |
Name, Age, and Position with the Fund | | Term of Office (1) and Length of Time Served | | Principal Occupation(s) During Past Five Years | | Number of Funds in Fund Complex
Overseen by Director | | Other Directorships Held by Director (3) |
INTERESTED DIRECTORS: |
Roger J. Sit (2) Age: 51 Chairman and President | | Chairman since 10/08; Officer since 1998. | | Chairman, President, CEO and Global CIO of Sit Investment Associates, Inc. (the “Adviser”); Chairman and CEO of Sit Investment Fixed Income Advisors, Inc. (“SF”); Chairman of SIA Securities Corp. (the “Distributor”). | | 12 | | None. |
William E. Frenzel (2) Age: 84 Director | | Director since 1991 or the Fund’s inception if later. | | Guest Scholar at The Brookings Institution and member of several government policy committees, foundations and organizations; Director of the Adviser; Director of SF. | | 12 | | None. |
INDEPENDENT DIRECTORS: |
Edward M. Giles Age: 77 Director | | Director since 2012. | | Senior Vice President of Peter B. Cannell & Co., 7/11 to present; Managing Member of GME Capital, 2005 to 2011; Advisory Director of Sit Investment Associates, Inc. 1/08 to 12/11. | | 12 | | Ventana Medical Systems, Inc. (1992 - 2008). |
Sidney L. Jones Age: 79 Director | | Director since 1993 or the Fund’s inception, if later: Director from 1988 to 1989. | | Lecturer, Washington Campus Consortium of 17 Universities. | | 12 | | None. |
Bruce C. Lueck Age: 72 Director | | Director since 2004 or the Fund’s inception, if later. | | Consultant for Zephyr Management, L.P. (investment management) and committee member of several investment funds and foundations. | | 12 | | None. |
Donald W. Phillips Age: 64 Director | | Director of the International Fund since1993, and since 1990 or the Fund’s inception if later for all other Funds. | | Chairman and CEO of WP Global Partners Inc.,7/05 to present. | | 12 | | None. |
Barry N. Winslow Age: 65 Director | | Director since 2010. | | Vice-Chairman of TCF Financial Corporation, 7/08 to present; COO 2006 to 2007. | | 12 | | TCF Financial Corporation. |
| | |
60 | | SIT MUTUAL FUNDS ANNUAL REPORT |
| | | | | | | | |
Name, Age, and Position with the Fund | | Term of Office (1) and Length of Time Served | | Principal Occupation(s) During
Past Five Years | | Number of Funds in Fund Complex
Overseen by Director | | Other Directorships Held by Director (3) |
OFFICERS: |
Mark H. Book Age: 49 Vice President – Investments of U.S. Govt. Fund only. | | Officer since 2002; Re-Elected by the Boards annually. | | Vice President and Portfolio Manager of SF. | | N/A | | N/A |
Kelly K. Boston Age: 44 Assistant Secretary & Assistant Treasurer | | Officer since 2000; Re-Elected by the Boards annually. | | Staff Attorney of the Adviser; Secretary of the Distributor. | | N/A | | N/A |
Michael C. Brilley Age: 67 Senior Vice President | | Officer since 1985; Re-Elected by the Boards annually. | | Senior Vice President and Senior Fixed Income Officer of the Adviser; Director and President and Chief Fixed-Income Officer of SF. | | N/A | | N/A |
Bryce A. Doty Age: 46 Vice President - Investments of U.S. Govt. Fund only. | | Officer since 1996; Re-Elected by the Boards annually. | | Senior Vice President and Senior Portfolio Manager of SF. | | N/A | | N/A |
Paul J. Junquist Age: 51 Vice President - Investments of Tax-Free & MN Tax-Free Funds only. | | Officer since 1996; Re-Elected by the Boards annually. | | Vice President and Portfolio Manager of SF. | | N/A | | N/A |
Michael J. Radmer 50 S. 6th Street Minneapolis, MN 55402 Age: 67 Secretary | | Officer since 1984; Re-Elected by the Boards annually. | | Partner of the Funds’ general counsel, Dorsey & Whitney, LLP. | | N/A | | N/A |
Paul E. Rasmussen Age: 52 Vice President, Treasurer & Chief Compliance Officer | | Officer since 1994; Re-Elected by the Boards annually. | | Vice President, Secretary, Controller and Chief Compliance Officer of the Adviser; Vice President, Secretary, and Chief Compliance Officer of SF; President and Treasurer of the Distributor. | | N/A | | N/A |
Carla J. Rose Age: 46 Vice President, Assistant Secretary & Assistant Treasurer | | Officer since 2000; Re-Elected by the Boards annually. | | Vice President, Administration & Deputy Controller of the Adviser; Vice President, Controller, Treasurer & Assistant Secretary of SF; Vice President and Assistant Secretary of the Distributor. | | N/A | | N/A |
Debra A. Sit Age: 52 Vice President - Investments | | Officer since 1994; Re-Elected by the Boards annually. | | Vice President – Bond Investments of the Adviser; Senior Vice President, Senior Portfolio Manager of SF. | | N/A | | N/A |
| 1 | Directors serve until their death, resignation, removal or the next shareholder meeting at which election of directors is an agenda item and a successor is duly elected and qualified. |
| 2 | Directors who are deemed to be “interested persons” of the Funds as that term is defined by the Investment Company Act of 1940. Mr. Sit is considered an “interested person” because he is a director and shareholder of Sit Investment Associates, Inc., the Fund’s investment adviser. Mr. Frenzel is deemed to be an interested person because he is a director and shareholder of the Fund’s investment adviser. |
| 3 | Includes only directorships of companies required to report under the Securities Exchange Act of 1934 (i.e., public companies) or other investment companies registered under the 1940 Act. |
ADDITIONAL INFORMATION (Unaudited)
PROXY VOTING
Each fund follows certain policies and procedures for voting proxies for securities held in each portfolio. A description of the Funds’ proxy voting policies and procedures is available without charge upon request by calling the Funds at 1-800-332-5580.
Information regarding how each Fund voted proxies relating to its portfolio securities during the most recent twelve-month period ended June 30 is available without charge upon request by calling the Funds at 1-800-332-5580, and is available on the U.S. Securities and Exchange Commission’s website at www.sec.gov.
AVAILABILITY OF QUARTERLY PORTFOLIO SCHEDULES
The Funds’ file their complete schedules of portfolio holdings with the U.S. Securities and Exchange Commission (SEC) for the first and third quarters of each fiscal year on Form N-Q. The Funds’ Form N-Qs are available without charge upon request by calling the Funds at 1-800-332-5580 and are available on the SEC’s website at www.sec.gov. In addition, the Funds’ Form N-Qs may be reviewed and copied at the SEC’s Public Reference Room in Washington, DC. Information on the operation of the Public Reference Room may be obtained by calling 1-202-551-8090.
RE-APPROVAL OF INVESTMENT MANAGEMENT AGREEMENTS
At their joint meeting held on October 29, 2012, the Boards of Directors of the Sit Mutual Funds unanimously approved the continuation for another one year period the investment management agreements entered into by and between Sit Investment Associates, Inc. (“SIA”) and Sit Mutual Funds II, Inc. dated November 1, 1992; and Sit U.S. Government Securities Fund, Inc. dated November 1, 1992 (the “Agreements”).
The Boards approved the Agreements after a lengthy discussion and consideration of various factors relating to both the Boards’ selection of SIA as the investment adviser and the Boards’ approval of the fees to be paid under the Agreements.
Investment Adviser Criteria. The Directors began their analysis by discussing their criteria for determining the quality of an investment adviser. The Directors’ noted that their analysis is similar to that used by institutional investors in evaluating and selecting investment advisers. The Directors discussed several factors used to determine the overall quality of an investment adviser and the nature, extent and quality of the services performed by SIA, including the following:
Investment Philosophy and Process. The Directors considered SIA’s philosophy of managing assets. With respect to fixed income securities, SIA stresses the consistent attainment of superior risk-adjusted returns using a conservative investment management approach that identifies pricing anomalies in the market and management of portfolio duration.
With respect to fixed income securities, SIA seeks investment grade securities with a special emphasis on interest income and significant stability of principal value. SIA’s style seeks to avoid excessive return volatility and generate consistent results over an economic cycle. The Directors noted that the Bond Funds’ objectives are to seek high current income. The Directors reviewed the Bond Funds’ characteristics, and noted that SIA has consistently managed the Bond Funds in this style. The Directors noted that since the Bond Funds emphasize income, they may at times not rank highly in total return comparisons with other funds during certain periods.
The Directors discussed SIA’s consistent and well-defined investment process. With respect to fixed income securities, the portfolio managers are responsible for implementing the strategy set forth in the Chief Fixed Income Officer’s duration targets and the Chief Investment Officer’s interest rate projections.
Investment Professionals. The Directors discussed the experience, knowledge and organizational stability of SIA and its investment professionals. The Directors noted that SIA’s senior professionals are actively involved in the investment process and have significant investment industry experience.
| | |
62 | | SIT MUTUAL FUNDS ANNUAL REPORT |
The Directors discussed the depth of SIA’s investment staff. The Directors noted that SIA has over 30 investment professionals. Given the investment products offered by SIA and the assets under management, the Directors determined that SIA’s investment staff is well positioned to meet the current needs of its clients, including the Funds, and to accommodate growth in the number of clients and assets under management for the near future. The Directors concluded that the depth of the investment staff, and in particular senior management and investment analysts, is actually greater than the Funds currently require at their present asset size. The Directors noted that SIA has the resources of a $14.8 billion investment firm working for the benefit of the Fund shareholders.
Investment Performance. The Directors reviewed and discussed the Funds’ investment performance on an absolute and comparable basis for various periods as discussed below. The Directors noted that the investment performance of the Funds has generally been competitive with indices and other funds with similar investment styles as the Funds, such as fixed income funds seeking to maximize income.
Corporate Culture. The Directors discussed SIA’s corporate values to operate under the highest ethical and professional standards. SIA’s culture is set and practiced by senior management who insist that all professionals exhibit honesty and integrity. The Board noted that the firm’s values are evident in all of the services provided to the Funds.
Review of Specific Factors. The Directors continued their analysis by reviewing specific information on SIA and the Funds and specific terms of the Agreements, including the following:
Investment Performance. The Directors reviewed investment performance of each Fund for 1 month, 3 months, 6 months, year-to-date, 1 year, 5 years (as applicable), 10 years (as applicable) and since inception, both on an absolute basis and on a comparative basis to indices and mutual funds within the same investment categories. As noted above, the Directors concluded that the investment performance of the Funds has been competitive in relation to their stated objectives and strategies on a comparable basis with funds with similar objectives and strategies.
Fees and Expenses. The Directors noted that the Funds pay SIA a monthly fee and SIA is responsible for all of the Funds’ expenses except interest, brokerage commissions and transaction charges and certain extraordinary expenses. The Directors reviewed fees paid in prior years and the fees to be paid under the Agreements.
The Directors reviewed the extent to which the fees to be paid under the Agreements by each Fund may be affected by an increase in the Fund’s assets, which included reviewing each Fund’s current and historical assets and the likelihood and magnitude of future increases in the Fund’s assets. The Directors agreed that it is appropriate that the Funds benefit from improved economies of scale as the Funds’ assets increase. However, the Directors concluded that given the amount of the Funds’ current assets and the likelihood and magnitude of future increases in the Funds’ assets, negotiating a graduated fee structure is unnecessary at this time since the fees to be paid under the current Agreements are reasonable and appropriate.
The Directors reviewed the average and median expense ratios of mutual funds within the same investment category for each Fund. The Directors noted that each Fund’s total expense ratio compares favorably to the total expense ratios of other no-load funds within the Fund’s Morningstar category, and are lower than the average total expense ratio for the full Morningstar category. The Directors concluded that the fees paid by the Funds are reasonable and appropriate.
The Directors reviewed the expenses paid by SIA relating to the operations of the Funds, and SIA’s income with respect to the management of the Funds for the past two calendar years. The Directors concluded that the expenses paid were appropriate.
The Directors reviewed SIA’s investment advisory fee schedule for investment management services provided to other clients. The Directors compared the services provided to the Funds and other clients of SIA, and recognized that the Funds’ expenses are borne by SIA. The Directors concluded that the fees paid by the Funds in relation to the fees paid by other SIA clients were appropriate and reasonable. The Directors also concluded that SIA’s profit margin with respect to the management of the Funds was appropriate.
The Directors discussed the extent to which SIA receives benefits from the relationship with the Funds such as soft dollar arrangements by which brokers provide research services to SIA as a result of brokerage generated by the Funds. The Board concluded that any benefits
ADDITIONAL INFORMATION (Unaudited) (Continued)
SIA receives from its relationship with the Funds are well within industry norms and are reflected in the amount of the fees paid by the Funds to SIA and are appropriate and reasonable.
Non-Advisory Services. The Directors considered the quality of non-advisory services which SIA provides to the Funds (and their shareholders) and the quality and depth of SIA’s non- investment personnel who provide such services. Directors concluded that the level of such services and the quality and depth of such personnel are consistent with industry standards.
Finally, the Directors considered the compliance staff and the regulatory history of SIA and the Funds, and concluded that both are consistent with industry standards.
Based on these conclusions, without any single conclusion being dispositive, the Directors determined that renewal of the Agreements was in the interest of each Fund and its shareholders.
Sit Quality Income Fund. At its meeting held on October 29, 2012, the Directors of Sit Mutual Funds II, Inc. approved various agreements, policies and procedures for Sit Quality Income Fund (series E of common shares of Sit Mutual Funds II, Inc.), a newly created fund with an anticipated inception date of December 31, 2012. During its discussion and consideration of various factors relating to both the Boards’ selection of SIA as the investment adviser and the Boards’ approval of the fees to be paid under the Agreements as set forth above, the Directors considered the same factors as will be applicable to Sit Quality Income Fund commencing on December 31, 2012. For example, the Directors noted that Sit Quality Income Fund will pay SIA a monthly fee and SIA will be responsible for all of the Fund’s expenses except interest, brokerage commissions and transaction charges and certain extraordinary expenses. The Directors reviewed the average and median expense ratios of mutual funds within the same anticipated investment category for Sit Quality Income Fund. The Directors noted that Sit Quality Income Fund’s total expense ratio will compare favorably to the total expense ratios of other no-load funds within the Fund’s anticipated Morningstar category. The Directors concluded that the proposed fees to be paid by Sit Quality Income Fund are reasonable and appropriate.
| | |
64 | | SIT MUTUAL FUNDS ANNUAL REPORT |
The registrant has adopted a code of ethics that applies to the registrant’s principal executive officer, principal financial officer, principal accounting officer, and persons performing similar functions. The registrant has not made any amendment to its code of ethics during the period covered by this report which must be described herein pursuant to Item 2. The registrant has not granted any waivers from any provisions of the code of ethics during the period covered by this report.
A copy of the registrant’s code of ethics is available without charge upon request by calling the registrant at 612-332-3223 or 1-800-332-5580, or by mail at Sit Mutual Funds, 3300 IDS Center, 80 South Eighth Street, Minneapolis, MN 55402.
| Item 3: | Audit Committee Financial Expert. |
The registrant’s Board of Directors has determined that Mr. Edward M. Giles, Mr. Sidney L. Jones, Mr. Bruce C. Lueck, Mr. Donald W. Phillips, and Mr. Barry N. Winslow are audit committee financial experts serving on its audit committee. Mr. Giles, Mr. Jones, Mr. Lueck, Mr. Phillips, and Mr. Winslow are independent for purposes of this item.
| Item 4: | Principal Accountant Fees and Services. |
(a) – (d) Aggregate fees billed to the registrant for the last two fiscal years for professional services rendered by the registrant’s principal accountant were as follows:
| | | | | | | | | | | | | | | | | | | | | | | | | | | | | | | | |
| | | 2013 | | | 2012 | |
| | | Audit
Fees | | | Audit
Related | | | Tax
Fees | | | Other
Fees | | | Audit
Fees | | | Audit
Related | | | Tax
Fees | | | Other
Fees | |
Fiscal year ended March 31 | | | | | | | | | | | | | | | | | | | | | | | | | | | | | | | | |
Sit Mutual Funds II, Inc. | | | | | | | | | | | | | | | | | | | | | | | | | | | | | | | | |
Sit Tax-Free Income Fund (series A) | | | 24,000 | | | | 0 | | | | 4,250 | | | | 0 | | | | 26,700 | | | | 0 | | | | 3,950 | | | | 0 | |
Sit Minnesota Tax-Free Income Fund (series B) | | | 23,000 | | | | 0 | | | | 4,250 | | | | 0 | | | | 21,400 | | | | 0 | | | | 3,950 | | | | 0 | |
Sit Quality Income Fund (Series E) | | | 11,000 | | | | 0 | | | | 4,250 | | | | 0 | | | | 0 | | | | 0 | | | | 0 | | | | 0 | |
| | | | | | | | | | | | | | | | | | | | | | | | | | | | | | | | |
Total Mutual Funds II, Inc. | | | 58,000 | | | | 0 | | | | 12,750 | | | | 0 | | | | 48,100 | | | | 0 | | | | 7,900 | | | | 0 | |
Audit fees include amounts related to the audit of the registrant’s annual financial statements and services normally provided by the accountant in connection with statutory and regulatory filings. Audit-related fees include amounts reasonably related to the performance of the audit of the registrant’s financial statements, and/or are traditionally performed by the auditor. Tax fees include amounts related to tax compliance, tax planning, and tax advice.
(e) (1) The Audit Committee is required to pre-approve audit and non-audit services performed for the registrant by the independent auditor in order to assure that the provision of such services does not impair the auditor’s independence. The audit committee also is required to pre-approve certain non-audit services performed by the registrant’s independent auditor for the registrant’s investment adviser and certain of the adviser’s affiliates if the services relate directly to the operations and financial reporting of the registrant. Services to be provided by the auditor must receive general pre-approval or specific pre-approval by the audit committee. Any proposed services exceeding pre-approved cost levels will require separate pre-approval by the audit committee.
The audit committee may delegate pre-approval authority to the audit committee chairman. The chairman shall report any pre-approval decisions to the audit committee at its next scheduled meeting. The audit committee does not delegate its responsibility to pre-approve services performed by the independent auditor to management.
(2) No services included in (b) – (d) were approved pursuant to paragraph (c)(7)(i)(C) of Rule 2-01 of Regulation S-X.
(f) Not applicable.
(g) The aggregate fees billed for the most recent fiscal year and the preceding fiscal year by the registrant’s principal accountant for non-audit services rendered to the registrant, its investment adviser, and any entity controlling, controlled by, or under common control with the investment adviser that provides ongoing services to the registrant were $4,000 and $4,000 respectively.
(h) The registrant’s audit committee has determined that the provision of non-audit services rendered to the registrant’s investment adviser, and any entity controlling, controlled by, or under common control with the investment adviser that provides ongoing services to the registrant, that were not pre-approved pursuant to paragraph (c)(7)(ii) of Rule 2-01 of Regulation S-X is considered compatible with maintaining the principal accountant’s independence.
| Item 5: | Audit Committee of Listed Registrants. |
Not applicable to open-end investment companies.
| Item 6: | Schedule of Investments. |
The schedule of investments is included as part of the report to shareholders filed under Item 1 of this Form.
| Item 7: | Disclosure of Proxy Voting Policies and Procedures for Closed-End Management Investment Companies. |
Not applicable to open-end investment companies.
| Item 8: | Portfolio Managers of Closed-End Management Investments Companies. |
Not applicable to open-end investment companies.
| Item 9: | Purchases of Equity Securities by Closed-End Management Investment Company and Affiliated Purchasers. |
Not applicable to open-end investment companies.
| Item 10. | Submission of Matters to a vote of Security Holders. |
There have been no material changes to the procedures by which shareholders may recommend nominees to the registrant’s board of directors.
| Item 11: | Controls and Procedures – |
(a) Based on their evaluation of the Registrant’s Disclosure Controls and Procedures as of a date within 90 days of the Filing Date, the Registrant’s Chairman and Treasurer have determined that the Disclosure Controls and Procedures (as defined in Rule 30a-2(c) under the Act) are designed to ensure that information required to be disclosed by the Registrant is recorded, processed, summarized and reported by the filing Date, and that information required to be disclosed in the report is communicated to the Registrant’s management, as appropriate, to allow timely decisions regarding required disclosure.
(b) There were no significant changes in the Registrant’s internal controls or in other factors that could significantly affect these controls subsequent to the date of their evaluation, and there were no corrective actions with regard to significant deficiencies and material weaknesses.
| (a) | The following exhibits are attached to this Form N-CSR: |
(2) A separate certification for each principal executive and principal financial officer of the registrant as required by Rule 30a-2(a) under the Act (17 CFR 270.30a-2) (certification required by Section 302 of the Sarbanes-Oxley Act of 2002).
(b) Certification required by Rule 30a-2(b) under the Act (certification required by Section 906 of the Sarbanes-Oxley Act of 2002).
SIGNATURES
Pursuant to the requirements of the Securities Exchange Act of 1934 and the Investment Company Act of 1940, the registrant has duly caused this report to be signed on its behalf by the undersigned, thereunto duly authorized.
| | | | | | | | |
| Sit Mutual Funds II, Inc. | | | | | | |
| | | | |
| By (Signature and Title)* | | | | | | /s/ Paul E. Rasmussen | | |
| | | | | | Paul E. Rasmussen | | |
| | | | | | Vice President, Treasurer | | |
Date May 30, 2013
Pursuant to the requirements of the Securities Exchange Act of 1934 and the Investment Company Act of 1940, this report has been signed below by the following persons on behalf of the registrant and in the capacities and on the dates indicated.
| | | | | | | | |
| | | | |
| By (Signature and Title) | | | | | | /s/ Paul E. Rasmussen | | |
| | | | | | Paul E. Rasmussen | | |
| | | | | | Vice President, Treasurer | | |
| | | | |
| Date May 30, 2013 | | | | | | | | |
| | | | |
| By (Signature and Title) | | | | | | /s/ Roger J. Sit | | |
| | | | | | Roger J. Sit | | |
| | | | | | Chairman | | |
| | | | |
| Date May 30, 2013 | | | | | | | | |