UNITED STATES
SECURITIES AND EXCHANGE COMMISSION
Washington, D.C. 20549
Form N-CSR
CERTIFIED SHAREHOLDER REPORT OF REGISTERED
MANAGEMENT INVESTMENT COMPANIES
Investment Company Act File Number: 811-02258
Eaton Vance Series Trust II
(Exact Name of Registrant as Specified in Charter)
Two International Place, Boston, Massachusetts 02110
(Address of Principal Executive Offices)
Maureen A. Gemma
Two International Place, Boston, Massachusetts 02110
(Name and Address of Agent for Services)
(617) 482-8260
(Registrant’s Telephone Number)
October 31
Date of Fiscal Year End
April 30, 2017
Date of Reporting Period
Item 1. Reports to Stockholders

Eaton Vance
Income Fund of Boston
Semiannual Report
April 30, 2017

Commodity Futures Trading Commission Registration. Effective December 31, 2012, the Commodity Futures Trading Commission (“CFTC”) adopted certain regulatory changes that subject registered investment companies and advisers to regulation by the CFTC if a fund invests more than a prescribed level of its assets in certain CFTC-regulated instruments (including futures, certain options and swap agreements) or markets itself as providing investment exposure to such instruments. The Fund has claimed an exclusion from the definition of the term “commodity pool operator” under the Commodity Exchange Act. Accordingly, neither the Fund nor the adviser with respect to the operation of the Fund is subject to CFTC regulation. Because of its management of other strategies, the Fund’s adviser is registered with the CFTC as a commodity pool operator and a commodity trading advisor.
Fund shares are not insured by the FDIC and are not deposits or other obligations of, or guaranteed by, any depository institution. Shares are subject to investment risks, including possible loss of principal invested.
This report must be preceded or accompanied by a current summary prospectus or prospectus. Before investing, investors should consider carefully the investment objective, risks, and charges and expenses of a mutual fund. This and other important information is contained in the summary prospectus and prospectus, which can be obtained from a financial advisor. Prospective investors should read the prospectus carefully before investing. For further information, please call 1-800-262-1122.
Semiannual Report April 30, 2017
Eaton Vance
Income Fund of Boston
Table of Contents
| | | | |
Performance | | | 2 | |
| |
Fund Profile | | | 2 | |
| |
Endnotes and Additional Disclosures | | | 3 | |
| |
Fund Expenses | | | 4 | |
| |
Financial Statements | | | 5 | |
| |
Board of Trustees’ Contract Approval | | | 41 | |
| |
Officers and Trustees | | | 45 | |
| |
Important Notices | | | 46 | |
Eaton Vance
Income Fund of Boston
April 30, 2017
Performance1,2
Portfolio Managers Michael W. Weilheimer, CFA and Stephen C. Concannon, CFA
| | | | | | | | | | | | | | | | | | | | | | | | |
| % Average Annual Total Returns | | Class
Inception Date | | | Performance
Inception Date | | | Six Months | | | One Year | | | Five Years | | | Ten Years | |
Class A at NAV | | | 06/15/1972 | | | | 06/15/1972 | | | | 4.79 | % | | | 10.26 | % | | | 6.11 | % | | | 6.28 | % |
Class A with 4.75% Maximum Sales Charge | | | — | | | | — | | | | –0.12 | | | | 4.99 | | | | 5.08 | | | | 5.77 | |
Class B at NAV | | | 06/20/2002 | | | | 06/15/1972 | | | | 4.40 | | | | 9.24 | | | | 5.32 | | | | 5.50 | |
Class B with 5% Maximum Sales Charge | | | — | | | | — | | | | –0.60 | | | | 4.24 | | | | 4.99 | | | | 5.50 | |
Class C at NAV | | | 06/21/2002 | | | | 06/15/1972 | | | | 4.22 | | | | 9.24 | | | | 5.28 | | | | 5.50 | |
Class C with 1% Maximum Sales Charge | | | — | | | | — | | | | 3.22 | | | | 8.24 | | | | 5.28 | | | | 5.50 | |
Class I at NAV | | | 07/01/1999 | | | | 06/15/1972 | | | | 4.91 | | | | 10.52 | | | | 6.37 | | | | 6.57 | |
Class R at NAV | | | 01/05/2004 | | | | 06/15/1972 | | | | 4.66 | | | | 9.98 | | | | 5.84 | | | | 6.03 | |
Class R6 at NAV | | | 07/01/2014 | | | | 06/15/1972 | | | | 4.96 | | | | 10.42 | | | | 6.42 | | | | 6.59 | |
BofA Merrill Lynch U.S. High Yield Index | | | — | | | | — | | | | 5.50 | % | | | 13.66 | % | | | 6.87 | % | | | 7.32 | % |
BofA Merrill Lynch U.S. High Yield Constrained Index | | | — | | | | — | | | | 5.49 | | | | 13.65 | | | | 6.87 | | | | 7.40 | |
| | | | | | |
| | | | | | | | | | | | | | | | | | | | | | | | |
| % Total Annual Operating Expense Ratios3 | | Class A | | | Class B | | | Class C | | | Class I | | | Class R | | | Class R6 | |
| | | 0.99 | % | | | 1.75 | % | | | 1.74 | % | | | 0.74 | % | | | 1.24 | % | | | 0.66 | % |
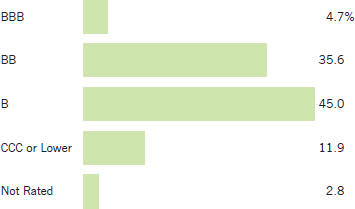
Fund Profile4
Credit Quality (% of bonds, loans and mortgage-backed securities)5
See Endnotes and Additional Disclosures in this report.
Past performance is no guarantee of future results. Returns are historical and are calculated by determining the percentage change in net asset value (NAV) or offering price (as applicable) with all distributions reinvested. Investment return and principal value will fluctuate so that shares, when redeemed, may be worth more or less than their original cost. Performance less than or equal to one year is cumulative. Performance is for the stated time period only; due to market volatility, the Fund’s current performance may be lower or higher than quoted. Returns are before taxes unless otherwise noted. For performance as of the most recent month-end, please refer to eatonvance.com.
Eaton Vance
Income Fund of Boston
April 30, 2017
Endnotes and Additional Disclosures
| 1 | BofA Merrill Lynch U.S. High Yield Index is an unmanaged index of below-investment grade U.S. corporate bonds. BofA Merrill Lynch U.S. High Yield Constrained Index is an unmanaged index of below-investment grade U.S. corporate bonds, with issuer exposure capped at 2%. BofA Merrill Lynch® indices not for redistribution or other uses; provided “as is”, without warranties, and with no liability. Eaton Vance has prepared this report, BofAML does not endorse it, or guarantee, review, or endorse Eaton Vance’s products. Unless otherwise stated, index returns do not reflect the effect of any applicable sales charges, commissions, expenses, taxes or leverage, as applicable. It is not possible to invest directly in an index. |
| 2 | Total Returns at NAV do not include applicable sales charges. If sales charges were deducted, the returns would be lower. Total Returns shown with maximum sales charge reflect the stated maximum sales charge. Unless otherwise stated, performance does not reflect the deduction of taxes on Fund distributions or redemptions of Fund shares. |
| | Performance prior to the inception date of a class may be linked to the performance of an older class of the Fund. This linked performance is adjusted for any applicable sales charge, but is not adjusted for class expense differences. If adjusted for such differences, the performance would be different. Performance presented in the financial highlights included in the financial statements is not linked. In the performance table, the performance of Class R6 is linked to Class I. Performance since inception for an index, if presented, is the performance since the Fund’s or oldest share class’ inception, as applicable. |
| 3 | Source: Fund prospectus. The expense ratios for the current reporting period can be found in the Financial Highlights section of this report. |
| 4 | Fund invests in an affiliated investment company (Portfolio) with the same objective(s) and policies as the Fund. References to investments are to the Portfolio’s holdings. |
| 5 | Credit ratings are categorized using S&P. If S&P does not publish a rating, then the Moody’s rating is applied. Ratings, which are subject to change, apply to the creditworthiness of the issuers of the underlying securities and not to the Fund or its shares. Credit ratings measure the quality of a bond based on the issuer’s creditworthiness, with ratings ranging from AAA, being the highest, to D, being the lowest based on S&P’s measures. Ratings of BBB or higher by S&P or Baa or higher by Moody’s are considered to be investment-grade quality. Credit ratings are based largely on the ratings agency’s analysis at the time of rating. The rating assigned to any particular security is not necessarily a reflection of the issuer’s current financial condition and does not necessarily reflect its assessment of the volatility of a security’s market value or of the liquidity of an investment in the security. Holdings designated as “Not Rated” are not rated by the national ratings agencies stated above. |
| | Fund profile subject to change due to active management. |
Eaton Vance
Income Fund of Boston
April 30, 2017
Fund Expenses
Example: As a Fund shareholder, you incur two types of costs: (1) transaction costs, including sales charges (loads) on purchases and redemption fees (if applicable); and (2) ongoing costs, including management fees; distribution and/or service fees; and other Fund expenses. This Example is intended to help you understand your ongoing costs (in dollars) of Fund investing and to compare these costs with the ongoing costs of investing in other mutual funds. The Example is based on an investment of $1,000 invested at the beginning of the period and held for the entire period (November 1, 2016 – April 30, 2017).
Actual Expenses: The first section of the table below provides information about actual account values and actual expenses. You may use the information in this section, together with the amount you invested, to estimate the expenses that you paid over the period. Simply divide your account value by $1,000 (for example, an $8,600 account value divided by $1,000 = 8.6), then multiply the result by the number in the first section under the heading entitled “Expenses Paid During Period” to estimate the expenses you paid on your account during this period.
Hypothetical Example for Comparison Purposes: The second section of the table below provides information about hypothetical account values and hypothetical expenses based on the actual Fund expense ratio and an assumed rate of return of 5% per year (before expenses), which is not the actual Fund return. The hypothetical account values and expenses may not be used to estimate the actual ending account balance or expenses you paid for the period. You may use this information to compare the ongoing costs of investing in your Fund and other funds. To do so, compare this 5% hypothetical example with the 5% hypothetical examples that appear in the shareholder reports of the other funds.
Please note that the expenses shown in the table are meant to highlight your ongoing costs only and do not reflect any transactional costs, such as sales charges (loads) or redemption fees (if applicable). Therefore, the second section of the table is useful in comparing ongoing costs only, and will not help you determine the relative total costs of owning different funds. In addition, if these transactional costs were included, your costs would be higher.
| | | | | | | | | | | | | | | | |
| | | Beginning Account Value (11/1/16) | | | Ending Account Value (4/30/17) | | | Expenses Paid During Period* (11/1/16 – 4/30/17) | | | Annualized Expense Ratio | |
| | | | |
| | | | | | | | | | | | | | | | |
Actual | | | | | | | | | | | | | | | | |
Class A | | $ | 1,000.00 | | | $ | 1,047.90 | | | $ | 5.13 | | | | 1.01 | % |
Class B | | $ | 1,000.00 | | | $ | 1,044.00 | | | $ | 8.92 | | | | 1.76 | % |
Class C | | $ | 1,000.00 | | | $ | 1,042.20 | | | $ | 8.91 | | | | 1.76 | % |
Class I | | $ | 1,000.00 | | | $ | 1,049.10 | | | $ | 3.86 | | | | 0.76 | % |
Class R | | $ | 1,000.00 | | | $ | 1,046.60 | | | $ | 6.39 | | | | 1.26 | % |
Class R6 | | $ | 1,000.00 | | | $ | 1,049.60 | | | $ | 3.40 | | | | 0.67 | % |
| | | | | | | | | | | | | | | | | |
| | | | |
| | | | | | | | | | | | | | | | |
Hypothetical | | | | | | | | | | | | | | | | |
(5% return per year before expenses) | | | | | | | | | | | | | | | | |
Class A | | $ | 1,000.00 | | | $ | 1,019.80 | | | $ | 5.06 | | | | 1.01 | % |
Class B | | $ | 1,000.00 | | | $ | 1,016.10 | | | $ | 8.80 | | | | 1.76 | % |
Class C | | $ | 1,000.00 | | | $ | 1,016.10 | | | $ | 8.80 | | | | 1.76 | % |
Class I | | $ | 1,000.00 | | | $ | 1,021.00 | | | $ | 3.81 | | | | 0.76 | % |
Class R | | $ | 1,000.00 | | | $ | 1,018.50 | | | $ | 6.31 | | | | 1.26 | % |
Class R6 | | $ | 1,000.00 | | | $ | 1,021.50 | | | $ | 3.36 | | | | 0.67 | % |
| * | Expenses are equal to the Fund’s annualized expense ratio for the indicated Class, multiplied by the average account value over the period, multiplied by 181/365 (to reflect the one-half year period). The Example assumes that the $1,000 was invested at the net asset value per share determined at the close of business on October 31, 2016. The Example reflects the expenses of both the Fund and the Portfolio. |
Eaton Vance
Income Fund of Boston
April 30, 2017
Statement of Assets and Liabilities (Unaudited)
| | | | |
| Assets | | April 30, 2017 | |
Investment in Boston Income Portfolio, at value (identified cost, $6,040,597,499) | | $ | 6,250,785,620 | |
Receivable for Fund shares sold | | | 13,111,808 | |
Total assets | | $ | 6,263,897,428 | |
| |
| Liabilities | | | | |
Payable for Fund shares redeemed | | $ | 34,952,814 | |
Distributions payable | | | 1,502,837 | |
Payable to affiliates: | | | | |
Distribution and service fees | | | 496,430 | |
Trustees’ fees | | | 42 | |
Accrued expenses | | | 1,625,724 | |
Total liabilities | | $ | 38,577,847 | |
Net Assets | | $ | 6,225,319,581 | |
| |
| Sources of Net Assets | | | | |
Paid-in capital | | $ | 6,236,738,641 | |
Accumulated net realized loss from Portfolio | | | (205,657,488 | ) |
Accumulated distributions in excess of net investment income | | | (15,949,693 | ) |
Net unrealized appreciation from Portfolio | | | 210,188,121 | |
Total | | $ | 6,225,319,581 | |
| |
| Class A Shares | | | | |
Net Assets | | $ | 1,226,811,155 | |
Shares Outstanding | | | 211,324,373 | |
Net Asset Value and Redemption Price Per Share | | | | |
(net assets ÷ shares of beneficial interest outstanding) | | $ | 5.81 | |
Maximum Offering Price Per Share | | | | |
(100 ÷ 95.25 of net asset value per share) | | $ | 6.10 | |
| |
| Class B Shares | | | | |
Net Assets | | $ | 11,485,687 | |
Shares Outstanding | | | 1,977,099 | |
Net Asset Value and Offering Price Per Share* | | | | |
(net assets ÷ shares of beneficial interest outstanding) | | $ | 5.81 | |
| |
| Class C Shares | | | | |
Net Assets | | $ | 250,005,434 | |
Shares Outstanding | | | 43,001,083 | |
Net Asset Value and Offering Price Per Share* | | | | |
(net assets ÷ shares of beneficial interest outstanding) | | $ | 5.81 | |
| |
| Class I Shares | | | | |
Net Assets | | $ | 4,571,019,407 | |
Shares Outstanding | | | 786,959,663 | |
Net Asset Value, Offering Price and Redemption Price Per Share | | | | |
(net assets ÷ shares of beneficial interest outstanding) | | $ | 5.81 | |
| |
| Class R Shares | | | | |
Net Assets | | $ | 45,638,413 | |
Shares Outstanding | | | 7,859,371 | |
Net Asset Value, Offering Price and Redemption Price Per Share | | | | |
(net assets ÷ shares of beneficial interest outstanding) | | $ | 5.81 | |
| |
| Class R6 Shares | | | | |
Net Assets | | $ | 120,359,485 | |
Shares Outstanding | | | 20,721,868 | |
Net Asset Value, Offering Price and Redemption Price Per Share | | | | |
(net assets ÷ shares of beneficial interest outstanding) | | $ | 5.81 | |
On sales of $50,000 or more, the offering price of Class A shares is reduced.
| * | Redemption price per share is equal to the net asset value less any applicable contingent deferred sales charge. |
| | | | |
| | 5 | | See Notes to Financial Statements. |
Eaton Vance
Income Fund of Boston
April 30, 2017
Statement of Operations (Unaudited)
| | | | |
| Investment Income | | Six Months Ended April 30, 2017 | |
Interest and other income allocated from Portfolio | | $ | 195,407,519 | |
Dividends allocated from Portfolio | | | 2,799,277 | |
Expenses allocated from Portfolio | | | (19,563,809 | ) |
Total investment income from Portfolio | | $ | 178,642,987 | |
| |
| Expenses | | | | |
Distribution and service fees | | | | |
Class A | | $ | 1,916,300 | |
Class B | | | 63,128 | |
Class C | | | 1,240,679 | |
Class R | | | 111,002 | |
Trustees’ fees and expenses | | | 250 | |
Custodian fee | | | 29,824 | |
Transfer and dividend disbursing agent fees | | | 2,962,031 | |
Legal and accounting services | | | 84,721 | |
Printing and postage | | | 1,224,954 | |
Registration fees | | | 165,124 | |
Miscellaneous | | | 23,562 | |
Total expenses | | $ | 7,821,575 | |
| |
Net investment income | | $ | 170,821,412 | |
| |
| Realized and Unrealized Gain (Loss) from Portfolio | | | | |
Net realized gain (loss) — | | | | |
Investment transactions | | $ | (4,983,606 | ) |
Swap contracts | | | 346,310 | |
Foreign currency and forward foreign currency exchange contract transactions | | | 70,498 | |
Net realized loss | | $ | (4,566,798 | ) |
Change in unrealized appreciation (depreciation) — | | | | |
Investments | | $ | 130,894,357 | |
Swap contracts | | | (331,062 | ) |
Foreign currency and forward foreign currency exchange contracts | | | 12,340 | |
Net change in unrealized appreciation (depreciation) | | $ | 130,575,635 | |
| |
Net realized and unrealized gain | | $ | 126,008,837 | |
| |
Net increase in net assets from operations | | $ | 296,830,249 | |
| | | | |
| | 6 | | See Notes to Financial Statements. |
Eaton Vance
Income Fund of Boston
April 30, 2017
Statements of Changes in Net Assets
| | | | | | | | |
| Increase (Decrease) in Net Assets | | Six Months Ended April 30, 2017 (Unaudited) | | | Year Ended October 31, 2016 | |
From operations — | | | | | | | | |
Net investment income | | $ | 170,821,412 | | | $ | 324,197,086 | |
Net realized loss from investment transactions, swap contracts and foreign currency and forward foreign currency exchange contract transactions | | | (4,566,798 | ) | | | (63,758,211 | ) |
Net change in unrealized appreciation (depreciation) from investments, swap contracts, foreign currency and forward foreign currency exchange contracts | | | 130,575,635 | | | | 177,726,574 | |
Net increase in net assets from operations | | $ | 296,830,249 | | | $ | 438,165,449 | |
Distributions to shareholders — | | | | | | | | |
From net investment income | | | | | | | | |
Class A | | $ | (43,020,822 | ) | | $ | (76,522,676 | ) |
Class B | | | (307,044 | ) | | | (817,440 | ) |
Class C | | | (6,035,746 | ) | | | (11,861,202 | ) |
Class I | | | (129,741,251 | ) | | | (240,455,379 | ) |
Class R | | | (1,189,042 | ) | | | (2,307,025 | ) |
Class R6 | | | (2,525,512 | ) | | | (2,161,401 | ) |
Tax return of capital | | | | | | | | |
Class A | | | — | | | | (6,307,831 | ) |
Class B | | | — | | | | (64,280 | ) |
Class C | | | — | | | | (971,446 | ) |
Class I | | | — | | | | (20,189,526 | ) |
Class R | | | — | | | | (184,370 | ) |
Class R6 | | | — | | | | (190,795 | ) |
Total distributions to shareholders | | $ | (182,819,417 | ) | | $ | (362,033,371 | ) |
Transactions in shares of beneficial interest — | | | | | | | | |
Proceeds from sale of shares | | | | | | | | |
Class A | | $ | 168,912,828 | | | $ | 611,868,271 | |
Class B | | | 15,195 | | | | 282,185 | |
Class C | | | 14,772,191 | | | | 48,632,020 | |
Class I | | | 1,006,805,136 | | | | 2,516,434,506 | |
Class R | | | 7,958,121 | | | | 18,548,685 | |
Class R6 | | | 65,330,931 | | | | 44,004,485 | |
Net asset value of shares issued to shareholders in payment of distributions declared | | | | | | | | |
Class A | | | 41,170,187 | | | | 79,077,089 | |
Class B | | | 266,488 | | | | 764,599 | |
Class C | | | 5,497,750 | | | | 11,589,767 | |
Class I | | | 122,579,897 | | | | 246,393,677 | |
Class R | | | 1,080,868 | | | | 2,365,990 | |
Class R6 | | | 2,058,723 | | | | 1,207,909 | |
Cost of shares redeemed | | | | | | | | |
Class A | | | (695,914,594 | ) | | | (368,664,965 | ) |
Class B | | | (1,624,597 | ) | | | (4,782,172 | ) |
Class C | | | (27,768,032 | ) | | | (56,377,082 | ) |
Class I | | | (1,016,891,688 | ) | | | (2,192,072,233 | ) |
Class R | | | (8,124,640 | ) | | | (24,611,506 | ) |
Class R6 | | | (9,724,232 | ) | | | (8,608,103 | ) |
Net asset value of shares exchanged | | | | | | | | |
Class A | | | 1,287,119 | | | | 2,815,183 | |
Class B | | | (1,287,119 | ) | | | (2,815,183 | ) |
Net increase (decrease) in net assets from Fund share transactions | | $ | (323,599,468 | ) | | $ | 926,053,122 | |
| | |
Net increase (decrease) in net assets | | $ | (209,588,636 | ) | | $ | 1,002,185,200 | |
| | |
| Net Assets | | | | | | | | |
At beginning of period | | $ | 6,434,908,217 | | | $ | 5,432,723,017 | |
At end of period | | $ | 6,225,319,581 | | | $ | 6,434,908,217 | |
| | |
Accumulated distributions in excess of net investment income
included in net assets | | | | | | | | |
At end of period | | $ | (15,949,693 | ) | | $ | (3,951,688 | ) |
| | | | |
| | 7 | | See Notes to Financial Statements. |
Eaton Vance
Income Fund of Boston
April 30, 2017
Financial Highlights
| | | | | | | | | | | | | | | | | | | | | | | | |
| | | Class A | |
| | | Six Months Ended April 30, 2017 (Unaudited) | | | Year Ended October 31, | |
| | | | 2016 | | | 2015 | | | 2014 | | | 2013 | | | 2012 | |
Net asset value — Beginning of period | | $ | 5.700 | | | $ | 5.660 | | | $ | 6.020 | | | $ | 6.060 | | | $ | 5.920 | | | $ | 5.720 | |
| | | | | | |
| Income (Loss) From Operations | | | | | | | | | | | | | | | | | | | | | | | | |
Net investment income(1) | | $ | 0.149 | | | $ | 0.302 | | | $ | 0.318 | | | $ | 0.331 | | | $ | 0.349 | | | $ | 0.355 | |
Net realized and unrealized gain (loss) | | | 0.120 | | | | 0.076 | | | | (0.323 | ) | | | (0.014 | ) | | | 0.156 | | | | 0.252 | |
| | | | | | |
Total income (loss) from operations | | $ | 0.269 | | | $ | 0.378 | | | $ | (0.005 | ) | | $ | 0.317 | | | $ | 0.505 | | | $ | 0.607 | |
| | | | | | |
| Less Distributions | | | | | | | | | | | | | | | | | | | | | | | | |
From net investment income | | $ | (0.159 | ) | | $ | (0.312 | ) | | $ | (0.329 | ) | | $ | (0.357 | ) | | $ | (0.365 | ) | | $ | (0.394 | ) |
Tax return of capital | | | — | | | | (0.026 | ) | | | (0.026 | ) | | | — | | | | — | | | | (0.013 | ) |
| | | | | | |
Total distributions | | $ | (0.159 | ) | | $ | (0.338 | ) | | $ | (0.355 | ) | | $ | (0.357 | ) | | $ | (0.365 | ) | | $ | (0.407 | ) |
| | | | | | |
Net asset value — End of period | | $ | 5.810 | | | $ | 5.700 | | | $ | 5.660 | | | $ | 6.020 | | | $ | 6.060 | | | $ | 5.920 | |
| | | | | | |
Total Return(2) | | | 4.79 | %(3) | | | 7.02 | % | | | (0.10 | )% | | | 5.34 | % | | | 8.75 | % | | | 11.00 | % |
| | | | | | |
| Ratios/Supplemental Data | | | | | | | | | | | | | | | | | | | | | | | | |
Net assets, end of period (000’s omitted) | | $ | 1,226,811 | | | $ | 1,686,369 | | | $ | 1,349,462 | | | $ | 1,551,838 | | | $ | 1,830,909 | | | $ | 1,997,735 | |
Ratios (as a percentage of average daily net assets):(4) | | | | | | | | | | | | | | | | | | | | | | | | |
Expenses(5) | | | 1.01 | %(6) | | | 0.99 | % | | | 1.00 | % | | | 1.00 | % | | | 1.00 | % | | | 1.02 | % |
Net investment income | | | 5.24 | %(6) | | | 5.43 | % | | | 5.43 | % | | | 5.45 | % | | | 5.80 | % | | | 6.12 | % |
Portfolio Turnover of the Portfolio | | | 24 | %(3) | | | 34 | % | | | 36 | % | | | 43 | % | | | 56 | % | | | 64 | % |
| (1) | Computed using average shares outstanding. |
| (2) | Returns are historical and are calculated by determining the percentage change in net asset value with all distributions reinvested and do not reflect the effect of sales charges. |
| (4) | Includes the Fund’s share of the Portfolio’s allocated expenses. |
| (5) | Excludes the effect of custody fee credits, if any, of less than 0.005%. Effective September 1, 2015, custody fee credits, which were earned on cash deposit balances, were discontinued by the custodian. |
| | | | |
| | 8 | | See Notes to Financial Statements. |
Eaton Vance
Income Fund of Boston
April 30, 2017
Financial Highlights — continued
| | | | | | | | | | | | | | | | | | | | | | | | |
| | | Class B | |
| | | Six Months Ended April 30, 2017 (Unaudited) | | | Year Ended October 31, | |
| | | | 2016 | | | 2015 | | | 2014 | | | 2013 | | | 2012 | |
Net asset value — Beginning of period | | $ | 5.700 | | | $ | 5.660 | | | $ | 6.020 | | | $ | 6.070 | | | $ | 5.930 | | | $ | 5.720 | |
| | | | | | |
| Income (Loss) From Operations | | | | | | | | | | | | | | | | | | | | | | | | |
Net investment income(1) | | $ | 0.128 | | | $ | 0.261 | | | $ | 0.276 | | | $ | 0.286 | | | $ | 0.303 | | | $ | 0.317 | |
Net realized and unrealized gain (loss) | | | 0.120 | | | | 0.075 | | | | (0.326 | ) | | | (0.023 | ) | | | 0.158 | | | | 0.257 | |
| | | | | | |
Total income (loss) from operations | | $ | 0.248 | | | $ | 0.336 | | | $ | (0.050 | ) | | $ | 0.263 | | | $ | 0.461 | | | $ | 0.574 | |
| | | | | | |
| Less Distributions | | | | | | | | | | | | | | | | | | | | | | | | |
From net investment income | | $ | (0.138 | ) | | $ | (0.274 | ) | | $ | (0.288 | ) | | $ | (0.313 | ) | | $ | (0.321 | ) | | $ | (0.352 | ) |
Tax return of capital | | | — | | | | (0.022 | ) | | | (0.022 | ) | | | — | | | | — | | | | (0.012 | ) |
| | | | | | |
Total distributions | | $ | (0.138 | ) | | $ | (0.296 | ) | | $ | (0.310 | ) | | $ | (0.313 | ) | | $ | (0.321 | ) | | $ | (0.364 | ) |
| | | | | | |
Net asset value — End of period | | $ | 5.810 | | | $ | 5.700 | | | $ | 5.660 | | | $ | 6.020 | | | $ | 6.070 | | | $ | 5.930 | |
| | | | | | |
Total Return(2) | | | 4.40 | %(3) | | | 6.20 | % | | | (0.87 | )% | | | 4.40 | % | | | 7.96 | % | | | 10.38 | % |
| | | | | | |
| Ratios/Supplemental Data | | | | | | | | | | | | | | | | | | | | | | | | |
Net assets, end of period (000’s omitted) | | $ | 11,486 | | | $ | 13,891 | | | $ | 20,491 | | | $ | 30,329 | | | $ | 39,996 | | | $ | 56,321 | |
Ratios (as a percentage of average daily net assets):(4) | | | | | | | | | | | | | | | | | | | | | | | | |
Expenses(5) | | | 1.76 | %(6) | | | 1.75 | % | | | 1.75 | % | | | 1.75 | % | | | 1.75 | % | | | 1.77 | % |
Net investment income | | | 4.48 | %(6) | | | 4.72 | % | | | 4.70 | % | | | 4.70 | % | | | 5.04 | % | | | 5.48 | % |
Portfolio Turnover of the Portfolio | | | 24 | %(3) | | | 34 | % | | | 36 | % | | | 43 | % | | | 56 | % | | | 64 | % |
| (1) | Computed using average shares outstanding. |
| (2) | Returns are historical and are calculated by determining the percentage change in net asset value with all distributions reinvested and do not reflect the effect of sales charges. |
| (4) | Includes the Fund’s share of the Portfolio’s allocated expenses. |
| (5) | Excludes the effect of custody fee credits, if any, of less than 0.005%. Effective September 1, 2015, custody fee credits, which were earned on cash deposit balances, were discontinued by the custodian. |
| | | | |
| | 9 | | See Notes to Financial Statements. |
Eaton Vance
Income Fund of Boston
April 30, 2017
Financial Highlights — continued
| | | | | | | | | | | | | | | | | | | | | | | | |
| | | Class C | |
| | | Six Months Ended April 30, 2017 (Unaudited) | | | Year Ended October 31, | |
| | | | 2016 | | | 2015 | | | 2014 | | | 2013 | | | 2012 | |
Net asset value — Beginning of period | | $ | 5.710 | | | $ | 5.660 | | | $ | 6.030 | | | $ | 6.070 | | | $ | 5.930 | | | $ | 5.720 | |
| | | | | | |
| Income (Loss) From Operations | | | | | | | | | | | | | | | | | | | | | | | | |
Net investment income(1) | | $ | 0.128 | | | $ | 0.260 | | | $ | 0.274 | | | $ | 0.286 | | | $ | 0.303 | | | $ | 0.313 | |
Net realized and unrealized gain (loss) | | | 0.110 | | | | 0.086 | | | | (0.334 | ) | | | (0.013 | ) | | | 0.158 | | | | 0.261 | |
| | | | | | |
Total income (loss) from operations | | $ | 0.238 | | | $ | 0.346 | | | $ | (0.060 | ) | | $ | 0.273 | | | $ | 0.461 | | | $ | 0.574 | |
| | | | | | |
| Less Distributions | | | | | | | | | | | | | | | | | | | | | | | | |
From net investment income | | $ | (0.138 | ) | | $ | (0.274 | ) | | $ | (0.288 | ) | | $ | (0.313 | ) | | $ | (0.321 | ) | | $ | (0.352 | ) |
Tax return of capital | | | — | | | | (0.022 | ) | | | (0.022 | ) | | | — | | | | — | | | | (0.012 | ) |
| | | | | | |
Total distributions | | $ | (0.138 | ) | | $ | (0.296 | ) | | $ | (0.310 | ) | | $ | (0.313 | ) | | $ | (0.321 | ) | | $ | (0.364 | ) |
| | | | | | |
Net asset value — End of period | | $ | 5.810 | | | $ | 5.710 | | | $ | 5.660 | | | $ | 6.030 | | | $ | 6.070 | | | $ | 5.930 | |
| | | | | | |
Total Return(2) | | | 4.22 | %(3) | | | 6.39 | % | | | (1.04 | )% | | | 4.57 | % | | | 7.95 | % | | | 10.37 | % |
| | | | | | |
| Ratios/Supplemental Data | | | | | | | | | | | | | | | | | | | | | | | | |
Net assets, end of period (000’s omitted) | | $ | 250,005 | | | $ | 252,990 | | | $ | 247,325 | | | $ | 295,436 | | | $ | 308,296 | | | $ | 318,029 | |
Ratios (as a percentage of average daily net assets):(4) | | | | | | | | | | | | | | | | | | | | | | | | |
Expenses(5) | | | 1.76 | %(6) | | | 1.74 | % | | | 1.75 | % | | | 1.75 | % | | | 1.75 | % | | | 1.77 | % |
Net investment income | | | 4.48 | %(6) | | | 4.69 | % | | | 4.68 | % | | | 4.70 | % | | | 5.04 | % | | | 5.39 | % |
Portfolio Turnover of the Portfolio | | | 24 | %(3) | | | 34 | % | | | 36 | % | | | 43 | % | | | 56 | % | | | 64 | % |
| (1) | Computed using average shares outstanding. |
| (2) | Returns are historical and are calculated by determining the percentage change in net asset value with all distributions reinvested and do not reflect the effect of sales charges. |
| (4) | Includes the Fund’s share of the Portfolio’s allocated expenses. |
| (5) | Excludes the effect of custody fee credits, if any, of less than 0.005%. Effective September 1, 2015, custody fee credits, which were earned on cash deposit balances, were discontinued by the custodian. |
| | | | |
| | 10 | | See Notes to Financial Statements. |
Eaton Vance
Income Fund of Boston
April 30, 2017
Financial Highlights — continued
| | | | | | | | | | | | | | | | | | | | | | | | |
| | | Class I | |
| | | Six Months Ended April 30, 2017
(Unaudited) | | | Year Ended October 31, | |
| | | | 2016 | | | 2015 | | | 2014 | | | 2013 | | | 2012 | |
Net asset value — Beginning of period | | $ | 5.700 | | | $ | 5.660 | | | $ | 6.020 | | | $ | 6.070 | | | $ | 5.930 | | | $ | 5.720 | |
| | | | | | |
| Income (Loss) From Operations | | | | | | | | | | | | | | | | | | | | | | | | |
Net investment income(1) | | $ | 0.156 | | | $ | 0.315 | | | $ | 0.330 | | | $ | 0.345 | | | $ | 0.363 | | | $ | 0.367 | |
Net realized and unrealized gain (loss) | | | 0.120 | | | | 0.077 | | | | (0.320 | ) | | | (0.023 | ) | | | 0.157 | | | | 0.265 | |
| | | | | | |
Total income from operations | | $ | 0.276 | | | $ | 0.392 | | | $ | 0.010 | | | $ | 0.322 | | | $ | 0.520 | | | $ | 0.632 | |
| | | | | | |
| Less Distributions | | | | | | | | | | | | | | | | | | | | | | | | |
From net investment income | | $ | (0.166 | ) | | $ | (0.325 | ) | | $ | (0.343 | ) | | $ | (0.372 | ) | | $ | (0.380 | ) | | $ | (0.409 | ) |
Tax return of capital | | | — | | | | (0.027 | ) | | | (0.027 | ) | | | — | | | | — | | | | (0.013 | ) |
| | | | | | |
Total distributions | | $ | (0.166 | ) | | $ | (0.352 | ) | | $ | (0.370 | ) | | $ | (0.372 | ) | | $ | (0.380 | ) | | $ | (0.422 | ) |
| | | | | | |
Net asset value — End of period | | $ | 5.810 | | | $ | 5.700 | | | $ | 5.660 | | | $ | 6.020 | | | $ | 6.070 | | | $ | 5.930 | |
| | | | | | |
Total Return(2) | | | 4.91 | %(3) | | | 7.28 | % | | | 0.15 | % | | | 5.42 | % | | | 9.01 | % | | | 11.46 | % |
| | | | | | |
| Ratios/Supplemental Data | | | | | | | | | | | | | | | | | | | | | | | | |
Net assets, end of period (000’s omitted) | | $ | 4,571,019 | | | $ | 4,376,959 | | | $ | 3,744,639 | | | $ | 2,903,827 | | | $ | 2,113,533 | | | $ | 2,224,443 | |
Ratios (as a percentage of average daily net assets):(4) | | | | | | | | | | | | | | | | | | | | | | | | |
Expenses(5) | | | 0.76 | %(6) | | | 0.74 | % | | | 0.75 | % | | | 0.75 | % | | | 0.75 | % | | | 0.77 | % |
Net investment income | | | 5.48 | %(6) | | | 5.67 | % | | | 5.64 | % | | | 5.68 | % | | | 6.04 | % | | | 6.32 | % |
Portfolio Turnover of the Portfolio | | | 24 | %(3) | | | 34 | % | | | 36 | % | | | 43 | % | | | 56 | % | | | 64 | % |
| (1) | Computed using average shares outstanding. |
| (2) | Returns are historical and are calculated by determining the percentage change in net asset value with all distributions reinvested. |
| (4) | Includes the Fund’s share of the Portfolio’s allocated expenses. |
| (5) | Excludes the effect of custody fee credits, if any, of less than 0.005%. Effective September 1, 2015, custody fee credits, which were earned on cash deposit balances, were discontinued by the custodian. |
| | | | |
| | 11 | | See Notes to Financial Statements. |
Eaton Vance
Income Fund of Boston
April 30, 2017
Financial Highlights — continued
| | | | | | | | | | | | | | | | | | | | | | | | |
| | | Class R | |
| | | Six Months Ended April 30, 2017
(Unaudited) | | | Year Ended October 31, | |
| | | | 2016 | | | 2015 | | | 2014 | | | 2013 | | | 2012 | |
Net asset value — Beginning of period | | $ | 5.700 | | | $ | 5.660 | | | $ | 6.020 | | | $ | 6.060 | | | $ | 5.920 | | | $ | 5.720 | |
| | | | | | |
| Income (Loss) From Operations | | | | | | | | | | | | | | | | | | | | | | | | |
Net investment income(1) | | $ | 0.142 | | | $ | 0.288 | | | $ | 0.301 | | | $ | 0.316 | | | $ | 0.333 | | | $ | 0.342 | |
Net realized and unrealized gain (loss) | | | 0.120 | | | | 0.076 | | | | (0.321 | ) | | | (0.014 | ) | | | 0.157 | | | | 0.251 | |
| | | | | | |
Total income (loss) from operations | | $ | 0.262 | | | $ | 0.364 | | | $ | (0.020 | ) | | $ | 0.302 | | | $ | 0.490 | | | $ | 0.593 | |
| | | | | | |
| Less Distributions | | | | | | | | | | | | | | | | | | | | | | | | |
From net investment income | | $ | (0.152 | ) | | $ | (0.299 | ) | | $ | (0.315 | ) | | $ | (0.342 | ) | | $ | (0.350 | ) | | $ | (0.381 | ) |
Tax return of capital | | | — | | | | (0.025 | ) | | | (0.025 | ) | | | — | | | | — | | | | (0.012 | ) |
| | | | | | |
Total distributions | | $ | (0.152 | ) | | $ | (0.324 | ) | | $ | (0.340 | ) | | $ | (0.342 | ) | | $ | (0.350 | ) | | $ | (0.393 | ) |
| | | | | | |
Net asset value — End of period | | $ | 5.810 | | | $ | 5.700 | | | $ | 5.660 | | | $ | 6.020 | | | $ | 6.060 | | | $ | 5.920 | |
| | | | | | |
Total Return(2) | | | 4.66 | %(3) | | | 6.75 | % | | | (0.36 | )% | | | 5.08 | % | | | 8.48 | % | | | 10.73 | % |
| | | | | | |
| Ratios/Supplemental Data | | | | | | | | | | | | | | | | | | | | | | | | |
Net assets, end of period (000’s omitted) | | $ | 45,638 | | | $ | 43,902 | | | $ | 47,575 | | | $ | 37,575 | | | $ | 34,457 | | | $ | 36,971 | |
Ratios (as a percentage of average daily net assets):(4) | | | | | | | | | | | | | | | | | | | | | | | | |
Expenses(5) | | | 1.26 | %(6) | | | 1.24 | % | | | 1.25 | % | | | 1.25 | % | | | 1.25 | % | | | 1.27 | % |
Net investment income | | | 4.98 | %(6) | | | 5.20 | % | | | 5.15 | % | | | 5.19 | % | | | 5.54 | % | | | 5.90 | % |
Portfolio Turnover of the Portfolio | | | 24 | %(3) | | | 34 | % | | | 36 | % | | | 43 | % | | | 56 | % | | | 64 | % |
| (1) | Computed using average shares outstanding. |
| (2) | Returns are historical and are calculated by determining the percentage change in net asset value with all distributions reinvested. |
| (4) | Includes the Fund’s share of the Portfolio’s allocated expenses |
| (5) | Excludes the effect of custody fee credits, if any, of less than 0.005%. Effective September 1, 2015, custody fee credits, which were earned on cash deposit balances, were discontinued by the custodian. |
| | | | |
| | 12 | | See Notes to Financial Statements. |
Eaton Vance
Income Fund of Boston
April 30, 2017
Financial Highlights — continued
| | | | | | | | | | | | | | | | |
| | | Class R6 | |
| | | Six Months Ended April 30, 2017
(Unaudited) | | | Year Ended October 31, | | | Period Ended October 31, 2014(1) | |
| | | | 2016 | | | 2015 | | |
Net asset value — Beginning of period | | $ | 5.700 | | | $ | 5.660 | | | $ | 6.020 | | | $ | 6.160 | |
| | | | |
| Income (Loss) From Operations | | | | | | | | | | | | | | | | |
Net investment income(2) | | $ | 0.158 | | | $ | 0.319 | | | $ | 0.326 | | | $ | 0.114 | |
Net realized and unrealized gain (loss) | | | 0.121 | | | | 0.078 | | | | (0.311 | ) | | | (0.129 | ) |
| | | | |
Total income (loss) from operations | | $ | 0.279 | | | $ | 0.397 | | | $ | 0.015 | | | $ | (0.015 | ) |
| | | | |
| Less Distributions | | | | | | | | | | | | | | | | |
From net investment income | | $ | (0.169 | ) | | $ | (0.330 | ) | | $ | (0.348 | ) | | $ | (0.125 | ) |
Tax return of capital | | | — | | | | (0.027 | ) | | | (0.027 | ) | | | — | |
| | | | |
Total distributions | | $ | (0.169 | ) | | $ | (0.357 | ) | | $ | (0.375 | ) | | $ | (0.125 | ) |
| | | | |
Net asset value — End of period | | $ | 5.810 | | | $ | 5.700 | | | $ | 5.660 | | | $ | 6.020 | |
| | | | |
Total Return(3) | | | 4.96 | %(4) | | | 7.38 | % | | | 0.24 | % | | | (0.23 | )%(4) |
| | | | |
| Ratios/Supplemental Data | | | | | | | | | | | | | | | | |
Net assets, end of period (000’s omitted) | | $ | 120,359 | | | $ | 60,797 | | | $ | 23,230 | | | $ | 1,173 | |
Ratios (as a percentage of average daily net assets):(5) | | | | | | | | | | | | | | | | |
Expenses(6) | | | 0.67 | %(7) | | | 0.66 | % | | | 0.66 | % | | | 0.69 | %(7) |
Net investment income | | | 5.56 | %(7) | | | 5.71 | % | | | 5.62 | % | | | 5.67 | %(7) |
Portfolio Turnover of the Portfolio | | | 24 | %(4) | | | 34 | % | | | 36 | % | | | 43 | %(8) |
| (1) | For the period from the commencement of operations, July 1, 2014, to October 31, 2014. |
| (2) | Computed using average shares outstanding. |
| (3) | Returns are historical and are calculated by determining the percentage change in net asset value with all distributions reinvested. |
| (5) | Includes the Fund’s share of the Portfolio’s allocated expenses. |
| (6) | Excludes the effect of custody fee credits, if any, of less than 0.005%. Effective September 1, 2015, custody fee credits, which were earned on cash deposit balances, were discontinued by the custodian. |
| (8) | For the Portfolio’s year ended October 31, 2014. |
| | | | |
| | 13 | | See Notes to Financial Statements. |
Eaton Vance
Income Fund of Boston
April 30, 2017
Notes to Financial Statements (Unaudited)
1 Significant Accounting Policies
Eaton Vance Income Fund of Boston (the Fund) is a diversified series of Eaton Vance Series Trust II (the Trust). The Trust is a Massachusetts business trust registered under the Investment Company Act of 1940, as amended (the 1940 Act), as an open-end management investment company. The Fund offers six classes of shares. Class A shares are generally sold subject to a sales charge imposed at time of purchase. Class B and Class C shares are sold at net asset value and are generally subject to a contingent deferred sales charge (see Note 5). Class I, Class R and Class R6 shares are sold at net asset value and are not subject to a sales charge. Class B shares automatically convert to Class A shares eight years after their purchase as described in the Fund’s prospectus. Beginning January 1, 2012, Class B shares are only available for purchase upon exchange from another Eaton Vance fund or through reinvestment of distributions. Each class represents a pro-rata interest in the Fund, but votes separately on class-specific matters and (as noted below) is subject to different expenses. Realized and unrealized gains and losses are allocated daily to each class of shares based on the relative net assets of each class to the total net assets of the Fund. Net investment income, other than class-specific expenses, is allocated daily to each class of shares based upon the ratio of the value of each class’s paid shares to the total value of all paid shares. Sub-accounting, recordkeeping and similar administrative fees payable to financial intermediaries, which are a component of transfer and dividend disbursing agent fees on the Statement of Operations, are not allocated to Class R6 shares. Each class of shares differs in its distribution plan and certain other class-specific expenses. The Fund invests all of its investable assets in interests in Boston Income Portfolio (the Portfolio), a Massachusetts business trust, having the same investment objectives and policies as the Fund. The value of the Fund’s investment in the Portfolio reflects the Fund’s proportionate interest in the net assets of the Portfolio (99.9% at April 30, 2017). The performance of the Fund is directly affected by the performance of the Portfolio. The financial statements of the Portfolio, including the portfolio of investments, are included elsewhere in this report and should be read in conjunction with the Fund’s financial statements.
The following is a summary of significant accounting policies of the Fund. The policies are in conformity with accounting principles generally accepted in the United States of America (U.S. GAAP). The Fund is an investment company and follows accounting and reporting guidance in the Financial Accounting Standards Board (FASB) Accounting Standards Codification Topic 946.
A Investment Valuation — Valuation of securities by the Portfolio is discussed in Note 1A of the Portfolio’s Notes to Financial Statements, which are included elsewhere in this report.
B Income — The Fund’s net investment income or loss consists of the Fund’s pro-rata share of the net investment income or loss of the Portfolio, less all actual and accrued expenses of the Fund.
C Federal Taxes — The Fund’s policy is to comply with the provisions of the Internal Revenue Code applicable to regulated investment companies and to distribute to shareholders each year substantially all of its net investment income, and all or substantially all of its net realized capital gains. Accordingly, no provision for federal income or excise tax is necessary.
As of April 30, 2017, the Fund had no uncertain tax positions that would require financial statement recognition, de-recognition, or disclosure. The Fund files a U.S. federal income tax return annually after its fiscal year-end, which is subject to examination by the Internal Revenue Service for a period of three years from the date of filing.
D Expenses — The majority of expenses of the Trust are directly identifiable to an individual fund. Expenses which are not readily identifiable to a specific fund are allocated taking into consideration, among other things, the nature and type of expense and the relative size of the funds.
E Use of Estimates — The preparation of the financial statements in conformity with U.S. GAAP requires management to make estimates and assumptions that affect the reported amounts of assets and liabilities at the date of the financial statements and the reported amounts of income and expense during the reporting period. Actual results could differ from those estimates.
F Indemnifications — Under the Trust’s organizational documents, its officers and Trustees may be indemnified against certain liabilities and expenses arising out of the performance of their duties to the Fund. Under Massachusetts law, if certain conditions prevail, shareholders of a Massachusetts business trust (such as the Trust) could be deemed to have personal liability for the obligations of the Trust. However, the Trust’s Declaration of Trust contains an express disclaimer of liability on the part of Fund shareholders and the By-laws provide that the Trust shall assume the defense on behalf of any Fund shareholders. Moreover, the By-laws also provide for indemnification out of Fund property of any shareholder held personally liable solely by reason of being or having been a shareholder for all loss or expense arising from such liability. Additionally, in the normal course of business, the Fund enters into agreements with service providers that may contain indemnification clauses. The Fund’s maximum exposure under these arrangements is unknown as this would involve future claims that may be made against the Fund that have not yet occurred.
G Other — Investment transactions are accounted for on a trade date basis.
H Interim Financial Statements — The interim financial statements relating to April 30, 2017 and for the six months then ended have not been audited by an independent registered public accounting firm, but in the opinion of the Fund’s management, reflect all adjustments, consisting only of normal recurring adjustments, necessary for the fair presentation of the financial statements.
Eaton Vance
Income Fund of Boston
April 30, 2017
Notes to Financial Statements (Unaudited) — continued
2 Distributions to Shareholders and Income Tax Information
The Fund declares dividends daily to shareholders of record at the time of declaration. Distributions are generally paid monthly. Distributions of realized capital gains (reduced by available capital loss carryforwards) are made at least annually. Distributions are declared separately for each class of shares. Shareholders may reinvest income and capital gain distributions in additional shares of the same class of the Fund at the net asset value as of the reinvestment date or, at the election of the shareholder, receive distributions in cash. Distributions to shareholders are determined in accordance with income tax regulations, which may differ from U.S. GAAP. As required by U.S. GAAP, only distributions in excess of tax basis earnings and profits are reported in the financial statements as a return of capital. Permanent differences between book and tax accounting relating to distributions are reclassified to paid-in capital. For tax purposes, distributions from short-term capital gains are considered to be from ordinary income.
At October 31, 2016, the Fund, for federal income tax purposes, had capital loss carryforwards of $45,934,301 and deferred capital losses of $134,521,398 which would reduce its taxable income arising from future net realized gains on investment transactions, if any, to the extent permitted by the Internal Revenue Code, and thus would reduce the amount of distributions to shareholders, which would otherwise be necessary to relieve the Fund of any liability for federal income or excise tax. Such capital loss carryforwards will expire on October 31, 2017 ($43,883,291) and October 31, 2019 ($2,051,010) and their character is short-term. Under tax regulations, capital losses incurred in taxable years beginning after December 2010 are considered deferred capital losses and are treated as arising on the first day of the Fund’s next taxable year, retaining the same short-term or long-term character as when originally deferred. Deferred capital losses are required to be used prior to capital loss carryforwards, which carry an expiration date. As a result of this ordering rule, capital loss carryforwards may be more likely to expire unused. Of the deferred capital losses at October 31, 2016, $20,903,743 are short-term and $113,617,655 are long-term.
3 Transactions with Affiliates
Eaton Vance Management (EVM) serves as the administrator of the Fund, but receives no compensation. The Portfolio has engaged Boston Management and Research (BMR), a subsidiary of EVM, to render investment advisory services. See Note 2 of the Portfolio’s Notes to Financial Statements which are included elsewhere in this report. EVM provides sub-transfer agency and related services to the Fund pursuant to a Sub-Transfer Agency Support Services Agreement. For the six months ended April 30, 2017, EVM earned $48,096 from the Fund pursuant to such agreement, which is included in transfer and dividend disbursing agent fees on the Statement of Operations. The Fund was informed that Eaton Vance Distributors, Inc. (EVD), an affiliate of EVM and the Fund’s principal underwriter, received $54,231 as its portion of the sales charge on sales of Class A shares for the six months ended April 30, 2017. EVD also received distribution and service fees from Class A, Class B, Class C and Class R shares (see Note 4) and contingent deferred sales charges (see Note 5).
Trustees and officers of the Fund who are members of EVM’s or BMR’s organizations receive remuneration for their services to the Fund out of the investment adviser fee. Certain officers and Trustees of the Fund and the Portfolio are officers of the above organizations.
4 Distribution Plans
The Fund has in effect a distribution plan for Class A shares (Class A Plan) pursuant to Rule 12b-1 under the 1940 Act. Pursuant to the Class A Plan, the Fund pays EVD a distribution and service fee of 0.25% per annum of its average daily net assets attributable to Class A shares for distribution services and facilities provided to the Fund by EVD, as well as for personal services and/or the maintenance of shareholder accounts. Distribution and service fees paid or accrued to EVD for the six months ended April 30, 2017 amounted to $1,916,300 for Class A shares. The Fund also has in effect distribution plans for Class B shares (Class B Plan), Class C shares (Class C Plan) and Class R shares (Class R Plan) pursuant to Rule 12b-1 under the 1940 Act. Pursuant to the Class B and Class C Plans, the Fund pays EVD amounts equal to 0.75% per annum of its average daily net assets attributable to Class B and Class C shares for providing ongoing distribution services and facilities to the Fund. For the six months ended April 30, 2017, the Fund paid or accrued to EVD $47,346 and $930,509 for Class B and Class C shares, respectively. The Class R Plan requires the Fund to pay EVD an amount up to 0.50% per annum of its average daily net assets attributable to Class R shares for providing ongoing distribution services and facilities to the Fund. The Trustees of the Trust have currently limited Class R distribution payments to 0.25% per annum of the average daily net assets attributable to Class R shares. For the six months ended April 30, 2017, the Fund paid or accrued to EVD $55,501 for Class R shares.
Pursuant to the Class B, Class C and Class R Plans, the Fund also makes payments of service fees to EVD, financial intermediaries and other persons in amounts equal to 0.25% per annum of its average daily net assets attributable to that class. Service fees paid or accrued are for personal services and/or the maintenance of shareholder accounts. They are separate and distinct from the sales commissions and distribution fees payable to EVD. Service fees paid or accrued for the six months ended April 30, 2017 amounted to $15,782, $310,170 and $55,501 for Class B, Class C and Class R shares, respectively.
Distribution and service fees are subject to the limitations contained in the Financial Industry Regulatory Authority Rule 2341(d) and for Class B, are further limited to a 5% maximum sales charge as determined in accordance with such rule.
Eaton Vance
Income Fund of Boston
April 30, 2017
Notes to Financial Statements (Unaudited) — continued
5 Contingent Deferred Sales Charges
A contingent deferred sales charge (CDSC) generally is imposed on redemptions of Class B shares made within six years of purchase and on redemptions of Class C shares made within one year of purchase. Class A shares may be subject to a 1% CDSC if redeemed within 18 months of purchase (depending on the circumstances of purchase). Generally, the CDSC is based upon the lower of the net asset value at date of redemption or date of purchase. No charge is levied on shares acquired by reinvestment of dividends or capital gain distributions. The CDSC for Class B shares is imposed at declining rates that begin at 5% in the case of redemptions in the first and second year after purchase, declining one percentage point each subsequent year. Class C shares are subject to a 1% CDSC if redeemed within one year of purchase. For the six months ended April 30, 2017, the Fund was informed that EVD received approximately $20,000, $1,000 and $7,000 of CDSCs paid by Class A, Class B and Class C shareholders, respectively.
6 Investment Transactions
For the six months ended April 30, 2017, increases and decreases in the Fund’s investment in the Portfolio aggregated $319,680,311 and $849,521,459, respectively.
7 Shares of Beneficial Interest
The Fund’s Declaration of Trust permits the Trustees to issue an unlimited number of full and fractional shares of beneficial interest (without par value). Such shares may be issued in a number of different series (such as the Fund) and classes. Transactions in Fund shares were as follows:
| | | | | | | | |
| Class A | | Six Months Ended April 30, 2017
(Unaudited) | | | Year Ended October 31, 2016 | |
| | |
Sales | | | 29,523,082 | | | | 109,009,587 | |
Issued to shareholders electing to receive payments of distributions in Fund shares | | | 7,159,483 | | | | 14,241,169 | |
Redemptions | | | (121,404,404 | ) | | | (66,482,062 | ) |
Exchange from Class B shares | | | 223,929 | | | | 509,078 | |
| | |
Net increase (decrease) | | | (84,497,910 | ) | | | 57,277,772 | |
| | |
| | | | | | | | |
| Class B | | Six Months Ended April 30, 2017
(Unaudited) | | | Year Ended October 31, 2016 | |
| | |
Sales | | | 2,638 | | | | 50,735 | |
Issued to shareholders electing to receive payments of distributions in Fund shares | | | 46,341 | | | | 137,985 | |
Redemptions | | | (283,351 | ) | | | (865,634 | ) |
Exchange to Class A shares | | | (223,647 | ) | | | (508,621 | ) |
| | |
Net decrease | | | (458,019 | ) | | | (1,185,535 | ) |
| | |
| | | | | | | | |
| Class C | | Six Months Ended April 30, 2017
(Unaudited) | | | Year Ended October 31, 2016 | |
| | |
Sales | | | 2,570,334 | | | | 8,769,444 | |
Issued to shareholders electing to receive payments of distributions in Fund shares | | | 954,202 | | | | 2,085,190 | |
Redemptions | | | (4,837,716 | ) | | | (10,209,560 | ) |
| | |
Net increase (decrease) | | | (1,313,180 | ) | | | 645,074 | |
Eaton Vance
Income Fund of Boston
April 30, 2017
Notes to Financial Statements (Unaudited) — continued
| | | | | | | | |
| Class I | | Six Months Ended April 30, 2017
(Unaudited) | | | Year Ended October 31, 2016 | |
| | |
Sales | | | 175,697,150 | | | | 456,925,142 | |
Issued to shareholders electing to receive payments of distributions in Fund shares | | | 21,303,094 | | | | 44,312,211 | |
Redemptions | | | (177,481,246 | ) | | | (395,530,956 | ) |
| | |
Net increase | | | 19,518,998 | | | | 105,706,397 | |
| | |
| | | | | | | | |
| Class R | | Six Months Ended April 30, 2017
(Unaudited) | | | Year Ended October 31, 2016 | |
| | |
Sales | | | 1,390,441 | | | | 3,343,505 | |
Issued to shareholders electing to receive payments of distributions in Fund shares | | | 187,865 | | | | 427,031 | |
Redemptions | | | (1,418,583 | ) | | | (4,479,655 | ) |
| | |
Net increase (decrease) | | | 159,723 | | | | (709,119 | ) |
| | |
| | | | | | | | |
| Class R6 | | Six Months Ended April 30, 2017
(Unaudited) | | | Year Ended October 31, 2016 | |
| | |
Sales | | | 11,399,685 | | | | 7,877,244 | |
Issued to shareholders electing to receive payments of distributions in Fund shares | | | 357,261 | | | | 215,395 | |
Redemptions | | | (1,694,701 | ) | | | (1,538,095 | ) |
| | |
Net increase | | | 10,062,245 | | | | 6,554,544 | |
Boston Income Portfolio
April 30, 2017
Portfolio of Investments (Unaudited)
| | | | | | | | |
| Corporate Bonds & Notes — 87.3% | |
| | |
| | | | | | | | |
| Security | | Principal Amount (000’s omitted) | | | Value | |
| | | | | | | | |
|
Aerospace — 0.8% | |
Booz Allen Hamilton, Inc.,
5.125%, 5/1/25(1) | | $ | 2,495 | | | $ | 2,535,544 | |
Huntington Ingalls Industries, Inc., 5.00%, 11/15/25(1) | | | 7,605 | | | | 8,042,287 | |
Orbital ATK, Inc., 5.25%, 10/1/21 | | | 6,870 | | | | 7,127,625 | |
Orbital ATK, Inc., 5.50%, 10/1/23 | | | 1,945 | | | | 2,027,663 | |
TransDigm, Inc., 6.00%, 7/15/22 | | | 15,200 | | | | 15,694,000 | |
TransDigm, Inc., 6.375%, 6/15/26 | | | 295 | | | | 297,950 | |
TransDigm, Inc., 6.50%, 7/15/24 | | | 14,665 | | | | 15,104,950 | |
| | | | | | | | | |
| | | | | | $ | 50,830,019 | |
| | | | | | | | | |
|
Air Transportation — 0.2% | |
VistaJet Malta Finance PLC/VistaJet Co. Finance, LLC, 7.75%, 6/1/20(1) | | $ | 12,880 | | | $ | 10,529,400 | |
| | | | | | | | | |
| | | | | | $ | 10,529,400 | |
| | | | | | | | | |
|
Automotive & Auto Parts — 1.0% | |
American Axle & Manufacturing, Inc., 5.125%, 2/15/19 | | $ | 3,205 | | | $ | 3,241,300 | |
American Axle & Manufacturing, Inc., 6.25%, 4/1/25(1) | | | 6,190 | | | | 6,174,525 | |
American Axle & Manufacturing, Inc., 6.50%, 4/1/27(1) | | | 5,085 | | | | 5,059,575 | |
American Tire Distributors, Inc., 10.25%, 3/1/22(1) | | | 12,310 | | | | 12,694,687 | |
General Motors Financial Co., Inc., 3.25%, 5/15/18 | | | 1,780 | | | | 1,803,662 | |
General Motors Financial Co., Inc., 4.75%, 8/15/17 | | | 1,955 | | | | 1,971,459 | |
General Motors Financial Co., Inc., 6.75%, 6/1/18 | | | 4,760 | | | | 5,003,246 | |
Navistar International Corp., 8.25%, 11/1/21 | | | 15,215 | | | | 15,481,262 | |
ZF North America Capital, Inc., 4.00%, 4/29/20(1) | | | 6,150 | | | | 6,426,750 | |
ZF North America Capital, Inc., 4.50%, 4/29/22(1) | | | 3,680 | | | | 3,877,800 | |
ZF North America Capital, Inc., 4.75%, 4/29/25(1) | | | 3,245 | | | | 3,387,196 | |
| | | | | | | | | |
| | | | | | $ | 65,121,462 | |
| | | | | | | | | |
|
Banks & Thrifts — 0.9% | |
Ally Financial, Inc., 3.50%, 1/27/19 | | $ | 16,565 | | | $ | 16,813,475 | |
Ally Financial, Inc., 6.25%, 12/1/17 | | | 5,890 | | | | 6,044,613 | |
Ally Financial, Inc., 8.00%, 12/31/18 | | | 2,500 | | | | 2,712,500 | |
CIT Group, Inc., 5.375%, 5/15/20 | | | 13,300 | | | | 14,347,375 | |
CIT Group, Inc., 5.50%, 2/15/19(1) | | | 2,601 | | | | 2,753,809 | |
JPMorgan Chase & Co., Series S, 6.75% to 2/1/24(2)(3) | | | 9,210 | | | | 10,400,392 | |
| | | | | | | | | |
| | | | | | $ | 53,072,164 | |
| | | | | | | | | |
|
Broadcasting — 1.3% | |
CBS Radio, Inc., 7.25%, 11/1/24(1) | | $ | 11,190 | | | $ | 12,197,100 | |
EW Scripps Co. (The), 5.125%, 5/15/25(1) | | | 2,495 | | | | 2,566,731 | |
iHeartCommunications, Inc., 11.25%, 3/1/21 | | | 10,550 | | | | 8,149,875 | |
| | | | | | | | |
| Security | | Principal Amount (000’s omitted) | | | Value | |
| | | | | | | | |
|
Broadcasting (continued) | |
Netflix, Inc., 5.50%, 2/15/22 | | $ | 8,685 | | | $ | 9,336,375 | |
Netflix, Inc., 5.875%, 2/15/25 | | | 5,730 | | | | 6,231,375 | |
Sirius XM Radio, Inc., 6.00%, 7/15/24(1) | | | 25,438 | | | | 27,282,255 | |
Tribune Media Co., 5.875%, 7/15/22 | | | 6,235 | | | | 6,581,167 | |
Univision Communications, Inc., 5.125%, 5/15/23(1) | | | 6,190 | | | | 6,313,800 | |
| | | | | | | | | |
| | | | | | $ | 78,658,678 | |
| | | | | | | | | |
|
Building Materials — 1.6% | |
Brundage-Bone Concrete Pumping, Inc., 10.375%, 9/1/21(1) | | $ | 6,215 | | | $ | 6,494,675 | |
Builders FirstSource, Inc.,
5.625%, 9/1/24(1) | | | 7,620 | | | | 7,934,325 | |
Builders FirstSource, Inc.,
10.75%, 8/15/23(1) | | | 5,199 | | | | 6,095,828 | |
FBM Finance, Inc., 8.25%, 8/15/21(1) | | | 10,650 | | | | 11,541,831 | |
HD Supply, Inc., 5.25%, 12/15/21(1) | | | 7,870 | | | | 8,332,363 | |
HD Supply, Inc., 5.75%, 4/15/24(1) | | | 8,750 | | | | 9,318,750 | |
Hillman Group, Inc. (The), 6.375%, 7/15/22(1) | | | 14,330 | | | | 13,720,975 | |
Rexel S.A., 5.25%, 6/15/20(1) | | | 9,191 | | | | 9,426,007 | |
Standard Industries, Inc.,
5.50%, 2/15/23(1) | | | 12,035 | | | | 12,546,487 | |
Standard Industries, Inc., 6.00%, 10/15/25(1) | | | 14,595 | | | | 15,653,137 | |
USG Corp., 5.50%, 3/1/25(1) | | | 1,695 | | | | 1,786,106 | |
| | | | | | | | | |
| | | | | | $ | 102,850,484 | |
| | | | | | | | | |
|
Cable / Satellite TV — 6.8% | |
Altice Financing S.A., 6.50%, 1/15/22(1) | | $ | 1,405 | | | $ | 1,477,006 | |
Altice Financing S.A., 6.625%, 2/15/23(1) | | | 13,855 | | | | 14,703,619 | |
Altice Luxembourg S.A.,
7.625%, 2/15/25(1) | | | 6,140 | | | | 6,577,475 | |
Altice Luxembourg S.A.,
7.75%, 5/15/22(1) | | | 27,860 | | | | 29,670,900 | |
Altice US Finance I Corp., 5.375%, 7/15/23(1) | | | 4,030 | | | | 4,221,425 | |
Altice US Finance I Corp.,
5.50%, 5/15/26(1) | | | 14,955 | | | | 15,497,119 | |
Cablevision Systems Corp., 5.875%, 9/15/22 | | | 12,265 | | | | 12,617,619 | |
Cablevision Systems Corp., 7.75%, 4/15/18 | | | 10,805 | | | | 11,331,744 | |
Cablevision Systems Corp., 8.00%, 4/15/20 | | | 12,960 | | | | 14,507,165 | |
CCO Holdings, LLC/CCO Holdings Capital Corp., 5.25%, 9/30/22 | | | 12,245 | | | | 12,734,800 | |
CCO Holdings, LLC/CCO Holdings Capital Corp., 5.375%, 5/1/25(1) | | | 13,405 | | | | 14,008,225 | |
CCO Holdings, LLC/CCO Holdings Capital Corp., 5.75%, 1/15/24 | | | 1,625 | | | | 1,714,375 | |
CCO Holdings, LLC/CCO Holdings Capital Corp., 5.75%, 2/15/26(1) | | | 11,655 | | | | 12,408,845 | |
CCO Holdings, LLC/CCO Holdings Capital Corp., 5.875%, 4/1/24(1) | | | 20,085 | | | | 21,541,162 | |
Cequel Communications Holdings I, LLC/Cequel Capital Corp., 5.125%, 12/15/21(1) | | | 8,884 | | | | 9,128,310 | |
Cequel Communications Holdings I, LLC/Cequel Capital Corp., 6.375%, 9/15/20(1) | | | 1,365 | | | | 1,410,222 | |
| | | | |
| | 18 | | See Notes to Financial Statements. |
Boston Income Portfolio
April 30, 2017
Portfolio of Investments (Unaudited) — continued
| | | | | | | | |
| Security | | Principal Amount (000’s omitted) | | | Value | |
| | | | | | | | |
|
Cable / Satellite TV (continued) | |
CSC Holdings, LLC, 5.25%, 6/1/24 | | $ | 1,900 | | | $ | 1,927,303 | |
CSC Holdings, LLC, 6.75%, 11/15/21 | | | 12,915 | | | | 14,238,787 | |
CSC Holdings, LLC, 8.625%, 2/15/19 | | | 4,385 | | | | 4,841,259 | |
CSC Holdings, LLC, 10.125%, 1/15/23(1) | | | 17,855 | | | | 20,756,437 | |
CSC Holdings, LLC, 10.875%, 10/15/25(1) | | | 20,770 | | | | 25,001,887 | |
DISH DBS Corp., 5.875%, 7/15/22 | | | 12,425 | | | | 13,192,741 | |
DISH DBS Corp., 5.875%, 11/15/24 | | | 1,805 | | | | 1,899,763 | |
DISH DBS Corp., 6.75%, 6/1/21 | | | 14,092 | | | | 15,360,280 | |
DISH DBS Corp., 7.75%, 7/1/26 | | | 10,115 | | | | 11,872,481 | |
SFR Group S.A., 6.00%, 5/15/22(1) | | | 23,425 | | | | 24,508,406 | |
SFR Group S.A., 6.25%, 5/15/24(1) | | | 2,925 | | | | 3,038,344 | |
SFR Group S.A., 7.375%, 5/1/26(1) | | | 12,495 | | | | 13,197,844 | |
Unitymedia GmbH, 6.125%, 1/15/25(1) | | | 3,975 | | | | 4,263,625 | |
Unitymedia Hessen GmbH & Co. KG/Unitymedia NRW GmbH, 5.50%, 1/15/23(1) | | | 13,345 | | | | 13,945,525 | |
UPCB Finance IV, Ltd.,
5.375%, 1/15/25(1) | | | 4,740 | | | | 4,846,650 | |
Virgin Media Finance PLC, 5.75%, 1/15/25(1) | | | 9,450 | | | | 9,674,438 | |
Virgin Media Finance PLC, 6.375%, 4/15/23(1) | | | 3,265 | | | | 3,440,494 | |
Virgin Media Secured Finance PLC, 5.25%, 1/15/26(1) | | | 12,495 | | | | 12,698,044 | |
Virgin Media Secured Finance PLC, 5.50%, 8/15/26(1) | | | 7,835 | | | | 8,021,081 | |
VTR Finance B.V., 6.875%, 1/15/24(1) | | | 8,330 | | | | 8,871,450 | |
Ziggo Bond Finance B.V., 5.875%, 1/15/25(1) | | | 6,220 | | | | 6,414,375 | |
Ziggo Bond Finance B.V.,
6.00%, 1/15/27(1) | | | 13,180 | | | | 13,476,550 | |
Ziggo Secured Finance B.V., 5.50%, 1/15/27(1) | | | 6,485 | | | | 6,679,550 | |
| | | | | | | | | |
| | | | | | $ | 425,717,325 | |
| | | | | | | | | |
|
Capital Goods — 0.6% | |
Anixter, Inc., 5.50%, 3/1/23 | | $ | 9,930 | | | $ | 10,563,038 | |
Welbilt, Inc., 9.50%, 2/15/24 | | | 20,975 | | | | 24,331,000 | |
| | | | | | | | | |
| | | | | | $ | 34,894,038 | |
| | | | | | | | | |
|
Chemicals — 1.9% | |
Alpha 3 B.V./Alpha US Bidco, Inc., 6.25%, 2/1/25(1) | | $ | 5,350 | | | $ | 5,457,000 | |
CF Industries, Inc., 4.95%, 6/1/43 | | | 7,920 | | | | 6,689,786 | |
Chemours Co. (The), 7.00%, 5/15/25 | | | 4,665 | | | | 5,148,994 | |
Platform Specialty Products Corp., 6.50%, 2/1/22(1) | | | 19,885 | | | | 20,481,550 | |
Platform Specialty Products Corp., 10.375%, 5/1/21(1) | | | 6,445 | | | | 7,194,231 | |
PQ Corp., 6.75%, 11/15/22(1) | | | 3,150 | | | | 3,425,594 | |
SPCM S.A., 4.875%, 9/15/25(1) | | | 4,070 | | | | 4,125,963 | |
Tronox Finance, LLC, 6.375%, 8/15/20 | | | 26,130 | | | | 26,685,262 | |
Tronox Finance, LLC, 7.50%, 3/15/22(1) | | | 10,220 | | | | 10,731,000 | |
Valvoline, Inc., 5.50%, 7/15/24(1) | | | 2,810 | | | | 2,978,600 | |
Versum Materials, Inc., 5.50%, 9/30/24(1) | | | 9,540 | | | | 9,933,525 | |
W.R. Grace & Co., 5.125%, 10/1/21(1) | | | 9,590 | | | | 10,321,237 | |
| | | | | | | | |
| Security | | Principal Amount (000’s omitted) | | | Value | |
| | | | | | | | |
|
Chemicals (continued) | |
W.R. Grace & Co., 5.625%, 10/1/24(1) | | $ | 2,500 | | | $ | 2,721,875 | |
| | | | | | | | | |
| | | | | | $ | 115,894,617 | |
| | | | | | | | | |
|
Consumer Products — 1.7% | |
CBC Ammo, LLC/CBC FinCo, Inc., 7.25%, 11/15/21(1) | | $ | 13,610 | | | $ | 13,780,125 | |
Central Garden & Pet Co., 6.125%, 11/15/23 | | | 15,080 | | | | 16,173,300 | |
HRG Group, Inc., 7.875%, 7/15/19 | | | 26,940 | | | | 28,024,335 | |
Scotts Miracle-Gro Co. (The), 6.00%, 10/15/23 | | | 4,115 | | | | 4,418,481 | |
Spectrum Brands, Inc., 5.75%, 7/15/25 | | | 15,435 | | | | 16,622,106 | |
Tempur Sealy International, Inc., 5.50%, 6/15/26 | | | 3,015 | | | | 3,007,463 | |
Tempur Sealy International, Inc., 5.625%, 10/15/23 | | | 8,905 | | | | 9,145,435 | |
Vista Outdoor, Inc., 5.875%, 10/1/23 | | | 14,965 | | | | 14,965,000 | |
| | | | | | | | | |
| | | | | | $ | 106,136,245 | |
| | | | | | | | | |
|
Containers — 2.7% | |
ARD Finance S.A., 7.125%, 9/15/23(1)(4) | | $ | 8,590 | | | $ | 8,933,600 | |
Ardagh Packaging Finance PLC/Ardagh Holdings USA, Inc., 4.25%, 9/15/22(1) | | | 5,600 | | | | 5,721,520 | |
Ardagh Packaging Finance PLC/Ardagh Holdings USA, Inc.,
4.625%, 5/15/23(1) | | | 13,015 | | | | 13,340,375 | |
Ardagh Packaging Finance PLC/Ardagh Holdings USA, Inc., 6.00%, 6/30/21(1) | | | 3,900 | | | | 4,056,000 | |
Ardagh Packaging Finance PLC/Ardagh Holdings USA, Inc., 6.00%, 2/15/25(1) | | | 19,270 | | | | 19,968,537 | |
Ardagh Packaging Finance PLC/Ardagh Holdings USA, Inc., 7.25%, 5/15/24(1) | | | 28,090 | | | | 30,688,325 | |
Berry Plastics Corp., 6.00%, 10/15/22 | | | 10,130 | | | | 10,801,113 | |
BWAY Holding Co., 5.50%, 4/15/24(1) | | | 14,980 | | | | 15,185,975 | |
BWAY Holding Co., 7.25%, 4/15/25(1) | | | 15,260 | | | | 15,279,075 | |
Owens-Brockway Glass Container, Inc., 5.875%, 8/15/23(1) | | | 19,975 | | | | 21,410,703 | |
Owens-Brockway Glass Container, Inc., 6.375%, 8/15/25(1) | | | 4,160 | | | | 4,531,800 | |
Reynolds Group Issuer, Inc./Reynolds Group Issuer, LLC, 5.125%, 7/15/23(1) | | | 8,925 | | | | 9,315,469 | |
Reynolds Group Issuer, Inc./Reynolds Group Issuer, LLC, 6.875%, 2/15/21 | | | 4,171 | | | | 4,290,661 | |
Reynolds Group Issuer, Inc./Reynolds Group Issuer, LLC, 7.00%, 7/15/24(1) | | | 7,115 | | | | 7,670,859 | |
| | | | | | | | | |
| | | | | | $ | 171,194,012 | |
| | | | | | | | | |
|
Diversified Financial Services — 2.3% | |
Aircastle, Ltd., 5.00%, 4/1/23 | | $ | 4,955 | | | $ | 5,301,850 | |
Alliance Data Systems Corp., 5.875%, 11/1/21(1) | | | 14,975 | | | | 15,536,562 | |
Alliance Data Systems Corp., 6.375%, 4/1/20(1) | | | 12,725 | | | | 12,979,500 | |
| | | | |
| | 19 | | See Notes to Financial Statements. |
Boston Income Portfolio
April 30, 2017
Portfolio of Investments (Unaudited) — continued
| | | | | | | | |
| Security | | Principal Amount (000’s omitted) | | | Value | |
| | | | | | | | |
|
Diversified Financial Services (continued) | |
Icahn Enterprises, L.P./Icahn Enterprises Finance Corp., 6.00%, 8/1/20 | | $ | 7,115 | | | $ | 7,381,813 | |
Icahn Enterprises, L.P./Icahn Enterprises Finance Corp., 6.25%, 2/1/22(1) | | | 9,255 | | | | 9,648,338 | |
MSCI, Inc., 5.75%, 8/15/25(1) | | | 5,390 | | | | 5,834,675 | |
Navient Corp., 4.875%, 6/17/19 | | | 1,245 | | | | 1,288,451 | |
Navient Corp., 5.50%, 1/15/19 | | | 12,170 | | | | 12,672,012 | |
Navient Corp., 6.50%, 6/15/22 | | | 10,105 | | | | 10,458,675 | |
Navient Corp., 7.25%, 1/25/22 | | | 1,240 | | | | 1,325,250 | |
Navient Corp., 8.00%, 3/25/20 | | | 10,785 | | | | 11,890,462 | |
Park Aerospace Holdings, Ltd., 5.25%, 8/15/22(1) | | | 30,525 | | | | 32,356,500 | |
Park Aerospace Holdings, Ltd., 5.50%, 2/15/24(1) | | | 17,915 | | | | 18,989,900 | |
| | | | | | | | | |
| | | | | | $ | 145,663,988 | |
| | | | | | | | | |
|
Diversified Media — 1.1% | |
Clear Channel Worldwide Holdings, Inc., Series A, 6.50%, 11/15/22 | | $ | 6,075 | | | $ | 6,226,875 | |
Clear Channel Worldwide Holdings, Inc., Series B, 6.50%, 11/15/22 | | | 11,805 | | | | 12,291,956 | |
Clear Channel Worldwide Holdings, Inc., Series A, 7.625%, 3/15/20 | | | 2,005 | | | | 1,999,988 | |
IAC/InterActiveCorp, 4.875%, 11/30/18 | | | 10,598 | | | | 10,749,021 | |
MDC Partners, Inc., 6.50%, 5/1/24(1) | | | 24,130 | | | | 23,647,400 | |
National CineMedia, LLC, 6.00%, 4/15/22 | | | 8,240 | | | | 8,507,800 | |
Nielsen Co. Luxembourg S.a.r.l. (The), 5.50%, 10/1/21(1) | | | 5,585 | | | | 5,815,381 | |
| | | | | | | | | |
| | | | | | $ | 69,238,421 | |
| | | | | | | | | |
|
Energy — 13.6% | |
AmeriGas Partners, L.P./AmeriGas Finance Corp., 5.50%, 5/20/25 | | $ | 11,360 | | | $ | 11,530,400 | |
AmeriGas Partners, L.P./AmeriGas Finance Corp., 5.625%, 5/20/24 | | | 2,720 | | | | 2,781,200 | |
AmeriGas Partners, L.P./AmeriGas Finance Corp., 5.75%, 5/20/27 | | | 6,660 | | | | 6,709,950 | |
AmeriGas Partners, L.P./AmeriGas Finance Corp., 5.875%, 8/20/26 | | | 5,505 | | | | 5,615,100 | |
Antero Midstream Partners L.P./Antero Midstream Finance Corp., 5.375%, 9/15/24(1) | | | 8,495 | | | | 8,728,612 | |
Antero Resources Corp., 5.375%, 11/1/21 | | | 16,185 | | | | 16,771,706 | |
Antero Resources Corp., 5.625%, 6/1/23 | | | 13,015 | | | | 13,454,256 | |
Blue Racer Midstream, LLC/Blue Racer Finance Corp., 6.125%, 11/15/22(1) | | | 3,580 | | | | 3,682,925 | |
Canbriam Energy, Inc.,
9.75%, 11/15/19(1) | | | 19,215 | | | | 20,271,825 | |
Cheniere Corpus Christi Holdings, LLC, 5.875%, 3/31/25(1) | | | 15,580 | | | | 16,651,125 | |
| | | | | | | | |
| Security | | Principal Amount (000’s omitted) | | | Value | |
| | | | | | | | |
|
Energy (continued) | |
Cheniere Corpus Christi Holdings, LLC, 7.00%, 6/30/24(1) | | $ | 17,635 | | | $ | 19,793,171 | |
Chesapeake Energy Corp., 8.00%, 12/15/22(1) | | | 4,500 | | | | 4,758,750 | |
Concho Resources, Inc., 5.50%, 4/1/23 | | | 27,330 | | | | 28,474,444 | |
Continental Resources, Inc., 4.50%, 4/15/23 | | | 8,720 | | | | 8,632,800 | |
CrownRock, L.P./CrownRock Finance, Inc., 7.125%, 4/15/21(1) | | | 14,435 | | | | 14,958,269 | |
CrownRock, L.P./CrownRock Finance, Inc., 7.75%, 2/15/23(1) | | | 12,150 | | | | 13,061,250 | |
CVR Refining, LLC/Coffeyville Finance, Inc., 6.50%, 11/1/22 | | | 18,895 | | | | 19,272,900 | |
Denbury Resources, Inc., 5.50%, 5/1/22 | | | 3,545 | | | | 2,658,750 | |
Denbury Resources, Inc.,
9.00%, 5/15/21(1) | | | 16,725 | | | | 17,728,500 | |
Diamondback Energy, Inc.,
4.75%, 11/1/24(1) | | | 3,690 | | | | 3,717,675 | |
Diamondback Energy, Inc., 5.375%, 5/31/25(1) | | | 10,360 | | | | 10,774,400 | |
Endeavor Energy Resources, L.P./EER Finance, Inc., 7.00%, 8/15/21(1) | | | 20,580 | | | | 21,506,100 | |
Endeavor Energy Resources, L.P./EER Finance, Inc., 8.125%, 9/15/23(1) | | | 16,191 | | | | 17,324,370 | |
Energy Transfer Equity, L.P., 5.875%, 1/15/24 | | | 17,880 | | | | 19,355,100 | |
Energy Transfer Equity, L.P., 7.50%, 10/15/20 | | | 7,970 | | | | 9,021,044 | |
EP Energy, LLC/Everest Acquisition Finance, Inc., 8.00%, 11/29/24(1) | | | 6,610 | | | | 6,948,762 | |
EP Energy, LLC/Everest Acquisition Finance, Inc., 8.00%, 2/15/25(1) | | | 6,860 | | | | 6,139,700 | |
Extraction Oil & Gas Holdings, LLC/Extraction Finance Corp., 7.875%, 7/15/21(1) | | | 13,112 | | | | 13,800,380 | |
Great Western Petroleum, LLC/Great Western Finance Corp., 9.00%, 9/30/21(1) | | | 15,380 | | | | 15,995,200 | |
Gulfport Energy Corp., 6.00%, 10/15/24(1) | | | 21,885 | | | | 21,666,150 | |
Gulfport Energy Corp., 6.625%, 5/1/23 | | | 14,100 | | | | 14,346,750 | |
Halcon Resources Corp., 6.75%, 2/15/25(1) | | | 15,460 | | | | 14,918,900 | |
Holly Energy Partners, L.P./Holly Energy Finance Corp., 6.00%, 8/1/24(1) | | | 3,935 | | | | 4,180,938 | |
Matador Resources Co., 6.875%, 4/15/23 | | | 18,470 | | | | 19,578,200 | |
Murphy Oil Corp., 6.875%, 8/15/24 | | | 3,725 | | | | 3,976,438 | |
Newfield Exploration Co., 5.375%, 1/1/26 | | | 3,090 | | | | 3,256,088 | |
Newfield Exploration Co., 5.625%, 7/1/24 | | | 6,100 | | | | 6,477,468 | |
Noble Holding International, Ltd., 7.75%, 1/15/24 | | | 10,525 | | | | 9,656,687 | |
Oasis Petroleum, Inc., 6.50%, 11/1/21 | | | 3,205 | | | | 3,253,075 | |
Oasis Petroleum, Inc., 6.875%, 3/15/22 | | | 3,085 | | | | 3,138,988 | |
Oasis Petroleum, Inc., 6.875%, 1/15/23 | | | 16,210 | | | | 16,453,150 | |
Parsley Energy, LLC/Parsley Finance Corp., 5.25%, 8/15/25(1) | | | 5,135 | | | | 5,199,188 | |
Parsley Energy, LLC/Parsley Finance Corp., 5.375%, 1/15/25(1) | | | 9,390 | | | | 9,530,850 | |
| | | | |
| | 20 | | See Notes to Financial Statements. |
Boston Income Portfolio
April 30, 2017
Portfolio of Investments (Unaudited) — continued
| | | | | | | | |
| Security | | Principal Amount (000’s omitted) | | | Value | |
| | | | | | | | |
|
Energy (continued) | |
Parsley Energy, LLC/Parsley Finance Corp., 6.25%, 6/1/24(1) | | $ | 10,105 | | | $ | 10,736,562 | |
PBF Holding Co., LLC/PBF Finance Corp., 7.00%, 11/15/23 | | | 11,400 | | | | 11,628,000 | |
PBF Holding Co., LLC/PBF Finance Corp., 8.25%, 2/15/20 | | | 12,485 | | | | 12,797,125 | |
PBF Logistics, L.P./PBF Logistics Finance Corp., 6.875%, 5/15/23 | | | 14,565 | | | | 15,001,950 | |
PDC Energy, Inc., 6.125%, 9/15/24(1) | | | 2,630 | | | | 2,708,900 | |
Precision Drilling Corp., 6.50%, 12/15/21 | | | 1,700 | | | | 1,729,750 | |
Precision Drilling Corp., 6.625%, 11/15/20 | | | 1,163 | | | | 1,186,368 | |
Precision Drilling Corp., 7.75%, 12/15/23(1) | | | 695 | | | | 740,175 | |
Resolute Energy Corp., 8.50%, 5/1/20 | | | 5,050 | | | | 5,163,625 | |
Rice Energy, Inc., 7.25%, 5/1/23 | | | 8,095 | | | | 8,783,075 | |
RSP Permian, Inc., 6.625%, 10/1/22 | | | 22,005 | | | | 23,297,794 | |
Seven Generations Energy, Ltd., 6.75%, 5/1/23(1) | | | 32,610 | | | | 34,729,650 | |
Seven Generations Energy, Ltd., 6.875%, 6/30/23(1) | | | 6,520 | | | | 6,943,800 | |
Seven Generations Energy, Ltd., 8.25%, 5/15/20(1) | | | 21,740 | | | | 22,827,000 | |
SM Energy Co., 5.625%, 6/1/25 | | | 6,495 | | | | 6,235,200 | |
SM Energy Co., 6.125%, 11/15/22 | | | 8,100 | | | | 8,262,000 | |
SM Energy Co., 6.50%, 11/15/21 | | | 11,000 | | | | 11,302,500 | |
SM Energy Co., 6.50%, 1/1/23 | | | 10,125 | | | | 10,327,500 | |
SM Energy Co., 6.75%, 9/15/26 | | | 5,260 | | | | 5,325,750 | |
Southwestern Energy Co., 5.80%, 1/23/20 | | | 10,850 | | | | 11,012,750 | |
Southwestern Energy Co., 7.50%, 2/1/18 | | | 1,070 | | | | 1,119,488 | |
Sunoco, L.P./Sunoco Finance Corp., 6.375%, 4/1/23 | | | 5,015 | | | | 5,353,513 | |
Tervita Escrow Corp., 7.625%, 12/1/21(1) | | | 12,545 | | | | 12,952,712 | |
Tesoro Corp., 5.375%, 10/1/22 | | | 11,035 | | | | 11,531,575 | |
Tesoro Logistics, L.P./Tesoro Logistics Finance Corp., 5.25%, 1/15/25 | | | 4,970 | | | | 5,293,050 | |
Tesoro Logistics, L.P./Tesoro Logistics Finance Corp., 5.50%, 10/15/19 | | | 3,100 | | | | 3,301,500 | |
Tesoro Logistics, L.P./Tesoro Logistics Finance Corp., 6.25%, 10/15/22 | | | 7,445 | | | | 8,021,987 | |
Tesoro Logistics, L.P./Tesoro Logistics Finance Corp., 6.375%, 5/1/24 | | | 6,250 | | | | 6,859,375 | |
Trinidad Drilling, Ltd., 6.625%, 2/15/25(1) | | | 6,271 | | | | 6,333,710 | |
Unit Corp., 6.625%, 5/15/21 | | | 1,225 | | | | 1,225,000 | |
Weatherford International, Ltd., 8.25%, 6/15/23 | | | 2,745 | | | | 2,981,756 | |
Weatherford International, Ltd., 9.875%, 2/15/24(1) | | | 6,340 | | | | 7,417,800 | |
Whiting Petroleum Corp., 5.00%, 3/15/19 | | | 2,925 | | | | 2,968,875 | |
Whiting Petroleum Corp., 5.75%, 3/15/21 | | | 1,725 | | | | 1,725,000 | |
WildHorse Resource Development Corp., 6.875%, 2/1/25(1) | | | 18,045 | | | | 17,368,312 | |
Williams Cos., Inc. (The), 3.70%, 1/15/23 | | | 12,106 | | | | 11,984,940 | |
Williams Cos., Inc. (The), 4.55%, 6/24/24 | | | 10,100 | | | | 10,390,375 | |
| | | | | | | | |
| Security | | Principal Amount (000’s omitted) | | | Value | |
| | | | | | | | |
|
Energy (continued) | |
Williams Cos., Inc. (The), 5.75%, 6/24/44 | | $ | 9,745 | | | $ | 10,134,800 | |
Williams Partners, L.P./ACMP Finance Corp., 4.875%, 3/15/24 | | | 12,015 | | | | 12,495,600 | |
WPX Energy, Inc., 7.50%, 8/1/20 | | | 6,372 | | | | 6,786,180 | |
| | | | | | | | | |
| | | | | | $ | 852,736,556 | |
| | | | | | | | | |
|
Entertainment / Film — 0.2% | |
AMC Entertainment Holdings, Inc., 5.875%, 11/15/26(1) | | $ | 5,700 | | | $ | 5,817,563 | |
Regal Entertainment Group, 5.75%, 3/15/22 | | | 5,440 | | | | 5,698,400 | |
| | | | | | | | | |
| | | | | | $ | 11,515,963 | |
| | | | | | | | | |
|
Environmental — 0.7% | |
Advanced Disposal Services, Inc., 5.625%, 11/15/24(1) | | $ | 10,625 | | | $ | 10,957,031 | |
Clean Harbors, Inc., 5.125%, 6/1/21 | | | 3,865 | | | | 3,963,210 | |
Covanta Holding Corp., 5.875%, 3/1/24 | | | 4,780 | | | | 4,815,850 | |
Covanta Holding Corp., 5.875%, 7/1/25 | | | 6,605 | | | | 6,605,000 | |
Covanta Holding Corp., 6.375%, 10/1/22 | | | 11,430 | | | | 11,787,187 | |
GFL Environmental, Inc.,
9.875%, 2/1/21(1) | | | 3,280 | | | | 3,542,400 | |
| | | | | | | | | |
| | | | | | $ | 41,670,678 | |
| | | | | | | | | |
|
Food & Drug Retail — 0.9% | |
AdvancePierre Foods Holdings, Inc., 5.50%, 12/15/24(1) | | $ | 7,870 | | | $ | 8,794,725 | |
Albertsons Cos., LLC/Safeway, Inc./New Albertson’s, Inc./Albertson’s, LLC, 5.75%, 3/15/25(1) | | | 8,670 | | | | 8,453,250 | |
Albertsons Cos., LLC/Safeway, Inc./New Albertson’s, Inc./Albertson’s, LLC, 6.625%, 6/15/24(1) | | | 6,175 | | | | 6,329,375 | |
New Albertsons, Inc., 8.00%, 5/1/31 | | | 2,350 | | | | 2,303,000 | |
Rite Aid Corp., 6.125%, 4/1/23(1) | | | 26,925 | | | | 26,790,375 | |
Safeway, Inc., 7.25%, 2/1/31 | | | 715 | | | | 695,337 | |
| | | | | | | | | |
| | | | | | $ | 53,366,062 | |
| | | | | | | | | |
|
Food / Beverage / Tobacco — 2.7% | |
Chobani, LLC/Chobani Finance Corp., Inc., 7.50%, 4/15/25(1) | | $ | 3,540 | | | $ | 3,663,900 | |
Dean Foods Co., 6.50%, 3/15/23(1) | | | 29,795 | | | | 31,508,212 | |
Dole Food Co., Inc., 7.25%, 6/15/25(1) | | | 14,120 | | | | 14,702,450 | |
Nature’s Bounty Co. (The), 7.625%, 5/15/21(1) | | | 23,715 | | | | 25,256,475 | |
Performance Food Group, Inc., 5.50%, 6/1/24(1) | | | 1,795 | | | | 1,862,313 | |
Pinnacle Foods Finance, LLC/Pinnacle Foods Finance Corp., 5.875%, 1/15/24 | | | 4,510 | | | | 4,831,337 | |
| | | | |
| | 21 | | See Notes to Financial Statements. |
Boston Income Portfolio
April 30, 2017
Portfolio of Investments (Unaudited) — continued
| | | | | | | | |
| Security | | Principal Amount (000’s omitted) | | | Value | |
| | | | | | | | |
|
Food / Beverage / Tobacco (continued) | |
Post Holdings, Inc., 5.00%, 8/15/26(1) | | $ | 15,190 | | | $ | 15,152,025 | |
Post Holdings, Inc., 5.50%, 3/1/25(1) | | | 15,390 | | | | 16,159,500 | |
Post Holdings, Inc., 6.00%, 12/15/22(1) | | | 4,205 | | | | 4,504,606 | |
Post Holdings, Inc., 7.75%, 3/15/24(1) | | | 7,925 | | | | 8,846,281 | |
Post Holdings, Inc., 8.00%, 7/15/25(1) | | | 3,965 | | | | 4,530,013 | |
TreeHouse Foods, Inc., 6.00%, 2/15/24(1) | | | 19,170 | | | | 20,511,900 | |
US Foods, Inc., 5.875%, 6/15/24(1) | | | 12,770 | | | | 13,408,500 | |
WhiteWave Foods Co. (The), 5.375%, 10/1/22 | | | 4,380 | | | | 4,927,500 | |
| | | | | | | | | |
| | | | | | $ | 169,865,012 | |
| | | | | | | | | |
|
Gaming — 2.5% | |
Buffalo Thunder Development Authority, 11.00%, 12/9/22(1) | | $ | 5,297 | | | $ | 2,198,441 | |
Eldorado Resorts, Inc., 6.00%, 4/1/25(1) | | | 3,580 | | | | 3,714,250 | |
GLP Capital, L.P./GLP Financing II, Inc., 4.375%, 4/15/21 | | | 3,030 | | | | 3,181,500 | |
GLP Capital, L.P./GLP Financing II, Inc., 4.875%, 11/1/20 | | | 10,445 | | | | 11,176,150 | |
GLP Capital, L.P./GLP Financing II, Inc., 5.375%, 4/15/26 | | | 10,365 | | | | 10,960,987 | |
International Game Technology PLC, 6.50%, 2/15/25(1) | | | 3,560 | | | | 3,916,000 | |
MGM Growth Properties Operating Partnership, L.P./MGP Finance Co-Issuer, Inc., 4.50%, 9/1/26 | | | 7,980 | | | | 7,989,975 | |
MGM Growth Properties Operating Partnership, L.P./MGP Finance Co-Issuer, Inc., 5.625%, 5/1/24 | | | 9,075 | | | | 9,835,031 | |
MGM Resorts International, 6.00%, 3/15/23 | | | 12,500 | | | | 13,687,500 | |
MGM Resorts International, 6.625%, 12/15/21 | | | 6,220 | | | | 6,997,500 | |
MGM Resorts International, 7.75%, 3/15/22 | | | 24,755 | | | | 28,901,462 | |
Penn National Gaming, Inc., 5.625%, 1/15/27(1) | | | 3,630 | | | | 3,666,300 | |
Scientific Games International, Inc., 7.00%, 1/1/22(1) | | | 10,765 | | | | 11,552,137 | |
Scientific Games International, Inc., 10.00%, 12/1/22 | | | 8,980 | | | | 9,761,260 | |
Station Casinos, LLC, 7.50%, 3/1/21 | | | 4,298 | | | | 4,486,038 | |
Studio City Co., Ltd., 7.25%, 11/30/21(1) | | | 6,755 | | | | 7,258,247 | |
Sugarhouse HSP Gaming Property, L.P./Sugarhouse HSP Gaming Finance Corp., 5.875%, 5/15/25(1)(5) | | | 10,140 | | | | 10,178,025 | |
Sugarhouse HSP Gaming Property, L.P./Sugarhouse HSP Gaming Finance Corp., 6.375%, 6/1/21(1) | | | 5,300 | | | | 5,405,073 | |
Tunica-Biloxi Gaming Authority, 9.00%, 11/15/15(1)(6) | | | 9,455 | | | | 3,545,625 | |
| | | | | | | | | |
| | | | | | $ | 158,411,501 | |
| | | | | | | | | |
|
Health Care — 9.5% | |
Acadia Healthcare Co., Inc., 5.625%, 2/15/23 | | $ | 1,450 | | | $ | 1,507,623 | |
Acadia Healthcare Co., Inc., 6.50%, 3/1/24 | | | 4,885 | | | | 5,190,313 | |
Alere, Inc., 6.375%, 7/1/23(1) | | | 9,674 | | | | 10,580,937 | |
Alere, Inc., 6.50%, 6/15/20 | | | 11,900 | | | | 12,227,250 | |
| | | | | | | | |
| Security | | Principal Amount (000’s omitted) | | | Value | |
| | | | | | | | |
|
Health Care (continued) | |
Alere, Inc., 7.25%, 7/1/18 | | $ | 2,470 | | | $ | 2,496,244 | |
Centene Corp., 4.75%, 5/15/22 | | | 4,335 | | | | 4,519,238 | |
Centene Corp., 4.75%, 1/15/25 | | | 18,525 | | | | 18,872,344 | |
Centene Corp., 5.625%, 2/15/21 | | | 9,335 | | | | 9,836,756 | |
Centene Corp., 6.125%, 2/15/24 | | | 9,335 | | | | 10,081,800 | |
CHS/Community Health Systems, Inc., 6.25%, 3/31/23 | | | 23,205 | | | | 23,698,106 | |
CHS/Community Health Systems, Inc., 7.125%, 7/15/20 | | | 13,765 | | | | 12,405,706 | |
Eagle Holding Co. II, LLC, 7.625%, 5/15/22(1)(4)(5) | | | 9,975 | | | | 10,199,438 | |
Envision Healthcare Corp., 5.625%, 7/15/22 | | | 9,090 | | | | 9,411,786 | |
Envision Healthcare Corp.,
6.25%, 12/1/24(1) | | | 13,245 | | | | 13,973,475 | |
Fresenius Medical Care US Finance II, Inc., 5.625%, 7/31/19(1) | | | 6,375 | | | | 6,829,219 | |
Fresenius Medical Care US Finance II, Inc., 5.875%, 1/31/22(1) | | | 5,315 | | | | 5,853,144 | |
HCA, Inc., 4.50%, 2/15/27 | | | 2,650 | | | | 2,681,774 | |
HCA, Inc., 5.25%, 6/15/26 | | | 18,460 | | | | 19,729,125 | |
HCA, Inc., 5.875%, 2/15/26 | | | 13,250 | | | | 14,111,250 | |
HCA, Inc., 6.50%, 2/15/20 | | | 12,235 | | | | 13,459,234 | |
HCA, Inc., 7.50%, 2/15/22 | | | 10,400 | | | | 11,990,160 | |
HCA Healthcare, Inc., 6.25%, 2/15/21 | | | 18,865 | | | | 20,515,687 | |
Hologic, Inc., 5.25%, 7/15/22(1) | | | 14,540 | | | | 15,376,050 | |
inVentiv Group Holdings, Inc./inVentiv Health, Inc./inVentiv Health Clinical, Inc., 7.50%, 10/1/24(1) | | | 18,450 | | | | 19,141,875 | |
Jaguar Holding Co. II/Pharmaceutical Product Development, LLC, 6.375%, 8/1/23(1) | | | 32,260 | | | | 33,711,700 | |
Kinetic Concepts, Inc./KCI USA, Inc., 7.875%, 2/15/21(1) | | | 8,735 | | | | 9,335,531 | |
Kinetic Concepts, Inc./KCI USA, Inc., 12.50%, 11/1/21(1) | | | 7,855 | | | | 8,836,875 | |
MEDNAX, Inc., 5.25%, 12/1/23(1) | | | 6,980 | | | | 7,154,500 | |
MPH Acquisition Holdings, LLC, 7.125%, 6/1/24(1) | | | 55,645 | | | | 59,957,487 | |
Opal Acquisition, Inc., 8.875%, 12/15/21(1) | | | 8,430 | | | | 7,776,675 | |
PRA Holdings, Inc., 9.50%, 10/1/23(1) | | | 10,289 | | | | 11,420,790 | |
Surgical Care Affiliates, Inc.,
6.00%, 4/1/23(1) | | | 13,242 | | | | 14,355,652 | |
Teleflex, Inc., 4.875%, 6/1/26 | | | 3,585 | | | | 3,656,700 | |
Teleflex, Inc., 5.25%, 6/15/24 | | | 4,200 | | | | 4,347,000 | |
Tenet Healthcare Corp., 6.00%, 10/1/20 | | | 7,755 | | | | 8,181,525 | |
Tenet Healthcare Corp., 6.75%, 6/15/23 | | | 4,275 | | | | 4,093,313 | |
Tenet Healthcare Corp., 7.50%, 1/1/22(1) | | | 5,135 | | | | 5,507,288 | |
Tenet Healthcare Corp., 8.125%, 4/1/22 | | | 27,335 | | | | 27,881,700 | |
Valeant Pharmaceuticals International, Inc., 5.625%, 12/1/21(1) | | | 5,520 | | | | 4,271,100 | |
Valeant Pharmaceuticals International, Inc., 5.875%, 5/15/23(1) | | | 13,520 | | | | 10,055,500 | |
| | | | |
| | 22 | | See Notes to Financial Statements. |
Boston Income Portfolio
April 30, 2017
Portfolio of Investments (Unaudited) — continued
| | | | | | | | |
| Security | | Principal Amount (000’s omitted) | | | Value | |
| | | | | | | | |
|
Health Care (continued) | |
Valeant Pharmaceuticals International, Inc., 6.375%, 10/15/20(1) | | $ | 38,705 | | | $ | 33,431,444 | |
Valeant Pharmaceuticals International, Inc., 6.50%, 3/15/22(1) | | | 12,820 | | | | 13,156,525 | |
Valeant Pharmaceuticals International, Inc., 6.75%, 8/15/18(1) | | | 312 | | | | 311,805 | |
Valeant Pharmaceuticals International, Inc., 7.00%, 3/15/24(1) | | | 18,025 | | | | 18,430,562 | |
Valeant Pharmaceuticals International, Inc., 7.50%, 7/15/21(1) | | | 7,980 | | | | 6,643,350 | |
WellCare Health Plans, Inc., 5.25%, 4/1/25 | | | 25,035 | | | | 26,098,987 | |
| | | | | | | | | |
| | | | | | $ | 593,304,543 | |
| | |
|
Homebuilders / Real Estate — 1.0% | |
Greystar Real Estate Partners, LLC, 8.25%, 12/1/22(1) | | $ | 12,660 | | | $ | 13,736,100 | |
Mattamy Group Corp.,
6.875%, 12/15/23(1) | | | 18,800 | | | | 19,599,000 | |
TRI Pointe Group, Inc./TRI Pointe Homes, Inc., 4.375%, 6/15/19 | | | 9,190 | | | | 9,511,650 | |
TRI Pointe Group, Inc./TRI Pointe Homes, Inc., 5.875%, 6/15/24 | | | 12,555 | | | | 13,276,912 | |
William Lyon Homes, Inc., 5.875%, 1/31/25(1) | | | 3,845 | | | | 3,950,738 | |
| | | | | | | | | |
| | | | | | $ | 60,074,400 | |
| | | | | | | | | |
|
Hotels — 0.5% | |
ESH Hospitality, Inc., 5.25%, 5/1/25(1) | | $ | 15,150 | | | $ | 15,377,250 | |
Hilton Domestic Operating Co., Inc., 4.25%, 9/1/24(1) | | | 10,600 | | | | 10,706,000 | |
RHP Hotel Properties, L.P./RHP Finance Corp., 5.00%, 4/15/23 | | | 6,190 | | | | 6,344,750 | |
| | | | | | | | | |
| | | | | | $ | 32,428,000 | |
| | | | | | | | | |
|
Insurance — 1.0% | |
Alliant Holdings Intermediate, LLC, 8.25%, 8/1/23(1) | | $ | 21,475 | | | $ | 22,980,934 | |
Hub Holdings, LLC/Hub Holdings Finance, Inc., 8.125%, 7/15/19(1)(4) | | | 11,950 | | | | 12,054,563 | |
Hub International, Ltd., 7.875%, 10/1/21(1) | | | 11,815 | | | | 12,407,522 | |
USI, Inc., 7.75%, 1/15/21(1) | | | 16,115 | | | | 16,446,969 | |
| | | | | | | | | |
| | | | | | $ | 63,889,988 | |
| | | | | | | | | |
|
Leisure — 0.7% | |
NCL Corp., Ltd., 4.625%, 11/15/20(1) | | $ | 11,585 | | | $ | 11,932,550 | |
NCL Corp., Ltd., 4.75%, 12/15/21(1) | | | 10,135 | | | | 10,413,713 | |
Royal Caribbean Cruises, Ltd., 7.25%, 3/15/18 | | | 4,390 | | | | 4,598,525 | |
Viking Cruises, Ltd., 6.25%, 5/15/25(1) | | | 8,680 | | | | 8,397,900 | |
Viking Cruises, Ltd., 8.50%, 10/15/22(1) | | | 10,590 | | | | 11,093,025 | |
| | | | | | | | | |
| | | | | | $ | 46,435,713 | |
| | | | | | | | | |
| | | | | | | | |
| Security | | Principal Amount (000’s omitted) | | | Value | |
| | | | | | | | |
|
Metals / Mining — 3.4% | |
Alcoa Nederland Holding B.V., 6.75%, 9/30/24(1) | | $ | 5,255 | | | $ | 5,775,245 | |
Eldorado Gold Corp., 6.125%, 12/15/20(1) | | | 25,725 | | | | 26,561,062 | |
First Quantum Minerals, Ltd., 7.00%, 2/15/21(1) | | | 5,005 | | | | 5,205,200 | |
First Quantum Minerals, Ltd., 7.25%, 5/15/22(1) | | | 8,410 | | | | 8,704,350 | |
First Quantum Minerals, Ltd., 7.25%, 4/1/23(1) | | | 7,775 | | | | 7,935,359 | |
First Quantum Minerals, Ltd., 7.50%, 4/1/25(1) | | | 28,075 | | | | 28,706,687 | |
Freeport-McMoRan, Inc., 3.10%, 3/15/20 | | | 2,875 | | | | 2,849,844 | |
Freeport-McMoRan, Inc., 4.55%, 11/14/24 | | | 5,915 | | | | 5,586,718 | |
Hudbay Minerals, Inc., 7.25%, 1/15/23(1) | | | 7,640 | | | | 8,165,250 | |
Hudbay Minerals, Inc., 7.625%, 1/15/25(1) | | | 13,720 | | | | 14,766,150 | |
Imperial Metals Corp., 7.00%, 3/15/19(1) | | | 4,715 | | | | 4,473,356 | |
Lundin Mining Corp., 7.875%, 11/1/22(1) | | | 3,665 | | | | 4,045,244 | |
New Gold, Inc., 6.25%, 11/15/22(1) | | | 18,590 | | | | 19,054,750 | |
Novelis Corp., 5.875%, 9/30/26(1) | | | 11,570 | | | | 11,917,100 | |
Novelis Corp., 6.25%, 8/15/24(1) | | | 7,970 | | | | 8,448,200 | |
Peabody Energy Corp., 6.00%, 3/31/22(1) | | | 4,245 | | | | 4,345,819 | |
Peabody Energy Corp.,
6.375%, 3/31/25(1) | | | 5,330 | | | | 5,443,263 | |
SunCoke Energy, Inc., 7.625%, 8/1/19 | | | 326 | | | | 322,740 | |
SunCoke Energy Partners, L.P./SunCoke Energy Partners Finance Corp., 7.375%, 2/1/20 | | | 16,730 | | | | 17,231,900 | |
Teck Resources, Ltd., 5.20%, 3/1/42 | | | 2,365 | | | | 2,268,934 | |
Teck Resources, Ltd., 5.40%, 2/1/43 | | | 5,275 | | | | 5,156,313 | |
Teck Resources, Ltd., 6.00%, 8/15/40 | | | 2,655 | | | | 2,744,606 | |
Teck Resources, Ltd., 8.50%, 6/1/24(1) | | | 8,670 | | | | 10,068,037 | |
| | | | | | | | | |
| | | | | | $ | 209,776,127 | |
| | | | | | | | | |
|
Paper — 0.0%(7) | |
Domtar Corp., 10.75%, 6/1/17 | | $ | 1,855 | | | $ | 1,865,575 | |
| | | | | | | | | |
| | | | | | $ | 1,865,575 | |
| | | | | | | | | |
|
Publishing / Printing — 0.2% | |
McGraw-Hill Global Education Holdings, LLC/McGraw-Hill Global Education Finance,
7.875%, 5/15/24(1) | | $ | 12,150 | | | $ | 11,876,625 | |
MHGE Parent, LLC/MHGE Parent Finance, Inc., 8.50%, 8/1/19(1)(4) | | | 2,010 | | | | 2,035,125 | |
| | | | | | | | | |
| | | | | | $ | 13,911,750 | |
| | | | | | | | | |
|
Railroad — 0.3% | |
Watco Cos., LLC/Watco Finance Corp., 6.375%, 4/1/23(1) | | $ | 16,180 | | | $ | 16,827,200 | |
| | | | | | | | | |
| | | | | | $ | 16,827,200 | |
| | | | | | | | | |
| | | | |
| | 23 | | See Notes to Financial Statements. |
Boston Income Portfolio
April 30, 2017
Portfolio of Investments (Unaudited) — continued
| | | | | | | | |
| Security | | Principal Amount (000’s omitted) | | | Value | |
| | | | | | | | |
|
Restaurants — 1.3% | |
1011778 B.C. ULC/New Red Finance, Inc., 4.625%, 1/15/22(1) | | $ | 17,095 | | | $ | 17,655,716 | |
1011778 B.C. ULC/New Red Finance, Inc., 6.00%, 4/1/22(1) | | | 26,595 | | | | 27,791,775 | |
Landry’s, Inc., 6.75%, 10/15/24(1) | | | 11,565 | | | | 12,143,250 | |
NPC International, Inc./NPC Quality Burgers, Inc./NPC Operating Company B, Inc., 10.50%, 1/15/20 | | | 10,535 | | | | 10,867,379 | |
Yum! Brands, Inc., 3.75%, 11/1/21 | | | 8,320 | | | | 8,496,800 | |
Yum! Brands, Inc., 3.875%, 11/1/20 | | | 3,280 | | | | 3,383,812 | |
Yum! Brands, Inc., 3.875%, 11/1/23 | | | 1,170 | | | | 1,159,763 | |
Yum! Brands, Inc., 5.30%, 9/15/19 | | | 2,623 | | | | 2,790,216 | |
| | | | | | | | | |
| | | | | | $ | 84,288,711 | |
| | | | | | | | | |
|
Services — 4.9% | |
BlueLine Rental Finance Corp./BlueLine Rental, LLC, 9.25%, 3/15/24(1) | | $ | 10,165 | | | $ | 10,635,131 | |
Carlson Travel, Inc., 6.75%, 12/15/23(1) | | | 9,120 | | | | 9,444,854 | |
Carlson Travel, Inc., 9.50%, 12/15/24(1) | | | 7,510 | | | | 7,772,850 | |
Cloud Crane, LLC, 10.125%, 8/1/24(1) | | | 9,635 | | | | 10,309,450 | |
Deck Chassis Acquisition, Inc., 10.00%, 6/15/23(1) | | | 13,300 | | | | 14,613,375 | |
FTI Consulting, Inc., 6.00%, 11/15/22 | | | 8,505 | | | | 8,919,619 | |
Gartner, Inc., 5.125%, 4/1/25(1) | | | 10,020 | | | | 10,395,750 | |
Hertz Corp. (The), 5.50%, 10/15/24(1) | | | 7,255 | | | | 6,257,438 | |
Hertz Corp. (The), 6.25%, 10/15/22 | | | 3,020 | | | | 2,801,050 | |
IHS Markit, Ltd., 5.00%, 11/1/22(1) | | | 9,300 | | | | 9,985,875 | |
Laureate Education, Inc., 8.25%, 5/1/25(1) | | | 20,025 | | | | 20,625,750 | |
Laureate Education, Inc., 9.25%, 9/1/19(1) | | | 32,200 | | | | 33,890,500 | |
Laureate Education, Inc., 9.25%, 9/1/19 | | | 18,575 | | | | 19,170,329 | |
Prime Security Services Borrower, LLC/Prime Finance, Inc., 9.25%, 5/15/23(1) | | | 17,425 | | | | 19,080,375 | |
Reliance Intermediate Holdings, L.P., 6.50%, 4/1/23(1) | | | 26,505 | | | | 28,757,925 | |
Ritchie Bros Auctioneers, Inc., 5.375%, 1/15/25(1) | | | 5,305 | | | | 5,490,675 | |
Sabre GLBL, Inc., 5.25%, 11/15/23(1) | | | 10,955 | | | | 11,393,200 | |
Sabre GLBL, Inc., 5.375%, 4/15/23(1) | | | 4,325 | | | | 4,519,625 | |
ServiceMaster Co., LLC (The), 7.45%, 8/15/27 | | | 19,140 | | | | 20,920,020 | |
Team Health Holdings, Inc., 6.375%, 2/1/25(1) | | | 15,420 | | | | 15,092,325 | |
TMS International Corp., 7.625%, 10/15/21(1) | | | 12,245 | | | | 12,398,062 | |
United Rentals North America, Inc., 5.50%, 5/15/27 | | | 2,245 | | | | 2,315,156 | |
United Rentals North America, Inc., 6.125%, 6/15/23 | | | 1,615 | | | | 1,691,713 | |
United Rentals North America, Inc., 7.625%, 4/15/22 | | | 5,747 | | | | 6,012,799 | |
Vizient, Inc., 10.375%, 3/1/24(1) | | | 10,690 | | | | 12,266,775 | |
| | | | | | | | | |
| | | | | | $ | 304,760,621 | |
| | | | | | | | | |
|
Steel — 0.4% | |
Allegheny Technologies, Inc., 5.95%, 1/15/21 | | $ | 3,490 | | | $ | 3,472,550 | |
| | | | | | | | |
| Security | | Principal Amount (000’s omitted) | | | Value | |
| | | | | | | | |
|
Steel (continued) | |
Allegheny Technologies, Inc., 7.875%, 8/15/23 | | $ | 8,295 | | | $ | 8,595,694 | |
ArcelorMittal, 7.00%, 2/25/22 | | | 3,775 | | | | 4,298,781 | |
United States Steel Corp., 8.375%, 7/1/21(1) | | | 8,985 | | | | 9,917,194 | |
Zekelman Industries, Inc., 9.875%, 6/15/23(1) | | | 1,060 | | | | 1,200,450 | |
| | | | | | | | | |
| | | | | | $ | 27,484,669 | |
| | | | | | | | | |
|
Super Retail — 2.2% | |
Dollar Tree, Inc., 5.25%, 3/1/20 | | $ | 9,275 | | | $ | 9,553,250 | |
Dollar Tree, Inc., 5.75%, 3/1/23 | | | 21,435 | | | | 22,849,710 | |
Hot Topic, Inc., 9.25%, 6/15/21(1) | | | 16,470 | | | | 16,840,575 | |
L Brands, Inc., 6.875%, 11/1/35 | | | 12,970 | | | | 12,853,270 | |
L Brands, Inc., 8.50%, 6/15/19 | | | 12,810 | | | | 14,347,200 | |
Michaels Stores, Inc., 5.875%, 12/15/20(1) | | | 6,650 | | | | 6,832,875 | |
Murphy Oil USA, Inc., 5.625%, 5/1/27 | | | 4,050 | | | | 4,161,375 | |
Murphy Oil USA, Inc., 6.00%, 8/15/23 | | | 6,605 | | | | 6,968,275 | |
Party City Holdings, Inc.,
6.125%, 8/15/23(1) | | | 13,190 | | | | 13,651,650 | |
PVH Corp., 7.75%, 11/15/23 | | | 13,090 | | | | 15,380,750 | |
Sally Holdings, LLC/Sally Capital, Inc., 5.625%, 12/1/25 | | | 8,115 | | | | 8,419,312 | |
Sally Holdings, LLC/Sally Capital, Inc., 5.75%, 6/1/22 | | | 4,245 | | | | 4,382,963 | |
| | | | | | | | | |
| | | | | | $ | 136,241,205 | |
| | | | | | | | | |
|
Technology — 8.4% | |
Avaya, Inc., 9.00%, 4/1/19(1)(6) | | $ | 11,110 | | | $ | 9,387,950 | |
Camelot Finance S.A.,
7.875%, 10/15/24(1) | | | 8,395 | | | | 9,024,625 | |
CommScope Technologies, LLC, 5.00%, 3/15/27(1) | | | 10,155 | | | | 10,269,244 | |
CommScope Technologies, LLC, 6.00%, 6/15/25(1) | | | 14,235 | | | | 15,249,244 | |
Dell International, LLC/EMC Corp., 5.45%, 6/15/23(1) | | | 8,730 | | | | 9,441,844 | |
Dell International, LLC/EMC Corp., 5.875%, 6/15/21(1) | | | 13,500 | | | | 14,343,750 | |
Dell International, LLC/EMC Corp., 6.02%, 6/15/26(1) | | | 23,105 | | | | 25,494,311 | |
Dell International, LLC/EMC Corp., 7.125%, 6/15/24(1) | | | 17,365 | | | | 19,203,450 | |
First Data Corp., 5.00%, 1/15/24(1) | | | 12,420 | | | | 12,749,130 | |
First Data Corp., 5.375%, 8/15/23(1) | | | 15,405 | | | | 16,059,713 | |
First Data Corp., 5.75%, 1/15/24(1) | | | 3,860 | | | | 4,019,225 | |
First Data Corp., 7.00%, 12/1/23(1) | | | 47,970 | | | | 51,553,359 | |
Infor (US), Inc., 5.75%, 8/15/20(1) | | | 5,090 | | | | 5,322,231 | |
Infor (US), Inc., 6.50%, 5/15/22 | | | 14,365 | | | | 15,011,425 | |
Infor Software Parent, LLC/Infor Software Parent, Inc., 7.125%, 5/1/21(1)(4) | | | 13,285 | | | | 13,643,695 | |
Match Group, Inc., 6.375%, 6/1/24 | | | 6,945 | | | | 7,587,413 | |
Micron Technology, Inc., 5.25%, 8/1/23(1) | | | 7,195 | | | | 7,482,800 | |
Micron Technology, Inc., 5.50%, 2/1/25 | | | 147 | | | | 154,350 | |
Micron Technology, Inc., 7.50%, 9/15/23 | | | 20,455 | | | | 22,960,737 | |
Microsemi Corp., 9.125%, 4/15/23(1) | | | 14,470 | | | | 16,712,850 | |
| | | | |
| | 24 | | See Notes to Financial Statements. |
Boston Income Portfolio
April 30, 2017
Portfolio of Investments (Unaudited) — continued
| | | | | | | | |
| Security | | Principal Amount (000’s omitted) | | | Value | |
| | | | | | | | |
|
Technology (continued) | |
Nuance Communications, Inc., 5.375%, 8/15/20(1) | | $ | 2,151 | | | $ | 2,198,053 | |
NXP B.V./NXP Funding, LLC, 4.125%, 6/1/21(1) | | | 11,340 | | | | 11,892,825 | |
NXP B.V./NXP Funding, LLC, 4.625%, 6/1/23(1) | | | 8,295 | | | | 8,948,231 | |
Rackspace Hosting, Inc., 8.625%, 11/15/24(1) | | | 8,680 | | | | 9,211,650 | |
Riverbed Technology, Inc., 8.875%, 3/1/23(1) | | | 21,405 | | | | 22,154,175 | |
Sensata Technologies UK Financing Co. PLC, 6.25%, 2/15/26(1) | | | 16,935 | | | | 18,416,813 | |
Solera, LLC/Solera Finance, Inc., 10.50%, 3/1/24(1) | | | 15,945 | | | | 18,276,956 | |
SS&C Technologies Holdings, Inc., 5.875%, 7/15/23 | | | 12,970 | | | | 13,845,475 | |
Symantec Corp., 5.00%, 4/15/25(1) | | | 7,590 | | | | 7,865,138 | |
Tempo Acquisition, LLC/Tempo Acquisition Finance Corp., 6.75%, 6/1/25(1)(5) | | | 7,520 | | | | 7,745,600 | |
Veritas US, Inc./Veritas Bermuda, Ltd., 7.50%, 2/1/23(1) | | | 18,145 | | | | 19,188,338 | |
Western Digital Corp., 7.375%, 4/1/23(1) | | | 29,115 | | | | 31,953,712 | |
Western Digital Corp., 10.50%, 4/1/24 | | | 27,405 | | | | 32,406,412 | |
Zebra Technologies Corp., 7.25%, 10/15/22 | | | 30,495 | | | | 33,048,956 | |
| | | | | | | | | |
| | | | | | $ | 522,823,680 | |
| | | | | | | | | |
|
Telecommunications — 7.7% | |
CenturyLink, Inc., 6.75%, 12/1/23 | | $ | 8,545 | | | $ | 9,185,875 | |
CenturyLink, Inc., 7.50%, 4/1/24 | | | 19,165 | | | | 20,865,894 | |
Cincinnati Bell, Inc., 7.00%, 7/15/24(1) | | | 5,240 | | | | 5,559,640 | |
Digicel, Ltd., 6.00%, 4/15/21(1) | | | 14,650 | | | | 13,990,750 | |
Digicel, Ltd., 6.75%, 3/1/23(1) | | | 8,490 | | | | 8,118,563 | |
Equinix, Inc., 5.375%, 5/15/27 | | | 7,730 | | | | 8,095,552 | |
Equinix, Inc., 5.875%, 1/15/26 | | | 16,660 | | | | 17,992,800 | |
Frontier Communications Corp., 6.25%, 9/15/21 | | | 11,985 | | | | 11,146,050 | |
Frontier Communications Corp., 6.875%, 1/15/25 | | | 9,340 | | | | 7,868,950 | |
Frontier Communications Corp., 7.625%, 4/15/24 | | | 2,695 | | | | 2,324,438 | |
Frontier Communications Corp., 8.875%, 9/15/20 | | | 7,595 | | | | 8,045,915 | |
Frontier Communications Corp., 10.50%, 9/15/22 | | | 16,585 | | | | 16,771,581 | |
Frontier Communications Corp., 11.00%, 9/15/25 | | | 7,375 | | | | 7,144,531 | |
Hughes Satellite Systems Corp., 5.25%, 8/1/26(1) | | | 9,375 | | | | 9,562,500 | |
Hughes Satellite Systems Corp., 6.50%, 6/15/19 | | | 11,723 | | | | 12,719,455 | |
Hughes Satellite Systems Corp., 6.625%, 8/1/26(1) | | | 10,660 | | | | 10,979,800 | |
Intelsat Jackson Holdings S.A., 5.50%, 8/1/23 | | | 10,495 | | | | 9,012,581 | |
Intelsat Jackson Holdings S.A., 7.25%, 10/15/20 | | | 19,455 | | | | 18,311,046 | |
Intelsat Jackson Holdings S.A., 7.50%, 4/1/21 | | | 900 | | | | 828,000 | |
Intelsat Jackson Holdings S.A., 8.00%, 2/15/24(1) | | | 8,090 | | | | 8,747,313 | |
Level 3 Financing, Inc., 5.25%, 3/15/26 | | | 8,495 | | | | 8,782,386 | |
Level 3 Financing, Inc., 5.375%, 1/15/24 | | | 6,180 | | | | 6,438,571 | |
SBA Communications Corp., 4.875%, 9/1/24(1) | | | 3,320 | | | | 3,357,350 | |
Sprint Capital Corp., 6.875%, 11/15/28 | | | 8,840 | | | | 9,613,500 | |
Sprint Communications, Inc., 6.00%, 11/15/22 | | | 1,245 | | | | 1,300,247 | |
| | | | | | | | |
| Security | | Principal Amount (000’s omitted) | | | Value | |
| | | | | | | | |
|
Telecommunications (continued) | |
Sprint Communications, Inc., 7.00%, 8/15/20 | | $ | 19,670 | | | $ | 21,366,537 | |
Sprint Communications, Inc., 9.00%, 11/15/18(1) | | | 28,115 | | | | 30,821,069 | |
Sprint Communications, Inc., 9.25%, 4/15/22 | | | 2,000 | | | | 2,430,000 | |
Sprint Corp., 7.125%, 6/15/24 | | | 7,445 | | | | 8,115,050 | |
Sprint Corp., 7.25%, 9/15/21 | | | 23,335 | | | | 25,580,994 | |
Sprint Corp., 7.625%, 2/15/25 | | | 14,960 | | | | 16,736,500 | |
Sprint Corp., 7.875%, 9/15/23 | | | 42,055 | | | | 47,311,875 | |
T-Mobile USA, Inc., 6.375%, 3/1/25 | | | 4,120 | | | | 4,512,718 | |
T-Mobile USA, Inc., 6.50%, 1/15/26 | | | 26,780 | | | | 29,759,275 | |
T-Mobile USA, Inc., 6.625%, 4/1/23 | | | 11,280 | | | | 12,083,700 | |
Uniti Group, Inc./CSL Capital, LLC, 8.25%, 10/15/23 | | | 2,480 | | | | 2,659,031 | |
Wind Acquisition Finance S.A., 4.75%, 7/15/20(1) | | | 19,610 | | | | 20,026,712 | |
Zayo Group, LLC/Zayo Capital, Inc., 5.75%, 1/15/27(1) | | | 6,385 | | | | 6,792,044 | |
Zayo Group, LLC/Zayo Capital, Inc., 6.00%, 4/1/23 | | | 8,780 | | | | 9,372,650 | |
Zayo Group, LLC/Zayo Capital, Inc., 6.375%, 5/15/25 | | | 6,060 | | | | 6,575,100 | |
| | | | | | | | | |
| | | | | | $ | 480,906,543 | |
| | | | | | | | | |
|
Transportation Ex Air / Rail — 0.6% | |
CEVA Group, PLC,
7.00%, 3/1/21(1) | | $ | 2,540 | | | $ | 2,286,000 | |
CEVA Group, PLC,
9.00%, 9/1/21(1) | | | 9,200 | | | | 7,084,000 | |
XPO Logistics, Inc., 6.125%, 9/1/23(1) | | | 5,325 | | | | 5,611,219 | |
XPO Logistics, Inc., 6.50%, 6/15/22(1) | | | 19,315 | | | | 20,522,187 | |
| | | | | | | | | |
| | | | | | $ | 35,503,406 | |
| | | | | | | | | |
|
Utilities — 1.7% | |
AES Corp. (The), 5.50%, 3/15/24 | | $ | 5,981 | | | $ | 6,175,383 | |
AES Corp. (The), 5.50%, 4/15/25 | | | 1,030 | | | | 1,060,900 | |
AES Corp. (The), 6.00%, 5/15/26 | | | 15,975 | | | | 16,913,531 | |
Calpine Corp., 5.25%, 6/1/26(1) | | | 3,190 | | | | 3,225,888 | |
Calpine Corp., 5.375%, 1/15/23 | | | 2,755 | | | | 2,727,450 | |
Dynegy, Inc., 6.75%, 11/1/19 | | | 10,685 | | | | 10,898,700 | |
Dynegy, Inc., 7.375%, 11/1/22 | | | 9,265 | | | | 8,917,562 | |
Dynegy, Inc., 7.625%, 11/1/24 | | | 7,035 | | | | 6,472,200 | |
NRG Energy, Inc., 7.25%, 5/15/26 | | | 14,370 | | | | 14,765,175 | |
NRG Energy, Inc., 7.875%, 5/15/21 | | | 1,673 | | | | 1,723,190 | |
NRG Yield Operating, LLC, 5.00%, 9/15/26(1) | | | 12,835 | | | | 12,642,475 | |
NRG Yield Operating, LLC, 5.375%, 8/15/24 | | | 8,490 | | | | 8,723,475 | |
Pattern Energy Group, Inc., 5.875%, 2/1/24(1) | | | 7,680 | | | | 7,920,000 | |
TerraForm Power Operating, LLC, 6.375%, 2/1/23(1) | | | 1,470 | | | | 1,525,125 | |
TerraForm Power Operating, LLC, 6.625%, 6/15/25(1) | | | 4,530 | | | | 4,813,125 | |
| | | | | | | | | |
| | | | | | $ | 108,504,179 | |
| | | | | | | | | |
| |
Total Corporate Bonds & Notes
(identified cost $5,232,837,393) | | | $ | 5,456,392,935 | |
| | | | | | | | | |
| | | | |
| | 25 | | See Notes to Financial Statements. |
Boston Income Portfolio
April 30, 2017
Portfolio of Investments (Unaudited) — continued
| | | | | | | | |
| Senior Floating-Rate Loans — 7.0%(8) | |
| | |
| | | | | | | | |
| Borrower/Tranche Description | | Principal Amount (000’s omitted) | | | Value | |
| | | | | | | | |
|
Automotive & Auto Parts — 0.0%(7) | |
American Tire Distributors Holdings, Inc., Term Loan, 5.25%, Maturing 9/1/21 | | $ | 3,011 | | | $ | 3,011,821 | |
| | | | | | | | | |
| | | | | | $ | 3,011,821 | |
| | | | | | | | | |
|
Capital Goods — 0.1% | |
Cortes NP Acquisition Corporation, Term Loan, 5.03%, Maturing 11/30/23 | | $ | 8,854 | | | $ | 8,923,380 | |
| | | | | | | | | |
| | | | | | $ | 8,923,380 | |
| | | | | | | | | |
|
Chemicals — 0.1% | |
Alpha 3 B.V., Term Loan, 4.15%, Maturing 1/31/24 | | $ | 3,130 | | | $ | 3,152,498 | |
| | | | | | | | | |
| | | | | | $ | 3,152,498 | |
| | | | | | | | | |
|
Diversified Financial Services — 0.2% | |
Avolon TLB Borrower 1 (Luxembourg) S.a.r.l., Term Loan, 3.74%, Maturing 3/20/22 | | $ | 11,975 | | | $ | 12,169,630 | |
| | | | | | | | | |
| | | | | | $ | 12,169,630 | |
| | | | | | | | | |
|
Energy — 0.4% | |
Chesapeake Energy Corporation, Term Loan, 8.55%, Maturing 8/23/21 | | $ | 23,545 | | | $ | 25,477,644 | |
| | | | | | | | | |
| | | | | | $ | 25,477,644 | |
| | | | | | | | | |
|
Food & Drug Retail — 0.1% | |
Rite Aid Corporation, Term Loan - Second Lien, 5.75%, Maturing 8/21/20 | | $ | 6,500 | | | $ | 6,533,312 | |
| | | | | | | | | |
| | | | | | $ | 6,533,312 | |
| | | | | | | | | |
|
Food / Beverage / Tobacco — 0.1% | |
Nature’s Bounty Co. (The), Term Loan, 4.65%, Maturing 5/5/23 | | $ | 7,424 | | | $ | 7,465,753 | |
| | | | | | | | | |
| | | | | | $ | 7,465,753 | |
| | | | | | | | | |
|
Gaming — 0.5% | |
Gateway Casinos & Entertainment Limited, Term Loan, 4.80%, Maturing 2/22/23 | | $ | 3,000 | | | $ | 3,044,064 | |
GLP Financing, LLC, Term Loan, 2.74%, Maturing 4/29/21 | | | 13,850 | | | | 13,746,125 | |
Lago Resort & Casino, LLC, Term Loan, 10.50%, Maturing 3/7/22 | | | 16,220 | | | | 16,301,100 | |
| | | | | | | | | |
| | | | | | $ | 33,091,289 | |
| | | | | | | | | |
| | | | | | | | |
| Borrower/Tranche Description | | Principal Amount (000’s omitted) | | | Value | |
| | | | | | | | |
|
Health Care — 1.0% | |
inVentiv Health, Inc., Term Loan, 4.80%, Maturing 11/9/23 | | $ | 12,174 | | | $ | 12,262,947 | |
MPH Acquisition Holdings, LLC, Term Loan, 4.90%, Maturing 6/7/23 | | | 15,273 | | | | 15,489,552 | |
Press Ganey Holdings, Inc., Term Loan, 4.25%, Maturing 10/21/23 | | | 16,813 | | | | 16,849,649 | |
Press Ganey Holdings, Inc., Term Loan - Second Lien, 8.25%, Maturing 10/21/24 | | | 12,770 | | | | 13,057,325 | |
Vizient, Inc., Term Loan, 5.00%, Maturing 2/13/23 | | | 3,506 | | | | 3,531,049 | |
| | | | | | | | | |
| | | | | | $ | 61,190,522 | |
| | | | | | | | | |
|
Metals / Mining — 0.3% | |
FMG Resources (August 2006) Pty. Ltd., Term Loan, 3.75%, Maturing 6/30/19 | | $ | 5,680 | | | $ | 5,721,608 | |
Peabody Energy Corporation, Term Loan, 5.50%, Maturing 3/31/22 | | | 12,300 | | | | 12,356,371 | |
| | | | | | | | | |
| | | | | | $ | 18,077,979 | |
| | | | | | | | | |
|
Publishing / Printing — 0.1% | |
McGraw-Hill Global Education Holdings, LLC, Term Loan, 5.00%, Maturing 5/4/22 | | $ | 7,199 | | | $ | 7,129,730 | |
| | | | | | | | | |
| | | | | | $ | 7,129,730 | |
| | | | | | | | | |
|
Services — 0.5% | |
Advantage Sales & Marketing, Inc., Term Loan - Second Lien, 7.50%, Maturing 7/25/22 | | $ | 19,715 | | | $ | 18,926,400 | |
Brickman Group, Ltd., LLC, Term Loan - Second Lien, 7.50%, Maturing 12/17/21 | | | 12,846 | | | | 12,926,213 | |
| | | | | | | | | |
| | | | | | $ | 31,852,613 | |
| | | | | | | | | |
|
Super Retail — 0.7% | |
National Vision, Inc., Term Loan, 4.00%, Maturing 3/12/21 | | $ | 19,788 | | | $ | 19,829,218 | |
National Vision, Inc., Term Loan - Second Lien, 6.75%, Maturing 3/11/22 | | | 10,000 | | | | 9,766,670 | |
PetSmart, Inc., Term Loan, 4.02%, Maturing 3/11/22 | | | 12,291 | | | | 11,346,180 | |
rue21, Inc., Term Loan, 0.00%, Maturing 10/9/20(6) | | | 18,502 | | | | 3,052,804 | |
| | | | | | | | | |
| | | | | | $ | 43,994,872 | |
| | | | | | | | | |
|
Technology — 1.3% | |
EIG Investors Corp., Term Loan, 6.04%, Maturing 2/9/23 | | $ | 26,089 | | | $ | 26,306,742 | |
EIG Investors Corp., Term Loan, 6.53%, Maturing 11/9/19 | | | 8,065 | | | | 8,123,332 | |
Misys Europe S.A., Term Loan, Maturing 4/27/24(9) | | | 6,185 | | | | 6,154,075 | |
| | | | |
| | 26 | | See Notes to Financial Statements. |
Boston Income Portfolio
April 30, 2017
Portfolio of Investments (Unaudited) — continued
| | | | | | | | |
| Borrower/Tranche Description | | Principal Amount (000’s omitted) | | | Value | |
| | | | | | | | |
|
Technology (continued) | |
Riverbed Technology, Inc., Term Loan, 4.25%, Maturing 4/24/22 | | $ | 3,006 | | | $ | 3,004,731 | |
SkillSoft Corporation, Term Loan - Second Lien, 9.25%, Maturing 4/28/22 | | | 1,050 | | | | 788,025 | |
Solera, LLC, Term Loan, 4.25%, Maturing 3/3/23 | | | 12,783 | | | | 12,886,618 | |
Veritas US, Inc., Term Loan, 6.77%, Maturing 1/27/23 | | | 21,416 | | | | 21,338,287 | |
| | | | | | | | | |
| | | | | | $ | 78,601,810 | |
| | | | | | | | | |
|
Telecommunications — 1.2% | |
Asurion, LLC, Term Loan, 4.25%, Maturing 8/4/22 | | $ | 4,814 | | | $ | 4,853,365 | |
Asurion, LLC, Term Loan - Second Lien, 8.50%, Maturing 3/3/21 | | | 45,550 | | | | 46,356,600 | |
Intelsat Jackson Holdings S.A., Term Loan, 3.89%, Maturing 6/30/19 | | | 8,210 | | | | 8,126,192 | |
Lonestar Intermediate Super Holdings, LLC, Term Loan, 10.00%, (10.00% Cash, 0.00% PIK), Maturing 8/31/21 | | | 15,610 | | | | 16,253,913 | |
| | | | | | | | | |
| | | | | | $ | 75,590,070 | |
| | | | | | | | | |
|
Transportation Ex Air / Rail — 0.1% | |
CEVA Group PLC, Term Loan, 6.50%, Maturing 3/19/21 | | $ | 2,451 | | | $ | 2,158,922 | |
CEVA Intercompany B.V., Term Loan, 6.67%, Maturing 3/19/21 | | | 1,883 | | | | 1,658,715 | |
CEVA Logistics Canada, ULC, Term Loan, 6.67%, Maturing 3/19/21 | | | 325 | | | | 285,985 | |
CEVA Logistics US Holdings, Inc., Term Loan, 6.67%, Maturing 3/19/21 | | | 2,598 | | | | 2,287,883 | |
| | | | | | | | | |
| | | | | | $ | 6,391,505 | |
| | | | | | | | | |
|
Utilities — 0.3% | |
Energy Future Intermediate Holding Co., LLC, DIP Loan, 4.30%, Maturing 6/30/17 | | $ | 17,456 | | | $ | 17,572,440 | |
| | | | | | | | | |
| | | | | | $ | 17,572,440 | |
| | | | | | | | | |
| |
Total Senior Floating-Rate Loans
(identified cost $448,403,744) | | | $ | 440,226,868 | |
| | | | | | | | | |
| | | | | | | | |
|
| Convertible Bonds — 0.4% | |
| | |
| | | | | | | | |
| Security | | Principal Amount (000’s omitted) | | | Value | |
| | | | | | | | |
|
Utilities — 0.4% | |
NRG Yield, Inc., 3.25%, 6/1/20(1) | | $ | 14,680 | | | $ | 14,505,675 | |
NRG Yield, Inc., 3.50%, 2/1/19(1) | | | 10,630 | | | | 10,849,244 | |
| | | | | | | | | |
| |
Total Convertible Bonds
(identified cost $23,655,510) | | | $ | 25,354,919 | |
| | | | | | | | | |
|
| Commercial Mortgage-Backed Securities — 0.1% | |
| | |
| | | | | | | | |
| Security | | Principal Amount (000’s omitted) | | | Value | |
Motel 6 Trust, Series 2015-MTL6, Class E, 5.279%, 2/5/30(1) | | $ | 8,101 | | | $ | 8,165,805 | |
| | | | | | | | | |
| |
Total Commercial Mortgage-Backed Securities
(identified cost $7,901,586) | | | $ | 8,165,805 | |
| | | | | | | | | |
|
| Common Stocks — 0.5% | |
| | |
| | | | | | | | |
| Security | | Shares | | | Value | |
|
Consumer Products — 0.0%(7) | |
HF Holdings, Inc.(10)(11)(12) | | | 3,400 | | | $ | 52,156 | |
| | | | | | | | | |
| | | | | | $ | 52,156 | |
| | | | | | | | | |
|
Energy — 0.5% | |
Ascent CNR Corp., Class A(10)(11)(12) | | | 32,029,863 | | | $ | 7,174,689 | |
Bonanza Creek Energy, Inc.(11)(12) | | | 256,308 | | | | 11,217,114 | |
Nine Point Energy Holdings,
Inc.(1)(11)(12) | | | 129,963 | | | | 1,911,224 | |
Patterson-UTI Energy, Inc. | | | 312,380 | | | | 6,749,139 | |
Seven Generations Energy, Ltd., Class A(12) | | | 251,036 | | | | 4,444,921 | |
| | | | | | | | | |
| | | | | | $ | 31,497,087 | |
| | | | | | | | | |
|
Gaming — 0.0%(7) | |
New Cotai Participation Corp., Class B(10)(11)(12) | | | 36 | | | $ | 251,460 | |
| | | | | | | | | |
| | | | | | $ | 251,460 | |
| | | | | | | | | |
| |
Total Common Stocks
(identified cost $38,700,393) | | | $ | 31,800,703 | |
| | | | | | | | | |
| | | | |
| | 27 | | See Notes to Financial Statements. |
Boston Income Portfolio
April 30, 2017
Portfolio of Investments (Unaudited) — continued
| | | | | | | | |
| Convertible Preferred Stocks — 0.1% | |
| | |
| | | | | | | | |
| Security | | Shares | | | Value | |
| | | | | | | | |
|
Energy — 0.1% | |
Nine Point Energy Holdings, Inc., Series A, 12.00%(1)(4)(11) | | | 2,928 | | | $ | 2,928,000 | |
| | | | | | | | | |
| |
Total Convertible Preferred Stocks
(identified cost $2,928,000) | | | $ | 2,928,000 | |
| | | | | | | | | |
|
| Miscellaneous — 0.4% | |
| | |
| | | | | | | | |
| Security | | Principal Amount/ Shares | | | Value | |
|
Cable / Satellite TV — 0.0% | |
ACC Claims Holdings, LLC(11)(12) | | | 11,599,560 | | | $ | 0 | |
| | | | | | | | | |
| | | | | | $ | 0 | |
| | | | | | | | | |
|
Energy — 0.0% | |
SemGroup Corp., Escrow
Certificate(11)(12) | | | 10,225,000 | | | $ | 0 | |
| | | | | | | | | |
| | | | | | $ | 0 | |
| | | | | | | | | |
|
Gaming — 0.4% | |
Buffalo Thunder Development Authority, Residual Claim Certificates, Expires 11/15/29(1)(12) | | $ | 2,349,221 | | | $ | 1,175 | |
PGP Investors, LLC, Membership Interests(10)(11)(12) | | | 38,571 | | | | 25,611,429 | |
| | | | | | | | | |
| | | | | | $ | 25,612,604 | |
| | | | | | | | | |
| |
Total Miscellaneous
(identified cost $13,303,125) | | | $ | 25,612,604 | |
| | | | | | | | | |
|
| Short-Term Investments — 2.8% | |
| | |
| | | | | | | | |
| Description | | Units | | | Value | |
| | | | | | | | |
Eaton Vance Cash Reserves Fund, LLC, 1.07%(13) | | | 171,453,379 | | | $ | 171,504,815 | |
| | | | | | | | | |
| |
Total Short-Term Investments
(identified cost $171,489,296) | | | $ | 171,504,815 | |
| | | | | | | | | |
| |
Total Investments — 98.6%
(identified cost $5,939,219,047) | | | $ | 6,161,986,649 | |
| | | | | | | | | |
| |
Other Assets, Less Liabilities — 1.4% | | | $ | 88,830,011 | |
| | | | | | | | | |
| |
Net Assets — 100.0% | | | $ | 6,250,816,660 | |
| | | | | | | | | |
The percentage shown for each investment category in the Portfolio of Investments is based on net assets.
| | (1) | Security exempt from registration pursuant to Rule 144A under the Securities Act of 1933, as amended. These securities may be sold in certain transactions in reliance on an exemption from registration (normally to qualified institutional buyers). At April 30, 2017, the aggregate value of these securities is $3,239,033,221 or 51.8% of the Portfolio’s net assets. |
| | (2) | Security converts to floating rate after the indicated fixed-rate coupon period. |
| | (3) | Perpetual security with no stated maturity date but may be subject to calls by the issuer. |
| | (4) | Represents a payment-in-kind security which may pay interest in additional principal at the issuer’s discretion. The interest rate paid in additional principal is generally higher than the indicated cash rate. |
| | (5) | When-issued/delayed delivery security. |
| | (6) | Currently the issuer is in default with respect to interest and/or principal payments or has filed for bankruptcy. For a variable rate security, interest rate has been adjusted to reflect non-accrual status. |
| | (7) | Amount is less than 0.05%. |
| | (8) | Senior floating-rate loans (Senior Loans) often require prepayments from excess cash flows or permit the borrowers to repay at their election. The degree to which borrowers repay, whether as a contractual requirement or at their election, cannot be predicted with accuracy. As a result, the actual remaining maturity may be substantially less than the stated maturities shown. However, Senior Loans will typically have an expected average life of approximately two to four years. The stated interest rate represents the weighted average interest rate of all contracts within the senior loan facility and includes commitment fees on unfunded loan commitments, if any. Senior Loans typically have rates of interest which are redetermined either daily, monthly, quarterly or semi-annually by reference to a base lending rate, plus a premium. These base lending rates are primarily the London Interbank Offered Rate (“LIBOR”) and secondarily, the prime rate offered by one or more major United States banks (the “Prime Rate”) and the certificate of deposit (“CD”) rate or other base lending rates used by commercial lenders. |
| | (9) | This Senior Loan will settle after April 30, 2017, at which time the interest rate will be determined. |
| (10) | Restricted security (see Note 5). |
| (11) | For fair value measurement disclosure purposes, security is categorized as Level 3 (see Note 9). |
| (12) | Non-income producing security. |
| (13) | Affiliated investment company, available to Eaton Vance portfolios and funds, which invests in high quality, U.S. dollar denominated money market instruments. The rate shown is the annualized seven-day yield as of April 30, 2017. |
| | | | |
| | 28 | | See Notes to Financial Statements. |
Boston Income Portfolio
April 30, 2017
Portfolio of Investments (Unaudited) — continued
| | | | | | | | | | | | | | | | | | | | | | | | |
| Forward Foreign Currency Exchange Contracts | |
| Currency Purchased | | | Currency Sold | | | Counterparty | | Settlement Date | | | Unrealized Appreciation | | | Unrealized (Depreciation) | |
| | | | | | | |
| USD | | | 4,457,696 | | | CAD | | | 6,065,030 | | | State Street Bank and Trust Company | | | 7/31/17 | | | $ | 8,526 | | | $ | — | |
| | | | | | | |
| | | | | | | | | | | | | | | | | | | $ | 8,526 | | | $ | — | |
Abbreviations:
| | | | |
| DIP | | – | | Debtor In Possession |
| PIK | | – | | Payment In Kind |
Currency Abbreviations:
| | | | |
| CAD | | – | | Canadian Dollar |
| USD | | – | | United States Dollar |
| | | | |
| | 29 | | See Notes to Financial Statements. |
Boston Income Portfolio
April 30, 2017
Statement of Assets and Liabilities (Unaudited)
| | | | |
| Assets | | April 30, 2017 | |
Unaffiliated investments, at value (identified cost, $5,767,729,751) | | $ | 5,990,481,834 | |
Affiliated investment, at value (identified cost, $171,489,296) | | | 171,504,815 | |
Cash | | | 1,603,470 | |
Foreign currency, at value (identified cost, $45) | | | 45 | |
Interest receivable | | | 95,445,544 | |
Dividends receivable from affiliated investment | | | 108,910 | |
Receivable for investments sold | | | 36,761,971 | |
Receivable for open forward foreign currency exchange contracts | | | 8,526 | |
Other assets | | | 284,237 | |
Total assets | | $ | 6,296,199,352 | |
| |
| Liabilities | | | | |
Payable for investments purchased | | $ | 14,191,480 | |
Payable for when-issued/delayed delivery securities | | | 27,654,013 | |
Payable to affiliates: | | | | |
Investment adviser fee | | | 3,046,068 | |
Trustees’ fees | | | 8,458 | |
Accrued expenses | | | 482,673 | |
Total liabilities | | $ | 45,382,692 | |
Net Assets applicable to investors’ interest in Portfolio | | $ | 6,250,816,660 | |
| |
| Sources of Net Assets | | | | |
Investors’ capital | | $ | 6,028,040,536 | |
Net unrealized appreciation | | | 222,776,124 | |
Total | | $ | 6,250,816,660 | |
| | | | |
| | 30 | | See Notes to Financial Statements. |
Boston Income Portfolio
April 30, 2017
Statement of Operations (Unaudited)
| | | | |
| Investment Income | | Six Months Ended April 30, 2017 | |
Interest and other income | | $ | 195,412,606 | |
Dividends | | | 1,738,724 | |
Dividends from affiliated investment | | | 1,060,576 | |
Total investment income | | $ | 198,211,906 | |
| |
| Expenses | | | | |
Investment adviser fee | | $ | 18,781,763 | |
Trustees’ fees and expenses | | | 53,542 | |
Custodian fee | | | 502,988 | |
Legal and accounting services | | | 113,073 | |
Miscellaneous | | | 112,949 | |
Total expenses | | $ | 19,564,315 | |
| |
Net investment income | | $ | 178,647,591 | |
| |
| Realized and Unrealized Gain (Loss) | | | | |
Net realized gain (loss) — | | | | |
Investment transactions | | $ | (5,062,148 | ) |
Investment transactions — affiliated investment | | | 78,678 | |
Swap contracts | | | 348,732 | |
Foreign currency and forward foreign currency exchange contract transactions | | | 70,498 | |
Net realized loss | | $ | (4,564,240 | ) |
Change in unrealized appreciation (depreciation) — | | | | |
Investments | | $ | 130,866,342 | |
Investments — affiliated investment | | | (51,727 | ) |
Swap contracts | | | (333,483 | ) |
Foreign currency and forward foreign currency exchange contracts | | | 12,320 | |
Net change in unrealized appreciation (depreciation) | | $ | 130,493,452 | |
| |
Net realized and unrealized gain | | $ | 125,929,212 | |
| |
Net increase in net assets from operations | | $ | 304,576,803 | |
| | | | |
| | 31 | | See Notes to Financial Statements. |
Boston Income Portfolio
April 30, 2017
Statements of Changes in Net Assets
| | | | | | | | |
| Increase (Decrease) in Net Assets | | Six Months Ended April 30, 2017 (Unaudited) | | | Year Ended October 31, 2016 | |
From operations — | | | | | | | | |
Net investment income | | $ | 178,647,591 | | | $ | 343,239,756 | |
Net realized loss from investment transactions, swap contracts and foreign currency and forward foreign currency exchange contract transactions | | | (4,564,240 | ) | | | (65,382,589 | ) |
Net change in unrealized appreciation (depreciation) from investments, swap contracts, foreign currency and forward foreign currency exchange contracts | | | 130,493,452 | | | | 178,062,044 | |
Net increase in net assets from operations | | $ | 304,576,803 | | | $ | 455,919,211 | |
Capital transactions — | | | | | | | | |
Contributions | | $ | 319,680,311 | | | $ | 1,212,272,358 | |
Withdrawals | | | (865,874,459 | ) | | | (781,028,952 | ) |
Net increase (decrease) in net assets from capital transactions | | $ | (546,194,148 | ) | | $ | 431,243,406 | |
| | |
Net increase (decrease) in net assets | | $ | (241,617,345 | ) | | $ | 887,162,617 | |
| | |
| Net Assets | | | | | | | | |
At beginning of period | | $ | 6,492,434,005 | | | $ | 5,605,271,388 | |
At end of period | | $ | 6,250,816,660 | | | $ | 6,492,434,005 | |
| | | | |
| | 32 | | See Notes to Financial Statements. |
Boston Income Portfolio
April 30, 2017
Financial Highlights
| | | | | | | | | | | | | | | | | | | | | | | | |
| | | Six Months Ended April 30, 2017
(Unaudited) | | | Year Ended October 31, | |
| Ratios/Supplemental Data | | | 2016 | | | 2015 | | | 2014 | | | 2013 | | | 2012 | |
Ratios (as a percentage of average daily net assets): | | | | | | | | | | | | | | | | | | | | | | | | |
Expenses(1) | | | 0.61 | %(2) | | | 0.61 | % | | | 0.62 | % | | | 0.62 | % | | | 0.62 | % | | | 0.62 | % |
Net investment income | | | 5.60 | %(2) | | | 5.79 | % | | | 5.78 | % | | | 5.81 | % | | | 6.15 | % | | | 6.49 | % |
Portfolio Turnover | | | 24 | %(3) | | | 34 | % | | | 36 | % | | | 43 | % | | | 56 | % | | | 64 | % |
| | | | | | |
Total Return | | | 5.00 | %(3) | | | 7.42 | % | | | 0.28 | % | | | 5.74 | % | | | 9.17 | % | | | 11.44 | % |
| | | | | | |
Net assets, end of period (000’s omitted) | | $ | 6,250,817 | | | $ | 6,492,434 | | | $ | 5,605,271 | | | $ | 5,045,293 | | | $ | 4,881,852 | | | $ | 5,344,748 | |
| (1) | Excludes the effect of custody fee credits, if any, of less than 0.005%. Effective September 1, 2015, custody fee credits, which were earned on cash deposit balances, were discontinued by the custodian. |
| | | | |
| | 33 | | See Notes to Financial Statements. |
Boston Income Portfolio
April 30, 2017
Notes to Financial Statements (Unaudited)
1 Significant Accounting Policies
Boston Income Portfolio (the Portfolio) is a Massachusetts business trust registered under the Investment Company Act of 1940, as amended (the 1940 Act), as a diversified, open-end management investment company. The Portfolio’s investment objective is to provide a high level of current income. The Portfolio’s secondary objectives are to seek growth of income and capital. The Declaration of Trust permits the Trustees to issue interests in the Portfolio. At April 30, 2017, Eaton Vance Income Fund of Boston, Eaton Vance Short Duration Strategic Income Fund and Eaton Vance International (Cayman Islands) Short Duration Strategic Income Fund held an interest of 99.9%, less than 0.05% and less than 0.05%, respectively, in the Portfolio.
The following is a summary of significant accounting policies of the Portfolio. The policies are in conformity with accounting principles generally accepted in the United States of America (U.S. GAAP). The Portfolio is an investment company and follows accounting and reporting guidance in the Financial Accounting Standards Board (FASB) Accounting Standards Codification Topic 946.
A Investment Valuation — The following methodologies are used to determine the market value or fair value of investments.
Debt Obligations. Debt obligations are generally valued on the basis of valuations provided by third party pricing services, as derived from such services’ pricing models. Inputs to the models may include, but are not limited to, reported trades, executable bid and asked prices, broker/dealer quotations, prices or yields of securities with similar characteristics, interest rates, anticipated prepayments, benchmark curves or information pertaining to the issuer, as well as industry and economic events. The pricing services may use a matrix approach, which considers information regarding securities with similar characteristics to determine the valuation for a security. Short-term obligations purchased with a remaining maturity of sixty days or less for which a valuation from a third party pricing service is not readily available may be valued at amortized cost, which approximates fair value.
Senior Floating-Rate Loans. Interests in senior floating-rate loans (Senior Loans) for which reliable market quotations are readily available are valued generally at the average mean of bid and ask quotations obtained from a third party pricing service. Other Senior Loans are valued at fair value by the investment adviser under procedures approved by the Trustees. In fair valuing a Senior Loan, the investment adviser utilizes one or more of the valuation techniques described in (i) through (iii) below to assess the likelihood that the borrower will make a full repayment of the loan underlying such Senior Loan relative to yields on other Senior Loans issued by companies of comparable credit quality. If the investment adviser believes that there is a reasonable likelihood of full repayment, the investment adviser will determine fair value using a matrix pricing approach that considers the yield on the Senior Loan. If the investment adviser believes there is not a reasonable likelihood of full repayment, the investment adviser will determine fair value using analyses that include, but are not limited to: (i) a comparison of the value of the borrower’s outstanding equity and debt to that of comparable public companies; (ii) a discounted cash flow analysis; or (iii) when the investment adviser believes it is likely that a borrower will be liquidated or sold, an analysis of the terms of such liquidation or sale. In certain cases, the investment adviser will use a combination of analytical methods to determine fair value, such as when only a portion of a borrower’s assets are likely to be sold. In conducting its assessment and analyses for purposes of determining fair value of a Senior Loan, the investment adviser will use its discretion and judgment in considering and appraising relevant factors. Fair value determinations are made by the portfolio managers of the Portfolio based on information available to such managers. The portfolio managers of other funds managed by the investment adviser that invest in Senior Loans may not possess the same information about a Senior Loan borrower as the portfolio managers of the Portfolio. At times, the fair value of a Senior Loan determined by the portfolio managers of other funds managed by the investment adviser that invest in Senior Loans may vary from the fair value of the same Senior Loan determined by the portfolio managers of the Portfolio. The fair value of each Senior Loan is periodically reviewed and approved by the investment adviser’s Valuation Committee and by the Trustees based upon procedures approved by the Trustees. Junior Loans (i.e., subordinated loans and second lien loans) are valued in the same manner as Senior Loans.
Equity Securities. Equity securities listed on a U.S. securities exchange generally are valued at the last sale or closing price on the day of valuation or, if no sales took place on such date, at the mean between the closing bid and asked prices therefore on the exchange where such securities are principally traded. Equity securities listed on the NASDAQ Global or Global Select Market generally are valued at the NASDAQ official closing price. Unlisted or listed securities for which closing sales prices or closing quotations are not available are valued at the mean between the latest available bid and asked prices or, in the case of preferred equity securities that are not listed or traded in the over-the-counter market, by a third party pricing service that uses various techniques that consider factors including, but not limited to, prices or yields of securities with similar characteristics, benchmark yields, broker/dealer quotes, quotes of underlying common stock, issuer spreads, as well as industry and economic events.
Derivatives. Forward foreign currency exchange contracts are generally valued at the mean of the average bid and average asked prices that are reported by currency dealers to a third party pricing service at the valuation time. Such third party pricing service valuations are supplied for specific settlement periods and the Portfolio’s forward foreign currency exchange contracts are valued at an interpolated rate between the closest preceding and subsequent settlement period reported by the third party pricing service. Swaps are normally valued using valuations provided by a third party pricing service. Such pricing service valuations are based on the present value of fixed and projected floating rate cash flows over the term of the swap contract, and in the case of credit default swaps, based on credit spread quotations obtained from broker/dealers and expected default recovery rates determined by the pricing service using proprietary models. Future cash flows on swaps are discounted to their present value using swap rates provided by electronic data services or by broker/dealers.
Foreign Securities and Currencies. Foreign securities and currencies are valued in U.S. dollars, based on foreign currency exchange rate quotations supplied by a third party pricing service. The pricing service uses a proprietary model to determine the exchange rate. Inputs to the model include reported trades and implied bid/ask spreads.
Affiliated Fund. The Portfolio may invest in Eaton Vance Cash Reserves Fund, LLC (Cash Reserves Fund), an affiliated investment company managed by Eaton Vance Management (EVM). While Cash Reserves Fund is not a registered money market mutual fund, it conducts all of its investment activities in
Boston Income Portfolio
April 30, 2017
Notes to Financial Statements (Unaudited) — continued
accordance with the requirements of Rule 2a-7 under the 1940 Act. Investments in Cash Reserves Fund are valued at the closing net asset value per unit on the valuation day. Cash Reserves Fund generally values its investment securities based on available market quotations provided by a third party pricing service.
Fair Valuation. Investments for which valuations or market quotations are not readily available or are deemed unreliable are valued at fair value using methods determined in good faith by or at the direction of the Trustees of the Portfolio in a manner that fairly reflects the security’s value, or the amount that the Portfolio might reasonably expect to receive for the security upon its current sale in the ordinary course. Each such determination is based on a consideration of relevant factors, which are likely to vary from one pricing context to another. These factors may include, but are not limited to, the type of security, the existence of any contractual restrictions on the security’s disposition, the price and extent of public trading in similar securities of the issuer or of comparable companies or entities, quotations or relevant information obtained from broker/dealers or other market participants, information obtained from the issuer, analysts, and/or the appropriate stock exchange (for exchange-traded securities), an analysis of the company’s or entity’s financial condition, and an evaluation of the forces that influence the issuer and the market(s) in which the security is purchased and sold.
B Investment Transactions — Investment transactions for financial statement purposes are accounted for on a trade date basis. Realized gains and losses on investments sold are determined on the basis of identified cost.
C Income — Interest income is recorded on the basis of interest accrued, adjusted for amortization of premium or accretion of discount. Fees associated with loan amendments are recognized immediately. Dividend income is recorded on the ex-dividend date for dividends received in cash and/or securities. Distributions from investment companies are recorded as dividend income, capital gains or return of capital based on the nature of the distribution.
D Federal Taxes — The Portfolio has elected to be treated as a partnership for federal tax purposes. No provision is made by the Portfolio for federal or state taxes on any taxable income of the Portfolio because each investor in the Portfolio is ultimately responsible for the payment of any taxes on its share of taxable income. Since at least one of the Portfolio’s investors is a regulated investment company that invests all or substantially all of its assets in the Portfolio, the Portfolio normally must satisfy the applicable source of income and diversification requirements (under the Internal Revenue Code) in order for its investors to satisfy them. The Portfolio will allocate, at least annually among its investors, each investor’s distributive share of the Portfolio’s net investment income, net realized capital gains and losses and any other items of income, gain, loss, deduction or credit.
As of April 30, 2017, the Portfolio had no uncertain tax positions that would require financial statement recognition, de-recognition, or disclosure. The Portfolio files a U.S. federal income tax return annually after its fiscal year-end, which is subject to examination by the Internal Revenue Service for a period of three years from the date of filing.
E Foreign Currency Translation — Investment valuations, other assets, and liabilities initially expressed in foreign currencies are translated each business day into U.S. dollars based upon current exchange rates. Purchases and sales of foreign investment securities and income and expenses denominated in foreign currencies are translated into U.S. dollars based upon currency exchange rates in effect on the respective dates of such transactions. Recognized gains or losses on investment transactions attributable to changes in foreign currency exchange rates are recorded for financial statement purposes as net realized gains and losses on investments. That portion of unrealized gains and losses on investments that results from fluctuations in foreign currency exchange rates is not separately disclosed.
F Use of Estimates — The preparation of the financial statements in conformity with U.S. GAAP requires management to make estimates and assumptions that affect the reported amounts of assets and liabilities at the date of the financial statements and the reported amounts of income and expense during the reporting period. Actual results could differ from those estimates.
G Indemnifications — Under the Portfolio’s organizational documents, its officers and Trustees may be indemnified against certain liabilities and expenses arising out of the performance of their duties to the Portfolio. Under Massachusetts law, if certain conditions prevail, interestholders in the Portfolio could be deemed to have personal liability for the obligations of the Portfolio. However, the Portfolio’s Declaration of Trust contains an express disclaimer of liability on the part of Portfolio interestholders and the By-laws provide that the Portfolio shall assume the defense on behalf of any Portfolio interestholder. Moreover, the By-laws also provide for indemnification out of Portfolio property of any interestholder held personally liable solely by reason of being or having been an interestholder for all loss or expense arising from such liability. Additionally, in the normal course of business, the Portfolio enters into agreements with service providers that may contain indemnification clauses. The Portfolio’s maximum exposure under these arrangements is unknown as this would involve future claims that may be made against the Portfolio that have not yet occurred.
H Forward Foreign Currency Exchange Contracts — The Portfolio may enter into forward foreign currency exchange contracts for the purchase or sale of a specific foreign currency at a fixed price on a future date. The forward foreign currency exchange contracts are adjusted by the daily exchange rate of the underlying currency and any gains or losses are recorded as unrealized until such time as the contracts have been closed. Risks may arise upon entering these contracts from the potential inability of counterparties to meet the terms of their contracts and from movements in the value of a foreign currency relative to the U.S. dollar.
I Credit Default Swaps — Swap contracts are privately negotiated agreements between the Portfolio and a counterparty. Certain swap contracts may be centrally cleared (“centrally cleared swaps”), whereby all payments made or received by the Portfolio pursuant to the contract are with a central clearing party (CCP) rather than the original counterparty. The CCP guarantees the performance of the original parties to the contract. When the Portfolio is the buyer of a credit default swap contract, the Portfolio is entitled to receive the par (or other agreed-upon) value of a referenced debt obligation (or basket of
Boston Income Portfolio
April 30, 2017
Notes to Financial Statements (Unaudited) — continued
debt obligations) from the counterparty (or CCP in the case of a centrally cleared swap) to the contract if a credit event by a third party, such as a U.S. or foreign corporate issuer or sovereign issuer, on the debt obligation occurs. In return, the Portfolio pays the counterparty a periodic stream of payments over the term of the contract provided that no credit event has occurred. If no credit event occurs, the Portfolio would have spent the stream of payments and received no proceeds from the contract. When the Portfolio is the seller of a credit default swap contract, it receives the stream of payments, but is obligated to pay to the buyer of the protection an amount up to the notional amount of the swap and in certain instances take delivery of securities of the reference entity upon the occurrence of a credit event, as defined under the terms of that particular swap agreement. Credit events are contract specific but may include bankruptcy, failure to pay, restructuring, obligation acceleration and repudiation/moratorium. If the Portfolio is a seller of protection and a credit event occurs, the maximum potential amount of future payments that the Portfolio could be required to make would be an amount equal to the notional amount of the agreement. This potential amount would be partially offset by any recovery value of the respective referenced obligation, or net amount received from the settlement of a buy protection credit default swap agreement entered into by the Portfolio for the same referenced obligation. As the seller, the Portfolio may create economic leverage to its portfolio because, in addition to its total net assets, the Portfolio is subject to investment exposure on the notional amount of the swap. The interest fee paid or received on the swap contract, which is based on a specified interest rate on a fixed notional amount, is accrued daily as a component of unrealized appreciation (depreciation) and is recorded as realized gain upon receipt or realized loss upon payment. The Portfolio also records an increase or decrease to unrealized appreciation (depreciation) in an amount equal to the daily valuation. For centrally cleared swaps, the daily change in valuation is recorded as a receivable or payable for variation margin and settled in cash with the CCP daily. All upfront payments, if any, are amortized over the life of the swap contract as realized gains or losses. Those upfront payments that are paid or received, typically for non-centrally cleared swaps, are recorded as other assets or other liabilities, respectively, net of amortization. For financial reporting purposes, unamortized upfront payments, if any, are netted with unrealized appreciation or depreciation on swap contracts to determine the market value of swaps as presented in Notes 6 and 9. The Portfolio segregates assets in the form of cash or liquid securities in an amount equal to the notional amount of the credit default swaps of which it is the seller. The Portfolio segregates assets in the form of cash or liquid securities in an amount equal to any unrealized depreciation of the credit default swaps of which it is the buyer, marked-to-market on a daily basis. Upon entering into centrally cleared swaps, the Portfolio is required to deposit with the CCP, either in cash or securities, an amount equal to a certain percentage of the notional amount (initial margin), which is subject to adjustment. These transactions involve certain risks, including the risk that the seller may be unable to fulfill the transaction. In the case of centrally cleared swaps, counterparty risk is minimal due to protections provided by the CCP.
J When-Issued Securities and Delayed Delivery Transactions — The Portfolio may purchase or sell securities on a delayed delivery or when-issued basis. Payment and delivery may take place after the customary settlement period for that security. At the time the transaction is negotiated, the price of the security that will be delivered is fixed. The Portfolio maintains cash and/or security positions for these commitments such that sufficient liquid assets will be available to make payments upon settlement. Securities purchased on a delayed delivery or when-issued basis are marked-to-market daily and begin earning interest on settlement date. Losses may arise due to changes in the market value of the underlying securities or if the counterparty does not perform under the contract.
K Interim Financial Statements — The interim financial statements relating to April 30, 2017 and for the six months then ended have not been audited by an independent registered public accounting firm, but in the opinion of the Portfolio’s management, reflect all adjustments, consisting only of normal recurring adjustments, necessary for the fair presentation of the financial statements.
2 Investment Adviser Fee and Other Transactions with Affiliates
The investment adviser fee is earned by Boston Management and Research (BMR), a subsidiary of EVM, as compensation for investment advisory services rendered to the Portfolio. Pursuant to the investment advisory agreement and subsequent fee reduction agreements between the Portfolio and BMR, the fee is computed at an annual rate of 0.625% of the Portfolio’s average daily net assets up to $1.5 billion, 0.60% from $1.5 billion up to $2 billion, 0.575% from $2 billion up to $5 billion, 0.555% from $5 billion up to $10 billion, and 0.535% of average daily net assets of $10 billion or more, and is payable monthly. The fee reductions cannot be terminated without the consent of a majority of Trustees and a majority of interestholders of the Portfolio. For the six months ended April 30, 2017, the Portfolio’s investment adviser fee amounted to $18,781,763 or 0.59% (annualized) of the Portfolio’s average daily net assets. The Portfolio invests its cash in Cash Reserves Fund. EVM does not currently receive a fee for advisory services provided to Cash Reserves Fund.
Trustees and officers of the Portfolio who are members of EVM’s or BMR’s organizations receive remuneration for their services to the Portfolio out of the investment adviser fee. Trustees of the Portfolio who are not affiliated with the investment adviser may elect to defer receipt of all or a percentage of their annual fees in accordance with the terms of the Trustees Deferred Compensation Plan. For the six months ended April 30, 2017, no significant amounts have been deferred. Certain officers and Trustees of the Portfolio are officers of the above organizations.
3 Purchases and Sales of Investments
Purchases and sales of investments, other than short-term obligations and including maturities and principal repayments on Senior Loans, aggregated $1,491,963,129 and $1,733,419,400, respectively, for the six months ended April 30, 2017.
Boston Income Portfolio
April 30, 2017
Notes to Financial Statements (Unaudited) — continued
4 Federal Income Tax Basis of Investments
The cost and unrealized appreciation (depreciation) of investments of the Portfolio at April 30, 2017, as determined on a federal income tax basis, were as follows:
| | | | |
| |
Aggregate cost | | $ | 5,951,021,300 | |
| |
Gross unrealized appreciation | | $ | 286,314,211 | |
Gross unrealized depreciation | | | (75,348,862 | ) |
| |
Net unrealized appreciation | | $ | 210,965,349 | |
5 Restricted Securities
At April 30, 2017, the Portfolio owned the following securities (representing 0.3% of net assets) which were restricted as to public resale and not registered under the Securities Act of 1933 (excluding Rule 144A securities). The Portfolio has various registration rights (exercisable under a variety of circumstances) with respect to these securities. The value of these securities is determined based on valuations provided by brokers when available, or if not available, they are valued at fair value using methods determined in good faith by or at the direction of the Trustees.
| | | | | | | | | | | | | | | | |
| Description | | Date of Acquisition | | | Shares | | | Cost | | | Value | |
| | | | |
Common Stocks | | | | | | | | | | | | | | | | |
Ascent CNR Corp., Class A | | | 4/25/16, 11/16/16 | | | | 32,029,863 | | | $ | 0 | | | $ | 7,174,689 | |
HF Holdings, Inc. | | | 10/27/09 | | | | 3,400 | | | | 182,613 | | | | 52,156 | |
New Cotai Participation Corp., Class B | | | 4/12/13 | | | | 36 | | | | 1,111,500 | | | | 251,460 | |
| | | | |
Total Common Stocks | | | | | | | | | | $ | 1,294,113 | | | $ | 7,478,305 | |
| | | | |
Miscellaneous | | | | | | | | | | | | | | | | |
PGP Investors, LLC, Membership Interests | | | 10/23/12, 2/18/15 | | | | 38,571 | | | $ | 13,303,125 | | | $ | 25,611,429 | |
| | | | |
Total Miscellaneous | | | | | | | | | | $ | 13,303,125 | | | $ | 25,611,429 | |
| | | | |
Total Restricted Securities | | | | | | | | | | $ | 14,597,238 | | | $ | 33,089,734 | |
6 Financial Instruments
The Portfolio may trade in financial instruments with off-balance sheet risk in the normal course of its investing activities. These financial instruments may include forward foreign currency exchange contracts and swap contracts and may involve, to a varying degree, elements of risk in excess of the amounts recognized for financial statement purposes. The notional or contractual amounts of these instruments represent the investment the Portfolio has in particular classes of financial instruments and do not necessarily represent the amounts potentially subject to risk. The measurement of the risks associated with these instruments is meaningful only when all related and offsetting transactions are considered. A summary of obligations under these financial instruments at April 30, 2017 is included in the Portfolio of Investments. At April 30, 2017, the Portfolio had sufficient cash and/or securities to cover commitments under these contracts.
In the normal course of pursuing its investment objectives, the Portfolio is subject to the following risks:
Credit Risk: During the six months ended April 30, 2017, the Portfolio entered into credit default swaps to manage its credit risk, to gain exposure to a credit which it may otherwise invest, or to enhance return.
Foreign Exchange Risk: The Portfolio holds foreign currency denominated investments. The value of these investments and related receivables and payables may change due to future changes in foreign currency exchange rates. To hedge against this risk, the Portfolio enters into forward foreign currency exchange contracts.
Boston Income Portfolio
April 30, 2017
Notes to Financial Statements (Unaudited) — continued
The Portfolio enters into over-the-counter (OTC) derivatives that may contain provisions whereby the counterparty may terminate the contract under certain conditions, including but not limited to a decline in the Portfolio’s net assets below a certain level over a certain period of time, which would trigger a payment by the Portfolio for those derivatives in a liability position. At April 30, 2017, the Portfolio had no open derivatives with credit-related contingent features in a net liability position.
The OTC derivatives in which the Portfolio invests are subject to the risk that the counterparty to the contract fails to perform its obligations under the contract. To mitigate this risk, the Portfolio has entered into an International Swaps and Derivatives Association, Inc. Master Agreement (“ISDA Master Agreement”) or similar agreement with substantially all its derivative counterparties. An ISDA Master Agreement is a bilateral agreement between the Portfolio and a counterparty that governs certain OTC derivatives and typically contains, among other things, set-off provisions in the event of a default and/or termination event as defined under the relevant ISDA Master Agreement. Under an ISDA Master Agreement, the Portfolio may, under certain circumstances, offset with the counterparty certain derivative financial instruments’ payables and/or receivables with collateral held and/or posted and create one single net payment. The provisions of the ISDA Master Agreement typically permit a single net payment in the event of default including the bankruptcy or insolvency of the counterparty. However, bankruptcy or insolvency laws of a particular jurisdiction may impose restrictions on or prohibitions against the right of offset in bankruptcy or insolvency. Certain ISDA Master Agreements allow counterparties to OTC derivatives to terminate derivative contracts prior to maturity in the event the Portfolio’s net assets decline by a stated percentage or the Portfolio fails to meet the terms of its ISDA Master Agreements, which would cause the counterparty to accelerate payment by the Portfolio of any net liability owed to it.
The collateral requirements for derivatives traded under an ISDA Master Agreement are governed by a Credit Support Annex to the ISDA Master Agreement. Collateral requirements are determined at the close of business each day and are typically based on changes in market values for each transaction under an ISDA Master Agreement and netted into one amount for such agreement. Generally, the amount of collateral due from or to a counterparty is subject to a minimum transfer threshold amount before a transfer is required, which may vary by counterparty. Collateral pledged for the benefit of the Portfolio and/or counterparty is held in segregated accounts by the Portfolio’s custodian and cannot be sold, re-pledged, assigned or otherwise used while pledged. The portion of such collateral representing cash, if any, is reflected as restricted cash and, in the case of cash pledged by a counterparty for the benefit of the Portfolio, a corresponding liability on the Statement of Assets and Liabilities. Securities pledged by the Portfolio as collateral, if any, are identified as such in the Portfolio of Investments.
The fair value of open derivative instruments (not considered to be hedging instruments for accounting disclosure purposes) by risk exposure at April 30, 2017 was as follows:
| | | | | | | | | | |
| | | | | Fair Value | |
| Risk | | Derivative | | Asset Derivative | | | Liability Derivative | |
| | | |
Foreign Exchange | | Forward foreign currency exchange contracts | | $ | 8,526 | (1) | | $ | — | |
| | |
Total Derivatives subject to master netting or similar agreements | | $ | 8,526 | | | $ | — | |
| (1) | Statement of Assets and Liabilities location: Receivable for open forward foreign currency exchange contracts; Net unrealized appreciation. |
The Portfolio’s derivative assets and liabilities at fair value by risk, which are reported gross in the Statement of Assets and Liabilities, are presented in the table above. The following table presents the Portfolio’s derivative assets by counterparty, net of amounts available for offset under a master netting agreement as of April 30, 2017.
| | | | | | | | | | | | | | | | | | | | |
| Counterparty | | Derivative Assets Subject to Master Netting Agreement | | | Derivatives Available for Offset | | | Non-cash Collateral Received(a) | | | Cash Collateral Received(a) | | | Net Amount of Derivative Assets(b) | |
| | | | | |
State Street Bank and Trust Company | | $ | 8,526 | | | $ | — | | | $ | — | | | $ | — | | | $ | 8,526 | |
| (a) | In some instances, the actual collateral received and/or pledged may be more than the amount shown due to overcollateralization. |
| (b) | Net amount represents the net amount due from the counterparty in the event of default. |
Boston Income Portfolio
April 30, 2017
Notes to Financial Statements (Unaudited) — continued
The effect of derivative instruments (not considered to be hedging instruments for accounting disclosure purposes) on the Statement of Operations by risk exposure for the six months ended April 30, 2017 was as follows:
| | | | | | | | | | |
| Risk | | Derivative | | Realized Gain (Loss)
on Derivatives Recognized in Income(1) | | | Change in Unrealized Appreciation (Depreciation) on Derivatives Recognized in Income(2) | |
| | | |
Credit | | Swap contracts | | $ | 348,732 | | | $ | (333,483 | ) |
Foreign Exchange | | Forward foreign currency exchange contracts | | | 70,499 | | | | 12,320 | |
| | | |
Total | | | | $ | 419,231 | | | $ | (321,163 | ) |
| (1) | Statement of Operations location: Net realized gain (loss) – Swap contracts and Foreign currency and forward foreign currency exchange contract transactions, respectively. |
| (2) | Statement of Operations location: Change in unrealized appreciation (depreciation) – Swap contracts and Foreign currency and forward foreign currency exchange contracts, respectively. |
The average notional amounts of derivative contracts outstanding during the six months ended April 30, 2017, which are indicative of the volume of these derivative types, were as follows:
| | | | | | |
Forward Foreign Currency Exchange Contracts* | | | Swap Contracts | |
| |
| | $5,219,000 | | | $ | 9,229,000 | |
| * | The average notional amount of forward foreign currency exchange contracts is based on the absolute value of notional amounts of currency purchased and currency sold. |
7 Line of Credit
The Portfolio participates with other portfolios and funds managed by EVM and its affiliates in a $625 million unsecured line of credit agreement with a group of banks, which is in effect through September 1, 2017. Borrowings are made by the Portfolio solely to facilitate the handling of unusual and/or unanticipated short-term cash requirements. Interest is charged to the Portfolio based on its borrowings at an amount above either the Eurodollar rate or Federal Funds rate. In addition, a fee computed at an annual rate of 0.15% on the daily unused portion of the line of credit is allocated among the participating portfolios and funds at the end of each quarter. Because the line of credit is not available exclusively to the Portfolio, it may be unable to borrow some or all of its requested amounts at any particular time. The Portfolio did not have any significant borrowings or allocated fees during the six months ended April 30, 2017.
8 Credit Risk
The Portfolio primarily invests in lower rated and comparable quality unrated high yield securities. These investments have different risks than investments in debt securities rated investment grade. Risk of loss upon default by the borrower is significantly greater with respect to such debt than with other debt securities because these securities are generally unsecured and are more sensitive to adverse economic conditions, such as recession or increasing interest rates, than are investment grade issuers.
9 Fair Value Measurements
Under generally accepted accounting principles for fair value measurements, a three-tier hierarchy to prioritize the assumptions, referred to as inputs, is used in valuation techniques to measure fair value. The three-tier hierarchy of inputs is summarized in the three broad levels listed below.
| • | | Level 1 – quoted prices in active markets for identical investments |
| • | | Level 2 – other significant observable inputs (including quoted prices for similar investments, interest rates, prepayment speeds, credit risk, etc.) |
| • | | Level 3 – significant unobservable inputs (including a fund’s own assumptions in determining the fair value of investments) |
Boston Income Portfolio
April 30, 2017
Notes to Financial Statements (Unaudited) — continued
In cases where the inputs used to measure fair value fall in different levels of the fair value hierarchy, the level disclosed is determined based on the lowest level input that is significant to the fair value measurement in its entirety. The inputs or methodology used for valuing securities are not necessarily an indication of the risk associated with investing in those securities.
At April 30, 2017, the hierarchy of inputs used in valuing the Portfolio’s investments and open derivative instruments, which are carried at value, were as follows:
| | | | | | | | | | | | | | | | |
| Asset Description | | Level 1 | | | Level 2 | | | Level 3* | | | Total | |
| | | | |
Corporate Bonds & Notes | | $ | — | | | $ | 5,456,392,935 | | | $ | — | | | $ | 5,456,392,935 | |
Senior Floating-Rate Loans | | | — | | | | 440,226,868 | | | | — | | | | 440,226,868 | |
Convertible Bonds | | | — | | | | 25,354,919 | | | | — | | | | 25,354,919 | |
Commercial Mortgage-Backed Securities | | | — | | | | 8,165,805 | | | | — | | | | 8,165,805 | |
Common Stocks | | | 11,194,060 | | | | — | | | | 20,606,643 | | | | 31,800,703 | |
Convertible Preferred Stocks | | | — | | | | — | | | | 2,928,000 | | | | 2,928,000 | |
Miscellaneous | | | — | | | | 1,175 | | | | 25,611,429 | | | | 25,612,604 | |
Short-Term Investments | | | — | | | | 171,504,815 | | | | — | | | | 171,504,815 | |
| | | | |
Total Investments | | $ | 11,194,060 | | | $ | 6,101,646,517 | | | $ | 49,146,072 | | | $ | 6,161,986,649 | |
| | | | |
Forward Foreign Currency Exchange Contracts | | $ | — | | | $ | 8,526 | | | $ | — | | | $ | 8,526 | |
| | | | |
Total | | $ | 11,194,060 | | | $ | 6,101,655,043 | | | $ | 49,146,072 | | | $ | 6,161,995,175 | |
| * | None of the unobservable inputs for Level 3 assets, individually or collectively, had a material impact on the Portfolio. |
Level 3 investments at the beginning and/or end of the period in relation to net assets were not significant and accordingly, a reconciliation of Level 3 assets for the six months ended April 30, 2017 is not presented. At April 30, 2017, there were no investments transferred between Level 1 and Level 2 during the six months then ended.
Eaton Vance
Income Fund of Boston
April 30, 2017
Board of Trustees’ Contract Approval
Overview of the Contract Review Process
The Investment Company Act of 1940, as amended (the “1940 Act”), provides, in substance, that each investment advisory agreement between a fund and its investment adviser will continue in effect from year to year only if its continuation is approved at least annually by the fund’s board of trustees, including by a vote of a majority of the trustees who are not “interested persons” of the fund (“Independent Trustees”), cast in person at a meeting called for the purpose of considering such approval.
At a meeting of the Boards of Trustees (each a “Board”) of the registered investment companies advised by either Eaton Vance Management or its affiliate, Boston Management and Research, (the “Eaton Vance Funds”) held on April 25, 2017, the Board, including a majority of the Independent Trustees, voted to approve continuation of existing investment advisory and sub-advisory agreements for the Eaton Vance Funds for an additional one-year period. In voting its approval, the Board relied upon the affirmative recommendation of its Contract Review Committee, which is a committee comprised exclusively of Independent Trustees. Prior to making its recommendation, the Contract Review Committee reviewed information furnished by each adviser to the Eaton Vance Funds (including information specifically requested by the Board) for a series of meetings of the Contract Review Committee held between February and April 2017. The Contract Review Committee also considered information received at prior meetings of the Board and its committees, as relevant to its annual evaluation of the investment advisory and sub-advisory agreements.
The information that the Board considered included, among other things, the following (for funds that invest through one or more underlying portfolio(s), references to “each fund” in this section may include information that was considered at the portfolio-level):
Information about Fees, Performance and Expenses
| • | | A report from an independent data provider comparing the advisory and related fees paid by each fund with fees paid by comparable funds as identified by the independent data provider (“comparable funds”); |
| • | | A report from an independent data provider comparing each fund’s total expense ratio and its components to comparable funds; |
| • | | A report from an independent data provider comparing the investment performance of each fund (including, where relevant, yield data, Sharpe ratios and information ratios) to the investment performance of comparable funds over various time periods; |
| • | | Data regarding investment performance in comparison to benchmark indices, as well as customized groups of peer funds and blended indices identified by the adviser in consultation with the Board; |
| • | | For each fund, comparative information concerning the fees charged and the services provided by each adviser in managing other accounts (including mutual funds, other collective investment funds and institutional accounts) using investment strategies and techniques similar to those used in managing such fund; |
| • | | Profitability analyses for each adviser with respect to each fund; |
Information about Portfolio Management and Trading
| • | | Descriptions of the investment management services provided to each fund, including the investment strategies and processes it employs; |
| • | | The procedures and processes used to determine the fair value of fund assets and actions taken to monitor and test the effectiveness of such procedures and processes; |
| • | | Information about each adviser’s policies and practices with respect to trading, including each adviser’s processes for monitoring best execution of portfolio transactions; |
| • | | Information about the allocation of brokerage transactions and the benefits received by each adviser as a result of brokerage allocation, including information concerning the acquisition of research through client commission arrangements and policies with respect to “soft dollars”; |
| • | | Data relating to portfolio turnover rates of each fund; |
Information about each Adviser
| • | | Reports detailing the financial results and condition of each adviser; |
| • | | Descriptions of the qualifications, education and experience of the individual investment professionals whose responsibilities include portfolio management and investment research for the funds, and information relating to their compensation and responsibilities with respect to managing other mutual funds and investment accounts; |
| • | | The Code of Ethics of each adviser and its affiliates, together with information relating to compliance with and the administration of such codes; |
| • | | Policies and procedures relating to proxy voting and the handling of corporate actions and class actions; |
| • | | Information concerning the resources devoted to compliance efforts undertaken by each adviser and its affiliates (including descriptions of various compliance programs) and their record of compliance; |
| • | | Information concerning the business continuity and disaster recovery plans of each adviser and its affiliates; |
| • | | A description of Eaton Vance Management’s procedures for overseeing third party advisers and sub-advisers, including with respect to regulatory and compliance issues, investment management and other matters; |
Eaton Vance
Income Fund of Boston
April 30, 2017
Board of Trustees’ Contract Approval — continued
Other Relevant Information
| • | | Information concerning the nature, cost and character of the administrative and other non-investment advisory services provided by Eaton Vance Management and its affiliates; |
| • | | Information concerning management of the relationship with the custodian, subcustodians and fund accountants by each adviser or the funds’ administrator; and |
| • | | The terms of each investment advisory agreement. |
Over the course of the twelve-month period ended April 30, 2017, with respect to one or more funds, the Board met ten times and the Contract Review Committee, the Audit Committee, the Governance Committee, the Portfolio Management Committee and the Compliance Reports and Regulatory Matters Committee, each of which is a Committee comprised solely of Independent Trustees, met seven, thirteen, six, eight and ten times, respectively. At such meetings, the Trustees participated in investment and performance reviews with the portfolio managers and other investment professionals of each investment adviser relating to each fund, and considered various investment and trading strategies used in pursuing each fund’s investment objective, such as the use of derivative instruments, as well as risk management techniques. The Board and its Committees also evaluated issues pertaining to industry and regulatory developments, compliance procedures, fund governance and other issues with respect to the funds, and received and participated in reports and presentations provided by Eaton Vance Management and other fund advisers with respect to such matters. In addition to the formal meetings of the Board and its Committees, the Independent Trustees hold regular teleconferences in between meetings to discuss, among other topics, matters relating to the continuation of investment advisory and sub-advisory agreements.
For funds that invest through one or more underlying portfolios, the Board considered similar information about the portfolio(s) when considering the approval of investment advisory agreements. In addition, in cases where the fund’s investment adviser has engaged a sub-adviser, the Board considered similar information about the sub-adviser when considering the approval of any sub-advisory agreement.
The Contract Review Committee was assisted throughout the contract review process by Goodwin Procter LLP, independent legal counsel for the Independent Trustees. The members of the Contract Review Committee relied upon the advice of such counsel and their own business judgment in determining the material factors to be considered in evaluating each investment advisory and sub-advisory agreement and the weight to be given to each such factor. The conclusions reached with respect to each investment advisory and sub-advisory agreement were based on a comprehensive evaluation of all the information provided and not any single factor. Moreover, each member of the Contract Review Committee may have placed varying emphasis on particular factors in reaching conclusions with respect to each investment advisory and sub-advisory agreement. In evaluating each investment advisory and sub-advisory agreement, including the specific fee structures and other terms of the agreements, the Contract Review Committee was informed by multiple years of analysis and discussion among the Independent Trustees and the Eaton Vance Funds’ advisers and sub-advisers.
Results of the Process
Based on its consideration of the foregoing, and such other information as it deemed relevant, including the factors and conclusions described below, the Contract Review Committee concluded that the continuation of the investment advisory agreement of Boston Income Portfolio (the “Portfolio”), the portfolio in which Eaton Vance Income Fund of Boston (the “Fund”) invests, with Boston Management and Research (the “Adviser”), including its fee structure, is in the interests of shareholders and, therefore, the Contract Review Committee recommended to the Board approval of the agreement. The Board accepted the recommendation of the Contract Review Committee based on the material factors considered and conclusions reached by the Contract Review Committee with respect to the agreement. Accordingly, the Board, including a majority of the Independent Trustees, voted to approve continuation of the investment advisory agreement for the Portfolio.
Nature, Extent and Quality of Services
In considering whether to approve the investment advisory agreement of the Portfolio, the Board evaluated the nature, extent and quality of services provided to the Portfolio by the Adviser.
The Board considered the Adviser’s management capabilities and investment process with respect to the types of investments held by the Portfolio, including the education, experience and number of its investment professionals and other personnel who provide portfolio management, investment research, and similar services to the Portfolio. In particular, the Board considered the abilities and experience of the Adviser’s investment professionals in analyzing special considerations relevant to investing in high-yield debt. The Board also took into account the resources dedicated to portfolio management and other services, as well as the compensation methods of the Adviser and other factors, such as the reputation and resources of the Adviser to recruit and retain highly qualified research, advisory and supervisory investment professionals. In addition, the Board considered the time and attention devoted to the Eaton Vance Funds, including the Portfolio, by senior management, as well as the infrastructure, operational capabilities and support staff in place to assist in the portfolio management and operations of the Portfolio, including the provision of administrative services. The Board also considered the business-related and other risks to which the Adviser or its affiliates may be subject in managing the Portfolio.
The Board considered the compliance programs of the Adviser and relevant affiliates thereof. Among other matters, the Board considered compliance and reporting matters relating to personal trading by investment professionals, selective disclosure of portfolio holdings, late trading, frequent trading, portfolio
Eaton Vance
Income Fund of Boston
April 30, 2017
Board of Trustees’ Contract Approval — continued
valuation, business continuity and the allocation of investment opportunities. The Board also considered the responses of the Adviser and its affiliates to requests in recent years from regulatory authorities such as the Securities and Exchange Commission and the Financial Industry Regulatory Authority.
The Board was aware that on April 24, 2017 a former employee of the Adviser agreed to plead guilty to fraud charges arising from the individual’s prior activities as an equity options trader for certain Eaton Vance Funds. The Board was informed that the Adviser became aware of the matter on April 18, 2017, at which time management contacted federal authorities, alerted the Board and began an internal investigation. The Adviser represented to the Board that, based on information available as of April 25, 2017, management had no reason to believe that any other employee of the Adviser or its affiliates was involved in any wrongful activities or that any fund had been materially harmed. The Adviser agreed to keep the Board fully apprised as additional information is learned, and assured the Board that any fund harmed by the former employee’s wrongful activities will be made whole, as determined in consultation with the Board. The Board concluded that the Adviser’s actions in response to these events are appropriate and consistent with the Adviser’s commitment to protect and provide quality services to the Eaton Vance Funds.
The Board considered shareholder and other administrative services provided or managed by Eaton Vance Management and its affiliates, including transfer agency and accounting services. The Board evaluated the benefits to shareholders of investing in a fund that is a part of a large fund complex offering exposure to a variety of asset classes and investment disciplines, as well as the ability, in many cases, to exchange an investment among different funds without incurring additional sales charges.
After consideration of the foregoing factors, among others, the Board concluded that the nature, extent and quality of services provided by the Adviser, taken as a whole, are appropriate and consistent with the terms of the investment advisory agreement.
Fund Performance
The Board compared the Fund’s investment performance to that of comparable funds and appropriate benchmark indices. The Board’s review included comparative performance data for the one-, three-, five- and ten-year periods ended September 30, 2016 for the Fund. The Board concluded that the performance of the Fund was satisfactory.
Management Fees and Expenses
The Board considered contractual fee rates payable by the Portfolio and by the Fund for advisory and administrative services (referred to collectively as “management fees”). As part of its review, the Board considered the Fund’s management fees and total expense ratio for the one year period ended September 30, 2016, as compared to those of comparable funds, before and after giving effect to any undertaking to waive fees or reimburse expenses. The Board also received and considered information about the services offered and the fee rates charged by the Adviser to other types of clients with investment objectives and strategies that are substantially similar to and/or managed in a similar investment style as the Portfolio. In this regard, the Board received information about the differences in the nature and scope of services the Adviser provides to the Portfolio as compared to other types of clients and the material differences in compliance, reporting and other legal burdens and risks to the Adviser as between the Portfolio and other types of clients. The Board also considered certain factors identified by management in response to inquiries from the Contract Review Committee regarding the Fund’s expense ratio relative to comparable funds.
After considering the foregoing information, and in light of the nature, extent and quality of the services provided by the Adviser, the Board concluded that the management fees charged for advisory and related services are reasonable.
Profitability and Other “Fall-Out” Benefits
The Board considered the level of profits realized by the Adviser and relevant affiliates thereof in providing investment advisory and administrative services to the Fund, to the Portfolio and to all Eaton Vance Funds as a group. The Board considered the level of profits realized without regard to marketing support or other payments by the Adviser and its affiliates to third parties in respect of distribution services. The Board also considered other direct or indirect fall-out benefits received by the Adviser and its affiliates in connection with their relationships with the Fund and the Portfolio, including the benefits of research services that may be available to the Adviser as a result of securities transactions effected for the Portfolio and other investment advisory clients.
The Board concluded that, in light of the foregoing factors and the nature, extent and quality of the services rendered, the profits realized by the Adviser and its affiliates are deemed not to be excessive.
Economies of Scale
In reviewing management fees and profitability, the Board also considered the extent to which the Adviser and its affiliates, on the one hand, and the Fund and the Portfolio, on the other hand, can expect to realize benefits from economies of scale as the assets of the Fund and the Portfolio increase. The Board acknowledged the difficulty in accurately measuring the benefits resulting from economies of scale, if any, with respect to the management of any specific fund or group of funds. The Board reviewed data summarizing the increases and decreases in the assets of the Fund and of all Eaton Vance Funds as a
Eaton Vance
Income Fund of Boston
April 30, 2017
Board of Trustees’ Contract Approval — continued
group over various time periods, and evaluated the extent to which the total expense ratio of the Fund and the profitability of the Adviser and its affiliates may have been affected by such increases or decreases. Based upon the foregoing, the Board concluded that the Fund currently shares in any benefits from economies of scale. The Board also concluded that, assuming reasonably foreseeable increases in the assets of the Fund and the Portfolio, the structure of the advisory fee, which includes breakpoints at several asset levels, will allow the Fund and the Portfolio to continue to benefit from any economies of scale in the future.
Eaton Vance
Income Fund of Boston
April 30, 2017
Officers and Trustees
Officers of Eaton Vance Income Fund of Boston
Payson F. Swaffield
President
Maureen A. Gemma
Vice President, Secretary and
Chief Legal Officer
James F. Kirchner
Treasurer
Paul M. O’Neil
Chief Compliance Officer
Officers of Boston Income Portfolio
Payson F. Swaffield
President
Maureen A. Gemma
Vice President, Secretary and
Chief Legal Officer
James F. Kirchner
Treasurer
Paul M. O’Neil
Chief Compliance Officer
Trustees of Eaton Vance Income Fund of Boston and Boston Income Portfolio
William H. Park
Chairperson
Scott E. Eston
Thomas E. Faust Jr.*
Mark R. Fetting**
Cynthia E. Frost
George J. Gorman
Valerie A. Mosley
Helen Frame Peters
Susan J. Sutherland
Harriett Tee Taggart
Ralph F. Verni
Scott E. Wennerholm**
| ** | Messrs. Fetting and Wennerholm began serving as Trustees effective September 1, 2016. |
Eaton Vance Funds
IMPORTANT NOTICES
Privacy. The Eaton Vance organization is committed to ensuring your financial privacy. Each of the financial institutions identified below has in effect the following policy (“Privacy Policy”) with respect to nonpublic personal information about its customers:
| • | | Only such information received from you, through application forms or otherwise, and information about your Eaton Vance fund transactions will be collected. This may include information such as name, address, social security number, tax status, account balances and transactions. |
| • | | None of such information about you (or former customers) will be disclosed to anyone, except as permitted by law (which includes disclosure to employees necessary to service your account). In the normal course of servicing a customer’s account, Eaton Vance may share information with unaffiliated third parties that perform various required services such as transfer agents, custodians and broker-dealers. |
| • | | Policies and procedures (including physical, electronic and procedural safeguards) are in place that are designed to protect the confidentiality of such information. |
| • | | We reserve the right to change our Privacy Policy at any time upon proper notification to you. Customers may want to review our Privacy Policy periodically for changes by accessing the link on our homepage: www.eatonvance.com. |
Our pledge of privacy applies to the following entities within the Eaton Vance organization: the Eaton Vance Family of Funds, Eaton Vance Management, Eaton Vance Investment Counsel, Eaton Vance Distributors, Inc., Eaton Vance Trust Company, Eaton Vance Management (International) Limited, Eaton Vance Management’s Real Estate Investment Group and Boston Management and Research. In addition, our Privacy Policy applies only to those Eaton Vance customers who are individuals and who have a direct relationship with us. If a customer’s account (i.e., fund shares) is held in the name of a third-party financial advisor/broker-dealer, it is likely that only such advisor’s privacy policies apply to the customer. This notice supersedes all previously issued privacy disclosures. For more information about Eaton Vance’s Privacy Policy, please call 1-800-262-1122.
Delivery of Shareholder Documents. The Securities and Exchange Commission (SEC) permits funds to deliver only one copy of shareholder documents, including prospectuses, proxy statements and shareholder reports, to fund investors with multiple accounts at the same residential or post office box address. This practice is often called “householding” and it helps eliminate duplicate mailings to shareholders. Eaton Vance, or your financial advisor, may household the mailing of your documents indefinitely unless you instruct Eaton Vance, or your financial advisor, otherwise. If you would prefer that your Eaton Vance documents not be householded, please contact Eaton Vance at 1-800-262-1122, or contact your financial advisor. Your instructions that householding not apply to delivery of your Eaton Vance documents will typically be effective within 30 days of receipt by Eaton Vance or your financial advisor. Separate statements will be generated for each separate account and will be householded as described above.
Portfolio Holdings. Each Eaton Vance Fund and its underlying Portfolio(s) (if applicable) will file a schedule of portfolio holdings on Form N-Q with the SEC for the first and third quarters of each fiscal year. The Form N-Q will be available on the Eaton Vance website at www.eatonvance.com, by calling Eaton Vance at 1-800-262-1122 or in the EDGAR database on the SEC’s website at www.sec.gov. Form N-Q may also be reviewed and copied at the SEC’s public reference room in Washington, D.C. (call 1-800-732-0330 for information on the operation of the public reference room).
Proxy Voting. From time to time, funds are required to vote proxies related to the securities held by the funds. The Eaton Vance Funds or their underlying Portfolios (if applicable) vote proxies according to a set of policies and procedures approved by the Funds’ and Portfolios’ Boards. You may obtain a description of these policies and procedures and information on how the Funds or Portfolios voted proxies relating to portfolio securities during the most recent 12-month period ended June 30, without charge, upon request, by calling 1-800-262-1122 and by accessing the SEC’s website at www.sec.gov.
This Page Intentionally Left Blank
This Page Intentionally Left Blank
Investment Adviser of Boston Income Portfolio
Boston Management and Research
Two International Place
Boston, MA 02110
Administrator of Eaton Vance Income Fund of Boston
Eaton Vance Management
Two International Place
Boston, MA 02110
Principal Underwriter*
Eaton Vance Distributors, Inc.
Two International Place
Boston, MA 02110
(617) 482-8260
Custodian
State Street Bank and Trust Company
State Street Financial Center, One Lincoln Street
Boston, MA 02111
Transfer Agent
BNY Mellon Investment Servicing (US) Inc.
Attn: Eaton Vance Funds
P.O. Box 9653
Providence, RI 02940-9653
(800) 262-1122
Fund Offices
Two International Place
Boston, MA 02110
| * | FINRA BrokerCheck. Investors may check the background of their Investment Professional by contacting the Financial Industry Regulatory Authority (FINRA). FINRA BrokerCheck is a free tool to help investors check the professional background of current and former FINRA-registered securities firms and brokers. FINRA BrokerCheck is available by calling 1-800-289-9999 and at www.FINRA.org. The FINRA BrokerCheck brochure describing this program is available to investors at www.FINRA.org. |
7710 4.30.17
Item 2. Code of Ethics
Not required in this filing.
Item 3. Audit Committee Financial Expert
Not required in this filing.
Item 4. Principal Accountant Fees and Services
Rule 2-01(c)(1)(ii)(A) of Regulation S-X (the “Loan Rule”) prohibits an accounting firm, such as the Trust’s principal accountant, Deloitte & Touche LLP (“D&T”), from having certain financial relationships with their audit clients and affiliated entities. Specifically, the Loan Rule provides, in relevant part, that an accounting firm generally would not be independent if it or a “covered person” of the accounting firm (within the meaning of applicable SEC rules relating to auditor independence) receives a loan from a lender that is a “record or beneficial owner of more than ten percent of the audit client’s equity securities.” Based on information provided to the Audit Committee of the Board of Trustees (the “Audit Committee”) of the Eaton Vance family of funds by D&T, certain relationships between D&T and its affiliates (“Deloitte Entities”) and one or more lenders who are record owners of shares of one or more funds within the Eaton Vance family of funds (the “Funds”) implicate the Loan Rule, calling into question D&T’s independence with respect to the Funds. The Funds are providing this disclosure to explain the facts and circumstances as well as D&T’s conclusions concerning D&T’s objectivity and impartiality with respect to the audits of the Funds notwithstanding the existence of one or more breaches of the Loan Rule.
On June 20, 2016, the U.S. Securities and Exchange Commission (the “SEC”) issued no-action relief to another mutual fund complex (see Fidelity Management & Research Company et al., No-Action Letter (June 20, 2016) (the “No-Action Letter”)) related to an auditor independence issue arising under the Loan Rule. In the No-Action Letter, the SEC indicated that it would not recommend enforcement action against the fund group if the auditor is not in compliance with the Loan Rule provided that: (1) the auditor has complied with PCAOB Rule 3526(b)(1) and 3526(b)(2); (2) the auditor’s non-compliance under the Loan Rule is with respect to certain lending relationships; and (3) notwithstanding such non-compliance, the auditor has concluded that it is objective and impartial with respect to the issues encompassed within its engagement as auditor of the funds. The SEC has indicated that the no-action relief will expire 18 months from its issuance.
Based on information provided by D&T to the Audit Committee, the requirements of the No-Action Letter appear to be met with respect to D&T’s lending relationships described above. Among other things, D&T has advised the Audit Committee of its conclusion that the consequences of the breach of the Loan Rule have been satisfactorily addressed, that D&T’s objectivity and impartiality in the planning and conduct of the audits of the Fund’s financial statements has not been compromised and that, notwithstanding the breach, D&T is in a position to continue as the auditor for the Funds and D&T does not believe any actions need to be taken with respect to previously issued reports by D&T. D&T has advised the Audit Committee that these conclusions were based in part on its consideration of the No-Action Letter and other relevant information communicated to the Audit Committee.
Item 5. Audit Committee of Listed Registrants
Not applicable.
Item 6. Schedule of Investments
Please see schedule of investments contained in the Report to Stockholders included under Item 1 of this Form N-CSR.
Item 7. Disclosure of Proxy Voting Policies and Procedures for Closed-End Management Investment Companies
Not applicable.
Item 8. Portfolio Managers of Closed-End Management Investment Companies
Not applicable.
Item 9. Purchases of Equity Securities by Closed-End Management Investment Company and Affiliated Purchasers
Not applicable.
Item 10. Submission of Matters to a Vote of Security Holders
No material changes.
Item 11. Controls and Procedures
(a) It is the conclusion of the registrant’s principal executive officer and principal financial officer that the effectiveness of the registrant’s current disclosure controls and procedures (such disclosure controls and procedures having been evaluated within 90 days of the date of this filing) provide reasonable assurance that the information required to be disclosed by the registrant has been recorded, processed, summarized and reported within the time period specified in the Commission’s rules and forms and that the information required to be disclosed by the registrant has been accumulated and communicated to the registrant’s principal executive officer and principal financial officer in order to allow timely decisions regarding required disclosure.
(b) There have been no changes in the registrant’s internal controls over financial reporting during the second fiscal quarter of the period covered by this report that has materially affected, or is reasonably likely to materially affect, the registrant’s internal control over financial reporting.
Item 12. Exhibits
| | |
| (a)(1) | | Registrant’s Code of Ethics – Not applicable (please see Item 2). |
| |
| (a)(2)(i) | | Treasurer’s Section 302 certification. |
| |
| (a)(2)(ii) | | President’s Section 302 certification. |
| |
| (b) | | Combined Section 906 certification. |
Signatures
Pursuant to the requirements of the Securities Exchange Act of 1934 and the Investment Company Act of 1940, the registrant has duly caused this report to be signed on its behalf by the undersigned, thereunto duly authorized.
Eaton Vance Series Trust II
| | |
| By: | | /s/ Payson F. Swaffield |
| | Payson F. Swaffield |
| | President |
| |
| Date: | | June 26, 2017 |
Pursuant to the requirements of the Securities Exchange Act of 1934 and the Investment Company Act of 1940, this report has been signed below by the following persons on behalf of the registrant and in the capacities and on the dates indicated.
| | |
| By: | | /s/ James F. Kirchner |
| | James F. Kirchner |
| | Treasurer |
| |
| Date: | | June 26, 2017 |
| |
| By: | | /s/ Payson F. Swaffield |
| | Payson F. Swaffield |
| | President |
| |
| Date: | | June 26, 2017 |