UNITED STATES SECURITIES AND EXCHANGE COMMISSION
Washington, D.C. 20549
FormN-CSR
CERTIFIED SHAREHOLDER REPORT OF REGISTERED
MANAGEMENT INVESTMENT COMPANIES
Investment Company Act File Number: 811-02258
Eaton Vance Series Trust II
(Exact Name of Registrant as Specified in Charter)
Two International Place, Boston, Massachusetts 02110
(Address of Principal Executive Offices)
Maureen A. Gemma
Two International Place, Boston, Massachusetts 02110
(Name and Address of Agent for Services)
(617)482-8260
(Registrant’s Telephone Number)
June 30
Date of Fiscal Year End
December 31, 2018
Date of Reporting Period
Item 1. Reports to Stockholders

Parametric
Tax-Managed Emerging Markets Fund
Semiannual Report
December 31, 2018
Important Note. Beginning on January 1, 2021, as permitted by regulations adopted by the Securities and Exchange Commission, paper copies of the Fund’s annual and semi-annual shareholder reports will no longer be sent by mail unless you specifically request paper copies of the reports. Instead, the reports will be made available on the Fund’s website (eatonvance.com/ppafunddocuments), and you will be notified by mail each time a report is posted and provided with a website address to access the report.
If you already elected to receive shareholder reports electronically, you will not be affected by this change and you need not take any action. If you are a direct investor, you may elect to receive shareholder reports and other communications from the Fund electronically by enrolling at eatonvance.com/edelivery. If you own your shares through a financial intermediary (such as a broker-dealer or bank), you must contact your financial intermediary to sign up.
You may elect to receive all future Fund shareholder reports in paper free of charge. If you are a direct investor, you can inform the Fund that you wish to continue receiving paper copies of your shareholder reports by calling 1-800-260-0761. If you own these shares through a financial intermediary, you must contact your financial intermediary or follow instructions included with this disclosure, if applicable, to elect to continue to receive paper copies of your shareholder reports. Your election to receive reports in paper will apply to all Eaton Vance funds held directly or to all funds held through your financial intermediary, as applicable.

Commodity Futures Trading Commission Registration. Effective December 31, 2012, the Commodity Futures Trading Commission (“CFTC”) adopted certain regulatory changes that subject registered investment companies and advisers to regulation by the CFTC if a fund invests more than a prescribed level of its assets in certain CFTC-regulated instruments (including futures, certain options and swap agreements) or markets itself as providing investment exposure to such instruments. The Fund has claimed an exclusion from the definition of the term “commodity pool operator” under the Commodity Exchange Act. Accordingly, neither the Fund nor the adviser with respect to the operation of the Fund is subject to CFTC regulation. Because of its management of other strategies, the Fund’s adviser is registered with the CFTC as a commodity pool operator and a commodity trading advisor.
Fund shares are not insured by the FDIC and are not deposits or other obligations of, or guaranteed by, any depository institution. Shares are subject to investment risks, including possible loss of principal invested.
This report must be preceded or accompanied by a current summary prospectus or prospectus. Before investing, investors should consider carefully the investment objective, risks, and charges and expenses of a mutual fund. This and other important information is contained in the summary prospectus and prospectus, which can be obtained from a financial advisor. Prospective investors should read the prospectus carefully before investing. For further information, please call 1-800-260-0761.
Semiannual ReportDecember 31, 2018
Parametric
Tax-Managed Emerging Markets Fund
Table of Contents
| | | | |
Performance | | | 2 | |
| |
Fund Profile | | | 3 | |
| |
Endnotes and Additional Disclosures | | | 4 | |
| |
Fund Expenses | | | 5 | |
| |
Financial Statements | | | 6 | |
| |
Special Meeting of Shareholders | | | 37 | |
| |
Officers and Trustees | | | 38 | |
| |
Important Notices | | | 39 | |
Parametric
Tax-Managed Emerging Markets Fund
December 31, 2018
Performance1,2
Portfolio ManagersThomas C. Seto and Timothy W. Atwill, Ph.D., CFA, each of Parametric Portfolio Associates LLC
| | | | | | | | | | | | | | | | | | | | | | | | |
| % Average Annual Total Returns | | Class
Inception Date | | | Performance
Inception Date | | | Six Months | | | One Year | | | Five Years | | | Ten Years | |
Institutional Class at NAV | | | 06/30/1998 | | | | 06/30/1998 | | | | –6.59 | % | | | –13.20 | % | | | 0.08 | % | | | 7.67 | % |
MSCI Emerging Markets Index | | | — | | | | — | | | | –8.49 | % | | | –14.58 | % | | | 1.65 | % | | | 8.02 | % |
| | | | | | |
| | | | | | | | | | | | | | | | | | | | | | | | |
| %After-Tax Returns | | | | | Class
Inception Date | | | Performance
Inception Date | | | One Year | | | Five Years | | | Ten Years | |
After Taxes on Distributions | | | | | | | 06/30/1998 | | | | 06/30/1998 | | | | –13.25 | % | | | –0.14 | % | | | 7.48 | % |
After Taxes on Distributions and Sales of Fund Shares | | | | | | | — | | | | — | | | | –7.08 | | | | 0.22 | | | | 6.68 | |
| | | | | | |
| | | | | | | | | | | | | | | | | | | | | | | | |
| % Total Annual Operating Expense Ratio3 | | | | | | | | | | | | | | | | | Institutional
Class | |
| | | | | | | | | | | | | | | | | | | | | | | 0.95 | % |
See Endnotes and Additional Disclosures in this report.
Past performance is no guarantee of future results. Returns are historical and are calculated by determining the percentage change in net asset value (NAV) or offering price (as applicable) with all distributions reinvested. Investment return and principal value will fluctuate so that shares, when redeemed, may be worth more or less than their original cost. Performance less than or equal to one year is cumulative. Performance is for the stated time period only; due to market volatility, the Fund’s current performance may be lower or higher than quoted. Returns are before taxes unless otherwise noted. For performance as of the most recentmonth-end, please refer to eatonvance.com.
Parametric
Tax-Managed Emerging Markets Fund
December 31, 2018
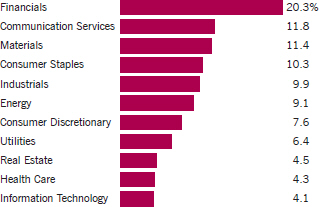
Fund Profile
Sector Allocation (% of net assets)4
Top 10 Holdings (% of net assets)4
| | | | |
| |
America Movil SAB de CV, Series L | | | 1.1 | % |
| |
Sberbank of Russia PJSC | | | 0.8 | |
| |
Naspers, Ltd., Class N | | | 0.8 | |
| |
China Mobile, Ltd. | | | 0.7 | |
| |
Lukoil PJSC ADR | | | 0.7 | |
| |
Credicorp, Ltd. | | | 0.6 | |
| |
Sasol, Ltd. | | | 0.5 | |
| |
Petroleo Brasileiro SA, PFC Shares | | | 0.5 | |
| |
Samsung Electronics Co., Ltd. | | | 0.5 | |
| |
Ahli United Bank BSC | | | 0.4 | |
| |
Total | | | 6.6 | % |
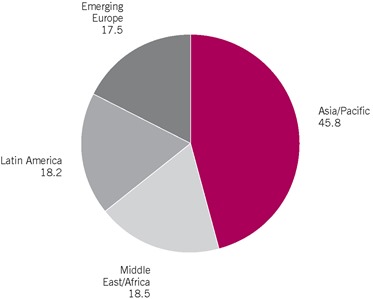
Geographic Allocation (% of common stocks)
See Endnotes and Additional Disclosures in this report.
Parametric
Tax-Managed Emerging Markets Fund
December 31, 2018
Endnotes and Additional Disclosures
| 1 | MSCI Emerging Markets Index is an unmanaged index of emerging markets common stocks. MSCI indexes are net of foreign withholding taxes. Source: MSCI. MSCI data may not be reproduced or used for any other purpose. MSCI provides no warranties, has not prepared or approved this report, and has no liability hereunder. Unless otherwise stated, index returns do not reflect the effect of any applicable sales charges, commissions, expenses, taxes or leverage, as applicable. It is not possible to invest directly in an index. |
| 2 | Institutional Class shares are offered at net asset value (NAV). Prior to September 1, 2016, Institutional Class shares were subject to a 2% redemption fee at the time of exchange or redemption. Returns are historical and are calculated by determining the percentage change in NAV with all distributions reinvested. Unless otherwise stated, performance does not reflect the deduction of taxes on Fund distributions or redemptions of Fund shares. Performance since inception for an index, if presented, is the performance since the Fund’s or oldest share class’ inception, as applicable.After-tax returns are calculated using certain assumptions, including using the highest historical individual federal income tax rates, and do not reflect the impact of state/ local taxes. Actualafter-tax returns depend on a shareholder’s tax situation and the actual characterization of distributions and may differ from those shown.After-tax returns are not relevant to shareholders who hold shares intax-deferred accounts or shares held by nontaxable entities. Return After Taxes on Distributions may be the same as Return Before Taxes for the same period because no taxable distributions were made during that period. Return After Taxes on Distributions and Sale of Fund Shares may be greater than or equal to Return After Taxes on Distributions for the same period because of losses realized on the sale of Fund shares. The Fund’safter-tax returns also may reflect foreign tax credits passed by the Fund to its shareholders. |
| 3 | Source: Fund prospectus. The expense ratio for the current reporting period can be found in the Financial Highlights section of this report. |
| 4 | Excludes cash and cash equivalents. |
| | Fund profile subject to change due to active management. |
Important Notice to Shareholders
| | Effective May 1, 2019, the portfolio managers of the Fund will be Thomas C. Seto, Paul Bouchey, CFA and Jennifer Sireklove, CFA, each of Parametric Portfolio Associates LLC. |
Parametric
Tax-Managed Emerging Markets Fund
December 31, 2018
Fund Expenses
Example: As a Fund shareholder, you incur two types of costs: (1) transaction costs, including sales charges (loads) on purchases and redemption fees (if applicable); and (2) ongoing costs, including management fees; distribution and/or service fees; and other Fund expenses. This Example is intended to help you understand your ongoing costs (in dollars) of Fund investing and to compare these costs with the ongoing costs of investing in other mutual funds. The Example is based on an investment of $1,000 invested at the beginning of the period and held for the entire period (July 1, 2018 – December 31, 2018).
Actual Expenses: The first section of the table below provides information about actual account values and actual expenses. You may use the information in this section, together with the amount you invested, to estimate the expenses that you paid over the period. Simply divide your account value by $1,000 (for example, an $8,600 account value divided by $1,000 = 8.6), then multiply the result by the number in the first section under the heading entitled “Expenses Paid During Period” to estimate the expenses you paid on your account during this period.
Hypothetical Example for Comparison Purposes: The second section of the table below provides information about hypothetical account values and hypothetical expenses based on the actual Fund expense ratio and an assumed rate of return of 5% per year (before expenses), which is not the actual Fund return. The hypothetical account values and expenses may not be used to estimate the actual ending account balance or expenses you paid for the period. You may use this information to compare the ongoing costs of investing in your Fund and other funds. To do so, compare this 5% hypothetical example with the 5% hypothetical examples that appear in the shareholder reports of the other funds.
Please note that the expenses shown in the table are meant to highlight your ongoing costs only and do not reflect any transactional costs, such as sales charges (loads) or redemption fees (if applicable). Therefore, the second section of the table is useful in comparing ongoing costs only, and will not help you determine the relative total costs of owning different funds. In addition, if these transactional costs were included, your costs would be higher.
| | | | | | | | | | | | | | | | |
| | | Beginning
Account Value
(7/1/18) | | | Ending
Account Value
(12/31/18) | | | Expenses Paid
During Period*
(7/1/18 – 12/31/18) | | | Annualized
Expense
Ratio | |
| | | |
Actual | | | | | | | | | | | | | |
Institutional Class | | $ | 1,000.00 | | | $ | 934.10 | | | $ | 4.68 | | | | 0.96 | % |
| | | | |
Hypothetical | | | | | | | | | | | | | |
(5% return per year before expenses) | | | | | | | | | | | | | |
Institutional Class | | $ | 1,000.00 | | | $ | 1,020.40 | | | $ | 4.89 | | | | 0.96 | % |
| * | Expenses are equal to the Fund’s annualized expense ratio for the indicated Class, multiplied by the average account value over the period, multiplied by 184/365 (to reflect the one-half year period). The Example assumes that the $1,000 was invested at the net asset value per share determined at the close of business on June 30, 2018. |
Parametric
Tax-Managed Emerging Markets Fund
December 31, 2018
Portfolio of Investments (Unaudited)
| | | | | | | | |
| Common Stocks — 99.7% | | | | | | | | |
| Security | | Shares | | | Value | |
| | |
| Argentina — 0.7% | | | | | | |
| | |
Adecoagro SA(1) | | | 128,000 | | | $ | 890,880 | |
| | |
Arcos Dorados Holdings, Inc., Class A | | | 105,900 | | | | 836,610 | |
| | |
Banco Macro SA, Class B | | | 130,676 | | | | 568,888 | |
| | |
BBVA Banco Frances SA | | | 76,594 | | | | 287,787 | |
| | |
BBVA Banco Frances SA ADR | | | 32,200 | | | | 364,826 | |
| | |
Cresud SA ADR | | | 19,400 | | | | 235,710 | |
| | |
Grupo Financiero Galicia SA, Class B ADR | | | 71,100 | | | | 1,960,227 | |
| | |
IRSA Inversiones y Representaciones SA | | | 119,544 | | | | 153,743 | |
| | |
IRSA Propiedades Comerciales SA | | | 1,325 | | | | 6,705 | |
| | |
Ledesma SAAI(1) | | | 259,501 | | | | 84,066 | |
| | |
MercadoLibre, Inc. | | | 17,500 | | | | 5,124,875 | |
| | |
Molinos Agro SA | | | 18,283 | | | | 103,406 | |
| | |
Molinos Rio de la Plata SA, Class B(1) | | | 75,026 | | | | 73,711 | |
| | |
Pampa Energia SA ADR(1) | | | 77,260 | | | | 2,457,641 | |
| | |
Telecom Argentina SA ADR | | | 102,600 | | | | 1,596,456 | |
| | |
Ternium Argentina SA | | | 2,005,200 | | | | 700,169 | |
| | |
Transportadora de Gas del Sur SA | | | 252,923 | | | | 738,755 | |
| | |
YPF SA ADR | | | 101,600 | | | | 1,360,424 | |
| | |
| | | | | | | $ | 17,544,879 | |
| | |
| Bahrain — 0.8% | | | | | | |
| | |
Ahli United Bank BSC | | | 16,892,374 | | | $ | 11,330,992 | |
| | |
Al Salam Bank-Bahrain BSC | | | 14,953,766 | | | | 3,634,642 | |
| | |
GFH Financial Group BSC | | | 11,232,727 | | | | 2,765,098 | |
| | |
Ithmaar Holding BSC(1) | | | 21,954,746 | | | | 1,810,607 | |
| | |
| | | | | | | $ | 19,541,339 | |
| | |
| Bangladesh — 0.8% | | | | | | |
| | |
ACI, Ltd. | | | 129,325 | | | $ | 506,860 | |
| | |
Aftab Automobiles, Ltd. | | | 378,354 | | | | 207,537 | |
| | |
Al-Arafah Islami Bank, Ltd. | | | 2,174,488 | | | | 513,308 | |
| | |
Bangladesh Export Import Co., Ltd. | | | 3,361,221 | | | | 927,203 | |
| | |
Bangladesh Submarine Cable Co., Ltd. | | | 178,728 | | | | 199,814 | |
| | |
Beximco Pharmaceuticals, Ltd. | | | 361,957 | | | | 342,286 | |
| | |
BRAC Bank, Ltd.(1) | | | 477,896 | | | | 411,215 | |
| | |
British American Tobacco Bangladesh Co., Ltd. | | | 41,583 | | | | 1,767,556 | |
| | |
BSRM Steels, Ltd. | | | 1,375,000 | | | | 986,972 | |
| | |
City Bank, Ltd. (The) | | | 933,797 | | | | 339,732 | |
| | |
Grameenphone, Ltd. | | | 511,299 | | | | 2,259,893 | |
| | |
Heidelberger Cement Bangladesh, Ltd. | | | 103,700 | | | | 416,362 | |
| | |
Islami Bank Bangladesh, Ltd. | | | 1,587,087 | | | | 460,268 | |
| | |
Jamuna Oil Co., Ltd. | | | 212,850 | | | | 487,282 | |
| | |
Khulna Power Co., Ltd. | | | 1,070,095 | | | | 748,147 | |
| | |
LafargeHolcim Bangladesh, Ltd. | | | 396,773 | | | | 207,287 | |
| | | | | | | | |
| Security | | Shares | | | Value | |
| | |
| Bangladesh (continued) | | | | | | |
| | |
LankaBangla Finance, Ltd. | | | 1,102,357 | | | $ | 302,971 | |
| | |
Malek Spinning Mills, Ltd. | | | 1,020,000 | | | | 213,743 | |
| | |
Meghna Petroleum, Ltd. | | | 210,100 | | | | 471,578 | |
| | |
National Bank, Ltd.(1) | | | 3,654,721 | | | | 405,719 | |
| | |
Olympic Industries, Ltd. | | | 311,098 | | | | 794,850 | |
| | |
Padma Oil Co., Ltd. | | | 175,100 | | | | 467,366 | |
| | |
Pubali Bank, Ltd. | | | 2,018,443 | | | | 630,177 | |
| | |
Renata, Ltd. | | | 30,361 | | | | 416,199 | |
| | |
Singer Bangladesh, Ltd. | | | 165,593 | | | | 437,356 | |
| | |
Social Islami Bank, Ltd.(1) | | | 2,833,792 | | | | 518,134 | |
| | |
Southeast Bank, Ltd.(1) | | | 2,195,925 | | | | 405,969 | |
| | |
Square Pharmaceuticals, Ltd. | | | 552,572 | | | | 1,669,948 | |
| | |
Summit Power, Ltd. | | | 767,049 | | | | 360,365 | |
| | |
Titas Gas Transmission & Distribution Co., Ltd. | | | 1,339,434 | | | | 580,481 | |
| | |
Unique Hotel & Resorts, Ltd. | | | 1,004,743 | | | | 636,024 | |
| | |
United Airways Bangladesh, Ltd.(1) | | | 7,278,815 | | | | 251,284 | |
| | |
United Commercial Bank, Ltd. | | | 1,270,726 | | | | 264,290 | |
| | |
| | | | | | | $ | 19,608,176 | |
| | |
| Botswana — 0.4% | | | | | | |
| | |
Barclays Bank of Botswana, Ltd. | | | 1,308,506 | | | $ | 637,377 | |
| | |
Botswana Insurance Holdings, Ltd. | | | 825,133 | | | | 1,348,622 | |
| | |
First National Bank of Botswana, Ltd. | | | 7,511,600 | | | | 1,716,097 | |
| | |
Letshego Holdings, Ltd. | | | 16,310,999 | | | | 2,468,740 | |
| | |
Sechaba Breweries Holdings, Ltd. | | | 1,086,400 | | | | 2,028,309 | |
| | |
Sefalana Holding Co. | | | 991,000 | | | | 812,236 | |
| | |
Standard Chartered Bank Botswana, Ltd.(1) | | | 850,790 | | | | 301,801 | |
| | |
| | | | | | | $ | 9,313,182 | |
| | |
| Brazil — 6.0% | | | | | | |
| | |
Aliansce Shopping Centers SA | | | 161,000 | | | $ | 794,251 | |
| | |
AMBEV SA | | | 2,062,925 | | | | 8,186,231 | |
| | |
Atacadao Distribuicao Comercio e Industria Ltda | | | 144,200 | | | | 673,051 | |
| | |
B2W Cia Digital(1) | | | 149,500 | | | | 1,620,845 | |
| | |
B3 SA - Brasil Bolsa Balcao | | | 404,085 | | | | 2,795,206 | |
| | |
Banco Bradesco SA, PFC Shares | | | 547,338 | | | | 5,458,199 | |
| | |
Banco do Brasil SA | | | 56,600 | | | | 678,923 | |
| | |
BR Malls Participacoes SA | | | 1,230,400 | | | | 4,149,217 | |
| | |
BR Properties SA | | | 113,000 | | | | 239,076 | |
| | |
Braskem SA, PFC Shares | | | 82,200 | | | | 1,004,873 | |
| | |
BRF SA(1) | | | 48,966 | | | | 277,062 | |
| | |
CCR SA | | | 160,000 | | | | 462,362 | |
| | |
Centrais Eletricas Brasileiras SA, PFC Shares | | | 448,866 | | | | 3,262,480 | |
| | |
Cia Brasileira de Distribuicao, PFC Shares | | | 52,556 | | | | 1,098,106 | |
| | |
Cia de Saneamento Basico do Estado de Sao Paulo | | | 61,700 | | | | 501,464 | |
| | | | |
| | 6 | | See Notes to Financial Statements. |
Parametric
Tax-Managed Emerging Markets Fund
December 31, 2018
Portfolio of Investments (Unaudited) — continued
| | | | | | | | |
| Security | | Shares | | | Value | |
| | |
| Brazil (continued) | | | | | | |
| | |
Cia de Saneamento Basico do Estado de Sao Paulo ADR | | | 372,098 | | | $ | 3,002,831 | |
| | |
Cia de Transmissao de Energia Eletrica Paulista, PFC Shares | | | 39,663 | | | | 707,963 | |
| | |
Cia Hering | | | 155,800 | | | | 1,175,409 | |
| | |
Cia Siderurgica Nacional SA(1) | | | 84,900 | | | | 193,644 | |
| | |
Cia Siderurgica Nacional SA ADR(1) | | | 62,200 | | | | 136,218 | |
| | |
Cielo SA | | | 545,438 | | | | 1,251,098 | |
| | |
Construtora Tenda SA | | | 62,686 | | | | 519,020 | |
| | |
Cosan SA | | | 123,000 | | | | 1,061,880 | |
| | |
CPFL Energia SA | | | 265,091 | | | | 1,973,263 | |
| | |
CVC Brasil Operadora e Agencia de Viagens SA | | | 91,021 | | | | 1,436,797 | |
| | |
Cyrela Brazil Realty SA Empreendimentos e Participacoes | | | 191,224 | | | | 763,268 | |
| | |
Duratex SA | | | 271,983 | | | | 830,177 | |
| | |
EcoRodovias Infraestrutura e Logistica SA | | | 98,900 | | | | 239,355 | |
| | |
EDP-Energias do Brasil SA | | | 331,900 | | | | 1,263,117 | |
| | |
Embraer SA | | | 268,332 | | | | 1,500,984 | |
| | |
Embraer SA ADR | | | 3,652 | | | | 80,819 | |
| | |
Engie Brasil Energia SA | | | 120,125 | | | | 1,023,422 | |
| | |
Equatorial Energia SA | | | 197,000 | | | | 3,789,801 | |
| | |
Estacio Participacoes SA | | | 246,300 | | | | 1,509,924 | |
| | |
Ez Tec Empreendimentos e Participacoes SA | | | 111,094 | | | | 717,170 | |
| | |
Fibria Celulose SA | | | 24,585 | | | | 428,806 | |
| | |
Fibria Celulose SA ADR | | | 54,900 | | | | 944,829 | |
| | |
Fleury SA | | | 191,500 | | | | 977,326 | |
| | |
Gafisa SA(1) | | | 64,286 | | | | 280,316 | |
| | |
Gerdau SA, PFC Shares | | | 227,900 | | | | 871,439 | |
| | |
Gol Linhas Aereas Inteligentes SA, PFC Shares | | | 242,400 | | | | 1,569,823 | |
| | |
Hypera SA | | | 541,800 | | | | 4,221,727 | |
| | |
Iguatemi Empresa de Shopping Centers SA | | | 125,100 | | | | 1,342,749 | |
| | |
Instituto Hermes Pardini SA | | | 81,900 | | | | 395,157 | |
| | |
Itau Unibanco Holding SA, PFC Shares | | | 661,993 | | | | 6,063,536 | |
| | |
Itausa-Investimentos Itau SA, PFC Shares | | | 961,354 | | | | 2,996,364 | |
| | |
JBS SA | | | 569,502 | | | | 1,703,032 | |
| | |
Klabin SA, PFC Shares | | | 981,500 | | | | 716,673 | |
| | |
Linx SA | | | 60,800 | | | | 511,406 | |
| | |
Localiza Rent a Car SA | | | 768,528 | | | | 5,899,170 | |
| | |
LOG Commercial Properties e Participacoes SA(1) | | | 34,401 | | | | 159,947 | |
| | |
Lojas Americanas SA, PFC Shares | | | 440,490 | | | | 2,238,961 | |
| | |
Lojas Renner SA | | | 327,591 | | | | 3,583,786 | |
| | |
M Dias Branco SA | | | 60,700 | | | | 670,312 | |
| | |
Magazine Luiza SA | | | 53,508 | | | | 2,499,824 | |
| | |
Marcopolo SA, PFC Shares | | | 696,300 | | | | 732,995 | |
| | |
MRV Engenharia e Participacoes SA | | | 476,800 | | | | 1,520,544 | |
| | |
Multiplan Empreendimentos Imobiliarios SA | | | 864,600 | | | | 5,423,060 | |
| | |
Natura Cosmeticos SA | | | 143,300 | | | | 1,663,807 | |
| | | | | | | | |
| Security | | Shares | | | Value | |
| | |
| Brazil (continued) | | | | | | |
| | |
Odontoprev SA | | | 779,700 | | | $ | 2,766,142 | |
| | |
Oi SA ADR | | | 315,800 | | | | 81,919 | |
| | |
Oi SA, PFC Shares | | | 248,684 | | | | 80,847 | |
| | |
Pagseguro Digital, Ltd., Class A(1) | | | 225,100 | | | | 4,216,123 | |
| | |
Petroleo Brasileiro SA, PFC Shares | | | 2,190,277 | | | | 12,816,999 | |
| | |
Raia Drogasil SA | | | 107,800 | | | | 1,589,568 | |
| | |
Randon SA Implementos e Participacoes, PFC Shares | | | 198,512 | | | | 474,288 | |
| | |
Rumo SA(1) | | | 387,599 | | | | 1,700,105 | |
| | |
Sao Martinho SA | | | 133,410 | | | | 626,131 | |
| | |
Suzano Papel e Celulose SA | | | 156,400 | | | | 1,536,660 | |
| | |
Telefonica Brasil SA, PFC Shares | | | 74,605 | | | | 889,889 | |
| | |
TIM Participacoes SA | | | 1,575,044 | | | | 4,815,654 | |
| | |
Totvs SA | | | 91,400 | | | | 640,266 | |
| | |
Transmissora Alianca de Energia Electrica SA | | | 444,093 | | | | 2,704,146 | |
| | |
Ultrapar Participacoes SA | | | 103,648 | | | | 1,422,711 | |
| | |
Usinas Siderurgicas de Minas Gerais SA, Class A, PFC Shares | | | 226,900 | | | | 539,771 | |
| | |
Vale SA | | | 715,518 | | | | 9,415,318 | |
| | |
Weg SA | | | 1,175,096 | | | | 5,317,986 | |
| | |
| | | | | | | $ | 153,427,618 | |
| | |
| Bulgaria — 0.1% | | | | | | |
| | |
Albena AD | | | 3,379 | | | $ | 86,979 | |
| | |
Bulgartabak Holding(1) | | | 3,450 | | | | 32,098 | |
| | |
CB First Investment Bank AD(1) | | | 54,000 | | | | 106,549 | |
| | |
Chimimport AD | | | 825,588 | | | | 962,801 | |
| | |
Industrial Holding Bulgaria PLC(1) | | | 576,865 | | | | 345,734 | |
| | |
Petrol AD(1) | | | 19,052 | | | | 8,928 | |
| | |
Sopharma AD | | | 303,500 | | | | 626,379 | |
| | |
| | | | | | | $ | 2,169,468 | |
| | |
| Chile — 2.9% | | | | | | |
| | |
AES Gener SA | | | 1,713,702 | | | $ | 477,812 | |
| | |
Aguas Andinas SA, Series A | | | 2,872,891 | | | | 1,575,081 | |
| | |
Almendral SA | | | 7,092,000 | | | | 423,068 | |
| | |
AntarChile SA | | | 44,419 | | | | 583,079 | |
| | |
Banco de Chile | | | 30,328,153 | | | | 4,330,283 | |
| | |
Banco de Chile ADR | | | 12,399 | | | | 354,611 | |
| | |
Banco de Credito e Inversiones SA | | | 46,945 | | | | 3,048,043 | |
| | |
Banco Santander Chile ADR | | | 118,249 | | | | 3,535,645 | |
| | |
Besalco SA | | | 596,000 | | | | 523,948 | |
| | |
Cap SA | | | 86,946 | | | | 761,717 | |
| | |
Cencosud SA | | | 1,993,533 | | | | 3,590,658 | |
| | |
Cia Cervecerias Unidas SA ADR | | | 119,300 | | | | 2,998,009 | |
| | |
Cia Sud Americana de Vapores SA(1) | | | 10,829,733 | | | | 311,316 | |
| | | | |
| | 7 | | See Notes to Financial Statements. |
Parametric
Tax-Managed Emerging Markets Fund
December 31, 2018
Portfolio of Investments (Unaudited) — continued
| | | | | | | | |
| Security | | Shares | | | Value | |
| | |
| Chile (continued) | | | | | | |
| | |
Colbun SA | | | 5,553,984 | | | $ | 1,120,400 | |
| | |
Embotelladora Andina SA, Series A ADR | | | 6,700 | | | | 124,084 | |
| | |
Embotelladora Andina SA, Series A, PFC Shares | | | 179,519 | | | | 581,962 | |
| | |
Embotelladora Andina SA, Series B ADR | | | 49,672 | | | | 1,133,515 | |
| | |
Empresa Nacional de Telecomunicaciones SA | | | 300,687 | | | | 2,339,640 | |
| | |
Empresas CMPC SA | | | 1,260,049 | | | | 3,999,112 | |
| | |
Empresas COPEC SA | | | 751,567 | | | | 9,016,638 | |
| | |
Enel Americas SA | | | 7,896,770 | | | | 1,388,193 | |
| | |
Enel Americas SA ADR | | | 140,171 | | | | 1,250,325 | |
| | |
Enel Chile SA | | | 4,683,503 | | | | 451,142 | |
| | |
Enel Chile SA ADR | | | 257,006 | | | | 1,272,180 | |
| | |
Engie Energia Chile SA | | | 253,400 | | | | 460,429 | |
| | |
Forus SA | | | 64,662 | | | | 177,029 | |
| | |
Inversiones Aguas Metropolitanas SA | | | 613,640 | | | | 893,050 | |
| | |
Itau CorpBanca | | | 145,664,426 | | | | 1,363,872 | |
| | |
Latam Airlines Group SA | | | 169,643 | | | | 1,689,683 | |
| | |
Latam Airlines Group SA ADR | | | 248,748 | | | | 2,562,104 | |
| | |
Parque Arauco SA | | | 818,312 | | | | 1,817,148 | |
| | |
Quinenco SA | | | 288,948 | | | | 753,180 | |
| | |
Ripley Corp. SA | | | 1,334,100 | | | | 1,105,342 | |
| | |
S.A.C.I. Falabella | | | 1,179,842 | | | | 8,626,787 | |
| | |
Salfacorp SA | | | 1,194,378 | | | | 1,695,191 | |
| | |
Sigdo Koppers SA | | | 678,341 | | | | 1,020,346 | |
| | |
Sociedad Matriz SAAM SA | | | 6,677,681 | | | | 573,472 | |
| | |
Sociedad Quimica y Minera de Chile SA ADR | | | 103,800 | | | | 3,975,540 | |
| | |
Sonda SA | | | 1,554,424 | | | | 2,418,988 | |
| | |
Vina Concha y Toro SA | | | 146,373 | | | | 283,297 | |
| | |
Vina Concha y Toro SA ADR(1) | | | 26,701 | | | | 1,033,567 | |
| | |
| | | | | | | $ | 75,639,486 | |
| | |
| China — 11.8% | | | | | | |
| | |
3SBio, Inc.(2) | | | 527,000 | | | $ | 673,728 | |
| | |
AECC Aviation Power Co., Ltd. | | | 66,500 | | | | 211,020 | |
| | |
Agile Group Holdings, Ltd. | | | 486,000 | | | | 573,339 | |
| | |
Agricultural Bank of China, Ltd., Class H | | | 1,705,000 | | | | 746,784 | |
| | |
Air China, Ltd., Class H | | | 1,770,000 | | | | 1,532,014 | |
| | |
Aisino Corp. | | | 73,800 | | | | 246,565 | |
| | |
Alibaba Group Holding, Ltd. ADR(1) | | | 19,000 | | | | 2,604,330 | |
| | |
Aluminum Corp. of China, Ltd., Class H(1) | | | 5,922,000 | | | | 1,895,062 | |
| | |
Angang Steel Co., Ltd., Class H | | | 1,148,000 | | | | 791,939 | |
| | |
Anhui Conch Cement Co., Ltd., Class H | | | 1,034,500 | | | | 5,002,605 | |
| | |
ANTA Sports Products, Ltd. | | | 676,000 | | | | 3,236,254 | |
| | |
AVIC Aircraft Co., Ltd., Class A | | | 162,200 | | | | 313,572 | |
| | |
Baidu, Inc. ADR(1) | | | 13,700 | | | | 2,172,820 | |
| | |
Bank of Beijing Co., Ltd. | | | 395,520 | | | | 323,530 | |
| | |
Bank of China, Ltd., Class H | | | 5,324,000 | | | | 2,295,189 | |
| | | | | | | | |
| Security | | Shares | | | Value | |
| | |
| China (continued) | | | | | | |
| | |
Bank of Communications, Ltd., Class H | | | 2,201,300 | | | $ | 1,718,846 | |
| | |
Bank of Nanjing Co., Ltd. | | | 294,427 | | | | 277,381 | |
| | |
Bank of Ningbo Co., Ltd., Class A | | | 87,300 | | | | 206,526 | |
| | |
BBMG Corp., Class H | | | 3,378,000 | | | | 1,063,753 | |
| | |
BeiGene, Ltd. ADR(1) | | | 24,425 | | | | 3,425,850 | |
| | |
Beijing Capital International Airport Co., Ltd., Class H | | | 596,000 | | | | 632,550 | |
| | |
Beijing Enterprises Holdings, Ltd. | | | 223,500 | | | | 1,185,095 | |
| | |
Beijing Enterprises Water Group, Ltd. | | | 3,456,000 | | | | 1,764,028 | |
| | |
Beijing Orient Landscape & Environment Co., Ltd., Class A | | | 94,800 | | | | 96,486 | |
| | |
Beijing Oriental Yuhong Waterproof Technology Co., Ltd., Class A | | | 82,619 | | | | 156,288 | |
| | |
Beijing Originwater Technology Co., Ltd., Class A | | | 292,776 | | | | 333,908 | |
| | |
Beijing Sanju Environmental Protection and New Material Co., Ltd., Class A | | | 60,580 | | | | 87,117 | |
| | |
Beijing Tongrentang Co., Ltd. | | | 47,000 | | | | 188,812 | |
| | |
Beijing Water Business Doctor Co., Ltd., Class A | | | 73,000 | | | | 81,888 | |
| | |
Beijing Xinwei Technology Group Co., Ltd.(1)(3) | | | 93,610 | | | | 0 | |
| | |
Beiqi Foton Motor Co., Ltd. | | | 407,100 | | | | 108,148 | |
| | |
BOE Technology Group Co., Ltd., Class A | | | 911,100 | | | | 350,186 | |
| | |
BYD Co., Ltd., Class H | | | 575,000 | | | | 3,683,113 | |
| | |
Cangzhou Mingzhu Plastic Co., Ltd., Class A | | | 165,750 | | | | 102,122 | |
| | |
CGN Power Co., Ltd., Class H(2) | | | 6,329,000 | | | | 1,502,687 | |
| | |
Changchun High & New Technology Industry Group, Inc., Class A | | | 10,400 | | | | 265,566 | |
| | |
Changjiang Securities Co., Ltd., Class A | | | 141,300 | | | | 106,282 | |
| | |
Chengdu Xingrong Environment Co., Ltd., Class A | | | 238,200 | | | | 140,121 | |
| | |
China Agri-Industries Holdings, Ltd. | | | 2,380,000 | | | | 847,681 | |
| | |
China Baoan Group Co., Ltd., Class A | | | 175,040 | | | | 110,079 | |
| | |
China Bluechemical, Ltd., Class H | | | 1,348,000 | | | | 423,509 | |
| | |
China Cinda Asset Management Co., Ltd., Class H | | | 3,202,000 | | | | 776,077 | |
| | |
China CITIC Bank Corp., Ltd., Class H | | | 1,627,000 | | | | 987,079 | |
| | |
China Coal Energy Co., Ltd., Class H | | | 1,005,000 | | | | 395,368 | |
| | |
China Communications Construction Co., Ltd., Class H | | | 1,677,000 | | | | 1,581,131 | |
| | |
China Communications Services Corp., Ltd., Class H | | | 2,166,000 | | | | 1,795,897 | |
| | |
China Construction Bank Corp., Class H | | | 6,290,580 | | | | 5,151,060 | |
| | |
China Dongxiang Group Co., Ltd. | | | 3,981,000 | | | | 609,426 | |
| | |
China Eastern Airlines Corp., Ltd., Class H | | | 1,436,000 | | | | 796,517 | |
| | |
China Everbright Bank Co., Ltd. | | | 341,400 | | | | 184,156 | |
| | |
China Everbright International, Ltd. | | | 1,584,148 | | | | 1,419,599 | |
| | |
China Everbright, Ltd. | | | 456,000 | | | | 808,256 | |
| | |
China Evergrande Group | | | 757,000 | | | | 2,261,543 | |
| | |
China Fortune Land Development Co., Ltd. | | | 52,400 | | | | 194,930 | |
| | |
China Gas Holdings, Ltd. | | | 1,086,000 | | | | 3,872,449 | |
| | |
China Gezhouba Group Co., Ltd. | | | 152,700 | | | | 141,016 | |
| | |
China Huishan Dairy Holdings Co., Ltd.(1)(3) | | | 1,750,000 | | | | 0 | |
| | | | |
| | 8 | | See Notes to Financial Statements. |
Parametric
Tax-Managed Emerging Markets Fund
December 31, 2018
Portfolio of Investments (Unaudited) — continued
| | | | | | | | |
| Security | | Shares | | | Value | |
| | |
| China (continued) | | | | | | |
| | |
China International Marine Containers Co., Ltd. | | | 413,812 | | | $ | 397,112 | |
| | |
China International Travel Service Corp., Ltd. | | | 62,976 | | | | 553,031 | |
| | |
China Life Insurance Co., Ltd., Class H | | | 178,000 | | | | 376,424 | |
| | |
China Longyuan Power Group Corp., Ltd., Class H | | | 2,519,000 | | | | 1,719,586 | |
| | |
China Medical System Holdings, Ltd. | | | 702,000 | | | | 655,317 | |
| | |
China Mengniu Dairy Co., Ltd. | | | 1,601,000 | | �� | | 4,981,545 | |
| | |
China Merchants Bank Co., Ltd., Class H | | | 512,500 | | | | 1,871,543 | |
| | |
China Merchants Port Holdings Co., Ltd. | | | 790,000 | | | | 1,420,429 | |
| | |
China Merchants Shekou Industrial Zone Holdings Co., Ltd.(3) | | | 935,251 | | | | 0 | |
| | |
China Minsheng Banking Corp., Ltd., Class H | | | 1,036,920 | | | | 715,179 | |
| | |
China Mobile, Ltd. | | | 1,910,400 | | | | 18,486,163 | |
| | |
China Modern Dairy Holdings, Ltd.(1) | | | 2,514,000 | | | | 250,222 | |
| | |
China Molybdenum Co., Ltd., Class H | | | 4,218,000 | | | | 1,553,293 | |
| | |
China National Building Material Co., Ltd., Class H | | | 2,156,000 | | | | 1,475,264 | |
| | |
China National Nuclear Power Co., Ltd. | | | 227,000 | | | | 174,527 | |
| | |
China Northern Rare Earth Group High-Tech Co., Ltd. | | | 185,300 | | | | 237,452 | |
| | |
China Oilfield Services, Ltd., Class H | | | 1,832,000 | | | | 1,576,595 | |
| | |
China Overseas Land & Investment, Ltd. | | | 760,360 | | | | 2,621,577 | |
| | |
China Pacific Insurance (Group) Co., Ltd., Class H | | | 282,800 | | | | 913,858 | |
| | |
China Petroleum & Chemical Corp., Class H | | | 11,161,800 | | | | 7,956,236 | |
| | |
China Power International Development, Ltd. | | | 2,268,000 | | | | 514,678 | |
| | |
China Railway Construction Corp., Ltd., Class H | | | 947,500 | | | | 1,316,047 | |
| | |
China Railway Group, Ltd., Class H | | | 2,265,000 | | | | 2,063,817 | |
| | |
China Resources Beer Holdings Co., Ltd. | | | 968,000 | | | | 3,384,308 | |
| | |
China Resources Cement Holdings, Ltd. | | | 870,000 | | | | 784,509 | |
| | |
China Resources Gas Group, Ltd. | | | 610,000 | | | | 2,417,164 | |
| | |
China Resources Land, Ltd. | | | 537,111 | | | | 2,066,090 | |
| | |
China Resources Medical Holdings Co., Ltd. | | | 803,000 | | | | 523,946 | |
| | |
China Resources Pharmaceutical Group, Ltd.(2) | | | 278,000 | | | | 362,059 | |
| | |
China Resources Power Holdings Co., Ltd. | | | 1,087,000 | | | | 2,090,772 | |
| | |
China Shenhua Energy Co., Ltd., Class H | | | 1,654,500 | | | | 3,608,373 | |
| | |
China Shipbuilding Industry Co., Ltd. | | | 375,300 | | | | 232,799 | |
| | |
China South City Holdings, Ltd. | | | 1,106,000 | | | | 156,691 | |
| | |
China Southern Airlines Co., Ltd., Class H | | | 2,064,500 | | | | 1,265,864 | |
| | |
China Sports Industry Group Co., Ltd. | | | 69,000 | | | | 89,727 | |
| | |
China State Construction Engineering Corp., Ltd. | | | 331,520 | | | | 275,850 | |
| | |
China Taiping Insurance Holdings Co., Ltd. | | | 277,000 | | | | 761,578 | |
| | |
China Telecom Corp., Ltd., Class H | | | 7,572,000 | | | | 3,879,641 | |
| | |
China Travel International Investment Hong Kong, Ltd. | | | 1,660,000 | | | | 442,991 | |
| | |
China Unicom (Hong Kong), Ltd. | | | 2,590,290 | | | | 2,759,713 | |
| | |
China Union Holdings, Ltd., Class A | | | 306,600 | | | | 246,850 | |
| | |
China United Network Communications, Ltd., Class A | | | 983,766 | | | | 742,492 | |
| | |
China Vanke Co., Ltd., Class H | | | 723,217 | | | | 2,449,273 | |
| | |
China Yangtze Power Co., Ltd. | | | 236,900 | | | | 548,441 | |
| | |
Chongqing Changan Automobile Co., Ltd., Class A | | | 98,738 | | | | 94,962 | |
| | | | | | | | |
| Security | | Shares | | | Value | |
| | |
| China (continued) | | | | | | |
| | |
CIFI Holdings Group Co., Ltd. | | | 990,000 | | | $ | 524,764 | |
| | |
CITIC Guoan Information Industry Co., Ltd., Class A | | | 585,250 | | | | 288,509 | |
| | |
CITIC, Ltd. | | | 1,614,000 | | | | 2,532,657 | |
| | |
CNOOC, Ltd. | | | 5,344,500 | | | | 8,232,255 | |
| | |
COFCO Tunhe Sugar Co., Ltd. | | | 116,500 | | | | 125,212 | |
| | |
COSCO SHIPPING Development Co., Ltd., Class H(1) | | | 3,803,000 | | | | 387,695 | |
| | |
COSCO SHIPPING Energy Transportation Co., Ltd., Class H | | | 1,778,000 | | | | 885,599 | |
| | |
COSCO SHIPPING Holdings Co., Ltd., Class H(1) | | | 2,729,150 | | | | 1,024,877 | |
| | |
COSCO SHIPPING Ports, Ltd. | | | 528,000 | | | | 519,085 | |
| | |
Country Garden Holdings Co., Ltd. | | | 2,431,000 | | | | 2,951,978 | |
| | |
Country Garden Services Holdings Co., Ltd.(1) | | | 279,425 | | | | 442,397 | |
| | |
CSPC Pharmaceutical Group, Ltd. | | | 2,054,000 | | | | 2,948,456 | |
| | |
Ctrip.com International, Ltd. ADR(1) | | | 108,700 | | | | 2,941,422 | |
| | |
Daqin Railway Co., Ltd. | | | 164,362 | | | | 197,261 | |
| | |
Datang International Power Generation Co., Ltd., Class H | | | 3,276,000 | | | | 770,512 | |
| | |
Deluxe Family Co., Ltd. | | | 311,800 | | | | 138,829 | |
| | |
DHC Software Co., Ltd., Class A | | | 183,200 | | | | 186,179 | |
| | |
Dong-E-E-Jiao Co., Ltd., Class A | | | 55,200 | | | | 318,790 | |
| | |
Dongfeng Motor Group Co., Ltd., Class H | | | 1,748,000 | | | | 1,588,731 | |
| | |
Dr Peng Telecom & Media Group Co., Ltd. | | | 473,778 | | | | 487,152 | |
| | |
East Money Information Co., Ltd., Class A | | | 113,760 | | | | 201,022 | |
| | |
Financial Street Holdings Co., Ltd., Class A | | | 298,166 | | | | 280,366 | |
| | |
Fullshare Holdings, Ltd. | | | 3,655,000 | | | | 840,111 | |
| | |
GD Power Development Co., Ltd. | | | 566,200 | | | | 211,511 | |
| | |
GEM Co., Ltd., Class A | | | 217,400 | | | | 121,971 | |
| | |
Gemdale Corp. | | | 247,101 | | | | 346,933 | |
| | |
GoerTek, Inc., Class A | | | 307,800 | | | | 308,932 | |
| | |
Golden Eagle Retail Group, Ltd. | | | 366,000 | | | | 379,251 | |
| | |
Great Wall Motor Co., Ltd., Class H | | | 2,510,250 | | | | 1,443,228 | |
| | |
Gree Electric Appliances, Inc. of Zhuhai, Class A(1) | | | 129,000 | | | | 673,514 | |
| | |
Greentown China Holdings, Ltd. | | | 235,500 | | | | 177,103 | |
| | |
Guangdong Baolihua New Energy Stock Co., Ltd., Class A | | | 257,300 | | | | 252,531 | |
| | |
Guangdong Golden Dragon Development, Inc., Class A | | | 98,800 | | | | 130,994 | |
| | |
Guangdong Investment, Ltd. | | | 2,320,000 | | | | 4,482,656 | |
| | |
Guangdong Shaoneng Group Co., Ltd., Class A | | | 732,110 | | | | 397,648 | |
| | |
Guanghui Energy Co., Ltd. | | | 682,345 | | | | 374,862 | |
| | |
Guangzhou Automobile Group Co., Ltd., Class H | | | 2,451,199 | | | | 2,443,767 | |
| | |
Guangzhou Baiyunshan Pharmaceutical Holdings Co., Ltd., Class H | | | 210,000 | | | | 751,678 | |
| | |
Guangzhou R&F Properties Co., Ltd., Class H | | | 670,400 | | | | 1,014,467 | |
| | |
Guosen Securities Co., Ltd., Class A | | | 176,600 | | | | 216,079 | |
| | |
Guoxuan High-Tech Co., Ltd., Class A | | | 63,830 | | | | 107,825 | |
| | |
Guoyuan Securities Co., Ltd., Class A | | | 159,500 | | | | 162,689 | |
| | |
Han’s Laser Technology Industry Group Co., Ltd., Class A | | | 46,800 | | | | 207,851 | |
| | | | |
| | 9 | | See Notes to Financial Statements. |
Parametric
Tax-Managed Emerging Markets Fund
December 31, 2018
Portfolio of Investments (Unaudited) — continued
| | | | | | | | |
| Security | | Shares | | | Value | |
| | |
| China (continued) | | | | | | |
| | |
Hangzhou Hikvision Digital Technology Co., Ltd., Class A | | | 111,200 | | | $ | 419,603 | |
| | |
Harbin Pharmaceutical Group Co., Ltd. | | | 150,695 | | | | 86,868 | |
| | |
Henan Shuanghui Investment & Development Co., Ltd., Class A | | | 61,400 | | | | 211,686 | |
| | |
Hengan International Group Co., Ltd. | | | 403,000 | | | | 2,925,928 | |
| | |
Hengtong Optic-electric Co., Ltd. | | | 98,560 | | | | 244,946 | |
| | |
Hesteel Co., Ltd., Class A | | | 284,800 | | | | 118,213 | |
| | |
Huabao International Holdings, Ltd. | | | 492,000 | | | | 208,566 | |
| | |
Huadian Fuxin Energy Corp., Ltd. | | | 820,000 | | | | 199,527 | |
| | |
Huadian Power International Corp., Ltd., Class H | | | 2,642,000 | | | | 1,191,530 | |
| | |
Huadong Medicine Co., Ltd., Class A | | | 44,300 | | | | 171,159 | |
| | |
Hualan Biological Engineering, Inc., Class A | | | 62,200 | | | | 297,925 | |
| | |
Huaneng Power International, Inc., Class H | | | 6,520,000 | | | | 4,138,502 | |
| | |
Huaneng Renewables Corp., Ltd., Class H | | | 2,704,000 | | | | 726,728 | |
| | |
Huaxia Bank Co., Ltd. | | | 287,622 | | | | 309,964 | |
| | |
Huayi Brothers Media Corp., Class A | | | 312,765 | | | | 214,226 | |
| | |
Huayu Automotive Systems Co., Ltd. | | | 82,100 | | | | 220,438 | |
| | |
Hubei Energy Group Co., Ltd., Class A | | | 272,100 | | | | 145,804 | |
| | |
Humanwell Healthcare Group Co., Ltd. | | | 69,600 | | | | 103,213 | |
| | |
Hundsun Technologies, Inc. | | | 33,750 | | | | 256,497 | |
| | |
Iflytek Co., Ltd., Class A | | | 37,950 | | | | 136,849 | |
| | |
iKang Healthcare Group, Inc. ADR(1) | | | 14,800 | | | | 301,624 | |
| | |
Industrial & Commercial Bank of China, Ltd., Class H | | | 4,715,000 | | | | 3,353,589 | |
| | |
Industrial Bank Co., Ltd. | | | 179,000 | | | | 390,104 | |
| | |
Inner Mongolia BaoTou Steel Union Co., Ltd. | | | 737,800 | | | | 159,273 | |
| | |
Inner Mongolia Yili Industrial Group Co., Ltd., Class A | | | 113,200 | | | | 378,220 | |
| | |
JD.com, Inc. ADR(1) | | | 39,400 | | | | 824,642 | |
| | |
Jiangsu Changjiang Electronics Technology Co., Ltd. | | | 76,294 | | | | 91,875 | |
| | |
Jiangsu Expressway Co., Ltd., Class H | | | 796,000 | | | | 1,111,072 | |
| | |
Jiangsu Hengrui Medicine Co., Ltd. | | | 64,116 | | | | 494,371 | |
| | |
Jiangsu Yanghe Brewery Joint-Stock Co., Ltd., Class A | | | 25,000 | | | | 346,455 | |
| | |
Jiangsu Yuyue Medical Equipment & Supply Co., Ltd., Class A | | | 81,550 | | | | 233,224 | |
| | |
Jiangxi Copper Co., Ltd., Class H | | | 1,415,000 | | | | 1,662,962 | |
| | |
Jiangxi Ganfeng Lithium Co., Ltd., Class A | | | 103,400 | | | | 334,323 | |
| | |
Jilin Aodong Pharmaceutical Group Co., Ltd., Class A | | | 64,100 | | | | 134,977 | |
| | |
Jinke Properties Group Co., Ltd., Class A | | | 361,000 | | | | 326,315 | |
| | |
Jinyu Bio-Technology Co., Ltd. | | | 73,710 | | | | 178,764 | |
| | |
Jizhong Energy Resources Co., Ltd., Class A | | | 283,400 | | | | 156,048 | |
| | |
Jonjee Hi-Tech Industrial And Commercial Holding Co., Ltd. | | | 41,300 | | | | 177,804 | |
| | |
Kaidi Ecological and Environmental Technology Co., Ltd., Class A(1) | | | 321,500 | | | | 56,950 | |
| | |
Kangde Xin Composite Material Group Co., Ltd., Class A | | | 113,300 | | | | 125,797 | |
| | |
Kangmei Pharmaceutical Co., Ltd. | | | 106,000 | | | | 142,790 | |
| | | | | | | | |
| Security | | Shares | | | Value | |
| | |
| China (continued) | | | | | | |
| | |
Kingboard Holdings., Ltd. | | | 169,200 | | | $ | 451,382 | |
| | |
Kingfa Sci & Tech Co., Ltd. | | | 171,400 | | | | 123,947 | |
| | |
Kweichow Moutai Co., Ltd. | | | 10,010 | | | | 864,651 | |
| | |
KWG Group Holdings, Ltd. | | | 618,500 | | | | 548,004 | |
| | |
Lee & Man Paper Manufacturing, Ltd. | | | 876,000 | | | | 741,354 | |
| | |
Lenovo Group, Ltd. | | | 2,596,000 | | | | 1,753,694 | |
| | |
Lepu Medical Technology Beijing Co., Ltd., Class A | | | 69,200 | | | | 210,121 | |
| | |
Leyou Technologies Holdings, Ltd.(1) | | | 1,240,000 | | | | 345,084 | |
| | |
Li Ning Co., Ltd.(1) | | | 1,892,312 | | | | 2,032,712 | |
| | |
Liaoning Cheng Da Co., Ltd. | | | 72,015 | | | | 110,025 | |
| | |
Longfor Group Holdings, Ltd. | | | 841,000 | | | | 2,501,223 | |
| | |
LONGi Green Energy Technology Co., Ltd. | | | 94,641 | | | | 240,837 | |
| | |
Lonking Holdings, Ltd. | | | 2,438,000 | | | | 629,912 | |
| | |
Luxshare Precision Industry Co., Ltd., Class A | | | 199,290 | | | | 409,206 | |
| | |
Luye Pharma Group, Ltd.(2) | | | 1,117,000 | | | | 777,439 | |
| | |
Luzhou Laojiao Co., Ltd., Class A | | | 31,300 | | | | 185,880 | |
| | |
Maanshan Iron & Steel Co., Ltd., Class H | | | 2,099,000 | | | | 926,042 | |
| | |
Midea Group Co., Ltd., Class A | | | 96,300 | | | | 520,135 | |
| | |
MMG, Ltd.(1) | | | 796,000 | | | | 341,964 | |
| | |
NARI Technology Co., Ltd. | | | 85,600 | | | | 231,570 | |
| | |
NavInfo Co., Ltd., Class A | | | 64,800 | | | | 133,713 | |
| | |
NetEase, Inc. ADR | | | 5,200 | | | | 1,223,924 | |
| | |
Neusoft Corp. | | | 74,400 | | | | 125,616 | |
| | |
New Hope Liuhe Co., Ltd., Class A | | | 264,326 | | | | 280,654 | |
| | |
New Oriental Education & Technology Group, Inc. ADR(1) | | | 50,300 | | | | 2,756,943 | |
| | |
Nine Dragons Paper Holdings, Ltd. | | | 1,412,000 | | | | 1,304,352 | |
| | |
O-film Tech Co., Ltd., Class A | | | 65,793 | | | | 88,380 | |
| | |
Oceanwide Holdings Co., Ltd., Class A | | | 270,200 | | | | 183,983 | |
| | |
Offshore Oil Engineering Co., Ltd. | | | 168,800 | | | | 120,385 | |
| | |
Oriental Energy Co., Ltd., Class A | | | 310,600 | | | | 365,436 | |
| | |
Ourpalm Co., Ltd., Class A | | | 363,500 | | | | 187,971 | |
| | |
Parkson Retail Group, Ltd. | | | 664,500 | | | | 47,391 | |
| | |
Perfect World Co. Ltd/China, Class A | | | 59,700 | | | | 242,608 | |
| | |
PetroChina Co., Ltd., Class H | | | 2,088,300 | | | | 1,295,782 | |
| | |
PICC Property & Casualty Co., Ltd., Class H | | | 513,000 | | | | 523,447 | |
| | |
Ping An Bank Co., Ltd., Class A | | | 457,200 | | | | 625,627 | |
| | |
Ping An Insurance (Group) Co. of China, Ltd., Class H | | | 477,500 | | | | 4,212,512 | |
| | |
Pingdingshan Tianan Coal Mining Co., Ltd.(1) | | | 262,515 | | | | 135,095 | |
| | |
Poly Developments and Holdings Group Co., Ltd., Class A | | | 292,400 | | | | 503,748 | |
| | |
Poly Property Group Co., Ltd. | | | 1,579,000 | | | | 493,845 | |
| | |
Power Construction Corp. of China, Ltd. | | | 186,917 | | | | 132,515 | |
| | |
Qingdao Haier Co., Ltd. | | | 135,829 | | | | 274,826 | |
| | |
Qinghai Salt Lake Industry Co., Ltd., Class A(1) | | | 106,500 | | | | 108,631 | |
| | |
Qingling Motors Co., Ltd., Class H | | | 1,448,966 | | | | 372,295 | |
| | |
RiseSun Real Estate Development Co., Ltd., Class A | | | 223,100 | | | | 258,836 | |
| | | | |
| | 10 | | See Notes to Financial Statements. |
Parametric
Tax-Managed Emerging Markets Fund
December 31, 2018
Portfolio of Investments (Unaudited) — continued
| | | | | | | | |
| Security | | Shares | | | Value | |
| | |
| China (continued) | | | | | | |
| | |
SAIC Motor Corp., Ltd. | | | 135,500 | | | $ | 527,182 | |
| | |
Sanan Optoelectronics Co., Ltd. | | | 132,000 | | | | 218,008 | |
| | |
SDIC Power Holdings Co., Ltd. | | | 112,800 | | | | 132,390 | |
| | |
Semiconductor Manufacturing International Corp.(1) | | | 1,241,200 | | | | 1,082,149 | |
| | |
Shandong Gold Mining Co., Ltd. | | | 44,309 | | | | 194,524 | |
| | |
Shandong Nanshan Aluminum Co., Ltd. | | | 532,350 | | | | 163,989 | |
| | |
Shanghai Dazhong Public Utilities Group Co., Ltd., Class A | | | 220,886 | | | | 151,019 | |
| | |
Shanghai Electric Group Co., Ltd., Class H | | | 1,644,000 | | | | 525,854 | |
| | |
Shanghai Fosun Pharmaceutical Group Co., Ltd. | | | 545,000 | | | | 1,593,226 | |
| | |
Shanghai Industrial Holdings, Ltd. | | | 291,000 | | | | 588,308 | |
| | |
Shanghai Oriental Pearl Group Co., Ltd., Class A | | | 300,595 | | | | 449,495 | |
| | |
Shanghai Pharmaceuticals Holding Co., Ltd., Class H | | | 756,400 | | | | 1,535,890 | |
| | |
Shanghai Pudong Development Bank Co., Ltd., Class A | | | 221,426 | | | | 316,480 | |
| | |
Shanghai Zhangjiang High-Tech Park Development Co., Ltd., Class A | | | 75,400 | | | | 164,014 | |
| | |
Shanxi Lu’an Environmental Energy Development Co., Ltd. | | | 152,200 | | | | 148,111 | |
| | |
Shanxi Securities Co., Ltd., Class A | | | 168,700 | | | | 145,884 | |
| | |
Shanxi Xishan Coal & Electricity Power Co., Ltd., Class A | | | 232,100 | | | | 186,091 | |
| | |
Shenergy Co., Ltd. | | | 227,799 | | | | 162,071 | |
| | |
Shenwan Hongyuan Group Co., Ltd., Class A | | | 357,100 | | | | 212,235 | |
| | |
Shenzhen Energy Group Co., Ltd., Class A | | | 241,960 | | | | 185,423 | |
| | |
Shenzhen Inovance Technology Co., Ltd., Class A | | | 60,600 | | | | 178,359 | |
| | |
Shenzhen Investment, Ltd. | | | 1,384,000 | | | | 457,482 | |
| | |
Shenzhen Overseas Chinese Town Co., Ltd., Class A | | | 176,600 | | | | 163,688 | |
| | |
Shenzhen Salubris Pharmaceuticals Co., Ltd., Class A | | | 56,300 | | | | 171,842 | |
| | |
Shenzhen Sunway Communication Co., Ltd., Class A | | | 52,400 | | | | 165,271 | |
| | |
Shenzhen World Union Properties Consultancy, Inc., Class A | | | 291,100 | | | | 216,355 | |
| | |
Shenzhen Zhongjin Lingnan Nonfemet Co., Ltd., Class A | | | 219,739 | | | | 126,852 | |
| | |
Shimao Property Holdings, Ltd. | | | 214,500 | | | | 571,302 | |
| | |
Shui On Land, Ltd. | | | 1,556,500 | | | | 346,589 | |
| | |
Siasun Robot & Automation Co., Ltd., Class A | | | 69,900 | | | | 134,945 | |
| | |
Sichuan Changhong Electric Co., Ltd. | | | 307,800 | | | | 103,881 | |
| | |
Sichuan Chuantou Energy Co., Ltd. | | | 152,000 | | | | 192,246 | |
| | |
Sihuan Pharmaceutical Holdings Group, Ltd. | | | 928,000 | | | | 162,069 | |
| | |
SINA Corp.(1) | | | 8,700 | | | | 466,668 | |
| | |
Sino Biopharmaceutical, Ltd. | | | 3,257,500 | | | | 2,144,374 | |
| | |
Sino-Ocean Group Holding, Ltd. | | | 1,881,500 | | | | 829,751 | |
| | |
Sinopec Oilfield Service Corp., Class H(1) | | | 4,801,500 | | | | 368,185 | |
| | |
Sinopec Shanghai Petrochemical Co., Ltd., Class H | | | 3,662,000 | | | | 1,603,002 | |
| | |
Sinopharm Group Co., Ltd., Class H | | | 756,800 | | | | 3,186,321 | |
| | |
SOHO China, Ltd.(1) | | | 381,500 | | | | 136,249 | |
| | | | | | | | |
| Security | | Shares | | | Value | |
| | |
| China (continued) | | | | | | |
| | |
Sohu.com, Ltd. ADR(1) | | | 8,700 | | | $ | 151,554 | |
| | |
Sun Art Retail Group, Ltd. | | | 1,281,000 | | | | 1,302,692 | |
| | |
Sunac China Holdings, Ltd. | | | 750,000 | | | | 2,434,022 | |
| | |
Suning.com Co., Ltd, Class A | | | 138,200 | | | | 198,742 | |
| | |
Talkweb Information System Co., Ltd., Class A | | | 380,500 | | | | 234,630 | |
| | |
Tasly Pharmaceutical Group Co., Ltd. | | | 82,976 | | | | 232,527 | |
| | |
TBEA Co., Ltd. | | | 168,219 | | | | 166,932 | |
| | |
TCL Corp., Class A | | | 372,800 | | | | 133,502 | |
| | |
Tencent Holdings, Ltd. | | | 242,900 | | | | 9,735,510 | |
| | |
Tianqi Lithium Corp., Class A | | | 31,855 | | | | 136,923 | |
| | |
Tibet Water Resources, Ltd.(1) | | | 528,000 | | | | 184,779 | |
| | |
Tingyi (Cayman Islands) Holding Corp. | | | 1,198,000 | | | | 1,604,490 | |
| | |
Tonghua Dongbao Pharmaceutical Co., Ltd. | | | 106,833 | | | | 216,910 | |
| | |
Tongling Nonferrous Metals Group Co., Ltd., Class A | | | 443,200 | | | | 127,384 | |
| | |
TravelSky Technology, Ltd., Class H | | | 984,000 | | | | 2,521,949 | |
| | |
Tsinghua Tongfang Co., Ltd. | | | 106,100 | | | | 150,668 | |
| | |
Tsingtao Brewery Co., Ltd., Class H | | | 654,000 | | | | 2,639,543 | |
| | |
Tus-Sound Environmental Resources Co., Ltd., Class A | | | 78,680 | | | | 119,481 | |
| | |
Uni-President China Holdings, Ltd. | | | 290,000 | | | | 251,127 | |
| | |
United Laboratories International Holdings, Ltd. (The) | | | 362,000 | | | | 191,728 | |
| | |
Wanhua Chemical Group Co., Ltd. | | | 52,720 | | | | 215,389 | |
| | |
Want Want China Holdings, Ltd. | | | 3,646,000 | | | | 2,550,992 | |
| | |
Weibo Corp. ADR(1) | | | 5,140 | | | | 300,330 | |
| | |
Weichai Power Co., Ltd., Class H | | | 907,200 | | | | 1,038,615 | |
| | |
Wens Foodstuffs Group Co., Ltd., Class A | | | 134,928 | | | | 515,838 | |
| | |
Western Mining Co., Ltd. | | | 274,000 | | | | 232,725 | |
| | |
Western Securities Co., Ltd., Class A | | | 166,539 | | | | 186,523 | |
| | |
WH Group, Ltd.(2) | | | 3,991,500 | | | | 3,065,658 | |
| | |
Wintime Energy Co., Ltd.(1) | | | 659,389 | | | | 128,459 | |
| | |
Wuhu Shunrong Sanqi Interactive Entertainment Network Technology Co., Ltd., Class A | | | 133,400 | | | | 184,230 | |
| | |
Wuliangye Yibin Co., Ltd., Class A | | | 31,400 | | | | 233,499 | |
| | |
Xinhu Zhongbao Co., Ltd. | | | 301,800 | | | | 127,865 | |
| | |
Xinjiang Zhongtai Chemical Co., Ltd., Class A | | | 104,700 | | | | 107,884 | |
| | |
Yang Quan Coal Industry Group Co., Ltd. | | | 189,257 | | | | 139,379 | |
| | |
Yango Group Co., Ltd., Class A | | | 259,600 | | | | 196,722 | |
| | |
Yangzijiang Shipbuilding Holdings, Ltd. | | | 1,652,000 | | | | 1,517,926 | |
| | |
Yanzhou Coal Mining Co., Ltd., Class H | | | 1,652,000 | | | | 1,334,220 | |
| | |
Yonghui Superstores Co., Ltd. | | | 140,200 | | | | 160,762 | |
| | |
Yonyou Network Technology Co., Ltd., Class A | | | 59,400 | | | | 185,026 | |
| | |
Youngor Group Co., Ltd. | | | 201,880 | | | | 211,945 | |
| | |
Yuan Longping High-tech Agriculture Co., Ltd., Class A | | | 84,332 | | | | 182,128 | |
| | |
Yuexiu Property Co., Ltd. | | | 3,386,000 | | | | 622,263 | |
| | |
Yunnan Baiyao Group Co., Ltd., Class A | | | 19,521 | | | | 210,447 | |
| | | | |
| | 11 | | See Notes to Financial Statements. |
Parametric
Tax-Managed Emerging Markets Fund
December 31, 2018
Portfolio of Investments (Unaudited) — continued
| | | | | | | | |
| Security | | Shares | | | Value | |
| | |
| China (continued) | | | | | | |
| | |
Yunnan Chihong Zinc & Germanium Co., Ltd. | | | 222,100 | | | $ | 132,874 | |
| | |
Zhaojin Mining Industry Co., Ltd., Class H | | | 409,500 | | | | 415,509 | |
| | |
Zhejiang China Commodities City Group Co., Ltd. | | | 354,157 | | | | 180,389 | |
| | |
Zhejiang Dahua Technology Co., Ltd., Class A | | | 94,600 | | | | 158,813 | |
| | |
Zhejiang Expressway Co., Ltd., Class H | | | 870,000 | | | | 754,762 | |
| | |
Zhejiang Huahai Pharmaceutical Co., Ltd. | | | 70,080 | | | | 113,930 | |
| | |
Zhejiang Longsheng Group Co., Ltd. | | | 155,000 | | | | 218,474 | |
| | |
Zhejiang Wanfeng Auto Wheel Co., Ltd., Class A | | | 84,800 | | | | 96,310 | |
| | |
Zhejiang Zheneng Electric Power Co., Ltd. | | | 246,600 | | | | 170,238 | |
| | |
Zhengzhou Yutong Bus Co., Ltd. | | | 66,400 | | | | 114,989 | |
| | |
Zhongjin Gold Corp., Ltd. | | | 120,570 | | | | 150,254 | |
| | |
Zhuzhou CRRC Times Electric Co., Ltd., Class H | | | 288,000 | | | | 1,599,068 | |
| | |
Zijin Mining Group Co., Ltd., Class H | | | 7,732,000 | | | | 2,930,177 | |
| | |
ZTE Corp., Class H(1) | | | 708,739 | | | | 1,337,306 | |
| | |
| | | | | | | $ | 304,902,447 | |
| | |
| Colombia — 1.3% | | | | | | |
| | |
Almacenes Exito SA | | | 519,955 | | | $ | 1,985,356 | |
| | |
Avianca Holdings SA, PFC Shares | | | 554,449 | | | | 283,414 | |
| | |
Banco Davivienda SA, PFC Shares | | | 164,849 | | | | 1,569,555 | |
| | |
Banco de Bogota SA | | | 43,116 | | | | 740,838 | |
| | |
Bancolombia SA | | | 86,292 | | | | 807,784 | |
| | |
Bancolombia SA ADR, PFC Shares | | | 85,000 | | | | 3,238,500 | |
| | |
Bolsa de Valores de Colombia | | | 121,383 | | | | 446,660 | |
| | |
Celsia SA ESP | | | 773,260 | | | | 952,437 | |
| | |
Cementos Argos SA | | | 409,358 | | | | 877,331 | |
| | |
Cementos Argos SA, PFC Shares | | | 190,626 | | | | 343,391 | |
| | |
Cemex Latam Holdings SA(1) | | | 206,452 | | | | 235,219 | |
| | |
Corporacion Financiera Colombiana SA(1) | | | 115,019 | | | | 580,850 | |
| | |
Ecopetrol SA | | | 4,480,900 | | | | 3,649,571 | |
| | |
Ecopetrol SA ADR | | | 251,500 | | | | 3,993,820 | |
| | |
Empresa de Telecommunicaciones de Bogota
SA(1) | | | 1,017,738 | | | | 79,131 | |
| | |
Fabricato SA(1) | | | 29,115,900 | | | | 52,404 | |
| | |
Grupo Argos SA | | | 396,460 | | | | 2,063,179 | |
| | |
Grupo Argos SA, PFC Shares | | | 140,122 | | | | 625,641 | |
| | |
Grupo Aval Acciones y Valores SA | | | 1,683,100 | | | | 494,694 | |
| | |
Grupo Aval Acciones y Valores SA, PFC Shares | | | 1,817,548 | | | | 559,116 | |
| | |
Grupo de Inversiones Suramericana SA | | | 238,579 | | | | 2,359,710 | |
| | |
Grupo Energia Bogota SA ESP | | | 2,027,382 | | | | 1,104,993 | |
| | |
Grupo Nutresa SA | | | 426,615 | | | | 3,087,129 | |
| | |
Interconexion Electrica SA | | | 945,400 | | | | 4,069,805 | |
| | |
Odinsa SA(3) | | | 53,817 | | | | 174,004 | |
| | |
Organizacion Terpel SA | | | 13,768 | | | | 41,124 | |
| | |
| | | | | | | $ | 34,415,656 | |
| | | | | | | | |
| Security | | Shares | | | Value | |
| | |
| Croatia — 0.8% | | | | | | |
| | |
AD Plastik DD | | | 48,858 | | | $ | 1,328,713 | |
| | |
Adris Grupa DD, PFC Shares | | | 45,976 | | | | 2,963,368 | |
| | |
Atlantic Grupa DD | | | 13,246 | | | | 2,388,038 | |
| | |
Atlantska Plovidba DD(1) | | | 11,069 | | | | 568,612 | |
| | |
Ericsson Nikola Tesla DD | | | 5,610 | | | | 873,426 | |
| | |
Hrvatski Telekom DD | | | 254,249 | | | | 5,918,369 | |
| | |
Koncar-Elektroindustrija DD | | | 6,024 | | | | 498,126 | |
| | |
Kras DD | | | 3,067 | | | | 177,429 | |
| | |
Ledo DD(1)(3) | | | 983 | | | | 0 | |
| | |
Petrokemija DD(1) | | | 1,183 | | | | 5,576 | |
| | |
Podravka Prehrambena Industrija DD | | | 40,146 | | | | 2,324,348 | |
| | |
Privredna Banka Zagreb DD | | | 3,310 | | | | 377,695 | |
| | |
Valamar Riviera DD | | | 298,489 | | | | 1,695,996 | |
| | |
Zagrebacka Banka DD | | | 30,550 | | | | 269,408 | |
| | |
| | | | | | | $ | 19,389,104 | |
| | |
| Czech Republic — 0.7% | | | | | | |
| | |
CEZ AS | | | 348,557 | | | $ | 8,308,959 | |
| | |
Komercni Banka AS | | | 219,211 | | | | 8,277,092 | |
| | |
New World Resources PLC, Class A(1)(3) | | | 860,500 | | | | 0 | |
| | |
O2 Czech Republic AS | | | 29,400 | | | | 316,092 | |
| | |
Philip Morris CR AS | | | 2,867 | | | | 1,793,904 | |
| | |
| | | | | | | $ | 18,696,047 | |
| | |
| Egypt — 0.7% | | | | | | |
| | |
Alexandria Mineral Oils Co. | | | 1,324,759 | | | $ | 460,354 | |
| | |
Commercial International Bank Egypt SAE | | | 1,068,329 | | | | 4,465,525 | |
| | |
Eastern Tobacco | | | 2,141,120 | | | | 1,958,623 | |
| | |
Egypt Kuwait Holding Co. SAE | | | 873,388 | | | | 938,040 | |
| | |
Egyptian Financial Group-Hermes Holding Co.(1) | | | 591,772 | | | | 496,001 | |
| | |
Egyptian International Pharmaceuticals EIPICO | | | 85,424 | | | | 509,624 | |
| | |
Egyptian Resorts Co.(1) | | | 2,375,648 | | | | 230,590 | |
| | |
ElSewedy Electric Co. | | | 2,422,800 | | | | 2,448,064 | |
| | |
Ezz Steel Co SAE(1) | | | 740,231 | | | | 745,705 | |
| | |
Global Telecom Holding SAE(1) | | | 6,446,866 | | | | 1,319,689 | |
| | |
Juhayna Food Industries | | | 1,017,936 | | | | 638,724 | |
| | |
Maridive & Oil Services SAE(1) | | | 787,652 | | | | 249,175 | |
| | |
Medinet Nasr Housing(1) | | | 2,227,743 | | | | 832,972 | |
| | |
Orascom Investment Holding(1) | | | 8,189,110 | | | | 264,703 | |
| | |
Oriental Weavers Co. | | | 756,427 | | | | 438,806 | |
| | |
Pioneers Holding for Financial Investments SAE (1) | | | 670,829 | | | | 229,087 | |
| | |
Sidi Kerir Petrochemicals Co. | | | 342,234 | | | | 328,228 | |
| | |
Six of October Development & Investment Co.(1) | | | 275,153 | | | | 205,445 | |
| | |
Talaat Moustafa Group | | | 2,918,560 | | | | 1,613,173 | |
| | |
Telecom Egypt | | | 1,189,277 | | | | 835,732 | |
| | |
| | | | | | | $ | 19,208,260 | |
| | | | |
| | 12 | | See Notes to Financial Statements. |
Parametric
Tax-Managed Emerging Markets Fund
December 31, 2018
Portfolio of Investments (Unaudited) — continued
| | | | | | | | |
| Security | | Shares | | | Value | |
| | |
| Estonia — 0.4% | | | | | | |
| | |
AS Baltika(1) | | | 226,000 | | | $ | 42,549 | |
| | |
AS Merko Ehitus | | | 75,000 | | | | 792,161 | |
| | |
AS Tallink Grupp | | | 5,354,470 | | | | 6,236,611 | |
| | |
AS Tallinna Kaubamaja Grupp | | | 202,800 | | | | 1,955,525 | |
| | |
AS Tallinna Vesi | | | 35,235 | | | | 387,364 | |
| | |
Nordecon AS | | | 223,282 | | | | 226,797 | |
| | |
| | | | | | | $ | 9,641,007 | |
| | |
| Ghana — 0.2% | | | | | | |
| | |
Aluworks Ghana, Ltd.(1) | | | 5,176,100 | | | $ | 84,508 | |
| | |
CAL Bank, Ltd.(1) | | | 5,036,062 | | | | 1,006,781 | |
| | |
Ghana Commercial Bank, Ltd. | | | 1,588,070 | | | | 1,492,791 | |
| | |
Societe Generale Ghana, Ltd.(1) | | | 1,345,362 | | | | 206,147 | |
| | |
Standard Chartered Bank of Ghana, Ltd.(1) | | | 283,150 | | | | 1,211,815 | |
| | |
Unilever Ghana, Ltd. | | | 249,000 | | | | 908,308 | |
| | |
| | | | | | | $ | 4,910,350 | |
| | |
| Greece — 1.5% | | | | | | |
| | |
Aegean Airlines SA | | | 64,124 | | | $ | 542,344 | |
| | |
Alpha Bank AE(1) | | | 1,763,300 | | | | 2,217,966 | |
| | |
Athens Water Supply & Sewage Co. SA | | | 210,831 | | | | 1,205,105 | |
| | |
Costamare, Inc. | | | 34,966 | | | | 153,501 | |
| | |
Diana Shipping, Inc.(1) | | | 226,620 | | | | 720,652 | |
| | |
Eurobank Ergasias SA(1) | | | 2,774,000 | | | | 1,714,110 | |
| | |
FF Group(1)(3) | | | 43,721 | | | | 0 | |
| | |
GasLog, Ltd. | | | 92,216 | | | | 1,517,875 | |
| | |
GEK Terna Holding Real Estate Construction SA(1) | | | 120,661 | | | | 661,938 | |
| | |
Grivalia Properties REIC AE | | | 33,405 | | | | 319,591 | |
| | |
Hellenic Exchanges - Athens Stock Exchange SA | | | 114,224 | | | | 484,017 | |
| | |
Hellenic Petroleum SA | | | 132,875 | | | | 1,123,225 | |
| | |
Hellenic Telecommunications Organization SA | | | 527,055 | | | | 5,750,654 | |
| | |
Holding Co. ADMIE IPTO SA | | | 970,278 | | | | 1,719,485 | |
| | |
JUMBO SA | | | 161,400 | | | | 2,346,263 | |
| | |
LAMDA Development SA(1) | | | 39,369 | | | | 256,885 | |
| | |
Marfin Investment Group Holdings SA(1) | | | 1,699,487 | | | | 138,515 | |
| | |
Motor Oil (Hellas) Corinth Refineries SA | | | 142,800 | | | | 3,438,843 | |
| | |
Mytilineos Holdings SA | | | 240,653 | | | | 2,005,252 | |
| | |
National Bank of Greece SA(1) | | | 121,470 | | | | 152,872 | |
| | |
Navios Maritime Holdings, Inc.(1) | | | 455,437 | | | | 124,790 | |
| | |
OPAP SA | | | 328,441 | | | | 2,856,540 | |
| | |
Piraeus Bank SA(1) | | | 169,722 | | | | 163,208 | |
| | |
Public Power Corp. SA(1) | | | 854,178 | | | | 1,264,317 | |
| | |
Safe Bulkers, Inc.(1) | | | 43,997 | | | | 78,315 | |
| | |
Star Bulk Carriers Corp.(1) | | | 62,600 | | | | 572,164 | |
| | |
StealthGas, Inc.(1) | | | 81,587 | | | | 225,180 | |
| | | | | | | | |
| Security | | Shares | | | Value | |
| | |
| Greece (continued) | | | | | | |
| | |
Terna Energy SA | | | 83,956 | | | $ | 537,802 | |
| | |
Titan Cement Co. SA | | | 193,774 | | | | 4,307,227 | |
| | |
Tsakos Energy Navigation, Ltd. | | | 159,400 | | | | 424,004 | |
| | |
Viohalco SA(1) | | | 184,517 | | | | 557,664 | |
| | |
| | | | | | | $ | 37,580,304 | |
| | |
| Hungary — 0.7% | | | | | | |
| | |
Magyar Telekom Telecommunications PLC | | | 922,636 | | | $ | 1,451,123 | |
| | |
MOL Hungarian Oil & Gas PLC | | | 528,136 | | | | 5,795,953 | |
| | |
OTP Bank Nyrt | | | 147,778 | | | | 5,972,165 | |
| | |
Richter Gedeon Nyrt. | | | 279,405 | | | | 5,411,995 | |
| | |
| | | | | | | $ | 18,631,236 | |
| | |
| India — 5.9% | | | | | | |
| | |
ABB India, Ltd. | | | 33,400 | | | $ | 635,838 | |
| | |
ACC, Ltd. | | | 33,034 | | | | 712,938 | |
| | |
Adani Enterprises, Ltd. | | | 207,300 | | | | 475,771 | |
| | |
Adani Gas, Ltd.(1) | | | 119,200 | | | | 171,249 | |
| | |
Adani Green Energy, Ltd.(1) | | | 90,711 | | | | 54,320 | |
| | |
Adani Ports and Special Economic Zone, Ltd. | | | 451,245 | | | | 2,495,161 | |
| | |
Adani Power, Ltd.(1) | | | 518,864 | | | | 378,684 | |
| | |
Aditya Birla Fashion and Retail, Ltd.(1) | | | 137,831 | | | | 397,656 | |
| | |
Ambuja Cements, Ltd. | | | 238,323 | | | | 767,301 | |
| | |
Apollo Hospitals Enterprise, Ltd. | | | 61,400 | | | | 1,103,040 | |
| | |
Ashok Leyland, Ltd. | | | 820,626 | | | | 1,203,660 | |
| | |
Asian Paints, Ltd. | | | 86,989 | | | | 1,704,123 | |
| | |
Aurobindo Pharma, Ltd. | | | 142,400 | | | | 1,493,109 | |
| | |
Axis Bank, Ltd.(1) | | | 157,800 | | | | 1,399,224 | |
| | |
Bajaj Auto, Ltd. | | | 23,052 | | | | 898,894 | |
| | |
Bajaj Holdings & Investment, Ltd. | | | 11,100 | | | | 468,989 | |
| | |
Bharat Forge, Ltd. | | | 139,872 | | | | 1,018,034 | |
| | |
Bharat Heavy Electricals, Ltd. | | | 555,450 | | | | 580,281 | |
| | |
Bharat Petroleum Corp., Ltd. | | | 141,600 | | | | 737,003 | |
| | |
Bharti Airtel, Ltd. | | | 1,131,005 | | | | 5,051,726 | |
| | |
Bharti Infratel, Ltd. | | | 588,600 | | | | 2,182,331 | |
| | |
Biocon, Ltd. | | | 79,799 | | | | 719,217 | |
| | |
Bosch, Ltd. | | | 3,900 | | | | 1,097,570 | |
| | |
Cadila Healthcare, Ltd. | | | 153,669 | | | | 766,586 | |
| | |
Century Textiles & Industries, Ltd. | | | 50,000 | | | | 659,114 | |
| | |
CESC, Ltd. | | | 24,742 | | | | 236,866 | |
| | |
Cipla, Ltd. | | | 180,487 | | | | 1,340,859 | |
| | |
Coal India, Ltd. | | | 302,500 | | | | 1,042,862 | |
| | |
Colgate-Palmolive (India), Ltd. | | | 18,900 | | | | 365,902 | |
| | |
Container Corp. of India, Ltd. | | | 174,750 | | | | 1,719,735 | |
| | |
Cummins India, Ltd. | | | 79,700 | | | | 966,341 | |
| | | | |
| | 13 | | See Notes to Financial Statements. |
Parametric
Tax-Managed Emerging Markets Fund
December 31, 2018
Portfolio of Investments (Unaudited) — continued
| | | | | | | | |
| Security | | Shares | | | Value | |
| | |
| India (continued) | | | | | | |
| | |
Dabur India, Ltd. | | | 142,300 | | | $ | 876,102 | |
| | |
Divi’s Laboratories, Ltd. | | | 49,800 | | | | 1,055,316 | |
| | |
DLF, Ltd. | | | 576,442 | | | | 1,461,274 | |
| | |
Dr. Reddy’s Laboratories, Ltd. | | | 24,300 | | | | 910,487 | |
| | |
Dr. Reddy’s Laboratories, Ltd. ADR | | | 12,700 | | | | 478,790 | |
| | |
Eicher Motors, Ltd. | | | 4,779 | | | | 1,579,040 | |
| | |
GAIL (India), Ltd. | | | 514,228 | | | | 2,644,483 | |
| | |
GlaxoSmithKline Pharmaceuticals, Ltd. | | | 16,000 | | | | 345,840 | |
| | |
Glenmark Pharmaceuticals, Ltd. | | | 114,000 | | | | 1,130,432 | |
| | |
Godrej Consumer Products, Ltd. | | | 43,125 | | | | 500,840 | |
| | |
Grasim Industries, Ltd. | | | 39,759 | | | | 470,718 | |
| | |
Great Eastern Shipping Co., Ltd. (The) | | | 36,164 | | | | 163,420 | |
| | |
Havells India, Ltd. | | | 119,300 | | | | 1,180,554 | |
| | |
HCL Technologies, Ltd. | | | 99,291 | | | | 1,371,824 | |
| | |
HDFC Bank, Ltd. | | | 142,131 | | | | 4,323,906 | |
| | |
Hero MotoCorp, Ltd. | | | 31,338 | | | | 1,386,123 | |
| | |
Hindalco Industries, Ltd. | | | 436,910 | | | | 1,409,647 | |
| | |
Hindustan Petroleum Corp., Ltd. | | | 139,450 | | | | 506,409 | |
| | |
Hindustan Unilever, Ltd. | | | 298,009 | | | | 7,757,598 | |
| | |
Hindustan Zinc, Ltd. | | | 193,759 | | | | 769,385 | |
| | |
Housing Development & Infrastructure, Ltd.(1) | | | 785,700 | | | | 296,697 | |
| | |
Housing Development Finance Corp., Ltd. | | | 137,559 | | | | 3,869,031 | |
| | |
ICICI Bank, Ltd. | | | 316,326 | | | | 1,635,226 | |
| | |
Indiabulls Real Estate, Ltd.(1) | | | 834,325 | | | | 1,040,080 | |
| | |
Indian Hotels Co., Ltd. (The) | | | 208,584 | | | | 441,076 | |
| | |
Indian Oil Corp., Ltd. | | | 457,990 | | | | 900,764 | |
| | |
Infosys, Ltd. | | | 650,470 | | | | 6,151,913 | |
| | |
ITC, Ltd. | | | 769,250 | | | | 3,101,120 | |
| | |
Jindal Steel & Power, Ltd.(1) | | | 90,000 | | | | 212,096 | |
| | |
JSW Energy, Ltd.(1) | | | 1,072,483 | | | | 1,055,220 | |
| | |
JSW Steel, Ltd. | | | 289,100 | | | | 1,272,150 | |
| | |
Kotak Mahindra Bank, Ltd. | | | 93,299 | | | | 1,673,692 | |
| | |
Larsen & Toubro, Ltd. | | | 107,049 | | | | 2,206,642 | |
| | |
Larsen & Toubro, Ltd. GDR(4) | | | 55,759 | | | | 1,139,946 | |
| | |
LIC Housing Finance, Ltd. | | | 62,800 | | | | 436,965 | |
| | |
Lupin, Ltd. | | | 97,200 | | | | 1,173,776 | |
| | |
Mahindra & Mahindra, Ltd. | | | 168,585 | | | | 1,942,049 | |
| | |
Maruti Suzuki India, Ltd. | | | 28,553 | | | | 3,045,449 | |
| | |
Mphasis, Ltd. | | | 34,428 | | | | 502,970 | |
| | |
Nestle India, Ltd. | | | 6,300 | | | | 1,000,706 | |
| | |
NHPC, Ltd. | | | 1,887,800 | | | | 702,796 | |
| | |
NTPC, Ltd. | | | 1,631,410 | | | | 3,472,950 | |
| | |
Oberoi Realty, Ltd. | | | 69,496 | | | | 441,661 | |
| | |
Oil & Natural Gas Corp., Ltd. | | | 509,063 | | | | 1,092,059 | |
| | |
Omaxe, Ltd. | | | 79,785 | | | | 243,809 | |
| | |
Oracle Financial Services Software, Ltd. | | | 8,100 | | | | 429,267 | |
| | | | | | | | |
| Security | | Shares | | | Value | |
| | |
| India (continued) | | | | | | |
| | |
Petronet LNG, Ltd. | | | 111,100 | | | $ | 355,650 | |
| | |
Phoenix Mills, Ltd. (The) | | | 30,232 | | | | 243,760 | |
| | |
Piramal Enterprises, Ltd. | | | 43,598 | | | | 1,482,691 | |
| | |
Power Grid Corporation of India, Ltd. | | | 1,419,700 | | | | 4,006,479 | |
| | |
Reliance Communications, Ltd.(1) | | | 4,956,415 | | | | 1,022,349 | |
| | |
Reliance Industries, Ltd. | | | 617,137 | | | | 9,939,792 | |
| | |
Reliance Infrastructure, Ltd. | | | 171,400 | | | | 773,154 | |
| | |
Reliance Power, Ltd.(1) | | | 546,400 | | | | 223,906 | |
| | |
RP-SG Business Process Services, Ltd.(1) | | | 4,948 | | | | 26,640 | |
| | |
RP-SG Retail, Ltd.(1) | | | 14,845 | | | | 26,641 | |
| | |
Siemens, Ltd. | | | 72,300 | | | | 1,084,411 | |
| | |
State Bank of India GDR(1)(4) | | | 23,880 | | | | 1,019,339 | |
| | |
Sun Pharmaceutical Industries, Ltd. | | | 473,300 | | | | 2,914,237 | |
| | |
Tata Chemicals, Ltd. | | | 58,600 | | | | 592,741 | |
| | |
Tata Communications, Ltd. | | | 167,800 | | | | 1,261,668 | |
| | |
Tata Consultancy Services, Ltd. | | | 158,085 | | | | 4,290,301 | |
| | |
Tata Global Beverages, Ltd. | | | 58,700 | | | | 184,411 | |
| | |
Tata Motors, Ltd.(1) | | | 481,916 | | | | 1,188,514 | |
| | |
Tata Power Co., Ltd. (The) | | | 1,002,648 | | | | 1,101,008 | |
| | |
Tata Steel, Ltd. | | | 120,340 | | | | 897,219 | |
| | |
Tech Mahindra, Ltd. | | | 76,867 | | | | 794,441 | |
| | |
Titan Co., Ltd. | | | 114,848 | | | | 1,525,588 | |
| | |
UltraTech Cement, Ltd. | | | 34,391 | | | | 1,963,838 | |
| | |
Unitech, Ltd.(1) | | | 2,242,680 | | | | 67,347 | |
| | |
United Spirits, Ltd.(1) | | | 107,665 | | | | 973,754 | |
| | |
UPL, Ltd. | | | 138,500 | | | | 1,503,379 | |
| | |
Vedanta, Ltd. | | | 587,914 | | | | 1,700,470 | |
| | |
Vodafone Idea, Ltd.(1) | | | 2,831,552 | | | | 1,527,581 | |
| | |
Voltas, Ltd. | | | 160,095 | | | | 1,270,489 | |
| | |
Wipro, Ltd. | | | 250,542 | | | | 1,184,934 | |
| | |
Zee Entertainment Enterprises, Ltd. | | | 557,395 | | | | 3,800,926 | |
| | |
| | | | | | | $ | 151,594,340 | |
| | |
| Indonesia — 3.0% | | | | | | |
| | |
Adaro Energy Tbk PT | | | 25,759,300 | | | $ | 2,179,221 | |
| | |
Adhi Karya Persero Tbk PT | | | 1,270,800 | | | | 140,343 | |
| | |
AKR Corporindo Tbk PT | | | 4,660,500 | | | | 1,391,516 | |
| | |
Alam Sutera Realty Tbk PT(1) | | | 12,514,600 | | | | 271,936 | |
| | |
Aneka Tambang Tbk | | | 8,587,500 | | | | 457,598 | |
| | |
Astra Argo Lestari Tbk PT | | | 654,000 | | | | 538,678 | |
| | |
Astra International Tbk PT | | | 14,916,500 | | | | 8,545,533 | |
| | |
Bank Central Asia Tbk PT | | | 3,787,000 | | | | 6,848,593 | |
| | |
Bank Danamon Indonesia Tbk PT | | | 3,237,181 | | | | 1,711,544 | |
| | |
Bank Mandiri Persero Tbk PT | | | 6,199,200 | | | | 3,180,008 | |
| | |
Bank Negara Indonesia Persero Tbk PT | | | 3,878,700 | | | | 2,379,134 | |
| | |
Bank Pan Indonesia Tbk PT(1) | | | 6,253,772 | | | | 498,141 | |
| | | | |
| | 14 | | See Notes to Financial Statements. |
Parametric
Tax-Managed Emerging Markets Fund
December 31, 2018
Portfolio of Investments (Unaudited) — continued
| | | | | | | | |
| Security | | Shares | | | Value | |
| | |
| Indonesia (continued) | | | | | | |
| | |
Bank Rakyat Indonesia Persero Tbk PT | | | 17,541,500 | | | $ | 4,468,840 | |
| | |
Bukit Asam Tbk PT | | | 4,892,300 | | | | 1,465,625 | |
| | |
Bumi Serpong Damai Tbk PT(1) | | | 8,439,700 | | | | 738,534 | |
| | |
Charoen Pokphand Indonesia Tbk PT | | | 4,000,700 | | | | 2,012,439 | |
| | |
Ciputra Development Tbk PT | | | 7,986,900 | | | | 562,218 | |
| | |
Gudang Garam Tbk PT | | | 276,100 | | | | 1,608,748 | |
| | |
Hanson International Tbk PT(1) | | | 110,720,800 | | | | 916,620 | |
| | |
Indah Kiat Pulp & Paper Corp. Tbk PT | | | 2,767,500 | | | | 2,222,233 | |
| | |
Indo Tambangraya Megah Tbk PT | | | 789,800 | | | | 1,113,855 | |
| | |
Indocement Tunggal Prakarsa Tbk PT | | | 1,829,200 | | | | 2,349,187 | |
| | |
Indofood CBP Sukses Makmur Tbk PT | | | 1,367,200 | | | | 994,788 | |
| | |
Indofood Sukses Makmur Tbk PT | | | 2,791,000 | | | | 1,445,512 | |
| | |
Jasa Marga (Persero) Tbk PT | | | 3,247,500 | | | | 967,344 | |
| | |
Kalbe Farma Tbk PT | | | 30,931,500 | | | | 3,268,104 | |
| | |
Lippo Karawaci Tbk PT | | | 26,506,000 | | | | 469,561 | |
| | |
Mitra Keluarga Karyasehat Tbk PT(1) | | | 935,900 | | | | 102,556 | |
| | |
Pakuwon Jati Tbk PT | | | 21,726,100 | | | | 936,829 | |
| | |
Perusahaan Gas Negara Persero Tbk PT | | | 12,436,900 | | | | 1,837,567 | |
| | |
Perusahaan Perkebunan London Sumatra Indonesia Tbk PT | | | 5,384,900 | | | | 469,324 | |
| | |
PP Persero Tbk PT | | | 4,793,002 | | | | 602,684 | |
| | |
Semen Indonesia Persero Tbk PT | | | 3,266,400 | | | | 2,611,733 | |
| | |
Sigmagold Inti Perkasa Tbk PT(1)(3) | | | 27,503,000 | | | | 30,601 | |
| | |
Summarecon Agung Tbk PT | | | 3,982,700 | | | | 223,226 | |
| | |
Telekomunikasi Indonesia Persero Tbk PT | | | 33,423,400 | | | | 8,737,994 | |
| | |
Unilever Indonesia Tbk PT | | | 601,800 | | | | 1,903,868 | |
| | |
United Tractors Tbk PT | | | 2,041,500 | | | | 3,886,510 | |
| | |
Vale Indonesia Tbk PT(1) | | | 4,748,000 | | | | 1,077,698 | |
| | |
Waskita Karya Persero Tbk PT | | | 1,713,400 | | | | 200,720 | |
| | |
Wijaya Karya Persero Tbk PT | | | 6,352,000 | | | | 732,671 | |
| | |
| | | | | | | $ | 76,099,834 | |
| | |
| Jordan — 0.7% | | | | | | |
| | |
Al-Eqbal Investment Co. PLC(1) | | | 109,424 | | | $ | 2,000,426 | |
| | |
Alia The Royal Jordanian Airlines PLC(1) | | | 115,334 | | | | 60,280 | |
| | |
Arab Bank PLC | | | 1,023,606 | | | | 8,944,961 | |
| | |
Arab Potash Co. PLC | | | 67,492 | | | | 1,522,158 | |
| | |
Bank of Jordan | | | 244,874 | | | | 845,508 | |
| | |
Cairo Amman Bank | | | 276,535 | | | | 517,747 | |
| | |
Capital Bank of Jordan | | | 393,566 | | | | 511,886 | |
| | |
Jordan Ahli Bank | | | 364,735 | | | | 555,000 | |
| | |
Jordan Islamic Bank | | | 212,374 | | | | 861,353 | |
| | |
Jordan Kuwait Bank | | | 51,749 | | | | 211,247 | |
| | |
Jordan Petroleum Refinery | | | 325,755 | | | | 1,042,013 | |
| | |
Jordan Phosphate Mines(1) | | | 31,290 | | | | 125,360 | |
| | |
Jordan Steel(1) | | | 269,400 | | | | 158,796 | |
| | | | | | | | |
| Security | | Shares | | | Value | |
| | |
| Jordan (continued) | | | | | | |
| | |
Jordan Telecommunications Co. | | | 245,934 | | | $ | 481,404 | |
| | |
Jordanian Electric Power Co. | | | 494,491 | | | | 830,019 | |
| | |
| | | | | | | $ | 18,668,158 | |
| | |
| Kazakhstan — 0.8% | | | | | | |
| | |
Halyk Savings Bank of Kazakhstan JSC GDR(4)(5) | | | 40,294 | | | $ | 417,043 | |
| | |
Halyk Savings Bank of Kazakhstan JSC GDR(4)(5) | | | 716,100 | | | | 7,448,789 | |
| | |
KAZ Minerals PLC | | | 1,215,218 | | | | 8,267,561 | |
| | |
Kcell JSC GDR(4) | | | 544,503 | | | | 2,593,664 | |
| | |
Nostrum Oil & Gas PLC(1) | | | 494,453 | | | | 647,262 | |
| | |
| | | | | | | $ | 19,374,319 | |
| | |
| Kenya — 0.7% | | | | | | |
| | |
ARM Cement, Ltd.(1)(3) | | | 1,677,000 | | | $ | 45,669 | |
| | |
Bamburi Cement Co., Ltd. | | | 460,041 | | | | 600,951 | |
| | |
Barclays Bank of Kenya, Ltd. | | | 6,031,120 | | | | 645,999 | |
| | |
British American Tobacco Kenya, Ltd. | | | 26,700 | | | | 189,975 | |
| | |
Centum Investment Co., Ltd. | | | 1,020,080 | | | | 278,896 | |
| | |
Co-operative Bank of Kenya, Ltd. (The) | | | 5,428,092 | | | | 727,230 | |
| | |
Diamond Trust Bank Kenya, Ltd. | | | 436,900 | | | | 669,581 | |
| | |
East African Breweries, Ltd. | | | 2,150,740 | | | | 3,678,448 | |
| | |
Equity Group Holdings PLC | | | 6,543,000 | | | | 2,236,039 | |
| | |
KCB Group, Ltd. | | | 5,401,360 | | | | 1,991,682 | |
| | |
KenolKobil, Ltd. | | | 3,645,800 | | | | 679,294 | |
| | |
Kenya Airways PLC(1) | | | 599,600 | | | | 53,047 | |
| | |
Kenya Electricity Generating Co. PLC | | | 1,875,100 | | | | 132,711 | |
| | |
Kenya Power & Lighting, Ltd.(1) | | | 5,995,293 | | | | 241,114 | |
| | |
Nation Media Group PLC | | | 442,376 | | | | 295,253 | |
| | |
NIC Group PLC | | | 938,272 | | | | 266,249 | |
| | |
Safaricom PLC | | | 22,455,700 | | | | 4,892,033 | |
| | |
Standard Chartered Bank Kenya, Ltd. | | | 278,178 | | | | 531,222 | |
| | |
| | | | | | | $ | 18,155,393 | |
| | |
| Kuwait — 1.5% | | | | | | |
| | |
Abyaar Real Estate Development Co. KSC(1) | | | 8,191,080 | | | $ | 408,488 | |
| | |
Agility Public Warehousing Co. KSC | | | 1,447,007 | | | | 3,823,001 | |
| | |
Ahli United Bank | | | 347,787 | | | | 340,696 | |
| | |
Al-Mazaya Holding Co. | | | 2,215,009 | | | | 511,024 | |
| | |
ALAFCO Aviation Lease and Finance Co. KSCP | | | 361,135 | | | | 415,678 | |
| | |
Boubyan Petrochemicals Co. KSCP | | | 1,735,987 | | | | 5,567,622 | |
| | |
Burgan Bank SAK | | | 455,532 | | | | 417,129 | |
| | |
Combined Group Contracting Co. KSC | | | 183,221 | | | | 192,439 | |
| | |
Commercial Bank of Kuwait KSCP | | | 1,153,013 | | | | 1,991,494 | |
| | |
Commercial Real Estate Co. KSCC | | | 1,287,729 | | | | 390,343 | |
| | |
Gulf Bank | | | 844,008 | | | | 699,728 | |
| | | | |
| | 15 | | See Notes to Financial Statements. |
Parametric
Tax-Managed Emerging Markets Fund
December 31, 2018
Portfolio of Investments (Unaudited) — continued
| | | | | | | | |
| Security | | Shares | | | Value | |
| | |
| Kuwait (continued) | | | | | | |
| | |
Gulf Cable & Electrical Industries Co. KSCP | | | 165,000 | | | $ | 190,062 | |
| | |
Gulf National Holding Co.(3) | | | 340,657 | | | | 0 | |
| | |
Humansoft Holding Co. KSC | | | 74,234 | | | | 801,283 | |
| | |
Kuwait Finance House KSCP | | | 1,624,771 | | | | 3,267,264 | |
| | |
Kuwait International Bank KSCP | | | 340,800 | | | | 295,961 | |
| | |
Kuwait Portland Cement Co. KSC | | | 212,231 | | | | 795,483 | |
| | |
Kuwait Projects Co. Holdings KSC | | | 382,496 | | | | 262,503 | |
| | |
Kuwait Real Estate Co. KSC(1) | | | 3,050,583 | | | | 544,554 | |
| | |
Mabanee Co. SAKC | | | 1,295,866 | | | | 2,590,614 | |
| | |
Mezzan Holding Co. KSCC | | | 217,400 | | | | 357,892 | |
| | |
Mobile Telecommunications Co. | | | 3,164,347 | | | | 4,675,157 | |
| | |
National Bank of Kuwait SAK | | | 1,911,597 | | | | 5,247,238 | |
| | |
National Industries Group Holding SAK | | | 1,875,275 | | | | 973,642 | |
| | |
National Investment Co. | | | 645,000 | | | | 174,943 | |
| | |
National Real Estate Co. KPSC(1) | | | 1,711,537 | | | | 511,505 | |
| | |
Qurain Petrochemical Industries Co. KSC | | | 1,460,000 | | | | 1,731,565 | |
| | |
Salhia Real Estate Co. KSCP | | | 243,824 | | | | 265,149 | |
| | |
Sultan Center Food Products Co.(1) | | | 2,132,359 | | | | 371,269 | |
| | |
VIVA Kuwait Telecom Co. | | | 209,914 | | | | 553,688 | |
| | |
| | | | | | | $ | 38,367,414 | |
| | |
| Latvia — 0.0%(6) | | | | | | |
| | |
Grindeks | | | 12,000 | | | $ | 89,155 | |
| | |
| | | | | | | $ | 89,155 | |
| | |
| Lebanon — 0.0%(6) | | | | | | |
| | |
Bank Audi SAL GDR(4) | | | 15,000 | | | $ | 73,200 | |
| | |
| | | | | | | $ | 73,200 | |
| | |
| Lithuania — 0.1% | | | | | | |
| | |
Apranga PVA | | | 363,680 | | | $ | 666,552 | |
| | |
Energijos Skirstymo Operatorius AB | | | 370,141 | | | | 274,657 | |
| | |
Klaipedos Nafta AB | | | 1,576,663 | | | | 741,090 | |
| | |
Panevezio Statybos Trestas | | | 323,592 | | | | 279,028 | |
| | |
Pieno Zvaigzdes(1) | | | 94,000 | | | | 100,408 | |
| | |
Rokiskio Suris | | | 177,000 | | | | 516,711 | |
| | |
Siauliu Bankas | | | 1,784,952 | | | | 817,595 | |
| | |
| | | | | | | $ | 3,396,041 | |
| | |
| Malaysia — 2.9% | | | | | | |
| | |
Aeon Co. (M) Bhd | | | 1,017,000 | | | $ | 361,557 | |
| | |
Alliance Bank Malaysia Bhd | | | 330,800 | | | | 321,915 | |
| | |
AMMB Holdings Bhd | | | 276,900 | | | | 290,283 | |
| | |
Astro Malaysia Holdings Bhd | | | 599,200 | | | | 188,695 | |
| | | | | | | | |
| Security | | Shares | | | Value | |
| | |
| Malaysia (continued) | | | | | | |
| | |
Axiata Group Bhd | | | 2,471,675 | | | $ | 2,348,275 | |
| | |
Batu Kawan Bhd | | | 100,300 | | | | 404,809 | |
| | |
Berjaya Corp. Bhd(1) | | | 2,573,043 | | | | 177,584 | |
| | |
Berjaya Sports Toto Bhd | | | 468,894 | | | | 239,391 | |
| | |
Boustead Holdings Bhd | | | 577,500 | | | | 197,136 | |
| | |
British American Tobacco Malaysia Bhd | | | 62,600 | | | | 545,925 | |
| | |
Bumi Armada Bhd(1) | | | 4,001,700 | | | | 150,396 | |
| | |
Bursa Malaysia Bhd | | | 336,900 | | | | 557,057 | |
| | |
Capitaland Malaysia Mall Trust | | | 1,763,200 | | | | 430,628 | |
| | |
CIMB Group Holdings Bhd | | | 641,366 | | | | 885,596 | |
| | |
Datasonic Group Bhd | | | 1,594,400 | | | | 156,450 | |
| | |
Dialog Group Bhd | | | 2,846,250 | | | | 2,142,607 | |
| | |
Digi.com Bhd | | | 1,971,300 | | | | 2,142,070 | |
| | |
Eco World Development Group Bhd(1) | | | 738,100 | | | | 161,789 | |
| | |
Fraser & Neave Holdings Bhd | | | 45,500 | | | | 368,307 | |
| | |
Gamuda Bhd | | | 1,487,900 | | | | 840,150 | |
| | |
Genting Bhd | | | 1,560,000 | | | | 2,301,442 | |
| | |
Genting Malaysia Bhd | | | 2,380,000 | | | | 1,737,818 | |
| | |
Genting Plantations Bhd | | | 199,400 | | | | 475,257 | |
| | |
Globetronics Technology Bhd | | | 839,766 | | | | 355,526 | |
| | |
Hartalega Holdings Bhd | | | 1,018,200 | | | | 1,510,997 | |
| | |
Hong Leong Bank Bhd | | | 108,500 | | | | 535,239 | |
| | |
Hong Leong Financial Group Bhd | | | 66,200 | | | | 297,022 | |
| | |
IGB Real Estate Investment Trust | | | 1,938,000 | | | | 811,666 | |
| | |
IHH Healthcare Bhd | | | 2,144,900 | | | | 2,792,502 | |
| | |
IJM Corp. Bhd | | | 1,497,540 | | | | 587,212 | |
| | |
Inari Amertron Bhd | | | 3,678,750 | | | | 1,335,604 | |
| | |
IOI Corp. Bhd | | | 1,346,668 | | | | 1,446,978 | |
| | |
IOI Properties Group Bhd | | | 2,239,484 | | | | 833,988 | |
| | |
KLCCP Stapled Group | | | 515,300 | | | | 955,136 | |
| | |
KNM Group Bhd(1) | | | 7,927,875 | | | | 143,697 | |
| | |
Kossan Rubber Industries | | | 430,700 | | | | 452,517 | |
| | |
KPJ Healthcare Bhd | | | 1,612,800 | | | | 407,029 | |
| | |
Kuala Lumpur Kepong Bhd | | | 173,350 | | | | 1,036,234 | |
| | |
Lafarge Malaysia Bhd(1) | | | 895,660 | | | | 393,143 | |
| | |
LBS Bina Group Bhd | | | 1,814,340 | | | | 281,158 | |
| | |
Magnum Bhd | | | 617,940 | | | | 291,697 | |
| | |
Mah Sing Group Bhd | | | 1,024,700 | | | | 226,917 | |
| | |
Malakoff Corp. Bhd | | | 749,800 | | | | 145,092 | |
| | |
Malayan Banking Bhd | | | 848,386 | | | | 1,948,875 | |
| | |
Malaysian Resources Corp. Bhd | | | 853,000 | | | | 126,833 | |
| | |
Maxis Bhd | | | 1,255,300 | | | | 1,622,753 | |
| | |
Media Prima Bhd(1) | | | 567,300 | | | | 47,219 | |
| | |
MISC Bhd | | | 314,240 | | | | 509,131 | |
| | |
MMC Corp. Bhd | | | 662,000 | | | | 132,541 | |
| | |
Muhibbah Engineering (M) Bhd | | | 1,581,000 | | | | 1,069,739 | |
| | | | |
| | 16 | | See Notes to Financial Statements. |
Parametric
Tax-Managed Emerging Markets Fund
December 31, 2018
Portfolio of Investments (Unaudited) — continued
| | | | | | | | |
| Security | | Shares | | | Value | |
| | |
| Malaysia (continued) | | | | | | |
| | |
My EG Services Bhd | | | 8,886,600 | | | $ | 2,099,962 | |
| | |
Nestle Malaysia Bhd | | | 18,600 | | | | 662,418 | |
| | |
Pavilion Real Estate Investment Trust | | | 771,100 | | | | 305,528 | |
| | |
Petronas Chemicals Group Bhd | | | 1,596,500 | | | | 3,586,495 | |
| | |
Petronas Dagangan Bhd | | | 588,000 | | | | 3,763,480 | |
| | |
Petronas Gas Bhd | | | 268,500 | | | | 1,247,447 | |
| | |
PPB Group Bhd | | | 281,060 | | | | 1,192,088 | |
| | |
Press Metal Aluminium Holdings Bhd | | | 2,232,800 | | | | 2,605,235 | |
| | |
Public Bank Bhd | | | 347,998 | | | | 2,083,377 | |
| | |
QL Resources Bhd | | | 339,170 | | | | 558,795 | |
| | |
RHB Bank Bhd | | | 233,159 | | | | 298,141 | |
| | |
Silverlake Axis, Ltd. | | | 1,586,300 | | | | 482,341 | |
| | |
Sime Darby Bhd | | | 1,019,709 | | | | 592,162 | |
| | |
Sime Darby Plantation Bhd | | | 1,019,709 | | | | 1,172,032 | |
| | |
Sime Darby Property Bhd | | | 1,019,709 | | | | 245,487 | |
| | |
Sona Petroleum Bhd(3) | | | 1,449,600 | | | | 0 | |
| | |
SP Setia Bhd | | | 2,486,760 | | | | 1,401,217 | |
| | |
Sunway Bhd | | | 1,363,189 | | | | 484,982 | |
| | |
Sunway Real Estate Investment Trust | | | 2,043,200 | | | | 855,431 | |
| | |
Supermax Corp. Bhd | | | 349,000 | | | | 293,748 | |
| | |
Ta Ann Holdings Bhd | | | 427,078 | | | | 279,022 | |
| | |
Telekom Malaysia Bhd | | | 1,280,400 | | | | 825,652 | |
| | |
Tenaga Nasional Bhd | | | 1,515,431 | | | | 4,992,678 | |
| | |
Top Glove Corp. Bhd | | | 1,285,200 | | | | 1,742,333 | |
| | |
UEM Sunrise Bhd | | | 2,038,500 | | | | 328,050 | |
| | |
UMW Holdings Bhd | | | 549,600 | | | | 728,107 | |
| | |
Unisem (M) Bhd | | | 3,101,700 | | | | 2,463,822 | |
| | |
UOA Development Bhd | | | 377,700 | | | | 193,440 | |
| | |
Velesto Energy Bhd(1) | | | 3,181,847 | | | | 138,230 | |
| | |
VS Industry Bhd | | | 850,875 | | | | 150,281 | |
| | |
YTL Corp. Bhd | | | 2,679,048 | | | | 653,863 | |
| | |
YTL Power International Bhd | | | 2,374,522 | | | | 476,870 | |
| | |
| | | | | | | $ | 74,624,296 | |
| | |
| Mauritius — 0.7% | | | | | | |
| | |
Alteo, Ltd. | | | 901,317 | | | $ | 611,399 | |
| | |
Attitude Property, Ltd. | | | 1,092,500 | | | | 406,483 | |
| | |
CIEL, Ltd. | | | 7,678,024 | | | | 1,451,510 | |
| | |
CIM Financial Services, Ltd. | | | 2,649,077 | | | | 829,571 | |
| | |
ENL Land, Ltd. | | | 783,385 | | | | 1,303,852 | |
| | |
IBL, Ltd. | | | 309,981 | | | | 469,145 | |
| | |
MCB Group, Ltd. | | | 1,148,214 | | | | 9,115,022 | |
| | |
Phoenix Beverages, Ltd. | | | 33,742 | | | | 559,450 | |
| | |
Rogers & Co., Ltd. | | | 608,300 | | | | 617,745 | |
| | |
SBM Holdings, Ltd. | | | 15,114,956 | | | | 2,620,697 | |
| | |
Sun, Ltd., Class A | | | 100,851 | | | | 142,884 | |
| | | | | | | | |
| Security | | Shares | | | Value | |
| | |
| Mauritius (continued) | | | | | | |
| | |
Terra Mauricia, Ltd. | | | 584,124 | | | $ | 373,945 | |
| | |
United Basalt Products, Ltd. | | | 187,150 | | | | 685,587 | |
| | |
| | | | | | | $ | 19,187,290 | |
| | |
| Mexico — 5.5% | | | | | | |
| | |
Alfa SAB de CV, Series A | | | 5,496,920 | | | $ | 6,542,570 | |
| | |
Alsea SAB de CV | | | 1,398,400 | | | | 3,646,190 | |
| | |
America Movil SAB de CV, Series L | | | 41,602,890 | | | | 29,616,926 | |
| | |
Arca Continental SAB de CV | | | 213,000 | | | | 1,191,176 | |
| | |
Banco Santander Mexico SA Institucion de Banca Multiple Grupo Financiero Santand | | | 652,200 | | | | 808,457 | |
| | |
Bolsa Mexicana de Valores SAB de CV | | | 766,900 | | | | 1,307,321 | |
| | |
Cemex SAB de CV, Series CPO(1) | | | 12,220,018 | | | | 5,907,371 | |
| | |
Coca-Cola Femsa SAB de CV, Series L | | | 192,600 | | | | 1,169,414 | |
| | |
Controladora Vuela Cia de Aviacion SAB de CV(1) | | | 363,200 | | | | 194,059 | |
| | |
El Puerto de Liverpool SAB de CV | | | 262,181 | | | | 1,683,412 | |
| | |
Empresas ICA SAB de CV(1)(3) | | | 2,075,736 | | | | 0 | |
| | |
Fibra Uno Administracion SA de CV | | | 2,059,767 | | | | 2,290,173 | |
| | |
Fomento Economico Mexicano SAB de CV, Series UBD | | | 1,139,100 | | | | 9,794,808 | |
| | |
Genomma Lab Internacional SAB de CV(1) | | | 2,039,300 | | | | 1,215,169 | |
| | |
Gentera SAB de CV | | | 2,038,862 | | | | 1,504,370 | |
| | |
Grupo Aeroportuario del Centro Norte SAB de CV | | | 143,800 | | | | 686,300 | |
| | |
Grupo Aeroportuario del Pacifico SAB de CV, Class B | | | 370,800 | | | | 3,021,609 | |
| | |
Grupo Aeroportuario del Sureste SAB de CV, Class B | | | 260,494 | | | | 3,929,199 | |
| | |
Grupo Bimbo SAB de CV, Series A | | | 1,312,108 | | | | 2,617,306 | |
| | |
Grupo Carso SAB de CV, Series A1 | | | 972,200 | | | | 3,482,293 | |
| | |
Grupo Comercial Chedraui SA de CV | | | 56,308 | | | | 113,150 | |
| | |
Grupo Elektra SAB de CV | | | 110,870 | | | | 5,345,264 | |
| | |
Grupo Financiero Banorte SAB de CV, Class O | | | 1,973,100 | | | | 9,631,686 | |
| | |
Grupo Financiero Inbursa SAB de CV, Class O | | | 3,006,516 | | | | 4,340,319 | |
| | |
Grupo Mexico SAB de CV, Series B | | | 3,812,235 | | | | 7,870,158 | |
| | |
Grupo Sanborns SAB de CV | | | 223,900 | | | | 201,663 | |
| | |
Grupo Televisa SAB, Series CPO | | | 4,153,171 | | | | 10,442,234 | |
| | |
Impulsora del Desarrollo y el Empleo en America Latina SA de CV, Series B1(1) | | | 1,134,930 | | | | 1,876,944 | |
| | |
Industrias CH SAB de CV, Series B(1) | | | 194,112 | | | | 839,497 | |
| | |
Industrias Penoles SAB de CV | | | 112,429 | | | | 1,373,056 | |
| | |
Infraestructura Energetica Nova SAB de CV | | | 250,400 | | | | 930,411 | |
| | |
Kimberly-Clark de Mexico SAB de CV, Class A | | | 633,710 | | | | 1,009,331 | |
| | |
Megacable Holdings SAB de CV, Series CPO | | | 40,500 | | | | 181,337 | |
| | |
Mexichem SAB de CV | | | 1,247,467 | | | | 3,168,221 | |
| | |
Minera Frisco SAB de CV(1) | | | 873,200 | | | | 231,500 | |
| | |
Nemak SAB de CV(2) | | | 325,400 | | | | 243,076 | |
| | |
Organizacion Soriana SAB de CV, Class B(1) | | | 166,700 | | | | 244,896 | |
| | |
Promotora y Operadora de Infraestructura SAB de CV | | | 352,255 | | | | 3,367,007 | |
| | |
Telesites SAB de CV(1) | | | 2,436,230 | | | | 1,449,211 | |
| | | | |
| | 17 | | See Notes to Financial Statements. |
Parametric
Tax-Managed Emerging Markets Fund
December 31, 2018
Portfolio of Investments (Unaudited) — continued
| | | | | | | | |
| Security | | Shares | | | Value | |
| | |
| Mexico (continued) | | | | | | |
| | |
Ternium SA ADR | | | 40,022 | | | $ | 1,084,596 | |
| | |
TV Azteca SAB de CV, Series CPO | | | 1,018,565 | | | | 121,284 | |
| | |
Wal-Mart de Mexico SAB de CV, Series V | | | 2,523,064 | | | | 6,416,871 | |
| | |
| | | | | | | $ | 141,089,835 | |
| | |
| Morocco — 0.7% | | | | | | |
| | |
Attijariwafa Bank | | | 69,194 | | | $ | 3,282,720 | |
| | |
Banque Centrale Populaire | | | 67,410 | | | | 1,974,448 | |
| | |
BMCE Bank | | | 46,412 | | | | 887,961 | |
| | |
Cosumar | | | 74,043 | | | | 1,356,308 | |
| | |
Delta Holding SA | | | 35,000 | | | | 116,008 | |
| | |
Douja Promotion Groupe Addoha SA | | | 372,601 | | | | 660,903 | |
| | |
Label Vie | | | 5,348 | | | | 1,091,022 | |
| | |
LafargeHolcim Maroc SA | | | 12,159 | | | | 2,274,630 | |
| | |
Lesieur Cristal | | | 38,360 | | | | 542,045 | |
| | |
Managem SA | | | 8,618 | | | | 810,196 | |
| | |
Maroc Telecom | | | 226,171 | | | | 3,348,685 | |
| | |
Marocaine Pour Le Commerce et L’Industrie Banque | | | 3,030 | | | | 227,668 | |
| | |
Samir(1)(3) | | | 19,247 | | | | 0 | |
| | |
Societe d’Exploitation des Ports | | | 28,600 | | | | 490,937 | |
| | |
Sonasid(1) | | | 5,872 | | | | 285,972 | |
| | |
Taqa Morocco | | | 14,348 | | | | 1,334,541 | |
| | |
Wafa Assurance | | | 716 | | | | 298,681 | |
| | |
| | | | | | | $ | 18,982,725 | |
| | |
| Nigeria — 0.7% | | | | | | |
| | |
Access Bank PLC | | | 32,908,148 | | | $ | 617,459 | |
| | |
Afriland Properties PLC(1)(3) | | | 1,223,812 | | | | 0 | |
| | |
Dangote Cement PLC | | | 4,680,691 | | | | 2,435,524 | |
| | |
Dangote Sugar Refinery PLC | | | 4,385,654 | | | | 181,029 | |
| | |
Ecobank Transnational, Inc.(1) | | | 12,099,560 | | | | 513,292 | |
| | |
FBN Holdings PLC | | | 63,919,199 | | | | 1,363,981 | |
| | |
Fidelity Bank PLC | | | 37,069,799 | | | | 204,397 | |
| | |
Flour Mills of Nigeria PLC | | | 2,929,523 | | | | 184,026 | |
| | |
Forte Oil PLC(1) | | | 2,086,402 | | | | 161,206 | |
| | |
Guaranty Trust Bank PLC | | | 29,136,638 | | | | 2,744,855 | |
| | |
Guiness Nigeria PLC | | | 1,245,140 | | | | 230,532 | |
| | |
Lafarge Africa PLC | | | 6,063,228 | | | | 208,285 | |
| | |
Lekoil, Ltd.(1) | | | 1,110,205 | | | | 109,929 | |
| | |
Nestle Nigeria PLC | | | 496,712 | | | | 2,016,646 | |
| | |
Nigerian Breweries PLC | | | 9,809,462 | | | | 2,307,052 | |
| | |
Oando PLC(1) | | | 14,592,401 | | | | 192,432 | |
| | |
SEPLAT Petroleum Development Co. PLC(2) | | | 728,540 | | | | 1,060,834 | |
| | |
Stanbic IBTC Holdings PLC | | | 3,126,624 | | | | 414,445 | |
| | |
Transnational Corp. of Nigeria PLC | | | 22,334,373 | | | | 80,546 | |
| | | | | | | | |
| Security | | Shares | | | Value | |
| | |
| Nigeria (continued) | | | | | | |
| | |
Unilever Nigeria PLC | | | 2,074,728 | | | $ | 210,801 | |
| | |
United Bank for Africa PLC | | | 44,535,174 | | | | 932,673 | |
| | |
Zenith Bank PLC | | | 41,708,535 | | | | 2,629,005 | |
| | |
| | | | | | | $ | 18,798,949 | |
| | |
| Oman — 0.7% | | | | | | |
| | |
Al Maha Petroleum Products Marketing Co., LLC | | | 36,500 | | | $ | 88,365 | |
| | |
Bank Dhofar SAOG | | | 2,134,153 | | | | 884,509 | |
| | |
Bank Muscat SAOG | | | 3,421,569 | | | | 3,590,861 | |
| | |
Bank Nizwa SAOG(1) | | | 941,624 | | | | 222,346 | |
| | |
Bank Sohar SAOG | | | 3,976,382 | | | | 1,135,149 | |
| | |
Dhofar International Development & Investment Holding SAOG | | | 316,407 | | | | 226,959 | |
| | |
HSBC Bank Oman SAOG | | | 2,331,977 | | | | 721,362 | |
| | |
National Bank of Oman SAOG | | | 2,801,885 | | | | 1,327,147 | |
| | |
Oman Cables Industry SAOG | | | 192,264 | | | | 486,845 | |
| | |
Oman Cement Co. SAOG | | | 956,735 | | | | 747,898 | |
| | |
Oman Flour Mills Co. SAOG | | | 543,700 | | | | 961,168 | |
| | |
Oman Telecommunications Co. SAOG | | | 1,348,933 | | | | 2,722,136 | |
| | |
Ominvest | | | 774,771 | | | | 701,190 | |
| | |
Ooredoo | | | 1,374,678 | | | | 2,010,558 | |
| | |
Raysut Cement Co. SAOG | | | 523,326 | | | | 511,852 | |
| | |
Renaissance Services SAOG(1) | | | 1,561,017 | | | | 1,490,277 | |
| | |
Sembcorp Salalah Power & Water Co. | | | 554,425 | | | | 254,866 | |
| | |
Shell Oman Marketing Co. SAOG | | | 66,100 | | | | 239,419 | |
| | |
| | | | | | | $ | 18,322,907 | |
| | |
| Pakistan — 0.8% | | | | | | |
| | |
Adamjee Insurance Co., Ltd. | | | 692,644 | | | $ | 211,974 | |
| | |
Attock Petroleum, Ltd. | | | 63,130 | | | | 197,550 | |
| | |
Bank Alfalah, Ltd. | | | 1,770,333 | | | | 518,486 | |
| | |
D.G. Khan Cement Co., Ltd. | | | 355,620 | | | | 205,357 | |
| | |
Engro Corp., Ltd. | | | 407,516 | | | | 855,313 | |
| | |
Engro Fertilizers, Ltd. | | | 845,500 | | | | 424,244 | |
| | |
Engro Foods, Ltd. | | | 467,100 | | | | 267,173 | |
| | |
Fauji Cement Co., Ltd. | | | 1,178,000 | | | | 177,536 | |
| | |
Fauji Fertilizer Bin Qasim, Ltd. | | | 841,000 | | | | 225,660 | |
| | |
Fauji Fertilizer Co., Ltd. | | | 1,373,114 | | | | 920,071 | |
| | |
Habib Bank, Ltd. | | | 1,021,733 | | | | 867,432 | |
| | |
Hascol Petroleum, Ltd. | | | 190,975 | | | | 203,506 | |
| | |
Hub Power Co., Ltd. (The) | | | 3,121,900 | | | | 1,931,352 | |
| | |
Indus Motor Co., Ltd. | | | 52,160 | | | | 446,216 | |
| | |
International Steels, Ltd. | | | 486,900 | | | | 231,209 | |
| | |
K-Electric, Ltd.(1) | | | 10,456,000 | | | | 447,413 | |
| | |
Kot Addu Power Co., Ltd. | | | 1,347,500 | | | | 482,667 | |
| | | | |
| | 18 | | See Notes to Financial Statements. |
Parametric
Tax-Managed Emerging Markets Fund
December 31, 2018
Portfolio of Investments (Unaudited) — continued
| | | | | | | | |
| Security | | Shares | | | Value | |
| | |
| Pakistan (continued) | | | | | | |
| | |
Lucky Cement, Ltd. | | | 270,250 | | | $ | 846,405 | |
| | |
Maple Leaf Cement Factory, Ltd. | | | 567,750 | | | | 166,272 | |
| | |
Mari Petroleum Co., Ltd. | | | 32,111 | | | | 276,989 | |
| | |
MCB Bank, Ltd. | | | 941,025 | | | | 1,315,995 | |
| | |
Millat Tractors, Ltd. | | | 137,549 | | | | 822,080 | |
| | |
National Bank of Pakistan(1) | | | 1,144,026 | | | | 346,304 | |
| | |
Nishat Mills, Ltd. | | | 1,380,080 | | | | 1,258,454 | |
| | |
Oil & Gas Development Co., Ltd. | | | 862,600 | | | | 794,587 | |
| | |
Packages, Ltd. | | | 93,450 | | | | 260,063 | |
| | |
Pak Elektron, Ltd. | | | 1,445,000 | | | | 259,432 | |
| | |
Pakistan Oilfields, Ltd. | | | 158,600 | | | | 487,177 | |
| | |
Pakistan Petroleum, Ltd. | | | 1,491,432 | | | | 1,606,320 | |
| | |
Pakistan State Oil Co., Ltd. | | | 394,283 | | | | 641,027 | |
| | |
Searle Co., Ltd. (The) | | | 714,796 | | | | 1,246,704 | |
| | |
SUI Northern Gas Pipelines, Ltd. | | | 1,530,800 | | | | 852,153 | |
| | |
SUI Southern Gas Co., Ltd.(1) | | | 3,059,652 | | | | 509,547 | |
| | |
Thal, Ltd. | | | 90,600 | | | | 280,897 | |
| | |
TRG Pakistan(1) | | | 3,036,087 | | | | 488,799 | |
| | |
United Bank, Ltd. | | | 758,625 | | | | 678,705 | |
| | |
| | | | | | | $ | 21,751,069 | |
| | |
| Panama — 0.3% | | | | | | |
| | |
Banco Latinoamericano de Comercio Exterior SA, Class E | | | 72,000 | | | $ | 1,245,600 | |
| | |
Copa Holdings SA, Class A | | | 79,608 | | | | 6,265,946 | |
| | |
| | | | | | | $ | 7,511,546 | |
| | |
| Peru — 1.5% | | | | | | |
| | |
Alicorp SAA | | | 1,960,434 | | | $ | 5,790,803 | |
| | |
BBVA Banco Continental SA | | | 505,510 | | | | 591,275 | |
| | |
Cementos Pacasmayo SAA | | | 174,644 | | | | 334,408 | |
| | |
Cia de Minas Buenaventura SA ADR | | | 280,456 | | | | 4,548,996 | |
| | |
Credicorp, Ltd. | | | 69,596 | | | | 15,427,345 | |
| | |
Enel Generacion Peru SAA | | | 2,013,664 | | | | 1,192,596 | |
| | |
Ferreycorp SAA | | | 2,154,997 | | | | 1,624,964 | |
| | |
Grana y Montero SAA(1) | | | 1,475,743 | | | | 867,440 | |
| | |
Intercorp Financial Services, Inc. | | | 8,901 | | | | 373,842 | |
| | |
Luz del Sur SAA | | | 54,936 | | | | 178,581 | |
| | |
Minsur SA(1) | | | 1,034,898 | | | | 440,872 | |
| | |
Nexa Resources Peru SAA(1) | | | 624,959 | | | | 779,228 | |
| | |
Sociedad Minera Cerro Verde SAA | | | 24,521 | | | | 510,037 | |
| | |
Southern Copper Corp. | | | 181,855 | | | | 5,595,678 | |
| | |
| | | | | | | $ | 38,256,065 | |
| | |
| Philippines — 2.9% | | | | | | |
| | |
Aboitiz Equity Ventures, Inc. | | | 1,976,750 | | | $ | 2,060,233 | |
| | | | | | | | |
| Security | | Shares | | | Value | |
| | |
| Philippines (continued) | | | | | | |
| | |
Aboitiz Power Corp. | | | 3,401,900 | | | $ | 2,268,221 | |
| | |
Alliance Global Group, Inc. | | | 2,897,300 | | | | 654,579 | |
| | |
Ayala Corp. | | | 170,638 | | | | 2,917,323 | |
| | |
Ayala Land, Inc. | | | 4,006,908 | | | | 3,097,036 | |
| | |
Ayala Land, Inc., PFC Shares(3) | | | 3,534,608 | | | | 0 | |
| | |
Bank of the Philippine Islands | | | 1,474,853 | | | | 2,634,011 | |
| | |
BDO Unibank, Inc. | | | 1,188,919 | | | | 2,956,775 | |
| | |
Bloomberry Resorts Corp. | | | 13,018,400 | | | | 2,327,881 | |
| | |
CEMEX Holdings Philippines, Inc.(1)(2) | | | 3,723,800 | | | | 134,126 | |
| | |
Century Pacific Food, Inc. | | | 1,007,500 | | | | 291,246 | |
| | |
Cosco Capital, Inc. | | | 1,868,100 | | | | 238,440 | |
| | |
D&L Industries, Inc. | | | 4,542,000 | | | | 949,611 | |
| | |
DMCI Holdings, Inc. | | | 2,556,500 | | | | 621,158 | |
| | |
Emperador, Inc. | | | 3,420,000 | | | | 462,701 | |
| | |
Filinvest Land, Inc. | | | 16,105,546 | | | | 430,519 | |
| | |
First Gen Corp. | | | 2,648,860 | | | | 1,007,433 | |
| | |
First Philippine Holdings Corp. | | | 403,650 | | | | 496,910 | |
| | |
Global Ferronickel Holdings, Inc.(1) | | | 7,533,659 | | | | 238,402 | |
| | |
Globe Telecom, Inc. | | | 68,575 | | | | 2,472,066 | |
| | |
GT Capital Holdings, Inc. | | | 55,890 | | | | 1,035,927 | |
| | |
International Container Terminal Services, Inc. | | | 551,900 | | | | 1,048,857 | |
| | |
JG Summit Holdings, Inc. | | | 2,048,150 | | | | 2,164,730 | |
| | |
Jollibee Foods Corp. | | | 1,063,900 | | | | 5,903,593 | |
| | |
Lopez Holdings Corp. | | | 8,390,900 | | | | 636,483 | |
| | |
LT Group, Inc. | | | 1,987,400 | | | | 627,101 | |
| | |
Manila Electric Co. | | | 464,684 | | | | 3,358,135 | |
| | |
Manila Water Co. | | | 1,474,000 | | | | 789,773 | |
| | |
Megaworld Corp. | | | 10,700,000 | | | | 963,126 | |
| | |
Metro Pacific Investments Corp. | | | 10,567,300 | | | | 930,017 | |
| | |
Metropolitan Bank & Trust Co. | | | 1,006,867 | | | | 1,554,495 | |
| | |
Nickel Asia Corp. | | | 16,433,888 | | | | 685,868 | |
| | |
Petron Corp. | | | 2,395,000 | | | | 350,707 | |
| | |
Philex Mining Corp. | | | 3,645,900 | | | | 214,478 | |
| | |
PLDT, Inc. | | | 203,575 | | | | 4,371,337 | |
| | |
Puregold Price Club, Inc. | | | 1,964,200 | | | | 1,604,565 | |
| | |
Robinsons Land Corp. | | | 1,636,615 | | | | 629,669 | |
| | |
Robinsons Retail Holdings, Inc. | | | 1,077,190 | | | | 1,643,650 | |
| | |
San Miguel Corp. | | | 414,610 | | | | 1,160,251 | |
| | |
Security Bank Corp. | | | 248,900 | | | | 733,950 | |
| | |
Semirara Mining & Power Corp. | | | 3,919,320 | | | | 1,721,285 | |
| | |
SM Investments Corp. | | | 354,720 | | | | 6,188,342 | |
| | |
SM Prime Holdings, Inc. | | | 7,618,550 | | | | 5,181,209 | |
| | |
Travellers International Hotel Group, Inc.(1) | | | 3,644,200 | | | | 369,005 | |
| | |
Universal Robina Corp. | | | 1,964,140 | | | | 4,732,743 | |
| | |
Vista Land & Lifescapes, Inc. | | | 6,128,000 | | | | 632,007 | |
| | |
| | | | | | | $ | 75,489,974 | |
| | | | |
| | 19 | | See Notes to Financial Statements. |
Parametric
Tax-Managed Emerging Markets Fund
December 31, 2018
Portfolio of Investments (Unaudited) — continued
| | | | | | | | |
| Security | | Shares | | | Value | |
| | |
| Poland — 3.0% | | | | | | |
| | |
Alior Bank SA(1) | | | 98,462 | | | $ | 1,401,876 | |
| | |
AmRest Holdings SE(1) | | | 244,410 | | | | 2,632,662 | |
| | |
Asseco Poland SA | | | 300,227 | | | | 3,703,976 | |
| | |
Bank Handlowy w Warszawie SA | | | 38,385 | | | | 708,720 | |
| | |
Bank Millennium SA(1) | | | 697,490 | | | | 1,653,599 | |
| | |
Bank Polska Kasa Opieki SA | | | 103,885 | | | | 3,028,686 | |
| | |
Boryszew SA(1) | | | 315,000 | | | | 395,255 | |
| | |
Budimex SA | | | 50,276 | | | | 1,528,581 | |
| | |
CCC SA | | | 27,466 | | | | 1,424,972 | |
| | |
CD Projekt SA(1) | | | 49,801 | | | | 1,937,453 | |
| | |
Ciech SA | | | 40,900 | | | | 484,626 | |
| | |
Cyfrowy Polsat SA(1) | | | 551,626 | | | | 3,337,443 | |
| | |
Enea SA(1) | | | 145,490 | | | | 385,565 | |
| | |
Energa SA(1) | | | 389,300 | | | | 930,093 | |
| | |
Eurocash SA | | | 188,203 | | | | 887,596 | |
| | |
Globe Trade Centre SA | | | 183,554 | | | | 401,380 | |
| | |
Grupa Azoty SA | | | 31,054 | | | | 260,204 | |
| | |
Grupa Lotos SA | | | 103,490 | | | | 2,451,989 | |
| | |
ING Bank Slaski SA | | | 15,900 | | | | 765,399 | |
| | |
Jastrzebska Spolka Weglowa SA(1) | | | 141,722 | | | | 2,562,308 | |
| | |
KGHM Polska Miedz SA(1) | | | 162,911 | | | | 3,864,938 | |
| | |
KRUK SA | | | 21,183 | | | | 887,927 | |
| | |
LPP SA | | | 1,852 | | | | 3,893,791 | |
| | |
Lubelski Wegiel Bogdanka SA(1) | | | 10,688 | | | | 147,446 | |
| | |
mBank SA | | | 13,753 | | | | 1,561,892 | |
| | |
Netia SA(1) | | | 284,937 | | | | 381,555 | |
| | |
Orange Polska SA(1) | | | 1,739,445 | | | | 2,232,391 | |
| | |
Orbis SA | | | 131,300 | | | | 3,175,156 | |
| | |
PGE SA(1) | | | 1,925,400 | | | | 5,162,738 | |
| | |
Polski Koncern Naftowy ORLEN SA | | | 223,522 | | | | 6,476,269 | |
| | |
Polskie Gornictwo Naftowe i Gazownictwo SA | | | 1,655,926 | | | | 3,061,761 | |
| | |
Powszechna Kasa Oszczednosci Bank Polski SA | | | 657,733 | | | | 6,947,999 | |
| | |
Powszechny Zaklad Ubezpieczen SA | | | 470,776 | | | | 5,546,490 | |
| | |
Santander Bank Polska SA | | | 19,704 | | | | 1,893,874 | |
| | |
Tauron Polska Energia SA(1) | | | 2,458,454 | | | | 1,441,238 | |
| | |
| | | | | | | $ | 77,557,848 | |
| | |
| Qatar — 1.4% | | | | | | |
| | |
Aamal Co. QSC | | | 97,022 | | | $ | 234,775 | |
| | |
Al Meera Consumer Goods Co. | | | 6,406 | | | | 259,536 | |
| | |
Barwa Real Estate Co. | | | 226,249 | | | | 2,469,773 | |
| | |
Commercial Bank PQSC (The) | | | 89,065 | | | | 958,204 | |
| | |
Doha Bank QPSC | | | 81,869 | | | | 498,465 | |
| | |
Gulf International Services QSC(1) | | | 69,744 | | | | 323,918 | |
| | |
Gulf Warehousing Co. | | | 32,900 | | | | 345,635 | |
| | |
Industries Qatar | | | 142,655 | | | | 5,203,616 | |
| | |
Masraf Al Rayan QSC | | | 179,314 | | | | 2,043,736 | |
| | | | | | | | |
| Security | | Shares | | | Value | |
| | |
| Qatar (continued) | | | | | | |
| | |
Mazaya Qatar Real Estate Development QSC(1) | | | 137,946 | | | $ | 294,950 | |
| | |
Medicare Group | | | 13,382 | | | | 230,955 | |
| | |
Ooredoo QPSC | | | 147,432 | | | | 3,028,446 | |
| | |
Qatar Electricity & Water Co. QSC | | | 60,415 | | | | 3,063,993 | |
| | |
Qatar First Bank(1) | | | 153,900 | | | | 171,723 | |
| | |
Qatar Gas Transport Co., Ltd. | | | 396,212 | | | | 1,941,274 | |
| | |
Qatar Insurance Co. | | | 84,259 | | | | 827,432 | |
| | |
Qatar International Islamic Bank | | | 21,319 | | | | 385,141 | |
| | |
Qatar Islamic Bank | | | 49,298 | | | | 2,046,677 | |
| | |
Qatar National Bank QPSC | | | 190,957 | | | | 10,145,657 | |
| | |
Qatar National Cement Co. QSC | | | 13,328 | | | | 217,769 | |
| | |
Qatar Navigation QSC | | | 35,689 | | | | 643,012 | |
| | |
United Development Co. QSC | | | 197,574 | | | | 797,071 | |
| | |
Vodafone Qatar QSC(1) | | | 409,304 | | | | 875,512 | |
| | |
| | | | | | | $ | 37,007,270 | |
| | |
| Romania — 0.6% | | | | | | |
| | |
Antibiotice SA | | | 1,843,129 | | | $ | 220,757 | |
| | |
Banca Transilvania SA | | | 10,708,865 | | | | 5,281,717 | |
| | |
BRD-Groupe Societe Generale SA | | | 747,156 | | | | 2,091,174 | |
| | |
OMV Petrom SA | | | 37,364,539 | | | | 2,751,196 | |
| | |
Societatea Energetica Electrica SA | | | 487,300 | | | | 1,161,179 | |
| | |
Societatea Nationala de Gaze Naturale ROMGAZ SA | | | 276,835 | | | | 1,897,618 | |
| | |
Societatea Nationala Nuclearelectrica SA | | | 322,130 | | | | 648,154 | |
| | |
Transelectrica SA(1) | | | 247,700 | | | | 1,309,784 | |
| | |
Transgaz SA Medias | | | 14,233 | | | | 1,106,429 | |
| | |
| | | | | | | $ | 16,468,008 | |
| | |
| Russia — 5.9% | | | | | | |
| | |
Aeroflot PJSC | | | 948,730 | | | $ | 1,375,577 | |
| | |
Alrosa PJSC | | | 1,861,500 | | | | 2,622,152 | |
| | |
Etalon Group PLC GDR(4) | | | 78,319 | | | | 128,275 | |
| | |
Evraz PLC | | | 315,476 | | | | 1,931,810 | |
| | |
Federal Grid Co. Unified Energy System PJSC | | | 1,250,240,600 | | | | 2,658,352 | |
| | |
Gazprom PJSC ADR | | | 2,056,796 | | | | 9,106,086 | |
| | |
Globaltrans Investment PLC GDR(4)(5) | | | 35,100 | | | | 318,006 | |
| | |
Globaltrans Investment PLC GDR(4)(5) | | | 236,017 | | | | 2,135,089 | |
| | |
Inter RAO UES PJSC | | | 28,782,001 | | | | 1,597,607 | |
| | |
Lenta, Ltd. GDR(1)(4) | | | 311,877 | | | | 961,349 | |
| | |
LSR Group PJSC GDR(4) | | | 32,005 | | | | 53,618 | |
| | |
Lukoil PJSC ADR | | | 252,061 | | | | 18,051,265 | |
| | |
Magnitogorsk Iron & Steel Works PJSC | | | 1,708,700 | | | | 1,056,165 | |
| | |
Mail.ru Group, Ltd. GDR(1)(4) | | | 203,512 | | | | 4,794,907 | |
| | |
MegaFon PJSC GDR(4) | | | 191,915 | | | | 1,762,285 | |
| | |
MMC Norilsk Nickel PJSC ADR(5) | | | 59,048 | | | | 1,112,464 | |
| | |
MMC Norilsk Nickel PJSC ADR(5) | | | 512,989 | | | | 9,626,522 | |
| | | | |
| | 20 | | See Notes to Financial Statements. |
Parametric
Tax-Managed Emerging Markets Fund
December 31, 2018
Portfolio of Investments (Unaudited) — continued
| | | | | | | | |
| Security | | Shares | | | Value | |
| | |
| Russia (continued) | | | | | | |
| | |
Mobile TeleSystems PJSC | | | 1,677,693 | | | $ | 5,732,752 | |
| | |
Moscow Exchange MICEX-RTS PJSC(1) | | | 1,352,520 | | | | 1,576,617 | |
| | |
Mosenergo PJSC | | | 12,772,962 | | | | 375,518 | |
| | |
Novatek PJSC GDR(4) | | | 47,573 | | | | 8,128,548 | |
| | |
Novolipetsk Steel PJSC GDR | | | 89,024 | | | | 2,040,605 | |
| | |
PhosAgro PJSC GDR(4) | | | 93,673 | | | | 1,195,621 | |
| | |
PIK Group PJSC | | | 113,450 | | | | 608,242 | |
| | |
Polymetal International PLC | | | 180,959 | | | | 1,898,456 | |
| | |
QIWI PLC ADR(1) | | | 94,500 | | | | 1,336,230 | |
| | |
Rosneft Oil Co. PJSC GDR(4) | | | 864,657 | | | | 5,335,447 | |
| | |
Rosseti PJSC | | | 129,516,873 | | | | 1,445,464 | |
| | |
Rostelecom PJSC | | | 554,268 | | | | 582,632 | |
| | |
Rostelecom PJSC ADR | | | 31,284 | | | | 189,268 | |
| | |
RusHydro PJSC | | | 241,400,952 | | | | 1,684,596 | |
| | |
Sberbank of Russia PJSC | | | 7,246,770 | | | | 19,556,533 | |
| | |
Severstal PJSC GDR(4) | | | 219,504 | | | | 2,997,470 | |
| | |
Sistema PJSFC | | | 3,087,600 | | | | 354,383 | |
| | |
Sistema PJSFC GDR(4) | | | 136,806 | | | | 317,670 | |
| | |
Surgutneftegas PJSC ADR | | | 656,684 | | | | 2,493,854 | |
| | |
Surgutneftegas PJSC, PFC Shares | | | 5,393,317 | | | | 3,044,096 | |
| | |
Surgutneftegas PJSC ADR, PFC Shares | | | 73,700 | | | | 404,613 | |
| | |
Tatneft PJSC ADR | | | 163,295 | | | | 10,283,861 | |
| | |
Transneft PJSC, PFC Shares | | | 1,225 | | | | 3,005,498 | |
| | |
Unipro PJSC | | | 7,701,000 | | | | 288,146 | |
| | |
United Wagon Co. PJSC(1) | | | 23,700 | | | | 137,363 | |
| | |
VEON, Ltd. ADR | | | 471,930 | | | | 1,104,316 | |
| | |
VTB Bank PJSC GDR(4) | | | 486,602 | | | | 540,867 | |
| | |
X5 Retail Group NV GDR(4) | | | 226,978 | | | | 5,631,371 | |
| | |
Yandex NV, Class A(1) | | | 342,000 | | | | 9,353,700 | |
| | |
| | | | | | | $ | 150,935,266 | |
| | |
| Saudi Arabia — 1.5% | | | | | | |
| | |
Abdullah Al Othaim Markets Co. | | | 41,082 | | | $ | 768,178 | |
| | |
Al Hammadi Co. for Development and Investment | | | 34,517 | | | | 230,271 | |
| | |
Al Rajhi Bank | | | 126,533 | | | | 2,948,766 | |
| | |
Al Tayyar Travel Group Holding Co. | | | 131,482 | | | | 700,272 | |
| | |
Alandalus Property Co. | | | 102,343 | | | | 390,061 | |
| | |
Aldrees Petroleum and Transport Services Co. | | | 20,900 | | | | 205,522 | |
| | |
Alinma Bank | | | 119,259 | | | | 729,493 | |
| | |
Almarai Co. JSC | | | 127,964 | | | | 1,635,065 | |
| | |
Arab National Bank | | | 48,974 | | | | 416,180 | |
| | |
Arriyadh Development Co. | | | 44,700 | | | | 208,920 | |
| | |
Bank AlBilad | | | 38,550 | | | | 279,235 | |
| | |
Banque Saudi Fransi | | | 65,833 | | | | 550,817 | |
| | |
Batic Investments and Logistic Co.(1) | | | 18,171 | | | | 184,105 | |
| | |
Co. for Cooperative Insurance (The)(1) | | | 16,075 | | | | 258,207 | |
| | |
Dallah Healthcare Co. | | | 21,424 | | | | 320,696 | |
| | | | | | | | |
| Security | | Shares | | | Value | |
| | |
| Saudi Arabia (continued) | | | | | | |
| | |
Dar Al Arkan Real Estate Development Co. | | | 931,720 | | | $ | 2,237,419 | |
| | |
Emaar Economic City(1) | | | 396,410 | | | | 835,729 | |
| | |
Etihad Etisalat Co.(1) | | | 233,523 | | | | 1,028,151 | |
| | |
Fawaz Abdulaziz Al Hokair & Co.(1) | | | 92,338 | | | | 540,425 | |
| | |
Jarir Marketing Co. | | | 56,342 | | | | 2,278,016 | |
| | |
Middle East Healthcare Co. | | | 30,400 | | | | 261,888 | |
| | |
Mobile Telecommunications Co. Saudi Arabia(1) | | | 186,447 | | | | 410,694 | |
| | |
Mouwasat Medical Services Co. | | | 39,812 | | | | 852,812 | |
| | |
National Agriculture Development Co. (The)(1) | | | 38,301 | | | | 300,958 | |
| | |
National Commercial Bank | | | 48,831 | | | | 620,909 | |
| | |
National Industrialization Co.(1) | | | 65,180 | | | | 261,735 | |
| | |
National Medical Care Co. | | | 25,900 | | | | 347,807 | |
| | |
Rabigh Refining & Petrochemical Co. | | | 176,700 | | | | 897,869 | |
| | |
Riyad Bank | | | 137,000 | | | | 722,110 | |
| | |
Sahara Petrochemical Co. | | | 50,710 | | | | 204,573 | |
| | |
Samba Financial Group | | | 89,776 | | | | 752,852 | |
| | |
Saudi Airlines Catering Co. | | | 35,452 | | | | 765,173 | |
| | |
Saudi Arabian Amiantit Co.(1) | | | 156,819 | | | | 243,767 | |
| | |
Saudi Arabian Fertilizer Co. | | | 24,333 | | | | 499,036 | |
| | |
Saudi Arabian Mining Co.(1) | | | 45,000 | | | | 590,032 | |
| | |
Saudi Automotive Services Co. | | | 44,564 | | | | 200,161 | |
| | |
Saudi Basic Industries Corp. | | | 60,743 | | | | 1,881,275 | |
| | |
Saudi British Bank (The) | | | 48,469 | | | | 421,291 | |
| | |
Saudi Ceramic Co.(1) | | | 42,675 | | | | 220,543 | |
| | |
Saudi Chemical Co. | | | 54,201 | | | | 448,746 | |
| | |
Saudi Co. For Hardware CJSC | | | 10,741 | | | | 189,808 | |
| | |
Saudi Electricity Co. | | | 658,277 | | | | 2,653,157 | |
| | |
Saudi Ground Services Co. | | | 69,126 | | | | 567,790 | |
| | |
Saudi Industrial Investment Group | | | 49,800 | | | | 303,311 | |
| | |
Saudi Industrial Services Co. | | | 93,777 | | | | 270,867 | |
| | |
Saudi International Petrochemical Co. | | | 22,570 | | | | 119,909 | |
| | |
Saudi Kayan Petrochemical Co.(1) | | | 82,300 | | | | 289,411 | |
| | |
Saudi Pharmaceutical Industries & Medical Appliances Corp. | | | 15,099 | | | | 118,395 | |
| | |
Saudi Public Transport Co. | | | 89,877 | | | | 334,000 | |
| | |
Saudi Telecom Co. | | | 128,106 | | | | 3,131,823 | |
| | |
Saudia Dairy & Foodstuff Co. | | | 5,419 | | | | 145,012 | |
| | |
Savola Group (The) | | | 202,528 | | | | 1,441,792 | |
| | |
United Electronics Co. | | | 26,771 | | | | 454,654 | |
| | |
United International Transportation Co. | | | 52,824 | | | | 369,120 | |
| | |
Yamama Cement Co.(1) | | | 23,300 | | | | 78,958 | |
| | |
Yanbu National Petrochemical Co. | | | 17,800 | | | | 302,762 | |
| | |
| | | | | | | $ | 38,420,528 | |
| | |
| Slovenia — 0.8% | | | | | | |
| | |
Cinkarna Celje DD | | | 3,106 | | | $ | 641,791 | |
| | |
KRKA DD | | | 130,011 | | | | 8,608,746 | |
| | | | |
| | 21 | | See Notes to Financial Statements. |
Parametric
Tax-Managed Emerging Markets Fund
December 31, 2018
Portfolio of Investments (Unaudited) — continued
| | | | | | | | |
| Security | | Shares | | | Value | |
| | |
| Slovenia (continued) | | | | | | |
| | |
Luka Koper | | | 26,836 | | | $ | 802,358 | |
| | |
Petrol | | | 14,032 | | | | 4,999,250 | |
| | |
Pozavarovalnica Sava DD | | | 64,657 | | | | 1,130,079 | |
| | |
Telekom Slovenije DD | | | 22,982 | | | | 1,553,935 | |
| | |
Zavarovalnica Triglav DD | | | 54,756 | | | | 1,902,592 | |
| | |
| | | | | | | $ | 19,638,751 | |
| | |
| South Africa — 5.9% | | | | | | |
| | |
Absa Group, Ltd. | | | 203,773 | | | $ | 2,287,082 | |
| | |
AECI, Ltd. | | | 108,017 | | | | 625,197 | |
| | |
African Rainbow Minerals, Ltd. | | | 33,300 | | | | 329,347 | |
| | |
Anglo American Platinum, Ltd. | | | 15,100 | | | | 562,969 | |
| | |
AngloGold Ashanti, Ltd. | | | 70,634 | | | | 897,315 | |
| | |
AngloGold Ashanti, Ltd. ADR | | | 79,199 | | | | 993,947 | |
| | |
Aspen Pharmacare Holdings, Ltd. | | | 301,772 | | | | 2,823,901 | |
| | |
Assore, Ltd. | | | 24,358 | | | | 492,381 | |
| | |
Astral Foods, Ltd. | | | 26,100 | | | | 290,315 | |
| | |
AVI, Ltd. | | | 228,000 | | | | 1,616,980 | |
| | |
Barloworld, Ltd. | | | 463,800 | | | | 3,718,111 | |
| | |
Bid Corp., Ltd. | | | 455,103 | | | | 8,372,033 | |
| | |
Bidvest Group, Ltd. (The) | | | 455,103 | | | | 6,537,392 | |
| | |
Clicks Group, Ltd. | | | 218,200 | | | | 2,900,840 | |
| | |
DataTec, Ltd. | | | 305,900 | | | | 577,862 | |
| | |
Discovery, Ltd. | | | 221,254 | | | | 2,456,741 | |
| | |
Exxaro Resources, Ltd. | | | 92,500 | | | | 892,323 | |
| | |
FirstRand, Ltd. | | | 956,285 | | | | 4,355,753 | |
| | |
Foschini Group, Ltd. (The) | | | 104,323 | | | | 1,204,733 | |
| | |
Gold Fields, Ltd. | | | 255,380 | | | | 884,506 | |
| | |
Grindrod Shipping Holdings, Ltd.(1) | | | 8,765 | | | | 45,921 | |
| | |
Grindrod, Ltd.(1) | | | 350,600 | | | | 150,380 | |
| | |
Growthpoint Properties, Ltd. | | | 1,244,700 | | | | 2,023,214 | |
| | |
Hosken Consolidated Investments, Ltd. | | | 33,700 | | | | 290,662 | |
| | |
Hyprop Investments, Ltd. | | | 65,400 | | | | 370,074 | |
| | |
Impala Platinum Holdings, Ltd.(1) | | | 133,586 | | | | 340,758 | |
| | |
Imperial Logistics, Ltd. | | | 130,900 | | | | 619,029 | |
| | |
Investec, Ltd. | | | 156,600 | | | | 855,520 | |
| | |
JSE, Ltd. | | | 45,700 | | | | 525,979 | |
| | |
Kumba Iron Ore, Ltd. | | | 22,200 | | | | 436,592 | |
| | |
Liberty Holdings, Ltd. | | | 67,700 | | | | 515,490 | |
| | |
Life Healthcare Group Holdings, Ltd. | | | 709,548 | | | | 1,304,672 | |
| | |
Massmart Holdings, Ltd. | | | 48,804 | | | | 352,367 | |
| | |
MMI Holdings, Ltd.(1) | | | 554,133 | | | | 657,995 | |
| | |
Mondi, Ltd. | | | 134,531 | | | | 2,897,874 | |
| | |
Motus Holdings, Ltd.(1) | | | 130,900 | | | | 800,730 | |
| | |
Mr Price Group, Ltd. | | | 188,400 | | | | 3,218,764 | |
| | |
MTN Group, Ltd. | | | 1,173,530 | | | | 7,253,895 | |
| | |
Murray & Roberts Holdings, Ltd. | | | 689,700 | | | | 689,235 | |
| | | | | | | | |
| Security | | Shares | | | Value | |
| | |
| South Africa (continued) | | | | | | |
| | |
Nampak, Ltd.(1) | | | 677,282 | | | $ | 652,837 | |
| | |
Naspers, Ltd., Class N | | | 97,460 | | | | 19,513,095 | |
| | |
Nedbank Group, Ltd. | | | 141,600 | | | | 2,700,662 | |
| | |
Netcare, Ltd. | | | 659,100 | | | | 1,206,153 | |
| | |
Northam Platinum, Ltd.(1) | | | 298,659 | | | | 896,235 | |
| | |
Novus Holdings, Ltd. | | | 43,537 | | | | 12,350 | |
| | |
Pick’n Pay Stores, Ltd. | | | 213,731 | | | | 1,008,301 | |
| | |
Rand Merchant Investment Holdings, Ltd. | | | 449,000 | | | | 1,134,556 | |
| | |
Redefine Properties, Ltd. | | | 1,959,096 | | | | 1,318,636 | |
| | |
Remgro, Ltd. | | | 237,905 | | | | 3,219,496 | |
| | |
Reunert, Ltd. | | | 401,800 | | | | 1,980,592 | |
| | |
RMB Holdings, Ltd. | | | 520,200 | | | | 2,849,812 | |
| | |
Sanlam, Ltd. | | | 789,334 | | | | 4,372,269 | |
| | |
Santam, Ltd. | | | 27,610 | | | | 568,576 | |
| | |
Sappi, Ltd. | | | 593,587 | | | | 3,367,247 | |
| | |
Sasol, Ltd. | | | 446,059 | | | | 13,255,313 | |
| | |
Shoprite Holdings, Ltd. | | | 419,647 | | | | 5,543,377 | |
| | |
Sibanye Gold, Ltd.(1) | | | 1,116,045 | | | | 811,730 | |
| | |
SPAR Group, Ltd. (The) | | | 79,260 | | | | 1,141,873 | |
| | |
Standard Bank Group, Ltd. | | | 505,102 | | | | 6,275,644 | |
| | |
Steinhoff International Holdings NV(1) | | | 1,020,600 | | | | 116,386 | |
| | |
Telkom SA SOC, Ltd. | | | 333,000 | | | | 1,466,378 | |
| | |
Tiger Brands, Ltd. | | | 207,487 | | | | 3,945,976 | |
| | |
Tongaat Hulett, Ltd. | | | 25,322 | | | | 97,839 | |
| | |
Truworths International, Ltd. | | | 299,341 | | | | 1,830,542 | |
| | |
Vodacom Group, Ltd. | | | 444,200 | | | | 4,085,470 | |
| | |
Wilson Bayly Holmes-Ovcon, Ltd. | | | 111,180 | | | | 1,021,635 | |
| | |
Woolworths Holdings, Ltd. | | | 355,542 | | | | 1,361,665 | |
| | |
| | | | | | | $ | 151,923,524 | |
| | |
| South Korea — 5.8% | | | | | | |
| | |
AMOREPACIFIC Corp. | | | 10,613 | | | $ | 1,996,895 | |
| | |
AMOREPACIFIC Group | | | 19,571 | | | | 1,277,070 | |
| | |
BNK Financial Group, Inc. | | | 55,807 | | | | 366,496 | |
| | |
Bukwang Pharmaceutical Co., Ltd. | | | 48,120 | | | | 1,073,846 | |
| | |
Cell Biotech Co., Ltd. | | | 7,242 | | | | 182,648 | |
| | |
Celltrion, Inc.(1) | | | 20,612 | | | | 4,140,718 | |
| | |
Chabiotech Co., Ltd.(1) | | | 12,772 | | | | 232,826 | |
| | |
Cheil Worldwide, Inc. | | | 38,050 | | | | 766,882 | |
| | |
CJ CheilJedang Corp. | | | 3,500 | | | | 1,037,466 | |
| | |
CJ Corp. | | | 7,083 | | | | 772,528 | |
| | |
CJ Corp., PFC Shares | | | 1,062 | | | | 46,246 | |
| | |
CJ ENM Co., Ltd. | | | 1,122 | | | | 203,093 | |
| | |
CJ Logistics Corp.(1) | | | 4,378 | | | | 654,859 | |
| | |
Coway Co., Ltd. | | | 15,560 | | | | 1,028,909 | |
| | |
Daelim Industrial Co., Ltd. | | | 6,870 | | | | 631,120 | |
| | |
Daesang Corp. | | | 29,700 | | | | 669,025 | |
| | | | |
| | 22 | | See Notes to Financial Statements. |
Parametric
Tax-Managed Emerging Markets Fund
December 31, 2018
Portfolio of Investments (Unaudited) — continued
| | | | | | | | |
| Security | | Shares | | | Value | |
| | |
| South Korea (continued) | | | | | | |
| | |
Daewoo Engineering & Construction Co., Ltd.(1) | | | 60,100 | | | $ | 290,176 | |
| | |
Daewoo Industrial Development Co., Ltd.(1) | | | 3,501 | | | | 8,989 | |
| | |
DB Insurance Co., Ltd. | | | 9,442 | | | | 594,652 | |
| | |
DGB Financial Group Co., Ltd. | | | 64,880 | | | | 483,307 | |
| | |
Dong-A ST Co., Ltd. | | | 5,069 | | | | 474,869 | |
| | |
Doosan Corp. | | | 4,600 | | | | 459,636 | |
| | |
E-MART, Inc. | | | 8,311 | | | | 1,357,272 | |
| | |
Green Cross Corp. | | | 2,863 | | | | 349,207 | |
| | |
Green Cross Holdings Corp. | | | 9,800 | | | | 221,021 | |
| | |
GS Engineering & Construction Corp. | | | 30,870 | | | | 1,210,723 | |
| | |
GS Holdings Corp. | | | 47,154 | | | | 2,178,974 | |
| | |
Hana Financial Group, Inc. | | | 58,027 | | | | 1,887,202 | |
| | |
Hanjin Kal Corp. | | | 8,977 | | | | 240,244 | |
| | |
Hanjin Transportation Co., Ltd. | | | 10,500 | | | | 505,773 | |
| | |
Hankook Tire Co., Ltd. | | | 27,617 | | | | 992,605 | |
| | |
Hanmi Pharm Co., Ltd. | | | 3,160 | | | | 1,319,105 | |
| | |
Hanmi Science Co., Ltd. | | | 22,491 | | | | 1,594,557 | |
| | |
Hanwha Chemical Corp.(1) | | | 65,820 | | | | 1,193,882 | |
| | |
Hanwha Corp. | | | 27,900 | | | | 783,701 | |
| | |
HDC Holdings Co., Ltd. | | | 11,087 | | | | 171,324 | |
| | |
HDC Hyundai Development Co-Engineering & Construction, Class E(1) | | | 15,492 | | | | 670,974 | |
| | |
Hotel Shilla Co., Ltd. | | | 12,750 | | | | 874,550 | |
| | |
Hyosung Advanced Materials Corp.(1) | | | 2,398 | | | | 221,576 | |
| | |
Hyosung Chemical Corp.(1) | | | 1,707 | | | | 217,848 | |
| | |
Hyosung Corp.(1) | | | 7,385 | | | | 331,366 | |
| | |
Hyosung Heavy Industries Corp.(1) | | | 4,991 | | | | 184,776 | |
| | |
Hyosung TNC Co., Ltd.(1) | | | 2,316 | | | | 382,483 | |
| | |
Hyundai Department Store Co., Ltd. | | | 5,600 | | | | 453,492 | |
| | |
Hyundai Engineering & Construction Co., Ltd. | | | 22,703 | | | | 1,111,893 | |
| | |
Hyundai Glovis Co., Ltd. | | | 9,736 | | | | 1,124,968 | |
| | |
Hyundai Heavy Industries Co., Ltd.(1) | | | 1,784 | | | | 205,767 | |
| | |
Hyundai Marine & Fire Insurance Co., Ltd. | | | 14,350 | | | | 526,982 | |
| | |
Hyundai Mobis Co., Ltd. | | | 12,626 | | | | 2,154,176 | |
| | |
Hyundai Motor Co. | | | 33,990 | | | | 3,608,389 | |
| | |
Hyundai Motor Co., Second PFC Shares | | | 3,773 | | | | 260,356 | |
| | |
Hyundai Steel Co. | | | 18,270 | | | | 742,932 | |
| | |
Hyundai Wia Corp. | | | 6,700 | | | | 217,705 | |
| | |
InBody Co., Ltd. | | | 11,574 | | | | 226,007 | |
| | |
Industrial Bank of Korea(1) | | | 71,500 | | | | 900,475 | |
| | |
Kangwon Land, Inc. | | | 36,658 | | | | 1,049,453 | |
| | |
KB Financial Group, Inc.(1) | | | 70,107 | | | | 2,924,640 | |
| | |
KCC Corp. | | | 1,710 | | | | 472,544 | |
| | |
Kia Motors Corp. | | | 64,887 | | | | 1,955,815 | |
| | |
KIWOOM Securities Co., Ltd. | | | 5,067 | | | | 356,379 | |
| | |
Korea Electric Power Corp.(1) | | | 106,430 | | | | 3,152,629 | |
| | |
Korea Gas Corp.(1) | | | 15,047 | | | | 650,386 | |
| | | | | | | | |
| Security | | Shares | | | Value | |
| | |
| South Korea (continued) | | | | | | |
| | |
Korea Investment Holdings Co., Ltd. | | | 10,700 | | | $ | 572,260 | |
| | |
Korea Zinc Co., Ltd. | | | 5,700 | | | | 2,207,079 | |
| | |
Korean Air Lines Co., Ltd. | | | 18,577 | | | | 550,628 | |
| | |
Korean Reinsurance Co. | | | 52,474 | | | | 407,092 | |
| | |
KT Corp.(1) | | | 16,507 | | | | 440,160 | |
| | |
KT&G Corp.(1) | | | 49,980 | | | | 4,550,506 | |
| | |
Kumho Petrochemical Co., Ltd. | | | 4,900 | | | | 383,656 | |
| | |
LG Chem, Ltd. | | | 13,706 | | | | 4,272,417 | |
| | |
LG Corp. | | | 32,997 | | | | 2,066,533 | |
| | |
LG Display Co., Ltd.(1) | | | 33,200 | | | | 538,760 | |
| | |
LG Electronics, Inc.(1) | | | 9,019 | | | | 505,725 | |
| | |
LG Hausys, Ltd. | | | 4,611 | | | | 233,982 | |
| | |
LG Household & Health Care, Ltd. | | | 3,800 | | | | 3,755,600 | |
| | |
LG Uplus Corp. | | | 278,220 | | | | 4,397,040 | |
| | |
Lotte Chemical Corp. | | | 7,483 | | | | 1,860,513 | |
| | |
Lotte Corp.(1) | | | 5,150 | | | | 243,315 | |
| | |
LOTTE Fine Chemical Co., Ltd. | | | 10,800 | | | | 397,796 | |
| | |
Lotte Shopping Co., Ltd. | | | 4,018 | | | | 758,623 | |
| | |
LS Corp. | | | 7,030 | | | | 309,809 | |
| | |
LS Industrial Systems Co., Ltd. | | | 4,500 | | | | 197,704 | |
| | |
Macrogen, Inc.(1) | | | 13,950 | | | | 367,437 | |
| | |
Medy-Tox, Inc. | | | 3,045 | | | | 1,582,381 | |
| | |
Mirae Asset Daewoo Co., Ltd. | | | 19,799 | | | | 116,235 | |
| | |
Naver Corp. | | | 15,655 | | | | 1,715,723 | |
| | |
NCsoft Corp. | | | 5,300 | | | | 2,221,602 | |
| | |
NH Investment & Securities Co., Ltd. | | | 51,222 | | | | 600,369 | |
| | |
Nong Shim Co., Ltd. | | | 1,100 | | | | 250,161 | |
| | |
Orion Corp. of Republic of Korea | | | 7,895 | | | | 846,716 | |
| | |
Osstem Implant Co., Ltd.(1) | | | 12,166 | | | | 584,911 | |
| | |
POSCO | | | 22,605 | | | | 4,944,427 | |
| | |
Posco Daewoo Corp. | | | 10,502 | | | | 171,456 | |
| | |
S-Oil Corp. | | | 24,372 | | | | 2,125,868 | |
| | |
S1 Corp. | | | 10,130 | | | | 910,150 | |
| | |
Samsung Biologics Co., Ltd.(1) | | | 5,364 | | | | 1,865,786 | |
| | |
Samsung C&T Corp. | | | 7,152 | | | | 676,973 | |
| | |
Samsung Card Co., Ltd. | | | 10,660 | | | | 329,332 | |
| | |
Samsung Electro-Mechanics Co., Ltd. | | | 12,680 | | | | 1,182,050 | |
| | |
Samsung Electronics Co., Ltd. | | | 334,200 | | | | 11,634,066 | |
| | |
Samsung Fire & Marine Insurance Co., Ltd. | | | 6,363 | | | | 1,530,042 | |
| | |
Samsung Life Insurance Co., Ltd. | | | 16,204 | | | | 1,185,713 | |
| | |
Samsung SDI Co., Ltd.(1) | | | 7,925 | | | | 1,557,721 | |
| | |
Samsung Securities Co., Ltd. | | | 14,212 | | | | 401,911 | |
| | |
Seegene, Inc.(1) | | | 19,291 | | | | 277,426 | |
| | |
Shinhan Financial Group Co., Ltd.(1) | | | 84,070 | | | | 2,980,793 | |
| | |
Shinsegae, Inc. | | | 2,179 | | | | 500,307 | |
| | |
SK Chemicals Co., Ltd.(1) | | | 6,265 | | | | 392,985 | |
| | |
SK Discovery Co., Ltd. | | | 5,834 | | | | 136,423 | |
| | | | |
| | 23 | | See Notes to Financial Statements. |
Parametric
Tax-Managed Emerging Markets Fund
December 31, 2018
Portfolio of Investments (Unaudited) — continued
| | | | | | | | |
| Security | | Shares | | | Value | |
| | |
| South Korea (continued) | | | | | | |
| | |
SK Holdings Co., Ltd. | | | 6,366 | | | $ | 1,485,391 | |
| | |
SK Hynix, Inc.(1) | | | 43,670 | | | | 2,380,735 | |
| | |
SK Innovation Co., Ltd. | | | 49,396 | | | | 7,928,765 | |
| | |
SK Telecom Co., Ltd. | | | 30,943 | | | | 7,465,921 | |
| | |
ViroMed Co., Ltd.(1) | | | 8,815 | | | | 2,019,411 | |
| | |
Woori Bank(1) | | | 20,809 | | | | 290,991 | |
| | |
Yuhan Corp. | | | 7,836 | | | | 1,438,035 | |
| | |
Zyle Motor Sales Corp.(1) | | | 4,895 | | | | 7,239 | |
| | |
| | | | | | | $ | 149,131,057 | |
| | |
| Sri Lanka — 0.7% | | | | | | |
| | |
Access Engineering PLC | | | 3,828,963 | | | $ | 294,667 | |
| | |
Aitken Spence PLC | | | 867,213 | | | | 225,392 | |
| | |
Ceylon Tobacco Co. PLC | | | 96,609 | | | | 753,388 | |
| | |
Chevron Lubricants Lanka PLC | | | 1,378,614 | | | | 549,180 | |
| | |
Commercial Bank of Ceylon PLC | | | 4,171,069 | | | | 2,609,951 | |
| | |
DFCC Bank PLC | | | 648,984 | | | | 329,512 | |
| | |
Dialog Axiata PLC | | | 15,786,381 | | | | 872,387 | |
| | |
Distilleries Co. of Sri Lanka PLC | | | 1,837,926 | | | | 161,749 | |
| | |
Hatton National Bank PLC | | | 1,908,949 | | | | 2,232,632 | |
| | |
Hemas Holdings PLC | | | 1,663,050 | | | | 809,416 | |
| | |
John Keells Holdings PLC | | | 6,067,440 | | | | 5,265,088 | |
| | |
Melstacorp PLC(1) | | | 6,203,001 | | | | 1,704,784 | |
| | |
National Development Bank PLC | | | 1,531,324 | | | | 893,272 | |
| | |
Nations Trust Bank PLC(1) | | | 958,472 | | | | 474,116 | |
| | |
Nestle Lanka PLC | | | 15,593 | | | | 145,090 | |
| | |
Sampath Bank PLC(1) | | | 904,643 | | | | 1,161,227 | |
| | |
Teejay Lanka PLC | | | 1,870,121 | | | | 331,796 | |
| | |
| | | | | | | $ | 18,813,647 | |
| | |
| Taiwan — 5.9% | | | | | | |
| | |
Advantech Co., Ltd. | | | 133,963 | | | $ | 915,168 | |
| | |
ASE Technology Holding Co., Ltd. | | | 669,415 | | | | 1,268,445 | |
| | |
Asia Cement Corp. | | | 1,183,967 | | | | 1,309,409 | |
| | |
Asia Optical Co., Inc. | | | 114,000 | | | | 246,026 | |
| | |
Asustek Computer, Inc. | | | 118,174 | | | | 774,493 | |
| | |
AU Optronics Corp. | | | 2,104,000 | | | | 836,027 | |
| | |
Capital Securities Corp. | | | 647,503 | | | | 188,481 | |
| | |
Catcher Technology Co., Ltd. | | | 113,100 | | | | 828,097 | |
| | |
Cathay Financial Holding Co., Ltd. | | | 2,145,019 | | | | 3,283,659 | |
| | |
Cathay Real Estate Development Co., Ltd. | | | 346,500 | | | | 224,782 | |
| | |
Chang Hwa Commercial Bank, Ltd. | | | 2,158,286 | | | | 1,208,660 | |
| | |
Cheng Shin Rubber Industry Co., Ltd. | | | 1,410,951 | | | | 1,876,776 | |
| | |
Chicony Electronics Co., Ltd. | | | 161,318 | | | | 328,501 | |
| | |
China Airlines, Ltd. | | | 940,963 | | | | 336,615 | |
| | | | | | | | |
| Security | | Shares | | | Value | |
| | |
| Taiwan (continued) | | | | | | |
| | |
China Development Financial Holding Corp. | | | 5,090,106 | | | $ | 1,611,875 | |
| | |
China Life Insurance Co., Ltd. | | | 519,639 | | | | 471,530 | |
| | |
China Motor Corp. | | | 1,026,930 | | | | 810,947 | |
| | |
China Petrochemical Development Corp.(1) | | | 1,006,857 | | | | 359,079 | |
| | |
China Steel Corp. | | | 6,433,886 | | | | 5,080,622 | |
| | |
Chipbond Technology Corp. | | | 240,000 | | | | 481,912 | |
| | |
Chong Hong Construction Co., Ltd. | | | 165,761 | | | | 416,276 | |
| | |
Chunghwa Telecom Co., Ltd. | | | 2,476,909 | | | | 9,043,602 | |
| | |
Clevo Co. | | | 206,579 | | | | 204,239 | |
| | |
Compal Electronics, Inc. | | | 465,000 | | | | 263,720 | |
| | |
Coretronic Corp. | | | 169,387 | | | | 211,271 | |
| | |
CTBC Financial Holding Co., Ltd. | | | 4,106,273 | | | | 2,700,832 | |
| | |
Delta Electronics, Inc. | | | 265,356 | | | | 1,116,836 | |
| | |
E.Sun Financial Holding Co., Ltd. | | | 2,996,398 | | | | 1,960,145 | |
| | |
Elan Microelectronics Corp. | | | 99,687 | | | | 244,824 | |
| | |
Eternal Materials Co., Ltd. | | | 388,561 | | | | 295,917 | |
| | |
EVA Airways Corp. | | | 1,912,551 | | | | 982,691 | |
| | |
Evergreen Marine Corp. | | | 1,229,879 | | | | 476,875 | |
| | |
Everlight Chemical Industrial Corp. | | | 259,054 | | | | 137,147 | |
| | |
Far Eastern Department Stores, Ltd. | | | 1,096,944 | | | | 559,975 | |
| | |
Far Eastern International Bank | | | 1,065,026 | | | | 346,018 | |
| | |
Far Eastern New Century Corp. | | | 2,069,313 | | | | 1,879,258 | |
| | |
Far EasTone Telecommunications Co., Ltd. | | | 1,199,364 | | | | 2,979,176 | |
| | |
Faraday Technology Corp. | | | 192,000 | | | | 264,022 | |
| | |
Feng Hsin Steel Co., Ltd. | | | 172,000 | | | | 327,184 | |
| | |
First Financial Holding Co., Ltd. | | | 2,808,397 | | | | 1,829,625 | |
| | |
Formosa Chemicals & Fibre Corp. | | | 1,496,214 | | | | 5,118,611 | |
| | |
Formosa Petrochemical Corp. | | | 985,153 | | | | 3,495,835 | |
| | |
Formosa Plastics Corp. | | | 1,651,853 | | | | 5,429,625 | |
| | |
Formosa Taffeta Co., Ltd. | | | 545,000 | | | | 613,085 | |
| | |
Formosan Rubber Group, Inc. | | | 214,500 | | | | 108,950 | |
| | |
Foxconn Technology Co., Ltd. | | | 236,305 | | | | 466,585 | |
| | |
Fubon Financial Holding Co., Ltd. | | | 1,538,833 | | | | 2,361,026 | |
| | |
Giant Manufacturing Co., Ltd. | | | 228,093 | | | | 1,070,569 | |
| | |
Goldsun Building Materials Co., Ltd. | | | 617,053 | | | | 167,674 | |
| | |
Great Wall Enterprise Co., Ltd. | | | 343,857 | | | | 374,100 | |
| | |
Highwealth Construction Corp. | | | 325,556 | | | | 476,298 | |
| | |
Hiwin Technologies Corp. | | | 194,261 | | | | 1,401,506 | |
| | |
Hon Hai Precision Industry Co., Ltd. | | | 1,094,108 | | | | 2,518,020 | |
| | |
Hotai Motor Co., Ltd. | | | 98,000 | | | | 812,153 | |
| | |
Hua Nan Financial Holdings Co., Ltd. | | | 3,114,140 | | | | 1,773,501 | |
| | |
Huaku Development Co., Ltd. | | | 187,010 | | | | 414,358 | |
| | |
Innolux Corp. | | | 330,262 | | | | 104,660 | |
| | |
Inventec Corp. | | | 1,330,753 | | | | 952,186 | |
| | |
King Yuan Electronics Co., Ltd. | | | 711,274 | | | | 534,954 | |
| | |
Largan Precision Co., Ltd. | | | 12,042 | | | | 1,256,522 | |
| | | | |
| | 24 | | See Notes to Financial Statements. |
Parametric
Tax-Managed Emerging Markets Fund
December 31, 2018
Portfolio of Investments (Unaudited) — continued
| | | | | | | | |
| Security | | Shares | | | Value | |
| | |
| Taiwan (continued) | | | | | | |
| | |
LCY Chemical Corp. | | | 253,644 | | | $ | 435,341 | |
| | |
Lite-On Technology Corp. | | | 478,048 | | | | 631,283 | |
| | |
Macronix International Corp., Ltd. | | | 249,322 | | | | 147,983 | |
| | |
MediaTek, Inc. | | | 103,664 | | | | 771,519 | |
| | |
Mega Financial Holding Co., Ltd. | | | 2,383,240 | | | | 2,011,982 | |
| | |
Merida Industry Co., Ltd. | | | 435,907 | | | | 1,953,384 | |
| | |
Mitac Holdings Corp. | | | 374,240 | | | | 298,910 | |
| | |
Nan Kang Rubber Tire Co., Ltd. | | | 759,819 | | | | 638,680 | |
| | |
Nan Ya Plastics Corp. | | | 2,404,303 | | | | 5,913,009 | |
| | |
Nanya Technology Corp. | | | 247,165 | | | | 442,627 | |
| | |
Novatek Microelectronics Corp., Ltd. | | | 198,479 | | | | 916,316 | |
| | |
Oriental Union Chemical Corp. | | | 453,200 | | | | 380,535 | |
| | |
Pegatron Corp. | | | 553,486 | | | | 926,612 | |
| | |
Phison Electronics Corp. | | | 43,692 | | | | 325,313 | |
| | |
Pou Chen Corp. | | | 2,168,764 | | | | 2,297,367 | |
| | |
Powertech Technology, Inc. | | | 366,725 | | | | 788,396 | |
| | |
President Chain Store Corp. | | | 619,120 | | | | 6,237,638 | |
| | |
Quanta Computer, Inc. | | | 782,065 | | | | 1,338,521 | |
| | |
Radiant Opto-Electronics Corp. | | | 206,350 | | | | 569,762 | |
| | |
Realtek Semiconductor Corp. | | | 165,542 | | | | 767,773 | |
| | |
Ruentex Development Co., Ltd. | | | 243,743 | | | | 355,159 | |
| | |
Ruentex Industries, Ltd. | | | 697,171 | | | | 1,782,796 | |
| | |
Sanyang Motor Co., Ltd. | | | 1,509,000 | | | | 979,468 | |
| | |
Shin Kong Financial Holding Co., Ltd. | | | 3,317,472 | | | | 970,167 | |
| | |
Shin Kong Synthetic Fibers Corp. | | | 965,996 | | | | 362,090 | |
| | |
Simplo Technology Co., Ltd. | | | 38,652 | | | | 262,075 | |
| | |
Sino-American Silicon Products, Inc. | | | 120,857 | | | | 240,400 | |
| | |
SinoPac Financial Holdings Co., Ltd. | | | 4,420,980 | | | | 1,479,547 | |
| | |
Synnex Technology International Corp. | | | 684,558 | | | | 808,836 | |
| | |
Tainan Spinning Co., Ltd. | | | 1,445,010 | | | | 561,625 | |
| | |
Taishin Financial Holding Co., Ltd. | | | 4,114,940 | | | | 1,749,616 | |
| | |
Taiwan Business Bank | | | 2,084,051 | | | | 701,679 | |
| | |
Taiwan Cement Corp. | | | 1,896,529 | | | | 2,188,996 | |
| | |
Taiwan Cooperative Financial Holding Co., Ltd. | | | 2,624,357 | | | | 1,507,641 | |
| | |
Taiwan Mobile Co., Ltd. | | | 1,170,052 | | | | 4,052,001 | |
| | |
Taiwan Semiconductor Manufacturing Co., Ltd. | | | 1,401,873 | | | | 10,179,321 | |
| | |
Taiwan Tea Corp. | | | 382,711 | | | | 191,997 | |
| | |
Tatung Co., Ltd.(1) | | | 1,214,645 | | | | 1,022,708 | |
| | |
Teco Electric & Machinery Co., Ltd. | | | 989,000 | | | | 562,805 | |
| | |
Tong Yang Industry Co., Ltd. | | | 379,826 | | | | 454,244 | |
| | |
Tripod Technology Corp. | | | 152,979 | | | | 398,894 | |
| | |
TSRC Corp. | | | 271,887 | | | | 239,396 | |
| | |
TTY Biopharm Co., Ltd. | | | 307,255 | | | | 765,576 | |
| | |
Tung Ho Steel Enterprise Corp. | | | 293,385 | | | | 181,367 | |
| | |
U-Ming Marine Transport Corp. | | | 202,000 | | | | 212,191 | |
| | |
Uni-President Enterprises Corp. | | | 3,855,626 | | | | 8,747,096 | |
| | | | | | | | |
| Security | | Shares | | | Value | |
| | |
| Taiwan (continued) | | | | | | |
| | |
United Microelectronics Corp. | | | 1,596,361 | | | $ | 577,238 | |
| | |
Vanguard International Semiconductor Corp. | | | 321,175 | | | | 622,950 | |
| | |
Walsin Lihwa Corp. | | | 1,085,980 | | | | 593,243 | |
| | |
Wan Hai Lines, Ltd. | | | 339,570 | | | | 176,396 | |
| | |
Waterland Financial Holdings | | | 1,665,009 | | | | 516,020 | |
| | |
WPG Holdings Co., Ltd. | | | 504,285 | | | | 605,091 | |
| | |
Yageo Corp. | | | 35,362 | | | | 366,273 | |
| | |
YFY, Inc. | | | 866,414 | | | | 317,170 | |
| | |
Yieh Phui Enterprise Co., Ltd. | | | 1,096,420 | | | | 367,271 | |
| | |
Yuanta Financial Holding Co., Ltd. | | | 4,019,729 | | | | 2,020,838 | |
| | |
Yulon Motor Co., Ltd. | | | 512,420 | | | | 303,499 | |
| | |
| | | | | | | $ | 153,347,586 | |
| | |
| Thailand — 2.9% | | | | | | |
| | |
Advanced Info Service PCL(7) | | | 560,800 | | | $ | 2,973,912 | |
| | |
Airports of Thailand PCL(7) | | | 2,309,500 | | | | 4,561,602 | |
| | |
AP Thailand PCL(7) | | | 4,609,660 | | | | 850,904 | |
| | |
Bangkok Bank PCL(7) | | | 198,400 | | | | 1,238,229 | |
| | |
Bangkok Dusit Medical Services PCL(7) | | | 5,604,200 | | | | 4,265,333 | |
| | |
Bangkok Expressway & Metro PCL(7) | | | 3,422,254 | | | | 1,020,484 | |
| | |
Banpu PCL(7) | | | 2,037,000 | | | | 926,968 | |
| | |
BEC World PCL(1)(7) | | | 1,693,300 | | | | 250,833 | |
| | |
Berli Jucker PCL(7) | | | 497,900 | | | | 776,680 | |
| | |
Bumrungrad Hospital PCL(7) | | | 559,800 | | | | 3,222,284 | |
| | |
Cal-Comp Electronics (Thailand) PCL(7) | | | 1,957,091 | | | | 106,480 | |
| | |
Central Pattana PCL(7) | | | 972,200 | | | | 2,233,855 | |
| | |
Charoen Pokphand Foods PCL(7) | | | 1,619,600 | | | | 1,224,043 | |
| | |
CP ALL PCL(7) | | | 1,593,800 | | | | 3,365,496 | |
| | |
Delta Electronics (Thailand) PCL(7) | | | 1,516,370 | | | | 3,238,128 | |
| | |
Electricity Generating PCL(7) | | | 382,000 | | | | 2,911,383 | |
| | |
Glow Energy PCL(7) | | | 803,700 | | | | 2,197,564 | |
| | |
Hana Microelectronics PCL(7) | | | 1,416,900 | | | | 1,437,211 | |
| | |
Home Product Center PCL(7) | | | 1,565,760 | | | | 730,678 | |
| | |
Indorama Ventures PCL(7) | | | 1,161,671 | | | | 1,938,607 | |
| | |
Intouch Holdings PCL(7) | | | 927,871 | | | | 1,360,761 | |
| | |
IRPC PCL(7) | | | 4,225,800 | | | | 746,458 | |
| | |
Italian-Thai Development PCL(1)(7) | | | 4,014,629 | | | | 264,040 | |
| | |
Kasikornbank PCL(7) | | | 364,900 | | | | 2,075,750 | |
| | |
KCE Electronics PCL(7) | | | 656,600 | | | | 529,207 | |
| | |
Kiatnakin Bank PCL(7) | | | 306,200 | | | | 623,577 | |
| | |
Krung Thai Bank PCL(7) | | | 1,610,225 | | | | 950,056 | |
| | |
Land & Houses PCL(7) | | | 896,600 | | | | 272,960 | |
| | |
Major Cineplex Group PCL(7) | | | 1,583,200 | | | | 1,002,135 | |
| | |
Minor International PCL(7) | | | 3,179,761 | | | | 3,322,856 | |
| | |
Precious Shipping PCL(1)(7) | | | 933,750 | | | | 248,412 | |
| | |
PTT Exploration & Production PCL(7) | | | 370,516 | | | | 1,285,828 | |
| | | | |
| | 25 | | See Notes to Financial Statements. |
Parametric
Tax-Managed Emerging Markets Fund
December 31, 2018
Portfolio of Investments (Unaudited) — continued
| | | | | | | | |
| Security | | Shares | | | Value | |
| | |
| Thailand (continued) | | | | | | |
| | |
PTT Global Chemical PCL(7) | | | 956,405 | | | $ | 2,095,574 | |
| | |
PTT PCL(7) | | | 2,284,700 | | | | 3,222,067 | |
| | |
Quality House PCL(7) | | | 9,121,583 | | | | 734,876 | |
| | |
Ratchaburi Electricity Generating Holding PCL(7) | | | 578,300 | | | | 901,805 | |
| | |
Samart Corp. PCL(7) | | | 718,600 | | | | 140,196 | |
| | |
Siam Cement PCL(7) | | | 153,811 | | | | 2,060,517 | |
| | |
Siam City Cement PCL(7) | | | 84,087 | | | | 529,614 | |
| | |
Siam Commercial Bank PCL(7) | | | 439,500 | | | | 1,804,057 | |
| | |
Sino-Thai Engineering & Construction PCL(1)(7) | | | 972,300 | | | | 609,646 | |
| | |
Super Energy Corp. PCL(1)(7) | | | 8,463,500 | | | | 137,916 | |
| | |
SVI PCL(7) | | | 1,450,800 | | | | 217,583 | |
| | |
Thai Airways International PCL(1)(7) | | | 1,290,500 | | | | 479,930 | |
| | |
Thai Beverage PCL(7) | | | 3,247,700 | | | | 1,455,883 | |
| | |
Thai Oil PCL(7) | | | 462,600 | | | | 940,174 | |
| | |
Thai Union Group PCL(7) | | | 1,779,692 | | | | 886,216 | |
| | |
Thanachart Capital PCL(7) | | | 460,200 | | | | 703,646 | |
| | |
Thoresen Thai Agencies PCL(7) | | | 2,257,887 | | | | 360,930 | |
| | |
TMB Bank PCL(7) | | | 5,321,200 | | | | 359,840 | |
| | |
Total Access Communication PCL(7) | | | 496,800 | | | | 660,417 | |
| | |
TPI Polene PCL(7) | | | 14,633,600 | | | | 889,974 | |
| | |
True Corp. PCL(7) | | | 7,849,382 | | | | 1,255,274 | |
| | |
TTW PCL(7) | | | 4,040,000 | | | | 1,538,876 | |
| | |
WHA Corp. PCL(7) | | | 2,277,900 | | | | 299,872 | |
| | |
| | | | | | | $ | 74,437,597 | |
| | |
| Tunisia — 0.2% | | | | | | |
| | |
Attijari Bank | | | 54,723 | | | $ | 751,565 | |
| | |
Banque de Tunisie | | | 160,285 | | | | 428,522 | |
| | |
Banque Internationale Arabe de Tunisie | | | 23,438 | | | | 937,908 | |
| | |
Banque Nationale Agricole(1) | | | 93,315 | | | | 437,722 | |
| | |
Carthage Cement(1)(3) | | | 469,841 | | | | 324,581 | |
| | |
Euro Cycles SA | | | 34,571 | | | | 213,204 | |
| | |
Poulina Group | | | 173,437 | | | | 723,629 | |
| | |
Societe D’Articles Hygieniques SA(1) | | | 114,457 | | | | 436,937 | |
| | |
Societe Frigorifique et Brasserie de Tunis SA | | | 135,340 | | | | 1,069,443 | |
| | |
Telnet Holding | | | 110,412 | | | | 355,231 | |
| | |
Union Internationale de Banques SA | | | 79,769 | | | | 631,070 | |
| | |
| | | | | | | $ | 6,309,812 | |
| | |
| Turkey — 3.0% | | | | | | |
| | |
AG Anadolu Grubu Holding AS | | | 107,100 | | | $ | 207,466 | |
| | |
Akbank T.A.S. | | | 1,840,745 | | | | 2,374,676 | |
| | |
Aksa Akrilik Kimya Sanayii AS | | | 335,654 | | | | 473,075 | |
| | |
Aksa Enerji Uretim AS(1) | | | 1,312,563 | | | | 663,227 | |
| | |
Alarko Holding AS | | | 404,315 | | | | 158,157 | |
| | | | | | | | |
| Security | | Shares | | | Value | |
| | |
| Turkey (continued) | | | | | | |
| | |
Anadolu Efes Biracilik ve Malt Sanayii AS | | | 399,548 | | | $ | 1,556,534 | |
| | |
Arcelik AS | | | 1,010,459 | | | | 3,010,330 | |
| | |
Aselsan Elektronik Sanayi Ve Ticaret AS | | | 154,326 | | | | 700,392 | |
| | |
Aygaz AS | | | 330,198 | | | | 706,298 | |
| | |
BIM Birlesik Magazalar AS | | | 374,373 | | | | 6,153,763 | |
| | |
Cimsa Cimento Sanayi ve Ticaret AS | | | 116,200 | | | | 165,401 | |
| | |
Coca-Cola Icecek AS | | | 161,900 | | | | 943,037 | |
| | |
Dogan Sirketler Grubu Holding AS(1) | | | 2,165,468 | | | | 417,247 | |
| | |
EIS Eczacibasi Ilac ve Sinai ve Finansal Yatirimlar Sanayi ve Ticaret AS | | | 735,375 | | | | 378,534 | |
| | |
Emlak Konut Gayrimenkul Yatirim Ortakligi AS | | | 17,754,313 | | | | 5,015,908 | |
| | |
Enerjisa Enerji AS(2) | | | 1,053,571 | | | | 1,014,937 | |
| | |
Enka Insaat ve Sanayi AS | | | 1,566,921 | | | | 1,356,504 | |
| | |
Eregli Demir ve Celik Fabrikalari TAS | | | 2,919,663 | | | | 3,969,486 | |
| | |
Ford Otomotiv Sanayi AS | | | 260,260 | | | | 2,455,219 | |
| | |
Gubre Fabrikalari TAS(1) | | | 386,800 | | | | 215,961 | |
| | |
Haci Omer Sabanci Holding AS | | | 1,047,729 | | | | 1,486,629 | |
| | |
Ipek Dogal Enerji Kaynaklari Arastirma Ve Uretim
AS(1) | | | 373,901 | | | | 378,545 | |
| | |
Is Gayrimenkul Yatirim Ortakligi AS | | | 2,448,816 | | | | 498,977 | |
| | |
Kardemir Karabuk Demir Celik Sanayi ve Ticaret AS, Class D(1) | | | 2,443,657 | | | | 1,005,322 | |
| | |
KOC Holding AS | | | 1,034,806 | | | | 2,769,628 | |
| | |
Koza Altin Isletmeleri AS(1) | | | 122,800 | | | | 1,186,977 | |
| | |
Migros Ticaret AS(1) | | | 186,855 | | | | 525,673 | |
| | |
Net Holding AS(1) | | | 1,199,227 | | | | 443,744 | |
| | |
Petkim Petrokimya Holding AS | | | 1,696,103 | | | | 1,611,787 | |
| | |
Selcuk Ecza Deposu Ticaret ve Sanayi AS | | | 243,000 | | | | 127,972 | |
| | |
Soda Sanayii AS | | | 166,303 | | | | 223,119 | |
| | |
TAV Havalimanlari Holding AS | | | 212,009 | | | | 957,440 | |
| | |
Tekfen Holding AS | | | 152,291 | | | | 594,837 | |
| | |
Tofas Turk Otomobil Fabrikasi AS | | | 469,986 | | | | 1,500,200 | |
| | |
Trakya Cam Sanayii AS | | | 904,783 | | | | 517,618 | |
| | |
Tupras-Turkiye Petrol Rafinerileri AS | | | 427,218 | | | | 9,411,304 | |
| | |
Turk Hava Yollari AO(1) | | | 748,507 | | | | 2,271,666 | |
| | |
Turk Sise ve Cam Fabrikalari AS | | | 401,274 | | | | 429,729 | |
| | |
Turk Telekomunikasyon AS(1) | | | 2,183,657 | | | | 1,607,138 | |
| | |
Turkcell Iletisim Hizmetleri AS | | | 3,847,629 | | | | 8,823,101 | |
| | |
Turkcell Iletisim Hizmetleri AS ADR | | | 2,894 | | | | 16,264 | |
| | |
Turkiye Garanti Bankasi AS | | | 1,637,600 | | | | 2,454,559 | |
| | |
Turkiye Halk Bankasi AS | | | 540,082 | | | | 713,698 | |
| | |
Turkiye Is Bankasi AS, Class C | | | 1,157,493 | | | | 987,853 | |
| | |
Turkiye Sinai Kalkinma Bankasi AS | | | 1,676,550 | | | | 256,041 | |
| | |
Turkiye Vakiflar Bankasi TAO, Class D | | | 905,498 | | | | 664,923 | |
| | |
Ulker Biskuvi Sanayi AS | | | 357,929 | | | | 991,879 | |
| | |
Vestel Elektronik Sanayi ve Ticaret AS(1) | | | 573,007 | | | | 600,228 | |
| | | | |
| | 26 | | See Notes to Financial Statements. |
Parametric
Tax-Managed Emerging Markets Fund
December 31, 2018
Portfolio of Investments (Unaudited) — continued
| | | | | | | | |
| Security | | Shares | | | Value | |
| | |
| Turkey (continued) | | | | | | |
| | |
Yapi ve Kredi Bankasi AS(1) | | | 1,927,043 | | | $ | 581,862 | |
| | |
Yatas Yatak ve Yorgan Sanayi ve Ticaret AS(1) | | | 262,604 | | | | 221,949 | |
| | |
Zorlu Enerji Elektrik Uretim AS(1) | | | 3,437,974 | | | | 799,209 | |
| | |
| | | | | | | $ | 76,596,023 | |
| | |
| United Arab Emirates — 1.5% | | | | | | |
| | |
Abu Dhabi Commercial Bank PJSC | | | 2,035,444 | | | $ | 4,515,032 | |
| | |
Abu Dhabi National Hotels | | | 832,200 | | | | 663,997 | |
| | |
Agthia Group PJSC | | | 623,000 | | | | 839,524 | |
| | |
Air Arabia PJSC | | | 6,041,100 | | | | 1,677,637 | |
| | |
Al Waha Capital PJSC | | | 1,401,285 | | | | 764,826 | |
| | |
Aldar Properties PJSC | | | 3,816,500 | | | | 1,664,396 | |
| | |
Arabtec Holding PJSC | | | 1,822,819 | | | | 944,546 | |
| | |
Dana Gas PJSC | | | 3,612,782 | | | | 947,821 | |
| | |
DP World, Ltd. | | | 416,236 | | | | 7,111,123 | |
| | |
Dubai Financial Market PJSC | | | 1,713,500 | | | | 371,363 | |
| | |
Dubai Investments PJSC | | | 1,379,272 | | | | 472,783 | |
| | |
Dubai Islamic Bank PJSC | | | 1,037,500 | | | | 1,412,358 | |
| | |
Emaar Properties PJSC | | | 3,506,022 | | | | 3,941,557 | |
| | |
Emirates Telecommunications Group Co. PJSC | | | 676,655 | | | | 3,128,766 | |
| | |
First Abu Dhabi Bank PJSC | | | 2,246,889 | | | | 8,624,869 | |
| | |
National Central Cooling Co. (Tabreed) | | | 1,050,547 | | | | 494,813 | |
| | |
RAK Properties PJSC | | | 1,262,100 | | | | 169,750 | |
| | |
Ras Al Khaimah Co. for White Cement & Construction Materials PSC | | | 732,778 | | | | 198,670 | |
| | |
| | | | | | | $ | 37,943,831 | |
| | |
| Vietnam — 1.4% | | | | | | |
| | |
Bank for Foreign Trade of Vietnam JSC | | | 1,367,969 | | | $ | 3,167,768 | |
| | |
Bank for Investment and Development of Vietnam JSC(1) | | | 599,090 | | | | 895,425 | |
| | |
Bao Viet Holdings | | | 371,340 | | | | 1,427,737 | |
| | |
Danang Rubber JSC | | | 277,686 | | | | 257,936 | |
| | |
Development Investment Construction Corp.(1) | | | 624,775 | | | | 418,257 | |
| | |
FLC Faros Construction JSC(1) | | | 365,126 | | | | 610,292 | |
| | |
FPT Corp. | | | 2 | | | | 4 | |
| | |
Gemadept Corp. | | | 810,119 | | | | 915,995 | |
| | |
HAGL JSC(1) | | | 1,003,770 | | | | 211,747 | |
| | |
Hoa Phat Group JSC(1) | | | 4,228,193 | | | | 5,659,306 | |
| | |
KIDO Group Corp. | | | 387,216 | | | | 402,795 | |
| | |
Kinh Bac City Development Share Holding Corp.(1) | | | 590,200 | | | | 336,659 | |
| | |
Masan Group Corp.(1) | | | 644,430 | | | | 2,153,420 | |
| | |
PetroVietnam Drilling & Well Services JSC(1) | | | 824,017 | | | | 516,454 | |
| | |
PetroVietnam Fertilizer & Chemical JSC | | | 342,540 | | | | 329,483 | |
| | |
PetroVietnam Gas JSC | | | 537,240 | | | | 2,009,051 | |
| | |
PetroVietnam Technical Services Corp. | | | 705,772 | | | | 537,719 | |
| | | | | | | | |
| Security | | Shares | | | Value | |
| | |
| Vietnam (continued) | | | | | | |
| | |
Pha Lai Thermal Power JSC | | | 636,420 | | | $ | 497,808 | |
| | |
Saigon Securities, Inc. | | | 143,640 | | | | 165,381 | |
| | |
Song Da Urban & Industrial Zone Investment and Development JSC | | | 2 | | | | 2 | |
| | |
Tan Tao Investment & Industry JSC(1) | | | 2,064,767 | | | | 273,128 | |
| | |
Vietjet Aviation JSC | | | 268,574 | | | | 1,386,635 | |
| | |
Vietnam Construction and Import-Export JSC | | | 459,600 | | | | 447,396 | |
| | |
Vietnam Dairy Products JSC | | | 890,400 | | | | 4,618,353 | |
| | |
Vietnam Joint Stock Commercial Bank for Industry and Trade(1) | | | 684,823 | | | | 571,732 | |
| | |
Vietnam National Petroleum Group | | | 309,590 | | | | 706,785 | |
| | |
Vincom Retail JSC(1) | | | 170,213 | | | | 204,574 | |
| | |
Vingroup JSC(1) | | | 1,717,244 | | | | 7,067,101 | |
| | |
Vinh Son - Song Hinh Hydropower JSC | | | 750,120 | | | | 541,876 | |
| | |
| | | | | | | $ | 36,330,819 | |
| | |
Total Common Stocks
(identified cost $2,145,764,237) | | | | | | $ | 2,569,312,636 | |
| | |
| Rights(1) — 0.0%(6) | | | | | | | | |
| Security | | Shares | | | Value | |
| | |
Attijari Bank, Exp. 5/25/48 | | | 22 | | | $ | 0 | |
| | |
Banque Nationale Agricole, Exp. 6/20/48 | | | 5 | | | | 0 | |
| | |
Lafarge Africa PLC, Exp. 1/22/19 | | | 5,197,052 | | | | 1,430 | |
| | |
Marcopolo SA, Exp. 1/17/19 | | | 16,578 | | | | 3,678 | |
| | |
Societe D’Articles Hygieniques SA, Exp. 8/6/48 | | | 7 | | | | 0 | |
| | |
Societe D’Articles Hygieniques SA, Exp. 12/3/48 | | | 114,457 | | | | 21,443 | |
| | |
Total Rights
(identified cost $29,021) | | | | | | $ | 26,551 | |
| | |
| Warrants(1) — 0.0%(6) | | | | | | | | |
| Security | | Shares | | | Value | |
| | |
Datasonic Group Bhd, Exp. 7/5/23, Strike MYR 1.09 | | | 797,200 | | | $ | 14,468 | |
| | |
Total Warrants
(identified cost $0) | | | | | | $ | 14,468 | |
| | |
Total Investments — 99.7%
(identified cost $2,145,793,258) | | | | | | $ | 2,569,353,655 | |
| | |
Other Assets, Less Liabilities — 0.3% | | | | | | $ | 7,629,328 | |
| | |
Net Assets — 100.0% | | | | | | $ | 2,576,982,983 | |
The percentage shown for each investment category in the Portfolio of Investments is based on net assets.
| | | | |
| | 27 | | See Notes to Financial Statements. |
Parametric
Tax-Managed Emerging Markets Fund
December 31, 2018
Portfolio of Investments (Unaudited) — continued
| (1) | Non-income producing security. |
| (2) | Security exempt from registration pursuant to Rule 144A under the Securities Act of 1933, as amended. These securities may be sold in certain transactions in reliance on an exemption from registration (normally to qualified institutional buyers). At December 31, 2018, the aggregate value of these securities is $8,834,544 or 0.3% of the Fund’s net assets. |
| (3) | For fair value measurement disclosure purposes, security is categorized as Level 3 (see Note 8). |
| (4) | Security exempt from registration under Regulation S of the Securities Act of 1933, which exempts from registration securities offered and sold outside the United States. Security may not be offered or sold in the United States except pursuant to an exemption from, or in a transaction not subject to, the registration requirements of the Securities Act of 1933. At December 31, 2018, the aggregate value of these securities is $46,992,504 or 1.8% of the Fund’s net assets. |
| (5) | Securities are traded on separate exchanges for the same entity. |
| (6) | Amount is less than 0.05%. |
| (7) | Indicates a foreign registered security. Shares issued to foreign investors in markets that have foreign ownership limits. |
| | | | | | | | |
| Currency Concentration of Portfolio | |
| Currency | | Percentage
of Net Assets | | | Value | |
| | |
Hong Kong Dollar | | | 9.7 | % | | $ | 248,643,701 | |
| | |
United States Dollar | | | 8.8 | | | | 226,683,543 | |
| | |
South African Rand | | | 7.3 | | | | 189,233,719 | |
| | |
New Taiwan Dollar | | | 5.9 | | | | 153,347,586 | |
| | |
South Korean Won | | | 5.8 | | | | 149,131,057 | |
| | |
Indian Rupee | | | 5.8 | | | | 148,956,265 | |
| | |
Brazilian Real | | | 5.6 | | | | 144,968,557 | |
| | |
Mexican Peso | | | 5.4 | | | | 140,005,239 | |
| | |
Polish Zloty | | | 3.0 | | | | 77,557,848 | |
| | |
New Turkish Lira | | | 3.0 | | | | 76,579,759 | |
| | |
Indonesian Rupiah | | | 3.0 | | | | 76,099,834 | |
| | |
Philippine Peso | | | 2.9 | | | | 75,489,974 | |
| | |
Malaysian Ringgit | | | 2.9 | | | | 74,156,423 | |
| | |
Thai Baht | | | 2.8 | | | | 72,981,714 | |
| | |
Euro | | | 2.6 | | | | 66,645,163 | |
| | |
Chilean Peso | | | 2.2 | | | | 57,399,906 | |
| | |
Kuwaiti Dinar | | | 2.0 | | | | 51,509,013 | |
| | |
Russian Ruble | | | 1.9 | | | | 47,701,693 | |
| | |
Chinese Yuan Renminbi | | | 1.5 | | | | 37,570,713 | |
| | |
United Arab Emirates Dirham | | | 1.4 | | | | 37,232,448 | |
| | |
Qatari Riyal | | | 1.4 | | | | 37,007,270 | |
| | |
Vietnamese Dong | | | 1.4 | | | | 36,330,819 | |
| | |
Colombian Peso | | | 1.1 | | | | 27,183,336 | |
| | |
Other currency, less than 1% each | | | 12.3 | | | | 316,938,075 | |
| | |
Total Investments | | | 99.7 | % | | $ | 2,569,353,655 | |
| | | | | | | | |
| Sector Classification of Portfolio | |
| Sector | | Percentage
of Net Assets | | | Value | |
| | |
Financials | | | 20.3 | % | | $ | 522,668,356 | |
| | |
Communication Services | | | 11.8 | | | | 303,418,751 | |
| | |
Materials | | | 11.4 | | | | 294,153,189 | |
| | |
Consumer Staples | | | 10.3 | | | | 264,607,909 | |
| | |
Industrials | | | 9.9 | | | | 254,175,497 | |
| | |
Energy | | | 9.1 | | | | 235,070,552 | |
| | |
Consumer Discretionary | | | 7.6 | | | | 195,530,922 | |
| | |
Utilities | | | 6.4 | | | | 164,607,635 | |
| | |
Real Estate | | | 4.5 | | | | 116,197,706 | |
| | |
Health Care | | | 4.3 | | | | 111,685,073 | |
| | |
Information Technology | | | 4.1 | | | | 107,238,065 | |
| | |
Total Investments | | | 99.7 | % | | $ | 2,569,353,655 | |
Abbreviations:
| | | | |
| | |
| ADR | | – | | American Depositary Receipt |
| | |
| GDR | | – | | Global Depositary Receipt |
| | |
| PCL | | – | | Public Company Ltd. |
| | |
| PFC Shares | | – | | Preference Shares |
Currency Abbreviations:
| | | | |
| | 28 | | See Notes to Financial Statements. |
Parametric
Tax-Managed Emerging Markets Fund
December 31, 2018
Statement of Assets and Liabilities (Unaudited)
| | | | |
| Assets | | December 31, 2018 | |
| |
Unaffiliated investments, at value (identified cost, $2,145,793,258) | | $ | 2,569,353,655 | |
| |
Cash | | | 204,242 | |
| |
Foreign currency, at value (identified cost, $5,627,571) | | | 5,602,022 | |
| |
Dividends receivable | | | 5,020,991 | |
| |
Receivable for investments sold | | | 22,091,932 | |
| |
Receivable for Fund shares sold | | | 3,864,557 | |
| |
Tax reclaims receivable | | | 200,383 | |
| |
Total assets | | $ | 2,606,337,782 | |
| |
| Liabilities | | | | |
| |
Demand note payable | | $ | 15,000,000 | |
| |
Payable for investments purchased | | | 336,721 | |
| |
Payable for Fund shares redeemed | | | 8,916,331 | |
| |
Payable to affiliates: | | | | |
| |
Investment adviser fee | | | 1,027,654 | |
| |
Administration fee | | | 1,141,838 | |
| |
Accrued foreign capital gains taxes | | | 2,871,955 | |
| |
Accrued expenses | | | 60,300 | |
| |
Total liabilities | | $ | 29,354,799 | |
| |
Net Assets | | $ | 2,576,982,983 | |
| |
| Sources of Net Assets | | | | |
| |
Paid-in capital | | $ | 2,267,418,022 | |
| |
Distributable earnings | | | 309,564,961 | |
| |
Total | | $ | 2,576,982,983 | |
| |
| Institutional Class Shares | | | | |
| |
Net Assets | | $ | 2,576,982,983 | |
| |
Shares Outstanding | | | 58,070,478 | |
| |
Net Asset Value, Offering Price and Redemption Price Per Share | | | | |
| |
(net assets ÷ shares of beneficial interest outstanding) | | $ | 44.38 | |
| | | | |
| | 29 | | See Notes to Financial Statements. |
Parametric
Tax-Managed Emerging Markets Fund
December 31, 2018
Statement of Operations (Unaudited)
| | | | |
| Investment Income | | Six Months Ended December 31, 2018 | |
| |
Dividends (net of foreign taxes, $6,454,219) | | $ | 41,788,368 | |
| |
Interest | | | 15,562 | |
| |
Total investment income | | $ | 41,803,930 | |
| |
| Expenses | | | | |
| |
Investment adviser fee | | $ | 6,800,639 | |
| |
Administration fee | | | 7,556,266 | |
| |
Interest expense and fees | | | 105,001 | |
| |
Total expenses | | $ | 14,461,906 | |
| |
Net investment income | | $ | 27,342,024 | |
| |
| Realized and Unrealized Gain (Loss) | | | | |
| |
Net realized gain (loss) — | | | | |
| |
Investment transactions (net of foreign capital gains taxes of $271,615) | | $ | (56,020,442 | ) |
| |
Foreign currency transactions | | | (1,255,910 | ) |
| |
Net realized loss | | $ | (57,276,352 | ) |
| |
Change in unrealized appreciation (depreciation) — | | | | |
| |
Investments (including net decrease in accrued foreign capital gains taxes of $283,083) | | $ | (172,124,970 | ) |
| |
Foreign currency | | | 117,594 | |
| |
Net change in unrealized appreciation (depreciation) | | $ | (172,007,376 | ) |
| |
Net realized and unrealized loss | | $ | (229,283,728 | ) |
| |
Net decrease in net assets from operations | | $ | (201,941,704 | ) |
| | | | |
| | 30 | | See Notes to Financial Statements. |
Parametric
Tax-Managed Emerging Markets Fund
December 31, 2018
Statements of Changes in Net Assets
| | | | | | | | |
| Increase (Decrease) in Net Assets | | Six Months Ended December 31, 2018
(Unaudited) | | | Year Ended June 30, 2018 | |
| | |
From operations — | | | | | | | | |
| | |
Net investment income | | $ | 27,342,024 | | | $ | 67,340,381 | |
| | |
Net realized gain (loss) | | | (57,276,352 | ) | | | 62,629,778 | |
| | |
Net change in unrealized appreciation (depreciation) | | | (172,007,376 | ) | | | 11,032,052 | |
| | |
Net increase (decrease) in net assets from operations | | $ | (201,941,704 | ) | | $ | 141,002,211 | |
| | |
Distributions to shareholders(1) — | | | | | | | | |
| | |
Institutional Class | | $ | (57,500,535 | ) | | $ | (64,914,501 | ) |
| | |
Distributions to shareholders | | $ | (57,500,535 | ) | | $ | (64,914,501 | ) |
| | |
Transactions in shares of beneficial interest — | | | | | | | | |
| | |
Proceeds from sale of shares | | $ | 118,288,969 | | | $ | 384,045,332 | |
| | |
Net asset value of shares issued to shareholders in payment of distributions declared | | | 51,412,970 | | | | 59,165,671 | |
| | |
Cost of shares redeemed | | | (591,049,762 | ) | | | (672,980,908 | ) |
| | |
Redemption fees | | | — | | | | 756,888 | |
| | |
Net decrease in net assets from Fund share transactions | | $ | (421,347,823 | ) | | $ | (229,013,017 | ) |
| | |
Net decrease in net assets | | $ | (680,790,062 | ) | | $ | (152,925,307 | ) |
| | |
| Net Assets | | | | | | | | |
| | |
At beginning of period | | $ | 3,257,773,045 | | | $ | 3,410,698,352 | |
| | |
At end of period | | $ | 2,576,982,983 | | | $ | 3,257,773,045 | (2) |
| (1) | For the year ended June 30, 2018, the source of distributions was from net investment income. The current period presentation of distributions conforms with the Disclosure Update and Simplification Rule issued by the Securities and Exchange Commission, effective November 5, 2018. |
| (2) | Includes accumulated distributions in excess of net investment income of $(114,522) at June 30, 2018. The requirement to disclose the corresponding amount as of December 31, 2018 was eliminated. |
| | | | |
| | 31 | | See Notes to Financial Statements. |
Parametric
Tax-Managed Emerging Markets Fund
December 31, 2018
Financial Highlights
| | | | | | | | | | | | | | | | | | | | | | | | |
| | | Institutional Class | |
| | |
| | | Six Months Ended
December 31, 2018
(Unaudited) | | | Year Ended June 30, | |
| | | 2018 | | | 2017 | | | 2016 | | | 2015 | | | 2014 | |
| | | | | | | |
Net asset value — Beginning of period | | $ | 48.590 | | | $ | 47.740 | | | $ | 41.370 | | | $ | 46.230 | | | $ | 52.430 | | | $ | 45.870 | |
| | | | | | |
| Income (Loss) From Operations | | | | | | | | | | | | | | | | | | | | | | | | |
| | | | | | |
Net investment income(1) | | $ | 0.431 | | | $ | 0.967 | | | $ | 0.777 | | | $ | 0.799 | | | $ | 0.838 | | | $ | 0.805 | |
| | | | | | |
Net realized and unrealized gain (loss) | | | (3.639 | ) | | | 0.811 | | | | 6.232 | | | | (5.019 | ) | | | (6.134 | ) | | | 6.518 | |
| | | | | | |
Total income (loss) from operations | | $ | (3.208 | ) | | $ | 1.778 | | | $ | 7.009 | | | $ | (4.220 | ) | | $ | (5.296 | ) | | $ | 7.323 | |
| | | | | | |
| Less Distributions | | | | | | | | | | | | | | | | | | | | | | | | |
| | | | | | |
From net investment income | | $ | (1.002 | ) | | $ | (0.939 | ) | | $ | (0.699 | ) | | $ | (0.802 | ) | | $ | (0.981 | ) | | $ | (0.854 | ) |
| | | | | | |
Total distributions | | $ | (1.002 | ) | | $ | (0.939 | ) | | $ | (0.699 | ) | | $ | (0.802 | ) | | $ | (0.981 | ) | | $ | (0.854 | ) |
| | | | | | |
Redemption fees(1)(2) | | $ | — | | | $ | 0.011 | | | $ | 0.060 | | | $ | 0.162 | | | $ | 0.077 | | | $ | 0.091 | |
| | | | | | |
Net asset value — End of period | | $ | 44.380 | | | $ | 48.590 | | | $ | 47.740 | | | $ | 41.370 | | | $ | 46.230 | | | $ | 52.430 | |
| | | | | | |
Total Return(3) | | | (6.59 | )%(4) | | | 3.63 | % | | | 17.34 | % | | | (8.64 | )% | | | (9.93 | )% | | | 16.30 | % |
| | | | | | |
| Ratios/Supplemental Data | | | | | | | | | | | | | | | | | | | | | | | | |
| | | | | | |
Net assets, end of period (000’s omitted) | | $ | 2,576,983 | | | $ | 3,257,773 | | | $ | 3,410,698 | | | $ | 2,850,969 | | | $ | 3,697,968 | | | $ | 3,886,328 | |
| | | | | | |
Ratios (as a percentage of average daily net assets): | | | | | | | | | | | | | | | | | | | | | | | | |
| | | | | | |
Expenses | | | 0.96 | %(5)(6) | | | 0.95 | % | | | 0.95 | % | | | 0.95 | % | | | 0.95 | % | | | 0.95 | % |
| | | | | | |
Net investment income | | | 1.81 | %(5) | | | 1.86 | % | | | 1.75 | % | | | 1.99 | % | | | 1.71 | % | | | 1.65 | % |
| | | | | | |
Portfolio Turnover | | | 2 | %(4) | | | 6 | % | | | 8 | % | | | 2 | % | | | 10 | % | | | 6 | % |
| (1) | Computed using average shares outstanding. |
| (2) | Redemption fees were discontinued as of September 1, 2016. |
| (3) | Returns are historical and are calculated by determining the percentage change in net asset value with all distributions reinvested. |
| (6) | Includes interest expense of 0.01%. |
| | | | |
| | 32 | | See Notes to Financial Statements. |
Parametric
Tax-Managed Emerging Markets Fund
December 31, 2018
Notes to Financial Statements (Unaudited)
1 Significant Accounting Policies
Parametric Tax-Managed Emerging Markets Fund (the Fund) is a diversified series of Eaton Vance Series Trust II (the Trust). The Trust is a Massachusetts business trust registered under the Investment Company Act of 1940, as amended (the 1940 Act), as an open-end management investment company. The Fund’s investment objective is to seek long-term, after-tax returns for its shareholders. The Fund offers Institutional Class shares, which are sold at net asset value and are not subject to a sales charge.
The following is a summary of significant accounting policies of the Fund. The policies are in conformity with accounting principles generally accepted in the United States of America (U.S. GAAP). The Fund is an investment company and follows accounting and reporting guidance in the Financial Accounting Standards Board (FASB) Accounting Standards Codification Topic 946.
A Investment Valuation — The following methodologies are used to determine the market value or fair value of investments.
Equity Securities.Equity securities listed on a U.S. securities exchange generally are valued at the last sale or closing price on the day of valuation or, if no sales took place on such date, at the mean between the closing bid and ask prices on the exchange where such securities are principally traded. Equity securities listed on the NASDAQ Global or Global Select Market generally are valued at the NASDAQ official closing price. Unlisted or listed securities for which closing sales prices or closing quotations are not available are valued at the mean between the latest available bid and ask prices.
Short-Term Debt Securities. Short-term debt securities with a remaining maturity at time of purchase of more than sixty days are valued on the basis of valuations provided by a third party pricing service. Short-term debt securities of sufficient credit quality purchased with remaining maturities of sixty days or less are valued at amortized cost, which approximates fair value.
Foreign Securities and Currencies.Foreign securities and currencies are valued in U.S. dollars, based on foreign currency exchange rate quotations supplied by a third party pricing service. The pricing service uses a proprietary model to determine the exchange rate. Inputs to the model include reported trades and implied bid/ask spreads. The daily valuation of exchange-traded foreign securities generally is determined as of the close of trading on the principal exchange on which such securities trade. Events occurring after the close of trading on foreign exchanges may result in adjustments to the valuation of foreign securities to more accurately reflect their fair value as of the close of regular trading on the New York Stock Exchange. When valuing foreign equity securities that meet certain criteria, the Fund’s Trustees have approved the use of a fair value service that values such securities to reflect market trading that occurs after the close of the applicable foreign markets of comparable securities or other instruments that have a strong correlation to the fair-valued securities.
Fair Valuation.Investments for which valuations or market quotations are not readily available or are deemed unreliable are valued at fair value using methods determined in good faith by or at the direction of the Trustees of the Fund in a manner that fairly reflects the security’s value, or the amount that the Fund might reasonably expect to receive for the security upon its current sale in the ordinary course. Each such determination is based on a consideration of relevant factors, which are likely to vary from one pricing context to another. These factors may include, but are not limited to, the type of security, the existence of any contractual restrictions on the security’s disposition, the price and extent of public trading in similar securities of the issuer or of comparable companies or entities, quotations or relevant information obtained from broker/dealers or other market participants, information obtained from the issuer, analysts, and/or the appropriate stock exchange (for exchange-traded securities), an analysis of the company’s or entity’s financial condition, and an evaluation of the forces that influence the issuer and the market(s) in which the security is purchased and sold.
B Investment Transactions — Investment transactions for financial statement purposes are accounted for on a trade date basis. Realized gains and losses on investments sold are determined on the basis of identified cost.
C Income — Dividend income is recorded on the ex-dividend date for dividends received in cash and/or securities. However, if the ex-dividend date has passed, certain dividends from foreign securities are recorded as the Fund is informed of the ex-dividend date. Withholding taxes on foreign dividends and capital gains have been provided for in accordance with the Fund’s understanding of the applicable countries’ tax rules and rates. In consideration of recent decisions rendered by European courts, the Fund has filed additional tax reclaims for previously withheld taxes on dividends earned in certain European Union countries. These filings are subject to various administrative and judicial proceedings within these countries. Due to the uncertainty as to the ultimate resolution of these proceedings, the likelihood of receipt of these reclaims, and the potential timing of payment, no amounts are reflected in the financial statements for such outstanding reclaims. Interest income is recorded on the basis of interest accrued, adjusted for amortization of premium or accretion of discount.
D Federal and Other Taxes — The Fund’s policy is to comply with the provisions of the Internal Revenue Code applicable to regulated investment companies and to distribute to shareholders each year substantially all of its net investment income, and all or substantially all of its net realized capital gains. Accordingly, no provision for federal income or excise tax is necessary.
In addition to the requirements of the Internal Revenue Code, the Fund may also be subject to local taxes on the recognition of capital gains in certain countries. In determining the daily net asset value, the Fund estimates the accrual for such taxes, if any, based on the unrealized appreciation on certain portfolio securities and the related tax rates. Taxes attributable to unrealized appreciation are included in the change in unrealized appreciation (depreciation) on investments. Capital gains taxes on securities sold are included in net realized gain (loss) on investments.
Parametric
Tax-Managed Emerging Markets Fund
December 31, 2018
Notes to Financial Statements (Unaudited) — continued
As of December 31, 2018, the Fund had no uncertain tax positions that would require financial statement recognition, de-recognition, or disclosure. The Fund files a U.S. federal income tax return annually after its fiscal year-end, which is subject to examination by the Internal Revenue Service for a period of three years from the date of filing.
E Expenses — The majority of expenses of the Trust are directly identifiable to an individual fund. Expenses which are not readily identifiable to a specific fund are allocated taking into consideration, among other things, the nature and type of expense and the relative size of the funds.
F Foreign Currency Translation — Investment valuations, other assets, and liabilities initially expressed in foreign currencies are translated each business day into U.S. dollars based upon current exchange rates. Purchases and sales of foreign investment securities and income and expenses denominated in foreign currencies are translated into U.S. dollars based upon currency exchange rates in effect on the respective dates of such transactions. Recognized gains or losses on investment transactions attributable to changes in foreign currency exchange rates are recorded for financial statement purposes as net realized gains and losses on investments. That portion of unrealized gains and losses on investments that results from fluctuations in foreign currency exchange rates is not separately disclosed.
G Use of Estimates — The preparation of the financial statements in conformity with U.S. GAAP requires management to make estimates and assumptions that affect the reported amounts of assets and liabilities at the date of the financial statements and the reported amounts of income and expense during the reporting period. Actual results could differ from those estimates.
H Indemnifications — Under the Trust’s organizational documents, its officers and Trustees may be indemnified against certain liabilities and expenses arising out of the performance of their duties to the Fund. Under Massachusetts law, if certain conditions prevail, shareholders of a Massachusetts business trust (such as the Trust) could be deemed to have personal liability for the obligations of the Trust. However, the Trust’s Declaration of Trust contains an express disclaimer of liability on the part of Fund shareholders and the By-laws provide that the Trust shall assume the defense on behalf of any Fund shareholders. Moreover, the By-laws also provide for indemnification out of Fund property of any shareholder held personally liable solely by reason of being or having been a shareholder for all loss or expense arising from such liability. Additionally, in the normal course of business, the Fund enters into agreements with service providers that may contain indemnification clauses. The Fund’s maximum exposure under these arrangements is unknown as this would involve future claims that may be made against the Fund that have not yet occurred.
I Redemption Fees — Fund shares acquired on or after April 1, 2005 were subject to a redemption fee, at the time of exchange or redemption, equal to 2% of the net asset value of the shares exchanged or redeemed. Fund shares purchased prior to April 1, 2005 were subject to a redemption fee equal to 1% of the net asset value of the shares exchanged or redeemed, and were subject to a purchase fee of 1% of the net asset value of the shares purchased at the time they were purchased. Shares acquired on or before June 30, 1998 were not subject to a redemption fee. The redemption fee was accounted for as an addition to paid-in capital. Effective September 1, 2016, Fund shares are no longer subject to a redemption fee.
J Interim Financial Statements — The interim financial statements relating to December 31, 2018 and for the six months then ended have not been audited by an independent registered public accounting firm, but in the opinion of the Fund’s management, reflect all adjustments, consisting only of normal recurring adjustments, necessary for the fair presentation of the financial statements.
2 Distributions to Shareholders and Income Tax Information
It is the present policy of the Fund to make at least one distribution annually (normally in December) of all or substantially all of its net investment income and to distribute annually all or substantially all of its net realized capital gains. Distributions to shareholders are recorded on the ex-dividend date. Shareholders may reinvest income and capital gain distributions in additional shares of the Fund at the net asset value as of the ex-dividend date or, at the election of the shareholder, receive distributions in cash. Distributions to shareholders are determined in accordance with income tax regulations, which may differ from U.S. GAAP. As required by U.S. GAAP, only distributions in excess of tax basis earnings and profits are reported in the financial statements as a return of capital. Permanent differences between book and tax accounting relating to distributions are reclassified to paid-in capital. For tax purposes, distributions from short-term capital gains are considered to be from ordinary income.
At June 30, 2018, the Fund, for federal income tax purposes, had deferred capital losses of $20,119,829 which would reduce its taxable income arising from future net realized gains on investment transactions, if any, to the extent permitted by the Internal Revenue Code, and thus would reduce the amount of distributions to shareholders, which would otherwise be necessary to relieve the Fund of any liability for federal income or excise tax. The deferred capital losses are treated as arising on the first day of the Fund’s next taxable year and retain the same short-term or long-term character as when originally deferred. Of the deferred capital losses at June 30, 2018, $8,424,903 are short-term and $11,694,926 are long-term.
Parametric
Tax-Managed Emerging Markets Fund
December 31, 2018
Notes to Financial Statements (Unaudited) — continued
The cost and unrealized appreciation (depreciation) of investments of the Fund at December 31, 2018, as determined on a federal income tax basis, were as follows:
| | | | |
| |
Aggregate cost | | $ | 2,182,157,543 | |
| |
Gross unrealized appreciation | | $ | 778,691,031 | |
| |
Gross unrealized depreciation | | | (391,494,919 | ) |
| |
Net unrealized appreciation | | $ | 387,196,112 | |
3 Investment Adviser Fee and Other Transactions with Affiliates
The investment adviser fee is earned by Eaton Vance Management (EVM) as compensation for management and investment advisory services rendered to the Fund. The fee is computed at an annual rate of 0.45% of the Fund’s average daily net assets and is payable monthly. For the six months ended December 31, 2018, the investment adviser fee amounted to $6,800,639. Pursuant to a sub-advisory agreement, EVM has delegated the investment management of the Fund to Parametric Portfolio Associates LLC (Parametric), a majority-owned subsidiary of Eaton Vance Corp. EVM pays Parametric a portion of its investment adviser fee for sub-advisory services provided to the Fund. The administration fee is earned by EVM for administering the business affairs of the Fund and is computed at an annual rate of 0.50% of the Fund’s average daily net assets. For the six months ended December 31, 2018, the administration fee amounted to $7,556,266. Pursuant to a sub-administrative services agreement with Parametric, EVM pays Parametric a portion of its administration fee for sub-administrative services provided to the Fund. EVM also pays all ordinary operating expenses of the Fund (excluding the investment adviser and administration fees). EVM serves as the sub-transfer agent of the Fund, at no additional cost to the Fund.
EVM identified certain shareholder redemption transactions for which redemption fees, which were discontinued effective September 1, 2016, were inadvertently not charged that related to the year ended June 30, 2017 and prior years. Redemption fees identified during the year ended June 30, 2018 aggregated $756,888, which were paid to the Fund by EVM. Such payment has been included in redemption fees in the Statements of Changes in Net Assets.
Trustees and officers of the Fund who are members of EVM’s organization receive remuneration for their services to the Fund out of the investment adviser fee. Trustees of the Fund who are not affiliated with EVM may elect to defer receipt of all or a percentage of their annual fees in accordance with the terms of the Trustees Deferred Compensation Plan. For the six months ended December 31, 2018, no significant amounts have been deferred. Trustees’ fees incurred by the Fund are paid by EVM. Certain officers and Trustees of the Fund are officers of EVM.
4 Purchases and Sales of Investments
Purchases and sales of investments, other than short-term obligations, aggregated $72,755,949 and $518,294,709, respectively, for the six months ended December 31, 2018.
5 Shares of Beneficial Interest
The Fund’s Declaration of Trust permits the Trustees to issue an unlimited number of full and fractional shares of beneficial interest (without par value). Transactions in Fund shares were as follows:
| | | | | | | | |
| | | Six Months Ended
December 31, 2018
(Unaudited) | | | Year Ended
June 30, 2018 | |
| | |
Sales | | | 2,541,431 | | | | 7,355,274 | |
| | |
Issued to shareholders electing to receive payments of distributions in Fund shares | | | 1,166,885 | | | | 1,143,077 | |
| | |
Redemptions | | | (12,684,956 | ) | | | (12,887,177 | ) |
| | |
Net decrease | | | (8,976,640 | ) | | | (4,388,826 | ) |
For the year ended June 30, 2018, the Fund received $756,888 in redemption fees (see Note 3).
6 Line of Credit
The Fund participates with other portfolios and funds managed by EVM and its affiliates in a $625 million unsecured line of credit agreement with a group of banks, which is in effect through October 29, 2019. Borrowings are made by the Fund solely to facilitate the handling of unusual and/or unanticipated
Parametric
Tax-Managed Emerging Markets Fund
December 31, 2018
Notes to Financial Statements (Unaudited) — continued
short-term cash requirements. Interest is charged to the Fund based on its borrowings at an amount above either the Eurodollar rate or Federal Funds rate. In addition, a fee computed at an annual rate of 0.15% on the daily unused portion of the line of credit is allocated among the participating portfolios and funds at the end of each quarter. Because the line of credit is not available exclusively to the Fund, it may be unable to borrow some or all of its requested amounts at any particular time. At December 31, 2018, the Fund had a balance outstanding pursuant to this line of credit of $15,000,000 at an interest rate of 3.40%. Based on the short-term nature of the borrowings under the line of credit and variable interest rate, the carrying value of the borrowings approximated its fair value at December 31, 2018. If measured at fair value, borrowings under the line of credit would have been considered as Level 2 in the fair value hierarchy (see Note 8) at December 31, 2018. Average borrowings and the average annual interest rate (excluding fees) for the six months ended December 31, 2018 were $4,638,000 and 3.27%, respectively.
7 Risks Associated with Foreign Investments
Investing in securities issued by companies whose principal business activities are outside the United States may involve significant risks not present in domestic investments. For example, there is generally less publicly available information about foreign companies, particularly those not subject to the disclosure and reporting requirements of the U.S. securities laws. Certain foreign issuers are generally not bound by uniform accounting, auditing, and financial reporting requirements and standards of practice comparable to those applicable to domestic issuers. Investments in foreign securities also involve the risk of possible adverse changes in investment or exchange control regulations, expropriation or confiscatory taxation, limitation on the removal of funds or other assets of a Fund, political or financial instability or diplomatic and other developments which could affect such investments. Foreign securities markets, while growing in volume and sophistication, are generally not as developed as those in the United States, and securities of some foreign issuers (particularly those located in developing countries) may be less liquid and more volatile than securities of comparable U.S. companies. In general, there is less overall governmental supervision and regulation of foreign securities markets, broker/dealers and issuers than in the United States. The foregoing risks of foreign investing can be more significant in less developed countries characterized as emerging market countries.
8 Fair Value Measurements
Under generally accepted accounting principles for fair value measurements, a three-tier hierarchy to prioritize the assumptions, referred to as inputs, is used in valuation techniques to measure fair value. The three-tier hierarchy of inputs is summarized in the three broad levels listed below.
| • | | Level 1 – quoted prices in active markets for identical investments |
| • | | Level 2 – other significant observable inputs (including quoted prices for similar investments, interest rates, prepayment speeds, credit risk, etc.) |
| • | | Level 3 – significant unobservable inputs (including a fund’s own assumptions in determining the fair value of investments) |
In cases where the inputs used to measure fair value fall in different levels of the fair value hierarchy, the level disclosed is determined based on the lowest level input that is significant to the fair value measurement in its entirety. The inputs or methodology used for valuing securities are not necessarily an indication of the risk associated with investing in those securities.
At December 31, 2018, the hierarchy of inputs used in valuing the Funds’ investments, which are carried at value, were as follows:
| | | | | | | | | | | | | | | | |
| Asset Description | | Level 1 | | | Level 2 | | | Level 3* | | | Total | |
| | | | |
Common Stocks | | | | | | | | | | | | | | | | |
| | | | |
Asia/Pacific | | $ | 18,253,417 | | | $ | 1,157,221,143 | | | $ | 30,601 | | | $ | 1,175,505,161 | |
| | | | |
Emerging Europe | | | 17,660,270 | | | | 433,127,988 | | | | 0 | | | | 450,788,258 | |
| | | | |
Latin America | | | 466,517,066 | | | | 1,194,015 | | | | 174,004 | | | | 467,885,085 | |
| | | | |
Middle East/Africa | | | 5,094,731 | | | | 469,669,151 | | | | 370,250 | | | | 475,134,132 | |
| | | | |
Total Common Stocks | | $ | 507,525,484 | | | $ | 2,061,212,297 | ** | | $ | 574,855 | | | $ | 2,569,312,636 | |
| | | | |
Rights | | $ | 25,121 | | | $ | 1,430 | | | $ | — | | | $ | 26,551 | |
| | | | |
Warrants | | | 14,468 | | | | — | | | | — | | | | 14,468 | |
| | | | |
Total Investments | | $ | 507,565,073 | | | $ | 2,061,213,727 | | | $ | 574,855 | | | $ | 2,569,353,655 | |
| * | None of the unobservable inputs for Level 3 assets, individually or collectively, had a material impact on the Fund. |
| ** | Includes foreign equity securities whose values were adjusted to reflect market trading of comparable securities or other correlated instruments that occurred after the close of trading in their applicable foreign markets. |
Level 3 investments at the beginning and/or end of the period in relation to net assets were not significant and accordingly, a reconciliation of Level 3 assets for the six months ended December 31, 2018 is not presented.
Parametric
Tax-Managed Emerging Markets Fund
December 31, 2018
Special Meeting of Shareholders (Unaudited)
The Fund held a Special Meeting of Shareholders on September 20, 2018 to elect the five Trustees listed below. The other Trustees named herein continue to serve as Trustees. The results of the vote with respect to the Fund were as follows:
| | | | | | | | |
| | | Number of Shares | |
| Nominee for Trustee | | For | | | Withheld | |
| | |
Mark R. Fetting | | | 36,704,985 | | | | 2,172,136 | |
| | |
Keith Quinton | | | 36,706,694 | | | | 2,170,428 | |
| | |
Marcus L. Smith | | | 36,341,683 | | | | 2,535,439 | |
| | |
Susan J. Sutherland | | | 36,705,727 | | | | 2,171,394 | |
| | |
Scott E. Wennerholm | | | 36,704,353 | | | | 2,172,768 | |
Results are rounded to the nearest whole number.
Parametric
Tax-Managed Emerging Markets Fund
December 31, 2018
Officers and Trustees
Officers of Parametric Tax-Managed Emerging Markets Fund
Payson F. Swaffield
President
Maureen A. Gemma
Vice President, Secretary and Chief Legal Officer
James F. Kirchner
Treasurer
Richard F. Froio
Chief Compliance Officer
Trustees of Parametric Tax-Managed Emerging Markets Fund
William H. Park
Chairperson
Thomas E. Faust Jr.*
Mark R. Fetting
Cynthia E. Frost
George J. Gorman
Valerie A. Mosley
Helen Frame Peters
Keith Quinton(1)
Marcus L. Smith(1)
Susan J. Sutherland
Scott E. Wennerholm
| (1) | Messrs. Quinton and Smith began serving as Trustees effective October 1, 2018. |
Eaton Vance Funds
IMPORTANT NOTICES
Privacy. The Eaton Vance organization is committed to ensuring your financial privacy. Each of the financial institutions identified below has in effect the following policy (“Privacy Policy”) with respect to nonpublic personal information about its customers:
| • | | Only such information received from you, through application forms or otherwise, and information about your Eaton Vance fund transactions will be collected. This may include information such as name, address, social security number, tax status, account balances and transactions. |
| • | | None of such information about you (or former customers) will be disclosed to anyone, except as permitted by law (which includes disclosure to employees necessary to service your account). In the normal course of servicing a customer’s account, Eaton Vance may share information with unaffiliated third parties that perform various required services such as transfer agents, custodians and broker-dealers. |
| • | | Policies and procedures (including physical, electronic and procedural safeguards) are in place that are designed to protect the confidentiality of such information. |
| • | | We reserve the right to change our Privacy Policy at any time upon proper notification to you. Customers may want to review our Privacy Policy periodically for changes by accessing the link on our homepage: www.eatonvance.com. |
Our pledge of privacy applies to the following entities within the Eaton Vance organization: the Eaton Vance Family of Funds, Eaton Vance Management, Eaton Vance Investment Counsel, Eaton Vance Distributors, Inc., Eaton Vance Trust Company, Eaton Vance Management (International) Limited, Eaton Vance Advisers International Ltd., Eaton Vance Management’s Real Estate Investment Group and Boston Management and Research. In addition, our Privacy Policy applies only to those Eaton Vance customers who are individuals and who have a direct relationship with us. If a customer’s account (i.e., fund shares) is held in the name of a third-party financial advisor/broker-dealer, it is likely that only such advisor’s privacy policies apply to the customer. This notice supersedes all previously issued privacy disclosures. For more information about Eaton Vance’s Privacy Policy, please call 1-800-262-1122.
Delivery of Shareholder Documents. The Securities and Exchange Commission (SEC) permits funds to deliver only one copy of shareholder documents, including prospectuses, proxy statements and shareholder reports, to fund investors with multiple accounts at the same residential or post office box address. This practice is often called “householding” and it helps eliminate duplicate mailings to shareholders.Eaton Vance, or your financial advisor, may household the mailing of your documents indefinitely unless you instruct Eaton Vance, or your financial advisor, otherwise.If you would prefer that your Eaton Vance documents not be householded, please contact Eaton Vance at 1-800-260-0761, or contact your financial advisor. Your instructions that householding not apply to delivery of your Eaton Vance documents will typically be effective within 30 days of receipt by Eaton Vance or your financial advisor.
Portfolio Holdings. Each Eaton Vance Fund and its underlying Portfolio(s) (if applicable) will file a schedule of portfolio holdings on Form N-Q with the SEC for the first and third quarters of each fiscal year. The Form N-Q will be available on the Eaton Vance website at www.eatonvance.com, by calling Eaton Vance at 1-800-260-0761 or in the EDGAR database on the SEC’s website at www.sec.gov. Form N-Q may also be reviewed and copied at the SEC’s public reference room in Washington, D.C. (call 1-800-732-0330 for information on the operation of the public reference room).
Proxy Voting. From time to time, funds are required to vote proxies related to the securities held by the funds. The Eaton Vance Funds or their underlying Portfolios (if applicable) vote proxies according to a set of policies and procedures approved by the Funds’ and Portfolios’ Boards. You may obtain a description of these policies and procedures and information on how the Funds or Portfolios voted proxies relating to portfolio securities during the most recent 12-month period ended June 30, without charge, upon request, by calling 1-800-260-0761 and by accessing the SEC’s website at www.sec.gov.
This Page Intentionally Left Blank
Investment Adviser and Administrator
Eaton Vance Management
Two International Place
Boston, MA 02110
Sub-Adviser
Parametric Portfolio Associates LLC
1918 Eighth Avenue, Suite 3100
Seattle, WA 98101
Principal Underwriter*
Eaton Vance Distributors, Inc.
Two International Place
Boston, MA 02110
(617) 482-8260
Custodian
State Street Bank and Trust Company
State Street Financial Center, One Lincoln Street
Boston, MA 02111
Transfer Agent
BNY Mellon Investment Servicing (US) Inc.
Attn: Eaton Vance Funds
P.O. Box 9653
Providence, RI 02940-9653
(800) 260-0761
Fund Offices
Two International Place
Boston, MA 02110
| * | FINRA BrokerCheck. Investors may check the background of their Investment Professional by contacting the Financial Industry Regulatory Authority (FINRA). FINRA BrokerCheck is a free tool to help investors check the professional background of current and former FINRA-registered securities firms and brokers. FINRA BrokerCheck is available by calling 1-800-289-9999 and at www.FINRA.org. The FINRA BrokerCheck brochure describing this program is available to investors at www.FINRA.org. |

7736 12.31.18
Item 2. Code of Ethics
Not required in this filing
Item 3. Audit Committee Financial Expert
Not required in this filing
Item 4. Principal Accountant Fees and Services
Not required in this filing
Item 5. Audit Committee of Listed Registrants
Not applicable.
Item 6. Schedule of Investments
Please see schedule of investments contained in the Report to Stockholders included under Item 1 of this FormN-CSR.
Item 7. Disclosure of Proxy Voting Policies and Procedures forClosed-End Management Investment Companies
Not applicable.
Item 8. Portfolio Managers ofClosed-End Management Investment Companies
Not applicable.
Item 9. Purchases of Equity Securities byClosed-End Management Investment Company and Affiliated Purchasers
Not applicable.
Item 10. Submission of Matters to a Vote of Security Holders
No material changes.
Item 11. Controls and Procedures
(a) It is the conclusion of the registrant’s principal executive officer and principal financial officer that the effectiveness of the registrant’s current disclosure controls and procedures (such disclosure controls and procedures having been evaluated within 90 days of the date of this filing) provide reasonable assurance that the information required to be disclosed by the registrant has been recorded, processed, summarized and reported within the time period specified in the Commission’s rules and forms and that the information required to be disclosed by the registrant has been accumulated and communicated to the registrant’s principal executive officer and principal financial officer in order to allow timely decisions regarding required disclosure.
(b) There have been no changes in the registrant’s internal controls over financial reporting during the second fiscal quarter of the period covered by this report that has materially affected, or is reasonably likely to materially affect, the registrant’s internal control over financial reporting.
Item 12. Disclosure of Securities Lending Activities forClosed-End Management Investment Companies
Not applicable.
Item 13. Exhibits
| (a)(1) | Registrant’s Code of Ethics – Not applicable (please see Item 2). |
| (a)(2)(i) | Treasurer’s Section 302 certification. |
| (a)(2)(ii) | President’s Section 302 certification. |
| (b) | Combined Section 906 certification. |
Signatures
Pursuant to the requirements of the Securities Exchange Act of 1934 and the Investment Company Act of 1940, the registrant has duly caused this report to be signed on its behalf by the undersigned, thereunto duly authorized.
Eaton Vance Series Trust II
| | |
| By: | | /s/ Payson F. Swaffield |
| | Payson F. Swaffield |
| | President |
| |
| Date: | | February 25, 2019 |
Pursuant to the requirements of the Securities Exchange Act of 1934 and the Investment Company Act of 1940, this report has been signed below by the following persons on behalf of the registrant and in the capacities and on the dates indicated.
| | |
| By: | | /s/ James F. Kirchner |
| | James F. Kirchner |
| | Treasurer |
| |
| Date: | | February 25, 2019 |
| |
| By: | | /s/ Payson F. Swaffield |
| | Payson F. Swaffield |
| | President |
| |
| Date: | | February 25, 2019 |