UNITED STATES
SECURITIES AND EXCHANGE COMMISSION
Washington, D.C. 20549
Form N-CSR
CERTIFIED SHAREHOLDER REPORT OF REGISTERED
MANAGEMENT INVESTMENT COMPANIES
Investment Company Act File Number: 811-02258
Eaton Vance Series Trust II
(Exact Name of Registrant as Specified in Charter)
Two International Place, Boston, Massachusetts 02110
(Address of Principal Executive Offices)
Maureen A. Gemma
Two International Place, Boston, Massachusetts 02110
(Name and Address of Agent for Services)
(617) 482-8260
(Registrant’s Telephone Number)
October 31
Date of Fiscal Year End
October 31, 2018
Date of Reporting Period
Item 1. Reports to Stockholders

Eaton Vance
Income Fund of Boston
Annual Report
October 31, 2018

Commodity Futures Trading Commission Registration. Effective December 31, 2012, the Commodity Futures Trading Commission (“CFTC”) adopted certain regulatory changes that subject registered investment companies and advisers to regulation by the CFTC if a fund invests more than a prescribed level of its assets in certain CFTC-regulated instruments (including futures, certain options and swap agreements) or markets itself as providing investment exposure to such instruments. The Fund has claimed an exclusion from the definition of the term “commodity pool operator” under the Commodity Exchange Act. Accordingly, neither the Fund nor the adviser with respect to the operation of the Fund is subject to CFTC regulation. Because of its management of other strategies, the Fund’s adviser is registered with the CFTC as a commodity pool operator and a commodity trading advisor.
Fund shares are not insured by the FDIC and are not deposits or other obligations of, or guaranteed by, any depository institution. Shares are subject to investment risks, including possible loss of principal invested.
This report must be preceded or accompanied by a current summary prospectus or prospectus. Before investing, investors should consider carefully the investment objective, risks, and charges and expenses of a mutual fund. This and other important information is contained in the summary prospectus and prospectus, which can be obtained from a financial advisor. Prospective investors should read the prospectus carefully before investing. For further information, please call 1-800-262-1122.
Annual Report October 31, 2018
Eaton Vance
Income Fund of Boston
Table of Contents
| | | | |
Management’s Discussion of Fund Performance | | | 2 | |
| |
Performance | | | 3 | |
| |
Fund Profile | | | 4 | |
| |
Endnotes and Additional Disclosures | | | 5 | |
| |
Fund Expenses | | | 6 | |
| |
Financial Statements | | | 7 | |
| |
Report of Independent Registered Public Accounting Firm | | | 20 and 43 | |
| |
Federal Tax Information | | | 21 | |
| |
Special Meeting of Shareholders | | | 44 | |
| |
Management and Organization | | | 45 | |
| |
Important Notices | | | 48 | |
Eaton Vance
Income Fund of Boston
October 31, 2018
Management’s Discussion of Fund Performance1
Economic and Market Conditions
U.S. high-yield, fixed-income securities outperformed investment-grade, fixed-income securities for the 12-month period ended October 31, 2018, with the ICE BofAML U.S. High Yield Index (the Index)2 returning 0.86% versus the Bloomberg Barclays U.S. Aggregate Bond Index, which returned –2.05%. U.S. high-yield bonds benefited from a healthy domestic economy and lower tax rates, which aided corporate earnings. U.S. gross domestic product growth accelerated through most of the period, reaching a quarterly annualized rate of 4.2% in the second quarter of 2018, the highest level in four years.
During the period, the corporate fundamentals of U.S. high-yield issuers modestly improved. The trailing 12-month, par-weighted default rate remained relatively benign at 2.02%, despite an increase in defaults in the final month of the period. Leverage — the ratio of debt to earnings — for high-yield issuers declined during the period.
At the same time, spreads — the difference between yields on high-yield bonds and U.S. Treasurys with comparable maturities — narrowed to the tightest levels since the 2008 financial crisis, resulting in valuations that management believed did not appropriately compensate investors for taking on additional risk. Heightened volatility at the end of the period, however, led to a reversal of this trend.
The balance of supply and demand for U.S. high-yield bonds was stable for most of the period, but deteriorated in late September 2018. Demand from retail investors — weak through much of the period — fell markedly in the final month. According to preliminary Lipper estimates, U.S. high-yield retail funds registered an outflow of $31 billion during the period, while new issuances were reduced. Gross issuance of $179.3 billion over the first 10 months of 2018 represented a 36% decrease year-over-year. At the same time, 62% of issuances were used for refinancing purposes while only 21% were used to finance the acquisition of other companies.
Fund Performance
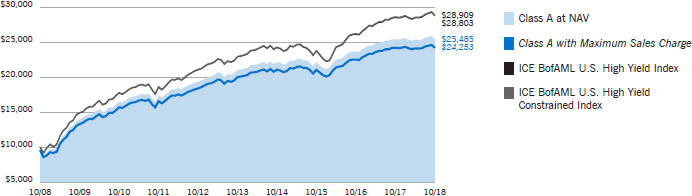
For the 12-month period ended October 31, 2018, Eaton Vance Income Fund of Boston (the Fund) Class A shares at net asset value (NAV) returned 0.13%, compared to the 0.86% return of its primary benchmark, the Index.
The Fund’s preference for higher-quality, less volatile issues weighed on performance relative to the Index as lower-quality issues outperformed during the period. In particular, the Fund’s underweight to CCC-rated6 issues and higher-quality bias within the segment detracted from performance.
Security selection by sector was positive, however, selection within the metals/mining sector had a negative impact on performance, as did an overweight in this sector. Sector allocation overall was detrimental to relative performance, and a modest position in cash was a further drag.
The Fund’s duration7 positioning was positive. An underweight to securities with durations between five and 10 years benefitted performance as did an overweight to securities with durations between zero and two years. Security selection by duration segments was negative overall with the largest headwinds emanating from selection in bonds with durations between two and five years. This was partially offset by positive selections in bonds with durations between five and 10 years. Selection among securities with durations between two and five years also weighed on relative performance.
Despite credit quality allocations being negative overall, an underweight to BB-rated securities lifted relative performance as the returns of this segment lagged the Index. Credit selection by ratings segments was also beneficial overall, and was strongest within the B- and BB-rated categories.
While sector allocation overall detracted from performance, an underweight to the poorly performing banks & thrifts sector contributed positively to relative performance. Security selection was strongest in the services sector.
Notable individual contributions resulted from the Fund not owning two poorly performing issues in the Index, a European telecom provider and a U.S. oil exploration and production company. Owning two poor performing out-of-Index names, an international gaming company and a Canadian-based mining company, and an overweight position in a third poor performer, a North American tire distributor, detracted from Fund performance during the period.
See Endnotes and Additional Disclosures in this report.
Past performance is no guarantee of future results. Returns are historical and are calculated by determining the percentage change in net asset value (NAV) or offering price (as applicable) with all distributions reinvested. Investment return and principal value will fluctuate so that shares, when redeemed, may be worth more or less than their original cost. Performance less than or equal to one year is cumulative. Performance is for the stated time period only; due to market volatility, the Fund’s current performance may be lower or higher than quoted. Returns are before taxes unless otherwise noted. For performance as of the most recent month-end, please refer to eatonvance.com.
Eaton Vance
Income Fund of Boston
October 31, 2018
Performance2,3
Portfolio Managers Michael W. Weilheimer, CFA and Stephen C. Concannon, CFA
| | | | | | | | | | | | | | | | | | | | | | | | |
| % Average Annual Total Returns | | | | | Class Inception Date | | | Performance Inception Date | | | One Year | | | Five Years | | | Ten Years | |
Class A at NAV | | | | | | | 06/15/1972 | | | | 06/15/1972 | | | | 0.13 | % | | | 3.93 | % | | | 9.80 | % |
Class A with 4.75% Maximum Sales Charge | | | | | | | — | | | | — | | | | –4.64 | | | | 2.93 | | | | 9.26 | |
Class B at NAV | | | | | | | 06/20/2002 | | | | 06/15/1972 | | | | –0.63 | | | | 3.15 | | | | 8.99 | |
Class B with 5% Maximum Sales Charge | | | | | | | — | | | | — | | | | –5.36 | | | | 2.82 | | | | 8.99 | |
Class C at NAV | | | | | | | 06/21/2002 | | | | 06/15/1972 | | | | –0.62 | | | | 3.15 | | | | 8.99 | |
Class C with 1% Maximum Sales Charge | | | | | | | — | | | | — | | | | –1.57 | | | | 3.15 | | | | 8.99 | |
Class I at NAV | | | | | | | 07/01/1999 | | | | 06/15/1972 | | | | 0.38 | | | | 4.18 | | | | 10.10 | |
Class R at NAV | | | | | | | 01/05/2004 | | | | 06/15/1972 | | | | 0.04 | | | | 3.70 | | | | 9.54 | |
Class R6 at NAV | | | | | | | 07/01/2014 | | | | 06/15/1972 | | | | 0.47 | | | | 4.26 | | | | 10.14 | |
ICE BofAML U.S. High Yield Index | | | | | | | — | | | | — | | | | 0.86 | % | | | 4.68 | % | | | 11.15 | % |
ICE BofAML U.S. High Yield Constrained Index | | | | | | | — | | | | — | | | | 0.86 | | | | 4.69 | | | | 11.19 | |
| | | | | | |
| | | | | | | | | | | | | | | | | | | | | | | | |
| % Total Annual Operating Expense Ratios4 | | Class A | | | Class B | | | Class C | | | Class I | | | Class R | | | Class R6 | |
| | | 1.00 | % | | | 1.75 | % | | | 1.75 | % | | | 0.75 | % | | | 1.25 | % | | | 0.66 | % |
Growth of $10,000
This graph shows the change in value of a hypothetical investment of $10,000 in Class A of the Fund for the period indicated. For comparison, the same investment is shown in the indicated index.
| | | | | | | | | | | | | | | | |
| Growth of Investment3 | | Amount Invested | | | Period Beginning | | | At NAV | | | With Maximum Sales Charge | |
Class B | | $ | 10,000 | | | | 10/31/2008 | | | $ | 23,667 | | | | N.A. | |
Class C | | $ | 10,000 | | | | 10/31/2008 | | | $ | 23,669 | | | | N.A. | |
Class I | | $ | 250,000 | | | | 10/31/2008 | | | $ | 654,585 | | | | N.A. | |
Class R | | $ | 10,000 | | | | 10/31/2008 | | | $ | 24,890 | | | | N.A. | |
Class R6 | | $ | 1,000,000 | | | | 10/31/2008 | | | $ | 2,627,697 | | | | N.A. | |
See Endnotes and Additional Disclosures in this report.
Past performance is no guarantee of future results. Returns are historical and are calculated by determining the percentage change in net asset value (NAV) or offering price (as applicable) with all distributions reinvested. Investment return and principal value will fluctuate so that shares, when redeemed, may be worth more or less than their original cost. Performance less than or equal to one year is cumulative. Performance is for the stated time period only; due to market volatility, the Fund’s current performance may be lower or higher than quoted. Returns are before taxes unless otherwise noted. For performance as of the most recent month-end, please refer to eatonvance.com.
Eaton Vance
Income Fund of Boston
October 31, 2018
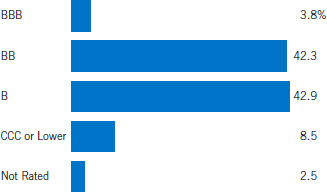
Fund Profile5
Credit Quality (% of bonds and loans)6
See Endnotes and Additional Disclosures in this report.
Eaton Vance
Income Fund of Boston
October 31, 2018
Endnotes and Additional Disclosures
| 1 | The views expressed in this report are those of the portfolio manager(s) and are current only through the date stated at the top of this page. These views are subject to change at any time based upon market or other conditions, and Eaton Vance and the Fund(s) disclaim any responsibility to update such views. These views may not be relied upon as investment advice and, because investment decisions are based on many factors, may not be relied upon as an indication of trading intent on behalf of any Eaton Vance fund. This commentary may contain statements that are not historical facts, referred to as “forward looking statements.” The Fund’s actual future results may differ significantly from those stated in any forward looking statement, depending on factors such as changes in securities or financial markets or general economic conditions, the volume of sales and purchases of Fund shares, the continuation of investment advisory, administrative and service contracts, and other risks discussed from time to time in the Fund’s filings with the Securities and Exchange Commission. |
| 2 | ICE BofAML U.S. High Yield Index is an unmanaged index of below-investment grade U.S. corporate bonds. ICE BofAML U.S. High Yield Constrained Index is an unmanaged index of below-investment grade U.S. corporate bonds, with issuer exposure capped at 2%. ICE® BofAML® indices are not for redistribution or other uses; provided “as is”, without warranties, and with no liability. Eaton Vance has prepared this report and ICE Data Indices, LLC does not endorse it, or guarantee, review, or endorse Eaton Vance’s products. BofAML® is a licensed registered trademark of Bank of America Corporation in the United States and other countries. Bloomberg Barclays U.S. Aggregate Bond Index is an unmanaged index of domestic investment-grade bonds, including corporate, government and mortgage-backed securities. Unless otherwise stated, index returns do not reflect the effect of any applicable sales charges, commissions, expenses, taxes or leverage, as applicable. It is not possible to invest directly in an index. |
| 3 | Total Returns at NAV do not include applicable sales charges. If sales charges were deducted, the returns would be lower. Total Returns shown with maximum sales charge reflect the stated maximum sales charge. Unless otherwise stated, performance does not reflect the deduction of taxes on Fund distributions or redemptions of Fund shares. |
| | Performance prior to the inception date of a class may be linked to the performance of an older class of the Fund. This linked performance is adjusted for any applicable sales charge, but is not adjusted for class expense differences. If adjusted for such differences, the performance would be different. The performance of Class R6 is linked to Class I. Performance since inception for an index, if presented, is the performance since the Fund’s or oldest share class’ inception, as applicable. Performance presented in the Financial Highlights included in the financial statements is not linked. |
| 4 | Source: Fund prospectus. The expense ratios for the current reporting period can be found in the Financial Highlights section of this report. |
| 5 | Fund invests in an affiliated investment company (Portfolio) with the same objective(s) and policies as the Fund. References to investments are to the Portfolio’s holdings. |
| 6 | Credit ratings are categorized using S&P Global Ratings (“S&P”). If S&P does not publish a rating, then the Moody’s Investors Service, Inc. (“Moody’s”) rating is applied. Ratings, which are subject to change, apply to the creditworthiness of the issuers of the underlying securities and not to the Fund or its shares. Credit ratings measure the quality of a bond based on the issuer’s creditworthiness, with ratings ranging from AAA, being the highest, to D, being the lowest based on S&P’s measures. Ratings of BBB or higher by S&P (Baa or higher by Moody’s) are considered to be investment-grade quality. Credit ratings are based largely on the ratings agency’s analysis at the time of rating. The rating assigned to any particular security is not necessarily a reflection of the issuer’s current financial condition and does not necessarily reflect its assessment of the volatility of a security’s market value or of the liquidity of an investment in the security. Holdings designated as “Not Rated” (if any) are not rated by the national ratings agencies stated above. |
| 7 | Duration is a measure of the expected change in price of a bond — in percentage terms — given a one percent change in interest rates, all else being constant. Securities with lower durations tend to be less sensitive to interest rate changes. |
| | Fund profile subject to change due to active management. |
Eaton Vance
Income Fund of Boston
October 31, 2018
Fund Expenses
Example: As a Fund shareholder, you incur two types of costs: (1) transaction costs, including sales charges (loads) on purchases and redemption fees (if applicable); and (2) ongoing costs, including management fees; distribution and/or service fees; and other Fund expenses. This Example is intended to help you understand your ongoing costs (in dollars) of Fund investing and to compare these costs with the ongoing costs of investing in other mutual funds. The Example is based on an investment of $1,000 invested at the beginning of the period and held for the entire period (May 1, 2018 – October 31, 2018).
Actual Expenses: The first section of the table below provides information about actual account values and actual expenses. You may use the information in this section, together with the amount you invested, to estimate the expenses that you paid over the period. Simply divide your account value by $1,000 (for example, an $8,600 account value divided by $1,000 = 8.6), then multiply the result by the number in the first section under the heading entitled “Expenses Paid During Period” to estimate the expenses you paid on your account during this period.
Hypothetical Example for Comparison Purposes: The second section of the table below provides information about hypothetical account values and hypothetical expenses based on the actual Fund expense ratio and an assumed rate of return of 5% per year (before expenses), which is not the actual Fund return. The hypothetical account values and expenses may not be used to estimate the actual ending account balance or expenses you paid for the period. You may use this information to compare the ongoing costs of investing in your Fund and other funds. To do so, compare this 5% hypothetical example with the 5% hypothetical examples that appear in the shareholder reports of the other funds.
Please note that the expenses shown in the table are meant to highlight your ongoing costs only and do not reflect any transactional costs, such as sales charges (loads) or redemption fees (if applicable). Therefore, the second section of the table is useful in comparing ongoing costs only, and will not help you determine the relative total costs of owning different funds. In addition, if these transactional costs were included, your costs would be higher.
| | | | | | | | | | | | | | | | |
| | | Beginning
Account Value
(5/1/18) | | | Ending
Account Value
(10/31/18) | | | Expenses Paid
During Period*
(5/1/18 – 10/31/18) | | | Annualized
Expense
Ratio | |
|
Actual | |
Class A | | $ | 1,000.00 | | | $ | 1,005.30 | | | $ | 4.95 | | | | 0.98 | % |
Class B | | $ | 1,000.00 | | | $ | 1,003.10 | | | $ | 8.68 | | | | 1.72 | % |
Class C | | $ | 1,000.00 | | | $ | 1,001.40 | | | $ | 8.73 | | | | 1.73 | % |
Class I | | $ | 1,000.00 | | | $ | 1,008.30 | | | $ | 3.70 | | | | 0.73 | % |
Class R | | $ | 1,000.00 | | | $ | 1,005.70 | | | $ | 6.22 | | | | 1.23 | % |
Class R6 | | $ | 1,000.00 | | | $ | 1,008.80 | | | $ | 3.29 | | | | 0.65 | % |
| |
Hypothetical | |
(5% return per year before expenses) | |
Class A | | $ | 1,000.00 | | | $ | 1,020.30 | | | $ | 4.99 | | | | 0.98 | % |
Class B | | $ | 1,000.00 | | | $ | 1,016.50 | | | $ | 8.74 | | | | 1.72 | % |
Class C | | $ | 1,000.00 | | | $ | 1,016.50 | | | $ | 8.79 | | | | 1.73 | % |
Class I | | $ | 1,000.00 | | | $ | 1,021.50 | | | $ | 3.72 | | | | 0.73 | % |
Class R | | $ | 1,000.00 | | | $ | 1,019.00 | | | $ | 6.26 | | | | 1.23 | % |
Class R6 | | $ | 1,000.00 | | | $ | 1,021.90 | | | $ | 3.31 | | | | 0.65 | % |
| * | Expenses are equal to the Fund’s annualized expense ratio for the indicated Class, multiplied by the average account value over the period, multiplied by 184/365 (to reflect the one-half year period). The Example assumes that the $1,000 was invested at the net asset value per share determined at the close of business on April 30, 2018. The Example reflects the expenses of both the Fund and the Portfolio. |
Eaton Vance
Income Fund of Boston
October 31, 2018
Statement of Assets and Liabilities
| | | | |
| Assets | | October 31, 2018 | |
Investment in Boston Income Portfolio, at value (identified cost, $4,750,134,309) | | $ | 4,691,128,403 | |
Receivable for Fund shares sold | | | 5,297,140 | |
Total assets | | $ | 4,696,425,543 | |
|
| Liabilities | |
Payable for Fund shares redeemed | | $ | 28,309,599 | |
Distributions payable | | | 1,761,754 | |
Payable to affiliates: | |
Distribution and service fees | | | 359,311 | |
Trustees’ fees | | | 42 | |
Accrued expenses | | | 1,374,375 | |
Total liabilities | | $ | 31,805,081 | |
Net Assets | | $ | 4,664,620,462 | |
|
| Sources of Net Assets | |
Paid-in capital | | $ | 4,872,833,831 | |
Accumulated loss | | | (208,213,369 | ) |
Total | | $ | 4,664,620,462 | |
|
| Class A Shares | |
Net Assets | | $ | 813,969,778 | |
Shares Outstanding | | | 148,159,230 | |
Net Asset Value and Redemption Price Per Share | |
(net assets ÷ shares of beneficial interest outstanding) | | $ | 5.49 | |
Maximum Offering Price Per Share | |
(100 ÷ 95.25 of net asset value per share) | | $ | 5.76 | |
|
| Class B Shares | |
Net Assets | | $ | 2,889,052 | |
Shares Outstanding | | | 525,396 | |
Net Asset Value and Offering Price Per Share* | |
(net assets ÷ shares of beneficial interest outstanding) | | $ | 5.50 | |
|
| Class C Shares | |
Net Assets | | $ | 184,382,912 | |
Shares Outstanding | | | 33,510,626 | |
Net Asset Value and Offering Price Per Share* | |
(net assets ÷ shares of beneficial interest outstanding) | | $ | 5.50 | |
|
| Class I Shares | |
Net Assets | | $ | 3,415,432,294 | |
Shares Outstanding | | | 621,286,214 | |
Net Asset Value, Offering Price and Redemption Price Per Share | |
(net assets ÷ shares of beneficial interest outstanding) | | $ | 5.50 | |
|
| Class R Shares | |
Net Assets | | $ | 40,116,407 | |
Shares Outstanding | | | 7,298,561 | |
Net Asset Value, Offering Price and Redemption Price Per Share | |
(net assets ÷ shares of beneficial interest outstanding) | | $ | 5.50 | |
|
| Class R6 Shares | |
Net Assets | | $ | 207,830,019 | |
Shares Outstanding | | | 37,806,628 | |
Net Asset Value, Offering Price and Redemption Price Per Share | |
(net assets ÷ shares of beneficial interest outstanding) | | $ | 5.50 | |
On sales of $50,000 or more, the offering price of Class A shares is reduced.
| * | Redemption price per share is equal to the net asset value less any applicable contingent deferred sales charge. |
| | | | |
| | 7 | | See Notes to Financial Statements. |
Eaton Vance
Income Fund of Boston
October 31, 2018
Statement of Operations
| | | | |
| Investment Income | | Year Ended October 31, 2018 | |
Interest and other income allocated from Portfolio | | $ | 307,617,812 | |
Dividends allocated from Portfolio | | | 3,692,559 | |
Expenses allocated from Portfolio | | | (31,410,476 | ) |
Total investment income from Portfolio | | $ | 279,899,895 | |
| |
| Expenses | | | | |
Distribution and service fees | | | | |
Class A | | $ | 2,311,268 | |
Class B | | | 47,616 | |
Class C | | | 2,090,812 | |
Class R | | | 217,738 | |
Trustees’ fees and expenses | | | 500 | |
Custodian fee | | | 60,000 | |
Transfer and dividend disbursing agent fees | | | 4,238,301 | |
Legal and accounting services | | | 78,334 | |
Printing and postage | | | 1,514,493 | |
Registration fees | | | 188,322 | |
Miscellaneous | | | 52,876 | |
Total expenses | | $ | 10,800,260 | |
| |
Net investment income | | $ | 269,099,635 | |
| |
| Realized and Unrealized Gain (Loss) from Portfolio | | | | |
Net realized gain (loss) — | | | | |
Investment transactions | | $ | 9,131,149 | |
Foreign currency | | | (111,722 | ) |
Forward foreign currency exchange contracts | | | 1,427,808 | |
Net realized gain | | $ | 10,447,235 | |
Change in unrealized appreciation (depreciation) — | | | | |
Investments | | $ | (262,192,094 | ) |
Foreign currency | | | (9,437 | ) |
Forward foreign currency exchange contracts | | | 192,411 | |
Net change in unrealized appreciation (depreciation) | | $ | (262,009,120 | ) |
| |
Net realized and unrealized loss | | $ | (251,561,885 | ) |
| |
Net increase in net assets from operations | | $ | 17,537,750 | |
| | | | |
| | 8 | | See Notes to Financial Statements. |
Eaton Vance
Income Fund of Boston
October 31, 2018
Statements of Changes in Net Assets
| | | | | | | | |
| | | Year Ended October 31, | |
| Increase (Decrease) in Net Assets | | 2018 | | | 2017 | |
From operations — | | | | | | | | |
Net investment income | | $ | 269,099,635 | | | $ | 326,334,136 | |
Net realized gain | | | 10,447,235 | | | | 11,223,622 | |
Net change in unrealized appreciation (depreciation) | | | (262,009,120 | ) | | | 123,390,728 | |
Net increase in net assets from operations | | $ | 17,537,750 | | | $ | 460,948,486 | |
Distributions to shareholders(1) | | | | | | | | |
Class A | | $ | (48,401,408 | ) | | $ | (70,180,503 | ) |
Class B | | | (215,213 | ) | | | (505,260 | ) |
Class C | | | (9,452,137 | ) | | | (11,174,018 | ) |
Class I | | | (202,766,237 | ) | | | (242,424,120 | ) |
Class R | | | (2,170,164 | ) | | | (2,274,193 | ) |
Class R6 | | | (10,925,470 | ) | | | (6,715,290 | ) |
Total distributions to shareholders | | $ | (273,930,629 | ) | | $ | (333,273,384 | ) |
Tax return of capital to shareholders | | | | | | | | |
Class A | | $ | (3,547,875 | ) | | $ | (3,468,475 | ) |
Class B | | | (14,549 | ) | | | (24,997 | ) |
Class C | | | (692,495 | ) | | | (578,615 | ) |
Class I | | | (14,734,163 | ) | | | (12,653,635 | ) |
Class R | | | (160,144 | ) | | | (118,891 | ) |
Class R6 | | | (830,155 | ) | | | (381,328 | ) |
Total tax return of capital to shareholders | | $ | (19,979,381 | ) | | $ | (17,225,941 | ) |
Transactions in shares of beneficial interest — | | | | | | | | |
Proceeds from sale of shares | | | | | | | | |
Class A | | $ | 143,345,388 | | | $ | 234,334,636 | |
Class B | | | 41,989 | | | | 22,851 | |
Class C | | | 14,381,029 | | | | 23,693,221 | |
Class I | | | 1,044,567,871 | | | | 1,680,468,149 | |
Class R | | | 8,604,645 | | | | 13,428,677 | |
Class R6 | | | 69,398,697 | | | | 133,319,916 | |
Net asset value of shares issued to shareholders in payment of distributions declared | | | | | | | | |
Class A | | | 48,504,148 | | | | 69,864,441 | |
Class B | | | 198,677 | | | | 463,406 | |
Class C | | | 9,469,162 | | | | 10,818,177 | |
Class I | | | 202,383,584 | | | | 241,189,334 | |
Class R | | | 2,121,494 | | | | 2,175,387 | |
Class R6 | | | 11,423,911 | | | | 6,257,830 | |
Cost of shares redeemed | | | | | | | | |
Class A | | | (351,246,742 | ) | | | (998,173,207 | ) |
Class B | | | (1,428,740 | ) | | | (3,307,488 | ) |
Class C | | | (59,563,649 | ) | | | (60,415,068 | ) |
Class I | | | (1,848,185,113 | ) | | | (2,159,623,101 | ) |
Class R | | | (14,500,694 | ) | | | (14,059,208 | ) |
Class R6 | | | (41,562,530 | ) | | | (22,775,736 | ) |
Net asset value of shares exchanged | | | | | | | | |
Class A | | | 3,231,911 | | | | 3,721,249 | |
Class B | | | (3,231,911 | ) | | | (3,721,249 | ) |
Net decrease in net assets from Fund share transactions | | $ | (762,046,873 | ) | | $ | (842,317,783 | ) |
| | |
Net decrease in net assets | | $ | (1,038,419,133 | ) | | $ | (731,868,622 | ) |
|
| Net Assets | |
At beginning of year | | $ | 5,703,039,595 | | | $ | 6,434,908,217 | |
At end of year | | $ | 4,664,620,462 | | | $ | 5,703,039,595 | (2) |
| (1) | For the year ended October 31, 2017, the source of distributions was from net investment income. |
| (2) | Includes accumulated distributions in excess of net investment income of $(4,152,058) at October 31, 2017. The requirement to disclose the corresponding amount as of October 31, 2018 was eliminated. |
| | | | |
| | 9 | | See Notes to Financial Statements. |
Eaton Vance
Income Fund of Boston
October 31, 2018
Financial Highlights
| | | | | | | | | | | | | | | | | | | | |
| | | Class A | |
| | | Year Ended October 31, | |
| | | 2018 | | | 2017 | | | 2016 | | | 2015 | | | 2014 | |
Net asset value — Beginning of year | | $ | 5.800 | | | $ | 5.700 | | | $ | 5.660 | | | $ | 6.020 | | | $ | 6.060 | |
| | | | | |
| Income (Loss) From Operations | | | | | | | | | | | | | | | | | | | | |
Net investment income(1) | | $ | 0.290 | | | $ | 0.298 | | | $ | 0.302 | | | $ | 0.318 | | | $ | 0.331 | |
Net realized and unrealized gain (loss) | | | (0.282 | ) | | | 0.122 | | | | 0.076 | | | | (0.323 | ) | | | (0.014 | ) |
| | | | | |
Total income (loss) from operations | | $ | 0.008 | | | $ | 0.420 | | | $ | 0.378 | | | $ | (0.005 | ) | | $ | 0.317 | |
| | | | | |
| Less Distributions | | | | | | | | | | | | | | | | | | | | |
From net investment income | | $ | (0.296 | ) | | $ | (0.304 | ) | | $ | (0.312 | ) | | $ | (0.329 | ) | | $ | (0.357 | ) |
Tax return of capital | | | (0.022 | ) | | | (0.016 | ) | | | (0.026 | ) | | | (0.026 | ) | | | — | |
| | | | | |
Total distributions | | $ | (0.318 | ) | | $ | (0.320 | ) | | $ | (0.338 | ) | | $ | (0.355 | ) | | $ | (0.357 | ) |
| | | | | |
Net asset value — End of year | | $ | 5.490 | | | $ | 5.800 | | | $ | 5.700 | | | $ | 5.660 | | | $ | 6.020 | |
| | | | | |
Total Return(2) | | | 0.13 | % | | | 7.52 | % | | | 7.02 | % | | | (0.10 | )% | | | 5.34 | % |
| | | | | |
| Ratios/Supplemental Data | | | | | | | | | | | | | | | | | | | | |
Net assets, end of year (000’s omitted) | | $ | 813,970 | | | $ | 1,020,935 | | | $ | 1,686,369 | | | $ | 1,349,462 | | | $ | 1,551,838 | |
Ratios (as a percentage of average daily net assets):(3) | | | | | | | | | | | | | | | | | | | | |
Expenses(4) | | | 0.99 | % | | | 1.00 | % | | | 0.99 | % | | | 1.00 | % | | | 1.00 | % |
Net investment income | | | 5.13 | % | | | 5.16 | % | | | 5.43 | % | | | 5.43 | % | | | 5.45 | % |
Portfolio Turnover of the Portfolio | | | 39 | % | | | 41 | % | | | 34 | % | | | 36 | % | | | 43 | % |
| (1) | Computed using average shares outstanding. |
| (2) | Returns are historical and are calculated by determining the percentage change in net asset value with all distributions reinvested and do not reflect the effect of sales charges. |
| (3) | Includes the Fund’s share of the Portfolio’s allocated expenses. |
| (4) | Excludes the effect of custody fee credits, if any, of less than 0.005%. Effective September 1, 2015, custody fee credits, which were earned on cash deposit balances, were discontinued by the custodian. |
| | | | |
| | 10 | | See Notes to Financial Statements. |
Eaton Vance
Income Fund of Boston
October 31, 2018
Financial Highlights — continued
| | | | | | | | | | | | | | | | | | | | |
| | | Class B | |
| | | Year Ended October 31, | |
| | | 2018 | | | 2017 | | | 2016 | | | 2015 | | | 2014 | |
Net asset value — Beginning of year | | $ | 5.810 | | | $ | 5.700 | | | $ | 5.660 | | | $ | 6.020 | | | $ | 6.070 | |
| | | | | |
| Income (Loss) From Operations | | | | | | | | | | | | | | | | | | | | |
Net investment income(1) | | $ | 0.248 | | | $ | 0.255 | | | $ | 0.261 | | | $ | 0.276 | | | $ | 0.286 | |
Net realized and unrealized gain (loss) | | | (0.284 | ) | | | 0.131 | | | | 0.075 | | | | (0.326 | ) | | | (0.023 | ) |
| | | | | |
Total income (loss) from operations | | $ | (0.036 | ) | | $ | 0.386 | | | $ | 0.336 | | | $ | (0.050 | ) | | $ | 0.263 | |
| | | | | |
| Less Distributions | | | | | | | | | | | | | | | | | | | | |
From net investment income | | $ | (0.255 | ) | | $ | (0.262 | ) | | $ | (0.274 | ) | | $ | (0.288 | ) | | $ | (0.313 | ) |
Tax return of capital | | | (0.019 | ) | | | (0.014 | ) | | | (0.022 | ) | | | (0.022 | ) | | | — | |
| | | | | |
Total distributions | | $ | (0.274 | ) | | $ | (0.276 | ) | | $ | (0.296 | ) | | $ | (0.310 | ) | | $ | (0.313 | ) |
| | | | | |
Net asset value — End of year | | $ | 5.500 | | | $ | 5.810 | | | $ | 5.700 | | | $ | 5.660 | | | $ | 6.020 | |
| | | | | |
Total Return(2) | | | (0.63 | )% | | | 6.91 | % | | | 6.20 | % | | | (0.87 | )% | | | 4.40 | % |
| | | | | |
| Ratios/Supplemental Data | | | | | | | | | | | | | | | | | | | | |
Net assets, end of year (000’s omitted) | | $ | 2,889 | | | $ | 7,575 | | | $ | 13,891 | | | $ | 20,491 | | | $ | 30,329 | |
Ratios (as a percentage of average daily net assets):(3) | | | | | | | | | | | | | | | | | | | | |
Expenses(4) | | | 1.75 | % | | | 1.75 | % | | | 1.75 | % | | | 1.75 | % | | | 1.75 | % |
Net investment income | | | 4.37 | % | | | 4.41 | % | | | 4.72 | % | | | 4.70 | % | | | 4.70 | % |
Portfolio Turnover of the Portfolio | | | 39 | % | | | 41 | % | | | 34 | % | | | 36 | % | | | 43 | % |
| (1) | Computed using average shares outstanding. |
| (2) | Returns are historical and are calculated by determining the percentage change in net asset value with all distributions reinvested and do not reflect the effect of sales charges. |
| (3) | Includes the Fund’s share of the Portfolio’s allocated expenses. |
| (4) | Excludes the effect of custody fee credits, if any, of less than 0.005%. Effective September 1, 2015, custody fee credits, which were earned on cash deposit balances, were discontinued by the custodian. |
| | | | |
| | 11 | | See Notes to Financial Statements. |
Eaton Vance
Income Fund of Boston
October 31, 2018
Financial Highlights — continued
| | | | | | | | | | | | | | | | | | | | |
| | | Class C | |
| | | Year Ended October 31, | |
| | | 2018 | | | 2017 | | | 2016 | | | 2015 | | | 2014 | |
Net asset value — Beginning of year | | $ | 5.810 | | | $ | 5.710 | | | $ | 5.660 | | | $ | 6.030 | | | $ | 6.070 | |
| | | | | |
| Income (Loss) From Operations | | | | | | | | | | | | | | | | | | | | |
Net investment income(1) | | $ | 0.248 | | | $ | 0.253 | | | $ | 0.260 | | | $ | 0.274 | | | $ | 0.286 | |
Net realized and unrealized gain (loss) | | | (0.283 | ) | | | 0.124 | | | | 0.086 | | | | (0.334 | ) | | | (0.013 | ) |
| | | | | |
Total income (loss) from operations | | $ | (0.035 | ) | | $ | 0.377 | | | $ | 0.346 | | | $ | (0.060 | ) | | $ | 0.273 | |
| | | | | |
| Less Distributions | | | | | | | | | | | | | | | | | | | | |
From net investment income | | $ | (0.256 | ) | | $ | (0.263 | ) | | $ | (0.274 | ) | | $ | (0.288 | ) | | $ | (0.313 | ) |
Tax return of capital | | | (0.019 | ) | | | (0.014 | ) | | | (0.022 | ) | | | (0.022 | ) | | | — | |
| | | | | |
Total distributions | | $ | (0.275 | ) | | $ | (0.277 | ) | | $ | (0.296 | ) | | $ | (0.310 | ) | | $ | (0.313 | ) |
| | | | | |
Net asset value — End of year | | $ | 5.500 | | | $ | 5.810 | | | $ | 5.710 | | | $ | 5.660 | | | $ | 6.030 | |
| | | | | |
Total Return(2) | | | (0.62 | )% | | | 6.72 | % | | | 6.39 | % | | | (1.04 | )% | | | 4.57 | % |
| | | | | |
| Ratios/Supplemental Data | | | | | | | | | | | | | | | | | | | | |
Net assets, end of year (000’s omitted) | | $ | 184,383 | | | $ | 231,504 | | | $ | 252,990 | | | $ | 247,325 | | | $ | 295,436 | |
Ratios (as a percentage of average daily net assets):(3) | | | | | | | | | | | | | | | | | | | | |
Expenses(4) | | | 1.74 | % | | | 1.75 | % | | | 1.74 | % | | | 1.75 | % | | | 1.75 | % |
Net investment income | | | 4.38 | % | | | 4.38 | % | | | 4.69 | % | | | 4.68 | % | | | 4.70 | % |
Portfolio Turnover of the Portfolio | | | 39 | % | | | 41 | % | | | 34 | % | | | 36 | % | | | 43 | % |
| (1) | Computed using average shares outstanding. |
| (2) | Returns are historical and are calculated by determining the percentage change in net asset value with all distributions reinvested and do not reflect the effect of sales charges. |
| (3) | Includes the Fund’s share of the Portfolio’s allocated expenses. |
| (4) | Excludes the effect of custody fee credits, if any, of less than 0.005%. Effective September 1, 2015, custody fee credits, which were earned on cash deposit balances, were discontinued by the custodian. |
| | | | |
| | 12 | | See Notes to Financial Statements. |
Eaton Vance
Income Fund of Boston
October 31, 2018
Financial Highlights — continued
| | | | | | | | | | | | | | | | | | | | |
| | | Class I | |
| | | Year Ended October 31, | |
| | | 2018 | | | 2017 | | | 2016 | | | 2015 | | | 2014 | |
Net asset value — Beginning of year | | $ | 5.810 | | | $ | 5.700 | | | $ | 5.660 | | | $ | 6.020 | | | $ | 6.070 | |
| | | | | |
| Income (Loss) From Operations | | | | | | | | | | | | | | | | | | | | |
Net investment income(1) | | $ | 0.304 | | | $ | 0.311 | | | $ | 0.315 | | | $ | 0.330 | | | $ | 0.345 | |
Net realized and unrealized gain (loss) | | | (0.282 | ) | | | 0.133 | | | | 0.077 | | | | (0.320 | ) | | | (0.023 | ) |
| | | | | |
Total income from operations | | $ | 0.022 | | | $ | 0.444 | | | $ | 0.392 | | | $ | 0.010 | | | $ | 0.322 | |
| | | | | |
| Less Distributions | | | | | | | | | | | | | | | | | | | | |
From net investment income | | $ | (0.309 | ) | | $ | (0.317 | ) | | $ | (0.325 | ) | | $ | (0.343 | ) | | $ | (0.372 | ) |
Tax return of capital | | | (0.023 | ) | | | (0.017 | ) | | | (0.027 | ) | | | (0.027 | ) | | | — | |
| | | | | |
Total distributions | | $ | (0.332 | ) | | $ | (0.334 | ) | | $ | (0.352 | ) | | $ | (0.370 | ) | | $ | (0.372 | ) |
| | | | | |
Net asset value — End of year | | $ | 5.500 | | | $ | 5.810 | | | $ | 5.700 | | | $ | 5.660 | | | $ | 6.020 | |
| | | | | |
Total Return(2) | | | 0.38 | % | | | 7.96 | % | | | 7.28 | % | | | 0.15 | % | | | 5.42 | % |
| | | | | |
| Ratios/Supplemental Data | | | | | | | | | | | | | | | | | | | | |
Net assets, end of year (000’s omitted) | | $ | 3,415,432 | | | $ | 4,217,385 | | | $ | 4,376,959 | | | $ | 3,744,639 | | | $ | 2,903,827 | |
Ratios (as a percentage of average daily net assets):(3) | | | | | | | | | | | | | | | | | | | | |
Expenses(4) | | | 0.74 | % | | | 0.75 | % | | | 0.74 | % | | | 0.75 | % | | | 0.75 | % |
Net investment income | | | 5.38 | % | | | 5.39 | % | | | 5.67 | % | | | 5.64 | % | | | 5.68 | % |
Portfolio Turnover of the Portfolio | | | 39 | % | | | 41 | % | | | 34 | % | | | 36 | % | | | 43 | % |
| (1) | Computed using average shares outstanding. |
| (2) | Returns are historical and are calculated by determining the percentage change in net asset value with all distributions reinvested. |
| (3) | Includes the Fund’s share of the Portfolio’s allocated expenses. |
| (4) | Excludes the effect of custody fee credits, if any, of less than 0.005%. Effective September 1, 2015, custody fee credits, which were earned on cash deposit balances, were discontinued by the custodian. |
| | | | |
| | 13 | | See Notes to Financial Statements. |
Eaton Vance
Income Fund of Boston
October 31, 2018
Financial Highlights — continued
| | | | | | | | | | | | | | | | | | | | |
| | | Class R | |
| | | Year Ended October 31, | |
| | | 2018 | | | 2017 | | | 2016 | | | 2015 | | | 2014 | |
Net asset value — Beginning of year | | $ | 5.810 | | | $ | 5.700 | | | $ | 5.660 | | | $ | 6.020 | | | $ | 6.060 | |
| | | | | |
| Income (Loss) From Operations | | | | | | | | | | | | | | | | | | | | |
Net investment income(1) | | $ | 0.276 | | | $ | 0.282 | | | $ | 0.288 | | | $ | 0.301 | | | $ | 0.316 | |
Net realized and unrealized gain (loss) | | | (0.283 | ) | | | 0.133 | | | | 0.076 | | | | (0.321 | ) | | | (0.014 | ) |
| | | | | |
Total income (loss) from operations | | $ | (0.007 | ) | | $ | 0.415 | | | $ | 0.364 | | | $ | (0.020 | ) | | $ | 0.302 | |
| | | | | |
| Less Distributions | | | | | | | | | | | | | | | | | | | | |
From net investment income | | $ | (0.282 | ) | | $ | (0.290 | ) | | $ | (0.299 | ) | | $ | (0.315 | ) | | $ | (0.342 | ) |
Tax return of capital | | | (0.021 | ) | | | (0.015 | ) | | | (0.025 | ) | | | (0.025 | ) | | | — | |
| | | | | |
Total distributions | | $ | (0.303 | ) | | $ | (0.305 | ) | | $ | (0.324 | ) | | $ | (0.340 | ) | | $ | (0.342 | ) |
| | | | | |
Net asset value — End of year | | $ | 5.500 | | | $ | 5.810 | | | $ | 5.700 | | | $ | 5.660 | | | $ | 6.020 | |
| | | | | |
Total Return(2) | | | 0.04 | % | | | 7.25 | % | | | 6.75 | % | | | (0.36 | )% | | | 5.08 | % |
| | | | | |
| Ratios/Supplemental Data | | | | | | | | | | | | | | | | | | | | |
Net assets, end of year (000’s omitted) | | $ | 40,116 | | | $ | 46,259 | | | $ | 43,902 | | | $ | 47,575 | | | $ | 37,575 | |
Ratios (as a percentage of average daily net assets):(3) | | | | | | | | | | | | | | | | | | | | |
Expenses(4) | | | 1.24 | % | | | 1.25 | % | | | 1.24 | % | | | 1.25 | % | | | 1.25 | % |
Net investment income | | | 4.88 | % | | | 4.89 | % | | | 5.20 | % | | | 5.15 | % | | | 5.19 | % |
Portfolio Turnover of the Portfolio | | | 39 | % | | | 41 | % | | | 34 | % | | | 36 | % | | | 43 | % |
| (1) | Computed using average shares outstanding. |
| (2) | Returns are historical and are calculated by determining the percentage change in net asset value with all distributions reinvested. |
| (3) | Includes the Fund’s share of the Portfolio’s allocated expenses. |
| (4) | Excludes the effect of custody fee credits, if any, of less than 0.005%. Effective September 1, 2015, custody fee credits, which were earned on cash deposit balances, were discontinued by the custodian. |
| | | | |
| | 14 | | See Notes to Financial Statements. |
Eaton Vance
Income Fund of Boston
October 31, 2018
Financial Highlights — continued
| | | | | | | | | | | | | | | | | | | | |
| | | Class R6 | |
| | | Year Ended October 31, | | | Period Ended
October 31, 2014(1) | |
| | | 2018 | | | 2017 | | | 2016 | | | 2015 | |
Net asset value — Beginning of period | | $ | 5.810 | | | $ | 5.700 | | | $ | 5.660 | | | $ | 6.020 | | | $ | 6.160 | |
| | | | | |
| Income (Loss) From Operations | | | | | | | | | | | | | | | | | | | | |
Net investment income(2) | | $ | 0.309 | | | $ | 0.314 | | | $ | 0.319 | | | $ | 0.326 | | | $ | 0.114 | |
Net realized and unrealized gain (loss) | | | (0.282 | ) | | | 0.135 | | | | 0.078 | | | | (0.311 | ) | | | (0.129 | ) |
| | | | | |
Total income (loss) from operations | | $ | 0.027 | | | $ | 0.449 | | | $ | 0.397 | | | $ | 0.015 | | | $ | (0.015 | ) |
| | | | | |
| Less Distributions | | | | | | | | | | | | | | | | | | | | |
From net investment income | | $ | (0.314 | ) | | $ | (0.322 | ) | | $ | (0.330 | ) | | $ | (0.348 | ) | | $ | (0.125 | ) |
Tax return of capital | | | (0.023 | ) | | | (0.017 | ) | | | (0.027 | ) | | | (0.027 | ) | | | — | |
| | | | | |
Total distributions | | $ | (0.337 | ) | | $ | (0.339 | ) | | $ | (0.357 | ) | | $ | (0.375 | ) | | $ | (0.125 | ) |
| | | | | |
Net asset value — End of period | | $ | 5.500 | | | $ | 5.810 | | | $ | 5.700 | | | $ | 5.660 | | | $ | 6.020 | |
| | | | | |
Total Return(3) | | | 0.47 | % | | | 8.06 | % | | | 7.38 | % | | | 0.24 | % | | | (0.23 | )%(4) |
| | | | | |
| Ratios/Supplemental Data | | | | | | | | | | | | | | | | | | | | |
Net assets, end of period (000’s omitted) | | $ | 207,830 | | | $ | 179,380 | | | $ | 60,797 | | | $ | 23,230 | | | $ | 1,173 | |
Ratios (as a percentage of average daily net assets):(5) | | | | | | | | | | | | | | | | | | | | |
Expenses(6) | | | 0.66 | % | | | 0.66 | % | | | 0.66 | % | | | 0.66 | % | | | 0.69 | %(7) |
Net investment income | | | 5.47 | % | | | 5.43 | % | | | 5.71 | % | | | 5.62 | % | | | 5.67 | %(7) |
Portfolio Turnover of the Portfolio | | | 39 | % | | | 41 | % | | | 34 | % | | | 36 | % | | | 43 | %(8) |
| (1) | For the period from the commencement of operations, July 1, 2014, to October 31, 2014. |
| (2) | Computed using average shares outstanding. |
| (3) | Returns are historical and are calculated by determining the percentage change in net asset value with all distributions reinvested. |
| (5) | Includes the Fund’s share of the Portfolio’s allocated expenses. |
| (6) | Excludes the effect of custody fee credits, if any, of less than 0.005%. Effective September 1, 2015, custody fee credits, which were earned on cash deposit balances, were discontinued by the custodian. |
| (8) | For the Portfolio’s year ended October 31, 2014. |
| | | | |
| | 15 | | See Notes to Financial Statements. |
Eaton Vance
Income Fund of Boston
October 31, 2018
Notes to Financial Statements
1 Significant Accounting Policies
Eaton Vance Income Fund of Boston (the Fund) is a diversified series of Eaton Vance Series Trust II (the Trust). The Trust is a Massachusetts business trust registered under the Investment Company Act of 1940, as amended (the 1940 Act), as an open-end management investment company. The Fund offers six classes of shares. Class A shares are generally sold subject to a sales charge imposed at time of purchase. Class B and Class C shares are sold at net asset value and are generally subject to a contingent deferred sales charge (see Note 5). Class I, Class R and Class R6 shares are sold at net asset value and are not subject to a sales charge. Class B shares automatically convert to Class A shares eight years after their purchase as described in the Fund’s prospectus. Beginning January 1, 2012, Class B shares are only available for purchase upon exchange from another Eaton Vance fund or through reinvestment of distributions. Each class represents a pro-rata interest in the Fund, but votes separately on class-specific matters and (as noted below) is subject to different expenses. Realized and unrealized gains and losses are allocated daily to each class of shares based on the relative net assets of each class to the total net assets of the Fund. Net investment income, other than class-specific expenses, is allocated daily to each class of shares based upon the ratio of the value of each class’s paid shares to the total value of all paid shares. Sub-accounting, recordkeeping and similar administrative fees payable to financial intermediaries, which are a component of transfer and dividend disbursing agent fees on the Statement of Operations, are not allocated to Class R6 shares. Each class of shares differs in its distribution plan and certain other class-specific expenses. The Fund invests all of its investable assets in interests in Boston Income Portfolio (the Portfolio), a Massachusetts business trust, having the same investment objectives and policies as the Fund. The value of the Fund’s investment in the Portfolio reflects the Fund’s proportionate interest in the net assets of the Portfolio (99.9% at October 31, 2018). The performance of the Fund is directly affected by the performance of the Portfolio. The financial statements of the Portfolio, including the portfolio of investments, are included elsewhere in this report and should be read in conjunction with the Fund’s financial statements.
The following is a summary of significant accounting policies of the Fund. The policies are in conformity with accounting principles generally accepted in the United States of America (U.S. GAAP). The Fund is an investment company and follows accounting and reporting guidance in the Financial Accounting Standards Board (FASB) Accounting Standards Codification Topic 946.
A Investment Valuation — Valuation of securities by the Portfolio is discussed in Note 1A of the Portfolio’s Notes to Financial Statements, which are included elsewhere in this report.
B Income — The Fund’s net investment income or loss consists of the Fund’s pro-rata share of the net investment income or loss of the Portfolio, less all actual and accrued expenses of the Fund.
C Federal Taxes — The Fund’s policy is to comply with the provisions of the Internal Revenue Code applicable to regulated investment companies and to distribute to shareholders each year substantially all of its net investment income, and all or substantially all of its net realized capital gains. Accordingly, no provision for federal income or excise tax is necessary.
As of October 31, 2018, the Fund had no uncertain tax positions that would require financial statement recognition, de-recognition, or disclosure. The Fund files a U.S. federal income tax return annually after its fiscal year-end, which is subject to examination by the Internal Revenue Service for a period of three years from the date of filing.
D Expenses — The majority of expenses of the Trust are directly identifiable to an individual fund. Expenses which are not readily identifiable to a specific fund are allocated taking into consideration, among other things, the nature and type of expense and the relative size of the funds.
E Use of Estimates — The preparation of the financial statements in conformity with U.S. GAAP requires management to make estimates and assumptions that affect the reported amounts of assets and liabilities at the date of the financial statements and the reported amounts of income and expense during the reporting period. Actual results could differ from those estimates.
F Indemnifications — Under the Trust’s organizational documents, its officers and Trustees may be indemnified against certain liabilities and expenses arising out of the performance of their duties to the Fund. Under Massachusetts law, if certain conditions prevail, shareholders of a Massachusetts business trust (such as the Trust) could be deemed to have personal liability for the obligations of the Trust. However, the Trust’s Declaration of Trust contains an express disclaimer of liability on the part of Fund shareholders and the By-laws provide that the Trust shall assume the defense on behalf of any Fund shareholders. Moreover, the By-laws also provide for indemnification out of Fund property of any shareholder held personally liable solely by reason of being or having been a shareholder for all loss or expense arising from such liability. Additionally, in the normal course of business, the Fund enters into agreements with service providers that may contain indemnification clauses. The Fund’s maximum exposure under these arrangements is unknown as this would involve future claims that may be made against the Fund that have not yet occurred.
G Other — Investment transactions are accounted for on a trade date basis.
2 Distributions to Shareholders and Income Tax Information
The Fund declares dividends daily to shareholders of record at the time of declaration. Distributions are generally paid monthly. Distributions of realized capital gains (reduced by available capital loss carryforwards) are made at least annually. Distributions are declared separately for each class of shares. Shareholders may reinvest income and capital gain distributions in additional shares of the same class of the Fund at the net asset value as of the reinvestment date or, at the election of the shareholder, receive distributions in cash. Distributions to shareholders are determined in accordance with
Eaton Vance
Income Fund of Boston
October 31, 2018
Notes to Financial Statements — continued
income tax regulations, which may differ from U.S. GAAP. As required by U.S. GAAP, only distributions in excess of tax basis earnings and profits are reported in the financial statements as a return of capital. Permanent differences between book and tax accounting relating to distributions are reclassified to paid-in capital. For tax purposes, distributions from short-term capital gains are considered to be from ordinary income.
The tax character of distributions declared for the years ended October 31, 2018 and October 31, 2017 was as follows:
| | | | | | | | |
| | | Year Ended October 31, | |
| | | 2018 | | | 2017 | |
Ordinary income | | $ | 273,930,629 | | | $ | 333,273,384 | |
Tax return of capital | | $ | 19,979,381 | | | $ | 17,225,941 | |
During the year ended October 31, 2018, accumulated loss was decreased by $2,051,009 and paid-in capital was decreased by $2,051,009 due to expired capital loss carryforwards. These reclassifications had no effect on the net assets or net asset value per share of the Fund.
As of October 31, 2018, the components of distributable earnings (accumulated loss) on a tax basis were as follows:
| | | | |
Deferred capital losses | | $ | (160,325,601 | ) |
Net unrealized depreciation | | $ | (46,126,014 | ) |
Distributions payable | | $ | (1,761,754 | ) |
At October 31, 2018, the Fund, for federal income tax purposes, had deferred capital losses of $160,325,601 which would reduce its taxable income arising from future net realized gains on investment transactions, if any, to the extent permitted by the Internal Revenue Code, and thus would reduce the amount of distributions to shareholders, which would otherwise be necessary to relieve the Fund of any liability for federal income or excise tax. The deferred capital losses are treated as arising on the first day of the Fund’s next taxable year and retain the same short-term or long-term character as when originally deferred. Of the deferred capital losses at October 31, 2018, $13,319,013 are short-term and $147,006,588 are long-term.
3 Transactions with Affiliates
Eaton Vance Management (EVM) serves as the administrator of the Fund, but receives no compensation. The Portfolio has engaged Boston Management and Research (BMR), a subsidiary of EVM, to render investment advisory services. See Note 2 of the Portfolio’s Notes to Financial Statements which are included elsewhere in this report. EVM provides sub-transfer agency and related services to the Fund pursuant to a Sub-Transfer Agency Support Services Agreement. For the year ended October 31, 2018, EVM earned $160,782 from the Fund pursuant to such agreement, which is included in transfer and dividend disbursing agent fees on the Statement of Operations. The Fund was informed that Eaton Vance Distributors, Inc. (EVD), an affiliate of EVM and the Fund’s principal underwriter, received $68,601 as its portion of the sales charge on sales of Class A shares for the year ended October 31, 2018. EVD also received distribution and service fees from Class A, Class B, Class C and Class R shares (see Note 4) and contingent deferred sales charges (see Note 5).
Trustees and officers of the Fund who are members of EVM’s or BMR’s organizations receive remuneration for their services to the Fund out of the investment adviser fee. Certain officers and Trustees of the Fund and the Portfolio are officers of the above organizations.
4 Distribution Plans
The Fund has in effect a distribution plan for Class A shares (Class A Plan) pursuant to Rule 12b-1 under the 1940 Act. Pursuant to the Class A Plan, the Fund pays EVD a distribution and service fee of 0.25% per annum of its average daily net assets attributable to Class A shares for distribution services and facilities provided to the Fund by EVD, as well as for personal services and/or the maintenance of shareholder accounts. Distribution and service fees paid or accrued to EVD for the year ended October 31, 2018 amounted to $2,311,268 for Class A shares. The Fund also has in effect distribution plans for Class B shares (Class B Plan), Class C shares (Class C Plan) and Class R shares (Class R Plan) pursuant to Rule 12b-1 under the 1940 Act. Pursuant to the Class B and Class C Plans, the Fund pays EVD amounts equal to 0.75% per annum of its average daily net assets attributable to Class B and Class C shares for providing ongoing distribution services and facilities to the Fund. For the year ended October 31, 2018, the Fund paid or accrued to EVD $35,712 and $1,568,109 for Class B and Class C shares, respectively. The Class R Plan requires the Fund to pay EVD an amount up to 0.50% per annum of its average daily net assets attributable to Class R shares for providing ongoing distribution services and facilities to the Fund. The Trustees of the Trust have currently limited Class R distribution payments to 0.25% per annum of the average daily net assets attributable to Class R shares. For the year ended October 31, 2018, the Fund paid or accrued to EVD $108,869 for Class R shares.
Pursuant to the Class B, Class C and Class R Plans, the Fund also makes payments of service fees to EVD, financial intermediaries and other persons in amounts equal to 0.25% per annum of its average daily net assets attributable to that class. Service fees paid or accrued are for personal services and/or
Eaton Vance
Income Fund of Boston
October 31, 2018
Notes to Financial Statements — continued
the maintenance of shareholder accounts. They are separate and distinct from the sales commissions and distribution fees payable to EVD. Service fees paid or accrued for the year ended October 31, 2018 amounted to $11,904, $522,703 and $108,869 for Class B, Class C and Class R shares, respectively.
Distribution and service fees are subject to the limitations contained in the Financial Industry Regulatory Authority Rule 2341(d) and for Class B, are further limited to a 5% maximum sales charge as determined in accordance with such rule.
5 Contingent Deferred Sales Charges
A contingent deferred sales charge (CDSC) generally is imposed on redemptions of Class B shares made within six years of purchase and on redemptions of Class C shares made within one year of purchase. Class A shares may be subject to a 1% CDSC if redeemed within 18 months of purchase (depending on the circumstances of purchase). Generally, the CDSC is based upon the lower of the net asset value at date of redemption or date of purchase. No charge is levied on shares acquired by reinvestment of dividends or capital gain distributions. The CDSC for Class B shares is imposed at declining rates that begin at 5% in the case of redemptions in the first and second year after purchase, declining one percentage point each subsequent year. Class C shares are subject to a 1% CDSC if redeemed within one year of purchase. For the year ended October 31, 2018, the Fund was informed that EVD received approximately $14,000, $1,000 and $8,000 of CDSCs paid by Class A, Class B and Class C shareholders, respectively.
6 Investment Transactions
For the year ended October 31, 2018, increases and decreases in the Fund’s investment in the Portfolio aggregated $248,837,596 and $1,301,449,921, respectively.
7 Shares of Beneficial Interest
The Fund’s Declaration of Trust permits the Trustees to issue an unlimited number of full and fractional shares of beneficial interest (without par value). Such shares may be issued in a number of different series (such as the Fund) and classes. Transactions in Fund shares were as follows:
| | | | | | | | |
| | | Year Ended October 31, | |
| Class A | | 2018 | | | 2017 | |
| | |
Sales | | | 25,411,665 | | | | 40,784,225 | |
Issued to shareholders electing to receive payments of distributions in Fund shares | | | 8,604,035 | | | | 12,096,690 | |
Redemptions | | | (62,349,928 | ) | | | (173,422,804 | ) |
Exchange from Class B shares | | | 570,453 | | | | 642,611 | |
| | |
Net decrease | | | (27,763,775 | ) | | | (119,899,278 | ) |
| |
| | | Year Ended October 31, | |
| Class B | | 2018 | | | 2017 | |
| | |
Sales | | | 7,327 | | | | 3,955 | |
Issued to shareholders electing to receive payments of distributions in Fund shares | | | 35,118 | | | | 80,191 | |
Redemptions | | | (251,925 | ) | | | (572,860 | ) |
Exchange to Class A shares | | | (569,551 | ) | | | (641,977 | ) |
| | |
Net decrease | | | (779,031 | ) | | | (1,130,691 | ) |
Eaton Vance
Income Fund of Boston
October 31, 2018
Notes to Financial Statements — continued
| | | | | | | | |
| | | Year Ended October 31, | |
| Class C | | 2018 | | | 2017 | |
| | |
Sales | | | 2,541,063 | | | | 4,104,193 | |
Issued to shareholders electing to receive payments of distributions in Fund shares | | | 1,677,582 | | | | 1,868,345 | |
Redemptions | | | (10,546,080 | ) | | | (10,448,740 | ) |
| | |
Net decrease | | | (6,327,435 | ) | | | (4,476,202 | ) |
| |
| | | Year Ended October 31, | |
| Class I | | 2018 | | | 2017 | |
| | |
Sales | | | 184,390,992 | | | | 291,613,694 | |
Issued to shareholders electing to receive payments of distributions in Fund shares | | | 35,876,289 | | | | 41,693,726 | |
Redemptions | | | (325,319,472 | ) | | | (374,409,680 | ) |
| | |
Net decrease | | | (105,052,191 | ) | | | (41,102,260 | ) |
| |
| | | Year Ended October 31, | |
| Class R | | 2018 | | | 2017 | |
| | |
Sales | | | 1,522,086 | | | | 2,332,203 | |
Issued to shareholders electing to receive payments of distributions in Fund shares | | | 376,244 | | | | 376,197 | |
Redemptions | | | (2,568,434 | ) | | | (2,439,383 | ) |
| | |
Net increase (decrease) | | | (670,104 | ) | | | 269,017 | |
| |
| | | Year Ended October 31, | |
| Class R6 | | 2018 | | | 2017 | |
| | |
Sales | | | 12,253,867 | | | | 23,091,860 | |
Issued to shareholders electing to receive payments of distributions in Fund shares | | | 2,028,806 | | | | 1,079,244 | |
Redemptions | | | (7,366,476 | ) | | | (3,940,296 | ) |
| | |
Net increase | | | 6,916,197 | | | | 20,230,808 | |
Eaton Vance
Income Fund of Boston
October 31, 2018
Report of Independent Registered Public Accounting Firm
To the Trustees of Eaton Vance Series Trust II and Shareholders of Eaton Vance Income Fund of Boston:
Opinion on the Financial Statements and Financial Highlights
We have audited the accompanying statement of assets and liabilities of Eaton Vance Income Fund of Boston (the “Fund”) (one of the funds constituting Eaton Vance Series Trust II), as of October 31, 2018, the related statement of operations for the year then ended, the statements of changes in net assets for each of the two years in the period then ended, the financial highlights for each of the five years in the period then ended, and the related notes. In our opinion, the financial statements and financial highlights present fairly, in all material respects, the financial position of the Fund as of October 31, 2018, and the results of its operations for the year then ended, the changes in its net assets for each of the two years in the period then ended, and the financial highlights for each of the five years in the period then ended, in conformity with accounting principles generally accepted in the United States of America.
Basis for Opinion
These financial statements and financial highlights are the responsibility of the Fund’s management. Our responsibility is to express an opinion on the Fund’s financial statements and financial highlights based on our audits. We are a public accounting firm registered with the Public Company Accounting Oversight Board (United States) (PCAOB) and are required to be independent with respect to the Fund in accordance with the U.S. federal securities laws and the applicable rules and regulations of the Securities and Exchange Commission and the PCAOB.
We conducted our audits in accordance with the standards of the PCAOB. Those standards require that we plan and perform the audit to obtain reasonable assurance about whether the financial statements and financial highlights are free of material misstatement, whether due to error or fraud. The Fund is not required to have, nor were we engaged to perform, an audit of its internal control over financial reporting. As part of our audits we are required to obtain an understanding of internal control over financial reporting but not for the purpose of expressing an opinion on the effectiveness of the Fund’s internal control over financial reporting. Accordingly, we express no such opinion.
Our audits included performing procedures to assess the risks of material misstatement of the financial statements and financial highlights, whether due to error or fraud, and performing procedures that respond to those risks. Such procedures included examining, on a test basis, evidence regarding the amounts and disclosures in the financial statements and financial highlights. Our audits also included evaluating the accounting principles used and significant estimates made by management, as well as evaluating the overall presentation of the financial statements and financial highlights. We believe that our audits provide a reasonable basis for our opinion.
/s/ Deloitte & Touche LLP
Boston, Massachusetts
December 20, 2018
We have served as the auditor of one or more Eaton Vance investment companies since 1959.
Eaton Vance
Income Fund of Boston
October 31, 2018
Federal Tax Information (Unaudited)
The Form 1099-DIV you receive in February 2019 will show the tax status of all distributions paid to your account in calendar year 2018. Shareholders are advised to consult their own tax adviser with respect to the tax consequences of their investment in the Fund.
Boston Income Portfolio
October 31, 2018
Portfolio of Investments
| | | | | | | | | | | | |
| Corporate Bonds & Notes — 87.1% | |
| Security | | | | | Principal
Amount
(000’s omitted) | | | Value | |
|
| Aerospace — 1.4% | |
Bombardier, Inc., 6.00%, 10/15/22(1) | | | | | | $ | 11,395 | | | $ | 11,238,319 | |
Bombardier, Inc., 6.125%, 1/15/23(1) | | | | | | | 935 | | | | 927,988 | |
Bombardier, Inc., 7.50%, 12/1/24(1) | | | | | | | 7,975 | | | | 8,124,531 | |
Bombardier, Inc., 7.50%, 3/15/25(1) | | | | | | | 2,320 | | | | 2,330,904 | |
TransDigm, Inc., 6.00%, 7/15/22 | | | | | | | 9,200 | | | | 9,269,000 | |
TransDigm, Inc., 6.375%, 6/15/26 | | | | | | | 4,635 | | | | 4,553,888 | |
TransDigm, Inc., 6.50%, 7/15/24 | | | | | | | 14,665 | | | | 14,860,631 | |
TransDigm, Inc., 6.50%, 5/15/25 | | | | | | | 7,070 | | | | 7,061,162 | |
TransDigm UK Holdings PLC, 6.875%, 5/15/26(1) | | | | | | | 5,020 | | | | 5,020,000 | |
| | | | | | | | | | | $ | 63,386,423 | |
|
| Automotive & Auto Parts — 0.5% | |
Navistar International Corp., 6.625%, 11/1/25(1) | | | | | | $ | 21,515 | | | $ | 22,052,875 | |
ZF North America Capital, Inc., 4.50%, 4/29/22(1) | | | | | | | 2,004 | | | | 2,008,870 | |
| | | | | | | | | | | $ | 24,061,745 | |
|
| Banks & Thrifts — 0.3% | |
Ally Financial, Inc., 8.00%, 12/31/18 | | | | | | $ | 740 | | | $ | 745,088 | |
CIT Group, Inc., 5.375%, 5/15/20 | | | | | | | 861 | | | | 886,313 | |
CIT Group, Inc., 6.125%, 3/9/28 | | | | | | | 4,300 | | | | 4,472,000 | |
JPMorgan Chase & Co., Series S, 6.75% to 2/1/24(2)(3) | | | | | | | 9,210 | | | | 9,833,977 | |
| | | | | | | | | | | $ | 15,937,378 | |
|
| Broadcasting — 1.4% | |
CBS Radio, Inc., 7.25%, 11/1/24(1) | | | | | | $ | 201 | | | $ | 190,196 | |
Netflix, Inc., 5.50%, 2/15/22 | | | | | | | 8,685 | | | | 8,901,170 | |
Netflix, Inc., 5.875%, 2/15/25 | | | | | | | 5,730 | | | | 5,837,438 | |
Netflix, Inc., 5.875%, 11/15/28(1) | | | | | | | 12,610 | | | | 12,452,375 | |
Sirius XM Radio, Inc., 5.00%, 8/1/27(1) | | | | | | | 11,487 | | | | 10,851,654 | |
Sirius XM Radio, Inc., 6.00%, 7/15/24(1) | | | | | | | 25,213 | | | | 25,838,282 | |
Tribune Media Co., 5.875%, 7/15/22 | | | | | | | 1,000 | | | | 1,017,500 | |
| | | | | | | | | | | $ | 65,088,615 | |
|
| Building Materials — 1.1% | |
Brundage-Bone Concrete Pumping, Inc., 10.375%, 9/1/23(1) | | | | | | $ | 10,755 | | | $ | 11,642,287 | |
Builders FirstSource, Inc., 5.625%, 9/1/24(1) | | | | | | | 6,088 | | | | 5,699,890 | |
Hillman Group, Inc. (The),
6.375%, 7/15/22(1) | | | | | | | 11,436 | | | | 10,120,860 | |
Standard Industries, Inc., 5.50%, 2/15/23(1) | | | | | | | 8,845 | | | | 8,690,213 | |
Standard Industries, Inc., 6.00%, 10/15/25(1) | | | | | | | 16,725 | | | | 16,515,937 | |
| | | | | | | | | | | $ | 52,669,187 | |
| | | | | | | | | | | | |
| Security | | | | | Principal
Amount
(000’s omitted) | | | Value | |
|
| Cable / Satellite TV — 5.5% | |
Altice France SA, 7.375%, 5/1/26(1) | | | | | | $ | 7,115 | | | $ | 6,857,081 | |
Altice France SA, 8.125%, 2/1/27(1) | | | | | | | 14,883 | | | | 14,728,215 | |
Altice Luxembourg SA, 7.75%, 5/15/22(1) | | | | | | | 10,166 | | | | 9,441,673 | |
Altice US Finance I Corp., 5.375%, 7/15/23(1) | | | | | | | 4,030 | | | | 4,039,309 | |
Altice US Finance I Corp., 5.50%, 5/15/26(1) | | | | | | | 14,955 | | | | 14,604,455 | |
Cablevision Systems Corp., 5.875%, 9/15/22 | | | | | | | 15,715 | | | | 15,832,862 | |
Cablevision Systems Corp., 8.00%, 4/15/20 | | | | | | | 12,960 | | | | 13,558,104 | |
CCO Holdings, LLC/CCO Holdings Capital Corp., 5.25%, 9/30/22 | | | | | | | 12,245 | | | | 12,329,184 | |
CCO Holdings, LLC/CCO Holdings Capital Corp., 5.375%, 5/1/25(1) | | | | | | | 13,405 | | | | 13,153,656 | |
CCO Holdings, LLC/CCO Holdings Capital Corp., 5.75%, 1/15/24 | | | | | | | 1,625 | | | | 1,645,313 | |
CCO Holdings, LLC/CCO Holdings Capital Corp., 5.75%, 2/15/26(1) | | | | | | | 11,655 | | | | 11,567,587 | |
CCO Holdings, LLC/CCO Holdings Capital Corp., 5.875%, 4/1/24(1) | | | | | | | 20,085 | | | | 20,310,956 | |
Cequel Communications Holdings I, LLC/Cequel Capital Corp., 5.125%, 12/15/21(1) | | | | | | | 8,884 | | | | 8,882,046 | |
CSC Holdings, LLC, 6.75%, 11/15/21 | | | | | | | 12,915 | | | | 13,556,230 | |
CSC Holdings, LLC, 10.125%, 1/15/23(1) | | | | | | | 9,865 | | | | 10,732,824 | |
CSC Holdings, LLC, 10.875%, 10/15/25(1) | | | | | | | 17,461 | | | | 20,189,281 | |
DISH DBS Corp., 5.875%, 7/15/22 | | | | | | | 9,745 | | | | 9,245,569 | |
DISH DBS Corp., 5.875%, 11/15/24 | | | | | | | 1,805 | | | | 1,541,019 | |
DISH DBS Corp., 6.75%, 6/1/21 | | | | | | | 2,662 | | | | 2,695,275 | |
DISH DBS Corp., 7.75%, 7/1/26 | | | | | | | 4,345 | | | | 3,905,069 | |
UPC Holding B.V., 5.50%, 1/15/28(1) | | | | | | | 10,840 | | | | 10,054,100 | |
UPCB Finance IV, Ltd., 5.375%, 1/15/25(1) | | | | | | | 4,740 | | | | 4,623,870 | |
Virgin Media Secured Finance PLC, 5.25%, 1/15/26(1) | | | | | | | 12,495 | | | | 11,698,444 | |
Virgin Media Secured Finance PLC, 5.50%, 8/15/26(1) | | | | | | | 7,835 | | | | 7,404,075 | |
Ziggo Bond Co., B.V., 5.875%, 1/15/25(1) | | | | | | | 5,135 | | | | 4,724,200 | |
Ziggo Bond Co., B.V., 6.00%, 1/15/27(1) | | | | | | | 3,310 | | | | 2,954,175 | |
Ziggo B.V., 5.50%, 1/15/27(1) | | | | | | | 6,485 | | | | 5,966,200 | |
| | | | | | | | | | | $ | 256,240,772 | |
|
| Capital Goods — 1.0% | |
BWX Technologies, Inc., 5.375%, 7/15/26(1) | | | | | | $ | 9,085 | | | $ | 9,130,425 | |
Titan Acquisition, Ltd./Titan Co-Borrower, LLC, 7.75%, 4/15/26(1) | | | | | | | 15,930 | | | | 13,301,550 | |
Wabash National Corp., 5.50%, 10/1/25(1) | | | | | | | 7,065 | | | | 6,376,162 | |
Welbilt, Inc., 9.50%, 2/15/24 | | | | | | | 14,780 | | | | 15,999,350 | |
| | | | | | | | | | | $ | 44,807,487 | |
| | | | |
| | 22 | | See Notes to Financial Statements. |
Boston Income Portfolio
October 31, 2018
Portfolio of Investments — continued
| | | | | | | | | | | | |
| Security | | | | | Principal
Amount
(000’s omitted) | | | Value | |
|
| Chemicals — 2.0% | |
Chemours Co. (The), 7.00%, 5/15/25 | | | | | | $ | 6,985 | | | $ | 7,229,475 | |
Nufarm Australia, Ltd./Nufarm Americas, Inc., 5.75%, 4/30/26(1) | | | | | | | 8,085 | | | | 7,589,794 | |
OCI N.V., 6.625%, 4/15/23(1) | | | | | | | 5,835 | | | | 6,002,756 | |
Olin Corp., 5.00%, 2/1/30 | | | | | | | 5,390 | | | | 4,859,516 | |
Platform Specialty Products Corp., 6.50%, 2/1/22(1) | | | | | | | 3,538 | | | | 3,595,492 | |
PQ Corp., 6.75%, 11/15/22(1) | | | | | | | 3,150 | | | | 3,256,312 | |
SPCM SA, 4.875%, 9/15/25(1) | | | | | | | 4,070 | | | | 3,774,925 | |
Starfruit Finco B.V./Starfruit US Holdco, LLC, 6.50%, 10/1/26(4) | | | EUR | | | | 9,645 | * | | | 10,716,849 | |
Starfruit Finco B.V./Starfruit US Holdco, LLC, 6.50%, 10/1/26(1) | | | EUR | | | | 2,970 | * | | | 3,300,056 | |
Starfruit Finco B.V./Starfruit US Holdco, LLC, 8.00%, 10/1/26(1) | | | | | | | 3,123 | | | | 3,037,118 | |
Tronox, Inc., 6.50%, 4/15/26(1) | | | | | | | 6,536 | | | | 5,996,780 | |
Tronox Finance PLC, 5.75%, 10/1/25(1) | | | | | | | 5,835 | | | | 5,134,800 | |
Valvoline, Inc., 5.50%, 7/15/24 | | | | | | | 2,810 | | | | 2,799,463 | |
Venator Finance S.a.r.l./Venator Materials, LLC, 5.75%, 7/15/25(1) | | | | | | | 6,000 | | | | 5,145,000 | |
Versum Materials, Inc., 5.50%, 9/30/24(1) | | | | | | | 9,540 | | | | 9,468,450 | |
W.R. Grace & Co., 5.125%, 10/1/21(1) | | | | | | | 9,590 | | | | 9,685,900 | |
W.R. Grace & Co., 5.625%, 10/1/24(1) | | | | | | | 2,500 | | | | 2,553,125 | |
| | | | | | | | | | | $ | 94,145,811 | |
|
| Consumer Products — 1.3% | |
Central Garden & Pet Co., 6.125%, 11/15/23 | | | | | | $ | 7,150 | | | $ | 7,310,875 | |
Energizer Gamma Acquisition B.V., 4.625%, 7/15/26(1) | | | EUR | | | | 20,435 | * | | | 23,770,644 | |
Energizer Gamma Acquisition B.V., 4.625%, 7/15/26(4) | | | EUR | | | | 1,000 | * | | | 1,163,232 | |
Energizer Gamma Acquisition, Inc., 6.375%, 7/15/26(1) | | | | | | | 12,900 | | | | 12,932,250 | |
Spectrum Brands, Inc., 5.75%, 7/15/25 | | | | | | | 14,685 | | | | 14,317,875 | |
| | | | | | | | | | | $ | 59,494,876 | |
|
| Containers — 2.6% | |
ARD Finance SA, 7.125%, (7.125% Cash or 7.875% PIK), 9/15/23(5) | | | | | | $ | 13,975 | | | $ | 13,625,625 | |
Ardagh Packaging Finance PLC/Ardagh Holdings USA, Inc., 4.25%, 9/15/22(1) | | | | | | | 3,020 | | | | 2,936,950 | |
Ardagh Packaging Finance PLC/Ardagh Holdings USA, Inc.,
4.625%, 5/15/23(1) | | | | | | | 13,015 | | | | 12,689,625 | |
Ardagh Packaging Finance PLC/Ardagh Holdings USA, Inc., 7.25%, 5/15/24(1) | | | | | | | 18,000 | | | | 18,157,500 | |
Berry Global, Inc., 4.50%, 2/15/26(1) | | | | | | | 8,524 | | | | 7,991,250 | |
Berry Global, Inc., 6.00%, 10/15/22 | | | | | | | 10,130 | | | | 10,370,587 | |
| | | | | | | | | | | | |
| Security | | | | | Principal
Amount
(000’s omitted) | | | Value | |
|
| Containers (continued) | |
BWAY Holding Co., 5.50%, 4/15/24(1) | | | | | | $ | 4,085 | | | $ | 3,931,813 | |
BWAY Holding Co., 7.25%, 4/15/25(1) | | | | | | | 8,058 | | | | 7,655,100 | |
Crown Americas, LLC/Crown Americas
Capital Corp., V, 4.25%, 9/30/26 | | | | | | | 4,555 | | | | 4,145,050 | |
Crown Americas, LLC/Crown Americas
Capital Corp., VI, 4.75%, 2/1/26(1) | | | | | | | 5,205 | | | | 4,925,231 | |
Owens-Brockway Glass Container, Inc., 5.875%, 8/15/23(1) | | | | | | | 17,425 | | | | 17,425,000 | |
Owens-Brockway Glass Container, Inc., 6.375%, 8/15/25(1) | | | | | | | 4,160 | | | | 4,201,600 | |
Reynolds Group Issuer, Inc./Reynolds Group Issuer, LLC, 5.125%, 7/15/23(1) | | | | | | | 7,650 | | | | 7,497,000 | |
Reynolds Group Issuer, Inc./Reynolds Group Issuer, LLC, 6.875%, 2/15/21 | | | | | | | 2,230 | | | | 2,249,480 | |
Reynolds Group Issuer, Inc./Reynolds Group Issuer, LLC, 7.00%, 7/15/24(1) | | | | | | | 1,965 | | | | 1,973,597 | |
| | | | | | | | | | | $ | 119,775,408 | |
|
| Diversified Financial Services — 2.4% | |
Alliance Data Systems Corp., 5.875%, 11/1/21(1) | | | | | | $ | 10,370 | | | $ | 10,575,326 | |
DAE Funding, LLC, 4.50%, 8/1/22(1) | | | | | | | 7,630 | | | | 7,458,325 | |
DAE Funding, LLC, 5.00%, 8/1/24(1) | | | | | | | 12,725 | | | | 12,438,688 | |
Icahn Enterprises, L.P./Icahn Enterprises
Finance Corp., 6.25%, 2/1/22 | | | | | | | 16,370 | | | | 16,567,422 | |
Icahn Enterprises, L.P./Icahn Enterprises
Finance Corp., 6.375%, 12/15/25 | | | | | | | 5,685 | | | | 5,663,681 | |
MSCI, Inc., 5.75%, 8/15/25(1) | | | | | | | 5,390 | | | | 5,565,175 | |
Navient Corp., 5.50%, 1/15/19 | | | | | | | 2,170 | | | | 2,180,850 | |
Navient Corp., 6.75%, 6/15/26 | | | | | | | 9,310 | | | | 8,914,325 | |
Navient Corp., 7.25%, 1/25/22 | | | | | | | 1,240 | | | | 1,294,250 | |
Navient Corp., 8.00%, 3/25/20 | | | | | | | 10,785 | | | | 11,283,806 | |
Park Aerospace Holdings, Ltd., 5.25%, 8/15/22(1) | | | | | | | 20,950 | | | | 20,871,438 | |
Park Aerospace Holdings, Ltd., 5.50%, 2/15/24(1) | | | | | | | 10,260 | | | | 10,185,615 | |
| | | | | | | | | | | $ | 112,998,901 | |
|
| Diversified Media — 0.8% | |
Clear Channel Worldwide Holdings, Inc., Series A, 6.50%, 11/15/22 | | | | | | $ | 6,075 | | | $ | 6,128,156 | |
Clear Channel Worldwide Holdings, Inc., Series B, 6.50%, 11/15/22 | | | | | | | 11,805 | | | | 12,043,461 | |
MDC Partners, Inc., 6.50%, 5/1/24(1) | | | | | | | 17,074 | | | | 14,086,050 | |
Nielsen Co. Luxembourg S.a.r.l. (The), 5.50%, 10/1/21(1) | | | | | | | 5,585 | | | | 5,626,888 | |
| | | | | | | | | | | $ | 37,884,555 | |
| | | | |
| | 23 | | See Notes to Financial Statements. |
Boston Income Portfolio
October 31, 2018
Portfolio of Investments — continued
| | | | | | | | | | |
| Security | | | | Principal
Amount
(000’s omitted) | | | Value | |
|
| Energy — 15.6% | |
Aker BP ASA, 5.875%, 3/31/25(1) | | | | $ | 4,445 | | | $ | 4,500,563 | |
AmeriGas Partners, L.P./AmeriGas Finance Corp., 5.50%, 5/20/25 | | | | | 5,305 | | | | 4,986,700 | |
AmeriGas Partners, L.P./AmeriGas Finance Corp., 5.625%, 5/20/24 | | | | | 1,553 | | | | 1,498,645 | |
Andeavor Logistics, L.P./Tesoro Logistics Finance Corp., 6.375%, 5/1/24 | | | | | 5,160 | | | | 5,467,020 | |
Antero Midstream Partners, L.P./Antero Midstream Finance Corp., 5.375%, 9/15/24 | | | | | 7,590 | | | | 7,438,200 | |
Antero Resources Corp., 5.375%, 11/1/21 | | | | | 8,635 | | | | 8,656,588 | |
Antero Resources Corp., 5.625%, 6/1/23 | | | | | 2,770 | | | | 2,776,925 | |
Ascent Resources Utica Holdings, LLC/ARU Finance Corp., 7.00%, 11/1/26(1) | | | | | 13,763 | | | | 13,384,517 | |
Berry Petroleum Co., LLC, 7.00%, 2/15/26(1) | | | | | 9,470 | | | | 9,434,014 | |
Canbriam Energy, Inc., 9.75%, 11/15/19(1) | | | | | 19,215 | | | | 18,974,812 | |
Centennial Resource Production, LLC, 5.375%, 1/15/26(1) | | | | | 4,745 | | | | 4,650,100 | |
Cheniere Corpus Christi Holdings, LLC, 5.875%, 3/31/25 | | | | | 11,840 | | | | 12,195,200 | |
Cheniere Corpus Christi Holdings, LLC, 7.00%, 6/30/24 | | | | | 17,635 | | | | 19,111,931 | |
Cheniere Energy Partners, L.P., 5.25%, 10/1/25 | | | | | 4,600 | | | | 4,525,250 | |
Cheniere Energy Partners, L.P., 5.625%, 10/1/26(1) | | | | | 8,670 | | | | 8,561,625 | |
Chesapeake Energy Corp., 7.00%, 10/1/24 | | | | | 3,647 | | | | 3,569,501 | |
Chesapeake Energy Corp.,
8.00%, 12/15/22(1) | | | | | 2,069 | | | | 2,162,105 | |
CrownRock, L.P./CrownRock Finance, Inc., 5.625%, 10/15/25(1) | | | | | 36,320 | | | | 34,640,200 | |
CVR Refining, LLC/Coffeyville Finance, Inc., 6.50%, 11/1/22 | | | | | 13,837 | | | | 13,992,666 | |
Denbury Resources, Inc., 9.00%, 5/15/21(1) | | | | | 1,625 | | | | 1,704,219 | |
Diamondback Energy, Inc., 4.75%, 11/1/24 | | | | | 3,690 | | | | 3,597,750 | |
Diamondback Energy, Inc., 5.375%, 5/31/25 | | | | | 9,445 | | | | 9,421,387 | |
Endeavor Energy Resources, L.P./EER Finance, Inc., 5.50%, 1/30/26(1) | | | | | 7,380 | | | | 7,619,850 | |
Endeavor Energy Resources, L.P./EER Finance, Inc., 5.75%, 1/30/28(1) | | | | | 9,840 | | | | 10,209,000 | |
Energy Transfer, L.P., 5.875%, 1/15/24 | | | | | 7,810 | | | | 8,220,025 | |
Energy Transfer, L.P., 7.50%, 10/15/20 | | | | | 7,970 | | | | 8,458,163 | |
Energy Transfer Operating, L.P., Series A, 6.25% to 2/15/23(2)(3) | | | | | 5,295 | | | | 4,960,753 | |
EP Energy, LLC/Everest Acquisition Finance, Inc., 7.75%, 5/15/26(1) | | | | | 4,380 | | | | 4,373,167 | |
EP Energy, LLC/Everest Acquisition Finance, Inc., 8.00%, 11/29/24(1) | | | | | 6,610 | | | | 6,411,700 | |
EP Energy, LLC/Everest Acquisition Finance, Inc., 8.00%, 2/15/25(1) | | | | | 6,860 | | | | 4,647,650 | |
Extraction Oil & Gas, Inc., 5.625%, 2/1/26(1) | | | | | 16,995 | | | | 14,445,750 | |
| | | | | | | | | | |
| Security | | | | Principal
Amount
(000’s omitted) | | | Value | |
|
| Energy (continued) | |
Extraction Oil & Gas, Inc., 7.375%, 5/15/24(1) | | | | $ | 3,925 | | | $ | 3,699,313 | |
Great Western Petroleum, LLC/Great Western Finance Corp., 9.00%, 9/30/21(1) | | | | | 18,251 | | | | 17,429,705 | |
Gulfport Energy Corp., 6.00%, 10/15/24 | | | | | 7,730 | | | | 7,285,525 | |
Gulfport Energy Corp., 6.625%, 5/1/23 | | | | | 5,710 | | | | 5,738,550 | |
Hilcorp Energy I, L.P./Hilcorp Finance Co., 6.25%, 11/1/28(1) | | | | | 8,606 | | | | 8,294,119 | |
Holly Energy Partners, L.P./Holly Energy Finance Corp., 6.00%, 8/1/24(1) | | | | | 3,935 | | | | 3,964,513 | |
Jagged Peak Energy, LLC, 5.875%, 5/1/26(1) | | | | | 2,010 | | | | 1,964,775 | |
Matador Resources Co., 5.875%, 9/15/26(1) | | | | | 15,245 | | | | 14,940,100 | |
Moss Creek Resources Holdings, Inc., 7.50%, 1/15/26(1) | | | | | 14,235 | | | | 13,768,092 | |
Nabors Industries, Inc., 4.625%, 9/15/21 | | | | | 1,725 | | | | 1,668,816 | |
Nabors Industries, Inc., 5.75%, 2/1/25 | | | | | 12,280 | | | | 11,364,951 | |
Neptune Energy Bondco PLC, 6.625%, 5/15/25(1) | | | | | 16,686 | | | | 16,289,707 | |
Newfield Exploration Co., 5.625%, 7/1/24 | | | | | 6,100 | | | | 6,298,250 | |
NGPL PipeCo, LLC, 4.375%, 8/15/22(1) | | | | | 2,440 | | | | 2,421,700 | |
Nine Energy Service, Inc., 8.75%, 11/1/23(1) | | | | | 4,270 | | | | 4,350,063 | |
Oasis Petroleum, Inc., 6.875%, 3/15/22 | | | | | 2,919 | | | | 2,940,893 | |
Oasis Petroleum, Inc., 6.875%, 1/15/23 | | | | | 16,210 | | | | 16,372,100 | |
Parsley Energy, LLC/Parsley Finance Corp., 5.25%, 8/15/25(1) | | | | | 10,260 | | | | 9,965,025 | |
Parsley Energy, LLC/Parsley Finance Corp., 5.375%, 1/15/25(1) | | | | | 9,390 | | | | 9,225,675 | |
Parsley Energy, LLC/Parsley Finance Corp., 5.625%, 10/15/27(1) | | | | | 6,671 | | | | 6,592,749 | |
Parsley Energy, LLC/Parsley Finance Corp., 6.25%, 6/1/24(1) | | | | | 10,105 | | | | 10,408,150 | |
PBF Holding Co., LLC/PBF Finance Corp., 7.00%, 11/15/23 | | | | | 13,780 | | | | 14,296,750 | |
PBF Holding Co., LLC/PBF Finance Corp., 7.25%, 6/15/25 | | | | | 13,889 | | | | 14,340,392 | |
PBF Logistics, L.P./PBF Logistics Finance Corp., 6.875%, 5/15/23 | | | | | 14,565 | | | | 14,892,712 | |
Plains All American Pipeline, L.P., Series B, 6.125% to 11/15/22(2)(3) | | | | | 13,365 | | | | 12,596,512 | |
Precision Drilling Corp., 6.50%, 12/15/21 | | | | | 917 | | | | 928,594 | |
Precision Drilling Corp., 7.125%, 1/15/26(1) | | | | | 3,570 | | | | 3,552,150 | |
Precision Drilling Corp., 7.75%, 12/15/23 | | | | | 695 | | | | 726,275 | |
QEP Resources, Inc., 5.625%, 3/1/26 | | | | | 10,247 | | | | 9,683,415 | |
SESI, LLC, 7.75%, 9/15/24 | | | | | 1,615 | | | | 1,592,794 | |
Seven Generations Energy, Ltd., 5.375%, 9/30/25(1) | | | | | 15,960 | | | | 14,942,550 | |
Seven Generations Energy, Ltd., 6.875%, 6/30/23(1) | | | | | 5,520 | | | | 5,713,200 | |
Shelf Drilling Holdings, Ltd., 8.25%, 2/15/25(1) | | | | | 18,610 | | | | 18,726,312 | |
SM Energy Co., 6.125%, 11/15/22 | | | | | 2,093 | | | | 2,129,628 | |
| | | | |
| | 24 | | See Notes to Financial Statements. |
Boston Income Portfolio
October 31, 2018
Portfolio of Investments — continued
| | | | | | | | | | | | |
| Security | | | | | Principal
Amount
(000’s omitted) | | | Value | |
|
| Energy (continued) | |
SM Energy Co., 6.625%, 1/15/27 | | | | | | $ | 6,380 | | | $ | 6,443,800 | |
SM Energy Co., 6.75%, 9/15/26 | | | | | | | 1,600 | | | | 1,612,000 | |
Sunoco, L.P./Sunoco Finance Corp., 4.875%, 1/15/23(1) | | | | | | | 7,065 | | | | 6,826,556 | |
Sunoco, L.P./Sunoco Finance Corp., 5.50%, 2/15/26(1) | | | | | | | 3,061 | | | | 2,923,255 | |
Tallgrass Energy Partners, L.P./Tallgrass Energy Finance Corp.,
5.50%, 1/15/28(1) | | | | | | | 23,780 | | | | 23,567,407 | |
Targa Resources Partners, L.P./Targa Resources Partners Finance Corp., 5.875%, 4/15/26(1) | | | | | | | 6,450 | | | | 6,518,531 | |
Tervita Escrow Corp., 7.625%, 12/1/21(1) | | | | | | | 21,970 | | | | 22,409,400 | |
Transocean, Inc., 7.25%, 11/1/25(1) | | | | | | | 9,132 | | | | 8,903,700 | |
Transocean, Inc., 7.50%, 1/15/26(1) | | | | | | | 5,115 | | | | 5,038,275 | |
Transocean Guardian, Ltd., 5.875%, 1/15/24(1) | | | | | | | 7,305 | | | | 7,259,344 | |
Transocean Pontus, Ltd., 6.125%, 8/1/25(1) | | | | | | | 4,990 | | | | 4,971,288 | |
Trinidad Drilling, Ltd., 6.625%, 2/15/25(1) | | | | | | | 10,380 | | | | 10,431,900 | |
Weatherford International, Ltd., 8.25%, 6/15/23 | | | | | | | 2,745 | | | | 2,113,650 | |
Weatherford International, Ltd., 9.875%, 2/15/24 | | | | | | | 6,340 | | | | 4,945,200 | |
Whiting Petroleum Corp., 5.75%, 3/15/21 | | | | | | | 6,215 | | | | 6,277,150 | |
Whiting Petroleum Corp., 6.625%, 1/15/26 | | | | | | | 14,950 | | | | 15,024,750 | |
WildHorse Resource Development Corp., 6.875%, 2/1/25 | | | | | | | 20,891 | | | | 20,891,000 | |
Williams Cos., Inc. (The), 3.70%, 1/15/23 | | | | | | | 7,106 | | | | 6,982,794 | |
Williams Cos., Inc. (The), 4.55%, 6/24/24 | | | | | | | 10,100 | | | | 10,178,937 | |
Williams Cos., Inc. (The), 5.75%, 6/24/44 | | | | | | | 5,020 | | | | 5,054,799 | |
| | | | | | | | | | | $ | 732,073,767 | |
|
| Entertainment / Film — 0.3% | |
AMC Entertainment Holdings, Inc., 5.875%, 11/15/26 | | | | | | $ | 14,605 | | | $ | 13,436,600 | |
| | | | | | | | | | | $ | 13,436,600 | |
|
| Environmental — 1.2% | |
Advanced Disposal Services, Inc., 5.625%, 11/15/24(1) | | | | | | $ | 10,625 | | | $ | 10,385,937 | |
Covanta Holding Corp., 5.875%, 3/1/24 | | | | | | | 4,780 | | | | 4,780,000 | |
Covanta Holding Corp., 5.875%, 7/1/25 | | | | | | | 6,605 | | | | 6,423,363 | |
Covanta Holding Corp., 6.375%, 10/1/22 | | | | | | | 11,430 | | | | 11,676,459 | |
GFL Environmental, Inc., 5.375%, 3/1/23(1) | | | | | | | 11,250 | | | | 10,350,000 | |
Hulk Finance Corp., 7.00%, 6/1/26(1) | | | | | | | 4,785 | | | | 4,414,163 | |
Waste Pro USA, Inc., 5.50%, 2/15/26(1) | | | | | | | 4,485 | | | | 4,260,750 | |
Wrangler Buyer Corp., 6.00%, 10/1/25(1) | | | | | | | 4,366 | | | | 4,693,450 | |
| | | | | | | | | | | $ | 56,984,122 | |
| | | | | | | | | | | | |
| Security | | | | | Principal
Amount
(000’s omitted) | | | Value | |
|
| Food / Beverage / Tobacco — 1.6% | |
Dole Food Co., Inc., 7.25%, 6/15/25(1) | | | | | | $ | 18,570 | | | $ | 17,920,050 | |
Pilgrim’s Pride Corp., 5.875%, 9/30/27(1) | | | | | | | 6,465 | | | | 5,899,313 | |
Post Holdings, Inc., 5.00%, 8/15/26(1) | | | | | | | 9,665 | | | | 8,952,206 | |
Post Holdings, Inc., 5.50%, 3/1/25(1) | | | | | | | 12,860 | | | | 12,482,237 | |
Post Holdings, Inc., 5.625%, 1/15/28(1) | | | | | | | 7,847 | | | | 7,398,152 | |
Post Holdings, Inc., 8.00%, 7/15/25(1) | | | | | | | 3,965 | | | | 4,336,719 | |
US Foods, Inc., 5.875%, 6/15/24(1) | | | | | | | 17,514 | | | | 17,426,430 | |
| | | | | | | | | | | $ | 74,415,107 | |
|
| Gaming — 3.5% | |
Caesars Resort Collection, LLC/CRC Finco, Inc., 5.25%, 10/15/25(1) | | | | | | $ | 22,323 | | | $ | 20,830,149 | |
Eldorado Resorts, Inc., 6.00%, 4/1/25 | | | | | | | 10,470 | | | | 10,391,475 | |
Gateway Casinos & Entertainment, Ltd., 8.25%, 3/1/24(1) | | | | | | | 4,000 | | | | 4,210,000 | |
GLP Capital, L.P./GLP Financing II, Inc., 4.375%, 4/15/21 | | | | | | | 3,030 | | | | 3,035,575 | |
GLP Capital, L.P./GLP Financing II, Inc., 4.875%, 11/1/20 | | | | | | | 2,360 | | | | 2,392,450 | |
GLP Capital, L.P./GLP Financing II, Inc., 5.375%, 4/15/26 | | | | | | | 10,365 | | | | 10,326,131 | |
GLP Capital, L.P./GLP Financing II, Inc., 5.75%, 6/1/28 | | | | | | | 7,790 | | | | 7,926,325 | |
International Game Technology PLC, 6.50%, 2/15/25(1) | | | | | | | 3,560 | | | | 3,622,300 | |
Jack Ohio Finance, LLC/Jack Ohio Finance 1 Corp., 10.25%, 11/15/22(1) | | | | | | | 5,519 | | | | 6,022,609 | |
MGM Growth Properties Operating Partnership, L.P./MGP Finance Co-Issuer, Inc., 4.50%, 9/1/26 | | | | | | | 6,735 | | | | 6,128,850 | |
MGM Growth Properties Operating Partnership, L.P./MGP Finance Co-Issuer, Inc., 5.625%, 5/1/24 | | | | | | | 11,505 | | | | 11,562,525 | |
MGM Resorts International, 5.75%, 6/15/25 | | | | | | | 10,020 | | | | 9,819,600 | |
MGM Resorts International, 6.625%, 12/15/21 | | | | | | | 2,785 | | | | 2,923,387 | |
MGM Resorts International, 7.75%, 3/15/22 | | | | | | | 13,100 | | | | 14,098,875 | |
Scientific Games International, Inc., 10.00%, 12/1/22 | | | | | | | 4,980 | | | | 5,222,775 | |
Stars Group Holdings B.V./Stars Group US Co-Borrower, LLC, 7.00%, 7/15/26(1) | | | | | | | 15,680 | | | | 15,954,400 | |
Studio City Co., Ltd., 7.25%, 11/30/21(1) | | | | | | | 6,755 | | | | 6,966,499 | |
Tunica-Biloxi Gaming Authority, 3.78%, 12/15/20(1) | | | | | | | 4,930 | | | | 1,380,505 | |
VICI Properties 1, LLC/VICI FC, Inc., 8.00%, 10/15/23 | | | | | | | 16,987 | | | | 18,728,161 | |
Wynn Las Vegas, LLC/Wynn Las Vegas Capital Corp., 5.25%, 5/15/27(1) | | | | | | | 2,285 | | | | 2,070,781 | |
Wynn Macau, Ltd., 5.50%, 10/1/27(1) | | | | | | | 1,027 | | | | 929,435 | |
| | | | | | | | | | | $ | 164,542,807 | |
| | | | |
| | 25 | | See Notes to Financial Statements. |
Boston Income Portfolio
October 31, 2018
Portfolio of Investments — continued
| | | | | | | | | | |
| Security | | | | Principal
Amount
(000’s omitted) | | | Value | |
|
| Health Care — 11.9% | |
Bausch Health Cos., Inc., 5.50%, 3/1/23(1) | | | | $ | 4,520 | | | $ | 4,299,650 | |
Bausch Health Cos., Inc., 5.50%, 11/1/25(1) | | | | | 4,795 | | | | 4,717,081 | |
Bausch Health Cos., Inc., 5.625%, 12/1/21(1) | | | | | 4,230 | | | | 4,182,413 | |
Bausch Health Cos., Inc., 5.875%, 5/15/23(1) | | | | | 11,210 | | | | 10,761,600 | |
Bausch Health Cos., Inc., 6.125%, 4/15/25(1) | | | | | 2,420 | | | | 2,231,724 | |
Bausch Health Cos., Inc., 6.50%, 3/15/22(1) | | | | | 10,220 | | | | 10,603,250 | |
Bausch Health Cos., Inc., 7.00%, 3/15/24(1) | | | | | 20,550 | | | | 21,571,129 | |
Bausch Health Cos., Inc., 7.50%, 7/15/21(1) | | | | | 5,709 | | | | 5,808,908 | |
Bausch Health Cos., Inc., 8.50%, 1/31/27(1) | | | | | 11,745 | | | | 11,979,900 | |
Bausch Health Cos., Inc., 9.00%, 12/15/25(1) | | | | | 16,210 | | | | 16,959,712 | |
Bausch Health Cos., Inc., 9.25%, 4/1/26(1) | | | | | 4,735 | | | | 4,977,669 | |
Carriage Services, Inc., 6.625%, 6/1/26(1) | | | | | 7,130 | | | | 7,183,475 | |
Catalent Pharma Solutions, Inc., 4.875%, 1/15/26(1) | | | | | 16,390 | | | | 15,447,575 | |
Centene Corp., 4.75%, 5/15/22 | | | | | 4,335 | | | | 4,362,094 | |
Centene Corp., 4.75%, 1/15/25 | | | | | 18,525 | | | | 18,343,640 | |
Centene Corp., 5.375%, 6/1/26(1) | | | | | 18,665 | | | | 18,991,637 | |
Centene Corp., 6.125%, 2/15/24 | | | | | 9,335 | | | | 9,778,413 | |
Charles River Laboratories International, Inc., 5.50%, 4/1/26(1) | | | | | 3,595 | | | | 3,595,000 | |
CHS/Community Health Systems, Inc., 6.25%, 3/31/23 | | | | | 14,915 | | | | 13,773,257 | |
Eagle Holding Co. II, LLC, 7.625%, (7.625% Cash or 8.375% PIK), 5/15/22(1)(5) | | | | | 9,090 | | | | 9,158,175 | |
Envision Healthcare Corp.,
8.75%, 10/15/26(1) | | | | | 22,169 | | | | 21,559,352 | |
HCA, Inc., 5.00%, 3/15/24 | | | | | 4,635 | | | | 4,701,628 | |
HCA, Inc., 5.25%, 6/15/26 | | | | | 11,030 | | | | 11,250,600 | |
HCA, Inc., 5.375%, 9/1/26 | | | | | 11,055 | | | | 10,999,725 | |
HCA, Inc., 5.625%, 9/1/28 | | | | | 13,635 | | | | 13,532,737 | |
HCA, Inc., 5.875%, 2/15/26 | | | | | 13,250 | | | | 13,581,250 | |
HCA, Inc., 7.50%, 2/15/22 | | | | | 10,400 | | | | 11,310,000 | |
HCA Healthcare, Inc., 6.25%, 2/15/21 | | | | | 18,865 | | | | 19,643,181 | |
Hologic, Inc., 4.375%, 10/15/25(1) | | | | | 5,535 | | | | 5,216,738 | |
Jaguar Holding Co. II/Pharmaceutical Product Development, LLC, 6.375%, 8/1/23(1) | | | | | 28,220 | | | | 28,282,084 | |
Kinetic Concepts, Inc./KCI USA, Inc., 7.875%, 2/15/21(1) | | | | | 8,735 | | | | 8,942,456 | |
Kinetic Concepts, Inc./KCI USA, Inc., 12.50%, 11/1/21(1) | | | | | 21,680 | | | | 23,522,800 | |
MPH Acquisition Holdings, LLC, 7.125%, 6/1/24(1) | | | | | 54,780 | | | | 55,783,570 | |
Polaris Intermediate Corp., 8.50%, (8.50% Cash or 9.25% PIK), 12/1/22(1)(5) | | | | | 20,565 | | | | 21,156,244 | |
Syneos Health, Inc./inVentiv Health, Inc./inVentiv Health Clinical, Inc., 7.50%, 10/1/24(1) | | | | | 12,702 | | | | 13,432,365 | |
Team Health Holdings, Inc.,
6.375%, 2/1/25(1) | | | | | 12,045 | | | | 10,418,925 | |
Teleflex, Inc., 4.625%, 11/15/27 | | | | | 7,455 | | | | 6,979,744 | |
Teleflex, Inc., 4.875%, 6/1/26 | | | | | 3,585 | | | | 3,513,300 | |
| | | | | | | | | | | | |
| Security | | | | | Principal
Amount
(000’s omitted) | | | Value | |
|
| Health Care (continued) | |
Teleflex, Inc., 5.25%, 6/15/24 | | | | | | $ | 4,200 | | | $ | 4,263,000 | |
Tenet Healthcare Corp., 6.00%, 10/1/20 | | | | | | | 12,205 | | | | 12,529,043 | |
Tenet Healthcare Corp., 6.75%, 6/15/23 | | | | | | | 4,275 | | | | 4,279,061 | |
Tenet Healthcare Corp., 7.50%, 1/1/22(1) | | | | | | | 5,135 | | | | 5,369,284 | |
Tenet Healthcare Corp., 8.125%, 4/1/22 | | | | | | | 9,000 | | | | 9,405,000 | |
Teva Pharmaceutical Finance Netherlands III B.V., 3.15%, 10/1/26 | | | | | | | 2,185 | | | | 1,783,113 | |
Teva Pharmaceutical Finance Netherlands III B.V., 6.75%, 3/1/28 | | | | | | | 4,576 | | | | 4,687,309 | |
WellCare Health Plans, Inc., 5.25%, 4/1/25 | | | | | | | 25,035 | | | | 25,035,000 | |
WellCare Health Plans, Inc.,
5.375%, 8/15/26(1) | | | | | | | 8,355 | | | | 8,355,000 | |
| | | | | | | | | | | $ | 558,258,811 | |
|
| Homebuilders / Real Estate — 1.0% | |
Five Point Operating Co., L.P./Five Point
Capital Corp., 7.875%, 11/15/25(1) | | | | | | $ | 14,085 | | | $ | 13,989,222 | |
Greystar Real Estate Partners, LLC, 5.75%, 12/1/25(1) | | | | | | | 15,666 | | | | 15,235,185 | |
Mattamy Group Corp., 6.875%, 12/15/23(1) | | | | | | | 3,319 | | | | 3,248,471 | |
TRI Pointe Group, Inc./TRI Pointe Homes, Inc., 4.375%, 6/15/19 | | | | | | | 9,190 | | | | 9,224,463 | |
TRI Pointe Group, Inc./TRI Pointe Homes, Inc., 5.875%, 6/15/24 | | | | | | | 3,699 | | | | 3,472,436 | |
| | | | | | | | | | | $ | 45,169,777 | |
|
| Hotels — 0.7% | |
ESH Hospitality, Inc., 5.25%, 5/1/25(1) | | | | | | $ | 15,150 | | | $ | 14,373,562 | |
Hilton Domestic Operating Co., Inc., 4.25%, 9/1/24 | | | | | | | 10,600 | | | | 10,205,680 | |
RHP Hotel Properties, L.P./RHP Finance Corp., 5.00%, 4/15/23 | | | | | | | 8,869 | | | | 8,824,655 | |
| | | | | | | | | | | $ | 33,403,897 | |
|
| Insurance — 1.2% | |
Alliant Holdings Intermediate, LLC/Alliant Holdings Co-Issuer, 8.25%, 8/1/23(1) | | | | | | $ | 24,315 | | | $ | 25,193,501 | |
Ardonagh Midco 3 PLC, 8.625%, 7/15/23(1) | | | | | | | 14,125 | | | | 13,206,875 | |
Hub International, Ltd., 7.00%, 5/1/26(1) | | | | | | | 16,440 | | | | 16,086,540 | |
| | | | | | | | | | | $ | 54,486,916 | |
|
| Leisure — 1.2% | |
Merlin Entertainments PLC,
5.75%, 6/15/26(1) | | | | | | $ | 11,256 | | | $ | 11,284,140 | |
NCL Corp., Ltd., 4.75%, 12/15/21(1) | | | | | | | 8,182 | | | | 8,202,455 | |
Viking Cruises, Ltd., 5.875%, 9/15/27(1) | | | | | | | 29,551 | | | | 28,221,205 | |
Viking Cruises, Ltd., 6.25%, 5/15/25(1) | | | | | | | 8,680 | | | | 8,723,400 | |
| | | | | | | | | | | $ | 56,431,200 | |
| | | | |
| | 26 | | See Notes to Financial Statements. |
Boston Income Portfolio
October 31, 2018
Portfolio of Investments — continued
| | | | | | | | | | | | |
| Security | | | | | Principal
Amount
(000’s omitted) | | | Value | |
|
| Metals / Mining — 3.3% | |
Alcoa Nederland Holding B.V., 6.125%, 5/15/28(1) | | | | | | $ | 6,735 | | | $ | 6,735,000 | |
Alcoa Nederland Holding B.V., 6.75%, 9/30/24(1) | | | | | | | 5,255 | | | | 5,544,025 | |
Constellium N.V., 5.875%, 2/15/26(1) | | | | | | | 9,225 | | | | 8,625,375 | |
Eldorado Gold Corp., 6.125%, 12/15/20(1) | | | | | | | 25,399 | | | | 23,748,065 | |
First Quantum Minerals, Ltd., 6.875%, 3/1/26(1) | | | | | | | 5,746 | | | | 4,984,655 | |
First Quantum Minerals, Ltd.,
7.25%, 4/1/23(1) | | | | | | | 11,215 | | | | 10,401,912 | |
First Quantum Minerals, Ltd.,
7.50%, 4/1/25(1) | | | | | | | 17,700 | | | | 15,863,625 | |
Freeport-McMoRan, Inc., 4.55%, 11/14/24 | | | | | | | 5,915 | | | | 5,493,556 | |
Freeport-McMoRan, Inc., 5.45%, 3/15/43 | | | | | | | 6,323 | | | | 5,390,358 | |
Hudbay Minerals, Inc., 7.25%, 1/15/23(1) | | | | | | | 7,640 | | | | 7,640,000 | |
Hudbay Minerals, Inc., 7.625%, 1/15/25(1) | | | | | | | 6,530 | | | | 6,578,975 | |
Imperial Metals Corp., 7.00%, 3/15/19(1) | | | | | | | 4,715 | | | | 3,253,350 | |
New Gold, Inc., 6.25%, 11/15/22(1) | | | | | | | 8,248 | | | | 7,217,000 | |
New Gold, Inc., 6.375%, 5/15/25(1) | | | | | | | 5,040 | | | | 4,063,500 | |
Novelis Corp., 5.875%, 9/30/26(1) | | | | | | | 11,570 | | | | 10,933,650 | |
Novelis Corp., 6.25%, 8/15/24(1) | | | | | | | 7,970 | | | | 7,910,225 | |
SunCoke Energy Partners, L.P./SunCoke Energy Partners Finance Corp., 7.50%, 6/15/25(1) | | | | | | | 11,070 | | | | 11,291,400 | |
Teck Resources, Ltd., 8.50%, 6/1/24(1) | | | | | | | 8,670 | | | | 9,428,625 | |
| | | | | | | | | | | $ | 155,103,296 | |
|
| Paper — 0.1% | |
Mercer International, Inc., 5.50%, 1/15/26 | | | | | | $ | 3,275 | | | $ | 3,183,955 | |
| | | | | | | | | | | $ | 3,183,955 | |
|
| Publishing / Printing — 0.2% | |
McGraw-Hill Global Education Holdings, LLC/McGraw-Hill Global Education Finance, 7.875%, 5/15/24(1) | | | | | | $ | 13,014 | | | $ | 11,126,970 | |
| | | | | | | | | | | $ | 11,126,970 | |
|
| Railroad — 0.3% | |
Watco Cos., LLC/Watco Finance Corp., 6.375%, 4/1/23(1) | | | | | | $ | 16,180 | | | $ | 16,463,150 | |
| | | | | | | | | | | $ | 16,463,150 | |
|
| Restaurants — 1.5% | |
1011778 B.C. Unlimited Liability Company/New Red Finance, Inc., 4.625%, 1/15/22(1) | | | | | | $ | 9,095 | | | $ | 9,037,019 | |
1011778 B.C. Unlimited Liability Company/New Red Finance, Inc., 5.00%, 10/15/25(1) | | | | | | | 21,520 | | | | 20,228,800 | |
Golden Nugget, Inc., 6.75%, 10/15/24(1) | | | | | | | 21,455 | | | | 21,455,000 | |
Golden Nugget, Inc., 8.75%, 10/1/25(1) | | | | | | | 14,310 | | | | 14,739,300 | |
IRB Holding Corp., 6.75%, 2/15/26(1) | | | | | | | 2,826 | | | | 2,712,960 | |
Yum! Brands, Inc., 3.875%, 11/1/20 | | | | | | | 3,280 | | | | 3,267,700 | |
| | | | | | | | | | | $ | 71,440,779 | |
| | | | | | | | | | | | |
| Security | | | | | Principal
Amount
(000’s omitted) | | | Value | |
|
| Retail — 0.9% | |
Murphy Oil USA, Inc., 6.00%, 8/15/23 | | | | | | $ | 6,605 | | | $ | 6,770,125 | |
Party City Holdings, Inc., 6.125%, 8/15/23(1) | | | | | | | 17,760 | | | | 17,804,400 | |
Party City Holdings, Inc., 6.625%, 8/1/26(1) | | | | | | | 4,355 | | | | 4,246,125 | |
PVH Corp., 7.75%, 11/15/23 | | | | | | | 13,090 | | | | 14,896,420 | |
| | | | | | | | | | | $ | 43,717,070 | |
|
| Services — 5.0% | |
Algeco Global Finance PLC,
8.00%, 2/15/23(1) | | | | | | $ | 4,374 | | | $ | 4,428,675 | |
Booz Allen Hamilton, Inc., 5.125%, 5/1/25(1) | | | | | | | 2,495 | | | | 2,441,981 | |
Cloud Crane, LLC, 10.125%, 8/1/24(1) | | | | | | | 12,125 | | | | 13,095,000 | |
Deck Chassis Acquisition, Inc., 10.00%, 6/15/23(1) | | | | | | | 13,300 | | | | 13,832,000 | |
frontdoor, Inc., 6.75%, 8/15/26(1) | | | | | | | 12,520 | | | | 12,801,700 | |
FTI Consulting, Inc., 6.00%, 11/15/22 | | | | | | | 8,505 | | | | 8,690,834 | |
Gartner, Inc., 5.125%, 4/1/25(1) | | | | | | | 3,520 | | | | 3,502,400 | |
IHS Markit, Ltd., 5.00%, 11/1/22(1) | | | | | | | 9,300 | | | | 9,539,940 | |
KAR Auction Services, Inc.,
5.125%, 6/1/25(1) | | | | | | | 11,225 | | | | 10,663,750 | |
Laureate Education, Inc., 8.25%, 5/1/25(1) | | | | | | | 28,928 | | | | 31,169,920 | |
Prime Security Services Borrower, LLC/Prime Finance, Inc.,
9.25%, 5/15/23(1) | | | | | | | 30,492 | | | | 32,297,126 | |
Sabre GLBL, Inc., 5.25%, 11/15/23(1) | | | | | | | 10,955 | | | | 10,871,523 | |
Sabre GLBL, Inc., 5.375%, 4/15/23(1) | | | | | | | 4,325 | | | | 4,346,625 | |
ServiceMaster Co., LLC (The), 7.45%, 8/15/27 | | | | | | | 19,140 | | | | 20,097,000 | |
TMS International Corp., 7.25%, 8/15/25(1) | | | | | | | 10,320 | | | | 10,294,200 | |
Vizient, Inc., 10.375%, 3/1/24(1) | | | | | | | 22,415 | | | | 24,544,425 | |
West Corp., 8.50%, 10/15/25(1) | | | | | | | 24,385 | | | | 22,129,388 | |
| | | | | | | | | | | $ | 234,746,487 | |
|
| Steel — 0.4% | |
Allegheny Ludlum, LLC, 6.95%, 12/15/25 | | | | | | $ | 2,425 | | | $ | 2,439,647 | |
Allegheny Technologies, Inc., 5.95%, 1/15/21 | | | | | | | 3,490 | | | | 3,516,175 | |
Allegheny Technologies, Inc., 7.875%, 8/15/23 | | | | | | | 12,605 | | | | 13,345,544 | |
Big River Steel, LLC/BRS Finance Corp., 7.25%, 9/1/25(1) | | | | | | | 755 | | | | 794,637 | |
| | | | | | | | | | | $ | 20,096,003 | |
|
| Technology — 6.4% | |
Camelot Finance SA, 7.875%, 10/15/24(1) | | | | | | $ | 15,949 | | | $ | 15,829,383 | |
CommScope Technologies, LLC, 5.00%, 3/15/27(1) | | | | | | | 12,245 | | | | 11,020,500 | |
CommScope Technologies, LLC, 6.00%, 6/15/25(1) | | | | | | | 19,664 | | | | 19,221,560 | |
Dell International, LLC/EMC Corp., 5.875%, 6/15/21(1) | | | | | | | 9,130 | | | | 9,278,757 | |
Dell International, LLC/EMC Corp., 6.02%, 6/15/26(1) | | | | | | | 20,410 | | | | 21,195,203 | |
Dell International, LLC/EMC Corp., 7.125%, 6/15/24(1) | | | | | | | 22,620 | | | | 23,958,125 | |
| | | | |
| | 27 | | See Notes to Financial Statements. |
Boston Income Portfolio
October 31, 2018
Portfolio of Investments — continued
| | | | | | | | | | | | |
| Security | | | | | Principal
Amount
(000’s omitted) | | | Value | |
|
| Technology (continued) | |
EIG Investors Corp., 10.875%, 2/1/24 | | | | | | $ | 16,060 | | | $ | 17,425,100 | |
Entegris, Inc., 4.625%, 2/10/26(1) | | | | | | | 9,640 | | | | 9,004,338 | |
First Data Corp., 5.00%, 1/15/24(1) | | | | | | | 12,420 | | | | 12,342,375 | |
First Data Corp., 5.375%, 8/15/23(1) | | | | | | | 7,405 | | | | 7,488,306 | |
First Data Corp., 7.00%, 12/1/23(1) | | | | | | | 13,440 | | | | 13,945,680 | |
Infor (US), Inc., 6.50%, 5/15/22 | | | | | | | 14,365 | | | | 14,400,913 | |
Infor Software Parent, LLC/Infor Software Parent, Inc., 7.125%, (7.125% Cash or 7.875% PIK), 5/1/21(1)(5) | | | | | | | 8,420 | | | | 8,504,200 | |
j2 Cloud Services, LLC/j2 Global Co-Obligor, Inc., 6.00%, 7/15/25(1) | | | | | | | 13,740 | | | | 13,671,300 | |
Riverbed Technology, Inc.,
8.875%, 3/1/23(1) | | | | | | | 21,625 | | | | 19,922,031 | |
Seagate HDD Cayman, 4.75%, 1/1/25 | | | | | | | 4,525 | | | | 4,146,503 | |
Sensata Technologies UK Financing Co. PLC, 6.25%, 2/15/26(1) | | | | | | | 16,935 | | | | 17,316,038 | |
Solera, LLC/Solera Finance, Inc., 10.50%, 3/1/24(1) | | | | | | | 10,945 | | | | 11,930,378 | |
Symantec Corp., 5.00%, 4/15/25(1) | | | | | | | 4,902 | | | | 4,623,992 | |
Vantiv, LLC/Vanity Issuer Corp., 4.375%, 11/15/25(1) | | | | | | | 7,375 | | | | 6,987,813 | |
Veritas US, Inc./Veritas Bermuda, Ltd., 7.50%, 2/1/23(1) | | | | | | | 6,555 | | | | 6,227,250 | |
Veritas US, Inc./Veritas Bermuda, Ltd., 10.50%, 2/1/24(1) | | | | | | | 17,240 | | | | 14,912,600 | |
Western Digital Corp., 4.75%, 2/15/26 | | | | | | | 16,850 | | | | 15,586,250 | |
| | | | | | | | | | | $ | 298,938,595 | |
|
| Telecommunications — 7.2% | |
CenturyLink, Inc., 6.75%, 12/1/23 | | | | | | $ | 16,848 | | | $ | 17,227,080 | |
CenturyLink, Inc., 7.50%, 4/1/24 | | | | | | | 11,410 | | | | 12,009,025 | |
Digicel, Ltd., 6.00%, 4/15/21(1) | | | | | | | 15,745 | | | | 14,347,631 | |
DKT Finance ApS, 9.375%, 6/17/23(1) | | | | | | | 3,320 | | | | 3,498,450 | |
Equinix, Inc., 5.375%, 5/15/27 | | | | | | | 7,730 | | | | 7,672,025 | |
Equinix, Inc., 5.875%, 1/15/26 | | | | | | | 13,010 | | | | 13,237,675 | |
Frontier California, Inc., 6.75%, 5/15/27 | | | | | | | 2,855 | | | | 2,576,638 | |
Frontier Communications Corp., 6.875%, 1/15/25 | | | | | | | 9,340 | | | | 5,323,800 | |
Frontier Communications Corp., 7.625%, 4/15/24 | | | | | | | 2,695 | | | | 1,630,475 | |
Frontier Communications Corp., 10.50%, 9/15/22 | | | | | | | 5,645 | | | | 4,727,688 | |
Hughes Satellite Systems Corp., 5.25%, 8/1/26 | | | | | | | 6,555 | | | | 6,251,831 | |
Hughes Satellite Systems Corp., 6.50%, 6/15/19 | | | | | | | 11,723 | | | | 11,907,344 | |
Hughes Satellite Systems Corp., 6.625%, 8/1/26 | | | | | | | 3,275 | | | | 3,127,625 | |
Intelsat Jackson Holdings SA, 5.50%, 8/1/23 | | | | | | | 6,875 | | | | 6,170,313 | |
Intelsat Jackson Holdings SA, 8.00%, 2/15/24(1) | | | | | | | 8,090 | | | | 8,484,387 | |
Intelsat Jackson Holdings SA, 8.50%, 10/15/24(1) | | | | | | | 8,704 | | | | 8,562,560 | |
Level 3 Financing, Inc., 5.25%, 3/15/26 | | | | | | | 8,495 | | | | 8,176,437 | |
Level 3 Financing, Inc., 5.375%, 1/15/24 | | | | | | | 8,975 | | | | 8,907,687 | |
Level 3 Parent, LLC, 5.75%, 12/1/22 | | | | | | | 2,300 | | | | 2,299,517 | |
| | | | | | | | | | | | |
| Security | | | | | Principal
Amount
(000’s omitted) | | | Value | |
|
| Telecommunications (continued) | |
Qualitytech, L.P./QTS Finance Corp., 4.75%, 11/15/25(1) | | | | | | $ | 2,671 | | | $ | 2,504,063 | |
SBA Communications Corp., 4.00%, 10/1/22 | | | | | | | 7,385 | | | | 7,108,062 | |
SBA Communications Corp., 4.875%, 9/1/24 | | | | | | | 3,320 | | | | 3,216,250 | |
Sprint Capital Corp., 6.875%, 11/15/28 | | | | | | | 10,245 | | | | 10,091,325 | |
Sprint Communications, Inc., 6.00%, 11/15/22 | | | | | | | 2,445 | | | | 2,474,034 | |
Sprint Communications, Inc., 7.00%, 8/15/20 | | | | | | | 4,317 | | | | 4,478,888 | |
Sprint Communications, Inc., 9.25%, 4/15/22 | | | | | | | 1,290 | | | | 1,460,925 | |
Sprint Corp., 7.125%, 6/15/24 | | | | | | | 7,445 | | | | 7,631,125 | |
Sprint Corp., 7.25%, 9/15/21 | | | | | | | 18,265 | | | | 19,109,756 | |
Sprint Corp., 7.625%, 2/15/25 | | | | | | | 14,960 | | | | 15,577,100 | |
Sprint Corp., 7.625%, 3/1/26 | | | | | | | 6,584 | | | | 6,835,015 | |
Sprint Corp., 7.875%, 9/15/23 | | | | | | | 42,779 | | | | 45,773,530 | |
T-Mobile USA, Inc., 4.50%, 2/1/26 | | | | | | | 6,770 | | | | 6,344,776 | |
T-Mobile USA, Inc., 4.75%, 2/1/28 | | | | | | | 7,115 | | | | 6,599,163 | |
T-Mobile USA, Inc., 6.375%, 3/1/25 | | | | | | | 4,120 | | | | 4,259,050 | |
T-Mobile USA, Inc., 6.50%, 1/15/26 | | | | | | | 26,120 | | | | 27,621,900 | |
Wind Tre SpA, 5.00%, 1/20/26(1) | | | | | | | 7,145 | | | | 6,116,835 | |
Zayo Group, LLC/Zayo Capital, Inc., 6.00%, 4/1/23 | | | | | | | 8,780 | | | | 8,999,500 | |
Zayo Group, LLC/Zayo Capital, Inc., 6.375%, 5/15/25 | | | | | | | 6,060 | | | | 6,219,075 | |
| | | | | | | | | | | $ | 338,558,560 | |
|
| Transportation Ex Air / Rail — 0.3% | |
XPO Logistics, Inc., 6.125%, 9/1/23(1) | | | | | | $ | 4,378 | | | $ | 4,500,365 | |
XPO Logistics, Inc., 6.50%, 6/15/22(1) | | | | | | | 11,486 | | | | 11,816,223 | |
| | | | | | | | | | | $ | 16,316,588 | |
|
| Utilities — 3.0% | |
AES Corp. (The), 4.00%, 3/15/21 | | | | | | $ | 6,990 | | | $ | 6,937,575 | |
AES Corp. (The), 5.50%, 4/15/25 | | | | | | | 2,379 | | | | 2,396,843 | |
AES Corp. (The), 6.00%, 5/15/26 | | | | | | | 19,875 | | | | 20,421,562 | |
Calpine Corp., 5.25%, 6/1/26(1) | | | | | | | 7,245 | | | | 6,683,513 | |
Calpine Corp., 5.50%, 2/1/24 | | | | | | | 1,875 | | | | 1,708,594 | |
Calpine Corp., 5.75%, 1/15/25 | | | | | | | 19,701 | | | | 17,677,707 | |
Clearway Energy Operating, LLC, 5.00%, 9/15/26 | | | | | | | 1,136 | | | | 1,062,160 | |
NextEra Energy Operating Partners, L.P., 4.25%, 9/15/24(1) | | | | | | | 4,750 | | | | 4,530,313 | |
NRG Energy, Inc., 5.75%, 1/15/28 | | | | | | | 8,150 | | | | 8,150,000 | |
NRG Energy, Inc., 7.25%, 5/15/26 | | | | | | | 16,520 | | | | 17,635,100 | |
Resideo Funding, Inc., 6.125%, 11/1/26(1) | | | | | | | 4,355 | | | | 4,388,664 | |
TerraForm Power Operating, LLC, 4.25%, 1/31/23(1) | | | | | | | 4,625 | | | | 4,393,750 | |
TerraForm Power Operating, LLC, 5.00%, 1/31/28(1) | | | | | | | 6,970 | | | | 6,255,575 | |
| | | | |
| | 28 | | See Notes to Financial Statements. |
Boston Income Portfolio
October 31, 2018
Portfolio of Investments — continued
| | | | | | | | | | | | |
| Security | | | | | Principal
Amount
(000’s omitted) | | | Value | |
|
| Utilities (continued) | |
TerraForm Power Operating, LLC, 6.625%, 6/15/25(1) | | | | | | $ | 8,790 | | | $ | 9,196,537 | |
Vistra Energy Corp., 7.375%, 11/1/22 | | | | | | | 9,265 | | | | 9,635,600 | |
Vistra Energy Corp., 7.625%, 11/1/24 | | | | | | | 9,410 | | | | 9,998,125 | |
Vistra Energy Corp., 8.125%, 1/30/26(1) | | | | | | | 8,770 | | | | 9,515,450 | |
| | | | | | | | | | | $ | 140,587,068 | |
| |
Total Corporate Bonds & Notes
(identified cost $4,141,348,309) | | | $ | 4,085,972,683 | |
|
| Senior Floating-Rate Loans— 8.0%(6) | |
| Borrower/Tranche Description | | | | | Principal
Amount
(000’s omitted) | | | Value | |
|
| Aerospace — 0.1% | |
TransDigm, Inc., Term Loan, 4.80%, (1 mo. USD LIBOR + 2.50%),
Maturing 5/30/25 | | | | | | $ | 5,327 | | | $ | 5,306,530 | |
| | | | | | | | | | | $ | 5,306,530 | |
|
| Automotive & Auto Parts — 0.4% | |
Navistar International Corp., Term Loan, 5.78%, (1 mo. USD LIBOR + 3.50%), Maturing 11/6/24 | | | | | | $ | 19,011 | | | $ | 19,058,866 | |
| | | | | | | | | | | $ | 19,058,866 | |
|
| Capital Goods — 0.1% | |
Cortes NP Acquisition Corporation, Term Loan, 6.31%, (3 mo. USD LIBOR + 4.00%), Maturing 11/30/23 | | | | | | $ | 6,882 | | | $ | 6,813,398 | |
| | | | | | | | | | | $ | 6,813,398 | |
|
| Chemicals — 0.1% | |
Starfruit Finco B.V., Term Loan, 5.51%, (1 mo. USD LIBOR + 3.25%), Maturing 10/1/25 | | | | | | $ | 6,705 | | | $ | 6,701,855 | |
| | | | | | | | | | | $ | 6,701,855 | |
|
| Consumer Products — 0.3% | |
HLF Financing S.a.r.l., Term Loan, 5.55%, (1 mo. USD LIBOR + 3.25%), Maturing 8/18/25 | | | | | | $ | 11,880 | | | $ | 11,939,400 | |
| | | | | | | | | | | $ | 11,939,400 | |
|
| Containers — 0.1% | |
BWAY Holding Co., Term Loan,
Maturing 4/3/24(7) | | | | | | $ | 6,540 | | | $ | 6,511,386 | |
| | | | | | | | | | | $ | 6,511,386 | |
| | | | | | | | | | | | |
| Borrower/Tranche Description | | | | | Principal
Amount
(000’s omitted) | | | Value | |
|
| Energy — 0.1% | |
Drillship Hydra Owners, Inc., Term Loan, 8.00%, Maturing 9/20/24(8) | | | | | | $ | 2,248 | | | $ | 2,365,786 | |
| | | | | | | | | | | $ | 2,365,786 | |
|
| Gaming — 0.3% | |
Lago Resort & Casino, LLC, Term Loan, 11.89%, (3 mo. USD LIBOR + 9.50%), Maturing 3/7/22 | | | | | | $ | 11,756 | | | $ | 11,550,073 | |
| | | | | | | | | | | $ | 11,550,073 | |
|
| Health Care — 1.1% | |
Bausch Health Companies, Inc., Term Loan, 5.27%, (1 mo. USD LIBOR + 3.00%),
Maturing 6/1/25 | | | | | | $ | 2,925 | | | $ | 2,932,111 | |
Envision Healthcare Corp., Term Loan, 6.05%, (1 mo. USD LIBOR + 3.75%), Maturing 10/10/25 | | | | | | | 10,756 | | | | 10,555,067 | |
MPH Acquisition Holdings, LLC, Term Loan, 5.14%, (3 mo. USD LIBOR + 2.75%),
Maturing 6/7/23 | | | | | | | 4,222 | | | | 4,217,983 | |
Press Ganey Holdings, Inc., Term Loan, 5.05%, (1 mo. USD LIBOR + 2.75%), Maturing 10/23/23 | | | | | | | 28,014 | | | | 28,078,180 | |
Press Ganey Holdings, Inc., Term Loan - Second Lien, 8.80%, (1 mo. USD LIBOR + 6.50%), Maturing 10/21/24 | | | | | | | 5,739 | | | | 5,796,746 | |
| | | | | | | | | | | $ | 51,580,087 | |
|
| Insurance — 0.1% | |
Hub International, Ltd., Term Loan, 5.49%, (3 mo. USD LIBOR + 3.00%),
Maturing 4/25/25 | | | | | | $ | 3,781 | | | $ | 3,776,476 | |
| | | | | | | | | | | $ | 3,776,476 | |
|
| Leisure — 0.2% | |
Peninsula Pacific Entertainment, LLC, Term Loan, Maturing 10/19/24(7) | | | | | | $ | 6,943 | | | $ | 6,925,642 | |
Peninsula Pacific Entertainment, LLC, Term Loan, Maturing 10/19/24(7) | | | | | | | 771 | | | | 769,073 | |
| | | | | | | | | | | $ | 7,694,715 | |
|
| Metals / Mining — 0.7% | |
GrafTech Finance, Inc., Term Loan, 5.80%, (1 mo. USD LIBOR + 3.50%),
Maturing 2/12/25 | | | | | | $ | 34,414 | | | $ | 34,629,465 | |
| | | | | | | | | | | $ | 34,629,465 | |
| | | | |
| | 29 | | See Notes to Financial Statements. |
Boston Income Portfolio
October 31, 2018
Portfolio of Investments — continued
| | | | | | | | | | | | |
| Borrower/Tranche Description | | | | | Principal
Amount
(000’s omitted) | | | Value | |
|
| Publishing / Printing — 0.3% | |
McGraw-Hill Global Education Holdings, LLC, Term Loan, 6.30%, (1 mo. USD LIBOR + 4.00%), Maturing 5/4/22 | | | | | | $ | 7,090 | | | $ | 6,800,995 | |
Meredith Corporation, Term Loan, 5.05%, (1 mo. USD LIBOR + 2.75%),
Maturing 1/31/25 | | | | | | | 7,011 | | | | 7,011,336 | |
| | | | | | | | | | | $ | 13,812,331 | |
|
| Services — 0.5% | |
Applied Systems, Inc., Term Loan, Maturing 9/19/24(7) | | | | | | $ | 7,024 | | | $ | 7,048,387 | |
Direct ChassisLink, Inc., Term Loan - Second Lien, 8.53%, (3 mo. USD LIBOR + 6.00%), Maturing 6/15/23 | | | | | | | 7,045 | | | | 7,106,644 | |
Trans Union, LLC, Term Loan, 4.30%, (1 mo. USD LIBOR + 2.00%),
Maturing 6/19/25 | | | | | | | 9,975 | | | | 9,972,327 | |
| | | | | | | | | | | $ | 24,127,358 | |
|
| Steel — 0.2% | |
Big River Steel, LLC, Term Loan, 7.39%, (3 mo. USD LIBOR + 5.00%),
Maturing 8/23/23 | | | | | | $ | 8,544 | | | $ | 8,661,176 | |
| | | | | | | | | | | $ | 8,661,176 | |
|
| Technology — 2.2% | |
EIG Investors Corp., Term Loan, 6.06%, (3 mo. USD LIBOR + 3.75%),
Maturing 2/9/23 | | | | | | $ | 24,602 | | | $ | 24,717,041 | |
Infor (US), Inc., Term Loan, 5.14%, (3 mo. USD LIBOR + 2.75%), Maturing 2/1/22 | | | | | | | 18,095 | | | | 18,055,408 | |
Riverbed Technology, Inc., Term Loan, 5.56%, (1 mo. USD LIBOR + 3.25%), Maturing 4/24/22 | | | | | | | 2,982 | | | | 2,970,550 | |
Solera, LLC, Term Loan, 5.05%, (1 mo. USD LIBOR + 2.75%), Maturing 3/3/23 | | | | | | | 12,589 | | | | 12,594,658 | |
SS&C Technologies, Inc., Term Loan, 4.55%, (1 mo. USD LIBOR + 2.25%), Maturing 4/16/25 | | | | | | | 6,300 | | | | 6,286,612 | |
SS&C Technologies, Inc., Term Loan, 4.55%, (1 mo. USD LIBOR + 2.25%), Maturing 4/16/25 | | | | | | | 6,657 | | | | 6,632,450 | |
SS&C Technologies Holdings Europe S.a.r.l., Term Loan, 4.55%, (1 mo. USD LIBOR + 2.25%), Maturing 4/16/25 | | | | | | | 2,638 | | | | 2,628,360 | |
VeriFone Systems, Inc., Term Loan, 6.32%, (3 mo. USD LIBOR + 4.00%), Maturing 8/20/25 | | | | | | | 12,550 | | | | 12,575,100 | |
Veritas Bermuda, Ltd., Term Loan, 6.82%, (USD LIBOR + 4.50%),
Maturing 1/27/23(9) | | | | | | | 17,535 | | | | 16,777,297 | |
| | | | | | | | | | | $ | 103,237,476 | |
| | | | | | | | | | | | |
| Borrower/Tranche Description | | | | | Principal
Amount
(000’s omitted) | | | Value | |
|
| Telecommunications — 1.2% | |
Asurion, LLC, Term Loan - Second Lien, 8.80%, (1 mo. USD LIBOR + 6.50%), Maturing 8/4/25 | | | | | | $ | 47,855 | | | $ | 49,200,922 | |
Intelsat Jackson Holdings SA, Term Loan, 6.63%, Maturing 1/2/24(8) | | | | | | | 5,420 | | | | 5,574,470 | |
| | | | | | | | | | | $ | 54,775,392 | |
| |
Total Senior Floating-Rate Loans
(identified cost $371,578,606) | | | $ | 372,541,770 | |
|
| Convertible Bonds — 0.1% | |
| Security | | | | | Principal
Amount
(000’s omitted) | | | Value | |
|
| Gaming — 0.1% | |
Caesars Entertainment Corp., 5.00%, 10/1/24 | | | | | | $ | 4,541 | | | $ | 6,495,674 | |
| |
Total Convertible Bonds
(identified cost $7,992,718) | | | $ | 6,495,674 | |
|
| Common Stocks — 0.4% | |
| Security | | | | | Shares | | | Value | |
|
| Consumer Products — 0.0%(10) | |
HF Holdings, Inc.(11)(12)(13) | | | | | | | 3,400 | | | $ | 8,398 | |
| | | | | | | | | | | $ | 8,398 | |
|
| Energy — 0.3% | |
Ascent CNR Corp., Class A(11)(12)(13) | | | | | | | 32,029,863 | | | $ | 10,249,556 | |
Nine Point Energy Holdings, Inc.(11)(12)(13) | | | | | | | 157,059 | | | | 174,335 | |
Seven Generations Energy, Ltd., Class A(11) | | | | | | | 251,036 | | | | 2,690,659 | |
| | | | | | | | | | | $ | 13,114,550 | |
|
| Gaming — 0.1% | |
Caesars Entertainment Corp.(11) | | | | | | | 769,170 | | | $ | 6,607,170 | |
New Cotai Participation Corp.,
Class B(11)(12)(13) | | | | | | | 36 | | | | 53,568 | |
| | | | | | | | | | | $ | 6,660,738 | |
|
| Technology — 0.0%(10) | |
Avaya Holdings Corp.(11) | | | | | | | 442 | | | $ | 7,258 | |
| | | | | | | | | | | $ | 7,258 | |
| |
Total Common Stocks
(identified cost $22,634,026) | | | $ | 19,790,944 | |
| | | | |
| | 30 | | See Notes to Financial Statements. |
Boston Income Portfolio
October 31, 2018
Portfolio of Investments — continued
| | | | | | | | | | | | |
| Convertible Preferred Stocks — 0.1% | |
| Security | | | | | Shares | | | Value | |
|
| Energy — 0.1% | |
Nine Point Energy Holdings, Inc., Series A, 12.00%(5)(11)(12)(13) | | | | | | | 2,928 | | | $ | 4,298,216 | |
| |
Total Convertible Preferred Stocks
(identified cost $2,928,000) | | | $ | 4,298,216 | |
|
| Miscellaneous — 0.6% | |
| Security | | | | | Principal
Amount/
Shares | | | Value | |
|
| Cable / Satellite TV — 0.0% | |
ACC Claims Holdings, LLC(11)(12) | | | | | | | 11,599,560 | | | $ | 0 | |
| | | | | | | | | | | $ | 0 | |
|
| Gaming — 0.6% | |
PGP Investors, LLC, Membership Interests(11)(12)(13) | | | | | | | 45,488 | | | $ | 27,429,433 | |
| | | | | | | | | | | $ | 27,429,433 | |
|
| Technology — 0.0% | |
Avaya, Inc., Escrow Certificates(11)(12) | | | | | | $ | 5,610,000 | | | $ | 0 | |
| | | | | | | | | | | $ | 0 | |
| |
Total Miscellaneous
(identified cost $16,657,797) | | | $ | 27,429,433 | |
|
| Short-Term Investments — 1.7% | |
| Description | | | | | Units | | | Value | |
Eaton Vance Cash Reserves Fund, LLC, 2.28%(14) | | | | | | | 81,608,186 | | | $ | 81,600,026 | |
| |
Total Short-Term Investments
(identified cost $81,606,073) | | | $ | 81,600,026 | |
| |
Total Investments — 98.0%
(identified cost $4,644,745,529) | | | $ | 4,598,128,746 | |
| |
Other Assets, Less Liabilities — 2.0% | | | $ | 93,031,780 | |
| |
Net Assets — 100.0% | | | $ | 4,691,160,526 | |
The percentage shown for each investment category in the Portfolio of Investments is based on net assets.
| | * | Principal amount is denominated in Euros. |
| | (1) | Security exempt from registration pursuant to Rule 144A under the Securities Act of 1933, as amended. These securities may be sold in certain transactions in reliance on an exemption from registration (normally to qualified institutional buyers). At October 31, 2018, the aggregate value of these securities is $2,560,436,762 or 54.6% of the Portfolio’s net assets. |
| | (2) | Security converts to floating rate after the indicated fixed-rate coupon period. |
| | (3) | Perpetual security with no stated maturity date but may be subject to calls by the issuer. |
| | (4) | Security exempt from registration under Regulation S of the Securities Act of 1933, which exempts from registration securities offered and sold outside the United States. Security may not be offered or sold in the United States except pursuant to an exemption from, or in a transaction not subject to, the registration requirements of the Securities Act of 1933. At October 31, 2018, the aggregate value of these securities is $11,880,081 or 0.3% of the Portfolio’s net assets. |
| | (5) | Represents a payment-in-kind security which may pay interest in additional principal at the issuer’s discretion. |
| | (6) | Senior floating-rate loans (Senior Loans) often require prepayments from excess cash flows or permit the borrowers to repay at their election. The degree to which borrowers repay, whether as a contractual requirement or at their election, cannot be predicted with accuracy. As a result, the actual remaining maturity may be substantially less than the stated maturities shown. However, Senior Loans will typically have an expected average life of approximately two to four years. Senior Loans typically have rates of interest which are redetermined periodically by reference to a base lending rate, plus a spread. These base lending rates are primarily the London Interbank Offered Rate (“LIBOR”) and secondarily, the prime rate offered by one or more major United States banks (the “Prime Rate”). Base lending rates may be subject to a floor, or minimum rate. |
| | (7) | This Senior Loan will settle after October 31, 2018, at which time the interest rate will be determined. |
| | (9) | The stated interest rate represents the weighted average interest rate at October 31, 2018 of contracts within the senior loan facility. Interest rates on contracts are primarily redetermined either weekly, monthly or quarterly by reference to the indicated base lending rate and spread and the reset period. |
| (10) | Amount is less than 0.05%. |
| (11) | Non-income producing security. |
| (12) | For fair value measurement disclosure purposes, security is categorized as Level 3 (see Note 9). |
| (13) | Restricted security (see Note 5). |
| (14) | Affiliated investment company, available to Eaton Vance portfolios and funds, which invests in high quality, U.S. dollar denominated money market instruments. The rate shown is the annualized seven-day yield as of October 31, 2018. |
| | | | |
| | 31 | | See Notes to Financial Statements. |
Boston Income Portfolio
October 31, 2018
Portfolio of Investments — continued
| | | | | | | | | | | | | | | | | | | | | | | | | | | | |
| Forward Foreign Currency Exchange Contracts | |
| | | | | |
| Currency Purchased | | | Currency Sold | | | Counterparty | | | Settlement
Date | | | Unrealized
Appreciation | | | Unrealized
(Depreciation) | |
| | | | | | | |
| USD | | | 2,611,255 | | | | CAD | | | | 3,420,326 | | | | State Street Bank and Trust Company | | | | 1/31/19 | | | $ | 8,291 | | | $ | — | |
| USD | | | 39,919,402 | | | | EUR | | | | 34,779,057 | | | | State Street Bank and Trust Company | | | | 1/31/19 | | | | 198,357 | | | | — | |
| | | | | | | |
| | | | | | | | | | | | | | | | | | | | | | | $ | 206,648 | | | $ | — | |
Abbreviations:
| | | | |
| LIBOR | | – | | London Interbank Offered Rate |
| PIK | | – | | Payment In Kind |
|
| Currency Abbreviations: |
| | |
| CAD | | – | | Canadian Dollar |
| EUR | | – | | Euro |
| USD | | – | | United States Dollar |
| | | | |
| | 32 | | See Notes to Financial Statements. |
Boston Income Portfolio
October 31, 2018
Statement of Assets and Liabilities
| | | | |
| Assets | | October 31, 2018 | |
Unaffiliated investments, at value (identified cost, $4,563,139,456) | | $ | 4,516,528,720 | |
Affiliated investment, at value (identified cost, $81,606,073) | | | 81,600,026 | |
Cash | | | 3,512,788 | |
Interest receivable | | | 74,283,463 | |
Dividends receivable from affiliated investment | | | 295,218 | |
Receivable for investments sold | | | 67,799,384 | |
Receivable for open forward foreign currency exchange contracts | | | 206,648 | |
Total assets | | $ | 4,744,226,247 | |
| |
| Liabilities | | | | |
Payable for investments purchased | | $ | 50,209,650 | |
Payable to affiliates: | | | | |
Investment adviser fee | | | 2,382,819 | |
Trustees’ fees | | | 8,458 | |
Accrued expenses | | | 464,794 | |
Total liabilities | | $ | 53,065,721 | |
Commitments (see Note 10) | | | | |
Net Assets applicable to investors’ interest in Portfolio | | $ | 4,691,160,526 | |
| | | | |
| | 33 | | See Notes to Financial Statements. |
Boston Income Portfolio
October 31, 2018
Statement of Operations
| | | | |
| Investment Income | | Year Ended October 31, 2018 | |
Interest and other income | | $ | 307,619,745 | |
Dividends | | | 225,842 | |
Dividends from affiliated investment | | | 3,466,740 | |
Total investment income | | $ | 311,312,327 | |
| |
| Expenses | | | | |
Investment adviser fee | | $ | 30,191,854 | |
Trustees’ fees and expenses | | | 101,500 | |
Custodian fee | | | 810,962 | |
Legal and accounting services | | | 158,996 | |
Miscellaneous | | | 147,360 | |
Total expenses | | $ | 31,410,672 | |
| |
Net investment income | | $ | 279,901,655 | |
| |
| Realized and Unrealized Gain (Loss) | | | | |
Net realized gain (loss) — | | | | |
Investment transactions | | $ | 9,172,219 | |
Investment transactions — affiliated investment | | | (41,024 | ) |
Foreign currency transactions | | | (111,724 | ) |
Forward foreign currency exchange contracts | | | 1,427,818 | |
Net realized gain | | $ | 10,447,289 | |
Change in unrealized appreciation (depreciation) — | | | | |
Investments | | $ | (262,191,958 | ) |
Investments — affiliated investment | | | (1,780 | ) |
Foreign currency | | | (9,439 | ) |
Forward foreign currency exchange contracts | | | 192,412 | |
Net change in unrealized appreciation (depreciation) | | $ | (262,010,765 | ) |
| |
Net realized and unrealized loss | | $ | (251,563,476 | ) |
| |
Net increase in net assets from operations | | $ | 28,338,179 | |
| | | | |
| | 34 | | See Notes to Financial Statements. |
Boston Income Portfolio
October 31, 2018
Statements of Changes in Net Assets
| | | | | | | | |
| | | Year Ended October 31, | |
| Increase (Decrease) in Net Assets | | 2018 | | | 2017 | |
From operations — | | | | | | | | |
Net investment income | | $ | 279,901,655 | | | $ | 340,667,510 | |
Net realized gain | | | 10,447,289 | | | | 11,226,261 | |
Net change in unrealized appreciation (depreciation) | | | (262,010,765 | ) | | | 123,308,515 | |
Net increase in net assets from operations | | $ | 28,338,179 | | | $ | 475,202,286 | |
Capital transactions — | | | | | | | | |
Contributions | | $ | 248,837,596 | | | $ | 505,774,907 | |
Withdrawals | | | (1,301,449,921 | ) | | | (1,757,976,526 | ) |
Net decrease in net assets from capital transactions | | $ | (1,052,612,325 | ) | | $ | (1,252,201,619 | ) |
| | |
Net decrease in net assets | | $ | (1,024,274,146 | ) | | $ | (776,999,333 | ) |
| | |
| Net Assets | | | | | | | | |
At beginning of year | | $ | 5,715,434,672 | | | $ | 6,492,434,005 | |
At end of year | | $ | 4,691,160,526 | | | $ | 5,715,434,672 | |
| | | | |
| | 35 | | See Notes to Financial Statements. |
Boston Income Portfolio
October 31, 2018
Financial Highlights
| | | | | | | | | | | | | | | | | | | | |
| | | Year Ended October 31, | |
| Ratios/Supplemental Data | | 2018 | | | 2017 | | | 2016 | | | 2015 | | | 2014 | |
Ratios (as a percentage of average daily net assets): | | | | | | | | | | | | | | | | | | | | |
Expenses(1) | | | 0.62 | % | | | 0.61 | % | | | 0.61 | % | | | 0.62 | % | | | 0.62 | % |
Net investment income | | | 5.49 | % | | | 5.51 | % | | | 5.79 | % | | | 5.78 | % | | | 5.81 | % |
Portfolio Turnover | | | 39 | % | | | 41 | % | | | 34 | % | | | 36 | % | | | 43 | % |
| | | | | |
Total Return | | | 0.50 | % | | | 7.94 | % | | | 7.42 | % | | | 0.28 | % | | | 5.74 | % |
| | | | | |
Net assets, end of year (000’s omitted) | | $ | 4,691,161 | | | $ | 5,715,435 | | | $ | 6,492,434 | | | $ | 5,605,271 | | | $ | 5,045,293 | |
| (1) | Excludes the effect of custody fee credits, if any, of less than 0.005%. Effective September 1, 2015, custody fee credits, which were earned on cash deposit balances, were discontinued by the custodian. |
| | | | |
| | 36 | | See Notes to Financial Statements. |
Boston Income Portfolio
October 31, 2018
Notes to Financial Statements
1 Significant Accounting Policies
Boston Income Portfolio (the Portfolio) is a Massachusetts business trust registered under the Investment Company Act of 1940, as amended (the 1940 Act), as a diversified, open-end management investment company. The Portfolio’s investment objective is to provide a high level of current income. The Portfolio’s secondary objectives are to seek growth of income and capital. The Declaration of Trust permits the Trustees to issue interests in the Portfolio. At October 31, 2018, Eaton Vance Income Fund of Boston, Eaton Vance Short Duration Strategic Income Fund and Eaton Vance International (Cayman Islands) Short Duration Strategic Income Fund held an interest of 99.9%, less than 0.05% and less than 0.05%, respectively, in the Portfolio.
The following is a summary of significant accounting policies of the Portfolio. The policies are in conformity with accounting principles generally accepted in the United States of America (U.S. GAAP). The Portfolio is an investment company and follows accounting and reporting guidance in the Financial Accounting Standards Board (FASB) Accounting Standards Codification Topic 946.
A Investment Valuation — The following methodologies are used to determine the market value or fair value of investments.
Debt Obligations. Debt obligations are generally valued on the basis of valuations provided by third party pricing services, as derived from such services’ pricing models. Inputs to the models may include, but are not limited to, reported trades, executable bid and asked prices, broker/dealer quotations, prices or yields of securities with similar characteristics, interest rates, anticipated prepayments, benchmark curves or information pertaining to the issuer, as well as industry and economic events. The pricing services may use a matrix approach, which considers information regarding securities with similar characteristics to determine the valuation for a security. Short-term debt obligations purchased with a remaining maturity of sixty days or less for which a valuation from a third party pricing service is not readily available may be valued at amortized cost, which approximates fair value.
Senior Floating-Rate Loans. Interests in senior floating-rate loans (Senior Loans) for which reliable market quotations are readily available are valued generally at the average mean of bid and ask quotations obtained from a third party pricing service. Other Senior Loans are valued at fair value by the investment adviser under procedures approved by the Trustees. In fair valuing a Senior Loan, the investment adviser utilizes one or more of the valuation techniques described in (i) through (iii) below to assess the likelihood that the borrower will make a full repayment of the loan underlying such Senior Loan relative to yields on other Senior Loans issued by companies of comparable credit quality. If the investment adviser believes that there is a reasonable likelihood of full repayment, the investment adviser will determine fair value using a matrix pricing approach that considers the yield on the Senior Loan. If the investment adviser believes there is not a reasonable likelihood of full repayment, the investment adviser will determine fair value using analyses that include, but are not limited to: (i) a comparison of the value of the borrower’s outstanding equity and debt to that of comparable public companies; (ii) a discounted cash flow analysis; or (iii) when the investment adviser believes it is likely that a borrower will be liquidated or sold, an analysis of the terms of such liquidation or sale. In certain cases, the investment adviser will use a combination of analytical methods to determine fair value, such as when only a portion of a borrower’s assets are likely to be sold. In conducting its assessment and analyses for purposes of determining fair value of a Senior Loan, the investment adviser will use its discretion and judgment in considering and appraising relevant factors. Fair value determinations are made by the portfolio managers of the Portfolio based on information available to such managers. The portfolio managers of other funds managed by the investment adviser that invest in Senior Loans may not possess the same information about a Senior Loan borrower as the portfolio managers of the Portfolio. At times, the fair value of a Senior Loan determined by the portfolio managers of other funds managed by the investment adviser that invest in Senior Loans may vary from the fair value of the same Senior Loan determined by the portfolio managers of the Portfolio. The fair value of each Senior Loan is periodically reviewed and approved by the investment adviser’s Valuation Committee and by the Trustees based upon procedures approved by the Trustees. Junior Loans (i.e., subordinated loans and second lien loans) are valued in the same manner as Senior Loans.
Equity Securities. Equity securities listed on a U.S. securities exchange generally are valued at the last sale or closing price on the day of valuation or, if no sales took place on such date, at the mean between the closing bid and asked prices on the exchange where such securities are principally traded. Equity securities listed on the NASDAQ Global or Global Select Market generally are valued at the NASDAQ official closing price. Unlisted or listed securities for which closing sales prices or closing quotations are not available are valued at the mean between the latest available bid and asked prices or, in the case of preferred equity securities that are not listed or traded in the over-the-counter market, by a third party pricing service that uses various techniques that consider factors including, but not limited to, prices or yields of securities with similar characteristics, benchmark yields, broker/dealer quotes, quotes of underlying common stock, issuer spreads, as well as industry and economic events.
Derivatives. Forward foreign currency exchange contracts are generally valued at the mean of the average bid and average asked prices that are reported by currency dealers to a third party pricing service at the valuation time. Such third party pricing service valuations are supplied for specific settlement periods and the Portfolio’s forward foreign currency exchange contracts are valued at an interpolated rate between the closest preceding and subsequent settlement period reported by the third party pricing service.
Foreign Securities and Currencies. Foreign securities and currencies are valued in U.S. dollars, based on foreign currency exchange rate quotations supplied by a third party pricing service. The pricing service uses a proprietary model to determine the exchange rate. Inputs to the model include reported trades and implied bid/ask spreads.
Affiliated Fund. The Portfolio may invest in Eaton Vance Cash Reserves Fund, LLC (Cash Reserves Fund), an affiliated investment company managed by Eaton Vance Management (EVM). While Cash Reserves Fund is not a registered money market mutual fund, it conducts all of its investment activities in accordance with the requirements of Rule 2a-7 under the 1940 Act. Investments in Cash Reserves Fund are valued at the closing net asset value per unit on the valuation day. Cash Reserves Fund generally values its investment securities based on available market quotations provided by a third party pricing service.
Boston Income Portfolio
October 31, 2018
Notes to Financial Statements — continued
Fair Valuation. Investments for which valuations or market quotations are not readily available or are deemed unreliable are valued at fair value using methods determined in good faith by or at the direction of the Trustees of the Portfolio in a manner that fairly reflects the security’s value, or the amount that the Portfolio might reasonably expect to receive for the security upon its current sale in the ordinary course. Each such determination is based on a consideration of relevant factors, which are likely to vary from one pricing context to another. These factors may include, but are not limited to, the type of security, the existence of any contractual restrictions on the security’s disposition, the price and extent of public trading in similar securities of the issuer or of comparable companies or entities, quotations or relevant information obtained from broker/dealers or other market participants, information obtained from the issuer, analysts, and/or the appropriate stock exchange (for exchange-traded securities), an analysis of the company’s or entity’s financial condition, and an evaluation of the forces that influence the issuer and the market(s) in which the security is purchased and sold.
B Investment Transactions — Investment transactions for financial statement purposes are accounted for on a trade date basis. Realized gains and losses on investments sold are determined on the basis of identified cost.
C Income — Interest income is recorded on the basis of interest accrued, adjusted for amortization of premium or accretion of discount. Fees associated with loan amendments are recognized immediately. Dividend income is recorded on the ex-dividend date for dividends received in cash and/or securities.
D Federal Taxes — The Portfolio has elected to be treated as a partnership for federal tax purposes. No provision is made by the Portfolio for federal or state taxes on any taxable income of the Portfolio because each investor in the Portfolio is ultimately responsible for the payment of any taxes on its share of taxable income. Since at least one of the Portfolio’s investors is a regulated investment company that invests all or substantially all of its assets in the Portfolio, the Portfolio normally must satisfy the applicable source of income and diversification requirements (under the Internal Revenue Code) in order for its investors to satisfy them. The Portfolio will allocate, at least annually among its investors, each investor’s distributive share of the Portfolio’s net investment income, net realized capital gains and losses and any other items of income, gain, loss, deduction or credit.
As of October 31, 2018, the Portfolio had no uncertain tax positions that would require financial statement recognition, de-recognition, or disclosure. The Portfolio files a U.S. federal income tax return annually after its fiscal year-end, which is subject to examination by the Internal Revenue Service for a period of three years from the date of filing.
E Foreign Currency Translation — Investment valuations, other assets, and liabilities initially expressed in foreign currencies are translated each business day into U.S. dollars based upon current exchange rates. Purchases and sales of foreign investment securities and income and expenses denominated in foreign currencies are translated into U.S. dollars based upon currency exchange rates in effect on the respective dates of such transactions. Recognized gains or losses on investment transactions attributable to changes in foreign currency exchange rates are recorded for financial statement purposes as net realized gains and losses on investments. That portion of unrealized gains and losses on investments that results from fluctuations in foreign currency exchange rates is not separately disclosed.
F Use of Estimates — The preparation of the financial statements in conformity with U.S. GAAP requires management to make estimates and assumptions that affect the reported amounts of assets and liabilities at the date of the financial statements and the reported amounts of income and expense during the reporting period. Actual results could differ from those estimates.
G Indemnifications — Under the Portfolio’s organizational documents, its officers and Trustees may be indemnified against certain liabilities and expenses arising out of the performance of their duties to the Portfolio. Under Massachusetts law, if certain conditions prevail, interestholders in the Portfolio could be deemed to have personal liability for the obligations of the Portfolio. However, the Portfolio’s Declaration of Trust contains an express disclaimer of liability on the part of Portfolio interestholders and the By-laws provide that the Portfolio shall assume the defense on behalf of any Portfolio interestholder. Moreover, the By-laws also provide for indemnification out of Portfolio property of any interestholder held personally liable solely by reason of being or having been an interestholder for all loss or expense arising from such liability. Additionally, in the normal course of business, the Portfolio enters into agreements with service providers that may contain indemnification clauses. The Portfolio’s maximum exposure under these arrangements is unknown as this would involve future claims that may be made against the Portfolio that have not yet occurred.
H Forward Foreign Currency Exchange Contracts — The Portfolio may enter into forward foreign currency exchange contracts for the purchase or sale of a specific foreign currency at a fixed price on a future date. The forward foreign currency exchange contracts are adjusted by the daily exchange rate of the underlying currency and any gains or losses are recorded as unrealized until such time as the contracts have been closed. Risks may arise upon entering these contracts from the potential inability of counterparties to meet the terms of their contracts and from movements in the value of a foreign currency relative to the U.S. dollar.
I When-Issued Securities and Delayed Delivery Transactions — The Portfolio may purchase or sell securities on a delayed delivery or when-issued basis. Payment and delivery may take place after the customary settlement period for that security. At the time the transaction is negotiated, the price of the security that will be delivered is fixed. The Portfolio maintains cash and/or security positions for these commitments such that sufficient liquid assets will be available to make payments upon settlement. Securities purchased on a delayed delivery or when-issued basis are marked-to-market daily and begin earning interest on settlement date. Losses may arise due to changes in the market value of the underlying securities or if the counterparty does not perform under the contract.
Boston Income Portfolio
October 31, 2018
Notes to Financial Statements — continued
2 Investment Adviser Fee and Other Transactions with Affiliates
The investment adviser fee is earned by Boston Management and Research (BMR), a subsidiary of EVM, as compensation for investment advisory services rendered to the Portfolio. Pursuant to the investment advisory agreement and subsequent fee reduction agreements between the Portfolio and BMR, the fee is computed at an annual rate of 0.625% of the Portfolio’s average daily net assets up to $1.5 billion, 0.60% from $1.5 billion up to $2 billion, 0.575% from $2 billion up to $5 billion, 0.555% from $5 billion up to $10 billion, and 0.535% of average daily net assets of $10 billion or more, and is payable monthly. The fee reductions cannot be terminated without the consent of a majority of Trustees and a majority of interestholders of the Portfolio. For the year ended October 31, 2018, the Portfolio’s investment adviser fee amounted to $30,191,854 or 0.59% of the Portfolio’s average daily net assets. The Portfolio invests its cash in Cash Reserves Fund. EVM does not currently receive a fee for advisory services provided to Cash Reserves Fund.
Trustees and officers of the Portfolio who are members of EVM’s or BMR’s organizations receive remuneration for their services to the Portfolio out of the investment adviser fee. Trustees of the Portfolio who are not affiliated with the investment adviser may elect to defer receipt of all or a percentage of their annual fees in accordance with the terms of the Trustees Deferred Compensation Plan. For the year ended October 31, 2018, no significant amounts have been deferred. Certain officers and Trustees of the Portfolio are officers of the above organizations.
3 Purchases and Sales of Investments
Purchases and sales of investments, other than short-term obligations and including maturities and principal repayments on Senior Loans, aggregated $1,881,658,584 and $2,557,681,018, respectively, for the year ended October 31, 2018.
4 Federal Income Tax Basis of Investments
The cost and unrealized appreciation (depreciation) of investments, including open derivative contracts, of the Portfolio at October 31, 2018, as determined on a federal income tax basis, were as follows:
| | | | |
| |
Aggregate cost | | $ | 4,650,679,212 | |
| |
Gross unrealized appreciation | | $ | 72,184,404 | |
Gross unrealized depreciation | | | (124,734,870 | ) |
| |
Net unrealized depreciation | | $ | (52,550,466 | ) |
5 Restricted Securities
At October 31, 2018, the Portfolio owned the following securities (representing 0.9% of net assets) which were restricted as to public resale and not registered under the Securities Act of 1933 (excluding Rule 144A securities). The Portfolio has various registration rights (exercisable under a variety of circumstances) with respect to these securities. The value of these securities is determined based on valuations provided by brokers when available, or if not available, they are valued at fair value using methods determined in good faith by or at the direction of the Trustees.
| | | | | | | | | | | | | | | | |
| Description | | Date of Acquisition | | | Shares | | | Cost | | | Value | |
| | | | |
Common Stocks | | | | | | | | | | | | | | | | |
Ascent CNR Corp., Class A | | | 4/25/16, 11/16/16 | | | | 32,029,863 | | | $ | 0 | | | $ | 10,249,556 | |
HF Holdings, Inc. | | | 10/27/09 | | | | 3,400 | | | | 182,613 | | | | 8,398 | |
New Cotai Participation Corp., Class B | | | 4/12/13 | | | | 36 | | | | 1,111,500 | | | | 53,568 | |
Nine Point Energy Holdings, Inc. | | | 7/15/14, 10/21/14 | | | | 157,059 | | | | 7,228,189 | | | | 174,335 | |
| | | | |
Total Common Stocks | | | | | | | | | | $ | 8,522,302 | | | $ | 10,485,857 | |
| | | | |
Convertible Preferred Stocks | | | | | | | | | | | | | | | | |
Nine Point Energy Holdings, Inc., Series A, 12.00% | | | 5/26/17 | | | | 2,928 | | | $ | 2,928,000 | | | $ | 4,298,216 | |
| | | | |
Total Convertible Preferred Stocks | | | | | | | | | | $ | 2,928,000 | | | $ | 4,298,216 | |
Boston Income Portfolio
October 31, 2018
Notes to Financial Statements — continued
| | | | | | | | | | | | | | | | |
| Description | | Date of Acquisition | | | Shares | | | Cost | | | Value | |
| | | | |
Miscellaneous | | | | | | | | | | | | | | | | |
PGP Investors, LLC, Membership Interests | | | 10/23/12, 2/18/15, 4/23/18 | | | | 45,488 | | | $ | 16,657,797 | | | $ | 27,429,433 | |
| | | | |
Total Miscellaneous | | | | | | | | | | $ | 16,657,797 | | | $ | 27,429,433 | |
| | | | |
Total Restricted Securities | | | | | | | | | | $ | 28,108,099 | | | $ | 42,213,506 | |
6 Financial Instruments
The Portfolio may trade in financial instruments with off-balance sheet risk in the normal course of its investing activities. These financial instruments may include forward foreign currency exchange contracts and may involve, to a varying degree, elements of risk in excess of the amounts recognized for financial statement purposes. The notional or contractual amounts of these instruments represent the investment the Portfolio has in particular classes of financial instruments and do not necessarily represent the amounts potentially subject to risk. The measurement of the risks associated with these instruments is meaningful only when all related and offsetting transactions are considered. A summary of obligations under these financial instruments at October 31, 2018 is included in the Portfolio of Investments. At October 31, 2018, the Portfolio had sufficient cash and/or securities to cover commitments under these contracts.
The Portfolio is subject to foreign exchange risk in the normal course of pursuing its investment objective. Because the Portfolio holds foreign currency denominated investments, the value of these investments and related receivables and payables may change due to future changes in foreign currency exchange rates. To hedge against this risk, the Portfolio enters into forward foreign currency exchange contracts.
The Portfolio enters into over-the-counter (OTC) derivatives that may contain provisions whereby the counterparty may terminate the contract under certain conditions, including but not limited to a decline in the Portfolio’s net assets below a certain level over a certain period of time, which would trigger a payment by the Portfolio for those derivatives in a liability position. At October 31, 2018, the Portfolio had no open derivatives with credit-related contingent features in a net liability position.
The OTC derivatives in which the Portfolio invests are subject to the risk that the counterparty to the contract fails to perform its obligations under the contract. To mitigate this risk, the Portfolio has entered into an International Swaps and Derivatives Association, Inc. Master Agreement (“ISDA Master Agreement”) or similar agreement with substantially all its derivative counterparties. An ISDA Master Agreement is a bilateral agreement between the Portfolio and a counterparty that governs certain OTC derivatives and typically contains, among other things, set-off provisions in the event of a default and/or termination event as defined under the relevant ISDA Master Agreement. Under an ISDA Master Agreement, the Portfolio may, under certain circumstances, offset with the counterparty certain derivative financial instruments’ payables and/or receivables with collateral held and/or posted and create one single net payment. The provisions of the ISDA Master Agreement typically permit a single net payment in the event of default including the bankruptcy or insolvency of the counterparty. However, bankruptcy or insolvency laws of a particular jurisdiction may impose restrictions on or prohibitions against the right of offset in bankruptcy or insolvency. Certain ISDA Master Agreements allow counterparties to OTC derivatives to terminate derivative contracts prior to maturity in the event the Portfolio’s net assets decline by a stated percentage or the Portfolio fails to meet the terms of its ISDA Master Agreements, which would cause the counterparty to accelerate payment by the Portfolio of any net liability owed to it.
The collateral requirements for derivatives traded under an ISDA Master Agreement are governed by a Credit Support Annex to the ISDA Master Agreement. Collateral requirements are determined at the close of business each day and are typically based on changes in market values for each transaction under an ISDA Master Agreement and netted into one amount for such agreement. Generally, the amount of collateral due from or to a counterparty is subject to a minimum transfer threshold amount before a transfer is required, which may vary by counterparty. Collateral pledged for the benefit of the Portfolio and/or counterparty is held in segregated accounts by the Portfolio’s custodian and cannot be sold, re-pledged, assigned or otherwise used while pledged. The portion of such collateral representing cash, if any, is reflected as deposits for derivatives collateral and, in the case of cash pledged by a counterparty for the benefit of the Portfolio, a corresponding liability on the Statement of Assets and Liabilities. Securities pledged by the Portfolio as collateral, if any, are identified as such in the Portfolio of Investments.
Boston Income Portfolio
October 31, 2018
Notes to Financial Statements — continued
The fair value of open derivative instruments (not considered to be hedging instruments for accounting disclosure purposes) and whose primary underlying risk exposure is foreign exchange risk at October 31, 2018 was as follows:
| | | | | | | | |
| | | Fair Value | |
| Derivative | | Asset Derivative | | | Liability Derivative | |
| | |
Forward foreign currency exchange contracts | | $ | 206,648 | (1) | | $ | — | |
| | |
Total Derivatives subject to master netting or similar agreements | | $ | 206,648 | | | $ | — | |
| (1) | Statement of Assets and Liabilities location: Receivable for open forward foreign currency exchange contracts. |
The Portfolio’s derivative assets at fair value by type, which are reported gross in the Statement of Assets and Liabilities, are presented in the table above. The following table presents the Portfolio’s derivative assets by counterparty, net of amounts available for offset under a master netting agreement and net of the related collateral received by the Portfolio for such assets as of October 31, 2018.
| | | | | | | | | | | | | | | | | | | | |
| Counterparty | | Derivative Assets
Subject to
Master Netting
Agreement | | | Derivatives
Available
for Offset | | | Non-cash
Collateral
Received(a) | | | Cash
Collateral
Received(a) | | | Net Amount
of Derivative
Assets(b) | |
| | | | | |
State Street Bank and Trust Company | | $ | 206,648 | | | $ | — | | | $ | (206,648 | ) | | $ | — | | | $ | — | |
| (a) | In some instances, the total collateral received and/or pledged may be more than the amount shown due to overcollateralization. |
| (b) | Net amount represents the net amount due from the counterparty in the event of default. |
The effect of derivative instruments (not considered to be hedging instruments for accounting disclosure purposes) on the Statement of Operations and whose primary underlying risk exposure is foreign exchange risk for the year ended October 31, 2018 was as follows:
| | | | | | | | |
| Derivative | | Realized Gain (Loss)
on Derivatives Recognized
in Income(1) | | | Change in Unrealized
Appreciation (Depreciation) on
Derivatives Recognized in Income(2) | |
| | |
Forward foreign currency exchange contracts | | $ | 1,427,818 | | | $ | 192,412 | |
| (1) | Statement of Operations location: Net realized gain (loss) – Forward foreign currency exchange contracts. |
| (2) | Statement of Operations location: Change in unrealized appreciation (depreciation) – Forward foreign currency exchange contracts. |
The average notional amount of forward foreign currency exchange contracts (based on the absolute value of notional amounts of currency purchased and currency sold) outstanding during the year ended October 31, 2018, which is indicative of the volume of this derivative type, was approximately $17,658,000.
7 Line of Credit
The Portfolio participates with other portfolios and funds managed by EVM and its affiliates in a $625 million unsecured line of credit agreement with a group of banks, which is in effect through October 29, 2019. Borrowings are made by the Portfolio solely to facilitate the handling of unusual and/or unanticipated short-term cash requirements. Interest is charged to the Portfolio based on its borrowings at an amount above either the Eurodollar rate or Federal Funds rate. In addition, a fee computed at an annual rate of 0.15% on the daily unused portion of the line of credit is allocated among the participating portfolios and funds at the end of each quarter. Because the line of credit is not available exclusively to the Portfolio, it may be unable to borrow some or all of its requested amounts at any particular time. The Portfolio did not have any significant borrowings or allocated fees during the year ended October 31, 2018.
Boston Income Portfolio
October 31, 2018
Notes to Financial Statements — continued
8 Credit Risk
The Portfolio primarily invests in lower rated and comparable quality unrated high yield securities. These investments have different risks than investments in debt securities rated investment grade. Risk of loss upon default by the borrower is significantly greater with respect to such debt than with other debt securities because these securities are generally unsecured and are more sensitive to adverse economic conditions, such as recession or increasing interest rates, than are investment grade issuers.
9 Fair Value Measurements
Under generally accepted accounting principles for fair value measurements, a three-tier hierarchy to prioritize the assumptions, referred to as inputs, is used in valuation techniques to measure fair value. The three-tier hierarchy of inputs is summarized in the three broad levels listed below.
| • | | Level 1 – quoted prices in active markets for identical investments |
| • | | Level 2 – other significant observable inputs (including quoted prices for similar investments, interest rates, prepayment speeds, credit risk, etc.) |
| • | | Level 3 – significant unobservable inputs (including a fund’s own assumptions in determining the fair value of investments) |
In cases where the inputs used to measure fair value fall in different levels of the fair value hierarchy, the level disclosed is determined based on the lowest level input that is significant to the fair value measurement in its entirety. The inputs or methodology used for valuing securities are not necessarily an indication of the risk associated with investing in those securities.
At October 31, 2018, the hierarchy of inputs used in valuing the Portfolio’s investments and open derivative instruments, which are carried at value, were as follows:
| | | | | | | | | | | | | | | | |
| Asset Description | | Level 1 | | | Level 2 | | | Level 3* | | | Total | |
| | | | |
Corporate Bonds & Notes | | $ | — | | | $ | 4,085,972,683 | | | $ | — | | | $ | 4,085,972,683 | |
Senior Floating-Rate Loans | | | — | | | | 372,541,770 | | | | — | | | | 372,541,770 | |
Convertible Bonds | | | — | | | | 6,495,674 | | | | — | | | | 6,495,674 | |
Common Stocks | | | 9,305,087 | | | | — | | | | 10,485,857 | | | | 19,790,944 | |
Convertible Preferred Stocks | | | — | | | | — | | | | 4,298,216 | | | | 4,298,216 | |
Miscellaneous | | | — | | | | — | | | | 27,429,433 | | | | 27,429,433 | |
Short-Term Investments | | | — | | | | 81,600,026 | | | | — | | | | 81,600,026 | |
| | | | |
Total Investments | | $ | 9,305,087 | | | $ | 4,546,610,153 | | | $ | 42,213,506 | | | $ | 4,598,128,746 | |
| | | | |
Forward Foreign Currency Exchange Contracts | | $ | — | | | $ | 206,648 | | | $ | — | | | $ | 206,648 | |
| | | | |
Total | | $ | 9,305,087 | | | $ | 4,546,816,801 | | | $ | 42,213,506 | | | $ | 4,598,335,394 | |
| * | None of the unobservable inputs for Level 3 assets, individually or collectively, had a material impact on the Portfolio. |
Level 3 investments at the beginning and/or end of the period in relation to net assets were not significant and accordingly, a reconciliation of Level 3 assets for the year ended October 31, 2018 is not presented.
10 Commitments
As of October 31, 2018, the Portfolio had a bridge loan commitment to provide temporary financing to a borrower for $16,200,000. At October 31, 2018, the Portfolio maintained sufficient liquid assets to cover its bridge loan commitment.
Boston Income Portfolio
October 31, 2018
Report of Independent Registered Public Accounting Firm
To the Trustees and Investors of Boston Income Portfolio:
Opinion on the Financial Statements and Financial Highlights
We have audited the accompanying statement of assets and liabilities of Boston Income Portfolio (the “Portfolio”), including the portfolio of investments, as of October 31, 2018, the related statement of operations for the year then ended, the statements of changes in net assets for each of the two years in the period then ended, the financial highlights for each of the five years in the period then ended, and the related notes. In our opinion, the financial statements and financial highlights present fairly, in all material respects, the financial position of the Portfolio as of October 31, 2018, and the results of its operations for the year then ended, the changes in its net assets for each of the two years in the period then ended, and the financial highlights for each of the five years in the period then ended, in conformity with accounting principles generally accepted in the United States of America.
Basis for Opinion
These financial statements and financial highlights are the responsibility of the Portfolio’s management. Our responsibility is to express an opinion on the Portfolio’s financial statements and financial highlights based on our audits. We are a public accounting firm registered with the Public Company Accounting Oversight Board (United States) (PCAOB) and are required to be independent with respect to the Portfolio in accordance with the U.S. federal securities laws and the applicable rules and regulations of the Securities and Exchange Commission and the PCAOB.
We conducted our audits in accordance with the standards of the PCAOB. Those standards require that we plan and perform the audit to obtain reasonable assurance about whether the financial statements and financial highlights are free of material misstatement, whether due to error or fraud. The Portfolio is not required to have, nor were we engaged to perform, an audit of its internal control over financial reporting. As part of our audits we are required to obtain an understanding of internal control over financial reporting but not for the purpose of expressing an opinion on the effectiveness of the Portfolio’s internal control over financial reporting. Accordingly, we express no such opinion.
Our audits included performing procedures to assess the risks of material misstatement of the financial statements and financial highlights, whether due to error or fraud, and performing procedures that respond to those risks. Such procedures included examining, on a test basis, evidence regarding the amounts and disclosures in the financial statements and financial highlights. Our audits also included evaluating the accounting principles used and significant estimates made by management, as well as evaluating the overall presentation of the financial statements and financial highlights. Our procedures included confirmation of securities and senior loans owned as of October 31, 2018, by correspondence with the custodian, brokers, and selling or agent banks; where replies were not received from brokers and selling or agent banks, we performed other auditing procedures. We believe that our audits provide a reasonable basis for our opinion. We believe that our audits provide a reasonable basis for our opinion.
/s/ Deloitte & Touche LLP
Boston, Massachusetts
December 20, 2018
We have served as the auditor of one or more Eaton Vance investment companies since 1959.
Eaton Vance Income Fund of Boston
Boston Income Portfolio
October 31, 2018
Special Meeting of Shareholders (Unaudited)
Eaton Vance Income Fund of Boston
The Fund held a Special Meeting of Shareholders on September 20, 2018 to elect the five Trustees listed below. The other Trustees named herein continue to serve as Trustees. The results of the vote with respect to the Fund were as follows:
| | | | | | | | |
| | | Number of Shares | |
| Nominee for Trustee | | For | | | Withheld | |
| | | | | | | | |
Mark R. Fetting | | | 718,894,907 | | | | 16,758,949 | |
Keith Quinton | | | 718,687,194 | | | | 16,966,663 | |
Marcus L. Smith | | | 718,702,385 | | | | 16,951,471 | |
Susan J. Sutherland | | | 718,901,364 | | | | 16,752,492 | |
Scott E. Wennerholm | | | 718,918,571 | | | | 16,735,285 | |
| Results | are rounded to the nearest whole number. |
Each nominee was also elected a Trustee of Boston Income Portfolio.
Boston Income Portfolio
The Portfolio held a Special Meeting of Interestholders on September 20, 2018 to elect the five Trustees listed below. The other Trustees named herein continue to serve as Trustees. The results of the vote with respect to the Fund’s interest in the Portfolio were as follows:
| | | | | | | | |
| | | Interest in the Portfolio | |
| Nominee for Trustee | | For | | | Withheld | |
| | | | | | | | |
Mark R. Fetting | | | 98% | | | | 2 | % |
Keith Quinton | | | 98% | | | | 2 | % |
Marcus L. Smith | | | 98% | | | | 2 | % |
Susan J. Sutherland | | | 98% | | | | 2 | % |
Scott E. Wennerholm | | | 98% | | | | 2 | % |
| Results | are rounded to the nearest whole number. |
Eaton Vance
Income Fund of Boston
October 31, 2018
Management and Organization
Fund Management. The Trustees of Eaton Vance Series Trust II (the Trust) and Boston Income Portfolio (the Portfolio) are responsible for the overall management and supervision of the Trust’s and Portfolio’s affairs. The Trustees and officers of the Trust and the Portfolio are listed below. Except as indicated, each individual has held the office shown or other offices in the same company for the last five years. Trustees and officers of the Trust and the Portfolio hold indefinite terms of office. The “Noninterested Trustees” consist of those Trustees who are not “interested persons” of the Trust and the Portfolio, as that term is defined under the 1940 Act. The business address of each Trustee and officer is Two International Place, Boston, Massachusetts 02110. As used below, “EVC” refers to Eaton Vance Corp., “EV” refers to Eaton Vance, Inc., “EVM” refers to Eaton Vance Management, “BMR” refers to Boston Management and Research and “EVD” refers to Eaton Vance Distributors, Inc. EVC and EV are the corporate parent and trustee, respectively, of EVM and BMR. EVD is the Fund’s principal underwriter, the Portfolio’s placement agent and a wholly-owned subsidiary of EVC. Each officer affiliated with Eaton Vance may hold a position with other Eaton Vance affiliates that is comparable to his or her position with EVM listed below. Each Trustee oversees 174 portfolios in the Eaton Vance Complex (including all master and feeder funds in a master feeder structure). Each officer serves as an officer of certain other Eaton Vance funds. Each Trustee and officer serves until his or her successor is elected.
| | | | | | |
| Name and Year of Birth | | Position(s) with the Trust and the Portfolio | | Trustee Since(1) | | Principal Occupation(s) and Directorships
During Past Five Years and Other Relevant Experience |
| Interested Trustee |
| | | |
Thomas E. Faust Jr. 1958 | | Trustee | | 2007 | | Chairman, Chief Executive Officer and President of EVC, Director and President of EV, Chief Executive Officer and President of EVM and BMR, and Director of EVD. Trustee and/or officer of 174 registered investment companies. Mr. Faust is an interested person because of his positions with EVM, BMR, EVD, EVC and EV, which are affiliates of the Trust and the Portfolio. Directorships in the Last Five Years.(2) Director of EVC and Hexavest Inc. (investment management firm). |
|
| Noninterested Trustees |
| | | |
Mark R. Fetting 1954 | | Trustee | | 2016 | | Private investor. Formerly held various positions at Legg Mason, Inc. (investment management firm) (2000-2012), including President, Chief Executive Officer, Director and Chairman (2008-2012), Senior Executive Vice President (2004-2008) and Executive Vice President (2001-2004). Formerly, President of Legg Mason family of funds (2001-2008). Formerly, Division President and Senior Officer of Prudential Financial Group, Inc. and related companies (investment management firm) (1991-2000). Directorships in the Last Five Years. None. |
| | | |
Cynthia E. Frost 1961 | | Trustee | | 2014 | | Private investor. Formerly, Chief Investment Officer of Brown University (university endowment) (2000-2012). Formerly, Portfolio Strategist for Duke Management Company (university endowment manager) (1995-2000). Formerly, Managing Director, Cambridge Associates (investment consulting company) (1989-1995). Formerly, Consultant, Bain and Company (management consulting firm) (1987-1989). Formerly, Senior Equity Analyst, BA Investment Management Company (1983-1985). Directorships in the Last Five Years. None. |
| | | |
George J. Gorman 1952 | | Trustee | | 2014 | | Principal at George J. Gorman LLC (consulting firm). Formerly, Senior Partner at Ernst & Young LLP (a registered public accounting firm) (1974-2009). Directorships in the Last Five Years. Formerly, Trustee of the BofA Funds Series Trust (11 funds) (2011-2014) and of the Ashmore Funds (9 funds) (2010-2014). |
| | | |
Valerie A. Mosley 1960 | | Trustee | | 2014 | | Chairwoman and Chief Executive Officer of Valmo Ventures (a consulting and investment firm). Former Partner and Senior Vice President, Portfolio Manager and Investment Strategist at Wellington Management Company, LLP (investment management firm) (1992-2012). Former Chief Investment Officer, PG Corbin Asset Management (1990-1992). Formerly worked in institutional corporate bond sales at Kidder Peabody (1986-1990). Directorships in the Last Five Years.(2) Director of Dynex Capital, Inc. (mortgage REIT) (since 2013). |
Eaton Vance
Income Fund of Boston
October 31, 2018
Management and Organization — continued
| | | | | | |
| Name and Year of Birth | | Position(s) with the Trust and the Portfolio | | Trustee Since(1) | | Principal Occupation(s) and Directorships
During Past Five Years and Other Relevant Experience |
| Noninterested Trustees (continued) |
| | | |
William H. Park 1947 | | Chairperson of the Board and Trustee | | 2016 (Chairperson); 2003 (Trustee) | | Private investor. Formerly, Consultant (management and transactional) (2012-2014). Formerly, Chief Financial Officer, Aveon Group L.P. (investment management firm) (2010-2011). Formerly, Vice Chairman, Commercial Industrial Finance Corp. (specialty finance company) (2006-2010). Formerly, President and Chief Executive Officer, Prizm Capital Management, LLC (investment management firm) (2002-2005). Formerly, Executive Vice President and Chief Financial Officer, United Asset Management Corporation (investment management firm) (1982-2001). Formerly, Senior Manager, Price Waterhouse (now PricewaterhouseCoopers) (a registered public accounting firm) (1972-1981). Directorships in the Last Five Years.(2) None. |
| | | |
Helen Frame Peters 1948 | | Trustee | | 2008 | | Professor of Finance, Carroll School of Management, Boston College. Formerly, Dean, Carroll School of Management, Boston College (2000-2002). Formerly, Chief Investment Officer, Fixed Income, Scudder Kemper Investments (investment management firm) (1998-1999). Formerly, Chief Investment Officer, Equity and Fixed Income, Colonial Management Associates (investment management firm) (1991-1998). Directorships in the Last Five Years.(2) None. |
| | | |
Keith Quinton(3) 1958 | | Trustee | | 2018 | | Independent Investment Committee Member at New Hampshire Retirement System (since 2017). Advisory Committee member at Northfield Information Services, Inc. (risk management analytics provider) (since 2016). Formerly, Portfolio Manager and Senior Quantitative Analyst at Fidelity Investments (investment management firm) (2001-2014). Directorships in the Last Five Years. Director of New Hampshire Municipal Bond Bank (since 2016). |
| | | |
Marcus L. Smith(3) 1966 | | Trustee | | 2018 | | Member of Posse Boston Advisory Board (foundation) (since 2015); Trustee at University of Mount Union (since 2008). Formerly, Portfolio Manager at MFS Investment Management (investment management firm) (1994-2017). Directorships in the Last Five Years. Director of MSCI Inc. (global provider of investment decision support tools) (since 2017). Director of DCT Industrial Trust Inc. (logistics real estate company) (since 2017). |
| | | |
Susan J. Sutherland 1957 | | Trustee | | 2015 | | Private investor. Formerly, Associate, Counsel and Partner at Skadden, Arps, Slate, Meagher & Flom LLP (law firm) (1982-2013). Directorships in the Last Five Years. Formerly, Director of Montpelier Re Holdings Ltd. (global provider of customized insurance and reinsurance products) (2013-2015). |
| | | |
Harriett Tee Taggart 1948 | | Trustee | | 2011 | | Managing Director, Taggart Associates (a professional practice firm). Formerly, Partner and Senior Vice President, Wellington Management Company, LLP (investment management firm) (1983-2006). Ms. Taggart has apprised the Board of Trustees that she intends to retire as a Trustee of all Eaton Vance Funds effective December 31, 2018. Directorships in the Last Five Years.(2) Director of Albemarle Corporation (chemicals manufacturer) (since 2007) and The Hanover Group (specialty property and casualty insurance company) (since 2009). |
| | | |
Scott E. Wennerholm 1959 | | Trustee | | 2016 | | Formerly, Trustee at Wheelock College (postsecondary institution) (2012-2018). Formerly, Consultant at GF Parish Group (executive recruiting firm) (2016-2017). Formerly, Chief Operating Officer and Executive Vice President at BNY Mellon Asset Management (investment management firm) (2005-2011). Formerly, Chief Operating Officer and Chief Financial Officer at Natixis Global Asset Management (investment management firm) (1997-2004). Formerly, Vice President at Fidelity Investments Institutional Services (investment management firm) (1994-1997). Directorships in the Last Five Years. None. |
Eaton Vance
Income Fund of Boston
October 31, 2018
Management and Organization — continued
| | | | | | |
| Name and Year of Birth | | Position(s) with the Trust and the Portfolio | | Officer
Since(4) | | Principal Occupation(s) During Past Five Years |
| Principal Officers who are not Trustees |
| | | |
Payson F. Swaffield 1956 | | President | | 2003 | | Vice President and Chief Income Investment Officer of EVM and BMR. Also Vice President of Calvert Research and Management (“CRM”). |
| | | |
Maureen A. Gemma 1960 | | Vice President, Secretary and Chief Legal Officer | | 2005 | | Vice President of EVM and BMR. Also Vice President of CRM. |
| | | |
James F. Kirchner 1967 | | Treasurer | | 2007 | | Vice President of EVM and BMR. Also Vice President of CRM. |
| | | |
Richard F. Froio 1968 | | Chief Compliance Officer | | 2017 | | Vice President of EVM and BMR since 2017. Formerly Deputy Chief Compliance Officer (Adviser/Funds) and Chief Compliance Officer (Distribution) at PIMCO (2012-2017) and Managing Director at BlackRock/Barclays Global Investors (2009-2012). |
| (1) | Year first appointed to serve as Trustee for a fund in the Eaton Vance family of funds. Each Trustee has served continuously since appointment unless indicated otherwise. |
| (2) | During their respective tenures, the Trustees (except for Mmes. Frost and Sutherland and Messrs. Fetting, Gorman, Quinton, Smith and Wennerholm) also served as Board members of one or more of the following funds (which operated in the years noted): eUnitsTM 2 Year U.S. Market Participation Trust: Upside to Cap / Buffered Downside (launched in 2012 and terminated in 2014); and eUnitsTM 2 Year U.S. Market Participation Trust II: Upside to Cap / Buffered Downside (launched in 2012 and terminated in 2014). However, Ms. Mosley did not serve as a Board member of eUnitsTM 2 Year U.S. Market Participation Trust: Upside to Cap / Buffered Downside (launched in 2012 and terminated in 2014). |
| (3) | Messrs. Quinton and Smith began serving as Trustees effective October 1, 2018. |
| (4) | Year first elected to serve as officer of a fund in the Eaton Vance family of funds when the officer has served continuously. Otherwise, year of most recent election as an officer of a fund in the Eaton Vance family of funds. Titles may have changed since initial election. |
The SAI for the Fund includes additional information about the Trustees and officers of the Fund and the Portfolio and can be obtained without charge on Eaton Vance’s website at www.eatonvance.com or by calling 1-800-262-1122.
Eaton Vance Funds
IMPORTANT NOTICES
Privacy. The Eaton Vance organization is committed to ensuring your financial privacy. Each of the financial institutions identified below has in effect the following policy (“Privacy Policy”) with respect to nonpublic personal information about its customers:
| • | | Only such information received from you, through application forms or otherwise, and information about your Eaton Vance fund transactions will be collected. This may include information such as name, address, social security number, tax status, account balances and transactions. |
| • | | None of such information about you (or former customers) will be disclosed to anyone, except as permitted by law (which includes disclosure to employees necessary to service your account). In the normal course of servicing a customer’s account, Eaton Vance may share information with unaffiliated third parties that perform various required services such as transfer agents, custodians and broker-dealers. |
| • | | Policies and procedures (including physical, electronic and procedural safeguards) are in place that are designed to protect the confidentiality of such information. |
| • | | We reserve the right to change our Privacy Policy at any time upon proper notification to you. Customers may want to review our Privacy Policy periodically for changes by accessing the link on our homepage: www.eatonvance.com. |
Our pledge of privacy applies to the following entities within the Eaton Vance organization: the Eaton Vance Family of Funds, Eaton Vance Management, Eaton Vance Investment Counsel, Eaton Vance Distributors, Inc., Eaton Vance Trust Company, Eaton Vance Management (International) Limited, Eaton Vance Advisers International Ltd., Eaton Vance Management’s Real Estate Investment Group and Boston Management and Research. In addition, our Privacy Policy applies only to those Eaton Vance customers who are individuals and who have a direct relationship with us. If a customer’s account (i.e., fund shares) is held in the name of a third-party financial advisor/broker-dealer, it is likely that only such advisor’s privacy policies apply to the customer. This notice supersedes all previously issued privacy disclosures. For more information about Eaton Vance’s Privacy Policy, please call 1-800-262-1122.
Delivery of Shareholder Documents. The Securities and Exchange Commission (SEC) permits funds to deliver only one copy of shareholder documents, including prospectuses, proxy statements and shareholder reports, to fund investors with multiple accounts at the same residential or post office box address. This practice is often called “householding” and it helps eliminate duplicate mailings to shareholders. Eaton Vance, or your financial advisor, may household the mailing of your documents indefinitely unless you instruct Eaton Vance, or your financial advisor, otherwise. If you would prefer that your Eaton Vance documents not be householded, please contact Eaton Vance at 1-800-262-1122, or contact your financial advisor. Your instructions that householding not apply to delivery of your Eaton Vance documents will typically be effective within 30 days of receipt by Eaton Vance or your financial advisor.
Portfolio Holdings. Each Eaton Vance Fund and its underlying Portfolio(s) (if applicable) will file a schedule of portfolio holdings on Form N-Q with the SEC for the first and third quarters of each fiscal year. The Form N-Q will be available on the Eaton Vance website at www.eatonvance.com, by calling Eaton Vance at 1-800-262-1122 or in the EDGAR database on the SEC’s website at www.sec.gov. Form N-Q may also be reviewed and copied at the SEC’s public reference room in Washington, D.C. (call 1-800-732-0330 for information on the operation of the public reference room).
Proxy Voting. From time to time, funds are required to vote proxies related to the securities held by the funds. The Eaton Vance Funds or their underlying Portfolios (if applicable) vote proxies according to a set of policies and procedures approved by the Funds’ and Portfolios’ Boards. You may obtain a description of these policies and procedures and information on how the Funds or Portfolios voted proxies relating to portfolio securities during the most recent 12-month period ended June 30, without charge, upon request, by calling 1-800-262-1122 and by accessing the SEC’s website at www.sec.gov.
Investment Adviser of Boston Income Portfolio
Boston Management and Research
Two International Place
Boston, MA 02110
Administrator of Eaton Vance Income Fund of Boston
Eaton Vance Management
Two International Place
Boston, MA 02110
Principal Underwriter*
Eaton Vance Distributors, Inc.
Two International Place
Boston, MA 02110
(617) 482-8260
Custodian
State Street Bank and Trust Company
State Street Financial Center, One Lincoln Street
Boston, MA 02111
Transfer Agent
BNY Mellon Investment Servicing (US) Inc.
Attn: Eaton Vance Funds
P.O. Box 9653
Providence, RI 02940-9653
(800) 262-1122
Independent Registered Public Accounting Firm
Deloitte & Touche LLP
200 Berkeley Street
Boston, MA 02116-5022
Fund Offices
Two International Place
Boston, MA 02110
| * | FINRA BrokerCheck. Investors may check the background of their Investment Professional by contacting the Financial Industry Regulatory Authority (FINRA). FINRA BrokerCheck is a free tool to help investors check the professional background of current and former FINRA-registered securities firms and brokers. FINRA BrokerCheck is available by calling 1-800-289-9999 and at www.FINRA.org. The FINRA BrokerCheck brochure describing this program is available to investors at www.FINRA.org. |

443 10.31.18
Item 2. Code of Ethics
The registrant has adopted a code of ethics applicable to its Principal Executive Officer, Principal Financial Officer and Principal Accounting Officer. The registrant undertakes to provide a copy of such code of ethics to any person upon request, without charge, by calling 1-800-262-1122. The registrant has not amended the code of ethics as described in Form N-CSR during the period covered by this report. The registrant has not granted any waiver, including an implicit waiver, from a provision of the code of ethics as described in Form N-CSR during the period covered by this report.
Item 3. Audit Committee Financial Expert
The registrant’s Board has designated George J. Gorman and William H. Park, each an independent trustee, as audit committee financial experts. Mr. Gorman is a certified public accountant who is the Principal at George J. Gorman LLC (a consulting firm). Previously, Mr. Gorman served in various capacities at Ernst & Young LLP (a registered public accounting firm), including as Senior Partner. Mr. Gorman also has experience serving as an independent trustee and audit committee financial expert of other mutual fund complexes. Mr. Park is a certified public accountant who is a private investor. Previously, he served as a consultant, as the Chief Financial Officer of Aveon Group, L.P. (an investment management firm), as the Vice Chairman of Commercial Industrial Finance Corp. (specialty finance company), as President and Chief Executive Officer of Prizm Capital Management, LLC (investment management firm), as Executive Vice President and Chief Financial Officer of United Asset Management Corporation (an institutional investment management firm) and as a Senior Manager at Price Waterhouse (now PricewaterhouseCoopers) (a registered public accounting firm).
Item 4. Principal Accountant Fees and Services
Eaton Vance Income Fund of Boston (the “Fund”) is a series of Eaton Vance Series Trust II (the “Trust”), a Massachusetts business trust, which, including the Fund, contains a total of 2 series (the “Series”). The Trust is registered under the Investment Company Act of 1940 as an open-end management investment company. This Form N-CSR relates to the Fund’s annual report.
(a)-(d)
The following table presents the aggregate fees billed to the fund for the fund’s fiscal years ended October 31, 2017 and October 31, 2018 D&T for professional services rendered for the audit of the fund’s annual financial statements and fees billed for other services rendered by D&T during such periods.
| | | | | | | | |
Eaton Vance Income Fund of Boston Fiscal Years Ended | | 10/31/17 | | | 10/31/18 | |
Audit Fees | | $ | 26,520 | | | $ | 26,520 | |
Audit-Related Fees(1) | | $ | 0 | | | $ | 0 | |
Tax Fees(2) | | $ | 14,022 | | | $ | 14,022 | |
All Other Fees(3) | | $ | 0 | | | $ | 0 | |
| | | | | | | | |
Total | | $ | 40,542 | | | $ | 40,542 | |
| | | | | | | | |
| (1) | Audit-related fees consist of the aggregate fees billed for assurance and related services that are reasonably related to the performance of the audit of financial statements and are not reported under the category of audit fees. |
| (2) | Tax fees consist of the aggregate fees billed for professional services rendered by the principal accountant relating to tax compliance, tax advice, and tax planning and specifically include fees for tax return preparation and other tax related compliance/planning matters. |
| (3) | All other fees consist of the aggregate fees billed for products and services provided by the principal accountant other than audit, audit-related, and tax services. |
The various Series comprising the Trust have differing fiscal year ends (October 31 or June 30). The following table presents the aggregate audit, audit-related, tax, and other fees billed to all of the Series in the Trust by D&T for the last two fiscal years of each Series.
| | | | | | | | | | | | | | | | |
Fiscal Years Ended | | 6/30/17 | | | 10/31/17 | | | 6/30/18 | | | 10/31/18 | |
Audit Fees | | $ | 78,070 | | | $ | 26,520 | | | $ | 78,070 | | | $ | 26,520 | |
Audit-Related Fees(1) | | $ | 0 | | | $ | 0 | | | $ | 0 | | | $ | 0 | |
Tax Fees(2) | | $ | 14,854 | | | $ | 14,022 | | | $ | 20,654 | | | $ | 14,022 | |
All Other Fees(3) | | $ | 0 | | | $ | 0 | | | $ | 0 | | | $ | 0 | |
| | | | | | | | | | | | | | | | |
Total | | $ | 92,924 | (4) | | $ | 40,542 | | | $ | 98,724 | (4) | | $ | 40,542 | |
| | | | | | | | | | | | | | | | |
| (1) | Audit-related fees consist of the aggregate fees billed for assurance and related services that are reasonably related to the performance of the audit of financial statements and are not reported under the category of audit fees. |
| (2) | Tax fees consist of the aggregate fees billed for professional services rendered by the principal accountant relating to tax compliance, tax advice, and tax planning and specifically include fees for tax return preparation and other tax related compliance/planning matters. |
| (3) | All other fees consist of the aggregate fees billed for products and services provided by the principal accountant other than audit, audit-related, and tax services. |
| (4) | Fees are paid by the Fund’s administrator pursuant to the terms of its administrative services agreement. |
(e)(1) The registrant’s audit committee has adopted policies and procedures relating to the pre-approval of services provided by the registrant’s principal accountant (the “Pre-Approval Policies”). The Pre-Approval Policies establish a framework intended to assist the audit committee in the proper discharge of its pre-approval responsibilities. As a general matter, the Pre-Approval Policies (i) specify certain types of audit, audit-related, tax, and other services determined to be pre-approved by the audit committee; and (ii) delineate specific procedures governing the mechanics of the pre-approval process, including the approval and monitoring of audit and non-audit service fees. Unless a service is specifically pre-approved under the Pre-Approval Policies, it must be separately pre-approved by the audit committee.
The Pre-Approval Policies and the types of audit and non-audit services pre-approved therein must be reviewed and ratified by the registrant’s audit committee at least annually. The registrant’s audit committee maintains full responsibility for the appointment, compensation, and oversight of the work of the registrant’s principal accountant.
(e)(2) No services described in paragraphs (b)-(d) above were approved by the registrant’s audit committee pursuant to the “de minimis exception” set forth in Rule 2-01(c)(7)(i)(C) of Regulation S-X.
(f) Not applicable.
(g) The following table presents (i) the aggregate non-audit fees (i.e., fees for audit-related, tax, and other services) billed for services rendered to all of the Series in the Trust by D&T for the last two fiscal years of each series; and (ii) the aggregate non-audit fees (i.e., fees for audit-related, tax, and other services) billed to the Eaton Vance organization by D&T for the last two fiscal years of each Series.
| | | | | | | | | | | | | | | | |
Fiscal Years Ended | | 6/30/17 | | | 10/31/17 | | | 6/30/18 | | | 10/31/18 | |
Registrant(1) | | $ | 14,854 | | | $ | 14,022 | | | $ | 20,654 | | | $ | 14,022 | |
Eaton Vance(2) | | $ | 148,018 | | | $ | 148,018 | | | $ | 51,855 | | | $ | 126,485 | |
| (1) | Includes all of the Series of the Trust. During the fiscal years reported above, certain of the Funds were “feeder” funds in a “master-feeder” fund structure or funds of funds. |
| (2) | Various subsidiaries of Eaton Vance Corp. act in either an investment advisory and/or service provider capacity with respect to the Series and/or their respective “master” funds (if applicable). |
(h) The registrant’s audit committee has considered whether the provision by the registrant’s principal accountant of non-audit services to the registrant’s investment adviser and any entity controlling, controlled by, or under common control with the adviser that provides ongoing services to the registrant that were not pre-approved pursuant to Rule 2-01(c)(7)(ii) of Regulation S-X is compatible with maintaining the principal accountant’s independence.
Item 5. Audit Committee of Listed Registrants
Not applicable.
Item 6. Schedule of Investments
Please see schedule of investments contained in the Report to Stockholders included under Item 1 of this Form N-CSR.
Item 7. Disclosure of Proxy Voting Policies and Procedures for Closed-End Management Investment Companies
Not applicable.
Item 8. Portfolio Managers of Closed-End Management Investment Companies
Not applicable.
Item 9. Purchases of Equity Securities by Closed-End Management Investment Company and Affiliated Purchasers
Not applicable.
Item 10. Submission of Matters to a Vote of Security Holders
No material changes.
Item 11. Controls and Procedures
(a) It is the conclusion of the registrant’s principal executive officer and principal financial officer that the effectiveness of the registrant’s current disclosure controls and procedures (such disclosure controls and procedures having been evaluated within 90 days of the date of this filing) provide reasonable assurance that the information required to be disclosed by the registrant has been recorded, processed, summarized and reported within the time period specified in the Commission’s rules and forms and that the information required to be disclosed by the registrant has been accumulated and communicated to the registrant’s principal executive officer and principal financial officer in order to allow timely decisions regarding required disclosure.
(b) There have been no changes in the registrant’s internal controls over financial reporting during the second fiscal quarter of the period covered by this report that has materially affected, or is reasonably likely to materially affect, the registrant’s internal control over financial reporting.
Item 12. Disclosure of Securities Lending Activities for Closed-End Management Investment Companies
Not applicable.
Item 13. Exhibits
| | |
| (a)(1) | | Registrant’s Code of Ethics – Not applicable (please see Item 2). |
| |
| (a)(2)(i) | | Treasurer’s Section 302 certification. |
| |
| (a)(2)(ii) | | President’s Section 302 certification. |
| |
| (b) | | Combined Section 906 certification. |
Signatures
Pursuant to the requirements of the Securities Exchange Act of 1934 and the Investment Company Act of 1940, the registrant has duly caused this report to be signed on its behalf by the undersigned, thereunto duly authorized.
Eaton Vance Series Trust II
| | |
| By: | | /s/ Payson F. Swaffield |
| | Payson F. Swaffield |
| | President |
| |
| Date: | | December 21, 2018 |
Pursuant to the requirements of the Securities Exchange Act of 1934 and the Investment Company Act of 1940, this report has been signed below by the following persons on behalf of the registrant and in the capacities and on the dates indicated.
| | |
| By: | | /s/ James F. Kirchner |
| | James F. Kirchner |
| | Treasurer |
| |
| Date: | | December 21, 2018 |
| |
| By: | | /s/ Payson F. Swaffield |
| | Payson F. Swaffield |
| | President |
| |
| Date: | | December 21, 2018 |