Table of Contents
UNITED STATES
SECURITIES AND EXCHANGE COMMISSION
Washington, D.C. 20549
FORM N-CSR
CERTIFIED SHAREHOLDER REPORT OF REGISTERED
MANAGEMENT INVESTMENT COMPANIES
Investment Company Act file number 811-04041
GE INVESTMENTS FUNDS, INC.
(Exact name of registrant as specified in charter)
3001 SUMMER STREET, STAMFORD, CONNECTICUT 06905
(Address of principal executive offices) (Zip code)
GE ASSET MANAGEMENT, INC.
3001 SUMMER STREET, STAMFORD, CONNECTICUT 06905
(Name and address of agent for service)
Registrant’s telephone number, including area code: 800-242-0134
Date of fiscal year end: 12/31
Date of reporting period: 06/30/11
Table of Contents
| ITEM 1. | REPORTS TO STOCKHOLDERS. |
Table of Contents
GE Investments Funds, Inc.
| U.S. Equity Fund | Letter from the Chairman | |

Michael J. Cosgrove Chairman,
GE Investments Funds, Inc.
Dear Shareholder: |
Attached is the semi-annual report for GE Investments Funds, Inc. — U.S. Equity Fund (the “Fund”) for the six-month period ended June 30, 2011. The report contains information about the performance of the Fund and other fund-specific data, along with portfolio manager commentary. We have provided
you with an overview of the investment markets, along with our investment outlook for the coming months.
Market Overview
Most major equity indices posted positive returns in the six-month period ended June 30, 2011, despite geopolitical tensions in the Middle East and North Africa, a devastating earthquake in Japan, ongoing concerns about unresolved sovereign debt issues in peripheral Europe and elevated inflation in emerging markets. Volatility increased in May and June, however, as some measures of global economic activity weakened and uncertainties over Greece’s ability to finance and service its debt rattled the financial markets. In the U.S., concerns over the end of quantitative easing by the Federal Reserve and political wrangling over the government debt ceiling further contributed to a challenging environment. The increase in risk aversion benefited the fixed income markets as many investors sought out safer investments. Toward the end of June, the Greek Parliament passed austerity measures that seemed to calm the markets and opened the way for the next round of financing from the European Central Bank and the International Monetary Fund.
Against this backdrop, financial markets posted positive results for the six- and 12-month periods ended June 30, 2011 as represented by the index returns in the below chart.
Total Returns (%) as of June 30, 2011 | 6-month | 12-month | ||||||
U.S. equities (S&P 500 Index) | 6.0 | 30.7 | ||||||
Global equities (MSCI World Index) | 5.3 | 30.5 | ||||||
International equities (MSCI EAFE Index) | 5.0 | 30.4 | ||||||
Small-cap U.S. equities (Russell 2000 Index) | 6.2 | 37.4 | ||||||
Mid-cap U.S. equities (Russell Mid Cap Index) | 8.1 | 38.5 | ||||||
U.S. fixed income | 2.7 | 3.9 | ||||||
U.S. short-term government fixed income | 0.9 | 1.4 | ||||||
Outlook
We remain constructive on the prospects for healthy global growth, although it may be at a slower pace than originally anticipated. Central banks in the U.S. and Europe remain accommodative and supply chain issues in Japan appear to have abated. There are also signs that inflation may be peaking in emerging markets as commodity prices have eased in recent months. Corporate balance sheets remain healthy and fundamentals remain intact, in our view. We believe that valuations for equities are not stretched and remain below historical averages while equity risk premiums are still high-offering the possibility for further gains. We expect that the financial markets are likely to remain volatile due to outstanding sovereign debt issues, but believe that returns are biased to the upside in the second half of the year.
Thank you for investing with GE Investments Funds.
Sincerely,

Michael J. Cosgrove
Chairman, GE Investments Funds, Inc.
July 2011
 |
This does not constitute a part of the Fund’s Shareholder Report
Table of Contents
GE Investments Funds, Inc.
| U.S. Equity Fund | ||
Mike Cosgrove is President and Chief Executive Officer – Mutual Funds and Intermediary Business at GE Asset Management Incorporated (“GEAM”). In addition to the GE Investments Funds, he is also Chairman of the Board and President of GE Institutional Funds and Director and President of GEAM’s broker-dealer which serves as underwriter and distributor for the GE Investments Funds. Mr. Cosgrove serves as a Trustee of the GE Savings & Security Funds, the GE Foundation, and the GE Pension Trust. He also serves on the Board of Directors of the Skin Cancer Foundation and is a Trustee of Fordham University. Previously Chief Financial Officer of GE Asset Management and Assistant Treasurer – GE Company, Mr. Cosgrove joined GE in 1970 and held a number of managerial positions in finance and sales in the International Operation and the GE Trading Company. He received a BS in Economics from Fordham University and an MBA from St. John’s University.
GE Investment Distributors, Inc., Member of FINRA & SIPC, is the principal underwriter and distributor of the GE Investments Funds, Inc.
This does not constitute a part of the Fund’s Shareholder Report
Table of Contents
GE Investments Funds, Inc.
U.S. Equity Fund
Semi-Annual Report
June 30, 2011

Table of Contents
GE Investments Funds, Inc.
| U.S. Equity Fund | Contents | |
| 1 | ||||
| 6 | ||||
| 10 | ||||
Financial Statements | ||||
| 11 | ||||
| 12 | ||||
| 13 | ||||
| 14 | ||||
| 15 | ||||
| 20 | ||||
| 23 | ||||
| 26 | ||||
This report is prepared for Policyholders of certain variable contracts and may be distributed to others only if preceded or accompanied by the variable contract’s current prospectus and the current prospectus of the Fund available for investments thereunder.
Table of Contents
| Notes to Performance | June 30, 2011 (unaudited) |
The information provided on the performance pages relates to the GE Investments U.S. Equity Fund (the “Fund”).
Total returns take into account changes in share price and assume reinvestment of dividends and capital gains distributions, if any. Total returns shown are net of Fund fees and expenses but do not reflect fees and charges associated with the variable contracts such as administrative fees, account charges and surrender charges, which, if reflected, would reduce the Fund’s total returns for all periods shown.
The performance data quoted represents past performance; past performance does not guarantee future results. Investment return and principal value will fluctuate so your shares, when redeemed, may be worth more or less than their original cost. Current performance may be higher or lower than the performance data quoted. Periods less than one year are not annualized. Please call toll-free 800-493-3042 or visit the Fund’s website at http://www.geam.com for the most recent month-end performance data.
An investment in the Fund is not a deposit of any bank and is not insured or guaranteed by the Federal Deposit Insurance Corporation (FDIC) or any other government agency. An investment in the Fund is subject to risk, including possible loss of principal invested.
The S&P 500® Index is an unmanaged market capitalization-weighted index of stocks of 500 large U.S. companies, which is widely used as a measure of large-cap U.S. stock market performance. The results shown for the foregoing index assume the reinvestment of net dividends or interest. They do not reflect the actual cost of investing in the instruments that comprise the index.
The peer universe of the underlying annuity funds used for the peer group average annual total return calculation is based on a blend of Morningstar peer categories, as shown. Morningstar is an independent mutual fund rating service. A Fund’s performance may be compared to or ranked within a universe of mutual funds with investment objectives and policies similar but not necessarily identical to that of the Fund.
©2011 Morningstar, Inc. All Rights Reserved. The Morningstar information contained herein: (1) is proprietary to Morningstar and/or its content providers; (2) may not be copied or distributed; and (3) is not warranted to be accurate, complete or timely. Neither Morningstar nor its content providers are responsible for any damage or losses relating from any use of this information. Past performance is no guarantee of future results.
GE Investment Distributors, Inc., Member of FINRA & SIPC, is the principal underwriter and distributor of the GE Investments Funds, Inc. and a wholly owned subsidiary of GE Asset Management Incorporated, the investment adviser of the Fund.
1
Table of Contents
| U.S. Equity Fund | (unaudited) |

David B. Carlson
Chief Investment Officer

Stephen V. Gelhaus
Senior Vice President

Thomas R. Lincoln
Senior Vice President

Paul C. Reinhardt
Senior Vice President
The U.S. Equity Fund is managed by a team of portfolio managers that includes David B. Carlson, Stephen V. Gelhaus, Thomas R. Lincoln and Paul C. Reinhardt. Each of the foregoing portfolio managers manages (or co-manages) one of three sub-portfolios, which comprise the Fund. A sub-portfolio refers to the portion of the Fund’s assets that are allocated to, and managed by, a particular portfolio manager on the Fund’s portfolio management team. The three sub-portfolios are managed independently of each other and the portfolio managers have full discretion over their sub-portfolio. The weightings to each sub-portfolio in the Fund, can be changed at any time but generally remain stable for 18 to 24 months, are driven by the objective of keeping the Fund “style neutral” such that it combines growth and value investment management styles and does not tend to favor either style.
David B. Carlson is the Chief Investment Officer — U.S. Equities at GE Asset Management. He co-manages the overall U.S. equity investments for GE Asset Management. Mr. Carlson has been a member of the portfolio management team for the Fund since May 2011. Mr. Carlson joined GE Asset Management in 1982 as a securities analyst for investment operations. He became a Vice President for mutual fund portfolios in 1987, a Senior Vice President in 1989 and an Executive Vice President in 2003.
Stephen V. Gelhaus is a Senior Vice President of GE Asset Management. He has been a member of the portfolio management team for the Fund since January 2002. Mr. Gelhaus joined GE Asset Management in June 1991 and was a research analyst in the U.S. Equities group from 1995 through 2001.
Thomas R. Lincoln is a Senior Vice President of GE Asset Management. He has been a member of the portfolio management team for the Fund since May 2007. Mr. Lincoln joined GE Asset Management in 1994 as a financial analyst in U.S. Equities. Mr. Lincoln became part of the investment management team for U.S. Equities at GE Asset Management in 1997 and a portfolio manager for U.S. Equities in 2003.
Paul C. Reinhardt is a Senior Vice President of GE Asset Management. He has been a portfolio manager for the Fund since January 2001. Mr. Reinhardt joined GE Asset Management in 1982 as an equity analyst and has been a portfolio manager since 1987.
| Q. | How did the U.S. Equity Fund perform compared to its benchmark and Morningstar peer group for the six-month period ended June 30, 2011? |
| A. | For the six-month period ended June 30, 2011; the U.S. Equity Fund returned 4.14% for Class 1 shares. The S&P 500 Index, the Fund’s benchmark, returned 6.02% and the Fund’s Morningstar peer group of 384 U.S. Insurance Large Blend funds returned an average of 5.25% over the same period. |
| Q. | What market factors affected Fund performance? |
| A. | The S&P 500 experienced major volatility during the period against a backdrop of concerns including political unrest in the Middle East and North Africa (which sent oil prices skyrocketing 22%, then down 17% after strategic reserves were released to mitigate supply disruptions), fears of European sovereign debt contagion (which punished bank stocks), and U.S. deficit and debt ceiling debate. Despite these worries, corporate earnings strength sent U.S. equity markets higher early in the year, before renewed macro fears reversed the advance by the end of March. Bolstered by positive economic data, the S&P 500 rebounded and hit a three-year high on April 29th, but fluctuated wildly as the drumbeat of concerns continued. While more cyclical sectors outperformed in the first calendar quarter, a defensive shift characterized the markets as mid-year approached. During the period the large cap growth style of investing outperformed the value style, driven largely by underperformance in the financials sector (-3% in the context of a +6% S&P 500 return). The information technology (+2%) sector also lagged as many investors questioned the strength of the recovery. Health care (+14%) was the strongest S&P 500 sector, followed by energy (+11%) and utilities (+9%) for the period. |
2
Table of Contents
(unaudited)

| Q. | What were the primary drivers of Fund performance? |
| A. | The Fund’s holdings in the health care, financials and consumer discretionary sectors cost the most relative performance during the period, while strength among the Fund’s holdings in information technology and materials added to returns. Within the health care sector, underweighting pharmaceuticals during the defensive rotation was a key performance detractor. Express Scripts (-0.1%), also lagged as it failed to renegotiate its contract with Walgreens — although we maintained conviction in the outlook for the pharmacy benefits manager, as we believe profitability should rise with increasing use of generic drugs. The Fund’s holdings in Resmed (-10%) also weighed on returns as the maker of sleep-disorder equipment proved more cyclical than other areas of health care. Volatility in the financials sector also challenged relative returns. CME Group (-8%) suffered amid speculation that the company might participate in the flurry of exchange acquisitions activity. As of mid-year, CME Group had not made a bid for any equities exchange and we believe our long-term thesis remains intact. Capital markets companies such as Goldman Sachs (-20%), and State Street (-2%) pulled back amid European Sovereign Debt concerns, and regulatory uncertainties. We believe a rising interest rate environment could benefit each of these financial companies, and investment banking activity should pick up at Goldman Sachs as disruptions in Europe, Japan and the Mideast abate. Among consumer stocks, retailer, Target (-21%), disappointed with its earnings outlook as the company deployed capital to expand into Canada, and put share repurchases on hold. |
| In terms of positive performance drivers, our stock selections in the technology sector were relatively strong, driven by rallies in Baidu, (an American Depository Receipt but not a U.S. company so not a typical holding, +45% on continued share gains and growth in Chinese internet search), Qualcomm (+16% on positive smart-phone fundamentals) and Visa (+20% as credit card interchange fee legislation was resolved in a relatively benign outcome). The strength in these holdings offset lags in Cisco (-23%) and Microsoft (-6%). Other strong individual contributors included, Covidien (+18%), El Paso Corp. (+47% as it |
| accelerated plans to spin off its oil exploration & production unit) and Allegheny Technologies (+16% on the rebound for commercial aircraft orders). |
| Q. | How was the Fund positioned at the end of the period? |
| A. | We continued to focus on bottom-up fundamentals during the quarter, searching for opportunities in the ups and downs of the market. At mid-year, our largest overweights were in health care, technology and materials, and our largest underweights were in consumer staples, industrials and consumer discretionary although we construct the Fund on a bottom-up, stock-by-stock basis. We are staying very close to[would “closely watching” work better?] the companies held in the Fund, monitoring changes in strategic direction and how management teams utilize excess capital. In our view, the U.S. economy remains in a prolonged period of deleveraging, as are many economies around the globe. We continue to emphasize our positioning in large cap, high quality companies that we believe have the potential to grow market share and take actions that benefit shareholders. |
| We continue to expect volatility, especially in light of U.S. budget and debt debates as well as accelerating geopolitical events. In light of recent challenges, in our opinion, S&P 500 earnings revisions have not fallen in a way that would be indicative of a double-dip, with S&P 500 earnings estimates above $99 on a bottom-up basis for 2011 at the end of June. We believe any future market rally could be dominated by outperformance by global market share winners that have the ability to meet or beat earnings expectations. Amid rapidly changing market conditions, we will maintain our bottom-up stock selection approach with a focus on the long-term investment horizon. |
3
Table of Contents
| U.S. Equity Fund | (unaudited) |
Understanding Your Fund’s Expenses
As a shareholder of the Fund you incur ongoing costs. Ongoing costs include portfolio management fees, distribution and services fees, professional fees, administrative fees and other Fund expenses. The following example is intended to help you understand your ongoing costs (in dollars) of investing in the Fund and to compare these costs with the ongoing costs of investing in other mutual funds.
To illustrate these ongoing costs, we have provided an example and calculated the expenses paid by investors of the Fund during the period. The information in the following table is based on an investment of $1,000, which is invested at the beginning of the period and held for the entire six-month period ended June 30, 2011.
Actual Expenses
The first section of the table provides information about actual account values and actual expenses. You may use the information in this section, together with the amount you invested, to estimate the expenses that you paid over the period. To do so, simply divide your account value by $1,000 (for example, an $8,600 account value divided by $1,000 = 8.6), then multiply the result by the
number given for your class under the heading “Expenses paid during period.”
Hypothetical Example for Comparison Purposes
The second section of the table provides information about hypothetical account values and hypothetical expenses based on the Fund’s actual expense ratio and an assumed rate of return of 5% per year before expenses, which is not the Fund’s actual return. The hypothetical account values and expenses may not be used to estimate the actual ending account balance or expenses you paid for the period. You may use this information to compare the ongoing costs of investing in the Fund and other funds. To do so, compare this 5% hypothetical example with the 5% hypothetical examples that appear in the shareholders reports of other funds.
Please note that the expenses shown in the table are meant to highlight and help you compare ongoing costs only and do not reflect any transaction costs, such as sales charges or redemption fees, if any. Additionally, the expenses shown do not reflect the fees or charges associated with variable contracts through which shares of the Fund are offered.
January 1, 2011 - June 30, 2011
| Account value at the beginning of the period ($) | Account value at the end of the period ($) | Expenses paid during the period ($)* | ||||||||||
Actual Fund Return** | ||||||||||||
Class 1 | 1,000.00 | 1,041.35 | 4.40 | |||||||||
Hypothetical 5% Return (2.5% for the period) |
| |||||||||||
Class 1 | 1,000.00 | 1,020.27 | 4.36 | |||||||||
| * | Expenses are equal to the Fund’s annualized expense ratio of 0.87% for Class 1 shares (for the period January 1, 2011 - June 30, 2011), multiplied by the average account value over the period, multiplied by 181/365 (to reflect the one-half year period). |
| ** | Actual Fund Return for the six-month period ended June 30, 2011 was 4.14% for Class 1 shares. Past performance does not guarantee future results. |
4
Table of Contents
| U.S. Equity Fund | (unaudited) |
Investment Profile
A mutual fund designed for investors who seek long-term growth of capital. The Fund seeks its objective by investing at least 80% of its net assets under normal circumstances in equity securities of U.S. companies, such as common and preferred stocks.
Morningstar Performance Comparison
Based on average annual returns for periods ended June 30, 2011
| Six Months** | One Year | Five Year | Ten Year | |||||||||||||
Number of Funds in peer group: | 384 | 384 | 353 | 276 | ||||||||||||
Peer group average annual total return: | 5.25% | 29.38% | 2.47% | 2.44% | ||||||||||||
Morningstar category in peer group: U.S. Insurance Large Blend | ||||||||||||||||
Sector Allocation
as a % of Fair Value(b) of $36,420 (in thousands) on June 30, 2011(a)(b)
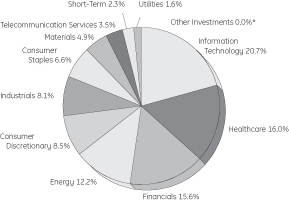
Top Ten Largest Holdings
as of June 30, 2011 (as a % of Fair Value)(a)(b)
Apple Inc. | 3.07% | |||
Schlumberger Ltd. | 2.79% | |||
PepsiCo Inc. | 2.71% | |||
QUALCOMM Inc. | 2.59% | |||
JPMorgan Chase & Co. | 2.27% | |||
Gilead Sciences Inc. | 2.23% | |||
Covidien PLC | 2.08% | |||
Microsoft Corp. | 2.03% | |||
Allegheny Technologies Inc. | 1.79% | |||
Exxon Mobil Corp. | 1.76% |
Change in Value of a $10,000 Investment
Class 1 Shares
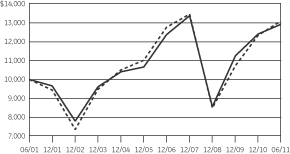
Average Annual Total Return
for the Periods Ended June 30, 2011
Class 1 Shares (Inception date: 1/3/95)
| Six Months** | One Year | Five Year | Ten Year | Ending value of a $10,000 investment | ||||||||||||||||
U.S. Equity Fund | 4.14% | 26.99% | 3.24% | 2.59% | $ | 12,916 | ||||||||||||||
S&P 500 Index | 6.02% | 30.69% | 2.94% | 2.72% | $ | 13,076 | ||||||||||||||

| (a) | The securities information regarding holdings, allocations and other characteristics is presented to illustrate examples of securities that the Fund has bought and the diversity of areas in which the Fund may invest as of a particular date. It may not be representative of the Fund’s current or future investments and should not be construed as a recommendation to purchase or sell a particular security. |
| (b) | Fair value basis is inclusive of Short-Term Investment in GE Institutional Money Market Fund. |
| * | Less than 0.01%. |
| ** | Total returns for the six month period ended June 30, 2011 are not annualized. |
See Notes to Performance on page 1 for further information, including an explanation of Morningstar peer categories.
Past performance does not predict future performance. The performance shown in the graphs and tables does not reflect the deduction of taxes that a shareholder would pay on Fund distributions or the redemption of Fund shares and does not reflect the fees or charges that would be associated with variable contracts through which shares of the Fund are offered.
5
Table of Contents
U.S. Equity Fund
| Schedule of Investments | June 30, 2011 (unaudited) |
U.S. Equity Fund
| Number of Shares | Fair Value | |||||||||||
Common Stock — 96.1%† |
| |||||||||||
Advertising — 1.4% |
| |||||||||||
Omnicom Group Inc. | 10,842 | $ | 522,151 | |||||||||
Aerospace & Defense — 4.1% |
| |||||||||||
CAE Inc. | 15,849 | 213,652 | ||||||||||
General Dynamics Corp. | 402 | 29,957 | ||||||||||
Hexcel Corp. | 4,396 | 96,228 | (a | ) | ||||||||
Honeywell International Inc. | 10,270 | 611,989 | ||||||||||
Rockwell Collins Inc. | 5,695 | 351,325 | ||||||||||
United Technologies Corp. | 2,157 | 190,916 | ||||||||||
| 1,494,067 | ||||||||||||
Agricultural Products — 0.5% |
| |||||||||||
Archer-Daniels-Midland Co. | 6,125 | 184,669 | ||||||||||
Air Freight & Logistics — 0.4% |
| |||||||||||
FedEx Corp. | 1,447 | 137,248 | ||||||||||
Asset Management & Custody Banks — 3.5% |
| |||||||||||
Ameriprise Financial Inc. | 3,778 | 217,915 | ||||||||||
Invesco Ltd. | 11,966 | 280,004 | ||||||||||
State Street Corp. | 13,658 | 615,839 | (c | ) | ||||||||
The Bank of New York Mellon Corp. | 5,907 | 151,337 | ||||||||||
| 1,265,095 | ||||||||||||
Automotive Retail — 0.1% |
| |||||||||||
O’Reilly Automotive Inc. | 791 | 51,818 | (a | ) | ||||||||
Biotechnology — 4.0% |
| |||||||||||
Amgen Inc. | 10,748 | 627,146 | (a | ) | ||||||||
Gilead Sciences Inc. | 19,653 | 813,831 | (a | ) | ||||||||
| 1,440,977 | ||||||||||||
Cable & Satellite — 1.1% |
| |||||||||||
DIRECTV | 6,018 | 305,835 | (a | ) | ||||||||
Liberty Global Inc. | 2,046 | 87,364 | (a | ) | ||||||||
Sirius XM Radio Inc. | 8,037 | 17,601 | (a | ) | ||||||||
| 410,800 | ||||||||||||
Coal & Consumable Fuels — 0.7% |
| |||||||||||
Peabody Energy Corp. | 4,641 | 273,401 | ||||||||||
Communications Equipment — 4.0% |
| |||||||||||
Cisco Systems Inc. | 32,227 | 503,063 | ||||||||||
QUALCOMM Inc. | 16,621 | 943,907 | ||||||||||
| 1,446,970 | ||||||||||||
| Number of Shares | Fair Value | |||||||||||
Computer Hardware — 3.4% |
| |||||||||||
Apple Inc. | 3,335 | $ | 1,119,459 | (a | ) | |||||||
Hewlett-Packard Co. | 2,730 | 99,372 | ||||||||||
| 1,218,831 | ||||||||||||
Construction & Farm Machinery & Heavy Trucks — 0.4% |
| |||||||||||
Deere & Co. | 1,607 | 132,497 | ||||||||||
Consumer Finance — 0.9% |
| |||||||||||
American Express Co. | 6,230 | 322,091 | ||||||||||
Discover Financial Services | 402 | 10,754 | ||||||||||
| 332,845 | ||||||||||||
Data Processing & Outsourced Services — 3.0% |
| |||||||||||
The Western Union Co. | 27,718 | 555,192 | ||||||||||
Visa Inc. | 6,288 | 529,827 | ||||||||||
| 1,085,019 | ||||||||||||
Department Stores — 0.3% |
| |||||||||||
Macy’s Inc. | 3,416 | 99,884 | ||||||||||
Diversified Financial Services — 4.0% |
| |||||||||||
Bank of America Corp. | 30,559 | 334,927 | ||||||||||
Citigroup Inc. | 1,848 | 76,951 | ||||||||||
JPMorgan Chase & Co. | 20,171 | 825,801 | ||||||||||
US BanCorp | 1,608 | 41,020 | ||||||||||
Wells Fargo & Co. | 5,623 | 157,781 | ||||||||||
| 1,436,480 | ||||||||||||
Diversified Metals & Mining — 0.4% |
| |||||||||||
Freeport-McMoRan Copper & Gold Inc. | 3,054 | 161,557 | ||||||||||
Drug Retail — 0.2% | ||||||||||||
CVS Caremark Corp. | 2,210 | 83,052 | ||||||||||
Electric Utilities — 0.7% | ||||||||||||
FirstEnergy Corp. | 764 | 33,731 | ||||||||||
ITC Holdings Corp. | 909 | 65,239 | ||||||||||
NextEra Energy Inc. | 3,014 | 173,184 | ||||||||||
| 272,154 | ||||||||||||
Electrical Components & Equipment — 0.5% |
| |||||||||||
Cooper Industries PLC | 2,913 | 173,819 | ||||||||||
Electronic Components — 0.3% |
| |||||||||||
Corning Inc. | 5,069 | 92,002 | ||||||||||
Fertilizers & Agricultural Chemicals — 1.4% |
| |||||||||||
Monsanto Co. | 5,876 | 426,245 | ||||||||||
Potash Corporation of Saskatchewan Inc. | 1,286 | 73,289 | ||||||||||
| 499,534 | ||||||||||||
See Notes to Schedule of Investments and Notes to Financial Statements.
6
Table of Contents
U.S. Equity Fund
| Schedule of Investments | June 30, 2011 (unaudited) |
| Number of Shares | Fair Value | |||||||||||
General Merchandise Stores — 1.5% |
| |||||||||||
Target Corp. | 11,580 | $ | 543,218 | |||||||||
Healthcare Distributors — 0.2% |
| |||||||||||
Cardinal Health Inc. | 1,245 | 56,548 | ||||||||||
Healthcare Equipment — 2.5% |
| |||||||||||
Covidien PLC | 14,218 | 756,824 | ||||||||||
ResMed Inc. | 5,139 | 159,052 | ||||||||||
| 915,876 | ||||||||||||
Healthcare Facilities — 0.2% |
| |||||||||||
HCA Holdings Inc. | 2,813 | 92,829 | (a | ) | ||||||||
Healthcare Services — 2.0% |
| |||||||||||
Express Scripts Inc. | 10,752 | 580,393 | (a | ) | ||||||||
Omnicare Inc. | 5,103 | 162,735 | ||||||||||
| 743,128 | ||||||||||||
Home Building — 0.1% |
| |||||||||||
MDC Holdings Inc. | 984 | 24,246 | ||||||||||
Home Improvement Retail — 0.8% |
| |||||||||||
Lowe’s companies Inc. | 13,162 | 306,806 | ||||||||||
Hotels, Resorts & Cruise Lines — 0.3% |
| |||||||||||
Carnival Corp. | 3,283 | 123,539 | ||||||||||
Household Products — 1.4% |
| |||||||||||
Clorox Co. | 2,813 | 189,709 | ||||||||||
The Procter & Gamble Co. | 5,344 | 339,718 | ||||||||||
| 529,427 | ||||||||||||
Independent Power Producers & Energy Traders — 0.8% |
| |||||||||||
Calpine Corp. | 5,023 | 81,021 | (a | ) | ||||||||
The AES Corp. | 16,879 | 215,038 | (a | ) | ||||||||
| 296,059 | ||||||||||||
Industrial Conglomerates — 0.2% |
| |||||||||||
Siemens AG ADR | 638 | 87,744 | ||||||||||
Industrial Gases — 1.3% |
| |||||||||||
Praxair Inc. | 4,356 | 472,147 | ||||||||||
Industrial Machinery — 0.1% |
| |||||||||||
Eaton Corp. | 546 | 28,092 | ||||||||||
Integrated Oil & Gas — 5.4% |
| |||||||||||
Chevron Corp. | 3,617 | 371,972 | ||||||||||
Exxon Mobil Corp. | 7,882 | 641,437 | (d | ) | ||||||||
Hess Corp. | 1,523 | 113,859 | ||||||||||
Marathon Oil Corp. | 2,210 | 116,423 | ||||||||||
Occidental Petroleum Corp. | 1,527 | 158,869 | ||||||||||
| Number of Shares | Fair Value | |||||||||||
Suncor Energy Inc. | 14,205 | $ | 555,416 | |||||||||
| 1,957,976 | ||||||||||||
Integrated Telecommunication Services — 1.1% |
| |||||||||||
AT&T Inc. | 7,234 | 227,220 | ||||||||||
Verizon Communications Inc. | 4,822 | 179,523 | ||||||||||
| 406,743 | ||||||||||||
Internet Retail — 0.4% |
| |||||||||||
Amazon.com Inc. | 703 | 143,756 | (a | ) | ||||||||
Internet Software & Services — 3.8% |
| |||||||||||
Baidu Inc. ADR | 4,550 | 637,592 | (a | ) | ||||||||
Equinix Inc. | 2,579 | 260,531 | (a | ) | ||||||||
Google Inc. | 925 | 468,401 | ||||||||||
| 1,366,524 | ||||||||||||
Investment Banking & Brokerage — 1.8% |
| |||||||||||
Morgan Stanley | 4,289 | 98,690 | ||||||||||
The Goldman Sachs Group Inc. | 4,260 | 566,963 | ||||||||||
| 665,653 | ||||||||||||
IT Consulting & Other Services — 1.7% |
| |||||||||||
International Business Machines Corp. | 3,639 | 624,270 | ||||||||||
Life & Health Insurance — 1.3% |
| |||||||||||
MetLife Inc. | 2,769 | 121,476 | ||||||||||
Prudential Financial Inc. | 5,611 | 356,803 | ||||||||||
| 478,279 | ||||||||||||
Life Sciences Tools & Services — 1.2% |
| |||||||||||
PerkinElmer Inc. | 4,823 | 129,787 | ||||||||||
Thermo Fisher Scientific Inc. | 4,615 | 297,160 | (a | ) | ||||||||
| 426,947 | ||||||||||||
Movies & Entertainment — 2.2% |
| |||||||||||
News Corp. | 12,011 | 212,595 | ||||||||||
The Walt Disney Co. | 5,281 | 206,170 | ||||||||||
Time Warner Inc. | 10,217 | 371,592 | ||||||||||
| 790,357 | ||||||||||||
Multi-Line Insurance — 0.5% |
| |||||||||||
Hartford Financial Services Group Inc. | 6,671 | 175,914 | ||||||||||
Multi-Utilities — 0.5% |
| |||||||||||
Dominion Resources Inc. | 4,179 | 201,720 | ||||||||||
Oil & Gas Equipment & Services — 3.5% |
| |||||||||||
Halliburton Co. | 2,451 | 125,001 | ||||||||||
National Oilwell Varco Inc. | 1,698 | 132,801 | ||||||||||
Schlumberger Ltd. | 11,762 | 1,016,237 | ||||||||||
| 1,274,039 | ||||||||||||
Oil & Gas Exploration & Production — 1.8% |
| |||||||||||
Apache Corp. | 3,696 | 456,049 | ||||||||||
See Notes to Schedule of Investments and Notes to Financial Statements.
7
Table of Contents
U.S. Equity Fund
| Schedule of Investments | June 30, 2011 (unaudited) |
| Number of Shares | Fair Value | |||||||||||
Devon Energy Corp. | 804 | $ | 63,363 | |||||||||
Southwestern Energy Co. | 3,394 | 145,535 | (a | ) | ||||||||
| 664,947 | ||||||||||||
Oil & Gas Storage & Transportation — 0.7% |
| |||||||||||
El Paso Corp. | 10,128 | 204,586 | ||||||||||
Spectra Energy Corp. | 2,331 | 63,893 | ||||||||||
| 268,479 | ||||||||||||
Packaged Foods & Meats — 1.7% |
| |||||||||||
ConAgra Foods Inc. | 3,215 | 82,979 | ||||||||||
Kraft Foods Inc. | 13,607 | 479,375 | ||||||||||
Nestle S.A. ADR | 804 | 50,154 | ||||||||||
| 612,508 | ||||||||||||
Pharmaceuticals — 4.7% |
| |||||||||||
Bristol-Myers Squibb Co. | 8,414 | 243,669 | ||||||||||
Hospira Inc. | 6,914 | 391,747 | (a | ) | ||||||||
Johnson & Johnson | 5,145 | 342,245 | ||||||||||
Novartis AG ADR | 2,692 | 164,508 | ||||||||||
Pfizer Inc. | 18,326 | 377,516 | ||||||||||
Teva Pharmaceutical Industries Ltd. ADR | 3,818 | 184,104 | ||||||||||
| 1,703,789 | ||||||||||||
Property & Casualty Insurance — 1.7% |
| |||||||||||
ACE Ltd. | 7,341 | 483,185 | ||||||||||
Chubb Corp. | 2,412 | 151,015 | ||||||||||
| 634,200 | ||||||||||||
Rail Roads — 0.6% |
| |||||||||||
Union Pacific Corp. | 2,090 | 218,196 | ||||||||||
Real Estate Services — 0.1% |
| |||||||||||
CB Richard Ellis Group Inc. (REIT) | 1,538 | 38,619 | (a | ) | ||||||||
Reinsurance — 0.5% |
| |||||||||||
PartnerRe Ltd. | 1,816 | 125,032 | ||||||||||
RenaissanceRe Holdings Ltd. | 603 | 42,180 | ||||||||||
| 167,212 | ||||||||||||
Research & Consulting Services — 0.4% |
| |||||||||||
Nielsen Holdings N.V. | 4,421 | 137,758 | (a | ) | ||||||||
Security & Alarm Services — 0.4% |
| |||||||||||
Corrections Corporation of America | 6,770 | 146,570 | (a | ) | ||||||||
Semiconductor Equipment — 0.3% |
| |||||||||||
Applied Materials Inc. | 2,572 | 33,462 | ||||||||||
KLA-Tencor Corp. | 1,487 | 60,194 | ||||||||||
| 93,656 | ||||||||||||
Semiconductors — 1.1% |
| |||||||||||
Intel Corp. | 6,631 | 146,943 | ||||||||||
| Number of Shares | Fair Value | |||||||||||
Microchip Technology Inc. | 1,366 | $ | 51,785 | |||||||||
Texas Instruments Inc. | 5,895 | 193,533 | ||||||||||
| 392,261 | ||||||||||||
Soft Drinks — 2.7% |
| |||||||||||
PepsiCo Inc. | 14,016 | 987,147 | ||||||||||
Specialized Finance — 1.3% |
| |||||||||||
CME Group Inc. | 1,568 | 457,213 | ||||||||||
Specialty Stores — 0.4% |
| |||||||||||
Dick’s Sporting Goods Inc. | 1,608 | 61,828 | (a | ) | ||||||||
Staples Inc. | 4,422 | 69,868 | ||||||||||
| 131,696 | ||||||||||||
Steel — 1.8% |
| |||||||||||
Allegheny Technologies Inc. | 10,296 | 653,487 | ||||||||||
Systems Software — 3.4% |
| |||||||||||
Microsoft Corp. | 28,367 | 737,542 | ||||||||||
Oracle Corp. | 14,715 | 484,271 | ||||||||||
| 1,221,813 | ||||||||||||
Wireless Telecommunication Services — 2.4% |
| |||||||||||
American Tower Corp. | 6,595 | 345,116 | (a | ) | ||||||||
NII Holdings Inc. | 12,101 | 512,840 | (a | ) | ||||||||
| 857,956 | ||||||||||||
Total Common Stock | 34,934,214 | |||||||||||
Exchange Traded Funds — 1.8% |
| |||||||||||
Financial Select Sector SPDR Fund | 8,289 | 127,070 | (f | ) | ||||||||
Industrial Select Sector SPDR Fund | 14,166 | 527,542 | (f | ) | ||||||||
Total Exchange Traded Funds | 654,612 | |||||||||||
Other Investments — 0.0%* |
| |||||||||||
GEI Investment Fund | 8,185 | (e | ) | |||||||||
Total Investments in Securities | 35,597,011 | |||||||||||
See Notes to Schedule of Investments and Notes to Financial Statements.
8
Table of Contents
U.S. Equity Fund
| Schedule of Investments | June 30, 2011 (unaudited) |
| Fair Value | ||||||||
Short-Term Investments — 2.3% |
| |||||||
GE Institutional Money Market Fund Investment Class 0.11% | $ | 822,959 | (b,e | ) | ||||
Total Investments | 36,419,970 | |||||||
Liabilities in Excess of Other Assets, net — (0.2)% | (57,678 | ) | ||||||
|
| |||||||
NET ASSETS — 100.0% | $ | 36,362,292 | ||||||
|
| |||||||
Other Information |
| |||||||
The Fund had the following long futures contracts open at June 30, 2011 (unaudited):
| Description | Expiration date | Number of Contracts | Current Notional Value | Unrealized Appreciation | ||||||||||||
S&P 500 Emini Index Futures | September 2011 | 2 | $ | 131,550 | $ | 3,344 | ||||||||||
See Notes to Schedule of Investments and Notes to Financial Statements.
9
Table of Contents
| Notes to Schedule of Investments | June 30, 2011 (unaudited) |
The views expressed in this document reflect our judgment as of the publication date and are subject to change at any time without notice. The securities information regarding holdings, allocations and other characteristics are presented to illustrate examples of securities that the Fund has bought and the diversity of areas in which the Fund may invest as of a particular date. It may not be representative of the Fund’s current or future investments and should not be construed as a recommendation to purchase or sell a particular security. See the Fund’s summary prospectus and statutory prospectus for complete descriptions of investment objectives, policies, risks and permissible investments
| (a) | Non-income producing security. |
| (b) | Coupon amount represents effective yield. |
| (c) | State Street Corp. is the parent company of State Street Bank & Trust Co., the Fund’s custodian and accounting agent. |
| (d) | At June 30, 2011 , all or a portion of this security was pledged to cover collateral requirements for futures, options, forward foreign currency contracts and/or TBA’s. |
| (e) | GE Asset Management, the investment adviser of the Fund, also serves as investment adviser of the GEI Investment Fund and the GE Institutional Money Market Fund. |
| (f) | Sponsored by SSgA Funds Management, Inc., an affiliate of State Street Bank & Trust Co., the Fund’s custodian and accounting agent. |
| * | Less than 0.05%. |
| † | Percentages are based on net assets as of June 30, 2011 . |
Abbreviations:
ADR | American Depository Receipt | |
REIT | Real Estate Investment Trust | |
SPDR | Standard & Poors Depository Receipts |
10
Table of Contents
Selected data based on a share outstanding throughout the fiscal years indicated
| CLASS 1 | ||||||||||||||||||||||||||
| 6/30/11† | 12/31/10 | 12/31/09 | 12/31/08 | 12/31/07 | 12/31/06 | |||||||||||||||||||||
| Inception date | — | — | — | — | — | 1/3/95 | ||||||||||||||||||||
Net asset value, beginning of period | $ | 31.92 | $ | 29.23 | $ | 22.44 | $ | 36.41 | $ | 39.02 | $ | 34.06 | ||||||||||||||
Income/(loss) from investment operations: | ||||||||||||||||||||||||||
Net investment income (loss) | 0.10 | 0.28 | ** | 0.30 | 0.37 | 0.45 | 0.53 | |||||||||||||||||||
Net realized and unrealized gains/(losses) on investments | 1.22 | 2.72 | 6.80 | (13.52 | ) | 2.70 | 4.96 | |||||||||||||||||||
Total income/(loss) from investment operations | 1.32 | 3.00 | 7.10 | (13.15 | ) | 3.15 | 5.49 | |||||||||||||||||||
Less distributions from: | ||||||||||||||||||||||||||
Net investment income | 0.00 | 0.31 | 0.31 | 0.36 | 0.44 | 0.53 | ||||||||||||||||||||
Net realized gains | 0.00 | — | — | 0.46 | 5.32 | — | ||||||||||||||||||||
Total distributions | 0.00 | 0.31 | 0.31 | 0.82 | 5.76 | 0.53 | ||||||||||||||||||||
Net asset value, end of period | $ | 33.24 | $ | 31.92 | $ | 29.23 | $ | 22.44 | $ | 36.41 | $ | 39.02 | ||||||||||||||
TOTAL RETURN(a) | 4.14 | % | 10.26 | % | 31.63 | % | (36.05 | )% | 8.01 | % | 16.12 | % | ||||||||||||||
RATIOS/ | ||||||||||||||||||||||||||
Net assets, end of period (in thousands) | $ | 36,362 | $ | 38,305 | $ | 41,792 | $ | 37,917 | $ | 77,777 | $ | 101,885 | ||||||||||||||
Ratios to average net assets: | ||||||||||||||||||||||||||
Net investment income | 0.60 | %* | 0.96 | % | 1.11 | % | 1.03 | % | 0.94 | % | 1.43 | % | ||||||||||||||
Net Expenses | 0.87 | %*(b) | 0.69 | %(b) | 0.86 | %(b) | 0.72 | %(b) | 0.66 | % | 0.63 | % | ||||||||||||||
Gross expenses | 0.87 | %* | 0.69 | % | 0.86 | % | 0.72 | % | 0.66 | % | 0.63 | % | ||||||||||||||
Portfolio turnover rate | 17 | % | 42 | % | 46 | % | 56 | % | 55 | % | 45 | % | ||||||||||||||
Notes to Financial Highlights
| (a) | Total returns are historical and assume changes in share price, reinvestment of dividends and capital gains distributions and do not include the effect of insurance contract charges. Past performance does not guarantee future results. |
| (b) | Reflects GE Asset Management’s waiver of a portion of the Fund’s management fee in an amount equal to the management fee earned by GEAM with respect to the Fund’s investment in the GE Money Market Fund and GE Institutional Money Market Fund. Excluding waiver, the expense ratios would be unchanged. |
| * | Annualized for periods less than one year. |
| ** | Per share values have been calculated using the average share method. |
| † | Unaudited |
The accompanying Notes are an integral part of these financial statements.
11
Table of Contents
The accompanying Notes are an integral part of these financial statements.
12
Table of Contents
For the six months ending June 30, 2011 (unaudited) | ||||
INVESTMENT INCOME | ||||
Income: | ||||
Dividend | $275,377 | |||
Interest | 1,237 | |||
Interest from affiliated investments | 482 | |||
Less: Foreign taxes withheld | (1,213 | ) | ||
Total Income | 275,883 | |||
Expenses: | ||||
Advisory and administration fees | 104,006 | |||
Distribution fees | ||||
Class 4* | 14 | |||
Transfer agent fees | 10,136 | |||
Director’s fees | 543 | |||
Custody and accounting expenses | 26,788 | |||
Professional fees | 9,593 | |||
Other expenses | 12,488 | |||
Total expenses before waiver and reimbursement | 163,568 | |||
Less: Expenses waived or borne by the adviser | (580 | ) | ||
Net expenses | 162,988 | |||
Net investment income | 112,895 | |||
NET REALIZED AND UNREALIZED GAIN (LOSS) | ||||
Realized gain (loss) on: | ||||
Investments | 1,781,591 | |||
Futures | (13,484 | ) | ||
Foreign currency related transactions | (5 | ) | ||
Increase (decrease) in unrealized appreciation/(depreciation) on: | ||||
Investments | (290,298 | ) | ||
Futures | (1,472 | ) | ||
Foreign currency related transactions | 3 | |||
Net realized and unrealized gain on investments | 1,476,335 | |||
Net increase in net assets resulting from operations | $1,589,230 | |||
| * | Effective April 30, 2011, share Class 4 was closed. |
The accompanying Notes are an integral part of these financial statements.
13
Table of Contents
Changes in Net Assets | ||||
| Six Months Ended June 30, 2011* | Year Ended December 31, 2010 | |||||||
INCREASE (DECREASE) IN NET ASSETS | ||||||||
Operations: | ||||||||
Net investment income | $ | 112,895 | $ | 366,984 | ||||
Net realized gain on investments, futures and foreign currency transactions | 1,768,102 | 498,105 | ||||||
Net increase (decrease) in unrealized appreciation/(depreciation) on investments, futures and foreign currency transaction | (291,767 | ) | 2,781,391 | |||||
Net increase (decrease) from operations | 1,589,230 | 3,646,480 | ||||||
Distributions to shareholders from : | ||||||||
Net investment income | ||||||||
Class 1 | — | (369,247 | ) | |||||
Class 4 | — | (53 | ) | |||||
Total distributions | — | (369,300 | ) | |||||
Increase in net assets from operations and distributions | 1,589,230 | 3,277,180 | ||||||
Share transactions : | ||||||||
Proceeds from sale of shares | ||||||||
Class 1 | 327,020 | 353,286 | ||||||
Class 4 | — | — | ||||||
Value of distributions reinvested | ||||||||
Class 1 | — | 369,247 | ||||||
Class 4 | — | 53 | ||||||
Cost of shares redeemed | ||||||||
Class 1 | (3,858,513 | ) | (7,485,265 | ) | ||||
Class 4 | (10,163 | ) | — | |||||
Net (decrease) from share transactions | (3,541,656 | ) | (6,762,679 | ) | ||||
Total (decrease) in net assets | (1,952,426 | ) | (3,485,499 | ) | ||||
NET ASSETS | ||||||||
Beginning of period | 38,314,718 | 41,800,217 | ||||||
End of period | $ | 36,362,292 | $ | 38,314,718 | ||||
Undistributed (distribution in excess of) | $ | 113,797 | $ | 902 | ||||
CHANGES IN FUND SHARES | ||||||||
Class 1 | ||||||||
Shares sold | 9,827 | 11,976 | ||||||
Issued for distributions reinvested | — | 11,546 | ||||||
Shares redeemed | (116,129 | ) | (253,018 | ) | ||||
Net increase (decrease) in fund shares | (106,302 | ) | (229,496 | ) | ||||
Class 4** | ||||||||
Shares sold | — | — | ||||||
Issued for distributions reinvested | — | 2 | ||||||
Shares redeemed | (296 | ) | — | |||||
Net increase (decrease) in fund shares | (296 | ) | 2 | |||||
| * | Unaudited |
| ** | Effective April 30, 2011, share Class 4 was closed. |
The accompanying Notes are an integral part of these financial statements.
14
Table of Contents
| Notes to Financial Statements | June 30, 2011 (unaudited) |
| 1. | Organization of the Company |
GE Investments Funds, Inc. (the “Company”) was incorporated under the laws of the Commonwealth of Virginia on May 14, 1984 and is registered under the Investment Company Act of 1940, as amended (the “1940 Act”), as an open-end management investment company. The Company is composed of fourteen investment portfolios (collectively the “Funds”), although only the following eleven are currently being offered: U.S. Equity Fund, (the “Fund”) S&P 500 Index Fund, Premier Growth Equity Fund, Core Value Equity Fund, Mid-Cap Equity Fund, Small-Cap Equity Fund, International Equity Fund, Total Return Fund, Income Fund, Money Market Fund and Real Estate Securities Fund.
Shares of the Funds of the Company are offered only to insurance company separate accounts that fund certain variable life insurance contracts and variable annuity contracts. GE Asset Management Incorporated (“GEAM”) is the investment adviser and administrator of each of the Funds.
The Company currently offers one share class (Class 1) as an investment option for variable life insurance and variable annuity contracts. Class 4 shares were first offered on May 1, 2008 and Fund shares outstanding prior to May 1, 2008 were designated as Class 1 shares. Effective April 30, 2011, Class 4 shares were closed and are no longer offered.
| 2. | Summary of Significant Accounting Policies |
The preparation of financial statements in conformity with U.S. generally accepted accounting principles (GAAP) requires management to make estimates and assumptions that affect the reported amounts of assets and liabilities and disclosure of contingent assets and liabilities at the date of the financial statements and the reported amounts of increases and decreases in net assets from operations during the reporting period. Actual results may differ from those estimates.
Subsequent events after the balance sheet date through the date the financial statements were issued, have been evaluated in the preparation of the financial statements. There are no items to report.
The following summarizes the significant accounting policies of the Company:
Securities Valuation and Transactions. All investments in securities are recorded at their estimated fair value, as described in Note 3.
Securities transactions are accounted for as of the trade date. Realized gains and losses on investments sold are recorded on the basis of identified cost for both financial statement and federal tax purposes.
Expenses Fund specific expenses are allocated to the Fund that incurs such expenses. Such expenses may include custodial fees, legal and accounting fees, printing costs and registration fees. Expenses that are not fund specific are allocated pro rata across the Funds. Certain class specific expenses (such as distribution fees) are allocated to the class that incurs such expense. Expenses of the Fund are generally paid directly by the Fund however, expenses may be paid by GEAM and reimbursed by the fund.
Futures Contracts A futures contract represents a commitment for the future purchase or sale of an asset at a specified price on a specified date. The Fund invests in stock index futures contracts subject to certain limitations to manage its exposure to the stock markets. Buying futures tends to increase a Fund’s exposure to the underlying instrument while selling futures tends to decrease a Fund’s exposure to the underlying instrument or to hedge other Fund investments. The Fund will not enter into a transaction involving futures for speculative purposes. With futures contracts, there is minimal counterparty credit risk to the Fund since futures contracts are exchange traded and the exchange’s clearinghouse, as counterparty to all traded futures, guarantees the futures against default. The Fund’s risks in using these contracts include changes in the value of the underlying instruments, non-performance of the counterparties under the contracts’ terms and changes in the liquidity of the secondary market for the contracts. Futures contracts are valued at the settlement price established each day by the board of trade or exchange on which they principally trade.
Upon entering into a financial futures contract, the Fund is required to pledge to the broker an amount of cash and/or other assets equal to a certain percentage of the contract amount, known as initial margin deposit. Subsequent payments, known as variation margin, are made or received by the Fund each day, depending on the daily fluctuation in the fair value of the underlying security. The Fund records an unrealized gain or loss equal to the daily variation margin. Should market conditions move unexpectedly, the Fund may not achieve the anticipated benefits of the futures contracts and may incur a loss. The Fund recognizes a realized gain or loss upon the expiration or closing of a futures contract.
15
Table of Contents
| Notes to Financial Statements | June 30, 2011 (unaudited) |
Investment Income Corporate actions (including cash dividends) are recorded on the ex-dividend date, net of applicable withholding taxes, except for certain foreign corporate actions which are recorded as soon after ex-dividend date as such information becomes available. Interest income is recorded on the accrual basis.
Expenses Fund specific expenses are allocated to the Fund that incurs such expenses. Such expenses may include custodial fees, legal and accounting fees, printing costs and registration fees. Expenses that are not fund specific are allocated pro rata across the Funds. Certain class specific expenses (such as distribution fees) are allocated to the class that incurs such expense. Expenses of the Fund are generally paid directly by the Fund however, expenses may be paid by GEAM and reimbursed by the fund.
Federal Income Taxes The Fund intends to comply with all sections of the Internal Revenue Code applicable to regulated investment companies including the distribution of substantially all of its taxable net investment income and net realized capital gains to its shareholders. Therefore, no provision for federal income tax has been made. The Fund is treated as a separate taxpayer for federal income tax purposes.
| 3. | Securities Valuation |
The Fund utilizes various methods to measure the fair value of most of its investments on a recurring basis. GAAP establishes a framework for measuring fair value and providing related disclosures. Broadly, the framework requires fair value to be determined based on the exchange price that would be received for an asset or paid to transfer a liability (an exit price) in the principal or most advantageous market for the asset or liability in an orderly transaction between market participants at the measurement date. In the absence of active markets for the identical assets or liabilities, such measurements involve developing assumptions based on market observable data and, in the absence of such data, internal information that is consistent with what market participants would use in a hypothetical transaction that occurs at the measurement date. It also establishes a three-level valuation hierarchy based upon observable and non-observable inputs.
Observable inputs reflect market data obtained from independent sources, while unobservable inputs reflect our market assumptions. Preference is given to observable inputs. These two types of inputs create the following fair value hierarchy:
Level 1 — Quoted prices for identical investments in active markets.
Level 2 — Quoted prices for similar investments in active markets; quoted prices for identical or similar investments in markets that are not active; and model-derived valuations whose inputs are observable or whose significant value drivers are observable.
Level 3 — Significant inputs to the valuation model are unobservable.
Policies and procedures are maintained to value investments using the best and most relevant data available. In addition, pricing vendors are utilized to assist in valuing investments. GEAM performs periodic reviews of the methodologies used by independent pricing services including price validation of individual securities.
Fair Value Measurement The following section describes the valuation methodologies the Fund uses to measure different financial investments at fair value.
The Fund’s portfolio securities are valued generally on the basis of market quotations. Equity securities generally are valued at the last reported sales price on the primary market in which they are traded. Portfolio securities listed on NASDAQ are valued using the NASDAQ Official Closing Price. Level 1 securities primarily include publicly-traded equity securities which may not necessarily represent the last sale price. If no sales occurred on the exchange or NASDAQ that day, the portfolio security generally is valued using the last reported bid price. In those circumstances the Fund classifies the investment securities in Level 2.
The Fund uses the net asset value per unit for the collective Fund. The Fund classifies the investment security in Level 2.
Other financial investments are derivative instruments that are not reflected in Total Investments, such as exchange traded futures. Futures are valued at the last sale price on the primary market they are traded and are typically included in level 1.
If prices are not readily available for a portfolio security, or if it is believed that a price for a portfolio security does not represent its fair value, the security may be valued using procedures approved by the Fund’s Board of Directors that are designed to establish its “fair” value. These securities would generally be classified in Level 3. Those procedures require that the fair value of a security be established by the valuation committee. The valuation committee follows different protocols for different types of investments and circumstances. The fair value procedures may be used to value any investment of the Fund in the appropriate circumstances.
16
Table of Contents
| Notes to Financial Statements | June 30, 2011 (unaudited) |
The following table presents the Fund’s investments measured at fair value on a recurring basis at June 30, 2011:
| Investments | Level 1 | Level 2 | Level 3 | Total | ||||||||||||
Investments in Securities† | ||||||||||||||||
Common Stock | $ | 34,934,214 | $ | — | $ | — | $ | 34,934,214 | ||||||||
Exchanged Traded Funds | 654,612 | — | — | 654,612 | ||||||||||||
Other Investments | — | 8,185 | — | 8,185 | ||||||||||||
Short-Term Investments | 822,959 | — | — | 822,959 | ||||||||||||
|
|
|
|
|
|
|
| |||||||||
Total Investments in Securities | $ | 36,411,785 | $ | 8,185 | $ | — | $ | 36,419,970 | ||||||||
|
|
|
|
|
|
|
| |||||||||
Other Financial Instruments* | ||||||||||||||||
Futures Contracts — Unrealized Appreciation | $ | 3,344 | $ | — | $ | — | $ | 3,344 | ||||||||
† See Schedule of Investments for Industry Classification. * Other financial instruments include derivative instruments such as futures contracts. Amounts shown represent unrealized appreciation (depreciation) at period end.
There were no significant transfers between the fair value levels. Transfers between fair value levels are considered to occur at the beginning of the period. |
| |||||||||||||||
| 4. | Derivatives Transactions |
Shown below are the derivative contracts entered into by the Fund, summarized by primary risk exposure as they appear on the Statement of Assets and Liabilities, all of which are not accounted for as hedging instruments under FASB Accounting Standards Codification (“ASC”) No. 815 Derivatives and Hedging as of June 30, 2011 .
Asset Derivatives June 30, 2011 | Liability Derivatives June 30, 2011 | |||||||||||
| Derivatives not accounted for as hedging instruments under ASC 815 | Location in the Statement of Assets and Liabilities | Fair Value($) | Location in the Statements of Assets and Liabilities | Fair Value($) | ||||||||
| Equity Contracts | Assets, Net Assets — Net Unrealized Appreciation/ (Depreciation) on Futures | 3,344 | * | Liabilities, Net Assets — Net Unrealized Appreciation/ (Depreciation) on Futures | — | |||||||
| * | Includes cumulative appreciation/depreciation of futures contracts as reported in the Schedule of Investments and within the components of Net Assets section of the Statement of Assets and Liabilities. Only the current day’s variation margin is reported within the Assets or Liabilities sections of the Statement of Assets and Liabilities. |
Shown below are the effects of derivative instruments on the Fund’s Statement of Operations, summarized by primary risk exposure all of which are not accounted for as hedging instruments under ASC 815.
| Derivatives not accounted for as hedging instruments under ASC 815 | Location in the Statement of Operations | Total Notional Amount of Futures Contracts Purchased/(Sold)($) | Realized Gain or (Loss) on Derivatives Recognized in Income($) | Change in Unrealized Appreciation/(Depreciation) on Derivatives Recognized in Income($) | ||||||||||
Equity Contracts | Realized gain/(loss) on Futures, Increase/(decrease) in unrealized appreciation/ (depreciation) on Futures | 4,143,171/(4,372,569) | (13,484 | ) | (1,472 | ) | ||||||||
| 5. | Line of Credit |
The Company shares a revolving credit facility of up to $150 million with a number of its affiliates. The credit facility is with its custodian bank, State Street Bank and Trust Company (“State Street”). The revolving credit facility requires the payment of a commitment fee equal to 0.125% per annum on the daily unused portion of the
credit facility, payable quarterly. The portion borne by the Funds generally is borne proportionally based upon net assets. In addition, the Company has a $100 million uncommitted, unsecured line of credit with State Street. Generally, borrowings under the credit facilities would accrue interest at the Federal Funds Rate plus 50 basis points and would be borne by the borrowing Fund. The maximum amount allowed to be borrowed by any one
17
Table of Contents
| Notes to Financial Statements | June 30, 2011 (unaudited) |
Fund is the lesser of (i) 33.33% of its total assets or (ii) 20% of its net assets. The credit facilities were not utilized by the Fund during the six-month period ended June 30, 2011.
| 6. | Fees and Compensation Paid to Affiliates |
GEAM, a registered investment adviser, was retained by the Company’s Board of Directors effective November 17, 1997 to act as investment adviser and administrator of the Fund. GEAM’s compensation for investment advisory and administrative services is paid monthly based on the average daily net assets of the Fund at an annualized rate of 0.55%.
GEAM has a contractual agreement with the Fund to waive a portion of the Fund’s management fee in the amount equal to the management fee earned by GEAM with respect to the Fund’s investment in the GE Institutional Money Market Fund.
Distribution and Service (12b-1) Fees The Company has adopted a Distribution and Service (12b-1) Plan (the “Plan”) pursuant to Rule 12b-1 under the 1940 Act with respect to Class 4 shares of the Fund. Under the Plan, the Fund may compensate GE Investment Distributors, Inc. (“GEID”), a wholly-owned subsidiary of GEAM and the Fund’s principal distributor, for certain sales services provided by GEID or other broker dealers and investor services provided by GEID or other service providers relating to the Fund’s Class 4 shares, including services to owners or prospective owners of variable contracts issued by insurance companies that offer such share class as an investment option. The amount of compensation paid under the Plan by the Fund’s Class 4 shares may not exceed 0.45% of the average daily net assets of the Fund attributable to such share class. The Plan continues in effect from year to year for so long as such continuance is approved annually by the Board of Directors, including by those directors who are not interested persons of the Company and who have no direct or indirect financial interest in the operation of the Plan or in any agreement related to it.
Directors’ Compensation The Fund pays no compensation to its directors who are officers or employees of GEAM or its affiliates. Directors who are not such officers or employees also serve in a similar capacity for other funds advised by GEAM. Compensation paid to unaffiliated directors are reflected on the Statement of Operations. These fees are allocated pro rata across all of the mutual fund platforms and share classes served by the directors, including the Fund, and are based upon the relative net assets of each Fund within such platforms.
| 7. | Investment Transactions |
Purchases and Sales of Securities The cost of purchases and the proceeds from sales of investments, other than short-term securities and options, for the period ended June 30, 2011 were as follows:
| Non U.S. Government Securities | ||
| Purchases | Sales | |
| $6,441,748 | $9,907,154 | |
| 8. | Income Taxes |
The Fund is subject to ASC 740, Income Taxes. ASC 740 provides guidance for financial accounting and reporting for the effects of income taxes that result from an entity’s activities during the year. ASC 740 also provides guidance regarding how certain uncertain tax positions should be recognized, measured, presented and disclosed in the financial statements. ASC 740 requires evaluation of tax positions taken or expected to be taken in the course of preparing the Fund’s tax returns to determine whether the tax positions are “more likely than not” of being sustained by the applicable tax authority. There are no adjustments to the Fund’s net assets required under ASC 740. The Fund’s 2007, 2008, 2009 and 2010 fiscal years tax returns are still open to examination by the Federal and applicable state tax authorities.
At June 30, 2011, information on the tax cost of investments was as follows:
Cost of investment for | Gross Tax | Net tax appreciation/ | ||||
| Appreciation | Depreciation | |||||
| 33,747,622 | 3,385,924 | (713,576) | 2,672,348 | |||
As of December 31, 2010, the Fund has capital loss carryovers as indicated below. Capital loss carryovers are available to offset future realized capital gains to the
extent provided in the Internal Revenue Code and regulations thereunder. To the extent that these carryover losses are used to offset future capital gains, it is probable
18
Table of Contents
| Notes to Financial Statements | June 30, 2011 (unaudited) |
that the gains so offset will not be distributed to shareholders because they would be taxable as ordinary income.
| Amount | Expires | |
| $ 26,864 | 12/31/2016 | |
| 7,924,617 | 12/31/2017 |
These amounts will be available to offset future taxable capital gains. Under the recently enacted Regulated Investment Company Modernization Act of 2010, the Fund will be permitted to carry forward capital losses incurred in taxable years beginning after December 22, 2010 for an unlimited period. However, any losses incurred during those future years will be required to be utilized prior to the losses incurred in pre-enactment tax years. As a result of this ordering rule, pre-enactment capital loss carryforwards may be more likely to expire unused. Additionally, post-enactment capital losses that are carried forward will retain their character as either short-term or long-term capital losses rather than being considered all short-term as under previous law.
During the year ended December 31, 2010, the Fund utilized $778,743 of prior year capital loss carryovers.
Any net capital and currency losses incurred after October 31, within the Fund’s tax year, are deemed to arise on the first day of the Fund’s next tax year if the Fund so elects to defer such losses.
The Fund elected to defer losses incurred after October 31, 2010 as follows:
| Capital | Currency | |
| $— | $5 |
The tax composition of distributions paid during the years ended December 31, 2010 and December 31, 2009 were as follows:
| Ordinary Income | Long-Term Capital Gains | Total | ||||||||||
2010 | $ | 369,300 | $ | — | $ | 369,300 | ||||||
2009 | 439,282 | — | 439,282 | |||||||||
Distributions to Shareholders The Fund declares and pays any dividends from net investment income annually. The Fund declares and pays any net realized capital gains in excess of capital loss carryforwards distributions annually. The character of income and gains to be distributed is determined in accordance with income tax regulations which may differ from generally accepted accounting principles. These differences include (but are not limited to) futures investments organized as partnerships for tax purposes and losses deferred due to wash sale transactions. Reclassifications due to permanent book/tax differences are made to the Fund’s capital accounts to reflect income and gains available for distribution (or available capital loss carryovers) under income tax regulations. These reclassifications have no impact on the net asset value of the Fund. The calculation of net investment income per share in the Financial Highlights table excludes these adjustments.
The reclassifications for the year ended December 31, 2010 were as follows:
Undistributed Net Investment Income | Accumulated Net Realized (Loss) | |
| $37 | $(37) |
| 9. | Significant Transaction |
Effective April 30, 2011 the Fund closed Class 4 shares. A full redemption was made by investors in the share class at the closing net asset value.
19
Table of Contents
| Special Meeting of Shareholders — Voting Results | (unaudited) |
On April 1, 2011, the GE Investments Funds, Inc. (the “Company”) held a special meeting of shareholders of each series portfolio of the Company, including shareholders of the U.S. Equity Fund (the “Fund”). Shareholders of record on January 28, 2011 were entitled to vote on the proposals. For each proposal, except Proposal 1, shareholders voted on a fund-by-fund basis. For Proposal 1, shareholders of all funds voted together and not by fund or share class. At the meeting, all proposals were approved by the Fund and the following votes were recorded:
Proposal 1:
Election of Mr. R. Sheldon Johnson and Mr. Matthew J. Simpson as Directors to the Board of Directors of the Company.
Company votes:
| No. of Shares | % of Outstanding Shares | % of Shares Present | ||||||||||
| Mr. R. Sheldon Johnson | ||||||||||||
Affirmative | 451,517,094.582 | 90.054 | % | 96.126 | % | |||||||
Abstain | 18,195,810.391 | 3.629 | % | 3.874 | % | |||||||
Total | 469,712,904.973 | 93.683 | % | 100.000 | % | |||||||
| Mr. Matthew J. Simpson | ||||||||||||
Affirmative | 451,949,730.789 | 90.140 | % | 96.218 | % | |||||||
Abstain | 17,763,174.184 | 3.543 | % | 3.782 | % | |||||||
Total | 469,712,904.973 | 93.683 | % | 100.000 | % | |||||||
Fund votes:
| No. of Shares | % of Outstanding Shares | % of Shares Present | ||||||||||
| Mr. R. Sheldon Johnson | ||||||||||||
Affirmative | 1,038,073.020 | 87.876 | % | 95.227 | % | |||||||
Abstain | 52,025.803 | 4.404 | % | 4.773 | % | |||||||
Total | 1,090,098.823 | 92.280 | % | 100.000 | % | |||||||
| Mr. Matthew J. Simpson | ||||||||||||
Affirmative | 1,037,933.279 | 87.864 | % | 95.215 | % | |||||||
Abstain | 52,165.544 | 4.416 | % | 4.785 | % | |||||||
Total | 1,090,098.823 | 92.280 | % | 100.000 | % | |||||||
Proposal 2:
Approval of the use of a “manager of managers” arrangement whereby GEAM, as the Fund’s investment adviser, under certain circumstances, will be able to hire and replace sub-advisers to the Fund without obtaining shareholder approval.
| No. of Shares | % of Outstanding Shares | % of Shares Present | ||||||||||
Affirmative | 979,902.388 | 82.952 | % | 89.891 | % | |||||||
Against | 60,018.778 | 5.081 | % | 5.506 | % | |||||||
Abstain | 50,177.657 | 4.247 | % | 4.603 | % | |||||||
Broker Non-votes | — | — | — | |||||||||
Total | 1,090,098.823 | 92.280 | % | 100.000 | % | |||||||
20
Table of Contents
| Special Meeting of Shareholders — Voting Results | (unaudited) |
Proposal 3:
Approval of the following changes in certain of the Fund’s investment policies, as follows:
| A. | Amendment of the Fund’s investment policy on senior securities. |
| No. of Shares | % of Outstanding Shares | % of Shares Present | ||||||||||
Affirmative | 999,806.986 | 84.637 | % | 91.717 | % | |||||||
Against | 37,504.531 | 3.175 | % | 3.441 | % | |||||||
Abstain | 52,787.306 | 4.468 | % | 4.842 | % | |||||||
Broker Non-votes | — | — | — | |||||||||
Total | 1,090,098.823 | 92.280 | % | 100.000 | % | |||||||
| C. | Amendment of the Fund’s investment policy on making loans. |
| No. of Shares | % of Outstanding Shares | % of Shares Present | ||||||||||
Affirmative | 990,911.830 | 83.884 | % | 90.901 | % | |||||||
Against | 39,733.002 | 3.363 | % | 3.645 | % | |||||||
Abstain | 59,453.991 | 5.033 | % | 5.454 | % | |||||||
Broker Non-votes | — | — | — | |||||||||
Total | 1,090,098.823 | 92.280 | % | 100.000 | % | |||||||
| D. | Amendment of the Fund’s investment policy on borrowing. |
| No. of Shares | % of Outstanding Shares | % of Shares Present | ||||||||||
Affirmative | 1,028,537.301 | 87.069 | % | 94.353 | % | |||||||
Against | 31,001.476 | 2.624 | % | 2.844 | % | |||||||
Abstain | 30,560.046 | 2.587 | % | 2.803 | % | |||||||
Broker Non-votes | — | — | — | |||||||||
Total | 1,090,098.823 | 92.280 | % | 100.000 | % | |||||||
| E. | Amendment of the Fund’s investment policy on diversification. |
| No. of Shares | % of Outstanding Shares | % of Shares Present | ||||||||||
Affirmative | 1,001,264.887 | 84.760 | % | 91.851 | % | |||||||
Against | 30,698.476 | 2.599 | % | 2.816 | % | |||||||
Abstain | 58,135.460 | 4.921 | % | 5.333 | % | |||||||
Broker Non-votes | — | — | — | |||||||||
Total | 1,090,098.823 | 92.280 | % | 100.000 | % | |||||||
| F. | Amendment of the Fund’s investment policy on concentration of investments. |
| �� | No. of Shares | % of Outstanding Shares | % of Shares Present | |||||||||
Affirmative | 1,005,004.360 | 85.077 | % | 92.194 | % | |||||||
Against | 37,050.548 | 3.136 | % | 3.399 | % | |||||||
Abstain | 48,043.915 | 4.067 | % | 4.407 | % | |||||||
Broker Non-votes | — | — | — | |||||||||
Total | 1,090,098.823 | 92.280 | % | 100.000 | % | |||||||
21
Table of Contents
| Special Meeting of Shareholders — Voting Results | (unaudited) |
| G. | Amendment of the Fund’s investment policy on investments in commodities and its reclassification from a non-fundamental policy to a fundamental policy. |
| No. of Shares | % of Outstanding Shares | % of Shares Present | ||||||||||
Affirmative | 997,229.395 | 84.419 | % | 91.481 | % | |||||||
Against | 37,064.744 | 3.137 | % | 3.400 | % | |||||||
Abstain | 55,804.684 | 4.724 | % | 5.119 | % | |||||||
Broker Non-votes | — | — | — | |||||||||
Total | 1,090,098.823 | 92.280 | % | 100.000 | % | |||||||
| H. | Amendment of the Fund’s fundamental investment policy on illiquid investments and its reclassification from a fundamental policy to a non-fundamental policy. |
| No. of Shares | % of Outstanding Shares | % of Shares Present | ||||||||||
Affirmative | 997,002.998 | 84.400 | % | 91.460 | % | |||||||
Against | 35,537.502 | 3.008 | % | 3.260 | % | |||||||
Abstain | 57,558.323 | 4.872 | % | 5.280 | % | |||||||
Broker Non-votes | — | — | — | |||||||||
Total | 1,090,098.823 | 92.280 | % | 100.000 | % | |||||||
| I. | Elimination of the Fund’s investment policy on mortgaging, pledging and hypothecating of investments. |
| No. of Shares | % of Outstanding Shares | % of Shares Present | ||||||||||
Affirmative | 1,055,705.322 | 89.369 | % | 96.845 | % | |||||||
Against | 11,648.112 | 0.986 | % | 1.068 | % | |||||||
Abstain | 22,745.389 | 1.925 | % | 2.087 | % | |||||||
Broker Non-votes | — | — | — | |||||||||
Total | 1,090,098.823 | 92.280 | % | 100.000 | % | |||||||
| J. | Amendment of the Fund’s investment policy on real estate investments. |
| No. of Shares | % of Outstanding Shares | % of Shares Present | ||||||||||
Affirmative | 1,017,436.428 | 86.129 | % | 93.334 | % | |||||||
Against | 27,002.855 | 2.286 | % | 2.477 | % | |||||||
Abstain | 45,659.540 | 3.865 | % | 4.189 | % | |||||||
Broker Non-votes | — | — | — | |||||||||
Total | 1,090,098.823 | 92.280 | % | 100.000 | % | |||||||
22
Table of Contents
| Additional Information | (unaudited) |
Information about Directors and Executive Officers:
The business and affairs of the Funds are managed under the direction of the Funds’ Board of Directors. Information pertaining to the Directors and officers of the Funds is set forth below.
Interested Directors and Executive Officers
Michael J. Cosgrove
Address c/o GEAM 3001 Summer St. Stamford, CT 06905
Age 62
Position(s) Held with Fund Chairman of the Board and President
Term of Office and Length of Time Served Until successor is elected and qualified – 14 years
Principal Occupation(s) During Past 5 years President and Chief Executive Officer – Mutual Funds and Intermediary Business at GEAM since March 2007; Executive Vice President of GEAM from February 1997 to March 2007; Vice President, GE Capital Corporation, an indirect wholly-owned subsidiary of GE, since December 1999; Executive Vice President – Mutual Funds of GEAM, a wholly-owned subsidiary of GE that is registered as an investment adviser under the Investment Advisers Act of 1940, as amended, since March 1993; President and Director of GE Investment Distributors, Inc., since June 2011. Director of GEAM since 1988.
Number of Portfolios in Fund Complex Overseen by Director 28
Other Directorships Held by Director Chairman of the Board and President of GE Institutional Funds since 1997; Trustee of Elfun Funds, GE Savings & Security Funds, General Relief and Loan Fund and General Electric Pension Trust since 1988; Trustee of Fordham University from 2002 to June 30, 2010 and since July 2011; Trustee of GE Volunteers since 1993; Director of GE Foundation; Director, GE Asset Management (Ireland) Limited, since February 1999, GE Asset Management Funds Plc since 1998, GE Asset Management Canada Company since 1998, GE Asset Management Limited since 1998 and GEAM since 1988; Chairman of the Board and President of GE Funds from 1993 to February 2011.
Matthew J. Simpson
Address c/o GEAM 3001 Summer St. Stamford, CT 06905
Age 50
Position(s) Held with Fund Director and Executive Vice President
Term of Office and Length of Time Served Until successor is elected and qualified – 3 years
Principal Occupation(s) During Past 5 years Executive Vice President, General Counsel and Secretary of GEAM since July 2007; Senior Vice President and General Counsel – Marketing and Client Services (formerly Asset Management Services) at GEAM and Senior Vice President and General Counsel of GE Asset Management Services from February 1997 to July 2007; Vice President and Associate General Counsel of GEAM from October 1992 to February 1997; Secretary of GE Funds from 1993 to July 2007 and Vice President from September 2003 to July 2007; Secretary of GE Institutional Funds and GE Investments Funds, Inc. from 1997 to July 2007; Secretary of Elfun Funds and GE Savings & Security Funds since July 2007; Assistant Secretary of Elfun Funds and GE Savings & Security Funds from 1998 to July 2007 and Vice President from October 2003 to July 2007.
Number of Portfolios in Fund Complex Overseen by Director 28
Other Directorships Held by Director Trustee of Elfun Funds, GE Savings & Security Funds and General Electric Pension Trust since July 2007; Trustee of GE Institutional Funds since April 2011 and Trustee of GE Funds from July 2007 to February 2011.
23
Table of Contents
| Additional Information | (unaudited) |
Joon Won Choe
Address c/o GEAM 3001 Summer St. Stamford, CT 06905
Age 41
Position(s) Held with Fund Vice President & Secretary
Term of Office and Length of Time Served Until successor is elected and qualified – Vice President and Secretary – less than 1 year
Principal Occupation(s) During Past 5 years Senior Vice President and Deputy General Counsel at GEAM since March 2011; Senior Vice President and Associate General Counsel at GEAM from June 2010 to March 2011; Vice President and Associate General Counsel at GEAM from November 2005 to June 2010; Vice President and Secretary of GE Institutional Funds and GE Investments Funds, Inc. since September 2010; Vice President and Assistant Secretary of Elfun Funds and GE Savings & Security Funds since September 2010.
Number of Portfolios in Fund Complex Overseen by Officer N/A
Other Directorships Held by Officer N/A
Robert Herlihy
Address c/o GEAM 3001 Summer St. Stamford, CT 06905
Age 43
Position(s) Held with Fund Chief Compliance Officer
Term of Office and Length of Time Served Until successor is elected and qualified — 5 years
Principal Occupation(s) During Past 5 years Chief Compliance Officer of GEAM, GE Institutional Funds, Elfun Funds, and GE Savings and Security Funds since July 2005; Chief Compliance Officer of GE Funds from July 2005 to February 2011; and Manager of Fund Administration at GEAM from 2002 – 2005.
Number of Portfolios in Fund Complex Overseen by Officer N/A
Other Directorships Held by Officer N/A
Arthur A. Jensen
Address c/o GEAM 3001 Summer St. Stamford, CT 06905
Age 44
Position(s) Held with Fund Treasurer
Term of Office and Length of Time Served Until successor is elected and qualified – less than 1 year
Principal Occupations(s) During Past 5 years Treasurer of GE Institutional Funds, Elfun Funds and GE Savings and Security Funds since June 2011; Mutual Funds Controller of GEAM since April 2011; Senior Vice President at Citigroup from 2008 to 2010 and Vice President at JPMorgan from 2005 to 2008.
Number of Portfolios in Fund Complex Overseen by Officer N/A
Other Directorships Held by Officer N/A
24
Table of Contents
| Additional Information | (unaudited) |
Non-Interested Directors
John R. Costantino
Address c/o GEAM 3001 Summer St. Stamford, CT 06905
Age 65
Position(s) Held with Fund Director
Term of Office and Length of Time Served Until successor is elected and qualified – 14 years
Principal Occupation(s) During Past 5 years General Partner, NGN Capital LLC since 2006; Managing Director, Vice President of Walden Capital Management since 1996.
Number of Portfolios in Fund Complex Overseen by Director 20
Other Directorships Held by Director Director of GE Institutional Funds since 1997; Trustee of Fordham University from 1989-1995 and 2001-2007 and Trustee Emeritus since 2007; Trustee of Neuroscience Research Institute since 1986; Trustee of GE Funds from 1993 to February 2011; Trustee of Gregorian University Foundation from 1992-2007; Director of Artes Medical from 2006-2008.
R. Sheldon Johnson
Address c/o GEAM 3001 Summer St. Stamford, CT 06905
Age 64
Positions(s) Held with Fund Director
Term of office and Length of Time served Unit Successor is elected and qualified – less than 1 year.
Principal Occupation(s) During Past 5 years Managing Director at Morgan Stanley & Co., Inc. from 1988 to 2006; Head of Global Institutional Equity Sales and Marketing at Morgan Stanley & Co., Inc. from 2002 to 2006.
Number of Portfolios in Fund Complex Overseen by Director 20
Other Directorships Held by Director Trustee of GE Institutional Funds since April 2011 and Trustee of St. Lawrence University since 2003.
Robert P. Quinn
Address c/o GEAM 3001 Summer St. Stamford, CT 06905
Age 75
Position(s) Held with Fund Director
Term of Office and Length of Time Served Until successor is elected and qualified – 14 years
Principal Occupation(s) During Past 5 years Retired since 1983 from Salomon Brothers Inc.
Number of Portfolios in Fund Complex Overseen by Director 20
Other Directorships Held by Director Trustee of GE Institutional Funds since 1997; Trustee of St. Francis Hospital since 1980; and Trustee of GE Funds from 1993 to February 2011.
The Statement of Additional Information for the Funds includes additional information about the Directors and Officers and is available, without charge, upon request by calling 1-800-242-0134.
25
Table of Contents
| Investment Team | (unaudited) |
Investment Adviser and Administrator
GE Asset Management Incorporated
Board of Directors
Michael J. Cosgrove, Chairman
John R. Costantino
R. Sheldon Johnson*
Robert P. Quinn
Matthew J. Simpson
Secretary
Joon Won Choe
Assistant Secretary
Michelle Matzelle
Treasurer
Arthur A. Jensen (effective June 6, 2011)
Assistant Treasurer
Casey Yantosca
Distributor
GE Investment Distributors, Inc.
Member FINRA and SIPC
Custodian
State Street Bank & Trust Company
Officers of the Investment Adviser
Dmitri Stockton, President and Chief Executive Officer (since May 2011)†
Cheryl H. Beacock, Senior Vice President, Human Resources
George A. Bicher, Chief Risk Officer
Paul M. Colonna, President and Chief Investment Officer – Fixed Income Investments
Michael J. Cosgrove, President and Chief Executive
Officer – Mutual Funds & Intermediary Business
Ralph R. Layman, President and Chief Investment Officer – Public Equity Investments
Maureen B. Mitchell, President – Institutional Sales and Marketing
Matthew J. Simpson, Executive Vice President, General Counsel and Secretary
Don W. Torey, President – Alternative Investments
John J. Walker, Executive Vice President, Chief Operating Officer
David Wiederecht, President and Chief Investment Officer – Investment Strategies
Tracie A. Winbigler, Executive Vice President, Chief Financial Officer (since January 2011)
| * | Mr. Johnson was elected as a Director of the Funds effective April 1, 2011. |
| † | Effective May 1, 2011, Mr. Stockton replaced James W. Ireland as President and Chief Executive Officer. |
At GE Asset Management, we’re dedicated to providing the investment options you’ll need to tailor your financial portfolio to every stage of your life. Each member of the GE Family of Funds is managed according to the same principles of integrity and quality that have guided GE over the past century, and have made it the world-class company that it is today. Each fund draws strength from a heritage of investment management experience that spans more than 80 years. Whether you’re creating a new investment portfolio or adding to an established one, the GE Family of Funds offers an array of professionally managed investment options that will help you meet a lifetime of financial needs.
26
Table of Contents
Investment Adviser
GE Asset Management Incorporated
3001 Summer Street
PO Box 7900
Stamford, CT 06904-7900
Distributor
GE Investment Distributors, Inc.
member FINRA and SIPC
3001 Summer Street
PO Box 7900
Stamford, CT 06904-7900
The Fund files its complete schedule of portfolio holdings with the Securities and Exchange Commission for the first and third quarters of each fiscal year on Form N-Q. The Fund’s Forms N-Q, as well as a description of the policies and procedures that the Fund uses to determine how to vote proxies (if any) relating to portfolio securities is available without charge (i) upon request, by calling 1-800-493-3042; (ii) on the Fund’s website at http://www.geam.com; and (iii) on the Commission’s website at http://www.sec.gov. The Fund’s Forms N-Q may be reviewed and copied at the Commission’s Public Reference Room in Washington, DC – information on the operation of the Public Reference Room may be obtained by calling 1-800-SEC-0330.
Information (if any) regarding how the Fund voted proxies relating to portfolio securities during the most recently disclosed 12-month period ended June 30 is available without charge (i) through the Fund’s website at http://www.geam.com; and (ii) on the Commission’s website at http://www.sec.gov.
Table of Contents
GE Investments Funds, Inc.
| S&P 500 Index Fund | Letter from the Chairman | |

Michael J. Cosgrove
Chairman,
GE Investments Funds, Inc.
Dear Shareholder: |
Attached is the semi-annual report for GE Investments Funds, Inc. — S&P 500 Index Fund (the “Fund”) for the six-month period ended June 30, 2011. The report contains information about the performance of the Fund and other fund-specific data, along with portfolio manager commentary.
We have provided you with an overview of the investment markets, along with our investment outlook for the coming months.
Market Overview
Most major equity indices posted positive returns in the six-month period ended June 30, 2011, despite geopolitical tensions in the Middle East and North Africa, a devastating earthquake in Japan, ongoing concerns about unresolved sovereign debt issues in peripheral Europe and elevated inflation in emerging markets. Volatility increased in May and June, however, as some measures of global economic activity weakened and uncertainties over Greece’s ability to finance and service its debt rattled the financial markets. In the U.S., concerns over the end of quantitative easing by the Federal Reserve and political wrangling over the government debt ceiling further contributed to a challenging environment. The increase in risk aversion benefited the fixed income markets as many investors sought out safer investments. Toward the end of June, the Greek Parliament passed austerity measures that seemed to calm the markets and opened the way for the next round of financing from the European Central Bank and the International Monetary Fund.
Against this backdrop, financial markets posted positive results for the six- and 12-month periods ended June 30, 2011 as represented by the index returns in the below chart.
| Total Returns (%) as of June 30, 2011 | 6-month | 12-month | ||||||
U.S. equities (S&P 500 Index) | 6.0 | 30.7 | ||||||
Global equities (MSCI World Index) | 5.3 | 30.5 | ||||||
International equities (MSCI EAFE Index) | 5.0 | 30.4 | ||||||
Small-cap U.S. equities (Russell 2000 Index) | 6.2 | 37.4 | ||||||
Mid-cap U.S. equities (Russell Mid Cap Index) | 8.1 | 38.5 | ||||||
U.S. fixed income (Barclays Capital U.S. Aggregate Bond Index) | 2.7 | 3.9 | ||||||
U.S. short-term government fixed income | 0.9 | 1.4 | ||||||
Outlook
We remain constructive on the prospects for healthy global growth, although it may be at a slower pace than originally anticipated. Central banks in the U.S. and Europe remain accommodative and supply chain issues in Japan appear to have abated. There are also signs that inflation may be peaking in emerging markets as commodity prices have eased in recent months. Corporate balance sheets remain healthy and fundamentals remain intact, in our view. We believe that valuations for equities are not stretched and remain below historical averages while equity risk premiums are still high–offering the possibility for further gains. We expect that the financial markets are likely to remain volatile due to outstanding sovereign debt issues, but believe that returns are biased to the upside in the second half of the year.
Thank you for investing with GE Investments Funds.
Sincerely,

Michael J. Cosgrove
Chairman, GE Investments Funds, Inc.
July 2011
 |
This does not constitute a part of the Fund’s Shareholder Report
Table of Contents
GE Investments Funds, Inc.
| S&P 500 Index Fund | ||
Mike Cosgrove is President and Chief Executive Officer — Mutual Funds and Intermediary Business at GE Asset Management Incorporated (“GEAM”). In addition to the GE Investments Funds, he is also Chairman of the Board and President of GE Institutional Funds and Director and President of GEAM’s broker-dealer which serves as underwriter and distributor for the GE Investments Funds. Mr. Cosgrove serves as a Trustee of the GE Savings & Security Funds, the GE Foundation, and the GE Pension Trust. He also serves on the Board of Directors of the Skin Cancer Foundation and is a Trustee of Fordham University. Previously Chief Financial Officer of GE Asset Management and Assistant Treasurer — GE Company, Mr. Cosgrove joined GE in 1970 and held a number of managerial positions in finance and sales in the International Operation and the GE Trading Company. He received a BS in Economics from Fordham University and an MBA from St. John’s University.
This does not constitute a part of the Fund’s Shareholder Report
Table of Contents
GE Investments Funds, Inc.
S&P 500 Index Fund
Semi-Annual Report
June 30, 2011

Table of Contents
| S&P 500 Index Fund | Contents | |
| 1 | ||||
| 2 | ||||
| 14 | ||||
Financial Statements | ||||
| 15 | ||||
| 16 | ||||
| 17 | ||||
| 18 | ||||
| 19 | ||||
| 24 | ||||
| 27 | ||||
| 30 | ||||
This report is prepared for Policyholders of certain variable contracts and may be distributed to others only if preceded or accompanied by the variable contract’s current prospectus and the current prospectus of the Fund available for investments thereunder.
Table of Contents
| Notes to Performance | June 30, 2011 (unaudited) |
The information provided on the performance pages relates to the GE Investments S&P 500 Index Fund (the “Fund”) and is unaudited.
Total returns take into account changes in share price and assume reinvestment of dividends and capital gains distributions, if any. Total returns shown are net of Fund fees and expenses but do not reflect fees and charges associated with the variable contracts such as administrative fees, account charges and surrender charges, which, if reflected, would reduce the Fund’s total returns for all periods shown.
The performance data quoted represents past performance; past performance does not guarantee future results. Investment return and principal value will fluctuate so your shares, when redeemed, may be worth more or less than their original cost. Current performance may be higher or lower than the performance data quoted. Periods less than one year are not annualized. Please call toll-free 800-493-3042 or visit the Fund’s website at http://www.geam.com for the most recent month-end performance data.
An investment in the Fund is not a deposit of any bank and is not insured or guaranteed by the Federal Deposit Insurance Corporation (FDIC) or any other government agency. An investment in the Fund is subject to risk, including possible loss of principal invested.
The S&P 500® Index is an unmanaged market capitalization-weighted index of stocks of 500 large U.S. companies, which is widely used as a measure of large-cap
U.S. stock market performance. The results shown for the foregoing index assume the reinvestment of net dividends or interest. They do not reflect the actual cost of investing in the instruments that comprise the index.
The peer universe of the underlying annuity funds used for the peer group average annual total return calculation is based on a blend of Morningstar peer categories, as shown. Morningstar is an independent mutual fund rating service. A Fund’s performance may be compared to or ranked within a universe of mutual funds with investment objectives and policies similar but not necessarily identical to that of the Fund.
The S&P 500 Index Fund is not sponsored, endorsed, sold or promoted by Standard & Poor’s, and Standard & Poor’s makes no representation or warranty, express or implied, to the investors of the Fund or any member of the public regarding the advisability of investing in the securities generally or in this Fund particularly or the ability of the S&P 500 Index Fund to track general stock market performance.
©2011 Morningstar, Inc. All Rights Reserved. The Morningstar information contained herein: (1) is proprietary to Morningstar and/or its content providers; (2) may not be copied or distributed; and (3) is not warranted to be accurate, complete or timely. Neither Morningstar nor its content providers are responsible for any damage or losses relating from any use of this information. Past performance is no guarantee of future results.
GE Investment Distributors, Inc., Member of FINRA & SIPC, is the principal underwriter and distributor of the GE Investments Funds, Inc. and a wholly owned subsidiary of GE Asset Management Incorporated, the investment adviser of the Fund.
1
Table of Contents

SSgA Funds Management, Inc. (“SSgA FM”) is the sub-adviser to the S&P 500 Index Fund. SSgA FM is registered with the SEC as an investment adviser under the Investment Advisers Act of 1940, as amended, and is a wholly owned subsidiary of State Street Corporation. The Fund is managed by a team of portfolio managers composed of the following members: Karl Schneider and John Tucker.
Karl A. Schneider, CAIA is a Vice President of SSgA FM and Head of US Equity Strategies for the Global Equity Beta Solutions Team (GEBS), where in addition to overseeing the management of the US equity index strategies, he also serves as a portfolio manager for a number of the group’s passive equity portfolios. Previously with (GEBS), he served as a portfolio manager and product specialist for synthetic beta strategies, including commodities, buy/write, and hedge fund replication. Karl is also a member of the SSgA Derivatives Committee. Prior to joining GEBS, Karl worked as a portfolio manager in SSgA’s Currency Management Group, managing both active currency selection and traditional passive hedging overlay portfolios. He joined State Street in 1996. Karl holds a BS in Finance and Investments from Babson College and also an MS in Finance from Boston College. He has earned the Chartered Alternative Investment Analyst designation and is a member of the CAIA Association.
John Tucker, CFA is a Managing Director of SSgA FM and Co-Head of Passive Equity Strategies in North America. John is responsible for overseeing the management of all equity index strategies and exchange traded funds managed in Boston and Montreal. He is a member of the Senior Management Group. Previously, John was head of the Structured Products group in SSgA’s London office, where he was responsible for the management of all index strategies in the firm’s second largest investment center. Prior to joining the investment management group, he was the Operations Manager for SSgA’s International Structured Products group, where he was responsible for the operations staff and functions. He joined State Street in 1988. John received a BA from Trinity College and an MS in Finance from Boston College. He has also earned the Chartered Financial Analyst designation and is a member of the Boston Security Analysts Society and the CFA Institute.
| Q. | How did the S&P 500 Index Fund perform compared to its benchmark and Morningstar peer group for the six-month period ended June 30, 2011? |
| A. | For the six-month period ended June 30, 2011, the S&P 500 Index Fund returned 5.86% for Class 1 shares. The S&P 500 Index, the Fund’s benchmark, returned |
| 6.02% and the Fund’s Morningstar peer group of 384 U.S. Insurance Large Growth funds returned an average of 5.25% over the same period. |
| Q. | What market conditions affected Fund performance? |
| A. | During the buoyant first quarter of 2011, global financial markets navigated turmoil in the Arab world and earthquake devastation in Japan with impressive resilience. But a surge in weekly U.S. unemployment claims and downbeat data on the soggy U.S. housing market soon made many investors wary. Core inflation also continued its steady climb, dampening investor hopes that the Federal Reserve might soon introduce a new round of asset purchases after the expiration of QE2. The only relief for equity holders came late in the quarter with the announcement that crude oil in storage would be allocated to the marketplace, as well as sovereign debt developments in Europe, which provided an additional boost to sentiment. |
| Q. | What were the primary drivers of Fund performance? |
| A. | By utilizing a passive, full replication investment style, the Fund owned the same stocks and sectors in approximately the same weights as the S&P 500 Index, and was not materially impacted by IPOs, M&A activity, or strategies which are not the principal strategy of the Fund. As of June 30, 2011, the four largest sectors in the S&P 500 Index were information technology (17.3%), financials (14.7%), energy (12.3%), and health care (11.4%). The highest returning sector for the last six months was health care (+13%) followed by energy (+11%). The lowest returning sectors were financials (-3%) and information technology (+2%). |
| Q. | Were there any significant changes in the Fund during the period? |
| A. | Over the last six months there were 10 index addition/deletion changes announced by Standard & Poor’s that impacted the Fund. Not all the additions and deletions were bought and sold in the Fund, however, many changes were as a result of a merger or acquisition, or a spin-off involving another S&P 500 constituent. Additionally, there were numerous index share changes throughout the period, as well as at each quarter’s end. Many of the share changes also required no trading, as the weight change within the portfolio was negligible. |
2
Table of Contents
| S&P 500 Index Fund | (unaudited) |
Understanding Your Fund’s Expenses
As a shareholder of the Fund you incur ongoing costs. Ongoing costs include portfolio management fees, distribution and services fees, professional fees, administrative fees and other Fund expenses. The following example is intended to help you understand your ongoing costs (in dollars) of investing in the Fund and to compare these costs with the ongoing costs of investing in other mutual funds.
To illustrate these ongoing costs, we have provided an example and calculated the expenses paid by investors of the Fund during the period. The information in the following table is based on an investment of $1,000, which is invested at the beginning of the period and held for the entire six-month period ended June 30, 2011.
Actual Expenses
The first section of the table provides information about actual account values and actual expenses. You may use the information in this section, together with the amount you invested, to estimate the expenses that you paid over the period. To do so, simply divide your account value by $1,000 (for example, an $8,600 account value divided by $1,000 = 8.6), then multiply the result by the
number given for your class under the heading “Expenses paid during period.”
Hypothetical Example for Comparison Purposes
The second section of the table provides information about hypothetical account values and hypothetical expenses based on the Fund’s actual expense ratio and an assumed rate of return of 5% per year before expenses, which is not the Fund’s actual return. The hypothetical account values and expenses may not be used to estimate the actual ending account balance or expenses you paid for the period. You may use this information to compare the ongoing costs of investing in the Fund and other funds. To do so, compare this 5% hypothetical example with the 5% hypothetical examples that appear in the shareholders reports of other funds.
Please note that the expenses shown in the table are meant to highlight and help you compare ongoing costs only and do not reflect any transaction costs, such as sales charges or redemption fees, if any. Additionally, the expenses shown do not reflect the fees or charges associated with variable contracts through which shares of the Fund are offered.
January 1, 2011 – June 30, 2011
| Account value at the beginning of the period ($) | Account value at the end of the period ($) | Expenses paid during the period ($)* | ||||||||||
Actual Fund Return** | ||||||||||||
Class 1 | 1,000.00 | 1,058.56 | 1.89 | |||||||||
Hypothetical 5% Return (2.5% for the period) |
| |||||||||||
Class 1 | 1,000.00 | 1,022.70 | 1.86 | |||||||||
| * | Expenses are equal to the Fund’s annualized expense ratio of 0.37% (for the period January 1, 2011—June 30, 2011), multiplied by the average account value over the period, multiplied by 181/365 (to reflect the six month period). |
| ** | Actual Fund Return for the six-month period ended June 30, 2011 was: 5.86%. Past performance does not guarantee future results. |
3
Table of Contents
| S&P 500 Index Fund | (unaudited) |
Investment Profile
A mutual fund designed for investors who seek growth of capital and accumulation of income that corresponds to the investment return of the S&P 500® Composite Stock Index (S&P 500 Index). The Fund seeks its objective by seeking to replicate the return of the S&P 500® Index while holding transaction costs low and minimizing portfolio turnover.
Morningstar Performance Comparison
Based on average annual returns for periods ended June 30, 2011
| Six Month** | One Year | Five Year | Ten Year | |||||||||||||
Number of Funds in peer group: | 384 | 384 | 353 | 276 | ||||||||||||
Peer group average annual total return: | 5.25% | 29.38% | 2.47% | 2.44% | ||||||||||||
Morningstar category in peer group : U.S. Insurance Large Blend |
| |||||||||||||||
Sector Allocation
as a % of Fair Value of $207,269 (in thousands) on June 30, 2011(a)(b)
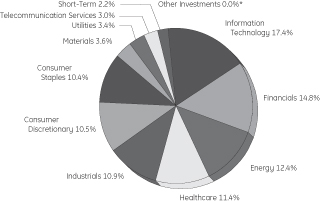
Top Ten Largest Holdings
as of June 30, 2011 (as a % of Fair Value)(b)(c)
Exxon Mobil Corp. | 3.26% | |||
Apple Inc. | 2.52% | |||
International Business Machines Corp. | 1.69% | |||
Chevron Corp. | 1.68% | |||
General Electric Co. | 1.62% | |||
Microsoft Corp. | 1.57% | |||
AT&T Inc. | 1.51% | |||
Johnson & Johnson | 1.48% | |||
The Procter & Gamble Co. | 1.44% | |||
Pfizer Inc. | 1.32% |
Change in Value of a $10,000 Investment
Class 1 Shares
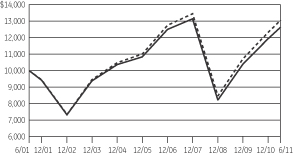
Average Annual Total Returns
for the Periods Ended June 30, 2011
Class 1 Shares (Inception date 4/15/85)
| Six Month** | One Year | Five Year | Ten Year | Ending value of a $10,000 investment | ||||||||||||||||
S&P 500 Index Fund | 5.86% | 30.45% | 2.60% | 2.36% | $ | 12,633 | ||||||||||||||
S&P 500 Index | 6.02% | 30.69% | 2.94% | 2.72% | $ | 13,076 | ||||||||||||||

| (a) | The securities information regarding holdings, allocations and other characteristics is presented to illustrate examples of securities that the Fund has bought and the diversity of areas in which the Fund may invest as of a particular date. It may not be representative of the Fund’s current or future investments and should not be construed as a recommendation to purchase or sell a particular security. |
| (b) | Fair value basis is inclusive of Short-Term Investment in GE Institutional Money Market Fund. |
| *Less | than 0.01% |
| **Total | returns for the six month period ended June 30, 2011 are not annualized. |
See Notes to Performance on page 1 for further information, including an explanation of Morningstar peer categories.
Past performance does not predict future performance and the graph and table do not reflect the deduction of taxes that a shareholder would pay on fund distributions or the redemption of fund shares and does not reflect the fees or charges that would be associated with variable contracts through which shares of the Fund are offered.
4
Table of Contents
S&P 500 Index Fund
| Schedule of Investments | June 30, 2011 (unaudited) |
S&P 500 Index Fund
| Number of Shares | Fair Value | |||||||||
Common Stock — 97.5%† |
| |||||||||
Advertising — 0.2% |
| |||||||||
Omnicom Group Inc. | 4,680 | $ | 225,389 | |||||||
The Interpublic Group of companies Inc. | 8,730 | 109,125 | ||||||||
| 334,514 | ||||||||||
Aerospace & Defense — 2.8% |
| |||||||||
General Dynamics Corp. | 6,167 | 459,565 | ||||||||
Goodrich Corp. | 2,184 | 208,572 | ||||||||
Honeywell International Inc. | 13,043 | 777,232 | ||||||||
ITT Corp. | 3,026 | 178,322 | ||||||||
L-3 Communications Holdings Inc. | 1,800 | 157,410 | ||||||||
Lockheed Martin Corp. | 4,752 | 384,769 | ||||||||
Northrop Grumman Corp. | 4,922 | 341,341 | ||||||||
Precision Castparts Corp. | 2,400 | 395,160 | ||||||||
Raytheon Co. | 5,969 | 297,555 | ||||||||
Rockwell Collins Inc. | 2,568 | 158,420 | ||||||||
Textron Inc. | 5,025 | 118,640 | ||||||||
The Boeing Co. | 12,286 | 908,304 | (d) | |||||||
United Technologies Corp. | 15,572 | 1,378,278 | (d) | |||||||
| 5,763,568 | ||||||||||
Agricultural Products — 0.2% |
| |||||||||
Archer-Daniels-Midland Co. | 11,386 | 343,288 | ||||||||
Air Freight & Logistics — 1.0% |
| |||||||||
CH Robinson Worldwide Inc. | 2,700 | 212,868 | ||||||||
Expeditors International of Washington Inc. | 3,500 | 179,165 | ||||||||
FedEx Corp. | 5,411 | 513,233 | ||||||||
United Parcel Service Inc. | 16,496 | 1,203,053 | ||||||||
| 2,108,319 | ||||||||||
Airlines — 0.1% |
| |||||||||
Southwest Airlines Co. | 12,949 | 147,878 | ||||||||
Aluminum — 0.1% |
| |||||||||
Alcoa Inc. | 18,040 | 286,114 | (d) | |||||||
Apparel Retail — 0.5% |
| |||||||||
Abercrombie & Fitch Co. | 1,600 | 107,072 | ||||||||
Ltd Brands Inc. | 4,488 | 172,564 | ||||||||
Ross Stores Inc. | 1,900 | 152,228 | ||||||||
The Gap Inc. | 7,079 | 128,130 | ||||||||
TJX companies Inc. | 6,780 | 356,153 | ||||||||
Urban Outfitters Inc. | 2,400 | 67,560 | (a) | |||||||
| 983,707 | ||||||||||
Apparel, Accessories & Luxury Goods — 0.3% |
| |||||||||
Coach Inc. | 4,800 | 306,864 | ||||||||
| Number of Shares | Fair Value | |||||||||
Polo Ralph Lauren Corp. | 1,000 | $ | 132,610 | |||||||
VF Corp. | 1,402 | 152,201 | ||||||||
| 591,675 | ||||||||||
Application Software — 0.6% |
| |||||||||
Adobe Systems Inc. | 8,784 | 276,257 | (a,d) | |||||||
Autodesk Inc. | 3,948 | 152,393 | (a) | |||||||
Citrix Systems Inc. | 3,100 | 248,000 | (a) | |||||||
Compuware Corp. | 4,100 | 40,016 | (a) | |||||||
Intuit Inc. | 4,500 | 233,370 | (a) | |||||||
Salesforce.com Inc. | 2,000 | 297,960 | (a) | |||||||
| 1,247,996 | ||||||||||
Asset Management & Custody Banks — 1.2% |
| |||||||||
Ameriprise Financial Inc. | 4,004 | 230,951 | ||||||||
BlackRock Inc. | 1,600 | 306,896 | ||||||||
Federated Investors Inc. | 1,500 | 35,760 | ||||||||
Franklin Resources Inc. | 2,500 | 328,225 | ||||||||
Invesco Ltd. | 8,000 | 187,200 | ||||||||
Janus Capital Group Inc. | 3,400 | 32,096 | ||||||||
Legg Mason Inc. | 2,900 | 95,004 | ||||||||
Northern Trust Corp. | 4,200 | 193,032 | ||||||||
State Street Corp. | 8,200 | 369,738 | (c) | |||||||
T Rowe Price Group Inc. | 4,400 | 265,496 | ||||||||
The Bank of New York Mellon Corp. | 21,303 | 545,783 | ||||||||
| 2,590,181 | ||||||||||
Auto Parts & Equipment — 0.2% |
| |||||||||
Johnson Controls, Inc. | 11,446 | 476,840 | ||||||||
Automobile Manufacturers — 0.4% |
| |||||||||
Ford Motor Co. | 63,027 | 869,142 | (a) | |||||||
Automotive Retail — 0.2% |
| |||||||||
AutoNation Inc. | 1,286 | 47,080 | (a) | |||||||
AutoZone Inc. | 394 | 116,171 | (a) | |||||||
CarMax Inc. | 3,800 | 125,666 | (a) | |||||||
O’Reilly Automotive Inc. | 2,400 | 157,224 | (a) | |||||||
| 446,141 | ||||||||||
Biotechnology — 1.2% |
| |||||||||
Amgen Inc. | 15,522 | 905,709 | (a,d) | |||||||
Biogen Idec Inc. | 4,000 | 427,680 | (a) | |||||||
Celgene Corp. | 7,663 | 462,232 | (a) | |||||||
Cephalon Inc. | 1,200 | 95,880 | (a) | |||||||
Gilead Sciences Inc. | 13,549 | 561,064 | (a) | |||||||
| 2,452,565 | ||||||||||
Brewers — 0.1% |
| |||||||||
Molson Coors Brewing Co. | 2,698 | 120,709 | ||||||||
Broadcasting — 0.3% |
| |||||||||
CBS Corp. | 11,709 | 333,589 | ||||||||
Discovery Communications Inc. (Class A) | 4,500 | 184,320 | (a) | |||||||
Scripps Networks Interactive Inc. | 1,600 | 78,208 | ||||||||
| 596,117 | ||||||||||
See Notes to Schedule of Investments and Notes to Financial Statements.
5
Table of Contents
S&P 500 Index Fund
| Schedule of Investments | June 30, 2011 (unaudited) |
| Number of Shares | Fair Value | |||||||||
Building Products — 0.0%* |
| |||||||||
Masco Corp. | 5,990 | $ | 72,060 | |||||||
Cable & Satellite — 1.2% |
| |||||||||
Cablevision Systems Corp. | 3,900 | 141,219 | ||||||||
Comcast Corp. (Class A) | 46,358 | 1,174,712 | ||||||||
DIRECTV | 12,800 | 650,496 | (a) | |||||||
Time Warner Cable Inc. | 5,696 | 444,516 | ||||||||
| 2,410,943 | ||||||||||
Casinos & Gaming — 0.1% |
| |||||||||
International Game Technology | 5,500 | 96,690 | ||||||||
Wynn Resorts Ltd. | 1,300 | 186,602 | ||||||||
| 283,292 | ||||||||||
Coal & Consumable Fuels — 0.3% |
| |||||||||
Alpha Natural Resources Inc. | 3,900 | 177,216 | (a) | |||||||
Consol Energy Inc. | 3,900 | 189,072 | ||||||||
Peabody Energy Corp. | 4,679 | 275,640 | ||||||||
| 641,928 | ||||||||||
Commercial Printing — 0.0%* |
| |||||||||
RR Donnelley & Sons Co. | 3,599 | 70,576 | ||||||||
Communications Equipment — 1.9% |
| |||||||||
Cisco Systems Inc. | 92,464 | 1,443,363 | (d) | |||||||
F5 Networks Inc. | 1,300 | 143,325 | (a) | |||||||
Harris Corp. | 2,100 | 94,626 | ||||||||
JDS Uniphase Corp. | 3,650 | 60,809 | (a) | |||||||
Juniper Networks Inc. | 8,700 | 274,050 | (a) | |||||||
Motorola Mobility Holdings Inc. | 4,943 | 108,944 | (a) | |||||||
Motorola Solutions Inc. | 5,735 | 264,039 | (a) | |||||||
QUALCOMM Inc. | 28,029 | 1,591,767 | ||||||||
Tellabs Inc. | 7,652 | 35,276 | ||||||||
| 4,016,199 | ||||||||||
Computer & Electronics Retail — 0.1% |
| |||||||||
Best Buy Company Inc. | 5,600 | 175,896 | ||||||||
GameStop Corp. | 2,300 | 61,341 | (a) | |||||||
| 237,237 | ||||||||||
Computer Hardware — 3.3% |
| |||||||||
Apple Inc. | 15,589 | 5,232,760 | (a) | |||||||
Dell Inc. | 27,728 | 462,226 | (a) | |||||||
Hewlett-Packard Co. | 34,849 | 1,268,504 | ||||||||
| 6,963,490 | ||||||||||
Computer Storage & Peripherals — 0.8% |
| |||||||||
EMC Corp. | 34,514 | 950,861 | (a) | |||||||
Lexmark International Inc. | 1,400 | 40,964 | (a) | |||||||
NetApp Inc. | 6,200 | 327,236 | (a) | |||||||
SanDisk Corp. | 3,800 | 157,700 | (a) | |||||||
Western Digital Corp. | 3,800 | 138,244 | (a) | |||||||
| 1,615,005 | ||||||||||
| Number of Shares | Fair Value | |||||||||
Construction & Engineering — 0.2% |
| |||||||||
Fluor Corp. | 2,878 | $ | 186,091 | |||||||
Jacobs Engineering Group Inc. | 2,300 | 99,475 | (a) | |||||||
Quanta Services Inc. | 4,000 | 80,800 | (a) | |||||||
| 366,366 | ||||||||||
Construction & Farm Machinery & Heavy Trucks — 1.2% |
| |||||||||
Caterpillar Inc. | 10,832 | 1,153,175 | ||||||||
Cummins Inc. | 3,256 | 336,963 | ||||||||
Deere & Co. | 6,940 | 572,203 | ||||||||
Joy Global Inc. | 1,800 | 171,432 | ||||||||
PACCAR Inc. | 6,203 | 316,911 | ||||||||
| 2,550,684 | ||||||||||
Construction Materials — 0.0%* |
| |||||||||
Vulcan Materials Co. | 2,400 | 92,472 | ||||||||
Consumer Electronics — 0.0%* |
| |||||||||
Harman International Industries Inc. | 1,200 | 54,684 | ||||||||
Consumer Finance — 0.8% |
| |||||||||
American Express Co. | 17,391 | 899,115 | (d) | |||||||
Capital One Financial Corp. | 7,525 | 388,817 | ||||||||
Discover Financial Services | 9,598 | 256,746 | ||||||||
SLM Corp. | 9,100 | 152,971 | ||||||||
| 1,697,649 | ||||||||||
Data Processing & Outsourced Services — 1.2% | ||||||||||
Automatic Data Processing Inc. | 8,480 | 446,726 | ||||||||
Computer Sciences Corp. | 2,882 | 109,401 | ||||||||
Fidelity National Information Services Inc. | 4,700 | 144,713 | ||||||||
Fiserv Inc. | 2,378 | 148,934 | (a) | |||||||
Mastercard Inc. | 1,600 | 482,144 | ||||||||
Paychex Inc. | 5,125 | 157,440 | ||||||||
The Western Union Co. | 10,524 | 210,796 | ||||||||
Total System Services Inc. | 2,902 | 53,919 | ||||||||
Visa Inc. | 8,000 | 674,080 | ||||||||
| 2,428,153 | ||||||||||
Department Stores — 0.4% |
| |||||||||
JC Penney Company Inc. | 3,787 | 130,803 | ||||||||
Kohl’s Corp. | 5,000 | 250,050 | ||||||||
Macy’s Inc. | 7,030 | 205,557 | ||||||||
Nordstrom Inc. | 2,892 | 135,750 | ||||||||
Sears Holdings Corp. | 819 | 58,509 | (a) | |||||||
| 780,669 | ||||||||||
Distillers & Vintners — 0.1% |
| |||||||||
Brown-Forman Corp. | 1,747 | 130,483 | ||||||||
Constellation Brands Inc. | 3,500 | 72,870 | (a) | |||||||
| 203,353 | ||||||||||
Distributors — 0.1% |
| |||||||||
Genuine Parts Co. | 2,496 | 135,782 | ||||||||
See Notes to Schedule of Investments and Notes to Financial Statements.
6
Table of Contents
S&P 500 Index Fund
| Schedule of Investments | June 30, 2011 (unaudited) |
| Number of Shares | Fair Value | |||||||||
Diversified Chemicals — 1.0% |
| |||||||||
Eastman Chemical Co. | 1,159 | $ | 118,299 | |||||||
EI du Pont de Nemours & Co. | 15,361 | 830,262 | ||||||||
FMC Corp. | 1,100 | 94,622 | ||||||||
PPG Industries Inc. | 2,737 | 248,492 | ||||||||
The Dow Chemical Co. | 19,494 | 701,784 | ||||||||
| 1,993,459 | ||||||||||
Diversified Financial Services — 4.8% |
| |||||||||
Bank of America Corp. | 169,529 | 1,858,038 | ||||||||
Citigroup Inc. | 49,170 | 2,047,439 | ||||||||
Comerica Inc. | 2,756 | 95,275 | ||||||||
JPMorgan Chase & Co. | 66,850 | 2,736,839 | (d) | |||||||
US BanCorp | 32,009 | 816,550 | ||||||||
Wells Fargo & Co. | 89,002 | 2,497,396 | ||||||||
| 10,051,537 | ||||||||||
Diversified Metals & Mining — 0.4% |
| |||||||||
Freeport-McMoRan Copper & Gold Inc. | 15,810 | 836,349 | ||||||||
Titanium Metals Corp. | 1,600 | 29,312 | ||||||||
| 865,661 | ||||||||||
Diversified REITs — 0.1% |
| |||||||||
Vornado Realty Trust | 2,847 | 265,283 | ||||||||
Diversified Support Services — 0.1% |
| |||||||||
Cintas Corp. | 1,900 | 62,757 | ||||||||
Iron Mountain Inc. | 3,500 | 119,315 | ||||||||
| 182,072 | ||||||||||
Drug Retail — 0.7% |
| |||||||||
CVS Caremark Corp. | 22,827 | 857,839 | ||||||||
Walgreen Co. | 15,413 | 654,436 | ||||||||
| 1,512,275 | ||||||||||
Education Services — 0.1% |
| |||||||||
Apollo Group Inc. | 1,900 | 82,992 | (a) | |||||||
DeVry Inc. | 1,200 | 70,956 | ||||||||
| 153,948 | ||||||||||
Electric Utilities — 1.8% |
| |||||||||
American Electric Power Company Inc. | 8,325 | 313,686 | (d) | |||||||
Duke Energy Corp. | 21,809 | 410,663 | ||||||||
Edison International | 5,242 | 203,128 | ||||||||
Entergy Corp. | 3,085 | 210,644 | ||||||||
Exelon Corp. | 10,952 | 469,184 | ||||||||
FirstEnergy Corp. | 7,054 | 311,434 | ||||||||
NextEra Energy Inc. | 7,262 | 417,275 | ||||||||
Northeast Utilities | 3,100 | 109,027 | ||||||||
Pepco Holdings Inc. | 4,000 | 78,520 | ||||||||
Pinnacle West Capital Corp. | 1,900 | 84,702 | ||||||||
PPL Corp. | 9,544 | 265,610 | ||||||||
Progress Energy Inc. | 4,856 | 233,137 | ||||||||
Southern Co. | 14,358 | 579,776 | ||||||||
| 3,686,786 | ||||||||||
| Number of Shares | Fair Value | |||||||||
Electrical Components & Equipment — 0.5% |
| |||||||||
Emerson Electric Co. | 12,838 | $ | 722,138 | |||||||
Rockwell Automation Inc. | 2,468 | 214,124 | ||||||||
Roper Industries Inc. | 1,600 | 133,280 | ||||||||
| 1,069,542 | ||||||||||
Electronic Components — 0.3% |
| |||||||||
Amphenol Corp. | 3,000 | 161,970 | ||||||||
Corning Inc. | 25,939 | 470,793 | ||||||||
| 632,763 | ||||||||||
Electronic Equipment & Instruments — 0.0%* |
| |||||||||
FLIR Systems Inc. | 2,700 | 91,017 | ||||||||
Electronic Manufacturing Services — 0.1% |
| |||||||||
Jabil Circuit Inc. | 2,900 | 58,580 | ||||||||
Molex Inc. | 2,650 | 68,290 | ||||||||
| 126,870 | ||||||||||
Environmental & Facilities Services — 0.3% |
| |||||||||
Republic Services Inc. | 5,450 | 168,132 | ||||||||
Stericycle Inc. | 1,400 | 124,768 | (a) | |||||||
Waste Management Inc. | 8,303 | 309,453 | ||||||||
| 602,353 | ||||||||||
Fertilizers & Agricultural Chemicals — 0.4% |
| |||||||||
CF Industries Holdings Inc. | 1,270 | 179,921 | ||||||||
Monsanto Co. | 9,123 | 661,782 | (d) | |||||||
| 841,703 | ||||||||||
Food Distributors — 0.2% |
| |||||||||
Sysco Corp. | 10,044 | 313,172 | ||||||||
Food Retail — 0.3% |
| |||||||||
Safeway Inc. | 6,200 | 144,894 | ||||||||
SUPERVALU Inc. | 3,213 | 30,234 | ||||||||
The Kroger Co. | 10,066 | 249,637 | ||||||||
Whole Foods Market Inc. | 2,300 | 145,935 | ||||||||
| 570,700 | ||||||||||
Footwear — 0.3% |
| |||||||||
NIKE Inc. | 6,310 | 567,774 | ||||||||
Gas Utilities — 0.1% |
| |||||||||
Nicor Inc. | 843 | 46,146 | ||||||||
Oneok Inc. | 1,900 | 140,619 | ||||||||
| 186,765 | ||||||||||
General Merchandise Stores — 0.3% |
| |||||||||
Big Lots Inc. | 1,400 | 46,410 | (a) | |||||||
Family Dollar Stores Inc. | 2,300 | 120,888 | ||||||||
Target Corp. | 11,549 | 541,764 | ||||||||
| 709,062 | ||||||||||
See Notes to Schedule of Investments and Notes to Financial Statements.
7
Table of Contents
S&P 500 Index Fund
| Schedule of Investments | June 30, 2011 (unaudited) |
| Number of Shares | Fair Value | |||||||||
Gold — 0.2% | ||||||||||
Newmont Mining Corp. | 8,128 | $ | 438,668 | |||||||
Healthcare Distributors — 0.4% |
| |||||||||
AmerisourceBergen Corp. | 4,661 | 192,965 | ||||||||
Cardinal Health Inc. | 5,751 | 261,210 | ||||||||
McKesson Corp. | 4,202 | 351,497 | ||||||||
Patterson companies Inc. | 1,700 | 55,913 | ||||||||
| 861,585 | ||||||||||
Healthcare Equipment — 1.8% |
| |||||||||
Baxter International Inc. | 9,529 | 568,786 | (d) | |||||||
Becton Dickinson and Co. | 3,788 | 326,412 | ||||||||
Boston Scientific Corp. | 24,843 | 171,665 | (a) | |||||||
CareFusion Corp. | 3,375 | 91,699 | (a) | |||||||
Covidien PLC | 8,100 | 431,163 | ||||||||
CR Bard Inc. | 1,502 | 165,010 | ||||||||
Edwards Lifesciences Corp. | 2,000 | 174,360 | (a) | |||||||
Intuitive Surgical Inc. | 620 | 230,708 | (a) | |||||||
Medtronic Inc. | 17,832 | 687,067 | ||||||||
St Jude Medical Inc. | 5,492 | 261,859 | ||||||||
Stryker Corp. | 5,852 | 343,454 | ||||||||
Varian Medical Systems Inc. | 1,900 | 133,038 | (a) | |||||||
Zimmer Holdings Inc. | 3,300 | 208,560 | (a) | |||||||
| 3,793,781 | ||||||||||
Healthcare Facilities — 0.0%* |
| |||||||||
Tenet Healthcare Corp. | 7,895 | 49,265 | (a) | |||||||
Healthcare Services — 0.6% |
| |||||||||
DaVita Inc. | 1,700 | 147,237 | (a) | |||||||
Express Scripts Inc. | 8,900 | 480,422 | (a) | |||||||
Laboratory Corporation of America Holdings | 1,600 | 154,864 | (a) | |||||||
Medco Health Solutions Inc. | 6,666 | 376,762 | (a) | |||||||
Quest Diagnostics Inc. | 2,600 | 153,660 | ||||||||
| 1,312,945 | ||||||||||
Healthcare Supplies — 0.0%* |
| |||||||||
DENTSPLY International Inc. | 2,500 | 95,200 | ||||||||
Healthcare Technology — 0.1% |
| |||||||||
Cerner Corp. | 2,600 | 158,886 | ||||||||
Home Building — 0.1% |
| |||||||||
DR Horton Inc. | 5,600 | 64,512 | ||||||||
Lennar Corp. | 3,200 | 58,080 | ||||||||
Pulte Group Inc. | 6,435 | 49,292 | (a) | |||||||
| 171,884 | ||||||||||
Home Entertainment Software — 0.1% |
| |||||||||
Electronic Arts Inc. | 6,100 | 143,960 | (a) | |||||||
Home Furnishing Retail — 0.1% |
| |||||||||
Bed Bath & Beyond Inc. | 4,400 | 256,828 | (a) | |||||||
| Number of Shares | Fair Value | |||||||||
Home Furnishings — 0.0%* |
| |||||||||
Leggett & Platt Inc. | 2,700 | $ | 65,826 | |||||||
Home Improvement Retail — 0.7% |
| |||||||||
Home Depot Inc. | 26,733 | 968,269 | ||||||||
Lowe’s companies Inc. | 21,702 | 505,874 | ||||||||
| 1,474,143 | ||||||||||
Hotels, Resorts & Cruise Lines — 0.3% |
| |||||||||
Carnival Corp. | 7,200 | 270,936 | ||||||||
Marriott International Inc. | 5,114 | 181,496 | ||||||||
Starwood Hotels & Resorts Worldwide Inc. | 3,200 | 179,328 | ||||||||
Wyndham Worldwide Corp. | 2,849 | 95,869 | ||||||||
| 727,629 | ||||||||||
Household Appliances — 0.0%* |
| |||||||||
Whirlpool Corp. | 1,143 | 92,949 | ||||||||
Household Products — 2.1% |
| |||||||||
Clorox Co. | 2,384 | 160,777 | ||||||||
Colgate-Palmolive Co. | 8,372 | 731,797 | ||||||||
Kimberly-Clark Corp. | 6,836 | 455,004 | (d) | |||||||
The Procter & Gamble Co. | 46,973 | 2,986,074 | ||||||||
| 4,333,652 | ||||||||||
Housewares & Specialties — 0.1% |
| |||||||||
Fortune Brands Inc. | 2,541 | 162,040 | ||||||||
Newell Rubbermaid Inc. | 5,156 | 81,362 | ||||||||
| 243,402 | ||||||||||
Human Resource & Employment Services — 0.0%* |
| |||||||||
Robert Half International Inc. | 2,600 | 70,278 | ||||||||
Hypermarkets & Super Centers — 1.1% |
| |||||||||
Costco Wholesale Corp. | 7,217 | 586,309 | ||||||||
Wal-Mart Stores Inc. | 32,087 | 1,705,103 | ||||||||
| 2,291,412 | ||||||||||
Independent Power Producers & Energy Traders — 0.2% |
| |||||||||
Constellation Energy Group Inc. | 3,403 | 129,178 | ||||||||
NRG Energy Inc. | 4,400 | 108,152 | (a) | |||||||
The AES Corp. | 10,600 | 135,044 | (a) | |||||||
| 372,374 | ||||||||||
Industrial Conglomerates — 2.3% |
| |||||||||
3M Co. | 11,880 | 1,126,818 | ||||||||
General Electric Co. | 178,162 | 3,360,135 | (f) | |||||||
Tyco International Ltd. | 8,100 | 400,383 | ||||||||
| 4,887,336 | ||||||||||
Industrial Gases — 0.5% |
| |||||||||
Air Products & Chemicals Inc. | 3,632 | 347,147 | (d) | |||||||
Airgas Inc. | 1,100 | 77,044 | ||||||||
See Notes to Schedule of Investments and Notes to Financial Statements.
8
Table of Contents
S&P 500 Index Fund
| Schedule of Investments | June 30, 2011 (unaudited) |
| Number of Shares | Fair Value | |||||||||
Praxair Inc. | 5,165 | $ | 559,834 | |||||||
| 984,025 | ||||||||||
Industrial Machinery — 1.2% |
| |||||||||
Danaher Corp. | 8,900 | 471,611 | ||||||||
Dover Corp. | 3,158 | 214,112 | ||||||||
Eaton Corp. | 5,900 | 303,555 | ||||||||
Flowserve Corp. | 1,000 | 109,890 | ||||||||
Illinois Tool Works Inc. | 8,227 | 464,743 | ||||||||
Ingersoll-Rand PLC | 5,400 | 245,214 | ||||||||
Pall Corp. | 1,778 | 99,977 | ||||||||
Parker Hannifin Corp. | 2,672 | 239,785 | ||||||||
Snap-On Inc. | 1,009 | 63,042 | ||||||||
Stanley Black & Decker Inc. | 2,692 | 193,959 | ||||||||
| 2,405,888 | ||||||||||
Industrial REITs — 0.1% |
| |||||||||
Prologis Inc. | 7,299 | 261,596 | ||||||||
Insurance Brokers — 0.3% |
| |||||||||
AON Corp. | 5,436 | 278,867 | ||||||||
Marsh & McLennan companies Inc. | 8,853 | 276,125 | ||||||||
| 554,992 | ||||||||||
Integrated Oil & Gas — 7.1% |
| |||||||||
Chevron Corp. | 33,858 | 3,481,957 | ||||||||
ConocoPhillips | 23,919 | 1,798,470 | ||||||||
Exxon Mobil Corp. | 82,993 | 6,753,970 | (d) | |||||||
Hess Corp. | 5,070 | 379,033 | (d) | |||||||
Marathon Oil Corp. | 11,842 | 623,837 | ||||||||
Murphy Oil Corp. | 3,300 | 216,678 | ||||||||
Occidental Petroleum Corp. | 13,779 | 1,433,567 | ||||||||
| 14,687,512 | ||||||||||
Integrated Telecommunication Services — 2.7% | ||||||||||
AT&T Inc. | 99,780 | 3,134,090 | ||||||||
CenturyLink Inc. | 10,299 | 416,389 | ||||||||
Frontier Communications Corp. | 16,974 | 136,980 | ||||||||
Verizon Communications Inc. | 47,367 | 1,763,473 | ||||||||
Windstream Corp. | 8,843 | 114,605 | ||||||||
| 5,565,537 | ||||||||||
Internet Retail — 0.9% |
| |||||||||
Amazon.com Inc. | 6,000 | 1,226,940 | (a) | |||||||
Expedia Inc. | 3,600 | 104,364 | ||||||||
NetFlix Inc. | 700 | 183,883 | (a) | |||||||
priceline.com Inc. | 820 | 419,783 | (a) | |||||||
| 1,934,970 | ||||||||||
Internet Software & Services — 1.6% |
| |||||||||
Akamai Technologies Inc. | 3,400 | 106,998 | (a) | |||||||
eBay Inc. | 19,000 | 613,130 | (a) | |||||||
Google Inc. | 4,224 | 2,138,949 | ||||||||
Monster Worldwide Inc. | 2,700 | 39,582 | (a) | |||||||
VeriSign Inc. | 3,162 | 105,801 | ||||||||
Yahoo! Inc. | 21,489 | 323,195 | (a) | |||||||
| 3,327,655 | ||||||||||
| Number of Shares | Fair Value | |||||||||
Investment Banking & Brokerage — 1.0% |
| |||||||||
E*Trade Financial Corp. | 3,440 | $ | 47,472 | (a) | ||||||
Morgan Stanley | 25,696 | 591,265 | ||||||||
The Charles Schwab Corp. | 17,311 | 284,766 | ||||||||
The Goldman Sachs Group Inc. | 8,699 | 1,157,750 | ||||||||
| 2,081,253 | ||||||||||
IT Consulting & Other Services — 2.0% |
| |||||||||
Cognizant Technology Solutions Corp. | 5,100 | 374,034 | (a) | |||||||
International Business Machines Corp. | 20,430 | 3,504,766 | ||||||||
SAIC Inc. | 5,200 | 87,464 | (a) | |||||||
Teradata Corp. | 3,000 | 180,600 | (a) | |||||||
| 4,146,864 | ||||||||||
Leisure Products — 0.1% |
| |||||||||
Hasbro Inc. | 2,196 | 96,470 | ||||||||
Mattel Inc. | 5,851 | 160,844 | ||||||||
| 257,314 | ||||||||||
Life & Health Insurance — 1.1% |
| |||||||||
Aflac Inc. | 8,000 | 373,440 | ||||||||
Lincoln National Corp. | 5,642 | 160,741 | ||||||||
MetLife Inc. | 17,973 | 788,475 | ||||||||
Principal Financial Group Inc. | 5,200 | 158,184 | ||||||||
Prudential Financial Inc. | 8,000 | 508,720 | ||||||||
Torchmark Corp. | 1,272 | 81,586 | ||||||||
Unum Group | 5,489 | 139,860 | ||||||||
| 2,211,006 | ||||||||||
Life Sciences Tools & Services — 0.5% |
| |||||||||
Agilent Technologies Inc. | 5,885 | 300,782 | (a) | |||||||
Life Technologies Corp. | 3,003 | 156,366 | (a) | |||||||
PerkinElmer Inc. | 2,310 | 62,162 | ||||||||
Thermo Fisher Scientific Inc. | 6,628 | 426,777 | (a) | |||||||
Waters Corp. | 1,500 | 143,610 | (a) | |||||||
| 1,089,697 | ||||||||||
Managed Healthcare — 1.1% |
| |||||||||
Aetna Inc. | 6,608 | 291,347 | ||||||||
CIGNA Corp. | 4,789 | 246,298 | ||||||||
Coventry Healthcare Inc. | 2,800 | 102,116 | (a) | |||||||
Humana Inc. | 2,727 | 219,633 | ||||||||
UnitedHealth Group Inc. | 18,276 | 942,676 | ||||||||
WellPoint Inc. | 6,200 | 488,374 | ||||||||
| 2,290,444 | ||||||||||
Metal & Glass Containers — 0.1% |
| |||||||||
Ball Corp. | 2,732 | 105,073 | ||||||||
Owens-Illinois Inc. | 3,100 | 80,011 | (a) | |||||||
| 185,084 | ||||||||||
Motorcycle Manufacturers — 0.1% |
| |||||||||
Harley-Davidson Inc. | 3,700 | 151,589 | ||||||||
See Notes to Schedule of Investments and Notes to Financial Statements.
9
Table of Contents
S&P 500 Index Fund
| Schedule of Investments | June 30, 2011 (unaudited) |
| Number of Shares | Fair Value | |||||||||
Movies & Entertainment — 1.5% |
| |||||||||
News Corp. | 37,900 | $ | 670,830 | |||||||
The Walt Disney Co. | 31,720 | 1,238,349 | ||||||||
Time Warner Inc. | 18,138 | 659,679 | ||||||||
Viacom Inc. | 9,913 | 505,563 | ||||||||
| 3,074,421 | ||||||||||
Multi-Line Insurance — 0.4% |
| |||||||||
American International Group Inc. | 7,525 | 220,633 | (a) | |||||||
Assurant Inc. | 1,800 | 65,286 | ||||||||
Genworth Financial Inc. | 8,400 | 86,352 | (a) | |||||||
Hartford Financial Services Group Inc. | 7,404 | 195,243 | ||||||||
Loews Corp. | 5,366 | 225,855 | ||||||||
| 793,369 | ||||||||||
Multi-Sector Holdings — 0.1% |
| |||||||||
Leucadia National Corp. | 3,100 | 105,710 | ||||||||
Multi-Utilities — 1.3% |
| |||||||||
Ameren Corp. | 3,842 | 110,803 | ||||||||
CenterPoint Energy Inc. | 7,618 | 147,408 | ||||||||
CMS Energy Corp. | 4,700 | 92,543 | ||||||||
Consolidated Edison Inc. | 4,907 | 261,249 | ||||||||
Dominion Resources Inc. | 10,000 | 482,700 | ||||||||
DTE Energy Co. | 3,066 | 153,361 | ||||||||
Integrys Energy Group Inc. | 1,531 | 79,367 | ||||||||
NiSource Inc. | 5,115 | 103,579 | ||||||||
PG&E Corp. | 6,454 | 271,262 | ||||||||
Public Service Enterprise Group Inc. | 8,492 | 277,179 | ||||||||
SCANA Corp. | 2,100 | 82,677 | ||||||||
Sempra Energy | 4,075 | 215,486 | ||||||||
TECO Energy Inc. | 3,600 | 68,004 | ||||||||
Wisconsin Energy Corp. | 3,800 | 119,130 | ||||||||
Xcel Energy Inc. | 8,480 | 206,064 | ||||||||
| 2,670,812 | ||||||||||
Office Electronics — 0.1% |
| |||||||||
Xerox Corp. | 22,747 | 236,796 | ||||||||
Office REITs — 0.1% |
| |||||||||
Boston Properties Inc. | 2,500 | 265,400 | ||||||||
Office Services & Supplies — 0.1% |
| |||||||||
Avery Dennison Corp. | 2,055 | 79,385 | ||||||||
Pitney Bowes Inc. | 3,632 | 83,500 | ||||||||
| 162,885 | ||||||||||
Oil & Gas Drilling — 0.3% |
| |||||||||
Diamond Offshore Drilling Inc. | 1,300 | 91,533 | ||||||||
Helmerich & Payne Inc. | 1,900 | 125,628 | ||||||||
Nabors Industries Ltd. | 4,500 | 110,880 | (a) | |||||||
Noble Corp. | 4,000 | 157,640 | ||||||||
Rowan companies Inc. | 2,177 | 84,489 | (a) | |||||||
| 570,170 | ||||||||||
| Number of Shares | Fair Value | |||||||||
Oil & Gas Equipment & Services — 2.1% |
| |||||||||
Baker Hughes Inc. | 7,432 | $ | 539,266 | |||||||
Cameron International Corp. | 4,300 | 216,247 | (a) | |||||||
FMC Technologies Inc. | 4,186 | 187,491 | ||||||||
Halliburton Co. | 15,591 | 795,141 | ||||||||
National Oilwell Varco Inc. | 7,200 | 563,112 | ||||||||
Schlumberger Ltd. | 22,846 | 1,973,894 | ||||||||
| 4,275,151 | ||||||||||
Oil & Gas Exploration & Production — 2.1% |
| |||||||||
Anadarko Petroleum Corp. | 8,456 | 649,083 | ||||||||
Apache Corp. | 6,348 | 783,280 | ||||||||
Cabot Oil & Gas Corp. | 1,900 | 125,989 | ||||||||
Chesapeake Energy Corp. | 11,400 | 338,466 | ||||||||
Denbury Resources Inc. | 6,700 | 134,000 | (a) | |||||||
Devon Energy Corp. | 7,292 | 574,682 | ||||||||
EOG Resources Inc. | 4,500 | 470,475 | ||||||||
EQT Corp. | 2,614 | 137,287 | ||||||||
Newfield Exploration Co. | 2,300 | 156,446 | (a) | |||||||
Noble Energy Inc. | 2,900 | 259,927 | ||||||||
Pioneer Natural Resources Co. | 1,900 | 170,183 | ||||||||
QEP Resources Inc. | 2,900 | 121,307 | ||||||||
Range Resources Corp. | 2,900 | 160,950 | ||||||||
Southwestern Energy Co. | 6,100 | 261,568 | (a) | |||||||
| 4,343,643 | ||||||||||
Oil & Gas Refining & Marketing — 0.2% |
| |||||||||
Sunoco Inc. | 1,976 | 82,419 | ||||||||
Tesoro Corp. | 2,300 | 52,693 | (a) | |||||||
Valero Energy Corp. | 9,700 | 248,029 | ||||||||
| 383,141 | ||||||||||
Oil & Gas Storage & Transportation — 0.4% |
| |||||||||
El Paso Corp. | 12,682 | 256,176 | ||||||||
Spectra Energy Corp. | 10,977 | 300,880 | ||||||||
The Williams companies Inc. | 9,586 | 289,976 | ||||||||
| 847,032 | ||||||||||
Packaged Foods & Meats — 1.6% |
| |||||||||
Campbell Soup Co. | 3,115 | 107,623 | ||||||||
ConAgra Foods Inc. | 6,668 | 172,101 | ||||||||
Dean Foods Co. | 3,700 | 45,399 | (a) | |||||||
General Mills Inc. | 10,462 | 389,396 | ||||||||
HJ Heinz Co. | 5,297 | 282,224 | ||||||||
Hormel Foods Corp. | 2,200 | 65,582 | ||||||||
Kellogg Co. | 4,290 | 237,323 | ||||||||
Kraft Foods Inc. | 29,190 | 1,028,364 | ||||||||
McCormick & Company Inc. | 2,300 | 114,011 | ||||||||
Mead Johnson Nutrition Co. | 3,450 | 233,048 | ||||||||
Sara Lee Corp. | 9,557 | 181,487 | ||||||||
The Hershey Co. | 2,584 | 146,900 | ||||||||
The JM Smucker Co. | 1,917 | 146,535 | ||||||||
Tyson Foods Inc. | 5,400 | 104,868 | ||||||||
| 3,254,861 | ||||||||||
See Notes to Schedule of Investments and Notes to Financial Statements.
10
Table of Contents
S&P 500 Index Fund
| Schedule of Investments | June 30, 2011 (unaudited) |
| Number of Shares | Fair Value | |||||||||
Paper Packaging — 0.1% |
| |||||||||
Bemis Company Inc. | 1,962 | $ | 66,276 | |||||||
Sealed Air Corp. | 2,814 | 66,945 | ||||||||
| 133,221 | ||||||||||
Paper Products — 0.1% |
| |||||||||
International Paper Co. | 7,575 | 225,886 | ||||||||
MeadWestvaco Corp. | 2,500 | 83,275 | ||||||||
| 309,161 | ||||||||||
Personal Products — 0.2% |
| |||||||||
Avon Products Inc. | 7,428 | 207,984 | ||||||||
The Estee Lauder companies Inc. | 1,900 | 199,861 | ||||||||
| 407,845 | ||||||||||
Pharmaceuticals — 5.6% |
| |||||||||
Abbott Laboratories | 26,204 | 1,378,854 | (d) | |||||||
Allergan Inc. | 5,255 | 437,479 | ||||||||
Bristol-Myers Squibb Co. | 28,318 | 820,089 | (d) | |||||||
Eli Lilly & Co. | 17,443 | 654,636 | ||||||||
Forest Laboratories Inc. | 4,700 | 184,898 | (a) | |||||||
Hospira Inc. | 2,639 | 149,526 | (a) | |||||||
Johnson & Johnson | 46,186 | 3,072,293 | ||||||||
Merck & Company Inc. | 51,645 | 1,822,552 | ||||||||
Mylan Inc. | 6,965 | 171,827 | (a) | |||||||
Pfizer Inc. | 133,014 | 2,740,088 | ||||||||
Watson Pharmaceuticals Inc. | 2,000 | 137,460 | (a) | |||||||
| 11,569,702 | ||||||||||
Property & Casualty Insurance — 1.9% |
| |||||||||
ACE Ltd. | 5,700 | 375,174 | ||||||||
Berkshire Hathaway Inc. | 28,969 | 2,241,911 | (a) | |||||||
Chubb Corp. | 5,094 | 318,935 | ||||||||
CIncinnati Financial Corp. | 2,692 | 78,553 | ||||||||
The Allstate Corp. | 9,186 | 280,449 | (d) | |||||||
The Progressive Corp. | 11,273 | 241,017 | ||||||||
The Travelers companies Inc. | 6,999 | 408,602 | ||||||||
XL Group Plc | 5,300 | 116,494 | ||||||||
| 4,061,135 | ||||||||||
Publishing — 0.2% |
| |||||||||
Gannett Company Inc. | 4,808 | 68,851 | ||||||||
The McGraw-Hill companies Inc. | 5,421 | 227,194 | ||||||||
The Washington Post Co. | 90 | 37,705 | ||||||||
| 333,750 | ||||||||||
Rail Roads — 0.9% |
| |||||||||
CSX Corp. | 18,417 | 482,894 | ||||||||
Norfolk Southern Corp. | 6,118 | 458,422 | ||||||||
Union Pacific Corp. | 8,137 | 849,503 | ||||||||
| 1,790,819 | ||||||||||
Real Estate Services — 0.1% |
| |||||||||
CB Richard Ellis Group Inc. (REIT) | 4,900 | 123,039 | (a) | |||||||
| Number of Shares | Fair Value | |||||||||
Regional Banks — 1.0% |
| |||||||||
BB&T Corp. | 11,700 | $ | 314,028 | |||||||
Fifth Third Bancorp | 14,816 | 188,904 | ||||||||
First Horizon National Corp. | 4,055 | 38,685 | ||||||||
Huntington Bancshares Inc. | 13,934 | 91,407 | ||||||||
KeyCorp | 15,228 | 126,849 | ||||||||
M&T Bank Corp. | 2,200 | 193,490 | ||||||||
Marshall & Ilsley Corp. | 10,298 | 82,075 | ||||||||
PNC Financial Services Group Inc. | 8,704 | 518,845 | ||||||||
Regions Financial Corp. | 21,568 | 133,722 | ||||||||
SunTrust Banks Inc. | 9,229 | 238,108 | ||||||||
Zions Bancorp. | 2,500 | 60,025 | ||||||||
| 1,986,138 | ||||||||||
Research & Consulting Services — 0.1% |
| |||||||||
Dun & Bradstreet Corp. | 900 | 67,986 | ||||||||
Equifax Inc. | 1,800 | 62,496 | ||||||||
| 130,482 | ||||||||||
Residential REITs — 0.3% |
| |||||||||
Apartment Investment & Management Co. | 2,431 | 62,063 | ||||||||
AvalonBay Communities Inc. | 1,501 | 192,728 | ||||||||
Equity Residential | 5,000 | 300,000 | ||||||||
| 554,791 | ||||||||||
Restaurants — 1.3% |
| |||||||||
Chipotle Mexican Grill Inc. | 500 | 154,095 | (a) | |||||||
Darden Restaurants Inc. | 2,429 | 120,867 | ||||||||
McDonald’s Corp. | 17,490 | 1,474,757 | ||||||||
Starbucks Corp. | 12,298 | 485,648 | ||||||||
Yum! Brands Inc. | 7,729 | 426,950 | ||||||||
| 2,662,317 | ||||||||||
Retail REITs — 0.3% |
| |||||||||
Kimco Realty Corp. | 6,500 | 121,160 | ||||||||
Simon Property Group Inc. | 5,037 | 585,450 | ||||||||
| 706,610 | ||||||||||
Semiconductor Equipment — 0.3% |
| |||||||||
Applied Materials Inc. | 23,100 | 300,531 | (d) | |||||||
KLA-Tencor Corp. | 2,800 | 113,344 | ||||||||
MEMC Electronic Materials Inc. | 4,500 | 38,385 | (a) | |||||||
Novellus Systems Inc. | 1,700 | 61,438 | (a) | |||||||
Teradyne Inc. | 3,600 | 53,280 | (a) | |||||||
| 566,978 | ||||||||||
Semiconductors — 2.1% |
| |||||||||
Advanced Micro Devices Inc. | 10,074 | 70,417 | (a,d) | |||||||
Altera Corp. | 5,200 | 241,020 | ||||||||
Analog Devices Inc. | 5,200 | 203,528 | ||||||||
Broadcom Corp. | 8,250 | 277,530 | ||||||||
First Solar Inc. | 1,010 | 133,593 | (a) | |||||||
Intel Corp. | 89,265 | 1,978,112 | (d) | |||||||
Linear Technology Corp. | 3,800 | 125,476 | ||||||||
LSI Corp. | 10,092 | 71,855 | (a) | |||||||
See Notes to Schedule of Investments and Notes to Financial Statements.
11
Table of Contents
S&P 500 Index Fund
| Schedule of Investments | June 30, 2011 (unaudited) |
| Number of Shares | Fair Value | |||||||||
Microchip Technology Inc. | 3,000 | $ | 113,730 | |||||||
Micron Technology Inc. | 15,254 | 114,100 | (a) | |||||||
National Semiconductor Corp. | 3,766 | 92,681 | ||||||||
NVIDIA Corp. | 9,300 | 148,195 | (a) | |||||||
Texas Instruments Inc. | 19,451 | 638,576 | ||||||||
Xilinx Inc. | 4,187 | 152,700 | ||||||||
| 4,361,513 | ||||||||||
Soft Drinks — 2.3% |
| |||||||||
Coca-Cola Enterprises Inc. | 5,318 | 155,179 | ||||||||
Dr Pepper Snapple Group Inc. | 3,700 | 155,141 | ||||||||
PepsiCo Inc. | 26,549 | 1,869,846 | (d) | |||||||
The Coca-Cola Co. | 38,502 | 2,590,800 | (d) | |||||||
| 4,770,966 | ||||||||||
Specialized Consumer Services — 0.0%* |
| |||||||||
H&R Block Inc. | 5,292 | 84,884 | ||||||||
Specialized Finance — 0.4% |
| |||||||||
CME Group Inc. | 1,161 | 338,536 | ||||||||
IntercontinentalExchange Inc. | 1,300 | 162,123 | (a) | |||||||
Moody’s Corp. | 3,184 | 122,106 | ||||||||
NYSE Euronext | 4,200 | 143,934 | ||||||||
The NASDAQ OMX Group Inc. | 2,600 | 65,780 | (a) | |||||||
| 832,479 | ||||||||||
Specialized REITs — 0.6% |
| |||||||||
HCP Inc. | 6,700 | 245,823 | ||||||||
Healthcare Inc. | 2,800 | 146,804 | ||||||||
Host Hotels & Resorts Inc. | 11,817 | 200,298 | ||||||||
Plum Creek Timber Company Inc. | 2,800 | 113,512 | ||||||||
Public Storage | 2,400 | 273,624 | ||||||||
Ventas Inc. | 2,600 | 137,046 | ||||||||
Weyerhaeuser Co. | 9,167 | 200,391 | ||||||||
| 1,317,498 | ||||||||||
Specialty Chemicals — 0.3% |
| |||||||||
Ecolab Inc. | 3,952 | 222,814 | ||||||||
International Flavors & Fragrances Inc. | 1,247 | 80,107 | ||||||||
Sigma-Aldrich Corp. | 2,182 | 160,115 | ||||||||
The Sherwin-Williams Co. | 1,463 | 122,702 | ||||||||
| 585,738 | ||||||||||
Specialty Stores — 0.2% |
| |||||||||
Staples Inc. | 12,450 | 196,710 | ||||||||
Tiffany & Co. | 2,000 | 157,040 | ||||||||
| 353,750 | ||||||||||
Steel — 0.3% |
| |||||||||
AK Steel Holding Corp. | 2,300 | 36,248 | ||||||||
Allegheny Technologies Inc. | 1,751 | 111,136 | ||||||||
Cliffs Natural Resources Inc. | 2,400 | 221,880 | ||||||||
Nucor Corp. | 5,236 | 215,828 | ||||||||
United States Steel Corp. | 2,665 | 122,697 | ||||||||
| 707,789 | ||||||||||
| Number of Shares | Fair Value | |||||||||
Systems Software — 2.9% |
| |||||||||
BMC Software Inc. | 2,900 | $ | 158,630 | (a) | ||||||
CA Inc. | 6,600 | 150,744 | ||||||||
Microsoft Corp. | 124,939 | 3,248,414 | (d) | |||||||
Oracle Corp. | 65,152 | 2,144,152 | (d) | |||||||
Red Hat Inc. | 3,300 | 151,470 | (a) | |||||||
Symantec Corp. | 12,685 | 250,148 | (a) | |||||||
| 6,103,558 | ||||||||||
Thrifts & Mortgage Finance — 0.1% |
| |||||||||
Hudson City Bancorp Inc. | 9,600 | 78,624 | ||||||||
People’s United Financial Inc. | 6,700 | 90,048 | ||||||||
| 168,672 | ||||||||||
Tires & Rubber — 0.0%* |
| |||||||||
The Goodyear Tire & Rubber Co. | 4,519 | 75,784 | (a) | |||||||
Tobacco — 1.6% | ||||||||||
Altria Group Inc. | 34,853 | 920,468 | ||||||||
Lorillard Inc. | 2,411 | 262,486 | ||||||||
Philip Morris International Inc. | 30,079 | 2,008,375 | ||||||||
Reynolds American Inc. | 5,900 | 218,595 | ||||||||
| 3,409,924 | ||||||||||
Trading Companies & Distributors — 0.2% |
| |||||||||
Fastenal Co. | 5,200 | 187,148 | ||||||||
WW Grainger Inc. | 982 | 150,884 | ||||||||
| 338,032 | ||||||||||
Trucking — 0.0%* |
| |||||||||
Ryder System Inc. | 931 | 52,927 | ||||||||
Wireless Telecommunication Services — 0.3% |
| |||||||||
American Tower Corp. | 6,700 | 350,611 | (a) | |||||||
MetroPCS Communications Inc. | 4,600 | 79,166 | (a) | |||||||
Sprint Nextel Corp. | 51,500 | 277,585 | (a) | |||||||
| 707,362 | ||||||||||
Total Common Stock | 202,569,722 | |||||||||
Other Investments — 0.1% |
| |||||||||
GEI Investment Fund | 73,206 | (e) | ||||||||
Total Investments in Securities | 202,642,928 | |||||||||
See Notes to Schedule of Investments and Notes to Financial Statements.
12
Table of Contents
S&P 500 Index Fund
| Schedule of Investments | June 30, 2011 (unaudited) |
| Number of Shares | Fair Value | |||||||
Short-Term Investments — 2.2% | ||||||||
GE Institutional Money Market Fund Investment Class 0.11% | $ | 4,625,660 | (b,e) | |||||
Total Investments | 207,268,588 | |||||||
Other Assets and Liabilities, | 480,544 | |||||||
|
| |||||||
NET ASSETS — 100.0% | $ | 207,749,132 | ||||||
|
| |||||||
Other Information |
| |||||||
The Fund had the following long futures contracts open at June 30, 2011 (unaudited):
| Description | Expiration date | Number of Contracts | Current Notional Value | Unrealized Appreciation | ||||||||||||
S&P 500 Emini Index Futures | September 2011 | 86 | $ | 5,656,650 | $ | 187,822 | ||||||||||
See Notes to Schedule of Investments and Notes to Financial Statements.
13
Table of Contents
| Notes to Schedule of Investments | June 30, 2011 (unaudited) |
The views expressed in this document reflect our judgment as of the publication date and are subject to change at any time without notice. The securities information regarding holdings, allocations and other characteristics are presented to illustrate examples of securities that the Fund has bought and the diversity of areas in which the Fund may invest as of a particular date. It may not be representative of the Fund’s current or future investments and should not be construed as a recommendation to purchase or sell a particular security. See the Fund’s summary prospectus and statutory prospectus for complete descriptions of investment objectives, policies, risks and permissible investments.
| (a) | Non-income producing security. |
| (b) | Coupon amount represents effective yield. |
| (c) | State Street Corp. is the parent company of State Street Bank & Trust Co., the Fund’s custodian and accounting agent. |
| (d) | At June 30, 2011 , all or a portion of this security was pledged to cover collateral requirements for futures, options, forward foreign currency contracts and/or TBA’s. |
| (e) | GE Asset Management, the investment adviser of the Fund, also serves as investment adviser of the GEI Investment Fund and the GE Institutional Money Market Fund. |
| (f) | General Electric Co. is the parent company of GE Asset Management Incorporated, the Fund’s investment Adviser. |
| * | Less than 0.05%. |
| † | Percentages are based on net assets as of June 30, 2011 . |
Abbreviations:
REIT | Real Estate Investment Trust |
14
Table of Contents
Selected data based on a share outstanding throughout the fiscal years indicated
| 6/30/11† | 12/31/10 | 12/31/09 | 12/31/08 | 12/31/07 | 12/31/06 | |||||||||||||||||||
| Inception date | — | — | — | — | — | 4/15/85 | ||||||||||||||||||
Net asset value, beginning of period | $ | 22.37 | $ | 19.82 | $ | 15.99 | $ | 26.52 | $ | 26.06 | $ | 22.94 | ||||||||||||
Income/(loss) from investment operations: | ||||||||||||||||||||||||
Net investment income | 0.20 | 0.40 | 0.38 | 0.52 | 0.47 | 0.42 | ||||||||||||||||||
Net realized and unrealized | 1.11 | 2.54 | 3.84 | (10.46) | 0.86 | 3.12 | ||||||||||||||||||
Total income/(loss) from | 1.31 | 2.94 | 4.22 | (9.94) | 1.33 | 3.54 | ||||||||||||||||||
Less distributions from: | ||||||||||||||||||||||||
Net investment income | — | 0.39 | 0.39 | 0.50 | 0.47 | 0.42 | ||||||||||||||||||
Net realized gains | — | — | — | 0.09 | 0.40 | — | ||||||||||||||||||
Total distributions | — | 0.39 | 0.39 | 0.59 | 0.87 | 0.42 | ||||||||||||||||||
Net asset value, end of period | $ | 23.68 | $ | 22.37 | $ | 19.82 | $ | 15.99 | $ | 26.52 | $ | 26.06 | ||||||||||||
TOTAL RETURN (a) | 5.86% | 14.84% | 26.30% | (37.40)% | 5.10% | 15.43% | ||||||||||||||||||
RATIOS/SUPPLEMENTAL DATA: | ||||||||||||||||||||||||
Net assets, end of period (in thousands) | $ | 207,749 | $ | 217,344 | $ | 224,165 | $ | 209,176 | $ | 447,426 | $ | 497,105 | ||||||||||||
Ratios to average net assets: | ||||||||||||||||||||||||
Net investment income (loss) | 1.66% | * | 1.79% | 2.05% | 1.91% | 1.62% | 1.58% | |||||||||||||||||
Net Expenses | 0.37% | (b)(c)* | 0.33% | (b)(c) | 0.43% | (b) | 0.41% | (b) | 0.39% | 0.40% | ||||||||||||||
Gross Expenses | 0.42% | * | 0.38% | 0.43% | 0.41% | 0.39% | 0.40% | |||||||||||||||||
Portfolio turnover rate | 1% | 4% | 5% | 4% | 6% | 4% | ||||||||||||||||||
Notes to Financial Highlights
| (a) | Total returns are historical and assume changes in share price, reinvestment of dividends and capital gains distributions and do not include the effect of insurance contract charges. Past performance does not guarantee future results. |
| (b) | Reflects GE Asset Management’s waiver of a portion of the Fund’s management fee in an amount equal to the management fee earned by GEAM with respect to the Fund’s investment in the GE Money Market Fund and/or GE Institutional Money Market Fund. Excluding waiver, the expense ratios would be unchanged. |
| (c) | Reflects GE Asset Management’s contractual agreement with GE Investment Funds, Inc. to limit the Fund’s management fee to 0.30% of the average daily net assets of the Fund. |
| * | Annualized for periods less than one year. |
| † | Unaudited |
The accompanying Notes are an integral part of these financial statements.
15
Table of Contents
The accompanying Notes are an integral part of these financial statements.
16
Table of Contents
For the Six Months Ended June 30, 2011 (unaudited) | ||||
INVESTMENT INCOME | ||||
Income | ||||
Dividend | $ | 2,105,740 | ||
Interest | 74,685 | |||
Interest from affiliated investments | 1,542 | |||
Total Income | 2,181,967 | |||
Expenses | ||||
Advisory and administration fees | 378,505 | |||
Director’s fees | 3,077 | |||
Custody and accounting expenses | 25,702 | |||
Professional fees | 16,833 | |||
Other expenses | 30,265 | |||
Total expenses before waiver and reimbursement | 454,382 | |||
Less: Expenses reimbursed by the adviser | (53,814 | ) | ||
Less: Expenses waived or borne by the adviser | (2,049 | ) | ||
Net expenses | 398,519 | |||
Net investment income | 1,783,448 | |||
NET REALIZED AND UNREALIZED GAIN (LOSS) | ||||
Realized gain on: | ||||
Investments | 2,852,040 | |||
Futures | 132,624 | |||
Increase in unrealized appreciation on: | ||||
Investments | 7,625,469 | |||
Futures | 112,955 | |||
Net realized and unrealized gain on investments | 10,723,088 | |||
Net increase in net assets resulting from operations | $ | 12,506,536 | ||
The accompanying Notes are an integral part of these financial statements.
17
Table of Contents
Changes in Net Assets | ||||||||
| Six months ended June 30, 2011* | Year Ended December 31, 2010 | |||||||
INCREASE (DECREASE) IN NET ASSETS | ||||||||
Operations: | ||||||||
Net investments income | $ | 1,783,448 | $ | 3,779,454 | ||||
Net realized gain (loss) on investments and futures | 2,984,664 | (3,346,379 | ) | |||||
Net increase in unrealized appreciationon investments and futures | 7,738,424 | 28,656,653 | ||||||
Net increase from operations | 12,506,536 | 29,089,728 | ||||||
Distributions to shareholders from : | ||||||||
Net investment income | — | (3,730,010 | ) | |||||
Total distributions | — | (3,730,010 | ) | |||||
Increase in net assets from operations and distributions | 12,506,536 | 25,359,718 | ||||||
Share transactions : | ||||||||
Proceeds from sale of shares | 1,934,037 | 2,496,222 | ||||||
Value of distributions reinvested | — | 3,730,010 | ||||||
Cost of shares redeemed | (24,035,009 | ) | (38,407,507 | ) | ||||
Net (decrease) from share transactions | (22,100,972 | ) | (32,181,275 | ) | ||||
Total (decrease) in net assets | (9,594,436 | ) | (6,821,557 | ) | ||||
NET ASSETS | ||||||||
Beginning of period | 217,343,568 | 224,165,125 | ||||||
End of period | $ | 207,749,132 | $ | 217,343,568 | ||||
Undistributed (distribution in excess of) | $ | 1,802,575 | $ | 19,127 | ||||
CHANGES IN FUND SHARES | ||||||||
Shares sold | 83,896 | 119,058 | ||||||
Issued for distributions reinvested | — | 166,444 | ||||||
Shares redeemed | (1,026,335 | ) | (1,880,228 | ) | ||||
Net Increase (Decrease) in Fund Shares | (942,439 | ) | (1,594,726 | ) | ||||
| * | Unaudited |
The accompanying Notes are an integral part of these financial statements.
18
Table of Contents
| Notes to Financial Statements | June 30, 2011 (unaudited) |
1. Organization of the Company
GE Investments Funds, Inc. (the “Company”) was incorporated under the laws of the Commonwealth of Virginia on May 14, 1984 and is registered under the Investment Company Act of 1940, as amended (the “1940 Act”), as an open-end management investment company. The Company is composed of fourteen investment portfolios (collectively the “Funds”), although only the following eleven are currently being offered: U.S. Equity Fund, S&P 500 Index Fund (the “Fund”), Premier Growth Equity Fund, Core Value Equity Fund, Mid-Cap Equity Fund, Small-Cap Equity Fund, International Equity Fund, Total Return Fund, Income Fund, Money Market Fund and Real Estate Securities Fund.
Shares of the Funds of the Company are offered only to insurance company separate accounts that fund certain variable life insurance contracts and variable annuity contracts. GE Asset Management Incorporated (“GEAM”) is the investment adviser and administrator of each of the Funds.
| 2. | Summary of Significant Accounting Policies |
The preparation of financial statements in conformity with U.S. generally accepted accounting principles (GAAP) requires management to make estimates and assumptions that affect the reported amounts of assets and liabilities and disclosure of contingent assets and liabilities at the date of the financial statements and the reported amounts of increases and decreases in net assets from operations during the reporting period. Actual results may differ from those estimates.
Subsequent events after the balance sheet date through the date the financial statements were issued, have been evaluated in the preparation of the financial statements. There are no items to report.
The following summarizes the significant accounting policies of the Company:
Securities Valuation and Transactions. All investments in securities are recorded at their estimated fair value, as described in Note 3.
Securities transactions are accounted for as of the trade date. Realized gains and losses on investments sold are recorded on the basis of identified cost for both financial statement and federal tax purposes.
The Fund’s income, expenses and realized and unrealized gains and losses are allocated proportionally each day among the share classes based upon the relative net assets of each class.
Derivates The Fund is subject to equity price risk in the normal course of pursuing its investment objective. The Fund may enter into derivative transactions to gain market exposure for residual and accumulating cash positions.
Futures Contracts A futures contract represents a commitment for the future purchase or sale of an asset at a specified price on a specified date. The Fund invests in stock index futures contracts subject to certain limitations to manage its exposure to the stock markets. Buying futures tends to increase a Fund’s exposure to the underlying instrument while selling futures tends to decrease a Fund’s exposure to the underlying instrument or to hedge other Fund investments. The Fund will not enter into a transaction involving futures for speculative purposes. With futures contracts, there is minimal counterparty credit risk to the Fund since futures contracts are exchange traded and the exchange’s clearinghouse, as counterparty to all traded futures, guarantees the futures against default. The Fund’s risks in using these contracts include changes in the value of the underlying instruments, non-performance of the counterparties under the contracts’ terms and changes in the liquidity of the secondary market for the contracts. Futures contracts are valued at the settlement price established each day by the board of trade or exchange on which they principally trade.
Upon entering into a financial futures contract, the Fund is required to pledge to the broker an amount of cash and/or other assets equal to a certain percentage of the contract amount, known as initial margin deposit. Subsequent payments, known as variation margin, are made or received by the Fund each day, depending on the daily fluctuation in the fair value of the underlying security. The Fund records an unrealized gain or loss equal to the daily variation margin. Should market conditions move unexpectedly, the Fund may not achieve the anticipated benefits of the futures contracts and may incur a loss. The Fund recognizes a realized gain or loss upon the expiration or closing of a futures contract.
Investment Income Corporate actions (including cash dividends) are recorded on the ex-dividend date, net of applicable withholding taxes, except for certain foreign corporate actions which are recorded as soon after ex-dividend date as such information becomes available. Interest income is recorded on the accrual basis.
19
Table of Contents
| Notes to Financial Statements | June 30, 2011 (unaudited) |
Expenses Fund specific expenses are allocated to the Fund that incurs such expenses. Such expenses may include custodial fees, legal and accounting fees, printing costs and registration fees. Expenses that are not fund specific are allocated pro rata across the Funds. Expenses of the Fund are generally paid directly by the Fund however, expenses may be paid by GEAM and reimbursed by the fund.
Federal Income Taxes The Fund intends to comply with all sections of the Internal Revenue Code applicable to regulated investment companies including the distribution of substantially all of its taxable net investment income and net realized capital gains to its shareholders. Therefore, no provision for federal income tax has been made. The Fund is treated as a separate taxpayer for federal income tax purposes.
| 3. | Securities Valuation |
The Fund utilizes various methods to measure the fair value of most of its investments on a recurring basis. GAAP establishes a framework for measuring fair value and providing related disclosures. Broadly, the framework requires fair value to be determined based on the exchange price that would be received for an asset or paid to transfer a liability (an exit price) in the principal or most advantageous market for the asset or liability in an orderly transaction between market participants at the measurement date. In the absence of active markets for the identical assets or liabilities, such measurements involve developing assumptions based on market observable data and, in the absence of such data, internal information that is consistent with what market participants would use in a hypothetical transaction that occurs at the measurement date. It also establishes a three-level valuation hierarchy based upon observable and non-observable inputs.
Observable inputs reflect market data obtained from independent sources, while unobservable inputs reflect our market assumptions. Preference is given to observable inputs. These two types of inputs create the following fair value hierarchy:
Level 1 — Quoted prices for identical investments in active markets.
Level 2 — Quoted prices for similar investments in active markets; quoted prices for identical or similar investments in markets that are not active; and
model-derived valuations whose inputs are observable or whose significant value drivers are observable.
Level 3 — Significant inputs to the valuation model are unobservable.
Policies and procedures are maintained to value investments using the best and most relevant data available. In addition, pricing vendors are utilized to assist in valuing investments. GEAM performs periodic reviews of the methodologies used by independent pricing services including price validation of individual securities.
Fair Value Measurement The following section describes the valuation methodologies the Fund uses to measure different financial investments at fair value.
The Fund’s portfolio securities are valued generally on the basis of market quotations. Equity securities generally are valued at the last reported sales price on the primary market in which they are traded. Portfolio securities listed on NASDAQ are valued using the NASDAQ Official Closing Price. Level 1 securities primarily include publicly-traded equity securities which may not necessarily represent the last sale price. If no sales occurred on the exchange or NASDAQ that day, the portfolio security generally is valued using the last reported bid price. In those circumstances the Fund classifies the investment securities in Level 2.
The Fund uses the net asset value per unit for the collective Fund. The Fund classifies the investment security in Level 2.
Other financial investments are derivative instruments that are not reflected in Total Investments, such as exchange traded futures. Futures are valued at the last sale price on the primary market they are traded and are typically included in level 1.
If prices are not readily available for a portfolio security, or if it is believed that a price for a portfolio security does not represent its fair value, the security may be valued using procedures approved by the Fund’s Board of Directors that are designed to establish its “fair” value. These securities would generally be classified in Level 3. Those procedures require that the fair value of a security be established by the valuation committee. The valuation committee follows different protocols for different types of investments and circumstances. The fair value procedures may be used to value any investment of the Fund in the appropriate circumstances.
20
Table of Contents
| Notes to Financial Statements | June 30, 2011 (unaudited) |
The following table presents the Fund’s investments measured at fair value on a recurring basis at June 30, 2011:
Investments | Level 1 | Level 2 | Level 3 | Total | ||||||||||||
Investments in Securities† | ||||||||||||||||
Common Stock | $ | 202,569,722 | $ | — | $ | — | $ | 202,569,722 | ||||||||
Other Investments | — | 73,206 | — | 73,206 | ||||||||||||
Short-Term Investments | 4,625,660 | — | — | 4,625,660 | ||||||||||||
|
|
|
|
|
|
|
| |||||||||
Total Investments in Securities | $ | 207,195,382 | $ | 73,206 | $ | — | $ | 207,268,588 | ||||||||
|
|
|
|
|
|
|
| |||||||||
Other Financial Instruments* | ||||||||||||||||
Futures Contracts — Unrealized Appreciation | $ | 187,822 | $ | — | $ | — | $ | 187,822 | ||||||||
|
|
|
|
|
|
|
| |||||||||
† Schedule of Investments for Industry Classification. * Other financial instruments include derivative instruments such as futures contracts. Amounts shown represent unrealized appreciation (depreciation) at period end. |
| |||||||||||||||
There were no significant transfers between the fair value levels. Transfers between fair value levels are considered to occur at the beginning of the period.
| 4. | Derivatives Transactions |
Shown below are the derivative contracts entered into by the Fund, summarized by primary risk exposure as they appear on the Statement of Assets and Liabilities, all of which are not accounted for as hedging instruments under FASB Accounting Standards Codification (“ASC”) No. 815 Derivatives and Hedging as of June 30, 2011.
Asset Derivatives June 30, 2011 | Liability Derivatives June 30, 2011 | |||||||||||
| Derivatives not accounted for as hedging instruments under ASC 815 | Location in the Statement of Assets and Liabilities | Fair Value ($) | Location in the Statements of Assets and Liabilities | Fair Value ($) | ||||||||
| Equity Contracts | Assets, Net Assets — Net Unrealized Appreciation/ (Depreciation) on Futures | 187,822* | Liabilities, Net Assets — Net Unrealized Appreciation/ (Depreciation) on Futures | — | ||||||||
| * | Includes cumulative appreciation/depreciation of futures contracts as reported in the Schedule of Investments and Net Assets section of the Statement of Assets and Liabilities. Only the current day’s variation margin is updated within the Assets and/or Liabilities section of the Statement of Assets and Liabilities. |
Shown below are the effects of derivative instruments on the Fund’s Statement of Operations, summarized by primary risk exposure all of which are not accounted for as hedging instruments under ASC 815.
| Derivatives not accounted for as hedging instruments under ASC 815 | Location in the Statement of Operations | Total Notional Amount of Futures Contracts Purchased/(Sold) ($) | Realized Gain or (Loss) on Derivatives Recognized in Income ($) | Change in Unrealized Appreciation/(Depreciation) on Derivatives Recognized in Income ($) | ||||||||||
Equity Contracts | Realized gain/(loss) on Futures, Increase/(decrease) in unrealized appreciation/ (depreciation) on Futures | 14,157,185/(12,506,063) | 132,624 | 112,955 | ||||||||||
| 5. | Fees and Compensation Paid to Affiliates |
GEAM, a registered investment adviser, was retained by the Company’s Board of Directors effective May 1, 1997 to act as investment adviser and administrator of the Fund. GEAM’s compensation for investment advisory and administrative services is paid monthly based on the average daily net assets of the Fund at an annualized rate of 0.35%.
GEAM has entered into a contractual arrangement with the Company to limit the management fee charged to the Fund to 0.30% of the average daily net assets of the Fund. Unless terminated or amended, this agreement will continue in effect until April 30, 2012. The agreement may only be changed or terminated with the approval of the Company’s Board of Directors and GEAM.
21
Table of Contents
| Notes to Financial Statements | June 30, 2011 (unaudited) |
GEAM has a contractual agreement with the Fund to waive a portion of the Fund’s management fee in the amount equal to the management fee earned by GEAM with respect to the Fund’s investment in the GE Institutional Money Market Fund.
Directors’ Compensation The Fund pays no compensation to its directors who are officers or employees of GEAM or its affiliates. Directors who are not such officers or employees also serve in a similar capacity for other funds advised by GEAM. Compensation paid to unaffiliated directors are reflected on the Statement of Operations. These fees are allocated pro rata across all of the mutual fund platforms and share classes served by the directors, including the Fund, and are based upon the relative net assets of each fund within such platforms.
| 6. | Sub-advisory Fees |
Pursuant to an investment sub-advisory agreement with GEAM, SSgA Funds Management, Inc. (“SSgA”) is the Sub-Adviser to the S&P 500 Index Fund. SSgA is responsible for the day-to-day portfolio management of the assets of the Fund, including the responsibility for making decisions to buy, sell or hold a particular security, under the general supervision of GEAM and the Board.
For its services, GEAM pays SSgA monthly sub-advisory fees which are calculated as a percentage of the average daily net assets of the Fund.
| 7. | Investment Transactions |
Purchases and Sales of Securities The cost of purchases and the proceeds from sales of investments, other than short-term securities and options, for the period ended June 30, 2011 were as follows:
| Non-U.S. Government Securities | ||
| Purchases | Sales | |
| $2,800,341 | $24,264,233 | |
| 8. | Income Taxes |
The Fund is subject to ASC 740, Income Taxes. ASC 740 provides guidance for financial accounting and reporting for the effects of income taxes that result from an entity’s activities during the year. ASC 740 also provides guidance regarding how certain tax positions should be recognized, measured, presented and disclosed in the financial statements. ASC 740 requires evaluation of tax positions taken or expected to be taken in the course of preparing the Fund’s tax returns to determine whether the tax positions are “more likely than not” of being sustained by the applicable tax authority. There are no adjustments to the Fund’s net assets required under ASC 740. The Fund’s 2007, 2008, 2009 and 2010 fiscal years tax returns are still open to examination by the Federal and applicable state tax authorities.
At June 30, 2011, information on the tax cost of investments was as follows:
| Cost of Investment for Tax Purposes | Gross Tax | Net Tax Appreciation / (Depreciation) | ||||
| Appreciation | Depreciation | |||||
| $182,917,831 | $49,316,602 | $(24,965,845) | $24,350,757 | |||
As of December 31, 2010, the Fund has capital loss carryovers, as indicated below. Capital loss carryovers are available to offset future realized capital gains to the extent provided in the Internal Revenue Code and regulations thereunder. To the extent that these carryover losses are used to offset future capital gains, it is probable that the gains so offset will not be distributed to shareholders because they would be taxable as ordinary income.
| Amount | Expires | |
| $21,852,323 | 12/31/16 | |
| 19,954,605 | 12/31/17 | |
| 2,872,721 | 12/31/18 |
These amounts will be available to offset future taxable capital gains. Under the recently enacted Regulated Investment Company Modernization Act of 2010, the Fund will be permitted to carry forward capital losses incurred in taxable years beginning after December 22, 2010 for an unlimited period. However, any losses incurred during those future years will be required to be utilized prior to the losses incurred in pre-enactment tax years. As a result of this ordering rule, pre-enactment capital loss carryforwards may be more likely to expire unused. Additionally, post-enactment capital losses that are carried forward will retain their character as either short-term or long-term capital losses rather than being considered all short-term as under previous law.
22
Table of Contents
| Notes to Financial Statements | June 30, 2011 (unaudited) |
During the year ended December 31, 2010, there were no capital loss carryover expirations.
Any net capital and currency losses incurred after October 31, within the Fund’s tax year, are deemed to arise on the first day of the Fund’s next tax year if the Fund so elects to defer such losses.
The Fund did not defer any post-October losses for the year ended December 31, 2010.
The tax composition of distributions paid during the years ended December 31, 2010 and December 31, 2009 were as follows:
| Ordinary Income | Long-Term Capital Gains | Total | ||||||||||
2010 | $ | 3,730,010 | $ | — | $ | 3,730,010 | ||||||
2009 | 4,356,429 | — | 4,356,429 | |||||||||
Distributions to Shareholders The Fund declares and pays any dividends from net investment income annually. The Fund declares and pays any net realized capital gains in excess of capital loss carryforwards distributions annually.
The character of income and gains to be distributed is determined in accordance with income tax regulations which may differ from generally accepted accounting principles. These differences include (but are not limited to) futures, investments organized as partnerships for tax purposes, distributions from Real Estate Investment Trusts (REITs), and losses deferred due to wash sale transactions. Reclassifications due to permanent book/tax differences are made to the Fund’s capital accounts to reflect income and gains available for distribution (or available capital loss carryovers) under income tax regulations. These reclassifications have no impact on the net asset value of the Fund. The calculation of net investment income per share in the Financial Highlights table excludes these adjustments.
The reclassifications for the year ended December 31, 2010 were as follows:
| Undistributed Net Investment Income | Accumulated Net Realized Gain | Paid In Capital | ||
| $(31,873) | $31,508 | $365 |
23
Table of Contents
| Special Meeting of Shareholders — Voting Results | (unaudited) |
On April 1, 2011, the GE Investments Funds, Inc. (the “Company”) held a special meeting of shareholders of each series portfolio of the Company, including shareholders of the S&P 500 Index Fund (the “Fund”). Shareholders of record on January 28, 2011 were entitled to vote on the proposals. For each proposal, except Proposal 1, shareholders voted on a fund-by-fund basis. For Proposal 1, shareholders of all funds voted together and not by fund or share class. At the meeting, all proposals were approved by the Fund and the following votes were recorded:
Proposal 1:
Election of Mr. R. Sheldon Johnson and Mr. Matthew J. Simpson as Directors to the Board of Directors of the Company.
Company votes:
| No. of Shares | % of Outstanding Shares | % of Shares Present | ||||||||||
| Mr. R. Sheldon Johnson | ||||||||||||
Affirmative | 451,517,094.582 | 90.054 | % | 96.126 | % | |||||||
Abstain | 18,195,810.391 | 3.629 | % | 3.874 | % | |||||||
Total | 469,712,904.973 | 93.683 | % | 100.000 | % | |||||||
| Mr. Matthew J. Simpson | ||||||||||||
Affirmative | 451,949,730.789 | 90.140 | % | 96.218 | % | |||||||
Abstain | 17,763,174.184 | 3.543 | % | 3.782 | % | |||||||
Total | 469,712,904.973 | 93.683 | % | 100.000 | % | |||||||
Fund votes:
| No. of Shares | % of Outstanding Shares | % of Shares Present | ||||||||||
| Mr. R. Sheldon Johnson | ||||||||||||
Affirmative | 8,408,903.555 | 87.540 | % | �� | 94.756 | % | ||||||
Abstain | 465,321.742 | 4.844 | % | 5.244 | % | |||||||
Total | 8,874,225.297 | 92.384 | % | 100.000 | % | |||||||
| Mr. Matthew J. Simpson | ||||||||||||
Affirmative | 8,422,864.734 | 87.685 | % | 94.914 | % | |||||||
Abstain | 451,360.563 | 4.699 | % | 5.086 | % | |||||||
Total | 8,874,225.297 | 92.384 | % | 100.000 | % | |||||||
Proposal 2:
Approval of the use of a “manager of managers” arrangement whereby GEAM, as the Fund’s investment adviser, under certain circumstances, will be able to hire and replace sub-advisers to the Fund without obtaining shareholder approval.
| No. of Shares | % of Outstanding Shares | % of Shares Present | ||||||||||
Affirmative | 7,796,973.567 | 81.169 | % | 87.861 | % | |||||||
Against | 477,112.801 | 4.967 | % | 5.376 | % | |||||||
Abstain | 600,138.929 | 6.248 | % | 6.763 | % | |||||||
Broker Non-votes | — | — | — | |||||||||
Total | 8,874,225.297 | 92.384 | % | 100.000 | % | |||||||
24
Table of Contents
| Special Meeting of Shareholders — Voting Results | (unaudited) |
Proposal 3:
Approval of the following changes in certain of the Fund’s investment policies, as follows:
| A. | Amendment of the Fund’s investment policy on senior securities. |
| No. of Shares | % of Outstanding Shares | % of Shares Present | ||||||||||
Affirmative | 7,755,080.506 | 80.733 | % | 87.389 | % | |||||||
Against | 505,557.515 | 5.263 | % | 5.697 | % | |||||||
Abstain | 613,587.276 | 6.388 | % | 6.914 | % | |||||||
Broker Non-votes | — | — | — | |||||||||
Total | 8,874,225.297 | 92.384 | % | 100.000 | % | |||||||
| C. | Amendment of the Fund’s investment policy on making loans. |
| No. of Shares | % of Outstanding Shares | % of Shares Present | ||||||||||
Affirmative | 7,813,475.801 | 81.341 | % | 88.047 | % | |||||||
Against | 464,518.048 | 4.836 | % | 5.234 | % | |||||||
Abstain | 596,231.448 | 6.207 | % | 6.719 | % | |||||||
Broker Non-votes | — | — | — | |||||||||
Total | 8,874,225.297 | 92.384 | % | 100.000 | % | |||||||
| D. | Amendment of the Fund’s investment policy on borrowing. |
| No. of Shares | % of Outstanding Shares | % of Shares Present | ||||||||||
Affirmative | 7,763,648.713 | 80.823 | % | 87.485 | % | |||||||
Against | 475,652.627 | 4.951 | % | 5.360 | % | |||||||
Abstain | 634,923.957 | 6.610 | % | 7.155 | % | |||||||
Broker Non-votes | — | — | — | |||||||||
Total | 8,874,225.297 | 92.384 | % | 100.000 | % | |||||||
| E. | Amendment of the Fund’s investment policy on diversification. |
| No. of Shares | % of Outstanding Shares | % of Shares Present | ||||||||||
Affirmative | 7,831,033.625 | 81.524 | % | 88.245 | % | |||||||
Against | 424,706.543 | 4.421 | % | 4.786 | % | |||||||
Abstain | 618,485.129 | 6.439 | % | 6.969 | % | |||||||
Broker Non-votes | — | — | — | |||||||||
Total | 8,874,225.297 | 92.384 | % | 100.000 | % | |||||||
| F. | Amendment of the Fund’s investment policy on concentration of investments. |
| No. of Shares | % of Outstanding Shares | % of Shares Present | ||||||||||
Affirmative | 7,843,963.735 | 81.659 | % | 88.390 | % | |||||||
Against | 425,835.069 | 4.433 | % | 4.799 | % | |||||||
Abstain | 604,426.493 | 6.292 | % | 6.811 | % | |||||||
Broker Non-votes | — | — | — | |||||||||
Total | 8,874,225.297 | 92.384 | % | 100.000 | % | |||||||
25
Table of Contents
| Special Meeting of Shareholders — Voting Results | (unaudited) |
| G. | Amendment of the Fund’s investment policy on investments in commodities and its reclassification from a non-fundamental policy to a fundamental policy. |
| No. of Shares | % of Outstanding Shares | % of Shares Present | ||||||||||
Affirmative | 7,672,962.827 | 79.878 | % | 86.463 | % | |||||||
Against | 541,214.960 | 5.635 | % | 6.099 | % | |||||||
Abstain | 660,047.510 | 6.871 | % | 7.438 | % | |||||||
Broker Non-votes | — | — | — | |||||||||
Total | 8,874,225.297 | 92.384 | % | 100.000 | % | |||||||
| H. | Amendment of the Fund’s fundamental investment policy on illiquid investments and its reclassification from a fundamental policy to a non-fundamental policy. |
| No. of Shares | % of Outstanding Shares | % of Shares Present | ||||||||||
Affirmative | 7,686,581.684 | 80.020 | % | 86.617 | % | |||||||
Against | 520,112.398 | 5.415 | % | 5.861 | % | |||||||
Abstain | 667,531.215 | 6.949 | % | 7.522 | % | |||||||
Broker Non-votes | — | — | — | |||||||||
Total | 8,874,225.297 | 92.384 | % | 100.000 | % | |||||||
| I. | Elimination of the Fund’s investment policy on mortgaging, pledging and hypothecating of investments. |
| No. of Shares | % of Outstanding Shares | % of Shares Present | ||||||||||
Affirmative | 8,379,284.293 | 87.232 | % | 94.423 | % | |||||||
Against | 261,510.099 | 2.722 | % | 2.947 | % | |||||||
Abstain | 233,430.905 | 2.430 | % | 2.630 | % | |||||||
Broker Non-votes | — | — | — | |||||||||
Total | 8,874,225.297 | 92.384 | % | 100.000 | % | |||||||
| J. | Amendment of the Fund’s investment policy on real estate investments. |
| No. of Shares | % of Outstanding Shares | % of Shares Present | ||||||||||
Affirmative | 7,804,649.781 | 81.249 | % | 87.947 | % | |||||||
Against | 542,408.126 | 5.647 | % | 6.113 | % | |||||||
Abstain | 527,167.390 | 5.488 | % | 5.940 | % | |||||||
Broker Non-votes | — | — | — | |||||||||
Total | 8,874,225.297 | 92.384 | % | 100.000 | % | |||||||
26
Table of Contents
| Additional Information | (unaudited) |
Information about Directors and Executive Officers:
The business and affairs of the Funds are managed under the direction of the Funds’ Board of Directors. Information pertaining to the Directors and officers of the Funds is set forth below.
Interested Directors and Executive Officers
Michael J. Cosgrove
Address c/o GEAM 3001 Summer St. Stamford, CT 06905
Age 62
Position(s) Held with Fund Chairman of the Board and President
Term of Office and Length of Time Served Until successor is elected and qualified – 14 years
Principal Occupation(s) During Past 5 years President and Chief Executive Officer – Mutual Funds and Intermediary Business at GEAM since March 2007; Executive Vice President of GEAM from February 1997 to March 2007; Vice President, GE Capital Corporation, an indirect wholly-owned subsidiary of GE, since December 1999; Executive Vice President – Mutual Funds of GEAM, a wholly-owned subsidiary of GE that is registered as an investment adviser under the Investment Advisers Act of 1940, as amended, since March 1993; President and Director of GE Investment Distributors, Inc., since June 2011. Director of GEAM since 1988.
Number of Portfolios in Fund Complex Overseen by Director 28
Other Directorships Held by Director Chairman of the Board and President of GE Institutional Funds since 1997; Trustee of Elfun Funds, GE Savings & Security Funds, General Relief and Loan Fund and General Electric Pension Trust since 1988; Trustee of Fordham University from 2002 to June 30, 2010 and since July 2011; Trustee of GE Volunteers since 1993; Director of GE Foundation; Director, GE Asset Management (Ireland) Limited, since February 1999, GE Asset Management Funds Plc since 1998, GE Asset Management Canada Company since 1998, GE Asset Management Limited since 1998 and GEAM since 1988; Chairman of the Board and President of GE Funds from 1993 to February 2011.
Matthew J. Simpson
Address c/o GEAM 3001 Summer St. Stamford, CT 06905
Age 50
Position(s) Held with Fund Director and Executive Vice President
Term of Office and Length of Time Served Until successor is elected and qualified – 3 years
Principal Occupation(s) During Past 5 years Executive Vice President, General Counsel and Secretary of GEAM since July 2007; Senior Vice President and General Counsel – Marketing and Client Services (formerly Asset Management Services) at GEAM and Senior Vice President and General Counsel of GE Asset Management Services from February 1997 to July 2007; Vice President and Associate General Counsel of GEAM from October 1992 to February 1997; Secretary of GE Funds from 1993 to July 2007 and Vice President from September 2003 to July 2007; Secretary of GE Institutional Funds and GE Investments Funds, Inc. from 1997 to July 2007; Secretary of Elfun Funds and GE Savings & Security Funds since July 2007; Assistant Secretary of Elfun Funds and GE Savings & Security Funds from 1998 to July 2007 and Vice President from October 2003 to July 2007.
Number of Portfolios in Fund Complex Overseen by Director 28
Other Directorships Held by Director Trustee of Elfun Funds, GE Savings & Security Funds and General Electric Pension Trust since July 2007; Trustee of GE Institutional Funds since April 2011 and Trustee of GE Funds from July 2007 to February 2011.
27
Table of Contents
| Additional Information | (unaudited) |
Joon Won Choe
Address c/o GEAM 3001 Summer St. Stamford, CT 06905
Age 41
Position(s) Held with Fund Vice President & Secretary
Term of Office and Length of Time Served Until successor is elected and qualified – Vice President and Secretary – less than 1 year
Principal Occupation(s) During Past 5 years Senior Vice President and Deputy General Counsel at GEAM since March 2011; Senior Vice President and Associate General Counsel at GEAM from June 2010 to March 2011; Vice President and Associate General Counsel at GEAM from November 2005 to June 2010; Vice President and Secretary of GE Institutional Funds and GE Investments Funds, Inc. since September 2010; Vice President and Assistant Secretary of Elfun Funds and GE Savings & Security Funds since September 2010.
Number of Portfolios in Fund Complex Overseen by Officer N/A
Other Directorships Held by Officer N/A
Robert Herlihy
Address c/o GEAM 3001 Summer St. Stamford, CT 06905
Age 43
Position(s) Held with Fund Chief Compliance Officer
Term of Office and Length of Time Served Until successor is elected and qualified — 5 years
Principal Occupation(s) During Past 5 years Chief Compliance Officer of GEAM, GE Institutional Funds, Elfun Funds, and GE Savings and Security Funds since July 2005; Chief Compliance Officer of GE Funds from July 2005 to February 2011; and Manager of Fund Administration at GEAM from 2002 – 2005.
Number of Portfolios in Fund Complex Overseen by Officer N/A
Other Directorships Held by Officer N/A
Arthur A. Jensen
Address c/o GEAM 3001 Summer St. Stamford, CT 06905
Age 44
Position(s) Held with Fund Treasurer
Term of Office and Length of Time Served Until successor is elected and qualified – less than 1 year
Principal Occupations(s) During Past 5 Years Treasurer of GE Institutional Funds, Elfun Funds and GE Savings and Security Funds since June 2011; Mutual Funds Controller of GEAM since April 2011; Senior Vice President at Citigroup from 2008 to 2010 and Vice President at JPMorgan from 2005 to 2008.
Number of Portfolios in Fund Complex Overseen by Officer N/A
Other Directorships Held by Officer N/A
28
Table of Contents
| Additional Information | (unaudited) |
Non-Interested Directors
John R. Costantino
Address c/o GEAM 3001 Summer St. Stamford, CT 06905
Age 65
Position(s) Held with Fund Director
Term of Office and Length of Time Served Until successor is elected and qualified – 14 years
Principal Occupation(s) During Past 5 years General Partner, NGN Capital LLC since 2006; Managing Director, Vice President of Walden Capital Management since 1996.
Number of Portfolios in Fund Complex Overseen by Director 20
Other Directorships Held by Director Director of GE Institutional Funds since 1997; Trustee of Fordham University from 1989-1995 and 2001-2007 and Trustee Emeritus since 2007; Trustee of Neuroscience Research Institute since 1986; Trustee of GE Funds from 1993 to February 2011; Trustee of Gregorian University Foundation from 1992-2007; Director of Artes Medical from 2006-2008.
R. Sheldon Johnson
Address c/o GEAM 3001 Summer St. Stamford, CT 06905
Age 64
Positions(s) Held with Fund Director
Term of office and Length of Time served Unit Successor is elected and qualified – less than 1 year.
Principal Occupation(s) During Past 5 years Managing Director at Morgan Stanley & Co.,Inc. from 1988 to 2006; Head of Global Institutional Equity Sales and Marketing at Morgan Stanley & Co., Inc. from 2002 to 2006.
Number of Portfolios in Fund Complex Overseen by Director 20
Other Directorships Held by Director Trustee of GE Institutional Funds since April 2011 and Trustee of St. Lawrence University since 2003.
Robert P. Quinn
Address c/o GEAM 3001 Summer St. Stamford, CT 06905
Age 75
Position(s) Held with Fund Director
Term of Office and Length of Time Served Until successor is elected and qualified – 14 years
Principal Occupation(s) During Past 5 years Retired since 1983 from Salomon Brothers Inc.
Number of Portfolios in Fund Complex Overseen by Director 20
Other Directorships Held by Director Trustee of GE Institutional Funds since 1997; Trustee of St. Francis Hospital since 1980; and Trustee of GE Funds from 1993 to February 2011.
The Statement of Additional Information for the Funds includes additional information about the Directors and Officers and is available, without charge, upon request by calling 1-800-242-0134.
29
Table of Contents
| Investment Team | (unaudited) |
Investment Adviser and Administrator
GE Asset Management Incorporated
Board of Directors
Michael J. Cosgrove, Chairman
John R. Costantino
R. Sheldon Johnson*
Robert P. Quinn
Matthew J. Simpson
Secretary
Joon Won Choe
Assistant Secretary
Michelle Matzelle
Treasurer
Arthur A. Jensen (effective June 6, 2011)
Assistant Treasurer
Casey Yantosca
Distributor
GE Investment Distributors, Inc.
Member FINRA and SIPC
Custodian
State Street Bank & Trust Company
Officers of the Investment Adviser
Dmitri Stockton, President and Chief Executive Officer (since May 2011)†
Cheryl H. Beacock, Senior Vice President, Human Resources
George A. Bicher, Chief Risk Officer
Paul M. Colonna, President and Chief Investment Officer – Fixed Income Investments
Michael J. Cosgrove, President and Chief Executive
Officer – Mutual Funds & Intermediary Business
Ralph R. Layman, President and Chief Investment Officer – Public Equity Investments
Maureen B. Mitchell, President – Institutional Sales and Marketing
Matthew J. Simpson, Executive Vice President, General Counsel and Secretary
Don W. Torey, President – Alternative Investments
John J. Walker, Executive Vice President, Chief Operating Officer
David Wiederecht, President and Chief Investment Officer – Investment Strategies
Tracie A. Winbigler, Executive Vice President, Chief Financial Officer (since January 2011)
| * | Mr. Johnson was elected as a Director of the Funds effective April 1, 2011. |
| † | Effective May 1, 2011, Mr. Stockton replaced James W. Ireland as President and Chief Executive Officer. |
At GE Asset Management, we’re dedicated to providing the investment options you’ll need to tailor your financial portfolio to every stage of your life. Each member of the GE Family of Funds is managed according to the same principles of integrity and quality that have guided GE over the past century, and have made it the world-class company that it is today. Each fund draws strength from a heritage of investment management experience that spans more than 80 years. Whether you’re creating a new investment portfolio or adding to an established one, the GE Family of Funds offers an array of professionally managed investment options that will help you meet a lifetime of financial needs.
30
Table of Contents
Investment Adviser
GE Asset Management Incorporated
3001 Summer Street
PO Box 7900
Stamford, CT 06904-7900
Distributor
GE Investment Distributors, Inc.
member FINRA and SIPC
3001 Summer Street
PO Box 7900
Stamford, CT 06904-7900
The Fund files its complete schedule of portfolio holdings with the Securities and Exchange Commission for the first and third quarters of each fiscal year on Form N-Q. The Fund’s Forms N-Q, as well as a description of the policies and procedures that the Fund uses to determine how to vote proxies (if any) relating to portfolio securities is available without charge (i) upon request, by calling 1-800-493-3042; (ii) on the Fund’s website at http://www.geam.com; and (iii) on the Commission’s website at http://www.sec.gov. The Fund’s Forms N-Q may be reviewed and copied at the Commission’s Public Reference Room in Washington, DC—information on the operation of the Public Reference Room may be obtained by calling 1-800-SEC-0330.
Information (if any) regarding how the Fund voted proxies relating to portfolio securities during the most recently disclosed 12-month period ended June 30 is available without charge (i) through the Fund’s website at http://www.geam.com; and (ii) on the Commission’s website at http://www.sec.gov.
Table of Contents
GE Investments Funds, Inc.
| Premier Growth Equity Fund | Letter from the Chairman | |

Michael J. Cosgrove Chairman,
GE Investments Funds, Inc.
Dear Shareholder: |
Attached is the semi-annual report for GE Investments Funds, Inc. — Premier Growth Equity Fund (the “Fund”) for the six-month period ended June 30, 2011. The report contains information about the performance of the Fund and other fund-specific data, along with portfolio manager commentary.
We have provided you with an overview of the investment markets, along with our investment outlook for the coming months.
Market Overview
Most major equity indices posted positive returns in the six-month period ended June 30, 2011, despite geopolitical tensions in the Middle East and North Africa, a devastating earthquake in Japan, ongoing concerns about unresolved sovereign debt issues in peripheral Europe and elevated inflation in emerging markets. Volatility increased in May and June, however, as some measures of global economic activity weakened and uncertainties over Greece’s ability to finance and service its debt rattled the financial markets. In the U.S., concerns over the end of quantitative easing by the Federal Reserve and political wrangling over the government debt ceiling further contributed to a challenging environment. The increase in risk aversion benefited the fixed income markets as many investors sought out safer investments. Toward the end of June, the Greek Parliament passed austerity measures that seemed to calm the markets and opened the way for the next round of financing from the European Central Bank and the International Monetary Fund.
Against this backdrop, financial markets posted positive results for the six- and 12-month periods ended June 30, 2011 as represented by the index returns in the below chart.
Total Returns (%) as of June 30, 2011 | 6-month | 12-month | ||||||
U.S. equities (S&P 500 Index) | 6.0 | 30.7 | ||||||
Global equities (MSCI World Index) | 5.3 | 30.5 | ||||||
International equities (MSCI EAFE Index) | 5.0 | 30.4 | ||||||
Small-cap U.S. equities | 6.2 | 37.4 | ||||||
Mid-cap U.S. equities (Russell Mid Cap Index) | 8.1 | 38.5 | ||||||
U.S. fixed income | 2.7 | 3.9 | ||||||
U.S. short-term government fixed income | 0.9 | 1.4 | ||||||
Outlook
We remain constructive on the prospects for healthy global growth, although it may be at a slower pace than originally anticipated. Central banks in the U.S. and Europe remain accommodative and supply chain issues in Japan appear to have abated. There are also signs that inflation may be peaking in emerging markets as commodity prices have eased in recent months. Corporate balance sheets remain healthy and fundamentals remain intact, in our view. We believe that valuations for equities are not stretched and remain below historical averages while equity risk premiums are still high-offering the possibility for further gains. We expect that the financial markets are likely to remain volatile due to outstanding sovereign debt issues, but believe that returns are biased to the upside in the second half of the year.
Thank you for investing with GE Investments Funds.
Sincerely,

Michael J. Cosgrove
Chairman, GE Investments Funds, Inc.
July 2011
 |
This does not constitute a part of the Fund’s Shareholder Report
Table of Contents
GE Investments Funds, Inc.
| Premier Growth Equity Fund | ||
Mike Cosgrove is President and Chief Executive Officer — Mutual Funds and Intermediary Business at GE Asset Management Incorporated (“GEAM”). In addition to the GE Investments Funds, he is also Chairman of the Board and President of GE Institutional Funds and Director and President of GEAM’s broker-dealer which serves as underwriter and distributor for the GE Investments Funds. Mr. Cosgrove serves as a Trustee of the GE Savings & Security Funds, the GE Foundation, and the GE Pension Trust. He also serves on the Board of Directors of the Skin Cancer Foundation and is a Trustee of Fordham University. Previously Chief Financial Officer of GE Asset Management and Assistant Treasurer — GE Company, Mr. Cosgrove joined GE in 1970 and held a number of managerial positions in finance and sales in the International Operation and the GE Trading Company. He received a BS in Economics from Fordham University and an MBA from St. John’s University.
This does not constitute a part of the Fund’s Shareholder Report
Table of Contents
GE Investments Funds, Inc.
Premier Growth Equity Fund
Semi-Annual Report
June 30, 2011

Table of Contents
GE Investments Funds, Inc.
| Premier Growth Equity Fund | Contents | |
| 1 | ||||
| 2 | ||||
| 8 | ||||
Financial Statements | ||||
| 9 | ||||
| 10 | ||||
| 11 | ||||
| 12 | ||||
| 13 | ||||
| 18 | ||||
| 21 | ||||
| 24 | ||||
This report is prepared for Policyholders of certain variable contracts and may be distributed to others only if preceded or accompanied by the variable contract’s current prospectus and the current prospectus of the Fund available for investments thereunder.
Table of Contents
| Notes to Performance | June 30, 2011 (unaudited) |
The information provided on the performance pages relates to the GE Investments Premier Growth Equity Fund (the “Fund”) and is unaudited.
Total returns take into account changes in share price and assume reinvestment of dividends and capital gains distributions, if any. Total returns shown are net of Fund fees and expenses but do not reflect fees and charges associated with the variable contracts such as administrative fees, account charges and surrender charges, which, if reflected, would reduce the Fund’s total returns for all periods shown.
The performance data quoted represents past performance; past performance does not guarantee future results. Investment return and principal value will fluctuate so your shares, when redeemed, may be worth more or less than their original cost. Current performance may be higher or lower than the performance data quoted. Periods less than one year are not annualized. Please call toll-free 800-493-3042 or visit the Fund’s website at http://www.geam.com for the most recent month-end performance data.
An investment in the Fund is not a deposit of any bank and is not insured or guaranteed by the Federal Deposit Insurance Corporation (FDIC) or any other government agency. An investment in the Fund is subject to risk, including possible loss of principal invested.
The S&P 500® Index is an unmanaged market capitalization-weighted index of stocks of 500 large U.S. companies, which is widely used as a measure of large-cap
U.S. stock market performance. The results shown for the foregoing index assume the reinvestment of net dividends or interest. They do not reflect the actual cost of investing in the instruments that comprise the index.
The Russell 1000 Growth Index measures the performance of the large-cap growth segment of the U.S. equity universe. It includes those Russell 1000 companies with higher price-to-book ratios and higher forecasted growth values.
The peer universe of the underlying annuity funds used for the peer group average annual total return calculation is based on a blend of Morningstar peer categories, as shown. Morningstar is an independent mutual fund rating service. A Fund’s performance may be compared to or ranked within a universe of mutual funds with investment objectives and policies similar but not necessarily identical to that of the Fund.
©2011 Morningstar, Inc. All Rights Reserved. The Morningstar information contained herein: (1) is proprietary to Morningstar and/or its content providers; (2) may not be copied or distributed; and (3) is not warranted to be accurate, complete or timely. Neither Morningstar nor its content providers are responsible for any damage or losses relating from any use of this information. Past performance is no guarantee of future results.
GE Investment Distributors, Inc., Member of FINRA & SIPC, is the principal underwriter and distributor of the GE Investments Funds, Inc. and a wholly owned subsidiary of GE Asset Management Incorporated, the investment adviser of the Fund.
1
Table of Contents
| Premier Growth Equity Fund | (unaudited) |

David B. Carlson is Chief Investment Officer — U.S. Equities at GE Asset Management. He co-manages the overall U.S. equity investments for GE Asset Management. Mr. Carlson has served as the portfolio manager for the Premier Growth Equity Fund and has served in that capacity since the Fund’s commencement. Mr. Carlson joined GE Asset Management in 1982 as a securities analyst for investment operations. He became a Vice President for Mutual Fund Portfolios in 1987, a Senior Vice President in 1989, and an Executive Vice President in 2013.
| Q. | How did the Premier Growth Equity Fund perform compared to its benchmark and Morningstar peer group for the six-month period ended June 30, 2011? |
| A. | For the six-month period ended June 30, 2011, the Premier Growth Equity Fund returned 7.32% for Class 1 shares. The S&P 500 Index and Russell 1000 Growth Index, the Fund’s benchmarks, returned 6.02% and 6.83% respectively, and the Fund’s Morningstar peer group of 388 U.S. Insurance Large Blend funds returned an average of 5.99% over the same period. |
| Q. | What market factors affected Fund performance? |
| A. | The S&P 500 experienced major volatility during the period against a backdrop of concerns including political unrest in the Middle East and North Africa (which sent oil prices skyrocketing 22%, then down 17% after strategic reserves were released to mitigate supply disruptions), fears of European sovereign debt contagion (which punished bank stocks), and U.S. deficit and debt ceiling debate. Despite these worries, corporate earnings strength sent U.S. equity markets higher early in the year, before renewed macro fears reversed the advance by the end of March. Bolstered by positive economic data, the S&P 500 rebounded and hit a three-year high on April 29th, but fluctuated wildly as the drumbeat of concerns continued. While more cyclical sectors outperformed in the first calendar quarter, a defensive shift characterized the |
| markets as mid-year approached. During the period the large cap growth style of investing outperformed the value style, driven largely by underperformance in the financials sector (-3% in the context of a +6% S&P 500 return) — Premier Growth Equity did well in this environment. The information technology (+2%) sector also lagged as many investors questioned the strength of the recovery. Health care (+14%) was the strongest S&P 500 sector, followed by energy (+11%) and utilities (+9%) for the period. |
| Q. | What were the primary drivers of Fund performance? |
| A. | The Fund benefited primarily from positive stock selections in information technology, consumer discretionary and industrials. In technology, Baidu (an American Depository Receipt, +45%), significantly outperformed Google (-15% and not owned), as it gained market share of internet search activity in China. Visa (+20%) also rallied as a regulatory overhang cleared regarding interchange fees. We continued to view Qualcomm (+16%) as a long-term winner in mobile communications, with near-term value. Additionally, we continued to find technology stocks attractively valued in general, with many trading at or below market multiples relative to their projected growth prospects. Our media holdings in cable and satellite distribution also outperformed. DirecTV (+27%) benefited from strong U.S. and Latin American subscriber growth. Liberty Global (+26%) ended a convertible equity deal which enabled share repurchases to resume, and avoided proposed industry regulation in Belgium. Finally, within industrials, Dover (+17%) was a relative outperformer, enjoying strength in its end markets. |
Despite the Fund’s positive overweight in health care, underweighting pharmaceuticals stocks as defensive industries outperformed, detracted from |
2
Table of Contents
(unaudited)

| returns. Our focus on companies we believed to be relatively immune to health care reform didn’t help performance in this environment. For example, animal care leader VCA Antech (-9% amid investor skepticism on economic recovery prospects) and pharmacy benefits manager, Express Scripts (-2.9% as its Walgreen’s relationship deteriorated), underperformed. Although Goldman Sachs (-20%), CME Group (-8%) and State Street (-2%) weighed on returns as European sovereign debt concerns pressured financials, fortunately the Fund’s underweight in the financials sector versus the S&P 500 counteracted their negative effects. Other key detractors included Carnival Corp. (-17% as fuel costs rose), Lowe’s (-6% as housing stress continued) and communications equipment behemoth, Cisco (-23% on perceived share losses). |
| Q. | How was the Fund positioned at the end of the period? |
| A. | Information technology remained the Fund’s largest absolute weighting at mid-year, followed by consumer discretionary, health care and financials. Utilities, telecommunications and industrials were the Fund’s smallest sector weightings. We have continued to maintain a pro-cyclical positioning as the recovery takes hold — and we remained consistent with that longer term view even in the context of macro driven market jitters. We remain optimistic for U.S. equities for the balance of 2011 given the double-digit earnings growth outlook and attractive valuations for U.S. stocks in general. In our view, equity valuations are compressed for many of our holdings — especially in technology as noted above. We believe equity investors could increasingly differentiate between the Fund’s quality growth companies and lower-quality alternatives. We believe the portfolio is well positioned to navigate the slow growth recovery in the second half of the fiscal year. |
3
Table of Contents
| Premier Growth Equity Fund | (unaudited) |
Understanding Your Fund’s Expenses
As a shareholder of the Fund you incur ongoing costs. Ongoing costs include portfolio management fees, distribution and services fees, professional fees, administrative fees and other Fund expenses. The following example is intended to help you understand your ongoing costs (in dollars) of investing in the Fund and to compare these costs with the ongoing costs of investing in other mutual funds.
To illustrate these ongoing costs, we have provided an example and calculated the expenses paid by investors of the Fund during the period. The information in the following table is based on an investment of $1,000, which is invested at the beginning of the period and held for the entire six-month period ended June 30, 2011.
Actual Expenses
The first section of the table provides information about actual account values and actual expenses. You may use the information in this section, together with the amount you invested, to estimate the expenses that you paid over the period. To do so, simply divide your account value by $1,000 (for example, an $8,600 account value divided by $1,000 = 8.6), then multiply the result by the
number given for your class under the heading “Expenses paid during period.”
Hypothetical Example for Comparison Purposes
The second section of the table provides information about hypothetical account values and hypothetical expenses based on the Fund’s actual expense ratio and an assumed rate of return of 5% per year before expenses, which is not the Fund’s actual return. The hypothetical account values and expenses may not be used to estimate the actual ending account balance or expenses you paid for the period. You may use this information to compare the ongoing costs of investing in the Fund and other funds. To do so, compare this 5% hypothetical example with the 5% hypothetical examples that appear in the shareholders reports of other funds.
Please note that the expenses shown in the table are meant to highlight and help you compare ongoing costs only and do not reflect any transaction costs, such as sales charges or redemption fees, if any. Additionally, the expenses shown do not reflect the fees or charges associated with variable contracts through which shares of the Fund are offered.
January 1, 2011 - June 30, 2011
| Account value at the beginning of the period ($) | Account value at the end of the period ($) | Expenses paid during the period ($)* | ||||||||||
Actual Fund Return** | ||||||||||||
Class 1 | 1,000.00 | 1,073.18 | 4.57 | |||||||||
Hypothetical 5% Return (2.5% for the period) |
| |||||||||||
Class 1 | 1,000.00 | 1,020.17 | 4.46 | |||||||||
| * | Expenses are equal to the Fund’s annualized expense ratio of 0.89% for Class 1 shares (for the period January 1, 2011 - June 30, 2011), multiplied by the average account value over the period, multiplied by 181/365 (to reflect the one-half year period). |
| ** | Actual Fund Return for the six-month period ended June 30, 2011 was 7.32% for Class 1 shares. Past performance does not guarantee future results. |
4
Table of Contents
| Premier Growth Equity Fund | (unaudited) |
Investment Profile
A Mutual Fund designed for investors who seek long-term growth of capital and future income rather than current income. The Fund seeks its objective by investing at least 80% of its net assets under normal circumstances in equity securities such as common and preferred stock. The Fund invests primarily in a limited number of large-and medium-sized companies (companies with a market capitalization of $2 billion or more) that the portfolio manager believes have above-average growth histories and/or growth potential.
Morningstar Performance Comparison
Based on average annual returns for periods ended June 30, 2011
| Six Months ** | One Year | Five Year | Ten Year | |||||||||||||
Number of Funds in peer group: | 388 | 388 | 343 | 271 | ||||||||||||
Peer group average annual total return: | 5.99 | % | 34.34 | % | 4.05 | % | 2.11 | % | ||||||||
Morningstar category in peer group: U.S. Insurance Large Growth |
| |||||||||||||||
Sector Allocation
as a % of Fair Value of $45,149 (in thousands) on June 30, 2011 (a) (b)
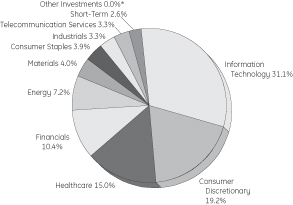
Top Ten Largest Holdings
as of June 30, 2011 (as a % of Fair Value) (a) (b)
QUALCOMM Inc. | 4.85% | |||
Schlumberger Ltd. | 4.55% | |||
The Western Union Co. | 4.22% | |||
Visa Inc. | 4.14% | |||
DIRECTV | 4.07% | |||
Express Scripts Inc. | 3.98% | |||
Apple Inc. | 3.98% | |||
PepsiCo Inc. | 3.86% | |||
CME Group Inc. | 3.81% | |||
Liberty Global Inc. | 3.73% |
Change in Value of a $10,000 Investment
Class 1 Shares
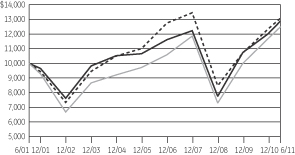
Average Annual Total Return
for the Periods Ended June 30, 2011
Class 1 Shares (Inception date: 12/12/97)
| Six Months ** | One Year | Five Year | Ten Year | Ending value of a $10,000 investment | ||||||||||||||||
Premier Growth Equity Fund | 7.32% | 31.20% | 4.13% | 2.57% | $ | 12,885 | ||||||||||||||
S&P 500 Index | 6.02% | 30.69% | 2.94% | 2.72% | $ | 13,076 | ||||||||||||||
Russell 1000 Growth Index | 6.83% | 35.01% | 5.33% | 2.24% | $ | 12,483 | ||||||||||||||
|

| (a) | The securities information regarding holdings, allocations and other characteristics is presented to illustrate examples of securities that the Fund has bought and the diversity of areas in which the Fund may invest as of a particular date. It may not be representative of the Fund’s current or future investments and should not be construed as a recommendation to purchase or sell a particular security. |
| (b) | Fair value basis is inclusive of Short-Term Investment in GE Institutional Money Market Fund. |
| * | Less than 0.1%. |
| ** | Total returns for the six month period ended June 30, 2011 are not annualized. |
See Notes to Performance on page 1 for further information, including an explanation of Morningstar peer categories.
Past performance does not predict future performance and the graph and table do not reflect the deduction of taxes that a shareholder would pay on Fund distributions or the redemption of Fund shares and does not reflect the fees or charges that would be associated with variable contracts through which shares of the Fund are offered.
5
Table of Contents
Premier Growth Equity Fund
| Schedule of Investments | June 30, 2011 (unaudited) |
Premier Growth Equity Fund
| Number of Shares | Fair Value | |||||||||
Common Stock — 97.7% † |
| |||||||||
Application Software — 1.3% | ||||||||||
Intuit Inc. | 11,417 | $ | 592,086 | (a,d) | ||||||
Asset Management & Custody Banks — 2.7% | ||||||||||
State Street Corp. | 27,401 | 1,235,511 | (c) | |||||||
Biotechnology — 5.0% | ||||||||||
Amgen Inc. | 26,164 | 1,526,669 | (a) | |||||||
Gilead Sciences Inc. | 17,126 | 709,188 | (a) | |||||||
| 2,235,857 | ||||||||||
Broadcasting — 2.3% | ||||||||||
Discovery Communications Inc. | 28,067 | 1,025,849 | (a) | |||||||
Cable & Satellite — 7.8% | ||||||||||
DIRECTV | 36,154 | 1,837,346 | (a) | |||||||
Liberty Global Inc. | 39,484 | 1,685,967 | (a) | |||||||
| 3,523,313 | ||||||||||
Communications Equipment — 6.1% | ||||||||||
Cisco Systems Inc. | 35,679 | 556,949 | (d) | |||||||
QUALCOMM Inc. | 38,533 | 2,188,289 | ||||||||
| 2,745,238 | ||||||||||
Computer Hardware — 4.0% | ||||||||||
Apple Inc. | 5,352 | 1,796,506 | (a) | |||||||
Data Processing & Outsourced Services — 10.8% | ||||||||||
Paychex Inc. | 34,727 | 1,066,814 | ||||||||
The Western Union Co. | 95,143 | 1,905,714 | ||||||||
Visa Inc. | 22,168 | 1,867,876 | ||||||||
| 4,840,404 | ||||||||||
Fertilizers & Agricultural Chemicals — 2.6% | ||||||||||
Monsanto Co. | 15,984 | 1,159,479 | ||||||||
Healthcare Equipment — 3.6% | ||||||||||
Covidien PLC | 30,866 | 1,642,998 | ||||||||
Healthcare Facilities — 0.9% | ||||||||||
VCA Antech Inc. | 19,980 | 423,576 | (a) | |||||||
Healthcare Services — 5.5% | ||||||||||
Express Scripts Inc. | 33,300 | 1,797,534 | (a) | |||||||
Lincare Holdings Inc. | 23,786 | 696,216 | ||||||||
| 2,493,750 | ||||||||||
| Number of Shares | Fair Value | |||||||||
Home Furnishing Retail — 3.1% |
| |||||||||
Bed Bath & Beyond Inc. | 24,262 | $ | 1,416,173 | (a) | ||||||
Home Improvement Retail — 2.5% | ||||||||||
Lowe’s companies Inc. | 47,571 | 1,108,880 | ||||||||
Hotels, Resorts & Cruise Lines — 2.0% | ||||||||||
Carnival Corp. | 24,261 | 912,941 | ||||||||
Industrial Machinery — 3.3% | ||||||||||
Dover Corp. | 22,073 | 1,496,549 | ||||||||
Internet Retail — 1.5% | ||||||||||
Amazon.com Inc. | 3,234 | 661,321 | (a) | |||||||
Internet Software & Services — 6.9% | ||||||||||
Baidu Inc. ADR | 11,190 | 1,568,055 | (a) | |||||||
eBay Inc. | 47,096 | 1,519,788 | (a) | |||||||
| 3,087,843 | ||||||||||
Investment Banking & Brokerage — 2.7% | ||||||||||
The Goldman Sachs Group Inc. | 9,039 | 1,203,001 | ||||||||
Oil & Gas Equipment & Services — 7.2% | ||||||||||
Halliburton Co. | 23,310 | 1,188,810 | ||||||||
Schlumberger Ltd. | 23,786 | 2,055,110 | ||||||||
| 3,243,920 | ||||||||||
Real Estate Services — 1.2% | ||||||||||
CB Richard Ellis Group Inc. (REIT) | 22,359 | 561,434 | (a) | |||||||
Soft Drinks — 3.9% | ||||||||||
PepsiCo Inc. | 24,737 | 1,742,227 | ||||||||
Specialized Finance — 3.8% | ||||||||||
CME Group Inc. | 5,899 | 1,720,089 | ||||||||
Specialty Chemicals — 1.5% | ||||||||||
Ecolab Inc. | 11,702 | 659,759 | ||||||||
Systems Software — 2.2% | ||||||||||
Microsoft Corp. | 38,056 | 989,456 | (d) | |||||||
Wireless Telecommunication Services — 3.3% | ||||||||||
American Tower Corp. | 28,067 | 1,468,746 | (a) | |||||||
Total Common Stock | 43,986,906 | |||||||||
See Notes to Schedule of Investments and Notes to Financial Statements.
6
Table of Contents
Premier Growth Equity Fund
| Schedule of Investments | June 30, 2011 (unaudited) |
| Fair Value | ||||||||
Other Investments — 0.0%* | ||||||||
GEI Investment Fund | $ | 2,797 | (e) | |||||
Total Investments in Securities | 43,989,703 | |||||||
Short-Term Investments — 2.6% |
| |||||||
GE Institutional Money Market Fund Investment Class 0.11% | 1,159,406 | (b,e) | ||||||
Total Investments | 45,149,109 | |||||||
Liabilities in Excess of Other Assets, net — (0.3)% | (121,781 | ) | ||||||
|
| |||||||
NET ASSETS — 100.0% | $ | 45,027,328 | ||||||
|
| |||||||
Other Information | ||||||
The Fund had the following short futures contracts open at June 30, 2011 (unaudited):
| Description | Expiration Date | Number of Contracts | Current Notional Value | Unrealized (Depreciation) | ||||||||||
S&P 500 Emini Index Futures | September 2011 | 2 | $ | (131,550 | ) | $ | (1,856 | ) | ||||||
See Notes to Schedule of Investments and Notes to Financial Statements.
7
Table of Contents
| Notes to Schedule of Investments | June 30, 2011 (unaudited) |
The views expressed in this document reflect our judgment as of the publication date and are subject to change at any time without notice. The securities information regarding holdings, allocations and other characteristics are presented to illustrate examples of securities that the Fund has bought and the diversity of areas in which the Fund may invest as of a particular date. It may not be representative of the Fund’s current or future investments and should not be construed as a recommendation to purchase or sell a particular security. See the Fund’s summary prospectus and statutory prospectus for complete descriptions of investment objectives, policies, risks and permissible investments.
| (a) | Non-income producing security. |
| (b) | Coupon amount represents effective yield. |
| (c) | State Street Corp. is the parent company of State Street Bank & Trust Co., the Fund’s custodian and accounting agent. |
| (d) | At June 30, 2011 , all or a portion of this security was pledged to cover collateral requirements for futures, options, forward foreign currency contracts and/or TBA’s. |
| (e) | GE Asset Management, the investment adviser of the Fund, also serves as investment adviser of the GEI Investment Fund and the GE Institutional Money Market Fund. |
| * | Less than 0.05%. |
| † | Percentages are based on net assets as of June 30, 2011 . |
Abbreviations:
ADR | American Depository Receipt | |
REIT | Real Estate Investment Trust |
8
Table of Contents
Selected data based on a share outstanding throughout the fiscal years indicated
| CLASS 1 | ||||||||||||||||||||||||
| 6/30/11† | 12/31/10 | 12/31/09 | 12/31/08 | 12/31/07 | 12/31/06 | |||||||||||||||||||
| Inception date | — | — | — | — | — | 12/12/97 | ||||||||||||||||||
Net asset value, beginning of period | $71.60 | $64.30 | $46.49 | $78.95 | $82.17 | $75.65 | ||||||||||||||||||
Income/(loss) from investment operations: | ||||||||||||||||||||||||
Net investment income (loss) | 0.04 | 0.14 | ** | 0.20 | 0.30 | 0.23 | 0.35 | |||||||||||||||||
Net realized and unrealized gains/(losses) on investments | 5.20 | 7.32 | 17.81 | (29.32) | 4.19 | 6.51 | ||||||||||||||||||
Total income/(loss) from investment operations | 5.24 | 7.46 | 18.01 | (29.02) | 4.42 | 6.86 | ||||||||||||||||||
Less distributions from: | ||||||||||||||||||||||||
Net investment income | — | 0.16 | 0.20 | 0.26 | 0.23 | 0.34 | ||||||||||||||||||
Return of Capital | — | — | — | 0.01 | — | — | ||||||||||||||||||
Net realized gains | — | — | — | 3.17 | 7.41 | — | ||||||||||||||||||
Total distributions | — | 0.16 | 0.20 | 3.44 | 7.64 | 0.34 | ||||||||||||||||||
Net asset value, end of period | $76.84 | $71.60 | $64.30 | $46.49 | $78.95 | $82.17 | ||||||||||||||||||
TOTAL RETURN(a) | 7.32% | 11.61% | 38.74% | (36.66)% | 5.34% | 9.07% | ||||||||||||||||||
RATIOS/SUPPLEMENTAL DATA: | ||||||||||||||||||||||||
Net assets, end of period (in thousands) | $45,027 | $45,280 | $48,620 | $43,308 | $94,720 | $110,538 | ||||||||||||||||||
Ratios to average net assets: | ||||||||||||||||||||||||
Net investment income (loss) | 0.09% | * | 0.22% | 0.33% | 0.36% | 0.24% | 0.41% | |||||||||||||||||
Net expenses | 0.89% | (b)* | 0.76% | (b) | 0.90% | (b) | 0.76% | (b) | 0.72% | 0.71% | ||||||||||||||
Gross expenses | 0.89% | (b)* | 0.76% | 0.90% | 0.76% | 0.72% | 0.71% | |||||||||||||||||
Portfolio turnover rate | 11% | 19% | 18% | 23% | 29% | 27% | ||||||||||||||||||
Notes to Financial Highlights
| (a) | Total returns are historical and assume changes in share price, reinvestment of dividends and capital gains distributions and do not include the effect of insurance contract charges. Past performance does not guarantee future results. |
| (b) | Reflects GE Asset Management waiver of a portion of the Fund’s management fee in an amount equal to the management fee earned by GEAM with respect to the Fund’s investment in the GE Money Market Fund and/or GE Institutional Money Market Fund. Excluding waiver, the expense ratios would be unchanged. |
| * | Annualized for periods less than one year. |
| ** | Per share values have been calculated using the average share method. |
| † | Unaudited |
The accompanying Notes are an integral part of these financial statements.
9
Table of Contents
The accompanying Notes are an integral part of these financial statements.
10
Table of Contents
| * | Effective April 30, 2011, Class 4 shares were closed. |
The accompanying Notes are an integral part of these financial statements.
11
Table of Contents
| * | Unaudited |
| ** | Effective April 30, 2011 Class 4 shares were closed. |
The accompanying Notes are an integral part of these financial statements.
12
Table of Contents
| Notes to Financial Statements | June 30, 2011 (unaudited) |
| 1. | Organization of the Company |
GE Investments Funds, Inc. (the “Company”) was incorporated under the laws of the Commonwealth of Virginia on May 14, 1984 and is registered under the Investment Company Act of 1940, as amended (the “1940 Act”), as an open-end management investment company. The Company is composed of fourteen investment portfolios (collectively the “Funds”), although only the following eleven are currently being offered: U.S. Equity Fund, S&P 500 Index Fund, Premier Growth Equity Fund (the “Fund”), Core Value Equity Fund, Mid-Cap Equity Fund, Small-Cap Equity Fund, International Equity Fund, Total Return Fund, Income Fund, Money Market Fund and Real Estate Securities Fund.
Shares of the Funds of the Company are offered only to insurance company separate accounts that fund certain variable life insurance contracts and variable annuity contracts. GE Asset Management Incorporated (“GEAM”) is the investment adviser and administrator of each of the Funds.
The Company currently offers one share class (Class 1) as an investment option for variable life insurance and variable annuity contracts. Class 4 shares were first offered on May 1, 2008 and Fund shares outstanding prior to May 1, 2008 were designated as Class 1 shares. Effective April 30, 2011, Class 4 shares were closed and are no longer offered.
| 2. | Summary of Significant Accounting Policies |
The preparation sof financial statements in conformity with U.S. generally accepted accounting principles (GAAP) requires management to make estimates and assumptions that affect the reported amounts of assets and liabilities and disclosure of contingent assets and liabilities at the date of the financial statements and the reported amounts of increases and decreases in net assets from operations during the reporting period. Actual results may differ from those estimates.
Subsequent events after the balance sheet date through the date the financial statements were issued, have been evaluated in the preparation of the financial statements. There are no items to report.
The following summarizes the significant accounting policies of the Company:
Securities Valuation and Transactions. All investments in securities are recorded at their estimated fair value, as described in Note 3.
Securities transactions are accounted for as of the trade date. Realized gains and losses on investments sold are recorded on the basis of identified cost for both financial statement and federal tax purposes.
The Fund’s income, expenses (other than distribution fees) and realized and unrealized gains and losses are allocated proportionally each day among the share classes based upon the relative net assets of each class.
Derivatives The Fund is subject to equity price risk in the normal course of pursuing its investment objective. The Fund may enter into derivative transactions to gain market exposure for residual and accumulating cash positions.
Futures Contracts A futures contract represents a commitment for the future purchase or sale of an asset at a specified price on a specified date. The Fund invests in stock index futures contracts subject to certain limitations to manage its exposure to the stock markets. Buying futures tends to increase a Fund’s exposure to the underlying instrument while selling futures tends to decrease a Fund’s exposure to the underlying instrument or to hedge other Fund investments. The Fund will not enter into a transaction involving futures for speculative purposes. With futures contracts, there is minimal counterparty credit risk to the Fund since futures contracts are exchange traded and the exchange’s clearinghouse, as counterparty to all traded futures, guarantees the futures against default. The Fund’s risks in using these contracts include changes in the value of the underlying instruments, non- performance of the counterparties under the contracts’ terms and changes in the liquidity of the secondary market for the contracts. Futures contracts are valued at the settlement price established each day by the board of trade or exchange on which they principally trade.
Upon entering into a financial futures contract, the Fund is required to pledge to the broker an amount of cash and/or other assets equal to a certain percentage of the contract amount, known as initial margin deposit. Subsequent payments, known as variation margin, are made or received by the Fund each day, depending on the daily fluctuation in the fair value of the underlying security. The Fund records an unrealized gain or loss equal to the daily variation margin. Should market conditions move unexpectedly, the Fund may not achieve the anticipated benefits of the futures contracts and may incur a loss. The Fund recognizes a realized gain or loss upon the expiration or closing of a futures contract.
Investment Income Corporate actions (including cash dividends) are recorded on the ex-dividend date, net of
13
Table of Contents
| Notes to Financial Statements | June 30, 2011 (unaudited) |
applicable withholding taxes, except for certain foreign corporate actions which are recorded as soon after the ex-dividend date as possible.
Expenses Fund specific expenses are allocated to the Fund that incurs such expenses. Such expenses may include custodial fees, legal and accounting fees, printing costs and registration fees. Expenses that are not fund specific are allocated pro rata across the Funds. Certain class specific expenses (such as distribution fees) are allocated to the class that incurs such expense. Expenses of the Fund are generally paid directly by the Fund however, expenses may be paid by GEAM and reimbursed by the fund.
Federal Income Taxes The Fund intends to comply with all sections of the Internal Revenue Code applicable to regulated investment companies including the distribution of substantially all of its taxable net investment income and net realized capital gains to its shareholders. Therefore, no provision for federal income tax has been made. The Fund is treated as a separate taxpayer for federal income tax purposes.
| 3. | Securities Valuation |
The Fund utilizes various methods to measure the fair value of most of its investments on a recurring basis. GAAP establishes a framework for measuring fair value and providing related disclosures. Broadly, the framework requires fair value to be determined based on the exchange price that would be received for an asset or paid to transfer a liability (an exit price) in the principal or most advantageous market for the asset or liability in an orderly transaction between market participants at the measurement date. In the absence of active markets for the identical assets or liabilities, such measurements involve developing assumptions based on market observable data and, in the absence of such data, internal information that is consistent with what market participants would use in a hypothetical transaction that occurs at the measurement date. It also establishes a three-level valuation hierarchy based upon observable and non-observable inputs.
Observable inputs reflect market data obtained from independent sources, while unobservable inputs reflect our market assumptions. Preference is given to observable inputs. These two types of inputs create the following fair value hierarchy:
Level 1 — Quoted prices for identical investments in active markets.
Level 2 — Quoted prices for similar investments in active markets; quoted prices for identical or similar investments in markets that are not active; and model-derived valuations whose inputs are observable or whose significant value drivers are observable.
Level 3 — Significant inputs to the valuation model are unobservable.
Policies and procedures are maintained to value investments using the best and most relevant data available. In addition, pricing vendors are utilized to assist in valuing investments. GEAM performs periodic reviews of the methodologies used by independent pricing services including price validation of individual securities.
Fair Value Measurement The following section describes the valuation methodologies the Fund uses to measure different financial investments at fair value.
The Fund’s portfolio securities are valued generally on the basis of market quotations. Equity securities generally are valued at the last reported sales price on the primary market in which they are traded. Portfolio securities listed on NASDAQ are valued using the NASDAQ Official Closing Price. Level 1 securities primarily include publicly-traded equity securities which may not necessarily represent the last sale price. If no sales occurred on the exchange or NASDAQ that day, the portfolio security generally is valued using the last reported bid price. In those circumstances the Fund classifies the investment securities in Level 2.
The Fund uses the net asset value per unit for the collective fund. The Fund classifies the investment security in level 2.
Other financial investments are derivative instruments that are not reflected in Total Investments, such as exchange traded futures. Futures are valued at the last sale price on the primary market they are traded and are typically included in level 1.
If prices are not readily available for a portfolio security, or if it is believed that a price for a portfolio security does not represent its fair value, the security may be valued using procedures approved by the Fund’s Board of Directors that are designed to establish its “fair” value. These securities would generally be classified in Level 3. Those procedures require that the fair value of a security be established by the valuation committee. The valuation committee follows different protocols for different types of investments and circumstances. The fair value procedures may be used to value any investment of the Fund in the appropriate circumstances.
14
Table of Contents
| Notes to Financial Statements | June 30, 2011 (unaudited) |
The following table presents the Fund’s investments measured at fair value on a recurring basis at June 30, 2011:
Investments | Level 1 | Level 2 | Level 3 | Total | ||||||||||||
Investments in Securities | ||||||||||||||||
Common Stock | $ | 43,986,906 | $ | — | $ | — | $ | 43,986,906 | ||||||||
Other Investments | — | 2,797 | — | 2,797 | ||||||||||||
Short-term Investments | 1,159,406 | — | — | 1,159,406 | ||||||||||||
Total Investments in Securities | $ | 45,146,312 | $ | 2,797 | $ | — | $ | 45,149,109 | ||||||||
Other Financial Instruments* | ||||||||||||||||
Futures Contracts — Unrealized Depreciation | $ | (1,856 | ) | $ | — | $ | — | $ | (1,856 | ) |
| * | Other financial instruments include derivative instruments such as futures contracts. Amounts shown represent unrealized appreciation (depreciation) at period end. |
There were no significant transfers between the fair value levels. Transfers between fair value levels are considered to occur at the beginning of the period.
| 4. | Derivatives Transactions |
Shown below are the derivative contracts entered into by each Fund, summarized by primary risk exposure as they
appear on the Statement of Assets and Liabilities, all of which are not accounted for as hedging instruments under FASB Accounting Standards Codification (“ASC”) No. 815 Derivatives and Hedging as of June 30, 2011.
| Equity Contracts | Assets, Net Assets —Net Unrealized Appreciation/ (Depreciation) on Futures | — | Liabilities, Net Assets — Net Unrealized Appreciation/ (Depreciation) on Futures | (1,856 | )* |
| * | Includes cumulative appreciation/depreciation of futures contracts as reported in the Schedule of Investments and Net Assets section of the Statement of Assets and Liabilities. Only the current day’s variation margin is reported within the Assets or Liabilities section of the Statement of Assets and Liabilities. |
Shown below are the effects of derivative instruments on the Fund’s Statement of Operations, summarized by primary risk exposure all of which are not accounted for as hedging instruments under FASB Accounting ASC 815.
| Derivatives not accounted for as hedging instruments under ASC 815 | Location in the Statement of Operations | Total Notional Amount of Futures Contracts Purchased/(Sold) ($) | Realized Gain or (Loss) on Derivatives Recognized in Income ($) | Change in Unrealized Appreciation/(Depreciation) on Derivatives Recognized in Income ($) | ||||||||||
Equity Contracts | Realized gain/(loss) on Futures, Increase/(decrease) in unrealized appreciation/(depreciation) on Futures | 4,878,367/(4,963,135) | $ | (44,926 | ) | $ | (1,856 | ) | ||||||
| 5. | Line of Credit |
The Company shares a revolving credit facility of up to $150 million with a number of its affiliates. The credit facility is with its custodian bank, State Street Bank and Trust Company (“State Street”). The revolving credit facility requires the payment of a commitment fee equal to 0.125% per annum on the daily unused portion of the credit facility, payable quarterly. The portion borne by the Fund generally is borne proportionally based upon net assets. In addition, the
Company has a $100 million uncommitted, unsecured line of credit with State Street. Generally, borrowings under the credit facilities would accrue interest at the Federal Funds Rate plus 50 basis points and would be borne by the borrowing Fund. The maximum amount allowed to be borrowed by any one Fund is the lesser of (i) 33.33% of the Fund’s total assets or (ii) 20% of its net assets. The credit facilities were not utilized by the Fund during the six month period ended June 30, 2011.
15
Table of Contents
| Notes to Financial Statements | June 30, 2011 (unaudited) |
| 6. | Fees and Compensation Paid to Affiliates |
GEAM, a registered investment adviser, was retained by the Company���s Board of Directors effective November 15, 1997 to act as investment adviser and administrator of the Fund. GEAM’s compensation for investment advisory and administrative services is paid monthly based on the average daily net assets of the Fund at an annualized rate of 0.65%.
GEAM has a contractual arrangement with the Fund to waive a portion of the Fund’s Management Fee in the amount equal to the management fee earned by GEAM with respect to the Funds Investment in the GE Institutional Money Market Fund.
Distribution and Service (12b-1) Fees The Company has adopted a Distribution and Service (12b-1) Plan (the “Plan”) pursuant to Rule 12b-1 under the 1940 Act with respect to Class 4 shares of the Fund. Under the Plan, the Fund may compensate GE Investment Distributors, Inc. (“GEID”), a wholly-owned subsidiary of GEAM and the Fund’s principal distributor, for certain sales services provided by GEID or other broker dealers and investor services provided by GEID or other service providers relating to the Fund’s Class 4 shares, including services to owners or prospective owners of variable contracts issued by insurance companies that offer such share class as an investment option. The amount of compensation paid under the Plan by the Fund’s Class 4 shares may not exceed 0.45% of the average daily net assets of the Fund attributable to such share class. The Plan continues in effect from year to year for so long as such continuance is approved annually by the Board of Directors, including by those directors who are not interested persons of the Company and who have no direct or indirect financial interest in the operation of the Plan or in any agreement related to it.
Directors’ Compensation The Fund pays no compensation to its directors who are officers or employees of GEAM or its
affiliates. Directors who are not such officers or employees also serve in a similar capacity for other funds advised by GEAM. Compensation paid to unaffiliated directors are reflected on the Statement of Operations. These fees are allocated pro rata across all of the mutual fund platforms and share classes served by the directors, including the Fund, and are based upon the relative net assets of each fund within such platforms.
| 7. | Investment Transactions |
Purchases and Sales of Securities The cost of purchases and the proceeds from sales of investments, other than short-term securities and options, for the six month period ended June 30, 2011 were as follows:
| Non-U.S. Government Securities | ||
| Purchases | Sales | |
| $4,840,786 | $8,239,275 | |
| 8. | Income Taxes |
The Fund is subject to ASC 740, Income Taxes. ASC 740 provides guidance for financial accounting and reporting for the effects of income taxes that result from an entity’s activities during the year. ASC 740 also provides guidance regarding how certain tax positions should be recognized, measured, presented and disclosed in the financial statements. ASC 740 requires evaluation of tax positions taken or expected to be taken in the course of preparing the Fund’s tax returns to determine whether the tax positions are “more likely than not” of being sustained by the applicable tax authority. There are no adjustments to the Fund’s net assets required under ASC 740. The Fund’s 2007, 2008, 2009 and 2010 fiscal years tax returns are still open to examination by the Federal and applicable state tax authorities.
At June 30, 2011, information on the tax cost of investments was as follows:
| Cost of Investment for Tax Purposes | Gross Tax | Net Tax Appreciation/ (Depreciation) | ||||
| Appreciation | Depreciation | |||||
| $38,814,096 | $7,349,631 | $(1,014,618) | $6,335,013 | |||
16
Table of Contents
| Notes to Financial Statements | June 30, 2011 (unaudited) |
As of December 31, 2010, the Fund has capital loss carryovers as indicated below.
| Amount | Expires | |
| $3,967,110 | 12/31/17 | |
| 976,843 | 12/31/18 |
These amounts will be available to offset future taxable capital gains. Under the recently enacted Regulated Investment Company Modernization Act of 2010, the Fund will be permitted to carry forward capital losses incurred in taxable years beginning after December 22, 2010 for an unlimited period. However, any losses incurred during those future years will be required to be utilized prior to the losses incurred in pre-enactment tax years. As a result of this ordering rule, pre-enactment capital loss carryforwards may be more likely to expire unused. Additionally, post-enactment capital losses that are carried forward will retain their character as either short-term or long-term capital losses rather than being considered all short-term as under previous law.
Capital loss carryovers are available to offset future realized capital gains to the extent provided in the Internal Revenue Code and regulations thereunder. To the extent that these carryover losses are used to offset future capital gains, it is probable that the gains so offset will not be distributed to shareholders because they would be taxable as ordinary income.
Any net capital and currency losses incurred after October 31, within the Fund’s tax year, are deemed to arise on the first day of the Fund’s next tax year if the Fund so elects to defer such losses.
The Fund did not defer any post-October losses for the year ended December 31, 2010.
The tax composition of distributions paid during the years ended December 31, 2010 and December 31, 2009 were as follows:
| Ordinary Income | Long- Term Capital Gains | Return of Capital | Total | |||||||||||||
2010 | $ | 102,983 | $ | — | $ | — | $ | 102,983 | ||||||||
2009 | 153,151 | — | — | 153,151 | ||||||||||||
Distributions to Shareholders The Fund declares and pays any dividends from net investment income annually. The Fund declares and pays any net realized capital gains in excess of capital loss carryforwards distributions annually. The character of income and gains to be distributed is determined in accordance with income tax regulations which may differ from generally accepted accounting principles. These differences include (but are not limited to) futures, investments organized as partnerships for tax purposes, and losses deferred due to wash sale transactions. Reclassifications due to permanent book/tax differences are made to the Fund’s capital accounts to reflect income and gains available for distribution (or available capital loss carryovers) under income tax regulations. These reclassifications have no impact on the net asset value of the Fund. The calculation of net investment income per share in the Financial Highlights table excludes these adjustments.
| Undistributed Net Investment Income | Accumulated Net Realized Loss | Paid in Capital | ||
| $4,530 | $(6) | $(4,524) |
| 9. | Significant Transaction |
Effective April 30, 2011 the Fund closed Class 4 shares. A full redemption was made by investors in the share class at the closing net asset value.
17
Table of Contents
| Special Meeting of Shareholders — Voting Results | (unaudited) |
On April 1, 2011, the GE Investments Funds, Inc. (the “Company”) held a special meeting of shareholders of each series portfolio of the Company, including shareholders of the Premier Growth Equity Fund (the “Fund”). Shareholders of record on January 28, 2011 were entitled to vote on the proposals. For each proposal, except Proposal 1, shareholders voted on a fund-by-fund basis. For Proposal 1, shareholders of all funds voted together and not by fund or share class. At the meeting, all proposals were approved by the Fund and the following votes were recorded:
Proposal 1:
Election of Mr. R. Sheldon Johnson and Mr. Matthew J. Simpson as Directors to the Board of Directors of the Company.
Company votes:
| No. of Shares | % of Outstanding Shares | % of Shares Present | ||||||||||
| Mr. R. Sheldon Johnson | ||||||||||||
Affirmative | 451,517,094.582 | 90.054 | % | 96.126 | % | |||||||
Abstain | 18,195,810.391 | 3.629 | % | 3.874 | % | |||||||
Total | 469,712,904.973 | 93.683 | % | 100.000 | % | |||||||
| Mr. Matthew J. Simpson | ||||||||||||
Affirmative | 451,949,730.789 | 90.140 | % | 96.218 | % | |||||||
Abstain | 17,763,174.184 | 3.543 | % | 3.782 | % | |||||||
Total | 469,712,904.973 | 93.683 | % | 100.000 | % | |||||||
Fund votes:
| No. of Shares | % of Outstanding Shares | % of Shares Present | ||||||||||
| Mr. R. Sheldon Johnson | ||||||||||||
Affirmative | 572,825.349 | 91.839 | % | 97.540 | % | |||||||
Abstain | 14,443.890 | 2.316 | % | 2.460 | % | |||||||
Total | 587,269.239 | 94.155 | % | 100.000 | % | |||||||
| Mr. Matthew J. Simpson | ||||||||||||
Affirmative | 572,856.881 | 91.844 | % | 97.546 | % | |||||||
Abstain | 14,412.358 | 2.311 | % | 2.454 | % | |||||||
Total | 587,269.239 | 94.155 | % | 100.000 | % | |||||||
Proposal 2:
Approval of the use of a “manager of managers” arrangement whereby GEAM, as the Fund’s investment adviser, under certain circumstances, will be able to hire and replace sub-advisers to the Fund without obtaining shareholder approval.
| No. of Shares | % of Outstanding Shares | % of Shares Present | ||||||||||
Affirmative | 540,077.319 | 86.589 | % | 91.964 | % | |||||||
Against | 38,175.748 | 6.121 | % | 6.501 | % | |||||||
Abstain | 9,016.172 | 1.445 | % | 1.535 | % | |||||||
Broker Non-votes | _ | _ | _ | |||||||||
Total | 587,269.239 | 94.155 | % | 100.000 | % | |||||||
18
Table of Contents
| Special Meeting of Shareholders — Voting Results | (unaudited) |
Proposal 3:
Approval of the following changes in certain of the Fund’s investment policies, as follows:
| A. | Amendment of the Fund’s investment policy on senior securities. |
| No. of Shares | % of Outstanding Shares | % of Shares Present | ||||||||||
Affirmative | 543,424.240 | 87.126 | % | 92.534 | % | |||||||
Against | 33,917.324 | 5.437 | % | 5.776 | % | |||||||
Abstain | 9,927.675 | 1.592 | % | 1.690 | % | |||||||
Broker Non-votes | — | — | — | |||||||||
Total | 587,269.239 | 94.155 | % | 100.000 | % | |||||||
| C. | Amendment of the Fund’s investment policy on making loans. |
| No. of Shares | % of Outstanding Shares | % of Shares Present | ||||||||||
Affirmative | 534,984.304 | 85.772 | % | 91.097 | % | |||||||
Against | 41,470.933 | 6.649 | % | 7.062 | % | |||||||
Abstain | 10,814.002 | 1.734 | % | 1.841 | % | |||||||
Broker Non-votes | — | — | — | |||||||||
Total | 587,269.239 | 94.155 | % | 100.000 | % | |||||||
| D. | Amendment of the Fund’s investment policy on borrowing. |
| No. of Shares | % of Outstanding Shares | % of Shares Present | ||||||||||
Affirmative | 536,760.770 | 86.057 | % | 91.399 | % | |||||||
Against | 39,074.091 | 6.265 | % | 6.654 | % | |||||||
Abstain | 11,434.378 | 1.833 | % | 1.947 | % | |||||||
Broker Non-votes | — | — | — | |||||||||
Total | 587,269.239 | 94.155 | % | 100.000 | % | |||||||
| E. | Amendment of the Fund’s investment policy on diversification. |
| No. of Shares | % of Outstanding Shares | % of Shares Present | ||||||||||
Affirmative | 546,928.433 | 87.687 | % | 93.131 | % | |||||||
Against | 29,682.872 | 4.759 | % | 5.054 | % | |||||||
Abstain | 10,657.934 | 1.709 | % | 1.815 | % | |||||||
Broker Non-votes | — | — | — | |||||||||
Total | 587,269.239 | 94.155 | % | 100.000 | % | |||||||
| F. | Amendment of the Fund’s investment policy on concentration of investments. |
| No. of Shares | % of Outstanding Shares | % of Shares Present | ||||||||||
Affirmative | 536,902.696 | 86.080 | % | 91.424 | % | |||||||
Against | 38,755.442 | 6.214 | % | 6.599 | % | |||||||
Abstain | 11,611.101 | 1.861 | % | 1.977 | % | |||||||
Broker Non-votes | — | — | — | |||||||||
Total | 587,269.239 | 94.155 | % | 100.000 | % | |||||||
19
Table of Contents
| Special Meeting of Shareholders — Voting Results | (unaudited) |
| G. | Amendment of the Fund’s investment policy on investments in commodities and its reclassification from a non-fundamental policy to a fundamental policy. |
| No. of Shares | % of Outstanding Shares | % of Shares Present | ||||||||||
Affirmative | 545,582.174 | 87.472 | % | 92.902 | % | |||||||
Against | 30,914.952 | 4.956 | % | 5.264 | % | |||||||
Abstain | 10,772.113 | 1.727 | % | 1.834 | % | |||||||
Broker Non-votes | — | — | — | |||||||||
Total | 587,269.239 | 94.155 | % | 100.000 | % | |||||||
| H. | Amendment of the Fund’s fundamental investment policy on illiquid investments and its reclassification from a fundamental policy to a non-fundamental policy. |
| No. of Shares | % of Outstanding Shares | % of Shares Present | ||||||||||
Affirmative | 537,360.388 | 86.153 | % | 91.502 | % | |||||||
Against | 40,512.859 | 6.496 | % | 6.898 | % | |||||||
Abstain | 9,395.992 | 1.506 | % | 1.600 | % | |||||||
Broker Non-votes | — | — | — | |||||||||
Total | 587,269.239 | 94.155 | % | 100.000 | % | |||||||
| I. | Elimination of the Fund’s investment policy on mortgaging, pledging and hypothecating of investments. |
| No. of Shares | % of Outstanding Shares | % of Shares Present | ||||||||||
Affirmative | 571,336.177 | 91.601 | % | 97.287 | % | |||||||
Against | 13,723.006 | 2.200 | % | 2.337 | % | |||||||
Abstain | 2,210.056 | 0.354 | % | 0.376 | % | |||||||
Broker Non-votes | — | — | — | |||||||||
Total | 587,269.239 | 94.155 | % | 100.000 | % | |||||||
| J. | Amendment of the Fund’s investment policy on real estate investments. |
| No. of Shares | % of Outstanding Shares | % of Shares Present | ||||||||||
Affirmative | 538,924.863 | 86.404 | % | 91.768 | % | |||||||
Against | 38,614.101 | 6.191 | % | 6.575 | % | |||||||
Abstain | 9,730.275 | 1.560 | % | 1.657 | % | |||||||
Broker Non-votes | — | — | — | |||||||||
Total | 587,269.239 | 94.155 | % | 100.000 | % | |||||||
20
Table of Contents
| Additional Information | (unaudited) |
Information about Directors and Executive Officers:
The business and affairs of the Funds are managed under the direction of the Funds’ Board of Directors. Information pertaining to the Directors and officers of the Funds is set forth below.
Interested Directors and Executive Officers
Michael J. Cosgrove
Address c/o GEAM 3001 Summer St. Stamford, CT 06905
Age 62
Position(s) Held with Fund Chairman of the Board and President
Term of Office and Length of Time Served Until successor is elected and qualified — 14 years
Principal Occupation(s) During Past 5 years President and Chief Executive Officer — Mutual Funds and Intermediary Business at GEAM since March 2007; Executive Vice President of GEAM from February 1997 to March 2007; Vice President, GE Capital Corporation, an indirect wholly-owned subsidiary of GE, since December 1999; Executive Vice President — Mutual Funds of GEAM, a wholly-owned subsidiary of GE that is registered as an investment adviser under the Investment Advisers Act of 1940, as amended, since March 1993; President and Director of GE Investment Distributors, Inc., since June 2011. Director of GEAM since 1988.
Number of Portfolios in Fund Complex Overseen by Director 28
Other Directorships Held by Director Chairman of the Board and President of GE Institutional Funds since 1997; Trustee of Elfun Funds, GE Savings & Security Funds, General Relief and Loan Fund and General Electric Pension Trust since 1988; Trustee of Fordham University from 2002 to June 30, 2010 and since July 2011; Trustee of GE Volunteers since 1993; Director of GE Foundation; Director, GE Asset Management (Ireland) Limited, since February 1999, GE Asset Management Funds Plc since 1998, GE Asset Management Canada Company since 1998, GE Asset Management Limited since 1998 and GEAM since 1988; Chairman of the Board and President of GE Funds from 1993 to February 2011.
Matthew J. Simpson
Address c/o GEAM 3001 Summer St. Stamford, CT 06905
Age 50
Position(s) Held with Fund Director and Executive Vice President
Term of Office and Length of Time Served Until successor is elected and qualified — 3 years
Principal Occupation(s) During Past 5 years Executive Vice President, General Counsel and Secretary of GEAM since July 2007; Senior Vice President and General Counsel — Marketing and Client Services (formerly Asset Management Services) at GEAM and Senior Vice President and General Counsel of GE Asset Management Services from February 1997 to July 2007; Vice President and Associate General Counsel of GEAM from October 1992 to February 1997; Secretary of GE Funds from 1993 to July 2007 and Vice President from September 2003 to July 2007; Secretary of GE Institutional Funds and GE Investments Funds, Inc. from 1997 to July 2007; Secretary of Elfun Funds and GE Savings & Security Funds since July 2007; Assistant Secretary of Elfun Funds and GE Savings & Security Funds from 1998 to July 2007 and Vice President from October 2003 to July 2007.
Number of Portfolios in Fund Complex Overseen by Director 28
Other Directorships Held by Director Trustee of Elfun Funds, GE Savings & Security Funds and General Electric Pension Trust since July 2007; Trustee of GE Institutional Funds since April 2011 and Trustee of GE Funds from July 2007 to February 2011.
21
Table of Contents
| Additional Information | (unaudited) |
Joon Won Choe
Address c/o GEAM 3001 Summer St. Stamford, CT 06905
Age 41
Position(s) Held with Fund Vice President & Secretary
Term of Office and Length of Time Served Until successor is elected and qualified — Vice President and Secretary — less than 1 year
Principal Occupation(s) During Past 5 years Senior Vice President and Deputy General Counsel at GEAM since March 2011; Senior Vice President and Associate General Counsel at GEAM from June 2010 to March 2011; Vice President and Associate General Counsel at GEAM from November 2005 to June 2010; Vice President and Secretary of GE Institutional Funds and GE Investments Funds, Inc. since September 2010; Vice President and Assistant Secretary of Elfun Funds and GE Savings & Security Funds since September 2010.
Number of Portfolios in Fund Complex Overseen by Officer N/A
Other Directorships Held by Officer N/A
Robert Herlihy
Address c/o GEAM 3001 Summer St. Stamford, CT 06905
Age 43
Position(s) Held with Fund Chief Compliance Officer
Term of Office and Length of Time Served Until successor is elected and qualified — 5 years
Principal Occupation(s) During Past 5 years Chief Compliance Officer of GEAM, GE Institutional Funds, Elfun Funds, and GE Savings and Security Funds since July 2005; Chief Compliance Officer of GE Funds from July 2005 to February 2011; and Manager of Fund Administration at GEAM from 2002 — 2005.
Number of Portfolios in Fund Complex Overseen by Officer N/A
Other Directorships Held by Officer N/A
Arthur A. Jensen
Address c/o GEAM 3001 Summer St. Stamford, CT 06905
Age 44
Position(s) Held with Fund Treasurer
Term of Office and Length of Time Served Until successor is elected and qualified — less than 1 year
Principal Occupations(s) During Past 5 Years Treasurer of GE Institutional Funds, Elfun Funds and GE Savings and Security Funds since June 2011; Mutual Funds Controller of GEAM since April 2011; Senior Vice President at Citigroup from 2008 to 2010 and Vice President at JPMorgan from 2005 to 2008.
Number of Portfolios in Fund Complex Overseen by Officer N/A
Other Directorships Held by Officer N/A
22
Table of Contents
| Additional Information | (unaudited) |
Non-Interested Directors
John R. Costantino
Address c/o GEAM 3001 Summer St. Stamford, CT 06905
Age 65
Position(s) Held with Fund Director
Term of Office and Length of Time Served Until successor is elected and qualified — 14 years
Principal Occupation(s) During Past 5 years General Partner, NGN Capital LLC since 2006; Managing Director, Vice President of Walden Capital Management since 1996.
Number of Portfolios in Fund Complex Overseen by Director 20
Other Directorships Held by Director Director of GE Institutional Funds since 1997; Trustee of Fordham University from 1989-1995 and 2001-2007 and Trustee Emeritus since 2007; Trustee of Neuroscience Research Institute since 1986; Trustee of GE Funds from 1993 to February 2011; Trustee of Gregorian University Foundation from 1992-2007; Director of Artes Medical from 2006-2008.
R. Sheldon Johnson
Address c/o GEAM 3001 Summer St. Stamford, CT 06905
Age 64
Positions(s) Held with Fund Director
Term of office and Length of Time served Unit Successor is elected and qualified — less than 1 year.
Principal Occupation(s) During Past 5 years Managing Director at Morgan Stanley & Co.,Inc. from 1988 to 2006; Head of Global Institutional Equity Sales and Marketing at Morgan Stanley & Co., Inc. from 2002 to 2006.
Number of Portfolios in Fund Complex Overseen by Director 20
Other Directorships Held by Director Trustee of GE Institutional Funds since April 2011 and Trustee of St. Lawrence University since 2003.
Robert P. Quinn
Address c/o GEAM 3001 Summer St. Stamford, CT 06905
Age 75
Position(s) Held with Fund Director
Term of Office and Length of Time Served Until successor is elected and qualified — 14 years
Principal Occupation(s) During Past 5 years Retired since 1983 from Salomon Brothers Inc.
Number of Portfolios in Fund Complex Overseen by Director 20
Other Directorships Held by Director Trustee of GE Institutional Funds since 1997; Trustee of St. Francis Hospital since 1980; and Trustee of GE Funds from 1993 to February 2011.
The Statement of Additional Information for the Funds includes additional information about the Directors and Officers and is available, without charge, upon request by calling 1-800-242-0134.
23
Table of Contents
| Investment Team | (unaudited) |
Investment Adviser and Administrator
GE Asset Management Incorporated
Board of Directors
Michael J. Cosgrove, Chairman
John R. Costantino
R. Sheldon Johnson*
Robert P. Quinn
Matthew J. Simpson
Secretary
Joon Won Choe
Assistant Secretary
Michelle Matzelle
Treasurer
Arthur A. Jensen (effective June 6, 2011)
Assistant Treasurer
Casey Yantosca
Distributor
GE Investment Distributors, Inc.
Member FINRA and SIPC
Custodian
State Street Bank & Trust Company
Officers of the Investment Adviser
Dmitri Stockton, President and Chief Executive Officer (since May 2011)†
Cheryl H. Beacock, Senior Vice President, Human Resources
George A. Bicher, Chief Risk Officer
Paul M. Colonna, President and Chief Investment Officer — Fixed Income Investments
Michael J. Cosgrove, President and Chief Executive
Officer — Mutual Funds & Intermediary Business
Ralph R. Layman, President and Chief Investment Officer — Public Equity Investments
Maureen B. Mitchell, President — Institutional Sales and Marketing
Matthew J. Simpson, Executive Vice President, General Counsel and Secretary
Don W. Torey, President — Alternative Investments
John J. Walker, Executive Vice President, Chief Operating Officer
David Wiederecht, President and Chief Investment Officer — Investment Strategies
Tracie A. Winbigler, Executive Vice President, Chief Financial Officer (since January 2011)
| * | Mr. Johnson was elected as a Director of the Funds effective April 1, 2011. |
| † | Effective May 1, 2011, Mr. Stockton replaced James W. Ireland as President and Chief Executive Officer. |
At GE Asset Management, we’re dedicated to providing the investment options you’ll need to tailor your financial portfolio to every stage of your life. Each member of the GE Family of Funds is managed according to the same principles of integrity and quality that have guided GE over the past century, and have made it the world-class company that it is today. Each fund draws strength from a heritage of investment management experience that spans more than 80 years. Whether you’re creating a new investment portfolio or adding to an established one, the GE Family of Funds offers an array of professionally managed investment options that will help you meet a lifetime of financial needs.
24
Table of Contents
Investment Adviser
GE Asset Management Incorporated
3001 Summer Street
PO Box 7900
Stamford, CT 06904-7900
Distributor
GE Investment Distributors, Inc.
member FINRA and SIPC
3001 Summer Street
PO Box 7900
Stamford, CT 06904-7900
The Fund files its complete schedule of portfolio holdings with the Securities and Exchange Commission for the first and third quarters of each fiscal year on Form N-Q. The Fund’s Forms N-Q, as well as a description of the policies and procedures that the Fund uses to determine how to vote proxies (if any) relating to portfolio securities is available without charge (i) upon request, by calling 1-800-493-3042; (ii) on the Fund’s website at http://www.geam.com; and (iii) on the Commission’s website at http://www.sec.gov. The Fund’s Forms N-Q may be reviewed and copied at the Commission’s Public Reference Room in Washington, DC—information on the operation of the Public Reference Room may be obtained by calling 1-800-SEC-0330.
Information (if any) regarding how the Fund voted proxies relating to portfolio securities during the most recently disclosed 12-month period ended June 30 is available without charge (i) through the Fund’s website at http://www.geam.com; and (ii) on the Commission’s website at http://www.sec.gov.
Table of Contents
GE Investments Funds, Inc.
| Core Value Equity Fund | Letter from the Chairman | |

Michael J. Cosgrove
Chairman,
GE Investments Funds, Inc.
Dear Shareholder: |
Attached is the semi-annual report for GE Investments Funds, Inc. — Core Value Equity Fund (the “Fund”) for the six-month period ended June 30, 2011. The report contains information about the performance of the Fund and other fund-specific data, along with portfolio manager commentary.
We have provided you with an overview of the investment markets, along with our investment outlook for the coming months.
Market Overview
Most major equity indices posted positive returns in the six-month period ended June 30, 2011, despite geopolitical tensions in the Middle East and North Africa, a devastating earthquake in Japan, ongoing concerns about unresolved sovereign debt issues in peripheral Europe and elevated inflation in emerging markets. Volatility increased in May and June, however, as some measures of global economic activity weakened and uncertainties over Greece’s ability to finance and service its debt rattled the financial markets. In the U.S., concerns over the end of quantitative easing by the Federal Reserve and political wrangling over the government debt ceiling further contributed to a challenging environment. The increase in risk aversion benefited the fixed income markets as many investors sought out safer investments. Toward the end of June, the Greek Parliament passed austerity measures that seemed to calm the markets and opened the way for the next round of financing from the European Central Bank and the International Monetary Fund.
Against this backdrop, financial markets posted positive results for the six- and 12-month periods ended June 30, 2011 as represented by the index returns in the below chart.
| Total Returns (%) as of June 30, 2011 | 6-month | 12-month | ||||||
U.S. equities (S&P 500 Index) | 6.0 | 30.7 | ||||||
Global equities (MSCI World Index) | 5.3 | 30.5 | ||||||
International equities (MSCI EAFE Index) | 5.0 | 30.4 | ||||||
Small-cap U.S. equities (Russell 2000 Index) | 6.2 | 37.4 | ||||||
Mid-cap U.S. equities (Russell Mid Cap Index) | 8.1 | 38.5 | ||||||
U.S. fixed income | 2.7 | 3.9 | ||||||
U.S. short-term government fixed income | 0.9 | 1.4 | ||||||
Outlook
We remain constructive on the prospects for healthy global growth, although it may be at a slower pace than originally anticipated. Central banks in the U.S. and Europe remain accommodative and supply chain issues in Japan appear to have abated. There are also signs that inflation may be peaking in emerging markets as commodity prices have eased in recent months. Corporate balance sheets remain healthy and fundamentals remain intact, in our view. We believe that valuations for equities are not stretched and remain below historical averages while equity risk premiums are still high-offering the possibility for further gains. We expect that the financial markets are likely to remain volatile due to outstanding sovereign debt issues, but believe that returns are biased to the upside in the second half of the year.
Thank you for investing with GE Investments Funds.
Sincerely,

Michael J. Cosgrove
Chairman, GE Investments Funds, Inc.
July 2011
 |
This does not constitute a part of the Fund’s Shareholder Report
Table of Contents
GE Investments Funds, Inc.
| Core Value Equity Fund | Letter from the Chairman (Continued) | |
Mike Cosgrove is President and Chief Executive Officer – Mutual Funds and Intermediary Business at GE Asset Management Incorporated (“GEAM”). In addition to the GE Investments Funds, he is also Chairman of the Board and President of GE Institutional Funds and Director and President of GEAM’s broker-dealer which serves as underwriter and distributor for the GE Investments Funds. Mr. Cosgrove serves as a Trustee of the GE Savings & Security Funds, the GE Foundation, and the GE Pension Trust. He also serves on the Board of Directors of the Skin Cancer Foundation and is a Trustee of Fordham University. Previously Chief Financial Officer of GE Asset Management and Assistant Treasurer – GE Company, Mr. Cosgrove joined GE in 1970 and held a number of managerial positions in finance and sales in the International Operation and the GE Trading Company. He received a BS in Economics from Fordham University and an MBA from St. John’s University.
This does not constitute a part of the Fund’s Shareholder Report
GE Investment Distributors, Inc., Member of FINRA & SIPC, is the principal underwriter and distributor of the GE Investments Funds, Inc.
Table of Contents
GE Investments Funds, Inc.
Core Value Equity Fund
Semi-Annual Report
June 30, 2011

Table of Contents
GE Investments Funds, Inc.
| Core Value Equity Fund | Contents | |
| 1 | ||||
| 2 | ||||
| 9 | ||||
Financial Statements | ||||
| 10 | ||||
| 11 | ||||
| 12 | ||||
| 13 | ||||
| 14 | ||||
| 19 | ||||
| 22 | ||||
| 25 | ||||
This report is prepared for Policyholders of certain variable contracts and may be distributed to others only if preceded or accompanied by the variable contract’s current prospectus and the current prospectus of the Fund available for investments thereunder.
Table of Contents
| Notes to Performance | June 30, 2011 (unaudited) |
The information provided on the performance pages relates to the GE Investments Core Value Equity Fund (the “Fund”) and is unaudited.
Total returns take into account changes in share price and assume reinvestment of dividends and capital gains distributions, if any. Total returns shown are net of Fund fees and expenses but do not reflect fees and charges associated with the variable contracts such as administrative fees, account charges and surrender charges, which, if reflected, would reduce the Fund’s total returns for all periods shown.
The performance data quoted represents past performance; past performance does not guarantee future results. Investment return and principal value will fluctuate so your shares, when redeemed, may be worth more or less than their original cost. Current performance may be higher or lower than the performance data quoted. Periods less than one year are not annualized. Please call toll-free 800-493-3042 or visit the Fund’s website at http://www.geam.com for the most recent month-end performance data.
An investment in the Fund is not a deposit of any bank and is not insured or guaranteed by the Federal Deposit Insurance Corporation (FDIC) or any other government agency. An investment in the Fund is subject to risk, including possible loss of principal invested.
The S&P 500® Index is an unmanaged, market capitalization-weighted index of stocks of 500 large U.S. companies, which is widely used as a measure of large-cap U.S. stock market performance. The results shown for the foregoing index assume the reinvestment of net dividends or interest. They do not reflect the actual cost of investing in the instruments that comprise the index.
The peer universe of the underlying annuity funds used for the peer group average annual total return calculation is based on a blend of Morningstar peer categories, as shown. Morningstar is an independent mutual fund rating service. A Fund’s performance may be compared to or ranked within a universe of mutual funds with investment objectives and policies similar but not necessarily identical to that of the Fund.
©2011 Morningstar, Inc. All Rights Reserved. The Morningstar information contained herein: (1) is proprietary to Morningstar and/or its content providers; (2) may not be copied or distributed; and (3) is not warranted to be accurate, complete or timely. Neither Morningstar nor its content providers are responsible for any damage or losses relating from any use of this information. Past performance is no guarantee of future results.
GE Investment Distributors, Inc., Member of FINRA & SIPC, is the principal underwriter and distributor of the GE Investments Funds, Inc. and a wholly owned subsidiary of GE Asset Management Incorporated, the investment adviser of the Fund.
1
Table of Contents
| Core Value Equity Fund | (unaudited) |

Stephen V. Gelhaus
Senior Vice President

Paul C. Reinhardt
Senior Vice President
The Core Value Equity Fund is co-managed by Paul C. Reinhardt and Stephen V. Gelhaus. Messrs. Reinhardt and Gelhaus both manage the Fund as a collaborative team. Both portfolio managers have the authority to increase or decrease existing positions in the Fund; however, Mr. Reinhardt, as lead manager, is vested with the authority to purchase securities that are new to the Fund or to divest the Fund of its entire position in a security. Mr. Reinhardt also has veto authority over Mr. Gelhaus’ trade decisions.
Paul C. Reinhardt is a Senior Vice President of GE Asset Management and lead portfolio manager of the Fund. He has served in this capacity since April 2002. Mr. Reinhardt joined GE Asset Management in 1982 as an equity analyst and has been a portfolio manager since 1987.
Stephen V. Gelhaus is a Senior Vice President of GE Asset Management. He has been a member of the portfolio management team for the Fund since January 2002. Mr. Gelhaus joined GE Asset Management in June 1991 and was a research analyst in the U.S. equities group from 1995 through 2001 and became an associate portfolio manager for the Fund in August 1999.
| Q. | How did the Core Value Equity Fund perform compared to its benchmark and Morningstar peer group for the six-month period ended June 30, 2011? |
| A. | For the six-month period ended June 30, 2011, the Core Value Equity Fund returned 5.20% for Class 1 shares and 5.08% for Class 4 shares. The S&P 500 Index, the Fund’s benchmark, returned 6.02% and the Fund’s Morningstar peer group of 384 U.S. Insurance Large Blend funds returned an average of 5.25% over the same period. |
| Q. | What market factors affected Fund performance? |
| A. | The S&P 500 experienced major volatility during the period against a backdrop of concerns including political unrest in the Middle East and North Africa (which sent oil prices skyrocketing 22%, then down 17% after strategic reserves were released to |
| mitigate supply disruptions), fears of European sovereign debt contagion (which punished bank stocks), and U.S. deficit and debt ceiling debate. Despite these worries, corporate earnings strength sent U.S. equity markets higher early in the year, before renewed macro fears reversed the advance by the end of March. Bolstered by positive economic data, the S&P 500 rebounded and hit a three-year high on April 29th, but fluctuated wildly as the drumbeat of concerns continued. While more cyclical sectors outperformed in the first calendar quarter, a defensive shift characterized the markets as mid-year approached. During the period the large cap growth style of investing outperformed the value style, driven largely by underperformance in the financials sector (-3% in the context of a +6% S&P 500 return). The information technology (+2%) sector also lagged as many investors questioned the strength of the recovery. Health care (+14%) was the strongest S&P 500 sector, followed by energy (+11%) and utilities (+9%) for the period. |
| Q. | What were the primary drivers of Fund performance? |
| A. | The key driver of underperformance was the Fund’s overweight position in financials. However, within the sector we placed a relative emphasis on insurance stocks — which we believed to be relatively immune to credit and regulatory concerns. Individual financials holdings that weighed on returns included, Morgan Stanley (-15%), Bank of New York Mellon (-15%), PartnerRe (-13%) and JP Morgan Chase (-3%). Retailer, Target (-21%), disappointed with its earnings outlook as the company deployed capital to expand into Canada, and put share repurchases on hold. Within consumer discretionary, the Fund’s portfolio managers have been cautious on leisure and internet retail stocks, given high valuations. This detracted from relative returns, as we were underweighted in industry groups that significantly outperformed. |
2
Table of Contents
| (unaudited) | ||

| In terms of positive performance drivers, strong stock selection and an overweight in energy bolstered the Fund’s performance, benefiting from significant rallies in El Paso (+47% as it accelerated plans to spin off its oil exploration and production unit) and Marathon Oil (+44% as it split off its refining business). Within technology, the Fund benefited from underweighting the sector and not owning Google as it dropped 15% during the period. Several health care holdings contributed positively to performance, including Covidien (+18%) and Omnicare (+26%). Finally, our media holdings were also solid contributors. Time Warner (+15%) and News Corp. (+22%) both benefited from the continued recovery in advertising spending, and increased cable-networks subscription fees. We participated in the IPO of Nielsen Holdings (+23%) and it was a top contributor, driven by improving fundamentals in media, as well as a market-leading position in media information and analytics. We continued to hold Nielsen at the end of the period. |
| Q. | How was the Fund positioned at the end of the period? |
| A. | In the current U.S. stock market, we believe the more attractive valuations are found in many large, high-quality companies with global franchises. Our team continues to find attractive opportunities across all economic sectors, and we have continued to apply our relative value discipline on a stock-by-stock basis, investing in attractive companies with strong free cash flow, experienced management, and balance sheet strength. At mid-year, the Fund’s largest absolute and relative weighting was in financials, and the largest underweights were in technology, industrials and consumer discretionary. We increased our exposure to health care during the period, making it a more meaningful overweight, and trimmed our underweight in consumer staples. We decreased our exposure to information technology, telecommunications and energy. |
| We have been building positions in the insurance industry within financials, initiating positions in Chubb, Hartford Financial and RenaissanceRe, and added to Ace and Hartford Financial Services. We appreciate the relative lack of exposure to regulatory uncertainties within insurance and believe these companies could benefit from pricing power in their respective markets. Based on improvements in |
| consumer credit trends, we added Discover Financial Services to the Fund and increased our position in American Express. We funded these purchases by eliminating our position in Principal Financial Group, and selling down our positions in what we believe are higher risk banks including Wells Fargo, a regional bank, and Citigroup. We increased our health care sector holdings, starting a new position in PerkinElmer, and added to existing holdings in Pfizer, Hospira and HCA. Our rationale was attractive valuations, given stock performance over the last twelve months. In energy, we were overweight at the end of the period in both oil service and E&P stocks given what we believe are attractive valuations. |
3
Table of Contents
| Core Value Equity Fund | (unaudited) |
Understanding Your Fund’s Expenses
As a shareholder of the Fund you incur ongoing costs. Ongoing costs include portfolio management fees, distribution and services fees (for Class 4 shares), professional fees, administrative fees and other Fund expenses. The following example is intended to help you understand your ongoing costs (in dollars) of investing in the Fund and to compare these costs with the ongoing costs of investing in other mutual funds.
To illustrate these ongoing costs, we have provided an example and calculated the expenses paid by investors in each share class of the Fund during the period. The information in the following table is based on an investment of $1,000, which is invested at the beginning of the period and held for the entire six-month period ended June 30, 2011.
Actual Expenses
The first section of the table provides information about actual account values and actual expenses. You may use the information in this section, together with the amount you invested, to estimate the expenses that you paid over the period. To do so, simply divide your account value by $1,000 (for example, an $8,600 account value divided by $1,000 = 8.6), then multiply the result by the
number given for your class under the heading “Expenses paid during period.”
Hypothetical Example for Comparison Purposes
The second section of the table provides information about hypothetical account values and hypothetical expenses based on the Fund’s actual expense ratio and an assumed rate of return of 5% per year before expenses, which is not the Fund’s actual return. The hypothetical account values and expenses may not be used to estimate the actual ending account balance or expenses you paid for the period. You may use this information to compare the ongoing costs of investing in the Fund and other funds. To do so, compare this 5% hypothetical example with the 5% hypothetical examples that appear in the shareholders reports of other funds.
Please note that the expenses shown in the table are meant to highlight and help you compare ongoing costs only and do not reflect any transaction costs, such as sales charges or redemption fees, if any. Additionally, the expenses shown do not reflect the fees or charges associated with variable contracts through which shares of the Fund are offered.
January 1, 2011 – June 30, 2011
| Account value at the beginning of the period ($) | Account value at the end of the period ($) | Expenses paid during the period ($)* | ||||||||||
Actual Fund Return** |
| |||||||||||
Class 1 | 1,000.00 | 1,051.98 | 6.05 | |||||||||
Class 4 | 1,000.00 | 1,050.85 | 8.34 | |||||||||
Hypothetical 5% Return (2.5% for the period) |
| |||||||||||
Class 1 | 1,000.00 | 1,018.72 | 5.96 | |||||||||
Class 4 | 1,000.00 | 1,016.52 | 8.20 | |||||||||
| * | Expenses are equal to the Fund’s annualized expense ratio of 1.19% for Class 1 shares and 1.64% for Class 4 shares (for the period January 1, 2011—June 30, 2011), multiplied by the average account value over the period, multiplied by 181/365 (to reflect the one-half year period). |
| ** | Actual Fund Returns for the six-month period ended June 30, 2011 were as follows: 5.20% for Class 1 shares, and 5.08% for Class 4 shares. Past performance does not guarantee future results. |
4
Table of Contents
| Core Value Equity Fund | (unaudited) |
Investment Profile
A mutual fund designed for investors who seek long-term growth of capital and future income. The Fund seeks its objectives by investing at least 80% of its net assets under normal circumstances in equity securities, such as common and preferred stocks. The Fund invests primarily in U.S. companies that the portfolio managers believe are undervalued by the market but have solid growth prospects.
Morningstar Performance Comparison
Based on average annual returns for periods ended June 30, 2011
| Six Months* | One Year | Three Year | Five Year | Ten Year | ||||||||||||||||
Number of Funds in peer group: | 384 | 384 | 371 | 353 | 276 | |||||||||||||||
Peer group | 5.25 | % | 29.38 | % | 2.69 | % | 2.47 | % | 2.44 | % | ||||||||||
Morningstar category in peer group: U.S. Insurance Large Blend |
| |||||||||||||||||||
Sector Allocation
as a % of Fair Value (c) of $18,922 (in thousands) on June 30, 2011 (b)(c)
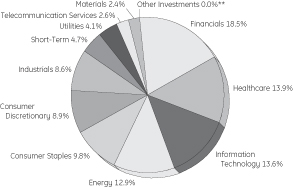
Top Ten Largest Holdings
as of June 30, 2011 (as a % of Fair Value) (b)(c)
International Business Machines Corp. | 2.69% | |||
PepsiCo Inc. | 2.58% | |||
JPMorgan Chase & Co. | 2.53% | |||
Pfizer Inc. | 2.46% | |||
Chevron Corp. | 2.42% | |||
Time Warner Inc. | 2.42% | |||
Microsoft Corp. | 2.38% | |||
Kraft Foods Inc. | 2.37% | |||
Covidien PLC | 2.18% | |||
ACE Ltd. | 2.05% |
Change in Value of a $10,000 Investment
Class 1 Shares
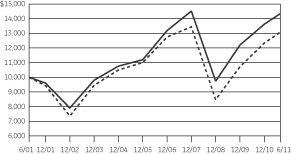
Average Annual Total Return
for the Periods Ended June 30, 2011
Class 1 Shares (Inception date: 4/28/00)
| Six Months* | One Year | Five Year | Ten Year | Ending Value of a $10,000 investment (a) | ||||||||||||||||
Core | 5.20% | 28.56% | 4.29% | 3.67% | $ | 14,333 | ||||||||||||||
S&P 500 Index | 6.02% | 30.69% | 2.94% | 2.72% | $ | 13,076 | ||||||||||||||
Change in Value of a $10,000 Investment
Class 4 Shares
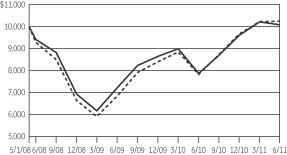
Average Annual Total Returns
for the Periods Ended June 30, 2011
Class 4 Shares (Inception date: 5/1/08)
| Six Months* | One Year | Three Year | Since Inception | Ending Value of a $10,000 investment (a) | ||||||||||||||||
Core | 5.08% | 28.08% | 2.30% | 0.27% | $ | 10,084 | ||||||||||||||
S&P 500 Index | 6.02% | 30.69% | 3.34% | 0.74% | $ | 10,235 | ||||||||||||||

| (a) | Ending value of a $10,000 investment for the ten-year period or since inception, whichever is less. |
| (b) | The securities information regarding holdings, allocations and other characteristics is presented to illustrate examples of securities that the Fund has bought and the diversity of areas in which the Fund may invest as of a particular date. It may not be representative of the Fund’s current or future investments and should not be construed as a recommendation to purchase or sell a particular security. |
| (c) | Fair value basis is inclusive of Short-Term Investment in GE Institutional Money Market Fund. |
| * | Total returns for the six month period ended June 30, 2011 are not annualized. |
| ** | Less than 0.05%. |
See Notes to Performance on page 1 for further information, including an explanation of Morningstar peer categories.
Past performance does not predict future performance and the graph and table do not reflect the deduction of taxes that a shareholder would pay on Fund distributions or the redemption of Fund shares and does not reflect the fees or charges that would be associated with variable contracts through which shares of the Fund are offered.
5
Table of Contents
Core Value Equity Fund
| Schedule of Investments | June 30, 2011 (unaudited) |
Core Value Equity Fund
| Number of Shares | Fair Value | |||||||||
Common Stock — 93.9%† | ||||||||||
Advertising — 1.9% | ||||||||||
Omnicom Group Inc. | 7,528 | $ | 362,548 | |||||||
Aerospace & Defense — 2.7% | ||||||||||
General Dynamics Corp. | 495 | 36,887 | ||||||||
Honeywell International Inc. | 6,247 | 372,259 | ||||||||
Rockwell Collins Inc. | 1,486 | 91,671 | ||||||||
| 500,817 | ||||||||||
Agricultural Products — 0.9% | ||||||||||
Archer-Daniels-Midland Co. | 5,943 | 179,181 | ||||||||
Air Freight & Logistics — 0.9% | ||||||||||
FedEx Corp. | 1,783 | 169,118 | ||||||||
Asset Management & Custody Banks — 4.3% | ||||||||||
Ameriprise Financial Inc. | 4,655 | 268,500 | ||||||||
Invesco Ltd. | 5,151 | 120,533 | ||||||||
State Street Corp. | 5,151 | 232,259 | (c) | |||||||
The Bank of New York Mellon Corp. | 7,280 | 186,514 | ||||||||
| 807,806 | ||||||||||
Biotechnology — 2.1% | ||||||||||
Amgen Inc. | 2,476 | 144,475 | (a) | |||||||
Gilead Sciences Inc. | 6,191 | 256,369 | (a) | |||||||
| 400,844 | ||||||||||
Coal & Consumable Fuels — 0.8% | ||||||||||
Peabody Energy Corp. | 2,625 | 154,639 | ||||||||
Communications Equipment — 0.9% | ||||||||||
Cisco Systems Inc. | 10,895 | 170,071 | ||||||||
Computer Hardware — 1.1% | ||||||||||
Apple Inc. | 272 | 91,302 | (a) | |||||||
Hewlett-Packard Co. | 3,364 | 122,450 | ||||||||
| 213,752 | ||||||||||
Construction & Farm Machinery & Heavy Trucks — 0.9% | ||||||||||
Deere & Co. | 1,981 | 163,333 | ||||||||
Consumer Finance — 1.2% | ||||||||||
American Express Co. | 4,210 | 217,657 | ||||||||
Discover Financial Services | 495 | 13,241 | ||||||||
| 230,898 | ||||||||||
Data Processing & Outsourced Services — 1.6% | ||||||||||
The Western Union Co. | 15,186 | 304,176 | ||||||||
| Number of Shares | Fair Value | |||||||||
Department Stores — 0.7% | ||||||||||
Macy’s Inc. | 4,210 | $ | 123,100 | |||||||
Diversified Financial Services — 5.4% | ||||||||||
Bank of America Corp. | 17,829 | 195,406 | ||||||||
Citigroup Inc. | 2,278 | 94,856 | ||||||||
JPMorgan Chase & Co. | 11,688 | 478,507 | ||||||||
US BanCorp | 1,981 | 50,535 | ||||||||
Wells Fargo & Co. | 6,934 | 194,568 | ||||||||
| 1,013,872 | ||||||||||
Diversified Metals & Mining — 0.8% | ||||||||||
Freeport-McMoRan Copper & Gold Inc. | 2,872 | 151,929 | ||||||||
Drug Retail — 0.5% | ||||||||||
CVS Caremark Corp. | 2,724 | 102,368 | ||||||||
Electric Utilities — 1.4% | ||||||||||
FirstEnergy Corp. | 941 | 41,545 | ||||||||
NextEra Energy Inc. | 3,714 | 213,406 | ||||||||
| 254,951 | ||||||||||
Electrical Components & Equipment — 0.5% | ||||||||||
Cooper Industries PLC | 1,733 | 103,408 | ||||||||
Electronic Components — 0.6% | ||||||||||
Corning Inc. | 6,247 | 113,383 | ||||||||
Fertilizers & Agricultural Chemicals — 0.5% | ||||||||||
Potash Corporation of Saskatchewan Inc. | 1,585 | 90,329 | ||||||||
General Merchandise Stores — 0.9% | ||||||||||
Target Corp. | 3,714 | 174,224 | ||||||||
Healthcare Distributors — 0.4% | ||||||||||
Cardinal Health Inc. | 1,535 | 69,720 | ||||||||
Healthcare Equipment — 2.2% | ||||||||||
Covidien PLC | 7,764 | 413,278 | ||||||||
Healthcare Facilities — 0.6% | ||||||||||
HCA Holdings Inc. | 3,467 | 114,411 | (a) | |||||||
Healthcare Services — 1.1% | ||||||||||
Omnicare Inc. | 6,290 | 200,588 | ||||||||
Home Improvement Retail — 0.6% | ||||||||||
Lowe’s companies Inc. | 4,953 | 115,454 | ||||||||
Hotels, Resorts & Cruise Lines — 0.1% | ||||||||||
Carnival Corp. | 517 | 19,455 | ||||||||
See Notes to Schedule of Investments and Notes to Financial Statements.
6
Table of Contents
Core Value Equity Fund
| Schedule of Investments | June 30, 2011 (unaudited) |
| Number of Shares | Fair Value | |||||||||
Household Products — 2.5% | ||||||||||
Clorox Co. | 3,466 | $ | 233,747 | |||||||
The Procter & Gamble Co. | 3,615 | 229,806 | ||||||||
| 463,553 | ||||||||||
Independent Power Producers & Energy Traders — 1.5% | ||||||||||
Calpine Corp. | 6,191 | 99,861 | (a) | |||||||
The AES Corp. | 13,867 | 176,666 | (a) | |||||||
| 276,527 | ||||||||||
Industrial Conglomerates — 0.5% | ||||||||||
Siemens AG ADR | 720 | 99,022 | ||||||||
Industrial Machinery — 0.2% | ||||||||||
Eaton Corp. | 673 | 34,626 | ||||||||
Integrated Oil & Gas — 5.5% | ||||||||||
Chevron Corp. | 4,457 | 458,358 | ||||||||
Exxon Mobil Corp. | 3,566 | 290,201 | (d) | |||||||
Marathon Oil Corp. | 2,724 | 143,500 | ||||||||
Suncor Energy Inc. | 3,863 | 151,043 | ||||||||
| 1,043,102 | ||||||||||
Integrated Telecommunication Services — 2.7% | ||||||||||
AT&T Inc. | 8,914 | 279,989 | ||||||||
Verizon Communications Inc. | 5,943 | 221,258 | ||||||||
| 501,247 | ||||||||||
Investment Banking & Brokerage — 0.6% | ||||||||||
Morgan Stanley | 5,286 | 121,631 | ||||||||
IT Consulting & Other Services — 2.7% | ||||||||||
International Business Machines Corp. | 2,971 | 509,675 | ||||||||
Life & Health Insurance — 2.4% | ||||||||||
MetLife Inc. | 3,412 | 149,684 | ||||||||
Prudential Financial Inc. | 4,806 | 305,613 | ||||||||
| 455,297 | ||||||||||
Life Sciences Tools & Services — 1.2% | ||||||||||
PerkinElmer Inc. | 765 | 20,586 | ||||||||
Thermo Fisher Scientific Inc. | 3,170 | 204,116 | (a) | |||||||
| 224,702 | ||||||||||
Movies & Entertainment — 4.7% | ||||||||||
News Corp. | 14,801 | 261,978 | ||||||||
The Walt Disney Co. | 4,210 | 164,358 | ||||||||
Time Warner Inc. | 12,591 | 457,935 | ||||||||
| 884,271 | ||||||||||
Multi-Line Insurance — 0.5% | ||||||||||
Hartford Financial Services Group Inc. | 3,764 | 99,257 | ||||||||
| Number of Shares | Fair Value | |||||||||
Multi-Utilities — 1.3% | ||||||||||
Dominion Resources Inc. | 5,151 | $ | 248,639 | |||||||
Oil & Gas Equipment & Services — 2.3% | ||||||||||
Halliburton Co. | 3,021 | 154,071 | ||||||||
National Oilwell Varco Inc. | 1,238 | 96,824 | ||||||||
Schlumberger Ltd. | 2,052 | 177,293 | ||||||||
| 428,188 | ||||||||||
Oil & Gas Exploration & Production — 2.7% | ||||||||||
Apache Corp. | 2,971 | 366,592 | ||||||||
Devon Energy Corp. | 990 | 78,022 | ||||||||
Southwestern Energy Co. | 1,733 | 74,311 | (a) | |||||||
| 518,925 | ||||||||||
Oil & Gas Storage & Transportation — 1.6% | ||||||||||
El Paso Corp. | 10,648 | 215,090 | ||||||||
Spectra Energy Corp. | 2,872 | 78,721 | ||||||||
| 293,811 | ||||||||||
Packaged Foods & Meats — 3.2% | ||||||||||
ConAgra Foods Inc. | 3,962 | 102,259 | ||||||||
Kraft Foods Inc. | 12,755 | 449,359 | ||||||||
Nestle S.A. ADR | 990 | 61,756 | ||||||||
| 613,374 | ||||||||||
Pharmaceuticals — 6.4% | ||||||||||
Bristol-Myers Squibb Co. | 5,695 | 164,927 | ||||||||
Hospira Inc. | 2,713 | 153,719 | (a) | |||||||
Johnson & Johnson | 3,368 | 224,039 | ||||||||
Novartis AG ADR | 3,318 | 202,763 | ||||||||
Pfizer Inc. | 22,583 | 465,210 | ||||||||
| 1,210,658 | ||||||||||
Property & Casualty Insurance — 3.0% | ||||||||||
ACE Ltd. | 5,893 | 387,877 | ||||||||
Chubb Corp. | 2,971 | 186,014 | ||||||||
| 573,891 | ||||||||||
Rail Roads — 0.5% | ||||||||||
Union Pacific Corp. | 891 | 93,020 | ||||||||
Reinsurance — 1.1% | ||||||||||
PartnerRe Ltd. | 2,156 | 148,441 | ||||||||
RenaissanceRe Holdings Ltd. | 743 | 51,973 | ||||||||
| 200,414 | ||||||||||
Research & Consulting Services — 0.9% | ||||||||||
Nielsen Holdings N.V. | 5,448 | 169,760 | (a) | |||||||
Semiconductor Equipment — 0.6% | ||||||||||
Applied Materials Inc. | 3,170 | 41,242 | ||||||||
KLA-Tencor Corp. | 1,832 | 74,159 | ||||||||
| 115,401 | ||||||||||
See Notes to Schedule of Investments and Notes to Financial Statements.
7
Table of Contents
Core Value Equity Fund
| Schedule of Investments | June 30, 2011 (unaudited) |
| Number of Shares | Fair Value | |||||||||
Semiconductors — 2.1% | ||||||||||
Intel Corp. | 8,172 | $ | 181,091 | |||||||
Microchip Technology Inc. | 1,684 | 63,840 | ||||||||
Texas Instruments Inc. | 4,705 | 154,465 | ||||||||
| 399,396 | ||||||||||
Soft Drinks — 2.6% | ||||||||||
PepsiCo Inc. | 6,933 | 488,291 | ||||||||
Steel — 1.1% | ||||||||||
Allegheny Technologies Inc. | 3,219 | 204,310 | ||||||||
Systems Software — 3.9% | ||||||||||
Microsoft Corp. | 17,300 | 449,800 | (d) | |||||||
Oracle Corp. | 8,890 | 292,570 | ||||||||
| 742,370 | ||||||||||
Total Common Stock | 17,731,011 | |||||||||
Exchange Traded Funds — 1.6% | ||||||||||
Financial Select Sector SPDR Fund | 3,936 | 60,339 | (f) | |||||||
Industrial Select Sector SPDR Fund | 6,524 | 242,954 | (d,f) | |||||||
Total Exchange Traded Funds | 303,293 | |||||||||
Other Investments — 0.0%* | ||||||||||
GEI Investment Fund | 8,188 | (e) | ||||||||
Total Investments in Securities | 18,042,492 | |||||||||
Short-Term Investments — 4.7% | ||||||||||
GE Institutional Money Market Fund Investment Class 0.11% | 879,868 | (b,e) | ||||||||
Total Investments | 18,922,360 | |||||||||
Liabilities in Excess of Other Assets, |
| (32,199 | ) | |||||||
|
| |||||||||
NET ASSETS — 100.0% | $ | 18,890,161 | ||||||||
|
| |||||||||
Other Information | ||||||
The Fund had the following long futures contracts open at June 30, 2011 (unaudited):
| Description | Expiration date | Number of Contracts | Current Notional Value | Unrealized Appreciation | ||||||||||||
S&P 500 Emini Index Futures | September 2011 | 11 | $ | 723,525 | $ | 29,186 | ||||||||||
See Notes to Schedule of Investments and Notes to Financial Statements.
8
Table of Contents
| Notes to Schedule of Investments | June 30, 2011 (unaudited) |
The views expressed in this document reflect our judgment as of the publication date and are subject to change at any time without notice. The securities information regarding holdings, allocations and other characteristics are presented to illustrate examples of securities that the Fund has bought and the diversity of areas in which the Fund may invest as of a particular date. It may not be representative of the Fund’s current or future investments and should not be construed as a recommendation to purchase or sell a particular security. See the Fund’s summary prospectus and statutory prospectus for complete descriptions of investment objectives, policies, risks and permissible investments.
| (a) | Non-income producing security. |
| (b) | Coupon amount represents effective yield. |
| (c) | State Street Corp. is the parent company of State Street Bank & Trust Co., the Fund’s custodian and accounting agent. |
| (d) | At June 30, 2011 , all or a portion of this security was pledged to cover collateral requirements for futures, options, forward foreign currency contracts and/or TBA’s. |
| (e) | GE Asset Management, the investment adviser of the Fund, also serves as investment adviser of the GEI Investment Fund and the GE Institutional Money Market Fund. |
| (f) | Sponsored by SSgA Funds Management, Inc., an affiliate of State Street Bank & Trust Co., the Fund’s custodian and accounting agent. |
| * | Less than 0.05%. |
| † | Percentages are based on net assets as of June 30, 2011. |
Abbreviations:
ADR | American Depository Receipt | |
SPDR | Standard & Poors Depository Receipts | |
9
Table of Contents
Selected data based on a share outstanding throughout the fiscal years indicated
| CLASS 1 | CLASS 4 | |||||||||||||||||||||||||||||||||||||||||
| 6/30/11† | 12/31/10 | 12/31/09 | 12/31/08 | 12/31/07 | 12/31/06 | 6/30/11† | 12/31/10 | 12/31/09 | 12/31/08 | |||||||||||||||||||||||||||||||||
| Inception date | — | — | — | — | — | 4/28/00 | — | — | — | 5/1/08 | ||||||||||||||||||||||||||||||||
Net asset value, beginning of period | $ | 8.85 | $ | 8.04 | $ | 6.48 | $ | 10.16 | $ | 10.70 | $ | 10.01 | $ | 8.85 | $ | 8.04 | $ | 6.49 | $9.82 | |||||||||||||||||||||||
Income/(loss) from investment operations: | ||||||||||||||||||||||||||||||||||||||||||
Net investment income | 0.04 | 0.11 | ** | 0.08 | 0.11 | 0.12 | �� | 0.17 | 0.01 | 0.07 | ** | 0.01 | 0.05 | ** | ||||||||||||||||||||||||||||
Net realized and unrealized | 0.42 | 0.82 | 1.57 | (3.46) | 0.97 | 1.62 | 0.44 | 0.82 | 1.60 | (3.08) | ||||||||||||||||||||||||||||||||
Total income/(loss) from | 0.46 | 0.93 | 1.65 | (3.35) | 1.09 | 1.79 | 0.45 | 0.89 | 1.61 | (3.03) | ||||||||||||||||||||||||||||||||
Less distributions from: | ||||||||||||||||||||||||||||||||||||||||||
Net investment income | — | 0.12 | 0.09 | 0.12 | 0.12 | 0.17 | — | 0.08 | 0.06 | 0.09 | ||||||||||||||||||||||||||||||||
Net realized gains | — | — | — | 0.21 | 1.51 | 0.93 | — | — | — | 0.21 | ||||||||||||||||||||||||||||||||
Total distributions | — | 0.12 | 0.09 | 0.33 | 1.63 | 1.10 | — | 0.08 | 0.06 | 0.30 | ||||||||||||||||||||||||||||||||
Net asset value, end of period | $ | 9.31 | $ | 8.85 | $ | 8.04 | $ | 6.48 | $ | 10.16 | $ | 10.70 | $ | 9.30 | $ | 8.85 | $ | 8.04 | $6.49 | |||||||||||||||||||||||
TOTAL RETURN (a) | 5.20% | 11.57% | 25.40% | (32.94)% | 10.10% | 17.85% | 5.08% | 11.12% | 24.74% | (30.77)% | ||||||||||||||||||||||||||||||||
RATIOS/SUPPLEMENTAL DATA: | ||||||||||||||||||||||||||||||||||||||||||
Net assets, end of period (in thousands) | $ | 18,880 | $19,756 | $21,847 | $20,361 | $37,765 | $39,683 | $ | 10 | $10 | $9 | $7 | ||||||||||||||||||||||||||||||
Ratios to average net assets: | ||||||||||||||||||||||||||||||||||||||||||
Net investment income (loss) | 0.75% | * | 1.32% | 1.16% | 1.18% | 0.96% | 1.55% | 0.30% | * | 0.91% | 0.72% | 0.95% | * | |||||||||||||||||||||||||||||
Net expenses | 1.19% | (b)* | 0.97% | (b) | 1.24% | (b) | 0.95% | (b) | 0.81% | 0.81% | 1.64% | (b)* | 1.39% | (b) | 1.69% | (b) | 1.40% | (b)* | ||||||||||||||||||||||||
Gross expenses | 1.19% | * | 0.97% | 1.24% | 0.95% | 0.81% | 0.81% | 1.64% | * | 1.39% | 1.69% | 1.40% | * | |||||||||||||||||||||||||||||
Portfolio turnover rate | 19% | 45% | 61% | 68% | 45% | 42% | 19% | 45% | 61% | 68% | ||||||||||||||||||||||||||||||||
Notes to Financial Highlights
| (a) | Total returns are historical and assume changes in share price, reinvestment of dividends and capital gains distributions, and do not include the effect of insurance contract charges. Past performance does not guarantee future results. |
| (b) | Reflects GE Asset Management’s waiver of a portion of the Fund’s management fee in an amount equal to the management fee earned by GEAM with respect to the Fund’s investment in the GE Money Market Fund and/or GE Institutional Money Market Fund. Excluding waiver, the expense ratios would be unchanged. |
| * | Annualized for periods less than one year. |
| ** | Per share values have been calculated using the average share method. |
| † | Unaudited |
The accompanying Notes are an integral part of these financial statements.
10
Table of Contents
The accompanying Notes are an integral part of these financial statements.
11
Table of Contents
The accompanying Notes are an integral part of these financial statements.
12
Table of Contents
| * | Unaudited |
The accompanying Notes are an integral part of these financial statements.
13
Table of Contents
| Notes to Financial Statements | June 30, 2011 (unaudited) |
| 1. | Organization of the Company |
GE Investments Funds, Inc. (the “Company”) was incorporated under the laws of the Commonwealth of Virginia on May 14, 1984 and is registered under the Investment Company Act of 1940, as amended (the “1940 Act”), as an open-end management investment company. The Company is composed of fourteen investment portfolios (collectively the “Funds”), although only the following eleven are currently being offered: U.S. Equity Fund, S&P 500 Index Fund, Premier Growth Equity Fund, Core Value Equity Fund (the “Fund”), Mid-Cap Equity Fund, Small-Cap Equity Fund, International Equity Fund, Total Return Fund, Income Fund, Money Market Fund and Real Estate Securities Fund.
Shares of the Funds of the Company are offered only to insurance company separate accounts that fund certain variable life insurance contracts and variable annuity contracts. GE Asset Management Incorporated (“GEAM”) is the investment adviser and administrator of each of the Funds.
The Company currently offers two share classes (Class 1 and Class 4) of the Fund as an investment option for variable life insurance and variable annuity contracts. Class 4 shares were first offered on May 1, 2008, and Fund shares outstanding prior to May 1, 2008 were designated as Class 1 shares. Each share class has different fees and expenses, and as a result, each share class will have different share price and performance. Not all variable contracts offer both share classes of the Fund.
| 2. | Summary of Significant Accounting Policies |
The preparation of financial statements in conformity with U.S. generally accepted accounting principles (GAAP) requires management to make estimates and assumptions that affect the reported amounts of assets and liabilities and disclosure of contingent assets and liabilities at the date of the financial statements and the reported amounts of increases and decreases in net assets from operations during the reporting period. Actual results may differ from those estimates.
Subsequent events after the balance sheet date through the date the financial statements were issued, have been evaluated in the preparation of the financial statements. There are no items to report.
The following summarizes the significant accounting policies of the Company:
Securities Valuation and Transactions. All investments in securities are recorded at their estimated fair value, as described in Note 3.
Securities transactions are accounted for as of the trade date. Realized gains and losses on investments sold are recorded on the basis of identified cost for both financial statement and federal tax purposes.
The Fund’s income, expenses (other than distribution fees) and realized and unrealized gains and losses are allocated proportionally each day among the share classes based upon the relative net assets of each class.
Derivatives The Fund is subject to equity price risk in the normal course of pursuing its investment objective. The Fund may enter into derivative transactions to gain market exposure for residual and accumulating cash positions.
Futures Contracts A futures contract represents a commitment for the future purchase or sale of an asset at a specified price on a specified date. The Fund invests in stock index futures contracts subject to certain limitations to manage its exposure to the stock markets. Buying futures tends to increase a Fund’s exposure to the underlying instrument while selling futures tends to decrease a Fund’s exposure to the underlying instrument or to hedge other Fund investments. The Fund will not enter into a transaction involving futures for speculative purposes. With futures contracts, there is minimal counterparty credit risk to the Fund since futures contracts are exchange traded and the exchange’s clearinghouse, as counterparty to all traded futures, guarantees the futures against default. The Fund’s risks in using these contracts include changes in the value of the underlying instruments, non-performance of the counterparties under the contracts’ terms and changes in the liquidity of the secondary market for the contracts. Futures contracts are valued at the settlement price established each day by the board of trade or exchange on which they principally trade.
Upon entering into a financial futures contract, the Fund is required to pledge to the broker an amount of cash and/or other assets equal to a certain percentage of the contract amount, known as initial margin deposit. Subsequent payments, known as variation margin, are made or received by the Fund each day, depending on the daily fluctuation in the fair value of the underlying security. The Fund records an unrealized gain or loss equal to the daily variation margin. Should market conditions move
14
Table of Contents
| Notes to Financial Statements | June 30, 2011 (unaudited) |
unexpectedly, the Fund may not achieve the anticipated benefits of the futures contracts and may incur a loss. The Fund recognizes a realized gain or loss upon the expiration or closing of a futures contract.
Investment Income Corporate actions (including cash dividends) are recorded on the ex-dividend date, net of applicable withholding taxes, except for certain foreign corporate actions which are recorded as soon after ex-dividend date as such information becomes available. Interest income is recorded on the accrual basis.
Expenses Fund specific expenses are allocated to the Fund that incurs such expenses. Such expenses may include custodial fees, legal and accounting fees, printing costs and registration fees. Expenses that are not fund specific are allocated pro rata across the Funds. Certain class specific expenses (such as distribution fees) are allocated to the class that incurs such expense. Expenses of the Fund are generally paid directly by the Fund however, expenses may be paid by GEAM and reimbursed by the fund.
Federal Income Taxes The Fund intends to comply with all sections of the Internal Revenue Code applicable to regulated investment companies including the distribution of substantially all of its taxable net investment income and net realized capital gains to its shareholders. Therefore, no provision for federal income tax has been made. The Fund is treated as a separate taxpayer for federal income tax purposes.
| 3. | Securities Valuation |
The Fund utilizes various methods to measure the fair value of most of its investments on a recurring basis. GAAP establishes a framework for measuring fair value and providing related disclosures. Broadly, the framework requires fair value to be determined based on the exchange price that would be received for an asset or paid to transfer a liability (an exit price) in the principal or most advantageous market for the asset or liability in an orderly transaction between market participants at the measurement date. In the absence of active markets for the identical assets or liabilities, such measurements involve developing assumptions based on market observable data and, in the absence of such data, internal information that is consistent with what market participants would use in a hypothetical transaction that occurs at the measurement date. It also establishes a three-level valuation hierarchy based upon observable and non-observable inputs.
Observable inputs reflect market data obtained from independent sources, while unobservable inputs reflect our market assumptions. Preference is given to observable inputs. These two types of inputs create the following fair value hierarchy:
Level 1 — Quoted prices for identical investments in active markets.
Level 2 — Quoted prices for similar investments in active markets; quoted prices for identical or similar investments in markets that are not active; and model-derived valuations whose inputs are observable or whose significant value drivers are observable.
Level 3 — Significant inputs to the valuation model are unobservable.
Policies and procedures are maintained to value investments using the best and most relevant data available. In addition, pricing vendors are utilized to assist in valuing investments. GEAM performs periodic reviews of the methodologies used by independent pricing services including price validation of individual securities.
Fair Value Measurement The following section describes the valuation methodologies the Fund uses to measure different financial investments at fair value.
The Fund’s portfolio securities are valued generally on the basis of market quotations. Equity securities generally are valued at the last reported sales price on the primary market in which they are traded. Portfolio securities listed on NASDAQ are valued using the NASDAQ Official Closing Price. Level 1 securities primarily include publicly-traded equity securities which may not necessarily represent the last sale price. If no sales occurred on the exchange or NASDAQ that day, the portfolio security generally is valued using the last reported bid price. In those circumstances the Fund classifies the investment securities in Level 2.
The Fund uses the net asset value per unit for the collective fund. The Fund classifies the investment security in level 2.
Other financial investments are derivative instruments that are not reflected in Total Investments, such as exchange traded futures. Futures are valued at the last sale price on the primary market they are traded and are typically included in level 1.
If prices are not readily available for a portfolio security, or if it is believed that a price for a portfolio security does not represent its fair value, the security may be valued using procedures approved by the Fund’s Board of Directors that
15
Table of Contents
| Notes to Financial Statements | June 30, 2011 (unaudited) |
are designed to establish its “fair” value. These securities would generally be classified in Level 3. Those procedures require that the fair value of a security be established by the valuation committee. The valuation committee follows
different protocols for different types of investments and circumstances. The fair value procedures may be used to value any investment of the Fund in the appropriate circumstances.
The following table presents the Fund’s investments measured at fair value on a recurring basis at June 30, 2011:
Investments | Level 1 | Level 2 | Level 3 | Total | ||||||||||||
Investments in Securities | ||||||||||||||||
Common Stock | $ | 17,731,011 | $ | — | $ | — | $ | 17,731,011 | ||||||||
Exchanged Traded Funds | 303,293 | — | — | 303,293 | ||||||||||||
Other Investments | — | 8,188 | — | 8,188 | ||||||||||||
Short-Term Investments | 879,868 | — | — | 879,868 | ||||||||||||
Total Investments in Securities | $ | 18,914,172 | $ | 8,188 | $ | — | $ | 18,922,360 | ||||||||
Other Financial Instruments | ||||||||||||||||
Futures Contracts — Unrealized Appreciation | $ | 29,186 | $ | — | $ | — | $ | 29,186 | ||||||||
|
|
|
|
|
|
|
| |||||||||
| * | Other financial instruments include derivative instruments such as futures contracts. Amounts shown represent unrealized appreciation (depreciation) at period end. |
There were no significant transfers between the fair value levels. Transfers between fair value levels are considered to occur at the beginning of the period.
| 4. | Derivatives Transactions |
Shown below are the derivative contracts entered into by the Fund, summarized by primary risk exposure as they appear on the Statement of Assets and Liabilities, all of which are not accounted for as hedging instruments under FASB Accounting Standards Codification (“ASC”) No. 815 Derivatives and Hedging as of June 30, 2011.
Asset Derivatives June 30, 2011 | Liability Derivatives June 30, 2011 | |||||||||||
| Derivatives not accounted for as hedging instruments under ASC 815 | Location in the Statement of Assets and Liabilities | Fair Value ($) | Location in the Statements of Assets and Liabilities | Fair Value ($) | ||||||||
| Equity Contracts | Assets, Net Assets — Net Unrealized Appreciation/ (Depreciation) on Futures | 29,186 | * | Liabilities, Net Assets — Net Unrealized Appreciation/ (Depreciation) on Futures | — | |||||||
| * | Includes cumulative appreciation/depreciation of futures contracts as reported in the Schedule of Investments and Net Assets section of the Statement of Assets and Liabilities. Only the current day’s variation margin is reported within the Assets or Liabilities section of the Statement of Assets and Liabilities. |
Shown below are the effects of derivative instruments on the Fund’s Statements of Operations, summarized by primary risk exposure all of which are not accounted for as hedging instruments under ASC 815.
| Derivatives not accounted for as hedging instruments under ASC 815 | Location in the Statement of Operations | Total Notional Amount of Futures Contracts Purchased/(Sold) ($) | Realized Gain or (Loss) on Derivatives Recognized in Income ($) | Change in Unrealized Appreciation/(Depreciation) on Derivatives Recognized in Income ($) | ||||||||||
Equity Contracts | Realized gain/(loss) on Futures, Increase/(decrease) in unrealized appreciation/ (depreciation) on Futures | 2,640,643/(2,087,294) | 17,294 | 27,582 | ||||||||||
| 5. | Line of Credit |
The Company shares a revolving credit facility of up to $150 million with a number of its affiliates. The credit facility is with its custodian bank, State Street Bank and Trust
Company (“State Street”). The revolving credit facility requires the payment of a commitment fee equal to 0.125% per annum on the daily unused portion of the credit facility, payable quarterly.
16
Table of Contents
| Notes to Financial Statements | June 30, 2011 (unaudited) |
The portion borne by the Fund generally is borne proportionally based upon net assets. In addition, the Company has a $100 million uncommitted, unsecured line of credit with State Street. Generally, borrowings under the credit facilities would accrue interest at the Federal Funds Rate plus 50 basis points and would be borne by the borrowing Fund. The maximum amount allowed to be borrowed by any one Fund is the lesser of (i) 33.33% of its total assets or (ii) 20% of its net assets. The credit facilities were not utilized by the Fund during the six month period ended June 30, 2011.
| 6. | Fees and Compensation Paid to Affiliates |
Advisory and Administration Fees GEAM, a registered investment adviser, was retained by the Company’s Board of Directors effective March 16, 2000 to act as investment adviser and administrator of the Fund. GEAM’s compensation for investment advisory and administrative services is paid monthly based on the average daily net assets of the Fund at an annualized rate of 0.65%.
GEAM has a contractual arrangement with the Fund to waives a portion of the Fund’s management fee in the amount equal to the management fee earned by GEAM with respect to the Fund’s investment in the GE Institutional Money Market Fund.
Distribution and Service (12b-1) Fee The Company has adopted a Distribution and Service (12b-1) Plan (the “Plan”) pursuant to Rule 12b-1 under the 1940 Act with respect to Class 4 shares of the Fund. Under the Plan, the Fund may compensate GE Investment Distributors, Inc. (“GEID”), a wholly-owned subsidiary of GEAM and the Fund’s principal distributor, for certain sales services provided by GEID or other broker dealers and investor services provided by GEID or other service providers relating to the Fund’s Class 4 shares, including services to owners or prospective owners of variable contracts issued by insurance companies that offer such share class as an investment option. The amount of compensation paid under the Plan by the Fund’s Class 4 shares may not exceed 0.45% of the average daily net assets of the Fund attributable to such share class. The Plan continues in effect from year to year for so long as such continuance is approved annually by the Board of
Directors, including by those directors who are not interested persons of the Company and who have no direct or indirect financial interest in the operation of the Plan or in any agreement related to it.
Directors’ Compensation The Fund pays no compensation to its directors who are officers or employees of GEAM or its affiliates. Directors who are not such officers or employees also serve in a similar capacity for other funds advised by GEAM. Compensation paid to unaffiliated directors are reflected on the Statement of Operations. These fees are allocated pro rata across all of the mutual fund platforms and share classes served by the directors, including the Fund, and are based upon the relative net assets of each fund within such platforms.
| 7. | Investment Transactions |
Purchases and Sales of Securities The cost of purchases and the proceeds from sales of investments, other than short-term securities and options, for the period ended June 30, 2011 were as follows:
| Non-U.S. Government Securities | ||
| Purchases | Sales | |
| $3,671,046 | $5,981,602 | |
| 8. | Income Taxes |
The Fund is subject to ASC 740, Income Taxes. ASC 740 provides guidance for financial accounting and reporting for the effects of income taxes that result from an entity’s activities during the year. ASC 740 also provides guidance regarding how certain tax positions should be recognized, measured, presented and disclosed in the financial statements. ASC 740 requires evaluation of tax positions taken or expected to be taken in the course of preparing the Fund’s tax returns to determine whether the tax positions are “more likely than not” of being sustained by the applicable tax authority. There are no adjustments to the Fund’s net assets required under ASC 740. The Fund’s 2007, 2008, 2009 and 2010 fiscal years tax returns are still open to examination by the Federal and applicable state tax authorities.
At June 30, 2011, information on the tax cost of investments was as follows:
| Cost of Investment for Tax Purposes | Gross Tax | Net Tax Appreciation/ (Depreciation) | ||||
| Appreciation | Depreciation | |||||
$16,917,962 | $2,355,057 | $(350,659) | $2,004,398 | |||
17
Table of Contents
| Notes to Financial Statements | June 30, 2011 (unaudited) |
As of December 31, 2010, the Fund has capital loss carryovers as indicated below. Capital loss carryovers are available to offset future realized capital gains to the extent provided in the Internal Revenue Code and regulations thereunder. To the extent that these carryover losses are used to offset future capital gains, it is probable that the gains so offset will not be distributed to shareholders because they would be taxable as ordinary income.
| Amount | Expires | |
| $2,661,418 | 12/31/2017 |
These amounts will be available to offset future taxable capital gains. Under the recently enacted Regulated Investment Company Modernization Act of 2010, the Fund will be permitted to carry forward capital losses incurred in taxable years beginning after December 22, 2010 for an unlimited period. However, any losses incurred during those future years will be required to be utilized prior to the losses incurred in pre-enactment tax years. As a result of this ordering rule, pre-enactment capital loss carryforwards may be more likely to expire unused. Additionally, post-enactment capital losses that are carried forward will retain their character as either short-term or long-term capital losses rather than being considered all short-term as under previous law.
During the year ended December 31, 2010, the Fund utilized $927,651 of prior year capital loss carryovers.
Any net capital and currency losses incurred after October 31, within the Fund’s tax year, are deemed to arise on the first day of the Fund’s next tax year if the Fund so elects to defer such losses.
The Fund did not defer any post-October losses for the year ended December 31, 2010.
The tax composition of distributions paid during the years ended December 31, 2010 and December 31, 2009 were as follows:
| | Ordinary Income | |
| Long-Term Capital Gains |
| Total | ||||||
2010 | $ | 265,456 | $ | — | $ | 265,456 | ||||||
2009 | 233,669 | — | 233,669 |
Distributions to Shareholders The Fund declares and pays any dividends from net investment income annually. The Fund declares and pays any net realized capital gains in excess of capital loss carryforwards distributions annually. The character of income and gains to be distributed is determined in accordance with income tax regulations which may differ from generally accepted accounting principles. These differences include (but are not limited to) futures, investments organized as partnerships for tax purposes, and losses deferred due to wash sale transactions. Reclassifications due to permanent book/tax differences are made to the Fund’s capital accounts to reflect income and gains available for distribution (or available capital loss carryovers) under income tax regulations. These reclassifications have no impact on the net asset value of the Fund. The calculation of net investment income per share in the Financial Highlights table excludes these adjustments.
The reclassifications for the year ended December 31, 2010 were as follows:
Undistributed Net Investment Income | Accumulated Net Realized Loss | Paid in Capital | ||
| $1,559 | $(14) | $(1,545) |
18
Table of Contents
| Special Meeting of Shareholders — Voting Results | (unaudited) |
On April 1, 2011, the GE Investments Funds, Inc. (the “Company”) held a special meeting of shareholders of each series portfolio of the Company, including shareholders of the Core Value Equity Fund (the “Fund”). Shareholders of record on January 28, 2011 were entitled to vote on the proposals. For each proposal, except Proposal 1, shareholders voted on a fund-by-fund basis. For Proposal 1, shareholders of all funds voted together and not by fund or share class. At the meeting, all proposals were approved by the Fund and the following votes were recorded:
Proposal 1:
Election of Mr. R. Sheldon Johnson and Mr. Matthew J. Simpson as Directors to the Board of Directors of the Company.
Company votes:
| No. of Shares | % of Outstanding Shares | % of Shares Present | ||||||||||
| Mr. R. Sheldon Johnson | ||||||||||||
Affirmative | 451,517,094.582 | 90.054 | % | 96.126 | % | |||||||
Abstain | 18,195,810.391 | 3.629 | % | 3.874 | % | |||||||
Total | 469,712,904.973 | 93.683 | % | 100.000 | % | |||||||
| Mr. Matthew J. Simpson | ||||||||||||
Affirmative | 451,949,730.789 | 90.140 | % | 96.218 | % | |||||||
Abstain | 17,763,174.184 | 3.543 | % | 3.782 | % | |||||||
Total | 469,712,904.973 | 93.683 | % | 100.000 | % | |||||||
Fund votes:
| No. of Shares | % of Outstanding Shares | % of Shares Present | ||||||||||
| Mr. R. Sheldon Johnson | ||||||||||||
Affirmative | 2,018,742.106 | 91.713 | % | 98.640 | % | |||||||
Abstain | 27,828.456 | 1.264 | % | 1.360 | % | |||||||
Total | 2,046,570.562 | 92.977 | % | 100.000 | % | |||||||
| Mr. Matthew J. Simpson | ||||||||||||
Affirmative | 2,018,742.106 | �� | 91.713 | % | 98.640 | % | ||||||
Abstain | 27,828.456 | 1.264 | % | 1.360 | % | |||||||
Total | 2,046,570.562 | 92.977 | % | 100.000 | % | |||||||
Proposal 2:
Approval of the use of a “manager of managers” arrangement whereby GEAM, as the Fund’s investment adviser, under certain circumstances, will be able to hire and replace sub-advisers to the Fund without obtaining shareholder approval.
| No. of Shares | % of Outstanding Shares | % of Shares Present | ||||||||||
Affirmative | 1,862,731.609 | 84.625 | % | 91.017 | % | |||||||
Against | 86,080.540 | 3.911 | % | 4.206 | % | |||||||
Abstain | 97,758.413 | 4.441 | % | 4.777 | % | |||||||
Broker Non-votes | — | — | — | |||||||||
Total | 2,046,570.562 | 92.977 | % | 100.000 | % | |||||||
19
Table of Contents
| Special Meeting of Shareholders — Voting Results | (unaudited) |
Proposal 3:
Approval of the following changes in certain of the Fund’s investment policies, as follows:
| A. | Amendment of the Fund’s investment policy on senior securities and its reclassification from a non-fundamental policy to a fundamental policy. |
| No. of Shares | % of Outstanding Shares | % of Shares Present | ||||||||||
Affirmative | 1,827,620.201 | 83.030 | % | 89.302 | % | |||||||
Against | 130,334.456 | 5.922 | % | 6.368 | % | |||||||
Abstain | 88,615.905 | 4.025 | % | 4.330 | % | |||||||
Broker Non-votes | — | — | — | |||||||||
Total | 2,046,570.562 | 92.977 | % | 100.000 | % | |||||||
| B. | Amendment of the Fund’s investment policy on short selling. |
| No. of Shares | % of Outstanding Shares | % of Shares Present | ||||||||||
Affirmative | 1,857,894.638 | 84.406 | % | 90.781 | % | |||||||
Against | 102,274.842 | 4.646 | % | 4.997 | % | |||||||
Abstain | 86,401.082 | 3.925 | % | 4.222 | % | |||||||
Broker Non-votes | — | — | — | |||||||||
Total | 2,046,570.562 | 92.977 | % | 100.000 | % | |||||||
| C. | Amendment of the Fund’s investment policy on making loans. |
| No. of Shares | % of Outstanding Shares | % of Shares Present | ||||||||||
Affirmative | 1,857,894.638 | 84.406 | % | 90.781 | % | |||||||
Against | 102,274.842 | 4.646 | % | 4.997 | % | |||||||
Abstain | 86,401.082 | 3.925 | % | 4.222 | % | |||||||
Broker Non-votes | — | — | — | |||||||||
Total | 2,046,570.562 | 92.977 | % | 100.000 | % | |||||||
| D. | Amendment of the Fund’s investment policy on borrowing. |
| No. of Shares | % of Outstanding Shares | % of Shares Present | ||||||||||
Affirmative | 1,857,894.638 | 84.406 | % | 90.781 | % | |||||||
Against | 102,274.842 | 4.646 | % | 4.997 | % | |||||||
Abstain | 86,401.082 | 3.925 | % | 4.222 | % | |||||||
Broker Non-votes | — | — | — | |||||||||
Total | 2,046,570.562 | 92.977 | % | 100.000 | % | |||||||
| E. | Amendment of the Fund’s investment policy on diversification. |
| No. of Shares | % of Outstanding Shares | % of Shares Present | ||||||||||
Affirmative | 1,830,535.831 | 83.163 | % | 89.444 | % | |||||||
Against | 129,633.649 | 5.889 | % | 6.334 | % | |||||||
Abstain | 86,401.082 | 3.925 | % | 4.222 | % | |||||||
Broker Non-votes | — | — | — | |||||||||
Total | 2,046,570.562 | 92.977 | % | 100.000 | % | |||||||
20
Table of Contents
| Special Meeting of Shareholders — Voting Results | (unaudited) |
| F. | Amendment of the Fund’s investment policy on concentration of investments. |
| No. of Shares | % of Outstanding Shares | % of Shares Present | ||||||||||
Affirmative | 1,832,786.308 | 83.265 | % | 89.554 | % | |||||||
Against | 129,633.649 | 5.889 | % | 6.334 | % | |||||||
Abstain | 84,150.605 | 3.823 | % | 4.112 | % | |||||||
Broker Non-votes | — | — | — | |||||||||
Total | 2,046,570.562 | 92.977 | % | 100.000 | % | |||||||
| G. | Amendment of the Fund’s investment policy on investments in commodities. |
| No. of Shares | % of Outstanding Shares | % of Shares Present | ||||||||||
Affirmative | 1,977,550.704 | 89.842 | % | 96.628 | % | |||||||
Against | 65,441.725 | 2.973 | % | 3.197 | % | |||||||
Abstain | 3,578.133 | 0.162 | % | 0.175 | % | |||||||
Broker Non-votes | — | — | — | |||||||||
Total | 2,046,570.562 | 92.977 | % | 100.000 | % | |||||||
| J. | Amendment of the Fund’s investment policy on real estate investments. |
| No. of Shares | % of Outstanding Shares | % of Shares Present | ||||||||||
Affirmative | 1,864,432.064 | 84.703 | % | 91.100 | % | |||||||
Against | 102,998.012 | 4.679 | % | 5.033 | % | |||||||
Abstain | 79,140.486 | 3.595 | % | 3.867 | % | |||||||
Broker Non-votes | — | — | — | |||||||||
Total | 2,046,570.562 | 92.977 | % | 100.000 | % | |||||||
21
Table of Contents
| Additional Information | (unaudited) |
Information about Directors and Executive Officers:
The business and affairs of the Funds are managed under the direction of the Funds’ Board of Directors. Information pertaining to the Directors and officers of the Funds is set forth below.
Interested Directors and Executive Officers
Michael J. Cosgrove
Address c/o GEAM 3001 Summer St. Stamford, CT 06905
Age 62
Position(s) Held with Fund Chairman of the Board and President
Term of Office and Length of Time Served Until successor is elected and qualified – 14 years
Principal Occupation(s) During Past 5 years President and Chief Executive Officer – Mutual Funds and Intermediary Business at GEAM since March 2007; Executive Vice President of GEAM from February 1997 to March 2007; Vice President, GE Capital Corporation, an indirect wholly-owned subsidiary of GE, since December 1999; Executive Vice President – Mutual Funds of GEAM, a wholly-owned subsidiary of GE that is registered as an investment adviser under the Investment Advisers Act of 1940, as amended, since March 1993; President and Director of GE Investment Distributors, Inc., since June 2011. Director of GEAM since 1988.
Number of Portfolios in Fund Complex Overseen by Director 28
Other Directorships Held by Director Chairman of the Board and President of GE Institutional Funds since 1997; Trustee of Elfun Funds, GE Savings & Security Funds, General Relief and Loan Fund and General Electric Pension Trust since 1988; Trustee of Fordham University from 2002 to June 30, 2010 and since July 2011; Trustee of GE Volunteers since 1993; Director of GE Foundation; Director, GE Asset Management (Ireland) Limited, since February 1999, GE Asset Management Funds Plc since 1998, GE Asset Management Canada Company since 1998, GE Asset Management Limited since 1998 and GEAM since 1988; Chairman of the Board and President of GE Funds from 1993 to February 2011.
Matthew J. Simpson
Address c/o GEAM 3001 Summer St. Stamford, CT 06905
Age 50
Position(s) Held with Fund Director and Executive Vice President
Term of Office and Length of Time Served Until successor is elected and qualified – 3 years
Principal Occupation(s) During Past 5 years Executive Vice President, General Counsel and Secretary of GEAM since July 2007; Senior Vice President and General Counsel – Marketing and Client Services (formerly Asset Management Services) at GEAM and Senior Vice President and General Counsel of GE Asset Management Services from February 1997 to July 2007; Vice President and Associate General Counsel of GEAM from October 1992 to February 1997; Secretary of GE Funds from 1993 to July 2007 and Vice President from September 2003 to July 2007; Secretary of GE Institutional Funds and GE Investments Funds, Inc. from 1997 to July 2007; Secretary of Elfun Funds and GE Savings & Security Funds since July 2007; Assistant Secretary of Elfun Funds and GE Savings & Security Funds from 1998 to July 2007 and Vice President from October 2003 to July 2007.
Number of Portfolios in Fund Complex Overseen by Director 28
Other Directorships Held by Director Trustee of Elfun Funds, GE Savings & Security Funds and General Electric Pension Trust since July 2007; Trustee of GE Institutional Funds since April 2011 and Trustee of GE Funds from July 2007 to February 2011.
22
Table of Contents
| Additional Information | (unaudited) |
Joon Won Choe
Address c/o GEAM 3001 Summer St. Stamford, CT 06905
Age 41
Position(s) Held with Fund Vice President & Secretary
Term of Office and Length of Time Served Until successor is elected and qualified – Vice President and Secretary – less than 1 year
Principal Occupation(s) During Past 5 years Senior Vice President and Deputy General Counsel at GEAM since March 2011; Senior Vice President and Associate General Counsel at GEAM from June 2010 to March 2011; Vice President and Associate General Counsel at GEAM from November 2005 to June 2010; Vice President and Secretary of GE Institutional Funds and GE Investments Funds, Inc. since September 2010; Vice President and Assistant Secretary of Elfun Funds and GE Savings & Security Funds since September 2010.
Number of Portfolios in Fund Complex Overseen by Officer N/A
Other Directorships Held by Officer N/A
Robert Herlihy
Address c/o GEAM 3001 Summer St. Stamford, CT 06905
Age 43
Position(s) Held with Fund Chief Compliance Officer
Term of Office and Length of Time Served Until successor is elected and qualified – 5 years
Principal Occupation(s) During Past 5 years Chief Compliance Officer of GEAM, GE Institutional Funds, Elfun Funds, and GE Savings and Security Funds since July 2005; Chief Compliance Officer of GE Funds from July 2005 to February 2011; and Manager of Fund Administration at GEAM from 2002 – 2005.
Number of Portfolios in Fund Complex Overseen by Officer N/A
Other Directorships Held by Officer N/A
Arthur A. Jensen
Address c/o GEAM 3001 Summer St. Stamford, CT 06905
Age 44
Position(s) Held with Fund Treasurer
Term of Office and Length of Time Served Until successor is elected and qualified – less than 1 year
Principal Occupations(s) During Past 5 Years Treasurer of GE Institutional Funds, Elfun Funds and GE Savings and Security Funds since June 2011; Mutual Funds Controller of GEAM since April 2011; Senior Vice President at Citigroup from 2008 to 2010 and Vice President at JPMorgan from 2005 to 2008.
Number of Portfolios in Fund Complex Overseen by Officer N/A
Other Directorships Held by Officer N/A
23
Table of Contents
| Additional Information | (unaudited) |
Non-Interested Directors
John R. Costantino
Address c/o GEAM 3001 Summer St. Stamford, CT 06905
Age 65
Position(s) Held with Fund Director
Term of Office and Length of Time Served Until successor is elected and qualified – 14 years
Principal Occupation(s) During Past 5 years General Partner, NGN Capital LLC since 2006; Managing Director, Vice President of Walden Capital Management since 1996.
Number of Portfolios in Fund Complex Overseen by Director 20
Other Directorships Held by Director Director of GE Institutional Funds since 1997; Trustee of Fordham University from 1989-1995 and 2001-2007 and Trustee Emeritus since 2007; Trustee of Neuroscience Research Institute since 1986; Trustee of GE Funds from 1993 to February 2011; Trustee of Gregorian University Foundation from 1992-2007; Director of Artes Medical from 2006-2008.
R. Sheldon Johnson
Address c/o GEAM 3001 Summer St. Stamford, CT 06905
Age 64
Positions(s) Held with Fund Director
Term of office and Length of Time served Unit Successor is elected and qualified – less than 1 year.
Principal Occupation(s) During Past 5 years Managing Director at Morgan Stanley & Co.,Inc. from 1988 to 2006; Head of Global Institutional Equity Sales and Marketing at Morgan Stanley & Co., Inc. from 2002 to 2006.
Number of Portfolios in Fund Complex Overseen by Director 20
Other Directorships Held by Director Trustee of GE Institutional Funds since April 2011 and Trustee of St. Lawrence University since 2003.
Robert P. Quinn
Address c/o GEAM 3001 Summer St. Stamford, CT 06905
Age 75
Position(s) Held with Fund Director
Term of Office and Length of Time Served Until successor is elected and qualified – 14 years
Principal Occupation(s) During Past 5 years Retired since 1983 from Salomon Brothers Inc.
Number of Portfolios in Fund Complex Overseen by Director 20
Other Directorships Held by Director Trustee of GE Institutional Funds since 1997; Trustee of St. Francis Hospital since 1980; and Trustee of GE Funds from 1993 to February 2011.
The Statement of Additional Information for the Funds includes additional information about the Directors and Officers and is available, without charge, upon request by calling 1-800-242-0134.
24
Table of Contents
| Investment Team | (unaudited) |
Investment Adviser and Administrator
GE Asset Management Incorporated
Board of Directors
Michael J. Cosgrove, Chairman
John R. Costantino
R. Sheldon Johnson*
Robert P. Quinn
Matthew J. Simpson
Secretary
Joon Won Choe
Assistant Secretary
Michelle Matzelle
Treasurer
Arthur A. Jensen (effective June 6, 2011)
Assistant Treasurer
Casey Yantosca
Distributor
GE Investment Distributors, Inc.
Member FINRA and SIPC
Custodian
State Street Bank & Trust Company
Officers of the Investment Adviser
Dmitri Stockton, President and Chief Executive Officer (since May 2011)†
Cheryl H. Beacock, Senior Vice President, Human Resources
George A. Bicher, Chief Risk Officer
Paul M. Colonna, President and Chief Investment Officer – Fixed Income Investments
Michael J. Cosgrove, President and Chief Executive
Officer – Mutual Funds & Intermediary Business
Ralph R. Layman, President and Chief Investment Officer – Public Equity Investments
Maureen B. Mitchell, President – Institutional Sales and Marketing
Matthew J. Simpson, Executive Vice President, General Counsel and Secretary
Don W. Torey, President – Alternative Investments
John J. Walker, Executive Vice President, Chief Operating Officer
David Wiederecht, President and Chief Investment Officer – Investment Strategies
Tracie A. Winbigler, Executive Vice President, Chief Financial Officer (since January 2011)
| * | Mr. Johnson was elected as a Director of the Funds effective April 1, 2011. |
| † | Effective May 1, 2011, Mr. Stockton replaced James W. Ireland as President and Chief Executive Officer. |
At GE Asset Management, we’re dedicated to providing the investment options you’ll need to tailor your financial portfolio to every stage of your life. Each member of the GE Family of Funds is managed according to the same principles of integrity and quality that have guided GE over the past century, and have made it the world-class company that it is today. Each fund draws strength from a heritage of investment management experience that spans more than 80 years. Whether you’re creating a new investment portfolio or adding to an established one, the GE Family of Funds offers an array of professionally managed investment options that will help you meet a lifetime of financial needs.
25
Table of Contents
Investment Adviser
GE Asset Management Incorporated
3001 Summer Street
PO Box 7900
Stamford, CT 06904-7900
Distributor
GE Investment Distributors, Inc.
member FINRA and SIPC
3001 Summer Street
PO Box 7900
Stamford, CT 06904-7900
The Fund files its complete schedule of portfolio holdings with the Securities and Exchange Commission for the first and third quarters of each fiscal year on Form N-Q. The Fund’s Forms N-Q, as well as a description of the policies and procedures that the Fund uses to determine how to vote proxies (if any) relating to portfolio securities is available without charge (i) upon request, by calling 1-800-493-3042; (ii) on the Fund’s website at http://www.geam.com; and (iii) on the Commission’s website at http://www.sec.gov. The Fund’s Forms N-Q may be reviewed and copied at the Commission’s Public Reference Room in Washington, DC—information on the operation of the Public Reference Room may be obtained by calling 1-800-SEC-0330.
Information (if any) regarding how the Fund voted proxies relating to portfolio securities during the most recently disclosed 12-month period ended June 30 is available without charge (i) through the Fund’s website at http://www.geam.com; and (ii) on the Commission’s website at http://www.sec.gov.
Table of Contents
GE Investments Funds, Inc.
| Mid-Cap Equity Fund | Letter from the Chairman | |

Michael J. Cosgrove
Chairman,
GE Investments Funds, Inc.
Dear Shareholder:
Attached is the semi-annual report for GE Investments Funds, Inc. — Mid-Cap Equity Fund (the “Fund”) for the six-month period ended June 30, 2011. The report contains information about the performance of the Fund and other fund-specific data, along with portfolio manager commentary. We have provided
you with an overview of the investment markets, along with our investment outlook for the coming months.
Market Overview
Most major equity indices posted positive returns in the six-month period ended June 30, 2011, despite geopolitical tensions in the Middle East and North Africa, a devastating earthquake in Japan, ongoing concerns about unresolved sovereign debt issues in peripheral Europe and elevated inflation in emerging markets. Volatility increased in May and June, however, as some measures of global economic activity weakened and uncertainties over Greece’s ability to finance and service its debt rattled the financial markets. In the U.S., concerns over the end of quantitative easing by the Federal Reserve and political wrangling over the government debt ceiling further contributed to a challenging environment. The increase in risk aversion benefited the fixed income markets as many investors sought out safer investments. Toward the end of June, the Greek Parliament passed austerity measures that seemed to calm the markets and opened the way for the next round of financing from the European Central Bank and the International Monetary Fund.
Against this backdrop, financial markets posted positive results for the six- and 12-month periods ended June 30, 2011 as represented by the index returns in the below chart.
| Total Returns (%) as of June 30, 2011 | 6-month | 12-month | ||||||
U.S. equities (S&P 500 Index) | 6.0 | 30.7 | ||||||
Global equities (MSCI World Index) | 5.3 | 30.5 | ||||||
International equities (MSCI EAFE Index) | 5.0 | 30.4 | ||||||
Small-cap U.S. equities (Russell 2000 Index) | 6.2 | 37.4 | ||||||
Mid-cap U.S. equities (Russell Mid Cap Index) | 8.1 | 38.5 | ||||||
U.S. fixed income | 2.7 | 3.9 | ||||||
U.S. short-term government fixed income (Barclays Capital 1-3 Year U.S. Government Bond Index) | 0.9 | 1.4 | ||||||
Outlook
We remain constructive on the prospects for healthy global growth, although it may be at a slower pace than originally anticipated. Central banks in the U.S. and Europe remain accommodative and supply chain issues in Japan appear to have abated. There are also signs that inflation may be peaking in emerging markets as commodity prices have eased in recent months. Corporate balance sheets remain healthy and fundamentals remain intact, in our view. We believe that valuations for equities are not stretched and remain below historical averages while equity risk premiums are still high–offering the possibility for further gains. We expect that the financial markets are likely to remain volatile due to outstanding sovereign debt issues, but believe that returns are biased to the upside in the second half of the year.
Thank you for investing with GE Investments Funds.
Sincerely,

Michael J. Cosgrove
Chairman, GE Investments Funds, Inc.
July 2011
 |
This does not constitute a part of the Fund’s Shareholder Report
Table of Contents
GE Investments Funds, Inc.
| Mid-Cap Equity Fund | Letter from the Chairman (Continued) | |
Mike Cosgrove is President and Chief Executive Officer – Mutual Funds and Intermediary Business at GE Asset Management Incorporated (“GEAM”). In addition to the GE Investments Funds, he is also Chairman of the Board and President of GE Institutional Funds and Director and President of GEAM’s broker-dealer which serves as underwriter and distributor for the GE Investments Funds. Mr. Cosgrove serves as a Trustee of the GE Savings & Security Funds, the GE Foundation, and the GE Pension Trust. He also serves on the Board of Directors of the Skin Cancer Foundation and is a Trustee of Fordham University. Previously Chief Financial Officer of GE Asset Management and Assistant Treasurer – GE Company, Mr. Cosgrove joined GE in 1970 and held a number of managerial positions in finance and sales in the International Operation and the GE Trading Company. He received a BS in Economics from Fordham University and an MBA from St. John’s University.
GE Investment Distributors, Inc., Member of FINRA & SIPC, is the principal underwriter and distributor of the GE Investments Funds, Inc.
This does not constitute a part of the Fund’s Shareholder Report
Table of Contents
GE Investments Funds, Inc.
Mid-Cap Equity Fund
Semi-Annual Report
June 30, 2011

Table of Contents
| Mid-Cap Equity Fund | Contents | |
| 1 | ||||
| 2 | ||||
| 9 | ||||
Financial Statements | ||||
| 10 | ||||
| 11 | ||||
| 12 | ||||
| 13 | ||||
| 14 | ||||
| 19 | ||||
| 22 | ||||
| 25 | ||||
This report is prepared for Policyholders of certain variable contracts and may be distributed to others only if preceded or accompanied by the variable contract’s current prospectus and the current prospectus of the Fund available for investments thereunder.
Table of Contents
| Notes to Performance | June 30, 2011 (unaudited) |
The information provided on the performance pages relates to the GE Investments Mid-Cap Equity Fund (the “Fund”) and is unaudited.
Total returns take into account changes in share price and assume reinvestment of dividends and capital gains distributions, if any. Total returns shown are net of Fund fees and expenses but do not reflect fees and charges associated with the variable contracts such as administrative fees, account charges and surrender charges, which, if reflected, would reduce the Fund’s total returns for all periods shown.
The performance data quoted represents past performance; past performance does not guarantee future results. Investment return and principal value will fluctuate so your shares, when redeemed, may be worth more or less than their original cost. Current performance may be higher or lower than the performance data quoted. Periods less than one year are not annualized. Please call toll-free 800-493-3042 or visit the Fund’s website at http://www.geam.com for the most recent month-end performance data.
An investment in the Fund is not a deposit of any bank and is not insured or guaranteed by the Federal Deposit Insurance Corporation (FDIC) or any other government agency. An investment in the Fund is subject to risk, including possible loss of principal invested.
Russell MidCap Index is an unmanaged market capitalization-weighted index of the smallest 800 companies included in the Russell 1000 Index. The Russell 1000 Index comprises the 1,000 largest U.S. domiciled
companies. The results shown for the foregoing index assume the reinvestment of net dividends or interest. They do not reflect the actual cost of investing in the instruments that comprise the index.
Russell Investment Group owns the Russell Index data, including all applicable trademarks and copyrights, used by GE Asset Management Incorporated in these materials. Any unauthorized use or redistribution of such Russell Index data is strictly prohibited. Russell Investment Group is not responsible for the configuration of this material or for any inaccuracy in GE Asset Management Incorporated’s presentation thereof.
The peer universe of the underlying annuity funds used for the peer group average annual total return calculation is based on a blend of Morningstar peer categories, as shown. Morningstar is an independent mutual fund rating service. A Fund’s performance may be compared to or ranked within a universe of mutual funds with investment objectives and policies similar but not necessarily identical to that of the Fund.
©2011 Morningstar, Inc. All Rights Reserved. The Morningstar information contained herein: (1) is proprietary to Morningstar and/or its content providers; (2) may not be copied or distributed; and (3) is not warranted to be accurate, complete or timely. Neither Morningstar nor its content providers are responsible for any damage or losses relating from any use of this information. Past performance is no guarantee of future results.
GE Investment Distributors, Inc., Member of FINRA & SIPC, is the principal underwriter and distributor of the GE Investments Funds, Inc. and a wholly owned subsidiary of GE Asset Management Incorporated, the investment adviser of the Fund.
1
Table of Contents
| Mid-Cap Equity Fund | (unaudited) |

Diane M. Wehner
Senior Vice President
The Mid-Cap Equity Fund is managed by Diane M. Wehner. Ms. Wehner is a Senior Vice President of GE Asset Management and portfolio manager of the Fund. She has served in this capacity since September 2004. Before joining GE Asset Management, Ms. Wehner was a Vice President and senior portfolio manager from January 1997 to June 2001, and associate portfolio manager from May 1995 to January 1997, with Benefit Capital Management Corporation. Ms. Wehner has served as an analyst/portfolio manager in the investment management industry since 1985.
| Q. | How did the Mid-Cap Equity Fund perform compared to its benchmark and Morningstar peer group for the six month period ended June 30, 2011? |
| A. | For the six-month period ended June 30, 2011, the Mid-Cap Equity Fund returned 5.69% for Class 1 shares and 5.43% for Class 4 shares. The Russell Mid-Cap Index, the Fund’s benchmark, returned 8.08% and the Fund’s Morningstar peer group of 165 U.S. Insurance Mid-Cap Growth funds returned an average of 8.25% over the same period. |
| Q. | What market conditions impacted Fund performance? |
| A. | Year-to-date, the U.S. equity market appeared to play out much like 2010 when stocks hit the ground running in the first quarter, but stumbled as the perfect storm of global political and financial issues injected uncertainty into the outlook for the economic recovery. In April, stocks advanced to levels unseen since July 2007 bolstered by strong Q1 corporate earnings results. Despite this positive momentum in economic growth, within the U.S., manufacturing activity pulled back due in part to supply constraints in the aftermath of the devastating Japanese earthquake and tsunami. In addition, severe weather, higher gasoline prices and the depressed housing market in the U.S. weighed heavily on consumer confidence. Finally, continued unrest in the Middle East and more recently |
| the re-emerging concerns around European Sovereign debt contagion has added to the uncertainty about the global economic recovery. Company managements paused to reassess their growth plans resulting in a slowdown in job growth, an increase in the unemployment rate and deteriorating economic statistics. |
| While more cyclical sectors outperformed in the first calendar quarter, a defensive shift characterized the markets as mid-year approached. Given our expectation in the early part of 2011 that the economic recovery in the U.S. was on a gradual upward trajectory, we continued the process begun mid-year 2010 to invest in higher quality industrial companies with both secular growth in earnings and leverage to an economic recovery. We were underweight more defensive sectors such as consumer staples and utilities, which have outperformed year-to-date. Despite the market’s shift toward defensively positioned sectors, higher quality stocks as measured by return on equity (which we favor) underperformed within the midcap space. The information technology sector where the Fund maintained an overweight position also lagged as investors seemed to question the strength of the recovery. Health care was the strongest sector in the Russell MidCap Index, followed by consumer staples, consumer discretionary and utilities for the period. |
| Performance correlation, though reduced, is still historically high for midcap stocks. Thus top-down factors have continued to dominate individual stock performance rather than company-specific fundamentals. In this environment, active managers continue to struggle with less than a third of managers outperforming the benchmark on a year-to-date basis. Offsetting this to a certain extent has been the ongoing active mergers and acquisitions environment where the Fund benefitted from an acquisition in the technology space and rumored buyouts in various other industries. |
2
Table of Contents
(unaudited) |

| Q. | What were the primary drivers of Fund performance? |
| A. | The Fund’s overweight in information technology companies, which as a group underperformed the benchmark, detracted from performance. More specifically, semiconductor companies, Cree (-49%) and Marvel (-20%), were pressured due to increased inventories and specifically for Cree, an LED lighting company, severe pricing pressure in the low end segment of the market. Software company Rovi Corp. (-8%), a digital media company and the Fund’s largest holding, took a breather after its 95% move upward in 2010 due to concerns surrounding the adoption of the company’s new digital media search guide called TotalGuide. These stocks’ underperformance more than offset the meaningful outperformance of Chinese internet company Baidu (an American Depository Receipt); +45% which continued to deliver good revenue and earnings growth and Telvent (+51%), which was acquired during the quarter. Within the consumer discretionary sector, Urban Outfitters (-21%) reported weaker than expected financial results as it copes with elevated store inventory and increased markdowns. Within the industrials sector, Corrections Corp. (-14%), a private prisons operator, declined as concerns rose about its exposure to California and that State’s budgetary issues. |
| The Fund’s performance was enhanced by stocks within the financials and energy sectors. In the financials sector, CB Richard Ellis Group (+23%) outperformed due to a improving leasing environment and improving demand for commercial real estate globally. Within the energy sector, Petrohawk Energy (+35%), an exploration and production company, continued to make progress towards transitioning its production mix from natural gas to oil, disclosing drilling results that have exceeded |
| expectations and unveiling acreage in a new oil field. Dresser-Rand (+26%), an energy equipment company, benefitted as the upstream capital equipment cycle gained momentum. Also adding to performance were several stocks within healthcare. Specifically, biotech companies Vertex (+48%), Incyte (+14%) and Alexion (+17%) benefitted from a combination of important drug approvals, positive clinical results and expanded use of commercialized drugs. Within medical technology, Illumina (+19%), a genetic instrumentation company, delivered excellent growth in revenue and earnings resulting from increased adoption of its newest DNA sequencing gene analyzers. These gains were offset however by Medassets (-33%) due to disappointing first quarter earnings and the Fund’s underweight in the managed care segment which has been is benefitting from low healthcare utilization. |
| Q. | How was the Fund positioned at the end of the fiscal period? |
| A. | Believing that we have been experiencing a mid-cycle slowdown and that the economy is on a sustainable growth trajectory-albeit a slow one- we increased the Fund’s weighting in industrials, consumer discretionary, and financials. We reduced our exposure to information technology and materials. We continue to believe that stock selection should matter over the long run. Therefore, we continue to focus on investing in attractively valued companies with strong balance sheets, experienced management teams, solid earnings prospects, leading market shares, and superior long-term fundamentals. With an emphasis on growth, we continue to look to invest in innovative companies that provide prospects for above-average earnings growth. Therefore, healthcare and information technology companies represented a meaningful percentage of the Fund’s holdings at the end of the period. |
3
Table of Contents
| Mid-Cap Equity Fund | (unaudited) |
Understanding Your Fund’s Expenses
As a shareholder of the Fund you incur ongoing costs. Ongoing costs include portfolio management fees, distribution and services fees (for Class 4 shares), professional fees, administrative fees and other Fund expenses. The following example is intended to help you understand your ongoing costs (in dollars) of investing in the Fund and to compare these costs with the ongoing costs of investing in other mutual funds.
To illustrate these ongoing costs, we have provided an example and calculated the expenses paid by investors in each share class of the Fund during the period. The information in the following table is based on an investment of $1,000, which is invested at the beginning of the period and held for the entire six-month period ended June 30, 2011.
Actual Expenses
The first section of the table provides information about actual account values and actual expenses. You may use the information in this section, together with the amount you invested, to estimate the expenses that you paid over the period. To do so, simply divide your account value by $1,000 (for example, an $8,600 account value divided by $1,000 = 8.6), then multiply the result by the
number given for your class under the heading “Expenses Paid During Period.”
Hypothetical Example for Comparison Purposes
The second section of the table provides information about hypothetical account values and hypothetical expenses based on the Fund’s actual expense ratio and an assumed rate of return of 5% per year before expenses, which is not the Fund’s actual return. The hypothetical account values and expenses may not be used to estimate the actual ending account balance or expenses you paid for the period. You may use this information to compare the ongoing costs of investing in the Fund and other funds. To do so, compare this 5% hypothetical example with the 5% hypothetical examples that appear in the shareholders reports of other funds.
Please note that the expenses shown in the table are meant to highlight and help you compare ongoing costs only and do not reflect any transaction costs, such as sales charges or redemption fees, if any. Additionally, the expenses shown do not reflect the fees or charges associated with variable contracts through which shares of the Fund are offered.
January 1, 2011 – June 30, 2011
| Account value at the beginning of the period ($) | Account value at the end of the period ($) | Expenses paid during the period ($)* | ||||||||||
Actual Fund Return** |
| |||||||||||
Class 1 | 1,000.00 | 1,056.87 | 3.98 | |||||||||
Class 4 | 1,000.00 | 1,054.27 | 6.32 | |||||||||
Hypothetical 5% Return (2.5% for the period) |
| |||||||||||
Class 1 | 1,000.00 | 1,020.71 | 3.91 | |||||||||
Class 4 | 1,000.00 | 1,018.47 | 6.21 | |||||||||
| * | Expenses are equal to the Fund’s annualized expense ratio of 0.78% for Class 1 shares 1.24% for Class 4 shares (for the period January 1, 2011—June 30, 2011), multiplied by the average account value over the period, multiplied by 181/365 (to reflect the six month period) |
| ** | Actual Fund Returns for the six-month period ended June 30, 2011 were as follows: 5.69% for Class 1 shares, and 5.43% for Class 4 shares. Past performance does not guarantee future results. |
4
Table of Contents
| Mid-Cap Equity Fund | (unaudited) |
Investment Profile
A mutual fund designed for investors who seek long-term growth of capital and future income. The Fund seeks its objective by investing at least 80% of its net assets under normal circumstances in equity securities of mid-cap companies, such as common and preferred stocks. The Fund invests primarily in mid-cap companies the portfolio manager believes are undervalued by the market and have above-average growth potential.
Morningstar Performance Comparison
Based on average annual returns for periods ended June 30, 2011
| Six Months** | One Year | Three Year | Five Year | Ten Year | ||||||||||||||||
Number of Funds in peer group: | 165 | 165 | 158 | 154 | 124 | |||||||||||||||
Peer group average annual total return: | 8.25% | 40.55% | 5.56% | 5.59% | 4.07% | |||||||||||||||
Morningstar category in peer group: U.S. Insurance Mid-Cap Growth |
| |||||||||||||||||||
Sector Allocation
as a % of Fair Value(b) of $90,126 (in thousands) on June 30, 2011(b)(c)
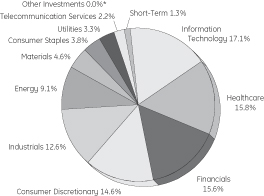
Top Ten Largest Holdings
as of June 30, 2011 (as a % of Fair Value)(b)(c)
Rovi Corp. | 2.41% | |||
HCC Insurance Holdings Inc. | 2.30% | |||
ITC Holdings Corp. | 2.29% | |||
Harsco Corp. | 2.15% | |||
Coach Inc. | 2.05% | |||
CB Richard Ellis Group Inc. (REIT) | 2.03% | |||
Illumina Inc. | 2.02% | |||
Catalyst Health Solutions Inc. | 1.98% | |||
Affiliated Managers Group Inc. | 1.87% | |||
Citrix Systems Inc. | 1.82% |
Change in Value of a $10,000 Investment
Class 1 Shares
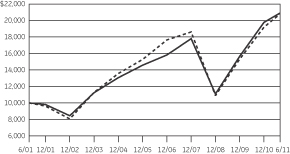
Average Annual Total Return
for the Periods Ended June 30, 2011
Class 1 Shares (Inception date: 5/1//97)
| Six Months** | One Year | Five Year | Ten Year | Ending Value of a $10,000 investment(a) | ||||||||||||||||
Mid-Cap | 5.69% | 38.69% | 6.96% | 7.65% | $ | 20,900 | ||||||||||||||
Russell Midcap Index | 8.08% | 38.47% | 5.31% | 7.59% | $ | 20,775 | ||||||||||||||
Change in Value of a $10,000 Investment
Class 4 Shares
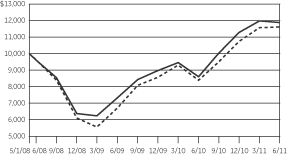
Average Annual Total Returns
for the Periods Ended June 30,2011
Class 4 Shares (Inception date: 5/1/08)
| Six Months** | One Year | Three Year | Since Incep tion | Ending Value of a $10,000 invest ment(a) | ||||||||||||||||
Mid-Cap Equity Fund | 5.43% | 38.07% | 7.38% | 5.59% | $ | 11,880 | ||||||||||||||
Russell Midcap Index | 8.08% | 38.47% | 6.46% | 4.81% | $ | 11,604 | ||||||||||||||

| (a) | Ending Value of a $10,000 investment for the ten-year period or since inception, whichever is less. |
| (b) | The securities information regarding holdings, allocations and other characteristics is presented to illustrate examples of securities that the Fund has bought and the diversity of areas in which the Fund may invest as of a particular date. It may not be representative of the Fund’s current or future investments and should not be construed as a recommendation to purchase or sell a particular security. |
| (c) | Fair value basis is inclusive of Short-Term Investment in GE Institutional Money Market Fund. |
| * | Less than 0.01%. |
| ** | Total returns for the six month period ended June 30, 2011 are not annualized. |
See Notes to Performance on page 1 for further information, including an explanation of Morningstar peer categories.
Past performance does not predict future performance and the graph and table do not reflect the deduction of taxes that a shareholder would pay on Fund distributions or the redemption of Fund shares and does not reflect the fees or charges that would be associated with variable contracts through which shares of the Fund are offered.
5
Table of Contents
Mid-Cap Equity Fund
| Schedule of Investments | June 30, 2011 (unaudited) |
Mid-Cap Equity Fund
| Number of Shares | Fair Value | |||||||||
Common Stock — 99.0%† |
| |||||||||
Advertising — 1.5% |
| |||||||||
Omnicom Group Inc. | 27,100 | $ | 1,305,136 | |||||||
Aerospace & Defense — 2.0% |
| |||||||||
Alliant Techsystems Inc. | 14,256 | 1,016,880 | (c) | |||||||
Hexcel Corp. | 37,197 | 814,242 | (a) | |||||||
| 1,831,122 | ||||||||||
Air Freight & Logistics — 0.6% |
| |||||||||
UTi Worldwide Inc. | 25,257 | 497,310 | ||||||||
Apparel Retail — 0.8% |
| |||||||||
Urban Outfitters Inc. | 26,811 | 754,730 | (a) | |||||||
Apparel, Accessories & Luxury Goods — 2.1% |
| |||||||||
Coach Inc. | 28,886 | 1,846,682 | ||||||||
Application Software — 2.7% |
| |||||||||
Blackboard Inc. | 12,232 | 530,747 | (a) | |||||||
Citrix Systems Inc. | 20,505 | 1,640,400 | (a) | |||||||
SuccessFactors Inc. | 9,101 | 267,569 | (a) | |||||||
| 2,438,716 | ||||||||||
Asset Management & Custody Banks — 3.0% |
| |||||||||
Affiliated Managers Group Inc. | 16,598 | 1,683,867 | (a) | |||||||
Invesco Ltd. | 44,537 | 1,042,166 | ||||||||
| 2,726,033 | ||||||||||
Automotive Retail — 1.6% |
| |||||||||
O’Reilly Automotive Inc. | 21,588 | 1,414,230 | (a) | |||||||
Biotechnology — 4.2% |
| |||||||||
Alexion Pharmaceuticals Inc. | 21,983 | 1,033,861 | �� | |||||||
Human Genome Sciences Inc. | 31,441 | 771,563 | (a) | |||||||
Incyte Corp Ltd. | 31,648 | 599,413 | (a) | |||||||
Vertex Pharmaceuticals Inc. | 26,713 | 1,388,809 | (a) | |||||||
| 3,793,646 | ||||||||||
Broadcasting — 0.9% |
| |||||||||
Discovery Communications Inc. (Class A) | 8,103 | 331,899 | (a) | |||||||
Discovery Communications Inc. (Class C) | 13,583 | 496,459 | (a) | |||||||
| 828,358 | ||||||||||
Cable & Satellite — 1.3% |
| |||||||||
Liberty Global Inc. | 27,655 | 1,180,869 | (a) | |||||||
| Number of Shares | Fair Value | |||||||||
Casinos & Gaming — 1.4% |
| |||||||||
Penn National Gaming Inc. | 31,911 | $ | 1,287,290 | (a) | ||||||
Coal & Consumable Fuels — 1.0% |
| |||||||||
Peabody Energy Corp. | 15,080 | 888,363 | ||||||||
Communications Equipment — 1.4% |
| |||||||||
Juniper Networks Inc. | 38,630 | 1,216,845 | (a) | |||||||
Computer Storage & Peripherals — 1.2% |
| |||||||||
Synaptics Inc. | 41,701 | 1,073,384 | (a) | |||||||
Construction & Engineering — 1.1% |
| |||||||||
Quanta Services Inc. | 47,307 | 955,601 | (a) | |||||||
Construction & Farm Machinery & Heavy Trucks — 0.8% |
| |||||||||
Cummins Inc. | 6,975 | 721,843 | ||||||||
Diversified Financial Services — 1.1% |
| |||||||||
Comerica Inc. | 28,668 | 991,053 | ||||||||
Electric Utilities — 2.3% |
| |||||||||
ITC Holdings Corp. | 28,813 | 2,067,909 | (c) | |||||||
Electrical Components & Equipment — 1.1% |
| |||||||||
Cooper Industries PLC | 16,369 | 976,738 | ||||||||
Fertilizers & Agricultural Chemicals — 1.4% |
| |||||||||
Intrepid Potash Inc. | 17,792 | 578,240 | (a) | |||||||
Monsanto Co. | 8,902 | 645,751 | (c) | |||||||
| 1,223,991 | ||||||||||
Healthcare Equipment — 2.2% |
| |||||||||
Gen-Probe Inc. | 8,710 | 602,296 | (a) | |||||||
Masimo Corp. | 44,530 | 1,321,651 | ||||||||
| 1,923,947 | ||||||||||
Healthcare Services — 2.0% |
| |||||||||
Catalyst Health Solutions Inc. | 31,949 | 1,783,393 | (a) | |||||||
Healthcare Technology — 0.7% |
| |||||||||
MedAssets Inc. | 44,950 | 600,532 | (a) | |||||||
Home Building — 0.8% |
| |||||||||
MDC Holdings Inc. | 28,944 | 713,181 | ||||||||
Home Entertainment Software — 1.4% |
| |||||||||
Activision Blizzard Inc. | 106,787 | 1,247,272 | ||||||||
Home Furnishing Retail — 1.8% |
| |||||||||
Bed Bath & Beyond Inc. | 27,714 | 1,617,666 | (a) | |||||||
See Notes to Schedule of Investments and Notes to Financial Statements.
6
Table of Contents
Mid-Cap Equity Fund
| Schedule of Investments | June 30, 2011 (unaudited) |
| Number of Shares | Fair Value | |||||||||
Hotels, Resorts & Cruise Lines — 1.1% |
| |||||||||
Royal Caribbean Cruises Ltd. | 27,191 | $ | 1,023,469 | (a) | ||||||
Independent Power Producers & Energy Traders — 1.1% |
| |||||||||
The AES Corp. | 73,445 | 935,690 | (a) | |||||||
Industrial Machinery — 2.2% |
| |||||||||
Harsco Corp. | 59,529 | 1,940,645 | ||||||||
Internet Retail — 0.1% |
| |||||||||
HomeAway Inc. | 2,316 | 89,629 | (a) | |||||||
Internet Software & Services — 4.2% |
| |||||||||
Baidu Inc. ADR | 6,496 | 910,284 | (a) | |||||||
Equinix Inc. | 9,779 | 987,874 | (a) | |||||||
MercadoLibre Inc. | 12,875 | 1,021,502 | ||||||||
Monster Worldwide Inc. | 55,179 | 808,924 | (a) | |||||||
| 3,728,584 | ||||||||||
IT Consulting & Other Services — 0.7% |
| |||||||||
Telvent GIT S.A. | 16,804 | 668,800 | (a) | |||||||
Life Sciences Tools & Services — 6.8% |
| |||||||||
Covance Inc. | 20,409 | 1,211,682 | (a) | |||||||
Illumina Inc. | 24,235 | 1,821,261 | (a) | |||||||
Mettler-Toledo International Inc. | 8,710 | 1,469,115 | (a,c) | |||||||
Thermo Fisher Scientific Inc. | 25,197 | 1,622,435 | (a,c) | |||||||
| 6,124,493 | ||||||||||
Movies & Entertainment — 0.8% |
| |||||||||
Liberty Media Corporation — Capital | 8,191 | 702,378 | (a) | |||||||
Multi-Line Insurance — 2.3% |
| |||||||||
HCC Insurance Holdings Inc. | 65,866 | 2,074,779 | ||||||||
Office (REITs) — 1.6% |
| |||||||||
Douglas Emmett Inc. | 39,474 | 785,138 | ||||||||
SL Green Realty Corp. | 8,244 | 683,181 | ||||||||
| 1,468,319 | ||||||||||
Oil & Gas Drilling — 1.1% |
| |||||||||
Noble Corp. | 25,317 | 997,743 | ||||||||
Oil & Gas Equipment & Services — 3.3% |
| |||||||||
Dresser-Rand Group Inc. | 25,664 | 1,379,440 | (a) | |||||||
McDermott International Inc. | 32,627 | 646,341 | (a) | |||||||
Weatherford International Ltd. | 49,901 | 935,644 | (a) | |||||||
| 2,961,425 | ||||||||||
Oil & Gas Exploration & Production — 3.7% |
| |||||||||
Petrohawk Energy Corp. | 44,304 | 1,092,979 | (a) | |||||||
Pioneer Natural Resources Co. | 11,777 | 1,054,866 | ||||||||
Quicksilver Resources Inc. | 48,872 | 721,351 | (a) | |||||||
Ultra Petroleum Corp. | 10,541 | 482,778 | (a) | |||||||
| 3,351,974 | ||||||||||
| Number of Shares | Fair Value | |||||||||
Packaged Foods & Meats — 1.9% |
| |||||||||
McCormick & Company Inc. | 17,938 | $ | 889,186 | (c) | ||||||
Mead Johnson Nutrition Co. | 12,543 | 847,279 | ||||||||
| 1,736,465 | ||||||||||
Personal Products — 0.8% |
| |||||||||
Avon Products Inc. | 25,571 | 715,988 | ||||||||
Property & Casualty Insurance — 1.3% |
| |||||||||
ACE Ltd. | 17,235 | 1,134,408 | ||||||||
Real Estate Services — 2.0% |
| |||||||||
CB Richard Ellis Group Inc. (REIT) | 72,808 | 1,828,209 | (a,c) | |||||||
Regional Banks — 0.7% |
| |||||||||
Zions Bancorp. | 27,639 | 663,612 | ||||||||
Research & Consulting Services — 2.1% |
| |||||||||
FTI Consulting Inc. | 14,380 | 545,577 | (a) | |||||||
IHS Inc. | 16,322 | 1,361,581 | (a) | |||||||
| 1,907,158 | ||||||||||
Restaurants — 0.4% |
| |||||||||
Arcos Dorados Holdings Inc. | 16,475 | 347,457 | ||||||||
Security & Alarm Services — 1.5% |
| |||||||||
Corrections Corporation of America | 60,240 | 1,304,196 | (a) | |||||||
Semiconductors — 3.2% |
| |||||||||
Cree Inc. | 12,696 | 426,459 | (a) | |||||||
Hittite Microwave Corp. | 22,669 | 1,403,438 | (a) | |||||||
Marvell Technology Group Ltd. | 69,980 | 1,033,255 | (a) | |||||||
| 2,863,152 | ||||||||||
Soft Drinks — 1.1% |
| |||||||||
Coca-Cola Enterprises Inc. | 33,368 | 973,678 | ||||||||
Specialized Finance — 1.4% |
| |||||||||
CBOE Holdings Inc. | 25,577 | 629,195 | ||||||||
MSCI Inc. | 17,097 | 644,215 | (a) | |||||||
| 1,273,410 | ||||||||||
Specialty Chemicals — 1.5% |
| |||||||||
Cytec Industries Inc. | 11,431 | 653,739 | ||||||||
Nalco Holding Co. | 25,510 | 709,433 | ||||||||
| 1,363,172 | ||||||||||
Steel — 1.7% |
| |||||||||
Allegheny Technologies Inc. | 17,705 | 1,123,736 | ||||||||
Steel Dynamics Inc. | 27,357 | 444,551 | ||||||||
| 1,568,287 | ||||||||||
Systems Software — 2.4% |
| |||||||||
Rovi Corp. | 37,911 | 2,174,575 | (a) | |||||||
See Notes to Schedule of Investments and Notes to Financial Statements.
7
Table of Contents
Mid-Cap Equity Fund
| Schedule of Investments | June 30, 2011 (unaudited) |
| Number of Shares | Fair Value | |||||||||
Thrifts & Mortgage Finance — 2.1% |
| |||||||||
BankUnited Inc. | 20,161 | $ | 535,073 | |||||||
People’s United Financial Inc. | 100,137 | 1,345,840 | ||||||||
| 1,880,913 | ||||||||||
Trading Companies & Distributors — 1.3% |
| |||||||||
MSC Industrial Direct Co. | 17,683 | 1,172,560 | ||||||||
Wireless Telecommunication Services — 2.2% |
| |||||||||
American Tower Corp. | 27,073 | 1,416,730 | (a) | |||||||
NII Holdings Inc. | 14,112 | 598,067 | (a) | |||||||
| 2,014,797 | ||||||||||
Total Common Stock | 88,895,805 | |||||||||
Other Investments — 0.0%* |
| |||||||||
GEI Investment Fund | 20,954 | (d) | ||||||||
Total Investments in Securities |
| 88,916,759 | ||||||||
Short-Term Investments — 1.3% | ||||||||||
GE Institutional Money Market Fund Investment Class 0.10% | 1,209,663 | (b,d) | ||||||||
Total Investments | 90,126,422 | |||||||||
Liabilities in Excess of Other Assets, net — (0.3)% | (250,709 | ) | ||||||||
|
| |||||||||
NET ASSETS — 100.0% | $ | 89,875,713 | ||||||||
|
| |||||||||
Other Information | ||||||||||
The Fund had the following long futures contracts open at June 30, 2011 (unaudited):
| Description | Expiration date | Number of Contracts | Current Notional Value | Unrealized Appreciation | ||||||||||||
S&P Midcap 400 Emini Index Futures | September 2011 | 2 | $ | 195,300 | $ | 6,944 | ||||||||||
See Notes to Schedule of Investments and Notes to Financial Statements.
8
Table of Contents
| Notes to Schedule of Investments | June 30, 2011 (unaudited) |
The views expressed in this document reflect our judgment as of the publication date and are subject to change at any time without notice. The securities information regarding holdings, allocations and other characteristics are presented to illustrate examples of securities that the Fund have bought and the diversity of areas in which the Fund may invest as of a particular date. It may not be representative of the Fund’s current or future investments and should not be construed as a recommendation to purchase or sell a particular security. See the Fund’s summary prospectus and statutory prospectus for complete descriptions of investment objectives, policies, risks and permissible investments.
| (a) | Non-income producing security. |
| (b) | Coupon amount represents effective yield. |
| (c) | At June 30, 2011, all or a portion of this security was pledged to cover collateral requirements for futures, options, forward foreign currency contracts and/or TBA’s. |
| (d) | GE Asset Management, the investment adviser of the Fund, also serves as investment adviser of the GEI Investment Fund and the GE Institutional Money Market Fund. |
| † | Percentages are based on net assets as of June 30, 2011. |
| * | Less than 0.05%. |
Abbreviations:
ADR | American Depository Receipt | |
REIT | Real Estate Investment Trust | |
9
Table of Contents
Selected data based on a share outstanding throughout the fiscal years indicated
| CLASS 1 | CLASS 4 | |||||||||||||||||||||||||||||||||||||||||
| 6/30/11† | 12/31/10 | 12/31/09 | 12/31/08 | 12/31/07 | 12/31/06 | 6/30/11† | 12/31/10 | 12/31/09 | 12/31/08 | |||||||||||||||||||||||||||||||||
| Inception date | — | — | — | — | — | 5/1/97 | — | — | — | 5/1/08 | ||||||||||||||||||||||||||||||||
Net asset value, beginning of period | $ | 18.64 | $ | 14.82 | $ | 10.50 | $ | 17.30 | $ | 18.19 | $ | 19.22 | $ | 18.61 | $ | 14.81 | $ | 10.51 | $ | 16.85 | ||||||||||||||||||||||
Income/(loss) from investment operations: | ||||||||||||||||||||||||||||||||||||||||||
Net investment income | 0.03 | 0.06 | ** | 0.09 | 0.10 | 0.08 | 0.23 | (0.02) | (0.01) | ** | (0.05) | (0.01) | ** | |||||||||||||||||||||||||||||
Net realized and unrealized gains/(losses) on investments | 1.03 | 3.82 | 4.26 | (6.65) | 2.23 | 1.40 | 1.03 | 3.81 | 4.35 | (6.12) | ||||||||||||||||||||||||||||||||
Total income/(loss) from investment operations | 1.06 | 3.88 | 4.35 | (6.55) | 2.31 | 1.63 | 1.01 | 3.80 | 4.30 | (6.13) | ||||||||||||||||||||||||||||||||
Less distributions from: | ||||||||||||||||||||||||||||||||||||||||||
Net investment income | — | 0.06 | 0.03 | 0.05 | 0.07 | 0.22 | — | — | — | 0.01 | ||||||||||||||||||||||||||||||||
Net realized gains | — | — | — | 0.20 | 3.13 | 2.44 | — | — | — | 0.20 | ||||||||||||||||||||||||||||||||
Total distributions | — | 0.06 | 0.03 | 0.25 | 3.20 | 2.66 | — | — | — | 0.21 | ||||||||||||||||||||||||||||||||
Net asset value, | $ | 19.70 | $ | 18.64 | $ | 14.82 | $ | 10.50 | $ | 17.30 | $ | 18.19 | $ | 19.62 | $ | 18.61 | $ | 14.81 | $ | 10.51 | ||||||||||||||||||||||
TOTAL RETURN (a) | 5.69% | 26.18% | 41.45% | (37.82)% | 12.60% | 8.40% | 5.43% | 25.66% | 40.91% | (36.36)% | ||||||||||||||||||||||||||||||||
RATIOS/SUPPLEMENTAL DATA: | ||||||||||||||||||||||||||||||||||||||||||
Net assets, end of period (in thousands) | $ | 89,864 | $97,829 | $92,374 | $81,791 | $191,339 | $199,311 | $ | 12 | $11 | $9 | $6 | ||||||||||||||||||||||||||||||
Ratios to average net assets: | ||||||||||||||||||||||||||||||||||||||||||
Net investment income | 0.30% | * | 0.35% | 0.19% | 0.29% | 0.35% | 1.01% | (0.17)% | * | (0.06)% | (0.22)% | (0.05)% | * | |||||||||||||||||||||||||||||
Net expenses | 0.78% | (b)* | 0.71% | (b) | 0.80% | (b) | 0.73% | (b) | 0.70% | (b) | 0.69% | (b) | 1.24% | (b)* | 1.13% | (b) | 1.25% | (b) | 1.18% | (b)* | ||||||||||||||||||||||
Gross expenses | 0.78% | * | 0.71% | 0.80% | 0.73% | 0.70% | 0.69% | 1.24% | * | 1.13% | 1.25% | 1.18% | * | |||||||||||||||||||||||||||||
Portfolio turnover rate | 14% | 31% | 24% | 49% | 65% | 29% | 14% | 31% | 24% | 49% | ||||||||||||||||||||||||||||||||
Notes to Financial Highlights
| (a) | Total returns are historical and assume changes in share price, reinvestment of dividends and capital gains distributions, and do not include the effect of insurance contract charges. Past performance does not guarantee future results. |
| (b) | Reflects GE Asset Management’s waiver of a portion of the Fund’s management fee in an amount equal to the management fee earned by GEAM with respect to the Fund’s investment in the GE Money Market Fund and/or GE Institutional Money Market Fund. Excluding waiver, the expense ratios would be unchanged. |
| * | Annualized for periods less than one year. |
| ** | Per share values have been calculated using the average share method. |
| † | Unaudited |
The accompanying Notes are an integral part of these financial statements.
10
Table of Contents
The accompanying Notes are an integral part of these financial statements.
11
Table of Contents
The accompanying Notes are an integral part of these financial statements.
12
Table of Contents
| * | Unaudited |
The accompanying Notes are an integral part of these financial statements.
13
Table of Contents
| Notes to Financial Statements | June 30, 2011 (unaudited) |
1. Organization of the Company
GE Investments Funds, Inc. (the “Company”) was incorporated under the laws of the Commonwealth of Virginia on May 14, 1984 and is registered under the Investment Company Act of 1940, as amended (the “1940 Act”), as an open-end management investment company. The Company is composed of fourteen investment portfolios (collectively the “Funds”), although only the following eleven are currently being offered: U.S. Equity Fund, S&P 500 Index Fund, Premier Growth Equity Fund, Core Value Equity Fund, Mid-Cap Equity Fund (the “Fund”), Small-Cap Equity Fund, International Equity Fund, Total Return Fund, Income Fund, Money Market Fund and Real Estate Securities Fund.
Shares of the Funds of the Company are offered only to insurance company separate accounts that fund certain variable life insurance contracts and variable annuity contracts. GE Asset Management Incorporated (“GEAM”), is the investment adviser and administrator of each of the Funds.
The Company currently offers two share classes (Class 1 and Class 4) of the Fund. Class 4 shares were first offered on May 1, 2008, and Fund shares outstanding prior to May 1, 2008 were designated as Class 1 shares. Each share class has different fees and expenses, and as a result, each share class will have different share price and performance. Not all variable contracts offer both share classes of the Fund.
| 2. | Summary of Significant Accounting Policies |
The preparation of financial statements in conformity with U.S. generally accepted accounting principles (GAAP) requires management to make estimates and assumptions that affect the reported amounts of assets and liabilities and disclosure of contingent assets and liabilities at the date of the financial statements and the reported amounts of increases and decreases in net assets from operations during the reporting period. Actual results may differ from those estimates.
Subsequent events after the balance sheet date through the date the financial statements were issued, have been evaluated in the preparation of the financial statements. There are no items to report.
The following summarizes the significant accounting policies of the Company:
Securities Valuation and Transactions. All investments in securities are recorded at their estimated fair value, as described in Note 3.
Securities transactions are accounted for as of the trade date. Realized gains and losses on investments sold are recorded on the basis of identified cost for both financial statement and federal tax purposes.
The Fund’s income, expenses (other than distribution fees) and realized and unrealized gains and losses are allocated proportionally each day among the share classes based upon the relative net assets of each class.
Derivatives The Fund is subject to equity price risk in the normal course of pursuing its investment objective. The Fund entered into derivative transactions to gain market exposure for residual and accumulating cash positions.
Futures Contracts A futures contract represents a commitment for the future purchase or sale of an asset at a specified price on a specified date. The Fund invests in stock index futures contracts subject to certain limitations to manage its exposure to the stock markets. Buying futures tends to increase a Fund’s exposure to the underlying instrument while selling futures tends to decrease a Fund’s exposure to the underlying instrument or to hedge other Fund investments. The Fund will not enter into a transaction involving futures for speculative purposes. With futures contracts, there is minimal counterparty credit risk to the Fund since futures contracts are exchange traded and the exchange’s clearinghouse, as counterparty to all traded futures, guarantees the futures against default. The Fund’s risks in using these contracts include changes in the value of the underlying instruments, non- performance of the counterparties under the contracts’ terms and changes in the liquidity of the secondary market for the contracts. Futures contracts are valued at the settlement price established each day by the board of trade or exchange on which they principally trade.
Upon entering into a financial futures contract, the Fund is required to pledge to the broker an amount of cash and/or other assets equal to a certain percentage of the contract amount, known as initial margin deposit. Subsequent payments, known as variation margin, are made or received by the Fund each day, depending on the daily fluctuation in the fair value of the underlying security. The Fund records an unrealized gain or loss equal to the daily variation margin. Should market conditions move unexpectedly, the Fund may not achieve the anticipated benefits of the futures contracts and may incur a loss. The Fund recognizes a realized gain or loss upon the expiration or closing of a futures contract.
14
Table of Contents
| Notes to Financial Statements | June 30, 2011 (unaudited) |
Investment Income Corporate actions (including cash dividends) are recorded on the ex-dividend date, net of applicable withholding taxes, except for certain foreign corporate actions which are recorded as soon after ex-dividend date as such information becomes available. Interest income is recorded on the accrual basis.
Expenses Fund specific expenses are allocated to the Fund that incurs such expenses. Such expenses may include custodial fees, legal and accounting fees, printing costs and registration fees. Expenses that are not fund specific are allocated pro rata across the Funds. Certain class specific expenses (such as distribution fees) are allocated to the class that incurs such expense. Expenses of the Fund are generally paid directly by the Fund however, expenses may be paid by GEAM and reimbursed by the fund.
Federal Income Taxes The Fund intends to comply with all sections of the Internal Revenue Code applicable to regulated investment companies including the distribution of substantially all of its taxable net investment income and net realized capital gains to its shareholders. Therefore, no provision for federal income tax has been made. The Fund is treated as a separate taxpayer for federal income tax purposes.
| 3. | Securities Valuation |
The Fund utilizes various methods to measure the fair value of most of its investments on a recurring basis. GAAP establishes a framework for measuring fair value and providing related disclosures. Broadly, the framework requires fair value to be determined based on the exchange price that would be received for an asset or paid to transfer a liability (an exit price) in the principal or most advantageous market for the asset or liability in an orderly transaction between market participants at the measurement date. In the absence of active markets for the identical assets or liabilities, such measurements involve developing assumptions based on market observable data and, in the absence of such data, internal information that is consistent with what market participants would use in a hypothetical transaction that occurs at the measurement date. It also establishes a three-level valuation hierarchy based upon observable and non-observable inputs.
Observable inputs reflect market data obtained from independent sources, while unobservable inputs reflect our market assumptions. Preference is given to observable inputs. These two types of inputs create the following fair value hierarchy:
Level 1 — Quoted prices for identical investments in active markets.
Level 2 — Quoted prices for similar investments in active markets; quoted prices for identical or similar investments in markets that are not active; and model-derived valuations whose inputs are observable or whose significant value drivers are observable.
Level 3 — Significant inputs to the valuation model are unobservable.
Policies and procedures are maintained to value investments using the best and most relevant data available. In addition, pricing vendors are utilized to assist in valuing investments. GEAM performs periodic reviews of the methodologies used by independent pricing services including price validation of individual securities.
Fair Value Measurement The following section describes the valuation methodologies the Fund uses to measure different financial investments at fair value.
The Fund’s portfolio securities are valued generally on the basis of market quotations. Equity securities generally are valued at the last reported sales price on the primary market in which they are traded. Portfolio securities listed on NASDAQ are valued using the NASDAQ Official Closing Price. Level 1 securities primarily include publicly-traded equity securities which may not necessarily represent the last sale price. If no sales occurred on the exchange or NASDAQ that day, the portfolio security generally is valued using the last reported bid price. In those circumstances the Fund classifies the investment securities in Level 2.
The Fund uses the net asset value per unit for the collective Fund. The Fund classifies the investment security in Level 2.
Other financial investments are derivative instruments that are not reflected in Total Investments, such as exchange traded futures. Futures are valued at the last sale price on the primary market they are traded and are typically included in level 1.
If prices are not readily available for a portfolio security, or if it is believed that a price for a portfolio security does not represent its fair value, the security may be valued using procedures approved by the Fund’s Board of Trustees that are designed to establish its “fair” value. These securities would generally be classified in Level 3. Those procedures require that the fair value of a security be established by the valuation committee. The valuation committee follows different protocols for different types of investments and circumstances. The fair value procedures may be used to value any investment of the Fund in the appropriate circumstances.
15
Table of Contents
| Notes to Financial Statements | June 30, 2011 (unaudited) |
The following table presents the Fund’s investments measured at fair value on a recurring basis at June 30, 2011:
Investments | Level 1 | Level 2 | Level 3 | Total | ||||||||||||
Investments in Securities† | ||||||||||||||||
Common Stock | $ | 88,895,805 | $ | — | $ | — | $ | 88,895,805 | ||||||||
Other Investments | — | 20,954 | — | 20,954 | ||||||||||||
Short-Term Investments | 1,209,663 | — | — | 1,209,663 | ||||||||||||
|
|
|
|
|
|
|
| |||||||||
Total Investments in Securities | $ | 90,105,468 | $ | 20,954 | $ | — | $ | 90,126,422 | ||||||||
|
|
|
|
|
|
|
| |||||||||
Other Financial Instruments* | ||||||||||||||||
Futures Contracts — Unrealized Appreciation | $ | 6,944 | $ | — | $ | — | $ | 6,944 | ||||||||
|
|
|
|
|
|
|
| |||||||||
† See Schedule of Investments for Industry Classification. * Other financial instruments include derivative instruments such as futures contracts. Amounts shown represent unrealized appreciation (depreciation) at period end. |
| |||||||||||||||
There were no significant transfers between the fair value levels. Transfers between fair value levels are considered to occur at the beginning of the period.
| 4. | Derivatives Transactions |
Shown below are the derivative contracts entered into by the Fund, summarized by primary risk exposure as they appear on the Statement of Assets and Liabilities, all of which are not accounted for as hedging instruments under FASB Accounting Standards Codification (“ASC”) No. 815 Derivatives and Hedging as of June 30, 2011.
Asset Derivatives June 30, 2011 | Liability Derivatives June 30, 2011 | |||||||||||
| Derivatives not accounted for as hedging instruments under ASC 815 | Location in the Statement of Assets and Liabilities | Fair Value ($) | Location in the Statements of Assets and Liabilities | Fair Value ($) | ||||||||
| Equity Contracts | Assets, Net Assets — Net Unrealized Appreciation/ (Depreciation) on Futures | 6,944* | Liabilities, Net Assets — Net Unrealized Appreciation/ (Depreciation) on Futures | — | ||||||||
| * | Includes cumulative appreciation/depreciation of futures contracts as reported in the Schedule of Investments and Net Assets section of the Statement of Assets and Liabilities. Only the current day’s variation margin is reported within the Assets or Liabilities sections of the Statement of Assets and Liabilities. |
Shown below are the effects of derivative instruments on the Fund’s Statement of Operations, summarized by primary risk exposure all of which are not accounted for as hedging instruments under ASC 815.
| Derivatives not accounted for as hedging instruments under ASC 815 | Location in the Statement of Operations | Total Notional Amount of Futures Contracts Purchased/(Sold) ($) | Realized Gain or (Loss) on Derivatives Recognized in Income ($) | Change in Unrealized Appreciation/(Depreciation) on Derivatives Recognized in Income ($) | ||||||||||
Equity Contracts | Realized gain/(loss) on Futures, Increase/(decrease) in unrealized appreciation/ (depreciation) on Futures | 17,128,190/(16,431,057) | 37,495 | 3,852 | ||||||||||
| 5. | Line of Credit |
The Company shares a revolving credit facility of up to $150 million with a number of its affiliates. The credit facility is with its custodian bank, State Street Bank and Trust Company (“State Street”). The revolving credit facility requires the payment of a commitment fee equal to 0.125% per annum on the daily unused portion of the credit
facility, payable quarterly. The portion borne by the Funds generally is borne proportionally based upon net assets. In addition, the Company has a $100 million uncommitted, unsecured line of credit with State Street. Generally, borrowings under the credit facilities would accrue interest at the Federal Funds Rate plus 50 basis points and would be borne by the borrowing Fund. The maximum amount
16
Table of Contents
| Notes to Financial Statements | June 30, 2011 (unaudited) |
allowed to be borrowed by any one Fund is the lesser of (i) 10% of its total assets or (ii) 20% of its net assets. The credit facilities were not utilized by the Fund during the six month period ended June 30, 2011.
| 6. | Fees and Compensation Paid to Affiliates |
GEAM, a registered investment adviser, was retained by the Company’s Board of Directors effective May 1, 1997 to act as investment adviser and administrator of the Fund.
GEAM’s compensation for investment advisory and administrative services is paid monthly based on the average daily net assets of the Fund at an annualized rate of 0.65%.
GEAM has a contractual arrangement with the Fund to waive a portion of the Fund’s management fee in the amount equal to the management fee earned by GEAM with respect to the Fund’s investment in the GE Institutional Money Market Fund.
Distribution and Service (12b-1) Fees The Company has adopted a Distribution and Service (12b-1) Plan (the “Plan”) pursuant to Rule 12b-1 under the 1940 Act with respect to Class 4 shares of the Fund. Under the Plan, the Fund may compensate GE Investment Distributors, Inc. (“GEID”), a wholly-owned subsidiary of GEAM and the Fund’s principal distributor, for certain sales services provided by GEID or other broker dealers and investor services provided by GEID or other service providers relating to the Fund’s Class 4 shares, including services to owners or prospective owners of variable contracts issued by insurance companies that offer such share class as an investment option. The amount of compensation paid under the Plan by the Fund’s Class 4 shares may not exceed 0.45% of the average daily net assets of the Fund attributable to such share class. The Plan continues in effect from year to year for so long as such continuance is approved annually by the Board of Directors, including by those directors who are not interested persons of the Company and who have no direct or indirect financial interest in the operation of the Plan or in any agreement related to it.
Directors’ Compensation The Fund pays no compensation to its directors who are officers or employees of GEAM or its affiliates. Directors who are not such officers or employees also serve in a similar capacity for other funds advised by GEAM. Compensation paid to unaffiliated directors are reflected on the Statement of Operations. These fees are allocated pro rata across all of the mutual fund platforms and share classes served by the directors, including the Fund, and are based upon the relative net assets of each fund within such platforms.
| 7. | Investment Transactions |
Purchases and Sales of Securities The cost of purchases and the proceeds from sales of investments, other than short-term securities and options, for the period ended June 30, 2011 were as follows:
| Non U.S. Government Securities | ||
| Purchases | Sales | |
| $13,289,706 | $25,585,239 | |
| 8. | Income Taxes |
The Fund is subject to ASC 740, Income Taxes. ASC 740 provides guidance for financial accounting and reporting for the effects of income taxes that result from an entity’s activities during the year. ASC 740 also provides guidance regarding how certain tax positions should be recognized, measured, presented and disclosed in the financial statements. ASC 740 requires evaluation of tax positions taken or expected to be taken in the course of preparing the Fund’s tax returns to determine whether the tax positions are “more likely than not” of being sustained by the applicable tax authority. There are no adjustments to the Fund’s net assets required under ASC 740. The Fund’s 2007, 2008, 2009 and 2010 fiscal years tax returns are still open to examination by the Federal and applicable state tax authorities.
At June 30, 2011, information on the tax cost of investments was as follows:
| Cost of Investment for Tax Purposes | Gross Tax | Net Tax Appreciation/ (Depreciation) | ||||
| Appreciation | Depreciation | |||||
| $70,850,016 | $21,962,771 | $(2,686,365) | $19,276,406 | |||
17
Table of Contents
| Notes to Financial Statements | June 30, 2011 (unaudited) |
As of December 31, 2010, the Fund has capital loss carryovers as indicated below. Capital loss carryovers are available to offset future realized capital gains to the extent provided in the Internal Revenue Code and regulations thereunder. To the extent that these carryover losses are used to offset future capital gains, it is probable that the gains so offset will not be distributed to shareholders because they would be taxable as ordinary income.
| Amount | Expires | |
$4,127,500 | 12/31/2017 |
These amounts will be available to offset future taxable capital gains. Under the recently enacted Regulated Investment Company Modernization Act of 2010, the Fund will be permitted to carry forward capital losses incurred in taxable years beginning after December 22, 2010 for an unlimited period. However, any losses incurred during those future years will be required to be utilized prior to the losses incurred in pre-enactment tax years. As a result of this ordering rule, pre-enactment capital loss carryforwards may be more likely to expire unused. Additionally, post-enactment capital losses that are carried forward will retain their character as either short-term or long-term capital losses rather than being considered all short-term as under previous law.
During the year ended December 31, 2010, the Fund utilized $7,105,929 of prior year capital loss carryovers.
Any net capital and currency losses incurred after October 31, within the Fund’s tax year, are deemed to arise on the first day of the Fund’s next tax year if the Fund so elects to defer such losses.
The Fund did not defer any post-October losses for the year ended December 31, 2010.
The tax composition of distributions paid during the years ended December 31, 2010 and December 31, 2009 were as follows:
| Ordinary Income | Long-Term Capital Gains | Total | ||||||||||
2010 | $ | 316,553 | $— | $ | 316,553 | |||||||
2009 | 200,960 | — | 200,960 | |||||||||
Distributions to Shareholders The Fund declares and pays any dividends from net investment income annually. The Fund declares and pays any net realized capital gains in excess of capital loss carryforwards distributions annually. The character of income and gains to be distributed is determined in accordance with income tax regulations which may differ from generally accepted accounting principles. These differences include (but are not limited to) futures, distributions from Real Estate Investment Trusts (REITS), investments organized as partnerships for tax purposes, and losses deferred due to wash sale transactions. Reclassifications due to permanent book/tax differences are made to the Fund’s capital accounts to reflect income and gains available for distribution (or available capital loss carryovers) under income tax regulations. These reclassifications have no impact on the net asset value of the Fund. The calculation of net investment income per share in the Financial Highlights table excludes these adjustments.
The reclassifications for the year ended December 31, 2010 were as follows:
| Undistributed Net Investment Income | Accumulated Net Realized Gain | Paid In Capital | ||
| $(1,713) | $2 | $1,711 |
18
Table of Contents
| Special Meeting of Shareholders — Voting Results | (unaudited) |
On April 1, 2011, the GE Investments Funds, Inc. (the “Company”) held a special meeting of shareholders of each series portfolio of the Company, including shareholders of the Mid-Cap Equity Fund (the “Fund”). Shareholders of record on January 28, 2011 were entitled to vote on the proposals. For each proposal, except Proposal 1, shareholders voted on a fund-by-fund basis. For Proposal 1, shareholders of all funds voted together and not by fund or share class. At the meeting, all proposals were approved by the Fund and the following votes were recorded:
Proposal 1:
Election of Mr. R. Sheldon Johnson and Mr. Matthew J. Simpson as Directors to the Board of Directors of the Company.
Company votes:
| No. of Shares | % of Outstanding Shares | % of Shares Present | ||||||||||
| Mr. R. Sheldon Johnson | ||||||||||||
Affirmative | 451,517,094.582 | 90.054 | % | 96.126 | % | |||||||
Abstain | 18,195,810.391 | 3.629 | % | 3.874 | % | |||||||
Total | 469,712,904.973 | 93.683 | % | 100.000 | % | |||||||
| Mr. Matthew J. Simpson | ||||||||||||
Affirmative | 451,949,730.789 | 90.140 | % | 96.218 | % | |||||||
Abstain | 17,763,174.184 | 3.543 | % | 3.782 | % | |||||||
Total | 469,712,904.973 | 93.683 | % | 100.000 | % | |||||||
Fund votes:
| No. of Shares | % of Outstanding Shares | % of Shares Present | ||||||||||
| Mr. R. Sheldon Johnson | ||||||||||||
Affirmative | 4,587,285.910 | 89.922 | % | 94.386 | % | |||||||
Abstain | 272,830.338 | 5.348 | % | 5.614 | % | |||||||
Total | 4,860,116.248 | 95.270 | % | 100.000 | % | |||||||
| Mr. Matthew J. Simpson | ||||||||||||
Affirmative | 4,555,139.721 | 89.291 | % | 93.725 | % | |||||||
Abstain | 304,976.527 | 5.979 | % | 6.275 | % | |||||||
Total | 4,860,116.248 | 95.270 | % | 100.000 | % | |||||||
Proposal 2:
Approval of the use of a “manager of managers” arrangement whereby GEAM, as the Fund’s investment adviser, under certain circumstances, will be able to hire and replace sub-advisers to the Fund without obtaining shareholder approval.
| No. of Shares | % of Outstanding Shares | % of Shares Present | ||||||||||
Affirmative | 4,337,656.527 | 85.028 | % | 89.250 | % | |||||||
Against | 304,051.283 | 5.960 | % | 6.256 | % | |||||||
Abstain | 218,408.438 | 4.282 | % | 4.494 | % | |||||||
Broker Non-votes | — | — | — | |||||||||
Total | 4,860,116.248 | 95.270 | % | 100.000 | % | |||||||
19
Table of Contents
| Special Meeting of Shareholders — Voting Results | (unaudited) |
Proposal 3:
Approval of the following changes in certain of the Fund’s investment policies, as follows:
| A. | Amendment of the Fund’s investment policy on senior securities. |
| No. of Shares | % of Outstanding Shares | % of Shares Present | ||||||||||
Affirmative | 4,282,024.882 | 83.938 | % | 88.105 | % | |||||||
Against | 302,382.328 | 5.927 | % | 6.222 | % | |||||||
Abstain | 275,709.038 | 5.405 | % | 5.673 | % | |||||||
Broker Non-votes | — | — | — | |||||||||
Total | 4,860,116.248 | 95.270 | % | 100.000 | % | |||||||
| C. | Amendment of the Fund’s investment policy on making loans. |
| No. of Shares | % of Outstanding Shares | % of Shares Present | ||||||||||
Affirmative | 4,272,835.130 | 83.758 | % | 87.916 | % | |||||||
Against | 312,931.838 | 6.134 | % | 6.439 | % | |||||||
Abstain | 274,349.280 | 5.378 | % | 5.645 | % | |||||||
Broker Non-votes | — | — | — | |||||||||
Total | 4,860,116.248 | 95.270 | % | 100.000 | % | |||||||
| D. | Amendment of the Fund’s investment policy on borrowing. |
| No. of Shares | % of Outstanding Shares | % of Shares Present | ||||||||||
Affirmative | 4,264,794.355 | 83.600 | % | 87.751 | % | |||||||
Against | 335,835.568 | 6.583 | % | 6.910 | % | |||||||
Abstain | 259,486.325 | 5.087 | % | 5.339 | % | |||||||
Broker Non-votes | — | — | — | |||||||||
Total | 4,860,116.248 | 95.270 | % | 100.000 | % | |||||||
| E. | Amendment of the Fund’s investment policy on diversification. |
| No. of Shares | % of Outstanding Shares | % of Shares Present | ||||||||||
Affirmative | 4,337,306.828 | 85.021 | % | 89.243 | % | |||||||
Against | 267,623.472 | 5.246 | % | 5.506 | % | |||||||
Abstain | 255,185.948 | 5.003 | % | 5.251 | % | |||||||
Broker Non-votes | — | — | — | |||||||||
Total | 4,860,116.248 | 95.270 | % | 100.000 | % | |||||||
| F. | Amendment of the Fund’s investment policy on concentration of investments. |
| No. of Shares | % of Outstanding Shares | % of Shares Present | ||||||||||
Affirmative | 4,362,117.848 | 85.508 | % | 89.753 | % | |||||||
Against | 255,118.067 | 5.001 | % | 5.250 | % | |||||||
Abstain | 242,880.333 | 4.761 | % | 4.997 | % | |||||||
Broker Non-votes | — | — | — | |||||||||
Total | 4,860,116.248 | 95.270 | % | 100.000 | % | |||||||
20
Table of Contents
| Special Meeting of Shareholders — Voting Results | (unaudited) |
| G. | Amendment of the Fund’s investment policy on investments in commodities and its reclassification from a non-fundamental policy to a fundamental policy. |
| No. of Shares | % of Outstanding Shares | % of Shares Present | ||||||||||
Affirmative | 4,293,651.970 | 84.166 | % | 88.345 | % | |||||||
Against | 320,204.059 | 6.276 | % | 6.588 | % | |||||||
Abstain | 246,260.219 | 4.828 | % | 5.067 | % | |||||||
Broker Non-votes | — | — | — | |||||||||
Total | 4,860,116.248 | 95.270 | % | 100.000 | % | |||||||
| H. | Amendment of the Fund’s fundamental investment policy on illiquid investments and its reclassification from a fundamental policy to a non-fundamental policy. |
| No. of Shares | % of Outstanding Shares | % of Shares Present | ||||||||||
Affirmative | 4,293,714.769 | 84.167 | % | 88.346 | % | |||||||
Against | 299,684.356 | 5.874 | % | 6.166 | % | |||||||
Abstain | 266,717.123 | 5.229 | % | 5.488 | % | |||||||
Broker Non-votes | — | — | — | |||||||||
Total | 4,860,116.248 | 95.270 | % | 100.000 | % | |||||||
| I. | Elimination of the Fund’s investment policy on mortgaging, pledging and hypothecating of investments. |
| No. of Shares | % of Outstanding Shares | % of Shares Present | ||||||||||
Affirmative | 4,575,989.902 | 89.700 | % | 94.154 | % | |||||||
Against | 159,269.882 | 3.122 | % | 3.277 | % | |||||||
Abstain | 124,856.464 | 2.448 | % | 2.569 | % | |||||||
Broker Non-votes | — | — | — | |||||||||
Total | 4,860,116.248 | 95.270 | % | 100.000 | % | |||||||
| J. | Amendment of the Fund’s investment policy on real estate investments. |
| No. of Shares | % of Outstanding Shares | % of Shares Present | ||||||||||
Affirmative | 4,388,258.060 | 86.020 | % | 90.291 | % | |||||||
Against | 235,411.453 | 4.615 | % | 4.844 | % | |||||||
Abstain | 236,446.735 | 4.635 | % | 4.865 | % | |||||||
Broker Non-votes | — | — | — | |||||||||
Total | 4,860,116.248 | 95.270 | % | 100.000 | % | |||||||
21
Table of Contents
| Additional Information | (unaudited) |
Information about Directors and Executive Officers:
The business and affairs of the Funds are managed under the direction of the Funds’ Board of Directors. Information pertaining to the Directors and officers of the Funds is set forth below.
Interested Directors and Executive Officers
Michael J. Cosgrove
Address c/o GEAM 3001 Summer St. Stamford, CT 06905
Age 62
Position(s) Held with Fund Chairman of the Board and President
Term of Office and Length of Time Served Until successor is elected and qualified – 14 years
Principal Occupation(s) During Past 5 years President and Chief Executive Officer – Mutual Funds and Intermediary Business at GEAM since March 2007; Executive Vice President of GEAM from February 1997 to March 2007; Vice President, GE Capital Corporation, an indirect wholly-owned subsidiary of GE, since December 1999; Executive Vice President – Mutual Funds of GEAM, a wholly-owned subsidiary of GE that is registered as an investment adviser under the Investment Advisers Act of 1940, as amended, since March 1993; President and Director of GE Investment Distributors, Inc., since June 2011. Director of GEAM since 1988.
Number of Portfolios in Fund Complex Overseen by Director 28
Other Directorships Held by Director Chairman of the Board and President of GE Institutional Funds since 1997; Trustee of Elfun Funds, GE Savings & Security Funds, General Relief and Loan Fund and General Electric Pension Trust since 1988; Trustee of Fordham University from 2002 to June 30, 2010 and since July 2011; Trustee of GE Volunteers since 1993; Director of GE Foundation; Director, GE Asset Management (Ireland) Limited, since February 1999, GE Asset Management Funds Plc since 1998, GE Asset Management Canada Company since 1998, GE Asset Management Limited since 1998 and GEAM since 1988; Chairman of the Board and President of GE Funds from 1993 to February 2011.
Matthew J. Simpson
Address c/o GEAM 3001 Summer St. Stamford, CT 06905
Age 50
Position(s) Held with Fund Director and Executive Vice President
Term of Office and Length of Time Served Until successor is elected and qualified – 3 years
Principal Occupation(s) During Past 5 years Executive Vice President, General Counsel and Secretary of GEAM since July 2007; Senior Vice President and General Counsel – Marketing and Client Services (formerly Asset Management Services) at GEAM and Senior Vice President and General Counsel of GE Asset Management Services from February 1997 to July 2007; Vice President and Associate General Counsel of GEAM from October 1992 to February 1997; Secretary of GE Funds from 1993 to July 2007 and Vice President from September 2003 to July 2007; Secretary of GE Institutional Funds and GE Investments Funds, Inc. from 1997 to July 2007; Secretary of Elfun Funds and GE Savings & Security Funds since July 2007; Assistant Secretary of Elfun Funds and GE Savings & Security Funds from 1998 to July 2007 and Vice President from October 2003 to July 2007.
Number of Portfolios in Fund Complex Overseen by Director 28
Other Directorships Held by Director Trustee of Elfun Funds, GE Savings & Security Funds and General Electric Pension Trust since July 2007; Trustee of GE Institutional Funds since April 2011 and Trustee of GE Funds from July 2007 to February 2011.
22
Table of Contents
| Additional Information | (unaudited) |
Joon Won Choe
Address c/o GEAM 3001 Summer St. Stamford, CT 06905
Age 41
Position(s) Held with Fund Vice President & Secretary
Term of Office and Length of Time Served Until successor is elected and qualified – Vice President and Secretary – less than 1 year
Principal Occupation(s) During Past 5 years Senior Vice President and Deputy General Counsel at GEAM since March 2011; Senior Vice President and Associate General Counsel at GEAM from June 2010 to March 2011; Vice President and Associate General Counsel at GEAM from November 2005 to June 2010; Vice President and Secretary of GE Institutional Funds and GE Investments Funds, Inc. since September 2010; Vice President and Assistant Secretary of Elfun Funds and GE Savings & Security Funds since September 2010.
Number of Portfolios in Fund Complex Overseen by Officer N/A
Other Directorships Held by Officer N/A
Robert Herlihy
Address c/o GEAM 3001 Summer St. Stamford, CT 06905
Age 43
Position(s) Held with Fund Chief Compliance Officer
Term of Office and Length of Time Served Until successor is elected and qualified – 5 years
Principal Occupation(s) During Past 5 years Chief Compliance Officer of GEAM, GE Institutional Funds, Elfun Funds, and GE Savings and Security Funds since July 2005; Chief Compliance Officer of GE Funds from July 2005 to February 2011; and Manager of Fund Administration at GEAM from 2002 – 2005.
Number of Portfolios in Fund Complex Overseen by Officer N/A
Other Directorships Held by Officer N/A
Arthur A. Jensen
Address c/o GEAM 3001 Summer St. Stamford, CT 06905
Age 44
Position(s) Held with Fund Treasurer
Term of Office and Length of Time Served Until successor is elected and qualified – less than 1 year
Principal Occupations(s) During Past 5 Years Treasurer of GE Institutional Funds, Elfun Funds and GE Savings and Security Funds since June 2011; Mutual Funds Controller of GEAM since April 2011; Senior Vice President at Citigroup from 2008 to 2010 and Vice President at JPMorgan from 2005 to 2008.
Number of Portfolios in Fund Complex Overseen by Officer N/A
Other Directorships Held by Officer N/A
23
Table of Contents
| Additional Information | (unaudited) |
Non-Interested Directors
John R. Costantino
Address c/o GEAM 3001 Summer St. Stamford, CT 06905
Age 65
Position(s) Held with Fund Director
Term of Office and Length of Time Served Until successor is elected and qualified – 14 years
Principal Occupation(s) During Past 5 years General Partner, NGN Capital LLC since 2006; Managing Director, Vice President of Walden Capital Management since 1996.
Number of Portfolios in Fund Complex Overseen by Director 20
Other Directorships Held by Director Director of GE Institutional Funds since 1997; Trustee of Fordham University from 1989-1995 and 2001-2007 and Trustee Emeritus since 2007; Trustee of Neuroscience Research Institute since 1986; Trustee of GE Funds from 1993 to February 2011; Trustee of Gregorian University Foundation from 1992-2007; Director of Artes Medical from 2006-2008.
R. Sheldon Johnson
Address c/o GEAM 3001 Summer St. Stamford, CT 06905
Age 64
Positions(s) Held with Fund Director
Term of office and Length of Time served Unit Successor is elected and qualified – less than 1 year.
Principal Occupation(s) During Past 5 years Managing Director at Morgan Stanley & Co.,Inc. from 1988 to 2006; Head of Global Institutional Equity Sales and Marketing at Morgan Stanley & Co., Inc. from 2002 to 2006.
Number of Portfolios in Fund Complex Overseen by Director 20
Other Directorships Held by Director Trustee of GE Institutional Funds since April 2011 and Trustee of St. Lawrence University since 2003.
Robert P. Quinn
Address c/o GEAM 3001 Summer St. Stamford, CT 06905
Age 75
Position(s) Held with Fund Director
Term of Office and Length of Time Served Until successor is elected and qualified – 14 years
Principal Occupation(s) During Past 5 years Retired since 1983 from Salomon Brothers Inc.
Number of Portfolios in Fund Complex Overseen by Director 20
Other Directorships Held by Director Trustee of GE Institutional Funds since 1997; Trustee of St. Francis Hospital since 1980; and Trustee of GE Funds from 1993 to February 2011.
The Statement of Additional Information for the Funds includes additional information about the Directors and Officers and is available, without charge, upon request by calling 1-800-242-0134.
24
Table of Contents
| Investment Team | (unaudited) |
Investment Adviser and Administrator
GE Asset Management Incorporated
Board of Directors
Michael J. Cosgrove, Chairman
John R. Costantino
R. Sheldon Johnson*
Robert P. Quinn
Matthew J. Simpson
Secretary
Joon Won Choe
Assistant Secretary
Michelle Matzelle
Treasurer
Arthur A. Jensen (effective June 6, 2011)
Assistant Treasurer
Casey Yantosca
Distributor
GE Investment Distributors, Inc.
Member FINRA and SIPC
Custodian
State Street Bank & Trust Company
Officers of the Investment Adviser
Dmitri Stockton, President and Chief Executive Officer (since May 2011)†
Cheryl H. Beacock, Senior Vice President, Human Resources
George A. Bicher, Chief Risk Officer
Paul M. Colonna, President and Chief Investment Officer – Fixed Income Investments
Michael J. Cosgrove, President and Chief Executive
Officer – Mutual Funds & Intermediary Business
Ralph R. Layman, President and Chief Investment Officer – Public Equity Investments
Maureen B. Mitchell, President – Institutional Sales and Marketing
Matthew J. Simpson, Executive Vice President, General Counsel and Secretary
Don W. Torey, President – Alternative Investments
John J. Walker, Executive Vice President, Chief Operating Officer
David Wiederecht, President and Chief Investment Officer – Investment Strategies
Tracie A. Winbigler, Executive Vice President, Chief Financial Officer (since January 2011)
| * | Mr. Johnson was elected as a Director of the Funds effective April 1, 2011. |
| † | Effective May 1, 2011, Mr. Stockton replaced James W. Ireland as President and Chief Executive Officer. |
At GE Asset Management, we’re dedicated to providing the investment options you’ll need to tailor your financial portfolio to every stage of your life. Each member of the GE Family of Funds is managed according to the same principles of integrity and quality that have guided GE over the past century, and have made it the world-class company that it is today. Each fund draws strength from a heritage of investment management experience that spans more than 80 years. Whether you’re creating a new investment portfolio or adding to an established one, the GE Family of Funds offers an array of professionally managed investment options that will help you meet a lifetime of financial needs.
25
Table of Contents
Investment Adviser
GE Asset Management Incorporated
3001 Summer Street
PO Box 7900
Stamford, CT 06904-7900
Distributor
GE Investment Distributors, Inc.
member FINRA and SIPC
3001 Summer Street
PO Box 7900
Stamford, CT 06904-7900
The Fund files its complete schedule of portfolio holdings with the Securities and Exchange Commission for the first and third quarters of each fiscal year on Form N-Q. The Fund’s Forms N-Q, as well as a description of the policies and procedures that the Fund uses to determine how to vote proxies (if any) relating to portfolio securities is available without charge (i) upon request, by calling 1-800-493-3042; (ii) on the Fund’s website at http://www.geam.com; and (iii) on the Commission’s website at http://www.sec.gov. The Fund’s Forms N-Q may be reviewed and copied at the Commission’s Public Reference Room in Washington, DC—information on the operation of the Public Reference Room may be obtained by calling 1-800-SEC-0330.
Information (if any) regarding how the Fund voted proxies relating to portfolio securities during the most recently disclosed 12-month period ended June 30 is available without charge (i) through the Fund’s website at http://www.geam.com; and (ii) on the Commission’s website at http://www.sec.gov.
Table of Contents
GE Investments Funds, Inc.
| Small-Cap Equity Fund | Letter from the Chairman | |

Michael J. Cosgrove
Chairman,
GE Investments Funds, Inc.
Dear Shareholder: |
Attached is the semi-annual report for GE Investments Funds, Inc. — Small-Cap Equity Fund (the “Fund”) for the six-month period ended June 30, 2011. The report contains information about the performance of the Fund and other fund-specific data, along with portfolio manager commentary.
We have provided you with an overview of the investment markets, along with our investment outlook for the coming months.
Market Overview
Most major equity indices posted positive returns in the six-month period ended June 30, 2011, despite geopolitical tensions in the Middle East and North Africa, a devastating earthquake in Japan, ongoing concerns about unresolved sovereign debt issues in peripheral Europe and elevated inflation in emerging markets. Volatility increased in May and June, however, as some measures of global economic activity weakened and uncertainties over Greece’s ability to finance and service its debt rattled the financial markets. In the U.S., concerns over the end of quantitative easing by the Federal Reserve and political wrangling over the government debt ceiling further contributed to a challenging environment. The increase in risk aversion benefited the fixed income markets as many investors sought out safer investments. Toward the end of June, the Greek Parliament passed austerity measures that seemed to calm the markets and opened the way for the next round of financing from the European Central Bank and the International Monetary Fund.
Against this backdrop, financial markets posted positive results for the six- and 12-month periods ended June 30, 2011 as represented by the index returns in the below chart.
| Total Returns (%) as of June 30, 2011 | 6-month | 12-month | ||||||
U.S. equities (S&P 500 Index) | 6.0 | 30.7 | ||||||
Global equities (MSCI World Index) | 5.3 | 30.5 | ||||||
International equities (MSCI EAFE Index) | 5.0 | 30.4 | ||||||
Small-cap U.S. equities (Russell 2000 Index) | 6.2 | 37.4 | ||||||
Mid-cap U.S. equities (Russell Mid Cap Index) | 8.1 | 38.5 | ||||||
U.S. fixed income (Barclays Capital U.S. Aggregate Bond Index) | 2.7 | 3.9 | ||||||
U.S. short-term government fixed income (Barclays Capital 1-3 Year U.S. Government Bond Index) | 0.9 | 1.4 | ||||||
Outlook
We remain constructive on the prospects for healthy global growth, although it may be at a slower pace than originally anticipated. Central banks in the U.S. and Europe remain accommodative and supply chain issues in Japan appear to have abated. There are also signs that inflation may be peaking in emerging markets as commodity prices have eased in recent months. Corporate balance sheets remain healthy and fundamentals remain intact, in our view. We believe that valuations for equities are not stretched and remain below historical averages while equity risk premiums are still high–offering the possibility for further gains. We expect that the financial markets are likely to remain volatile due to outstanding sovereign debt issues, but believe that returns are biased to the upside in the second half of the year.
Thank you for investing with GE Investments Funds.
Sincerely,

Michael J. Cosgrove
Chairman, GE Investments Funds, Inc.
July 2011
 |
This does not constitute a part of the Fund’s Shareholder Report
Table of Contents
GE Investments Funds, Inc.
| Small-Cap Equity Fund | Letter from the Chairman (Continued) | |
Mike Cosgrove is President and Chief Executive Officer — Mutual Funds and Intermediary Business at GE Asset Management Incorporated (“GEAM”). In addition to the GE Investments Funds, he is also Chairman of the Board and President of GE Institutional Funds and Director and President of GEAM’s broker-dealer which serves as underwriter and distributor for the GE Investments Funds. Mr. Cosgrove serves as a Trustee of the GE Savings & Security Funds, the GE Foundation, and the GE Pension Trust. He also serves on the Board of Directors of the Skin Cancer Foundation and is a Trustee of Fordham University. Previously Chief Financial Officer of GE Asset Management and Assistant Treasurer — GE Company, Mr. Cosgrove joined GE in 1970 and held a number of managerial positions in finance and sales in the International Operation and the GE Trading Company. He received a BS in Economics from Fordham University and an MBA from St. John’s University.
This does not constitute a part of the Fund’s Shareholder Report
GE Investment Distributors, Inc., Member of FINRA & SIPC, is the principal underwriter and distributor of the GE Investments Funds, Inc.
Table of Contents
GE Investments Funds, Inc.
Small-Cap Equity Fund
Semi-Annual Report
June 30, 2011

Table of Contents
| Small-Cap Equity Fund | Contents | |
| 1 | ||||
| 2 | ||||
| 13 | ||||
Financial Statements | ||||
| 14 | ||||
| 15 | ||||
| 16 | ||||
| 17 | ||||
| 18 | ||||
| 23 | ||||
| 25 | ||||
| 28 | ||||
This report is prepared for Policyholders of certain variable contracts and may be distributed to others only if preceded or accompanied by the variable contract’s current prospectus and the current prospectus of the Fund available for investments thereunder.
Table of Contents
| Notes to Performance | June 30, 2011 (unaudited) |
The information provided on the performance pages relates to the GE Investments Small-Cap Equity Fund (the “Fund”).
Total returns take into account changes in share price and assume reinvestment of dividends and capital gains distributions, if any. Total returns shown are net of Fund expenses but do not reflect fees and charges associated with the variable contracts such as administrative fees, account charges and surrender charges, which, if reflected, would reduce the Fund’s total returns for all periods shown.
The performance data quoted represents past performance; past performance does not guarantee future results. Investment return and principal value will fluctuate so your shares, when redeemed, may be worth more or less than their original cost. Current performance may be higher or lower than the performance data quoted. Periods less than one year are not annualized. Please call 800-493-3042 or visit the Fund’s website at http://www.geam.com for the most recent month-end performance data.
An investment in the Fund is not a deposit of any bank and is not insured or guaranteed by the Federal Deposit Insurance Corporation (FDIC) or any other government agency. An investment in the Fund is subject to risk, including possible loss of principal invested.
The Russell 2000® Index is an unmanaged market capitalization-weighted index consisting of 2,000 of the smallest U.S.-domiciled publicly traded common stocks that are included in the Russell 3000® Index. The Russell 3000®
Index is comprised of the 3,000 largest U.S. domiciled companies. The results shown for the foregoing index assume the reinvestment of net dividends or interest. They do not reflect the actual cost of investing in the instruments that comprise the index.
Russell Investment Group owns the Russell Index data, including all applicable trademarks and copyrights, used by GE Asset Management Incorporated in these materials. Any unauthorized use or redistribution of such Russell Index data is strictly prohibited. Russell Investment Group is not responsible for the configuration of this material or for any inaccuracy in GE Asset Management Incorporated’s presentation thereof.
The peer universe of the underlying annuity funds used for the peer group average annual total return calculation is based on a blend of Morningstar peer categories, as shown. Morningstar is an independent mutual fund rating service. A Fund’s performance may be compared to or ranked within a universe of mutual funds with investment objectives and policies similar but not necessarily identical to that of the Fund.
©2011 Morningstar, Inc. All Rights Reserved. The Morningstar information contained herein: (1) is proprietary to Morningstar and/or its content providers; (2) may not be copied or distributed; and (3) is not warranted to be accurate, complete or timely. Neither Morningstar nor its content providers are responsible for any damage or losses relating from any use of this information. Past performance is no guarantee of future results.
GE Investment Distributors, Inc., Member of FINRA & SIPC, is the principal underwriter and distributor of the GE Investments Funds, Inc. and a wholly owned subsidiary of GE Asset Management Incorporated, the investment adviser of the Fund.
1
Table of Contents
| Small-Cap Equity Fund | (unaudited) |

David Wiederecht
President and Chief
Investment Officer –
Investment Strategies
The Small-Cap Equity Fund utilizes a multiple sub-adviser Fund structure to manage the Fund’s assets. The Fund is managed by David Wiederecht, who is vested with oversight authority over the Fund’s sub-advisers that provide day-to-day management of the assets of the Fund allocated to them. David Wiederecht has full discretion in determining the assets that are allocated to each sub-adviser. The current sub-advisers of the Fund are as follows: Palisade Capital Management L.L.C.; Champlain Investment Partners, LLC; GlobeFlex Capital, LP; Kennedy Capital Management, Inc.; and SouthernSun Asset Management, LLC.
David Wiederecht is the President and Chief Investment Officer — Investment Strategies and a Director at GE Asset Management. He has served as a portfolio manager of the Fund since September 2010. Mr. Wiederecht joined GE Asset Management in 1988 and has held various positions at GE Asset Management including Vice President — Alternative Investments/Private Equity/Hedge Fund from 1998 to 2004, Managing Director — Alternative Investments from 2004 to 2008, and President — Investment Strategies since 2008.
| Q. | How did the Small-Cap Equity Fund perform compared to its benchmark and Morningstar peer group for the six-month period ended June 30, 2011? |
| A. | For the six-month period ended June 30, 2011, the Small-Cap Equity Fund returned 9.23% for Class 1 shares and 8.96% for Class 4 shares. The Russell 2000 Index, the Fund’s benchmark, returned 6.20% and the Fund’s Morningstar peer group of 136 Small Blend funds returned an average of 6.29% over the same period. |
| Q. | What market factors affected Fund performance? |
| A. | During the first quarter of 2011 the market was affected by several exogenous shocks including the uprisings in the Middle East and North Africa, a massive earthquake in Japan and the ensuing tsunami that claimed thousands of lives and affected the |
| global supply chain, as well as higher prices for oil and commodities that led to rising inflation. However, global economic data remained strong and purchasing managers indices (PMI) continued to expand both in the U.S. and abroad. In the U.S., leading economic indicators, small business lending and consumer confidence all pointed to improvement in the economy and the unemployment rate fell to 8.8%. Central banks in the U.S. and Europe kept interest rates close to or at historical lows. |
| In the second quarter the sovereign debt crisis in Europe intensified and economic data in the U.S. and China pointed to a slowing economy. The U.S. Federal Reserve said it would maintain record monetary stimulus to support a flagging economic recovery after completing a $600 billion bond-purchase that concluded at the end of June. U.S. housing prices remained weak and unemployment remained higher than the U.S. Federal Reserve anticipated. In Europe, the Greek parliament narrowly approved a €78 billion austerity package of spending cuts, tax rises, and privatizations, and paved the way for the release of a further installment of the €110 billion international credit facility. In emerging markets, China’s PMI data showed that the economy slowed in each of the last three months and a series of increases in the reserve ratio for banks increased concerns about tighter lending conditions. |
| Q. | What were the primary drivers of Fund performance? |
| A. | During the past six months the Fund benefited from strong security selection by its underlying sub-advisers. Positive security selection came from a majority of the sectors and the industrial, consumer discretionary and financial sectors were the greatest contributors to the relative outperformance of the Fund. Such stocks as Pioneer Drilling (energy equipment & services), Tractor Supply (specialty retail) and Molina Healthcare were among the |
2
Table of Contents
(unaudited)

| Fund’s top performing stocks. The Fund was negatively impacted in the first half of the year by the materials sector namely due to Arch Chemicals (specialty chemicals). The Fund was also hurt by its underweight to the telecommunications sector, which was the best performing sector, up 18.2%, during the period. |
| Q. | How was the Fund positioned at the end of the period? |
| A. | Negative headlines have increased risk aversion and volatility during the most recent quarter, but we remain constructive on the prospects for healthy global growth, though it may be at a slower pace than originally anticipated. In our view corporate balance sheets remain in good shape and have been assisted by very low interest rates as the Federal Reserve has kept interest rates close to zero. Commodity prices have eased, which we believe will provide consumers with some much needed breathing room and supply chain issues in Japan have abated, which we believe can help boost growth in the second half of the year. Despite strength in underlying fundamentals, unresolved matters at a macro level such as the outstanding sovereign debt issues in Europe and negotiations in the U.S. around the debt ceiling may keep volatility elevated. As of June 30th, the Fund’s largest overweight positions were in the consumer staples and industrials sectors, while the largest underweights were in financials and IT. |
3
Table of Contents
| Small-Cap Equity Fund | (unaudited) |
Understanding Your Fund’s Expenses
As a shareholder of the Fund you incur ongoing costs. Ongoing costs include portfolio management fees, distribution and services fees (for Class 4 shares), professional fees, administrative fees and other Fund expenses. The following example is intended to help you understand your ongoing costs (in dollars) of investing in the Fund and to compare these costs with the ongoing costs of investing in other mutual funds.
To illustrate these ongoing costs, we have provided an example and calculated the expenses paid by investors in each share class of the Fund during the period. The information in the following table is based on an investment of $1,000, which is invested at the beginning of the period and held for the entire six-month period ended June 30, 2011.
Actual Expenses
The first section of the table provides information about actual account values and actual expenses. You may use the information in this section, together with the amount you invested, to estimate the expenses that you paid over the period. To do so, simply divide your account value by $1,000 (for example, an $8,600 account value divided by $1,000 = 8.6), then multiply the result by the
number given for your class under the heading “Expenses paid during period.”
Hypothetical Example for Comparison Purposes
The second section of the table provides information about hypothetical account values and hypothetical expenses based on the Fund’s actual expense ratio and an assumed rate of return of 5% per year before expenses, which is not the Fund’s actual return. The hypothetical account values and expenses may not be used to estimate the actual ending account balance or expenses you paid for the period. You may use this information to compare the ongoing costs of investing in the Fund and other funds. To do so, compare this 5% hypothetical example with the 5% hypothetical examples that appear in the shareholders reports of other funds.
Please note that the expenses shown in the table are meant to highlight and help you compare ongoing costs only and do not reflect any transaction costs, such as sales charges or redemption fees, if any. Additionally, the expenses shown do not reflect the fees or charges associated with variable contracts through which shares of the Fund are offered.
January 1, 2011 – June 30, 2011
| Account value at the beginning of the period ($) | Account value at the end of the period ($) | Expenses paid during the period ($)* | ||||||||||
Actual Fund Return** |
| |||||||||||
Class 1 | 1,000.00 | 1,092.30 | 6.59 | |||||||||
Class 4 | 1,000.00 | 1,089.59 | 8.86 | |||||||||
Hypothetical 5% Return (2.5% for the period) |
| |||||||||||
Class 1 | 1,000.00 | 1,018.33 | 6.36 | |||||||||
Class 4 | 1,000.00 | 1,016.18 | 8.55 | |||||||||
| * | Expenses are equal to the Fund’s annualized expense ratio of 1.27% for Class 1 shares 1.71% for Class 4 shares (for the period January 1, 2011—June 30, 2011), multiplied by the average account value over the period, multiplied by 181/365 (to reflect the six month period) |
| ** | Actual Fund Returns for the six month period ended June 30, 2011 were as follows: 9.23% for Class 1 shares, and 8.96% for Class 4 shares. Past performance does not guarantee future results. |
4
Table of Contents
| Small-Cap Equity Fund | (unaudited) |
Investment Profile
A mutual fund designed for investors who seek long-term growth of capital. The Fund seeks its objective by investing at least 80% of its net assets under normal circumstances in equity securities of small-cap companies, such as common and preferred stocks. The Fund uses a multi-sub-adviser investment strategy that combines growth, value and core investment management styles, which allows the Fund the potential to benefit from both value and growth cycles in the marketplace.
Morningstar Performance Comparison
Based on average annual returns for periods ended June 30, 2011
| Six Months** | One Year | Three Year | Five Year | Ten Year | ||||||||||||||||
Number of Funds in peer group: | 136 | 136 | 129 | 121 | 95 | |||||||||||||||
Peer group average annual total return: | 6.29 | % | 37.24 | % | 7.09 | % | 3.47 | % | 6.07 | % | ||||||||||
Morningstar category in peer group: U.S. Insurance Small Blend Funds. |
| |||||||||||||||||||
Sector Allocation
as a % of Fair Value of $53,850 (in thousands) on June 30, 2011(b)(c)
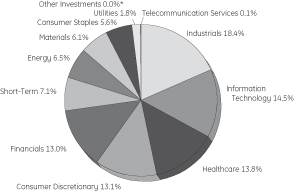
Top Ten Largest Holdings
as of June 30, 2011 (as a % of Fair Value)(b)(c)
Sensient Technologies Corp. | 1.18% | |||
Oil States International Inc. | 1.02% | |||
Bio-Reference Laboratories Inc. | 0.93% | |||
LKQ Corp. | 0.93% | |||
Smithfield Foods Inc. | 0.93% | |||
Genesee & Wyoming Inc. | 0.88% | |||
John Wiley & Sons Inc. | 0.84% | |||
Deckers Outdoor Corp. | 0.82% | |||
Darling International Inc. | 0.80% | |||
Jarden Corp. | 0.79% |
Change in Value of a $10,000 Investment
Class 1 Shares
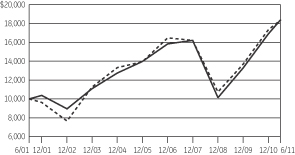
Average Annual Total Return
for the Periods Ended June 30, 2011
Class 1 Shares (Inception date: 4/28/00)
| Six Months** | One Year | Five Year | Ten Year | Ending value of a $10,000 investment(a) | ||||||||||||||||
Small-Cap Equity Fund | 9.23% | 40.67% | 4.63% | 6.30% | $ | 18,415 | ||||||||||||||
Russell 2000 Index | 6.20% | 37.41% | 4.08% | 6.28% | $ | 18,384 | ||||||||||||||
Change in Value of a $10,000 Investment
Class 4 Shares
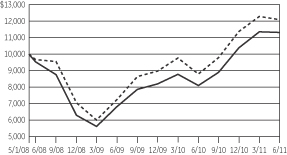
Average Annual Total Returns
for the Periods Ended June 30, 2011
Class 4 Shares (Inception date: 5/1/08)
| Six Months** | One Year | Three Year | Since Inception | Ending value of a $10,000 investment(a) | ||||||||||||||||
Small-Cap Equity Fund | 8.96% | 40.04% | 5.88% | 3.99% | $ | 11,319 | ||||||||||||||
Russell 2000 Index | 6.20% | 37.41% | 7.78% | 6.16% | $ | 12,084 | ||||||||||||||

| (a) | Ending Value of a $10,000 investment for the ten-year period or since inception, whichever is less. |
| (b) | The securities information regarding holdings, allocations and other characteristics is presented to illustrate examples of securities that the Fund has bought and the diversity of areas in which the Fund may invest as of a particular date. It may not be representative of the Fund’s current or future investments and should not be construed as a recommendation to purchase or sell a particular security. |
| (c) | Fair value basis is inclusive of Short-Term Investment in GE Institutional Money Market Fund. |
| * | Less than 0.01%. |
| ** | Total returns for the six month period ended June 30, 2011 are not annualized. |
See Notes to Performance on page 1 for further information, including an explanation of Morningstar peer categories.
Past performance does not predict future performance and the graph and table do not reflect the deduction of taxes that a shareholder would pay on Fund distributions on the redemption of Fund shares and does not reflect the fees or charges that would be associated with variable contracts through which shares of the Fund are offered.
5
Table of Contents
Small-Cap Equity Fund
| Schedule of Investments | June 30, 2011 (unaudited) |
Small-Cap Equity Fund
| Number of Shares | Fair Value | |||||||||
Common Stock — 93.0% † |
| |||||||||
Advertising — 0.7% |
| |||||||||
Arbitron Inc. | 9,700 | $ | 400,901 | |||||||
Aerospace & Defense — 1.1% |
| |||||||||
Esterline Technologies Corp. | 1,246 | 95,194 | (a) | |||||||
Hexcel Corp. | 1,000 | 21,890 | (a) | |||||||
Moog Inc. | 1,149 | 50,004 | (a) | |||||||
Teledyne Technologies Inc. | 7,750 | 390,290 | (a) | |||||||
Triumph Group Inc. | 249 | 24,795 | ||||||||
| 582,173 | ||||||||||
Agricultural Products — 0.9% |
| |||||||||
Darling International Inc. | 24,400 | 431,880 | (a) | |||||||
Fresh Del Monte Produce Inc. | 1,579 | 42,112 | ||||||||
| 473,992 | ||||||||||
Air Freight & Logistics — 0.2% |
| |||||||||
UTi Worldwide Inc. | 4,450 | 87,621 | ||||||||
Alternative Carriers — 0.0%* |
| |||||||||
Vonage Holdings Corp. | 4,400 | 19,404 | (a) | |||||||
Apparel Retail — 1.0% |
| |||||||||
Aeropostale Inc. | 9,350 | 163,625 | (a) | |||||||
American Eagle Outfitters Inc. | 6,100 | 77,775 | ||||||||
ANN Inc. | 700 | 18,270 | (a) | |||||||
Brown Shoe Company Inc. | 961 | 10,235 | ||||||||
DSW Inc. | 500 | 25,305 | (a) | |||||||
Express Inc. | 900 | 19,620 | ||||||||
Genesco Inc. | 1,226 | 63,875 | (a) | |||||||
The Buckle Inc. | 3,200 | 136,640 | ||||||||
The Cato Corp. | 800 | 23,040 | ||||||||
| 538,385 | ||||||||||
Apparel, Accessories & Luxury Goods — 1.1% |
| |||||||||
Columbia Sportswear Co. | 5,783 | 366,642 | ||||||||
Maidenform Brands Inc. | 6,900 | 190,854 | (a) | |||||||
Movado Group Inc. | 1,142 | 19,540 | ||||||||
| 577,036 | ||||||||||
Application Software — 5.2% |
| |||||||||
ACI Worldwide Inc. | 5,050 | 170,538 | (a) | |||||||
Actuate Corp. | 3,200 | 18,720 | (a) | |||||||
Blackbaud Inc. | 11,760 | 325,987 | ||||||||
Blackboard Inc. | 6,300 | 273,357 | (a) | |||||||
Bottomline Technologies Inc. | 8,100 | 200,151 | (a) | |||||||
Concur Technologies Inc. | 3,800 | 190,266 | (a) | |||||||
Ebix Inc. | 4,700 | 89,535 | (a) | |||||||
Manhattan Associates Inc. | 600 | 20,664 | (a) | |||||||
| Number of Shares | Fair Value | |||||||||
Monotype Imaging Holdings Inc. | 1,700 | $ | 24,021 | (a) | ||||||
NICE Systems Ltd. ADR | 4,700 | 170,892 | (a) | |||||||
Parametric Technology Corp. | 14,800 | 339,364 | (a) | |||||||
QLIK Technologies Inc. | 1,600 | 54,496 | (a) | |||||||
Quest Software Inc. | 3,109 | 70,668 | (a) | |||||||
SolarWinds Inc. | 11,300 | 295,382 | (a) | |||||||
Solera Holdings Inc. | 1,750 | 103,530 | ||||||||
SS&C Technologies Holdings Inc. | 12,990 | 258,111 | (a) | |||||||
TeleNav Inc. | 2,400 | 42,552 | (a) | |||||||
Ultimate Software Group Inc. | 3,000 | 163,290 | (a) | |||||||
| 2,811,524 | ||||||||||
Asset Management & Custody Banks — 1.0% |
| |||||||||
Affiliated Managers Group Inc. | 3,575 | 362,684 | (a) | |||||||
Financial Engines Inc. | 4,400 | 114,048 | (a) | |||||||
Janus Capital Group Inc. | 2,100 | 19,824 | ||||||||
Pzena Investment Management Inc. | 2,800 | 15,904 | ||||||||
| 512,460 | ||||||||||
Auto Parts & Equipment — 0.4% |
| |||||||||
Dana Holding Corp. | 4,289 | 78,489 | (a) | |||||||
Dorman Products Inc. | 258 | 10,212 | (a) | |||||||
Federal-Mogul Corp. | 800 | 18,264 | (a) | |||||||
Modine Manufacturing Co. | 3,242 | 49,830 | (a) | |||||||
Spartan Motors Inc. | 2,139 | 11,551 | ||||||||
Stoneridge Inc. | 3,312 | 48,819 | (a) | |||||||
Tenneco Inc. | 500 | 22,035 | (a) | |||||||
| 239,200 | ||||||||||
Automobile Manufacturers — 0.3% |
| |||||||||
Thor Industries Inc. | 5,480 | 158,043 | ||||||||
Automotive Retail — 0.1% |
| |||||||||
America’s Car-Mart Inc. | 1,843 | 60,819 | (a) | |||||||
Biotechnology — 1.1% |
| |||||||||
Alkermes Inc. | 1,100 | 20,460 | (a) | |||||||
Amylin Pharmaceuticals Inc. | 1,600 | 21,376 | (a) | |||||||
Cubist Pharmaceuticals Inc. | 3,300 | 118,767 | (a) | |||||||
Genomic Health Inc. | 5,200 | 145,132 | (a) | |||||||
Myriad Genetics Inc. | 8,900 | 202,119 | (a) | |||||||
Nabi Biopharmaceuticals | 3,500 | 18,830 | (a) | |||||||
PDL BioPharma Inc. | 2,220 | 13,031 | ||||||||
Sciclone Pharmaceuticals Inc. | 4,800 | 28,992 | (a) | |||||||
| 568,707 | ||||||||||
Building Products — 0.2% |
| |||||||||
AAON Inc. | 1,515 | 33,088 | ||||||||
Apogee Enterprises Inc. | 2,139 | 27,401 | ||||||||
Simpson Manufacturing Company Inc. | 800 | 23,896 | ||||||||
Universal Forest Products Inc. | 1,905 | 45,644 | ||||||||
| 130,029 | ||||||||||
Casinos & Gaming — 0.0%* |
| |||||||||
Ameristar Casinos Inc. | 1,000 | 23,710 | ||||||||
See Notes to Schedule of Investments and Notes to Financial Statements.
6
Table of Contents
Small-Cap Equity Fund
| Schedule of Investments | June 30, 2011 (unaudited) |
| Number of Shares | Fair Value | |||||||||
Coal & Consumable Fuels — 0.6% |
| |||||||||
James River Coal Co. | 14,350 | $ | 298,767 | (a) | ||||||
Commercial Printing — 0.1% |
| |||||||||
Consolidated Graphics Inc. | 406 | 22,310 | (a) | |||||||
Multi-Color Corp. | 1,200 | 29,628 | ||||||||
| 51,938 | ||||||||||
Commodity Chemicals — 0.7% |
| |||||||||
Koppers Holdings Inc. | 9,850 | 373,611 | ||||||||
Communications Equipment — 0.4% |
| |||||||||
Acme Packet Inc. | 250 | 17,533 | (a) | |||||||
ADTRAN Inc. | 500 | 19,355 | ||||||||
Arris Group Inc. | 4,387 | 50,933 | (a) | |||||||
DG FastChannel Inc. | 600 | 19,230 | (a) | |||||||
Netgear Inc. | 1,318 | 57,623 | (a) | |||||||
Plantronics Inc. | 550 | 20,092 | ||||||||
Riverbed Technology Inc. | 500 | 19,795 | ||||||||
| 204,561 | ||||||||||
Computer & Electronics Retail — 0.0%* |
| |||||||||
Systemax Inc. | 1,920 | 28,685 | (a) | |||||||
Computer Storage & Peripherals — 0.0%* |
| |||||||||
QLogic Corp. | 1,100 | 17,512 | (a) | |||||||
Construction & Engineering — 1.8% |
| |||||||||
Chicago Bridge & Iron Company N.V. | 9,670 | 376,163 | ||||||||
Primoris Services Corp. | 2,000 | 25,800 | ||||||||
Quanta Services Inc. | 9,350 | 188,870 | (a) | |||||||
URS Corp. | 8,700 | 389,238 | (a) | |||||||
| 980,071 | ||||||||||
Construction & Farm Machinery & Heavy Trucks — 2.3% |
| |||||||||
AGCO Corp. | 7,240 | 357,366 | (a) | |||||||
Astec Industries Inc. | 2,255 | 83,390 | (a) | |||||||
Cascade Corp. | 2,600 | 123,682 | ||||||||
Greenbrier companies Inc. | 4,048 | 79,988 | (a) | |||||||
Sauer-Danfoss Inc. | 400 | 20,156 | (a) | |||||||
The Toro Co. | 364 | 22,022 | ||||||||
Trinity Industries Inc. | 11,275 | 393,272 | ||||||||
WABCO Holdings Inc. | 600 | 41,436 | (a) | |||||||
Wabtec Corp. | 1,500 | 98,580 | ||||||||
| 1,219,892 | ||||||||||
Consumer Electronics — 0.0%* |
| |||||||||
Harman International Industries Inc. | 294 | 13,398 | ||||||||
Consumer Finance — 0.1% |
| |||||||||
Ezcorp Inc. | 950 | 33,796 | (a) | |||||||
First Cash Financial Services Inc. | 650 | 27,294 | (a) | |||||||
Nelnet Inc. | 950 | 20,957 | ||||||||
| 82,047 | ||||||||||
| Number of Shares | Fair Value | |||||||||
Data Processing & Outsourced Services — 2.3% | ||||||||||
Broadridge Financial Solutions Inc. | 14,675 | $ | 353,227 | |||||||
Cardtronics Inc. | 10,300 | 241,535 | (a) | |||||||
Global Cash Access Holdings Inc. | 20,800 | 66,144 | (a) | |||||||
Jack Henry & Associates Inc. | 5,200 | 156,052 | ||||||||
NeuStar Inc. | 7,358 | 192,780 | (a) | |||||||
TeleTech Holdings Inc. | 850 | 17,918 | (a) | |||||||
TNS Inc. | 1,697 | 28,170 | (a) | |||||||
Wright Express Corp. | 3,400 | 177,038 | (a) | |||||||
| 1,232,864 | ||||||||||
Distributors — 0.9% |
| |||||||||
LKQ Corp. | 19,201 | 500,954 | (a) | |||||||
Diversified Chemicals — 0.1% |
| |||||||||
LSB Industries Inc. | 500 | 21,460 | (a) | |||||||
Solutia Inc. | 800 | 18,280 | (a) | |||||||
| 39,740 | ||||||||||
Diversified Metals & Mining — 0.5% |
| |||||||||
Compass Minerals International Inc. | 2,490 | 214,314 | ||||||||
Globe Specialty Metals Inc. | 900 | 20,178 | ||||||||
Materion Corp. | 500 | 18,485 | (a) | |||||||
| 252,977 | ||||||||||
Diversified REITs — 0.1% |
| |||||||||
Washington Real Estate Investment Trust | 1,378 | 44,813 | ||||||||
Diversified Support Services — 0.8% |
| |||||||||
Copart Inc. | 4,400 | 205,040 | (a) | |||||||
Healthcare Services Group Inc. | 11,550 | 187,687 | ||||||||
Unifirst Corp. | 856 | 48,099 | ||||||||
| 440,826 | ||||||||||
Education Services — 1.1% |
| |||||||||
American Public Education Inc. | 3,000 | 133,530 | (a) | |||||||
Bridgepoint Education Inc. | 800 | 20,000 | (a) | |||||||
Capella Education Co. | 2,200 | 92,070 | (a) | |||||||
K12 Inc. | 4,900 | 162,386 | (a) | |||||||
Lincoln Educational Services Corp. | 4,963 | 85,116 | ||||||||
Strayer Education Inc. | 900 | 113,751 | ||||||||
| 606,853 | ||||||||||
Electric Utilities — 0.8% |
| |||||||||
Allete Inc. | 1,452 | 59,590 | ||||||||
IDACORP Inc. | 7,600 | 300,200 | ||||||||
Westar Energy Inc. | 1,950 | 52,475 | ||||||||
| 412,265 | ||||||||||
Electrical Components & Equipment — 1.6% |
| |||||||||
Acuity Brands Inc. | 300 | 16,734 | ||||||||
Belden Inc. | 600 | 20,916 | ||||||||
Brady Corp. | 10,499 | 336,598 | ||||||||
EnerSys | 600 | 20,652 | (a) | |||||||
See Notes to Schedule of Investments and Notes to Financial Statements.
7
Table of Contents
Small-Cap Equity Fund
| Schedule of Investments | June 30, 2011 (unaudited) |
| Number of Shares | Fair Value | |||||||||
Franklin Electric Company Inc. | 500 | $ | 23,475 | |||||||
Generac Holdings Inc. | 1,192 | 23,125 | (a) | |||||||
II-VI Inc. | 1,480 | 37,888 | (a) | |||||||
LSI Industries Inc. | 2,147 | 17,047 | ||||||||
Preformed Line Products Co. | 231 | 16,443 | ||||||||
Regal-Beloit Corp. | 917 | 61,228 | ||||||||
Woodward Governor Co. | 7,600 | 264,936 | ||||||||
| 839,042 | ||||||||||
Electronic Components — 0.0%* |
| |||||||||
Vishay Intertechnology Inc. | 1,600 | 24,064 | ||||||||
Electronic Equipment & Instruments — 0.9% |
| |||||||||
Checkpoint Systems Inc. | 700 | 12,516 | (a) | |||||||
Daktronics Inc. | 2,059 | 22,217 | ||||||||
Elster Group SE ADR | 6,300 | 103,194 | (a) | |||||||
FARO Technologies Inc. | 3,700 | 162,060 | (a) | |||||||
National Instruments Corp. | 3,700 | 109,853 | ||||||||
Rofin-Sinar Technologies Inc. | 1,527 | 52,147 | (a) | |||||||
| 461,987 | ||||||||||
Electronic Manufacturing Services — 0.6% |
| |||||||||
Measurement Specialties Inc. | 4,554 | 162,578 | (a) | |||||||
Methode Electronics Inc. | 4,365 | 50,678 | ||||||||
Multi-Fineline Electronix Inc. | 2,763 | 59,708 | (a) | |||||||
Plexus Corp. | 1,129 | 39,300 | (a) | |||||||
| 312,264 | ||||||||||
Environmental & Facilities Services — 1.0% |
| |||||||||
ABM Industries Inc. | 11,800 | 275,412 | ||||||||
Waste Connections Inc. | 8,900 | 282,397 | ||||||||
| 557,809 | ||||||||||
Food Distributors — 0.2% |
| |||||||||
Nash Finch Co. | 575 | 20,591 | ||||||||
Spartan Stores Inc. | 3,650 | 71,285 | ||||||||
| 91,876 | ||||||||||
Food Retail — 0.6% |
| |||||||||
Ruddick Corp. | 7,400 | 322,196 | ||||||||
Footwear — 1.3% |
| |||||||||
Deckers Outdoor Corp. | 5,000 | 440,700 | ||||||||
K-Swiss Inc. | 1,915 | 20,356 | (a) | |||||||
Wolverine World Wide Inc. | 5,998 | 250,417 | ||||||||
| 711,473 | ||||||||||
Gas Utilities — 0.2% |
| |||||||||
South Jersey Industries Inc. | 1,599 | 86,842 | ||||||||
Healthcare Distributors — 0.7% |
| |||||||||
Owens & Minor Inc. | 11,091 | 382,529 | ||||||||
Healthcare Equipment — 3.2% |
| |||||||||
Analogic Corp. | 300 | 15,777 | ||||||||
| Number of Shares | Fair Value | |||||||||
Arthrocare Corp. | 600 | $ | 20,082 | (a) | ||||||
Exactech Inc. | 1,011 | 18,208 | (a) | |||||||
Gen-Probe Inc. | 2,500 | 172,875 | (a) | |||||||
Hill-Rom Holdings Inc. | 1,311 | 60,358 | ||||||||
Integra LifeSciences Holdings Corp. | 5,500 | 262,955 | (a) | |||||||
Masimo Corp. | 5,400 | 160,272 | ||||||||
Natus Medical Inc. | 950 | 14,393 | (a) | |||||||
NuVasive Inc. | 7,685 | 252,683 | (a) | |||||||
SonoSite Inc. | 4,400 | 154,748 | (a) | |||||||
STERIS Corp. | 400 | 13,992 | ||||||||
Teleflex Inc. | 3,330 | 203,330 | ||||||||
Thoratec Corp. | 6,700 | 219,894 | (a) | |||||||
Volcano Corp. | 2,900 | 93,641 | (a) | |||||||
Zoll Medical Corp. | 671 | 38,019 | (a) | |||||||
| 1,701,227 | ||||||||||
Healthcare Facilities — 0.4% |
| |||||||||
National Healthcare Corp. | 250 | 12,393 | ||||||||
Sun Healthcare Group Inc. | 5,111 | 40,990 | (a) | |||||||
The Ensign Group Inc. | 645 | 19,602 | ||||||||
VCA Antech Inc. | 7,400 | 156,880 | (a) | |||||||
| 229,865 | ||||||||||
Healthcare Services — 2.3% |
| |||||||||
Bio-Reference Laboratories Inc. | 24,000 | 501,600 | (a) | |||||||
Continucare Corp. | 2,811 | 17,372 | (a) | |||||||
HMS Holdings Corp. | 4,000 | 307,480 | (a) | |||||||
Mednax Inc. | 5,400 | 389,826 | (a) | |||||||
| 1,216,278 | ||||||||||
Healthcare Supplies — 1.0% |
| |||||||||
Atrion Corp. | 50 | 9,890 | ||||||||
Immucor Inc. | 4,475 | 91,379 | (a) | |||||||
Meridian Bioscience Inc. | 3,700 | 89,207 | ||||||||
Merit Medical Systems Inc. | 3,363 | 60,433 | ||||||||
West Pharmaceutical Services Inc. | 7,000 | 306,320 | ||||||||
| 557,229 | ||||||||||
Healthcare Technology — 1.2% |
| |||||||||
Allscripts Healthcare Solutions Inc. | 861 | 16,721 | (a) | |||||||
athenahealth Inc. | 2,200 | 90,420 | (a) | |||||||
Computer Programs & Systems Inc. | 2,900 | 184,092 | ||||||||
MedAssets Inc. | 11,800 | 157,648 | (a) | |||||||
Medidata Solutions Inc. | 5,200 | 124,124 | (a) | |||||||
Quality Systems Inc. | 700 | 61,110 | ||||||||
| 634,115 | ||||||||||
Home Furnishing Retail — 0.6% |
| |||||||||
Aaron’s Inc. | 10,137 | 286,472 | ||||||||
Pier 1 Imports Inc. | 2,142 | 24,783 | (a) | |||||||
| 311,255 | ||||||||||
Home Furnishings — 0.0%* |
| |||||||||
Hooker Furniture Corp. | 295 | 2,614 | ||||||||
Household Products — 0.2% |
| |||||||||
WD-40 Co. | 3,000 | 117,120 | ||||||||
See Notes to Schedule of Investments and Notes to Financial Statements.
8
Table of Contents
Small-Cap Equity Fund
| Schedule of Investments | June 30, 2011 (unaudited) |
| Number of Shares | Fair Value | |||||||||
Housewares & Specialties — 1.2% |
| |||||||||
Jarden Corp. | 12,350 | $ | 426,198 | |||||||
Tupperware Brands Corp. | 3,000 | 202,350 | ||||||||
| 628,548 | ||||||||||
Human Resource & Employment |
| |||||||||
GP Strategies Corp. | 1,600 | 21,856 | (a) | |||||||
Korn International | 900 | 19,791 | (a) | |||||||
| 41,647 | ||||||||||
Hypermarkets & Super Centers — 0.0%* |
| |||||||||
Pricesmart Inc. | 500 | 25,615 | ||||||||
Industrial Conglomerates — 0.2% |
| |||||||||
Raven Industries Inc. | 1,600 | 89,136 | ||||||||
Industrial Machinery — 4.8% |
| |||||||||
Actuant Corp. | 2,600 | 69,758 | ||||||||
Briggs & Stratton Corp. | 1,289 | 25,600 | ||||||||
CIRCOR International Inc. | 1,300 | 55,679 | ||||||||
CLARCOR Inc. | 7,400 | 349,872 | ||||||||
Columbus McKinnon Corp. | 2,073 | 37,231 | (a) | |||||||
EnPro Industries Inc. | 1,500 | 72,105 | (a) | |||||||
Flowserve Corp. | 2,150 | 236,264 | ||||||||
Harsco Corp. | 3,650 | 118,990 | ||||||||
IDEX Corp. | 5,900 | 270,515 | ||||||||
Kaydon Corp. | 400 | 14,928 | ||||||||
Lincoln Electric Holdings Inc. | 1,324 | 47,465 | ||||||||
Middleby Corp. | 3,850 | 362,054 | (a) | |||||||
Mueller Industries Inc. | 3,250 | 123,207 | ||||||||
Nordson Corp. | 5,350 | 293,447 | ||||||||
Robbins & Myers Inc. | 2,200 | 116,270 | ||||||||
Timken Co. | 5,050 | 254,520 | ||||||||
Trimas Corp. | 4,400 | 108,900 | (a) | |||||||
Valmont Industries Inc. | 459 | 44,243 | ||||||||
| 2,601,048 | ||||||||||
Industrial REITs — 0.2% |
| |||||||||
DuPont Fabros Technology Inc. | 2,184 | 55,037 | ||||||||
First Potomac Realty Trust | 2,819 | 43,159 | ||||||||
| 98,196 | ||||||||||
Insurance Brokers — 0.6% |
| |||||||||
Arthur J Gallagher & Co. | 4,400 | 125,576 | ||||||||
Brown & Brown Inc. | 7,400 | 189,884 | ||||||||
| 315,460 | ||||||||||
Internet Software & Services — 1.0% |
| |||||||||
comScore Inc. | 7,400 | 191,660 | (a) | |||||||
Constant Contact Inc. | 5,900 | 149,742 | (a) | |||||||
Dice Holdings Inc. | 1,500 | 20,280 | (a) | |||||||
Infospace Inc. | 2,500 | 22,800 | (a) | |||||||
Liquidity Services Inc. | 1,000 | 23,610 | (a) | |||||||
LogMeIn Inc. | 2,400 | 92,568 | (a) | |||||||
Monster Worldwide Inc. | 1,200 | 17,592 | (a) | |||||||
| Number of Shares | Fair Value | |||||||||
ValueClick Inc. | 1,200 | $ | 19,920 | (a) | ||||||
| 538,172 | ||||||||||
Investment Banking & Brokerage — 1.0% |
| |||||||||
BGC Partners Inc. | 3,439 | 26,583 | ||||||||
GFI Group Inc. | 21,000 | 96,390 | ||||||||
Piper Jaffray companies | 1,424 | 41,025 | (a) | |||||||
Raymond James Financial Inc. | 10,100 | 324,715 | ||||||||
Stifel Financial Corp. | 925 | 33,171 | (a) | |||||||
| 521,884 | ||||||||||
IT Consulting & Other Services — 0.0%* |
| |||||||||
Unisys Corp. | 500 | 12,850 | (a) | |||||||
Leisure Products — 0.7% |
| |||||||||
Brunswick Corp. | 1,046 | 21,338 | ||||||||
Polaris Industries Inc. | 3,375 | 375,199 | ||||||||
| 396,537 | ||||||||||
Life & Health Insurance — 0.1% |
| |||||||||
American Equity Investment Life Holding Co. | 2,175 | 27,644 | ||||||||
Delphi Financial Group Inc. | 1,219 | 35,607 | ||||||||
| 63,251 | ||||||||||
Life Sciences Tools & Services — 2.2% |
| |||||||||
Bio-Rad Laboratories Inc. | 1,900 | 226,784 | (a) | |||||||
Bruker Corp. | 20,135 | 409,949 | (a) | |||||||
ICON PLC ADR | 9,100 | 214,396 | (a) | |||||||
Luminex Corp. | 7,628 | 159,425 | (a) | |||||||
Techne Corp. | 2,000 | 166,740 | ||||||||
| 1,177,294 | ||||||||||
Managed Healthcare — 1.5% |
| |||||||||
AMERIGROUP Corp. | 550 | 38,758 | (a) | |||||||
Centene Corp. | 10,425 | 370,400 | (a) | |||||||
Metropolitan Health Networks Inc. | 2,886 | 13,824 | (a) | |||||||
Molina Healthcare Inc. | 13,761 | 373,198 | ||||||||
| 796,180 | ||||||||||
Metal & Glass Containers — 1.1% |
| |||||||||
AEP Industries Inc. | 1,139 | 33,247 | (a) | |||||||
Aptargroup Inc. | 5,900 | 308,806 | ||||||||
Myers Industries Inc. | 2,243 | 23,058 | ||||||||
Silgan Holdings Inc. | 5,100 | 208,947 | ||||||||
| 574,058 | ||||||||||
Multi-Line Insurance — 0.8% |
| |||||||||
HCC Insurance Holdings Inc. | 12,900 | 406,350 | ||||||||
Horace Mann Educators Corp. | 2,004 | 31,282 | ||||||||
| 437,632 | ||||||||||
Multi-Sector Holdings — 0.0%* |
| |||||||||
Compass Diversified Holdings | 1,083 | 17,859 | ||||||||
See Notes to Schedule of Investments and Notes to Financial Statements.
9
Table of Contents
Small-Cap Equity Fund
| Schedule of Investments | June 30, 2011 (unaudited) |
| Number of Shares | Fair Value | |||||||||
Multi-Utilities — 0.9% |
| |||||||||
Avista Corp. | 2,754 | $ | 70,750 | |||||||
Black Hills Corp. | 1,411 | 42,457 | ||||||||
OGE Energy Corp. | 7,675 | 386,206 | ||||||||
| 499,413 | ||||||||||
Office Electronics — 0.4% |
| |||||||||
Zebra Technologies Corp. | 4,900 | 206,633 | (a) | |||||||
Office REITs — 1.6% |
| |||||||||
BioMed Realty Trust Inc. | 18,663 | 359,076 | ||||||||
Coresite Realty Corp. | 6,050 | 99,220 | ||||||||
Digital Realty Trust Inc. | 6,050 | 373,769 | ||||||||
Lexington Realty Trust | 3,038 | 27,737 | ||||||||
| 859,802 | ||||||||||
Office Services & Supplies — 0.3% |
| |||||||||
Herman Miller Inc. | 2,800 | 76,216 | ||||||||
Kimball International Inc. | 1,617 | 10,397 | ||||||||
Knoll Inc. | 1,458 | 29,262 | ||||||||
Steelcase Inc. | 1,800 | 20,502 | ||||||||
| 136,377 | ||||||||||
Oil & Gas Drilling — 0.4% |
| |||||||||
Pioneer Drilling Co. | 14,200 | 216,408 | (a) | |||||||
Oil & Gas Equipment & Services — 2.1% |
| |||||||||
Dawson Geophysical Co. | 1,709 | 58,362 | (a) | |||||||
Dril-Quip Inc. | 1,100 | 74,613 | (a) | |||||||
Hornbeck Offshore Services Inc. | 618 | 16,995 | (a) | |||||||
Oil States International Inc. | 6,850 | 547,383 | (a) | |||||||
RPC Inc. | 600 | 14,724 | ||||||||
Superior Energy Services Inc. | 7,400 | 274,836 | (a) | |||||||
Tetra Technologies Inc. | 11,700 | 148,941 | (a) | |||||||
| 1,135,854 | ||||||||||
Oil & Gas Exploration & Production — 3.3% |
| |||||||||
Bill Barrett Corp. | 1,094 | 50,707 | (a) | |||||||
Brigham Exploration Co. | 4,650 | 139,175 | (a) | |||||||
Carrizo Oil & Gas Inc. | 803 | 33,525 | (a) | |||||||
Clayton Williams Energy Inc. | 200 | 12,010 | (a) | |||||||
Contango Oil & Gas Co. | 300 | 17,532 | ||||||||
Energy XXI Bermuda Ltd. | 700 | 23,254 | (a) | |||||||
GMX Resources Inc. | 5,491 | 24,435 | (a) | |||||||
Gulfport Energy Corp. | 5,400 | 160,326 | (a) | |||||||
HollyFrontier Corp. | 400 | 27,760 | ||||||||
Kodiak Oil & Gas Corp. | 2,460 | 14,194 | (a) | |||||||
Northern Oil and Gas Inc. | 7,400 | 163,910 | (a) | |||||||
Oasis Petroleum Inc. | 5,500 | 163,240 | (a) | |||||||
Petroleum Development Corp. | 394 | 11,785 | (a) | |||||||
Petroquest Energy Inc. | 2,700 | 18,954 | (a) | |||||||
Resolute Energy Corp. | 8,800 | 142,208 | (a) | |||||||
Rosetta Resources Inc. | 3,500 | 180,390 | (a) | |||||||
SandRidge Energy Inc. | 14,900 | 158,834 | (a) | |||||||
SM Energy Co. | 5,350 | 393,118 | ||||||||
Stone Energy Corp. | 900 | 27,351 | (a) | |||||||
| Number of Shares | Fair Value | |||||||||
Venoco Inc. | 800 | $ | 10,192 | (a) | ||||||
W&T Offshore Inc. | 800 | 20,896 | ||||||||
| 1,793,796 | ||||||||||
Oil & Gas Refining & Marketing — 0.1% |
| |||||||||
Western Refining Inc. | 1,849 | 33,411 | (a) | |||||||
Packaged Foods & Meats — 3.6% |
| |||||||||
Flowers Foods Inc. | 15,450 | 340,518 | ||||||||
Lancaster Colony Corp. | 5,100 | 310,182 | ||||||||
Sanderson Farms Inc. | 5,535 | 264,462 | ||||||||
Smart Balance Inc. | 11,800 | 61,124 | (a) | |||||||
Smithfield Foods Inc. | 22,925 | 501,370 | (a) | |||||||
Snyders-Lance Inc. | 11,100 | 240,093 | ||||||||
TreeHouse Foods Inc. | 4,400 | 240,284 | (a) | |||||||
| 1,958,033 | ||||||||||
Paper Packaging — 0.7% |
| |||||||||
Packaging Corporation of America | 14,050 | 393,259 | ||||||||
Paper Products — 0.1% |
| |||||||||
Buckeye Technologies Inc. | 1,102 | 29,732 | ||||||||
Clearwater Paper Corp. | 200 | 13,656 | (a) | |||||||
Neenah Paper Inc. | 953 | 20,280 | ||||||||
| 63,668 | ||||||||||
Personal Products — 0.0%* |
| |||||||||
Revlon Inc. | 900 | 15,120 | ||||||||
Pharmaceuticals — 0.3% |
| |||||||||
Akorn Inc. | 3,725 | 26,075 | (a) | |||||||
Hi-Tech Pharmacal Company Inc. | 1,943 | 56,211 | (a) | |||||||
Obagi Medical Products Inc. | 1,700 | 16,031 | (a) | |||||||
Par Pharmaceutical Companies Inc. | 1,461 | 48,184 | (a) | |||||||
Salix Pharmaceuticals Ltd. | 500 | 19,915 | (a) | |||||||
The Medicines Co. | 1,150 | 18,986 | (a) | |||||||
| 185,402 | ||||||||||
Precious Metals & Minerals — 0.1% |
| |||||||||
Coeur d’Alene Mines Corp. | 800 | 19,408 | (a) | |||||||
Stillwater Mining Co. | 1,000 | 22,010 | (a) | |||||||
| 41,418 | ||||||||||
Property & Casualty Insurance — 1.8% |
| |||||||||
Allied World Assurance Company Holdings Ltd. | 5,500 | 316,690 | ||||||||
American Safety Insurance Holdings Ltd. | 2,094 | 40,079 | (a) | |||||||
Amtrust Financial Services Inc. | 1,900 | 43,282 | ||||||||
Argo Group International Holdings Ltd. | 3,718 | 110,499 | ||||||||
Aspen Insurance Holdings Ltd. | 8,000 | 205,840 | ||||||||
The Navigators Group Inc. | 4,400 | 206,800 | (a) | |||||||
Tower Group Inc. | 1,761 | 41,947 | ||||||||
| 965,137 | ||||||||||
See Notes to Schedule of Investments and Notes to Financial Statements.
10
Table of Contents
Small-Cap Equity Fund
| Schedule of Investments | June 30, 2011 (unaudited) |
| Number of Shares | Fair Value | |||||||||
Publishing — 1.3% |
| |||||||||
John Wiley & Sons Inc. | 8,700 | $ | 452,487 | |||||||
Meredith Corp. | 600 | 18,678 | ||||||||
Morningstar Inc. | 3,700 | 224,886 | ||||||||
| 696,051 | ||||||||||
Rail Roads — 0.9% |
| |||||||||
Genesee & Wyoming Inc. | 8,100 | 474,984 | (a) | |||||||
Regional Banks — 3.9% |
| |||||||||
BancorpSouth Inc. | 1,839 | 22,822 | ||||||||
Bank of the Ozarks Inc. | 990 | 51,539 | ||||||||
Banner Corp. | 1,105 | 19,337 | ||||||||
Camden National Corp. | 507 | 16,635 | ||||||||
Cardinal Financial Corp. | 1,280 | 14,016 | ||||||||
CoBiz Financial Inc. | 1,801 | 11,779 | ||||||||
Cullen Frost Bankers Inc. | 4,140 | 235,359 | ||||||||
East West Bancorp Inc. | 2,870 | 58,003 | ||||||||
First Horizon National Corp. | 2,593 | 24,737 | ||||||||
Fulton Financial Corp. | 7,400 | 79,254 | ||||||||
Glacier Bancorp Inc. | 911 | 12,280 | ||||||||
Great Southern Bancorp Inc. | 1,069 | 20,258 | ||||||||
Hancock Holding Co. | 900 | 27,882 | ||||||||
Home Bancshares Inc. | 822 | 19,432 | ||||||||
Iberiabank Corp. | 1,068 | 61,560 | ||||||||
Independent Bank Corp. | 3,700 | 97,125 | ||||||||
Lakeland Financial Corp. | 1,095 | 24,375 | ||||||||
National Penn Bancshares Inc. | 1,957 | 15,519 | ||||||||
Old National Bancorp | 1,873 | 20,228 | ||||||||
PacWest BanCorp. | 1,981 | 40,749 | ||||||||
Prosperity Bancshares Inc. | 6,668 | 292,192 | ||||||||
Sandy Spring Bancorp Inc. | 1,124 | 20,221 | ||||||||
Southwest Bancorp Inc. | 2,519 | 24,661 | ||||||||
Susquehanna Bancshares Inc. | 4,121 | 32,968 | ||||||||
SVB Financial Group | 4,700 | 280,637 | (a) | |||||||
UMB Financial Corp. | 8,000 | 335,040 | ||||||||
Umpqua Holdings Corp. | 3,996 | 46,234 | ||||||||
Westamerica Bancorp. | 2,900 | 142,825 | ||||||||
Wintrust Financial Corp. | 906 | 29,155 | ||||||||
| 2,076,822 | ||||||||||
Reinsurance — 0.1% |
| |||||||||
Maiden Holdings Ltd. | 3,233 | 29,420 | ||||||||
Research & Consulting Services — 0.4% |
| |||||||||
CoStar Group Inc. | 2,400 | 142,272 | (a) | |||||||
ICF International Inc. | 895 | 22,715 | (a) | |||||||
Resources Connection Inc. | 3,800 | 45,752 | ||||||||
The Corporate Executive Board Co. | 500 | 21,825 | ||||||||
| 232,564 | ||||||||||
Residential REITs — 0.1% |
| |||||||||
Equity Lifestyle Properties Inc. | 300 | 18,732 | ||||||||
Mid-America Apartment Communities Inc. | 701 | 47,296 | ||||||||
| 66,028 | ||||||||||
| Number of Shares | Fair Value | |||||||||
Restaurants — 1.0% |
| |||||||||
Buffalo Wild Wings Inc. | 300 | $ | 19,893 | (a) | ||||||
Cracker Barrel Old Country Store Inc. | 7,950 | 392,014 | ||||||||
Domino’s Pizza Inc. | 850 | 21,454 | (a) | |||||||
Einstein Noah Restaurant Group Inc. | 1,050 | 15,718 | ||||||||
The Wendy’s Co. | 15,000 | 76,050 | ||||||||
| 525,129 | ||||||||||
Retail REITs — 0.0%* |
| |||||||||
Ramco-Gershenson Properties Trust | 1,117 | 13,828 | ||||||||
Security & Alarm Services — 0.4% |
| |||||||||
The Brink’s Co. | 7,325 | 218,505 | ||||||||
Semiconductor Equipment — 0.5% |
| |||||||||
MKS Instruments Inc. | 834 | 22,034 | ||||||||
Rudolph Technologies Inc. | 21,900 | 234,549 | (a) | |||||||
| 256,583 | ||||||||||
Semiconductors — 1.7% |
| |||||||||
Alpha & Omega Semiconductor Ltd. | 1,600 | 21,200 | (a) | |||||||
Diodes Inc. | 2,010 | 52,461 | (a) | |||||||
Fairchild Semiconductor International Inc. | 3,551 | 59,337 | (a) | |||||||
Hittite Microwave Corp. | 1,000 | 61,910 | (a) | |||||||
Integrated Device Technology Inc. | 4,957 | 38,962 | (a) | |||||||
Intersil Corp. | 1,800 | 23,130 | ||||||||
IXYS Corp. | 1,359 | 20,358 | (a) | |||||||
Lattice Semiconductor Corp. | 3,109 | 20,271 | (a) | |||||||
Microsemi Corp. | 14,650 | 300,325 | (a) | |||||||
Pericom Semiconductor Corp. | 2,061 | 18,425 | (a) | |||||||
RF Micro Devices Inc. | 5,785 | 35,404 | (a) | |||||||
Semtech Corp. | 7,900 | 215,986 | (a) | |||||||
Standard Microsystems Corp. | 2,258 | 60,943 | (a) | |||||||
| 928,712 | ||||||||||
Soft Drinks — 0.1% |
| |||||||||
Coca-Cola Bottling Company Consolidated | 300 | 20,298 | ||||||||
National Beverage Corp. | 1,000 | 14,650 | ||||||||
| 34,948 | ||||||||||
Specialized Consumer Services — 0.2% |
| |||||||||
Matthews International Corp. | 2,800 | 112,420 | ||||||||
Specialized Finance — 0.1% |
| |||||||||
Interactive Brokers Group Inc. | 1,200 | 18,780 | ||||||||
NewStar Financial Inc. | 4,116 | 43,959 | (a) | |||||||
| 62,739 | ||||||||||
Specialized REITs — 1.4% |
| |||||||||
DiamondRock Hospitality Co. | 3,618 | 38,821 | ||||||||
Healthcare Realty Trust Inc. | 11,800 | 243,434 | ||||||||
Hersha Hospitality Trust | 5,873 | 32,713 | ||||||||
National Health Investors Inc. | 667 | 29,635 | ||||||||
See Notes to Schedule of Investments and Notes to Financial Statements.
11
Table of Contents
Small-Cap Equity Fund
| Schedule of Investments | June 30, 2011 (unaudited) |
| Number of Shares | Fair Value | |||||||||
Omega Healthcare Investors Inc. | 13,300 | $ | 279,433 | |||||||
Sabra Healthcare REIT Inc. | 4,216 | 70,449 | ||||||||
Summit Hotel Properties Inc. | 3,538 | 40,156 | ||||||||
| 734,641 | ||||||||||
Specialty Chemicals — 2.2% |
| |||||||||
Arch Chemicals Inc. | 10,825 | 372,813 | ||||||||
Ferro Corp. | 1,200 | 16,128 | (a) | |||||||
HB Fuller Co. | 2,728 | 66,618 | ||||||||
Minerals Technologies Inc. | 300 | 19,887 | ||||||||
Rockwood Holdings Inc. | 400 | 22,116 | (a) | |||||||
Sensient Technologies Corp. | 17,119 | 634,601 | ||||||||
Stepan Co. | 589 | 41,760 | ||||||||
| 1,173,923 | ||||||||||
Specialty Stores — 0.8% |
| |||||||||
Cabela’s Inc. | 1,296 | 35,186 | (a) | |||||||
Tractor Supply Co. | 5,700 | 381,216 | ||||||||
| 416,402 | ||||||||||
Steel — 0.7% |
| |||||||||
Carpenter Technology Corp. | 1,547 | 89,231 | ||||||||
Commercial Metals Co. | 17,780 | 255,143 | ||||||||
Schnitzer Steel Industries Inc. | 572 | 32,947 | ||||||||
| 377,321 | ||||||||||
Systems Software — 1.2% |
| |||||||||
Fortinet Inc. | 1,000 | 27,290 | ||||||||
MICROS Systems Inc. | 8,150 | 405,137 | (a) | |||||||
Progress Software Corp. | 8,446 | 203,802 | ||||||||
| 636,229 | ||||||||||
Technology Distributors — 0.3% |
| |||||||||
Anixter International Inc. | 300 | 19,602 | ||||||||
Insight Enterprises Inc. | 1,050 | 18,595 | (a) | |||||||
Scansource Inc. | 1,309 | 49,061 | (a) | |||||||
Tech Data Corp. | 1,192 | 58,277 | (a) | |||||||
| 145,535 | ||||||||||
Thrifts & Mortgage Finance — 0.3% |
| |||||||||
BankUnited Inc. | 1,504 | 39,916 | ||||||||
Northwest Bancshares Inc. | 3,733 | 46,961 | ||||||||
Washington Federal Inc. | 3,521 | 57,850 | ||||||||
| 144,727 | ||||||||||
Tires & Rubber — 0.1% |
| |||||||||
Cooper Tire & Rubber Co. | 3,711 | 73,441 | ||||||||
Trading Companies & Distributors — 0.9% |
| |||||||||
Applied Industrial Technologies Inc. | 9,300 | 331,173 | ||||||||
DXP Enterprises Inc. | 691 | 17,517 | (a) | |||||||
RSC Holdings Inc. | 8,350 | 99,866 | (a) | |||||||
TAL International Group Inc. | 600 | 20,718 | ||||||||
Watsco Inc. | 300 | 20,397 | ||||||||
| 489,671 | ||||||||||
| Number of Shares | Fair Value | |||||||||
Trucking — 1.3% |
| |||||||||
Knight Transportation Inc. | 1,100 | $ | 18,689 | |||||||
Landstar System Inc. | 5,200 | 241,696 | ||||||||
Marten Transport Ltd. | 2,090 | 45,144 | ||||||||
Old Dominion Freight Line Inc. | 10,750 | 400,975 | ||||||||
Werner Enterprises Inc. | 800 | 20,040 | ||||||||
| 726,544 | ||||||||||
Wireless Telecommunication |
| |||||||||
NTELOS Holdings Corp. | 1,000 | 20,420 | ||||||||
Total Common Stock | 50,052,248 | |||||||||
Other Investments — 0.0%* |
| |||||||||
GEI Investment Fund | 10 | (c) | ||||||||
Total Investments in Securities | 50,052,258 | |||||||||
Short-Term Investments — 7.0% |
| |||||||||
GE Institutional Money Market Fund Investment Class 0.11% | 3,797,683 | (b,c) | ||||||||
Total Investments | 53,849,941 | |||||||||
Liabilities in Excess of Other | (21,661 | ) | ||||||||
|
| |||||||||
NET ASSETS — 100.0% | $ | 53,828,280 | ||||||||
|
| |||||||||
Other Information |
| |||||||||
The Fund had the following long futures contracts open at June 30, 2011 (unaudited):
| Description | Expiration date | Number of Contracts | Current Notional Value | Unrealized Appreciation | ||||||||||||
Russell 2000 | September 2011 | 22 | $ | 1,815,880 | $ | 100,254 | ||||||||||
See Notes to Schedule of Investments and Notes to Financial Statements.
12
Table of Contents
| Notes to Schedule of Investments | June 30, 2011 (unaudited) |
The views expressed in this document reflect our judgment as of the publication date and are subject to change at any time without notice. The securities information regarding holdings, allocations and other characteristics are presented to illustrate examples of securities that the Fund has bought and the diversity of areas in which the Fund may invest as of a particular date. It may not be representative of the Fund’s current or future investments and should not be construed as a recommendation to purchase or sell a particular security. See the Fund’s summary prospectus and statutory prospectus for complete descriptions of investment objectives, policies, risks and permissible investments.
| (a) | Non-income producing security. |
| (b) | Coupon amount represents effective yield. |
| (c) | GE Asset Management, the investment adviser of the Fund, also serves as investment adviser of the GEI Investment Fund and the GE Institutional Money Market Fund. |
| * | Less than 0.05%. |
| † | Percentages are based on net assets as of June 30, 2011 . |
Abbreviations:
ADR | American Depository Receipt | |
REIT | Real Estate Investment Trust | |
13
Table of Contents
Selected data based on a share outstanding throughout the fiscal years indicated
| CLASS 1 | CLASS 4 | |||||||||||||||||||||||||||||||||||||||||
| 6/30/11† | 12/31/10 | 12/31/09 | 12/31/08(c) | 12/31/07 | 12/31/06 | 6/30/11† | 12/31/10 | 12/31/09 | 12/31/08(c) | |||||||||||||||||||||||||||||||||
| Inception date | — | — | — | — | — | 4/28/00 | — | — | — | 5/1/08 | ||||||||||||||||||||||||||||||||
Net asset value, beginning of period | $ | 12.46 | $ | 9.79 | $ | 7.48 | $ | 12.17 | $ | 14.39 | $ | 14.44 | $ 12.39 | $ 9.76 | $7.49 | $12.06 | ||||||||||||||||||||||||||
Income/(loss) from investment operations: | ||||||||||||||||||||||||||||||||||||||||||
Net investment income | (0.02) | 0.02 | ** | 0.04 | 0.09 | 0.06 | 0.05 | (0.04) | (0.02 | )** | (0.05) | 0.02 | ** | |||||||||||||||||||||||||||||
Net realized and unrealized | 1.17 | 2.67 | 2.27 | (4.67) | 0.31 | 1.87 | 1.15 | 2.65 | 2.32 | (4.51) | ||||||||||||||||||||||||||||||||
Total income/(loss) from | 1.15 | 2.69 | 2.31 | (4.58) | 0.37 | 1.92 | 1.11 | 2.63 | 2.27 | (4.49) | ||||||||||||||||||||||||||||||||
Less distributions from: | ||||||||||||||||||||||||||||||||||||||||||
Net investment income | — | 0.02 | — | 0.05 | 0.06 | 0.04 | — | — | — | 0.02 | ||||||||||||||||||||||||||||||||
Net realized gains | — | — | — | 0.06 | 2.53 | 1.93 | — | — | — | 0.06 | ||||||||||||||||||||||||||||||||
Total distributions | — | 0.02 | — | 0.11 | 2.59 | 1.97 | — | — | — | 0.08 | ||||||||||||||||||||||||||||||||
Net asset value, end of period | 13.61 | $ | 12.46 | $ | 9.79 | $ | 7.48 | $ | 12.17 | $ | 14.39 | 13.50 | $12.39 | $9.76 | $ 7.49 | |||||||||||||||||||||||||||
TOTAL RETURN (a) | 9.23% | 27.47% | 30.88% | (37.59)% | 2.39% | 13.27% | 8.96% | 26.95% | 30.31% | (37.20)% | ||||||||||||||||||||||||||||||||
RATIOS/ | ||||||||||||||||||||||||||||||||||||||||||
Net assets, end of period (in thousands) | $ | 53,817 | $ | 55,527 | $ | 54,114 | $ | 50,210 | $ | 104,010 | $ | 127,381 | $11 | $10 | $8 | $6 | ||||||||||||||||||||||||||
Ratios to average net assets: | ||||||||||||||||||||||||||||||||||||||||||
Net investment income (loss) | (0.26)% | * | 0.18% | (0.04)% | 0.46% | 0.31% | 0.31% | (0.69)% | * | (0.23)% | (0.51)% | (0.01)% | * | |||||||||||||||||||||||||||||
Net Expenses | 1.27% | (b)* | 1.12% | (b) | 1.52% | (b) | 0.94% | (b) | 0.87% | 0.86% | 1.71% | (b)* | 1.54% | (b) | 1.97% | (b) | 1.39% | (b)* | ||||||||||||||||||||||||
Gross Expenses | 1.27% | * | 1.13% | 1.52% | 0.94% | 0.87% | 0.86% | 1.71% | * | 1.55% | 1.97% | 1.39% | ||||||||||||||||||||||||||||||
Portfolio turnover rate | 25% | 47% | 40% | 85% | 25% | 52% | 25% | 47% | 40% | 85% | ||||||||||||||||||||||||||||||||
Notes to Financial Highlights
| (a) | Total returns are historical and assume changes in share price, reinvestment of dividends and capital gains distributions and do not include the effect of insurance contract charges. Past performance does not guarantee future results. |
| (b) | Reflects GE Asset Management’s waiver of a portion of the Fund’s management fee in an amount equal to the management fee earned by GEAM with respect to the Fund’s investment in the GE Money Market Fund and/or GE Institutional Money Market Fund. Excluding waiver, the expense ratios would be unchanged. |
| (c) | Less than $0.01 per share of the distribution paid was from Return of Capital. |
| * | Annualized for periods less than one year. |
| ** | Per share values have been calculated using the average share method. |
| † | Unaudited |
The accompanying Notes are an integral part of these financial statements.
14
Table of Contents
The accompanying notes are an integral part of these financial statements.
15
Table of Contents
For the six months ended June 30, 2011 (unaudited) | ||||
INVESTMENT INCOME | ||||
Income: | ||||
Dividend | $ | 267,392 | ||
Interest | 14,858 | |||
Interest from affiliated investments | 1,721 | |||
Less: Foreign taxes withheld | (287 | ) | ||
Total Income | 283,684 | |||
Expenses | ||||
Advisory and administration fees | 265,760 | |||
Distribution fees | ||||
Class 4 | 25 | |||
Transfer agent fees | 10,136 | |||
Director’s fees | 724 | |||
Custody and accounting expenses | 57,558 | |||
Professional fees | 9,774 | |||
Other expenses | 14,347 | |||
Total expenses before waiver and reimbursement | 358,324 | |||
Less: Expenses waived or borne by the adviser | (2,323 | ) | ||
Net expenses | 356,001 | |||
Net investment (loss) | (72,317 | ) | ||
NET REALIZED AND UNREALIZED GAIN (LOSS) | ||||
Realized gain (loss) on: | ||||
Investments | 5,263,109 | |||
Futures | 57,470 | |||
Increase (decrease) in unrealized appreciation/(depreciation) on: | ||||
Investments | (419,715 | ) | ||
Futures | 109,594 | |||
Net realized and unrealized gain on investments | 5,010,458 | |||
Net increase in net assets resulting from operations | $ | 4,938,141 | ||
The accompanying Notes are an integral part of these financial statements.
16
Table of Contents
| * | Unaudited |
The accompanying Notes are an integral part of these financial statements.
17
Table of Contents
| Notes to Financial Statements | June 30, 2011 (unaudited) |
| 1. | Organization of the Company |
GE Investments Funds, Inc. (the “Company”) was incorporated under the laws of the Commonwealth of Virginia on May 14, 1984 and is registered under the Investment Company Act of 1940, as amended (the “1940 Act”), as an open-end management investment company. The Company is composed of fourteen investment portfolios (collectively the “Funds”), although only the following eleven are currently being offered: U.S. Equity Fund, S&P 500 Index Fund, Premier Growth Equity Fund, Core Value Equity Fund, Mid-Cap Equity Fund, Small-Cap Equity Fund (the “Fund”), International Equity Fund, Total Return Fund, Income Fund, Money Market Fund and Real Estate Securities Fund.
Shares of the Funds of the Company are offered only to insurance company separate accounts that fund certain variable life insurance contracts and variable annuity contracts. GE Asset Management Incorporated (“GEAM”) is the investment adviser and administrator of each of the Funds.
The Company offers two share classes (Class 1 and Class 4) of the Fund. Class 4 shares were first offered on May 1, 2008, and Fund shares outstanding prior to May 1, 2008 were designated as Class 1 shares. Each share class has different fees and expenses, and as a result, each share class will have different share price and performance. Not all variable contracts offer both share classes of the Fund.
| 2. | Summary of Significant Accounting Policies |
The preparation of financial statements in conformity with U.S. generally accepted accounting principles (GAAP) requires management to make estimates and assumptions that affect the reported amounts of assets and liabilities and disclosure of contingent assets and liabilities at the date of the financial statements and the reported amounts of increases and decreases in net assets from operations during the reporting period. Actual results may differ from those estimates.
Subsequent events after the balance sheet date through the date the financial statements were issued, have been evaluated in the preparation of the financial statements. There are no items to report.
The following summarizes the significant accounting policies of the Company:
Securities Valuation and Transactions. All investments in securities are recorded at their estimated fair value, as described in Note 3.
Securities transactions are accounted for as of the trade date. Realized gains and losses on investments sold are recorded on the basis of identified cost for both financial statement and federal tax purposes.
The Fund’s income, expenses (other than distribution fees) and realized and unrealized gains and losses are allocated proportionally each day among the share classes based upon the relative net assets of each class.
Derivatives
The Fund is subject to equity price risk in the normal course of pursuing its investment objective. The Fund may enter into derivative transactions to gain market exposure for residual and accumulating cash positions.
Futures Contracts A futures contract represents a commitment for the future purchase or sale of an asset at a specified price on a specified date. The Fund invests in stock index futures contracts subject to certain limitations to manage its exposure to the stock markets. Buying futures tends to increase a Fund’s exposure to the underlying instrument while selling futures tends to decrease a Fund’s exposure to the underlying instrument or to hedge other Fund investments. The Fund will not enter into a transaction involving futures for speculative purposes. With futures contracts, there is minimal counterparty credit risk to the Fund since futures contracts are exchange traded and the exchange’s clearinghouse, as counterparty to all traded futures, guarantees the futures against default. The Fund’s risks in using these contracts include changes in the value of the underlying instruments, non- performance of the counterparties under the contracts’ terms and changes in the liquidity of the secondary market for the contracts. Futures contracts are valued at the settlement price established each day by the board of trade or exchange on which they principally trade.
Upon entering into a financial futures contract, the Fund is required to pledge to the broker an amount of cash and/or other assets equal to a certain percentage of the contract amount, known as initial margin deposit. Subsequent payments, known as variation margin, are made or received by the Fund each day, depending on the daily fluctuation in the fair value of the underlying security. The Fund records an unrealized gain or loss equal to the daily variation margin. Should market conditions move unexpectedly, the Fund may not achieve the anticipated benefits of the futures contracts and may incur a loss. The Fund recognizes a realized gain or loss upon the expiration or closing of a futures contract.
18
Table of Contents
| Notes to Financial Statements | June 30, 2011 (unaudited) |
Investment Income Corporate actions (including cash dividends) are recorded on the ex-dividend date, net of applicable withholding taxes, except for certain foreign corporate actions which are recorded as soon after ex-dividend date as such information becomes available. Interest income is recorded on the accrual basis.
Expenses Fund specific expenses are allocated to the Fund that incurs such expenses. Such expenses may include custodial fees, legal and accounting fees, printing costs and registration fees. Expenses that are not fund specific are allocated pro rata across the Funds. Certain class specific expenses (such as distribution fees) are allocated to the class that incurs such expense. Expenses of the Fund are generally paid directly by the Fund however, expenses may be paid by GEAM and reimbursed by the fund.
Federal Income Taxes The Fund intends to comply with all sections of the Internal Revenue Code applicable to regulated investment companies including the distribution of substantially all of its taxable net investment income and net realized capital gains to its shareholders. Therefore, no provision for federal income tax has been made. The Fund is treated as a separate taxpayer for federal income tax purposes.
| 3. | Securities Valuation |
The Fund utilizes various methods to measure the fair value of most of its investments on a recurring basis. GAAP establishes a framework for measuring fair value and providing related disclosures. Broadly, the framework requires fair value to be determined based on the exchange price that would be received for an asset or paid to transfer a liability (an exit price) in the principal or most advantageous market for the asset or liability in an orderly transaction between market participants at the measurement date. In the absence of active markets for the identical assets or liabilities, such measurements involve developing assumptions based on market observable data and, in the absence of such data, internal information that is consistent with what market participants would use in a hypothetical transaction that occurs at the measurement date. It also establishes a three-level valuation hierarchy based upon observable and non-observable inputs.
Observable inputs reflect market data obtained from independent sources, while unobservable inputs reflect our market assumptions. Preference is given to observable inputs. These two types of inputs create the following fair value hierarchy:
Level 1 — Quoted prices for identical investments in active markets.
Level 2 — Quoted prices for similar investments in active markets; quoted prices for identical or similar investments in markets that are not active; and model-derived valuations whose inputs are observable or whose significant value drivers are observable.
Level 3 — Significant inputs to the valuation model are unobservable.
Policies and procedures are maintained to value investments using the best and most relevant data available. In addition, pricing vendors are utilized to assist in valuing investments. GEAM performs periodic reviews of the methodologies used by independent pricing services including price validation of individual securities.
Fair Value Measurement The following section describes the valuation methodologies the Fund uses to measure different financial investments at fair value.
The Fund’s portfolio securities are valued generally on the basis of market quotations. Equity securities generally are valued at the last reported sale, price on the primary market in which they are traded. Portfolio securities listed on NASDAQ are valued using the NASDAQ Official Closing Price. Level 1 securities primarily include publicly-traded equity securities which may not necessarily represent the last sale price. If no sales occurred on the exchange or NASDAQ that day, the portfolio security generally is valued using the last reported bid price. In those circumstances the Fund classifies the investment securities in Level 2.
The Fund uses the net asset value per unit for the collective Fund. The Fund classifies the investment security in Level 2.
Other financial investments are derivative instruments that are not reflected in Total Investments, such as exchange traded futures. Futures are valued at the last sale price on the primary market they are traded and are typically included in level 1.
If prices are not readily available for a portfolio security, or if it is believed that a price for a portfolio security does not represent its fair value, the security may be valued using procedures approved by the Funds Board of Directors that are designed to establish its “fair” value. These securities would generally be classified in Level 3. Those procedures require that the fair value of a security be established by the fair valuation committee. The fair valuation committee follows different protocols for different types of investments and circumstances. The fair value procedures may be used to value any investment of the Fund in the appropriate circumstances.
19
Table of Contents
| Notes to Financial Statements | June 30, 2011 (unaudited) |
The following table presents the Fund’s investments measured at fair value on a recurring basis at June 30, 2011.
Investments | Level 1 | Level 2 | Level 3 | Total | ||||||||||||
Investments in Securities† | ||||||||||||||||
Common Stock | $ | 50,052,248 | $ | — | $ | — | $ | 50,052,248 | ||||||||
Other Investments | — | 10 | — | 10 | ||||||||||||
Short-Term Investments | 3,797,683 | — | — | 3,797,683 | ||||||||||||
Total Investments in Securities | $ | 53,849,931 | $ | 10 | $ | — | $ | 53,849,941 | ||||||||
Other Financial Instruments* | ||||||||||||||||
Futures Contracts — Unrealized Appreciation | $ | 100,254 | $ | — | $ | — | $ | 100,254 | ||||||||
There were no significant transfers between the fair value levels. Transfers between fair value levels are considered to occur at the beginning of the period.
† See Schedule of Investments for Industry Classification. * Other financial instruments include derivative instruments such as futures contracts. Amounts shown represent unrealized appreciation (depreciation) at period end. |
| |||||||||||||||
| 4. | Derivatives Transactions |
Shown below are the derivative contracts entered into by the Fund, summarized by primary risk exposure as they appear on the Statement of Assets and Liabilities, all of which are not accounted for as hedging instruments under FASB Accounting Standards Codification (“ASC”) No. 815 Derivatives and Hedging as of June 30, 2011.
Asset Derivatives June 30, 2011 | Liability Derivatives June 30, 2011 | |||||||||||
| Derivatives not accounted for as hedging instruments under ASC 815 | Location in the Statement of Assets and Liabilities | Fair Value ($) | Location in the Statements of Assets and Liabilities | Fair Value ($) | ||||||||
| Equity Contracts | Assets, Net Assets — Net Unrealized Appreciation/ (Depreciation) on Futures | 100,254 | * | Liabilities, Net Assets — Net Unrealized Appreciation/ (Depreciation) on Futures | — | |||||||
| * | Includes cumulative appreciation/depreciation of futures contracts as reported in the Schedule of Investments and Net Assets section of the Statement of Assets and Liabilities. Only the current day's variation margin is reported within the Assets or Liabilities sections of the Statement of Assets and Liabilities. |
Shown below are the effects of derivative instruments on the Fund’s Statements of Operations, summarized by primary risk exposure all of which are not accounted for as hedging instruments under ASC 815.
| Derivatives not accounted for as hedging instruments under ASC 815 | Location in the Statement | Total Notional Amount of Futures Contracts Purchased/(Sold) ($) | Realized Gain | Change in Unrealized | ||||||||||
Equity Contracts | Realized gain/(loss) on Futures, Increase/(decrease) in unrealized appreciation/ (depreciation) on Futures | 7,227,578/(6,752,211) | 57,470 | 109,594 | ||||||||||
20
Table of Contents
| Notes to Financial Statements | June 30, 2011 (unaudited) |
| 5. | Line of Credit |
The Company shares a revolving credit facility of up to $150 million with a number of its affiliates. The credit facility is with its custodian bank, State Street Bank and Trust Company (“State Street”). The revolving credit facility requires the payment of a commitment fee equal to 0.125% per annum on the daily unused portion of the credit facility, payable quarterly. The portion borne by the Funds generally is borne proportionally based upon net assets. In addition, the Company has a $100 million uncommitted, unsecured line of credit with State Street. Generally, borrowings under the credit facilities would accrue interest at the Federal Funds Rate plus 50 basis points and would be borne by the borrowing Fund. The maximum amount allowed to be borrowed by any one Fund is the lesser of (i) 33.33% of its total assets or (ii) 20% of its net assets. The credit facilities were not utilized by the Fund during the six month period ended June 30, 2011.
| 6. | Fees and Compensation Paid to Affiliates |
GEAM, a registered investment adviser, was retained by the Company’s Board of Directors effective March 16, 2000 to act as investment adviser and administrator of the Fund. GEAM’s compensation for investment advisory and administrative services is paid monthly based on the average daily net assets of the Fund at an annualized rate of 0.95%.
GEAM has a contractual agreement with the Fund to waive a portion of the Fund’s management fee in the amount equal to the management fee earned by GEAM with respect to the Fund’s investment in the GE Institutional Money Market Fund.
Distribution and Service (12b-1) Fees The Company has adopted a Distribution and Service (12b-1) Plan (the “Plan”) pursuant to Rule 12b-1 under the 1940 Act with respect to Class 4 shares of the Fund. Under the Plan, the Fund may compensate GE Investment Distributors, Inc. (“GEID”), a wholly-owned subsidiary of GEAM and the Fund’s principal distributor, for certain sales services provided by GEID or other broker dealers and investor services provided by GEID or other service providers relating to the Fund’s Class 4 shares, including services to owners or prospective owners of variable contracts issued by insurance companies that offer such share class as an investment option. The amount of compensation paid under the Plan by the Fund’s Class 4 shares may not exceed 0.45% of the average daily net assets of the Fund attributable to such share class. The Plan continues in effect from year to year for so long as such continuance is approved annually by the Board of Directors, including by those directors who are not
interested persons of the Company and who have no direct or indirect financial interest in the operation of the Plan or in any agreement related to it.
Directors’ Compensation The Fund pays no compensation to its directors who are officers or employees of GEAM or its affiliates. Directors who are not such officers or employees also serve in a similar capacity for other funds advised by GEAM. Compensation paid to unaffiliated directors are reflected on the Statement of Operations. These fees are allocated pro rata across all of the mutual fund platforms and share classes served by the directors, including the Fund, and are based upon the relative net assets of each fund within such platforms.
| 7. | Sub-advisory Fees |
Pursuant to investment sub-advisory agreements with GEAM, the assets of the Small-Cap Equity Fund are allocated to and managed by each of the following sub-advisers: (i) Palisade Capital Management, L.L.C.; (ii) Champlain Investment Partners, LLC; (iii) GlobeFlex Capital, LP; (iv) Kennedy Capital Management, Inc. and (v) SouthernSun Asset Management, LLC. GEAM is responsible for allocating the Fund’s assets among the sub-advisers in its discretion (Allocated Assets), and for managing the Fund’s cash position, while each sub-adviser is responsible for the day-to-day management of their portion of the Allocated Assets, under the general supervision and oversight of GEAM and the Board.
For their services, GEAM pays each sub-adviser an investment sub-advisory fee, which is calculated as a percentage of the average daily net assets of the respective Allocated Assets that it manages.
| 8. | Investment Transactions |
Purchases and Sales of Securities The cost of purchases and the proceeds from sales of investments, other than short-term securities and options, for the period ended June 30, 2011 were as follows:
| Non-U.S. Government Securities | ||
| Purchases | Sales | |
$ 13,600,401 | $ 20,568,728 | |
| 9. | Income Taxes |
The Fund is subject to ASC 740, Income Taxes. ASC 740 provides guidance for financial accounting and reporting for the effects of income taxes that result from an entity’s
21
Table of Contents
| Notes to Financial Statements | June 30, 2011 (unaudited) |
activities during the year. ASC 740 also provides guidance regarding how certain uncertain tax positions should be recognized, measured, presented and disclosed in the financial statements. ASC 740 requires evaluation of tax positions taken or expected to be taken in the course of preparing the Funds’ tax returns to determine whether the
tax positions are “more likely than not” of being sustained by the applicable tax authority. There are no adjustments to the Fund’s net assets required under ASC 740. The Fund’s 2007, 2008, 2009 and 2010 fiscal years tax returns are still open to examination by the Federal and applicable state tax authorities.
At June 30, 2011, information on the tax cost of investments was as follows:
| Cost of Investment for Tax Purposes | Gross Tax | Net Tax Appreciation/ (Depreciation) | ||||
| Appreciation | Depreciation | |||||
| $45,293,084 | $9,902,202 | $(1,345,345) | $8,556,857 | |||
As of December 31, 2010, the Fund has capital loss carryovers as indicated below.
Capital loss carryovers are available to offset future realized capital gain to the extent provided in the Internal Revenue Code and regulations thereunder. To the extent that these carryover losses are used to offset future capital gains, it is probable that gains so offset will not be distributed to shareholders because they would be taxable as ordinary income.
| Amount | Expires | |
| $8,014,209 | 12/31/2017 |
These amounts will be available to offset future taxable capital gains. Under the recently enacted Regulated Investment Company Modernization Act of 2010, the Fund will be permitted to carry forward capital losses incurred in taxable years beginning after December 22, 2010 for an unlimited period. However, any losses incurred during those future years will be required to be utilized prior to the losses incurred in pre-enactment tax years. As a result of this ordering rule, pre-enactment capital loss carryforwards may be more likely to expire unused. Additionally, post-enactment capital losses that are carried forward will retain their character as either short-term or long-term capital losses rather than being considered all short-term as under previous law.
During the year ended December 31, 2010, the Fund utilized $3,538,221 of prior year capital loss carryovers.
Any net capital and currency losses incurred after October 31, within the Fund’s tax year, are deemed to arise on the first day of the Fund’s next tax year if the Fund so elects to defer such losses.
The Fund did not defer any post-October losses for the year ended December 31, 2010.
The tax composition of distributions paid during the years ended December 31, 2010 and December 31, 2009 were as follows:
| Ordinary Income | Long-Term Capital Gains | Return of Capital | Total | |||||
2010 | $86,511 | $— | $— | $86,511 | ||||
2009 | — | — | — | — |
Distributions to Shareholders The Fund declares and pays any dividends from net investment income annually. The Fund declares and pays any net realized capital gains in excess of capital loss carryforwards distributions annually. The character of income and gains to be distributed is determined in accordance with income tax regulations which may differ from generally accepted accounting principles. These differences include (but are not limited to) futures, distributions from Real Estate Investment Trusts (REITS) and losses deferred due to wash sale transactions. Reclassifications due to permanent book/tax differences are made to the Fund’s capital accounts to reflect income and gains available for distribution (or available capital loss carryovers) under income tax regulations. These reclassifications have no impact on the net asset value of the Fund. The calculation of net investment income per share in the Financial Highlights table excludes these adjustments.
The reclassifications for the year ended December 31, 2010 were as follows:
| Undistributed Net Investment Income | Accumulated Net Realized Gain | Paid In Capital | ||
| $(3,560) | $11,728 | $(8,168) |
22
Table of Contents
| Special Meeting of Shareholders — Voting Results | (unaudited) |
On April 1, 2011, the GE Investments Funds, Inc. (the “Company”) held a special meeting of shareholders of each series portfolio of the Company, including shareholders of the Small-Cap Equity Fund (the “Fund”). Shareholders of record on January 28, 2011 were entitled to vote on the proposals. For each proposal, except Proposal 1, shareholders voted on a fund-by-fund basis. For Proposal 1, shareholders of all funds voted together and not by fund or share class. At the meeting, all proposals were approved by the Fund and the following votes were recorded:
Proposal 1:
Election of Mr. R. Sheldon Johnson and Mr. Matthew J. Simpson as Directors to the Board of Directors of the Company.
Company votes:
| No. of Shares | % of Outstanding Shares | % of Shares Present | ||||||||||
| Mr. R. Sheldon Johnson | ||||||||||||
Affirmative | 451,517,094.582 | 90.054 | % | 96.126 | % | |||||||
Abstain | 18,195,810.391 | 3.629 | % | 3.874 | % | |||||||
Total | 469,712,904.973 | 93.683 | % | 100.000 | % | |||||||
| Mr. Matthew J. Simpson | ||||||||||||
Affirmative | 451,949,730.789 | 90.140 | % | 96.218 | % | |||||||
Abstain | 17,763,174.184 | 3.543 | % | 3.782 | % | |||||||
Total | 469,712,904.973 | 93.683 | % | 100.000 | % | |||||||
Fund votes:
| No. of Shares | % of Outstanding Shares | % of Shares Present | ||||||||||
| Mr. R. Sheldon Johnson | ||||||||||||
Affirmative | 4,069,479.800 | 91.663 | % | 96.598 | % | |||||||
Abstain | 143,338.226 | 3.229 | % | 3.402 | % | |||||||
Total | 4,212,818.026 | 94.892 | % | 100.000 | % | |||||||
| Mr. Matthew J. Simpson | ||||||||||||
Affirmative | 4,074,849.664 | 91.784 | % | 96.725 | % | |||||||
Abstain | 137,968.362 | 3.108 | % | 3.275 | % | |||||||
Total | 4,212,818.026 | 94.892 | % | 100.000 | % | |||||||
Proposal 3:
Approval of the following changes in certain of the Fund’s investment policies, as follows:
| C. | Amendment of the Fund’s investment policy on making loans. |
| No. of Shares | % of Outstanding Shares | % of Shares Present | ||||||||||
Affirmative | 3,879,500.480 | 87.384 | % | 92.088 | % | |||||||
Against | 126,080.779 | 2.840 | % | 2.993 | % | |||||||
Abstain | 207,236.767 | 4.668 | % | 4.919 | % | |||||||
Broker Non-votes | — | — | — | |||||||||
Total | 4,212,818.026 | 94.892 | % | 100.000 | % | |||||||
23
Table of Contents
| Special Meeting of Shareholders — Voting Results | (unaudited) |
| D. | Amendment of the Fund’s investment policy on borrowing. |
| No. of Shares | % of Outstanding Shares | % of Shares Present | ||||||||||
Affirmative | 3,853,638.087 | 86.802 | % | 91.474 | % | |||||||
Against | 142,345.134 | 3.206 | % | 3.379 | % | |||||||
Abstain | 216,834.805 | 4.884 | % | 5.147 | % | |||||||
Broker Non-votes | — | — | — | |||||||||
Total | 4,212,818.026 | 94.892 | % | 100.000 | % | |||||||
| F. | Amendment of the Fund’s investment policy on concentration of investments. |
| No. of Shares | % of Outstanding Shares | % of Shares Present | ||||||||||
Affirmative | 3,870,361.731 | 87.178 | % | 91.871 | % | |||||||
Against | 130,216.204 | 2.933 | % | 3.091 | % | |||||||
Abstain | 212,240.091 | 4.781 | % | 5.038 | % | |||||||
Broker Non-votes | — | — | — | |||||||||
Total | 4,212,818.026 | 94.892 | % | 100.000 | % | |||||||
| G. | Amendment of the Fund’s investment policy on investments in commodities. |
| No. of Shares | % of Outstanding Shares | % of Shares Present | ||||||||||
Affirmative | 3,877,320.924 | 87.335 | % | 92.036 | % | |||||||
Against | 131,788.482 | 2.968 | % | 3.129 | % | |||||||
Abstain | 203,708.620 | 4.589 | % | 4.835 | % | |||||||
Broker Non-votes | — | — | — | |||||||||
Total | 4,212,818.026 | 94.892 | % | 100.000 | % | |||||||
| J. | Amendment of the Fund’s investment policy on real estate investments. |
| No. of Shares | % of Outstanding Shares | % of Shares Present | ||||||||||
Affirmative | 3,873,756.227 | 87.255 | % | 91.952 | % | |||||||
Against | 141,615.537 | 3.189 | % | 3.361 | % | |||||||
Abstain | 197,446.262 | 4.448 | % | 4.687 | % | |||||||
Broker Non-votes | — | — | — | |||||||||
Total | 4,212,818.026 | 94.892 | % | 100.000 | % | |||||||
24
Table of Contents
| Additional Information | (unaudited) |
Information about Directors and Executive Officers:
The business and affairs of the Funds are managed under the direction of the Funds’ Board of Directors. Information pertaining to the Directors and officers of the Funds is set forth below.
Interested Directors and Executive Officers
Michael J. Cosgrove
Address c/o GEAM 3001 Summer St. Stamford, CT 06905
Age 62
Position(s) Held with Fund Chairman of the Board and President
Term of Office and Length of Time Served Until successor is elected and qualified – 14 years
Principal Occupation(s) During Past 5 years President and Chief Executive Officer – Mutual Funds and Intermediary Business at GEAM since March 2007; Executive Vice President of GEAM from February 1997 to March 2007; Vice President, GE Capital Corporation, an indirect wholly-owned subsidiary of GE, since December 1999; Executive Vice President – Mutual Funds of GEAM, a wholly-owned subsidiary of GE that is registered as an investment adviser under the Investment Advisers Act of 1940, as amended, since March 1993; President and Director of GE Investment Distributors, Inc., since June 2011. Director of GEAM since 1988.
Number of Portfolios in Fund Complex Overseen by Director 28
Other Directorships Held by Director Chairman of the Board and President of GE Institutional Funds since 1997; Trustee of Elfun Funds, GE Savings & Security Funds, General Relief and Loan Fund and General Electric Pension Trust since 1988; Trustee of Fordham University from 2002 to June 30, 2010 and since July 2011; Trustee of GE Volunteers since 1993; Director of GE Foundation; Director, GE Asset Management (Ireland) Limited, since February 1999, GE Asset Management Funds Plc since 1998, GE Asset Management Canada Company since 1998, GE Asset Management Limited since 1998 and GEAM since 1988; Chairman of the Board and President of GE Funds from 1993 to February 2011.
Matthew J. Simpson
Address c/o GEAM 3001 Summer St. Stamford, CT 06905
Age 50
Position(s) Held with Fund Director and Executive Vice President
Term of Office and Length of Time Served Until successor is elected and qualified – 3 years
Principal Occupation(s) During Past 5 years Executive Vice President, General Counsel and Secretary of GEAM since July 2007; Senior Vice President and General Counsel – Marketing and Client Services (formerly Asset Management Services) at GEAM and Senior Vice President and General Counsel of GE Asset Management Services from February 1997 to July 2007; Vice President and Associate General Counsel of GEAM from October 1992 to February 1997; Secretary of GE Funds from 1993 to July 2007 and Vice President from September 2003 to July 2007; Secretary of GE Institutional Funds and GE Investments Funds, Inc. from 1997 to July 2007; Secretary of Elfun Funds and GE Savings & Security Funds since July 2007; Assistant Secretary of Elfun Funds and GE Savings & Security Funds from 1998 to July 2007 and Vice President from October 2003 to July 2007.
Number of Portfolios in Fund Complex Overseen by Director 28
Other Directorships Held by Director Trustee of Elfun Funds, GE Savings & Security Funds and General Electric Pension Trust since July 2007; Trustee of GE Institutional Funds since April 2011 and Trustee of GE Funds from July 2007 to February 2011.
25
Table of Contents
| Additional Information | (unaudited) |
Joon Won Choe
Address c/o GEAM 3001 Summer St. Stamford, CT 06905
Age 41
Position(s) Held with Fund Vice President & Secretary
Term of Office and Length of Time Served Until successor is elected and qualified – Vice President and Secretary – less than 1 year
Principal Occupation(s) During Past 5 years Senior Vice President and Deputy General Counsel at GEAM since March 2011; Senior Vice President and Associate General Counsel at GEAM from June 2010 to March 2011; Vice President and Associate General Counsel at GEAM from November 2005 to June 2010; Vice President and Secretary of GE Institutional Funds and GE Investments Funds, Inc. since September 2010; Vice President and Assistant Secretary of Elfun Funds and GE Savings & Security Funds since September 2010.
Number of Portfolios in Fund Complex Overseen by Officer N/A
Other Directorships Held by Officer N/A
Robert Herlihy
Address c/o GEAM 3001 Summer St. Stamford, CT 06905
Age 43
Position(s) Held with Fund Chief Compliance Officer
Term of Office and Length of Time Served Until successor is elected and qualified — 5 years
Principal Occupation(s) During Past 5 years Chief Compliance Officer of GEAM, GE Institutional Funds, Elfun Funds, and GE Savings and Security Funds since July 2005; Chief Compliance Officer of GE Funds from July 2005 to February 2011; and Manager of Fund Administration at GEAM from 2002 – 2005.
Number of Portfolios in Fund Complex Overseen by Officer N/A
Other Directorships Held by Officer N/A
Arthur A. Jensen
Address c/o GEAM 3001 Summer St. Stamford, CT 06905
Age 44
Position(s) Held with Fund Treasurer
Term of Office and Length of Time Served Until successor is elected and qualified – less than 1 year
Principal Occupations(s) During Past 5 Years Treasurer of GE Institutional Funds, Elfun Funds and GE Savings and Security Funds since June 2011; Mutual Funds Controller of GEAM since April 2011; Senior Vice President at Citigroup from 2008 to 2010 and Vice President at JPMorgan from 2005 to 2008.
Number of Portfolios in Fund Complex Overseen by Officer N/A
Other Directorships Held by Officer N/A
26
Table of Contents
| Additional Information | (unaudited) |
Non-Interested Directors
John R. Costantino
Address c/o GEAM 3001 Summer St. Stamford, CT 06905
Age 65
Position(s) Held with Fund Director
Term of Office and Length of Time Served Until successor is elected and qualified – 14 years
Principal Occupation(s) During Past 5 years General Partner, NGN Capital LLC since 2006; Managing Director, Vice President of Walden Capital Management since 1996.
Number of Portfolios in Fund Complex Overseen by Director 20
Other Directorships Held by Director Director of GE Institutional Funds since 1997; Trustee of Fordham University from 1989-1995 and 2001-2007 and Trustee Emeritus since 2007; Trustee of Neuroscience Research Institute since 1986; Trustee of GE Funds from 1993 to February 2011; Trustee of Gregorian University Foundation from 1992-2007; Director of Artes Medical from 2006-2008.
R. Sheldon Johnson
Address c/o GEAM 3001 Summer St. Stamford, CT 06905
Age 64
Positions(s) Held with Fund Director
Term of office and Length of Time served Unit Successor is elected and qualified – less than 1 year.
Principal Occupation(s) During Past 5 years Managing Director at Morgan Stanley & Co.,Inc. from 1988 to 2006; Head of Global Institutional Equity Sales and Marketing at Morgan Stanley & Co., Inc. from 2002 to 2006.
Number of Portfolios in Fund Complex Overseen by Director 20
Other Directorships Held by Director Trustee of GE Institutional Funds since April 2011 and Trustee of St. Lawrence University since 2003.
Robert P. Quinn
Address c/o GEAM 3001 Summer St. Stamford, CT 06905
Age 75
Position(s) Held with Fund Director
Term of Office and Length of Time Served Until successor is elected and qualified – 14 years
Principal Occupation(s) During Past 5 years Retired since 1983 from Salomon Brothers Inc.
Number of Portfolios in Fund Complex Overseen by Director 20
Other Directorships Held by Director Trustee of GE Institutional Funds since 1997; Trustee of St. Francis Hospital since 1980; and Trustee of GE Funds from 1993 to February 2011.
The Statement of Additional Information for the Funds includes additional information about the Directors and Officers and is available, without charge, upon request by calling 1-800-242-0134.
27
Table of Contents
| Investment Team |
Investment Adviser and Administrator
GE Asset Management Incorporated
Board of Directors
Michael J. Cosgrove, Chairman
John R. Costantino
R. Sheldon Johnson*
Robert P. Quinn
Matthew J. Simpson
Secretary
Joon Won Choe
Assistant Secretary
Michelle Matzelle
Treasurer
Arthur A. Jensen (effective June 6, 2011)
Assistant Treasurer
Casey Yantosca
Distributor
GE Investment Distributors, Inc.
Member FINRA and SIPC
Custodian
State Street Bank & Trust Company
Officers of the Investment Adviser
Dmitri Stockton, President and Chief Executive Officer (since May 2011)†
Cheryl H. Beacock, Senior Vice President, Human Resources
George A. Bicher, Chief Risk Officer
Paul M. Colonna, President and Chief Investment Officer – Fixed Income Investments
Michael J. Cosgrove, President and Chief Executive
Officer – Mutual Funds & Intermediary Business
Ralph R. Layman, President and Chief Investment Officer – Public Equity Investments
Maureen B. Mitchell, President – Institutional Sales and Marketing
Matthew J. Simpson, Executive Vice President, General Counsel and Secretary
Don W. Torey, President – Alternative Investments
John J. Walker, Executive Vice President, Chief Operating Officer
David Wiederecht, President and Chief Investment Officer – Investment Strategies
Tracie A. Winbigler, Executive Vice President, Chief Financial Officer (since January 2011)
| * | Mr. Johnson was elected as a Director of the Funds effective April 1, 2011. |
| † | Effective May 1, 2011, Mr. Stockton replaced James W. Ireland as President and Chief Executive Officer. |
At GE Asset Management, we’re dedicated to providing the investment options you’ll need to tailor your financial portfolio to every stage of your life. Each member of the GE Family of Funds is managed according to the same principles of integrity and quality that have guided GE over the past century, and have made it the world-class company that it is today. Each fund draws strength from a heritage of investment management experience that spans more than 80 years. Whether you’re creating a new investment portfolio or adding to an established one, the GE Family of Funds offers an array of professionally managed investment options that will help you meet a lifetime of financial needs.
28
Table of Contents
Investment Adviser
GE Asset Management Incorporated
3001 Summer Street
PO Box 7900
Stamford, CT 06904-7900
Distributor
GE Investment Distributors, Inc.
member FINRA and SIPC
3001 Summer Street
PO Box 7900
Stamford, CT 06904-7900
The Fund files its complete schedule of portfolio holdings with the Securities and Exchange Commission for the first and third quarters of each fiscal year on Form N-Q. The Fund’s Forms N-Q, as well as a description of the policies and procedures that the Fund uses to determine how to vote proxies (if any) relating to portfolio securities is available without charge (i) upon request, by calling 1-800-493-3042; (ii) on the Fund’s website at http://www.geam.com; and (iii) on the Commission’s website at http://www.sec.gov. The Fund’s Forms N-Q may be reviewed and copied at the Commission’s Public Reference Room in Washington, DC—information on the operation of the Public Reference Room may be obtained by calling 1-800-SEC-0330.
Information (if any) regarding how the Fund voted proxies relating to portfolio securities during the most recently disclosed 12-month period ended June 30 is available without charge (i) through the Fund’s website at http://www.geam.com; and (ii) on the Commission’s website at http://www.sec.gov.
Table of Contents
GE Investments Funds, Inc.
| International Equity Fund | Letter from the Chairman | |

Michael J. Cosgrove
Chairman,
GE Investments Funds, Inc.
Dear Shareholder:
Attached is the semi-annual report for GE Investments Funds, Inc. — International Equity Fund (the “Fund”) for the six-month period ended June 30, 2011. The report contains information about the performance of the Fund and other fund-specific data, along with portfolio manager commentary.
We have provided you with an overview of the investment markets, along with our investment outlook for the coming months.
Market Overview
Most major equity indices posted positive returns in the six-month period ended June 30, 2011, despite geopolitical tensions in the Middle East and North Africa, a devastating earthquake in Japan, ongoing concerns about unresolved sovereign debt issues in peripheral Europe and elevated inflation in emerging markets. Volatility increased in May and June, however, as some measures of global economic activity weakened and uncertainties over Greece’s ability to finance and service its debt rattled the financial markets. In the U.S., concerns over the end of quantitative easing by the Federal Reserve and political wrangling over the government debt ceiling further contributed to a challenging environment. The increase in risk aversion benefited the fixed income markets as many investors sought out safer investments. Toward the end of June, the Greek Parliament passed austerity measures that seemed to calm the markets and opened the way for the next round of financing from the European Central Bank and the International Monetary Fund.
Against this backdrop, financial markets posted positive results for the six- and 12-month periods ended June 30, 2011 as represented by the index returns in the below chart.
| Total Returns (%) as of June 30, 2011 | 6-month | 12-month | ||||||
U.S. equities (S&P 500 Index) | 6.0 | 30.7 | ||||||
Global equities (MSCI World Index) | 5.3 | 30.5 | ||||||
International equities (MSCI EAFE Index) | 5.0 | 30.4 | ||||||
Small-cap U.S. equities (Russell 2000 Index) | 6.2 | 37.4 | ||||||
Mid-cap U.S. equities (Russell Mid Cap Index) | 8.1 | 38.5 | ||||||
U.S. fixed income | 2.7 | 3.9 | ||||||
U.S. short-term government fixed income (Barclays Capital 1-3 Year U.S. Government Bond Index) | 0.9 | 1.4 | ||||||
Outlook
We remain constructive on the prospects for healthy global growth, although it may be at a slower pace than originally anticipated. Central banks in the U.S. and Europe remain accommodative and supply chain issues in Japan appear to have abated. There are also signs that inflation may be peaking in emerging markets as commodity prices have eased in recent months. Corporate balance sheets remain healthy and fundamentals remain intact, in our view. We believe that valuations for equities are not stretched and remain below historical averages while equity risk premiums are still high — offering the possibility for further gains. We expect that the financial markets are likely to remain volatile due to outstanding sovereign debt issues, but believe that returns are biased to the upside in the second half of the year.
Thank you for investing with GE Investments Funds.
Sincerely,

Michael J. Cosgrove
Chairman, GE Investments Funds, Inc.
July 2011
 |
This does not constitute a part of the Fund’s Shareholder Report
Table of Contents
GE Investments Funds, Inc.
| International Equity Fund | Letter from the Chairman (Continued) | |
Mike Cosgrove is President and Chief Executive Officer – Mutual Funds and Intermediary Business at GE Asset Management Incorporated (“GEAM”). In addition to the GE Investments Funds, he is also Chairman of the Board and President of GE Institutional Funds and Director and President of GEAM’s broker-dealer which serves as underwriter and distributor for the GE Investments Funds. Mr. Cosgrove serves as a Trustee of the GE Savings & Security Funds, the GE Foundation, and the GE Pension Trust. He also serves on the Board of Directors of the Skin Cancer Foundation and is a Trustee of Fordham University. Previously Chief Financial Officer of GE Asset Management and Assistant Treasurer – GE Company, Mr. Cosgrove joined GE in 1970 and held a number of managerial positions in finance and sales in the International Operation and the GE Trading Company. He received a BS in Economics from Fordham University and an MBA from St. John’s University.
GE Investment Distributors, Inc., Member of FINRA & SIPC, is the principal underwriter and distributor of the GE Investments Funds, Inc.
This does not constitute a part of the Fund’s Shareholder Report
Table of Contents
GE Investments Funds, Inc.
International Equity Fund
Semi-Annual Report
June 30, 2011

Table of Contents
GE Investments Funds, Inc.
| International Equity Fund | Contents | |
| 1 | ||||
| 2 | ||||
| 9 | ||||
| 10 | ||||
| 11 | ||||
| 12 | ||||
| 13 | ||||
| 14 | ||||
| 21 | ||||
| 24 | ||||
| 27 | ||||
This report is prepared for Policyholders of certain variable contracts and may be distributed to others only if preceded or accompanied by the variable contract’s current prospectus and the current prospectus of the Fund available for investments thereunder.
Table of Contents
| Notes to Performance | June 30, 2011 (unaudited) |
The information provided on the performance pages relates to the GE Investments International Equity Fund (the “Fund”) and is unaudited.
Total returns take into account changes in share price and assume reinvestment of dividends and capital gains distributions, if any. Total returns shown are net of Fund fees and expenses but do not reflect fees and charges associated with the variable contracts such as administrative fees, account charges and surrender charges, which, if reflected, would reduce the Fund’s total returns for all periods shown.
The performance data quoted represents past performance; past performance does not guarantee future results. Investment return and principal value will fluctuate so your shares, when redeemed, may be worth more or less than their original cost. Current performance may be higher or lower than the performance data quoted. Periods less than one year are not annualized. Please call toll-free 800-493-3042 or visit the Fund’s website at http://www.geam.com for the most recent month-end performance data.
An investment in the Fund is not a deposit of any bank and is not insured or guaranteed by the Federal Deposit Insurance Corporation (FDIC) or any other government agency. An investment in the Fund is subject to risk, including possible loss of principal invested.
GE Investment Distributors, Inc., Member of FINRA & SIPC, is the principal underwriter and distributor of the GE Investments Funds, Inc. and a wholly owned subsidiary of GE Asset Management Incorporated, the investment adviser of the Fund.
The MSCI® EAFE® Index is an unmanaged market capitalization-weighted index of equity securities of companies domiciled in various countries. The Index is designed to represent the performance of developed stock markets outside the U.S. and Canada. The results shown for the foregoing index assume the reinvestment of net dividends or interest. They do not reflect the actual cost of investing in the instruments that comprise the index.
The peer universe of the underlying annuity funds used for the peer group average annual total return calculation is based on a blend of Morningstar peer categories, as shown. Morningstar is an independent mutual fund rating service. A Fund’s performance may be compared to or ranked within a universe of mutual funds with investment objectives and policies similar but not necessarily identical to that of the Fund.
©2011 Morningstar, Inc. All Rights Reserved. The Morningstar information contained herein: (1) is proprietary to Morningstar and/or its content providers; (2) may not be copied or distributed; and (3) is not warranted to be accurate, complete or timely. Neither Morningstar nor its content providers are responsible for any damage or losses relating from any use of this information. Past performance is no guarantee of future results.
1
Table of Contents
(unaudited)

Ralph R. Layman
President and Chief Investment Officer
The International Equity Fund is managed by a team of portfolio managers that includes Brian Hopkinson, Ralph R. Layman, Paul Nestro, Jonathan L. Passmore and Michael J. Solecki. As lead portfolio manager for the Fund, Mr. Layman oversees the entire team and assigns a portion of the Fund to each manager, including himself. Each portfolio manager is limited to the management of his or her portion of the Fund, the size of the portion which Mr. Layman determines on an annual basis. The portfolio managers do not operate independently of each other, rather, the team operates collaboratively, communicating purchases or sales of securities on behalf of the Fund.
Ralph R. Layman is President and Chief Investment Officer — Public Equities and a Director at GE Asset Management. Mr. Layman has led the team of portfolio managers for the Fund since 1997. Mr. Layman joined GE Asset Management in 1991 as Senior Vice President for International Investments and became an Executive Vice President in 1992, President —International Equities in March 2007 and President — Public Equities since July 2009.
Brian Hopkinson is a Senior Vice President of GE Asset Management. He has been a portfolio manager for the Fund since 1997. Prior to joining GE Asset Management, Mr. Hopkinson worked for Fiduciary Trust International in both London and New York.
Paul Nestro is a Senior Vice President of GE Asset Management. He has been a member of the portfolio management team for the Fund since February 2007. Mr. Nestro joined GE Asset Management in 1993 as a performance and attribution analyst in U.S. Equities. He became a senior performance and attribution analyst in 1994 and since 1996 has been an analyst and portfolio manager in the international equities group.
Jonathan L. Passmore is a Senior Vice President of GE Asset Management. He has served as a portfolio manager of the Fund since January 2002. Prior to joining GE Asset Management in January 2001, he was with Merrill Lynch for six years, most recently as Director, international equity.
Michael J. Solecki is a Senior Vice President and Chief Investment Officer — International Equities at GE Asset Management. He has served as a portfolio manager of the Fund since September 1997. He joined GE Asset Management in 1990 as an international equity analyst. He became a Vice President for international equity portfolios in 1996 and Senior Vice President in 2000.
| Q. | How did the International Equity Fund perform compared to its benchmark and Morningstar peer group for the six-month period ended June 30, 2011? |
| A. | For the six-month period ended June 30, 2011, the International Equity Fund returned 1.96% for Class 1 shares. The MSCI EAFE Index, the Fund’s benchmark, returned 4.98% and the Fund’s Morningstar peer group of 139 U.S. Insurance Foreign Large Blend Funds returned an average of 4.56% over the same period. |
| Q. | What market factors affected the fund’s performance? |
| A. | The positive influence of strong corporate earnings were countered by a host of negative macro-regional issues including: Europe’s Sovereign Debt crisis; political turmoil in Middle East/North Africa; rising inflation in the high growth developing markets of Asia; and Japan’s earthquake and tsunami disaster. Overall, performance trended better in the developed world than in the emerging, a change from recent performance. However, upward progress was further slowed by continued uncertainty regarding regulation in the financial sector, notably over capital adequacy. When political uncertainty in both Europe over sovereign debt and the U.S. over the debt ceiling and solutions to the deficit are taken into account, the period’s positive returns look all the more impressive. |
2
Table of Contents
(unaudited)

| Q. | What were the primary drivers of Fund performance? |
| A. | Positive performance derived from holdings in the materials sector, notably in industrial gases (Linde — Germany), fertilizers (Potash — Canada) and seeds (Syngenta — Switzerland). In addition, the absence of the Japanese utility most heavily affected by the disaster in March (Tokyo Electric Power) proved additive. Strong stock selection in IT (Baidu — China; Cap Gemini — France) and aviation-related industrials (EADS; Safran — France) also enhanced returns. |
| A uranium mining company (Paladin — Australia) was the holding most affected by the Japanese disaster although all holdings in Japan itself were weak as a result. Negative attribution came from consumer staples companies (including Metro — Germany) and telecom holdings, especially in Emerging Markets adversely affected performance. |
| Q. | How is the Fund positioned for the rest of the fiscal year? |
| A. | The portfolio managers believe that developed markets will show below-trend but positive growth while the emerging markets will continue to grow at a faster pace. This is despite the negative impact of rising inflation, which has prompted higher interest rates in many parts of the world. With the portfolio’s focus on larger-cap, well-diversified companies (by both product and geography), the managers believe the portfolio is well positioned to take advantage of this growth, especially in the IT, materials and industrial sectors where the portfolio is overweight. Regionally, the portfolio has a sizeable weight in Continental Europe, believing that companies in Core Europe will benefit from any weakness in the Euro, aiding their already superior performance in export markets around the world. |
3
Table of Contents
International Equity Fund
(unaudited)
Understanding Your Fund’s Expenses
As a shareholder of the Fund you incur ongoing costs. Ongoing costs include portfolio management fees, distribution and services fees, professional fees, administrative fees and other Fund expenses. The following example is intended to help you understand your ongoing costs (in dollars) of investing in the Fund and to compare these costs with the ongoing costs of investing in other mutual funds.
To illustrate these ongoing costs, we have provided an example and calculated the expenses paid by investors of the Fund during the period. The information in the following table is based on an investment of $1,000, which is invested at the beginning of the period and held for the entire six-month period ended June 30, 2011.
Actual Expenses
The first section of the table provides information about actual account values and actual expenses. You may use the information in this section, together with the amount you invested, to estimate the expenses that you paid over the period. To do so, simply divide your account value by $1,000 (for example, an $8,600 account value divided by $1,000 = 8.6), then multiply the result by the
number given for your class under the heading “Expenses paid during period.”
Hypothetical Example for Comparison Purposes
The second section of the table provides information about hypothetical account values and hypothetical expenses based on the Fund’s actual expense ratio and an assumed rate of return of 5% per year before expenses, which is not the Fund’s actual return. The hypothetical account values and expenses may not be used to estimate the actual ending account balance or expenses you paid for the period. You may use this information to compare the ongoing costs of investing in the Fund and other funds. To do so, compare this 5% hypothetical example with the 5% hypothetical examples that appear in the shareholders reports of other funds.
Please note that the expenses shown in the table are meant to highlight and help you compare ongoing costs only and do not reflect any transaction costs, such as sales charges or redemption fees, if any. Additionally, the expenses shown do not reflect the fees or charges associated with variable contracts through which shares of the Fund are offered.
January 1, 2011 – June 30, 2011
| Account value at the beginning of the period ($) | Account value at the end of the period ($) | Expenses paid during the period ($)* | ||||||||||
Actual Fund Return** | ||||||||||||
Class 1 | 1,000.00 | 1,019.61 | 10.12 | |||||||||
Hypothetical 5% Return (2.5% for the period) |
| |||||||||||
Class 1 | 1,000.00 | 1,014.67 | 10.09 | |||||||||
| * | Expenses are equal to the Fund’s annualized expense ratio of 2.02% for Class 1 shares (for the period January 1, 2011 – June 30, 2011), multiplied by the average account value over the period, multiplied by 181/365 (to reflect the six month period). |
| ** | Actual Fund Return for six month period ended June 30, 2011 was 1.96% for Class 1 shares. Past performance does not guarantee future results. |
4
Table of Contents
| International Equity Fund | (unaudited) |
Investment Profile
A mutual fund designed for investors who seek long-term growth of capital. The Fund seeks its objective by investing at least 80% of its net assets under normal circumstances in equity securities, such as common and preferred stocks. The Fund invests primarily in developed and emerging market countries outside the United States.
Morningstar Performance Comparison
Based on average annual returns for periods ended June 30, 2011
| Six Months* | One Year | Five Year | Ten Year | |||||||||||||
Number of Funds in peer group: | 139 | 137 | 111 | 84 | ||||||||||||
Peer group average annual total return: | 4.56 | % | 31.20 | % | 1.47 | % | 4.72 | % | ||||||||
Morningstar category in peer group: U.S. Insurance Foreign Large Blend. | ||||||||||||||||
Sector Allocation
as a % of Fair Value of $13,573 (in thousands) on June 30, 2011 (b)(c)
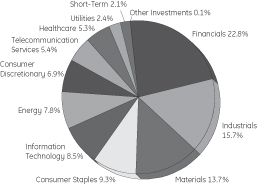
Top Ten Largest Holdings
as of June 30, 2011 (as a % of Fair Value) (b)(c)
BNP Paribas | 2.83% | |||
Rio Tinto PLC | 2.70% | |||
Royal Dutch Shell PLC | 2.65% | |||
HSBC Holdings PLC | 2.43% | |||
Nestle S.A. | 2.40% | |||
BHP Billiton PLC | 2.18% | |||
Linde AG | 2.18% | |||
Siemens AG | 2.08% | |||
Potash Corporation of Saskatchewan Inc. | 1.86% | |||
Volkswagen AG | 1.73% |
Change in Value of a $10,000 Investment
Class 1 Shares
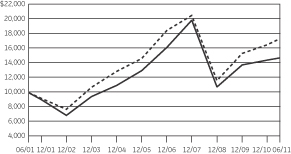
Average Annual Total Return
for the Periods Ended June 30, 2011
Class 1 Shares (Inception date: 5/1/95)
| Six Months* | One Year | Five Year | Ten Year | Ending value of a $10,000 investment (a) | ||||||||||||||||
International Equity fund | 1.96% | 27.77% | 0.74% | 3.94% | $ | 14,724 | ||||||||||||||
MSCI | 4.98% | 30.36% | 1.48% | 5.66% | $ | 17,361 | ||||||||||||||

| (a) | Ending value of a $10,000 investment for the ten-year period or since inception, whichever is less. |
| (b) | The securities information regarding holdings, allocations and other characteristics is presented to illustrate examples of securities that the Fund has bought and the diversity of areas in which the Fund may invest as of a particular date. It may not be representative of the Fund’s current or future investments and should not be construed as a recommendation to purchase or sell a particular security. |
| (c) | Fair value basis is inclusive of Short-Term Investment in GE Institutional Money Market Fund. |
See Notes to Performance on page 1 for further information, including an explanation of Morningstar peer categories.
Past performance does not predict future performance and the graph and table do not reflect the deduction of taxes that a shareholder would pay on Fund distributions or the redemption of Fund shares and does not reflect the fees or charges that would be associated with variable contracts through which shares of the Fund are offered.
| * | Total returns for the six month period ended June 30, 2011 are not annualized. |
5
Table of Contents
International Equity Fund
| Schedule of Investments | June 30, 2011 (unaudited) |
International Equity Fund
| Number of Shares | Fair Value | |||||||||
Common Stock — 96.5% † |
| |||||||||
Australia — 1.7% | ||||||||||
Brambles Ltd. | 11,924 | $ | 92,169 | |||||||
Lynas Corporation Ltd. | 57,718 | 110,241 | ||||||||
Paladin Energy Ltd. | 12,682 | 34,215 | (a) | |||||||
| 236,625 | ||||||||||
Brazil — 2.4% | ||||||||||
Banco Santander Brasil S.A. | 4,600 | 53,884 | ||||||||
Petroleo Brasileiro S.A. ADR | 4,709 | 144,472 | (c) | |||||||
Vale S.A. ADR | 4,435 | 128,438 | ||||||||
| 326,794 | ||||||||||
Canada — 4.4% | ||||||||||
Canadian Natural Resources Ltd. | 2,493 | 104,437 | ||||||||
Kinross Gold Corp. | 5,553 | 87,631 | ||||||||
Potash Corporation of Saskatchewan Inc. | 4,432 | 252,942 | ||||||||
Suncor Energy Inc. | 3,818 | 149,539 | ||||||||
| 594,549 | ||||||||||
China — 1.7% | ||||||||||
Baidu Inc. ADR | 1,094 | 153,302 | (a) | |||||||
Bank of China Ltd. | 152,998 | 74,717 | ||||||||
| 228,019 | ||||||||||
Denmark — 0.6% | ||||||||||
AP Moller—Maersk A/S | 9 | 77,604 | ||||||||
France — 12.8% | ||||||||||
Accor S.A. | 1,064 | 47,567 | ||||||||
AXA S.A. | 9,904 | 225,010 | (c) | |||||||
BNP Paribas | 4,972 | 383,716 | (c) | |||||||
Cap Gemini S.A. | 2,190 | 128,277 | ||||||||
Cie Generale d’Optique Essilor International S.A. | 2,464 | 199,806 | ||||||||
European Aeronautic Defence and Space Company N.V. | 3,811 | 127,526 | ||||||||
Safran S.A. | 5,303 | 226,428 | ||||||||
Schneider Electric S.A. | 536 | 89,524 | ||||||||
Total S.A. | 1,632 | 94,362 | ||||||||
Veolia Environnement S.A. | 3,461 | 97,599 | ||||||||
Vinci S.A. | 1,833 | 117,385 | ||||||||
| 1,737,200 | ||||||||||
Germany — 11.6% | ||||||||||
Adidas AG | 1,461 | 115,867 | ||||||||
Bayer AG | 1,604 | 128,929 | ||||||||
Daimler AG | 1,178 | 88,641 | ||||||||
Deutsche Boerse AG | 1,363 | 103,550 | ||||||||
Fresenius SE & Company KGAA | 1,564 | 163,219 | ||||||||
| Number of Shares | Fair Value | |||||||||
Linde AG | 1,686 | $ | 295,534 | |||||||
Metro AG | 2,815 | 170,559 | ||||||||
SAP AG | 1,913 | 115,796 | ||||||||
Siemens AG | 2,053 | 281,878 | ||||||||
ThyssenKrupp AG | 1,987 | 103,235 | ||||||||
| 1,567,208 | ||||||||||
Hong Kong — 3.1% | ||||||||||
AIA Group Ltd. | 38,186 | 132,501 | (a) | |||||||
Esprit Holdings Ltd. | 21,661 | 67,367 | ||||||||
Hutchison Whampoa Ltd. | 12,570 | 135,695 | ||||||||
Wharf Holdings Ltd. | 11,998 | 83,340 | ||||||||
| 418,903 | ||||||||||
India — 1.8% | ||||||||||
ICICI Bank Ltd. | 3,907 | 95,332 | ||||||||
Larsen & Toubro Ltd. | 2,520 | 103,280 | ||||||||
Power Grid Corporation of India Ltd. | 17,303 | 42,500 | ||||||||
| 241,112 | ||||||||||
Italy — 1.5% | ||||||||||
ENI S.p.A. | 1,923 | 45,473 | ||||||||
UniCredit S.p.A. | 77,963 | 165,031 | ||||||||
| 210,504 | ||||||||||
Japan — 12.1% | ||||||||||
Daikin Industries Ltd. | 3,000 | 105,424 | ||||||||
FANUC Corp. | 900 | 149,109 | ||||||||
Mitsubishi Corp. | 6,000 | 148,588 | ||||||||
Mitsubishi Estate Company Ltd. (REIT) | 1,982 | 34,506 | ||||||||
Nomura Holdings Inc. | 17,842 | 87,487 | ||||||||
SMC Corp. | 600 | 107,281 | ||||||||
Softbank Corp. | 4,600 | 172,585 | ||||||||
Sony Financial Holdings Inc. | 6,400 | 114,829 | ||||||||
Sumitomo Realty & Development Company Ltd. (REIT) | 5,000 | 110,760 | ||||||||
Suzuki Motor Corp. | 10,000 | 223,502 | ||||||||
The Bank of Yokohama Ltd. | 20,129 | 99,947 | ||||||||
Toyota Motor Corp. | 2,646 | 108,120 | ||||||||
Unicharm Corp. | 4,000 | 173,848 | ||||||||
| 1,635,986 | ||||||||||
Mexico — 0.8% | ||||||||||
America Movil SAB de C.V. ADR | 1,899 | 102,318 | ||||||||
Netherlands — 3.0% | ||||||||||
ING Groep N.V. | 9,887 | 121,687 | (a) | |||||||
Koninklijke Ahold N.V. | 3,109 | 41,767 | ||||||||
Koninklijke Philips Electronics N.V. | 6,428 | 165,051 | ||||||||
Unilever N.V., CVA | 2,177 | 71,349 | ||||||||
| 399,854 | ||||||||||
Russian Federation — 0.4% |
| |||||||||
Mobile Telesystems OJSC ADR | 2,619 | 49,813 | ||||||||
Singapore — 1.0% | ||||||||||
United Overseas Bank Ltd. | 8,166 | 130,911 | ||||||||
See Notes to Schedule of Investments and Notes to Financial Statements.
6
Table of Contents
International Equity Fund
| Schedule of Investments | June 30, 2011 (unaudited) |
| Number of Shares | Fair Value | |||||||||
South Africa — 0.5% | ||||||||||
MTN Group Ltd. | 3,386 | $ | 71,876 | |||||||
South Korea — 1.9% | ||||||||||
Hyundai Motor Co. | 240 | 53,276 | ||||||||
Samsung Electronics Company Ltd. | 170 | 131,523 | ||||||||
Samsung Electronics Company Ltd. GDR | 181 | 70,156 | ||||||||
| 254,955 | ||||||||||
Spain — 2.4% | ||||||||||
Banco Santander S.A. | 16,193 | 186,951 | (c) | |||||||
Telefonica S.A. | 5,473 | 133,785 | ||||||||
| 320,736 | ||||||||||
Sweden — 1.0% | ||||||||||
Hexagon AB | 436 | 10,765 | ||||||||
Telefonaktiebolaget LM Ericsson | 8,484 | 122,620 | ||||||||
| 133,385 | ||||||||||
Switzerland — 7.4% | ||||||||||
Credit Suisse Group AG | 3,830 | 148,742 | ||||||||
Nestle S.A. | 5,259 | 326,345 | ||||||||
Novartis AG | 3,704 | 226,551 | ||||||||
Syngenta AG | 647 | 218,074 | ||||||||
Zurich Financial Services AG | 337 | 85,091 | ||||||||
| 1,004,803 | ||||||||||
Taiwan — 2.5% | ||||||||||
Delta Electronics Inc. | 32,000 | 117,534 | ||||||||
Taiwan Semiconductor Manufacturing Company Ltd. | 83,634 | 210,224 | ||||||||
Taiwan Semiconductor Manufacturing Company Ltd. ADR | 1,240 | 15,636 | ||||||||
| 343,394 | ||||||||||
United Kingdom — 21.9% |
| |||||||||
Aggreko PLC | 1,271 | 39,362 | (a) | |||||||
Autonomy Corporation PLC | 3,436 | 94,164 | (a) | |||||||
BG Group PLC | 5,663 | 128,556 | ||||||||
BHP Billiton PLC | 7,505 | 295,439 | (c) | |||||||
Diageo PLC | 8,795 | 179,747 | ||||||||
G4S PLC †† | 7,765 | 34,881 | ||||||||
G4S PLC †† | 2,817 | 12,786 | ||||||||
HSBC Holdings PLC | 33,192 | 329,534 | ||||||||
International Consolidated Airlines Group S.A. | 12,855 | 52,359 | (a) | |||||||
Lloyds Banking Group PLC | 147,123 | 115,737 | (a,c) | |||||||
National Grid PLC | 18,959 | 186,431 | ||||||||
Prudential PLC | 18,194 | 210,309 | (c) | |||||||
Reckitt Benckiser Group PLC | 3,539 | 195,450 | ||||||||
Rio Tinto PLC | 5,082 | 366,376 | ||||||||
Royal Dutch Shell PLC | 10,086 | 359,151 | ||||||||
Tesco PLC | 16,368 | 105,638 | ||||||||
The Capita Group PLC | 5,132 | 58,951 | ||||||||
| Number of Shares | Fair Value | |||||||||
Vodafone Group PLC | 73,511 | $ | 195,084 | (c) | ||||||
| 2,959,955 | ||||||||||
Total Common Stock | 13,046,504 | |||||||||
Preferred Stock — 1.7% |
| |||||||||
Volkswagen AG | 1,137 | 234,661 | ||||||||
Other Investments — 0.1% |
| |||||||||
GEI Investment Fund | 10,452 | (d) | ||||||||
Total Investments in Securities | 13,291,617 | |||||||||
Short-Term Investments — 2.1% |
| |||||||||
GE Institutional Money Market Fund Investment Class 0.11% | 281,415 | (b,d) | ||||||||
Total Investments | 13,573,032 | |||||||||
Liabilities in Excess of Other Assets, net — (0.4)% | (52,266 | ) | ||||||||
|
| |||||||||
NET ASSETS — 100.0% | $ | 13,520,766 | ||||||||
|
| |||||||||
Other Information
The Fund was invested in the following categories at June 30, 2011:
| Industry | Percentage (based on Fair Value) | |||
Diversified Financial Services | 12.21 | % | ||
Integrated Oil & Gas | 6.79 | % | ||
Diversified Metals & Mining | 5.69 | % | ||
Automobile Manufacturers | 5.22 | % | ||
Wireless Telecommunication Services | 4.36 | % | ||
Industrial Conglomerates | 4.29 | % | ||
Fertilizers & Agricultural Chemicals | 3.47 | % | ||
Life & Health Insurance | 3.37 | % | ||
Semiconductors | 3.15 | % | ||
Packaged Foods & Meats | 2.93 | % | ||
Household Products | 2.72 | % | ||
Pharmaceuticals | 2.62 | % | ||
Aerospace & Defense | 2.61 | % | ||
See Notes to Schedule of Investments and Notes to Financial Statements.
7
Table of Contents
International Equity Fund
| Schedule of Investments | June 30, 2011 (unaudited) |
| Industry | Percentage (based on Fair Value) | |||
Multi-Line Insurance | 2.28 | % | ||
Industrial Gases | 2.18 | % | ||
Multi-Utilities | 2.09 | % | ||
Industrial Machinery | 1.97 | % | ||
Steel | 1.71 | % | ||
Diversified Real Estate Activities | 1.68 | % | ||
Construction & Engineering | 1.63 | % | ||
Application Software | 1.55 | % | ||
Healthcare Supplies | 1.47 | % | ||
Distillers & Vintners | 1.32 | % | ||
Hypermarkets & Super Centers | 1.26 | % | ||
Healthcare Services | 1.20 | % | ||
Internet Software & Services | 1.13 | % | ||
Diversified Capital Markets | 1.10 | % | ||
Food Retail | 1.09 | % | ||
Trading Companies & Distributors | 1.09 | % | ||
Integrated Telecommunication Services | 0.99 | % | ||
Diversified Support Services | 0.97 | % | ||
IT Consulting & Other Services | 0.95 | % | ||
Communications Equipment | 0.90 | % | ||
Electronic Components | 0.86 | % | ||
Apparel, Accessories & Luxury Goods | 0.85 | % | ||
Building Products | 0.78 | % | ||
Oil & Gas Exploration & Production | 0.77 | % | ||
Specialized Finance | 0.76 | % | ||
Regional Banks | 0.74 | % | ||
Electrical Components & Equipment | 0.66 | % | ||
Gold | 0.65 | % | ||
Investment Banking & Brokerage | 0.64 | % | ||
Marine | 0.57 | % | ||
Apparel Retail | 0.50 | % | ||
Human Resource & Employment Services | 0.43 | % | ||
Airlines | 0.39 | % | ||
Hotels, Resorts & Cruise Lines | 0.35 | % | ||
Security & Alarm Services | 0.35 | % | ||
Electric Utilities | 0.31 | % | ||
Coal & Consumable Fuels | 0.25 | % | ||
|
| |||
| 97.85 | % | |||
|
| |||
| Short Term and Other Investments | ||||
Short-Term | 2.07 | % | ||
Other Investments | 0.08 | % | ||
|
| |||
| 2.15 | % | |||
|
| |||
| 100.00 | % | |||
|
| |||
See Notes to Schedule of Investments and Notes to Financial Statements.
8
Table of Contents
| Notes to Schedule of Investments | June 30, 2011 (unaudited) |
The views expressed in this document reflect our judgment as of the publication date and are subject to change at any time without notice. The securities information regarding holdings, allocations and other characteristics are presented to illustrate examples of securities that the Fund has bought and the diversity of areas in which the Fund may invest as of a particular date. It may not be representative of the Fund’s current or future investments and should not be construed as a recommendation to purchase or sell a particular security. See the Fund’s summary prospectus and statutory prospectus for complete descriptions of investment objectives, policies, risks and permissible investments.
| (a) | Non-income producing security. |
| (b) | Coupon amount represents effective yield. |
| (c) | At June 30, 2011 , all or a portion of this security was pledged to cover collateral requirements for futures, options, forward foreign currency contracts and/or TBA’s. |
| (d) | GE Asset Management, the investment adviser of the Fund, also serves as investment adviser of the GEI Investment Fund and the GE Institutional Money Market Fund. |
| † | Percentages are based on net assets as of June 30, 2011 . |
| †† | Security traded on different exchanges. |
Abbreviations:
ADR | American Depository Receipt | |
GDR | Global Depository Receipt | |
REIT | Real Estate Investment Trust | |
9
Table of Contents
Selected data based on a share outstanding throughout the fiscal years indicated
| CLASS 1 | ||||||||||||||||||||||||
| 6/30/11†† | 12/31/10 | 12/31/09 | 12/31/08 | 12/31/07 | 12/31/06 | |||||||||||||||||||
| Inception date | — | — | — | — | — | 5/1/95 | ||||||||||||||||||
Net asset value, beginning of period | $ | 0.51 | $ | 0.49 | $ | 0.39 | $ | 14.67 | $ | 14.08 | $ | 11.42 | ||||||||||||
Income/(loss) from investment operations: | ||||||||||||||||||||||||
Net investment income (loss) | 0.00 | ** | 0.00 | †** | 0.01 | 0.51 | 0.23 | 0.15 | ||||||||||||||||
Net realized and unrealized | 0.01 | 0.02 | 0.10 | (7.04 | ) | 2.98 | 2.67 | |||||||||||||||||
Total income/(loss) from | 0.01 | 0.02 | 0.11 | (6.53 | ) | 3.21 | 2.82 | |||||||||||||||||
Less distributions from: | ||||||||||||||||||||||||
Net investment income | — | 0.00 | † | 0.01 | 0.51 | 0.23 | 0.16 | |||||||||||||||||
Net realized gains | — | — | 0.00 | 7.24 | 2.39 | — | ||||||||||||||||||
Total distributions | — | 0.00 | † | 0.01 | 7.75 | 2.62 | 0.16 | |||||||||||||||||
Net asset value, end of period | $ | 0.52 | $ | 0.51 | $ | 0.49 | $ | 0.39 | $ | 14.67 | $ | 14.08 | ||||||||||||
TOTAL RETURN (a) | 1.96 | % | 4.85 | % | 27.68 | % | (45.83 | )% | 22.98 | % | 24.69 | % | ||||||||||||
RATIOS/SUPPLEMENTAL DATA: | ||||||||||||||||||||||||
Net assets, end of period (in thousands) | $ | 13,521 | $ | 15,240 | $ | 18,307 | $ | 17,920 | $ | 84,272 | $ | 80,648 | ||||||||||||
Ratios to average net assets: | ||||||||||||||||||||||||
Net investment income | 1.44 | %* | 0.75 | % | 1.28 | % | 2.57 | % | 1.30 | % | 1.16 | % | ||||||||||||
Net expenses | 2.02 | %(b,c)* | 1.67 | %(b,c) | 1.68 | %(b,c) | 1.18 | %(b,c) | 1.13 | % | 1.13 | % | ||||||||||||
Gross expenses | 2.23 | %* | 1.91 | % | 1.88 | % | 1.29 | % | 1.13 | % | 1.13 | % | ||||||||||||
Portfolio turnover rate | 21 | % | 41 | % | 46 | % | 41 | % | 32 | % | 34 | % | ||||||||||||
Notes to Financial Highlights
| (a) | Total returns are historical and assume changes in share price, reinvestment of dividends and capital gains distributions and do not include the effect of insurance contract charges. Past performance does not guarantee future results. |
| (b) | Reflects GE Asset Management’s waiver of a portion of the Fund’s management fee in an amount equal to the management fee earned by GEAM with respect to the Fund’s investment in the GE Institutional Money Market Fund. |
| (c) | Reflects GE Asset Management’s contractual arrangement with GE Investments Funds, Inc. to limit the Fund’s management fee to 0.80% of the average daily net assets of the Fund until April 30, 2012. |
| * | Annualized for periods less than one year. |
| ** | Per share values have been calculated using the average share method. |
| † | Less than 0.005 per share. |
| †† | Unaudited |
The accompanying Notes are an integral part of these financial statements.
10
Table of Contents
The accompanying Notes are an integral part of these financial statements.
11
Table of Contents
| * | Effective April 30, 2011 share Class 4 was closed. |
The accompanying Notes are an integral part of these financial statements.
12
Table of Contents
| * | Unaudited |
| ** | Effective April 30, 2011, share Class 4 was closed. |
The accompanying Notes are an integral part of these financial statements.
13
Table of Contents
| Notes to Financial Statements | June 30, 2011 (unaudited) |
| 1. Organization | of the Company |
GE Investments Funds, Inc. (the “Company”) was incorporated under the laws of the Commonwealth of Virginia on May 14, 1984 and is registered under the Investment Company Act of 1940, as amended (the “1940 Act”), as an open-end management investment company. The Company is composed of fourteen investment portfolios (collectively the “Funds”), although only the following eleven are currently being offered: U.S. Equity Fund, S&P 500 Index Fund, Premier Growth Equity Fund, Core Value Equity Fund, Mid-Cap Equity Fund, Small-Cap Equity Fund, International Equity Fund (the “Fund”), Total Return Fund, Income Fund, Money Market Fund and Real Estate Securities Fund.
Shares of the Funds of the Company are offered only to insurance company separate accounts that fund certain variable life insurance contracts and variable annuity contracts. GE Asset Management Incorporated (“GEAM”) is the investment adviser and administrator of each of the Funds.
The Company currently offers one share class (Class 1) as an investment option for variable life insurance and variable annuity contracts. Class 4 shares were first offered on May 1, 2008 and Fund shares outstanding prior to May 1, 2008 were designated as Class 1 shares. Effective April 30, 2011, Class 4 shares were closed and are no longer offered.
| 2. Summary | of Significant Accounting Policies |
The preparation of financial statements in conformity with U.S. generally accepted accounting principles (GAAP) requires management to make estimates and assumptions that affect the reported amounts of assets and liabilities and disclosure of contingent assets and liabilities at the date of the financial statements and the reported amounts of increases and decreases in net assets from operations during the reporting period. Actual results may differ from those estimates.
Subsequent events after the balance sheet date through the date the financial statements were issued, have been evaluated in the preparation of the financial statements. There are no items to report.
The following summarizes the significant accounting policies of the Company.
Securities Valuation and Transactions. All investments in securities are recorded at their estimated fair value, as described in Note 3.
Securities transactions are accounted for as of the trade date. Realized gains and losses on investments sold are recorded on the basis of identified cost for both financial statement and federal tax purposes.
Derivatives The Fund is subject to equity price risk in the normal course of pursuing its investment objective. The Fund may enter into derivative transactions to gain market exposure for residual and accumulating cash positions.
Foreign Currency Accounting records of the Fund are maintained in U.S. dollars. Investment securities and other assets and liabilities denominated in a foreign currency are translated to U.S. dollars at the prevailing rates of exchange at period end. Purchases and sales of securities, income receipts and expense payments denominated in foreign currencies are translated into U.S. dollars at the prevailing exchange rate on the respective dates of such transactions.
All assets and liabilities of the Fund initially expressed in foreign currency values will be converted into U.S. dollars at the WM/Reuter exchange rate computed at 11:00 a.m., Eastern time.
The Fund does not isolate the portion of the results of operations resulting from changes in foreign exchange rates from the fluctuations arising from changes in the market prices of securities during the year. Such fluctuations are included in the net realized or unrealized gain or loss from investments. Net realized gains or losses on foreign currency transactions represent net gains or losses on sales and maturities of foreign currency contracts, disposition of foreign currencies, the difference between the amount of net investment income and withholding taxes accrued and the U.S. dollar amount actually received or paid, and gains or losses between the trade and settlement date on purchases and sales of foreign securities. Net unrealized foreign exchange gains and losses arising from changes in the value of other assets and liabilities (including foreign currencies and open foreign currency contracts) as a result of changes in foreign exchange rates are included as increases or decreases in unrealized appreciation/depreciation on foreign currency related transactions.
Futures Contracts A futures contract represents a commitment for the future purchase or sale of an asset at a specified price on a specified date. The Fund invests in stock index futures contracts to manage its exposure to the stock markets and fluctuations in currency values. Buying futures tends to increase a Fund’s exposure to the underlying instrument while selling futures tends to decrease a Fund’s exposure to the underlying instrument or to hedge other
14
Table of Contents
| Notes to Financial Statements | June 30, 2011 (unaudited) |
Fund investments. The Fund will not enter into a transaction involving futures for speculative purposes. With futures contracts, there is minimal counterparty credit risk to the Fund since futures contracts are exchange traded and the exchange’s clearinghouse, as counterparty to all traded futures, guarantees the futures against default. The Fund’s risks in using these contracts include changes in the value of the underlying instruments, non-performance of the counterparties under the contracts’ terms and changes in the liquidity of the secondary market for the contracts. Futures contracts are valued at the settlement price established each day by the board of trade or exchange on which they principally trade.
Upon entering into a financial futures contract, the Fund is required to pledge to the broker an amount of cash and/or other assets equal to a certain percentage of the contract amount, known as initial margin deposit. Subsequent payments, known as variation margin, are made or received by the Fund each day, depending on the daily fluctuation in the fair value of the underlying security. The Fund records an unrealized gain or loss equal to the daily variation margin. Should market conditions move unexpectedly, the Fund may not achieve the anticipated benefits of the futures contracts and may incur a loss. The Fund recognizes a realized gain or loss on the expiration or closing of a futures contract.
Forward Foreign Currency Exchange Contracts The Fund enters into forward foreign currency exchange contracts to facilitate transactions in foreign denominated securities and to manage the Funds’ currency exposure. Forward foreign currency exchange contracts are valued at the mean between the bid and the offered forward rates as last quoted by a recognized dealer. The aggregate principal amounts of the contracts are not recorded in the Funds’ financial statements. Such amounts appear under the caption Forward Foreign Currency Contracts in the Schedule of Investments. Fluctuations in the value of the contracts are recorded in the Statement of Assets and Liabilities as an asset (or liability) and in the Statement of Operations as unrealized appreciation (depreciation) until the contracts are closed, when they are recorded as realized gains or losses on foreign currency related transactions. The Funds’ risks in using these contracts include changes in the value of foreign currency or the possibility that the counterparties do not perform under the contracts’ terms. When a Fund enters into a forward foreign currency exchange contract, it is required to segregate cash or liquid securities with its custodian in an amount
equal to the value of the Fund’s total assets committed to the consummation of the forward contract. If the value of the segregated securities declines, additional cash or securities are segregated so that the value of the account will equal the amount of the Fund’s commitment with respect to the contract.
Investments in Foreign Markets Investments in foreign markets involve special risks and considerations not typically associated with investing in the United States. These risks include revaluation of currencies, high rates of inflation, restrictions on repatriation of income and capital, and adverse political and economic developments. Moreover, securities issued in these markets may be less liquid, subject to government ownership controls, tariffs and taxes, subject to delays in settlements, and their prices may be more volatile.
The Fund may be subject to capital gains and repatriation taxes imposed by certain countries in which they invest. Such taxes are generally based upon income and/or capital gains earned or repatriated. Taxes are accrued based on net investment income, net realized gains and net unrealized appreciation as income and/or capital gains are earned.
Investment Income Corporate actions (including cash dividends) are recorded on the ex-dividend date, net of applicable withholding taxes, except for certain foreign corporate actions which may be recorded as soon after the ex-dividend date as such information becomes available. Withholding taxes in foreign dividends have been provided for in accordance with the Fund’s understanding of the applicable country’s tax rules and rates.
Interest income is recorded on the accrual basis. Accretion of discounts and amortization of premiums on taxable bonds are to the call or maturity date, whichever is shorter, using the effective yield method.
Expenses Fund specific expenses are allocated to the Fund that incurs such expenses. Such expenses may include custodial fees, legal and accounting fees, printing costs and registration fees. Expenses that are not fund specific are allocated pro rata across the Funds. Certain class specific expenses (such as distribution fees) are allocated to the class that incurs such expense. Expenses of the Fund are generally paid directly by the Fund however, expenses may be paid by GEAM and reimbursed by the fund.
Federal Income Taxes The Funds intend to comply with all sections of the Internal Revenue Code applicable to regulated investment companies including the distribution
15
Table of Contents
| Notes to Financial Statements | June 30, 2011 (unaudited) |
of substantially all its taxable net investment income and net realized capital gains to its shareholders. Therefore, no provision for federal income tax has been made. Each Fund is treated as a separate taxpayer for federal income tax purposes.
| 3. | Securities Valuation |
The Funds utilize various methods to measure the fair value of most of its investments on a recurring basis. GAAP establishes a framework for measuring fair value and providing related disclosures. Broadly, the framework requires fair value to be determined based on the exchange price that would be received for an asset or paid to transfer a liability (an exit price) in the principal or most advantageous market for the asset or liability in an orderly transaction between market participants at the measurement date. In the absence of active markets for the identical assets or liabilities, such measurements involve developing assumptions based on market observable data and, in the absence of such data, internal information that is consistent with what market participants would use in a hypothetical transaction that occurs at the measurement date. It also establishes a three-level valuation hierarchy based upon observable and non-observable inputs.
Observable inputs reflect market data obtained from independent sources, while unobservable inputs reflect our market assumptions. Preference is given to observable inputs. These two types of inputs create the following fair value hierarchy:
Level 1 — Quoted prices for identical investments in active markets.
Level 2 — Quoted prices for similar investments in active markets; quoted prices for identical or similar investments in markets that are not active; and model-derived valuations whose inputs are observable or whose significant value drivers are observable.
Level 3 — Significant inputs to the valuation model are unobservable.
Policies and procedures are maintained to value investments using the best and most relevant data available. In addition, pricing vendors are utilized to assist in valuing investments. GEAM performs periodic reviews of the methodologies used by independent pricing services including price validation of individual securities.
Fair Value Measurement The following section describes the valuation methodologies the Fund uses to measure different financial investments at fair value.
The Fund’s portfolio securities are valued generally on the basis of market quotations. Equity securities generally are valued at the last reported sales price on the primary market in which they are traded. Portfolio securities listed on NASDAQ are valued using the NASDAQ Official Closing Price. Level 1 securities primarily include publicly-traded equity securities which may not necessarily represent the last sale price. If no sales occurred on the exchange or NASDAQ that day, the portfolio security generally is valued using the last reported bid price. In those circumstances the Fund classifies the investment securities in Level 2.
The Fund uses the net asset value per unit for the collective Fund. The Fund classifies the investment security in Level 2.
If prices are not readily available for a portfolio security, or if it is believed that a price for a portfolio security does not represent its fair value, the security may be valued using procedures approved by the Fund’s Board of Directors that are designed to establish its “fair” value. These securities would generally be classified in Level 3. Those procedures require that the fair value of a security be established by the valuation committee. The valuation committee follows different protocols for different types of investments and circumstances. The fair value procedures may be used to value any investment of any Fund in the appropriate circumstances.
Foreign securities may be valued with the assistance of an independent fair value pricing service in circumstances where it is believed that they have been or would be materially affected by events occurring after the close of the portfolio security’s primary market and before the close of regular trading on the NYSE. In these circumstances the Fund classifies the investment securities in Level 2. This independent fair value pricing service uses a model to identify affected securities and portfolios taking into consideration various factors and the fair value of such securities may be something other than the last available quotation or other market price.
Portfolio securities may be valued using techniques other than market quotations, under the circumstances described above. The value established for a portfolio security may be different than what would be produced through the use of another methodology or if it had been priced using market quotations. Portfolio securities that are valued using techniques other than market quotations, including “fair valued” securities, may be subject to greater fluctuation in their value from one day to the next than would be the case if market quotations were used. In addition, there is no assurance that the Fund could sell a portfolio security for the
16
Table of Contents
| Notes to Financial Statements | June 30, 2011 (unaudited) |
value established for it at any time and it is possible that the Fund would incur a loss because a portfolio security is sold at a discount to its established value.
Other financial investments are derivative instruments that are not reflected in Total Investments, such as futures, forwards, swaps, and written options contracts, which are valued based on fair value as discussed above.
The Fund uses closing prices for derivatives included in Level 1, which are traded either on exchanges or liquid over-the counter markets. Derivative assets and liabilities included in Level 2 primarily represent interest rate swaps, cross-currency swaps and foreign currency and
commodity forward and option contracts. Derivative assets and liabilities included in Level 3 primarily represent interest rate products that contain embedded optionality or prepayment features.
The inputs or methodology used for valuing securities are not an indication of the risk associated with investing in those securities. Fair value determinations are required for securities whose value is affected by a significant event that will materially affect the value of a domestic or foreign security and which occurs subsequent to the time of the close of the principal market on which such domestic or foreign security trades but prior to the calculation of the Fund’s NAV.
The following table presents the Fund’s investments measured at fair value on a recurring basis at June 30, 2011:
| Investments | Level 1 | Level 2 | Level 3 | Total | ||||||||||||
Investments in Securities† | ||||||||||||||||
Common Stock | $ | 12,936,263 | $ | 110,241 | $ | — | $ | 13,046,504 | ||||||||
Preferred Stock | 234,661 | — | — | 234,661 | ||||||||||||
Other Investments | — | 10,452 | — | 10,452 | ||||||||||||
Short-Term Investments | 281,415 | — | — | 281,415 | ||||||||||||
Total Investments in Securities | $ | 13,452,339 | $ | 120,693 | $ | — | $ | 13,573,032 | ||||||||
| † | See Schedule of Investments for Industry Classification. |
There were no significant transfers between the fair value levels. Transfers between fair value levels are considered to occur at the beginning of the period.
4. Derivatives Transactions
Shown below are the derivative contracts entered into by the Fund, summarized by primary risk exposure as they
appear on the Statement of Operations, all of which are not accounted for as hedging instruments under FASB Accounting Standards Codification (“ASC”) No. 815 Derivatives and Hedging as of June 30, 2011.
Shown below are the effects of derivative instruments on the Fund’s Statements of Operations, summarized by primary risk exposure all of which are not accounted for as hedging instruments under ASC 815.
| Derivatives not accounted for as hedging instruments under ASC 815 | Location in the Statement of Operations | Total Notional Amount of Futures Contracts Purchased/(Sold) ($) | Realized Gain or (Loss) on Derivatives Recognized in Income ($) | Change in Unrealized Appreciation/(Depreciation) on Derivatives Recognized in Income ($) | ||||||||||
Equity Contracts | Realized gain/(loss) on Futures, Increase/(decrease) in unrealized appreciation/ (depreciation) on Futures | 2,211,457/ (2,504,280) | (10,505 | ) | (440 | ) | ||||||||
| * | Includes cumulative appreciation/depreciation of futures contracts as reported in the Schedule of Investments and Net Assets section of the Statement of Assets and Liabilities. Only the current day’s variation margin is reported within the Assets & Liabilities sections of the Statement of Assets and Liabilities. |
17
Table of Contents
| Notes to Financial Statements | June 30, 2011 (unaudited) |
| 5. | Line of Credit |
The Company shares a revolving credit facility of up to $150 million with a number of its affiliates. The credit facility is with its custodian bank, State Street Bank and Trust Company (“State Street”). The revolving credit facility requires the payment of a commitment fee equal to 0.125% per annum on the daily unused portion of the credit facility, payable quarterly. The portion borne by the Funds generally is borne proportionally based upon net assets. In addition, the Company has a $100 million uncommitted, unsecured line of credit with State Street. Generally, borrowings under the credit facilities would accrue interest at the Federal Funds Rate plus 50 basis points and would be borne by the borrowing Fund. The maximum amount allowed to be borrowed by any one Fund is the lesser of (i) 10% of its total assets, or (ii) 20% of its net assets. The credit facilities were not utilized by the Fund during the six month period ended June 30, 2011.
| 6. | Fees and Compensation Paid to Affiliates |
GEAM, a registered investment adviser, was retained by the Company’s Board of Directors effective May 1, 1997 to act as investment adviser and administrator of the Fund. Compensation of GEAM for investment advisory and administrative services is paid monthly based on the average daily net assets of the Fund. The advisory and administrative fee is stated in the following schedule:
| Annualized based on average daily net assets | ||
| Average Daily Net Assets of Fund | Advisory and Administration Fees | |
| First $100 million | 1.00% | |
| Next $100 million | 0.95% | |
| Over $200 million | 0.90% | |
GEAM has entered into a contractual arrangement with the Company to limit the management fee charged to the Fund to 0.80% of the average daily net assets of the Fund (the “Management Fee Waiver Agreement”). Unless terminated or amended, the Management Fee Waiver Agreement will continue until April 30, 2012. The fee waiver will terminate automatically if the management agreement terminates. The Management Fee Limitation Agreement can only be changed or terminated with the approval of the Company’s Board of Directors.
GEAM waives a portion of the Fund’s management fee in the amount equal to the management fee earned by GEAM with respect to the Fund’s Investment in the GE Institutional Money Market Fund.
Distribution and Service (12b-1) Fees The Company has adopted a Distribution and Service (12b-1) Plan (the “Plan”) pursuant to Rule 12b-1 under the 1940 Act with respect to Class 4 shares of the Fund. Under the Plan, the Fund may compensate GE Investment Distributors, Inc. (“GEID”), a wholly-owned subsidiary of GEAM and the Fund’s principal distributor, for certain sales services provided by GEID or other broker dealers and investor services provided by GEID or other service providers relating to the Fund’s Class 4 shares, including services to owners or prospective owners of variable contracts issued by insurance companies that offer such share class as an investment option. The amount of compensation paid under the Plan by the Fund’s Class 4 shares may not exceed 0.45% of the average daily net assets of the Fund attributable to such share class. The Plan continues in effect from year to year for so long as such continuance is approved annually by the Board of Directors, including by those directors who are not interested persons of the Company and who have no direct or indirect financial interest in the operation of the Plan or in any agreement related to it.
Directors’ Compensation The Fund pays no compensation to its directors who are officers or employees of GEAM or its affiliates. Directors who are not such officers or employees also serve in a similar capacity for other funds advised by GEAM. Compensation paid to unaffiliated directors are reflected on the Statement of Operations. These fees are allocated pro rata across all of the mutual fund platforms and share classes served by the directors, including the Fund, and are based upon the relative net assets of each fund within such platforms.
| 7. | Investment Transactions |
Purchases and Sales of Securities The cost of purchases and the proceeds from sales of investments, other than short-term securities and options, for the period ended June 30, 2011 were as follows:
| Non U.S. Government Securities | ||
| Purchases | Sales | |
$2,979,305 | $4,884,028 | |
| 8. | Income Taxes |
The Fund is subject to ASC 740, Income Taxes. ASC 740 provides guidance for financial accounting and reporting for the effects of income taxes that result from an entity’s activities during the year. ASC 740 also provides guidance regarding how certain uncertain tax positions should be
18
Table of Contents
| Notes to Financial Statements | June 30, 2011 (unaudited) |
recognized, measured, presented and disclosed in the financial statements. ASC 740 requires evaluation of tax positions taken or expected to be taken in the course of preparing the Fund’s tax returns to determine whether the tax positions are “more likely than not” of being sustained
by the applicable tax authority. There are no adjustments to the Fund’s net assets required under ASC 740. The Fund’s 2007, 2008, 2009 and 2010 fiscal years tax returns are still open to examination by the Federal and applicable state tax authorities.
At June 30, 2011, information on the tax cost of investments was as follows:
Cost of Investment for Tax Purposes | Gross Tax | Net Tax Appreciation/ (Depreciation) | ||||
| Appreciation | Depreciation | |||||
| $13,691,536 | $198,473 | $(316,977) | $(118,504) | |||
As of December 31, 2010, the Fund has capital loss carryovers as indicated below. Capital loss carryovers are available to offset future realized capital gains to the extent provided in the Internal Revenue Code and regulations thereunder. To the extent that these carryover losses are used to offset future capital gains, it is probable that the gains so offset will not be distributed to shareholders because they would be taxable as ordinary income.
As of December 31, 2010, the Fund has capital loss carryovers as follows:
| Amount | Expires | |
| $5,547,226 | 12/31/2017 | |
| 1,229,692 | 12/31/2018 |
These amounts will be available to offset future taxable capital gains. Under the recently enacted Regulated Investment Company Modernization Act of 2010, the Fund will be permitted to carry forward capital losses incurred in taxable years beginning after December 22, 2010 for an unlimited period. However, any losses incurred during those future years will be required to be utilized prior to the losses incurred in pre-enactment tax years. As a result of this ordering rule, pre-enactment capital loss carryforwards may be more likely to expire unused. Additionally, post-enactment capital losses that are carried forward will retain their character as either short-term or long-term capital losses rather than being considered all short-term as under previous law.
Any net capital and currency losses incurred after October 31, within the Fund’s tax year, are deemed to arise on the first day of the Fund’s next tax year if the Fund so elects to defer such losses.
The Fund did not defer any post-October losses for the year ended December 31, 2010.
The tax composition of distributions paid during the years ended December 31, 2010 and December 31, 2009 were as follows:
| Ordinary Income | Long-Term Capital Gains | Total | ||||||||||
2010 | $ | 113,014 | $ | — | $ | 113,014 | ||||||
2009 | 294,001 | — | 294,001 | |||||||||
Distributions to Shareholders The Fund declares and pays any dividends from net investment income annually. The Fund declares and pays any net realized capital gains in excess of capital loss carryforwards distributions annually. The character of income and gains to be distributed is determined in accordance with income tax regulations which may differ from generally accepted accounting principles. These differences include (but are not limited to) futures, treatment of realized gains and losses on foreign currency contracts, investments organized as partnerships for tax purposes, and losses deferred due to wash sale transactions. Reclassifications due to permanent book/tax differences are made to the Fund’s capital accounts to reflect income and gains available for distribution (or available capital loss carryovers) under income tax regulations. These reclassifications have no impact on the net asset value of the Fund. The calculation of net investment income per share in the Financial Highlights table excludes these adjustments.
The reclassifications for the year ended December 31, 2010 were as follows:
| Undistributed Net Investment Income | Accumulated Net Realized (Loss) | Paid In Capital | ||
| $13,864 | $(20,317) | $6,453 |
19
Table of Contents
| Notes to Financial Statements | June 30, 2011 (unaudited) |
| 9. | Significant Transaction |
Effective April 30, 2011 the Fund closed Class 4 shares. A full redemption was made by investors in the share class at the closing net asset value.
20
Table of Contents
| Special Meeting of Shareholders — Voting Results | (unaudited) |
On April 1, 2011, the GE Investments Funds, Inc. (the “Company”) held a special meeting of shareholders of each series portfolio of the Company, including shareholders of the International Equity Fund (the “Fund”). Shareholders of record on January 28, 2011 were entitled to vote on the proposals. For each proposal, except Proposal 1, shareholders voted on a fund-by-fund basis. For Proposal 1, shareholders of all funds voted together and not by fund or share class. At the meeting, all proposals were approved by the Fund and the following votes were recorded:
Proposal 1:
Election of Mr. R. Sheldon Johnson and Mr. Matthew J. Simpson as Directors to the Board of Directors of the Company.
Company votes:
| No. of Shares | % of Outstanding Shares | % of Shares Present | ||||||||||
| Mr. R. Sheldon Johnson | ||||||||||||
Affirmative | 451,517,094.582 | 90.054 | % | 96.126 | % | |||||||
Abstain | 18,195,810.391 | 3.629 | % | 3.874 | % | |||||||
Total | 469,712,904.973 | 93.683 | % | 100.000 | % | |||||||
| Mr. Matthew J. Simpson | ||||||||||||
Affirmative | 451,949,730.789 | 90.140 | % | 96.218 | % | |||||||
Abstain | 17,763,174.184 | 3.543 | % | 3.782 | % | |||||||
Total | 469,712,904.973 | 93.683 | % | 100.000 | % | |||||||
Fund votes:
| No. of Shares | % of Outstanding Shares | % of Shares Present | ||||||||||
| Mr. R. Sheldon Johnson | ||||||||||||
Affirmative | 27,583,972.353 | 96.357 | % | 98.799 | % | |||||||
Abstain | 335,348.256 | 1.171 | % | 1.201 | % | |||||||
Total | 27,919,320.609 | 97.528 | % | 100.000 | % | |||||||
| Mr. Matthew J. Simpson | ||||||||||||
Affirmative | 27,511,947.513 | 96.105 | % | 98.541 | % | |||||||
Abstain | 407,373.096 | 1.423 | % | 1.459 | % | |||||||
Total | 27,919,320.609 | 97.528 | % | 100.000 | % | |||||||
Proposal 2:
Approval of the use of a “manager of managers” arrangement whereby GEAM, as the Fund’s investment adviser, under certain circumstances, will be able to hire and replace sub-advisers to the Fund without obtaining shareholder approval.
| No. of Shares | % of Outstanding Shares | % of Shares Present | ||||||||||
Affirmative | 23,866,598.795 | 83.371 | % | 85.484 | % | |||||||
Against | 2,842,025.324 | 9.928 | % | 10.180 | % | |||||||
Abstain | 1,210,696.490 | 4.229 | % | 4.336 | % | |||||||
Broker Non-votes | — | — | — | |||||||||
Total | 27,919,320.609 | 97.528 | % | 100.000 | % | |||||||
21
Table of Contents
| Special Meeting of Shareholders — Voting Results | (unaudited) |
Proposal 3:
Approval of the following changes in certain of the Fund’s investment policies, as follows:
| A. | Amendment of the Fund’s investment policy on senior securities. |
| No. of Shares | % of Outstanding Shares | % of Shares Present | ||||||||||
Affirmative | 24,583,563.403 | 85.876 | % | 88.052 | % | |||||||
Against | 1,249,507.388 | 4.365 | % | 4.476 | % | |||||||
Abstain | 2,086,249.818 | 7.287 | % | 7.472 | % | |||||||
Broker Non-votes | — | — | — | |||||||||
Total | 27,919,320.609 | 97.528 | % | 100.000 | % | |||||||
| C. | Amendment of the Fund’s investment policy on making loans. |
| No. of Shares | % of Outstanding Shares | % of Shares Present | ||||||||||
Affirmative | 24,146,048.468 | 84.347 | % | 86.485 | % | |||||||
Against | 1,772,494.894 | 6.192 | % | 6.349 | % | |||||||
Abstain | 2,000,777.247 | 6.989 | % | 7.166 | % | |||||||
Broker Non-votes | — | — | — | |||||||||
Total | 27,919,320.609 | 97.528 | % | 100.000 | % | |||||||
| D. | Amendment of the Fund’s investment policy on borrowing. |
| No. of Shares | % of Outstanding Shares | % of Shares Present | ||||||||||
Affirmative | 24,762,896.905 | 86.502 | % | 88.694 | % | |||||||
Against | 1,120,181.103 | 3.913 | % | 4.013 | % | |||||||
Abstain | 2,036,242.601 | �� | 7.113 | % | 7.293 | % | ||||||
Broker Non-votes | — | — | — | |||||||||
Total | 27,919,320.609 | 97.528 | % | 100.000 | % | |||||||
| E. | Amendment of the Fund’s investment policy on diversification. |
| No. of Shares | % of Outstanding Shares | % of Shares Present | ||||||||||
Affirmative | 24,614,142.709 | 85.983 | % | 88.162 | % | |||||||
Against | 1,304,400.653 | 4.556 | % | 4.672 | % | |||||||
Abstain | 2,000,777.247 | 6.989 | % | 7.166 | % | |||||||
Broker Non-votes | — | — | — | |||||||||
Total | 27,919,320.609 | 97.528 | % | 100.000 | % | |||||||
| F. | Amendment of the Fund’s investment policy on concentration of investments. |
| No. of Shares | % of Outstanding Shares | % of Shares Present | ||||||||||
Affirmative | 24,030,203.668 | 83.943 | % | 86.070 | % | |||||||
Against | 1,759,937.817 | 6.148 | % | 6.304 | % | |||||||
Abstain | 2,129,179.124 | 7.437 | % | 7.626 | % | |||||||
Broker Non-votes | — | — | — | |||||||||
Total | 27,919,320.609 | 97.528 | % | 100.000 | % | |||||||
22
Table of Contents
| Special Meeting of Shareholders — Voting Results | (unaudited) |
| G. | Amendment of the Fund’s investment policy on investments in commodities and its reclassification from a non-fundamental policy to a fundamental policy. |
| No. of Shares | % of Outstanding Shares | % of Shares Present | ||||||||||
Affirmative | 23,844,691.230 | 83.295 | % | 85.406 | % | |||||||
Against | 1,945,450.255 | 6.796 | % | 6.968 | % | |||||||
Abstain | 2,129,179.124 | 7.437 | % | 7.626 | % | |||||||
Broker Non-votes | — | — | — | |||||||||
Total | 27,919,320.609 | 97.528 | % | 100.000 | % | |||||||
| H. | Amendment of the Fund’s fundamental investment policy on illiquid investments and its reclassification from a fundamental policy to a non-fundamental policy. |
| No. of Shares | % of Outstanding Shares | % of Shares Present | ||||||||||
Affirmative | 23,797,095.824 | 83.129 | % | 85.235 | % | |||||||
Against | 1,993,045.661 | 6.962 | % | 7.139 | % | |||||||
Abstain | 2,129,179.124 | 7.437 | % | 7.626 | % | |||||||
Broker Non-votes | — | — | — | |||||||||
Total | 27,919,320.609 | 97.528 | % | 100.000 | % | |||||||
| I. | Elimination of the Fund’s investment policy on mortgaging, pledging and hypothecating of investments. |
| No. of Shares | % of Outstanding Shares | % of Shares Present | ||||||||||
Affirmative | 24,116,690.158 | 84.245 | % | 86.380 | % | |||||||
Against | 1,899,885.980 | 6.637 | % | 6.805 | % | |||||||
Abstain | 1,902,744.471 | 6.646 | % | 6.815 | % | |||||||
Broker Non-votes | — | — | — | |||||||||
Total | 27,919,320.609 | 97.528 | % | 100.000 | % | |||||||
| J. | Amendment of the Fund’s investment policy on real estate investments. |
| No. of Shares | % of Outstanding Shares | % of Shares Present | ||||||||||
Affirmative | 24,176,521.011 | 84.454 | % | 86.594 | % | |||||||
Against | 1,840,055.127 | 6.428 | % | 6.591 | % | |||||||
Abstain | 1,902,744.471 | 6.646 | % | 6.815 | % | |||||||
Broker Non-votes | — | — | — | |||||||||
Total | 27,919,320.609 | 97.528 | % | 100.000 | % | |||||||
23
Table of Contents
| Additional Information | (unaudited) |
Information about Directors and Executive Officers:
The business and affairs of the Funds are managed under the direction of the Funds’ Board of Directors. Information pertaining to the Directors and officers of the Funds is set forth below.
Interested Directors and Executive Officers
Michael J. Cosgrove
Address c/o GEAM 3001 Summer St. Stamford, CT 06905
Age 62
Position(s) Held with Fund Chairman of the Board and President
Term of Office and Length of Time Served Until successor is elected and qualified – 14 years
Principal Occupation(s) During Past 5 years President and Chief Executive Officer – Mutual Funds and Intermediary Business at GEAM since March 2007; Executive Vice President of GEAM from February 1997 to March 2007; Vice President, GE Capital Corporation, an indirect wholly-owned subsidiary of GE, since December 1999; Executive Vice President – Mutual Funds of GEAM, a wholly-owned subsidiary of GE that is registered as an investment adviser under the Investment Advisers Act of 1940, as amended, since March 1993; President and Director of GE Investment Distributors, Inc., since June 2011. Director of GEAM since 1988.
Number of Portfolios in Fund Complex Overseen by Director 28
Other Directorships Held by Director Chairman of the Board and President of GE Institutional Funds since 1997; Trustee of Elfun Funds, GE Savings & Security Funds, General Relief and Loan Fund and General Electric Pension Trust since 1988; Trustee of Fordham University from 2002 to June 30, 2010 and since July 2011; Trustee of GE Volunteers since 1993; Director of GE Foundation; Director, GE Asset Management (Ireland) Limited, since February 1999, GE Asset Management Funds Plc since 1998, GE Asset Management Canada Company since 1998, GE Asset Management Limited since 1998 and GEAM since 1988; Chairman of the Board and President of GE Funds from 1993 to February 2011.
Matthew J. Simpson
Address c/o GEAM 3001 Summer St. Stamford, CT 06905
Age 50
Position(s) Held with Fund Director and Executive Vice President
Term of Office and Length of Time Served Until successor is elected and qualified – 3 years
Principal Occupation(s) During Past 5 years Executive Vice President, General Counsel and Secretary of GEAM since July 2007; Senior Vice President and General Counsel – Marketing and Client Services (formerly Asset Management Services) at GEAM and Senior Vice President and General Counsel of GE Asset Management Services from February 1997 to July 2007; Vice President and Associate General Counsel of GEAM from October 1992 to February 1997; Secretary of GE Funds from 1993 to July 2007 and Vice President from September 2003 to July 2007; Secretary of GE Institutional Funds and GE Investments Funds, Inc. from 1997 to July 2007; Secretary of Elfun Funds and GE Savings & Security Funds since July 2007; Assistant Secretary of Elfun Funds and GE Savings & Security Funds from 1998 to July 2007 and Vice President from October 2003 to July 2007.
Number of Portfolios in Fund Complex Overseen by Director 28
Other Directorships Held by Director Trustee of Elfun Funds, GE Savings & Security Funds and General Electric Pension Trust since July 2007; Trustee of GE Institutional Funds since April 2011 and Trustee of GE Funds from July 2007 to February 2011.
24
Table of Contents
| Additional Information | (unaudited) |
Joon Won Choe
Address c/o GEAM 3001 Summer St. Stamford, CT 06905
Age 41
Position(s) Held with Fund Vice President & Secretary
Term of Office and Length of Time Served Until successor is elected and qualified – Vice President and Secretary – less than 1 year
Principal Occupation(s) During Past 5 years Senior Vice President and Deputy General Counsel at GEAM since March 2011; Senior Vice President and Associate General Counsel at GEAM from June 2010 to March 2011; Vice President and Associate General Counsel at GEAM from November 2005 to June 2010; Vice President and Secretary of GE Institutional Funds and GE Investments Funds, Inc. since September 2010; Vice President and Assistant Secretary of Elfun Funds and GE Savings & Security Funds since September 2010.
Number of Portfolios in Fund Complex Overseen by Officer N/A
Other Directorships Held by Officer N/A
Robert Herlihy
Address c/o GEAM 3001 Summer St. Stamford, CT 06905
Age 43
Position(s) Held with Fund Chief Compliance Officer
Term of Office and Length of Time Served Until successor is elected and qualified — 5 years
Principal Occupation(s) During Past 5 years Chief Compliance Officer of GEAM, GE Institutional Funds, Elfun Funds, and GE Savings and Security Funds since July 2005; Chief Compliance Officer of GE Funds from July 2005 to February 2011; and Manager of Fund Administration at GEAM from 2002 – 2005.
Number of Portfolios in Fund Complex Overseen by Officer N/A
Other Directorships Held by Officer N/A
Arthur A. Jensen
Address c/o GEAM 3001 Summer St. Stamford, CT 06905
Age 44
Position(s) Held with Fund Treasurer
Term of Office and Length of Time Served Until successor is elected and qualified – less than 1 year
Principal Occupations(s) During Past 5 Years Treasurer of GE Institutional Funds, Elfun Funds and GE Savings and Security Funds since June 2011; Mutual Funds Controller of GEAM since April 2011; Senior Vice President at Citigroup from 2008 to 2010 and Vice President at JPMorgan from 2005 to 2008.
Number of Portfolios in Fund Complex Overseen by Officer N/A
Other Directorships Held by Officer N/A
25
Table of Contents
| Additional Information | (unaudited) |
Non-Interested Directors
John R. Costantino
Address c/o GEAM 3001 Summer St. Stamford, CT 06905
Age 65
Position(s) Held with Fund Director
Term of Office and Length of Time Served Until successor is elected and qualified – 14 years
Principal Occupation(s) During Past 5 years General Partner, NGN Capital LLC since 2006; Managing Director, Vice President of Walden Capital Management since 1996.
Number of Portfolios in Fund Complex Overseen by Director 20
Other Directorships Held by Director Director of GE Institutional Funds since 1997; Trustee of Fordham University from 1989-1995 and 2001-2007 and Trustee Emeritus since 2007; Trustee of Neuroscience Research Institute since 1986; Trustee of GE Funds from 1993 to February 2011; Trustee of Gregorian University Foundation from 1992-2007; Director of Artes Medical from 2006-2008.
R. Sheldon Johnson
Address c/o GEAM 3001 Summer St. Stamford, CT 06905
Age 64
Positions(s) Held with Fund Director
Term of office and Length of Time served Unit Successor is elected and qualified – less than 1 year.
Principal Occupation(s) During Past 5 years Managing Director at Morgan Stanley & Co.,Inc. from 1988 to 2006; Head of Global Institutional Equity Sales and Marketing at Morgan Stanley & Co., Inc. from 2002 to 2006.
Number of Portfolios in Fund Complex Overseen by Director 20
Other Directorships Held by Director Trustee of GE Institutional Funds since April 2011 and Trustee of St. Lawrence University since 2003.
Robert P. Quinn
Address c/o GEAM 3001 Summer St. Stamford, CT 06905
Age 75
Position(s) Held with Fund Director
Term of Office and Length of Time Served Until successor is elected and qualified – 14 years
Principal Occupation(s) During Past 5 years Retired since 1983 from Salomon Brothers Inc.
Number of Portfolios in Fund Complex Overseen by Director 20
Other Directorships Held by Director Trustee of GE Institutional Funds since 1997; Trustee of St. Francis Hospital since 1980; and Trustee of GE Funds from 1993 to February 2011.
The Statement of Additional Information for the Funds includes additional information about the Directors and Officers and is available, without charge, upon request by calling 1-800-242-0134.
26
Table of Contents
| Investment Team | (unaudited) |
Investment Adviser and Administrator
GE Asset Management Incorporated
Board of Directors
Michael J. Cosgrove, Chairman
John R. Costantino
R. Sheldon Johnson*
Robert P. Quinn
Matthew J. Simpson
Secretary
Joon Won Choe
Assistant Secretary
Michelle Matzelle
Treasurer
Arthur A. Jensen (effective June 6, 2011)
Assistant Treasurer
Casey Yantosca
Distributor
GE Investment Distributors, Inc.
Member FINRA and SIPC
Custodian
State Street Bank & Trust Company
Officers of the Investment Adviser
Dmitri Stockton, President and Chief Executive Officer (since May 2011)†
Cheryl H. Beacock, Senior Vice President, Human Resources
George A. Bicher, Chief Risk Officer
Paul M. Colonna, President and Chief Investment Officer – Fixed Income Investments
Michael J. Cosgrove, President and Chief Executive
Officer – Mutual Funds & Intermediary Business
Ralph R. Layman, President and Chief Investment Officer – Public Equity Investments
Maureen B. Mitchell, President – Institutional Sales and Marketing
Matthew J. Simpson, Executive Vice President, General Counsel and Secretary
Don W. Torey, President – Alternative Investments
John J. Walker, Executive Vice President, Chief Operating Officer
David Wiederecht, President and Chief Investment Officer – Investment Strategies
Tracie A. Winbigler, Executive Vice President, Chief Financial Officer (since January 2011)
| * | Mr. Johnson was elected as a Director of the Funds effective April 1, 2011. |
| † | Effective May 1, 2011, Mr. Stockton replaced James W. Ireland as President and Chief Executive Officer. |
At GE Asset Management, we’re dedicated to providing the investment options you’ll need to tailor your financial portfolio to every stage of your life. Each member of the GE Family of Funds is managed according to the same principles of integrity and quality that have guided GE over the past century, and have made it the world-class company that it is today. Each fund draws strength from a heritage of investment management experience that spans more than 80 years. Whether you’re creating a new investment portfolio or adding to an established one, the GE Family of Funds offers an array of professionally managed investment options that will help you meet a lifetime of financial needs.
27
Table of Contents
Investment Adviser
GE Asset Management Incorporated
3001 Summer Street
PO Box 7900
Stamford, CT 06904-7900
Distributor
GE Investment Distributors, Inc.
member FINRA and SIPC
3001 Summer Street
PO Box 7900
Stamford, CT 06904-7900
The Fund files its complete schedule of portfolio holdings with the Securities and Exchange Commission for the first and third quarters of each fiscal year on Form N-Q. The Fund’s Forms N-Q, as well as a description of the policies and procedures that the Fund uses to determine how to vote proxies (if any) relating to portfolio securities is available without charge (i) upon request, by calling 1-800-493-3042; (ii) on the Fund’s website at http://www.geam.com; and (iii) on the Commission’s website at http://www.sec.gov. The Fund’s Forms N-Q may be reviewed and copied at the Commission’s Public Reference Room in Washington, DC—information on the operation of the Public Reference Room may be obtained by calling 1-800-SEC-0330.
Information (if any) regarding how the Fund voted proxies relating to portfolio securities during the most recently disclosed 12-month period ended June 30 is available without charge (i) through the Fund’s website at http://www.geam.com; and (ii) on the Commission’s website at http://www.sec.gov.
Table of Contents
GE Investments Funds, Inc.
| Income Fund | Letter from the Chairman | |

Michael J. Cosgrove
Chairman,
GE Investments Funds, Inc.
| Dear Shareholder: |
Attached is the semi-annual report for GE Investments Funds, Inc. — Income Fund (the “Fund”) for the six-month period ended June 30, 2011. The report contains information about the performance of the Fund and other fund-specific data, along with portfolio manager commentary. We have provided
you with an overview of the investment markets, along with our investment outlook for the coming months.
Market Overview
Most major equity indices posted positive returns in the six-month period ended June 30, 2011, despite geopolitical tensions in the Middle East and North Africa, a devastating earthquake in Japan, ongoing concerns about unresolved sovereign debt issues in peripheral Europe and elevated inflation in emerging markets. Volatility increased in May and June, however, as some measures of global economic activity weakened and uncertainties over Greece’s ability to finance and service its debt rattled the financial markets. In the U.S., concerns over the end of quantitative easing by the Federal Reserve and political wrangling over the government debt ceiling further contributed to a challenging environment. The increase in risk aversion benefited the fixed income markets as many investors sought out safer investments. Toward the end of June, the Greek Parliament passed austerity measures that seemed to calm the markets and opened the way for the next round of financing from the European Central Bank and the International Monetary Fund.
Against this backdrop, financial markets posted positive results for the six- and 12-month periods ended June 30, 2011 as represented by the index returns in the below chart.
| Total Returns (%) as of June 30, 2011 | 6-month | 12-month | ||||||
U.S. equities (S&P 500 Index) | 6.0 | 30.7 | ||||||
Global equities (MSCI World Index) | 5.3 | 30.5 | ||||||
International equities (MSCI EAFE Index) | 5.0 | 30.4 | ||||||
Small-cap U.S. equities (Russell 2000 Index) | 6.2 | 37.4 | ||||||
Mid-cap U.S. equities (Russell Mid Cap Index) | 8.1 | 38.5 | ||||||
U.S. fixed income | 2.7 | 3.9 | ||||||
U.S. short-term government fixed income (Barclays Capital 1-3 Year U.S. Government Bond Index) | 0.9 | 1.4 | ||||||
Outlook
We remain constructive on the prospects for healthy global growth, although it may be at a slower pace than originally anticipated. Central banks in the U.S. and Europe remain accommodative and supply chain issues in Japan appear to have abated. There are also signs that inflation may be peaking in emerging markets as commodity prices have eased in recent months. Corporate balance sheets remain healthy and fundamentals remain intact, in our view. We believe that valuations for equities are not stretched and remain below historical averages while equity risk premiums are still high–offering the possibility for further gains. We expect that the financial markets are likely to remain volatile due to outstanding sovereign debt issues, but believe that returns are biased to the upside in the second half of the year.
Thank you for investing with GE Investments Funds.
Sincerely,

Michael J. Cosgrove
Chairman, GE Investments Funds, Inc.
July 2011
 |
This does not constitute a part of the Fund’s Shareholder Report
Table of Contents
GE Investments Funds, Inc.
| Income Fund | Letter from the Chairman (Continued) | |
Mike Cosgrove is President and Chief Executive Officer – Mutual Funds and Intermediary Business at GE Asset Management Incorporated (“GEAM”). In addition to the GE Investments Funds, he is also Chairman of the Board and President of GE Institutional Funds and Director and President of GEAM’s broker-dealer which serves as underwriter and distributor for the GE Investments Funds. Mr. Cosgrove serves as a Trustee of the GE Savings & Security Funds, the GE Foundation, and the GE Pension Trust. He also serves on the Board of Directors of the Skin Cancer Foundation and is a Trustee of Fordham University. Previously Chief Financial Officer of GE Asset Management and Assistant Treasurer – GE Company, Mr. Cosgrove joined GE in 1970 and held a number of managerial positions in finance and sales in the International Operation and the GE Trading Company. He received a BS in Economics from Fordham University and an MBA from St. John’s University.
GE Investment Distributors, Inc., Member of FINRA & SIPC, is the principal underwriter and distributor of the GE Investments Funds, Inc.
This does not constitute a part of the Fund’s Shareholder Report
Table of Contents
GE Investments Funds, Inc.
Income Fund
Semi-Annual Report
June 30, 2011

Table of Contents
GE Investments Funds, Inc.
| Income Fund | Contents | |
| 1 | ||||
| 2 | ||||
| 14 | ||||
Financial Statements | ||||
| 15 | ||||
| 16 | ||||
| 17 | ||||
| 18 | ||||
| 19 | ||||
| 26 | ||||
| 29 | ||||
| 32 | ||||
This report is prepared for Policyholders of certain variable contracts and may be distributed to others only if preceded or accompanied by the variable contract’s current prospectus and the current prospectus of the Fund available for investments thereunder.
Table of Contents
| Notes to Performance | June 30, 2011 (unaudited) |
The information provided on the performance pages relates to the GE Investments Income Fund (the “Fund”) and is unaudited.
Total returns take into account changes in share price and assume reinvestment of dividends and capital gains distributions, if any. Total returns shown are net of Fund fees and expenses but do not reflect fees and charges associated with the variable contracts such as administrative fees, account charges and surrender charges, which, if reflected, would reduce the Fund’s total returns for all periods shown.
The performance data quoted represents past performance; past performance does not guarantee future results. Investment return and principal value will fluctuate so your shares, when redeemed, may be worth more or less than their original cost. Current performance may be higher or lower than the performance data quoted. Periods less than one year are not annualized. Please call toll-free 800-493-3042 or visit the Fund’s website at http://www.geam.com for the most recent month-end performance data.
An investment in the Fund is not a deposit of any bank and is not insured or guaranteed by the Federal Deposit Insurance Corporation (FDIC) or any other government agency. An investment in the Fund is subject to risk, including possible loss of principal invested.
The Barclays Capital U.S. Aggregate Bond Index is a market value-weighted unmanaged index of taxable investment-grade debt issues, including government, corporate, asset-backed and mortgage-backed securities, with maturities of one year or more. This index is designed to represent the performance of the U.S. investment-grade first rate bond market. The results shown for the foregoing index assume the reinvestment of net dividends or interest. They do not reflect the actual cost of investing in the instruments that comprise the index.
The peer universe of the underlying annuity funds used for the peer group average annual total return calculation is based on the blend of Morningstar peer categories, as shown. Morningstar is an independent mutual fund rating service. A Fund’s performance may be compared to or ranked within a universe of mutual funds with investment objectives and policies similar but not necessarily identical to that of the Fund.
©2011 Morningstar, Inc. All Rights Reserved. The Morningstar information contained herein: (1) is proprietary to Morningstar and/or its content providers; (2) may not be copied or distributed; and (3) is not warranted to be accurate, complete or timely. Neither Morningstar nor its content providers are responsible for any damage or losses relating from any use of this information. Past performance is no guarantee of future results.
GE Investment Distributors, Inc., Member of FINRA & SIPC, is the principal underwriter and distributor of the GE Investments Funds, Inc. and a wholly owned subsidiary of GE Asset Management Incorporated, the investment adviser of the Fund.
1
Table of Contents
| Income Fund | (unaudited) |

Paul M. Colonna
President and Chief Investment Officer
The Income Fund is managed by a team of portfolio managers that includes Paul M. Colonna, William M. Healey, Mark H. Johnson and Vita Marie Pike. As lead portfolio manager for the Income Fund, Mr. Colonna is vested with oversight authority. Each portfolio manager is assigned a class of assets, the size of which are determined by team consensus and adjusted on a monthly basis, if necessary. Although each portfolio manager manages his or her asset class independent of the other team members, the team is highly collaborative and communicative.
Paul M. Colonna is the President and Chief Investment Officer — Fixed Income and a Director at GE Asset Management. Since January 2005, he has led the team of portfolio managers for the Fund and became President-Fixed Income in March 2007. Prior to joining GE Asset Management in February 2000, Mr. Colonna was a senior portfolio manager with the Federal Home Loan Mortgage Corporation, overseeing the Mortgage Investment Group.
William M. Healey is a Senior Vice President of GE Asset Management. He has served on the portfolio management team for the Income Fund since September 1997. Prior to joining GE Asset Management, Mr. Healey spent over 10 years in the fixed income group at MetLife.
Mark H. Johnson is a Senior Vice President of GE Asset Management and senior portfolio manager of structured products. He has been a member of the portfolio management team for the Fund since September 2007. Mr. Johnson joined GE Company (GE) in 1998 in its Employers Reinsurance Corporation as a taxable income portfolio manager. Mr. Johnson joined GE Asset Management as a Vice President and portfolio manager in 2002 and became a Senior Vice President and senior portfolio manager of structured products in 2007.
Vita Marie Pike is a Senior Vice President of GE Asset Management. She has served on the portfolio management team for the Fund since June 2004. Prior to joining GE Asset Management in January 2001, she was with Alliance Capital for over nine years serving in a number of different capacities including portfolio manager.
| Q. | How did the Income Fund perform compared to its benchmark and Morningstar peer group for the six-month period ended June 30, 2011? |
| A. | For the six-month period ended June 30, 2011, the Income Fund returned 3.08% for Class 1 shares. The Barclays Capital U.S. Aggregate Bond Index, the Fund’s benchmark, returned 2.72% and the Fund’s Morningstar peer group of 211 U.S. Insurance Intermediate-Term Bond funds returned an average of 2.83% over the same period. |
| Q. | What market factors affected Fund performance? |
| A. | The path of interest rates was a key driver affecting the Fund’s performance over the six-month period ending June 30, 2011. The U.S. Treasury 10-year note yield began the year at roughly 3.3% and traded up above 3.7% early in the period as economic activity trended higher and the recovery looked to be on firmer footing. Turmoil in the Middle East and the tragic disasters in Japan, however, caused a flight to safety in February pushing Treasury yields lower. The flight to safety continued in the second quarter as attention focused on the Greek debt crisis. Coupled with slowing economic activity, the 10-year note traded down to roughly 2.85% in late June before going back up to 3.16% after poor auctions of 2, 5 and 7 year maturities. While Treasury yields moved up and then down, credit spreads tightened earlier in the period then widened later, with more volatility coming in lower quality high yield and emerging market debt. Commercial mortgage-backed security yield spreads also experienced widening in the second quarter as well. |
| Q. | What were the primary drivers of Fund performance? |
| A. | The primary drivers of the Fund’s positive relative performance were duration positioning, sector allocation and security selection. The Fund benefited from its |
2
Table of Contents
(unaudited)

| overweight position in commercial mortgage-backed securities (MBS) and allocations to high yield and emerging market debt as each of those sectors outperformed U.S. Treasuries during the period. Security selection within the residential MBS holdings, particularly in interest only and inverse interest only securities, added return in the first quarter as those investments richened in the slow prepayment environment. Although the long duration positioning was a slight drag to performance in the first quarter, the large decline in interest rates in May generated a strong positive impact in the second quarter. |
| Q. | How was the Fund positioned at the end of the period? |
| A. | We believe slow economic activity should keep rates low over the near-term, with peripheral Europe still able to cause another flight to safety. A risk to this position may be a complete breakdown of budget deficit reduction talks resulting in no extension of the debt ceiling on August 2nd and a government shutdown. At this time, we do not foresee this as a high probability scenario. We began reducing the exposure to investment grade credit earlier this year and still maintained an underweight position as of June 30, seeing better relative value in other sectors. Within this asset class, the Fund ended the period overweight in the Communications, Insurance and Electric Utilities sectors, and underweight in the Non-Corporate sector. With the recent cheapening in commercial MBS, we began increasing the overweight to this sector emphasizing AAA-rated securities with strong underlying properties. |
| As we did with investment grade credit, we reduced the exposure to high yield earlier this year to roughly 4% in anticipation of a spread widening. After the spread widening in May and June, we gradually increased our high yield exposure to near 5% at the end of June. We continue to invest in bonds rated B and BB, while generally avoiding lower quality issuers. We still believe there is relative value in emerging market debt. In general, we are cautiously optimistic on spread sectors going forward with room in the Fund to add exposure should valuations cheapen further. |
3
Table of Contents
| Income Fund | (unaudited) |
Understanding Your Fund’s Expenses
As a shareholder of the Fund you incur ongoing costs. Ongoing costs include portfolio management fees, distribution and services fees, professional fees, administrative fees and other Fund expenses. The following example is intended to help you understand your ongoing costs (in dollars) of investing in the Fund and to compare these costs with the ongoing costs of investing in other mutual funds.
To illustrate these ongoing costs, we have provided an example and calculated the expenses paid by investors of the Fund during the period. The information in the following table is based on an investment of $1,000, which is invested at the beginning of the period and held for the entire six-month period ended June 30, 2011.
Actual Expenses
The first section of the table provides information about actual account values and actual expenses. You may use the information in this section, together with the amount you invested, to estimate the expenses that you paid over the period. To do so, simply divide your account value by $1,000 (for example, an $8,600 account value
divided by $1,000 = 8.6), then multiply the result by the number given for your class under the heading “Expenses paid during period.”
Hypothetical Example for Comparison Purposes
The second section of the table provides information about hypothetical account values and hypothetical expenses based on the Fund’s actual expense ratio and an assumed rate of return of 5% per year before expenses, which is not the Fund’s actual return. The hypothetical account values and expenses may not be used to estimate the actual ending account balance or expenses you paid for the period. You may use this information to compare the ongoing costs of investing in the Fund and other funds. To do so, compare this 5% hypothetical example with the 5% hypothetical examples that appear in the shareholders reports of other funds.
Please note that the expenses shown in the table are meant to highlight and help you compare ongoing costs only and do not reflect any transaction costs, such as sales charges or redemption fees, if any. Additionally, the expenses shown do not reflect the fees or charges associated with variable contracts through which shares of the Fund are offered.
January 1, 2011 – June 30, 2011
| Account value at the beginning of the period ($) | Account value at the end of the period ($) | Expenses paid during the period ($)* | ||||||||||
Actual Fund Return** | ||||||||||||
Class 1 | 1,000.00 | 1,030.77 | 4.38 | |||||||||
Hypothetical 5% Return (2.5% for the period) |
| |||||||||||
Class 1 | 1,000.00 | 1,020.27 | 4.36 | |||||||||
| * | Expenses are equal to the Fund’s annualized expense ratio of 0.87% for Class 1 shares (for the period January 1, 2011—June 30, 2011), multiplied by the average account value over the period, multiplied by 181/365 (to reflect the one-half year period). |
| ** | Actual Fund Return for the six-month period ended June 30, 2011 was 3.08% for Class 1 shares. Past performance does not guarantee future results. |
4
Table of Contents
| Income Fund | (unaudited) |
Investment Profile
A mutual fund designed for investors who seek maximum income consistent with prudent investment management and the preservation of capital. The Fund seeks its objective by investing at least 80% of its net assets under normal circumstances in debt securities.
Morningstar Performance Comparison
Based on average annual returns for periods ended June 30, 2011
| Six Months** | One Year | Five Year | Ten Year | |||||||||||||
Number of Funds in peer group: | 211 | 209 | 184 | 150 | ||||||||||||
Peer group average annual total return: | 2.83% | 5.10% | 5.85% | 5.25% | ||||||||||||
Morningstar category in peer group: U.S. Insurance Intermediate-Term Bond | ||||||||||||||||
Sector Allocation
as a % of Fair Value(b) of $54,834 (in thousands) on June 30, 2011(a)(b)
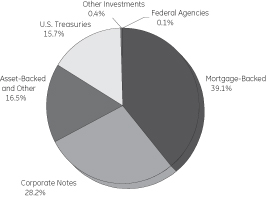
Quality Ratings
as of June 30, 2011 (as a % of Fair Value)(a)(b)
Moody’s / S&P* | | Percentage of Fair Value | | |
Aaa / AAA | 57.38% | |||
Aa / AA | 1.00% | |||
A / A | 14.95% | |||
Baa / BBB | 16.95% | |||
Ba / BB and lower | 9.34% | |||
NR/ Others | 0.38% | |||
| 100.00% |
Change in Value of a $10,000 Investment
Class 1 Shares
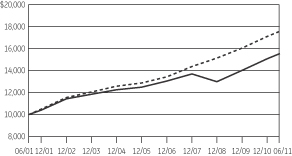
Average Annual Total Return
for the Periods Ended June 30, 2011
Class 1 Shares (Inception date: 1/3/95)
| Six Months** | One Year | Five Year | Ten Year | Ending value of a $10,000 investment | ||||||||||||||||
Income Fund | 3.08% | 6.66% | 4.51% | 4.47% | $ | 15,484 | ||||||||||||||
Barclays Capital U.S. Aggregate Bond Index | 2.72% | 3.90% | 6.52% | 5.75% | $ | 17,481 | ||||||||||||||

| (a) | The securities information regarding holdings, allocations and other characteristics is presented to illustrate examples of securities that the Fund has bought and the diversity of areas in which the Fund may invest as of a particular date. It may not be representative of the Fund’s current or future investments and should not be construed as a recommendation to purchase or sell a particular security. |
| (b) | Fair value basis is inclusive of Short-Term Investment in the GE Institutional Money Market Fund. |
| * | Moody's Investors Services Inc and Standard & Poor's are nationally recognized statistical rating organizations. |
| ** | Total returns for the six month period ended June 30, 2011 are not annualized. |
See Notes to Performance on page 1 for further information, including an explanation of Morningstar peer categories.
Past performance does not predict future performance and the graph and table do not reflect the deduction of taxes that a shareholder would pay on Fund distributions or the redemption of Fund shares and does not reflect the fees or charges that would be associated with variable contracts through which shares of the Fund are offered.
5
Table of Contents
Income Fund
| Schedule of Investments | June 30, 2011 (unaudited) |
Income Fund
| Principal Amount | Fair Value | |||||||||||
Bonds and Notes — 91.5%† | ||||||||||||
U.S. Treasuries — 16.4% | ||||||||||||
U.S. Treasury Bonds | ||||||||||||
4.75% | 02/15/41 | $ | 2,927,100 | $ | 3,111,417 | (f) | ||||||
U.S. Treasury Notes | ||||||||||||
0.63% | 12/31/12 - 04/30/13 | 561,100 | 563,139 | (c) | ||||||||
1.75% | 05/31/16 | 257,000 | 257,401 | |||||||||
2.00% | 04/30/16 | 3,213,300 | 3,262,014 | |||||||||
3.13% | 05/15/21 | 1,391,800 | 1,387,889 | (f) | ||||||||
| 8,581,860 | ||||||||||||
Agency Mortgage Backed — 30.8% |
| |||||||||||
Federal Home Loan Mortgage Corp. |
| |||||||||||
4.50% | 06/01/33 - 02/01/41 | 621,506 | 643,244 | (f) | ||||||||
5.00% | 07/01/35 - 08/01/40 | 927,119 | 987,553 | (f) | ||||||||
5.50% | 05/01/20 - 01/01/38 | 266,831 | 292,072 | (f) | ||||||||
6.00% | 04/01/17 - 11/01/37 | 601,478 | 667,133 | (f) | ||||||||
6.50% | 02/01/29 | 292 | 331 | (f) | ||||||||
7.00% | 10/01/16 - 08/01/36 | 79,425 | 91,759 | (f) | ||||||||
7.50% | 09/01/12 - 09/01/33 | 15,564 | 18,099 | (f) | ||||||||
8.00% | 11/01/30 | 15,939 | 18,986 | (f) | ||||||||
8.25% | 06/01/26 | 60,000 | 80,155 | (f,h) | ||||||||
8.50% | 04/01/30 - 05/01/30 | 20,249 | 24,360 | (f) | ||||||||
5.50% | TBA | 180,000 | 194,428 | (b) | ||||||||
Federal National Mortgage Assoc. | ||||||||||||
4.00% | 05/01/19 - 06/01/19 | 117,445 | 124,278 | (f) | ||||||||
4.50% | 05/01/18 - 10/01/40 | 1,690,350 | 1,763,337 | (f) | ||||||||
5.00% | 03/01/34 - 11/01/40 | 1,411,494 | 1,504,465 | (f) | ||||||||
5.32% | 03/01/37 | 2,691 | 2,712 | (g) | ||||||||
5.50% | 12/01/13 - 01/01/39 | 1,783,427 | 1,940,124 | (f) | ||||||||
5.53% | 04/01/37 | 1,169 | 1,242 | (g) | ||||||||
6.00% | 06/01/14 - 05/01/38 | 1,793,564 | 1,987,768 | (f) | ||||||||
6.50% | 07/01/17 - 08/01/34 | 162,424 | 182,930 | (f) | ||||||||
7.00% | 03/01/15 - 02/01/34 | 61,573 | 69,765 | (f) | ||||||||
7.50% | 08/01/13 - 03/01/34 | 90,514 | 105,563 | (f) | ||||||||
8.00% | 12/01/12 - 11/01/33 | 65,147 | 76,357 | (f) | ||||||||
8.50% | 05/01/31 | 3,900 | 4,614 | (f) | ||||||||
9.00% | 04/01/16 - 12/01/22 | 7,927 | 8,763 | (f) | ||||||||
4.50% | TBA | 1,684,000 | 1,742,150 | (b) | ||||||||
5.00% | TBA | 547,000 | 586,828 | (b) | ||||||||
Government National Mortgage Assoc. | ||||||||||||
2.13% | 12/20/24 | 2,598 | 2,679 | (f,g) | ||||||||
2.38% | 02/20/23 - 02/20/26 | 9,083 | 9,400 | (f,g) | ||||||||
4.50% | 08/15/33 - 03/20/41 | 853,182 | 901,471 | (f) | ||||||||
6.00% | 04/15/27 - 09/15/36 | 283,356 | 317,626 | (f) | ||||||||
6.50% | 04/15/19 - 08/15/36 | 232,503 | 265,810 | (f) | ||||||||
7.00% | 03/15/12 - 10/15/36 | 141,466 | 164,599 | (f) | ||||||||
7.50% | 11/15/31 - 10/15/33 | 4,774 | 5,636 | (f) | ||||||||
8.00% | 12/15/29 | 2,598 | 2,757 | (f) | ||||||||
8.50% | 10/15/17 | 9,433 | 10,697 | (f) | ||||||||
9.00% | 11/15/16 - 12/15/21 | 26,359 | 29,967 | (f) | ||||||||
| Principal Amount | Fair Value | |||||||||||
4.50% | TBA | $ | 1,190,000 | $ | 1,255,821 | (b) | ||||||
| 16,085,479 | ||||||||||||
Agency Collateralized Mortgage Obligations — 3.5% |
| |||||||||||
Fannie Mae Whole Loan | ||||||||||||
0.98% | 08/25/43 | 286,493 | 7,813 | (e,f,l) | ||||||||
Federal Home Loan Mortgage Corp. | ||||||||||||
0.08% | 09/25/43 | 1,085,466 | 9,692 | (e,f,l) | ||||||||
Federal Home Loan Mortgage Corp. | ||||||||||||
5.00% | 05/15/38 | 80,966 | 86,275 | |||||||||
5.50% | 04/15/17 | 18,735 | 377 | (e,f,l) | ||||||||
6.41% | 08/15/25 | 221,849 | 40,509 | (e,g,l) | ||||||||
Federal Home Loan Mortgage Corp. | ||||||||||||
5.00% | 05/15/17 | 16,546 | 733 | (e,f,l) | ||||||||
Federal Home Loan Mortgage Corp. | ||||||||||||
7.50% | 07/15/27 | 7,279 | 1,435 | (e,f,l) | ||||||||
Federal Home Loan Mortgage Corp. | ||||||||||||
5.50% | 06/15/33 | 159,890 | 33,481 | (e,f,l) | ||||||||
Federal Home Loan Mortgage Corp. | ||||||||||||
4.50% | 03/15/18 | 118,333 | 9,364 | (e,f,l) | ||||||||
Federal Home Loan Mortgage Corp. | ||||||||||||
4.50% | 02/15/18 | 17,830 | 1,185 | (e,f,l) | ||||||||
Federal Home Loan Mortgage Corp. | ||||||||||||
4.50% | 10/15/16 | 4,370 | 35 | (e,f,l) | ||||||||
Federal Home Loan Mortgage Corp. | ||||||||||||
5.00% | 06/15/28 | 7,402 | 146 | (e,f,l) | ||||||||
Federal Home Loan Mortgage Corp. | ||||||||||||
5.00% | 10/15/18 | 74,240 | 6,060 | (e,f,l) | ||||||||
Federal Home Loan Mortgage Corp. | ||||||||||||
5.00% | 11/15/17 - 05/15/18 | 60,262 | 3,370 | (e,f,l) | ||||||||
Federal Home Loan Mortgage Corp. | ||||||||||||
5.00% | 07/15/17 | 10,696 | 262 | (e,f,l) | ||||||||
Federal Home Loan Mortgage Corp. | ||||||||||||
0.00% | 09/15/34 | 1,055 | 932 | (c,d) | ||||||||
Federal Home Loan Mortgage Corp. | ||||||||||||
8.00% | 02/01/23 - 07/01/24 | 3,600 | 715 | (e,f,l) | ||||||||
Federal Home Loan Mortgage Corp. | ||||||||||||
5.00% | 12/01/34 | 70,864 | 14,584 | (e,f,l) | ||||||||
Federal Home Loan Mortgage STRIPS | ||||||||||||
5.06% | 08/01/27 | 947 | 775 | (c,d,f) | ||||||||
Federal National Mortgage Assoc. | ||||||||||||
1.08% | 11/25/33 | 125,760 | 5,109 | (e,g,l) | ||||||||
See Notes to Schedule of Investments and Notes to Financial Statements.
6
Table of Contents
Income Fund
| Schedule of Investments | June 30, 2011 (unaudited) |
| Principal Amount | Fair Value | |||||||||||
Federal National Mortgage Assoc. REMIC | ||||||||||||
5.00% | 08/25/38 | $ | 80,862 | $ | 85,663 | |||||||
5.00% | 09/25/40 | 274,386 | 46,351 | (e,l) | ||||||||
5.81% | 07/25/38 | 121,379 | 15,773 | (e,l) | ||||||||
Federal National Mortgage Assoc. REMIC (Class 109J) | ||||||||||||
7.00% | 09/25/20 | 494 | 541 | (f) | ||||||||
Federal National Mortgage Assoc. REMIC (Class B) | ||||||||||||
3.36% | 12/25/22 | 224 | 201 | (c,d,f) | ||||||||
Federal National Mortgage Assoc. REMIC (Class BZ) | ||||||||||||
5.50% | 01/25/33 | 167,401 | 184,125 | (f) | ||||||||
Federal National Mortgage Assoc. REMIC (Class VZ) | ||||||||||||
5.00% | 10/25/35 | 77,725 | 79,088 | |||||||||
Federal National Mortgage Assoc. REMIC (Series 1992) (Class K) | ||||||||||||
8.00% | 05/25/22 | 5 | 111 | (e,f,l) | ||||||||
Federal National Mortgage Assoc. REMIC (Series 2003) | ||||||||||||
5.00% | 08/25/17 | 38,156 | 1,926 | (e,f,l) | ||||||||
7.31% | 05/25/18 | 308,859 | 38,661 | (e,f,l) | ||||||||
Federal National Mortgage Assoc. REMIC (Series 2003) (Class HI) | ||||||||||||
5.00% | 10/25/22 | 36,539 | 2,869 | (e,f,l) | ||||||||
Federal National Mortgage Assoc. REMIC (Series 2003) (Class IJ) | ||||||||||||
5.00% | 02/25/32 | 109,228 | 11,496 | (e,f,l) | ||||||||
Federal National Mortgage Assoc. REMIC (Series 2003) (Class IO) | ||||||||||||
1.22% | 12/25/42 | 64,711 | 2,051 | (e,f,l) | ||||||||
Federal National Mortgage Assoc. REMIC (Series 2003) (Class KI) | ||||||||||||
4.50% | 05/25/18 | 10,318 | 336 | (e,f,l) | ||||||||
Federal National Mortgage Assoc. REMIC (Series 2003) (Class SL) | ||||||||||||
16.20% | 03/25/31 | 148,990 | 174,267 | (f) | ||||||||
Federal National Mortgage Assoc. REMIC (Series 2008) (Class ZW) | ||||||||||||
5.00% | 07/25/38 | 65,183 | 68,523 | |||||||||
Federal National Mortgage Assoc. STRIPS | ||||||||||||
6.00% | 01/01/35 | 51,750 | 9,049 | (e,f,l) | ||||||||
Federal National Mortgage Assoc. STRIPS (Class 2) | ||||||||||||
4.50% | 08/01/35 | 111,592 | 16,336 | (e,f,l) | ||||||||
5.00% | 03/25/38 | 85,639 | 16,258 | (e,f,l) | ||||||||
5.50% | 12/01/33 | 43,266 | 9,219 | (e,f,l) | ||||||||
7.50% | 11/01/23 | 22,088 | 3,821 | (e,f,l) | ||||||||
8.00% | 08/01/23 - 07/01/24 | �� | 7,511 | 1,715 | (e,f,l) | |||||||
8.50% | 07/25/22 | 337 | 64 | (e,f,l) | ||||||||
9.00% | 05/25/22 | 226 | 42 | (e,f,l) | ||||||||
Federal National Mortgage Assoc. STRIPS (Series 354) (Class 1) | ||||||||||||
3.82% | 12/01/34 | 161,831 | 139,574 | (c,d,f) | ||||||||
Federal National Mortgage Assoc. STRIPS (Series 378) (Class 1) | ||||||||||||
4.50% | 01/01/36 | 142,276 | 21,676 | (e,f,l) | ||||||||
| Principal Amount | Fair Value | |||||||||||
Federal National Mortgage Assoc. STRIPS (Series 387) (Class 1) | ||||||||||||
5.00% | 05/25/38 | $ | 82,709 | $ | 15,942 | (e,f,l) | ||||||
Government National Mortgage Assoc. | ||||||||||||
4.50% | 04/16/34 - 08/16/39 | 1,154,312 | 202,487 | (e,l) | ||||||||
4.50% | 11/20/39 | 107,859 | 105,164 | |||||||||
5.00% | 12/20/35 | 129,133 | 18,473 | (e,l) | ||||||||
5.00% | 10/20/37 - 09/20/38 | 372,764 | 69,775 | (e,f,l) | ||||||||
5.96% | 02/20/38 | 314,743 | 51,584 | (e,g,l) | ||||||||
6.31% | 01/16/39 | 382,681 | 64,834 | (e,g,l) | ||||||||
6.41% | 08/20/40 | 513,002 | 97,737 | (e,g,l) | ||||||||
Government National Mortgage Assoc. (Class IC) | ||||||||||||
6.06% | 04/16/37 | 147,399 | 28,652 | (e,f,l) | ||||||||
Vendee Mortgage Trust | ||||||||||||
0.38% | 04/15/40 | 452,572 | 9,776 | (e,g,l) | ||||||||
0.58% | 09/15/46 | 794,289 | 29,067 | (e,g,l) | ||||||||
Vendee Mortgage Trust (Class IO) | ||||||||||||
0.85% | 05/15/33 | 174,418 | 5,198 | (e,f,g,l) | ||||||||
| 1,851,277 | ||||||||||||
Asset Backed — 1.8% | ||||||||||||
Bear Stearns Asset Backed Securities Trust (Class 2A2) | ||||||||||||
5.00% | 02/25/36 | 379,344 | 361,677 | (c,f) | ||||||||
Chase Funding Mortgage Loan Asset-Backed Certificates (Class IB) | ||||||||||||
5.75% | 11/25/34 | 18,437 | 10,893 | (k) | ||||||||
Chase Funding Mortgage Loan Asset-Backed Certificates (Class IIA2) | ||||||||||||
2.32% | 02/25/33 | 18,289 | 17,029 | (c,k) | ||||||||
Citicorp Residential Mortgage Securities Inc. (Series 2006) (Class A5) | ||||||||||||
6.04% | 09/25/36 | 60,000 | 51,740 | |||||||||
Countrywide Asset-Backed Certificates | ||||||||||||
1.05% | 05/25/33 | 8,460 | 6,818 | (f) | ||||||||
Mid-State Trust (Class A3) | ||||||||||||
7.54% | 07/01/35 | 1,772 | 1,792 | (k) | ||||||||
Popular ABS Mortgage Pass-Through Trust (Class AF4) | ||||||||||||
5.30% | 11/25/35 | 50,000 | 42,342 | |||||||||
Residential Asset Mortgage Products Inc. (Class A2) | ||||||||||||
6.62% | 06/25/32 | 19,766 | 16,186 | (c,k) | ||||||||
Residential Asset Securities Corp. (Series 2002) (Class AIIB) | ||||||||||||
24.68% | 07/25/32 | 3,750 | 2,222 | (c,k) | ||||||||
Saxon Asset Securities Trust | ||||||||||||
5.23% | 08/25/35 | 440,794 | 413,567 | (f) | ||||||||
| 924,266 | ||||||||||||
Corporate Notes — 29.6% |
| |||||||||||
ABN Amro Bank N.V. | ||||||||||||
3.00% | 01/31/14 | 200,000 | 204,308 | (a) | ||||||||
See Notes to Schedule of Investments and Notes to Financial Statements.
7
Table of Contents
Income Fund
| Schedule of Investments | June 30, 2011 (unaudited) |
| Principal Amount | Fair Value | |||||||||||
AES El Salvador Trust | ||||||||||||
6.75% | 02/01/16 | $ | 100,000 | $ | 101,500 | (a) | ||||||
AES Panama S.A. | ||||||||||||
6.35% | 12/21/16 | 40,000 | 43,000 | (a) | ||||||||
Agilent Technologies Inc. | ||||||||||||
5.50% | 09/14/15 | 34,000 | 37,649 | |||||||||
Allergan Inc. | ||||||||||||
3.38% | 09/15/20 | 125,000 | 119,892 | |||||||||
Alliance One International Inc. | ||||||||||||
10.00% | 07/15/16 | 95,000 | 91,675 | |||||||||
Alpha Natural Resources Inc. | ||||||||||||
6.00% | 06/01/19 | 21,000 | 20,947 | |||||||||
Ameren Illinois Co. | ||||||||||||
9.75% | 11/15/18 | 98,000 | 128,777 | |||||||||
American International Group Inc. | ||||||||||||
5.85% | 01/16/18 | 93,000 | 97,313 | |||||||||
Amgen Inc. | ||||||||||||
2.30% | 06/15/16 | 42,000 | 41,637 | |||||||||
4.10% | 06/15/21 | 59,000 | 58,534 | |||||||||
5.65% | 06/15/42 | 42,000 | 42,068 | |||||||||
Amsted Industries Inc. | ||||||||||||
8.13% | 03/15/18 | 74,000 | 77,700 | (a) | ||||||||
Anadarko Petroleum Corp. | ||||||||||||
6.20% | 03/15/40 | 129,000 | 130,741 | |||||||||
6.95% | 06/15/19 | 105,000 | 122,641 | |||||||||
Anheuser-Busch InBev Worldwide Inc. | ||||||||||||
3.63% | 04/15/15 | 96,000 | 101,565 | |||||||||
5.38% | 11/15/14 | 89,000 | 99,389 | |||||||||
AON Corp. | ||||||||||||
3.13% | 05/27/16 | 72,000 | 71,765 | |||||||||
Applied Materials Inc. | ||||||||||||
2.65% | 06/15/16 | 30,000 | 30,114 | |||||||||
4.30% | 06/15/21 | 60,000 | 60,200 | |||||||||
5.85% | 06/15/41 | 60,000 | 60,857 | |||||||||
ArcelorMittal | ||||||||||||
3.75% | 03/01/16 | 43,000 | 43,481 | |||||||||
5.50% | 03/01/21 | 151,000 | 151,236 | |||||||||
Arch Coal Inc. | ||||||||||||
7.00% | 06/15/19 | 52,000 | 51,870 | (a) | ||||||||
Archer-Daniels-Midland Co. | ||||||||||||
5.77% | 03/01/41 | 174,000 | 183,625 | |||||||||
Arizona Public Service Co. | ||||||||||||
6.25% | 08/01/16 | 165,000 | 188,648 | (f) | ||||||||
AT&T Inc. | ||||||||||||
2.95% | 05/15/16 | 90,000 | 91,151 | |||||||||
4.45% | 05/15/21 | 90,000 | 91,590 | |||||||||
6.40% | 05/15/38 | 146,000 | 156,609 | (f) | ||||||||
6.70% | 11/15/13 | 108,000 | 121,110 | (f) | ||||||||
Banco de Credito del Peru | ||||||||||||
4.75% | 03/16/16 | 32,000 | 31,680 | (a) | ||||||||
Banco Mercantil del Norte S.A. (Series REGS) | ||||||||||||
6.14% | 10/13/16 | 14,000 | 13,965 | (g) | ||||||||
BanColombia S.A. | ||||||||||||
5.95% | 06/03/21 | 100,000 | 101,500 | (a) | ||||||||
6.13% | 07/26/20 | 10,000 | 10,137 | |||||||||
Bank of America Corp. | ||||||||||||
5.42% | 03/15/17 | 300,000 | 306,047 | |||||||||
5.63% | 07/01/20 | 215,000 | 221,990 | |||||||||
| Principal Amount | Fair Value | |||||||||||
6.50% | 08/01/16 | $ | 105,000 | $ | 117,102 | |||||||
Boise Paper Holdings LLC | ||||||||||||
8.00% | 04/01/20 | 55,000 | 57,750 | |||||||||
Bombardier Inc. | ||||||||||||
7.75% | 03/15/20 | 52,000 | 58,500 | (a,f) | ||||||||
BP Capital Markets PLC | ||||||||||||
3.13% | 10/01/15 | 32,000 | 32,854 | |||||||||
4.50% | 10/01/20 | 32,000 | 32,633 | |||||||||
Calpine Corp. | ||||||||||||
7.25% | 10/15/17 | 25,000 | 25,375 | (a) | ||||||||
Camden Property Trust (REIT) | ||||||||||||
4.88% | 06/15/23 | 42,000 | 40,984 | |||||||||
Capex S.A. | ||||||||||||
10.00% | 03/10/18 | 11,000 | 10,807 | (a) | ||||||||
Cargill Inc. | ||||||||||||
5.20% | 01/22/13 | 162,000 | 172,242 | (a,f) | ||||||||
6.00% | 11/27/17 | 63,000 | 72,604 | (a) | ||||||||
Caterpillar Inc. | ||||||||||||
3.90% | 05/27/21 | 90,000 | 90,012 | |||||||||
CCO Holdings LLC | ||||||||||||
7.88% | 04/30/18 | 32,000 | 33,720 | |||||||||
8.13% | 04/30/20 | 40,000 | 43,200 | |||||||||
Central American Bank for Economic Integration | ||||||||||||
5.38% | 09/24/14 | 70,000 | 75,853 | (a) | ||||||||
CenturyLink Inc. | ||||||||||||
5.15% | 06/15/17 | 60,000 | 60,099 | |||||||||
6.45% | 06/15/21 | 60,000 | 59,314 | |||||||||
CenturyLink Inc. (Series G) | ||||||||||||
6.88% | 01/15/28 | 43,000 | 40,597 | |||||||||
CFG Investment SAC | ||||||||||||
9.25% | 12/19/13 | 100,000 | 102,500 | (f) | ||||||||
Chesapeake Midstream Partners LP | ||||||||||||
5.88% | 04/15/21 | 74,000 | 73,075 | (a) | ||||||||
Chrysler Group LLC | ||||||||||||
8.00% | 06/15/19 | 200,000 | 196,500 | (a) | ||||||||
Chubb Corp. | ||||||||||||
6.38% | 03/29/67 | 21,000 | 21,735 | (g) | ||||||||
Cincinnati Bell Inc. | ||||||||||||
8.25% | 10/15/17 | 122,000 | 122,610 | (f) | ||||||||
Cinemark USA Inc. | ||||||||||||
7.38% | 06/15/21 | 31,000 | 30,845 | (a) | ||||||||
Citigroup Inc. | ||||||||||||
5.00% | 09/15/14 | 171,000 | 179,201 | |||||||||
5.13% | 05/05/14 | 66,000 | 70,741 | (f) | ||||||||
Consolidated Edison Company of New York Inc. | ||||||||||||
6.65% | 04/01/19 | 74,000 | 88,520 | |||||||||
Consolidated Edison Company of New York Inc. (Series 2008) | ||||||||||||
5.85% | 04/01/18 | 45,000 | 51,620 | |||||||||
Corp Nacional del Cobre de Chile | ||||||||||||
3.75% | 11/04/20 | 100,000 | 95,007 | (a) | ||||||||
5.63% | 09/21/35 | 14,000 | 14,196 | (a) | ||||||||
COX Communications Inc. | ||||||||||||
6.25% | 06/01/18 | 83,000 | 95,063 | (a) | ||||||||
Credit Suisse First Boston International for CJSC The EXIM of Ukraine | ||||||||||||
7.65% | 09/07/11 | 100,000 | 101,000 | |||||||||
See Notes to Schedule of Investments and Notes to Financial Statements.
8
Table of Contents
Income Fund
| Schedule of Investments | June 30, 2011 (unaudited) |
| Principal Amount | Fair Value | |||||||||||
Crown Castle Towers LLC | ||||||||||||
4.88% | 08/15/40 | $ | 100,000 | $ | 100,552 | (a) | ||||||
6.11% | 01/15/40 | 66,000 | 72,014 | (a) | ||||||||
CVS Caremark Corp. | ||||||||||||
3.25% | 05/18/15 | 35,000 | 36,325 | |||||||||
5.75% | 06/01/17 | 38,000 | 42,681 | |||||||||
Danaher Corp. | ||||||||||||
2.30% | 06/23/16 | 60,000 | 59,952 | |||||||||
3.90% | 06/23/21 | 12,000 | 11,953 | |||||||||
Denbury Resources Inc. | ||||||||||||
6.38% | 08/15/21 | 45,000 | 45,000 | |||||||||
8.25% | 02/15/20 | 66,000 | 71,940 | |||||||||
DirecTV Holdings LLC | ||||||||||||
3.55% | 03/15/15 | 62,000 | 64,778 | |||||||||
4.75% | 10/01/14 | 70,000 | 76,624 | |||||||||
Drummond Company Inc. | ||||||||||||
9.00% | 10/15/14 | 67,000 | 70,517 | (a) | ||||||||
Duke Realty LP (REIT) | ||||||||||||
6.50% | 01/15/18 | 31,000 | 34,475 | |||||||||
European Investment Bank | ||||||||||||
4.88% | 01/17/17 | 200,000 | 226,629 | (f) | ||||||||
Exelon Corp. | ||||||||||||
4.90% | 06/15/15 | 70,000 | 75,267 | |||||||||
Finansbank AS | ||||||||||||
5.50% | 05/11/16 | 200,000 | 191,500 | (a) | ||||||||
First Horizon National Corp. | ||||||||||||
5.38% | 12/15/15 | 94,000 | 100,008 | |||||||||
FPL Group Capital Inc. | ||||||||||||
2.60% | 09/01/15 | 131,000 | 130,399 | |||||||||
Fresenius Medical Care US Finance Inc. | ||||||||||||
5.75% | 02/15/21 | 10,000 | 9,800 | (a) | ||||||||
Frontier Communications Corp. | ||||||||||||
7.13% | 03/15/19 | 53,000 | 54,325 | |||||||||
Georgia-Pacific LLC | ||||||||||||
5.40% | 11/01/20 | 35,000 | 35,670 | (a) | ||||||||
Goldman Sachs Capital I | ||||||||||||
6.35% | 02/15/34 | 64,000 | 60,522 | |||||||||
Great Plains Energy Inc. | ||||||||||||
4.85% | 06/01/21 | 60,000 | 60,192 | |||||||||
Hanesbrands Inc. | ||||||||||||
6.38% | 12/15/20 | 67,000 | 64,990 | |||||||||
HCA Inc. | ||||||||||||
9.25% | 11/15/16 | 74,000 | 78,533 | (f) | ||||||||
HCP Inc. (REIT) | ||||||||||||
6.00% | 01/30/17 | 53,000 | 58,361 | |||||||||
Hewlett-Packard Co. | ||||||||||||
4.30% | 06/01/21 | 120,000 | 121,173 | |||||||||
HSBC Finance Corp. | ||||||||||||
6.68% | 01/15/21 | 332,000 | 340,636 | (a) | ||||||||
Huntington BancShares Inc. | ||||||||||||
7.00% | 12/15/20 | 44,000 | 49,610 | |||||||||
ING Bank N.V. | ||||||||||||
4.00% | 03/15/16 | 200,000 | 202,408 | (a) | ||||||||
Ingles Markets Inc. | ||||||||||||
8.88% | 05/15/17 | 140,000 | 149,800 | |||||||||
Intergas Finance BV | ||||||||||||
6.38% | 05/14/17 | 100,000 | 107,125 | (a,f) | ||||||||
Inversiones CMPC S.A. | ||||||||||||
4.75% | 01/19/18 | 11,000 | 10,989 | (a) | ||||||||
| Principal Amount | Fair Value | |||||||||||
JP Morgan Chase Capital XXV (Series Y) | ||||||||||||
6.80% | 10/01/37 | $ | 33,000 | $ | 32,641 | (f) | ||||||
JPMorgan Chase & Co. | ||||||||||||
3.15% | 07/05/16 | 60,000 | 60,367 | |||||||||
5.13% | 09/15/14 | 20,000 | 21,613 | (f) | ||||||||
KeyCorp. | ||||||||||||
5.10% | 03/24/21 | 61,000 | 62,128 | |||||||||
Korea Development Bank | ||||||||||||
3.25% | 03/09/16 | 100,000 | 99,709 | |||||||||
Kraft Foods Inc. | ||||||||||||
4.13% | 02/09/16 | 64,000 | 68,435 | |||||||||
5.38% | 02/10/20 | 215,000 | 235,038 | (f) | ||||||||
6.50% | 02/09/40 | 63,000 | 69,979 | |||||||||
Kreditanstalt fuer Wiederaufbau | ||||||||||||
3.50% | 03/10/14 | 44,000 | 46,887 | (f) | ||||||||
4.50% | 07/16/18 | 85,000 | 94,108 | (f) | ||||||||
Majapahit Holding BV | ||||||||||||
7.25% | 10/17/11 | 100,000 | 101,500 | (a,f) | ||||||||
Merrill Lynch & Company Inc. | ||||||||||||
6.88% | 04/25/18 | 110,000 | 121,706 | (f) | ||||||||
MetroPCS Wireless Inc. | ||||||||||||
6.63% | 11/15/20 | 38,000 | 37,620 | |||||||||
Midamerican Energy Holdings Co. | ||||||||||||
6.13% | 04/01/36 | 115,000 | 123,842 | (f) | ||||||||
Mylan Inc. | ||||||||||||
7.88% | 07/15/20 | 64,000 | 70,240 | (a,f) | ||||||||
NAK Naftogaz Ukraine | ||||||||||||
9.50% | 09/30/14 | 100,000 | 109,625 | |||||||||
National Agricultural Cooperative Federation | ||||||||||||
4.25% | 01/28/16 | 100,000 | 102,426 | (a) | ||||||||
National Power Corp. | ||||||||||||
4.51% | 08/23/11 | 121,000 | 121,083 | (g) | ||||||||
Nationwide Mutual Insurance Co. | ||||||||||||
7.88% | 04/01/33 | 27,000 | 28,955 | (a) | ||||||||
9.38% | 08/15/39 | 12,000 | 14,888 | (a) | ||||||||
News America Inc. | ||||||||||||
4.50% | 02/15/21 | 106,000 | 104,612 | (a) | ||||||||
6.65% | 11/15/37 | 96,000 | 102,883 | |||||||||
Nisource Finance Corp. | ||||||||||||
6.13% | 03/01/22 | 62,000 | 68,305 | |||||||||
Noble Holding International Ltd. | ||||||||||||
3.05% | 03/01/16 | 92,000 | 92,805 | |||||||||
NRG Energy Inc. | ||||||||||||
7.63% | 05/15/19 | 80,000 | 79,600 | (a) | ||||||||
Oglethorpe Power Corp. | ||||||||||||
5.38% | 11/01/40 | 64,000 | 61,763 | |||||||||
ONEOK Partners LP | ||||||||||||
6.13% | 02/01/41 | 64,000 | 65,196 | |||||||||
Pacific Gas & Electric Co. | ||||||||||||
5.80% | 03/01/37 | 53,000 | 54,437 | |||||||||
6.05% | 03/01/34 | 34,000 | 35,952 | |||||||||
Pacific Rubiales Energy Corp. | ||||||||||||
8.75% | 11/10/16 | 100,000 | 112,750 | (a) | ||||||||
PacifiCorp | ||||||||||||
6.25% | 10/15/37 | 2,000 | 2,262 | |||||||||
PAETEC Holding Corp. | ||||||||||||
8.88% | 06/30/17 | 46,000 | 48,300 | |||||||||
See Notes to Schedule of Investments and Notes to Financial Statements.
9
Table of Contents
Income Fund
| Schedule of Investments | June 30, 2011 (unaudited) |
| Principal Amount | Fair Value | |||||||||||
Pemex Project Funding Master Trust | ||||||||||||
6.63% | 06/15/35 - 06/15/38 | $ | 32,000 | $ | 33,621 | |||||||
Petrobras International Finance Co. | ||||||||||||
3.88% | 01/27/16 | 56,000 | 57,026 | |||||||||
Petroleos de Venezuela S.A. | ||||||||||||
0.00% | 07/10/11 | 10,000 | 9,995 | (c) | ||||||||
Petroleos Mexicanos | ||||||||||||
6.00% | 03/05/20 | 30,000 | 32,925 | |||||||||
8.00% | 05/03/19 | 10,000 | 12,330 | |||||||||
Philip Morris International Inc. | ||||||||||||
2.50% | 05/16/16 | 120,000 | 120,179 | |||||||||
Pioneer Natural Resources Co. | ||||||||||||
7.50% | 01/15/20 | 58,000 | 65,355 | |||||||||
Plains All American Pipeline LP | ||||||||||||
5.00% | 02/01/21 | 63,000 | 64,061 | |||||||||
Plains All American Pipeline LP Corp. | ||||||||||||
3.95% | 09/15/15 | 68,000 | 71,326 | |||||||||
Protective Life Corp. | ||||||||||||
8.45% | 10/15/39 | 108,000 | 119,011 | |||||||||
Prudential Financial Inc. | ||||||||||||
3.00% | 05/12/16 | 60,000 | 59,471 | |||||||||
5.38% | 06/21/20 | 28,000 | 29,498 | |||||||||
5.40% | 06/13/35 | 40,000 | 36,643 | |||||||||
5.63% | 05/12/41 | 60,000 | 55,490 | |||||||||
QVC Inc. | ||||||||||||
7.50% | 10/01/19 | 78,000 | 82,680 | (a) | ||||||||
RailAmerica Inc. | ||||||||||||
9.25% | 07/01/17 | 76,000 | 83,410 | |||||||||
Reinsurance Group of America Inc. | ||||||||||||
5.00% | 06/01/21 | 90,000 | 89,040 | |||||||||
Republic Services Inc. | ||||||||||||
5.25% | 11/15/21 | 64,000 | 67,621 | |||||||||
5.70% | 05/15/41 | 38,000 | 37,096 | |||||||||
Reynolds Group Issuer Inc. | ||||||||||||
8.50% | 10/15/16 | 167,000 | 174,097 | (a) | ||||||||
Roche Holdings Inc. | ||||||||||||
6.00% | 03/01/19 | 76,000 | 87,564 | (a) | ||||||||
Societe Generale | ||||||||||||
5.20% | 04/15/21 | 100,000 | 98,206 | (a) | ||||||||
Southern Copper Corp. | ||||||||||||
5.38% | 04/16/20 | 86,000 | 88,090 | |||||||||
6.75% | 04/16/40 | 77,000 | 74,906 | |||||||||
Teck Resources Ltd. | ||||||||||||
3.15% | 01/15/17 | 30,000 | 30,019 | |||||||||
4.75% | 01/15/22 | 59,000 | 59,154 | |||||||||
Teva Pharmaceutical Finance II BV | ||||||||||||
3.00% | 06/15/15 | 132,000 | 135,829 | |||||||||
Texas Instruments Inc. | ||||||||||||
2.38% | 05/16/16 | 150,000 | 150,046 | |||||||||
Textron Inc. | ||||||||||||
6.20% | 03/15/15 | 82,000 | 90,984 | |||||||||
The AES Corp. | ||||||||||||
8.00% | 10/15/17 | 66,000 | 69,960 | |||||||||
The Goldman Sachs Group Inc. | ||||||||||||
3.63% | 02/07/16 | 111,000 | 112,205 | |||||||||
3.70% | 08/01/15 | 55,000 | 56,005 | |||||||||
5.38% | 03/15/20 | 30,000 | 30,979 | |||||||||
6.00% | 06/15/20 | 75,000 | 80,699 | |||||||||
6.15% | 04/01/18 | 167,000 | 181,753 | |||||||||
| Principal Amount | Fair Value | |||||||||||
6.75% | 10/01/37 | 62,000 | 61,999 | |||||||||
The Potomac Edison Co. | ||||||||||||
5.35% | 11/15/14 | 95,000 | 104,343 | (f) | ||||||||
The Williams companies Inc. | ||||||||||||
7.50% | 01/15/31 | 12,000 | 13,724 | |||||||||
Time Warner Cable Inc. | ||||||||||||
5.00% | 02/01/20 | 40,000 | 41,558 | |||||||||
6.75% | 07/01/18 | 119,000 | 138,003 | |||||||||
7.50% | 04/01/14 | 31,000 | 35,714 | |||||||||
Time Warner Inc. | ||||||||||||
3.15% | 07/15/15 | 121,000 | 125,135 | |||||||||
5.88% | 11/15/16 | 83,000 | 94,873 | |||||||||
6.20% | 03/15/40 | 68,000 | 69,664 | |||||||||
TNK-BP Finance S.A. | ||||||||||||
7.25% | 02/02/20 | 15,000 | 16,575 | (a) | ||||||||
Transocean Inc. | ||||||||||||
6.00% | 03/15/18 | 20,000 | 22,144 | |||||||||
6.80% | 03/15/38 | 13,000 | 13,958 | |||||||||
UBS AG | ||||||||||||
5.88% | 07/15/16 | 100,000 | 109,691 | |||||||||
UnitedHealth Group Inc. | ||||||||||||
5.80% | 03/15/36 | 48,000 | 48,443 | |||||||||
Verizon Communications Inc. | ||||||||||||
5.50% | 02/15/18 | 56,000 | 62,282 | |||||||||
6.40% | 02/15/38 | 70,000 | 75,865 | |||||||||
Visteon Corp. | ||||||||||||
6.75% | 04/15/19 | 53,000 | 51,145 | (a) | ||||||||
Weatherford International Ltd. | ||||||||||||
5.13% | 09/15/20 | 60,000 | 61,261 | |||||||||
Williams Partners LP | ||||||||||||
4.13% | 11/15/20 | 30,000 | 28,797 | |||||||||
Willis Group Holdings PLC | ||||||||||||
4.13% | 03/15/16 | 61,000 | 62,192 | |||||||||
Windstream Corp. | ||||||||||||
7.75% | 10/01/21 | 53,000 | 55,385 | |||||||||
7.88% | 11/01/17 | 91,000 | 96,574 | (f) | ||||||||
Woodside Finance Ltd. | ||||||||||||
4.50% | 11/10/14 | 165,000 | 176,782 | (a,f) | ||||||||
Wynn Las Vegas LLC | ||||||||||||
7.88% | 05/01/20 | 50,000 | 54,500 | |||||||||
XL Group PLC (Series E) | ||||||||||||
6.50% | 12/29/49 | 75,000 | 68,813 | (g) | ||||||||
Xstrata Finance Canada Ltd. | ||||||||||||
5.80% | 11/15/16 | 92,873 | 104,008 | (a,f) | ||||||||
| 15,480,275 | ||||||||||||
Non-Agency Collateralized Mortgage Obligations — 6.8% |
| |||||||||||
Banc of America Commercial Mortgage Inc. | ||||||||||||
5.68% | 07/10/46 | 60,000 | 59,625 | |||||||||
5.73% | 07/10/46 | 50,000 | 41,915 | |||||||||
5.93% | 02/10/51 | 270,000 | 293,390 | |||||||||
6.39% | 02/10/51 | 60,000 | 66,842 | (g) | ||||||||
Banc of America Commercial Mortgage Inc. (Class A4) | ||||||||||||
5.63% | 07/10/46 | 60,000 | 65,650 | |||||||||
Banc of America Merrill Lynch Commercial Mortgage Inc. | ||||||||||||
6.00% | 02/10/51 | 60,000 | 58,731 | (g) | ||||||||
See Notes to Schedule of Investments and Notes to Financial Statements.
10
Table of Contents
Income Fund
| Schedule of Investments | June 30, 2011 (unaudited) |
| Principal Amount | Fair Value | |||||||||||
Banc of America Mortgage Securities Inc. (Class B1) | ||||||||||||
4.78% | 01/25/36 | $ | 36,467 | $ | 1,675 | (k) | ||||||
Bear Stearns Commercial Mortgage Securities | ||||||||||||
5.94% | 09/11/38 | 60,000 | 62,435 | (g) | ||||||||
Bear Stearns Commercial Mortgage Securities (Class AJ) | ||||||||||||
5.91% | 06/11/40 | 60,000 | 47,296 | |||||||||
Bear Stearns Commercial Mortgage Securities (Class AM) | ||||||||||||
5.71% | 04/12/38 | 60,000 | 62,960 | |||||||||
Bear Stearns Commercial Mortgage Securities (Series 2007) (Class D) | ||||||||||||
6.18% | 09/11/42 | 20,000 | 14,377 | (k) | ||||||||
Citigroup Commercial Mortgage Trust (Series 2006) (Class AJ) | ||||||||||||
5.48% | 10/15/49 | 60,000 | 52,797 | |||||||||
Commercial Mortgage Pass Through Certificates (Class AM) | ||||||||||||
5.97% | 06/10/46 | 30,000 | 30,874 | |||||||||
Countrywide Commercial Mortgage Trust (Class AJ) | ||||||||||||
6.10% | 06/12/46 | 70,000 | 64,618 | (g) | ||||||||
Credit Suisse First Boston Mortgage Securities Corp. | ||||||||||||
5.23% | 12/15/40 | 60,000 | 57,062 | (g) | ||||||||
Credit Suisse First Boston Mortgage Securities Corp. (Class CB1) | ||||||||||||
5.33% | 10/25/35 | 71,892 | 4,002 | (k) | ||||||||
Credit Suisse Mortgage Capital Certificates | ||||||||||||
5.47% | 09/15/39 | 60,000 | 64,707 | |||||||||
Credit Suisse Mortgage Capital Certificates (Class C) | ||||||||||||
5.78% | 02/15/39 | 150,000 | 126,355 | (f) | ||||||||
Credit Suisse Mortgage Capital Certificates (Class CB1) | ||||||||||||
5.62% | 02/25/36 | 37,532 | 1,919 | (k) | ||||||||
DBUBS Mortgage Trust | ||||||||||||
5.73% | 11/10/46 | 50,000 | 38,110 | (a) | ||||||||
Extended Stay America Trust | ||||||||||||
5.50% | 11/05/27 | 200,000 | 199,664 | (a) | ||||||||
Greenwich Capital Commercial Funding Corp. | ||||||||||||
5.48% | 03/10/39 | 25,000 | 24,213 | |||||||||
GS Mortgage Securities Corp. | ||||||||||||
5.99% | 08/10/45 | 60,000 | 64,416 | (g) | ||||||||
GS Mortgage Securities Corp. II | ||||||||||||
5.73% | 03/10/44 | 100,000 | 91,440 | (a,g) | ||||||||
Indymac INDA Mortgage Loan Trust (Class B1) | ||||||||||||
4.59% | 01/25/36 | 54,172 | 949 | (k) | ||||||||
JP Morgan Chase Commercial Mortgage Securities Corp. | ||||||||||||
5.34% | 08/12/37 | 150,000 | 163,304 | (f,g) | ||||||||
JP Morgan Chase Commercial Mortgage Securities Corp. (Class A4) | ||||||||||||
5.44% | 06/12/47 | 160,000 | 171,002 | (f) | ||||||||
5.79% | 02/12/51 | 90,000 | 97,698 | (f) | ||||||||
| Principal Amount | Fair Value | |||||||||||
JP Morgan Chase Commercial Mortgage Securities Corp. (Class AM) | ||||||||||||
5.44% | 05/15/45 | $ | 90,000 | $ | 91,323 | |||||||
6.10% | 02/12/51 | 60,000 | 58,955 | (f) | ||||||||
JP Morgan Chase Commercial Mortgage Securities Corp. (Class B) | ||||||||||||
5.70% | 04/15/43 | 40,000 | 34,251 | |||||||||
JP Morgan Chase Commercial Mortgage Securities Corp. (Class F) | ||||||||||||
6.40% | 02/12/51 | 40,000 | 20,537 | (k) | ||||||||
LB-UBS Commercial Mortgage Trust | ||||||||||||
6.31% | 04/15/41 | 40,000 | 39,934 | (g) | ||||||||
LB-UBS Commercial Mortgage Trust (Class A2) | ||||||||||||
6.31% | 04/15/41 | 160,000 | 178,182 | (g) | ||||||||
LB-UBS Commercial Mortgage Trust (Class A4) | ||||||||||||
5.16% | 02/15/31 | 70,000 | 75,738 | (f) | ||||||||
LB-UBS Commercial Mortgage Trust (Class AJ) | ||||||||||||
6.31% | 04/15/41 | 30,000 | 25,396 | (f,g) | ||||||||
LB-UBS Commercial Mortgage Trust (Class AM) | ||||||||||||
6.37% | 09/15/45 | 30,000 | 29,486 | (g) | ||||||||
LB-UBS Commercial Mortgage Trust (Series 2006) (Class AJ) | ||||||||||||
5.28% | 02/15/41 | 60,000 | 56,014 | (g) | ||||||||
MASTR Alternative Loans Trust (Class 15 AX) | ||||||||||||
5.00% | 08/25/18 | 75,492 | 8,635 | (e,k,l) | ||||||||
Merrill Lynch Mortgage Trust (Class AJ) | ||||||||||||
5.86% | 05/12/39 | 250,000 | 230,967 | (g) | ||||||||
Merrill Lynch Mortgage Trust (Series 2006) (Class B) | ||||||||||||
5.86% | 05/12/39 | 70,000 | 54,125 | (f) | ||||||||
Morgan Stanley Capital I | ||||||||||||
5.48% | 02/12/44 | 95,000 | 90,864 | (g) | ||||||||
5.90% | 10/15/42 | 76,000 | 66,233 | (f) | ||||||||
Morgan Stanley Capital I (Class A4) | ||||||||||||
5.81% | 12/12/49 | 100,000 | 109,730 | |||||||||
5.99% | 08/12/41 | 30,000 | 33,571 | (g) | ||||||||
Morgan Stanley Capital I (Class AM) | ||||||||||||
6.46% | 01/11/43 | 70,000 | 72,917 | (f) | ||||||||
Morgan Stanley Capital I (Class B) | ||||||||||||
5.90% | 10/15/42 | 50,000 | 46,165 | (f) | ||||||||
Puma Finance Ltd. (Class A) | ||||||||||||
5.25% | 10/11/34 | 36,368 | 36,360 | (c,f) | ||||||||
Residential Funding Mortgage Securities I (Class M1) | ||||||||||||
5.75% | 01/25/36 | 65,934 | 1 | (k) | ||||||||
Vornado DP LLC | ||||||||||||
6.36% | 09/13/28 | 30,000 | 28,238 | (a) | ||||||||
Wachovia Bank Commercial Mortgage Trust (Class AJ) | ||||||||||||
5.52% | 01/15/45 | 90,000 | 84,951 | (f,g) | ||||||||
Wachovia Bank Commercial Mortgage Trust (Class AM) | ||||||||||||
5.47% | 01/15/45 | 70,000 | 71,962 | (f,g) | ||||||||
See Notes to Schedule of Investments and Notes to Financial Statements.
11
Table of Contents
Income Fund
| Schedule of Investments | June 30, 2011 (unaudited) |
| Principal Amount | Fair Value | |||||||||||
Wells Fargo Mortgage Backed Securities Trust (Class B1) | ||||||||||||
5.50% | 01/25/36 | $ | 113,066 | $ | 520 | (k) | ||||||
| 3,573,081 | ||||||||||||
Sovereign Bonds — 1.8% |
| |||||||||||
Government of Argentina |
| |||||||||||
1.00% | 08/03/12 | 54,700 | 13,412 | (c,g) | ||||||||
2.50% | 12/31/38 | 13,737 | 5,976 | (h) | ||||||||
7.00% | 10/03/15 | 8,678 | 8,565 | |||||||||
8.28% | 12/31/33 | 14,297 | 12,618 | |||||||||
Government of Belize | ||||||||||||
6.00% | 02/20/29 | 38,100 | 24,765 | (h) | ||||||||
Government of Brazil | ||||||||||||
6.00% | 02/20/29 | 11,100 | 7,215 | (a,h) | ||||||||
8.25% | 01/20/34 | 13,000 | 17,875 | |||||||||
Government of Colombia | ||||||||||||
6.13% | 01/18/41 | 100,000 | 108,750 | |||||||||
Government of Costa Rica | ||||||||||||
10.00% | 08/01/20 | 12,000 | 16,500 | (a) | ||||||||
Government of El Salvador | ||||||||||||
7.65% | 06/15/35 | 20,000 | 20,700 | (a) | ||||||||
Government of Grenada | ||||||||||||
2.50% | 09/15/25 | 25,900 | 16,058 | (a,f,h) | ||||||||
Government of Hungary | ||||||||||||
6.25% | 01/29/20 | 60,000 | 63,360 | |||||||||
6.38% | 03/29/21 | 21,000 | 22,155 | |||||||||
7.63% | 03/29/41 | 32,000 | 34,520 | |||||||||
Government of Lebanon | ||||||||||||
4.00% | 12/31/17 | 4,550 | 4,395 | |||||||||
Government of Panama | ||||||||||||
6.70% | 01/26/36 | 56,000 | 66,080 | |||||||||
Government of Peruvian | ||||||||||||
6.55% | 03/14/37 | 41,000 | 45,735 | |||||||||
Government of Poland | ||||||||||||
5.13% | 04/21/21 | 11,000 | 11,371 | |||||||||
6.38% | 07/15/19 | 7,000 | 7,997 | |||||||||
Government of Turkey | ||||||||||||
5.63% | 03/30/21 | 100,000 | 104,500 | (f) | ||||||||
Government of Uruguay | ||||||||||||
6.88% | 09/28/25 | 20,114 | 24,439 | |||||||||
Government of Venezuela | ||||||||||||
10.75% | 09/19/13 | 14,000 | 13,930 | |||||||||
Government of Vietnam | ||||||||||||
1.27% | 03/12/16 | 5,217 | 4,600 | (g) | ||||||||
Korea National Oil Corp. | ||||||||||||
2.88% | 11/09/15 | 100,000 | 97,828 | (a) | ||||||||
Lebanese Republic | ||||||||||||
5.15% | 11/12/18 | 11,000 | 10,615 | |||||||||
Republic of Dominican | ||||||||||||
9.50% | 09/27/11 | 12,515 | 12,734 | |||||||||
Republic of Lebanese | ||||||||||||
6.10% | 10/04/22 | 11,000 | 10,670 | |||||||||
Russian Foreign Bond – Eurobond | ||||||||||||
5.00% | 04/29/20 | 100,000 | 103,375 | (a) | ||||||||
United Mexican States | ||||||||||||
5.13% | 01/15/20 | 20,000 | 21,600 | |||||||||
6.05% | 01/11/40 | 18,000 | 19,152 | |||||||||
| 931,490 | ||||||||||||
| Principal Amount | Fair Value | |||||||||||
Municipal Bonds and Notes — 0.8% | ||||||||||||
Municipal Electric Authority of Georgia | ||||||||||||
6.64% | 04/01/57 | $ | 174,000 | $ | 166,807 | (f) | ||||||
New Jersey State Turnpike Authority | ||||||||||||
7.10% | 01/01/41 | 30,000 | 34,883 | |||||||||
7.41% | 01/01/40 | 110,000 | 132,774 | |||||||||
New Jersey Transportation Trust Fund Authority | ||||||||||||
6.88% | 12/15/39 | 15,000 | 15,621 | |||||||||
South Carolina State Public Service Authority | ||||||||||||
6.45% | 01/01/50 | 30,000 | 33,165 | |||||||||
State of California | ||||||||||||
5.70% | 11/01/21 | 40,000 | 42,094 | |||||||||
| 425,344 | ||||||||||||
FNMA — 0.0%* | ||||||||||||
Lehman TBA | ||||||||||||
5.50%** | TBA | 83,122 | — | (b,j,k) | ||||||||
Total Bonds and Notes | 47,853,072 | |||||||||||
Other Investments — 0.4% |
| |||||||||||
GEI Investment Fund | 237,717 | (i) | ||||||||||
Total Investments in Securities | 48,090,789 | |||||||||||
Short-Term Investments — 12.9% |
| |||||||||||
GE Institutional Money Market Fund | 6,743,275 | (c,i) | ||||||||||
Total Investments (Cost $53,853,576) | 54,834,064 | |||||||||||
Liabilities in Excess of Other Assets, | (2,524,686 | ) | ||||||||||
|
| |||||||||||
NET ASSETS — 100.0% | $ | 52,309,378 | ||||||||||
|
| |||||||||||
See Notes to Schedule of Investments and Notes to Financial Statements.
12
Table of Contents
Income Fund
| Schedule of Investments | June 30, 2011 (unaudited) |
Other Information | ||||||||
The Fund had the following long futures contracts open at June 30,2011 (unaudited):
| Description | Expiration Date | Number of Contracts | Current Notional Value | Unrealized Appreciation | ||||||||||||
2 Yr. U.S. Treasury Notes Futures | September 2011 | 26 | $ | 5,702,938 | $ | 12,457 | ||||||||||
5 Yr. U.S. Treasury Notes Futures | September 2011 | 19 | 2,264,711 | 16,627 | ||||||||||||
|
| |||||||||||||||
| $ | 29,084 | |||||||||||||||
|
| |||||||||||||||
The Fund had the following short futures contracts open at June 30, 2011 (unaudited):
| Description | Expiration Date | Number of Contracts | Current Notional Value | Unrealized Appreciation | ||||||||||||
Ultra Long U.S. Treasury Bond Futures | September 2011 | 2 | $ | (252,500 | ) | $ | 4,495 | |||||||||
10 Yr. U.S. Treasury Notes Futures | September 2011 | 8 | (978,625 | ) | 9,244 | |||||||||||
|
| |||||||||||||||
| $ | 13,739 | |||||||||||||||
|
| |||||||||||||||
| $ | 42,823 | |||||||||||||||
|
| |||||||||||||||
See Notes to Schedule of Investments and Notes to Financial Statements.
13
Table of Contents
| Notes to Schedule of Investments | June 30, 2011 (unaudited) |
The views expressed in this document reflect our judgment as of the publication date and are subject to change at any time without notice. The securities information regarding holdings, allocations and other characteristics are presented to illustrate examples of securities that the Fund has bought and the diversity of areas in which the Fund’s may invest as of a particular date. It may not be representative of the Fund’s current or future investments and should not be construed as a recommendation to purchase or sell a particular security. See the Fund’s summary prospectus and statutory prospectus for complete descriptions of investment objectives, policies, risks and permissible investments.
| (a) | Pursuant to Rule 144A of the Securities Act of 1933, these securities may be resold in transactions exempt from registration, normally to qualified institutional buyers. At June 30, 2011, these securities amounted to $4,697,992 or 8.98% of the net assets of the GE Investments Income Fund. These securities have been determined to be liquid using procedures established by the Fund’s Board of Directors. |
| (b) | Settlement is on a delayed delivery or when-issued basis with final maturity to be announced (TBA) in the future. |
| (c) | Coupon amount represents effective yield. |
| (d) | Principal only security. These securities represent the right to receive the monthly principal payments on an underlying pool of mortgages. No payments of interest on the pool are passed through to the “principal only” holder. |
| (e) | Interest only security. These securities represent the right to receive the monthly interest payments on an underlying pool of mortgages. Payments of principal on the pool reduce the value of the “interest only” holding. |
| (f) | At June 30, 2011 , all or a portion of this security was pledged to cover collateral requirements for futures, options, forward foreign currency contracts and/or TBA’s. |
| (g) | Variable or floating rate security. The stated rate represents the rate at June 30, 2011. |
| (h) | Step coupon bond. Security becomes interest bearing at a future date. |
| (i) | GE Asset Management, the investment adviser of the Fund, also serves as investment adviser of the GEI Investment Fund and the GE Institutional Money Market Fund. |
| (j) | Securities in default |
| (k) | Illiquid securities. At June 30, 2011, these securities amounted to $100,737 or 0.19% of net assets for the GE Investments Income Fund. These securities have been determined to be illiquid using procedures established by the Fund’s Board of Directors. |
| (l) | Coupon amount represents the coupon of the underlying mortgage securities on which monthly interest payments are based. |
| * | Less than 0.05%. |
| ** | Amount is less than $ 0.50. |
| † | Percentages are based on net assets as of June 30, 2011. |
Abbreviations:
REIT | Real Estate Investment Trust | |
REMIC | Real Estate Mortgage Investment Conduit | |
STRIPS | Separate Trading of Registered Interest and Principal of Security | |
TBA | To Be Announced | |
14
Table of Contents
Selected data based on a share outstanding throughout the fiscal years indicated
| CLASS 1 | ||||||||||||||||||||||||
| 6/30/11† | 12/31/10 | 12/31/09 | 12/31/08 | 12/31/07 | 12/31/06 | |||||||||||||||||||
| Inception date | — | — | — | — | — | 1/3/95 | ||||||||||||||||||
Net asset value, beginning of period | $ | 11.05 | $ | 10.62 | $ | 10.26 | $ | 11.50 | $ | 11.80 | $ | 11.84 | ||||||||||||
Income/(loss) from investment operations: | ||||||||||||||||||||||||
Net investment income (loss) | 0.24 | 0.34 | ** | 0.37 | 0.56 | 0.81 | 0.56 | |||||||||||||||||
Net realized and unrealized | 0.10 | 0.46 | 0.45 | (1.16) | (0.25) | (0.04) | ||||||||||||||||||
Total income/(loss) from investment operations | 0.34 | 0.80 | 0.82 | (0.60) | 0.56 | 0.52 | ||||||||||||||||||
Less distributions from: | ||||||||||||||||||||||||
Net investment income | — | 0.37 | 0.46 | 0.64 | 0.82 | 0.56 | ||||||||||||||||||
Return of capital | — | — | — | 0.00 | (b) | 0.04 | — | |||||||||||||||||
Net realized gains | — | — | — | — | — | — | ||||||||||||||||||
Total distributions | — | 0.37 | 0.46 | 0.64 | 0.86 | 0.56 | ||||||||||||||||||
Net asset value, end of period | $ | 11.39 | $ | 11.05 | $ | 10.62 | $ | 10.26 | $ | 11.50 | $ | 11.80 | ||||||||||||
TOTAL RETURN (a) | 3.08% | 7.56% | 7.88% | (5.21)% | 4.83% | 4.37% | ||||||||||||||||||
RATIOS/SUPPLEMENTAL DATA: | ||||||||||||||||||||||||
Net assets, end of period (in thousands) | $ | 52,309 | $ | 54,884 | $ | 59,532 | $ | 68,731 | $ | 93,480 | $ | 126,732 | ||||||||||||
Ratios to average net assets: | ||||||||||||||||||||||||
Net investment income | 4.25% | * | 3.07% | 4.01% | 4.63% | 5.07% | 5.07% | |||||||||||||||||
Net expenses | 0.87% | (c)* | 0.83% | (c) | 0.84% | (c) | 0.63% | (c) | 0.61% | 0.61% | ||||||||||||||
Gross expenses | 0.88% | * | 1.00% | 0.84% | 0.65% | 0.61% | 0.61% | |||||||||||||||||
Portfolio turnover rate | 171% | 320% | 251% | 385% | 448% | 270% | ||||||||||||||||||
Notes to Financial Highlights
| (a) | Total returns are historical and assume changes in share price, reinvestment of dividends and capital gains distributions and do not include the effect of insurance contract charges. Past performance does not guarantee future results. |
| (b) | Less than $0.01 per share. |
| (c) | Reflects GE Asset Management’s waiver of a portion of the Fund’s management fee in an amount equal to the management fee earned by GEAM with respect to the Fund’s investment in the GE Money Market Fund and/or GE Institutional Money Market Fund. |
| * | Annualized for periods less than one year. |
| ** | Per share values have been calculated using the average share method. |
| † | Unaudited |
The accompanying Notes are an integral part of these financial statements.
15
Table of Contents
The accompanying Notes are an integral part of these financial statements.
16
Table of Contents
For the six months ended June 30, 2011 (unaudited) | ||||
INVESTMENT INCOME | ||||
Income | ||||
Interest | $ | 1,360,921 | ||
Interest from affiliated investments | 2,891 | |||
Less: Foreign taxes withheld | (1,367 | ) | ||
Total Income | 1,362,445 | |||
Expenses | ||||
Advisory and administration fees | 133,607 | |||
Distribution fees | ||||
Class 4* | 16 | |||
Transfer agent fees | 10,136 | |||
Director’s fees | 905 | |||
Custody and accounting expenses | 65,703 | |||
Professional fees | 10,317 | |||
Other expenses | 13,394 | |||
Total expenses before waiver and reimbursement | 234,078 | |||
Less: Expenses waived or borne by the adviser | (3,397 | ) | ||
Net expenses | 230,681 | |||
Net investment income | 1,131,764 | |||
NET REALIZED AND UNREALIZED GAIN (LOSS) | ||||
Realized gain (loss) on: | ||||
Investments | 1,007,268 | |||
Futures | (304,123 | ) | ||
Increase (decrease) in unrealized appreciation/(depreciation) on: | ||||
Investments | (161,435 | ) | ||
Futures | (68,794 | ) | ||
Net realized and unrealized gain on investments | 472,916 | |||
Net increase in net assets resulting from operations | $ | 1,604,680 | ||
| * | Share Class 4 was closed as of April 30, 2011. |
The accompanying Notes are an integral part of these financial statements.
17
Table of Contents
| * | Unaudited |
| ** | Share Class 4 was closed as of April 30, 2011. |
The accompanying Notes are an integral part of these financial statements.
18
Table of Contents
| Notes to Financial Statements | June 30, 2011 (unaudited) |
| 1. | Organization of the Company |
GE Investments Funds, Inc. (the “Company”) was incorporated under the laws of the Commonwealth of Virginia on May 14, 1984 and is registered under the Investment Company Act of 1940, as amended (the “1940 Act”), as an open-end management investment company. The Company is composed of fourteen investment portfolios (collectively the “Funds”), although only the following eleven are currently being offered: U.S. Equity Fund, S&P 500 Index Fund, Premier Growth Equity Fund, Core Value Equity Fund, Mid-Cap Equity Fund, Small-Cap Equity Fund, International Equity Fund, Total Return Fund, Income Fund (the “Fund”), Money Market Fund and Real Estate Securities Fund.
Shares of the Funds of the Company are offered only to insurance company separate accounts that fund certain variable life insurance contracts and variable annuity contracts. GE Asset Management Incorporated (“GEAM”) is the investment adviser and administrator of each of the Funds.
The Company currently offers one share class (Class 1) as an investment option for variable life insurance and variable annuity contracts. Class 4 shares were first offered on May 1, 2008 and Fund shares outstanding prior to May 1, 2008 were designated as Class 1 shares. Effective April 30, 2011, Class 4 shares were closed and are no longer offered.
| 2. | Summary of Significant Accounting Policies |
The preparation of financial statements in conformity with U.S. generally accepted accounting principles (GAAP) requires management to make estimates and assumptions that affect the reported amounts of assets and liabilities and disclosure of contingent assets and liabilities at the date of the financial statements and the reported amounts of increases and decreases in net assets from operations during the reporting period. Actual results may differ from those estimates.
Subsequent events after the balance sheet date through the date the financial statements were issued, have been evaluated in the preparation of the financial statements. There are no items to report.
The following summarizes the significant accounting policies of the Company:
Securities Valuation and Transactions. All investments in securities are recorded at their estimated fair value, as described in Note 3.
Securities transactions are accounted for as of the trade date. Realized gains and losses on investments sold are recorded on the basis of identified cost for both financial statement and federal tax purposes.
The Fund’s income, expenses (other than distribution fees) and realized and unrealized gains and losses are allocated proportionally each day among the share classes based upon the relative net assets of each class.
Repurchase Agreements The Fund engages in repurchase agreement transactions with respect to instruments that are consistent with the Fund’s investment objectives or policies. The Fund’s custodian takes possession of the collateral pledged for investments in repurchase agreements on behalf of the Fund. The Fund values the underlying collateral daily on a mark-to-market basis to determine that the value, including accrued interest, is at least equal to 102% for domestic securities and 105% international securities of the repurchase price. In the event the seller defaults and the value of the security declines, or if the seller enters an insolvency proceeding, realization of the collateral by the Fund may be delayed or limited.
Foreign Currency Accounting records of the Fund are maintained in U.S. dollars. Investment securities and other assets and liabilities denominated in a foreign currency are translated to U.S. dollars at the prevailing rates of exchange at period end. Purchases and sales of securities, income receipts and expense payments denominated in foreign currencies are translated into U.S. dollars at the prevailing exchange rate on the respective dates of such transactions.
All assets and liabilities of the Fund initially expressed in foreign currency values will be converted into U.S. dollars at the WM/Reuter exchange rate computed at 11:00 a.m., Eastern time.
The Fund does not isolate the portion of the results of operations resulting from changes in foreign exchange rates from the fluctuations arising from changes in the market prices of securities during the year. Such fluctuations are included in the net realized or unrealized gain or loss from investments. Net realized gains or losses on foreign currency transactions represent net gains or losses on sales and maturities of foreign currency contracts, disposition of foreign currencies, the difference between the amount of net investment income and withholding taxes accrued and the U.S. dollar amount actually received or paid, and gains or losses between the trade and settlement date on purchases and sales of foreign securities. Net unrealized foreign exchange gains and losses arising from changes in the value of other assets
19
Table of Contents
| Notes to Financial Statements | June 30, 2011 (unaudited) |
and liabilities (including foreign currencies and open foreign currency contracts) as a result of changes in foreign exchange rates are included as increases or decreases in unrealized appreciation/depreciation on foreign currency related transactions.
Derivatives The Fund is subject to interest rate risk, credit risk, and foreign currency exchange rate risk in the normal course of pursuing its investment objectives. The Fund enters into derivative transactions to gain market exposure for residual and accumulating cash positions, and for managing the duration of fixed-income investments.
Futures Contracts A futures contract represents a commitment for the future purchase or sale of an asset at a specified price on a specified date. The Fund invests in interest rate, financial and bond index futures contracts subject to certain limitations. The Fund invests in futures contracts to manage its exposure to the bond markets and fluctuations in currency values. Buying futures tends to increase a Fund’s exposure to the underlying instrument while selling futures tends to decrease a Fund’s exposure to the underlying instrument or to hedge other Fund investments. The Fund will not enter into a transaction involving futures for speculative purposes. With futures contracts, there is minimal counterparty credit risk to the Fund since futures contracts are exchange traded and the exchange’s clearinghouse, as counterparty to all traded futures, guarantees the futures against default. A Fund’s risks in using these contracts include changes in the value of the underlying instruments, non- performance of the counterparties under the contracts’ terms and changes in the liquidity of the secondary market for the contracts. Futures contracts are valued at the settlement price established each day by the board of trade or exchange on which they principally trade.
Upon entering into a financial futures contract, the Fund is required to pledge to the broker an amount of cash and/or other assets equal to a certain percentage of the contract amount, known as initial margin deposit. Subsequent payments, known as variation margin, are made or received by the Fund each day, depending on the daily fluctuation in the fair value of the underlying security. The Fund records an unrealized gain or loss equal to the daily variation margin. Should market conditions move unexpectedly, the Fund may not achieve the anticipated benefits of the futures contracts and may incur a loss. The Fund recognizes a realized gain or loss on the expiration or closing of a futures contract.
Investments in Foreign Markets Investments in foreign markets involve special risks and considerations not typically associated with investing in the United States. These risks include revaluation of currencies, high rates of inflation, restrictions on repatriation of income and capital, and adverse political and economic developments. Moreover, securities issued in these markets may be less liquid, subject to government ownership controls, tariffs and taxes, subject to delays in settlements, and their prices may be more volatile.
The Fund may be subject to capital gains and repatriation taxes imposed by certain countries in which they invest. Such taxes are generally based upon income and/or capital gains earned or repatriated. Taxes are accrued based on net investment income, net realized gains and net unrealized appreciation as income and/or capital gains are earned.
Investment Income Corporate actions (including cash dividends) are recorded on the ex-dividend date, net of applicable withholding taxes, except for certain foreign corporate actions which are recorded as soon after the ex-dividend date as such information becomes available. Interest income is recorded on the accrual basis.
Accretion of discounts and amortization of premiums on taxable bonds are to the call or maturity date, whichever is shorter, using the effective yield method. Withholding taxes in foreign dividends have been provided for in accordance with the Fund’s understanding of the applicable country’s tax rules and rates.
Expenses Fund specific expenses are allocated to the Fund that incurs such expenses. Such expenses may include custodial fees, legal and accounting fees, printing costs and registration fees. Expenses that are not fund specific are allocated pro rata across the Funds. Certain class specific expenses (such as distribution fees) are allocated to the class that incurs such expense. Expenses of the Fund are generally paid directly by the Fund however, expenses may be paid by GEAM and reimbursed by the fund.
Federal Income Taxes The Fund intends to comply with all sections of the Internal Revenue Code applicable to regulated investment companies including the distribution of substantially all its taxable net investment income and net realized capital gains to its shareholders. Therefore, no provision for federal income tax has been made. The Fund is treated as a separate taxpayer for federal income tax purposes.
20
Table of Contents
| Notes to Financial Statements | June 30, 2011 (unaudited) |
| 3. | Securities Valuation |
The Fund utilizes various methods to measure the fair value of most of its investments on a recurring basis. GAAP establishes a framework for measuring fair value and providing related disclosures. Broadly, the framework requires fair value to be determined based on the exchange price that would be received for an asset or paid to transfer a liability (an exit price) in the principal or most advantageous market for the asset or liability in an orderly transaction between market participants at the measurement date. In the absence of active markets for the identical assets or liabilities, such measurements involve developing assumptions based on market observable data and, in the absence of such data, internal information that is consistent with what market participants would use in a hypothetical transaction that occurs at the measurement date. It also establishes a three-level valuation hierarchy based upon observable and non-observable inputs.
Observable inputs reflect market data obtained from independent sources, while unobservable inputs reflect our market assumptions. Preference is given to observable inputs. These two types of inputs create the following fair value hierarchy:
Level 1 — Quoted prices for identical investments in active markets.
Level 2 — Quoted prices for similar investments in active markets; quoted prices for identical or similar investments in markets that are not active; and model-derived valuations whose inputs are observable or whose significant value drivers are observable.
Level 3 — Significant inputs to the valuation model are unobservable.
Policies and procedures are maintained to value investments using the best and most relevant data available. In addition, pricing vendors are utilized to assist in valuing investments. GEAM performs periodic reviews of the methodologies used by independent pricing services including price validation of individual securities.
Fair Value Measurement The following section describes the valuation methodologies the Funds use to measure different financial investments at fair value.
The Fund’s portfolio securities are valued generally on the basis of market quotations. Equity securities generally are valued at the last reported sales price on the primary market in which they are traded. Portfolio securities listed
on NASDAQ are valued using the NASDAQ Official Closing Price. Level 1 securities primarily include publicly-traded equity securities which may not necessarily represent the last sale price. If no sales occurred on the exchange or NASDAQ that day, the portfolio security generally is valued using the last reported bid price. In those circumstances the Fund classifies the investment securities in Level 2.
Debt securities (other than short-term securities described below) generally are valued at an evaluated bid as reported by an independent pricing service. Municipal obligations are valued at the quoted bid prices, when available. The pricing vendor uses various pricing models for each asset class that are consistent with what other market participants would use. The inputs and assumptions to the model of the pricing vendor are derived from market observable sources including: benchmark yields, reported trades, broker/dealer quotes, issuer spreads, benchmark securities, bids, offers, and other market related data. Since many fixed income securities do not trade on a daily basis, the methodology of the pricing vendor uses available information as applicable such as benchmark curves, benchmarking of like securities, sector groupings, and matrix pricing. The pricing vendor considers all available market observable inputs in determining the evaluation for a security. Thus, certain securities may not be priced using quoted prices, but rather determined from market observable information. These investments are included in Level 2 and primarily comprise our portfolio of corporate fixed income, government, mortgage and asset-backed securities.
In the absence of a reliable price from such a pricing service, debt securities may be valued based on dealer supplied valuations or quotations. In these infrequent circumstances, pricing vendors may provide the Funds with valuations that are based on significant unobservable inputs, and in those circumstances we classify the investment securities in Level 3.
The Fund uses the net asset value per unit for the collective fund. The Fund classifies the investment security in level 2.
Any short-term securities of sufficient credit quality held by the Fund with remaining maturities of sixty days or less at the time of purchase are valued on the basis of amortized cost which approximates market value and these are included in Level 2.
If prices are not readily available for a portfolio security, or if it is believed that a price for a portfolio security does not represent its fair value, the security may be valued using procedures approved by the Fund’s Board of Directors that
21
Table of Contents
| Notes to Financial Statements | June 30, 2011 (unaudited) |
are designed to establish its “fair” value. These securities would generally be classified in Level 3. Those procedures require that the fair value of a security be established by the valuation committee. The valuation committee follows different protocols for different types of investments and circumstances. The fair value procedures may be used to value any investment of the Fund in the appropriate circumstances.
Foreign securities may be valued with the assistance of an independent fair value pricing service in circumstances where it is believed that they have been or would be materially affected by events occurring after the close of the portfolio security’s primary market and before the close of regular trading on the NYSE. In these circumstances the Fund classifies the investment securities in Level 2. This independent fair value pricing service uses a model to identify affected securities and portfolios taking into consideration various factors and the fair value of such securities may be something other than the last available quotation or other market price.
Portfolio securities may be valued using techniques other than market quotations, under the circumstances described above. The value established for a portfolio security may be different than what would be produced through the use of another methodology or if it had been priced using market quotations. Portfolio securities that are valued using techniques other than market quotations, including “fair valued” securities, may be subject to greater fluctuation in
their value from one day to the next than would be the case if market quotations were used. In addition, there is no assurance that the Fund could sell a portfolio security for the value established for it at any time and it is possible that the Fund would incur a loss because a portfolio security is sold at a discount to its established value.
Other financial investments are derivative instruments that are not reflected in Total Investments, such as futures, forwards, swaps, and written options contracts, which are valued based on fair value as discussed above.
The Fund uses closing prices for derivatives included in Level 1, which are traded either on exchanges or liquid over-the counter markets. Derivative assets and liabilities included in Level 2 primarily represent interest rate swaps, cross-currency swaps and foreign currency and commodity forward and option contracts. Derivative assets and liabilities included in Level 3 primarily represent interest rate products that contain embedded optionality or prepayment features.
The inputs or methodology used for valuing securities are not an indication of the risk associated with investing in those securities. Fair value determinations are required for securities whose value is affected by a significant event that will materially affect the value of a domestic or foreign security and which occurs subsequent to the time of the close of the principal market on which such domestic or foreign security trades but prior to the calculation of the Fund’s NAV.
The following tables present the Fund’s investments measured at fair value on a recurring basis at June 30, 2011:
| Investments | Level 1 | Level 2 | Level 3 | Total | ||||||||||||
Investments in Securities | ||||||||||||||||
U.S. Treasuries | $ | — | $ | 8,581,860 | $ | — | $ | 8,581,860 | ||||||||
Federal Agencies | — | 80,155 | — | 80,155 | ||||||||||||
Agency Mortgage Backed | — | 16,005,324 | — | 16,005,324 | ||||||||||||
Agency CMOs | — | 1,837,268 | 14,009 | 1,851,277 | ||||||||||||
Asset Backed | — | 913,373 | 10,893 | 924,266 | ||||||||||||
Corporate Notes | — | 15,480,275 | — | 15,480,275 | ||||||||||||
Non-Agency CMOs | — | 3,573,081 | — | 3,573,081 | ||||||||||||
Sovereign Bonds | — | 931,490 | — | 931,490 | ||||||||||||
Municipal Notes and Bonds | — | 425,344 | — | 425,344 | ||||||||||||
Other Investments | — | 237,717 | — | 237,717 | ||||||||||||
Short-Term Investments | 6,743,275 | — | — | 6,743,275 | ||||||||||||
Total Investments in Securities | $ | 6,743,275 | $ | 48,065,887 | $ | 24,902 | $ | 54,834,064 | ||||||||
Other Financial Instruments* | ||||||||||||||||
Futures Contracts — Unrealized Appreciation | $ | 42,823 | $ | — | $ | — | $ | 42,823 | ||||||||
| * | Other financial instruments include derivative instruments such as futures contracts. Amounts shown represent unrealized appreciation (depreciation) at period end. |
22
Table of Contents
| Notes to Financial Statements | June 30, 2011 (unaudited) |
The following table presents the changes in Level 3 investments measured on a recurring basis for the period ended June 30, 2011, within Income Fund:
| Agency CMOs | Asset Backed | Non-Agency CMOs | Total | |||||||||||||
Balance at 12/31/10 | $ | 190,530 | $ | 11,686 | $ | 124 | $ | 202,340 | ||||||||
Accrued discounts/premiums | (5,659 | ) | — | — | (5,659 | ) | ||||||||||
Realized gain (loss) | 8,130 | 44 | (38,479 | ) | (30,305 | ) | ||||||||||
Change in unrealized gain (loss) | (8,364 | ) | 1,117 | 38,396 | 31,149 | |||||||||||
Purchases | 3,182 | — | — | 3,182 | ||||||||||||
Sales | (36,634 | ) | (1,954 | ) | (41 | ) | (38,629 | ) | ||||||||
Issuances | — | — | — | — | ||||||||||||
Settlements | — | — | — | — | ||||||||||||
Transfers into Level 3 | — | — | — | — | ||||||||||||
Transfers out of Level 3 | (137,176 | ) | — | — | (137,176 | ) | ||||||||||
Balance at 06/30/11 | $ | 14,009 | $ | 10,893 | $ | — | $ | 24,902 | ||||||||
Change in unrealized appreciation relating to securities still held at 06/30/11 | $ | 1,587 | $ | 1,117 | $ | — | $ | 2,704 | ||||||||
There were no significant transfers between Level 1 and Level 2. Transfers between fair value levels are considered to occur at the beginning of the period.
| 4. | Derivatives Transactions |
Shown below are the derivative contracts entered into by the Fund, summarized by primary risk exposure as they appear on the Statement of Assets and Liabilities, all of which are not accounted for as hedging instruments under FASB Accounting Standards Codification (“ASC”) No. 815 Derivatives and Hedging as of June 30, 2011.
Asset Derivatives June 30, 2011 | Liability Derivatives June 30, 2011 | |||||||||||
| Derivatives not accounted for as hedging instruments under ASC 815 | Location in the Statement of Assets and Liabilities | Fair Value ($) | Location in the Statements of Assets and Liabilities | Fair Value ($) | ||||||||
Interest Rate Contracts | Assets, Net Assets — Net Unrealized Appreciation/ (Depreciation) on Futures | 42,823 | * | Liabilities, Net Assets — Net Unrealized Appreciation/ (Depreciation) on Futures | — | |||||||
| * | Includes cumulative appreciation/depreciation of futures contracts as reported in the Schedule of Investments and within the components of Net Assets section of the Statement of Assets and Liabilities. Only the current day’s variation margin is reported within the Assets or Liabilities sections of the Statement of Assets and Liabilities. |
Shown below are the effects of derivative instruments on the Fund’s Statement of Operations, summarized by primary risk exposure all of which are not accounted for as hedging instruments under ASC 815.
| Derivatives not accounted for as hedging instruments under ASC 815 | Location in the Statement of Operations | Total Notional Amount of Futures Contracts Purchased/(Sold) ($) | Realized Gain or (Loss) on Derivatives Recognized in Income ($) | Change in Unrealized Appreciation/(Depreciation) on Derivatives Recognized in Income ($) | ||||||||||
Interest Rate Contracts | Realized gain/(loss) on Futures, Increase/(decrease) in unrealized appreciation/ (depreciation) on Futures | 80,515,568/(70,048,348) | (304,123 | ) | (68,794 | ) | ||||||||
| 5. | Line of Credit |
The Company shares a revolving credit facility of up to $150 million with a number of its affiliates. The credit facility is with its custodian bank, State Street Bank and
Trust Company (“State Street”). The revolving credit facility requires the payment of a commitment fee equal to 0.125% per annum on the daily unused portion of the credit facility, payable quarterly. The portion borne by the
23
Table of Contents
| Notes to Financial Statements | June 30, 2011 (unaudited) |
Funds generally is borne proportionally based upon net assets. In addition, the Company has a $100 million uncommitted, unsecured line of credit with State Street. Generally, borrowings under the credit facilities would accrue interest at the Federal Funds Rate plus 50 basis points and would be borne by the borrowing Fund. The maximum amount allowed to be borrowed by any one Fund is the lesser of (i) 33.33% of its total assets or (ii) 20% of its net assets. The credit facilities were not utilized by the Fund during the six-month period ended June 30, 2011.
| 6. | Fees and Compensation Paid to Affiliates |
Advisory and Administration Fees GEAM, a registered investment adviser, was retained by the Company’s Board of Directors effective November 15, 1997 to act as investment adviser and administrator of the Fund. Compensation of GEAM for investment advisory and administrative services is paid monthly based on the average daily net assets of the Fund at an annualized rate of 0.50%.
GEAM has a contractual agreement with the Fund to waive the amount equal to the management fee earned by GEAM with respect to the Fund’s investment in the GE Institutional Money Market Fund.
Distribution and Service (12b-1) Fees The Company has adopted a Distribution and Service (12b-1) Plan (the “Plan”) pursuant to Rule 12b-1 under the 1940 Act with respect to Class 4 shares of the Fund. Under the Plan, the Fund may compensate GE Investment Distributors, Inc. (“GEID”), a wholly-owned subsidiary of GEAM and the Fund’s principal distributor, for certain sales services provided by GEID or other broker dealers and investor services provided by GEID or other service providers relating to the Fund’s Class 4 shares, including services to owners or prospective owners of variable contracts issued by insurance companies that offer such share class as an investment option. The amount of compensation paid under the Plan by the Fund’s Class 4 shares may not exceed 0.45% of the average daily net assets of the Fund attributable to such share class. The Plan continues in effect from year to year for so long as such continuance is approved annually by the Board of Directors, including by those directors who are not interested persons of the Company and who have no direct or indirect financial interest in the operation of the Plan or in any agreement related to it.
Directors’ Compensation The Fund pays no compensation to its directors who are officers or employees of GEAM or its affiliates. Directors who are not such officers or employees also serve in a similar capacity for other funds advised by GEAM. Compensation paid to unaffiliated directors are reflected on the Statement of Operations. These fees are allocated pro rata across all of the mutual fund platforms and share classes served by the directors, including the Fund, and are based upon the relative net assets of each fund within such platforms.
| 7. | Investment Transactions |
Purchases and Sales of Securities The cost of purchases and the proceeds from sales of investments, other than short-term securities and options, for the year ended June 30, 2011 were as follows:
| U.S. Government Securities | ||
| Purchases | Sales | |
$75,446,879 | $74,599,266 | |
| Other Securities | ||
| Purchases | Sales | |
$11,936,071 | $19,223,013 | |
| 8. | Income Taxes |
The Fund is subject to ASC 740, Income Taxes. ASC 740 provides guidance for financial accounting and reporting for the effects of income taxes that result from an entity’s activities during the year. ASC 740 also provides guidance regarding how certain tax positions should be recognized, measured, presented and disclosed in the financial statements. ASC 740 requires evaluation of tax positions taken or expected to be taken in the course of preparing the Fund’s tax returns to determine whether the tax positions are “more likely than not” of being sustained by the applicable tax authority. There are no adjustments to the Fund’s net assets required under ASC 740. The Fund’s 2007, 2008, 2009 and 2010 fiscal years tax returns are still open to examination by the Federal and applicable state tax authorities.
24
Table of Contents
| Notes to Financial Statements | June 30, 2011 (unaudited) |
At June 30, 2011, information on the tax cost of investments was as follows:
| Cost of investment for tax purposes | Gross Tax | Net tax appreciation / (depreciation) | ||||
| Appreciation | Depreciation | |||||
| $54,115,310 | $1,494,412 | $(775,658) | $718,754 | |||
As of December 31, 2010, the Fund has capital loss carryovers as indicated below. Capital loss carryovers are available to offset future realized capital gains to the extent provided in the Internal Revenue Code and regulations thereunder. To the extent that these carryover losses are used to offset future capital gains, it is probable that the gains so offset will not be distributed to shareholders because they would be taxable as ordinary income.
| Amount | Expires | |
| $1,044,853 | 12/31/2014 | |
| 1,335,730 | 12/31/2015 | |
| 972,866 | 12/31/2016 | |
| 7,409,447 | 12/31/2017 |
These amounts will be available to offset future taxable capital gains. Under the recently enacted Regulated Investment Company Modernization Act of 2010, the Fund will be permitted to carry forward capital losses incurred in taxable years beginning after December 22, 2010 for an unlimited period. However, any losses incurred during those future years will be required to be utilized prior to the losses incurred in pre-enactment tax years. As a result of this ordering rule, pre-enactment capital loss carryforwards may be more likely to expire unused. Additionally, post -enactment capital losses that are carried forward will retain their character as either short-term or long-term capital losses rather than being considered all short-term as under previous law.
During the year ended December 31, 2010, the Fund utilized $1,333,223 of prior year capital loss carryovers.
Any net capital and currency losses incurred after October 31, within the Fund’s tax year, are deemed to arise on the first day of the Fund’s next tax year if the Fund so elects to defer such losses.
The Fund elected to defer losses incurred after October 31, 2010 as follows:
| Capital | Currency | |
| $61,918 | $— |
The tax composition of distributions paid during the years ended December 31, 2010 and December 31, 2009 were as follows:
| Ordinary Income | Long-Term Capital Gains | |||||
2010 | $1,793,830 | $— | ||||
2009 | 2,473,213 | — | ||||
Distributions to Shareholders The Fund declares and pays any dividends from net investment income annually. The Fund declares and pays any net realized capital gains in excess of capital loss carryforwards distributions annually. The character of income and gains to be distributed is determined in accordance with income tax regulations which may differ from generally accepted accounting principles. These differences include (but are not limited to) futures, treatment of realized and unrealized gains and losses on foreign currency contracts, paydown gains and losses on mortgage-backed securities, investments organized as partnerships for tax purposes, losses deferred due to offsetting positions, and losses deferred due to wash sale transactions. Reclassifications due to permanent book/tax differences are made to the Fund’s capital accounts to reflect income and gains available for distribution (or available capital loss carryovers) under income tax regulations. These reclassifications have no impact on the net asset value of the Fund. The calculation of net investment income per share in the Financial Highlights table excludes these adjustments.
The reclassifications for the year ended December 31, 2010 were as follows:
Undistributed Net Investment Income | Accumulated Net Realized | Paid in Capital | ||
| $(14,730) | $25,809 | $(11,079) |
| 9. | Significant Transaction |
Effective April 30, 2011 the Fund closed class 4 shares. A full redemption was made by investors in the share class at the closing net asset value.
25
Table of Contents
| Special Meeting of Shareholders — Voting Results | (unaudited) |
On April 1, 2011, the GE Investments Funds, Inc. (the “Company”) held a special meeting of shareholders of each series portfolio of the Company, including shareholders of the Income Fund (the “Fund”). Shareholders of record on January 28, 2011 were entitled to vote on the proposals. For each proposal, except Proposal 1, shareholders voted on a fund-by-fund basis. For Proposal 1, shareholders of all funds voted together and not by fund or share class. At the meeting, all proposals were approved by the Fund and the following votes were recorded:
Proposal 1:
Election of Mr. R. Sheldon Johnson and Mr. Matthew J. Simpson as Directors to the Board of Directors of the Company.
Company votes:
| No. of Shares | % of Outstanding Shares | % of Shares Present | ||||||||||
| Mr. R. Sheldon Johnson | ||||||||||||
Affirmative | 451,517,094.582 | 90.054 | % | 96.126 | % | |||||||
Abstain | 18,195,810.391 | 3.629 | % | 3.874 | % | |||||||
Total | 469,712,904.973 | 93.683 | % | 100.000 | % | |||||||
| Mr. Matthew J. Simpson | ||||||||||||
Affirmative | 451,949,730.789 | 90.140 | % | 96.218 | % | |||||||
Abstain | 17,763,174.184 | 3.543 | % | 3.782 | % | |||||||
Total | 469,712,904.973 | 93.683 | % | 100.000 | % | |||||||
Fund votes:
| No. of Shares | % of Outstanding Shares | % of Shares Present | ||||||||||
| Mr. R. Sheldon Johnson | ||||||||||||
Affirmative | 4,420,778.546 | 90.254 | % | 94.373 | % | |||||||
Abstain | 263,588.886 | 5.381 | % | 5.627 | % | |||||||
Total | 4,684,367.432 | 95.635 | % | 100.000 | % | |||||||
| Mr. Matthew J. Simpson | ||||||||||||
Affirmative | 4,446,133.649 | 90.771 | % | 94.914 | % | |||||||
Abstain | 238,233.783 | 4.864 | % | 5.086 | % | |||||||
Total | 4,684,367.432 | 95.635 | % | 100.000 | % | |||||||
Proposal 2:
Approval of the use of a “manager of managers” arrangement whereby GEAM, as the Fund’s investment adviser, under certain circumstances, will be able to hire and replace sub-advisers to the Fund without obtaining shareholder approval.
| No. of Shares | % of Outstanding Shares | % of Shares Present | ||||||||||
Affirmative | 4,268,489.218 | 87.145 | % | 91.122 | % | |||||||
Against | 234,334.370 | 4.784 | % | 5.002 | % | |||||||
Abstain | 181,543.844 | 3.706 | % | 3.876 | % | |||||||
Broker Non-votes | — | — | — | |||||||||
Total | 4,684,367.432 | 95.635 | % | 100.000 | % | |||||||
26
Table of Contents
| Special Meeting of Shareholders — Voting Results | (unaudited) |
Proposal 3:
Approval of the following changes in certain of the Fund’s investment policies, as follows:
| A. | Amendment of the Fund’s investment policy on senior securities. |
| No. of Shares | % of Outstanding Shares | % of Shares Present | ||||||||||
Affirmative | 4,270,023.489 | 87.176 | % | 91.155 | % | |||||||
Against | 221,740.579 | 4.527 | % | 4.733 | % | |||||||
Abstain | 192,603.364 | 3.932 | % | 4.112 | % | |||||||
Broker Non-votes | — | — | — | |||||||||
Total | 4,684,367.432 | 95.635 | % | 100.000 | % | |||||||
| C. | Amendment of the Fund’s investment policy on making loans. |
| No. of Shares | % of Outstanding Shares | % of Shares Present | ||||||||||
Affirmative | 4,288,156.225 | 87.546 | % | 91.542 | % | |||||||
Against | 178,520.371 | 3.645 | % | 3.811 | % | |||||||
Abstain | 217,690.836 | 4.444 | % | 4.647 | % | |||||||
Broker Non-votes | — | — | — | |||||||||
Total | 4,684,367.432 | 95.635 | % | 100.000 | % | |||||||
| D. | Amendment of the Fund’s investment policy on borrowing. |
| No. of Shares | % of Outstanding Shares | % of Shares Present | ||||||||||
Affirmative | 4,313,850.931 | 88.071 | % | 92.090 | % | |||||||
Against | 177,908.007 | 3.632 | % | 3.798 | % | |||||||
Abstain | 192,608.494 | 3.932 | % | 4.112 | % | |||||||
Broker Non-votes | — | — | — | |||||||||
Total | 4,684,367.432 | 95.635 | % | 100.000 | % | |||||||
| E. | Amendment of the Fund’s investment policy on diversification. |
| No. of Shares | % of Outstanding Shares | % of Shares Present | ||||||||||
Affirmative | 4,283,237.620 | 87.446 | % | 91.437 | % | |||||||
Against | 175,116.977 | 3.575 | % | 3.738 | % | |||||||
Abstain | 226,012.835 | 4.614 | % | 4.825 | % | |||||||
Broker Non-votes | — | — | — | |||||||||
Total | 4,684,367.432 | 95.635 | % | 100.000 | % | |||||||
| F. | Amendment of the Fund’s investment policy on concentration of investments. |
| No. of Shares | % of Outstanding Shares | % of Shares Present | ||||||||||
Affirmative | 4,315,086.298 | 88.096 | % | 92.117 | % | |||||||
Against | 172,075.009 | 3.513 | % | 3.673 | % | |||||||
Abstain | 197,206.125 | 4.026 | % | 4.210 | % | |||||||
Broker Non-votes | — | — | — | |||||||||
Total | 4,684,367.432 | 95.635 | % | 100.000 | % | |||||||
27
Table of Contents
| Special Meeting of Shareholders — Voting Results | (unaudited) |
| G. | Amendment of the Fund’s investment policy on investments in commodities and its reclassification from a non-fundamental policy to a fundamental policy. |
| No. of Shares | % of Outstanding Shares | % of Shares Present | ||||||||||
Affirmative | 4,268,537.134 | 87.146 | % | 91.123 | % | |||||||
Against | 215,576.003 | 4.401 | % | 4.602 | % | |||||||
Abstain | 200,254.295 | 4.088 | % | 4.275 | % | |||||||
Broker Non-votes | — | — | — | |||||||||
Total | 4,684,367.432 | 95.635 | % | 100.000 | % | |||||||
| H. | Amendment of the Fund’s fundamental investment policy on illiquid investments and its reclassification from a fundamental policy to a non-fundamental policy. |
| No. of Shares | % of Outstanding Shares | % of Shares Present | ||||||||||
Affirmative | 4,256,840.545 | 86.907 | % | 90.873 | % | |||||||
Against | 194,962.496 | 3.980 | % | 4.162 | % | |||||||
Abstain | 232,564.391 | 4.748 | % | 4.965 | % | |||||||
Broker Non-votes | — | — | — | |||||||||
Total | 4,684,367.432 | 95.635 | % | 100.000 | % | |||||||
| I. | Elimination of the Fund’s investment policy on mortgaging, pledging and hypothecating of investments. |
| No. of Shares | % of Outstanding Shares | % of Shares Present | ||||||||||
Affirmative | 4,421,869.807 | 90.276 | % | 94.396 | % | |||||||
Against | 138,732.563 | 2.832 | % | 2.962 | % | |||||||
Abstain | 123,765.062 | 2.527 | % | 2.642 | % | |||||||
Broker Non-votes | — | — | — | |||||||||
Total | 4,684,367.432 | 95.635 | % | 100.000 | % | |||||||
| J. | Amendment of the Fund’s investment policy on real estate investments. |
| No. of Shares | % of Outstanding Shares | % of Shares Present | ||||||||||
Affirmative | 4,323,731.419 | 88.272 | % | 92.301 | % | |||||||
Against | 173,759.264 | 3.548 | % | 3.710 | % | |||||||
Abstain | 186,876.749 | 3.815 | % | 3.989 | % | |||||||
Broker Non-votes | — | — | — | |||||||||
Total | 4,684,367.432 | 95.635 | % | 100.000 | % | |||||||
28
Table of Contents
| Additional Information | (unaudited) |
Information about Directors and Executive Officers:
The business and affairs of the Funds are managed under the direction of the Funds’ Board of Directors. Information pertaining to the Directors and officers of the Funds is set forth below.
Interested Directors and Executive Officers
Michael J. Cosgrove
Address c/o GEAM 3001 Summer St. Stamford, CT 06905
Age 62
Position(s) Held with Fund Chairman of the Board and President
Term of Office and Length of Time Served Until successor is elected and qualified – 14 years
Principal Occupation(s) During Past 5 years President and Chief Executive Officer – Mutual Funds and Intermediary Business at GEAM since March 2007; Executive Vice President of GEAM from February 1997 to March 2007; Vice President, GE Capital Corporation, an indirect wholly-owned subsidiary of GE, since December 1999; Executive Vice President – Mutual Funds of GEAM, a wholly-owned subsidiary of GE that is registered as an investment adviser under the Investment Advisers Act of 1940, as amended, since March 1993; President and Director of GE Investment Distributors, Inc., since June 2011. Director of GEAM since 1988.
Number of Portfolios in Fund Complex Overseen by Director 28
Other Directorships Held by Director Chairman of the Board and President of GE Institutional Funds since 1997; Trustee of Elfun Funds, GE Savings & Security Funds, General Relief and Loan Fund and General Electric Pension Trust since 1988; Trustee of Fordham University from 2002 to June 30, 2010 and since July 2011; Trustee of GE Volunteers since 1993; Director of GE Foundation; Director, GE Asset Management (Ireland) Limited, since February 1999, GE Asset Management Funds Plc since 1998, GE Asset Management Canada Company since 1998, GE Asset Management Limited since 1998 and GEAM since 1988; Chairman of the Board and President of GE Funds from 1993 to February 2011.
Matthew J. Simpson
Address c/o GEAM 3001 Summer St. Stamford, CT 06905
Age 50
Position(s) Held with Fund Director and Executive Vice President
Term of Office and Length of Time Served Until successor is elected and qualified – 3 years
Principal Occupation(s) During Past 5 years Executive Vice President, General Counsel and Secretary of GEAM since July 2007; Senior Vice President and General Counsel – Marketing and Client Services (formerly Asset Management Services) at GEAM and Senior Vice President and General Counsel of GE Asset Management Services from February 1997 to July 2007; Vice President and Associate General Counsel of GEAM from October 1992 to February 1997; Secretary of GE Funds from 1993 to July 2007 and Vice President from September 2003 to July 2007; Secretary of GE Institutional Funds and GE Investments Funds, Inc. from 1997 to July 2007; Secretary of Elfun Funds and GE Savings & Security Funds since July 2007; Assistant Secretary of Elfun Funds and GE Savings & Security Funds from 1998 to July 2007 and Vice President from October 2003 to July 2007.
Number of Portfolios in Fund Complex Overseen by Director 28
Other Directorships Held by Director Trustee of Elfun Funds, GE Savings & Security Funds and General Electric Pension Trust since July 2007; Trustee of GE Institutional Funds since April 2011 and Trustee of GE Funds from July 2007 to February 2011.
29
Table of Contents
| Additional Information | (unaudited) |
Joon Won Choe
Address c/o GEAM 3001 Summer St. Stamford, CT 06905
Age 41
Position(s) Held with Fund Vice President & Secretary
Term of Office and Length of Time Served Until successor is elected and qualified – Vice President and Secretary – less than 1 year
Principal Occupation(s) During Past 5 years Senior Vice President and Deputy General Counsel at GEAM since March 2011; Senior Vice President and Associate General Counsel at GEAM from June 2010 to March 2011; Vice President and Associate General Counsel at GEAM from November 2005 to June 2010; Vice President and Secretary of GE Institutional Funds and GE Investments Funds, Inc. since September 2010; Vice President and Assistant Secretary of Elfun Funds and GE Savings & Security Funds since September 2010.
Number of Portfolios in Fund Complex Overseen by Officer N/A
Other Directorships Held by Officer N/A
Robert Herlihy
Address c/o GEAM 3001 Summer St. Stamford, CT 06905
Age 43
Position(s) Held with Fund Chief Compliance Officer
Term of Office and Length of Time Served Until successor is elected and qualified – 5 years
Principal Occupation(s) During Past 5 years Chief Compliance Officer of GEAM, GE Institutional Funds, Elfun Funds, and GE Savings and Security Funds since July 2005; Chief Compliance Officer of GE Funds from July 2005 to February 2011; and Manager of Fund Administration at GEAM from 2002 – 2005.
Number of Portfolios in Fund Complex Overseen by Officer N/A
Other Directorships Held by Officer N/A
Arthur A. Jensen
Address c/o GEAM 3001 Summer St. Stamford, CT 06905
Age 44
Position(s) Held with Fund Treasurer
Term of Office and Length of Time Served Until successor is elected and qualified – less than 1 year
Principal Occupations(s) During Past 5 Years Treasurer of GE Institutional Funds, Elfun Funds and GE Savings and Security Funds since June 2011; Mutual Funds Controller of GEAM since April 2011; Senior Vice President at Citigroup from 2008 to 2010 and Vice President at JPMorgan from 2005 to 2008.
Number of Portfolios in Fund Complex Overseen by Officer N/A
Other Directorships Held by Officer N/A
30
Table of Contents
| Additional Information | (unaudited) |
Non-Interested Directors
John R. Costantino
Address c/o GEAM 3001 Summer St. Stamford, CT 06905
Age 65
Position(s) Held with Fund Director
Term of Office and Length of Time Served Until successor is elected and qualified – 14 years
Principal Occupation(s) During Past 5 years General Partner, NGN Capital LLC since 2006; Managing Director, Vice President of Walden Capital Management since 1996.
Number of Portfolios in Fund Complex Overseen by Director 20
Other Directorships Held by Director Director of GE Institutional Funds since 1997; Trustee of Fordham University from 1989-1995 and 2001-2007 and Trustee Emeritus since 2007; Trustee of Neuroscience Research Institute since 1986; Trustee of GE Funds from 1993 to February 2011; Trustee of Gregorian University Foundation from 1992-2007; Director of Artes Medical from 2006-2008.
R. Sheldon Johnson
Address c/o GEAM 3001 Summer St. Stamford, CT 06905
Age 64
Positions(s) Held with Fund Director
Term of office and Length of Time served Unit Successor is elected and qualified – less than 1 year.
Principal Occupation(s) During Past 5 years Managing Director at Morgan Stanley & Co., Inc. from 1988 to 2006; Head of Global Institutional Equity Sales and Marketing at Morgan Stanley & Co., Inc. from 2002 to 2006.
Number of Portfolios in Fund Complex Overseen by Director 20
Other Directorships Held by Director Trustee of GE Institutional Funds since April 2011 and Trustee of St. Lawrence University since 2003.
Robert P. Quinn
Address c/o GEAM 3001 Summer St. Stamford, CT 06905
Age 75
Position(s) Held with Fund Director
Term of Office and Length of Time Served Until successor is elected and qualified – 14 years
Principal Occupation(s) During Past 5 years Retired since 1983 from Salomon Brothers Inc.
Number of Portfolios in Fund Complex Overseen by Director 20
Other Directorships Held by Director Trustee of GE Institutional Funds since 1997; Trustee of St. Francis Hospital since 1980; and Trustee of GE Funds from 1993 to February 2011.
The Statement of Additional Information for the Funds includes additional information about the Directors and Officers and is available, without charge, upon request by calling 1-800-242-0134.
31
Table of Contents
| Investment Team | (unaudited) |
Investment Adviser and Administrator
GE Asset Management Incorporated
Board of Directors
Michael J. Cosgrove, Chairman
John R. Costantino
R. Sheldon Johnson*
Robert P. Quinn
Matthew J. Simpson
Secretary
Joon Won Choe
Assistant Secretary
Michelle Matzelle
Treasurer
Arthur A. Jensen (effective June 6, 2011)
Assistant Treasurer
Casey Yantosca
Distributor
GE Investment Distributors, Inc.
Member FINRA and SIPC
Custodian
State Street Bank & Trust Company
Officers of the Investment Adviser
Dmitri Stockton, President and Chief Executive Officer (since May 2011)†
Cheryl H. Beacock, Senior Vice President, Human Resources
George A. Bicher, Chief Risk Officer
Paul M. Colonna, President and Chief Investment Officer – Fixed Income Investments
Michael J. Cosgrove, President and Chief Executive
Officer – Mutual Funds & Intermediary Business
Ralph R. Layman, President and Chief Investment Officer – Public Equity Investments
Maureen B. Mitchell, President – Institutional Sales and Marketing
Matthew J. Simpson, Executive Vice President, General Counsel and Secretary
Don W. Torey, President – Alternative Investments
John J. Walker, Executive Vice President, Chief Operating Officer
David Wiederecht, President and Chief Investment Officer – Investment Strategies
Tracie A. Winbigler, Executive Vice President, Chief Financial Officer (since January 2011)
| * | Mr. Johnson was elected as a Director of the Funds effective April 1, 2011. |
| † | Effective May 1, 2011, Mr. Stockton replaced James W. Ireland as President and Chief Executive Officer. |
At GE Asset Management, we’re dedicated to providing the investment options you’ll need to tailor your financial portfolio to every stage of your life. Each member of the GE Family of Funds is managed according to the same principles of integrity and quality that have guided GE over the past century, and have made it the world-class company that it is today. Each fund draws strength from a heritage of investment management experience that spans more than 80 years. Whether you’re creating a new investment portfolio or adding to an established one, the GE Family of Funds offers an array of professionally managed investment options that will help you meet a lifetime of financial needs.
32
Table of Contents
Investment Adviser
GE Asset Management Incorporated
3001 Summer Street
PO Box 7900
Stamford, CT 06904-7900
Distributor
GE Investment Distributors, Inc.
member FINRA and SIPC
3001 Summer Street
PO Box 7900
Stamford, CT 06904-7900
The Fund files its complete schedule of portfolio holdings with the Securities and Exchange Commission for the first and third quarters of each fiscal year on Form N-Q. The Fund’s Forms N-Q, as well as a description of the policies and procedures that the Fund uses to determine how to vote proxies (if any) relating to portfolio securities is available without charge (i) upon request, by calling 1-800-493-3042; (ii) on the Fund’s website at http://www.geam.com; and (iii) on the Commission’s website at http://www.sec.gov. The Fund’s Forms N-Q may be reviewed and copied at the Commission’s Public Reference Room in Washington, DC—information on the operation of the Public Reference Room may be obtained by calling 1-800-SEC-0330.
Information (if any) regarding how the Fund voted proxies relating to portfolio securities during the most recently disclosed 12-month period ended June 30 is available without charge (i) through the Fund’s website at http://www.geam.com; and (ii) on the Commission’s website at http://www.sec.gov.
Table of Contents
GE Investments Funds, Inc.
| Total Return Fund | Letter from the Chairman | |

Michael J. Cosgrove
Chairman,
GE Investments Funds, Inc.
Dear Shareholder: |
Attached is the semi-annual report for GE Investments Funds, Inc. — Total Return Fund (the “Fund”) for the six-month period ended June 30, 2011. The report contains information about the performance of the Fund and other fund-specific data, along with portfolio manager commentary.
We have provided you with an overview of the investment markets, along with our investment outlook for the coming months.
Market Overview
Most major equity indices posted positive returns in the six-month period ended June 30, 2011, despite geopolitical tensions in the Middle East and North Africa, a devastating earthquake in Japan, ongoing concerns about unresolved sovereign debt issues in peripheral Europe and elevated inflation in emerging markets. Volatility increased in May and June, however, as some measures of global economic activity weakened and uncertainties over Greece’s ability to finance and service its debt rattled the financial markets. In the U.S., concerns over the end of quantitative easing by the Federal Reserve and political wrangling over the government debt ceiling further contributed to a challenging environment. The increase in risk aversion benefited the fixed income markets as many investors sought out safer investments. Toward the end of June, the Greek Parliament passed austerity measures that seemed to calm the markets and opened the way for the next round of financing from the European Central Bank and the International Monetary Fund.
Against this backdrop, financial markets posted positive results for the six- and 12-month periods ended June 30, 2011 as represented by the index returns in the below chart.
| Total Returns (%) as of June 30, 2011 | 6-month | 12-month | ||||||
U.S. equities (S&P 500 Index) | 6.0 | 30.7 | ||||||
Global equities (MSCI World Index) | 5.3 | 30.5 | ||||||
International equities (MSCI EAFE Index) | 5.0 | 30.4 | ||||||
Small-cap U.S. equities (Russell 2000 Index) | 6.2 | 37.4 | ||||||
Mid-cap U.S. equities (Russell Mid Cap Index) | 8.1 | 38.5 | ||||||
U.S. fixed income | 2.7 | 3.9 | ||||||
U.S. short-term government fixed income | 0.9 | 1.4 | ||||||
Outlook
We remain constructive on the prospects for healthy global growth, although it may be at a slower pace than originally anticipated. Central banks in the U.S. and Europe
remain accommodative and supply chain issues in Japan appear to have abated. There are also signs that inflation may be peaking in emerging markets as commodity prices have eased in recent months. Corporate balance sheets remain healthy and fundamentals remain intact, in our view. We believe that valuations for equities are not stretched and remain below historical averages while equity risk premiums are still high–offering the possibility for further gains. We expect that the financial markets are likely to remain volatile due to outstanding sovereign debt issues, but believe that returns are biased to the upside in the second half of the year.
Thank you for investing with GE Investments Funds.
Sincerely,

Michael J. Cosgrove
Chairman, GE Investments Funds, Inc.
July 2011
 |
This does not constitute a part of the Fund’s Shareholder Report
Table of Contents
GE Investments Funds, Inc.
| Total Return Fund | ||
Mike Cosgrove is President and Chief Executive Officer – Mutual Funds and Intermediary Business at GE Asset Management Incorporated (“GEAM”). In addition to the GE Investments Funds, he is also Chairman of the Board and President of GE Institutional Funds and Director and President of GEAM’s broker-dealer which serves as underwriter and distributor for the GE Investments Funds. Mr. Cosgrove serves as a Trustee of the GE Savings & Security Funds, the GE Foundation, and the GE Pension Trust. He also serves on the Board of Directors of the Skin Cancer Foundation and is a Trustee of Fordham University. Previously Chief Financial Officer of GE Asset Management and Assistant Treasurer — GE Company, Mr. Cosgrove joined GE in 1970 and held a number of managerial positions in finance and sales in the International Operation and the GE Trading Company. He received a BS in Economics from Fordham University and an MBA from St. John’s University.
GE Investment Distributors, Inc., Member of FINRA & SIPC, is the principal underwriter and distributor of the GE Investments Funds, Inc.
This does not constitute a part of the Fund’s Shareholder Report
Table of Contents
GE Investments Funds, Inc.
Total Return Fund
Semi-Annual Report
June 30, 2011

Table of Contents
| Total Return Fund | Contents | |
| 1 | ||||
| 2 | ||||
| 28 | ||||
Financial Statements | ||||
| 29 | ||||
| 31 | ||||
| 32 | ||||
| 33 | ||||
| 35 | ||||
| 44 | ||||
| 45 | ||||
| 48 | ||||
This report is prepared for Policyholders of certain variable contracts and may be distributed to others only if preceded or accompanied by the variable contract’s current prospectus and the current prospectus of the Fund available for investments thereunder.
Table of Contents
| Notes to Performance | June 30, 2011 (unaudited) |
The information provided on the performance pages relates to the GE Investments Total Return Fund (the “Fund”).
Total returns take into account changes in share price and assume reinvestment of dividends and capital gains distributions, if any. Total returns shown are net of Fund fees and expenses but do not reflect fees and charges associated with the variable contracts such as administrative fees, account charges and surrender charges, which, if reflected, would reduce the Fund’s total returns for all periods shown.
The performance data quoted represents past performance; past performance does not guarantee future results. Investment return and principal value will fluctuate so your shares, when redeemed, may be worth more or less than their original cost. Current performance may be higher or lower than the performance data quoted. Periods less than one year are not annualized. Please call toll-free 800-493-3042 or visit the Fund’s website at http://www.geam.com for the most recent month-end performance data.
An investment in the Fund is not a deposit of any bank and is not insured or guaranteed by the Federal Deposit Insurance Corporation (FDIC) or any other government agency. An investment in the Fund is subject to risk, including possible loss of principal invested.
The S&P 500® Index is an unmanaged, market capitalization-weighted index of stocks of 500 large U.S.
companies, which is widely used as a measure of large-cap U.S. stock market performance. The Barclays Capital U.S. Aggregate Bond Index is an unmanaged market value-weighted index of taxable investment-grade debt issues, including government, corporate, asset-backed and mortgage-backed securities, with maturities of one year or more. This index is designed to represent the performance of the U.S. investment-grade first rate bond market. The results shown for the foregoing indices assume the reinvestment of net dividends or interest. They do not reflect the actual cost of investing in the instruments that comprise each index.
The peer universe of the underlying annuity funds used for the peer group average annual total return calculation is based on a blend of Morningstar peer categories, as shown. Morningstar is an independent mutual fund rating service. A Fund’s performance may be compared to or ranked within a universe of mutual funds with investment objectives and policies similar but not necessarily identical to that of the Fund.
©2011 Morningstar, Inc. All Rights Reserved. The Morningstar information contained herein: (1) is proprietary to Morningstar and/or its content providers; (2) may not be copied or distributed; and (3) is no warranted to be accurate, complete or timely. Neither Morningstar nor its content providers are responsible for any damage or losses relating from any use of this information. Past performance is no guarantee of future results.
GE Investment Distributors, Inc., Member of FINRA & SIPC, is the principal underwriter and distributor of the GE Investments Funds, Inc. and a wholly owned subsidiary of GE Asset Management Incorporated, the investment adviser of the Fund.
1
Table of Contents
| Total Return Fund | (unaudited) |

Paul M. Colonna
President and Chief Investment Officer — Fixed Income

Ralph R. Layman
President and Chief Investment Officer — Public Equities

Diane M. Wehner
Senior Vice President

Greg Hartch
Senior Vice President

Thomas R. Lincoln
Senior Vice President

David Wiederecht
President and Chief Investment Officer — Investment Strategies
The Total Return Fund is managed by a team of portfolio managers that includes Paul M. Colonna, Greg Hartch, Ralph R. Layman, Thomas R. Lincoln, Diane M. Wehner and David Wiederecht. Mr. Hartch and Mr. Wiederecht are each vested with oversight authority for determining asset allocations for the Fund, including the full discretion to allocate the Fund’s assets to sub-adviser(s) retained by GE Asset Management. Each of the other portfolio managers is responsible for managing one of the following sub-portfolios: U.S. equity, U.S. mid-cap equity, international equity and fixed income. Mr. Lincoln manages the U.S. equity portion, Ms. Wehner manages the U.S. mid-cap equity portion, Mr. Layman manages the international equity portion and Mr. Colonna manages the fixed income portion, each with a team of portfolio managers and analysts. GE Asset Management has also retained Urdang Securities Management, Inc. (“Urdang”) and Palisade Capital Management, L.L.C. (“Palisade”) to each act as sub-adviser to that portion of the Fund’s assets allocated by Mr. Hartch and Mr. Wiederecht to real estate-related investments and small-cap equity investments, respectively. The sub-portfolios underlying the Fund are managed independently of each other and the portfolio managers and sub-adviser(s) have full discretion over their particular sub-portfolio; however, the portfolio management team is collaborative to ensure strict adherence to the Fund’s objectives. In addition to oversight authority for asset allocation, Mr. Hartch and Mr. Wiederecht may at times adjust the Fund’s investment exposure through the use of various investment techniques such as investments in derivative instruments.
Paul M. Colonna is President and Chief Investment Officer — Fixed Income and a Director at GE Asset Management. Since January 2005, he has been responsible for the fixed income portion of the Total Return Fund. Mr. Colonna became President — Fixed Income in March 2007. Prior to joining GE Asset Management in February 2000, Mr. Colonna was a senior portfolio manager with the Federal Home Loan Mortgage Corporation, overseeing the Mortgage Investment Group.
Greg Hartch is a Senior Vice President — Tactical Asset Allocation at GE Asset Management. He has served as a portfolio manager to the Fund since January 2011. Mr. Hartch joined GE Asset Management in 2002 and has held various positions at GE Asset Management including Senior Vice President — Alternative Assets from 2002-2004, Director of Fixed Income Research from 2004-2007 and Managing Director — International Real Estate from 2007 to 2010.
Ralph R. Layman is President and Chief Investment Officer — Public Equities and a Director at GE Asset Management. He manages the overall public equity investments for GE Asset Management. Mr. Layman has been responsible for the international equity portion of the Fund since 1997. Mr. Layman joined GE Asset Management in 1991 as senior vice president for international investments and became an Executive Vice President in 1992 and President — International Equities in March 2007 and President — Public Equities since July 2009.
Thomas R. Lincoln is a Senior Vice President of GE Asset Management. He has been a member of the portfolio management team for the Fund since May 2007. Mr. Lincoln joined GE Asset
2
Table of Contents
| (unaudited) |

Management in 1994 as a financial analyst in U.S. Equities. Mr. Lincoln became part of the investment management team for U.S. Equities in 1997 and portfolio manager for U.S. Equities in 2003.
Diane M. Wehner is a Senior Vice President of GE Asset Management. She has been a portfolio manager of the Fund since January 2006. Before joining GE Asset Management, Ms. Wehner was a Vice President and senior portfolio manager from January 1997 to June 2001, and associate portfolio manager from May 1995 to January 1997, with Benefit Capital Management Corporation. Ms. Wehner has served as an analyst/ portfolio manager in the investment management industry since 1985.
David Wiederecht is the President and Chief Investment Officer — Investment Strategies and a Director at GE Asset Management. He has served as a portfolio manager to the Fund since January 2011. Mr. Wiederecht joined GE Asset Management in 1988 and has held various positions at GE Asset Management including Vice President — Alternative Investments/Private Equity/Hedge Fund from 1998 to 2004, Managing Director — Alternative Investments from 2004 to 2008, and President — Investment Strategies since 2008.
| Q. | How did the Total Return Fund perform compared to its benchmark and Morningstar peer group for the six-month period ended June 30, 2011? |
| A. | For the six-month period ended June 30, 2011, the Total Return Fund returned 3.65% for Class 1 shares and 3.54% for Class 3 shares. The Fund’s broad based benchmarks, the S&P 500 Index and the Barclays Capital U.S. Aggregate Bond Index, returned 6.02% and 2.72%, respectively. The Fund’s Morningstar peer group of 304 U.S. Moderate Allocation funds returned an average of 4.51% over the same period. |
| Q. | What market factors affected Fund performance? |
| A. | During the first quarter of 2011 the market was affected by several exogenous shocks including the uprisings in the Middle East and North Africa, a massive earthquake in Japan and ensuing tsunami that claimed thousands of lives and affected the global supply chain, and higher prices for oil and commodities that led to rising inflation. However, global economic data remained strong and purchasing managers indices (PMI) continued to expand both in the U.S. and abroad. In the U.S., leading economic indicators, small business lending and |
| consumer confidence all pointed to improvement in the economy and the unemployment rate fell to 8.8%. Central banks in the U.S. and Europe kept interest rates close to or at historical lows. The fixed income markets, as measured by the Barclays Capital U.S. Aggregate Bond Index, posted lower returns than equities in the first quarter as treasury yields moved higher, reflecting stronger U.S. and global economic growth. |
| However, in the second quarter the sovereign debt crisis in Europe intensified and economic data in the U.S. and China continued to point to a slowing economy. The U.S. Federal Reserve said they would maintain record monetary stimulus to support a flagging economic recovery after completing a $600 billion bond-purchase that concluded at the end of June. U.S. housing prices remained weak and unemployment came in higher than the U.S. Federal Reserve desired. In Europe, the Greek parliament narrowly approved a €78 billion austerity package of spending cuts, tax hikes, and privatizations, and paved the way for the release of a further installment of the €110 billion international credit facility. In emerging markets, China’s PMI data showed that the economy slowed in each of the last three months and a series of increases in the reserve ratio for banks increased concerns. However, recent comments by Premier Jiabao that price levels are within a controllable range have led many investors to believe that we are close to the end in the tightening cycle. |
| Q. | What were the primary drivers of Fund performance? |
| A. | The primary driver of performance was the Fund’s increased allocation to the equity markets. The Fund benefited from its holdings in U.S. and international stocks with the S&P 500 Index and the MSCI EAFE Index climbing 6.02% and 4.98%, respectively, the last six months. A lower allocation to fixed income markets was beneficial as the Barclays Capital U.S. Aggregate Bond Index only rose 2.72% during the same period. The Fund’s ending allocation to equities as of June 30th was approximately 67% and the allocation to fixed income was 31% with the remaining 2% held in cash. Security selection as a result of active management was a negative factor as several strategies were adversely impacted by the macro events described above. |
3
Table of Contents
| Total Return Fund | (unaudited) |
| Q. | How is the Fund positioned at the end of the period? |
| A. | As of June 30th the Fund’s equity allocation was 67%, while fixed income exposure was 31% and 2% was allocated to cash. Within U.S. equities the Fund had a higher exposure to large caps at 30%, while mid cap and small cap exposure was 9% and 1%, respectively. The Fund’s exposure to International stocks was 21% and the allocation to Emerging Markets remained at 3%. The Fund also maintained a 1% allocation to REIT’s. |
We remain constructive on the prospects for healthy global growth, though it may be at a slower pace than originally anticipated. Central banks in the U.S. and Europe remain accommodative and supply chain issues in Japan have abated. There are also signs that inflation may be peaking in emerging markets as commodity prices have eased since last quarter. Corporate balance sheets remain healthy and have been assisted by very low interest rates. We believe valuations for equities are not stretched and remain below historical averages while equity risk premiums are still high offering the possibility for further gains. Additionally, commodity prices have eased, which should provide consumers some much needed breathing room. We anticipate that the markets are likely to remain volatile due to outstanding sovereign debt issues, but believe that there is potential for price appreciation in the second half of the year.
4
Table of Contents
| Total Return Fund | (unaudited) |
Understanding Your Fund’s Expenses
As a shareholder of the Fund you incur ongoing costs. Ongoing costs include portfolio management fees, distribution and services fees (for Class 3 shares), professional fees, administrative fees and other Fund expenses. The following example is intended to help you understand your ongoing costs (in dollars) of investing in the Fund and to compare these costs with the ongoing costs of investing in other mutual funds.
To illustrate these ongoing costs, we have provided an example and calculated the expenses paid by investors in each share class of the Fund during the period. The information in the following table is based on an investment of $1,000, which is invested at the beginning of the period and held for the entire six-month period ended June 30, 2011.
Actual Expenses
The first section of the table provides information about actual account values and actual expenses. You may use the information in this section, together with the amount you invested, to estimate the expenses that you paid over the period. To do so, simply divide your account value by $1,000 (for example, an $8,600 account value
divided by $1,000 = 8.6), then multiply the result by the number given for your class under the heading “Expenses paid during period.”
Hypothetical Example for Comparison Purposes
The second section of the table provides information about hypothetical account values and hypothetical expenses based on the Fund’s actual expense ratio and an assumed rate of return of 5% per year before expenses, which is not the Fund’s actual return. The hypothetical account values and expenses may not be used to estimate the actual ending account balance or expenses you paid for the period. You may use this information to compare the ongoing costs of investing in the Fund and other funds. To do so, compare this 5% hypothetical example with the 5% hypothetical examples that appear in the shareholders reports of other funds.
Please note that the expenses shown in the table are meant to highlight and help you compare ongoing costs only and do not reflect any transaction costs, such as sales charges or redemption fees, if any. Additionally, the expenses shown do not reflect the fees or charges associated with variable contracts through which shares of the Fund are offered.
January 1, 2011 - June 30, 2011
| Account value at the beginning of the period ($) | Account value at the end of the period ($) | Expenses paid during the period ($)* | ||||||||||
Actual Fund Return** |
| |||||||||||
Class 1 | 1,000.00 | 1,036.54 | 3.69 | |||||||||
Class 3 | 1,000.00 | 1,035.41 | 4.95 | |||||||||
Hypothetical 5% Return (2.5% for the period) |
| |||||||||||
Class 1 | 1,000.00 | 1,020.95 | 3.66 | |||||||||
Class 3 | 1,000.00 | 1,019.74 | 4.91 | |||||||||
| * | Expenses are equal to the Fund’s annualized expense ratio of 0.73% for Class 1 Shares and 0.98% for Class 3 Shares (for the period January 1, 2011—June 30, 2011), multiplied by the average account value over the period, multiplied by 181/365 (to reflect the one-half year period). |
| ** | Actual Fund Returns for the six-month period ended June 30, 2011 were as follows: 3.65% for Class 1 shares and 3.54% for Class 3 shares. Past performance does not guarantee future results. |
5
Table of Contents
| Total Return Fund | (unaudited) |
Investment Profile
A mutual fund designed for investors who seek the highest total return, composed of current income and capital appreciation, as is consistent with prudent investment risk. The Fund seeks its objective by investing primarily in a combination of U.S. and foreign (non-U.S.) equity and debt securities and cash. The Fund’s asset allocation process utilizes information from GE Asset Management’s Asset Allocation Committee to diversify holdings across these asset classes.
Morningstar Performance Comparison
Based on average annual returns for periods ended June 30, 2011
| Six Months* | One Year | Five Year | Ten Year | |||||||||||||
Number of Funds in peer group: | 304 | 292 | 196 | 135 | ||||||||||||
Peer group average annual total return: | 4.51% | 21.09% | 3.97% | 4.09% | ||||||||||||
Morningstar category in peer group: U.S. Insurance Moderate Allocation |
| |||||||||||||||
Sector Allocation
as a % of Fair Value of $3,008,388 (in thousands) on June 30, 2011 (b)(c)
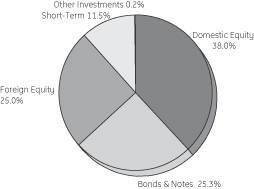
Top Ten Largest Holdings
as of June 30, 2011 (as a % of Fair Value) (b)(c)
U.S. Treasury Note 2.00%, 04/30/16 | 1.60 | % | ||
U.S. Treasury Bonds 4.75%, 02/15/41 | 1.54 | % | ||
Government National Mortgage Assoc. 4.50%, TBA | 1.25 | % | ||
Federal National Mortgage Assoc. 4.50%, TBA | 1.21 | % | ||
Federal National Mortgage Assoc. 4.50%, 05/01/08 | 1.17 | % | ||
Federal National Mortgage Assoc. 5.50%, 04/01/14 | 0.90 | % | ||
PepsiCo Inc. | 0.77 | % | ||
Schlumberger Ltd. | 0.72 | % | ||
Federal National Mortgage Assoc. 4.00%, TBA | 0.71 | % | ||
Baidu Inc. ADR | 0.68 | % |
Change in Value of a $10,000 Investment
Class 1 Shares
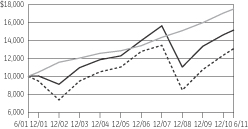
Average Annual Total Return
for the Periods Ended June 30, 2011
Class 1 Shares (Inception date: 7/1/85)
| Six Months* | One Year | Five Year | Ten Year | Ending Value of a $10,000 investment (a) | ||||||||||||||||
Total Return Fund | 3.65% | 20.98% | 3.68% | 4.23% | $ | 15,135 | ||||||||||||||
S&P 500 Index | 6.02% | 30.69% | 2.94% | 2.72% | $ | 13,076 | ||||||||||||||
Barclays Capital U.S. Aggregate Bond Index | 2.72% | 3.90% | 6.52% | 5.75% | $ | 17,481 | ||||||||||||||
Change in Value of a $10,000 Investment
Class 3 Shares
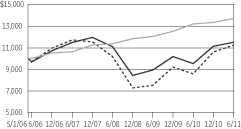
Average Annual Total Return
for the Periods Ended June 30, 2011
Class 3 Shares (Inception date: 5/1/06)
| Six Months* | One Year | Five Year | Since Inception | Ending Value of a $10,000 investment (a) | ||||||||||||||||
Total Return Fund | 3.54% | 20.73% | 3.52% | 2.79% | $ | 11,530 | ||||||||||||||
S&P 500 Index | 6.02% | 30.69% | 2.94% | 2.29% | $ | 11,244 | ||||||||||||||
Barclays Capital U.S. Aggregate Bond Index | 2.72% | 3.90% | 6.52% | 6.33% | $ | 13,730 | ||||||||||||||

| (a) | Ending value of a $10,000 investment for the ten-year period or since inception, whichever is less. |
| (b) | The securities information regarding holdings, allocations and other characteristics is presented to illustrate examples of securities that the Fund has bought and the diversity of areas in which the Fund may invest as of a particular date. It may not be representative of the Fund’s current or future investments and should not be construed as a recommendation to purchase or sell a particular security. |
| (c) | Fair value basis is inclusive of Short-Term Investment in GE Institutional Money Market Fund. |
| * | Total returns for the six month period ended June 30, 2011 are not annualized. |
See Notes to Performance on page 1 for further information, including an explanation of Morningstar peer categories.
Past performance does not predict future performance and the graphs and tables do not reflect the deduction of taxes that a shareholder would pay on Fund distributions or the redemption of Fund shares and does not reflect the fees or charges that would be associated with variable contracts through which shares of the Fund are offered.
6
Table of Contents
Total Return Fund
| Schedule of Investments | June 30, 2011 (unaudited) |
Total Return Fund
| Number of Shares | Fair Value | |||||||||
Domestic Equity — 38.9%† |
| |||||||||
Advertising — 0.5% |
| |||||||||
Arbitron Inc. | 23,300 | $ | 962,989 | |||||||
Omnicom Group Inc. | 293,631 | 14,141,270 | ||||||||
| 15,104,259 | ||||||||||
Aerospace & Defense — 1.0% |
| |||||||||
Alliant Techsystems Inc. | 41,117 | 2,932,876 | ||||||||
General Dynamics Corp. | 11,529 | 859,141 | ||||||||
Hexcel Corp. | 186,302 | 4,078,150 | (a) | |||||||
Honeywell International Inc. | 223,917 | 13,343,214 | ||||||||
Rockwell Collins Inc. | 90,926 | 5,609,225 | ||||||||
Teledyne Technologies Inc. | 17,400 | 876,264 | (a) | |||||||
United Technologies Corp. | 22,717 | 2,010,682 | ||||||||
| 29,709,552 | ||||||||||
Agricultural Products — 0.1% |
| |||||||||
Archer-Daniels-Midland Co. | 138,348 | 4,171,192 | ||||||||
Air Freight & Logistics — 0.2% |
| |||||||||
FedEx Corp. | 41,504 | 3,936,654 | ||||||||
United Parcel Service Inc. | 5,923 | 431,964 | ||||||||
UTi Worldwide Inc. | 72,843 | 1,434,279 | ||||||||
| 5,802,897 | ||||||||||
Apparel Retail — 0.1% |
| |||||||||
Aeropostale Inc. | 22,700 | 397,250 | (a) | |||||||
American Eagle Outfitters Inc. | 14,600 | 186,150 | ||||||||
The Buckle Inc. | 7,800 | 333,060 | ||||||||
Urban Outfitters Inc. | 77,325 | 2,176,699 | (a) | |||||||
| 3,093,159 | ||||||||||
Apparel, Accessories & Luxury Goods — 0.2% |
| |||||||||
Coach Inc. | 83,310 | 5,326,008 | ||||||||
Maidenform Brands Inc. | 15,800 | 437,028 | (a) | |||||||
| 5,763,036 | ||||||||||
Application Software — 0.3% |
| |||||||||
ACI Worldwide Inc. | 12,200 | 411,994 | (a) | |||||||
Blackbaud Inc. | 28,300 | 784,476 | ||||||||
Blackboard Inc. | 35,278 | 1,530,712 | (a) | |||||||
Citrix Systems Inc. | 59,139 | 4,731,120 | (a) | |||||||
Ebix Inc. | 10,600 | 201,930 | (a) | |||||||
Parametric Technology Corp. | 35,600 | 816,308 | (a) | |||||||
Solera Holdings Inc. | 3,000 | 177,480 | ||||||||
SS&C Technologies Holdings Inc. | 28,300 | 562,321 | (a) | |||||||
SuccessFactors Inc. | 26,248 | 771,691 | (a) | |||||||
| 9,988,032 | ||||||||||
Asset Management & Custody Banks — 1.3% |
| |||||||||
Affiliated Managers Group Inc. | 47,872 | 4,856,614 | (a) | |||||||
| Number of Shares | Fair Value | |||||||||
Ameriprise Financial Inc. | 140,825 | $ | 8,122,786 | |||||||
Invesco Ltd. | 375,613 | 8,789,344 | ||||||||
State Street Corp. | 251,250 | 11,328,862 | (e) | |||||||
The Bank of New York Mellon Corp. | 169,476 | 4,341,975 | ||||||||
| 37,439,581 | ||||||||||
Automotive Retail — 0.1% |
| |||||||||
O’Reilly Automotive Inc. | 62,262 | 4,078,784 | (a) | |||||||
Biotechnology — 1.2% |
| |||||||||
Alexion Pharmaceuticals Inc. | 63,402 | 2,981,796 | ||||||||
Amgen Inc. | 169,895 | 9,913,373 | (a,h) | |||||||
Cubist Pharmaceuticals Inc. | 6,500 | 233,935 | (a) | |||||||
Gilead Sciences Inc. | 356,501 | 14,762,706 | (a) | |||||||
Human Genome Sciences Inc. | 90,680 | 2,225,287 | (a) | |||||||
Incyte Corp Ltd. | 91,276 | 1,728,767 | (a) | |||||||
Vertex Pharmaceuticals Inc. | 77,042 | 4,005,414 | (a) | |||||||
| 35,851,278 | ||||||||||
Broadcasting — 0.1% |
| |||||||||
Discovery Communications Inc. (Class A) | 23,369 | 957,194 | (a) | |||||||
Discovery Communications Inc. (Class C) | 39,174 | 1,431,810 | (a) | |||||||
| 2,389,004 | ||||||||||
Cable & Satellite — 0.4% |
| |||||||||
DIRECTV | 108,159 | 5,496,640 | (a) | |||||||
Liberty Global Inc. | 116,537 | 4,976,130 | (a) | |||||||
Sirius XM Radio Inc. | 144,463 | 316,374 | (a) | |||||||
| 10,789,144 | ||||||||||
Casinos & Gaming — 0.1% |
| |||||||||
Penn National Gaming Inc. | 92,033 | 3,712,611 | (a) | |||||||
Coal & Consumable Fuels — 0.3% |
| |||||||||
Peabody Energy Corp. | 148,011 | 8,719,329 | ||||||||
Communications Equipment — 1.0% |
| |||||||||
Cisco Systems Inc. | 593,081 | 9,257,994 | (h) | |||||||
Juniper Networks Inc. | 111,414 | 3,509,541 | (a) | |||||||
QUALCOMM Inc. | 300,376 | 17,058,353 | ||||||||
| 29,825,888 | ||||||||||
Computer Hardware — 0.7% |
| |||||||||
Apple Inc. | 48,036 | 16,124,244 | (a) | |||||||
Hewlett-Packard Co. | 78,310 | 2,850,484 | ||||||||
| 18,974,728 | ||||||||||
Computer Storage & Peripherals — 0.1% |
| |||||||||
Synaptics Inc. | 120,271 | 3,095,776 | (a) | |||||||
Construction & Engineering — 0.1% |
| |||||||||
Quanta Services Inc. | 159,038 | 3,212,568 | (a) | |||||||
See Notes to Schedule of Investments and Notes to Financial Statements.
7
Table of Contents
Total Return Fund
| Schedule of Investments | June 30, 2011 (unaudited) |
| Number of Shares | Fair Value | |||||||||
Construction & Farm Machinery & Heavy Trucks — 0.3% |
| |||||||||
Cummins Inc. | 20,117 | $ | 2,081,908 | |||||||
Deere & Co. | 64,079 | 5,283,313 | ||||||||
| 7,365,221 | ||||||||||
Consumer Finance — 0.2% |
| |||||||||
American Express Co. | 131,260 | 6,786,142 | ||||||||
Discover Financial Services | 11,529 | 308,401 | ||||||||
| 7,094,543 | ||||||||||
Data Processing & Outsourced Services — 0.7% |
| |||||||||
Automatic Data Processing Inc. | 24,340 | 1,282,231 | ||||||||
Global Cash Access Holdings Inc. | 44,100 | 140,238 | (a) | |||||||
The Western Union Co. | 560,888 | 11,234,586 | ||||||||
Visa Inc. | 80,318 | 6,767,595 | ||||||||
| 19,424,650 | ||||||||||
Department Stores — 0.1% |
| |||||||||
Macy’s Inc. | 97,996 | 2,865,403 | ||||||||
Distributors — 0.1% |
| |||||||||
Genuine Parts Co. | 26,334 | 1,432,570 | ||||||||
LKQ Corp. | 46,200 | 1,205,358 | (a) | |||||||
| 2,637,928 | ||||||||||
Diversified Chemicals — 0.1% |
| |||||||||
EI du Pont de Nemours & Co. | 30,390 | 1,642,579 | ||||||||
Diversified Financial Services — 1.4% |
| |||||||||
Bank of America Corp. | 516,458 | 5,660,379 | ||||||||
Citigroup Inc. | 53,034 | 2,208,336 | ||||||||
Comerica Inc. | 82,682 | 2,858,317 | ||||||||
JPMorgan Chase & Co. | 472,347 | 19,337,886 | ||||||||
US BanCorp | 76,946 | 1,962,892 | ||||||||
Wells Fargo & Co. | 249,029 | 6,987,753 | ||||||||
| 39,015,563 | ||||||||||
Diversified Metals & Mining — 0.2% |
| |||||||||
Compass Minerals International Inc. | 5,900 | 507,813 | ||||||||
Freeport-McMoRan Copper & Gold Inc. | 83,094 | 4,395,672 | ||||||||
Molycorp Inc. | 21,659 | 1,322,499 | (a) | |||||||
| 6,225,984 | ||||||||||
Diversified REITs — 0.1% |
| |||||||||
Colonial Properties Trust | 23,670 | 482,868 | ||||||||
Liberty Property Trust | 10,600 | 345,348 | ||||||||
Vornado Realty Trust | 19,390 | 1,806,760 | ||||||||
| 2,634,976 | ||||||||||
Diversified Support Services — 0.0%* |
| |||||||||
Healthcare Services Group Inc. | 28,000 | 455,000 | ||||||||
Drug Retail — 0.1% | ||||||||||
CVS Caremark Corp. | 63,410 | 2,382,948 | ||||||||
| Number of Shares | Fair Value | |||||||||
Education Services — 0.0%* |
| |||||||||
Lincoln Educational Services Corp. | 5,800 | $ | 99,470 | |||||||
Electric Utilities — 0.6% |
| |||||||||
FirstEnergy Corp. | 21,906 | 967,150 | ||||||||
IDACORP Inc. | 18,500 | 730,750 | ||||||||
ITC Holdings Corp. | 111,940 | 8,033,934 | ||||||||
NextEra Energy Inc. | 100,845 | 5,794,554 | ||||||||
Southern Co. | 75,453 | 3,046,792 | ||||||||
| 18,573,180 | ||||||||||
Electrical Components & Equipment — 0.4% |
| |||||||||
Cooper Industries PLC | 130,968 | 7,814,860 | ||||||||
Emerson Electric Co. | 52,736 | 2,966,400 | ||||||||
Woodward Governor Co. | 18,300 | 637,938 | ||||||||
| 11,419,198 | ||||||||||
Electronic Components — 0.1% |
| |||||||||
Corning Inc. | 145,434 | 2,639,627 | ||||||||
Fertilizers & Agricultural Chemicals — 0.4% |
| |||||||||
Intrepid Potash Inc. | 51,315 | 1,667,737 | (a) | |||||||
Monsanto Co. | 130,646 | 9,477,061 | ||||||||
The Mosaic Co. | 12,695 | 859,832 | ||||||||
| 12,004,630 | ||||||||||
Food Distributors — 0.1% |
| |||||||||
Spartan Stores Inc. | 8,000 | 156,240 | ||||||||
Sysco Corp. | 44,623 | 1,391,345 | ||||||||
| 1,547,585 | ||||||||||
Footwear — 0.0%* |
| |||||||||
Deckers Outdoor Corp. | 11,500 | 1,013,610 | ||||||||
General Merchandise Stores — 0.3% |
| |||||||||
Target Corp. | 190,570 | 8,939,639 | ||||||||
Healthcare Distributors — 0.1% |
| |||||||||
Cardinal Health Inc. | 35,739 | 1,623,265 | ||||||||
Owens & Minor Inc. | 23,000 | 793,270 | ||||||||
| 2,416,535 | ||||||||||
Healthcare Equipment — 0.9% |
| |||||||||
Covidien PLC | 296,185 | 15,765,928 | ||||||||
Gen-Probe Inc. | 25,120 | 1,737,048 | (a) | |||||||
Masimo Corp. | 128,429 | 3,811,773 | ||||||||
ResMed Inc. | 92,373 | 2,858,944 | ||||||||
Thoratec Corp. | 15,400 | 505,428 | (a) | |||||||
| 24,679,121 | ||||||||||
Healthcare Facilities — 0.1% |
| |||||||||
HCA Holdings Inc. | 80,703 | 2,663,199 | (a) | |||||||
Sun Healthcare Group Inc. | 10,601 | 85,020 | (a) | |||||||
| 2,748,219 | ||||||||||
See Notes to Schedule of Investments and Notes to Financial Statements.
8
Table of Contents
Total Return Fund
| Schedule of Investments | June 30, 2011 (unaudited) |
| Number of Shares | Fair Value | |||||||||
Healthcare Services — 0.7% |
| |||||||||
Bio-Reference Laboratories Inc. | 46,300 | $ | 967,670 | (a) | ||||||
Catalyst Health Solutions Inc. | 92,145 | 5,143,534 | (a) | |||||||
Express Scripts Inc. | 166,536 | 8,989,613 | (a) | |||||||
HMS Holdings Corp. | 9,700 | 745,639 | (a) | |||||||
Mednax Inc. | 12,500 | 902,375 | (a) | |||||||
Omnicare Inc. | 146,418 | 4,669,270 | ||||||||
| 21,418,101 | ||||||||||
Healthcare Technology — 0.1% |
| |||||||||
Computer Programs & Systems Inc. | 6,000 | 380,880 | ||||||||
MedAssets Inc. | 129,640 | 1,731,990 | (a) | |||||||
| 2,112,870 | ||||||||||
Home Building — 0.1% |
| |||||||||
MDC Holdings Inc. | 83,477 | 2,056,873 | ||||||||
Home Entertainment Software — 0.1% |
| |||||||||
Activision Blizzard Inc. | 307,986 | 3,597,276 | ||||||||
Home Furnishing Retail — 0.2% |
| |||||||||
Aaron’s Inc. | 19,300 | 545,418 | ||||||||
Bed Bath & Beyond Inc. | 79,931 | 4,665,572 | (a) | |||||||
| 5,210,990 | ||||||||||
Home Improvement Retail — 0.4% |
| |||||||||
Home Depot Inc. | 56,792 | 2,057,006 | ||||||||
Lowe’s companies Inc. | 368,900 | 8,599,059 | ||||||||
| 10,656,065 | ||||||||||
Hotels, Resorts & Cruise Lines — 0.2% |
| |||||||||
Carnival Corp. | 63,315 | 2,382,543 | ||||||||
Hyatt Hotels Corp. | 9,610 | 392,280 | (a) | |||||||
Royal Caribbean Cruises Ltd. | 78,421 | 2,951,766 | (a) | |||||||
| 5,726,589 | ||||||||||
Household Products — 0.6% |
| |||||||||
Clorox Co. | 103,422 | 6,974,779 | ||||||||
Kimberly-Clark Corp. | 32,140 | 2,139,238 | ||||||||
The Procter & Gamble Co. | 147,268 | 9,361,827 | ||||||||
| 18,475,844 | ||||||||||
Housewares & Specialties — 0.0%* |
| |||||||||
Jarden Corp. | 29,200 | 1,007,692 | ||||||||
Hypermarkets & Super Centers — 0.1% |
| |||||||||
Wal-Mart Stores Inc. | 33,047 | 1,756,118 | ||||||||
Independent Power Producers & Energy Traders — 0.4% |
| |||||||||
Calpine Corp. | 192,391 | 3,103,267 | (a) | |||||||
The AES Corp. | 638,307 | 8,132,031 | (a) | |||||||
| 11,235,298 | ||||||||||
| Number of Shares | Fair Value | |||||||||
Industrial Gases — 0.4% |
| |||||||||
Praxair Inc. | 101,104 | $ | 10,958,662 | |||||||
Industrial Machinery — 0.3% |
| |||||||||
Eaton Corp. | 70,832 | 3,644,306 | ||||||||
Harsco Corp. | 179,789 | 5,861,121 | ||||||||
Mueller Industries Inc. | 7,900 | 299,489 | ||||||||
| 9,804,916 | ||||||||||
Industrial REITs — 0.1% |
| |||||||||
DCT Industrial Trust Inc. | 34,140 | 178,552 | ||||||||
Prologis Inc. | 52,520 | 1,882,317 | ||||||||
| 2,060,869 | ||||||||||
Integrated Oil & Gas — 1.4% |
| |||||||||
Chevron Corp. | 144,327 | 14,842,588 | ||||||||
ConocoPhillips | 66,528 | 5,002,240 | ||||||||
Exxon Mobil Corp. | 139,459 | 11,349,173 | (h) | |||||||
Marathon Oil Corp. | 63,409 | 3,340,386 | ||||||||
Occidental Petroleum Corp. | 44,645 | 4,644,866 | ||||||||
| 39,179,253 | ||||||||||
Integrated Telecommunication Services — 0.6% |
| |||||||||
AT&T Inc. | 292,062 | 9,173,667 | ||||||||
Verizon Communications Inc. | 196,763 | 7,325,486 | ||||||||
Windstream Corp. | 61,706 | 799,710 | ||||||||
| 17,298,863 | ||||||||||
Internet Retail — 0.1% |
| |||||||||
Amazon.com Inc. | 7,727 | 1,580,094 | (a) | |||||||
HomeAway Inc. | 6,873 | 265,985 | (a) | |||||||
| 1,846,079 | ||||||||||
Internet Software & Services — 0.7% |
| |||||||||
Equinix Inc. | 74,565 | 7,532,556 | (a) | |||||||
Google Inc. | 16,647 | 8,429,708 | ||||||||
MercadoLibre Inc. | 37,099 | 2,943,435 | ||||||||
Monster Worldwide Inc. | 159,143 | 2,333,036 | (a) | |||||||
| 21,238,735 | ||||||||||
Investment Banking & Brokerage — 0.4% |
| |||||||||
GFI Group Inc. | 47,900 | 219,861 | ||||||||
Morgan Stanley | 123,059 | 2,831,588 | ||||||||
Raymond James Financial Inc. | 24,300 | 781,245 | ||||||||
The Goldman Sachs Group Inc. | 59,498 | 7,918,589 | ||||||||
| 11,751,283 | ||||||||||
IT Consulting & Other Services — 0.7% |
| |||||||||
International Business Machines Corp. | 111,998 | 19,213,257 | (h) | |||||||
Life & Health Insurance — 0.5% |
| |||||||||
MetLife Inc. | 145,146 | 6,367,555 | ||||||||
Prudential Financial Inc. | 140,263 | 8,919,324 | ||||||||
| 15,286,879 | ||||||||||
See Notes to Schedule of Investments and Notes to Financial Statements.
9
Table of Contents
Total Return Fund
| Schedule of Investments | June 30, 2011 (unaudited) |
| Number of Shares | Fair Value | |||||||||
Life Sciences Tools & Services — 0.9% |
| |||||||||
Bruker Corp. | 44,000 | $ | 895,840 | (a) | ||||||
Covance Inc. | 58,862 | 3,494,637 | (a) | |||||||
Illumina Inc. | 69,897 | 5,252,760 | (a) | |||||||
Mettler-Toledo International Inc. | 25,122 | 4,237,328 | (a) | |||||||
PerkinElmer Inc. | 60,632 | 1,631,608 | ||||||||
Thermo Fisher Scientific Inc. | 146,457 | 9,430,367 | (a) | |||||||
| 24,942,540 | ||||||||||
Managed Healthcare — 0.0%* |
| |||||||||
Molina Healthcare Inc. | 31,350 | 850,212 | ||||||||
Movies & Entertainment — 0.8% |
| |||||||||
Liberty Media Corporation-Capital | 23,623 | 2,025,672 | (a) | |||||||
News Corp. | 344,565 | 6,098,801 | ||||||||
The Walt Disney Co. | 97,996 | 3,825,764 | ||||||||
Time Warner Inc. | 319,066 | 11,604,430 | ||||||||
| 23,554,667 | ||||||||||
Multi-Line Insurance — 0.3% |
| |||||||||
Hartford Financial Services Group Inc. | 87,620 | 2,310,539 | ||||||||
HCC Insurance Holdings Inc. | 210,564 | 6,632,766 | ||||||||
| 8,943,305 | ||||||||||
Multi-Utilities — 0.3% |
| |||||||||
Dominion Resources Inc. | 187,177 | 9,035,034 | ||||||||
Xcel Energy Inc. | 38,474 | 934,918 | ||||||||
| 9,969,952 | ||||||||||
Office Electronics — 0.0%* |
| |||||||||
Zebra Technologies Corp. | 11,700 | 493,389 | (a) | |||||||
Office REITs — 0.4% |
| |||||||||
Alexandria Real Estate Equities Inc. | 9,250 | 716,135 | ||||||||
BioMed Realty Trust Inc. | 38,400 | 738,816 | ||||||||
Boston Properties Inc. | 11,430 | 1,213,409 | ||||||||
Brandywine Realty Trust | 24,020 | 278,392 | ||||||||
CommonWealth | 24,580 | 635,147 | ||||||||
Coresite Realty Corp. | 13,700 | 224,680 | ||||||||
Corporate Office Properties Trust | 6,980 | 217,148 | ||||||||
Digital Realty Trust Inc. | 26,960 | 1,665,589 | ||||||||
Douglas Emmett Inc. | 140,508 | 2,794,704 | ||||||||
Duke Realty Corp. | 44,730 | 626,667 | ||||||||
Hudson Pacific Properties Inc. | 18,160 | 282,025 | ||||||||
Kilroy Realty Corp. | 12,550 | 495,600 | ||||||||
Parkway Properties Inc. | 11,130 | 189,878 | ||||||||
SL Green Realty Corp. | 31,136 | 2,580,240 | ||||||||
| 12,658,430 | ||||||||||
Office Services & Supplies — 0.0%* |
| |||||||||
Herman Miller Inc. | 6,600 | 179,652 | ||||||||
Oil & Gas Drilling — 0.1% |
| |||||||||
Noble Corp. | 73,016 | 2,877,561 | ||||||||
Pioneer Drilling Co. | 34,300 | 522,732 | (a) | |||||||
| 3,400,293 | ||||||||||
| Number of Shares | Fair Value | |||||||||
Oil & Gas Equipment & Services — 1.3% |
| |||||||||
Dresser-Rand Group Inc. | 74,017 | $ | 3,978,414 | (a) | ||||||
Dril-Quip Inc. | 2,900 | 196,707 | (a) | |||||||
Halliburton Co. | 91,004 | 4,641,204 | ||||||||
McDermott International Inc. | 94,100 | 1,864,121 | (a) | |||||||
National Oilwell Varco Inc. | 28,822 | 2,254,169 | ||||||||
Oil States International Inc. | 12,700 | 1,014,857 | (a) | |||||||
Schlumberger Ltd. | 250,657 | 21,656,765 | ||||||||
Weatherford International Ltd. | 143,919 | 2,698,481 | (a) | |||||||
| 38,304,718 | ||||||||||
Oil & Gas Exploration & Production — 1.0% |
| |||||||||
Apache Corp. | 107,223 | 13,230,246 | ||||||||
Devon Energy Corp. | 23,058 | 1,817,201 | ||||||||
Petrohawk Energy Corp. | 127,688 | 3,150,063 | (a) | |||||||
Pioneer Natural Resources Co. | 33,966 | 3,042,335 | ||||||||
Quicksilver Resources Inc. | 140,953 | 2,080,466 | (a) | |||||||
SM Energy Co. | 13,000 | 955,240 | ||||||||
Southwestern Energy Co. | 95,249 | 4,084,277 | (a) | |||||||
Ultra Petroleum Corp. | 30,400 | 1,392,320 | (a) | |||||||
| 29,752,148 | ||||||||||
Oil & Gas Storage & Transportation — 0.4% |
| |||||||||
El Paso Corp. | 341,079 | 6,889,796 | ||||||||
Spectra Energy Corp. | 123,660 | 3,389,521 | ||||||||
| 10,279,317 | ||||||||||
Packaged Foods & Meats — 0.8% |
| |||||||||
ConAgra Foods Inc. | 92,232 | 2,380,508 | ||||||||
Kellogg Co. | 30,830 | 1,705,516 | ||||||||
Kraft Foods Inc. | 389,822 | 13,733,429 | ||||||||
McCormick & Company Inc. | 51,736 | 2,564,554 | (h) | |||||||
Mead Johnson Nutrition Co. | 36,175 | 2,443,621 | ||||||||
Smithfield Foods Inc. | 13,200 | 288,684 | (a) | |||||||
| 23,116,312 | ||||||||||
Paper Packaging — 0.0%* |
| |||||||||
Packaging Corporation of America | 33,500 | 937,665 | ||||||||
Personal Products — 0.1% |
| |||||||||
Avon Products Inc. | 73,749 | 2,064,972 | ||||||||
Pharmaceuticals — 1.6% |
| |||||||||
Abbott Laboratories | 21,906 | 1,152,694 | ||||||||
Bristol-Myers Squibb Co. | 251,847 | 7,293,489 | ||||||||
Hospira Inc. | 112,434 | 6,370,511 | (a) | |||||||
Johnson & Johnson | 188,669 | 12,550,262 | ||||||||
Merck & Company Inc. | 67,000 | 2,364,430 | ||||||||
Pfizer Inc. | 769,117 | 15,843,811 | ||||||||
| 45,575,197 | ||||||||||
Precious Metals & Minerals — 0.0%* |
| |||||||||
Stillwater Mining Co. | 64,980 | 1,430,210 | (a) | |||||||
See Notes to Schedule of Investments and Notes to Financial Statements.
10
Table of Contents
Total Return Fund
| Schedule of Investments | June 30, 2011 (unaudited) |
| Number of Shares | Fair Value | |||||||||
Property & Casualty Insurance — 0.7% |
| |||||||||
ACE Ltd. | 212,054 | $ | 13,957,395 | |||||||
Chubb Corp. | 69,174 | 4,330,984 | ||||||||
The Travelers companies Inc. | 34,887 | 2,036,703 | ||||||||
| 20,325,082 | ||||||||||
Publishing — 0.0%* |
| |||||||||
John Wiley & Sons Inc. | 5,000 | 260,050 | ||||||||
Rail Roads — 0.2% |
| |||||||||
Genesee & Wyoming Inc. | 19,300 | 1,131,752 | (a) | |||||||
Union Pacific Corp. | 37,790 | 3,945,276 | ||||||||
| 5,077,028 | ||||||||||
Real Estate Services — 0.2% |
| |||||||||
CB Richard Ellis Group Inc. (REIT) | 237,657 | 5,967,567 | (a) | |||||||
Regional Banks — 0.2% |
| |||||||||
Cullen Frost Bankers Inc. | 9,900 | 562,815 | ||||||||
Fulton Financial Corp. | 18,000 | 192,780 | ||||||||
Prosperity Bancshares Inc. | 14,300 | 626,626 | ||||||||
Sterling Bancorp | 9,500 | 90,155 | ||||||||
SVB Financial Group | 11,200 | 668,752 | (a) | |||||||
Westamerica Bancorp. | 7,300 | 359,525 | ||||||||
Zions Bancorp. | 79,715 | 1,913,957 | ||||||||
| 4,414,610 | ||||||||||
Reinsurance — 0.2% |
| |||||||||
PartnerRe Ltd. | 51,908 | 3,573,866 | ||||||||
RenaissanceRe Holdings Ltd. | 17,294 | 1,209,715 | ||||||||
| 4,783,581 | ||||||||||
Research & Consulting Services — 0.3% |
| |||||||||
FTI Consulting Inc. | 41,472 | 1,573,448 | (a) | |||||||
IHS Inc. | 47,073 | 3,926,830 | (a) | |||||||
Nielsen Holdings N.V. | 126,819 | 3,951,680 | (a) | |||||||
Resources Connection Inc. | 8,500 | 102,340 | ||||||||
| 9,554,298 | ||||||||||
Residential REITs — 0.2% |
| |||||||||
American Campus Communities Inc. | 9,680 | 343,834 | ||||||||
Apartment Investment & Management Co. | 16,720 | 426,862 | ||||||||
AvalonBay Communities Inc. | 5,020 | 644,568 | ||||||||
Camden Property Trust | 11,490 | 730,994 | ||||||||
Equity Residential | 36,230 | 2,173,800 | ||||||||
Essex Property Trust Inc. | 7,320 | 990,323 | ||||||||
UDR Inc. | 19,770 | 485,354 | ||||||||
| 5,795,735 | ||||||||||
Restaurants — 0.2% |
| |||||||||
Cracker Barrel Old Country Store Inc. | 19,300 | 951,683 | ||||||||
McDonald’s Corp. | 53,547 | 4,515,083 | ||||||||
| Number of Shares | Fair Value | |||||||||
Wendy’s Arby’s Group Inc. | 36,000 | $ | 182,520 | |||||||
| 5,649,286 | ||||||||||
Retail REITs — 0.3% |
| |||||||||
Acadia Realty Trust | 12,770 | 259,614 | ||||||||
Developers Diversified Realty Corp. | 34,240 | 482,784 | ||||||||
Excel Trust Inc. | 13,660 | 150,670 | ||||||||
Federal Realty Investment Trust | 4,540 | 386,717 | ||||||||
General Growth Properties Inc. | 39,280 | 655,583 | ||||||||
Kimco Realty Corp. | 50,470 | 940,761 | ||||||||
National Retail Properties Inc. | 28,470 | 697,800 | ||||||||
Pennsylvania Real Estate Investment Trust | 2,070 | 32,499 | ||||||||
Simon Property Group Inc. | 21,790 | 2,532,652 | ||||||||
Tanger Factory Outlet Centers | 8,820 | 236,111 | ||||||||
Taubman Centers Inc. | 4,060 | 240,352 | ||||||||
The Macerich Co. | 27,260 | 1,458,410 | ||||||||
| 8,073,953 | ||||||||||
Security & Alarm Services — 0.2% |
| |||||||||
Corrections Corporation of America | 295,421 | 6,395,864 | (a) | |||||||
Semiconductor Equipment — 0.1% |
| |||||||||
Applied Materials Inc. | 73,786 | 959,956 | ||||||||
KLA-Tencor Corp. | 60,506 | 2,449,283 | ||||||||
Rudolph Technologies Inc. | 52,200 | 559,062 | (a) | |||||||
| 3,968,301 | ||||||||||
Semiconductors — 0.9% |
| |||||||||
Cree Inc. | 36,616 | 1,229,931 | (a) | |||||||
Hittite Microwave Corp. | 65,380 | 4,047,676 | (a) | |||||||
Intel Corp. | 328,152 | 7,271,848 | ||||||||
Marvell Technology Group Ltd. | 201,757 | 2,978,942 | (a) | |||||||
Microchip Technology Inc. | 92,746 | 3,516,001 | ||||||||
Microsemi Corp. | 35,100 | 719,550 | (a) | |||||||
Semtech Corp. | 19,300 | 527,662 | (a) | |||||||
Texas Instruments Inc. | 206,884 | 6,792,002 | ||||||||
| 27,083,612 | ||||||||||
Soft Drinks — 0.9% |
| |||||||||
Coca-Cola Enterprises Inc. | 96,236 | 2,808,166 | ||||||||
PepsiCo Inc. | 327,172 | 23,042,724 | ||||||||
| 25,850,890 | ||||||||||
Specialized Consumer Services — 0.0%* |
| |||||||||
Matthews International Corp. | 2,900 | 116,435 | ||||||||
Specialized Finance — 0.4% |
| |||||||||
CBOE Holdings Inc. | 73,767 | 1,814,668 | ||||||||
CME Group Inc. | 26,838 | 7,825,692 | ||||||||
MSCI Inc. | 49,308 | 1,857,925 | (a) | |||||||
| 11,498,285 | ||||||||||
Specialized REITs — 0.4% |
| |||||||||
DiamondRock Hospitality Co. | 22,310 | 239,386 | ||||||||
See Notes to Schedule of Investments and Notes to Financial Statements.
11
Table of Contents
Total Return Fund
| Schedule of Investments | June 30, 2011 (unaudited) |
| Number of Shares | Fair Value | |||||||||
HCP Inc. | 29,840 | $ | 1,094,830 | |||||||
Healthcare Inc. | 51,251 | 2,687,090 | ||||||||
Host Hotels & Resorts Inc. | 47,840 | 810,888 | ||||||||
LaSalle Hotel Properties | 14,280 | 376,135 | ||||||||
Omega Healthcare Investors Inc. | 32,100 | 674,421 | ||||||||
Pebblebrook Hotel Trust | 11,960 | 241,472 | ||||||||
Public Storage | 23,370 | 2,664,414 | ||||||||
Rayonier Inc. | 12,628 | 825,240 | ||||||||
RLJ Lodging Trust | 12,380 | 215,041 | ||||||||
Sabra Healthcare REIT Inc. | 10,101 | 168,788 | ||||||||
Senior Housing Properties Trust | 3,970 | 92,938 | ||||||||
Sunstone Hotel Investors Inc. | 29,770 | 275,968 | (a) | |||||||
U-Store-It Trust | 20,580 | 216,502 | ||||||||
Ventas Inc. | 33,050 | 1,742,065 | ||||||||
| 12,325,178 | ||||||||||
Specialty Chemicals — 0.2% |
| |||||||||
Albemarle Corp. | 10,146 | 702,103 | ||||||||
Cytec Industries Inc. | 32,968 | 1,885,440 | ||||||||
Nalco Holding Co. | 95,597 | 2,658,553 | ||||||||
Sensient Technologies Corp. | 15,700 | 581,999 | ||||||||
| 5,828,095 | ||||||||||
Specialty Stores — 0.1% |
| |||||||||
Dick’s Sporting Goods Inc. | 28,892 | 1,110,897 | (a) | |||||||
Staples Inc. | 79,453 | 1,255,357 | ||||||||
| 2,366,254 | ||||||||||
Steel — 0.6% |
| |||||||||
Allegheny Technologies Inc. | 238,408 | 15,131,756 | ||||||||
Cliffs Natural Resources Inc. | 6,642 | 614,053 | ||||||||
Commercial Metals Co. | 40,300 | 578,305 | ||||||||
Steel Dynamics Inc. | 78,902 | 1,282,157 | ||||||||
| 17,606,271 | ||||||||||
Systems Software — 1.2% |
| |||||||||
MICROS Systems Inc. | 18,800 | 934,548 | (a) | |||||||
Microsoft Corp. | 678,077 | 17,630,002 | (h) | |||||||
Oracle Corp. | 282,552 | 9,298,786 | ||||||||
Rovi Corp. | 109,339 | 6,271,685 | (a) | |||||||
| 34,135,021 | ||||||||||
Thrifts & Mortgage Finance — 0.2% |
| |||||||||
BankUnited Inc. | 58,146 | 1,543,195 | ||||||||
People’s United Financial Inc. | 288,805 | 3,881,539 | ||||||||
| 5,424,734 | ||||||||||
Tobacco — 0.1% |
| |||||||||
Philip Morris International Inc. | 50,942 | 3,401,397 | ||||||||
Trading Companies & Distributors — 0.2% |
| |||||||||
Applied Industrial Technologies Inc. | 21,000 | 747,810 | ||||||||
MSC Industrial Direct Co. | 51,000 | 3,381,810 | ||||||||
RSC Holdings Inc. | 19,900 | 238,004 | (a) | |||||||
| 4,367,624 | ||||||||||
| Number of Shares | Fair Value | |||||||||
Trucking — 0.0%* |
| |||||||||
Old Dominion Freight Line Inc. | 25,650 | $ | 956,745 | |||||||
Water Utilities — 0.0%* |
| |||||||||
American Water Works Company Inc. | 35,698 | 1,051,306 | ||||||||
Wireless Telecommunication Services — 0.7% |
| |||||||||
American Tower Corp. | 161,147 | 8,432,822 | (a) | |||||||
NII Holdings Inc. | 258,214 | 10,943,109 | (a) | |||||||
| 19,375,931 | ||||||||||
Total Domestic Equity | 1,129,545,051 | |||||||||
Foreign Equity — 25.9% | ||||||||||
Common Stock — 25.3% |
| |||||||||
Aerospace & Defense — 0.7% |
| |||||||||
CAE Inc. | 284,869 | 3,840,168 | ||||||||
European Aeronautic Defence and Space Company N.V. | 168,826 | 5,649,343 | ||||||||
Safran S.A. | 234,856 | 10,027,894 | ||||||||
| 19,517,405 | ||||||||||
Agricultural Products — 0.1% |
| |||||||||
China Agri-Industries Holdings Ltd. | 598,274 | 634,315 | ||||||||
Cosan SA Industria e Comercio | 69,540 | 1,095,013 | ||||||||
| 1,729,328 | ||||||||||
Airlines — 0.1% |
| |||||||||
International Consolidated Airlines Group S.A. | 569,021 | 2,317,639 | (a) | |||||||
Apparel Retail — 0.1% |
| |||||||||
Belle International Holdings Ltd. | 125,438 | 264,377 | ||||||||
Esprit Holdings Ltd. | 1,025,976 | 3,190,827 | ||||||||
| 3,455,204 | ||||||||||
Apparel, Accessories & Luxury Goods — 0.2% |
| |||||||||
Adidas AG | 64,693 | 5,130,591 | ||||||||
China Dongxiang Group Co. | 2,602,496 | 826,110 | ||||||||
Ports Design Ltd. | 297,244 | 702,881 | ||||||||
| 6,659,582 | ||||||||||
Application Software — 0.3% |
| |||||||||
Autonomy Corporation PLC | 152,209 | 4,171,295 | (a) | |||||||
SAP AG | 84,729 | 5,128,748 | ||||||||
| 9,300,043 | ||||||||||
Auto Parts & Equipment — 0.0%* |
| |||||||||
Exide Industries Ltd. | 124,800 | 452,130 | ||||||||
See Notes to Schedule of Investments and Notes to Financial Statements.
12
Table of Contents
Total Return Fund
| Schedule of Investments | June 30, 2011 (unaudited) |
| Number of Shares | Fair Value | |||||||||
Automobile Manufacturers — 0.8% |
| |||||||||
Daimler AG | 52,225 | $ | 3,929,783 | |||||||
Hyundai Motor Co. | 17,938 | 3,981,929 | ||||||||
Kia Motors Corp. | 8,070 | 546,491 | ||||||||
Mahindra & Mahindra Ltd. | 24,852 | 389,159 | ||||||||
Suzuki Motor Corp. | 472,995 | 10,571,520 | ||||||||
Toyota Motor Corp. | 113,665 | 4,644,558 | ||||||||
| 24,063,440 | ||||||||||
Brewers — 0.0%* |
| |||||||||
Anadolu Efes Biracilik Ve Malt Sanayii AS | 42,447 | 573,714 | ||||||||
Carlsberg A/S | 3,852 | 418,924 | ||||||||
| 992,638 | ||||||||||
Broadcasting — 0.1% |
| |||||||||
Grupo Televisa S.A. ADR | 29,498 | 725,651 | ||||||||
Zee Entertainment Enterprises Ltd. | 338,322 | 1,021,721 | ||||||||
| 1,747,372 | ||||||||||
Building Products — 0.2% |
| |||||||||
Daikin Industries Ltd. | 134,000 | 4,708,915 | ||||||||
Casinos & Gaming — 0.0%* |
| |||||||||
Genting Bhd | 318,198 | 1,182,375 | ||||||||
Coal & Consumable Fuels — 0.1% |
| |||||||||
Adaro Energy Tbk PT | 2,265,878 | 647,356 | ||||||||
Paladin Energy Ltd. | 562,413 | 1,517,340 | (a) | |||||||
| 2,164,696 | ||||||||||
Communications Equipment — 0.2% |
| |||||||||
HTC Corp. | 22,115 | 743,750 | ||||||||
Telefonaktiebolaget LM Ericsson | 375,740 | 5,430,621 | ||||||||
| 6,174,371 | ||||||||||
Construction & Engineering — 0.4% |
| |||||||||
China State Construction International Holdings Ltd. | 1,311,198 | 1,331,208 | ||||||||
Doosan Heavy Industries and Construction Company Ltd. | 12,136 | 642,237 | ||||||||
Larsen & Toubro Ltd. | 126,330 | 5,177,545 | ||||||||
Vinci S.A. | 81,207 | 5,200,483 | ||||||||
| 12,351,473 | ||||||||||
Construction & Farm Machinery & Heavy Trucks — 0.1% |
| |||||||||
First Tractor Company Ltd. | 597,486 | 743,282 | ||||||||
Sany Heavy Equipment International Holdings Company Ltd. | 1,470,339 | 1,676,068 | ||||||||
United Tractors Tbk PT | 340,837 | 989,661 | ||||||||
| 3,409,011 | ||||||||||
Department Stores — 0.0%* |
| |||||||||
Golden Eagle Retail Group Ltd. | 135,000 | 343,518 | ||||||||
| Number of Shares | Fair Value | |||||||||
Distillers & Vintners — 0.3% | ||||||||||
Diageo PLC | 389,179 | $ | 7,953,803 | |||||||
Diageo PLC ADR | 16,597 | 1,358,796 | ||||||||
| 9,312,599 | ||||||||||
Diversified Capital Markets — 0.2% |
| |||||||||
Credit Suisse Group AG | 169,666 | 6,589,167 | ||||||||
Diversified Financial Services — 2.9% |
| |||||||||
Axis Bank Ltd. | 34,316 | 986,050 | ||||||||
Banco Santander Brasil S.A. | 227,253 | 2,662,013 | ||||||||
Banco Santander S.A. | 717,264 | 8,280,919 | ||||||||
Bank of China Ltd. | 10,401,949 | 5,079,827 | ||||||||
Bank Rakyat Indonesia Persero Tbk PT | 1,672,996 | 1,268,086 | ||||||||
BNP Paribas | 220,234 | 16,996,661 | ||||||||
Grupo Financiero Banorte SAB de C.V. | 145,825 | 661,049 | ||||||||
HSBC Holdings PLC | 1,469,577 | 14,590,119 | ||||||||
ICICI Bank Ltd. | 217,113 | 5,297,600 | ||||||||
ING Groep N.V. | 437,804 | 5,388,390 | (a) | |||||||
Kasikornbank PCL | 281,247 | 1,144,211 | ||||||||
KB Financial Group Inc. | 9,285 | 439,182 | ||||||||
Lloyds Banking Group PLC | 6,516,760 | 5,126,545 | (a) | |||||||
Metropolitan Bank & Trust | 529,126 | 854,709 | ||||||||
Standard Bank Group Ltd. | 50,160 | 739,710 | ||||||||
UniCredit S.p.A. | 3,453,454 | 7,310,201 | ||||||||
United Overseas Bank Ltd. | 377,717 | 6,055,287 | ||||||||
VTB Bank OJSC GDR | 96,716 | 596,254 | (a) | |||||||
| 83,476,813 | ||||||||||
Diversified Metals & Mining — 1.5% |
| |||||||||
Anglo American PLC | 21,007 | 1,041,281 | ||||||||
Antofagasta PLC | 113,878 | 2,548,588 | ||||||||
BHP Billiton PLC | 332,422 | 13,086,010 | ||||||||
Eurasian Natural Resources Corporation PLC | 137,911 | 1,730,314 | ||||||||
First Quantum Minerals Ltd. | 5,183 | 755,190 | ||||||||
Lynas Corporation Ltd. | 2,556,609 | 4,883,123 | ||||||||
New World Resources PLC | 30,914 | 454,123 | ||||||||
Rio Tinto PLC | 242,034 | 17,448,901 | ||||||||
Xstrata PLC | 73,090 | 1,609,351 | ||||||||
| 43,556,881 | ||||||||||
Diversified Real Estate Activities — 0.3% |
| |||||||||
Mitsubishi Estate Company Ltd. (REIT) | 94,982 | 1,653,599 | ||||||||
Sumitomo Realty & Development Company Ltd. (REIT) | 198,000 | 4,386,107 | ||||||||
Wharf Holdings Ltd. | 517,942 | 3,597,721 | ||||||||
| 9,637,427 | ||||||||||
Diversified Support Services — 0.2% |
| |||||||||
Aggreko PLC | 56,220 | 1,741,085 | (a) | |||||||
Brambles Ltd. | 527,995 | 4,081,258 | ||||||||
| 5,822,343 | ||||||||||
See Notes to Schedule of Investments and Notes to Financial Statements.
13
Table of Contents
Total Return Fund
| Schedule of Investments | June 30, 2011 (unaudited) |
| Number of Shares | Fair Value | |||||||||
Electric Utilities — 0.2% |
| |||||||||
Farglory Land Development Company Ltd. GDR | 21,440 | $ | 620,763 | |||||||
Power Grid Corporation of India Ltd. | 1,067,617 | 2,622,322 | ||||||||
Reliance Infrastructure Ltd. | 92,805 | 1,111,625 | (a) | |||||||
| 4,354,710 | ||||||||||
Electrical Components & Equipment — 0.2% |
| |||||||||
Schneider Electric S.A. | 23,708 | 3,959,772 | ||||||||
Zhuzhou CSR Times Electric Company Ltd. | 265,574 | 894,206 | ||||||||
| 4,853,978 | ||||||||||
Electronic Components — 0.2% |
| |||||||||
Delta Electronics Inc. | 1,841,890 | 6,765,171 | ||||||||
Electronic Equipment & Instruments — 0.0%* |
| |||||||||
China Security & Surveillance Technology Inc. | 91,360 | 484,208 | (a) | |||||||
Elster Group SE ADR | 15,000 | 245,700 | (a) | |||||||
Wasion Group Holdings Ltd. | 479,154 | 224,760 | ||||||||
| 954,668 | ||||||||||
Electronic Manufacturing Services — 0.1% |
| |||||||||
Hon Hai Precision Industry Company Ltd. | 430,725 | 1,477,063 | ||||||||
Fertilizers & Agricultural Chemicals — 0.9% |
| |||||||||
Potash Corporation of Saskatchewan Inc.†† | 36,893 | 2,102,532 | ||||||||
Potash Corporation of Saskatchewan Inc.†† | 215,460 | 12,296,692 | ||||||||
Sociedad Quimica y Minera de Chile S.A. ADR | 28,530 | 1,846,462 | ||||||||
Syngenta AG | 27,779 | 9,363,041 | ||||||||
| 25,608,727 | ||||||||||
Food Distributors — 0.0%* |
| |||||||||
Bizim Toptan Satis Magazalari AS | 19,041 | 304,844 | ||||||||
Food Retail — 0.3% |
| |||||||||
Koninklijke Ahold N.V. | 137,789 | 1,851,099 | ||||||||
Magnit OJSC GDR | 24,392 | 765,665 | (a) | |||||||
Shoprite Holdings Ltd. | 57,240 | 859,571 | ||||||||
Tesco PLC | 724,967 | 4,678,873 | ||||||||
| 8,155,208 | ||||||||||
Gold — 0.2% |
| |||||||||
Kinross Gold Corp. | 290,372 | 4,582,288 | ||||||||
Healthcare Distributors — 0.0%* |
| |||||||||
Sinopharm Group Co. | 31,042 | 104,122 | ||||||||
Healthcare Services — 0.3% |
| |||||||||
Diagnosticos da America S.A. | 50,600 | 680,173 | ||||||||
| Number of Shares | Fair Value | |||||||||
Fresenius SE & Company KGAA | 69,287 | $ | 7,230,800 | |||||||
| 7,910,973 | ||||||||||
Healthcare Supplies — 0.3% |
| |||||||||
Cie Generale d’Optique Essilor International S.A. | 109,178 | 8,853,250 | ||||||||
Shandong Weigao Group Medical Polymer Company Ltd. | 442,797 | 641,896 | ||||||||
| 9,495,146 | ||||||||||
Heavy Electrical Equipment — 0.0%* |
| |||||||||
Dongfang Electric Corporation Ltd. | 132,000 | 487,711 | ||||||||
Hotels, Resorts & Cruise Lines — 0.1% |
| |||||||||
Accor S.A. | 47,115 | 2,106,328 | ||||||||
Minor International PCL | 1,211,000 | 449,321 | ||||||||
| 2,555,649 | ||||||||||
Household Appliances — 0.0%* |
| |||||||||
Techtronic Industries Co. | 467,998 | 558,139 | ||||||||
Household Products — 0.6% |
| |||||||||
Reckitt Benckiser Group PLC | 156,688 | 8,653,488 | ||||||||
Unicharm Corp. | 178,900 | 7,775,371 | ||||||||
| 16,428,859 | ||||||||||
Human Resource & Employment Services — 0.1% |
| |||||||||
The Capita Group PLC | 227,411 | 2,612,270 | ||||||||
Hypermarkets & Super Centers — 0.3% |
| |||||||||
Metro AG | 124,685 | 7,554,563 | ||||||||
Industrial Conglomerates — 1.0% |
| |||||||||
Chongqing Machinery & Electric Company Ltd. | 1,724,541 | 558,502 | ||||||||
Hutchison Whampoa Ltd. | 556,777 | 6,010,508 | ||||||||
Koninklijke Philips Electronics N.V. | 284,769 | 7,311,964 | ||||||||
Siemens AG | 92,664 | 12,722,832 | ||||||||
Siemens AG ADR | 24,036 | 3,305,671 | ||||||||
| 29,909,477 | ||||||||||
Industrial Gases — 0.5% |
| |||||||||
Linde AG | 82,943 | 14,538,809 | ||||||||
OCI Materials Company Ltd. | 9,431 | 1,175,728 | ||||||||
| 15,714,537 | ||||||||||
Industrial Machinery — 0.4% |
| |||||||||
FANUC Corp. | 40,500 | 6,709,881 | ||||||||
Hexagon AB | 19,273 | 475,865 | ||||||||
SMC Corp. | 28,300 | 5,060,079 | ||||||||
| 12,245,825 | ||||||||||
Integrated Oil & Gas — 2.2% |
| |||||||||
BG Group PLC | 250,836 | 5,694,247 | ||||||||
Cenovus Energy Inc. | 21,463 | 809,505 | ||||||||
See Notes to Schedule of Investments and Notes to Financial Statements.
14
Table of Contents
Total Return Fund
| Schedule of Investments | June 30, 2011 (unaudited) |
| Number of Shares | Fair Value | |||||||||
China Petroleum & Chemical Corp. | 1,396,000 | $ | 1,408,334 | |||||||
ENI S.p.A. | 85,169 | 2,013,995 | ||||||||
Gazprom OAO ADR | 137,455 | 1,999,970 | ||||||||
Lukoil OAO ADR | 29,102 | 1,855,253 | ||||||||
Petroleo Brasileiro S.A. ADR | 344,722 | 10,576,072 | ||||||||
Royal Dutch Shell PLC | 512,348 | 18,244,148 | ||||||||
Suncor Energy Inc.†† | 221,720 | 8,669,252 | ||||||||
Suncor Energy Inc.†† | 215,141 | 8,426,412 | ||||||||
Total S.A. | 72,273 | 4,178,823 | ||||||||
| 63,876,011 | ||||||||||
Integrated Telecommunication Services — 0.3% |
| |||||||||
China Unicom Hong Kong Ltd. | 479,361 | 967,193 | ||||||||
Telefonica S.A. | 242,409 | 5,925,556 | ||||||||
Telefonica S.A. ADR | 63,283 | 1,549,801 | ||||||||
| 8,442,550 | ||||||||||
Internet Software & Services — 0.7% |
| |||||||||
Baidu Inc. ADR | 145,626 | 20,406,572 | (a) | |||||||
Tencent Holdings Ltd. | 11,700 | 317,864 | ||||||||
Yandex N.V. | 1,244 | 44,174 | (a) | |||||||
| 20,768,610 | ||||||||||
Investment Banking & Brokerage — 0.2% |
| |||||||||
Egyptian Financial Group-Hermes Holding | 291,119 | 980,396 | ||||||||
Nomura Holdings Inc. | 790,338 | 3,875,357 | ||||||||
| 4,855,753 | ||||||||||
IT Consulting & Other Services — 0.3% |
| |||||||||
Cap Gemini S.A. | 96,978 | 5,680,380 | ||||||||
HCL Technologies Ltd. | 77,982 | 862,900 | ||||||||
Infosys Technologies Ltd. | 10,815 | 702,355 | ||||||||
Telvent GIT S.A. | 48,461 | 1,928,748 | (a) | |||||||
| 9,174,383 | ||||||||||
Life & Health Insurance — 0.8% |
| |||||||||
AIA Group Ltd. | 1,904,234 | 6,607,462 | (a) | |||||||
Ping An Insurance Group Co. | 60,500 | 625,118 | ||||||||
Prudential PLC | 805,906 | 9,315,666 | ||||||||
Sony Financial Holdings Inc. | 283,300 | 5,082,983 | ||||||||
| 21,631,229 | ||||||||||
Life Sciences Tools & Services — 0.0%* |
| |||||||||
ICON PLC ADR | 22,100 | 520,676 | (a) | |||||||
Marine — 0.1% |
| |||||||||
AP Moller-Maersk A/S | 385 | 3,319,714 | ||||||||
Metal & Glass Containers — 0.0%* |
| |||||||||
Everest Kanto Cylinder Ltd. | 618,041 | 1,269,886 | ||||||||
Multi-Line Insurance — 0.5% |
| |||||||||
AXA S.A. | 438,702 | 9,966,929 | ||||||||
Porto Seguro S.A. | 25,715 | 399,984 | ||||||||
Zurich Financial Services AG | 14,930 | 3,769,736 | ||||||||
| 14,136,649 | ||||||||||
| Number of Shares | Fair Value | |||||||||
Multi-Utilities — 0.5% |
| |||||||||
National Grid PLC | 839,769 | $ | 8,257,773 | |||||||
Veolia Environnement S.A. | 175,539 | 4,950,123 | ||||||||
| 13,207,896 | ||||||||||
Oil & Gas Drilling — 0.0%* |
| |||||||||
China Oilfield Services Ltd. | 326,000 | 594,079 | ||||||||
Oil & Gas Equipment & Services — 0.1% |
| |||||||||
Cie Generale de Geophysique-Veritas | 40,264 | 1,482,769 | (a) | |||||||
Gasfrac Energy Services Inc. | 110,416 | 1,006,798 | ||||||||
| 2,489,567 | ||||||||||
Oil & Gas Exploration & Production — 0.3% |
| |||||||||
Afren PLC | 1,087,149 | 2,755,930 | (a) | |||||||
Canadian Natural Resources Ltd. | 110,479 | 4,628,190 | ||||||||
CNOOC Ltd. | 409,000 | 956,633 | ||||||||
Pacific Rubiales Energy Corp. | 18,931 | 507,063 | ||||||||
| 8,847,816 | ||||||||||
Oil & Gas Refining & Marketing — 0.0%* |
| |||||||||
Reliance Industries Ltd. | 48,450 | 970,084 | ||||||||
Packaged Foods & Meats — 0.7% |
| |||||||||
Nestle S.A. | 232,949 | 14,455,564 | ||||||||
Nestle S.A. ADR | 23,058 | 1,438,358 | ||||||||
Unilever N.V., CVA | 96,533 | 3,163,757 | ||||||||
| 19,057,679 | ||||||||||
Pharmaceuticals — 0.9% |
| |||||||||
Bayer AG | 71,020 | 5,708,561 | ||||||||
Lijun International Pharmaceutical Holding Ltd. | 1,382,856 | 284,346 | ||||||||
Novartis AG | 163,983 | 10,029,839 | ||||||||
Novartis AG ADR | 115,782 | 7,075,438 | ||||||||
Teva Pharmaceutical Industries Ltd. ADR | 68,620 | 3,308,856 | ||||||||
| 26,407,040 | ||||||||||
Precious Metals & Minerals — 0.0%* |
| |||||||||
Aquarius Platinum Ltd. | 237,905 | 1,214,585 | ||||||||
Real Estate Operating Companies — 0.0%* |
| |||||||||
Iguatemi Empresa de Shopping Centers S.A. (REIT) | 36,149 | 887,383 | ||||||||
Regional Banks — 0.1% |
| |||||||||
The Bank of Yokohama Ltd. | 868,948 | 4,314,613 | ||||||||
Restaurants — 0.1% |
| |||||||||
Arcos Dorados Holdings Inc. | 70,227 | 1,481,087 | ||||||||
See Notes to Schedule of Investments and Notes to Financial Statements.
15
Table of Contents
Total Return Fund
| Schedule of Investments | June 30, 2011 (unaudited) |
| Number of Shares | Fair Value | |||||||||
Security & Alarm Services — 0.1% |
| |||||||||
G4S PLC†† | 344,461 | $ | 1,547,337 | |||||||
G4S PLC†† | 124,779 | 566,339 | ||||||||
| 2,113,676 | ||||||||||
Semiconductors — 0.8% |
| |||||||||
Samsung Electronics Company Ltd. | 15,180 | 11,744,186 | ||||||||
Taiwan Semiconductor Manufacturing Company Ltd. | 4,322,433 | 10,864,959 | ||||||||
Taiwan Semiconductor Manufacturing Company Ltd. ADR | 41,011 | 517,149 | ||||||||
| 23,126,294 | ||||||||||
Specialized Finance — 0.2% |
| |||||||||
Deutsche Boerse AG | 60,381 | 4,587,271 | ||||||||
Specialty Chemicals — 0.1% |
| |||||||||
Neo Material Technologies Inc. | 161,848 | 1,556,263 | (a) | |||||||
Novozymes A/S | 6,789 | 1,104,535 | ||||||||
| 2,660,798 | ||||||||||
Steel — 0.5% |
| |||||||||
Mechel ADR | 42,892 | 1,024,690 | ||||||||
Mechel Preference ADR | 109,726 | 946,935 | ||||||||
Tata Steel Ltd. | 35,332 | 483,713 | ||||||||
ThyssenKrupp AG | 88,013 | 4,572,745 | ||||||||
Vale S.A. ADR | 275,620 | 7,981,955 | ||||||||
| 15,010,038 | ||||||||||
Tobacco — 0.0%* |
| |||||||||
ITC Ltd. | 51,126 | 232,170 | ||||||||
Trading Companies & Distributors — 0.3% |
| |||||||||
Barloworld Ltd. | 40,695 | 413,613 | ||||||||
Mitsubishi Corp. | 293,000 | 7,256,067 | ||||||||
| 7,669,680 | ||||||||||
Wireless Telecommunication Services — 1.0% |
| |||||||||
America Movil SAB de C.V. ADR | 113,751 | 6,128,904 | ||||||||
Mobile Telesystems OJSC ADR | 159,098 | 3,026,044 | ||||||||
MTN Group Ltd. | 218,320 | 4,634,349 | ||||||||
Softbank Corp. | 205,098 | 7,694,984 | ||||||||
Vodafone Group PLC | 3,254,475 | 8,636,759 | ||||||||
| 30,121,040 | ||||||||||
Total Common Stock | 734,586,555 | |||||||||
Preferred Stock — 0.6% |
| |||||||||
Automobile Manufacturers — 0.4% |
| |||||||||
Volkswagen AG | 50,388 | 10,399,378 | ||||||||
| Number of Shares | Fair Value | |||||||||
Diversified Financial Services — 0.1% |
| |||||||||
Itau Unibanco Holding S.A. | 77,091 | $ | 1,798,667 | |||||||
Integrated Oil & Gas — 0.0%* |
| |||||||||
Petroleo Brasileiro S.A. | 86,715 | 1,316,614 | ||||||||
Steel — 0.1% |
| |||||||||
Vale S.A. | 113,194 | 3,234,425 | ||||||||
Total Preferred Stock | 16,749,084 | |||||||||
Total Foreign Equity | 751,335,639 | |||||||||
| Principal Amount | Fair Value | |||||||||||
Bonds and Notes — 26.3% |
| |||||||||||
U.S. Treasuries — 4.2% |
| |||||||||||
U.S. Treasury Bonds |
| |||||||||||
4.75% | 02/15/41 | $ | 43,613,000 | $ | 46,359,267 | (h) | ||||||
U.S. Treasury Notes |
| |||||||||||
0.35% | 12/31/12 | 614,300 | 616,820 | (d) | ||||||||
0.43% | 04/30/13 | 8,637,000 | 8,668,007 | (d) | ||||||||
1.75% | 05/31/16 | 4,332,000 | 4,338,758 | |||||||||
2.00% | 04/30/16 | 47,465,700 | 48,185,280 | (h) | ||||||||
3.13% | 05/15/21 | 13,495,800 | 13,457,877 | (h) | ||||||||
| 121,626,009 | ||||||||||||
Federal Agencies — 0.0%* |
| |||||||||||
Republic of Belarus |
| |||||||||||
8.95% | 01/26/18 | 500,000 | 438,750 | |||||||||
Wakala Global Sukuk Bhd |
| |||||||||||
2.99% | 07/06/16 | 250,000 | 249,087 | (b) | ||||||||
4.65% | 07/06/21 | 250,000 | 249,167 | (b) | ||||||||
| 937,004 | ||||||||||||
Agency Mortgage Backed — 9.7% |
| |||||||||||
Federal Home Loan Mortgage Corp. |
| |||||||||||
4.50% | 06/01/33 - 02/01/41 | 9,935,524 | 10,279,521 | (h) | ||||||||
5.00% | 07/01/35 - 08/01/40 | 12,611,613 | 13,417,525 | (h) | ||||||||
5.50% | 05/01/20 - 04/01/39 | 2,805,732 | 3,063,622 | (h) | ||||||||
6.00% | 04/01/17 - 11/01/37 | 2,801,044 | 3,107,059 | (h) | ||||||||
6.50% | 06/01/29 - 03/01/30 | 4,257 | 4,824 | (h) | ||||||||
7.00% | 06/01/29 - 08/01/36 | 140,460 | 162,107 | (h) | ||||||||
7.50% | 01/01/28 - 09/01/33 | 18,200 | 21,235 | (h) | ||||||||
8.00% | 01/01/30 - 11/01/30 | 11,103 | 13,207 | (h) | ||||||||
9.00% | 10/01/25 | 361 | 443 | (h) | ||||||||
Federal National Mortgage Assoc. | ||||||||||||
4.00% | 05/01/19 - 06/01/19 | 109,831 | 116,221 | (h) | ||||||||
4.50% | 05/01/18 - 10/01/40 | 33,921,879 | 35,164,659 | (h) | ||||||||
5.00% | 07/01/20 - 11/01/40 | 18,363,425 | 19,557,688 | (h) | ||||||||
5.32% | 03/01/37 | 10,008 | 10,087 | (i) | ||||||||
5.50% | 04/01/14 - 01/01/39 | 24,924,591 | 27,100,209 | (h) | ||||||||
See Notes to Schedule of Investments and Notes to Financial Statements.
16
Table of Contents
Total Return Fund
| Schedule of Investments | June 30, 2011 (unaudited) |
| Principal Amount | Fair Value | |||||||||||
5.53% | 04/01/37 | $ | 4,346 | $ | 4,621 | (i) | ||||||
6.00% | 09/01/19 - 05/01/38 | 15,310,544 | 16,943,445 | (h) | ||||||||
6.50% | 09/01/17 - 08/01/36 | 428,849 | 483,316 | (h) | ||||||||
7.00% | 04/01/17 - 12/01/33 | 7,639 | 8,611 | (h) | ||||||||
7.50% | 09/01/13 - 03/01/34 | 43,249 | 49,660 | (h) | ||||||||
8.00% | 12/01/11 - 11/01/33 | 14,789 | 17,287 | (h) | ||||||||
8.50% | 06/01/30 | 39 | 40 | (h) | ||||||||
9.00% | 04/01/16 - 12/01/22 | 3,745 | 4,140 | (h) | ||||||||
4.00% | TBA | 21,370,000 | 21,370,000 | (c) | ||||||||
4.50% | TBA | 35,116,000 | 36,328,591 | (c) | ||||||||
5.00% | TBA | 13,535,000 | 14,380,938 | (c) | ||||||||
5.50% | TBA | 9,600,000 | 10,404,000 | (c) | ||||||||
6.00% | TBA | 10,767,000 | 11,819,554 | (c) | ||||||||
6.50% | TBA | 5,044,000 | 5,710,756 | (c) | ||||||||
Government National Mortgage Assoc. |
| |||||||||||
4.50% | 08/15/33 - 03/20/41 | 12,454,794 | 13,136,708 | (h) | ||||||||
6.00% | 04/15/27 - 09/15/36 | 377,104 | 425,342 | (h) | ||||||||
6.50% | 04/15/24 - 09/15/36 | 291,624 | 336,555 | (h) | ||||||||
7.00% | 03/15/12 - 10/15/36 | 239,043 | 278,070 | (h) | ||||||||
8.00% | 03/15/30 | 3,139 | 3,408 | (h) | ||||||||
9.00% | 11/15/16 - 12/15/21 | 9,290 | 10,567 | (h) | ||||||||
4.50% | TBA | 35,810,000 | 37,744,185 | (c) | ||||||||
| 281,478,201 | ||||||||||||
Agency Collateralized Mortgage Obligations — 0.6% |
| |||||||||||
Fannie Mae Whole Loan |
| |||||||||||
0.98% | 08/25/43 | 3,510,870 | 95,751 | (g,o) | ||||||||
Federal Home Loan Mortgage Corp. | ||||||||||||
0.08% | 09/25/43 | 263,613 | 2,354 | (g,h,o) | ||||||||
Federal Home Loan Mortgage Corp. REMIC | ||||||||||||
3.50% | 11/15/24 | 1,428,846 | 190,520 | (g,o) | ||||||||
5.00% | 02/15/38 | 506,706 | 68,446 | (g,o) | ||||||||
5.00% | 05/15/38 | 636,159 | 677,879 | |||||||||
5.50% | 04/15/17 | 12,490 | 251 | (g,h,o) | ||||||||
6.41% | 08/15/25 | 3,852,098 | 703,388 | (g,i,o) | ||||||||
Federal Home Loan Mortgage Corp. REMIC (Series 1980) (Class 1980) | ||||||||||||
7.50% | 07/15/27 | 3,122 | 616 | (g,h,o) | ||||||||
Federal Home Loan Mortgage Corp. REMIC (Series 2631) (Class DI) | ||||||||||||
5.50% | 06/15/33 | 34,976 | 7,324 | (g,h,o) | ||||||||
Federal Home Loan Mortgage Corp. REMIC (Series 2643) (Class IM) | ||||||||||||
4.50% | 03/15/18 | 30,869 | 2,443 | (g,h,o) | ||||||||
Federal Home Loan Mortgage Corp. REMIC (Series 2645) (Class BI) | ||||||||||||
4.50% | 02/15/18 | 14,264 | 948 | (g,h,o) | ||||||||
Federal Home Loan Mortgage Corp. REMIC (Series 2647) (Class DI) | ||||||||||||
4.50% | 10/15/16 | 2,497 | 20 | (g,h,o) | ||||||||
| Principal Amount | Fair Value | |||||||||||
Federal Home Loan Mortgage Corp. REMIC (Series 2722) (Class PI) | ||||||||||||
5.00% | 06/15/28 | $ | 4,230 | $ | 84 | (g,h,o) | ||||||
Federal Home Loan Mortgage Corp. REMIC (Series 2763) (Class JI) | ||||||||||||
5.00% | 10/15/18 | 37,120 | 3,030 | (g,h,o) | ||||||||
Federal Home Loan Mortgage Corp. REMIC (Series 2781) (Class IC) | ||||||||||||
5.00% | 11/15/17 - 05/15/18 | 37,346 | 2,002 | (g,h,o) | ||||||||
Federal Home Loan Mortgage Corp. REMIC (Series 2795) (Class IC) | ||||||||||||
5.00% | 07/15/17 | 8,557 | 209 | (g,h,o) | ||||||||
Federal Home Loan Mortgage Corp. REMIC (Series 2852) (Class OJ) | ||||||||||||
0.00% | 09/15/34 | 10,969 | 9,691 | (d,f) | ||||||||
Federal Home Loan Mortgage Corp. STRIPS | ||||||||||||
8.00% | 02/01/23 - 07/01/24 | 2,201 | 438 | (g,h,o) | ||||||||
Federal Home Loan Mortgage STRIPS | ||||||||||||
5.06% | 08/01/27 | 538 | 440 | (d,f,h) | ||||||||
Federal National Mortgage Assoc. (Class 1IO2) | ||||||||||||
1.08% | 11/25/33 | 2,015,411 | 81,881 | (g,i,o) | ||||||||
Federal National Mortgage Assoc. REMIC | ||||||||||||
5.00% | 08/25/38 | 642,220 | 680,352 | |||||||||
5.00% | 02/25/40 - 09/25/40 | 5,304,680 | 896,105 | (g,o) | ||||||||
5.81% | 07/25/38 | 1,866,206 | 242,514 | (g,o) | ||||||||
Federal National Mortgage Assoc. REMIC (Class BZ) | ||||||||||||
5.50% | 01/25/33 | 725,404 | 797,874 | |||||||||
Federal National Mortgage Assoc. REMIC (Class VZ) | ||||||||||||
5.00% | 10/25/35 | 496,247 | 504,948 | |||||||||
Federal National Mortgage Assoc. REMIC (Series 1992) (Class K) | ||||||||||||
12.40% | 05/25/22 | 2 | 55 | (g,h,o) | ||||||||
Federal National Mortgage Assoc. REMIC (Series 2003) (Class HI) | ||||||||||||
5.00% | 10/25/22 | 30,917 | 2,428 | (g,h,o) | ||||||||
Federal National Mortgage Assoc. REMIC (Series 2003) (Class IJ) | ||||||||||||
5.00% | 02/25/32 | 839,757 | 88,380 | (g,o) | ||||||||
Federal National Mortgage Assoc. REMIC (Series 2003) (Class IO) | ||||||||||||
1.22% | 12/25/42 | 129,422 | 4,103 | (g,h,o) | ||||||||
Federal National Mortgage Assoc. REMIC (Series 2003) (Class KI) | ||||||||||||
4.50% | 05/25/18 | 9,458 | 308 | (g,h,o) | ||||||||
Federal National Mortgage Assoc. REMIC (Series 2003) (Class SL) | ||||||||||||
16.20% | 03/25/31 | 27,235 | 31,855 | (h) | ||||||||
Federal National Mortgage Assoc. REMIC (Series 2008) (Class ZW) | ||||||||||||
5.00% | 07/25/38 | 511,975 | 538,204 | |||||||||
See Notes to Schedule of Investments and Notes to Financial Statements.
17
Table of Contents
Total Return Fund
| Schedule of Investments | June 30, 2011 (unaudited) |
| Principal Amount | Fair Value | |||||||||||
Federal National Mortgage Assoc. STRIPS | ||||||||||||
6.00% | 01/01/35 | $ | 574,537 | $ | 100,471 | (g,o) | ||||||
Federal National Mortgage Assoc. STRIPS (Class 2) | ||||||||||||
4.50% | 08/01/35 | 859,562 | 125,835 | (g,o) | ||||||||
5.00% | 03/25/38 | 646,357 | 122,707 | (g,o) | ||||||||
5.50% | 12/01/33 | 178,340 | 38,001 | (g,o) | ||||||||
7.50% | 11/01/23 | 9,894 | 1,712 | (g,h,o) | ||||||||
8.00% | 08/01/23 - 07/01/24 | 4,481 | 1,027 | (g,h,o) | ||||||||
Federal National Mortgage Assoc. STRIPS (Series 378) (Class 1) | ||||||||||||
4.50% | 01/01/36 | 1,019,970 | 155,391 | (g,o) | ||||||||
Federal National Mortgage Assoc. STRIPS (Series 387) (Class 1) | ||||||||||||
5.00% | 05/25/38 | 619,591 | 119,424 | (g,o) | ||||||||
Government National Mortgage Assoc. | ||||||||||||
4.50% | 04/16/34 - 08/16/39 | 19,610,252 | 3,426,227 | (g,o) | ||||||||
4.50% | 11/20/39 | 1,845,626 | 1,799,516 | |||||||||
5.00% | 12/20/35 - 09/20/38 | 6,619,576 | 1,145,279 | (g,o) | ||||||||
5.96% | 02/20/38 | 5,422,166 | 888,657 | (g,i,o) | ||||||||
6.31% | 01/16/39 | 5,608,096 | 950,132 | (g,i,o) | ||||||||
6.41% | 08/20/40 | 8,877,219 | 1,691,292 | (g,i,o) | ||||||||
Government National Mortgage Assoc. (Class IC) | ||||||||||||
6.06% | 04/16/37 | 1,800,571 | 350,005 | (g,o) | ||||||||
Vendee Mortgage Trust | ||||||||||||
0.38% | 04/15/40 | 6,293,080 | 135,931 | (g,i,o) | ||||||||
0.58% | 09/15/46 | 13,791,659 | 504,699 | (g,i,o) | ||||||||
Vendee Mortgage Trust (Class IO) | ||||||||||||
0.85% | 05/15/33 | 2,137,427 | 63,699 | (g,i,o) | ||||||||
| 17,254,846 | ||||||||||||
Asset Backed — 0.3% |
| |||||||||||
Bear Stearns Asset Backed Securities Trust (Class 2A2) | ||||||||||||
5.00% | 02/25/36 | 948,361 | 904,192 | (d,h) | ||||||||
Bear Stearns Asset Backed Securities Trust (Series 2003) (Class A) | ||||||||||||
5.48% | 01/25/34 | 4,051 | 3,059 | (d,n) | ||||||||
Capital One Multi-Asset Execution Trust (Class B) | ||||||||||||
1.07% | 01/15/19 | 500,000 | 485,908 | (d) | ||||||||
Chase Funding Mortgage Loan Asset-Backed Certificates | ||||||||||||
3.99% | 11/25/33 | 1,145,919 | 1,092,696 | (j) | ||||||||
Citicorp Residential Mortgage Securities Inc. (Series 2006) (Class A5) | ||||||||||||
6.04% | 09/25/36 | 3,750,000 | 3,233,771 | (h) | ||||||||
Countrywide Asset-Backed Certificates (Class M1T4) | ||||||||||||
1.24% | 06/26/33 | 586,601 | 288,482 | (h) | ||||||||
GSAMP Trust | ||||||||||||
9.06% | 05/25/46 | 38,440 | 38,212 | (b,d) | ||||||||
Hertz Vehicle Financing LLC | ||||||||||||
2.60% | 02/25/15 | 1,500,000 | 1,530,106 | (b) | ||||||||
Indymac Seconds Asset Backed Trust (Class A) | ||||||||||||
1.00% | 02/25/37 | 1,150,692 | 559,015 | (d,h) | ||||||||
| Principal Amount | Fair Value | |||||||||||
Mid-State Trust (Class A3) | ||||||||||||
7.54% | 07/01/35 | $ | 3,544 | $ | 3,584 | (h,n) | ||||||
Popular ABS Mortgage Pass-Through Trust (Class AF4) | ||||||||||||
5.30% | 11/25/35 | 700,000 | 592,786 | |||||||||
Residential Asset Securities Corp. (Series 2002) (Class AIIB) | ||||||||||||
10.00% | 07/25/32 | 4,125 | 2,445 | (d,h,n) | ||||||||
| 8,734,256 | ||||||||||||
Corporate Notes — 8.8% |
| |||||||||||
ABN Amro Bank N.V. | ||||||||||||
3.00% | 01/31/14 | 1,694,000 | 1,730,487 | (b,h) | ||||||||
AES El Salvador Trust | ||||||||||||
6.75% | 02/01/16 | 200,000 | 203,000 | (b) | ||||||||
AES Panama S.A. | ||||||||||||
6.35% | 12/21/16 | 443,000 | 476,225 | (b) | ||||||||
Agilent Technologies Inc. | ||||||||||||
5.50% | 09/14/15 | 829,000 | 917,963 | (h) | ||||||||
Air Jamaica Ltd. | ||||||||||||
9.38% | 07/08/15 | 212,143 | 226,993 | |||||||||
Allergan Inc. | ||||||||||||
3.38% | 09/15/20 | 1,590,000 | 1,525,023 | |||||||||
Alliance One International Inc. | ||||||||||||
10.00% | 07/15/16 | 821,000 | 792,265 | (h) | ||||||||
Alpha Natural Resources Inc. | ||||||||||||
6.00% | 06/01/19 | 889,000 | 886,777 | |||||||||
ALROSA Finance S.A. | ||||||||||||
7.75% | 11/03/20 | 200,000 | 217,500 | (b) | ||||||||
Ameren Illinois Co. | ||||||||||||
9.75% | 11/15/18 | 796,000 | 1,045,985 | (h) | ||||||||
American International Group Inc. | ||||||||||||
5.85% | 01/16/18 | 1,481,000 | 1,549,683 | (h) | ||||||||
Amgen Inc. | ||||||||||||
2.30% | 06/15/16 | 701,000 | 694,942 | |||||||||
4.10% | 06/15/21 | 1,002,000 | 994,094 | |||||||||
5.65% | 06/15/42 | 1,072,000 | 1,073,734 | |||||||||
Amsted Industries Inc. | ||||||||||||
8.13% | 03/15/18 | 694,000 | 728,700 | (b,h) | ||||||||
Anadarko Petroleum Corp. | ||||||||||||
6.20% | 03/15/40 | 1,612,000 | 1,633,756 | |||||||||
6.95% | 06/15/19 | 1,757,000 | 2,052,195 | |||||||||
Anheuser-Busch InBev Worldwide Inc. | ||||||||||||
3.63% | 04/15/15 | 1,433,000 | 1,516,071 | (h) | ||||||||
5.38% | 11/15/14 | 2,246,000 | 2,508,189 | |||||||||
AON Corp. | ||||||||||||
3.13% | 05/27/16 | 1,205,000 | 1,201,074 | |||||||||
Applied Materials Inc. | ||||||||||||
2.65% | 06/15/16 | 502,000 | 503,915 | |||||||||
4.30% | 06/15/21 | 1,004,000 | 1,007,350 | |||||||||
5.85% | 06/15/41 | 1,004,000 | 1,018,336 | |||||||||
ArcelorMittal | ||||||||||||
3.75% | 03/01/16 | 744,000 | 752,314 | (h) | ||||||||
5.50% | 03/01/21 | 2,569,000 | 2,573,010 | |||||||||
Arch Coal Inc. | ||||||||||||
7.00% | 06/15/19 | 893,000 | 890,767 | (b) | ||||||||
Archer-Daniels-Midland Co. | ||||||||||||
5.77% | 03/01/41 | 3,049,000 | 3,217,658 | |||||||||
See Notes to Schedule of Investments and Notes to Financial Statements.
18
Table of Contents
Total Return Fund
| Schedule of Investments | June 30, 2011 (unaudited) |
| Principal Amount | Fair Value | |||||||||||
Arizona Public Service Co. | ||||||||||||
6.25% | 08/01/16 | $ | 370,000 | $ | 423,028 | (h) | ||||||
AT&T Inc. | ||||||||||||
2.95% | 05/15/16 | 1,583,000 | 1,603,237 | |||||||||
4.45% | 05/15/21 | 1,583,000 | 1,610,972 | |||||||||
6.40% | 05/15/38 | 3,628,000 | 3,891,629 | |||||||||
6.70% | 11/15/13 | 934,000 | 1,047,375 | (h) | ||||||||
Banco de Credito del Peru | ||||||||||||
4.75% | 03/16/16 | 557,000 | 551,430 | (b) | ||||||||
Banco do Brasil S.A. | ||||||||||||
5.88% | 01/26/22 | 1,004,000 | 992,956 | (b) | ||||||||
Banco Mercantil del Norte S.A. (Series REGS) | ||||||||||||
6.14% | 10/13/16 | 148,000 | 147,630 | (i) | ||||||||
BanColombia S.A. | ||||||||||||
5.95% | 06/03/21 | 675,000 | 685,125 | (b) | ||||||||
6.13% | 07/26/20 | 170,000 | 172,329 | |||||||||
Bank of America Corp. | ||||||||||||
5.42% | 03/15/17 | 4,000,000 | 4,080,628 | |||||||||
5.63% | 07/01/20 | 2,945,000 | 3,040,748 | (h) | ||||||||
6.50% | 08/01/16 | 1,040,000 | 1,159,864 | (h) | ||||||||
Banque Centrale de Tunisie S.A. | ||||||||||||
7.38% | 04/25/12 | 600,000 | 622,500 | |||||||||
BBVA Bancomer S.A. | ||||||||||||
6.50% | 03/10/21 | 200,000 | 204,000 | (b) | ||||||||
Boise Paper Holdings LLC | ||||||||||||
8.00% | 04/01/20 | 1,158,000 | 1,215,900 | (h) | ||||||||
Bombardier Inc. | ||||||||||||
7.75% | 03/15/20 | 1,251,000 | 1,407,375 | (b,h) | ||||||||
BP Capital Markets PLC | ||||||||||||
3.13% | 10/01/15 | 473,000 | 485,627 | (h) | ||||||||
4.50% | 10/01/20 | 773,000 | 788,301 | (h) | ||||||||
Braskem Finance Ltd. | ||||||||||||
5.75% | 04/15/21 | 200,000 | 201,260 | (b) | ||||||||
Calpine Corp. | ||||||||||||
7.25% | 10/15/17 | 1,419,000 | 1,440,285 | (b,h) | ||||||||
Camden Property Trust | ||||||||||||
4.88% | 06/15/23 | 702,000 | 685,014 | |||||||||
Capex S.A. | ||||||||||||
10.00% | 03/10/18 | 185,000 | 181,762 | (b) | ||||||||
Cargill Inc. | ||||||||||||
5.20% | 01/22/13 | 2,235,000 | 2,376,299 | (b,h) | ||||||||
Caterpillar Inc. | ||||||||||||
3.90% | 05/27/21 | 1,506,000 | 1,506,197 | |||||||||
CCO Holdings LLC | ||||||||||||
7.88% | 04/30/18 | 2,140,000 | 2,255,025 | |||||||||
8.13% | 04/30/20 | 402,000 | 434,160 | |||||||||
Centrais Eletricas Brasileiras S.A. | ||||||||||||
6.88% | 07/30/19 | 136,000 | 154,020 | (b) | ||||||||
Central American Bank for Economic Integration | ||||||||||||
5.38% | 09/24/14 | 770,000 | 834,380 | (b) | ||||||||
CenturyLink Inc. | ||||||||||||
5.15% | 06/15/17 | 1,006,000 | 1,007,652 | |||||||||
6.45% | 06/15/21 | 1,004,000 | 992,523 | |||||||||
CenturyLink Inc. (Series G) | ||||||||||||
6.88% | 01/15/28 | 743,000 | 701,475 | |||||||||
CFG Investment SAC | ||||||||||||
9.25% | 12/19/13 | 400,000 | 410,000 | |||||||||
| Principal Amount | Fair Value | |||||||||||
Chesapeake Midstream Partners LP | ||||||||||||
5.88% | 04/15/21 | $ | 1,277,000 | $ | 1,261,037 | (b) | ||||||
Chrysler Group LLC | ||||||||||||
8.00% | 06/15/19 | 400,000 | 393,000 | (b) | ||||||||
Chubb Corp. | ||||||||||||
6.38% | 03/29/67 | 382,000 | 395,370 | (i) | ||||||||
Cincinnati Bell Inc. | ||||||||||||
8.25% | 10/15/17 | 1,065,000 | 1,070,325 | |||||||||
Cinemark USA Inc. | ||||||||||||
7.38% | 06/15/21 | 529,000 | 526,355 | (b) | ||||||||
Citigroup Inc. | ||||||||||||
5.00% | 09/15/14 | 4,522,000 | 4,738,866 | (h) | ||||||||
5.13% | 05/05/14 | 1,137,000 | 1,218,678 | (h) | ||||||||
Comision Federal de Electricidad | ||||||||||||
4.88% | 05/26/21 | 1,750,000 | 1,747,550 | (b) | ||||||||
Consolidated Edison Company of New York Inc. | ||||||||||||
6.65% | 04/01/19 | 528,000 | 631,603 | (h) | ||||||||
Consolidated Edison Company of New York Inc. (Series 2008) | ||||||||||||
5.85% | 04/01/18 | 1,565,000 | 1,795,232 | (h) | ||||||||
Corp Nacional del Cobre de Chile | ||||||||||||
3.75% | 11/04/20 | 871,000 | 827,514 | (b,h) | ||||||||
5.63% | 09/21/35 | 134,000 | 135,872 | (b,h) | ||||||||
COX Communications Inc. | ||||||||||||
6.25% | 06/01/18 | 2,000,000 | 2,290,682 | (b,h) | ||||||||
Credit Suisse AG | ||||||||||||
2.60% | 05/27/16 | 1,009,000 | 1,006,599 | (b) | ||||||||
Credit Suisse First Boston International for CJSC The EXIM of Ukraine | ||||||||||||
7.65% | 09/07/11 | 600,000 | 606,000 | |||||||||
Crown Castle Towers LLC | ||||||||||||
4.88% | 08/15/40 | 1,250,000 | 1,256,906 | (b,h) | ||||||||
6.11% | 01/15/40 | 326,000 | 355,705 | (b,h) | ||||||||
CVS Caremark Corp. | ||||||||||||
3.25% | 05/18/15 | 365,000 | 378,815 | |||||||||
5.75% | 06/01/17 | 264,000 | 296,518 | |||||||||
Danaher Corp. | ||||||||||||
2.30% | 06/23/16 | 1,004,000 | 1,003,200 | |||||||||
3.90% | 06/23/21 | 201,000 | 200,209 | |||||||||
Denbury Resources Inc. | ||||||||||||
6.38% | 08/15/21 | 761,000 | 761,000 | |||||||||
8.25% | 02/15/20 | 662,000 | 721,580 | (h) | ||||||||
Digicel Ltd. | ||||||||||||
8.25% | 09/01/17 | 100,000 | 103,750 | (b) | ||||||||
DirecTV Holdings LLC | ||||||||||||
3.55% | 03/15/15 | 1,057,000 | 1,104,362 | (h) | ||||||||
4.75% | 10/01/14 | 1,026,000 | 1,123,083 | (h) | ||||||||
Dolphin Energy Ltd. | ||||||||||||
5.89% | 06/15/19 | 353,440 | 380,832 | (b,h) | ||||||||
Drummond Company Inc. | ||||||||||||
9.00% | 10/15/14 | 898,000 | 945,145 | (b,h) | ||||||||
Dubai Electricity & Water Authority | ||||||||||||
6.38% | 10/21/16 | 160,000 | 166,000 | (b,h) | ||||||||
7.38% | 10/21/20 | 240,000 | 246,900 | (b,h) | ||||||||
Duke Realty LP | ||||||||||||
6.50% | 01/15/18 | 529,000 | 588,305 | (h) | ||||||||
See Notes to Schedule of Investments and Notes to Financial Statements.
19
Table of Contents
Total Return Fund
| Schedule of Investments | June 30, 2011 (unaudited) |
| Principal Amount | Fair Value | |||||||||||
EH Holding Corp. | ||||||||||||
6.50% | 06/15/19 | $ | 979,000 | $ | 996,132 | (b) | ||||||
Empresa Nacional del Petroleo | ||||||||||||
5.25% | 08/10/20 | 250,000 | 253,452 | (b,h) | ||||||||
6.25% | 07/08/19 | 250,000 | 270,614 | (b,h) | ||||||||
ENN Energy Holdings Ltd. | ||||||||||||
6.00% | 05/13/21 | 300,000 | 294,770 | (b) | ||||||||
European Investment Bank | ||||||||||||
4.88% | 01/17/17 | 2,440,000 | 2,764,871 | (h) | ||||||||
Exelon Corp. | ||||||||||||
4.90% | 06/15/15 | 1,393,000 | 1,497,818 | (h) | ||||||||
First Citizens St. Lucia Ltd. | ||||||||||||
4.90% | 02/09/16 | 450,000 | 459,505 | (b) | ||||||||
First Horizon National Corp. | ||||||||||||
5.38% | 12/15/15 | 1,522,000 | 1,619,280 | |||||||||
Ford Motor Credit Company LLC | ||||||||||||
5.00% | 05/15/18 | 700,000 | 697,607 | |||||||||
FPL Group Capital Inc. | ||||||||||||
2.60% | 09/01/15 | 1,886,000 | 1,877,355 | (h) | ||||||||
Fresenius Medical Care US Finance Inc. | ||||||||||||
5.75% | 02/15/21 | 2,274,000 | 2,228,520 | (b) | ||||||||
Frontier Communications Corp. | ||||||||||||
7.13% | 03/15/19 | 928,000 | 951,200 | |||||||||
Georgia-Pacific LLC | ||||||||||||
5.40% | 11/01/20 | 1,643,000 | 1,674,434 | (b) | ||||||||
Globo Comunicacao e Participacoes S.A. | ||||||||||||
6.25% | 12/31/49 | 180,000 | 188,550 | (b,j) | ||||||||
Gold Fields Orogen Holding BVI Ltd. | ||||||||||||
4.88% | 10/07/20 | 284,000 | 268,817 | (b) | ||||||||
Goldman Sachs Capital I | ||||||||||||
6.35% | 02/15/34 | 982,000 | 928,640 | |||||||||
Great Plains Energy Inc. | ||||||||||||
4.85% | 06/01/21 | 1,004,000 | 1,007,216 | |||||||||
Gruposura Finance | ||||||||||||
5.70% | 05/18/21 | 300,000 | 299,250 | (b) | ||||||||
Hanesbrands Inc. | ||||||||||||
6.38% | 12/15/20 | 949,000 | 920,530 | (h) | ||||||||
HCA Inc. | ||||||||||||
9.25% | 11/15/16 | 823,000 | 873,409 | (h) | ||||||||
HCP Inc. | ||||||||||||
6.00% | 01/30/17 | 919,000 | 1,011,954 | |||||||||
Hewlett-Packard Co. | ||||||||||||
4.30% | 06/01/21 | 2,008,000 | 2,027,632 | |||||||||
Hidili Industry International Development Ltd. | ||||||||||||
8.63% | 11/04/15 | 175,000 | 171,937 | (b) | ||||||||
HSBC Finance Corp. | ||||||||||||
6.68% | 01/15/21 | 4,934,000 | 5,062,348 | (b,h) | ||||||||
Huntington BancShares Inc. | ||||||||||||
7.00% | 12/15/20 | 693,000 | 781,360 | |||||||||
Indo Energy Finance BV | ||||||||||||
7.00% | 05/07/18 | 300,000 | 309,000 | (b) | ||||||||
ING Bank N.V. | ||||||||||||
4.00% | 03/15/16 | 1,450,000 | 1,467,455 | (b) | ||||||||
Ingles Markets Inc. | ||||||||||||
8.88% | 05/15/17 | 2,590,000 | 2,771,300 | (h) | ||||||||
| Principal Amount | Fair Value | |||||||||||
Intergas Finance BV | ||||||||||||
6.38% | 05/14/17 | $ | 100,000 | $ | 107,125 | (b,h) | ||||||
6.88% | 11/04/11 | 200,000 | 203,000 | |||||||||
Inversiones CMPC S.A. | ||||||||||||
4.75% | 01/19/18 | 174,000 | 173,832 | (b) | ||||||||
JP Morgan Chase Capital XXV (Series Y) | ||||||||||||
6.80% | 10/01/37 | 846,000 | 836,798 | |||||||||
JPMorgan Chase & Co. | ||||||||||||
3.15% | 07/05/16 | 1,005,000 | 1,011,149 | |||||||||
5.13% | 09/15/14 | 839,000 | 906,664 | (h) | ||||||||
JPMorgan Chase Bank NA | ||||||||||||
5.88% | 06/13/16 | 163,000 | 180,429 | |||||||||
6.00% | 10/01/17 | 1,300,000 | 1,444,654 | (h) | ||||||||
Kazakhstan Temir Zholy Finance BV | ||||||||||||
6.38% | 10/06/20 | 200,000 | 213,600 | (b) | ||||||||
KazMunaiGaz Finance Sub BV | ||||||||||||
9.13% | 07/02/18 | 100,000 | 123,240 | (b) | ||||||||
11.75% | 01/23/15 | 100,000 | 124,280 | (b) | ||||||||
KeyCorp. | ||||||||||||
5.10% | 03/24/21 | 1,062,000 | 1,081,640 | |||||||||
Korea Development Bank | ||||||||||||
3.25% | 03/09/16 | 897,000 | 894,390 | |||||||||
4.00% | 09/09/16 | 518,000 | 529,723 | |||||||||
Korea Hydro & Nuclear Power Company Ltd. | ||||||||||||
6.25% | 06/17/14 | 200,000 | 219,415 | (b) | ||||||||
Korea National Oil Corp. | ||||||||||||
5.38% | 07/30/14 | 250,000 | 268,596 | (b) | ||||||||
Kraft Foods Inc. | ||||||||||||
4.13% | 02/09/16 | 981,000 | 1,048,980 | |||||||||
5.38% | 02/10/20 | 4,828,000 | 5,277,960 | |||||||||
6.50% | 02/09/40 | 1,001,000 | 1,111,885 | |||||||||
Kreditanstalt fuer Wiederaufbau | ||||||||||||
3.50% | 03/10/14 | 587,000 | 625,513 | |||||||||
4.50% | 07/16/18 | 1,567,000 | 1,734,909 | |||||||||
Levi Strauss & Co. | ||||||||||||
7.63% | 05/15/20 | 950,000 | 950,000 | |||||||||
Listrindo Capital BV | ||||||||||||
9.25% | 01/29/15 | 250,000 | 273,750 | (b) | ||||||||
Lyondell Chemical Compan | ||||||||||||
8.00% | 11/01/17 | 565,000 | 628,562 | (b) | ||||||||
Majapahit Holding BV | ||||||||||||
7.25% | 10/17/11 | 348,000 | 353,220 | (b) | ||||||||
7.75% | 10/17/16 | 400,000 | 464,000 | (b) | ||||||||
MDC-GMTN B.V. | ||||||||||||
5.50% | 04/20/21 | 400,000 | 400,911 | (b) | ||||||||
Mega Advance Investments Ltd. | ||||||||||||
5.00% | 05/12/21 | 301,000 | 296,431 | (b) | ||||||||
6.38% | 05/12/41 | 307,000 | 294,195 | (b) | ||||||||
Merrill Lynch & Company Inc. | ||||||||||||
6.88% | 04/25/18 | 544,000 | 601,891 | |||||||||
MetroPCS Wireless Inc. | ||||||||||||
6.63% | 11/15/20 | 855,000 | 846,450 | |||||||||
Midamerican Energy Holdings Co. | ||||||||||||
6.13% | 04/01/36 | 1,000,000 | 1,076,890 | |||||||||
Mylan Inc. | ||||||||||||
7.88% | 07/15/20 | 679,000 | 745,202 | (b) | ||||||||
See Notes to Schedule of Investments and Notes to Financial Statements.
20
Table of Contents
Total Return Fund
| Schedule of Investments | June 30, 2011 (unaudited) |
| Principal Amount | Fair Value | |||||||||||
NAK Naftogaz Ukraine | ||||||||||||
9.50% | 09/30/14 | $ | 200,000 | $ | 219,250 | |||||||
National Agricultural Cooperative Federation | ||||||||||||
4.25% | 01/28/16 | 545,000 | 558,223 | (b) | ||||||||
5.00% | 09/30/14 | 200,000 | 213,343 | (b) | ||||||||
National Power Corp. | ||||||||||||
4.51% | 08/23/11 | 517,000 | 517,356 | (i) | ||||||||
Nationwide Mutual Insurance Co. | ||||||||||||
7.88% | 04/01/33 | 475,000 | 509,387 | (b) | ||||||||
9.38% | 08/15/39 | 212,000 | 263,026 | (b) | ||||||||
NET Servicos de Comunicacao S.A. | ||||||||||||
7.50% | 01/27/20 | 200,000 | 228,800 | |||||||||
News America Inc. | ||||||||||||
4.50% | 02/15/21 | 1,824,000 | 1,800,124 | (b) | ||||||||
6.65% | 11/15/37 | 2,272,000 | 2,434,900 | |||||||||
Nisource Finance Corp. | ||||||||||||
6.13% | 03/01/22 | 1,302,000 | 1,434,411 | |||||||||
Noble Holding International Ltd. | ||||||||||||
3.05% | 03/01/16 | 1,587,000 | 1,600,894 | |||||||||
NRG Energy Inc. | ||||||||||||
7.63% | 01/15/18 - 05/15/19 | 1,259,000 | 1,258,697 | (b) | ||||||||
Oglethorpe Power Corp. | ||||||||||||
5.38% | 11/01/40 | 982,000 | 947,672 | |||||||||
ONEOK Partners LP | ||||||||||||
6.13% | 02/01/41 | 1,064,000 | 1,083,880 | |||||||||
Pacific Gas & Electric Co. | ||||||||||||
5.80% | 03/01/37 | 250,000 | 256,777 | |||||||||
6.05% | 03/01/34 | 2,144,000 | 2,267,066 | |||||||||
Pacific Rubiales Energy Corp. | ||||||||||||
8.75% | 11/10/16 | 100,000 | 112,750 | (b) | ||||||||
PacifiCorp | ||||||||||||
6.00% | 01/15/39 | 1,250,000 | 1,380,016 | |||||||||
6.25% | 10/15/37 | 153,000 | 173,023 | |||||||||
PAETEC Holding Corp. | ||||||||||||
8.88% | 06/30/17 | 424,000 | 445,200 | |||||||||
Pemex Project Funding Master Trust | ||||||||||||
6.63% | 06/15/38 | 210,000 | 220,217 | |||||||||
Pertamina Persero PT | ||||||||||||
5.25% | 05/23/21 | 2,000,000 | 2,014,000 | (b) | ||||||||
Petrobras International Finance Co. | ||||||||||||
3.88% | 01/27/16 | 945,000 | 962,311 | |||||||||
Petroleos de Venezuela S.A. | ||||||||||||
2.00% | 07/10/11 | 163,000 | 162,919 | (d) | ||||||||
Petroleos Mexicanos | ||||||||||||
6.50% | 06/02/41 | 1,500,000 | 1,521,970 | (b) | ||||||||
8.00% | 05/03/19 | 130,000 | 160,290 | |||||||||
Petroleum Company of Trinidad & Tobago Ltd. | ||||||||||||
6.00% | 05/08/22 | 458,333 | 466,354 | |||||||||
Petronas Capital Ltd. | ||||||||||||
5.25% | 08/12/19 | 200,000 | 214,455 | (b) | ||||||||
7.88% | 05/22/22 | 200,000 | 255,394 | (b) | ||||||||
Petronas Global Sukuk Ltd. | ||||||||||||
4.25% | 08/12/14 | 400,000 | 422,648 | (b) | ||||||||
Philip Morris International Inc. | ||||||||||||
2.50% | 05/16/16 | 2,008,000 | 2,010,988 | |||||||||
| Principal Amount | Fair Value | |||||||||||
Pioneer Natural Resources Co. | ||||||||||||
7.50% | 01/15/20 | $ | 605,000 | $ | 681,718 | |||||||
Plains All American Pipeline LP | ||||||||||||
5.00% | 02/01/21 | 996,000 | 1,012,782 | |||||||||
Plains All American Pipeline LP Corp. | ||||||||||||
3.95% | 09/15/15 | 866,000 | 908,358 | |||||||||
Power Sector Assets & Liabilities Management Corp. | ||||||||||||
7.25% | 05/27/19 | 600,000 | 707,956 | |||||||||
7.39% | 12/02/24 | 100,000 | 118,000 | (b) | ||||||||
Protective Life Corp. | ||||||||||||
8.45% | 10/15/39 | 1,843,000 | 2,030,907 | |||||||||
Prudential Financial Inc. | ||||||||||||
3.00% | 05/12/16 | 1,005,000 | 996,145 | |||||||||
5.38% | 06/21/20 | 468,000 | 493,039 | |||||||||
5.40% | 06/13/35 | 614,000 | 562,469 | |||||||||
5.63% | 05/12/41 | 1,004,000 | 928,529 | |||||||||
PTTEP Canada International Finance Ltd. | ||||||||||||
5.69% | 04/05/21 | 300,000 | 299,010 | (b) | ||||||||
Qatari Diar Finance QSC | ||||||||||||
5.00% | 07/21/20 | 250,000 | 256,250 | (b) | ||||||||
QVC Inc. | ||||||||||||
7.50% | 10/01/19 | 1,328,000 | 1,407,680 | (b) | ||||||||
RailAmerica Inc. | ||||||||||||
9.25% | 07/01/17 | 796,000 | 873,610 | |||||||||
Reinsurance Group of America Inc. | ||||||||||||
5.00% | 06/01/21 | 1,506,000 | 1,489,934 | |||||||||
Reliance Holdings USA Inc. | ||||||||||||
4.50% | 10/19/20 | 250,000 | 233,580 | (b) | ||||||||
Republic Services Inc. | ||||||||||||
5.25% | 11/15/21 | 1,087,000 | 1,148,494 | |||||||||
5.70% | 05/15/41 | 660,000 | 644,306 | |||||||||
Reynolds Group Issuer Inc. | ||||||||||||
8.50% | 10/15/16 | 1,870,000 | 1,949,475 | (b) | ||||||||
Roche Holdings Inc. | ||||||||||||
6.00% | 03/01/19 | 1,649,000 | 1,899,913 | (b) | ||||||||
RSHB Capital SA for OJSC Russian Agricultural Bank | ||||||||||||
6.97% | 09/21/16 | 200,000 | 201,000 | (i) | ||||||||
Russian Agricultural Bank OJSC Via RSHB Capital S.A. | ||||||||||||
6.00% | 06/03/21 | 1,600,000 | 1,596,000 | (b) | ||||||||
Russian Railways | ||||||||||||
5.74% | 04/03/17 | 200,000 | 212,500 | |||||||||
Societe Generale | ||||||||||||
5.20% | 04/15/21 | 578,000 | 567,630 | (b) | ||||||||
Southern Copper Corp. | ||||||||||||
5.38% | 04/16/20 | 1,266,000 | 1,296,765 | |||||||||
6.75% | 04/16/40 | 1,097,000 | 1,067,171 | |||||||||
Stoneheath RE | ||||||||||||
6.87% | 12/29/49 | 816,000 | 752,760 | (i) | ||||||||
TAM Capital 3 Inc. | ||||||||||||
8.38% | 06/03/21 | 500,000 | 506,250 | (b) | ||||||||
Teck Resources Ltd. | ||||||||||||
3.15% | 01/15/17 | 501,000 | 501,324 | |||||||||
4.75% | 01/15/22 | 1,001,000 | 1,003,616 | |||||||||
See Notes to Schedule of Investments and Notes to Financial Statements.
21
Table of Contents
Total Return Fund
| Schedule of Investments | June 30, 2011 (unaudited) |
| Principal Amount | Fair Value | |||||||||||
Teva Pharmaceutical Finance II BV | ||||||||||||
3.00% | 06/15/15 | $ | 1,889,000 | $ | 1,943,794 | |||||||
Texas Instruments Inc. | ||||||||||||
2.38% | 05/16/16 | 2,511,000 | 2,511,773 | |||||||||
Textron Inc. | ||||||||||||
6.20% | 03/15/15 | 1,284,000 | 1,424,674 | |||||||||
TGI International Ltd. | ||||||||||||
9.50% | 10/03/17 | 100,000 | 112,375 | |||||||||
The AES Corp. | ||||||||||||
8.00% | 10/15/17 | 669,000 | 709,140 | (h) | ||||||||
The Goldman Sachs Group Inc. | ||||||||||||
3.63% | 02/07/16 | 2,335,000 | 2,360,353 | |||||||||
3.70% | 08/01/15 | 954,000 | 971,428 | |||||||||
5.38% | 03/15/20 | 524,000 | 541,106 | |||||||||
6.00% | 06/15/20 | 1,256,000 | 1,351,441 | |||||||||
6.15% | 04/01/18 | 2,211,000 | 2,406,326 | |||||||||
6.75% | 10/01/37 | 974,000 | 973,983 | |||||||||
The Williams companies Inc. | ||||||||||||
7.50% | 01/15/31 | 200,000 | 228,730 | |||||||||
Ticketmaster Entertainment LLC | ||||||||||||
10.75% | 08/01/16 | 500,000 | 545,000 | |||||||||
Time Warner Cable Inc. | ||||||||||||
5.00% | 02/01/20 | 670,000 | 696,092 | |||||||||
6.75% | 07/01/18 | 2,925,000 | 3,392,102 | |||||||||
7.50% | 04/01/14 | 370,000 | 426,260 | |||||||||
Time Warner Inc. | ||||||||||||
3.15% | 07/15/15 | 1,924,000 | 1,989,749 | |||||||||
5.88% | 11/15/16 | 1,582,000 | 1,808,296 | |||||||||
6.20% | 03/15/40 | 1,240,000 | 1,270,351 | |||||||||
TNK-BP Finance S.A. | ||||||||||||
6.13% | 03/20/12 | 300,000 | 308,700 | |||||||||
7.25% | 02/02/20 | 33,000 | 36,465 | (b) | ||||||||
Transnet Ltd. | ||||||||||||
4.50% | 02/10/16 | 300,000 | 309,626 | (b) | ||||||||
Transocean Inc. | ||||||||||||
6.00% | 03/15/18 | 287,000 | 317,761 | |||||||||
6.80% | 03/15/38 | 191,000 | 205,079 | |||||||||
UBS AG | ||||||||||||
5.88% | 07/15/16 | 950,000 | 1,042,068 | |||||||||
Union Electric Co. | ||||||||||||
6.70% | 02/01/19 | 2,500,000 | 2,935,588 | |||||||||
UnitedHealth Group Inc. | ||||||||||||
5.80% | 03/15/36 | 717,000 | 723,614 | (h) | ||||||||
Verizon Communications Inc. | ||||||||||||
5.50% | 02/15/18 | 951,000 | 1,057,687 | |||||||||
6.40% | 02/15/38 | 1,035,000 | 1,121,714 | |||||||||
Vimpel Communications Via VIP Finance Ireland Limited OJSC | ||||||||||||
6.49% | 02/02/16 | 200,000 | 206,000 | (b,h) | ||||||||
Visteon Corp. | ||||||||||||
6.75% | 04/15/19 | 928,000 | 895,520 | (b) | ||||||||
Weatherford International Ltd. | ||||||||||||
5.13% | 09/15/20 | 1,004,000 | 1,025,105 | |||||||||
Williams Partners LP | ||||||||||||
4.13% | 11/15/20 | 501,000 | 480,906 | |||||||||
Willis Group Holdings PLC | ||||||||||||
4.13% | 03/15/16 | 1,063,000 | 1,083,765 | (h) | ||||||||
Windstream Corp. | ||||||||||||
7.75% | 10/01/21 | 928,000 | 969,760 | |||||||||
7.88% | 11/01/17 | 138,000 | 146,452 | |||||||||
| Principal Amount | Fair Value | |||||||||||
Woodside Finance Ltd. | ||||||||||||
4.50% | 11/10/14 | $ | 1,517,000 | $ | 1,625,326 | (b,h) | ||||||
Woori Bank | ||||||||||||
5.88% | 04/13/21 | 980,000 | 981,123 | (b) | ||||||||
Wynn Las Vegas LLC | ||||||||||||
7.88% | 05/01/20 | 1,324,000 | 1,443,160 | (h) | ||||||||
XL Group PLC (Series E) | ||||||||||||
6.50% | 12/29/49 | 1,256,000 | 1,152,380 | (i) | ||||||||
Xstrata Finance Canada Ltd. | ||||||||||||
5.80% | 11/15/16 | 1,187,275 | 1,329,619 | (b) | ||||||||
| 253,773,848 | ||||||||||||
Non-Agency Collateralized Mortgage Obligations — 2.1% |
| |||||||||||
Banc of America Commercial Mortgage Inc. | ||||||||||||
5.68% | 07/10/46 | 1,060,000 | 1,053,381 | (h) | ||||||||
5.73% | 07/10/46 | 1,110,000 | 930,523 | (h) | ||||||||
5.93% | 02/10/51 | 4,167,000 | 4,527,980 | (h) | ||||||||
6.39% | 02/10/51 | 1,272,000 | 1,417,051 | (i) | ||||||||
Banc of America Commercial Mortgage Inc. (Class A4) | ||||||||||||
5.63% | 07/10/46 | 2,100,000 | 2,297,758 | |||||||||
Banc of America Merrill Lynch Commercial Mortgage Inc. | ||||||||||||
6.00% | 02/10/51 | 1,000,000 | 978,853 | (i) | ||||||||
Banc of America Mortgage Securities Inc. (Class B1) | ||||||||||||
4.52% | 02/25/36 | 140,714 | 6,765 | (n) | ||||||||
4.78% | 01/25/36 | 113,776 | 5,227 | (n) | ||||||||
Bear Stearns Commercial Mortgage Securities | ||||||||||||
5.94% | 09/11/38 | 1,070,000 | 1,113,421 | (i) | ||||||||
Bear Stearns Commercial Mortgage Securities (Class A2) | ||||||||||||
5.57% | 03/11/39 | 1,000,000 | 1,005,000 | (h,i) | ||||||||
Bear Stearns Commercial Mortgage Securities (Class AJ) | ||||||||||||
5.91% | 06/11/40 | 710,000 | 559,668 | (h) | ||||||||
Bear Stearns Commercial Mortgage Securities (Class AM) | ||||||||||||
5.71% | 04/12/38 | 1,050,000 | 1,101,792 | |||||||||
Citigroup Commercial Mortgage Trust (Series 2006) (Class AJ) | ||||||||||||
5.48% | 10/15/49 | 730,000 | 642,365 | (h) | ||||||||
Commercial Mortgage Pass Through Certificates (Class AM) | ||||||||||||
5.97% | 06/10/46 | 4,900,000 | 5,042,802 | (h) | ||||||||
Countrywide Commercial Mortgage Trust (Class AJ) | ||||||||||||
6.10% | 06/12/46 | 1,050,000 | 969,277 | (i) | ||||||||
Credit Suisse First Boston Mortgage Securities Corp. | ||||||||||||
5.23% | 12/15/40 | 1,000,000 | 951,038 | (i) | ||||||||
Credit Suisse First Boston Mortgage Securities Corp. (Class CB1) | ||||||||||||
5.33% | 10/25/35 | 162,954 | 9,072 | (n) | ||||||||
Credit Suisse Mortgage Capital Certificates | ||||||||||||
5.47% | 09/15/39 | 1,210,000 | 1,304,933 | |||||||||
See Notes to Schedule of Investments and Notes to Financial Statements.
22
Table of Contents
Total Return Fund
| Schedule of Investments | June 30, 2011 (unaudited) |
| Principal Amount | Fair Value | |||||||||||
Credit Suisse Mortgage Capital Certificates (Class C) | ||||||||||||
5.78% | 02/15/39 | $ | 500,000 | $ | 421,183 | |||||||
Credit Suisse Mortgage Capital Certificates (Class CB1) | ||||||||||||
5.62% | 02/25/36 | 107,904 | 5,517 | (h,n) | ||||||||
DBUBS Mortgage Trust | ||||||||||||
5.73% | 11/10/46 | 1,060,000 | 807,941 | (b,h) | ||||||||
Extended Stay America Trust | ||||||||||||
5.50% | 11/05/27 | 2,000,000 | 1,996,641 | (b) | ||||||||
Greenwich Capital Commercial Funding Corp. | ||||||||||||
5.48% | 03/10/39 | 400,000 | 387,403 | |||||||||
GS Mortgage Securities Corp. | ||||||||||||
5.99% | 08/10/45 | 1,020,000 | 1,095,072 | (i) | ||||||||
GS Mortgage Securities Corp. II | ||||||||||||
5.73% | 03/10/44 | 1,870,000 | 1,709,922 | (b,i) | ||||||||
Impac CMB Trust (Class 1A1) | ||||||||||||
5.00% | 04/25/35 | 213,850 | 167,526 | (d,h) | ||||||||
Indymac INDA Mortgage Loan Trust (Class B1) | ||||||||||||
4.59% | 01/25/36 | 58,506 | 1,025 | (h,n) | ||||||||
JP Morgan Chase Commercial Mortgage Securities Corp. | ||||||||||||
5.34% | 08/12/37 | 860,000 | 936,277 | (i) | ||||||||
JP Morgan Chase Commercial Mortgage Securities Corp. (Class A4) | ||||||||||||
5.44% | 06/12/47 | 1,950,000 | 2,084,081 | (h) | ||||||||
5.79% | 02/12/51 | 2,220,000 | 2,409,877 | (h) | ||||||||
JP Morgan Chase Commercial Mortgage Securities Corp. (Class AM) | ||||||||||||
5.44% | 05/15/45 | 695,000 | 705,219 | |||||||||
6.10% | 02/12/51 | 350,000 | 343,905 | |||||||||
JP Morgan Chase Commercial Mortgage Securities Corp. (Class B) | ||||||||||||
5.70% | 04/15/43 | 690,000 | 590,823 | (h) | ||||||||
LB-UBS Commercial Mortgage Trust | ||||||||||||
6.31% | 04/15/41 | 700,000 | 698,845 | (i) | ||||||||
LB-UBS Commercial Mortgage Trust ( Class A2) | ||||||||||||
6.31% | 04/15/41 | 2,460,000 | 2,739,542 | (i) | ||||||||
LB-UBS Commercial Mortgage Trust (Class A4) | ||||||||||||
4.95% | 09/15/30 | 630,000 | 680,736 | |||||||||
5.16% | 02/15/31 | 860,000 | 930,490 | |||||||||
LB-UBS Commercial Mortgage Trust (Class AJ) | ||||||||||||
6.31% | 04/15/41 | 320,000 | 270,887 | (i) | ||||||||
LB-UBS Commercial Mortgage Trust (Class AM) | ||||||||||||
6.37% | 09/15/45 | 530,000 | 520,921 | (i) | ||||||||
LB-UBS Commercial Mortgage Trust (Series 2006) (Class AJ) | ||||||||||||
5.28% | 02/15/41 | 1,000,000 | 933,564 | (i) | ||||||||
MASTR Alternative Loans Trust (Class 15 AX) | ||||||||||||
5.00% | 08/25/18 | 23,591 | 2,698 | (g,h,o) | ||||||||
| Principal Amount | Fair Value | |||||||||||
Medallion Trust (Series 2005) (Class A) | ||||||||||||
5.33% | 08/22/36 | $ | 608,208 | $ | 588,240 | (d) | ||||||
Merrill Lynch Mortgage Trust (Class AJ) | ||||||||||||
5.86% | 05/12/39 | 1,750,000 | 1,616,770 | (i) | ||||||||
Merrill Lynch Mortgage Trust (Series 2006) (Class B) | ||||||||||||
5.86% | 05/12/39 | 768,000 | 593,829 | |||||||||
Morgan Stanley Capital I | ||||||||||||
5.16% | 10/12/52 | 2,000,000 | 2,171,689 | (i) | ||||||||
5.48% | 02/12/44 | 1,610,000 | 1,539,899 | (i) | ||||||||
5.90% | 10/15/42 | 922,000 | 803,506 | |||||||||
Morgan Stanley Capital I (Class A4) | ||||||||||||
5.81% | 12/12/49 | 2,500,000 | 2,743,239 | |||||||||
5.99% | 08/12/41 | 380,000 | 425,230 | (i) | ||||||||
Morgan Stanley Capital I (Class AM) | ||||||||||||
6.46% | 01/11/43 | 910,000 | 947,919 | |||||||||
Morgan Stanley Capital I (Class B) |
| |||||||||||
5.90% | 10/15/42 | 150,000 | 138,494 | |||||||||
MortgageIT Trust (Class A1) | ||||||||||||
5.00% | 08/25/35 | 1,474,626 | 1,132,973 | (d) | ||||||||
Opteum Mortgage Acceptance Corp. (Class A1A) | ||||||||||||
8.32% | 02/25/35 | 70,410 | 66,923 | (d,h) | ||||||||
Residential Funding Mortgage Securities I (Class M1) | ||||||||||||
5.75% | 01/25/36 | 87,692 | 1 | (h,n) | ||||||||
Vornado DP LLC | ||||||||||||
6.36% | 09/13/28 | 380,000 | 357,688 | (b,h) | ||||||||
Wachovia Bank Commercial Mortgage Trust | ||||||||||||
6.23% | 06/15/45 | 780,000 | 572,132 | |||||||||
Wachovia Bank Commercial Mortgage Trust (Class AJ) | ||||||||||||
5.52% | 01/15/45 | 1,390,000 | 1,312,028 | (i) | ||||||||
Wachovia Bank Commercial Mortgage Trust (Class AM) | ||||||||||||
5.47% | 01/15/45 | 810,000 | 832,703 | (i) | ||||||||
Wells Fargo Mortgage Backed Securities Trust (Class B1) | ||||||||||||
5.50% | 01/25/36 - 03/25/36 | 1,047,445 | 178,120 | (h,n) | ||||||||
Wells Fargo Mortgage Backed Securities Trust (Class B2) | ||||||||||||
5.50% | 03/25/36 | 141,554 | 1 | (h,n) | ||||||||
| 60,378,385 | ||||||||||||
Sovereign Bonds — 0.4% |
| |||||||||||
Democratic Socialist Republic of Sri Lanka | ||||||||||||
7.40% | 01/22/15 | 100,000 | 108,875 | (b,h) | ||||||||
8.25% | 10/24/12 | 100,000 | 106,401 | |||||||||
Eskom Holdings Ltd. | ||||||||||||
5.75% | 01/26/21 | 200,000 | 207,000 | (b) | ||||||||
Financing of Infrastrucural Projects State Enterprise | ||||||||||||
8.38% | 11/03/17 | 171,000 | 178,695 | (b) | ||||||||
See Notes to Schedule of Investments and Notes to Financial Statements.
23
Table of Contents
Total Return Fund
| Schedule of Investments | June 30, 2011 (unaudited) |
| Principal Amount | Fair Value | |||||||||||
Government of 1Malaysia Sukuk Global Berhad | ||||||||||||
3.93% | 06/04/15 | $ | 250,000 | $ | 261,630 | (b) | ||||||
Government of Argentina | ||||||||||||
2.50% | 12/31/38 | 214,767 | 93,424 | (j) | ||||||||
4.21% | 08/03/12 | 861,100 | 211,142 | (d,i) | ||||||||
Government of Belize | ||||||||||||
6.00% | 02/20/29 | 443,100 | 288,015 | (j) | ||||||||
Government of Brazil | ||||||||||||
5.63% | 01/07/41 | 330,000 | 339,075 | |||||||||
6.00% | 01/17/17 | 200,000 | 233,700 | |||||||||
6.00% | 02/20/29 | 171,100 | 111,215 | (b,j) | ||||||||
8.25% | 01/20/34 | 133,000 | 182,875 | |||||||||
Government of Colombia | ||||||||||||
7.38% | 03/18/19 | 100,000 | 124,650 | |||||||||
Government of Costa Rica | ||||||||||||
10.00% | 08/01/20 | 149,000 | 204,875 | (b,h) | ||||||||
Government of Croatia | ||||||||||||
6.38% | 03/24/21 | 300,000 | 312,000 | (b) | ||||||||
Government of El Salvador | ||||||||||||
7.65% | 06/15/35 | 280,000 | 289,800 | (b,h) | ||||||||
Government of Grenada | ||||||||||||
2.50% | 09/15/25 | 350,200 | 217,124 | (b,j) | ||||||||
Government of Hungary | ||||||||||||
4.75% | 02/03/15 | 500,000 | 513,750 | |||||||||
6.25% | 01/29/20 | 1,029,000 | 1,086,624 | |||||||||
6.38% | 03/29/21 | 371,000 | 391,405 | |||||||||
7.63% | 03/29/41 | 558,000 | 601,942 | |||||||||
Government of Lebanon | ||||||||||||
4.00% | 12/31/17 | 66,950 | 64,674 | |||||||||
6.38% | 03/09/20 | 200,000 | 206,500 | |||||||||
Government of Lithuania | ||||||||||||
6.75% | 01/15/15 | 200,000 | 221,000 | (b) | ||||||||
7.38% | 02/11/20 | 300,000 | 347,250 | (b) | ||||||||
Government of Peruvian | ||||||||||||
6.55% | 03/14/37 | 447,000 | 498,629 | |||||||||
7.35% | 07/21/25 | 100,000 | 122,150 | |||||||||
Government of Philippine | ||||||||||||
6.38% | 10/23/34 | 200,000 | 218,500 | |||||||||
6.50% | 01/20/20 | 186,000 | 216,467 | |||||||||
Government of Poland | ||||||||||||
5.13% | 04/21/21 | 185,000 | 191,244 | |||||||||
6.38% | 07/15/19 | 74,000 | 84,545 | |||||||||
Government of Turkey | ||||||||||||
5.63% | 03/30/21 | 360,000 | 376,200 | |||||||||
Government of Ukraine | ||||||||||||
6.25% | 06/17/16 | 1,500,000 | 1,498,200 | (b) | ||||||||
Government of Uruguay | ||||||||||||
6.88% | 09/28/25 | 220,478 | 267,881 | |||||||||
Government of Vietnam | ||||||||||||
1.27% | 03/12/16 | 73,044 | 64,400 | (i) | ||||||||
Korea Expressway Corp. | ||||||||||||
4.50% | 03/23/15 | 133,000 | 139,160 | (b) | ||||||||
Korea National Oil Corp. | ||||||||||||
2.88% | 11/09/15 | 686,000 | 671,097 | (b) | ||||||||
Lebanese Republic | ||||||||||||
5.15% | 11/12/18 | 173,000 | 166,945 | |||||||||
| Principal Amount | Fair Value | |||||||||||
Province of Manitoba Canada |
| |||||||||||
4.90% | 12/06/16 | $ | 165,000 | $ | 186,575 | (h) | ||||||
Republic of Dominican | ||||||||||||
7.50% | 05/06/21 | 100,000 | 104,000 | (b,h) | ||||||||
9.50% | 09/27/11 | 57,088 | 58,087 | |||||||||
Republic of Ghana | ||||||||||||
8.50% | 10/04/17 | 200,000 | 226,000 | (b) | ||||||||
Republic of Indonesia | ||||||||||||
4.88% | 05/05/21 | 300,000 | 307,125 | (b) | ||||||||
Republic of Lebanese | ||||||||||||
6.10% | 10/04/22 | 173,000 | 167,810 | |||||||||
Russian Foreign Bond — | ||||||||||||
5.00% | 04/29/20 | 200,000 | 206,750 | (b) | ||||||||
United Mexican States | ||||||||||||
5.13% | 01/15/20 | 199,000 | 214,920 | |||||||||
6.05% | 01/11/40 | 130,000 | 138,320 | |||||||||
| 13,028,646 | ||||||||||||
Municipal Bonds and Notes — 0.2% |
| |||||||||||
Municipal Electric Authority of Georgia | ||||||||||||
6.64% | 04/01/57 | 2,119,000 | 2,031,401 | |||||||||
New Jersey State Turnpike Authority | ||||||||||||
7.10% | 01/01/41 | 495,000 | 575,566 | |||||||||
7.41% | 01/01/40 | 200,000 | 241,408 | |||||||||
New Jersey Transportation Trust Fund Authority | ||||||||||||
6.88% | 12/15/39 | 620,000 | 645,680 | |||||||||
South Carolina State Public Service Authority | ||||||||||||
6.45% | 01/01/50 | 495,000 | 547,222 | |||||||||
State of California | ||||||||||||
5.70% | 11/01/21 | 705,000 | 741,900 | |||||||||
| 4,783,177 | ||||||||||||
FNMA — 0.0%* |
| |||||||||||
Lehman TBA | ||||||||||||
5.50%** | TBA | 620,251 | — | (c,l,n) | ||||||||
Total Bonds and Notes | 761,994,372 | |||||||||||
| Number of Shares | Fair Value | |||||||||||
Exchange Traded Funds — 0.5% |
| |||||||||||
Financial Select Sector SPDR Fund | 187,080 | $ | 2,867,937 | (m) | ||||||||
Industrial Select Sector SPDR Fund | 318,515 | 11,861,499 | (m) | |||||||||
Total Exchange Traded Funds | 14,729,436 | |||||||||||
See Notes to Schedule of Investments and Notes to Financial Statements.
24
Table of Contents
Total Return Fund
| Schedule of Investments | June 30, 2011 (unaudited) |
| Fair Value | ||||||||||||
Other Investments — 0.2% |
| |||||||||||
GEI Investment Fund | $ | 5,094,421 | (k) | |||||||||
Total Investments in Securities | 2,662,698,919 | |||||||||||
Short-Term Investments — 11.9% |
| |||||||||||
Short-Term Investments — 5.5% |
| |||||||||||
GE Institutional Money Market Fund Investment Class | 160,961,248 | (d,k) | ||||||||||
| Principal Amount | Fair Value | |||||||||||
Time Deposit — 0.0%* |
| |||||||||||
State Street Corp. | ||||||||||||
0.01% | 07/01/11 | $ | 258,191 | $ | 258,191 | (e) | ||||||
Federal Agencies — 6.4% |
| |||||||||||
Federal National Mortgage Assoc. |
| |||||||||||
0.08% | 10/03/11 | 10,000,000 | 9,998,680 | (d) | ||||||||
0.09% | 11/02/11 | 46,000,000 | 45,988,822 | (d) | ||||||||
Federal Home Loan Bank Discount Notes | ||||||||||||
0.05% | 08/19/11 | 32,000,000 | 31,999,104 | (d) | ||||||||
0.07% | 09/02/11 | 3,000,000 | 2,999,841 | (d) | ||||||||
0.08% | 11/02/11 | 40,000,000 | 39,990,280 | (d) | ||||||||
Federal Home Loan Mortgage Corp. Discount Notes | ||||||||||||
0.06% | 10/12/11 | 18,500,000 | 18,497,336 | (d) | ||||||||
0.08% | 10/06/11 | 35,000,000 | 34,995,240 | (d) | ||||||||
| 184,469,303 | ||||||||||||
Total Short-Term Investments (Cost $345,670,108) | 345,688,742 | |||||||||||
Total Investments | 3,008,387,661 | |||||||||||
Liabilities in Excess of Other Assets, net — (3.7)% | (108,132,838 | ) | ||||||||||
|
| |||||||||||
NET ASSETS — 100.0% | $ | 2,900,254,823 | ||||||||||
|
| |||||||||||
Other Information | ||||||||
The Fund had the following long futures contracts open at June 30, 2011:
| Description | Expiration Date | Number of Contracts | Current Notional Value | Unrealized Appreciation/ (Depreciation) | ||||||||||||
EURO Stoxx 50 Index Futures | | September 2011 | | 109 | $ | 4,500,795 | $ | 181,642 | ||||||||
FTSE 100 Index Futures | | September 2011 | | 43 | 4,074,755 | 120,703 | ||||||||||
S&P 500 Emini Index Futures | | September 2011 | | 144 | 9,471,600 | 241,081 | ||||||||||
S&P Midcap 400 Emini Index Futures | | September 2011 | | 52 | 5,077,800 | 80,114 | ||||||||||
Topix Index Futures | | September 2011 | | 20 | 2,103,764 | 108,983 | ||||||||||
2 Yr. U.S.Treasury Notes Futures | | September 2011 | | 579 | 127,000,031 | 283,876 | ||||||||||
5 Yr. U.S.Treasury Notes Futures | | September 2011 | | 115 | 13,707,461 | 100,738 | ||||||||||
10 Yr. U.S.Treasury Notes Futures | | September 2011 | | 46 | 5,627,094 | (94,469 | ) | |||||||||
|
| |||||||||||||||
| $ | 1,022,668 | |||||||||||||||
|
| |||||||||||||||
The Fund had the following short futures contracts open at June 30, 2011:
| Description | Expiration date | Number of Contracts | Current Notional Value | Unrealized Appreciation | ||||||||||||
EURO Currency Futures | | September 2011 | | 322 | $ | (58,314,200 | ) | $ | 215,135 | |||||||
JPY Currency Futures | | September 2011 | | 136 | (21,136,100 | ) | 106,440 | |||||||||
Ultra long U.S. Treasury Bond Futures | | September 2011 | | 5 | (631,250 | ) | 8,635 | |||||||||
|
| |||||||||||||||
| $ | 330,210 | |||||||||||||||
|
| |||||||||||||||
| $ | 1,352,878 | |||||||||||||||
|
| |||||||||||||||
The Fund was invested in the following countries at June 30, 2011:
| Country | Percentage (based on Fair Value) | |||
United States | 72.57 | % | ||
United Kingdom | 4.90 | % | ||
Germany | 2.98 | % | ||
France | 2.65 | % | ||
Japan | 2.45 | % | ||
Switzerland | 1.82 | % | ||
Canada | 1.75 | % | ||
China | 1.40 | % | ||
Brazil | 1.15 | % | ||
See Notes to Schedule of Investments and Notes to Financial Statements.
25
Table of Contents
Total Return Fund
| Schedule of Investments | June 30, 2011 (unaudited) |
| Country | Percentage (based on Fair Value) | |||
South Korea | 0.76 | % | ||
India | 0.72 | % | ||
Netherlands | 0.70 | % | ||
Taiwan | 0.68 | % | ||
Hong Kong | 0.66 | % | ||
Spain | 0.52 | % | ||
Russian Federation | 0.44 | % | ||
Australia | 0.40 | % | ||
Mexico | 0.39 | % | ||
Italy | 0.31 | % | ||
South Africa | 0.29 | % | ||
Sweden | 0.26 | % | ||
Indonesia | 0.22 | % | ||
Singapore | 0.20 | % | ||
Israel | 0.17 | % | ||
Denmark | 0.16 | % | ||
Supranational | 0.12 | % | ||
Peru | 0.12 | % | ||
Chile | 0.12 | % | ||
Luxembourg | 0.11 | % | ||
Malaysia | 0.09 | % | ||
Philippines | 0.09 | % | ||
Hungary | 0.09 | % | ||
Ukraine | 0.08 | % | ||
Argentina | 0.06 | % | ||
Thailand | 0.06 | % | ||
Colombia | 0.05 | % | ||
Turkey | 0.04 | % | ||
United Arab Emirates | 0.04 | % | ||
Egypt | 0.03 | % | ||
Trinidad and Tobago | 0.03 | % | ||
Kazakhstan | 0.03 | % | ||
Cayman Islands | 0.02 | % | ||
Tunisia | 0.02 | % | ||
Finland | 0.02 | % | ||
Lebanon | 0.02 | % | ||
Lithuania | 0.02 | % | ||
Ireland | 0.02 | % | ||
El Salvador | 0.02 | % | ||
Panama | 0.02 | % | ||
Belarus | 0.01 | % | ||
Belize | 0.01 | % | ||
Jamaica | 0.01 | % | ||
Croatia | 0.01 | % | ||
Poland | 0.01 | % | ||
Uruguay | 0.01 | % | ||
Qatar | 0.01 | % | ||
Ghana | 0.01 | % | ||
Grenada | 0.01 | % | ||
Sri Lanka | 0.01 | % | ||
Costa Rica | 0.01 | % | ||
Bolivarian Republic of Venezuela | 0.01 | % | ||
Dominican Republic | 0.01 | % | ||
|
| |||
| 100.00 | % | |||
|
| |||
The Fund’s % share of investment in the various categories, based on Fair Value, is as follows at June 30, 2011:
| Industry | Domestic | Foreign | Total | |||||||||
Diversified Financial Services | 1.30 | % | 2.83 | % | 4.13 | % | ||||||
Integrated Oil & Gas | 1.30 | % | 2.17 | % | 3.47 | % | ||||||
Pharmaceuticals | 1.51 | % | 0.88 | % | 2.39 | % | ||||||
Semiconductors | 0.90 | % | 0.77 | % | 1.67 | % | ||||||
Diversified Metals & Mining | 0.21 | % | 1.45 | % | 1.66 | % | ||||||
Aerospace & Defense | 0.99 | % | 0.65 | % | 1.64 | % | ||||||
Wireless Telecommunication Services | 0.64 | % | 1.00 | % | 1.64 | % | ||||||
Internet Software & Services | 0.71 | % | 0.69 | % | 1.40 | % | ||||||
Packaged Foods & Meats | 0.77 | % | 0.63 | % | 1.40 | % | ||||||
Oil & Gas Equipment & Services | 1.27 | % | 0.08 | % | 1.35 | % | ||||||
Oil & Gas Exploration & Production | 0.99 | % | 0.29 | % | 1.28 | % | ||||||
Fertilizers & Agricultural Chemicals | 0.40 | % | 0.85 | % | 1.25 | % | ||||||
Asset Management & Custody Banks | 1.25 | % | 0.00 | % | 1.25 | % | ||||||
Life & Health Insurance | 0.51 | % | 0.72 | % | 1.23 | % | ||||||
Communications Equipment | 0.99 | % | 0.21 | % | 1.20 | % | ||||||
Steel | 0.59 | % | 0.61 | % | 1.20 | % | ||||||
Biotechnology | 1.19 | % | 0.00 | % | 1.19 | % | ||||||
Household Products | 0.61 | % | 0.55 | % | 1.16 | % | ||||||
Automobile Manufacturers | 0.00 | % | 1.15 | % | 1.15 | % | ||||||
Systems Software | 1.13 | % | 0.00 | % | 1.13 | % | ||||||
Industrial Conglomerates | 0.00 | % | 0.99 | % | 0.99 | % | ||||||
Healthcare Services | 0.71 | % | 0.26 | % | 0.97 | % | ||||||
IT Consulting & Other Services | 0.64 | % | 0.30 | % | 0.94 | % | ||||||
Industrial Gases | 0.36 | % | 0.52 | % | 0.88 | % | ||||||
Integrated Telecommunication Services | 0.58 | % | 0.28 | % | 0.86 | % | ||||||
Soft Drinks | 0.86 | % | 0.00 | % | 0.86 | % | ||||||
Life Sciences Tools & Services | 0.83 | % | 0.02 | % | 0.85 | % | ||||||
Healthcare Equipment | 0.82 | % | 0.00 | % | 0.82 | % | ||||||
Movies & Entertainment | 0.78 | % | 0.00 | % | 0.78 | % | ||||||
Multi-Line Insurance | 0.30 | % | 0.47 | % | 0.77 | % | ||||||
Multi-Utilities | 0.33 | % | 0.44 | % | 0.77 | % | ||||||
Electric Utilities | 0.62 | % | 0.14 | % | 0.76 | % | ||||||
Industrial Machinery | 0.33 | % | 0.41 | % | 0.74 | % | ||||||
Property & Casualty Insurance | 0.68 | % | 0.00 | % | 0.68 | % | ||||||
Data Processing & Outsourced Services | 0.65 | % | 0.00 | % | 0.65 | % | ||||||
Application Software | 0.33 | % | 0.31 | % | 0.64 | % | ||||||
Computer Hardware | 0.63 | % | 0.00 | % | 0.63 | % | ||||||
Investment Banking & Brokerage | 0.39 | % | 0.16 | % | 0.55 | % | ||||||
Electrical Components & Equipment | 0.38 | % | 0.16 | % | 0.54 | % | ||||||
Specialized Finance | 0.38 | % | 0.15 | % | 0.53 | % | ||||||
Construction & Engineering | 0.11 | % | 0.41 | % | 0.52 | % | ||||||
Advertising | 0.50 | % | 0.00 | % | 0.50 | % | ||||||
Exchange Traded Fund | 0.49 | % | 0.00 | % | 0.49 | % | ||||||
Office REITs | 0.42 | % | 0.00 | % | 0.42 | % | ||||||
Apparel, Accessories & Luxury Goods | 0.19 | % | 0.22 | % | 0.41 | % | ||||||
Specialized REITs | 0.41 | % | 0.00 | % | 0.41 | % | ||||||
Trading Companies & Distributors | 0.15 | % | 0.25 | % | 0.40 | % | ||||||
See Notes to Schedule of Investments and Notes to Financial Statements.
26
Table of Contents
Total Return Fund
| Schedule of Investments | June 30, 2011 (unaudited) |
| Industry | Domestic | Foreign | Total | |||||||||
Independent Power Producers & Energy Traders | 0.37 | % | 0.00 | % | 0.37 | % | ||||||
Cable & Satellite | 0.36 | % | 0.00 | % | 0.36 | % | ||||||
Coal & Consumable Fuels | 0.29 | % | 0.07 | % | 0.36 | % | ||||||
Construction & Farm Machinery & Heavy Trucks | 0.25 | % | 0.11 | % | 0.36 | % | ||||||
Home Improvement Retail | 0.35 | % | 0.00 | % | 0.35 | % | ||||||
Oil & Gas Storage & Transportation | 0.34 | % | 0.00 | % | 0.34 | % | ||||||
Diversified Real Estate Activities | 0.00 | % | 0.32 | % | 0.32 | % | ||||||
Healthcare Supplies | 0.00 | % | 0.32 | % | 0.32 | % | ||||||
Research & Consulting Services | 0.32 | % | 0.00 | % | 0.32 | % | ||||||
Distillers & Vintners | 0.00 | % | 0.31 | % | 0.31 | % | ||||||
Electronic Components | 0.09 | % | 0.22 | % | 0.31 | % | ||||||
Hypermarkets & Super Centers | 0.06 | % | 0.25 | % | 0.31 | % | ||||||
General Merchandise Stores | 0.30 | % | 0.00 | % | 0.30 | % | ||||||
Regional Banks | 0.15 | % | 0.14 | % | 0.29 | % | ||||||
Security & Alarm Services | 0.21 | % | 0.07 | % | 0.28 | % | ||||||
Specialty Chemicals | 0.19 | % | 0.09 | % | 0.28 | % | ||||||
Food Retail | 0.00 | % | 0.27 | % | 0.27 | % | ||||||
Hotels, Resorts & Cruise Lines | 0.19 | % | 0.08 | % | 0.27 | % | ||||||
Retail REITs | 0.27 | % | 0.00 | % | 0.27 | % | ||||||
Consumer Finance | 0.24 | % | 0.00 | % | 0.24 | % | ||||||
Restaurants | 0.19 | % | 0.05 | % | 0.24 | % | ||||||
Diversified Capital Markets | 0.00 | % | 0.22 | % | 0.22 | % | ||||||
Apparel Retail | 0.10 | % | 0.11 | % | 0.21 | % | ||||||
Diversified Support Services | 0.02 | % | 0.19 | % | 0.21 | % | ||||||
Agricultural Products | 0.14 | % | 0.06 | % | 0.20 | % | ||||||
Real Estate Services | 0.20 | % | 0.00 | % | 0.20 | % | ||||||
Air Freight & Logistics | 0.19 | % | 0.00 | % | 0.19 | % | ||||||
Residential REITs | 0.19 | % | 0.00 | % | 0.19 | % | ||||||
Thrifts & Mortgage Finance | 0.18 | % | 0.00 | % | 0.18 | % | ||||||
Home Furnishing Retail | 0.17 | % | 0.00 | % | 0.17 | % | ||||||
Rail Roads | 0.17 | % | 0.00 | % | 0.17 | % | ||||||
Building Products | 0.00 | % | 0.16 | % | 0.16 | % | ||||||
Casinos & Gaming | 0.12 | % | 0.04 | % | 0.16 | % | ||||||
Reinsurance | 0.16 | % | 0.00 | % | 0.16 | % | ||||||
Gold | 0.00 | % | 0.15 | % | 0.15 | % | ||||||
Automotive Retail | 0.14 | % | 0.00 | % | 0.14 | % | ||||||
Broadcasting | 0.08 | % | 0.06 | % | 0.14 | % | ||||||
Oil & Gas Drilling | 0.11 | % | 0.02 | % | 0.13 | % | ||||||
Semiconductor Equipment | 0.13 | % | 0.00 | % | 0.13 | % | ||||||
Home Entertainment Software | 0.12 | % | 0.00 | % | 0.12 | % | ||||||
Tobacco | 0.11 | % | 0.01 | % | 0.12 | % | ||||||
Department Stores | 0.10 | % | 0.01 | % | 0.11 | % | ||||||
Marine | 0.00 | % | 0.11 | % | 0.11 | % | ||||||
Computer Storage & Peripherals | 0.10 | % | 0.00 | % | 0.10 | % | ||||||
Distributors | 0.09 | % | 0.00 | % | 0.09 | % | ||||||
Diversified REITs | 0.09 | % | 0.00 | % | 0.09 | % | ||||||
Healthcare Facilities | 0.09 | % | 0.00 | % | 0.09 | % | ||||||
Human Resource & Employment Services | 0.00 | % | 0.09 | % | 0.09 | % | ||||||
Precious Metals & Minerals | 0.05 | % | 0.04 | % | 0.09 | % | ||||||
Airlines | 0.00 | % | 0.08 | % | 0.08 | % | ||||||
Drug Retail | 0.08 | % | 0.00 | % | 0.08 | % | ||||||
Healthcare Distributors | 0.08 | % | 0.00 | % | 0.08 | % | ||||||
| Industry | Domestic | Foreign | Total | |||||||||
Specialty Stores | 0.08 | % | 0.00 | % | 0.08 | % | ||||||
Healthcare Technology | 0.07 | % | 0.00 | % | 0.07 | % | ||||||
Home Building | 0.07 | % | 0.00 | % | 0.07 | % | ||||||
Industrial REITs | 0.07 | % | 0.00 | % | 0.07 | % | ||||||
Personal Products | 0.07 | % | 0.00 | % | 0.07 | % | ||||||
Food Distributors | 0.05 | % | 0.01 | % | 0.06 | % | ||||||
Internet Retail | 0.06 | % | 0.00 | % | 0.06 | % | ||||||
Diversified Chemicals | 0.06 | % | 0.00 | % | 0.06 | % | ||||||
Electronic Manufacturing Services | 0.00 | % | 0.05 | % | 0.05 | % | ||||||
Metal & Glass Containers | 0.00 | % | 0.04 | % | 0.04 | % | ||||||
Brewers | 0.00 | % | 0.03 | % | 0.03 | % | ||||||
Electronic Equipment & Instruments | 0.00 | % | 0.03 | % | 0.03 | % | ||||||
Footwear | 0.03 | % | 0.00 | % | 0.03 | % | ||||||
Housewares & Specialties | 0.03 | % | 0.00 | % | 0.03 | % | ||||||
Managed Healthcare | 0.03 | % | 0.00 | % | 0.03 | % | ||||||
Oil & Gas Refining & Marketing | 0.00 | % | 0.03 | % | 0.03 | % | ||||||
Paper Packaging | 0.03 | % | 0.00 | % | 0.03 | % | ||||||
Real Estate Operating Companies | 0.00 | % | 0.03 | % | 0.03 | % | ||||||
Trucking | 0.03 | % | 0.00 | % | 0.03 | % | ||||||
Water Utilities | 0.03 | % | 0.00 | % | 0.03 | % | ||||||
Auto Parts & Equipment | 0.00 | % | 0.02 | % | 0.02 | % | ||||||
Heavy Electrical Equipment | 0.00 | % | 0.02 | % | 0.02 | % | ||||||
Household Appliances | 0.00 | % | 0.02 | % | 0.02 | % | ||||||
Office Electronics | 0.02 | % | 0.00 | % | 0.02 | % | ||||||
Office Services & Supplies | 0.01 | % | 0.00 | % | 0.01 | % | ||||||
Publishing | 0.01 | % | 0.00 | % | 0.01 | % | ||||||
|
| |||||||||||
| 63.01 | % | |||||||||||
|
| |||||||||||
| Sector | Percentage (based on Fair Value) | |||
Agency Mortgage Backed | 9.36 | % | ||
Corporate Notes | 8.44 | % | ||
U.S. Treasuries | 4.04 | % | ||
Non-Agency Collateralized Mortgage Obligations | 2.01 | % | ||
Agency Collateralized Mortgage Obligations | 0.57 | % | ||
Sovereign Bonds | 0.43 | % | ||
Asset Backed | 0.29 | % | ||
Municipal Bonds and Notes | 0.16 | % | ||
Federal Agencies | 0.03 | % | ||
|
| |||
| 25.33 | % | |||
|
| |||
Short-Term and Other Investments | ||||
Short-Term | 11.49 | % | ||
Other Investments | 0.17 | % | ||
|
| |||
| 11.66 | % | |||
|
| |||
| 100.00 | % | |||
|
| |||
See Notes to Schedule of Investments and Notes to Financial Statements.
27
Table of Contents
| Notes to Schedule of Investments | June 30, 2011 (unaudited) |
The views expressed in this document reflect our judgment as of the publication date and are subject to change at any time without notice. The securities information regarding holdings, allocations and other characteristics are presented to illustrate examples of securities that the Fund has bought and the diversity of areas in which the Fund may invest as of a particular date. It may not be representative of the Fund’s current or future investments and should not be construed as a recommendation to purchase or sell a particular security. See the Fund’s summary prospectus and statutory prospectus for complete descriptions of investment objectives, policies, risks and permissible investments.
| (a) | Non-income producing security. |
| (b) | Pursuant to Rule 144A of the Securities Act of 1933, these securities may be resold in transactions exempt from registration, normally to qualified institutional buyers. At June 30, 2011, these securities amounted to $79,462,605 or 2.74% of the net assets of the GE Investments Total Return Fund. These securities have been determined to be liquid using procedures established by the Fund’s Board of Directors. |
| (c) | Settlement is on a delayed delivery or when-issued basis with final maturity to be announced (TBA) in the future. |
| (d) | Coupon amount represents effective yield. |
| (e) | State Street Corp. is the parent company of State Street Bank & Trust Co., the Fund’s custodian and accounting agent. |
| (f) | Principal only security. These securities represent the right to receive the monthly principal payments on an underlying pool of mortgages. No payments of interest on the pool are passed through to the “principal only” holder. |
| (g) | Interest only security. These securities represent the right to receive the monthly interest payments on an underlying pool of mortgages. Payments of principal on the pool reduce the value of the “interest only” holding. |
| (h) | At June 30, 2011 , all or a portion of this security was pledged to cover collateral requirements for futures, options, forward foreign currency contracts and/or TBA’s. |
| (i) | Variable or floating rate security. The stated rate represents the rate at June 30, 2011. |
| (j) | Step coupon bond. Security becomes interest bearing at a future date. |
| (k) | GE Asset Management, the investment adviser of the Fund, also serves as investment adviser of the GEI Investment Fund and the GE Institutional Money Market Fund. |
| (l) | Securities in default |
| (m) | Sponsored by SSgA Funds Management, Inc., an affiliate of State Street Bank & Trust Co., the Fund’s custodian and accounting agent. |
| (n) | Illiquid securities. At June 30, 2011, these securities amounted to $217,514 or 0.01% of net assets for the GE Investments Total Return Fund. These securities have been determined to be illiquid using procedures established by the Fund’s Board of Trustees. |
| (o) | Coupon amount represents the coupon of the underlying mortgage securities on which monthly interest payments are based. |
| * | Less than 0.05%. |
| ** | Amount is less than $ 0.50. |
| † | Percentages are based on net assets as of June 30, 2011. |
| †† | Security traded on different exchanges. |
Abbreviations:
ADR | American Depository Receipt | |
GDR | Global Depository Receipt | |
REIT | Real Estate Investment Trust | |
REMIC | Real Estate Mortgage Investment Conduit | |
SPDR | Standard & Poors Depository Receipts | |
STRIPS | Separate Trading of Registered Interest and Principal of Security | |
TBA | To Be Announced | |
28
Table of Contents
Selected data based on a share outstanding throughout the fiscal years indicated
| CLASS 1 | ||||||||||||||||||||||||
| 6/30/11* | 12/31/10 | 12/31/09 | 12/31/08(d) | 12/31/07 | 12/31/06 | |||||||||||||||||||
| Inception date | — | — | — | — | — | 7/1/85 | ||||||||||||||||||
Net asset value, beginning of period | $ | 16.42 | $ | 15.18 | $ | 12.75 | $ | 18.61 | $ | 17.69 | $ | 16.04 | ||||||||||||
Income/(loss) from investment operations: | ||||||||||||||||||||||||
Net investment income | 0.15 | 0.23 | ** | 0.20 | ** | 0.35 | ** | 0.35 | 0.36 | |||||||||||||||
Net realized and unrealized gains/(losses) on investments | 0.45 | 1.23 | 2.45 | (5.80) | 1.71 | 1.84 | ||||||||||||||||||
Total income/(loss) from investment operations | 0.60 | 1.46 | 2.65 | (5.45) | 2.06 | 2.20 | ||||||||||||||||||
Less distributions from: | ||||||||||||||||||||||||
Net investment income | — | 0.22 | 0.19 | 0.34 | 0.35 | 0.31 | ||||||||||||||||||
Net realized gains | — | — | — | 0.07 | 0.79 | 0.24 | ||||||||||||||||||
Return of capital | — | — | 0.03 | — | — | — | ||||||||||||||||||
Total distributions | — | 0.22 | 0.22 | 0.41 | 1.14 | 0.55 | ||||||||||||||||||
Net asset value, end of period | $ | 17.02 | $ | 16.42 | $ | 15.18 | $ | 12.75 | $ | 18.61 | $ | 17.69 | ||||||||||||
TOTAL RETURN(a) | 3.65% | 9.64% | 20.81% | (29.28)% | 11.68% | (b) | 13.75% | |||||||||||||||||
RATIOS/SUPPLEMENTAL DATA: | ||||||||||||||||||||||||
Net assets, end of period (in thousands) | $ | 1,138,306 | $ | 1,152,587 | $ | 1,131,038 | $ | 989,975 | $ | 1,525,002 | $ | 1,390,230 | ||||||||||||
Ratios to average net assets: | ||||||||||||||||||||||||
Net investment income | 1.79% | † | 1.51% | 1.47% | 2.16% | 2.20% | 2.33% | |||||||||||||||||
Net Expenses | 0.73% | (b)(c)† | 0.69% | (b)(c) | 0.67% | (b)(c) | 0.51% | (b)(c) | 0.52% | (c) | 0.48% | (c) | ||||||||||||
Gross Expenses | 0.75% | † | 0.73% | 0.70% | 0.55% | 0.56% | 0.53% | |||||||||||||||||
Portfolio turnover rate | 94% | 148% | 174% | 203% | 176% | 138% | ||||||||||||||||||
The accompanying Notes are an integral part of these financial statements.
29
Table of Contents
Financial Highlights
Selected data based on a share outstanding throughout the fiscal years indicated
| CLASS 3 | ||||||||||||||||||||||||
| 6/30/11* | 12/31/10 | 12/31/09 | 12/31/08(d) | 12/31/07 | 12/31/06 | |||||||||||||||||||
| Inception date | — | — | — | — | — | 5/1/06 | ||||||||||||||||||
Net asset value, beginning of period | $ | 16.38 | $ | 15.15 | $ | 12.73 | $ | 18.59 | $ | 17.69 | $ | 17.03 | ||||||||||||
Income/(loss) from investment operations: | ||||||||||||||||||||||||
Net investment income | 0.13 | 0.19 | ** | 0.17 | ** | 0.34 | ** | 0.35 | 0.12 | |||||||||||||||
Net realized and unrealized gains/(losses) on investments | 0.45 | 1.23 | 2.45 | (5.80) | 1.69 | 1.10 | ||||||||||||||||||
Total income/(loss) from investment operations | 0.58 | 1.42 | 2.62 | (5.46) | 2.04 | 1.22 | ||||||||||||||||||
Less distributions from: | ||||||||||||||||||||||||
Net investment income | — | 0.19 | 0.17 | 0.33 | 0.35 | 0.32 | ||||||||||||||||||
Net realized gains | — | — | — | 0.07 | 0.79 | 0.24 | ||||||||||||||||||
Return of capital | — | — | 0.03 | — | — | — | ||||||||||||||||||
Total distributions | — | 0.19 | 0.20 | 0.40 | 1.14 | 0.56 | ||||||||||||||||||
Net asset value, end of period | $ | 16.96 | $ | 16.38 | $ | 15.15 | $ 12.73 | $ 18.59 | $ 17.69 | |||||||||||||||
TOTAL RETURN(a) | 3.54% | 9.37% | 20.57% | (29.37)% | 11.56% | (b) | 7.17% | |||||||||||||||||
RATIOS/SUPPLEMENTAL DATA: | ||||||||||||||||||||||||
Net assets, end of period (in thousands) | $ | 1,761,949 | $ | 1,691,910 | $ | 1,421,191 | $1,110,117 | $1,173,708 | $396,349 | |||||||||||||||
Ratios to average net assets: | ||||||||||||||||||||||||
Net investment income | 1.54% | † | 1.26% | 1.26% | 2.05% | 2.04% | 2.09% | |||||||||||||||||
Net Expenses | 0.98% | (b)(c)† | 0.94% | (b)(c) | 0.87% | (b)(c) | 0.61% | (b)(c) | 0.61% | (c) | 0.62% | (c) | ||||||||||||
Gross Expenses | 1.00% | † | 0.98% | 0.91% | 0.65% | 0.65% | 0.69% | |||||||||||||||||
Portfolio turnover rate | 94% | 148% | 174% | 203% | 176% | 138% | ||||||||||||||||||
Notes to Financial Highlights
| (a) | Total returns are historical and assume changes in share price, reinvestment of dividends and capital gains distributions and do not include the effect of insurance contract charges. Past performance does not guarantee future results. |
| (b) | Reflects GE Asset Management’s waiver of a portion of the Fund’s management fee in an amount equal to the management fee earned by GEAM with respect to the Fund’s investment in the GE Money Market Fund (“GE Money Market Fund”) and the GE Institutional Money Market Fund. |
| (c) | Reflects GE Asset Management’s contractual arrangement with GE Investments Funds, Inc. to limit the Fund’s total operating expenses of each class share (excluding class specific expenses) to 0.32% of the average daily net assets of the Fund attributable to such class share on an annual basis. This arrangement expired on April 30, 2011. |
| (d) | Less than $0.01 per share of the distribution paid was from return of capital. |
| * | Unaudited |
| ** | Per share values have been calculated using the average share method. |
| † | Annualized for periods less than one year. |
The accompanying Notes are an integral part of these financial statements.
30
Table of Contents
The accompanying Notes are an integral part of these financial statements.
31
Table of Contents
| * | Share Class 2 was closed as of June 22, 2011. |
The accompanying Notes are an integral part of these financial statements.
32
Table of Contents
| * | Unaudited |
| ** | Share Class 2 was closed as of June 22, 2011. |
The accompanying Notes are an integral part of these financial statements.
33
Table of Contents
| Statements of Changes in Net Assets (continued) Changes in Fund Shares | ||||||||
| Six Months Ended June 30, 2011* | Year Ended December 31, 2010 | |||||||
CHANGES IN FUND SHARES | ||||||||
Class 1 | ||||||||
Shares sold | 79,059 | 495,434 | ||||||
Issued for distributions reinvested | — | 941,849 | ||||||
Shares redeemed | (3,415,344 | ) | (5,752,425 | ) | ||||
Net increase (decrease) in fund shares | (3,336,285 | ) | (4,315,142 | ) | ||||
Class 2** | ||||||||
Shares sold | 97,549 | 363,249 | ||||||
Issued for distributions reinvested | — | 19,420 | ||||||
Shares redeemed | (1,567,546 | ) | (111,812 | ) | ||||
Net increase (decrease) in fund shares | (1,469,997 | ) | 270,857 | |||||
Class 3 | ||||||||
Shares sold | 5,292,450 | 12,570,250 | ||||||
Issued for distributions reinvested | — | 1,177,209 | ||||||
Shares redeemed | (4,713,724 | ) | (4,260,891 | ) | ||||
Net increase (decrease) in fund shares | 578,726 | 9,486,568 | ||||||
| * | Unaudited |
| ** | Share Class 2 was closed as of June 22, 2011 |
The accompanying Notes are an integral part of these financial statements.
34
Table of Contents
| Notes to Financial Statements | June 30, 2011 (unaudited) |
| 1. | Organization of the Company |
GE Investments Funds, Inc. (the “Company”) was incorporated under the laws of the Commonwealth of Virginia on May 14, 1984 and is registered under the Investment Company Act of 1940, as amended (the “1940 Act”), as an open-end management investment company. The Company is composed of fourteen investment portfolios (collectively the “Funds”), although only the following eleven are currently being offered: U.S. Equity Fund, S&P 500 Index Fund, Premier Growth Equity Fund, Core Value Equity Fund, Mid-Cap Equity Fund, Small-Cap Equity Fund, International Equity Fund, Total Return Fund (the “Fund”), Income Fund, Money Market Fund and Real Estate Securities Fund.
Shares of the Funds of the Company are offered only to insurance company separate accounts that fund certain variable life insurance contracts and variable annuity contracts. GE Asset Management Incorporated (“GEAM”) is the investment adviser and administrator of each of the Funds.
The Company currently offers two share classes of the Fund as investment options for variable life insurance and variable annuity contracts — Class 1 and Class 3. Class 2 and 3 shares were first offered on May 1, 2006, and Fund shares outstanding prior to May 1, 2006 were designated as Class 1 shares. As of June 22, 2011, Class 2 shares of the Fund are no longer available. Each class of shares has different fees and expenses, and as a result, each class of shares will have a different share price and performance. Not all variable contracts offer every class of the Fund’s shares.
| 2. | Summary of Significant Accounting Policies |
The preparation of financial statements in conformity with U.S. generally accepted accounting principles (GAAP) requires management to make estimates and assumptions that affect the reported amounts of assets and liabilities and disclosure of contingent assets and liabilities at the date of the financial statements and the reported amounts of increases and decreases in net assets from operations during the reporting period. Actual results may differ from those estimates.
Subsequent events after the balance sheet date through the date the financial statements were issued, have been evaluated in the preparation of the financial statements. There are no items to report.
The following summarizes the significant accounting policies of the Company:
Securities Valuation and Transactions. All investments in securities are recorded at their estimated fair value, as described in Note 3.
Securities transactions are accounted for as of the trade date. Realized gains and losses on investments sold are recorded on the basis of identified cost for both financial statement and federal tax purposes.
The Fund’s income, expenses (other than distribution fees) and realized and unrealized gains and losses are allocated proportionally each day among the share classes based upon the relative net assets of each class.
Derivatives The Fund is subject to equity price risk, interest rate risk, and foreign currency exchange rate risk in the normal course of pursuing its investment objective. The Fund may enter into derivative transactions for the purpose of hedging against the effects of changes in the value of portfolio securities due to anticipated changes in market conditions, to gain market exposure for residual and accumulating cash positions, and for managing the duration of fixed-income investments. A futures contract represents a commitment for the future purchase or sale of an asset at a specified price on a specified date. Upon entering into such contracts, the Fund is required to deposit with the broker, either in cash or securities, an initial margin in an amount equal to a certain percentage of the contract amount. Subsequent payments (variation margin) are made or received by the Fund each day, depending on the daily fluctuations in the value of the contract, and are recorded for financial statement purposes as unrealized gains or losses by the Fund. Upon entering into such contracts, the Fund bears the risk of interest or exchange rates and securities prices moving unexpectedly, in which case, the Fund may not achieve the anticipated benefits of the futures contracts and may realize a loss. With futures contracts, there is minimal counterparty credit risk to the Fund since futures contracts are exchange traded and the exchange’s clearinghouse, as counterparty to all traded futures, guarantees the futures against default.
Foreign Currency Accounting records of the Fund are maintained in U.S. dollars. Investment securities and other assets and liabilities denominated in a foreign currency are translated to U.S. dollars at the prevailing rates of exchange at period end. Purchases and sales of securities, income receipts and expense payments denominated in foreign
35
Table of Contents
| Notes to Financial Statements | June 30, 2011 (unaudited) |
currencies are translated into U.S. dollars at the prevailing exchange rate on the respective dates of such transactions.
All assets and liabilities of the Fund initially expressed in foreign currency values will be converted into U.S. dollars at the WM/Reuter exchange rate computed at 11:00 a.m., Eastern time.
The Fund does not isolate the portion of the results of operations resulting from changes in foreign exchange rates from the fluctuations arising from changes in the market prices of securities during the year. Such fluctuations are included in the net realized or unrealized gain or loss from investments. Net realized gains or losses on foreign currency transactions represent net gains or losses on sales and maturities of foreign currency contracts, disposition of foreign currencies, the difference between the amount of net investment income and withholding taxes accrued and the U.S. dollar amount actually received or paid, and gains or losses between the trade and settlement date on purchases and sales of foreign securities. Net unrealized foreign exchange gains and losses arising from changes in the value of other assets and liabilities (including foreign currencies and open foreign currency contracts) as a result of changes in foreign exchange rates are included as increases or decreases in unrealized appreciation/depreciation on foreign currency related transactions.
Futures Contracts A futures contract represents a commitment for the future purchase or sale of an asset at a specified price on a specified date. The Fund invests in interest rate, financial and stock or bond index futures contracts subject to certain limitations. The Fund invests in futures contracts to manage its exposure to the stock and bond markets and fluctuations in currency values. Buying futures tends to increase the Fund’s exposure to the underlying instrument while selling futures tends to decrease a Fund’s exposure to the underlying instrument or to hedge other Fund investments. The Fund will not enter into a transaction involving futures for speculative purposes. With futures contracts, there is minimal counterparty credit risk to the Fund since futures contracts are exchange traded and the exchange’s clearinghouse, as counterparty to all traded futures, guarantees the futures against default. The Fund’s risks in using these contracts include changes in the value of the underlying instruments, non-performance of the counterparties under the contracts’ terms and changes in the liquidity of the secondary market for the contracts. Futures contracts are valued at the settlement price established each day by the board of trade or exchange on which they principally trade.
Upon entering into a financial futures contract, the Fund is required to pledge to the broker an amount of cash and/or other assets equal to a certain percentage of the contract amount, known as initial margin deposit. Subsequent payments, known as variation margin, are made or received by the Fund each day, depending on the daily fluctuation in the fair value of the underlying security. The Fund records an unrealized gain or loss equal to the daily variation margin. Should market conditions move unexpectedly, the Fund may not achieve the anticipated benefits of the futures contracts and may incur a loss. The Fund recognizes a realized gain or loss on the expiration or closing of a futures contract.
Investments in Foreign Markets Investments in foreign markets involve special risks and considerations not typically associated with investing in the United States. These risks include revaluation of currencies, high rates of inflation, restrictions on repatriation of income and capital, and adverse political and economic developments. Moreover, securities issued in these markets may be less liquid, subject to government ownership controls, tariffs and taxes, subject to delays in settlements, and their prices may be more volatile.
The Fund may be subject to capital gains and repatriation taxes imposed by certain countries in which they invest. Such taxes are generally based upon income and/or capital gains earned or repatriated. Taxes are accrued based on net investment income, net realized gains and net unrealized appreciation as income and/or capital gains are earned.
Investment Income Corporate actions (including cash dividends) are recorded on the ex-dividend date, net of applicable withholding taxes, except for certain foreign corporate actions which are recorded as soon after the ex-dividend date as such information becomes available.
Interest income is recorded on the accrual basis. Accretion of discounts and amortization of premiums on taxable bonds are to the call or maturity date, whichever is shorter, using the effective yield method. Withholding taxes in foreign dividends have been provided for in accordance with the Fund’s understanding of the applicable country’s tax rules and rates.
Expenses Fund specific expenses are allocated to the Fund that incurs such expenses. Such expenses may include custodial fees, legal and accounting fees, printing costs and registration fees. Expenses that are not fund specific are allocated pro rata across the Funds. Certain class specific
36
Table of Contents
| Notes to Financial Statements | June 30, 2011 (unaudited) |
expenses (such as distribution fees) are allocated to the class that incurs such expense. Expenses of the Fund are generally paid directly by the Fund however, expenses may be paid by GEAM and reimbursed by the fund.
Federal Income Taxes The Fund intends to comply with all sections of the Internal Revenue Code applicable to regulated investment companies including the distribution of substantially all of its taxable net investment income and net realized capital gains to its shareholders. Therefore, no provision for federal income tax has been made. The Fund is treated as a separate taxpayer for federal income tax purposes.
| 3. | Securities Valuation |
The Fund utilizes various methods to measure the fair value of most of its investments on a recurring basis. GAAP establishes a framework for measuring fair value and providing related disclosures. Broadly, the framework requires fair value to be determined based on the exchange price that would be received for an asset or paid to transfer a liability (an exit price) in the principal or most advantageous market for the asset or liability in an orderly transaction between market participants at the measurement date. In the absence of active markets for the identical assets or liabilities, such measurements involve developing assumptions based on market observable data and, in the absence of such data, internal information that is consistent with what market participants would use in a hypothetical transaction that occurs at the measurement date. It also establishes a three-level valuation hierarchy based upon observable and non-observable inputs.
Observable inputs reflect market data obtained from independent sources, while unobservable inputs reflect our market assumptions. Preference is given to observable inputs. These two types of inputs create the following fair value hierarchy:
Level 1 — Quoted prices for identical investments in active markets.
Level 2 — Quoted prices for similar investments in active markets; quoted prices for identical or similar investments in markets that are not active; and model-derived valuations whose inputs are observable or whose significant value drivers are observable.
Level 3 — Significant inputs to the valuation model are unobservable.
Policies and procedures are maintained to value investments using the best and most relevant data available. In addition, pricing vendors are utilized to assist in valuing investments. GEAM performs periodic reviews of the methodologies used by independent pricing services including price validation of individual securities.
Fair Value Measurement The following section describes the valuation methodologies the Fund uses to measure different financial investments at fair value.
The Fund’s portfolio securities are valued generally on the basis of market quotations. Equity securities generally are valued at the last reported sales price on the primary market in which they are traded. Portfolio securities listed on NASDAQ are valued using the NASDAQ Official Closing Price. Level 1 securities primarily include publicly-traded equity securities which may not necessarily represent the last sale price. If no sales occurred on the exchange or NASDAQ that day, the portfolio security generally is valued using the last reported bid price. In those circumstances the Fund classifies the investment securities in Level 2.
Debt securities (other than short-term securities described below) generally are valued at an evaluated bid as reported by an independent pricing service. Municipal obligations are valued at the quoted bid prices, when available. The pricing vendor uses various pricing models for each asset class that are consistent with what other market participants would use. The inputs and assumptions to the model of the pricing vendor are derived from market observable sources including: benchmark yields, reported trades, broker/dealer quotes, issuer spreads, benchmark securities, bids, offers, and other market related data. Since many fixed income securities do not trade on a daily basis, the methodology of the pricing vendor uses available information as applicable such as benchmark curves, benchmarking of like securities, sector groupings, and matrix pricing. The pricing vendor considers all available market observable inputs in determining the evaluation for a security. Thus, certain securities may not be priced using quoted prices, but rather determined from market observable information. These investments are included in Level 2 and primarily comprise our portfolio of corporate fixed income, government, mortgage and asset-backed securities.
In the absence of a reliable price from such a pricing service, debt securities may be valued based on dealer supplied valuations or quotations. In these infrequent circumstances, pricing vendors may provide the Funds with
37
Table of Contents
| Notes to Financial Statements | June 30, 2011 (unaudited) |
valuations that are based on significant unobservable inputs, and in those circumstances we classify the investment securities in Level 3.
The Fund uses non-binding broker quotes as the primary basis for valuation when there is limited, or no, relevant market activity for a specific investment or for other investments that share similar characteristics. The Funds have not adjusted the prices obtained. Investment securities priced using non-binding broker quotes are included in Level 3. As is the case with the primary pricing vendor, third-party brokers do not provide access to their proprietary valuation models, inputs and assumptions. Accordingly, GEAM conducts internal reviews of pricing for all such investment securities periodically to ensure reasonableness of valuations used in the Funds‘ financial statements. These reviews are designed to identify prices that appear stale, those that have changed significantly from prior valuations, and other anomalies that may indicate that a price may not be accurate. Based on the information available, GEAM believes that the fair values provided by the brokers are representative of prices that would be received to sell the assets at the measurement date (exit prices).
The Fund uses the net asset value per unit for the collective fund. The Fund classifies the investment security in level 2.
Short-term investments of sufficient credit quality with remaining maturities of sixty days or less at the time of purchase are valued on a basis of amortized cost, which approximates market value and those are included in Level 2.
If prices are not readily available for a portfolio security, or if it is believed that a price for a portfolio security does not represent its fair value, the security may be valued using procedures approved by the Fund’s Board of Directors that are designed to establish its “fair” value. These securities would generally be classified in Level 3. Those procedures require that the fair value of a security be established by the valuation committee. The valuation committee follows different protocols for different types of investments and circumstances. The fair value procedures may be used to value any investment of any Fund in the appropriate circumstances.
Foreign securities may be valued with the assistance of an independent fair value pricing service in circumstances where it is believed that they have been or would be materially affected by events occurring after the close of the portfolio security’s primary market and before the close
of regular trading on the NYSE. In these circumstances the Fund classifies the investment securities in Level 2. This independent fair value pricing service uses a model to identify affected securities and portfolios taking into consideration various factors and the fair value of such securities may be something other than the last available quotation or other market price.
Portfolio securities may be valued using techniques other than market quotations, under the circumstances described above. The value established for a portfolio security may be different than what would be produced through the use of another methodology or if it had been priced using market quotations. Portfolio securities that are valued using techniques other than market quotations, including “fair valued” securities, may be subject to greater fluctuation in their value from one day to the next than would be the case if market quotations were used. In addition, there is no assurance that the Fund could sell a portfolio security for the value established for it at any time and it is possible that the Fund would incur a loss because a portfolio security is sold at a discount to its established value.
Other financial investments are derivative instruments that are not reflected in Total Investments, such as futures, forwards, swaps, and written options contracts, which are valued based on fair value as discussed above.
The Fund uses closing prices for derivatives included in Level 1, which are traded either on exchanges or liquid over-the counter markets. Derivative assets and liabilities included in Level 2 primarily represent interest rate swaps, cross-currency swaps and foreign currency and commodity forward and option contracts. Derivative assets and liabilities included in Level 3 primarily represent interest rate products that contain embedded optionality or prepayment features.
The inputs or methodology used for valuing securities are not an indication of the risk associated with investing in those securities. Fair value determinations are required for securities whose value is affected by a significant event that will materially affect the value of a domestic or foreign security and which occurs subsequent to the time of the close of the principal market on which such domestic or foreign security trades but prior to the calculation of the Fund’s NAV.
38
Table of Contents
| Notes to Financial Statements | June 30, 2011 (unaudited) |
The following tables present the Fund’s investments measured at fair value on a recurring basis at June 30, 2011:
Investments | Level 1 | Level 2 | Level 3 | Total | ||||||||||||
Investments in Securities | ||||||||||||||||
Domestic Equity | $ | 1,129,545,051 | $ | — | $ | — | $ | 1,129,545,051 | ||||||||
Foreign Equity | 729,703,432 | 4,883,123 | — | 734,586,555 | ||||||||||||
U.S. Treasuries | — | 121,626,009 | — | 121,626,009 | ||||||||||||
Federal Agencies | — | 937,004 | — | 937,004 | ||||||||||||
Agency Mortgage Backed | — | 281,478,201 | — | 281,478,201 | ||||||||||||
Agency CMOs | — | 17,116,952 | 137,894 | 17,254,846 | ||||||||||||
Asset Backed | — | 8,734,256 | — | 8,734,256 | ||||||||||||
Corporate Notes | — | 253,773,848 | — | 253,773,848 | ||||||||||||
Non-Agency CMOs | — | 60,378,385 | — | 60,378,385 | ||||||||||||
Sovereign Bonds | — | 13,028,646 | — | 13,028,646 | ||||||||||||
Municipal Notes and Bonds | — | 4,783,177 | — | 4,783,177 | ||||||||||||
Exchange Traded Funds | 14,729,436 | — | — | 14,729,436 | ||||||||||||
Preferred Stock | 16,749,084 | — | — | 16,749,084 | ||||||||||||
Other Investments | — | 5,094,421 | — | 5,094,421 | ||||||||||||
Short-Term Investments | 160,961,248 | 184,727,494 | — | 345,688,742 | ||||||||||||
|
|
|
|
|
|
|
| |||||||||
Total Investments in Securities | $ | 2,051,688,251 | $ | 956,561,516 | $ | 137,894 | $ | 3,008,387,661 | ||||||||
|
|
|
|
|
|
|
| |||||||||
Other Financial Instruments* | ||||||||||||||||
Futures Contracts — Unrealized Appreciation | $ | 1,447,347 | $ | — | $ | — | $ | 1,447,347 | ||||||||
Futures Contracts — Unrealized Depreciation | (94,469 | ) | — | �� | (94,469 | ) | ||||||||||
|
|
|
|
|
|
|
| |||||||||
Total Other Financial Instruments | $ | 1,352,878 | $ | — | $ | — | $ | 1,352,878 | ||||||||
|
|
|
|
|
|
|
| |||||||||
* Other financial instruments include derivative instruments such as futures contracts. Amounts shown represent unrealized appreciation (depreciation), at period end. |
| |||||||||||||||
The following table presents the changes in Level 3 investments measured on a recurring basis for the period ended June 30, 2011, within Total Return Fund:
| Agency CMOs | Non-Agency CMOs | Total | ||||||||||
Balance at 12/31/10 | $ | 780,609 | $ | 207 | $ | 780,816 | ||||||
Accrued discounts/premiums | (33,350 | ) | — | (33,350 | ) | |||||||
Realized gain (loss) | 63,895 | (56,568 | ) | 7,327 | ||||||||
Change in unrealized gain (loss) | (64,279 | ) | 56,426 | (7,853 | ) | |||||||
Purchases | 55,252 | — | 55,252 | |||||||||
Sales | (262,629 | ) | (65 | ) | (262,694 | ) | ||||||
Issuances | — | — | — | |||||||||
Settlements | — | — | — | |||||||||
Transfers into Level 3 | — | — | — | |||||||||
Transfers out of Level 3 | (401,604 | ) | — | (401,604 | ) | |||||||
Balance at 06/30/11 | $ | 137,894 | $ | — | $ | 137,894 | ||||||
Change in unrealized appreciation (depreciation) relating to | $ | 7,374 | $ | — | $ | 7,374 | ||||||
There were no significant transfers between Level 1 and Level 2. Transfers between fair value levels are considered to occur at the beginning of the period.
39
Table of Contents
| Notes to Financial Statements | June 30, 2011 (unaudited) |
| 4. | Derivatives Transactions |
Shown below are the derivative contracts entered into by the Fund, summarized by primary risk exposure as they appear on the Statement of Assets and Liabilities, all of which are not accounted for as hedging instruments under FASB Accounting Standards Codification (“ASC”) No. 815 Derivatives and Hedging as of June 30, 2011.
Asset Derivatives June 30, 2011 |
| Liability Derivatives June 30, 2011 |
| |||||||||
| Derivatives not accounted for as hedging instruments under ASC 815 | Location in the Statement | | Fair Value ($) | | Location in the Statement | | Fair Value ($) | | ||||
Interest Rate Contracts | Assets, Net Assets - | 393,249 | * | Liabilities, Net Assets - | (94,469 | )* | ||||||
| Net Unrealized Appreciation/ | Net Unrealized Appreciation/ | |||||||||||
| (Depreciation) on Futures | (Depreciation) on Futures | |||||||||||
Equity Contracts | Assets, Net Assets - | 732,523 | * | Liabilities, Net Assets - | — | |||||||
| Net Unrealized Appreciation/ | Net Unrealized Appreciation/ | |||||||||||
| (Depreciation) on Futures | (Depreciation) on Futures | |||||||||||
Foreign Currency Contracts | Assets, Net Assets - | 321,575 | * | Liabilities, Net Assets - | — | |||||||
| Net Unrealized Appreciation/ | Net Unrealized Appreciation/ | |||||||||||
| (Depreciation) on Futures | (Depreciation) on Futures | |||||||||||
| * | Includes cumulative appreciation/depreciation of futures contracts as reported in the Schedule of Investments and within the components of Net Assets section of the Statements of Assets and Liabilities. Only the current day’s variation margin is reported within the Assets or Liabilities sections of the Statement of Assets and Liabilities. |
Shown below are the effects of derivative instruments on the Fund's Statements of Operations, summarized by primary risk exposure all of which are not accounted for as hedging instruments under ASC 815.
| Derivatives not accounted for as hedging instruments under ASC 815 | Location in the Statement of Operations | | Total Notional Amount of Futures Contracts Purchased/(Sold) ($) | | Realized Gain or (Loss) on Derivatives Recognized in Income ($) | | Change in Unrealized Appreciation/ (Depreciation) on Derivatives Recognized in Income ($) | | ||||
Equity Contracts | Realized gain/(loss) on | 248,656,926/ | 2,869,139 | 259,034 | ||||||||
| Futures, Increase/(decrease) | (267,201,764 | ) | ||||||||||
| in unrealized appreciation/ | ||||||||||||
| (depreciation) on Futures | ||||||||||||
Interest Rate Contracts | Realized gain/(loss) on | 1,329,713,919/ | (4,393,938) | (952,420 | ) | |||||||
| Futures, Increase/(decrease) | (1,138,412,912 | ) | ||||||||||
| in unrealized appreciation/ | ||||||||||||
| (depreciation) on Futures | ||||||||||||
Foreign Currency Contracts | Realized gain/(loss) on | 156,493,747/ | (4,419,110) | 320,593 | ||||||||
| Futures, Increase/(decrease) | (231,847,327 | ) | ||||||||||
| in unrealized appreciation/ | ||||||||||||
| (depreciation) on Futures |
| 5. | Line of Credit |
The Company shares a revolving credit facility of up to $150 million with a number of its affiliates. The credit facility is with its custodian bank, State Street Bank and Trust Company (“State Street”). The revolving credit facility requires the payment of a commitment fee equal to 0.125% per annum on the daily unused portion of the credit facility, payable quarterly. The portion borne by the Funds generally is borne proportionally based upon net assets. In addition, the Company has a $100 million uncommitted, unsecured line of
credit with State Street. Generally, borrowings under the credit facilities would accrue interest at the Federal Funds Rate plus 50 basis points and would be borne by the borrowing Fund. The maximum amount allowed to be borrowed by any one Fund is the lesser of (i) 33.33% of its total assets or (ii) 20% of its net assets. The credit facilities were not utilized by the Fund during the six month period ended June 30, 2011.
40
Table of Contents
| Notes to Financial Statements | June 30, 2011 (unaudited) |
| 6. | Fees and Compensation Paid to Affiliates |
GEAM, a registered investment adviser, was retained by the Company’s Board of Directors effective May 1, 1997 to act as investment adviser and administrator of the Fund. GEAM’s compensation for investment advisory and administrative services is paid monthly based on the average daily net assets of the Fund at an annualized rate of 0.50%.
GEAM has a contractual arrangement with the Fund to waive a portion of the Fund’s management fee in the amount equal to the management fee earned by GEAM with respect to the Fund’s investment in the GE Institutional Money Market Fund.
For periods prior to May 1, 2010: Pursuant to an expense limitation agreement with the Fund, GEAM had agreed to limit the advisory and administrative fees paid by the Fund on an annual basis to 0.48% of the average daily net assets of the Fund. The advisory and administrative fee reduced by GEAM may however be recouped by GEAM for up to three years from the date reduced, provided that the total operating expense ratio for the Fund’s Class 1 shares, after giving effect to the recoupment, would not exceed 0.80% for the fiscal year in which the recoupment is made. This agreement was terminated on April 30, 2010.
For the period May 1, 2010 - April 30, 2011: GEAM entered into a contractual arrangement with the Company to limit other expenses of each share class of the Fund (excluding applicable Investor Service Plan fee of 0.20%) at or below 0.03% on an annualized basis. Expenses borne by GEAM pursuant to the expense limitation agreement may be recouped by GEAM for up to three years from the date the expense was incurred. A reimbursement payment was not made if it caused the Company to exceed its expense limit.
Investor Service Plan — Class 1 and Class 3 Shares The Company adopted an Investor Service Plan (the “Service Plan”) on December 9, 2005 for Class 1 shares and on May 1, 2009 for Class 3 shares of the Fund. The Service Plans were not adopted pursuant to Rule 12b-1 under the 1940 Act. Each Service Plan provides that during any fiscal year, the amount of compensation paid under the Services Plan by the Total Return Fund Class 1 or Class 3 shares may not exceed the annual rate of 0.20% of the average daily net assets of the Total Return Fund attributable to each such class shares.
Distribution and Shareholder Service (12b-1) Fees The Company has adopted a Distribution and Service (12b-1) Plan (12b-1 Plan) pursuant to Rule 12b-1 under the 1940 Act with respect to each of Class 1 and Class 3 shares of the Total Return Fund. Under the 12b-1 Plan for Class 1 shares that became effective May 1, 2009, payments made under the Class 1 Investor Service Plan are covered in the event that any portion of compensation paid pursuant to the Class 1 Investor Service Plan is determined to be an indirect use of the assets attributable to the Class 1 shares to finance distribution of such shares. Under the 12b-1 Plan for Class 3 shares, the Company, on behalf of the Fund, may compensate GE Investment Distributors, Inc. (GEID), the distributor of the shares of the Fund, for certain sales services provided by GEID or other broker dealers and investor services provided by GEID or other service providers relating to the Fund’s Class 3 shares, including services to owners or prospective owners of variable contracts issued by insurance companies that offer Class 3 shares as an investment option under such variable contracts. The amount of compensation paid under the 12b-1 Plan may not exceed 0.25% for Class 3 shares, of the average daily net assets of the Fund attributable to such share class. The 12b-1 Plan continues in effect from year to year for so long as such continuance is approved annually by the Board of Directors, including by those directors who are not interested persons of the Company and who have no direct or indirect financial interest in the operation of the 12b-1 Plan or in any agreement related to it. In addition, the Class 3 12b-1 Plan covers payments made under the Class 3 Investor Service Plan in the event that any portion of compensation paid pursuant to the Class 3 Investor Service Plan is determined to be an indirect use of the assets attributable to the Class 3 shares to finance distribution of such shares.
Directors’ Compensation The Fund pays no compensation to its directors who are officers or employees of GEAM or its affiliates. Directors who are not such officers or employees also serve in a similar capacity for other funds advised by GEAM. Compensation paid to unaffiliated directors are reflected on the Statement of Operations. These fees are allocated pro rata across all of the mutual fund platforms and share classes served by the directors, including the Fund, and are based upon the relative net assets of each fund within such platforms.
41
Table of Contents
| Notes to Financial Statements | June 30, 2011 (unaudited) |
| 7. | Investment Transactions |
Purchases and Sales of Securities The cost of purchases and the proceeds from sales of investments, other than short-term securities and options, for the period ended June 30, 2011, were as follows:
| U.S. Government Securities | ||
| Purchases | Sales | |
| $1,752,950,734 | $1,750,406,298 | |
| Other Securities | ||
| Purchases | Sales | |
| $809,689,742 | $927,279,877 | |
| 8. | Income Taxes |
The Fund is subject to ASC 740, Income Taxes. ASC 740 provides guidance for financial accounting and reporting for the effects of income taxes that result from an entity’s activities during the year. ASC 740 also provides guidance regarding how certain tax positions should be recognized, measured, presented and disclosed in the financial statements. ASC 740 requires evaluation of tax positions taken or expected to be taken in the course of preparing the Fund’s tax returns to determine whether the tax positions are “more likely than not” of being sustained by the applicable tax authority. There are no adjustments to the Fund’s net assets required under ASC 740. The Fund’s 2007, 2008, 2009 and 2010 fiscal years tax returns are still open to examination by the Federal and applicable state tax authorities.
As of June 30, 2011, information on the tax cost of investments was as follows:
| Cost of investment for tax purposes | Gross Tax | Net tax appreciation/ (depreciation) | ||||
| Appreciation | Depreciation | |||||
| $2,815,882,309 | $245,847,700 | $(53,342,348) | $192,505,352 | |||
As of December 31, 2010, the Fund has capital loss carryovers, as indicated below. Capital loss carryovers are available to offset future realized capital gains to the extent provided in the Internal Revenue Code and regulations thereunder. To the extent that these carryover losses are used to offset future capital gains, it is probable that the gains so offset will not be distributed to shareholders because they would be taxable as ordinary income.
| Amount | Expires | |
| $ 9,200,542 | 12/31/2016 | |
| 252,149,075 | 12/31/2017 |
These amounts will be available to offset future taxable capital gains. Under the recently enacted Regulated Investment Company Modernization Act of 2010, the Fund will be permitted to carry forward capital losses incurred in taxable years beginning after December 22, 2010 for an unlimited period. However, any losses incurred during those future years will be required to be utilized prior to the losses incurred in pre-enactment tax years. As a result of this ordering rule, pre-enactment capital loss carryforwards may be more likely to expire unused. Additionally, post-enactment capital losses that are carried forward will retain their character as either short-term or long-term capital losses rather than being considered all short-term as under previous law.
During the year ended December 31, 2010, the Fund utilized $12,523,032 of prior year capital loss carryovers.
Any net capital and currency losses incurred after October 31, within the Fund’s tax year, are deemed to arise on the first day of the Fund’s next tax year if the Fund so elects to defer such losses.
The Fund elected to defer losses incurred after October 31, 2010 as follows:
| Capital | Currency | |
| $— | $84,226 |
The tax composition of distributions paid during the year ended December 31, 2010 was as follows:
| Ordinary Income | Long-Term Capital Gains | |||||
2010 | $ | 35,022,799 | $— | |||
2009 | 30,701,311 | — | ||||
Distributions to Shareholders The Fund declares and pays net investment income and any net realized capital gains in excess of capital loss carryforwards distributions annually. The character of income and gains to be distributed is determined in accordance with income tax regulations
42
Table of Contents
| Notes to Financial Statements | June 30, 2011 (unaudited) |
which may differ from generally accepted accounting principles. These differences include (but are not limited to) futures, treatment of realized and unrealized gains and losses on foreign currency transactions, paydown gains and losses on mortgage-backed securities, investments organized as partnerships for tax purposes, losses deferred due to offsetting positions, distributions from Real Estate Investment Trusts (REITs), and losses deferred due to wash sale transactions. Reclassifications due to permanent book/tax differences are made to the Fund’s capital accounts to reflect income and gains available for distribution (or available capital loss carryovers) under income tax regulations. These reclassifications have no impact on the net asset value of the Fund. The calculation of net investment income per share in the Financial Highlights table excludes these adjustments.
The reclassifications for the year ended December 31, 2010 were as follows:
| Undistributed Net Investment Income | Accumulated Net Realized Gain | Paid In Capital | ||
| $(853,731) | $765,630 | $88,101 |
| 9. | Significant Transaction |
Effective June 22, 2011 the Fund closed Class 2 shares. A full redemption was made by investors in the share class at the closing net asset value.
43
Table of Contents
| Special Meeting of Shareholders — Voting Results | (unaudited) |
On April 1, 2011, the GE Investments Funds, Inc. (the “Company”) held a special meeting of shareholders of each series portfolio of the Company, including shareholders of the Total Return Fund (the “Fund”). Shareholders of record on January 28, 2011 were entitled to vote on the proposal. At the meeting, the proposal was approved by the Fund and the following votes were recorded:
Proposal:
Election of Mr. R. Sheldon Johnson and Mr. Matthew J. Simpson as Directors to the Board of Directors of the Company.
Company votes:
| No. of Shares | % of Outstanding Shares | % of Shares Present | ||||||||||
| Mr. R. Sheldon Johnson | ||||||||||||
Affirmative | 451,517,094.582 | 90.054 | % | 96.126 | % | |||||||
Abstain | 18,195,810.391 | 3.629 | % | 3.874 | % | |||||||
Total | 469,712,904.973 | 93.683 | % | 100.000 | % | |||||||
| Mr. Matthew J. Simpson | ||||||||||||
Affirmative | 451,949,730.789 | 90.140 | % | 96.218 | % | |||||||
Abstain | 17,763,174.184 | 3.543 | % | 3.782 | % | |||||||
Total | 469,712,904.973 | 93.683 | % | 100.000 | % | |||||||
Fund votes:
| No. of Shares | % of Outstanding Shares | % of Shares Present | ||||||||||
| Mr. R. Sheldon Johnson | ||||||||||||
Affirmative | 158,699,893.402 | 90.664 | % | 96.550 | % | |||||||
Abstain | 5,670,860.097 | 3.240 | % | 3.450 | % | |||||||
Total | 164,370,753.499 | 93.904 | % | 100.000 | % | |||||||
| Mr. Matthew J. Simpson | ||||||||||||
Affirmative | 158,718,885.622 | 90.675 | % | 96.562 | % | |||||||
Abstain | 5,651,867.877 | 3.229 | % | 3.438 | % | |||||||
Total | 164,370,753.499 | 93.904 | % | 100.000 | % | |||||||
44
Table of Contents
| Additional Information | (unaudited) |
Information about Directors and Executive Officers:
The business and affairs of the Funds are managed under the direction of the Funds’ Board of Directors. Information pertaining to the Directors and officers of the Funds is set forth below.
Interested Directors and Executive Officers
Michael J. Cosgrove
Address c/o GEAM 3001 Summer St. Stamford, CT 06905
Age 62
Position(s) Held with Fund Chairman of the Board and President
Term of Office and Length of Time Served Until successor is elected and qualified – 14 years
Principal Occupation(s) During Past 5 years President and Chief Executive Officer – Mutual Funds and Intermediary Business at GEAM since March 2007; Executive Vice President of GEAM from February 1997 to March 2007; Vice President, GE Capital Corporation, an indirect wholly-owned subsidiary of GE, since December 1999; Executive Vice President – Mutual Funds of GEAM, a wholly-owned subsidiary of GE that is registered as an investment adviser under the Investment Advisers Act of 1940, as amended, since March 1993; President and Director of GE Investment Distributors, Inc., since June 2011. Director of GEAM since 1988.
Number of Portfolios in Fund Complex Overseen by Director 28
Other Directorships Held by Director Chairman of the Board and President of GE Institutional Funds since 1997; Trustee of Elfun Funds, GE Savings & Security Funds, General Relief and Loan Fund and General Electric Pension Trust since 1988; Trustee of Fordham University from 2002 to June 30, 2010 and since July 2011; Trustee of GE Volunteers since 1993; Director of GE Foundation; Director, GE Asset Management (Ireland) Limited, since February 1999, GE Asset Management Funds Plc since 1998, GE Asset Management Canada Company since 1998, GE Asset Management Limited since 1998 and GEAM since 1988; Chairman of the Board and President of GE Funds from 1993 to February 2011.
Matthew J. Simpson
Address c/o GEAM 3001 Summer St. Stamford, CT 06905
Age 50
Position(s) Held with Fund Director and Executive Vice President
Term of Office and Length of Time Served Until successor is elected and qualified – 3 years
Principal Occupation(s) During Past 5 years Executive Vice President, General Counsel and Secretary of GEAM since July 2007; Senior Vice President and General Counsel – Marketing and Client Services (formerly Asset Management Services) at GEAM and Senior Vice President and General Counsel of GE Asset Management Services from February 1997 to July 2007; Vice President and Associate General Counsel of GEAM from October 1992 to February 1997; Secretary of GE Funds from 1993 to July 2007 and Vice President from September 2003 to July 2007; Secretary of GE Institutional Funds and GE Investments Funds, Inc. from 1997 to July 2007; Secretary of Elfun Funds and GE Savings & Security Funds since July 2007; Assistant Secretary of Elfun Funds and GE Savings & Security Funds from 1998 to July 2007 and Vice President from October 2003 to July 2007.
Number of Portfolios in Fund Complex Overseen by Director 28
Other Directorships Held by Director Trustee of Elfun Funds, GE Savings & Security Funds and General Electric Pension Trust since July 2007; Trustee of GE Institutional Funds since April 2011 and Trustee of GE Funds from July 2007 to February 2011.
45
Table of Contents
| Additional Information | (unaudited) |
Joon Won Choe
Address c/o GEAM 3001 Summer St. Stamford, CT 06905
Age 41
Position(s) Held with Fund Vice President & Secretary
Term of Office and Length of Time Served Until successor is elected and qualified – Vice President and Secretary – less than 1 year
Principal Occupation(s) During Past 5 years Senior Vice President and Deputy General Counsel at GEAM since March 2011; Senior Vice President and Associate General Counsel at GEAM from June 2010 to March 2011; Vice President and Associate General Counsel at GEAM from November 2005 to June 2010; Vice President and Secretary of GE Institutional Funds and GE Investments Funds, Inc. since September 2010; Vice President and Assistant Secretary of Elfun Funds and GE Savings & Security Funds since September 2010.
Number of Portfolios in Fund Complex Overseen by Officer N/A
Other Directorships Held by Officer N/A
Robert Herlihy
Address c/o GEAM 3001 Summer St. Stamford, CT 06905
Age 43
Position(s) Held with Fund Chief Compliance Officer
Term of Office and Length of Time Served Until successor is elected and qualified — 5 years
Principal Occupation(s) During Past 5 years Chief Compliance Officer of GEAM, GE Institutional Funds, Elfun Funds, and GE Savings and Security Funds since July 2005; Chief Compliance Officer of GE Funds from July 2005 to February 2011; and Manager of Fund Administration at GEAM from 2002 – 2005.
Number of Portfolios in Fund Complex Overseen by Officer N/A
Other Directorships Held by Officer N/A
Arthur A. Jensen
Address c/o GEAM 3001 Summer St. Stamford, CT 06905
Age 44
Position(s) Held with Fund Treasurer
Term of Office and Length of Time Served Until successor is elected and qualified – less than 1 year
Principal Occupations(s) During Past 5 Years Treasurer of GE Institutional Funds, Elfun Funds and GE Savings and Security Funds since June 2011; Mutual Funds Controller of GEAM since April 2011; Senior Vice President at Citigroup from 2008 to 2010 and Vice President at JPMorgan from 2005 to 2008.
Number of Portfolios in Fund Complex Overseen by Officer N/A
Other Directorships Held by Officer N/A
46
Table of Contents
| Additional Information | (unaudited) |
Non-Interested Directors
John R. Costantino
Address c/o GEAM 3001 Summer St. Stamford, CT 06905
Age 65
Position(s) Held with Fund Director
Term of Office and Length of Time Served Until successor is elected and qualified – 14 years
Principal Occupation(s) During Past 5 years General Partner, NGN Capital LLC since 2006; Managing Director, Vice President of Walden Capital Management since 1996.
Number of Portfolios in Fund Complex Overseen by Director 20
Other Directorships Held by Director Director of GE Institutional Funds since 1997; Trustee of Fordham University from 1989-1995 and 2001-2007 and Trustee Emeritus since 2007; Trustee of Neuroscience Research Institute since 1986; Trustee of GE Funds from 1993 to February 2011; Trustee of Gregorian University Foundation from 1992-2007; Director of Artes Medical from 2006-2008.
R. Sheldon Johnson
Address c/o GEAM 3001 Summer St. Stamford, CT 06905
Age 64
Positions(s) Held with Fund Director
Term of office and Length of Time served Unit Successor is elected and qualified – less than 1 year.
Principal Occupation(s) During Past 5 years Managing Director at Morgan Stanley & Co.,Inc. from 1988 to 2006; Head of Global Institutional Equity Sales and Marketing at Morgan Stanley & Co., Inc. from 2002 to 2006.
Number of Portfolios in Fund Complex Overseen by Director 20
Other Directorships Held by Director Trustee of GE Institutional Funds since April 2011 and Trustee of St. Lawrence University since 2003.
Robert P. Quinn
Address c/o GEAM 3001 Summer St. Stamford, CT 06905
Age 75
Position(s) Held with Fund Director
Term of Office and Length of Time Served Until successor is elected and qualified – 14 years
Principal Occupation(s) During Past 5 years Retired since 1983 from Salomon Brothers Inc.
Number of Portfolios in Fund Complex Overseen by Director 20
Other Directorships Held by Director Trustee of GE Institutional Funds since 1997; Trustee of St. Francis Hospital since 1980; and Trustee of GE Funds from 1993 to February 2011.
The Statement of Additional Information for the Funds includes additional information about the Directors and Officers and is available, without charge, upon request by calling 1-800-242-0134.
47
Table of Contents
| Investment Team | (unaudited) |
Investment Adviser and Administrator
GE Asset Management Incorporated
Board of Directors
Michael J. Cosgrove, Chairman
John R. Costantino
R. Sheldon Johnson*
Robert P. Quinn
Matthew J. Simpson
Secretary
Joon Won Choe
Assistant Secretary
Michelle Matzelle
Treasurer
Arthur A. Jensen (effective June 6, 2011)
Assistant Treasurer
Casey Yantosca
Distributor
GE Investment Distributors, Inc.
Member FINRA and SIPC
Custodian
State Street Bank & Trust Company
Officers of the Investment Adviser
Dmitri Stockton, President and Chief Executive Officer (since May 2011)†
Cheryl H. Beacock, Senior Vice President, Human Resources
George A. Bicher, Chief Risk Officer
Paul M. Colonna, President and Chief Investment Officer – Fixed Income Investments
Michael J. Cosgrove, President and Chief Executive
Officer – Mutual Funds & Intermediary Business
Ralph R. Layman, President and Chief Investment Officer – Public Equity Investments
Maureen B. Mitchell, President – Institutional Sales and Marketing
Matthew J. Simpson, Executive Vice President, General Counsel and Secretary
Don W. Torey, President – Alternative Investments
John J. Walker, Executive Vice President, Chief Operating Officer
David Wiederecht, President and Chief Investment Officer – Investment Strategies
Tracie A. Winbigler, Executive Vice President, Chief Financial Officer (since January 2011)
| * | Mr. Johnson was elected as a Director of the Funds effective April 1, 2011. |
| † | Effective May 1, 2011, Mr. Stockton replaced James W. Ireland as President and Chief Executive Officer. |
At GE Asset Management, we’re dedicated to providing the investment options you’ll need to tailor your financial portfolio to every stage of your life. Each member of the GE Family of Funds is managed according to the same principles of integrity and quality that have guided GE over the past century, and have made it the world-class company that it is today. Each fund draws strength from a heritage of investment management experience that spans more than 80 years. Whether you’re creating a new investment portfolio or adding to an established one, the GE Family of Funds offers an array of professionally managed investment options that will help you meet a lifetime of financial needs.
48
Table of Contents
Investment Adviser
GE Asset Management Incorporated
3001 Summer Street
PO Box 7900
Stamford, CT 06904-7900
Distributor
GE Investment Distributors, Inc.
member FINRA and SIPC
3001 Summer Street
PO Box 7900
Stamford, CT 06904-7900
The Fund files its complete schedule of portfolio holdings with the Securities and Exchange Commission for the first and third quarters of each fiscal year on Form N-Q. The Fund’s Forms N-Q, as well as a description of the policies and procedures that the Fund uses to determine how to vote proxies (if any) relating to portfolio securities is available without charge (i) upon request, by calling 1-800-493-3042; (ii) on the Fund’s website at http://www.geam.com; and (iii) on the Commission’s website at http://www.sec.gov. The Fund’s Forms N-Q may be reviewed and copied at the Commission’s Public Reference Room in Washington, DC—information on the operation of the Public Reference Room may be obtained by calling 1-800-SEC-0330.
Information (if any) regarding how the Fund voted proxies relating to portfolio securities during the most recently disclosed 12-month period ended June 30 is available without charge (i) through the Fund’s website at http://www.geam.com; and (ii) on the Commission’s website at http://www.sec.gov.
Table of Contents
GE Investments Funds, Inc.
| Money Market Fund | Letter from the Chairman | |

Michael J. Cosgrove
Chairman,
GE Investments Funds, Inc.
Dear Shareholder:
Attached is the semi-annual report for GE Investments Funds, Inc. — Money Market Fund (the “Fund”) for the six-month period ended June 30, 2011. The report contains information about the performance of the Fund and other fund-specific data, along with portfolio manager commentary.
We have provided you with an overview of the investment markets, along with our investment outlook for the coming months.
Market Overview
Most major equity indices posted positive returns in the six-month period ended June 30, 2011, despite geopolitical tensions in the Middle East and North Africa, a devastating earthquake in Japan, ongoing concerns about unresolved sovereign debt issues in peripheral Europe and elevated inflation in emerging markets. Volatility increased in May and June, however, as some measures of global economic activity weakened and uncertainties over Greece’s ability to finance and service its debt rattled the financial markets. In the U.S., concerns over the end of quantitative easing by the Federal Reserve and political wrangling over the government debt ceiling further contributed to a challenging environment. The increase in risk aversion benefited the fixed income markets as many investors sought out safer investments. Toward the end of June, the Greek Parliament passed austerity measures that seemed to calm the markets and opened the way for the next round of financing from the European Central Bank and the International Monetary Fund.
Against this backdrop, financial markets posted positive results for the six- and 12-month periods ended June 30, 2011 as represented by the index returns in the below chart.
| Total Returns (%) as of June 30, 2011 | 6-month | 12-month | ||||||
U.S. equities (S&P 500 Index) | 6.0 | 30.7 | ||||||
Global equities (MSCI World Index) | 5.3 | 30.5 | ||||||
International equities (MSCI EAFE Index) | 5.0 | 30.4 | ||||||
Small-cap U.S. equities | 6.2 | 37.4 | ||||||
Mid-cap U.S. equities | 8.1 | 38.5 | ||||||
U.S. fixed income | 2.7 | 3.9 | ||||||
U.S. short-term government fixed income | 0.9 | 1.4 | ||||||
Outlook
We remain constructive on the prospects for healthy global growth, although it may be at a slower pace than originally anticipated. Central banks in the U.S. and Europe remain accommodative and supply chain issues in Japan appear to have abated. There are also signs that inflation may be peaking in emerging markets as commodity prices have eased in recent months. Corporate balance sheets remain healthy and fundamentals remain intact, in our view. We believe that valuations for equities are not stretched and remain below historical averages while equity risk premiums are still high-offering the possibility for further gains. We expect that the financial markets are likely to remain volatile due to outstanding sovereign debt issues, but believe that returns are biased to the upside in the second half of the year.
Thank you for investing with GE Investments Funds.
Sincerely,

Michael J. Cosgrove
Chairman, GE Investments Funds, Inc.
July 2011
 |
This does not constitute a part of the Fund’s Shareholder Report
Table of Contents
GE Investments Funds, Inc.
| Money Market Fund | ||
Mike Cosgrove is President and Chief Executive Officer — Mutual Funds and Intermediary Business at GE Asset Management Incorporated (“GEAM”). In addition to the GE Investments Funds, he is also Chairman of the Board and President of GE Institutional Funds and Director and President of GEAM’s broker-dealer which serves as underwriter and distributor for the GE Investments Funds. Mr. Cosgrove serves as a Trustee of the GE Savings & Security Funds, the GE Foundation, and the GE Pension Trust. He also serves on the Board of Directors of the Skin Cancer Foundation and is a Trustee of Fordham University. Previously Chief Financial Officer of GE Asset Management and Assistant Treasurer — GE Company, Mr. Cosgrove joined GE in 1970 and held a number of managerial positions in finance and sales in the International Operation and the GE Trading Company. He received a BS in Economics from Fordham University and an MBA from St. John’s University.
GE Investment Distributors, Inc., Member of FINRA & SIPC, is the principal underwriter and distributor of the GE Investments Funds, Inc.
This does not constitute a part of the Fund’s Shareholder Report
Table of Contents
GE Investments Funds, Inc.
Money Market Fund
Semi-Annual Report
June 30, 2011

Table of Contents
GE Investments Funds, Inc.
| Money Market Fund | Contents | |
| 1 | ||||
| 2 | ||||
| 8 | ||||
Financial Statements | ||||
| 9 | ||||
| 10 | ||||
| 11 | ||||
| 12 | ||||
| 13 | ||||
| 17 | ||||
| 20 | ||||
| 23 | ||||
This report is prepared for Policyholders of certain variable contracts and may be distributed to others only if preceded or accompanied by the variable contract’s current prospectus and the current prospectus of the Fund available for investments thereunder.
Table of Contents
| Notes to Performance | June 30, 2011 (unaudited) |
The information provided on the performance pages relates to the GE Investments Money Market Fund (the “Fund”).
Total returns take into account changes in share price and assume reinvestment of dividends and capital gains distributions, if any. Total returns shown are net of Fund fees and expenses but do not reflect fees and charges associated with the variable contracts such as administrative fees, account charges and surrender charges, which, if reflected, would reduce the Fund’s total returns for all periods shown.
The performance data quoted represents past performance; past performance does not guarantee future results. Investment return and principal value will fluctuate so your shares, when redeemed, may be worth more or less than their original cost. Current performance may be higher or lower than the performance data quoted. Periods less than one year are not annualized. Please call toll-free 800-493-3042 or visit the Fund’s website at http://www.geam.com for the most recent month-end performance data.
An investment in the Fund is not a deposit of any bank and is not insured or guaranteed by the Federal Deposit Insurance Corporation (FDIC) or any other government agency. An investment in the Fund is subject to risk, including possible loss of principal invested.
The 90 Day U.S. T-Bill is an unmanaged measure/index of the performance of U.S. Treasury bills currently available in the marketplace having a remaining maturity of 90 days.
The peer universe of the underlying annuity funds used for the peer group average annual total return calculation is based on the blend of Morningstar peer categories, as shown. Morningstar is an independent mutual fund rating service. A Fund’s performance may be compared to or ranked within a universe of mutual funds with investment objectives and policies similar but not necessarily identical to that of the Fund.
©2011 Morningstar, Inc. All Rights Reserved. The Morningstar information contained herein: (1) is proprietary to Morningstar and/or its content providers; (2) may not be copied or distributed; and (3) is not warranted to be accurate, complete or timely. Neither Morningstar nor its content providers are responsible for any damage or losses relating from any use of this information. Past performance is no guarantee of future results.
GE Investment Distributors, Inc., Member of FINRA & SIPC, is the principal underwriter and distributor of the GE Investments Funds, Inc. and a wholly owned subsidiary of GE Asset Management Incorporated, the investment adviser of the Fund.
1
Table of Contents
| Money Market Fund | (unaudited) |

Michael E. Martini
Vice President
The Money Market Fund is managed by a team of portfolio managers that includes James C. Gannon and Michael E. Martini. As lead portfolio manager for the Money Market Fund, Mr. Martini has oversight responsibilities over the Fund.
Michael E. Martini is a Vice President and a Portfolio Manager at GE Asset Management. He has served on the portfolio management team for the Fund since joining GE Asset Management in March of 2008. Prior to joining GE Asset Management, Mr. Martini was a Vice President at Ceres Capital Partners LLC, where he worked at the firm’s treasury desk from March 2006 to January 2008, and a Senior Vice President at Pacific Investment Management Company (PIMCO) from 1996 to 2004, where he was a portfolio manager at the firm’s money market/short-term desk.
James C. Gannon is an Assistant Portfolio Manager of GE Asset Management. He has served on the portfolio management team for the Fund since December 2000. Since joining GE Asset Management in 1995, Mr. Gannon served in various positions at GE Asset Management including Trade Operations Specialist in fixed income, and became an Assistant Portfolio Manager in February 2003.
| Q. | How did the Money Market Fund perform compared to its benchmark and Morningstar peer group for the six-month period ended June 30, 2011? |
| A. | For the six-month period ended June 30, 2011, the Money Market Fund returned 0.00% for Class 1 shares. The 90-day Treasury Bill, the Fund’s benchmark, returned 0.04% and the Fund’s Morningstar peer group of 100 U.S. Insurance Money Market Taxable funds returned an average of -0.01% over the same period. |
| Q. | What market factors affected Fund performance? |
| A. | The first quarter was notable for the decrease in U.S. Treasury float, affecting money market rates. The Federal Reserve’s $600 billion treasury purchase program (QEII) and Treasury’s decision to run down |
| their Supplementary Financing Program of U.S. Treasury Bills by $195 billion, a debt ceiling issue, pushed short U.S. Treasury and agency debt yields lower. The FDIC’s impending new insurance fund assessment (assets minus tangible equity versus domestic deposits prior) caused some banks to reduce their repo business. Cash borrowed in such transactions, parked at bank accounts at the Fed, will now be included in the FDIC’s new fee calculation. Repo rates fell to zero on the first day of this new assessment. Short U.S. Treasury Bill yields fell to 52-week lows, and LIBOR rates declined. Heading into the second quarter, money market funds faced even lower yields and shrinking supply. |
The primary concern for money market funds in the second quarter was European banks’ exposure to Greek debt. One rating agency analysis highlighted that with little alternative supply, prime money funds on average held about one half their assets in European bank names. In the final days of June, with Greek fiscal headlines causing increased “risk-off”, prime money funds experienced about $90 billion in outflows. However, roughly 50% of those funds flowed into government money market funds, we believe a strong commentary on the continued confidence and commitment to the money market sector. Interestingly, non-U.S. banks held over half of the excess reserves deposited at the Fed. With such ample liquidity, LIBOR rates declined throughout the quarter. Interest rate products, including U.S. Treasury Bills, repos and short agencies rallied due to lack of supply as well as flight-to-safety.
| Q. | What were the primary drivers of Fund performance? |
| A. | During the first quarter, the Fund’s allocation to U.S. government and agency issues was maintained at roughly 39% of total holdings throughout the first quarter. The exposure to Scandinavia, Australia and Canada was approximately 25%. Allocation to Europe was roughly 37% with 1.5% exposure to |
2
Table of Contents
(unaudited)

| Spain. Within the European holdings, supranational and sovereign issuers made up 1.5% of the Fund’s portfolio. The weighted average maturity of the Fund ranged between 32-45 days throughout the quarter. The Fund’s investment in floating rate notes with coupons above 0.3% was a positive contributor to the Fund’s performance. A 39% position in government securities provided the Fund with the flexibility to take advantage of credit opportunities in commercial paper and certificates of deposit when available. |
In the second quarter, the Fund’s allocation to U.S. government and agency issues was roughly 40% of total holdings however the allocation dropped to 28% on June 30. Its exposure to Scandinavia, Australia and Canada was 23%. The Fund’s allocation to Europe was 38% (2.5% to Spain). The remainder (at June 30th) was allocated to one domestic bank and four non-financials. Within European holdings, supranational and sovereign issuers made up 5% of the Fund’s portfolio. The weighted average maturity of the Fund ranged between 40-46 days throughout the quarter. The Fund outperformed its benchmark during the quarter as U.S. Treasury Bill yields drifted towards zero. The Fund’s investment in assets with coupons/yields above 0.3% was a positive contributor to performance. Investments in government securities provided the Fund with the flexibility to take advantage of “credit” opportunities when available and to meet redemption requests.
3
Table of Contents
| Money Market Fund | (unaudited) |
Understanding Your Fund’s Expenses
As a shareholder of the Fund you incur ongoing costs. Ongoing costs include portfolio management fees, distribution and services fees, professional fees, administrative fees and other Fund expenses. The following example is intended to help you understand your ongoing costs (in dollars) of investing in the Fund and to compare these costs with the ongoing costs of investing in other mutual funds.
To illustrate these ongoing costs, we have provided an example and calculated the expenses paid by investors of the Fund during the period. The information in the following table is based on an investment of $1,000, which is invested at the beginning of the period and held for the entire six-month period ended June 30, 2011.
Actual Expenses
The first section of the table provides information about actual account values and actual expenses. You may use the information in this section, together with the amount you invested, to estimate the expenses that you paid over the period. To do so, simply divide your account value by $1,000 (for example, an $8,600 account value divided by $1,000 = 8.6), then multiply the result by the
number given for your class under the heading “Expenses paid during period.”
Hypothetical Example for Comparison Purposes
The second section of the table provides information about hypothetical account values and hypothetical expenses based on the Fund’s actual expense ratio and an assumed rate of return of 5% per year before expenses, which is not the Fund’s actual return. The hypothetical account values and expenses may not be used to estimate the actual ending account balance or expenses you paid for the period. You may use this information to compare the ongoing costs of investing in the Fund and other funds. To do so, compare this 5% hypothetical example with the 5% hypothetical examples that appear in the shareholders reports of other funds.
Please note that the expenses shown in the table are meant to highlight and help you compare ongoing costs only and do not reflect any transaction costs, such as sales charges or redemption fees, if any. Additionally, the expenses shown do not reflect the fees or charges associated with variable contracts through which shares of the Fund are offered.
January 1, 2011 - June 30, 2011
| Account value at the beginning of the period ($) | Account value at the end of the period ($) | Expenses paid during the period ($)* | ||||||||||
Actual Fund Return** | ||||||||||||
Class 1 | 1,000.00 | 1,000.00 | 1.24 | |||||||||
Hypothetical 5% Return (2.5% for the period) |
| |||||||||||
Class 1 | 1,000.00 | 1,023.28 | 1.25 | |||||||||
| * | Expenses are equal to the Fund’s annualized expense ratio of 0.25% for Class 1 shares (for the period January 1, 2011 - June 30, 2011), multiplied by the average account value over the period, multiplied by 181/365 (to reflect the one-half year period). |
| ** | Actual Fund Return for the six-month period ended June 30, 2011 was 0.00% for Class 1 shares. Past performance does not guarantee future results. |
4
Table of Contents
| Money Market Fund | (unaudited) |
Investment Profile
A mutual fund designed for investors who seek a high level of current income consistent with the preservation of capital and maintenance of liquidity. The Fund seeks its objective by investing primarily in short-term, U.S. dollar-denominated money market instruments.
Morningstar Performance Comparison
Based on average annual returns for periods ended June 30, 2011
| Six Months* | One Year | Five Year | Ten Year | |||||||||||||
Number of Funds in peer group: | 100 | 100 | 99 | 94 | ||||||||||||
Peer group average annual total return: | -0.01 | % | -0.01 | % | 1.84 | % | 1.80 | % | ||||||||
Morningstar category in peer group: U.S. Insurance Money Market Taxable |
| |||||||||||||||
Sector Allocation
as a % of Fair Value of $240,011 (in thousands) on June 30, 2011 (a)
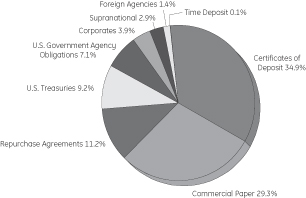
Change in Value of a $10,000 Investment
Class 1 Shares
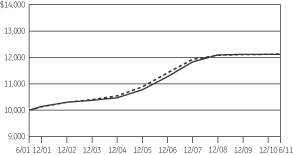
Average Annual Total Returns
for the Periods Ended June 30, 2011
Class 1 Shares (Inception date: 7/1/85)
| Six Months* | One Year | Five Year | Ten Year | Ending value of a $10,000 investment | ||||||||||||||||
Money | 0.00% | 0.00% | 1.96% | 1.94% | $ | 12,123 | ||||||||||||||
90 Day T-Bill | 0.04% | 0.12% | 1.72% | 1.95% | $ | 12,127 | ||||||||||||||

Fund Yield
for the Periods Ended June 30, 2011
| Fund | Money Fund Report** | |||||||
7-day current† | 0.00% | 0.04% | ||||||
7-day effective | 0.00% | 0.04% | ||||||
Current yield represents income earned on an investment in the Money Market Fund for a seven day period and then annualized.
Effective yield is calculated similarly but could be slightly higher because it reflects the compounding effect of earnings on reinvested dividends.
| † | The seven day current yield, rather than the total return, more closely reflects the current earnings of the Money Market Fund at June 30, 2011. |
| ** | IBC’s Money Fund report provides average yield for all major money market funds. |
| (a) | The securities information regarding holdings, allocations and other characteristics is presented to illustrate examples of securities that the Fund has bought and the diversity of areas in which the Fund may invest as of a particular date. It may not be representative of the Fund’s current or future investments and should not be construed as a recommendation to purchase or sell a particular security. |
| * | Total returns for the six month period ended June 30, 2011 are not annualized. |
See Notes to Performance on page 1 for further information, including an explanation of Morningstar peer categories.
Past performance does not predict future performance and the graph and table do not reflect the deduction of taxes that a shareholder would pay on Fund distributions or the redemption of Fund shares and does not reflect the fees or charges that would be associated with variable contracts through which shares of the Fund are offered.
An investment in the Money Market Fund is not insured or guaranteed by the Federal Deposit Insurance Corporation or any other Government agency. Although the Fund seeks to preserve the value of your investment at $1.00 per share, it is possible to lose money by investing in the Fund.
5
Table of Contents
Money Market Fund
| Schedule of Investments | June 30, 2011 (unaudited) |
Money Market Fund
| Principal Amount | Amortized Cost | |||||||||||
Short-Term Investments — 100.6% † | ||||||||||||
U.S. Treasuries — 9.3% | ||||||||||||
United States Treasury Bill | ||||||||||||
0.16% | 08/25/11 | $ | 5,200,000 | $ | 5,198,749 | (a) | ||||||
United States Treasury Notes | ||||||||||||
0.75% | 11/30/11 | 3,500,000 | 3,507,687 | |||||||||
0.88% | 01/31/12 | 4,050,000 | 4,066,433 | |||||||||
1.00% | 07/31/11 - 12/31/11 | 9,400,000 | 9,419,237 | |||||||||
| 22,192,106 | ||||||||||||
U.S. Government Agency Obligations — 7.2% |
| |||||||||||
Fannie Mae Discount Note | ||||||||||||
0.13% | 07/05/11 - 12/01/11 | 9,850,000 | 9,847,141 | (a) | ||||||||
Federal Home Loan Bank Discount Note | ||||||||||||
0.13% | 07/01/11 | 3,700,000 | 3,700,000 | (a) | ||||||||
Freddie Mac Discount Note | ||||||||||||
0.03% | 08/10/11 | 3,550,000 | 3,549,901 | (a) | ||||||||
| 17,097,042 | ||||||||||||
Foreign Agency — 1.4% |
| |||||||||||
KFW Group | ||||||||||||
0.15% | 08/19/11 | 3,250,000 | 3,249,336 | (a) | ||||||||
Commercial Paper — 29.5% |
| |||||||||||
Banco Bilbao Vizcaya Argentaria SA | ||||||||||||
0.50% | 08/12/11 | 6,100,000 | 6,096,442 | (a) | ||||||||
Commonwealth Bank of Australia | ||||||||||||
0.27% | 05/21/12 | 6,600,000 | 6,600,000 | (a ,c) | ||||||||
Credit Suisse Group AG | ||||||||||||
0.20% | 07/14/11 | 6,250,000 | 6,249,549 | (a) | ||||||||
European Investment Bank | ||||||||||||
0.19% | 07/08/11 | 4,950,000 | 4,949,817 | (a) | ||||||||
HSBC Holdings PLC | ||||||||||||
0.13% | 07/13/11 | 4,050,000 | 4,049,831 | (a) | ||||||||
JPMorgan Chase & Co | ||||||||||||
0.05% | 07/01/11 | 7,500,000 | 7,500,000 | (a) | ||||||||
Nordea Bank AB | ||||||||||||
0.21% | 07/18/11 | 2,500,000 | 2,499,752 | (a) | ||||||||
0.23% | 12/09/11 | 4,900,000 | 4,894,960 | (a) | ||||||||
Novartis AG | ||||||||||||
0.18% | 10/11/11 | 2,000,000 | 1,998,980 | (a) | ||||||||
Procter & Gamble Co | ||||||||||||
0.08% | 07/05/11 | 5,500,000 | 5,499,951 | (a) | ||||||||
| Principal Amount | Amortized Cost | |||||||||||
Rabobank Nederland NV NY | ||||||||||||
0.21% | 09/09/11 | $ | 2,650,000 | $ | 2,648,918 | (a) | ||||||
Societe Generale | ||||||||||||
0.47% | 07/06/11 | 6,500,000 | 6,499,576 | (a) | ||||||||
0.54% | 08/08/11 | 2,600,000 | 2,598,518 | (a) | ||||||||
UBS AG | ||||||||||||
0.32% | 12/12/11 | 3,450,000 | 3,444,971 | (a) | ||||||||
Wal-Mart Stores Inc | ||||||||||||
0.05% | 07/11/11 | 4,750,000 | 4,749,934 | (a) | ||||||||
| 70,281,199 | ||||||||||||
Repurchase Agreements — 11.3% |
| |||||||||||
Barclays Capital Inc. Gov Agcy Repo | 7,300,000 | 7,300,000 | ||||||||||
Deutsche Bank Securities, Inc. Gov Agcy Repo | 2,500,000 | 2,500,000 | ||||||||||
Goldman Sachs & Co. Gov Agcy Repo | 8,100,000 | 8,100,000 | ||||||||||
HSBC Securities (USA) Inc. Gov Agcy Repo | 9,050,000 | 9,050,000 | ||||||||||
| 26,950,000 | ||||||||||||
Certificates of Deposit — 35.0% |
| |||||||||||
Abbey National Treasury Services PLC/Stamford CT | ||||||||||||
0.54% | 08/24/11 | 7,950,000 | 7,950,000 | (c) | ||||||||
Bank of Montreal | ||||||||||||
0.14% | 07/06/11 | 4,250,000 | 4,250,000 | |||||||||
See Notes to Schedule of Investments and Notes to Financial Statements.
6
Table of Contents
Money Market Fund
| Schedule of Investments | June 30, 2011 (unaudited) |
| Principal Amount | Amortized Cost | |||||||||||
Bank of Nova Scotia | ||||||||||||
0.24% | 07/01/11 | $ | 5,050,000 | $ | 5,050,000 | |||||||
Barclays Bank PLC | ||||||||||||
0.23% | 08/03/11 | 3,000,000 | 3,000,000 | |||||||||
BNP Paribas | ||||||||||||
0.45% | 07/18/11 | 7,550,000 | 7,550,000 | |||||||||
Credit Agricole SA | ||||||||||||
0.35% | 11/03/11 | 6,500,000 | 6,500,000 | |||||||||
Deutsche Bank AG | ||||||||||||
0.20% | 10/17/11 | 6,850,000 | 6,850,000 | |||||||||
Lloyds Banking Group PLC | �� | |||||||||||
0.24% | 07/22/11 | 3,750,000 | 3,750,000 | |||||||||
Rabobank Nederland NV NY | ||||||||||||
0.31% | 10/12/11 | 6,650,000 | 6,650,230 | (c) | ||||||||
Royal Bank of Canada/New York NY | ||||||||||||
0.21% | 08/26/11 | 6,550,000 | 6,550,000 | (c) | ||||||||
0.25% | 03/12/12 | 2,500,000 | 2,500,000 | (c) | ||||||||
Svenska Handelsbanken AB | ||||||||||||
0.18% | 09/15/11 | 5,450,000 | 5,450,000 | |||||||||
0.20% | 08/18/11 | 3,250,000 | 3,250,011 | |||||||||
Toronto Dominion Bank | ||||||||||||
0.13% | 08/05/11 | 6,100,000 | 6,100,000 | |||||||||
Westpac Banking Corp/NY | ||||||||||||
0.28% | 05/11/12 | 8,250,000 | 8,250,000 | (c) | ||||||||
| 83,650,241 | ||||||||||||
Supranational — 2.9% | ||||||||||||
International Bank for Reconstruction & Development | ||||||||||||
0.24% | 07/13/11 | 3,950,000 | 3,950,000 | (c) | ||||||||
World Bank Discount Notes | ||||||||||||
0.04% | 07/27/11 | 3,050,000 | 3,049,912 | (a) | ||||||||
| 6,999,912 | ||||||||||||
Corporates — 3.9% | ||||||||||||
Eksportfinans ASA | ||||||||||||
5.13% | 10/26/11 | 2,150,000 | 2,182,577 | |||||||||
Shell International Finance BV | ||||||||||||
0.28% | 09/22/11 | 7,200,000 | 7,201,562 | (c) | ||||||||
| 9,384,139 | ||||||||||||
Time Deposit — 0.1% | ||||||||||||
State Street Corporation | ||||||||||||
0.01% | 07/01/11 | 207,255 | 207,255 | (b) | ||||||||
Total Short-Term Investments | 240,011,230 | |||||||||||
Liabilities in Excess of Other Assets, net — (0.6)% | (1,372,654 | ) | ||||||||||
|
| |||||||||||
NET ASSETS — 100.0% | $ | 238,638,576 | ||||||||||
|
| |||||||||||
See Notes to Schedule of Investments and Notes to Financial Statements.
7
Table of Contents
| Notes to Schedule of Investments | June 30, 2011 (unaudited) |
The views expressed in this document reflect our judgment as of the publication date and are subject to change at any time without notice. The securities information regarding holdings, allocations and other characteristics are presented to illustrate examples of securities that the Fund has bought and the diversity of areas in which the Fund may invest as of a particular date. It may not be representative of the Fund’s current or future investments and should not be construed as a recommendation to purchase or sell a particular security. See the Fund’s summary prospectus and statutory prospectus for complete descriptions of investment objectives, policies, risks and permissible investments.
| (a) | Coupon amount represents effective yield. |
| (b) | State Street Corp. is the parent company of State Street Bank & Trust Co., the Fund’s custodian and accounting agent. |
| (c) | Variable or floating rate security. The stated rate represents the rate at June 30, 2011 . |
| † | Percentages are based on net assets as of June 30, 2011. |
8
Table of Contents
Selected data based on a share outstanding throughout the fiscal years indicated
| 6/30/11† | 12/31/10 | 12/31/09 | 12/31/08 | 12/31/07 | 12/31/06 | |||||||||||||||||||
| Inception date | — | — | — | — | — | 7/1/85 | ||||||||||||||||||
Net asset value, beginning of period | $ | 1.00 | $ | 1.00 | $ | 1.00 | $ | 1.00 | $ | 1.00 | $ | 1.00 | ||||||||||||
Income (Loss) from investment operations: | ||||||||||||||||||||||||
Net investment income | — | — | — | 0.02 | 0.05 | 0.05 | ||||||||||||||||||
Net realized and unrealized | — | 0.00 | (c)† | — | — | — | — | |||||||||||||||||
Total income (loss) from | — | 0.00 | (c)† | — | 0.02 | 0.05 | 0.05 | |||||||||||||||||
Less distributions from: | ||||||||||||||||||||||||
Net investment income | — | — | — | 0.02 | 0.05 | 0.05 | ||||||||||||||||||
Net realized gains | — | — | — | — | — | — | ||||||||||||||||||
Total distributions | — | — | — | 0.02 | 0.05 | 0.05 | ||||||||||||||||||
Net asset value, end of period | $ | 1.00 | $ | 1.00 | $ | 1.00 | $ | 1.00 | $ | 1.00 | $ | 1.00 | ||||||||||||
TOTAL RETURN (a) | 0.00% | 0.00% | 0.27% | 2.24% | 4.92% | 4.65% | ||||||||||||||||||
RATIOS/SUPPLEMENTAL DATA: | ||||||||||||||||||||||||
Net assets, end of period (in thousands) | $ | 238,639 | $ | 266,442 | $ | 326,072 | $ | 547,554 | $ | 340,690 | $ | 279,622 | ||||||||||||
Ratios to average net assets: | ||||||||||||||||||||||||
Net investment income (loss) | 0.00% | * | 0.00% | 0.32% | 2.15% | 4.81% | 4.58% | |||||||||||||||||
Net expenses | 0.25% | (b)* | 0.28% | (b) | 0.43% | 0.45% | 0.48% | 0.49% | ||||||||||||||||
Gross expenses | 0.53% | * | 0.53% | 0.47% | 0.45% | 0.48% | 0.49% | |||||||||||||||||
Notes to Financial Highlights
| (a) | Total returns are historical and assume changes in share price, reinvestment of dividends and capital gains distributions and do not include the effect of insurance contract charges. Past performance does not guarantee future results. |
| (b) | GE Asset Management has voluntarily undertaken to reduce its management fee and/or subsidize certain expenses of the Fund to the extent necessary to maintain a minimum annualized yield of 0.00%. |
| (c) | Less than 0.005. |
| † | Unaudited |
| * | Annualized for periods less than one year. |
The accompanying Notes are an integral part of these financial statements.
9
Table of Contents
The accompanying Notes are an integral part of these financial statements.
10
Table of Contents
The accompanying Notes are an integral part of these financial statements.
11
Table of Contents
| * | Unaudited |
The accompanying Notes are an integral part of these financial statements.
12
Table of Contents
| Notes to Financial Statements | June 30, 2011 (unaudited) |
| 1. | Organization of the Company |
GE Investments Funds, Inc. (the “Company”) was incorporated under the laws of the Commonwealth of Virginia on May 14, 1984 and is registered under the Investment Company Act of 1940, as amended (the “1940 Act”), as an open-end management investment company. The Company is composed of fourteen investment portfolios (collectively the “Funds”), although only the following eleven are currently being offered: U.S. Equity Fund, S&P 500 Index Fund, Premier Growth Equity Fund, Core Value Equity Fund, Mid-Cap Equity Fund, Small-Cap Equity Fund, International Equity Fund, Total Return Fund, Income Fund, Money Market Fund (the “Fund”) and Real Estate Securities Fund.
Shares of the Funds of the Company are offered only to insurance company separate accounts that fund certain variable life insurance contracts and variable annuity contracts. GE Asset Management Incorporated (“GEAM”) is the investment adviser and administrator of each of the Funds.
| 2. | Summary of Significant Accounting Policies |
The preparation of financial statements in conformity with U.S. generally accepted accounting principles (GAAP) requires management to make estimates and assumptions that affect the reported amounts of assets and liabilities and disclosure of contingent assets and liabilities at the date of the financial statements and the reported amounts of increases and decreases in net assets from operations during the reporting period. Actual results may differ from those estimates.
Subsequent events after the balance sheet date through the date the financial statements were issued, have been evaluated in the preparation of the financial statements. There are no items to report.
The following summarizes the significant accounting policies of the Company:
Securities Valuation and Transactions. All investments in securities are recorded at their estimated fair value, as described in Note 3.
Securities transactions are accounted for as of the trade date. Realized gains and losses on investments sold are recorded on the basis of identified cost for both financial statement and federal tax purposes.
Repurchase Agreements The Fund engages in repurchase agreement transactions with respect to instruments that are consistent with the Fund’s investment objectives or policies. The Fund’s custodian takes possession of the collateral pledged for investments in repurchase agreements on behalf of the Fund. The Fund values the underlying collateral daily on a mark-to-market basis to determine that the value, including accrued interest, is at least equal to 102% for domestic securities and 105% international securities of the repurchase price. In the event the seller defaults and the value of the security declines, or if the seller enters an insolvency proceeding, realization of the collateral by the Fund may be delayed or limited.
Investment Income Corporate actions (including cash dividends) are recorded on the ex-dividend date, net of applicable withholding taxes.
Interest income is recorded on the accrual basis. Accretion of discounts and amortization of premiums on taxable bonds are to the call or maturity date, whichever is shorter, using the effective yield method.
Expenses Fund specific expenses are allocated to the Fund that incurs such expenses. Such expenses may include custodial fees, legal and accounting fees, printing costs and registration fees. Expenses that are not Fund specific are allocated pro rata across the Funds. Expenses of the Fund are generally paid directly by the Fund however, expenses may be paid by GEAM and reimbursed by the Fund.
Federal Income Taxes The Fund intends to comply with all sections of the Internal Revenue Code applicable to regulated investment companies including the distribution of substantially all of its taxable net investment income and net realized capital gains to its shareholders. Therefore, no provision for federal income tax has been made. The Fund is treated as a separate taxpayer for federal income tax purposes.
| 3. | Securities Valuation |
The Fund utilizes various methods to measure the fair value of most of its investments on a recurring basis. GAAP establishes a framework for measuring fair value and providing related disclosures. Broadly, the framework requires fair value to be determined based on the exchange price that would be received for an asset or paid to transfer a liability (an exit price) in the principal or most advantageous market for the asset or liability in an orderly transaction between market participants at the measurement date. In the absence of active markets for
13
Table of Contents
| Notes to Financial Statements | June 30, 2011 (unaudited) |
the identical assets or liabilities, such measurements involve developing assumptions based on market observable data and, in the absence of such data, internal information that is consistent with what market participants would use in a hypothetical transaction that occurs at the measurement date. It also establishes a three-level valuation hierarchy based upon observable and non-observable inputs.
Observable inputs reflect market data obtained from independent sources, while unobservable inputs reflect our market assumptions. Preference is given to observable inputs. These two types of inputs create the following fair value hierarchy:
Level 1 — Quoted prices for identical investments in active markets.
Level 2 — Quoted prices for similar investments in active markets; quoted prices for identical or similar investments in markets that are not active; and model-derived valuations whose inputs are observable or whose significant value drivers are observable.
Level 3 — Significant inputs to the valuation model are unobservable.
Policies and procedures are maintained to value investments using the best and most relevant data available. In addition, pricing vendors are utilized to assist in valuing investments. GEAM performs periodic reviews of the methodologies used by independent pricing services including price validation of individual securities.
Fair Value Measurement The following section describes the valuation methodologies the Fund uses to measure different financial investments at fair value.
All portfolio securities held by the Fund are valued on the basis of amortized cost which approximates fair value and these are included in Level 2.
The inputs or methodology used for valuing securities are not an indication of the risk associated with investing in those securities. Fair value determinations are required for securities whose value is affected by a significant event that will materially affect the value of a domestic or foreign security and which occurs subsequent to the time of the close of the principal market on which such domestic or foreign security trades but prior to the calculation of the Fund’s NAV.
The following tables present the Fund’s investments measured at fair value on a recurring basis at June 30, 2011:
| Investments | Level 1 | Level 2 | Level 3 | Total | ||||||||||||
Short-Term Investments | ||||||||||||||||
U.S. Treasuries | $ | — | $ | 22,192,106 | $ | — | $ | 22,192,106 | ||||||||
U.S. Government Agency Obligations | — | 17,097,042 | — | 17,097,042 | ||||||||||||
Foreign Agencies | — | 3,249,336 | — | 3,249,336 | ||||||||||||
Commercial Paper | — | 70,281,199 | — | 70,281,199 | ||||||||||||
Repurchase Agreements | — | 26,950,000 | — | 26,950,000 | ||||||||||||
Certificates of Deposit | — | 83,650,241 | — | 83,650,241 | ||||||||||||
Supranational | — | 6,999,912 | — | 6,999,912 | ||||||||||||
Corporate | — | 9,384,139 | — | 9,384,139 | ||||||||||||
Time Deposit | — | 207,255 | — | 207,255 | ||||||||||||
|
|
|
|
|
|
|
| |||||||||
Total Short-Term Investments | $ | — | $ | 240,011,230 | $ | — | $ | 240,011,230 | ||||||||
|
|
|
|
|
|
|
| |||||||||
There were no significant transfers between the fair value levels. Transfers between fair value levels are considered to occur at the beginning of the period.
| 4. | Line of Credit |
The Company shares a revolving credit facility of up to $150 million with a number of its affiliates. The credit facility is (“State Street”) with its custodian bank, State Street Bank and Trust Company. The revolving credit facility requires the payment of a commitment fee equal to 0.125% per annum on the daily unused portion of the credit facility, payable quarterly. The portion borne by the Funds generally is borne proportionally based upon net assets. In
addition, the Company has a $100 million uncommitted, unsecured line of credit with State Street. Generally, borrowings under the credit facilities would accrue interest at the Federal Funds Rate plus 50 basis points and would be borne by the borrowing Fund. The maximum amount allowed to be borrowed by any one Fund is the lesser of (i) 10% of its total assets or (ii) 20% of its net assets. The credit facilities were not utilized by the Fund during the six-month period ended June 30, 2011.
14
Table of Contents
| Notes to Financial Statements | June 30, 2011 (unaudited) |
| 5. | Fees and Compensation Paid to Affiliates |
Advisory and Administration Fees GEAM, a registered investment adviser, was retained by the Company’s Board of Directors effective May 1, 1997 to act as investment adviser and administrator of the Fund. Compensation of GEAM for investment advisory and administrative services is paid monthly based on the average daily net assets of the Fund. The advisory and administrative fee is stated in the following schedule:
Average Daily Net Assets of Fund | Advisory and Administration Fees | |||||||
Money Market Fund | First $ | 100 million | .50 | % | ||||
| Next $ | 100 million | .45 | % | |||||
| Next $ | 100 million | .40 | % | |||||
| Next $ | 100 million | .35 | % | |||||
| Over $ | 400 million | .30 | % | |||||
GEAM has voluntarily undertaken to reduce its management fee and/or subsidize certain expenses of the Fund to the extent necessary to maintain a minimum annualized net yield of 0.00%. This voluntary management fee reduction and/or expense subsidy may be modified or discontinued by GEAM at any time without prior notice. There can be no assurance that this fee reduction will be sufficient to avoid any loss.
Directors’ Compensation The Fund pays no compensation to its directors who are officers or employees of GEAM or its affiliates. Directors who are not such officers or employees also serve in a similar capacity for other funds advised by GEAM. Compensation paid to unaffiliated directors are reflected on the Statement of Operations. These fees are allocated pro rata across all of the mutual fund platforms and share classes served by the directors, including the Fund, and are based upon the relative net assets of each fund within such platforms.
| 6. | Income Taxes |
The Fund is subject to ASC 740, Income Taxes. ASC 740 provides guidance for financial accounting and reporting for the effects of income taxes that result from an entity’s activities during the year. ASC 740 also provides guidance regarding how certain tax positions should be recognized, measured, presented and disclosed in the financial statements. ASC 740 requires evaluation of tax positions taken or expected to be taken in the course of preparing the Fund’s tax returns to determine whether the tax positions are ��more likely than not” of being sustained by the applicable tax authority. There are no adjustments to the Fund’s net assets required under ASC 740. The Fund’s 2007, 2008, 2009 and 2010 fiscal years tax returns are still open to examination by the Federal and applicable state tax authorities.
At June 30, 2011, information on the tax cost of investments was as follows:
| Cost of Investment for Tax Purposes | Gross Tax | Net Tax Appreciation/ (Depreciation) | ||||
| Appreciation | Depreciation | |||||
| 240,011,230 | — | — | — | |||
As of December 31, 2010, the Fund has capital loss carryovers as indicated below. Capital loss carryovers are available to offset future realized capital gains to the extent provided in the Internal Revenue Code and regulations thereunder. To the extent that these carryover losses are used to offset future capital gains, it is probable that the gains so offset will not be distributed to shareholders because they would be taxable as ordinary income.
During the year ended December 31, 2010, the Fund utilized $2,038 of prior year capital loss carryovers. $37,585 of prior year capital loss carryovers expired on December 31, 2010.
| Amount | Expires | |
| $148,062 | 12/31/2016 |
These amounts will be available to offset future taxable capital gains. Under the recently enacted Regulated Investment Company Modernization Act of 2010, the Fund will be permitted to carry forward capital losses incurred in taxable years beginning after December 22, 2010 for an unlimited period. However, any losses incurred during those future years will be required to be utilized prior to the losses incurred in pre-enactment tax years. As a result of this ordering rule, pre-enactment capital loss carryforwards may be more likely to expire unused. Additionally, post-enactment capital losses that are carried forward will retain their character as either short-term or long-term capital losses rather than being considered all short-term as under previous law.
15
Table of Contents
| Notes to Financial Statements | June 30, 2011 (unaudited) |
Any net capital and currency losses incurred after October 31, within the Fund’s tax year, are deemed to arise on the first day of the Fund’s next tax year if the Fund so elects to defer such losses.
The Fund incurred no such losses after October 31, 2010.
The tax composition of distributions paid during the years ended December 31, 2010 and December 31, 2009 were as follows:
Ordinary Income | Long-Term Capital Gains | Total | ||||||||||
2010 | $ | — | $ | — | $ | — | ||||||
2009 | 1,362,973 | — | 1,362,973 | |||||||||
Distributions to Shareholders The Fund declares any net investment income dividends daily and pays them monthly. The character of income and gains to be distributed is
determined in accordance with income tax regulations which may differ from generally accepted accounting principles. Reclassifications due to permanent book/tax differences are made to the Fund’s capital accounts to reflect income and gains available for distribution (or available capital loss carryovers) under income tax regulations. These reclassifications have no impact on the net asset value of the Fund. The calculation of net investment income per share in the Financial Highlights table excludes these adjustments.
The reclassification for the year ended December 31, 2010 was as follows:
| Accumulated Net Realized Loss | Paid In Capital | |
| $37,585 | $(37,585) |
16
Table of Contents
| Special Meeting of Shareholders — Voting Results | (unaudited) |
On April 1, 2011, the GE Investments Funds, Inc. (the “Company”) held a special meeting of shareholders of each series portfolio of the Company, including shareholders of the Money Market Fund (the “Fund”). Shareholders of record on January 28, 2011 were entitled to vote on the proposals. For each proposal, except Proposal 1, shareholders voted on a fund-by-fund basis. For Proposal 1, shareholders of all funds voted together and not by fund or share class. At the meeting, all proposals were approved by the Fund and the following votes were recorded:
Proposal 1:
Election of Mr. R. Sheldon Johnson and Mr. Matthew J. Simpson as Directors to the Board of Directors of the Company.
Company votes:
| No. of Shares | % of Outstanding Shares | % of Shares Present | ||||||||||
| Mr. R. Sheldon Johnson | ||||||||||||
Affirmative | 451,517,094.582 | 90.054 | % | 96.126 | % | |||||||
Abstain | 18,195,810.391 | 3.629 | % | 3.874 | % | |||||||
Total | 469,712,904.973 | 93.683 | % | 100.000 | % | |||||||
| Mr. Matthew J. Simpson | ||||||||||||
Affirmative | 451,949,730.789 | 90.140 | % | 96.218 | % | |||||||
Abstain | 17,763,174.184 | 3.543 | % | 3.782 | % | |||||||
Total | 469,712,904.973 | 93.683 | % | 100.000 | % | |||||||
Fund votes:
| No. of Shares | % of Outstanding Shares | % of Shares Present | ||||||||||
| Mr. R. Sheldon Johnson | ||||||||||||
Affirmative | 233,564,064.375 | 89.051 | % | 95.670 | % | |||||||
Abstain | 10,571,674.145 | 4.031 | % | 4.330 | % | |||||||
Total | 244,135,738.520 | 93.082 | % | 100.000 | % | |||||||
| Mr. Matthew J. Simpson | ||||||||||||
Affirmative | 233,972,258.597 | 89.207 | % | 95.837 | % | |||||||
Abstain | 10,163,479.923 | 3.875 | % | 4.163 | % | |||||||
Total | 244,135,738.520 | 93.082 | % | 100.000 | % | |||||||
Proposal 2:
Approval of the use of a “manager of managers” arrangement whereby GEAM, as the Fund’s investment adviser, under certain circumstances, will be able to hire and replace sub-advisers to the Fund without obtaining shareholder approval.
| No. of Shares | % of Outstanding Shares | % of Shares Present | ||||||||||
Affirmative | 220,561,109.791 | 84.093 | % | 90.344 | % | |||||||
Against | 14,324,798.976 | 5.462 | % | 5.867 | % | |||||||
Abstain | 9,249,829.753 | 3.527 | % | 3.789 | % | |||||||
Broker Non-votes | — | — | — | |||||||||
Total | 244,135,738.520 | 93.082 | % | 100.000 | % | |||||||
17
Table of Contents
| Special Meeting of Shareholders — Voting Results | (unaudited) |
Proposal 3:
Approval of the following changes in certain of the Fund’s investment policies, as follows:
| A. | Amendment of the Fund’s investment policy on senior securities. |
| No. of Shares | % of Outstanding Shares | % of Shares Present | ||||||||||
Affirmative | 223,307,316.543 | 85.141 | % | 91.469 | % | |||||||
Against | 9,664,820.226 | 3.684 | % | 3.958 | % | |||||||
Abstain | 11,163,601.751 | 4.257 | % | 4.573 | % | |||||||
Broker Non-votes | — | — | — | |||||||||
Total | 244,135,738.520 | 93.082 | % | 100.000 | % | |||||||
| C. | Amendment of the Fund’s investment policy on making loans. |
| No. of Shares | % of Outstanding Shares | % of Shares Present | ||||||||||
Affirmative | 224,260,591.897 | 85.504 | % | 91.859 | % | |||||||
Against | 9,798,531.417 | 3.736 | % | 4.014 | % | |||||||
Abstain | 10,076,615.206 | 3.842 | % | 4.127 | % | |||||||
Broker Non-votes | — | — | — | |||||||||
Total | 244,135,738.520 | 93.082 | % | 100.000 | % | |||||||
| D. | Amendment of the Fund’s investment policy on borrowing. |
| No. of Shares | % of Outstanding Shares | % of Shares Present | ||||||||||
Affirmative | 221,523,641.306 | 84.460 | % | 90.738 | % | |||||||
Against | 12,935,524.049 | 4.932 | % | 5.298 | % | |||||||
Abstain | 9,676,573.165 | 3.690 | % | 3.964 | % | |||||||
Broker Non-votes | — | — | — | |||||||||
Total | 244,135,738.520 | 93.082 | % | 100.000 | % | |||||||
| E. | Amendment of the Fund’s investment policy on diversification. |
| No. of Shares | % of Outstanding Shares | % of Shares Present | ||||||||||
Affirmative | 225,257,526.776 | 85.884 | % | 92.267 | % | |||||||
Against | 9,855,403.570 | 3.758 | % | 4.037 | % | |||||||
Abstain | 9,022,808.174 | 3.440 | % | 3.696 | % | |||||||
Broker Non-votes | — | — | — | |||||||||
Total | 244,135,738.520 | 93.082 | % | 100.000 | % | |||||||
| F. | Amendment of the Fund’s investment policy on concentration of investments. |
| No. of Shares | % of Outstanding Shares | % of Shares Present | ||||||||||
Affirmative | 226,321,826.764 | 86.290 | % | 92.703 | % | |||||||
Against | 8,828,302.545 | 3.366 | % | 3.616 | % | |||||||
Abstain | 8,985,609.211 | 3.426 | % | 3.681 | % | |||||||
Broker Non-votes | — | — | — | |||||||||
Total | 244,135,738.520 | 93.082 | % | 100.000 | % | |||||||
18
Table of Contents
| Special Meeting of Shareholders — Voting Results | (unaudited) |
| G. | Amendment of the Fund’s investment policy on investments in commodities and its reclassification from a non-fundamental policy to a fundamental policy. |
| No. of Shares | % of Outstanding Shares | % of Shares Present | ||||||||||
Affirmative | 223,733,566.801 | 85.303 | % | 91.643 | % | |||||||
Against | 9,544,992.790 | 3.639 | % | 3.910 | % | |||||||
Abstain | 10,857,178.929 | 4.140 | % | 4.447 | % | |||||||
Broker Non-votes | — | — | — | |||||||||
Total | 244,135,738.520 | 93.082 | % | 100.000 | % | |||||||
| H. | Amendment of the Fund’s fundamental investment policy on illiquid investments and its reclassification from a fundamental policy to a non-fundamental policy. |
| No. of Shares | % of Outstanding Shares | % of Shares Present | ||||||||||
Affirmative | 224,401,049.291 | 85.558 | % | 91.917 | % | |||||||
Against | 9,561,267.611 | 3.645 | % | 3.916 | % | |||||||
Abstain | 10,173,421.618 | 3.879 | % | 4.167 | % | |||||||
Broker Non-votes | — | — | — | |||||||||
Total | 244,135,738.520 | 93.082 | % | 100.000 | % | |||||||
| I. | Elimination of the Fund’s investment policy on mortgaging, pledging and hypothecating of investments. |
| No. of Shares | % of Outstanding Shares | % of Shares Present | ||||||||||
Affirmative | 255,794,542.152 | 86.089 | % | 92.487 | % | |||||||
Against | 9,560,836.711 | 3.645 | % | 3.916 | % | |||||||
Abstain | 8,780,359.657 | 3.348 | % | 3.597 | % | |||||||
Broker Non-votes | — | — | — | |||||||||
Total | 244,135,738.520 | 93.082 | % | 100.000 | % | |||||||
| J. | Amendment of the Fund’s investment policy on real estate investments. |
| No. of Shares | % of Outstanding Shares | % of Shares Present | ||||||||||
Affirmative | 225,772,947.369 | 86.081 | % | 92.478 | % | |||||||
Against | 9,546,627.767 | 3.639 | % | 3.911 | % | |||||||
Abstain | 8,816,163.384 | 3.362 | % | 3.611 | % | |||||||
Broker Non-votes | — | — | — | |||||||||
Total | 244,135,738.520 | 93.082 | % | 100.000 | % | |||||||
19
Table of Contents
| Additional Information | (unaudited) |
Information about Directors and Executive Officers:
The business and affairs of the Funds are managed under the direction of the Funds’ Board of Directors. Information pertaining to the Directors and officers of the Funds is set forth below.
Interested Directors and Executive Officers
Michael J. Cosgrove
Address c/o GEAM 3001 Summer St. Stamford, CT 06905
Age 62
Position(s) Held with Fund Chairman of the Board and President
Term of Office and Length of Time Served Until successor is elected and qualified – 14 years
Principal Occupation(s) During Past 5 years President and Chief Executive Officer – Mutual Funds and Intermediary Business at GEAM since March 2007; Executive Vice President of GEAM from February 1997 to March 2007; Vice President, GE Capital Corporation, an indirect wholly-owned subsidiary of GE, since December 1999; Executive Vice President – Mutual Funds of GEAM, a wholly-owned subsidiary of GE that is registered as an investment adviser under the Investment Advisers Act of 1940, as amended, since March 1993; President and Director of GE Investment Distributors, Inc., since June 2011. Director of GEAM since 1988.
Number of Portfolios in Fund Complex Overseen by Director 28
Other Directorships Held by Director Chairman of the Board and President of GE Institutional Funds since 1997; Trustee of Elfun Funds, GE Savings & Security Funds, General Relief and Loan Fund and General Electric Pension Trust since 1988; Trustee of Fordham University from 2002 to June 30, 2010 and since July 2011; Trustee of GE Volunteers since 1993; Director of GE Foundation; Director, GE Asset Management (Ireland) Limited, since February 1999, GE Asset Management Funds Plc since 1998, GE Asset Management Canada Company since 1998, GE Asset Management Limited since 1998 and GEAM since 1988; Chairman of the Board and President of GE Funds from 1993 to February 2011.
Matthew J. Simpson
Address c/o GEAM 3001 Summer St. Stamford, CT 06905
Age 50
Position(s) Held with Fund Director and Executive Vice President
Term of Office and Length of Time Served Until successor is elected and qualified – 3 years
Principal Occupation(s) During Past 5 years Executive Vice President, General Counsel and Secretary of GEAM since July 2007; Senior Vice President and General Counsel – Marketing and Client Services (formerly Asset Management Services) at GEAM and Senior Vice President and General Counsel of GE Asset Management Services from February 1997 to July 2007; Vice President and Associate General Counsel of GEAM from October 1992 to February 1997; Secretary of GE Funds from 1993 to July 2007 and Vice President from September 2003 to July 2007; Secretary of GE Institutional Funds and GE Investments Funds, Inc. from 1997 to July 2007; Secretary of Elfun Funds and GE Savings & Security Funds since July 2007; Assistant Secretary of Elfun Funds and GE Savings & Security Funds from 1998 to July 2007 and Vice President from October 2003 to July 2007.
Number of Portfolios in Fund Complex Overseen by Director 28
Other Directorships Held by Director Trustee of Elfun Funds, GE Savings & Security Funds and General Electric Pension Trust since July 2007; Trustee of GE Institutional Funds since April 2011 and Trustee of GE Funds from July 2007 to February 2011.
20
Table of Contents
| Additional Information | (unaudited) |
Joon Won Choe
Address c/o GEAM 3001 Summer St. Stamford, CT 06905
Age 41
Position(s) Held with Fund Vice President & Secretary
Term of Office and Length of Time Served Until successor is elected and qualified – Vice President and Secretary – less than 1 year
Principal Occupation(s) During Past 5 years Senior Vice President and Deputy General Counsel at GEAM since March 2011; Senior Vice President and Associate General Counsel at GEAM from June 2010 to March 2011; Vice President and Associate General Counsel at GEAM from November 2005 to June 2010; Vice President and Secretary of GE Institutional Funds and GE Investments Funds, Inc. since September 2010; Vice President and Assistant Secretary of Elfun Funds and GE Savings & Security Funds since September 2010.
Number of Portfolios in Fund Complex Overseen by Officer N/A
Other Directorships Held by Officer N/A
Robert Herlihy
Address c/o GEAM 3001 Summer St. Stamford, CT 06905
Age 43
Position(s) Held with Fund Chief Compliance Officer
Term of Office and Length of Time Served Until successor is elected and qualified — 5 years
Principal Occupation(s) During Past 5 years Chief Compliance Officer of GEAM, GE Institutional Funds, Elfun Funds, and GE Savings and Security Funds since July 2005; Chief Compliance Officer of GE Funds from July 2005 to February 2011; and Manager of Fund Administration at GEAM from 2002 – 2005.
Number of Portfolios in Fund Complex Overseen by Officer N/A
Other Directorships Held by Officer N/A
Arthur A. Jensen
Address c/o GEAM 3001 Summer St. Stamford, CT 06905
Age 44
Position(s) Held with Fund Treasurer
Term of Office and Length of Time Served Until successor is elected and qualified – less than 1 year
Principal Occupations(s) During Past 5 Years Treasurer of GE Institutional Funds, Elfun Funds and GE Savings and Security Funds since June 2011; Mutual Funds Controller of GEAM since April 2011; Senior Vice President at Citigroup from 2008 to 2010 and Vice President at JPMorgan from 2005 to 2008.
Number of Portfolios in Fund Complex Overseen by Officer N/A
Other Directorships Held by Officer N/A
21
Table of Contents
| Additional Information | (unaudited) |
Non-Interested Directors
John R. Costantino
Address c/o GEAM 3001 Summer St. Stamford, CT 06905
Age 65
Position(s) Held with Fund Director
Term of Office and Length of Time Served Until successor is elected and qualified – 14 years
Principal Occupation(s) During Past 5 years General Partner, NGN Capital LLC since 2006; Managing Director, Vice President of Walden Capital Management since 1996.
Number of Portfolios in Fund Complex Overseen by Director 20
Other Directorships Held by Director Director of GE Institutional Funds since 1997; Trustee of Fordham University from 1989-1995 and 2001-2007 and Trustee Emeritus since 2007; Trustee of Neuroscience Research Institute since 1986; Trustee of GE Funds from 1993 to February 2011; Trustee of Gregorian University Foundation from 1992-2007; Director of Artes Medical from 2006-2008.
R. Sheldon Johnson
Address c/o GEAM 3001 Summer St. Stamford, CT 06905
Age 64
Positions(s) Held with Fund Director
Term of office and Length of Time served Unit Successor is elected and qualified – less than 1 year.
Principal Occupation(s) During Past 5 years Managing Director at Morgan Stanley & Co.,Inc. from 1988 to 2006; Head of Global Institutional Equity Sales and Marketing at Morgan Stanley & Co., Inc. from 2002 to 2006.
Number of Portfolios in Fund Complex Overseen by Director 20
Other Directorships Held by Director Trustee of GE Institutional Funds since April 2011 and Trustee of St. Lawrence University since 2003.
Robert P. Quinn
Address c/o GEAM 3001 Summer St. Stamford, CT 06905
Age 75
Position(s) Held with Fund Director
Term of Office and Length of Time Served Until successor is elected and qualified – 14 years
Principal Occupation(s) During Past 5 years Retired since 1983 from Salomon Brothers Inc.
Number of Portfolios in Fund Complex Overseen by Director 20
Other Directorships Held by Director Trustee of GE Institutional Funds since 1997; Trustee of St. Francis Hospital since 1980; and Trustee of GE Funds from 1993 to February 2011.
The Statement of Additional Information for the Funds includes additional information about the Directors and Officers and is available, without charge, upon request by calling 1-800-242-0134.
22
Table of Contents
| Investment Team | (unaudited) |
Investment Adviser and Administrator
GE Asset Management Incorporated
Board of Directors
Michael J. Cosgrove, Chairman
John R. Costantino
R. Sheldon Johnson*
Robert P. Quinn
Matthew J. Simpson
Secretary
Joon Won Choe
Assistant Secretary
Michelle Matzelle
Treasurer
Arthur A. Jensen (effective June 6, 2011)
Assistant Treasurer
Casey Yantosca
Distributor
GE Investment Distributors, Inc.
Member FINRA and SIPC
Custodian
State Street Bank & Trust Company
Officers of the Investment Adviser
Dmitri Stockton, President and Chief Executive Officer (since May 2011)†
Cheryl H. Beacock, Senior Vice President, Human Resources
George A. Bicher, Chief Risk Officer
Paul M. Colonna, President and Chief Investment Officer – Fixed Income Investments
Michael J. Cosgrove, President and Chief Executive
Officer – Mutual Funds & Intermediary Business
Ralph R. Layman, President and Chief Investment Officer – Public Equity Investments
Maureen B. Mitchell, President – Institutional Sales and Marketing
Matthew J. Simpson, Executive Vice President, General Counsel and Secretary
Don W. Torey, President – Alternative Investments
John J. Walker, Executive Vice President, Chief Operating Officer
David Wiederecht, President and Chief Investment Officer – Investment Strategies
Tracie A. Winbigler, Executive Vice President, Chief Financial Officer (since January 2011)
| * | Mr. Johnson was elected as a Director of the Funds effective April 1, 2011. |
| † | Effective May 1, 2011, Mr. Stockton replaced James W. Ireland as President and Chief Executive Officer. |
At GE Asset Management, we’re dedicated to providing the investment options you’ll need to tailor your financial portfolio to every stage of your life. Each member of the GE Family of Funds is managed according to the same principles of integrity and quality that have guided GE over the past century, and have made it the world-class company that it is today. Each fund draws strength from a heritage of investment management experience that spans more than 80 years. Whether you’re creating a new investment portfolio or adding to an established one, the GE Family of Funds offers an array of professionally managed investment options that will help you meet a lifetime of financial needs.
23
Table of Contents
Investment Adviser
GE Asset Management Incorporated
3001 Summer Street
PO Box 7900
Stamford, CT 06904-7900
Distributor
GE Investment Distributors, Inc.
member FINRA and SIPC
3001 Summer Street
PO Box 7900
Stamford, CT 06904-7900
The Fund files its complete schedule of portfolio holdings with the Securities and Exchange Commission for the first and third quarters of each fiscal year on Form N-Q. The Fund’s Forms N-Q, as well as a description of the policies and procedures that the Fund uses to determine how to vote proxies (if any) relating to portfolio securities is available without charge (i) upon request, by calling 1-800-493-3042; (ii) on the Fund’s website at http://www.geam.com; and (iii) on the Commission’s website at http://www.sec.gov. The Fund’s Forms N-Q may be reviewed and copied at the Commission’s Public Reference Room in Washington, DC—information on the operation of the Public Reference Room may be obtained by calling 1-800-SEC-0330.
Information (if any) regarding how the Fund voted proxies relating to portfolio securities during the most recently disclosed 12-month period ended June 30 is available without charge (i) through the Fund’s website at http://www.geam.com; and (ii) on the Commission’s website at http://www.sec.gov.
Table of Contents
GE Investments Funds, Inc.
| Real Estate Securities Fund | Letter from the Chairman | |

Michael J. Cosgrove
Chairman,
GE Investments Funds, Inc.
Dear Shareholder:
Attached is the semi-annual report for GE Investments Funds, Inc. — Real Estate Securities Fund (the “Fund”) for the six-month period ended June 30, 2011. The report contains information about the performance of the Fund and other fund-specific data, along with portfolio manager commentary.
We have provided you with an overview of the investment markets, along with our investment outlook for the coming months.
Market Overview
Most major equity indices posted positive returns in the six-month period ended June 30, 2011, despite geopolitical tensions in the Middle East and North Africa, a devastating earthquake in Japan, ongoing concerns about unresolved sovereign debt issues in peripheral Europe and elevated inflation in emerging markets. Volatility increased in May and June, however, as some measures of global economic activity weakened and uncertainties over Greece’s ability to finance and service its debt rattled the financial markets. In the U.S., concerns over the end of quantitative easing by the Federal Reserve and political wrangling over the government debt ceiling further contributed to a challenging environment. The increase in risk aversion benefited the fixed income markets as many investors sought out safer investments. Toward the end of June, the Greek Parliament passed austerity measures that seemed to calm the markets and opened the way for the next round of financing from the European Central Bank and the International Monetary Fund.
Against this backdrop, financial markets posted positive results for the six- and 12-month periods ended June 30, 2011 as represented by the index returns in the below chart.
| Total Returns (%) as of June 30, 2011 | 6-month | 12-month | ||||||
U.S. equities (S&P 500 Index) | 6.0 | 30.7 | ||||||
Global equities (MSCI World Index) | 5.3 | 30.5 | ||||||
International equities (MSCI EAFE Index) | 5.0 | 30.4 | ||||||
Small-cap U.S. equities (Russell 2000 Index) | 6.2 | 37.4 | ||||||
Mid-cap U.S. equities (Russell Mid Cap Index) | 8.1 | 38.5 | ||||||
U.S. fixed income | 2.7 | 3.9 | ||||||
U.S. short-term government fixed income (Barclays Capital 1-3 Year U.S. Government Bond Index) | 0.9 | 1.4 | ||||||
Outlook
We remain constructive on the prospects for healthy global growth, although it may be at a slower pace than originally anticipated. Central banks in the U.S. and Europe remain accommodative and supply chain issues in Japan appear to have abated. There are also signs that inflation may be peaking in emerging markets as commodity prices have eased in recent months. Corporate balance sheets remain healthy and fundamentals remain intact, in our view. We believe that valuations for equities are not stretched and remain below historical averages while equity risk premiums are still high-offering the possibility for further gains. We expect that the financial markets are likely to remain volatile due to outstanding sovereign debt issues, but believe that returns are biased to the upside in the second half of the year.
Thank you for investing with GE Investments Funds.
Sincerely,

Michael J. Cosgrove
Chairman, GE Investments Funds, Inc.
July 2011
 |
This does not constitute a part of the Fund’s Shareholder Report
Table of Contents
GE Investments Funds, Inc.
| Real Estate Securities Fund | Letter from the Chairman (Continued) | |
Mike Cosgrove is President and Chief Executive Officer — Mutual Funds and Intermediary Business at GE Asset Management Incorporated (“GEAM”). In addition to the GE Investments Funds, he is also Chairman of the Board and President of GE Institutional Funds and Director and President of GEAM’s broker-dealer which serves as underwriter and distributor for the GE Investments Funds. Mr. Cosgrove serves as a Trustee of the GE Savings & Security Funds, the GE Foundation, and the GE Pension Trust. He also serves on the Board of Directors of the Skin Cancer Foundation and is a Trustee of Fordham University. Previously Chief Financial Officer of GE Asset Management and Assistant Treasurer — GE Company, Mr. Cosgrove joined GE in 1970 and held a number of managerial positions in finance and sales in the International Operation and the GE Trading Company. He received a BS in Economics from Fordham University and an MBA from St. John’s University.
GE Investment Distributors, Inc., Member of FINRA & SIPC, is the principal underwriter and distributor of the GE Investments Funds, Inc.
This does not constitute a part of the Fund’s Shareholder Report
Table of Contents
GE Investments Funds, Inc.
Real Estate Securities Fund
Semi-Annual Report
June 30, 2011

Table of Contents
| Real Estate Securities Fund | Contents | |
| 1 | ||||
| 6 | ||||
| 8 | ||||
Financial Statements | ||||
| 9 | ||||
| 10 | ||||
| 11 | ||||
| 12 | ||||
| 13 | ||||
| 18 | ||||
| 20 | ||||
| 23 | ||||
This report is prepared for Policyholders of certain variable contracts and may be distributed to others only if preceded or accompanied by the variable contract’s current prospectus and the current prospectus of the Fund available for investments thereunder.
Table of Contents
| Notes to Performance | June 30, 2011 (unaudited) |
The information provided on the performance pages relates to the GE Investments Real Estate Securities Fund (the “Fund”) and is unaudited.
Total returns take into account changes in share price and assume reinvestment of dividends and capital gains distributions, if any. Total returns shown are net of Fund fees and expenses but do not reflect fees and charges associated with the variable contracts such as administrative fees, account charges and surrender charges, which, if reflected, would reduce the Fund’s total returns for all periods shown.
The performance data quoted represents past performance; past performance does not guarantee future results. Investment return and principal value will fluctuate so your shares, when redeemed, may be worth more or less than their original cost. Current performance may be higher or lower than the performance data quoted. Periods less than one year are not annualized. Please call toll-free 800-493-3042 or visit the Fund’s website at http://www.geam.com for the most recent month-end performance data.
An investment in the Fund is not a deposit of any bank and is not insured or guaranteed by the Federal Deposit Insurance Corporation (FDIC) or any other government agency. An investment in the Fund is subject to risk, including possible loss of principal invested.
FTSE NAREIT U.S. Real Estate Index is an unmanaged index of all tax-qualified real estate investment trusts (REITs) listed on the New York Stock Exchange, American Stock Exchange and NASDAQ which have 75% or more of their gross invested book assets invested directly or indirectly in the equity ownership of real estate. The results shown for the foregoing indices assume the reinvestment of net dividends or interest. They do not reflect the actual cost of investing in the instruments that comprise the index.
The peer universe of the underlying annuity funds used for the peer group average annual total return calculation is based on a blend of Morningstar peer categories, as shown. Morningstar is an independent mutual fund rating service. A Fund’s performance may be compared to or ranked within a universe of mutual funds with investment objectives and policies similar but not necessarily identical to that of the Fund.
©2011 Morningstar, Inc. All Rights Reserved. The Morningstar information contained herein: (1) is proprietary to Morningstar and/or its content providers; (2) may not be copied or distributed; and (3) is not warranted to be accurate, complete or timely. Neither Morningstar nor its content providers are responsible for any damage or losses relating from any use of this information. Past performance is no guarantee of future results.
GE Investment Distributors, Inc., Member of FINRA & SIPC, is the principal underwriter and distributor of the GE Investments Funds, Inc. and a wholly owned subsidiary of GE Asset Management Incorporated, the investment adviser of the Fund.
1
Table of Contents
| Real Estate Securities Fund | (unaudited) |
Urdang Securities Management, Inc. (Urdang) is the sub-adviser for the Real Estate Securities Fund. Urdang is a wholly owned subsidiary of Urdang Capital Management, Inc. (Urdang Capital). Urdang Capital is wholly owned by The Bank of New York Mellon Corporation (BNY Mellon) and operates as part of BNY Mellon’s Asset Management Division. As a wholly owned subsidiary of Urdang Capital, Urdang is a second tier subsidiary of BNY Mellon. Urdang is a registered investment adviser that was formed in 1995 to focus exclusively on opportunities in the real estate securities market, including publicly traded real estate investment trusts (REITs).
The Real Estate Securities Fund is co-managed by Dean Frankel, CFA and Eric Rothman, CFA.
Dean Frankel is a senior portfolio manager, North America Real Estate Securities, at Urdang and serves as the senior portfolio manager to the Fund. He joined Urdang in 1997 and has over 19 years of real estate securities investment experience. Mr. Frankel is responsible for management of Urdang’s proprietary research process including the firm’s relative value model. In addition, Mr. Frankel analyzes and interprets implications of major events and economic trends while managing the daily operations of the North American Real Estate Securities investment team.
Eric Rothman serves as a portfolio manager at Urdang, where he helps direct Urdang’s U.S. Real Estate Securities strategy. As portfolio manager, Mr. Rothman is responsible for market research, sector allocations, and real estate securities analysis. Additionally he has primary coverage responsibility for the lodging, self storage and retail sectors. Mr. Rothman joined Urdang in 2006 and has over 14 years of real estate securities and real estate investment experience, including being a sell-side REIT analyst at Wachovia Securities from 2001 to 2006 and an analyst at AEW Capital Management, LP from 1997 to 2000.
| Q. | How did the Real Estate Securities Fund perform compared to its benchmark and Morningstar peer group for the six-month period ended June 30, 2011? |
| A. | For the six-month period ended June 30, 2011, the Real Estate Securities Fund returned 11.61% for Class 1 shares and 11.43% for Class 4 shares. The FTSE NAREIT U.S. Real Estate Index, the Fund’s benchmark, returned 10.62%. The Fund’s Morningstar peer group of 46 U.S. Insurance Real Estate funds returned an average of 9.74% for the same period. |
| Q. | What market conditions impacted Fund performance? |
| A. | As historically high dividend paying stocks, REITs benefitted from the search for yield in the first half of 2011 as they have for much of the prior two years. The dividend yield on U.S. REITs was in the mid-3% range as of June 30, compared favorably to a ten-year treasury yield that declined over the six-month period to less than 3%. Improvement in the overall economy has helped the REIT market even more. Throughout the first half of 2011, property fundamentals continued to steadily improve for all property sectors, particularly for those sectors that are most sensitive to improvement in the macro economy. Generally speaking, vacancy rates and rental rates have moved past bottom in almost all sectors. The U.S. REIT market rallied in April and May, but declined in June as uncertainty surrounding the European sovereign debt crisis and raising the U.S. debt ceiling grew. In our view, systematic risk presents the single biggest challenge for REITs today, as it does for all public securities. |
| Q. | What were the primary drivers of Fund performance? |
| A. | Sector and stock selection contributed positively to the Fund’s outperformance. The effect of cash drag and minor items including rounding reduced relative performance. The contribution to relative performance from sector selection was primarily the result of an underweight to the least economically sensitive property sectors, triple net lease and healthcare. Fund performance was also driven by an overweight to sectors more sensitive to the economy (such as apartments, industrial and hotels) early in the year as the economy was expanding, and then a modest reversal of this positioning later in the year ahead of concerns about faltering economic growth. Stock selection was particularly strong among picks within the office, healthcare, regional mall and shopping center sectors, partially offset by negative performance from stock selection within the industrial and specialty sectors. |
2
Table of Contents
(unaudited)

| Q. | Were there any significant changes to the Fund over the period? |
| A. | While we did not deviate from our investment process or philosophy during the period, we did make a number of tactical changes to the Fund’s positioning to take advantage of changing market conditions. Following significant underperformance from the healthcare and net lease sectors early in 2011, and in light of concerns about a deteriorating economic outlook, we chose to further reduce the Fund’s underweight to both of these defensive sectors early in the second quarter, just ahead of the market’s greater focus on concern that growth could be faltering. Conversely, we reduced the Fund’s exposure to the apartment and hotel sectors (both of which had performed disproportionately well in the first quarter of 2011 and prior) as each appeared to represent a less attractive relative value. |
3
Table of Contents
| Real Estate Securities Fund | (unaudited) |
Understanding Your Fund’s Expenses
As a shareholder of the Fund you incur ongoing costs. Ongoing costs include portfolio management fees, distribution and services fees (for Class 4 shares), professional fees, administrative fees and other Fund expenses. The following example is intended to help you understand your ongoing costs (in dollars) of investing in the Fund and to compare these costs with the ongoing costs of investing in other mutual funds.
To illustrate these ongoing costs, we have provided an example and calculated the expenses paid by investors of the Fund during the period. The information in the following table is based on an investment of $1,000, which is invested at the beginning of the period and held for the entire six-month period ended June 30, 2011.
Actual Expenses
The first section of the table provides information about actual account values and actual expenses. You may use the information in this section, together with the amount you invested, to estimate the expenses that you paid over the period. To do so, simply divide your account value by $1,000 (for example, an $8,600 account value
divided by $1,000 = 8.6), then multiply the result by the
number given for your class under the heading “Expenses paid during period.”
Hypothetical Example for Comparison Purposes
The second section of the table provides information about hypothetical account values and hypothetical expenses based on the Fund’s actual expense ratio and an assumed rate of return of 5% per year before expenses, which is not the Fund’s actual return. The hypothetical account values and expenses may not be used to estimate the actual ending account balance or expenses you paid for the period. You may use this information to compare the ongoing costs of investing in the Fund and other funds. To do so, compare this 5% hypothetical example with the 5% hypothetical examples that appear in the shareholders reports of other funds.
Please note that the expenses shown in the table are meant to highlight and help you compare ongoing costs only and do not reflect any transaction costs, such as sales charges or redemption fees, if any. Additionally, the expenses shown do not reflect the fees or charges associated with variable contracts through which shares of the Fund are offered.
January 1, 2011 – June 30, 2011
| Account value at the beginning of the period ($) | Account value at the end of the period ($) | Expenses paid during the period ($)* | ||||||||||
Actual Fund Return** |
| |||||||||||
Class 1 | 1,000.00 | 1,116.10 | 5.19 | |||||||||
Class 4 | 1,000.00 | 1,114.34 | 7.55 | |||||||||
Hypothetical 5% Return (2.5% for the period) |
| |||||||||||
Class 1 | 1,000.00 | 1,019.69 | 4.96 | |||||||||
Class 4 | 1,000.00 | 1,017.50 | 7.20 | |||||||||
| * | Expenses are equal to the Fund’s annualized expense ratio of 0.99% for Class 1 shares 1.44% for Class 4 shares (for the period January 1, 2011—June 30, 2011), multiplied by the average account value over the period, multiplied by 181/365 (to reflect the six months period) |
| ** | Actual Fund Returns for the six-month period ended June 30, 2011 were as follows: 11.61% for Class 1 shares, and 11.43% for Class 4 shares. Past performance does not guarantee future results. |
4
Table of Contents
| Real Estate Securities Fund | (unaudited) |
Investment Profile
A mutual fund designed for investors who seek maximum total return through current income and capital appreciation. The Fund seeks its objective by investing at least 80% of its net assets under normal circumstances in common and preferred stocks, and equity securities, such as debt securities of U.S. issuers that are principally engaged in or related to the real estate industry, including those that own significant real estate assets.
Morningstar Performance Comparison
Based on average annual returns for periods ended June 30, 2011
| Six Months** | One Year | Three Year | Five Year | Ten Year | ||||||||||||||||
Number of Funds in peer group: | 46 | 46 | 46 | 42 | 31 | |||||||||||||||
Peer group average annual total return: | 9.74% | 32.78% | 4.37% | 1.88% | 10.32% | |||||||||||||||
Morningstar category in peer group: U.S. Insurance Real Estate |
| |||||||||||||||||||
Sector Allocation
as a % of Fair Value(c) of $84,026 (in thousands) on June 30, 2011(b)(c)
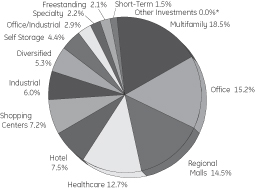
Top Ten Largest Holdings
as of June 30, 2011 (as a % of Fair Value)(b)(c)
Simon Property Group Inc. | 7.48% | |||
Equity Residential | 6.42% | |||
Prologis Inc. | 5.53% | |||
Vornado Realty Trust | 5.34% | |||
Ventas Inc. | 5.15% | |||
The Macerich Co. | 4.31% | |||
Healthcare Inc. | 4.01% | |||
Public Storage | 3.74% | |||
Boston Properties Inc. | 3.56% | |||
HCP Inc. | 3.23% |
Change in Value of a $10,000 Investment
Class 1 Shares
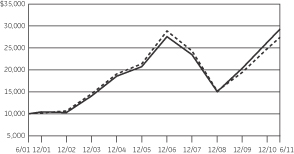
Average Annual Total Return
for the Periods Ended June 30, 2011
Class 1 Shares (Inception date: 5/1/95)
| Six Months** | One Year | Five Year | Ten Year | Ending value of a $10,000 investment(a) | ||||||||||||||||
Real | 11.61% | 36.91% | 4.88% | 11.41% | $ | 29,466 | ||||||||||||||
FTSE NAREIT U.S. Real Estate Index | 10.62% | 34.09% | 2.61% | 10.68% | $ | 27,592 | ||||||||||||||
Change in Value of a $10,000 Investment
Class 4 Shares
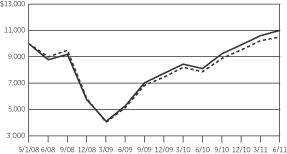
Average Annual Total Returns
for the Periods Ended June 30, 2011
Class 4 Shares (Inception date: 5/1/08)
| Six Months** | One Year | Three Year | Since Inception | Ending value of a $10,000 investment(a) | ||||||||||||||||
Real Estate Securities Fund | 11.43% | 36.34% | 7.92% | 3.10% | $ | 11,016 | ||||||||||||||
FTSE NAREIT U.S. Real Estate Index | 10.62% | 34.09% | 5.38% | 1.58% | $ | 10,509 | ||||||||||||||

| (a) | Ending value of a $10,000 investment for the ten-year period or since inception, whichever is less. |
| (b) | The securities information regarding holdings, allocations and other characteristics is presented to illustrate examples of securities that the Fund has bought and the diversity of areas in which the Fund may invest as of a particular date. It may not be representative of the Fund’s current or future investments and should not be construed as a recommendation to purchase or sell a particular security. |
| (c) | Fair value basis is inclusive of Short-Term Investment in GE Institutional Money Market Fund. |
| * | Less than 0.01%. |
| ** | Total returns for the six month period ended June 30, 2011 are not annualized. |
See Notes to Performance on page 1 for further information, including an explanation of Morningstar peer categories.
Past performance does not predict future performance and the graph and table do not reflect the deduction of taxes that a shareholder would pay on Fund distributions or the redemption of Fund shares and does not reflect the fees or charges that would be associated with variable contracts through which shares of the Fund are offered.
5
Table of Contents
Real Estate Securities Fund
| Schedule of Investments | June 30, 2011 (unaudited) |
Real Estate Securities Fund
| Number of Shares | Fair Value | |||||||||
Common Stock (REITs) — 97.2 % † |
| |||||||||
Diversified — 5.3% |
| |||||||||
Vornado Realty Trust | 48,120 | $ | 4,483,822 | |||||||
Freestanding — 2.1% |
| |||||||||
National Retail Properties Inc. | 70,673 | 1,732,195 | ||||||||
Healthcare — 12.6% |
| |||||||||
HCP Inc. | 74,070 | 2,717,628 | ||||||||
Healthcare Inc. | 64,290 | 3,370,725 | ||||||||
Senior Housing Properties Trust | 9,870 | 231,057 | ||||||||
Ventas Inc. | 82,050 | 4,324,856 | ||||||||
| 10,644,266 | ||||||||||
Hotel — 6.4% |
| |||||||||
DiamondRock Hospitality Co. | 55,380 | 594,227 | ||||||||
Host Hotels & Resorts Inc. | 118,510 | 2,008,745 | ||||||||
LaSalle Hotel Properties | 35,200 | 927,168 | ||||||||
Pebblebrook Hotel Trust | 29,680 | 599,239 | ||||||||
RLJ Lodging Trust | 30,733 | 533,832 | ||||||||
Sunstone Hotel Investors Inc. | 73,880 | 684,868 | (a) | |||||||
| 5,348,079 | ||||||||||
Industrial — 6.0% |
| |||||||||
DCT Industrial Trust Inc. | 84,540 | 442,144 | ||||||||
Prologis Inc. | 129,580 | 4,644,147 | ||||||||
| 5,086,291 | ||||||||||
Multifamily — 18.5% |
| |||||||||
American Campus Communities Inc. | 23,970 | 851,414 | ||||||||
Apartment Investment & Management Co. | 41,410 | 1,057,197 | ||||||||
AvalonBay Communities Inc. | 12,360 | 1,587,024 | ||||||||
Camden Property Trust | 28,500 | 1,813,170 | ||||||||
Colonial Properties Trust | 58,320 | 1,189,728 | ||||||||
Equity Residential | 89,920 | 5,395,200 | ||||||||
Essex Property Trust Inc. | 18,110 | 2,450,102 | ||||||||
UDR Inc. | 48,950 | 1,201,722 | ||||||||
| 15,545,557 | ||||||||||
Office — 15.2% |
| |||||||||
Alexandria Real Estate Equities Inc. | 22,780 | 1,763,628 | ||||||||
Boston Properties Inc. | 28,180 | 2,991,589 | ||||||||
Brandywine Realty Trust | 59,240 | 686,592 | ||||||||
CommonWealth | 61,000 | 1,576,240 | ||||||||
Corporate Office Properties Trust | 17,180 | 534,470 | ||||||||
Douglas Emmett Inc. | 65,910 | 1,310,950 | ||||||||
Hudson Pacific Properties Inc. | 44,750 | 694,968 | ||||||||
Kilroy Realty Corp. | 31,160 | 1,230,508 | (c) | |||||||
Parkway Properties Inc. | 27,999 | 477,663 | ||||||||
| Number of Shares | Fair Value | |||||||||
SL Green Realty Corp. | 18,250 | $ | 1,512,378 | |||||||
| 12,778,986 | ||||||||||
Office/Industrial — 2.8% |
| |||||||||
Duke Realty Corp. | 110,140 | 1,543,061 | ||||||||
Liberty Property Trust | 26,290 | 856,528 | ||||||||
| 2,399,589 | ||||||||||
Regional Malls — 14.5% |
| |||||||||
General Growth Properties Inc. | 97,590 | 1,628,777 | ||||||||
Pennsylvania Real Estate Investment Trust | 5,100 | 80,070 | ||||||||
Simon Property Group Inc. | 54,080 | 6,285,718 | ||||||||
Taubman Centers Inc. | 10,060 | 595,552 | ||||||||
The Macerich Co. | 67,630 | 3,618,205 | ||||||||
| 12,208,322 | ||||||||||
Self Storage — 4.4% |
| |||||||||
Public Storage | 27,580 | 3,144,396 | ||||||||
U-Store-It Trust | 50,920 | 535,678 | ||||||||
| 3,680,074 | ||||||||||
Shopping Centers — 7.2% |
| |||||||||
Acadia Realty Trust | 31,430 | 638,972 | ||||||||
Developers Diversified Realty Corp. | 84,370 | 1,189,617 | ||||||||
Excel Trust Inc. | 33,895 | 373,862 | ||||||||
Federal Realty Investment Trust | 11,280 | 960,830 | ||||||||
Kimco Realty Corp. | 124,960 | 2,329,254 | ||||||||
Tanger Factory Outlet Centers | 21,750 | 582,248 | ||||||||
| 6,074,783 | ||||||||||
Specialty — 2.2% |
| |||||||||
Digital Realty Trust Inc. | 29,930 | 1,849,075 | ||||||||
Total Common Stock (REITs) | 81,831,039 | |||||||||
Common Stock — 1.2% |
| |||||||||
Hotel — 1.4% |
| |||||||||
Hyatt Hotels Corp. | 23,800 | 971,516 | (a) | |||||||
Other Investments — 0.0%* |
| |||||||||
GEI Investment Fund | 2,708 | (d) | ||||||||
Total Investments in Securities | 82,805,263 | |||||||||
See Notes to Schedule of Investments and Notes to Financial Statements.
6
Table of Contents
Real Estate Securities Fund
| Schedule of Investments | June 30, 2011 (unaudited) |
| Fair Value | ||||||
Short-Term Investments — 1.4% | ||||||
GE Institutional Money Market Fund Investment Class 0.11% | $ | 1,220,794 | (b,d) | |||
Total Investments | 84,026,057 | |||||
Other Assets and Liabilities, | 142,180 | |||||
|
| |||||
NET ASSETS — 100.0% | $ | 84,168,237 | ||||
|
| |||||
See Notes to Schedule of Investments and Notes to Financial Statements.
7
Table of Contents
| Notes to Schedule of Investments | June 30, 2011 (unaudited) |
The views expressed in this document reflect our judgment as of the publication date and are subject to change at any time without notice. The securities information regarding holdings, allocations and other characteristics are presented to illustrate examples of securities that the Fund has bought and the diversity of areas in which the Fund may invest as of a particular date. It may not be representative of the Fund’s current or future investments and should not be construed as a recommendation to purchase or sell a particular security. See the Fund’s summary prospectus and statutory prospectus for complete descriptions of investment objectives, policies, risks and permissible investments.
| (a) | Non-income producing security. |
| (b) | Coupon amount represents effective yield. |
| (c) | At June 30, 2011 , all or a portion of this security was pledged to cover collateral requirements for futures, options, forward foreign currency contracts and/or TBA’s. |
| (d) | GE Asset Management, the investment adviser of the Fund, also serves as investment adviser of the GEI Investment Fund and the GE Institutional Money Market Fund. |
| * | Less than 0.05%. |
| † | Percentages are based on net assets as of June 30, 2011 . |
Abbreviations:
REIT | Real Estate Investment Trust |
8
Table of Contents
Selected data based on a share outstanding throughout the fiscal years indicated
| CLASS 1 | CLASS 4 | |||||||||||||||||||||||||||||||||||||||||
| 6/30/11† | 12/31/10 | 12/31/09 | 12/31/08 | 12/31/07 | 12/31/06 | 6/30/11† | 12/31/10 | 12/31/09 | 12/31/08 | |||||||||||||||||||||||||||||||||
| Inception date | — | — | — | — | — | 5/1/95 | — | — | — | 5/1/08 | ||||||||||||||||||||||||||||||||
Net asset value, beginning of period | $10.68 | $ 8.41 | $6.46 | $10.87 | $21.49 | $19.20 | $10.67 | $ 8.41 | $6.47 | $12.15 | ||||||||||||||||||||||||||||||||
Income/(loss) from investment operations: | ||||||||||||||||||||||||||||||||||||||||||
Net investment income | 0.14 | 0.19 | ** | 1.03 | 1.11 | 0.72 | 0.65 | 0.11 | 0.15 | ** | 0.29 | 0.39 | ** | |||||||||||||||||||||||||||||
Net realized and unrealized gains/(losses) on investments | 1.10 | 2.24 | 1.29 | (5.05) | (3.87) | 5.68 | 1.11 | 2.23 | 1.99 | (5.63) | ||||||||||||||||||||||||||||||||
Total income/(loss) from investment operations | 1.24 | 2.43 | 2.32 | (3.94) | (3.15) | 6.33 | 1.22 | 2.38 | 2.28 | (5.24) | ||||||||||||||||||||||||||||||||
Less distributions from: | ||||||||||||||||||||||||||||||||||||||||||
Net investment income | — | 0.16 | 0.22 | 0.28 | 0.73 | 0.48 | — | 0.12 | 0.19 | 0.25 | ||||||||||||||||||||||||||||||||
Return of capital | — | — | 0.15 | 0.19 | 0.02 | — | — | — | 0.15 | 0.19 | ||||||||||||||||||||||||||||||||
Net realized gains | — | — | — | — | 6.72 | 3.56 | — | — | — | — | ||||||||||||||||||||||||||||||||
Total distributions | — | 0.16 | 0.37 | 0.47 | 7.47 | 4.04 | — | 0.12 | 0.34 | 0.44 | ||||||||||||||||||||||||||||||||
Net asset value, end of period | $11.92 | $10.68 | $8.41 | $ 6.46 | $10.87 | $21.49 | $11.89 | $10.67 | $8.41 | $ 6.47 | ||||||||||||||||||||||||||||||||
TOTAL RETURN(a) | 11.61% | 28.94% | 35.77% | (36.03)% | (14.86)% | 33.03% | 11.43% | 28.31% | 35.14% | (42.99)% | ||||||||||||||||||||||||||||||||
RATIOS/SUPPLEMENTAL DATA: | ||||||||||||||||||||||||||||||||||||||||||
Net assets, end of period | $84,157 | $78,316 | $70,574 | $59,969 | $96,650 | $178,317 | $11 | $10 | $8 | $6 | ||||||||||||||||||||||||||||||||
Ratios to average net assets: | ||||||||||||||||||||||||||||||||||||||||||
Net investment income | 2.41% | * | 1.97% | 4.75% | 4.67% | 2.59% | 3.08% | 1.95% | * | 1.52% | 4.26% | 4.67% | * | |||||||||||||||||||||||||||||
Net Expenses | 0.99% | (b)* | 0.92% | (b) | 1.04% | (b) | 0.95% | (b) | 0.90% | 0.88% | 1.44% | (b)* | 1.36% | (b) | 1.49% | (b) | 1.40% | (b)* | ||||||||||||||||||||||||
Gross Expenses | 0.99% | * | 0.93% | 1.04% | 0.95% | 0.90% | 0.88% | 1.44% | * | 1.37% | 1.49% | 1.40% | ||||||||||||||||||||||||||||||
Portfolio turnover rate | 37% | 113% | 105% | 121% | 106% | 92% | 37% | 113% | 105% | 121% | ||||||||||||||||||||||||||||||||
Notes to Financial Highlights
| (a) | Total returns are historical and assume changes in share price, reinvestment of dividends and capital gains distributions and do not include the effect of insurance contract charges. Past performance does not guarantee future results. |
| (b) | Reflects GE Asset Management’s waiver of a portion of the Fund’s management fee in an amount equal to the management fee earned by GEAM with respect to the Fund’s investment in the GE Money Market Fund and/or GE Institutional Money Market Fund. |
| * | Annualized for periods less than one year. |
| ** | Per share values have been calculated using the average share method. |
| † | Unaudited |
The accompanying Notes are an integral part of these financial statements.
9
Table of Contents
The accompanying Notes are an integral part of these financial statements.
10
Table of Contents
For the six months ended June 30, 2011 (unaudited) | ||||
INVESTMENT INCOME | ||||
Income: | ||||
Dividend | $ | 1,321,282 | ||
Interest | 59,616 | |||
Interest from affiliated investments | 784 | |||
Total Income | 1,381,682 | |||
Expenses | ||||
Advisory and administration fees | 346,281 | |||
Distribution fees | ||||
Class 4 | 24 | |||
Transfer agent fees | 10,136 | |||
Director’s fees | 1,086 | |||
Custody and accounting expenses | 20,815 | |||
Professional fees | 10,317 | |||
Other expenses | 13,948 | |||
Total expenses before waiver and reimbursement | 402,607 | |||
Less: Expenses waived or borne by the adviser | (1,075 | ) | ||
Net expenses | 401,532 | |||
Net investment income | 980,150 | |||
NET REALIZED AND UNREALIZED GAIN (LOSS) | ||||
Realized gain on: | ||||
Investments | 7,285,290 | |||
Increase in unrealized appreciation on: | ||||
Investments | 818,944 | |||
Net realized and unrealized gain on investments | 8,104,234 | |||
Net increase in net assets resulting from operations | $ | 9,084,384 | ||
The accompanying Notes are an integral part of these financial statements.
11
Table of Contents
| * | Unaudited |
The accompanying Notes are an integral part of these financial statements.
12
Table of Contents
| Notes to Financial Statements | June 30, 2011 (unaudited) |
| 1. | Organization of the Company |
GE Investments Funds, Inc. (the “Company”) was incorporated under the laws of the Commonwealth of Virginia on May 14, 1984 and is registered under the Investment Company Act of 1940, as amended (the “1940 Act”), as an open-end management investment company. The Company is composed of fourteen investment portfolios (collectively the “Funds”), although only the following eleven are currently being offered: U.S. Equity Fund, S&P 500 Index Fund, Premier Growth Equity Fund, Core Value Equity Fund, Mid-Cap Equity Fund, Small-Cap Equity Fund, International Equity Fund, Total Return Fund, Income Fund, Money Market Fund and Real Estate Securities Fund (the “Fund”).
Shares of the Funds of the Company are offered only to insurance company separate accounts that fund certain variable life insurance contracts and variable annuity contracts. GE Asset Management Incorporated (“GEAM”) is the investment adviser and administrator of each of the Funds.
The Company currently offers two share classes (Class 1 and Class 4) of the Fund as investment options for variable life insurance and variable annuity contracts. Class 4 shares were first offered on May 1, 2008, and Fund shares outstanding prior to May 1, 2008 were designated as Class 1 shares. Each share class has different fees and expenses, and as a result, each share class will have different share price and performance. Not all variable contracts offer both share classes of the Fund.
| 2. | Summary of Significant Accounting Policies |
The preparation of financial statements in conformity with U.S. generally accepted accounting principles (GAAP) requires management to make estimates and assumptions that affect the reported amounts of assets and liabilities and disclosure of contingent assets and liabilities at the date of the financial statements and the reported amounts of increases and decreases in net assets from operations during the reporting period. Actual results may differ from those estimates.
Subsequent events after the balance sheet date through the date the financial statements were issued, have been evaluated in the preparation of the financial statements. There are no items to report.
The following summarizes the significant accounting policies of the Company.
Securities Valuation and Transactions. All investments in securities are recorded at their estimated fair value, as described in Note 3.
Securities transactions are accounted for as of the trade date. Realized gains and losses on investments sold are recorded on the basis of identified cost for both financial statement and federal tax purposes.
The Fund’s income, expenses (other than distribution fees) and realized and unrealized gains and losses are allocated proportionally each day among the share classes based upon the relative net assets of each class.
Derivatives The Fund is subject to equity price risk in the normal course of pursuing its investment objective. The Fund may enter into derivative transactions to gain market exposure for residual and accumulating cash positions.
Real Estate Investment Trusts Dividend income, attributable to real estate investment trusts (“REITs”), is recorded based on management’s estimate of the income included in the distributions received. Distributions received in excess of this amount are recorded as a reduction of the cost of the investments. The actual amounts of income and return of capital are determined by each REIT only after its fiscal year-end and may differ from the estimated amounts.
Investment Income Corporate actions (including cash dividends) are recorded on the ex-dividend date, net of applicable withholding taxes, except for certain foreign corporate actions which are recorded as soon after ex-dividend date as such information becomes available. Withholding taxes in foreign dividends have been provided for in accordance with the Fund’s understanding of the applicable country’s tax rules and rates.
Interest income is recorded on the accrual basis. Accretion of discounts and amortization of premiums on taxable bonds are to the call or maturity date, whichever is shorter, using the effective yield method.
Expenses Fund specific expenses are allocated to the Fund that incurs such expenses. Such expenses may include custodial fees, legal and accounting fees, printing costs and registration fees. Expenses that are not fund specific are allocated pro rata across the Funds. Certain class specific expenses (such as distribution fees) are allocated to the class that incurs such expense. Expenses of the Fund are generally paid directly by the Fund however, expenses may be paid by GEAM and reimbursed by the fund.
Federal Income Taxes The Fund intends to comply with all sections of the Internal Revenue Code applicable to regulated investment companies including the distribution of substantially all of its taxable net investment income and
13
Table of Contents
| Notes to Financial Statements | June 30, 2011 (unaudited) |
net realized capital gains to its shareholders. Therefore, no provision for federal income tax has been made. The Fund is treated as a separate taxpayer for federal income tax purposes.
| 3. | Securities Valuation |
The Fund utilizes various methods to measure the fair value of most of its investments on a recurring basis. GAAP establishes a framework for measuring fair value and providing related disclosures. Broadly, the framework requires fair value to be determined based on the exchange price that would be received for an asset or paid to transfer a liability (an exit price) in the principal or most advantageous market for the asset or liability in an orderly transaction between market participants at the measurement date. In the absence of active markets for the identical assets or liabilities, such measurements involve developing assumptions based on market observable data and, in the absence of such data, internal information that is consistent with what market participants would use in a hypothetical transaction that occurs at the measurement date. It also establishes a three-level valuation hierarchy based upon observable and non-observable inputs.
Observable inputs reflect market data obtained from independent sources, while unobservable inputs reflect our market assumptions. Preference is given to observable inputs. These two types of inputs create the following fair value hierarchy:
Level 1 — Quoted prices for identical investments in active markets.
Level 2 — Quoted prices for similar investments in active markets; quoted prices for identical or similar investments in markets that are not active; and model-derived valuations whose inputs are observable or whose significant value drivers are observable.
Level 3 — Significant inputs to the valuation model are unobservable.
Policies and procedures are maintained to value investments using the best and most relevant data available. In addition, pricing vendors are utilized to assist in valuing investments. GEAM performs periodic reviews of the methodologies used by independent pricing services including price validation of individual securities.
Fair Value Measurement The following section describes the valuation methodologies the Fund uses to measure different financial investments at fair value.
The Fund’s portfolio securities are valued generally on the basis of market quotations. Equity securities generally are valued at the last reported sales price on the primary market in which they are traded. Portfolio securities listed on NASDAQ are valued using the NASDAQ Official Closing Price. Level 1 securities primarily include publicly-traded equity securities which may not necessarily represent the last sale price. If no sales occurred on the exchange or NASDAQ that day, the portfolio security generally is valued using the last reported bid price. In those circumstances the Fund classifies the investment securities in Level 2.
Debt securities (other than short-term securities described below) generally are valued at an evaluated bid as reported by an independent pricing service. Municipal obligations are valued at the quoted bid prices, when available. The pricing vendor uses various pricing models for each asset class that are consistent with what other market participants would use. The inputs and assumptions to the model of the pricing vendor are derived from market observable sources including: benchmark yields, reported trades, broker/dealer quotes, issuer spreads, benchmark securities, bids, offers, and other market related data. Since many fixed income securities do not trade on a daily basis, the methodology of the pricing vendor uses available information as applicable such as benchmark curves, benchmarking of like securities, sector groupings, and matrix pricing. The pricing vendor considers all available market observable inputs in determining the evaluation for a security. Thus, certain securities may not be priced using quoted prices, but rather determined from market observable information. These investments are included in Level 2 and primarily comprise our portfolio of corporate fixed income, government, mortgage and asset-backed securities.
In the absence of a reliable price from such a pricing service, debt securities may be valued based on dealer supplied valuations or quotations. In these infrequent circumstances, pricing vendors may provide the Funds with valuations that are based on significant unobservable inputs, and in those circumstances we classify the investment securities in Level 3.
The Fund uses the net asset value per unit for the collective fund. The Fund classifies the investment security in level 2.
Other financial investments are derivative instruments that are not reflected in Total Investments, such as exchange traded futures. Futures are valued at the last sale price on the primary market they are traded and are typically included in level 1.
14
Table of Contents
| Notes to Financial Statements | June 30, 2011 (unaudited) |
The short-term investments of sufficient credit quality held by the Fund with remaining maturities of sixty days or less at the time of purchase are valued on the basis of amortized cost which approximates market value and these are included in Level 2.
If prices are not readily available for a portfolio security, or if it is believed that a price for a portfolio security does not represent its fair value, the security may be valued using procedures approved by the Fund’s Board of Directors that are designed to establish its “fair” value. These securities would generally be classified in Level 3. Those procedures require that the fair value of a security be established by the valuation committee. The valuation committee follows different protocols for different types of investments and circumstances. The fair value procedures may be used to value any investment of any Fund in the appropriate circumstances.
Portfolio securities may be valued using techniques other than market quotations, under the circumstances described
above. The value established for a portfolio security may be different than what would be produced through the use of another methodology or if it had been priced using market quotations. Portfolio securities that are valued using techniques other than market quotations, including “fair valued” securities, may be subject to greater fluctuation in their value from one day to the next than would be the case if market quotations were used. In addition, there is no assurance that the Fund could sell a portfolio security for the value established for it at any time and it is possible that the Fund would incur a loss because a portfolio security is sold at a discount to its established value.
The inputs or methodology used for valuing securities are not an indication of the risk associated with investing in those securities. Fair value determinations are required for securities whose value is affected by a significant event that will materially affect the value of a domestic or foreign security and which occurs subsequent to the time of the close of the principal market on which such domestic or foreign security trades but prior to the calculation of the Fund’s NAV.
The following table presents the Fund’s investments measured at fair value on a recurring basis at June 30, 2011:
| Investments | Level 1 | Level 2 | Level 3 | Total | ||||||||||||
Investments in Securities | ||||||||||||||||
Common Stock | $ | 82,802,555 | $ | — | $ | — | $ | 82,802,555 | ||||||||
Other Investments | — | 2,708 | — | 2,708 | ||||||||||||
Short-Term Investments | 1,220,794 | — | — | 1,220,794 | ||||||||||||
Total Investments in Securities | $ | 84,023,349 | $ | 2,708 | $ | — | $ | 84,026,057 | ||||||||
There were no significant transfers between the fair value levels. Transfers between fair value levels are considered to occur at the beginning of the period.
| 4. | Line of Credit |
The Company shares a revolving credit facility of up to $150 million with a number of its affiliates. The credit facility is with its custodian bank, State Street Bank and Trust Company (“State Street”). The revolving credit facility requires the payment of a commitment fee equal to 0.125% per annum on the daily unused portion of the credit facility, payable quarterly. The portion borne by the Funds generally is borne proportionally based upon net assets. In addition, the Company has a $100 million uncommitted, unsecured line of credit with State Street. Generally, borrowings under the credit facilities would accrue interest at the Federal Funds Rate plus 50 basis points and would be borne by the borrowing Fund. The maximum amount allowed to be borrowed by any one Fund is the lesser of (i)33.33% of the Fund’s assets or (ii) 20% of its net assets.
The credit facilities were not utilized by the Fund during the six month period ended June 30, 2011.
| 5. | Fees and Compensation Paid to Affiliates |
GEAM, a registered investment adviser, was retained by the Company’s Board of Directors effective May 1, 1997 to act as investment adviser and administrator of the Fund. GEAM’s compensation for investment advisory and administrative services is paid monthly based on the average daily net assets of the Fund. The advisory and administrative fee is stated in the following schedule:
| Average Daily Net Assets of Fund | Advisory and Administration Fees | |
| First $100 million | 0.85% | |
| Next $100 million | 0.80% | |
| Over $200 million | 0.75% |
15
Table of Contents
| Notes to Financial Statements | June 30, 2011 (unaudited) |
GEAM has a contractual arrangement with the Fund to waive a portion of the Fund’s management fee in the amount equal to the management fee earned by GEAM with respect to the Funds investment in the GE Institutional Money Market Fund.
Distribution and Service (12b-1) Fees The Company has adopted a Distribution and Service (12b-1) Plan (the “Plan”) pursuant to Rule 12b-1 under the 1940 Act with respect to Class 4 shares of the Fund. Under the Plan, the Fund may compensate GE Investment Distributors, Inc. (“GEID”), a wholly-owned subsidiary of GEAM and the Fund’s principal distributor, for certain sales services provided by GEID or other broker dealers and investor services provided by GEID or other service providers relating to the Fund’s Class 4 shares, including services to owners or prospective owners of variable contracts issued by insurance companies that offer such share class as an investment option. The amount of compensation paid under the Plan by the Fund’s Class 4 shares may not exceed 0.45% of the average daily net assets of the Fund attributable to such share class. The Plan continues in effect from year to year for so long as such continuance is approved annually by the Board of Directors, including by those directors who are not interested persons of the Company and who have no direct or indirect financial interest in the operation of the Plan or in any agreement related to it.
Directors’ Compensation The Fund pays no compensation to its directors who are officers or employees of GEAM or its affiliates. Directors who are not such officers or employees also serve in a similar capacity for other funds advised by GEAM. Compensation paid to unaffiliated directors are reflected on the Statement of Operations. These fees are allocated pro rata across all of the mutual fund platforms and share classes served by the directors, including the Fund, and are based upon the relative net assets of each fund within such platforms.
| 6. | Sub-advisory Fees |
Pursuant to an investment sub-advisory agreement with GEAM, Urdang Securities Management, Inc. (“Urdang”) is the Sub-Adviser to the Fund. Urdang is responsible for the day-to-day portfolio management of the assets of the Fund, including the responsibility for making decisions to buy, sell or hold a particular security, under the general supervision of GEAM and the Board.
For their services, GEAM pays Urdang monthly sub-advisory fees which are calculated as a percentage of the average daily net assets of the Fund.
| 7. | Investment Transactions |
Purchases and Sales of Securities The cost of purchases and the proceeds from sales of investments, other than short-term securities and short-term options, for the period ended June 30, 2011 were as follows:
| Non U.S. Gov’t Securities | ||
| Purchases | Sales | |
$30,200,161 | $32,719,920 | |
| 8. | Income Taxes |
The Fund is subject to ASC 740, Income Taxes. ASC 740 provides guidance for financial accounting and reporting for the effects of income taxes that result from an entity’s activities during the year. ASC 740 also provides guidance regarding how certain tax positions should be recognized, measured, presented and disclosed in the financial statements. ASC 740 requires evaluation of tax positions taken or expected to be taken in the course of preparing the Fund’s tax returns to determine whether the tax positions are “more likely than not” of being sustained by the applicable tax authority. There are no adjustments to the Funds’ net assets required under ASC 740. The Fund’s 2007, 2008, 2009 and 2010 fiscal years tax returns are still open to examination by the Federal and applicable state tax authorities.
At June 30, 2011, information on the tax cost of investments was as follows:
| Cost of Investment for Tax Purposes | Gross Tax | Net Tax Appreciation/ (Depreciation) | ||||
| Appreciation | Depreciation | |||||
| $77,386,132 | $6,824,538 | $(184,613) | $6,639,925 | |||
As of December 31, 2010, the Fund has capital loss carryovers, as indicated below. Capital loss carryovers are available to offset future realized capital gains to the extent provided in the Internal Revenue Code and regulations
thereunder. To the extent that these carryover losses are used to offset future capital gains, it is probable that the gains so offset will not be distributed to shareholders because they would be taxable as ordinary income.
16
Table of Contents
| Notes to Financial Statements | June 30, 2011 (unaudited) |
During the year ended December 31, 2010, the Fund utilized $15,410,139 of prior year capital loss carryovers.
| Amount | Expires | |
| $16,946,275 | 12/31/2017 |
These amounts will be available to offset future taxable capital gains. Under the recently enacted Regulated Investment Company Modernization Act of 2010, the Fund will be permitted to carry forward capital losses incurred in taxable years beginning after December 22, 2010 for an unlimited period. However, any losses incurred during those future years will be required to be utilized prior to the losses incurred in pre-enactment tax years. As a result of this ordering rule, pre-enactment capital loss carryforwards may be more likely to expire unused. Additionally, post-enactment capital losses that are carried forward will retain their character as either short-term or long-term capital losses rather than being considered all short-term as under previous law.
Any net capital and currency losses incurred after October 31, within the Fund’s tax year, are deemed to arise on the first day of the Fund’s next tax year if the Fund so elects to defer such losses.
The Fund did not defer any post-October losses for the year ended December 31, 2010.
The tax composition of distributions paid during the years ended December 31, 2010 and December 31, 2009 were as follows:
| Ordinary Income | Long-Term Capital Gains | Return of Capital | Total | |||||||||||||
| 2010 | $ | 1,190,970 | $ | — | $ | — | $ | 1,190,970 | ||||||||
| 2009 | $ | 2,058,769 | $ | — | $ | 895,211 | $ | 2,953,980 | ||||||||
Distributions to Shareholders The Fund declares and pays any dividends from net investment income annually. The Fund declares and pays any net realized capital gains in excess of capital loss carryforwards distributions annually. The character of income and gains to be distributed is determined in accordance with income tax regulations which may differ from generally accepted accounting principles. These differences include (but are not limited to) distributions from Real Estate Investment Trusts (REITS), and losses deferred due to wash sale transactions. Reclassifications due to permanent book/tax differences are made to the Fund’s capital accounts to reflect income and gains available for distribution (or available capital loss carryovers) under income tax regulations. These reclassifications have no impact on the net asset value of the Fund. The calculation of net investment income per share in the Financial Highlights table excludes these adjustments.
The reclassifications for the year ended December 31, 2010 were as follows:
Undistributed Income | Accumulated Net Realized Gain | Paid in Capital | ||
| $(175,573) | $573,079 | $(397,506) |
17
Table of Contents
| Special Meeting of Shareholders — Voting Results | (unaudited) |
On April 1, 2011, the GE Investments Funds, Inc. (the “Company”) held a special meeting of shareholders of each series portfolio of the Company, including shareholders of the Real Estate Securities Fund (the “Fund”). Shareholders of record on January 28, 2011 were entitled to vote on the proposals. For each proposal, except Proposal 1, shareholders voted on a fund-by-fund basis. For Proposal 1, shareholders of all funds voted together and not by fund or share class. At the meeting, all proposals were approved by the Fund and the following votes were recorded:
Proposal 1:
Election of Mr. R. Sheldon Johnson and Mr. Matthew J. Simpson as Directors to the Board of Directors of the Company.
Company votes:
| No. of Shares | % of Outstanding Shares | % of Shares Present | ||||||||||
| Mr. R. Sheldon Johnson | ||||||||||||
Affirmative | 451,517,094.582 | 90.054 | % | 96.126 | % | |||||||
Abstain | 18,195,810.391 | 3.629 | % | 3.874 | % | |||||||
Total | 469,712,904.973 | 93.683 | % | 100.000 | % | |||||||
| Mr. Matthew J. Simpson | ||||||||||||
Affirmative | 451,949,730.789 | 90.140 | % | 96.218 | % | |||||||
Abstain | 17,763,174.184 | 3.543 | % | 3.782 | % | |||||||
Total | 469,712,904.973 | 93.683 | % | 100.000 | % | |||||||
Fund votes:
| No. of Shares | % of Outstanding Shares | % of Shares Present | ||||||||||
| Mr. R. Sheldon Johnson | ||||||||||||
Affirmative | 6,553,076.166 | 88.720 | % | 94.539 | % | |||||||
Abstain | 378,550.552 | 5.125 | % | 5.461 | % | |||||||
Total | 6,931,626.718 | 93.845 | % | 100.000 | % | |||||||
| Mr. Matthew J. Simpson | ||||||||||||
Affirmative | 6,618,119.023 | 89.601 | % | 95.477 | % | |||||||
Abstain | 313,507.695 | 4.244 | % | 4.523 | % | |||||||
Total | 6,931,626.718 | 93.845 | % | 100.000 | % | |||||||
Proposal 3:
Approval of the following changes in certain of the Fund’s investment policies, as follows:
| A. | Amendment of the Fund’s investment policy on senior securities. |
| No. of Shares | % of Outstanding Shares | % of Shares Present | ||||||||||
Affirmative | 6,218,964.231 | 84.197 | % | 89.719 | % | |||||||
Against | 321,036.738 | 4.346 | % | 4.631 | % | |||||||
Abstain | 391,625.749 | 5.302 | % | 5.650 | % | |||||||
Broker Non-votes | — | — | — | |||||||||
Total | 6,931,626.718 | 93.845 | % | 100.000 | % | |||||||
18
Table of Contents
| Special Meeting of Shareholders — Voting Results | (unaudited) |
| C. | Amendment of the Fund’s investment policy on making loans. |
| No. of Shares | % of Outstanding Shares | % of Shares Present | ||||||||||
Affirmative | 6,223,369.757 | 84.257 | % | 89.782 | % | |||||||
Against | 355,781.358 | 4.816 | % | 5.133 | % | |||||||
Abstain | 352,475.603 | 4.772 | % | 5.085 | % | |||||||
Broker Non-votes | — | — | — | |||||||||
Total | 6,931,626.718 | 93.845 | % | 100.000 | % | |||||||
| D. | Amendment of the Fund’s investment policy on borrowing. |
| No. of Shares | % of Outstanding Shares | % of Shares Present | ||||||||||
Affirmative | 6,170,521.109 | 83.541 | % | 89.020 | % | |||||||
Against | 407,911.585 | 5.523 | % | 5.885 | % | |||||||
Abstain | 353,194.024 | 4.781 | % | 5.095 | % | |||||||
Broker Non-votes | — | — | — | |||||||||
Total | 6,931,626.718 | 93.845 | % | 100.000 | % | |||||||
| F. | Amendment of the Fund’s investment policy on concentration of investments. |
| No. of Shares | % of Outstanding Shares | % of Shares Present | ||||||||||
Affirmative | 6,283,876.392 | 85.076 | % | 90.655 | % | |||||||
Against | 298,807.711 | 4.045 | % | 4.311 | % | |||||||
Abstain | 348,942.615 | 4.724 | % | 5.034 | % | |||||||
Broker Non-votes | — | — | — | |||||||||
Total | 6,931,626.718 | 93.845 | % | 100.000 | % | |||||||
| G. | Amendment of the Fund’s investment policy on investments in commodities and its reclassification from a non-fundamental policy to a fundamental policy. |
| No. of Shares | % of Outstanding Shares | % of Shares Present | ||||||||||
Affirmative | 6,198,101.192 | 83.914 | % | 89.418 | % | |||||||
Against | 367,783.774 | 4.980 | % | 5.306 | % | |||||||
Abstain | 365,741.752 | 4.951 | % | 5.276 | % | |||||||
Broker Non-votes | — | — | — | |||||||||
Total | 6,931,626.718 | 93.845 | % | 100.000 | % | |||||||
| J. | Amendment of the Fund’s investment policy on real estate investments. |
| No. of Shares | % of Outstanding Shares | % of Shares Present | ||||||||||
Affirmative | 6,247,140.752 | 84.578 | % | 90.125 | % | |||||||
Against | 340,078.839 | 4.605 | % | 4.906 | % | |||||||
Abstain | 344,407.127 | 4.662 | % | 4.969 | % | |||||||
Broker Non-votes | — | — | — | |||||||||
Total | 6,931,626.718 | 93.845 | % | 100.000 | % | |||||||
19
Table of Contents
| Additional Information | (unaudited) |
Information about Directors and Executive Officers:
The business and affairs of the Funds are managed under the direction of the Funds’ Board of Directors. Information pertaining to the Directors and officers of the Funds is set forth below.
Interested Directors and Executive Officers
Michael J. Cosgrove
Address c/o GEAM 3001 Summer St. Stamford, CT 06905
Age 62
Position(s) Held with Fund Chairman of the Board and President
Term of Office and Length of Time Served Until successor is elected and qualified — 14 years
Principal Occupation(s) During Past 5 years President and Chief Executive Officer — Mutual Funds and Intermediary Business at GEAM since March 2007; Executive Vice President of GEAM from February 1997 to March 2007; Vice President, GE Capital Corporation, an indirect wholly-owned subsidiary of GE, since December 1999; Executive Vice President — Mutual Funds of GEAM, a wholly-owned subsidiary of GE that is registered as an investment adviser under the Investment Advisers Act of 1940, as amended, since March 1993; President and Director of GE Investment Distributors, Inc., since June 2011. Director of GEAM since 1988.
Number of Portfolios in Fund Complex Overseen by Director 28
Other Directorships Held by Director Chairman of the Board and President of GE Institutional Funds since 1997; Trustee of Elfun Funds, GE Savings & Security Funds, General Relief and Loan Fund and General Electric Pension Trust since 1988; Trustee of Fordham University from 2002 to June 30, 2010 and since July 2011; Trustee of GE Volunteers since 1993; Director of GE Foundation; Director, GE Asset Management (Ireland) Limited, since February 1999, GE Asset Management Funds Plc since 1998, GE Asset Management Canada Company since 1998, GE Asset Management Limited since 1998 and GEAM since 1988; Chairman of the Board and President of GE Funds from 1993 to February 2011.
Matthew J. Simpson
Address c/o GEAM 3001 Summer St. Stamford, CT 06905
Age 50
Position(s) Held with Fund Director and Executive Vice President
Term of Office and Length of Time Served Until successor is elected and qualified – 3 years
Principal Occupation(s) During Past 5 years Executive Vice President, General Counsel and Secretary of GEAM since July 2007; Senior Vice President and General Counsel — Marketing and Client Services (formerly Asset Management Services) at GEAM and Senior Vice President and General Counsel of GE Asset Management Services from February 1997 to July 2007; Vice President and Associate General Counsel of GEAM from October 1992 to February 1997; Secretary of GE Funds from 1993 to July 2007 and Vice President from September 2003 to July 2007; Secretary of GE Institutional Funds and GE Investments Funds, Inc. from 1997 to July 2007; Secretary of Elfun Funds and GE Savings & Security Funds since July 2007; Assistant Secretary of Elfun Funds and GE Savings & Security Funds from 1998 to July 2007 and Vice President from October 2003 to July 2007.
Number of Portfolios in Fund Complex Overseen by Director 28
Other Directorships Held by Director Trustee of Elfun Funds, GE Savings & Security Funds and General Electric Pension Trust since July 2007; Trustee of GE Institutional Funds since April 2011 and Trustee of GE Funds from July 2007 to February 2011.
20
Table of Contents
| Additional Information | (unaudited) |
Joon Won Choe
Address c/o GEAM 3001 Summer St. Stamford, CT 06905
Age 41
Position(s) Held with Fund Vice President & Secretary
Term of Office and Length of Time Served Until successor is elected and qualified — Vice President and Secretary — less than 1 year
Principal Occupation(s) During Past 5 years Senior Vice President and Deputy General Counsel at GEAM since March 2011; Senior Vice President and Associate General Counsel at GEAM from June 2010 to March 2011; Vice President and Associate General Counsel at GEAM from November 2005 to June 2010; Vice President and Secretary of GE Institutional Funds and GE Investments Funds, Inc. since September 2010; Vice President and Assistant Secretary of Elfun Funds and GE Savings & Security Funds since September 2010.
Number of Portfolios in Fund Complex Overseen by Officer N/A
Other Directorships Held by Officer N/A
Robert Herlihy
Address c/o GEAM 3001 Summer St. Stamford, CT 06905
Age 43
Position(s) Held with Fund Chief Compliance Officer
Term of Office and Length of Time Served Until successor is elected and qualified — 5 years
Principal Occupation(s) During Past 5 years Chief Compliance Officer of GEAM, GE Institutional Funds, Elfun Funds, and GE Savings and Security Funds since July 2005; Chief Compliance Officer of GE Funds from July 2005 to February 2011; and Manager of Fund Administration at GEAM from 2002-2005.
Number of Portfolios in Fund Complex Overseen by Officer N/A
Other Directorships Held by Officer N/A
Arthur A. Jensen
Address c/o GEAM 3001 Summer St. Stamford, CT 06905
Age 44
Position(s) Held with Fund Treasurer
Term of Office and Length of Time Served Until successor is elected and qualified — less than 1 year
Principal Occupations(s) During Past 5 Years Treasurer of GE Institutional Funds, Elfun Funds and GE Savings and Security Funds since June 2011; Mutual Funds Controller of GEAM since April 2011; Senior Vice President at Citigroup from 2008 to 2010 and Vice President at JPMorgan from 2005 to 2008.
Number of Portfolios in Fund Complex Overseen by Officer N/A
Other Directorships Held by Officer N/A
21
Table of Contents
| Additional Information | (unaudited) |
Non-Interested Directors
John R. Costantino
Address c/o GEAM 3001 Summer St. Stamford, CT 06905
Age 65
Position(s) Held with Fund Director
Term of Office and Length of Time Served Until successor is elected and qualified — 14 years
Principal Occupation(s) During Past 5 years General Partner, NGN Capital LLC since 2006; Managing Director, Vice President of Walden Capital Management since 1996.
Number of Portfolios in Fund Complex Overseen by Director 20
Other Directorships Held by Director Director of GE Institutional Funds since 1997; Trustee of Fordham University from 1989-1995 and 2001-2007 and Trustee Emeritus since 2007; Trustee of Neuroscience Research Institute since 1986; Trustee of GE Funds from 1993 to February 2011; Trustee of Gregorian University Foundation from 1992-2007; Director of Artes Medical from 2006-2008.
R. Sheldon Johnson
Address c/o GEAM 3001 Summer St. Stamford, CT 06905
Age 64
Positions(s) Held with Fund Director
Term of office and Length of Time served Unit Successor is elected and qualified — less than 1 year.
Principal Occupation(s) During Past 5 years Managing Director at Morgan Stanley & Co.,Inc. from 1988 to 2006; Head of Global Institutional Equity Sales and Marketing at Morgan Stanley & Co., Inc. from 2002 to 2006.
Number of Portfolios in Fund Complex Overseen by Director 20
Other Directorships Held by Director Trustee of GE Institutional Funds since April 2011 and Trustee of St. Lawrence University since 2003.
Robert P. Quinn
Address c/o GEAM 3001 Summer St. Stamford, CT 06905
Age 75
Position(s) Held with Fund Director
Term of Office and Length of Time Served Until successor is elected and qualified – 14 years
Principal Occupation(s) During Past 5 years Retired since 1983 from Salomon Brothers Inc.
Number of Portfolios in Fund Complex Overseen by Director 20
Other Directorships Held by Director Trustee of GE Institutional Funds since 1997; Trustee of St. Francis Hospital since 1980; and Trustee of GE Funds from 1993 to February 2011.
The Statement of Additional Information for the Funds includes additional information about the Directors and Officers and is available, without charge, upon request by calling 1-800-242-0134.
22
Table of Contents
| Investment Team | (unaudited) |
Investment Adviser and Administrator
GE Asset Management Incorporated
Board of Directors
Michael J. Cosgrove, Chairman
John R. Costantino
R. Sheldon Johnson*
Robert P. Quinn
Matthew J. Simpson
Secretary
Joon Won Choe
Assistant Secretary
Michelle Matzelle
Treasurer
Arthur A. Jensen (effective June 6, 2011)
Assistant Treasurer
Casey Yantosca
Distributor
GE Investment Distributors, Inc.
Member FINRA and SIPC
Custodian
State Street Bank & Trust Company
Officers of the Investment Adviser
Dmitri Stockton, President and Chief Executive Officer (since May 2011)†
Cheryl H. Beacock, Senior Vice President, Human Resources
George A. Bicher, Chief Risk Officer
Paul M. Colonna, President and Chief Investment Officer – Fixed Income Investments
Michael J. Cosgrove, President and Chief Executive
Officer – Mutual Funds & Intermediary Business
Ralph R. Layman, President and Chief Investment Officer – Public Equity Investments
Maureen B. Mitchell, President – Institutional Sales and Marketing
Matthew J. Simpson, Executive Vice President, General Counsel and Secretary
Don W. Torey, President – Alternative Investments
John J. Walker, Executive Vice President, Chief Operating Officer
David Wiederecht, President and Chief Investment Officer – Investment Strategies
Tracie A. Winbigler, Executive Vice President, Chief Financial Officer (since January 2011)
| * | Mr. Johnson was elected as a Director of the Funds effective April 1, 2011. |
| † | Effective May 1, 2011, Mr. Stockton replaced James W. Ireland as President and Chief Executive Officer. |
At GE Asset Management, we’re dedicated to providing the investment options you’ll need to tailor your financial portfolio to every stage of your life. Each member of the GE Family of Funds is managed according to the same principles of integrity and quality that have guided GE over the past century, and have made it the world-class company that it is today. Each fund draws strength from a heritage of investment management experience that spans more than 80 years. Whether you’re creating a new investment portfolio or adding to an established one, the GE Family of Funds offers an array of professionally managed investment options that will help you meet a lifetime of financial needs.
23
Table of Contents
Investment Adviser
GE Asset Management Incorporated
3001 Summer Street
PO Box 7900
Stamford, CT 06904-7900
Distributor
GE Investment Distributors, Inc.
member FINRA and SIPC
3001 Summer Street
PO Box 7900
Stamford, CT 06904-7900
The Fund files its complete schedule of portfolio holdings with the Securities and Exchange Commission for the first and third quarters of each fiscal year on Form N-Q. The Fund’s Forms N-Q, as well as a description of the policies and procedures that the Fund uses to determine how to vote proxies (if any) relating to portfolio securities is available without charge (i) upon request, by calling 1-800-493-3042; (ii) on the Fund’s website at http://www.geam.com; and (iii) on the Commission’s website at http://www.sec.gov. The Fund’s Forms N-Q may be reviewed and copied at the Commission’s Public Reference Room in Washington, DC—information on the operation of the Public Reference Room may be obtained by calling 1-800-SEC-0330.
Information (if any) regarding how the Fund voted proxies relating to portfolio securities during the most recently disclosed 12-month period ended June 30 is available without charge (i) through the Fund’s website at http://www.geam.com; and (ii) on the Commission’s website at http://www.sec.gov.
Table of Contents
| ITEM 2. | CODE OF ETHICS. |
Applicable only to an annual filing.
| ITEM 3. | AUDIT COMMITTEE FINANCIAL EXPERT. |
Applicable only to an annual filing.
| ITEM 4. | PRINCIPAL ACCOUNTANT FEES AND SERVICES. |
Applicable only to an annual filing.
| ITEM 5. | AUDIT COMMITTEE OF LISTED REGISTRANTS |
Applicable only to an annual filing.
| ITEM 6. | SCHEDULE OF INVESTMENTS. |
Attached as part of ITEM 1.
| ITEM 7. | DISCLOSURE OF PROXY VOTING POLICIES AND PROCEDURES FOR CLOSED-END MANAGEMENT INVESTMENT COMPANIES. |
Applicable only to Closed-End Management Investment Companies.
| ITEM 8. | PORTFOLIO MANAGERS OF CLOSED-END MANAGEMENT INVESTMENT COMPANIES. |
Applicable only to Closed-End Management Investment Companies.
| ITEM 9. | PURCHASES OF EQUITY SECURITIES BY CLOSED-END MANAGEMENT INVESTMENT COMPANY AND AFFILIATED PURCHASERS. |
Applicable only to Closed-End Management Investment Companies.
| ITEM 10. | SUBMISSION OF MATTERS TO A VOTE OF SECURITY HOLDERS. |
No material changes.
| ITEM 11. | CONTROLS AND PROCEDURES. |
The officers providing the certifications in this report in accordance with Rule 30a-3 under the Investment Company Act of 1940 have concluded, based on their evaluation of the registrant’s disclosure controls and procedures (as such term is defined in such rule),
Table of Contents
that such controls and procedures are adequate and reasonably designed to achieve the purpose described in paragraph (c) of such rule.
There were no significant changes in the registrant’s internal controls or in other factors that could significantly affect these controls subsequent to the date of their last evaluation, including any corrective actions with regard to significant deficiencies and material weaknesses.
| ITEM 12. | EXHIBITS. |
(a) Not applicable.
(b) Attached hereto as Exhibit 1 and Exhibit 2 are the Certifications of Michael J. Cosgrove and Arthur A. Jensen as principal executive officer and principal financial officer, respectively, as required by Rule 30a-2 under the Investment Company Act of 1940.
Table of Contents
SIGNATURES
Pursuant to the requirements of the Securities Exchange Act of 1934 and the Investment Company Act of 1940, the Registrant has duly caused this Report to be signed on its behalf by the undersigned, thereunto duly authorized.
GE INVESTMENTS FUNDS, INC
By: | /s/ Michael J. Cosgrove | |
| Michael J. Cosgrove | ||
| Chairman, GE Investments Funds, Inc. |
Date: August 23, 2011
Pursuant to the requirements of the Securities Exchange Act of 1934 and the Investment Company Act of 1940, this Report has been signed below by the following persons on behalf of the Registrant and in the capacities and on the dates indicated.
By: | /s/ Michael J. Cosgrove | |
| Michael J. Cosgrove | ||
| Chairman, GE Investments Funds, Inc. |
Date: August 23, 2011
By: | /s/ Arthur A. Jensen | |
| Arthur A. Jensen | ||
| Treasurer, GE Investments Funds, Inc. |
Date: August 23, 2011
Table of Contents
EXHIBIT INDEX
(b)(1) Certifications of principal executive officer and principal financial officer as required by Rule 30a-2 under the Investment Company Act of 1940.
(b)(2) Certification of principal executive officer and principal financial officer as required by Section 906 of the Sarbanes-Oxley Act of 2002.