Table of Contents
UNITED STATES
SECURITIES AND EXCHANGE COMMISSION
Washington, D.C. 20549
FORM N-CSR
CERTIFIED SHAREHOLDER REPORT OF REGISTERED
MANAGEMENT INVESTMENT COMPANIES
Investment Company Act file number 811-04041
GE INVESTMENTS FUNDS, INC.
(Exact name of registrant as specified in charter)
1600 SUMMER STREET, STAMFORD, CONNECTICUT 06905
(Address of principal executive offices) (Zip code)
GE ASSET MANAGEMENT, INC.
1600 SUMMER STREET, STAMFORD, CONNECTICUT 06905
(Name and address of agent for service)
Registrant’s telephone number, including area code: 800-242-0134
Date of fiscal year end: 12/31
Date of reporting period: 06/30/12
Table of Contents
EXPLANATORY NOTE: The Registrant is filing this amendment to its Form N-CSR for the period ended June 30, 2012, originally filed with the Securities and Exchange Commission on September 6, 2012 (Accession Number 0001193125-12-382142). The sole purpose of this amendment is to correct the Series and Class Summary in the submission header of the original Form N-CSR filing. Class C000033160, Total Return Fund – Class 2, was incorrectly referenced, when the correct reference should have been Class C000033161, Total Return Fund – Class 3. Except as set forth above, this Form N-CSR/A does not amend, update or change any other items or disclosure found in the original Form N-CSR filing.
Table of Contents
| ITEM 1. | REPORTS TO STOCKHOLDERS. |
Table of Contents
GE Investments Funds, Inc.
U.S. Equity Fund
Semi-Annual Report
June 30, 2012

Table of Contents
GE Investments Funds, Inc.
| U.S. Equity Fund | Contents | |
| 1 | ||||
| 2 | ||||
| 3 | ||||
| 6 | ||||
Financial Statements | ||||
| 7 | ||||
| 8 | ||||
| 9 | ||||
| 10 | ||||
| 11 | ||||
| 17 | ||||
| 21 | ||||
This report is prepared for Policyholders of certain variable contracts and may be distributed to others only if preceded or accompanied by the variable contract’s current prospectus and the current summary prospectus of the Fund available for investments thereunder.
Table of Contents
| U.S. Equity Fund | (Unaudited) |
Notes to Performance
Total return performance shown in this report for the GE Investments U.S. Equity Fund (the “Fund”) takes into account changes in share price and assumes reinvestment of dividends and capital gains distributions, if any. Total returns shown are net of Fund fees and expenses but do not reflect fees and charges associated with the variable contracts such as administrative fees, account charges and surrender charges, which, if reflected, would reduce the Fund’s total returns for all periods shown.
The performance data quoted represents past performance; past performance does not guarantee future results. Investment return and principal value will fluctuate so your shares, when redeemed, may be worth more or less than their original cost. Current performance may be higher or lower than the performance data quoted. Periods less than one year are not annualized. Please call 800-493-3042 or visit the Fund’s website at http://www.geam.com for the most recent month-end performance data.
An investment in the Fund is not a deposit of any bank and is not insured or guaranteed by the Federal Deposit Insurance Corporation (FDIC) or any other government agency. An investment in the Fund is subject to risk, including possible loss of principal invested.
Investment Profile
A mutual fund designed for investors who seek long-term growth of capital. The Fund seeks its investment objective by investing at least 80% of its net assets under normal circumstances in equity securities of U.S. companies, such as common and preferred stocks. A U.S. company is a company that generates at least 50% of its revenues or profits from business activities in the U.S., has at least 50% of its assets situated in the U.S., or has the principal trading market for its securities in the U.S.
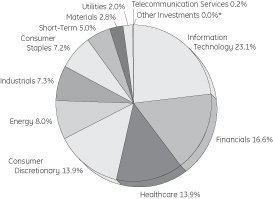
Sector Allocation
as a % of Fair Value of $30,639 (in thousands) on June 30, 2012(a)(b)
Top Ten Largest Holdings
as of June 30, 2012 as a % of Fair Value(a)(b)(c)
Apple Inc. | 4.29% | |||
Express Scripts Holding Co. | 2.95% | |||
Covidien PLC | 2.80% | |||
Microsoft Corp. | 2.60% | |||
Wells Fargo & Co. | 2.34% | |||
United Parcel Service Inc. | 2.29% | |||
Cisco Systems Inc. | 2.29% | |||
Chevron Corp. | 2.20% | |||
PepsiCo Inc. | 2.08% | |||
Time Warner Inc. | 1.99% |
| (a) | The securities information regarding holdings, allocations and other characteristics is presented to illustrate examples of securities that the Fund has bought and the diversity of areas in which the Fund may invest as of a particular date. It may not be representative of the Fund’s current or future investments and should not be construed as a recommendation to purchase or sell a particular security. |
| (b) | Fair value basis is inclusive of the short-term investment in GE Institutional Money Market Fund Investment Class. |
| (c) | The figures presented to not include the Fund’s entire investment portfolio and may change at any time. |
| * | Less than 0.01%. |
GE Investment Distributors, Inc., Member of FINRA & SIPC, is the principal underwriter and distributor of the GE Investments Funds, Inc. and a wholly owned subsidiary of GE Asset Management Incorporated, the investment adviser of the Fund.
1
Table of Contents
| U.S. Equity Fund | (Unaudited) |
Understanding Your Fund’s Expenses
As a shareholder of the Fund you incur ongoing costs. Ongoing costs include portfolio management fees, professional fees, administrative fees and other Fund expenses. The following example is intended to help you understand your ongoing costs (in dollars) of investing in the Fund and to compare these costs with the ongoing costs of investing in other mutual funds.
To illustrate these ongoing costs, we have provided an example and calculated the expenses paid by investors in the Fund during the period. The information in the following table is based on an investment of $1,000, which is invested at the beginning of the period and held for the entire six-month period ended June 30, 2012.
Actual Expenses
The first section of the table provides information about actual account values and actual expenses. You may use the information in this section, together with the amount you invested, to estimate the expenses that you paid over the period. To do so, simply divide your account value by $1,000 (for example, an $8,600 account value divided by $1,000 = 8.6), then multiply the result by the number given for your class under the heading “Expenses Paid During Period” to estimate the expenses paid on your account during the period.
Hypothetical Example for Comparison Purposes
The second section of the table provides information about hypothetical account values and hypothetical expenses based on the Fund’s actual expense ratio and an assumed rate of return of 5% per year before expenses, which is not the Fund’s actual return. The hypothetical account values and expenses may not be used to estimate the actual ending account balance or expenses you paid for the period. You may use this information to compare the ongoing costs of investing in the Fund and other funds. To do so, compare this 5% hypothetical example with the 5% hypothetical examples that appear in the shareholders reports of other funds.
Please note that the expenses shown in the table are meant to highlight and help you compare ongoing costs only and do not reflect transaction costs, such as sales charges or redemption fees, if any. Therefore, the second section of the table is useful in comparing ongoing costs only, and will not help you determine the relative total costs of owning different funds. Additionally, the expenses shown do not reflect the fees or charges associated with variable contracts through which shares of the Fund are offered.
January 1, 2012 - June 30, 2012
| Account value at the beginning of the period ($) | Account value at the end of the period ($) | Expenses paid during the period ($)* | ||||||||||
Actual Fund Return* | 1,000.00 | 1,086.50 | 4.05 | |||||||||
Hypothetical 5% Return (2.5% for the period) | 1,000.00 | 1,020.98 | 3.92 | |||||||||
| * | Expenses are equal to the Fund’s annualized expense ratio of 0.78% (for the period January 1, 2012 - June 30, 2012), multiplied by the average account value over the period, multiplied by 182/366 (to reflect the one-half year period). |
2
Table of Contents
U.S. Equity Fund
| Schedule of Investments | June 30, 2012 (Unaudited) |
U.S. Equity Fund
| Number of Shares | Fair Value | |||||||||||
Common Stock — 93.1%† |
| |||||||||||
Advertising — 0.7% |
| |||||||||||
Omnicom Group Inc. | 4,347 | $ | 211,264 | |||||||||
Aerospace & Defense — 1.4% |
| |||||||||||
Honeywell International Inc. | 7,672 | 428,404 | ||||||||||
Agricultural Products — 1.3% |
| |||||||||||
Archer-Daniels-Midland Co. | 13,700 | 404,424 | ||||||||||
Air Freight & Logistics — 2.4% |
| |||||||||||
FedEx Corp. | 310 | 28,399 | ||||||||||
United Parcel Service Inc. | 8,910 | 701,752 | ||||||||||
| 730,151 | ||||||||||||
Application Software — 0.4% |
| |||||||||||
Intuit Inc. | 1,946 | 115,495 | ||||||||||
Asset Management & Custody Banks — 4.3% |
| |||||||||||
Ameriprise Financial Inc. | 9,013 | 471,019 | ||||||||||
Invesco Ltd. | 19,103 | 431,728 | ||||||||||
State Street Corp. | 9,067 | 404,751 | (c | ) | ||||||||
| 1,307,498 | ||||||||||||
Automobile Manufacturers — 0.2% |
| |||||||||||
Ford Motor Co. | 6,211 | 59,563 | ||||||||||
Biotechnology — 2.1% |
| |||||||||||
Amgen Inc. | 6,293 | 459,641 | ||||||||||
Gilead Sciences Inc. | 3,768 | 193,223 | (a | ) | ||||||||
| 652,864 | ||||||||||||
Broadcasting — 1.1% |
| |||||||||||
CBS Corp. | 2,319 | 76,017 | ||||||||||
Discovery Communications Inc. | 5,010 | 250,951 | (a | ) | ||||||||
| 326,968 | ||||||||||||
Cable & Satellite — 3.2% |
| |||||||||||
Comcast Corp. | 14,272 | 456,276 | ||||||||||
DIRECTV | 5,548 | 270,853 | (a | ) | ||||||||
Liberty Global Inc. | 5,426 | 259,092 | (a | ) | ||||||||
| 986,221 | ||||||||||||
Casinos & Gaming — 0.4% |
| |||||||||||
Las Vegas Sands Corp. | 3,105 | 135,036 | ||||||||||
Communications Equipment — 3.9% |
| |||||||||||
Cisco Systems Inc. | 40,836 | 701,154 | ||||||||||
Qualcomm Inc. | 8,736 | 486,420 | ||||||||||
| 1,187,574 | ||||||||||||
| Number of Shares | Fair Value | |||||||||||
Computer Hardware — 4.3% |
| |||||||||||
Apple Inc. | 2,252 | $ | 1,315,168 | (a | ) | |||||||
Construction & Farm Machinery & Heavy Trucks — 0.6% |
| |||||||||||
Caterpillar Inc. | 538 | 45,682 | ||||||||||
Deere & Co. | 1,656 | 133,921 | ||||||||||
| 179,603 | ||||||||||||
Consumer Finance — 1.3% |
| |||||||||||
American Express Co. | 6,885 | 400,776 | ||||||||||
Data Processing & Outsourced Services — 3.8% |
| |||||||||||
Paychex Inc. | 8,281 | 260,106 | ||||||||||
The Western Union Co. | 33,346 | 561,547 | ||||||||||
Visa Inc. | 2,733 | 337,881 | ||||||||||
| 1,159,534 | ||||||||||||
Department Stores — 0.4% |
| |||||||||||
Macy’s Inc. | 3,727 | 128,022 | ||||||||||
Diversified Chemicals — 0.3% |
| |||||||||||
EI du Pont de Nemours & Co. | 1,656 | 83,744 | ||||||||||
Diversified Financial Services — 3.5% |
| |||||||||||
Citigroup Inc. | 9,510 | 260,669 | ||||||||||
JPMorgan Chase & Co. | 3,022 | 107,976 | ||||||||||
Wells Fargo & Co. | 21,447 | 717,188 | ||||||||||
| 1,085,833 | ||||||||||||
Diversified Metals & Mining — 0.9% |
| |||||||||||
Freeport-McMoRan Copper & Gold Inc. | 7,730 | 263,361 | ||||||||||
Drug Retail — 0.4% |
| |||||||||||
CVS Caremark Corp. | 2,774 | 129,629 | ||||||||||
Electric Utilities — 1.2% |
| |||||||||||
Exelon Corp. | 3,105 | 116,810 | ||||||||||
FirstEnergy Corp. | 4,852 | 238,670 | ||||||||||
| 355,480 | ||||||||||||
Electrical Components & Equipment — 0.3% |
| |||||||||||
Cooper Industries PLC | 1,366 | 93,134 | ||||||||||
Fertilizers & Agricultural Chemicals — 1.2% |
| |||||||||||
Monsanto Co. | 3,395 | 281,038 | ||||||||||
Potash Corporation of Saskatchewan Inc. | 2,194 | 95,856 | ||||||||||
| 376,894 | ||||||||||||
General Merchandise Stores — 1.1% |
| |||||||||||
Target Corp. | 5,850 | 340,412 | ||||||||||
See Notes to Schedule of Investments and Notes to Financial Statements.
3
Table of Contents
U.S. Equity Fund
| Schedule of Investments | June 30, 2012 (Unaudited) |
| Number of Shares | Fair Value | |||||||||||
Healthcare Equipment — 3.1% |
| |||||||||||
Covidien PLC | 16,056 | $ | 858,996 | |||||||||
Medtronic Inc. | 2,692 | 104,261 | ||||||||||
| 963,257 | ||||||||||||
Healthcare Facilities — 0.3% |
| |||||||||||
HCA Holdings Inc. | 2,691 | 81,887 | ||||||||||
Healthcare Services — 2.9% |
| |||||||||||
Express Scripts Holding Co. | 16,213 | 905,172 | (a | ) | ||||||||
Heavy Electrical Equipment — 0.2% |
| |||||||||||
ABB Ltd. ADR | 3,643 | 59,454 | ||||||||||
Home Building — 0.7% |
| |||||||||||
MDC Holdings Inc. | 6,409 | 209,382 | ||||||||||
Home Furnishing Retail — 0.5% |
| |||||||||||
Bed Bath & Beyond Inc. | 2,608 | 161,174 | (a | ) | ||||||||
Home Improvement Retail — 2.0% |
| |||||||||||
Lowe’s Companies Inc. | 21,157 | 601,705 | ||||||||||
Independent Power Producers & Energy Traders — 0.9% |
| |||||||||||
Calpine Corp. | 6,086 | 100,480 | (a | ) | ||||||||
The AES Corp. | 12,835 | 164,673 | (a | ) | ||||||||
| 265,153 | ||||||||||||
Industrial Machinery — 0.9% |
| |||||||||||
Dover Corp. | 4,265 | 228,647 | ||||||||||
Eaton Corp. | 1,035 | 41,017 | ||||||||||
| 269,664 | ||||||||||||
Insurance Brokers — 0.3% |
| |||||||||||
Marsh & McLennan Companies Inc. | 2,774 | 89,406 | ||||||||||
Integrated Oil & Gas — 4.3% |
| |||||||||||
Chevron Corp. | 6,380 | 673,090 | ||||||||||
Exxon Mobil Corp. | 1,780 | 152,315 | (d | ) | ||||||||
Hess Corp. | 2,153 | 93,548 | ||||||||||
Occidental Petroleum Corp. | 4,658 | 399,517 | ||||||||||
| 1,318,470 | ||||||||||||
Integrated Telecommunication Services — 0.2% |
| |||||||||||
AT&T Inc. | 2,070 | 73,816 | ||||||||||
Internet Retail — 0.4% |
| |||||||||||
Amazon.com Inc. | 518 | 118,285 | (a | ) | ||||||||
| Number of Shares | Fair Value | |||||||||||
Internet Software & Services — 2.7% |
| |||||||||||
Baidu Inc. ADR | 2,960 | $ | 340,341 | (a | ) | |||||||
eBay Inc. | 9,730 | 408,757 | (a | ) | ||||||||
Google Inc. | 124 | 71,929 | (a | ) | ||||||||
| 821,027 | ||||||||||||
Investment Banking & Brokerage — 1.1% |
| |||||||||||
The Goldman Sachs Group Inc. | 3,416 | 327,458 | ||||||||||
IT Consulting & Other Services — 0.7% |
| |||||||||||
International Business Machines Corp. | 1,159 | 226,677 | ||||||||||
Life & Health Insurance — 0.6% |
| |||||||||||
MetLife Inc. | 2,277 | 70,245 | ||||||||||
Prudential Financial Inc. | 2,070 | 100,250 | ||||||||||
| 170,495 | ||||||||||||
Life Sciences Tools & Services — 1.3% |
| |||||||||||
Agilent Technologies Inc. | 7,515 | 294,889 | ||||||||||
PerkinElmer Inc. | 4,554 | 117,493 | ||||||||||
| 412,382 | ||||||||||||
Managed Healthcare — 0.1% |
| |||||||||||
UnitedHealth Group Inc. | 787 | 46,040 | ||||||||||
Movies & Entertainment — 2.7% |
| |||||||||||
The Walt Disney Co. | 4,720 | 228,920 | ||||||||||
Time Warner Inc. | 15,808 | 608,608 | ||||||||||
| 837,528 | ||||||||||||
Multi-Line Insurance — 0.4% |
| |||||||||||
American International Group Inc. | 2,789 | 89,499 | (a | ) | ||||||||
Hartford Financial Services Group Inc. | 1,739 | 30,659 | ||||||||||
| 120,158 | ||||||||||||
Oil & Gas Equipment & Services — 1.7% |
| |||||||||||
Schlumberger Ltd. | 7,991 | 518,696 | ||||||||||
Oil & Gas Exploration & Production — 1.6% |
| |||||||||||
Anadarko Petroleum Corp. | 6,579 | 435,530 | ||||||||||
Southwestern Energy Co. | 2,277 | 72,705 | (a | ) | ||||||||
| 508,235 | ||||||||||||
Oil & Gas Refining & Marketing — 0.2% |
| |||||||||||
Marathon Petroleum Corp. | 1,408 | 63,247 | ||||||||||
Oil & Gas Storage & Transportation — 0.2% |
| |||||||||||
The Williams Companies Inc. | 1,739 | 50,118 | ||||||||||
See Notes to Schedule of Investments and Notes to Financial Statements.
4
Table of Contents
U.S. Equity Fund
| Schedule of Investments | June 30, 2012 (Unaudited) |
| Number of Shares | Fair Value | |||||||||||
Packaged Foods & Meats — 1.9% |
| |||||||||||
Kraft Foods Inc. | 13,766 | $ | 531,643 | |||||||||
Nestle S.A. ADR | 994 | 59,382 | ||||||||||
| 591,025 | ||||||||||||
Pharmaceuticals — 3.9% |
| |||||||||||
Bristol-Myers Squibb Co. | 7,622 | 274,011 | ||||||||||
Johnson & Johnson | 4,140 | 279,698 | ||||||||||
Novartis AG ADR | 787 | 43,993 | ||||||||||
Pfizer Inc. | 26,146 | 601,358 | ||||||||||
| 1,199,060 | ||||||||||||
Property & Casualty Insurance — 1.4% |
| |||||||||||
ACE Ltd. | 5,987 | 443,816 | ||||||||||
Real Estate Services — 0.3% |
| |||||||||||
CBRE Group Inc. | 5,507 | 90,095 | (a | ) | ||||||||
Regional Banks — 0.9% |
| |||||||||||
Regions Financial Corp. | 40,343 | 272,315 | ||||||||||
Reinsurance — 0.2% |
| |||||||||||
PartnerRe Ltd. | 745 | 56,374 | ||||||||||
Research & Consulting Services — 0.3% |
| |||||||||||
Nielsen Holdings N.V. | 3,354 | 87,942 | (a | ) | ||||||||
Semiconductors — 2.8% |
| |||||||||||
Altera Corp. | 1,656 | 56,039 | ||||||||||
Analog Devices Inc. | 1,656 | 62,381 | ||||||||||
Intel Corp. | 16,934 | 451,291 | ||||||||||
Texas Instruments Inc. | 10,115 | 290,199 | ||||||||||
| 859,910 | ||||||||||||
Soft Drinks — 2.6% |
| |||||||||||
Coca-Cola Enterprises Inc. | 6,086 | 170,651 | ||||||||||
PepsiCo Inc. | 9,026 | 637,777 | ||||||||||
| 808,428 | ||||||||||||
Specialized Finance — 1.0% |
| |||||||||||
CME Group Inc. | 1,201 | 322,000 | ||||||||||
Specialized REITs — 0.9% |
| |||||||||||
American Tower Corp. | 4,140 | 289,427 | ||||||||||
Specialty Stores — 0.4% |
| |||||||||||
Dick’s Sporting Goods Inc. | 2,815 | 135,120 | ||||||||||
Steel — 0.4% |
| |||||||||||
Allegheny Technologies Inc. | 3,727 | 118,854 | ||||||||||
| Number of Shares | Fair Value | |||||||||||
Systems Software — 4.5% |
| |||||||||||
Microsoft Corp. | 26,059 | $ | 797,145 | |||||||||
Oracle Corp. | 19,501 | 579,180 | ||||||||||
| 1,376,325 | ||||||||||||
Tobacco — 0.9% |
| |||||||||||
Altria Group Inc. | 7,958 | 274,949 | ||||||||||
Total Common Stock | 28,601,578 | |||||||||||
Exchange Traded Funds — 1.6% |
| |||||||||||
Financial Select Sector SPDR Fund | 6,768 | 98,948 | (f | ) | ||||||||
Industrial Select Sector SPDR Fund | 10,966 | 391,157 | (f | ) | ||||||||
Total Exchange Traded Funds | 490,105 | |||||||||||
Other Investments — 0.1% |
| |||||||||||
GEI Investment Fund | 7,196 | (e | ) | |||||||||
Total Investments in Securities | 29,098,879 | |||||||||||
Short-Term Investments — 5.0% |
| |||||||||||
GE Institutional Money Market | 1,540,451 | (b,e | ) | |||||||||
Total Investments | 30,639,330 | |||||||||||
Other Assets and Liabilities, | 71,655 | |||||||||||
|
| |||||||||||
NET ASSETS — 100.0% | $ | 30,710,985 | ||||||||||
|
| |||||||||||
Other Information |
| |||||||||||
The Fund had the following long futures contracts open at June 30, 2012 (Unaudited):
| Description | Expiration date | Number of Contracts | Current Notional Value | Unrealized Appreciation | ||||||||||||
S&P 500 Emini Index Futures | September 2012 | 14 | $ | 949,480 | $ | 4,438 | ||||||||||
See Notes to Schedule of Investments and Notes to Financial Statements.
5
Table of Contents
| Notes to Schedule of Investments | June 30, 2012 (Unaudited) |
The views expressed in this document reflect our judgment as of the publication date and are subject to change at any time without notice. The securities information regarding holdings, allocations and other characteristics are presented to illustrate examples of securities that the Fund has bought and the diversity of areas in which the Fund may invest as of a particular date. It may not be representative of the Fund’s current or future investments and should not be construed as a recommendation to purchase or sell a particular security. See the Fund’s summary prospectus and statutory prospectus for complete descriptions of investment objectives, policies, risks and permissible investments.
| (a) | Non-income producing security. |
| (b) | Coupon amount represents effective yield. |
| (c) | State Street Corp. is the parent company of State Street Bank & Trust Co., the Fund’s custodian and accounting agent. |
| (d) | At June 30, 2012 , all or a portion of this security was pledged to cover collateral requirements for futures, options, forward foreign currency contracts and/or TBA’s. |
| (e) | GE Asset Management, the investment adviser of the Fund, also serves as investment adviser of the GEI Investment Fund and the GE Institutional Money Market Fund. The GEI Investment Fund has been determined to be illiquid using procedures established by the Board of Directors. |
| (f) | Sponsored by SSgA Funds Management, Inc., an affiliate of State Street Bank & Trust Co., the Fund’s custodian and accounting agent. |
| * | Less than 0.05%. |
| † | Percentages are based on net assets as of June 30, 2012 . |
Abbreviations:
ADR | American Depository Receipt | |
REIT | Real Estate Investment Trust | |
SPDR | Standard & Poors Depository Receipts |
6
Table of Contents
Selected data based on a share outstanding throughout the fiscal years indicated
| CLASS 1 | ||||||||||||||||||||||||
| 6/30/12† | 12/31/11 | 12/31/10 | 12/31/09 | 12/31/08 | 12/31/07 | |||||||||||||||||||
| Inception date | — | — | — | — | — | 1/3/95 | ||||||||||||||||||
Net asset value, | $ | 30.74 | $ | 31.92 | $ | 29.23 | $ | 22.44 | $ | 36.41 | $ | 39.02 | ||||||||||||
Income/(loss) | ||||||||||||||||||||||||
Net investment | 0.17 | 0.24 | 0.28 | ** | 0.30 | 0.37 | 0.45 | |||||||||||||||||
Net realized and unrealized | 2.49 | (1.17 | ) | 2.72 | 6.80 | (13.52 | ) | 2.70 | ||||||||||||||||
Total income/(loss) | 2.66 | (0.93 | ) | 3.00 | 7.10 | (13.15 | ) | 3.15 | ||||||||||||||||
Less distributions | ||||||||||||||||||||||||
Net investment | — | 0.25 | 0.31 | 0.31 | 0.36 | 0.44 | ||||||||||||||||||
Net realized | — | — | — | — | 0.46 | 5.32 | ||||||||||||||||||
Total distributions | — | 0.25 | 0.31 | 0.31 | 0.82 | 5.76 | ||||||||||||||||||
Net asset value, | $ | 33.40 | $ | 30.74 | $ | 31.92 | $ | 29.23 | $ | 22.44 | $ | 36.41 | ||||||||||||
TOTAL RETURN(a) | 8.65 | % | (2.91 | )% | 10.26 | % | 31.63 | % | (36.05 | )% | 8.01 | % | ||||||||||||
RATIOS/ | ||||||||||||||||||||||||
Net assets, | $ | 30,711 | $ | 30,940 | $ | 38,305 | $ | 41,792 | $ | 37,917 | $ | 77,777 | ||||||||||||
Ratios to | ||||||||||||||||||||||||
Net invest | 0.97 | %* | 0.70 | % | 0.96 | % | 1.11 | % | 1.03 | % | 0.94 | % | ||||||||||||
Net Expenses | 0.78 | %(b)* | 0.89 | %(b) | 0.69 | %(b) | 0.86 | %(b) | 0.72 | %(b) | 0.66 | % | ||||||||||||
Gross expenses | 0.78 | %* | 0.90 | % | 0.69 | % | 0.86 | % | 0.72 | % | 0.66 | % | ||||||||||||
Portfolio turnover rate | 45 | % | 39 | % | 42 | % | 46 | % | 56 | % | 55 | % | ||||||||||||
Notes to Financial Highlights
| (a) | Total returns are historical and assume changes in share price, reinvestment of dividends and capital gains distributions and do not include the effect of insurance contract charges. Past performance does not guarantee future results. |
| (b) | Reflects GE Asset Management’s waiver of a portion of the Fund’s management fee in an amount equal to the management fee earned by GEAM with respect to the Fund’s investment in the GE Institutional Money Market Fund or, prior to 2011, in another affiliated Money Market Fund formerly managed by GEAM. |
| * | Annualized for periods less than one year. |
| ** | Per share values have been calculated using the average share method. |
| † | Unaudited. |
The accompanying Notes are an integral part of these financial statements.
7
Table of Contents
The accompanying Notes are an integral part of these financial statements.
8
Table of Contents
For the period ending June 30, 2012 | (Unaudited) | |||
INVESTMENT INCOME | ||||
Income: | ||||
Dividend | $279,863 | |||
Interest | 788 | |||
Interest from affiliated investments | 181 | |||
Less: Foreign taxes withheld | (2,150 | ) | ||
Total Income | 278,682 | |||
Expenses: | ||||
Advisory and administration fees | 88,278 | |||
Director’s fees | 662 | |||
Custody and accounting expenses | 16,427 | |||
Professional fees | 9,206 | |||
Other expenses | 9,948 | |||
Total expenses before waiver and reimbursement | 124,521 | |||
Less: Expenses waived or borne by the adviser | (390 | ) | ||
Net expenses | 124,131 | |||
Net investment income | 154,551 | |||
NET REALIZED AND UNREALIZED GAIN (LOSS) | ||||
Realized gain (loss) on: | ||||
Investments | 2,008,498 | |||
Futures | 33,672 | |||
Foreign currency related transactions | (85 | ) | ||
Increase (decrease) in unrealized appreciation/(depreciation) on: | ||||
Investments | 499,247 | |||
Futures | (5,339 | ) | ||
Foreign currency related transactions | 2 | |||
Net realized and unrealized gain on investments | 2,535,995 | |||
Net increase in net assets resulting from operations | $ | 2,690,546 | ||
The accompanying Notes are an integral part of these financial statements.
9
Table of Contents
| * | (Unaudited) |
| ** | Share Class 4 was closed effective April 30, 2011 |
The accompanying Notes are an integral part of these financial statements.
10
Table of Contents
| Notes to Financial Statements | June 30, 2012 (Unaudited) |
| 1. | Organization of the Company |
GE Investments Funds, Inc. (the “Company”) was incorporated under the laws of the Commonwealth of Virginia on May 14, 1984 and is registered under the Investment Company Act of 1940, as amended (the “1940 Act”), as an open-end management investment company. The Company is composed of thirteen investment portfolios (collectively the “Funds”), although only the following ten are currently being offered: U.S. Equity Fund, (the “Fund”) S&P 500 Index Fund, Premier Growth Equity Fund, Core Value Equity Fund, Mid-Cap Equity Fund, Small-Cap Equity Fund, Total Return Fund, Income Fund, Money Market Fund and Real Estate Securities Fund.
Shares of the Funds of the Company are offered only to insurance company separate accounts that fund certain variable life insurance contracts and variable annuity contracts. GE Asset Management Incorporated (“GEAM”) is the investment adviser and administrator of each of the Funds.
The Company currently offers one share class (Class 1) as an investment option for variable life insurance contracts and variable annuity contracts.
| 2. | Summary of Significant Accounting Policies |
The preparation of financial statements in conformity with U.S. generally accepted accounting principles (GAAP) requires management to make estimates and assumptions that affect the reported amounts of assets and liabilities and disclosure of contingent assets and liabilities at the date of the financial statements and the reported amounts of increases and decreases in net assets from operations during the reporting period. Actual results may differ from those estimates.
The following summarizes the significant accounting policies of the Company:
Securities Valuation and Transactions. All investments in securities are recorded at their estimated fair value, as described in Note 3.
Securities transactions are accounted for as of the trade date. Realized gains and losses on investments sold are recorded on the basis of identified cost for both financial statement and federal tax purposes.
Derivatives The Fund is subject to equity price risk in the normal course of pursuing its investment objectives. The
Fund may enter into derivative transactions to gain market exposure for residual and accumulating cash positions.
Futures Contracts A futures contract represents a commitment for the future purchase or sale of an asset at a specified price on a specified date. The Fund invested in futures for a variety of portfolio management purposes such as hedging against the effects of changes in the value of portfolio securities due to anticipated changes in market conditions, gaining market exposure for accumulating and residual cash positions, or when the transactions were economically appropriate to the reduction of risks inherent in the management of the Fund. Buying futures tends to increase a Fund’s exposure to the underlying instrument while selling futures tends to decrease a Fund’s exposure to the underlying instrument, or hedge other Fund investments. The Fund will not enter into a transaction involving futures for speculative purposes. With futures contracts, there is minimal counterparty credit risk to the Fund since futures contracts are exchange traded and the exchange’s clearinghouse, as counterparty to all traded futures, guarantees the futures against default. The Fund’s risks in using these contracts include changes in the value of the underlying instruments, non-performance of the counterparties under the contracts’ terms and changes in the liquidity of the secondary market for the contracts. Futures contracts are valued at the settlement price established each day by the board of trade or exchange on which they principally trade.
Upon entering into a financial futures contract, the Fund is required to pledge to the broker an amount of cash and/or other assets equal to a certain percentage of the contract amount, known as initial margin deposit. Subsequent payments, known as variation margin, are made or received by the Fund each day, depending on the daily fluctuation in the fair value of the underlying security. The Fund records an unrealized gain or loss equal to the daily variation margin. Should market conditions move unexpectedly, the Fund may not achieve the anticipated benefits of the futures contracts and may incur a loss. The Fund recognizes a realized gain or loss on the expiration or closing of a futures contract.
Investment Income Corporate actions (including cash dividends) are recorded on the ex-dividend date, net of applicable withholding taxes, except for certain foreign corporate actions which are recorded as soon after the ex-dividend date as such information becomes available. Withholding taxes in foreign dividends have been provided
11
Table of Contents
| Notes to Financial Statements | June 30, 2012 (Unaudited) |
for in accordance with the Fund’s understanding of the applicable country’s tax rules and rates.
Interest income is recorded on the accrual basis. Accretion of discounts and amortization of premiums on taxable bonds are to the call or maturity date, whichever is shorter, using the effective yield method.
Expenses Fund specific expenses are allocated to the Fund that incurs such expenses. Such expenses may include custodial fees, legal and accounting fees, printing costs and registration fees. Expenses that are not fund specific are allocated pro rata across the Funds. Expenses of the Fund are generally paid directly by the Fund, however, expenses may be paid by GEAM and reimbursed by the Fund.
Federal Income Taxes The Fund intends to comply with all sections of the Internal Revenue Code applicable to regulated investment companies including the distribution of substantially all of its taxable net investment income and net realized capital gains to its shareholders. Therefore, no provision for federal income tax has been made.
| 3. | Securities Valuation |
The Fund utilizes various methods to measure the fair value of most of its investments on a recurring basis. GAAP establishes a framework for measuring fair value and providing related disclosures. Broadly, the framework requires fair value to be determined based on the exchange price that would be received for an asset or paid to transfer a liability (an exit price) in the principal or most advantageous market for the asset or liability in an orderly transaction between market participants at the measurement date. In the absence of active markets for the identical assets or liabilities, such measurements involve developing assumptions based on market observable data and, in the absence of such data, internal information that is consistent with what market participants would use in a hypothetical transaction that occurs at the measurement date. It also establishes a three-level valuation hierarchy based upon observable and non-observable inputs.
Observable inputs reflect market data obtained from independent sources, while unobservable inputs reflect our market assumptions. Preference is given to observable inputs. These two types of inputs create the following fair value hierarchy:
Level 1 — Quoted prices for identical investments in active markets.
Level 2 — Quoted prices for similar investments in active markets; quoted prices for identical or similar investments in markets that are not active; and model-derived valuations whose inputs are observable or whose significant value drivers are observable.
Level 3 — Significant inputs to the valuation model are unobservable.
Policies and procedures are maintained to value investments using the best and most relevant data available. In addition, pricing vendors are utilized to assist in valuing investments. GEAM performs periodic reviews of the methodologies used by independent pricing services including price validation of individual securities.
Fair Value Measurement The following section describes the valuation methodologies the Fund uses to measure different financial investments at fair value.
The Fund’s portfolio securities are valued generally on the basis of market quotations. Equity securities generally are valued at the last reported sale price on the primary market in which they are traded. Portfolio securities listed on NASDAQ are valued using the NASDAQ Official Closing Price, Level 1 securities primarily include publicly-traded equity securities. If no sales occurred on the exchange or NASDAQ that day, the portfolio security generally is valued using the last reported bid price. In those circumstances the Fund classifies the investment securities in Level 2.
Short-term investments of sufficient credit quality with remaining maturities of sixty days or less at the time of purchase are typically valued on the basis of amortized cost which approximates fair value and these are included in Level 2. If it is determined that amortized cost does not approximate fair value, securities may be valued based on dealer supplied valuations or quotations. In these infrequent circumstances, pricing services may provide the Fund with valuations that are based on significant unobservable inputs, and in those circumstances the investment securities are classified in Level 3.
The Fund uses the net asset value per unit for collective funds (i.e., GEI Investment Fund). The Fund classifies the investment security in Level 2.
If prices are not readily available for a portfolio security, or if it is believed that a price for a portfolio security does not represent its fair value, the security may be valued using procedures approved by the Fund’s Board of Directors that are designed to establish its “fair” value. These securities are typically classified in Level 3. Those procedures require
12
Table of Contents
| Notes to Financial Statements | June 30, 2012 (Unaudited) |
that the fair value of a security be established by a valuation committee of GEAM. The valuation committee follows different protocols for different types of investments and circumstances. The fair value procedures may be used to value any investment of the Fund in the appropriate circumstances.
Fair value determinations generally are used for securities whose value is affected by a significant event that will materially affect the value of a security and which occurs subsequent to the time of the close of the principal market on which such security trades but prior to the calculation of the Fund’s NAV.
The value established for such a portfolio security may be different than what would be produced through the use of market quotations or another methodology. Portfolio securities that are valued using techniques other than market quotations, including “fair valued” securities, may be subject to greater fluctuation in their value from one day to the next than would be the case if market quotations were used. In addition, there is no assurance that the Fund could sell a portfolio security for the value established for it
at any time and it is possible that the Fund would incur a loss because a portfolio security is sold at a discount to its established value.
Other financial investments are derivative instruments that are not reflected in total investments, such as futures, forwards, swaps, and written options contracts, which are valued based on fair value as discussed above.
The Fund uses closing prices for derivatives included in Level 1, which are traded either on exchanges or liquid over-the counter markets. Derivative assets and liabilities included in Level 2 primarily represent interest rate swaps, cross-currency swaps and foreign currency and commodity forward and option contracts. Derivative assets and liabilities included in Level 3 primarily represent interest rate products that contain embedded optionality or prepayment features.
The inputs or methodology used for valuing securities are not an indication of the risk associated with investing in those securities.
The following tables present the Fund’s investments measured at fair value on a recurring basis at June 30, 2012:
| Investments | Level 1 | Level 2 | Level 3 | Total | ||||||||||||
Investments in Securities† | ||||||||||||||||
Common Stock | $ | 28,601,578 | $ | — | $ | — | $ | 28,601,578 | ||||||||
Exchange Traded Funds | 490,105 | — | — | 490,105 | ||||||||||||
Other Investments | — | 7,196 | — | 7,196 | ||||||||||||
Short-Term Investments | 1,540,451 | — | — | 1,540,451 | ||||||||||||
|
|
|
|
|
|
|
| |||||||||
Total Investments in Securities | $ | 30,632,134 | $ | 7,196 | $ | — | $ | 30,639,330 | ||||||||
|
|
|
|
|
|
|
| |||||||||
Other Financial Instruments* | ||||||||||||||||
Futures Contracts — Unrealized Appreciation | $ | 4,438 | $ | — | $ | — | $ | 4,438 | ||||||||
† See Schedule of Investments for Industry Classification * Other financial instruments include derivative instruments such as futures contracts. Amounts shown represent unrealized appreciation (depreciation), at period end. |
| |||||||||||||||
There were no transfers between fair value levels. Transfers between fair value levels are considered to occur at the beginning of the period.
13
Table of Contents
| Notes to Financial Statements | June 30, 2012 (Unaudited) |
| 4. | Derivatives Transactions |
Shown below are the derivative contracts entered into by the Fund, summarized by primary risk exposure as they appear on the Statement of Assets and Liabilities, all of which are not accounted for as hedging instruments under FASB Accounting Standards Codification (“ASC”) No. 815 Derivatives and Hedging as of June 30, 2012.
Asset Derivatives June 30, 2012 | Liability Derivatives June 30, 2012 | |||||||||||
| Derivatives not accounted for as hedging instruments under ASC 815 | Location in the Statement of Assets and Liabilities | Fair Value ($) | Location in the Statements of Assets and Liabilities | Fair Value ($) | ||||||||
| Equity Contracts | Assets, Net Assets — Net Unrealized Appreciation/ (Depreciation) on Futures | 4,438 | * | Liabilities, Net Assets — Net Unrealized Appreciation/ (Depreciation) on Futures | — | |||||||
| * | Includes cumulative unrealized appreciation/(depreciation) of futures contracts as reported in the Schedule of Investments and within the components of the net assets section of the Statement of Assets and Liabilities. Only the current day’s variation margin is reported within the Assets and/or Liabilities section on the Statement of Assets and Liabilities. |
Shown below are the effects of derivative instruments on the Fund’s Statement of Operation, summarized by primary risk exposure all of which are not accounted for as hedging instruments under ASC 815.
| Derivatives not accounted for as hedging instruments under ASC 815 | Location in the Statements of Operations | Total Notional Amount of Futures Contracts Purchased/(Sold) ($) | Realized Gain or (Loss) on Derivatives Recognized in Income ($) | Change in Unrealized Appreciation/(Depreciation) on Derivatives Recognized in Income ($) | ||||||||||
Equity Contracts | Realized gain/(loss) on Futures, Increase/(decrease) in unrealized appreciation/ (depreciation) on Futures | 4,988,305/(4,442,937) | 33,672 | (5,339 | ) | |||||||||
| 5. | Line of Credit |
The Company shares a revolving credit facility of up to $150 million with a number of its affiliates. The credit facility is with its custodian bank, State Street Bank and Trust Company (“State Street”). The revolving credit facility requires the payment of a commitment fee equal to 0.100% per annum on the daily unused portion of the credit facility, payable quarterly. The portion borne by the Funds generally is borne proportionally based upon net assets. In addition, the Company has a $100 million uncommitted, unsecured line of credit with State Street. Generally, borrowings under the credit facilities would accrue interest at the Federal Funds Rate plus 50 basis points and would be borne by the borrowing Fund. The maximum amount allowed to be borrowed by any one Fund is the lesser of (i) 33.33% of its total assets or (ii) 20% of its net assets. The credit facilities were not utilized by the Fund during the six-month period ended June 30, 2012.
| 6. | Compensation and Fees Paid to Affiliates |
GEAM, a registered investment adviser, was retained by the Company’s Board of Directors effective November 17, 1997
to act as investment adviser and administrator of the Fund. GEAM’s compensation for investment advisory and administrative services is paid monthly based on the average daily net assets of the Fund at an annualized rate of 0.55%.
GEAM has a contractual arrangement with the Fund to waive a portion of the Fund’s management fee in the amount equal to the management fee earned by GEAM with respect to the Fund’s investment in the GE Institutional Money Market Fund.
Directors’ Compensation The Fund pays no compensation to its directors who are officers or employees of GEAM or its affiliates. Directors who are not such officers or employees also serve in a similar capacity for other funds advised by GEAM. Compensation paid to non-interested Directors are reflected on the Statement of Operations. These fees are allocated pro rata across all of the mutual fund platforms served by the Directors, including the Fund, and are based upon the relative net assets of each Fund within such platforms.
14
Table of Contents
| Notes to Financial Statements | June 30, 2012 (Unaudited) |
| 7. | Investment Transactions |
Purchases and Sales of Securities The cost of purchases and the proceeds from sales of investments, other than short-term securities, for the six-month period ended June 30, 2012 were as follows:
| Non U.S. Government Securities | ||
| Purchases | Sales | |
| $13,944,781 | $17,495,515 | |
| 8. | Income Taxes |
The Fund is subject to ASC 740, Income Taxes. ASC 740 provides guidance for financial accounting and reporting for the effects of income taxes that result from an entity’s activities during the year. ASC 740 also provides guidance regarding how certain uncertain tax positions should be recognized, measured, presented and disclosed in the financial statements. ASC 740 requires evaluation of tax positions taken or expected to be taken in the course of preparing the Fund’s tax returns to determine whether the tax positions are “more likely than not” of being sustained by the applicable tax authority. There are no adjustments to the Fund’s net assets required under ASC 740. The Fund’s 2008, 2009, 2010 and 2011 fiscal years tax returns are still open to examination by the Federal and applicable state tax authorities.
At June 30, 2012, information on the tax cost of investments was as follows:
| Gross Tax | ||||||
| Cost of Investments For Tax Purposes | Appreciation | Depreciation | Net Tax | |||
| $29,006,130 | $3,406,485 | $(1,773,285) | $1,633,200 | |||
As of December 31, 2011, the Fund has capital loss carryovers as indicated below. Capital loss carryovers are available to offset future realized capital gains to the extent provided in the Internal Revenue Code and regulations thereunder. To the extent that these carryover losses are used to offset future capital gains, it is probable that the gains so offset will not be distributed to shareholders because they would be taxable as ordinary income.
| Amount | ||||
| Short-Term | Long-Term | Expires | ||
| $6,866,202 | $— | 12/31/2017 | ||
| 412,664 | — | 12/31/2018 | ||
These amounts will be available to offset future taxable capital gains. Under the recently enacted Regulated Investment Company Modernization Act of 2010, the Fund will be permitted to carry forward capital losses incurred in taxable years beginning after December 22, 2010 for an unlimited period. However, any losses incurred during those future years will be required to be utilized prior to the losses incurred in pre-enactment tax years. As a result of this ordering rule, pre-enactment capital loss carryforwards may be more likely to expire unused. Additionally, post-enactment capital losses that are carried forward will retain
their character as either short-term or long-term capital losses rather than being considered all short-term as under previous law.
During the year ended December 31, 2011, the Fund utilized $1,864,022 of prior year capital loss carryovers.
Any qualified late-year loss is deemed to arise on the first day of the Fund’s next tax year (if the Fund elects to defer such loss). Under this regime, generally, the Fund can elect to defer any post-October capital loss and/or any late-year ordinary loss as defined by the Internal Revenue Code.
The Fund elected to defer qualified late-year losses for the year ended December 31, 2011 as follows:
| Capital | Ordinary | |
| $9,968 | $17 |
The tax composition of distributions paid during the years ended December 31, 2011 and December 31, 2010 were as follows:
| Ordinary Income | Long-Term Capital Gains | Total | ||||||||||
2011 | $ | 249,303 | $ | — | $ | 249,303 | ||||||
2010 | 369,300 | — | 369,300 | |||||||||
15
Table of Contents
| Notes to Financial Statements | June 30, 2012 (Unaudited) |
Distributions to Shareholders The Fund declares and pays any dividends from net investment income annually. The Fund declares and pays any net realized capital gains in excess of capital loss carryforwards distributions annually. The character of income and gains to be distributed is determined in accordance with income tax regulations which may differ from generally accepted accounting principles. These differences include (but are not limited to) futures investments organized as partnerships for tax purposes and losses deferred due to wash sale transactions. Reclassifications due to permanent book/tax differences are made to the Fund’s capital accounts to reflect income and gains available for distribution (or available capital loss carryovers) under income tax regulations. These reclassifications have no impact on net investment income, realized gains or losses, or the net asset value of the Fund. The calculation of net investment income per share in the Financial Highlights table excludes these adjustments.
The reclassifications for the year ended December 31, 2011 were as follows:
| Undistributed Net Investment Income | Accumulated Net Realized Gain (Loss) | Capital Paid In | ||
| $3,476 | $106 | $(3,582) |
| 9. | Subsequent Events |
Subsequent events after the balance sheet date through the date the financial statements were issued have been evaluated in the preparation of the financial statements. As of August 3, 2012, the assets of the Mid-Cap Equity Fund and the Money Market Fund were liquidated. These funds ceased operations and are no longer offered for investment.
16
Table of Contents
| Additional Information | (Unaudited) |
Information about Directors and Executive Officers:
The business and affairs of the Funds are managed under the direction of the Funds’ Board of Directors. Information pertaining to the Directors and officers of the Funds is set forth below.
Interested Directors and Executive Officers
Michael J. Cosgrove
Address c/o GEAM 1600 Summer St. Stamford, CT 06905
Age 63
Position(s) Held with Fund Chairman of the Board and President
Term of Office and Length of Time Served Until successor is elected and qualified – 15 years
Principal Occupation(s) During Past 5 years President of Mutual Funds and Global Investment Programs of GEAM since November 2011; President and Chief Executive Officer – Mutual Funds and Intermediary Business of GEAM from March 2007 to November 2011; Executive Vice President of GEAM from February 1997 to March 2007; and Executive Vice President-Mutual Funds of GEAM from March 1993 to March 2007. Also serves as Treasurer of GE Foundation since 1988.
Number of Portfolios in Fund Complex Overseen by Director 25
Other Directorships Held by Director Chairman of the Board and President of GE Institutional Funds since 1997; Trustee of Elfun Funds, GE Savings & Security Funds and General Electric Pension Trust since 1988; Director of GEAM since 1988; Trustee of Fordham University from 2002 to June 30, 2010 and since July 2011; Director of GE Investments Distributors, Inc since June 2011; Director of Skin Cancer Foundation since August 2010; Member of the Board of Governors for the Investment Company Institute since October 2006; Director, GE Asset Management (Ireland) Limited, since February 1999, GE Asset Management Funds Plc since 1998, GE Asset Management Canada Company since 1998, GE Asset Management Limited since 1998; Trustee of General Electric Pension Trust since 1988; and Chairman of the Board and President of GE Funds from 1993 to February 2011.
Matthew J. Simpson
Address c/o GEAM 1600 Summer St. Stamford, CT 06905
Age 51
Position(s) Held with Fund Director and Executive Vice President
Term of Office and Length of Time Served Until successor is elected and qualified – 4 years
Principal Occupation(s) During Past 5 years Executive Vice President, General Counsel and Secretary of GEAM since July 2007; Secretary of Elfun Funds and GE Savings & Security Funds since July 2007; Senior Vice President and General Counsel – Marketing and Client Services (formerly Asset Management Services) of GEAM and Senior Vice President and General Counsel of GE Asset Management Services from February 1997 to July 2007; Vice President and Associate General Counsel of GEAM from October 1992 to February 1997; Secretary of GE Institutional Funds and GE Investments Funds, Inc. from 1997 to July 2007 and Vice President from September 2003 to July 2007; Assistant Secretary of Elfun Funds and GE Savings & Security Funds from 1998 to July 2007 and Vice President from October 2003 to July 2007; and Secretary of GE Funds from 1993 to July 2007 and Vice President from September 2003 to July 2007.
Number of Portfolios in Fund Complex Overseen by Director 25
Other Directorships Held by Director Trustee of Elfun Funds, GE Savings & Security Funds and General Electric Pension Trust since July 2007; Trustee and Executive Vice President of GE Institutional Funds since July 2007; Director of GEAM since July 2007; and Trustee and Executive Vice President of GE Funds from July 2007 to February 2011.
17
Table of Contents
| Additional Information | (Unaudited) |
Joon Won Choe
Address c/o GEAM 1600 Summer St. Stamford, CT 06905
Age 42
Position(s) Held with Fund Vice President & Secretary
Term of Office and Length of Time Served Until successor is elected and qualified – Vice President and Secretary – 1 year
Principal Occupation(s) During Past 5 years Senior Vice President and Deputy General Counsel at GEAM since March 2011; Vice President and Secretary of GE Institutional Funds since September 2010; Vice President and Assistant Secretary of Elfun Funds and GE Savings & Security Funds since September 2010; Senior Vice President and Associate General Counsel at GEAM from June 2010 to March 2011; Vice President and Associate General Counsel of GEAM from November 2005 to June 2010 and Vice President and Secretary of GE Funds from September 2010 to February 2011.
Number of Portfolios in Fund Complex Overseen by Officer N/A
Other Directorships Held by Officer N/A
Robert Herlihy
Address c/o GEAM 1600 Summer St. Stamford, CT 06905
Age 44
Position(s) Held with Fund Chief Compliance Officer
Term of Office and Length of Time Served Until successor is elected and qualified — 6 years
Principal Occupation(s) During Past 5 years Chief Compliance Officer of GEAM, GE Institutional Funds, Elfun Funds, and GE Savings & Security Funds since July 2005; Chief Compliance Officer of GE Funds from July 2005 to February 2011 and Manager of Fund Administration at GEAM from 2002-2005.
Number of Portfolios in Fund Complex Overseen by Officer N/A
Other Directorships Held by Officer N/A
Arthur A. Jensen
Address c/o GEAM 1600 Summer St. Stamford, CT 06905
Age 45
Position(s) Held with Fund Treasurer
Term of Office and Length of Time Served Until successor is elected and qualified – 1 year
Principal Occupation(s) During Past 5 Years Treasurer of GE Institutional Funds, Elfun Funds and GE Savings & Security Funds since June 2011; Mutual Funds Controller of GEAM since April 2011; Senior Vice President at Citigroup from 2008 to 2010 and Vice President at JPMorgan from 2005 to 2008.
Number of Portfolios in Fund Complex Overseen by Officer N/A
Other Directorships Held by Officer N/A
18
Table of Contents
| Additional Information | (Unaudited) |
Jeanne M. LaPorta
Address c/o GEAM 1600 Summer St. Stamford, CT 06905
Age 46
Position(s) Held with Fund Vice President
Term of Office and Length of Time Served Until successor is elected and qualified – 8 years
Principal Occupation(s) During Past 5 Years Senior Vice President and Commercial Administrative Officer of GEAM since April 2010; Vice President of GE Institutional Funds since July 2003; Vice President of Elfun Funds and GE Savings & Security Funds since October 2003; Secretary of GE Funds from July 2007 to September 2010 and Vice President from July 2007 to February 2011; Senior Vice President and Deputy General Counsel of GEAM from October 2007 to April 2010; Vice President and Assistant Secretary of Elfun Funds and GE Savings & Security Funds from July 2003 to June 2010; and Vice President and Associate General Counsel – Marketing and Client Services (formerly Asset Management Services) at GEAM from May 1997 to October 2007.
Number of Portfolios in Fund Complex Overseen by Officer N/A
Other Directorships Held by Officer N/A
Non-Interested Directors
John R. Costantino
Address c/o GEAM 1600 Summer St. Stamford, CT 06905
Age 66
Position(s) Held with Fund Director
Term of Office and Length of Time Served Until successor is elected and qualified – 15 years
Principal Occupation(s) During Past 5 years General Partner, NGN Capital LLC since 2006; Managing Director, Vice President of Walden Capital Management since 1996.
Number of Portfolios in Fund Complex Overseen by Director 17
Other Directorships Held by Director Trustee of GE Institutional Funds since 1997; Trustee of Fordham University from 1989 to 1995 and from 2001 to 2007 and Trustee Emeritus since 2007; Trustee of Neuroscience Research Institute since 1986; Trustee of GE Funds from 1993 to February 2011; Director of Artes Medical from 2006-2008 and Trustee of Gregorian University Foundation from 1992-2007.
19
Table of Contents
| Additional Information | (Unaudited) |
R. Sheldon Johnson
Address c/o GEAM 1600 Summer St. Stamford, CT 06905
Age 65
Positions(s) Held with Fund Director
Term of office and Length of Time served Unit Successor is elected and qualified – 1 year.
Principal Occupation(s) During Past 5 years Head of Global Institutional Equity Sales and Marketing at Morgan Stanley & Co., Inc. from 2002 to 2006 and Managing Director at Morgan Stanley & Co., Inc. from 1988 to 2006.
Number of Portfolios in Fund Complex Overseen by Director 17
Other Directorships Held by Director Trustee of GE Institutional Funds since April 2011 and Trustee of St. Lawrence University since 2003.
Donna M. Rapaccioli
Address c/o GEAM 1600 Summer St. Stamford, CT 06905
Age 49
Position(s) Held with Fund Director
Term of Office and Length of Time Served Until successor is elected and qualified – Less than 1 year
Principal Occupation(s) During Past 5 Years Dean of the Gabelli School of Business since 2007 and Accounting professor since 1987 at Fordham University.
Number of Portfolios in Fund Complex Overseen by Officer 17
Other Directorships Held by Director Trustee of GE Institutional Funds since January 2012 and Trustee of Emmanuel College since 2010.
The Statement of Additional Information for the Funds includes additional information about the Directors and Officers and is available, without charge, upon request by calling 1-800-242-0134.
20
Table of Contents
| Investment Team | (Unaudited) |
Investment Adviser and Administrator
GE Asset Management Incorporated
Board of Directors
Michael J. Cosgrove, Chairman
John R. Costantino
R. Sheldon Johnson
Donna M. Rapaccioli
Matthew J. Simpson
Secretary
Joon Won Choe
Assistant Secretary
Michelle Matzelle
Treasurer
Arthur A. Jensen
Assistant Treasurer
Casey Yantosca
Distributor
GE Investment Distributors, Inc.
Member FINRA and SIPC
Custodian
State Street Bank & Trust Company
Officers of the Investment Adviser
Dmitri Stockton, President and Chief Executive Officer
Cheryl H. Beacock, Senior Vice President, Human Resources
George A. Bicher, Chief Risk Officer
Paul M. Colonna, President and Chief Investment Officer – Public Investments
Michael J. Cosgrove, President of Mutual Funds and Global Investment Programs
Gregory B. Hartch, Senior Vice President – Strategy and Business Development Leader
Ralph R. Layman, Executive Vice President and Chief Investment Officer Emeritus Public Equities
Maureen B. Mitchell, President of Global Sales and Marketing
Steven M. Rullo, Senior Vice President – Services and Technology
Matthew J. Simpson, Executive Vice President, General Counsel and Secretary
Donald W. Torey, President and Chief Investment Officer – Alternative Investments
David Wiederecht, President and Chief Investment Officer – Investment Solutions
Jessica Holscott, Executive Vice President, Chief Financial Officer*
| * | Effective August 1, 2012, Ms. Holcott replaced Tracie A. Winbigler as Executive Vice President and Chief Financial Officer |
At GE Asset Management, we’re dedicated to providing the investment options you’ll need to tailor your financial portfolio to every stage of your life. Each member of the GE Family of Funds is managed according to the same principles of integrity and quality that have guided GE over the past century, and have made it the world-class company that it is today. Each fund draws strength from a heritage of investment management experience that spans more than 80 years. Whether you’re creating a new investment portfolio or adding to an established one, the GE Family of Funds offers an array of professionally managed investment options that will help you meet a lifetime of financial needs.
21
Table of Contents
Investment Adviser
GE Asset Management Incorporated
1600 Summer Street
Stamford, CT 06905
or at:
PO Box 7900
Stamford, CT 06904-7900
Distributor
GE Investment Distributors, Inc.
member FINRA and SIPC
1600 Summer Street
Stamford, CT 06905
or at:
PO Box 7900
Stamford, CT 06904-7900
The Fund files its complete schedule of portfolio holdings with the Securities and Exchange Commission for the first and third quarters of each fiscal year on Form N-Q. The Fund’s Forms N-Q, as well as a description of the policies and procedures that the Fund uses to determine how to vote proxies (if any) relating to portfolio securities is available without charge (i) upon request, by calling 1-800-493-3042; (ii) on the Fund’s website at http://www.geam.com; and (iii) on the Commission’s website at http://www.sec.gov. The Fund’s Forms N-Q may be reviewed and copied at the Commission’s Public Reference Room in Washington, DC – information on the operation of the Public Reference Room may be obtained by calling 1-800-SEC-0330.
Information (if any) regarding how the Fund voted proxies relating to portfolio securities during the most recently disclosed 12-month period ended June 30 is available without charge (i) through the Fund’s website at http://www.geam.com; and (ii) on the Commission’s website at http://www.sec.gov.

Table of Contents
GE Investments Funds, Inc.
S&P 500 Index Fund
Semi-Annual Report
June 30, 2012

Table of Contents
| S&P 500 Index Fund | Contents | |
| 1 | ||||
| 2 | ||||
| 3 | ||||
| 12 | ||||
| 13 | ||||
| 14 | ||||
| 15 | ||||
| 16 | ||||
| 17 | ||||
| 23 | ||||
| 27 | ||||
This report is prepared for Policyholders of certain variable contracts and may be distributed to others only if preceded or accompanied by the variable contract’s current prospectus and the current summary prospectus of the Fund available for investments thereunder.
Table of Contents
| S&P 500 Index Fund | (Unaudited) |
Notes to Performance
Total return performance shown in this report for the GE Investments S&P 500 Index Fund (the “Fund”) takes into account changes in share price and assumes reinvestment of dividends and capital gains distributions, if any. Total returns shown are net of Fund fees and expenses but do not reflect fees and charges associated with the variable contracts such as administrative fees, account charges and surrender charges, which, if reflected, would reduce the Fund’s total returns for all periods shown.
The performance data quoted represents past performance; past performance does not guarantee future results. Investment return and principal value will fluctuate so your shares, when redeemed, may be worth more or less than their original cost. Current performance may be higher or lower than the performance data quoted. Periods less than one year are not annualized. Please call 800-493-3042 or visit the Fund’s website at http://www.geam.com for the most recent month-end performance data.
An investment in the Fund is not a deposit of any bank and is not insured or guaranteed by the Federal Deposit Insurance Corporation (FDIC) or any other government agency. An investment in the Fund is subject to risk, including possible loss of principal invested.
Investment Profile
A mutual fund designed for investors who seek growth of capital and accumulation of income that corresponds to the investment return of the Standard & Poor’s 500® Composite Stock Index (S&P 500 Index). The Fund seeks to replicate the return of the S&P 500® Index while holding transaction costs low and minimizing portfolio turnover.
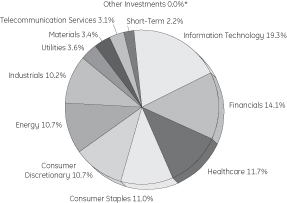
Sector Allocation
as a % of Fair Value of $189,678 (in thousands) on June 30, 2012(a)(b)
Top Ten Largest Holdings
as of June 30, 2012 as a % of Fair Value(a)(b)(c)
Apple Inc. | 4.34% | |||
Exxon Mobil Corp. | 3.18% | |||
Microsoft Corp. | 1.81% | |||
International Business Machines Corp. | 1.80% | |||
General Electric Co. | 1.75% | |||
AT&T Inc. | 1.66% | |||
Chevron Corp. | 1.66% | |||
Johnson & Johnson | 1.47% | |||
Wells Fargo & Co. | 1.41% | |||
The Coca-Cola Co. | 1.40% |
| (a) | The securities information regarding holdings, allocations and other characteristics is presented to illustrate examples of securities that the Fund has bought and the diversity of areas in which the Fund may invest as of a particular date. It may not be representative of the Fund’s current or future investments and should not be construed as a recommendation to purchase or sell a particular security. |
| (b) | Fair value basis is inclusive of the short-term investment in GE Institutional Money Market Fund Investment Class. |
| (c) | The figures presented to not include the Fund’s entire investment portfolio and may change at any time. |
| * | Less than 0.05% |
GE Investment Distributors, Inc., Member of FINRA & SIPC, is the principal underwriter and distributor of the GE Investments Funds, Inc. and a wholly owned subsidiary of GE Asset Management Incorporated, the investment adviser of the Fund.
1
Table of Contents
| S&P 500 Index Fund | (Unaudited) |
Understanding Your Fund’s Expenses
As a shareholder of the Fund you incur ongoing costs. Ongoing costs include portfolio management fees, professional fees, administrative fees and other Fund expenses. The following example is intended to help you understand your ongoing costs (in dollars) of investing in the Fund and to compare these costs with the ongoing costs of investing in other mutual funds.
To illustrate these ongoing costs, we have provided an example and calculated the expenses paid by investors of the Fund during the period. The information in the following table is based on an investment of $1,000, which is invested at the beginning of the period and held for the entire six-month period ended June 30, 2012.
Actual Expenses
The first section of the table provides information about actual account values and actual expenses. You may use the information in this section, together with the amount you invested, to estimate the expenses that you paid over the period. To do so, simply divide your account value by $1,000 (for example, an $8,600 account value divided by $1,000 = 8.6), then multiply the result by the number given for your class under the heading “Expenses Paid During Period” to estimate the expenses paid on your account during the period.
Hypothetical Example for Comparison Purposes
The second section of the table provides information about hypothetical account values and hypothetical expenses based on the Fund’s actual expense ratio and an assumed rate of return of 5% per year before expenses, which is not the Fund’s actual return. The hypothetical account values and expenses may not be used to estimate the actual ending account balance or expenses you paid for the period. You may use this information to compare the ongoing costs of investing in the Fund and other funds. To do so, compare this 5% hypothetical example with the 5% hypothetical examples that appear in the shareholders reports of other funds.
Please note that the expenses shown in the table are meant to highlight and help you compare ongoing costs only and do not reflect transaction costs, such as sales charges or redemption fees, if any. Therefore, the second section of the table is useful in comparing ongoing costs only, and will not help you determine the relative total costs of owning different funds. Additionally, the expenses shown do not reflect the fees or charges associated with variable contracts through which shares of the Fund are offered.
January 1, 2012 – June 30, 2012
| Account value at the beginning of the period ($) | Account value at the end of the period ($) | Expenses paid during the period ($)* | ||||||||||
Actual Fund Return* | 1,000.00 | 1,093.20 | 1.93 | |||||||||
Hypothetical 5% Return (2.5% for the period) | 1,000.00 | 1,023.02 | 1.86 | |||||||||
| * | Expenses are equal to the Fund’s annualized expense ratio of 0.37% (for the period January 1, 2012 - June 30, 2012), multiplied by the average account value over the period, multiplied by 182/366 (to reflect the one-half year period). |
2
Table of Contents
S&P 500 Index Fund
| Schedule of Investments | June 30, 2012 (Unaudited) |
S&P 500 Index Fund
| Number of Shares | Fair Value | |||||||||
Common Stock — 97.7%† | ||||||||||
Advertising — 0.1% | ||||||||||
Omnicom Group Inc. | 3,980 | $ | 193,428 | |||||||
The Interpublic Group of Companies Inc. | 6,930 | 75,191 | ||||||||
| 268,619 | ||||||||||
Aerospace & Defense — 2.5% | ||||||||||
General Dynamics Corp. | 5,267 | 347,411 | ||||||||
Goodrich Corp. | 1,884 | 239,080 | ||||||||
Honeywell International Inc. | 11,543 | 644,561 | ||||||||
L-3 Communications Holdings Inc. | 1,500 | 111,015 | ||||||||
Lockheed Martin Corp. | 4,052 | 352,848 | ||||||||
Northrop Grumman Corp. | 3,922 | 250,184 | ||||||||
Precision Castparts Corp. | 2,200 | 361,878 | ||||||||
Raytheon Co. | 5,169 | 292,514 | ||||||||
Rockwell Collins Inc. | 2,268 | 111,926 | ||||||||
Textron Inc. | 4,225 | 105,076 | ||||||||
The Boeing Co. | 11,186 | 831,120 | (d) | |||||||
United Technologies Corp. | 13,672 | 1,032,646 | (d) | |||||||
| 4,680,259 | ||||||||||
Agricultural Products — 0.2% | ||||||||||
Archer-Daniels-Midland Co. | 10,086 | 297,739 | ||||||||
Air Freight & Logistics — 1.0% | ||||||||||
CH Robinson Worldwide Inc. | 2,500 | 146,325 | ||||||||
Expeditors International of Washington Inc. | 3,200 | 124,000 | ||||||||
FedEx Corp. | 4,811 | 440,736 | ||||||||
United Parcel Service Inc. | 14,396 | 1,133,829 | ||||||||
| 1,844,890 | ||||||||||
Airlines — 0.1% | ||||||||||
Southwest Airlines Co. | 11,049 | 101,872 | ||||||||
Aluminum — 0.1% | ||||||||||
Alcoa Inc. | 16,840 | 147,350 | (d) | |||||||
Apparel Retail — 0.6% | ||||||||||
Abercrombie & Fitch Co. | 1,300 | 44,382 | ||||||||
Ltd Brands Inc. | 3,888 | 165,357 | ||||||||
Ross Stores Inc. | 3,400 | 212,398 | ||||||||
The Gap Inc. | 5,179 | 141,697 | ||||||||
TJX Companies Inc. | 11,260 | 483,392 | ||||||||
Urban Outfitters Inc. | 1,700 | 46,903 | (a) | |||||||
| 1,094,129 | ||||||||||
Apparel, Accessories & Luxury Goods — 0.3% | ||||||||||
Coach Inc. | 4,400 | 257,312 | ||||||||
Fossil Inc. | 800 | 61,232 | (a) | |||||||
| Number of Shares | Fair Value | |||||||||
Ralph Lauren Corp. | 1,000 | $ | 140,060 | |||||||
VF Corp. | 1,302 | 173,752 | ||||||||
| 632,356 | ||||||||||
Application Software — 0.6% | ||||||||||
Adobe Systems Inc. | 7,384 | 239,020 | (a,d) | |||||||
Autodesk Inc. | 3,348 | 117,147 | (a) | |||||||
Citrix Systems Inc. | 2,900 | 243,426 | (a) | |||||||
Intuit Inc. | 4,300 | 255,205 | ||||||||
Salesforce.com Inc. | 2,100 | 290,346 | (a) | |||||||
| 1,145,144 | ||||||||||
Asset Management & Custody Banks — 1.1% | ||||||||||
Ameriprise Financial Inc. | 3,304 | 172,667 | ||||||||
BlackRock Inc. | 1,965 | 333,696 | ||||||||
Federated Investors Inc. | 1,500 | 32,775 | ||||||||
Franklin Resources Inc. | 2,200 | 244,178 | ||||||||
Invesco Ltd. | 6,800 | 153,680 | ||||||||
Legg Mason Inc. | 1,800 | 47,466 | ||||||||
Northern Trust Corp. | 3,700 | 170,274 | ||||||||
State Street Corp. | 7,200 | 321,408 | (c) | |||||||
T Rowe Price Group Inc. | 3,800 | 239,248 | ||||||||
The Bank of New York Mellon Corp. | 18,503 | 406,141 | ||||||||
| 2,121,533 | ||||||||||
Auto Parts & Equipment — 0.2% | ||||||||||
BorgWarner Inc. | 1,700 | 111,503 | (a) | |||||||
Johnson Controls Inc. | 10,346 | 286,688 | ||||||||
| 398,191 | ||||||||||
Automobile Manufacturers — 0.3% | ||||||||||
Ford Motor Co. | 56,727 | 544,012 | ||||||||
Automotive Retail — 0.2% | ||||||||||
AutoNation Inc. | 486 | 17,146 | (a) | |||||||
AutoZone Inc. | 344 | 126,306 | (a) | |||||||
CarMax Inc. | 3,400 | 88,196 | (a) | |||||||
O’Reilly Automotive Inc. | 1,900 | 159,163 | (a) | |||||||
| 390,811 | ||||||||||
Biotechnology — 1.4% | ||||||||||
Alexion Pharmaceuticals Inc. | 2,700 | 268,110 | (a) | |||||||
Amgen Inc. | 11,681 | 853,180 | (d) | |||||||
Biogen Idec Inc. | 3,600 | 519,768 | (a) | |||||||
Celgene Corp. | 6,563 | 421,082 | (a) | |||||||
Gilead Sciences Inc. | 11,549 | 592,233 | (a) | |||||||
| 2,654,373 | ||||||||||
Brewers — 0.1% | ||||||||||
Molson Coors Brewing Co. | 2,298 | 95,620 | ||||||||
Broadcasting — 0.3% | ||||||||||
CBS Corp. | 9,809 | 321,539 | ||||||||
Discovery Communications Inc. | 3,800 | 205,200 | (a) | |||||||
Scripps Networks Interactive Inc. | 1,300 | 73,918 | ||||||||
| 600,657 | ||||||||||
See Notes to Schedule of Investments and Notes to Financial Statements.
3
Table of Contents
S&P 500 Index Fund
| Schedule of Investments | June 30, 2012 (unaudited) |
| Number of Shares | Fair Value | |||||||||
Building Products — 0.0%* | ||||||||||
Masco Corp. | 5,990 | $ | 83,081 | |||||||
Cable & Satellite — 1.2% | ||||||||||
Cablevision Systems Corp. | 3,900 | 51,831 | ||||||||
Comcast Corp. | 40,458 | 1,293,442 | ||||||||
DIRECTV | 9,800 | 478,436 | (a) | |||||||
Time Warner Cable Inc. | 4,696 | 385,542 | ||||||||
| 2,209,251 | ||||||||||
Casinos & Gaming — 0.1% | ||||||||||
International Game Technology | 4,500 | 70,875 | ||||||||
Wynn Resorts Ltd. | 1,100 | 114,092 | ||||||||
| 184,967 | ||||||||||
Coal & Consumable Fuels — 0.1% | ||||||||||
Alpha Natural Resources Inc. | 3,300 | 28,743 | (a) | |||||||
CONSOL Energy Inc. | 3,600 | 108,864 | ||||||||
Peabody Energy Corp. | 4,279 | 104,921 | ||||||||
| 242,528 | ||||||||||
Commercial Printing — 0.0%* | ||||||||||
RR Donnelley & Sons Co. | 2,599 | 30,590 | ||||||||
Communications Equipment — 1.8% | ||||||||||
Cisco Systems Inc. | 80,764 | 1,386,718 | (d) | |||||||
Comverse Technology Inc. | 99 | 576 | (a) | |||||||
F5 Networks Inc. | 1,200 | 119,472 | (a) | |||||||
Harris Corp. | 1,700 | 71,145 | ||||||||
JDS Uniphase Corp. | 3,650 | 40,150 | (a) | |||||||
Juniper Networks Inc. | 8,100 | 132,111 | (a) | |||||||
Motorola Solutions Inc. | 4,335 | 208,557 | ||||||||
Qualcomm Inc. | 25,729 | 1,432,591 | ||||||||
| 3,391,320 | ||||||||||
Computer & Electronics Retail — 0.1% | ||||||||||
Best Buy Company Inc. | 4,200 | 88,032 | ||||||||
GameStop Corp. | 2,300 | 42,228 | ||||||||
| 130,260 | ||||||||||
Computer Hardware — 4.8% | ||||||||||
Apple Inc. | 14,089 | 8,227,976 | (a) | |||||||
Dell Inc. | 23,128 | 289,563 | (a,d) | |||||||
Hewlett-Packard Co. | 29,549 | 594,230 | ||||||||
| 9,111,769 | ||||||||||
Computer Storage & Peripherals — 0.7% | ||||||||||
EMC Corp. | 31,514 | 807,704 | (a) | |||||||
Lexmark International Inc. | 1,000 | 26,580 | ||||||||
NetApp Inc. | 5,700 | 181,374 | (a) | |||||||
SanDisk Corp. | 3,800 | 138,624 | (a) | |||||||
Seagate Technology PLC | 5,700 | 140,961 | ||||||||
Western Digital Corp. | 3,300 | 100,584 | (a) | |||||||
| 1,395,827 | ||||||||||
| Number of Shares | Fair Value | |||||||||
Construction & Engineering — 0.2% | ||||||||||
Fluor Corp. | 2,578 | $ | 127,199 | |||||||
Jacobs Engineering Group Inc. | 1,900 | 71,934 | (a) | |||||||
Quanta Services Inc. | 3,200 | 77,024 | (a) | |||||||
| 276,157 | ||||||||||
Construction & Farm Machinery & Heavy Trucks — 1.0% | ||||||||||
Caterpillar Inc. | 9,732 | 826,344 | ||||||||
Cummins Inc. | 2,956 | 286,466 | ||||||||
Deere & Co. | 6,140 | 496,542 | ||||||||
Joy Global Inc. | 1,600 | 90,768 | ||||||||
PACCAR Inc. | 5,403 | 211,744 | ||||||||
| 1,911,864 | ||||||||||
Construction Materials — 0.0%* | ||||||||||
Vulcan Materials Co. | 2,000 | 79,420 | ||||||||
Consumer Electronics — 0.0%* | ||||||||||
Harman International Industries Inc. | 1,200 | 47,520 | ||||||||
Consumer Finance — 0.9% | ||||||||||
American Express Co. | 15,191 | 884,268 | (d) | |||||||
Capital One Financial Corp. | 8,725 | 476,908 | ||||||||
Discover Financial Services | 8,098 | 280,029 | ||||||||
SLM Corp. | 7,600 | 119,396 | ||||||||
| 1,760,601 | ||||||||||
Data Processing & Outsourced Services — 1.4% | ||||||||||
Automatic Data Processing Inc. | 7,480 | 416,337 | ||||||||
Computer Sciences Corp. | 2,282 | 56,639 | ||||||||
Fidelity National Information Services Inc. | 3,400 | 115,872 | ||||||||
Fiserv Inc. | 2,078 | 150,073 | (a) | |||||||
Mastercard Inc. | 1,550 | 666,671 | ||||||||
Paychex Inc. | 4,725 | 148,412 | ||||||||
The Western Union Co. | 9,524 | 160,384 | ||||||||
Total System Services Inc. | 2,302 | 55,087 | ||||||||
Visa Inc. | 7,400 | 914,862 | ||||||||
| 2,684,337 | ||||||||||
Department Stores — 0.3% | ||||||||||
JC Penney Company Inc. | 2,287 | 53,310 | ||||||||
Kohl’s Corp. | 3,700 | 168,313 | ||||||||
Macy’s Inc. | 6,130 | 210,566 | ||||||||
Nordstrom Inc. | 2,492 | 123,827 | ||||||||
Sears Holdings Corp. | 519 | 30,984 | ||||||||
| 587,000 | ||||||||||
Distillers & Vintners — 0.2% | ||||||||||
Beam Inc. | 2,241 | 140,040 | ||||||||
Brown-Forman Corp. | 1,547 | 149,827 | ||||||||
Constellation Brands Inc. | 2,400 | 64,944 | (a) | |||||||
| 354,811 | ||||||||||
Distributors — 0.1% | ||||||||||
Genuine Parts Co. | 2,296 | 138,334 | ||||||||
See Notes to Schedule of Investments and Notes to Financial Statements.
4
Table of Contents
S&P 500 Index Fund
| Schedule of Investments | June 30, 2012 (Unaudited) |
| Number of Shares | Fair Value | |||||||||
Diversified Chemicals — 0.9% | ||||||||||
Eastman Chemical Co. | 2,018 | $ | 101,647 | |||||||
EI du Pont de Nemours & Co. | 14,161 | 716,122 | ||||||||
FMC Corp. | 2,200 | 117,656 | ||||||||
PPG Industries Inc. | 2,237 | 237,390 | ||||||||
The Dow Chemical Co. | 18,094 | 569,961 | ||||||||
| 1,742,776 | ||||||||||
Diversified Financial Services — 4.3% | ||||||||||
Bank of America Corp. | 160,929 | 1,316,399 | ||||||||
Citigroup Inc. | 43,870 | 1,202,477 | ||||||||
Comerica Inc. | 2,856 | 87,708 | ||||||||
JPMorgan Chase & Co. | 57,350 | 2,049,116 | (d) | |||||||
US Bancorp | 28,609 | 920,065 | ||||||||
Wells Fargo & Co. | 79,902 | 2,671,923 | ||||||||
| 8,247,688 | ||||||||||
Diversified Metals & Mining — 0.3% | ||||||||||
Freeport-McMoRan Copper & Gold Inc. | 14,510 | 494,356 | ||||||||
Titanium Metals Corp. | 1,600 | 18,096 | ||||||||
| 512,452 | ||||||||||
Diversified REITs — 0.1% | ||||||||||
Vornado Realty Trust | 2,847 | 239,091 | ||||||||
Diversified Support Services — 0.1% | ||||||||||
Cintas Corp. | 1,500 | 57,915 | ||||||||
Iron Mountain Inc. | 2,700 | 88,992 | ||||||||
| 146,907 | ||||||||||
Drug Retail — 0.7% | ||||||||||
CVS Caremark Corp. | 19,227 | 898,478 | ||||||||
Walgreen Co. | 13,313 | 393,799 | ||||||||
| 1,292,277 | ||||||||||
Education Services — 0.1% | ||||||||||
Apollo Group Inc. | 1,900 | 68,761 | (a) | |||||||
DeVry Inc. | 800 | 24,776 | ||||||||
| 93,537 | ||||||||||
Electric Utilities — 2.0% | ||||||||||
American Electric Power Company Inc. | 7,125 | 284,287 | (d) | |||||||
Duke Energy Corp. | 20,409 | 470,632 | ||||||||
Edison International | 4,842 | 223,700 | ||||||||
Entergy Corp. | 2,585 | 175,496 | ||||||||
Exelon Corp. | 12,644 | 475,667 | ||||||||
FirstEnergy Corp. | 6,354 | 312,553 | ||||||||
NextEra Energy Inc. | 6,162 | 424,007 | ||||||||
Northeast Utilities | 4,830 | 187,452 | ||||||||
Pepco Holdings Inc. | 3,300 | 64,581 | ||||||||
Pinnacle West Capital Corp. | 1,600 | 82,784 | ||||||||
PPL Corp. | 8,944 | 248,733 | ||||||||
| Number of Shares | Fair Value | |||||||||
Progress Energy Inc. | 4,556 | $ | 274,135 | |||||||
The Southern Co. | 12,958 | 599,955 | ||||||||
| 3,823,982 | ||||||||||
Electrical Components & Equipment — 0.5% | ||||||||||
Cooper Industries PLC | 2,400 | 163,632 | ||||||||
Emerson Electric Co. | 10,938 | 509,492 | ||||||||
Rockwell Automation Inc. | 2,168 | 143,218 | ||||||||
Roper Industries Inc. | 1,500 | 147,870 | ||||||||
| 964,212 | ||||||||||
Electronic Components — 0.2% | ||||||||||
Amphenol Corp. | 2,500 | 137,300 | ||||||||
Corning Inc. | 23,139 | 299,187 | ||||||||
| 436,487 | ||||||||||
Electronic Equipment & Instruments — 0.0%* | ||||||||||
FLIR Systems Inc. | 2,100 | 40,950 | ||||||||
Electronic Manufacturing Services — 0.2% | ||||||||||
Jabil Circuit Inc. | 2,900 | 58,957 | ||||||||
Molex Inc. | 1,950 | 46,683 | ||||||||
TE Connectivity Ltd. | 6,400 | 204,224 | ||||||||
| 309,864 | ||||||||||
Environmental & Facilities Services — 0.2% | ||||||||||
Republic Services Inc. | 4,750 | 125,685 | ||||||||
Stericycle Inc. | 1,200 | 110,004 | (a) | |||||||
Waste Management Inc. | 6,803 | 227,220 | ||||||||
| 462,909 | ||||||||||
Fertilizers & Agricultural Chemicals — 0.6% | ||||||||||
CF Industries Holdings Inc. | 970 | 187,928 | ||||||||
Monsanto Co. | 8,023 | 664,144 | (d) | |||||||
The Mosaic Co. | 4,600 | 251,896 | ||||||||
| 1,103,968 | ||||||||||
Food Distributors — 0.1% | ||||||||||
Sysco Corp. | 8,644 | 257,678 | ||||||||
Food Retail — 0.3% | ||||||||||
Safeway Inc. | 3,900 | 70,785 | ||||||||
The Kroger Co. | 8,666 | 200,965 | ||||||||
Whole Foods Market Inc. | 2,400 | 228,768 | ||||||||
| 500,518 | ||||||||||
Footwear — 0.3% | ||||||||||
NIKE Inc. | 5,510 | 483,668 | ||||||||
Gas Utilities — 0.1% | ||||||||||
AGL Resources Inc. | 1,800 | 69,750 | ||||||||
ONEOK Inc. | 3,000 | 126,930 | ||||||||
| 196,680 | ||||||||||
See Notes to Schedule of Investments and Notes to Financial Statements.
5
Table of Contents
S&P 500 Index Fund
| Schedule of Investments | June 30, 2012 (Unaudited) |
| Number of Shares | Fair Value | |||||||||
General Merchandise Stores — 0.5% | ||||||||||
Big Lots Inc. | 900 | $ | 36,711 | (a) | ||||||
Dollar Tree Inc. | 3,400 | 182,920 | (a) | |||||||
Family Dollar Stores Inc. | 1,800 | 119,664 | ||||||||
Target Corp. | 9,949 | 578,932 | ||||||||
| 918,227 | ||||||||||
Gold — 0.2% | ||||||||||
Newmont Mining Corp. | 7,528 | 365,183 | ||||||||
Healthcare Distributors — 0.4% | ||||||||||
AmerisourceBergen Corp. | 3,761 | 147,995 | ||||||||
Cardinal Health Inc. | 5,351 | 224,742 | ||||||||
McKesson Corp. | 3,602 | 337,687 | ||||||||
Patterson Companies Inc. | 1,200 | 41,364 | ||||||||
| 751,788 | ||||||||||
Healthcare Equipment — 1.7% | ||||||||||
Baxter International Inc. | 8,329 | 442,686 | (d) | |||||||
Becton Dickinson and Co. | 3,188 | 238,303 | ||||||||
Boston Scientific Corp. | 21,443 | 121,582 | (a) | |||||||
CareFusion Corp. | 3,375 | 86,670 | (a) | |||||||
Covidien PLC | 7,400 | 395,900 | ||||||||
CR Bard Inc. | 1,302 | 139,887 | ||||||||
Edwards Lifesciences Corp. | 1,800 | 185,940 | (a) | |||||||
Intuitive Surgical Inc. | 620 | 343,350 | (a) | |||||||
Medtronic Inc. | 15,532 | �� | 601,554 | |||||||
St Jude Medical Inc. | 4,992 | 199,231 | ||||||||
Stryker Corp. | 4,752 | 261,835 | ||||||||
Varian Medical Systems Inc. | 1,700 | 103,309 | (a) | |||||||
Zimmer Holdings Inc. | 2,700 | 173,772 | ||||||||
| 3,294,019 | ||||||||||
Healthcare Facilities — 0.0%* | ||||||||||
Tenet Healthcare Corp. | 7,895 | 41,370 | (a) | |||||||
Healthcare Services — 0.6% | ||||||||||
DaVita Inc. | 1,400 | 137,494 | (a) | |||||||
Express Scripts Holding Co. | 11,951 | 667,224 | (a) | |||||||
Laboratory Corporation of America Holdings | 1,400 | 129,654 | (a) | |||||||
Quest Diagnostics Inc. | 2,400 | 143,760 | ||||||||
| 1,078,132 | ||||||||||
Healthcare Supplies — 0.0%* | ||||||||||
DENTSPLY International Inc. | 2,100 | 79,401 | ||||||||
Healthcare Technology — 0.1% | ||||||||||
Cerner Corp. | 2,200 | 181,852 | (a) | |||||||
Home Building — 0.1% | ||||||||||
DR Horton Inc. | 4,000 | 73,520 | ||||||||
Lennar Corp. | 2,200 | 68,002 | ||||||||
PulteGroup Inc. | 4,635 | 49,595 | (a) | |||||||
| 191,117 | ||||||||||
| Number of Shares | Fair Value | |||||||||
Home Entertainment Software — 0.0%* | ||||||||||
Electronic Arts Inc. | 5,400 | $ | 66,690 | (a) | ||||||
Home Furnishing Retail — 0.1% | ||||||||||
Bed Bath & Beyond Inc. | 3,600 | 222,480 | (a) | |||||||
Home Furnishings — 0.0%* | ||||||||||
Leggett & Platt Inc. | 1,900 | 40,147 | ||||||||
Home Improvement Retail — 0.9% | ||||||||||
Lowe’s Companies Inc. | 17,602 | 500,601 | ||||||||
The Home Depot Inc. | 23,133 | 1,225,818 | ||||||||
| 1,726,419 | ||||||||||
Hotels, Resorts & Cruise Lines — 0.3% | ||||||||||
Carnival Corp. | 6,700 | 229,609 | ||||||||
Marriott International Inc. | 4,014 | 157,349 | ||||||||
Starwood Hotels & Resorts Worldwide Inc. | 2,900 | 153,816 | ||||||||
Wyndham Worldwide Corp. | 2,249 | 118,612 | ||||||||
| 659,386 | ||||||||||
Household Appliances — 0.0%* | ||||||||||
Whirlpool Corp. | 1,143 | 69,906 | ||||||||
Household Products — 2.1% | ||||||||||
Colgate-Palmolive Co. | 7,272 | 757,015 | ||||||||
Kimberly-Clark Corp. | 5,836 | 488,882 | (d) | |||||||
The Clorox Co. | 1,984 | 143,761 | ||||||||
The Procter & Gamble Co. | 41,373 | 2,534,096 | ||||||||
| 3,923,754 | ||||||||||
Housewares & Specialties — 0.0%* | ||||||||||
Newell Rubbermaid Inc. | 4,256 | 77,204 | ||||||||
Human Resource & Employment Services — 0.0%* | ||||||||||
Robert Half International Inc. | 2,100 | 59,997 | ||||||||
Hypermarkets & Super Centers — 1.3% | ||||||||||
Costco Wholesale Corp. | 6,617 | 628,615 | ||||||||
Wal-Mart Stores Inc. | 25,987 | 1,811,814 | ||||||||
| 2,440,429 | ||||||||||
Independent Power Producers & Energy Traders — 0.1% | ||||||||||
NRG Energy Inc. | 3,500 | 60,760 | (a) | |||||||
The AES Corp. | 9,300 | 119,319 | (a) | |||||||
| 180,079 | ||||||||||
Industrial Conglomerates — 2.7% | ||||||||||
Danaher Corp. | 8,700 | 453,096 | ||||||||
General Electric Co. | 159,462 | 3,323,188 | (f) | |||||||
Tyco International Ltd. | 7,000 | 369,950 | ||||||||
3M Co. | 10,380 | 930,048 | ||||||||
| 5,076,282 | ||||||||||
See Notes to Schedule of Investments and Notes to Financial Statements.
6
Table of Contents
S&P 500 Index Fund
| Schedule of Investments | June 30, 2012 (Unaudited) |
| Number of Shares | Fair Value | |||||||||
Industrial Gases — 0.4% | ||||||||||
Air Products & Chemicals Inc. | 3,132 | $ | 252,846 | (d) | ||||||
Airgas Inc. | 1,100 | 92,411 | ||||||||
Praxair Inc. | 4,565 | 496,352 | ||||||||
| 841,609 | ||||||||||
Industrial Machinery — 0.8% | ||||||||||
Dover Corp. | 2,858 | 153,217 | ||||||||
Eaton Corp. | 5,100 | 202,113 | ||||||||
Flowserve Corp. | 800 | 91,800 | ||||||||
Illinois Tool Works Inc. | 7,427 | 392,814 | ||||||||
Ingersoll-Rand PLC | 4,300 | 181,374 | ||||||||
Pall Corp. | 1,778 | 97,452 | ||||||||
Parker Hannifin Corp. | 2,372 | 182,359 | ||||||||
Snap-on Inc. | 1,009 | 62,810 | ||||||||
Stanley Black & Decker Inc. | 2,492 | 160,385 | ||||||||
Xylem Inc. | 3,026 | 76,164 | ||||||||
| 1,600,488 | ||||||||||
Industrial REITs — 0.1% | ||||||||||
Prologis Inc. | 6,699 | 222,608 | ||||||||
Insurance Brokers — 0.3% | ||||||||||
Aon PLC | 5,036 | 235,584 | ||||||||
Marsh & McLennan Companies Inc. | 8,153 | 262,771 | ||||||||
| 498,355 | ||||||||||
Integrated Oil & Gas — 5.6% | ||||||||||
Chevron Corp. | 29,758 | 3,139,469 | ||||||||
Exxon Mobil Corp. | 70,393 | 6,023,529 | (d) | |||||||
Hess Corp. | 4,670 | 202,912 | (d) | |||||||
Murphy Oil Corp. | 2,900 | 145,841 | ||||||||
Occidental Petroleum Corp. | 12,179 | 1,044,593 | ||||||||
| 10,556,344 | ||||||||||
Integrated Telecommunication Services — 2.9% | ||||||||||
AT&T Inc. | 88,180 | 3,144,499 | ||||||||
CenturyLink Inc. | 9,399 | 371,167 | ||||||||
Frontier Communications Corp. | 14,674 | 56,201 | ||||||||
Verizon Communications Inc. | 42,567 | 1,891,677 | ||||||||
Windstream Corp. | 9,143 | 88,321 | ||||||||
| 5,551,865 | ||||||||||
Internet Retail — 1.0% | ||||||||||
Amazon.com Inc. | 5,400 | 1,233,090 | (a) | |||||||
Expedia Inc. | 1,550 | 74,508 | ||||||||
Netflix Inc. | 900 | 61,623 | (a) | |||||||
priceline.com Inc. | 790 | 524,971 | (a) | |||||||
TripAdvisor Inc. | 1,550 | 69,269 | (a) | |||||||
| 1,963,461 | ||||||||||
Internet Software & Services — 1.8% | ||||||||||
Akamai Technologies Inc. | 2,500 | 79,375 | (a) | |||||||
eBay Inc. | 17,100 | 718,371 | (a) | |||||||
Google Inc. | 3,824 | 2,218,188 | (a) | |||||||
| Number of Shares | Fair Value | |||||||||
VeriSign Inc. | 2,362 | $ | 102,912 | (a) | ||||||
Yahoo! Inc. | 18,389 | 291,098 | (a) | |||||||
| 3,409,944 | ||||||||||
Investment Banking & Brokerage — 0.7% | ||||||||||
E*TRADE Financial Corp. | 3,440 | 27,658 | (a) | |||||||
Morgan Stanley | 22,696 | 331,135 | ||||||||
The Charles Schwab Corp. | 16,211 | 209,608 | ||||||||
The Goldman Sachs Group Inc. | 7,399 | 709,268 | ||||||||
| 1,277,669 | ||||||||||
IT Consulting & Other Services — 2.4% | ||||||||||
Accenture PLC | 9,700 | 582,873 | ||||||||
Cognizant Technology Solutions Corp. | 4,700 | 282,000 | (a) | |||||||
International Business Machines Corp. | 17,430 | 3,408,959 | ||||||||
SAIC Inc. | 3,700 | 44,844 | ||||||||
Teradata Corp. | 2,600 | 187,226 | (a) | |||||||
| 4,505,902 | ||||||||||
Leisure Products — 0.1% | ||||||||||
Hasbro Inc. | 1,696 | 57,444 | ||||||||
Mattel Inc. | 5,151 | 167,098 | ||||||||
| 224,542 | ||||||||||
Life & Health Insurance — 0.8% | ||||||||||
Aflac Inc. | 7,000 | 298,130 | ||||||||
Lincoln National Corp. | 4,642 | 101,521 | ||||||||
MetLife Inc. | 15,773 | 486,597 | ||||||||
Principal Financial Group Inc. | 4,500 | 118,035 | ||||||||
Prudential Financial Inc. | 7,200 | 348,696 | ||||||||
Torchmark Corp. | 1,508 | 76,229 | ||||||||
Unum Group | 4,589 | 87,788 | ||||||||
| 1,516,996 | ||||||||||
Life Sciences Tools & Services — 0.4% | ||||||||||
Agilent Technologies Inc. | 5,285 | 207,383 | ||||||||
Life Technologies Corp. | 2,603 | 117,109 | (a) | |||||||
PerkinElmer Inc. | 1,410 | 36,378 | ||||||||
Thermo Fisher Scientific Inc. | 5,528 | 286,958 | ||||||||
Waters Corp. | 1,300 | 103,311 | (a) | |||||||
| 751,139 | ||||||||||
Managed Healthcare — 1.0% | ||||||||||
Aetna Inc. | 5,108 | 198,037 | ||||||||
Cigna Corp. | 4,489 | 197,516 | ||||||||
Coventry Healthcare Inc. | 2,000 | 63,580 | ||||||||
Humana Inc. | 2,527 | 195,691 | ||||||||
UnitedHealth Group Inc. | 15,676 | 917,046 | ||||||||
WellPoint Inc. | 5,100 | 325,329 | ||||||||
| 1,897,199 | ||||||||||
Metal & Glass Containers — 0.1% | ||||||||||
Ball Corp. | 2,232 | 91,624 | ||||||||
Owens-Illinois Inc. | 2,300 | 44,091 | (a) | |||||||
| 135,715 | ||||||||||
See Notes to Schedule of Investments and Notes to Financial Statements.
7
Table of Contents
S&P 500 Index Fund
| Schedule of Investments | June 30, 2012 (Unaudited) |
| Number of Shares | Fair Value | |||||||||
Motorcycle Manufacturers — 0.1% | ||||||||||
Harley-Davidson Inc. | 3,300 | $ | 150,909 | |||||||
Movies & Entertainment — 1.6% | ||||||||||
News Corp. | 31,600 | 704,364 | ||||||||
The Walt Disney Co. | 26,920 | 1,305,620 | ||||||||
Time Warner Inc. | 14,438 | 555,863 | ||||||||
Viacom Inc. | 8,013 | 376,771 | ||||||||
| 2,942,618 | ||||||||||
Multi-Line Insurance — 0.4% | ||||||||||
American International Group Inc. | 9,825 | 315,284 | (a) | |||||||
Assurant Inc. | 1,300 | 45,292 | ||||||||
Genworth Financial Inc. | 8,400 | 47,544 | (a) | |||||||
Hartford Financial Services Group Inc. | 6,704 | 118,192 | ||||||||
Loews Corp. | 4,466 | 182,704 | ||||||||
| 709,016 | ||||||||||
Multi-Sector Holdings — 0.0%* | ||||||||||
Leucadia National Corp. | 3,100 | 65,937 | ||||||||
Multi-Utilities — 1.4% | ||||||||||
Ameren Corp. | 3,842 | 128,861 | ||||||||
CenterPoint Energy Inc. | 6,418 | 132,660 | ||||||||
CMS Energy Corp. | 3,800 | 89,300 | ||||||||
Consolidated Edison Inc. | 4,407 | 274,071 | ||||||||
Dominion Resources Inc. | 8,700 | 469,800 | ||||||||
DTE Energy Co. | 2,566 | 152,241 | ||||||||
Integrys Energy Group Inc. | 1,231 | 70,007 | ||||||||
NiSource Inc. | 4,115 | 101,846 | ||||||||
PG&E Corp. | 6,154 | 278,592 | ||||||||
Public Service Enterprise Group Inc. | 7,592 | 246,740 | ||||||||
SCANA Corp. | 1,700 | 81,328 | ||||||||
Sempra Energy | 3,575 | 246,246 | ||||||||
TECO Energy Inc. | 3,600 | 65,016 | ||||||||
Wisconsin Energy Corp. | 3,400 | 134,538 | ||||||||
Xcel Energy Inc. | 7,480 | 212,507 | ||||||||
| 2,683,753 | ||||||||||
Office Electronics — 0.1% | ||||||||||
Xerox Corp. | 19,947 | 156,983 | ||||||||
Office REITs — 0.1% | ||||||||||
Boston Properties Inc. | 2,300 | 249,251 | ||||||||
Office Services & Supplies — 0.1% | ||||||||||
Avery Dennison Corp. | 1,555 | 42,514 | ||||||||
Pitney Bowes Inc. | 2,932 | 43,892 | ||||||||
| 86,406 | ||||||||||
Oil & Gas Drilling — 0.4% | ||||||||||
Diamond Offshore Drilling Inc. | 1,100 | 65,043 | ||||||||
Helmerich & Payne Inc. | 1,600 | 69,568 | ||||||||
Nabors Industries Ltd. | 4,500 | 64,800 | (a) | |||||||
| Number of Shares | Fair Value | |||||||||
Noble Corp. | 4,000 | $ | 130,120 | |||||||
Phillips 66 | 9,859 | 327,713 | (a) | |||||||
Rowan Companies PLC | 1,677 | 54,217 | (a) | |||||||
| 711,461 | ||||||||||
Oil & Gas Equipment & Services — 1.4% | ||||||||||
Baker Hughes Inc. | 6,632 | 272,575 | ||||||||
Cameron International Corp. | 3,800 | 162,298 | (a) | |||||||
FMC Technologies Inc. | 3,686 | 144,602 | (a) | |||||||
Halliburton Co. | 14,091 | 400,043 | ||||||||
National Oilwell Varco Inc. | 6,500 | 418,860 | ||||||||
Schlumberger Ltd. | 20,046 | 1,301,186 | ||||||||
| 2,699,564 | ||||||||||
Oil & Gas Exploration & Production — 2.4% | ||||||||||
Anadarko Petroleum Corp. | 7,456 | 493,587 | ||||||||
Apache Corp. | 5,848 | 513,981 | ||||||||
Cabot Oil & Gas Corp. | 3,200 | 126,080 | ||||||||
Chesapeake Energy Corp. | 9,700 | 180,420 | ||||||||
ConocoPhillips | 19,219 | 1,073,958 | ||||||||
Denbury Resources Inc. | 5,700 | 86,127 | (a) | |||||||
Devon Energy Corp. | 6,192 | 359,074 | ||||||||
EOG Resources Inc. | 4,000 | 360,440 | ||||||||
EQT Corp. | 2,314 | 124,100 | ||||||||
Marathon Oil Corp. | 10,342 | 264,445 | ||||||||
Newfield Exploration Co. | 1,900 | 55,689 | (a) | |||||||
Noble Energy Inc. | 2,700 | 229,014 | ||||||||
Pioneer Natural Resources Co. | 1,900 | 167,599 | ||||||||
QEP Resources Inc. | 2,900 | 86,913 | ||||||||
Range Resources Corp. | 2,400 | 148,488 | ||||||||
Southwestern Energy Co. | 5,500 | 175,615 | (a) | |||||||
WPX Energy Inc. | 2,995 | 48,459 | (a) | |||||||
| 4,493,989 | ||||||||||
Oil & Gas Refining & Marketing — 0.3% | ||||||||||
Marathon Petroleum Corp. | 5,421 | 243,511 | ||||||||
Sunoco Inc. | 1,576 | 74,860 | ||||||||
Tesoro Corp. | 2,300 | 57,408 | (a) | |||||||
Valero Energy Corp. | 8,400 | 202,860 | ||||||||
| 578,639 | ||||||||||
Oil & Gas Storage & Transportation — 0.3% | ||||||||||
Spectra Energy Corp. | 9,877 | 287,026 | ||||||||
The Williams Companies Inc. | 8,886 | 256,095 | ||||||||
| 543,121 | ||||||||||
Packaged Foods & Meats — 1.5% | ||||||||||
Campbell Soup Co. | 2,615 | 87,289 | ||||||||
ConAgra Foods Inc. | 5,968 | 154,750 | ||||||||
Dean Foods Co. | 2,400 | 40,872 | (a) | |||||||
General Mills Inc. | 9,862 | 380,081 | ||||||||
HJ Heinz Co. | 4,697 | 255,423 | ||||||||
Hormel Foods Corp. | 2,200 | 66,924 | ||||||||
Kellogg Co. | 3,590 | 177,095 | ||||||||
Kraft Foods Inc. | 26,490 | 1,023,044 | ||||||||
McCormick & Company Inc. | 2,000 | 121,300 | ||||||||
See Notes to Schedule of Investments and Notes to Financial Statements.
8
Table of Contents
S&P 500 Index Fund
| Schedule of Investments | June 30, 2012 (Unaudited) |
| Number of Shares | Fair Value | |||||||||
Mead Johnson Nutrition Co. | 3,050 | $ | 245,556 | |||||||
The Hershey Co. | 2,284 | 164,517 | ||||||||
The JM Smucker Co. | 1,717 | 129,668 | ||||||||
Tyson Foods Inc. | 4,600 | 86,618 | ||||||||
| 2,933,137 | ||||||||||
Paper Packaging — 0.1% | ||||||||||
Bemis Company Inc. | 1,362 | 42,685 | ||||||||
Sealed Air Corp. | 2,814 | 43,448 | ||||||||
| 86,133 | ||||||||||
Paper Products — 0.1% | ||||||||||
International Paper Co. | 6,775 | 195,865 | ||||||||
MeadWestvaco Corp. | 2,500 | 71,875 | ||||||||
| 267,740 | ||||||||||
Personal Products — 0.2% | ||||||||||
Avon Products Inc. | 6,728 | 109,061 | ||||||||
The Estee Lauder Companies Inc. | 3,500 | 189,420 | ||||||||
| 298,481 | ||||||||||
Pharmaceuticals — 6.1% | ||||||||||
Abbott Laboratories | 23,604 | 1,521,750 | (d) | |||||||
Allergan Inc. | 4,655 | 430,913 | ||||||||
Bristol-Myers Squibb Co. | 25,318 | 910,182 | (d) | |||||||
Eli Lilly & Co. | 15,243 | 654,077 | ||||||||
Forest Laboratories Inc. | 4,100 | 143,459 | (a) | |||||||
Hospira Inc. | 2,639 | 92,312 | (a) | |||||||
Johnson & Johnson | 41,286 | 2,789,282 | ||||||||
Merck & Company Inc. | 45,745 | 1,909,854 | ||||||||
Mylan Inc. | 6,165 | 131,746 | (a) | |||||||
Perrigo Co. | 1,400 | 165,102 | ||||||||
Pfizer Inc. | 112,614 | 2,590,122 | ||||||||
Watson Pharmaceuticals Inc. | 2,000 | 147,980 | (a) | |||||||
| 11,486,779 | ||||||||||
Pipelines — 0.1% | ||||||||||
Kinder Morgan Inc. | 7,484 | 241,134 | ||||||||
Property & Casualty Insurance — 2.1% | ||||||||||
ACE Ltd. | 5,100 | 378,063 | ||||||||
Berkshire Hathaway Inc. | 26,369 | 2,197,329 | (a) | |||||||
Cincinnati Financial Corp. | 2,292 | 87,256 | ||||||||
The Allstate Corp. | 7,386 | 259,175 | (d) | |||||||
The Chubb Corp. | 4,094 | 298,125 | ||||||||
The Progressive Corp. | 9,273 | 193,157 | ||||||||
The Travelers Companies Inc. | 5,999 | 382,976 | ||||||||
XL Group PLC | 4,600 | 96,784 | ||||||||
| 3,892,865 | ||||||||||
Publishing — 0.1% | ||||||||||
Gannett Company Inc. | 3,508 | 51,673 | ||||||||
The McGraw-Hill Companies Inc. | 4,221 | 189,945 | ||||||||
The Washington Post Co. | 90 | 33,644 | ||||||||
| 275,262 | ||||||||||
| Number of Shares | Fair Value | |||||||||
Railroads — 0.8% | ||||||||||
CSX Corp. | 16,017 | $ | 358,140 | |||||||
Norfolk Southern Corp. | 5,018 | 360,142 | ||||||||
Union Pacific Corp. | 7,137 | 851,515 | ||||||||
| 1,569,797 | ||||||||||
Real Estate Services — 0.0%* | ||||||||||
CBRE Group Inc. | 4,900 | 80,164 | (a) | |||||||
Regional Banks — 0.9% | ||||||||||
BB&T Corp. | 10,600 | 327,010 | ||||||||
Fifth Third Bancorp | 13,416 | 179,774 | ||||||||
First Horizon National Corp. | 4,055 | 35,076 | ||||||||
Huntington Bancshares Inc. | 13,934 | 89,178 | ||||||||
KeyCorp | 15,228 | 117,865 | ||||||||
M&T Bank Corp. | 1,900 | 156,883 | ||||||||
PNC Financial Services Group Inc. | 7,804 | 476,902 | ||||||||
Regions Financial Corp. | 18,468 | 124,659 | ||||||||
SunTrust Banks Inc. | 7,729 | 187,274 | ||||||||
Zions Bancorporation | 2,500 | 48,550 | ||||||||
| 1,743,171 | ||||||||||
Research & Consulting Services — 0.1% | ||||||||||
Equifax Inc. | 1,800 | 83,880 | ||||||||
The Dun & Bradstreet Corp. | 700 | 49,819 | ||||||||
| 133,699 | ||||||||||
Residential REITs — 0.3% | ||||||||||
Apartment Investment & Management Co. | 1,831 | 49,492 | ||||||||
AvalonBay Communities Inc. | 1,401 | 198,213 | ||||||||
Equity Residential | 4,400 | 274,384 | ||||||||
| 522,089 | ||||||||||
Restaurants — 1.4% | ||||||||||
Chipotle Mexican Grill Inc. | 500 | 189,975 | (a) | |||||||
Darden Restaurants Inc. | 1,829 | 92,602 | ||||||||
McDonald’s Corp. | 15,290 | 1,353,624 | ||||||||
Starbucks Corp. | 11,398 | 607,741 | ||||||||
Yum! Brands Inc. | 7,029 | 452,808 | ||||||||
| 2,696,750 | ||||||||||
Retail REITs — 0.4% | ||||||||||
Kimco Realty Corp. | 6,500 | 123,695 | ||||||||
Simon Property Group Inc. | 4,537 | 706,229 | ||||||||
| 829,924 | ||||||||||
Semiconductor Equipment — 0.3% | ||||||||||
Applied Materials Inc. | 18,900 | �� | 216,594 | (d) | ||||||
KLA-Tencor Corp. | 2,500 | 123,125 | ||||||||
Lam Research Corp. | 3,125 | 117,937 | (a) | |||||||
Teradyne Inc. | 2,500 | 35,150 | (a) | |||||||
| 492,806 | ||||||||||
See Notes to Schedule of Investments and Notes to Financial Statements.
9
Table of Contents
S&P 500 Index Fund
| Schedule of Investments | June 30, 2012 (Unaudited) |
| Number of Shares | Fair Value | |||||||||
Semiconductors — 2.0% | ||||||||||
Advanced Micro Devices Inc. | 10,074 | $ | 57,724 | (a,d) | ||||||
Altera Corp. | 4,700 | 159,048 | ||||||||
Analog Devices Inc. | 4,700 | 177,049 | ||||||||
Broadcom Corp. | 7,550 | 255,190 | ||||||||
First Solar Inc. | 910 | 13,705 | (a) | |||||||
Intel Corp. | 75,665 | 2,016,472 | (d) | |||||||
Linear Technology Corp. | 3,400 | 106,522 | ||||||||
LSI Corp. | 8,092 | 51,546 | (a) | |||||||
Microchip Technology Inc. | 3,000 | 99,240 | ||||||||
Micron Technology Inc. | 15,254 | 96,253 | (a) | |||||||
NVIDIA Corp. | 9,300 | 128,526 | (a) | |||||||
Texas Instruments Inc. | 17,051 | 489,193 | ||||||||
Xilinx Inc. | 4,187 | 140,558 | ||||||||
| 3,791,026 | ||||||||||
Soft Drinks — 2.5% | ||||||||||
Coca-Cola Enterprises Inc. | 4,818 | 135,097 | ||||||||
Dr Pepper Snapple Group Inc. | 3,300 | 144,375 | ||||||||
Monster Beverage Corp. | 2,300 | 163,760 | ||||||||
PepsiCo Inc. | 23,549 | 1,663,972 | (d) | |||||||
The Coca-Cola Co. | 34,002 | 2,658,616 | (d) | |||||||
| 4,765,820 | ||||||||||
Specialized Consumer Services — 0.0%* | ||||||||||
H&R Block Inc. | 4,492 | 71,782 | ||||||||
Specialized Finance — 0.4% | ||||||||||
CME Group Inc. | 961 | 257,654 | ||||||||
IntercontinentalExchange Inc. | 1,100 | 149,578 | (a) | |||||||
Moody’s Corp. | 2,784 | 101,755 | ||||||||
NYSE Euronext | 4,200 | 107,436 | ||||||||
The NASDAQ OMX Group Inc. | 1,700 | 38,539 | ||||||||
| 654,962 | ||||||||||
Specialized REITs — 1.0% | ||||||||||
American Tower Corp. | 6,000 | 419,460 | ||||||||
HCP Inc. | 6,200 | 273,730 | ||||||||
Healthcare Inc. | 3,100 | 180,730 | ||||||||
Host Hotels & Resorts Inc. | 10,617 | 167,961 | ||||||||
Plum Creek Timber Company Inc. | 2,400 | 95,280 | ||||||||
Public Storage | 2,200 | 317,702 | ||||||||
Ventas Inc. | 4,300 | 271,416 | ||||||||
Weyerhaeuser Co. | 8,167 | 182,614 | ||||||||
| 1,908,893 | ||||||||||
Specialty Chemicals — 0.4% | ||||||||||
Ecolab Inc. | 4,452 | 305,096 | ||||||||
International Flavors & Fragrances Inc. | 1,247 | 68,336 | ||||||||
Sigma-Aldrich Corp. | 1,882 | 139,136 | ||||||||
The Sherwin-Williams Co. | 1,363 | 180,393 | ||||||||
| 692,961 | ||||||||||
Specialty Stores — 0.1% | ||||||||||
Staples Inc. | 11,050 | 144,203 | ||||||||
| Number of Shares | Fair Value | |||||||||
Tiffany & Co. | 2,000 | $ | 105,900 | |||||||
| 250,103 | ||||||||||
Steel — 0.2% | ||||||||||
Allegheny Technologies Inc. | 1,751 | 55,839 | ||||||||
Cliffs Natural Resources Inc. | 2,200 | 108,438 | ||||||||
Nucor Corp. | 4,936 | 187,074 | ||||||||
United States Steel Corp. | 2,065 | 42,539 | ||||||||
| 393,890 | ||||||||||
Systems Software — 3.0% | ||||||||||
BMC Software Inc. | 2,400 | 102,432 | (a) | |||||||
CA Inc. | 5,700 | 154,413 | ||||||||
Microsoft Corp. | 112,239 | 3,433,391 | (d) | |||||||
Oracle Corp. | 58,852 | 1,747,904 | (d) | |||||||
Red Hat Inc. | 2,900 | 163,792 | (a) | |||||||
Symantec Corp. | 10,585 | 154,647 | (a) | |||||||
| 5,756,579 | ||||||||||
Thrifts & Mortgage Finance — 0.1% | ||||||||||
Hudson City Bancorp Inc. | 7,500 | 47,775 | ||||||||
People’s United Financial Inc. | 5,400 | 62,694 | ||||||||
| 110,469 | ||||||||||
Tires & Rubber — 0.0%* | ||||||||||
The Goodyear Tire & Rubber Co. | 3,419 | 40,378 | (a) | |||||||
Tobacco — 2.0% | ||||||||||
Altria Group Inc. | 30,653 | 1,059,061 | ||||||||
Lorillard Inc. | 2,011 | 265,351 | ||||||||
Philip Morris International Inc. | 25,679 | 2,240,750 | ||||||||
Reynolds American Inc. | 4,900 | 219,863 | ||||||||
| 3,785,025 | ||||||||||
Trading Companies & Distributors — 0.2% | ||||||||||
Fastenal Co. | 4,500 | 181,395 | ||||||||
WW Grainger Inc. | 882 | 168,674 | ||||||||
| 350,069 | ||||||||||
Trucking — 0.0%* | ||||||||||
Ryder System Inc. | 931 | 33,525 | ||||||||
Wireless Telecommunication Services — 0.2% | ||||||||||
Crown Castle International Corp. | 3,900 | 228,774 | (a) | |||||||
MetroPCS Communications Inc. | 4,600 | 27,830 | (a) | |||||||
Sprint Nextel Corp. | 47,500 | 154,850 | (a) | |||||||
| 411,454 | ||||||||||
Total Common Stock | 185,529,048 | |||||||||
See Notes to Schedule of Investments and Notes to Financial Statements.
10
Table of Contents
S&P 500 Index Fund
| Schedule of Investments | June 30, 2012 (Unaudited) |
| Number of Shares | Fair Value | |||||||
Other Investments — 0.0%* | ||||||||
GEI Investment Fund | $ | 64,359 | (e) | |||||
Total Investments in Securities | 185,593,407 | |||||||
Short-Term Investments — 2.1% | ||||||||
GE Institutional Money Market Fund — Investment Class 0.04% | 4,085,064 | (b,e) | ||||||
Total Investments | 189,678,471 | |||||||
Other Assets and Liabilities, | 299,541 | |||||||
|
| |||||||
NET ASSETS — 100.0% | $ | 189,978,012 | ||||||
|
| |||||||
Other Information | ||||||||
The Fund had the following long futures contracts open at June 30, 2012 (unaudited);
| Description | Expiration date | Number of Contracts | Current Notional Value | Unrealized Appreciation | ||||||||||||
S&P | September 2012 | 75 | $ | 5,086,500 | $ | 172,438 | ||||||||||
See Notes to Schedule of Investments and Notes to Financial Statements.
11
Table of Contents
| Notes to Schedules of Investments | June 30, 2012 (Unaudited) |
The views expressed in this document reflect our judgment as of the publication date and are subject to change at any time without notice. The securities information regarding holdings, allocations and other characteristics are presented to illustrate examples of securities that the Fund has bought and the diversity of areas in which the Fund may invest as of a particular date. It may not be representative of the Fund’s current or future investments and should not be construed as a recommendation to purchase or sell a particular security. See the Fund’s summary prospectus and statutory prospectus for complete descriptions of investment objectives, policies, risks and permissible investments.
| (a) | Non-income producing security. |
| (b) | Coupon amount represents effective yield. |
| (c) | State Street Corp. is the parent company of State Street Bank & Trust Co., the Fund’s custodian and accounting agent. State Street Corp. is also affiliated with SSgA Management, Inc., the sub-adviser. |
| (d) | At June 30, 2012 , all or a portion of this security was pledged to cover collateral requirements for futures, options, forward foreign currency contracts and/or TBA’s. |
| (e) | GE Asset Management, the investment adviser of the Fund, also serves as investment adviser of the GEI Investment Fund and the GE Institutional Money Market Fund. The GE Investment Fund has been determined to be illiquid using procedures established by the Board of Directors. |
| (f) | General Electric Co. is the parent company of GE Asset Management Incorporated, the Fund’s investment Adviser. |
| * | Less than 0.05%. |
| † | Percentages are based on net assets as of June 30, 2012. |
Abbreviations:
REIT | Real Estate Investment Trust |
12
Table of Contents
Selected data based on a share outstanding throughout the fiscal years indicated
| 6/30/12† | 12/31/11 | 12/31/10 | 12/31/09 | 12/31/08 | 12/31/07 | |||||||||||||||||||
| Inception date | — | — | — | — | — | 4/15/85 | ||||||||||||||||||
Net asset value, beginning of period | $ | 22.31 | $ | 22.37 | $ | 19.82 | $ | 15.99 | $ | 26.52 | $ | 26.06 | ||||||||||||
Income/(loss) from investment operations: | ||||||||||||||||||||||||
Net investment income | $ | 0.22 | 0.44 | 0.40 | 0.38 | 0.52 | 0.47 | |||||||||||||||||
Net realized and unrealized | 1.86 | (0.06) | 2.54 | 3.84 | (10.46) | 0.86 | ||||||||||||||||||
Total income/(loss) from | 2.08 | 0.38 | 2.94 | 4.22 | (9.94) | 1.33 | ||||||||||||||||||
Less distributions from: | ||||||||||||||||||||||||
Net investment income | — | 0.44 | 0.39 | 0.39 | 0.50 | 0.47 | ||||||||||||||||||
Net realized gains | — | — | — | — | 0.09 | 0.40 | ||||||||||||||||||
Total distributions | — | 0.44 | 0.39 | 0.39 | 0.59 | 0.87 | ||||||||||||||||||
Net asset value, end of period | $ | 24.39 | $ | 22.31 | $ | 22.37 | $ | 19.82 | $ | 15.99 | $ | 26.52 | ||||||||||||
TOTAL RETURN (a) | 9.32% | 1.71% | 14.84% | 26.30% | (37.40)% | 5.10% | ||||||||||||||||||
RATIOS/SUPPLEMENTAL DATA: | ||||||||||||||||||||||||
Net assets, end of period (in thousands) | $ | 189,978 | $ | 179,556 | $ | 217,344 | $ | 224,165 | $ | 209,176 | $ | 447,426 | ||||||||||||
Ratios to average net assets: | ||||||||||||||||||||||||
Net investment income | 1.76% | * | 1.73% | 1.79% | 2.05% | 1.91% | 1.62% | |||||||||||||||||
Net Expenses | 0.37% | (b)(c)* | 0.40% | (b)(c) | 0.33% | (b)(c) | 0.43% | (b) | 0.41% | (b) | 0.39% | |||||||||||||
Gross Expenses | 0.42% | * | 0.45% | 0.38% | 0.43% | 0.41% | 0.39% | |||||||||||||||||
Portfolio turnover rate | 4% | 3% | 4% | 5% | 4% | 6% | ||||||||||||||||||
Notes to Financial Highlights
| (a) | Total returns are historical and assume changes in share price, reinvestment of dividends and capital gains distributions and do not include the effect of insurance contract charges. Past performance does not guarantee future results. |
| (b) | Reflects GE Asset Management’s waiver of a portion of the Fund’s management fee in an amount equal to the management fee earned by GEAM with respect to the Fund’s investment in the GE Institutional Money Market Fund or, prior to 2011, in another affiliated money market fund formerly managed by GEAM. |
| (c) | Reflects GE Asset Management’s contractual arrangement with the Company to limit the management fee charged to the Fund to 0.30% of the average daily net assets of the Fund. |
| † | Unaudited |
| * | Annualized for periods less than one year. |
The accompanying Notes are an integral part of these financial statements.
13
Table of Contents
The accompanying Notes are an integral part of these financial statements.
14
Table of Contents
For the period ending June 30, 2012 | (Unaudited) | |||
INVESTMENT INCOME | ||||
Income | ||||
Dividends | $ | 2,033,303 | ||
Interest | 11,636 | |||
Interest from affiliated investments | 817 | |||
Total income | 2,045,756 | |||
Expenses | ||||
Advisory and administration fees | 337,406 | |||
Transfer agent fees | 11 | |||
Director’s fees | 3,817 | |||
Custody and accounting expenses | 19,369 | |||
Professional fees | 6,045 | |||
Other expenses | 39,625 | |||
Total expenses before waiver and reimbursement | 406,273 | |||
Less: Expenses waived or borne by the adviser | (1,887 | ) | ||
Less: Expenses reimbursed by the adviser | (47,974 | ) | ||
Net expenses | 356,412 | |||
Net investment income | 1,689,344 | |||
NET REALIZED AND UNREALIZED GAIN (LOSS) | ||||
Realized gain (loss) on: | ||||
Investments | 3,604,471 | |||
Futures | 150,210 | |||
Foreign currency related transactions | (28 | ) | ||
Increase in unrealized appreciation on: | ||||
Investments | 11,309,731 | |||
Futures | 173,086 | |||
Net realized and unrealized gain on Investments | 15,237,470 | |||
Net increase in net assets resulting from operations | $ | 16,926,814 | ||
The accompanying Notes are an integral part of these financial statements.
15
Table of Contents
| * | Unaudited |
The accompanying Notes are an integral part of these financial statements.
16
Table of Contents
| Notes to Financial Statements | June 30, 2012 (Unaudited) |
1. Organization of the Company
GE Investments Funds, Inc. (the “Company”) was incorporated under the laws of the Commonwealth of Virginia on May 14, 1984 and is registered under the Investment Company Act of 1940, as amended (the “1940 Act”), as an open-end management investment company. The Company is composed of thirteen investment portfolios (collectively the “Funds”), although only the following ten are currently being offered: U.S. Equity Fund, S&P 500 Index Fund (the “Fund”), Premier Growth Equity Fund, Core Value Equity Fund, Mid-Cap Equity Fund, Small-Cap Equity Fund, Total Return Fund, Income Fund, Money Market Fund and Real Estate Securities Fund.
Shares of the Funds of the Company are offered only to insurance company separate accounts that fund certain variable life insurance contracts and variable annuity contracts. GE Asset Management Incorporated (“GEAM”) is the investment adviser and administrator of each of the Funds.
| 2. | Summary of Significant Accounting Policies |
The preparation of financial statements in conformity with U.S. generally accepted accounting principles (GAAP) requires management to make estimates and assumptions that affect the reported amounts of assets and liabilities and disclosure of contingent assets and liabilities at the date of the financial statements and the reported amounts of increases and decreases in net assets from operations during the reporting period. Actual results may differ from those estimates.
The following summarizes the significant accounting policies of the Company:
Securities Valuation and Transactions. All investments in securities are recorded at their estimated fair value, as described in Note 3.
Securities transactions are accounted for as of the trade date. Realized gains and losses on investments sold are recorded on the basis of identified cost for both financial statement and federal tax purposes.
Derivatives The Fund is subject to equity price risk in the normal course of pursuing its investment objectives. The Fund may enter into derivative transactions to gain market exposure for residual and accumulating cash positions.
Futures Contracts A futures contract represents a commitment for the future purchase or sale of an asset at a
specified price on a specified date. The Fund invested in futures for a variety of portfolio management purposes such as hedging against the effects of changes in the value of portfolio securities due to anticipated changes in market conditions, gaining market exposure for accumulating and residual cash positions, or when the transactions were economically appropriate to the reduction of risks inherent in the management of the Fund. Buying futures tends to increase a Fund’s exposure to the underlying instrument while selling futures tends to decrease a Fund’s exposure to the underlying instrument, or hedge other Fund investments. The Fund will not enter into a transaction involving futures for speculative purposes. With futures contracts, there is minimal counterparty credit risk to the Fund since futures contracts are exchange traded and the exchange’s clearinghouse, as counterparty to all traded futures, guarantees the futures against default. The Fund’s risks in using these contracts include changes in the value of the underlying instruments, non-performance of the counterparties under the contracts’ terms and changes in the liquidity of the secondary market for the contracts. Futures contracts are valued at the settlement price established each day by the board of trade or exchange on which they principally trade.
Upon entering into a financial futures contract, the Fund is required to pledge to the broker an amount of cash and/or other assets equal to a certain percentage of the contract amount, known as initial margin deposit. Subsequent payments, known as variation margin, are made or received by the Fund each day, depending on the daily fluctuation in the fair value of the underlying security. The Fund records an unrealized gain or loss equal to the daily variation margin. Should market conditions move unexpectedly, the Fund may not achieve the anticipated benefits of the futures contracts and may incur a loss. The Fund recognizes a realized gain or loss on the expiration or closing of a futures contract.
Investment Income Corporate actions (including cash dividends) are recorded on the ex-dividend date, net of applicable withholding taxes, except for certain foreign corporate actions which are recorded as soon after the ex-dividend date as such information becomes available. Withholding taxes in foreign dividends have been provided for in accordance with the Fund’s understanding of the applicable country’s tax rules and rates.
Interest income is recorded on the accrual basis. Accretion of discounts and amortization of premiums on taxable bonds are to the call or maturity date, whichever is shorter, using the effective yield method.
17
Table of Contents
| Notes to Financial Statements | June 30, 2012 (unaudited) |
Expenses Fund specific expenses are allocated to the Fund that incurs such expenses. Such expenses may include custodial fees, legal and accounting fees, printing costs and registration fees. Expenses that are not fund specific are allocated pro rata across the Funds. Expenses of the Fund are generally paid directly by the Fund, however, expenses may be paid by GEAM and reimbursed by the Fund.
Federal Income Taxes The Fund intends to comply with all sections of the Internal Revenue Code applicable to regulated investment companies including the distribution of substantially all of its taxable net investment income and net realized capital gains to its shareholders. Therefore, no provision for federal income tax has been made.
| 3. | Securities Valuation |
The Fund utilizes various methods to measure the fair value of most of its investments on a recurring basis. GAAP establishes a framework for measuring fair value and providing related disclosures. Broadly, the framework requires fair value to be determined based on the exchange price that would be received for an asset or paid to transfer a liability (an exit price) in the principal or most advantageous market for the asset or liability in an orderly transaction between market participants at the measurement date. In the absence of active markets for the identical assets or liabilities, such measurements involve developing assumptions based on market observable data and, in the absence of such data, internal information that is consistent with what market participants would use in a hypothetical transaction that occurs at the measurement date. It also establishes a three-level valuation hierarchy based upon observable and non-observable inputs.
Observable inputs reflect market data obtained from independent sources, while unobservable inputs reflect our market assumptions. Preference is given to observable inputs. These two types of inputs create the following fair value hierarchy:
Level 1 — Quoted prices for identical investments in active markets.
Level 2 — Quoted prices for similar investments in active markets; quoted prices for identical or similar investments in markets that are not active; and model-derived valuations whose inputs are observable or whose significant value drivers are observable.
Level 3 — Significant inputs to the valuation model are unobservable.
Policies and procedures are maintained to value investments using the best and most relevant data available. In addition, pricing vendors are utilized to assist in valuing investments. GEAM performs periodic reviews of the methodologies used by independent pricing services including price validation of individual securities.
Fair Value Measurement The following section describes the valuation methodologies the Fund uses to measure different financial investments at fair value.
The Fund’s portfolio securities are valued generally on the basis of market quotations. Equity securities generally are valued at the last reported sale price on the primary market in which they are traded. Portfolio securities listed on NASDAQ are valued using the NASDAQ Official Closing Price, Level 1 securities primarily include publicly-traded equity securities. If no sales occurred on the exchange or NASDAQ that day, the portfolio security generally is valued using the last reported bid price. In those circumstances the Fund classifies the investment securities in Level 2.
Short-term investments of sufficient credit quality with remaining maturities of sixty days or less at the time of purchase are typically valued on the basis of amortized cost which approximates fair value and these are included in Level 2. If it is determined that amortized cost does not
approximate fair value, securities may be valued based on dealer supplied valuations or quotations. In these infrequent circumstances, pricing services may provide the Fund with valuations that are based on significant unobservable inputs, and in those circumstances the investment securities are classified in Level 3.
The Fund uses the net asset value per unit for collective funds (i.e., GEI Investment Fund). The Fund classifies the investment security in Level 2.
If prices are not readily available for a portfolio security, or if it is believed that a price for a portfolio security does not represent its fair value, the security may be valued using procedures approved by the Fund’s Board of Directors that are designed to establish its “fair” value. These securities are typically classified in Level 3. Those procedures require that the fair value of a security be established by a valuation committee of GEAM. The valuation committee follows different protocols for different types of investments and circumstances. The fair value procedures may be used to value any investment of the Fund in the appropriate circumstances.
Fair value determinations generally are used for securities whose value is affected by a significant event that will
18
Table of Contents
| Notes to Financial Statements | June 30, 2012 (Unaudited) |
materially affect the value of a security and which occurs subsequent to the time of the close of the principal market on which such security trades but prior to the calculation of the Fund’s NAV.
The value established for such a portfolio security may be different than what would be produced through the use of market quotations or another methodology. Portfolio securities that are valued using techniques other than market quotations, including “fair valued” securities, may be subject to greater fluctuation in their value from one day to the next than would be the case if market quotations were used. In addition, there is no assurance that the Fund could sell a portfolio security for the value established for it at any time and it is possible that the Fund would incur a loss because a portfolio security is sold at a discount to its established value.
Other financial investments are derivative instruments that are not reflected in total investments, such as futures, forwards, swaps, and written options contracts, which are valued based on fair value as discussed above.
The Fund uses closing prices for derivatives included in Level 1, which are traded either on exchanges or liquid over-the counter markets. Derivative assets and liabilities included in Level 2 primarily represent interest rate swaps, cross-currency swaps and foreign currency and commodity forward and option contracts. Derivative assets and liabilities included in Level 3 primarily represent interest rate products that contain embedded optionality or prepayment features.
The inputs or methodology used for valuing securities are not an indication of the risk associated with investing in those securities.
The following table presents the Fund’s investments measured at fair value on a recurring basis at June 30, 2012:
Investments | Level 1 | Level 2 | Level 3 | Total | ||||||||||||
Investments in Securities† | ||||||||||||||||
Common Stock | $ | 185,529,048 | $ | — | $ | — | $ | 185,529,048 | ||||||||
Other Investments | — | 64,359 | — | 64,359 | ||||||||||||
Short-Term Investments | 4,085,064 | — | — | 4,085,064 | ||||||||||||
|
|
|
|
|
|
|
| |||||||||
Total Investments in Securities | $ | 189,614,112 | $ | 64,359 | $ | — | $ | 189,678,471 | ||||||||
|
|
|
|
|
|
|
| |||||||||
Other Financial Instruments* | ||||||||||||||||
Futures Contracts — Unrealized Appreciation | $ | 172,438 | $ | — | $ | — | $ | 172,438 | ||||||||
|
|
|
|
|
|
|
| |||||||||
† See Schedule of Investments for Industry Classification * Other financial instruments include derivative instruments such as futures contracts. Amounts shown represent unrealized appreciation, at period end. |
| |||||||||||||||
The following table presents the changes in Level 3 investments measured on a recurring basis for the period ended June 30, 2012:
S&P 500 Index Fund | | Common Stock | | | Preferred Stock | | Total | |||||
Balance at 12/31/11 | $ | 173 | $ | — | $ | 173 | ||||||
Accrued discounts/premiums | — | — | — | |||||||||
Realized gain (loss) | (2,105 | ) | (21 | ) | (2,126 | ) | ||||||
Change in unrealized gain (loss) | 78 | 252 | 330 | |||||||||
Issuances | 2,271 | (175 | ) | 2,096 | ||||||||
Sales | (417 | ) | (56 | ) | (473 | ) | ||||||
| Balance at 06/30/12 | $ | — | $ | — | $ | — | ||||||
Change in unrealized depreciation relating to securities still held at 06/30/12 |
$ |
— |
|
$ |
— |
|
$ |
— |
|
There were no transfers between fair value levels. Transfers between fair value levels are considered to occur at the beginning of the period.
19
Table of Contents
| Notes to Financial Statements | June 30, 2012 (Unaudited) |
| 4. | Derivatives Transactions |
Shown below are the derivative contracts entered into by the Fund, summarized by primary risk exposure as they appear on the Statement of Assets and Liabilities, all of which are not accounted for as hedging instruments under FASB Accounting Standards Codification (“ASC”) No. 815 Derivatives and Hedging as of June 30, 2012.
Asset Derivatives June 30, 2012 | Liability Derivatives June 30, 2012 | |||||||||||
Derivatives not accounted for as hedging instruments under ASC 815 | Location in the Statement of Assets and Liabilities | Fair Value ($) | Location in the Statements of Assets and Liabilities | Fair Value ($) | ||||||||
| Equity Contracts | Assets, Net Assets – Net Unrealized Appreciation/ (Depreciation) on Futures | 172,438* | Liabilities, Net Assets – Net Unrealized Appreciation/ (Depreciation) on Futures | — | ||||||||
| * | Includes cumulative unrealized appreciation/(depreciation) of futures contracts reported in the Schedule of Investments and as within the components of the net assets section of the Statement of Assets and Liabilities. Only the current day’s variation margin is reported within the Assets and/or Liabilities section on the Statement of Assets and Liabilities. |
Shown below are the effects of derivative instruments on the Fund’s Statement of Operation, summarized by primary risk exposure all of which are not accounted for as hedging instruments under ASC 815.
| Derivatives not accounted for as hedging instruments under ASC 815 | Location in the Statements of Operations | Total Notional Amount of Futures Contracts Purchased/(Sold) ($) | Realized Gain or (Loss) on Derivatives Recognized in Income ($) | Change in Unrealized Appreciation/(Depreciation) on Derivatives Recognized in Income ($) | ||||||||||
Equity Contracts | Realized gain/(loss) on Futures, Increase/(decrease) in unrealized appreciation/ (depreciation) on Futures | 20,802,563/(18,358,230) | 150,210 | 173,086 | ||||||||||
| 5. | Compensation and Fees Paid to Affiliates |
GEAM, a registered investment adviser, was retained by the Company’s Board of Directors effective May 1, 1997 to act as investment adviser and administrator of the Fund. GEAM’s compensation for investment advisory and administrative services is paid monthly based on the average daily net assets of the Fund at an annualized rate of 0.35%.
GEAM has entered into a contractual arrangement with the Company to limit the management fee charged to the Fund to 0.30% of the average daily net assets of the Fund (the “Agreement”). Unless terminated or amended, this Agreement will continue in effect until April 30, 2013. The Agreement may only be changed or terminated with the approval of the Company’s Board of Directors and GEAM.
GEAM has a contractual arrangement with the Fund to waive a portion of the Fund’s management fee in the amount equal to the management fee earned by GEAM with respect to the Fund’s investment in the GE Institutional Money Market Fund, if any.
Directors’ Compensation The Fund pays no compensation to its directors who are officers or employees of GEAM or its affiliates. Directors who are not such officers or employees also serve in a similar capacity for other funds advised by GEAM. Compensation paid to
non-interested Directors are reflected on the Statement of Operations. These fees are allocated pro rata across all of the mutual fund platforms served by the Directors, including the Fund, and are based upon the relative net assets of each fund within such platforms.
| 6. | Sub-advisory Fees |
Pursuant to an investment sub-advisory agreement with GEAM, SSgA Funds Management, Inc. (“SSgA”) is the sub-adviser to the S&P 500 Index Fund. SSgA is responsible for the day-to-day portfolio management of the assets of the Fund, including the responsibility for making decisions to buy, sell or hold a particular security, under the general supervision of GEAM and the Board.
For its services, GEAM pays SSgA monthly sub-advisory fees which are calculated as a percentage of the average daily net assets of the Fund.
| 7. | Investment Transactions |
Purchases and Sales of Securities The cost of purchases and the proceeds from sales of investments, other than short-term securities, for the six-month period ended June 30, 2012 were as follows:
| Non-U.S. Government Securities | ||
| Purchases | Sales | |
| $7,956,283 | $14,975,381 | |
20
Table of Contents
| Notes to Financial Statements | June 30, 2012 (Unaudited) |
| 8. | Income Taxes |
The Fund is subject to ASC 740, Income Taxes. ASC 740 provides guidance for financial accounting and reporting for the effects of income taxes that result from an entity’s activities during the year. ASC 740 also provides guidance regarding how certain tax positions should be recognized, measured, presented and disclosed in the financial statements. ASC 740 requires evaluation of tax positions
taken or expected to be taken in the course of preparing the Fund’s tax returns to determine whether the tax positions are “more likely than not” of being sustained by the applicable tax authority. There are no adjustments to the Fund’s net assets required under ASC 740. The Fund’s 2008, 2009, 2010 and 2011 fiscal years tax returns are still open to examination by the Federal and applicable state tax authorities.
At June 30, 2012, information on the tax cost of investments was as follows:
| Gross Tax | Net Tax Appreciation | |||||
| Cost of Investments For Tax Purposes | Appreciation | Depreciation | ||||
$160,989,123 | $57,858,037 | $(29,168,689) | $28,689,348 | |||
As of December 31, 2011, the Fund has capital loss carryovers, as indicated below. Capital loss carryovers are available to offset future realized capital gains to the extent provided in the Internal Revenue Code and regulations thereunder. To the extent that these carryover losses are used to offset future capital gains, it is probable that the gains so offset will not be distributed to shareholders because they would be taxable as ordinary income.
Amount | ||||
| Short-Term | Long-Term | Expires | ||
| $21,017,557 | $— | 12/31/2016 | ||
| 20,177,021 | — | 12/31/2017 | ||
| 3,073,444 | — | 12/31/2018 | ||
These amounts will be available to offset future taxable capital gains. Under the recently enacted Regulated Investment Company Modernization Act of 2010, the Fund will be permitted to carry forward capital losses incurred in taxable years beginning after December 22, 2010 for an unlimited period. However, any losses incurred during those future years will be required to be utilized prior to the losses incurred in pre-enactment tax years. As a result of this ordering rule, pre-enactment capital loss carryforwards may be more likely to expire unused. Additionally, post-enactment capital losses that are carried forward will retain their character as either short-term or long-term capital losses rather than being considered all short-term as under previous law.
During the year ended December 31, 2011, the Fund utilized $834,766 of prior year capital loss carryovers.
Any qualified late-year loss is deemed to arise on the first day of the Fund’s next tax year (if the Fund elects to defer such loss). Under this regime, generally, the Fund can elect to defer any post-October capital loss and/or any late-year ordinary loss as defined by the Internal Revenue Code.
The Fund elected to defer qualified late-year losses for the year ended December 31, 2011 as follows:
| Capital | Ordinary | |
| $672,990 | $— |
The tax composition of distributions paid during the years ended December 31, 2011 and December 31, 2010 were as follows:
| Ordinary Income | Long-Term Capital Gains | Total | ||||||||||
2011 | $ | 3,467,935 | $ | — | $ | 3,467,935 | ||||||
2010 | 3,730,010 | — | 4,356,429 | |||||||||
Distributions to Shareholders The Fund declares and pays any dividends from net investment income annually. The Fund declares and pays any net realized capital gains in excess of capital loss carryforwards distributions annually. The character of income and gains to be distributed is determined in accordance with income tax regulations which may differ from generally accepted accounting principles. These differences include (but are not limited to) futures, investments organized as partnerships for tax purposes, distributions from Real Estate Investment Trusts (REITs) and other equity investments, and losses deferred due to wash sale transactions. Reclassifications due to permanent book/tax differences are made to the Fund’s capital accounts to reflect income and gains available for distribution (or available capital loss carryovers) under income tax regulations. These reclassifications have no impact on net investment income, realized gains or losses, or the net asset value of the Fund. The calculation of net investment income per share in the Financial Highlights table excludes these adjustments.
21
Table of Contents
| Notes to Financial Statements | June 30, 2012 (Unaudited) |
The reclassifications for the year ended December 31, 2011 were as follows:
| Undistributed Net Investment Income | Accumulated Net Realized | Capital Paid In | ||
| $1,483 | $28,544 | $(30,027) |
| 9. | Subsequent Events |
Subsequent events after the balance sheet date through the date the financial statements were issued have been evaluated in the preparation of the financial statements. As of August 3, 2012, the assets of the Mid-Cap Equity Fund and the Money Market Fund were liquidated. These funds ceased operations and are no longer offered for investment.
22
Table of Contents
| Additional Information | (Unaudited) |
Information about Directors and Executive Officers:
The business and affairs of the Funds are managed under the direction of the Funds’ Board of Directors. Information pertaining to the Directors and officers of the Funds is set forth below.
Interested Directors and Executive Officers
Michael J. Cosgrove
Address c/o GEAM 1600 Summer St. Stamford, CT 06905
Age 63
Position(s) Held with Fund Chairman of the Board and President
Term of Office and Length of Time Served Until successor is elected and qualified – 15 years
Principal Occupation(s) During Past 5 years President of Mutual Funds and Global Investment Programs of GEAM since November 2011; President and Chief Executive Officer – Mutual Funds and Intermediary Business of GEAM from March 2007 to November 2011; Executive Vice President of GEAM from February 1997 to March 2007; and Executive Vice President-Mutual Funds of GEAM from March 1993 to March 2007. Also serves as Treasurer of GE Foundation since 1988.
Number of Portfolios in Fund Complex Overseen by Director 25
Other Directorships Held by Director Chairman of the Board and President of GE Institutional Funds since 1997; Trustee of Elfun Funds, GE Savings & Security Funds and General Electric Pension Trust since 1988; Director of GEAM since 1988; Trustee of Fordham University from 2002 to June 30, 2010 and since July 2011; Director of GE Investments Distributors, Inc since June 2011; Director of Skin Cancer Foundation since August 2010; Member of the Board of Governors for the Investment Company Institute since October 2006; Director, GE Asset Management (Ireland) Limited, since February 1999, GE Asset Management Funds Plc since 1998, GE Asset Management Canada Company since 1998, GE Asset Management Limited since 1998; Trustee of General Electric Pension Trust since 1988; and Chairman of the Board and President of GE Funds from 1993 to February 2011.
Matthew J. Simpson
Address c/o GEAM 1600 Summer St. Stamford, CT 06905
Age 51
Position(s) Held with Fund Director and Executive Vice President
Term of Office and Length of Time Served Until successor is elected and qualified – 4 years
Principal Occupation(s) During Past 5 years Executive Vice President, General Counsel and Secretary of GEAM since July 2007; Secretary of Elfun Funds and GE Savings & Security Funds since July 2007; Senior Vice President and General Counsel – Marketing and Client Services (formerly Asset Management Services) of GEAM and Senior Vice President and General Counsel of GE Asset Management Services from February 1997 to July 2007; Vice President and Associate General Counsel of GEAM from October 1992 to February 1997; Secretary of GE Institutional Funds and GE Investments Funds, Inc. from 1997 to July 2007 and Vice President from September 2003 to July 2007; Assistant Secretary of Elfun Funds and GE Savings & Security Funds from 1998 to July 2007 and Vice President from October 2003 to July 2007; and Secretary of GE Funds from 1993 to July 2007 and Vice President from September 2003 to July 2007.
Number of Portfolios in Fund Complex Overseen by Director 25
Other Directorships Held by Director Trustee of Elfun Funds, GE Savings & Security Funds and General Electric Pension Trust since July 2007; Trustee and Executive Vice President of GE Institutional Funds since July 2007; Director of GEAM since July 2007; and Trustee and Executive Vice President of GE Funds from July 2007 to February 2011.
23
Table of Contents
| Additional Information | (Unaudited) |
Joon Won Choe
Address c/o GEAM 1600 Summer St. Stamford, CT 06905
Age 42
Position(s) Held with Fund Vice President & Secretary
Term of Office and Length of Time Served Until successor is elected and qualified – Vice President and Secretary – 1 year
Principal Occupation(s) During Past 5 years Senior Vice President and Deputy General Counsel at GEAM since March 2011; Vice President and Secretary of GE Institutional Funds since September 2010; Vice President and Assistant Secretary of Elfun Funds and GE Savings & Security Funds since September 2010; Senior Vice President and Associate General Counsel at GEAM from June 2010 to March 2011; Vice President and Associate General Counsel of GEAM from November 2005 to June 2010 and Vice President and Secretary of GE Funds from September 2010 to February 2011.
Number of Portfolios in Fund Complex Overseen by Officer N/A
Other Directorships Held by Officer N/A
Robert Herlihy
Address c/o GEAM 1600 Summer St. Stamford, CT 06905
Age 44
Position(s) Held with Fund Chief Compliance Officer
Term of Office and Length of Time Served Until successor is elected and qualified — 6 years
Principal Occupation(s) During Past 5 years Chief Compliance Officer of GEAM, GE Institutional Funds, Elfun Funds, and GE Savings & Security Funds since July 2005; Chief Compliance Officer of GE Funds from July 2005 to February 2011 and Manager of Fund Administration at GEAM from 2002-2005.
Number of Portfolios in Fund Complex Overseen by Officer N/A
Other Directorships Held by Officer N/A
Arthur A. Jensen
Address c/o GEAM 1600 Summer St. Stamford, CT 06905
Age 45
Position(s) Held with Fund Treasurer
Term of Office and Length of Time Served Until successor is elected and qualified – 1 year
Principal Occupation(s) During Past 5 Years Treasurer of GE Institutional Funds, Elfun Funds and GE Savings & Security Funds since June 2011; Mutual Funds Controller of GEAM since April 2011; Senior Vice President at Citigroup from 2008 to 2010 and Vice President at JPMorgan from 2005 to 2008.
Number of Portfolios in Fund Complex Overseen by Officer N/A
Other Directorships Held by Officer N/A
24
Table of Contents
| Additional Information | (Unaudited) |
Jeanne M. LaPorta
Address c/o GEAM 1600 Summer St. Stamford, CT 06905
Age 46
Position(s) Held with Fund Vice President
Term of Office and Length of Time Served Until successor is elected and qualified – 8 years
Principal Occupation(s) During Past 5 Years Senior Vice President and Commercial Administrative Officer of GEAM since April 2010; Vice President of GE Institutional Funds since July 2003; Vice President of Elfun Funds and GE Savings & Security Funds since October 2003; Secretary of GE Funds from July 2007 to September 2010 and Vice President from July 2007 to February 2011; Senior Vice President and Deputy General Counsel of GEAM from October 2007 to April 2010; Vice President and Assistant Secretary of Elfun Funds and GE Savings & Security Funds from July 2003 to June 2010; and Vice President and Associate General Counsel – Marketing and Client Services (formerly Asset Management Services) at GEAM from May 1997 to October 2007.
Number of Portfolios in Fund Complex Overseen by Officer N/A
Other Directorships Held by Officer N/A
Non-Interested Directors
John R. Costantino
Address c/o GEAM 1600 Summer St. Stamford, CT 06905
Age 66
Position(s) Held with Fund Director
Term of Office and Length of Time Served Until successor is elected and qualified – 15 years
Principal Occupation(s) During Past 5 years General Partner, NGN Capital LLC since 2006; Managing Director, Vice President of Walden Capital Management since 1996.
Number of Portfolios in Fund Complex Overseen by Director 17
Other Directorships Held by Director Trustee of GE Institutional Funds since 1997; Trustee of Fordham University from 1989 to 1995 and from 2001 to 2007 and Trustee Emeritus since 2007; Trustee of Neuroscience Research Institute since 1986; Trustee of GE Funds from 1993 to February 2011; Director of Artes Medical from 2006-2008 and Trustee of Gregorian University Foundation from 1992-2007.
25
Table of Contents
| Additional Information | (Unaudited) |
R. Sheldon Johnson
Address c/o GEAM 1600 Summer St. Stamford, CT 06905
Age 65
Positions(s) Held with Fund Director
Term of office and Length of Time served Unit Successor is elected and qualified – 1 year.
Principal Occupation(s) During Past 5 years Head of Global Institutional Equity Sales and Marketing at Morgan Stanley & Co., Inc. from 2002 to 2006 and Managing Director at Morgan Stanley & Co., Inc. from 1988 to 2006.
Number of Portfolios in Fund Complex Overseen by Director 17
Other Directorships Held by Director Trustee of GE Institutional Funds since April 2011 and Trustee of St. Lawrence University since 2003.
Donna M. Rapaccioli
Address c/o GEAM 1600 Summer St. Stamford, CT 06905
Age 49
Position(s) Held with Fund Director
Term of Office and Length of Time Served Until successor is elected and qualified – Less than 1 year
Principal Occupation(s) During Past 5 Years Dean of the Gabelli School of Business since 2007 and Accounting professor since 1987 at Fordham University.
Number of Portfolios in Fund Complex Overseen by Officer 17
Other Directorships Held by Director Trustee of GE Institutional Funds since January 2012 and Trustee of Emmanuel College since 2010.
The Statement of Additional Information for the Funds includes additional information about the Directors and Officers and is available, without charge, upon request by calling 1-800-242-0134.
26
Table of Contents
| Investment Team | (Unaudited) |
Investment Adviser and Administrator
GE Asset Management Incorporated
Board of Directors
Michael J. Cosgrove, Chairman
John R. Costantino
R. Sheldon Johnson
Donna M. Rapaccioli
Matthew J. Simpson
Secretary
Joon Won Choe
Assistant Secretary
Michelle Matzelle
Treasurer
Arthur A. Jensen
Assistant Treasurer
Casey Yantosca
Distributor
GE Investment Distributors, Inc.
Member FINRA and SIPC
Custodian
State Street Bank & Trust Company
Officers of the Investment Adviser
Dmitri Stockton, President and Chief Executive Officer
Cheryl H. Beacock, Senior Vice President, Human Resources
George A. Bicher, Chief Risk Officer
Paul M. Colonna, President and Chief Investment Officer – Public Investments
Michael J. Cosgrove, President of Mutual Funds and Global Investment Programs
Gregory B. Hartch, Senior Vice President – Strategy and Business Development Leader
Ralph R. Layman, Executive Vice President and Chief Investment Officer Emeritus Public Equities
Maureen B. Mitchell, President of Global Sales and Marketing
Steven M. Rullo, Senior Vice President – Services and Technology
Matthew J. Simpson, Executive Vice President, General Counsel and Secretary
Donald W. Torey, President and Chief Investment Officer – Alternative Investments
David Wiederecht, President and Chief Investment Officer – Investment Solutions
Jessica Holscott, Executive Vice President, Chief Financial Officer*
| * | Effective August 1, 2012, Ms. Holcott replaced Tracie A. Winbigler as Executive Vice President and Chief Financial Officer. |
At GE Asset Management, we’re dedicated to providing the investment options you’ll need to tailor your financial portfolio to every stage of your life. Each member of the GE Family of Funds is managed according to the same principles of integrity and quality that have guided GE over the past century, and have made it the world-class company that it is today. Each fund draws strength from a heritage of investment management experience that spans more than 80 years. Whether you’re creating a new investment portfolio or adding to an established one, the GE Family of Funds offers an array of professionally managed investment options that will help you meet a lifetime of financial needs.
27
Table of Contents
Investment Adviser
GE Asset Management Incorporated
1600 Summer Street
Stamford, CT 06905
or at:
PO Box 7900
Stamford, CT 06904-7900
Distributor
GE Investment Distributors, Inc.
member FINRA and SIPC
1600 Summer Street
Stamford, CT 06905
or at:
PO Box 7900
Stamford, CT 06904-7900
The Fund files its complete schedule of portfolio holdings with the Securities and Exchange Commission for the first and third quarters of each fiscal year on Form N-Q. The Fund’s Forms N-Q, as well as a description of the policies and procedures that the Fund uses to determine how to vote proxies (if any) relating to portfolio securities is available without charge (i) upon request, by calling 1-800-493-3042; (ii) on the Fund’s website at http://www.geam.com; and (iii) on the Commission’s website at http://www.sec.gov. The Fund’s Forms N-Q may be reviewed and copied at the Commission’s Public Reference Room in Washington, DC—information on the operation of the Public Reference Room may be obtained by calling 1-800-SEC-0330.
Information (if any) regarding how the Fund voted proxies relating to portfolio securities during the most recently disclosed 12-month period ended June 30 is available without charge (i) through the Fund’s website at http://www.geam.com; and (ii) on the Commission’s website at http://www.sec.gov.

Table of Contents
GE Investments Funds, Inc.
Premier Growth Equity Fund
Semi-Annual Report
June 30, 2012

Table of Contents
GE Investments Funds, Inc.
| Premier Growth Equity Fund | Contents | |
| 1 | ||||
| 2 | ||||
| 3 | ||||
| 5 | ||||
Financial Statements | ||||
| 6 | ||||
| 7 | ||||
| 8 | ||||
| 9 | ||||
| 10 | ||||
| 16 | ||||
| 20 | ||||
This report is prepared for Policyholders of certain variable contracts and may be distributed to others only if preceded or accompanied by the variable contract’s current prospectus and the current summary prospectus of the Fund available for investments thereunder.
Table of Contents
| Premier Growth Equity Fund | (Unaudited) |
Notes to Performance
Total return performance shown in this report for the GE Investments Premier Growth Equity Fund (the “Fund”) takes into account changes in share price and assumes reinvestment of dividends and capital gains distributions, if any. Total returns shown are net of Fund fees and expenses but do not reflect fees and charges associated with the variable contracts such as administrative fees, account charges and surrender charges, which, if reflected, would reduce the Fund’s total returns for all periods shown.
The performance data quoted represents past performance; past performance does not guarantee future results. Investment return and principal value will fluctuate so your shares, when redeemed, may be worth more or less than their original cost. Current performance may be higher or lower than the performance data quoted. Periods less than one year are not annualized. Please call 800-493-3042 or visit the Fund’s website at http://www.geam.com for the most recent month-end performance data.
An investment in the Fund is not a deposit of any bank and is not insured or guaranteed by the Federal Deposit Insurance Corporation (FDIC) or any other government agency. An investment in the Fund is subject to risk, including possible loss of principal invested.
Investment Profile
A mutual fund designed for investors who seek long-term growth of capital and future income rather than current income. The Fund seeks its investment objectives by investing at least 80% of its net assets under normal circumstances in equity securities, such as common and preferred stocks. The Fund invests primarily in a limited number of large-and medium-sized companies (meaning companies with a market capitalization of $2 billion or more) that the portfolio manager believes have above-average growth histories and/or growth potential.
Sector Allocation
as a % of Fair Value of $36,827 (in thousands) on June 30, 2012 (a) (b)
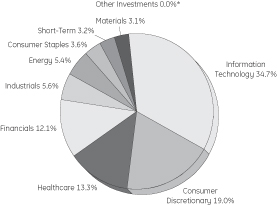
Top Ten Largest Holdings
as of June 30, 2012 (as a % of Fair Value) (a) (b) (c)
Apple Inc. | 6.80% | |||
eBay Inc. | 4.44% | |||
Express Scripts Holding Co. | 4.35% | |||
Schlumberger Ltd. | 4.13% | |||
Qualcomm Inc. | 4.09% | |||
Covidien PLC | 3.91% | |||
Liberty Global Inc. | 3.84% | |||
Visa Inc. | 3.78% | |||
PepsiCo Inc. | 3.63% | |||
CME Group Inc. | 3.60% |
| (a) | The securities information regarding holdings, allocations and other characteristics is presented to illustrate examples of securities that the Fund has bought and the diversity of areas in which the Fund may invest as of a particular date. It may not be representative of the Fund’s current or future investments and should not be construed as a recommendation to purchase or sell a particular security. |
| (b) | Fair value basis is inclusive of the short-term investment in GE Institutional Money Market Fund Investment Class. |
| (c) | The figures presented to not include the Fund’s entire investment portfolio and may change at any time. |
| * | Less than 0.05%. |
GE Investment Distributors, Inc., Member of FINRA & SIPC, is the principal underwriter and distributor of the GE Investments Funds, Inc. and a wholly owned subsidiary of GE Asset Management Incorporated, the investment adviser of the Fund.
1
Table of Contents
Premier Growth Equity Fund
(Unaudited)
Understanding Your Fund’s Expenses
As a shareholder of the Fund you incur ongoing costs. Ongoing costs include portfolio management fees, professional fees, administrative fees and other Fund expenses. The following example is intended to help you understand your ongoing costs (in dollars) of investing in the Fund and to compare these costs with the ongoing costs of investing in other mutual funds.
To illustrate these ongoing costs, we have provided an example and calculated the expenses paid by investors in the Fund during the period. The information in the following table is based on an investment of $1,000, which is invested at the beginning of the period and held for the entire six-month period ended June 30, 2012.
Actual Expenses
The first section of the table provides information about actual account values and actual expenses. You may use the information in this section, together with the amount you invested, to estimate the expenses that you paid over the period. To do so, simply divide your account value by $1,000 (for example, an $8,600 account value divided by $1,000 = 8.6), then multiply the result by the number given for your class under the heading “Expenses paid during period” to estimate the expenses paid on your account during the period.
Hypothetical Example for Comparison Purposes
The second section of the table provides information about hypothetical account values and hypothetical expenses based on the Fund’s actual expense ratio and an assumed rate of return of 5% per year before expenses, which is not the Fund’s actual return. The hypothetical account values and expenses may not be used to estimate the actual ending account balance or expenses you paid for the period. You may use this information to compare the ongoing costs of investing in the Fund and other funds. To do so, compare this 5% hypothetical example with the 5% hypothetical examples that appear in the shareholders reports of other funds.
Please note that the expenses shown in the table are meant to highlight and help you compare ongoing costs only and do not reflect transaction costs, such as sales charges or redemption fees, if any. Therefore, the second section of the table is useful in comparing ongoing costs only, and will not help you determine the relative total costs of owning different funds. Additionally, the expenses shown do not reflect the fees or charges associated with variable contracts through which shares of the Fund are offered.
January 1, 2012 – June 30, 2012
| Account value at the beginning of the period ($) | Account value at the end of the period ($) | Expenses paid during the period ($)* | ||||||||||
Actual Fund Return | 1,000.00 | 1,125.10 | 4.39 | |||||||||
Hypothetical 5% Return (2.5% for the period) | 1,000.00 | 1,020.74 | 4.17 | |||||||||
| * | Expenses are equal to the Fund’s annualized expense ratio of 0.83% (for the period January 1, 2012—June 30, 2012), multiplied by the average account value over the period, multiplied by 182/366 (to reflect the one-half year period). |
2
Table of Contents
Premier Growth Equity Fund
| Schedule of Investments | June 30, 2012 (Unaudited) |
Premier Growth Equity Fund
| Number of Shares | Fair Value | |||||||||
Common Stock — 96.1% † |
| |||||||||
Air Freight & Logistics — 3.0% |
| |||||||||
United Parcel Service Inc. | 14,028 | $ | 1,104,845 | |||||||
Application Software — 1.3% |
| |||||||||
Intuit Inc. | 7,995 | 474,503 | ||||||||
Asset Management & Custody Banks — 2.5% |
| |||||||||
State Street Corp. | 20,933 | 934,449 | (c) | |||||||
Biotechnology — 5.0% |
| |||||||||
Amgen Inc. | 14,536 | 1,061,709 | ||||||||
Gilead Sciences Inc. | 15,627 | 801,353 | (a) | |||||||
| 1,863,062 | ||||||||||
Broadcasting — 2.8% |
| |||||||||
Discovery Communications Inc. | 20,714 | 1,037,564 | (a) | |||||||
Cable & Satellite — 6.8% |
| |||||||||
DIRECTV | 22,895 | 1,117,734 | (a) | |||||||
Liberty Global Inc. | 29,654 | 1,415,979 | (a) | |||||||
| 2,533,713 | ||||||||||
Casinos & Gaming — 1.5% |
| |||||||||
Las Vegas Sands Corp. | 12,848 | 558,759 | ||||||||
Communications Equipment — 5.2% |
| |||||||||
Cisco Systems Inc. | 24,712 | 424,305 | (d) | |||||||
Qualcomm Inc. | 27,038 | 1,505,476 | ||||||||
| 1,929,781 | ||||||||||
Computer Hardware — 6.8% |
| |||||||||
Apple Inc. | 4,288 | 2,504,192 | (a) | |||||||
Data Processing & Outsourced Services — 10.2% | ||||||||||
Paychex Inc. | 34,161 | 1,072,997 | ||||||||
The Western Union Co. | 78,134 | 1,315,777 | ||||||||
Visa Inc. | 11,266 | 1,392,816 | ||||||||
| 3,781,590 | ||||||||||
Fertilizers & Agricultural Chemicals — 3.1% |
| |||||||||
Monsanto Co. | 13,955 | 1,155,195 | ||||||||
Healthcare Equipment — 3.9% |
| |||||||||
Covidien PLC | 26,892 | 1,438,722 | ||||||||
Healthcare Services — 4.3% |
| |||||||||
Express Scripts Holding Co. | 28,710 | 1,602,879 | (a) | |||||||
| Number of Shares | Fair Value | |||||||||
Home Furnishing Retail — 1.8% |
| |||||||||
Bed Bath & Beyond Inc. | 10,830 | $ | 669,294 | (a) | ||||||
Home Improvement Retail — 3.2% |
| |||||||||
Lowe’s Companies Inc. | 41,429 | 1,178,241 | ||||||||
Industrial Machinery — 2.5% |
| |||||||||
Dover Corp. | 17,589 | 942,946 | ||||||||
Internet Retail — 1.3% |
| |||||||||
Amazon.com Inc. | 2,071 | 472,913 | (a) | |||||||
Internet Software & Services — 7.6% |
| |||||||||
Baidu Inc. ADR | 10,248 | 1,178,315 | (a) | |||||||
eBay Inc. | 38,885 | 1,633,559 | (a) | |||||||
| 2,811,874 | ||||||||||
Investment Banking & Brokerage — 1.7% |
| |||||||||
The Goldman Sachs Group Inc. | 6,541 | 627,020 | ||||||||
Oil & Gas Equipment & Services — 4.1% |
| |||||||||
Schlumberger Ltd. | 23,434 | 1,521,101 | ||||||||
Oil & Gas Exploration & Production — 1.2% |
| |||||||||
Anadarko Petroleum Corp. | 6,862 | 454,264 | ||||||||
Real Estate Services — 1.0% |
| |||||||||
CBRE Group Inc. | 22,789 | 372,828 | (a) | |||||||
Soft Drinks — 3.6% |
| |||||||||
PepsiCo Inc. | 18,897 | 1,335,262 | ||||||||
Specialized Finance — 3.6% |
| |||||||||
CME Group Inc. | 4,942 | 1,325,000 | ||||||||
Specialized REITs — 3.2% |
| |||||||||
American Tower Corp. | 17,080 | 1,194,063 | ||||||||
Specialty Stores — 1.5% |
| |||||||||
Dick’s Sporting Goods Inc. | 11,629 | 558,192 | ||||||||
Systems Software — 3.4% |
| |||||||||
Microsoft Corp. | 25,802 | 789,283 | (d) | |||||||
Oracle Corp. | 15,990 | 474,903 | ||||||||
| 1,264,186 | ||||||||||
Total Common Stock | 35,646,438 | |||||||||
See Notes to Schedule of Investments and Notes to Financial Statements.
3
Table of Contents
Premier Growth Equity Fund
| Schedule of Investments | June 30, 2012 (Unaudited) |
| Fair Value | ||||||||
Other Investments — 0.0%* | ||||||||
GEI Investment Fund | $ | 2,459 | (e) | |||||
Total Investments in Securities | 35,648,897 | |||||||
Short-Term Investments — 3.2% | ||||||||
GE Institutional Money Market Fund—Investment Class 0.04% | 1,178,167 | (b,e) | ||||||
Total Investments | 36,827,064 | |||||||
Other Assets and Liabilities, | 270,183 | |||||||
|
|
| ||||||
NET ASSETS — 100.0% | $ | 37,097,247 | ||||||
|
|
| ||||||
Other Information | ||||||||
The Fund had the following long futures contracts open at June 30, 2012 (Unaudited):
| Description | Expiration date | Number of Contracts | Current Notional Value | Unrealized Appreciation | ||||||||||||
S&P 500 Emini Index Futures | September 2012 | 1 | $ | 67,820 | $ | 2,802 | ||||||||||
See Notes to Schedule of Investments and Notes to Financial Statements.
4
Table of Contents
| Notes to Schedule of Investments | June 30, 2012 (Unaudited) |
The views expressed in this document reflect our judgment as of the publication date and are subject to change at any time without notice. The securities information regarding holdings, allocations and other characteristics are presented to illustrate examples of securities that the Fund has bought and the diversity of areas in which the Fund may invest as of a particular date. It may not be representative of the Fund’s current or future investments and should not be construed as a recommendation to purchase or sell a particular security. See the Fund’s summary prospectus and statutory prospectus for complete descriptions of investment objectives, policies, risks and permissible investments.
| (a) | Non-income producing security. |
| (b) | Coupon amount represents effective yield. |
| (c) | State Street Corp. is the parent company of State Street Bank & Trust Co., the Fund’s custodian and accounting agent. |
| (d) | At June 30, 2012 , all or a portion of this security was pledged to cover collateral requirements for futures, options, forward foreign currency contracts and/or TBA’s. |
| (e) | GE Asset Management, the investment adviser of the Fund, also serves as investment adviser of the GEI Investment Fund and the GE Institutional Money Market Fund. The GE Investment Fund has been determined to be illiquid using procedures established by the Board of Directors. |
| * | Less than 0.05%. |
| † | Percentages are based on net assets as of June 30, 2012 . |
Abbreviations:
ADR | American Depository Receipt |
5
Table of Contents
Selected data based on a share outstanding throughout the fiscal years indicated
| CLASS 1 | ||||||||||||||||||||||||
| 6/30/12† | 12/31/11 | 12/31/10 | 12/31/09 | 12/31/08 | 12/31/07 | |||||||||||||||||||
| Inception date | — | — | — | — | — | 12/12/97 | ||||||||||||||||||
Net asset value, beginning of period | $71.78 | $71.60 | $64.30 | $46.49 | $78.95 | $82.17 | ||||||||||||||||||
Income/(loss) from investment operations: | ||||||||||||||||||||||||
Net investment income (loss) | 0.22 | 0.15 | 0.14 | * | 0.20 | 0.30 | 0.23 | |||||||||||||||||
Net realized and unrealized gains/(losses) on investments | 8.76 | 0.19 | 7.32 | 17.81 | (29.32) | 4.19 | ||||||||||||||||||
Total income/(loss) from investment operations | 8.98 | 0.34 | 7.46 | 18.01 | (29.02) | 4.42 | ||||||||||||||||||
Less distributions from: | ||||||||||||||||||||||||
Net investment income | — | 0.16 | 0.16 | 0.20 | 0.26 | 0.23 | ||||||||||||||||||
Return of Capital | — | — | — | — | 0.01 | — | ||||||||||||||||||
Net realized gains | — | — | — | — | 3.17 | 7.41 | ||||||||||||||||||
Total distributions | — | 0.16 | 0.16 | 0.20 | 3.44 | 7.64 | ||||||||||||||||||
Net asset value, end of period | $80.76 | $71.78 | $71.60 | $64.30 | $46.49 | $78.95 | ||||||||||||||||||
TOTAL RETURN(a) | 12.51% | 0.47% | 11.61% | 38.74% | (36.66)% | 5.34% | ||||||||||||||||||
RATIOS/SUPPLEMENTAL DATA: | ||||||||||||||||||||||||
Net assets, end of period (in thousands) | $37,097 | $37,871 | $45,280 | $48,620 | $43,308 | $94,720 | ||||||||||||||||||
Ratios to average net assets: | ||||||||||||||||||||||||
Net investment income (loss) | 0.52% | ** | 0.19% | 0.22% | 0.33% | 0.36% | 0.24% | |||||||||||||||||
Net expenses | 0.83% | (b)** | 0.91% | (b) | 0.76% | (b) | 0.90% | (b) | 0.76% | (b) | 0.72% | |||||||||||||
Gross expenses | 0.84% | ** | 0.92% | 0.76% | 0.90% | 0.76% | 0.72% | |||||||||||||||||
Portfolio turnover rate | 8% | 21% | 19% | 18% | 23% | 29% | ||||||||||||||||||
Notes to Financial Highlights
| (a) | Total returns are historical and assume changes in share price, reinvestment of dividends and capital gains distributions and do not include the effect of insurance contract charges. Past performance does not guarantee future results. |
| (b) | Reflects GE Asset Management waiver of a portion of the Fund’s management fee in an amount equal to the management fee earned by GEAM with respect to the Fund’s investment in the GE Institutional Money Market Fund or, prior to 2011, in another affiliated Money Market Fund formerly managed by GEAM. |
| * | Per share values have been calculated using the average share method. |
| ** | Annualized for periods less than one year. |
| † | Unaudited |
The accompanying Notes are an integral part of these financial statements.
6
Table of Contents
The accompanying Notes are an integral part of these financial statements.
7
Table of Contents
For the period ending June 30, 2012 | (Unaudited) | |||
INVESTMENT INCOME | ||||
Income: | ||||
Dividend | $262,290 | |||
Interest | 101 | |||
Interest from affiliated investments | 337 | |||
Total Income | 262,728 | |||
Expenses: | ||||
Advisory and administration fees | 126,358 | |||
Director’s fees | 820 | |||
Custody and accounting expenses | 14,912 | |||
Professional fees | 9,341 | |||
Other expenses | 11,035 | |||
Total expenses before waiver and reimbursement | 162,466 | |||
Less: Expenses waived or borne by the adviser | (702 | ) | ||
Net expenses | 161,764 | |||
Net investment income | 100,964 | |||
NET REALIZED AND UNREALIZED GAIN | ||||
Realized gain (loss) on: | ||||
Investments | 1,486,878 | |||
Futures | (69,607 | ) | ||
Increase (decrease) in unrealized appreciation/ (depreciation) on: | ||||
Investments | 3,180,675 | |||
Futures | (13,493 | ) | ||
Net realized and unrealized gain on investments | 4,584,453 | |||
Net increase in net assets resulting from operations | $4,685,417 | |||
The accompanying Notes are an integral part of these financial statements.
8
Table of Contents
Six months ended 2012 * | Year Ended December 31, 2011 | |||||||
INCREASE (DECREASE) IN NET ASSETS | ||||||||
Operations: | ||||||||
Net investment income | $ | 100,964 | $ | 79,873 | ||||
Net realized gain on investments and futures | 1,417,271 | 1,979,153 | ||||||
Net increase (decrease) in unrealized appreciation /(depreciation) on investments and futures | 3,167,182 | (1,697,130 | ) | |||||
Net increase from operations | 4,685,417 | 361,896 | ||||||
Distributions to shareholders from : | ||||||||
Net investment income | ||||||||
Class 1 | — | (82,406 | ) | |||||
Class 4 ** | — | — | ||||||
Total distributions | — | (82,406 | ) | |||||
Increase in net assets from operations and distributions | 4,685,417 | 279,490 | ||||||
Share transactions : | ||||||||
Proceeds from sale of shares | ||||||||
Class 1 | 506,021 | 1,061,170 | ||||||
Class 4 ** | — | — | ||||||
Value of distributions reinvested | ||||||||
Class 1 | — | 82,406 | ||||||
Class 4 ** | — | — | ||||||
Cost of shares redeemed | ||||||||
Class 1 | (5,965,183 | ) | (8,830,674 | ) | ||||
Class 4 ** | — | (10,658 | ) | |||||
Net decrease from share transactions | (5,459,162 | ) | (7,697,756 | ) | ||||
Total decrease in net assets | (773,745 | ) | (7,418,266 | ) | ||||
NET ASSETS | ||||||||
Beginning of period | 37,870,992 | 45,289,258 | ||||||
End of period | $ | 37,097,247 | $ | 37,870,992 | ||||
Undistributed (distribution in excess of) | $ | 100,489 | $ | (475 | ) | |||
CHANGES IN FUND SHARES | ||||||||
Class 1 | ||||||||
Shares sold | 6,289 | 14,293 | ||||||
Issued for distributions reinvested | — | 1,155 | ||||||
Shares redeemed | (74,567 | ) | (120,204 | ) | ||||
Net Decrease in Fund Shares | (68,278 | ) | (104,756 | ) | ||||
Class 4** | ||||||||
Shares sold | — | — | ||||||
Issued for distributions reinvested | — | — | ||||||
Shares redeemed | — | (136 | ) | |||||
Net Decrease in Fund Shares | — | (136 | ) | |||||
| * | (Unaudited) |
| ** | Share Class 4 was closed effective April 30, 2011 |
The accompanying Notes are an integral part of these financial statements.
9
Table of Contents
| Notes to Financial Statements | June 30, 2012 (Unaudited) |
| 1. | Organization of the Company |
GE Investments Funds, Inc. (the “Company”) was incorporated under the laws of the Commonwealth of Virginia on May 14, 1984 and is registered under the Investment Company Act of 1940, as amended (the “1940 Act”), as an open-end management investment company. The Company is composed of thirteen investment portfolios (collectively the “Funds”), although only the following ten are currently being offered: U.S. Equity Fund, S&P 500 Index Fund, Premier Growth Equity Fund (the “Fund”), Core Value Equity Fund, Mid-Cap Equity Fund, Small-Cap Equity Fund, International Equity Fund, Total Return Fund, Income Fund, Money Market Fund and Real Estate Securities Fund.
Shares of the Funds of the Company are offered only to insurance company separate accounts that fund certain variable life insurance contracts and variable annuity contracts. GE Asset Management Incorporated (“GEAM”) is the investment adviser and administrator of each of the Funds.
The Company currently offers one share class (Class 1) as an investment option for variable life insurance and variable annuity contracts.
| 2. | Summary of Significant Accounting Policies |
The preparation of financial statements in conformity with U.S. generally accepted accounting principles (GAAP) requires management to make estimates and assumptions that affect the reported amounts of assets and liabilities and disclosure of contingent assets and liabilities at the date of the financial statements and the reported amounts of increases and decreases in net assets from operations during the reporting period. Actual results may differ from those estimates.
The following summarizes the significant accounting policies of the Company:
Securities Valuation and Transactions. All investments in securities are recorded at their estimated fair value, as described in Note 3.
Securities transactions are accounted for as of the trade date. Realized gains and losses on investments sold are recorded on the basis of identified cost for both financial statement and federal tax purposes.
Derivatives The Fund is subject to equity price risk in the normal course of pursuing its investment objectives. The
Fund may enter into derivative transactions to gain market exposure for residual and accumulating cash positions.
Futures Contracts A futures contract represents a commitment for the future purchase or sale of an asset at a specified price on a specified date. The Fund invested in futures for a variety of portfolio management purposes such as hedging against the effects of changes in the value of portfolio securities due to anticipated changes in market conditions, gaining market exposure for accumulating and residual cash positions, or when the transactions were economically appropriate to the reduction of risks inherent in the management of the Fund. Buying futures tends to increase a Fund’s exposure to the underlying instrument while selling futures tends to decrease a Fund’s exposure to the underlying instrument, or hedge other Fund investments. The Fund will not enter into a transaction involving futures for speculative purposes. With futures contracts, there is minimal counterparty credit risk to the Fund since futures contracts are exchange traded and the exchange’s clearinghouse, as counterparty to all traded futures, guarantees the futures against default. The Fund’s risks in using these contracts include changes in the value of the underlying instruments, non-performance of the counterparties under the contracts’ terms and changes in the liquidity of the secondary market for the contracts. Futures contracts are valued at the settlement price established each day by the board of trade or exchange on which they principally trade.
Upon entering into a financial futures contract, the Fund is required to pledge to the broker an amount of cash and/or other assets equal to a certain percentage of the contract amount, known as initial margin deposit. Subsequent payments, known as variation margin, are made or received by the Fund each day, depending on the daily fluctuation in the fair value of the underlying security. The Fund records an unrealized gain or loss equal to the daily variation margin. Should market conditions move unexpectedly, the Fund may not achieve the anticipated benefits of the futures contracts and may incur a loss. The Fund recognizes a realized gain or loss on the expiration or closing of a futures contract.
Investment Income Corporate actions (including cash dividends) are recorded on the ex-dividend date, net of applicable withholding taxes, except for certain foreign corporate actions which are recorded as soon after the ex-dividend date as such information becomes available. Withholding taxes in foreign dividends have been provided
10
Table of Contents
| Notes to Financial Statements | June 30, 2012 (Unaudited) |
for in accordance with the Fund’s understanding of the applicable country’s tax rules and rates.
Interest income is recorded on the accrual basis. Accretion of discounts and amortization of premiums on taxable bonds are to the call or maturity date, whichever is shorter, using the effective yield method.
Expenses Fund specific expenses are allocated to the Fund that incurs such expenses. Such expenses may include custodial fees, legal and accounting fees, printing costs and registration fees. Expenses that are not fund specific are allocated pro rata across the Funds. Expenses of the Fund are generally paid directly by the Fund, however, expenses may be paid by GEAM and reimbursed by the Fund.
Federal Income Taxes The Fund intends to comply with all sections of the Internal Revenue Code applicable to regulated investment companies including the distribution of substantially all of its taxable net investment income and net realized capital gains to its shareholders. Therefore, no provision for federal income tax has been made.
| 3. | Securities Valuation |
The Fund utilizes various methods to measure the fair value of most of its investments on a recurring basis. GAAP establishes a framework for measuring fair value and providing related disclosures. Broadly, the framework requires fair value to be determined based on the exchange price that would be received for an asset or paid to transfer a liability (an exit price) in the principal or most advantageous market for the asset or liability in an orderly transaction between market participants at the measurement date. In the absence of active markets for the identical assets or liabilities, such measurements involve developing assumptions based on market observable data and, in the absence of such data, internal information that is consistent with what market participants would use in a hypothetical transaction that occurs at the measurement date. It also establishes a three-level valuation hierarchy based upon observable and non-observable inputs.
Observable inputs reflect market data obtained from independent sources, while unobservable inputs reflect our market assumptions. Preference is given to observable inputs. These two types of inputs create the following fair value hierarchy:
Level 1 — Quoted prices for identical investments in active markets.
Level 2 — Quoted prices for similar investments in active markets; quoted prices for identical or similar investments in markets that are not active; and model-derived valuations whose inputs are observable or whose significant value drivers are observable.
Level 3 — Significant inputs to the valuation model are unobservable.
Policies and procedures are maintained to value investments using the best and most relevant data available. In addition, pricing vendors are utilized to assist in valuing investments. GEAM performs periodic reviews of the methodologies used by independent pricing services including price validation of individual securities.
Fair Value Measurement The following section describes the valuation methodologies the Fund uses to measure different financial investments at fair value.
The Fund’s portfolio securities are valued generally on the basis of market quotations. Equity securities generally are valued at the last reported sale price on the primary market in which they are traded. Portfolio securities listed on NASDAQ are valued using the NASDAQ Official Closing Price, Level 1 securities primarily include publicly-traded equity securities. If no sales occurred on the exchange or NASDAQ that day, the portfolio security generally is valued using the last reported bid price. In those circumstances the Fund classifies the investment securities in Level 2.
Short-term investments of sufficient credit quality with remaining maturities of sixty days or less at the time of purchase are typically valued on the basis of amortized cost which approximates fair value and these are included in Level 2. If it is determined that amortized cost does not approximate fair value, securities may be valued based on dealer supplied valuations or quotations. In these infrequent circumstances, pricing services may provide the Fund with valuations that are based on significant unobservable inputs, and in those circumstances the investment securities are classified in Level 3.
The Fund uses the net asset value per unit for collective funds (i.e., GEI Investment Fund). The Fund classifies the investment security in Level 2.
If prices are not readily available for a portfolio security, or if it is believed that a price for a portfolio security does not represent its fair value, the security may be valued using procedures approved by the Fund’s Board of Directors that are designed to establish its “fair” value. These securities
11
Table of Contents
| Notes to Financial Statements | June 30, 2012 (Unaudited) |
are typically classified in Level 3. Those procedures require that the fair value of a security be established by a valuation committee of GEAM. The valuation committee follows different protocols for different types of investments and circumstances. The fair value procedures may be used to value any investment of the Fund in the appropriate circumstances.
Fair value determinations generally are used for securities whose value is affected by a significant event that will materially affect the value of a security and which occurs subsequent to the time of the close of the principal market on which such security trades but prior to the calculation of the Fund’s NAV.
The value established for such a portfolio security may be different than what would be produced through the use of market quotations or another methodology. Portfolio securities that are valued using techniques other than market quotations, including “fair valued” securities, may be subject to greater fluctuation in their value from one day to the next than would be the case if market quotations were used. In addition, there is no assurance
that the Fund could sell a portfolio security for the value established for it at any time and it is possible that the Fund would incur a loss because a portfolio security is sold at a discount to its established value.
Other financial investments are derivative instruments that are not reflected in total investments, such as futures, forwards, swaps, and written options contracts, which are valued based on fair value as discussed above.
The Fund uses closing prices for derivatives included in Level 1, which are traded either on exchanges or liquid over-the counter markets. Derivative assets and liabilities included in Level 2 primarily represent interest rate swaps, cross-currency swaps and foreign currency and commodity forward and option contracts. Derivative assets and liabilities included in Level 3 primarily represent interest rate products that contain embedded optionality or prepayment features.
The inputs or methodology used for valuing securities are not an indication of the risk associated with investing in those securities.
The following tables present the Fund’s investments measured at fair value on a recurring basis at June 30, 2012:
Investments | Level 1 | Level 2 | Level 3 | Total | ||||||||||||
Investments in Securities† | ||||||||||||||||
Common Stock | $ | 35,646,438 | $ | — | $ | — | $ | 35,646,438 | ||||||||
Other Investments | — | 2,459 | — | 2,459 | ||||||||||||
Short-Term Investments | 1,178,167 | — | — | 1,178,167 | ||||||||||||
Total Investments in Securities | $ | 36,824,605 | $ | 2,459 | $ | — | $ | 36,827,064 | ||||||||
Other Financial Instruments* | ||||||||||||||||
Futures Contracts — Unrealized Appreciation | $ | 2,802 | $ | — | $ | — | $ | 2,802 |
| † | See Schedule of Investments for Industry Classification. |
| * | Other financial instruments include derivative instruments such as futures contracts. Amounts shown represent unrealized appreciation (depreciation), at period end. |
There were no transfers between the fair value levels. Transfers between fair value levels are considered to occur at the beginning of the period.
12
Table of Contents
| Notes to Financial Statements | June 30, 2012 (Unaudited) |
| 4. | Derivatives Transactions |
Shown below are the derivative contracts entered into by the Fund, summarized by primary risk exposure as they appear on the Statement of Assets and Liabilities, all of which are not accounted for as hedging instruments under FASB Accounting Standards Codification (“ASC”) No. 815 Derivatives and Hedging as of June 30, 2012.
| Asset Derivatives June 30, 2012 | Liability Derivatives June 30, 2012 | |||||||||||
| Derivatives not accounted for as hedging instruments under ASC 815 | Location in the Statement of Assets and Liabilities | Fair Value ($) | Location in the Statements of Assets and Liabilities | Fair Value ($) | ||||||||
Equity Contracts | Assets, Net Assets – Net Unrealized Appreciation/ (Depreciation) on Futures | 2,802 | * | Liabilities, Net Assets – Net Unrealized Appreciation/ (Depreciation) on Futures | — | |||||||
| * | Includes cumulative unrealized appreciation/(depreciation) of futures contracts as reported in the Schedule of Investments and within the components of the net assets section of the Statement of Assets and Liabilities. Only the current day’s variation margin is reported within the Assets and/or Liabilities section on the Statement of Assets and Liabilities. |
Shown below are the effects of derivative instruments on each Fund’s Statement of Operation, summarized by primary risk exposure all of which are not accounted for as hedging instruments under ASC 815.
| Derivatives not accounted for as hedging instruments under ASC 815 | Location in the Statements of Operations | Total Notional Amount Purchased/(Sold) ($) | Realized Gain or (Loss) on Derivatives Recognized in Income ($) | Change in Unrealized Appreciation/(Depreciation) on Derivatives Recognized in Income ($) | ||||||||||
Equity Contracts | Realized gain/(loss) on Futures, Increase/(decrease) in unrealized appreciation/ (depreciation) on Futures |
| 7,081,574/ (7,556,954 | ) | (69,607 | ) | (13,493 | ) | ||||||
| 5. | Line of Credit |
The Company shares a revolving credit facility of up to $150 million with a number of its affiliates. The credit facility is with its custodian bank, State Street Bank and Trust Company (“State Street”). The revolving credit facility requires the payment of a commitment fee equal to 0.100% per annum on the daily unused portion of the credit facility, payable quarterly. The portion borne by the Fund generally is borne proportionally based upon net assets. In addition, the Company has a $100 million uncommitted, unsecured line of credit with State Street. Generally, borrowings under the credit facilities would accrue interest at the Federal Funds Rate plus 50 basis points and would be borne by the borrowing Fund. The maximum amount allowed to be borrowed by any one Fund is the lesser of (i) 33.33% of the Fund’s total assets or (ii) 20% of its net assets. The credit facilities were not utilized by the Fund during the six-month period ended June 30, 2012.
| 6. | Compensation and Fees Paid to Affiliates |
GEAM, a registered investment adviser, was retained by the Company’s Board of Directors effective November 15, 1997 to act as investment adviser and administrator of the Fund. GEAM’s compensation for investment advisory and administrative services is paid monthly based on the average daily net assets of the Fund at an annualized rate of 0.65%.
GEAM has a contractual arrangement with the Fund to waive a portion of the Fund’s management fee in the amount equal to the management fee earned by GEAM with respect to the Fund’s investment in the GE Institutional Money Market Fund, if any.
Directors’ Compensation The Fund pays no compensation to its directors who are officers or employees of GEAM or its affiliates. Directors who are not such officers or employees also serve in a similar capacity for other funds advised by GEAM. Compensation paid to non-interested Directors are reflected on the Statement of Operations. These fees are allocated pro rata across all of
13
Table of Contents
| Notes to Financial Statements | June 30, 2012 (Unaudited) |
the mutual fund platforms and share classes served by the Directors, including the Fund, and are based upon the relative net assets of each fund within such platforms.
| 7. | Investment Transactions |
Purchases and Sales of Securities The cost of purchases and the proceeds from sales of investments, other than short-term securities, for the six-month period ended June 30, 2012 were as follows:
| Non-U.S. Government Securities | ||
| Purchases | Sales | |
| $2,992,843 | $8,074,503 | |
| 8. | Income Taxes |
The Fund is subject to ASC 740, Income Taxes. ASC 740 provides guidance for financial accounting and reporting for the effects of income taxes that result from an entity’s activities during the year. ASC 740 also provides guidance regarding how certain tax positions should be recognized, measured, presented and disclosed in the financial statements. ASC 740 requires evaluation of tax positions taken or expected to be taken in the course of preparing the Fund’s tax returns to determine whether the tax positions are “more likely than not” of being sustained by the applicable tax authority. There are no adjustments to the Fund’s net assets required under ASC 740. The Fund’s 2008, 2009, 2010 and 2011 fiscal years tax returns are still open to examination by the Federal and applicable state tax authorities.
At June 30, 2012, information on the tax cost of investments was as follows:
| Cost of Investments For Tax Purposes | Gross Tax | Net Tax Appreciation | ||||
| Appreciation | Depreciation | |||||
$30,115,699 | $9,146,797 | $(2,435,432) | $6,711,365 | |||
As of December 31, 2011, the Fund has capital loss carryovers as indicated below. Capital loss carryovers are available to offset future realized capital gains to the extent provided in the Internal Revenue Code and regulations thereunder. To the extent that these carryover losses are used to offset future capital gains, it is probable that the gains so offset will not be distributed to shareholders because they would be taxable as ordinary income.
| Amount | ||||
| Short-Term | Long-Term | Expires | ||
| $2,273,559 | $— | 12/31/2017 | ||
| 1,355,120 | — | 12/31/2018 | ||
These amounts will be available to offset future taxable capital gains. Under the recently enacted Regulated Investment Company Modernization Act of 2010, the Fund will be permitted to carry forward capital losses incurred in taxable years beginning after December 22, 2010 for an unlimited period. However, any losses incurred during those future years will be required to be utilized prior to the
losses incurred in pre-enactment tax years. As a result of this ordering rule, pre-enactment capital loss carryforwards may be more likely to expire unused. Additionally, post-enactment capital losses that are carried forward will retain their character as either short-term or long-term capital losses rather than being considered all short-term as under previous law.
During the year ended December 31, 2011 the Fund utilized $1,693,552 of prior year capital loss carryovers.
Any qualified late-year loss is deemed to arise on the first day of the Fund’s next tax year (if the Fund elects to defer such loss). Under this regime, generally, the Fund can elect to defer any post-October capital loss and/or any late-year ordinary loss as defined by the Internal Revenue Code.
The Fund elected to defer qualified late-year losses for the year ended December 31, 2011 as follows:
| Capital | Ordinary | |
| $2,434 | $— |
14
Table of Contents
| Notes to Financial Statements | June 30, 2012 (Unaudited) |
The tax composition of distributions paid during the years ended December 31, 2011 and December 31, 2010 were as follows:
| Ordinary Income | Long-Term Capital Gains | Total | ||||
2011 | $ 82,406 | $— | $ 82,406 | |||
2010 | 102,983 | — | 102,983 |
Distributions to Shareholders The Fund declares and pays any dividends from net investment income annually. The Fund declares and pays any net realized capital gains in excess of capital loss carryforwards distributions annually. The character of income and gains to be distributed is determined in accordance with income tax regulations which may differ from generally accepted accounting principles. These differences include (but are not limited to) futures, investments organized as partnerships for tax purposes, and losses deferred due to wash sale transactions. Reclassifications due to permanent book/tax differences are made to the Fund’s capital accounts to
reflect income and gains available for distribution (or available capital loss carryovers) under income tax regulations. These reclassifications have no impact on net investment income, realized gains or losses, or the net asset value of the Fund. The calculation of net investment income per share in the Financial Highlights table excludes these adjustments.
| Undistributed Net Investment Income | Accumulated Net Realized Gain (Loss) | Capital Paid In | ||
| $2,288 | $— | $(2,288) |
| 9. | Subsequent Events |
Subsequent events after the balance sheet date through the date the financial statements were issued have been evaluated in the preparation of the financial statements. As of August 3, 2012, the assets of the Mid-Cap Equity Fund and the Money Market Fund were liquidated. These funds ceased operations and are no longer offered for investment.
15
Table of Contents
| Additional Information | (Unaudited) |
Information about Directors and Executive Officers:
The business and affairs of the Funds are managed under the direction of the Funds’ Board of Directors. Information pertaining to the Directors and officers of the Funds is set forth below.
Interested Directors and Executive Officers
Michael J. Cosgrove
Address c/o GEAM 1600 Summer St. Stamford, CT 06905
Age 63
Position(s) Held with Fund Chairman of the Board and President
Term of Office and Length of Time Served Until successor is elected and qualified – 15 years
Principal Occupation(s) During Past 5 years President of Mutual Funds and Global Investment Programs of GEAM since November 2011; President and Chief Executive Officer – Mutual Funds and Intermediary Business of GEAM from March 2007 to November 2011; Executive Vice President of GEAM from February 1997 to March 2007; and Executive Vice President-Mutual Funds of GEAM from March 1993 to March 2007. Also serves as Treasurer of GE Foundation since 1988.
Number of Portfolios in Fund Complex Overseen by Director 25
Other Directorships Held by Director Chairman of the Board and President of GE Institutional Funds since 1997; Trustee of Elfun Funds, GE Savings & Security Funds and General Electric Pension Trust since 1988; Director of GEAM since 1988; Trustee of Fordham University from 2002 to June 30, 2010 and since July 2011; Director of GE Investments Distributors, Inc since June 2011; Director of Skin Cancer Foundation since August 2010; Member of the Board of Governors for the Investment Company Institute since October 2006; Director, GE Asset Management (Ireland) Limited, since February 1999, GE Asset Management Funds Plc since 1998, GE Asset Management Canada Company since 1998, GE Asset Management Limited since 1998; Trustee of General Electric Pension Trust since 1988; and Chairman of the Board and President of GE Funds from 1993 to February 2011.
Matthew J. Simpson
Address c/o GEAM 1600 Summer St. Stamford, CT 06905
Age 51
Position(s) Held with Fund Director and Executive Vice President
Term of Office and Length of Time Served Until successor is elected and qualified – 4 years
Principal Occupation(s) During Past 5 years Executive Vice President, General Counsel and Secretary of GEAM since July 2007; Secretary of Elfun Funds and GE Savings & Security Funds since July 2007; Senior Vice President and General Counsel – Marketing and Client Services (formerly Asset Management Services) of GEAM and Senior Vice President and General Counsel of GE Asset Management Services from February 1997 to July 2007; Vice President and Associate General Counsel of GEAM from October 1992 to February 1997; Secretary of GE Institutional Funds and GE Investments Funds, Inc. from 1997 to July 2007 and Vice President from September 2003 to July 2007; Assistant Secretary of Elfun Funds and GE Savings & Security Funds from 1998 to July 2007 and Vice President from October 2003 to July 2007; and Secretary of GE Funds from 1993 to July 2007 and Vice President from September 2003 to July 2007.
Number of Portfolios in Fund Complex Overseen by Director 25
Other Directorships Held by Director Trustee of Elfun Funds, GE Savings & Security Funds and General Electric Pension Trust since July 2007; Trustee and Executive Vice President of GE Institutional Funds since July 2007; Director of GEAM since July 2007; and Trustee and Executive Vice President of GE Funds from July 2007 to February 2011.
16
Table of Contents
| Additional Information | (Unaudited) |
Joon Won Choe
Address c/o GEAM 1600 Summer St. Stamford, CT 06905
Age 42
Position(s) Held with Fund Vice President & Secretary
Term of Office and Length of Time Served Until successor is elected and qualified – Vice President and Secretary – 1 year
Principal Occupation(s) During Past 5 years Senior Vice President and Deputy General Counsel at GEAM since March 2011; Vice President and Secretary of GE Institutional Funds since September 2010; Vice President and Assistant Secretary of Elfun Funds and GE Savings & Security Funds since September 2010; Senior Vice President and Associate General Counsel at GEAM from June 2010 to March 2011; Vice President and Associate General Counsel of GEAM from November 2005 to June 2010 and Vice President and Secretary of GE Funds from September 2010 to February 2011.
Number of Portfolios in Fund Complex Overseen by Officer N/A
Other Directorships Held by Officer N/A
Robert Herlihy
Address c/o GEAM 1600 Summer St. Stamford, CT 06905
Age 44
Position(s) Held with Fund Chief Compliance Officer
Term of Office and Length of Time Served Until successor is elected and qualified – 6 years
Principal Occupation(s) During Past 5 years Chief Compliance Officer of GEAM, GE Institutional Funds, Elfun Funds, and GE Savings & Security Funds since July 2005; Chief Compliance Officer of GE Funds from July 2005 to February 2011 and Manager of Fund Administration at GEAM from 2002-2005.
Number of Portfolios in Fund Complex Overseen by Officer N/A
Other Directorships Held by Officer N/A
Arthur A. Jensen
Address c/o GEAM 1600 Summer St. Stamford, CT 06905
Age 45
Position(s) Held with Fund Treasurer
Term of Office and Length of Time Served Until successor is elected and qualified – 1 year
Principal Occupation(s) During Past 5 Years Treasurer of GE Institutional Funds, Elfun Funds and GE Savings & Security Funds since June 2011; Mutual Funds Controller of GEAM since April 2011; Senior Vice President at Citigroup from 2008 to 2010 and Vice President at JPMorgan from 2005 to 2008.
Number of Portfolios in Fund Complex Overseen by Officer N/A
Other Directorships Held by Officer N/A
17
Table of Contents
| Additional Information | (Unaudited) |
Jeanne M. LaPorta
Address c/o GEAM 1600 Summer St. Stamford, CT 06905
Age 46
Position(s) Held with Fund Vice President
Term of Office and Length of Time Served Until successor is elected and qualified – 8 years
Principal Occupation(s) During Past 5 Years Senior Vice President and Commercial Administrative Officer of GEAM since April 2010; Vice President of GE Institutional Funds since July 2003; Vice President of Elfun Funds and GE Savings & Security Funds since October 2003; Secretary of GE Funds from July 2007 to September 2010 and Vice President from July 2007 to February 2011; Senior Vice President and Deputy General Counsel of GEAM from October 2007 to April 2010; Vice President and Assistant Secretary of Elfun Funds and GE Savings & Security Funds from July 2003 to June 2010; and Vice President and Associate General Counsel – Marketing and Client Services (formerly Asset Management Services) at GEAM from May 1997 to October 2007.
Number of Portfolios in Fund Complex Overseen by Officer N/A
Other Directorships Held by Officer N/A
Non-Interested Directors
John R. Costantino
Address c/o GEAM 1600 Summer St. Stamford, CT 06905
Age 66
Position(s) Held with Fund Director
Term of Office and Length of Time Served Until successor is elected and qualified – 15 years
Principal Occupation(s) During Past 5 years General Partner, NGN Capital LLC since 2006; Managing Director, Vice President of Walden Capital Management since 1996.
Number of Portfolios in Fund Complex Overseen by Director 17
Other Directorships Held by Director Trustee of GE Institutional Funds since 1997; Trustee of Fordham University from 1989 to 1995 and from 2001 to 2007 and Trustee Emeritus since 2007; Trustee of Neuroscience Research Institute since 1986; Trustee of GE Funds from 1993 to February 2011; Director of Artes Medical from 2006-2008 and Trustee of Gregorian University Foundation from 1992-2007.
18
Table of Contents
| Additional Information | (Unaudited) |
R. Sheldon Johnson
Address c/o GEAM 1600 Summer St. Stamford, CT 06905
Age 65
Positions(s) Held with Fund Director
Term of office and Length of Time served Unit Successor is elected and qualified – 1 year.
Principal Occupation(s) During Past 5 years Head of Global Institutional Equity Sales and Marketing at Morgan Stanley & Co., Inc. from 2002 to 2006 and Managing Director at Morgan Stanley & Co., Inc. from 1988 to 2006.
Number of Portfolios in Fund Complex Overseen by Director 17
Other Directorships Held by Director Trustee of GE Institutional Funds since April 2011 and Trustee of St. Lawrence University since 2003.
Donna M. Rapaccioli
Address c/o GEAM 1600 Summer St. Stamford, CT 06905
Age 49
Position(s) Held with Fund Director
Term of Office and Length of Time Served Until successor is elected and qualified – Less than 1 year
Principal Occupation(s) During Past 5 Years Dean of the Gabelli School of Business since 2007 and Accounting professor since 1987 at Fordham University.
Number of Portfolios in Fund Complex Overseen by Officer 17
Other Directorships Held by Director Trustee of GE Institutional Funds since January 2012 and Trustee of Emmanuel College since 2010.
The Statement of Additional Information for the Funds includes additional information about the Directors and Officers and is available, without charge, upon request by calling 1-800-242-0134.
19
Table of Contents
| Investment Team | (Unaudited) |
Investment Adviser and Administrator
GE Asset Management Incorporated
Board of Directors
Michael J. Cosgrove, Chairman
John R. Costantino
R. Sheldon Johnson
Donna M. Rapaccioli
Matthew J. Simpson
Secretary
Joon Won Choe
Assistant Secretary
Michelle Matzelle
Treasurer
Arthur A. Jensen
Assistant Treasurer
Casey Yantosca
Distributor
GE Investment Distributors, Inc.
Member FINRA and SIPC
Custodian
State Street Bank & Trust Company
Officers of the Investment Adviser
Dmitri Stockton, President and Chief Executive Officer
Cheryl H. Beacock, Senior Vice President, Human Resources
George A. Bicher, Chief Risk Officer
Paul M. Colonna, President and Chief Investment Officer – Public Investments
Michael J. Cosgrove, President of Mutual Funds and Global Investment Programs
Gregory B. Hartch, Senior Vice President – Strategy and Business Development Leader
Ralph R. Layman, Executive Vice President and Chief Investment Officer Emeritus Public Equities
Maureen B. Mitchell, President of Global Sales and Marketing
Steven M. Rullo, Senior Vice President – Services and Technology
Matthew J. Simpson, Executive Vice President, General Counsel and Secretary
Donald W. Torey, President and Chief Investment Officer – Alternative Investments
David Wiederecht, President and Chief Investment Officer – Investment Solutions
Jessica Holscott, Executive Vice President, Chief Financial Officer*
| * | Effective August 1, 2012, Ms. Holcott replaced Tracie A. Winbigler as Executive Vice President and Chief Financial Officer. |
At GE Asset Management, we’re dedicated to providing the investment options you’ll need to tailor your financial portfolio to every stage of your life. Each member of the GE Family of Funds is managed according to the same principles of integrity and quality that have guided GE over the past century, and have made it the world-class company that it is today. Each fund draws strength from a heritage of investment management experience that spans more than 80 years. Whether you’re creating a new investment portfolio or adding to an established one, the GE Family of Funds offers an array of professionally managed investment options that will help you meet a lifetime of financial needs.
20
Table of Contents
Investment Adviser
GE Asset Management Incorporated
1600 Summer Street
Stamford, CT 06905
or at:
PO Box 7900
Stamford, CT 06904-7900
Distributor
GE Investment Distributors, Inc.
member FINRA and SIPC
1600 Summer Street
Stamford, CT 06905
or at:
PO Box 7900
Stamford, CT 06904-7900
The Fund files its complete schedule of portfolio holdings with the Securities and Exchange Commission for the first and third quarters of each fiscal year on Form N-Q. The Fund’s Forms N-Q, as well as a description of the policies and procedures that the Fund uses to determine how to vote proxies (if any) relating to portfolio securities is available without charge (i) upon request, by calling 1-800-493-3042; (ii) on the Fund’s website at http://www.geam.com; and (iii) on the Commission’s website at http://www.sec.gov. The Fund’s Forms N-Q may be reviewed and copied at the Commission’s Public Reference Room in Washington, DC—information on the operation of the Public Reference Room may be obtained by calling 1-800-SEC-0330.
Information (if any) regarding how the Fund voted proxies relating to portfolio securities during the most recently disclosed 12-month period ended June 30 is available without charge (i) through the Fund’s website at http://www.geam.com; and (ii) on the Commission’s website at http://www.sec.gov.

Table of Contents
GE Investments Funds, Inc.
Core Value Equity Fund
Semi–Annual Report
June 30, 2012

Table of Contents
GE Investments Funds, Inc.
| Core Value Equity Fund | Contents | |
| 1 | ||||
| 2 | ||||
| 3 | ||||
| 6 | ||||
Financial Statements | ||||
| 7 | ||||
| 8 | ||||
| 9 | ||||
| 10 | ||||
| 11 | ||||
| 17 | ||||
| 21 | ||||
This report is prepared for Policyholders of certain variable contracts and may be distributed to others only if preceded or accompanied by the variable contract’s current prospectus and the current summary prospectus of the Fund available for investments thereunder.
Table of Contents
| Core Value Equity Fund | (Unaudited) |
Notes to Performance
Total return performance shown in this report for the GE Investments Core Value Equity Fund (the “Fund”) takes into account changes in share price and assumes reinvestment of dividends and capital gains distributions, if any. Total returns shown are net of Fund fees and expenses but do not reflect fees and charges associated with the variable contracts such as administrative fees, account charges and surrender charges, which, if reflected, would reduce the Fund’s total returns for all periods shown.
The performance data quoted represents past performance; past performance does not guarantee future results. Investment return and principal value will fluctuate so your shares, when redeemed, may be worth more or less than their original cost. Current performance may be higher or lower than the performance data quoted. Periods less than one year are not annualized. Please call 800-493-3042 or visit the Fund’s website at http://www.geam.com for the most recent month-end performance data.
An investment in the Fund is not a deposit of any bank and is not insured or guaranteed by the Federal Deposit Insurance Corporation (FDIC) or any other government agency. An investment in the Fund is subject to risk, including possible loss of principal invested.
Investment Profile
A mutual fund designed for investors who seek long-term growth of capital and future income. The Fund seeks its investment objectives by investing at least 80% of its net assets under normal circumstances in equity securities, such as common and preferred stocks. The Fund invests primarily in U.S. companies that the portfolio managers believe are undervalued by the market but have solid growth prospects.
Sector Allocation
as a % of Fair Value of $15,746 (in thousands) on June 30, 2012 (a)(b)
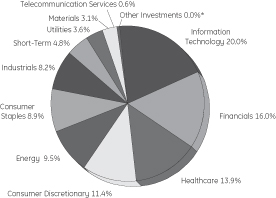
Top Ten Largest Holdings
as of June 30, 2012 (as a % of Fair Value) (a)(b)(c)
Apple Inc. | 4.25% | |||
Microsoft Corp. | 3.42% | |||
Wells Fargo & Co. | 2.81% | |||
Cisco Systems Inc. | 2.64% | |||
Time Warner Inc. | 2.60% | |||
PepsiCo Inc. | 2.51% | |||
Chevron Corp. | 2.50% | |||
Covidien PLC | 2.32% | |||
Johnson & Johnson | 2.25% | |||
Oracle Corp. | 2.21% |
| (a) | The securities information regarding holdings, allocations and other characteristics is presented to illustrate examples of securities that the Fund has bought and the diversity of areas in which the Fund may invest as of a particular date. It may not be representative of the Fund’s current or future investments and should not be construed as a recommendation to purchase or sell a particular security. |
| (b) | Fair value basis is inclusive of the short-term investment in GE Institutional Money Market Fund Investment Class. |
| (c) | The figures presented to not include the Fund’s entire investment portfolio and may change at any time. |
| * | Less than 0.05% |
GE Investment Distributors, Inc., Member of FINRA & SIPC, is the principal underwriter and distributor of the GE Investments Funds, Inc. and a wholly owned subsidiary of GE Asset Management Incorporated, the investment adviser of the Fund.
1
Table of Contents
| Core Value Equity Fund | (Unaudited) |
Understanding Your Fund’s Expenses
As a shareholder of the Fund you incur ongoing costs. Ongoing costs include portfolio management fees, professional fees, administrative fees and other Fund expenses. The following example is intended to help you understand your ongoing costs (in dollars) of investing in the Fund and to compare these costs with the ongoing costs of investing in other mutual funds.
To illustrate these ongoing costs, we have provided an example and calculated the expenses paid by investors in each share class of the Fund during the period. The information in the following table is based on an investment of $1,000, which is invested at the beginning of the period and held for the entire six-month period ended June 30, 2012.
Actual Expenses
The first section of the table provides information about actual account values and actual expenses. You may use the information in this section, together with the amount you invested, to estimate the expenses that you paid over the period. To do so, simply divide your account value by $1,000 (for example, an $8,600 account value divided by $1,000 = 8.6), then multiply the result by the number given for your class under the heading “Expenses paid during period” to estimate the expenses paid during the period.
Hypothetical Example for Comparison Purposes
The second section of the table provides information about hypothetical account values and hypothetical expenses based on the Fund’s actual expense ratio and an assumed rate of return of 5% per year before expenses, which is not the Fund’s actual return. The hypothetical account values and expenses may not be used to estimate the actual ending account balance or expenses you paid for the period. You may use this information to compare the ongoing costs of investing in the Fund and other funds. To do so, compare this 5% hypothetical example with the 5% hypothetical examples that appear in the shareholders reports of other funds.
Please note that the expenses shown in the table are meant to highlight and help you compare ongoing costs only and do not reflect transaction costs, such as sales charges or redemption fees, if any. Therefore, the second section of the table is useful in comparing ongoing costs only, and will not help you determine the relative total costs of owning different funds. Additionally, the expenses shown do not reflect the fees or charges associated with variable contracts through which shares of the Fund are offered.
January 1, 2012 – June 30, 2012
| Account value at the beginning of the period ($) | Account value at the end of the period ($) | Expenses paid during the period ($)* | ||||||||||
Actual Fund Return* | 1,000.00 | 1,070.70 | 5.20 | |||||||||
Hypothetical 5% Return (2.5% for the period) | 1,000.00 | 1,019.84 | 5.07 | |||||||||
| * | Expenses are equal to the Fund’s annualized expense ratio of 1.01% (for the period January 1, 2012 – June 30, 2012), multiplied by the average account value over the period, multiplied by 182/366 (to reflect the one-half year period). |
2
Table of Contents
Core Value Equity Fund
| Schedule of Investments | June 30, 2012 (Unaudited) |
Core Value Equity Fund
| Number of Shares | Fair Value | |||||||||
Common Stock — 93.5%† | ||||||||||
Advertising — 1.7% | ||||||||||
Omnicom Group Inc. | 5,504 | $ | 267,494 | |||||||
Aerospace & Defense — 1.7% |
| |||||||||
Honeywell International Inc. | 4,756 | 265,575 | ||||||||
Agricultural Products — 1.3% |
| |||||||||
Archer-Daniels-Midland Co. | 7,178 | 211,895 | ||||||||
Air Freight & Logistics — 1.6% |
| |||||||||
FedEx Corp. | 404 | 37,010 | ||||||||
United Parcel Service Inc. | 2,630 | 207,139 | ||||||||
| 244,149 | ||||||||||
Asset Management & Custody Banks — 4.4% |
| |||||||||
Ameriprise Financial Inc. | 4,624 | 241,650 | ||||||||
Invesco Ltd. | 9,600 | 216,960 | ||||||||
State Street Corp. | 5,064 | 226,057 | (c) | |||||||
| 684,667 | ||||||||||
Automobile Manufacturers — 0.5% | ||||||||||
Ford Motor Co. | 7,873 | 75,502 | ||||||||
Biotechnology — 1.6% | ||||||||||
Amgen Inc. | 3,481 | 254,252 | ||||||||
Broadcasting — 0.6% | ||||||||||
CBS Corp. | 2,950 | 96,701 | ||||||||
Cable & Satellite — 1.4% | ||||||||||
Comcast Corp. | 7,134 | 228,074 | ||||||||
Communications Equipment — 3.6% | ||||||||||
Cisco Systems Inc. | 24,219 | 415,840 | ||||||||
Qualcomm Inc. | 2,799 | 155,848 | ||||||||
| 571,688 | ||||||||||
Computer Hardware — 4.2% |
| |||||||||
Apple Inc. | 1,145 | 668,680 | (a) | |||||||
Construction & Farm Machinery & Heavy Trucks — 1.4% |
| |||||||||
Caterpillar Inc. | 671 | 56,975 | ||||||||
Deere & Co. | 2,098 | 169,665 | ||||||||
| 226,640 | ||||||||||
| Number of Shares | Fair Value | |||||||||
Consumer Finance — 1.4% |
| |||||||||
American Express Co. | 3,747 | $ | 218,113 | |||||||
Data Processing & Outsourced Services — 0.5% |
| |||||||||
The Western Union Co. | 4,998 | 84,166 | ||||||||
Department Stores — 1.0% |
| |||||||||
Macy’s Inc. | 4,747 | 163,059 | ||||||||
Diversified Chemicals — 0.7% |
| |||||||||
EI du Pont de Nemours & Co. | 2,070 | 104,680 | ||||||||
Diversified Financial Services — 4.4% | ||||||||||
Citigroup Inc. | 3,963 | 108,626 | ||||||||
JPMorgan Chase & Co. | 3,831 | 136,882 | ||||||||
Wells Fargo & Co. | 13,210 | 441,742 | ||||||||
| 687,250 | ||||||||||
Diversified Metals & Mining — 0.7% | ||||||||||
Freeport-McMoRan Copper & Gold Inc. | 3,303 | 112,533 | ||||||||
Drug Retail — 1.0% | ||||||||||
CVS Caremark Corp. | 3,523 | 164,630 | ||||||||
Electric Utilities — 1.4% | ||||||||||
Exelon Corp. | 3,963 | 149,088 | ||||||||
FirstEnergy Corp. | 1,499 | 73,736 | ||||||||
| 222,824 | ||||||||||
Electrical Components & Equipment — 0.7% |
| |||||||||
Cooper Industries PLC | 1,717 | 117,065 | ||||||||
Fertilizers & Agricultural Chemicals — 0.8% |
| |||||||||
Potash Corporation of Saskatchewan Inc. | 2,818 | 123,118 | ||||||||
General Merchandise Stores — 1.0% | ||||||||||
Target Corp. | 2,605 | 151,585 | ||||||||
Healthcare Equipment — 3.2% |
| |||||||||
Covidien PLC | 6,825 | 365,137 | ||||||||
Medtronic Inc. | 3,422 | 132,534 | ||||||||
| 497,671 | ||||||||||
Healthcare Facilities — 0.7% |
| |||||||||
HCA Holdings Inc. | 3,376 | 102,732 | ||||||||
Healthcare Services — 2.0% |
| |||||||||
Express Scripts Holding Co. | 5,502 | 307,177 | (a) | |||||||
Heavy Electrical Equipment — 0.5% |
| |||||||||
ABB Ltd. ADR | 4,624 | 75,464 | ||||||||
See Notes to Schedule of Investments and Notes to Financial Statements.
3
Table of Contents
Core Value Equity Fund
| Schedule of Investments | June 30, 2012 (Unaudited) |
| Number of Shares | Fair Value | |||||||||
Home Improvement Retail — 0.8% |
| |||||||||
Lowe’s Companies Inc. | 4,183 | $ | 118,965 | |||||||
Independent Power Producers & Energy Traders — 2.1% |
| |||||||||
Calpine Corp. | 7,706 | 127,226 | (a) | |||||||
The AES Corp. | 16,293 | 209,039 | (a) | |||||||
| 336,265 | ||||||||||
Industrial Machinery — 0.3% |
| |||||||||
Eaton Corp. | 1,321 | 52,351 | ||||||||
Insurance Brokers — 0.7% |
| |||||||||
Marsh & McLennan Companies Inc. | 3,523 | 113,546 | ||||||||
Integrated Oil & Gas — 5.6% |
| |||||||||
Chevron Corp. | 3,734 | 393,937 | ||||||||
Exxon Mobil Corp. | 2,234 | 191,163 | (d) | |||||||
Hess Corp. | 2,774 | 120,530 | ||||||||
Occidental Petroleum Corp. | 2,023 | 173,513 | ||||||||
| 879,143 | ||||||||||
Integrated Telecommunication Services — 0.6% |
| |||||||||
AT&T Inc. | 2,642 | 94,214 | ||||||||
Internet Software & Services — 1.1% | ||||||||||
Baidu Inc. ADR | 603 | 69,333 | (a) | |||||||
eBay Inc. | 440 | 18,484 | (a) | |||||||
Google Inc. | 157 | 91,071 | (a) | |||||||
| 178,888 | ||||||||||
IT Consulting & Other Services — 1.8% | ||||||||||
International Business Machines Corp. | 1,446 | 282,809 | ||||||||
Life & Health Insurance — 1.4% |
| |||||||||
MetLife Inc. | 2,862 | 88,293 | ||||||||
Prudential Financial Inc. | 2,642 | 127,952 | ||||||||
| 216,245 | ||||||||||
Life Sciences Tools & Services — 1.6% | ||||||||||
Agilent Technologies Inc. | 2,686 | 105,399 | ||||||||
PerkinElmer Inc. | 5,769 | 148,840 | ||||||||
| 254,239 | ||||||||||
Managed Healthcare — 0.4% |
| |||||||||
UnitedHealth Group Inc. | 1,013 | 59,261 | ||||||||
Movies & Entertainment — 4.4% |
| |||||||||
The Walt Disney Co. | 5,945 | 288,333 | ||||||||
Time Warner Inc. | 10,634 | 409,409 | ||||||||
| 697,742 | ||||||||||
| Number of Shares | Fair Value | |||||||||
Multi-Line Insurance — 1.0% |
| |||||||||
American International Group Inc. | 3,523 | $ | 113,053 | (a) | ||||||
Hartford Financial Services Group Inc. | 2,202 | 38,821 | ||||||||
| 151,874 | ||||||||||
Oil & Gas Equipment & Services — 1.2% | ||||||||||
Schlumberger Ltd. | 2,950 | 191,485 | ||||||||
Oil & Gas Exploration & Production — 1.8% |
| |||||||||
Anadarko Petroleum Corp. | 2,818 | 186,552 | ||||||||
Southwestern Energy Co. | 2,862 | 91,384 | (a) | |||||||
| 277,936 | ||||||||||
Oil & Gas Refining & Marketing — 0.5% | ||||||||||
Marathon Petroleum Corp. | 1,761 | 79,104 | ||||||||
Oil & Gas Storage & Transportation — 0.4% |
| |||||||||
The Williams Companies Inc. | 2,202 | 63,462 | ||||||||
Packaged Foods & Meats — 2.6% |
| |||||||||
Kraft Foods Inc. | 8,807 | 340,126 | ||||||||
Nestle S.A. ADR | 1,277 | 76,288 | ||||||||
| 416,414 | ||||||||||
Pharmaceuticals — 4.5% | ||||||||||
Johnson & Johnson | 5,252 | 354,825 | ||||||||
Novartis AG ADR | 977 | 54,614 | ||||||||
Pfizer Inc. | 13,127 | 301,921 | ||||||||
| 711,360 | ||||||||||
Property & Casualty Insurance — 1.4% | ||||||||||
ACE Ltd. | 3,038 | 225,207 | ||||||||
Regional Banks — 0.6% | ||||||||||
Regions Financial Corp. | 14,972 | 101,061 | ||||||||
Reinsurance — 0.5% | ||||||||||
PartnerRe Ltd. | 969 | 73,324 | ||||||||
Research & Consulting Services — 0.7% | ||||||||||
Nielsen Holdings N.V. | 4,227 | 110,832 | (a) | |||||||
Semiconductors — 3.0% | ||||||||||
Altera Corp. | 2,114 | 71,538 | ||||||||
Analog Devices Inc. | 2,114 | 79,634 | ||||||||
Intel Corp. | 6,605 | 176,023 | ||||||||
Texas Instruments Inc. | 5,064 | 145,286 | ||||||||
| 472,481 | ||||||||||
Soft Drinks — 3.9% | ||||||||||
Coca-Cola Enterprises Inc. | 7,706 | 216,076 | ||||||||
PepsiCo Inc. | 5,592 | 395,131 | ||||||||
| 611,207 | ||||||||||
See Notes to Schedule of Investments and Notes to Financial Statements.
4
Table of Contents
Core Value Equity Fund
| Schedule of Investments | June 30, 2012 (Unaudited) |
| Number of Shares | Fair Value | |||||||||
Steel — 1.0% | ||||||||||
Allegheny Technologies Inc. | 4,699 | $ | 149,851 | |||||||
Systems Software — 5.6% |
| |||||||||
Microsoft Corp. | 17,614 | 538,812 | (d) | |||||||
Oracle Corp. | 11,701 | 347,520 | ||||||||
| 886,332 | ||||||||||
Total Common Stock | 14,732,982 | |||||||||
Exchange Traded Funds — 1.6% | ||||||||||
Financial Select Sector SPDR Fund | 3,461 | 50,600 | (f) | |||||||
Industrial Select Sector SPDR Fund | 5,546 | 197,826 | (d,f) | |||||||
Total Exchange Traded Funds | 248,426 | |||||||||
Other Investments — 0.1% |
| |||||||||
GEI Investment Fund | 7,198 | (e) | ||||||||
Total Investments in Securities | 14,988,606 | |||||||||
| Fair Value | ||||||||
Short-Term Investments — 4.8% | ||||||||
GE Institutional Money Market Fund — Investment Class 0.04% | $ | 757,546 | (b,e) | |||||
Total Investments | 15,746,152 | |||||||
Other Assets and Liabilities, | 3,091 | |||||||
|
|
| ||||||
NET ASSETS —100.0% | $ | 15,749,243 | ||||||
|
|
| ||||||
Other Information |
The Fund had the following long futures contracts open at June 30, 2012 (Unaudited):
| Description | Expiration date | Number of Contracts | Current Notional Value | Unrealized Appreciation | ||||||||||||
S&P 500 Emini Index Futures | September 2012 | 9 | $ | 610,380 | $ | 18,716 | ||||||||||
See Notes to Schedule of Investments and Notes to Financial Statements.
5
Table of Contents
| Notes to Schedule of Investments | June 30, 2012 (Unaudited) |
The views expressed in this document reflect our judgment as of the publication date and are subject to change at any time without notice. The securities information regarding holdings, allocations and other characteristics are presented to illustrate examples of securities that the Fund has bought and the diversity of areas in which the Fund may invest as of a particular date. It may not be representative of the Fund’s current or future investments and should not be construed as a recommendation to purchase or sell a particular security. See the Fund’s summary prospectus and statutory prospectus for complete descriptions of investment objectives, policies, risks and permissible investments.
| (a) | Non-income producing security. |
| (b) | Coupon amount represents effective yield. |
| (c) | State Street Corp. is the parent company of State Street Bank & Trust Co., the Fund’s custodian and accounting agent. |
| (d) | At June 30, 2012 , all or a portion of this security was pledged to cover collateral requirements for futures, options, forward foreign currency contracts and/or TBA’s. |
| (e) | GE Asset Management, the investment adviser of the Fund, also serves as investment adviser of the GEI Investment Fund and the GE Institutional Money Market Fund. The GE Investment Fund has been determined to be illiquid using procedures determined by the Board of Directors. |
| (f) | Sponsored by SSgA Funds Management, Inc., an affiliate of State Street Bank & Trust Co., the Fund’s custodian and accounting agent. |
| * | Less than 0.05%. |
| † | Percentages are based on net assets as of June 30, 2012 . |
Abbreviations:
ADR | American Depository Receipt | |
SPDR | Standard & Poors Depository Receipts | |
6
Table of Contents
Selected data based on a share outstanding throughout the fiscal years indicated
| CLASS 1 | ||||||||||||||||||||||||
| 6/30/12† | 12/31/11 | 12/31/10 | 12/31/09 | 12/31/08 | 12/31/07 | |||||||||||||||||||
| Inception date | — | — | — | — | — | 4/28/00 | ||||||||||||||||||
Net asset value, beginning of period | $ | 8.63 | $ | 8.85 | $ | 8.04 | $ | 6.48 | $ | 10.16 | $ | 10.70 | ||||||||||||
Income/(loss) from investment operations: | ||||||||||||||||||||||||
Net investment income | 0.06 | 0.08 | 0.11 | ** | 0.08 | 0.11 | 0.12 | |||||||||||||||||
Net realized and unrealized | 0.55 | (0.22) | 0.82 | 1.57 | (3.46) | 0.97 | ||||||||||||||||||
Total income/(loss) from | 0.61 | (0.14) | 0.93 | 1.65 | (3.35) | 1.09 | ||||||||||||||||||
Less distributions from: | ||||||||||||||||||||||||
Net investment income | — | 0.08 | 0.12 | 0.09 | 0.12 | 0.12 | ||||||||||||||||||
Net realized gains | — | — | — | — | 0.21 | 1.51 | ||||||||||||||||||
Total distributions | — | 0.08 | 0.12 | 0.09 | 0.33 | 1.63 | ||||||||||||||||||
Net asset value, end of period | $ | 9.24 | $ | 8.63 | $ | 8.85 | $ | 8.04 | $ | 6.48 | $ | 10.16 | ||||||||||||
TOTAL RETURN (a) | 7.07% | (1.60)% | 11.57% | 25.40% | (32.94)% | 10.10% | ||||||||||||||||||
RATIOS/SUPPLEMENTAL DATA: | ||||||||||||||||||||||||
Net assets, end of period (in thousands) | $ | 15,749 | $16,251 | $19,756 | $21,847 | $20,361 | $37,765 | |||||||||||||||||
Ratios to average net assets: | ||||||||||||||||||||||||
Net investment income | 1.21% | * | 0.80% | 1.32% | 1.16% | 1.18% | 0.96% | |||||||||||||||||
Net expenses | 1.01% | (b)* | 1.28% | (b) | 0.97% | (b) | 1.24% | (b) | 0.95% | (b) | 0.81% | |||||||||||||
Gross expenses | 1.01% | * | 1.28% | 0.97% | 1.24% | 0.95% | 0.81% | |||||||||||||||||
Portfolio turnover rate | 30% | 49% | 45% | 61% | 68% | 45% | ||||||||||||||||||
Notes to Financial Highlights
| (a) | Total returns are historical and assume changes in share price, reinvestment of dividends and capital gains distributions, and do not include the effect of insurance contract charges. Past performance does not guarantee future results. |
| (b) | Reflects GE Asset Management’s waiver of a portion of the Fund’s management fee in an amount equal to the management fee earned by GEAM with respect to the Fund’s investment in the GE Institutional Money Market Fund or, prior to 2011, in another affiliated Money Market Fund formerly managed by GEAM. |
| * | Annualized for periods less than one year. |
| ** | Per share values have been calculated using the average share method. |
| † | Unaudited |
The accompanying Notes are an integral part of these financial statements.
7
Table of Contents
The accompanying Notes are an integral part of these financial statements.
8
Table of Contents
For the period ending June 30, 2012 | Unaudited | |||
INVESTMENT INCOME | ||||
Income | ||||
Dividends | $ | 184,518 | ||
Interest | 104 | |||
Interest from affiliated investments | 153 | |||
Less: Foreign taxes withheld | (1,899 | ) | ||
Total Income | 182,876 | |||
Expenses | ||||
Advisory and administration fees | 53,817 | |||
Distribution fees | 23 | |||
Director’s fees | 343 | |||
Custody and accounting expenses | 16,731 | |||
Professional fees | 8,952 | |||
Other expenses | 3,813 | |||
Total expenses before waiver and reimbursement | 83,679 | |||
Less: Expenses waived or borne by the adviser | (325 | ) | ||
Net expenses | 83,354 | |||
Net investment income | 99,522 | |||
NET REALIZED AND UNREALIZED GAIN | ||||
Realized gain on: | ||||
Investments | 528,237 | |||
Futures | 45,652 | |||
Increase in unrealized appreciation on: | ||||
Investments | 472,603 | |||
Futures | 23,071 | |||
Net realized and unrealized gain on Investments | 1,069,563 | |||
Net increase in net assets resulting from operations | $ | 1,169,085 | ||
| * | Share Class 4 was closed effective June 29, 2012. |
The accompanying Notes are an integral part of these financial statements.
9
Table of Contents
| * | (Unaudited) |
| ** | Share Class 4 was closed effective June 29, 2012 |
The accompanying Notes are an integral part of these financial statements.
10
Table of Contents
| Notes to Financial Statements | June 30, 2012 (Unaudited) |
| 1. | Organization of the Company |
GE Investments Funds, Inc. (the “Company”) was incorporated under the laws of the Commonwealth of Virginia on May 14, 1984 and is registered under the Investment Company Act of 1940, as amended (the “1940 Act”), as an open-end management investment company. The Company is composed of thirteen investment portfolios (collectively the “Funds”), although only the following ten are currently being offered: U.S. Equity Fund, S&P 500 Index Fund, Premier Growth Equity Fund, Core Value Equity Fund (the “Fund”), Mid-Cap Equity Fund, Small-Cap Equity Fund, International Equity Fund, Total Return Fund, Income Fund, Money Market Fund and Real Estate Securities Fund.
Shares of the Funds of the Company are offered only to insurance company separate accounts that fund certain variable life insurance contracts and variable annuity contracts. GE Asset Management Incorporated (“GEAM”) is the investment adviser and administrator of each of the Funds.
The Company currently offers one share class (Class 1) of the Fund as an investment option for variable life insurance and variable annuity contracts. Class 4 shares were closed on June 29, 2012.
| 2. | Summary of Significant Accounting Policies |
The preparation of financial statements in conformity with U.S. generally accepted accounting principles (GAAP) requires management to make estimates and assumptions that affect the reported amounts of assets and liabilities and disclosure of contingent assets and liabilities at the date of the financial statements and the reported amounts of increases and decreases in net assets from operations during the reporting period. Actual results may differ from those estimates.
The following summarizes the significant accounting policies of the Company:
Securities Valuation and Transactions. All investments in securities are recorded at their estimated fair value, as described in Note 3.
Securities transactions are accounted for as of the trade date. Realized gains and losses on investments sold are recorded on the basis of identified cost for both financial statement and federal tax purposes.
The Fund’s income, expenses (other than distribution fees) and realized and unrealized gains and losses are allocated proportionally each day among the share classes based upon the relative net assets of each class.
Derivatives The Fund is subject to equity price risk, in the normal course of pursuing its investment objectives. The Fund may enter into derivative transactions to gain market exposure for residual and accumulating cash positions.
Futures Contracts A futures contract represents a commitment for the future purchase or sale of an asset at a specified price on a specified date. The Fund invested in futures for a variety of portfolio management purposes such as hedging against the effects of changes in the value of portfolio securities due to anticipated changes in market conditions, gaining market exposure for accumulating and residual cash positions, or when the transactions were economically appropriate to the reduction of risks inherent in the management of the Fund. Buying futures tends to increase a Fund’s exposure to the underlying instrument while selling futures tends to decrease a Fund’s exposure to the underlying instrument, or hedge other Fund investments. The Fund will not enter into a transaction involving futures for speculative purposes. With futures contracts, there is minimal counterparty credit risk to the Fund since futures contracts are exchange traded and the exchange’s clearinghouse, as counterparty to all traded futures, guarantees the futures against default. The Fund’s risks in using these contracts include changes in the value of the underlying instruments, non-performance of the counterparties under the contracts’ terms and changes in the liquidity of the secondary market for the contracts. Futures contracts are valued at the settlement price established each day by the board of trade or exchange on which they principally trade.
Upon entering into a financial futures contract, the Fund is required to pledge to the broker an amount of cash and/or other assets equal to a certain percentage of the contract amount, known as initial margin deposit. Subsequent payments, known as variation margin, are made or received by the Fund each day, depending on the daily fluctuation in the fair value of the underlying security. The Fund records an unrealized gain or loss equal to the daily variation margin. Should market conditions move unexpectedly, the Fund may not achieve the anticipated benefits of the futures contracts and may incur a loss. The Fund recognizes a realized gain or loss on the expiration or closing of a futures contract.
Investment Income Corporate actions (including cash dividends) are recorded on the ex-dividend date, net of applicable withholding taxes, except for certain foreign corporate actions which are recorded as soon after the ex-dividend date as such information becomes available.
11
Table of Contents
| Notes to Financial Statements | June 30, 2012 (Unaudited) |
Withholding taxes in foreign dividends have been provided for in accordance with the Fund’s understanding of the applicable country’s tax rules and rates.
Interest income is recorded on the accrual basis. Accretion of discounts and amortization of premiums on taxable bonds are to the call or maturity date, whichever is shorter, using the effective yield method.
Expenses Fund specific expenses are allocated to the Fund that incurs such expenses. Such expenses may include custodial fees, legal and accounting fees, printing costs and registration fees. Expenses that are not fund specific are allocated pro rata across the Funds. Certain class specific expenses (such as distribution fees) are allocated to the class that incurs such expense. Expenses of the Fund are generally paid directly by the Fund, however, expenses may be paid by GEAM and reimbursed by the Fund.
Federal Income Taxes The Fund intends to comply with all sections of the Internal Revenue Code applicable to regulated investment companies including the distribution of substantially all of its taxable net investment income and net realized capital gains to its shareholders. Therefore, no provision for federal income tax has been made.
| 3. | Securities Valuation |
The Fund utilizes various methods to measure the fair value of most of its investments on a recurring basis. GAAP establishes a framework for measuring fair value and providing related disclosures. Broadly, the framework requires fair value to be determined based on the exchange price that would be received for an asset or paid to transfer a liability (an exit price) in the principal or most advantageous market for the asset or liability in an orderly transaction between market participants at the measurement date. In the absence of active markets for the identical assets or liabilities, such measurements involve developing assumptions based on market observable data and, in the absence of such data, internal information that is consistent with what market participants would use in a hypothetical transaction that occurs at the measurement date. It also establishes a three-level valuation hierarchy based upon observable and non-observable inputs.
Observable inputs reflect market data obtained from independent sources, while unobservable inputs reflect our market assumptions. Preference is given to observable inputs. These two types of inputs create the following fair value hierarchy:
Level 1 — Quoted prices for identical investments in active markets.
Level 2 — Quoted prices for similar investments in active markets; quoted prices for identical or similar investments in markets that are not active; and model-derived valuations whose inputs are observable or whose significant value drivers are observable.
Level 3 — Significant inputs to the valuation model are unobservable.
Policies and procedures are maintained to value investments using the best and most relevant data available. In addition, pricing vendors are utilized to assist in valuing investments. GEAM performs periodic reviews of the methodologies used by independent pricing services including price validation of individual securities.
Fair Value Measurement The following section describes the valuation methodologies the Fund uses to measure different financial investments at fair value.
The Fund’s portfolio securities are valued generally on the basis of market quotations. Equity securities generally are valued at the last reported sale price on the primary market in which they are traded. Portfolio securities listed on NASDAQ are valued using the NASDAQ Official Closing Price, Level 1 securities primarily include publicly-traded equity securities. If no sales occurred on the exchange or NASDAQ that day, the portfolio security generally is valued using the last reported bid price. In those circumstances the Fund classifies the investment securities in Level 2.
Short-term investments of sufficient credit quality with remaining maturities of sixty days or less at the time of purchase are typically valued on the basis of amortized cost which approximates fair value and these are included in Level 2. If it is determined that amortized cost does not approximate fair value, securities may be valued based on dealer supplied valuations or quotations. In these infrequent circumstances, pricing services may provide the Fund with valuations that are based on significant unobservable inputs, and in those circumstances the investment securities are classified in Level 3.
The Fund uses the net asset value per unit for collective funds (i.e., GEI Investment Fund). The Fund classifies the investment security in Level 2.
If prices are not readily available for a portfolio security, or if it is believed that a price for a portfolio security does not represent its fair value, the security may be valued using procedures approved by the Fund’s Board of Directors that
12
Table of Contents
| Notes to Financial Statements | June 30, 2012 (Unaudited) |
are designed to establish its “fair” value. These securities are typically classified in Level 3. Those procedures require that the fair value of a security be established by a valuation committee of GEAM. The valuation committee follows different protocols for different types of investments and circumstances. The fair value procedures may be used to value any investment of the Fund in the appropriate circumstances.
Fair value determinations generally are used for securities whose value is affected by a significant event that will materially affect the value of a security and which occurs subsequent to the time of the close of the principal market on which such security trades but prior to the calculation of the Fund’s NAV.
The value established for such a portfolio security may be different than what would be produced through the use of market quotations or another methodology. Portfolio securities that are valued using techniques other than market quotations, including “fair valued” securities, may be subject to greater fluctuation in their value from one day to the next than would be the case if market quotations were used. In addition, there is no assurance that the Fund
could sell a portfolio security for the value established for it at any time and it is possible that the Fund would incur a loss because a portfolio security is sold at a discount to its established value.
Other financial investments are derivative instruments that are not reflected in total investments, such as futures, forwards, swaps, and written options contracts, which are valued based on fair value as discussed above.
The Fund uses closing prices for derivatives included in Level 1, which are traded either on exchanges or liquid over-the counter markets. Derivative assets and liabilities included in Level 2 primarily represent interest rate swaps, cross-currency swaps and foreign currency and commodity forward and option contracts. Derivative assets and liabilities included in Level 3 primarily represent interest rate products that contain embedded optionality or prepayment features.
The inputs or methodology used for valuing securities are not an indication of the risk associated with investing in those securities.
The following table presents the Fund’s investments measured at fair value on a recurring basis at June 30, 2012:
Investments | Level 1 | Level 2 | Level 3 | Total | ||||||||||||
Investments in Securities† | ||||||||||||||||
Common Stock | $ | 14,732,982 | $ | — | $ | — | $ | 14,732,982 | ||||||||
Exchange Traded Funds | 248,426 | — | — | 248,426 | ||||||||||||
Other Investments | — | 7,198 | — | 7,198 | ||||||||||||
Short-Term Investments | 757,546 | — | — | 757,546 | ||||||||||||
|
|
|
|
|
|
|
| |||||||||
Total Investments in Securities | $ | 15,738,954 | $ | 7,198 | $ | — | $ | 15,746,152 | ||||||||
|
|
|
|
|
|
|
| |||||||||
Other Financial Instruments* | ||||||||||||||||
Futures Contracts — Unrealized Appreciation | $ | 18,716 | $ | — | $ | — | $ | 18,716 | ||||||||
|
|
|
|
|
|
|
| |||||||||
| † | See Schedule of Investments for Industry Classification |
| * | Other financial instruments include derivative instruments such as futures contracts. Amounts shown represent unrealized appreciation (depreciation), at period end. |
There were no transfers between the fair value levels. Transfers between fair value levels are considered to occur at the beginning of the period.
13
Table of Contents
| Notes to Financial Statements | June 30, 2012 (Unaudited) |
| 4. | Derivatives Transactions |
Shown below are the derivative contracts entered into by the Fund, summarized by primary risk exposure as they appear on the Statement of Assets and Liabilities, all of which are not accounted for as hedging instruments under FASB Accounting Standards Codification (“ASC”) No. 815 Derivatives and Hedging as of June 30, 2012.
Asset Derivatives June 30, 2012 | Liability Derivatives June 30, 2012 | |||||||
Derivatives not accounted for as hedging instruments under ASC 815 | Location in the Statement of Assets and Liabilities | Fair Value ($) | Location in the Statements of Assets and Liabilities | Fair Value ($) | ||||
| Equity Contracts | Assets, Net Assets — Net Unrealized Appreciation/(Depreciation) on Futures | 18,716* | Liabilities, Net Assets — Net Unrealized Appreciation/(Depreciation) on Futures | — | ||||
| * | Includes cumulative unrealized appreciation/(depreciation) of futures contracts reported in the Schedule of Investments and as within the components of the net assets section of the Statement of Assets and Liabilities. Only the current day’s variation margin is reported within the Assets and/or Liabilities section on the Statement of Assets and Liabilities. |
Shown below are the effects of derivative instruments on the Fund’s Statement of Operation, summarized by primary risk exposure all of which are not accounted for as hedging instruments under ASC 815.
Derivatives not accounted for as hedging instruments under ASC 815 | Location in the Statements of Operations | Total Notional Amount of Purchased/(Sold) ($) | Realized Gain or (Loss) on Derivatives Recognized in Income ($) | Change in Unrealized Appreciation/(Depreciation) on Derivatives Recognized in Income ($) | ||||
Equity Contracts | Realized gain/(loss) on Futures, Increase/(decrease) in unrealized appreciation/ (depreciation) on Futures | 2,149,471/(2,234,114) | 45,652 | 23,071 |
| 5. | Line of Credit |
The Company shares a revolving credit facility of up to $150 million with a number of its affiliates. The credit facility is with its custodian bank, State Street Bank and Trust Company (“State Street”). The revolving credit facility requires the payment of a commitment fee equal to 0.100% per annum on the daily unused portion of the credit facility, payable quarterly. The portion borne by the Fund generally is borne proportionally based upon net assets. In addition, the Company has a $100 million uncommitted, unsecured line of credit with State Street. Generally, borrowings under the credit facilities would accrue interest at the Federal Funds Rate plus 50 basis points and would be borne by the borrowing Fund. The maximum amount allowed to be borrowed by any one Fund is the lesser of (i) 33.33% of its total assets or (ii) 20% of its net assets. The credit facilities were not utilized by the Fund during the six-month period ended June 30, 2012.
| 6. | Compensation and Fees Paid to Affiliates |
GEAM, a registered investment adviser, was retained by the Company’s Board of Directors effective March 16, 2000 to act as investment adviser and administrator of the Fund. GEAM’s compensation for investment advisory and administrative
services is paid monthly based on the average daily net assets of the Fund at an annualized rate of 0.65%.
GEAM has a contractual arrangement with the Fund to waive a portion of the Fund’s management fee in the amount equal to the management fee earned by GEAM with respect to the Fund’s investment in the GE Institutional Money Market Fund, if any.
Distribution and Service (12b-1) Fee Prior to the closure of Class 4 shares on June 29, 2012 the Company had adopted a Distribution and Service (12b-1) Plan (the “Plan”) pursuant to Rule 12b-1 under the 1940 Act with respect to Class 4 shares of the Fund. Under the Plan, the Fund could compensate GE Investment Distributors, Inc. (“GEID”), a wholly-owned subsidiary of GEAM and the Fund’s principal distributor, for certain sales services provided by GEID or other broker dealers and investor services provided by GEID or other service providers relating to the Fund’s Class 4 shares, including services to owners or prospective owners of variable contracts issued by insurance companies that offered such share class as an investment option. The amount of compensation paid under the Plan by the Fund’s Class 4 shares was not exceed to 0.45% of the average daily net assets of the Fund attributable to such share class.
14
Table of Contents
| Notes to Financial Statements | June 30, 2012 (Unaudited) |
Directors’ Compensation The Fund pays no compensation to its directors who are officers or employees of GEAM or its affiliates. Directors who are not such officers or employees also serve in a similar capacity for other funds advised by GEAM. Compensation paid to non-interested Directors are reflected on the Statement of Operations. These fees are allocated pro rata across all of the mutual fund platforms served by the Directors, including the Fund, and are based upon the relative net assets of each fund within such platforms.
| 7. | Investment Transactions |
Purchases and Sales of Securities The cost of purchases and the proceeds from sales of investments, other than short-term securities, for the six-month period ended June 30, 2012 were as follows:
| Non-U.S. Government Securities | ||
| Purchases | Sales | |
| $4,832,991 | $6,379,565 | |
| 8. | Income Taxes |
The Fund is subject to ASC 740, Income Taxes. ASC 740 provides guidance for financial accounting and reporting for the effects of income taxes that result from an entity’s activities during the year. ASC 740 also provides guidance regarding how certain tax positions should be recognized, measured, presented and disclosed in the financial statements. ASC 740 requires evaluation of tax positions taken or expected to be taken in the course of preparing the Fund’s tax returns to determine whether the tax positions are “more likely than not” of being sustained by the applicable tax authority. There are no adjustments to the Fund’s net assets required under ASC 740. The Fund’s 2008, 2009, 2010 and 2011 fiscal years tax returns are still open to examination by the Federal and applicable state tax authorities.
At June 30, 2012, information on the tax cost of investments was as follows:
| Cost of Investments For Tax Purposes | Gross Tax | |||||
| Appreciation | Depreciation | Net Tax Appreciation | ||||
$14,454,703 | $1,902,623 | $(611,174) | $1,291,449 | |||
As of December 31, 2011, the Fund has capital loss carryovers as indicated below. Capital loss carryovers are available to offset future realized capital gains to the extent provided in the Internal Revenue Code and regulations thereunder. To the extent that these carryover losses are used to offset future capital gains, it is probable that the gains so offset will not be distributed to shareholders because they would be taxable as ordinary income.
| Amount | ||||
| Short-Term | Long-Term | Expires | ||
| $1,583,949 | $— | 12/31/2017 | ||
These amounts will be available to offset future taxable capital gains. Under the recently enacted Regulated Investment Company Modernization Act of 2010, the Fund will be permitted to carry forward capital losses incurred in taxable years beginning after December 22, 2010 for an unlimited period. However, any losses incurred during those future years will be required to be utilized prior to the losses incurred in pre-enactment tax years. As a result of
this ordering rule, pre-enactment capital loss carryforwards may be more likely to expire unused. Additionally, post-enactment capital losses that are carried forward will retain their character as either short-term or long-term capital losses rather than being considered all short-term as under previous law.
During the year ended December 31, 2011, the Fund utilized $1,375,316 of prior year capital loss carryovers.
Any qualified late-year loss is deemed to arise on the first day of the Fund’s next tax year (if the Fund elects to defer such loss). Under this regime, generally, the Fund can elect to defer any post-October capital loss and/or any late-year ordinary loss as defined by the Internal Revenue Code.
The Fund elected to defer qualified late-year losses for the year ended December 31, 2011 as follows:
| Capital | Ordinary | |
| $48,361 | $— |
15
Table of Contents
| Notes to Financial Statements | June 30, 2012 (Unaudited) |
The tax composition of distributions paid during the years ended December 31, 2011 and December 31, 2010 were as follows:
| | Ordinary Income | | | Long-Term Capital Gains | | Total | ||||||
2011 | $ | 146,163 | $ | — | $ | 146,163 | ||||||
2010 | 265,456 | — | 265,456 |
Distributions to Shareholders The Fund declares and pays any dividends from net investment income annually. The Fund declares and pays any net realized capital gains in excess of capital loss carryforwards distributions annually. The character of income and gains to be distributed is determined in accordance with income tax regulations which may differ from generally accepted accounting principles. These differences include (but are not limited to) futures, investments organized as partnerships for tax purposes, and losses deferred due to wash sale transactions. Reclassifications due to permanent book/tax differences are made to the Fund’s capital accounts to reflect income and gains available for distribution (or available capital loss
carryovers) under income tax regulations. These reclassifications have no impact on net investment income, realized gains or losses, or the net asset value of the Fund. The calculation of net investment income per share in the Financial Highlights table excludes these adjustments.
The reclassifications for the year ended December 31, 2011 were as follows:
| Undistributed Net Investment Income | Accumulated Net Realized Gain (Loss) | Capital Paid In | ||
| $1,304 | $25 | ($1,329) |
| 9. | Subsequent Events |
Subsequent events after the balance sheet date through the date the financial statements were issued have been evaluated in the preparation of the financial statements. As of August 3, 2012, the assets of the Mid-Cap Equity Fund and the Money Market Fund were liquidated. These funds ceased operations and are no longer offered for investment.
16
Table of Contents
| Additional Information | (Unaudited) |
Information about Directors and Executive Officers:
The business and affairs of the Funds are managed under the direction of the Funds’ Board of Directors. Information pertaining to the Directors and officers of the Funds is set forth below.
Interested Directors and Executive Officers
Michael J. Cosgrove
Address c/o GEAM 1600 Summer St. Stamford, CT 06905
Age 63
Position(s) Held with Fund Chairman of the Board and President
Term of Office and Length of Time Served Until successor is elected and qualified – 15 years
Principal Occupation(s) During Past 5 years President of Mutual Funds and Global Investment Programs of GEAM since November 2011; President and Chief Executive Officer – Mutual Funds and Intermediary Business of GEAM from March 2007 to November 2011; Executive Vice President of GEAM from February 1997 to March 2007; and Executive Vice President-Mutual Funds of GEAM from March 1993 to March 2007. Also serves as Treasurer of GE Foundation since 1988.
Number of Portfolios in Fund Complex Overseen by Director 25
Other Directorships Held by Director Chairman of the Board and President of GE Institutional Funds since 1997; Trustee of Elfun Funds, GE Savings & Security Funds and General Electric Pension Trust since 1988; Director of GEAM since 1988; Trustee of Fordham University from 2002 to June 30, 2010 and since July 2011; Director of GE Investments Distributors, Inc since June 2011; Director of Skin Cancer Foundation since August 2010; Member of the Board of Governors for the Investment Company Institute since October 2006; Director, GE Asset Management (Ireland) Limited, since February 1999, GE Asset Management Funds Plc since 1998, GE Asset Management Canada Company since 1998, GE Asset Management Limited since 1998; Trustee of General Electric Pension Trust since 1988; and Chairman of the Board and President of GE Funds from 1993 to February 2011.
Matthew J. Simpson
Address c/o GEAM 1600 Summer St. Stamford, CT 06905
Age 51
Position(s) Held with Fund Director and Executive Vice President
Term of Office and Length of Time Served Until successor is elected and qualified – 4 years
Principal Occupation(s) During Past 5 years Executive Vice President, General Counsel and Secretary of GEAM since July 2007; Secretary of Elfun Funds and GE Savings & Security Funds since July 2007; Senior Vice President and General Counsel – Marketing and Client Services (formerly Asset Management Services) of GEAM and Senior Vice President and General Counsel of GE Asset Management Services from February 1997 to July 2007; Vice President and Associate General Counsel of GEAM from October 1992 to February 1997; Secretary of GE Institutional Funds and GE Investments Funds, Inc. from 1997 to July 2007 and Vice President from September 2003 to July 2007; Assistant Secretary of Elfun Funds and GE Savings & Security Funds from 1998 to July 2007 and Vice President from October 2003 to July 2007; and Secretary of GE Funds from 1993 to July 2007 and Vice President from September 2003 to July 2007.
Number of Portfolios in Fund Complex Overseen by Director 25
Other Directorships Held by Director Trustee of Elfun Funds, GE Savings & Security Funds and General Electric Pension Trust since July 2007; Trustee and Executive Vice President of GE Institutional Funds since July 2007; Director of GEAM since July 2007; and Trustee and Executive Vice President of GE Funds from July 2007 to February 2011.
17
Table of Contents
| Additional Information | (Unaudited) |
Joon Won Choe
Address c/o GEAM 1600 Summer St. Stamford, CT 06905
Age 42
Position(s) Held with Fund Vice President & Secretary
Term of Office and Length of Time Served Until successor is elected and qualified – Vice President and Secretary – 1 year
Principal Occupation(s) During Past 5 years Senior Vice President and Deputy General Counsel at GEAM since March 2011; Vice President and Secretary of GE Institutional Funds since September 2010; Vice President and Assistant Secretary of Elfun Funds and GE Savings & Security Funds since September 2010; Senior Vice President and Associate General Counsel at GEAM from June 2010 to March 2011; Vice President and Associate General Counsel of GEAM from November 2005 to June 2010 and Vice President and Secretary of GE Funds from September 2010 to February 2011.
Number of Portfolios in Fund Complex Overseen by Officer N/A
Other Directorships Held by Officer N/A
Robert Herlihy
Address c/o GEAM 1600 Summer St. Stamford, CT 06905
Age 44
Position(s) Held with Fund Chief Compliance Officer
Term of Office and Length of Time Served Until successor is elected and qualified – 6 years
Principal Occupation(s) During Past 5 years Chief Compliance Officer of GEAM, GE Institutional Funds, Elfun Funds, and GE Savings & Security Funds since July 2005; Chief Compliance Officer of GE Funds from July 2005 to February 2011 and Manager of Fund Administration at GEAM from 2002-2005.
Number of Portfolios in Fund Complex Overseen by Officer N/A
Other Directorships Held by Officer N/A
Arthur A. Jensen
Address c/o GEAM 1600 Summer St. Stamford, CT 06905
Age 45
Position(s) Held with Fund Treasurer
Term of Office and Length of Time Served Until successor is elected and qualified – 1 year
Principal Occupation(s) During Past 5 Years Treasurer of GE Institutional Funds, Elfun Funds and GE Savings & Security Funds since June 2011; Mutual Funds Controller of GEAM since April 2011; Senior Vice President at Citigroup from 2008 to 2010 and Vice President at JPMorgan from 2005 to 2008.
Number of Portfolios in Fund Complex Overseen by Officer N/A
Other Directorships Held by Officer N/A
18
Table of Contents
| Additional Information | (Unaudited) |
Jeanne M. LaPorta
Address c/o GEAM 1600 Summer St. Stamford, CT 06905
Age 46
Position(s) Held with Fund Vice President
Term of Office and Length of Time Served Until successor is elected and qualified – 8 years
Principal Occupation(s) During Past 5 Years Senior Vice President and Commercial Administrative Officer of GEAM since April 2010; Vice President of GE Institutional Funds since July 2003; Vice President of Elfun Funds and GE Savings & Security Funds since October 2003; Secretary of GE Funds from July 2007 to September 2010 and Vice President from July 2007 to February 2011; Senior Vice President and Deputy General Counsel of GEAM from October 2007 to April 2010; Vice President and Assistant Secretary of Elfun Funds and GE Savings & Security Funds from July 2003 to June 2010; and Vice President and Associate General Counsel – Marketing and Client Services (formerly Asset Management Services) at GEAM from May 1997 to October 2007.
Number of Portfolios in Fund Complex Overseen by Officer N/A
Other Directorships Held by Officer N/A
Non-Interested Directors
John R. Costantino
Address c/o GEAM 1600 Summer St. Stamford, CT 06905
Age 66
Position(s) Held with Fund Director
Term of Office and Length of Time Served Until successor is elected and qualified – 15 years
Principal Occupation(s) During Past 5 years General Partner, NGN Capital LLC since 2006; Managing Director, Vice President of Walden Capital Management since 1996.
Number of Portfolios in Fund Complex Overseen by Director 17
Other Directorships Held by Director Trustee of GE Institutional Funds since 1997; Trustee of Fordham University from 1989 to 1995 and from 2001 to 2007 and Trustee Emeritus since 2007; Trustee of Neuroscience Research Institute since 1986; Trustee of GE Funds from 1993 to February 2011; Director of Artes Medical from 2006-2008 and Trustee of Gregorian University Foundation from 1992-2007.
19
Table of Contents
| Additional Information | (Unaudited) |
R. Sheldon Johnson
Address c/o GEAM 1600 Summer St. Stamford, CT 06905
Age 65
Positions(s) Held with Fund Director
Term of office and Length of Time served Unit Successor is elected and qualified – 1 year.
Principal Occupation(s) During Past 5 years Head of Global Institutional Equity Sales and Marketing at Morgan Stanley & Co., Inc. from 2002 to 2006 and Managing Director at Morgan Stanley & Co., Inc. from 1988 to 2006.
Number of Portfolios in Fund Complex Overseen by Director 17
Other Directorships Held by Director Trustee of GE Institutional Funds since April 2011 and Trustee of St. Lawrence University since 2003.
Donna M. Rapaccioli
Address c/o GEAM 1600 Summer St. Stamford, CT 06905
Age 49
Position(s) Held with Fund Director
Term of Office and Length of Time Served Until successor is elected and qualified – Less than 1 year
Principal Occupation(s) During Past 5 Years Dean of the Gabelli School of Business since 2007 and Accounting professor since 1987 at Fordham University.
Number of Portfolios in Fund Complex Overseen by Officer 17
Other Directorships Held by Director Trustee of GE Institutional Funds since January 2012 and Trustee of Emmanuel College since 2010.
The Statement of Additional Information for the Funds includes additional information about the Directors and Officers and is available, without charge, upon request by calling 1-800-242-0134.
20
Table of Contents
| Investment Team | (Unaudited) |
Investment Adviser and Administrator
GE Asset Management Incorporated
Board of Directors
Michael J. Cosgrove, Chairman
John R. Costantino
R. Sheldon Johnson
Donna M. Rapaccioli
Matthew J. Simpson
Secretary
Joon Won Choe
Assistant Secretary
Michelle Matzelle
Treasurer
Arthur A. Jensen
Assistant Treasurer
Casey Yantosca
Distributor
GE Investment Distributors, Inc.
Member FINRA and SIPC
Custodian
State Street Bank & Trust Company
Officers of the Investment Adviser
Dmitri Stockton, President and Chief Executive Officer
Cheryl H. Beacock, Senior Vice President, Human Resources
George A. Bicher, Chief Risk Officer
Paul M. Colonna, President and Chief Investment Officer – Public Investments
Michael J. Cosgrove, President of Mutual Funds and Global Investment Programs
Gregory B. Hartch, Senior Vice President – Strategy and Business Development Leader
Ralph R. Layman, Executive Vice President and Chief Investment Officer Emeritus Public Equities
Maureen B. Mitchell, President of Global Sales and Marketing
Steven M. Rullo, Senior Vice President – Services and Technology
Matthew J. Simpson, Executive Vice President, General Counsel and Secretary
Donald W. Torey, President and Chief Investment Officer – Alternative Investments
David Wiederecht, President and Chief Investment Officer – Investment Solutions
Jessica Holscott, Executive Vice President, Chief Financial Officer*
| * | Effective August 1, 2012, Ms. Holcott replaced Tracie A. Winbigler as Executive Vice President and Chief Financial Officer. |
At GE Asset Management, we’re dedicated to providing the investment options you’ll need to tailor your financial portfolio to every stage of your life. Each member of the GE Family of Funds is managed according to the same principles of integrity and quality that have guided GE over the past century, and have made it the world-class company that it is today. Each fund draws strength from a heritage of investment management experience that spans more than 80 years. Whether you’re creating a new investment portfolio or adding to an established one, the GE Family of Funds offers an array of professionally managed investment options that will help you meet a lifetime of financial needs.
21
Table of Contents
Investment Adviser
GE Asset Management Incorporated
1600 Summer Street
Stamford, CT 06905
or at:
PO Box 7900
Stamford, CT 06904-7900
Distributor
GE Investment Distributors, Inc.
member FINRA and SIPC
1600 Summer Street
Stamford, CT 06905
or at:
PO Box 7900
Stamford, CT 06904-7900
The Fund files its complete schedule of portfolio holdings with the Securities and Exchange Commission for the first and third quarters of each fiscal year on Form N-Q. The Fund’s Forms N-Q, as well as a description of the policies and procedures that the Fund uses to determine how to vote proxies (if any) relating to portfolio securities is available without charge (i) upon request, by calling 1-800-493-3042; (ii) on the Fund’s website at http://www.geam.com; and (iii) on the Commission’s website at http://www.sec.gov. The Fund’s Forms N-Q may be reviewed and copied at the Commission’s Public Reference Room in Washington, DC—information on the operation of the Public Reference Room may be obtained by calling 1-800-SEC-0330.
Information (if any) regarding how the Fund voted proxies relating to portfolio securities during the most recently disclosed 12-month period ended June 30 is available without charge (i) through the Fund’s website at http://www.geam.com; and (ii) on the Commission’s website at http://www.sec.gov.

Table of Contents
GE Investments Funds, Inc.
Mid-Cap Equity Fund
Semi-Annual Report
June 30, 2012

Table of Contents
| Mid-Cap Equity Fund | Contents | |
| 1 | ||||
| 2 | ||||
| 3 | ||||
| 6 | ||||
Financial Statements | ||||
| 7 | ||||
| 8 | ||||
| 9 | ||||
| 10 | ||||
| 11 | ||||
| 17 | ||||
| 21 | ||||
This report is prepared for Policyholders of certain variable contracts and may be distributed to others only if preceded or accompanied by the variable contract’s current prospectus and the current summary prospectus of the Fund available for investments thereunder.
Table of Contents
| Mid-Cap Equity Fund† | (Unaudited) |
Notes to Performance
Total return performance shown in this report for the GE Investments Mid-Cap Equity Fund (the “Fund”) takes into account changes in share price and assumes reinvestment of dividends and capital gains distributions, if any. Total returns shown are net of Fund fees and expenses but do not reflect fees and charges associated with the variable contracts such as administrative fees, account charges and surrender charges, which, if reflected, would reduce the Fund’s total returns for all periods shown.
The performance data quoted represents past performance; past performance does not guarantee future results. Investment return and principal value will fluctuate so your shares, when redeemed, may be worth more or less than their original cost. Current performance may be higher or lower than the performance data quoted. Periods less than one year are not annualized. Please call 800-493-3042 or visit the Fund’s website at http://www.geam.com for the most recent month-end performance data.
An investment in the Fund is not a deposit of any bank and is not insured or guaranteed by the Federal Deposit Insurance Corporation (FDIC) or any other government agency. An investment in the Fund is subject to risk, including possible loss of principal invested.
Investment Profile
A mutual fund designed for investors who seek long-term growth of capital and future income. The Fund seeks its investment objective by investing at least 80% of its net assets under normal circumstances in equity securities of mid-cap companies, such as common and preferred stocks. The Fund invests primarily in mid-cap companies the portfolio manager believes are undervalued by the market and have above-average growth potential.
Sector Allocation
as a % of Fair Value(c) of $71,294 (in thousands) on June 30, 2012(a)(b)
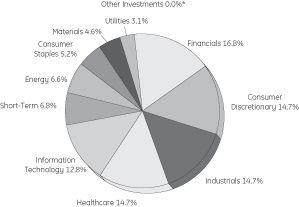
Top Ten Largest Holdings
as of June 30, 2012 as a % of Fair Value (a)(b)(c)
Alexion Pharmaceuticals Inc. | 2.39 | % | ||
Catalyst Health Solutions Inc. | 2.34 | % | ||
HCC Insurance Holdings Inc. | 2.27 | % | ||
American Tower Corp. (REIT) | 2.08 | % | ||
Affiliated Managers Group Inc. | 1.99 | % | ||
IHS Inc. | 1.93 | % | ||
Corrections Corporation of America | 1.91 | % | ||
Citrix Systems Inc. | 1.89 | % | ||
ITC Holdings Corp. | 1.87 | % | ||
Bed Bath & Beyond Inc. | 1.66 | % |
| (a) | The securities information regarding holdings, allocations and other characteristics is presented to illustrate examples of securities that the Fund has bought and the diversity of areas in which the Fund may invest as of a particular date. It may not be representative of the Fund’s current or future investments and should not be construed as a recommendation to purchase or sell a particular security. |
| (b) | Fair value basis is inclusive of the short-term investment in GE Institutional Money Market Fund Investment Class. |
| (c) | The figures presented to not include the Fund’s entire investment portfolio and may change at any time. |
| * | Less than 0.01%. |
| † | As of August 3, 2012, the assets of the Fund were liquidated. The Fund ceased operations and is and no longer offered for investment. |
GE Investment Distributors, Inc., Member of FINRA & SIPC, is the principal underwriter and distributor of the GE Investments Funds, Inc. and a wholly owned subsidiary of GE Asset Management Incorporated, the investment adviser of the Fund.
1
Table of Contents
| Mid-Cap Equity Fund | (Unaudited) |
Understanding Your Fund’s Expenses
As a shareholder of the Fund you incur ongoing costs. Ongoing costs include portfolio management fees, professional fees, administrative fees and other Fund expenses. The following example is intended to help you understand your ongoing costs (in dollars) of investing in the Fund and to compare these costs with the ongoing costs of investing in other mutual funds.
To illustrate these ongoing costs, we have provided an example and calculated the expenses paid by investors in each share class of the Fund during the period. The information in the following table is based on an investment of $1,000, which is invested at the beginning of the period and held for the entire six-month period ended June 30, 2012.
Actual Expenses
The first section of the table provides information about actual account values and actual expenses. You may use the information in this section, together with the amount you invested, to estimate the expenses that you paid over the period. To do so, simply divide your account value by $1,000 (for example, an $8,600 account value divided by $1,000 = 8.6), then multiply the result by the number given for your class under the heading “Expenses Paid During Period” to estimate the expenses paid on your account during the period.
Hypothetical Example for Comparison Purposes
The second section of the table provides information about hypothetical account values and hypothetical expenses based on the Fund’s actual expense ratio and an assumed rate of return of 5% per year before expenses, which is not the Fund’s actual return. The hypothetical account values and expenses may not be used to estimate the actual ending account balance or expenses you paid for the period. You may use this information to compare the ongoing costs of investing in the Fund and other funds. To do so, compare this 5% hypothetical example with the 5% hypothetical examples that appear in the shareholders reports of other funds.
Please note that the expenses shown in the table are meant to highlight and help you compare ongoing costs only and do not reflect transaction costs, such as sales charges or redemption fees, if any. Therefore, the second section of the table is useful in comparing ongoing costs only, and will not help you determine the relative total costs of owning different funds. Additionally, the expenses shown do not reflect the fees or charges associated with variable contracts through which shares of the Fund are offered.
January 1, 2012 – June 30, 2012
| Account value at the beginning of the period ($) | Account value at the end of the period ($) | Expenses paid during the period ($)* | ||||||||||
Actual Fund Return* | 1,000.00 | 1,107.90 | 3.98 | |||||||||
Hypothetical 5% Return (2.5% for the period) | 1,000.00 | 1,021.08 | 3.82 | |||||||||
| * | Expenses are equal to the Fund’s annualized expense ratio of 0.76% for (for the period January 1, 2012 – June 30, 2012), multiplied by the average account value over the period, multiplied by 182/366 (to reflect the one-half year period). |
2
Table of Contents
Mid-Cap Equity Fund
| Schedule of Investments | June 30, 2012 (Unaudited) |
Mid-Cap Equity Fund
| Number of Shares | Fair Value | |||||||||
Common Stock — 93.3%† | ||||||||||
Advertising — 1.1% | ||||||||||
Omnicom Group Inc. | 15,847 | $ | 770,164 | |||||||
Aerospace & Defense — 1.1% | ||||||||||
Hexcel Corp. | 29,074 | 749,818 | (a) | |||||||
Apparel Retail — 0.8% | ||||||||||
Urban Outfitters Inc. | 20,956 | 578,176 | (a) | |||||||
Apparel, Accessories & Luxury Goods — 1.4% |
| |||||||||
Coach Inc. | 17,046 | 996,850 | ||||||||
Application Software — 2.5% | ||||||||||
Citrix Systems Inc. | 16,027 | 1,345,306 | (a) | |||||||
Splunk Inc. | 14,539 | 408,546 | (a) | |||||||
| 1,753,852 | ||||||||||
Asset Management & Custody Banks — 3.3% |
| |||||||||
Affiliated Managers Group Inc. | 12,974 | 1,420,004 | (a) | |||||||
Financial Engines Inc. | 6,637 | 142,364 | (a) | |||||||
Invesco Ltd. | 34,812 | 786,751 | ||||||||
| 2,349,119 | ||||||||||
Automotive Retail — 1.5% | ||||||||||
O’Reilly Automotive Inc. | 12,606 | 1,056,005 | (a) | |||||||
Biotechnology — 5.3% | ||||||||||
Alexion Pharmaceuticals Inc. | 17,183 | 1,706,272 | (a) | |||||||
Human Genome Sciences Inc. | 24,263 | 318,573 | (a) | |||||||
Incyte Corp Ltd. | 24,737 | 561,530 | (a) | |||||||
Isis Pharmaceuticals Inc. | 28,851 | 346,212 | (a) | |||||||
Vertex Pharmaceuticals Inc. | 14,775 | 826,218 | (a) | |||||||
| 3,758,805 | ||||||||||
Brewers — 0.4% | ||||||||||
Molson Coors Brewing Co. | 7,512 | 312,574 | ||||||||
Broadcasting — 2.3% | ||||||||||
Discovery Communications Inc. †† | 6,333 | 341,982 | (a) | |||||||
Discovery Communications Inc. †† | 10,617 | 531,806 | (a) | |||||||
Liberty Media Corporation — Capital | 8,342 | 733,345 | (a) | |||||||
| 1,607,133 | ||||||||||
Cable & Satellite — 1.4% | ||||||||||
Liberty Global Inc. | 21,615 | 1,032,116 | (a) | |||||||
Casinos & Gaming — 1.6% | ||||||||||
Penn National Gaming Inc. | 24,942 | 1,112,164 | (a) | |||||||
| Number of Shares | Fair Value | |||||||||
Coal & Consumable Fuels — 0.6% | ||||||||||
Peabody Energy Corp. | 16,667 | $ | 408,675 | |||||||
Communications Equipment — 0.7% | ||||||||||
Juniper Networks Inc. | 30,194 | 492,464 | (a) | |||||||
Computer Storage & Peripherals — 1.0% | ||||||||||
Synaptics Inc. | 24,058 | 688,781 | (a) | |||||||
Construction & Engineering — 1.2% | ||||||||||
Quanta Services Inc. | 36,976 | 890,012 | (a) | |||||||
Construction & Farm Machinery & Heavy Trucks — 0.9% | ||||||||||
Cummins Inc. | 6,875 | 666,256 | ||||||||
Diversified Financial Services — 0.8% | ||||||||||
Comerica Inc. | 17,428 | 535,214 | ||||||||
Diversified Metals & Mining — 0.4% | ||||||||||
Molycorp Inc. | 12,072 | 260,152 | (a) | |||||||
Electric Utilities — 1.9% | ||||||||||
ITC Holdings Corp. | 19,320 | 1,331,341 | ||||||||
Electrical Components & Equipment — 0.7% | ||||||||||
Cooper Industries PLC | 7,815 | 532,827 | ||||||||
Environmental & Facilities Services — 1.0% | ||||||||||
Stericycle Inc. | 8,010 | 734,277 | (a) | |||||||
Fertilizers & Agricultural Chemicals — 1.3% | ||||||||||
Intrepid Potash Inc. | 13,907 | 316,523 | (a) | |||||||
Monsanto Co. | 6,958 | 575,983 | (c) | |||||||
| 892,506 | ||||||||||
Healthcare Equipment — 1.4% | ||||||||||
Gen-Probe Inc. | 6,808 | 559,618 | (a) | |||||||
Insulet Corp. | 20,395 | 435,841 | (a) | |||||||
| 995,459 | ||||||||||
Healthcare Facilities — 1.3% | ||||||||||
Universal Health Services Inc. | 21,696 | 936,399 | ||||||||
Healthcare Services — 2.3% | ||||||||||
Catalyst Health Solutions Inc. | 17,859 | 1,668,745 | (a) | |||||||
Home Building — 1.0% | ||||||||||
MDC Holdings Inc. | 21,929 | 716,420 | ||||||||
Home Entertainment Software — 1.4% | ||||||||||
Activision Blizzard Inc. | 83,467 | 1,000,769 | ||||||||
See Notes to Schedule of Investments and Notes to Financial Statements.
3
Table of Contents
Mid-Cap Equity Fund
| Schedule of Investments | June 30, 2012 (Unaudited) |
| Number of Shares | Fair Value | |||||||||
Home Furnishing Retail — 1.7% | ||||||||||
Bed Bath & Beyond Inc. | 19,172 | $ | 1,184,830 | (a) | ||||||
Hotels, Resorts & Cruise Lines — 1.1% | ||||||||||
Royal Caribbean Cruises Ltd. | 29,434 | 766,167 | ||||||||
Household Products — 1.2% | ||||||||||
The Clorox Co. | 11,737 | 850,463 | ||||||||
Independent Power Producers & Energy Traders — 1.2% | ||||||||||
The AES Corp. | 68,020 | 872,697 | (a) | |||||||
Industrial Machinery — 2.5% | ||||||||||
Harsco Corp. | 46,530 | 948,281 | ||||||||
Rexnord Corp. | 41,138 | 824,406 | (a) | |||||||
| 1,772,687 | ||||||||||
Internet Software & Services — 3.3% | ||||||||||
Baidu Inc. ADR | 5,092 | 585,478 | (a) | |||||||
Equinix Inc. | 5,886 | 1,033,876 | (a) | |||||||
MercadoLibre Inc. | 10,047 | 761,563 | ||||||||
| 2,380,917 | ||||||||||
Life Sciences Tools & Services — 4.3% | ||||||||||
Covance Inc. | 15,029 | 719,138 | (a) | |||||||
Illumina Inc. | 18,943 | 765,108 | ||||||||
Mettler-Toledo International Inc. | 3,749 | 584,282 | (a,c) | |||||||
Thermo Fisher Scientific Inc. | 19,695 | 1,022,367 | (c) | |||||||
| 3,090,895 | ||||||||||
Multi-Line Insurance — 2.3% | ||||||||||
HCC Insurance Holdings Inc. | 51,482 | 1,616,535 | ||||||||
Office REITs — 1.7% | ||||||||||
Douglas Emmett Inc. | 30,854 | 712,727 | ||||||||
SL Green Realty Corp. | 6,444 | 517,067 | ||||||||
| 1,229,794 | ||||||||||
Oil & Gas Drilling — 1.1% | ||||||||||
Noble Corp. | 23,567 | 766,634 | ||||||||
Oil & Gas Equipment & Services — 2.4% | ||||||||||
Cameron International Corp. | 9,348 | 399,253 | (a) | |||||||
McDermott International Inc. | 48,059 | 535,377 | (a) | |||||||
Weatherford International Ltd. | 63,197 | 798,178 | (a) | |||||||
| 1,732,808 | ||||||||||
Oil & Gas Exploration & Production — 2.5% | ||||||||||
Forest Oil Corp. | 33,341 | 244,390 | (a) | |||||||
Pioneer Natural Resources Co. | 7,661 | 675,777 | ||||||||
Range Resources Corp. | 13,980 | 864,943 | ||||||||
| 1,785,110 | ||||||||||
| Number of Shares | Fair Value | |||||||||
Packaged Foods & Meats — 2.3% | ||||||||||
McCormick & Company Inc. | 14,021 | $ | 850,374 | (c) | ||||||
Mead Johnson Nutrition Co. | 9,804 | 789,320 | ||||||||
| 1,639,694 | ||||||||||
Property & Casualty Insurance — 1.4% | ||||||||||
ACE Ltd. | 13,471 | 998,605 | ||||||||
Real Estate Services — 1.3% | ||||||||||
CBRE Group Inc. | 56,908 | 931,015 | (a,c) | |||||||
Regional Banks — 1.4% | ||||||||||
Regions Financial Corp. | 39,799 | 268,643 | ||||||||
Zions Bancorporation | 37,253 | 723,453 | ||||||||
| 992,096 | ||||||||||
Research & Consulting Services — 4.0% | ||||||||||
FTI Consulting Inc. | 20,807 | 598,201 | (a) | |||||||
IHS Inc. | 12,757 | 1,374,312 | (a) | |||||||
Nielsen Holdings N.V. | 34,109 | 894,338 | (a) | |||||||
| 2,866,851 | ||||||||||
Restaurants — 1.0% | ||||||||||
Arcos Dorados Holdings Inc. | 46,360 | 685,201 | ||||||||
Security & Alarm Services — 1.9% | ||||||||||
Corrections Corporation of America | 46,217 | 1,361,091 | ||||||||
Semiconductors — 2.1% | ||||||||||
Hittite Microwave Corp. | 17,719 | 905,795 | (a) | |||||||
Marvell Technology Group Ltd. | 54,696 | 616,971 | ||||||||
| 1,522,766 | ||||||||||
Soft Drinks — 1.2% | ||||||||||
Coca-Cola Enterprises Inc. | 31,772 | 890,887 | ||||||||
Specialized Finance — 0.6% | ||||||||||
MSCI Inc. | 13,363 | 454,609 | (a) | |||||||
Specialized REITs — 2.1% | ||||||||||
American Tower Corp. | 21,161 | 1,479,365 | ||||||||
Specialty Chemicals — 2.3% | ||||||||||
Cytec Industries Inc. | 12,349 | 724,145 | ||||||||
Ecolab Inc. | 13,134 | 900,073 | ||||||||
| 1,624,218 | ||||||||||
Steel — 0.7% | ||||||||||
Allegheny Technologies Inc. | 16,684 | 532,053 | ||||||||
Systems Software — 1.8% | ||||||||||
Fortinet Inc. | 25,864 | 600,562 | (a) | |||||||
Rovi Corp. | 33,900 | 665,118 | (a) | |||||||
See Notes to Schedule of Investments and Notes to Financial Statements.
4
Table of Contents
Mid-Cap Equity Fund
| Schedule of Investments | June 30, 2012 (Unaudited) |
| Number of Shares | Fair Value | |||||||||
ServiceNow Inc. | 603 | $ | 14,834 | (a) | ||||||
| 1,280,514 | ||||||||||
Thrifts & Mortgage Finance — 2.0% | ||||||||||
BankUnited Inc. | 21,093 | 497,373 | ||||||||
People’s United Financial Inc. | 78,269 | 908,703 | ||||||||
| 1,406,076 | ||||||||||
Trading Companies & Distributors — 1.3% | ||||||||||
MSC Industrial Direct Company Inc. | 13,822 | 906,032 | ||||||||
Total Common Stock | 66,447,683 | |||||||||
Other Investments — 0.0%* | ||||||||||
GEI Investment Fund | 18,422 | (d) | ||||||||
Total Investments in Securities | 66,466,105 | |||||||||
Short-Term Investments — 6.8% | ||||||||||
GE Institutional Money Market Fund —Investment Class 0.04% | 4,827,840 | (b,d) | ||||||||
Total Investments | 71,293,945 | |||||||||
Liabilities in Excess of Other Assets, net — (0.1)% | (47,172 | ) | ||||||||
|
| |||||||||
NET ASSETS — 100.0% | $ | 71,246,773 | ||||||||
|
| |||||||||
Other Information | ||||||||||
The Fund had the following long futures contracts open at June 30, 2012 (Unaudited);
| Description | Expiration date | Number of Contracts | Current Notional Value | Unrealized Appreciation | ||||||||||||
S&P Midcap 400 Emini Index Futures | September 2012 | 35 | $ | 3,288,250 | $ | 13,974 | ||||||||||
See Notes to Schedule of Investments and Notes to Financial Statements.
5
Table of Contents
| Notes to Schedule of Investments | June 30, 2012 (Unaudited) |
The views expressed in this document reflect our judgment as of the publication date and are subject to change at any time without notice. The securities information regarding holdings, allocations and other characteristics are presented to illustrate examples of securities that the Fund has bought and the diversity of areas in which the Fund may invest as of a particular date. It may not be representative of the Fund’s current or future investments and should not be construed as a recommendation to purchase or sell a particular security. See the Fund’s summary prospectus and statutory prospectus for complete descriptions of investment objectives, policies, risks and permissible investments.
| (a) | Non-income producing security. |
| (b) | Coupon amount represents effective yield. |
| (c) | At June 30, 2012 , all or a portion of this security was pledged to cover collateral requirements for futures, options, forward foreign currency contracts and/or TBA’s. |
| (d) | GE Asset Management ("GEAM"), the investment adviser of the Fund, also serves as investment adviser of the GEI Investment Fund and the GE Institutional Money Market Fund. The GE Investment Fund has been determined to be illiquid using procedures established by the Board of Directors. |
| † | Percentages are based on net assets as of June 30, 2012 . |
| †† | Security traded on different exchanges. |
| * | Less than 0.05%. |
Abbreviations:
ADR | American Depository Receipt | |
REIT | Real Estate Investment Trust | |
6
Table of Contents
Selected data based on a share outstanding throughout the fiscal years indicated
| CLASS 1 | ||||||||||||||||||||||||||
| 6/30/12† | 12/31/11 | 12/31/10 | 12/31/09 | 12/31/08 | 12/31/07 | |||||||||||||||||||||
| Inception date | — | — | — | — | — | 5/1/97 | ||||||||||||||||||||
Net asset value, beginning of period | $ | 15.75 | $ | 18.64 | $ | 14.82 | $ | 10.50 | $ | 17.30 | $ | 18.19 | ||||||||||||||
Income/(loss) from investment operations: | ||||||||||||||||||||||||||
Net investment income | 0.02 | 0.03 | 0.06 | ** | 0.09 | 0.10 | 0.08 | |||||||||||||||||||
Net realized and unrealized gains/(losses) on investments | 1.68 | (1.60) | 3.82 | 4.26 | (6.65) | 2.23 | ||||||||||||||||||||
Total income/(loss) from investment operations | 1.70 | (1.57) | 3.88 | 4.35 | (6.55) | 2.31 | ||||||||||||||||||||
Less distributions from: | ||||||||||||||||||||||||||
Net investment income | — | 0.02 | 0.06 | 0.03 | 0.05 | 0.07 | ||||||||||||||||||||
Return of capital | 0.35 | — | — | — | — | |||||||||||||||||||||
Net realized gains | — | 0.95 | — | — | 0.20 | 3.13 | ||||||||||||||||||||
Total distributions | — | 1.32 | 0.06 | 0.03 | 0.25 | 3.20 | ||||||||||||||||||||
Net asset value, end of period | $ | 17.45 | $ | 15.75 | $ | 18.64 | $ | 14.82 | $ | 10.50 | $ | 17.30 | ||||||||||||||
TOTAL RETURN (a) | 10.79% | (8.34)% | 26.18% | 41.45% | (37.82)% | 12.60% | ||||||||||||||||||||
RATIOS/SUPPLEMENTAL DATA: | ||||||||||||||||||||||||||
Net assets, end of period (in thousands) | $ | 71,247 | $ | 71,253 | $ | 97,829 | $ | 92,374 | $ | 81,791 | $ | 191,339 | ||||||||||||||
Ratios to average net assets: | ||||||||||||||||||||||||||
Net investment income | 0.22% | * | 0.12% | 0.35% | 0.19% | 0.29% | 0.35% | |||||||||||||||||||
Net expenses | 0.76% | (b)* | 0.82% | (b) | 0.71% | (b) | 0.80% | (b) | 0.73% | (b) | 0.70% | (b) | ||||||||||||||
Gross expenses | 0.76% | * | 0.83% | 0.71% | 0.80% | 0.73% | 0.70% | |||||||||||||||||||
Portfolio turnover rate | 12% | 26% | 31% | 24% | 49% | 65% | ||||||||||||||||||||
Notes to Financial Highlights
| (a) | Total returns are historical and assume changes in share price, reinvestment of dividends and capital gains distributions, and do not include the effect of insurance contract charges. Past performance does not guarantee future results. |
| (b) | Reflects GEAM’s waiver of a portion of the Fund’s management fee in an amount equal to the management fee earned by GEAM with respect to the Fund’s investment in the GE Institutional Money Market Fund or, prior to 2011, in another affiliated money market fund formerly managed by GEAM. Excluding waiver, the expense ratios would be unchanged. |
| * | Annualized for periods less than one year. |
| ** | Per share values have been calculated using the average share method. |
| † | Unaudited. |
The accompanying Notes are an integral part of these financial statements.
7
Table of Contents
The accompanying Notes are an integral part of these financial statements.
8
Table of Contents
| * | Share Class 4 was closed effective June 29, 2012. |
The accompanying Notes are an integral part of these financial statements.
9
Table of Contents
| * | (Unaudited) |
| ** | Share Class 4 was closed effective June 29, 2012 |
The accompanying Notes are an integral part of these financial statements.
10
Table of Contents
| Notes to Financial Statements | June 30, 2012 (Unaudited) |
1. Organization of the Company
GE Investments Funds, Inc. (the “Company”) was incorporated under the laws of the Commonwealth of Virginia on May 14, 1984 and is registered under the Investment Company Act of 1940, as amended (the “1940 Act”), as an open-end management investment company. The Company is composed of thirteen investment portfolios (collectively the “Funds”), although only the following ten are currently being offered: U.S. Equity Fund, S&P 500 Index Fund, Premier Growth Equity Fund, Core Value Equity Fund, Mid-Cap Equity Fund (the “Fund”), Small-Cap Equity Fund, Total Return Fund, Income Fund, Money Market Fund and Real Estate Securities Fund.
Shares of the Funds of the Company are offered only to insurance company separate accounts that fund certain variable life insurance contracts and variable annuity contracts. GE Asset Management Incorporated (“GEAM”), is the investment adviser and administrator of each of the Funds.
The Company currently offers one share class (Class 1) of the Fund as an investment option for variable life insurance and variable annuity contracts. Class 4 shares were closed on June 29, 2012.
| 2. | Summary of Significant Accounting Policies |
The preparation of financial statements in conformity with U.S. generally accepted accounting principles (GAAP) requires management to make estimates and assumptions that affect the reported amounts of assets and liabilities and disclosure of contingent assets and liabilities at the date of the financial statements and the reported amounts of increases and decreases in net assets from operations during the reporting period. Actual results may differ from those estimates.
The following summarizes the significant accounting policies of the Company:
Securities Valuation and Transactions. All investments in securities are recorded at their estimated fair value, as described in Note 3.
Securities transactions are accounted for as of the trade date. Realized gains and losses on investments sold are recorded on the basis of identified cost for both financial statement and federal tax purposes.
The Fund’s income, expenses (other than distribution fees) and realized and unrealized gains and losses are allocated proportionally each day among the share classes based upon the relative net assets of each class.
Derivatives The Fund is subject to equity price risk in the normal course of pursuing its investment objectives. The Fund may enter into derivative transactions to gain market exposure for residual and accumulating cash positions.
Futures Contracts A futures contract represents a commitment for the future purchase or sale of an asset at a specified price on a specified date. The Fund invested in futures for a variety of portfolio management purposes such as hedging against the effects of changes in the value of portfolio securities due to anticipated changes in market conditions, gaining market exposure for accumulating and residual cash positions, or when the transactions were economically appropriate to the reduction of risks inherent in the management of the Fund. Buying futures tends to increase a Fund’s exposure to the underlying instrument while selling futures tends to decrease a Fund’s exposure to the underlying instrument, or hedge other Fund investments. The Fund will not enter into a transaction involving futures for speculative purposes. With futures contracts, there is minimal counterparty credit risk to the Fund since futures contracts are exchange traded and the exchange’s clearinghouse, as counterparty to all traded futures, guarantees the futures against default. The Fund’s risks in using these contracts include changes in the value of the underlying instruments, non-performance of the counterparties under the contracts’ terms and changes in the liquidity of the secondary market for the contracts. Futures contracts are valued at the settlement price established each day by the board of trade or exchange on which they principally trade.
Upon entering into a financial futures contract, the Fund is required to pledge to the broker an amount of cash and/or other assets equal to a certain percentage of the contract amount, known as initial margin deposit. Subsequent payments, known as variation margin, are made or received by the Fund each day, depending on the daily fluctuation in the fair value of the underlying security. The Fund records an unrealized gain or loss equal to the daily variation margin. Should market conditions move unexpectedly, the Fund may not achieve the anticipated benefits of the futures contracts and may incur a loss. The Fund recognizes a realized gain or loss on the expiration or closing of a futures contract.
Investment Income Corporate actions (including cash dividends) are recorded on the ex-dividend date, net of applicable withholding taxes, except for certain foreign corporate actions which are recorded as soon after the ex-dividend date as such information becomes available.
11
Table of Contents
| Notes to Financial Statements | June 30, 2012 (Unaudited) |
Withholding taxes in foreign dividends have been provided for in accordance with the Fund’s understanding of the applicable country’s tax rules and rates.
Interest income is recorded on the accrual basis. Accretion of discounts and amortization of premiums on taxable bonds are to the call or maturity date, whichever is shorter, using the effective yield method.
Expenses Fund specific expenses are allocated to the Fund that incurs such expenses. Such expenses may include custodial fees, legal and accounting fees, printing costs and registration fees. Expenses that are not fund specific are allocated pro rata across the Funds. Certain class specific expenses (such as distribution fees) are allocated to the class that incurs such expense. Expenses of the Fund are generally paid directly by the Fund, however, expenses may be paid by GEAM and reimbursed by the Fund.
Federal Income Taxes The Fund intends to comply with all sections of the Internal Revenue Code applicable to regulated investment companies including the distribution of substantially all of its taxable net investment income and net realized capital gains to its shareholders. Therefore, no provision for federal income tax has been made.
| 3. | Securities Valuation |
The Fund utilizes various methods to measure the fair value of most of its investments on a recurring basis. GAAP establishes a framework for measuring fair value and providing related disclosures. Broadly, the framework requires fair value to be determined based on the exchange price that would be received for an asset or paid to transfer a liability (an exit price) in the principal or most advantageous market for the asset or liability in an orderly transaction between market participants at the measurement date. In the absence of active markets for the identical assets or liabilities, such measurements involve developing assumptions based on market observable data and, in the absence of such data, internal information that is consistent with what market participants would use in a hypothetical transaction that occurs at the measurement date. It also establishes a three-level valuation hierarchy based upon observable and non-observable inputs.
Observable inputs reflect market data obtained from independent sources, while unobservable inputs reflect our market assumptions. Preference is given to observable inputs. These two types of inputs create the following fair value hierarchy:
Level 1 — Quoted prices for identical investments in active markets.
Level 2 — Quoted prices for similar investments in active markets; quoted prices for identical or similar investments in markets that are not active; and model-derived valuations whose inputs are observable or whose significant value drivers are observable.
Level 3 — Significant inputs to the valuation model are unobservable.
Policies and procedures are maintained to value investments using the best and most relevant data available. In addition, pricing vendors are utilized to assist in valuing investments. GEAM performs periodic reviews of the methodologies used by independent pricing services including price validation of individual securities.
Fair Value Measurement The following section describes the valuation methodologies the Fund uses to measure different financial investments at fair value.
The Fund’s portfolio securities are valued generally on the basis of market quotations. Equity securities generally are valued at the last reported sale price on the primary market in which they are traded. Portfolio securities listed on NASDAQ are valued using the NASDAQ Official Closing Price, Level 1 securities primarily include publicly-traded equity securities. If no sales occurred on the exchange or NASDAQ that day, the portfolio security generally is valued using the last reported bid price. In those circumstances the Fund classifies the investment securities in Level 2.
Short-term investments of sufficient credit quality with remaining maturities of sixty days or less at the time of purchase are typically valued on the basis of amortized cost which approximates fair value and these are included in Level 2. If it is determined that amortized cost does not approximate fair value, securities may be valued based on dealer supplied valuations or quotations. In these infrequent circumstances, pricing services may provide the Fund with valuations that are based on significant unobservable inputs, and in those circumstances the investment securities are classified in Level 3.
The Fund uses the net asset value per unit for collective funds (i.e., GEI Investment Fund). The Fund classifies the investment security in Level 2.
If prices are not readily available for a portfolio security, or if it is believed that a price for a portfolio security does not
12
Table of Contents
| Notes to Financial Statements | June 30, 2012 (Unaudited) |
represent its fair value, the security may be valued using procedures approved by the Fund’s Board of Directors that are designed to establish its “fair” value. These securities are typically classified in Level 3. Those procedures require that the fair value of a security be established by a valuation committee of GEAM. The valuation committee follows different protocols for different types of investments and circumstances. The fair value procedures may be used to value any investment of the Fund in the appropriate circumstances.
Fair value determinations generally are used for securities whose value is affected by a significant event that will materially affect the value of a security and which occurs subsequent to the time of the close of the principal market on which such security trades but prior to the calculation of the Fund’s NAV.
The value established for such a portfolio security may be different than what would be produced through the use of market quotations or another methodology. Portfolio securities that are valued using techniques other than market quotations, including “fair valued” securities, may be subject to greater fluctuation in their value from one day to the next than would be the case if market quotations
were used. In addition, there is no assurance that the Fund could sell a portfolio security for the value established for it at any time and it is possible that the Fund would incur a loss because a portfolio security is sold at a discount to its established value.
Other financial investments are derivative instruments that are not reflected in total investments, such as futures, forwards, swaps, and written options contracts, which are valued based on fair value as discussed above.
The Fund uses closing prices for derivatives included in Level 1, which are traded either on exchanges or liquid over-the counter markets. Derivative assets and liabilities included in Level 2 primarily represent interest rate swaps, cross-currency swaps and foreign currency and commodity forward and option contracts. Derivative assets and liabilities included in Level 3 primarily represent interest rate products that contain embedded optionality or prepayment features.
The inputs or methodology used for valuing securities are not an indication of the risk associated with investing in those securities.
The following table presents the Fund’s investments measured at fair value on a recurring basis at June 30, 2012:
Investments | Level 1 | Level 2 | Level 3 | Total | ||||||||||||
Investments in Securities† | ||||||||||||||||
Common Stock | $ | 66,447,683 | $ | — | $ | — | $ | 66,447,683 | ||||||||
Other Investments | — | 18,422 | — | 18,422 | ||||||||||||
Short-Term Investments | 4,827,840 | — | — | 4,827,840 | ||||||||||||
|
|
|
|
|
|
|
| |||||||||
Total Investments in Securities | $ | 71,275,523 | $ | 18,422 | $ | — | $ | 71,293,945 | ||||||||
|
|
|
|
|
|
|
| |||||||||
Other Financial Instruments* | ||||||||||||||||
Futures Contracts — Unrealized Appreciation | $ | 13,974 | $ | — | $ | — | $ | 13,974 | ||||||||
|
|
|
|
|
|
|
| |||||||||
† See Schedule of Investments for Industry Classification * Other financial instruments include derivative instruments such as futures contracts. Amounts shown represent unrealized appreciation (depreciation), at period end. |
| |||||||||||||||
There were no transfers between the fair value levels. Transfers between fair value levels are considered to occur at the beginning of the period.
| 4. | Derivatives Transactions |
Shown below are the derivative contracts entered into by each Fund, summarized by primary risk exposure as they appear on the Statement of Assets and Liabilities, all of which are not accounted for as hedging instruments under FASB Accounting Standards Codification (“ASC”) No. 815 Derivatives and Hedging as of June 30, 2012.
13
Table of Contents
| Notes to Financial Statements | June 30, 2012 (Unaudited) |
Asset Derivatives June 30, 2012 | Liability Derivatives June 30, 2012 | |||||||
| Derivatives not accounted for as hedging instruments under ASC 815 | Location in the Statement of Assets and Liabilities | Fair Value ($) | Location in the Statements of Assets and Liabilities | Fair Value ($) | ||||
| Equity Contracts | Assets, Net Assets — Net Unrealized Appreciation/ (Depreciation) on Futures | 13,974* | Liabilities, Net Assets — Net Unrealized Appreciation/ (Depreciation) on Futures | — | ||||
* Includes cumulative unrealized appreciation/(depreciation) of futures contracts as reported in the Schedule of Investments and within the components of the net assets section of the Statement of Assets and Liabilities. Only the current day’s variation margin is reported within the Assets and/or Liabilities section on the Statement of Assets and Liabilities. | ||||||||
Shown below are the effects of derivative instruments on the Fund’s Statement of Operations, summarized by primary risk exposure all of which are not accounted for as hedging instruments under ASC 815.
| Derivatives not accounted for as hedging instruments under ASC 815 | Location in the Statements of Operations | Total Notional Amount of Futures Contracts Purchased/(Sold) ($) | Realized Gain or (Loss) on Derivatives Recognized in Income ($) | Change in Unrealized Appreciation/(Depreciation) on Derivatives Recognized in Income ($) | ||||||||||
| Equity Contracts | Realized gain/(loss) on Futures, Increase/(decrease) in unrealized appreciation/ (depreciation) on Futures | 13,055,997/(9,110,113) | 108,685 | 23,251 | ||||||||||
| 5. | Line of Credit |
The Company shares a revolving credit facility of up to $150 million with a number of its affiliates. The credit facility is with its custodian bank, State Street Bank and Trust Company (“State Street”). The revolving credit facility requires the payment of a commitment fee equal to 0.100% per annum on the daily unused portion of the credit facility, payable quarterly. The portion borne by the Funds generally is borne proportionally based upon net assets. In addition, the Company has a $100 million uncommitted, unsecured line of credit with State Street. Generally, borrowings under the credit facilities would accrue interest at the Federal Funds Rate plus 50 basis points and would be borne by the borrowing Fund. The maximum amount allowed to be borrowed by any one Fund is the lesser of (i) 10% of its total assets or (ii) 20% of its net assets. The credit facilities were not utilized by the Fund during the six-month period ended June 30, 2012.
| 6. | Compensation and Fees Paid to Affiliates |
GEAM, a registered investment adviser, was retained by the Company’s Board of Directors effective May 1, 1997 to act as investment adviser and administrator of the Fund.
GEAM’s compensation for investment advisory and administrative services is paid monthly based on the average daily net assets of the Fund at an annualized rate of 0.65%.
GEAM has a contractual arrangement with the Fund to waive a portion of the Fund’s management fee in the
amount equal to the management fee earned by GEAM with respect to the Fund’s investment in the GE Institutional Money Market Fund, if any.
Distribution and Service (12b-1) Fees Prior to the closure of Class 4 shares on June 29, 2012, the Company had adopted a Distribution and Service (12b-1) Plan (the “Plan”) pursuant to Rule 12b-1 under the 1940 Act with respect to Class 4 shares of the Fund. Under the Plan, the Fund could compensate GE Investment Distributors, Inc. (“GEID”), a wholly-owned subsidiary of GEAM and the Fund’s principal distributor, for certain sales services provided by GEID or other broker dealers and investor services provided by GEID or other service providers relating to the Fund’s Class 4 shares, including services to owners or prospective owners of variable contracts issued by insurance companies that offered such share class as an investment option. The amount of compensation paid under the Plan by the Fund’s Class 4 shares was not to exceed 0.45% of the average daily net assets of the Fund attributable to such share class.
Directors’ Compensation The Fund pays no compensation to its directors who are officers or employees of GEAM or its affiliates. Directors who are not such officers or employees also serve in a similar capacity for other funds advised by GEAM. Compensation paid to non-interested Directors are reflected on the Statement of Operations. These fees are allocated pro rata across all of the mutual fund platforms served by the Directors, including the Fund, and are based upon the relative net assets of each fund within such platforms.
14
Table of Contents
| Notes to Financial Statements | June 30, 2012 (Unaudited) |
| 7. | Investment Transactions |
Purchases and Sales of Securities The cost of purchases and the proceeds from sales of investments, other than short-term securities and options, for the six-month period ended June 30, 2012, were as follows:
| Non U.S. Government Securities | ||
| Purchases | Sales | |
| $8,721,174 | $20,401,710 | |
| 8. | Income Taxes |
The Fund is subject to ASC 740, Income Taxes. ASC 740 provides guidance for financial accounting and reporting for the effects of income taxes that result from an entity’s activities during the year. ASC 740 also provides guidance regarding how certain tax positions should be recognized, measured, presented and disclosed in the financial statements. ASC 740 requires evaluation of tax positions taken or expected to be taken in the course of preparing the Fund’s tax returns to determine whether the tax positions are “more likely than not” of being sustained by the applicable tax authority. There are no adjustments to the Fund’s net assets required under ASC 740. The Fund’s 2008, 2009, 2010 and 2011 fiscal years tax returns are still open to examination by the Federal and applicable state tax authorities.
At June 30, 2012, information on the tax cost of investments was as follows:
| Gross Tax | ||||||
| Cost of Investments for Tax Purposes | Appreciation | Depreciation | Net Tax Appreciation | |||
$58,585,333 | $18,583,925 | $(5,875,313) | $12,708,612 | |||
Capital loss carryovers are available to offset future realized capital gains to the extent provided in the Internal Revenue Code and regulations thereunder. To the extent that these carryover losses are used to offset future capital gains, it is probable that the gains so offset will not be distributed to shareholders because they would be taxable as ordinary income. As of December 31, 2011, the Fund did not have any capital loss carryovers.
Under the recently enacted Regulated Investment Company Modernization Act of 2010, the Fund will be permitted to carry forward capital losses incurred in taxable years beginning after December 22, 2010 for an unlimited period. However, any losses incurred during those future years will be required to be utilized prior to the losses incurred in pre-enactment tax years. As a result of this ordering rule, pre-enactment capital loss carryforwards may be more likely to expire unused. Additionally, post-enactment capital losses that are carried forward will retain their character as either short-term or long-term capital losses rather than being considered all short-term as under previous law.
During the year ended December 31, 2011, the Fund utilized $5,212,895 of prior year capital loss carryovers.
Any qualified late-year loss is deemed to arise on the first day of the Fund’s next tax year (if the Fund elects to defer
such loss). Under this regime, generally, the Fund can elect to defer any post-October capital loss and/or any late-year ordinary loss as defined by the Internal Revenue Code.
The Fund elected to defer qualified late-year losses for the year ended December 31, 2011 as follows:
| Capital | Ordinary | |
$635,157 | $— |
The tax composition of distributions paid during the years ended December 31, 2011 and December 31, 2010 were as follows:
| Ordinary Income | Long-Term Capital Gains | Return of Capital | Total | |||||||||||||
2011 | $ | 93,615 | $3,965,080 | $1,471,919 | $ | 5,530,614 | ||||||||||
2010 | 316,553 | — | — | 316,553 | ||||||||||||
Distributions to Shareholders The Fund declares and pays any dividends from net investment income annually. The Fund declares and pays any net realized capital gains in excess of capital loss carryforwards distributions annually. The character of income and gains to be distributed is determined in accordance with income tax regulations which may differ from generally accepted accounting principles. These differences include (but are not limited to) futures, distributions from Real Estate Investment Trusts (REITS) and other equity investments, investments
15
Table of Contents
| Notes to Financial Statements | June 30, 2012 (Unaudited) |
organized as partnerships for tax purposes, and losses deferred due to wash sale transactions. Reclassifications due to permanent book/tax differences are made to the Fund’s capital accounts to reflect income and gains available for distribution (or available capital loss carryovers) under income tax regulations. These reclassifications have no impact on net investment income, realized gains or losses, or the net asset value of the Fund. The calculation of net investment income per share in the Financial Highlights table excludes these adjustments.
The reclassifications for the year ended December 31, 2011 were as follows:
Undistributed Income | Accumulated Net Realized Gain (Loss) | Capital Paid In | ||
| $(4,836) | $1,476,755 | $(1,471,919) |
| 9. | Subsequent Events |
Subsequent events after the balance sheet date through the date the financial statements were issued have been evaluated in the preparation of the financial statements. As of August 3, 2012, the assets of the Fund and the Money Market Fund were liquidated. These funds ceased operations and are no longer offered for investment.
16
Table of Contents
| Additional Information | (Unaudited) |
Information about Directors and Executive Officers:
The business and affairs of the Funds are managed under the direction of the Funds’ Board of Directors. Information pertaining to the Directors and officers of the Funds is set forth below.
Interested Directors and Executive Officers
Michael J. Cosgrove
Address c/o GEAM 1600 Summer St. Stamford, CT 06905
Age 63
Position(s) Held with Fund Chairman of the Board and President
Term of Office and Length of Time Served Until successor is elected and qualified – 15 years
Principal Occupation(s) During Past 5 years President of Mutual Funds and Global Investment Programs of GEAM since November 2011; President and Chief Executive Officer – Mutual Funds and Intermediary Business of GEAM from March 2007 to November 2011; Executive Vice President of GEAM from February 1997 to March 2007; and Executive Vice President-Mutual Funds of GEAM from March 1993 to March 2007. Also serves as Treasurer of GE Foundation since 1988.
Number of Portfolios in Fund Complex Overseen by Director 25
Other Directorships Held by Director Chairman of the Board and President of GE Institutional Funds since 1997; Trustee of Elfun Funds, GE Savings & Security Funds and General Electric Pension Trust since 1988; Director of GEAM since 1988; Trustee of Fordham University from 2002 to June 30, 2010 and since July 2011; Director of GE Investments Distributors, Inc since June 2011; Director of Skin Cancer Foundation since August 2010; Member of the Board of Governors for the Investment Company Institute since October 2006; Director, GE Asset Management (Ireland) Limited, since February 1999, GE Asset Management Funds Plc since 1998, GE Asset Management Canada Company since 1998, GE Asset Management Limited since 1998; Trustee of General Electric Pension Trust since 1988; and Chairman of the Board and President of GE Funds from 1993 to February 2011.
Matthew J. Simpson
Address c/o GEAM 1600 Summer St. Stamford, CT 06905
Age 51
Position(s) Held with Fund Director and Executive Vice President
Term of Office and Length of Time Served Until successor is elected and qualified – 4 years
Principal Occupation(s) During Past 5 years Executive Vice President, General Counsel and Secretary of GEAM since July 2007; Secretary of Elfun Funds and GE Savings & Security Funds since July 2007; Senior Vice President and General Counsel – Marketing and Client Services (formerly Asset Management Services) of GEAM and Senior Vice President and General Counsel of GE Asset Management Services from February 1997 to July 2007; Vice President and Associate General Counsel of GEAM from October 1992 to February 1997; Secretary of GE Institutional Funds and GE Investments Funds, Inc. from 1997 to July 2007 and Vice President from September 2003 to July 2007; Assistant Secretary of Elfun Funds and GE Savings & Security Funds from 1998 to July 2007 and Vice President from October 2003 to July 2007; and Secretary of GE Funds from 1993 to July 2007 and Vice President from September 2003 to July 2007.
Number of Portfolios in Fund Complex Overseen by Director 25
Other Directorships Held by Director Trustee of Elfun Funds, GE Savings & Security Funds and General Electric Pension Trust since July 2007; Trustee and Executive Vice President of GE Institutional Funds since July 2007; Director of GEAM since July 2007; and Trustee and Executive Vice President of GE Funds from July 2007 to February 2011.
17
Table of Contents
| Additional Information | (Unaudited) |
Joon Won Choe
Address c/o GEAM 1600 Summer St. Stamford, CT 06905
Age 42
Position(s) Held with Fund Vice President & Secretary
Term of Office and Length of Time Served Until successor is elected and qualified – Vice President and Secretary – 1 year
Principal Occupation(s) During Past 5 years Senior Vice President and Deputy General Counsel at GEAM since March 2011; Vice President and Secretary of GE Institutional Funds since September 2010; Vice President and Assistant Secretary of Elfun Funds and GE Savings & Security Funds since September 2010; Senior Vice President and Associate General Counsel at GEAM from June 2010 to March 2011; Vice President and Associate General Counsel of GEAM from November 2005 to June 2010 and Vice President and Secretary of GE Funds from September 2010 to February 2011.
Number of Portfolios in Fund Complex Overseen by Officer N/A
Other Directorships Held by Officer N/A
Robert Herlihy
Address c/o GEAM 1600 Summer St. Stamford, CT 06905
Age 44
Position(s) Held with Fund Chief Compliance Officer
Term of Office and Length of Time Served Until successor is elected and qualified — 6 years
Principal Occupation(s) During Past 5 years Chief Compliance Officer of GEAM, GE Institutional Funds, Elfun Funds, and GE Savings & Security Funds since July 2005; Chief Compliance Officer of GE Funds from July 2005 to February 2011 and Manager of Fund Administration at GEAM from 2002-2005.
Number of Portfolios in Fund Complex Overseen by Officer N/A
Other Directorships Held by Officer N/A
Arthur A. Jensen
Address c/o GEAM 1600 Summer St. Stamford, CT 06905
Age 45
Position(s) Held with Fund Treasurer
Term of Office and Length of Time Served Until successor is elected and qualified – 1 year
Principal Occupation(s) During Past 5 Years Treasurer of GE Institutional Funds, Elfun Funds and GE Savings & Security Funds since June 2011; Mutual Funds Controller of GEAM since April 2011; Senior Vice President at Citigroup from 2008 to 2010 and Vice President at JPMorgan from 2005 to 2008.
Number of Portfolios in Fund Complex Overseen by Officer N/A
Other Directorships Held by Officer N/A
18
Table of Contents
| Additional Information | (Unaudited) |
Jeanne M. LaPorta
Address c/o GEAM 1600 Summer St. Stamford, CT 06905
Age 46
Position(s) Held with Fund Vice President
Term of Office and Length of Time Served Until successor is elected and qualified – 8 years
Principal Occupation(s) During Past 5 Years Senior Vice President and Commercial Administrative Officer of GEAM since April 2010; Vice President of GE Institutional Funds since July 2003; Vice President of Elfun Funds and GE Savings & Security Funds since October 2003; Secretary of GE Funds from July 2007 to September 2010 and Vice President from July 2007 to February 2011; Senior Vice President and Deputy General Counsel of GEAM from October 2007 to April 2010; Vice President and Assistant Secretary of Elfun Funds and GE Savings & Security Funds from July 2003 to June 2010; and Vice President and Associate General Counsel – Marketing and Client Services (formerly Asset Management Services) at GEAM from May 1997 to October 2007.
Number of Portfolios in Fund Complex Overseen by Officer N/A
Other Directorships Held by Officer N/A
Non-Interested Directors
John R. Costantino
Address c/o GEAM 1600 Summer St. Stamford, CT 06905
Age 66
Position(s) Held with Fund Director
Term of Office and Length of Time Served Until successor is elected and qualified – 15 years
Principal Occupation(s) During Past 5 years General Partner, NGN Capital LLC since 2006; Managing Director, Vice President of Walden Capital Management since 1996.
Number of Portfolios in Fund Complex Overseen by Director 17
Other Directorships Held by Director Trustee of GE Institutional Funds since 1997; Trustee of Fordham University from 1989 to 1995 and from 2001 to 2007 and Trustee Emeritus since 2007; Trustee of Neuroscience Research Institute since 1986; Trustee of GE Funds from 1993 to February 2011; Director of Artes Medical from 2006-2008 and Trustee of Gregorian University Foundation from 1992-2007.
19
Table of Contents
| Additional Information | (Unaudited) |
R. Sheldon Johnson
Address c/o GEAM 1600 Summer St. Stamford, CT 06905
Age 65
Positions(s) Held with Fund Director
Term of office and Length of Time served Unit Successor is elected and qualified – 1 year.
Principal Occupation(s) During Past 5 years Head of Global Institutional Equity Sales and Marketing at Morgan Stanley & Co., Inc. from 2002 to 2006 and Managing Director at Morgan Stanley & Co., Inc. from 1988 to 2006.
Number of Portfolios in Fund Complex Overseen by Director 17
Other Directorships Held by Director Trustee of GE Institutional Funds since April 2011 and Trustee of St. Lawrence University since 2003.
Donna M. Rapaccioli
Address c/o GEAM 1600 Summer St. Stamford, CT 06905
Age 49
Position(s) Held with Fund Director
Term of Office and Length of Time Served Until successor is elected and qualified – Less than 1 year
Principal Occupation(s) During Past 5 Years Dean of the Gabelli School of Business since 2007 and Accounting professor since 1987 at Fordham University.
Number of Portfolios in Fund Complex Overseen by Officer 17
Other Directorships Held by Director Trustee of GE Institutional Funds since January 2012 and Trustee of Emmanuel College since 2010.
The Statement of Additional Information for the Funds includes additional information about the Directors and Officers and is available, without charge, upon request by calling 1-800-242-0134.
20
Table of Contents
| Investment Team | (Unaudited) |
Investment Adviser and Administrator
GE Asset Management Incorporated
Board of Directors
Michael J. Cosgrove, Chairman
John R. Costantino
R. Sheldon Johnson
Donna M. Rapaccioli
Matthew J. Simpson
Secretary
Joon Won Choe
Assistant Secretary
Michelle Matzelle
Treasurer
Arthur A. Jensen
Assistant Treasurer
Casey Yantosca
Distributor
GE Investment Distributors, Inc.
Member FINRA and SIPC
Custodian
State Street Bank & Trust Company
Officers of the Investment Adviser
Dmitri Stockton, President and Chief Executive Officer
Cheryl H. Beacock, Senior Vice President, Human Resources
George A. Bicher, Chief Risk Officer
Paul M. Colonna, President and Chief Investment Officer – Public Investments
Michael J. Cosgrove, President of Mutual Funds and Global Investment Programs
Gregory B. Hartch, Senior Vice President – Strategy and Business Development Leader
Ralph R. Layman, Executive Vice President and Chief Investment Officer Emeritus Public Equities
Maureen B. Mitchell, President of Global Sales and Marketing
Steven M. Rullo, Senior Vice President – Services and Technology
Matthew J. Simpson, Executive Vice President, General Counsel and Secretary
Donald W. Torey, President and Chief Investment Officer – Alternative Investments
David Wiederecht, President and Chief Investment Officer – Investment Solutions
Jessica Holscott, Executive Vice President, Chief Financial Officer*
| * | Effective August 1, 2012, Ms. Holcott replaced Tracie A. Winbigler as Executive Vice President and Chief Financial Officer. |
At GE Asset Management, we’re dedicated to providing the investment options you’ll need to tailor your financial portfolio to every stage of your life. Each member of the GE Family of Funds is managed according to the same principles of integrity and quality that have guided GE over the past century, and have made it the world-class company that it is today. Each fund draws strength from a heritage of investment management experience that spans more than 80 years. Whether you’re creating a new investment portfolio or adding to an established one, the GE Family of Funds offers an array of professionally managed investment options that will help you meet a lifetime of financial needs.
21
Table of Contents
Investment Adviser
GE Asset Management Incorporated
1600 Summer Street
Stamford, CT 06905
or at:
PO Box 7900
Stamford, CT 06904-7900
Distributor
GE Investment Distributors, Inc.
member FINRA and SIPC
1600 Summer Street
Stamford, CT 06905
or at:
PO Box 7900
Stamford, CT 06904-7900
The Fund files its complete schedule of portfolio holdings with the Securities and Exchange Commission for the first and third quarters of each fiscal year on Form N-Q. The Fund’s Forms N-Q, as well as a description of the policies and procedures that the Fund uses to determine how to vote proxies (if any) relating to portfolio securities is available without charge (i) upon request, by calling 1-800-493-3042; (ii) on the Fund’s website at http://www.geam.com; and (iii) on the Commission’s website at http://www.sec.gov. The Fund’s Forms N-Q may be reviewed and copied at the Commission’s Public Reference Room in Washington, DC—information on the operation of the Public Reference Room may be obtained by calling 1-800-SEC-0330.
Information (if any) regarding how the Fund voted proxies relating to portfolio securities during the most recently disclosed 12-month period ended June 30 is available without charge (i) through the Fund’s website at http://www.geam.com; and (ii) on the Commission’s website at http://www.sec.gov.

Table of Contents
GE Investments Funds, Inc.
Small-Cap Equity Fund
Semi-Annual Report
June 30, 2012

Table of Contents
| Small-Cap Equity Fund | Contents | |
| 1 | ||||
| 2 | ||||
| 3 | ||||
| 10 | ||||
Financial Statements | ||||
| 11 | ||||
| 12 | ||||
| 13 | ||||
| 14 | ||||
| 15 | ||||
| 21 | ||||
| 25 | ||||
This report is prepared for Policyholders of certain variable contracts and may be distributed to others only if preceded or accompanied by the variable contract’s current prospectus and the current summary prospectus of the Fund available for investments thereunder.
Table of Contents
| Small-Cap Equity Fund | (Unaudited) |
Notes to Performance
Total return performance shown in this report for the GE Investments Small Cap Equity Fund (the “Fund”) takes into account changes in share price and assumes reinvestment of dividends and capital gains distributions, if any. Total returns shown are net of Fund fees and expenses but do not reflect fees and charges associated with the variable contracts such as administrative fees, account charges and surrender charges, which, if reflected, would reduce the Fund’s total returns for all periods shown.
The performance data quoted represents past performance; past performance does not guarantee future results. Investment return and principal value will fluctuate so your shares, when redeemed, may be worth more or less than their original cost. Current performance may be higher or lower than the performance data quoted. Periods less than one year are not annualized. Please call 800-493-3042 or visit the Fund’s website at http://www.geam.com for the most recent month-end performance data.
An investment in the Fund is not a deposit of any bank and is not insured or guaranteed by the Federal Deposit Insurance Corporation (FDIC) or any other government agency. An investment in the Fund is subject to risk, including possible loss of principal invested.
Investment Profile
A mutual fund designed for investors who seek long-term growth of capital. The Fund seeks its investment objective by investing at least 80% of its net assets under normal circumstances in equity securities of small-cap companies, such as common and preferred stocks. The Fund uses a multi-sub-adviser investment strategy that combines growth, value and core investment management styles. This orientation will typically produce a portfolio that does not materially favor value or growth style investing, and allows the Fund the potential to benefit from both value and growth cycles in the marketplace.
Sector Allocation
as a % of Fair Value of $43,974 (in thousands) on June 30, 2012 (a)(b)
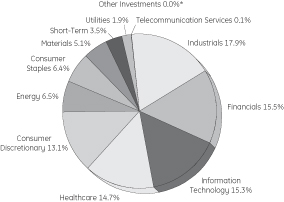
Top Ten Largest Holdings
as of June 30, 2012 as a % of Fair Value (a)(b)(c)
Sensient Technologies Corp. | 1.21% | |||
Bio-Reference Labs Inc. | 1.18% | |||
LKQ Corp. | 0.98% | |||
Jarden Corp. | 0.96% | |||
John Wiley & Sons Inc. | 0.91% | |||
Darling International Inc. | 0.90% | |||
Allied World Assurance Company Holdings AG | 0.89% | |||
AGCO Corp. | 0.87% | |||
Smithfield Foods Inc. | 0.87% | |||
Omega Healthcare Investors Inc. (REIT) | 0.84% |
| (a) | The securities information regarding holdings, allocations and other characteristics is presented to illustrate examples of securities that the Fund has bought and the diversity of areas in which the Fund may invest as of a particular date. It may not be representative of the Fund’s current or future investments and should not be construed as a recommendation to purchase or sell a particular security. |
| (b) | Fair value basis is inclusive of the short-term investment in GE Institutional Money Market Fund Investment Class. |
| (c) | The figures presented to not include the Fund’s entire investment portfolio and may change at any time. |
| * | Less than 0.01%. |
GE Investment Distributors, Inc., Member of FINRA & SIPC, is the principal underwriter and distributor of the GE Investments Funds, Inc. and a wholly owned subsidiary of GE Asset Management Incorporated, the investment adviser of the Fund.
1
Table of Contents
| Small-Cap Equity Fund | (Unaudited) |
Understanding Your Fund’s Expenses
As a shareholder of the Fund you incur ongoing costs. Ongoing costs include portfolio management fees, professional fees, administrative fees and other Fund expenses. The following example is intended to help you understand your ongoing costs (in dollars) of investing in the Fund and to compare these costs with the ongoing costs of investing in other mutual funds.
To illustrate these ongoing costs, we have provided an example and calculated the expenses paid by investors in each share class of the Fund during the period. The information in the following table is based on an investment of $1,000, which is invested at the beginning of the period and held for the entire six-month period ended June 30, 2012.
Actual Expenses
The first section of the table provides information about actual account values and actual expenses. You may use the information in this section, together with the amount you invested, to estimate the expenses that you paid over the period. To do so, simply divide your account value by $1,000 (for example, an $8,600 account value divided by $1,000 = 8.6), then multiply the result by the
number given for your class under the heading “Expenses Paid During Period” to estimate the expenses paid on your account during the period.
Hypothetical Example for Comparison Purposes
The second section of the table provides information about hypothetical account values and hypothetical expenses based on the Fund’s actual expense ratio and an assumed rate of return of 5% per year before expenses, which is not the Fund’s actual return. The hypothetical account values and expenses may not be used to estimate the actual ending account balance or expenses you paid for the period. You may use this information to compare the ongoing costs of investing in the Fund and other funds. To do so, compare this 5% hypothetical example with the 5% hypothetical examples that appear in the shareholders reports of other funds.
Please note that the expenses shown in the table are meant to highlight and help you compare ongoing costs only and do not reflect transaction costs, such as sales charges or redemption fees, if any. Therefore, the second section of the table is useful in comparing ongoing costs only, and will not help you determine the relative total costs of owning different funds. Additionally, the expenses shown do not reflect the fees or charges associated with variable contracts through which shares of the Fund are offered.
January 1, 2012 - June 30, 2012
| Account value at the beginning of the period ($) | Account value at the end of the period ($) | Expenses paid during the period ($)* | ||||||||||
Actual Fund Return | 1,000.00 | 1,066.90 | 6.68 | |||||||||
Hypothetical 5% Return (2.5% for the period) | 1,000.00 | 1,018.40 | 6.52 | |||||||||
| * | Expenses are equal to the Fund’s annualized expense ratio of 1.30% (for the period January 1, 2012 - June 30, 2012), multiplied by the average account value over the period, multiplied by 182/366 (to reflect the one-half year period). |
2
Table of Contents
Small-Cap Equity Fund
| Schedule of Investments | June 30, 2012 (Unaudited) |
Small-Cap Equity Fund
| Number of Shares | Fair Value | |||||||||
Common Stock—96.0% † |
| |||||||||
Advertising — 0.8% |
| |||||||||
Arbitron Inc. | 9,500 | $ | 332,500 | |||||||
RtheLocal Inc. | 1,700 | 18,700 | (a) | |||||||
| 351,200 | ||||||||||
Aerospace & Defense — 1.1% |
| |||||||||
AAR Corp. | 529 | 7,131 | ||||||||
Esterline Technologies Corp. | 2,735 | 170,527 | (a) | |||||||
Hexcel Corp. | 800 | 20,632 | (a) | |||||||
Moog Inc. | 991 | 40,978 | (a) | |||||||
Teledyne Technologies Inc. | 3,000 | 184,950 | (a) | |||||||
Triumph Group Inc. | 746 | 41,977 | ||||||||
| 466,195 | ||||||||||
Agricultural Products — 1.0% |
| |||||||||
Darling International Inc. | 24,075 | 396,997 | (a) | |||||||
Fresh Del Monte Produce Inc. | 1,942 | 45,579 | ||||||||
| 442,576 | ||||||||||
Air Freight & Logistics — 0.5% |
| |||||||||
Hub Group Inc. | 3,100 | 112,220 | (a) | |||||||
UTi Worldwide Inc. | 7,300 | 106,653 | ||||||||
| 218,873 | ||||||||||
Alternative Carriers — 0.0%* |
| |||||||||
Vonage Holdings Corp. | 5,800 | 11,658 | (a) | |||||||
Apparel Retail — 1.3% | ||||||||||
Aeropostale Inc. | 8,676 | 154,693 | (a) | |||||||
American Eagle Outfitters Inc. | 4,900 | 96,677 | ||||||||
Ascena Retail Group Inc. | 1,000 | 18,620 | ||||||||
Crocs Inc. | 1,200 | 19,380 | (a) | |||||||
DSW Inc. | 400 | 21,760 | ||||||||
Express Inc. | 700 | 12,719 | (a) | |||||||
Genesco Inc. | 368 | 22,135 | (a) | |||||||
The Buckle Inc. | 5,500 | 217,635 | ||||||||
Zumiez Inc. | 600 | 23,760 | (a) | |||||||
| 587,379 | ||||||||||
Apparel, Accessories & Luxury Goods — 1.5% |
| |||||||||
Columbia Sportswear Co. | 5,619 | 301,291 | ||||||||
Iconix Brand Group Inc. | 15,250 | 266,418 | (a) | |||||||
Maidenform Brands Inc. | 3,900 | 77,688 | (a) | |||||||
True Religion Apparel Inc. | 600 | 17,388 | ||||||||
| 662,785 | ||||||||||
Application Software — 4.8% |
| |||||||||
ACI Worldwide Inc. | 6,250 | 276,313 | (a) | |||||||
Actuate Corp. | 3,200 | 22,176 | (a) | |||||||
| Number of Shares | Fair Value | |||||||||
Advent Software Inc. | 1,400 | $ | 37,954 | (a) | ||||||
Blackbaud Inc. | 7,000 | 179,690 | ||||||||
Bottomline Technologies Inc. | 7,200 | 129,960 | (a) | |||||||
Compuware Corp. | 2,200 | 20,438 | (a) | |||||||
Concur Technologies Inc. | 3,700 | 251,970 | (a) | |||||||
Ebix Inc. | 4,800 | 95,760 | ||||||||
Fair Isaac Corp. | 500 | 21,140 | ||||||||
Kenexa Corp. | 700 | 20,321 | (a) | |||||||
Mentor Graphics Corp. | 1,500 | 22,500 | (a) | |||||||
Monotype Imaging Holdings Inc. | 1,700 | 28,509 | (a) | |||||||
NICE Systems Ltd. ADR | 3,900 | 142,740 | (a) | |||||||
Parametric Technology Corp. | 14,800 | 310,208 | (a) | |||||||
PROS Holdings Inc. | 3,200 | 53,824 | (a) | |||||||
QLIK Technologies Inc. | 8,100 | 179,172 | (a) | |||||||
SolarWinds Inc. | 550 | 23,958 | (a) | |||||||
SS&C Technologies Holdings Inc. | 10,890 | 272,250 | (a) | |||||||
Tyler Technologies Inc. | 500 | 20,175 | (a) | |||||||
| 2,109,058 | ||||||||||
Asset Management & Custody Banks — 1.3% |
| |||||||||
Affiliated Managers Group Inc. | 2,875 | 314,669 | (a) | |||||||
Financial Engines Inc. | 4,900 | 105,105 | (a) | |||||||
Manning & Napier Inc. | 1,500 | 21,345 | ||||||||
Waddell & Reed Financial Inc. | 4,900 | 148,372 | ||||||||
| 589,491 | ||||||||||
Auto Parts & Equipment — 0.3% | ||||||||||
Accuride Corp. | 1,731 | 10,386 | ||||||||
Dana Holding Corp. | 5,438 | 69,661 | ||||||||
Federal-Mogul Corp. | 800 | 8,800 | (a) | |||||||
Modine Manufacturing Co. | 3,522 | 24,407 | (a) | |||||||
Stoneridge Inc. | 2,911 | 19,824 | (a) | |||||||
Tenneco Inc. | 600 | 16,092 | (a) | |||||||
| 149,170 | ||||||||||
Automobile Manufacturers — 0.5% |
| |||||||||
Thor Industries Inc. | 8,635 | 236,685 | ||||||||
Automotive Retail — 0.1% |
| |||||||||
America’s Car-Mart Inc. | 676 | 26,263 | (a) | |||||||
Biotechnology — 1.2% |
| |||||||||
Acorda Therapeutics Inc. | 900 | 21,204 | (a) | |||||||
Alkermes PLC | 1,100 | 18,667 | (a) | |||||||
Cepheid Inc. | 400 | 17,900 | (a) | |||||||
Cubist Pharmaceuticals Inc. | 4,300 | 163,013 | (a) | |||||||
Emergent Biosolutions Inc. | 1,400 | 21,210 | (a) | |||||||
Genomic Health Inc. | 2,400 | 80,160 | (a) | |||||||
Myriad Genetics Inc. | 5,800 | 137,866 | (a) | |||||||
PDL BioPharma Inc. | 2,220 | 14,719 | ||||||||
Sciclone Pharmaceuticals Inc. | 4,800 | 33,648 | (a) | |||||||
Spectrum Pharmaceuticals Inc. | 1,800 | 28,008 | (a) | |||||||
| 536,395 | ||||||||||
Building Products — 0.3% |
| |||||||||
AAON Inc. | 1,252 | 23,600 | ||||||||
Apogee Enterprises Inc. | 1,880 | 30,212 | ||||||||
| See Notes to Schedule of Investments and Notes to Financial Statements. |
| 3 |
Table of Contents
Small-Cap Equity Fund
| Schedule of Investments | June 30, 2012 (Unaudited) |
| Number of Shares | Fair Value | |||||||||
Simpson Manufacturing Company Inc. | 600 | $ | 17,706 | |||||||
Universal Forest Products Inc. | 1,230 | 47,945 | ||||||||
| 119,463 | ||||||||||
Casinos & Gaming — 0.1% |
| |||||||||
Ameristar Casinos Inc. | 1,000 | 17,770 | ||||||||
WMS Industries Inc. | 2,262 | 45,127 | (a) | |||||||
| 62,897 | ||||||||||
Catalog Retail — 0.0%* |
| |||||||||
HSN Inc. | 500 | 20,175 | ||||||||
Commercial Banks — 0.0%* |
| |||||||||
First Commonwealth Financial Corp. | 1,647 | 11,084 | ||||||||
Sterling Financial Corp. | 273 | 5,157 | (a) | |||||||
| 16,241 | ||||||||||
Commercial Printing — 0.0%* |
| |||||||||
Consolidated Graphics Inc. | 435 | 12,637 | (a) | |||||||
Commodity Chemicals — 0.6% |
| |||||||||
Koppers Holdings Inc. | 7,825 | 266,050 | ||||||||
OM Group Inc. | 984 | 18,696 | (a) | |||||||
| 284,746 | ||||||||||
Communications Equipment — 0.4% |
| |||||||||
Arris Group Inc. | 3,650 | 50,772 | (a) | |||||||
Calix Inc. | 2,800 | 23,016 | (a) | |||||||
NETGEAR Inc. | 1,789 | 61,738 | (a) | |||||||
Plantronics Inc. | 1,621 | 54,141 | ||||||||
| 189,667 | ||||||||||
Computer & Electronics Retail — 0.0%* |
| |||||||||
Conn’s Inc. | 1,300 | 19,240 | (a) | |||||||
Computer Storage & Peripherals — 0.1% |
| |||||||||
MTS Systems Corp. | 863 | 33,269 | ||||||||
QLogic Corp. | 1,200 | 16,428 | (a) | |||||||
| 49,697 | ||||||||||
Construction & Engineering — 1.9% |
| |||||||||
Chicago Bridge & Iron Company N.V. | 7,765 | 294,759 | ||||||||
Dycom Industries Inc. | 1,000 | 18,610 | (a) | |||||||
Quanta Services Inc. | 8,500 | 204,595 | (a) | |||||||
URS Corp. | 8,850 | 308,688 | ||||||||
| 826,652 | ||||||||||
Construction & Farm Machinery & Heavy Trucks — 2.1% | ||||||||||
AGCO Corp. | 8,400 | 384,132 | (a) | |||||||
Astec Industries Inc. | 2,330 | 71,484 | (a) | |||||||
Greenbrier Companies Inc. | 3,859 | 67,841 | (a) | |||||||
Lindsay Corp. | 300 | 19,470 | ||||||||
Sauer-Danfoss Inc. | 600 | 20,958 | ||||||||
Trinity Industries Inc. | 13,825 | 345,349 | ||||||||
| 909,234 | ||||||||||
| Number of Shares | Fair Value | |||||||||
Construction Materials — 0.1% |
| |||||||||
Drew Industries Inc. | 965 | $ | 26,875 | (a) | ||||||
Eagle Materials Inc. | 600 | 22,404 | ||||||||
| 49,279 | ||||||||||
Consumer Electronics — 0.0%* |
| |||||||||
Harman International Industries Inc. | 358 | 14,177 | ||||||||
Consumer Finance — 0.0%* |
| |||||||||
EZCORP Inc. | 750 | 17,595 | (a) | |||||||
Data Processing & Outsourced Services — 2.6% | ||||||||||
Broadridge Financial Solutions Inc. | 13,875 | 295,121 | ||||||||
Cardtronics Inc. | 3,700 | 111,777 | (a) | |||||||
Global Cash Access Holdings Inc. | 27,600 | 198,996 | (a) | |||||||
Heartland Payment Systems Inc. | 700 | 21,056 | ||||||||
Jack Henry & Associates Inc. | 4,900 | 169,148 | ||||||||
NeuStar Inc. | 3,700 | 123,580 | (a) | |||||||
TeleTech Holdings Inc. | 1,150 | 18,400 | (a) | |||||||
TNS Inc. | 2,496 | 44,778 | (a) | |||||||
Wright Express Corp. | 2,400 | 148,128 | (a) | |||||||
| 1,130,984 | ||||||||||
Distributors — 1.0% |
| |||||||||
LKQ Corp. | 12,901 | 430,893 | (a) | |||||||
Diversified Metals & Mining — 0.3% |
| |||||||||
Compass Minerals International Inc. | 2,000 | 152,560 | ||||||||
Diversified REITs — 0.1% |
| |||||||||
Cousins Properties Inc. | 2,378 | 18,429 | ||||||||
Washington Real Estate Investment Trust | 1,142 | 32,490 | ||||||||
| 50,919 | ||||||||||
Diversified Support Services — 0.6% |
| |||||||||
Coinstar Inc. | 340 | 23,344 | (a) | |||||||
Healthcare Services Group Inc. | 9,800 | 189,924 | ||||||||
UniFirst Corp. | 708 | 45,135 | ||||||||
| 258,403 | ||||||||||
Education Services — 0.8% |
| |||||||||
American Public Education Inc. | 1,700 | 54,400 | (a) | |||||||
Capella Education Co. | 1,900 | 66,044 | (a) | |||||||
K12 Inc. | 4,900 | 114,170 | (a) | |||||||
Lincoln Educational Services Corp. | 2,850 | 18,525 | ||||||||
Strayer Education Inc. | 800 | 87,216 | ||||||||
| 340,355 | ||||||||||
Electric Utilities — 0.8% |
| |||||||||
ALLETE Inc. | 1,201 | 50,202 | ||||||||
IDACORP Inc. | 6,634 | 279,159 | ||||||||
Westar Energy Inc. | 1,436 | 43,008 | ||||||||
| 372,369 | ||||||||||
| See Notes to Schedule of Investments and Notes to Financial Statements. |
| 4 |
Table of Contents
Small-Cap Equity Fund
| Schedule of Investments | June 30, 2012 (Unaudited) |
| Number of Shares | Fair Value | |||||||||
Electrical Components & Equipment — 1.2% |
| |||||||||
Acuity Brands Inc. | 330 | $ | 16,800 | |||||||
Belden Inc. | 500 | 16,675 | ||||||||
Brady Corp. | 6,100 | 167,811 | ||||||||
EnerSys | 2,181 | 76,488 | (a) | |||||||
Generac Holdings Inc. | 800 | 19,248 | (a) | |||||||
General Cable Corp. | 700 | 18,158 | (a) | |||||||
II-VI Inc. | 7,318 | 121,991 | (a) | |||||||
LSI Industries Inc. | 1,779 | 12,666 | ||||||||
Regal-Beloit Corp. | 620 | 38,601 | ||||||||
Vicor Corp. | 3,000 | 20,820 | ||||||||
| 509,258 | ||||||||||
Electronic Components — 0.3% |
| |||||||||
Dolby Laboratories Inc. | 550 | 22,715 | (a) | |||||||
Littelfuse Inc. | 369 | 20,992 | ||||||||
Micrel Inc. | 1,900 | 18,107 | ||||||||
Monolithic Power Systems Inc. | 1,000 | 19,870 | (a) | |||||||
Silicon Laboratories Inc. | 600 | 22,740 | (a) | |||||||
Ultratech Inc. | 700 | 22,050 | (a) | |||||||
| 126,474 | ||||||||||
Electronic Equipment & Instruments — 0.4% |
| |||||||||
Badger Meter Inc. | 367 | 13,781 | ||||||||
National Instruments Corp. | 5,600 | 150,416 | ||||||||
| 164,197 | ||||||||||
Electronic Manufacturing Services — 0.7% |
| |||||||||
Measurement Specialties Inc. | 5,157 | 167,654 | (a) | |||||||
Methode Electronics Inc. | 3,898 | 33,172 | ||||||||
Multi-Fineline Electronix Inc. | 2,505 | 61,723 | (a) | |||||||
Plexus Corp. | 1,256 | 35,419 | (a) | |||||||
| 297,968 | ||||||||||
Environmental & Facilities Services — 0.3% |
| |||||||||
ABM Industries Inc. | 6,000 | 117,360 | ||||||||
Food Distributors — 0.1% |
| |||||||||
Nash Finch Co. | 268 | 5,757 | ||||||||
Spartan Stores Inc. | 3,250 | 58,923 | ||||||||
| 64,680 | ||||||||||
Food Retail — 0.6% | ||||||||||
Harris Teeter Supermarkets Inc. | 6,600 | 270,534 | ||||||||
Footwear — 1.1% | ||||||||||
Deckers Outdoor Corp. | 4,300 | 189,243 | (a) | |||||||
Wolverine World Wide Inc. | 8,009 | 310,589 | ||||||||
| 499,832 | ||||||||||
Gas Utilities — 0.1% | ||||||||||
South Jersey Industries Inc. | 1,077 | 54,895 | ||||||||
Healthcare Distributors — 0.6% |
| |||||||||
Owens & Minor Inc. | 9,202 | 281,857 | ||||||||
| Number of Shares | Fair Value | |||||||||
Healthcare Equipment — 3.8% |
| |||||||||
Analogic Corp. | 370 | $ | 22,940 | |||||||
Conceptus Inc. | 1,200 | 23,784 | (a) | |||||||
Cyberonics Inc. | 600 | 26,964 | (a) | |||||||
Exactech Inc. | 770 | 12,913 | (a) | |||||||
Gen-Probe Inc. | 3,700 | 304,140 | (a) | |||||||
Hill-Rom Holdings Inc. | 1,478 | 45,596 | ||||||||
Integra LifeSciences Holdings Corp. | 6,100 | 226,798 | (a) | |||||||
Masimo Corp. | 8,600 | 192,468 | (a) | |||||||
NuVasive Inc. | 8,400 | 213,024 | (a) | |||||||
Orthofix International N.V. | 500 | 20,625 | (a) | |||||||
STERIS Corp. | 4,700 | 147,439 | ||||||||
Teleflex Inc. | 3,300 | 201,003 | ||||||||
Thoratec Corp. | 4,100 | 137,678 | (a) | |||||||
Volcano Corp. | 3,700 | 106,005 | (a) | |||||||
| 1,681,377 | ||||||||||
Healthcare Facilities — 0.4% |
| |||||||||
The Ensign Group Inc. | 823 | 23,266 | ||||||||
VCA Antech Inc. | 6,100 | 134,078 | (a) | |||||||
| 157,344 | ||||||||||
Healthcare Services — 2.6% |
| |||||||||
Bio-Reference Labs Inc. | 19,700 | 517,716 | (a) | |||||||
HMS Holdings Corp. | 7,600 | 253,156 | ||||||||
Magellan Health Services Inc. | 528 | 23,934 | (a) | |||||||
MEDNAX Inc. | 4,500 | 308,430 | (a) | |||||||
Metropolitan Health Networks Inc. | 2,636 | 25,227 | (a) | |||||||
| 1,128,463 | ||||||||||
Healthcare Supplies — 0.9% |
| |||||||||
Align Technology Inc. | 700 | 23,422 | (a) | |||||||
Merit Medical Systems Inc. | 1,664 | 22,980 | (a) | |||||||
RTI Biologics Inc. | 4,900 | 18,424 | (a) | |||||||
Staar Surgical Co. | 2,100 | 16,317 | (a) | |||||||
West Pharmaceutical Services Inc. | 6,100 | 307,989 | ||||||||
| 389,132 | ||||||||||
Healthcare Technology — 1.3% |
| |||||||||
Computer Programs & Systems Inc. | 1,850 | 105,857 | ||||||||
MedAssets Inc. | 9,600 | 129,120 | (a) | |||||||
Medidata Solutions Inc. | 4,200 | 137,214 | (a) | |||||||
Omnicell Inc. | 1,400 | 20,496 | (a) | |||||||
Quality Systems Inc. | 7,200 | 198,072 | ||||||||
| 590,759 | ||||||||||
Heavy Electrical Equipment — 0.1% |
| |||||||||
AZZ Inc. | 400 | 24,504 | ||||||||
Home Furnishing Retail — 0.6% |
| |||||||||
Aaron’s Inc. | 8,972 | 253,997 | ||||||||
Home Furnishings — 0.0%* |
| |||||||||
Hooker Furniture Corp. | 960 | 11,318 | ||||||||
| See Notes to Schedule of Investments and Notes to Financial Statements. |
| 5 |
Table of Contents
Small-Cap Equity Fund
| Schedule of Investments | June 30, 2012 (Unaudited) |
| Number of Shares | Fair Value | |||||||||
Household Products — 0.5% |
| |||||||||
Spectrum Brands Holdings Inc. | 6,375 | $ | 207,634 | (a) | ||||||
Housewares & Specialties — 1.3% | ||||||||||
American Greetings Corp. | 1,200 | 17,544 | ||||||||
Jarden Corp. | 10,050 | 422,301 | ||||||||
Tupperware Brands Corp. | 2,400 | 131,424 | ||||||||
| 571,269 | ||||||||||
Human Resource & Employment Services — 0.1% | ||||||||||
GP Strategies Corp. | 1,200 | 22,164 | (a) | |||||||
Industrial Conglomerates — 0.3% |
| |||||||||
Raven Industries Inc. | 1,800 | 125,262 | ||||||||
Industrial Machinery — 5.8% |
| |||||||||
Actuant Corp. | 1,222 | 33,190 | ||||||||
Briggs & Stratton Corp. | 1,496 | 26,165 | ||||||||
CLARCOR Inc. | 2,400 | 115,584 | ||||||||
Columbus McKinnon Corp. | 1,802 | 27,192 | (a) | |||||||
EnPro Industries Inc. | 5,100 | 190,587 | (a) | |||||||
ESCO Technologies Inc. | 2,600 | 94,744 | ||||||||
Flowserve Corp. | 2,300 | 263,925 | ||||||||
Harsco Corp. | 3,000 | 61,140 | ||||||||
IDEX Corp. | 4,900 | 191,002 | ||||||||
Kaydon Corp. | 1,800 | 38,502 | ||||||||
LB Foster Co. | 433 | 12,388 | ||||||||
Lincoln Electric Holdings Inc. | 100 | 4,379 | ||||||||
Middleby Corp. | 2,800 | 278,908 | (a) | |||||||
Mueller Industries Inc. | 2,600 | 110,734 | ||||||||
Nordson Corp. | 3,675 | 188,491 | ||||||||
RBC Bearings Inc. | 700 | 33,110 | (a) | |||||||
Robbins & Myers Inc. | 3,600 | 150,552 | ||||||||
Timken Co. | 6,000 | 274,740 | ||||||||
Trimas Corp. | 9,600 | 192,960 | (a) | |||||||
Valmont Industries Inc. | 379 | 45,848 | ||||||||
Woodward Inc. | 5,300 | 209,032 | ||||||||
| 2,543,173 | ||||||||||
Industrial REITs — 0.1% |
| |||||||||
DuPont Fabros Technology Inc. | 873 | 24,933 | ||||||||
First Potomac Realty Trust | 3,481 | 40,971 | ||||||||
| 65,904 | ||||||||||
Insurance Brokers — 0.4% |
| |||||||||
Brown & Brown Inc. | 6,100 | 166,347 | ||||||||
Internet Software & Services — 1.5% |
| |||||||||
Ancestry.com Inc. | 600 | 16,518 | (a) | |||||||
comScore Inc. | 7,200 | 118,512 | (a) | |||||||
CoStar Group Inc. | 1,200 | 97,440 | (a) | |||||||
Demand Media Inc. | 2,200 | 24,640 | (a) | |||||||
Dice Holdings Inc. | 2,000 | 18,780 | (a) | |||||||
IntraLinks Holdings Inc. | 4,500 | 19,710 | (a) | |||||||
Liquidity Services Inc. | 500 | 25,595 | (a) | |||||||
| Number of Shares | Fair Value | |||||||||
LogMeIn Inc. | 4,300 | $ | 131,236 | (a) | ||||||
Monster Worldwide Inc. | 2,000 | 17,000 | (a) | |||||||
NIC Inc. | 9,100 | 115,570 | ||||||||
Responsys Inc. | 1,800 | 21,816 | (a) | |||||||
The Active Network Inc. | 1,800 | 27,702 | (a) | |||||||
XO Group Inc. | 2,000 | 17,740 | (a) | |||||||
| 652,259 | ||||||||||
Investment Banking & Brokerage — 1.1% |
| |||||||||
BGC Partners Inc. | 3,908 | 22,940 | ||||||||
Duff & Phelps Corp. | 1,400 | 20,300 | ||||||||
GFI Group Inc. | 17,600 | 62,656 | ||||||||
Greenhill & Company Inc. | 500 | 17,825 | ||||||||
Piper Jaffray Co. | 2,169 | 50,820 | (a) | |||||||
Raymond James Financial Inc. | 8,400 | 287,616 | ||||||||
Stifel Financial Corp. | 1,144 | 35,350 | (a) | |||||||
| 497,507 | ||||||||||
IT Consulting & Other Services — 0.3% |
| |||||||||
Sapient Corp. | 10,900 | 109,763 | ||||||||
Unisys Corp. | 1,300 | 25,415 | (a) | |||||||
| 135,178 | ||||||||||
Leisure Products — 0.5% |
| |||||||||
Brunswick Corp. | 2,346 | 52,128 | ||||||||
Polaris Industries Inc. | 2,450 | 175,126 | ||||||||
| 227,254 | ||||||||||
Life & Health Insurance — 0.1% |
| |||||||||
American Equity Investment Life Holding Co. | 3,691 | 40,638 | ||||||||
StanCorp Financial Group Inc. | 652 | 24,228 | ||||||||
| 64,866 | ||||||||||
Life Sciences Tools & Services — 2.3% |
| |||||||||
Bio-Rad Laboratories Inc. | 2,400 | 240,024 | (a) | |||||||
Bruker Corp. | 18,600 | 247,566 | (a) | |||||||
Charles River Laboratories International Inc. | 600 | 19,656 | (a) | |||||||
ICON PLC ADR | 7,300 | 164,469 | (a) | |||||||
Luminex Corp. | 6,100 | 149,389 | (a) | |||||||
PAREXEL International Corp. | 1,200 | 33,876 | (a) | |||||||
Techne Corp. | 1,900 | 140,980 | ||||||||
| 995,960 | ||||||||||
Managed Healthcare — 1.2% |
| |||||||||
Centene Corp. | 10,770 | 324,823 | (a) | |||||||
Molina Healthcare Inc. | 8,100 | 190,026 | (a) | |||||||
WellCare Health Plans Inc. | 400 | 21,200 | (a) | |||||||
| 536,049 | ||||||||||
Metal & Glass Containers — 1.0% |
| |||||||||
AEP Industries Inc. | 674 | 29,353 | (a) | |||||||
Aptargroup Inc. | 3,700 | 188,885 | ||||||||
Kaiser Aluminum Corp. | 400 | 20,736 | ||||||||
Silgan Holdings Inc. | 4,900 | 209,181 | ||||||||
| 448,155 | ||||||||||
| See Notes to Schedule of Investments and Notes to Financial Statements. |
| 6 |
Table of Contents
Small-Cap Equity Fund
| Schedule of Investments | June 30, 2012 (Unaudited) |
| Number of Shares | Fair Value | |||||||||
Movies & Entertainment — 0.1% |
| |||||||||
Cinemark Holdings Inc. | 900 | $ | 20,565 | |||||||
Regal Entertainment Group | 1,500 | 20,640 | ||||||||
| 41,205 | ||||||||||
Multi-Line Insurance — 0.7% |
| |||||||||
HCC Insurance Holdings Inc. | 8,200 | 257,480 | ||||||||
Horace Mann Educators Corp. | 2,097 | 36,656 | ||||||||
| 294,136 | ||||||||||
Multi-Utilities — 0.9% |
| |||||||||
Avista Corp. | 2,283 | 60,956 | ||||||||
Black Hills Corp. | 1,166 | 37,510 | ||||||||
OGE Energy Corp. | 5,675 | 293,908 | ||||||||
| 392,374 | ||||||||||
Office Electronics — 0.4% |
| |||||||||
Zebra Technologies Corp. | 5,400 | 185,544 | (a) | |||||||
Office REITs — 1.6% |
| |||||||||
BioMed Realty Trust Inc. | 18,641 | 348,214 | ||||||||
Coresite Realty Corp. | 6,350 | 163,957 | ||||||||
Digital Realty Trust Inc. | 1,400 | 105,098 | ||||||||
Kilroy Realty Corp. | 879 | 42,552 | ||||||||
Lexington Realty Trust | 3,107 | 26,316 | ||||||||
| 686,137 | ||||||||||
Office Services & Supplies — 0.3% |
| |||||||||
Herman Miller Inc. | 5,200 | 96,304 | ||||||||
Knoll Inc. | 1,208 | 16,211 | ||||||||
| 112,515 | ||||||||||
Oil & Gas Drilling — 0.5% |
| |||||||||
Pioneer Drilling Co. | 29,500 | 235,115 | (a) | |||||||
Oil & Gas Equipment & Services — 2.7% |
| |||||||||
Basic Energy Services Inc. | 1,100 | 11,352 | (a) | |||||||
Cal Dive International Inc. | 5,350 | 15,515 | (a) | |||||||
CARBO Ceramics Inc. | 2,875 | 220,599 | ||||||||
Dawson Geophysical Co. | 544 | 12,958 | (a) | |||||||
Dril-Quip Inc. | 900 | 59,031 | (a) | |||||||
Hornbeck Offshore Services Inc. | 1,001 | 38,819 | (a) | |||||||
Key Energy Services Inc. | 15,600 | 118,560 | (a) | |||||||
Lufkin Industries Inc. | 1,800 | 97,776 | ||||||||
Natural Gas Services Group Inc. | 826 | 12,241 | (a) | |||||||
Oil States International Inc. | 5,100 | 337,620 | (a) | |||||||
Superior Energy Services Inc. | 8,100 | 163,863 | (a) | |||||||
TETRA Technologies Inc. | 11,900 | 84,847 | (a) | |||||||
| 1,173,181 | ||||||||||
Oil & Gas Exploration & Production — 3.0% |
| |||||||||
Approach Resources Inc. | 6,200 | 158,348 | (a) | |||||||
Berry Petroleum Co. | 1,066 | 42,278 | ||||||||
Bill Barrett Corp. | 1,804 | 38,642 | (a) | |||||||
| Number of Shares | Fair Value | |||||||||
Carrizo Oil & Gas Inc. | 550 | $ | 12,931 | (a) | ||||||
Energy XXI Bermuda Ltd. | 900 | 28,161 | ||||||||
Gulfport Energy Corp. | 5,000 | 103,150 | (a) | |||||||
Kodiak Oil & Gas Corp. | 2,154 | 17,684 | (a) | |||||||
Newfield Exploration Co. | 9,000 | 263,790 | (a) | |||||||
Northern Oil and Gas Inc. | 8,400 | 133,896 | (a) | |||||||
Oasis Petroleum Inc. | 4,900 | 118,482 | (a) | |||||||
PDC Energy Inc. | 2,500 | 61,300 | (a) | |||||||
Petroquest Energy Inc. | 2,600 | 13,000 | (a) | |||||||
Resolute Energy Corp. | 14,500 | 138,765 | (a) | |||||||
SM Energy Co. | 3,900 | 191,529 | ||||||||
Stone Energy Corp. | 900 | 22,806 | (a) | |||||||
| 1,344,762 | ||||||||||
Oil & Gas Refining & Marketing — 0.2% |
| |||||||||
Alon USA Energy Inc. | 2,300 | 19,458 | ||||||||
Western Refining Inc. | 3,148 | 70,106 | ||||||||
| 89,564 | ||||||||||
Oil & Gas Storage & Transportation — 0.0%* |
| |||||||||
Targa Resources Corp. | 500 | 21,350 | ||||||||
Packaged Foods & Meats — 4.0% |
| |||||||||
Flowers Foods Inc. | 13,300 | 308,959 | ||||||||
Lancaster Colony Corp. | 3,700 | 263,477 | ||||||||
Sanderson Farms Inc. | 5,925 | 271,484 | ||||||||
Smart Balance Inc. | 9,600 | 90,144 | (a) | |||||||
Smithfield Foods Inc. | 17,750 | 383,933 | (a) | |||||||
Snyders-Lance Inc. | 8,400 | 211,932 | ||||||||
TreeHouse Foods Inc. | 4,200 | 261,618 | (a) | |||||||
| 1,791,547 | ||||||||||
Paper Packaging — 0.7% |
| |||||||||
Packaging Corporation of America | 11,700 | 330,408 | ||||||||
Paper Products — 0.1% |
| |||||||||
Buckeye Technologies Inc. | 911 | 25,954 | ||||||||
Personal Products — 0.1% |
| |||||||||
Revlon Inc. | 900 | 12,807 | (a) | |||||||
USANA Health Sciences Inc. | 500 | 20,560 | (a) | |||||||
| 33,367 | ||||||||||
Pharmaceuticals — 0.4% |
| |||||||||
Auxilium Pharmaceuticals Inc. | 900 | 24,201 | (a) | |||||||
Hi-Tech Pharmacal Company Inc. | 922 | 29,873 | (a) | |||||||
Medicis Pharmaceutical Corp. | 600 | 20,490 | ||||||||
Par Pharmaceutical Companies Inc. | 2,355 | 85,110 | (a) | |||||||
| 159,674 | ||||||||||
Property & Casualty Insurance — 2.4% |
| |||||||||
Allied World Assurance Company Holdings AG | 4,900 | 389,403 | ||||||||
American Safety Insurance | 1,735 | 32,531 | (a) | |||||||
See Notes to Schedule of Investments and Notes to Financial Statements.
7
Table of Contents
Small-Cap Equity Fund
| Schedule of Investments | June 30, 2012 (Unaudited) |
| Number of Shares | Fair Value | |||||||||
Amtrust Financial Services Inc. | 3,700 | $ | 109,927 | |||||||
Argo Group International | 5,495 | 160,839 | ||||||||
Aspen Insurance Holdings Ltd. | 6,700 | 193,630 | ||||||||
The Navigators Group Inc. | 3,700 | 185,185 | (a) | |||||||
| 1,071,515 | ||||||||||
Publishing — 1.3% | ||||||||||
John Wiley & Sons Inc. | 8,200 | 401,718 | ||||||||
Morningstar Inc. | 3,000 | 173,520 | ||||||||
| 575,238 | ||||||||||
Railroads — 0.7% | ||||||||||
Genesee & Wyoming Inc. | 5,500 | 290,620 | (a) | |||||||
Regional Banks — 4.8% |
| |||||||||
BancorpSouth Inc. | 1,524 | 22,128 | ||||||||
Bank of the Ozarks Inc. | 1,501 | 45,150 | ||||||||
Banner Corp. | 1,277 | 27,979 | ||||||||
Bryn Mawr Bank Corp. | 3,000 | 63,210 | ||||||||
Camden National Corp. | 520 | 19,042 | ||||||||
Cardinal Financial Corp. | 894 | 10,978 | ||||||||
CoBiz Financial Inc. | 1,493 | 9,346 | ||||||||
Community Bank System Inc. | 2,200 | 59,664 | ||||||||
Cullen Frost Bankers Inc. | 3,400 | 195,466 | ||||||||
East West Bancorp Inc. | 2,379 | 55,811 | ||||||||
First Horizon National Corp. | 2,964 | 25,639 | ||||||||
Fulton Financial Corp. | 6,200 | 61,938 | ||||||||
Glacier Bancorp Inc. | 1,259 | 19,502 | ||||||||
Great Southern Bancorp Inc. | 881 | 24,298 | ||||||||
Hancock Holding Co. | 745 | 22,678 | ||||||||
Home Bancshares Inc. | 1,335 | 40,824 | ||||||||
Iberiabank Corp. | 2,082 | 105,037 | ||||||||
Independent Bank Corp. | 2,400 | 70,104 | ||||||||
Lakeland Financial Corp. | 924 | 24,791 | ||||||||
Old National Bancorp | 1,553 | 18,652 | ||||||||
PacWest Bancorp | 550 | 13,018 | ||||||||
Prosperity Bancshares Inc. | 5,500 | 231,165 | ||||||||
Southwest Bancorp Inc. | 2,232 | 21,003 | (a) | |||||||
Susquehanna Bancshares Inc. | 5,074 | 52,262 | ||||||||
SVB Financial Group | 3,700 | 217,264 | (a) | |||||||
UMB Financial Corp. | 7,200 | 368,856 | ||||||||
Umpqua Holdings Corp. | 3,312 | 43,586 | ||||||||
Washington Trust Bancorp Inc. | 3,000 | 73,140 | ||||||||
Westamerica Bancorporation | 3,000 | 141,570 | ||||||||
Wintrust Financial Corp. | 751 | 26,661 | ||||||||
| 2,110,762 | ||||||||||
Reinsurance — 0.5% | ||||||||||
Endurance Specialty Holdings Ltd. | 4,200 | 160,944 | ||||||||
Maiden Holdings Ltd. | 2,662 | 23,106 | ||||||||
Platinum Underwriters Holdings Ltd. | 1,016 | 38,710 | ||||||||
| 222,760 | ||||||||||
Research & Consulting Services — 0.3% |
| |||||||||
ICF International Inc. | 1,949 | 46,464 | (a) | |||||||
Resources Connection Inc. | 3,400 | 41,820 | ||||||||
| Number of Shares | Fair Value | |||||||||
The Corporate Executive Board Co. | 600 | $ | 24,528 | |||||||
| 112,812 | ||||||||||
Residential REITs — 0.3% |
| |||||||||
American Capital Mortgage Investment Corp. | 800 | 19,104 | ||||||||
Colonial Properties Trust | 496 | 10,981 | ||||||||
Home Properties Inc. | 300 | 18,408 | ||||||||
Mid-America Apartment Communities Inc. | 1,133 | 77,316 | ||||||||
| 125,809 | ||||||||||
Restaurants — 0.9% | ||||||||||
CEC Entertainment Inc. | 600 | 21,822 | ||||||||
Cracker Barrel Old Country Store Inc. | 4,300 | 270,040 | ||||||||
Einstein Noah Restaurant Group Inc. | 1,050 | 18,438 | ||||||||
Texas Roadhouse Inc. | 1,300 | 23,959 | ||||||||
The Wendy’s Co. | 15,700 | 74,104 | ||||||||
| 408,363 | ||||||||||
Retail REITs — 0.1% | ||||||||||
CBL & Associates Properties Inc. | 1,100 | 21,494 | ||||||||
Ramco-Gershenson Properties Trust | 2,539 | 31,915 | ||||||||
| 53,409 | ||||||||||
Security & Alarm Services — 0.8% | ||||||||||
The Brink’s Co. | 15,125 | 350,598 | ||||||||
Semiconductor Equipment — 0.5% | ||||||||||
MKS Instruments Inc. | 1,028 | 29,740 | ||||||||
Rudolph Technologies Inc. | 19,800 | 172,656 | (a) | |||||||
Veeco Instruments Inc. | 550 | 18,898 | (a) | |||||||
| 221,294 | ||||||||||
Semiconductors — 1.7% |
| |||||||||
Diodes Inc. | 1,661 | 31,177 | (a) | |||||||
Fairchild Semiconductor International Inc. | 2,944 | 41,510 | (a) | |||||||
First Solar Inc. | 1,500 | 22,590 | (a) | |||||||
Hittite Microwave Corp. | 1,900 | 97,128 | (a) | |||||||
Integrated Device Technology Inc. | 4,096 | 23,020 | (a) | |||||||
Microsemi Corp. | 12,900 | 238,521 | (a) | |||||||
Pericom Semiconductor Corp. | 1,397 | 12,573 | (a) | |||||||
RF Micro Devices Inc. | 4,545 | 19,316 | (a) | |||||||
Semtech Corp. | 6,300 | 153,216 | (a) | |||||||
Standard Microsystems Corp. | 1,872 | 69,058 | (a) | |||||||
TriQuint Semiconductor Inc. | 4,898 | 26,939 | (a) | |||||||
| 735,048 | ||||||||||
Specialized Consumer Services — 0.1% |
| |||||||||
Matthews International Corp. | 1,100 | 35,739 | ||||||||
Specialized Finance — 0.1% |
| |||||||||
NewStar Financial Inc. | 3,206 | 41,550 | (a) | |||||||
See Notes to Schedule of Investments and Notes to Financial Statements.
8
Table of Contents
Small-Cap Equity Fund
| Schedule of Investments | June 30, 2012 (Unaudited) |
| Number of Shares | Fair Value | |||||||||
Specialized REITs — 1.4% |
| |||||||||
DiamondRock Hospitality Co. | 3,749 | $ | 38,240 | |||||||
Hersha Hospitality Trust | 4,855 | 25,634 | ||||||||
Inland Real Estate Corp. | 1,846 | 15,469 | ||||||||
National Health Investors Inc. | 553 | 28,159 | ||||||||
Omega Healthcare Investors Inc. | 16,500 | 371,250 | ||||||||
Sabra Healthcare REIT Inc. | 7,900 | 135,169 | ||||||||
Summit Hotel Properties Inc. | 2,632 | 22,030 | ||||||||
| 635,951 | ||||||||||
Specialty Chemicals — 1.6% |
| |||||||||
Chemtura Corp. | 1,300 | 18,850 | (a) | |||||||
HB Fuller Co. | 2,961 | 90,903 | ||||||||
Rockwood Holdings Inc. | 400 | 17,740 | ||||||||
Sensient Technologies Corp. | 14,463 | 531,226 | ||||||||
Stepan Co. | 488 | 45,960 | ||||||||
| 704,679 | ||||||||||
Specialty Stores — 0.3% |
| |||||||||
Cabela’s Inc. | 1,456 | 55,051 | (a) | |||||||
Tractor Supply Co. | 1,125 | 93,443 | ||||||||
| 148,494 | ||||||||||
Steel — 0.6% | ||||||||||
Carpenter Technology Corp. | 610 | 29,182 | ||||||||
Commercial Metals Co. | 14,500 | 183,280 | ||||||||
Schnitzer Steel Industries Inc. | 1,705 | 47,774 | ||||||||
| 260,236 | ||||||||||
Systems Software — 1.6% |
| |||||||||
Ariba Inc. | 7,100 | 317,796 | (a) | |||||||
CommVault Systems Inc. | 500 | 24,785 | (a) | |||||||
Fortinet Inc. | 700 | 16,254 | (a) | |||||||
MICROS Systems Inc. | 6,730 | 344,576 | (a) | |||||||
| 703,411 | ||||||||||
Technology Distributors — 0.2% |
| |||||||||
ScanSource Inc. | 918 | 28,128 | (a) | |||||||
Tech Data Corp. | 988 | 47,592 | (a) | |||||||
| 75,720 | ||||||||||
Thrifts & Mortgage Finance — 0.2% | ||||||||||
BankUnited Inc. | 1,246 | 29,381 | ||||||||
Dime Community Bancshares Inc. | 328 | 4,359 | ||||||||
Northwest Bancshares Inc. | 2,703 | 31,652 | ||||||||
Washington Federal Inc. | 2,394 | 40,435 | ||||||||
| 105,827 | ||||||||||
Tires & Rubber — 0.2% | ||||||||||
Cooper Tire & Rubber Co. | 5,438 | 95,383 | ||||||||
Trading Companies & Distributors — 0.8% |
| |||||||||
Applied Industrial Technologies Inc. | 8,800 | 324,280 | ||||||||
DXP Enterprises Inc. | 505 | 20,952 | (a) | |||||||
| 345,232 | ||||||||||
| Number of Shares | Fair Value | |||||||||
Trucking — 1.0% | ||||||||||
Avis Budget Group Inc. | 1,300 | $ | 19,760 | (a) | ||||||
Dollar Thrifty Automotive Group Inc. | 270 | 21,859 | (a) | |||||||
Marten Transport Ltd. | 1,873 | 39,820 | ||||||||
Old Dominion Freight Line Inc. | 8,300 | 359,307 | (a) | |||||||
Swift Transportation Co. | 1,700 | 16,065 | (a) | |||||||
| 456,811 | ||||||||||
Wire & Cable Products — 0.1% | ||||||||||
Encore Wire Corp. | 939 | 25,146 | ||||||||
Wireless Telecommunication Services — 0.0%* | ||||||||||
Leap Wireless International Inc. | 2,100 | 13,503 | (a) | |||||||
Total Common Stock | 42,441,584 | |||||||||
Other Investments — 0.0%* | ||||||||||
GEI Investment Fund | 9 | (c) | ||||||||
Total Investments in Securities | 42,441,593 | |||||||||
Short-Term Investments — 3.5% | ||||||||||
GE Institutional Money Market | 1,532,601 | (b,c) | ||||||||
Total Investments | 43,974,194 | |||||||||
Other Assets and Liabilities, net — 0.5% |
| 234,544 | ||||||||
|
| |||||||||
NET ASSETS — 100.0% |
| $ | 44,208,738 | |||||||
|
| |||||||||
Other Information | ||||||||||
The Fund had the following long futures contracts open at June 30, 2012 (Unaudited):
| Description | Expiration date | Number of Contracts | Current Notional Value | Unrealized Appreciation | ||||||||||
Russell 2000 | September 2012 | 7 | $ | 556,780 | $ | 11,389 | ||||||||
| See Notes to Schedule of Investments and Notes to Financial Statements. |
| 9 |
Table of Contents
| Notes to Schedule of Investments | June 30, 2012 (Unaudited) |
The views expressed in this document reflect our judgment as of the publication date and are subject to change at any time without notice. The securities information regarding holdings, allocations and other characteristics are presented to illustrate examples of securities that the Fund has bought and the diversity of areas in which the Fund may invest as of a particular date. It may not be representative of the Fund’s current or future investments and should not be construed as a recommendation to purchase or sell a particular security. See the Fund’s summary prospectus and statutory prospectus for complete descriptions of investment objectives, policies, risks and permissible investments.
| (a) | Non-income producing security. |
| (b) | Coupon amount represents effective yield. |
| (c) | GE Asset Management, the investment adviser of the Fund, also serves as investment adviser of the GEI Investment Fund and the GE Institutional Money Market Fund. The GE Investment Fund has been determined to be illiquid using procedures established by the Board of Directors. |
| * | Less than 0.05%. |
| † | Percentages are based on net assets as of June 30, 2012. |
Abbreviations:
ADR | American Depository Receipt | |
REIT | Real Estate Investment Trust | |
10
Table of Contents
Selected data based on a share outstanding throughout the fiscal years indicated
| CLASS 1 | ||||||||||||||||||||||||
| 6/30/12† | 12/31/11 | 12/31/10 | 12/31/09 | 12/31/08(c) | 12/31/07 | |||||||||||||||||||
| Inception date | — | — | — | — | — | 4/28/00 | ||||||||||||||||||
Net asset value, beginning of period | $ | 12.85 | $ | 12.46 | $ | 9.79 | $ | 7.48 | $ | 12.17 | $ | 14.39 | ||||||||||||
Income/(loss) from investment operations: | ||||||||||||||||||||||||
Net investment income (loss) | (0.02) | (0.01) | 0.02 | ** | 0.04 | 0.09 | 0.06 | |||||||||||||||||
Net realized and unrealized | 0.88 | 0.40 | 2.67 | 2.27 | (4.67) | 0.31 | ||||||||||||||||||
Total income/(loss) from investment operations | 0.86 | 0.39 | 2.69 | 2.31 | (4.58) | 0.37 | ||||||||||||||||||
Less distributions from: | ||||||||||||||||||||||||
Net investment income | — | 0.00 | *** | 0.02 | — | 0.05 | 0.06 | |||||||||||||||||
Net realized gains | — | — | — | — | 0.06 | 2.53 | ||||||||||||||||||
Total distributions | — | 0.00 | 0.02 | 0.00 | 0.11 | 2.59 | ||||||||||||||||||
Net asset value, end of period | $ | 13.71 | $ | 12.85 | $ | 12.46 | $ | 9.79 | $ | 7.48 | $ | 12.17 | ||||||||||||
TOTAL RETURN (a) | 6.69% | 3.13% | 27.47% | 30.88% | (37.59)% | 2.39% | ||||||||||||||||||
RATIOS/ | ||||||||||||||||||||||||
Net assets, end of period (in thousands) | $ | 44,209 | $ | 46,855 | $ | 55,527 | $ | 54,114 | $ | 50,210 | $ | 104,010 | ||||||||||||
Ratios to average net assets: | ||||||||||||||||||||||||
Net investment income (loss) | (0.25)% | * | (0.07)% | 0.18% | (0.04)% | 0.46% | 0.31% | |||||||||||||||||
Net Expenses | 1.30% | (b)(d)* | 1.28% | (b)(d) | 1.12% | (b) | 1.52% | (b) | 0.94% | (b) | 0.87% | |||||||||||||
Gross Expenses | 1.36% | * | 1.50% | 1.13% | 1.52% | 0.94% | 0.87% | |||||||||||||||||
Portfolio turnover rate | 18% | 44% | 47% | 40% | 85% | 25% | ||||||||||||||||||
Notes to Financial Highlights
| (a) | Total returns are historical and assume changes in share price, reinvestment of dividends and capital gains distributions and do not include the effect of insurance contract charges. Past performance does not guarantee future results. |
| (b) | Reflects GE Asset Management’s waiver of a portion of the Fund’s management fee in an amount equal to the management fee earned by GEAM with respect to the Fund’s investment in the GE Institutional Money Market Fund or, prior to 2011, in another affiliated money market fund formerly managed by GEAM. |
| (c) | Less than $0.01 per share of the distribution paid was from return of capital. |
| (d) | Reflects a voluntary reimbursement of other operating expenses by GE Asset Management. |
| * | Annualized for periods less than one year. |
| ** | Per share values have been calculated using the average share method. |
| *** | Rounds to less than $0.01. |
| † | Unaudited |
The accompanying Notes are an integral part of these financial statements.
11
Table of Contents
The accompanying Notes are an integral part of these financial statements.
12
Table of Contents
| * | Share Class 4 was closed effective June 29, 2012. |
The accompanying Notes are an integral part of these financial statements.
13
Table of Contents
| ** | Share Class 4 was closed effective June 29, 2012 |
| * | (Unaudited) |
The accompanying Notes are an integral part of these financial statements.
14
Table of Contents
| Notes to Financial Statements | June 30, 2012 (Unaudited) |
| 1. | Organization of the Company |
GE Investments Funds, Inc. (the “Company”) was incorporated under the laws of the Commonwealth of Virginia on May 14, 1984 and is registered under the Investment Company Act of 1940, as amended (the “1940 Act”), as an open-end management investment company. The Company is composed of thirteen investment portfolios (collectively the “Funds”), although only the following ten are currently being offered: U.S. Equity Fund, S&P 500 Index Fund, Premier Growth Equity Fund, Core Value Equity Fund, Mid-Cap Equity Fund, Small-Cap Equity Fund (the “Fund”), Total Return Fund, Income Fund, Money Market Fund and Real Estate Securities Fund.
Shares of the Funds of the Company are offered only to insurance company separate accounts that fund certain variable life insurance contracts and variable annuity contracts. GE Asset Management Incorporated (“GEAM”) is the investment adviser and administrator of each of the Funds.
The Company offers one share class (Class 1) of the Fund as investment options for variable life insurance and variable annuity contracts. Class 4 shares were closed on June 29, 2012.
| 2. | Summary of Significant Accounting Policies |
The preparation of financial statements in conformity with U.S. generally accepted accounting principles (GAAP) requires management to make estimates and assumptions that affect the reported amounts of assets and liabilities and disclosure of contingent assets and liabilities at the date of the financial statements and the reported amounts of increases and decreases in net assets from operations during the reporting period. Actual results may differ from those estimates.
The following summarizes the significant accounting policies of the Company:
Securities Valuation and Transactions. All investments in securities are recorded at their estimated fair value, as described in Note 3.
Securities transactions are accounted for as of the trade date. Realized gains and losses on investments sold are recorded on the basis of identified cost for both financial statement and federal tax purposes.
The Fund’s income, expenses (other than distribution fees) and realized and unrealized gains and losses are allocated
proportionally each day among the share classes based upon the relative net assets of each class.
Derivatives The Fund is subject to equity price risk in the normal course of pursuing its investment objective. The Fund may enter into derivative transactions to gain market exposure for residual and accumulating cash positions.
Futures Contracts A futures contract represents a commitment for the future purchase or sale of an asset at a specified price on a specified date. The Fund invested in futures for a variety of portfolio management purposes such as hedging against the effects of changes in the value of portfolio securities due to anticipated changes in market conditions, gaining market exposure for accumulating and residual cash positions, or when the transactions are economically appropriate to the reduction of risks inherent in the management of the Fund. Buying futures tends to increase a Fund’s exposure to the underlying instrument while selling futures tends to decrease a Fund’s exposure to the underlying instrument or to hedge other Fund investments. The Fund will not enter into a transaction involving futures for speculative purposes. With futures contracts, there is minimal counterparty credit risk to the Fund since futures contracts are exchange traded and the exchange’s clearinghouse, as counterparty to all traded futures, guarantees the futures against default. The Fund’s risks in using these contracts include changes in the value of the underlying instruments, non- performance of the counterparties under the contracts’ terms and changes in the liquidity of the secondary market for the contracts. Futures contracts are valued at the settlement price established each day by the board of trade or exchange on which they principally trade.
Upon entering into a financial futures contract, the Fund is required to pledge to the broker an amount of cash and/or other assets equal to a certain percentage of the contract amount, known as initial margin deposit. Subsequent payments, known as variation margin, are made or received by the Fund each day, depending on the daily fluctuation in the fair value of the underlying security. The Fund records an unrealized gain or loss equal to the daily variation margin. Should market conditions move unexpectedly, the Fund may not achieve the anticipated benefits of the futures contracts and may incur a loss. The Fund recognizes a realized gain or loss upon the expiration or closing of a futures contract.
Investment Income Corporate actions (including cash dividends) are recorded on the ex-dividend date, net of applicable withholding taxes, except for certain foreign
15
Table of Contents
| Notes to Financial Statements | June 30, 2012 (Unaudited) |
corporate actions which are recorded as soon after ex-dividend date as such information becomes available. Interest income is recorded on the accrual basis.
Expenses Fund specific expenses are allocated to the Fund that incurs such expenses. Such expenses may include custodial fees, legal and accounting fees, printing costs and registration fees. Expenses that are not fund specific are allocated pro rata across the Funds. Certain class specific expenses (such as distribution fees) are allocated to the class that incurs such expense. Expenses of the Fund are generally paid directly by the Fund however, expenses may be paid by GEAM and reimbursed by the Fund.
Federal Income Taxes The Fund intends to comply with all sections of the Internal Revenue Code applicable to regulated investment companies including the distribution of substantially all of its taxable net investment income and net realized capital gains to its shareholders. Therefore, no provision for federal income tax has been made. The Fund is treated as a separate taxpayer for federal income tax purposes.
| 3. | Securities Valuation |
The Fund utilizes various methods to measure the fair value of most of its investments on a recurring basis. GAAP establishes a framework for measuring fair value and providing related disclosures. Broadly, the framework requires fair value to be determined based on the exchange price that would be received for an asset or paid to transfer a liability (an exit price) in the principal or most advantageous market for the asset or liability in an orderly transaction between market participants at the measurement date. In the absence of active markets for the identical assets or liabilities, such measurements involve developing assumptions based on market observable data and, in the absence of such data, internal information that is consistent with what market participants would use in a hypothetical transaction that occurs at the measurement date. It also establishes a three-level valuation hierarchy based upon observable and non-observable inputs.
Observable inputs reflect market data obtained from independent sources, while unobservable inputs reflect our market assumptions. Preference is given to observable inputs. These two types of inputs create the following fair value hierarchy:
Level 1 — Quoted prices for identical investments in active markets.
Level 2 — Quoted prices for similar investments in active markets; quoted prices for identical or similar investments in markets that are not active; and model-derived valuations whose inputs are observable or whose significant value drivers are observable.
Level 3 — Significant inputs to the valuation model are unobservable.
Policies and procedures are maintained to value investments using the best and most relevant data available. In addition, pricing vendors are utilized to assist in valuing investments. GEAM performs periodic reviews of the methodologies used by independent pricing services including price validation of individual securities.
Fair Value Measurement The following section describes the valuation methodologies the Fund uses to measure different financial investments at fair value.
The Fund’s portfolio securities are valued generally on the basis of market quotations. Equity securities generally are valued at the last reported sale price on the primary market in which they are traded. Portfolio securities listed on NASDAQ are valued using the NASDAQ Official Closing Price, Level 1 securities primarily include publicly-traded equity securities. If no sales occurred on the exchange or NASDAQ that day, the portfolio security generally is valued using the last reported bid price. In those circumstances the Fund classifies the investment securities in Level 2.
Short-term investments of sufficient credit quality with remaining maturities of sixty days or less at the time of purchase are typically valued on the basis of amortized cost which approximates fair value and these are included in Level 2. If it is determined that amortized cost does not approximate fair value, securities may be valued based on dealer supplied valuations or quotations. In these infrequent circumstances, pricing services may provide the Fund with valuations that are based on significant unobservable inputs, and in those circumstances the investment securities are classified in Level 3.
The Fund uses the net asset value per unit for collective funds (i.e., GEI Investment Fund). The Fund classifies the investment security in Level 2.
If prices are not readily available for a portfolio security, or if it is believed that a price for a portfolio security does not represent its fair value, the security may be valued using
procedures approved by the Fund’s Board of Directors that are designed to establish its “fair” value. These securities
16
Table of Contents
| Notes to Financial Statements | June 30, 2012 (Unaudited) |
are typically classified in Level 3. Those procedures require that the fair value of a security be established by a valuation committee of GEAM. The valuation committee follows different protocols for different types of investments and circumstances. The fair value procedures may be used to value any investment of the Fund in the appropriate circumstances.
Fair value determinations generally are used for securities whose value is affected by a significant event that will materially affect the value of a security and which occurs subsequent to the time of the close of the principal market on which such security trades but prior to the calculation of the Fund’s NAV.
The value established for such a portfolio security may be different than what would be produced through the use of market quotations or another methodology. Portfolio securities that are valued using techniques other than market quotations, including “fair valued” securities, may be subject to greater fluctuation in their value from one day to the next than would be the case if market quotations were used. In addition, there is no assurance
that the Fund could sell a portfolio security for the value established for it at any time and it is possible that the Fund would incur a loss because a portfolio security is sold at a discount to its established value.
Other financial investments are derivative instruments that are not reflected in total investments, such as futures, forwards, swaps, and written options contracts, which are valued based on fair value as discussed above.
The Fund uses closing prices for derivatives included in Level 1, which are traded either on exchanges or liquid over-the counter markets. Derivative assets and liabilities included in Level 2 primarily represent interest rate swaps, cross-currency swaps and foreign currency and commodity forward and option contracts. Derivative assets and liabilities included in Level 3 primarily represent interest rate products that contain embedded optionality or prepayment features.
The inputs or methodology used for valuing securities are not an indication of the risk associated with investing in those securities.
The following tables present the Fund’s investments measured at fair value on a recurring basis at June 30, 2012:
Investments | Level 1 | Level 2 | Level 3 | Total | ||||||||||||
Investments in Securities† | ||||||||||||||||
Common Stock | $ | 42,441,584 | $ | — | $ | — | $ | 42,441,584 | ||||||||
Other Investments | — | 9 | — | 9 | ||||||||||||
Short-Term Investments | 1,532,601 | — | — | 1,532,601 | ||||||||||||
Total Investments in Securities | $ | 43,974,185 | $ | 9 | $ | — | $ | 43,974,194 | ||||||||
Other Financial Instruments* | ||||||||||||||||
Futures Contracts — Unrealized Appreciation | $ | 11,389 | $ | — | $ | — | $ | 11,389 | ||||||||
† See Schedule of Investments for Industry Classification * Other financial instruments include derivative instruments such as futures contracts. Amounts shown represent unrealized appreciation (depreciation), at period end. |
| |||||||||||||||
There were no transfers between the fair value levels. Transfers between fair value levels are considered to occur at the beginning of the period.
17
Table of Contents
| Notes to Financial Statements | June 30, 2012 (Unaudited) |
| 4. | Derivatives Transactions |
Shown below are the derivative contracts entered into by the Fund, summarized by primary risk exposure as they
appear on the Statement of Assets and Liabilities, all of which are not accounted for as hedging instruments under FASB Accounting Standards Codification (“ASC”) No. 815 Derivatives and Hedging as of June 30, 2012.
Asset Derivatives | Liability Derivatives | |||||||||||
| Derivatives not accounted for as hedging instruments under ASC 815 | Location in the Statement of Assets and Liabilities | Fair Value ($) | Location in the Statements of Assets and Liabilities | Fair Value ($) | ||||||||
Equity Contracts | Assets, Net Assets — Net Unrealized Appreciation/ (Depreciation) on Futures | 11,389 | * | Liabilities, Net Assets — Net Unrealized Appreciation/ (Depreciation) on Futures | — | |||||||
| * | Includes cumulative unrealized appreciation/(depreciation) of futures contracts as reported in the Schedule of Investments and as within the components of the net assets section of the Statement of Assets and Liabilities. Only the current day’s variation margin is reported within the Assets and/or Liabilities section on the Statement of Assets and Liabilities. |
Shown below are the effects of derivative instruments on the Fund’s Statement of Operation, summarized by primary risk exposure all of which are not accounted for as hedging instruments under ASC 815.
Derivatives not accounted for as hedging instruments under ASC 815 | Location in the Statements of Operations | Total Notional Amount of Futures Contracts Purchased/(Sold) ($) | Realized Gain or (Loss) on Derivatives Recognized in Income ($) | Change in Unrealized on Derivatives Recognized in | ||||||||
Equity Contracts | Realized gain/(loss) on Futures, Increase/(decrease) in unrealized appreciation/ (depreciation) on Futures | 6,290,039/(6,467,083) | 8,845 | (13,821 | ) | |||||||
| 5. | Line of Credit |
The Company shares a revolving credit facility of up to $150 million with a number of its affiliates. The credit facility is with its custodian bank, State Street Bank and Trust Company (“State Street”). The revolving credit facility requires the payment of a commitment fee equal to 0.100% per annum on the daily unused portion of the credit facility, payable quarterly. The portion borne by the Funds generally is borne proportionally based upon net assets. In addition, the Company has a $100 million uncommitted, unsecured line of credit with State Street. Generally, borrowings under the credit facilities would accrue interest at the Federal Funds Rate plus 50 basis points and would be borne by the borrowing Fund. The maximum amount allowed to be borrowed by any one Fund is the lesser of (i) 33.33% of its total assets or (ii) 20% of its net assets. The credit facilities were not utilized by the Fund during the six-month period ended June 30, 2012.
| 6. | Compensation and Fees Paid to Affiliates |
GEAM, a registered investment adviser, was retained by the Company’s Board of Directors effective March 16, 2000 to act as investment adviser and administrator of the Fund. GEAM’s compensation for investment advisory and administrative
services is paid monthly based on the average daily net assets of the Fund at an annualized rate of 0.95%.
GEAM has a contractual arrangement with the Fund to waive a portion of the Fund’s management fee in the amount equal to the management fee earned by GEAM with respect to the Fund’s investment in the GE Institutional Money Market Fund, if any.
Distribution and Service (12b-1) Fees Prior to the closure of Class 4 shares on June 29, 2012, the Company had adopted a Distribution and Service (12b-1) Plan (the “Plan”) pursuant to Rule 12b-1 under the 1940 Act with respect to Class 4 shares of the Fund. Under the Plan, the Fund could compensate GE Investment Distributors, Inc. (“GEID”), a wholly-owned subsidiary of GEAM and the Fund’s principal distributor, for certain sales services provided by GEID or other broker dealers and investor services provided by GEID or other service providers relating to the Fund’s Class 4 shares, including services to owners or prospective owners of variable contracts issued by insurance companies that offered such share class as an investment option. The amount of compensation paid under the Plan by the Fund’s Class 4 shares was not to exceed 0.45% of the average daily net assets of the Fund attributable to such share class.
18
Table of Contents
| Notes to Financial Statements | June 30, 2012 (Unaudited) |
Directors’ Compensation The Fund pays no compensation to its directors who are officers or employees of GEAM or its affiliates. Directors who are not such officers or employees also serve in a similar capacity for other funds advised by GEAM. Compensation paid to non-interested Directors are reflected on the Statement of Operations. These fees are allocated pro rata across all of the mutual fund platforms and share classes served by the Directors, including the Fund, and are based upon the relative net assets of each fund within such platforms.
| 7. | Sub-advisory Fees |
Pursuant to investment sub-advisory agreements with GEAM, the assets of the Small-Cap Equity Fund are allocated to and managed by each of the following sub-advisers: (i) Palisade Capital Management, L.L.C.; (ii) Champlain Investment Partners, LLC; (iii) GlobeFlex Capital, LP; (iv) Kennedy Capital Management, Inc. and (v) SouthernSun Asset Management, LLC. GEAM is responsible for allocating the Fund’s assets among the sub-advisers in its discretion (Allocated Assets), and for managing the Fund’s cash position, while each sub-adviser is responsible for the day-to-day management of their portion of the Allocated Assets, under the general supervision and oversight of GEAM and the Board.
For their services, GEAM pays each sub-adviser an investment sub-advisory fee, which is calculated as a percentage of the average daily net assets of the respective Allocated Assets that it manages.
| 8. | Investment Transactions |
Purchases and Sales of Securities The cost of purchases and the proceeds from sales of investments, other than short-term securities, for the six-month period ended June 30, 2012 were as follows:
| Non-U.S. Government Securities | ||
| Purchases | Sales | |
$7,904,738 | $13,418,721 | |
| 9. | Income Taxes |
The Fund is subject to ASC 740, Income Taxes. ASC 740 provides guidance for financial accounting and reporting for the effects of income taxes that result from an entity’s activities during the year. ASC 740 also provides guidance regarding how certain uncertain tax positions should be recognized, measured, presented and disclosed in the financial statements. ASC 740 requires evaluation of tax positions taken or expected to be taken in the course of preparing the Funds’ tax returns to determine whether the tax positions are “more likely than not” of being sustained by the applicable tax authority. There are no adjustments to the Fund’s net assets required under ASC 740. The Fund’s 2008, 2009, 2010 and 2011 fiscal years tax returns are still open to examination by the Federal and applicable state tax authorities.
At June 30, 2012, information on the tax cost of investments was as follows:
| Gross Tax | ||||||
| Cost of Investments For Tax Purposes | Appreciation | Depreciation | Net Tax Appreciation | |||
| $40,401,784 | $6,537,068 | $(2,964,658) | $3,572,410 | |||
As of December 31, 2011, the Fund has capital loss carryovers as indicated below. Capital loss carryovers are available to offset future realized capital gain to the extent provided in the Internal Revenue Code and regulations thereunder. To the extent that these carryover losses are used to offset future capital gains, it is probable that gains so offset will not be distributed to shareholders because they would be taxable as ordinary income.
| Amount | ||||
| Short-Term | Long-Term | Expires | ||
| $666,956 | $— | 12/31/2017 | ||
These amounts will be available to offset future taxable capital gains. Under the recently enacted Regulated Investment Company Modernization Act of 2010, the Fund will be permitted to carry forward capital losses incurred in taxable years beginning after December 22, 2010 for an unlimited period. However, any losses incurred during those future years will be required to be utilized prior to the losses incurred in pre-enactment tax years. As a result of this ordering rule, pre-enactment capital loss carryforwards may be more likely to expire unused. Additionally, post-enactment capital losses that are carried forward will retain their character as either short-term or long-term capital losses rather than being considered all short-term as under previous law.
19
Table of Contents
| Notes to Financial Statements | June 30, 2012 (Unaudited) |
During the year ended December 31, 2011, the Fund utilized $7,120,864 of prior year capital loss carryovers.
Any qualified late-year loss is deemed to arise on the first day of the Fund’s next tax year (if the Fund elects to defer such loss). Under this regime, generally, the Fund can elect to defer any post-October capital loss and/or any late-year ordinary loss as defined by the Internal Revenue Code.
The Fund did not defer any such losses for the year ended December 31, 2011.
The tax composition of distributions paid during the years ended December 31, 2011 and December 31, 2010 were as follows:
| Ordinary Income | Long-Term Capital Gains | Total | ||||
2011 | $ 120 | $— | $ 120 | |||
2010 | 86,511 | — | 86,511 |
Distributions to Shareholders The Fund declares and pays any dividends from net investment income annually. The Fund declares and pays any net realized capital gains in excess of capital loss carryforwards distributions annually. The character of income and gains to be distributed is determined in accordance with income tax regulations which may differ from generally accepted
accounting principles. These differences include (but are not limited to) futures, distributions from Real Estate Investment Trusts (REITS) and losses deferred due to wash sale transactions. Reclassifications due to permanent book/tax differences are made to the Fund’s capital accounts to reflect income and gains available for distribution (or available capital loss carryovers) under income tax regulations. These reclassifications have no impact on net investment income, realized gains or losses, or the net asset value of the Fund. The calculation of net investment income per share in the Financial Highlights table excludes these adjustments.
The reclassifications for the year ended December 31, 2011 were as follows:
| Undistributed Net Investment Income | Accumulated Net Realized Gain (Loss) | Capital Paid In | ||
| $31,156 | $2,038 | $(33,194) |
| 10. | Subsequent Events |
Subsequent events after the balance sheet date through the date the financial statements were issued have been evaluated in the preparation of the financial statements. As of August 3, 2012, the assets of the Mid-Cap Equity Fund and the Money Market Fund were liquidated. These funds ceased operations and are no longer offered for investment.
20
Table of Contents
| Additional Information | (Unaudited) |
Information about Directors and Executive Officers:
The business and affairs of the Funds are managed under the direction of the Funds’ Board of Directors. Information pertaining to the Directors and officers of the Funds is set forth below.
Interested Directors and Executive Officers
Michael J. Cosgrove
Address c/o GEAM 1600 Summer St. Stamford, CT 06905
Age 63
Position(s) Held with Fund Chairman of the Board and President
Term of Office and Length of Time Served Until successor is elected and qualified – 15 years
Principal Occupation(s) During Past 5 years President of Mutual Funds and Global Investment Programs of GEAM since November 2011; President and Chief Executive Officer – Mutual Funds and Intermediary Business of GEAM from March 2007 to November 2011; Executive Vice President of GEAM from February 1997 to March 2007; and Executive Vice President-Mutual Funds of GEAM from March 1993 to March 2007. Also serves as Treasurer of GE Foundation since 1988.
Number of Portfolios in Fund Complex Overseen by Director 25
Other Directorships Held by Director Chairman of the Board and President of GE Institutional Funds since 1997; Trustee of Elfun Funds, GE Savings & Security Funds and General Electric Pension Trust since 1988; Director of GEAM since 1988; Trustee of Fordham University from 2002 to June 30, 2010 and since July 2011; Director of GE Investments Distributors, Inc since June 2011; Director of Skin Cancer Foundation since August 2010; Member of the Board of Governors for the Investment Company Institute since October 2006; Director, GE Asset Management (Ireland) Limited, since February 1999, GE Asset Management Funds Plc since 1998, GE Asset Management Canada Company since 1998, GE Asset Management Limited since 1998; Trustee of General Electric Pension Trust since 1988; and Chairman of the Board and President of GE Funds from 1993 to February 2011.
Matthew J. Simpson
Address c/o GEAM 1600 Summer St. Stamford, CT 06905
Age 51
Position(s) Held with Fund Director and Executive Vice President
Term of Office and Length of Time Served Until successor is elected and qualified – 4 years
Principal Occupation(s) During Past 5 years Executive Vice President, General Counsel and Secretary of GEAM since July 2007; Secretary of Elfun Funds and GE Savings & Security Funds since July 2007; Senior Vice President and General Counsel – Marketing and Client Services (formerly Asset Management Services) of GEAM and Senior Vice President and General Counsel of GE Asset Management Services from February 1997 to July 2007; Vice President and Associate General Counsel of GEAM from October 1992 to February 1997; Secretary of GE Institutional Funds and GE Investments Funds, Inc. from 1997 to July 2007 and Vice President from September 2003 to July 2007; Assistant Secretary of Elfun Funds and GE Savings & Security Funds from 1998 to July 2007 and Vice President from October 2003 to July 2007; and Secretary of GE Funds from 1993 to July 2007 and Vice President from September 2003 to July 2007.
Number of Portfolios in Fund Complex Overseen by Director 25
Other Directorships Held by Director Trustee of Elfun Funds, GE Savings & Security Funds and General Electric Pension Trust since July 2007; Trustee and Executive Vice President of GE Institutional Funds since July 2007; Director of GEAM since July 2007; and Trustee and Executive Vice President of GE Funds from July 2007 to February 2011.
21
Table of Contents
| Additional Information | (Unaudited) |
Joon Won Choe
Address c/o GEAM 1600 Summer St. Stamford, CT 06905
Age 42
Position(s) Held with Fund Vice President & Secretary
Term of Office and Length of Time Served Until successor is elected and qualified – Vice President and Secretary – 1 year
Principal Occupation(s) During Past 5 years Senior Vice President and Deputy General Counsel at GEAM since March 2011; Vice President and Secretary of GE Institutional Funds since September 2010; Vice President and Assistant Secretary of Elfun Funds and GE Savings & Security Funds since September 2010; Senior Vice President and Associate General Counsel at GEAM from June 2010 to March 2011; Vice President and Associate General Counsel of GEAM from November 2005 to June 2010 and Vice President and Secretary of GE Funds from September 2010 to February 2011.
Number of Portfolios in Fund Complex Overseen by Officer N/A
Other Directorships Held by Officer N/A
Robert Herlihy
Address c/o GEAM 1600 Summer St. Stamford, CT 06905
Age 44
Position(s) Held with Fund Chief Compliance Officer
Term of Office and Length of Time Served Until successor is elected and qualified – 6 years
Principal Occupation(s) During Past 5 years Chief Compliance Officer of GEAM, GE Institutional Funds, Elfun Funds, and GE Savings & Security Funds since July 2005; Chief Compliance Officer of GE Funds from July 2005 to February 2011 and Manager of Fund Administration at GEAM from 2002-2005.
Number of Portfolios in Fund Complex Overseen by Officer N/A
Other Directorships Held by Officer N/A
Arthur A. Jensen
Address c/o GEAM 1600 Summer St. Stamford, CT 06905
Age 45
Position(s) Held with Fund Treasurer
Term of Office and Length of Time Served Until successor is elected and qualified – 1 year
Principal Occupation(s) During Past 5 Years Treasurer of GE Institutional Funds, Elfun Funds and GE Savings & Security Funds since June 2011; Mutual Funds Controller of GEAM since April 2011; Senior Vice President at Citigroup from 2008 to 2010 and Vice President at JPMorgan from 2005 to 2008.
Number of Portfolios in Fund Complex Overseen by Officer N/A
Other Directorships Held by Officer N/A
22
Table of Contents
| Additional Information | (Unaudited) |
Jeanne M. LaPorta
Address c/o GEAM 1600 Summer St. Stamford, CT 06905
Age 46
Position(s) Held with Fund Vice President
Term of Office and Length of Time Served Until successor is elected and qualified – 8 years
Principal Occupation(s) During Past 5 Years Senior Vice President and Commercial Administrative Officer of GEAM since April 2010; Vice President of GE Institutional Funds since July 2003; Vice President of Elfun Funds and GE Savings & Security Funds since October 2003; Secretary of GE Funds from July 2007 to September 2010 and Vice President from July 2007 to February 2011; Senior Vice President and Deputy General Counsel of GEAM from October 2007 to April 2010; Vice President and Assistant Secretary of Elfun Funds and GE Savings & Security Funds from July 2003 to June 2010; and Vice President and Associate General Counsel – Marketing and Client Services (formerly Asset Management Services) at GEAM from May 1997 to October 2007.
Number of Portfolios in Fund Complex Overseen by Officer N/A
Other Directorships Held by Officer N/A
Non-Interested Directors
John R. Costantino
Address c/o GEAM 1600 Summer St. Stamford, CT 06905
Age 66
Position(s) Held with Fund Director
Term of Office and Length of Time Served Until successor is elected and qualified – 15 years
Principal Occupation(s) During Past 5 years General Partner, NGN Capital LLC since 2006; Managing Director, Vice President of Walden Capital Management since 1996.
Number of Portfolios in Fund Complex Overseen by Director 17
Other Directorships Held by Director Trustee of GE Institutional Funds since 1997; Trustee of Fordham University from 1989 to 1995 and from 2001 to 2007 and Trustee Emeritus since 2007; Trustee of Neuroscience Research Institute since 1986; Trustee of GE Funds from 1993 to February 2011; Director of Artes Medical from 2006-2008 and Trustee of Gregorian University Foundation from 1992-2007.
23
Table of Contents
| Additional Information | (Unaudited) |
R. Sheldon Johnson
Address c/o GEAM 1600 Summer St. Stamford, CT 06905
Age 65
Positions(s) Held with Fund Director
Term of office and Length of Time served Unit Successor is elected and qualified – 1 year.
Principal Occupation(s) During Past 5 years Head of Global Institutional Equity Sales and Marketing at Morgan Stanley & Co., Inc. from 2002 to 2006 and Managing Director at Morgan Stanley & Co., Inc. from 1988 to 2006.
Number of Portfolios in Fund Complex Overseen by Director 17
Other Directorships Held by Director Trustee of GE Institutional Funds since April 2011 and Trustee of St. Lawrence University since 2003.
Donna M. Rapaccioli
Address c/o GEAM 1600 Summer St. Stamford, CT 06905
Age 49
Position(s) Held with Fund Director
Term of Office and Length of Time Served Until successor is elected and qualified – Less than 1 year
Principal Occupation(s) During Past 5 Years Dean of the Gabelli School of Business since 2007 and Accounting professor since 1987 at Fordham University.
Number of Portfolios in Fund Complex Overseen by Officer 17
Other Directorships Held by Director Trustee of GE Institutional Funds since January 2012 and Trustee of Emmanuel College since 2010.
The Statement of Additional Information for the Funds includes additional information about the Directors and Officers and is available, without charge, upon request by calling 1-800-242-0134.
24
Table of Contents
| Investment Team | (Unaudited) |
Investment Adviser and Administrator
GE Asset Management Incorporated
Board of Directors
Michael J. Cosgrove, Chairman
John R. Costantino
R. Sheldon Johnson
Donna M. Rapaccioli
Matthew J. Simpson
Secretary
Joon Won Choe
Assistant Secretary
Michelle Matzelle
Treasurer
Arthur A. Jensen
Assistant Treasurer
Casey Yantosca
Distributor
GE Investment Distributors, Inc.
Member FINRA and SIPC
Custodian
State Street Bank & Trust Company
Officers of the Investment Adviser
Dmitri Stockton, President and Chief Executive Officer
Cheryl H. Beacock, Senior Vice President, Human Resources
George A. Bicher, Chief Risk Officer
Paul M. Colonna, President and Chief Investment Officer – Public Investments
Michael J. Cosgrove, President of Mutual Funds and Global Investment Programs
Gregory B. Hartch, Senior Vice President – Strategy and Business Development Leader
Ralph R. Layman, Executive Vice President and Chief Investment Officer Emeritus Public Equities
Maureen B. Mitchell, President of Global Sales and Marketing
Steven M. Rullo, Senior Vice President – Services and Technology
Matthew J. Simpson, Executive Vice President, General Counsel and Secretary
Donald W. Torey, President and Chief Investment Officer – Alternative Investments
David Wiederecht, President and Chief Investment Officer – Investment Solutions
Jessica Holscott, Executive Vice President, Chief Financial Officer*
| * | Effective August 1, 2012, Ms. Holcott replaced Tracie A. Winbigler as Executive Vice President and Chief Financial Officer. |
At GE Asset Management, we’re dedicated to providing the investment options you’ll need to tailor your financial portfolio to every stage of your life. Each member of the GE Family of Funds is managed according to the same principles of integrity and quality that have guided GE over the past century, and have made it the world-class company that it is today. Each fund draws strength from a heritage of investment management experience that spans more than 80 years. Whether you’re creating a new investment portfolio or adding to an established one, the GE Family of Funds offers an array of professionally managed investment options that will help you meet a lifetime of financial needs.
25
Table of Contents
Investment Adviser
GE Asset Management Incorporated
1600 Summer Street
Stamford, CT 06905
or at:
PO Box 7900
Stamford, CT 06904-7900
Distributor
GE Investment Distributors, Inc.
member FINRA and SIPC
1600 Summer Street
Stamford, CT 06905
or at:
PO Box 7900
Stamford, CT 06904-7900
The Fund files its complete schedule of portfolio holdings with the Securities and Exchange Commission for the first and third quarters of each fiscal year on Form N-Q. The Fund’s Forms N-Q, as well as a description of the policies and procedures that the Fund uses to determine how to vote proxies (if any) relating to portfolio securities is available without charge (i) upon request, by calling 1-800-493-3042; (ii) on the Fund’s website at http://www.geam.com; and (iii) on the Commission’s website at http://www.sec.gov. The Fund’s Forms N-Q may be reviewed and copied at the Commission’s Public Reference Room in Washington, DC—information on the operation of the Public Reference Room may be obtained by calling 1-800-SEC-0330.
Information (if any) regarding how the Fund voted proxies relating to portfolio securities during the most recently disclosed 12-month period ended June 30 is available without charge (i) through the Fund’s website at http://www.geam.com; and (ii) on the Commission’s website at http://www.sec.gov.

Table of Contents
GE Investments Funds, Inc.
Income Fund
Semi–Annual Report
June 30, 2012

Table of Contents
GE Investments Funds, Inc.
| Income Fund | Contents | |
| 1 | ||||
| 2 | ||||
| 3 | ||||
| 10 | ||||
Financial Statements | ||||
| 11 | ||||
| 12 | ||||
| 13 | ||||
| 14 | ||||
| 15 | ||||
| 22 | ||||
| 26 | ||||
This report is prepared for Policyholders of certain variable contracts and may be distributed to others only if preceded or accompanied by the variable contract’s current prospectus and the current summary prospectus of the Fund available for investments thereunder.
Table of Contents
| Income Fund | (Unaudited) |
Notes to Performance
Total return performance shown in this report for the GE Investments Income Fund (the “Fund”) takes into account changes in share price and assumes reinvestment of dividends and capital gains distributions, if any. Total returns shown are net of Fund fees and expenses but do not reflect fees and charges associated with the variable contracts such as administrative fees, account charges and surrender charges, which, if reflected, would reduce the Fund’s total returns for all periods shown.
The performance data quoted represents past performance; past performance does not guarantee future results. Investment return and principal value will fluctuate so your shares, when redeemed, may be worth more or less than their original cost. Current performance may be higher or lower than the performance data quoted. Periods less than one year are not annualized. Please call 800-493-3042 or visit the Fund’s website at http://www.geam.com for the most recent month-end performance data.
An investment in the Fund is not a deposit of any bank and is not insured or guaranteed by the Federal Deposit Insurance Corporation (FDIC) or any other government agency. An investment in the Fund is subject to risk, including possible loss of principal invested.
Investment Profile
A mutual fund designed for investors who seek maximum income consistent with prudent investment management and the preservation of capital. The Fund seeks to achieve its investment objective by investing at least 80% of its net assets under normal circumstances in debt securities.
Sector Allocation
as a % of Fair Value of $54,936 (in thousands) on June 30, 2012(a)(b)
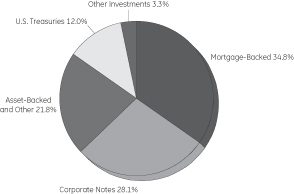
Quality Ratings
as of June 30, 2012 (as a % of Fair Value) (a) (b)
Moody’s / S&P Rating * | | Percentage of Fair Value | | |
Aaa / AAA | 24.64% | |||
Aa / AA | 45.43% | |||
A / A | 10.58% | |||
Baa / BBB | 13.38% | |||
Ba / BB and lower | 5.73% | |||
NR / Other | 0.24% | |||
Total | 100.00% |
| (a) | The securities information regarding holdings, allocations and other characteristics is presented to illustrate examples of securities that the Fund has bought and the diversity of areas in which the Fund may invest as of a particular date. It may not be representative of the Fund’s current or future investments and should not be construed as a recommendation to purchase or sell a particular security. |
| (b) | Fair value basis is inclusive of the short-term investment in the GE Institutional Money Market Fund. |
| * | Moody’s Investors Services Inc and Standard & Poor’s are nationally recognized statistical rating organizations. |
GE Investment Distributors, Inc., Member of FINRA & SIPC, is the principal underwriter and distributor of the GE Investments Funds, Inc. and a wholly owned subsidiary of GE Asset Management Incorporated, the investment adviser of the Fund.
1
Table of Contents
| Income Fund | (Unaudited) |
Understanding Your Fund’s Expenses
As a shareholder of the Fund you incur ongoing costs. Ongoing costs include portfolio management fees, professional fees, administrative fees and other Fund expenses. The following example is intended to help you understand your ongoing costs (in dollars) of investing in the Fund and to compare these costs with the ongoing costs of investing in other mutual funds.
To illustrate these ongoing costs, we have provided an example and calculated the expenses paid by investors in the fund during the period. The information in the following table is based on an investment of $1,000, which is invested at the beginning of the period and held for the entire six-month period ended June 30, 2012.
Actual Expenses
The first section of the table provides information about actual account values and actual expenses. You may use the information in this section, together with the amount you invested, to estimate the expenses that you paid over the period. To do so, simply divide your account value by $1,000 (for example, an $8,600 account value divided by $1,000 = 8.6), then multiply the result by the number given for your class under the heading “Expenses Paid During Period” to estimate the expenses paid on your account during the period.
Hypothetical Example for Comparison Purposes
The second section of the table provides information about hypothetical account values and hypothetical expenses based on the Fund’s actual expense ratio and an assumed rate of return of 5% per year before expenses, which is not the Fund’s actual return. The hypothetical account values and expenses may not be used to estimate the actual ending account balance or expenses you paid for the period. You may use this information to compare the ongoing costs of investing in the Fund and other funds. To do so, compare this 5% hypothetical example with the 5% hypothetical examples that appear in the shareholders reports of other funds.
Please note that the expenses shown in the table are meant to highlight and help you compare ongoing costs only and do not reflect transaction costs, such as sales charges or redemption fees, if any. Therefore, the second section of the table is useful in comparing ongoing costs only, and will not help you determine the relative total costs of owning different funds. Additionally, the expenses shown do not reflect the fees or charges associated with variable contracts through which shares of the Fund are offered.
January 1, 2012 – June 30, 2012
| Account value at the beginning of the period ($) | Account value at the end of the period ($) | Expenses paid during the period ($)* | ||||||||||
Actual Fund Return* | 1,000.00 | 1,035.20 | 3.90 | |||||||||
Hypothetical 5% Return (2.5% for the period) | 1,000.00 | 1,021.03 | 3.87 | |||||||||
| * | Expenses are equal to the Fund’s annualized expense ratio of 0.77% (for the period January 1, 2012—June 30, 2012), multiplied by the average account value over the period, multiplied by 182/366 (to reflect the one-half year period). |
2
Table of Contents
Income Fund
| Schedule of Investments | June 30, 2012 (Unaudited) |
Income Fund
| Principal Amount | Fair Value | |||||||||||
Bonds and Notes — 87.8%† | ||||||||||||
U.S. Treasuries — 13.5% |
| |||||||||||
U.S. Treasury Bonds | ||||||||||||
3.00% | 05/15/42 | $ | 1,017,400 | $ | 1,065,568 | |||||||
3.13% | 02/15/42 | 2,692,400 | 2,891,805 | (f) | ||||||||
U.S. Treasury Notes | ||||||||||||
0.32% | 03/31/14 | 220,600 | 220,341 | (c,f) | ||||||||
0.72% | 05/31/17 | 838,500 | 834,635 | (c) | ||||||||
1.75% | 05/15/22 | 1,580,500 | 1,593,342 | |||||||||
| 6,605,691 | ||||||||||||
Agency Mortgage Backed — 35.0% |
| |||||||||||
Federal Home Loan Mortgage Corp. | ||||||||||||
2.38% | 01/13/22 | 282,000 | 289,404 | |||||||||
4.50% | 06/01/33 - 02/01/35 | 21,650 | 23,178 | (f) | ||||||||
5.00% | 07/01/35 - 06/01/41 | �� | 404,685 | 448,739 | (f) | |||||||
5.50% | 05/01/20 - 01/01/38 | 213,451 | 237,471 | (f) | ||||||||
6.00% | 04/01/17 - 11/01/37 | 487,812 | 544,732 | (f) | ||||||||
6.50% | 02/01/29 | 241 | 275 | (f) | ||||||||
7.00% | 10/01/16 - 08/01/36 | 66,222 | 78,157 | (f) | ||||||||
7.50% | 09/01/12 - 09/01/33 | 10,098 | 12,049 | (f) | ||||||||
8.00% | 11/01/30 | 14,972 | 18,209 | (f) | ||||||||
8.25% | 06/01/26 | 60,000 | 90,991 | (f,h) | ||||||||
8.50% | 04/01/30 - 05/01/30 | 16,390 | 20,551 | (f) | ||||||||
Federal National Mortgage Assoc. | ||||||||||||
2.72% | 04/01/37 | 1,149 | 1,198 | (g) | ||||||||
2.89% | 03/01/37 | 1,847 | 1,873 | (g) | ||||||||
4.00% | 05/01/19 - 05/01/42 | 3,118,406 | 3,332,590 | (f) | ||||||||
4.50% | 05/01/18 - 04/01/41 | 2,184,045 | 2,350,457 | (f) | ||||||||
5.00% | 03/01/34 - 06/01/41 | 655,336 | 727,718 | (f) | ||||||||
5.50% | 12/01/13 - 01/01/39 | 1,121,918 | 1,232,608 | (f) | ||||||||
6.00% | 06/01/14 - 07/01/35 | 995,964 | 1,119,108 | (f) | ||||||||
6.50% | 07/01/17 - 08/01/34 | 133,045 | 150,602 | (f) | ||||||||
7.00% | 03/01/15 - 02/01/34 | 53,383 | 60,871 | (f) | ||||||||
7.50% | 08/01/13 - 03/01/34 | 79,068 | 92,605 | (f) | ||||||||
8.00% | 07/01/15 - 11/01/33 | 55,593 | 67,208 | (f) | ||||||||
8.50% | 05/01/31 | 3,572 | 4,474 | (f) | ||||||||
9.00% | 12/01/17 - 12/01/22 | 6,186 | 7,136 | (f) | ||||||||
3.50% | TBA | 3,035,000 | 3,190,070 | (b) | ||||||||
4.00% | TBA | 490,000 | 521,467 | (b) | ||||||||
5.00% | TBA | 547,000 | 589,563 | (b) | ||||||||
Government National Mortgage Assoc. | ||||||||||||
1.63% | 02/20/23 - 12/20/24 | 9,841 | 10,203 | (f,g) | ||||||||
2.38% | 02/20/26 | 703 | 729 | (f,g) | ||||||||
4.50% | 08/15/33 - 03/20/41 | 700,539 | 771,343 | (f) | ||||||||
6.00% | 04/15/27 - 09/15/36 | 254,916 | 290,538 | (f) | ||||||||
6.50% | 04/15/19 - 08/15/36 | 206,788 | 239,740 | (f) | ||||||||
7.00% | 01/15/28 - 10/15/36 | 118,932 | 141,976 | (f) | ||||||||
7.50% | 11/15/31 - 10/15/33 | 4,654 | 5,599 | (f) | ||||||||
8.00% | 12/15/29 | 2,536 | 2,819 | (f) | ||||||||
8.50% | 10/15/17 | 7,110 | 7,680 | (f) | ||||||||
9.00% | 11/15/16 - 12/15/21 | 20,543 | 22,900 | (f) | ||||||||
| Principal Amount | Fair Value | |||||||||||
4.00% | TBA | $ | 395,000 | $ | 431,352 | (b) | ||||||
| 17,138,183 | ||||||||||||
Agency Collateralized Mortgage Obligations — 1.2% | ||||||||||||
Federal Home Loan Mortgage Corp. | ||||||||||||
0.08% | 09/25/43 | 991,764 | 8,004 | (e,f,g) | ||||||||
Federal Home Loan Mortgage Corp. REMIC | ||||||||||||
3.50% | 03/15/27 - 11/15/30 | 559,954 | 70,518 | (e,k) | ||||||||
4.50% | 02/15/18 - 03/15/18 | 90,857 | 4,559 | (e,f,k) | ||||||||
5.00% | 05/15/17 - 10/15/18 | 92,138 | 4,140 | (e,f,k) | ||||||||
5.50% | 06/15/33 | 113,782 | 16,298 | (e,f,k) | ||||||||
6.36% | 08/15/25 | 180,971 | 26,090 | (e,g) | ||||||||
7.50% | 07/15/27 | 6,194 | 1,365 | (e,f,k) | ||||||||
Federal Home Loan Mortgage Corp. STRIPS | ||||||||||||
3.33% | 08/01/27 | 805 | 708 | (c,d,f) | ||||||||
8.00% | 02/01/23 - 07/01/24 | 2,901 | 593 | (e,f,k) | ||||||||
Federal National Mortgage Assoc. REMIC | ||||||||||||
1.19% | 12/25/42 | 58,194 | 1,634 | (e,f,g) | ||||||||
2.53% | 12/25/22 | 180 | 167 | (c,d,f) | ||||||||
3.50% | 05/25/27 | 137,716 | 17,557 | (e,k) | ||||||||
4.50% | 05/25/18 | 3,614 | 41 | (e,f,k) | ||||||||
5.00% | 08/25/17 - 09/25/40 | 343,480 | 37,573 | (e,f,k) | ||||||||
5.75% | 07/25/38 | 90,344 | 11,990 | (e,g) | ||||||||
7.00% | 09/25/20 | 426 | 470 | (f) | ||||||||
7.25% | 05/25/18 | 215,093 | 24,280 | (e,f,g) | ||||||||
8.00% | 05/25/22 | 4 | 103 | (e,f,k) | ||||||||
Federal National Mortgage Assoc. STRIPS | ||||||||||||
1.49% | 12/01/34 | 117,442 | 112,097 | (c,d,f) | ||||||||
4.50% | 08/01/35 - 01/01/36 | 165,596 | 19,207 | (e,f,k) | ||||||||
5.00% | 03/25/38 - 05/25/38 | 103,507 | 13,901 | (e,f,k) | ||||||||
5.50% | 12/01/33 | 30,010 | 4,116 | (e,f,k) | ||||||||
6.00% | 01/01/35 | 42,268 | 7,380 | (e,f,k) | ||||||||
7.50% | 11/01/23 | 17,629 | 3,751 | (e,f,k) | ||||||||
8.00% | 08/01/23 - 07/01/24 | 6,093 | 1,307 | (e,f,k) | ||||||||
8.50% | 07/25/22 | 264 | 46 | (e,f,k) | ||||||||
9.00% | 05/25/22 | 184 | 32 | (e,f,k) | ||||||||
Government National Mortgage Assoc. | ||||||||||||
4.50% | 10/20/37 - 08/16/39 | 380,920 | 43,716 | (e,k) | ||||||||
5.00% | 12/20/35 - 09/20/38 | 432,525 | 43,751 | (e,f,k) | ||||||||
6.41% | 06/20/40 | 694,633 | 107,594 | (e,g) | ||||||||
| 582,988 | ||||||||||||
Asset Backed — 0.7% | ||||||||||||
Bear Stearns Asset Backed | ||||||||||||
3.46% | 02/25/36 | 229,362 | 223,770 | (c,f,g) | ||||||||
Chase Funding Mortgage Loan | ||||||||||||
2.81% | 02/25/33 | 18,289 | 15,995 | (c,f,g) | ||||||||
Citicorp Residential Mortgage Securities Inc. | ||||||||||||
6.04% | 09/25/36 | 60,000 | 44,155 | (f) | ||||||||
Mid-State Trust | ||||||||||||
7.54% | 07/01/35 | 1,609 | 1,633 | |||||||||
See Notes to Schedule of Investments and Notes to Financial Statements.
3
Table of Contents
Income Fund
| Schedule of Investments | June 30, 2012 (Unaudited) |
| Principal Amount | Fair Value | |||||||||||
Popular ABS Mortgage Pass-Through Trust | ||||||||||||
5.30% | 11/25/35 | $ | 50,000 | $ | 29,553 | (f) | ||||||
Residential Asset Mortgage Products Inc. | ||||||||||||
5.04% | 06/25/32 | 19,766 | 15,926 | (c,f,g) | ||||||||
Residential Asset Securities Corp. | ||||||||||||
14.91% | 07/25/32 | 3,339 | 2,037 | (c,f,g) | ||||||||
| 333,069 | ||||||||||||
Corporate Notes — 31.5% |
| |||||||||||
ABB Finance USA Inc. | ||||||||||||
1.63% | 05/08/17 | 54,000 | 54,261 | |||||||||
2.88% | 05/08/22 | 54,000 | 54,624 | |||||||||
AES Panama S.A. | ||||||||||||
6.35% | 12/21/16 | 40,000 | 43,000 | (a,f) | ||||||||
Agilent Technologies Inc. | ||||||||||||
5.50% | 09/14/15 | 59,000 | 66,025 | (f) | ||||||||
Allergan Inc. | ||||||||||||
3.38% | 09/15/20 | 49,000 | 52,120 | (f) | ||||||||
ALROSA Finance S.A. | ||||||||||||
7.75% | 11/03/20 | 200,000 | 209,454 | (a) | ||||||||
American Axle & Manufacturing Inc. | ||||||||||||
7.88% | 03/01/17 | 52,000 | 53,690 | (f) | ||||||||
American Express Credit Corp. | ||||||||||||
1.75% | 06/12/15 | 79,000 | 79,897 | |||||||||
American International Group Inc. | ||||||||||||
4.88% | 06/01/22 | 40,000 | 40,929 | |||||||||
Amgen Inc. | ||||||||||||
2.13% | 05/15/17 | 27,000 | 27,317 | |||||||||
2.30% | 06/15/16 | 42,000 | 43,166 | (f) | ||||||||
2.50% | 11/15/16 | 24,000 | 24,936 | (f) | ||||||||
3.63% | 05/15/22 | 27,000 | 27,920 | |||||||||
5.38% | 05/15/43 | 27,000 | 29,207 | |||||||||
5.65% | 06/15/42 | 27,000 | 30,130 | (f) | ||||||||
Amphenol Corp. | ||||||||||||
4.00% | 02/01/22 | 111,000 | 113,080 | (f) | ||||||||
Amsted Industries Inc. | ||||||||||||
8.13% | 03/15/18 | 44,000 | 46,530 | (a,f) | ||||||||
Anadarko Petroleum Corp. | ||||||||||||
5.95% | 09/15/16 | 48,000 | 54,469 | (f) | ||||||||
6.38% | 09/15/17 | 22,000 | 25,556 | (f) | ||||||||
Anheuser-Busch InBev Worldwide Inc. | ||||||||||||
3.63% | 04/15/15 | 96,000 | 102,793 | (f) | ||||||||
5.38% | 11/15/14 | 64,000 | 70,555 | (f) | ||||||||
Apache Corp. | ||||||||||||
4.75% | 04/15/43 | 56,000 | 62,203 | (f) | ||||||||
Arch Coal Inc. | ||||||||||||
7.00% | 06/15/19 | 52,000 | 43,940 | |||||||||
Archer-Daniels-Midland Co. | ||||||||||||
5.77% | 03/01/41 | 96,000 | 122,087 | (f) | ||||||||
Arizona Public Service Co. | ||||||||||||
6.25% | 08/01/16 | 122,000 | 143,113 | (f) | ||||||||
AT&T Inc. | ||||||||||||
0.90% | 02/13/15 | 112,000 | 111,916 | (c,f) | ||||||||
1.60% | 02/15/17 | 56,000 | 56,072 | (f) | ||||||||
2.95% | 05/15/16 | 48,000 | 50,840 | (f) | ||||||||
5.55% | 08/15/41 | 39,000 | 46,486 | (f) | ||||||||
5.60% | 05/15/18 | 10,000 | 11,969 | |||||||||
6.40% | 05/15/38 | 84,000 | 105,725 | (f) | ||||||||
| Principal Amount | Fair Value | |||||||||||
Banco Mercantil del Norte S.A. | ||||||||||||
6.86% | 10/13/21 | $ | 50,000 | $ | 51,750 | (a,f,g) | ||||||
Bank of America Corp. | ||||||||||||
3.88% | 03/22/17 | 83,000 | 84,552 | (f) | ||||||||
5.63% | 10/14/16 | 30,000 | 31,883 | (f) | ||||||||
5.70% | 01/24/22 | 142,000 | 156,384 | (f) | ||||||||
5.75% | 12/01/17 | 55,000 | 58,696 | (f) | ||||||||
5.88% | 02/07/42 | 28,000 | 30,671 | (f) | ||||||||
6.50% | 08/01/16 | 35,000 | 38,435 | (f) | ||||||||
Barclays Bank PLC | ||||||||||||
2.25% | 05/10/17 | 200,000 | 199,988 | (a) | ||||||||
Baxter International Inc. | ||||||||||||
1.85% | 01/15/17 | 68,000 | 69,485 | (f) | ||||||||
Berkshire Hathaway Finance Corp. | ||||||||||||
1.60% | 05/15/17 | 54,000 | 54,376 | |||||||||
3.00% | 05/15/22 | 81,000 | 81,967 | |||||||||
Berkshire Hathaway Inc. | ||||||||||||
3.75% | 08/15/21 | 27,000 | 28,803 | |||||||||
BG Energy Capital PLC | ||||||||||||
4.00% | 10/15/21 | 57,000 | 60,822 | (a,f) | ||||||||
BHP Billiton Finance USA Ltd. | ||||||||||||
1.63% | 02/24/17 | 79,000 | 79,543 | (f) | ||||||||
Bombardier Inc. | ||||||||||||
7.75% | 03/15/20 | 52,000 | 57,850 | (a,f) | ||||||||
Boston Properties LP (REIT) | ||||||||||||
3.85% | 02/01/23 | 53,000 | 53,498 | |||||||||
BP Capital Markets PLC | ||||||||||||
1.85% | 05/05/17 | 38,000 | 38,378 | |||||||||
2.25% | 11/01/16 | 86,000 | 88,569 | (f) | ||||||||
3.25% | 05/06/22 | 82,000 | 84,902 | |||||||||
Broadcom Corp. | ||||||||||||
2.70% | 11/01/18 | 57,000 | 58,771 | (f) | ||||||||
Calpine Corp. | ||||||||||||
7.25% | 10/15/17 | 16,000 | 17,200 | (a,f) | ||||||||
Cameron International Corp. | ||||||||||||
1.60% | 04/30/15 | 27,000 | 27,019 | |||||||||
3.60% | 04/30/22 | 27,000 | 27,044 | |||||||||
Cardinal Health Inc. | ||||||||||||
1.90% | 06/15/17 | 81,000 | 81,607 | |||||||||
Cargill Inc. | ||||||||||||
5.20% | 01/22/13 | 162,000 | 165,869 | (a,f) | ||||||||
6.00% | 11/27/17 | 63,000 | 74,933 | (a,f) | ||||||||
Carolina Power & Light Co. | ||||||||||||
2.80% | 05/15/22 | 101,000 | 102,657 | |||||||||
Case New Holland Inc. | ||||||||||||
7.88% | 12/01/17 | 31,000 | 35,805 | (f) | ||||||||
Caterpillar Inc. | ||||||||||||
1.50% | 06/26/17 | 60,000 | 60,083 | |||||||||
2.60% | 06/26/22 | 49,000 | 48,872 | |||||||||
CBS Corp. | ||||||||||||
1.95% | 07/01/17 | 25,000 | 24,975 | |||||||||
4.85% | 07/01/42 | 25,000 | 24,469 | |||||||||
CCO Holdings LLC | ||||||||||||
8.13% | 04/30/20 | 60,000 | 66,900 | (f) | ||||||||
Central American Bank for Economic Integration | ||||||||||||
5.38% | 09/24/14 | 70,000 | 74,876 | (a,f) | ||||||||
CenturyLink Inc. | ||||||||||||
5.80% | 03/15/22 | 31,000 | 30,861 | (f) | ||||||||
7.65% | 03/15/42 | 32,000 | 31,058 | (f) | ||||||||
See Notes to Schedule of Investments and Notes to Financial Statements.
4
Table of Contents
Income Fund
| Schedule of Investments | June 30, 2012 (Unaudited) |
| Principal Amount | Fair Value | |||||||||||
Cigna Corp. | ||||||||||||
2.75% | 11/15/16 | $ | 189,000 | $ | 194,721 | (f) | ||||||
5.38% | 02/15/42 | 57,000 | 60,648 | (f) | ||||||||
Cincinnati Bell Inc. | ||||||||||||
8.25% | 10/15/17 | 72,000 | 74,880 | (f) | ||||||||
Citigroup Inc. | ||||||||||||
4.45% | 01/10/17 | 112,000 | 117,403 | (f) | ||||||||
5.00% | 09/15/14 | 133,000 | 136,334 | (f) | ||||||||
5.88% | 01/30/42 | 42,000 | 45,871 | (f) | ||||||||
CityCenter Holdings LLC | ||||||||||||
7.63% | 01/15/16 | 31,000 | 32,705 | (f) | ||||||||
CNA Financial Corp. | ||||||||||||
5.88% | 08/15/20 | 56,000 | 61,581 | (f) | ||||||||
Consolidated Edison Company of | ||||||||||||
5.85% | 04/01/18 | 44,000 | 53,617 | (f) | ||||||||
6.65% | 04/01/19 | 49,000 | 62,199 | (f) | ||||||||
Corning Inc. | ||||||||||||
4.75% | 03/15/42 | 65,000 | 68,113 | (f) | ||||||||
Corp Nacional del Cobre de Chile | ||||||||||||
3.75% | 11/04/20 | 100,000 | 104,288 | (a,f) | ||||||||
5.63% | 09/21/35 | 14,000 | 16,371 | (a,f) | ||||||||
Covidien International Finance S.A. | ||||||||||||
1.35% | 05/29/15 | 54,000 | 54,070 | |||||||||
3.20% | 06/15/22 | 54,000 | 55,672 | |||||||||
Crown Castle Towers LLC | ||||||||||||
4.88% | 08/15/40 | 100,000 | 108,572 | (a,f) | ||||||||
6.11% | 01/15/40 | 66,000 | 76,403 | (a,f) | ||||||||
CSX Corp. | ||||||||||||
4.25% | 06/01/21 | 55,000 | 60,067 | (f) | ||||||||
CVS Caremark Corp. | ||||||||||||
3.25% | 05/18/15 | 35,000 | 36,841 | (f) | ||||||||
5.75% | 06/01/17 | 66,000 | 77,945 | (f) | ||||||||
DaVita Inc. | ||||||||||||
6.38% | 11/01/18 | 51,000 | 52,658 | (f) | ||||||||
DDR Corp. (REIT) | ||||||||||||
4.63% | 07/15/22 | 35,000 | 34,542 | |||||||||
Deere & Co. | ||||||||||||
2.60% | 06/08/22 | 53,000 | 52,907 | |||||||||
3.90% | 06/09/42 | 47,000 | 46,695 | |||||||||
Denbury Resources Inc. | ||||||||||||
6.38% | 08/15/21 | 45,000 | 46,800 | (f) | ||||||||
8.25% | 02/15/20 | 40,000 | 43,800 | (f) | ||||||||
DENTSPLY International Inc. | ||||||||||||
2.75% | 08/15/16 | 87,000 | 88,454 | (f) | ||||||||
4.13% | 08/15/21 | 57,000 | 59,341 | (f) | ||||||||
Devon Energy Corp. | ||||||||||||
1.88% | 05/15/17 | 54,000 | 54,009 | |||||||||
Diageo Capital PLC | ||||||||||||
1.50% | 05/11/17 | 81,000 | 81,298 | |||||||||
Diageo Investment Corp. | ||||||||||||
2.88% | 05/11/22 | 81,000 | 83,207 | |||||||||
4.25% | 05/11/42 | 22,000 | 23,282 | |||||||||
DIRECTV Holdings LLC | ||||||||||||
2.40% | 03/15/17 | 25,000 | 25,165 | |||||||||
3.80% | 03/15/22 | 14,000 | 14,158 | |||||||||
4.60% | 02/15/21 | 56,000 | 59,558 | (f) | ||||||||
4.75% | 10/01/14 | 70,000 | 75,140 | (f) | ||||||||
5.15% | 03/15/42 | 25,000 | 25,161 | |||||||||
| Principal Amount | Fair Value | |||||||||||
Dominion Resources Inc. | ||||||||||||
1.95% | 08/15/16 | $ | 40,000 | $ | 40,761 | (f) | ||||||
4.90% | 08/01/41 | 23,000 | 25,994 | (f) | ||||||||
DPL Inc. | ||||||||||||
7.25% | 10/15/21 | 138,000 | 153,180 | (a,f) | ||||||||
Duke Realty LP (REIT) | ||||||||||||
6.50% | 01/15/18 | 59,000 | 66,871 | (f) | ||||||||
Eastman Chemical Co. | ||||||||||||
2.40% | 06/01/17 | 150,000 | 151,589 | |||||||||
Ecopetrol S.A. | ||||||||||||
7.63% | 07/23/19 | 10,000 | 12,600 | |||||||||
Empresa de Energia de Bogota S.A. | ||||||||||||
6.13% | 11/10/21 | 10,000 | 10,550 | (a) | ||||||||
Energy Transfer Equity LP | ||||||||||||
7.50% | 10/15/20 | 39,000 | 42,803 | (f) | ||||||||
Energy Transfer Partners LP | ||||||||||||
6.50% | 02/01/42 | 13,000 | 13,931 | |||||||||
6.70% | 07/01/18 | 41,000 | 47,029 | (f) | ||||||||
European Investment Bank | ||||||||||||
0.73% | 12/15/14 | 100,000 | 100,343 | (c,f) | ||||||||
4.88% | 01/17/17 | 200,000 | 230,143 | (f) | ||||||||
Exelon Corp. | ||||||||||||
4.90% | 06/15/15 | 70,000 | 76,082 | (f) | ||||||||
Express Scripts Holding Co. | ||||||||||||
2.65% | 02/15/17 | 95,000 | 96,650 | (a,f) | ||||||||
3.13% | 05/15/16 | 84,000 | 87,458 | (f) | ||||||||
3.90% | 02/15/22 | 28,000 | 29,022 | (a,f) | ||||||||
4.75% | 11/15/21 | 28,000 | 30,984 | (a,f) | ||||||||
6.13% | 11/15/41 | 43,000 | 52,253 | (a,f) | ||||||||
Florida Power & Light Co. | ||||||||||||
4.13% | 02/01/42 | 51,000 | 53,397 | (f) | ||||||||
Ford Motor Credit Company LLC | ||||||||||||
3.00% | 06/12/17 | 53,000 | 52,708 | |||||||||
Forest Oil Corp. | ||||||||||||
7.25% | 06/15/19 | 51,000 | 46,793 | (f) | ||||||||
Fresenius Medical Care US Finance Inc. | ||||||||||||
5.75% | 02/15/21 | 30,000 | 31,238 | (a,f) | ||||||||
Frontier Communications Corp. | ||||||||||||
7.13% | 03/15/19 | 52,000 | 52,520 | (f) | ||||||||
Georgia Power Co. | ||||||||||||
4.30% | 03/15/42 | 27,000 | 28,125 | |||||||||
Goldman Sachs Capital I | ||||||||||||
6.35% | 02/15/34 | 49,000 | 46,347 | (f) | ||||||||
Great Plains Energy Inc. | ||||||||||||
4.85% | 06/01/21 | 60,000 | 64,439 | (f) | ||||||||
Hanesbrands Inc. | ||||||||||||
6.38% | 12/15/20 | 59,000 | 62,098 | (f) | ||||||||
Hartford Financial Services Group Inc. | ||||||||||||
5.13% | 04/15/22 | 56,000 | 57,666 | (f) | ||||||||
HCA Inc. | ||||||||||||
6.50% | 02/15/20 | 36,000 | 39,015 | (f) | ||||||||
Heineken N.V. | ||||||||||||
3.40% | 04/01/22 | 112,000 | 114,708 | (a,f) | ||||||||
Hewlett-Packard Co. | ||||||||||||
4.05% | 09/15/22 | 67,000 | 67,498 | |||||||||
Host Hotels & Resorts LP (REIT) | ||||||||||||
6.00% | 11/01/20 | 25,000 | 27,125 | (f) | ||||||||
HSBC Finance Corp. | ||||||||||||
6.68% | 01/15/21 | 34,000 | 36,812 | (f) | ||||||||
See Notes to Schedule of Investments and Notes to Financial Statements.
5
Table of Contents
Income Fund
| Schedule of Investments | June 30, 2012 (Unaudited) |
| Principal Amount | Fair Value | |||||||||||
HSBC Holdings PLC | ||||||||||||
4.00% | 03/30/22 | $ | 56,000 | $ | 58,150 | (f) | ||||||
Hughes Satellite Systems Corp. | ||||||||||||
6.50% | 06/15/19 | 28,000 | 29,750 | (f) | ||||||||
Ingles Markets Inc. | ||||||||||||
8.88% | 05/15/17 | 103,000 | 112,141 | (f) | ||||||||
Inter-American Development Bank | ||||||||||||
1.38% | 10/18/16 | 86,000 | 87,959 | (f) | ||||||||
Intergas Finance BV | ||||||||||||
6.38% | 05/14/17 | 100,000 | 108,558 | (a,f) | ||||||||
John Deere Capital Corp. | ||||||||||||
2.25% | 04/17/19 | 56,000 | 57,238 | |||||||||
3.15% | 10/15/21 | 67,000 | 69,682 | (f) | ||||||||
JPMorgan Chase & Co. | ||||||||||||
4.35% | 08/15/21 | 74,000 | 78,099 | (f) | ||||||||
4.50% | 01/24/22 | 109,000 | 117,417 | |||||||||
Kinross Gold Corp. | ||||||||||||
6.88% | 09/01/41 | 17,000 | 17,252 | |||||||||
Koninklijke Philips Electronics N.V. | ||||||||||||
3.75% | 03/15/22 | 27,000 | 28,023 | (f) | ||||||||
5.00% | 03/15/42 | 28,000 | 30,101 | (f) | ||||||||
Korea Development Bank | ||||||||||||
3.25% | 03/09/16 | 100,000 | 103,226 | (f) | ||||||||
Korea National Oil Corp. | ||||||||||||
2.88% | 11/09/15 | 100,000 | 101,635 | (a,f) | ||||||||
Kraft Foods Group Inc. | ||||||||||||
1.63% | 06/04/15 | 53,000 | 53,561 | (a) | ||||||||
2.25% | 06/05/17 | 53,000 | 54,266 | (a) | ||||||||
5.00% | 06/04/42 | 64,000 | 67,736 | (a) | ||||||||
Kreditanstalt fuer Wiederaufbau | ||||||||||||
3.50% | 03/10/14 | 44,000 | 46,188 | (f) | ||||||||
4.50% | 07/16/18 | 85,000 | 99,628 | (f) | ||||||||
Liberty Mutual Group Inc. | ||||||||||||
4.95% | 05/01/22 | 37,000 | 36,770 | (a) | ||||||||
6.50% | 05/01/42 | 41,000 | 41,500 | (a) | ||||||||
Linn Energy LLC | ||||||||||||
8.63% | 04/15/20 | 42,000 | 45,255 | (f) | ||||||||
Lorillard Tobacco Co. | ||||||||||||
3.50% | 08/04/16 | 58,000 | 60,463 | (f) | ||||||||
Lowe’s Companies Inc. | ||||||||||||
4.65% | 04/15/42 | 29,000 | 30,795 | |||||||||
Marathon Petroleum Corp. | ||||||||||||
6.50% | 03/01/41 | 27,000 | 30,684 | (f) | ||||||||
McDonald’s Corp. | ||||||||||||
1.88% | 05/29/19 | 54,000 | 53,878 | |||||||||
MidAmerican Energy Holdings Co. | ||||||||||||
6.13% | 04/01/36 | 115,000 | 143,893 | (f) | ||||||||
Molson Coors Brewing Co. | ||||||||||||
5.00% | 05/01/42 | 43,000 | 46,456 | |||||||||
Morgan Stanley | ||||||||||||
5.50% | 07/28/21 | 51,000 | 50,248 | (f) | ||||||||
5.75% | 01/25/21 | 100,000 | 98,604 | (f) | ||||||||
Mylan Inc. | ||||||||||||
7.88% | 07/15/20 | 70,000 | 78,488 | (a,f) | ||||||||
National Agricultural Cooperative Federation | ||||||||||||
4.25% | 01/28/16 | 100,000 | 105,305 | (a,f) | ||||||||
National JSC Naftogaz of Ukraine | ||||||||||||
9.50% | 09/30/14 | 100,000 | 95,875 | |||||||||
| Principal Amount | Fair Value | |||||||||||
Newfield Exploration Co. | ||||||||||||
5.63% | 07/01/24 | $ | 10,000 | $ | 10,225 | |||||||
5.75% | 01/30/22 | 51,000 | 53,295 | (f) | ||||||||
Newmont Mining Corp. | ||||||||||||
4.88% | 03/15/42 | 41,000 | 39,979 | |||||||||
News America Inc. | ||||||||||||
6.65% | 11/15/37 | 25,000 | 29,183 | (f) | ||||||||
NextEra Energy Capital Holdings Inc. | ||||||||||||
2.60% | 09/01/15 | 131,000 | 134,590 | (f) | ||||||||
Nisource Finance Corp. | ||||||||||||
3.85% | 02/15/23 | 60,000 | 59,942 | |||||||||
Nordea Bank AB | ||||||||||||
3.13% | 03/20/17 | 200,000 | 200,854 | (a,f) | ||||||||
Occidental Petroleum Corp. | ||||||||||||
2.70% | 02/15/23 | 75,000 | 75,472 | |||||||||
Oglethorpe Power Corp. | ||||||||||||
5.38% | 11/01/40 | 32,000 | 37,559 | (f) | ||||||||
Omnicom Group Inc. | ||||||||||||
3.63% | 05/01/22 | 71,000 | 72,143 | |||||||||
ONEOK Partners LP | ||||||||||||
6.13% | 02/01/41 | 64,000 | 72,165 | (f) | ||||||||
Pacific Gas & Electric Co. | ||||||||||||
6.05% | 03/01/34 | 24,000 | 30,244 | (f) | ||||||||
PacifiCorp | ||||||||||||
6.25% | 10/15/37 | 2,000 | 2,689 | |||||||||
PAETEC Holding Corp. | ||||||||||||
8.88% | 06/30/17 | 26,000 | 28,015 | (f) | ||||||||
Peabody Energy Corp. | ||||||||||||
6.25% | 11/15/21 | 30,000 | 29,700 | (a,f) | ||||||||
PepsiCo Inc. | ||||||||||||
2.75% | 03/05/22 | 74,000 | 74,689 | |||||||||
Petrobras International Finance Co. | ||||||||||||
2.88% | 02/06/15 | 22,000 | 22,330 | (f) | ||||||||
3.50% | 02/06/17 | 84,000 | 86,225 | (f) | ||||||||
3.88% | 01/27/16 | 25,000 | 25,811 | (f) | ||||||||
Philip Morris International Inc. | ||||||||||||
2.50% | 05/16/16 | 60,000 | 62,957 | (f) | ||||||||
Phillips 66 | ||||||||||||
5.88% | 05/01/42 | 24,000 | 25,836 | (a) | ||||||||
Pioneer Natural Resources Co. | ||||||||||||
3.95% | 07/15/22 | 50,000 | 50,121 | |||||||||
Power Sector Assets & Liabilities Management Corp. | ||||||||||||
7.39% | 12/02/24 | 100,000 | 129,000 | (a,f) | ||||||||
Pride International Inc. | ||||||||||||
6.88% | 08/15/20 | 58,000 | 71,164 | (f) | ||||||||
Prudential Financial Inc. | ||||||||||||
5.63% | 05/12/41 | 28,000 | 28,595 | (f) | ||||||||
5.80% | 11/16/41 | 14,000 | 14,656 | |||||||||
Range Resources Corp. | ||||||||||||
5.75% | 06/01/21 | 51,000 | 53,295 | (f) | ||||||||
Raytheon Co. | ||||||||||||
1.40% | 12/15/14 | 57,000 | 57,832 | (f) | ||||||||
Rio Tinto Finance USA PLC | ||||||||||||
3.50% | 03/22/22 | 55,000 | 57,965 | (f) | ||||||||
Roche Holdings Inc. | ||||||||||||
6.00% | 03/01/19 | 76,000 | 94,532 | (a,f) | ||||||||
Rowan Companies Inc. | ||||||||||||
4.88% | 06/01/22 | 27,000 | 27,237 | |||||||||
See Notes to Schedule of Investments and Notes to Financial Statements.
6
Table of Contents
Income Fund
| Schedule of Investments | June 30, 2012 (Unaudited) |
| Principal Amount | Fair Value | |||||||||||
Russian Agricultural Bank OJSC Via RSHB Capital S.A. | ||||||||||||
6.00% | 06/03/21 | $ | 200,000 | $ | 196,876 | (a,f,g) | ||||||
Sempra Energy | ||||||||||||
2.30% | 04/01/17 | 110,000 | 112,733 | (f) | ||||||||
Simon Property Group LP (REIT) | ||||||||||||
2.15% | 09/15/17 | 83,000 | 82,873 | (f) | ||||||||
Symantec Corp. | ||||||||||||
2.75% | 06/15/17 | 75,000 | 75,337 | |||||||||
Target Corp. | ||||||||||||
4.00% | 07/01/42 | 50,000 | 49,251 | |||||||||
Texas Instruments Inc. | ||||||||||||
2.38% | 05/16/16 | 90,000 | 94,640 | (f) | ||||||||
Textron Inc. | ||||||||||||
6.20% | 03/15/15 | 82,000 | 90,116 | �� | (f) | |||||||
The ADT Corp. | ||||||||||||
2.25% | 07/15/17 | 35,000 | 35,164 | (a) | ||||||||
3.50% | 07/15/22 | 50,000 | 50,168 | (a) | ||||||||
4.88% | 07/15/42 | 50,000 | 48,980 | (a) | ||||||||
The AES Corp. | ||||||||||||
8.00% | 10/15/17 | 6,000 | 6,825 | |||||||||
The Coca-Cola Co. | ||||||||||||
3.30% | 09/01/21 | 63,000 | 67,581 | (f) | ||||||||
The Goldman Sachs Group Inc. | ||||||||||||
3.30% | 05/03/15 | 58,000 | 57,992 | |||||||||
5.75% | 01/24/22 | 106,000 | 111,894 | (f) | ||||||||
The Potomac Edison Co. | ||||||||||||
5.35% | 11/15/14 | 95,000 | 103,391 | (f) | ||||||||
Time Warner Cable Inc. | ||||||||||||
5.50% | 09/01/41 | 86,000 | 93,576 | (f) | ||||||||
6.75% | 07/01/18 | 61,000 | 74,309 | (f) | ||||||||
Time Warner Inc. | ||||||||||||
3.15% | 07/15/15 | 121,000 | 127,610 | (f) | ||||||||
3.40% | 06/15/22 | 26,000 | 26,218 | |||||||||
4.90% | 06/15/42 | 19,000 | 19,278 | |||||||||
Total Capital International S.A. | ||||||||||||
1.55% | 06/28/17 | 125,000 | 125,293 | |||||||||
Toyota Motor Credit Corp. | ||||||||||||
1.75% | 05/22/17 | 80,000 | 80,648 | |||||||||
United Technologies Corp. | ||||||||||||
1.20% | 06/01/15 | 27,000 | 27,314 | |||||||||
1.80% | 06/01/17 | 27,000 | 27,573 | |||||||||
4.50% | 06/01/42 | 40,000 | 43,936 | |||||||||
Vail Resorts Inc. | ||||||||||||
6.50% | 05/01/19 | 80,000 | 84,000 | (f) | ||||||||
Valero Energy Corp. | ||||||||||||
6.63% | 06/15/37 | 27,000 | 30,275 | |||||||||
Verizon Communications Inc. | ||||||||||||
2.00% | 11/01/16 | 140,000 | 143,267 | (f) | ||||||||
Viacom Inc. | ||||||||||||
1.25% | 02/27/15 | 39,000 | 39,097 | (f) | ||||||||
2.50% | 12/15/16 | 87,000 | 90,076 | (f) | ||||||||
Visteon Corp. | ||||||||||||
6.75% | 04/15/19 | 53,000 | 51,543 | (f) | ||||||||
Vivendi S.A. | ||||||||||||
3.45% | 01/12/18 | 84,000 | 82,258 | (a) | ||||||||
Weatherford International Ltd. |
| |||||||||||
4.50% | 04/15/22 | 46,000 | 47,146 | (f) | ||||||||
5.95% | 04/15/42 | 42,000 | 44,180 | (f) | ||||||||
| Principal Amount | Fair Value | |||||||||||
Wells Fargo & Co. | ||||||||||||
1.50% | 07/01/15 | $ | 75,000 | $ | 75,057 | |||||||
Willis Group Holdings PLC | ||||||||||||
4.13% | 03/15/16 | 61,000 | 63,770 | (f) | ||||||||
Woodside Finance Ltd. | ||||||||||||
4.50% | 11/10/14 | 95,000 | 100,493 | (a,f) | ||||||||
Xstrata Finance Canada Ltd. | ||||||||||||
5.80% | 11/15/16 | 58,873 | 65,765 | (a,f) | ||||||||
| 15,464,396 | ||||||||||||
Non-Agency Collateralized Mortgage Obligations — 3.4% |
| |||||||||||
Banc of America Merrill Lynch Commercial Mortgage Inc. | ||||||||||||
5.37% | 09/10/47 | 80,000 | 89,449 | (f,g) | ||||||||
5.92% | 02/10/51 | 50,000 | 57,556 | (f,g) | ||||||||
6.39% | 02/10/51 | 30,000 | 35,243 | (f,g) | ||||||||
Bear Stearns Commercial Mortgage Securities | ||||||||||||
4.93% | 02/13/42 | 100,000 | 108,903 | (f,g) | ||||||||
5.71% | 04/12/38 | 60,000 | 64,139 | (f,g) | ||||||||
5.91% | 06/11/40 | 30,000 | 21,730 | (f,g) | ||||||||
Citigroup Commercial Mortgage Trust | ||||||||||||
5.48% | 10/15/49 | 30,000 | 26,075 | (f) | ||||||||
Commercial Mortgage Pass Through Certificates | ||||||||||||
4.98% | 05/10/43 | 30,000 | 32,786 | (f,g) | ||||||||
Credit Suisse First Boston Mortgage Securities Corp. | ||||||||||||
5.32% | 10/25/35 | 71,892 | 1,572 | (g) | ||||||||
Credit Suisse Mortgage Capital Certificates | ||||||||||||
5.60% | 02/25/36 | 25,805 | 720 | (g) | ||||||||
DBUBS Mortgage Trust | ||||||||||||
5.73% | 11/10/46 | 50,000 | 38,428 | (a,f,g) | ||||||||
Extended Stay America Trust | ||||||||||||
5.50% | 11/05/27 | 100,000 | 100,930 | (a,f) | ||||||||
Greenwich Capital Commercial Funding Corp. | ||||||||||||
5.44% | 03/10/39 | 20,000 | 22,187 | |||||||||
GS Mortgage Securities Corp. II | ||||||||||||
3.00% | 08/10/44 | 60,000 | 63,255 | (f) | ||||||||
3.55% | 04/10/34 | 100,000 | 103,374 | (a) | ||||||||
JP Morgan Chase Commercial Mortgage Securities Corp. | ||||||||||||
4.27% | 06/15/45 | 50,000 | 51,051 | |||||||||
5.04% | 03/15/46 | 30,000 | 32,567 | (f,g) | ||||||||
5.34% | 08/12/37 | 130,000 | 142,824 | (f,g) | ||||||||
5.44% | 06/12/47 | 120,000 | 135,425 | (f) | ||||||||
5.79% | 02/12/51 | 50,000 | 57,800 | (f,g) | ||||||||
LB-UBS Commercial Mortgage Trust | ||||||||||||
5.16% | 02/15/31 | 70,000 | 77,978 | (f) | ||||||||
MASTR Alternative Loans Trust | ||||||||||||
5.00% | 08/25/18 | 58,374 | 5,492 | (e,f,k) | ||||||||
Merrill Lynch Mortgage Trust | ||||||||||||
5.85% | 05/12/39 | 70,000 | 44,900 | (f,g) | ||||||||
Morgan Stanley Capital I Inc. | ||||||||||||
5.62% | 12/12/49 | 24,854 | 24,893 | (f) | ||||||||
5.82% | 06/11/42 | 50,000 | 43,810 | (f,g) | ||||||||
5.90% | 10/15/42 | 126,000 | 90,463 | (f,g) | ||||||||
See Notes to Schedule of Investments and Notes to Financial Statements.
7
Table of Contents
Income Fund
| Schedule of Investments | June 30, 2012 (Unaudited) |
| Principal Amount | Fair Value | |||||||||||
5.99% | 08/12/41 | $ | 30,000 | $ | 34,784 | (g) | ||||||
6.46% | 01/11/43 | 70,000 | 77,159 | (f,g) | ||||||||
Residential Funding Mortgage Securities I Inc. | ||||||||||||
5.75% | 01/25/36 | 12,404 | — | ** | ||||||||
Wachovia Bank Commercial Mortgage Trust | ||||||||||||
5.47% | 01/15/45 | 70,000 | 75,599 | (f,g) | ||||||||
Wells Fargo Mortgage Backed Securities Trust | ||||||||||||
5.50% | 01/25/36 | 27,155 | — | ** | ||||||||
| 1,661,092 | ||||||||||||
Sovereign Bonds — 1.7% |
| |||||||||||
Government of Argentina | ||||||||||||
2.50% | 12/31/38 | 8,242 | 2,658 | (h) | ||||||||
8.28% | 12/31/33 | 5,737 | 3,628 | |||||||||
Government of Dominican Republic | ||||||||||||
7.50% | 05/06/21 | 100,000 | 106,500 | (a,f) | ||||||||
Government of El Salvador | ||||||||||||
7.65% | 06/15/35 | 20,000 | 21,080 | (a,f) | ||||||||
Government of Hungary | ||||||||||||
6.25% | 01/29/20 | 29,000 | 28,260 | |||||||||
7.63% | 03/29/41 | 12,000 | 11,730 | |||||||||
Government of Indonesia | ||||||||||||
3.75% | 04/25/22 | 27,579 | 27,510 | (a) | ||||||||
Government of Lebanon | ||||||||||||
4.00% | 12/31/17 | 4,200 | 4,074 | |||||||||
5.15% | 11/12/18 | 11,000 | 10,863 | |||||||||
6.10% | 10/04/22 | 11,000 | 11,000 | |||||||||
Government of Mexico | ||||||||||||
4.75% | 03/08/44 | 34,000 | 36,635 | (f) | ||||||||
5.75% | 10/12/49 | 10,000 | 11,375 | |||||||||
6.05% | 01/11/40 | 18,000 | 23,220 | (f) | ||||||||
Government of Panama | ||||||||||||
6.70% | 01/26/36 | 56,000 | 75,600 | (f) | ||||||||
Government of Peru | ||||||||||||
6.55% | 03/14/37 | 41,000 | 55,801 | (f) | ||||||||
Government of Philippines | ||||||||||||
6.38% | 01/15/32 | 100,000 | 126,250 | |||||||||
Government of Poland | ||||||||||||
5.00% | 03/23/22 | 30,000 | 32,745 | |||||||||
6.38% | 07/15/19 | 7,000 | 8,245 | |||||||||
Government of Romania | ||||||||||||
6.75% | 02/07/22 | 20,000 | 20,850 | (a,f) | ||||||||
Government of Turkey | ||||||||||||
5.63% | 03/30/21 | 100,000 | 109,125 | (f) | ||||||||
6.88% | 03/17/36 | 10,000 | 11,740 | |||||||||
Government of Uruguay | ||||||||||||
6.88% | 09/28/25 | 27,038 | 35,555 | |||||||||
Government of Venezuela | ||||||||||||
10.75% | 09/19/13 | 33,000 | 33,990 | |||||||||
Government of Vietnam | ||||||||||||
1.56% | 03/12/16 | 4,174 | 3,785 | (g) | ||||||||
Russian Foreign Bond - Eurobond | ||||||||||||
7.50% | 03/31/30 | 8,189 | 9,832 | (h) | ||||||||
| 822,051 | ||||||||||||
| Principal Amount | Fair Value | |||||||||||
Municipal Bonds and Notes — 0.8% |
| |||||||||||
American Municipal Power Inc. | ||||||||||||
6.27% | 02/15/50 | $ | 25,000 | $ | 28,766 | (f) | ||||||
Municipal Electric Authority of Georgia | ||||||||||||
6.64% | 04/01/57 | 39,000 | 45,248 | (f) | ||||||||
New Jersey State Turnpike Authority | ||||||||||||
7.10% | 01/01/41 | 30,000 | 42,296 | (f) | ||||||||
7.41% | 01/01/40 | 110,000 | 160,342 | (f) | ||||||||
New Jersey Transportation Trust Fund Authority | ||||||||||||
6.88% | 12/15/39 | 15,000 | 17,224 | |||||||||
South Carolina State Public Service Authority | ||||||||||||
6.45% | 01/01/50 | 30,000 | 42,409 | (f) | ||||||||
State of California | ||||||||||||
5.70% | 11/01/21 | 40,000 | 45,540 | (f) | ||||||||
| 381,825 | ||||||||||||
FNMA — 0.0%* |
| |||||||||||
Lehman TBA | ||||||||||||
5.50%** | TBA | 83,122 | — | (b,j,l) | ||||||||
Total Bonds and Notes | 42,989,295 | |||||||||||
Other Investments — 0.4% |
| |||||||||||
GEI Investment Fund | 208,989 | (i) | ||||||||||
Total Investments in Securities | 43,198,284 | |||||||||||
Short-Term Investments — 23.9% |
| |||||||||||
GE Institutional Money Market Fund — Investment Class | 11,737,848 | (c,i) | ||||||||||
Total Investments | 54,936,132 | |||||||||||
Liabilities in Excess of Other Assets, | (5,932,888 | ) | ||||||||||
|
| |||||||||||
NET ASSETS — 100.0% | $ | 49,003,244 | ||||||||||
|
| |||||||||||
See Notes to Schedule of Investments and Notes to Financial Statements.
8
Table of Contents
Income Fund
| Schedule of Investments | June 30, 2012 (Unaudited) |
Other Information | ||||||||
The Fund had the following long futures contracts open at June 30,2012 (Unaudited):
| Description | Expiration date | Number of Contracts | Current Notional Value | Unrealized Appreciation/ (Depreciation) | ||||||||||||
2 Yr. U.S. Treasury | September 2012 | 8 | $ | 1,761,500 | $ | (725 | ) | |||||||||
5 Yr. U.S. Treasury | September 2012 | 111 | 13,760,531 | 6,367 | ||||||||||||
30 Yr. U.S. Treasury | September 2012 | 8 | 1,183,750 | (764 | ) | |||||||||||
|
| |||||||||||||||
| $ | 4,877 | |||||||||||||||
|
| |||||||||||||||
The Fund had the following short futures contracts open at June 30, 2012 (Unaudited):
| Description | Expiration Date | Number of Contracts | Current Notional Value | Unrealized (Depreciation) | ||||||||||||
Ultra Long-Term U.S. Treasury Bond Futures | September 2012 | 17 | $ | (2,836,344 | ) | $ | (36,797 | ) | ||||||||
10 Yr. U.S. Treasury Notes Futures | September 2012 | 71 | (9,469,625 | ) | (21,484 | ) | ||||||||||
|
| |||||||||||||||
| $ | (58,281 | ) | ||||||||||||||
|
| |||||||||||||||
| $ | (53,404 | ) | ||||||||||||||
|
| |||||||||||||||
See Notes to Schedule of Investments and Notes to Financial Statements.
9
Table of Contents
| Notes to Schedule of Investments | June 30, 2012 (Unaudited) |
The views expressed in this document reflect our judgment as of the publication date and are subject to change at any time without notice. The securities information regarding holdings, allocations and other characteristics are presented to illustrate examples of securities that the Fund has bought and the diversity of areas in which the Fund may invest as of a particular date. It may not be representative of the Fund’s current or future investments and should not be construed as a recommendation to purchase or sell a particular security. See the Fund’s summary prospectus and statutory prospectus for complete descriptions of investment objectives, policies, risks and permissible investments.
| (a) | Pursuant to Rule 144A of the Securities Act of 1933, these securities may be resold in transactions exempt from registration, normally to qualified institutional buyers. At June 30, 2012, these securities amounted to $3,952,608 or 8.07% of the net assets of the GE Investments Income Fund. These securities have been determined to be liquid using procedures established by the Fund’s Board of Directors. |
| (b) | Settlement is on a delayed delivery or when-issued basis with final maturity to be announced (TBA) in the future. |
| (c) | Coupon amount represents effective yield. |
| (d) | Principal only security. These securities represent the right to receive the monthly principal payments on an underlying pool of mortgages. No payments of interest on the pool are passed through to the “principal only” holder. |
| (e) | Interest only security. These securities represent the right to receive the monthly interest payments on an underlying pool of mortgages. Payments of principal on the pool reduce the value of the “interest only” holding. |
| (f) | At June 30, 2012 , all or a portion of this security was pledged to cover collateral requirements for futures, options, forward foreign currency contracts and/or TBA’s. |
| (g) | Variable or floating rate security. The stated rate represents the rate at June 30, 2012 . |
| (h) | Step coupon bond. Security becomes interest bearing at a future date. |
| (i) | GE Asset Management, the investment adviser of the Fund, also serves as investment adviser of the GEI Investment Fund and the GE Institutional Money Market Fund. The GE Investment Fund has been determined to be illiquid using procedures established by the Board of Directors. |
| (j) | Securities in default |
| (k) | Coupon amount represents the coupon of the underlying mortgage securities on which monthly interest payments are based |
| (l) | Fair Valued Security. |
| * | Less than 0.05%. |
| ** | Amount is less than $ 0.50. |
| † | Percentages are based on net assets as of June 30, 2012 . |
Abbreviations:
REIT | Real Estate Investment Trust | |
REMIC | Real Estate Mortgage Investment Conduit | |
STRIPS | Separate Trading of Registered Interest and Principal of Security | |
TBA | To be Announced | |
10
Table of Contents
Selected data based on a share outstanding throughout the fiscal years indicated
| CLASS 1 | ||||||||||||||||||||||||
| 6/30/12† | 12/31/11 | 12/31/10 | 12/31/09 | 12/31/08 | 12/31/07 | |||||||||||||||||||
| Inception date | — | — | — | — | — | 1/3/95 | ||||||||||||||||||
Net asset value, beginning of period | $ | 11.35 | $ | 11.05 | $ | 10.62 | $ | 10.26 | $ | 11.50 | $ | 11.80 | ||||||||||||
Income (loss) from investment operations: | ||||||||||||||||||||||||
Net investment income | 0.15 | 0.48 | 0.34 | * | 0.37 | 0.56 | 0.81 | |||||||||||||||||
Net realized and unrealized | 0.25 | 0.32 | 0.46 | 0.45 | (1.16) | (0.25) | ||||||||||||||||||
Total income (loss) from investment operations | 0.40 | 0.80 | 0.80 | 0.82 | (0.60) | 0.56 | ||||||||||||||||||
Less distributions from: | ||||||||||||||||||||||||
Net investment income | — | 0.50 | 0.37 | 0.46 | 0.64 | 0.82 | ||||||||||||||||||
Net realized gains | — | — | — | — | — | — | ||||||||||||||||||
Return of capital | — | — | — | 0.00 | (b) | 0.04 | ||||||||||||||||||
Total distributions | — | 0.50 | 0.37 | 0.46 | 0.64 | 0.86 | ||||||||||||||||||
Net asset value, end of period | $ | 11.75 | $ | 11.35 | $ | 11.05 | $ | 10.62 | $ | 10.26 | $ | 11.50 | ||||||||||||
TOTAL RETURN (a) | 3.52% | 7.20% | 7.56% | 7.88% | (5.21)% | 4.83% | ||||||||||||||||||
RATIOS/SUPPLEMENTAL DATA: | ||||||||||||||||||||||||
Net assets, end of period | $ | 49,003 | $ | 51,191 | $ | 54,884 | $ | 59,532 | $ | 68,731 | $ | 93,480 | ||||||||||||
Ratios to average net assets: | ||||||||||||||||||||||||
Net investment income | 2.52% | ** | 3.99% | 3.07% | 4.01% | 4.63% | 5.07% | |||||||||||||||||
Net expenses | 0.77% | (c)** | 0.86% | (c) | 0.83% | (c) | 0.84% | (c) | 0.63% | (c) | 0.61% | |||||||||||||
Gross expenses | 0.78% | ** | 0.87% | 1.00% | 0.84% | 0.65% | 0.61% | |||||||||||||||||
Portfolio turnover rate | 169% | 359% | 320% | 251% | 385% | 448% | ||||||||||||||||||
Notes to Financial Highlights
| (a) | Total returns are historical and assume changes in share price, reinvestment of dividends and capital gains distributions and do not include the effect of insurance contract charges. Past performance does not guarantee future results. |
| (b) | Less than $0.01 per share. |
| (c) | Reflects GE Asset Management’s waiver of a portion of the Fund’s management fee in an amount equal to the management fee earned by GEAM with respect to the Fund’s investment in the GE Institutional Money Market Fund or, prior to 2011, in another affiliated Money Market Fund formerly managed by GEAM. |
| * | Per share values have been calculated using the average share method. |
| ** | Annualized for periods less than one year. |
| † | Unaudited |
The accompanying Notes are an integral part of these financial statements.
11
Table of Contents
The accompanying Notes are an integral part of these financial statements.
12
Table of Contents
For the period ending June 30, 2012 | (Unaudited) | |||
INVESTMENT INCOME | ||||
Income | ||||
Interest | $ | 827,846 | ||
Interest from affiliated investments | 1,766 | |||
Less: Foreign taxes withheld | — | |||
Total income | 829,612 | |||
Expenses | ||||
Advisory and administration fees | 126,651 | |||
Director’s fees | 1,087 | |||
Custody and accounting expenses | 42,664 | |||
Professional fees | 14,975 | |||
Other expenses | 11,759 | |||
Total expenses before waiver and reimbursement | 197,136 | |||
Less: Expenses waived or borne by the adviser | (3,855 | ) | ||
Net expenses | 193,281 | |||
Net investment income | 636,331 | |||
NET REALIZED AND UNREALIZED GAIN (LOSS) | ||||
Realized gain (loss) on: | ||||
Investments | 1,121,982 | |||
Futures | (385,427 | ) | ||
Increase in unrealized appreciation on: | ||||
Investments | 331,317 | |||
Futures | 52,903 | |||
Net realized and unrealized gain on investments | 1,120,775 | |||
Net increase in net assets resulting from operations | $ | 1,757,106 | ||
The accompanying Notes are an integral part of these financial statements.
13
Table of Contents
| * | (Unaudited) |
| ** | Share Class 4 was closed effective April 30, 2011 |
The accompanying Notes are an integral part of these financial statements.
14
Table of Contents
| Notes to Financial Statements | June 30, 2012 (Unaudited) |
| 1. | Organization of the Company |
GE Investments Funds, Inc. (the “Company”) was incorporated under the laws of the Commonwealth of Virginia on May 14, 1984 and is registered under the Investment Company Act of 1940, as amended (the “1940 Act”), as an open-end management investment company. The Company is composed of thirteen investment portfolios (collectively the “Funds”), although only the following ten are currently being offered: U.S. Equity Fund, S&P 500 Index Fund, Premier Growth Equity Fund, Core Value Equity Fund, Mid-Cap Equity Fund, Small-Cap Equity Fund, Total Return Fund, Income Fund (the “Fund”), Money Market Fund and Real Estate Securities Fund.
Shares of the Funds of the Company are offered only to insurance company separate accounts that fund certain variable life insurance contracts and variable annuity contracts. GE Asset Management Incorporated (“GEAM”) is the investment adviser and administrator of each of the Funds.
The Company currently offers one share class (Class 1) of the Fund as an investment option for variable life insurance and variable annuity contracts.
| 2. | Summary of Significant Accounting Policies |
The preparation of financial statements in conformity with U.S. generally accepted accounting principles (GAAP) requires management to make estimates and assumptions that affect the reported amounts of assets and liabilities and disclosure of contingent assets and liabilities at the date of the financial statements and the reported amounts of increases and decreases in net assets from operations during the reporting period. Actual results may differ from those estimates.
The following summarizes the significant accounting policies of the Company:
Securities Valuation and Transactions. All investments in securities are recorded at their estimated fair value, as described in Note 3.
Securities transactions are accounted for as of the trade date. Realized gains and losses on investments sold are recorded on the basis of identified cost for both financial statement and federal tax purposes.
The Fund’s income, expenses (other than distribution fees) and realized and unrealized gains and losses are allocated proportionally each day among the share classes based upon the relative net assets of each class.
Foreign Currency Accounting records of the Fund are maintained in U.S. dollars. Investment securities and other assets and liabilities denominated in a foreign currency are translated to U.S. dollars at the prevailing rates of exchange at period end. Purchases and sales of securities, income receipts and expense payments denominated in foreign currencies are translated into U.S. dollars at the prevailing
exchange rate on the respective dates of such transactions.
All assets and liabilities of the Fund initially expressed in foreign currency values will be converted into U.S. dollars at the WM/Reuter exchange rate computed at 11:00 a.m., Eastern Time.
The Fund does not isolate the portion of the results of operations resulting from changes in foreign exchange rates from the fluctuations arising from changes in the market prices of securities during the year. Such fluctuations are included in the net realized or unrealized gain or loss from investments. Net realized gains or losses on foreign currency transactions represent net gains or losses on sales and maturities of foreign currency contracts, disposition of foreign currencies, the difference between the amount of net investment income and withholding taxes accrued and the U.S. dollar amount actually received or paid, and gains or losses between the trade and settlement date on purchases and sales of foreign securities. Net unrealized foreign exchange gains and losses arising from changes in the value of other assets and liabilities (including foreign currencies and open foreign currency contracts) as a result of changes in foreign exchange rates are included as increases or decreases in unrealized appreciation/depreciation on foreign currency related transactions.
Derivatives The Fund is subject to equity price risk, interest rate risk, credit risk, and foreign currency exchange rate risk in the normal course of pursuing its investment objectives. The Fund may enter into derivative transactions to gain market exposure for residual and accumulating cash positions, and for managing the duration of fixed-income investments.
Futures Contracts A futures contract represents a commitment for the future purchase or sale of an asset at a specified price on a specified date. The Fund invested in futures for a variety of portfolio management purposes such as hedging against the effects of changes in the value of portfolio securities due to anticipated changes in interest rates and/or market conditions, gaining market exposure for accumulating and residual cash positions, for duration
15
Table of Contents
| Notes to Financial Statements | June 30, 2012 (Unaudited) |
management, or when the transactions were economically appropriate to the reduction of risks inherent in the management of the Fund. Buying futures tends to increase a Fund’s exposure to the underlying instrument while selling futures tends to decrease a Fund’s exposure to the underlying instrument, or hedge other Fund investments. The Fund will not enter into a transaction involving futures for speculative purposes. With futures contracts, there is minimal counterparty credit risk to the Fund since futures contracts are exchange traded and the exchange’s clearinghouse, as counterparty to all traded futures, guarantees the futures against default. The Fund’s risks in using these contracts include changes in the value of the underlying instruments, non-performance of the counterparties under the contracts’ terms and changes in the liquidity of the secondary market for the contracts. Futures contracts are valued at the settlement price established each day by the board of trade or exchange on which they principally trade.
Upon entering into a financial futures contract, the Fund is required to pledge to the broker an amount of cash and/or other assets equal to a certain percentage of the contract amount, known as initial margin deposit. Subsequent payments, known as variation margin, are made or received by the Fund each day, depending on the daily fluctuation in the fair value of the underlying security. The Fund records an unrealized gain or loss equal to the daily variation margin. Should market conditions move unexpectedly, the Fund may not achieve the anticipated benefits of the futures contracts and may incur a loss. The Fund recognizes a realized gain or loss on the expiration or closing of a futures contract.
Investments in Foreign Markets Investments in foreign markets involve special risks and considerations not typically associated with investing in the United States. These risks include revaluation of currencies, high rates of inflation, restrictions on repatriation of income and capital, and adverse political and economic developments. Moreover, securities issued in these markets may be less liquid, subject to government ownership controls, tariffs and taxes, subject to delays in settlements, and their prices may be more volatile.
The Fund may be subject to capital gains and repatriation taxes imposed by certain countries in which they invest. Such taxes are generally based upon income and/or capital gains earned or repatriated. Taxes are accrued based on net investment income, net realized gains and net unrealized appreciation as income and/or capital gains are earned.
Investment Income Corporate actions (including cash dividends) are recorded on the ex-dividend date, net of applicable withholding taxes, except for certain foreign corporate actions which are recorded as soon after the ex-dividend date as such information becomes available. Withholding taxes in foreign dividends have been provided for in accordance with the Fund’s understanding of the applicable country’s tax rules and rates.
Interest income is recorded on the accrual basis. Accretion of discounts and amortization of premiums on taxable bonds are to the call or maturity date, whichever is shorter, using the effective yield method.
Expenses Fund specific expenses are allocated to the Fund that incurs such expenses. Such expenses may include custodial fees, legal and accounting fees, printing costs and registration fees. Expenses that are not fund specific are allocated pro rata across the Funds. Expenses of the Fund are generally paid directly by the Fund, however, expenses may be paid by GEAM and reimbursed by the Fund.
Federal Income Taxes The Fund intends to comply with all sections of the Internal Revenue Code applicable to regulated investment companies including the distribution of substantially all of its taxable net investment income and net realized capital gains to its shareholders. Therefore, no provision for federal income tax has been made.
| 3. | Securities Valuation |
The Fund utilizes various methods to measure the fair value of most of its investments on a recurring basis. GAAP establishes a framework for measuring fair value and providing related disclosures. Broadly, the framework requires fair value to be determined based on the exchange price that would be received for an asset or paid to transfer a liability (an exit price) in the principal or most advantageous market for the asset or liability in an orderly transaction between market participants at the measurement date. In the absence of active markets for the identical assets or liabilities, such measurements involve developing assumptions based on market observable data and, in the absence of such data, internal information that is consistent with what market participants would use in a hypothetical transaction that occurs at the measurement date. It also establishes a three-level valuation hierarchy based upon observable and non-observable inputs.
Observable inputs reflect market data obtained from independent sources, while unobservable inputs reflect our
16
Table of Contents
| Notes to Financial Statements | June 30, 2012 (Unaudited) |
market assumptions. Preference is given to observable inputs. These two types of inputs create the following fair value hierarchy:
Level 1 — Quoted prices for identical investments in active markets.
Level 2 — Quoted prices for similar investments in active markets; quoted prices for identical or similar investments in markets that are not active; and model-derived valuations whose inputs are observable or whose significant value drivers are observable.
Level 3 — Significant inputs to the valuation model are unobservable.
Policies and procedures are maintained to value investments using the best and most relevant data available. In addition, pricing vendors are utilized to assist in valuing investments. GEAM performs periodic reviews of the methodologies used by independent pricing services including price validation of individual securities.
Fair Value Measurement The following section describes the valuation methodologies the Fund uses to measure different financial investments at fair value.
Debt securities (other than short-term securities described below) generally are valued at an evaluated bid price as reported by independent pricing services. The pricing services use various pricing models for each asset class. The inputs and assumptions to the model of the pricing services are derived from market observable sources, which may include: benchmark yields, reported trades, broker/dealer quotes, issuer spreads, benchmark securities, bids, offers, and other market related data. Since many fixed income securities do not trade on a daily basis, the methodology of the pricing service may also use other available information as applicable such as benchmark curves, benchmarking of similar securities, sector groupings and matrix pricing. Thus, certain securities may not be priced using market quotations, but rather determined from market observable information. These investments are included in Level 2 and are primarily comprised of corporate fixed income, government, mortgage and asset-backed securities. In the absence of a reliable bid price from such a pricing service, debt securities may be valued based on broker or dealer supplied valuations or quotations. In these infrequent circumstances, pricing services may provide the Fund with valuations that are based on significant unobservable inputs, and in those circumstances the investment securities are classified as Level 3.
The Fund may use non-binding broker or dealer quotes for valuation when there is limited or no relevant market
activity for a specific investment or for other investments that share similar characteristics and a price is not provided by a pricing service or is deemed not to be reliable. The Fund has not adjusted the prices obtained. Investment securities priced using non-binding broker or dealer quotes are included in Level 3.
Short-term investments of sufficient credit quality with remaining maturities of sixty days or less at the time of purchase are typically valued on the basis of amortized cost which approximates fair value and these are included in Level 2. If it is determined that amortized cost does not approximate fair value, securities may be valued based on dealer supplied valuations or quotations. In these infrequent circumstances, pricing services may provide the Fund with valuations that are based on significant unobservable inputs, and in those circumstances the investment securities are classified in Level 3.
The Fund uses the net asset value per unit for collective funds (i.e., GEI Investment Fund). The Fund classifies the investment security in Level 2.
If prices are not readily available for a portfolio security, or if it is believed that a price for a portfolio security does not represent its fair value, the security may be valued using procedures approved by the Fund’s Board of Directors that are designed to establish its “fair” value. These securities are typically classified in Level 3. Those procedures require that the fair value of a security be established by a valuation committee of GEAM. The valuation committee follows different protocols for different types of investments and circumstances. The fair value procedures may be used to value any investment of the Fund in the appropriate circumstances.
Fair value determinations generally are used for securities whose value is affected by a significant event that will materially affect the value of a security and which occurs subsequent to the time of the close of the principal market on which such security trades but prior to the calculation of the Fund’s NAV.
The value established for such a portfolio security may be different than what would be produced through the use of market quotations or another methodology. Portfolio securities that are valued using techniques other than market quotations, including “fair valued” securities, may be subject to greater fluctuation in their value from one day to the next than would be the case if market quotations were used. In addition, there is no assurance that the Fund could sell a portfolio security for the value established for it at any time and it is possible that the Fund would incur a
17
Table of Contents
| Notes to Financial Statements | June 30, 2012 (Unaudited) |
loss because a portfolio security is sold at a discount to its established value.
Other financial investments are derivative instruments that are not reflected in total investments, such as futures, forwards, swaps, and written options contracts, which are valued based on fair value as discussed above.
The Fund uses closing prices for derivatives included in Level 1, which are traded either on exchanges or liquid over-the counter markets. Derivative assets and liabilities
included in Level 2 primarily represent interest rate swaps, cross-currency swaps and foreign currency and commodity forward and option contracts. Derivative assets and liabilities included in Level 3 primarily represent interest rate products that contain embedded optionality or prepayment features.
The inputs or methodology used for valuing securities are not an indication of the risk associated with investing in those securities.
The following table presents the Fund’s investments measured at fair value on a recurring basis at June 30, 2012:
| Investments | Level 1 | Level 2 | Level 3 | Total | ||||||||||||
Investments in Securities† | ||||||||||||||||
U.S. Treasuries | $ | — | $ | 6,605,691 | $ | — | $ | 6,605,691 | ||||||||
Agency Mortgage Backed | — | 17,138,183 | — | 17,138,183 | ||||||||||||
Agency CMOs | — | 582,988 | — | 582,988 | ||||||||||||
Asset Backed | — | 333,069 | — | 333,069 | ||||||||||||
Corporate Notes | — | 15,464,396 | — | 15,464,396 | ||||||||||||
Non-Agency CMOs | — | 1,661,092 | — | 1,661,092 | ||||||||||||
Sovereign Bonds | — | 822,051 | — | 822,051 | ||||||||||||
Municipal Notes and Bonds | — | 381,825 | — | 381,825 | ||||||||||||
Other Investments | — | 208,989 | — | 208,989 | ||||||||||||
Short-Term Investments | 11,737,848 | — | — | 11,737,848 | ||||||||||||
Total Investments in Securities | $ | 11,737,848 | $ | 43,198,284 | $ | — | $ | 54,936,132 | ||||||||
Other Financial Instruments* | ||||||||||||||||
Futures Contracts — Unrealized Appreciation | $ | 6,367 | $ | — | $ | — | $ | 6,367 | ||||||||
Futures Contracts — Unrealized Depreciation | (59,770 | ) | — | — | (59,770 | ) | ||||||||||
Total Other Financial Instruments | $ | (53,404 | ) | $ | — | $ | — | $ | (53,403 | ) | ||||||
| † | See Schedule of Investments for Industry Classification |
| * | Other financial instruments include derivative instruments such as futures contracts. Amounts shown represent unrealized appreciation (depreciation), at period end. |
There were no transfers between fair value levels. Transfers between fair value levels are considered to occur at the beginning of the period.
| 4. | Derivatives Transactions |
Shown below are the derivative contracts entered into by the Fund, summarized by primary risk exposure as they appear on the Statement of Assets and Liabilities, all of which are not accounted for as hedging instruments under FASB Accounting Standards Codification (“ASC”) No. 815 Derivatives and Hedging as of June 30, 2012.
Asset Derivatives June 30, 2012 | Liability Derivatives June 30, 2012 | |||||||||||
| Derivatives not accounted for as hedging instruments under ASC 815 | Location in the Statement of Assets and Liabilities | Fair Value ($) | Location in the Statements of Assets and Liabilities | Fair Value ($) | ||||||||
Interest Rate Contracts | Assets, Net Assets — Net Unrealized Appreciation/ (Depreciation) on Futures | 6,367 | * | Liabilities, Net Assets — Net Unrealized Appreciation/ (Depreciation) on Futures | (59,770 | )* | ||||||
| * | Includes cumulative unrealized appreciation/(depreciation) of futures contracts as reported in the Schedule of Investments and as within the components of the net assets section of the Statement of Assets and Liabilities. Only the current day’s variation margin is reported within the Assets and/or Liabilities section on the Statement of Assets and Liabilities. |
18
Table of Contents
| Notes to Financial Statements | June 30, 2012 (Unaudited) |
Shown below are the effects of derivative instruments on the Fund’s Statement of Operation, summarized by primary risk exposure all of which are not accounted for as hedging instruments under ASC 815.
Derivatives not accounted for as hedging instruments under ASC 815 | Location in the Statements of Operations | Total Notional Amount of Futures Contracts Purchased/(Sold) ($) | Realized Gain or (Loss) on Derivatives Recognized in Income ($) | Change in Unrealized Appreciation/(Depreciation) on Derivatives Recognized in Income ($) | ||||||||||
Interest Rate Contracts | Realized gain/(loss) on Futures, Increase/(decrease) in unrealized appreciation/ (depreciation) on Futures | 85,407,091/(80,016,385) | (385,427 | ) | 52,903 | |||||||||
| 5. | Line of Credit |
The Company shares a revolving credit facility of up to $150 million with a number of its affiliates. The credit facility is with its custodian bank, State Street Bank and Trust Company (“State Street”). The revolving credit facility requires the payment of a commitment fee equal to 0.100% per annum on the daily unused portion of the credit facility, payable quarterly. The portion borne by the Funds generally is borne proportionally based upon net assets. In addition, the Company has a $100 million uncommitted, unsecured line of credit with State Street. Generally, borrowings under the credit facilities would accrue interest at the Federal Funds Rate plus 50 basis points and would be borne by the borrowing Fund. The maximum amount allowed to be borrowed by any one Fund is the lesser of (i) 33.33% of its total assets or (ii) 20% of its net assets. The credit facilities were not utilized by the Fund during the six-month period ended June 30, 2012.
| 6. | Fees and Compensation Paid to Affiliates |
Advisory and Administration Fees GEAM, a registered investment adviser, was retained by the Company’s Board of Directors effective November 15, 1997 to act as investment adviser and administrator of the Fund. Compensation of GEAM for investment advisory and administrative services is paid monthly based on the average daily net assets of the Fund at an annualized rate of 0.50%.
GEAM has a contractual arrangement with the Fund to waive a portion of the Fund’s management fee in the amount equal to the management fee earned by GEAM with respect to the Fund’s investment in the GE Institutional Money Market Fund, if any.
Directors’ Compensation The Fund pays no compensation to its directors who are officers or employees of GEAM or its affiliates. Directors who are not such officers or employees also serve in a similar capacity for other funds advised by GEAM. Compensation paid to non-interested Directors are reflected on the Statement of Operations. These fees are allocated pro rata across all of the mutual fund platforms served by the Directors, including the Fund, and are based upon the relative net assets of each fund within such platforms.
| 7. | Investment Transactions |
Purchases and Sales of Securities The cost of purchases and the proceeds from sales of investments, other than short-term securities, for the six-month period ended June 30, 2012 were as follows:
| U.S. Government Securities | ||
| Purchases | Sales | |
| $65,266,208 | $63,893,414 | |
| Other Securities | ||
| Purchases | Sales | |
| $13,537,882 | $20,764,431 | |
| 8. | Income Taxes |
The Fund is subject to ASC 740, Income Taxes. ASC 740 provides guidance for financial accounting and reporting for the effects of income taxes that result from an entity’s activities during the year. ASC 740 also provides guidance regarding how certain tax positions should be recognized, measured, presented and disclosed in the financial statements. ASC 740 requires evaluation of tax positions taken or expected to be taken in the course of preparing the Fund’s tax returns to determine whether the tax positions are “more likely than not” of being sustained by the applicable tax authority. There are no adjustments to the Fund’s net assets required under ASC 740. The Fund’s 2008, 2009, 2010, and 2011 fiscal years tax returns are still open to examination by the Federal and applicable state tax authorities.
19
Table of Contents
| Notes to Financial Statements | June 30, 2012 (Unaudited) |
At June 30, 2012, information on the tax cost of investments was as follows:
Gross Tax | ||||||
| Cost of Investments For Tax Purposes | Appreciation | Depreciation | Net Tax Appreciation | |||
$53,782,410 | $1,772,593 | $(618,871) | $1,153,722 | |||
Capital loss carryovers are available to offset future realized capital gains to the extent provided in the Internal Revenue Code and regulations thereunder. To the extent that these carryover losses are used to offset future capital gains, it is probable that the gains so offset will not be distributed to shareholders because they would be taxable as ordinary income.
As of December 31, 2011, the Fund has capital loss carryovers as follows:
| Amount | ||||
| Short-Term | Long-Term | Expires | ||
| $ 719,074 | $— | 12/31/2015 | ||
| 972,866 | — | 12/31/2016 | ||
| 7,409,448 | — | 12/31/2017 | ||
These amounts will be available to offset future taxable capital gains. Under the recently enacted Regulated Investment Company Modernization Act of 2010, the Fund will be permitted to carry forward capital losses incurred in taxable years beginning after December 22, 2010 for an unlimited period. However, any losses incurred during those future years will be required to be utilized prior to the losses incurred in pre-enactment tax years. As a result of this ordering rule, pre-enactment capital loss
carryforwards may be more likely to expire unused. Additionally, post-enactment capital losses that are carried forward will retain their character as either short-term or long-term capital losses rather than being considered all short-term as under previous law.
During the year ended December 31, 2011, the Fund utilized $1,662,452 of prior year capital loss carryovers.
Any qualified late-year loss is deemed to arise on the first day of the Fund’s next tax year (if the Fund elects to defer such loss). Under this regime, generally, the Fund can elect to defer any post-October capital loss and/or any late-year ordinary loss as defined by the Internal Revenue Code.
The Fund elected to defer qualified late-year losses for the year ended December 31, 2011 as follows:
| Capital | Ordinary | |
| $63,301 | $— |
The tax composition of distributions paid during the years ended December 31, 2011 and December 31, 2010 were as follows:
| Ordinary Income | Long-Term Capital | Total | ||||
2011 | $2,140,730 | $— | $2,140,730 | |||
2010 | 1,793,830 | — | 1,793,830 |
Distributions to Shareholders The Fund declares and pays any dividends from net investment income annually. The Fund declares and pays any net realized capital gains in excess of capital loss carryforwards distributions annually. The character of income and gains to be distributed is determined in accordance with income tax regulations which may differ from generally accepted accounting principles. These differences include (but are not limited to) futures, treatment of realized and unrealized gains and losses on foreign currency contracts, paydown gains and losses on mortgage-backed securities, investments organized as partnerships for tax purposes, losses deferred due to offsetting positions, and losses deferred due to wash sale transactions. Reclassifications due to permanent book/tax differences are made to the Fund’s capital accounts to reflect income and gains available for distribution (or available capital loss carryovers) under income tax regulations. These reclassifications have no impact on net investment income, realized gains or losses, or the net asset value of the Fund. The calculation of net investment income per share in the Financial Highlights table excludes these adjustments.
20
Table of Contents
| Notes to Financial Statements | June 30, 2012 (Unaudited) |
21
The reclassifications for the year ended December 31, 2011 were as follows:
| Undistributed Net Investment Income | Accumulated Net Realized Gain (Loss) | Capital Paid In | ||
| $30,411 | $83,122 | $(113,533) |
| 9. | Subsequent Events |
Subsequent events after the balance sheet date through the date the financial statements were issued have been evaluated in the preparation of the financial statements. As of August 3, 2012, the assets of the Mid-Cap Equity Fund and the Money Market Fund were liquidated. These funds ceased operations and are no longer offered for investment.
Table of Contents
| Additional Information | (Unaudited) |
Information about Directors and Executive Officers:
The business and affairs of the Funds are managed under the direction of the Funds’ Board of Directors. Information pertaining to the Directors and officers of the Funds is set forth below.
Interested Directors and Executive Officers
Michael J. Cosgrove
Address c/o GEAM 1600 Summer St. Stamford, CT 06905
Age 63
Position(s) Held with Fund Chairman of the Board and President
Term of Office and Length of Time Served Until successor is elected and qualified – 15 years
Principal Occupation(s) During Past 5 years President of Mutual Funds and Global Investment Programs of GEAM since November 2011; President and Chief Executive Officer – Mutual Funds and Intermediary Business of GEAM from March 2007 to November 2011; Executive Vice President of GEAM from February 1997 to March 2007; and Executive Vice President-Mutual Funds of GEAM from March 1993 to March 2007. Also serves as Treasurer of GE Foundation since 1988.
Number of Portfolios in Fund Complex Overseen by Director 25
Other Directorships Held by Director Chairman of the Board and President of GE Institutional Funds since 1997; Trustee of Elfun Funds, GE Savings & Security Funds and General Electric Pension Trust since 1988; Director of GEAM since 1988; Trustee of Fordham University from 2002 to June 30, 2010 and since July 2011; Director of GE Investments Distributors, Inc since June 2011; Director of Skin Cancer Foundation since August 2010; Member of the Board of Governors for the Investment Company Institute since October 2006; Director, GE Asset Management (Ireland) Limited, since February 1999, GE Asset Management Funds Plc since 1998, GE Asset Management Canada Company since 1998, GE Asset Management Limited since 1998; Trustee of General Electric Pension Trust since 1988; and Chairman of the Board and President of GE Funds from 1993 to February 2011.
Matthew J. Simpson
Address c/o GEAM 1600 Summer St. Stamford, CT 06905
Age 51
Position(s) Held with Fund Director and Executive Vice President
Term of Office and Length of Time Served Until successor is elected and qualified – 4 years
Principal Occupation(s) During Past 5 years Executive Vice President, General Counsel and Secretary of GEAM since July 2007; Secretary of Elfun Funds and GE Savings & Security Funds since July 2007; Senior Vice President and General Counsel – Marketing and Client Services (formerly Asset Management Services) of GEAM and Senior Vice President and General Counsel of GE Asset Management Services from February 1997 to July 2007; Vice President and Associate General Counsel of GEAM from October 1992 to February 1997; Secretary of GE Institutional Funds and GE Investments Funds, Inc. from 1997 to July 2007 and Vice President from September 2003 to July 2007; Assistant Secretary of Elfun Funds and GE Savings & Security Funds from 1998 to July 2007 and Vice President from October 2003 to July 2007; and Secretary of GE Funds from 1993 to July 2007 and Vice President from September 2003 to July 2007.
Number of Portfolios in Fund Complex Overseen by Director 25
Other Directorships Held by Director Trustee of Elfun Funds, GE Savings & Security Funds and General Electric Pension Trust since July 2007; Trustee and Executive Vice President of GE Institutional Funds since July 2007; Director of GEAM since July 2007; and Trustee and Executive Vice President of GE Funds from July 2007 to February 2011.
22
Table of Contents
| Additional Information | (Unaudited) |
Joon Won Choe
Address c/o GEAM 1600 Summer St. Stamford, CT 06905
Age 42
Position(s) Held with Fund Vice President & Secretary
Term of Office and Length of Time Served Until successor is elected and qualified – Vice President and Secretary – 1 year
Principal Occupation(s) During Past 5 years Senior Vice President and Deputy General Counsel at GEAM since March 2011; Vice President and Secretary of GE Institutional Funds since September 2010; Vice President and Assistant Secretary of Elfun Funds and GE Savings & Security Funds since September 2010; Senior Vice President and Associate General Counsel at GEAM from June 2010 to March 2011; Vice President and Associate General Counsel of GEAM from November 2005 to June 2010 and Vice President and Secretary of GE Funds from September 2010 to February 2011.
Number of Portfolios in Fund Complex Overseen by Officer N/A
Other Directorships Held by Officer N/A
Robert Herlihy
Address c/o GEAM 1600 Summer St. Stamford, CT 06905
Age 44
Position(s) Held with Fund Chief Compliance Officer
Term of Office and Length of Time Served Until successor is elected and qualified — 6 years
Principal Occupation(s) During Past 5 years Chief Compliance Officer of GEAM, GE Institutional Funds, Elfun Funds, and GE Savings & Security Funds since July 2005; Chief Compliance Officer of GE Funds from July 2005 to February 2011 and Manager of Fund Administration at GEAM from 2002-2005.
Number of Portfolios in Fund Complex Overseen by Officer N/A
Other Directorships Held by Officer N/A
Arthur A. Jensen
Address c/o GEAM 1600 Summer St. Stamford, CT 06905
Age 45
Position(s) Held with Fund Treasurer
Term of Office and Length of Time Served Until successor is elected and qualified – 1 year
Principal Occupation(s) During Past 5 Years Treasurer of GE Institutional Funds, Elfun Funds and GE Savings & Security Funds since June 2011; Mutual Funds Controller of GEAM since April 2011; Senior Vice President at Citigroup from 2008 to 2010 and Vice President at JPMorgan from 2005 to 2008.
Number of Portfolios in Fund Complex Overseen by Officer N/A
Other Directorships Held by Officer N/A
23
Table of Contents
| Additional Information | (Unaudited) |
Jeanne M. LaPorta
Address c/o GEAM 1600 Summer St. Stamford, CT 06905
Age 46
Position(s) Held with Fund Vice President
Term of Office and Length of Time Served Until successor is elected and qualified – 8 years
Principal Occupation(s) During Past 5 Years Senior Vice President and Commercial Administrative Officer of GEAM since April 2010; Vice President of GE Institutional Funds since July 2003; Vice President of Elfun Funds and GE Savings & Security Funds since October 2003; Secretary of GE Funds from July 2007 to September 2010 and Vice President from July 2007 to February 2011; Senior Vice President and Deputy General Counsel of GEAM from October 2007 to April 2010; Vice President and Assistant Secretary of Elfun Funds and GE Savings & Security Funds from July 2003 to June 2010; and Vice President and Associate General Counsel – Marketing and Client Services (formerly Asset Management Services) at GEAM from May 1997 to October 2007.
Number of Portfolios in Fund Complex Overseen by Officer N/A
Other Directorships Held by Officer N/A
Non-Interested Directors
John R. Costantino
Address c/o GEAM 1600 Summer St. Stamford, CT 06905
Age 66
Position(s) Held with Fund Director
Term of Office and Length of Time Served Until successor is elected and qualified – 15 years
Principal Occupation(s) During Past 5 years General Partner, NGN Capital LLC since 2006; Managing Director, Vice President of Walden Capital Management since 1996.
Number of Portfolios in Fund Complex Overseen by Director 17
Other Directorships Held by Director Trustee of GE Institutional Funds since 1997; Trustee of Fordham University from 1989 to 1995 and from 2001 to 2007 and Trustee Emeritus since 2007; Trustee of Neuroscience Research Institute since 1986; Trustee of GE Funds from 1993 to February 2011; Director of Artes Medical from 2006-2008 and Trustee of Gregorian University Foundation from 1992-2007.
24
Table of Contents
| Additional Information | (Unaudited) |
R. Sheldon Johnson
Address c/o GEAM 1600 Summer St. Stamford, CT 06905
Age 65
Positions(s) Held with Fund Director
Term of office and Length of Time served Unit Successor is elected and qualified – 1 year.
Principal Occupation(s) During Past 5 years Head of Global Institutional Equity Sales and Marketing at Morgan Stanley & Co., Inc. from 2002 to 2006 and Managing Director at Morgan Stanley & Co., Inc. from 1988 to 2006.
Number of Portfolios in Fund Complex Overseen by Director 17
Other Directorships Held by Director Trustee of GE Institutional Funds since April 2011 and Trustee of St. Lawrence University since 2003.
Donna M. Rapaccioli
Address c/o GEAM 1600 Summer St. Stamford, CT 06905
Age 49
Position(s) Held with Fund Director
Term of Office and Length of Time Served Until successor is elected and qualified – Less than 1 year
Principal Occupation(s) During Past 5 Years Dean of the Gabelli School of Business since 2007 and Accounting professor since 1987 at Fordham University.
Number of Portfolios in Fund Complex Overseen by Officer 17
Other Directorships Held by Director Trustee of GE Institutional Funds since January 2012 and Trustee of Emmanuel College since 2010.
The Statement of Additional Information for the Funds includes additional information about the Directors and Officers and is available, without charge, upon request by calling 1-800-242-0134.
25
Table of Contents
| Investment Team | (Unaudited) |
Investment Adviser and Administrator
GE Asset Management Incorporated
Board of Directors
Michael J. Cosgrove, Chairman
John R. Costantino
R. Sheldon Johnson
Donna M. Rapaccioli
Matthew J. Simpson
Secretary
Joon Won Choe
Assistant Secretary
Michelle Matzelle
Treasurer
Arthur A. Jensen
Assistant Treasurer
Casey Yantosca
Distributor
GE Investment Distributors, Inc.
Member FINRA and SIPC
Custodian
State Street Bank & Trust Company
Officers of the Investment Adviser
Dmitri Stockton, President and Chief Executive Officer
Cheryl H. Beacock, Senior Vice President, Human Resources
George A. Bicher, Chief Risk Officer
Paul M. Colonna, President and Chief Investment Officer – Public Investments
Michael J. Cosgrove, President of Mutual Funds and Global Investment Programs
Gregory B. Hartch, Senior Vice President – Strategy and Business Development Leader
Ralph R. Layman, Executive Vice President and Chief Investment Officer Emeritus Public Equities
Maureen B. Mitchell, President of Global Sales and Marketing
Steven M. Rullo, Senior Vice President – Services and Technology
Matthew J. Simpson, Executive Vice President, General Counsel and Secretary
Donald W. Torey, President and Chief Investment Officer – Alternative Investments
David Wiederecht, President and Chief Investment Officer – Investment Solutions
Jessica Holscott, Executive Vice President, Chief Financial Officer*
| * | Effective August 1, 2012, Ms. Holcott replaced Tracie A. Winbigler as Executive Vice President and Chief Financial Officer. |
At GE Asset Management, we’re dedicated to providing the investment options you’ll need to tailor your financial portfolio to every stage of your life. Each member of the GE Family of Funds is managed according to the same principles of integrity and quality that have guided GE over the past century, and have made it the world-class company that it is today. Each fund draws strength from a heritage of investment management experience that spans more than 80 years. Whether you’re creating a new investment portfolio or adding to an established one, the GE Family of Funds offers an array of professionally managed investment options that will help you meet a lifetime of financial needs.
26
Table of Contents
Investment Adviser
GE Asset Management Incorporated
1600 Summer Street
Stamford, CT 06905
or at:
PO Box 7900
Stamford, CT 06904-7900
Distributor
GE Investment Distributors, Inc.
member FINRA and SIPC
1600 Summer Street
Stamford, CT 06905
or at:
PO Box 7900
Stamford, CT 06904-7900
The Fund files its complete schedule of portfolio holdings with the Securities and Exchange Commission for the first and third quarters of each fiscal year on Form N-Q. The Fund’s Forms N-Q, as well as a description of the policies and procedures that the Fund uses to determine how to vote proxies (if any) relating to portfolio securities is available without charge (i) upon request, by calling 1-800-493-3042; (ii) on the Fund’s website at http://www.geam.com; and (iii) on the Commission’s website at http://www.sec.gov. The Fund’s Forms N-Q may be reviewed and copied at the Commission’s Public Reference Room in Washington, DC—information on the operation of the Public Reference Room may be obtained by calling 1-800-SEC-0330.
Information (if any) regarding how the Fund voted proxies relating to portfolio securities during the most recently disclosed 12-month period ended June 30 is available without charge (i) through the Fund’s website at http://www.geam.com; and (ii) on the Commission’s website at http://www.sec.gov.

Table of Contents
GE Investments Funds, Inc.
Total Return Fund
Semi-Annual Report
June 30, 2012

Table of Contents
| Total Return Fund | Contents | |
| 1 | ||||
| 2 | ||||
| 3 | ||||
| 21 | ||||
| 22 | ||||
| 24 | ||||
| 25 | ||||
| 26 | ||||
| 28 | ||||
| 37 | ||||
| 41 | ||||
This report is prepared for Policyholders of certain variable contracts and may be distributed to others only if preceded or accompanied by the variable contract’s current prospectus and the current summary prospectus of the Fund available for investments thereunder.
Table of Contents
| Total Return Fund | (Unaudited) |
Notes to Performance
Total return performance shown in this report for the GE Investments Total Return Fund (the “Fund”) takes into account changes in share price and assumes reinvestment of dividends and capital gains distributions, if any. Total returns shown are net of Fund fees and expenses but do not reflect fees and charges associated with the variable contracts such as administrative fees, account charges and surrender charges, which, if reflected, would reduce the Fund’s total returns for all periods shown.
The performance data quoted represents past performance; past performance does not guarantee future results. Investment return and principal value will fluctuate so your shares, when redeemed, may be worth more or less than their original cost. Current performance may be higher or lower than the performance data quoted. Periods less than one year are not annualized. Please call 800-493-3042 or visit the Fund’s website at http://www.geam.com for the most recent month-end performance data.
An investment in the Fund is not a deposit of any bank and is not insured or guaranteed by the Federal Deposit Insurance Corporation (FDIC) or any other government agency. An investment in the Fund is subject to risk, including possible loss of principal invested.
Investment Profile
A mutual fund designed for investors who seek the highest total return, composed of current income and capital appreciation, as is consistent with prudent investment risk. The Fund seeks its investment objective by investing primarily in a combination of U.S. and foreign (non-U.S.) equity and debt securities and cash. The Fund’s asset allocation process utilizes information from GE Asset Management’s Asset Allocation Committee to diversify holdings across these asset classes.
Sector Allocation
as a % of Fair Value of $2,832,903 (in thousands) on June 30, 2012 (a)(b)
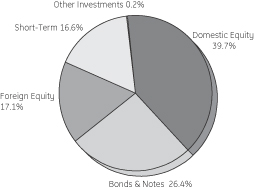
Top Ten Largest Holdings
as of June 30, 2012 (as a % of Fair Value) (a)(b)(c)
Federal National Mortgage Assoc. TBA 3.50% | 3.75% | |||
Federal National Mortgage Assoc. 4.00%, 05/01/19 - 05/01/42 | 2.26% | |||
Vanguard MSCI Emerging Markets Fund | 1.92% | |||
Apple Inc. | 1.20% | |||
Federal National Mortgage Assoc. 4.50%, 05/01/18 - 04/01/41 | 1.15% | |||
Federal Home Loan Bank Discount Notes 0.09%, 08/22/12 - 10/04/12 | 1.12% | |||
U.S. Treasury Bonds 3.13%, 02/15/42 | 1.08% | |||
U.S. Treasury Notes 0.72%, 05/31/17 | 0.88% | |||
Microsoft Corp. | 0.82% | |||
PepsiCo Inc. | 0.82% |
| (a) | The securities information regarding holdings, allocations and other characteristics is presented to illustrate examples of securities that the Fund has bought and the diversity of areas in which the Fund may invest as of a particular date. It may not be representative of the Fund’s current or future investments and should not be construed as a recommendation to purchase or sell a particular security. |
| (b) | Fair value basis is inclusive of the short-term investment in GE Institutional Money Market Fund Investment Class. |
| (c) | The figures presented to not include the Fund’s entire investment portfolio and may change at any time. |
GE Investment Distributors, Inc., Member of FINRA & SIPC, is the principal underwriter and distributor of the GE Investments Funds, Inc. and a wholly owned subsidiary of GE Asset Management Incorporated, the investment adviser of the Fund.
1
Table of Contents
| Total Return Fund | (Unaudited) |
Understanding Your Fund’s Expenses
As a shareholder of the Fund you incur ongoing costs. Ongoing costs include portfolio management fees, distribution and services fees, professional fees, administrative fees and other Fund expenses. The following example is intended to help you understand your ongoing costs (in dollars) of investing in the Fund and to compare these costs with the ongoing costs of investing in other mutual funds.
To illustrate these ongoing costs, we have provided an example and calculated the expenses paid by investors in each share class of the Fund during the period. The information in the following table is based on an investment of $1,000, which is invested at the beginning of the period and held for the entire six-month period ended June 30, 2012.
Actual Expenses
The first section of the table provides information about actual account values and actual expenses. You may use the information in this section, together with the amount you invested, to estimate the expenses that you paid over the period. To do so, simply divide your account value by $1,000 (for example, an $8,600 account value divided by $1,000 = 8.6), then multiply the result by the number given for your class under the heading “Expenses Paid During Period” to estimate the expenses paid on your account during the period.
Hypothetical Example for Comparison Purposes
The second section of the table provides information about hypothetical account values and hypothetical expenses based on the Fund’s actual expense ratio and an assumed rate of return of 5% per year before expenses, which is not the Fund’s actual return. The hypothetical account values and expenses may not be used to estimate the actual ending account balance or expenses you paid for the period. You may use this information to compare the ongoing costs of investing in the Fund and other funds. To do so, compare this 5% hypothetical example with the 5% hypothetical examples that appear in the shareholders reports of other funds.
Please note that the expenses shown in the table are meant to highlight and help you compare ongoing costs only and do not reflect transaction costs, such as sales charges or redemption fees, if any. Therefore, the second section of the table is useful in comparing ongoing costs only, and will not help you determine the relative total costs of owning different funds. Additionally, the expenses shown do not reflect the fees or charges associated with variable contracts through which shares of the Fund are offered.
January 1, 2012 - June 30, 2012
| Account value at the beginning of the period ($) | Account value at the end of the period ($) | Expenses paid during the period ($)* | ||||||||||
Actual Fund Return* |
| |||||||||||
Class 1 | 1,000.00 | 1,061.30 | 3.79 | |||||||||
Class 3 | 1,000.00 | 1,060.20 | 5.07 | |||||||||
Hypothetical 5% Return (2.5% for the period) |
| |||||||||||
Class 1 | 1,000.00 | 1,021.18 | 3.72 | |||||||||
Class 3 | 1,000.00 | 1,019.94 | 4.97 | |||||||||
| * | Expenses are equal to the Fund’s annualized expense ratio of 0.74% for Class 1 shares and 0.99% for Class 3 shares (for the period January 1, 2012 - June 30, 2012), multiplied by the average account value over the period, multiplied by 182/366 (to reflect the one-half year period). |
2
Table of Contents
Total Return Fund
| Schedule of Investments | June 30, 2012 (Unaudited) |
Total Return Fund
| Number of Shares | Fair Value | |||||||||
Domestic Equity — 39.0% † | ||||||||||
Advertising — 0.3% | ||||||||||
Arbitron Inc. | 27,400 | $ | 959,000 | |||||||
Omnicom Group Inc. | 143,931 | 6,995,047 | ||||||||
| 7,954,047 | ||||||||||
Aerospace & Defense — 0.5% |
| |||||||||
Honeywell International Inc. | 221,121 | 12,347,397 | ||||||||
Teledyne Technologies Inc. | 9,100 | 561,015 | (a) | |||||||
The Boeing Co. | 20,727 | 1,540,016 | ||||||||
| 14,448,428 | ||||||||||
Agricultural Products — 0.4% |
| |||||||||
Archer-Daniels-Midland Co. | 353,560 | 10,437,091 | ||||||||
Air Freight & Logistics — 0.9% |
| |||||||||
FedEx Corp. | 10,570 | 968,318 | ||||||||
United Parcel Service Inc. | 290,914 | 22,912,387 | ||||||||
| 23,880,705 | ||||||||||
Apparel Retail — 0.0%* |
| |||||||||
Aeropostale Inc. | 22,800 | 406,524 | (a) | |||||||
American Eagle Outfitters Inc. | 14,700 | 290,031 | ||||||||
The Buckle Inc. | 15,200 | 601,464 | ||||||||
| 1,298,019 | ||||||||||
Apparel, Accessories & Luxury Goods — 0.0%* |
| |||||||||
Maidenform Brands Inc. | 11,400 | 227,088 | (a) | |||||||
Application Software — 0.3% |
| |||||||||
ACI Worldwide Inc. | 18,500 | 817,885 | (a) | |||||||
Blackbaud Inc. | 20,500 | 526,235 | ||||||||
Ebix Inc. | 14,000 | 279,300 | ||||||||
Intuit Inc. | 72,652 | 4,311,896 | ||||||||
Parametric Technology Corp. | 40,200 | 842,592 | (a) | |||||||
SS&C Technologies Holdings Inc. | 31,500 | 787,500 | (a) | |||||||
| 7,565,408 | ||||||||||
Asset Management & Custody Banks — 1.3% |
| |||||||||
Ameriprise Financial Inc. | 192,794 | 10,075,414 | ||||||||
Franklin Resources Inc. | 13,818 | 1,533,660 | ||||||||
Invesco Ltd. | 394,800 | 8,922,480 | ||||||||
State Street Corp. | 322,745 | 14,407,337 | (e) | |||||||
| 34,938,891 | ||||||||||
Automobile Manufacturers — 0.1% |
| |||||||||
Ford Motor Co. | 206,128 | 1,976,768 | ||||||||
| Number of Shares | Fair Value | |||||||||
Biotechnology — 0.9% | ||||||||||
Amgen Inc. | 223,145 | $ | 16,298,510 | (h) | ||||||
Cubist Pharmaceuticals Inc. | 11,200 | 424,592 | (a) | |||||||
Gilead Sciences Inc. | 142,002 | 7,281,863 | (a) | |||||||
| 24,004,965 | ||||||||||
Broadcasting — 0.4% | ||||||||||
CBS Corp. | 77,171 | 2,529,665 | ||||||||
Discovery Communications Inc. | 188,236 | 9,428,741 | (a) | |||||||
| 11,958,406 | ||||||||||
Cable & Satellite — 1.1% | ||||||||||
Comcast Corp. | 186,592 | 5,965,346 | ||||||||
DIRECTV | 208,050 | 10,157,001 | (a) | |||||||
Liberty Global Inc. | 269,474 | 12,867,383 | (a) | |||||||
| 28,989,730 | ||||||||||
Casinos & Gaming — 0.2% | ||||||||||
Las Vegas Sands Corp. | 116,748 | 5,077,371 | ||||||||
Communications Equipment — 1.7% | ||||||||||
Cisco Systems Inc. | 1,209,031 | 20,759,063 | (h) | |||||||
Qualcomm Inc. | 464,870 | 25,883,962 | ||||||||
| 46,643,025 | ||||||||||
Computer Hardware — 1.9% | ||||||||||
Apple Inc. | 86,477 | 50,502,568 | (a) | |||||||
Construction & Engineering — 0.0%* | ||||||||||
Quanta Services Inc. | 24,400 | 587,308 | (a) | |||||||
Construction & Farm Machinery & Heavy | ||||||||||
Caterpillar Inc. | 17,554 | 1,490,510 | ||||||||
Deere & Co. | 54,819 | 4,433,213 | ||||||||
| 5,923,723 | ||||||||||
Consumer Finance — 0.3% | ||||||||||
American Express Co. | 154,703 | 9,005,262 | ||||||||
Data Processing & Outsourced Services — 1.5% | ||||||||||
Global Cash Access Holdings Inc. | 80,300 | 578,963 | (a) | |||||||
Paychex Inc. | 455,515 | 14,307,726 | ||||||||
The Western Union Co. | 839,667 | 14,139,992 | ||||||||
Visa Inc. | 102,374 | 12,656,498 | ||||||||
| 41,683,179 | ||||||||||
Department Stores — 0.2% | ||||||||||
Macy's Inc. | 124,151 | 4,264,587 | ||||||||
Distributors — 0.1% | ||||||||||
Genuine Parts Co. | 44,851 | 2,702,273 | ||||||||
LKQ Corp. | 37,600 | 1,255,840 | (a) | |||||||
| 3,958,113 | ||||||||||
See Notes to Schedule of Investments and Notes to Financial Statements.
3
Table of Contents
Total Return Fund
| Schedule of Investments | June 30, 2012 (Unaudited) |
| Number of Shares | Fair Value | |||||||||
Diversified Chemicals — 0.3% |
| |||||||||
EI du Pont de Nemours & Co. | 148,512 | $ | 7,510,251 | |||||||
Diversified Financial Services — 1.3% |
| |||||||||
Citigroup Inc. | 103,691 | 2,842,170 | ||||||||
JPMorgan Chase & Co. | 293,661 | 10,492,507 | ||||||||
Wells Fargo & Co. | 614,994 | 20,565,399 | ||||||||
| 33,900,076 | ||||||||||
Diversified Metals & Mining — 0.2% |
| |||||||||
Compass Minerals International Inc. | 5,900 | 450,052 | ||||||||
Freeport-McMoRan Copper & Gold Inc. | 114,035 | 3,885,173 | ||||||||
| 4,335,225 | ||||||||||
Diversified REITs — 0.1% |
| |||||||||
Liberty Property Trust | 12,900 | 475,236 | ||||||||
Vornado Realty Trust | 14,390 | 1,208,472 | ||||||||
| 1,683,708 | ||||||||||
Diversified Support Services — 0.0%* |
| |||||||||
Healthcare Services Group Inc. | 28,500 | 552,330 | ||||||||
Drug Retail — 0.2% |
| |||||||||
CVS Caremark Corp. | 92,145 | 4,305,936 | ||||||||
Education Services — 0.0%* |
| |||||||||
Lincoln Educational Services Corp. | 5,800 | 37,700 | ||||||||
Electric Utilities — 0.4% |
| |||||||||
Exelon Corp. | 103,662 | 3,899,764 | ||||||||
FirstEnergy Corp. | 39,205 | 1,928,494 | ||||||||
IDACORP Inc. | 19,100 | 803,728 | ||||||||
The Southern Co. | 90,371 | 4,184,177 | ||||||||
| 10,816,163 | ||||||||||
Electrical Components & Equipment — 0.2% |
| |||||||||
Cooper Industries PLC | 64,266 | 4,381,656 | ||||||||
Fertilizers & Agricultural Chemicals — 0.4% |
| |||||||||
Monsanto Co. | 126,811 | 10,497,415 | ||||||||
Food Distributors — 0.0%* |
| |||||||||
Spartan Stores Inc. | 8,000 | 145,040 | ||||||||
Footwear — 0.0%* |
| |||||||||
Deckers Outdoor Corp. | 12,700 | 558,927 | (a) | |||||||
General Merchandise Stores — 0.1% |
| |||||||||
Target Corp. | 68,131 | 3,964,543 | ||||||||
Healthcare Distributors — 0.0%* |
| |||||||||
Owens & Minor Inc. | 23,100 | 707,553 | ||||||||
| Number of Shares | Fair Value | |||||||||
Healthcare Equipment — 1.1% |
| |||||||||
Covidien PLC | 486,468 | $ | 26,026,038 | |||||||
Medtronic Inc. | 89,545 | 3,468,078 | ||||||||
Thoratec Corp. | 10,200 | 342,516 | (a) | |||||||
| 29,836,632 | ||||||||||
Healthcare Facilities — 0.1% |
| |||||||||
HCA Holdings Inc. | 88,310 | 2,687,273 | ||||||||
Healthcare Services — 0.9% |
| |||||||||
Bio-Reference Labs Inc. | 43,900 | 1,153,692 | (a) | |||||||
Express Scripts Holding Co. | 404,821 | 22,601,156 | (a) | |||||||
HMS Holdings Corp. | 22,000 | 732,820 | ||||||||
MEDNAX Inc. | 13,000 | 891,020 | (a) | |||||||
| 25,378,688 | ||||||||||
Healthcare Technology — 0.0%* |
| |||||||||
Computer Programs & Systems Inc. | 4,200 | 240,324 | ||||||||
Home Building — 0.1% |
| |||||||||
MDC Holdings Inc. | 48,364 | 1,580,052 | ||||||||
Home Furnishing Retail — 0.2% |
| |||||||||
Aaron's Inc. | 18,100 | 512,411 | ||||||||
Bed Bath & Beyond Inc. | 98,411 | 6,081,800 | (a) | |||||||
| 6,594,211 | ||||||||||
Home Improvement Retail — 0.9% |
| |||||||||
Lowe's Companies Inc. | 630,983 | 17,945,156 | ||||||||
The Home Depot Inc. | 110,546 | 5,857,833 | ||||||||
| 23,802,989 | ||||||||||
Hotels, Resorts & Cruise Lines — 0.0%* |
| |||||||||
Orient-Express Hotels Ltd. | 44,990 | 376,566 | (a) | |||||||
Household Products — 0.4% |
| |||||||||
Kimberly-Clark Corp. | 58,037 | 4,861,759 | ||||||||
The Clorox Co. | 76,000 | 5,506,960 | ||||||||
| 10,368,719 | ||||||||||
Housewares & Specialties — 0.0%* |
| |||||||||
Jarden Corp. | 29,100 | 1,222,782 | ||||||||
Independent Power Producers & Energy Traders — 0.3% |
| |||||||||
Calpine Corp. | 201,564 | 3,327,822 | (a) | |||||||
The AES Corp. | 426,164 | 5,467,684 | (a) | |||||||
| 8,795,506 | ||||||||||
Industrial Gases — 0.1% |
| |||||||||
Praxair Inc. | 34,670 | 3,769,669 | ||||||||
| See Notes to Schedule of Investments and Notes to Financial Statements. |
4
Table of Contents
Total Return Fund
| Schedule of Investments | June 30, 2012 (Unaudited) |
| Number of Shares | Fair Value | |||||||||
Industrial Machinery — 0.6% |
| |||||||||
Dover Corp. | 159,835 | $ | 8,568,754 | |||||||
Eaton Corp. | 131,280 | 5,202,626 | ||||||||
ESCO Technologies Inc. | 7,500 | 273,300 | ||||||||
Harsco Corp. | 8,100 | 165,078 | ||||||||
Mueller Industries Inc. | 7,900 | 336,461 | ||||||||
Woodward Inc. | 15,700 | 619,208 | ||||||||
| 15,165,427 | ||||||||||
Industrial REITs — 0.1% | ||||||||||
Prologis Inc. | 52,900 | 1,757,867 | ||||||||
Insurance Brokers — 0.1% | ||||||||||
Marsh & McLennan Companies Inc. | 92,144 | 2,969,801 | ||||||||
Integrated Oil & Gas — 1.3% | ||||||||||
Chevron Corp. | 187,503 | 19,781,566 | ||||||||
Exxon Mobil Corp. | 58,432 | 5,000,026 | (h) | |||||||
Hess Corp. | 72,563 | 3,152,862 | ||||||||
Occidental Petroleum Corp. | 99,262 | 8,513,702 | ||||||||
| 36,448,156 | ||||||||||
Integrated Telecommunication Services — 0.6% |
| |||||||||
AT&T Inc. | 276,381 | 9,855,746 | ||||||||
Verizon Communications Inc. | 131,273 | 5,833,772 | ||||||||
| 15,689,518 | ||||||||||
Internet Retail — 0.2% | ||||||||||
Amazon.com Inc. | 18,824 | 4,298,460 | (a) | |||||||
Internet Software & Services — 0.7% | ||||||||||
eBay Inc. | 364,873 | 15,328,315 | (a) | |||||||
Google Inc. | 4,111 | 2,384,668 | (a) | |||||||
NIC Inc. | 26,200 | 332,740 | ||||||||
The Active Network Inc. | 5,500 | 84,645 | (a) | |||||||
| 18,130,368 | ||||||||||
Investment Banking & Brokerage — 0.3% | ||||||||||
GFI Group Inc. | 48,100 | 171,236 | ||||||||
Raymond James Financial Inc. | 24,400 | 835,456 | ||||||||
The Goldman Sachs Group Inc. | 59,443 | 5,698,206 | ||||||||
| 6,704,898 | ||||||||||
IT Consulting & Other Services — 0.7% |
| |||||||||
International Business Machines Corp. | 95,885 | 18,753,188 | (h) | |||||||
Life & Health Insurance — 0.4% |
| |||||||||
MetLife Inc. | 123,188 | 3,800,349 | ||||||||
Prudential Financial Inc. | 121,617 | 5,889,911 | ||||||||
| 9,690,260 | ||||||||||
| Number of Shares | Fair Value | |||||||||
Life Sciences Tools & Services — 0.3% | ||||||||||
Agilent Technologies Inc. | 70,281 | $ | 2,757,826 | |||||||
Bruker Corp. | 53,700 | 714,747 | (a) | |||||||
PerkinElmer Inc. | 150,885 | 3,892,833 | ||||||||
| 7,365,406 | ||||||||||
Managed Healthcare — 0.1% | ||||||||||
Molina Healthcare Inc. | 23,450 | 550,137 | (a) | |||||||
UnitedHealth Group Inc. | 26,491 | 1,549,723 | ||||||||
| 2,099,860 | ||||||||||
Movies & Entertainment — 0.7% | ||||||||||
The Walt Disney Co. | 155,449 | 7,539,276 | ||||||||
Time Warner Inc. | 322,377 | 12,411,515 | ||||||||
| 19,950,791 | ||||||||||
Multi-Line Insurance — 0.2% | ||||||||||
American International Group Inc. | 92,373 | 2,964,250 | (a) | |||||||
Hartford Financial Services Group Inc. | 57,633 | 1,016,070 | ||||||||
HCC Insurance Holdings Inc. | 23,600 | 741,040 | ||||||||
| 4,721,360 | ||||||||||
Multi-Utilities — 0.2% | ||||||||||
Dominion Resources Inc. | 90,648 | 4,894,992 | ||||||||
Office Electronics — 0.0%* | ||||||||||
Zebra Technologies Corp. | 15,600 | 536,016 | (a) | |||||||
Office REITs — 0.3% | ||||||||||
Alexandria Real Estate Equities Inc. | 12,030 | 874,822 | ||||||||
BioMed Realty Trust Inc. | 46,900 | 876,092 | ||||||||
Boston Properties Inc. | 15,600 | 1,690,572 | ||||||||
Brandywine Realty Trust | 11,370 | 140,306 | ||||||||
CommonWealth | 33,970 | 649,506 | ||||||||
Coresite Realty Corp. | 18,000 | 464,760 | ||||||||
Digital Realty Trust Inc. | 21,750 | 1,632,773 | ||||||||
Duke Realty Corp. | 34,700 | 508,008 | ||||||||
Hudson Pacific Properties Inc. | 11,440 | 199,170 | ||||||||
Mack-Cali Realty Corp. | 24,540 | 713,378 | ||||||||
SL Green Realty Corp. | 11,940 | 958,066 | ||||||||
| 8,707,453 | ||||||||||
Office Services & Supplies — 0.0%* |
| |||||||||
Herman Miller Inc. | 15,100 | 279,652 | ||||||||
Oil & Gas Drilling — 0.0%* |
| |||||||||
Pioneer Drilling Co. | 80,500 | 641,585 | (a) | |||||||
Oil & Gas Equipment & Services — 0.9% |
| |||||||||
Dril-Quip Inc. | 2,900 | 190,211 | (a) | |||||||
Oil States International Inc. | 14,800 | 979,760 | (a) | |||||||
Schlumberger Ltd. | 342,623 | 22,239,659 | ||||||||
| 23,409,630 | ||||||||||
| See Notes to Schedule of Investments and Notes to Financial Statements. |
5
Table of Contents
Total Return Fund
| Schedule of Investments | June 30, 2012 (Unaudited) |
| Number of Shares | Fair Value | |||||||||
Oil & Gas Exploration & Production — 0.4% |
| |||||||||
Anadarko Petroleum Corp. | 136,069 | $ | 9,007,768 | |||||||
SM Energy Co. | 10,800 | 530,388 | ||||||||
Southwestern Energy Co. | 74,867 | 2,390,503 | (a) | |||||||
| 11,928,659 | ||||||||||
Oil & Gas Refining & Marketing — 0.1% |
| |||||||||
Marathon Petroleum Corp. | 46,072 | 2,069,554 | ||||||||
Oil & Gas Storage & Transportation — 0.1% |
| |||||||||
Spectra Energy Corp. | 62,182 | 1,807,009 | ||||||||
The Williams Companies Inc. | 57,590 | 1,659,744 | ||||||||
| 3,466,753 | ||||||||||
Packaged Foods & Meats — 0.6% |
| |||||||||
Kraft Foods Inc. | 409,895 | 15,830,145 | ||||||||
Smithfield Foods Inc. | 13,200 | 285,516 | (a) | |||||||
| 16,115,661 | ||||||||||
Paper Packaging — 0.0%* |
| |||||||||
Packaging Corporation of America | 33,700 | 951,688 | ||||||||
Pharmaceuticals — 1.8% |
| |||||||||
Bristol-Myers Squibb Co. | 225,237 | 8,097,270 | ||||||||
Johnson & Johnson | 279,637 | 18,892,276 | ||||||||
Merck & Company Inc. | 122,982 | 5,134,498 | ||||||||
Pfizer Inc. | 708,068 | 16,285,564 | ||||||||
| 48,409,608 | ||||||||||
Property & Casualty Insurance — 0.3% |
| |||||||||
ACE Ltd. | 125,087 | 9,272,699 | ||||||||
Publishing — 0.0%* |
| |||||||||
John Wiley & Sons Inc. | 7,900 | 387,021 | ||||||||
Railroads — 0.2% |
| |||||||||
Genesee & Wyoming Inc. | 16,200 | 856,008 | (a) | |||||||
Union Pacific Corp. | 41,455 | 4,945,996 | ||||||||
| 5,802,004 | ||||||||||
Real Estate Services — 0.1% |
| |||||||||
CBRE Group Inc. | 207,075 | 3,387,747 | (a) | |||||||
Regional Banks — 0.2% |
| |||||||||
Cullen Frost Bankers Inc. | 9,900 | 569,151 | ||||||||
Fulton Financial Corp. | 18,100 | 180,819 | ||||||||
Iberiabank Corp. | 4,000 | 201,800 | ||||||||
Prosperity Bancshares Inc. | 16,000 | 672,480 | ||||||||
Regions Financial Corp. | 391,954 | 2,645,689 | ||||||||
Sterling Bancorp | 9,500 | 94,810 | ||||||||
SVB Financial Group | 10,600 | 622,432 | (a) | |||||||
Westamerica Bancorporation | 8,500 | 401,115 | ||||||||
| 5,388,296 | ||||||||||
| Number of Shares | Fair Value | |||||||||
Reinsurance — 0.1% |
| |||||||||
PartnerRe Ltd. | 25,340 | $ | 1,917,478 | |||||||
Research & Consulting Services — 0.1% | ||||||||||
Nielsen Holdings N.V. | 110,572 | 2,899,198 | (a) | |||||||
Resources Connection Inc. | 8,500 | 104,550 | ||||||||
| 3,003,748 | ||||||||||
Residential REITs — 0.3% | ||||||||||
American Campus Communities Inc. | 8,890 | 399,872 | ||||||||
AvalonBay Communities Inc. | 6,270 | 887,080 | ||||||||
BRE Properties Inc. | 8,210 | 410,664 | ||||||||
Camden Property Trust | 10,630 | 719,332 | ||||||||
Colonial Properties Trust | 21,770 | 481,988 | ||||||||
Equity Residential | 33,460 | 2,086,566 | ||||||||
Essex Property Trust Inc. | 6,480 | 997,402 | ||||||||
Home Properties Inc. | 8,100 | 497,016 | ||||||||
UDR Inc. | 47,450 | 1,226,108 | ||||||||
| 7,706,028 | ||||||||||
Restaurants — 0.3% | ||||||||||
Cracker Barrel Old Country Store Inc. | 12,500 | 785,000 | ||||||||
Darden Restaurants Inc. | 64,946 | 3,288,216 | ||||||||
McDonald's Corp. | 51,128 | 4,526,362 | ||||||||
The Wendy's Co. | 43,900 | 207,208 | ||||||||
| 8,806,786 | ||||||||||
Retail REITs — 0.5% |
| |||||||||
Acadia Realty Trust | 7,300 | 169,214 | ||||||||
DDR Corp. | 61,970 | 907,241 | ||||||||
Equity One Inc. | 7,270 | 154,124 | ||||||||
Excel Trust Inc. | 5,900 | 70,564 | ||||||||
General Growth Properties Inc. | 34,740 | 628,447 | ||||||||
Kimco Realty Corp. | 51,020 | 970,911 | ||||||||
National Retail Properties Inc. | 39,590 | 1,120,001 | ||||||||
Regency Centers Corp. | 7,380 | 351,067 | ||||||||
Simon Property Group Inc. | 43,864 | 6,827,870 | ||||||||
Tanger Factory Outlet Centers | 22,730 | 728,496 | ||||||||
Taubman Centers Inc. | 3,260 | 251,542 | ||||||||
The Macerich Co. | 20,150 | 1,189,858 | ||||||||
| 13,369,335 | ||||||||||
Semiconductor Equipment — 0.0%* | ||||||||||
Rudolph Technologies Inc. | 57,100 | 497,912 | (a) | |||||||
Semiconductors — 0.9% | ||||||||||
Altera Corp. | 55,286 | 1,870,878 | ||||||||
Analog Devices Inc. | 55,285 | 2,082,586 | ||||||||
Intel Corp. | 407,679 | 10,864,646 | ||||||||
Microchip Technology Inc. | 48,364 | 1,599,881 | ||||||||
Microsemi Corp. | 37,500 | 693,375 | (a) | |||||||
Semtech Corp. | 19,400 | 471,808 | (a) | |||||||
Texas Instruments Inc. | 249,911 | 7,169,947 | ||||||||
| 24,753,121 | ||||||||||
See Notes to Schedule of Investments and Notes to Financial Statements.
6
Table of Contents
Total Return Fund
| Schedule of Investments | June 30, 2012 (Unaudited) |
| Number of Shares | Fair Value | |||||||||
Soft Drinks — 1.3% |
| |||||||||
Coca-Cola Enterprises Inc. | 201,564 | $ | 5,651,855 | |||||||
PepsiCo Inc. | 426,477 | 30,134,865 | ||||||||
| 35,786,720 | ||||||||||
Specialized Consumer Services — 0.0%* | ||||||||||
Matthews International Corp. | 2,900 | 94,221 | ||||||||
Specialized Finance — 0.6% | ||||||||||
CME Group Inc. | 57,625 | 15,449,838 | ||||||||
Specialized REITs — 1.1% |
| |||||||||
American Tower Corp. | 155,212 | 10,850,871 | ||||||||
DiamondRock Hospitality Co. | 12,790 | 130,458 | ||||||||
HCP Inc. | 85,253 | 3,763,920 | ||||||||
Healthcare Inc. | 32,930 | 1,919,819 | ||||||||
Host Hotels & Resorts Inc. | 54,710 | 865,512 | ||||||||
LaSalle Hotel Properties | 8,020 | 233,703 | ||||||||
Omega Healthcare Investors Inc. | 47,200 | 1,062,000 | ||||||||
Pebblebrook Hotel Trust | 7,250 | 168,998 | ||||||||
Public Storage | 31,975 | 4,617,510 | ||||||||
Rayonier Inc. | 49,745 | 2,233,551 | ||||||||
RLJ Lodging Trust | 30,120 | 546,076 | ||||||||
Sabra Healthcare REIT Inc. | 22,800 | 390,108 | ||||||||
Senior Housing Properties Trust | 7,080 | 158,026 | ||||||||
Sunstone Hotel Investors Inc. | 12,520 | 137,595 | (a) | |||||||
Ventas Inc. | 32,210 | 2,033,095 | ||||||||
| 29,111,242 | ||||||||||
Specialty Chemicals — 0.0%* |
| |||||||||
Sensient Technologies Corp. | 15,800 | 580,334 | ||||||||
Specialty Stores — 0.2% |
| |||||||||
Dick's Sporting Goods Inc. | 105,676 | 5,072,448 | ||||||||
Steel — 0.2% |
| |||||||||
Allegheny Technologies Inc. | 122,923 | 3,920,014 | ||||||||
Commercial Metals Co. | 40,500 | 511,920 | ||||||||
| 4,431,934 | ||||||||||
Systems Software — 1.7% |
| |||||||||
MICROS Systems Inc. | 18,600 | 952,320 | (a) | |||||||
Microsoft Corp. | 999,187 | 30,565,131 | ||||||||
Oracle Corp. | 451,347 | 13,405,006 | ||||||||
| 44,922,457 | ||||||||||
Tobacco — 0.5% |
| |||||||||
Altria Group Inc. | 158,909 | 5,490,306 | ||||||||
Philip Morris International Inc. | 77,090 | 6,726,873 | ||||||||
| 12,217,179 | ||||||||||
Trading Companies & Distributors — 0.0%* |
| |||||||||
Applied Industrial Technologies Inc. | 25,500 | 939,675 | ||||||||
Trucking — 0.0%* |
| |||||||||
Old Dominion Freight Line Inc. | 24,150 | 1,045,454 | (a) | |||||||
| Number of Shares | Fair Value | |||||||||
Water Utilities — 0.1% |
| |||||||||
American Water Works Company Inc. | 60,800 | $ | 2,084,224 | |||||||
Total Domestic Equity | 1,054,559,128 | |||||||||
Foreign Equity — 17.7% | ||||||||||
Common Stock — 17.3% |
| |||||||||
Advertising — 0.2% |
| |||||||||
WPP PLC | 411,374 | 5,001,309 | ||||||||
Aerospace & Defense — 0.3% |
| |||||||||
Safran S.A. | 218,450 | 8,135,213 | ||||||||
Apparel, Accessories & Luxury Goods — 0.4% |
| |||||||||
Adidas AG | 38,910 | 2,796,811 | ||||||||
Luxottica Group S.p.A. | 117,461 | 4,113,052 | ||||||||
LVMH Moet Hennessy Louis Vuitton S.A. | 33,843 | 5,165,008 | ||||||||
Ports Design Ltd. | 105,497 | 110,795 | ||||||||
| 12,185,666 | ||||||||||
Application Software — 0.3% |
| |||||||||
SAP AG | 152,394 | 9,049,388 | ||||||||
Automobile Manufacturers — 0.6% |
| |||||||||
Astra International Tbk PT | 454,500 | 335,057 | ||||||||
Brilliance China Automotive Holdings Ltd. | 418,585 | 370,002 | (a) | |||||||
Hyundai Motor Co. | 7,236 | 1,485,510 | ||||||||
Kia Motors Corp. | 4,769 | 314,323 | ||||||||
Suzuki Motor Corp. | 275,995 | 5,677,268 | ||||||||
Toyota Motor Corp. | 220,365 | 8,910,582 | ||||||||
| 17,092,742 | ||||||||||
Biotechnology — 0.1% |
| |||||||||
CSL Ltd. | 61,574 | 2,501,329 | ||||||||
Brewers — 0.2% |
| |||||||||
Anadolu Efes Biracilik Ve Malt Sanayii AS | 25,096 | 321,320 | ||||||||
Anheuser-Busch InBev N.V. | 62,761 | 4,962,037 | ||||||||
| 5,283,357 | ||||||||||
Broadcasting — 0.0%* |
| |||||||||
Zee Entertainment Enterprises Ltd. | 52,790 | 140,841 | ||||||||
Casinos & Gaming — 0.0%* |
| |||||||||
Genting Bhd | 188,098 | 561,710 | ||||||||
Sands China Ltd. | 78,568 | 252,791 | ||||||||
| 814,501 | ||||||||||
| See Notes to Schedule of Investments and Notes to Financial Statements. |
7
Table of Contents
Total Return Fund
| Schedule of Investments | June 30, 2012 (Unaudited) |
| Number of Shares | Fair Value | |||||||||
Commodity Chemicals — 0.0%* |
| |||||||||
LG Chem Ltd. | 1,115 | $ | 288,646 | |||||||
Communications Equipment — 0.2% |
| |||||||||
Telefonaktiebolaget LM Ericsson | 505,083 | 4,631,445 | ||||||||
Construction & Engineering — 0.2% |
| |||||||||
China State Construction International Holdings Ltd. | 869,688 | 830,013 | ||||||||
Doosan Heavy Industries & Construction Company Ltd. | 4,401 | 223,577 | ||||||||
JGC Corp. | 74,000 | 2,149,257 | ||||||||
Vinci S.A. | 50,284 | 2,356,621 | ||||||||
| 5,559,468 | ||||||||||
Construction & Farm Machinery & Heavy | ||||||||||
First Tractor Company Ltd. | 244,982 | 197,899 | ||||||||
Kubota Corp. | 349,000 | 3,231,109 | ||||||||
Sany Heavy Equipment International Holdings Company Ltd. | 385,776 | 208,419 | ||||||||
United Tractors Tbk PT | 159,902 | 367,911 | ||||||||
| 4,005,338 | ||||||||||
Construction Materials — 0.2% |
| |||||||||
HeidelbergCement AG | 88,815 | 4,275,911 | ||||||||
Department Stores — 0.0%* |
| |||||||||
Golden Eagle Retail Group Ltd. | 125,312 | 258,004 | ||||||||
Distillers & Vintners — 0.5% |
| |||||||||
Diageo PLC | 418,946 | 10,814,181 | ||||||||
Diageo PLC ADR | 23,491 | 2,421,217 | ||||||||
| 13,235,398 | ||||||||||
Diversified Banks — 0.0%* |
| |||||||||
ICICI Bank Ltd. | 15,767 | 253,245 | ||||||||
Turkiye Halk Bankasi AS | 58,865 | 461,774 | ||||||||
| 715,019 | ||||||||||
Diversified Capital Markets — 0.2% |
| |||||||||
Deutsche Bank AG | 129,028 | 4,670,105 | ||||||||
Diversified Financial Services — 1.6% |
| |||||||||
African Bank Investments Ltd. | 67,533 | 300,450 | ||||||||
Banco Santander Chile ADR | 5,307 | 411,239 | ||||||||
Bank of China Ltd. | 2,105,980 | 809,074 | ||||||||
Bank Rakyat Indonesia Persero Tbk PT | 437,964 | 299,964 | ||||||||
BNP Paribas S.A. | 112,304 | 4,341,994 | ||||||||
Chinatrust Financial Holding Company Ltd. | 695,074 | 401,234 | ||||||||
Credicorp Ltd. | 4,934 | 621,141 | ||||||||
Grupo Financiero Banorte SAB de C.V. | 86,244 | 442,850 | ||||||||
| Number of Shares | Fair Value | |||||||||
HSBC Holdings PLC | 1,307,531 | $ | 11,538,668 | |||||||
Industrial & Commercial Bank of China | 1,097,433 | 615,295 | ||||||||
ING Groep N.V. | 489,417 | 3,290,305 | (a) | |||||||
Lloyds Banking Group PLC | 5,192,482 | 2,540,299 | (a) | |||||||
Malayan Banking Bhd | 128,300 | 352,880 | ||||||||
Metropolitan Bank & Trust | 312,816 | 690,421 | ||||||||
Sberbank of Russia ADR | 60,006 | 649,337 | ||||||||
Shinhan Financial Group Company Ltd. | 12,020 | 421,392 | ||||||||
Standard Bank Group Ltd. | 14,223 | 192,723 | ||||||||
Standard Chartered PLC | 349,764 | 7,609,069 | ||||||||
United Overseas Bank Ltd. | 535,705 | 7,954,653 | ||||||||
| 43,482,988 | ||||||||||
Diversified Metals & Mining — 0.6% |
| |||||||||
Anglo American PLC | 15,268 | 502,525 | ||||||||
Antofagasta PLC | 45,970 | 787,511 | ||||||||
BHP Billiton PLC | 261,730 | 7,449,925 | ||||||||
Rio Tinto PLC | 142,882 | 6,800,245 | ||||||||
| 15,540,206 | ||||||||||
Diversified Real Estate Activities — 0.3% |
| |||||||||
Daito Trust Construction Company Ltd. | 26,000 | 2,469,072 | ||||||||
Sumitomo Realty & Development Company Ltd. | 212,000 | 5,223,906 | ||||||||
Wharf Holdings Ltd. | 196,709 | 1,095,331 | ||||||||
| 8,788,309 | ||||||||||
Diversified Support Services — 0.3% |
| |||||||||
Aggreko PLC | 140,822 | 4,586,350 | ||||||||
Brambles Ltd. | 722,013 | 4,586,157 | ||||||||
| 9,172,507 | ||||||||||
Drug Retail — 0.0%* |
| |||||||||
Raia Drogasil S.A. | 39,827 | 399,562 | ||||||||
Electric Utilities — 0.1% |
| |||||||||
Power Grid Corporation of India Ltd. | 752,567 | 1,542,306 | ||||||||
Electrical Components & Equipment — 0.0%* |
| |||||||||
Zhuzhou CSR Times Electric Company Ltd. | 186,599 | 515,077 | ||||||||
Electronic Components — 0.0%* |
| |||||||||
Largan Precision Company Ltd. | 17,000 | 355,473 | (a) | |||||||
Electronic Equipment & Instruments — 0.1% |
| |||||||||
Hexagon AB | 194,504 | 3,345,921 | ||||||||
Electronic Manufacturing Services — 0.0%* |
| |||||||||
Hon Hai Precision Industry Company Ltd. | 243,086 | 734,981 | ||||||||
| See Notes to Schedule of Investments and Notes to Financial Statements. |
8
Table of Contents
Total Return Fund
| Schedule of Investments | June 30, 2012 (Unaudited) |
| Number of Shares | Fair Value | |||||||||
Fertilizers & Agricultural Chemicals — 0.6% |
| |||||||||
Potash Corporation of Saskatchewan Inc.†† | 73,715 | $ | 3,220,608 | |||||||
Potash Corporation of Saskatchewan Inc.†† | 120,876 | 5,276,357 | ||||||||
Sociedad Quimica y Minera de Chile S.A. ADR | 15,725 | 875,411 | ||||||||
Syngenta AG | 19,829 | 6,806,968 | ||||||||
| 16,179,344 | ||||||||||
Food Retail — 0.1% |
| |||||||||
Magnit OJSC GDR | 21,229 | 638,568 | ||||||||
President Chain Store Corp. | 64,991 | 346,765 | (a) | |||||||
Shoprite Holdings Ltd. | 52,919 | 976,564 | ||||||||
TESCO PLC | 38,726 | 188,478 | ||||||||
| 2,150,375 | ||||||||||
Healthcare Services — 0.3% |
| |||||||||
Diagnosticos da America S.A. | 29,941 | 195,953 | ||||||||
Fresenius SE & Company KGaA | 80,267 | 8,333,975 | ||||||||
| 8,529,928 | ||||||||||
Healthcare Supplies — 0.3% |
| |||||||||
Cie Generale d'Optique Essilor International S.A. | 85,036 | 7,921,983 | ||||||||
Shandong Weigao Group Medical Polymer Company Ltd. | 150,447 | 167,965 | ||||||||
| 8,089,948 | ||||||||||
Heavy Electrical Equipment — 0.1% |
| |||||||||
ABB Ltd. ADR | 120,939 | 1,973,724 | ||||||||
Dongfang Electric Corporation Ltd. | 113,284 | 232,624 | ||||||||
| 2,206,348 | ||||||||||
Highways & Railtracks — 0.0%* |
| |||||||||
CCR S.A. | 40,590 | 328,388 | ||||||||
Household Appliances — 0.0%* |
| |||||||||
Techtronic Industries Co. | 276,781 | 351,475 | ||||||||
Household Products — 0.6% |
| |||||||||
Reckitt Benckiser Group PLC | 127,346 | 6,741,007 | ||||||||
Unicharm Corp. | 145,200 | 8,279,984 | ||||||||
| 15,020,991 | ||||||||||
Human Resource & Employment Services — 0.2% | ||||||||||
Capita PLC | 546,040 | 5,619,140 | ||||||||
Industrial Conglomerates — 0.1% |
| |||||||||
Chongqing Machinery & Electric Company Ltd. | 148,600 | 20,224 | ||||||||
Siemens AG | 36,510 | 3,076,435 | ||||||||
| 3,096,659 | ||||||||||
Industrial Gases — 0.4% |
| |||||||||
Linde AG | 64,908 | 10,137,174 | ||||||||
| Number of Shares | Fair Value | |||||||||
Industrial Machinery — 0.8% |
| |||||||||
Alfa Laval AB | 225,462 | $ | 3,871,660 | |||||||
FANUC Corp. | 43,400 | 7,147,100 | ||||||||
Mitsubishi Heavy Industries Ltd. | 787,000 | 3,205,098 | ||||||||
Nikon Corp. | 67,458 | 2,057,202 | ||||||||
SMC Corp. | 20,600 | 3,578,071 | ||||||||
Vallourec S.A. | 49,120 | 2,012,732 | ||||||||
| 21,871,863 | ||||||||||
Integrated Oil & Gas — 1.5% | ||||||||||
BG Group PLC | 457,289 | 9,375,124 | (a) | |||||||
Cenovus Energy Inc. | 23,816 | 756,216 | ||||||||
China Petroleum & Chemical Corp. | 746,496 | 667,258 | ||||||||
Eni S.p.A. | 220,941 | 4,707,093 | ||||||||
Gazprom OAO ADR | 83,498 | 793,231 | ||||||||
Lukoil OAO ADR | 15,302 | 858,136 | ||||||||
Petroleo Brasileiro S.A. ADR | 126,517 | 2,295,018 | ||||||||
Royal Dutch Shell PLC | 249,294 | 8,411,784 | ||||||||
Royal Dutch Shell PLC ADR | 55,273 | 3,727,058 | ||||||||
Suncor Energy Inc. | 212,957 | 6,149,840 | ||||||||
Total S.A. | 35,842 | 1,617,734 | ||||||||
| 39,358,492 | ||||||||||
Internet Software & Services — 0.7% | ||||||||||
Baidu Inc. ADR | 167,372 | 19,244,433 | (a) | |||||||
IT Consulting & Other Services — 0.1% | ||||||||||
Cap Gemini S.A. | 87,048 | 3,212,851 | ||||||||
HCL Technologies Ltd. | 46,105 | 394,630 | ||||||||
Infosys Ltd. | 6,394 | 288,579 | ||||||||
| 3,896,060 | ||||||||||
Life & Health Insurance — 0.9% | ||||||||||
AIA Group Ltd. | 2,715,020 | 9,379,164 | ||||||||
Ping An Insurance Group Co. | 33,515 | 270,816 | ||||||||
Prudential PLC | 823,155 | 9,558,509 | ||||||||
Sony Financial Holdings Inc. | 243,800 | 3,986,459 | ||||||||
| 23,194,948 | ||||||||||
Life Sciences Tools & Services — 0.0%* | ||||||||||
ICON PLC ADR | 22,200 | 500,166 | (a) | |||||||
Managed Healthcare — 0.0%* | ||||||||||
Odontoprev S.A. | 53,022 | 267,940 | ||||||||
Marine Ports & Services — 0.0%* | ||||||||||
Adani Ports and Special Economic Zone | 171,869 | 374,493 | ||||||||
Multi-Line Insurance — 0.3% | ||||||||||
AXA S.A. | 235,062 | 3,151,291 | ||||||||
Zurich Insurance Group AG | 19,818 | 4,493,872 | ||||||||
| 7,645,163 | ||||||||||
Multi-Utilities — 0.3% | ||||||||||
National Grid PLC | 764,695 | 8,116,161 | ||||||||
| See Notes to Schedule of Investments and Notes to Financial Statements. |
9
Table of Contents
Total Return Fund
| Schedule of Investments | June 30, 2012 (Unaudited) |
| Number of Shares | Fair Value | |||||||||
Office Electronics — 0.0%* | ||||||||||
Canon Inc. | 29,285 | $ | 1,170,903 | |||||||
Oil & Gas Equipment & Services — 0.0%* | ||||||||||
Subsea 7 S.A. | 34,770 | 688,588 | ||||||||
Oil & Gas Exploration & Production — 0.1% | ||||||||||
Afren PLC | 368,282 | 599,539 | (a) | |||||||
Canadian Natural Resources Ltd. | 34,185 | 915,780 | ||||||||
CNOOC Ltd. | 329,056 | 663,510 | ||||||||
Pacific Rubiales Energy Corp. | 11,193 | 236,717 | ||||||||
| 2,415,546 | ||||||||||
Packaged Foods &; Meats — 0.7% | ||||||||||
Nestle S.A. | 196,334 | 11,749,599 | ||||||||
Nestle S.A. ADR | 33,402 | 1,995,435 | ||||||||
Thai Union Frozen Products PCL | 199,072 | 449,730 | ||||||||
Unilever N.V. | 143,453 | 4,805,554 | ||||||||
| 19,000,318 | ||||||||||
Pharmaceuticals — 0.8% | ||||||||||
Aspen Pharmacare Holdings Ltd. | 17,531 | 270,029 | ||||||||
Bayer AG | 60,142 | 4,345,948 | ||||||||
Novartis AG | 136,988 | 7,680,623 | ||||||||
Novartis AG ADR | 98,790 | 5,522,361 | ||||||||
Roche Holding AG | 24,059 | 4,167,417 | ||||||||
| 21,986,378 | ||||||||||
Real Estate Operating Companies — 0.0%* | ||||||||||
Iguatemi Empresa de Shopping Centers S.A. | 21,372 | 439,415 | (a) | |||||||
Regional Banks — 0.1% | ||||||||||
The Bank of Yokohama Ltd. | 771,948 | 3,656,503 | ||||||||
Semiconductors — 0.8% |
| |||||||||
Samsung Electronics Company Ltd. | 10,884 | 11,526,011 | ||||||||
Taiwan Semiconductor Manufacturing Company Ltd. | 3,481,433 | 9,530,305 | (a) | |||||||
Taiwan Semiconductor Manufacturing Company Ltd. ADR | 28,483 | 397,622 | (a) | |||||||
| 21,453,938 | ||||||||||
Thrifts & Mortgage Finance — 0.0%* |
| |||||||||
Housing Development Finance Corp. | 36,978 | 434,381 | ||||||||
Tobacco — 0.0%* |
| |||||||||
ITC Ltd. | 126,569 | 591,667 | ||||||||
Trading Companies & Distributors — 0.2% |
| |||||||||
Mitsubishi Corp. | 196,700 | 3,983,375 | ||||||||
| Number of Shares | Fair Value | |||||||||
Wireless Telecommunication Services — 0.7% |
| |||||||||
America Movil SAB de C.V. ADR | 29,839 | $ | 777,604 | |||||||
Millicom International Cellular S.A. | 4,171 | 394,500 | ||||||||
MTN Group Ltd. | 19,980 | 345,838 | ||||||||
Softbank Corp. | 196,198 | 7,316,477 | ||||||||
Vodafone Group PLC | 3,322,811 | 9,353,321 | ||||||||
| 18,187,740 | ||||||||||
Total Common Stock | 471,909,251 | |||||||||
Preferred Stock — 0.4% | ||||||||||
Automobile Manufacturers — 0.2% |
| |||||||||
Volkswagen AG | 38,983 | 6,193,321 | ||||||||
Diversified Financial Services — 0.0%* |
| |||||||||
Itau Unibanco Holding S.A. | 56,640 | 793,850 | ||||||||
Electric Utilities — 0.0%* |
| |||||||||
Cia Energetica de Minas Gerais | 19,473 | 362,061 | ||||||||
Hypermarkets & Super Centers — 0.0%* |
| |||||||||
Cia Brasileira de Distribuicao Grupo Pao de Acucar | 7,261 | 287,785 | ||||||||
Integrated Oil & Gas — 0.0%* |
| |||||||||
Petroleo Brasileiro S.A. | 51,227 | 463,174 | ||||||||
Multi-Line Insurance — 0.1% |
| |||||||||
XLIT Ltd 3.58%. | 1,655 | 1,206,081 | (i) | |||||||
Steel — 0.1% |
| |||||||||
Vale S.A. | 66,891 | 1,297,754 | ||||||||
Total Preferred Stock | 10,604,026 | |||||||||
Total Foreign Equity | 482,513,277 | |||||||||
| Principal Amount | Fair Value | |||||||||||
Bonds and Notes — 27.7% |
| |||||||||||
U.S. Treasuries — 4.4% |
| |||||||||||
U.S. Treasury Bonds |
| |||||||||||
3.00% | 05/15/42 | $ | 19,639,500 | $ | 20,569,313 | (h) | ||||||
3.13% | 02/15/42 | 29,923,900 | 32,140,124 | (h) | ||||||||
See Notes to Schedule of Investments and Notes to Financial Statements.
10
Table of Contents
Total Return Fund
| Schedule of Investments | June 30, 2012 (Unaudited) |
| Principal Amount | Fair Value | |||||||||||
U.S. Treasury Notes |
| |||||||||||
0.32% | 03/31/14 | $ | 11,190,700 | $ | 11,177,585 | (d,h) | ||||||
0.68% | 01/31/17 | 653,200 | 658,865 | (d,h) | ||||||||
0.72% | 05/31/17 | 31,606,800 | 31,461,124 | (d,h) | ||||||||
1.75% | 05/15/22 | 23,138,900 | 23,326,904 | (h) | ||||||||
| 119,333,915 | ||||||||||||
Agency Mortgage Backed — 11.2% |
| |||||||||||
Federal Home Loan Mortgage Corp. | ||||||||||||
2.38% | 01/13/22 | 4,992,000 | 5,123,060 | |||||||||
4.50% | 06/01/33 - 02/01/35 | 21,650 | 23,178 | (h) | ||||||||
5.00% | 07/01/35 - 06/01/41 | 4,720,208 | 5,229,603 | (h) | ||||||||
5.50% | 05/01/20 - 04/01/39 | 2,141,228 | 2,375,890 | (h) | ||||||||
6.00% | 04/01/17 - 11/01/37 | 2,173,549 | 2,421,434 | (h) | ||||||||
6.50% | 06/01/29 - 03/01/30 | 2,880 | 3,296 | (h) | ||||||||
7.00% | 06/01/29 - 08/01/36 | 115,225 | 135,568 | (h) | ||||||||
7.50% | 01/01/28 - 09/01/33 | 16,018 | 18,818 | (h) | ||||||||
8.00% | 01/01/30 - 11/01/30 | 10,541 | 12,672 | (h) | ||||||||
9.00% | 10/01/25 | 305 | 377 | (h) | ||||||||
Federal National Mortgage Assoc. | ||||||||||||
2.72% | 04/01/37 | 4,274 | 4,456 | (i) | ||||||||
2.89% | 03/01/37 | 6,871 | 6,965 | (i) | ||||||||
4.00% | 05/01/19 - 05/01/42 | 63,033,638 | 67,335,375 | (h) | ||||||||
4.50% | 05/01/18 - 04/01/41 | 42,493,119 | 45,711,855 | (h) | ||||||||
5.00% | 07/01/20 - 06/01/41 | 8,648,423 | 9,598,001 | (h) | ||||||||
5.50% | 04/01/14 - 01/01/39 | 18,423,185 | 20,215,932 | (h) | ||||||||
6.00% | 09/01/19 - 08/01/35 | 4,129,992 | 4,638,302 | (h) | ||||||||
6.50% | 09/01/17 - 08/01/36 | 333,657 | 376,707 | (h) | ||||||||
7.00% | 04/01/17 - 12/01/33 | 5,986 | 6,665 | (h) | ||||||||
7.50% | 09/01/13 - 03/01/34 | 36,366 | 42,301 | (h) | ||||||||
8.00% | 12/01/15 - 11/01/33 | 12,507 | 15,170 | (h) | ||||||||
9.00% | 12/01/17 - 12/01/22 | 2,921 | 3,370 | (h) | ||||||||
3.50% | TBA | 65,580,000 | 68,984,325 | (c) | ||||||||
4.00% | TBA | 3,895,000 | 4,145,132 | (c) | ||||||||
4.50% | TBA | 350,000 | 375,430 | (c) | ||||||||
5.00% | TBA | 13,535,000 | 14,647,408 | (c) | ||||||||
6.00% | TBA | 9,810,000 | 10,780,270 | (c) | ||||||||
6.50% | TBA | 5,044,000 | 5,676,076 | (c) | ||||||||
Government National Mortgage Assoc. | ||||||||||||
4.50% | 08/15/33 - 03/20/41 | 19,753,594 | 21,791,061 | (h) | ||||||||
6.00% | 04/15/27 - 09/15/36 | 347,218 | 395,626 | (h) | ||||||||
6.50% | 04/15/24 - 09/15/36 | 229,249 | 266,249 | (h) | ||||||||
7.00% | 06/15/34 - 10/15/36 | 184,035 | 218,102 | (h) | ||||||||
8.00% | 03/15/30 | 3,065 | 3,241 | (h) | ||||||||
9.00% | 11/15/16 - 12/15/21 | 7,234 | 8,050 | (h) | ||||||||
4.00% | TBA | 6,635,000 | 7,245,627 | (c) | ||||||||
4.50% | TBA | 5,680,000 | 6,243,562 | (c) | ||||||||
| 304,079,154 | ||||||||||||
Agency Collateralized Mortgage Obligations — 0.2% | ||||||||||||
Federal Home Loan Mortgage Corp. | ||||||||||||
0.08% | 09/25/43 | 240,857 | 1,944 | (g,h,i) | ||||||||
| Principal Amount | Fair Value | |||||||||||
Federal Home Loan Mortgage Corp. REMIC | ||||||||||||
3.50% | 11/15/24 - 11/15/30 | $ | 10,765,236 | $ | 1,291,627 | (g,n) | ||||||
4.50% | 02/15/18 - 03/15/18 | 28,978 | 1,381 | (g,h,n) | ||||||||
5.00% | 07/15/17 - 02/15/38 | 370,193 | 27,701 | (g,h,n) | ||||||||
5.50% | 06/15/33 | 24,890 | 3,565 | (g,h,n) | ||||||||
6.36% | 08/15/25 | 3,142,296 | 453,017 | (g,i) | ||||||||
7.50% | 07/15/27 | 2,657 | 586 | (g,h,n) | ||||||||
Federal Home Loan Mortgage Corp. STRIPS | ||||||||||||
3.33% | 08/01/27 | 457 | 402 | (d,f,h) | ||||||||
8.00% | 02/01/23 - 07/01/24 | 1,774 | 362 | (g,h,n) | ||||||||
Federal National Mortgage Assoc. REMIC | ||||||||||||
1.19% | 12/25/42 | 116,387 | 3,269 | (g,h,i) | ||||||||
3.50% | 05/25/27 | 2,341,170 | 298,472 | (g,n) | ||||||||
4.50% | 05/25/18 | 3,312 | 37 | (g,h,n) | ||||||||
5.00% | 10/25/22 - 09/25/40 | 5,004,306 | 632,329 | (g,h,n) | ||||||||
5.75% | 07/25/38 | 1,389,042 | 184,353 | (g,i) | ||||||||
8.00% | 05/25/22 | 2 | 51 | (g,h,n) | ||||||||
Federal National Mortgage Assoc. STRIPS | ||||||||||||
4.50% | 08/01/35 - 01/01/36 | 1,228,908 | 142,464 | (g,n) | ||||||||
5.00% | 03/25/38 - 05/25/38 | 778,454 | 104,544 | (g,n) | ||||||||
5.50% | 12/01/33 | 123,701 | 16,967 | (g,n) | ||||||||
6.00% | 01/01/35 | 469,260 | 81,940 | (g,n) | ||||||||
7.50% | 11/01/23 | 7,897 | 1,680 | (g,h,n) | ||||||||
8.00% | 08/01/23 - 07/01/24 | 3,635 | 780 | (g,h,n) | ||||||||
Government National Mortgage Assoc. | ||||||||||||
4.50% | 10/20/37 - 08/16/39 | 6,906,533 | 789,077 | (g,n) | ||||||||
5.00% | 12/20/35 - 09/20/38 | 5,700,549 | 565,738 | (g,n) | ||||||||
6.41% | 06/20/40 | 11,949,201 | 1,850,861 | (g,i) | ||||||||
| 6,453,147 | ||||||||||||
Asset Backed — 0.3% |
| |||||||||||
Bear Stearns Asset Backed Securities Trust | ||||||||||||
3.46% | 02/25/36 | 573,405 | 559,426 | (d,h,i) | ||||||||
5.74% | 01/25/34 | 4,239 | 3,241 | (d,h,i) | ||||||||
Capital One Multi-Asset Execution Trust | ||||||||||||
1.07% | 01/15/19 | 500,000 | 490,013 | (d,i) | ||||||||
Chase Funding Mortgage Loan Asset-Backed Certificates | ||||||||||||
3.99% | 11/25/33 | 1,019,489 | 911,903 | (h) | ||||||||
Citicorp Residential Mortgage Securities Inc. | ||||||||||||
6.04% | 09/25/36 | 3,750,000 | 2,759,706 | (h) | ||||||||
Countrywide Asset-Backed Certificates | ||||||||||||
1.30% | 06/26/33 | 586,601 | 249,213 | (h,i) | ||||||||
Hertz Vehicle Financing LLC | ||||||||||||
2.60% | 02/25/15 | 1,500,000 | 1,529,892 | (b,h) | ||||||||
Mid-State Trust | ||||||||||||
7.54% | 07/01/35 | 3,217 | 3,265 | |||||||||
Popular ABS Mortgage Pass-Through Trust | ||||||||||||
5.30% | 11/25/35 | 700,000 | 413,748 | (h) | ||||||||
See Notes to Schedule of Investments and Notes to Financial Statements.
11
Table of Contents
Total Return Fund
| Schedule of Investments | June 30, 2012 (Unaudited) |
| Principal Amount | Fair Value | |||||||||||
Residential Asset Securities Corp. | ||||||||||||
14.91% | 07/25/32 | $ | 3,673 | $ | 2,240 | (d,h,i) | ||||||
| 6,922,647 | ||||||||||||
Corporate Notes — 9.8% |
| |||||||||||
ABB Finance USA Inc. | ||||||||||||
1.63% | 05/08/17 | 945,000 | 949,564 | (h) | ||||||||
2.88% | 05/08/22 | 945,000 | 955,920 | (h) | ||||||||
AES Panama S.A. | ||||||||||||
6.35% | 12/21/16 | 443,000 | 476,225 | (b,h) | ||||||||
Agilent Technologies Inc. | ||||||||||||
5.50% | 09/14/15 | 909,000 | 1,017,227 | (h) | ||||||||
Air Jamaica Ltd. | ||||||||||||
9.38% | 07/08/15 | 165,000 | 171,188 | |||||||||
Allergan Inc. | ||||||||||||
3.38% | 09/15/20 | 655,000 | 696,712 | (h) | ||||||||
ALROSA Finance S.A. | ||||||||||||
7.75% | 11/03/20 | 600,000 | 628,362 | (b,h) | ||||||||
America Movil SAB de C.V. | ||||||||||||
2.38% | 09/08/16 | 3,032,000 | 3,110,532 | (h) | ||||||||
American Axle & Manufacturing Inc. | ||||||||||||
7.88% | 03/01/17 | 865,000 | 893,113 | (h) | ||||||||
American Express Credit Corp. | ||||||||||||
1.75% | 06/12/15 | 1,413,000 | 1,429,049 | |||||||||
American International Group Inc. | ||||||||||||
4.88% | 06/01/22 | 708,000 | 724,441 | (h) | ||||||||
Amgen Inc. | ||||||||||||
2.13% | 05/15/17 | 472,000 | 477,541 | (h) | ||||||||
2.30% | 06/15/16 | 701,000 | 720,468 | (h) | ||||||||
2.50% | 11/15/16 | 470,000 | 488,330 | (h) | ||||||||
3.63% | 05/15/22 | 472,000 | 488,088 | (h) | ||||||||
5.38% | 05/15/43 | 472,000 | 510,583 | (h) | ||||||||
5.65% | 06/15/42 | 1,055,000 | 1,177,299 | (h) | ||||||||
Amphenol Corp. | ||||||||||||
4.00% | 02/01/22 | 1,875,000 | 1,910,128 | (h) | ||||||||
Amsted Industries Inc. | ||||||||||||
8.13% | 03/15/18 | 416,000 | 439,920 | (b,h) | ||||||||
Anadarko Petroleum Corp. | ||||||||||||
5.95% | 09/15/16 | 794,000 | 901,014 | (h) | ||||||||
6.38% | 09/15/17 | 531,000 | 616,828 | (h) | ||||||||
Anheuser-Busch InBev Worldwide Inc. | ||||||||||||
3.63% | 04/15/15 | 1,433,000 | 1,534,395 | (h) | ||||||||
5.38% | 11/15/14 | 1,296,000 | 1,428,734 | (h) | ||||||||
Apache Corp. | ||||||||||||
4.75% | 04/15/43 | 950,000 | 1,055,234 | (h) | ||||||||
Arch Coal Inc. | ||||||||||||
7.00% | 06/15/19 | 893,000 | 754,585 | |||||||||
Archer-Daniels-Midland Co. | ||||||||||||
5.77% | 03/01/41 | 1,698,000 | 2,159,406 | (h) | ||||||||
Arizona Public Service Co. | ||||||||||||
6.25% | 08/01/16 | 273,000 | 320,245 | (h) | ||||||||
AT&T Inc. | ||||||||||||
0.90% | 02/13/15 | 1,895,000 | 1,893,584 | (d,h) | ||||||||
1.60% | 02/15/17 | 948,000 | 949,213 | (h) | ||||||||
2.95% | 05/15/16 | 844,000 | 893,943 | (h) | ||||||||
5.55% | 08/15/41 | 665,000 | 792,651 | (h) | ||||||||
5.60% | 05/15/18 | 165,000 | 197,482 | (h) | ||||||||
6.40% | 05/15/38 | 2,084,000 | 2,622,997 | (h) | ||||||||
| Principal Amount | Fair Value | |||||||||||
Banco del Estado de Chile | ||||||||||||
3.88% | 02/08/22 | $ | 200,000 | $ | 203,430 | (b,h) | ||||||
Banco do Nordeste do Brasil S.A. | ||||||||||||
3.63% | 11/09/15 | 200,000 | 202,000 | (b,h) | ||||||||
Banco Mercantil del Norte S.A. | ||||||||||||
6.86% | 10/13/21 | 100,000 | 103,500 | (b,h,i) | ||||||||
Bank of America Corp. | ||||||||||||
3.88% | 03/22/17 | 1,424,000 | 1,450,625 | (h) | ||||||||
5.63% | 10/14/16 | 475,000 | 504,812 | (h) | ||||||||
5.70% | 01/24/22 | 2,496,000 | 2,748,830 | (h) | ||||||||
5.75% | 12/01/17 | 955,000 | 1,019,172 | (h) | ||||||||
5.88% | 02/07/42 | 474,000 | 519,210 | (h) | ||||||||
6.50% | 08/01/16 | 510,000 | 560,048 | (h) | ||||||||
Barclays Bank PLC | ||||||||||||
2.25% | 05/10/17 | 2,354,000 | 2,353,861 | (b,h) | ||||||||
Baxter International Inc. | ||||||||||||
1.85% | 01/15/17 | 1,128,000 | 1,152,639 | (h) | ||||||||
Berkshire Hathaway Finance Corp. | ||||||||||||
1.60% | 05/15/17 | 944,000 | 950,573 | (h) | ||||||||
3.00% | 05/15/22 | 1,416,000 | 1,432,899 | |||||||||
Berkshire Hathaway Inc. | ||||||||||||
3.75% | 08/15/21 | 457,000 | 487,519 | |||||||||
BG Energy Capital PLC | ||||||||||||
2.88% | 10/15/16 | 486,000 | 512,113 | (b,h) | ||||||||
4.00% | 10/15/21 | 475,000 | 506,851 | (b,h) | ||||||||
BHP Billiton Finance USA Ltd. | ||||||||||||
1.63% | 02/24/17 | 1,414,000 | 1,423,716 | (h) | ||||||||
Bombardier Inc. | ||||||||||||
7.75% | 03/15/20 | 1,251,000 | 1,391,738 | (b,h) | ||||||||
Boston Properties LP (REIT) | ||||||||||||
3.85% | 02/01/23 | 943,000 | 951,859 | |||||||||
BP Capital Markets PLC | ||||||||||||
1.85% | 05/05/17 | 661,000 | 667,574 | (h) | ||||||||
2.25% | 11/01/16 | 1,425,000 | 1,467,560 | (h) | ||||||||
3.25% | 05/06/22 | 1,418,000 | 1,468,183 | (h) | ||||||||
Broadcom Corp. | ||||||||||||
2.70% | 11/01/18 | 949,000 | 978,492 | |||||||||
Calpine Corp. | ||||||||||||
7.25% | 10/15/17 | 887,000 | 953,525 | (b,h) | ||||||||
Cameron International Corp. | ||||||||||||
1.60% | 04/30/15 | 472,000 | 472,336 | |||||||||
3.60% | 04/30/22 | 472,000 | 472,764 | |||||||||
Cardinal Health Inc. | ||||||||||||
1.90% | 06/15/17 | 1,416,000 | 1,426,603 | |||||||||
Cargill Inc. | ||||||||||||
5.20% | 01/22/13 | 2,235,000 | 2,288,381 | (b,h) | ||||||||
Carolina Power & Light Co. | ||||||||||||
2.80% | 05/15/22 | 1,763,000 | 1,791,929 | |||||||||
Case New Holland Inc. | ||||||||||||
7.88% | 12/01/17 | 507,000 | 585,585 | |||||||||
Caterpillar Inc. | ||||||||||||
1.50% | 06/26/17 | 1,073,000 | 1,074,486 | |||||||||
2.60% | 06/26/22 | 894,000 | 891,657 | |||||||||
CBS Corp. | ||||||||||||
1.95% | 07/01/17 | 448,000 | 447,552 | |||||||||
4.85% | 07/01/42 | 448,000 | 438,484 | |||||||||
CCO Holdings LLC | ||||||||||||
8.13% | 04/30/20 | 739,000 | 823,985 | |||||||||
Central American Bank for Economic Integration | ||||||||||||
5.38% | 09/24/14 | 770,000 | 823,634 | (b) | ||||||||
| See Notes to Schedule of Investments and Notes to Financial Statements. |
12
Table of Contents
Total Return Fund
| Schedule of Investments | June 30, 2012 (Unaudited) |
| Principal Amount | Fair Value | |||||||||||
CenturyLink Inc. | ||||||||||||
5.80% | 03/15/22 | $ | 671,000 | $ | 667,984 | |||||||
7.65% | 03/15/42 | 688,000 | 667,746 | |||||||||
Cigna Corp. | ||||||||||||
2.75% | 11/15/16 | 3,169,000 | 3,264,932 | (h) | ||||||||
5.38% | 02/15/42 | 948,000 | 1,008,668 | (h) | ||||||||
Cincinnati Bell Inc. | ||||||||||||
8.25% | 10/15/17 | �� | 626,000 | 651,040 | (h) | |||||||
Citigroup Inc. | ||||||||||||
4.45% | 01/10/17 | 1,897,000 | 1,988,517 | |||||||||
5.00% | 09/15/14 | 3,057,000 | 3,133,630 | (h) | ||||||||
5.88% | 01/30/42 | 706,000 | 771,069 | |||||||||
6.13% | 08/25/36 | 470,000 | 462,281 | |||||||||
CityCenter Holdings LLC | ||||||||||||
7.63% | 01/15/16 | 506,000 | 533,830 | |||||||||
CNA Financial Corp. | ||||||||||||
5.88% | 08/15/20 | 927,000 | 1,019,379 | (h) | ||||||||
CNPC HK Overseas Capital Ltd. | ||||||||||||
4.50% | 04/28/21 | 200,000 | 213,877 | (b) | ||||||||
Columbus International Inc. | ||||||||||||
11.50% | 11/20/14 | 200,000 | 213,008 | (b) | ||||||||
Comision Federal de Electricidad | ||||||||||||
4.88% | 05/26/21 | 1,075,000 | 1,161,000 | (b,h) | ||||||||
Consolidated Edison Company of New York Inc. | ||||||||||||
5.85% | 04/01/18 | 1,505,000 | 1,833,951 | (h) | ||||||||
6.65% | 04/01/19 | 528,000 | 670,221 | (h) | ||||||||
Corning Inc. | ||||||||||||
4.75% | 03/15/42 | 1,109,000 | 1,162,114 | |||||||||
Corp Lindley S.A. | ||||||||||||
6.75% | 11/23/21 | 85,000 | 91,800 | (b) | ||||||||
Corp Nacional del Cobre de Chile | ||||||||||||
3.75% | 11/04/20 | 871,000 | 908,353 | (b,h) | ||||||||
5.63% | 09/21/35 | 134,000 | 156,698 | (b,h) | ||||||||
Covidien International Finance S.A. | ||||||||||||
1.35% | 05/29/15 | 944,000 | 945,226 | |||||||||
3.20% | 06/15/22 | 944,000 | 973,237 | |||||||||
Credit Suisse AG | ||||||||||||
2.60% | 05/27/16 | 1,009,000 | 1,036,615 | (b) | ||||||||
Crown Castle Towers LLC | ||||||||||||
4.88% | 08/15/40 | 1,250,000 | 1,357,145 | (b,h) | ||||||||
6.11% | 01/15/40 | 326,000 | 377,383 | (b,h) | ||||||||
CSX Corp. | ||||||||||||
4.25% | 06/01/21 | 909,000 | 992,743 | |||||||||
CVS Caremark Corp. | ||||||||||||
3.25% | 05/18/15 | 365,000 | 384,198 | |||||||||
5.75% | 06/01/17 | 735,000 | 868,025 | |||||||||
DaVita Inc. | ||||||||||||
6.38% | 11/01/18 | 843,000 | 870,398 | (h) | ||||||||
DDR Corp. (REIT) | ||||||||||||
4.63% | 07/15/22 | 626,000 | 617,815 | |||||||||
Deere & Co. | ||||||||||||
2.60% | 06/08/22 | 942,000 | 940,352 | |||||||||
3.90% | 06/09/42 | 848,000 | 842,491 | |||||||||
Denbury Resources Inc. | ||||||||||||
6.38% | 08/15/21 | 761,000 | 791,440 | (h) | ||||||||
8.25% | 02/15/20 | 399,000 | 436,905 | (h) | ||||||||
DENTSPLY International Inc. | ||||||||||||
2.75% | 08/15/16 | 1,456,000 | 1,480,337 | (h) | ||||||||
4.13% | 08/15/21 | 953,000 | 992,143 | (h) | ||||||||
| Principal Amount | Fair Value | |||||||||||
Deutsche Telekom International Finance BV | ||||||||||||
2.25% | 03/06/17 | $ | 474,000 | $ | 468,367 | (b,h) | ||||||
Development Bank of Kazakhstan JSC | ||||||||||||
5.50% | 12/20/15 | 200,000 | 208,250 | (b,h) | ||||||||
Devon Energy Corp. | ||||||||||||
1.88% | 05/15/17 | 944,000 | 944,166 | (h) | ||||||||
Diageo Capital PLC | ||||||||||||
1.50% | 05/11/17 | 1,416,000 | 1,421,217 | (h) | ||||||||
Diageo Investment Corp. | ||||||||||||
2.88% | 05/11/22 | 1,416,000 | 1,454,589 | (h) | ||||||||
4.25% | 05/11/42 | 378,000 | 400,024 | (h) | ||||||||
DIRECTV Holdings LLC | ||||||||||||
2.40% | 03/15/17 | 964,000 | 970,348 | (h) | ||||||||
3.80% | 03/15/22 | 482,000 | 487,443 | (h) | ||||||||
4.60% | 02/15/21 | 945,000 | 1,005,043 | (h) | ||||||||
4.75% | 10/01/14 | 1,026,000 | 1,101,337 | (h) | ||||||||
5.15% | 03/15/42 | 964,000 | 970,217 | (h) | ||||||||
Dominion Resources Inc. | ||||||||||||
1.95% | 08/15/16 | 667,000 | 679,696 | (h) | ||||||||
4.90% | 08/01/41 | 398,000 | 449,801 | (h) | ||||||||
DPL Inc. | ||||||||||||
7.25% | 10/15/21 | 844,000 | 936,840 | (b,h) | ||||||||
Duke Realty LP (REIT) | ||||||||||||
6.50% | 01/15/18 | 986,000 | 1,117,544 | (h) | ||||||||
Eastman Chemical Co. | ||||||||||||
2.40% | 06/01/17 | 2,654,000 | 2,682,116 | |||||||||
Ecopetrol S.A. | ||||||||||||
7.63% | 07/23/19 | 345,000 | 434,700 | (h) | ||||||||
Empresa de Energia de Bogota S.A. | ||||||||||||
6.13% | 11/10/21 | 168,000 | 177,240 | (b,h) | ||||||||
Empresa Nacional del Petroleo | ||||||||||||
4.75% | 12/06/21 | 250,000 | 261,192 | (b,h) | ||||||||
Energy Transfer Equity LP | ||||||||||||
7.50% | 10/15/20 | 632,000 | 693,620 | (h) | ||||||||
Energy Transfer Partners LP | ||||||||||||
6.50% | 02/01/42 | 225,000 | 241,119 | (h) | ||||||||
6.70% | 07/01/18 | 701,000 | 804,083 | (h) | ||||||||
European Investment Bank | ||||||||||||
0.73% | 12/15/14 | 1,420,000 | 1,424,866 | (d,h) | ||||||||
4.88% | 01/17/17 | 2,440,000 | 2,807,749 | (h) | ||||||||
Exelon Corp. | ||||||||||||
4.90% | 06/15/15 | 1,393,000 | 1,514,025 | (h) | ||||||||
Export Credit Bank of Turkey | ||||||||||||
5.38% | 11/04/16 | 300,000 | 309,750 | (b,h) | ||||||||
Express Scripts Holding Co. | ||||||||||||
2.65% | 02/15/17 | 1,626,000 | 1,654,242 | (b,h) | ||||||||
3.13% | 05/15/16 | 1,421,000 | 1,479,504 | (h) | ||||||||
3.90% | 02/15/22 | 474,000 | 491,308 | (b,h) | ||||||||
4.75% | 11/15/21 | 474,000 | 524,518 | (b,h) | ||||||||
6.13% | 11/15/41 | 730,000 | 887,083 | (b,h) | ||||||||
First Citizens St Lucia Ltd. | ||||||||||||
4.90% | 02/09/16 | 450,000 | 464,541 | (b) | ||||||||
Florida Power & Light Co. | ||||||||||||
4.13% | 02/01/42 | 847,000 | 886,803 | |||||||||
Ford Motor Credit Company LLC | ||||||||||||
3.00% | 06/12/17 | 942,000 | 936,811 | |||||||||
5.88% | 08/02/21 | 994,000 | 1,105,833 | |||||||||
See Notes to Schedule of Investments and Notes to Financial Statements.
13
Table of Contents
Total Return Fund
| Schedule of Investments | June 30, 2012 (Unaudited) |
| Principal Amount | Fair Value | |||||||||||
Forest Oil Corp. | ||||||||||||
7.25% | 06/15/19 | $ | 843,000 | $ | 773,453 | |||||||
Fresenius Medical Care US Finance Inc. | ||||||||||||
5.75% | 02/15/21 | 1,734,000 | 1,805,528 | (b) | ||||||||
Frontier Communications Corp. | ||||||||||||
7.13% | 03/15/19 | 886,000 | 894,860 | (h) | ||||||||
Georgia Power Co. | ||||||||||||
4.30% | 03/15/42 | 472,000 | 491,665 | |||||||||
Globo Comunicacao e Participacoes S.A. | ||||||||||||
6.25% | 12/31/49 | 180,000 | 192,114 | (b,j) | ||||||||
Goldman Sachs Capital I | ||||||||||||
6.35% | 02/15/34 | 750,000 | 709,391 | |||||||||
Great Plains Energy Inc. | ||||||||||||
4.85% | 06/01/21 | 1,004,000 | 1,078,272 | |||||||||
Grupo Bimbo SAB de C.V. | ||||||||||||
4.50% | 01/25/22 | 200,000 | 212,759 | (b) | ||||||||
Hanesbrands Inc. | ||||||||||||
6.38% | 12/15/20 | 903,000 | 950,408 | (h) | ||||||||
Hartford Financial Services Group Inc. | ||||||||||||
5.13% | 04/15/22 | 949,000 | 977,238 | |||||||||
HCA Inc. | ||||||||||||
6.50% | 02/15/20 | 799,000 | 865,916 | (h) | ||||||||
Heineken N.V. | ||||||||||||
3.40% | 04/01/22 | 1,901,000 | 1,946,957 | (b,h) | ||||||||
Hewlett-Packard Co. | ||||||||||||
4.05% | 09/15/22 | 1,180,000 | 1,188,778 | |||||||||
Host Hotels & Resorts LP (REIT) | ||||||||||||
6.00% | 11/01/20 | 421,000 | 456,785 | |||||||||
HSBC Finance Corp. | ||||||||||||
6.68% | 01/15/21 | 506,000 | 547,853 | (h) | ||||||||
HSBC Holdings PLC | ||||||||||||
4.00% | 03/30/22 | 951,000 | 987,517 | |||||||||
Hughes Satellite Systems Corp. | ||||||||||||
6.50% | 06/15/19 | 905,000 | 961,563 | (h) | ||||||||
Indo Energy Finance BV | ||||||||||||
7.00% | 05/07/18 | 100,000 | 97,750 | (b) | ||||||||
Ingles Markets Inc. | ||||||||||||
8.88% | 05/15/17 | 926,000 | 1,008,183 | |||||||||
Instituto Costarricense de Electricidad | ||||||||||||
6.95% | 11/10/21 | 300,000 | 307,656 | (b) | ||||||||
Inter-American Development Bank | ||||||||||||
1.38% | 10/18/16 | 1,425,000 | 1,457,460 | |||||||||
Intergas Finance BV | ||||||||||||
6.38% | 05/14/17 | 100,000 | 108,558 | (b,h) | ||||||||
IPIC GMTN Ltd. | ||||||||||||
3.75% | 03/01/17 | 316,000 | 328,640 | (b) | ||||||||
John Deere Capital Corp. | ||||||||||||
2.25% | 04/17/19 | 948,000 | 968,951 | |||||||||
3.15% | 10/15/21 | 1,122,000 | 1,166,909 | (h) | ||||||||
JPMorgan Chase & Co. | ||||||||||||
4.35% | 08/15/21 | 1,233,000 | 1,301,306 | |||||||||
4.50% | 01/24/22 | 1,889,000 | 2,034,865 | |||||||||
Kazakhstan Temir Zholy Finance BV | ||||||||||||
6.38% | 10/06/20 | 200,000 | 220,000 | (b) | ||||||||
| Principal Amount | Fair Value | |||||||||||
KazMunayGas National Co. | ||||||||||||
9.13% | 07/02/18 | $ | 100,000 | $ | 123,750 | (b) | ||||||
11.75% | 01/23/15 | 100,000 | 118,995 | (b) | ||||||||
Kinross Gold Corp. | ||||||||||||
6.88% | 09/01/41 | 283,000 | 287,195 | |||||||||
Koninklijke Philips Electronics N.V. | ||||||||||||
3.75% | 03/15/22 | 964,000 | 1,000,514 | (h) | ||||||||
5.00% | 03/15/42 | 964,000 | 1,036,343 | (h) | ||||||||
Korea Development Bank | ||||||||||||
3.25% | 03/09/16 | 897,000 | 925,938 | (h) | ||||||||
4.00% | 09/09/16 | 518,000 | 551,191 | (h) | ||||||||
Korea Expressway Corp. | ||||||||||||
4.50% | 03/23/15 | 133,000 | 140,432 | (b,h) | ||||||||
Korea Hydro & Nuclear Power Company Ltd. | ||||||||||||
4.75% | 07/13/21 | 332,000 | 360,921 | (b,h) | ||||||||
Korea National Oil Corp. | ||||||||||||
2.88% | 11/09/15 | 686,000 | 697,219 | (b,h) | ||||||||
3.13% | 04/03/17 | 951,000 | 969,755 | (b,h) | ||||||||
Kraft Foods Group Inc. | ||||||||||||
1.63% | 06/04/15 | 943,000 | 952,976 | (b,h) | ||||||||
2.25% | 06/05/17 | 943,000 | 965,517 | (b,h) | ||||||||
5.00% | 06/04/42 | 1,132,000 | 1,198,082 | (b,h) | ||||||||
Kreditanstalt fuer Wiederaufbau | ||||||||||||
3.50% | 03/10/14 | 587,000 | 616,184 | (h) | ||||||||
4.50% | 07/16/18 | 1,567,000 | 1,836,671 | (h) | ||||||||
Levi Strauss & Co. | ||||||||||||
7.63% | 05/15/20 | 888,000 | 943,500 | (h) | ||||||||
Liberty Mutual Group Inc. | ||||||||||||
4.95% | 05/01/22 | 662,000 | 657,892 | (b) | ||||||||
6.50% | 05/01/42 | 710,000 | 718,659 | (b) | ||||||||
Linn Energy LLC |
| |||||||||||
8.63% | 04/15/20 | 694,000 | 747,785 | |||||||||
Listrindo Capital BV |
| |||||||||||
6.95% | 02/21/19 | 300,000 | 306,948 | (b) | ||||||||
Lorillard Tobacco Co. |
| |||||||||||
3.50% | 08/04/16 | 974,000 | 1,015,358 | |||||||||
Lowe's Companies Inc. |
| |||||||||||
4.65% | 04/15/42 | 496,000 | 526,702 | (h) | ||||||||
LyondellBasell Industries N.V. |
| |||||||||||
5.00% | 04/15/19 | 500,000 | 524,375 | (b,h) | ||||||||
Majapahit Holding BV |
| |||||||||||
7.75% | 10/17/16 | 400,000 | 457,000 | (b,h) | ||||||||
Marathon Petroleum Corp. |
| |||||||||||
6.50% | 03/01/41 | 477,000 | 542,090 | (h) | ||||||||
McDonald's Corp. |
| |||||||||||
1.88% | 05/29/19 | 944,000 | 941,867 | (h) | ||||||||
MidAmerican Energy Holdings Co. |
| |||||||||||
6.13% | 04/01/36 | 1,000,000 | 1,251,246 | (h) | ||||||||
Molson Coors Brewing Co. |
| |||||||||||
5.00% | 05/01/42 | 757,000 | 817,842 | |||||||||
Morgan Stanley |
| |||||||||||
5.50% | 07/28/21 | 898,000 | 884,761 | |||||||||
5.75% | 01/25/21 | 473,000 | 466,398 | |||||||||
Mylan Inc. |
| |||||||||||
7.88% | 07/15/20 | 281,000 | 315,071 | (b) | ||||||||
National Agricultural Cooperative Federation | ||||||||||||
4.25% | 01/28/16 | 545,000 | 573,910 | (b,h) | ||||||||
5.00% | 09/30/14 | 200,000 | 212,089 | (b) | ||||||||
See Notes to Schedule of Investments and Notes to Financial Statements.
14
Table of Contents
Total Return Fund
| Schedule of Investments | June 30, 2012 (Unaudited) |
| Principal Amount | Fair Value | |||||||||||
National JSC Naftogaz of Ukraine | ||||||||||||
9.50% | 09/30/14 | $ | 200,000 | $ | 191,750 | |||||||
Newfield Exploration Co. |
| |||||||||||
5.63% | 07/01/24 | 788,000 | 805,730 | |||||||||
5.75% | 01/30/22 | 844,000 | 881,980 | (h) | ||||||||
Newmont Mining Corp. |
| |||||||||||
4.88% | 03/15/42 | 954,000 | 930,244 | |||||||||
News America Inc. |
| |||||||||||
6.65% | 11/15/37 | 579,000 | 675,872 | |||||||||
NextEra Energy Capital Holdings Inc. | ||||||||||||
2.60% | 09/01/15 | 1,886,000 | 1,937,680 | (h) | ||||||||
Nisource Finance Corp. |
| |||||||||||
3.85% | 02/15/23 | 1,074,000 | 1,072,964 | |||||||||
Nordea Bank AB |
| |||||||||||
3.13% | 03/20/17 | 2,852,000 | 2,864,175 | (b) | ||||||||
Occidental Petroleum Corp. |
| |||||||||||
2.70% | 02/15/23 | 1,342,000 | 1,350,441 | |||||||||
Odebrecht Drilling Norbe VIII/IX Ltd. |
| |||||||||||
6.35% | 06/30/21 | 294,000 | 307,965 | (b) | ||||||||
Oglethorpe Power Corp. |
| |||||||||||
5.38% | 11/01/40 | 491,000 | 576,301 | |||||||||
Omnicom Group Inc. |
| |||||||||||
3.63% | 05/01/22 | 1,253,000 | 1,273,175 | |||||||||
ONEOK Partners LP |
| |||||||||||
6.13% | 02/01/41 | 1,064,000 | 1,199,742 | (h) | ||||||||
Pacific Gas & Electric Co. |
| |||||||||||
6.05% | 03/01/34 | 1,936,000 | 2,439,722 | (h) | ||||||||
PacifiCorp | ||||||||||||
6.00% | 01/15/39 | 1,250,000 | 1,642,359 | (h) | ||||||||
6.25% | 10/15/37 | 153,000 | 205,727 | |||||||||
PAETEC Holding Corp. | ||||||||||||
8.88% | 06/30/17 | 236,000 | 254,290 | |||||||||
Peabody Energy Corp. | ||||||||||||
6.25% | 11/15/21 | 502,000 | 496,980 | (b) | ||||||||
Penerbangan Malaysia Bhd | ||||||||||||
5.63% | 03/15/16 | 230,000 | 256,678 | |||||||||
PepsiCo Inc. | ||||||||||||
2.75% | 03/05/22 | 1,276,000 | 1,287,881 | (h) | ||||||||
Pernod-Ricard S.A. | ||||||||||||
4.45% | 01/15/22 | 707,000 | 732,559 | (b) | ||||||||
Petrobras International Finance Co. | ||||||||||||
2.88% | 02/06/15 | 380,000 | 385,700 | |||||||||
3.50% | 02/06/17 | 1,424,000 | 1,461,713 | (h) | ||||||||
3.88% | 01/27/16 | 420,000 | 433,625 | |||||||||
Petroleos Mexicanos | ||||||||||||
5.50% | 06/27/44 | 179,000 | 183,028 | (b) | ||||||||
6.50% | 06/02/41 | 167,000 | 194,973 | (b) | ||||||||
Petronas Capital Ltd. | ||||||||||||
5.25% | 08/12/19 | 580,000 | 666,506 | (b) | ||||||||
7.88% | 05/22/22 | 380,000 | 519,370 | (b) | ||||||||
Philip Morris International Inc. | ||||||||||||
2.50% | 05/16/16 | 1,004,000 | 1,053,479 | (h) | ||||||||
Phillips 66 | ||||||||||||
5.88% | 05/01/42 | 424,000 | 456,430 | (b) | ||||||||
Pioneer Natural Resources Co. | ||||||||||||
3.95% | 07/15/22 | 894,000 | 896,163 | |||||||||
Power Sector Assets & Liabilities Management Corp. | ||||||||||||
7.25% | 05/27/19 | 600,000 | 753,000 | |||||||||
7.39% | 12/02/24 | 200,000 | 258,000 | (b,h) | ||||||||
| Principal Amount | Fair Value | |||||||||||
Pride International Inc. | ||||||||||||
6.88% | 08/15/20 | $ | 950,000 | $ | 1,165,622 | (h) | ||||||
Prudential Financial Inc. | ||||||||||||
5.63% | 05/12/41 | 475,000 | 485,098 | (h) | ||||||||
5.80% | 11/16/41 | 238,000 | 249,146 | (h) | ||||||||
Qatari Diar Finance QSC (REIT) | ||||||||||||
5.00% | 07/21/20 | 250,000 | 280,000 | (b,h) | ||||||||
Range Resources Corp. | ||||||||||||
5.75% | 06/01/21 | 843,000 | 880,935 | (h) | ||||||||
Raytheon Co. | ||||||||||||
1.40% | 12/15/14 | 942,000 | 955,746 | (h) | ||||||||
Rio Tinto Finance USA PLC | ||||||||||||
3.50% | 03/22/22 | 957,000 | 1,008,598 | (h) | ||||||||
Roche Holdings Inc. | ||||||||||||
6.00% | 03/01/19 | 1,649,000 | 2,051,099 | (b,h) | ||||||||
Rowan Companies Inc. | ||||||||||||
4.88% | 06/01/22 | 472,000 | 476,152 | (h) | ||||||||
Russian Agricultural Bank OJSC Via RSHB Capital S.A. | ||||||||||||
5.30% | 12/27/17 | 400,000 | 405,000 | (b) | ||||||||
6.00% | 06/03/21 | 600,000 | 590,628 | (b,h,i) | ||||||||
RZD Capital Ltd. | ||||||||||||
5.74% | 04/03/17 | 200,000 | 213,486 | |||||||||
Sempra Energy | ||||||||||||
2.30% | 04/01/17 | 1,904,000 | 1,951,309 | (h) | ||||||||
Simon Property Group LP (REIT) | ||||||||||||
2.15% | 09/15/17 | 1,430,000 | 1,427,814 | (h) | ||||||||
Sinochem Overseas Capital Company Ltd. | ||||||||||||
4.50% | 11/12/20 | 200,000 | 201,237 | (b) | ||||||||
Sinopec Group Overseas Development 2012 Ltd. | ||||||||||||
2.75% | 05/17/17 | 944,000 | 959,990 | (b,h) | ||||||||
Symantec Corp. | ||||||||||||
2.75% | 06/15/17 | 1,343,000 | 1,349,029 | (h) | ||||||||
Target Corp. | ||||||||||||
4.00% | 07/01/42 | 894,000 | 880,612 | |||||||||
Texas Instruments Inc. | ||||||||||||
2.38% | 05/16/16 | 1,507,000 | 1,584,692 | (h) | ||||||||
Textron Inc. | ||||||||||||
6.20% | 03/15/15 | 1,284,000 | 1,411,081 | (h) | ||||||||
The ADT Corp. | ||||||||||||
2.25% | 07/15/17 | 624,000 | 626,927 | (b) | ||||||||
3.50% | 07/15/22 | 891,000 | 893,990 | (b) | ||||||||
4.88% | 07/15/42 | 891,000 | 872,816 | (b) | ||||||||
The AES Corp. | ||||||||||||
8.00% | 10/15/17 | 669,000 | 760,988 | (h) | ||||||||
The Coca-Cola Co. | ||||||||||||
3.30% | 09/01/21 | 326,000 | 349,703 | |||||||||
The Goldman Sachs Group Inc. | ||||||||||||
3.30% | 05/03/15 | 1,002,000 | 1,001,862 | |||||||||
5.75% | 01/24/22 | 1,862,000 | 1,965,535 | |||||||||
Time Warner Cable Inc. | ||||||||||||
5.50% | 09/01/41 | 1,419,000 | 1,544,000 | (h) | ||||||||
6.75% | 07/01/18 | 1,288,000 | 1,569,020 | (h) | ||||||||
Time Warner Inc. | ||||||||||||
3.15% | 07/15/15 | 1,799,000 | 1,897,274 | (h) | ||||||||
3.40% | 06/15/22 | 471,000 | 474,958 | |||||||||
4.90% | 06/15/42 | 330,000 | 334,834 | |||||||||
See Notes to Schedule of Investments and Notes to Financial Statements.
15
Table of Contents
Total Return Fund
| Schedule of Investments | June 30, 2012 (Unaudited) |
| Principal Amount | Fair Value | |||||||
Total Capital International S.A. | ||||||||
1.55% | 06/28/17 | $2,226,000 | $2,231,213 | |||||
Toyota Motor Credit Corp. | ||||||||
1.75% | 05/22/17 | 1,416,000 | 1,427,474 | (h) | ||||
Transnet SOC Ltd. | ||||||||
4.50% | 02/10/16 | 500,000 | 521,270 | (b,h) | ||||
United Technologies Corp. | ||||||||
1.20% | 06/01/15 | 472,000 | 477,493 | |||||
1.80% | 06/01/17 | 472,000 | 482,024 | (h) | ||||
4.50% | 06/01/42 | 708,000 | 777,671 | (h) | ||||
Vail Resorts Inc. | ||||||||
6.50% | 05/01/19 | 1,324,000 | 1,390,200 | (h) | ||||
Valero Energy Corp. | ||||||||
6.63% | 06/15/37 | 474,000 | 531,490 | (h) | ||||
Verizon Communications Inc. | ||||||||
2.00% | 11/01/16 | 2,350,000 | 2,404,837 | (h) | ||||
Viacom Inc. | ||||||||
1.25% | 02/27/15 | 662,000 | 663,648 | (h) | ||||
2.50% | 12/15/16 | 1,461,000 | 1,512,664 | (h) | ||||
Visteon Corp. | ||||||||
6.75% | 04/15/19 | 928,000 | 902,480 | (h) | ||||
Vivendi S.A. | ||||||||
3.45% | 01/12/18 | 1,425,000 | 1,395,441 | (b,h) | ||||
Voto-Votorantim Ltd. | ||||||||
6.75% | 04/05/21 | 168,000 | 183,120 | (b,h) | ||||
Weatherford International Ltd. | ||||||||
4.50% | 04/15/22 | 761,000 | 779,952 | (h) | ||||
5.95% | 04/15/42 | 713,000 | 750,008 | (h) | ||||
Wells Fargo & Co. | ||||||||
1.50% | 07/01/15 | 1,341,000 | 1,342,014 | |||||
Willis Group Holdings PLC | ||||||||
4.13% | 03/15/16 | 1,063,000 | 1,111,273 | (h) | ||||
Woodside Finance Ltd. | ||||||||
4.50% | 11/10/14 | 1,517,000 | 1,604,722 | (b,h) | ||||
Xstrata Finance Canada Ltd. | ||||||||
5.80% | 11/15/16 | 751,275 | 839,218 | (b,h) | ||||
| 264,335,768 | ||||||||
Non-Agency Collateralized Mortgage Obligations — 1.0% | ||||||||
Banc of America Merrill Lynch Commercial Mortgage Inc. | ||||||||
5.37% | 09/10/47 | 1,350,000 | 1,509,457 | (h,i) | ||||
5.63% | 07/10/46 | 400,000 | 450,902 | (h) | ||||
5.92% | 02/10/51 | 717,000 | 825,352 | (h,i) | ||||
6.39% | 02/10/51 | 792,000 | 930,420 | (h,i) | ||||
Banc of America Mortgage Securities Inc. | ||||||||
5.58% | 02/25/36 | 18,657 | 149 | (i) | ||||
Bear Stearns Commercial Mortgage Securities | ||||||||
4.93% | 02/13/42 | 1,800,000 | 1,960,254 | (h,i) | ||||
5.57% | 03/11/39 | 949,480 | 952,145 | (h,i) | ||||
5.71% | 04/12/38 | 1,050,000 | 1,122,433 | (h,i) | ||||
5.91% | 06/11/40 | 240,000 | 173,837 | (h,i) | ||||
Citigroup Commercial Mortgage Trust | ||||||||
5.48% | 10/15/49 | 470,000 | 408,504 | |||||
Commercial Mortgage Pass Through Certificates | ||||||||
4.98% | 05/10/43 | 500,000 | 546,433 | (h,i) | ||||
| Principal Amount | Fair Value | |||||||||||
Credit Suisse First Boston Mortgage Securities Corp. | ||||||||||||
5.32% | 10/25/35 | $ | 162,954 | $ | 3,564 | (i) | ||||||
Credit Suisse Mortgage Capital Certificates | ||||||||||||
5.60% | 02/25/36 | 74,190 | 2,070 | (i) | ||||||||
DBUBS Mortgage Trust | ||||||||||||
5.73% | 11/10/46 | 1,060,000 | 814,681 | (b,h,i) | ||||||||
Extended Stay America Trust | ||||||||||||
5.50% | 11/05/27 | 1,050,000 | 1,059,765 | (b,h) | ||||||||
Greenwich Capital Commercial Funding Corp. | ||||||||||||
5.44% | 03/10/39 | 480,000 | 532,478 | |||||||||
GS Mortgage Securities Corp II | ||||||||||||
3.55% | 04/10/34 | 950,000 | 982,050 | (b) | ||||||||
GS Mortgage Securities Corp. II | ||||||||||||
3.00% | 08/10/44 | 950,000 | 1,001,540 | |||||||||
JP Morgan Chase Commercial Mortgage Securities Corp. | ||||||||||||
4.27% | 06/15/45 | 900,000 | 918,911 | |||||||||
5.04% | 03/15/46 | 710,000 | 770,751 | (i) | ||||||||
5.34% | 08/12/37 | 390,000 | 428,472 | (i) | ||||||||
5.44% | 06/12/47 | 1,420,000 | 1,602,532 | |||||||||
5.79% | 02/12/51 | 1,610,000 | 1,861,147 | (h,i) | ||||||||
LB-UBS Commercial Mortgage Trust | ||||||||||||
4.95% | 09/15/30 | 630,000 | 691,327 | |||||||||
5.16% | 02/15/31 | 860,000 | 958,012 | |||||||||
MASTR Alternative Loans Trust | ||||||||||||
5.00% | 08/25/18 | 18,242 | 1,716 | (g,n) | ||||||||
Merrill Lynch Mortgage Trust | ||||||||||||
5.85% | 05/12/39 | 768,000 | 492,617 | (i) | ||||||||
Morgan Stanley Capital I Inc. | ||||||||||||
5.16% | 10/12/52 | 2,000,000 | 2,228,880 | (i) | ||||||||
5.62% | 12/12/49 | 377,786 | 378,372 | |||||||||
5.82% | 06/11/42 | 1,000,000 | 876,209 | (i) | ||||||||
5.90% | 10/15/42 | 1,072,000 | 743,863 | (i) | ||||||||
5.99% | 08/12/41 | 1,055,000 | 1,223,241 | (i) | ||||||||
6.46% | 01/11/43 | 910,000 | 1,003,070 | (i) | ||||||||
Residential Funding Mortgage Securities I Inc. | ||||||||||||
5.75% | 01/25/36 | 16,497 | — | ** | ||||||||
Wachovia Bank Commercial Mortgage Trust | ||||||||||||
5.47% | 01/15/45 | 810,000 | 874,786 | (i) | ||||||||
Wells Fargo Mortgage Backed Securities Trust | ||||||||||||
5.50% | 01/25/36 - 03/25/36 | 773,954 | 22,983 | |||||||||
| 28,352,923 | ||||||||||||
Sovereign Bonds — 0.6% | ||||||||||||
Banco Nacional de Desenvolvimento Economico e Social | ||||||||||||
5.50% | 07/12/20 | 100,000 | 113,625 | (b) | ||||||||
Eskom Holdings SOC Ltd. | ||||||||||||
5.75% | 01/26/21 | 500,000 | 546,875 | (b,h) | ||||||||
Gabonese Republic | ||||||||||||
8.20% | 12/12/17 | 100,000 | 116,000 | |||||||||
See Notes to Schedule of Investments and Notes to Financial Statements.
16
Table of Contents
Total Return Fund
| Schedule of Investments | June 30, 2012 (Unaudited) |
| Principal Amount | Fair Value | |||||||||||
Government of Argentina | ||||||||||||
2.50% | 12/31/38 | $ | 128,860 | $ | 41,557 | (h,j) | ||||||
Government of Colombia | ||||||||||||
4.38% | 07/12/21 | 300,000 | 336,900 | (h) | ||||||||
7.38% | 03/18/19 | 100,000 | 130,750 | (h) | ||||||||
Government of Croatia | ||||||||||||
6.38% | 03/24/21 | 300,000 | 293,613 | (b) | ||||||||
Government of Dominican Republic | ||||||||||||
7.50% | 05/06/21 | 300,000 | 319,500 | (b,h) | ||||||||
Government of El Salvador | ||||||||||||
7.65% | 06/15/35 | 280,000 | 295,120 | (b,h) | ||||||||
Government of Ghana Republic | ||||||||||||
8.50% | 10/04/17 | 300,000 | 332,250 | (b) | ||||||||
Government of Hungary | ||||||||||||
4.75% | 02/03/15 | 121,000 | 116,160 | |||||||||
6.25% | 01/29/20 | 492,000 | 479,449 | |||||||||
7.63% | 03/29/41 | 246,000 | 240,465 | |||||||||
Government of Indonesia | ||||||||||||
3.75% | 04/25/22 | 872,651 | 870,469 | (b) | ||||||||
4.88% | 05/05/21 | 300,000 | 327,000 | (b) | ||||||||
5.25% | 01/17/42 | 475,000 | 496,969 | (b) | ||||||||
Government of Lebanon | ||||||||||||
4.00% | 12/31/17 | 61,800 | 59,946 | |||||||||
5.15% | 11/12/18 | 173,000 | 170,838 | |||||||||
6.10% | 10/04/22 | 173,000 | 173,000 | |||||||||
Government of Lithuania | ||||||||||||
6.13% | 03/09/21 | 350,000 | 385,000 | (b) | ||||||||
6.75% | 01/15/15 | 200,000 | 216,000 | (b,h) | ||||||||
7.38% | 02/11/20 | 300,000 | 353,928 | (b) | ||||||||
Government of Mexico | ||||||||||||
4.75% | 03/08/44 | 1,156,000 | 1,245,590 | (h) | ||||||||
5.75% | 10/12/49 | 172,000 | 195,650 | (h) | ||||||||
6.05% | 01/11/40 | 130,000 | 167,700 | (h) | ||||||||
Government of Namibia | ||||||||||||
5.50% | 11/03/21 | 600,000 | 624,000 | (b,h) | ||||||||
Government of Peru | ||||||||||||
6.55% | 03/14/37 | 447,000 | 608,367 | (h) | ||||||||
7.35% | 07/21/25 | 100,000 | 140,500 | |||||||||
Government of Philippines | ||||||||||||
4.00% | 01/15/21 | 200,000 | 215,250 | |||||||||
6.38% | 01/15/32 — 10/23/34 | 800,000 | 1,018,750 | (h) | ||||||||
Government of Poland | ||||||||||||
5.00% | 03/23/22 | 500,000 | 545,750 | |||||||||
6.38% | 07/15/19 | 74,000 | 87,160 | |||||||||
Government of Romania | ||||||||||||
6.75% | 02/07/22 | 346,000 | 360,705 | (b,h) | ||||||||
Government of Serbia Republic | ||||||||||||
7.25% | 09/28/21 | 300,000 | 308,250 | (b,h) | ||||||||
Government of South Africa | ||||||||||||
6.25% | 03/08/41 | 100,000 | 126,500 | (h) | ||||||||
Government of Sri Lanka | ||||||||||||
7.40% | 01/22/15 | 100,000 | 107,000 | (b,h) | ||||||||
8.25% | 10/24/12 | 100,000 | 101,250 | |||||||||
Government of Turkey | ||||||||||||
5.13% | 03/25/22 | 400,000 | 416,500 | (h) | ||||||||
5.63% | 03/30/21 | 160,000 | 174,600 | (h) | ||||||||
6.88% | 03/17/36 | 168,000 | 197,232 | (h) | ||||||||
Government of Ukraine | ||||||||||||
6.25% | 06/17/16 | 172,000 | 153,940 | (b,h) | ||||||||
| Principal Amount | Fair Value | |||||||||||
Government of Uruguay | ||||||||||||
6.88% | 09/28/25 | $ | 381,075 | $ | 501,114 | (h) | ||||||
Government of Venezuela | ||||||||||||
10.75% | 09/19/13 | 332,000 | 341,960 | |||||||||
Government of Vietnam | ||||||||||||
1.56% | 03/12/16 | 58,435 | 52,985 | (i) | ||||||||
Province of Manitoba Canada | ||||||||||||
4.90% | 12/06/16 | 165,000 | 192,793 | (h) | ||||||||
Russian Foreign Bond — Eurobond | ||||||||||||
3.25% | 04/04/17 | 800,000 | 804,992 | (b,h) | ||||||||
5.00% | 04/29/20 | 300,000 | 326,250 | (b,h) | ||||||||
7.50% | 03/31/30 | 135,511 | 162,694 | (j) | ||||||||
| 15,592,896 | ||||||||||||
Municipal Bonds and Notes — 0.2% |
| |||||||||||
American Municipal Power Inc. | ||||||||||||
6.27% | 02/15/50 | 655,000 | 753,656 | (h) | ||||||||
Municipal Electric Authority of Georgia | ||||||||||||
6.64% | 04/01/57 | 474,000 | 549,935 | |||||||||
New Jersey State Turnpike Authority | ||||||||||||
7.10% | 01/01/41 | 495,000 | 697,886 | |||||||||
7.41% | 01/01/40 | 200,000 | 291,530 | |||||||||
New Jersey Transportation Trust Fund Authority | ||||||||||||
6.88% | 12/15/39 | 620,000 | 711,927 | (h) | ||||||||
South Carolina State Public Service Authority | ||||||||||||
6.45% | 01/01/50 | 495,000 | 699,747 | (h) | ||||||||
State of California | ||||||||||||
5.70% | 11/01/21 | 705,000 | 802,635 | |||||||||
| 4,507,316 | ||||||||||||
FNMA — 0.0%* |
| |||||||||||
Lehman TBA | ||||||||||||
5.50% | TBA | 620,251 | — | **(c,l,0) | ||||||||
Total Bonds and Notes | 749,577,766 | |||||||||||
| Number of Shares | Fair Value | |||||||||||
Exchange Traded Funds — 2.7% |
| |||||||||||
Financial Select Sector SPDR Fund | 156,417 | $ | 2,286,816 | (m) | ||||||||
Industrial Select Sector SPDR Fund | 248,928 | 8,879,262 | (m) | |||||||||
Vanguard MSCI Emerging Markets Fund | 1,528,143 | 61,049,313 | ||||||||||
Total Exchange Traded Funds | 72,215,391 | |||||||||||
See Notes to Schedule of Investments and Notes to Financial Statements.
17
Table of Contents
Total Return Fund
| Schedule of Investments | June 30, 2012 (Unaudited) |
| Number of Shares | Fair Value | |||||||||||
Other Investments — 0.2% |
| |||||||||||
GEI Investment Fund | $ | 4,478,770 | (k) | |||||||||
Total Investments in Securities | 2,363,344,332 | |||||||||||
Short-Term Investments — 17.3% |
| |||||||||||
Short-Term Investments — 15.1% |
| |||||||||||
GE Institutional Money Market Fund — Investment Class | 409,857,965 | (d,k) | ||||||||||
0.04% | ||||||||||||
| Principal Amount | Fair Value | |||||||||||
Time Deposit — 0.0%* |
| |||||||||||
State Street Corp. | ||||||||||||
0.01% | 07/02/12 | $ | 707,572 | $ | 707,572 | (e) | ||||||
Federal Agencies — 2.2% |
| |||||||||||
Federal Home Loan Bank Discount Notes | ||||||||||||
0.09% | 08/22/12 — 10/04/12 | 33,000,000 | 32,994,895 | (d) | ||||||||
Federal Home Loan Mortgage Corp. Discount Notes | ||||||||||||
0.10% | 07/23/12 | 11,000,000 | 10,999,703 | (d) | ||||||||
Federal National Mortgage Assoc. Discount Notes | ||||||||||||
0.10% | 08/27/12 | 15,000,000 | 14,998,275 | (d) | ||||||||
| 58,992,873 | ||||||||||||
Total Short-Term Investments | 469,558,410 | |||||||||||
Total Investments | 2,832,902,742 | |||||||||||
Liabilities in Excess of Other | (124,912,116 | ) | ||||||||||
|
| |||||||||||
NET ASSETS — 100.0% | $ | 2,707,990,626 | ||||||||||
|
| |||||||||||
Other Information | ||||||||
The Fund had the following long futures contracts open at June 30, 2012 (Unaudited):
| Description | Expiration Date | Number of Contracts | Current Notional Value | Unrealized Appreciation/ (Depreciation) | ||||||||||||
EURO Stoxx 50 Index Futures | September 2012 | 123 | $ | 3,519,901 | $ | 186,161 | ||||||||||
FTSE 100 Index Futures | September 2012 | 36 | 3,118,518 | 49,581 | ||||||||||||
S&P Midcap 400 Emini Index Futures | September 2012 | 974 | 91,507,300 | 2,266,314 | ||||||||||||
S&P 500 Emini Index Futures | September 2012 | 303 | 20,549,460 | 846,241 | ||||||||||||
Topix Index Futures | September 2012 | 16 | 1,542,048 | 87,106 | ||||||||||||
2 Yr. U.S.Treasury Notes Futures | September 2012 | 227 | 49,982,563 | (23,425 | ) | |||||||||||
5 Yr. U.S.Treasury Notes Futures | September 2012 | 1549 | 192,027,594 | 38,432 | ||||||||||||
30 Yr. U.S.Treasury Bonds Futures | September 2012 | 96 | 14,205,000 | (65,748 | ) | |||||||||||
|
| |||||||||||||||
| $ | 3,384,662 | |||||||||||||||
|
| |||||||||||||||
The Fund had the following short futures contracts open at June 30, 2012 (Unaudited):
| Description | Expiration date | Number of Contracts | Current Notional Value | Unrealized (Depreciation) | ||||||||||||
Ultra long U.S.Treasury Bond Futures | September 2012 | 171 | $ | (28,530,281 | ) | $ | (407,142 | ) | ||||||||
10 Yr. U.S.Treasury Notes Futures | September 2012 | 949 | (126,572,875 | ) | (285,977 | ) | ||||||||||
|
| |||||||||||||||
| $ | (693,119 | ) | ||||||||||||||
|
| |||||||||||||||
| $ | 2,691,543 | |||||||||||||||
|
| |||||||||||||||
At June 30, 2012, the Fund had the following forward foreign currency exchange contracts (Unaudited):
| Description | Unrealized Appreciation | |||
Sold 47,500,000 EURO; Purchased $62,741,828 for settlement on 09/19/2012 | $ | 2,417,434 | ||
Sold 20,800,000 GBP; Purchased $33,648,576 for settlement on 09/19/2012 | 1,031,509 | |||
Sold 1,999,999,966 Japanese yen; Purchased $25,379,744 for settlement on 12/12/2012 | 252,625 | |||
|
| |||
| $ | 3,701,568 | |||
|
| |||
See Notes to Schedule of Investments and Notes to Financial Statements.
18
Table of Contents
Total Return Fund
| Schedule of Investments | June 30, 2012 (Unaudited) |
The Fund was invested in the following Countries at June 30, 2012 (Unaudited):
| Country | Percentage (based on Fair Value) | |||
United States | 79.95 | % | ||
United Kingdom | 4.52 | % | ||
Japan | 2.59 | % | ||
Germany | 2.03 | % | ||
Switzerland | 1.67 | % | ||
France | 1.49 | % | ||
China | 0.94 | % | ||
Canada | 0.68 | % | ||
South Korea | 0.66 | % | ||
Sweden | 0.53 | % | ||
Netherlands | 0.43 | % | ||
Taiwan | 0.42 | % | ||
Australia | 0.39 | % | ||
Hong Kong | 0.39 | % | ||
Brazil | 0.37 | % | ||
Italy | 0.31 | % | ||
Singapore | 0.28 | % | ||
Mexico | 0.28 | % | ||
Ireland | 0.24 | % | ||
Supranational | 0.23 | % | ||
Russian Federation | 0.21 | % | ||
Belgium | 0.18 | % | ||
India | 0.14 | % | ||
Indonesia | 0.13 | % | ||
South Africa | 0.12 | % | ||
Philippines | 0.10 | % | ||
Chile | 0.10 | % | ||
Malaysia | 0.08 | % | ||
Turkey | 0.07 | % | ||
Peru | 0.05 | % | ||
Colombia | 0.04 | % | ||
Lithuania | 0.03 | % | ||
Hungary | 0.03 | % | ||
Kazakhstan | 0.03 | % | ||
Norway | 0.02 | % | ||
Poland | 0.02 | % | ||
Namibia | 0.02 | % | ||
Uruguay | 0.02 | % | ||
Panama | 0.02 | % | ||
Trinidad and Tobago | 0.02 | % | ||
Thailand | 0.02 | % | ||
Lebanon | 0.01 | % | ||
Romania | 0.01 | % | ||
Ukraine | 0.01 | % | ||
Venezuela | 0.01 | % | ||
Ghana | 0.01 | % | ||
United Arab Emirates | 0.01 | % | ||
Dominican Republic | 0.01 | % | ||
Serbia | 0.01 | % | ||
Costa Rica | 0.01 | % | ||
El Salvador | 0.01 | % | ||
| Country | Percentage (based on Fair Value) | |||
Croatia | 0.01 | % | ||
Qatar | 0.01 | % | ||
Barbados | 0.01 | % | ||
Sri Lanka | 0.01 | % | ||
Jamaica | 0.01 | % | ||
|
| |||
| 100.00 | % | |||
|
| |||
The Fund’s % share of investment in the various categories, based on Fair Value, is as follows at June 30, 2012 (Unaudited):
| Industry | Domestic | Foreign | Total | |||||||||
Diversified Financial Services | 1.20 | % | 1.56 | % | 2.76 | % | ||||||
Integrated Oil & Gas | 1.29 | % | 1.41 | % | 2.70 | % | ||||||
Exchange Traded Funds | 2.55 | % | 0.00 | % | 2.55 | % | ||||||
Pharmaceuticals | 1.71 | % | 0.78 | % | 2.49 | % | ||||||
Communications Equipment | 1.65 | % | 0.16 | % | 1.81 | % | ||||||
Computer Hardware | 1.78 | % | 0.00 | % | 1.78 | % | ||||||
Semiconductors | 0.87 | % | 0.76 | % | 1.63 | % | ||||||
Systems Software | 1.59 | % | 0.00 | % | 1.59 | % | ||||||
Data Processing & Outsourced Services | 1.47 | % | 0.00 | % | 1.47 | % | ||||||
Internet Software & Services | 0.64 | % | 0.68 | % | 1.32 | % | ||||||
Industrial Machinery | 0.54 | % | 0.77 | % | 1.31 | % | ||||||
Soft Drinks | 1.26 | % | 0.00 | % | 1.26 | % | ||||||
Packaged Foods & Meats | 0.57 | % | 0.67 | % | 1.24 | % | ||||||
Asset Management & Custody Banks | 1.23 | % | 0.00 | % | 1.23 | % | ||||||
Healthcare Services | 0.90 | % | 0.30 | % | 1.20 | % | ||||||
Life & Health Insurance | 0.34 | % | 0.82 | % | 1.16 | % | ||||||
Healthcare Equipment | 1.05 | % | 0.00 | % | 1.05 | % | ||||||
Specialized REITs | 1.03 | % | 0.00 | % | 1.03 | % | ||||||
Cable & Satellite | 1.02 | % | 0.00 | % | 1.02 | % | ||||||
Biotechnology | 0.85 | % | 0.09 | % | 0.94 | % | ||||||
Fertilizers & Agricultural Chemicals | 0.37 | % | 0.57 | % | 0.94 | % | ||||||
Household Products | 0.37 | % | 0.53 | % | 0.90 | % | ||||||
Automobile Manufacturers | 0.07 | % | 0.82 | % | 0.89 | % | ||||||
Oil & Gas Equipment & Services | 0.83 | % | 0.02 | % | 0.85 | % | ||||||
Air Freight & Logistics | 0.84 | % | 0.00 | % | 0.84 | % | ||||||
Home Improvement Retail | 0.84 | % | 0.00 | % | 0.84 | % | ||||||
Aerospace & Defense | 0.51 | % | 0.29 | % | 0.80 | % | ||||||
IT Consulting & Other Services | 0.66 | % | 0.14 | % | 0.80 | % | ||||||
Diversified Metals & Mining | 0.15 | % | 0.55 | % | 0.70 | % | ||||||
Movies & Entertainment | 0.70 | % | 0.00 | % | 0.70 | % | ||||||
Wireless Telecommunication Services | 0.00 | % | 0.64 | % | 0.64 | % | ||||||
Application Software | 0.27 | % | 0.32 | % | 0.59 | % | ||||||
Integrated Telecommunication Services | 0.55 | % | 0.00 | % | 0.55 | % | ||||||
Specialized Finance | 0.55 | % | 0.00 | % | 0.55 | % | ||||||
Oil & Gas Exploration & Production | 0.42 | % | 0.09 | % | 0.51 | % | ||||||
Industrial Gases | 0.13 | % | 0.36 | % | 0.49 | % | ||||||
Multi-Line Insurance | 0.17 | % | 0.31 | % | 0.48 | % | ||||||
Distillers & Vintners | 0.00 | % | 0.47 | % | 0.47 | % | ||||||
See Notes to Schedule of Investments and Notes to Financial Statements.
19
Table of Contents
Total Return Fund
| Schedule of Investments | June 30, 2012 (Unaudited) |
| Industry | Domestic | Foreign | Total | |||||||||
Retail REITs | 0.47 | % | 0.00 | % | 0.47 | % | ||||||
Advertising | 0.28 | % | 0.18 | % | 0.46 | % | ||||||
Multi-Utilities | 0.17 | % | 0.29 | % | 0.46 | % | ||||||
Electric Utilities | 0.38 | % | 0.07 | % | 0.45 | % | ||||||
Tobacco | 0.43 | % | 0.02 | % | 0.45 | % | ||||||
Apparel, Accessories & Luxury Goods | 0.01 | % | 0.43 | % | 0.44 | % | ||||||
Broadcasting | 0.42 | % | 0.00 | % | 0.42 | % | ||||||
Agricultural Products | 0.37 | % | 0.00 | % | 0.37 | % | ||||||
Construction & Farm Machinery & Heavy Trucks | 0.21 | % | 0.14 | % | 0.35 | % | ||||||
Diversified Support Services | 0.02 | % | 0.32 | % | 0.34 | % | ||||||
Property & Casualty Insurance | 0.33 | % | 0.00 | % | 0.33 | % | ||||||
Consumer Finance | 0.32 | % | 0.00 | % | 0.32 | % | ||||||
Regional Banks | 0.19 | % | 0.13 | % | 0.32 | % | ||||||
Diversified Real Estate Activities | 0.00 | % | 0.31 | % | 0.31 | % | ||||||
Independent Power Producers & Energy Traders | 0.31 | % | 0.00 | % | 0.31 | % | ||||||
Office REITs | 0.31 | % | 0.00 | % | 0.31 | % | ||||||
Restaurants | 0.31 | % | 0.00 | % | 0.31 | % | ||||||
Healthcare Supplies | 0.00 | % | 0.29 | % | 0.29 | % | ||||||
Life Sciences Tools & Services | 0.26 | % | 0.02 | % | 0.28 | % | ||||||
Diversified Chemicals | 0.27 | % | 0.00 | % | 0.27 | % | ||||||
Residential REITs | 0.27 | % | 0.00 | % | 0.27 | % | ||||||
Investment Banking & Brokerage | 0.24 | % | 0.00 | % | 0.24 | % | ||||||
Home Furnishing Retail | 0.23 | % | 0.00 | % | 0.23 | % | ||||||
Construction & Engineering | 0.02 | % | 0.20 | % | 0.22 | % | ||||||
Casinos & Gaming | 0.18 | % | 0.03 | % | 0.21 | % | ||||||
Steel | 0.16 | % | 0.05 | % | 0.21 | % | ||||||
Human Resource & Employment Services | 0.00 | % | 0.20 | % | 0.20 | % | ||||||
Railroads | 0.20 | % | 0.00 | % | 0.20 | % | ||||||
Brewers | 0.00 | % | 0.19 | % | 0.19 | % | ||||||
Specialty Stores | 0.18 | % | 0.00 | % | 0.18 | % | ||||||
Electrical Components & Equipment | 0.15 | % | 0.02 | % | 0.17 | % | ||||||
Trading Companies & Distributors | 0.03 | % | 0.14 | % | 0.17 | % | ||||||
Department Stores | 0.15 | % | 0.01 | % | 0.16 | % | ||||||
Diversified Capital Markets | 0.00 | % | 0.16 | % | 0.16 | % | ||||||
Drug Retail | 0.15 | % | 0.01 | % | 0.16 | % | ||||||
Construction Materials | 0.00 | % | 0.15 | % | 0.15 | % | ||||||
Internet Retail | 0.15 | % | 0.00 | % | 0.15 | % | ||||||
Distributors | 0.14 | % | 0.00 | % | 0.14 | % | ||||||
General Merchandise Stores | 0.14 | % | 0.00 | % | 0.14 | % | ||||||
Electronic Equipment & Instruments | 0.00 | % | 0.12 | % | 0.12 | % | ||||||
Oil & Gas Storage & Transportation | 0.12 | % | 0.00 | % | 0.12 | % | ||||||
Real Estate Services | 0.12 | % | 0.00 | % | 0.12 | % | ||||||
Industrial Conglomerates | 0.00 | % | 0.11 | % | 0.11 | % | ||||||
Research & Consulting Services | 0.11 | % | 0.00 | % | 0.11 | % | ||||||
Insurance Brokers | 0.10 | % | 0.00 | % | 0.10 | % | ||||||
Healthcare Facilities | 0.09 | % | 0.00 | % | 0.09 | % | ||||||
Food Retail | 0.00 | % | 0.08 | % | 0.08 | % | ||||||
Heavy Electrical Equipment | 0.00 | % | 0.08 | % | 0.08 | % | ||||||
Managed Healthcare | 0.07 | % | 0.01 | % | 0.08 | % | ||||||
Oil & Gas Refining & Marketing | 0.07 | % | 0.00 | % | 0.07 | % | ||||||
| Industry | Domestic | Foreign | Total | |||||||||
Reinsurance | 0.07 | % | 0.00 | % | 0.07 | % | ||||||
Water Utilities | 0.07 | % | 0.00 | % | 0.07 | % | ||||||
Diversified REITs | 0.06 | % | 0.00 | % | 0.06 | % | ||||||
Home Building | 0.06 | % | 0.00 | % | 0.06 | % | ||||||
Industrial REITs | 0.06 | % | 0.00 | % | 0.06 | % | ||||||
Office Electronics | 0.02 | % | 0.04 | % | 0.06 | % | ||||||
Apparel Retail | 0.05 | % | 0.00 | % | 0.05 | % | ||||||
Housewares & Specialties | 0.04 | % | 0.00 | % | 0.04 | % | ||||||
Trucking | 0.04 | % | 0.00 | % | 0.04 | % | ||||||
Electronic Manufacturing Services | 0.00 | % | 0.03 | % | 0.03 | % | ||||||
Paper Packaging | 0.03 | % | 0.00 | % | 0.03 | % | ||||||
Diversified Banks | 0.00 | % | 0.02 | % | 0.02 | % | ||||||
Footwear | 0.02 | % | 0.00 | % | 0.02 | % | ||||||
Healthcare Distributors | 0.02 | % | 0.00 | % | 0.02 | % | ||||||
Oil & Gas Drilling | 0.02 | % | 0.00 | % | 0.02 | % | ||||||
Real Estate Operating Companies | 0.00 | % | 0.02 | % | 0.02 | % | ||||||
Semiconductor Equipment | 0.02 | % | 0.00 | % | 0.02 | % | ||||||
Specialty Chemicals | 0.02 | % | 0.00 | % | 0.02 | % | ||||||
Thrifts & Mortgage Finance | 0.00 | % | 0.02 | % | 0.02 | % | ||||||
Commodity Chemicals | 0.00 | % | 0.01 | % | 0.01 | % | ||||||
Electronic Components | 0.00 | % | 0.01 | % | 0.01 | % | ||||||
Food Distributors | 0.01 | % | 0.00 | % | 0.01 | % | ||||||
Healthcare Technology | 0.01 | % | 0.00 | % | 0.01 | % | ||||||
Highways & Railtracks | 0.00 | % | 0.01 | % | 0.01 | % | ||||||
Hotels, Resorts & Cruise Lines | 0.01 | % | 0.00 | % | 0.01 | % | ||||||
Household Appliances | 0.00 | % | 0.01 | % | 0.01 | % | ||||||
Hypermarkets & Super Centers | 0.00 | % | 0.01 | % | 0.01 | % | ||||||
Marine Ports & Services | 0.00 | % | 0.01 | % | 0.01 | % | ||||||
Office Services & Supplies | 0.01 | % | 0.00 | % | 0.01 | % | ||||||
Publishing | 0.01 | % | 0.00 | % | 0.01 | % | ||||||
|
| |||||||||||
| 56.81 | % | |||||||||||
|
| |||||||||||
Sector | Percentage (based on Fair Value) | |||
Agency Mortgage Backed | 10.55 | % | ||
Corporate Notes | 9.33 | % | ||
U.S. Treasuries | 4.21 | % | ||
Non-Agency Collateralized Mortgage Obligations | 1.00 | % | ||
Sovereign Bonds | 0.73 | % | ||
Asset Backed | 0.24 | % | ||
Agency Collateralized Mortgage Obligations | 0.23 | % | ||
Municipal Bonds and Notes | 0.16 | % | ||
|
| |||
| 26.45 | % | |||
|
| |||
Short Term and Other Investments | ||||
Short-Term | 16.58 | % | ||
Other Investments | 0.16 | % | ||
|
| |||
| 16.74 | % | |||
|
| |||
| 100.00 | % | |||
|
| |||
See Notes to Schedule of Investments and Notes to Financial Statements.
20
Table of Contents
| Notes to Schedules of Investments | June 30, 2012 (Unaudited) |
The views expressed in this document reflect our judgment as of the publication date and are subject to change at any time without notice. The securities information regarding holdings, allocations and other characteristics are presented to illustrate examples of securities that the Fund has bought and the diversity of areas in which the Fund may invest as of a particular date. It may not be representative of the Fund’s current or future investments and should not be construed as a recommendation to purchase or sell a particular security. See the Fund’s summary prospectus and statutory prospectus for complete descriptions of investment objectives, policies, risks and permissible investments.
| (a) | Non-income producing security. |
| (b) | Pursuant to Rule 144A of the Securities Act of 1933, these securities may be resold in transactions exempt from registration, normally to qualified institutional buyers. At June 30, 2012, these securities amounted to $67,023,621 or 2.48% of the net assets of the GE Investments Total Return Fund. These securities have been determined to be liquid using procedures established by the Fund’s Board of Directors. |
| (c) | Settlement is on a delayed delivery or when-issued basis with final maturity to be announced (TBA) in the future. |
| (d) | Coupon amount represents effective yield. |
| (e) | State Street Corp. is the parent company of State Street Bank & Trust Co., the Fund’s custodian and accounting agent. |
| (f) | Principal only security. These securities represent the right to receive the monthly principal payments on an underlying pool of mortgages. No payments of interest on the pool are passed through to the “principal only” holder. |
| (g) | Interest only security. These securities represent the right to receive the monthly interest payments on an underlying pool of mortgages. Payments of principal on the pool reduce the value of the “interest only” holding. |
| (h) | At June 30, 2012 , all or a portion of this security is reserved and/or pledged to cover collateral requirements for futures, options, forward foreign currency contracts and/or TBA’s. |
| (i) | Variable or Floating rate security. The stated rate represents the rate at June 30, 2012. |
| (j) | Step coupon bond. Security becomes interest bearing at a future date. |
| (k) | GE Asset Management, the investment adviser of the Fund, also serves as investment adviser of the GE Investment Fund and the GE Institutional Money Market Fund. The GE Investment Fund has been determined to be illiquid using procedures established by the Board of Directors. |
| (l) | Securities in default |
| (m) | Sponsored by SSgA Funds Management, Inc., an affiliate of State Street Bank & Trust Co., the Fund’s custodian and accounting agent. |
| (n) | Coupon amount represents the coupon of the underlying mortgage securities on which monthly interest payments are based. |
| (o) | Fair valued security. |
| * | Less than 0.05%. |
| ** | Amount is less than $ 0.50. |
| † | Percentages are based on net assets as of June 30, 2012 . |
| †† | Security traded on different exchanges. |
Abbreviations:
ADR | American Depository Receipt | |
GDR | Global Depository Receipt | |
REIT | Real Estate Investment Trust | |
REMIC | Real Estate Mortgage Investment Conduit | |
SPDR | Standard & Poors Depository Receipts | |
STRIPS | Separate Trading of Registered Interest and Principal of Security | |
TBA | To be announced | |
21
Table of Contents
Selected data based on a share outstanding throughout the fiscal years indicated
| CLASS 1 | ||||||||||||||||||||||||
| 6/30/12* | 12/31/11 | 12/31/10 | 12/31/09 | 12/31/08(d) | 12/31/07 | |||||||||||||||||||
| Inception date | — | — | — | — | — | 7/1/85 | ||||||||||||||||||
Net asset value, beginning of period | $ | 15.66 | $ | 16.42 | $ | 15.18 | $ | 12.75 | $ | 18.61 | $ | 17.69 | ||||||||||||
Income/(loss) from investment operations: | ||||||||||||||||||||||||
Net investment income | $ | 0.15 | 0.31 | 0.23 | ** | 0.20 | ** | 0.35 | ** | 0.35 | ||||||||||||||
Net realized and unrealized gains/(losses) on investments | 0.81 | (0.78) | 1.23 | 2.45 | (5.80) | 1.71 | ||||||||||||||||||
Total income/(loss) from investment operations | 0.96 | (0.47) | 1.46 | 2.65 | (5.45) | 2.06 | ||||||||||||||||||
Less distributions from: | ||||||||||||||||||||||||
Net investment income | — | 0.29 | 0.22 | 0.19 | 0.34 | 0.35 | ||||||||||||||||||
Net realized gains | — | — | — | — | 0.07 | 0.79 | ||||||||||||||||||
Return of capital | — | — | — | 0.03 | — | — | ||||||||||||||||||
Total distributions | — | 0.29 | 0.22 | 0.22 | 0.41 | 1.14 | ||||||||||||||||||
Net asset value, end of period | $ | 16.62 | $ | 15.66 | $ | 16.42 | $ | 15.18 | $ | 12.75 | $ | 18.61 | ||||||||||||
TOTAL RETURN(a) | 6.13% | (2.85)% | 9.64% | 20.81% | (29.28)% | 11.68% | (b) | |||||||||||||||||
RATIOS/SUPPLEMENTAL DATA: | ||||||||||||||||||||||||
Net assets, end of period (in thousands) | $ | 1,012,721 | $ | 1,006,391 | $ | 1,152,587 | $ | 1,131,038 | $ | 989,975 | $ | 1,525,002 | ||||||||||||
Ratios to average net assets: | ||||||||||||||||||||||||
Net investment income | 1.63% | 1.67% | 1.51% | 1.47% | 2.16% | 2.20% | ||||||||||||||||||
Net Expenses | 0.74% | (b) | 0.74% | (b)(c) | 0.69% | (b)(c) | 0.67% | (b)(c) | 0.51% | (b)(c) | 0.52% | (c) | ||||||||||||
Gross Expenses | 0.74% | 0.76% | 0.73% | 0.70% | 0.55% | 0.56% | ||||||||||||||||||
Portfolio turnover rate | 94% | 195% | 148% | 174% | 203% | 176% | ||||||||||||||||||
| CLASS 3 | ||||||||||||||||||||||||
| 6/30/12* | 12/31/11 | 12/31/10 | 12/31/09 | 12/31/08(d) | 12/31/07 | |||||||||||||||||||
| Inception date | — | — | — | — | 5/1/06 | |||||||||||||||||||
Net asset value, beginning of period | $ | 15.62 | $ | 16.38 | $ | 15.15 | $ | 12.73 | $ | 18.59 | $ | 17.69 | ||||||||||||
Income/(loss) from investment operations: | ||||||||||||||||||||||||
Net investment income | $ | 0.11 | 0.24 | 0.19 | ** | 0.17 | ** | 0.34 | ** | 0.35 | ||||||||||||||
Net realized and unrealized gains/(losses) on investments | 0.83 | (0.75) | 1.23 | 2.45 | (5.80) | 1.69 | ||||||||||||||||||
Total income/(loss) from investment operations | 0.94 | (0.51) | 1.42 | 2.62 | (5.46) | 2.04 | ||||||||||||||||||
Less distributions from: | ||||||||||||||||||||||||
Net investment income | — | 0.25 | 0.19 | 0.17 | 0.33 | 0.35 | ||||||||||||||||||
Net realized gains | — | — | — | — | 0.07 | 0.79 | ||||||||||||||||||
Return of capital | — | — | — | 0.03 | — | — | ||||||||||||||||||
Total distributions | — | 0.25 | 0.19 | 0.20 | 0.40 | 1.14 | ||||||||||||||||||
Net asset value, end of period | $ | 16.56 | $ | 15.62 | $ | 16.38 | $ | 15.15 | $ | 12.73 | $ | 18.59 | ||||||||||||
TOTAL RETURN(a) | 6.02% | (3.10)% | 9.37% | 20.57% | (29.37)% | 11.56% | (b) | |||||||||||||||||
RATIOS/SUPPLEMENTAL DATA: | �� | |||||||||||||||||||||||
Net assets, end of period (in thousands) | $ | 1,695,270 | $ | 1,624,263 | $ | 1,691,910 | $ | 1,421,191 | $ | 1,110,117 | $ | 1,173,708 | ||||||||||||
Ratios to average net assets: | ||||||||||||||||||||||||
Net investment income | 1.38% | 1.42% | 1.26% | 1.26% | 2.05% | 2.04% | ||||||||||||||||||
Net Expenses | 0.99% | (b) | 0.99% | (b)(c) | 0.94% | (b)(c) | 0.87% | (b)(c) | 0.61% | (b)(c) | 0.61% | (c) | ||||||||||||
Gross Expenses | 0.99% | 1.01% | 0.98% | 0.91% | 0.65% | 0.65% | ||||||||||||||||||
Portfolio turnover rate | 94% | 195% | 148% | 174% | 203% | 176% | ||||||||||||||||||
The accompanying Notes are an integral part of these financial statements.
22
Table of Contents
Notes to Financial Highlights
| (a) | Total returns are historical and assume changes in share price, reinvestment of dividends and capital gains distributions and do not include the effect of insurance contract charges. Past performance does not guarantee future results. |
| (b) | Reflects GE Asset Management’s waiver of a portion of the Fund’s management fee in an amount equal to the management fee earned by GEAM with respect to the Fund’s investment in the GE Institutional Money Market Fund or, prior to 2011, in another affiliated money market fund formerly managed by GEAM. |
| (c) | Reflects GEAM’s contractual arrangement with the Fund to waive management fees or limit operating expenses. The most recent arrangement expired on April 30, 2011. |
| (d) | Less than $0.01 per share of the distribution paid was from return of capital. |
| * | Unaudited. |
| ** | Per share values have been calculated using the average share method. |
The accompanying Notes are an integral part of these financial statements.
23
Table of Contents
The accompanying Notes are an integral part of these financial statements.
24
Table of Contents
The accompanying Notes are an integral part of these financial statements.
25
Table of Contents
Statements of Changes in Net Assets
Six months June 30, 2012 * | Year Ended December 31, 2011 | |||||||
INCREASE (DECREASE) IN NET ASSETS | ||||||||
Operations: | ||||||||
Net investments income | $ | 20,084,532 | $ | 42,442,285 | ||||
Net realized gain on investments, futures and foreign currency transactions | 42,651,690 | 101,996,846 | ||||||
Net increase (decrease) in unrealized appreciation / (depreciation) on investments, futures and foreign currency transactions | 97,182,988 | (225,582,850 | ) | |||||
Net increase (decrease) from operations | 159,919,210 | (81,143,719 | ) | |||||
Distributions to shareholders from : | ||||||||
Net investment income | ||||||||
Class 1 | — | (18,364,052 | ) | |||||
Class 3 | — | (25,662,167 | ) | |||||
Total distributions | — | (44,026,219 | ) | |||||
Increase (decrease) in net assets from operations and distributions | 159,919,210 | (125,169,938 | ) | |||||
Share transactions : | ||||||||
Proceeds from sale of shares | ||||||||
Class 1 | 2,616,396 | 2,754,427 | ||||||
Class 2 | — | 1,631,262 | ||||||
Class 3 | 74,664,544 | 159,668,664 | ||||||
Value of distributions reinvested | ||||||||
Class 1 | — | 18,364,052 | ||||||
Class 3 | — | 25,662,167 | ||||||
Cost of shares redeemed | ||||||||
Class 1 | (58,176,579 | ) | (119,192,713 | ) | ||||
Class 2 | — | (26,443,050 | ) | |||||
Class 3 | (101,687,151 | ) | (175,162,061 | ) | ||||
Net decrease from share transactions | (82,582,790 | ) | (112,717,252 | ) | ||||
Total increase (decrease) in net assets | 77,336,420 | (237,887,190 | ) | |||||
NET ASSETS | ||||||||
Beginning of period | 2,630,654,206 | 2,868,541,396 | ||||||
End of period | $ | 2,707,990,626 | $ | 2,630,654,206 | ||||
Undistributed net investment income, end of period | $ | 20,785,257 | $ | 700,725 | ||||
| * | (Unaudited) |
The accompanying Notes are an integral part of these financial statements.
26
Table of Contents
| Statements of Changes in Net Assets (continued) Changes in Fund Shares | ||||||||
Six Months Ended 2012* | Year Ended December 31, 2011 | |||||||
CHANGES IN FUND SHARES | ||||||||
Class 1 | ||||||||
Shares sold | 158,411 | 170,771 | ||||||
Issued for distributions reinvested | — | 1,180,968 | ||||||
Shares redeemed | (3,511,419 | ) | (7,281,539 | ) | ||||
Net decrease in Fund Shares | (3,353,008 | ) | (5,929,800 | ) | ||||
Class 3 | ||||||||
Shares sold | 4,527,823 | 9,748,413 | ||||||
Issued for distributions reinvested | — | 1,654,556 | ||||||
Shares redeemed | (6,159,260 | ) | (10,716,890 | ) | ||||
Net increase (decrease) in Fund Shares | (1,631,437 | ) | 686,079 | |||||
| * | (Unaudited) |
The accompanying Notes are an integral part of these financial statements.
27
Table of Contents
| Notes to Financial Statements | June 30, 2012 (Unaudited) |
| 1. | Organization of the Company |
GE Investments Funds, Inc. (the “Company”) was incorporated under the laws of the Commonwealth of Virginia on May 14, 1984 and is registered under the Investment Company Act of 1940, as amended (the “1940 Act”), as an open-end management investment company. The Company is composed of thirteen investment portfolios (collectively the “Funds”), although only the following ten are currently being offered: U.S. Equity Fund, S&P 500 Index Fund, Premier Growth Equity Fund, Core Value Equity Fund, Mid-Cap Equity Fund, Small-Cap Equity Fund, Total Return Fund (the “Fund”), Income Fund, Money Market Fund and Real Estate Securities Fund.
Shares of the Funds of the Company are offered only to insurance company separate accounts that fund certain variable life insurance contracts and variable annuity contracts. GE Asset Management Incorporated (“GEAM”) is the investment adviser and administrator of each of the Funds.
The Company currently offers two share classes of the Fund as investment options for variable life insurance and variable annuity contracts — Class 1 and Class 3. Class 3 shares were first offered on May 1, 2006, and Fund shares outstanding prior to May 1, 2006 were designated as Class 1 shares. Each class of shares has different fees and expenses, and as a result, each class of shares will have different share price and performance. Not all variable contracts offer every class of the Fund’s shares.
| 2. | Summary of Significant Accounting Policies |
The preparation of financial statements in conformity with U.S. generally accepted accounting principles (GAAP) requires management to make estimates and assumptions that affect the reported amounts of assets and liabilities and disclosure of contingent assets and liabilities at the date of the financial statements and the reported amounts of increases and decreases in net assets from operations during the reporting period. Actual results may differ from those estimates.
The following summarizes the significant accounting policies of the Company:
Securities Valuation and Transactions. All investments in securities are recorded at their estimated fair value, as described in Note 3.
Securities transactions are accounted for as of the trade date. Realized gains and losses on investments sold are recorded on the basis of identified cost for both financial statement and federal tax purposes.
The Fund’s income, expenses (other than distribution fees) and realized and unrealized gains and losses are allocated proportionally each day among the share classes based upon the relative net assets of each class.
Foreign Currency Accounting records of the Fund are maintained in U.S. dollars. Investment securities and other assets and liabilities denominated in a foreign currency are translated to U.S. dollars at the prevailing rates of exchange at period end. Purchases and sales of securities, income receipts and expense payments denominated in foreign currencies are translated into U.S. dollars at the prevailing exchange rate on the respective dates of such transactions.
All assets and liabilities of the Fund initially expressed in foreign currency values will be converted into U.S. dollars at the WM/Reuter exchange rate computed at 11:00 a.m., Eastern Time.
The Fund does not isolate the portion of the results of operations resulting from changes in foreign exchange rates from the fluctuations arising from changes in the market prices of securities during the year. Such fluctuations are included in the net realized or unrealized gain or loss from investments. Net realized gains or losses on foreign currency transactions represent net gains or losses on sales and maturities of foreign currency contracts, disposition of foreign currencies, the difference between the amount of net investment income and withholding taxes accrued and the U.S. dollar amount actually received or paid, and gains or losses between the trade and settlement date on purchases and sales of foreign securities. Net unrealized foreign exchange gains and losses arising from changes in the value of other assets and liabilities (including foreign currencies and open foreign currency contracts) as a result of changes in foreign exchange rates are included as increases or decreases in unrealized appreciation/depreciation on foreign currency related transactions.
Derivatives The Fund is subject to equity price risk, interest rate risk, credit risk, and foreign currency exchange rate risk in the normal course of pursuing its investment objectives. The Fund may enter into derivative transactions to gain market exposure for residual and accumulating cash positions and for managing the duration of fixed-income investments.
28
Table of Contents
| Notes to Financial Statements | June 30, 2012 (Unaudited) |
Futures Contracts A futures contract represents a commitment for the future purchase or sale of an asset at a specified price on a specified date. The Fund invested in futures for a variety of portfolio management purposes such as hedging against the effects of changes in the value of portfolio securities due to anticipated changes in interest rates and/or market conditions, gaining market exposure for accumulating and residual cash positions, for duration management, or when the transactions were economically appropriate to the reduction of risks inherent in the management of the Fund. Buying futures tends to increase a Fund’s exposure to the underlying instrument while selling futures tends to decrease a Fund’s exposure to the underlying instrument, or hedge other Fund investments. The Fund will not enter into a transaction involving futures for speculative purposes. With futures contracts, there is minimal counterparty credit risk to the Fund since futures contracts are exchange traded and the exchange’s clearinghouse, as counterparty to all traded futures, guarantees the futures against default. The Fund’s risks in using these contracts include changes in the value of the underlying instruments, non-performance of the counterparties under the contracts’ terms and changes in the liquidity of the secondary market for the contracts. Futures contracts are valued at the settlement price established each day by the board of trade or exchange on which they principally trade.
Upon entering into a financial futures contract, the Fund is required to pledge to the broker an amount of cash and/or other assets equal to a certain percentage of the contract amount, known as initial margin deposit. Subsequent payments, known as variation margin, are made or received by the Fund each day, depending on the daily fluctuation in the fair value of the underlying security. The Fund records an unrealized gain or loss equal to the daily variation margin. Should market conditions move unexpectedly, the Fund may not achieve the anticipated benefits of the futures contracts and may incur a loss. The Fund recognizes a realized gain or loss on the expiration or closing of a futures contract.
When-Issued Securities and Forward Commitments The Fund may purchase or sell securities on a when issued or forward commitment basis. These transactions are arrangements in which the Fund purchases and sells securities with payment and delivery scheduled a month or more after entering into the transaction. The price of the underlying securities and the date when these securities will be delivered and paid for are fixed at the time the transaction is negotiated. Losses may arise due to changes in the market value of the underlying securities or if the
counterparty does not perform under the commitments. In connection with such purchases, the Fund maintains cash or liquid assets in an amount equal to the purchase commitments for such underlying securities until settlement date and for sales commitments the Fund maintains equivalent deliverable securities as “cover” for the transaction. Unsettled commitments are valued at the current market value of the underlying security. Daily fluctuations in the value of such commitments are recorded as unrealized gains or losses. The Fund will not enter into such commitments for the purpose of investment leverage.
Forward Foreign Currency Exchange Contracts The Fund may enter into forward foreign currency exchange contracts to facilitate transactions in foreign denominated securities and to manage the Fund’s currency exposure. Forward foreign currency exchange contracts are valued at the mean between the bid and the offered forward rates as last quoted by a recognized dealer. The aggregate principal amounts of the contracts are not recorded in the Fund’s financial statements. Such amounts appear under the caption Forward Foreign Currency Contracts in the Schedules of Investments. Fluctuations in the value of the contracts are recorded in the Statements of Assets and Liabilities as an asset (or liability) and in the Statements of Operations as unrealized appreciation (depreciation) until the contracts are closed, when they are recorded as realized gains or losses on foreign currency related transactions. The Fund’s risks in using these contracts include changes in the value of foreign currency or the possibility that the counterparties do not perform under the contracts’ terms. When the Fund enters into a forward foreign currency exchange contract, it is required to segregate cash or liquid securities with its custodian in an amount equal to the value of the Fund’s total assets committed to the consummation of the forward contract. If the value of the segregated securities declines, additional cash or securities are segregated so that the value of the account will equal the amount of the Fund’s commitment with respect to the contract.
Investments in Foreign Markets Investments in foreign markets involve special risks and considerations not typically associated with investing in the United States. These risks include revaluation of currencies, high rates of inflation, restrictions on repatriation of income and capital, and adverse political and economic developments. Moreover, securities issued in these markets may be less liquid, subject to government ownership controls, tariffs and taxes, subject to delays in settlements, and their prices may be more volatile.
29
Table of Contents
| Notes to Financial Statements | June 30, 2012 (Unaudited) |
The Fund may be subject to capital gains and repatriation taxes imposed by certain countries in which they invest. Such taxes are generally based upon income and/or capital gains earned or repatriated. Taxes are accrued based on net investment income, net realized gains and net unrealized appreciation as income and/or capital gains are earned.
Investment Income Corporate actions (including cash dividends) are recorded on the ex-dividend date, net of applicable withholding taxes, except for certain foreign corporate actions which are recorded as soon after the ex-dividend date as such information becomes available. Withholding taxes in foreign dividends have been provided for in accordance with the Fund’s understanding of the applicable country’s tax rules and rates.
Interest income is recorded on the accrual basis. Accretion of discounts and amortization of premiums on taxable bonds are to the call or maturity date, whichever is shorter, using the effective yield method.
Expenses Fund specific expenses are allocated to the Fund that incurs such expenses. Such expenses may include custodial fees, legal and accounting fees, printing costs and registration fees. Expenses that are not fund specific are allocated pro rata across the Funds. Certain class specific expenses (such as distribution fees) are allocated to the class that incurs such expense. Expenses of the Fund are generally paid directly by the Fund, however, expenses may be paid by GEAM and reimbursed by the Fund.
Federal Income Taxes The Fund intends to comply with all sections of the Internal Revenue Code applicable to regulated investment companies including the distribution of substantially all of its taxable net investment income and net realized capital gains to its shareholders. Therefore, no provision for federal income tax has been made.
| 3. | Securities Valuation |
The Fund utilizes various methods to measure the fair value of most of its investments on a recurring basis. GAAP establishes a framework for measuring fair value and providing related disclosures. Broadly, the framework requires fair value to be determined based on the exchange price that would be received for an asset or paid to transfer a liability (an exit price) in the principal or most advantageous market for the asset or liability in an orderly transaction between market participants at the measurement date. In the absence of active markets for the identical assets or liabilities, such measurements involve developing assumptions based on market
observable data and, in the absence of such data, internal information that is consistent with what market participants would use in a hypothetical transaction that occurs at the measurement date. It also establishes a three-level valuation hierarchy based upon observable and non-observable inputs.
Observable inputs reflect market data obtained from independent sources, while unobservable inputs reflect our market assumptions. Preference is given to observable inputs. These two types of inputs create the following fair value hierarchy:
Level 1 — Quoted prices for identical investments in active markets.
Level 2 — Quoted prices for similar investments in active markets; quoted prices for identical or similar investments in markets that are not active; and model-derived valuations whose inputs are observable or whose significant value drivers are observable.
Level 3 — Significant inputs to the valuation model are unobservable.
Policies and procedures are maintained to value investments using the best and most relevant data available. In addition, pricing vendors are utilized to assist in valuing investments. GEAM performs periodic reviews of the methodologies used by independent pricing services including price validation of individual securities.
Fair Value Measurement The following section describes the valuation methodologies the Fund uses to measure different financial investments at fair value.
The Fund’s portfolio securities are valued generally on the basis of market quotations. Equity securities generally are valued at the last reported sale price on the primary market in which they are traded. Portfolio securities listed on NASDAQ are valued using the NASDAQ Official Closing Price, Level 1 securities primarily include publicly-traded equity securities. If no sales occurred on the exchange or NASDAQ that day, the portfolio security generally is valued using the last reported bid price. In those circumstances the Fund classifies the investment securities in Level 2.
Debt securities (other than short-term securities described below) generally are valued at an evaluated bid price as reported by independent pricing services. The pricing services use various pricing models for each asset class. The inputs and assumptions to the model of the pricing services are derived from market observable sources,
30
Table of Contents
| Notes to Financial Statements | June 30, 2012 (Unaudited) |
including: benchmark yields, reported trades, broker/dealer quotes, issuer spreads, benchmark securities, bids, offers, and other market related data. Since many fixed income securities do not trade on a daily basis, the methodology of the pricing service uses other available information as applicable such as benchmark curves, benchmarking of similar securities, sector groupings, and matrix pricing. Thus, certain securities may not be priced using quoted prices, but rather determined from market observable information. These investments are included in Level 2 and are primarily comprised of corporate fixed income, government, mortgage and asset-backed securities. In the absence of a reliable bid price from such a pricing service, debt securities may be valued based on broker or dealer supplied valuations or quotations. In these infrequent circumstances, pricing services may provide the Fund with valuations that are based on significant unobservable inputs, and in those circumstances the investment securities are classified as Level 3.
The Fund may use non-binding broker or dealer quotes for valuation when there is limited or no relevant market activity for a specific investment or for other investments that share similar characteristics and a price is not provided by a pricing service or is deemed not to be reliable. The Fund has not adjusted the prices obtained. Investment securities priced using non-binding broker or dealer quotes are included in Level 3.
Short-term investments of sufficient credit quality with remaining maturities of sixty days or less at the time of purchase are typically valued on the basis of amortized cost which approximates fair value and these are included in Level 2. If it is determined that amortized cost does not approximate fair value, securities may be valued based on dealer supplied valuations or quotations. In these infrequent circumstances, pricing services may provide the Fund with valuations that are based on significant unobservable inputs, and in those circumstances the investment securities are classified in Level 3.
The Fund uses the net asset value per unit for collective funds (i.e., GEI Investment Fund). The Fund classifies the investment security in Level 2.
If prices are not readily available for a portfolio security, or if it is believed that a price for a portfolio security does not represent its fair value, the security may be valued using procedures approved by the Fund’s Board of Directors that are designed to establish its “fair” value. These securities are typically classified in Level 3. Those procedures require that the fair value of a security be established by a
valuation committee of GEAM. The valuation committee follows different protocols for different types of investments and circumstances. The fair value procedures may be used to value any investment of the Fund in the appropriate circumstances.
Foreign securities may be valued with the assistance of an independent fair value pricing service in circumstances where it is believed that they have been or would be materially affected by events occurring after the close of the portfolio security’s primary market and before the close of regular trading on the NYSE. In these circumstances the Fund classifies the investment securities in Level 2. This independent fair value pricing service uses a proprietary model to identify affected securities, taking into consideration various factors, and the fair value of such securities may be something other than the last available quotation or other market price.
All assets and liabilities of the Fund initially expressed in foreign currency values will be converted into U.S. dollars at the WM/Reuters exchange rate computed at 11:00 a.m. Eastern time.
Fair value determinations generally are used for securities whose value is affected by a significant event that will materially affect the value of a security and which occurs subsequent to the time of the close of the principal market on which such security trades but prior to the calculation of the Fund’s NAV.
The value established for such a portfolio security may be different than what would be produced through the use of market quotations or another methodology. Portfolio securities that are valued using techniques other than market quotations, including “fair valued” securities, may be subject to greater fluctuation in their value from one day to the next than would be the case if market quotations were used. In addition, there is no assurance that the Fund could sell a portfolio security for the value established for it at any time and it is possible that the Fund would incur a loss because a portfolio security is sold at a discount to its established value.
Other financial investments are derivative instruments that are not reflected in total investments, such as futures, forwards, swaps, and written options contracts, which are valued based on fair value as discussed above.
The Fund uses closing prices for derivatives included in Level 1, which are traded either on exchanges or liquid over-the counter markets. Derivative assets and liabilities included in Level 2 primarily represent interest rate swaps,
31
Table of Contents
| Notes to Financial Statements | June 30, 2012 (Unaudited) |
cross-currency swaps and foreign currency and commodity forward and option contracts. Derivative assets and liabilities included in Level 3 primarily represent interest rate products that contain embedded optionality or prepayment features.
The inputs or methodology used for valuing securities are not an indication of the risk associated with investing in those securities.
The following table presents the Fund’s investments measured at fair value on a recurring basis at June 30, 2012:
Investments | Level 1 | Level 2 | Level 3 | Total | ||||||||||||
Investments in Securities† | ||||||||||||||||
Domestic Equity | $ | 1,054,559,128 | $ | — | $— | $ | 1,054,559,128 | |||||||||
Foreign Equity | 62,131,724 | 409,777,527 | — | 471,909,251 | ||||||||||||
U.S. Treasuries | — | 119,333,915 | — | 119,333,915 | ||||||||||||
Agency Mortgage Backed | — | 298,956,094 | — | 298,956,094 | ||||||||||||
Agency CMOs | — | 6,453,147 | — | 6,453,147 | ||||||||||||
Asset Backed | — | 6,922,647 | — | 6,922,647 | ||||||||||||
Corporate Notes | — | 264,335,768 | — | 264,335,768 | ||||||||||||
Non-Agency CMOs | — | 28,352,923 | — | 28,352,923 | ||||||||||||
Sovereign Bonds | — | 20,715,956 | — | 20,715,956 | ||||||||||||
Municipal Notes and Bonds | — | 4,507,316 | — | 4,507,316 | ||||||||||||
Exchange Traded Funds | 72,215,391 | — | — | 72,215,391 | ||||||||||||
Preferred Stock | 3,204,624 | 7,399,402 | — | 10,604,026 | ||||||||||||
Other Investments | — | 4,478,770 | — | 4,478,770 | ||||||||||||
Short-Term Investments | 409,857,965 | 59,700,445 | — | 469,558,410 | ||||||||||||
|
|
|
|
|
|
|
| |||||||||
Total Investments in Securities | $ | 1,601,968,832 | $ | 1,230,933,910 | $— | $ | 2,832,902,742 | |||||||||
|
|
|
|
|
|
|
| |||||||||
Other Financial Instruments * | ||||||||||||||||
Futures Contracts — Unrealized Appreciation | $ | 3,473,835 | $ | — | $— | $ | 3,473,835 | |||||||||
Futures Contracts — Unrealized Depreciation | (782,292 | ) | — | — | (782,292 | ) | ||||||||||
Foreign Currency Forward Exchange Contracts — Unrealized Appreciation | 3,701,568 | — | — | 3,701,568 | ||||||||||||
|
|
|
|
|
|
|
| |||||||||
Total Other Financial Instruments | $ | 6,393,111 | $ | — | $— | $ | 6,393,111 | |||||||||
|
|
|
|
|
|
|
| |||||||||
| † | See Schedule of Investments for Industry Classification |
| * | Other financial instruments include derivative instruments such as futures contracts and foreign currency forward exchange contracts. Amounts shown represent unrealized appreciation (depreciation), at period end. |
The Fund utilized the fair value pricing service on June 30, 2012 due to events occurring after the close of foreign local markets and before the close of regular trading on the NYSE. This resulted in certain foreign securities being classified as Level 2 at the end of the period which were classified as Level 1 at December 31, 2011. The value of securities that were transferred to Level 2 from Level 1 as a result was $360,882,990.
There were no other transfers between fair value levels during the period. Transfers between fair value levels are considered to occur at the beginning of the period.
32
Table of Contents
| Notes to Financial Statements | June 30, 2012 (Unaudited) |
| 4. | Derivatives Transactions |
Shown below are the derivative contracts entered into by the Fund, summarized by primary risk exposure as they appear on the Statement of Assets and Liabilities, all of which are not accounted for as hedging instruments under FASB Accounting Standards Codification (“ASC”) No. 815 Derivatives and Hedging as of June 30, 2012.
Asset Derivatives June 30, 2012 |
| Liability Derivatives June 30, 2012 |
| |||||||||
| Derivatives not accounted for as hedging instruments under ASC 815 | Location in the Statement of Assets and Liabilities | | Fair Value ($) | | Location in the Statements of Assets and Liabilities | | Fair Value ($) | | ||||
Interest Rate Contracts | Assets, Net Assets - Net Unrealized Appreciation/(Depreciation) on Futures | 38,432 | * | Liabilities, Net Assets - Net Unrealized Appreciation/ (Depreciation) on Futures | (782,292) | * | ||||||
Equity Contracts | Assets, Net Assets - Net Unrealized Appreciation/ (Depreciation) on Futures | 3,435,403 | * | Liabilities, Net Assets - Net Unrealized Appreciation/ (Depreciation) on Futures | — | |||||||
Foreign Currency Forward Exchange Contracts | Assets, Net Assets - Net Unrealized Appreciation/ (Depreciation) on Foreign Currency Forward Exchange | 3,701,568, | * | Liabilities, Net Assets - Net Unrealized Appreciation/ (Depreciation) on Foreign Currency Forward Exchange | — | |||||||
| * | Includes cumulative unrealized appreciation/(depreciation) of futures contracts and foreign currency forward exchange contracts as reported in the Schedule of Investments and within the components of the net assets section of the Statement of Assets and Liabilities. Only the current day’s variation margin for futures contracts is reported within the Assets and/or Liabilities section on the Statement of Assets and Liabilities. |
Shown below are the effects of derivative instruments on the Fund’s Statement of Operations, summarized by primary risk exposure all of which are not accounted for as hedging instruments under ASC 815.
| Derivatives not accounted for as hedging instruments under ASC 815 | Location in the Statements of Operations | | Total Notional Amount of Futures/Foreign Currency Forward Contracts Purchased/(Sold) ($) | | Realized Gain or (Loss) on Derivatives Recognized in Income ($) | | Change in Unrealized Appreciation/ (Depreciation) on Derivatives Recognized in Income ($) | | ||||
Equity Contracts | Realized gain/(loss) on Futures, Increase/(decrease) in unrealized appreciation/ (depreciation) on Futures | | 306,527,853/ (200,271,394) | | 1,023,412 | 3,261,282 | ||||||
Interest Rate Contracts | Realized gain/(loss) on Futures, Increase/(decrease) in unrealized appreciation/ (depreciation) on Futures |
| 1,237,960,130/ (1,123,436,615) |
| (5,839,312) | 876,358 | ||||||
Foreign Currency Forward Exchange Contracts | Assets, Net Assets – Net Unrealized Appreciation/ (Depreciation) on Foreign Currency Forward Exchange | 0/(121,770,148) | (293,004) | 3,701,568 |
33
Table of Contents
| Notes to Financial Statements | June 30, 2012 (Unaudited) |
| 5. | Line of Credit |
The Company shares a revolving credit facility of up to $150 million with a number of its affiliates. The credit facility is with its custodian bank, State Street Bank and Trust Company (“State Street”). The revolving credit facility requires the payment of a commitment fee equal to 0.100% per annum on the daily unused portion of the credit facility, payable quarterly. The portion borne by the Funds generally is borne proportionally based upon net assets. In addition, the Company has a $100 million uncommitted, unsecured line of credit with State Street. Generally, borrowings under the credit facilities would accrue interest at the Federal Funds Rate plus 50 basis points and would be borne by the borrowing Fund. The maximum amount allowed to be borrowed by any one Fund is the lesser of (i) 33.33% of its total assets or (ii) 20% of its net assets. The credit facilities were not utilized by the Fund during the six-month period ended June 30, 2012.
| 6. | Compensation and Fees Paid to Affiliates |
GEAM, a registered investment adviser, was retained by the Company’s Board of Directors effective May 1, 1997 to act as investment adviser and administrator of the Fund. GEAM’s compensation for investment advisory and administrative services is paid monthly based on the average daily net assets of the Fund. GEAM’s compensation for investment advisory and administrative services is paid monthly based on average daily net assets of the Fund at an annualized rate of 0.50%.
GEAM has a contractual arrangement with the Fund to waive a portion of the Fund’s management fee in the amount equal to the management fee earned by GEAM with respect to the Fund’s investment in the GE Institutional Money Market Fund.
From May 1, 2010 through April 30, 2011, GEAM entered into a contractual arrangement with the Company to limit other expenses of each share class of the Fund (excluding applicable investor Service Plan fee of 0.20%) at or below 0.03% on an annualized basis. This arrangement was terminated on April 30, 2011. Expenses borne by GEAM pursuant to the expense limitation agreement may be recouped by GEAM for up to three years from the date the expense was incurred. A reimbursement will not be made if it would cause the total operating expenses of Class 1 Shares and Class 3 Shares to exceed 0.80% and 1.05% of average net assets, respectively, for the fiscal year in which the recoupment is made.
Investor Service Plan — Class 1 and Class 3 Shares The Company adopted an Investor Service Plan (the “Service Plan”) on December 9, 2005 for Class 1 shares and on May 1, 2009 for Class 3 shares of the Fund. The Service Plan was not adopted pursuant to Rule 12b-1 under the 1940 Act. Each Service Plan provides that during any fiscal year, the amount of compensation paid under the Service Plan by the Total Return Fund Class 1 or Class 3 shares may not exceed the annual rate of 0.20% of the average daily net assets of the Total Return Fund attributable to each such class shares.
Distribution and Shareholder Service (12b-1) Fees The Company has adopted a Distribution and Service (12b-1) Plan (12b-1 Plan) pursuant to Rule 12b-1 under the 1940 Act with respect to each of Class 1 and Class 3 shares of the Total Return Fund. Under the 12b-1 Plan for Class 1 shares that became effective May 1, 2009, payments made under the Class 1 Investor Service Plan are covered in the event that any portion of compensation paid pursuant to the Class 1 Investor Service Plan is determined to be an indirect use of the assets attributable to the Class 1 shares to finance distribution of such shares. Under each 12b-1 Plan for Class 3 shares, the Company, on behalf of the Fund, may compensate GE Investment Distributors, Inc. (GEID), the distributor of the shares of the Fund, for certain sales services provided by GEID or other broker dealers and investor services provided by GEID or other service providers relating to the Fund’s Class 3 shares, including services to owners or prospective owners of variable contracts issued by insurance companies that offer Class 3 shares as an investment option under such variable contracts. The amount of compensation paid under the 12b-1 Plan may not exceed 0.25% for Class 3 shares, of the average daily net assets of the Fund attributable to such share class. The 12b-1 Plan continues in effect from year to year for so long as such continuance is approved annually by the Board of Directors, including by those directors who are not interested persons of the Company and who have no direct or indirect financial interest in the operation of the 12b-1 Plan or in any agreement related to it. In addition, the Class 3 12b-1 Plan covers payments made under the Class 3 Investor Service Plan in the event that any portion of compensation paid pursuant to the Class 3 Investor Service Plan is determined to be an indirect use of the assets attributable to the Class 3 shares to finance distribution of such shares.
Directors’ Compensation The Fund pays no compensation to its directors who are officers or employees of GEAM or its
34
Table of Contents
| Notes to Financial Statements | June 30, 2012 (Unaudited) |
affiliates. Directors who are not such officers or employees also serve in a similar capacity for other funds advised by GEAM. Compensation paid to non-interested Directors are reflected on the Statement of Operations. These fees are allocated pro rata across all of the mutual fund platforms served by the Directors, including the Fund, and are based upon the relative net assets of each fund within such platforms.
| 7. | Sub-Advisory Fees |
Pursuant to investment sub-advisory agreements with GEAM, a portion of the assets of the Total Return Fund are allocated to and managed by each of the following sub-advisers: (i) Palisade Capital Management, L.L.C. (“Palisade”); and (ii) Urdang Securities Management, Inc. (“Urdang”). GEAM is responsible for allocating the Fund’s assets among the sub-advisers at its discretion (Allocated Assets), and for managing the Fund’s cash position, while each sub-adviser is responsible for the day-to-day management of their portion of the Allocated Assets, under the general supervision and oversight of GEAM and the Board.
For their services, GEAM pays each sub-adviser an investment sub-advisory fee, which is calculated as a percentage of the average daily net assets of the respective Allocated Assets that they manage.
| 8. | Investment Transactions |
Purchases and Sales of Securities The cost of purchases and the proceeds from sales of investments, other than short-term securities, for the six-month period ended June 30, 2012, were as follows:
| U.S. Government Securities | ||
| Purchases | Sales | |
| $1,467,732,206 | $1,456,219,873 | |
| Other Securities | ||
| Purchases | Sales | |
| $888,318,945 | $1,174,037,208 | |
| 9. | Income Taxes |
The Fund is subject to ASC 740, Income Taxes. ASC 740 provides guidance for financial accounting and reporting for the effects of income taxes that result from an entity’s activities during the year. ASC 740 also provides guidance regarding how certain tax positions should be recognized, measured, presented and disclosed in the financial statements. ASC 740 requires evaluation of tax positions taken or expected to be taken in the course of preparing the Fund’s tax returns to determine whether the tax positions are “more likely than not” of being sustained by the applicable tax authority. There are no adjustments to the Fund’s net assets required under ASC 740. The Fund’s 2008, 2009, 2010, and 2011 fiscal years tax returns are still open to examination by the Federal and applicable state tax authorities.
At June 30, 2012, information on the tax cost of investments was as follows:
Cost of Investments For Tax Purposes | Gross Tax | |||||
| Appreciation | Depreciation | Net Tax Appreciation | ||||
$2,745,321,292 | $187,477,693 | $(99,896,243) | $87,581,450 | |||
As of December 31, 2011, the Fund has capital loss carryovers, as indicated below. Capital loss carryovers are available to offset future realized capital gains to the extent provided in the Internal Revenue Code and regulations thereunder. To the extent that these carryover losses are used to offset future capital gains, it is probable that the gains so offset will not be distributed to shareholders because they would be taxable as ordinary income.
Amount | ||||
| Short-Term | Long-Term | Expires | ||
| $181,807,461 | $— | 12/31/2017 | ||
These amounts will be available to offset future taxable capital gains. [Under the recently enacted Regulated Investment Company Modernization Act of 2010, the Fund will be permitted to carry forward capital losses incurred in taxable years beginning after December 22, 2010 for an unlimited period. However, any losses incurred during those future years will be required to be utilized prior to the losses incurred in pre-enactment tax years. As a result of this ordering rule, pre-enactment capital loss carryforwards may be more likely to expire unused. Additionally, post-enactment capital losses that are carried forward will retain
35
Table of Contents
| Notes to Financial Statements | June 30, 2012 (Unaudited) |
their character as either short-term or long-term capital losses rather than being considered all short-term as under previous law.]
During the year ended December 31, 2011, the Fund utilized $87,839,961 of prior year capital loss carryovers.
Any qualified late-year loss is deemed to arise on the first day of the Fund’s next tax year (if the Fund elects to defer such loss). Under this regime, generally, the Fund can elect to defer any post-October capital loss and/or any late-year ordinary loss as defined by the Internal Revenue Code.
The Fund elected to defer qualified late-year losses for the year ended December 31, 2011 as follows:
| Capital | Ordinary | |
| $3,550,670 | $— |
The tax composition of distributions paid during the years ended December 31, 2011 and December 31, 2010 were as follows:
| Ordinary Income | Long-Term Capital Gains | Total | ||||||||||
2011 | $ | 44,026,219 | $ | — | $ | 44,026,219 | ||||||
2010 | 35,022,799 | — | 35,022,799 | |||||||||
Distributions to Shareholders The Fund declares and pays any dividends from net investment income annually. The Fund declares and pays any net realized capital gains in excess of capital loss carryforwards distributions annually. The character of income and gains to be distributed is determined in accordance with income tax regulations which may differ from generally accepted
accounting principles. These differences include (but are not limited to) futures, treatment of realized and unrealized gains and losses on foreign currency transactions, paydown gains and losses on mortgage-backed securities, investments organized as partnerships for tax purposes, losses deferred due to offsetting positions, distributions from Real Estate Investment Trusts (REITs) and other equity investments, and losses deferred due to wash sale transactions. Reclassifications due to permanent book/tax differences are made to the Fund’s capital accounts to reflect income and gains available for distribution (or available capital loss carryovers) under income tax regulations. These reclassifications have no impact on net investment income, realized gains or losses, or the net asset value of the Fund. The calculation of net investment income per share in the Financial Highlights table excludes these adjustments.
The reclassifications for the year ended December 31, 2011 were as follows:
| Undistributed Net Investment Income | Accumulated Net Realized Gain (Loss) | Capital Paid In | ||
| $2,720,265 | $(2,468,570) | $(251,695) |
| 10. | Subsequent Events |
Subsequent events after the balance sheet date through the date the financial statements were issued have been evaluated in the preparation of the financial statements. As of August 3, 2012, the assets of the Mid-Cap Equity Fund and the Money Market Fund were liquidated. These funds ceased operations and are no longer offered for investment.
36
Table of Contents
| Additional Information | (Unaudited) |
Information about Directors and Executive Officers:
The business and affairs of the Funds are managed under the direction of the Funds’ Board of Directors. Information pertaining to the Directors and officers of the Funds is set forth below.
Interested Directors and Executive Officers
Michael J. Cosgrove
Address c/o GEAM 1600 Summer St. Stamford, CT 06905
Age 63
Position(s) Held with Fund Chairman of the Board and President
Term of Office and Length of Time Served Until successor is elected and qualified – 15 years
Principal Occupation(s) During Past 5 years President of Mutual Funds and Global Investment Programs of GEAM since November 2011; President and Chief Executive Officer – Mutual Funds and Intermediary Business of GEAM from March 2007 to November 2011; Executive Vice President of GEAM from February 1997 to March 2007; and Executive Vice President-Mutual Funds of GEAM from March 1993 to March 2007. Also serves as Treasurer of GE Foundation since 1988.
Number of Portfolios in Fund Complex Overseen by Director 25
Other Directorships Held by Director Chairman of the Board and President of GE Institutional Funds since 1997; Trustee of Elfun Funds, GE Savings & Security Funds and General Electric Pension Trust since 1988; Director of GEAM since 1988; Trustee of Fordham University from 2002 to June 30, 2010 and since July 2011; Director of GE Investments Distributors, Inc since June 2011; Director of Skin Cancer Foundation since August 2010; Member of the Board of Governors for the Investment Company Institute since October 2006; Director, GE Asset Management (Ireland) Limited, since February 1999, GE Asset Management Funds Plc since 1998, GE Asset Management Canada Company since 1998, GE Asset Management Limited since 1998; Trustee of General Electric Pension Trust since 1988; and Chairman of the Board and President of GE Funds from 1993 to February 2011.
Matthew J. Simpson
Address c/o GEAM 1600 Summer St. Stamford, CT 06905
Age 51
Position(s) Held with Fund Director and Executive Vice President
Term of Office and Length of Time Served Until successor is elected and qualified – 4 years
Principal Occupation(s) During Past 5 years Executive Vice President, General Counsel and Secretary of GEAM since July 2007; Secretary of Elfun Funds and GE Savings & Security Funds since July 2007; Senior Vice President and General Counsel – Marketing and Client Services (formerly Asset Management Services) of GEAM and Senior Vice President and General Counsel of GE Asset Management Services from February 1997 to July 2007; Vice President and Associate General Counsel of GEAM from October 1992 to February 1997; Secretary of GE Institutional Funds and GE Investments Funds, Inc. from 1997 to July 2007 and Vice President from September 2003 to July 2007; Assistant Secretary of Elfun Funds and GE Savings & Security Funds from 1998 to July 2007 and Vice President from October 2003 to July 2007; and Secretary of GE Funds from 1993 to July 2007 and Vice President from September 2003 to July 2007.
Number of Portfolios in Fund Complex Overseen by Director 25
Other Directorships Held by Director Trustee of Elfun Funds, GE Savings & Security Funds and General Electric Pension Trust since July 2007; Trustee and Executive Vice President of GE Institutional Funds since July 2007; Director of GEAM since July 2007; and Trustee and Executive Vice President of GE Funds from July 2007 to February 2011.
37
Table of Contents
| Additional Information | (Unaudited) |
Joon Won Choe
Address c/o GEAM 1600 Summer St. Stamford, CT 06905
Age 42
Position(s) Held with Fund Vice President & Secretary
Term of Office and Length of Time Served Until successor is elected and qualified – Vice President and Secretary – 1 year
Principal Occupation(s) During Past 5 years Senior Vice President and Deputy General Counsel at GEAM since March 2011; Vice President and Secretary of GE Institutional Funds since September 2010; Vice President and Assistant Secretary of Elfun Funds and GE Savings & Security Funds since September 2010; Senior Vice President and Associate General Counsel at GEAM from June 2010 to March 2011; Vice President and Associate General Counsel of GEAM from November 2005 to June 2010 and Vice President and Secretary of GE Funds from September 2010 to February 2011.
Number of Portfolios in Fund Complex Overseen by Officer N/A
Other Directorships Held by Officer N/A
Robert Herlihy
Address c/o GEAM 1600 Summer St. Stamford, CT 06905
Age 44
Position(s) Held with Fund Chief Compliance Officer
Term of Office and Length of Time Served Until successor is elected and qualified — 6 years
Principal Occupation(s) During Past 5 years Chief Compliance Officer of GEAM, GE Institutional Funds, Elfun Funds, and GE Savings & Security Funds since July 2005; Chief Compliance Officer of GE Funds from July 2005 to February 2011 and Manager of Fund Administration at GEAM from 2002-2005.
Number of Portfolios in Fund Complex Overseen by Officer N/A
Other Directorships Held by Officer N/A
Arthur A. Jensen
Address c/o GEAM 1600 Summer St. Stamford, CT 06905
Age 45
Position(s) Held with Fund Treasurer
Term of Office and Length of Time Served Until successor is elected and qualified – 1 year
Principal Occupation(s) During Past 5 Years Treasurer of GE Institutional Funds, Elfun Funds and GE Savings & Security Funds since June 2011; Mutual Funds Controller of GEAM since April 2011; Senior Vice President at Citigroup from 2008 to 2010 and Vice President at JPMorgan from 2005 to 2008.
Number of Portfolios in Fund Complex Overseen by Officer N/A
Other Directorships Held by Officer N/A
38
Table of Contents
| Additional Information | (Unaudited) |
Jeanne M. LaPorta
Address c/o GEAM 1600 Summer St. Stamford, CT 06905
Age 46
Position(s) Held with Fund Vice President
Term of Office and Length of Time Served Until successor is elected and qualified – 8 years
Principal Occupation(s) During Past 5 Years Senior Vice President and Commercial Administrative Officer of GEAM since April 2010; Vice President of GE Institutional Funds since July 2003; Vice President of Elfun Funds and GE Savings & Security Funds since October 2003; Secretary of GE Funds from July 2007 to September 2010 and Vice President from July 2007 to February 2011; Senior Vice President and Deputy General Counsel of GEAM from October 2007 to April 2010; Vice President and Assistant Secretary of Elfun Funds and GE Savings & Security Funds from July 2003 to June 2010; and Vice President and Associate General Counsel – Marketing and Client Services (formerly Asset Management Services) at GEAM from May 1997 to October 2007.
Number of Portfolios in Fund Complex Overseen by Officer N/A
Other Directorships Held by Officer N/A
Non-Interested Directors
John R. Costantino
Address c/o GEAM 1600 Summer St. Stamford, CT 06905
Age 66
Position(s) Held with Fund Director
Term of Office and Length of Time Served Until successor is elected and qualified – 15 years
Principal Occupation(s) During Past 5 years General Partner, NGN Capital LLC since 2006; Managing Director, Vice President of Walden Capital Management since 1996.
Number of Portfolios in Fund Complex Overseen by Director 17
Other Directorships Held by Director Trustee of GE Institutional Funds since 1997; Trustee of Fordham University from 1989 to 1995 and from 2001 to 2007 and Trustee Emeritus since 2007; Trustee of Neuroscience Research Institute since 1986; Trustee of GE Funds from 1993 to February 2011; Director of Artes Medical from 2006-2008 and Trustee of Gregorian University Foundation from 1992-2007.
39
Table of Contents
| Additional Information | (Unaudited) |
R. Sheldon Johnson
Address c/o GEAM 1600 Summer St. Stamford, CT 06905
Age 65
Positions(s) Held with Fund Director
Term of office and Length of Time served Unit Successor is elected and qualified – 1 year.
Principal Occupation(s) During Past 5 years Head of Global Institutional Equity Sales and Marketing at Morgan Stanley & Co., Inc. from 2002 to 2006 and Managing Director at Morgan Stanley & Co., Inc. from 1988 to 2006.
Number of Portfolios in Fund Complex Overseen by Director 17
Other Directorships Held by Director Trustee of GE Institutional Funds since April 2011 and Trustee of St. Lawrence University since 2003.
Donna M. Rapaccioli
Address c/o GEAM 1600 Summer St. Stamford, CT 06905
Age 49
Position(s) Held with Fund Director
Term of Office and Length of Time Served Until successor is elected and qualified – Less than 1 year
Principal Occupation(s) During Past 5 Years Dean of the Gabelli School of Business since 2007 and Accounting professor since 1987 at Fordham University.
Number of Portfolios in Fund Complex Overseen by Officer 17
Other Directorships Held by Director Trustee of GE Institutional Funds since January 2012 and Trustee of Emmanuel College since 2010.
The Statement of Additional Information for the Funds includes additional information about the Directors and Officers and is available, without charge, upon request by calling 1-800-242-0134.
40
Table of Contents
| Investment Team | (Unaudited) |
Investment Adviser and Administrator
GE Asset Management Incorporated
Board of Directors
Michael J. Cosgrove, Chairman
John R. Costantino
R. Sheldon Johnson
Donna M. Rapaccioli
Matthew J. Simpson
Secretary
Joon Won Choe
Assistant Secretary
Michelle Matzelle
Treasurer
Arthur A. Jensen
Assistant Treasurer
Casey Yantosca
Distributor
GE Investment Distributors, Inc.
Member FINRA and SIPC
Custodian
State Street Bank & Trust Company
Officers of the Investment Adviser
Dmitri Stockton, President and Chief Executive Officer
Cheryl H. Beacock, Senior Vice President, Human Resources
George A. Bicher, Chief Risk Officer
Paul M. Colonna, President and Chief Investment Officer – Public Investments
Michael J. Cosgrove, President of Mutual Funds and Global Investment Programs
Gregory B. Hartch, Senior Vice President – Strategy and Business Development Leader
Ralph R. Layman, Executive Vice President and Chief Investment Officer Emeritus Public Equities
Maureen B. Mitchell, President of Global Sales and Marketing
Steven M. Rullo, Senior Vice President – Services and Technology
Matthew J. Simpson, Executive Vice President, General Counsel and Secretary
Donald W. Torey, President and Chief Investment Officer – Alternative Investments
David Wiederecht, President and Chief Investment Officer – Investment Solutions
Jessica Holscott, Executive Vice President, Chief Financial Officer*
| * | Effective August 1, 2012, Ms. Holcott replaced Tracie A. Winbigler as Executive Vice President and Chief Financial Officer. |
At GE Asset Management, we’re dedicated to providing the investment options you’ll need to tailor your financial portfolio to every stage of your life. Each member of the GE Family of Funds is managed according to the same principles of integrity and quality that have guided GE over the past century, and have made it the world-class company that it is today. Each fund draws strength from a heritage of investment management experience that spans more than 80 years. Whether you’re creating a new investment portfolio or adding to an established one, the GE Family of Funds offers an array of professionally managed investment options that will help you meet a lifetime of financial needs.
41
Table of Contents
Investment Adviser
GE Asset Management Incorporated
1600 Summer Street
Stamford, CT 06905
or at:
PO Box 7900
Stamford, CT 06904-7900
Distributor
GE Investment Distributors, Inc.
member FINRA and SIPC
1600 Summer Street
Stamford, CT 06905
or at:
PO Box 7900
Stamford, CT 06904-7900
The Fund files its complete schedule of portfolio holdings with the Securities and Exchange Commission for the first and third quarters of each fiscal year on Form N-Q. The Fund’s Forms N-Q, as well as a description of the policies and procedures that the Fund uses to determine how to vote proxies (if any) relating to portfolio securities is available without charge (i) upon request, by calling 1-800-493-3042; (ii) on the Fund’s website at http://www.geam.com; and (iii) on the Commission’s website at http://www.sec.gov. The Fund’s Forms N-Q may be reviewed and copied at the Commission’s Public Reference Room in Washington, DC—information on the operation of the Public Reference Room may be obtained by calling 1-800-SEC-0330.
Information (if any) regarding how the Fund voted proxies relating to portfolio securities during the most recently disclosed 12-month period ended June 30 is available without charge (i) through the Fund’s website at http://www.geam.com; and (ii) on the Commission’s website at http://www.sec.gov.

Table of Contents
GE Investments Funds, Inc.
Money Market Fund
Semi-Annual Report
June 30, 2012

Table of Contents
GE Investments Funds, Inc.
| Money Market Fund | Contents | |
| 1 | ||||
| 2 | ||||
| 3 | ||||
| 5 | ||||
Financial Statements | ||||
| 6 | ||||
| 7 | ||||
| 8 | ||||
| 9 | ||||
| 10 | ||||
| 14 | ||||
| 18 | ||||
This report is prepared for Policyholders of certain variable contracts and may be distributed to others only if preceded or accompanied by the variable contract’s current prospectus and the current summary prospectus of the Fund available for investments thereunder.
Table of Contents
| Money Market Fund† | (Unaudited) |
Notes to Performance
Total return performance shown in this report for the GE Investments Money Market Fund (the “Fund”) assumes reinvestment of dividends and capital gains distributions, if any. Total returns shown are net of Fund fees and expenses but do not reflect fees and charges associated with the variable contracts such as administrative fees, account charges and surrender charges, which, if reflected, would reduce the Fund’s total returns for all periods shown.
The performance data quoted represents past performance; past performance does not guarantee future results. Investment return and principal value will fluctuate so your shares, when redeemed, may be worth more or less than their original cost. Current performance may be higher or lower than the performance data quoted. Periods less than one year are not annualized. Please call 800-493-3042 or visit the Fund’s website at http://www.geam.com for the most recent month-end performance data.
An investment in the Fund is not a deposit of any bank and is not insured or guaranteed by the Federal Deposit Insurance Corporation (“FDIC”) or any other government agency. An investment in the Fund is subject to risk, including possible loss of principal invested.
Investment Profile
A mutual fund designed for investors who seek a high level of current income consistent with the preservation of capital and maintenance of liquidity. The Fund seeks its investment objective by investing primarily in short-term, U.S. dollar-denominated money market instruments.
Sector Allocation
as a % of Fair Value of $208,756 (in thousands) on June 30, 2012 (a)
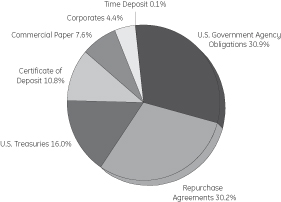
| (a) | The securities information regarding holdings, allocations and other characteristics is presented to illustrate examples of securities that the Fund has bought and the diversity of areas in which the Fund may invest as of a particular date. It may not be representative of the Fund’s current or future investments and should not be construed as a recommendation to purchase or sell a particular security. |
| † | As of August 3, 2012, the assets of the Fund were liquidated. The Fund ceased operations and is no longer offered for investment. |
An investment in the Money Market Fund is not insured or guaranteed by the Federal Deposit Insurance Corporation or any other Government agency. Although the Fund seeks to preserve the value of your investment at $1.00 per share, it is possible to lose money by investing in the Fund.
GE Investment Distributors, Inc., Member of FINRA & SIPC, is the principal underwriter and distributor of the GE Investments Funds, Inc. and a wholly owned subsidiary of GE Asset Management Incorporated, the investment adviser of the Fund.
1
Table of Contents
| Money Market Fund | (Unaudited) |
Understanding Your Fund’s Expenses
As a shareholder of the Fund you incur ongoing costs. Ongoing costs include portfolio management fees, professional fees, administrative fees and other Fund expenses. The following example is intended to help you understand your ongoing costs (in dollars) of investing in the Fund and to compare these costs with the ongoing costs of investing in other mutual funds.
To illustrate these ongoing costs, we have provided an example and calculated the expenses paid by investors in shares of the Fund during the period. The information in the following table is based on an investment of $1,000, which is invested at the beginning of the period and held for the entire six-month period ended June 30, 2012.
Actual Expenses
The first section of the table provides information about actual account values and actual expenses. You may use the information in this section, together with the amount you invested, to estimate the expenses that you paid over the period. To do so, simply divide your account value by $1,000 (for example, an $8,600 account value divided by $1,000 = 8.6), then multiply the result by the number given for your class under the heading “Expenses Paid During Period” to estimate the expenses paid on your account during the period.
Hypothetical Example for Comparison Purposes
The second section of the table provides information about hypothetical account values and hypothetical expenses based on the Fund’s actual expense ratio and an assumed rate of return of 5% per year before expenses, which is not the Fund’s actual return. The hypothetical account values and expenses may not be used to estimate the actual ending account balance or expenses you paid for the period. You may use this information to compare the ongoing costs of investing in the Fund and other funds. To do so, compare this 5% hypothetical example with the 5% hypothetical examples that appear in the shareholders reports of other funds.
Please note that the expenses shown in the table are meant to highlight and help you compare ongoing costs only and do not reflect transaction costs, such as sales charges or redemption fees, if any. Therefore, the second section of the table is useful in comparing ongoing costs only, and will not help you determine the relative total costs of owning different funds. Additionally, the expenses shown do not reflect the fees or charges associated with variable contracts through which shares of the Fund are offered.
January 1, 2012 - June 30, 2012
| Account value at the beginning of the period ($) | Account value at the end of the period ($) | Expenses paid during the period ($)* | ||||||||||
Actual Fund Return* | 1,000.00 | 1,000.00 | 0.85 | |||||||||
Hypothetical 5% Return (2.5% for the period) | 1,000.00 | 1,024.02 | 0.86 | |||||||||
| * | Expenses are equal to the Fund’s annualized expense ratio of 0.17% (for the period January 1, 2012—June 30, 2012), multiplied by the average account value over the period, multiplied by 182/366 (to reflect the one-half year period). |
2
Table of Contents
Money Market Fund
| Schedule of Investments | June 30, 2012 (Unaudited) |
Money Market Fund
| Principal Amount | Amortized Cost | |||||||||||
Short-Term Investments — 101.6% † |
| |||||||||||
U.S. Treasuries — 16.3% |
| |||||||||||
United States Treasury Bills | ||||||||||||
0.12% | 08/23/12 | $ | 4,300,000 | $ | 4,299,240 | (a) | ||||||
0.15% | 09/13/12 | 2,850,000 | 2,849,121 | (a) | ||||||||
United States Treasury Notes | ||||||||||||
0.38% | 08/31/12 | 3,000,000 | 3,001,103 | |||||||||
0.50% | 11/30/12 | 5,750,000 | 5,758,168 | |||||||||
0.63% | 06/30/12 - 07/31/12 | 15,250,000 | 15,253,101 | |||||||||
1.38% | 09/15/12 | 2,300,000 | 2,305,767 | |||||||||
| 33,466,500 | ||||||||||||
U.S. Government Agency Obligations — 31.4% |
| |||||||||||
Fannie Mae Discount Notes | ||||||||||||
0.08% | 07/19/12 | 7,300,000 | 7,299,708 | (a) | ||||||||
Federal Home Loan Bank Discount Notes | ||||||||||||
0.09% | 08/03/12 | 12,450,000 | 12,448,631 | (a) | ||||||||
0.11% | 07/05/12 - 07/18/12 | 16,000,000 | 15,999,574 | (a) | ||||||||
Federal Home Loan Mortgage Corp | ||||||||||||
1.13% | 07/27/12 | 2,850,000 | 2,852,026 | (c) | ||||||||
Federal National Mortgage Association | ||||||||||||
0.24% | 07/26/12 | 6,500,000 | 6,500,640 | (c) | ||||||||
0.27% | 10/18/12 | 1,800,000 | 1,800,822 | (c) | ||||||||
Freddie Mac Discount Notes | ||||||||||||
0.08% | 08/07/12 | 4,850,000 | 4,849,601 | (a) | ||||||||
0.09% | 07/23/12 | 2,650,000 | 2,649,862 | (a) | ||||||||
0.11% | 07/09/12 - 07/13/12 | 4,900,000 | 4,899,846 | (a) | ||||||||
0.12% | 08/14/12 | 2,900,000 | 2,899,575 | (a) | ||||||||
0.13% | 08/01/12 | 2,300,000 | 2,299,743 | (a) | ||||||||
| 64,500,028 | ||||||||||||
Commercial Paper — 7.8% |
| |||||||||||
HSBC Bank PLC | ||||||||||||
0.31% | 09/24/12 | 5,200,000 | 5,200,000 | (c) | ||||||||
John Deere Capital Corp | ||||||||||||
0.14% | 07/19/12 | 3,100,000 | 3,099,783 | (a) | ||||||||
Novartis AG | ||||||||||||
0.18% | 07/09/12 | 2,800,000 | 2,799,888 | (a) | ||||||||
The Procter & Gamble Co. | ||||||||||||
0.10% | 07/06/12 | 2,000,000 | 1,999,972 | (a) | ||||||||
0.12% | 07/11/12 | 2,850,000 | 2,849,905 | (a) | ||||||||
| 15,949,548 | ||||||||||||
| Principal Amount | Amortized Cost | |||||||||||
Repurchase Agreements — 30.7% |
| |||||||||||
Barclays Capital Inc. U.S. Treasury Repo | $ | 20,000,000 | $ | 20,000,000 | ||||||||
Deutsche Bank Securities, Inc. Gov Agcy Repo | 4,500,000 | 4,500,000 | ||||||||||
Goldman Sachs & Co. Gov Agcy Repo | 11,400,000 | 11,400,000 | ||||||||||
HSBC Securities (USA) Inc. Gov Agcy Repo | 15,830,000 | 15,830,000 | ||||||||||
J.P. Morgan Securities LLC U.S. Treasury Repo | 11,300,000 | 11,300,000 | ||||||||||
| 63,030,000 | ||||||||||||
Certificate of Deposit — 10.9% |
| |||||||||||
Bank of Montreal/Chicago Il | ||||||||||||
0.40% | 09/26/12 | 2,800,000 | 2,800,000 | (c) | ||||||||
Bank of Nova Scotia | ||||||||||||
0.18% | 07/13/12 | 4,250,000 | 4,250,000 | |||||||||
See Notes to Schedule of Investments and Notes to Financial Statements.
3
Table of Contents
Money Market Fund
| Schedule of Investments | June 30, 2012 (Unaudited) |
| Principal Amount | Amortized Cost | |||||||||||
Barclays PLC | ||||||||||||
0.20% | 07/18/12 | $ | 3,400,000 | $ | 3,400,000 | |||||||
National Australia Bank /New York | ||||||||||||
0.30% | 10/29/12 | 4,250,000 | 4,250,000 | (c) | ||||||||
Royal Bank of Canada/New York | ||||||||||||
0.46% | 04/10/13 | 2,800,000 | 2,800,000 | (c) | ||||||||
Svenska Handelsbanken AB | ||||||||||||
0.27% | 07/10/12 | 5,000,000 | 5,000,000 | |||||||||
| 22,500,000 | ||||||||||||
Corporates — 4.4% |
| |||||||||||
Inter-American Development Bank Discount Notes | ||||||||||||
0.11% | 07/03/12 | 5,100,000 | 5,099,969 | (a) | ||||||||
International Bank for Reconstruction & Development | ||||||||||||
0.80% | 07/13/12 | 4,050,000 | 4,050,844 | |||||||||
| 9,150,813 | ||||||||||||
| Principal Amount | Amortized Cost | |||||||||||
Time Deposit — 0.1% |
| |||||||||||
State Street Corp | ||||||||||||
0.13% | 07/02/12 | $ | 158,821 | $ | 158,821 | (b) | ||||||
Total Short-Term Investments | 208,755,710 | |||||||||||
Liabilities in Excess of Other | (3,245,411 | ) | ||||||||||
|
| |||||||||||
NET ASSETS — 100.0% | $ | 205,510,299 | ||||||||||
|
| |||||||||||
See Notes to Schedule of Investments and Notes to Financial Statements.
4
Table of Contents
| Notes to Schedule of Investments | June 30, 2012 (Unaudited) |
The views expressed in this document reflect our judgment as of the publication date and are subject to change at any time without notice. The securities information regarding holdings, allocations and other characteristics are presented to illustrate examples of securities that the Fund has bought and the diversity of areas in which the Fund may invest as of a particular date. It may not be representative of the Fund’s current or future investments and should not be construed as a recommendation to purchase or sell a particular security. See the Fund’s summary prospectus and statutory prospectus for complete descriptions of investment objectives, policies, risks and permissible investments
| (a) | Coupon amount represents effective yield. |
| (b) | State Street Corp. is the parent company of State Street Bank & Trust Co., the Fund’s custodian and accounting agent. |
| (c) | Variable or floating rate security. The stated rate represents the rate at June 30, 2012. |
| † | Percentages are based on net assets as of June 30, 2012. |
5
Table of Contents
Selected data based on a share outstanding throughout the fiscal years indicated
| 6/30/12† | 12/31/11 | 12/31/10 | 12/31/09 | 12/31/08 | 12/31/07 | |||||||||||||||||||
| Inception date | — | — | — | — | — | 7/1/85 | ||||||||||||||||||
Net asset value, beginning of period | $ | 1.00 | $ | 1.00 | $ | 1.00 | $ | 1.00 | $ | 1.00 | $ | 1.00 | ||||||||||||
Income (Loss) from investment operations: | ||||||||||||||||||||||||
Net investment income | — | — | — | — | 0.02 | 0.05 | ||||||||||||||||||
Net realized and unrealized | 0.00 | ** | 0.00 | ** | 0.00 | ** | — | — | — | |||||||||||||||
Total income (loss) from | — | 0.00 | ** | 0.00 | ** | — | 0.02 | 0.05 | ||||||||||||||||
Less distributions from: | ||||||||||||||||||||||||
Net investment income | — | — | — | — | 0.02 | 0.05 | ||||||||||||||||||
Net realized gains | — | — | — | — | — | — | ||||||||||||||||||
Total distributions | — | — | — | — | 0.02 | 0.05 | ||||||||||||||||||
Net asset value, end of period | $ | 1.00 | $ | 1.00 | $ | 1.00 | $ | 1.00 | $ | 1.00 | $ | 1.00 | ||||||||||||
TOTAL RETURN (a) | 0.00% | 0.00% | 0.00% | 0.27% | 2.24% | 4.92% | ||||||||||||||||||
RATIOS/SUPPLEMENTAL DATA: | ||||||||||||||||||||||||
Net assets, end of period (in thousands) | $ | 205,510 | $ | 228,063 | $ | 266,442 | $ | 326,072 | $ | 547,554 | $ | 340,690 | ||||||||||||
Ratios to average net assets: | ||||||||||||||||||||||||
Net investment income | 0.00% | 0.00% | 0.00% | 0.32% | 2.15% | 4.81% | ||||||||||||||||||
Net expenses | 0.17% | * | 0.23% | * | 0.28% | * | 0.43% | * | 0.45% | 0.48% | ||||||||||||||
Gross expenses | 0.53% | 0.54% | 0.53% | 0.47% | 0.45% | 0.48% | ||||||||||||||||||
Portfolio turnover rate | — | — | — | — | — | — | ||||||||||||||||||
Notes to Financial Highlights
| (a) | Total returns are historical and assume changes in share price, reinvestment of dividends and capital gains distributions and do not include the effect of insurance contract charges. Past performance does not guarantee future results. |
| * | GE Asset Management has voluntarily undertaken to reduce its management fee and/or subsidize certain expenses of the Fund to the extent necessary to maintain a minimum annualized yield of 0.00%. |
| ** | Less than 0.005. |
| † | Unaudited |
The accompanying Notes are an integral part of these financial statements.
6
Table of Contents
The accompanying Notes are an integral part of these financial statements.
7
Table of Contents
The accompanying Notes are an integral part of these financial statements.
8
Table of Contents
| * | Unaudited |
The accompanying Notes are an integral part of these financial statements.
9
Table of Contents
| Notes to Financial Statements | June 30, 2012 (Unaudited) |
| 1. | Organization of the Company |
GE Investments Funds, Inc. (the “Company”) was incorporated under the laws of the Commonwealth of Virginia on May 14, 1984 and is registered under the Investment Company Act of 1940, as amended (the “1940 Act”), as an open-end management investment company. The Company is composed of thirteen investment portfolios (collectively the “Funds”), although only the following eleven are currently being offered: U.S. Equity Fund, S&P 500 Index Fund, Premier Growth Equity Fund, Core Value Equity Fund, Mid-Cap Equity Fund, Small-Cap Equity Fund, Total Return Fund, Income Fund, Money Market Fund (the “Fund”) and Real Estate Securities Fund.
Shares of the Funds of the Company are offered only to insurance company separate accounts that fund certain variable life insurance contracts and variable annuity contracts. GE Asset Management Incorporated (“GEAM”) is the investment adviser and administrator of each of the Funds.
| 2. | Summary of Significant Accounting Policies |
The preparation of financial statements in conformity with U.S. generally accepted accounting principles (GAAP) requires management to make estimates and assumptions that affect the reported amounts of assets and liabilities and disclosure of contingent assets and liabilities at the date of the financial statements and the reported amounts of increases and decreases in net assets from operations during the reporting period. Actual results may differ from those estimates.
The following summarizes the significant accounting policies of the Company:
Securities Valuation and Transactions. All investments in securities are recorded at their estimated fair value, as described in Note 3.
Securities transactions are accounted for as of the trade date. Realized gains and losses on investments sold are recorded on the basis of identified cost for both financial statement and federal tax purposes.
Repurchase Agreements The Fund engages in repurchase agreement transactions with respect to instruments that are consistent with the Fund’s investment objectives or policies. The Fund’s custodian takes possession of the collateral pledged for investments in repurchase agreements on behalf of the Fund. The Fund values the underlying collateral daily on a mark-to-market basis to determine that the value, including accrued interest, is at least equal to 102% for domestic securities and 105%
international securities of the repurchase price. In the event the seller defaults and the value of the security declines, or if the seller enters an insolvency proceeding, realization of the collateral by the Fund may be delayed or limited.
Investment Income Corporate actions (including cash dividends) are recorded on the ex-dividend date, net of applicable withholding taxes.
Interest income is recorded on the accrual basis. Accretion of discounts and amortization of premiums on taxable bonds are to the call or maturity date, whichever is shorter, using the effective yield method.
Expenses Fund specific expenses are allocated to the Fund that incurs such expenses. Such expenses may include custodial fees, legal and accounting fees, printing costs and registration fees. Expenses that are not fund specific are allocated pro rata across the Funds. Expenses of the Fund are generally paid directly by the Fund however, expenses may be paid by GEAM and reimbursed by the Fund.
Federal Income Taxes The Fund intends to comply with all sections of the Internal Revenue Code applicable to regulated investment companies including the distribution of substantially all of its taxable net investment income and net realized capital gains to its shareholders. Therefore, no provision for federal income tax has been made. The Fund is treated as a separate taxpayer for federal income tax purposes.
| 3. | Securities Valuation |
The Fund utilizes various methods to measure the fair value of most of its investments on a recurring basis. GAAP establishes a framework for measuring fair value and providing related disclosures. Broadly, the framework requires fair value to be determined based on the exchange price that would be received for an asset or paid to transfer a liability (an exit price) in the principal or most advantageous market for the asset or liability in an orderly transaction between market participants at the measurement date. In the absence of active markets for the identical assets or liabilities, such measurements involve developing assumptions based on market observable data and, in the absence of such data, internal information that is consistent with what market participants would use in a hypothetical transaction that occurs at the measurement date. It also establishes a three-level valuation hierarchy based upon observable and non-observable inputs.
10
Table of Contents
| Notes to Financial Statements | June 30, 2012 (Unaudited) |
Observable inputs reflect market data obtained from independent sources, while unobservable inputs reflect our market assumptions. Preference is given to observable inputs. These two types of inputs create the following fair value hierarchy:
Level 1 — Quoted prices for identical investments in active markets.
Level 2 — Quoted prices for similar investments in active markets; quoted prices for identical or similar investments in markets that are not active; and model-derived valuations whose inputs are observable or whose significant value drivers are observable.
Level 3 — Significant inputs to the valuation model are unobservable.
Policies and procedures are maintained to value investments using the best and most relevant data available. In addition, pricing vendors are utilized to assist in valuing investments. GEAM performs periodic reviews of the
methodologies used by independent pricing services including price validation of individual securities.
Fair Value Measurement The following section describes the valuation methodologies the Fund uses to measure different financial investments at fair value.
Portfolio securities are typically valued on the basis of amortized cost which approximates fair value and these are included in Level 2. If it is determined that amortized cost does not approximate fair value, securities may be valued based on dealer supplied valuations or quotations. In these infrequent circumstances, pricing services may provide the Fund with valuations that are based on significant unobservable inputs, and in those circumstances the investment securities are classified in Level 3.
Portfolio securities that are valued using techniques other than market quotations, particularly securities that are “fair valued,” are subject to valuation risk. The inputs or methodology used for valuing securities are not an indication of the risk associated with investing in those securities.
The following tables present the Funds’ investments measured at fair value on a recurring basis at June 30, 2012:
| Investments | Level 1 | Level 2 | Level 3 | Total | ||||||||||||
Investments in Securities† | ||||||||||||||||
U.S. Treasuries | $ | — | $ | 33,466,500 | $ | — | $ | 33,466,500 | ||||||||
U.S. Government Agency Obligations | — | 64,500,028 | — | 64,500,028 | ||||||||||||
Commercial Paper | — | 15,949,548 | — | 15,949,548 | ||||||||||||
Repurchase Agreements | — | 63,030,000 | — | 63,030,000 | ||||||||||||
Certificate of Deposit | — | 22,500,000 | — | 22,500,000 | ||||||||||||
Corporates | — | 9,150,813 | — | 9,150,813 | ||||||||||||
Time Deposit | — | 158,821 | — | 158,821 | ||||||||||||
|
|
|
| �� |
|
|
|
| ||||||||
Total Investments in Securities | $ | — | $ | 208,755,710 | $ | — | $ | 208,755,710 | ||||||||
|
|
|
|
|
|
|
| |||||||||
| † | See Schedule of Investments for Industry Classification |
The following table presents the changes in Level 3 investments measured on a recurring basis for the period ended June 30, 2012:
| Corporates | Total | |||||||
Balance at 12/31/11 | $ | 4,522,125 | $ | 4,522,125 | ||||
Accrued discounts/premiums | (736 | ) | (736 | ) | ||||
Realized gain (loss) | — | — | ||||||
Change in unrealized gain (loss) | 128,611 | 128,611 | ||||||
Purchases | — | — | ||||||
Sales | (4,650,000 | ) | (4,650,000 | ) | ||||
Balance at 06/30/12 | $ | — | $ | — | ||||
Change in unrealized depreciation relating to securities still held at 06/30/12 | $ | — | $ | — | ||||
There were no transfers between fair value levels. Transfers between fair value levels are considered to occur at the beginning of the period.
11
Table of Contents
| Notes to Financial Statements | June 30, 2012 (Unaudited) |
| 4. | Line of Credit |
The Company shares a revolving credit facility of up to $150 million with a number of its affiliates. The credit facility is (“State Street”) with its custodian bank, State Street Bank and Trust Company. The revolving credit facility requires the payment of a commitment fee equal to 0.100% per annum on the daily unused portion of the credit facility, payable quarterly. The portion borne by the Funds generally is borne proportionally based upon net assets. In addition, the Company has a $100 million uncommitted, unsecured line of credit with State Street. Generally, borrowings under the credit facilities would accrue interest at the Federal Funds Rate plus 50 basis points and would be borne by the borrowing Fund. The maximum amount allowed to be borrowed by any one Fund is the lesser of (i) 10% of its total assets or (ii) 20% of its net assets. The credit facilities were not utilized by the Fund during the six-month period ended June 30, 2012.
| 5. | Compensation and Fees Paid to Affiliates |
Advisory and Administration Fees GEAM, a registered investment adviser, was retained by the Company’s Board of Directors effective May 1, 1997 to act as investment adviser and administrator of the Fund. Compensation of GEAM for investment advisory and administrative services is paid monthly based on the average daily net assets of the Fund. The advisory and administrative fee is stated in the following schedule:
Average Daily Net Assets of Fund | Advisory and Administration Fees | |||||||
Money Market Fund | First $ | 100 million | .50 | % | ||||
| Next $ | 100 million | .45 | % | |||||
| Next $ | 100 million | .40 | % | |||||
| Next $ | 100 million | .35 | % | |||||
| Over $ | 400 million | .30 | % | |||||
GEAM has voluntarily undertaken to reduce its management fee and/or subsidize certain expenses of the Fund to the extent necessary to maintain a minimum annualized net yield of 0.00%. This voluntary management fee reduction and/or expense subsidy may be modified or discontinued by GEAM at any time without prior notice. There can be no assurance that this fee reduction will be sufficient to avoid any loss.
Directors’ Compensation The Fund pays no compensation to its directors who are officers or employees of GEAM or its affiliates. Directors who are not such officers or employees also serve in a similar capacity for other funds advised by GEAM. Compensation paid to non-interested Directors are reflected on the Statement of Operations. These fees are allocated pro rata across all of the mutual fund platforms served by the Directors, including the Fund, and are based upon the relative net assets of each fund within such platforms.
| 6. | Income Taxes |
The Fund is subject to ASC 740, Income Taxes. ASC 740 provides guidance for financial accounting and reporting for the effects of income taxes that result from an entity’s activities during the year. ASC 740 also provides guidance regarding how certain tax positions should be recognized, measured, presented and disclosed in the financial statements. ASC 740 requires evaluation of tax positions taken or expected to be taken in the course of preparing the Fund’s tax returns to determine whether the tax positions are “more likely than not” of being sustained by the applicable tax authority. There are no adjustments to the Fund’s net assets required under ASC 740. The Fund’s 2008, 2009, 2010 and 2011 fiscal years tax returns are still open to examination by the Federal and applicable state tax authorities.
At June 30, 2012, information on the tax cost of investments was as follows:
Gross Tax | Net Tax | |||||
Cost of Investments For Tax Purposes | Appreciation | Depreciation | ||||
| $208,755,710 | $— | $— | $— | |||
Capital loss carryovers are available to offset future realized capital gains to the extent provided in the Internal Revenue Code and regulations thereunder. To the extent that these carryover losses are used to offset future capital
gains, it is probable that the gains so offset will not be distributed to shareholders because they would be taxable as ordinary income.
12
Table of Contents
| Notes to Financial Statements | June 30, 2012 (Unaudited) |
Amount | ||||
| Short-Term | Long-Term | Expires | ||
| $147,031 | $— | 12/31/2016 | ||
During the year ended December 31, 2011, the Fund utilized $1,031 of prior year capital loss carryovers.
These amounts will be available to offset future taxable capital gains. Under the recently enacted Regulated Investment Company Modernization Act of 2010, the Fund will be permitted to carry forward capital losses incurred in taxable years beginning after December 22, 2010 for an unlimited period. However, any losses incurred during those future years will be required to be utilized prior to the losses incurred in pre-enactment tax years. As a result of this ordering rule, pre-enactment capital loss carryforwards may be more likely to expire unused. Additionally, post-enactment capital losses that are carried forward will retain their character as either short-term or long-term capital losses rather than being considered all short-term as under previous law.
Any qualified late-year loss is deemed to arise on the first day of the Fund’s next tax year (if the Fund elects to defer such loss). Under this regime, generally, the Fund can elect to defer any post-October capital loss and/or any late-year ordinary loss as defined by the Internal Revenue Code.
The Fund incurred no such losses for the year ended December 31, 2011.
Distributions to Shareholders The Fund declares any net investment income dividends daily and pays them monthly. The character of income and gains to be distributed is determined in accordance with income tax regulations which may differ from generally accepted accounting principles. Reclassifications due to permanent book/tax differences are made to the Fund’s capital accounts to reflect income and gains available for distribution (or available capital loss carryovers) under income tax regulations. These reclassifications have no impact on net investment income, realized gains or losses, or the net asset value of the Fund. The calculation of net investment income per share in the Financial Highlights table excludes these adjustments.
There was no reclassification for the year ended December 31, 2011.
| 7. | Subsequent Events |
Subsequent events after the balance sheet date through the date the financial statements were issued have been evaluated in the preparation of the financial statements. As of August 3, 2012, the assets of the Fund and the Mid-Cap Equity Fund were liquidated. These funds ceased operations and are no longer offered for investment.
13
Table of Contents
| Additional Information | (Unaudited) |
Information about Directors and Executive Officers:
The business and affairs of the Funds are managed under the direction of the Funds’ Board of Directors. Information pertaining to the Directors and officers of the Funds is set forth below.
Interested Directors and Executive Officers
Michael J. Cosgrove
Address c/o GEAM 1600 Summer St. Stamford, CT 06905
Age 63
Position(s) Held with Fund Chairman of the Board and President
Term of Office and Length of Time Served Until successor is elected and qualified – 15 years
Principal Occupation(s) During Past 5 years President of Mutual Funds and Global Investment Programs of GEAM since November 2011; President and Chief Executive Officer – Mutual Funds and Intermediary Business of GEAM from March 2007 to November 2011; Executive Vice President of GEAM from February 1997 to March 2007; and Executive Vice President-Mutual Funds of GEAM from March 1993 to March 2007. Also serves as Treasurer of GE Foundation since 1988.
Number of Portfolios in Fund Complex Overseen by Director 25
Other Directorships Held by Director Chairman of the Board and President of GE Institutional Funds since 1997; Trustee of Elfun Funds, GE Savings & Security Funds and General Electric Pension Trust since 1988; Director of GEAM since 1988; Trustee of Fordham University from 2002 to June 30, 2010 and since July 2011; Director of GE Investments Distributors, Inc since June 2011; Director of Skin Cancer Foundation since August 2010; Member of the Board of Governors for the Investment Company Institute since October 2006; Director, GE Asset Management (Ireland) Limited, since February 1999, GE Asset Management Funds Plc since 1998, GE Asset Management Canada Company since 1998, GE Asset Management Limited since 1998; Trustee of General Electric Pension Trust since 1988; and Chairman of the Board and President of GE Funds from 1993 to February 2011.
Matthew J. Simpson
Address c/o GEAM 1600 Summer St. Stamford, CT 06905
Age 51
Position(s) Held with Fund Director and Executive Vice President
Term of Office and Length of Time Served Until successor is elected and qualified – 4 years
Principal Occupation(s) During Past 5 years Executive Vice President, General Counsel and Secretary of GEAM since July 2007; Secretary of Elfun Funds and GE Savings & Security Funds since July 2007; Senior Vice President and General Counsel – Marketing and Client Services (formerly Asset Management Services) of GEAM and Senior Vice President and General Counsel of GE Asset Management Services from February 1997 to July 2007; Vice President and Associate General Counsel of GEAM from October 1992 to February 1997; Secretary of GE Institutional Funds and GE Investments Funds, Inc. from 1997 to July 2007 and Vice President from September 2003 to July 2007; Assistant Secretary of Elfun Funds and GE Savings & Security Funds from 1998 to July 2007 and Vice President from October 2003 to July 2007; and Secretary of GE Funds from 1993 to July 2007 and Vice President from September 2003 to July 2007.
Number of Portfolios in Fund Complex Overseen by Director 25
Other Directorships Held by Director Trustee of Elfun Funds, GE Savings & Security Funds and General Electric Pension Trust since July 2007; Trustee and Executive Vice President of GE Institutional Funds since July 2007; Director of GEAM since July 2007; and Trustee and Executive Vice President of GE Funds from July 2007 to February 2011.
14
Table of Contents
| Additional Information | (Unaudited) |
Joon Won Choe
Address c/o GEAM 1600 Summer St. Stamford, CT 06905
Age 42
Position(s) Held with Fund Vice President & Secretary
Term of Office and Length of Time Served Until successor is elected and qualified – Vice President and Secretary – 1 year
Principal Occupation(s) During Past 5 years Senior Vice President and Deputy General Counsel at GEAM since March 2011; Vice President and Secretary of GE Institutional Funds since September 2010; Vice President and Assistant Secretary of Elfun Funds and GE Savings & Security Funds since September 2010; Senior Vice President and Associate General Counsel at GEAM from June 2010 to March 2011; Vice President and Associate General Counsel of GEAM from November 2005 to June 2010 and Vice President and Secretary of GE Funds from September 2010 to February 2011.
Number of Portfolios in Fund Complex Overseen by Officer N/A
Other Directorships Held by Officer N/A
Robert Herlihy
Address c/o GEAM 1600 Summer St. Stamford, CT 06905
Age 44
Position(s) Held with Fund Chief Compliance Officer
Term of Office and Length of Time Served Until successor is elected and qualified – 6 years
Principal Occupation(s) During Past 5 years Chief Compliance Officer of GEAM, GE Institutional Funds, Elfun Funds, and GE Savings & Security Funds since July 2005; Chief Compliance Officer of GE Funds from July 2005 to February 2011 and Manager of Fund Administration at GEAM from 2002-2005.
Number of Portfolios in Fund Complex Overseen by Officer N/A
Other Directorships Held by Officer N/A
Arthur A. Jensen
Address c/o GEAM 1600 Summer St. Stamford, CT 06905
Age 45
Position(s) Held with Fund Treasurer
Term of Office and Length of Time Served Until successor is elected and qualified – 1 year
Principal Occupation(s) During Past 5 Years Treasurer of GE Institutional Funds, Elfun Funds and GE Savings & Security Funds since June 2011; Mutual Funds Controller of GEAM since April 2011; Senior Vice President at Citigroup from 2008 to 2010 and Vice President at JPMorgan from 2005 to 2008.
Number of Portfolios in Fund Complex Overseen by Officer N/A
Other Directorships Held by Officer N/A
15
Table of Contents
| Additional Information | (Unaudited) |
Jeanne M. LaPorta
Address c/o GEAM 1600 Summer St. Stamford, CT 06905
Age 46
Position(s) Held with Fund Vice President
Term of Office and Length of Time Served Until successor is elected and qualified – 8 years
Principal Occupation(s) During Past 5 Years Senior Vice President and Commercial Administrative Officer of GEAM since April 2010; Vice President of GE Institutional Funds since July 2003; Vice President of Elfun Funds and GE Savings & Security Funds since October 2003; Secretary of GE Funds from July 2007 to September 2010 and Vice President from July 2007 to February 2011; Senior Vice President and Deputy General Counsel of GEAM from October 2007 to April 2010; Vice President and Assistant Secretary of Elfun Funds and GE Savings & Security Funds from July 2003 to June 2010; and Vice President and Associate General Counsel – Marketing and Client Services (formerly Asset Management Services) at GEAM from May 1997 to October 2007.
Number of Portfolios in Fund Complex Overseen by Officer N/A
Other Directorships Held by Officer N/A
Non-Interested Directors
John R. Costantino
Address c/o GEAM 1600 Summer St. Stamford, CT 06905
Age 66
Position(s) Held with Fund Director
Term of Office and Length of Time Served Until successor is elected and qualified – 15 years
Principal Occupation(s) During Past 5 years General Partner, NGN Capital LLC since 2006; Managing Director, Vice President of Walden Capital Management since 1996.
Number of Portfolios in Fund Complex Overseen by Director 17
Other Directorships Held by Director Trustee of GE Institutional Funds since 1997; Trustee of Fordham University from 1989 to 1995 and from 2001 to 2007 and Trustee Emeritus since 2007; Trustee of Neuroscience Research Institute since 1986; Trustee of GE Funds from 1993 to February 2011; Director of Artes Medical from 2006-2008 and Trustee of Gregorian University Foundation from 1992-2007.
16
Table of Contents
| Additional Information | (Unaudited) |
R. Sheldon Johnson
Address c/o GEAM 1600 Summer St. Stamford, CT 06905
Age 65
Positions(s) Held with Fund Director
Term of office and Length of Time served Unit Successor is elected and qualified – 1 year.
Principal Occupation(s) During Past 5 years Head of Global Institutional Equity Sales and Marketing at Morgan Stanley & Co., Inc. from 2002 to 2006 and Managing Director at Morgan Stanley & Co., Inc. from 1988 to 2006.
Number of Portfolios in Fund Complex Overseen by Director 17
Other Directorships Held by Director Trustee of GE Institutional Funds since April 2011 and Trustee of St. Lawrence University since 2003.
Donna M. Rapaccioli
Address c/o GEAM 1600 Summer St. Stamford, CT 06905
Age 49
Position(s) Held with Fund Director
Term of Office and Length of Time Served Until successor is elected and qualified – Less than 1 year
Principal Occupation(s) During Past 5 Years Dean of the Gabelli School of Business since 2007 and Accounting professor since 1987 at Fordham University.
Number of Portfolios in Fund Complex Overseen by Officer 17
Other Directorships Held by Director Trustee of GE Institutional Funds since January 2012 and Trustee of Emmanuel College since 2010.
The Statement of Additional Information for the Funds includes additional information about the Directors and Officers and is available, without charge, upon request by calling 1-800-242-0134.
17
Table of Contents
| Investment Team | (Unaudited) |
Investment Adviser and Administrator
GE Asset Management Incorporated
Board of Directors
Michael J. Cosgrove, Chairman
John R. Costantino
R. Sheldon Johnson
Donna M. Rapaccioli
Matthew J. Simpson
Secretary
Joon Won Choe
Assistant Secretary
Michelle Matzelle
Treasurer
Arthur A. Jensen
Assistant Treasurer
Casey Yantosca
Distributor
GE Investment Distributors, Inc.
Member FINRA and SIPC
Custodian
State Street Bank & Trust Company
Officers of the Investment Adviser
Dmitri Stockton, President and Chief Executive Officer
Cheryl H. Beacock, Senior Vice President, Human Resources
George A. Bicher, Chief Risk Officer
Paul M. Colonna, President and Chief Investment Officer – Public Investments
Michael J. Cosgrove, President of Mutual Funds and Global Investment Programs
Gregory B. Hartch, Senior Vice President – Strategy and Business Development Leader
Ralph R. Layman, Executive Vice President and Chief Investment Officer Emeritus Public Equities
Maureen B. Mitchell, President of Global Sales and Marketing
Steven M. Rullo, Senior Vice President – Services and Technology
Matthew J. Simpson, Executive Vice President, General Counsel and Secretary
Donald W. Torey, President and Chief Investment Officer – Alternative Investments
David Wiederecht, President and Chief Investment Officer – Investment Solutions
Jessica Holscott, Executive Vice President, Chief Financial Officer*
| * | Effective August 1, 2012, Ms. Holcott replaced Tracie A. Winbigler as Executive Vice President and Chief Financial Officer. |
At GE Asset Management, we’re dedicated to providing the investment options you’ll need to tailor your financial portfolio to every stage of your life. Each member of the GE Family of Funds is managed according to the same principles of integrity and quality that have guided GE over the past century, and have made it the world-class company that it is today. Each fund draws strength from a heritage of investment management experience that spans more than 80 years. Whether you’re creating a new investment portfolio or adding to an established one, the GE Family of Funds offers an array of professionally managed investment options that will help you meet a lifetime of financial needs.
18
Table of Contents
Investment Adviser
GE Asset Management Incorporated
1600 Summer Street
Stamford, CT 06905
or at:
PO Box 7900
Stamford, CT 06904-7900
Distributor
GE Investment Distributors, Inc.
member FINRA and SIPC
1600 Summer Street
Stamford, CT 06905
or at:
PO Box 7900
Stamford, CT 06904-7900
The Fund files its complete schedule of portfolio holdings with the Securities and Exchange Commission for the first and third quarters of each fiscal year on Form N-Q. The Fund’s Forms N-Q, as well as a description of the policies and procedures that the Fund uses to determine how to vote proxies (if any) relating to portfolio securities is available without charge (i) upon request, by calling 1-800-493-3042; (ii) on the Fund’s website at http://www.geam.com; and (iii) on the Commission’s website at http://www.sec.gov. The Fund’s Forms N-Q may be reviewed and copied at the Commission’s Public Reference Room in Washington, DC—information on the operation of the Public Reference Room may be obtained by calling 1-800-SEC-0330.
Information (if any) regarding how the Fund voted proxies relating to portfolio securities during the most recently disclosed 12-month period ended June 30 is available without charge (i) through the Fund’s website at http://www.geam.com; and (ii) on the Commission’s website at http://www.sec.gov.

Table of Contents
GE Investments Funds, Inc.
Real Estate Securities Fund
Semi-Annual Report
June 30, 2012

Table of Contents
| Real Estate Securities Fund | Contents | |
| 1 | ||||
| 2 | ||||
| 3 | ||||
| 5 | ||||
Financial Statements | ||||
| 6 | ||||
| 7 | ||||
| 8 | ||||
| 9 | ||||
| 10 | ||||
| 15 | ||||
| 19 | ||||
This report is prepared for Policyholders of certain variable contracts and may be distributed to others only if preceded or accompanied by the variable contract’s current prospectus and the current summary prospectus of the Fund available for investments thereunder.
Table of Contents
| Real Estate Securities Fund | (Unaudited) |
Notes to Performance
Total return performance shown in this report for the GE Investments Real Estate Securities Fund (the “Fund”) takes into account changes in share price and assumes reinvestment of dividends and capital gains distributions, if any. Total returns shown are net of Fund fees and expenses but do not reflect fees and charges associated with the variable contracts such as administrative fees, account charges and surrender charges, which, if reflected, would reduce the Fund’s total returns for all periods shown.
The performance data quoted represents past performance; past performance does not guarantee future results. Investment return and principal value will fluctuate so your shares, when redeemed, may be worth more or less than their original cost. Current performance may be higher or lower than the performance data quoted. Periods less than one year are not annualized. Please call 800-493-3042 or visit the Fund’s website at http://www.geam.com for the most recent month-end performance data.
An investment in the Fund is not a deposit of any bank and is not insured or guaranteed by the Federal Deposit Insurance Corporation (FDIC) or any other government agency. An investment in the Fund is subject to risk, including possible loss of principal invested.
Investment Profile
A mutual fund designed for investors who seek maximum total return through current income and capital appreciation. The Fund seeks its investment objective by investing at least 80% of its net assets under normal circumstances in equity securities, such as common and preferred stocks, and debt securities of U.S. issuers that are principally engaged in or related to the real estate industry, including those that own significant real estate assets. The Fund does not invest directly in real estate.
Sector Allocation
as a % of Fair Value of $78,416 (in thousands) on June 30, 2012 (a)(b)
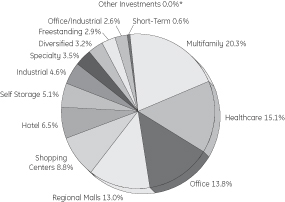
Top Ten Largest Holdings
as of June 30, 2012 (as a % of Fair Value)(a)(b)(c)
Simon Property Group Inc. | 7.51% | |||
Equity Residential | 5.52% | |||
Ventas Inc. | 5.36% | |||
Public Storage | 5.07% | |||
Healthcare Inc. | 5.06% | |||
Prologis Inc. | 4.63% | |||
Boston Properties Inc. | 4.45% | |||
HCP Inc. | 4.30% | |||
Digital Realty Trust Inc. | 3.46% | |||
UDR Inc. | 3.23% |
| (a) | The securities information regarding holdings, allocations and other characteristics is presented to illustrate examples of securities that the Fund has bought and the diversity of areas in which the Fund may invest as of a particular date. It may not be representative of the Fund’s current or future investments and should not be construed as a recommendation to purchase or sell a particular security. |
| (b) | Fair value basis is inclusive of the short-term investment in GE Institutional Money Market Fund Investment Class. |
| (c) | The figures presented to not include the Fund’s entire investment portfolio and may change at any time. |
| * | Less than 0.01%. |
GE Investment Distributors, Inc., Member of FINRA & SIPC, is the principal underwriter and distributor of the GE Investments Funds, Inc. and a wholly owned subsidiary of GE Asset Management Incorporated, the investment adviser of the Fund.
1
Table of Contents
| Real Estate Securities Fund | (Unaudited) |
Understanding Your Fund’s Expenses
As a shareholder of the Fund you incur ongoing costs. Ongoing costs include portfolio management fees, professional fees, administrative fees and other Fund expenses. The following example is intended to help you understand your ongoing costs (in dollars) of investing in the Fund and to compare these costs with the ongoing costs of investing in other mutual funds.
To illustrate these ongoing costs, we have provided an example and calculated the expenses paid by investors in each share class of the Fund during the period. The information in the following table is based on an investment of $1,000, which is invested at the beginning of the period and held for the entire six-month period ended June 30, 2012.
Actual Expenses
The first section of the table provides information about actual account values and actual expenses. You may use the information in this section, together with the amount you invested, to estimate the expenses that you paid over the period. To do so, simply divide your account value by $1,000 (for example, an $8,600 account value divided by $1,000 = 8.6), then multiply the result by the number given for your class under the heading “Expenses Paid During Period” to estimate the expenses paid on your account during the period.
Hypothetical Example for Comparison Purposes
The second section of the table provides information about hypothetical account values and hypothetical expenses based on the Fund’s actual expense ratio and an assumed rate of return of 5% per year before expenses, which is not the Fund’s actual return. The hypothetical account values and expenses may not be used to estimate the actual ending account balance or expenses you paid for the period. You may use this information to compare the ongoing costs of investing in the Fund and other funds. To do so, compare this 5% hypothetical example with the 5% hypothetical examples that appear in the shareholders reports of other funds.
Please note that the expenses shown in the table are meant to highlight and help you compare ongoing costs only and do not reflect transaction costs, such as sales charges or redemption fees, if any. Therefore, the second section of the table is useful in comparing ongoing costs only, and will not help you determine the relative total costs of owning different funds. Additionally, the expenses shown do not reflect the fees or charges associated with variable contracts through which shares of the Fund are offered.
January 1, 2012 – June 30, 2012
| Account value at the beginning of the period ($) | Account value at the end of the period ($) | Expenses paid during the period ($)* | ||||||||||
Actual Fund Return* | 1,000.00 | 1,145.90 | 5.18 | |||||||||
Hypothetical 5% Return (2.5% for the period) | 1,000.00 | 1,020.04 | 4.87 | |||||||||
| * | Expenses are equal to the Fund’s annualized expense ratio of 0.97% (for the period January 1, 2012—June 30, 2012), multiplied by the average account value over the period, multiplied by 182/366 (to reflect the one-half year period). |
2
Table of Contents
Real Estate Securities Fund
| Schedule of Investments | June 30, 2012 (Unaudited) |
Real Estate Securities Fund
| Number of Shares | Fair Value | |||||||||
Common Stock (REITs) — 97.1%† |
| |||||||||
Diversified — 3.1% | ||||||||||
Vornado Realty Trust | 29,760 | $ | 2,499,245 | |||||||
Freestanding — 2.9% | ||||||||||
National Retail Properties Inc. | 81,830 | 2,314,971 | ||||||||
Healthcare — 14.9% | ||||||||||
HCP Inc. | 76,290 | 3,368,203 | ||||||||
Healthcare Inc. | 68,110 | 3,970,813 | ||||||||
Senior Housing Properties Trust | 14,740 | 328,997 | ||||||||
Ventas Inc. | 66,570 | 4,201,898 | ||||||||
| 11,869,911 | ||||||||||
Hotel — 5.4% | ||||||||||
DiamondRock Hospitality Co. | 26,610 | 271,422 | ||||||||
Host Hotels & Resorts Inc. | 113,050 | 1,788,451 | ||||||||
LaSalle Hotel Properties | 16,640 | 484,890 | ||||||||
Pebblebrook Hotel Trust | 15,090 | 351,748 | ||||||||
RLJ Lodging Trust | 62,270 | 1,128,955 | ||||||||
Sunstone Hotel Investors Inc. | 26,020 | 285,960 | (a) | |||||||
| 4,311,426 | ||||||||||
Industrial — 4.6% | ||||||||||
Prologis Inc. | 109,370 | 3,634,365 | ||||||||
Multifamily — 20.1% | ||||||||||
American Campus Communities Inc. | 18,350 | 825,383 | ||||||||
AvalonBay Communities Inc. | 12,970 | 1,834,996 | ||||||||
BRE Properties Inc. | 16,960 | 848,339 | ||||||||
Camden Property Trust | 21,950 | 1,485,356 | ||||||||
Colonial Properties Trust | 45,000 | 996,300 | ||||||||
Equity Residential | 69,450 | 4,330,902 | ||||||||
Essex Property Trust Inc. | 13,400 | 2,062,528 | ||||||||
Home Properties Inc. | 16,760 | 1,028,394 | ||||||||
UDR Inc. | 98,070 | 2,534,129 | ||||||||
| 15,946,327 | ||||||||||
Office — 13.6% | ||||||||||
Alexandria Real Estate Equities Inc. | 24,890 | 1,810,001 | ||||||||
Boston Properties Inc. | 32,210 | 3,490,598 | ||||||||
Brandywine Realty Trust | 23,480 | 289,743 | ||||||||
CommonWealth | 70,220 | 1,342,606 | ||||||||
Hudson Pacific Properties Inc. | 23,660 | 411,921 | ||||||||
Mack-Cali Realty Corp. | 50,750 | 1,475,302 | ||||||||
SL Green Realty Corp. | 24,670 | 1,979,521 | ||||||||
| 10,799,692 | ||||||||||
| Number of Shares | Fair Value | |||||||||
Office/Industrial — 2.6% | ||||||||||
Duke Realty Corp. | 71,680 | $ | 1,049,395 | |||||||
Liberty Property Trust | 26,650 | 981,786 | ||||||||
| 2,031,181 | ||||||||||
Regional Malls — 12.8% | ||||||||||
General Growth Properties Inc. | 71,870 | 1,300,128 | ||||||||
Simon Property Group Inc. | 37,840 | 5,890,174 | ||||||||
Taubman Centers Inc. | 6,760 | 521,602 | ||||||||
The Macerich Co. | 41,640 | 2,458,842 | ||||||||
| 10,170,746 | ||||||||||
Self Storage — 5.0% | ||||||||||
Public Storage | 27,530 | 3,975,607 | ||||||||
Shopping Centers — 8.7% | ||||||||||
Acadia Realty Trust | 15,090 | 349,786 | ||||||||
DDR Corp. | 128,130 | 1,875,823 | ||||||||
Equity One Inc. | 15,030 | 318,636 | ||||||||
Excel Trust Inc. | 12,260 | 146,629 | ||||||||
Kimco Realty Corp. | 105,460 | 2,006,904 | ||||||||
Regency Centers Corp. | 15,280 | 726,870 | ||||||||
Tanger Factory Outlet Centers | 47,000 | 1,506,350 | ||||||||
| 6,930,998 | ||||||||||
Specialty — 3.4% | ||||||||||
Digital Realty Trust Inc. | 36,100 | 2,710,027 | ||||||||
Total Common Stock (REIT) | 77,194,496 | |||||||||
Common Stock — 1.0% |
| |||||||||
Hotels, Resorts & Cruise Lines — 1.0% |
| |||||||||
Orient-Express Hotels Ltd. | 93,010 | 778,494 | (a) | |||||||
Other Investments — 0.0%* |
| |||||||||
GEI Investment Fund | 2,381 | (c) | ||||||||
Total Investments in Securities | 77,975,371 | |||||||||
See Notes to Schedule of Investments and Notes to Financial Statements.
3
Table of Contents
Real Estate Securities Fund
| Schedule of Investments | June 30, 2012 (Unaudited) |
| Fair Value | ||||||||
Short-Term Investments — 0.6% |
| |||||||
GE Institutional Money Market Fund – Investment Class 0.04% | $ | 440,440 | (b,c) | |||||
Total Investments | 78,415,811 | |||||||
Other Assets and Liabilities, | 1,070,665 | |||||||
|
|
| ||||||
NET ASSETS — 100.0% | $ | 79,486,476 | ||||||
|
|
| ||||||
See Notes to Schedule of Investments and Notes to Financial Statements.
4
Table of Contents
| Notes to Schedules of Investments | June 30, 2012 (Unaudited) |
The views expressed in this document reflect our judgment as of the publication date and are subject to change at any time without notice. The securities information regarding holdings, allocations and other characteristics are presented to illustrate examples of securities that the Fund has bought and the diversity of areas in which the Fund may invest as of a particular date. It may not be representative of the Fund’s current or future investments and should not be construed as a recommendation to purchase or sell a particular security. See the Fund’s summary prospectus and statutory prospectus for complete descriptions of investment objectives, policies, risks and permissible investments.
| (a) | Non-income producing security. |
| (b) | Coupon amount represents effective yield. |
| (c) | GE Asset Management, the investment adviser of the Fund, also serves as investment adviser of the GEI Investment Fund and the GE Institutional Money Market Fund. The GE Investment Fund has been determined to be illiquid using procedures established by the Board of Directors. |
| * | Less than 0.05%. |
| † | Percentages are based on net assets as of June 30, 2012 . |
Abbreviations:
| REIT | Real Estate Investment Trust |
5
Table of Contents
Selected data based on a share outstanding throughout the fiscal years indicated
| CLASS 1 | ||||||||||||||||||||||||
| 6/30/12† | 12/31/11 | 12/31/10 | 12/31/09 | 12/31/08 | 12/31/07 | |||||||||||||||||||
| Inception date | — | — | — | — | 5/1/95 | |||||||||||||||||||
Net asset value, beginning of period | $ | 11.58 | $ | 10.68 | $ | 8.41 | $ | 6.46 | $ | 10.87 | $ | 21.49 | ||||||||||||
Income/(loss) from investment operations: | ||||||||||||||||||||||||
Net investment income | 0.12 | 0.21 | 0.19 | ** | 1.03 | 1.11 | 0.72 | |||||||||||||||||
Net realized and unrealized gains/(losses) on investments | 1.57 | 0.84 | 2.24 | 1.29 | (5.05) | (3.87) | ||||||||||||||||||
Total income/(loss) from investment operations | 1.69 | 1.05 | 2.43 | 2.32 | (3.94) | (3.15) | ||||||||||||||||||
Less distributions from: | ||||||||||||||||||||||||
Net investment income | — | 0.15 | 0.16 | 0.22 | 0.28 | 0.73 | ||||||||||||||||||
Return of capital | — | — | — | 0.15 | 0.19 | 0.02 | ||||||||||||||||||
Net realized gains | — | — | — | — | — | 6.72 | ||||||||||||||||||
Total distributions | — | 0.15 | 0.16 | 0.37 | 0.47 | 7.47 | ||||||||||||||||||
Net asset value, end of period | $ | 13.27 | $ | 11.58 | $ | 10.68 | $ | 8.41 | $ | 6.46 | $ | 10.87 | ||||||||||||
TOTAL RETURN(a) | 14.59% | 9.85% | 28.94% | 35.77% | (36.03)% | (14.86)% | ||||||||||||||||||
RATIOS/SUPPLEMENTAL DATA: | ||||||||||||||||||||||||
Net assets, end of period | $ | 79,486 | $ | 75,012 | $ | 78,316 | $ | 70,574 | $ | 59,969 | $ | 96,650 | ||||||||||||
Ratios to average net assets: | ||||||||||||||||||||||||
Net investment income | 1.84% | * | 1.73% | 1.97% | 4.75% | 4.67% | 2.59% | |||||||||||||||||
Net Expenses | 0.97% | (b)* | 1.04% | (b) | 0.92% | (b) | 1.04% | (b) | 0.95% | (b) | 0.90% | |||||||||||||
Gross Expenses | 0.97% | * | 1.04% | 0.93% | 1.04% | 0.95% | 0.90% | |||||||||||||||||
Portfolio turnover rate | 23% | 69% | 113% | 105% | 121% | 106% | ||||||||||||||||||
Notes to Financial Highlights
| (a) | Total returns are historical and assume changes in share price, reinvestment of dividends and capital gains distributions and do not include the effect of insurance contract charges. Past performance does not guarantee future results. |
| (b) | Reflects GE Asset Management’s waiver of a portion of the Fund’s management fee in an amount equal to the management fee earned by GEAM with respect to the Fund’s investment in the GE Institutional Money Market Fund or, prior to 2011, in another affiliated money market fund formerly managed by GEAM. |
| * | Annualized for periods less than one year. |
| ** | Per share values have been calculated using the average share method. |
| † | Unaudited |
The accompanying Notes are an integral part of these financial statements.
6
Table of Contents
The accompanying Notes are an integral part of these financial statements.
7
Table of Contents
For the period ending June 30, 2012 | (Unaudited) | |||
INVESTMENT INCOME | ||||
Income: | ||||
Dividend | $ | 1,100,966 | ||
Interest | — | |||
Interest from affiliated investments | 255 | |||
Total Income | 1,101,221 | |||
Expenses | ||||
Advisory and administration fees | 333,373 | |||
Distributors Fees | 26 | |||
Director’s fees | 1,544 | |||
Custody and accounting expenses | 10,855 | |||
Professional fees | 9,957 | |||
Other expenses | 24,683 | |||
Total expenses before waiver and reimbursement | 380,438 | |||
Less: Expenses waived or borne by the adviser | (514 | ) | ||
Net expenses | 379,924 | |||
Net investment income | 721,297 | |||
NET REALIZED AND UNREALIZED GAIN | ||||
Realized gain on: | ||||
Investments | 4,999,869 | |||
Increase in unrealized appreciation on: | ||||
Investments | 4,980,605 | |||
Net realized and unrealized gain on investments | 9,980,474 | |||
Net increase in net assets resulting from operations | $ | 10,701,771 | ||
| * | Share Class 4 was closed effective June 29, 2012. |
The accompanying Notes are an integral part of these financial statements.
8
Table of Contents
| * | (Unaudited) |
| ** | Share Class 4 was closed effective June 29, 2012 |
The accompanying Notes are an integral part of these financial statements.
9
Table of Contents
| Notes to Financial Statements | June 30, 2012 (Unaudited) |
| 1. | Organization of the Company |
GE Investments Funds, Inc. (the “Company”) was incorporated under the laws of the Commonwealth of Virginia on May 14, 1984 and is registered under the Investment Company Act of 1940, as amended (the “1940 Act”), as an open-end management investment company. The Company is composed of thirteen investment portfolios (collectively the “Funds”), although only the following ten are currently being offered: U.S. Equity Fund, S&P 500 Index Fund, Premier Growth Equity Fund, Core Value Equity Fund, Mid-Cap Equity Fund, Small-Cap Equity Fund, Total Return Fund, Income Fund, Money Market Fund and Real Estate Securities Fund (the “Fund”).
Shares of the Funds of the Company are offered only to insurance company separate accounts that fund certain variable life insurance contracts and variable annuity contracts. GE Asset Management Incorporated (“GEAM”) is the investment adviser and administrator of each of the Funds.
The Company currently offers one share class (Class 1) of the Fund as investment options for variable life insurance and variable annuity contracts. Class 4 shares were closed on June 29, 2012.
| 2. | Summary of Significant Accounting Policies |
The preparation of financial statements in conformity with U.S. generally accepted accounting principles (GAAP) requires management to make estimates and assumptions that affect the reported amounts of assets and liabilities and disclosure of contingent assets and liabilities at the date of the financial statements and the reported amounts of increases and decreases in net assets from operations during the reporting period. Actual results may differ from those estimates.
The following summarizes the significant accounting policies of the Company.
Securities Valuation and Transactions. All investments in securities are recorded at their estimated fair value, as described in Note 3.
Securities transactions are accounted for as of the trade date. Realized gains and losses on investments sold are recorded on the basis of identified cost for both financial statement and federal tax purposes.
The Fund’s income, expenses (other than distribution fees) and realized and unrealized gains and losses are allocated
proportionally each day among the share classes based upon the relative net assets of each class.
Derivatives The Fund is subject to equity price risk in the normal course of pursuing its investment objective. The Fund may enter into derivative transactions to gain market exposure for residual and accumulating cash positions.
Real Estate Investment Trusts Dividend income, attributable to real estate investment trusts (“REITs”), is recorded based on management’s estimate of the income included in the distributions received. Distributions received in excess of this amount are recorded as a reduction of the cost of the investments. The actual amounts of income and return of capital are determined by each REIT only after its fiscal year-end and may differ from the estimated amounts.
Investment Income Corporate actions (including cash dividends) are recorded on the ex-dividend date, net of applicable withholding taxes, except for certain foreign corporate actions which are recorded as soon after ex-dividend date as such information becomes available. Withholding taxes in foreign dividends have been provided for in accordance with the Fund’s understanding of the applicable country’s tax rules and rates.
Interest income is recorded on the accrual basis. Accretion of discounts and amortization of premiums on taxable bonds are to the call or maturity date, whichever is shorter, using the effective yield method.
Expenses Fund specific expenses are allocated to the Fund that incurs such expenses. Such expenses may include custodial fees, legal and accounting fees, printing costs and registration fees. Expenses that are not fund specific are allocated pro rata across the Funds. Certain class specific expenses (such as distribution fees) are allocated to the class that incurs such expense. Expenses of the Fund are generally paid directly by the Fund; however, expenses may be paid by GEAM and reimbursed by the Fund.
Federal Income Taxes The Fund intends to comply with all sections of the Internal Revenue Code applicable to regulated investment companies including the distribution of substantially all of its taxable net investment income and net realized capital gains to its shareholders. Therefore, no provision for federal income tax has been made. The Fund is treated as a separate taxpayer for federal income tax purposes.
10
Table of Contents
| Notes to Financial Statements | June 30, 2012 (Unaudited) |
| 3. | Securities Valuation |
The Fund utilizes various methods to measure the fair value of most of its investments on a recurring basis. GAAP establishes a framework for measuring fair value and providing related disclosures. Broadly, the framework requires fair value to be determined based on the exchange price that would be received for an asset or paid to transfer a liability (an exit price) in the principal or most advantageous market for the asset or liability in an orderly transaction between market participants at the measurement date. In the absence of active markets for the identical assets or liabilities, such measurements involve developing assumptions based on market observable data and, in the absence of such data, internal information that is consistent with what market participants would use in a hypothetical transaction that occurs at the measurement date. It also establishes a three-level valuation hierarchy based upon observable and non-observable inputs.
Observable inputs reflect market data obtained from independent sources, while unobservable inputs reflect our market assumptions. Preference is given to observable inputs. These two types of inputs create the following fair value hierarchy:
Level 1 — Quoted prices for identical investments in active markets.
Level 2 — Quoted prices for similar investments in active markets; quoted prices for identical or similar investments in markets that are not active; and model-derived valuations whose inputs are observable or whose significant value drivers are observable.
Level 3 — Significant inputs to the valuation model are unobservable.
Policies and procedures are maintained to value investments using the best and most relevant data available. In addition, pricing vendors are utilized to assist in valuing investments. GEAM performs periodic reviews of the methodologies used by independent pricing services including price validation of individual securities.
Fair Value Measurement The following section describes the valuation methodologies the Fund uses to measure different financial investments at fair value.
The Fund’s portfolio securities are valued generally on the basis of market quotations. Equity securities generally are valued at the last reported sale price on the primary market in which they are traded. Portfolio securities listed on
NASDAQ are valued using the NASDAQ Official Closing Price, Level 1 securities primarily include publicly-traded equity securities. If no sales occurred on the exchange or NASDAQ that day, the portfolio security generally is valued using the last reported bid price. In those circumstances the Fund classifies the investment securities in Level 2.
Short-term investments of sufficient credit quality with remaining maturities of sixty days or less at the time of purchase are typically valued on the basis of amortized cost which approximates fair value and these are included in Level 2. If it is determined that amortized cost does not approximate fair value, securities may be valued based on dealer supplied valuations or quotations. In these infrequent circumstances, pricing services may provide the Fund with valuations that are based on significant unobservable inputs, and in those circumstances the investment securities are classified in Level 3.
The Fund uses the net asset value per unit for collective funds (i.e., GEI Investment Fund). The Fund classifies the investment security in Level 2.
If prices are not readily available for a portfolio security, or if it is believed that a price for a portfolio security does not represent its fair value, the security may be valued using procedures approved by the Fund’s Board of Directors that are designed to establish its “fair” value. These securities are typically classified in Level 3. Those procedures require that the fair value of a security be established by a valuation committee of GEAM. The valuation committee follows different protocols for different types of investments and circumstances. The fair value procedures may be used to value any investment of the Fund in the appropriate circumstances.
Fair value determinations generally are used for securities whose value is affected by a significant event that will materially affect the value of a security and which occurs subsequent to the time of the close of the principal market on which such security trades but prior to the calculation of the Fund’s NAV.
The value established for such a portfolio security may be different than what would be produced through the use of market quotations or another methodology. Portfolio securities that are valued using techniques other than market quotations, including “fair valued” securities, may be subject to greater fluctuation in their value from one day to the next than would be the case if market quotations were used. In addition, there is no assurance that the Fund could sell a portfolio security for the value established for it
11
Table of Contents
| Notes to Financial Statements | June 30, 2012 (Unaudited) |
at any time and it is possible that the Fund would incur a loss because a portfolio security is sold at a discount to its established value.
Other financial investments are derivative instruments that are not reflected in total investments, such as futures, forwards, swaps, and written options contracts, which are valued based on fair value as discussed above.
The Fund uses closing prices for derivatives included in Level 1, which are traded either on exchanges or liquid
over-the-counter markets. Derivative assets and liabilities included in Level 2 primarily represent interest rate swaps, cross-currency swaps and foreign currency and commodity forward and option contracts. Derivative assets and liabilities included in Level 3 primarily represent interest rate products that contain embedded optionality or prepayment features.
The inputs or methodology used for valuing securities are not an indication of the risk associated with investing in those securities.
The following table presents the Fund’s investments measured at fair value on a recurring basis at June 30, 2012:
| Investments | Level 1 | Level 2 | Level 3 | Total | ||||||||||||
Investments in Securities† | ||||||||||||||||
Common Stock | $ | 77,972,990 | $ | — | $ | — | $ | 77,972,990 | ||||||||
Other Investments | — | 2,381 | — | 2,381 | ||||||||||||
Short-Term Investments | 440,440 | — | — | 440,440 | ||||||||||||
Total Investments in Securities | $ | 78,413,430 | $ | 2,381 | $ | — | $ | 78,415,811 | ||||||||
† See Schedule of Investments for Industry Classifications |
| |||||||||||||||
There were no transfers between fair value levels. Transfers between fair value levels are considered to occur at the beginning of the period.
| 4. | Line of Credit |
The Company shares a revolving credit facility of up to $150 million with a number of its affiliates. The credit facility is with its custodian bank, State Street Bank and Trust Company (“State Street”). The revolving credit facility requires the payment of a commitment fee equal to 0.100% per annum on the daily unused portion of the credit facility, payable quarterly. The portion borne by the Funds generally is borne proportionally based upon net assets. In addition, the Company has a $100 million uncommitted, unsecured line of credit with State Street. Generally, borrowings under the credit facilities would accrue interest at the Federal Funds Rate plus 50 basis points and would be borne by the borrowing Fund. The maximum amount allowed to be borrowed by any one Fund is the lesser of (i)33.33% of the Fund’s assets or (ii) 20% of its net assets. The credit facilities were not utilized by the Fund during the six-month period ended June 30, 2012.
| 5. | Compensation and Fees Paid to Affiliates |
GEAM, a registered investment adviser, was retained by the Company’s Board of Directors effective May 1, 1997 to act as investment adviser and administrator of the Fund. GEAM’s compensation for investment advisory and
administrative services is paid monthly based on the average daily net assets of the Fund. The advisory and administrative fee is stated in the following schedule:
| Average Daily Net Assets of Fund | Advisory and Administration Fees | |
| First $100 million | 0.85% | |
| Next $100 million | 0.80% | |
| Over $200 million | 0.75% |
GEAM has a contractual arrangement with the Fund to waive a portion of the Fund’s management fee in the amount equal to the management fee earned by GEAM with respect to the Fund’s investment in the GE Institutional Money Market Fund, if any.
Distribution and Service (12b-1) Fees Prior to the closure of Class 4 shares on June 29, 2012, the Company had adopted a Distribution and Service (12b-1) Plan (the “Plan”) pursuant to Rule 12b-1 under the 1940 Act with respect to Class 4 shares of the Fund. Under the Plan, the Fund could compensate GE Investment Distributors, Inc. (“GEID”), a wholly-owned subsidiary of GEAM and the Fund’s principal distributor, for certain sales services provided by GEID or other broker dealers and investor services provided by GEID or other service providers relating to the Fund’s Class 4
12
Table of Contents
| Notes to Financial Statements | June 30, 2012 (Unaudited) |
shares, including services to owners or prospective owners of variable contracts issued by insurance companies that offer such share class as an investment option. The amount of compensation paid under the Plan by the Fund’s Class 4 shares was not to exceed 0.45% of the average daily net assets of the Fund attributable to such share class.
Directors’ Compensation The Fund pays no compensation to its directors who are officers or employees of GEAM or its affiliates. Directors who are not such officers or employees also serve in a similar capacity for other funds advised by GEAM. Compensation paid to non-interested Directors are reflected on the Statement of Operations. These fees are allocated pro rata across all of the mutual fund platforms served by the Directors, including the Fund, and are based upon the relative net assets of each fund within such platforms.
| 6. | Sub-advisory Fees |
Pursuant to an investment sub-advisory agreement with GEAM, Urdang Securities Management, Inc. (“Urdang”) is the Sub-Adviser to the Fund. Urdang is responsible for the day-to-day portfolio management of the assets of the Fund, including the responsibility for making decisions to buy, sell or hold a particular security, under the general supervision of GEAM and the Board.
For their services, GEAM pays Urdang monthly sub-advisory fees which are calculated as a percentage of the average daily net assets of the Fund.
| 7. | Investment Transactions |
Purchases and Sales of Securities The cost of purchases and the proceeds from sales of investments, other than short-term securities, for the six-month period ended June 30, 2012 were as follows:
| Non U.S. Gov’t Securities | ||
| Purchases | Sales | |
| $17,742,511 | $22,861,728 | |
| 8. | Income Taxes |
The Fund is subject to ASC 740, Income Taxes. ASC 740 provides guidance for financial accounting and reporting for the effects of income taxes that result from an entity’s activities during the year. ASC 740 also provides guidance regarding how certain tax positions should be recognized, measured, presented and disclosed in the financial statements. ASC 740 requires evaluation of tax positions taken or expected to be taken in the course of preparing the Fund’s tax returns to determine whether the tax positions are “more likely than not” of being sustained by the applicable tax authority. There are no adjustments to the Funds’ net assets required under ASC 740. The Fund’s 2008, 2009, 2010 and 2011 fiscal years tax returns are still open to examination by the Federal and applicable state tax authorities.
At June 30, 2012, information on the tax cost of investments was as follows:
| Gross Tax | Net Tax Appreciation | |||||
| Cost of Investments For Tax Purposes | Appreciation | Depreciation | ||||
$65,664,126 | $14,234,090 | $(1,482,405) | $12,751,685 | |||
Capital loss carryovers are available to offset future realized capital gains to the extent provided in the Internal Revenue Code and regulations thereunder. To the extent that these carryover losses are used to offset future capital gains, it is probable that the gains so offset will not be distributed to shareholders because they would be taxable as ordinary income.
As of December 31, 2011, the Fund has capital loss carryovers as follows:
| Amount | ||||
| Short-Term | Long-Term | Expires | ||
| $11,619,641 | $— | 12/31/2017 | ||
These amounts will be available to offset future taxable capital gains. Under the recently enacted Regulated Investment Company Modernization Act of 2010, the Fund will be permitted to carry forward capital losses incurred in taxable years beginning after December 22, 2010 for an
13
Table of Contents
| Notes to Financial Statements | June 30, 2012 (Unaudited) |
unlimited period. However, any losses incurred during those future years will be required to be utilized prior to the losses incurred in pre-enactment tax years. As a result of this ordering rule, pre-enactment capital loss carryforwards may be more likely to expire unused. Additionally, post-enactment capital losses that are carried forward will retain their character as either short-term or long-term capital losses rather than being considered all short-term as under previous law.
During the year ended December 31, 2011, the Fund utilized $10,263,859 of prior year capital loss carryovers.
Any qualified late-year loss is deemed to arise on the first day of the Fund’s next tax year (if the Fund elects to defer such loss). Under this regime, generally, the Fund can elect to defer any post-October capital loss and/or any late-year ordinary loss as defined by the Internal Revenue Code.
The Fund incurred no such losses for the year ended December 31, 2011.
The tax composition of distributions paid during the years ended December 31, 2011 and December 31, 2010 were as follows:
| Ordinary Income | Long-Term Capital Gains | Total | ||||||||||
| 2011 | $ | 970,457 | $ | — | $ | 970,457 | ||||||
| 2010 | $ | 1,190,970 | $ | — | $ | 1,190,970 | ||||||
Distributions to Shareholders The Fund declares and pays any dividends from net investment income annually. The Fund declares and pays any net realized capital gains in excess of capital loss carryforwards distributions annually.
The character of income and gains to be distributed is determined in accordance with income tax regulations which may differ from generally accepted accounting principles. These differences include (but are not limited to) distributions from Real Estate Investment Trusts (REITS), investments organized as partnerships for tax purposes; and losses deferred due to wash sale transactions. Reclassifications due to permanent book/tax differences are made to the Fund’s capital accounts to reflect income and gains available for distribution (or available capital loss carryovers) under income tax regulations. These reclassifications have no impact on net investment income, realized gains or losses, or the net asset value of the Fund. The calculation of net investment income per share in the Financial Highlights table excludes these adjustments.
The reclassifications for the year ended December 31, 2011 were as follows:
| Undistributed Net Investment Income | Accumulated Net Realized Gain (Loss) | Capital Paid In | ||
| ($336,940) | $348,439 | ($11,499) |
| 9. | Subsequent Events |
Subsequent events after the balance sheet date through the date the financial statements were issued have been evaluated in the preparation of the financial statements. As of August 3, 2012, the assets of the Mid-Cap Equity Fund and the Money Market Fund were liquidated. These funds ceased operations and are no longer offered for investment.
14
Table of Contents
| Additional Information | (Unaudited) |
Information about Directors and Executive Officers:
The business and affairs of the Funds are managed under the direction of the Funds’ Board of Directors. Information pertaining to the Directors and officers of the Funds is set forth below.
Interested Directors and Executive Officers
Michael J. Cosgrove
Address c/o GEAM 1600 Summer St. Stamford, CT 06905
Age 63
Position(s) Held with Fund Chairman of the Board and President
Term of Office and Length of Time Served Until successor is elected and qualified – 15 years
Principal Occupation(s) During Past 5 years President of Mutual Funds and Global Investment Programs of GEAM since November 2011; President and Chief Executive Officer – Mutual Funds and Intermediary Business of GEAM from March 2007 to November 2011; Executive Vice President of GEAM from February 1997 to March 2007; and Executive Vice President-Mutual Funds of GEAM from March 1993 to March 2007. Also serves as Treasurer of GE Foundation since 1988.
Number of Portfolios in Fund Complex Overseen by Director 25
Other Directorships Held by Director Chairman of the Board and President of GE Institutional Funds since 1997; Trustee of Elfun Funds, GE Savings & Security Funds and General Electric Pension Trust since 1988; Director of GEAM since 1988; Trustee of Fordham University from 2002 to June 30, 2010 and since July 2011; Director of GE Investments Distributors, Inc since June 2011; Director of Skin Cancer Foundation since August 2010; Member of the Board of Governors for the Investment Company Institute since October 2006; Director, GE Asset Management (Ireland) Limited, since February 1999, GE Asset Management Funds Plc since 1998, GE Asset Management Canada Company since 1998, GE Asset Management Limited since 1998; Trustee of General Electric Pension Trust since 1988; and Chairman of the Board and President of GE Funds from 1993 to February 2011.
Matthew J. Simpson
Address c/o GEAM 1600 Summer St. Stamford, CT 06905
Age 51
Position(s) Held with Fund Director and Executive Vice President
Term of Office and Length of Time Served Until successor is elected and qualified – 4 years
Principal Occupation(s) During Past 5 years Executive Vice President, General Counsel and Secretary of GEAM since July 2007; Secretary of Elfun Funds and GE Savings & Security Funds since July 2007; Senior Vice President and General Counsel – Marketing and Client Services (formerly Asset Management Services) of GEAM and Senior Vice President and General Counsel of GE Asset Management Services from February 1997 to July 2007; Vice President and Associate General Counsel of GEAM from October 1992 to February 1997; Secretary of GE Institutional Funds and GE Investments Funds, Inc. from 1997 to July 2007 and Vice President from September 2003 to July 2007; Assistant Secretary of Elfun Funds and GE Savings & Security Funds from 1998 to July 2007 and Vice President from October 2003 to July 2007; and Secretary of GE Funds from 1993 to July 2007 and Vice President from September 2003 to July 2007.
Number of Portfolios in Fund Complex Overseen by Director 25
Other Directorships Held by Director Trustee of Elfun Funds, GE Savings & Security Funds and General Electric Pension Trust since July 2007; Trustee and Executive Vice President of GE Institutional Funds since July 2007; Director of GEAM since July 2007; and Trustee and Executive Vice President of GE Funds from July 2007 to February 2011.
15
Table of Contents
| Additional Information | (Unaudited) |
Joon Won Choe
Address c/o GEAM 1600 Summer St. Stamford, CT 06905
Age 42
Position(s) Held with Fund Vice President & Secretary
Term of Office and Length of Time Served Until successor is elected and qualified – Vice President and Secretary – 1 year
Principal Occupation(s) During Past 5 years Senior Vice President and Deputy General Counsel at GEAM since March 2011; Vice President and Secretary of GE Institutional Funds since September 2010; Vice President and Assistant Secretary of Elfun Funds and GE Savings & Security Funds since September 2010; Senior Vice President and Associate General Counsel at GEAM from June 2010 to March 2011; Vice President and Associate General Counsel of GEAM from November 2005 to June 2010 and Vice President and Secretary of GE Funds from September 2010 to February 2011.
Number of Portfolios in Fund Complex Overseen by Officer N/A
Other Directorships Held by Officer N/A
Robert Herlihy
Address c/o GEAM 1600 Summer St. Stamford, CT 06905
Age 44
Position(s) Held with Fund Chief Compliance Officer
Term of Office and Length of Time Served Until successor is elected and qualified — 6 years
Principal Occupation(s) During Past 5 years Chief Compliance Officer of GEAM, GE Institutional Funds, Elfun Funds, and GE Savings & Security Funds since July 2005; Chief Compliance Officer of GE Funds from July 2005 to February 2011 and Manager of Fund Administration at GEAM from 2002-2005.
Number of Portfolios in Fund Complex Overseen by Officer N/A
Other Directorships Held by Officer N/A
Arthur A. Jensen
Address c/o GEAM 1600 Summer St. Stamford, CT 06905
Age 45
Position(s) Held with Fund Treasurer
Term of Office and Length of Time Served Until successor is elected and qualified – 1 year
Principal Occupation(s) During Past 5 Years Treasurer of GE Institutional Funds, Elfun Funds and GE Savings & Security Funds since June 2011; Mutual Funds Controller of GEAM since April 2011; Senior Vice President at Citigroup from 2008 to 2010 and Vice President at JPMorgan from 2005 to 2008.
Number of Portfolios in Fund Complex Overseen by Officer N/A
Other Directorships Held by Officer N/A
16
Table of Contents
| Additional Information | (Unaudited) |
Jeanne M. LaPorta
Address c/o GEAM 1600 Summer St. Stamford, CT 06905
Age 46
Position(s) Held with Fund Vice President
Term of Office and Length of Time Served Until successor is elected and qualified – 8 years
Principal Occupation(s) During Past 5 Years Senior Vice President and Commercial Administrative Officer of GEAM since April 2010; Vice President of GE Institutional Funds since July 2003; Vice President of Elfun Funds and GE Savings & Security Funds since October 2003; Secretary of GE Funds from July 2007 to September 2010 and Vice President from July 2007 to February 2011; Senior Vice President and Deputy General Counsel of GEAM from October 2007 to April 2010; Vice President and Assistant Secretary of Elfun Funds and GE Savings & Security Funds from July 2003 to June 2010; and Vice President and Associate General Counsel – Marketing and Client Services (formerly Asset Management Services) at GEAM from May 1997 to October 2007.
Number of Portfolios in Fund Complex Overseen by Officer N/A
Other Directorships Held by Officer N/A
Non-Interested Directors
John R. Costantino
Address c/o GEAM 1600 Summer St. Stamford, CT 06905
Age 66
Position(s) Held with Fund Director
Term of Office and Length of Time Served Until successor is elected and qualified – 15 years
Principal Occupation(s) During Past 5 years General Partner, NGN Capital LLC since 2006; Managing Director, Vice President of Walden Capital Management since 1996.
Number of Portfolios in Fund Complex Overseen by Director 17
Other Directorships Held by Director Trustee of GE Institutional Funds since 1997; Trustee of Fordham University from 1989 to 1995 and from 2001 to 2007 and Trustee Emeritus since 2007; Trustee of Neuroscience Research Institute since 1986; Trustee of GE Funds from 1993 to February 2011; Director of Artes Medical from 2006-2008 and Trustee of Gregorian University Foundation from 1992-2007.
17
Table of Contents
| Additional Information | (Unaudited) |
R. Sheldon Johnson
Address c/o GEAM 1600 Summer St. Stamford, CT 06905
Age 65
Positions(s) Held with Fund Director
Term of office and Length of Time served Unit Successor is elected and qualified – 1 year.
Principal Occupation(s) During Past 5 years Head of Global Institutional Equity Sales and Marketing at Morgan Stanley & Co., Inc. from 2002 to 2006 and Managing Director at Morgan Stanley & Co., Inc. from 1988 to 2006.
Number of Portfolios in Fund Complex Overseen by Director 17
Other Directorships Held by Director Trustee of GE Institutional Funds since April 2011 and Trustee of St. Lawrence University since 2003.
Donna M. Rapaccioli
Address c/o GEAM 1600 Summer St. Stamford, CT 06905
Age 49
Position(s) Held with Fund Director
Term of Office and Length of Time Served Until successor is elected and qualified – Less than 1 year
Principal Occupation(s) During Past 5 Years Dean of the Gabelli School of Business since 2007 and Accounting professor since 1987 at Fordham University.
Number of Portfolios in Fund Complex Overseen by Officer 17
Other Directorships Held by Director Trustee of GE Institutional Funds since January 2012 and Trustee of Emmanuel College since 2010.
The Statement of Additional Information for the Funds includes additional information about the Directors and Officers and is available, without charge, upon request by calling 1-800-242-0134.
18
Table of Contents
| Investment Team | (Unaudited) |
Investment Adviser and Administrator
GE Asset Management Incorporated
Board of Directors
Michael J. Cosgrove, Chairman
John R. Costantino
R. Sheldon Johnson
Donna M. Rapaccioli
Matthew J. Simpson
Secretary
Joon Won Choe
Assistant Secretary
Michelle Matzelle
Treasurer
Arthur A. Jensen
Assistant Treasurer
Casey Yantosca
Distributor
GE Investment Distributors, Inc.
Member FINRA and SIPC
Custodian
State Street Bank & Trust Company
Officers of the Investment Adviser
Dmitri Stockton, President and Chief Executive Officer
Cheryl H. Beacock, Senior Vice President, Human Resources
George A. Bicher, Chief Risk Officer
Paul M. Colonna, President and Chief Investment Officer – Public Investments
Michael J. Cosgrove, President of Mutual Funds and Global Investment Programs
Gregory B. Hartch, Senior Vice President – Strategy and Business Development Leader
Ralph R. Layman, Executive Vice President and Chief Investment Officer Emeritus Public Equities
Maureen B. Mitchell, President of Global Sales and Marketing
Steven M. Rullo, Senior Vice President – Services and Technology
Matthew J. Simpson, Executive Vice President, General Counsel and Secretary
Donald W. Torey, President and Chief Investment Officer – Alternative Investments
David Wiederecht, President and Chief Investment Officer – Investment Solutions
Jessica Holscott, Executive Vice President, Chief Financial Officer*
| * | Effective August 1, 2012, Ms. Holcott replaced Tracie A. Winbigler as Executive Vice President and Chief Financial Officer. |
At GE Asset Management, we’re dedicated to providing the investment options you’ll need to tailor your financial portfolio to every stage of your life. Each member of the GE Family of Funds is managed according to the same principles of integrity and quality that have guided GE over the past century, and have made it the world-class company that it is today. Each fund draws strength from a heritage of investment management experience that spans more than 80 years. Whether you’re creating a new investment portfolio or adding to an established one, the GE Family of Funds offers an array of professionally managed investment options that will help you meet a lifetime of financial needs.
19
Table of Contents
Investment Adviser
GE Asset Management Incorporated
1600 Summer Street
Stamford, CT 06905
or at:
PO Box 7900
Stamford, CT 06904-7900
Distributor
GE Investment Distributors, Inc.
member FINRA and SIPC
1600 Summer Street
Stamford, CT 06905
or at:
PO Box 7900
Stamford, CT 06904-7900
The Fund files its complete schedule of portfolio holdings with the Securities and Exchange Commission for the first and third quarters of each fiscal year on Form N-Q. The Fund’s Forms N-Q, as well as a description of the policies and procedures that the Fund uses to determine how to vote proxies (if any) relating to portfolio securities is available without charge (i) upon request, by calling 1-800-493-3042; (ii) on the Fund’s website at http://www.geam.com; and (iii) on the Commission’s website at http://www.sec.gov. The Fund’s Forms N-Q may be reviewed and copied at the Commission’s Public Reference Room in Washington, DC—information on the operation of the Public Reference Room may be obtained by calling 1-800-SEC-0330.
Information (if any) regarding how the Fund voted proxies relating to portfolio securities during the most recently disclosed 12-month period ended June 30 is available without charge (i) through the Fund’s website at http://www.geam.com; and (ii) on the Commission’s website at http://www.sec.gov.
Table of Contents
| ITEM 2. | CODE OF ETHICS. |
Applicable only to an annual filing.
| ITEM 3. | AUDIT COMMITTEE FINANCIAL EXPERT. |
Applicable only to an annual filing.
| ITEM 4. | PRINCIPAL ACCOUNTANT FEES AND SERVICES. |
Applicable only to an annual filing.
| ITEM 5. | AUDIT COMMITTEE OF LISTED REGISTRANTS |
Applicable only to an annual filing.
| ITEM 6. | SCHEDULE OF INVESTMENTS. |
Attached as part of ITEM 1.
| ITEM 7. | DISCLOSURE OF PROXY VOTING POLICIES AND PROCEDURES FOR CLOSED-END MANAGEMENT INVESTMENT COMPANIES. |
Applicable only to Closed-End Management Investment Companies.
| ITEM 8. | PORTFOLIO MANAGERS OF CLOSED-END MANAGEMENT INVESTMENT COMPANIES. |
Applicable only to Closed-End Management Investment Companies.
| ITEM 9. | PURCHASES OF EQUITY SECURITIES BY CLOSED-END MANAGEMENT INVESTMENT COMPANY AND AFFILIATED PURCHASERS. |
Applicable only to Closed-End Management Investment Companies.
| ITEM 10. | SUBMISSION OF MATTERS TO A VOTE OF SECURITY HOLDERS. |
No material changes.
| ITEM 11. | CONTROLS AND PROCEDURES. |
The officers providing the certifications in this report in accordance with Rule 30a-3 under the Investment Company Act of 1940 have concluded, based on their evaluation of the registrant’s disclosure controls and procedures (as such term is defined in such rule),
that such controls and procedures are adequate and reasonably designed to achieve the purpose described in paragraph (c) of such rule.
There were no significant changes in the registrant’s internal controls or in other factors that could significantly affect these controls subsequent to the date of their last evaluation, including any corrective actions with regard to significant deficiencies and material weaknesses.
| ITEM 12. | EXHIBITS. |
(a) Not applicable.
(b) Attached hereto as Exhibit 1 and Exhibit 2 are the Certifications of Michael J. Cosgrove and Arthur A. Jensen as principal executive officer and principal financial officer, respectively, as required by Rule 30a-2 under the Investment Company Act of 1940.
Table of Contents
SIGNATURES
Pursuant to the requirements of the Securities Exchange Act of 1934 and the Investment Company Act of 1940, the Registrant has duly caused this Report to be signed on its behalf by the undersigned, thereunto duly authorized.
GE INVESTMENTS FUNDS, INC
By: | /s/ Michael J. Cosgrove | |
| Michael J. Cosgrove | ||
| Chairman, GE Investments Funds, Inc. |
Date: August 27, 2012
Pursuant to the requirements of the Securities Exchange Act of 1934 and the Investment Company Act of 1940, this Report has been signed below by the following persons on behalf of the Registrant and in the capacities and on the dates indicated.
By: | /s/ Michael J. Cosgrove | |
| Michael J. Cosgrove | ||
| Chairman, GE Investments Funds, Inc. |
Date: August 27, 2012
By: | /s/ Arthur A. Jensen | |
| Arthur A. Jensen | ||
| Treasurer, GE Investments Funds, Inc. |
Date: August 27, 2012
Table of Contents
EXHIBIT INDEX
(b)(1) Certifications of principal executive officer and principal financial officer as required by Rule 30a-2 under the Investment Company Act of 1940.
(b)(2) Certification of principal executive officer and principal financial officer as required by Section 906 of the Sarbanes-Oxley Act of 2002.