0000746687ssga:GEINDEXBLOOMBERGUSAGGREGATEBONDINDEX1154AdditionalIndexMember2015-12-31
UNITED STATES
SECURITIES AND EXCHANGE COMMISSION
Washington, D.C. 20549
FORM N-CSR
CERTIFIED SHAREHOLDER REPORT OF REGISTERED
MANAGEMENT INVESTMENT COMPANIES
Investment Company Act file number: 811-04041
STATE STREET VARIABLE INSURANCE SERIES FUNDS, INC.
(Exact name of registrant as specified in charter)
One Iron Street
Boston, Massachusetts 02210
(Address of principal executive offices) (Zip code)
| | |
| (Name and Address of Agent for Service) | | Copy to: |
| |
Andrew J. DeLorme, Esq. Chief Legal Officer c/o SSGA Funds Management, Inc. One Iron Street Boston, Massachusetts 02210 | | Adam M. Schlichtmann, Esq. Ropes & Gray LLP Prudential Tower 800 Boylston Street Boston, Massachusetts 02199-3600 |
Registrant’s telephone number, including area code: 800-242-0134
Date of fiscal year end: December 31
Date of reporting period: December 31, 2024
Item 1. Report to Shareholders.
| (a) | The Report to Shareholders is attached herewith. |
State Street Income V.I.S. Fund
Annual Shareholder Report
December 31, 2024
This annual shareholder report contains important information about the State Street Income V.I.S. Fund (the "Fund") for the period of January 1, 2024 to December 31, 2024. You can find additional information about the Fund, including the Prospectus, Statement of Additional Information, financial statements and other information at www.ssga.com/us/en/individual/fund-finder?tab=documents&type=mf. You can also request this information about the Fund by contacting us at 1-800-242-0134.
What were the Fund costs for the last year? (based on a hypothetical $10,000 Investment)
| Class Name | Costs of a $10,000 investment | Costs paid as a percentage of a $10,000 investment |
|---|
| Class 1 | $136 | 1.37% |
|---|
How did the Fund perform last year and what affected its performance?
Duration allocation had a negative impact on performance and was the primary driver of Fund performance relative to the Index during the reporting period, while security selection had a positive impact. Our view in the fourth quarter of 2023 was that the economy, inflation and interest rates had peaked and were likely to decline over the reporting period. This outlook had the Fund begin the reporting period with a significant over-weight allocation to duration and a modest over-weight to credit sectors. The Fed cut the Fed Funds rate by 100bps, but the yield on the 10-year U.S. Treasury note increased from 3.88% to 4.57%, due to the positive expected economic impact from the Republican 2024 electoral sweep, during the reporting period. The Fund’s duration over-weight position contributed negatively to its performance relative to its Benchmark.
Security selection in the investment grade corporate and CMBS allocations generated positive excess returns, while agency MBS detracted from performance.
The Fund used treasury futures and index credit default swaps in order to actively manage duration and credit spread duration during the reporting period, with each product negatively contributing to Fund performance relative to the Index.
The Fund's benchmark is an unmanaged index used as a general measure of market performance. Calculations assume dividends and capital gains.
Comparison of Change in Value of a $10,000 Investment
(Based on Net Asset Value)
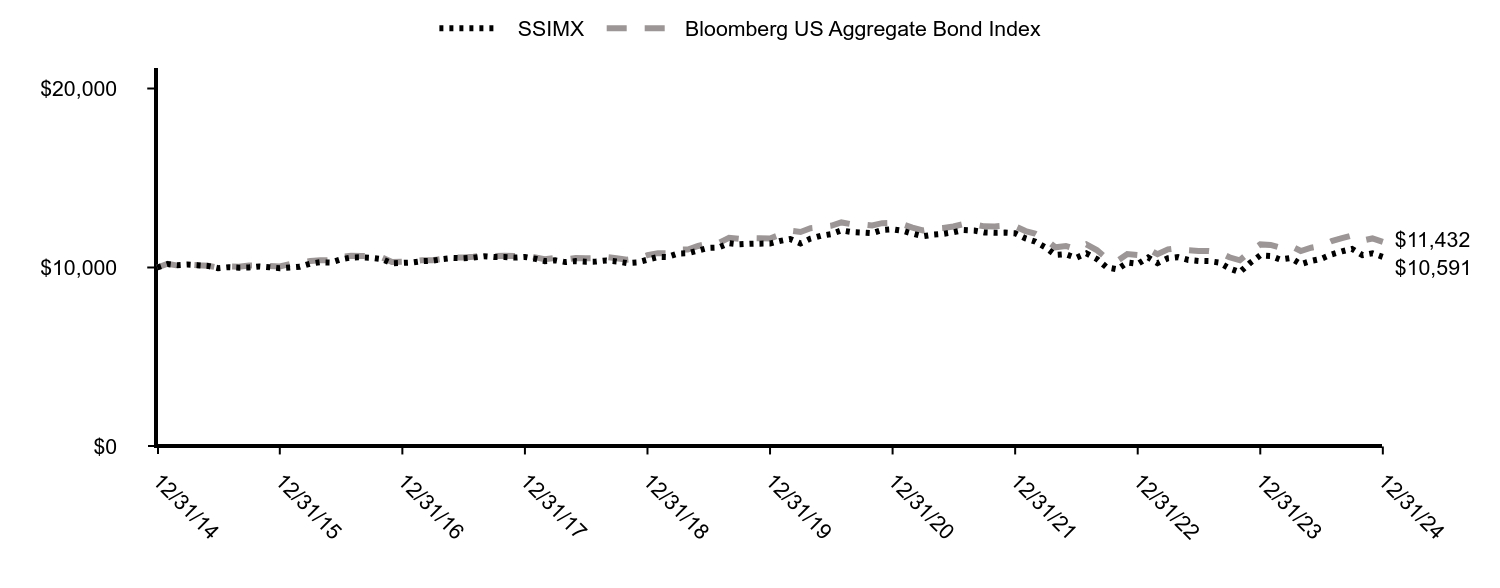
| SSIMX | Bloomberg US Aggregate Bond Index |
|---|
| 12/31/14 | $10,000 | $10,000 |
|---|
| 01/31/15 | $10,190 | $10,210 |
|---|
| 02/28/15 | $10,130 | $10,114 |
|---|
| 03/31/15 | $10,164 | $10,161 |
|---|
| 04/30/15 | $10,130 | $10,124 |
|---|
| 05/31/15 | $10,087 | $10,100 |
|---|
| 06/30/15 | $9,965 | $9,990 |
|---|
| 07/31/15 | $10,017 | $10,059 |
|---|
| 08/31/15 | $9,991 | $10,045 |
|---|
| 09/30/15 | $10,000 | $10,113 |
|---|
| 10/31/15 | $10,061 | $10,114 |
|---|
| 11/30/15 | $10,017 | $10,088 |
|---|
| 12/31/15 | $9,958 | $10,055 |
|---|
| 01/31/16 | $10,002 | $10,193 |
|---|
| 02/29/16 | $10,046 | $10,266 |
|---|
| 03/31/16 | $10,214 | $10,360 |
|---|
| 04/30/16 | $10,294 | $10,400 |
|---|
| 05/31/16 | $10,276 | $10,402 |
|---|
| 06/30/16 | $10,453 | $10,589 |
|---|
| 07/31/16 | $10,560 | $10,656 |
|---|
| 08/31/16 | $10,568 | $10,644 |
|---|
| 09/30/16 | $10,542 | $10,638 |
|---|
| 10/31/16 | $10,471 | $10,556 |
|---|
| 11/30/16 | $10,232 | $10,307 |
|---|
| 12/31/16 | $10,255 | $10,321 |
|---|
| 01/31/17 | $10,282 | $10,341 |
|---|
| 02/28/17 | $10,354 | $10,411 |
|---|
| 03/31/17 | $10,381 | $10,405 |
|---|
| 04/30/17 | $10,471 | $10,486 |
|---|
| 05/31/17 | $10,534 | $10,566 |
|---|
| 06/30/17 | $10,516 | $10,556 |
|---|
| 07/31/17 | $10,552 | $10,601 |
|---|
| 08/31/17 | $10,625 | $10,696 |
|---|
| 09/30/17 | $10,580 | $10,645 |
|---|
| 10/31/17 | $10,580 | $10,652 |
|---|
| 11/30/17 | $10,552 | $10,638 |
|---|
| 12/31/17 | $10,588 | $10,687 |
|---|
| 01/31/18 | $10,486 | $10,564 |
|---|
| 02/28/18 | $10,357 | $10,464 |
|---|
| 03/31/18 | $10,403 | $10,531 |
|---|
| 04/30/18 | $10,302 | $10,452 |
|---|
| 05/31/18 | $10,357 | $10,527 |
|---|
| 06/30/18 | $10,320 | $10,514 |
|---|
| 07/31/18 | $10,330 | $10,516 |
|---|
| 08/31/18 | $10,394 | $10,584 |
|---|
| 09/30/18 | $10,339 | $10,516 |
|---|
| 10/31/18 | $10,247 | $10,433 |
|---|
| 11/30/18 | $10,284 | $10,495 |
|---|
| 12/31/18 | $10,437 | $10,688 |
|---|
| 01/31/19 | $10,588 | $10,801 |
|---|
| 02/28/19 | $10,578 | $10,795 |
|---|
| 03/31/19 | $10,776 | $11,002 |
|---|
| 04/30/19 | $10,795 | $11,005 |
|---|
| 05/31/19 | $10,946 | $11,201 |
|---|
| 06/30/19 | $11,097 | $11,341 |
|---|
| 07/31/19 | $11,116 | $11,366 |
|---|
| 08/31/19 | $11,361 | $11,661 |
|---|
| 09/30/19 | $11,295 | $11,599 |
|---|
| 10/31/19 | $11,323 | $11,634 |
|---|
| 11/30/19 | $11,333 | $11,628 |
|---|
| 12/31/19 | $11,337 | $11,620 |
|---|
| 01/31/20 | $11,488 | $11,843 |
|---|
| 02/29/20 | $11,592 | $12,056 |
|---|
| 03/31/20 | $11,346 | $11,985 |
|---|
| 04/30/20 | $11,611 | $12,198 |
|---|
| 05/31/20 | $11,771 | $12,255 |
|---|
| 06/30/20 | $11,866 | $12,332 |
|---|
| 07/31/20 | $12,073 | $12,517 |
|---|
| 08/31/20 | $11,979 | $12,416 |
|---|
| 09/30/20 | $11,951 | $12,409 |
|---|
| 10/31/20 | $11,913 | $12,353 |
|---|
| 11/30/20 | $12,092 | $12,475 |
|---|
| 12/31/20 | $12,133 | $12,492 |
|---|
| 01/31/21 | $12,046 | $12,402 |
|---|
| 02/28/21 | $11,890 | $12,223 |
|---|
| 03/31/21 | $11,744 | $12,071 |
|---|
| 04/30/21 | $11,832 | $12,166 |
|---|
| 05/31/21 | $11,880 | $12,206 |
|---|
| 06/30/21 | $11,968 | $12,291 |
|---|
| 07/31/21 | $12,094 | $12,429 |
|---|
| 08/31/21 | $12,065 | $12,405 |
|---|
| 09/30/21 | $11,958 | $12,298 |
|---|
| 10/31/21 | $11,939 | $12,294 |
|---|
| 11/30/21 | $11,948 | $12,331 |
|---|
| 12/31/21 | $11,913 | $12,299 |
|---|
| 01/31/22 | $11,622 | $12,034 |
|---|
| 02/28/22 | $11,451 | $11,900 |
|---|
| 03/31/22 | $11,130 | $11,569 |
|---|
| 04/30/22 | $10,698 | $11,130 |
|---|
| 05/31/22 | $10,738 | $11,202 |
|---|
| 06/30/22 | $10,537 | $11,026 |
|---|
| 07/31/22 | $10,788 | $11,296 |
|---|
| 08/31/22 | $10,477 | $10,977 |
|---|
| 09/30/22 | $10,005 | $10,502 |
|---|
| 10/31/22 | $9,894 | $10,366 |
|---|
| 11/30/22 | $10,276 | $10,748 |
|---|
| 12/31/22 | $10,200 | $10,699 |
|---|
| 01/31/23 | $10,556 | $11,028 |
|---|
| 02/28/23 | $10,242 | $10,743 |
|---|
| 03/31/23 | $10,514 | $11,016 |
|---|
| 04/30/23 | $10,577 | $11,083 |
|---|
| 05/31/23 | $10,420 | $10,962 |
|---|
| 06/30/23 | $10,368 | $10,923 |
|---|
| 07/31/23 | $10,357 | $10,915 |
|---|
| 08/31/23 | $10,273 | $10,846 |
|---|
| 09/30/23 | $9,948 | $10,570 |
|---|
| 10/31/23 | $9,739 | $10,403 |
|---|
| 11/30/23 | $10,242 | $10,874 |
|---|
| 12/31/23 | $10,678 | $11,291 |
|---|
| 01/31/24 | $10,646 | $11,260 |
|---|
| 02/29/24 | $10,442 | $11,100 |
|---|
| 03/31/24 | $10,528 | $11,203 |
|---|
| 04/30/24 | $10,186 | $10,920 |
|---|
| 05/31/24 | $10,367 | $11,105 |
|---|
| 06/30/24 | $10,485 | $11,210 |
|---|
| 07/31/24 | $10,731 | $11,472 |
|---|
| 08/31/24 | $10,902 | $11,637 |
|---|
| 09/30/24 | $11,041 | $11,793 |
|---|
| 10/31/24 | $10,688 | $11,500 |
|---|
| 11/30/24 | $10,795 | $11,622 |
|---|
| 12/31/24 | $10,591 | $11,432 |
|---|
Average Annual Total Returns (%)
| Name | 1 Year | 5 Years | 10 Years |
|---|
| SSIMX | (0.82%) | (1.35%) | 0.58% |
|---|
| Bloomberg US Aggregate Bond Index | 1.25% | (0.33%) | 1.35% |
|---|
The Fund’s past performance is not necessarily an indication of how the Fund will perform in the future. The returns do not reflect the deduction of taxes that a shareholder would pay on Fund distributions or on the redemption or sale of Fund shares. Updated performance information is available by calling 1-800-242-0134 or visiting our website at www.ssga.com.
Key Fund Statistics as of 12/31/2024
- Total Net Assets$8,916,380
- Number of Portfolio Holdings979
- Portfolio Turnover Rate52%
- Total Advisory Fees Paid$47,303
What did the Fund invest in as of 12/31/2024? (as a percentage of total net assets)
| Holdings | % |
| U.S. Treasury Notes, 3.88%, due 08/15/33 | 8.9% |
| U.S. Treasury Notes, 2.75%, due 08/15/32 | 5.4% |
| Uniform Mortgage-Backed Security, TBA, 2.50%, due 01/01/55 | 4.7% |
| Uniform Mortgage-Backed Security, TBA, 6.00%, due 01/01/55 | 4.7% |
| Uniform Mortgage-Backed Security, TBA, 6.50%, due 01/01/55 | 2.9% |
| U.S. Treasury Notes, 3.88%, due 08/15/34 | 2.7% |
| Uniform Mortgage-Backed Security, TBA, 2.00%, due 01/01/55 | 2.6% |
| U.S. Treasury Inflation-Indexed Notes, 1.88%, due 07/15/34 | 2.6% |
| U.S. Treasury Bonds, 3.00%, due 08/15/48 | 2.2% |
| Federal National Mortgage Association, 2.50%, due 03/01/51 | 1.9% |
| Asset | % |
| U.S. Treasuries | 31.8% |
| Agency Mortgage Backed | 31.3% |
| Corporate Notes | 27.2% |
| Short-Term Investments | 19.9% |
| Non-Agency Collateralized Mortgage Obligations | 6.2% |
| Agency Collateralized Mortgage Obligations | 1.2% |
| Sovereign Bonds | 0.4% |
| Municipal Bonds and Notes | 0.2% |
Availability of Additional Information
For additional information about the Fund, including its Prospectus, Statement of Additional Information, financial statements, holdings and proxy information please visit: www.ssga.com/us/en/individual/fund-finder?tab=documents&type=mf.
State Street Premier Growth Equity V.I.S. Fund
Annual Shareholder Report
December 31, 2024
This annual shareholder report contains important information about the State Street Premier Growth Equity V.I.S. Fund (the "Fund") for the period of January 1, 2024 to December 31, 2024. You can find additional information about the Fund, including the Prospectus, Statement of Additional Information, financial statements and other information at www.ssga.com/us/en/individual/fund-finder?tab=documents&type=mf. You can also request this information about the Fund by contacting us at 1-800-242-0134.
What were the Fund costs for the last year? (based on a hypothetical $10,000 Investment)
| Class Name | Costs of a $10,000 investment | Costs paid as a percentage of a $10,000 investment |
|---|
| Class 1 | $99 | 0.86% |
|---|
How did the Fund perform last year and what affected its performance?
Primary drivers of performance relative to the Russell 1000 Growth Index included the following:
Outperformance and Overweight in IT. IT was one of the best performing Index sectors during the reporting period rising 40.6%. On top of this strong return, the Fund outperformed by 3.6%, adding value through overweight positions in companies that are beneficiaries of Artificial Intelligence investment such as Nvidia and Broadcom. Additionally, the Fund was overweight the sector, adding additional value. Outperformance in Industrials. The Fund benefitted from holdings including Eaton and Parker-Hannifin, which significantly outperformed during the reporting period , as they benefitted from a range of tailwinds including infrastructure/capex spending driven by reshoring, green investment, and increased data center demand. Additionally, the Fund did not own Uber, which underperformed.
Underperformance in Healthcare. The Healthcare sector, which is defensive, underperformed in the strong risk-on market. This impacted Fund positions including Thermo Fisher Scientific (life sciences tools & services), Astrazeneca (pharma), and Unitedhealth Group (services).
The Fund's benchmarks are unmanaged indices used as a general measure of market performance. Calculations assume dividends and capital gains.
Comparison of Change in Value of a $10,000 Investment
(Based on Net Asset Value)
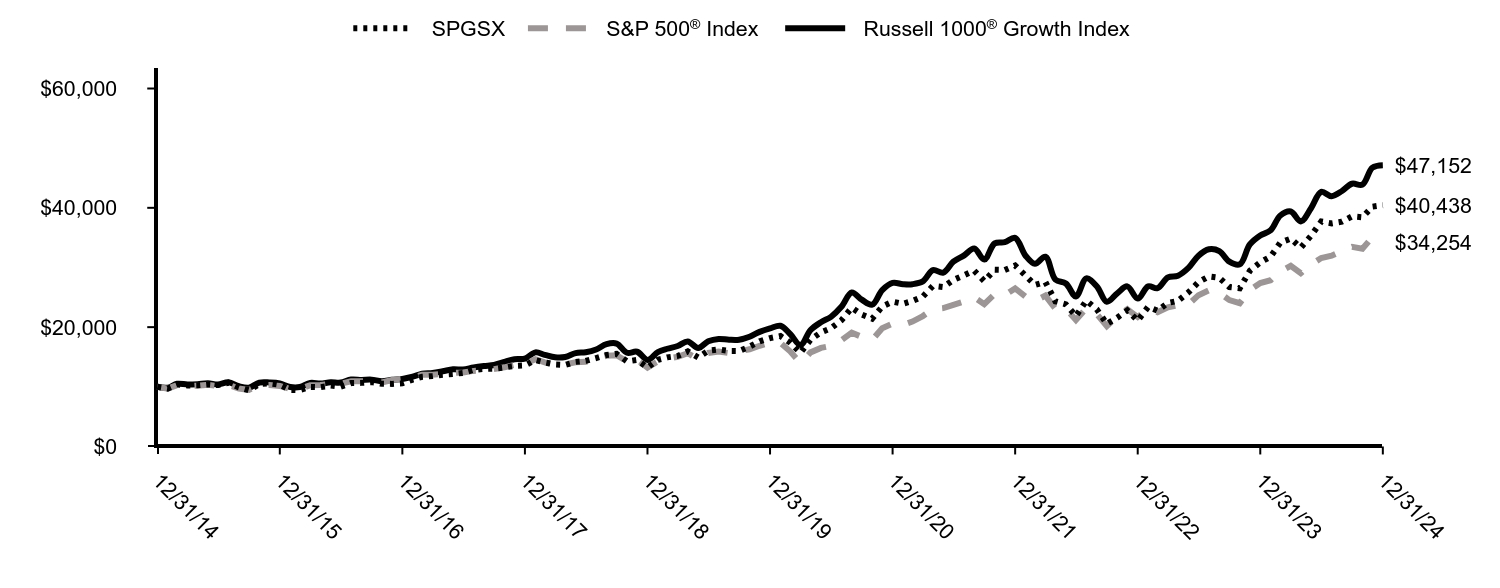
| SPGSX | S&P 500® Index | Russell 1000® Growth Index |
|---|
| 12/31/14 | $10,000 | $10,000 | $10,000 |
|---|
| 01/31/15 | $9,709 | $9,700 | $9,847 |
|---|
| 02/28/15 | $10,375 | $10,257 | $10,503 |
|---|
| 03/31/15 | $10,224 | $10,095 | $10,384 |
|---|
| 04/30/15 | $10,260 | $10,192 | $10,436 |
|---|
| 05/31/15 | $10,418 | $10,323 | $10,583 |
|---|
| 06/30/15 | $10,290 | $10,123 | $10,396 |
|---|
| 07/31/15 | $10,683 | $10,335 | $10,749 |
|---|
| 08/31/15 | $9,897 | $9,712 | $10,096 |
|---|
| 09/30/15 | $9,406 | $9,471 | $9,846 |
|---|
| 10/31/15 | $10,474 | $10,270 | $10,694 |
|---|
| 11/30/15 | $10,597 | $10,301 | $10,724 |
|---|
| 12/31/15 | $10,330 | $10,138 | $10,567 |
|---|
| 01/31/16 | $9,484 | $9,635 | $9,977 |
|---|
| 02/29/16 | $9,463 | $9,622 | $9,973 |
|---|
| 03/31/16 | $9,976 | $10,275 | $10,645 |
|---|
| 04/30/16 | $9,933 | $10,315 | $10,548 |
|---|
| 05/31/16 | $10,205 | $10,500 | $10,753 |
|---|
| 06/30/16 | $10,007 | $10,527 | $10,711 |
|---|
| 07/31/16 | $10,627 | $10,915 | $11,216 |
|---|
| 08/31/16 | $10,659 | $10,931 | $11,160 |
|---|
| 09/30/16 | $10,790 | $10,933 | $11,201 |
|---|
| 10/31/16 | $10,509 | $10,733 | $10,938 |
|---|
| 11/30/16 | $10,491 | $11,131 | $11,176 |
|---|
| 12/31/16 | $10,585 | $11,351 | $11,314 |
|---|
| 01/31/17 | $11,206 | $11,566 | $11,696 |
|---|
| 02/28/17 | $11,678 | $12,025 | $12,182 |
|---|
| 03/31/17 | $11,797 | $12,039 | $12,322 |
|---|
| 04/30/17 | $12,017 | $12,163 | $12,604 |
|---|
| 05/31/17 | $12,148 | $12,334 | $12,932 |
|---|
| 06/30/17 | $12,332 | $12,411 | $12,898 |
|---|
| 07/31/17 | $12,843 | $12,666 | $13,241 |
|---|
| 08/31/17 | $13,006 | $12,705 | $13,483 |
|---|
| 09/30/17 | $13,032 | $12,967 | $13,659 |
|---|
| 10/31/17 | $13,239 | $13,270 | $14,188 |
|---|
| 11/30/17 | $13,506 | $13,677 | $14,619 |
|---|
| 12/31/17 | $13,585 | $13,829 | $14,733 |
|---|
| 01/31/18 | $14,495 | $14,621 | $15,776 |
|---|
| 02/28/18 | $14,088 | $14,082 | $15,363 |
|---|
| 03/31/18 | $13,743 | $13,724 | $14,941 |
|---|
| 04/30/18 | $13,667 | $13,777 | $14,994 |
|---|
| 05/31/18 | $14,176 | $14,108 | $15,651 |
|---|
| 06/30/18 | $14,354 | $14,195 | $15,801 |
|---|
| 07/31/18 | $14,822 | $14,724 | $16,265 |
|---|
| 08/31/18 | $15,329 | $15,203 | $17,155 |
|---|
| 09/30/18 | $15,520 | $15,290 | $17,251 |
|---|
| 10/31/18 | $14,259 | $14,245 | $15,708 |
|---|
| 11/30/18 | $14,503 | $14,535 | $15,875 |
|---|
| 12/31/18 | $13,223 | $13,223 | $14,510 |
|---|
| 01/31/19 | $14,529 | $14,282 | $15,814 |
|---|
| 02/28/19 | $14,933 | $14,741 | $16,380 |
|---|
| 03/31/19 | $15,172 | $15,027 | $16,846 |
|---|
| 04/30/19 | $15,941 | $15,636 | $17,607 |
|---|
| 05/31/19 | $14,914 | $14,642 | $16,495 |
|---|
| 06/30/19 | $16,068 | $15,674 | $17,628 |
|---|
| 07/31/19 | $16,273 | $15,899 | $18,026 |
|---|
| 08/31/19 | $16,010 | $15,648 | $17,888 |
|---|
| 09/30/19 | $16,002 | $15,940 | $17,890 |
|---|
| 10/31/19 | $16,731 | $16,286 | $18,394 |
|---|
| 11/30/19 | $17,613 | $16,877 | $19,210 |
|---|
| 12/31/19 | $18,159 | $17,386 | $19,790 |
|---|
| 01/31/20 | $18,507 | $17,379 | $20,232 |
|---|
| 02/29/20 | $17,414 | $15,949 | $18,854 |
|---|
| 03/31/20 | $15,699 | $13,979 | $17,000 |
|---|
| 04/30/20 | $17,907 | $15,771 | $19,515 |
|---|
| 05/31/20 | $19,120 | $16,522 | $20,825 |
|---|
| 06/30/20 | $19,817 | $16,850 | $21,732 |
|---|
| 07/31/20 | $21,133 | $17,801 | $23,404 |
|---|
| 08/31/20 | $23,267 | $19,080 | $25,819 |
|---|
| 09/30/20 | $22,114 | $18,355 | $24,604 |
|---|
| 10/31/20 | $21,426 | $17,867 | $23,769 |
|---|
| 11/30/20 | $23,451 | $19,823 | $26,203 |
|---|
| 12/31/20 | $24,263 | $20,585 | $27,408 |
|---|
| 01/31/21 | $23,914 | $20,377 | $27,205 |
|---|
| 02/28/21 | $24,380 | $20,939 | $27,199 |
|---|
| 03/31/21 | $25,114 | $21,856 | $27,666 |
|---|
| 04/30/21 | $26,910 | $23,022 | $29,548 |
|---|
| 05/31/21 | $26,708 | $23,183 | $29,140 |
|---|
| 06/30/21 | $27,922 | $23,724 | $30,968 |
|---|
| 07/31/21 | $28,682 | $24,288 | $31,988 |
|---|
| 08/31/21 | $29,469 | $25,026 | $33,184 |
|---|
| 09/30/21 | $27,709 | $23,863 | $31,326 |
|---|
| 10/31/21 | $29,623 | $25,534 | $34,039 |
|---|
| 11/30/21 | $29,579 | $25,357 | $34,247 |
|---|
| 12/31/21 | $30,322 | $26,494 | $34,971 |
|---|
| 01/31/22 | $28,647 | $25,123 | $31,970 |
|---|
| 02/28/22 | $27,071 | $24,371 | $30,612 |
|---|
| 03/31/22 | $27,576 | $25,276 | $31,809 |
|---|
| 04/30/22 | $24,323 | $23,071 | $27,968 |
|---|
| 05/31/22 | $23,832 | $23,114 | $27,318 |
|---|
| 06/30/22 | $21,856 | $21,206 | $25,154 |
|---|
| 07/31/22 | $24,449 | $23,161 | $28,173 |
|---|
| 08/31/22 | $23,009 | $22,217 | $26,861 |
|---|
| 09/30/22 | $20,543 | $20,170 | $24,249 |
|---|
| 10/31/22 | $21,596 | $21,804 | $25,667 |
|---|
| 11/30/22 | $22,801 | $23,022 | $26,836 |
|---|
| 12/31/22 | $21,094 | $21,696 | $24,782 |
|---|
| 01/31/23 | $23,399 | $23,059 | $26,847 |
|---|
| 02/28/23 | $22,772 | $22,496 | $26,528 |
|---|
| 03/31/23 | $24,062 | $23,322 | $28,342 |
|---|
| 04/30/23 | $24,407 | $23,686 | $28,621 |
|---|
| 05/31/23 | $25,828 | $23,789 | $29,926 |
|---|
| 06/30/23 | $27,558 | $25,361 | $31,972 |
|---|
| 07/31/23 | $28,505 | $26,176 | $33,050 |
|---|
| 08/31/23 | $28,278 | $25,759 | $32,753 |
|---|
| 09/30/23 | $26,715 | $24,531 | $30,972 |
|---|
| 10/31/23 | $26,526 | $24,015 | $30,531 |
|---|
| 11/30/23 | $29,453 | $26,208 | $33,859 |
|---|
| 12/31/23 | $30,856 | $27,399 | $35,358 |
|---|
| 01/31/24 | $31,833 | $27,859 | $36,240 |
|---|
| 02/29/24 | $34,178 | $29,347 | $38,713 |
|---|
| 03/31/24 | $34,836 | $30,291 | $39,394 |
|---|
| 04/30/24 | $33,327 | $29,054 | $37,723 |
|---|
| 05/31/24 | $35,345 | $30,494 | $39,981 |
|---|
| 06/30/24 | $37,710 | $31,589 | $42,677 |
|---|
| 07/31/24 | $37,399 | $31,973 | $41,951 |
|---|
| 08/31/24 | $37,677 | $32,749 | $42,825 |
|---|
| 09/30/24 | $38,569 | $33,448 | $44,038 |
|---|
| 10/31/24 | $38,418 | $33,145 | $43,893 |
|---|
| 11/30/24 | $40,198 | $35,090 | $46,740 |
|---|
| 12/31/24 | $40,438 | $34,254 | $47,152 |
|---|
Average Annual Total Returns (%)
| Name | 1 Year | 5 Years | 10 Years |
|---|
| SPGSX | 31.06% | 17.37% | 15.00% |
|---|
S&P 500® Index | 25.02% | 14.53% | 13.10% |
|---|
Russell 1000® Growth Index | 33.36% | 18.96% | 16.78% |
|---|
The Fund’s past performance is not necessarily an indication of how the Fund will perform in the future. The returns do not reflect the deduction of taxes that a shareholder would pay on Fund distributions or on the redemption or sale of Fund shares. Updated performance information is available by calling 1-800-242-0134 or visiting our website at www.ssga.com.
Key Fund Statistics as of 12/31/2024
- Total Net Assets$34,525,116
- Number of Portfolio Holdings36
- Portfolio Turnover Rate28%
- Total Advisory Fees Paid$224,815
What did the Fund invest in as of 12/31/2024? (as a percentage of total net assets)
| Holdings | % |
| NVIDIA Corp. | 12.6% |
| Microsoft Corp. | 12.2% |
| Amazon.com, Inc. | 8.4% |
| Meta Platforms, Inc., Class A | 6.0% |
| Apple, Inc. | 4.8% |
| Broadcom, Inc. | 4.7% |
| Alphabet, Inc., Class C | 4.5% |
| Alphabet, Inc., Class A | 4.1% |
| The Technology Select Sector SPDR Fund | 3.9% |
| Visa, Inc., Class A | 2.8% |
| Industry | % |
| Semiconductors & Semiconductor Equipment | 20.4% |
| Software | 19.9% |
| Interactive Media & Services | 14.6% |
| Broadline Retail | 8.4% |
| Financial Services | 5.2% |
| Technology Hardware, Storage & Peripherals | 4.8% |
| Specialty Retail | 4.5% |
| Exchange Traded & Mutual Funds | 3.9% |
| Machinery | 1.5% |
| Trading Companies & Distributors | 1.5% |
Availability of Additional Information
For additional information about the Fund, including its Prospectus, Statement of Additional Information, financial statements, holdings and proxy information please visit: www.ssga.com/us/en/individual/fund-finder?tab=documents&type=mf.
State Street Real Estate Securities V.I.S. Fund
Annual Shareholder Report
December 31, 2024
This annual shareholder report contains important information about the State Street Real Estate Securities V.I.S. Fund (the "Fund") for the period of January 1, 2024 to December 31, 2024. You can find additional information about the Fund, including the Prospectus, Statement of Additional Information, financial statements and other information at www.ssga.com/us/en/individual/fund-finder?tab=documents&type=mf. You can also request this information about the Fund by contacting us at 1-800-242-0134.
What were the Fund costs for the last year? (based on a hypothetical $10,000 Investment)
| Class Name | Costs of a $10,000 investment | Costs paid as a percentage of a $10,000 investment |
|---|
| Class 1 | $106 | 1.01% |
|---|
How did the Fund perform last year and what affected its performance?
The portfolio generated outperformance relative to the benchmark from both stock selection and sector allocation. Positioning within the Health Care and Shopping Center sectors was the primary driver of alpha. Outperformance in Health Care came from overweight positions in Seniors’ Housing and underweights to Life Sciences and Medical Office properties. Shopping Centers saw strong capital markets activity in Q4 which directly benefited the portfolio’s positions and raised valuations across the sector. Positioning within the Net Lease, Hotel, and Office sectors also contributed to stock selection. Overweight allocations in the strongest-performing sectors like Data Centers, Health Care, Office, and Shopping Centers also added to strong absolute and relative performance. The underweight allocation to Industrial, which faced the stiffest challenge during the year, contributed to relative performance. Underweights in two sectors that outperformed, Regional Malls and Specialty, partially detracted from relative performance. Both sectors gained on optimism for strong economic growth. The impact of fees and expenses also detracted; however, the net performance of the Fund outperformed the Index by more than 170 basis points in 2024.
The Fund's benchmarks are unmanaged indices used as a general measure of market performance. Calculations assume dividends and capital gains.
Comparison of Change in Value of a $10,000 Investment
(Based on Net Asset Value)
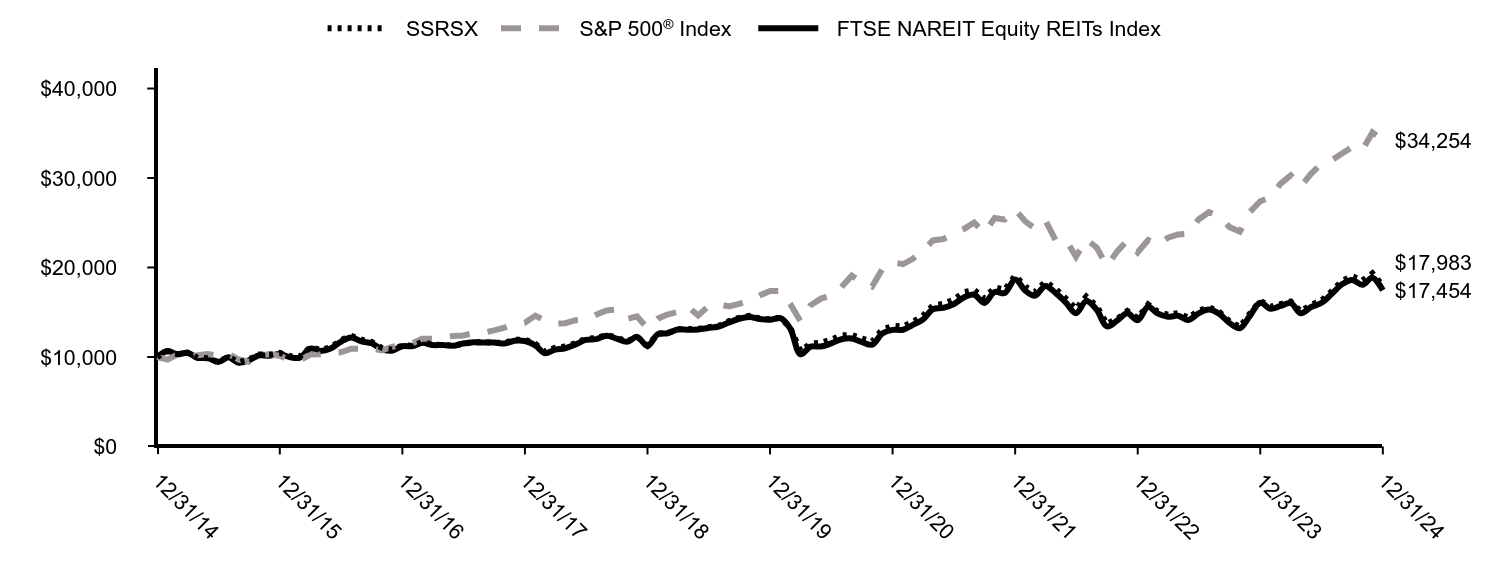
| SSRSX | S&P 500® Index | FTSE NAREIT Equity REITs Index |
|---|
| 12/31/14 | $10,000 | $10,000 | $10,000 |
|---|
| 01/31/15 | $10,651 | $9,700 | $10,671 |
|---|
| 02/28/15 | $10,312 | $10,257 | $10,299 |
|---|
| 03/31/15 | $10,488 | $10,095 | $10,475 |
|---|
| 04/30/15 | $9,905 | $10,192 | $9,900 |
|---|
| 05/31/15 | $9,871 | $10,323 | $9,888 |
|---|
| 06/30/15 | $9,450 | $10,123 | $9,433 |
|---|
| 07/31/15 | $10,020 | $10,335 | $9,965 |
|---|
| 08/31/15 | $9,410 | $9,712 | $9,348 |
|---|
| 09/30/15 | $9,729 | $9,471 | $9,621 |
|---|
| 10/31/15 | $10,285 | $10,270 | $10,186 |
|---|
| 11/30/15 | $10,244 | $10,301 | $10,133 |
|---|
| 12/31/15 | $10,456 | $10,138 | $10,320 |
|---|
| 01/31/16 | $10,095 | $9,635 | $9,974 |
|---|
| 02/29/16 | $10,063 | $9,622 | $9,932 |
|---|
| 03/31/16 | $11,077 | $10,275 | $10,939 |
|---|
| 04/30/16 | $10,794 | $10,315 | $10,678 |
|---|
| 05/31/16 | $11,070 | $10,500 | $10,937 |
|---|
| 06/30/16 | $11,871 | $10,527 | $11,700 |
|---|
| 07/31/16 | $12,367 | $10,915 | $12,186 |
|---|
| 08/31/16 | $11,934 | $10,931 | $11,739 |
|---|
| 09/30/16 | $11,691 | $10,933 | $11,532 |
|---|
| 10/31/16 | $11,007 | $10,733 | $10,880 |
|---|
| 11/30/16 | $10,818 | $11,131 | $10,697 |
|---|
| 12/31/16 | $11,293 | $11,351 | $11,199 |
|---|
| 01/31/17 | $11,256 | $11,566 | $11,212 |
|---|
| 02/28/17 | $11,649 | $12,025 | $11,594 |
|---|
| 03/31/17 | $11,384 | $12,039 | $11,329 |
|---|
| 04/30/17 | $11,338 | $12,163 | $11,343 |
|---|
| 05/31/17 | $11,265 | $12,334 | $11,255 |
|---|
| 06/30/17 | $11,484 | $12,411 | $11,501 |
|---|
| 07/31/17 | $11,649 | $12,666 | $11,642 |
|---|
| 08/31/17 | $11,667 | $12,705 | $11,612 |
|---|
| 09/30/17 | $11,603 | $12,967 | $11,609 |
|---|
| 10/31/17 | $11,576 | $13,270 | $11,497 |
|---|
| 11/30/17 | $11,913 | $13,677 | $11,809 |
|---|
| 12/31/17 | $11,952 | $13,829 | $11,784 |
|---|
| 01/31/18 | $11,467 | $14,621 | $11,292 |
|---|
| 02/28/18 | $10,594 | $14,082 | $10,421 |
|---|
| 03/31/18 | $11,030 | $13,724 | $10,818 |
|---|
| 04/30/18 | $11,186 | $13,777 | $10,973 |
|---|
| 05/31/18 | $11,525 | $14,108 | $11,406 |
|---|
| 06/30/18 | $12,039 | $14,195 | $11,904 |
|---|
| 07/31/18 | $12,098 | $14,724 | $11,999 |
|---|
| 08/31/18 | $12,476 | $15,203 | $12,364 |
|---|
| 09/30/18 | $12,166 | $15,290 | $12,050 |
|---|
| 10/31/18 | $11,739 | $14,245 | $11,693 |
|---|
| 11/30/18 | $12,263 | $14,535 | $12,247 |
|---|
| 12/31/18 | $11,270 | $13,223 | $11,239 |
|---|
| 01/31/19 | $12,575 | $14,282 | $12,560 |
|---|
| 02/28/19 | $12,655 | $14,741 | $12,651 |
|---|
| 03/31/19 | $13,101 | $15,027 | $13,075 |
|---|
| 04/30/19 | $13,101 | $15,636 | $13,044 |
|---|
| 05/31/19 | $13,141 | $14,642 | $13,073 |
|---|
| 06/30/19 | $13,323 | $15,674 | $13,238 |
|---|
| 07/31/19 | $13,475 | $15,899 | $13,407 |
|---|
| 08/31/19 | $14,001 | $15,648 | $13,863 |
|---|
| 09/30/19 | $14,375 | $15,940 | $14,269 |
|---|
| 10/31/19 | $14,588 | $16,286 | $14,464 |
|---|
| 11/30/19 | $14,315 | $16,877 | $14,246 |
|---|
| 12/31/19 | $14,217 | $17,386 | $14,161 |
|---|
| 01/31/20 | $14,382 | $17,379 | $14,332 |
|---|
| 02/29/20 | $13,292 | $15,949 | $13,185 |
|---|
| 03/31/20 | $10,673 | $13,979 | $10,295 |
|---|
| 04/30/20 | $11,488 | $15,771 | $11,149 |
|---|
| 05/31/20 | $11,587 | $16,522 | $11,171 |
|---|
| 06/30/20 | $11,928 | $16,850 | $11,512 |
|---|
| 07/31/20 | $12,412 | $17,801 | $11,978 |
|---|
| 08/31/20 | $12,456 | $19,080 | $12,072 |
|---|
| 09/30/20 | $12,060 | $18,355 | $11,677 |
|---|
| 10/31/20 | $11,730 | $17,867 | $11,372 |
|---|
| 11/30/20 | $13,050 | $19,823 | $12,614 |
|---|
| 12/31/20 | $13,473 | $20,585 | $13,028 |
|---|
| 01/31/21 | $13,394 | $20,377 | $13,042 |
|---|
| 02/28/21 | $13,899 | $20,939 | $13,565 |
|---|
| 03/31/21 | $14,594 | $21,856 | $14,184 |
|---|
| 04/30/21 | $15,759 | $23,022 | $15,327 |
|---|
| 05/31/21 | $15,927 | $23,183 | $15,484 |
|---|
| 06/30/21 | $16,376 | $23,724 | $15,889 |
|---|
| 07/31/21 | $17,228 | $24,288 | $16,653 |
|---|
| 08/31/21 | $17,474 | $25,026 | $16,959 |
|---|
| 09/30/21 | $16,555 | $23,863 | $16,044 |
|---|
| 10/31/21 | $17,766 | $25,534 | $17,263 |
|---|
| 11/30/21 | $17,508 | $25,357 | $17,147 |
|---|
| 12/31/21 | $19,105 | $26,494 | $18,661 |
|---|
| 01/31/22 | $17,840 | $25,123 | $17,383 |
|---|
| 02/28/22 | $17,276 | $24,371 | $16,839 |
|---|
| 03/31/22 | $18,404 | $25,276 | $17,942 |
|---|
| 04/30/22 | $17,633 | $23,071 | $17,154 |
|---|
| 05/31/22 | $16,533 | $23,114 | $16,084 |
|---|
| 06/30/22 | $15,378 | $21,206 | $14,892 |
|---|
| 07/31/22 | $16,753 | $23,161 | $16,241 |
|---|
| 08/31/22 | $15,680 | $22,217 | $15,271 |
|---|
| 09/30/22 | $13,713 | $20,170 | $13,411 |
|---|
| 10/31/22 | $14,263 | $21,804 | $14,068 |
|---|
| 11/30/22 | $15,130 | $23,022 | $14,879 |
|---|
| 12/31/22 | $14,343 | $21,696 | $14,114 |
|---|
| 01/31/23 | $15,864 | $23,059 | $15,621 |
|---|
| 02/28/23 | $15,095 | $22,496 | $14,871 |
|---|
| 03/31/23 | $14,719 | $23,322 | $14,493 |
|---|
| 04/30/23 | $14,899 | $23,686 | $14,614 |
|---|
| 05/31/23 | $14,392 | $23,789 | $14,143 |
|---|
| 06/30/23 | $15,161 | $25,361 | $14,872 |
|---|
| 07/31/23 | $15,569 | $26,176 | $15,296 |
|---|
| 08/31/23 | $15,030 | $25,759 | $14,820 |
|---|
| 09/30/23 | $13,999 | $24,531 | $13,812 |
|---|
| 10/31/23 | $13,362 | $24,015 | $13,209 |
|---|
| 11/30/23 | $14,833 | $26,208 | $14,604 |
|---|
| 12/31/23 | $16,279 | $27,399 | $16,052 |
|---|
| 01/31/24 | $15,627 | $27,859 | $15,386 |
|---|
| 02/29/24 | $15,911 | $29,347 | $15,698 |
|---|
| 03/31/24 | $16,196 | $30,291 | $16,021 |
|---|
| 04/30/24 | $15,092 | $29,054 | $14,897 |
|---|
| 05/31/24 | $15,845 | $30,494 | $15,581 |
|---|
| 06/30/24 | $16,279 | $31,589 | $16,031 |
|---|
| 07/31/24 | $17,332 | $31,973 | $17,029 |
|---|
| 08/31/24 | $18,486 | $32,749 | $18,120 |
|---|
| 09/30/24 | $19,030 | $33,448 | $18,610 |
|---|
| 10/31/24 | $18,554 | $33,145 | $18,070 |
|---|
| 11/30/24 | $19,352 | $35,090 | $18,846 |
|---|
| 12/31/24 | $17,983 | $34,254 | $17,454 |
|---|
Average Annual Total Returns (%)
| Name | 1 Year | 5 Years | 10 Years |
|---|
| SSRSX | 10.46% | 4.81% | 6.04% |
|---|
S&P 500® Index | 25.02% | 14.53% | 13.10% |
|---|
| FTSE NAREIT Equity REITs Index | 8.73% | 4.27% | 5.73% |
|---|
The Fund’s past performance is not necessarily an indication of how the Fund will perform in the future. The returns do not reflect the deduction of taxes that a shareholder would pay on Fund distributions or on the redemption or sale of Fund shares. Updated performance information is available by calling 1-800-242-0134 or visiting our website at www.ssga.com.
Key Fund Statistics as of 12/31/2024
- Total Net Assets$21,619,006
- Number of Portfolio Holdings48
- Portfolio Turnover Rate38%
- Total Advisory Fees Paid$391,833
What did the Fund invest in as of 12/31/2024? (as a percentage of total net assets)
| Holdings | % |
| Equinix, Inc. | 8.7% |
| Prologis, Inc. | 6.9% |
| Welltower, Inc. | 6.3% |
| Digital Realty Trust, Inc. | 4.8% |
| UDR, Inc. | 4.1% |
| Invitation Homes, Inc. | 4.1% |
| Ventas, Inc. | 3.9% |
| Extra Space Storage, Inc. | 3.8% |
| Equity Residential | 3.6% |
| Simon Property Group, Inc. | 3.5% |
| Industry | % |
| Specialized REITs | 27.8% |
| Retail REITs | 17.1% |
| Residential REITs | 17.0% |
| Health Care REITs | 16.2% |
| Industrial REITs | 12.1% |
| Office REITs | 5.2% |
| Hotel & Resort REITs | 3.2% |
| Diversified REITs | 0.7% |
Availability of Additional Information
For additional information about the Fund, including its Prospectus, Statement of Additional Information, financial statements, holdings and proxy information please visit: www.ssga.com/us/en/individual/fund-finder?tab=documents&type=mf.
State Street S&P 500 Index V.I.S. Fund
Annual Shareholder Report
December 31, 2024
This annual shareholder report contains important information about the State Street S&P 500 Index V.I.S. Fund (the "Fund") for the period of January 1, 2024 to December 31, 2024. You can find additional information about the Fund, including the Prospectus, Statement of Additional Information, financial statements and other information at www.ssga.com/us/en/individual/fund-finder?tab=documents&type=mf. You can also request this information about the Fund by contacting us at 1-800-242-0134.
What were the Fund costs for the last year? (based on a hypothetical $10,000 Investment)
| Class Name | Costs of a $10,000 investment | Costs paid as a percentage of a $10,000 investment |
|---|
| Class 1 | $34 | 0.30% |
|---|
How did the Fund perform last year and what affected its performance?
Global economic activity expanded further in the fourth quarter, closing 2024 on a high note as strong growth in service sector activity offset manufacturing weakness. U.S. equities delivered a strong performance in 2024, with the S&P 500 bringing the year’s tally to almost 25%, making it the top-performing equity market. While the Magnificent Seven continued to generate outsized returns, broader economic momentum began to translate into stronger earnings expectations, a trend likely to persist into 2025. Inflation ticked higher in major developed economies, sitting above central banks targets, while unemployment rate remained at or near historical lows. Although this outlook has risks, viz. tariffs and deportations, lower interest rates should spur demand. All sectors but materials were positive, with communication services (+39.76%) and information technology (+36.33%) leading the performance. The weakest sector was materials (-0.67%). On security basis top positive securities were NVIDIA, Apple, and Amazon. The weakest contributors were Intel, Adobe, and Boeing.
The Fund's benchmark is an unmanaged index used as a general measure of market performance. Calculations assume dividends and capital gains.
Comparison of Change in Value of a $10,000 Investment
(Based on Net Asset Value)
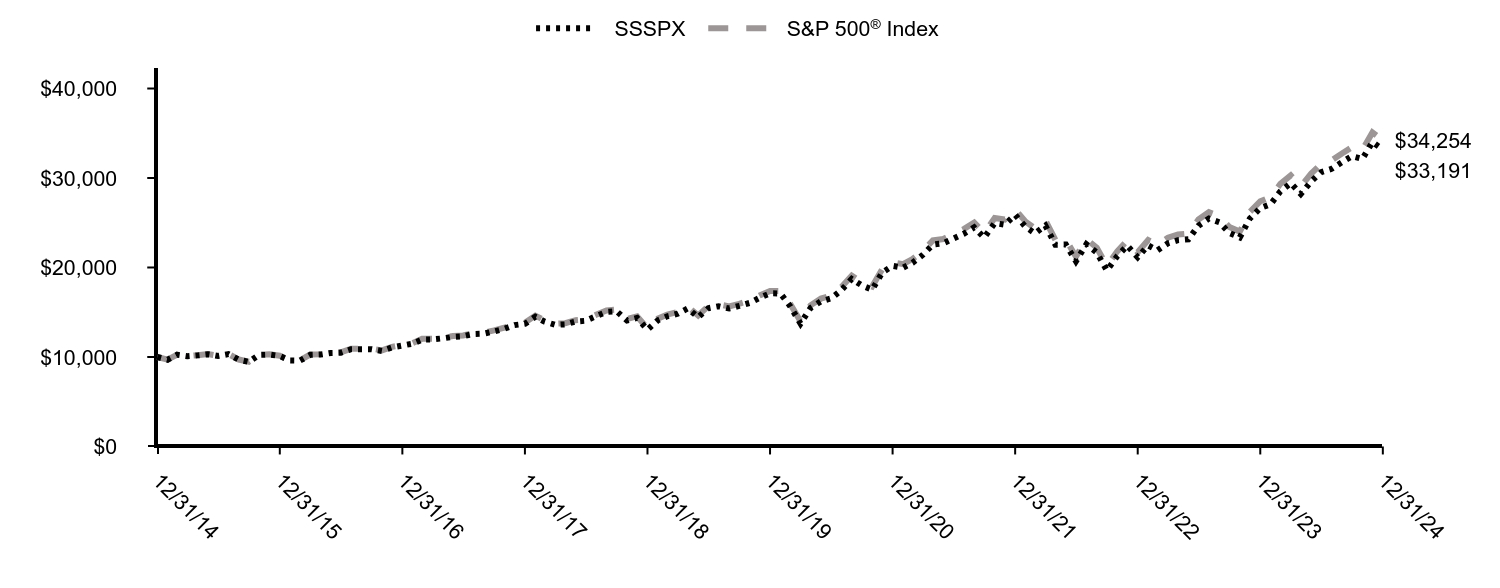
| SSSPX | S&P 500® Index |
|---|
| 12/31/14 | $10,000 | $10,000 |
|---|
| 01/31/15 | $9,697 | $9,700 |
|---|
| 02/28/15 | $10,251 | $10,257 |
|---|
| 03/31/15 | $10,085 | $10,095 |
|---|
| 04/30/15 | $10,180 | $10,192 |
|---|
| 05/31/15 | $10,309 | $10,323 |
|---|
| 06/30/15 | $10,107 | $10,123 |
|---|
| 07/31/15 | $10,320 | $10,335 |
|---|
| 08/31/15 | $9,691 | $9,712 |
|---|
| 09/30/15 | $9,448 | $9,471 |
|---|
| 10/31/15 | $10,243 | $10,270 |
|---|
| 11/30/15 | $10,270 | $10,301 |
|---|
| 12/31/15 | $10,107 | $10,138 |
|---|
| 01/31/16 | $9,601 | $9,635 |
|---|
| 02/29/16 | $9,590 | $9,622 |
|---|
| 03/31/16 | $10,239 | $10,275 |
|---|
| 04/30/16 | $10,272 | $10,315 |
|---|
| 05/31/16 | $10,454 | $10,500 |
|---|
| 06/30/16 | $10,476 | $10,527 |
|---|
| 07/31/16 | $10,862 | $10,915 |
|---|
| 08/31/16 | $10,873 | $10,931 |
|---|
| 09/30/16 | $10,871 | $10,933 |
|---|
| 10/31/16 | $10,672 | $10,733 |
|---|
| 11/30/16 | $11,066 | $11,131 |
|---|
| 12/31/16 | $11,281 | $11,351 |
|---|
| 01/31/17 | $11,494 | $11,566 |
|---|
| 02/28/17 | $11,948 | $12,025 |
|---|
| 03/31/17 | $11,960 | $12,039 |
|---|
| 04/30/17 | $12,081 | $12,163 |
|---|
| 05/31/17 | $12,246 | $12,334 |
|---|
| 06/30/17 | $12,320 | $12,411 |
|---|
| 07/31/17 | $12,568 | $12,666 |
|---|
| 08/31/17 | $12,604 | $12,705 |
|---|
| 09/30/17 | $12,860 | $12,967 |
|---|
| 10/31/17 | $13,155 | $13,270 |
|---|
| 11/30/17 | $13,557 | $13,677 |
|---|
| 12/31/17 | $13,707 | $13,829 |
|---|
| 01/31/18 | $14,487 | $14,621 |
|---|
| 02/28/18 | $13,949 | $14,082 |
|---|
| 03/31/18 | $13,592 | $13,724 |
|---|
| 04/30/18 | $13,639 | $13,777 |
|---|
| 05/31/18 | $13,962 | $14,108 |
|---|
| 06/30/18 | $14,046 | $14,195 |
|---|
| 07/31/18 | $14,562 | $14,724 |
|---|
| 08/31/18 | $15,034 | $15,203 |
|---|
| 09/30/18 | $15,115 | $15,290 |
|---|
| 10/31/18 | $14,074 | $14,245 |
|---|
| 11/30/18 | $14,363 | $14,535 |
|---|
| 12/31/18 | $13,059 | $13,223 |
|---|
| 01/31/19 | $14,100 | $14,282 |
|---|
| 02/28/19 | $14,548 | $14,741 |
|---|
| 03/31/19 | $14,829 | $15,027 |
|---|
| 04/30/19 | $15,425 | $15,636 |
|---|
| 05/31/19 | $14,439 | $14,642 |
|---|
| 06/30/19 | $15,452 | $15,674 |
|---|
| 07/31/19 | $15,672 | $15,899 |
|---|
| 08/31/19 | $15,418 | $15,648 |
|---|
| 09/30/19 | $15,706 | $15,940 |
|---|
| 10/31/19 | $16,038 | $16,286 |
|---|
| 11/30/19 | $16,617 | $16,877 |
|---|
| 12/31/19 | $17,113 | $17,386 |
|---|
| 01/31/20 | $17,102 | $17,379 |
|---|
| 02/29/20 | $15,688 | $15,949 |
|---|
| 03/31/20 | $13,728 | $13,979 |
|---|
| 04/30/20 | $15,486 | $15,771 |
|---|
| 05/31/20 | $16,220 | $16,522 |
|---|
| 06/30/20 | $16,540 | $16,850 |
|---|
| 07/31/20 | $17,469 | $17,801 |
|---|
| 08/31/20 | $18,721 | $19,080 |
|---|
| 09/30/20 | $18,001 | $18,355 |
|---|
| 10/31/20 | $17,520 | $17,867 |
|---|
| 11/30/20 | $19,433 | $19,823 |
|---|
| 12/31/20 | $20,180 | $20,585 |
|---|
| 01/31/21 | $19,974 | $20,377 |
|---|
| 02/28/21 | $20,519 | $20,939 |
|---|
| 03/31/21 | $21,416 | $21,856 |
|---|
| 04/30/21 | $22,555 | $23,022 |
|---|
| 05/31/21 | $22,704 | $23,183 |
|---|
| 06/30/21 | $23,225 | $23,724 |
|---|
| 07/31/21 | $23,762 | $24,288 |
|---|
| 08/31/21 | $24,477 | $25,026 |
|---|
| 09/30/21 | $23,334 | $23,863 |
|---|
| 10/31/21 | $24,958 | $25,534 |
|---|
| 11/30/21 | $24,776 | $25,357 |
|---|
| 12/31/21 | $25,884 | $26,494 |
|---|
| 01/31/22 | $24,540 | $25,123 |
|---|
| 02/28/22 | $23,812 | $24,371 |
|---|
| 03/31/22 | $24,688 | $25,276 |
|---|
| 04/30/22 | $22,535 | $23,071 |
|---|
| 05/31/22 | $22,567 | $23,114 |
|---|
| 06/30/22 | $20,692 | $21,206 |
|---|
| 07/31/22 | $22,598 | $23,161 |
|---|
| 08/31/22 | $21,672 | $22,217 |
|---|
| 09/30/22 | $19,667 | $20,170 |
|---|
| 10/31/22 | $21,263 | $21,804 |
|---|
| 11/30/22 | $22,445 | $23,022 |
|---|
| 12/31/22 | $21,144 | $21,696 |
|---|
| 01/31/23 | $22,467 | $23,059 |
|---|
| 02/28/23 | $21,913 | $22,496 |
|---|
| 03/31/23 | $22,709 | $23,322 |
|---|
| 04/30/23 | $23,057 | $23,686 |
|---|
| 05/31/23 | $23,152 | $23,789 |
|---|
| 06/30/23 | $24,675 | $25,361 |
|---|
| 07/31/23 | $25,465 | $26,176 |
|---|
| 08/31/23 | $25,054 | $25,759 |
|---|
| 09/30/23 | $23,858 | $24,531 |
|---|
| 10/31/23 | $23,357 | $24,015 |
|---|
| 11/30/23 | $25,481 | $26,208 |
|---|
| 12/31/23 | $26,632 | $27,399 |
|---|
| 01/31/24 | $27,074 | $27,859 |
|---|
| 02/29/24 | $28,514 | $29,347 |
|---|
| 03/31/24 | $29,425 | $30,291 |
|---|
| 04/30/24 | $28,216 | $29,054 |
|---|
| 05/31/24 | $29,607 | $30,494 |
|---|
| 06/30/24 | $30,661 | $31,589 |
|---|
| 07/31/24 | $31,025 | $31,973 |
|---|
| 08/31/24 | $31,770 | $32,749 |
|---|
| 09/30/24 | $32,443 | $33,448 |
|---|
| 10/31/24 | $32,140 | $33,145 |
|---|
| 11/30/24 | $34,011 | $35,090 |
|---|
| 12/31/24 | $33,191 | $34,254 |
|---|
Average Annual Total Returns (%)
| Name | 1 Year | 5 Years | 10 Years |
|---|
| SSSPX | 24.63% | 14.17% | 12.75% |
|---|
S&P 500® Index | 25.02% | 14.53% | 13.10% |
|---|
The Fund’s past performance is not necessarily an indication of how the Fund will perform in the future. The returns do not reflect the deduction of taxes that a shareholder would pay on Fund distributions or on the redemption or sale of Fund shares. Updated performance information is available by calling 1-800-242-0134 or visiting our website at www.ssga.com.
Key Fund Statistics as of 12/31/2024
- Total Net Assets$200,149,123
- Number of Portfolio Holdings506
- Portfolio Turnover Rate2%
- Total Advisory Fees Paid$486,755
What did the Fund invest in as of 12/31/2024? (as a percentage of total net assets)
| Holdings | % |
| Apple, Inc. | 7.6% |
| NVIDIA Corp. | 6.6% |
| Microsoft Corp. | 6.3% |
| Amazon.com, Inc. | 4.1% |
| Meta Platforms, Inc., Class A | 2.6% |
| Tesla, Inc. | 2.3% |
| Alphabet, Inc., Class A | 2.2% |
| Broadcom, Inc. | 2.2% |
| Alphabet, Inc., Class C | 1.8% |
| Berkshire Hathaway, Inc., Class B | 1.7% |
| Industry | % |
| Semiconductors & Semiconductor Equipment | 11.5% |
| Software | 10.4% |
| Technology Hardware, Storage & Peripherals | 7.9% |
| Interactive Media & Services | 6.6% |
| Financial Services | 4.4% |
| Broadline Retail | 4.2% |
| Banks | 3.4% |
| Capital Markets | 3.1% |
| Pharmaceuticals | 3.1% |
| Oil, Gas & Consumable Fuels | 2.9% |
Availability of Additional Information
For additional information about the Fund, including its Prospectus, Statement of Additional Information, financial statements, holdings and proxy information please visit: www.ssga.com/us/en/individual/fund-finder?tab=documents&type=mf.
State Street Small-Cap Equity V.I.S. Fund
Annual Shareholder Report
December 31, 2024
This annual shareholder report contains important information about the State Street Small-Cap Equity V.I.S. Fund (the "Fund") for the period of January 1, 2024 to December 31, 2024. You can find additional information about the Fund, including the Prospectus, Statement of Additional Information, financial statements and other information at www.ssga.com/us/en/individual/fund-finder?tab=documents&type=mf. You can also request this information about the Fund by contacting us at 1-800-242-0134.This report describes changes to the Fund that occurred during the reporting period.
What were the Fund costs for the last year? (based on a hypothetical $10,000 Investment)
| Class Name | Costs of a $10,000 investment | Costs paid as a percentage of a $10,000 investment |
|---|
| Class 1 | $151 | 1.44% |
|---|
How did the Fund perform last year and what affected its performance?
Champlain, Palisade and Kennedy were primary drivers of Fund performance over the reporting period, relative to the funds Index. Champlain and Palisade, both core allocations within the portfolio had a very strong relative year, outperforming the Index by 3.45% and 2.06%, respectively, followed by Kennedy outperforming by 2.91%. SouthernSun, another core allocation and Westfield, the funds growth manager each had a tougher year underperforming the index by -5.87% and -2.49%, respectively.
From a sector standpoint over the last year, sector allocations were the main driver of relative results while security selection offset some of the positive results and detracted from relative results. Security selection in consumer discretionary and financials, along with allocation effect in consumer staples and health care were top contributors. Top detractors were security selection in consumer staples and healthcare over the reporting period.
On an individual security level, the top relative contributors to the Fund’s performance were Boot Barn Holdings, Pure Storage and Dycom Industries. The top relative detractors over the reporting period were MGP Ingredients, Super Micro Computer and Darling International.
The Fund's benchmarks are unmanaged indices used as a general measure of market performance. Calculations assume dividends and capital gains.
Comparison of Change in Value of a $10,000 Investment
(Based on Net Asset Value)
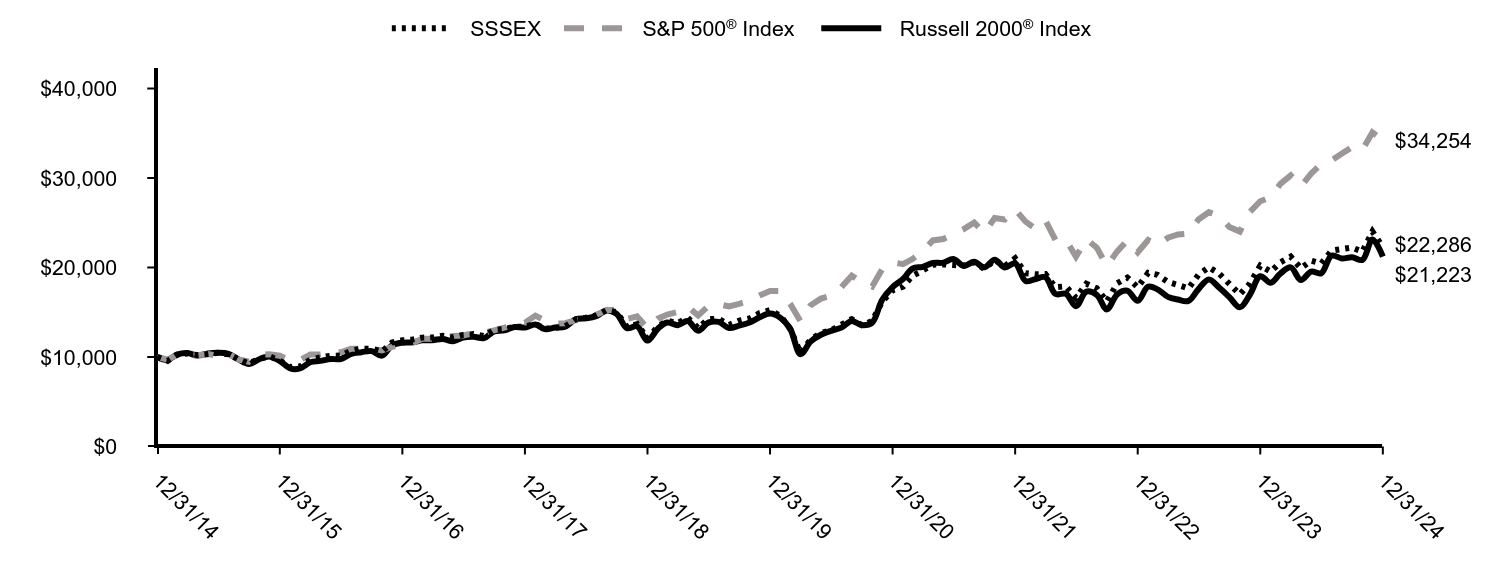
| SSSEX | S&P 500® Index | Russell 2000® Index |
|---|
| 12/31/14 | $10,000 | $10,000 | $10,000 |
|---|
| 01/31/15 | $9,562 | $9,700 | $9,678 |
|---|
| 02/28/15 | $10,250 | $10,257 | $10,253 |
|---|
| 03/31/15 | $10,396 | $10,095 | $10,432 |
|---|
| 04/30/15 | $10,202 | $10,192 | $10,165 |
|---|
| 05/31/15 | $10,327 | $10,323 | $10,398 |
|---|
| 06/30/15 | $10,459 | $10,123 | $10,475 |
|---|
| 07/31/15 | $10,306 | $10,335 | $10,354 |
|---|
| 08/31/15 | $9,729 | $9,712 | $9,703 |
|---|
| 09/30/15 | $9,277 | $9,471 | $9,227 |
|---|
| 10/31/15 | $9,785 | $10,270 | $9,747 |
|---|
| 11/30/15 | $10,083 | $10,301 | $10,064 |
|---|
| 12/31/15 | $9,588 | $10,138 | $9,559 |
|---|
| 01/31/16 | $8,873 | $9,635 | $8,718 |
|---|
| 02/29/16 | $8,935 | $9,622 | $8,718 |
|---|
| 03/31/16 | $9,706 | $10,275 | $9,413 |
|---|
| 04/30/16 | $9,949 | $10,315 | $9,561 |
|---|
| 05/31/16 | $10,138 | $10,500 | $9,777 |
|---|
| 06/30/16 | $10,161 | $10,527 | $9,770 |
|---|
| 07/31/16 | $10,696 | $10,915 | $10,354 |
|---|
| 08/31/16 | $10,924 | $10,931 | $10,537 |
|---|
| 09/30/16 | $10,924 | $10,933 | $10,654 |
|---|
| 10/31/16 | $10,601 | $10,733 | $10,148 |
|---|
| 11/30/16 | $11,615 | $11,131 | $11,279 |
|---|
| 12/31/16 | $11,866 | $11,351 | $11,595 |
|---|
| 01/31/17 | $11,957 | $11,566 | $11,641 |
|---|
| 02/28/17 | $12,163 | $12,025 | $11,866 |
|---|
| 03/31/17 | $12,188 | $12,039 | $11,881 |
|---|
| 04/30/17 | $12,361 | $12,163 | $12,012 |
|---|
| 05/31/17 | $12,188 | $12,334 | $11,767 |
|---|
| 06/30/17 | $12,468 | $12,411 | $12,174 |
|---|
| 07/31/17 | $12,558 | $12,666 | $12,264 |
|---|
| 08/31/17 | $12,344 | $12,705 | $12,108 |
|---|
| 09/30/17 | $13,036 | $12,967 | $12,864 |
|---|
| 10/31/17 | $13,119 | $13,270 | $12,974 |
|---|
| 11/30/17 | $13,382 | $13,677 | $13,348 |
|---|
| 12/31/17 | $13,374 | $13,829 | $13,294 |
|---|
| 01/31/18 | $13,710 | $14,621 | $13,641 |
|---|
| 02/28/18 | $13,147 | $14,082 | $13,113 |
|---|
| 03/31/18 | $13,265 | $13,724 | $13,283 |
|---|
| 04/30/18 | $13,420 | $13,777 | $13,397 |
|---|
| 05/31/18 | $14,200 | $14,108 | $14,211 |
|---|
| 06/30/18 | $14,391 | $14,195 | $14,312 |
|---|
| 07/31/18 | $14,636 | $14,724 | $14,562 |
|---|
| 08/31/18 | $15,217 | $15,203 | $15,190 |
|---|
| 09/30/18 | $15,018 | $15,290 | $14,824 |
|---|
| 10/31/18 | $13,356 | $14,245 | $13,214 |
|---|
| 11/30/18 | $13,665 | $14,535 | $13,424 |
|---|
| 12/31/18 | $12,077 | $13,223 | $11,830 |
|---|
| 01/31/19 | $13,410 | $14,282 | $13,160 |
|---|
| 02/28/19 | $14,033 | $14,741 | $13,845 |
|---|
| 03/31/19 | $13,796 | $15,027 | $13,555 |
|---|
| 04/30/19 | $14,387 | $15,636 | $14,015 |
|---|
| 05/31/19 | $13,227 | $14,642 | $12,925 |
|---|
| 06/30/19 | $14,226 | $15,674 | $13,839 |
|---|
| 07/31/19 | $14,269 | $15,899 | $13,918 |
|---|
| 08/31/19 | $13,581 | $15,648 | $13,231 |
|---|
| 09/30/19 | $14,054 | $15,940 | $13,507 |
|---|
| 10/31/19 | $14,301 | $16,286 | $13,862 |
|---|
| 11/30/19 | $14,903 | $16,877 | $14,433 |
|---|
| 12/31/19 | $15,232 | $17,386 | $14,849 |
|---|
| 01/31/20 | $14,595 | $17,379 | $14,373 |
|---|
| 02/29/20 | $13,137 | $15,949 | $13,163 |
|---|
| 03/31/20 | $10,440 | $13,979 | $10,303 |
|---|
| 04/30/20 | $11,933 | $15,771 | $11,718 |
|---|
| 05/31/20 | $12,697 | $16,522 | $12,481 |
|---|
| 06/30/20 | $12,963 | $16,850 | $12,922 |
|---|
| 07/31/20 | $13,623 | $17,801 | $13,280 |
|---|
| 08/31/20 | $14,225 | $19,080 | $14,028 |
|---|
| 09/30/20 | $13,554 | $18,355 | $13,559 |
|---|
| 10/31/20 | $14,017 | $17,867 | $13,843 |
|---|
| 11/30/20 | $16,204 | $19,823 | $16,395 |
|---|
| 12/31/20 | $17,445 | $20,585 | $17,813 |
|---|
| 01/31/21 | $17,850 | $20,377 | $18,709 |
|---|
| 02/28/21 | $19,064 | $20,939 | $19,876 |
|---|
| 03/31/21 | $19,671 | $21,856 | $20,075 |
|---|
| 04/30/21 | $20,313 | $23,022 | $20,497 |
|---|
| 05/31/21 | $20,337 | $23,183 | $20,539 |
|---|
| 06/30/21 | $20,277 | $23,724 | $20,937 |
|---|
| 07/31/21 | $20,206 | $24,288 | $20,181 |
|---|
| 08/31/21 | $20,563 | $25,026 | $20,632 |
|---|
| 09/30/21 | $19,849 | $23,863 | $20,024 |
|---|
| 10/31/21 | $20,813 | $25,534 | $20,876 |
|---|
| 11/30/21 | $20,158 | $25,357 | $20,006 |
|---|
| 12/31/21 | $21,027 | $26,494 | $20,453 |
|---|
| 01/31/22 | $19,351 | $25,123 | $18,484 |
|---|
| 02/28/22 | $19,253 | $24,371 | $18,681 |
|---|
| 03/31/22 | $19,267 | $25,276 | $18,914 |
|---|
| 04/30/22 | $17,788 | $23,071 | $17,039 |
|---|
| 05/31/22 | $17,901 | $23,114 | $17,065 |
|---|
| 06/30/22 | $16,591 | $21,206 | $15,661 |
|---|
| 07/31/22 | $18,182 | $23,161 | $17,296 |
|---|
| 08/31/22 | $17,675 | $22,217 | $16,942 |
|---|
| 09/30/22 | $16,196 | $20,170 | $15,319 |
|---|
| 10/31/22 | $18,239 | $21,804 | $17,005 |
|---|
| 11/30/22 | $18,872 | $23,022 | $17,402 |
|---|
| 12/31/22 | $17,790 | $21,696 | $16,273 |
|---|
| 01/31/23 | $19,405 | $23,059 | $17,859 |
|---|
| 02/28/23 | $19,180 | $22,496 | $17,557 |
|---|
| 03/31/23 | $18,373 | $23,322 | $16,718 |
|---|
| 04/30/23 | $18,044 | $23,686 | $16,418 |
|---|
| 05/31/23 | $17,655 | $23,789 | $16,266 |
|---|
| 06/30/23 | $19,195 | $25,361 | $17,589 |
|---|
| 07/31/23 | $20,032 | $26,176 | $18,664 |
|---|
| 08/31/23 | $19,300 | $25,759 | $17,731 |
|---|
| 09/30/23 | $18,164 | $24,531 | $16,687 |
|---|
| 10/31/23 | $16,998 | $24,015 | $15,549 |
|---|
| 11/30/23 | $18,209 | $26,208 | $16,956 |
|---|
| 12/31/23 | $20,201 | $27,399 | $19,028 |
|---|
| 01/31/24 | $19,532 | $27,859 | $18,288 |
|---|
| 02/29/24 | $20,577 | $29,347 | $19,322 |
|---|
| 03/31/24 | $21,214 | $30,291 | $20,013 |
|---|
| 04/30/24 | $19,923 | $29,054 | $18,605 |
|---|
| 05/31/24 | $20,756 | $30,494 | $19,538 |
|---|
| 06/30/24 | $20,446 | $31,589 | $19,357 |
|---|
| 07/31/24 | $21,883 | $31,973 | $21,324 |
|---|
| 08/31/24 | $22,063 | $32,749 | $21,006 |
|---|
| 09/30/24 | $22,226 | $33,448 | $21,152 |
|---|
| 10/31/24 | $21,769 | $33,145 | $20,847 |
|---|
| 11/30/24 | $24,022 | $35,090 | $23,134 |
|---|
| 12/31/24 | $22,286 | $34,254 | $21,223 |
|---|
Average Annual Total Returns (%)
| Name | 1 Year | 5 Years | 10 Years |
|---|
| SSSEX | 10.32% | 7.91% | 8.34% |
|---|
S&P 500® Index | 25.02% | 14.53% | 13.10% |
|---|
Russell 2000® Index | 11.54% | 7.40% | 7.82% |
|---|
The Fund’s past performance is not necessarily an indication of how the Fund will perform in the future. The returns do not reflect the deduction of taxes that a shareholder would pay on Fund distributions or on the redemption or sale of Fund shares. Updated performance information is available by calling 1-800-242-0134 or visiting our website at www.ssga.com.
Key Fund Statistics as of 12/31/2024
- Total Net Assets$25,277,576
- Number of Portfolio Holdings326
- Portfolio Turnover Rate42%
- Total Advisory Fees Paid$244,658
What did the Fund invest in as of 12/31/2024? (as a percentage of total net assets)
| Holdings | % |
| Belden, Inc. | 1.3% |
| Enerpac Tool Group Corp. | 1.3% |
| Brink's Co. | 1.2% |
| Darling Ingredients, Inc. | 1.1% |
| Boot Barn Holdings, Inc. | 1.1% |
| U.S. Physical Therapy, Inc. | 1.1% |
| Louisiana-Pacific Corp. | 1.1% |
| Cullen/Frost Bankers, Inc. | 1.1% |
| Repligen Corp. | 1.0% |
| RB Global, Inc. | 0.9% |
| Industry | % |
| Banks | 9.3% |
| Machinery | 8.6% |
| Software | 7.6% |
| Healthcare Equipment & Supplies | 4.9% |
| Commercial Services & Supplies | 4.3% |
| Specialty Retail | 3.7% |
| Chemicals | 3.4% |
| Food Products | 3.2% |
| Insurance | 3.2% |
| Electronic Equipment, Instruments & Components | 3.1% |
This is a summary of certain changes of the Fund since December 31, 2024. For more information contact 1-800-242-0134 (toll free) or wait for the next filing to be available.
As approved by the Board of Trustees of the Trust, Westfield Capital Management Company, L.P. became a sub-adviser to the Fund effective March 1, 2024.
Availability of Additional Information
For additional information about the Fund, including its Prospectus, Statement of Additional Information, financial statements, holdings and proxy information please visit: www.ssga.com/us/en/individual/fund-finder?tab=documents&type=mf.
State Street Total Return V.I.S. Fund
Annual Shareholder Report
December 31, 2024
This annual shareholder report contains important information about the State Street Total Return V.I.S. Fund (the "Fund") for the period of January 1, 2024 to December 31, 2024. You can find additional information about the Fund, including the Prospectus, Statement of Additional Information, financial statements and other information at www.ssga.com/us/en/individual/fund-finder?tab=documents&type=mf. You can also request this information about the Fund by contacting us at 1-800-242-0134.
What were the Fund costs for the last year? (based on a hypothetical $10,000 Investment)
| Class Name | Costs of a $10,000 investment | Costs paid as a percentage of a $10,000 investment |
|---|
| Class 1 | $63 | 0.60% |
|---|
How did the Fund perform last year and what affected its performance?
The main drivers of the Fund outperformance relative to the blended benchmark was the overweight position to US equity and the underweight position to US investment grade fixed income throughout the reporting period. On an individual security level, the top positive contributors to the Fund’s performance on an absolute basis during the reporting period were U.S. Large Cap Equity, Emerging Market Equity, and U.S. Small Cap Equity. The Fund’s position in non-US Government bonds was a negative contributor to the Fund’s performance on an absolute basis during the reporting period. Tactical positioning within global equity and fixed income markets were the primary drivers of Fund performance during the reporting period relative to the Index. The Fund did not invest in derivatives during the reporting period.
The Fund's benchmarks are unmanaged indices used as a general measure of market performance. Calculations assume dividends and capital gains.
Comparison of Change in Value of a $10,000 Investment
(Based on Net Asset Value)
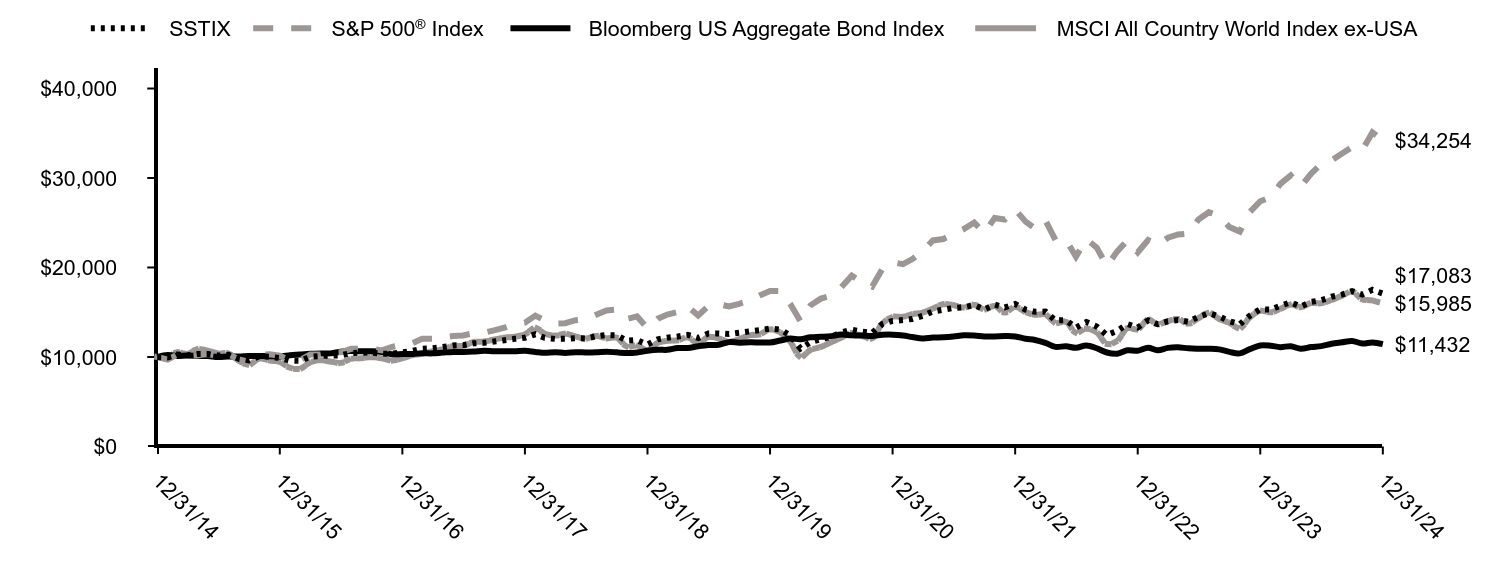
| SSTIX | S&P 500® Index | Bloomberg US Aggregate Bond Index | MSCI All Country World Index ex-USA |
|---|
| 12/31/14 | $10,000 | $10,000 | $10,000 | $10,000 |
|---|
| 01/31/15 | $9,936 | $9,700 | $10,210 | $9,985 |
|---|
| 02/28/15 | $10,271 | $10,257 | $10,114 | $10,519 |
|---|
| 03/31/15 | $10,181 | $10,095 | $10,161 | $10,349 |
|---|
| 04/30/15 | $10,330 | $10,192 | $10,124 | $10,872 |
|---|
| 05/31/15 | $10,340 | $10,323 | $10,100 | $10,702 |
|---|
| 06/30/15 | $10,159 | $10,123 | $9,990 | $10,403 |
|---|
| 07/31/15 | $10,239 | $10,335 | $10,059 | $10,375 |
|---|
| 08/31/15 | $9,798 | $9,712 | $10,045 | $9,582 |
|---|
| 09/30/15 | $9,612 | $9,471 | $10,113 | $9,137 |
|---|
| 10/31/15 | $10,069 | $10,270 | $10,114 | $9,818 |
|---|
| 11/30/15 | $10,021 | $10,301 | $10,088 | $9,615 |
|---|
| 12/31/15 | $9,887 | $10,138 | $10,055 | $9,434 |
|---|
| 01/31/16 | $9,590 | $9,635 | $10,193 | $8,792 |
|---|
| 02/29/16 | $9,562 | $9,622 | $10,266 | $8,692 |
|---|
| 03/31/16 | $10,027 | $10,275 | $10,360 | $9,398 |
|---|
| 04/30/16 | $10,116 | $10,315 | $10,400 | $9,646 |
|---|
| 05/31/16 | $10,139 | $10,500 | $10,402 | $9,483 |
|---|
| 06/30/16 | $10,183 | $10,527 | $10,589 | $9,338 |
|---|
| 07/31/16 | $10,447 | $10,915 | $10,656 | $9,800 |
|---|
| 08/31/16 | $10,469 | $10,931 | $10,644 | $9,862 |
|---|
| 09/30/16 | $10,503 | $10,933 | $10,638 | $9,983 |
|---|
| 10/31/16 | $10,357 | $10,733 | $10,556 | $9,840 |
|---|
| 11/30/16 | $10,368 | $11,131 | $10,307 | $9,612 |
|---|
| 12/31/16 | $10,514 | $11,351 | $10,321 | $9,858 |
|---|
| 01/31/17 | $10,688 | $11,566 | $10,341 | $10,207 |
|---|
| 02/28/17 | $10,915 | $12,025 | $10,411 | $10,370 |
|---|
| 03/31/17 | $10,979 | $12,039 | $10,405 | $10,633 |
|---|
| 04/30/17 | $11,113 | $12,163 | $10,486 | $10,860 |
|---|
| 05/31/17 | $11,287 | $12,334 | $10,566 | $11,213 |
|---|
| 06/30/17 | $11,322 | $12,411 | $10,556 | $11,248 |
|---|
| 07/31/17 | $11,532 | $12,666 | $10,601 | $11,662 |
|---|
| 08/31/17 | $11,578 | $12,705 | $10,696 | $11,723 |
|---|
| 09/30/17 | $11,718 | $12,967 | $10,645 | $11,941 |
|---|
| 10/31/17 | $11,869 | $13,270 | $10,652 | $12,165 |
|---|
| 11/30/17 | $12,026 | $13,677 | $10,638 | $12,264 |
|---|
| 12/31/17 | $12,152 | $13,829 | $10,687 | $12,538 |
|---|
| 01/31/18 | $12,536 | $14,621 | $10,564 | $13,237 |
|---|
| 02/28/18 | $12,134 | $14,082 | $10,464 | $12,613 |
|---|
| 03/31/18 | $12,018 | $13,724 | $10,531 | $12,390 |
|---|
| 04/30/18 | $12,036 | $13,777 | $10,452 | $12,588 |
|---|
| 05/31/18 | $12,103 | $14,108 | $10,527 | $12,297 |
|---|
| 06/30/18 | $12,061 | $14,195 | $10,514 | $12,066 |
|---|
| 07/31/18 | $12,310 | $14,724 | $10,516 | $12,355 |
|---|
| 08/31/18 | $12,451 | $15,203 | $10,584 | $12,096 |
|---|
| 09/30/18 | $12,414 | $15,290 | $10,516 | $12,151 |
|---|
| 10/31/18 | $11,811 | $14,245 | $10,433 | $11,163 |
|---|
| 11/30/18 | $11,890 | $14,535 | $10,495 | $11,269 |
|---|
| 12/31/18 | $11,381 | $13,223 | $10,688 | $10,758 |
|---|
| 01/31/19 | $11,980 | $14,282 | $10,801 | $11,571 |
|---|
| 02/28/19 | $12,158 | $14,741 | $10,795 | $11,797 |
|---|
| 03/31/19 | $12,280 | $15,027 | $11,002 | $11,868 |
|---|
| 04/30/19 | $12,466 | $15,636 | $11,005 | $12,181 |
|---|
| 05/31/19 | $12,126 | $14,642 | $11,201 | $11,527 |
|---|
| 06/30/19 | $12,628 | $15,674 | $11,341 | $12,222 |
|---|
| 07/31/19 | $12,636 | $15,899 | $11,366 | $12,074 |
|---|
| 08/31/19 | $12,571 | $15,648 | $11,661 | $11,701 |
|---|
| 09/30/19 | $12,709 | $15,940 | $11,599 | $12,002 |
|---|
| 10/31/19 | $12,863 | $16,286 | $11,634 | $12,421 |
|---|
| 11/30/19 | $12,984 | $16,877 | $11,628 | $12,530 |
|---|
| 12/31/19 | $13,181 | $17,386 | $11,620 | $13,073 |
|---|
| 01/31/20 | $13,065 | $17,379 | $11,843 | $12,722 |
|---|
| 02/29/20 | $12,402 | $15,949 | $12,056 | $11,716 |
|---|
| 03/31/20 | $10,944 | $13,979 | $11,985 | $10,020 |
|---|
| 04/30/20 | $11,656 | $15,771 | $12,198 | $10,779 |
|---|
| 05/31/20 | $11,996 | $16,522 | $12,255 | $11,132 |
|---|
| 06/30/20 | $12,220 | $16,850 | $12,332 | $11,635 |
|---|
| 07/31/20 | $12,742 | $17,801 | $12,517 | $12,153 |
|---|
| 08/31/20 | $13,040 | $19,080 | $12,416 | $12,674 |
|---|
| 09/30/20 | $12,841 | $18,355 | $12,409 | $12,362 |
|---|
| 10/31/20 | $12,700 | $17,867 | $12,353 | $12,096 |
|---|
| 11/30/20 | $13,678 | $19,823 | $12,475 | $13,724 |
|---|
| 12/31/20 | $14,030 | $20,585 | $12,492 | $14,465 |
|---|
| 01/31/21 | $14,123 | $20,377 | $12,402 | $14,497 |
|---|
| 02/28/21 | $14,249 | $20,939 | $12,223 | $14,784 |
|---|
| 03/31/21 | $14,612 | $21,856 | $12,071 | $14,971 |
|---|
| 04/30/21 | $15,084 | $23,022 | $12,166 | $15,411 |
|---|
| 05/31/21 | $15,279 | $23,183 | $12,206 | $15,893 |
|---|
| 06/30/21 | $15,473 | $23,724 | $12,291 | $15,790 |
|---|
| 07/31/21 | $15,557 | $24,288 | $12,429 | $15,530 |
|---|
| 08/31/21 | $15,785 | $25,026 | $12,405 | $15,825 |
|---|
| 09/30/21 | $15,312 | $23,863 | $12,298 | $15,319 |
|---|
| 10/31/21 | $15,852 | $25,534 | $12,294 | $15,684 |
|---|
| 11/30/21 | $15,532 | $25,357 | $12,331 | $14,978 |
|---|
| 12/31/21 | $15,917 | $26,494 | $12,299 | $15,597 |
|---|
| 01/31/22 | $15,292 | $25,123 | $12,034 | $15,022 |
|---|
| 02/28/22 | $15,045 | $24,371 | $11,900 | $14,725 |
|---|
| 03/31/22 | $15,074 | $25,276 | $11,569 | $14,748 |
|---|
| 04/30/22 | $14,083 | $23,071 | $11,130 | $13,822 |
|---|
| 05/31/22 | $14,123 | $23,114 | $11,202 | $13,922 |
|---|
| 06/30/22 | $13,271 | $21,206 | $11,026 | $12,724 |
|---|
| 07/31/22 | $13,905 | $23,161 | $11,296 | $13,160 |
|---|
| 08/31/22 | $13,409 | $22,217 | $10,977 | $12,736 |
|---|
| 09/30/22 | $12,448 | $20,170 | $10,502 | $11,464 |
|---|
| 10/31/22 | $12,914 | $21,804 | $10,366 | $11,806 |
|---|
| 11/30/22 | $13,687 | $23,022 | $10,748 | $13,200 |
|---|
| 12/31/22 | $13,289 | $21,696 | $10,699 | $13,101 |
|---|
| 01/31/23 | $14,093 | $23,059 | $11,028 | $14,164 |
|---|
| 02/28/23 | $13,666 | $22,496 | $10,743 | $13,667 |
|---|
| 03/31/23 | $13,991 | $23,322 | $11,016 | $14,001 |
|---|
| 04/30/23 | $14,134 | $23,686 | $11,083 | $14,244 |
|---|
| 05/31/23 | $13,920 | $23,789 | $10,962 | $13,726 |
|---|
| 06/30/23 | $14,490 | $25,361 | $10,923 | $14,342 |
|---|
| 07/31/23 | $14,877 | $26,176 | $10,915 | $14,925 |
|---|
| 08/31/23 | $14,531 | $25,759 | $10,846 | $14,251 |
|---|
| 09/30/23 | $14,002 | $24,531 | $10,570 | $13,801 |
|---|
| 10/31/23 | $13,656 | $24,015 | $10,403 | $13,231 |
|---|
| 11/30/23 | $14,622 | $26,208 | $10,874 | $14,422 |
|---|
| 12/31/23 | $15,347 | $27,399 | $11,291 | $15,147 |
|---|
| 01/31/24 | $15,285 | $27,859 | $11,260 | $14,996 |
|---|
| 02/29/24 | $15,722 | $29,347 | $11,100 | $15,376 |
|---|
| 03/31/24 | $16,117 | $30,291 | $11,203 | $15,857 |
|---|
| 04/30/24 | $15,638 | $29,054 | $10,920 | $15,572 |
|---|
| 05/31/24 | $16,159 | $30,494 | $11,105 | $16,024 |
|---|
| 06/30/24 | $16,346 | $31,589 | $11,210 | $16,009 |
|---|
| 07/31/24 | $16,731 | $31,973 | $11,472 | $16,380 |
|---|
| 08/31/24 | $16,970 | $32,749 | $11,637 | $16,846 |
|---|
| 09/30/24 | $17,345 | $33,448 | $11,793 | $17,300 |
|---|
| 10/31/24 | $16,981 | $33,145 | $11,500 | $16,451 |
|---|
| 11/30/24 | $17,501 | $35,090 | $11,622 | $16,302 |
|---|
| 12/31/24 | $17,083 | $34,254 | $11,432 | $15,985 |
|---|
Average Annual Total Returns (%)
| Name | 1 Year | 5 Years | 10 Years |
|---|
| SSTIX | 11.31% | 5.32% | 5.50% |
|---|
S&P 500® Index | 25.02% | 14.53% | 13.10% |
|---|
| Bloomberg US Aggregate Bond Index | 1.25% | (0.33%) | 1.35% |
|---|
| MSCI All Country World Index ex-USA | 5.53% | 4.10% | 4.80% |
|---|
The Fund’s past performance is not necessarily an indication of how the Fund will perform in the future. The returns do not reflect the deduction of taxes that a shareholder would pay on Fund distributions or on the redemption or sale of Fund shares. Updated performance information is available by calling 1-800-242-0134 or visiting our website at www.ssga.com.
Key Fund Statistics as of 12/31/2024
- Total Net Assets$1,058,203,231
- Number of Portfolio Holdings4,966
- Portfolio Turnover Rate77%
- Total Advisory Fees Paid$4,125,737
What did the Fund invest in as of 12/31/2024? (as a percentage of total net assets)
| Holdings | % |
| SPDR Portfolio Aggregate Bond ETF | 15.7% |
| SPDR Bloomberg High Yield Bond ETF | 9.7% |
| Apple, Inc. | 2.2% |
| NVIDIA Corp. | 1.9% |
| Microsoft Corp. | 1.9% |
| Amazon.com, Inc. | 1.3% |
| Taiwan Semiconductor Manufacturing Co. Ltd. | 1.1% |
| Meta Platforms, Inc., Class A | 0.8% |
| Tesla, Inc. | 0.7% |
| Alphabet, Inc., Class A | 0.7% |
| Asset | % |
| Common Stocks | 60.9% |
| Mutual Funds and Exchange Traded Products | 25.5% |
| Short-Term Investments | 8.2% |
| U.S. Treasury Obligations | 5.0% |
| Preferred Stock | 0.2% |
Availability of Additional Information
For additional information about the Fund, including its Prospectus, Statement of Additional Information, financial statements, holdings and proxy information please visit: www.ssga.com/us/en/individual/fund-finder?tab=documents&type=mf.
State Street Total Return V.I.S. Fund
Annual Shareholder Report
December 31, 2024
This annual shareholder report contains important information about the State Street Total Return V.I.S. Fund (the "Fund") for the period of January 1, 2024 to December 31, 2024. You can find additional information about the Fund, including the Prospectus, Statement of Additional Information, financial statements and other information at www.ssga.com/us/en/individual/fund-finder?tab=documents&type=mf. You can also request this information about the Fund by contacting us at 1-800-242-0134.
What were the Fund costs for the last year? (based on a hypothetical $10,000 Investment)
| Class Name | Costs of a $10,000 investment | Costs paid as a percentage of a $10,000 investment |
|---|
| Class 3 | $90 | 0.85% |
|---|
How did the Fund perform last year and what affected its performance?
The main drivers of the Fund outperformance relative to the blended benchmark was the overweight position to US equity and the underweight position to US investment grade fixed income throughout the reporting period. On an individual security level, the top positive contributors to the Fund’s performance on an absolute basis during the reporting period were U.S. Large Cap Equity, Emerging Market Equity, and U.S. Small Cap Equity. The Fund’s position in non-US Government bonds was a negative contributor to the Fund’s performance on an absolute basis during the reporting period. Tactical positioning within global equity and fixed income markets were the primary drivers of Fund performance during the reporting period relative to the Index. The Fund did not invest in derivatives during the reporting period.
The Fund's benchmarks are unmanaged indices used as a general measure of market performance. Calculations assume dividends and capital gains.
Comparison of Change in Value of a $10,000 Investment
(Based on Net Asset Value)
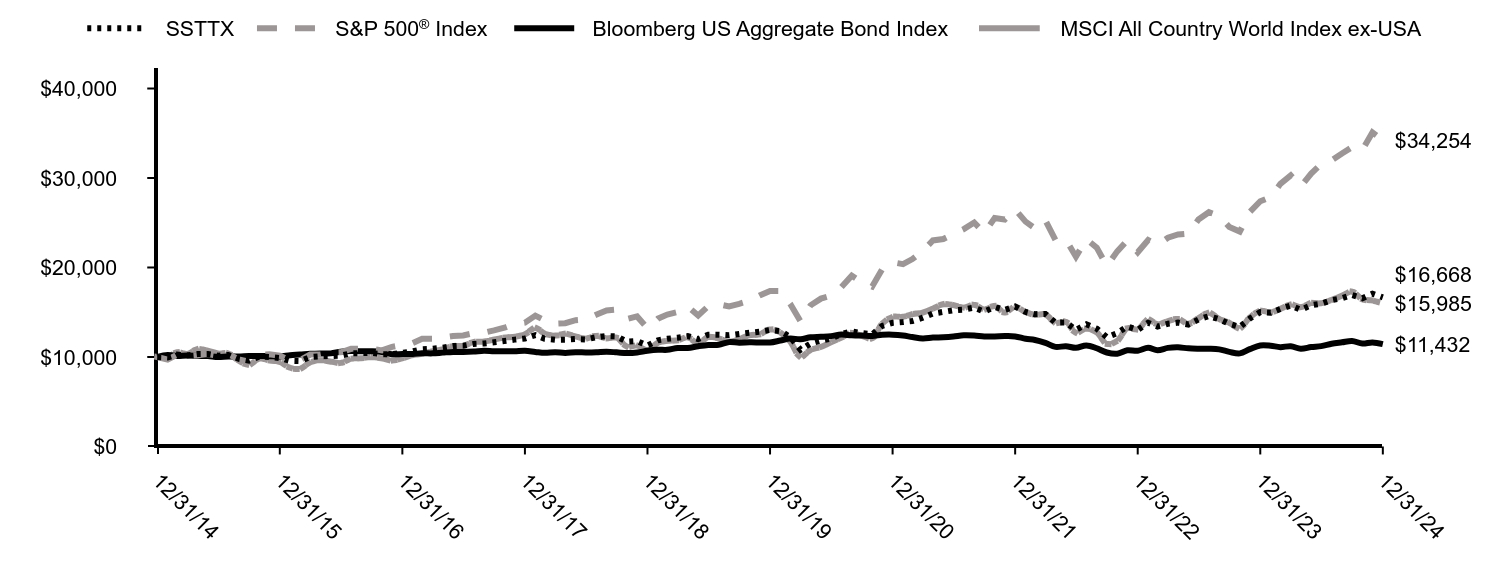
| SSTTX | S&P 500® Index | Bloomberg US Aggregate Bond Index | MSCI All Country World Index ex-USA |
|---|
| 12/31/14 | $10,000 | $10,000 | $10,000 | $10,000 |
|---|
| 01/31/15 | $9,936 | $9,700 | $10,210 | $9,985 |
|---|
| 02/28/15 | $10,267 | $10,257 | $10,114 | $10,519 |
|---|
| 03/31/15 | $10,176 | $10,095 | $10,161 | $10,349 |
|---|
| 04/30/15 | $10,320 | $10,192 | $10,124 | $10,872 |
|---|
| 05/31/15 | $10,331 | $10,323 | $10,100 | $10,702 |
|---|
| 06/30/15 | $10,149 | $10,123 | $9,990 | $10,403 |
|---|
| 07/31/15 | $10,224 | $10,335 | $10,059 | $10,375 |
|---|
| 08/31/15 | $9,787 | $9,712 | $10,045 | $9,582 |
|---|
| 09/30/15 | $9,595 | $9,471 | $10,113 | $9,137 |
|---|
| 10/31/15 | $10,048 | $10,270 | $10,114 | $9,818 |
|---|
| 11/30/15 | $10,000 | $10,301 | $10,088 | $9,615 |
|---|
| 12/31/15 | $9,866 | $10,138 | $10,055 | $9,434 |
|---|
| 01/31/16 | $9,563 | $9,635 | $10,193 | $8,792 |
|---|
| 02/29/16 | $9,535 | $9,622 | $10,266 | $8,692 |
|---|
| 03/31/16 | $9,995 | $10,275 | $10,360 | $9,398 |
|---|
| 04/30/16 | $10,084 | $10,315 | $10,400 | $9,646 |
|---|
| 05/31/16 | $10,101 | $10,500 | $10,402 | $9,483 |
|---|
| 06/30/16 | $10,146 | $10,527 | $10,589 | $9,338 |
|---|
| 07/31/16 | $10,409 | $10,915 | $10,656 | $9,800 |
|---|
| 08/31/16 | $10,426 | $10,931 | $10,644 | $9,862 |
|---|
| 09/30/16 | $10,454 | $10,933 | $10,638 | $9,983 |
|---|
| 10/31/16 | $10,308 | $10,733 | $10,556 | $9,840 |
|---|
| 11/30/16 | $10,320 | $11,131 | $10,307 | $9,612 |
|---|
| 12/31/16 | $10,466 | $11,351 | $10,321 | $9,858 |
|---|
| 01/31/17 | $10,634 | $11,566 | $10,341 | $10,207 |
|---|
| 02/28/17 | $10,860 | $12,025 | $10,411 | $10,370 |
|---|
| 03/31/17 | $10,918 | $12,039 | $10,405 | $10,633 |
|---|
| 04/30/17 | $11,046 | $12,163 | $10,486 | $10,860 |
|---|
| 05/31/17 | $11,220 | $12,334 | $10,566 | $11,213 |
|---|
| 06/30/17 | $11,255 | $12,411 | $10,556 | $11,248 |
|---|
| 07/31/17 | $11,458 | $12,666 | $10,601 | $11,662 |
|---|
| 08/31/17 | $11,505 | $12,705 | $10,696 | $11,723 |
|---|
| 09/30/17 | $11,638 | $12,967 | $10,645 | $11,941 |
|---|
| 10/31/17 | $11,789 | $13,270 | $10,652 | $12,165 |
|---|
| 11/30/17 | $11,940 | $13,677 | $10,638 | $12,264 |
|---|
| 12/31/17 | $12,063 | $13,829 | $10,687 | $12,538 |
|---|
| 01/31/18 | $12,445 | $14,621 | $10,564 | $13,237 |
|---|
| 02/28/18 | $12,039 | $14,082 | $10,464 | $12,613 |
|---|
| 03/31/18 | $11,923 | $13,724 | $10,531 | $12,390 |
|---|
| 04/30/18 | $11,936 | $13,777 | $10,452 | $12,588 |
|---|
| 05/31/18 | $12,002 | $14,108 | $10,527 | $12,297 |
|---|
| 06/30/18 | $11,960 | $14,195 | $10,514 | $12,066 |
|---|
| 07/31/18 | $12,203 | $14,724 | $10,516 | $12,355 |
|---|
| 08/31/18 | $12,336 | $15,203 | $10,584 | $12,096 |
|---|
| 09/30/18 | $12,300 | $15,290 | $10,516 | $12,151 |
|---|
| 10/31/18 | $11,705 | $14,245 | $10,433 | $11,163 |
|---|
| 11/30/18 | $11,772 | $14,535 | $10,495 | $11,269 |
|---|
| 12/31/18 | $11,266 | $13,223 | $10,688 | $10,758 |
|---|
| 01/31/19 | $11,861 | $14,282 | $10,801 | $11,571 |
|---|
| 02/28/19 | $12,030 | $14,741 | $10,795 | $11,797 |
|---|
| 03/31/19 | $12,150 | $15,027 | $11,002 | $11,868 |
|---|
| 04/30/19 | $12,335 | $15,636 | $11,005 | $12,181 |
|---|
| 05/31/19 | $11,998 | $14,642 | $11,201 | $11,527 |
|---|
| 06/30/19 | $12,488 | $15,674 | $11,341 | $12,222 |
|---|
| 07/31/19 | $12,488 | $15,899 | $11,366 | $12,074 |
|---|
| 08/31/19 | $12,424 | $15,648 | $11,661 | $11,701 |
|---|
| 09/30/19 | $12,561 | $15,940 | $11,599 | $12,002 |
|---|
| 10/31/19 | $12,705 | $16,286 | $11,634 | $12,421 |
|---|
| 11/30/19 | $12,826 | $16,877 | $11,628 | $12,530 |
|---|
| 12/31/19 | $13,020 | $17,386 | $11,620 | $13,073 |
|---|
| 01/31/20 | $12,897 | $17,379 | $11,843 | $12,722 |
|---|
| 02/29/20 | $12,240 | $15,949 | $12,056 | $11,716 |
|---|
| 03/31/20 | $10,803 | $13,979 | $11,985 | $10,020 |
|---|
| 04/30/20 | $11,501 | $15,771 | $12,198 | $10,779 |
|---|
| 05/31/20 | $11,838 | $16,522 | $12,255 | $11,132 |
|---|
| 06/30/20 | $12,059 | $16,850 | $12,332 | $11,635 |
|---|
| 07/31/20 | $12,568 | $17,801 | $12,517 | $12,153 |
|---|
| 08/31/20 | $12,856 | $19,080 | $12,416 | $12,674 |
|---|
| 09/30/20 | $12,667 | $18,355 | $12,409 | $12,362 |
|---|
| 10/31/20 | $12,519 | $17,867 | $12,353 | $12,096 |
|---|
| 11/30/20 | $13,480 | $19,823 | $12,475 | $13,724 |
|---|
| 12/31/20 | $13,819 | $20,585 | $12,492 | $14,465 |
|---|
| 01/31/21 | $13,911 | $20,377 | $12,402 | $14,497 |
|---|
| 02/28/21 | $14,027 | $20,939 | $12,223 | $14,784 |
|---|
| 03/31/21 | $14,386 | $21,856 | $12,071 | $14,971 |
|---|
| 04/30/21 | $14,845 | $23,022 | $12,166 | $15,411 |
|---|
| 05/31/21 | $15,037 | $23,183 | $12,206 | $15,893 |
|---|
| 06/30/21 | $15,220 | $23,724 | $12,291 | $15,790 |
|---|
| 07/31/21 | $15,303 | $24,288 | $12,429 | $15,530 |
|---|
| 08/31/21 | $15,520 | $25,026 | $12,405 | $15,825 |
|---|
| 09/30/21 | $15,062 | $23,863 | $12,298 | $15,319 |
|---|
| 10/31/21 | $15,587 | $25,534 | $12,294 | $15,684 |
|---|
| 11/30/21 | $15,262 | $25,357 | $12,331 | $14,978 |
|---|
| 12/31/21 | $15,643 | $26,494 | $12,299 | $15,597 |
|---|
| 01/31/22 | $15,027 | $25,123 | $12,034 | $15,022 |
|---|
| 02/28/22 | $14,783 | $24,371 | $11,900 | $14,725 |
|---|
| 03/31/22 | $14,812 | $25,276 | $11,569 | $14,748 |
|---|
| 04/30/22 | $13,835 | $23,071 | $11,130 | $13,822 |
|---|
| 05/31/22 | $13,864 | $23,114 | $11,202 | $13,922 |
|---|
| 06/30/22 | $13,023 | $21,206 | $11,026 | $12,724 |
|---|
| 07/31/22 | $13,649 | $23,161 | $11,296 | $13,160 |
|---|
| 08/31/22 | $13,160 | $22,217 | $10,977 | $12,736 |
|---|
| 09/30/22 | $12,212 | $20,170 | $10,502 | $11,464 |
|---|
| 10/31/22 | $12,661 | $21,804 | $10,366 | $11,806 |
|---|
| 11/30/22 | $13,414 | $23,022 | $10,748 | $13,200 |
|---|
| 12/31/22 | $13,028 | $21,696 | $10,699 | $13,101 |
|---|
| 01/31/23 | $13,817 | $23,059 | $11,028 | $14,164 |
|---|
| 02/28/23 | $13,397 | $22,496 | $10,743 | $13,667 |
|---|
| 03/31/23 | $13,707 | $23,322 | $11,016 | $14,001 |
|---|
| 04/30/23 | $13,837 | $23,686 | $11,083 | $14,244 |
|---|
| 05/31/23 | $13,627 | $23,789 | $10,962 | $13,726 |
|---|
| 06/30/23 | $14,186 | $25,361 | $10,923 | $14,342 |
|---|
| 07/31/23 | $14,565 | $26,176 | $10,915 | $14,925 |
|---|
| 08/31/23 | $14,216 | $25,759 | $10,846 | $14,251 |
|---|
| 09/30/23 | $13,697 | $24,531 | $10,570 | $13,801 |
|---|
| 10/31/23 | $13,357 | $24,015 | $10,403 | $13,231 |
|---|
| 11/30/23 | $14,296 | $26,208 | $10,874 | $14,422 |
|---|
| 12/31/23 | $15,009 | $27,399 | $11,291 | $15,147 |
|---|
| 01/31/24 | $14,938 | $27,859 | $11,260 | $14,996 |
|---|
| 02/29/24 | $15,365 | $29,347 | $11,100 | $15,376 |
|---|
| 03/31/24 | $15,752 | $30,291 | $11,203 | $15,857 |
|---|
| 04/30/24 | $15,274 | $29,054 | $10,920 | $15,572 |
|---|
| 05/31/24 | $15,783 | $30,494 | $11,105 | $16,024 |
|---|
| 06/30/24 | $15,956 | $31,589 | $11,210 | $16,009 |
|---|
| 07/31/24 | $16,343 | $31,973 | $11,472 | $16,380 |
|---|
| 08/31/24 | $16,567 | $32,749 | $11,637 | $16,846 |
|---|
| 09/30/24 | $16,923 | $33,448 | $11,793 | $17,300 |
|---|
| 10/31/24 | $16,567 | $33,145 | $11,500 | $16,451 |
|---|
| 11/30/24 | $17,076 | $35,090 | $11,622 | $16,302 |
|---|
| 12/31/24 | $16,668 | $34,254 | $11,432 | $15,985 |
|---|
Average Annual Total Returns (%)
| Name | 1 Year | 5 Years | 10 Years |
|---|
| SSTTX | 11.06% | 5.06% | 5.24% |
|---|
S&P 500® Index | 25.02% | 14.53% | 13.10% |
|---|
| Bloomberg US Aggregate Bond Index | 1.25% | (0.33%) | 1.35% |
|---|
| MSCI All Country World Index ex-USA | 5.53% | 4.10% | 4.80% |
|---|
The Fund’s past performance is not necessarily an indication of how the Fund will perform in the future. The returns do not reflect the deduction of taxes that a shareholder would pay on Fund distributions or on the redemption or sale of Fund shares. Updated performance information is available by calling 1-800-242-0134 or visiting our website at www.ssga.com.
Key Fund Statistics as of 12/31/2024
- Total Net Assets$1,058,203,231
- Number of Portfolio Holdings4,966
- Portfolio Turnover Rate77%
- Total Advisory Fees Paid$4,125,737
What did the Fund invest in as of 12/31/2024? (as a percentage of total net assets)
| Holdings | % |
| SPDR Portfolio Aggregate Bond ETF | 15.7% |
| SPDR Bloomberg High Yield Bond ETF | 9.7% |
| Apple, Inc. | 2.2% |
| NVIDIA Corp. | 1.9% |
| Microsoft Corp. | 1.9% |
| Amazon.com, Inc. | 1.3% |
| Taiwan Semiconductor Manufacturing Co. Ltd. | 1.1% |
| Meta Platforms, Inc., Class A | 0.8% |
| Tesla, Inc. | 0.7% |
| Alphabet, Inc., Class A | 0.7% |
| Asset | % |
| Common Stocks | 60.9% |
| Mutual Funds and Exchange Traded Products | 25.5% |
| Short-Term Investments | 8.2% |
| U.S. Treasury Obligations | 5.0% |
| Preferred Stock | 0.2% |
Availability of Additional Information
For additional information about the Fund, including its Prospectus, Statement of Additional Information, financial statements, holdings and proxy information please visit: www.ssga.com/us/en/individual/fund-finder?tab=documents&type=mf.
State Street U.S. Equity V.I.S. Fund
Annual Shareholder Report
December 31, 2024
This annual shareholder report contains important information about the State Street U.S. Equity V.I.S. Fund (the "Fund") for the period of January 1, 2024 to December 31, 2024. You can find additional information about the Fund, including the Prospectus, Statement of Additional Information, financial statements and other information at www.ssga.com/us/en/individual/fund-finder?tab=documents&type=mf. You can also request this information about the Fund by contacting us at 1-800-242-0134.
What were the Fund costs for the last year? (based on a hypothetical $10,000 Investment)
| Class Name | Costs of a $10,000 investment | Costs paid as a percentage of a $10,000 investment |
|---|
| Class 1 | $95 | 0.85% |
|---|
How did the Fund perform last year and what affected its performance?
Primary drivers of relative performance included the following:
Outperformance in IT. IT was the best performing Index sector during the reporting period rising 36.7%. On top of this strong return, the Fund outperformed by more than 7%, adding value through overweight positions in companies that are beneficiaries of Artificial Intelligence investment such as Nvidia and Broadcom. Outperformance in industrials. The Fund benefitted from holdings including Parker-Hannifin, Emerson Electric, Eaton, and Trane Technologies all of which significantly outperformed during the reporting period, as they benefitted from a range of tailwinds including infrastructure/capex spending driven by reshoring, green investment, and increased data center demand.
Underperformance and Overweight in healthcare. The healthcare sector, which is more defensive, lagged in the strong risk-on market. This negatively impacted the Fund, which was overweight the sector. In addition, the Fund’s stock selections underperformed. The largest detracting positions included BioMarin Pharma (biotech), Merck (pharma) and Humana (healthcare services).
The Fund's benchmark is an unmanaged index used as a general measure of market performance. Calculations assume dividends and capital gains.
Comparison of Change in Value of a $10,000 Investment
(Based on Net Asset Value)
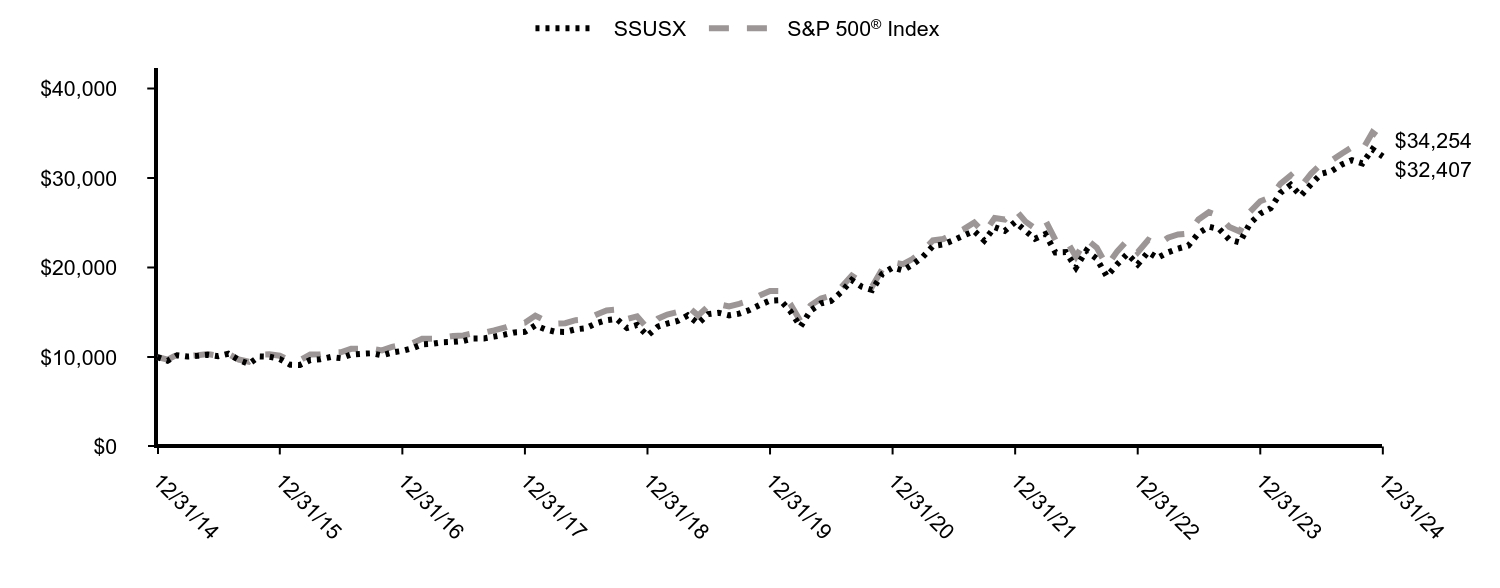
| SSUSX | S&P 500® Index |
|---|
| 12/31/14 | $10,000 | $10,000 |
|---|
| 01/31/15 | $9,581 | $9,700 |
|---|
| 02/28/15 | $10,186 | $10,257 |
|---|
| 03/31/15 | $10,047 | $10,095 |
|---|
| 04/30/15 | $10,122 | $10,192 |
|---|
| 05/31/15 | $10,246 | $10,323 |
|---|
| 06/30/15 | $10,083 | $10,123 |
|---|
| 07/31/15 | $10,361 | $10,335 |
|---|
| 08/31/15 | $9,657 | $9,712 |
|---|
| 09/30/15 | $9,236 | $9,471 |
|---|
| 10/31/15 | $10,062 | $10,270 |
|---|
| 11/30/15 | $10,029 | $10,301 |
|---|
| 12/31/15 | $9,770 | $10,138 |
|---|
| 01/31/16 | $9,127 | $9,635 |
|---|
| 02/29/16 | $9,104 | $9,622 |
|---|
| 03/31/16 | $9,668 | $10,275 |
|---|
| 04/30/16 | $9,746 | $10,315 |
|---|
| 05/31/16 | $9,998 | $10,500 |
|---|
| 06/30/16 | $9,871 | $10,527 |
|---|
| 07/31/16 | $10,278 | $10,915 |
|---|
| 08/31/16 | $10,355 | $10,931 |
|---|
| 09/30/16 | $10,412 | $10,933 |
|---|
| 10/31/16 | $10,179 | $10,733 |
|---|
| 11/30/16 | $10,500 | $11,131 |
|---|
| 12/31/16 | $10,679 | $11,351 |
|---|
| 01/31/17 | $10,984 | $11,566 |
|---|
| 02/28/17 | $11,419 | $12,025 |
|---|
| 03/31/17 | $11,480 | $12,039 |
|---|
| 04/30/17 | $11,640 | $12,163 |
|---|
| 05/31/17 | $11,688 | $12,334 |
|---|
| 06/30/17 | $11,787 | $12,411 |
|---|
| 07/31/17 | $12,067 | $12,666 |
|---|
| 08/31/17 | $12,077 | $12,705 |
|---|
| 09/30/17 | $12,270 | $12,967 |
|---|
| 10/31/17 | $12,496 | $13,270 |
|---|
| 11/30/17 | $12,748 | $13,677 |
|---|
| 12/31/17 | $12,806 | $13,829 |
|---|
| 01/31/18 | $13,530 | $14,621 |
|---|
| 02/28/18 | $13,113 | $14,082 |
|---|
| 03/31/18 | $12,817 | $13,724 |
|---|
| 04/30/18 | $12,803 | $13,777 |
|---|
| 05/31/18 | $13,092 | $14,108 |
|---|
| 06/30/18 | $13,208 | $14,195 |
|---|
| 07/31/18 | $13,759 | $14,724 |
|---|
| 08/31/18 | $14,112 | $15,203 |
|---|
| 09/30/18 | $14,260 | $15,290 |
|---|
| 10/31/18 | $13,240 | $14,245 |
|---|
| 11/30/18 | $13,576 | $14,535 |
|---|
| 12/31/18 | $12,371 | $13,223 |
|---|
| 01/31/19 | $13,394 | $14,282 |
|---|
| 02/28/19 | $13,739 | $14,741 |
|---|
| 03/31/19 | $14,025 | $15,027 |
|---|
| 04/30/19 | $14,648 | $15,636 |
|---|
| 05/31/19 | $13,742 | $14,642 |
|---|
| 06/30/19 | $14,788 | $15,674 |
|---|
| 07/31/19 | $14,938 | $15,899 |
|---|
| 08/31/19 | $14,655 | $15,648 |
|---|
| 09/30/19 | $14,837 | $15,940 |
|---|
| 10/31/19 | $15,250 | $16,286 |
|---|
| 11/30/19 | $15,805 | $16,877 |
|---|
| 12/31/19 | $16,301 | $17,386 |
|---|
| 01/31/20 | $16,356 | $17,379 |
|---|
| 02/29/20 | $15,142 | $15,949 |
|---|
| 03/31/20 | $13,396 | $13,979 |
|---|
| 04/30/20 | $15,180 | $15,771 |
|---|
| 05/31/20 | $15,985 | $16,522 |
|---|
| 06/30/20 | $16,245 | $16,850 |
|---|
| 07/31/20 | $17,258 | $17,801 |
|---|
| 08/31/20 | $18,598 | $19,080 |
|---|
| 09/30/20 | $17,852 | $18,355 |
|---|
| 10/31/20 | $17,491 | $17,867 |
|---|
| 11/30/20 | $19,285 | $19,823 |
|---|
| 12/31/20 | $19,991 | $20,585 |
|---|
| 01/31/21 | $19,668 | $20,377 |
|---|
| 02/28/21 | $20,321 | $20,939 |
|---|
| 03/31/21 | $21,177 | $21,856 |
|---|
| 04/30/21 | $22,396 | $23,022 |
|---|
| 05/31/21 | $22,576 | $23,183 |
|---|
| 06/30/21 | $23,041 | $23,724 |
|---|
| 07/31/21 | $23,585 | $24,288 |
|---|
| 08/31/21 | $24,077 | $25,026 |
|---|
| 09/30/21 | $23,004 | $23,863 |
|---|
| 10/31/21 | $24,508 | $25,534 |
|---|
| 11/30/21 | $24,088 | $25,357 |
|---|
| 12/31/21 | $25,087 | $26,494 |
|---|
| 01/31/22 | $24,075 | $25,123 |
|---|
| 02/28/22 | $23,206 | $24,371 |
|---|
| 03/31/22 | $23,734 | $25,276 |
|---|
| 04/30/22 | $21,684 | $23,071 |
|---|
| 05/31/22 | $21,720 | $23,114 |
|---|
| 06/30/22 | $19,990 | $21,206 |
|---|
| 07/31/22 | $21,884 | $23,161 |
|---|
| 08/31/22 | $20,974 | $22,217 |
|---|
| 09/30/22 | $19,005 | $20,170 |
|---|
| 10/31/22 | $20,362 | $21,804 |
|---|
| 11/30/22 | $21,520 | $23,022 |
|---|
| 12/31/22 | $20,343 | $21,696 |
|---|
| 01/31/23 | $21,725 | $23,059 |
|---|
| 02/28/23 | $21,071 | $22,496 |
|---|
| 03/31/23 | $21,685 | $23,322 |
|---|
| 04/30/23 | $22,114 | $23,686 |
|---|
| 05/31/23 | $22,434 | $23,789 |
|---|
| 06/30/23 | $23,826 | $25,361 |
|---|
| 07/31/23 | $24,555 | $26,176 |
|---|
| 08/31/23 | $24,285 | $25,759 |
|---|
| 09/30/23 | $23,107 | $24,531 |
|---|
| 10/31/23 | $22,808 | $24,015 |
|---|
| 11/30/23 | $24,904 | $26,208 |
|---|
| 12/31/23 | $26,020 | $27,399 |
|---|
| 01/31/24 | $26,617 | $27,859 |
|---|
| 02/29/24 | $28,337 | $29,347 |
|---|
| 03/31/24 | $29,229 | $30,291 |
|---|
| 04/30/24 | $28,019 | $29,054 |
|---|
| 05/31/24 | $29,326 | $30,494 |
|---|
| 06/30/24 | $30,470 | $31,589 |
|---|
| 07/31/24 | $30,777 | $31,973 |
|---|
| 08/31/24 | $31,513 | $32,749 |
|---|
| 09/30/24 | $31,997 | $33,448 |
|---|
| 10/31/24 | $31,626 | $33,145 |
|---|
| 11/30/24 | $33,217 | $35,090 |
|---|
| 12/31/24 | $32,407 | $34,254 |
|---|
Average Annual Total Returns (%)
| Name | 1 Year | 5 Years | 10 Years |
|---|
| SSUSX | 24.55% | 14.73% | 12.48% |
|---|
S&P 500® Index | 25.02% | 14.53% | 13.10% |
|---|
The Fund’s past performance is not necessarily an indication of how the Fund will perform in the future. The returns do not reflect the deduction of taxes that a shareholder would pay on Fund distributions or on the redemption or sale of Fund shares. Updated performance information is available by calling 1-800-242-0134 or visiting our website at www.ssga.com.
Key Fund Statistics as of 12/31/2024
- Total Net Assets$21,080,665
- Number of Portfolio Holdings94
- Portfolio Turnover Rate45%
- Total Advisory Fees Paid$126,419
What did the Fund invest in as of 12/31/2024? (as a percentage of total net assets)
| Holdings | % |
| NVIDIA Corp. | 7.7% |
| Microsoft Corp. | 7.0% |
| Apple, Inc. | 6.6% |
| Amazon.com, Inc. | 4.9% |
| Alphabet, Inc., Class A | 4.4% |
| Meta Platforms, Inc., Class A | 3.5% |
| Broadcom, Inc. | 2.7% |
| Bank of America Corp. | 2.3% |
| JPMorgan Chase & Co. | 2.2% |
| Home Depot, Inc. | 1.8% |
| Industry | % |
| Semiconductors & Semiconductor Equipment | 13.4% |
| Software | 11.8% |
| Interactive Media & Services | 8.5% |
| Technology Hardware, Storage & Peripherals | 6.6% |
| Banks | 5.4% |
| Broadline Retail | 4.9% |
| Financial Services | 4.4% |
| Pharmaceuticals | 4.3% |
| Specialty Retail | 3.6% |
| Healthcare Equipment & Supplies | 2.6% |
Availability of Additional Information
For additional information about the Fund, including its Prospectus, Statement of Additional Information, financial statements, holdings and proxy information please visit: www.ssga.com/us/en/individual/fund-finder?tab=documents&type=mf.
Item 2. Code of Ethics.
As of the end of the period covered by this report, State Street Variable Insurance Series Funds, Inc. (the “Company,” “Fund Entity” or “Registrant”) has adopted a code of ethics, as defined in Item 2(b) of Form N-CSR, that applies to the Registrant’s principal executive officer, principal financial officer, principal accounting officer or controller, or persons performing similar functions, regardless of whether these individuals are employed by the Registrant or a third party (the “Code”). That Code comprises written standards that are reasonably designed to deter wrongdoing and to promote: (1) honest and ethical conduct, including the ethical handling of actual or apparent conflicts of interest between personal and professional relationships; (2) full, fair, accurate, timely and understandable disclosure in reports and documents that the Registrant files with, or submits to, the U.S. Securities Exchange Commission (the “SEC”) and in other public communications made by the Registrant; (3) compliance with applicable laws and governmental rules and regulations; (4) the prompt internal reporting to an appropriate person or persons identified in the Code of violations of the Code; and (5) accountability for adherence to the Code. For the period covered by the report, the Code was combined with other mutual funds advised by SSGA Funds Management, Inc. (“SSGA FM” or the “Adviser”). The Registrant has not made any amendments to the Code that relates to any element of the code of ethics definition set forth in Item 2(b) of Form N-CSR during the covered period. The Registrant has not granted any waivers from any provisions of the Code during the covered period. A copy of the Code is filed as Exhibit 19(a)(1) to this Form N-CSR.
Item 3. Audit Committee Financial Expert.
The Company’s Board of Directors (the “Board”) has determined that the Company has the following “audit committee financial experts” as defined in Item 3(b) of Form N-CSR serving on its audit committee (the “Audit Committee”): Mr. George M. Pereira, Mr. Mark E. Swanson and Ms. Donna M. Rapaccioli. Each of the “audit committee financial experts” is “independent” as that term is defined in Item 3(a)(2) of Form N-CSR.
An “audit committee financial expert” is not an “expert” for any purpose, including for purposes of Section 11 of the Securities Act of 1933, as amended, as a result of being designated as an “audit committee financial expert.” Further, the designation of a person as an “audit committee financial expert” does not mean that the person has any greater duties, obligations, or liability than those imposed on the person without the “audit committee financial expert” designation. Similarly, the designation of a person as an “audit committee financial expert” does not affect the duties, obligations, or liability of any other member of the Audit Committee or the Board.
Item 4. Principal Accountant Fees and Services.
For the fiscal years ended December 31, 2024 and December 31, 2023, the aggregate audit fees billed for professional services rendered by Ernst & Young LLP (“EY”), the Company’s principal accountant, for the audit of the Company’s annual financial statements or services normally provided by EY in connection with the Company’s statutory and regulatory filings and engagements were $220,958 and $217,458, respectively.
For the fiscal years ended December 31, 2024 and December 31, 2023, there were no fees for assurance and related services by EY reasonably related to the performance of the audit of the Company’s financial statements that were not reported under paragraph (a) of this Item.
For the fiscal years ending December 31, 2024 and December 31, 2023 the aggregate tax fees billed for professional services rendered by EY for the review of year-end distribution requirements were $13,407 and $13,407, respectively.
For the fiscal years ended December 31, 2024 and December 31, 2023, there were no fees billed for professional services rendered by EY for products and services provided by EY to the Company, other than the services reported in paragraphs (a) through (c).
For the fiscal years ended December 31, 2024 and December 31, 2023, the aggregate fees for professional services rendered by EY for products and services provided by EY to the Adviser and any entity controlling, controlled by, or under common control with the Adviser that provides ongoing services to the Company that (i) relate directly to the operations and financial reporting of the Company and (ii) were pre-approved by the Audit Committee were approximately $9,556,710 and $9,540,002, respectively.
(e)(1) Audit Committee Pre-Approval Policies and Procedures
The Company’s Audit Committee Charter states the following with respect to pre-approval procedures:
The Audit Committee shall have the following duties and powers:
| | • | | To pre-approve engagements by a Fund Entity’s independent auditor for non-audit services to be rendered to the Fund’s investment adviser (not including any subadviser whose role is primarily portfolio management and is subcontracted with or overseen by another investment adviser), and any entity controlling, controlled by, or under common control with the investment adviser that provides ongoing services to the Fund, if the engagement relates directly to the operations and financial reporting of the Fund; |
| | • | | To establish, if deemed necessary or appropriate as an alternative to Audit Committee pre-approval of services to be provided by the independent auditor as required by paragraph (b) above, policies and procedures to permit such services to be pre-approved by other means, such as by action of a designated member or members of the Audit Committee, subject to the requirement that the decision of any member to whom authority is delegated to pre-approve an activity shall be presented to the full Audit Committee at its next scheduled meeting; |
Alternate Pre-Approval Procedure:
| | • | | The Chairperson, or a Co-Chairperson, of the Audit Committee is authorized to pre-approve any engagement involving the Fund Entity’s independent auditors to the same extent as the Audit Committee. Any pre-approval decision by the Chairperson, or a Co-Chairperson, under the foregoing authority shall be presented to the Audit Committee at its next scheduled meeting. |
(e)(2) Percentages of Services
None of the services described in paragraphs (b) through (d) of this Item were performed in reliance on paragraph (c)(7)(i)(C) of Rule 2-01 of Regulation S-X during the period of time for which such rule was effective.
| (g) | Total Fees Paid By Adviser and Certain Affiliates |
For the fiscal years ended December 31, 2024 and December 31, 2023, the aggregate non-audit fees billed by EY for services rendered to the Company and the Adviser and any entity controlling, controlled by, or under common control with the Adviser that provided ongoing services to the Company were approximately $36,700,000 and $39,000,000, respectively.
(h) EY notified the Company’s Audit Committee of all non-audit services that were rendered by EY to the Adviser and any entity controlling, controlled by, or under common control with the Adviser that provides services to the Company, which services were not required to be pre-approved pursuant to paragraph (c)(7)(ii) of Rule 2-01 of Regulation S-X, allowing the Company’s Audit Committee to consider whether such services were compatible with maintaining EY’s independence.
Item 5. Audit Committee of Listed Registrants.
Not applicable to the Registrant.
Item 6. Investments.
| (a) | Schedules of Investments are included as part of the reports to shareholders filed under Item 1 of this Form N-CSR. |
| (b) | Not applicable to the Registrant. |
Item 7. Financial Statements and Financial Highlights for Open-End Management Investment Companies
| (a) | The Registrant’s Financial Statements are attached herewith. |
| (b) | The Registrant’s Financial Highlights are included as part of the Financial Statements filed under Item 7(a) of this Form. |
Annual Financial Statements and Other Information
December 31, 2024
| State Street S&P 500 Index V.I.S. Fund |
State Street S&P 500 Index V.I.S. Fund
Annual Report Financial Statements and Other Information
December 31, 2024
Changes in and Disagreements with Accountants for Open-End Management Investment Companies (N-CSR Item 8) - Not Applicable
Remuneration Paid to Directors, Officers, and Others of Open-End Management Investment Companies (N-CSR Item 10) - Please see Statement of Operations in the Financial Statements under Item 7 above
Statement Regarding Basis for Approval of Investment Advisory Contract (Unaudited) (N-CSR Item 11) - Not Applicable
This report is prepared for Policyholders of certain variable contracts and may be distributed to others only if preceded or accompanied by the variable contract’s current prospectus and the current summary prospectus of the Fund available for investments thereunder.
[This page intentionally left blank]
State Street S&P 500 Index V.I.S. Fund
Schedule of Investments — December 31, 2024
| | Number
of Shares | Fair
Value |
| Common Stock - 99.8% † |
| Advertising - 0.1% |
| Interpublic Group of Cos., Inc. | 1,662 | $46,569 |
| Omnicom Group, Inc. | 814 | 70,037 |
| | | 116,606 |
| Aerospace & Defense - 1.9% |
| Axon Enterprise, Inc. (a) | 300 | 178,296 |
| Boeing Co. (a) | 2,964 | 524,628 |
| General Dynamics Corp. | 1,027 | 270,604 |
| General Electric Co. | 4,312 | 719,199 |
| Howmet Aerospace, Inc. | 1,636 | 178,929 |
| Huntington Ingalls Industries, Inc. | 171 | 32,314 |
| L3Harris Technologies, Inc. | 765 | 160,864 |
| Lockheed Martin Corp. | 843 | 409,648 |
| Northrop Grumman Corp. | 560 | 262,802 |
| RTX Corp. | 5,362 | 620,491 |
| Textron, Inc. | 723 | 55,302 |
| TransDigm Group, Inc. | 225 | 285,138 |
| | | 3,698,215 |
| Agricultural & Farm Machinery - 0.2% |
| Deere & Co. | 1,015 | 430,056 |
| Agricultural Products & Services - 0.1% |
| Archer-Daniels-Midland Co. | 2,061 | 104,122 |
| Bunge Global SA | 627 | 48,755 |
| | | 152,877 |
| Air Freight & Logistics - 0.4% |
| CH Robinson Worldwide, Inc. | 452 | 46,701 |
| Expeditors International of Washington, Inc. | 528 | 58,487 |
| FedEx Corp. | 874 | 245,882 |
| United Parcel Service, Inc., Class B | 2,883 | 363,546 |
| | | 714,616 |
| Apparel Retail - 0.4% |
| Ross Stores, Inc. | 1,361 | 205,878 |
| TJX Cos., Inc. | 4,479 | 541,108 |
| | | 746,986 |
| Apparel, Accessories & Luxury Goods - 0.1% |
| Lululemon Athletica, Inc. (a) | 453 | 173,232 |
| Ralph Lauren Corp. | 170 | 39,266 |
| Tapestry, Inc. | 990 | 64,677 |
| | | 277,175 |
| | Number
of Shares | Fair
Value |
| Application Software - 2.6% |
| Adobe, Inc. (a) | 1,776 | $789,752 |
| ANSYS, Inc. (a) | 358 | 120,764 |
| Autodesk, Inc. (a) | 824 | 243,550 |
| Cadence Design Systems, Inc. (a)(b) | 1,056 | 317,286 |
| Fair Isaac Corp. (a) | 100 | 199,093 |
| Intuit, Inc. | 1,122 | 705,177 |
| Palantir Technologies, Inc., Class A (a) | 8,200 | 620,166 |
| PTC, Inc. (a) | 500 | 91,935 |
| Roper Technologies, Inc. | 430 | 223,535 |
| Salesforce, Inc. | 3,803 | 1,271,457 |
| Synopsys, Inc. (a) | 614 | 298,011 |
| Tyler Technologies, Inc. (a) | 182 | 104,948 |
| Workday, Inc., Class A (a) | 856 | 220,874 |
| | | 5,206,548 |
| Asset Management & Custody Banks - 1.1% |
| Ameriprise Financial, Inc. | 403 | 214,569 |
| Bank of New York Mellon Corp. | 2,896 | 222,500 |
| Blackrock, Inc. | 567 | 581,237 |
| Blackstone, Inc. | 2,900 | 500,018 |
| Franklin Resources, Inc. | 991 | 20,107 |
| Invesco Ltd. | 1,674 | 29,262 |
| KKR & Co., Inc. | 2,600 | 384,566 |
| Northern Trust Corp. | 820 | 84,050 |
| State Street Corp. (c) | 1,122 | 110,124 |
| T. Rowe Price Group, Inc. | 928 | 104,948 |
| | | 2,251,381 |
| Automobile Manufacturers - 2.5% |
| Ford Motor Co. | 15,953 | 157,935 |
| General Motors Co. | 4,461 | 237,637 |
| Tesla, Inc. (a) | 11,207 | 4,525,835 |
| | | 4,921,407 |
| Automotive Parts & Equipment - 0.0%* |
| Aptiv PLC (a) | 915 | 55,339 |
| BorgWarner, Inc. | 863 | 27,435 |
| | | 82,774 |
| Automotive Retail - 0.3% |
| AutoZone, Inc. (a) | 68 | 217,736 |
| CarMax, Inc. (a) | 678 | 55,433 |
| O'Reilly Automotive, Inc. (a) | 237 | 281,035 |
| | | 554,204 |
See Notes to Schedule of Investments and Notes to Financial Statements.
| State Street S&P 500 Index V.I.S. Fund | 1 |
State Street S&P 500 Index V.I.S. Fund
Schedule of Investments, continued — December 31, 2024
| | Number
of Shares | Fair
Value |
| Biotechnology - 1.6% |
| AbbVie, Inc. | 7,055 | $1,253,674 |
| Amgen, Inc. | 2,146 | 559,333 |
| Biogen, Inc. (a) | 625 | 95,575 |
| Gilead Sciences, Inc. | 5,024 | 464,067 |
| Incyte Corp. (a) | 618 | 42,685 |
| Moderna, Inc. (a) | 1,415 | 58,836 |
| Regeneron Pharmaceuticals, Inc. (a) | 431 | 307,014 |
| Vertex Pharmaceuticals, Inc. (a) | 1,042 | 419,613 |
| | | 3,200,797 |
| Brewers - 0.0%* |
| Molson Coors Beverage Co., Class B | 810 | 46,429 |
| Broadcasting - 0.0%* |
| Fox Corp., Class A | 867 | 42,119 |
| Fox Corp., Class B | 495 | 22,641 |
| Paramount Global, Class B | 2,036 | 21,297 |
| | | 86,057 |
| Broadline Retail - 4.2% |
| Amazon.com, Inc. (a) | 37,544 | 8,236,778 |
| eBay, Inc. | 1,896 | 117,457 |
| | | 8,354,235 |
| Building Products - 0.5% |
| A.O. Smith Corp. | 491 | 33,491 |
| Allegion PLC | 398 | 52,011 |
| Builders FirstSource, Inc. (a)(b) | 500 | 71,465 |
| Carrier Global Corp. | 3,408 | 232,630 |
| Johnson Controls International PLC | 2,654 | 209,480 |
| Lennox International, Inc. | 129 | 78,600 |
| Masco Corp. | 906 | 65,748 |
| Trane Technologies PLC | 877 | 323,920 |
| | | 1,067,345 |
| Cable & Satellite - 0.4% |
| Charter Communications, Inc., Class A (a) | 398 | 136,423 |
| Comcast Corp., Class A | 15,295 | 574,021 |
| | | 710,444 |
| | Number
of Shares | Fair
Value |
| Cargo Ground Transportation - 0.1% |
| JB Hunt Transport Services, Inc. | 354 | $60,414 |
| Old Dominion Freight Line, Inc. | 756 | 133,358 |
| | | 193,772 |
| Casinos & Gaming - 0.1% |
| Caesars Entertainment, Inc. (a) | 771 | 25,767 |
| Las Vegas Sands Corp. | 1,425 | 73,188 |
| MGM Resorts International (a) | 917 | 31,774 |
| Wynn Resorts Ltd. | 411 | 35,412 |
| | | 166,141 |
| Commodity Chemicals - 0.1% |
| Dow, Inc. | 2,855 | 114,571 |
| LyondellBasell Industries NV, Class A | 1,039 | 77,167 |
| | | 191,738 |
| Communications Equipment - 0.9% |
| Arista Networks, Inc. (a) | 4,120 | 455,383 |
| Cisco Systems, Inc. | 16,092 | 952,646 |
| F5, Inc. (a) | 257 | 64,628 |
| Juniper Networks, Inc. | 1,208 | 45,240 |
| Motorola Solutions, Inc. | 677 | 312,930 |
| | | 1,830,827 |
| Computer & Electronics Retail - 0.0%* |
| Best Buy Co., Inc. | 760 | 65,208 |
| Construction & Engineering - 0.1% |
| Quanta Services, Inc. | 584 | 184,573 |
| Construction Machinery & Heavy Transportation Equipment - 0.6% |
| Caterpillar, Inc. | 1,932 | 700,852 |
| Cummins, Inc. | 551 | 192,079 |
| PACCAR, Inc. | 2,025 | 210,640 |
| Westinghouse Air Brake Technologies Corp. | 681 | 129,111 |
| | | 1,232,682 |
| Construction Materials - 0.1% |
| Martin Marietta Materials, Inc. | 245 | 126,543 |
| Vulcan Materials Co. | 474 | 121,927 |
| | | 248,470 |
See Notes to Schedule of Investments and Notes to Financial Statements.
| 2 | State Street S&P 500 Index V.I.S. Fund |
State Street S&P 500 Index V.I.S. Fund
Schedule of Investments, continued — December 31, 2024
| | Number
of Shares | Fair
Value |
| Consumer Electronics - 0.1% |
| Garmin Ltd. | 641 | $132,213 |
| Consumer Finance - 0.6% |
| American Express Co. | 2,233 | 662,732 |
| Capital One Financial Corp. | 1,512 | 269,620 |
| Discover Financial Services | 1,009 | 174,789 |
| Synchrony Financial | 1,581 | 102,765 |
| | | 1,209,906 |
| Consumer Staples Merchandise Retail - 1.8% |
| Costco Wholesale Corp. | 1,779 | 1,630,044 |
| Dollar General Corp. | 888 | 67,328 |
| Dollar Tree, Inc. (a) | 861 | 64,523 |
| Target Corp. | 1,893 | 255,896 |
| Walmart, Inc. | 17,444 | 1,576,066 |
| | | 3,593,857 |
| Copper - 0.1% |
| Freeport-McMoRan, Inc. | 5,712 | 217,513 |
| Data Center REITs - 0.3% |
| Digital Realty Trust, Inc. | 1,226 | 217,407 |
| Equinix, Inc. | 387 | 364,898 |
| | | 582,305 |
| Data Processing & Outsourced Services - 0.1% |
| Broadridge Financial Solutions, Inc. | 475 | 107,393 |
| Distillers & Vintners - 0.1% |
| Brown-Forman Corp., Class B | 755 | 28,675 |
| Constellation Brands, Inc., Class A | 604 | 133,484 |
| | | 162,159 |
| Distributors - 0.1% |
| Genuine Parts Co. | 586 | 68,421 |
| LKQ Corp. | 1,038 | 38,147 |
| Pool Corp. | 151 | 51,482 |
| | | 158,050 |
| Diversified Banks - 3.1% |
| Bank of America Corp. | 26,738 | 1,175,135 |
| Citigroup, Inc. | 7,543 | 530,952 |
| Fifth Third Bancorp | 2,653 | 112,169 |
| JPMorgan Chase & Co. | 11,303 | 2,709,442 |
| KeyCorp | 3,987 | 68,337 |
| | Number
of Shares | Fair
Value |
| PNC Financial Services Group, Inc. | 1,586 | $305,860 |
| U.S. Bancorp | 6,014 | 287,650 |
| Wells Fargo & Co. | 13,277 | 932,576 |
| | | 6,122,121 |
| Diversified Financial Services - 0.2% |
| Apollo Global Management, Inc. | 1,800 | 297,288 |
| Diversified Support Services - 0.2% |
| Cintas Corp. | 1,388 | 253,587 |
| Copart, Inc. (a) | 3,576 | 205,227 |
| | | 458,814 |
| Drug Retail - 0.0%* |
| Walgreens Boots Alliance, Inc. | 3,007 | 28,055 |
| Electric Utilities - 1.5% |
| Alliant Energy Corp. | 1,002 | 59,258 |
| American Electric Power Co., Inc. | 2,171 | 200,231 |
| Constellation Energy Corp. | 1,265 | 282,993 |
| Duke Energy Corp. | 2,982 | 321,281 |
| Edison International | 1,623 | 129,580 |
| Entergy Corp. | 1,800 | 136,476 |
| Evergy, Inc. | 888 | 54,656 |
| Eversource Energy | 1,362 | 78,220 |
| Exelon Corp. | 4,140 | 155,830 |
| FirstEnergy Corp. | 1,761 | 70,053 |
| NextEra Energy, Inc. | 8,308 | 595,601 |
| NRG Energy, Inc. | 891 | 80,386 |
| PG&E Corp. | 8,613 | 173,810 |
| Pinnacle West Capital Corp. | 489 | 41,453 |
| PPL Corp. | 3,183 | 103,320 |
| Southern Co. | 4,381 | 360,644 |
| Xcel Energy, Inc. | 2,320 | 156,646 |
| | | 3,000,438 |
| Electrical Components & Equipment - 0.6% |
| AMETEK, Inc. | 968 | 174,492 |
| Eaton Corp. PLC | 1,592 | 528,337 |
| Emerson Electric Co. | 2,244 | 278,099 |
| Generac Holdings, Inc. (a) | 265 | 41,088 |
| Hubbell, Inc. | 200 | 83,778 |
| Rockwell Automation, Inc. | 414 | 118,317 |
| | | 1,224,111 |
See Notes to Schedule of Investments and Notes to Financial Statements.
| State Street S&P 500 Index V.I.S. Fund | 3 |
State Street S&P 500 Index V.I.S. Fund
Schedule of Investments, continued — December 31, 2024
| | Number
of Shares | Fair
Value |
| Electronic Components - 0.2% |
| Amphenol Corp., Class A | 4,780 | $331,971 |
| Corning, Inc. | 3,162 | 150,258 |
| | | 482,229 |
| Electronic Equipment & Instruments - 0.2% |
| Keysight Technologies, Inc. (a) | 691 | 110,995 |
| Teledyne Technologies, Inc. (a) | 194 | 90,041 |
| Trimble, Inc. (a) | 941 | 66,491 |
| Zebra Technologies Corp., Class A (a) | 222 | 85,741 |
| | | 353,268 |
| Electronic Manufacturing Services - 0.1% |
| Jabil, Inc. | 500 | 71,950 |
| TE Connectivity PLC | 1,236 | 176,711 |
| | | 248,661 |
| Environmental & Facilities Services - 0.3% |
| Republic Services, Inc. | 792 | 159,335 |
| Rollins, Inc. | 1,200 | 55,620 |
| Veralto Corp. | 947 | 96,452 |
| Waste Management, Inc. | 1,457 | 294,008 |
| | | 605,415 |
| Fertilizers & Agricultural Chemicals - 0.1% |
| CF Industries Holdings, Inc. | 739 | 63,051 |
| Corteva, Inc. | 2,836 | 161,539 |
| FMC Corp. | 553 | 26,881 |
| Mosaic Co. | 1,427 | 35,076 |
| | | 286,547 |
| Financial Exchanges & Data - 1.1% |
| Cboe Global Markets, Inc. | 438 | 85,585 |
| CME Group, Inc. | 1,454 | 337,663 |
| FactSet Research Systems, Inc. | 157 | 75,404 |
| Intercontinental Exchange, Inc. | 2,333 | 347,640 |
| MarketAxess Holdings, Inc. | 180 | 40,687 |
| Moody's Corp. | 637 | 301,537 |
| MSCI, Inc. | 317 | 190,203 |
| Nasdaq, Inc. | 1,512 | 116,893 |
| S&P Global, Inc. | 1,264 | 629,510 |
| | | 2,125,122 |
| | Number
of Shares | Fair
Value |
| Food Distributors - 0.1% |
| Sysco Corp. | 2,060 | $157,508 |
| Food Retail - 0.1% |
| Kroger Co. | 2,748 | 168,040 |
| Footwear - 0.2% |
| Deckers Outdoor Corp. (a) | 600 | 121,854 |
| NIKE, Inc., Class B | 4,790 | 362,459 |
| | | 484,313 |
| Gas Utilities - 0.0%* |
| Atmos Energy Corp. | 660 | 91,918 |
| Gold - 0.1% |
| Newmont Corp. | 4,524 | 168,383 |
| Health Care REITs - 0.3% |
| Alexandria Real Estate Equities, Inc. | 600 | 58,530 |
| Healthpeak Properties, Inc. | 3,169 | 64,236 |
| Ventas, Inc. | 1,762 | 103,764 |
| Welltower, Inc. | 2,244 | 282,811 |
| | | 509,341 |
| Healthcare Distributors - 0.3% |
| Cardinal Health, Inc. | 954 | 112,830 |
| Cencora, Inc. | 701 | 157,501 |
| Henry Schein, Inc. (a) | 561 | 38,821 |
| McKesson Corp. | 510 | 290,654 |
| | | 599,806 |
| Healthcare Equipment - 2.2% |
| Abbott Laboratories | 6,996 | 791,317 |
| Baxter International, Inc. | 2,181 | 63,598 |
| Becton Dickinson & Co. | 1,152 | 261,354 |
| Boston Scientific Corp. (a) | 5,809 | 518,860 |
| Dexcom, Inc. (a) | 1,654 | 128,632 |
| Edwards Lifesciences Corp. (a) | 2,369 | 175,377 |
| GE HealthCare Technologies, Inc. | 1,721 | 134,548 |
| Hologic, Inc. (a) | 962 | 69,351 |
| IDEXX Laboratories, Inc. (a) | 330 | 136,435 |
| Insulet Corp. (a) | 300 | 78,321 |
| Intuitive Surgical, Inc. (a) | 1,440 | 751,622 |
| Medtronic PLC | 5,198 | 415,216 |
| ResMed, Inc. | 617 | 141,102 |
| STERIS PLC | 400 | 82,224 |
See Notes to Schedule of Investments and Notes to Financial Statements.
| 4 | State Street S&P 500 Index V.I.S. Fund |
State Street S&P 500 Index V.I.S. Fund
Schedule of Investments, continued — December 31, 2024
| | Number
of Shares | Fair
Value |
| Stryker Corp. | 1,348 | $485,347 |
| Teleflex, Inc. | 222 | 39,512 |
| Zimmer Biomet Holdings, Inc. | 862 | 91,053 |
| | | 4,363,869 |
| Healthcare Facilities - 0.1% |
| HCA Healthcare, Inc. | 745 | 223,612 |
| Universal Health Services, Inc., Class B | 241 | 43,240 |
| | | 266,852 |
| Healthcare Services - 0.4% |
| Cigna Group | 1,140 | 314,799 |
| CVS Health Corp. | 4,953 | 222,340 |
| DaVita, Inc. (a) | 158 | 23,629 |
| Labcorp Holdings, Inc. | 293 | 67,191 |
| Quest Diagnostics, Inc. | 458 | 69,094 |
| | | 697,053 |
| Healthcare Supplies - 0.1% |
| Align Technology, Inc. (a) | 287 | 59,842 |
| Cooper Cos., Inc. (a) | 858 | 78,876 |
| Solventum Corp. (a) | 616 | 40,693 |
| | | 179,411 |
| Heavy Electrical Equipment - 0.2% |
| GE Vernova, Inc. | 1,078 | 354,587 |
| Home Building - 0.2% |
| DR Horton, Inc. | 1,211 | 169,322 |
| Lennar Corp., Class A | 967 | 131,870 |
| NVR, Inc. (a) | 12 | 98,147 |
| PulteGroup, Inc. | 807 | 87,882 |
| | | 487,221 |
| Home Furnishings - 0.0%* |
| Mohawk Industries, Inc. (a) | 175 | 20,848 |
| Home Improvement Retail - 1.1% |
| Home Depot, Inc. | 3,980 | 1,548,180 |
| Lowe's Cos., Inc. | 2,279 | 562,457 |
| | | 2,110,637 |
| Hotel & Resort REITs - 0.0%* |
| Host Hotels & Resorts, Inc. | 2,755 | 48,268 |
| Hotels, Resorts & Cruise Lines - 0.9% |
| Airbnb, Inc., Class A (a) | 1,746 | 229,442 |
| Booking Holdings, Inc. | 134 | 665,768 |
| | Number
of Shares | Fair
Value |
| Carnival Corp. (a) | 4,167 | $103,842 |
| Expedia Group, Inc. (a) | 489 | 91,115 |
| Hilton Worldwide Holdings, Inc. | 1,000 | 247,160 |
| Marriott International, Inc., Class A | 926 | 258,299 |
| Norwegian Cruise Line Holdings Ltd. (a) | 1,496 | 38,492 |
| Royal Caribbean Cruises Ltd. | 936 | 215,926 |
| | | 1,850,044 |
| Household Products - 1.1% |
| Church & Dwight Co., Inc. | 869 | 90,993 |
| Clorox Co. | 513 | 83,316 |
| Colgate-Palmolive Co. | 3,205 | 291,367 |
| Kimberly-Clark Corp. | 1,355 | 177,559 |
| Procter & Gamble Co. | 9,471 | 1,587,813 |
| | | 2,231,048 |
| Human Resource & Employment Services - 0.4% |
| Automatic Data Processing, Inc. | 1,656 | 484,761 |
| Dayforce, Inc. (a) | 666 | 48,378 |
| Paychex, Inc. | 1,283 | 179,902 |
| Paycom Software, Inc. | 203 | 41,609 |
| | | 754,650 |
| Independent Power Producers & Energy Traders - 0.1% |
| AES Corp. | 2,716 | 34,955 |
| Vistra Corp. | 1,400 | 193,018 |
| | | 227,973 |
| Industrial Conglomerates - 0.4% |
| 3M Co. | 2,187 | 282,320 |
| Honeywell International, Inc. | 2,594 | 585,958 |
| | | 868,278 |
| Industrial Gases - 0.5% |
| Air Products & Chemicals, Inc. | 863 | 250,305 |
| Linde PLC | 1,906 | 797,985 |
| | | 1,048,290 |
| Industrial Machinery & Supplies & Components - 0.8% |
| Dover Corp. | 526 | 98,678 |
| Fortive Corp. | 1,455 | 109,125 |
| IDEX Corp. | 296 | 61,950 |
| Illinois Tool Works, Inc. | 1,054 | 267,252 |
| Ingersoll Rand, Inc. | 1,662 | 150,345 |
See Notes to Schedule of Investments and Notes to Financial Statements.
| State Street S&P 500 Index V.I.S. Fund | 5 |
State Street S&P 500 Index V.I.S. Fund
Schedule of Investments, continued — December 31, 2024
| | Number
of Shares | Fair
Value |
| Nordson Corp. | 237 | $49,590 |
| Otis Worldwide Corp. | 1,651 | 152,899 |
| Parker-Hannifin Corp. | 514 | 326,919 |
| Pentair PLC | 696 | 70,046 |
| Snap-on, Inc. | 182 | 61,785 |
| Stanley Black & Decker, Inc. | 649 | 52,108 |
| Xylem, Inc. | 957 | 111,031 |
| | | 1,511,728 |
| Industrial REITs - 0.2% |
| Prologis, Inc. | 3,649 | 385,699 |
| Insurance Brokers - 0.6% |
| Aon PLC, Class A | 848 | 304,568 |
| Arthur J Gallagher & Co. | 978 | 277,605 |
| Brown & Brown, Inc. | 940 | 95,899 |
| Marsh & McLennan Cos., Inc. | 2,003 | 425,457 |
| Willis Towers Watson PLC | 405 | 126,862 |
| | | 1,230,391 |
| Integrated Oil & Gas - 1.5% |
| Chevron Corp. | 6,720 | 973,325 |
| Exxon Mobil Corp. | 17,591 | 1,892,264 |
| Occidental Petroleum Corp. | 2,842 | 140,423 |
| | | 3,006,012 |
| Integrated Telecommunication Services - 0.7% |
| AT&T, Inc. | 28,910 | 658,280 |
| Verizon Communications, Inc. | 17,020 | 680,630 |
| | | 1,338,910 |
| Interactive Home Entertainment - 0.1% |
| Electronic Arts, Inc. | 965 | 141,179 |
| Take-Two Interactive Software, Inc. (a) | 685 | 126,095 |
| | | 267,274 |
| Interactive Media & Services - 6.6% |
| Alphabet, Inc., Class A | 23,377 | 4,425,266 |
| Alphabet, Inc., Class C | 19,107 | 3,638,737 |
| Match Group, Inc. (a) | 959 | 31,369 |
| Meta Platforms, Inc., Class A | 8,748 | 5,122,042 |
| | | 13,217,414 |
| Internet Services & Infrastructure - 0.1% |
| Akamai Technologies, Inc. (a) | 614 | 58,729 |
| GoDaddy, Inc., Class A (a) | 555 | 109,541 |
| | Number
of Shares | Fair
Value |
| VeriSign, Inc. (a) | 323 | $66,848 |
| | | 235,118 |
| Investment Banking & Brokerage - 1.0% |
| Charles Schwab Corp. | 5,908 | 437,251 |
| Goldman Sachs Group, Inc. | 1,269 | 726,655 |
| Morgan Stanley | 4,982 | 626,337 |
| Raymond James Financial, Inc. | 723 | 112,303 |
| | | 1,902,546 |
| IT Consulting & Other Services - 1.0% |
| Accenture PLC, Class A | 2,474 | 870,329 |
| Cognizant Technology Solutions Corp., Class A | 1,980 | 152,262 |
| EPAM Systems, Inc. (a) | 173 | 40,451 |
| Gartner, Inc. (a) | 304 | 147,279 |
| International Business Machines Corp. | 3,651 | 802,599 |
| | | 2,012,920 |
| Leisure Products - 0.0%* |
| Hasbro, Inc. | 563 | 31,477 |
| Life & Health Insurance - 0.3% |
| Aflac, Inc. | 1,973 | 204,087 |
| Globe Life, Inc. | 370 | 41,262 |
| MetLife, Inc. | 2,251 | 184,312 |
| Principal Financial Group, Inc. | 911 | 70,521 |
| Prudential Financial, Inc. | 1,480 | 175,424 |
| | | 675,606 |
| Life Sciences Tools & Services - 1.1% |
| Agilent Technologies, Inc. | 1,165 | 156,506 |
| Bio-Techne Corp. | 612 | 44,082 |
| Charles River Laboratories International, Inc. (a) | 226 | 41,720 |
| Danaher Corp. | 2,587 | 593,846 |
| IQVIA Holdings, Inc. (a) | 699 | 137,360 |
| Mettler-Toledo International, Inc. (a) | 85 | 104,013 |
| Revvity, Inc. | 533 | 59,488 |
| Thermo Fisher Scientific, Inc. | 1,531 | 796,472 |
| Waters Corp. (a) | 230 | 85,325 |
| West Pharmaceutical Services, Inc. | 310 | 101,544 |
| | | 2,120,356 |
See Notes to Schedule of Investments and Notes to Financial Statements.
| 6 | State Street S&P 500 Index V.I.S. Fund |
State Street S&P 500 Index V.I.S. Fund
Schedule of Investments, continued — December 31, 2024
| | Number
of Shares | Fair
Value |
| Managed Healthcare - 1.3% |
| Centene Corp. (a) | 2,124 | $128,672 |
| Elevance Health, Inc. | 943 | 347,873 |
| Humana, Inc. | 489 | 124,064 |
| Molina Healthcare, Inc. (a) | 252 | 73,345 |
| UnitedHealth Group, Inc. | 3,696 | 1,869,658 |
| | | 2,543,612 |
| Metal, Glass & Plastic Containers - 0.0%* |
| Ball Corp. | 1,174 | 64,723 |
| Movies & Entertainment - 1.3% |
| Live Nation Entertainment, Inc. (a) | 639 | 82,750 |
| Netflix, Inc. (a) | 1,721 | 1,533,962 |
| Walt Disney Co. | 7,226 | 804,615 |
| Warner Bros Discovery, Inc. (a) | 9,394 | 99,295 |
| | | 2,520,622 |
| Multi-Family Residential REITs - 0.2% |
| AvalonBay Communities, Inc. | 520 | 114,385 |
| Camden Property Trust | 400 | 46,416 |
| Equity Residential | 1,384 | 99,316 |
| Essex Property Trust, Inc. | 248 | 70,789 |
| Mid-America Apartment Communities, Inc. | 434 | 67,083 |
| UDR, Inc. | 1,307 | 56,737 |
| | | 454,726 |
| Multi-Line Insurance - 0.1% |
| American International Group, Inc. | 2,559 | 186,295 |
| Multi-Sector Holdings - 1.7% |
| Berkshire Hathaway, Inc., Class B (a) | 7,361 | 3,336,594 |
| Multi-Utilities - 0.6% |
| Ameren Corp. | 1,067 | 95,112 |
| CenterPoint Energy, Inc. | 2,726 | 86,496 |
| CMS Energy Corp. | 1,200 | 79,980 |
| Consolidated Edison, Inc. | 1,442 | 128,670 |
| Dominion Energy, Inc. | 3,280 | 176,661 |
| DTE Energy Co. | 702 | 84,766 |
| NiSource, Inc. | 1,785 | 65,617 |
| Public Service Enterprise Group, Inc. | 2,060 | 174,049 |
| Sempra | 2,522 | 221,230 |
| | Number
of Shares | Fair
Value |
| WEC Energy Group, Inc. | 1,327 | $124,791 |
| | | 1,237,372 |
| Office REITs - 0.0%* |
| BXP, Inc. | 678 | 50,416 |
| Oil & Gas Equipment & Services - 0.2% |
| Baker Hughes Co. | 3,929 | 161,168 |
| Halliburton Co. | 3,544 | 96,361 |
| Schlumberger NV | 5,543 | 212,519 |
| | | 470,048 |
| Oil & Gas Exploration & Production - 0.7% |
| APA Corp. | 1,668 | 38,514 |
| ConocoPhillips | 5,171 | 512,808 |
| Coterra Energy, Inc. | 3,158 | 80,656 |
| Devon Energy Corp. | 2,567 | 84,018 |
| Diamondback Energy, Inc. | 694 | 113,698 |
| EOG Resources, Inc. | 2,259 | 276,908 |
| EQT Corp. | 2,500 | 115,275 |
| Hess Corp. | 1,122 | 149,237 |
| Texas Pacific Land Corp. | 76 | 84,053 |
| | | 1,455,167 |
| Oil & Gas Refining & Marketing - 0.3% |
| Marathon Petroleum Corp. | 1,265 | 176,468 |
| Phillips 66 Co. | 1,723 | 196,301 |
| Valero Energy Corp. | 1,290 | 158,141 |
| | | 530,910 |
| Oil & Gas Storage & Transportation - 0.4% |
| Kinder Morgan, Inc. | 7,642 | 209,391 |
| ONEOK, Inc. | 2,317 | 232,627 |
| Targa Resources Corp. | 893 | 159,400 |
| Williams Cos., Inc. | 4,626 | 250,359 |
| | | 851,777 |
| Other Specialized REITs - 0.1% |
| Iron Mountain, Inc. | 1,186 | 124,661 |
| VICI Properties, Inc. | 4,029 | 117,687 |
| | | 242,348 |
| Other Specialty Retail - 0.1% |
| Tractor Supply Co. | 2,113 | 112,116 |
| Ulta Beauty, Inc. (a) | 185 | 80,462 |
| | | 192,578 |
See Notes to Schedule of Investments and Notes to Financial Statements.
| State Street S&P 500 Index V.I.S. Fund | 7 |
State Street S&P 500 Index V.I.S. Fund
Schedule of Investments, continued — December 31, 2024
| | Number
of Shares | Fair
Value |
| Packaged Foods & Meats - 0.5% |
| Campbell's Co. | 776 | $32,499 |
| Conagra Brands, Inc. | 1,941 | 53,863 |
| General Mills, Inc. | 2,252 | 143,610 |
| Hershey Co. | 563 | 95,344 |
| Hormel Foods Corp. | 1,297 | 40,687 |
| J.M. Smucker Co. | 459 | 50,545 |
| Kellanova | 886 | 71,739 |
| Kraft Heinz Co. | 3,317 | 101,865 |
| Lamb Weston Holdings, Inc. | 568 | 37,959 |
| McCormick & Co., Inc. | 1,028 | 78,375 |
| Mondelez International, Inc., Class A | 5,257 | 314,001 |
| Tyson Foods, Inc., Class A | 1,173 | 67,377 |
| | | 1,087,864 |
| Paper & Plastic Packaging Products & Materials - 0.2% |
| Amcor PLC | 5,636 | 53,035 |
| Avery Dennison Corp. | 351 | 65,683 |
| International Paper Co. | 1,399 | 75,294 |
| Packaging Corp. of America | 389 | 87,575 |
| Smurfit WestRock PLC | 2,028 | 109,228 |
| | | 390,815 |
| Passenger Airlines - 0.2% |
| Delta Air Lines, Inc. | 2,552 | 154,396 |
| Southwest Airlines Co. | 2,270 | 76,317 |
| United Airlines Holdings, Inc. (a) | 1,288 | 125,065 |
| | | 355,778 |
| Passenger Ground Transportation - 0.3% |
| Uber Technologies, Inc. (a) | 8,410 | 507,291 |
| Personal Care Products - 0.1% |
| Estee Lauder Cos., Inc., Class A | 1,010 | 75,730 |
| Kenvue, Inc. | 8,008 | 170,971 |
| | | 246,701 |
| Pharmaceuticals - 3.1% |
| Bristol-Myers Squibb Co. | 8,110 | 458,702 |
| Eli Lilly & Co. | 3,170 | 2,447,240 |
| Johnson & Johnson | 9,680 | 1,399,921 |
| Merck & Co., Inc. | 10,110 | 1,005,743 |
| Pfizer, Inc. | 22,782 | 604,406 |
| Viatris, Inc. | 4,835 | 60,196 |
| | Number
of Shares | Fair
Value |
| Zoetis, Inc. | 1,782 | $290,341 |
| | | 6,266,549 |
| Property & Casualty Insurance - 1.0% |
| Allstate Corp. | 1,033 | 199,152 |
| Arch Capital Group Ltd. | 1,502 | 138,710 |
| Assurant, Inc. | 152 | 32,410 |
| Chubb Ltd. | 1,518 | 419,423 |
| Cincinnati Financial Corp. | 623 | 89,525 |
| Erie Indemnity Co., Class A | 100 | 41,223 |
| Hartford Financial Services Group, Inc. | 1,207 | 132,046 |
| Loews Corp. | 746 | 63,179 |
| Progressive Corp. | 2,346 | 562,125 |
| Travelers Cos., Inc. | 899 | 216,560 |
| W.R. Berkley Corp. | 1,212 | 70,926 |
| | | 1,965,279 |
| Publishing - 0.0%* |
| News Corp., Class A | 1,664 | 45,826 |
| News Corp., Class B | 348 | 10,590 |
| | | 56,416 |
| Rail Transportation - 0.5% |
| CSX Corp. | 7,633 | 246,317 |
| Norfolk Southern Corp. | 874 | 205,128 |
| Union Pacific Corp. | 2,436 | 555,505 |
| | | 1,006,950 |
| Real Estate Services - 0.1% |
| CBRE Group, Inc., Class A (a) | 1,220 | 160,174 |
| CoStar Group, Inc. (a) | 1,700 | 121,703 |
| | | 281,877 |
| Regional Banks - 0.3% |
| Citizens Financial Group, Inc. | 1,800 | 78,768 |
| Huntington Bancshares, Inc. | 5,728 | 93,194 |
| M&T Bank Corp. | 657 | 123,523 |
| Regions Financial Corp. | 3,805 | 89,494 |
| Truist Financial Corp. | 5,422 | 235,206 |
| | | 620,185 |
| Reinsurance - 0.0%* |
| Everest Group Ltd. | 152 | 55,094 |
| Research & Consulting Services - 0.2% |
| Equifax, Inc. | 508 | 129,464 |
| Jacobs Solutions, Inc. | 548 | 73,224 |
| Leidos Holdings, Inc. | 524 | 75,487 |
See Notes to Schedule of Investments and Notes to Financial Statements.
| 8 | State Street S&P 500 Index V.I.S. Fund |
State Street S&P 500 Index V.I.S. Fund
Schedule of Investments, continued — December 31, 2024
| | Number
of Shares | Fair
Value |
| Verisk Analytics, Inc. | 513 | $141,296 |
| | | 419,471 |
| Restaurants - 0.9% |
| Chipotle Mexican Grill, Inc. (a) | 5,500 | 331,650 |
| Darden Restaurants, Inc. | 493 | 92,038 |
| Domino's Pizza, Inc. | 137 | 57,507 |
| McDonald's Corp. | 2,895 | 839,232 |
| Starbucks Corp. | 4,446 | 405,697 |
| Yum! Brands, Inc. | 1,110 | 148,918 |
| | | 1,875,042 |
| Retail REITs - 0.3% |
| Federal Realty Investment Trust | 317 | 35,488 |
| Kimco Realty Corp. | 2,766 | 64,807 |
| Realty Income Corp. | 3,365 | 179,725 |
| Regency Centers Corp. | 620 | 45,837 |
| Simon Property Group, Inc. | 1,197 | 206,135 |
| | | 531,992 |
| Self Storage REITs - 0.2% |
| Extra Space Storage, Inc. | 812 | 121,475 |
| Public Storage | 642 | 192,241 |
| | | 313,716 |
| Semiconductor Materials & Equipment - 0.7% |
| Applied Materials, Inc. | 3,293 | 535,540 |
| Enphase Energy, Inc. (a) | 600 | 41,208 |
| KLA Corp. | 547 | 344,676 |
| Lam Research Corp. | 5,138 | 371,118 |
| Teradyne, Inc. | 677 | 85,248 |
| | | 1,377,790 |
| Semiconductors - 10.8% |
| Advanced Micro Devices, Inc. (a) | 6,549 | 791,054 |
| Analog Devices, Inc. | 2,022 | 429,594 |
| Broadcom, Inc. | 18,764 | 4,350,246 |
| First Solar, Inc. (a) | 400 | 70,496 |
| Intel Corp. | 17,155 | 343,958 |
| Microchip Technology, Inc. | 2,233 | 128,063 |
| Micron Technology, Inc. | 4,423 | 372,240 |
| Monolithic Power Systems, Inc. | 193 | 114,198 |
| NVIDIA Corp. | 98,436 | 13,218,970 |
| NXP Semiconductors NV | 1,013 | 210,552 |
| ON Semiconductor Corp. (a) | 1,799 | 113,427 |
| QUALCOMM, Inc. | 4,446 | 682,994 |
| | Number
of Shares | Fair
Value |
| Skyworks Solutions, Inc. | 636 | $56,400 |
| Texas Instruments, Inc. | 3,626 | 679,911 |
| | | 21,562,103 |
| Single-Family Residential REITs - 0.0%* |
| Invitation Homes, Inc. | 2,500 | 79,925 |
| Soft Drinks & Non-alcoholic Beverages - 1.0% |
| Coca-Cola Co. | 15,488 | 964,283 |
| Keurig Dr. Pepper, Inc. | 4,313 | 138,534 |
| Monster Beverage Corp. (a) | 2,779 | 146,064 |
| PepsiCo, Inc. | 5,526 | 840,283 |
| | | 2,089,164 |
| Specialty Chemicals - 0.5% |
| Albemarle Corp. | 441 | 37,961 |
| Celanese Corp. | 473 | 32,736 |
| DuPont de Nemours, Inc. | 1,643 | 125,279 |
| Eastman Chemical Co. | 441 | 40,272 |
| Ecolab, Inc. | 971 | 227,525 |
| International Flavors & Fragrances, Inc. | 1,082 | 91,483 |
| PPG Industries, Inc. | 988 | 118,017 |
| Sherwin-Williams Co. | 910 | 309,336 |
| | | 982,609 |
| Steel - 0.1% |
| Nucor Corp. | 976 | 113,909 |
| Steel Dynamics, Inc. | 626 | 71,408 |
| | | 185,317 |
| Systems Software - 7.8% |
| Crowdstrike Holdings, Inc., Class A (a) | 900 | 307,944 |
| Fortinet, Inc. (a) | 2,501 | 236,294 |
| Gen Digital, Inc. | 2,420 | 66,260 |
| Microsoft Corp. | 29,835 | 12,575,453 |
| Oracle Corp. | 6,399 | 1,066,329 |
| Palo Alto Networks, Inc. (a) | 2,602 | 473,460 |
| ServiceNow, Inc. (a) | 832 | 882,020 |
| | | 15,607,760 |
| Technology Distributors - 0.0%* |
| CDW Corp. | 500 | 87,020 |
| Technology Hardware, Storage & Peripherals - 7.9% |
| ABIOMED, Inc. (a) | 199 | 203 |
| Apple, Inc. | 60,622 | 15,180,961 |
See Notes to Schedule of Investments and Notes to Financial Statements.
| State Street S&P 500 Index V.I.S. Fund | 9 |
State Street S&P 500 Index V.I.S. Fund
Schedule of Investments, continued — December 31, 2024
| | Number
of Shares | Fair
Value |
| Dell Technologies, Inc., Class C | 1,234 | $142,206 |
| Hewlett Packard Enterprise Co. | 5,333 | 113,860 |
| HP, Inc. | 3,529 | 115,151 |
| NetApp, Inc. | 873 | 101,338 |
| Seagate Technology Holdings PLC | 815 | 70,343 |
| Super Micro Computer, Inc. (a) | 2,000 | 60,960 |
| Western Digital Corp. (a) | 1,358 | 80,977 |
| | | 15,865,999 |
| Telecom Tower REITs - 0.3% |
| American Tower Corp. | 1,884 | 345,544 |
| Crown Castle, Inc. | 1,673 | 151,842 |
| SBA Communications Corp. | 455 | 92,729 |
| | | 590,115 |
| Timber REITs - 0.0%* |
| Weyerhaeuser Co. | 3,043 | 85,660 |
| Tobacco - 0.6% |
| Altria Group, Inc. | 6,806 | 355,886 |
| Philip Morris International, Inc. | 6,223 | 748,938 |
| | | 1,104,824 |
| Trading Companies & Distributors - 0.3% |
| Fastenal Co. | 2,305 | 165,753 |
| United Rentals, Inc. | 267 | 188,085 |
| WW Grainger, Inc. | 175 | 184,459 |
| | | 538,297 |
| | Number
of Shares | Fair
Value |
| Transaction & Payment Processing Services - 2.6% |
| Corpay, Inc. (a) | 279 | $94,419 |
| Fidelity National Information Services, Inc. | 2,147 | 173,413 |
| Fiserv, Inc. (a) | 2,299 | 472,260 |
| Global Payments, Inc. | 1,029 | 115,310 |
| Jack Henry & Associates, Inc. | 249 | 43,650 |
| Mastercard, Inc., Class A | 3,285 | 1,729,782 |
| PayPal Holdings, Inc. (a) | 4,028 | 343,790 |
| Visa, Inc., Class A | 6,895 | 2,179,096 |
| | | 5,151,720 |
| Water Utilities - 0.1% |
| American Water Works Co., Inc. | 817 | 101,708 |
| Wireless Telecommunication Services - 0.2% |
| T-Mobile U.S., Inc. | 1,922 | 424,243 |
Total Common Stock
(Cost $49,101,099) | | 199,703,279 |
| Short-Term Investments - 0.4% |
State Street Institutional U.S. Government Money Market Fund - Class G Shares 4.47% (b)(d)(e)
(Cost $820,009) | 820,009 | 820,009 |
Total Investments
(Cost $49,921,108) | | 200,523,288 |
| Liabilities in Excess of Other Assets, net - (0.2)% | | (374,165) |
| NET ASSETS - 100.0% | | $200,149,123 |
Other Information:
| The Fund had the following long futures contracts open at December 31, 2024: |
| Description | Expiration
Date | Number of
Contracts | Notional
Amount | Value | Unrealized
Appreciation
(Depreciation) |
| S&P 500 E-mini Index Futures | March 2025 | 4 | $1,228,451 | $1,187,139 | $(41,312) |
During the year ended December 31, 2024, the average notional value related to long futures contracts was $2,712,638.
See Notes to Schedule of Investments and Notes to Financial Statements.
| 10 | State Street S&P 500 Index V.I.S. Fund |
State Street S&P 500 Index V.I.S. Fund
Schedule of Investments, continued — December 31, 2024
Notes to Schedule of Investments
The views expressed in this document reflect our judgment as of the publication date and are subject to change at any time without notice. The securities cited may not be representative of the Fund’s future investments and should not be construed as a recommendation to purchase or sell a particular security. See the Fund’s summary prospectus and statutory prospectus for complete descriptions of investment objectives, policies, risks and permissible investments.
| (a) | Non-income producing security. |
| (b) | At December 31, 2024, all or a portion of this security was pledged to cover collateral requirements for futures contracts. |
| (c) | State Street Corporation is the parent company of SSGA Funds Management, Inc., the Fund's investment adviser and administrator, and State Street Bank & Trust Co., the Fund’s sub-administrator, custodian and accounting agent. |
| (d) | Sponsored by SSGA Funds Management, Inc., the Fund’s investment adviser and administrator, and an affiliate of State Street Bank & Trust Co., the Fund’s sub-administrator, custodian and accounting agent. |
| (e) | Coupon amount represents effective yield. |
| † | Percentages are based on net assets as of December 31, 2024. |
| * | Less than 0.05%. |
| Abbreviations: |
| REIT - Real Estate Investment Trust |
The following table presents the Fund’s investments measured at fair value on a recurring basis at December 31, 2024:
| Investments | Level 1 | | Level 2 | | Level 3 | | Total |
| Investments in Securities | | | | | | | |
| Common Stock | $199,703,076 | | $203 | | $— | | $199,703,279 |
| Short-Term Investments | 820,009 | | — | | — | | 820,009 |
| Total Investments in Securities | $200,523,085 | | $203 | | $— | | $200,523,288 |
| Other Financial Instruments | | | | | | | |
| Long Futures Contracts - Unrealized Depreciation | $(41,312) | | $— | | $— | | $(41,312) |
| Total Other Financial Instruments | $(41,312) | | $— | | $— | | $(41,312) |
| | Number
of Shares
Held at
12/31/23 | Value at
12/31/23 | | Cost of
Purchases | | Proceeds
from
Shares
Sold | | Realized
Gain
(Loss) | | Change in
Unrealized
Appreciation
(Depreciation) | Number of
Shares
Held at
12/31/24 | Value at
12/31/24 | | Dividend
Income |
| State Street Corp. | 1,468 | $113,711 | | $— | | $28,414 | | $8,741 | | $16,086 | 1,122 | $110,124 | | $2,778 |
| State Street Institutional Liquid Reserves Fund, Premier Class | 2,954,234 | 2,955,416 | | 18,061,919 | | 21,017,803 | | 635 | | (167) | — | — | | 93,511 |
| State Street Institutional U.S. Government Money Market Fund - Class G Shares | — | — | | 8,570,127 | | 7,750,118 | | — | | — | 820,009 | 820,009 | | 45,695 |
| TOTAL | | $3,069,127 | | $26,632,046 | | $28,796,335 | | $9,376 | | $15,919 | | $930,133 | | $141,984 |
See Notes to Schedule of Investments and Notes to Financial Statements.
| State Street S&P 500 Index V.I.S. Fund | 11 |
State Street S&P 500 Index V.I.S. Fund
Financial Highlights
Selected data based on a share outstanding throughout the fiscal years indicated
| | 12/31/24 | | 12/31/23 | | 12/31/22 | | 12/31/21 | | 12/31/20 |
| Inception date | | | 4/15/85 |
| Net asset value, beginning of period | $48.26 | | $40.12 | | $57.58 | | $49.96 | | $46.61 |
| Income/(loss) from investment operations: | | | | | | | | | |
| Net investment income(a) | 0.62 | | 0.64 | | 0.65 | | 0.60 | | 0.72 |
| Net realized and unrealized gains/(losses) on investments | 11.35 | | 9.78 | | (11.22) | | 13.56 | | 7.61 |
| Total income/(loss) from investment operations | 11.97 | | 10.42 | | (10.57) | | 14.16 | | 8.33 |
| Less distributions from: | | | | | | | | | |
| Net investment income | (0.65) | | (0.63) | | (0.68) | | (0.66) | | (0.88) |
| Net realized gains | (4.99) | | (1.65) | | (6.21) | | (5.88) | | (4.10) |
| Total distributions | (5.64) | | (2.28) | | (6.89) | | (6.54) | | (4.98) |
| Net asset value, end of period | $54.59 | | $48.26 | | $40.12 | | $57.58 | | $49.96 |
| Total Return(b) | 24.63% | | 25.96% | | (18.31)% | | 28.27% | | 17.92% |
| Ratios/Supplemental Data: | | | | | | | | | |
| Net assets, end of period (in thousands) | $200,149 | | $182,157 | | $146,235 | | $208,535 | | $184,164 |
| Ratios to average net assets: | | | | | | | | | |
| Gross expenses | 0.30% | | 0.31% | | 0.32% | | 0.31% | | 0.31% |
| Net investment income | 1.12% | | 1.42% | | 1.29% | | 1.06% | | 1.54% |
| Portfolio turnover rate | 2% | | 6% | | 5% | | 2% | | 3% |
| Notes to Financial Highlights |
| (a) | Per share values have been calculated using the average shares method. |
| (b) | Total returns are historical and assume changes in share price, reinvestment of dividends and capital gains distributions and do not include the effect of insurance contract charges. Past performance does not guarantee future results. |
The accompanying Notes are an integral part of these financial statements.
State Street S&P 500 Index V.I.S. Fund
Statement of Assets and Liabilities — December 31, 2024
| Assets | |
| Investments in unaffiliated securities, at fair value (cost $49,052,640) | $199,593,155 |
| Investments in affiliated securities, at fair value (cost $868,468) | 930,133 |
| Cash | 67,435 |
| Net cash collateral on deposit with broker for future contracts | 118,925 |
| Income receivables | 130,500 |
| Receivable for fund shares sold | 6,087 |
| Other assets | 1,228 |
| Total assets | 200,847,463 |
| Liabilities | |
| Payable for fund shares redeemed | 564,681 |
| Payable for accumulated variation margin on futures contracts | 41,301 |
| Payable to the Adviser | 43,734 |
| Payable for custody, fund accounting and sub-administration fees | 15,053 |
| Accrued other expenses | 33,571 |
| Total liabilities | 698,340 |
|
| Net Assets | $200,149,123 |
| Net Assets Consist of: | |
| Capital paid in | $51,271,432 |
| Total distributable earnings (loss) | 148,877,691 |
| Net Assets | $200,149,123 |
| Shares outstanding ($0.01 par value; unlimited shares authorized) | 3,666,522 |
| Net asset value per share | $54.59 |
The accompanying Notes are an integral part of these financial statements.
| Statement of Assets and Liabilities | 13 |
State Street S&P 500 Index V.I.S. Fund
Statement of Operations — For the year ended December 31, 2024
| Investment Income | |
| Income | |
| Dividend | $2,624,905 |
| Interest | 6,257 |
| Income from affiliated investments | 141,984 |
| Less: Foreign taxes withheld | (653) |
| Total income | 2,772,493 |
| Expenses | |
| Advisory and administration fees | 486,755 |
| Directors' fees | 22,150 |
| Custody, fund accounting and sub-administration fees | 40,793 |
| Professional fees | 22,193 |
| Printing and shareholder reports | 6,620 |
| Other expenses | 8,241 |
| Total expenses | 586,752 |
| Net investment income (loss) | $2,185,741 |
| Net Realized and Unrealized Gain (Loss) on Investments | |
| Realized gain (loss) on: | |
| Unaffiliated investments | $14,373,580 |
| Affiliated investments | 9,376 |
| Futures | 717,482 |
| Increase (decrease) in unrealized appreciation/depreciation on: | |
| Unaffiliated investments | 25,098,822 |
| Affiliated investments | 15,919 |
| Futures | (130,420) |
| Net realized and unrealized gain (loss) on investments | 40,084,759 |
| Net Increase (Decrease) in Net Assets Resulting from Operations | $42,270,500 |
The accompanying Notes are an integral part of these financial statements.
| 14 | Statement of Operations |
State Street S&P 500 Index V.I.S. Fund
Statements of Changes in Net Assets
| | Year Ended
December 31,
2024 | | Year Ended
December 31,
2023 |
| Increase (Decrease) in Net Assets | | | |
| Operations: | | | |
| Net investment income (loss) | $2,185,741 | | $2,289,334 |
| Net realized gain (loss) on investments and futures | 15,100,438 | | 3,249,627 |
| Net increase (decrease) in unrealized appreciation/depreciation on investments and futures | 24,984,321 | | 31,763,856 |
| Net increase (decrease) from operations | 42,270,500 | | 37,302,817 |
| Distributions to shareholders: | | | |
| Total distributions | (18,833,754) | | (8,223,707) |
| Increase (decrease) in assets from operations and distributions | 23,436,746 | | 29,079,110 |
| Share transactions: | | | |
| Proceeds from sale of shares | 4,123,551 | | 19,116,934 |
| Value of distributions reinvested | 18,833,754 | | 8,223,707 |
| Cost of shares redeemed | (28,401,499) | | (20,498,253) |
| Net increase (decrease) from share transactions | (5,444,194) | | 6,842,388 |
| Total increase (decrease) in net assets | 17,992,552 | | 35,921,498 |
| Net Assets | | | |
| Beginning of year | 182,156,571 | | 146,235,073 |
| End of year | $200,149,123 | | $182,156,571 |
| Changes in Fund Shares | | | |
| Shares sold | 71,092 | | 418,923 |
| Issued for distributions reinvested | 339,898 | | 170,263 |
| Shares redeemed | (518,714) | | (459,622) |
| Net increase (decrease) in fund shares | (107,724) | | 129,564 |
The accompanying Notes are an integral part of these financial statements.
| Statements of Changes in Net Assets | 15 |
State Street S&P 500 Index V.I.S. Fund
Notes to Financial Statements — December 31, 2024
1.Organization of the Company
State Street Variable Insurance Series Funds, Inc. (the “Company”) was incorporated under the laws of the Commonwealth of Virginia on May 14, 1984 and is registered under the Investment Company Act of 1940, as amended (the “1940 Act”), as an open-end management investment company. The Company is currently composed of the following seven investment portfolios (collectively, the “Funds”): State Street U.S. Equity V.I.S. Fund, State Street S&P 500 Index V.I.S. Fund (the “Fund”), State Street Premier Growth Equity V.I.S. Fund, State Street Small-Cap Equity V.I.S. Fund, State Street Total Return V.I.S. Fund, State Street Income V.I.S. Fund and State Street Real Estate Securities V.I.S. Fund. Each Fund is a diversified investment company within the meaning of the 1940 Act, except for the State Street Premier Growth Equity V.I.S. Fund, which is a non-diversified investment company.
Shares of the Funds of the Company are offered only to insurance company separate accounts that fund certain variable life insurance contracts and variable annuity contracts.
The Company currently offers one share class (Class 1) of the Fund as an investment option for variable life insurance and variable annuity contracts.
Under the Company’s organizational documents, its officers and directors are indemnified against certain liabilities arising out of the performance of their duties to the Company. Additionally, in the normal course of business, the Company enters into contracts with service providers that contain general indemnification clauses. The Company’s maximum exposure under these arrangements is unknown as this would involve future claims that may be made against the Company that have not yet occurred.
2.Segment Reporting
The Fund has one reportable segment. Business activities are managed on a consolidated basis and revenues are derived primarily through the Fund’s investments in accordance with its investment objective. The Fund’s chief operating decision maker (“CODM”) is the President of the Company. The CODM assesses performance based on the Fund’s Total Return as reported in the Financial Highlights, and the same accounting policies are applied as described in the summary of significant accounting policies. The Fund’s Total Return is utilized by the CODM to compare results, including the impact of the Fund’s costs, to the Fund’s competitors and to the Fund’s benchmark index.
3.Summary of Significant Accounting Policies
The following is a summary of significant accounting policies followed by the Company in the preparation of its financial statements:
The preparation of financial statements in accordance with U.S. generally accepted accounting principles (“U.S. GAAP”) requires management to make estimates and assumptions that affect the reported amounts and disclosures in the financial statements. Actual results could differ from those estimates. The Fund is an investment company under U.S. GAAP and follows the accounting and reporting guidance applicable to investment companies.
Security Valuation The Fund’s investments are valued at fair value each day that the New York Stock Exchange (“NYSE”) is open and, for financial reporting purposes, as of the report date should the reporting period end on a day that the NYSE is not open. Fair value is generally defined as the price a fund would receive to sell an asset or pay to transfer a liability in an orderly transaction between market participants at the measurement date. By its nature, a fair value price is a good faith estimate of the valuation in a current sale and may not reflect an actual market price. The investments of the Fund are valued pursuant to the policy and procedures developed by the Oversight Committee (the “Committee”) and approved by the Company's Board of Directors (the “Board”). The Committee provides oversight of the valuation of investments for the Fund. The Board has responsibility for overseeing the determination of the fair value of investments.
Valuation techniques used to value the Fund’s investments by major category are as follows:
| 16 | Notes to Financial Statements |
State Street S&P 500 Index V.I.S. Fund
Notes to Financial Statements, continued — December 31, 2024
| • | Equity investments traded on a recognized securities exchange for which market quotations are readily available are valued at the last sale price or official closing price, as applicable, on the primary market or exchange on which they trade. Equity investments traded on a recognized exchange for which there were no sales on that day are valued at the last published sale price or at fair value. |
| • | Rights and warrants are valued at the last reported sale price obtained from independent pricing services or brokers on the valuation date. If no price is obtained from pricing services or brokers, valuation will be based upon the intrinsic value pursuant to the valuation policy and procedures approved by the Board. |
| • | Investments in registered investment companies (including money market funds) or other unitized pooled investment vehicles that are not traded on an exchange are valued at that day’s published net asset value (“NAV”) per share or unit. |
| • | Exchange-traded futures contracts are valued at the closing settlement price on the primary market on which they are traded most extensively. Exchange-traded futures contracts traded on a recognized exchange for which there were no sales on that day are valued at the last reported sale price obtained from independent pricing services or brokers or at fair value. |
In the event prices or quotations are not readily available or that the application of these valuation methods results in a price for an investment that is deemed to be not representative of the fair value of such investment, fair value will be determined in good faith by the Committee, in accordance with the valuation policy and procedures approved by the Board.
The Fund values its assets and liabilities at fair value using a fair value hierarchy consisting of three broad levels that prioritize the inputs to valuation techniques giving the highest priority to readily available unadjusted quoted prices in active markets for identical assets or liabilities (Level 1 measurements) and the lowest priority to unobservable inputs (Level 3 measurements) when market prices are not readily available or reliable. The categorization of a value determined for an investment within the hierarchy is based upon the pricing transparency of the investment and is not necessarily an indication of the risk associated with investing in it.
The three levels of the fair value hierarchy are as follows:
| • | Level 1 — Unadjusted quoted prices in active markets for an identical asset or liability; |
| • | Level 2 — Inputs other than quoted prices included within Level 1 that are observable for the asset or liability either directly or indirectly, including quoted prices for similar assets or liabilities in active markets, quoted prices for identical or similar assets or liabilities in markets that are not considered to be active, inputs other than quoted prices that are observable for the asset or liability (such as exchange rates, financing terms, interest rates, yield curves, volatilities, prepayment speeds, loss severities, credit risks and default rates) or other market-corroborated inputs; and |
| • | Level 3 — Unobservable inputs for the asset or liability, including the Committee’s assumptions used in determining the fair value of investments. |
The value of the Fund’s investments according to the fair value hierarchy as of December 31, 2024 is disclosed in the Fund’s Schedule of Investments.
Investment Transactions and Income Recognition Investment transactions are accounted for on trade date for financial reporting purposes. Realized gains and losses from the sale or disposition of investments and foreign exchange transactions, if any, are determined using the identified cost method.
Dividend income and capital gain distributions, if any, are recognized on the ex-dividend date, net of any foreign taxes withheld at source, if any.
Interest income is recorded daily on an accrual basis. All premiums and discounts are amortized/accreted for financial reporting purposes.
Non-cash dividends received in the form of stock are recorded as dividend income at fair value.
| Notes to Financial Statements | 17 |
State Street S&P 500 Index V.I.S. Fund
Notes to Financial Statements, continued — December 31, 2024
The Fund invests in real estate investment trusts (“REITs”). REITs determine the tax character of their distributions annually and may characterize a portion of their distributions as a return of capital or capital gain. The Fund’s policy is to record all REIT distributions initially as dividend income and re-designate a portion to return of capital or capital gain distributions at year-end based on information provided by the REIT and/or SSGA Funds Management, Inc.’s (the “Adviser” or “SSGA FM”) estimates of such re-designations for which actual information has not yet been reported.
Expenses Certain expenses, which are directly identifiable to a specific Fund, are applied to the Fund within the Company. Other expenses which cannot be attributed to a specific Fund are allocated in such a manner as deemed equitable, taking into consideration the nature and type of expense and the relative net assets of the Fund within the Company.
Distributions The Fund declares and pays any dividends from net investment income annually.
Net realized capital gains, if any, are distributed annually, unless additional distributions are required for compliance with applicable tax regulations. The amount and character of income and capital gains to be distributed are determined in accordance with applicable tax regulations which may differ from net investment income and realized gains recognized for U.S. GAAP purposes.
4.Derivative Financial Instruments
Futures Contracts The Fund may enter into futures contracts to meet the Fund’s objectives. A futures contract is a standardized, exchange-traded agreement to buy or sell a financial instrument at a set price on a future date. Upon entering into a futures contract, the Fund is required to deposit with the broker, cash or securities in an amount equal to the minimum initial margin requirements of the clearing house. Securities deposited, if any, are designated on the Schedule of Investments and cash deposited, if any, is included in Net cash collateral on deposit with broker for future contracts on the Statement of Assets and Liabilities. Subsequent payments are made or received by the Fund equal to the daily change in the contract value, accumulated, exchange rates, and/or other transactional fees. The accumulation of those payments are recorded as variation margin receivable or payable with a corresponding offset to unrealized gains or losses. The Fund recognizes a realized gain or loss when the contract is closed.
Losses may arise if the value of a futures contract decreases due to unfavorable changes in the market rates or values of the underlying instrument during the term of the contract or if the counterparty does not perform under the contract. The use of futures contracts also involves the risk that the movements in the price of the futures contracts do not correlate with the movement of the assets underlying such contracts.
For the fiscal year ended December 31, 2024, the Fund entered into futures contracts for cash equitization.
The following tables summarize the value of the Fund’s derivative instruments as of December 31, 2024 and the related location in the accompanying Statement of Assets and Liabilities and Statement of Operations, presented by primary underlying risk exposure:
| Liability Derivatives |
| | Interest
Rate
Risk | Foreign
Exchange
Risk | Credit
Risk | Equity
Risk | Commodity
Risk | Total |
| State Street S&P 500 Index V.I.S. Fund | | | | | | |
| Futures Contracts | $— | $— | $— | $41,301 | $— | $41,301 |
| 18 | Notes to Financial Statements |
State Street S&P 500 Index V.I.S. Fund
Notes to Financial Statements, continued — December 31, 2024
| Realized Gain (Loss) |
| | Interest
Rate
Risk | Foreign
Exchange
Risk | Credit
Risk | Equity
Risk | Commodity
Risk | Total |
| State Street S&P 500 Index V.I.S. Fund | | | | | | |
| Futures Contracts | $— | $— | $— | $717,482 | $— | $717,482 |
| Net Change in Unrealized Appreciation/Depreciation |
| | Interest
Rate
Risk | Foreign
Exchange
Risk | Credit
Risk | Equity
Risk | Commodity
Risk | Total |
| State Street S&P 500 Index V.I.S. Fund | | | | | | |
| Futures Contracts | $— | $— | $— | $(130,420) | $— | $(130,420) |
5.Fees and Transactions with Affiliates
Advisory Fee SSGA FM, a registered investment adviser, was retained by the Board to act as investment adviser and administrator of the Fund. SSGA FM’s compensation for investment advisory and administrative services (“Management Fee”) is paid monthly based on the average daily net assets of the Fund at an annualized rate of 0.25%.
Custody, Fund Accounting and Sub-Administration Fees State Street Bank and Trust Company (“State Street”) serves as the custodian, fund accountant and sub-administrator to the Fund. Amounts paid by the Fund to State Street for performing such services are included as custody, fund accounting and sub-administration fees in the Statement of Operations.
Other Transactions with Affiliates The Fund may invest in affiliated entities, including securities issued by State Street Corporation, affiliated funds, or entities deemed to be affiliates as a result of the Fund owning more than five percent of the entity’s voting securities or outstanding shares. Amounts relating to these transactions during the fiscal year ended December 31, 2024 are disclosed in the Schedule of Investments.
6.Directors’ Fees
The fees and expenses of the Company’s directors who are not “interested persons” of the Company, as defined in the 1940 Act (“Independent Directors”), are paid directly by the Fund. The Independent Directors are reimbursed for travel and other out-of-pocket expenses in connection with meeting attendance and industry seminars.
7.Investment Transactions
Purchases and sales of investments (excluding in-kind transactions, short term investments and derivative contracts) for the fiscal year ended December 31, 2024 were as follows:
| Non-U.S. Government Securities |
| Purchases | Sales |
| $4,234,700 | $22,978,219 |
8.Income Taxes
The Fund has qualified and intends to continue to qualify as a regulated investment company under Subchapter M of the Internal Revenue Code of 1986, as amended. The Fund will not be subject to federal income taxes to the extent it distributes its taxable income, including any net realized capital gains, for each fiscal year. Therefore, no provision for federal income tax is required.
The Fund files federal and various state and local tax returns as required. No income tax returns are currently under examination. Generally, the federal returns are subject to examination by the Internal Revenue Service for a
| Notes to Financial Statements | 19 |
State Street S&P 500 Index V.I.S. Fund
Notes to Financial Statements, continued — December 31, 2024
period of three years from date of filing, while the state returns may remain open for an additional year depending upon jurisdiction. SSGA FM has analyzed the Fund's tax positions taken on tax returns for all open years and does not believe there are any uncertain tax positions that would require recognition of a tax liability.
Distributions to shareholders are recorded on ex-dividend date. Income dividends and gain distributions are determined in accordance with income tax rules and regulations, which may differ from generally accepted accounting principles. Certain capital accounts in the financial statements have been adjusted for permanent book-tax differences. These adjustments have no impact on net asset values or results of operations. Temporary book-tax differences will reverse in the future. These book-tax differences are primarily due to nontaxable dividend adjustments to income, REITs, investments in futures, corporate actions, and wash sale loss deferrals.
The tax character of distributions paid during the year ended December 31, 2024 was as follows:
Ordinary
Income | Long-Term
Capital Gains | Total |
| $2,423,912 | $16,409,842 | $18,833,754 |
The tax character of distributions paid during the year ended December 31, 2023 was as follows:
Ordinary
Income | Long-Term
Capital Gains | Total |
| $2,441,645 | $5,782,062 | $8,223,707 |
At December 31, 2024, the components of distributable earnings on a tax basis were as follows:
Undistributed
Ordinary
Income | Tax Exempt
Income | Capital Loss
Carryforwards | Undistributed
long term
gain | Net
Unrealized
Gains
(Losses) | Qualified
Late-Year
Losses | Total |
| $684,457 | $— | $— | $161,231 | $148,032,003 | $— | $148,877,691 |
As of December 31, 2024, gross unrealized appreciation and gross unrealized depreciation of investments and other financial instruments based on cost for federal income tax purposes were as follows:
Tax
Cost | Gross
Unrealized
Appreciation | Gross
Unrealized
Depreciation | Net
Unrealized
Appreciation
(Depreciation) |
| $52,449,973 | $150,084,896 | $2,052,893 | $148,032,003 |
9.Line of Credit
The Fund and other affiliated funds (each, a “Participant” and collectively, the “Participants”) have access to $194.29 million of a $1.36 billion ($180 million of $1.26 billion prior to November 1, 2024 and $180 million of $960 million prior to October 3, 2024) revolving credit facility provided by a syndication of banks under which the Participants may borrow to fund shareholder redemptions. This agreement expires in October 2025 unless extended or renewed.
The Participants are charged an annual commitment fee which is calculated based on the unused portion of the shared credit line. Commitment fees are allocated among each of the Participants based on relative net assets. Commitment fees are ordinary fund operating expenses. A Participant incurs and pays the interest expense related to its borrowing. Interest is calculated at a rate per annum equal to the sum of 1.00% plus the greater of the
New York Fed Bank Rate and the one-month SOFR Rate.
The Fund had no outstanding loans as of December 31, 2024.
| 20 | Notes to Financial Statements |
State Street S&P 500 Index V.I.S. Fund
Notes to Financial Statements, continued — December 31, 2024
10.Risks
Concentration Risk As a result of the Fund's ability to invest a large percentage of its assets in obligations of issuers within the same country, state, region, currency or economic sector, an adverse economic, business or political development may affect the value of the Fund's investments more than if the Fund was more broadly diversified.
Credit Risk The Fund may be exposed to credit risk in the event that an issuer or guarantor fails to perform or that an institution or entity with which the Fund has unsettled or open transactions defaults.
Market Risk The Fund’s investments are subject to changes in general economic conditions, and general market fluctuations and the risks inherent in investment in securities markets. Investment markets can be volatile and prices of investments can change substantially due to various factors including, but not limited to, economic growth or recession, changes in interest rates, changes in the actual or perceived creditworthiness of issuers, and general market liquidity. The Fund is subject to the risk that geopolitical events will disrupt securities markets and adversely affect global economies and markets. Local, regional or global events such as war, acts of terrorism, the spread of infectious illness, such as COVID-19, or other public health issues, or other events could have a significant impact on the Fund and its investments.
11.Subsequent Events
Management has evaluated the impact of all subsequent events on the Fund through the date on which the financial statements were available to be issued and has determined that there were no subsequent events requiring adjustment or disclosure in the financial statements.
| Notes to Financial Statements | 21 |
State Street S&P 500 Index V.I.S. Fund
Report of Independent Registered Public Accounting Firm
To the Shareholders of State Street S&P 500 Index V.I.S. Fund and the Board of Directors of State Street Variable Insurance Series Funds, Inc.
Opinion on the Financial Statements
We have audited the accompanying statement of assets and liabilities of State Street S&P 500 Index V.I.S. Fund (the “Fund”) (one of the series constituting State Street Variable Insurance Series Funds, Inc. (the “Company”)), including the schedule of investments, as of December 31, 2024, and the related statement of operations for the year then ended, the statements of changes in net assets for each of the two years in the period then ended, the financial highlights for each of the five years in the period then ended and the related notes (collectively referred to as the “financial statements”). In our opinion, the financial statements present fairly, in all material respects, the financial position of the Fund (one of the series constituting State Street Variable Insurance Series Funds, Inc.) at December 31, 2024, the results of its operations for the year then ended, the changes in its net assets for each of the two years in the period then ended and its financial highlights for each of the five years in the period then ended, in conformity with U.S. generally accepted accounting principles.
Basis for Opinion
These financial statements are the responsibility of the Trust’s management. Our responsibility is to express an opinion on the Fund’s financial statements based on our audits. We are a public accounting firm registered with the Public Company Accounting Oversight Board (United States) (“PCAOB”) and are required to be independent with respect to the Trust in accordance with the U.S. federal securities laws and the applicable rules and regulations of the Securities and Exchange Commission and the PCAOB.
We conducted our audits in accordance with the standards of the PCAOB. Those standards require that we plan and perform the audit to obtain reasonable assurance about whether the financial statements are free of material misstatement, whether due to error or fraud. The Trust is not required to have, nor were we engaged to perform, an audit of the Trust’s internal control over financial reporting. As part of our audits we are required to obtain an understanding of internal control over financial reporting, but not for the purpose of expressing an opinion on the effectiveness of the Trust’s internal control over financial reporting. Accordingly, we express no such opinion.
Our audits included performing procedures to assess the risks of material misstatement of the financial statements, whether due to error or fraud, and performing procedures that respond to those risks. Such procedures included examining, on a test basis, evidence regarding the amounts and disclosures in the financial statements. Our procedures included confirmation of securities owned as of December 31, 2024, by correspondence with the custodian, brokers and others; when replies were not received from brokers and others, we performed other auditing procedures. Our audits also included evaluating the accounting principles used and significant estimates made by management, as well as evaluating the overall presentation of the financial statements. We believe that our audits provide a reasonable basis for our opinion.
We have served as the auditor of one or more State Street Global Advisors investment companies since 2000.
Boston, Massachusetts
February 18, 2025
| 22 | Report of Independent Registered Public Accounting Firm |
State Street S&P 500 Index V.I.S. Fund
Other Information — December 31, 2024
Tax Information
For federal income tax purposes, the following information is furnished with respect to the distributions of the Fund for their fiscal year ended December 31, 2024.
Dividends Received Deduction
The Fund reports the maximum amount allowable of its net taxable income as eligible for the corporate dividends received deduction.
Long Term Capital Gain Distributions
Long term capital gains dividends were paid from the Fund during the year ended December 31, 2024 in the amount of $16,409,842.
State Street S&P 500 Index V.I.S. Fund
Proxy Disclosure for Open-End Management Investment Companies — December 31, 2024 (Unaudited)
Shareholder Meeting Results
Rule 30e-1 under the Investment Company Act of 1940, as amended, requires registered management companies to report on all subject matters put to the vote of shareholders and provide final results. Shareholders were asked to participate in a special meeting of shareholders on December 6, 2024 (the “Shareholder Meeting”). The final results of the Shareholder Meeting are reported in the table below.
All Funds
Proposal 1: To elect the following as Directors of the Company:
| Proposed Director | Shares For | Shares Withheld |
| Patrick J. Riley | 73,750,198.987 | 1,759,144.984 |
| Donna M. Rapaccioli | 73,872,469.845 | 1,636,874.126 |
| Margaret K. McLaughlin | 73,959,592.918 | 1,549,751.053 |
| George M. Pereira | 73,932,719.109 | 1,576,624.862 |
| Mark E. Swanson | 73,862,069.730 | 1,647,274.241 |
| Jeanne LaPorta | 73,881,354.092 | 1,627,989.879 |
Annual Financial Statements and Other Information
December 31, 2024
| State Street Small-Cap Equity V.I.S. Fund |
State Street Small-Cap Equity V.I.S. Fund
Annual Report Financial Statements and Other Information
December 31, 2024
Changes in and Disagreements with Accountants for Open-End Management Investment Companies (N-CSR Item 8) - Not Applicable
Remuneration Paid to Directors, Officers, and Others of Open-End Management Investment Companies (N-CSR Item 10) - Please see Statement of Operations in the Financial Statements under Item 7 above
Statement Regarding Basis for Approval of Investment Advisory Contract (Unaudited) (N-CSR Item 11) - Not applicable
This report is prepared for Policyholders of certain variable contracts and may be distributed to others only if preceded or accompanied by the variable contract’s current prospectus and the current summary prospectus of the Fund available for investments thereunder.
[This page intentionally left blank]
State Street Small-Cap Equity V.I.S. Fund
Schedule of Investments — December 31, 2024
| | Number
of Shares | Fair
Value |
| Common Stock - 94.4% † |
| Aerospace & Defense - 0.8% |
| Hexcel Corp. | 554 | $34,736 |
| Mercury Systems, Inc. (a) | 904 | 37,968 |
| Moog, Inc., Class A | 172 | 33,856 |
| Rocket Lab USA, Inc. (a) | 808 | 20,580 |
| Woodward, Inc. | 514 | 85,540 |
| | | 212,680 |
| Agricultural & Farm Machinery - 1.1% |
| AGCO Corp. | 2,343 | 219,023 |
| Alamo Group, Inc. | 259 | 48,151 |
| | | 267,174 |
| Agricultural Products & Services - 1.1% |
| Darling Ingredients, Inc. (a)(b) | 8,468 | 285,287 |
| Apparel Retail - 2.0% |
| Abercrombie & Fitch Co., Class A (a) | 330 | 49,325 |
| Boot Barn Holdings, Inc. (a) | 1,831 | 277,983 |
| Buckle, Inc. | 1,837 | 93,338 |
| Revolve Group, Inc. (a) | 2,266 | 75,888 |
| | | 496,534 |
| Apparel, Accessories & Luxury Goods - 0.6% |
| Oxford Industries, Inc. | 1,806 | 142,277 |
| Application Software - 5.7% |
| ACI Worldwide, Inc. (a) | 2,872 | 149,086 |
| Alkami Technology, Inc. (a) | 1,900 | 69,692 |
| Blackbaud, Inc. (a) | 1,944 | 143,700 |
| BlackLine, Inc. (a) | 1,463 | 88,892 |
| Braze, Inc., Class A (a) | 3,015 | 126,268 |
| CCC Intelligent Solutions Holdings, Inc. (a) | 8,597 | 100,843 |
| Clearwater Analytics Holdings, Inc., Class A (a) | 3,812 | 104,906 |
| Confluent, Inc., Class A (a) | 4,135 | 115,615 |
| Dynatrace, Inc. (a) | 784 | 42,610 |
| Lightspeed Commerce, Inc. (a) | 1,887 | 28,739 |
| Nutanix, Inc., Class A (a) | 2,100 | 128,478 |
| Procore Technologies, Inc. (a) | 610 | 45,707 |
| Samsara, Inc., Class A (a) | 842 | 36,787 |
| Smartsheet, Inc., Class A (a) | 2,435 | 136,433 |
| Vertex, Inc., Class A (a) | 2,471 | 131,828 |
| | | 1,449,584 |
| | Number
of Shares | Fair
Value |
| Asset Management & Custody Banks - 0.2% |
| DigitalBridge Group, Inc. | 4,371 | $49,305 |
| Automobile Manufacturers - 0.3% |
| Thor Industries, Inc. | 913 | 87,383 |
| Automotive Parts & Equipment - 1.1% |
| Dana, Inc. | 2,698 | 31,189 |
| Dorman Products, Inc. (a) | 1,753 | 227,101 |
| Patrick Industries, Inc. | 205 | 17,031 |
| | | 275,321 |
| Automotive Retail - 1.5% |
| Group 1 Automotive, Inc. | 338 | 142,460 |
| Murphy USA, Inc. | 368 | 184,644 |
| Valvoline, Inc. (a) | 1,155 | 41,788 |
| | | 368,892 |
| Biotechnology - 2.1% |
| 89bio, Inc. (a) | 2,032 | 15,890 |
| ADMA Biologics, Inc. (a) | 1,141 | 19,568 |
| Ascendis Pharma AS ADR (a) | 621 | 85,493 |
| Bicycle Therapeutics PLC ADR (a) | 1,002 | 14,028 |
| Catalyst Pharmaceuticals, Inc. (a) | 2,307 | 48,147 |
| Cytokinetics, Inc. (a) | 361 | 16,982 |
| Emergent BioSolutions, Inc. (a) | 3,452 | 33,001 |
| Halozyme Therapeutics, Inc. (a) | 708 | 33,850 |
| Heron Therapeutics, Inc. (a) | 14,649 | 22,413 |
| Insmed, Inc. (a) | 302 | 20,850 |
| Krystal Biotech, Inc. (a) | 73 | 11,436 |
| Merus NV (a) | 346 | 14,549 |
| MoonLake Immunotherapeutics (a) | 660 | 35,739 |
| Rocket Pharmaceuticals, Inc. (a) | 1,233 | 15,499 |
| Soleno Therapeutics, Inc. (a) | 282 | 12,676 |
| Vaxcyte, Inc. (a) | 594 | 48,625 |
| Veracyte, Inc. (a) | 930 | 36,828 |
| Vericel Corp. (a) | 730 | 40,084 |
| Xenon Pharmaceuticals, Inc. (a) | 400 | 15,680 |
| | | 541,338 |
| Brewers - 0.8% |
| Boston Beer Co., Inc., Class A (a) | 661 | 198,287 |
See Notes to Schedule of Investments and Notes to Financial Statements.
| State Street Small-Cap Equity V.I.S. Fund | 1 |
State Street Small-Cap Equity V.I.S. Fund
Schedule of Investments, continued — December 31, 2024
| | Number
of Shares | Fair
Value |
| Broadline Retail - 0.2% |
| Ollie's Bargain Outlet Holdings, Inc. (a) | 570 | $62,546 |
| Building Products - 2.0% |
| Armstrong World Industries, Inc. | 1,320 | 186,556 |
| AZZ, Inc. | 558 | 45,711 |
| Gibraltar Industries, Inc. (a) | 1,983 | 116,799 |
| Hayward Holdings, Inc. (a) | 2,515 | 38,454 |
| Simpson Manufacturing Co., Inc. | 587 | 97,342 |
| UFP Industries, Inc. | 190 | 21,404 |
| | | 506,266 |
| Cargo Ground Transportation - 0.6% |
| Saia, Inc. (a) | 313 | 142,644 |
| Casinos & Gaming - 0.2% |
| Churchill Downs, Inc. | 265 | 35,388 |
| Genius Sports Ltd. (a) | 1,184 | 10,242 |
| | | 45,630 |
| Coal & Consumable Fuels - 0.0%* |
| Uranium Energy Corp. (a) | 1,352 | 9,045 |
| Commercial & Residential Mortgage Finance - 0.3% |
| PennyMac Financial Services, Inc. | 710 | 72,519 |
| Commercial Printing - 0.1% |
| Brady Corp., Class A | 490 | 36,187 |
| Commodity Chemicals - 0.1% |
| Hawkins, Inc. | 259 | 31,772 |
| Communications Equipment - 0.1% |
| F5, Inc. (a) | 140 | 35,206 |
| Construction & Engineering - 1.7% |
| Comfort Systems USA, Inc. | 182 | 77,179 |
| Dycom Industries, Inc. (a) | 1,214 | 211,309 |
| Fluor Corp. (a) | 594 | 29,296 |
| IES Holdings, Inc. (a) | 172 | 34,565 |
| Primoris Services Corp. | 180 | 13,752 |
| Valmont Industries, Inc. | 102 | 31,280 |
| WillScot Holdings Corp. (a) | 668 | 22,345 |
| | | 419,726 |
| | Number
of Shares | Fair
Value |
| Construction Machinery & Heavy Transportation Equipment - 0.3% |
| Astec Industries, Inc. | 383 | $12,869 |
| Manitowoc Co., Inc. (a) | 1,711 | 15,621 |
| Oshkosh Corp. | 317 | 30,137 |
| Wabash National Corp. | 936 | 16,034 |
| | | 74,661 |
| Construction Materials - 0.1% |
| Eagle Materials, Inc. | 143 | 35,287 |
| Consumer Finance - 0.3% |
| PROG Holdings, Inc. | 1,945 | 82,196 |
| Data Processing & Outsourced Services - 0.8% |
| CSG Systems International, Inc. | 1,661 | 84,894 |
| Verra Mobility Corp. (a) | 4,653 | 112,509 |
| | | 197,403 |
| Distillers & Vintners - 0.2% |
| MGP Ingredients, Inc. | 1,405 | 55,315 |
| Distributors - 0.4% |
| LKQ Corp. | 2,892 | 106,281 |
| Diversified Metals & Mining - 0.1% |
| Materion Corp. | 167 | 16,513 |
| Diversified REITs - 0.2% |
| Alpine Income Property Trust, Inc. | 974 | 16,354 |
| American Assets Trust, Inc. | 751 | 19,721 |
| Essential Properties Realty Trust, Inc. | 497 | 15,546 |
| | | 51,621 |
| Diversified Support Services - 1.6% |
| Healthcare Services Group, Inc. (a) | 7,436 | 86,369 |
| Matthews International Corp., Class A | 2,055 | 56,882 |
| RB Global, Inc. | 2,590 | 233,644 |
| Vestis Corp. | 2,527 | 38,512 |
| | | 415,407 |
| Education Services - 0.7% |
| Bright Horizons Family Solutions, Inc. (a) | 593 | 65,734 |
See Notes to Schedule of Investments and Notes to Financial Statements.
| 2 | State Street Small-Cap Equity V.I.S. Fund |
State Street Small-Cap Equity V.I.S. Fund
Schedule of Investments, continued — December 31, 2024
| | Number
of Shares | Fair
Value |
| Stride, Inc. (a) | 1,066 | $110,789 |
| | | 176,523 |
| Electric Utilities - 0.8% |
| ALLETE, Inc. | 193 | 12,506 |
| IDACORP, Inc. | 1,768 | 193,207 |
| | | 205,713 |
| Electrical Components & Equipment - 0.4% |
| Acuity Brands, Inc. | 90 | 26,292 |
| Atkore, Inc. | 364 | 30,376 |
| NEXTracker, Inc., Class A (a) | 610 | 22,283 |
| Regal Rexnord Corp. | 193 | 29,940 |
| | | 108,891 |
| Electronic Components - 1.8% |
| Belden, Inc. (b) | 2,886 | 324,992 |
| Littelfuse, Inc. | 503 | 118,532 |
| | | 443,524 |
| Electronic Equipment & Instruments - 1.1% |
| Advanced Energy Industries, Inc. | 789 | 91,232 |
| Novanta, Inc. (a) | 470 | 71,802 |
| Vontier Corp. | 2,972 | 108,389 |
| | | 271,423 |
| Electronic Manufacturing Services - 0.2% |
| Fabrinet (a) | 113 | 24,846 |
| Plexus Corp. (a) | 191 | 29,888 |
| | | 54,734 |
| Environmental & Facilities Services - 0.5% |
| Aris Water Solutions, Inc., Class A | 2,592 | 62,078 |
| Casella Waste Systems, Inc., Class A (a) | 545 | 57,667 |
| | | 119,745 |
| Food Distributors - 0.8% |
| Chefs' Warehouse, Inc. (a) | 839 | 41,380 |
| Performance Food Group Co. (a) | 1,813 | 153,289 |
| | | 194,669 |
| Forest Products - 1.1% |
| Louisiana-Pacific Corp. | 2,603 | 269,541 |
| | Number
of Shares | Fair
Value |
| Gas Utilities - 0.1% |
| UGI Corp. | 494 | $13,946 |
| Health Care REITs - 0.2% |
| Community Healthcare Trust, Inc. | 2,821 | 54,191 |
| Healthcare Distributors - 0.5% |
| AdaptHealth Corp. (a) | 10,504 | 99,998 |
| Owens & Minor, Inc. (a) | 1,941 | 25,369 |
| | | 125,367 |
| Healthcare Equipment - 4.3% |
| AtriCure, Inc. (a) | 2,945 | 89,999 |
| CONMED Corp. | 1,505 | 103,002 |
| Envista Holdings Corp. (a) | 3,785 | 73,013 |
| Glaukos Corp. (a) | 204 | 30,588 |
| Globus Medical, Inc., Class A (a) | 1,285 | 106,282 |
| Inspire Medical Systems, Inc. (a) | 515 | 95,471 |
| Integer Holdings Corp. (a) | 496 | 65,730 |
| iRhythm Technologies, Inc. (a) | 1,232 | 111,089 |
| LeMaitre Vascular, Inc. | 359 | 33,078 |
| Omnicell, Inc. (a) | 1,700 | 75,684 |
| Penumbra, Inc. (a) | 610 | 144,863 |
| PROCEPT BioRobotics Corp. (a) | 637 | 51,291 |
| SI-BONE, Inc. (a) | 3,075 | 43,112 |
| Tandem Diabetes Care, Inc. (a) | 1,630 | 58,713 |
| | | 1,081,915 |
| Healthcare Facilities - 1.4% |
| Acadia Healthcare Co., Inc. (a) | 2,001 | 79,340 |
| Ensign Group, Inc. | 76 | 10,097 |
| U.S. Physical Therapy, Inc. | 3,078 | 273,049 |
| | | 362,486 |
| Healthcare Services - 0.5% |
| Addus HomeCare Corp. (a) | 219 | 27,451 |
| Castle Biosciences, Inc. (a) | 1,763 | 46,984 |
| Option Care Health, Inc. (a) | 1,719 | 39,881 |
| | | 114,316 |
| Healthcare Supplies - 0.7% |
| Haemonetics Corp. (a) | 405 | 31,622 |
| Lantheus Holdings, Inc. (a) | 410 | 36,679 |
See Notes to Schedule of Investments and Notes to Financial Statements.
| State Street Small-Cap Equity V.I.S. Fund | 3 |
State Street Small-Cap Equity V.I.S. Fund
Schedule of Investments, continued — December 31, 2024
| | Number
of Shares | Fair
Value |
| Neogen Corp. (a) | 8,030 | $97,484 |
| | | 165,785 |
| Healthcare Technology - 0.5% |
| Definitive Healthcare Corp. (a) | 8,458 | 34,762 |
| Phreesia, Inc. (a) | 2,880 | 72,461 |
| Simulations Plus, Inc. | 920 | 25,659 |
| | | 132,882 |
| Home Building - 0.7% |
| Cavco Industries, Inc. (a) | 43 | 19,188 |
| Green Brick Partners, Inc. (a) | 501 | 28,302 |
| Installed Building Products, Inc. | 129 | 22,607 |
| M/I Homes, Inc. (a) | 164 | 21,804 |
| Taylor Morrison Home Corp. (a) | 1,244 | 76,145 |
| | | 168,046 |
| Hotel & Resort REITs - 0.6% |
| RLJ Lodging Trust | 10,640 | 108,634 |
| Xenia Hotels & Resorts, Inc. | 2,066 | 30,701 |
| | | 139,335 |
| Household Products - 0.2% |
| Central Garden & Pet Co., Class A (a) | 1,785 | 58,994 |
| Human Resource & Employment Services - 0.3% |
| First Advantage Corp. (a) | 4,182 | 78,329 |
| Independent Power Producers & Energy Traders - 0.0%* |
| Talen Energy Corp. (a) | 56 | 11,282 |
| Industrial Machinery & Supplies & Components - 7.2% |
| Albany International Corp., Class A | 1,215 | 97,164 |
| Barnes Group, Inc. | 355 | 16,777 |
| Chart Industries, Inc. (a) | 146 | 27,863 |
| Enerpac Tool Group Corp. (b) | 7,891 | 324,241 |
| Enpro, Inc. | 233 | 40,181 |
| Esab Corp. | 1,050 | 125,937 |
| ESCO Technologies, Inc. | 1,195 | 159,186 |
| Gates Industrial Corp. PLC (a) | 1,971 | 40,543 |
| Hillenbrand, Inc. | 1,151 | 35,428 |
| ITT, Inc. | 384 | 54,866 |
| John Bean Technologies Corp. | 1,110 | 141,081 |
| Kadant, Inc. | 55 | 18,974 |
| Mueller Industries, Inc. | 2,853 | 226,414 |
| | Number
of Shares | Fair
Value |
| RBC Bearings, Inc. (a) | 255 | $76,281 |
| SPX Technologies, Inc. (a) | 62 | 9,022 |
| Standex International Corp. | 715 | 133,698 |
| Timken Co. | 2,797 | 199,622 |
| Watts Water Technologies, Inc., Class A | 490 | 99,617 |
| | | 1,826,895 |
| Industrial REITs - 0.5% |
| EastGroup Properties, Inc. | 862 | 138,342 |
| Insurance Brokers - 0.4% |
| Baldwin Insurance Group, Inc. (a) | 2,759 | 106,939 |
| Internet Services & Infrastructure - 0.1% |
| Wix.com Ltd. (a) | 128 | 27,462 |
| Investment Banking & Brokerage - 1.3% |
| Piper Sandler Cos. | 106 | 31,795 |
| PJT Partners, Inc., Class A | 655 | 103,366 |
| Raymond James Financial, Inc. | 1,097 | 170,397 |
| Stifel Financial Corp. | 79 | 8,380 |
| StoneX Group, Inc. (a) | 100 | 9,797 |
| | | 323,735 |
| IT Consulting & Other Services - 0.2% |
| Kyndryl Holdings, Inc. (a) | 681 | 23,563 |
| Unisys Corp. (a) | 5,385 | 34,087 |
| | | 57,650 |
| Leisure Facilities - 0.5% |
| Lucky Strike Entertainment Corp., Class A | 3,430 | 34,334 |
| Planet Fitness, Inc., Class A (a) | 950 | 93,927 |
| | | 128,261 |
| Leisure Products - 0.7% |
| Acushnet Holdings Corp. | 415 | 29,498 |
| Johnson Outdoors, Inc., Class A | 381 | 12,573 |
| Polaris, Inc. | 1,975 | 113,800 |
| YETI Holdings, Inc. (a) | 212 | 8,164 |
| | | 164,035 |
| Life & Health Insurance - 0.2% |
| Oscar Health, Inc., Class A (a) | 1,012 | 13,601 |
See Notes to Schedule of Investments and Notes to Financial Statements.
| 4 | State Street Small-Cap Equity V.I.S. Fund |
State Street Small-Cap Equity V.I.S. Fund
Schedule of Investments, continued — December 31, 2024
| | Number
of Shares | Fair
Value |
| Primerica, Inc. | 98 | $26,599 |
| | | 40,200 |
| Life Sciences Tools & Services - 2.8% |
| Azenta, Inc. (a) | 2,753 | 137,650 |
| BioLife Solutions, Inc. (a) | 2,756 | 71,546 |
| Bio-Rad Laboratories, Inc., Class A (a) | 63 | 20,696 |
| Bruker Corp. | 2,194 | 128,612 |
| ICON PLC (a) | 299 | 62,703 |
| Mesa Laboratories, Inc. | 315 | 41,539 |
| Repligen Corp. (a) | 1,753 | 252,327 |
| | | 715,073 |
| Metal, Glass & Plastic Containers - 0.1% |
| TriMas Corp. | 1,255 | 30,860 |
| Mortgage REITs - 0.0%* |
| Redwood Trust, Inc. | 1,374 | 8,972 |
| Multi-Line Insurance - 0.2% |
| Horace Mann Educators Corp. | 1,209 | 47,429 |
| Multi-Utilities - 0.1% |
| Avista Corp. | 686 | 25,128 |
| Office REITs - 0.8% |
| COPT Defense Properties | 648 | 20,056 |
| Cousins Properties, Inc. | 3,490 | 106,934 |
| Easterly Government Properties, Inc. | 5,329 | 60,537 |
| Hudson Pacific Properties, Inc. | 1,550 | 4,696 |
| | | 192,223 |
| Office Services & Supplies - 0.8% |
| MSA Safety, Inc. | 1,152 | 190,967 |
| Oil & Gas Drilling - 0.0%* |
| Helmerich & Payne, Inc. | 349 | 11,175 |
| Oil & Gas Equipment & Services - 0.7% |
| Atlas Energy Solutions, Inc. | 1,942 | 43,074 |
| Cactus, Inc., Class A | 1,320 | 77,035 |
| ChampionX Corp. | 1,428 | 38,827 |
| Oil States International, Inc. (a) | 3,471 | 17,563 |
| | | 176,499 |
| | Number
of Shares | Fair
Value |
| Oil & Gas Exploration & Production - 1.9% |
| Civitas Resources, Inc. | 524 | $24,036 |
| Northern Oil & Gas, Inc. | 5,736 | 213,150 |
| Range Resources Corp. | 1,218 | 43,824 |
| SM Energy Co. | 5,382 | 208,606 |
| | | 489,616 |
| Oil & Gas Refining & Marketing - 0.1% |
| HF Sinclair Corp. | 481 | 16,859 |
| Other Specialty Retail - 0.3% |
| Bath & Body Works, Inc. | 1,150 | 44,586 |
| Upbound Group, Inc. | 1,095 | 31,941 |
| | | 76,527 |
| Packaged Foods & Meats - 2.1% |
| Calavo Growers, Inc. | 1,008 | 25,704 |
| Freshpet, Inc. (a) | 670 | 99,233 |
| J&J Snack Foods Corp. | 415 | 64,379 |
| Lancaster Colony Corp. | 520 | 90,033 |
| Simply Good Foods Co. (a) | 4,005 | 156,115 |
| Utz Brands, Inc. | 6,035 | 94,508 |
| | | 529,972 |
| Paper & Plastic Packaging Products & Materials - 0.1% |
| Ranpak Holdings Corp. (a) | 4,620 | 31,786 |
| Personal Care Products - 0.7% |
| BellRing Brands, Inc. (a) | 564 | 42,492 |
| elf Beauty, Inc. (a) | 1,143 | 143,503 |
| | | 185,995 |
| Pharmaceuticals - 0.2% |
| ANI Pharmaceuticals, Inc. (a) | 454 | 25,097 |
| Corcept Therapeutics, Inc. (a) | 216 | 10,884 |
| Intra-Cellular Therapies, Inc. (a) | 290 | 24,221 |
| | | 60,202 |
| Property & Casualty Insurance - 2.5% |
| AMERISAFE, Inc. | 1,916 | 98,751 |
| Hamilton Insurance Group Ltd., Class B (a) | 630 | 11,989 |
| Kemper Corp. | 924 | 61,390 |
| Palomar Holdings, Inc. (a) | 1,249 | 131,882 |
| RLI Corp. | 690 | 113,733 |
| Selective Insurance Group, Inc. | 869 | 81,269 |
See Notes to Schedule of Investments and Notes to Financial Statements.
| State Street Small-Cap Equity V.I.S. Fund | 5 |
State Street Small-Cap Equity V.I.S. Fund
Schedule of Investments, continued — December 31, 2024
| | Number
of Shares | Fair
Value |
| Skyward Specialty Insurance Group, Inc. (a) | 1,865 | $94,257 |
| Trupanion, Inc. (a) | 559 | 26,944 |
| | | 620,215 |
| Publishing - 0.6% |
| John Wiley & Sons, Inc., Class A | 3,235 | 141,402 |
| Regional Banks - 9.3% |
| 1st Source Corp. | 746 | 43,551 |
| Banc of California, Inc. | 2,415 | 37,336 |
| BancFirst Corp. | 410 | 48,044 |
| Bank OZK | 1,234 | 54,950 |
| BankUnited, Inc. | 632 | 24,123 |
| Columbia Banking System, Inc. | 5,242 | 141,586 |
| Cullen/Frost Bankers, Inc. | 1,978 | 265,547 |
| Enterprise Financial Services Corp. | 537 | 30,287 |
| Equity Bancshares, Inc., Class A | 276 | 11,708 |
| First Financial Bankshares, Inc. | 3,190 | 115,000 |
| Five Star Bancorp | 819 | 24,644 |
| Fulton Financial Corp. | 5,539 | 106,792 |
| German American Bancorp, Inc. | 1,370 | 55,101 |
| Heritage Commerce Corp. | 2,489 | 23,347 |
| Home BancShares, Inc. | 1,431 | 40,497 |
| Lakeland Financial Corp. | 400 | 27,504 |
| Live Oak Bancshares, Inc. | 5,438 | 215,073 |
| National Bank Holdings Corp., Class A | 908 | 39,098 |
| Origin Bancorp, Inc. | 972 | 32,358 |
| Peapack-Gladstone Financial Corp. | 588 | 18,845 |
| Pinnacle Financial Partners, Inc. | 454 | 51,933 |
| Preferred Bank | 382 | 32,997 |
| Prosperity Bancshares, Inc. | 1,810 | 136,384 |
| Renasant Corp. | 3,559 | 127,234 |
| ServisFirst Bancshares, Inc. | 1,510 | 127,957 |
| SouthState Corp. | 250 | 24,870 |
| Stock Yards Bancorp, Inc. | 1,055 | 75,549 |
| Texas Capital Bancshares, Inc. (a) | 490 | 38,318 |
| WaFd, Inc. | 948 | 30,564 |
| Westamerica BanCorp | 1,359 | 71,293 |
| Western Alliance Bancorp | 204 | 17,042 |
| Wintrust Financial Corp. | 494 | 61,607 |
| | Number
of Shares | Fair
Value |
| WSFS Financial Corp. | 3,848 | $204,444 |
| | | 2,355,583 |
| Research & Consulting Services - 0.1% |
| Huron Consulting Group, Inc. (a) | 284 | 35,290 |
| Restaurants - 1.5% |
| Brinker International, Inc. (a) | 250 | 33,073 |
| Cheesecake Factory, Inc. | 2,076 | 98,485 |
| First Watch Restaurant Group, Inc. (a) | 3,035 | 56,481 |
| Shake Shack, Inc., Class A (a) | 260 | 33,748 |
| Texas Roadhouse, Inc. | 855 | 154,268 |
| | | 376,055 |
| Retail REITs - 0.3% |
| Kite Realty Group Trust | 1,544 | 38,971 |
| Phillips Edison & Co., Inc. | 681 | 25,510 |
| | | 64,481 |
| Security & Alarm Services - 1.2% |
| Brink's Co. | 3,373 | 312,913 |
| Self Storage REITs - 0.1% |
| National Storage Affiliates Trust | 618 | 23,428 |
| Semiconductor Materials & Equipment - 0.7% |
| Axcelis Technologies, Inc. (a) | 204 | 14,253 |
| Ichor Holdings Ltd. (a) | 1,409 | 45,398 |
| MKS Instruments, Inc. | 310 | 32,361 |
| Onto Innovation, Inc. (a) | 544 | 90,669 |
| | | 182,681 |
| Semiconductors - 0.9% |
| Diodes, Inc. (a) | 275 | 16,959 |
| Lattice Semiconductor Corp. (a) | 347 | 19,658 |
| Rambus, Inc. (a) | 695 | 36,738 |
| Semtech Corp. (a) | 2,393 | 148,007 |
| | | 221,362 |
| Single-Family Residential REITs - 0.1% |
| UMH Properties, Inc. | 918 | 17,332 |
| Soft Drinks & Non-alcoholic Beverages - 1.3% |
| Celsius Holdings, Inc. (a) | 3,735 | 98,380 |
| Primo Brands Corp., Class A | 6,411 | 197,267 |
See Notes to Schedule of Investments and Notes to Financial Statements.
| 6 | State Street Small-Cap Equity V.I.S. Fund |
State Street Small-Cap Equity V.I.S. Fund
Schedule of Investments, continued — December 31, 2024
| | Number
of Shares | Fair
Value |
| Vita Coco Co., Inc. (a) | 975 | $35,987 |
| | | 331,634 |
| Specialized Consumer Services - 0.4% |
| OneSpaWorld Holdings Ltd. | 5,416 | 107,778 |
| Specialty Chemicals - 3.3% |
| Avient Corp. | 4,419 | 180,560 |
| Axalta Coating Systems Ltd. (a) | 1,156 | 39,558 |
| HB Fuller Co. | 541 | 36,507 |
| Ingevity Corp. (a) | 5,255 | 214,141 |
| Quaker Chemical Corp. | 681 | 95,858 |
| Sensient Technologies Corp. | 1,130 | 80,524 |
| Stepan Co. | 2,703 | 174,884 |
| | | 822,032 |
| Steel - 0.4% |
| Carpenter Technology Corp. | 203 | 34,451 |
| Commercial Metals Co. | 1,536 | 76,186 |
| | | 110,637 |
| Systems Software - 1.9% |
| JFrog Ltd. (a) | 2,835 | 83,377 |
| Onestream, Inc. (a) | 4,545 | 129,624 |
| Progress Software Corp. | 434 | 28,275 |
| Rubrik, Inc., Class A (a) | 715 | 46,732 |
| SentinelOne, Inc., Class A (a) | 5,275 | 117,105 |
| Tenable Holdings, Inc. (a) | 1,920 | 75,610 |
| | | 480,723 |
| Technology Distributors - 0.1% |
| Insight Enterprises, Inc. (a) | 159 | 24,184 |
| Technology Hardware, Storage & Peripherals - 0.9% |
| Corsair Gaming, Inc. (a) | 8,191 | 54,143 |
| Pure Storage, Inc., Class A (a) | 2,650 | 162,789 |
| | | 216,932 |
| | Number
of Shares | Fair
Value |
| Timber REITs - 0.1% |
| PotlatchDeltic Corp. | 557 | $21,862 |
| Trading Companies & Distributors - 1.6% |
| Applied Industrial Technologies, Inc. | 936 | 224,144 |
| FTAI Aviation Ltd. | 504 | 72,596 |
| Transcat, Inc. (a) | 655 | 69,260 |
| WESCO International, Inc. | 209 | 37,820 |
| | | 403,820 |
| Transaction & Payment Processing Services - 1.0% |
| EVERTEC, Inc. | 1,045 | 36,084 |
| Flywire Corp. (a) | 3,102 | 63,963 |
| Shift4 Payments, Inc., Class A (a) | 1,405 | 145,811 |
| | | 245,858 |
| Water Utilities - 0.1% |
| American States Water Co. | 360 | 27,979 |
Total Common Stock
(Cost $17,580,581) | | 23,868,907 |
| Short-Term Investments - 5.9% |
State Street Institutional U.S. Government Money Market Fund - Class G Shares 4.47% (c)(d)
(Cost $1,490,635) | 1,490,635 | 1,490,635 |
Total Investments
(Cost $19,071,216) | | 25,359,542 |
| Liabilities in Excess of Other Assets, net - (0.3)% | | (81,966) |
| NET ASSETS - 100.0% | | $25,277,576 |
Other Information:
| The Fund had the following long futures contracts open at December 31, 2024: |
| Description | Expiration
Date | Number of
Contracts | Notional
Amount | Value | Unrealized
Appreciation
(Depreciation) |
| E-mini Russell 2000 Index Futures | March 2025 | 5 | $577,832 | $562,450 | $(15,382) |
See Notes to Schedule of Investments and Notes to Financial Statements.
| State Street Small-Cap Equity V.I.S. Fund | 7 |
State Street Small-Cap Equity V.I.S. Fund
Schedule of Investments, continued — December 31, 2024
During the period ended December 31, 2024, the average notional value related to long futures contracts was $407,913.
Notes to Schedule of Investments
The views expressed in this document reflect our judgment as of the publication date and are subject to change at any time without notice. The securities cited may not be representative of the Fund’s future investments and should not be construed as a recommendation to purchase or sell a particular security. See the Fund’s summary prospectus and statutory prospectus for complete descriptions of investment objectives, policies, risks and permissible investments.
| (a) | Non-income producing security. |
| (b) | At December 31, 2024, all or a portion of this security was pledged to cover collateral requirements for futures contracts. |
| (c) | Sponsored by SSGA Funds Management, Inc., the Fund’s investment adviser and administrator, and an affiliate of State Street Bank & Trust Co., the Fund’s sub-administrator, custodian and accounting agent. |
| (d) | Coupon amount represents effective yield. |
| † | Percentages are based on net assets as of December 31, 2024. |
| * | Less than 0.05%. |
| Abbreviations: |
| ADR - American Depositary Receipt |
| REIT - Real Estate Investment Trust |
The following table presents the Fund’s investments measured at fair value on a recurring basis at December 31, 2024:
| Investments | Level 1 | | Level 2 | | Level 3 | | Total |
| Investments in Securities | | | | | | | |
| Common Stock | $23,868,907 | | $— | | $— | | $23,868,907 |
| Short-Term Investments | 1,490,635 | | — | | — | | 1,490,635 |
| Total Investments in Securities | $25,359,542 | | $— | | $— | | $25,359,542 |
| Other Financial Instruments | | | | | | | |
| Long Futures Contracts - Unrealized Depreciation | $(15,382) | | $— | | $— | | $(15,382) |
| Total Other Financial Instruments | $(15,382) | | $— | | $— | | $(15,382) |
| | Number
of Shares
Held at
12/31/23 | Value at
12/31/23 | Cost of
Purchases | Proceeds
from
Shares
Sold | Realized
Gain
(Loss) | Change in
Unrealized
Appreciation
(Depreciation) | Number of
Shares
Held at
12/31/24 | Value at
12/31/24 | Dividend
Income |
| State Street Institutional U.S. Government Money Market Fund - Class G Shares | 1,171,516 | $1,171,516 | $8,955,917 | $8,636,798 | $— | $— | 1,490,635 | $1,490,635 | $61,708 |
See Notes to Schedule of Investments and Notes to Financial Statements.
| 8 | State Street Small-Cap Equity V.I.S. Fund |
State Street Small-Cap Equity V.I.S. Fund
Financial Highlights
Selected data based on a share outstanding throughout the fiscal years indicated
| | 12/31/24 | | 12/31/23 | | 12/31/22 | | 12/31/21 | | 12/31/20 |
| Inception date | | | 4/28/00 |
| Net asset value, beginning of period | $12.37 | | $11.90 | | $14.93 | | $14.66 | | $13.16 |
| Income/(loss) from investment operations: | | | | | | | | | |
| Net investment income (loss)(a) | (0.02) | | 0.02 | | (0.03) | | (0.04) | | (0.01) |
| Net realized and unrealized gains/(losses) on investments | 1.30 | | 1.61 | | (2.27) | | 3.06 | | 1.92 |
| Total income/(loss) from investment operations | 1.28 | | 1.63 | | (2.30) | | 3.02 | | 1.91 |
| Less distributions from: | | | | | | | | | |
| Net investment income | (0.01) | | — | | — | | — | | — |
| Net realized gains | (1.09) | | (1.16) | | (0.73) | | (2.75) | | (0.41) |
| Total distributions | (1.10) | | (1.16) | | (0.73) | | (2.75) | | (0.41) |
| Net asset value, end of period | $12.55 | | $12.37 | | $11.90 | | $14.93 | | $14.66 |
| Total Return(b) | 10.32% | | 13.55% | | (15.40)% | | 20.53% | | 14.53% |
| Ratios/Supplemental Data: | | | | | | | | | |
| Net assets, end of period (in thousands) | $25,278 | | $25,910 | | $26,066 | | $36,890 | | $34,621 |
| Ratios to average net assets: | | | | | | | | | |
| Gross expenses | 1.44% | | 1.28% | | 1.31% | | 1.21% | | 1.27% |
| Net investment income (loss) | (0.17)% | | 0.13% | | (0.21)% | | (0.22)% | | (0.06)% |
| Portfolio turnover rate | 42% | | 30% | | 29% | | 39% | | 37% |
| Notes to Financial Highlights |
| (a) | Per share values have been calculated using the average shares method. |
| (b) | Total returns are historical and assume changes in share price, reinvestment of dividends and capital gains distributions and do not include the effect of insurance contract charges. Past performance does not guarantee future results. |
The accompanying Notes are an integral part of these financial statements.
State Street Small-Cap Equity V.I.S. Fund
Statement of Assets and Liabilities — December 31, 2024
| Assets | |
| Investments in unaffiliated securities, at fair value (cost $17,580,581) | $23,868,907 |
| Investments in affiliated securities, at fair value (cost $1,490,635) | 1,490,635 |
| Net cash collateral on deposit with broker for future contracts | 60,415 |
| Receivable for investments sold | 4,135 |
| Income receivables | 15,170 |
| Receivable for fund shares sold | 690 |
| Income receivable from affiliated investments | 5,786 |
| Other assets | 155 |
| Total assets | 25,445,893 |
| Liabilities | |
| Payable for investments purchased | 85,364 |
| Payable for fund shares redeemed | 237 |
| Payable for accumulated variation margin on futures contracts | 15,371 |
| Payable to the Adviser | 21,238 |
| Payable for custody, fund accounting and sub-administration fees | 10,010 |
| Accrued other expenses | 36,097 |
| Total liabilities | 168,317 |
|
| Net Assets | $25,277,576 |
| Net Assets Consist of: | |
| Capital paid in | $18,749,145 |
| Total distributable earnings (loss) | 6,528,431 |
| Net Assets | $25,277,576 |
| Shares outstanding ($0.01 par value; unlimited shares authorized) | 2,014,172 |
| Net asset value per share | $12.55 |
The accompanying Notes are an integral part of these financial statements.
| 10 | Statement of Assets and Liabilities |
State Street Small-Cap Equity V.I.S. Fund
Statement of Operations — For the year ended December 31, 2024
| Investment Income | |
| Income | |
| Dividend | $264,614 |
| Interest | 1,395 |
| Income from affiliated investments | 61,708 |
| Less: Foreign taxes withheld | (1,727) |
| Total income | 325,990 |
| Expenses | |
| Advisory and administration fees | 244,658 |
| Directors' fees | 21,154 |
| Custody, fund accounting and sub-administration fees | 29,663 |
| Professional fees | 59,696 |
| Other expenses | 15,339 |
| Total expenses | 370,510 |
| Net investment income (loss) | $(44,520) |
| Net Realized and Unrealized Gain (Loss) on Investments | |
| Realized gain (loss) on: | |
| Unaffiliated investments | $2,712,292 |
| Futures | 65,501 |
| Increase (decrease) in unrealized appreciation/depreciation on: | |
| Unaffiliated investments | (177,994) |
| Futures | (35,533) |
| Net realized and unrealized gain (loss) on investments | 2,564,266 |
| Net Increase (Decrease) in Net Assets Resulting from Operations | $2,519,746 |
The accompanying Notes are an integral part of these financial statements.
| Statement of Operations | 11 |
State Street Small-Cap Equity V.I.S. Fund
Statements of Changes in Net Assets
| | Year Ended
December 31,
2024 | | Year Ended
December 31,
2023 |
| Increase (Decrease) in Net Assets | | | |
| Operations: | | | |
| Net investment income (loss) | $(44,520) | | $32,547 |
| Net realized gain (loss) on investments and futures | 2,777,793 | | 1,991,573 |
| Net increase (decrease) in unrealized appreciation/depreciation on investments and futures | (213,527) | | 1,234,893 |
| Net increase (decrease) from operations | 2,519,746 | | 3,259,013 |
| Distributions to shareholders: | | | |
| Total distributions | (2,041,158) | | (2,232,962) |
| Increase (decrease) in assets from operations and distributions | 478,588 | | 1,026,051 |
| Share transactions: | | | |
| Proceeds from sale of shares | 237,222 | | 193,752 |
| Value of distributions reinvested | 2,041,158 | | 2,232,962 |
| Cost of shares redeemed | (3,389,328) | | (3,608,386) |
| Net increase (decrease) from share transactions | (1,110,948) | | (1,181,672) |
| Total increase (decrease) in net assets | (632,360) | | (155,621) |
| Net Assets | | | |
| Beginning of year | 25,909,936 | | 26,065,557 |
| End of year | $25,277,576 | | $25,909,936 |
| Changes in Fund Shares | | | |
| Shares sold | 18,504 | | 15,689 |
| Issued for distributions reinvested | 161,868 | | 178,067 |
| Shares redeemed | (259,986) | | (289,897) |
| Net increase (decrease) in fund shares | (79,614) | | (96,141) |
The accompanying Notes are an integral part of these financial statements.
| 12 | Statements of Changes in Net Assets |
State Street Small-Cap Equity V.I.S. Fund
Notes to Financial Statements — December 31, 2024
1.Organization of the Company
State Street Variable Insurance Series Funds, Inc. (the “Company”) was incorporated under the laws of the Commonwealth of Virginia on May 14, 1984 and is registered under the Investment Company Act of 1940, as amended (the “1940 Act”), as an open-end management investment company. The Company is currently
composed of the following seven investment portfolios (collectively, the “Funds”): State Street U.S. Equity V.I.S. Fund, State Street S&P 500 Index V.I.S. Fund, State Street Premier Growth Equity V.I.S. Fund, State Street Small-Cap Equity V.I.S. Fund (the “Fund”), State Street Total Return V.I.S. Fund, State Street Income V.I.S. Fund and State Street Real Estate Securities V.I.S. Fund. Each Fund is a diversified investment company within the meaning of the 1940 Act, except for the State Street Premier Growth Equity V.I.S. Fund, which is a non-diversified investment company.
Shares of the Funds of the Company are offered only to insurance company separate accounts that fund certain variable life insurance contracts and variable annuity contracts.
The Company currently offers one share class (Class 1) of the Fund as an investment option for variable life insurance and variable annuity contracts.
Under the Company’s organizational documents, its officers and directors are indemnified against certain liabilities arising out of the performance of their duties to the Company. Additionally, in the normal course of business, the Company enters into contracts with service providers that contain general indemnification clauses. The Company’s maximum exposure under these arrangements is unknown as this would involve future claims that may be made against the Company that have not yet occurred.
2.Segment Reporting
The Fund has one reportable segment. Business activities are managed on a consolidated basis and revenues are derived primarily through the Fund’s investments in accordance with its investment objective. The Fund’s chief operating decision maker (“CODM”) is the President of the Company. The CODM assesses performance based on the Fund’s Total Return as reported in the Financial Highlights, and the same accounting policies are applied as described in the summary of significant accounting policies. The Fund’s Total Return is utilized by the CODM to compare results, including the impact of the Fund’s costs, to the Fund’s competitors and to the Fund’s benchmark index.
3.Summary of Significant Accounting Policies
The following is a summary of significant accounting policies followed by the Company in the preparation of its financial statements:
The preparation of financial statements in accordance with U.S. generally accepted accounting principles (“U.S. GAAP”) requires management to make estimates and assumptions that affect the reported amounts and disclosures in the financial statements. Actual results could differ from those estimates. The Fund is an investment company under U.S. GAAP and follows the accounting and reporting guidance applicable to investment companies.
Security Valuation The Fund’s investments are valued at fair value each day that the New York Stock Exchange (“NYSE”) is open and, for financial reporting purposes, as of the report date should the reporting period end on a day that the NYSE is not open. Fair value is generally defined as the price a fund would receive to sell an asset or pay to transfer a liability in an orderly transaction between market participants at the measurement date. By its nature, a fair value price is a good faith estimate of the valuation in a current sale and may not reflect an actual market price. The investments of the Fund are valued pursuant to the policy and procedures developed by the Oversight Committee (the “Committee”) and approved by the Company's Board of Directors (the “Board”). The Committee provides oversight of the valuation of investments for the Fund. The Board has responsibility for overseeing the determination of the fair value of investments.
Valuation techniques used to value the Fund’s investments by major category are as follows:
| Notes to Financial Statements | 13 |
State Street Small-Cap Equity V.I.S. Fund
Notes to Financial Statements, continued — December 31, 2024
| • | Equity investments traded on a recognized securities exchange for which market quotations are readily available are valued at the last sale price or official closing price, as applicable, on the primary market or exchange on which they trade. Equity investments traded on a recognized exchange for which there were no sales on that day are valued at the last published sale price or at fair value. |
| • | Investments in registered investment companies (including money market funds) or other unitized pooled investment vehicles that are not traded on an exchange are valued at that day’s published net asset value (“NAV”) per share or unit. |
| • | Exchange-traded futures contracts are valued at the closing settlement price on the primary market on which they are traded most extensively. Exchange-traded futures contracts traded on a recognized exchange for which there were no sales on that day are valued at the last reported sale price obtained from independent pricing services or brokers or at fair value. |
In the event prices or quotations are not readily available or that the application of these valuation methods results in a price for an investment that is deemed to be not representative of the fair value of such investment, fair value will be determined in good faith by the Committee, in accordance with the valuation policy and procedures approved by the Board.
The Fund values its assets and liabilities at fair value using a fair value hierarchy consisting of three broad levels that prioritize the inputs to valuation techniques giving the highest priority to readily available unadjusted quoted prices in active markets for identical assets or liabilities (Level 1 measurements) and the lowest priority to unobservable inputs (Level 3 measurements) when market prices are not readily available or reliable. The categorization of a value determined for an investment within the hierarchy is based upon the pricing transparency of the investment and is not necessarily an indication of the risk associated with investing in it.
The three levels of the fair value hierarchy are as follows:
| • | Level 1 — Unadjusted quoted prices in active markets for an identical asset or liability; |
| • | Level 2 — Inputs other than quoted prices included within Level 1 that are observable for the asset or liability either directly or indirectly, including quoted prices for similar assets or liabilities in active markets, quoted prices for identical or similar assets or liabilities in markets that are not considered to be active, inputs other than quoted prices that are observable for the asset or liability (such as exchange rates, financing terms, interest rates, yield curves, volatilities, prepayment speeds, loss severities, credit risks and default rates) or other market-corroborated inputs; and |
| • | Level 3 — Unobservable inputs for the asset or liability, including the Committee’s assumptions used in determining the fair value of investments. |
The value of the Fund’s investments according to the fair value hierarchy as of December 31, 2024 is disclosed in the Fund’s Schedule of Investments.
Investment Transactions and Income Recognition Investment transactions are accounted for on trade date for financial reporting purposes. Realized gains and losses from the sale or disposition of investments and foreign exchange transactions, if any, are determined using the identified cost method.
Dividend income and capital gain distributions, if any, are recognized on the ex-dividend date, net of any foreign taxes withheld at source, if any.
Interest income is recorded daily on an accrual basis. All premiums and discounts are amortized/accreted for financial reporting purposes.
Non-cash dividends received in the form of stock are recorded as dividend income at fair value.
The Fund invests in real estate investment trusts (“REITs”). REITs determine the tax character of their distributions annually and may characterize a portion of their distributions as a return of capital or capital gain. The Fund’s policy is to record all REIT distributions initially as dividend income and re-designate a portion to return of capital or
| 14 | Notes to Financial Statements |
State Street Small-Cap Equity V.I.S. Fund
Notes to Financial Statements, continued — December 31, 2024
capital gain distributions at year-end based on information provided by the REIT and/or SSGA Funds Management, Inc.’s (the “Adviser” or “SSGA FM”) estimates of such re-designations for which actual information has not yet been reported.
Expenses Certain expenses, which are directly identifiable to a specific Fund, are applied to the Fund within the Company. Other expenses which cannot be attributed to a specific Fund are allocated in such a manner as deemed equitable, taking into consideration the nature and type of expense and the relative net assets of the Fund within the Company.
Foreign Taxes The Fund may be subject to foreign taxes (a portion of which may be reclaimable) on income, stock dividends, realized and unrealized capital gains on investments or certain foreign currency transactions. Foreign taxes are recorded in accordance with SSGA FM's understanding of the applicable foreign tax regulations and rates that exist in the foreign jurisdictions in which the Fund invests. These foreign taxes, if any, are paid by the Fund and are reflected in the Statement of Operations, if applicable. Foreign taxes payable or deferred as of December 31, 2024, if any, are disclosed in the Fund’s Statement of Assets and Liabilities.
Distributions The Fund declares and pays any dividends from net investment income annually.
Net realized capital gains, if any, are distributed annually, unless additional distributions are required for compliance with applicable tax regulations. The amount and character of income and capital gains to be distributed are determined in accordance with applicable tax regulations which may differ from net investment income and realized gains recognized for U.S. GAAP purposes.
4.Derivative Financial Instruments
Futures Contracts The Fund may enter into futures contracts to meet the Fund’s objectives. A futures contract is a standardized, exchange-traded agreement to buy or sell a financial instrument at a set price on a future date. Upon entering into a futures contract, the Fund is required to deposit with the broker, cash or securities in an amount equal to the minimum initial margin requirements of the clearing house. Securities deposited, if any, are designated on the Schedule of Investments and cash deposited, if any, is included in Net cash collateral on deposit with broker for future contracts on the Statement of Assets and Liabilities. Subsequent payments are made or received by the Fund equal to the daily change in the contract value, accumulated, exchange rates, and/or other transactional fees. The accumulation of those payments are recorded as variation margin receivable or payable with a corresponding offset to unrealized gains or losses. The Fund recognizes a realized gain or loss when the contract is closed.
Losses may arise if the value of a futures contract decreases due to unfavorable changes in the market rates or values of the underlying instrument during the term of the contract or if the counterparty does not perform under the contract. The use of futures contracts also involves the risk that the movements in the price of the futures contracts do not correlate with the movement of the assets underlying such contracts.
For the fiscal year ended December 31, 2024, the Fund entered into futures contracts for cash equitization.
The following tables summarize the value of the Fund’s derivative instruments as of December 31, 2024 and the related location in the accompanying Statement of Assets and Liabilities and Statement of Operations, presented by primary underlying risk exposure:
| Liability Derivatives |
| | Interest
Rate
Risk | Foreign
Exchange
Risk | Credit
Risk | Equity
Risk | Commodity
Risk | Total |
| State Street Small-Cap Equity V.I.S. Fund | | | | | | |
| Futures Contracts | $— | $— | $— | $15,371 | $— | $15,371 |
| Notes to Financial Statements | 15 |
State Street Small-Cap Equity V.I.S. Fund
Notes to Financial Statements, continued — December 31, 2024
| Realized Gain (Loss) |
| | Interest
Rate
Risk | Foreign
Exchange
Risk | Credit
Risk | Equity
Risk | Commodity
Risk | Total |
| State Street Small-Cap Equity V.I.S. Fund | | | | | | |
| Futures Contracts | $— | $— | $— | $65,501 | $— | $65,501 |
| Net Change in Unrealized Appreciation/Depreciation |
| | Interest
Rate
Risk | Foreign
Exchange
Risk | Credit
Risk | Equity
Risk | Commodity
Risk | Total |
| State Street Small-Cap Equity V.I.S. Fund | | | | | | |
| Futures Contracts | $— | $— | $— | $(35,533) | $— | $(35,533) |
5.Fees and Transactions with Affiliates
Advisory Fee SSGA FM, a registered investment adviser, was retained by the Board to act as investment adviser and administrator of the Fund. SSGA FM’s compensation for investment advisory and administrative services (“Management Fee”) is paid monthly based on the average daily net assets of the Fund at an annualized rate of 0.95%.
Custody, Fund Accounting and Sub-Administration Fees State Street Bank and Trust Company (“State Street”) serves as the custodian, fund accountant and sub-administrator to the Fund. Amounts paid by the Fund to State Street for performing such services are included as custody, fund accounting and sub-administration fees in the Statement of Operations.
Due to Custodian In certain circumstances, the Fund may have cash overdrafts with the custodian due to expense payments, capital transactions, trading of securities, investment operations or derivative transactions. The Due to Custodian amount, if any, reflects cash overdrawn with State Street as custodian, who is an affiliate of the Fund.
Other Transactions with Affiliates The Fund may invest in affiliated entities, including securities issued by State Street Corporation, affiliated funds, or entities deemed to be affiliates as a result of the Fund owning more than five percent of the entity’s voting securities or outstanding shares. Amounts relating to these transactions during the fiscal year ended December 31, 2024 are disclosed in the Schedule of Investments.
6.Sub-Advisory Fees
Pursuant to investment sub-advisory agreements with SSGA FM, the assets of the Fund are allocated to and managed by each of the following sub-advisers: (i) Palisade Capital Management, LP; (ii) Champlain Investment Partners, LLC; (iii) Kennedy Capital Management, LLC; (iv) SouthernSun Asset Management, LLC; and (v) Westfield Capital Management Company, LP. SSGA FM is responsible for allocating the Fund’s assets among the sub-advisers in its discretion (“Allocated Assets”), and for managing the Fund’s cash position, while each sub-adviser is responsible for the day-to-day management of their portion of the Allocated Assets, under the general supervision and oversight of SSGA FM and the Board. For their services, SSGA FM pays each sub-adviser an investment sub-advisory fee, which is calculated as a percentage of the average daily net assets of the respective Allocated Assets that it manages.
7.Directors' Fees
The fees and expenses of the Company’s directors who are not “interested persons” of the Company, as defined in the 1940 Act (“Independent Directors”), are paid directly by the Fund. The Independent Directors are reimbursed for travel and other out-of-pocket expenses in connection with meeting attendance and industry seminars.
| 16 | Notes to Financial Statements |
State Street Small-Cap Equity V.I.S. Fund
Notes to Financial Statements, continued — December 31, 2024
8.Investment Transactions
Purchases and sales of investments (excluding in-kind transactions, short term investments and derivative contracts) for the fiscal year ended December 31, 2024 were as follows:
| Non-U.S. Government Securities |
| Purchases | Sales |
| $10,462,931 | $13,926,699 |
9.Income Taxes
The Fund has qualified and intends to continue to qualify as a regulated investment company under Subchapter M of the Internal Revenue Code of 1986, as amended. The Fund will not be subject to federal income taxes to the extent it distributes its taxable income, including any net realized capital gains, for each fiscal year. Therefore, no provision for federal income tax is required.
The Fund files federal and various state and local tax returns as required. No income tax returns are currently under examination. Generally, the federal returns are subject to examination by the Internal Revenue Service for a period of three years from date of filing, while the state returns may remain open for an additional year depending upon jurisdiction. SSGA FM has analyzed the Fund's tax positions taken on tax returns for all open years and does not believe there are any uncertain tax positions that would require recognition of a tax liability.
Distributions to shareholders are recorded on ex-dividend date. Income dividends and gain distributions are determined in accordance with income tax rules and regulations, which may differ from generally accepted accounting principles. Certain capital accounts in the financial statements have been adjusted for permanent book-tax differences. These adjustments have no impact on net asset values or results of operations. Temporary book-tax differences will reverse in the future. These book-tax differences are primarily due to nontaxable dividend adjustments to income, REITs, investments in futures, and wash sale loss deferrals.
The tax character of distributions paid during the fiscal year ended December 31, 2024 were as follows:
Ordinary
Income | Long-Term
Capital Gains | Total |
| $214,508 | $1,826,650 | $2,041,158 |
The tax character of distributions paid during the fiscal year ended December 31, 2023 was as follows:
Ordinary
Income | Long-Term
Capital Gains | Total |
| $142,246 | $2,090,716 | $2,232,962 |
At December 31, 2024, the components of distributable earnings on a tax basis were as follows:
Undistributed
Ordinary
Income | Tax Exempt
Income | Capital Loss
Carryforwards | Undistributed
long term
gain | Net
Unrealized
Gains
(Losses) | Qualified
Late-Year
Losses | Total |
| $102,999 | $— | $— | $686,347 | $5,739,085 | $— | $6,528,431 |
As of December 31, 2024, gross unrealized appreciation and gross unrealized depreciation of investments and other financial instruments based on cost for federal income tax purposes were as follows:
Tax
Cost | Gross
Unrealized
Appreciation | Gross
Unrealized
Depreciation | Net
Unrealized
Appreciation
(Depreciation) |
| $19,605,075 | $6,868,671 | $1,129,586 | $5,739,085 |
| Notes to Financial Statements | 17 |
State Street Small-Cap Equity V.I.S. Fund
Notes to Financial Statements, continued — December 31, 2024
10.Line of Credit
The Fund and other affiliated funds (each, a “Participant” and collectively, the “Participants”) have access to $194.29 million of a $1.36 billion ($180 million of $1.26 billion prior to November 1, 2024 and $180 million of $960 million prior to October 3, 2024) revolving credit facility provided by a syndication of banks under which the Participants may borrow to fund shareholder redemptions. This agreement expires in October 2025 unless extended or renewed.
The Participants are charged an annual commitment fee which is calculated based on the unused portion of the shared credit line. Commitment fees are allocated among each of the Participants based on relative net assets. Commitment fees are ordinary fund operating expenses. A Participant incurs and pays the interest expense related to its borrowing. Interest is calculated at a rate per annum equal to the sum of 1.00% plus the greater of the
New York Fed Bank Rate and the one-month SOFR Rate.
The Fund had no outstanding loans as of December 31, 2024.
11.Risks
Concentration Risk As a result of the Fund's ability to invest a large percentage of its assets in obligations of issuers within the same country, state, region, currency or economic sector, an adverse economic, business or political development may affect the value of the Fund's investments more than if the Fund was more broadly diversified.
Credit Risk The Fund may be exposed to credit risk in the event that an issuer or guarantor fails to perform or that an institution or entity with which the Fund has unsettled or open transactions defaults.
Market Risk The Fund’s investments are subject to changes in general economic conditions, and general market fluctuations and the risks inherent in investment in securities markets. Investment markets can be volatile and prices of investments can change substantially due to various factors including, but not limited to, economic growth or recession, changes in interest rates, changes in the actual or perceived creditworthiness of issuers, and general market liquidity. The Fund is subject to the risk that geopolitical events will disrupt securities markets and adversely affect global economies and markets. Local, regional or global events such as war, acts of terrorism, the spread of infectious illness, such as COVID-19, or other public health issues, or other events could have a significant impact on the Fund and its investments.
12.Subsequent Events
Management has evaluated the impact of all subsequent events on the Fund through the date on which the financial statements were available to be issued and has determined that there were no subsequent events requiring adjustment or disclosure in the financial statements.
| 18 | Notes to Financial Statements |
State Street Small-Cap Equity V.I.S. Fund
Report of Independent Registered Public Accounting Firm
To the Shareholders of State Street Small-Cap Equity V.I.S. Fund and the Board of Directors of State Street Variable Insurance Series Funds, Inc.
Opinion on the Financial Statements
We have audited the accompanying statement of assets and liabilities of State Street Small-Cap Equity V.I.S. Fund (the “Fund”) (one of the series constituting State Street Variable Insurance Series Funds, Inc. (the “Company”)), including the schedule of investments, as of December 31, 2024, and the related statement of operations for the year then ended, the statements of changes in net assets for each of the two years in the period then ended, the financial highlights for each of the five years in the period then ended and the related notes (collectively referred to as the “financial statements”). In our opinion, the financial statements present fairly, in all material respects, the financial position of the Fund (one of the series constituting State Street Variable Insurance Series Funds, Inc.) at December 31, 2024, the results of its operations for the year then ended, the changes in its net assets for each of the two years in the period then ended and its financial highlights for each of the five years in the period then ended, in conformity with U.S. generally accepted accounting principles.
Basis for Opinion
These financial statements are the responsibility of the Trust’s management. Our responsibility is to express an opinion on the Fund’s financial statements based on our audits. We are a public accounting firm registered with the Public Company Accounting Oversight Board (United States) (“PCAOB”) and are required to be independent with respect to the Trust in accordance with the U.S. federal securities laws and the applicable rules and regulations of the Securities and Exchange Commission and the PCAOB.
We conducted our audits in accordance with the standards of the PCAOB. Those standards require that we plan and perform the audit to obtain reasonable assurance about whether the financial statements are free of material misstatement, whether due to error or fraud. The Trust is not required to have, nor were we engaged to perform, an audit of the Trust’s internal control over financial reporting. As part of our audits we are required to obtain an understanding of internal control over financial reporting, but not for the purpose of expressing an opinion on the effectiveness of the Trust’s internal control over financial reporting. Accordingly, we express no such opinion.
Our audits included performing procedures to assess the risks of material misstatement of the financial statements, whether due to error or fraud, and performing procedures that respond to those risks. Such procedures included examining, on a test basis, evidence regarding the amounts and disclosures in the financial statements. Our procedures included confirmation of securities owned as of December 31, 2024, by correspondence with the custodian, brokers and others; when replies were not received from brokers and others, we performed other auditing procedures. Our audits also included evaluating the accounting principles used and significant estimates made by management, as well as evaluating the overall presentation of the financial statements. We believe that our audits provide a reasonable basis for our opinion.
We have served as the auditor of one or more State Street Global Advisors investment companies since 2000.
Boston, Massachusetts
February 18, 2025
| Report of Independent Registered Public Accounting Firm | 19 |
State Street Small-Cap Equity V.I.S. Fund
Other Information — December 31, 2024
Tax Information
For federal income tax purposes, the following information is furnished with respect to the distributions of the Fund for their fiscal year ended December 31, 2024.
Dividends Received Deduction
The Fund reports the maximum amount allowable of its net taxable income as eligible for the corporate dividends received deduction.
Long Term Capital Gain Distributions
Long term capital gains dividends were paid from the Fund during the year ended December 31, 2024 in the amount of $1,826,650.
State Street Small-Cap Equity V.I.S. Fund
Proxy Disclosure for Open-End Management Investment Companies — December 31, 2024 (Unaudited)
Shareholder Meeting Results
Rule 30e-1 under the Investment Company Act of 1940, as amended, requires registered management companies to report on all subject matters put to the vote of shareholders and provide final results. Shareholders were asked to participate in a special meeting of shareholders on December 6, 2024 (the “Shareholder Meeting”). The final results of the Shareholder Meeting are reported in the table below.
All Funds
Proposal 1: To elect the following as Directors of the Company:
| Proposed Director | Shares For | Shares Withheld |
| Patrick J. Riley | 73,750,198.987 | 1,759,144.984 |
| Donna M. Rapaccioli | 73,872,469.845 | 1,636,874.126 |
| Margaret K. McLaughlin | 73,959,592.918 | 1,549,751.053 |
| George M. Pereira | 73,932,719.109 | 1,576,624.862 |
| Mark E. Swanson | 73,862,069.730 | 1,647,274.241 |
| Jeanne LaPorta | 73,881,354.092 | 1,627,989.879 |
Annual Financial Statements and Other Information
December 31, 2024
| State Street U.S. Equity V.I.S. Fund |
State Street U.S. Equity V.I.S. Fund
Annual Report Financial Statements and Other Information
December 31, 2024
Changes in and Disagreements with Accountants for Open-End Management Investment Companies (N-CSR Item 8) - Not Applicable
Remuneration Paid to Directors, Officers, and Others of Open-End Management Investment Companies (N-CSR Item 10) - Please see Statement of Operations in the Financial Statements under Item 7 above
Statement Regarding Basis for Approval of Investment Advisory Contract (Unaudited) (N-CSR Item 11) - Not Applicable
This report is prepared for Policyholders of certain variable contracts and may be distributed to others only if preceded or accompanied by the variable contract’s current prospectus and the current summary prospectus of the Fund available for investments thereunder.
[This page intentionally left blank]
State Street U.S. Equity V.I.S. Fund
Schedule of Investments — December 31, 2024
| | Number
of Shares | Fair
Value |
| Common Stock - 98.6% † |
| Aerospace & Defense - 0.5% |
| RTX Corp. | 930 | $107,620 |
| Apparel Retail - 0.4% |
| Ross Stores, Inc. | 502 | 75,937 |
| Application Software - 3.4% |
| Adobe, Inc. (a) | 545 | 242,351 |
| Intuit, Inc. | 96 | 60,336 |
| Salesforce, Inc. | 749 | 250,413 |
| Synopsys, Inc. (a) | 329 | 159,683 |
| | | 712,783 |
| Automobile Manufacturers - 1.3% |
| General Motors Co. | 2,245 | 119,591 |
| Tesla, Inc. (a) | 384 | 155,075 |
| | | 274,666 |
| Automotive Retail - 0.5% |
| O'Reilly Automotive, Inc. (a) | 93 | 110,279 |
| Biotechnology - 0.9% |
| BioMarin Pharmaceutical, Inc. (a) | 480 | 31,550 |
| Vertex Pharmaceuticals, Inc. (a) | 373 | 150,207 |
| | | 181,757 |
| Broadline Retail - 4.9% |
| Amazon.com, Inc. (a) | 4,683 | 1,027,403 |
| Building Products - 0.6% |
| Trane Technologies PLC (b) | 332 | 122,624 |
| Construction Materials - 0.6% |
| Martin Marietta Materials, Inc. | 266 | 137,389 |
| Consumer Staples Merchandise Retail - 1.3% |
| Costco Wholesale Corp. | 88 | 80,632 |
| Walmart, Inc. | 2,047 | 184,946 |
| | | 265,578 |
| Data Processing & Outsourced Services - 0.9% |
| Broadridge Financial Solutions, Inc. | 822 | 185,846 |
| Diversified Banks - 4.5% |
| Bank of America Corp. | 10,885 | 478,396 |
| | Number
of Shares | Fair
Value |
| JPMorgan Chase & Co. | 1,930 | $462,640 |
| | | 941,036 |
| Electric Utilities - 0.9% |
| NextEra Energy, Inc. | 2,658 | 190,552 |
| Electrical Components & Equipment - 1.7% |
| Eaton Corp. PLC | 381 | 126,443 |
| Emerson Electric Co. | 1,941 | 240,548 |
| | | 366,991 |
| Electronic Components - 0.3% |
| Amphenol Corp., Class A | 795 | 55,213 |
| Environmental & Facilities Services - 1.4% |
| Tetra Tech, Inc. | 854 | 34,023 |
| Waste Management, Inc. | 1,274 | 257,081 |
| | | 291,104 |
| Financial Exchanges & Data - 2.2% |
| Intercontinental Exchange, Inc. | 637 | 94,919 |
| Nasdaq, Inc. | 714 | 55,199 |
| S&P Global, Inc. | 620 | 308,779 |
| | | 458,897 |
| Healthcare Equipment - 2.6% |
| Abbott Laboratories | 975 | 110,282 |
| Becton Dickinson & Co. | 1,105 | 250,691 |
| IDEXX Laboratories, Inc. (a) | 216 | 89,303 |
| Zimmer Biomet Holdings, Inc. | 842 | 88,941 |
| | | 539,217 |
| Home Improvement Retail - 1.8% |
| Home Depot, Inc. | 993 | 386,267 |
| Household Products - 0.8% |
| Procter & Gamble Co. | 1,077 | 180,559 |
| Industrial Gases - 1.2% |
| Linde PLC | 584 | 244,503 |
| Industrial Machinery & Supplies & Components - 1.3% |
| Parker-Hannifin Corp. | 433 | 275,401 |
| Insurance Brokers - 0.3% |
| Marsh & McLennan Cos., Inc. | 266 | 56,501 |
| Integrated Oil & Gas - 1.5% |
| Chevron Corp. | 827 | 119,783 |
See Notes to Schedule of Investments and Notes to Financial Statements.
| State Street U.S. Equity V.I.S. Fund | 1 |
State Street U.S. Equity V.I.S. Fund
Schedule of Investments, continued — December 31, 2024
| | Number
of Shares | Fair
Value |
| Exxon Mobil Corp. | 1,773 | $190,721 |
| | | 310,504 |
| Interactive Media & Services - 8.5% |
| Alphabet, Inc., Class A | 4,850 | 918,105 |
| Alphabet, Inc., Class C | 693 | 131,975 |
| Meta Platforms, Inc., Class A | 1,278 | 748,282 |
| | | 1,798,362 |
| IT Consulting & Other Services - 0.3% |
| Accenture PLC, Class A | 203 | 71,413 |
| Life Sciences Tools & Services - 1.9% |
| IQVIA Holdings, Inc. (a) | 892 | 175,287 |
| Thermo Fisher Scientific, Inc. | 416 | 216,416 |
| | | 391,703 |
| Managed Healthcare - 1.1% |
| Elevance Health, Inc. | 194 | 71,566 |
| UnitedHealth Group, Inc. | 336 | 169,969 |
| | | 241,535 |
| Movies & Entertainment - 1.0% |
| Netflix, Inc. (a) | 125 | 111,415 |
| Walt Disney Co. | 952 | 106,005 |
| | | 217,420 |
| Multi-Line Insurance - 0.2% |
| American International Group, Inc. | 517 | 37,638 |
| Multi-Sector Holdings - 1.2% |
| Berkshire Hathaway, Inc., Class B (a) | 570 | 258,370 |
| Multi-Utilities - 0.7% |
| Sempra | 1,579 | 138,510 |
| Oil & Gas Equipment & Services - 0.2% |
| Schlumberger NV | 1,279 | 49,037 |
| Oil & Gas Exploration & Production - 1.0% |
| ConocoPhillips | 2,100 | 208,257 |
| Other Specialty Retail - 0.9% |
| Ulta Beauty, Inc. (a) | 428 | 186,150 |
| Packaged Foods & Meats - 0.1% |
| Mondelez International, Inc., Class A | 481 | 28,730 |
| | Number
of Shares | Fair
Value |
| Passenger Ground Transportation - 0.4% |
| Uber Technologies, Inc. (a) | 1,496 | $90,239 |
| Personal Care Products - 1.0% |
| Kenvue, Inc. | 10,122 | 216,105 |
| Pharmaceuticals - 4.3% |
| AstraZeneca PLC ADR | 1,368 | 89,631 |
| Elanco Animal Health, Inc. (a) | 4,020 | 48,682 |
| Eli Lilly & Co. | 102 | 78,744 |
| Johnson & Johnson | 2,358 | 341,014 |
| Merck & Co., Inc. | 3,449 | 343,107 |
| | | 901,178 |
| Property & Casualty Insurance - 1.3% |
| Chubb Ltd. | 732 | 202,252 |
| Progressive Corp. | 305 | 73,081 |
| | | 275,333 |
| Rail Transportation - 0.5% |
| Union Pacific Corp. | 499 | 113,792 |
| Regional Banks - 0.9% |
| Regions Financial Corp. | 8,354 | 196,486 |
| Restaurants - 0.5% |
| McDonald's Corp. | 367 | 106,390 |
| Semiconductor Materials & Equipment - 1.1% |
| Applied Materials, Inc. | 1,167 | 189,789 |
| ASML Holding NV NY Reg Shrs | 57 | 39,506 |
| | | 229,295 |
| Semiconductors - 12.3% |
| Advanced Micro Devices, Inc. (a) | 764 | 92,284 |
| Broadcom, Inc. | 2,461 | 570,558 |
| NVIDIA Corp. | 12,093 | 1,623,969 |
| ON Semiconductor Corp. (a) | 2,944 | 185,619 |
| Texas Instruments, Inc. | 654 | 122,631 |
| | | 2,595,061 |
| Soft Drinks & Non-alcoholic Beverages - 1.4% |
| Monster Beverage Corp. (a) | 1,472 | 77,368 |
| PepsiCo, Inc. | 1,467 | 223,072 |
| | | 300,440 |
See Notes to Schedule of Investments and Notes to Financial Statements.
| 2 | State Street U.S. Equity V.I.S. Fund |
State Street U.S. Equity V.I.S. Fund
Schedule of Investments, continued — December 31, 2024
| | Number
of Shares | Fair
Value |
| Specialty Chemicals - 0.5% |
| Ecolab, Inc. | 167 | $39,132 |
| International Flavors & Fragrances, Inc. | 347 | 29,339 |
| PPG Industries, Inc. | 252 | 30,101 |
| | | 98,572 |
| Systems Software - 8.4% |
| Microsoft Corp. | 3,524 | 1,485,366 |
| Oracle Corp. | 817 | 136,145 |
| ServiceNow, Inc. (a) | 139 | 147,356 |
| | | 1,768,867 |
| Technology Hardware, Storage & Peripherals - 6.6% |
| Apple, Inc. | 5,573 | 1,395,591 |
| Telecom Tower REITs - 1.0% |
| American Tower Corp. | 1,202 | 220,459 |
| Trading Companies & Distributors - 1.4% |
| United Rentals, Inc. | 318 | 224,012 |
| WW Grainger, Inc. | 74 | 78,000 |
| | | 302,012 |
| Transaction & Payment Processing Services - 3.2% |
| Fidelity National Information Services, Inc. | 378 | 30,531 |
| | Number
of Shares | Fair
Value |
| Mastercard, Inc., Class A | 552 | $290,667 |
| Visa, Inc., Class A | 1,104 | 348,908 |
| | | 670,106 |
| Water Utilities - 0.6% |
| American Water Works Co., Inc. | 945 | 117,643 |
| Wireless Telecommunication Services - 0.3% |
| T-Mobile U.S., Inc. | 257 | 56,728 |
Total Common Stock
(Cost $11,987,011) | | 20,780,049 |
| Short-Term Investments - 1.5% |
State Street Institutional U.S. Government Money Market Fund - Class G Shares 4.47% (c)(d)
(Cost $331,182) | 331,182 | 331,182 |
Total Investments
(Cost $12,318,193) | | 21,111,231 |
| Liabilities in Excess of Other Assets, net - (0.1)% | | (30,566) |
| NET ASSETS - 100.0% | | $21,080,665 |
Other Information:
| The Fund had the following long futures contracts open at December 31, 2024: |
| Description | Expiration
Date | Number of
Contracts | Notional
Amount | Value | Unrealized
Appreciation
(Depreciation) |
| S&P 500 E-mini Index Futures | March 2025 | 4 | $123,095 | $118,715 | $(4,380) |
During the year ended December 31, 2024, the average notional value related to long futures contracts was $244,350.
See Notes to Schedule of Investments and Notes to Financial Statements.
| State Street U.S. Equity V.I.S. Fund | 3 |
State Street U.S. Equity V.I.S. Fund
Schedule of Investments, continued — December 31, 2024
Notes to Schedule of Investments
The views expressed in this document reflect our judgment as of the publication date and are subject to change at any time without notice. The securities cited may not be representative of the Fund’s future investments and should not be construed as a recommendation to purchase or sell a particular security. See the Fund’s summary prospectus and statutory prospectus for complete descriptions of investment objectives, policies, risks and permissible investments.
| (a) | Non-income producing security. |
| (b) | At December 31, 2024, all or a portion of this security was pledged to cover collateral requirements for futures contracts. |
| (c) | Sponsored by SSGA Funds Management, Inc., the Fund’s investment adviser and administrator, and an affiliate of State Street Bank & Trust Co., the Fund’s sub-administrator, custodian and accounting agent. |
| (d) | Coupon amount represents effective yield. |
| † | Percentages are based on net assets as of December 31, 2024. |
| Abbreviations: |
| ADR - American Depositary Receipt |
| REIT - Real Estate Investment Trust |
The following table presents the Fund’s investments measured at fair value on a recurring basis at December 31, 2024:
| Investments | Level 1 | | Level 2 | | Level 3 | | Total |
| Investments in Securities | | | | | | | |
| Common Stock | $20,780,049 | | $— | | $— | | $20,780,049 |
| Short-Term Investments | 331,182 | | — | | — | | 331,182 |
| Total Investments in Securities | $21,111,231 | | $— | | $— | | $21,111,231 |
| Other Financial Instruments | | | | | | | |
| Long Futures Contracts - Unrealized Depreciation | $(4,380) | | $— | | $— | | $(4,380) |
| Total Other Financial Instruments | $(4,380) | | $— | | $— | | $(4,380) |
| | Number
of Shares
Held at
12/31/23 | Value at
12/31/23 | Cost of
Purchases | Proceeds
from
Shares
Sold | Realized
Gain
(Loss) | Change in
Unrealized
Appreciation
(Depreciation) | Number of
Shares
Held at
12/31/24 | Value at
12/31/24 | Dividend
Income |
| State Street Institutional U.S. Government Money Market Fund - Class G Shares | 709,663 | $709,663 | $5,726,862 | $6,105,343 | $— | $— | 331,182 | $331,182 | $31,145 |
See Notes to Schedule of Investments and Notes to Financial Statements.
| 4 | State Street U.S. Equity V.I.S. Fund |
State Street U.S. Equity V.I.S. Fund
Financial Highlights
Selected data based on a share outstanding throughout the fiscal years indicated
| | 12/31/24 | | 12/31/23 | | 12/31/22 | | 12/31/21 | | 12/31/20 |
| Inception date | | | 1/3/95 |
| Net asset value, beginning of period | $48.41 | | $40.76 | | $56.55 | | $53.28 | | $46.97 |
| Income/(loss) from investment operations: | | | | | | | | | |
| Net investment income(a) | 0.20 | | 0.22 | | 0.22 | | 0.18 | | 0.27 |
| Net realized and unrealized gains/(losses) on investments | 11.86 | | 11.15 | | (10.93) | | 13.47 | | 10.34 |
| Total income/(loss) from investment operations | 12.06 | | 11.37 | | (10.71) | | 13.65 | | 10.61 |
| Less distributions from: | | | | | | | | | |
| Net investment income | (0.24) | | (0.23) | | (0.24) | | (0.22) | | (0.27) |
| Net realized gains | (11.86) | | (3.49) | | (4.84) | | (10.16) | | (4.03) |
| Total distributions | (12.10) | | (3.72) | | (5.08) | | (10.38) | | (4.30) |
| Net asset value, end of period | $48.37 | | $48.41 | | $40.76 | | $56.55 | | $53.28 |
| Total Return(b) | 24.55% | | 27.91% | | (18.91)% | | 25.49% | | 22.64% |
| Ratios/Supplemental Data: | | | | | | | | | |
| Net assets, end of period (in thousands) | $21,081 | | $21,170 | | $20,449 | | $29,595 | | $27,729 |
| Ratios to average net assets: | | | | | | | | | |
| Gross expenses | 0.85% | | 0.91% | | 0.88% | | 0.82% | | 0.86% |
| Net investment income | 0.36% | | 0.48% | | 0.46% | | 0.30% | | 0.56% |
| Portfolio turnover rate | 45% | | 42% | | 33% | | 32% | | 38% |
| Notes to Financial Highlights |
| (a) | Per share values have been calculated using the average shares method. |
| (b) | Total returns are historical and assume changes in share price, reinvestment of dividends and capital gains distributions and do not include the effect of insurance contract charges. Past performance does not guarantee future results. |
The accompanying Notes are an integral part of these financial statements.
State Street U.S. Equity V.I.S. Fund
Statement of Assets and Liabilities — December 31, 2024
| Assets | |
| Investments in unaffiliated securities, at fair value (cost $11,987,011) | $20,780,049 |
| Investments in affiliated securities, at fair value (cost $331,182) | 331,182 |
| Cash | 303 |
| Net cash collateral on deposit with broker for future contracts | 12,299 |
| Income receivables | 15,209 |
| Receivable for fund shares sold | 526 |
| Income receivable from affiliated investments | 2,232 |
| Other assets | 147 |
| Total assets | 21,141,947 |
| Liabilities | |
| Payable for fund shares redeemed | 4,085 |
| Payable for accumulated variation margin on futures contracts | 4,370 |
| Payable to the Adviser | 10,615 |
| Payable for custody, fund accounting and sub-administration fees | 6,778 |
| Accrued other expenses | 35,434 |
| Total liabilities | 61,282 |
|
| Net Assets | $21,080,665 |
| Net Assets Consist of: | |
| Capital paid in | $11,257,781 |
| Total distributable earnings (loss) | 9,822,884 |
| Net Assets | $21,080,665 |
| Shares outstanding ($0.01 par value; unlimited shares authorized) | 435,802 |
| Net asset value per share | $48.37 |
The accompanying Notes are an integral part of these financial statements.
| 6 | Statement of Assets and Liabilities |
State Street U.S. Equity V.I.S. Fund
Statement of Operations — For the year ended December 31, 2024
| Investment Income | |
| Income | |
| Dividend | $247,562 |
| Interest | 865 |
| Income from affiliated investments | 31,145 |
| Less: Foreign taxes withheld | (125) |
| Total income | 279,447 |
| Expenses | |
| Advisory and administration fees | 126,419 |
| Directors' fees | 21,136 |
| Custody, fund accounting and sub-administration fees | 20,283 |
| Professional fees | 27,358 |
| Other expenses | 1,259 |
| Total expenses | 196,455 |
| Net investment income (loss) | $82,992 |
| Net Realized and Unrealized Gain (Loss) on Investments | |
| Realized gain (loss) on: | |
| Unaffiliated investments | $4,528,705 |
| Futures | 75,927 |
| Increase (decrease) in unrealized appreciation/depreciation on: | |
| Unaffiliated investments | 352,310 |
| Futures | (13,306) |
| Net realized and unrealized gain (loss) on investments | 4,943,636 |
| Net Increase (Decrease) in Net Assets Resulting from Operations | $5,026,628 |
The accompanying Notes are an integral part of these financial statements.
State Street U.S. Equity V.I.S. Fund
Statements of Changes in Net Assets
| | Year Ended
December 31,
2024 | | Year Ended
December 31,
2023 |
| Increase (Decrease) in Net Assets | | | |
| Operations: | | | |
| Net investment income (loss) | $82,992 | | $97,131 |
| Net realized gain (loss) on investments and futures | 4,604,632 | | 1,990,080 |
| Net increase (decrease) in unrealized appreciation/depreciation on investments and futures | 339,004 | | 2,919,583 |
| Net increase (decrease) from operations | 5,026,628 | | 5,006,794 |
| Distributions to shareholders: | | | |
| Total distributions | (4,232,544) | | (1,515,250) |
| Increase (decrease) in assets from operations and distributions | 794,084 | | 3,491,544 |
| Share transactions: | | | |
| Proceeds from sale of shares | 317,783 | | 253,428 |
| Value of distributions reinvested | 4,232,544 | | 1,515,250 |
| Cost of shares redeemed | (5,433,420) | | (4,539,387) |
| Net increase (decrease) from share transactions | (883,093) | | (2,770,709) |
| Total increase (decrease) in net assets | (89,009) | | 720,835 |
| Net Assets | | | |
| Beginning of year | 21,169,674 | | 20,448,839 |
| End of year | $21,080,665 | | $21,169,674 |
| Changes in Fund Shares | | | |
| Shares sold | 5,800 | | 5,608 |
| Issued for distributions reinvested | 86,238 | | 31,281 |
| Shares redeemed | (93,550) | | (101,242) |
| Net increase (decrease) in fund shares | (1,512) | | (64,353) |
The accompanying Notes are an integral part of these financial statements.
| 8 | Statements of Changes in Net Assets |
State Street U.S. Equity V.I.S. Fund
Notes to Financial Statements — December 31, 2024
1.Organization of the Company
State Street Variable Insurance Series Funds, Inc. (the “Company”) was incorporated under the laws of the Commonwealth of Virginia on May 14, 1984 and is registered under the Investment Company Act of 1940, as amended (the “1940 Act”), as an open-end management investment company. The Company is currently composed of the following seven investment portfolios (collectively, the “Funds”): State Street U.S. Equity V.I.S. Fund (the “Fund”), State Street S&P 500 Index V.I.S. Fund, State Street Premier Growth Equity V.I.S. Fund, State Street Small-Cap Equity V.I.S. Fund, State Street Total Return V.I.S. Fund, State Street Income V.I.S. Fund and State Street Real Estate Securities V.I.S. Fund. Each Fund is a diversified investment company within the meaning of the 1940 Act, except for the State Street Premier Growth Equity V.I.S. Fund, which is a non-diversified investment company.
Shares of the Funds of the Company are offered only to insurance company separate accounts that fund certain variable life insurance contracts and variable annuity contracts.
The Company currently offers one share class (Class 1) of the Fund as an investment option for variable life insurance and variable annuity contracts.
Under the Company’s organizational documents, its officers and directors are indemnified against certain liabilities arising out of the performance of their duties to the Company. Additionally, in the normal course of business, the Company enters into contracts with service providers that contain general indemnification clauses. The Company’s maximum exposure under these arrangements is unknown as this would involve future claims that may be made against the Company that have not yet occurred.
2.Segment Reporting
The Fund has one reportable segment. Business activities are managed on a consolidated basis and revenues are derived primarily through the Fund’s investments in accordance with its investment objective. The Fund’s chief operating decision maker (“CODM”) is the President of the Company. The CODM assesses performance based on the Fund’s Total Return as reported in the Financial Highlights, and the same accounting policies are applied as described in the summary of significant accounting policies. The Fund’s Total Return is utilized by the CODM to compare results, including the impact of the Fund’s costs, to the Fund’s competitors and to the Fund’s benchmark index.
3.Summary of Significant Accounting Policies
The following is a summary of significant accounting policies followed by the Company in the preparation of its financial statements:
The preparation of financial statements in accordance with U.S. generally accepted accounting principles (“U.S. GAAP”) requires management to make estimates and assumptions that affect the reported amounts and disclosures in the financial statements. Actual results could differ from those estimates. The Fund is an investment company under U.S. GAAP and follows the accounting and reporting guidance applicable to investment companies.
Security Valuation The Fund’s investments are valued at fair value each day that the New York Stock Exchange (“NYSE”) is open and, for financial reporting purposes, as of the report date should the reporting period end on a day that the NYSE is not open. Fair value is generally defined as the price a fund would receive to sell an asset or pay to transfer a liability in an orderly transaction between market participants at the measurement date. By its nature, a fair value price is a good faith estimate of the valuation in a current sale and may not reflect an actual market price. The investments of the Fund are valued pursuant to the policy and procedures developed by the Oversight Committee (the “Committee”) and approved by the Company's Board of Directors (the “Board”). The Committee provides oversight of the valuation of investments for the Fund. The Board has responsibility for overseeing the determination of the fair value of investments.
Valuation techniques used to value the Fund’s investments by major category are as follows:
| Notes to Financial Statements | 9 |
State Street U.S. Equity V.I.S. Fund
Notes to Financial Statements, continued — December 31, 2024
| • | Equity investments traded on a recognized securities exchange for which market quotations are readily available are valued at the last sale price or official closing price, as applicable, on the primary market or exchange on which they trade. Equity investments traded on a recognized exchange for which there were no sales on that day are valued at the last published sale price or at fair value. |
| • | Exchange-traded futures contracts are valued at the closing settlement price on the primary market on which they are traded most extensively. Exchange-traded futures contracts traded on a recognized exchange for which there were no sales on that day are valued at the last reported sale price obtained from independent pricing services or brokers or at fair value. |
| • | Investments in registered investment companies (including money market funds) or other unitized pooled investment vehicles that are not traded on an exchange are valued at that day’s published net asset value (“NAV”) per share or unit. |
In the event prices or quotations are not readily available or that the application of these valuation methods results in a price for an investment that is deemed to be not representative of the fair value of such investment, fair value will be determined in good faith by the Committee, in accordance with the valuation policy and procedures approved by the Board.
The Fund values its assets and liabilities at fair value using a fair value hierarchy consisting of three broad levels that prioritize the inputs to valuation techniques giving the highest priority to readily available unadjusted quoted prices in active markets for identical assets or liabilities (Level 1 measurements) and the lowest priority to unobservable inputs (Level 3 measurements) when market prices are not readily available or reliable. The categorization of a value determined for an investment within the hierarchy is based upon the pricing transparency of the investment and is not necessarily an indication of the risk associated with investing in it.
The three levels of the fair value hierarchy are as follows:
| • | Level 1 — Unadjusted quoted prices in active markets for an identical asset or liability; |
| • | Level 2 — Inputs other than quoted prices included within Level 1 that are observable for the asset or liability either directly or indirectly, including quoted prices for similar assets or liabilities in active markets, quoted prices for identical or similar assets or liabilities in markets that are not considered to be active, inputs other than quoted prices that are observable for the asset or liability (such as exchange rates, financing terms, interest rates, yield curves, volatilities, prepayment speeds, loss severities, credit risks and default rates) or other market-corroborated inputs; and |
| • | Level 3 — Unobservable inputs for the asset or liability, including the Committee’s assumptions used in determining the fair value of investments. |
The value of the Fund’s investments according to the fair value hierarchy as of December 31, 2024 is disclosed in the Fund’s Schedule of Investments.
Investment Transactions and Income Recognition Investment transactions are accounted for on trade date for financial reporting purposes. Realized gains and losses from the sale or disposition of investments and foreign exchange transactions, if any, are determined using the identified cost method.
Dividend income and capital gain distributions, if any, are recognized on the ex-dividend date, net of any foreign taxes withheld at source, if any.
Interest income is recorded daily on an accrual basis. All premiums and discounts are amortized/accreted for financial reporting purposes.
Non-cash dividends received in the form of stock are recorded as dividend income at fair value.
The Fund invests in real estate investment trusts (“REITs”). REITs determine the tax character of their distributions annually and may characterize a portion of their distributions as a return of capital or capital gain. The Fund’s policy is to record all REIT distributions initially as dividend income and re-designate a portion to return of capital or
| 10 | Notes to Financial Statements |
State Street U.S. Equity V.I.S. Fund
Notes to Financial Statements, continued — December 31, 2024
capital gain distributions at year-end based on information provided by the REIT and/or SSGA Funds Management, Inc.’s (the “Adviser” or “SSGA FM”) estimates of such re-designations for which actual information has not yet been reported.
Expenses Certain expenses, which are directly identifiable to a specific Fund, are applied to the Fund within the Company. Other expenses which cannot be attributed to a specific Fund are allocated in such a manner as deemed equitable, taking into consideration the nature and type of expense and the relative net assets of the Fund within the Company.
Foreign Currency Translation The accounting records of the Fund are maintained in U.S. dollars. Foreign currencies as well as investment securities and other assets and liabilities denominated in a foreign currency are translated to U.S. dollars using exchange rates at period end. Purchases and sales of securities, income receipts and expense payments denominated in foreign currencies are translated into U.S. dollars at the prevailing exchange rate on the respective dates of the transactions.
The effects of exchange rate fluctuations on investments are included with the net realized and unrealized gain (loss) on investment securities. Other foreign currency transactions resulting in realized and unrealized gain (loss) are disclosed separately.
Foreign Taxes The Fund may be subject to foreign taxes (a portion of which may be reclaimable) on income, stock dividends, realized and unrealized capital gains on investments or certain foreign currency transactions. Foreign taxes are recorded in accordance with SSGA FM's understanding of the applicable foreign tax regulations and rates that exist in the foreign jurisdictions in which the Fund invests. These foreign taxes, if any, are paid by the Fund and are reflected in the Statement of Operations, if applicable. Foreign taxes payable or deferred as of December 31, 2024, if any, are disclosed in the Fund’s Statement of Assets and Liabilities.
Distributions The Fund declares and pays any dividends from net investment income annually.
Net realized capital gains, if any, are distributed annually, unless additional distributions are required for compliance with applicable tax regulations. The amount and character of income and capital gains to be distributed are determined in accordance with applicable tax regulations which may differ from net investment income and realized gains recognized for U.S. GAAP purposes.
4.Derivative Financial Instruments
Futures Contracts The Fund may enter into futures contracts to meet the Fund’s objectives. A futures contract is a standardized, exchange-traded agreement to buy or sell a financial instrument at a set price on a future date. Upon entering into a futures contract, the Fund is required to deposit with the broker, cash or securities in an amount equal to the minimum initial margin requirements of the clearing house. Securities deposited, if any, are designated on the Schedule of Investments and cash deposited, if any, is included in Net cash collateral on deposit with broker for future contracts on the Statement of Assets and Liabilities. Subsequent payments are made or received by the Fund equal to the daily change in the contract value, accumulated, exchange rates, and/or other transactional fees. The accumulation of those payments are recorded as variation margin receivable or payable with a corresponding offset to unrealized gains or losses. The Fund recognizes a realized gain or loss when the contract is closed.
Losses may arise if the value of a futures contract decreases due to unfavorable changes in the market rates or values of the underlying instrument during the term of the contract or if the counterparty does not perform under the contract. The use of futures contracts also involves the risk that the movements in the price of the futures contracts do not correlate with the movement of the assets underlying such contracts.
For the fiscal year ended December 31, 2024, the Fund entered into futures contracts for cash equitization.
| Notes to Financial Statements | 11 |
State Street U.S. Equity V.I.S. Fund
Notes to Financial Statements, continued — December 31, 2024
The following tables summarize the value of the Fund’s derivative instruments as of December 31, 2024 and the related location in the accompanying Statement of Assets and Liabilities and Statement of Operations, presented by primary underlying risk exposure:
| Liability Derivatives |
| | Interest
Rate
Risk | Foreign
Exchange
Risk | Credit
Risk | Equity
Risk | Commodity
Risk | Total |
| State Street U.S. Equity V.I.S. Fund | | | | | | |
| Futures Contracts | $— | $— | $— | $4,370 | $— | $4,370 |
| Realized Gain (Loss) |
| | Interest
Rate
Risk | Foreign
Exchange
Risk | Credit
Risk | Equity
Risk | Commodity
Risk | Total |
| State Street U.S. Equity V.I.S. Fund | | | | | | |
| Futures Contracts | $— | $— | $— | $75,927 | $— | $75,927 |
| Net Change in Unrealized Appreciation/Depreciation |
| | Interest
Rate
Risk | Foreign
Exchange
Risk | Credit
Risk | Equity
Risk | Commodity
Risk | Total |
| State Street U.S. Equity V.I.S. Fund | | | | | | |
| Futures Contracts | $— | $— | $— | $(13,306) | $— | $(13,306) |
5.Fees and Transactions with Affiliates
Advisory Fee SSGA FM, a registered investment adviser, was retained by the Board to act as investment adviser and administrator of the Fund. SSGA FM’s compensation for investment advisory and administrative services (“Management Fee”) is paid monthly based on the average daily net assets of the Fund at an annualized rate of 0.55%.
Custody, Fund Accounting and Sub-Administration Fees State Street Bank and Trust Company (“State Street”) serves as the custodian, fund accountant and sub-administrator to the Fund. Amounts paid by the Fund to State Street for performing such services are included as custody, fund accounting and sub-administration fees in the Statement of Operations.
Other Transactions with Affiliates The Fund may invest in affiliated entities, including securities issued by State Street Corporation, affiliated funds, or entities deemed to be affiliates as a result of the Fund owning more than five percent of the entity’s voting securities or outstanding shares. Amounts relating to these transactions during the fiscal year ended December 31, 2024 are disclosed in the Schedule of Investments.
6.Directors’ Fees
The fees and expenses of the Company’s directors who are not “interested persons” of the Company, as defined in the 1940 Act (“Independent Directors”), are paid directly by the Fund. The Independent Directors are reimbursed for travel and other out-of-pocket expenses in connection with meeting attendance and industry seminars.
| 12 | Notes to Financial Statements |
State Street U.S. Equity V.I.S. Fund
Notes to Financial Statements, continued — December 31, 2024
7.Investment Transactions
Purchases and sales of investments (excluding in-kind transactions, short term investments and derivative contracts) for the fiscal year ended December 31, 2024 were as follows:
| Non-U.S. Government Securities |
| Purchases | Sales |
| $10,045,590 | $14,683,552 |
8.Income Taxes
The Fund has qualified and intends to continue to qualify as a regulated investment company under Subchapter M of the Internal Revenue Code of 1986, as amended. The Fund will not be subject to federal income taxes to the extent it distributes its taxable income, including any net realized capital gains, for each fiscal year. Therefore, no provision for federal income tax is required.
The Fund files federal and various state and local tax returns as required. No income tax returns are currently under examination. Generally, the federal returns are subject to examination by the Internal Revenue Service for a period of three years from date of filing, while the state returns may remain open for an additional year depending upon jurisdiction. SSGA FM has analyzed the Fund’s tax positions taken on tax returns for all open years and does not believe there are any uncertain tax positions that would require recognition of a tax liability.
Distributions to shareholders are recorded on ex-dividend date. Income dividends and gain distributions are determined in accordance with income tax rules and regulations, which may differ from generally accepted accounting principles. Certain capital accounts in the financial statements have been adjusted for permanent book-tax differences. These adjustments have no impact on NAVs or results of operations. Temporary book-tax differences will reverse in the future. These book-tax differences are primarily due to nontaxable dividend adjustments to income, investments in futures, and wash sale loss deferrals.
The tax character of distributions paid during the fiscal year ended December 31, 2024 were as follows:
Ordinary
Income | Long-Term
Capital Gains | Total |
| $455,047 | $3,777,497 | $4,232,544 |
The tax character of distributions paid during the year ended December 31, 2023 was as follows:
Ordinary
Income | Long-Term
Capital Gains | Total |
| $95,392 | $1,419,858 | $1,515,250 |
At December 31, 2024, the components of distributable earnings on a tax basis were as follows:
Undistributed
Ordinary
Income | Tax Exempt
Income | Capital Loss
Carryforwards | Undistributed
long term
gain | Net
Unrealized
Gains
(Losses) | Qualified
Late-Year
Losses | Total |
| $92,303 | $— | $— | $1,088,856 | $8,641,725 | $— | $9,822,884 |
As of December 31, 2024, gross unrealized appreciation and gross unrealized depreciation of investments and other financial instruments based on cost for federal income tax purposes were as follows:
Tax
Cost | Gross
Unrealized
Appreciation | Gross
Unrealized
Depreciation | Net
Unrealized
Appreciation
(Depreciation) |
| $12,465,126 | $8,829,303 | $187,578 | $8,641,725 |
| Notes to Financial Statements | 13 |
State Street U.S. Equity V.I.S. Fund
Notes to Financial Statements, continued — December 31, 2024
9.Line of Credit
The Fund and other affiliated funds (each, a “Participant” and collectively, the “Participants”) have access to $194.29 million of a $1.36 billion ($180 million of $1.26 billion prior to November 1, 2024 and $180 million of $960 million prior to October 3, 2024) revolving credit facility provided by a syndication of banks under which the Participants may borrow to fund shareholder redemptions. This agreement expires in October 2025 unless extended or renewed.
The Participants are charged an annual commitment fee which is calculated based on the unused portion of the shared credit line. Commitment fees are allocated among each of the Participants based on relative net assets. Commitment fees are ordinary fund operating expenses. A Participant incurs and pays the interest expense related to its borrowing. Interest is calculated at a rate per annum equal to the sum of 1.00% plus the greater of the
New York Fed Bank Rate and the one-month SOFR Rate.
The Fund had no outstanding loans as of December 31, 2024.
10.Risks
Concentration Risk As a result of the Fund's ability to invest a large percentage of its assets in obligations of issuers within the same country, state, region, currency or economic sector, an adverse economic, business or political development may affect the value of the Fund's investments more than if the Fund was more broadly diversified.
Credit Risk The Fund may be exposed to credit risk in the event that an issuer or guarantor fails to perform or that an institution or entity with which the Fund has unsettled or open transactions defaults.
Market Risk The Fund’s investments are subject to changes in general economic conditions, and general market fluctuations and the risks inherent in investment in securities markets. Investment markets can be volatile and prices of investments can change substantially due to various factors including, but not limited to, economic growth or recession, changes in interest rates, changes in the actual or perceived creditworthiness of issuers, and general market liquidity. The Fund is subject to the risk that geopolitical events will disrupt securities markets and adversely affect global economies and markets. Local, regional or global events such as war, acts of terrorism, the spread of infectious illness, such as COVID-19, or other public health issues, or other events could have a significant impact on the Fund and its investments.
11.Subsequent Events
Management has evaluated the impact of all subsequent events on the Fund through the date on which the financial statements were available to be issued and has determined that there were no subsequent events requiring adjustment or disclosure in the financial statements.
| 14 | Notes to Financial Statements |
State Street U.S. Equity V.I.S. Fund
Report of Independent Registered Public Accounting Firm
To the Shareholders of State Street U.S. Equity V.I.S. Fund and the Board of Directors of State Street Variable Insurance Series Funds, Inc.
Opinion on the Financial Statements
We have audited the accompanying statement of assets and liabilities of State Street U.S. Equity V.I.S. Fund (the “Fund”) (one of the series constituting State Street Variable Insurance Series Funds, Inc. (the “Company”)), including the schedule of investments, as of December 31, 2024, and the related statement of operations for the year then ended, the statements of changes in net assets for each of the two years in the period then ended, the financial highlights for each of the five years in the period then ended and the related notes (collectively referred to as the “financial statements”). In our opinion, the financial statements present fairly, in all material respects, the financial position of the Fund (one of the series constituting State Street Variable Insurance Series Funds, Inc.) at December 31, 2024, the results of its operations for the year then ended, the changes in its net assets for each of the two years in the period then ended and its financial highlights for each of the five years in the period then ended, in conformity with U.S. generally accepted accounting principles.
Basis for Opinion
These financial statements are the responsibility of the Trust’s management. Our responsibility is to express an opinion on the Fund’s financial statements based on our audits. We are a public accounting firm registered with the Public Company Accounting Oversight Board (United States) (“PCAOB”) and are required to be independent with respect to the Trust in accordance with the U.S. federal securities laws and the applicable rules and regulations of the Securities and Exchange Commission and the PCAOB.
We conducted our audits in accordance with the standards of the PCAOB. Those standards require that we plan and perform the audit to obtain reasonable assurance about whether the financial statements are free of material misstatement, whether due to error or fraud. The Trust is not required to have, nor were we engaged to perform, an audit of the Trust’s internal control over financial reporting. As part of our audits we are required to obtain an understanding of internal control over financial reporting, but not for the purpose of expressing an opinion on the effectiveness of the Trust’s internal control over financial reporting. Accordingly, we express no such opinion.
Our audits included performing procedures to assess the risks of material misstatement of the financial statements, whether due to error or fraud, and performing procedures that respond to those risks. Such procedures included examining, on a test basis, evidence regarding the amounts and disclosures in the financial statements. Our procedures included confirmation of securities owned as of December 31, 2024, by correspondence with the custodian, brokers and others; when replies were not received from brokers and others, we performed other auditing procedures. Our audits also included evaluating the accounting principles used and significant estimates made by management, as well as evaluating the overall presentation of the financial statements. We believe that our audits provide a reasonable basis for our opinion.
We have served as the auditor of one or more State Street Global Advisors investment companies since 2000.
Boston, Massachusetts
February 18, 2025
| Report of Independent Registered Public Accounting Firm | 15 |
State Street U.S. Equity V.I.S. Fund
Other Information — December 31, 2024
Tax Information
For federal income tax purposes, the following information is furnished with respect to the distributions of the Fund for its fiscal year ended December 31, 2024.
Dividends Received Deduction
The Fund reports the maximum amount allowable of its net taxable income as eligible for the corporate dividends received deduction.
Long Term Capital Gain Distributions
Long term capital gains dividends were paid from the Fund during the year ended December 31, 2024 in the amount of $3,777,497.
State Street U.S. Equity V.I.S. Fund
Proxy Disclosure for Open-End Management Investment Companies — December 31, 2024 (Unaudited)
Shareholder Meeting Results
Rule 30e-1 under the Investment Company Act of 1940, as amended, requires registered management companies to report on all subject matters put to the vote of shareholders and provide final results. Shareholders were asked to participate in a special meeting of shareholders on December 6, 2024 (the “Shareholder Meeting”). The final results of the Shareholder Meeting are reported in the table below.
All Funds
Proposal 1: To elect the following as Directors of the Company:
| Proposed Director | Shares For | Shares Withheld |
| Patrick J. Riley | 73,750,198.987 | 1,759,144.984 |
| Donna M. Rapaccioli | 73,872,469.845 | 1,636,874.126 |
| Margaret K. McLaughlin | 73,959,592.918 | 1,549,751.053 |
| George M. Pereira | 73,932,719.109 | 1,576,624.862 |
| Mark E. Swanson | 73,862,069.730 | 1,647,274.241 |
| Jeanne LaPorta | 73,881,354.092 | 1,627,989.879 |
Annual Financial Statements and Other Information
December 31, 2024
| State Street Premier Growth Equity V.I.S. Fund |
State Street Premier Growth Equity V.I.S. Fund
Annual Report Financial Statements and Other Information
December 31, 2024
Changes in and Disagreements with Accountants for Open-End Management Investment Companies (N-CSR Item 8) - Not Applicable
Remuneration Paid to Directors, Officers, and Others of Open-End Management Investment Companies (N-CSR Item 10) - Please see Statement of Operations in the Financial Statements under Item 7 above
Statement Regarding Basis for Approval of Investment Advisory Contract (Unaudited) (N-CSR Item 11) - Not Applicable
This report is prepared for Policyholders of certain variable contracts and may be distributed to others only if preceded or accompanied by the variable contract’s current prospectus and the current summary prospectus of the Fund available for investments thereunder.
[This page intentionally left blank]
State Street Premier Growth Equity V.I.S. Fund
Schedule of Investments — December 31, 2024
| | Number
of Shares | Fair
Value |
| Common Stock - 93.6% † |
| Apparel Retail - 1.0% |
| Ross Stores, Inc. | 2,291 | $346,560 |
| Application Software - 5.5% |
| Adobe, Inc. (a) | 1,617 | 719,048 |
| Salesforce, Inc. | 2,038 | 681,364 |
| Synopsys, Inc. (a) | 1,026 | 497,979 |
| | | 1,898,391 |
| Automobile Manufacturers - 1.0% |
| Tesla, Inc. (a) | 872 | 352,149 |
| Biotechnology - 1.3% |
| Vertex Pharmaceuticals, Inc. (a)(b) | 1,107 | 445,789 |
| Broadline Retail - 8.4% |
| Amazon.com, Inc. (a) | 13,260 | 2,909,111 |
| Construction Materials - 1.1% |
| Martin Marietta Materials, Inc. | 711 | 367,232 |
| Electrical Components & Equipment - 0.9% |
| Eaton Corp. PLC | 932 | 309,303 |
| Financial Exchanges & Data - 1.3% |
| S&P Global, Inc. | 873 | 434,780 |
| Healthcare Equipment - 1.5% |
| Abbott Laboratories | 4,444 | 502,661 |
| Home Improvement Retail - 2.3% |
| Home Depot, Inc. | 2,030 | 789,650 |
| Industrial Machinery & Supplies & Components - 1.5% |
| Parker-Hannifin Corp. | 835 | 531,085 |
| Interactive Media & Services - 14.6% |
| Alphabet, Inc., Class A | 7,548 | 1,428,836 |
| Alphabet, Inc., Class C | 8,138 | 1,549,801 |
| Meta Platforms, Inc., Class A | 3,533 | 2,068,607 |
| | | 5,047,244 |
| Life Sciences Tools & Services - 1.3% |
| Thermo Fisher Scientific, Inc. | 888 | 461,964 |
| Managed Healthcare - 1.0% |
| UnitedHealth Group, Inc. | 662 | 334,879 |
| | Number
of Shares | Fair
Value |
| Other Specialty Retail - 1.2% |
| Ulta Beauty, Inc. (a) | 956 | $415,793 |
| Pharmaceuticals - 1.1% |
| AstraZeneca PLC ADR | 5,529 | 362,260 |
| Semiconductor Materials & Equipment - 2.0% |
| Applied Materials, Inc. | 3,496 | 568,554 |
| ASML Holding NV NY Reg Shrs | 199 | 137,923 |
| | | 706,477 |
| Semiconductors - 18.3% |
| Broadcom, Inc. | 7,019 | 1,627,285 |
| NVIDIA Corp. | 32,302 | 4,337,836 |
| ON Semiconductor Corp. (a) | 5,791 | 365,123 |
| | | 6,330,244 |
| Soft Drinks & Non-alcoholic Beverages - 1.1% |
| Monster Beverage Corp. (a) | 7,486 | 393,464 |
| Systems Software - 14.4% |
| Microsoft Corp. | 9,996 | 4,213,314 |
| ServiceNow, Inc. (a) | 724 | 767,527 |
| | | 4,980,841 |
| Technology Hardware, Storage & Peripherals - 4.8% |
| Apple, Inc. | 6,600 | 1,652,772 |
| Telecom Tower REITs - 1.3% |
| American Tower Corp. | 2,361 | 433,031 |
| Trading Companies & Distributors - 1.5% |
| United Rentals, Inc. | 723 | 509,310 |
| Transaction & Payment Processing Services - 5.2% |
| Mastercard, Inc., Class A | 1,586 | 835,140 |
| Visa, Inc., Class A | 3,068 | 969,611 |
| | | 1,804,751 |
Total Common Stock
(Cost $12,246,171) | | 32,319,741 |
| Exchange Traded & Mutual Funds - 3.9% |
The Technology Select Sector SPDR Fund (c)
(Cost $1,194,076) | 5,787 | 1,345,593 |
Total Investments in Securities
(Cost $13,440,247) | | 33,665,334 |
See Notes to Schedule of Investments and Notes to Financial Statements.
| State Street Premier Growth Equity V.I.S. Fund | 1 |
State Street Premier Growth Equity V.I.S. Fund
Schedule of Investments, continued — December 31, 2024
| | Number
of Shares | Fair
Value |
| Short-Term Investments - 3.2% |
State Street Institutional U.S. Government Money Market Fund - Class G Shares 4.47% (c)(d)
(Cost $1,104,965) | 1,104,965 | $1,104,965 |
Total Investments
(Cost $14,545,212) | | 34,770,299 |
| Liabilities in Excess of Other Assets, net - (0.7)% | | (245,183) |
| NET ASSETS - 100.0% | | $34,525,116 |
Other Information:
| The Fund had the following long futures contracts open at December 31, 2024: |
| Description | Expiration
Date | Number of
Contracts | Notional
Amount | Value | Unrealized
Appreciation
(Depreciation) |
| Micro E-mini NASDAQ-100 Futures | March 2025 | 10 | $441,626 | $424,530 | $(17,096) |
During the year ended December 31, 2024, the average notional value related to long and short futures contracts were $547,018 and $11,181, respectively.
Notes to Schedule of Investments
The views expressed in this document reflect our judgment as of the publication date and are subject to change at any time without notice. The securities cited may not be representative of the Fund’s future investments and should not be construed as a recommendation to purchase or sell a particular security. See the Fund’s summary prospectus and statutory prospectus for complete descriptions of investment objectives, policies, risks and permissible investments.
| (a) | Non-income producing security. |
| (b) | At December 31, 2024, all or a portion of this security was pledged to cover collateral requirements for futures contracts. |
| (c) | Sponsored by SSGA Funds Management, Inc., the Fund’s investment adviser and administrator, and an affiliate of State Street Bank & Trust Co., the Fund’s sub-administrator, custodian and accounting agent. |
| (d) | Coupon amount represents effective yield. |
| † | Percentages are based on net assets as of December 31, 2024. |
| Abbreviations: |
| ADR - American Depositary Receipt |
| REIT - Real Estate Investment Trust |
See Notes to Schedule of Investments and Notes to Financial Statements.
| 2 | State Street Premier Growth Equity V.I.S. Fund |
State Street Premier Growth Equity V.I.S. Fund
Schedule of Investments, continued — December 31, 2024
The following table presents the Fund’s investments measured at fair value on a recurring basis at December 31, 2024:
| Investments | Level 1 | | Level 2 | | Level 3 | | Total |
| Investments in Securities | | | | | | | |
| Common Stock | $32,319,741 | | $— | | $— | | $32,319,741 |
| Exchange Traded & Mutual Funds | 1,345,593 | | — | | — | | 1,345,593 |
| Short-Term Investments | 1,104,965 | | — | | — | | 1,104,965 |
| Total Investments in Securities | $34,770,299 | | $— | | $— | | $34,770,299 |
| Other Financial Instruments | | | | | | | |
| Long Futures Contracts - Unrealized Depreciation | $(17,096) | | $— | | $— | | $(17,096) |
| Total Other Financial Instruments | $(17,096) | | $— | | $— | | $(17,096) |
| | Number
of Shares
Held at
12/31/23 | Value at
12/31/23 | | Cost of
Purchases | | Proceeds
from
Shares
Sold | | Realized
Gain
(Loss) | | Change in
Unrealized
Appreciation
(Depreciation) | Number of
Shares
Held at
12/31/24 | Value at
12/31/24 | | Dividend
Income |
| State Street Institutional U.S. Government Money Market Fund - Class G Shares | 902,796 | $902,796 | | $8,921,028 | | $8,718,859 | | $— | | $— | 1,104,965 | $1,104,965 | | $50,435 |
| The Technology Select Sector SPDR Fund | — | — | | 1,678,461 | | 520,751 | | 36,366 | | 151,517 | 5,787 | 1,345,593 | | — |
| TOTAL | | $902,796 | | $10,599,489 | | $9,239,610 | | $36,366 | | $151,517 | | $2,450,558 | | $50,435 |
See Notes to Schedule of Investments and Notes to Financial Statements.
| State Street Premier Growth Equity V.I.S. Fund | 3 |
State Street Premier Growth Equity V.I.S. Fund
Financial Highlights
Selected data based on a share outstanding throughout the fiscal years indicated
| | 12/31/24 | | 12/31/23 | | 12/31/22 | | 12/31/21 | | 12/31/20 |
| Inception date | | | 12/12/97 |
| Net asset value, beginning of period | $110.25 | | $77.05 | | $126.76 | | $122.96 | | $100.89 |
| Income/(loss) from investment operations: | | | | | | | | | |
| Net investment loss(a) | (0.21) | | (0.09) | | (0.32) | | (0.44) | | (0.22) |
| Net realized and unrealized gains/(losses) on investments | 35.00 | | 35.75 | | (38.35) | | 31.51 | | 34.12 |
| Total income/(loss) from investment operations | 34.79 | | 35.66 | | (38.67) | | 31.07 | | 33.90 |
| Less distributions from: | | | | | | | | | |
| Net investment income | — | | — | | — | | — | | (0.04) |
| Net realized gains | (28.90) | | (2.46) | | (11.04) | | (27.27) | | (11.79) |
| Total distributions | (28.90) | | (2.46) | | (11.04) | | (27.27) | | (11.83) |
| Net asset value, end of period | $116.14 | | $110.25 | | $77.05 | | $126.76 | | $122.96 |
| Total Return(b) | 31.06% | | 46.28% | | (30.43)% | | 24.97% | | 33.61% |
| Ratios/Supplemental Data: | | | | | | | | | |
| Net assets, end of period (in thousands) | $34,525 | | $32,045 | | $25,498 | | $41,961 | | $39,144 |
| Ratios to average net assets: | | | | | | | | | |
| Gross expenses | 0.86% | | 0.91% | | 0.93% | | 0.88% | | 0.89% |
| Net investment loss | (0.16)% | | (0.09)% | | (0.31)% | | (0.32)% | | (0.19)% |
| Portfolio turnover rate | 28% | | 24% | | 23% | | 30% | | 22% |
| Notes to Financial Highlights |
| (a) | Per share values have been calculated using the average shares method. |
| (b) | Total returns are historical and assume changes in share price, reinvestment of dividends and capital gains distributions and do not include the effect of insurance contract charges. Past performance does not guarantee future results. |
The accompanying Notes are an integral part of these financial statements.
State Street Premier Growth Equity V.I.S. Fund
Statement of Assets and Liabilities — December 31, 2024
| Assets | |
| Investments in unaffiliated securities, at fair value (cost $12,246,171) | $32,319,741 |
| Investments in affiliated securities, at fair value (cost $2,299,041) | 2,450,558 |
| Net cash collateral on deposit with broker for future contracts | 38,377 |
| Receivable for investments sold | 17,356 |
| Income receivables | 4,986 |
| Receivable for fund shares sold | 169 |
| Income receivable from affiliated investments | 4,605 |
| Other assets | 225 |
| Total assets | 34,836,017 |
| Liabilities | |
| Payable for investments purchased | 104,078 |
| Payable for fund shares redeemed | 125,434 |
| Payable for accumulated variation margin on futures contracts | 17,074 |
| Payable to the Adviser | 19,521 |
| Payable for custody, fund accounting and sub-administration fees | 7,336 |
| Accrued other expenses | 37,458 |
| Total liabilities | 310,901 |
|
| Net Assets | $34,525,116 |
| Net Assets Consist of: | |
| Capital paid in | $13,669,004 |
| Total distributable earnings (loss) | 20,856,112 |
| Net Assets | $34,525,116 |
| Shares outstanding ($0.01 par value; unlimited shares authorized) | 297,263 |
| Net asset value per share | $116.14 |
The accompanying Notes are an integral part of these financial statements.
| Statement of Assets and Liabilities | 5 |
State Street Premier Growth Equity V.I.S. Fund
Statement of Operations — For the year ended December 31, 2024
| Investment Income | |
| Income | |
| Dividend | $191,772 |
| Interest | 1,387 |
| Income from affiliated investments | 50,435 |
| Less: Foreign taxes withheld | (450) |
| Total income | 243,144 |
| Expenses | |
| Advisory and administration fees | 224,815 |
| Directors' fees | 21,205 |
| Custody, fund accounting and sub-administration fees | 21,773 |
| Professional fees | 27,476 |
| Other expenses | 2,884 |
| Total expenses | 298,153 |
| Net investment income (loss) | $(55,009) |
| Net Realized and Unrealized Gain (Loss) on Investments | |
| Realized gain (loss) on: | |
| Unaffiliated investments | $7,004,888 |
| Affiliated investments | 36,366 |
| Futures | 119,583 |
| Increase (decrease) in unrealized appreciation/depreciation on: | |
| Unaffiliated investments | 2,049,897 |
| Affiliated investments | 151,517 |
| Futures | (43,875) |
| Net realized and unrealized gain (loss) on investments | 9,318,376 |
| Net Increase (Decrease) in Net Assets Resulting from Operations | $9,263,367 |
The accompanying Notes are an integral part of these financial statements.
State Street Premier Growth Equity V.I.S. Fund
Statements of Changes in Net Assets
| | Year Ended
December 31,
2024 | | Year Ended
December 31,
2023 |
| Increase (Decrease) in Net Assets | | | |
| Operations: | | | |
| Net investment income (loss) | $(55,009) | | $(26,128) |
| Net realized gain (loss) on investments and futures | 7,160,837 | | 1,154,522 |
| Net increase (decrease) in unrealized appreciation/depreciation on investments and futures | 2,157,539 | | 9,800,096 |
| Net increase (decrease) from operations | 9,263,367 | | 10,928,490 |
| Distributions to shareholders: | | | |
| Total distributions | (6,931,618) | | (702,283) |
| Increase (decrease) in assets from operations and distributions | 2,331,749 | | 10,226,207 |
| Share transactions: | | | |
| Proceeds from sale of shares | 145,621 | | 282,062 |
| Value of distributions reinvested | 6,931,618 | | 702,283 |
| Cost of shares redeemed | (6,928,588) | | (4,663,584) |
| Net increase (decrease) from share transactions | 148,651 | | (3,679,239) |
| Total increase (decrease) in net assets | 2,480,400 | | 6,546,968 |
| Net Assets | | | |
| Beginning of year | 32,044,716 | | 25,497,748 |
| End of year | $34,525,116 | | $32,044,716 |
| Changes in Fund Shares | | | |
| Shares sold | 1,028 | | 2,971 |
| Issued for distributions reinvested | 58,554 | | 6,362 |
| Shares redeemed | (52,968) | | (49,598) |
| Net increase (decrease) in fund shares | 6,614 | | (40,265) |
The accompanying Notes are an integral part of these financial statements.
State Street Premier Growth Equity V.I.S. Fund
Notes to Financial Statements — December 31, 2024
1.Organization of the Company
State Street Variable Insurance Series Funds, Inc. (the “Company”) was incorporated under the laws of the Commonwealth of Virginia on May 14, 1984 and is registered under the Investment Company Act of 1940, as amended (the “1940 Act”), as an open-end management investment company. The Company is currently composed of the following seven investment portfolios (collectively, the “Funds”): State Street U.S. Equity V.I.S. Fund, State Street S&P 500 Index V.I.S. Fund, State Street Premier Growth Equity V.I.S. Fund (the “Fund”), State Street Small-Cap Equity V.I.S. Fund, State Street Total Return V.I.S. Fund, State Street Income V.I.S. Fund and State Street Real Estate Securities V.I.S. Fund. Each Fund is a diversified investment company within the meaning of the 1940 Act, except for the State Street Premier Growth Equity V.I.S. Fund, which is a non-diversified investment company.
Shares of the Funds of the Company are offered only to insurance company separate accounts that fund certain variable life insurance contracts and variable annuity contracts.
The Company currently offers one share class (Class 1) of the Fund as an investment option for variable life insurance and variable annuity contracts.
Under the Company’s organizational documents, its officers and directors are indemnified against certain liabilities arising out of the performance of their duties to the Company. Additionally, in the normal course of business, the Company enters into contracts with service providers that contain general indemnification clauses. The Company’s maximum exposure under these arrangements is unknown as this would involve future claims that may be made against the Company that have not yet occurred.
2.Segment Reporting
The Fund has one reportable segment. Business activities are managed on a consolidated basis and revenues are derived primarily through the Fund’s investments in accordance with its investment objective. The Fund’s chief operating decision maker (“CODM”) is the President of the Company. The CODM assesses performance based on the Fund’s Total Return as reported in the Financial Highlights, and the same accounting policies are applied as described in the summary of significant accounting policies. The Fund’s Total Return is utilized by the CODM to compare results, including the impact of the Fund’s costs, to the Fund’s competitors and to the Fund’s benchmark index.
3.Summary of Significant Accounting Policies
The following is a summary of significant accounting policies followed by the Company in the preparation of its financial statements:
The preparation of financial statements in accordance with U.S. generally accepted accounting principles (“U.S. GAAP”) requires management to make estimates and assumptions that affect the reported amounts and disclosures in the financial statements. Actual results could differ from those estimates. The Fund is an investment company under U.S. GAAP and follows the accounting and reporting guidance applicable to investment companies.
Security Valuation The Fund’s investments are valued at fair value each day that the New York Stock Exchange (“NYSE”) is open and, for financial reporting purposes, as of the report date should the reporting period end on a day that the NYSE is not open. Fair value is generally defined as the price a fund would receive to sell an asset or pay to transfer a liability in an orderly transaction between market participants at the measurement date. By its nature, a fair value price is a good faith estimate of the valuation in a current sale and may not reflect an actual market price. The investments of the Fund are valued pursuant to the policy and procedures developed by the Oversight Committee (the “Committee”) and approved by the Company's Board of Directors (the “Board”). The Committee provides oversight of the valuation of investments for the Fund. The Board has responsibility for overseeing the determination of the fair value of investments.
Valuation techniques used to value the Fund’s investments by major category are as follows:
| 8 | Notes to Financial Statements |
State Street Premier Growth Equity V.I.S. Fund
Notes to Financial Statements, continued — December 31, 2024
| • | Equity investments traded on a recognized securities exchange for which market quotations are readily available are valued at the last sale price or official closing price, as applicable, on the primary market or exchange on which they trade. Equity investments traded on a recognized exchange for which there were no sales on that day are valued at the last published sale price or at fair value. |
| • | Investments in registered investment companies (including money market funds) or other unitized pooled investment vehicles that are not traded on an exchange are valued at that day’s published net asset value (“NAV”) per share or unit. |
| • | Exchange-traded futures contracts are valued at the closing settlement price on the primary market on which they are traded most extensively. Exchange-traded futures contracts traded on a recognized exchange for which there were no sales on that day are valued at the last reported sale price obtained from independent pricing services or brokers or at fair value. |
In the event prices or quotations are not readily available or that the application of these valuation methods results in a price for an investment that is deemed to be not representative of the fair value of such investment, fair value will be determined in good faith by the Committee, in accordance with the valuation policy and procedures approved by the Board.
The Fund values its assets and liabilities at fair value using a fair value hierarchy consisting of three broad levels that prioritize the inputs to valuation techniques giving the highest priority to readily available unadjusted quoted prices in active markets for identical assets or liabilities (Level 1 measurements) and the lowest priority to unobservable inputs (Level 3 measurements) when market prices are not readily available or reliable. The categorization of a value determined for an investment within the hierarchy is based upon the pricing transparency of the investment and is not necessarily an indication of the risk associated with investing in it.
The three levels of the fair value hierarchy are as follows:
| • | Level 1 — Unadjusted quoted prices in active markets for an identical asset or liability; |
| • | Level 2 — Inputs other than quoted prices included within Level 1 that are observable for the asset or liability either directly or indirectly, including quoted prices for similar assets or liabilities in active markets, quoted prices for identical or similar assets or liabilities in markets that are not considered to be active, inputs other than quoted prices that are observable for the asset or liability (such as exchange rates, financing terms, interest rates, yield curves, volatilities, prepayment speeds, loss severities, credit risks and default rates) or other market-corroborated inputs; and |
| • | Level 3 — Unobservable inputs for the asset or liability, including the Committee’s assumptions used in determining the fair value of investments. |
The value of the Fund’s investments according to the fair value hierarchy as of December 31, 2024 is disclosed in the Fund’s Schedule of Investments.
Investment Transactions and Income Recognition Investment transactions are accounted for on trade date for financial reporting purposes. Realized gains and losses from the sale or disposition of investments and foreign exchange transactions, if any, are determined using the identified cost method.
Dividend income and capital gain distributions, if any, are recognized on the ex-dividend date, net of any foreign taxes withheld at source, if any.
Interest income is recorded daily on an accrual basis. All premiums and discounts are amortized/accreted for financial reporting purposes.
Non-cash dividends received in the form of stock are recorded as dividend income at fair value.
The Fund invests in real estate investment trusts (“REITs”). REITs determine the tax character of their distributions annually and may characterize a portion of their distributions as a return of capital or capital gain. The Fund’s policy is to record all REIT distributions initially as dividend income and re-designate a portion to return of capital or
| Notes to Financial Statements | 9 |
State Street Premier Growth Equity V.I.S. Fund
Notes to Financial Statements, continued — December 31, 2024
capital gain distributions at year-end based on information provided by the REIT and/or SSGA Funds Management, Inc.’s (the “Adviser” or “SSGA FM”) estimates of such re-designations for which actual information has not yet been reported.
Expenses Certain expenses, which are directly identifiable to a specific Fund, are applied to the Fund within the Company. Other expenses which cannot be attributed to a specific Fund are allocated in such a manner as deemed equitable, taking into consideration the nature and type of expense and the relative net assets of the Fund within the Company.
Distributions The Fund declares and pays any dividends from net investment income annually.
Net realized capital gains, if any, are distributed annually, unless additional distributions are required for compliance with applicable tax regulations. The amount and character of income and capital gains to be distributed are determined in accordance with applicable tax regulations which may differ from net investment income and realized gains recognized for U.S. GAAP purposes.
4.Derivative Financial Instruments
Futures Contracts The Fund may enter into futures contracts to meet the Fund’s objectives. A futures contract is a standardized, exchange-traded agreement to buy or sell a financial instrument at a set price on a future date. Upon entering into a futures contract, the Fund is required to deposit with the broker, cash or securities in an amount equal to the minimum initial margin requirements of the clearing house. Securities deposited, if any, are designated on the Schedule of Investments and cash deposited, if any, is shown as Net cash collateral on deposit with broker for future contracts on the Statement of Assets and Liabilities. Subsequent payments are made or received by the Fund equal to the daily change in the contract value, accumulated, exchange rates, and/or other transactional fees. The accumulation of those payments are recorded as variation margin receivable or payable with a corresponding offset to unrealized gains or losses. The Fund recognizes a realized gain or loss when the contract is closed.
Losses may arise if the value of a futures contract decreases due to unfavorable changes in the market rates or values of the underlying instrument during the term of the contract or if the counterparty does not perform under the contract. The use of futures contracts also involves the risk that the movements in the price of the futures contracts do not correlate with the movement of the assets underlying such contracts.
For the fiscal year ended December 31, 2024, the Fund entered into futures contracts for cash equitization.
The following tables summarize the value of the Fund’s derivative instruments as of December 31, 2024 and the related location in the accompanying Statement of Assets and Liabilities and Statement of Operations, presented by primary underlying risk exposure:
| Liability Derivatives |
| | Interest
Rate
Risk | Foreign
Exchange
Risk | Credit
Risk | Equity
Risk | Commodity
Risk | Total |
| State Street Premier Growth Equity V.I.S. Fund | | | | | | |
| Futures Contracts | $— | $— | $— | $17,074 | $— | $17,074 |
| Realized Gain (Loss) |
| | Interest
Rate
Risk | Foreign
Exchange
Risk | Credit
Risk | Equity
Risk | Commodity
Risk | Total |
| State Street Premier Growth Equity V.I.S. Fund | | | | | | |
| Futures Contracts | $— | $— | $— | $119,583 | $— | $119,583 |
| 10 | Notes to Financial Statements |
State Street Premier Growth Equity V.I.S. Fund
Notes to Financial Statements, continued — December 31, 2024
| Net Change in Unrealized Appreciation/Depreciation |
| | Interest
Rate
Risk | Foreign
Exchange
Risk | Credit
Risk | Equity
Risk | Commodity
Risk | Total |
| State Street Premier Growth Equity V.I.S. Fund | | | | | | |
| Futures Contracts | $— | $— | $— | $(43,875) | $— | $(43,875) |
5.Fees and Transactions with Affiliates
Advisory Fee SSGA FM, a registered investment adviser, was retained by the Board to act as investment adviser and administrator of the Fund. SSGA FM’s compensation for investment advisory and administrative services (“Management Fee”) is paid monthly based on the average daily net assets of the Fund at an annualized rate of 0.65%.
Custody, Fund Accounting and Sub-Administration Fees State Street Bank and Trust Company (“State Street”) serves as the custodian, fund accountant and sub-administrator to the Fund. Amounts paid by the Fund to State Street for performing such services are included as custody, fund accounting and sub-administration fees in the Statement of Operations.
Other Transactions with Affiliates The Fund may invest in affiliated entities, including securities issued by State Street Corporation, affiliated funds, or entities deemed to be affiliates as a result of the Fund owning more than five percent of the entity’s voting securities or outstanding shares. Amounts relating to these transactions during the fiscal year ended December 31, 2024 are disclosed in the Schedule of Investments.
6.Directors' Fees
The fees and expenses of the Company’s directors who are not “interested persons” of the Company, as defined in the 1940 Act (“Independent Directors”), are paid directly by the Fund. The Independent Directors are reimbursed for travel and other out-of-pocket expenses in connection with meeting attendance and industry seminars.
7.Investment Transactions
Purchases and sales of investments (excluding in-kind transactions, short term investments and derivative contracts) for the fiscal year ended December 31, 2024 were as follows:
| Non-U.S. Government Securities |
| Purchases | Sales |
| $9,186,312 | $15,899,897 |
8.Income Taxes
The Fund has qualified and intends to continue to qualify as a regulated investment company under Subchapter M of the Internal Revenue Code of 1986, as amended. The Fund will not be subject to federal income taxes to the extent it distributes its taxable income, including any net realized capital gains, for each fiscal year. Therefore, no provision for federal income tax is required.
The Fund files federal and various state and local tax returns as required. No income tax returns are currently under examination. Generally, the federal returns are subject to examination by the Internal Revenue Service for a period of three years from date of filing, while the state returns may remain open for an additional year depending upon jurisdiction. SSGA FM has analyzed the Fund’s tax positions taken on tax returns for all open years and does not believe there are any uncertain tax positions that would require recognition of a tax liability.
Distributions to shareholders are recorded on ex-dividend date. Income dividends and gain distributions are determined in accordance with income tax rules and regulations, which may differ from generally accepted accounting principles. Certain capital accounts in the financial statements have been adjusted for permanent book-tax differences. These adjustments have no impact on net asset values or results of operations. Temporary
| Notes to Financial Statements | 11 |
State Street Premier Growth Equity V.I.S. Fund
Notes to Financial Statements, continued — December 31, 2024
book-tax differences will reverse in the future. These book-tax differences are primarily due to futures contracts and wash sale loss deferrals.
The tax character of distributions paid during the fiscal year ended December 31, 2024 were as follows:
Ordinary
Income | Long-Term
Capital Gains | Total |
| $212,733 | $6,718,885 | $6,931,618 |
The tax character of distributions paid during the fiscal year ended December 31, 2023 was as follows:
Ordinary
Income | Long-Term
Capital Gains | Total |
| $— | $702,283 | $702,283 |
At December 31, 2024, the components of distributable earnings on a tax basis were as follows:
Undistributed
Ordinary
Income | Tax Exempt
Income | Capital Loss
Carryforwards | Undistributed
long term
gain | Net
Unrealized
Gains
(Losses) | Qualified
Late-Year
Losses | Total |
| $16,172 | $— | $— | $694,330 | $20,145,610 | $— | $20,856,112 |
As of December 31, 2024, gross unrealized appreciation and gross unrealized depreciation of investments and other financial instruments based on cost for federal income tax purposes were as follows:
Tax
Cost | Gross
Unrealized
Appreciation | Gross
Unrealized
Depreciation | Net
Unrealized
Appreciation
(Depreciation) |
| $14,607,593 | $20,369,557 | $223,947 | $20,145,610 |
9.Line of Credit
The Fund and other affiliated funds (each, a “Participant” and collectively, the “Participants”) have access to $194.29 million of a $1.36 billion ($180 million of $1.26 billion prior to November 1, 2024 and $180 million of $960 million prior to October 3, 2024) revolving credit facility provided by a syndication of banks under which the Participants may borrow to fund shareholder redemptions. This agreement expires in October 2025 unless extended or renewed.
The Participants are charged an annual commitment fee which is calculated based on the unused portion of the shared credit line. Commitment fees are allocated among each of the Participants based on relative net assets. Commitment fees are ordinary fund operating expenses. A Participant incurs and pays the interest expense related to its borrowing. Interest is calculated at a rate per annum equal to the sum of 1.00% plus the greater of the
New York Fed Bank Rate and the one-month SOFR Rate.
The Fund had no outstanding loans as of December 31, 2024.
10.Risks
Concentration Risk As a result of the Fund's ability to invest a large percentage of its assets in obligations of issuers within the same country, state, region, currency or economic sector, an adverse economic, business or political development may affect the value of the Fund's investments more than if the Fund was more broadly diversified.
Credit Risk The Fund may be exposed to credit risk in the event that an issuer or guarantor fails to perform or that an institution or entity with which the Fund has unsettled or open transactions defaults.
Market Risk The Fund’s investments are subject to changes in general economic conditions, and general market fluctuations and the risks inherent in investment in securities markets. Investment markets can be volatile and
| 12 | Notes to Financial Statements |
State Street Premier Growth Equity V.I.S. Fund
Notes to Financial Statements, continued — December 31, 2024
prices of investments can change substantially due to various factors including, but not limited to, economic growth or recession, changes in interest rates, changes in the actual or perceived creditworthiness of issuers, and general market liquidity. The Fund is subject to the risk that geopolitical events will disrupt securities markets and adversely affect global economies and markets. Local, regional or global events such as war, acts of terrorism, the spread of infectious illness, such as COVID-19, or other public health issues, or other events could have a significant impact on the Fund and its investments.
11.Subsequent Events
Management has evaluated the impact of all subsequent events on the Fund through the date on which the financial statements were available to be issued and has determined that there were no subsequent events requiring adjustment or disclosure in the financial statements.
| Notes to Financial Statements | 13 |
State Street Premier Growth Equity V.I.S. Fund
Report of Independent Registered Public Accounting Firm
To the Shareholders of State Street Premier Growth Equity V.I.S. Fund and the Board of Directors of State Street Variable Insurance Series Funds, Inc.
Opinion on the Financial Statements
We have audited the accompanying statement of assets and liabilities of State Street Premier Growth Equity V.I.S. Fund (the “Fund”) (one of the series constituting State Street Variable Insurance Series Funds, Inc. (the “Company”)), including the schedule of investments, as of December 31, 2024, and the related statement of operations for the year then ended, the statements of changes in net assets for each of the two years in the period then ended, the financial highlights for each of the five years in the period then ended and the related notes (collectively referred to as the “financial statements”). In our opinion, the financial statements present fairly, in all material respects, the financial position of the Fund (one of the series constituting State Street Variable Insurance Series Funds, Inc.) at December 31, 2024, the results of its operations for the year then ended, the changes in its net assets for each of the two years in the period then ended and its financial highlights for each of the five years in the period then ended, in conformity with U.S. generally accepted accounting principles.
Basis for Opinion
These financial statements are the responsibility of the Trust’s management. Our responsibility is to express an opinion on the Fund’s financial statements based on our audits. We are a public accounting firm registered with the Public Company Accounting Oversight Board (United States) (“PCAOB”) and are required to be independent with respect to the Trust in accordance with the U.S. federal securities laws and the applicable rules and regulations of the Securities and Exchange Commission and the PCAOB.
We conducted our audits in accordance with the standards of the PCAOB. Those standards require that we plan and perform the audit to obtain reasonable assurance about whether the financial statements are free of material misstatement, whether due to error or fraud. The Trust is not required to have, nor were we engaged to perform, an audit of the Trust’s internal control over financial reporting. As part of our audits we are required to obtain an understanding of internal control over financial reporting, but not for the purpose of expressing an opinion on the effectiveness of the Trust’s internal control over financial reporting. Accordingly, we express no such opinion.
Our audits included performing procedures to assess the risks of material misstatement of the financial statements, whether due to error or fraud, and performing procedures that respond to those risks. Such procedures included examining, on a test basis, evidence regarding the amounts and disclosures in the financial statements. Our procedures included confirmation of securities owned as of December 31, 2024, by correspondence with the custodian, brokers and others; when replies were not received from brokers and others, we performed other auditing procedures. Our audits also included evaluating the accounting principles used and significant estimates made by management, as well as evaluating the overall presentation of the financial statements. We believe that our audits provide a reasonable basis for our opinion.
We have served as the auditor of one or more State Street Global Advisors investment companies since 2000.
Boston, Massachusetts
February 18, 2025
| 14 | Report of Independent Registered Public Accounting Firm |
State Street Premier Growth Equity V.I.S. Fund
Other Information — December 31, 2024
Tax Information
For federal income tax purposes, the following information is furnished with respect to the distributions of the Fund for its fiscal year ended December 31, 2024.
Dividends Received Deduction
The Fund reports the maximum amount allowable of its net taxable income as eligible for the corporate dividends received deduction.
Long Term Capital Gain Distributions
Long term capital gains dividends were paid from the Fund during the year ended December 31, 2024 in the amount of $6,718,885.
State Street Premier Growth Equity V.I.S. Fund
Proxy Disclosure for Open-End Management Investment Companies — December 31, 2024 (Unaudited)
Shareholder Meeting Results
Rule 30e-1 under the Investment Company Act of 1940, as amended, requires registered management companies to report on all subject matters put to the vote of shareholders and provide final results. Shareholders were asked to participate in a special meeting of shareholders on December 6, 2024 (the “Shareholder Meeting”). The final results of the Shareholder Meeting are reported in the table below.
All Funds
Proposal 1: To elect the following as Directors of the Company:
| Proposed Director | Shares For | Shares Withheld |
| Patrick J. Riley | 73,750,198.987 | 1,759,144.984 |
| Donna M. Rapaccioli | 73,872,469.845 | 1,636,874.126 |
| Margaret K. McLaughlin | 73,959,592.918 | 1,549,751.053 |
| George M. Pereira | 73,932,719.109 | 1,576,624.862 |
| Mark E. Swanson | 73,862,069.730 | 1,647,274.241 |
| Jeanne LaPorta | 73,881,354.092 | 1,627,989.879 |
Annual Financial Statements and Other Information
December 31, 2024
| State Street Income V.I.S. Fund |
State Street Income V.I.S. Fund
Annual Report Financial Statements and Other Information
December 31, 2024
Changes in and Disagreements with Accountants for Open-End Management Investment Companies (N-CSR Item 8) - Not Applicable
Remuneration Paid to Directors, Officers, and Others of Open-End Management Investment Companies (N-CSR Item 10) - Please see Statement of Operations in the Financial Statements under Item 7 above
Statement Regarding Basis for Approval of Investment Advisory Contract (Unaudited) (N-CSR Item 11) - Not Applicable
This report is prepared for Policyholders of certain variable contracts and may be distributed to others only if preceded or accompanied by the variable contract’s current prospectus and the current summary prospectus of the Fund available for investments thereunder.
[This page intentionally left blank]
State Street Income V.I.S. Fund
Schedule of Investments — December 31, 2024
| | Principal
Amount | Fair
Value |
| Bonds and Notes - 98.3% † |
| U.S. Treasuries - 31.8% |
| U.S. Treasury Bonds | | |
| 2.25%, 08/15/46 (a) | $93,000 | $60,058 |
| 3.00%, 08/15/48 (a) | 271,000 | 198,126 |
| 4.13%, 08/15/53 (a) | 154,000 | 137,373 |
| 4.38%, 08/15/43 (a) | 14,000 | 13,182 |
| U.S. Treasury Inflation-Indexed Notes | | |
| 1.63%, 10/15/29 | 158,902 | 156,292 |
| 1.88%, 07/15/34 | 235,395 | 228,232 |
| U.S. Treasury Notes | | |
| 1.63%, 05/15/31 (a) | 81,000 | 68,350 |
| 2.75%, 08/15/32 (a) | 544,000 | 482,715 |
| 3.50%, 04/30/28 (a) | 64,000 | 62,395 |
| 3.88%, 12/31/27 - 08/15/34 (a) | 1,219,100 | 1,163,931 |
| 4.00%, 07/31/29 (a) | 55,000 | 54,145 |
| 4.44%, 07/31/25 (a) | 47,900 | 46,807 |
| 4.63%, 04/30/29 (a) | 157,000 | 158,558 |
| | | 2,830,164 |
| Agency Mortgage Backed - 31.3% |
| Federal Home Loan Mortgage Corp. | | |
| 3.00%, 04/01/43 - 10/01/49 (a) | 262,936 | 229,616 |
| 4.50%, 06/01/33 - 02/01/35 (a) | 957 | 943 |
| 5.00%, 07/01/35 (a) | 11,951 | 11,951 |
| 5.50%, 01/01/38 (a) | 10,287 | 10,465 |
| 6.00%, 04/01/29 - 11/01/37 (a) | 34,521 | 35,663 |
| 6.50%, 02/01/29 (a) | 11 | 11 |
| 6.93%, 06/01/26 (a)(b) | 60,000 | 62,032 |
| 7.00%, 12/01/29 - 08/01/36 (a) | 8,100 | 8,608 |
| 7.50%, 01/01/30 - 09/01/33 (a) | 1,152 | 1,183 |
| 8.00%, 11/01/30 (a) | 1,752 | 1,809 |
| 8.50%, 04/01/30 (a) | 1,697 | 1,820 |
| Federal National Mortgage Association | | |
| 2.50%, 03/01/51 (a) | 210,172 | 171,263 |
| 3.00%, 03/01/50 (a) | 47,012 | 40,478 |
| 3.50%, 08/01/45 - 01/01/48 (a) | 93,808 | 84,586 |
| 4.00%, 01/01/41 - 01/01/50 (a) | 135,684 | 126,494 |
| | Principal
Amount | Fair
Value |
| 4.50%, 07/01/33 - 12/01/48 (a) | $54,287 | $52,192 |
| 5.00%, 03/01/34 - 08/01/35 (a) | 11,959 | 11,947 |
| 5.50%, 12/01/32 - 01/01/39 (a) | 46,920 | 47,691 |
| 6.00%, 02/01/33 - 07/01/35 (a) | 52,815 | 54,501 |
| 6.50%, 01/01/29 - 08/01/34 (a) | 6,534 | 6,815 |
| 7.00%, 10/01/32 - 12/01/33 (a) | 3,015 | 3,196 |
| 7.50%, 12/01/26 - 03/01/33 (a) | 3,512 | 3,609 |
| 8.00%, 11/01/25 - 10/01/31 (a) | 713 | 726 |
| Federal National Mortgage Association 1 yr. USD RFUCCT + 1.60% | | |
| 6.97%, 04/01/37 (a)(c) | 373 | 376 |
| Government National Mortgage Association | | |
| 3.00%, 12/20/42 - 05/20/45 (a) | 216,278 | 191,887 |
| 3.50%, 08/20/48 (a) | 38,225 | 34,545 |
| 4.00%, 01/20/41 - 04/20/43 (a) | 37,851 | 35,919 |
| 4.50%, 08/15/33 - 03/20/41 (a) | 28,005 | 27,415 |
| 6.00%, 04/15/27 - 04/15/34 (a) | 31,526 | 32,453 |
| 6.50%, 08/15/32 - 08/15/34 (a) | 11,332 | 11,729 |
| 7.00%, 01/15/28 - 10/15/36 (a) | 6,997 | 7,109 |
| Government National Mortgage Association 1 yr. CMT + 1.50% | | |
| 4.63%, 02/20/26 (a)(c) | 20 | 20 |
| Government National Mortgage Association REMICS 30 day USD SOFR Average + 5.85% | | |
| 1.25%, 05/20/64 (a)(c)(d) | 255,640 | 6,374 |
| Uniform Mortgage-Backed Security, TBA | | |
| 2.00%, 01/01/55 | 297,304 | 231,174 |
| 2.50%, 01/01/55 | 519,009 | 422,567 |
| 3.00%, 01/01/55 | 88,270 | 74,893 |
| 3.50%, 01/01/55 | 81,111 | 71,715 |
| 6.00%, 01/01/55 | 418,280 | 420,254 |
See Notes to Schedule of Investments and Notes to Financial Statements.
| State Street Income V.I.S. Fund | 1 |
State Street Income V.I.S. Fund
Schedule of Investments, continued — December 31, 2024
| | Principal
Amount | Fair
Value |
| 6.50%, 01/01/55 | $250,968 | $256,268 |
| | | 2,792,297 |
| Agency Collateralized Mortgage Obligations - 1.2% |
| Federal Home Loan Mortgage Corp. Multifamily Structured Pass-Through Certificates | | |
| 2.51%, 07/25/29 (a) | 55,000 | 50,075 |
| 4.05%, 09/25/28 (a)(c) | 31,000 | 30,342 |
| Federal Home Loan Mortgage Corp. REMICS | | |
| 5.50%, 06/15/33 (a)(d) | 5,220 | 620 |
| 7.50%, 07/15/27 (a)(d) | 210 | 12 |
| Federal Home Loan Mortgage Corp. STRIPS | | |
| 0.00%, 08/01/27 (a)(e) | 35 | 33 |
| Federal Home Loan Mortgage Corp. Structured Pass-Through Certificates | | |
| 0.08%, 09/25/43 (a)(c)(d) | 215,644 | 5,693 |
| Federal National Mortgage Association Interest STRIPS | | |
| 0.00%, 12/25/34 (a)(e) | 4,816 | 3,860 |
| 4.50%, 08/25/35 - 01/25/36 (a)(d) | 5,234 | 669 |
| 5.00%, 03/25/38 - 05/25/38 (a)(d) | 3,443 | 540 |
| 5.50%, 12/25/33 (a)(d) | 1,531 | 246 |
| 6.00%, 01/25/35 (a)(d) | 2,648 | 439 |
| Federal National Mortgage Association REMICS | | |
| 1.14%, 12/25/42 (a)(c)(d) | 10,149 | 252 |
| 5.00%, 09/25/40 (a)(d) | 1,771 | 168 |
| Federal National Mortgage Association REMICS 30 day USD SOFR Average + 5.89% | | |
| 1.32%, 07/25/38 (a)(c)(d) | 2,016 | 138 |
| Federal National Mortgage Association REMICS 30 day USD SOFR Average + 6.44% | | |
| 1.87%, 11/25/41 (a)(c)(d) | 95,493 | 9,296 |
| | | 102,383 |
| Corporate Notes - 27.2% |
| 3M Co. | | |
| 3.13%, 09/19/46 (a) | 2,000 | 1,371 |
| 7-Eleven, Inc. | | |
| 0.95%, 02/10/26 (a)(f) | 3,000 | 2,870 |
| | Principal
Amount | Fair
Value |
| Abbott Laboratories | | |
| 3.75%, 11/30/26 (a) | $4,000 | $3,953 |
| 4.90%, 11/30/46 (a) | 3,000 | 2,798 |
| AbbVie, Inc. | | |
| 2.95%, 11/21/26 (a) | 3,000 | 2,915 |
| 3.20%, 05/14/26 - 11/21/29 (a) | 5,000 | 4,750 |
| 4.05%, 11/21/39 (a) | 3,000 | 2,565 |
| 4.25%, 11/21/49 (a) | 2,000 | 1,629 |
| 4.30%, 05/14/36 (a) | 3,000 | 2,739 |
| 4.40%, 11/06/42 (a) | 2,000 | 1,730 |
| 4.63%, 10/01/42 (a) | 2,000 | 1,769 |
| 4.88%, 11/14/48 (a) | 3,000 | 2,694 |
| 5.05%, 03/15/34 (a) | 4,000 | 3,954 |
| 5.40%, 03/15/54 (a) | 4,000 | 3,854 |
| 5.50%, 03/15/64 (a) | 3,000 | 2,870 |
| Accenture Capital, Inc. | | |
| 4.50%, 10/04/34 | 5,000 | 4,753 |
| Advanced Micro Devices, Inc. | | |
| 4.39%, 06/01/52 (a) | 3,000 | 2,508 |
| AEP Texas, Inc. | | |
| 3.45%, 05/15/51 (a) | 3,000 | 1,992 |
| 5.70%, 05/15/34 (a) | 6,000 | 6,039 |
| AEP Transmission Co. LLC | | |
| 5.40%, 03/15/53 (a) | 3,000 | 2,860 |
| Aircastle Ltd. | | |
| 4.25%, 06/15/26 (a) | 3,000 | 2,970 |
| Alexandria Real Estate Equities, Inc. | | |
| 1.88%, 02/01/33 (a) | 3,000 | 2,312 |
| 2.95%, 03/15/34 (a) | 3,000 | 2,472 |
| 3.55%, 03/15/52 (a) | 3,000 | 2,040 |
| 4.70%, 07/01/30 (a) | 3,000 | 2,926 |
| Allstate Corp. | | |
| 4.20%, 12/15/46 (a) | 2,000 | 1,611 |
| Allstate Corp. (7.72% fixed rate until 01/31/25; 3.20% + 3 mo. Term SOFR thereafter) | | |
| 7.72%, 08/15/53 (a)(c) | 7,000 | 6,989 |
| Ally Financial, Inc. | | |
| 2.20%, 11/02/28 (a) | 3,000 | 2,671 |
| Altria Group, Inc. | | |
| 3.40%, 02/04/41 (a) | 4,000 | 2,888 |
| 4.00%, 02/04/61 (a) | 2,000 | 1,394 |
| 4.25%, 08/09/42 (a) | 2,000 | 1,593 |
| 4.45%, 05/06/50 (a) | 3,000 | 2,321 |
| 4.50%, 05/02/43 (a) | 3,000 | 2,449 |
| Amazon.com, Inc. | | |
| 1.50%, 06/03/30 (a) | 2,000 | 1,696 |
See Notes to Schedule of Investments and Notes to Financial Statements.
| 2 | State Street Income V.I.S. Fund |
State Street Income V.I.S. Fund
Schedule of Investments, continued — December 31, 2024
| | Principal
Amount | Fair
Value |
| 2.50%, 06/03/50 (a) | $3,000 | $1,788 |
| 2.70%, 06/03/60 (a) | 3,000 | 1,719 |
| 2.88%, 05/12/41 (a) | 2,000 | 1,470 |
| 3.15%, 08/22/27 (a) | 2,000 | 1,934 |
| 3.25%, 05/12/61 (a) | 3,000 | 1,955 |
| 4.05%, 08/22/47 (a) | 3,000 | 2,468 |
| Ameren Corp. | | |
| 3.65%, 02/15/26 (a) | 3,000 | 2,962 |
| American Electric Power Co., Inc. | | |
| 2.30%, 03/01/30 (a) | 3,000 | 2,609 |
| 3.25%, 03/01/50 (a) | 3,000 | 1,930 |
| American Honda Finance Corp. | | |
| 5.85%, 10/04/30 (a) | 11,000 | 11,452 |
| American Tower Corp. | | |
| 1.50%, 01/31/28 (a) | 2,000 | 1,804 |
| 2.90%, 01/15/30 (a) | 2,000 | 1,800 |
| 3.70%, 10/15/49 (a) | 3,000 | 2,162 |
| 3.80%, 08/15/29 (a) | 2,000 | 1,894 |
| American Water Capital Corp. | | |
| 2.95%, 09/01/27 (a) | 6,000 | 5,734 |
| 5.45%, 03/01/54 (a) | 6,000 | 5,752 |
| Americold Realty Operating Partnership LP | | |
| 5.41%, 09/12/34 (a) | 5,000 | 4,785 |
| Amgen, Inc. | | |
| 2.45%, 02/21/30 (a) | 2,000 | 1,767 |
| 3.00%, 01/15/52 (a) | 2,000 | 1,263 |
| 3.15%, 02/21/40 (a) | 3,000 | 2,230 |
| 5.51%, 03/02/26 (a) | 3,000 | 2,999 |
| 5.60%, 03/02/43 (a) | 3,000 | 2,920 |
| 5.65%, 03/02/53 (a) | 3,000 | 2,892 |
| 5.75%, 03/02/63 (a) | 3,000 | 2,878 |
| Anheuser-Busch Cos. LLC/Anheuser-Busch InBev Worldwide, Inc. | | |
| 4.70%, 02/01/36 (a) | 10,000 | 9,483 |
| 4.90%, 02/01/46 (a) | 8,000 | 7,285 |
| Anheuser-Busch InBev Worldwide, Inc. | | |
| 3.50%, 06/01/30 (a) | 4,000 | 3,748 |
| 5.55%, 01/23/49 (a) | 2,000 | 1,975 |
| Aon Corp./Aon Global Holdings PLC | | |
| 2.90%, 08/23/51 (a) | 2,000 | 1,217 |
| Apollo Debt Solutions BDC | | |
| 6.90%, 04/13/29 (a)(f) | 5,000 | 5,165 |
| | Principal
Amount | Fair
Value |
| Apollo Management Holdings LP | | |
| 2.65%, 06/05/30 (a)(f) | $2,000 | $1,754 |
| Apple, Inc. | | |
| 2.20%, 09/11/29 (a) | 3,000 | 2,700 |
| 2.65%, 02/08/51 (a) | 4,000 | 2,466 |
| 2.80%, 02/08/61 (a) | 2,000 | 1,186 |
| 2.95%, 09/11/49 (a) | 3,000 | 2,001 |
| 3.45%, 02/09/45 (a) | 2,000 | 1,531 |
| 3.95%, 08/08/52 (a) | 3,000 | 2,386 |
| 4.85%, 05/10/53 (a) | 4,000 | 3,780 |
| Applied Materials, Inc. | | |
| 4.35%, 04/01/47 (a) | 2,000 | 1,693 |
| Aptiv Swiss Holdings Ltd. | | |
| 4.40%, 10/01/46 (a) | 3,000 | 2,261 |
| ArcelorMittal SA | | |
| 4.55%, 03/11/26 (a) | 9,000 | 8,945 |
| 6.00%, 06/17/34 (a) | 3,000 | 3,042 |
| 6.35%, 06/17/54 (a) | 6,000 | 5,930 |
| 6.80%, 11/29/32 (a) | 2,000 | 2,138 |
| Archer-Daniels-Midland Co. | | |
| 2.50%, 08/11/26 (a) | 2,000 | 1,935 |
| ARES Capital Corp. | | |
| 2.88%, 06/15/28 (a) | 3,000 | 2,765 |
| Arthur J Gallagher & Co. | | |
| 3.50%, 05/20/51 (a) | 3,000 | 2,067 |
| Ascension Health | | |
| 4.85%, 11/15/53 (a) | 7,000 | 6,258 |
| Astrazeneca Finance LLC | | |
| 1.75%, 05/28/28 (a) | 3,000 | 2,720 |
| 5.00%, 02/26/34 (a) | 2,000 | 1,978 |
| AstraZeneca PLC | | |
| 3.00%, 05/28/51 (a) | 3,000 | 1,966 |
| 4.00%, 01/17/29 (a) | 3,000 | 2,919 |
| 4.38%, 08/17/48 (a) | 2,000 | 1,692 |
| AT&T, Inc. | | |
| 2.75%, 06/01/31 (a) | 8,000 | 6,960 |
| 3.55%, 09/15/55 | 2,000 | 1,349 |
| 3.65%, 06/01/51 (a) | 7,000 | 4,939 |
| 3.85%, 06/01/60 (a) | 5,000 | 3,467 |
| 4.35%, 03/01/29 (a) | 2,000 | 1,958 |
| 4.50%, 05/15/35 (a) | 3,000 | 2,776 |
| 4.55%, 03/09/49 (a) | 2,000 | 1,661 |
| 4.75%, 05/15/46 (a) | 2,000 | 1,737 |
| 5.40%, 02/15/34 (a) | 2,000 | 2,009 |
| Athene Holding Ltd. | | |
| 4.13%, 01/12/28 (a) | 2,000 | 1,951 |
| 6.15%, 04/03/30 (a) | 3,000 | 3,116 |
See Notes to Schedule of Investments and Notes to Financial Statements.
| State Street Income V.I.S. Fund | 3 |
State Street Income V.I.S. Fund
Schedule of Investments, continued — December 31, 2024
| | Principal
Amount | Fair
Value |
| Atmos Energy Corp. | | |
| 6.20%, 11/15/53 (a) | $3,000 | $3,201 |
| Bain Capital Specialty Finance, Inc. | | |
| 2.95%, 03/10/26 (a) | 4,000 | 3,883 |
| Bank of America Corp. | | |
| 3.25%, 10/21/27 (a) | 3,000 | 2,892 |
| 4.18%, 11/25/27 (a) | 2,000 | 1,964 |
| 4.25%, 10/22/26 (a) | 2,000 | 1,982 |
| Bank of America Corp. (2.09% fixed rate until 06/14/28; 1.06% + SOFR thereafter) | | |
| 2.09%, 06/14/29 (a)(c) | 3,000 | 2,720 |
| Bank of America Corp. (2.97% fixed rate until 07/21/51; 1.56% + SOFR thereafter) | | |
| 2.97%, 07/21/52 (a)(c) | 2,000 | 1,269 |
| Bank of America Corp. (3.37% fixed rate until 01/23/25; 1.07% + 3 mo. Term SOFR thereafter) | | |
| 3.37%, 01/23/26 (a)(c) | 2,000 | 1,998 |
| Bank of America Corp. (3.71% fixed rate until 04/24/27; 1.77% + 3 mo. Term SOFR thereafter) | | |
| 3.71%, 04/24/28 (a)(c) | 2,000 | 1,947 |
| Bank of America Corp. (3.85% fixed rate until 03/08/32; 2.00% + 5 yr. CMT thereafter) | | |
| 3.85%, 03/08/37 (a)(c) | 2,000 | 1,771 |
| Bank of America Corp. (3.95% fixed rate until 01/23/48; 1.45% + 3 mo. Term SOFR thereafter) | | |
| 3.95%, 01/23/49 (a)(c) | 2,000 | 1,530 |
| Bank of America Corp. (4.30% fixed rate until 01/28/25; 2.93% + 3 mo. Term SOFR thereafter) | | |
| 4.30%, 01/28/25 (a)(c) | 5,000 | 4,983 |
| Bank of America Corp. (5.29% fixed rate until 04/25/33; 1.91% + SOFR thereafter) | | |
| 5.29%, 04/25/34 (a)(c) | 5,000 | 4,963 |
| Bank of America Corp. (5.47% fixed rate until 01/23/34; 1.65% + SOFR thereafter) | | |
| 5.47%, 01/23/35 (a)(c) | 2,000 | 2,006 |
| | Principal
Amount | Fair
Value |
| Bank of America Corp. (5.87% fixed rate until 09/15/33; 1.84% + SOFR thereafter) | | |
| 5.87%, 09/15/34 (a)(c) | $6,000 | $6,165 |
| Bank of New York Mellon Corp. (4.63% fixed rate until 09/20/26; 3.39% + 3 mo. Term SOFR thereafter) | | |
| 4.63%, 09/20/26 (a)(c) | 4,000 | 3,900 |
| Bank of Nova Scotia (7.57% fixed rate until 04/12/25; 2.91% + 3 mo. Term SOFR thereafter) | | |
| 7.57%, 04/12/25 (a)(c) | 6,000 | 5,956 |
| BAT Capital Corp. | | |
| 2.73%, 03/25/31 (a) | 2,000 | 1,727 |
| 4.39%, 08/15/37 (a) | 3,000 | 2,590 |
| 4.54%, 08/15/47 (a) | 2,000 | 1,578 |
| 5.83%, 02/20/31 (a) | 3,000 | 3,067 |
| 7.08%, 08/02/53 (a) | 3,000 | 3,294 |
| Baxter International, Inc. | | |
| 1.92%, 02/01/27 (a) | 6,000 | 5,657 |
| 2.27%, 12/01/28 (a) | 3,000 | 2,705 |
| 3.95%, 04/01/30 (a) | 3,000 | 2,832 |
| Becton Dickinson & Co. | | |
| 3.70%, 06/06/27 (a) | 5,000 | 4,879 |
| 4.67%, 06/06/47 (a) | 3,000 | 2,563 |
| 4.69%, 12/15/44 (a) | 2,000 | 1,731 |
| 5.11%, 02/08/34 (a) | 6,000 | 5,912 |
| Berkshire Hathaway Energy Co. | | |
| 3.25%, 04/15/28 (a) | 2,000 | 1,904 |
| 3.70%, 07/15/30 (a) | 3,000 | 2,823 |
| 3.80%, 07/15/48 (a) | 3,000 | 2,227 |
| 4.25%, 10/15/50 (a) | 2,000 | 1,580 |
| 6.13%, 04/01/36 (a) | 3,000 | 3,155 |
| Berkshire Hathaway Finance Corp. | | |
| 2.85%, 10/15/50 (a) | 4,000 | 2,505 |
| 4.25%, 01/15/49 (a) | 2,000 | 1,668 |
| Berry Global, Inc. | | |
| 4.88%, 07/15/26 (a)(f) | 2,000 | 1,994 |
| Biogen, Inc. | | |
| 2.25%, 05/01/30 (a) | 3,000 | 2,592 |
| BlackRock TCP Capital Corp. | | |
| 6.95%, 05/30/29 (a) | 8,000 | 8,333 |
| Block Financial LLC | | |
| 2.50%, 07/15/28 (a) | 3,000 | 2,729 |
| 3.88%, 08/15/30 (a) | 3,000 | 2,770 |
See Notes to Schedule of Investments and Notes to Financial Statements.
| 4 | State Street Income V.I.S. Fund |
State Street Income V.I.S. Fund
Schedule of Investments, continued — December 31, 2024
| | Principal
Amount | Fair
Value |
| Boardwalk Pipelines LP | | |
| 4.80%, 05/03/29 (a) | $2,000 | $1,972 |
| Boeing Co. | | |
| 2.70%, 02/01/27 (a) | 2,000 | 1,907 |
| 2.95%, 02/01/30 (a) | 2,000 | 1,784 |
| 3.25%, 03/01/28 (a) | 3,000 | 2,817 |
| 3.75%, 02/01/50 (a) | 2,000 | 1,362 |
| 5.04%, 05/01/27 (a) | 3,000 | 3,007 |
| 5.15%, 05/01/30 (a) | 3,000 | 2,961 |
| 5.81%, 05/01/50 (a) | 6,000 | 5,570 |
| Boston Properties LP | | |
| 3.40%, 06/21/29 (a) | 4,000 | 3,672 |
| BP Capital Markets America, Inc. | | |
| 3.00%, 02/24/50 (a) | 3,000 | 1,909 |
| 3.38%, 02/08/61 (a) | 4,000 | 2,539 |
| 4.81%, 02/13/33 (a) | 4,000 | 3,859 |
| 5.23%, 11/17/34 (a) | 10,000 | 9,845 |
| BP Capital Markets PLC (4.88% fixed rate until 03/22/30; 4.40% + 5 yr. CMT thereafter) | | |
| 4.88%, 03/22/30 (a)(c) | 5,000 | 4,781 |
| Bristol-Myers Squibb Co. | | |
| 1.45%, 11/13/30 (a) | 2,000 | 1,656 |
| 2.35%, 11/13/40 (a) | 2,000 | 1,325 |
| 3.20%, 06/15/26 (a) | 2,000 | 1,965 |
| 3.40%, 07/26/29 (a) | 2,000 | 1,886 |
| 4.13%, 06/15/39 (a) | 3,000 | 2,588 |
| 4.25%, 10/26/49 (a) | 3,000 | 2,430 |
| 4.55%, 02/20/48 (a) | 2,000 | 1,701 |
| 5.20%, 02/22/34 (a) | 5,000 | 4,987 |
| Brixmor Operating Partnership LP | | |
| 2.25%, 04/01/28 (a) | 4,000 | 3,657 |
| Broadcom, Inc. | | |
| 3.14%, 11/15/35 (a)(f) | 3,000 | 2,451 |
| 3.42%, 04/15/33 (a)(f) | 5,000 | 4,378 |
| 3.47%, 04/15/34 (a)(f) | 2,000 | 1,733 |
| 4.15%, 11/15/30 (a) | 2,000 | 1,915 |
| 4.30%, 11/15/32 (a) | 2,000 | 1,887 |
| Brown-Forman Corp. | | |
| 4.00%, 04/15/38 (a) | 2,000 | 1,747 |
| Bunge Ltd. Finance Corp. | | |
| 3.75%, 09/25/27 (a) | 3,000 | 2,922 |
| Burlington Northern Santa Fe LLC | | |
| 4.15%, 12/15/48 (a) | 2,000 | 1,608 |
| 4.55%, 09/01/44 (a) | 3,000 | 2,613 |
| | Principal
Amount | Fair
Value |
| Campbell's Co. | | |
| 5.40%, 03/21/34 (a) | $5,000 | $4,981 |
| Canadian Natural Resources Ltd. | | |
| 3.85%, 06/01/27 (a) | 3,000 | 2,935 |
| 4.95%, 06/01/47 (a) | 2,000 | 1,717 |
| Canadian Pacific Railway Co. | | |
| 1.75%, 12/02/26 (a) | 3,000 | 2,841 |
| 3.50%, 05/01/50 (a) | 3,000 | 2,129 |
| Capital One Financial Corp. | | |
| 3.75%, 07/28/26 (a) | 3,000 | 2,946 |
| Carlisle Cos., Inc. | | |
| 2.20%, 03/01/32 (a) | 3,000 | 2,449 |
| Carrier Global Corp. | | |
| 2.72%, 02/15/30 (a) | 3,000 | 2,684 |
| CDW LLC/CDW Finance Corp. | | |
| 5.10%, 03/01/30 (a) | 5,000 | 4,931 |
| Cenovus Energy, Inc. | | |
| 2.65%, 01/15/32 (a) | 3,000 | 2,495 |
| 3.75%, 02/15/52 (a) | 3,000 | 2,072 |
| Centene Corp. | | |
| 3.00%, 10/15/30 (a) | 3,000 | 2,588 |
| 4.25%, 12/15/27 (a) | 13,000 | 12,585 |
| CenterPoint Energy, Inc. | | |
| 2.65%, 06/01/31 (a) | 3,000 | 2,578 |
| Charles Schwab Corp. | | |
| 2.45%, 03/03/27 (a) | 22,000 | 21,001 |
| Charles Schwab Corp. (4.00% fixed rate until 12/01/30; 3.08% + 10 yr. CMT thereafter) | | |
| 4.00%, 12/01/30 (a)(c) | 6,000 | 5,174 |
| Charles Schwab Corp. (5.64% fixed rate until 05/19/28; 2.21% + SOFR thereafter) | | |
| 5.64%, 05/19/29 (a)(c) | 7,000 | 7,141 |
| Charles Schwab Corp. (6.14% fixed rate until 08/24/33; 2.01% + SOFR thereafter) | | |
| 6.14%, 08/24/34 (a)(c) | 3,000 | 3,145 |
| Charter Communications Operating LLC/Charter Communications Operating Capital | | |
| 3.50%, 06/01/41 (a) | 2,000 | 1,371 |
| 3.70%, 04/01/51 (a) | 9,000 | 5,648 |
| 4.80%, 03/01/50 (a) | 3,000 | 2,254 |
| 6.55%, 06/01/34 (a) | 7,000 | 7,157 |
| Cheniere Energy, Inc. | | |
| 5.65%, 04/15/34 | 5,000 | 5,009 |
See Notes to Schedule of Investments and Notes to Financial Statements.
| State Street Income V.I.S. Fund | 5 |
State Street Income V.I.S. Fund
Schedule of Investments, continued — December 31, 2024
| | Principal
Amount | Fair
Value |
| Chevron USA, Inc. | | |
| 3.85%, 01/15/28 (a) | $2,000 | $1,973 |
| Chubb INA Holdings LLC | | |
| 4.35%, 11/03/45 (a) | 2,000 | 1,705 |
| Church & Dwight Co., Inc. | | |
| 2.30%, 12/15/31 (a) | 3,000 | 2,512 |
| Cigna Group | | |
| 2.40%, 03/15/30 (a) | 3,000 | 2,623 |
| 3.25%, 04/15/25 (a) | 2,000 | 1,990 |
| 3.40%, 03/01/27 (a) | 5,000 | 4,861 |
| 4.38%, 10/15/28 (a) | 3,000 | 2,940 |
| Cisco Systems, Inc. | | |
| 5.30%, 02/26/54 (a) | 4,000 | 3,884 |
| 5.35%, 02/26/64 (a) | 4,000 | 3,841 |
| 5.90%, 02/15/39 (a) | 3,000 | 3,161 |
| Citigroup, Inc. | | |
| 4.45%, 09/29/27 (a) | 3,000 | 2,958 |
| 4.65%, 07/23/48 (a) | 7,000 | 6,006 |
| Citigroup, Inc. (2.98% fixed rate until 11/05/29; 1.42% + SOFR thereafter) | | |
| 2.98%, 11/05/30 (a)(c) | 4,000 | 3,611 |
| Citigroup, Inc. (3.88% fixed rate until 01/24/38; 1.43% + 3 mo. Term SOFR thereafter) | | |
| 3.88%, 01/24/39 (a)(c) | 4,000 | 3,340 |
| Citigroup, Inc. (4.70% fixed rate until 01/30/25; 3.23% + SOFR thereafter) | | |
| 4.70%, 01/30/25 (a)(c) | 6,000 | 5,973 |
| Citigroup, Inc. (6.17% fixed rate until 05/25/33; 2.66% + SOFR thereafter) | | |
| 6.17%, 05/25/34 (a)(c) | 4,000 | 4,074 |
| Cleveland Electric Illuminating Co. | | |
| 4.55%, 11/15/30 (a)(f) | 4,000 | 3,852 |
| Clorox Co. | | |
| 1.80%, 05/15/30 (a) | 2,000 | 1,702 |
| CME Group, Inc. | | |
| 3.75%, 06/15/28 (a) | 2,000 | 1,946 |
| CMS Energy Corp. | | |
| 4.88%, 03/01/44 (a) | 2,000 | 1,774 |
| Coca-Cola Co. | | |
| 2.60%, 06/01/50 (a) | 3,000 | 1,811 |
| 2.75%, 06/01/60 (a) | 3,000 | 1,754 |
| Comcast Corp. | | |
| 2.80%, 01/15/51 (a) | 3,000 | 1,784 |
| 2.94%, 11/01/56 (a) | 3,000 | 1,749 |
| | Principal
Amount | Fair
Value |
| 2.99%, 11/01/63 (a) | $3,000 | $1,692 |
| 3.20%, 07/15/36 (a) | 3,000 | 2,421 |
| 3.25%, 11/01/39 (a) | 3,000 | 2,276 |
| 3.97%, 11/01/47 (a) | 3,000 | 2,280 |
| 4.15%, 10/15/28 (a) | 3,000 | 2,927 |
| 5.65%, 06/01/54 (a) | 5,000 | 4,836 |
| Conagra Brands, Inc. | | |
| 5.30%, 11/01/38 (a) | 3,000 | 2,824 |
| ConocoPhillips Co. | | |
| 4.30%, 11/15/44 (a) | 2,000 | 1,671 |
| 5.55%, 03/15/54 (a) | 3,000 | 2,882 |
| 5.70%, 09/15/63 (a) | 3,000 | 2,874 |
| Consolidated Edison Co. of New York, Inc. | | |
| 3.35%, 04/01/30 (a) | 3,000 | 2,790 |
| 3.88%, 06/15/47 (a) | 2,000 | 1,519 |
| 3.95%, 04/01/50 (a) | 3,000 | 2,342 |
| Constellation Brands, Inc. | | |
| 3.15%, 08/01/29 (a) | 2,000 | 1,842 |
| 3.70%, 12/06/26 (a) | 2,000 | 1,966 |
| 4.50%, 05/09/47 (a) | 2,000 | 1,658 |
| Constellation Energy Generation LLC | | |
| 6.50%, 10/01/53 (a) | 3,000 | 3,190 |
| Continental Resources, Inc. | | |
| 2.88%, 04/01/32 (a)(f) | 3,000 | 2,462 |
| COPT Defense Properties LP | | |
| 2.00%, 01/15/29 (a) | 3,000 | 2,640 |
| 2.25%, 03/15/26 (a) | 3,000 | 2,903 |
| 2.75%, 04/15/31 (a) | 7,000 | 5,974 |
| Corebridge Financial, Inc. | | |
| 3.90%, 04/05/32 (a) | 9,000 | 8,194 |
| Corning, Inc. | | |
| 4.38%, 11/15/57 (a) | 2,000 | 1,534 |
| Coterra Energy, Inc. | | |
| 5.60%, 03/15/34 (a) | 8,000 | 7,926 |
| 5.90%, 02/15/55 | 5,000 | 4,720 |
| Crown Castle, Inc. | | |
| 2.90%, 03/15/27 (a) | 3,000 | 2,882 |
| CSL Finance PLC | | |
| 4.25%, 04/27/32 (a)(f) | 4,000 | 3,757 |
| CSX Corp. | | |
| 4.50%, 03/15/49 - 08/01/54 (a) | 6,000 | 5,041 |
| CubeSmart LP | | |
| 4.38%, 02/15/29 (a) | 3,000 | 2,913 |
| CVS Health Corp. | | |
| 3.00%, 08/15/26 (a) | 2,000 | 1,938 |
| 3.63%, 04/01/27 (a) | 3,000 | 2,910 |
See Notes to Schedule of Investments and Notes to Financial Statements.
| 6 | State Street Income V.I.S. Fund |
State Street Income V.I.S. Fund
Schedule of Investments, continued — December 31, 2024
| | Principal
Amount | Fair
Value |
| 3.75%, 04/01/30 (a) | $3,000 | $2,750 |
| 4.78%, 03/25/38 (a) | 3,000 | 2,593 |
| 5.13%, 07/20/45 (a) | 2,000 | 1,682 |
| 5.30%, 12/05/43 (a) | 2,000 | 1,743 |
| 5.70%, 06/01/34 | 3,000 | 2,949 |
| CVS Health Corp. (7.00% fixed rate until 12/10/29; 2.89% + 5 yr. CMT thereafter) | | |
| 7.00%, 03/10/55 (c) | 3,000 | 3,012 |
| Dell International LLC/EMC Corp. | | |
| 6.02%, 06/15/26 (a) | 2,000 | 2,029 |
| DH Europe Finance II SARL | | |
| 2.60%, 11/15/29 (a) | 2,000 | 1,809 |
| 3.25%, 11/15/39 (a) | 3,000 | 2,337 |
| 3.40%, 11/15/49 (a) | 3,000 | 2,124 |
| Diamondback Energy, Inc. | | |
| 3.13%, 03/24/31 (a) | 2,000 | 1,770 |
| 4.40%, 03/24/51 (a) | 3,000 | 2,329 |
| 5.40%, 04/18/34 (a) | 5,000 | 4,920 |
| Dick's Sporting Goods, Inc. | | |
| 4.10%, 01/15/52 | 9,000 | 6,574 |
| Digital Realty Trust LP | | |
| 3.60%, 07/01/29 (a) | 4,000 | 3,779 |
| Discovery Communications LLC | | |
| 3.95%, 03/20/28 (a) | 2,000 | 1,894 |
| 5.00%, 09/20/37 (a) | 3,000 | 2,495 |
| Dollar General Corp. | | |
| 3.50%, 04/03/30 (a) | 2,000 | 1,835 |
| 4.13%, 04/03/50 (a) | 2,000 | 1,472 |
| Dollar Tree, Inc. | | |
| 4.00%, 05/15/25 (a) | 3,000 | 2,988 |
| Dominion Energy, Inc. | | |
| 3.38%, 04/01/30 (a) | 4,000 | 3,680 |
| Dover Corp. | | |
| 2.95%, 11/04/29 (a) | 3,000 | 2,734 |
| Dow Chemical Co. | | |
| 2.10%, 11/15/30 (a) | 3,000 | 2,547 |
| 3.60%, 11/15/50 (a) | 3,000 | 2,061 |
| 4.25%, 10/01/34 (a) | 3,000 | 2,723 |
| 5.15%, 02/15/34 (a) | 3,000 | 2,934 |
| 6.30%, 03/15/33 (a) | 3,000 | 3,180 |
| DTE Energy Co. | | |
| 2.85%, 10/01/26 (a) | 5,000 | 4,844 |
| Duke Energy Carolinas LLC | | |
| 3.95%, 03/15/48 (a) | 3,000 | 2,301 |
| Duke Energy Corp. | | |
| 2.55%, 06/15/31 (a) | 4,000 | 3,419 |
| | Principal
Amount | Fair
Value |
| 3.30%, 06/15/41 (a) | $2,000 | $1,466 |
| 3.50%, 06/15/51 (a) | 2,000 | 1,352 |
| 3.75%, 09/01/46 (a) | 3,000 | 2,209 |
| Duke Energy Progress LLC | | |
| 4.15%, 12/01/44 (a) | 7,000 | 5,687 |
| Duquesne Light Holdings, Inc. | | |
| 3.62%, 08/01/27 (a)(f) | 2,000 | 1,925 |
| Eastern Energy Gas Holdings LLC | | |
| 5.65%, 10/15/54 | 5,000 | 4,722 |
| Eastman Chemical Co. | | |
| 4.65%, 10/15/44 (a) | 2,000 | 1,689 |
| Eaton Corp. | | |
| 3.10%, 09/15/27 (a) | 2,000 | 1,926 |
| Edison International | | |
| 4.95%, 04/15/25 (a) | 6,000 | 5,994 |
| EIDP, Inc. | | |
| 2.30%, 07/15/30 (a) | 2,000 | 1,747 |
| Electronic Arts, Inc. | | |
| 1.85%, 02/15/31 (a) | 3,000 | 2,491 |
| Elevance Health, Inc. | | |
| 2.88%, 09/15/29 (a) | 3,000 | 2,728 |
| 3.60%, 03/15/51 (a) | 3,000 | 2,079 |
| 3.70%, 09/15/49 (a) | 3,000 | 2,133 |
| 5.65%, 06/15/54 (a) | 3,000 | 2,877 |
| Eli Lilly & Co. | | |
| 5.00%, 02/09/54 (a) | 3,000 | 2,760 |
| 5.10%, 02/09/64 (a) | 3,000 | 2,744 |
| Emera U.S. Finance LP | | |
| 2.64%, 06/15/31 (a) | 3,000 | 2,535 |
| Emerson Electric Co. | | |
| 1.80%, 10/15/27 (a) | 2,000 | 1,859 |
| 2.75%, 10/15/50 (a) | 2,000 | 1,245 |
| Enbridge Energy Partners LP | | |
| 5.50%, 09/15/40 (a) | 2,000 | 1,910 |
| Enbridge, Inc. | | |
| 1.60%, 10/04/26 (a) | 3,000 | 2,841 |
| Enbridge, Inc. (5.75% fixed rate until 04/15/30; 5.31% + 5 yr. CMT thereafter) | | |
| 5.75%, 07/15/80 (a)(c) | 7,000 | 6,762 |
| Energy Transfer LP | | |
| 5.30%, 04/01/44 - 04/15/47 (a) | 5,000 | 4,449 |
| 5.35%, 05/15/45 (a) | 2,000 | 1,799 |
| 5.75%, 02/15/33 (a) | 3,000 | 3,037 |
| 6.10%, 12/01/28 (a) | 3,000 | 3,116 |
| 6.40%, 12/01/30 (a) | 3,000 | 3,168 |
| 6.50%, 02/01/42 (a) | 2,000 | 2,071 |
See Notes to Schedule of Investments and Notes to Financial Statements.
| State Street Income V.I.S. Fund | 7 |
State Street Income V.I.S. Fund
Schedule of Investments, continued — December 31, 2024
| | Principal
Amount | Fair
Value |
| Enterprise Products Operating LLC | | |
| 4.25%, 02/15/48 (a) | $6,000 | $4,806 |
| 4.85%, 01/31/34 (a) | 8,000 | 7,743 |
| Enterprise Products Operating LLC (5.25% fixed rate until 08/16/27; 3.30% + 3 mo. Term SOFR thereafter) | | |
| 5.25%, 08/16/77 (a)(c) | 3,000 | 2,926 |
| EOG Resources, Inc. | | |
| 5.10%, 01/15/36 (a) | 2,000 | 1,952 |
| Equinix, Inc. | | |
| 1.25%, 07/15/25 (a) | 3,000 | 2,942 |
| 2.15%, 07/15/30 (a) | 2,000 | 1,720 |
| ERP Operating LP | | |
| 4.50%, 07/01/44 (a) | 6,000 | 5,164 |
| Everest Reinsurance Holdings, Inc. | | |
| 3.13%, 10/15/52 (a) | 3,000 | 1,856 |
| Eversource Energy | | |
| 3.45%, 01/15/50 (a) | 3,000 | 2,055 |
| Exelon Corp. | | |
| 4.05%, 04/15/30 (a) | 3,000 | 2,859 |
| 4.45%, 04/15/46 (a) | 3,000 | 2,495 |
| 4.70%, 04/15/50 (a) | 2,000 | 1,691 |
| 5.60%, 03/15/53 (a) | 5,000 | 4,821 |
| Expand Energy Corp. | | |
| 6.75%, 04/15/29 (a)(f) | 17,000 | 17,178 |
| Extra Space Storage LP | | |
| 2.20%, 10/15/30 (a) | 4,000 | 3,410 |
| 5.90%, 01/15/31 (a) | 2,000 | 2,063 |
| Exxon Mobil Corp. | | |
| 2.61%, 10/15/30 (a) | 2,000 | 1,782 |
| 3.45%, 04/15/51 (a) | 2,000 | 1,406 |
| FedEx Corp. | | |
| 4.10%, 02/01/45 (a) | 4,000 | 3,130 |
| FirstEnergy Corp. | | |
| 3.40%, 03/01/50 (a) | 2,000 | 1,355 |
| FirstEnergy Transmission LLC | | |
| 4.55%, 04/01/49 (a)(f) | 2,000 | 1,675 |
| Fiserv, Inc. | | |
| 3.50%, 07/01/29 (a) | 3,000 | 2,815 |
| 4.40%, 07/01/49 (a) | 3,000 | 2,451 |
| Florida Power & Light Co. | | |
| 2.85%, 04/01/25 (a) | 2,000 | 1,991 |
| 4.13%, 02/01/42 (a) | 4,000 | 3,333 |
| Flowers Foods, Inc. | | |
| 2.40%, 03/15/31 (a) | 3,000 | 2,540 |
| | Principal
Amount | Fair
Value |
| Flowserve Corp. | | |
| 2.80%, 01/15/32 (a) | $3,000 | $2,546 |
| Fox Corp. | | |
| 6.50%, 10/13/33 (a) | 3,000 | 3,158 |
| Freeport-McMoRan, Inc. | | |
| 4.25%, 03/01/30 (a) | 3,000 | 2,857 |
| GA Global Funding Trust | | |
| 1.63%, 01/15/26 (a)(f) | 3,000 | 2,899 |
| General Dynamics Corp. | | |
| 4.25%, 04/01/50 (a) | 3,000 | 2,476 |
| General Mills, Inc. | | |
| 3.00%, 02/01/51 (a) | 3,000 | 1,895 |
| General Motors Co. | | |
| 5.20%, 04/01/45 (a) | 3,000 | 2,599 |
| 5.40%, 04/01/48 (a) | 2,000 | 1,757 |
| 6.13%, 10/01/25 (a) | 2,000 | 2,015 |
| 6.80%, 10/01/27 (a) | 3,000 | 3,132 |
| General Motors Financial Co., Inc. | | |
| 1.25%, 01/08/26 (a) | 2,000 | 1,927 |
| 2.35%, 01/08/31 (a) | 2,000 | 1,676 |
| 5.25%, 03/01/26 (a) | 6,000 | 6,018 |
| 5.85%, 04/06/30 (a) | 9,000 | 9,200 |
| 6.10%, 01/07/34 (a) | 7,000 | 7,106 |
| Genuine Parts Co. | | |
| 2.75%, 02/01/32 (a) | 3,000 | 2,531 |
| Georgia Power Co. | | |
| 5.25%, 03/15/34 (a) | 11,000 | 10,926 |
| Georgia-Pacific LLC | | |
| 1.75%, 09/30/25 (a)(f) | 2,000 | 1,958 |
| 3.60%, 03/01/25 (a)(f) | 7,000 | 6,983 |
| Gilead Sciences, Inc. | | |
| 2.60%, 10/01/40 (a) | 2,000 | 1,384 |
| 3.50%, 02/01/25 (a) | 2,000 | 1,997 |
| 3.65%, 03/01/26 (a) | 2,000 | 1,978 |
| 4.15%, 03/01/47 (a) | 3,000 | 2,402 |
| 4.60%, 09/01/35 (a) | 3,000 | 2,827 |
| GlaxoSmithKline Capital PLC | | |
| 3.38%, 06/01/29 (a) | 3,000 | 2,837 |
| GlaxoSmithKline Capital, Inc. | | |
| 3.63%, 05/15/25 (a) | 4,000 | 3,984 |
| Goldman Sachs Group, Inc. | | |
| 3.85%, 01/26/27 (a) | 2,000 | 1,963 |
| 4.25%, 10/21/25 (a) | 2,000 | 1,990 |
| 5.15%, 05/22/45 (a) | 3,000 | 2,762 |
| Goldman Sachs Group, Inc. (2.38% fixed rate until 07/21/31; 1.25% + SOFR thereafter) | | |
| 2.38%, 07/21/32 (a)(c) | 4,000 | 3,341 |
See Notes to Schedule of Investments and Notes to Financial Statements.
| 8 | State Street Income V.I.S. Fund |
State Street Income V.I.S. Fund
Schedule of Investments, continued — December 31, 2024
| | Principal
Amount | Fair
Value |
| Goldman Sachs Group, Inc. (2.91% fixed rate until 07/21/41; 1.47% + SOFR thereafter) | | |
| 2.91%, 07/21/42 (a)(c) | $4,000 | $2,777 |
| Goldman Sachs Group, Inc. (3.21% fixed rate until 04/22/41; 1.51% + SOFR thereafter) | | |
| 3.21%, 04/22/42 (a)(c) | 4,000 | 2,916 |
| Goldman Sachs Group, Inc. (3.44% fixed rate until 02/24/42; 1.63% + SOFR thereafter) | | |
| 3.44%, 02/24/43 (a)(c) | 4,000 | 2,977 |
| Goldman Sachs Group, Inc. (3.81% fixed rate until 04/23/28; 1.42% + 3 mo. Term SOFR thereafter) | | |
| 3.81%, 04/23/29 (a)(c) | 2,000 | 1,923 |
| Goldman Sachs Group, Inc. (4.02% fixed rate until 10/31/37; 1.64% + 3 mo. Term SOFR thereafter) | | |
| 4.02%, 10/31/38 (a)(c) | 2,000 | 1,694 |
| Goldman Sachs Group, Inc. (4.22% fixed rate until 05/01/28; 1.56% + 3 mo. Term SOFR thereafter) | | |
| 4.22%, 05/01/29 (a)(c) | 2,000 | 1,947 |
| Graphic Packaging International LLC | | |
| 1.51%, 04/15/26 (a)(f) | 4,000 | 3,813 |
| Gray Oak Pipeline LLC | | |
| 2.60%, 10/15/25 (a)(f) | 4,000 | 3,923 |
| Halliburton Co. | | |
| 5.00%, 11/15/45 (a) | 2,000 | 1,791 |
| Harley-Davidson Financial Services, Inc. | | |
| 5.95%, 06/11/29 (a)(f) | 11,000 | 11,012 |
| Hartford Financial Services Group, Inc. (6.91% fixed rate until 01/31/25; 2.39% + 3 mo. Term SOFR thereafter) | | |
| 6.91%, 02/12/67 (a)(c)(f) | 2,000 | 1,839 |
| HCA, Inc. | | |
| 3.13%, 03/15/27 (a) | 5,000 | 4,812 |
| 3.38%, 03/15/29 (a) | 3,000 | 2,787 |
| 3.50%, 09/01/30 (a) | 3,000 | 2,724 |
| 3.63%, 03/15/32 (a) | 3,000 | 2,642 |
| 4.63%, 03/15/52 (a) | 2,000 | 1,563 |
| | Principal
Amount | Fair
Value |
| 5.38%, 02/01/25 (a) | $21,000 | $20,987 |
| 5.60%, 04/01/34 (a) | 5,000 | 4,926 |
| 6.00%, 04/01/54 (a) | 2,000 | 1,908 |
| Health Care Service Corp. A Mutual Legal Reserve Co. | | |
| 2.20%, 06/01/30 (a)(f) | 3,000 | 2,590 |
| 3.20%, 06/01/50 (a)(f) | 2,000 | 1,284 |
| Healthcare Realty Holdings LP | | |
| 2.00%, 03/15/31 (a) | 3,000 | 2,454 |
| Helmerich & Payne, Inc. | | |
| 2.90%, 09/29/31 (a) | 3,000 | 2,497 |
| Hess Corp. | | |
| 5.60%, 02/15/41 (a) | 2,000 | 1,972 |
| 5.80%, 04/01/47 (a) | 2,000 | 2,004 |
| Hewlett Packard Enterprise Co. | | |
| 6.35%, 10/15/45 (a) | 3,000 | 3,108 |
| Highwoods Realty LP | | |
| 4.13%, 03/15/28 (a) | 3,000 | 2,870 |
| 4.20%, 04/15/29 (a) | 2,000 | 1,899 |
| Home Depot, Inc. | | |
| 2.70%, 04/15/30 (a) | 2,000 | 1,801 |
| 3.35%, 04/15/50 (a) | 3,000 | 2,096 |
| 3.50%, 09/15/56 (a) | 3,000 | 2,086 |
| 3.90%, 12/06/28 (a) | 2,000 | 1,949 |
| 4.50%, 12/06/48 (a) | 2,000 | 1,707 |
| 5.40%, 06/25/64 (a) | 3,000 | 2,873 |
| Honeywell International, Inc. | | |
| 1.75%, 09/01/31 (a) | 3,000 | 2,458 |
| 2.70%, 08/15/29 (a) | 2,000 | 1,833 |
| 5.25%, 03/01/54 (a) | 10,000 | 9,385 |
| Hormel Foods Corp. | | |
| 1.80%, 06/11/30 (a) | 3,000 | 2,558 |
| Howmet Aerospace, Inc. | | |
| 5.95%, 02/01/37 (a) | 4,000 | 4,143 |
| Huntington Bancshares, Inc. | | |
| 2.55%, 02/04/30 (a) | 3,000 | 2,638 |
| Huntington Bancshares, Inc. (5.27% fixed rate until 01/15/30; 1.28% + SOFR thereafter) | | |
| 5.27%, 01/15/31 (c) | 10,000 | 10,001 |
| Huntington Bancshares, Inc. (6.14% fixed rate until 08/18/34; 1.70% + 5 yr. CMT thereafter) | | |
| 6.14%, 11/18/39 (c) | 5,000 | 5,018 |
| Hyundai Capital America | | |
| 5.40%, 01/08/31 (a)(f) | 11,000 | 10,994 |
See Notes to Schedule of Investments and Notes to Financial Statements.
| State Street Income V.I.S. Fund | 9 |
State Street Income V.I.S. Fund
Schedule of Investments, continued — December 31, 2024
| | Principal
Amount | Fair
Value |
| Indiana Michigan Power Co. | | |
| 3.25%, 05/01/51 (a) | $3,000 | $1,970 |
| Ingersoll Rand, Inc. | | |
| 5.70%, 08/14/33 (a) | 3,000 | 3,068 |
| Ingredion, Inc. | | |
| 3.90%, 06/01/50 (a) | 2,000 | 1,475 |
| Intel Corp. | | |
| 2.00%, 08/12/31 (a) | 2,000 | 1,611 |
| 2.45%, 11/15/29 (a) | 4,000 | 3,509 |
| 2.80%, 08/12/41 (a) | 3,000 | 1,912 |
| 3.10%, 02/15/60 (a) | 3,000 | 1,600 |
| Intercontinental Exchange, Inc. | | |
| 1.85%, 09/15/32 (a) | 2,000 | 1,586 |
| 2.65%, 09/15/40 (a) | 2,000 | 1,396 |
| Interstate Power & Light Co. | | |
| 3.40%, 08/15/25 (a) | 6,000 | 5,942 |
| Intuit, Inc. | | |
| 5.50%, 09/15/53 (a) | 3,000 | 2,943 |
| ITC Holdings Corp. | | |
| 2.95%, 05/14/30 (a)(f) | 4,000 | 3,575 |
| J.M. Smucker Co. | | |
| 6.50%, 11/15/43 - 11/15/53 (a) | 6,000 | 6,420 |
| Jacobs Engineering Group, Inc. | | |
| 5.90%, 03/01/33 (a) | 9,000 | 9,118 |
| JBS USA Holding Lux SARL/JBS USA Food Co./JBS Lux Co. SARL | | |
| 5.13%, 02/01/28 (a) | 6,000 | 5,970 |
| 5.75%, 04/01/33 (a) | 3,000 | 2,990 |
| 6.75%, 03/15/34 | 5,000 | 5,293 |
| Jefferies Financial Group, Inc. | | |
| 5.88%, 07/21/28 (a) | 6,000 | 6,134 |
| Johnson & Johnson | | |
| 3.63%, 03/03/37 (a) | 3,000 | 2,597 |
| Johnson Controls International PLC | | |
| 4.50%, 02/15/47 (a) | 3,000 | 2,488 |
| JPMorgan Chase & Co. (2.96% fixed rate until 05/13/30; 2.52% + 3 mo. Term SOFR thereafter) | | |
| 2.96%, 05/13/31 (a)(c) | 3,000 | 2,681 |
| JPMorgan Chase & Co. (3.16% fixed rate until 04/22/41; 1.46% + SOFR thereafter) | | |
| 3.16%, 04/22/42 (a)(c) | 2,000 | 1,465 |
| | Principal
Amount | Fair
Value |
| JPMorgan Chase & Co. (3.88% fixed rate until 07/24/37; 1.62% + 3 mo. Term SOFR thereafter) | | |
| 3.88%, 07/24/38 (a)(c) | $2,000 | $1,698 |
| JPMorgan Chase & Co. (3.90% fixed rate until 01/23/48; 1.48% + 3 mo. Term SOFR thereafter) | | |
| 3.90%, 01/23/49 (a)(c) | 10,000 | 7,696 |
| JPMorgan Chase & Co. (4.01% fixed rate until 04/23/28; 1.38% + 3 mo. Term SOFR thereafter) | | |
| 4.01%, 04/23/29 (a)(c) | 2,000 | 1,939 |
| JPMorgan Chase & Co. (4.03% fixed rate until 07/24/47; 1.72% + 3 mo. Term SOFR thereafter) | | |
| 4.03%, 07/24/48 (a)(c) | 3,000 | 2,362 |
| JPMorgan Chase & Co. (4.49% fixed rate until 03/24/30; 3.79% + 3 mo. Term SOFR thereafter) | | |
| 4.49%, 03/24/31 (a)(c) | 2,000 | 1,948 |
| JPMorgan Chase & Co. (4.60% fixed rate until 02/01/25; 3.13% + 3 mo. Term SOFR thereafter) | | |
| 4.60%, 02/01/25 (a)(c) | 6,000 | 5,976 |
| JPMorgan Chase & Co. (5.34% fixed rate until 01/23/34; 1.62% + SOFR thereafter) | | |
| 5.34%, 01/23/35 (a)(c) | 5,000 | 4,972 |
| Kenvue, Inc. | | |
| 4.90%, 03/22/33 (a) | 2,000 | 1,966 |
| 5.05%, 03/22/53 (a) | 2,000 | 1,855 |
| Keurig Dr. Pepper, Inc. | | |
| 3.20%, 05/01/30 (a) | 3,000 | 2,742 |
| 3.80%, 05/01/50 (a) | 2,000 | 1,470 |
| Kinder Morgan Energy Partners LP | | |
| 4.70%, 11/01/42 (a) | 2,000 | 1,683 |
| 5.00%, 03/01/43 (a) | 2,000 | 1,744 |
| 6.38%, 03/01/41 (a) | 3,000 | 3,058 |
| Kinder Morgan, Inc. | | |
| 1.75%, 11/15/26 (a) | 3,000 | 2,844 |
| 5.05%, 02/15/46 (a) | 6,000 | 5,211 |
| 5.20%, 06/01/33 (a) | 3,000 | 2,931 |
| KLA Corp. | | |
| 3.30%, 03/01/50 (a) | 3,000 | 2,075 |
See Notes to Schedule of Investments and Notes to Financial Statements.
| 10 | State Street Income V.I.S. Fund |
State Street Income V.I.S. Fund
Schedule of Investments, continued — December 31, 2024
| | Principal
Amount | Fair
Value |
| Kraft Heinz Foods Co. | | |
| 5.20%, 07/15/45 (a) | $2,000 | $1,812 |
| L3Harris Technologies, Inc. | | |
| 3.85%, 12/15/26 (a) | 2,000 | 1,968 |
| Las Vegas Sands Corp. | | |
| 5.90%, 06/01/27 (a) | 5,000 | 5,072 |
| 6.20%, 08/15/34 (a) | 4,000 | 4,023 |
| Leidos, Inc. | | |
| 3.63%, 05/15/25 (a) | 3,000 | 2,985 |
| 4.38%, 05/15/30 (a) | 3,000 | 2,869 |
| 5.75%, 03/15/33 (a) | 3,000 | 3,044 |
| Liberty Mutual Group, Inc. | | |
| 3.95%, 05/15/60 (a)(f) | 3,000 | 2,012 |
| Lincoln National Corp. | | |
| 4.35%, 03/01/48 (a) | 4,000 | 3,101 |
| Lockheed Martin Corp. | | |
| 4.50%, 05/15/36 (a) | 3,000 | 2,816 |
| Lowe's Cos., Inc. | | |
| 1.30%, 04/15/28 (a) | 3,000 | 2,682 |
| 1.70%, 09/15/28 - 10/15/30 (a) | 6,000 | 5,189 |
| 3.00%, 10/15/50 (a) | 3,000 | 1,868 |
| 4.05%, 05/03/47 (a) | 2,000 | 1,550 |
| 5.63%, 04/15/53 (a) | 2,000 | 1,925 |
| LYB International Finance III LLC | | |
| 3.63%, 04/01/51 (a) | 3,000 | 2,013 |
| Marvell Technology, Inc. | | |
| 5.95%, 09/15/33 | 3,000 | 3,116 |
| Masco Corp. | | |
| 3.50%, 11/15/27 (a) | 2,000 | 1,928 |
| McCormick & Co., Inc. | | |
| 1.85%, 02/15/31 (a) | 3,000 | 2,483 |
| 3.25%, 11/15/25 (a) | 2,000 | 1,970 |
| McDonald's Corp. | | |
| 3.60%, 07/01/30 (a) | 5,000 | 4,687 |
| 3.63%, 09/01/49 (a) | 3,000 | 2,162 |
| 4.88%, 12/09/45 (a) | 5,000 | 4,485 |
| Medtronic Global Holdings SCA | | |
| 4.50%, 03/30/33 (a) | 10,000 | 9,558 |
| Medtronic, Inc. | | |
| 4.63%, 03/15/45 (a) | 2,000 | 1,779 |
| Memorial Sloan-Kettering Cancer Center | | |
| 4.13%, 07/01/52 (a) | 5,000 | 4,046 |
| Merck & Co., Inc. | | |
| 1.90%, 12/10/28 (a) | 5,000 | 4,510 |
| 2.45%, 06/24/50 (a) | 3,000 | 1,729 |
| 2.75%, 12/10/51 (a) | 3,000 | 1,813 |
| | Principal
Amount | Fair
Value |
| 4.00%, 03/07/49 (a) | $2,000 | $1,572 |
| 4.50%, 05/17/33 (a) | 4,000 | 3,855 |
| Meritage Homes Corp. | | |
| 3.88%, 04/15/29 (a)(f) | 11,000 | 10,291 |
| Meta Platforms, Inc. | | |
| 3.85%, 08/15/32 (a) | 4,000 | 3,718 |
| 4.45%, 08/15/52 (a) | 2,000 | 1,684 |
| MetLife, Inc. | | |
| 4.72%, 12/15/44 (a) | 4,000 | 3,538 |
| Micron Technology, Inc. | | |
| 3.37%, 11/01/41 (a) | 3,000 | 2,187 |
| 3.48%, 11/01/51 (a) | 3,000 | 2,019 |
| 5.30%, 01/15/31 (a) | 3,000 | 2,998 |
| Microsoft Corp. | | |
| 2.40%, 08/08/26 (a) | 2,000 | 1,941 |
| 2.68%, 06/01/60 (a) | 3,000 | 1,754 |
| 2.92%, 03/17/52 (a) | 3,000 | 1,987 |
| 3.45%, 08/08/36 (a) | 3,000 | 2,612 |
| 3.50%, 02/12/35 (a) | 3,000 | 2,716 |
| Mid-America Apartments LP | | |
| 2.88%, 09/15/51 (a) | 3,000 | 1,847 |
| Molson Coors Beverage Co. | | |
| 4.20%, 07/15/46 (a) | 2,000 | 1,599 |
| Morgan Stanley | | |
| 3.97%, 07/22/38 (a)(c) | 5,000 | 4,251 |
| Morgan Stanley (1.51% fixed rate until 07/20/26; 0.86% + SOFR thereafter) | | |
| 1.51%, 07/20/27 (a)(c) | 4,000 | 3,807 |
| Morgan Stanley (2.48% fixed rate until 09/16/31; 1.36% + SOFR thereafter) | | |
| 2.48%, 09/16/36 (a)(c) | 8,000 | 6,507 |
| Morgan Stanley (2.80% fixed rate until 01/25/51; 1.43% + SOFR thereafter) | | |
| 2.80%, 01/25/52 (a)(c) | 8,000 | 4,893 |
| Morgan Stanley (5.47% fixed rate until 01/18/34; 1.73% + SOFR thereafter) | | |
| 5.47%, 01/18/35 (a)(c) | 3,000 | 2,985 |
| MPLX LP | | |
| 2.65%, 08/15/30 (a) | 3,000 | 2,625 |
| Mylan, Inc. | | |
| 5.20%, 04/15/48 (a) | 3,000 | 2,481 |
| Netflix, Inc. | | |
| 4.90%, 08/15/34 (a) | 5,000 | 4,905 |
| Nevada Power Co. | | |
| 6.00%, 03/15/54 (a) | 3,000 | 3,066 |
See Notes to Schedule of Investments and Notes to Financial Statements.
| State Street Income V.I.S. Fund | 11 |
State Street Income V.I.S. Fund
Schedule of Investments, continued — December 31, 2024
| | Principal
Amount | Fair
Value |
| Newmont Corp. | | |
| 4.88%, 03/15/42 (a) | $3,000 | $2,736 |
| NextEra Energy Capital Holdings, Inc. (5.65% fixed rate until 05/01/29; 3.16% + 3 mo. Term SOFR thereafter) | | |
| 5.65%, 05/01/79 (a)(c) | 3,000 | 2,929 |
| NGPL PipeCo LLC | | |
| 3.25%, 07/15/31 (a)(f) | 4,000 | 3,446 |
| Niagara Mohawk Power Corp. | | |
| 5.66%, 01/17/54 (a)(f) | 2,000 | 1,940 |
| NIKE, Inc. | | |
| 3.38%, 03/27/50 (a) | 2,000 | 1,411 |
| NNN REIT, Inc. | | |
| 4.00%, 11/15/25 (a) | 2,000 | 1,985 |
| Norfolk Southern Corp. | | |
| 3.95%, 10/01/42 (a) | 2,000 | 1,609 |
| Northern Trust Corp. | | |
| 6.13%, 11/02/32 (a) | 3,000 | 3,163 |
| Northwestern Mutual Life Insurance Co. | | |
| 3.45%, 03/30/51 (a)(f) | 8,000 | 5,474 |
| NOV, Inc. | | |
| 3.60%, 12/01/29 (a) | 3,000 | 2,799 |
| Novant Health, Inc. | | |
| 3.32%, 11/01/61 (a) | 4,000 | 2,556 |
| Novartis Capital Corp. | | |
| 2.20%, 08/14/30 (a) | 2,000 | 1,750 |
| 3.00%, 11/20/25 (a) | 3,000 | 2,964 |
| Nutrien Ltd. | | |
| 4.90%, 03/27/28 - 06/01/43 (a) | 7,000 | 6,770 |
| 5.40%, 06/21/34 (a) | 11,000 | 10,936 |
| NVIDIA Corp. | | |
| 2.85%, 04/01/30 (a) | 2,000 | 1,832 |
| 3.50%, 04/01/50 (a) | 2,000 | 1,484 |
| Occidental Petroleum Corp. | | |
| 6.13%, 01/01/31 (a) | 6,000 | 6,140 |
| Oklahoma Gas & Electric Co. | | |
| 3.25%, 04/01/30 (a) | 3,000 | 2,750 |
| Oncor Electric Delivery Co. LLC | | |
| 3.80%, 09/30/47 (a) | 2,000 | 1,519 |
| ONEOK, Inc. | | |
| 4.35%, 03/15/29 (a) | 2,000 | 1,947 |
| 6.10%, 11/15/32 (a) | 3,000 | 3,107 |
| 6.63%, 09/01/53 (a) | 4,000 | 4,213 |
| Oracle Corp. | | |
| 2.95%, 04/01/30 (a) | 5,000 | 4,514 |
| | Principal
Amount | Fair
Value |
| 3.60%, 04/01/50 (a) | $2,000 | $1,399 |
| 3.95%, 03/25/51 (a) | 3,000 | 2,219 |
| 4.00%, 07/15/46 - 11/15/47 (a) | 5,000 | 3,831 |
| 4.10%, 03/25/61 (a) | 3,000 | 2,148 |
| 5.55%, 02/06/53 (a) | 3,000 | 2,839 |
| 6.90%, 11/09/52 (a) | 3,000 | 3,354 |
| Otis Worldwide Corp. | | |
| 2.06%, 04/05/25 (a) | 3,000 | 2,978 |
| 2.57%, 02/15/30 (a) | 3,000 | 2,666 |
| 3.36%, 02/15/50 (a) | 3,000 | 2,059 |
| Owens Corning | | |
| 3.88%, 06/01/30 (a) | 5,000 | 4,708 |
| 4.40%, 01/30/48 (a) | 3,000 | 2,410 |
| 5.70%, 06/15/34 (a) | 5,000 | 5,080 |
| Pacific Gas & Electric Co. | | |
| 2.10%, 08/01/27 (a) | 3,000 | 2,798 |
| 2.50%, 02/01/31 (a) | 2,000 | 1,712 |
| 3.00%, 06/15/28 (a) | 3,000 | 2,812 |
| 3.30%, 08/01/40 (a) | 2,000 | 1,495 |
| 3.50%, 08/01/50 (a) | 3,000 | 2,059 |
| 4.30%, 03/15/45 (a) | 4,000 | 3,188 |
| PacifiCorp | | |
| 2.70%, 09/15/30 (a) | 3,000 | 2,650 |
| 2.90%, 06/15/52 (a) | 3,000 | 1,788 |
| 5.80%, 01/15/55 (a) | 2,000 | 1,950 |
| 6.25%, 10/15/37 (a) | 2,000 | 2,095 |
| Paramount Global | | |
| 2.90%, 01/15/27 (a) | 2,000 | 1,912 |
| 3.70%, 06/01/28 (a) | 2,000 | 1,886 |
| 5.25%, 04/01/44 (a) | 3,000 | 2,344 |
| Parker-Hannifin Corp. | | |
| 3.25%, 06/14/29 (a) | 3,000 | 2,807 |
| 4.50%, 09/15/29 (a) | 3,000 | 2,959 |
| Patterson-UTI Energy, Inc. | | |
| 7.15%, 10/01/33 (a) | 3,000 | 3,145 |
| PayPal Holdings, Inc. | | |
| 2.65%, 10/01/26 (a) | 2,000 | 1,937 |
| 3.25%, 06/01/50 (a) | 2,000 | 1,354 |
| PepsiCo, Inc. | | |
| 1.63%, 05/01/30 (a) | 3,000 | 2,557 |
| 2.75%, 10/21/51 (a) | 3,000 | 1,866 |
| Pfizer Investment Enterprises Pte. Ltd. | | |
| 4.45%, 05/19/28 (a) | 8,000 | 7,930 |
| 4.75%, 05/19/33 (a) | 2,000 | 1,937 |
| Pfizer, Inc. | | |
| 2.70%, 05/28/50 (a) | 4,000 | 2,464 |
| 3.90%, 03/15/39 (a) | 3,000 | 2,536 |
See Notes to Schedule of Investments and Notes to Financial Statements.
| 12 | State Street Income V.I.S. Fund |
State Street Income V.I.S. Fund
Schedule of Investments, continued — December 31, 2024
| | Principal
Amount | Fair
Value |
| 4.40%, 05/15/44 (a) | $2,000 | $1,728 |
| Philip Morris International, Inc. | | |
| 1.50%, 05/01/25 (a) | 2,000 | 1,979 |
| 2.10%, 05/01/30 (a) | 3,000 | 2,593 |
| 4.13%, 03/04/43 (a) | 2,000 | 1,622 |
| 5.13%, 02/15/30 (a) | 8,000 | 8,046 |
| 5.25%, 02/13/34 (a) | 3,000 | 2,968 |
| 5.63%, 11/17/29 (a) | 7,000 | 7,210 |
| Phillips 66 Co. | | |
| 2.15%, 12/15/30 (a) | 4,000 | 3,393 |
| 3.15%, 12/15/29 (a) | 4,000 | 3,669 |
| 3.30%, 03/15/52 (a) | 3,000 | 1,930 |
| 3.75%, 03/01/28 (a) | 3,000 | 2,904 |
| 4.68%, 02/15/45 (a) | 2,000 | 1,675 |
| Pioneer Natural Resources Co. | | |
| 1.13%, 01/15/26 (a) | 9,000 | 8,686 |
| 2.15%, 01/15/31 (a) | 4,000 | 3,397 |
| Plains All American Pipeline LP/PAA Finance Corp. | | |
| 3.55%, 12/15/29 (a) | 3,000 | 2,791 |
| Precision Castparts Corp. | | |
| 4.38%, 06/15/45 (a) | 2,000 | 1,699 |
| Progressive Corp. | | |
| 3.00%, 03/15/32 (a) | 6,000 | 5,267 |
| Prologis LP | | |
| 3.05%, 03/01/50 (a) | 4,000 | 2,591 |
| 3.25%, 06/30/26 (a) | 2,000 | 1,964 |
| Prudential Financial, Inc. | | |
| 3.94%, 12/07/49 (a) | 4,000 | 3,026 |
| Prudential Financial, Inc. (5.70% fixed rate until 09/15/28; 2.67% + 3 mo. Term SOFR thereafter) | | |
| 5.70%, 09/15/48 (a)(c) | 3,000 | 2,975 |
| Public Service Co. of Colorado | | |
| 3.70%, 06/15/28 (a) | 3,000 | 2,896 |
| PVH Corp. | | |
| 4.63%, 07/10/25 (a) | 3,000 | 2,988 |
| QUALCOMM, Inc. | | |
| 4.30%, 05/20/47 (a) | 3,000 | 2,480 |
| 4.50%, 05/20/52 (a) | 2,000 | 1,674 |
| Quanta Services, Inc. | | |
| 2.35%, 01/15/32 (a) | 3,000 | 2,483 |
| 3.05%, 10/01/41 (a) | 3,000 | 2,109 |
| Regeneron Pharmaceuticals, Inc. | | |
| 1.75%, 09/15/30 (a) | 4,000 | 3,330 |
| | Principal
Amount | Fair
Value |
| Regions Financial Corp. (5.72% fixed rate until 06/06/29; 1.49% + SOFR thereafter) | | |
| 5.72%, 06/06/30 (a)(c) | $20,000 | $20,258 |
| RenaissanceRe Holdings Ltd. | | |
| 5.75%, 06/05/33 (a) | 3,000 | 3,010 |
| Republic Services, Inc. | | |
| 5.00%, 04/01/34 (a) | 3,000 | 2,928 |
| Rockwell Automation, Inc. | | |
| 4.20%, 03/01/49 (a) | 2,000 | 1,648 |
| Rogers Communications, Inc. | | |
| 5.00%, 03/15/44 (a) | 2,000 | 1,772 |
| Ross Stores, Inc. | | |
| 4.70%, 04/15/27 (a) | 3,000 | 2,976 |
| Royalty Pharma PLC | | |
| 1.20%, 09/02/25 (a) | 3,000 | 2,925 |
| 1.75%, 09/02/27 (a) | 3,000 | 2,764 |
| 2.20%, 09/02/30 (a) | 3,000 | 2,547 |
| RPM International, Inc. | | |
| 3.75%, 03/15/27 (a) | 2,000 | 1,955 |
| RTX Corp. | | |
| 1.90%, 09/01/31 (a) | 3,000 | 2,453 |
| 2.82%, 09/01/51 (a) | 5,000 | 3,032 |
| 3.95%, 08/16/25 (a) | 2,000 | 1,990 |
| 4.15%, 05/15/45 (a) | 3,000 | 2,424 |
| 4.45%, 11/16/38 (a) | 2,000 | 1,781 |
| 6.10%, 03/15/34 (a) | 5,000 | 5,264 |
| 6.40%, 03/15/54 (a) | 5,000 | 5,433 |
| Ryder System, Inc. | | |
| 2.90%, 12/01/26 (a) | 3,000 | 2,894 |
| Salesforce, Inc. | | |
| 1.95%, 07/15/31 (a) | 4,000 | 3,359 |
| 2.70%, 07/15/41 (a) | 3,000 | 2,116 |
| Schlumberger Holdings Corp. | | |
| 3.90%, 05/17/28 (a)(f) | 2,000 | 1,941 |
| Schlumberger Investment SA | | |
| 5.00%, 06/01/34 (a) | 11,000 | 10,809 |
| Sealed Air Corp. | | |
| 1.57%, 10/15/26 (a)(f) | 5,000 | 4,705 |
| Selective Insurance Group, Inc. | | |
| 5.38%, 03/01/49 (a) | 3,000 | 2,737 |
| Sempra (4.13% fixed rate until 01/01/27; 2.87% + 5 yr. CMT thereafter) | | |
| 4.13%, 04/01/52 (a)(c) | 2,000 | 1,915 |
| Shell Finance U.S., Inc. | | |
| 2.38%, 11/07/29 | 5,000 | 4,484 |
| 3.25%, 04/06/50 | 1,000 | 674 |
See Notes to Schedule of Investments and Notes to Financial Statements.
| State Street Income V.I.S. Fund | 13 |
State Street Income V.I.S. Fund
Schedule of Investments, continued — December 31, 2024
| | Principal
Amount | Fair
Value |
| 3.75%, 09/12/46 | $6,000 | $4,506 |
| Simon Property Group LP | | |
| 3.38%, 06/15/27 (a) | 2,000 | 1,944 |
| Sonoco Products Co. | | |
| 4.60%, 09/01/29 (a) | 5,000 | 4,872 |
| 5.00%, 09/01/34 (a) | 5,000 | 4,742 |
| South Bow USA Infrastructure Holdings LLC | | |
| 5.58%, 10/01/34 (a)(f) | 11,000 | 10,700 |
| Southern California Edison Co. | | |
| 4.00%, 04/01/47 (a) | 7,000 | 5,391 |
| 4.20%, 03/01/29 (a) | 6,000 | 5,815 |
| 5.65%, 10/01/28 (a) | 19,000 | 19,451 |
| Southern Co. | | |
| 3.70%, 04/30/30 (a) | 4,000 | 3,754 |
| Southwest Airlines Co. | | |
| 2.63%, 02/10/30 (a) | 5,000 | 4,425 |
| Southwestern Electric Power Co. | | |
| 2.75%, 10/01/26 (a) | 3,000 | 2,893 |
| Spectra Energy Partners LP | | |
| 3.38%, 10/15/26 (a) | 2,000 | 1,953 |
| 4.50%, 03/15/45 (a) | 3,000 | 2,460 |
| Starbucks Corp. | | |
| 4.00%, 11/15/28 (a) | 2,000 | 1,938 |
| Stryker Corp. | | |
| 1.95%, 06/15/30 (a) | 2,000 | 1,719 |
| Sumitomo Mitsui Financial Group, Inc. | | |
| 6.18%, 07/13/43 (a) | 3,000 | 3,201 |
| Suncor Energy, Inc. | | |
| 4.00%, 11/15/47 (a) | 3,000 | 2,224 |
| Take-Two Interactive Software, Inc. | | |
| 3.70%, 04/14/27 (a) | 11,000 | 10,736 |
| 4.00%, 04/14/32 (a) | 3,000 | 2,771 |
| Tampa Electric Co. | | |
| 2.40%, 03/15/31 (a) | 3,000 | 2,564 |
| 3.45%, 03/15/51 (a) | 3,000 | 2,043 |
| 4.35%, 05/15/44 (a) | 4,000 | 3,302 |
| Tanger Properties LP | | |
| 2.75%, 09/01/31 | 7,000 | 5,908 |
| Tapestry, Inc. | | |
| 3.05%, 03/15/32 (a) | 3,000 | 2,555 |
| 5.10%, 03/11/30 | 10,000 | 9,894 |
| 5.50%, 03/11/35 | 5,000 | 4,863 |
| Targa Resources Corp. | | |
| 6.50%, 03/30/34 (a) | 7,000 | 7,403 |
| | Principal
Amount | Fair
Value |
| Targa Resources Partners LP/Targa Resources Partners Finance Corp. | | |
| 5.00%, 01/15/28 (a) | $3,000 | $2,968 |
| Target Corp. | | |
| 1.95%, 01/15/27 (a) | 2,000 | 1,903 |
| Texas Instruments, Inc. | | |
| 3.88%, 03/15/39 (a) | 2,000 | 1,717 |
| Thermo Fisher Scientific, Inc. | | |
| 2.80%, 10/15/41 (a) | 3,000 | 2,110 |
| Time Warner Cable LLC | | |
| 6.55%, 05/01/37 (a) | 3,000 | 2,891 |
| T-Mobile USA, Inc. | | |
| 3.50%, 04/15/31 (a) | 17,000 | 15,413 |
| 3.75%, 04/15/27 (a) | 2,000 | 1,954 |
| 4.50%, 04/15/50 (a) | 3,000 | 2,463 |
| 4.80%, 07/15/28 (a) | 13,000 | 12,928 |
| Toronto-Dominion Bank | | |
| 3.20%, 03/10/32 (a) | 8,000 | 6,991 |
| 4.46%, 06/08/32 (a) | 3,000 | 2,843 |
| Toronto-Dominion Bank (3.63% fixed rate until 09/15/26; 2.21% + 5 yr. USD Swap thereafter) | | |
| 3.63%, 09/15/31 (a)(c) | 4,000 | 3,887 |
| TotalEnergies Capital International SA | | |
| 2.83%, 01/10/30 (a) | 14,000 | 12,741 |
| Tractor Supply Co. | | |
| 5.25%, 05/15/33 (a) | 3,000 | 2,997 |
| Trane Technologies Financing Ltd. | | |
| 3.80%, 03/21/29 (a) | 2,000 | 1,917 |
| TransCanada PipeLines Ltd. | | |
| 4.25%, 05/15/28 (a) | 5,000 | 4,881 |
| Transcanada Trust (5.63% fixed rate until 05/20/25; 3.53% + 3 mo. Term SOFR thereafter) | | |
| 5.63%, 05/20/75 (a)(c) | 7,000 | 6,937 |
| Transcontinental Gas Pipe Line Co. LLC | | |
| 4.00%, 03/15/28 (a) | 2,000 | 1,943 |
| Travelers Cos., Inc. | | |
| 2.55%, 04/27/50 (a) | 4,000 | 2,362 |
| Truist Financial Corp. (6.67% fixed rate until 03/01/25; 3.00% + 5 yr. CMT thereafter) | | |
| 6.67%, 03/01/25 (a)(c) | 7,000 | 6,984 |
See Notes to Schedule of Investments and Notes to Financial Statements.
| 14 | State Street Income V.I.S. Fund |
State Street Income V.I.S. Fund
Schedule of Investments, continued — December 31, 2024
| | Principal
Amount | Fair
Value |
| TWDC Enterprises 18 Corp. | | |
| 4.13%, 06/01/44 (a) | $2,000 | $1,645 |
| Tyco Electronics Group SA | | |
| 3.13%, 08/15/27 (a) | 3,000 | 2,886 |
| Tyson Foods, Inc. | | |
| 5.70%, 03/15/34 (a) | 5,000 | 5,059 |
| U.S. Bancorp (4.97% fixed rate until 07/22/32; 2.11% + SOFR thereafter) | | |
| 4.97%, 07/22/33 (a)(c) | 8,000 | 7,672 |
| U.S. Bancorp (5.68% fixed rate until 01/23/34; 1.86% + SOFR thereafter) | | |
| 5.68%, 01/23/35 (a)(c) | 3,000 | 3,028 |
| UDR, Inc. | | |
| 2.10%, 08/01/32 (a) | 3,000 | 2,383 |
| 3.00%, 08/15/31 (a) | 3,000 | 2,634 |
| Union Pacific Corp. | | |
| 3.55%, 05/20/61 (a) | 3,000 | 2,004 |
| 3.80%, 04/06/71 (a) | 4,000 | 2,712 |
| 4.10%, 09/15/67 (a) | 4,000 | 2,914 |
| UnitedHealth Group, Inc. | | |
| 2.00%, 05/15/30 (a) | 4,000 | 3,445 |
| 4.20%, 05/15/32 (a) | 3,000 | 2,827 |
| 4.45%, 12/15/48 (a) | 2,000 | 1,647 |
| 4.75%, 07/15/45 - 05/15/52 (a) | 4,000 | 3,479 |
| 5.05%, 04/15/53 (a) | 3,000 | 2,686 |
| 5.20%, 04/15/63 (a) | 3,000 | 2,693 |
| Vale Overseas Ltd. | | |
| 6.13%, 06/12/33 (a) | 5,000 | 5,042 |
| 6.40%, 06/28/54 (a) | 5,000 | 4,898 |
| Ventas Realty LP | | |
| 3.25%, 10/15/26 (a) | 5,000 | 4,865 |
| 5.63%, 07/01/34 (a) | 3,000 | 3,017 |
| Verisk Analytics, Inc. | | |
| 5.25%, 06/05/34 (a) | 5,000 | 4,945 |
| Verizon Communications, Inc. | | |
| 2.36%, 03/15/32 (a) | 4,000 | 3,315 |
| 3.00%, 03/22/27 (a) | 2,000 | 1,931 |
| 3.40%, 03/22/41 (a) | 2,000 | 1,514 |
| 3.55%, 03/22/51 (a) | 3,000 | 2,117 |
| 3.70%, 03/22/61 (a) | 2,000 | 1,357 |
| 4.40%, 11/01/34 (a) | 2,000 | 1,852 |
| Viatris, Inc. | | |
| 4.00%, 06/22/50 (a) | 2,000 | 1,364 |
| Virginia Electric & Power Co. | | |
| 4.00%, 11/15/46 (a) | 3,000 | 2,327 |
| Visa, Inc. | | |
| 2.70%, 04/15/40 (a) | 2,000 | 1,459 |
| | Principal
Amount | Fair
Value |
| Vistra Operations Co. LLC | | |
| 6.00%, 04/15/34 (a)(f) | $3,000 | $3,034 |
| VMware LLC | | |
| 4.70%, 05/15/30 | 7,000 | 6,855 |
| Vontier Corp. | | |
| 2.40%, 04/01/28 (a) | 4,000 | 3,630 |
| 2.95%, 04/01/31 (a) | 2,000 | 1,716 |
| Vornado Realty LP | | |
| 2.15%, 06/01/26 (a) | 2,000 | 1,905 |
| Vulcan Materials Co. | | |
| 3.90%, 04/01/27 (a) | 2,000 | 1,966 |
| Walmart, Inc. | | |
| 1.80%, 09/22/31 (a) | 3,000 | 2,506 |
| 2.50%, 09/22/41 (a) | 3,000 | 2,065 |
| Walt Disney Co. | | |
| 2.65%, 01/13/31 (a) | 2,000 | 1,768 |
| 3.38%, 11/15/26 (a) | 3,000 | 2,939 |
| 3.60%, 01/13/51 (a) | 2,000 | 1,468 |
| 4.75%, 11/15/46 (a) | 2,000 | 1,777 |
| 6.65%, 11/15/37 (a) | 2,000 | 2,228 |
| Warnermedia Holdings, Inc. | | |
| 4.28%, 03/15/32 (a) | 17,000 | 14,978 |
| Waste Connections, Inc. | | |
| 2.20%, 01/15/32 (a) | 3,000 | 2,474 |
| 2.95%, 01/15/52 (a) | 3,000 | 1,871 |
| WEC Energy Group, Inc. | | |
| 3.55%, 06/15/25 (a) | 2,000 | 1,984 |
| Wells Fargo & Co. | | |
| 4.15%, 01/24/29 (a) | 5,000 | 4,849 |
| 4.75%, 12/07/46 (a) | 2,000 | 1,682 |
| 5.88%, 06/15/25 (a)(c) | 9,000 | 8,983 |
| Wells Fargo & Co. (2.19% fixed rate until 04/30/25; 2.00% + SOFR thereafter) | | |
| 2.19%, 04/30/26 (a)(c) | 6,000 | 5,945 |
| Wells Fargo & Co. (2.39% fixed rate until 06/02/27; 2.10% + SOFR thereafter) | | |
| 2.39%, 06/02/28 (a)(c) | 2,000 | 1,883 |
| Wells Fargo & Co. (3.07% fixed rate until 04/30/40; 2.53% + SOFR thereafter) | | |
| 3.07%, 04/30/41 (a)(c) | 5,000 | 3,632 |
| Wells Fargo & Co. (5.50% fixed rate until 01/23/34; 1.78% + SOFR thereafter) | | |
| 5.50%, 01/23/35 (a)(c) | 3,000 | 2,982 |
See Notes to Schedule of Investments and Notes to Financial Statements.
| State Street Income V.I.S. Fund | 15 |
State Street Income V.I.S. Fund
Schedule of Investments, continued — December 31, 2024
| | Principal
Amount | Fair
Value |
| Wells Fargo & Co. (6.49% fixed rate until 10/23/33; 2.06% + SOFR thereafter) | | |
| 6.49%, 10/23/34 (a)(c) | $7,000 | $7,435 |
| Westlake Corp. | | |
| 2.88%, 08/15/41 (a) | 3,000 | 2,008 |
| 3.13%, 08/15/51 (a) | 3,000 | 1,863 |
| 3.38%, 08/15/61 (a) | 2,000 | 1,199 |
| Westpac Banking Corp. (2.89% fixed rate until 02/04/25; 1.35% + 5 yr. CMT thereafter) | | |
| 2.89%, 02/04/30 (a)(c) | 5,000 | 4,989 |
| Westpac Banking Corp. (4.11% fixed rate until 07/24/29; 2.00% + 5 yr. CMT thereafter) | | |
| 4.11%, 07/24/34 (a)(c) | 3,000 | 2,826 |
| Williams Cos., Inc. | | |
| 3.75%, 06/15/27 (a) | 3,000 | 2,923 |
| 4.85%, 03/01/48 (a) | 3,000 | 2,562 |
| 4.90%, 01/15/45 (a) | 2,000 | 1,744 |
| 5.40%, 03/04/44 (a) | 2,000 | 1,874 |
| Willis North America, Inc. | | |
| 3.88%, 09/15/49 (a) | 2,000 | 1,467 |
| Workday, Inc. | | |
| 3.50%, 04/01/27 (a) | 3,000 | 2,923 |
| 3.70%, 04/01/29 (a) | 3,000 | 2,854 |
| Zoetis, Inc. | | |
| 3.00%, 09/12/27 (a) | 3,000 | 2,875 |
| 3.90%, 08/20/28 (a) | 2,000 | 1,938 |
| 5.60%, 11/16/32 (a) | 5,000 | 5,151 |
| | | 2,427,113 |
| Non-Agency Collateralized Mortgage Obligations - 6.2% |
| Bank | | |
| 3.18%, 09/15/60 (a) | 158,000 | 150,835 |
| 4.41%, 11/15/61 (a)(c) | 66,000 | 64,450 |
| BPR Trust 1 mo. Term SOFR + 1.90% | | |
| 6.30%, 04/15/37 (a)(c)(f) | 24,770 | 24,863 |
| Cantor Commercial Real Estate Lending | | |
| 3.01%, 01/15/53 (a) | 34,000 | 30,668 |
| CD Mortgage Trust | | |
| 2.91%, 08/15/57 (a) | 63,000 | 56,314 |
| Citigroup Commercial Mortgage Trust | | |
| 4.03%, 12/10/49 (a)(c) | 31,273 | 28,857 |
| | Principal
Amount | Fair
Value |
| GS Mortgage Securities Trust | | |
| 2.75%, 09/10/52 (a) | $105,000 | $94,946 |
| 3.05%, 11/10/52 (a) | 56,000 | 50,900 |
| 4.14%, 03/10/51 (a)(c) | 25,000 | 23,047 |
| 4.42%, 11/10/48 (a)(c) | 25,000 | 20,023 |
| JPMBB Commercial Mortgage Securities Trust | | |
| 4.65%, 11/15/48 (a)(c) | 20,000 | 7,973 |
| MASTR Alternative Loan Trust | | |
| 5.00%, 08/25/18 (a)(d) | 733 | 33 |
| Morgan Stanley Bank of America Merrill Lynch Trust | | |
| 0.74%, 03/15/48 (a)(c)(d) | 198,364 | 160 |
| Wells Fargo Commercial Mortgage Trust | | |
| 4.32%, 08/15/50 (a) | 3,566 | 3,328 |
| | | 556,397 |
| Sovereign Bonds - 0.4% |
| Peru Government International Bonds | | |
| 1.86%, 12/01/32 (a) | 10,000 | 7,576 |
| 2.78%, 12/01/60 (a) | 15,000 | 7,917 |
| 5.63%, 11/18/50 (a) | 11,000 | 10,291 |
| Uruguay Government International Bonds | | |
| 5.10%, 06/18/50 (a) | 14,040 | 12,884 |
| | | 38,668 |
| Municipal Bonds and Notes - 0.2% |
| State of California, CA | | |
| 4.60%, 04/01/38 | 15,000 | 13,960 |
Total Bonds and Notes
(Cost $9,482,093) | | 8,760,982 |
Total Investments in Securities
(Cost $9,482,093) | | 8,760,982 |
See Notes to Schedule of Investments and Notes to Financial Statements.
| 16 | State Street Income V.I.S. Fund |
State Street Income V.I.S. Fund
Schedule of Investments, continued — December 31, 2024
| | Number
of Shares | Fair
Value |
| Short-Term Investments - 19.9% |
State Street Institutional U.S. Government Money Market Fund - Class G Shares 4.47% (g)(h)
(Cost $1,776,614) | 1,776,614 | $1,776,614 |
Total Investments
(Cost $11,258,707) | | 10,537,596 |
| Liabilities in Excess of Other Assets, net - (18.2)% | | (1,621,216) |
| NET ASSETS - 100.0% | | $8,916,380 |
Other Information:
| Centrally Cleared Credit Default Swaps: |
| Reference Entity | Counterparty | Notional
Amount
(000s
omitted) | Contract
Annual
Fixed Rate/
Payment
Frequency | Termination
Date | Market
Value | Unamortized
Upfront
Payments
Received (Paid) | Unrealized
Appreciation
(Depreciation) |
| Buy Protection | | | | | | | |
| Markit CDX North America High Yield Index | Intercontinental Exchange | $325 | 1.00%/
Quarterly | 06/20/29 | $(7,298) | $(6,008) | $(1,290) |
| The Fund had the following long futures contracts open at December 31, 2024: |
| Description | Expiration
Date | Number of
Contracts | Notional
Amount | Value | Unrealized
Appreciation
(Depreciation) |
| 2 Yr. U.S. Treasury Notes Futures | March 2025 | 4 | $822,789 | $822,438 | $(351) |
| 5 Yr. U.S. Treasury Notes Futures | March 2025 | 19 | 2,037,118 | 2,019,789 | (17,329) |
| | | | | | $(17,680) |
| The Fund had the following short futures contracts open at December 31, 2024: |
| Description | Expiration
date | Number of
Contracts | Notional
Amount | Value | Unrealized
Appreciation
(Depreciation) |
| 10 Yr. U.S. Treasury Notes Futures | March 2025 | 4 | $(440,477) | $(435,000) | $5,477 |
| 10 Yr. U.S. Treasury Ultra Futures | March 2025 | 4 | (456,680) | (445,216) | 11,464 |
| | | | | | $16,941 |
See Notes to Schedule of Investments and Notes to Financial Statements.
| State Street Income V.I.S. Fund | 17 |
State Street Income V.I.S. Fund
Schedule of Investments, continued — December 31, 2024
| During the year ended December 31, 2024, the average notional values related to derivative contracts were as follows: |
| | Long
Futures
Contracts | Short
Futures
Contracts | Credit
Default
Swap
Contracts |
| Average Notional Value | $2,769,302 | $719,207 | $233,093 |
Notes to Schedule of Investments
The views expressed in this document reflect our judgment as of the publication date and are subject to change at any time without notice. The securities cited may not be representative of the Fund’s future investments and should not be construed as a recommendation to purchase or sell a particular security. See the Fund’s summary prospectus and statutory prospectus for complete descriptions of investment objectives, policies, risks and permissible investments.
| (a) | At December 31, 2024, all or a portion of this security was pledged to cover collateral requirements for futures contracts, swaps and/or TBAs. |
| (b) | Step coupon bond. |
| (c) | Variable Rate Security - Interest rate shown is rate in effect at December 31, 2024. For securities based on a published reference rate and spread, the reference rate and spread are indicated in the description above. |
| (d) | Interest only security. These securities represent the right to receive the monthly interest payments on an underlying pool of mortgages. Payments of principal on the pool reduce the value of the "interest only" holding. |
| (e) | Principal only security. These securities represent the right to receive the monthly principal payments on an underlying pool of mortgages. No payments of interest on the pool are passed through to the "principal only" holder. |
| (f) | Pursuant to Rule 144A of the Securities Act of 1933, as amended, these securities may be resold in transactions exempt from registration, normally to qualified institutional buyers. At December 31, 2024, these securities amounted to $170,470 or 1.91% of the net assets of the State Street Income V.I.S. Fund. These securities have been determined to be liquid using procedures established by the Fund's Board of Directors. |
| (g) | Sponsored by SSGA Funds Management, Inc., the Fund’s investment adviser and administrator, and an affiliate of State Street Bank & Trust Co., the Fund’s sub-administrator, custodian and accounting agent. |
| (h) | Coupon amount represents effective yield. |
| † | Percentages are based on net assets as of December 31, 2024. |
| Abbreviations: |
| CMT - Constant Maturity Treasury |
| REIT - Real Estate Investment Trust |
| REMICS - Real Estate Mortgage Investment Conduits |
| RFUCCT - Refinitiv USD IBOR Consumer Cash Fallbacks Term |
| SOFR - Secured Overnight Financing Rate |
| STRIPS - Separate Trading of Registered Interest and Principal of Security |
| TBA - To Be Announced |
See Notes to Schedule of Investments and Notes to Financial Statements.
| 18 | State Street Income V.I.S. Fund |
State Street Income V.I.S. Fund
Schedule of Investments, continued — December 31, 2024
The following table presents the Fund’s investments measured at fair value on a recurring basis at December 31, 2024:
| Investments | Level 1 | | Level 2 | | Level 3 | | Total |
| Investments in Securities | | | | | | | |
| U.S. Treasuries | $— | | $2,830,164 | | $— | | $2,830,164 |
| Agency Mortgage Backed | — | | 2,792,297 | | — | | 2,792,297 |
| Agency Collateralized Mortgage Obligations | — | | 102,383 | | — | | 102,383 |
| Corporate Notes | — | | 2,427,113 | | — | | 2,427,113 |
| Non-Agency Collateralized Mortgage Obligations | — | | 556,397 | | — | | 556,397 |
| Sovereign Bonds | — | | 38,668 | | — | | 38,668 |
| Municipal Bonds and Notes | — | | 13,960 | | — | | 13,960 |
| Short-Term Investments | 1,776,614 | | — | | — | | 1,776,614 |
| Total Investments in Securities | $1,776,614 | | $8,760,982 | | $— | | $10,537,596 |
| Other Financial Instruments | | | | | | | |
| Credit Default Swap Contracts - Unrealized Depreciation | $— | | $(1,290) | | $— | | $(1,290) |
| Long Futures Contracts - Unrealized Depreciation | (17,680) | | — | | — | | (17,680) |
| Short Futures Contracts - Unrealized Appreciation | 16,941 | | — | | — | | 16,941 |
| Total Other Financial Instruments | $(739) | | $(1,290) | | $— | | $(2,029) |
| | Number
of Shares
Held at
12/31/23 | Value at
12/31/23 | Cost of
Purchases | Proceeds
from
Shares
Sold | Realized
Gain
(Loss) | Change in
Unrealized
Appreciation
(Depreciation) | Number of
Shares
Held at
12/31/24 | Value at
12/31/24 | Dividend
Income |
| State Street Institutional U.S. Government Money Market Fund - Class G Shares | 1,329,784 | $1,329,784 | $3,760,335 | $3,313,505 | $— | $— | 1,776,614 | $1,776,614 | $78,486 |
See Notes to Schedule of Investments and Notes to Financial Statements.
| State Street Income V.I.S. Fund | 19 |
State Street Income V.I.S. Fund
Financial Highlights
Selected data based on a share outstanding throughout the fiscal years indicated
| | 12/31/24 | | 12/31/23 | | 12/31/22 | | 12/31/21 | | 12/31/20 |
| Inception date | | | 1/3/95 |
| Net asset value, beginning of period | $9.98 | | $9.73 | | $11.86 | | $12.48 | | $12.00 |
| Income/(loss) from investment operations: | | | | | | | | | |
| Net investment income(a) | 0.30 | | 0.26 | | 0.17 | | 0.12 | | 0.19 |
| Net realized and unrealized gains/(losses) on investments | (0.38) | | 0.20 | | (1.87) | | (0.35) | | 0.65 |
| Total income/(loss) from investment operations | (0.08) | | 0.46 | | (1.70) | | (0.23) | | 0.84 |
| Less distributions from: | | | | | | | | | |
| Net investment income | (0.33) | | (0.21) | | (0.29) | | (0.28) | | (0.32) |
| Net realized gains | — | | — | | (0.14) | | (0.11) | | (0.04) |
| Total distributions | (0.33) | | (0.21) | | (0.43) | | (0.39) | | (0.36) |
| Net asset value, end of period | $9.57 | | $9.98 | | $9.73 | | $11.86 | | $12.48 |
| Total Return(b) | (0.82)% | | 4.68% | | (14.38)% | | (1.81)% | | 7.03% |
| Ratios/Supplemental Data: | | | | | | | | | |
| Net assets, end of period (in thousands) | $8,916 | | $10,157 | | $10,616 | | $14,766 | | $17,435 |
| Ratios to average net assets: | | | | | | | | | |
| Net expenses | 1.37% | | 1.36% | | 1.24% | | 1.06% | | 1.06% |
| Gross expenses | 1.37% | | 1.38% | | 1.24% | | 1.06% | | 1.06% |
| Net investment income | 2.98% | | 2.69% | | 1.62% | | 1.01% | | 1.50% |
| Portfolio turnover rate | 52%(c) | | 59%(c) | | 51%(c) | | 81%(c) | | 120%(c) |
| Notes to Financial Highlights |
| (a) | Per share values have been calculated using the average shares method. |
| (b) | Total returns are historical and assume changes in share price, reinvestment of dividends and capital gains distributions and do not include the effect of insurance contract charges. Past performance does not guarantee future results. |
| (c) | The portfolio turnover calculated for the fiscal years ended 12/31/24, 12/31/23, 12/31/22, 12/31/21 and 12/31/20 did not include To-Be-Announced transactions and, if it had, the portfolio turnover would have been 219%, 263%, 178%, 183% and 277%, respectively. |
The accompanying Notes are an integral part of these financial statements.
State Street Income V.I.S. Fund
Statement of Assets and Liabilities — December 31, 2024
| Assets | |
| Investments in unaffiliated securities, at fair value (cost $9,482,093) | $8,760,982 |
| Investments in affiliated securities, at fair value (cost $1,776,614) | 1,776,614 |
| Cash | 133 |
| Net cash collateral on deposit with broker for future contracts | 733 |
| Net cash collateral on deposit with broker for swap contracts | 7,334 |
| Receivable for investments sold | 197,651 |
| Income receivables | 71,901 |
| Receivable for fund shares sold | 744 |
| Income receivable from affiliated investments | 5,310 |
| Other assets | 61 |
| Total assets | 10,821,463 |
| Liabilities | |
| Payable for investments purchased | 1,828,032 |
| Payable for fund shares redeemed | 13,585 |
| Payable for accumulated variation margin on swap contracts | 7,406 |
| Payable for accumulated variation margin on futures contracts | 714 |
| Payable to the Adviser | 3,829 |
| Payable for custody, fund accounting and sub-administration fees | 13,749 |
| Accrued other expenses | 37,768 |
| Total liabilities | 1,905,083 |
|
| Net Assets | $8,916,380 |
| Net Assets Consist of: | |
| Capital paid in | $10,785,594 |
| Total distributable earnings (loss) | (1,869,214) |
| Net Assets | $8,916,380 |
| Shares outstanding ($0.01 par value; unlimited shares authorized) | 931,797 |
| Net asset value per share | $9.57 |
The accompanying Notes are an integral part of these financial statements.
| Statement of Assets and Liabilities | 21 |
State Street Income V.I.S. Fund
Statement of Operations — For the year ended December 31, 2024
| Investment Income | |
| Income | |
| Interest | $340,070 |
| Income from affiliated investments | 78,486 |
| Total income | 418,556 |
| Expenses | |
| Advisory and administration fees | 48,190 |
| Directors' fees | 21,060 |
| Custody, fund accounting and sub-administration fees | 29,551 |
| Professional fees | 31,699 |
| Other expenses | 1,470 |
| Total expenses before waivers | 131,970 |
| Less: Fees waived by the adviser | (887) |
| Net expenses | 131,083 |
| Net investment income (loss) | $287,473 |
| Net Realized and Unrealized Gain (Loss) on Investments | |
| Realized gain (loss) on: | |
| Unaffiliated investments | $(58,367) |
| Futures | (20,852) |
| Swap contracts | 13,065 |
| Increase (decrease) in unrealized appreciation/depreciation on: | |
| Unaffiliated investments | (219,463) |
| Futures | (58,475) |
| Swap contracts | (15,060) |
| Net realized and unrealized gain (loss) on investments | (359,152) |
| Net Increase (Decrease) in Net Assets Resulting from Operations | $(71,679) |
The accompanying Notes are an integral part of these financial statements.
| 22 | Statement of Operations |
State Street Income V.I.S. Fund
Statements of Changes in Net Assets
| | Year Ended
December 31,
2024 | | Year Ended
December 31,
2023 |
| Increase (Decrease) in Net Assets | | | |
| Operations: | | | |
| Net investment income (loss) | $287,473 | | $274,658 |
| Net realized gain (loss) on investments, futures and swap contracts | (66,154) | | (541,848) |
| Net increase (decrease) in unrealized appreciation/depreciation on investments, futures and swap contracts | (292,998) | | 730,932 |
| Net increase (decrease) from operations | (71,679) | | 463,742 |
| Distributions to shareholders: | | | |
| Total distributions | (295,495) | | (204,660) |
| Increase (decrease) in assets from operations and distributions | (367,174) | | 259,082 |
| Share transactions: | | | |
| Proceeds from sale of shares | 338,662 | | 503,196 |
| Value of distributions reinvested | 295,495 | | 204,660 |
| Cost of shares redeemed | (1,507,215) | | (1,426,452) |
| Net increase (decrease) from share transactions | (873,058) | | (718,596) |
| Total increase (decrease) in net assets | (1,240,232) | | (459,514) |
| Net Assets | | | |
| Beginning of year | 10,156,612 | | 10,616,126 |
| End of year | $8,916,380 | | $10,156,612 |
| Changes in Fund Shares | | | |
| Shares sold | 34,703 | | 50,808 |
| Issued for distributions reinvested | 30,974 | | 20,569 |
| Shares redeemed | (151,753) | | (144,078) |
| Net increase (decrease) in fund shares | (86,076) | | (72,701) |
The accompanying Notes are an integral part of these financial statements.
| Statements of Changes in Net Assets | 23 |
State Street Income V.I.S. Fund
Notes to Financial Statements — December 31, 2024
1.Organization of the Company
State Street Variable Insurance Series Funds, Inc. (the “Company”) was incorporated under the laws of the Commonwealth of Virginia on May 14, 1984 and is registered under the Investment Company Act of 1940, as amended (the “1940 Act”), as an open-end management investment company. The Company is currently composed of the following seven investment portfolios (collectively, the “Funds”): State Street U.S. Equity V.I.S. Fund, State Street S&P 500 Index V.I.S. Fund, State Street Premier Growth Equity V.I.S. Fund, State Street Small-Cap Equity V.I.S. Fund, State Street Total Return V.I.S. Fund, State Street Income V.I.S. Fund (the “Fund”) and State Street Real Estate Securities V.I.S. Fund. Each Fund is a diversified investment company within the meaning of the 1940 Act, except for the State Street Premier Growth Equity V.I.S. Fund, which is a non-diversified investment company.
Shares of the Funds of the Company are offered only to insurance company separate accounts that fund certain variable life insurance contracts and variable annuity contracts.
The Company currently offers one share class (Class 1) of the Fund as an investment option for variable life insurance and variable annuity contracts.
Under the Company’s organizational documents, its officers and directors are indemnified against certain liabilities arising out of the performance of their duties to the Company. Additionally, in the normal course of business, the Company enters into contracts with service providers that contain general indemnification clauses. The Company’s maximum exposure under these arrangements is unknown as this would involve future claims that may be made against the Company that have not yet occurred.
2.Segment Reporting
The Fund has one reportable segment. Business activities are managed on a consolidated basis and revenues are derived primarily through the Fund’s investments in accordance with its investment objective. The Fund’s chief operating decision maker (“CODM”) is the President of the Company. The CODM assesses performance based on the Fund’s Total Return as reported in the Financial Highlights, and the same accounting policies are applied as described in the summary of significant accounting policies. The Fund’s Total Return is utilized by the CODM to compare results, including the impact of the Fund’s costs, to the Fund’s competitors and to the Fund’s benchmark index.
3.Summary of Significant Accounting Policies
The following is a summary of significant accounting policies followed by the Company in the preparation of its financial statements:
The preparation of financial statements in accordance with U.S. generally accepted accounting principles (“U.S. GAAP”) requires management to make estimates and assumptions that affect the reported amounts and disclosures in the financial statements. Actual results could differ from those estimates. The Fund is an investment company under U.S. GAAP and follows the accounting and reporting guidance applicable to investment companies.
Security Valuation The Fund’s investments are valued at fair value each day that the New York Stock Exchange (“NYSE”) is open and, for financial reporting purposes, as of the report date should the reporting period end on a day that the NYSE is not open. Fair value is generally defined as the price a fund would receive to sell an asset or pay to transfer a liability in an orderly transaction between market participants at the measurement date. By its nature, a fair value price is a good faith estimate of the valuation in a current sale and may not reflect an actual market price. The investments of the Fund are valued pursuant to the policy and procedures developed by the Oversight Committee (the “Committee”) and approved by the Company's Board of Directors (the “Board”). The Committee provides oversight of the valuation of investments for the Fund. The Board has responsibility for overseeing the determination of the fair value of investments.
Valuation techniques used to value the Fund’s investments by major category are as follows:
| 24 | Notes to Financial Statements |
State Street Income V.I.S. Fund
Notes to Financial Statements, continued — December 31, 2024
| • | Equity investments traded on a recognized securities exchange for which market quotations are readily available are valued at the last sale price or official closing price, as applicable, on the primary market or exchange on which they trade. Equity investments traded on a recognized exchange for which there were no sales on that day are valued at the last published sale price or at fair value. |
| • | Government and municipal fixed income securities are generally valued using quotations from independent pricing services or brokers. Certain government inflation-indexed securities may require a calculated fair valuation as the cumulative inflation is contained within the price provided by the pricing service or broker. For these securities, the inflation component of the price is “cleaned” from the pricing service or broker price utilizing the published inflation factors in order to ensure proper accrual of income. |
| • | Debt obligations (including short term investments and convertible debt securities) are valued using quotations from independent pricing services or brokers or are generally valued at the last reported evaluated prices. |
| • | Exchange-traded futures contracts are valued at the closing settlement price on the primary market on which they are traded most extensively. Exchange-traded futures contracts traded on a recognized exchange for which there were no sales on that day are valued at the last reported sale price obtained from independent pricing services or brokers or at fair value. |
| • | Swap agreements are valued daily based upon prices supplied by Board approved pricing vendors or through brokers. Depending on the product and terms of the transaction, the value of agreements is determined using a series of techniques including valuation models that incorporate a number of market data factors, such as discounted cash flows, yields, curves, trades and values of the underlying reference instruments. In the event SSGA Funds Management, Inc. (the “Adviser” or “SSGA FM”) is unable to obtain an independent, third-party valuation the agreements will be fair valued. |
In the event prices or quotations are not readily available or that the application of these valuation methods results in a price for an investment that is deemed to be not representative of the fair value of such investment, fair value will be determined in good faith by the Committee, in accordance with the valuation policy and procedures approved by the Board.
The Fund values its assets and liabilities at fair value using a fair value hierarchy consisting of three broad levels that prioritize the inputs to valuation techniques giving the highest priority to readily available unadjusted quoted prices in active markets for identical assets or liabilities (Level 1 measurements) and the lowest priority to unobservable inputs (Level 3 measurements) when market prices are not readily available or reliable. The categorization of a value determined for an investment within the hierarchy is based upon the pricing transparency of the investment and is not necessarily an indication of the risk associated with investing in it.
The three levels of the fair value hierarchy are as follows:
| • | Level 1 — Unadjusted quoted prices in active markets for an identical asset or liability; |
| • | Level 2 — Inputs other than quoted prices included within Level 1 that are observable for the asset or liability either directly or indirectly, including quoted prices for similar assets or liabilities in active markets, quoted prices for identical or similar assets or liabilities in markets that are not considered to be active, inputs other than quoted prices that are observable for the asset or liability (such as exchange rates, financing terms, interest rates, yield curves, volatilities, prepayment speeds, loss severities, credit risks and default rates) or other market-corroborated inputs; and |
| • | Level 3 — Unobservable inputs for the asset or liability, including the Committee’s assumptions used in determining the fair value of investments. |
The value of the Fund’s investments according to the fair value hierarchy as of December 31, 2024 is disclosed in the Fund’s Schedule of Investments.
| Notes to Financial Statements | 25 |
State Street Income V.I.S. Fund
Notes to Financial Statements, continued — December 31, 2024
Investment Transactions and Income Recognition Investment transactions are accounted for on trade date for financial reporting purposes. Realized gains and losses from the sale or disposition of investments and foreign exchange transactions, if any, are determined using the identified cost method.
Dividend income and capital gain distributions, if any, are recognized on the ex-dividend date, net of any foreign taxes withheld at source, if any.
Interest income is recorded daily on an accrual basis. All premiums and discounts are amortized/accreted for financial reporting purposes.
Non-cash dividends received in the form of stock are recorded as dividend income at fair value.
Expenses Certain expenses, which are directly identifiable to a specific Fund, are applied to the Fund within the Company. Other expenses which cannot be attributed to a specific Fund are allocated in such a manner as deemed equitable, taking into consideration the nature and type of expense and the relative net assets of the Fund within the Company.
Foreign Currency Translation The accounting records of the Fund are maintained in U.S. dollars. Foreign currencies as well as investment securities and other assets and liabilities denominated in a foreign currency are translated to U.S. dollars using exchange rates at period end. Purchases and sales of securities, income receipts and expense payments denominated in foreign currencies are translated into U.S. dollars at the prevailing exchange rate on the respective dates of the transactions.
The effects of exchange rate fluctuations on investments are included with the net realized and unrealized gain (loss) on investment securities. Other foreign currency transactions resulting in realized and unrealized gain (loss) are disclosed separately.
Foreign Taxes The Fund may be subject to foreign taxes (a portion of which may be reclaimable) on income, stock dividends, realized and unrealized capital gains on investments or certain foreign currency transactions. Foreign taxes are recorded in accordance with SSGA FM's understanding of the applicable foreign tax regulations and rates that exist in the foreign jurisdictions in which the Fund invests. These foreign taxes, if any, are paid by the Fund and are reflected in the Statement of Operations, if applicable. Foreign taxes payable or deferred as of December 31, 2024, if any, are disclosed in the Fund’s Statement of Assets and Liabilities.
Distributions The Fund declares and pays any dividends from net investment income annually.
Net realized capital gains, if any, are distributed annually, unless additional distributions are required for compliance with applicable tax regulations. The amount and character of income and capital gains to be distributed are determined in accordance with applicable tax regulations which may differ from net investment income and realized gains recognized for U.S. GAAP purposes.
4.Securities and Other Investments
Delayed Delivery Transactions and When-Issued Securities During the fiscal year ended December 31, 2024, the Fund transacted in securities on a delayed delivery or when-issued basis. Payment and delivery may take place after the customary settlement period for that security. The price of the underlying securities and the date when the securities will be delivered and paid for are fixed at the time the transaction is negotiated. The securities purchased on a delayed delivery or when-issued basis are identified as such in the Fund’s Schedule of Investments. The Fund may receive compensation for interest forgone in the purchase of a delayed delivery or when-issued security. With respect to such purchase commitments, the Fund identifies securities as segregated in its records with a value at least equal to the amount of the commitment. Losses may arise due to changes in the value of the underlying securities or if the counterparty does not perform under the contract’s terms, or if the issuer does not issue the securities due to political, economic or other factors.
To-Be-Announced Transactions The Fund may seek to obtain exposure to U.S. agency mortgage pass-through securities through the use of “to-be-announced” or “TBA transactions.” “TBA” refers to a commonly used
| 26 | Notes to Financial Statements |
State Street Income V.I.S. Fund
Notes to Financial Statements, continued — December 31, 2024
mechanism for the forward settlement of U.S. agency mortgage pass-through securities. In a TBA transaction, the buyer and seller decide on general trade parameters, such as agency, settlement date, coupon, and price.
The Fund may use TBA transactions to “roll over” such agreements prior to the settlement date. This type of TBA transaction is sometimes known as a “TBA roll.” In a TBA roll, the Fund generally will sell the obligation to purchase the pools stipulated in the TBA agreement prior to the settlement date and will enter into a new TBA agreement for future delivery of pools of mortgage pass-through securities. The Fund may also enter into TBA agreements and settle such transactions on the stipulated settlement date by accepting actual receipt or delivery of the pools of mortgage pass-through securities.
Default by or bankruptcy of a counterparty to a TBA transaction would expose the Fund to possible loss because of adverse market action, expenses or delays in connection with the purchase or sale of the pools of mortgage pass-through securities specified in the TBA transaction. To minimize this risk, the Fund will enter into TBA transactions only with established counterparties. The Fund’s use of “TBA rolls” may impact portfolio turnover, transaction costs and capital gain distributions to shareholders.
5.Derivative Financial Instruments
Futures Contracts The Fund may enter into futures contracts to meet the Fund’s objectives. A futures contract is a standardized, exchange-traded agreement to buy or sell a financial instrument at a set price on a future date. Upon entering into a futures contract, the Fund is required to deposit with the broker, cash or securities in an amount equal to the minimum initial margin requirements of the clearing house. Securities deposited, if any, are designated on the Schedule of Investments and cash deposited, if any, is included in Net cash collateral on deposit with broker for future contracts on the Statement of Assets and Liabilities. Subsequent payments are made or received by the Fund equal to the daily change in the contract value, accumulated, exchange rates, and/or other transactional fees. The accumulation of those payments are recorded as variation margin receivable or payable with a corresponding offset to unrealized gains or losses. The Fund recognizes a realized gain or loss when the contract is closed.
Losses may arise if the value of a futures contract decreases due to unfavorable changes in the market rates or values of the underlying instrument during the term of the contract or if the counterparty does not perform under the contract. The use of futures contracts also involves the risk that the movements in the price of the futures contracts do not correlate with the movement of the assets underlying such contracts.
For the fiscal year ended December 31, 2024, the Fund entered into futures contracts to manage interest rate risk.
Credit Default Swaps During the fiscal year ended December 31, 2024, the Fund engaged in credit default swaps to manage credit risk. When the Fund is the buyer in a credit default swap contract, the Fund is entitled to receive the par (or other agreed upon) value (full notional value) of a referenced debt obligation (or basket of debt obligations) from the counterparty (or central clearing party (“CCP”) in the case of a centrally cleared swap) to the contract if a credit event by a third party, such as a U.S. or foreign corporate issuer or sovereign issuer, on the debt obligation occurs. In return, the Fund pays the counterparty a periodic stream of payments over the term of the contract provided that no credit event has occurred. If no credit event occurs, the Fund loses its investment and recovers nothing. However, if a credit event occurs, the Fund receives full notional value for a referenced debt obligation that may have little or no value. When the Fund is the seller of a credit default swap, it receives a fixed rate of income throughout the term of the contract, provided there is no credit event. If a credit event occurs, the Fund is obligated to pay the notional amount of the swap and in certain instances take delivery of securities of the reference entity upon the occurrence of a credit event, as defined under the terms of that particular swap agreement. Credit events are contract specific but may include bankruptcy, failure to pay, restructuring, obligation acceleration and repudiation/moratorium. If the Fund is a seller of protection and a credit event occurs, the maximum potential amount of future payments that the Fund could be required to make would be an amount equal to the notional amount of the agreement. This potential amount would be partially offset by any recovery value of the respective referenced obligation, or net amount received from the settlement of a buy protection credit default swap agreement entered into by the Fund for the same referenced obligation.
| Notes to Financial Statements | 27 |
State Street Income V.I.S. Fund
Notes to Financial Statements, continued — December 31, 2024
As the seller, the Fund may create economic leverage to its portfolio because, in addition to its total net assets, the Fund is subject to investment exposure on the notional amount of the swap. The interest fee paid or received on the swap, which is based on a specified interest rate on a fixed notional amount, is accrued daily as a component of unrealized appreciation (depreciation) and is recorded as realized gain upon receipt or realized loss upon payment. The Fund also records an increase or decrease to unrealized appreciation (depreciation) in an amount equal to the daily valuation. For centrally cleared swaps, the daily change in valuation is recorded as a receivable or payable for variation margin and settled in cash with the CCP daily. All upfront payments, if any, are amortized over the life of the swap as realized gains or losses. Those upfront payments that are paid or received, typically for non-centrally cleared swaps, are recorded as other assets or other liabilities, respectively, net of amortization. For financial reporting purposes, unamortized upfront payments, if any, are netted with unrealized appreciation or depreciation on swaps to determine the market value of swaps. The Fund segregates assets in the form of cash or liquid securities in an amount equal to the notional amount of the credit default swaps of which it is the seller. The Fund segregates assets in the form of cash or liquid securities in an amount equal to any unrealized depreciation of the credit default swaps of which it is the buyer, marked to market on a daily basis. Credit default swaps involve greater risks than if the Fund had invested in the referenced debt obligation directly. If the Fund is a buyer of a credit default swap and no credit event occurs, the Fund will not earn any return on its investment. If the Fund is a seller of a credit default swap, the Fund’s risk of loss may be the entire notional amount of the swap. Swaps may also subject the Fund to the risk that the counterparty to the transaction may not fulfill its its obligation. In the case of centrally cleared swaps, counterparty risk is minimal due to protections provided by the CCP.
The following tables summarize the value of the Fund’s derivative instruments as of December 31, 2024 and the related location in the accompanying Statement of Assets and Liabilities and Statement of Operations, presented by primary underlying risk exposure:
| Liability Derivatives |
| | Interest
Rate
Risk | Foreign
Exchange
Risk | Credit
Risk | Equity
Risk | Commodity
Risk | Total |
| State Street Income V.I.S. Fund | | | | | | |
| Futures Contracts | $714 | $— | $— | $— | $— | $714 |
| Swap Contracts | — | — | 7,406 | — | — | 7,406 |
| Realized Gain (Loss) |
| | Interest
Rate
Risk | Foreign
Exchange
Risk | Credit
Risk | Equity
Risk | Commodity
Risk | Total |
| State Street Income V.I.S. Fund | | | | | | |
| Futures Contracts | $(20,852) | $— | $— | $— | $— | $(20,852) |
| Swap Contracts | — | — | 13,065 | — | — | 13,065 |
| Net Change in Unrealized Appreciation/Depreciation |
| | Interest
Rate
Risk | Foreign
Exchange
Risk | Credit
Risk | Equity
Risk | Commodity
Risk | Total |
| State Street Income V.I.S. Fund | | | | | | |
| Futures Contracts | $(58,475) | $— | $— | $$— | $— | $(58,475) |
| Swap Contracts | — | — | (15,060) | — | — | (15,060) |
6.Fees and Transactions with Affiliates
Advisory Fee SSGA FM, a registered investment adviser, was retained by the Board to act as investment adviser and administrator of the Fund. SSGA FM’s compensation for investment advisory and administrative services (“Management Fee”) is paid monthly based on the average daily net assets of the Fund at an annualized rate of 0.50%. SSGA FM is contractually obligated until April 30, 2025 to waive its management fee and/or reimburse
| 28 | Notes to Financial Statements |
State Street Income V.I.S. Fund
Notes to Financial Statements, continued — December 31, 2024
certain expenses for the Fund, in an amount equal to any acquired fund fees and expenses (“AFFEs”), excluding AFFEs derived from the Fund’s holdings in acquired funds for cash management purposes, if any. This fee waiver and/or expense reimbursement arrangement may not be terminated prior to April 30, 2025 except with approval of the Board.
Custody, Fund Accounting and Sub-Administration Fees State Street Bank and Trust Company (“State Street”) serves as the custodian, fund accountant and sub-administrator to the Fund. Amounts paid by the Fund to State Street for performing such services are included as custody, fund accounting and sub-administration fees in the Statement of Operations.
Other Transactions with Affiliates The Fund may invest in affiliated entities, including securities issued by State Street Corporation, affiliated funds, or entities deemed to be affiliates as a result of the Fund owning more than five percent of the entity’s voting securities or outstanding shares. Amounts relating to these transactions during the fiscal year ended December 31, 2024 are disclosed in the Schedule of Investments.
7.Directors’ Fees
The fees and expenses of the Company’s directors who are not “interested persons” of the Company, as defined in the 1940 Act (“Independent Directors”), are paid directly by the Fund. The Independent Directors are reimbursed for travel and other out-of-pocket expenses in connection with meeting attendance and industry seminars.
8.Investment Transactions
Purchases and sales of investments (excluding in-kind transactions, short term investments and derivative contracts) for the fiscal year ended December 31, 2024 were as follows:
| U.S. Government Securities |
| Purchases | Sales |
| $19,699,765 | $19,869,511 |
| Non-U.S. Government Securities |
| Purchases | Sales |
| $715,018 | $1,197,825 |
9.Income Taxes
The Fund has qualified and intends to continue to qualify as a regulated investment company under Subchapter M of the Internal Revenue Code of 1986, as amended. The Fund will not be subject to federal income taxes to the extent it distributes its taxable income, including any net realized capital gains, for each fiscal year. Therefore, no provision for federal income tax is required.
The Fund files federal and various state and local tax returns as required. No income tax returns are currently under examination. Generally, the federal returns are subject to examination by the Internal Revenue Service for a period of three years from date of filing, while the state returns may remain open for an additional year depending upon jurisdiction. SSGA FM has analyzed the Fund’s tax positions taken on tax returns for all open years and does not believe there are any uncertain tax positions that would require recognition of a tax liability.
Distributions to shareholders are recorded on ex-dividend date. Income dividends and gain distributions are determined in accordance with income tax rules and regulations, which may differ from generally accepted accounting principles. Certain capital accounts in the financial statements have been adjusted for permanent book-tax differences. These adjustments have no impact on NAVs or results of operations. Temporary book-tax differences will reverse in the future. These book-tax differences are primarily due to capital loss carryforwards, straddles, premium amortization, investments in futures, paydown gains and losses, swaps, and wash sale loss deferrals.
| Notes to Financial Statements | 29 |
State Street Income V.I.S. Fund
Notes to Financial Statements, continued — December 31, 2024
The tax character of distributions paid during the fiscal year ended December 31, 2024 were as follows:
Ordinary
Income | Long-Term
Capital Gains | Total |
| $295,495 | $— | $295,495 |
The tax character of distributions paid during the fiscal year ended December 31, 2023 was as follows:
Ordinary
Income | Long-Term
Capital Gains | Total |
| $204,660 | $— | $204,660 |
At December 31, 2024, the components of distributable earnings on a tax basis were as follows:
Undistributed
Ordinary
Income | Tax Exempt
Income | Capital Loss
Carryforwards | Undistributed
long term
gain | Net
Unrealized
Gains
(Losses) | Qualified
Late-Year
Losses | Total |
| $301,386 | $— | $(1,412,148) | $— | $(758,452) | $— | $(1,869,214) |
As of December 31, 2024, the Fund had capital loss carryforwards available to offset future realized capital gains as follows:
Non-Expiring
Short Term | Non-Expiring
Long Term |
| $(347,061) | $(1,065,087) |
As of December 31, 2024, gross unrealized appreciation and gross unrealized depreciation of investments and other financial instruments based on cost for federal income tax purposes were as follows:
Tax
Cost | Gross
Unrealized
Appreciation | Gross
Unrealized
Depreciation | Net
Unrealized
Appreciation
(Depreciation) |
| $11,294,019 | $21,169 | $779,621 | $(758,452) |
10.Line of Credit
The Fund and other affiliated funds (each, a “Participant” and collectively, the “Participants”) have access to $194.29 million of a $1.36 billion ($180 million of $1.26 billion prior to November 1, 2024 and $180 million of $960 million prior to October 3, 2024) revolving credit facility provided by a syndication of banks under which the Participants may borrow to fund shareholder redemptions. This agreement expires in October 2025 unless extended or renewed.
The Participants are charged an annual commitment fee which is calculated based on the unused portion of the shared credit line. Commitment fees are allocated among each of the Participants based on relative net assets. Commitment fees are ordinary fund operating expenses. A Participant incurs and pays the interest expense related to its borrowing. Interest is calculated at a rate per annum equal to the sum of 1.00% plus the greater of the
New York Fed Bank Rate and the one-month SOFR Rate.
The Fund had no outstanding loans as of December 31, 2024.
11.Risks
Concentration Risk As a result of the Fund's ability to invest a large percentage of its assets in obligations of issuers within the same country, state, region, currency or economic sector, an adverse economic, business or political development may affect the value of the Fund's investments more than if the Fund was more broadly diversified.
| 30 | Notes to Financial Statements |
State Street Income V.I.S. Fund
Notes to Financial Statements, continued — December 31, 2024
Interest Rate Risk The risk that fixed income securities will decline in value because of changes in interest rates. Bond prices generally rise when interest rates decline and generally decline when interest rates rise. Changes in governmental policy, including changes in central bank monetary policy, could cause interest rates to rise rapidly, or cause investors to expect a rapid rise in interest rates. This could lead to heightened levels of interest rate, volatility and liquidity risks for the fixed income markets generally and could have a substantial and immediate effect on the values of the Fund’s investments. High levels of inflation and/or a significantly changing interest rate environment can lead to heightened levels of volatility and reduced liquidity.
Foreign and Emerging Markets Risk Investing in foreign markets involves risks and considerations not typically associated with investing in the U.S. Foreign securities may be subject to risk of loss because of government regulation, economic, political and social instability in the countries in which the Fund invests. Foreign markets may be less liquid than investments in the U.S. and may be subject to the risks of currency fluctuations. To the extent that the Fund invests in securities of issuers located in emerging markets, these risks may be even more pronounced.
Credit Risk The Fund may be exposed to credit risk in the event that an issuer or guarantor fails to perform or that an institution or entity with which the Fund has unsettled or open transactions defaults.
Market Risk The Fund’s investments are subject to changes in general economic conditions, and general market fluctuations and the risks inherent in investment in securities markets. Investment markets can be volatile and prices of investments can change substantially due to various factors including, but not limited to, economic growth or recession, changes in interest rates, changes in the actual or perceived creditworthiness of issuers, and general market liquidity. The Fund is subject to the risk that geopolitical events will disrupt securities markets and adversely affect global economies and markets. Local, regional or global events such as war, acts of terrorism, the spread of infectious illness, such as COVID-19, or other public health issues, or other events could have a significant impact on the Fund and its investments.
12.Subsequent Events
Management has evaluated the impact of all subsequent events on the Fund through the date on which the financial statements were available to be issued and has determined that there were no subsequent events requiring adjustment or disclosure in the financial statements.
| Notes to Financial Statements | 31 |
State Street Income V.I.S. Fund
Report of Independent Registered Public Accounting Firm
To the Shareholders of State Street Income V.I.S. Fund and the Board of Directors of State Street Variable Insurance Series Funds, Inc.
Opinion on the Financial Statements
We have audited the accompanying statement of assets and liabilities of State Street Income V.I.S. Fund (the “Fund”) (one of the series constituting State Street Variable Insurance Series Funds, Inc. (the “Company”)), including the schedule of investments, as of December 31, 2024, and the related statement of operations for the year then ended, the statements of changes in net assets for each of the two years in the period then ended, the financial highlights for each of the five years in the period then ended and the related notes (collectively referred to as the “financial statements”). In our opinion, the financial statements present fairly, in all material respects, the financial position of the Fund (one of the series constituting State Street Variable Insurance Series Funds, Inc.) at December 31, 2024, the results of its operations for the year then ended, the changes in its net assets for each of the two years in the period then ended and its financial highlights for each of the five years in the period then ended, in conformity with U.S. generally accepted accounting principles.
Basis for Opinion
These financial statements are the responsibility of the Trust’s management. Our responsibility is to express an opinion on the Fund’s financial statements based on our audits. We are a public accounting firm registered with the Public Company Accounting Oversight Board (United States) (“PCAOB”) and are required to be independent with respect to the Trust in accordance with the U.S. federal securities laws and the applicable rules and regulations of the Securities and Exchange Commission and the PCAOB.
We conducted our audits in accordance with the standards of the PCAOB. Those standards require that we plan and perform the audit to obtain reasonable assurance about whether the financial statements are free of material misstatement, whether due to error or fraud. The Trust is not required to have, nor were we engaged to perform, an audit of the Trust’s internal control over financial reporting. As part of our audits we are required to obtain an understanding of internal control over financial reporting, but not for the purpose of expressing an opinion on the effectiveness of the Trust’s internal control over financial reporting. Accordingly, we express no such opinion.
Our audits included performing procedures to assess the risks of material misstatement of the financial statements, whether due to error or fraud, and performing procedures that respond to those risks. Such procedures included examining, on a test basis, evidence regarding the amounts and disclosures in the financial statements. Our procedures included confirmation of securities owned as of December 31, 2024, by correspondence with the custodian, brokers and others; when replies were not received from brokers and others, we performed other auditing procedures. Our audit also included evaluating the accounting principles used and significant estimates made by management, as well as evaluating the overall presentation of the financial statements. We believe that our audits provide a reasonable basis for our opinion.
We have served as the auditor of one or more State Street Global Advisors investment companies since 2000.
Boston, Massachusetts
February 18, 2025
| 32 | Report of Independent Registered Public Accounting Firm |
State Street Income V.I.S. Fund
Other Information — December 31, 2024 (Unaudited)
Tax Information
For federal income tax purposes, the following information is furnished with respect to the distributions of the Fund for its fiscal year ended December 31, 2024.
Interest Dividends
The Fund reports the maximum amount allowable as Section 163(j) Interest Dividends.
State Street Income V.I.S. Fund
Proxy Disclosure for Open-End Management Investment Companies — December 31, 2024 (Unaudited)
Shareholder Meeting Results
Rule 30e-1 under the Investment Company Act of 1940, as amended, requires registered management companies to report on all subject matters put to the vote of shareholders and provide final results. Shareholders were asked to participate in a special meeting of shareholders on December 6, 2024 (the “Shareholder Meeting”). The final results of the Shareholder Meeting are reported in the table below.
All Funds
Proposal 1: To elect the following as Directors of the Company:
| Proposed Director | Shares For | Shares Withheld |
| Patrick J. Riley | 73,750,198.987 | 1,759,144.984 |
| Donna M. Rapaccioli | 73,872,469.845 | 1,636,874.126 |
| Margaret K. McLaughlin | 73,959,592.918 | 1,549,751.053 |
| George M. Pereira | 73,932,719.109 | 1,576,624.862 |
| Mark E. Swanson | 73,862,069.730 | 1,647,274.241 |
| Jeanne LaPorta | 73,881,354.092 | 1,627,989.879 |
Annual Financial Statements and Other Information
December 31, 2024
| State Street Real Estate Securities V.I.S. Fund |
State Street Real Estate Securities V.I.S. Fund
Annual Report Financial Statements and Other Information
December 31, 2024
Changes in and Disagreements with Accountants for Open-End Management Investment Companies (N-CSR Item 8) - Not Applicable
Remuneration Paid to Directors, Officers, and Others of Open-End Management Investment Companies (N-CSR Item 10) - Please see Statement of Operations in the Financial Statements under Item 7 above
Statement Regarding Basis for Approval of Investment Advisory Contract (Unaudited) (N-CSR Item 11) - Not Applicable
This report is prepared for Policyholders of certain variable contracts and may be distributed to others only if preceded or accompanied by the variable contract’s current prospectus and the current summary prospectus of the Fund available for investments thereunder.
[This page intentionally left blank]
State Street Real Estate Securities V.I.S. Fund
Schedule of Investments — December 31, 2024
| | Number
of Shares | Fair
Value |
| Common Stock (REITs) - 99.3% † |
| Alternate Housing - 6.2% |
| Invitation Homes, Inc. | 27,670 | $884,610 |
| Sun Communities, Inc. | 3,720 | 457,448 |
| | | 1,342,058 |
| Data Center - 13.5% |
| Digital Realty Trust, Inc. | 5,810 | 1,030,287 |
| Equinix, Inc. | 1,994 | 1,880,123 |
| | | 2,910,410 |
| Healthcare - 16.2% |
| Alexandria Real Estate Equities, Inc. | 1,760 | 171,688 |
| American Healthcare REIT, Inc. | 8,540 | 242,707 |
| Healthpeak Properties, Inc. | 26,850 | 544,249 |
| National Health Investors, Inc. | 1,369 | 94,872 |
| Omega Healthcare Investors, Inc. | 6,880 | 260,408 |
| Ventas, Inc. | 14,180 | 835,060 |
| Welltower, Inc. | 10,790 | 1,359,864 |
| | | 3,508,848 |
| Hotel - 3.2% |
| DiamondRock Hospitality Co. | 14,287 | 129,012 |
| Host Hotels & Resorts, Inc. | 25,970 | 454,994 |
| Pebblebrook Hotel Trust | 4,510 | 61,111 |
| Sunstone Hotel Investors, Inc. | 4,542 | 53,777 |
| | | 698,894 |
| Industrial - 12.1% |
| Americold Realty Trust, Inc. | 8,620 | 184,468 |
| EastGroup Properties, Inc. | 1,267 | 203,341 |
| First Industrial Realty Trust, Inc. | 4,470 | 224,081 |
| Lineage, Inc. | 2,870 | 168,096 |
| Prologis, Inc. | 14,030 | 1,482,971 |
| Rexford Industrial Realty, Inc. | 9,270 | 358,378 |
| | | 2,621,335 |
| Multifamily - 10.7% |
| Camden Property Trust | 5,730 | 664,909 |
| Equity Residential | 10,750 | 771,420 |
| UDR, Inc. | 20,420 | 886,433 |
| | | 2,322,762 |
| Net Lease - 6.8% |
| Agree Realty Corp. | 4,900 | 345,205 |
| Broadstone Net Lease, Inc. | 9,722 | 154,191 |
| NETSTREIT Corp. | 6,620 | 93,673 |
| NNN REIT, Inc. | 6,333 | 258,703 |
| Realty Income Corp. | 11,390 | 608,340 |
| | | 1,460,112 |
| | Number
of Shares | Fair
Value |
| Office - 5.2% |
| BXP, Inc. | 4,860 | $361,389 |
| Cousins Properties, Inc. | 12,062 | 369,580 |
| Douglas Emmett, Inc. | 4,160 | 77,210 |
| Kilroy Realty Corp. | 3,019 | 122,118 |
| Vornado Realty Trust | 4,690 | 197,168 |
| | | 1,127,465 |
| Regional Malls - 4.1% |
| Macerich Co. | 6,520 | 129,878 |
| Simon Property Group, Inc. | 4,356 | 750,147 |
| | | 880,025 |
| Self Storage - 7.3% |
| CubeSmart | 4,410 | 188,968 |
| Extra Space Storage, Inc. | 5,560 | 831,776 |
| Public Storage | 1,870 | 559,953 |
| | | 1,580,697 |
| Shopping Centers - 7.0% |
| Brixmor Property Group, Inc. | 17,550 | 488,592 |
| Federal Realty Investment Trust | 2,340 | 261,963 |
| InvenTrust Properties Corp. | 2,973 | 89,576 |
| Kimco Realty Corp. | 19,070 | 446,810 |
| Kite Realty Group Trust | 8,840 | 223,122 |
| | | 1,510,063 |
| Specialty - 7.0% |
| Iron Mountain, Inc. | 5,570 | 585,463 |
| Lamar Advertising Co., Class A | 2,086 | 253,950 |
| VICI Properties, Inc. | 23,060 | 673,582 |
| | | 1,512,995 |
Total Common Stock (REITs)
(Cost $17,518,463) | | 21,475,664 |
| Short-Term Investments - 0.7% | |
State Street Institutional U.S. Government Money Market Fund - Class G Shares 4.47% (a)(b)
(Cost $144,695) | 144,695 | 144,695 |
Total Investments
(Cost $17,663,158) | | 21,620,359 |
| Liabilities in Excess of Other Assets, net - (0.0)%* | | (1,353) |
| NET ASSETS - 100.0% | | $21,619,006 |
See Notes to Schedule of Investments and Notes to Financial Statements.
| State Street Real Estate Securities V.I.S. Fund | 1 |
State Street Real Estate Securities V.I.S. Fund
Schedule of Investments, continued — December 31, 2024
Notes to Schedule of Investments
The views expressed in this document reflect our judgment as of the publication date and are subject to change at any time without notice. The securities cited may not be representative of the Fund’s future investments and should not be construed as a recommendation to purchase or sell a particular security. See the Fund’s summary prospectus and statutory prospectus for complete descriptions of investment objectives, policies, risks and permissible investments.
| (a) | Sponsored by SSGA Funds Management, Inc., the Fund’s investment adviser and administrator, and an affiliate of State Street Bank & Trust Co., the Fund’s sub-administrator, custodian and accounting agent. |
| (b) | Coupon amount represents effective yield. |
| † | Percentages are based on net assets as of December 31, 2024. |
| * | Less than 0.05%. |
| Abbreviations: |
| REIT - Real Estate Investment Trust |
The following table presents the Fund’s investments measured at fair value on a recurring basis at December 31, 2024:
| Investments | Level 1 | | Level 2 | | Level 3 | | Total |
| Investments in Securities | | | | | | | |
| Common Stock | $21,475,664 | | $— | | $— | | $21,475,664 |
| Short-Term Investments | 144,695 | | — | | — | | 144,695 |
| Total Investments in Securities | $21,620,359 | | $— | | $— | | $21,620,359 |
| | Number
of Shares
Held at
12/31/23 | Value at
12/31/23 | Cost of
Purchases | Proceeds
from
Shares
Sold | Realized
Gain
(Loss) | Change in
Unrealized
Appreciation
(Depreciation) | Number of
Shares
Held at
12/31/24 | Value at
12/31/24 | Dividend
Income |
| State Street Institutional U.S. Government Money Market Fund - Class G Shares | 347,181 | $347,181 | $7,660,934 | $7,863,420 | $— | $— | 144,695 | $144,695 | $13,437 |
See Notes to Schedule of Investments and Notes to Financial Statements.
| 2 | State Street Real Estate Securities V.I.S. Fund |
State Street Real Estate Securities V.I.S. Fund
Financial Highlights
Selected data based on a share outstanding throughout the fiscal years indicated
| | 12/31/24 | | 12/31/23 | | 12/31/22 | | 12/31/21 | | 12/31/20 |
| Inception date | | | 5/1/95 |
| Net asset value, beginning of period | $9.74 | | $8.77 | | $13.89 | | $12.02 | | $12.92 |
| Income/(loss) from investment operations: | | | | | | | | | |
| Net investment income(a) | 0.24 | | 0.25 | | 0.20 | | 0.13 | | 0.17 |
| Net realized and unrealized gains/(losses) on investments | 0.77 | | 0.93 | | (3.66) | | 4.85 | | (0.85) |
| Total income/(loss) from investment operations | 1.01 | | 1.18 | | (3.46) | | 4.98 | | (0.68) |
| Less distributions from: | | | | | | | | | |
| Net investment income | (0.18) | | (0.21) | | (0.17) | | (0.34) | | (0.06) |
| Net realized gains | — | | — | | (1.49) | | (2.77) | | (0.16) |
| Total distributions | (0.18) | | (0.21) | | (1.66) | | (3.11) | | (0.22) |
| Net asset value, end of period | $10.57 | | $9.74 | | $8.77 | | $13.89 | | $12.02 |
| Total Return(b) | 10.46% | | 13.50% | | (24.93)% | | 41.80% | | (5.23)% |
| Ratios/Supplemental Data: | | | | | | | | | |
| Net assets, end of period (in thousands) | $21,619 | | $65,246 | | $40,669 | | $45,748 | | $47,588 |
| Ratios to average net assets: | | | | | | | | | |
| Gross expenses | 1.01% | | 1.00% | | 1.05% | | 1.04% | | 1.04% |
| Net investment income | 2.44% | | 2.75% | | 1.72% | | 0.93% | | 1.49% |
| Portfolio turnover rate | 38% | | 54% | | 86% | | 85% | | 108% |
| Notes to Financial Highlights |
| (a) | Per share values have been calculated using the average shares method. |
| (b) | Total returns are historical and assume changes in share price, reinvestment of dividends and capital gains distributions and do not include the effect of insurance contract charges. Past performance does not guarantee future results. |
The accompanying Notes are an integral part of these financial statements.
State Street Real Estate Securities V.I.S. Fund
Statement of Assets and Liabilities — December 31, 2024
| Assets | |
| Investments in unaffiliated securities, at fair value (cost $17,518,463) | $21,475,664 |
| Investments in affiliated securities, at fair value (cost $144,695) | 144,695 |
| Receivable for investments sold | 25,935 |
| Income receivables | 91,384 |
| Receivable for fund shares sold | 359 |
| Income receivable from affiliated investments | 433 |
| Other assets | 395 |
| Total assets | 21,738,865 |
| Liabilities | |
| Payable for investments purchased | 63,178 |
| Payable for fund shares redeemed | 601 |
| Payable to the Adviser | 16,059 |
| Payable for custody, fund accounting and sub-administration fees | 6,937 |
| Accrued other expenses | 33,084 |
| Total liabilities | 119,859 |
|
| Net Assets | $21,619,006 |
| Net Assets Consist of: | |
| Capital paid in | $18,254,157 |
| Total distributable earnings (loss) | 3,364,849 |
| Net Assets | $21,619,006 |
| Shares outstanding ($0.01 par value, unlimited shares authorized) | 2,046,148 |
| Net asset value per share | $10.57 |
The accompanying Notes are an integral part of these financial statements.
| 4 | Statement of Assets and Liabilities |
State Street Real Estate Securities V.I.S. Fund
Statement of Operations — For the year ended December 31, 2024
| Investment Income | |
| Income | |
| Dividend | $1,578,670 |
| Income from affiliated investments | 13,437 |
| Total income | 1,592,107 |
| Expenses | |
| Advisory and administration fees | 391,833 |
| Directors' fees | 21,347 |
| Custody, fund accounting and sub-administration fees | 22,335 |
| Professional fees | 27,556 |
| Other expenses | 2,395 |
| Total expenses | 465,466 |
| Net investment income (loss) | $1,126,641 |
| Net Realized and Unrealized Gain (Loss) on Investments | |
| Realized gain (loss) on investments | $3,163,175 |
| Increase (decrease) in unrealized appreciation/(depreciation) on investments | 278,587 |
| Net realized and unrealized gain (loss) on investments | 3,441,762 |
| Net Increase (Decrease) in Net Assets Resulting from Operations | $4,568,403 |
The accompanying Notes are an integral part of these financial statements.
State Street Real Estate Securities V.I.S. Fund
Statements of Changes in Net Assets
| | Year Ended
December 31,
2024 | | Year Ended
December 31,
2023 |
| Increase (Decrease) in Net Assets | | | |
| Operations: | | | |
| Net investment income (loss) | $1,126,641 | | $1,379,214 |
| Net realized gain (loss) on investments | 3,163,175 | | (2,942,655) |
| Net increase (decrease) in unrealized appreciation/depreciation on investments | 278,587 | | 7,683,727 |
| Net increase (decrease) from operations | 4,568,403 | | 6,120,286 |
| Distributions to shareholders: | | | |
| Total distributions | (1,047,350) | | (1,420,514) |
| Increase (decrease) in assets from operations and distributions | 3,521,053 | | 4,699,772 |
| Share transactions: | | | |
| Proceeds from sale of shares | 2,683,751 | | 27,811,078 |
| Value of distributions reinvested | 1,047,350 | | 1,420,514 |
| Cost of shares redeemed | (50,879,339) | | (9,353,725) |
| Net increase (decrease) from share transactions | (47,148,238) | | 19,877,867 |
| Total increase (decrease) in net assets | (43,627,185) | | 24,577,639 |
| Net Assets | | | |
| Beginning of year | 65,246,191 | | 40,668,552 |
| End of year | $21,619,006 | | $65,246,191 |
| Changes in Fund Shares | | | |
| Shares sold | 282,940 | | 2,918,808 |
| Issued for distributions reinvested | 103,905 | | 145,544 |
| Shares redeemed | (5,039,702) | | (1,001,549) |
| Net increase (decrease) in fund shares | (4,652,857) | | 2,062,803 |
The accompanying Notes are an integral part of these financial statements.
| 6 | Statements of Changes in Net Assets |
State Street Real Estate Securities V.I.S. Fund
Notes to Financial Statements — December 31, 2024
1.Organization of the Company
State Street Variable Insurance Series Funds, Inc. (the “Company”) was incorporated under the laws of the Commonwealth of Virginia on May 14, 1984 and is registered under the Investment Company Act of 1940, as amended (the “1940 Act”), as an open-end management investment company. The Company is currently composed of the following seven investment portfolios (collectively, the “Funds”): State Street U.S. Equity V.I.S. Fund, State Street S&P 500 Index V.I.S. Fund, State Street Premier Growth Equity V.I.S. Fund, State Street Small-Cap Equity V.I.S. Fund, State Street Total Return V.I.S. Fund, State Street Income V.I.S. Fund and State Street Real Estate Securities V.I.S. Fund (the “Fund”). Each Fund is a diversified investment company within the meaning of the 1940 Act, except for the State Street Premier Growth Equity V.I.S. Fund, which is a non-diversified investment company.
Shares of the Funds of the Company are offered only to insurance company separate accounts that fund certain variable life insurance contracts and variable annuity contracts.
The Company currently offers one share class (Class 1) of the Fund as an investment option for variable life insurance and variable annuity contracts.
Under the Company’s organizational documents, its officers and directors are indemnified against certain liabilities arising out of the performance of their duties to the Company. Additionally, in the normal course of business, the Company enters into contracts with service providers that contain general indemnification clauses. The Company’s maximum exposure under these arrangements is unknown as this would involve future claims that may be made against the Company that have not yet occurred.
2.Segment Reporting
The Fund has one reportable segment. Business activities are managed on a consolidated basis and revenues are derived primarily through the Fund’s investments in accordance with its investment objective. The Fund’s chief operating decision maker (“CODM”) is the President of the Company. The CODM assesses performance based on the Fund’s Total Return as reported in the Financial Highlights, and the same accounting policies are applied as described in the summary of significant accounting policies. The Fund’s Total Return is utilized by the CODM to compare results, including the impact of the Fund’s costs, to the Fund’s competitors and to the Fund’s benchmark index.
3.Summary of Significant Accounting Policies
The following is a summary of significant accounting policies followed by the Company in the preparation of its financial statements:
The preparation of financial statements in accordance with U.S. generally accepted accounting principles (“U.S. GAAP”) requires management to make estimates and assumptions that affect the reported amounts and disclosures in the financial statements. Actual results could differ from those estimates. The Fund is an investment company under U.S. GAAP and follows the accounting and reporting guidance applicable to investment companies.
Security Valuation The Fund’s investments are valued at fair value each day that the New York Stock Exchange (“NYSE”) is open and, for financial reporting purposes, as of the report date should the reporting period end on a day that the NYSE is not open. Fair value is generally defined as the price a fund would receive to sell an asset or pay to transfer a liability in an orderly transaction between market participants at the measurement date. By its nature, a fair value price is a good faith estimate of the valuation in a current sale and may not reflect an actual market price. The investments of the Fund are valued pursuant to the policy and procedures developed by the Oversight Committee (the “Committee”) and approved by the Company's Board of Directors (the “Board”). The Committee provides oversight of the valuation of investments for the Fund. The Board has responsibility for overseeing the determination of the fair value of investments.
Valuation techniques used to value the Fund’s investments by major category are as follows:
| Notes to Financial Statements | 7 |
State Street Real Estate Securities V.I.S. Fund
Notes to Financial Statements, continued — December 31, 2024
| • | Equity investments traded on a recognized securities exchange for which market quotations are readily available are valued at the last sale price or official closing price, as applicable, on the primary market or exchange on which they trade. Equity investments traded on a recognized exchange for which there were no sales on that day are valued at the last published sale price or at fair value. |
| • | Investments in registered investment companies (including money market funds) or other unitized pooled investment vehicles that are not traded on an exchange are valued at that day’s published net asset value (“NAV”) per share or unit. |
In the event prices or quotations are not readily available or that the application of these valuation methods results in a price for an investment that is deemed to be not representative of the fair value of such investment, fair value will be determined in good faith by the Committee, in accordance with the valuation policy and procedures approved by the Board.
The Fund values its assets and liabilities at fair value using a fair value hierarchy consisting of three broad levels that prioritize the inputs to valuation techniques giving the highest priority to readily available unadjusted quoted prices in active markets for identical assets or liabilities (Level 1 measurements) and the lowest priority to unobservable inputs (Level 3 measurements) when market prices are not readily available or reliable. The categorization of a value determined for an investment within the hierarchy is based upon the pricing transparency of the investment and is not necessarily an indication of the risk associated with investing in it.
The three levels of the fair value hierarchy are as follows:
| • | Level 1 — Unadjusted quoted prices in active markets for an identical asset or liability; |
| • | Level 2 — Inputs other than quoted prices included within Level 1 that are observable for the asset or liability either directly or indirectly, including quoted prices for similar assets or liabilities in active markets, quoted prices for identical or similar assets or liabilities in markets that are not considered to be active, inputs other than quoted prices that are observable for the asset or liability (such as exchange rates, financing terms, interest rates, yield curves, volatilities, prepayment speeds, loss severities, credit risks and default rates) or other market-corroborated inputs; and |
| • | Level 3 — Unobservable inputs for the asset or liability, including the Committee’s assumptions used in determining the fair value of investments. |
The value of the Fund’s investments according to the fair value hierarchy as of December 31, 2024 is disclosed in the Fund’s Schedule of Investments.
Investment Transactions and Income Recognition Investment transactions are accounted for on trade date for financial reporting purposes. Realized gains and losses from the sale or disposition of investments and foreign exchange transactions, if any, are determined using the identified cost method.
Dividend income and capital gain distributions, if any, are recognized on the ex-dividend date, net of any foreign taxes withheld at source, if any.
Interest income is recorded daily on an accrual basis. All premiums and discounts are amortized/accreted for financial reporting purposes.
Non-cash dividends received in the form of stock are recorded as dividend income at fair value.
The Fund invests in real estate investment trusts (“REITs”). REITs determine the tax character of their distributions annually and may characterize a portion of their distributions as a return of capital or capital gain. The Fund’s policy is to record all REIT distributions initially as dividend income and re-designate a portion to return of capital or capital gain distributions at year-end based on information provided by the REIT and/or SSGA Funds Management, Inc.’s (the “Adviser” or “SSGA FM”) estimates of such re-designations for which actual information has not yet been reported.
| 8 | Notes to Financial Statements |
State Street Real Estate Securities V.I.S. Fund
Notes to Financial Statements, continued — December 31, 2024
Expenses Certain expenses, which are directly identifiable to a specific Fund, are applied to the Fund within the Company. Other expenses which cannot be attributed to a specific Fund are allocated in such a manner as deemed equitable, taking into consideration the nature and type of expense and the relative net assets of the Fund within the Company.
Foreign Currency Translation The accounting records of the Fund are maintained in U.S. dollars. Foreign currencies as well as investment securities and other assets and liabilities denominated in a foreign currency are translated to U.S. dollars using exchange rates at period end. Purchases and sales of securities, income receipts and expense payments denominated in foreign currencies are translated into U.S. dollars at the prevailing exchange rate on the respective dates of the transactions.
The effects of exchange rate fluctuations on investments are included with the net realized and unrealized gain (loss) on investment securities. Other foreign currency transactions resulting in realized and unrealized gain (loss) are disclosed separately.
Foreign Taxes The Fund may be subject to foreign taxes (a portion of which may be reclaimable) on income, stock dividends, realized and unrealized capital gains on investments or certain foreign currency transactions. Foreign taxes are recorded in accordance with SSGA FM's understanding of the applicable foreign tax regulations and rates that exist in the foreign jurisdictions in which the Fund invests. These foreign taxes, if any, are paid by the Fund and are reflected in the Statement of Operations, if applicable. Foreign taxes payable or deferred as of December 31, 2024, if any, are disclosed in the Fund’s Statement of Assets and Liabilities.
Distributions The Fund declares and pays any dividends from net investment income annually.
Net realized capital gains, if any, are distributed annually, unless additional distributions are required for compliance with applicable tax regulations. The amount and character of income and capital gains to be distributed are determined in accordance with applicable tax regulations which may differ from net investment income and realized gains recognized for U.S. GAAP purposes.
4.Fees and Transactions with Affiliates
Advisory Fee SSGA FM, a registered investment adviser, was retained by the Board to act as investment adviser and administrator of the Fund. SSGA FM’s compensation for investment advisory and administrative services (“Management Fee”) is paid monthly based on the average daily net assets of the Fund. The Management Fee is stated in the following schedule:
Average Daily
Net Assets of the Fund | Management Fee |
| First $100 million | 0.85% |
| Next $100 million | 0.80% |
| Over $200 million | 0.75% |
Custody, Fund Accounting and Sub-Administration Fees State Street Bank and Trust Company (“State Street”) serves as the custodian, fund accountant and sub-administrator to the Fund. Amounts paid by the Fund to State Street for performing such services are included as custody, fund accounting and sub-administration fees in the Statement of Operations.
Other Transactions with Affiliates The Fund may invest in affiliated entities, including securities issued by State Street Corporation, affiliated funds, or entities deemed to be affiliates as a result of the Fund owning more than five percent of the entity’s voting securities or outstanding shares. Amounts relating to these transactions during the fiscal year ended December 31, 2024 are disclosed in the Schedule of Investments.
5.Sub-Advisory Fees
Pursuant to an investment sub-advisory agreement with SSGA FM, CenterSquare Investment Management LLC (“CenterSquare”) is the sub-adviser to the Fund. CenterSquare is responsible for the day-to-day portfolio management of the assets of the Fund, including the responsibility for making decisions to buy, sell or hold a
| Notes to Financial Statements | 9 |
State Street Real Estate Securities V.I.S. Fund
Notes to Financial Statements, continued — December 31, 2024
particular security, under the general supervision of SSGA FM and the Board. For its services, SSGA FM pays CenterSquare monthly sub-advisory fees which are calculated as a percentage of the average daily net assets of the Fund.
6.Directors’ Fees
The fees and expenses of the Company’s directors who are not “interested persons” of the Company, as defined in the 1940 Act (“Independent Directors”), are paid directly by the Fund. The Independent Directors are reimbursed for travel and other out-of-pocket expenses in connection with meeting attendance and industry seminars.
7.Investment Transactions
Purchases and sales of investments (excluding in-kind transactions, short term investments and derivative contracts) for the fiscal year ended December 31, 2024 were as follows:
| Non-U.S. Government Securities |
| Purchases | Sales |
| $16,865,030 | $63,457,053 |
8.Income Taxes
The Fund has qualified and intends to continue to qualify as a regulated investment company under Subchapter M of the Internal Revenue Code of 1986, as amended. The Fund will not be subject to federal income taxes to the extent it distributes its taxable income, including any net realized capital gains, for each fiscal year. Therefore, no provision for federal income tax is required.
The Fund files federal and various state and local tax returns as required. No income tax returns are currently under examination. Generally, the federal returns are subject to examination by the Internal Revenue Service for a period of three years from date of filing, while the state returns may remain open for an additional year depending upon jurisdiction. SSGA FM has analyzed the Fund’s tax positions taken on tax returns for all open years and does not believe there are any uncertain tax positions that would require recognition of a tax liability.
Distributions to shareholders are recorded on ex-dividend date. Income dividends and gain distributions are determined in accordance with income tax rules and regulations, which may differ from generally accepted accounting principles. Certain capital accounts in the financial statements have been adjusted for permanent book-tax differences. These adjustments have no impact on NAVs or results of operations. Temporary book-tax differences will reverse in the future. These book-tax differences are primarily due to capital loss carryforwards, REITs, and wash sale loss deferrals.
The tax character of distributions paid during the fiscal year ended December 31, 2024 were as follows:
Ordinary
Income | Long-Term
Capital Gains | Total |
| $1,047,350 | $— | $1,047,350 |
The tax character of distributions paid during the fiscal year ended December 31, 2023 was as follows:
Ordinary
Income | Long-Term
Capital Gains | Total |
| $1,420,514 | $— | $1,420,514 |
At December 31, 2024, the components of distributable earnings on a tax basis were as follows:
Undistributed
Ordinary
Income | Tax Exempt
Income | Capital Loss
Carryforwards | Undistributed
long term
gain | Net
Unrealized
Gains
(Losses) | Qualified
Late-Year
Losses | Total |
| $242,564 | $— | $(324,609) | $— | $3,446,894 | $— | $3,364,849 |
| 10 | Notes to Financial Statements |
State Street Real Estate Securities V.I.S. Fund
Notes to Financial Statements, continued — December 31, 2024
As of December 31, 2024, the Fund had capital loss carryforwards available to offset future realized capital gains as follows
Non-Expiring
Short Term | Non-Expiring
Long Term |
| $— | $(324,609) |
As of December 31, 2024, gross unrealized appreciation and gross unrealized depreciation of investments and other financial instruments based on cost for federal income tax purposes were as follows:
Tax
Cost | Gross
Unrealized
Appreciation | Gross
Unrealized
Depreciation | Net
Unrealized
Appreciation
(Depreciation) |
| $18,173,465 | $3,806,717 | $359,823 | $3,446,894 |
9.Line of Credit
The Fund and other affiliated funds (each, a “Participant” and collectively, the “Participants”) have access to $194.29 million of a $1.36 billion ($180 million of $1.26 billion prior to November 1, 2024 and $180 million of $960 million prior to October 3, 2024) revolving credit facility provided by a syndication of banks under which the Participants may borrow to fund shareholder redemptions. This agreement expires in October 2025 unless extended or renewed.
The Participants are charged an annual commitment fee which is calculated based on the unused portion of the shared credit line. Commitment fees are allocated among each of the Participants based on relative net assets. Commitment fees are ordinary fund operating expenses. A Participant incurs and pays the interest expense related to its borrowing. Interest is calculated at a rate per annum equal to the sum of 1.00% plus the greater of the
New York Fed Bank Rate and the one-month SOFR Rate.
The Fund had no outstanding loans as of December 31, 2024.
10.Risks
Concentration Risk As a result of the Fund’s ability to invest a large percentage of its assets in obligations of issuers within the same country, state, region, currency or economic sector, an adverse economic, business or political development may affect the value of the Fund’s investments more than if the Fund was more broadly diversified.
Credit Risk The Fund may be exposed to credit risk in the event that an issuer or guarantor fails to perform or that an institution or entity with which the Fund has unsettled or open transactions defaults.
Market Risk The Fund’s investments are subject to changes in general economic conditions, and general market fluctuations and the risks inherent in investment in securities markets. Investment markets can be volatile and prices of investments can change substantially due to various factors including, but not limited to, economic growth or recession, changes in interest rates, changes in the actual or perceived creditworthiness of issuers, and general market liquidity. The Fund is subject to the risk that geopolitical events will disrupt securities markets and adversely affect global economies and markets. Local, regional or global events such as war, acts of terrorism, the spread of infectious illness, such as COVID-19, or other public health issues, or other events could have a significant impact on the Fund and its investments.
11.Subsequent Events
Management has evaluated the impact of all subsequent events on the Fund through the date on which the financial statements were available to be issued and has determined that there were no subsequent events requiring adjustment or disclosure in the financial statements.
| Notes to Financial Statements | 11 |
State Street Real Estate Securities V.I.S. Fund
Report of Independent Registered Public Accounting Firm
To the Shareholders of State Street Real Estate Securities V.I.S. Fund and the Board of Directors of State Street Variable Insurance Series Funds, Inc.
Opinion on the Financial Statements
We have audited the accompanying statement of assets and liabilities of State Street Real Estate Securities V.I.S. Fund (the “Fund”) (one of the series constituting State Street Variable Insurance Series Funds, Inc. (the “Company”)), including the schedule of investments, as of December 31, 2024, and the related statement of operations for the year then ended, the statements of changes in net assets for each of the two years in the period then ended, the financial highlights for each of the five years in the period then ended and the related notes (collectively referred to as the “financial statements”). In our opinion, the financial statements present fairly, in all material respects, the financial position of the Fund (one of the series constituting State Street Variable Insurance Series Funds, Inc.) at December 31, 2024, the results of its operations for the year then ended, the changes in its net assets for each of the two years in the period then ended and its financial highlights for each of the five years in the period then ended, in conformity with U.S. generally accepted accounting principles.
Basis for Opinion
These financial statements are the responsibility of the Trust’s management. Our responsibility is to express an opinion on the Fund’s financial statements based on our audits. We are a public accounting firm registered with the Public Company Accounting Oversight Board (United States) (“PCAOB”) and are required to be independent with respect to the Trust in accordance with the U.S. federal securities laws and the applicable rules and regulations of the Securities and Exchange Commission and the PCAOB.
We conducted our audits in accordance with the standards of the PCAOB. Those standards require that we plan and perform the audit to obtain reasonable assurance about whether the financial statements are free of material misstatement, whether due to error or fraud. The Trust is not required to have, nor were we engaged to perform, an audit of the Trust’s internal control over financial reporting. As part of our audits we are required to obtain an understanding of internal control over financial reporting, but not for the purpose of expressing an opinion on the effectiveness of the Trust’s internal control over financial reporting. Accordingly, we express no such opinion.
Our audits included performing procedures to assess the risks of material misstatement of the financial statements, whether due to error or fraud, and performing procedures that respond to those risks. Such procedures included examining, on a test basis, evidence regarding the amounts and disclosures in the financial statements. Our procedures included confirmation of securities owned as of December 31, 2024, by correspondence with the custodian, brokers and others; when replies were not received from brokers and others, we performed other auditing procedures. Our audits also included evaluating the accounting principles used and significant estimates made by management, as well as evaluating the overall presentation of the financial statements. We believe that our audits provide a reasonable basis for our opinion.
We have served as the auditor of one or more State Street Global Advisors investment companies since 2000.
Boston, Massachusetts
February 18, 2025
| 12 | Report of Independent Registered Public Accounting Firm |
State Street Real Estate Securities V.I.S. Fund
Other Information — December 31, 2024
Tax Information
For federal income tax purposes, the following information is furnished with respect to the distributions of the Fund for its fiscal year ended December 31, 2024.
Dividends Received Deduction
The Fund reports the maximum amount allowable of its net taxable income as eligible for the corporate dividends received deduction.
State Street Real Estate Securities V.I.S. Fund
Proxy Disclosure for Open-End Management Investment Companies — December 31, 2024 (Unaudited)
Shareholder Meeting Results
Rule 30e-1 under the Investment Company Act of 1940, as amended, requires registered management companies to report on all subject matters put to the vote of shareholders and provide final results. Shareholders were asked to participate in a special meeting of shareholders on December 6, 2024 (the “Shareholder Meeting”). The final results of the Shareholder Meeting are reported in the table below.
All Funds
Proposal 1: To elect the following as Directors of the Company:
| Proposed Director | Shares For | Shares Withheld |
| Patrick J. Riley | 73,750,198.987 | 1,759,144.984 |
| Donna M. Rapaccioli | 73,872,469.845 | 1,636,874.126 |
| Margaret K. McLaughlin | 73,959,592.918 | 1,549,751.053 |
| George M. Pereira | 73,932,719.109 | 1,576,624.862 |
| Mark E. Swanson | 73,862,069.730 | 1,647,274.241 |
| Jeanne LaPorta | 73,881,354.092 | 1,627,989.879 |
Annual Financial Statements and Other Information
December 31, 2024
| State Street Total Return V.I.S. Fund |
State Street Total Return V.I.S. Fund
Annual Report Financial Statements and Other Information
December 31, 2024
Changes in and Disagreements with Accountants for Open-End Management Investment Companies (N-CSR Item 8) - Not Applicable
Remuneration Paid to Directors, Officers, and Others of Open-End Management Investment Companies (N-CSR Item 10) - Please see Statement of Operations in the Financial Statements under Item 7 above
Statement Regarding Basis for Approval of Investment Advisory Contract (Unaudited) (N-CSR Item 11) - Not applicable
This report is prepared for Policyholders of certain variable contracts and may be distributed to others only if preceded or accompanied by the variable contract’s current prospectus and the current summary prospectus of the Fund available for investments thereunder.
[This page intentionally left blank]
State Street Total Return V.I.S. Fund
Schedule of Investments — December 31, 2024
| | Number
of Shares | Fair
Value |
| Domestic Equity - 40.5% † |
| Common Stock - 40.5% |
| Advertising - 0.1% |
| Advantage Solutions, Inc. (a) | 3,183 | $9,294 |
| Boston Omaha Corp., Class A (a) | 651 | 9,231 |
| Cardlytics, Inc. (a) | 1,128 | 4,185 |
| Clear Channel Outdoor Holdings, Inc. (a) | 9,927 | 13,600 |
| Emerald Holding, Inc. | 546 | 2,632 |
| Entravision Communications Corp., Class A | 1,438 | 3,379 |
| Ibotta, Inc., Class A (a) | 413 | 26,878 |
| Integral Ad Science Holding Corp. (a) | 1,872 | 19,544 |
| Interpublic Group of Cos., Inc. | 2,242 | 62,821 |
| Magnite, Inc. (a) | 3,316 | 52,791 |
| National CineMedia, Inc. (a) | 2,006 | 13,320 |
| Omnicom Group, Inc. | 1,227 | 105,571 |
| PubMatic, Inc., Class A (a) | 1,071 | 15,733 |
| Stagwell, Inc. (a) | 2,201 | 14,482 |
| TechTarget, Inc. (a) | 666 | 13,200 |
| Thryv Holdings, Inc. (a) | 940 | 13,912 |
| Trade Desk, Inc., Class A (a) | 2,911 | 342,130 |
| | | 722,703 |
| Aerospace & Defense - 0.7% |
| AAR Corp. (a) | 910 | 55,765 |
| AeroVironment, Inc. (a) | 741 | 114,032 |
| AerSale Corp. (a) | 976 | 6,149 |
| Archer Aviation, Inc., Class A (a) | 6,071 | 59,192 |
| Astronics Corp. (a) | 767 | 12,241 |
| Axon Enterprise, Inc. (a) | 470 | 279,330 |
| Boeing Co. (a) | 4,663 | 825,351 |
| BWX Technologies, Inc. | 600 | 66,834 |
| Byrna Technologies, Inc. (a) | 421 | 12,129 |
| Cadre Holdings, Inc. | 674 | 21,770 |
| Curtiss-Wright Corp. | 300 | 106,461 |
| Ducommun, Inc. (a) | 352 | 22,408 |
| Eve Holding, Inc. (a) | 770 | 4,189 |
| General Dynamics Corp. | 1,735 | 457,155 |
| General Electric Co. | 7,148 | 1,192,215 |
| HEICO Corp. | 300 | 71,322 |
| HEICO Corp., Class A | 551 | 102,530 |
| Hexcel Corp. | 400 | 25,080 |
| Howmet Aerospace, Inc. | 2,625 | 287,096 |
| Huntington Ingalls Industries, Inc. | 200 | 37,794 |
| Intuitive Machines, Inc. (a) | 691 | 12,549 |
| | Number
of Shares | Fair
Value |
| Kratos Defense & Security Solutions, Inc. (a) | 3,929 | $103,647 |
| L3Harris Technologies, Inc. | 1,280 | 269,158 |
| Leonardo DRS, Inc. (a) | 1,948 | 62,940 |
| Lockheed Martin Corp. | 1,395 | 677,886 |
| Mercury Systems, Inc. (a) | 1,374 | 57,708 |
| Moog, Inc., Class A | 751 | 147,827 |
| National Presto Industries, Inc. | 130 | 12,795 |
| Northrop Grumman Corp. | 857 | 402,182 |
| Park Aerospace Corp. | 550 | 8,057 |
| Redwire Corp. (a) | 536 | 8,823 |
| Rocket Lab USA, Inc. (a) | 9,236 | 235,241 |
| RTX Corp. | 8,753 | 1,012,897 |
| Spirit AeroSystems Holdings, Inc., Class A (a) | 600 | 20,448 |
| Textron, Inc. | 1,271 | 97,219 |
| TransDigm Group, Inc. | 355 | 449,884 |
| Triumph Group, Inc. (a) | 1,915 | 35,734 |
| V2X, Inc. (a) | 317 | 15,162 |
| Virgin Galactic Holdings, Inc. (a) | 569 | 3,346 |
| VirTra, Inc. (a) | 450 | 3,038 |
| Woodward, Inc. | 400 | 66,568 |
| | | 7,462,152 |
| Agricultural & Farm Machinery - 0.1% |
| AGCO Corp. | 423 | 39,542 |
| Alamo Group, Inc. | 270 | 50,196 |
| CNH Industrial NV | 5,600 | 63,448 |
| Deere & Co. | 1,641 | 695,292 |
| Lindsay Corp. | 284 | 33,600 |
| Titan International, Inc. (a) | 1,484 | 10,076 |
| Toro Co. | 768 | 61,517 |
| | | 953,671 |
| Agricultural Products & Services - 0.0%* |
| Alico, Inc. | 211 | 5,471 |
| Archer-Daniels-Midland Co. | 2,972 | 150,146 |
| Bunge Global SA | 837 | 65,085 |
| Darling Ingredients, Inc. (a) | 1,200 | 40,428 |
| Fresh Del Monte Produce, Inc. | 882 | 29,291 |
| Ingredion, Inc. | 444 | 61,077 |
| Limoneira Co. | 437 | 10,689 |
| | | 362,187 |
| Air Freight & Logistics - 0.1% |
| Air Transport Services Group, Inc. (a) | 1,335 | 29,343 |
| CH Robinson Worldwide, Inc. | 669 | 69,121 |
See Notes to Schedule of Investments and Notes to Financial Statements.
| State Street Total Return V.I.S. Fund | 1 |
State Street Total Return V.I.S. Fund
Schedule of Investments, continued — December 31, 2024
| | Number
of Shares | Fair
Value |
| Expeditors International of Washington, Inc. | 801 | $88,727 |
| FedEx Corp. | 1,472 | 414,118 |
| Forward Air Corp. (a) | 645 | 20,801 |
| GXO Logistics, Inc. (a) | 873 | 37,976 |
| Hub Group, Inc., Class A | 1,583 | 70,538 |
| Radiant Logistics, Inc. (a) | 1,024 | 6,861 |
| United Parcel Service, Inc., Class B | 4,692 | 591,661 |
| | | 1,329,146 |
| Airport Services - 0.0%* |
| Sky Harbour Group Corp. (a) | 277 | 3,305 |
| Alternative Carriers - 0.0%* |
| Anterix, Inc. (a) | 303 | 9,293 |
| AST SpaceMobile, Inc. (a) | 3,552 | 74,947 |
| Bandwidth, Inc., Class A (a) | 700 | 11,914 |
| Cogent Communications Holdings, Inc. | 1,168 | 90,018 |
| Globalstar, Inc. (a) | 19,124 | 39,587 |
| Iridium Communications, Inc. | 600 | 17,412 |
| Lumen Technologies, Inc. (a) | 26,746 | 142,021 |
| | | 385,192 |
| Aluminum - 0.0%* |
| Alcoa Corp. | 1,558 | 58,861 |
| Century Aluminum Co. (a) | 1,372 | 24,998 |
| Constellium SE (a) | 3,399 | 34,908 |
| Kaiser Aluminum Corp. | 418 | 29,373 |
| Tredegar Corp. (a) | 665 | 5,107 |
| | | 153,247 |
| Apparel Retail - 0.2% |
| Abercrombie & Fitch Co., Class A (a) | 1,335 | 199,542 |
| American Eagle Outfitters, Inc. | 4,694 | 78,249 |
| Boot Barn Holdings, Inc. (a) | 786 | 119,331 |
| Buckle, Inc. | 809 | 41,105 |
| Burlington Stores, Inc. (a) | 433 | 123,431 |
| Caleres, Inc. | 903 | 20,914 |
| Citi Trends, Inc. (a) | 190 | 4,988 |
| Designer Brands, Inc., Class A | 1,286 | 6,867 |
| Destination XL Group, Inc. (a) | 1,525 | 4,102 |
| Foot Locker, Inc. (a) | 2,200 | 47,872 |
| Gap, Inc. | 1,500 | 35,445 |
| Genesco, Inc. (a) | 279 | 11,927 |
| J Jill, Inc. | 179 | 4,944 |
| Lands' End, Inc. (a) | 413 | 5,427 |
| | Number
of Shares | Fair
Value |
| RealReal, Inc. (a) | 2,636 | $28,812 |
| Revolve Group, Inc. (a) | 1,003 | 33,591 |
| Ross Stores, Inc. | 2,085 | 315,398 |
| Shoe Carnival, Inc. | 501 | 16,573 |
| Stitch Fix, Inc., Class A (a) | 2,782 | 11,990 |
| ThredUp, Inc., Class A (a) | 2,078 | 2,888 |
| Tilly's, Inc., Class A (a) | 339 | 1,441 |
| TJX Cos., Inc. | 7,353 | 888,316 |
| Torrid Holdings, Inc. (a) | 305 | 1,595 |
| Urban Outfitters, Inc. (a) | 1,674 | 91,869 |
| Victoria's Secret & Co. (a) | 2,077 | 86,029 |
| Zumiez, Inc. (a) | 460 | 8,818 |
| | | 2,191,464 |
| Apparel, Accessories & Luxury Goods - 0.1% |
| Capri Holdings Ltd. (a) | 705 | 14,847 |
| Carter's, Inc. | 400 | 21,676 |
| Columbia Sportswear Co. | 200 | 16,786 |
| Figs, Inc., Class A (a) | 3,316 | 20,526 |
| G-III Apparel Group Ltd. (a) | 1,056 | 34,447 |
| Hanesbrands, Inc. (a) | 9,352 | 76,125 |
| Kontoor Brands, Inc. | 1,455 | 124,272 |
| Lululemon Athletica, Inc. (a) | 727 | 278,012 |
| Movado Group, Inc. | 468 | 9,210 |
| Oxford Industries, Inc. | 387 | 30,488 |
| PVH Corp. | 400 | 42,300 |
| Ralph Lauren Corp. | 300 | 69,294 |
| Superior Group of Cos., Inc. | 387 | 6,397 |
| Tapestry, Inc. | 1,374 | 89,764 |
| Under Armour, Inc., Class A (a) | 2,600 | 21,528 |
| Vera Bradley, Inc. (a) | 680 | 2,672 |
| VF Corp. | 2,100 | 45,066 |
| | | 903,410 |
| Application Software - 1.4% |
| 8x8, Inc. (a) | 3,505 | 9,358 |
| ACI Worldwide, Inc. (a) | 2,796 | 145,140 |
| Adobe, Inc. (a)(b) | 2,887 | 1,283,791 |
| Agilysys, Inc. (a) | 596 | 78,499 |
| Alarm.com Holdings, Inc. (a) | 1,251 | 76,061 |
| Alkami Technology, Inc. (a) | 1,378 | 50,545 |
| Altair Engineering, Inc., Class A (a) | 1,435 | 156,573 |
| Amplitude, Inc., Class A (a) | 1,969 | 20,773 |
| ANSYS, Inc. (a) | 571 | 192,615 |
| Appfolio, Inc., Class A (a) | 100 | 24,672 |
| AppLovin Corp., Class A (a) | 1,700 | 550,511 |
| Asana, Inc., Class A (a) | 2,134 | 43,256 |
See Notes to Schedule of Investments and Notes to Financial Statements.
| 2 | State Street Total Return V.I.S. Fund |
State Street Total Return V.I.S. Fund
Schedule of Investments, continued — December 31, 2024
| | Number
of Shares | Fair
Value |
| Aspen Technology, Inc. (a) | 120 | $29,956 |
| Atlassian Corp., Class A (a) | 996 | 242,407 |
| AudioEye, Inc. (a) | 175 | 2,662 |
| Aurora Innovation, Inc. (a) | 25,369 | 159,825 |
| Autodesk, Inc. (a) | 1,374 | 406,113 |
| AvePoint, Inc. (a) | 3,345 | 55,226 |
| Bentley Systems, Inc., Class B | 800 | 37,360 |
| Bill Holdings, Inc. (a) | 692 | 58,619 |
| Bit Digital, Inc. (a) | 3,062 | 8,972 |
| Blackbaud, Inc. (a) | 1,071 | 79,168 |
| BlackLine, Inc. (a) | 1,531 | 93,024 |
| Blend Labs, Inc., Class A (a) | 6,011 | 25,306 |
| Box, Inc., Class A (a) | 3,729 | 117,836 |
| Braze, Inc., Class A (a) | 1,742 | 72,955 |
| C3.ai, Inc., Class A (a) | 2,923 | 100,639 |
| Cadence Design Systems, Inc. (a) | 1,751 | 526,106 |
| CCC Intelligent Solutions Holdings, Inc. (a) | 3,000 | 35,190 |
| Cerence, Inc. (a) | 1,087 | 8,533 |
| Cipher Mining, Inc. (a) | 5,352 | 24,833 |
| Cleanspark, Inc. (a) | 6,576 | 60,565 |
| Clear Secure, Inc., Class A | 2,320 | 61,805 |
| Clearwater Analytics Holdings, Inc., Class A (a) | 4,740 | 130,445 |
| Confluent, Inc., Class A (a) | 1,800 | 50,328 |
| Consensus Cloud Solutions, Inc. (a) | 449 | 10,713 |
| CS Disco, Inc. (a) | 987 | 4,925 |
| Daily Journal Corp. (a) | 39 | 22,152 |
| Datadog, Inc., Class A (a) | 1,996 | 285,208 |
| Digimarc Corp. (a) | 426 | 15,954 |
| Digital Turbine, Inc. (a) | 2,741 | 4,632 |
| DocuSign, Inc. (a) | 1,289 | 115,933 |
| Domo, Inc., Class B (a) | 1,007 | 7,130 |
| DoubleVerify Holdings, Inc. (a) | 1,300 | 24,973 |
| Dropbox, Inc., Class A (a) | 1,900 | 57,076 |
| Dynatrace, Inc. (a) | 1,900 | 103,265 |
| E2open Parent Holdings, Inc. (a) | 5,209 | 13,856 |
| eGain Corp. (a) | 496 | 3,090 |
| Elastic NV (a) | 500 | 49,540 |
| Enfusion, Inc., Class A (a) | 1,359 | 13,998 |
| EverCommerce, Inc. (a) | 628 | 6,914 |
| Fair Isaac Corp. (a) | 155 | 308,594 |
| Five9, Inc. (a) | 500 | 20,320 |
| Freshworks, Inc., Class A (a) | 5,483 | 88,660 |
| Guidewire Software, Inc. (a) | 500 | 84,290 |
| HashiCorp, Inc., Class A (a) | 1,100 | 37,631 |
| HubSpot, Inc. (a) | 316 | 220,179 |
| | Number
of Shares | Fair
Value |
| Informatica, Inc., Class A (a) | 100 | $2,593 |
| Intapp, Inc. (a) | 1,409 | 90,303 |
| InterDigital, Inc. | 668 | 129,405 |
| Intuit, Inc. | 1,779 | 1,118,102 |
| Jamf Holding Corp. (a) | 2,141 | 30,081 |
| Kaltura, Inc. (a) | 2,236 | 4,919 |
| Life360, Inc. (a) | 271 | 11,184 |
| LiveRamp Holdings, Inc. (a) | 1,739 | 52,813 |
| Logility Supply Chain Solutions, Inc. | 944 | 10,460 |
| Manhattan Associates, Inc. (a) | 431 | 116,473 |
| MARA Holdings, Inc. (a) | 7,524 | 126,178 |
| Matterport, Inc. (a) | 6,940 | 32,896 |
| Meridianlink, Inc. (a) | 777 | 16,045 |
| MicroStrategy, Inc., Class A (a) | 1,100 | 318,582 |
| Mitek Systems, Inc. (a) | 1,324 | 14,736 |
| nCino, Inc. (a) | 500 | 16,790 |
| NCR Voyix Corp. (a) | 3,837 | 53,104 |
| NextNav, Inc. (a) | 1,955 | 30,420 |
| Nutanix, Inc., Class A (a) | 1,474 | 90,179 |
| Olo, Inc., Class A (a) | 2,677 | 20,559 |
| ON24, Inc. (a) | 770 | 4,974 |
| Ooma, Inc. (a) | 727 | 10,222 |
| Pagaya Technologies Ltd., Class A (a) | 951 | 8,835 |
| PagerDuty, Inc. (a) | 2,422 | 44,226 |
| Palantir Technologies, Inc., Class A (a) | 13,129 | 992,946 |
| Pegasystems, Inc. | 200 | 18,640 |
| Porch Group, Inc. (a) | 2,319 | 11,410 |
| Prairie Operating Co. (a) | 201 | 1,391 |
| Procore Technologies, Inc. (a) | 600 | 44,958 |
| PROS Holdings, Inc. (a) | 1,189 | 26,110 |
| PTC, Inc. (a) | 748 | 137,535 |
| Q2 Holdings, Inc. (a) | 1,555 | 156,511 |
| Red Violet, Inc. (a) | 292 | 10,570 |
| Rekor Systems, Inc. (a) | 2,882 | 4,496 |
| ReposiTrak, Inc. | 309 | 6,838 |
| Rimini Street, Inc. (a) | 1,465 | 3,912 |
| RingCentral, Inc., Class A (a) | 500 | 17,505 |
| Riot Platforms, Inc. (a) | 7,578 | 77,371 |
| Roper Technologies, Inc. | 697 | 362,335 |
| Salesforce, Inc. | 6,028 | 2,015,341 |
| SEMrush Holdings, Inc., Class A (a) | 1,035 | 12,296 |
| Smartsheet, Inc., Class A (a) | 1,000 | 56,030 |
| SoundHound AI, Inc., Class A (a) | 8,151 | 161,716 |
| SoundThinking, Inc. (a) | 247 | 3,226 |
See Notes to Schedule of Investments and Notes to Financial Statements.
| State Street Total Return V.I.S. Fund | 3 |
State Street Total Return V.I.S. Fund
Schedule of Investments, continued — December 31, 2024
| | Number
of Shares | Fair
Value |
| Sprinklr, Inc., Class A (a) | 3,083 | $26,051 |
| Sprout Social, Inc., Class A (a) | 1,294 | 39,739 |
| SPS Commerce, Inc. (a) | 987 | 181,598 |
| Synopsys, Inc. (a) | 990 | 480,506 |
| Terawulf, Inc. (a) | 7,071 | 40,022 |
| Tyler Technologies, Inc. (a) | 268 | 154,540 |
| Unity Software, Inc. (a) | 2,198 | 49,389 |
| Verint Systems, Inc. (a) | 1,603 | 44,002 |
| Vertex, Inc., Class A (a) | 1,436 | 76,611 |
| Viant Technology, Inc., Class A (a) | 391 | 7,425 |
| Weave Communications, Inc. (a) | 1,082 | 17,225 |
| WM Technology, Inc. (a) | 2,760 | 3,809 |
| Workday, Inc., Class A (a) | 1,410 | 363,822 |
| Workiva, Inc. (a) | 1,338 | 146,511 |
| Yext, Inc. (a) | 2,707 | 17,217 |
| Zeta Global Holdings Corp., Class A (a) | 4,759 | 85,614 |
| Zoom Communications, Inc. (a) | 1,674 | 136,615 |
| | | 14,864,612 |
| Asset Management & Custody Banks - 0.5% |
| Affiliated Managers Group, Inc. | 200 | 36,984 |
| AlTi Global, Inc. (a) | 936 | 4,128 |
| Ameriprise Financial, Inc. | 657 | 349,807 |
| ARES Management Corp., Class A | 1,222 | 216,331 |
| Artisan Partners Asset Management, Inc., Class A | 1,669 | 71,850 |
| Bank of New York Mellon Corp. | 4,806 | 369,245 |
| Blackrock, Inc. | 963 | 987,181 |
| Blackstone, Inc. | 4,612 | 795,201 |
| Blue Owl Capital, Inc. | 3,400 | 79,084 |
| Brightsphere Investment Group, Inc. | 713 | 18,780 |
| Carlyle Group, Inc. | 1,551 | 78,310 |
| Cohen & Steers, Inc. | 728 | 67,224 |
| Diamond Hill Investment Group, Inc. | 66 | 10,237 |
| DigitalBridge Group, Inc. | 4,190 | 47,263 |
| Franklin Resources, Inc. | 2,200 | 44,638 |
| GCM Grosvenor, Inc., Class A | 1,072 | 13,153 |
| Hamilton Lane, Inc., Class A | 1,019 | 150,863 |
| Invesco Ltd. | 1,900 | 33,212 |
| Janus Henderson Group PLC | 700 | 29,771 |
| KKR & Co., Inc. | 4,359 | 644,740 |
| | Number
of Shares | Fair
Value |
| Northern Trust Corp. | 1,332 | $136,530 |
| P10, Inc., Class A | 1,027 | 12,950 |
| SEI Investments Co. | 700 | 57,736 |
| Silvercrest Asset Management Group, Inc., Class A | 236 | 4,340 |
| State Street Corp. (c) | 1,861 | 182,657 |
| StepStone Group, Inc., Class A | 1,734 | 100,364 |
| T. Rowe Price Group, Inc. | 1,457 | 164,772 |
| TPG, Inc. | 500 | 31,420 |
| Victory Capital Holdings, Inc., Class A | 1,089 | 71,286 |
| Virtus Investment Partners, Inc. | 178 | 39,263 |
| WisdomTree, Inc. | 3,661 | 38,441 |
| | | 4,887,761 |
| Automobile Manufacturers - 0.8% |
| Canoo, Inc. (a) | 118 | 167 |
| Ford Motor Co. | 25,291 | 250,381 |
| General Motors Co. | 7,227 | 384,983 |
| Lucid Group, Inc. (a) | 7,700 | 23,254 |
| Rivian Automotive, Inc., Class A (a) | 5,000 | 66,500 |
| Stellantis NV | 12,933 | 168,181 |
| Tesla, Inc. (a) | 18,161 | 7,334,138 |
| Thor Industries, Inc. | 334 | 31,967 |
| Winnebago Industries, Inc. | 745 | 35,596 |
| | | 8,295,167 |
| Automotive Parts & Equipment - 0.1% |
| Adient PLC (a) | 2,357 | 40,611 |
| American Axle & Manufacturing Holdings, Inc. (a) | 2,959 | 17,251 |
| BorgWarner, Inc. | 1,286 | 40,882 |
| Cooper-Standard Holdings, Inc. (a) | 496 | 6,726 |
| Dana, Inc. | 3,420 | 39,535 |
| Dorman Products, Inc. (a) | 683 | 88,483 |
| Fox Factory Holding Corp. (a) | 1,109 | 33,569 |
| Gentex Corp. | 1,658 | 47,634 |
| Gentherm, Inc. (a) | 823 | 32,858 |
| Holley, Inc. (a) | 1,305 | 3,941 |
| LCI Industries | 657 | 67,927 |
| Lear Corp. | 300 | 28,410 |
| Luminar Technologies, Inc. (a) | 617 | 3,319 |
| Modine Manufacturing Co. (a) | 1,370 | 158,824 |
| Patrick Industries, Inc. | 858 | 71,283 |
| Phinia, Inc. | 1,105 | 53,228 |
See Notes to Schedule of Investments and Notes to Financial Statements.
| 4 | State Street Total Return V.I.S. Fund |
State Street Total Return V.I.S. Fund
Schedule of Investments, continued — December 31, 2024
| | Number
of Shares | Fair
Value |
| QuantumScape Corp. (a) | 2,200 | $11,418 |
| Solid Power, Inc. (a) | 4,732 | 8,944 |
| Standard Motor Products, Inc. | 537 | 16,636 |
| Stoneridge, Inc. (a) | 811 | 5,085 |
| Visteon Corp. (a) | 722 | 64,056 |
| XPEL, Inc. (a)(d) | 658 | 26,281 |
| | | 866,901 |
| Automotive Retail - 0.2% |
| Advance Auto Parts, Inc. | 398 | 18,821 |
| America's Car-Mart, Inc. (a) | 177 | 9,071 |
| Arko Corp. | 2,040 | 13,444 |
| Asbury Automotive Group, Inc. (a) | 520 | 126,376 |
| AutoNation, Inc. (a) | 182 | 30,911 |
| AutoZone, Inc. (a) | 111 | 355,422 |
| Camping World Holdings, Inc., Class A | 1,469 | 30,967 |
| CarMax, Inc. (a) | 1,000 | 81,760 |
| Carvana Co. (a) | 700 | 142,352 |
| EVgo, Inc. (a) | 2,568 | 10,400 |
| Group 1 Automotive, Inc. | 351 | 147,939 |
| Lithia Motors, Inc. | 200 | 71,486 |
| Monro, Inc. | 773 | 19,170 |
| Murphy USA, Inc. | 122 | 61,213 |
| OneWater Marine, Inc., Class A (a) | 361 | 6,274 |
| O'Reilly Automotive, Inc. (a) | 377 | 447,047 |
| Penske Automotive Group, Inc. | 170 | 25,915 |
| RumbleON, Inc., Class B (a) | 453 | 2,460 |
| Sonic Automotive, Inc., Class A | 411 | 26,037 |
| Valvoline, Inc. (a) | 600 | 21,708 |
| | | 1,648,773 |
| Biotechnology - 1.2% |
| 2seventy bio, Inc. (a) | 1,428 | 4,198 |
| 4D Molecular Therapeutics, Inc. (a) | 1,539 | 8,572 |
| 89bio, Inc. (a) | 2,212 | 17,298 |
| AbbVie, Inc. | 11,567 | 2,055,456 |
| Absci Corp. (a) | 2,200 | 5,764 |
| ACADIA Pharmaceuticals, Inc. (a) | 3,158 | 57,949 |
| ACELYRIN, Inc. (a) | 2,126 | 6,676 |
| Achieve Life Sciences, Inc. (a) | 1,024 | 3,604 |
| Acrivon Therapeutics, Inc. (a) | 376 | 2,264 |
| Actinium Pharmaceuticals, Inc. (a) | 1,134 | 1,429 |
| | Number
of Shares | Fair
Value |
| Acumen Pharmaceuticals, Inc. (a) | 1,387 | $2,386 |
| ADMA Biologics, Inc. (a) | 5,989 | 102,711 |
| Aduro Biotech, Inc. (a)(e)** | 4,580 | — |
| Adverum Biotechnologies, Inc. (a) | 518 | 2,419 |
| Aerovate Therapeutics, Inc. (a) | 429 | 1,137 |
| Agenus, Inc. (a) | 613 | 1,680 |
| Agios Pharmaceuticals, Inc. (a) | 1,499 | 49,257 |
| Akebia Therapeutics, Inc. (a) | 5,620 | 10,678 |
| Akero Therapeutics, Inc. (a) | 1,790 | 49,798 |
| Aldeyra Therapeutics, Inc. (a) | 1,318 | 6,577 |
| Alector, Inc. (a) | 2,277 | 4,304 |
| Alkermes PLC (a) | 4,255 | 122,374 |
| Allogene Therapeutics, Inc. (a) | 3,817 | 8,130 |
| Alnylam Pharmaceuticals, Inc. (a) | 781 | 183,777 |
| Altimmune, Inc. (a) | 2,015 | 14,528 |
| ALX Oncology Holdings, Inc. (a) | 812 | 1,356 |
| Amgen, Inc. | 3,443 | 897,384 |
| Amicus Therapeutics, Inc. (a) | 7,775 | 73,240 |
| AnaptysBio, Inc. (a) | 565 | 7,481 |
| Anavex Life Sciences Corp. (a) | 1,922 | 20,642 |
| Anika Therapeutics, Inc. (a) | 391 | 6,436 |
| Annexon, Inc. (a) | 2,846 | 14,600 |
| Apellis Pharmaceuticals, Inc. (a) | 600 | 19,146 |
| Apogee Therapeutics, Inc. (a) | 1,001 | 45,345 |
| Applied Therapeutics, Inc. (a) | 2,772 | 2,373 |
| Arbutus Biopharma Corp. (a) | 4,053 | 13,253 |
| Arcellx, Inc. (a) | 1,146 | 87,887 |
| Arcturus Therapeutics Holdings, Inc. (a) | 574 | 9,741 |
| Arcus Biosciences, Inc. (a) | 1,437 | 21,397 |
| Arcutis Biotherapeutics, Inc. (a) | 2,770 | 38,586 |
| Ardelyx, Inc. (a) | 6,056 | 30,704 |
| ArriVent Biopharma, Inc. (a) | 731 | 19,474 |
| Arrowhead Pharmaceuticals, Inc. (a) | 3,158 | 59,370 |
| ARS Pharmaceuticals, Inc. (a) | 1,403 | 14,802 |
| Astria Therapeutics, Inc. (a) | 1,278 | 11,425 |
| Atossa Therapeutics, Inc. (a) | 3,176 | 2,998 |
| Aura Biosciences, Inc. (a) | 1,304 | 10,719 |
| Avid Bioservices, Inc. (a) | 1,737 | 21,452 |
| Avidity Biosciences, Inc. (a) | 2,910 | 84,623 |
See Notes to Schedule of Investments and Notes to Financial Statements.
| State Street Total Return V.I.S. Fund | 5 |
State Street Total Return V.I.S. Fund
Schedule of Investments, continued — December 31, 2024
| | Number
of Shares | Fair
Value |
| Avita Medical, Inc. (a) | 754 | $9,651 |
| Beam Therapeutics, Inc. (a) | 2,019 | 50,071 |
| Bicara Therapeutics, Inc. (a) | 510 | 8,884 |
| BioCryst Pharmaceuticals, Inc. (a) | 5,431 | 40,841 |
| Biogen, Inc. (a) | 992 | 151,697 |
| Biohaven Ltd. (a) | 2,269 | 84,747 |
| BioMarin Pharmaceutical, Inc. (a) | 1,089 | 71,580 |
| Biomea Fusion, Inc. (a) | 869 | 3,372 |
| Black Diamond Therapeutics, Inc. (a) | 961 | 2,057 |
| Bluebird Bio, Inc. (a) | 282 | 2,352 |
| Blueprint Medicines Corp. (a) | 1,667 | 145,396 |
| Bridgebio Pharma, Inc. (a) | 3,730 | 102,351 |
| C4 Therapeutics, Inc. (a) | 1,632 | 5,875 |
| Cabaletta Bio, Inc. (a) | 1,422 | 3,228 |
| Candel Therapeutics, Inc. (a) | 482 | 4,184 |
| Capricor Therapeutics, Inc. (a) | 766 | 10,571 |
| Cardiff Oncology, Inc. (a) | 1,295 | 5,620 |
| CareDx, Inc. (a) | 1,319 | 28,240 |
| Cargo Therapeutics, Inc. (a) | 883 | 12,733 |
| Caribou Biosciences, Inc. (a) | 2,303 | 3,662 |
| Cartesian Therapeutics, Inc. (a) | 239 | 4,280 |
| Catalyst Pharmaceuticals, Inc. (a) | 2,957 | 61,713 |
| Celcuity, Inc. (a) | 671 | 8,783 |
| Celldex Therapeutics, Inc. (a) | 1,698 | 42,908 |
| Century Therapeutics, Inc. (a) | 921 | 930 |
| CervoMed, Inc. (a) | 222 | 519 |
| CG oncology, Inc. (a) | 1,249 | 35,821 |
| Chinook Therapeutics, Inc. (a) | 2,824 | 1,101 |
| Cibus, Inc. (a) | 582 | 1,618 |
| Climb Bio, Inc. (a) | 875 | 1,575 |
| Cogent Biosciences, Inc. (a) | 2,379 | 18,556 |
| Coherus Biosciences, Inc. (a) | 2,726 | 3,762 |
| Compass Therapeutics, Inc. (a) | 3,033 | 4,398 |
| Corbus Pharmaceuticals Holdings, Inc. (a) | 291 | 3,434 |
| Crinetics Pharmaceuticals, Inc. (a) | 2,333 | 119,286 |
| CSL Ltd. | 3,125 | 544,813 |
| Cullinan Therapeutics, Inc. (a) | 1,338 | 16,297 |
| Cytokinetics, Inc. (a) | 3,030 | 142,531 |
| Day One Biopharmaceuticals, Inc. (a) | 1,371 | 17,371 |
| Denali Therapeutics, Inc. (a) | 3,300 | 67,254 |
| Design Therapeutics, Inc. (a) | 759 | 4,683 |
| | Number
of Shares | Fair
Value |
| Dianthus Therapeutics, Inc. (a) | 632 | $13,778 |
| Disc Medicine, Inc. (a) | 516 | 32,714 |
| Dynavax Technologies Corp. (a) | 3,466 | 44,261 |
| Dyne Therapeutics, Inc. (a) | 2,131 | 50,206 |
| Editas Medicine, Inc. (a) | 2,530 | 3,213 |
| Elevation Oncology, Inc. (a) | 2,063 | 1,161 |
| Enanta Pharmaceuticals, Inc. (a) | 609 | 3,502 |
| Entrada Therapeutics, Inc. (a) | 690 | 11,930 |
| Erasca, Inc. (a) | 5,278 | 13,248 |
| Exact Sciences Corp. (a) | 1,300 | 73,047 |
| Exelixis, Inc. (a) | 1,800 | 59,940 |
| Fate Therapeutics, Inc. (a) | 2,800 | 4,620 |
| Fibrobiologics, Inc. (a) | 1,018 | 2,036 |
| Foghorn Therapeutics, Inc. (a) | 803 | 3,790 |
| Galectin Therapeutics, Inc. (a) | 922 | 1,189 |
| Generation Bio Co. (a) | 1,471 | 1,559 |
| Geron Corp. (a) | 15,376 | 54,431 |
| Gilead Sciences, Inc. | 8,111 | 749,213 |
| GRAIL, Inc. (a) | 195 | 3,481 |
| Greenwich Lifesciences, Inc. (a) | 244 | 2,740 |
| Gyre Therapeutics, Inc. (a) | 207 | 2,505 |
| Halozyme Therapeutics, Inc. (a) | 3,308 | 158,155 |
| Heron Therapeutics, Inc. (a) | 3,882 | 5,939 |
| HilleVax, Inc. (a) | 1,102 | 2,281 |
| Humacyte, Inc. (a) | 2,614 | 13,201 |
| Ideaya Biosciences, Inc. (a) | 2,198 | 56,489 |
| IGM Biosciences, Inc. (a) | 451 | 2,756 |
| ImmunityBio, Inc. (a) | 4,085 | 10,458 |
| Immunome, Inc. (a) | 1,438 | 15,272 |
| Immunovant, Inc. (a) | 1,527 | 37,824 |
| Incyte Corp. (a) | 1,046 | 72,247 |
| Inhibrx Biosciences, Inc. (a) | 398 | 6,129 |
| Inmune Bio, Inc. (a) | 404 | 1,887 |
| Inovio Pharmaceuticals, Inc. (a) | 677 | 1,239 |
| Inozyme Pharma, Inc. (a) | 1,382 | 3,828 |
| Insmed, Inc. (a) | 4,556 | 314,546 |
| Intellia Therapeutics, Inc. (a) | 2,532 | 29,523 |
| Invivyd, Inc. (a) | 2,358 | 1,045 |
| Ionis Pharmaceuticals, Inc. (a) | 1,100 | 38,456 |
| Iovance Biotherapeutics, Inc. (a) | 7,256 | 53,694 |
| Ironwood Pharmaceuticals, Inc. (a) | 3,621 | 16,041 |
| iTeos Therapeutics, Inc. (a) | 735 | 5,645 |
See Notes to Schedule of Investments and Notes to Financial Statements.
| 6 | State Street Total Return V.I.S. Fund |
State Street Total Return V.I.S. Fund
Schedule of Investments, continued — December 31, 2024
| | Number
of Shares | Fair
Value |
| Janux Therapeutics, Inc. (a) | 735 | $39,352 |
| Jasper Therapeutics, Inc. (a) | 302 | 6,457 |
| KalVista Pharmaceuticals, Inc. (a) | 901 | 7,631 |
| Keros Therapeutics, Inc. (a) | 777 | 12,300 |
| Kiniksa Pharmaceuticals International PLC (a) | 964 | 19,068 |
| Kodiak Sciences, Inc. (a) | 727 | 7,234 |
| Korro Bio, Inc. (a) | 189 | 7,195 |
| Krystal Biotech, Inc. (a) | 657 | 102,926 |
| Kura Oncology, Inc. (a) | 1,895 | 16,505 |
| Kymera Therapeutics, Inc. (a) | 1,175 | 47,270 |
| Kyverna Therapeutics, Inc. (a) | 501 | 1,874 |
| Larimar Therapeutics, Inc. (a) | 1,163 | 4,501 |
| Legend Biotech Corp. ADR (a) | 1,100 | 35,794 |
| LENZ Therapeutics, Inc. | 346 | 9,989 |
| Lexeo Therapeutics, Inc. (a) | 701 | 4,613 |
| Lexicon Pharmaceuticals, Inc. (a) | 2,985 | 2,204 |
| Lineage Cell Therapeutics, Inc. (a) | 5,431 | 2,729 |
| Lyell Immunopharma, Inc. (a) | 5,294 | 3,388 |
| MacroGenics, Inc. (a) | 1,629 | 5,294 |
| Madrigal Pharmaceuticals, Inc. (a) | 465 | 143,485 |
| MannKind Corp. (a) | 6,984 | 44,907 |
| MeiraGTx Holdings PLC (a) | 928 | 5,652 |
| Mersana Therapeutics, Inc. (a) | 3,319 | 4,746 |
| MiMedx Group, Inc. (a) | 3,069 | 29,524 |
| Mineralys Therapeutics, Inc. (a) | 791 | 9,737 |
| Mirum Pharmaceuticals, Inc. (a) | 1,030 | 42,590 |
| Moderna, Inc. (a) | 2,208 | 91,809 |
| Monte Rosa Therapeutics, Inc. (a) | 1,027 | 7,127 |
| Myriad Genetics, Inc. (a) | 2,347 | 32,177 |
| Natera, Inc. (a) | 700 | 110,810 |
| Neurocrine Biosciences, Inc. (a) | 700 | 95,550 |
| Neurogene, Inc. (a) | 289 | 6,607 |
| Nkarta, Inc. (a) | 1,447 | 3,603 |
| Novavax, Inc. (a) | 3,692 | 29,684 |
| Nurix Therapeutics, Inc. (a) | 1,855 | 34,948 |
| Nuvalent, Inc., Class A (a) | 918 | 71,861 |
| Ocugen, Inc. (a) | 7,101 | 5,716 |
| Olema Pharmaceuticals, Inc. (a) | 1,141 | 6,652 |
| Organogenesis Holdings, Inc. (a) | 2,077 | 6,646 |
| | Number
of Shares | Fair
Value |
| ORIC Pharmaceuticals, Inc. (a) | 1,627 | $13,130 |
| Outlook Therapeutics, Inc. (a) | 299 | 565 |
| Ovid therapeutics, Inc. (a) | 2,406 | 2,246 |
| PepGen, Inc. (a) | 389 | 1,474 |
| Perspective Therapeutics, Inc. (a) | 1,608 | 5,130 |
| Poseida Therapeutics, Inc. (a) | 1,814 | 17,414 |
| Praxis Precision Medicines, Inc. (a) | 452 | 34,786 |
| Precigen, Inc. (a) | 3,642 | 4,079 |
| Prelude Therapeutics, Inc. (a) | 429 | 547 |
| Prime Medicine, Inc. (a) | 1,599 | 4,669 |
| ProKidney Corp. (a) | 3,605 | 6,092 |
| Protagonist Therapeutics, Inc. (a) | 1,546 | 59,676 |
| PTC Therapeutics, Inc. (a) | 2,020 | 91,183 |
| Puma Biotechnology, Inc. (a) | 1,048 | 3,196 |
| Pyxis Oncology, Inc. (a) | 1,252 | 1,953 |
| Q32 Bio, Inc. (a) | 199 | 685 |
| RAPT Therapeutics, Inc. (a) | 1,175 | 1,857 |
| Recursion Pharmaceuticals, Inc., Class A (a) | 6,659 | 45,015 |
| Regeneron Pharmaceuticals, Inc. (a) | 678 | 482,960 |
| REGENXBIO, Inc. (a) | 1,320 | 10,204 |
| Regulus Therapeutics, Inc. (a) | 2,477 | 3,914 |
| Relay Therapeutics, Inc. (a) | 2,983 | 12,290 |
| Renovaro, Inc. (a) | 927 | 775 |
| Replimune Group, Inc. (a) | 1,566 | 18,964 |
| REVOLUTION Medicines, Inc. (a) | 4,440 | 194,206 |
| Rhythm Pharmaceuticals, Inc. (a) | 1,452 | 81,283 |
| Rigel Pharmaceuticals, Inc. (a) | 491 | 8,259 |
| Rocket Pharmaceuticals, Inc. (a) | 1,739 | 21,859 |
| Roivant Sciences Ltd. (a) | 2,500 | 29,575 |
| Sage Therapeutics, Inc. (a) | 1,598 | 8,677 |
| Sana Biotechnology, Inc. (a) | 3,950 | 6,438 |
| Sarepta Therapeutics, Inc. (a) | 600 | 72,954 |
| Savara, Inc. (a) | 3,431 | 10,533 |
| Scholar Rock Holding Corp. (a) | 2,048 | 88,515 |
| Sera Prognostics, Inc., Class A (a) | 728 | 5,926 |
| Shattuck Labs, Inc. (a) | 976 | 1,181 |
| Skye Bioscience, Inc. (a) | 673 | 1,905 |
| Soleno Therapeutics, Inc. (a) | 605 | 27,195 |
| Solid Biosciences, Inc. (a) | 576 | 2,304 |
See Notes to Schedule of Investments and Notes to Financial Statements.
| State Street Total Return V.I.S. Fund | 7 |
State Street Total Return V.I.S. Fund
Schedule of Investments, continued — December 31, 2024
| | Number
of Shares | Fair
Value |
| SpringWorks Therapeutics, Inc. (a) | 1,816 | $65,612 |
| Spyre Therapeutics, Inc. (a) | 906 | 21,092 |
| Stoke Therapeutics, Inc. (a) | 1,015 | 11,195 |
| Summit Therapeutics, Inc. (a) | 2,306 | 41,151 |
| Sutro Biopharma, Inc. (a) | 2,601 | 4,786 |
| Syndax Pharmaceuticals, Inc. (a) | 2,162 | 28,582 |
| Tango Therapeutics, Inc. (a) | 1,484 | 4,586 |
| Taysha Gene Therapies, Inc. (a) | 4,292 | 7,425 |
| Tenaya Therapeutics, Inc. (a) | 1,931 | 2,761 |
| Tevogen Bio Holdings, Inc. (a) | 907 | 934 |
| TG Therapeutics, Inc. (a) | 3,689 | 111,039 |
| Tourmaline Bio, Inc. (a) | 646 | 13,101 |
| Travere Therapeutics, Inc. (a) | 1,930 | 33,621 |
| TScan Therapeutics, Inc. (a) | 1,030 | 3,131 |
| Twist Bioscience Corp. (a) | 1,522 | 70,727 |
| Tyra Biosciences, Inc. (a) | 564 | 7,840 |
| Ultragenyx Pharmaceutical, Inc. (a) | 700 | 29,449 |
| United Therapeutics Corp. (a) | 311 | 109,733 |
| Upstream Bio, Inc. (a) | 460 | 7,562 |
| UroGen Pharma Ltd. (a) | 1,044 | 11,119 |
| Vanda Pharmaceuticals, Inc. (a) | 1,652 | 7,913 |
| Vaxcyte, Inc. (a) | 3,281 | 268,583 |
| Vera Therapeutics, Inc. (a) | 1,172 | 49,564 |
| Veracyte, Inc. (a) | 2,035 | 80,586 |
| Verastem, Inc. (a) | 1,102 | 5,697 |
| Vericel Corp. (a) | 1,282 | 70,395 |
| Vertex Pharmaceuticals, Inc. (a) | 1,688 | 679,758 |
| Verve Therapeutics, Inc. (a) | 2,017 | 11,376 |
| Viking Therapeutics, Inc. (a) | 700 | 28,168 |
| Vir Biotechnology, Inc. (a) | 2,316 | 16,999 |
| Viridian Therapeutics, Inc. (a) | 1,931 | 37,017 |
| Voyager Therapeutics, Inc. (a) | 1,279 | 7,252 |
| Werewolf Therapeutics, Inc. (a) | 1,319 | 1,952 |
| X4 Pharmaceuticals, Inc. (a) | 5,092 | 3,735 |
| XBiotech, Inc. (a) | 612 | 2,417 |
| Xencor, Inc. (a) | 1,779 | 40,881 |
| XOMA Royalty Corp. (a) | 239 | 6,281 |
| Y-mAbs Therapeutics, Inc. (a) | 931 | 7,290 |
| Zenas Biopharma, Inc. (a) | 406 | 3,325 |
| Zentalis Pharmaceuticals, Inc. (a) | 1,765 | 5,348 |
| Zymeworks, Inc. (a) | 1,441 | 21,096 |
| | | 12,510,212 |
| | Number
of Shares | Fair
Value |
| Brewers - 0.0%* |
| Boston Beer Co., Inc., Class A (a) | 14 | $4,200 |
| Molson Coors Beverage Co., Class B | 1,000 | 57,320 |
| | | 61,520 |
| Broadcasting - 0.0%* |
| AMC Networks, Inc., Class A (a) | 930 | 9,207 |
| EW Scripps Co., Class A (a) | 1,732 | 3,828 |
| Fox Corp., Class A | 1,600 | 77,728 |
| Fox Corp., Class B | 700 | 32,018 |
| Gray Television, Inc. | 2,647 | 8,338 |
| iHeartMedia, Inc., Class A (a) | 2,448 | 4,847 |
| Nexstar Media Group, Inc. | 224 | 35,385 |
| Paramount Global, Class B | 4,304 | 45,020 |
| Sinclair, Inc. | 809 | 13,057 |
| TEGNA, Inc. | 4,375 | 80,019 |
| Townsquare Media, Inc., Class A | 445 | 4,045 |
| | | 313,492 |
| Broadline Retail - 1.3% |
| 1stdibs.com, Inc. (a) | 606 | 2,145 |
| Amazon.com, Inc. (a) | 61,263 | 13,440,490 |
| eBay, Inc. | 3,248 | 201,214 |
| Etsy, Inc. (a) | 891 | 47,125 |
| Groupon, Inc. (a) | 617 | 7,496 |
| Kohl's Corp. | 500 | 7,020 |
| Macy's, Inc. | 2,000 | 33,860 |
| Nordstrom, Inc. | 700 | 16,905 |
| Ollie's Bargain Outlet Holdings, Inc. (a) | 400 | 43,892 |
| Savers Value Village, Inc. (a) | 696 | 7,134 |
| | | 13,807,281 |
| Building Products - 0.3% |
| A.O. Smith Corp. | 606 | 41,335 |
| AAON, Inc. | 400 | 47,072 |
| Advanced Drainage Systems, Inc. | 500 | 57,800 |
| Allegion PLC | 556 | 72,658 |
| American Woodmark Corp. (a) | 409 | 32,528 |
| Apogee Enterprises, Inc. | 576 | 41,132 |
| Armstrong World Industries, Inc. | 300 | 42,399 |
| AZEK Co., Inc. (a) | 1,000 | 47,470 |
| AZZ, Inc. | 776 | 63,570 |
| Builders FirstSource, Inc. (a) | 800 | 114,344 |
See Notes to Schedule of Investments and Notes to Financial Statements.
| 8 | State Street Total Return V.I.S. Fund |
State Street Total Return V.I.S. Fund
Schedule of Investments, continued — December 31, 2024
| | Number
of Shares | Fair
Value |
| Caesarstone Ltd. (a) | 615 | $2,614 |
| Carlisle Cos., Inc. | 315 | 116,185 |
| Carrier Global Corp. | 5,492 | 374,884 |
| CSW Industrials, Inc. | 439 | 154,879 |
| Fortune Brands Innovations, Inc. | 735 | 50,223 |
| Gibraltar Industries, Inc. (a) | 808 | 47,591 |
| Griffon Corp. | 995 | 70,914 |
| Hayward Holdings, Inc. (a) | 500 | 7,645 |
| Insteel Industries, Inc. | 474 | 12,803 |
| Janus International Group, Inc. (a) | 3,678 | 27,033 |
| JELD-WEN Holding, Inc. (a) | 2,232 | 18,280 |
| Johnson Controls International PLC | 4,395 | 346,897 |
| Lennox International, Inc. | 194 | 118,204 |
| Masco Corp. | 1,500 | 108,855 |
| Masterbrand, Inc. (a) | 3,344 | 48,856 |
| Owens Corning | 567 | 96,571 |
| Quanex Building Products Corp. | 1,159 | 28,094 |
| Resideo Technologies, Inc. (a) | 3,859 | 88,950 |
| Simpson Manufacturing Co., Inc. | 300 | 49,749 |
| Tecnoglass, Inc. | 591 | 46,878 |
| Trane Technologies PLC | 1,513 | 558,826 |
| Trex Co., Inc. (a) | 796 | 54,948 |
| UFP Industries, Inc. | 1,607 | 181,029 |
| Zurn Elkay Water Solutions Corp. | 3,819 | 142,449 |
| | | 3,313,665 |
| Cable & Satellite - 0.1% |
| Cable One, Inc. | 149 | 53,956 |
| Charter Communications, Inc., Class A (a) | 623 | 213,546 |
| Comcast Corp., Class A | 24,853 | 932,733 |
| EchoStar Corp., Class A (a) | 3,226 | 73,875 |
| Liberty Broadband Corp., Class C (a) | 800 | 59,808 |
| Sirius XM Holdings, Inc. | 1,383 | 31,532 |
| WideOpenWest, Inc. (a) | 1,461 | 7,247 |
| | | 1,372,697 |
| Cargo Ground Transportation - 0.1% |
| ArcBest Corp. | 623 | 58,138 |
| Covenant Logistics Group, Inc. | 202 | 11,011 |
| Heartland Express, Inc. | 1,183 | 13,273 |
| | Number
of Shares | Fair
Value |
| JB Hunt Transport Services, Inc. | 554 | $94,546 |
| Knight-Swift Transportation Holdings, Inc. | 1,122 | 59,511 |
| Landstar System, Inc. | 244 | 41,934 |
| Marten Transport Ltd. | 1,511 | 23,587 |
| Old Dominion Freight Line, Inc. | 1,268 | 223,675 |
| PAMT Corp. (a) | 196 | 3,210 |
| Proficient Auto Logistics, Inc. (a) | 450 | 3,632 |
| RXO, Inc. (a) | 4,214 | 100,462 |
| Ryder System, Inc. | 294 | 46,117 |
| Saia, Inc. (a) | 176 | 80,208 |
| U-Haul Holding Co. | 647 | 41,440 |
| Universal Logistics Holdings, Inc. | 204 | 9,372 |
| Werner Enterprises, Inc. | 1,631 | 58,586 |
| XPO, Inc. (a) | 800 | 104,920 |
| | | 973,622 |
| Casinos & Gaming - 0.1% |
| Accel Entertainment, Inc. (a) | 1,313 | 14,023 |
| Bally's Corp. (a) | 633 | 11,324 |
| Boyd Gaming Corp. | 400 | 29,016 |
| Caesars Entertainment, Inc. (a) | 1,559 | 52,102 |
| Churchill Downs, Inc. | 500 | 66,770 |
| DraftKings, Inc., Class A (a) | 3,100 | 115,320 |
| Everi Holdings, Inc. (a) | 2,055 | 27,763 |
| Full House Resorts, Inc. (a) | 841 | 3,431 |
| Golden Entertainment, Inc. | 515 | 16,274 |
| Inspired Entertainment, Inc. (a) | 630 | 5,701 |
| International Game Technology PLC | 3,007 | 53,104 |
| Las Vegas Sands Corp. | 2,459 | 126,294 |
| Light & Wonder, Inc. (a) | 600 | 51,828 |
| MGM Resorts International (a) | 1,700 | 58,905 |
| Monarch Casino & Resort, Inc. | 334 | 26,353 |
| Penn Entertainment, Inc. (a) | 700 | 13,874 |
| PlayAGS, Inc. (a) | 1,141 | 13,156 |
| Red Rock Resorts, Inc., Class A | 1,301 | 60,158 |
| Rush Street Interactive, Inc. (a) | 1,966 | 26,974 |
| Wynn Resorts Ltd. | 570 | 49,111 |
| | | 821,481 |
See Notes to Schedule of Investments and Notes to Financial Statements.
| State Street Total Return V.I.S. Fund | 9 |
State Street Total Return V.I.S. Fund
Schedule of Investments, continued — December 31, 2024
| | Number
of Shares | Fair
Value |
| Coal & Consumable Fuels - 0.0%* |
| Centrus Energy Corp., Class A (a) | 369 | $24,579 |
| CONSOL Energy, Inc. | 777 | 82,890 |
| Energy Fuels, Inc. (a) | 4,825 | 24,752 |
| Hallador Energy Co. (a) | 660 | 7,557 |
| NACCO Industries, Inc., Class A | 108 | 3,221 |
| Peabody Energy Corp. | 3,356 | 70,275 |
| Uranium Energy Corp. (a) | 10,568 | 70,700 |
| Ur-Energy, Inc. (a) | 10,086 | 11,599 |
| | | 295,573 |
| Commercial & Residential Mortgage Finance - 0.1% |
| Enact Holdings, Inc. | 760 | 24,609 |
| Essent Group Ltd. | 2,758 | 150,145 |
| Federal Agricultural Mortgage Corp., Class C | 241 | 47,465 |
| Merchants Bancorp | 510 | 18,600 |
| MGIC Investment Corp. | 1,700 | 40,307 |
| Mr. Cooper Group, Inc. (a) | 1,667 | 160,049 |
| NMI Holdings, Inc. (a) | 2,078 | 76,387 |
| Onity Group, Inc. (a) | 166 | 5,098 |
| PennyMac Financial Services, Inc. | 708 | 72,315 |
| Radian Group, Inc. | 4,015 | 127,356 |
| Rocket Cos., Inc., Class A (a) | 500 | 5,630 |
| Velocity Financial, Inc. (a) | 230 | 4,499 |
| Walker & Dunlop, Inc. | 853 | 82,920 |
| Waterstone Financial, Inc. | 480 | 6,451 |
| | | 821,831 |
| Commercial Printing - 0.0%* |
| Deluxe Corp. | 1,151 | 26,001 |
| Ennis, Inc. | 709 | 14,953 |
| Quad/Graphics, Inc. | 845 | 5,890 |
| | | 46,844 |
| Commodity Chemicals - 0.1% |
| AdvanSix, Inc. | 719 | 20,484 |
| Cabot Corp. | 1,417 | 129,386 |
| Core Molding Technologies, Inc. (a) | 197 | 3,258 |
| Dow, Inc. | 4,786 | 192,062 |
| Hawkins, Inc. | 511 | 62,684 |
| Koppers Holdings, Inc. | 526 | 17,043 |
| Kronos Worldwide, Inc. | 650 | 6,338 |
| LyondellBasell Industries NV, Class A | 1,734 | 128,784 |
| | Number
of Shares | Fair
Value |
| Mativ Holdings, Inc. | 1,426 | $15,544 |
| Olin Corp. | 990 | 33,462 |
| PureCycle Technologies, Inc. (a) | 3,237 | 33,179 |
| Tronox Holdings PLC | 3,110 | 31,318 |
| Westlake Corp. | 200 | 22,930 |
| | | 696,472 |
| Communications Equipment - 0.3% |
| ADTRAN Holdings, Inc. (a) | 2,009 | 16,735 |
| Applied Optoelectronics, Inc. (a) | 1,031 | 38,003 |
| Arista Networks, Inc. (a) | 6,756 | 746,741 |
| Aviat Networks, Inc. (a) | 345 | 6,248 |
| Calix, Inc. (a) | 1,549 | 54,014 |
| Ciena Corp. (a) | 879 | 74,548 |
| Cisco Systems, Inc. | 26,416 | 1,563,827 |
| Clearfield, Inc. (a) | 359 | 11,129 |
| CommScope Holding Co., Inc. (a) | 5,479 | 28,545 |
| Digi International, Inc. (a) | 929 | 28,084 |
| Extreme Networks, Inc. (a) | 3,314 | 55,476 |
| F5, Inc. (a) | 400 | 100,588 |
| Harmonic, Inc. (a) | 2,892 | 38,261 |
| Infinera Corp. (a) | 5,839 | 38,362 |
| Juniper Networks, Inc. | 2,255 | 84,450 |
| Lumentum Holdings, Inc. (a) | 400 | 33,580 |
| Motorola Solutions, Inc. | 1,047 | 483,955 |
| NETGEAR, Inc. (a) | 786 | 21,906 |
| NetScout Systems, Inc. (a) | 1,816 | 39,334 |
| Ribbon Communications, Inc. (a) | 2,757 | 11,469 |
| Viasat, Inc. (a) | 3,222 | 27,419 |
| Viavi Solutions, Inc. (a) | 5,816 | 58,742 |
| | | 3,561,416 |
| Computer & Electronics Retail - 0.0%* |
| Best Buy Co., Inc. | 1,438 | 123,380 |
| GameStop Corp., Class A (a) | 2,200 | 68,948 |
| | | 192,328 |
| Construction & Engineering - 0.2% |
| AECOM | 800 | 85,456 |
| Ameresco, Inc., Class A (a) | 834 | 19,582 |
| API Group Corp. (a) | 1,400 | 50,358 |
| Arcosa, Inc. | 1,286 | 124,408 |
| Argan, Inc. | 326 | 44,675 |
| Bowman Consulting Group Ltd. (a) | 369 | 9,206 |
See Notes to Schedule of Investments and Notes to Financial Statements.
| 10 | State Street Total Return V.I.S. Fund |
State Street Total Return V.I.S. Fund
Schedule of Investments, continued — December 31, 2024
| | Number
of Shares | Fair
Value |
| Centuri Holdings, Inc. (a) | 407 | $7,859 |
| Comfort Systems USA, Inc. | 241 | 102,198 |
| Concrete Pumping Holdings, Inc. (a) | 590 | 3,929 |
| Construction Partners, Inc., Class A (a) | 1,134 | 100,314 |
| Dycom Industries, Inc. (a) | 753 | 131,067 |
| EMCOR Group, Inc. | 294 | 133,447 |
| Everus Construction Group, Inc. (a) | 375 | 24,656 |
| Ferrovial SE | 3,132 | 131,673 |
| Fluor Corp. (a) | 4,535 | 223,666 |
| Granite Construction, Inc. | 1,170 | 102,621 |
| Great Lakes Dredge & Dock Corp. (a) | 1,702 | 19,216 |
| IES Holdings, Inc. (a) | 217 | 43,608 |
| Limbach Holdings, Inc. (a) | 264 | 22,583 |
| MasTec, Inc. (a) | 400 | 54,456 |
| Matrix Service Co. (a) | 714 | 8,547 |
| MYR Group, Inc. (a) | 423 | 62,930 |
| Northwest Pipe Co. (a) | 244 | 11,775 |
| Orion Group Holdings, Inc. (a) | 926 | 6,788 |
| Primoris Services Corp. | 1,412 | 107,877 |
| Quanta Services, Inc. | 938 | 296,455 |
| Southland Holdings, Inc. (a) | 505 | 1,641 |
| Sterling Infrastructure, Inc. (a) | 788 | 132,739 |
| Tutor Perini Corp. (a) | 1,132 | 27,394 |
| Valmont Industries, Inc. | 139 | 42,627 |
| WillScot Holdings Corp. (a) | 1,400 | 46,830 |
| | | 2,180,581 |
| Construction Machinery & Heavy Transportation Equipment - 0.3% |
| Allison Transmission Holdings, Inc. | 600 | 64,836 |
| Astec Industries, Inc. | 590 | 19,824 |
| Atmus Filtration Technologies, Inc. | 2,223 | 87,097 |
| Blue Bird Corp. (a) | 841 | 32,488 |
| Caterpillar, Inc. | 3,145 | 1,140,880 |
| Commercial Vehicle Group, Inc. (a) | 1,297 | 3,216 |
| Cummins, Inc. | 857 | 298,750 |
| Douglas Dynamics, Inc. | 576 | 13,611 |
| Federal Signal Corp. | 1,594 | 147,270 |
| Greenbrier Cos., Inc. | 809 | 49,341 |
| Hyliion Holdings Corp. (a) | 3,686 | 9,620 |
| Manitowoc Co., Inc. (a) | 911 | 8,317 |
| Miller Industries, Inc. | 287 | 18,758 |
| Oshkosh Corp. | 300 | 28,521 |
| | Number
of Shares | Fair
Value |
| PACCAR, Inc. | 3,305 | $343,786 |
| REV Group, Inc. | 1,348 | 42,961 |
| Shyft Group, Inc. | 893 | 10,484 |
| Terex Corp. | 1,768 | 81,717 |
| Trinity Industries, Inc. | 2,166 | 76,027 |
| Twin Disc, Inc. | 273 | 3,208 |
| Wabash National Corp. | 1,128 | 19,323 |
| Westinghouse Air Brake Technologies Corp. | 1,141 | 216,322 |
| | | 2,716,357 |
| Construction Materials - 0.2% |
| CRH PLC | 4,500 | 416,340 |
| Eagle Materials, Inc. | 200 | 49,352 |
| Holcim AG | 3,359 | 323,885 |
| James Hardie Industries PLC CDI (a) | 2,851 | 88,383 |
| Knife River Corp. (a) | 1,506 | 153,070 |
| Martin Marietta Materials, Inc. | 406 | 209,699 |
| Smith-Midland Corp. (a) | 110 | 4,891 |
| Summit Materials, Inc., Class A (a) | 3,211 | 162,477 |
| U.S. Lime & Minerals, Inc. | 276 | 36,636 |
| Vulcan Materials Co. | 831 | 213,758 |
| | | 1,658,491 |
| Consumer Electronics - 0.0%* |
| Garmin Ltd. | 984 | 202,960 |
| GoPro, Inc., Class A (a) | 3,593 | 3,916 |
| Sonos, Inc. (a) | 3,242 | 48,760 |
| | | 255,636 |
| Consumer Finance - 0.3% |
| Ally Financial, Inc. | 1,527 | 54,987 |
| American Express Co. | 3,657 | 1,085,361 |
| Atlanticus Holdings Corp. (a) | 134 | 7,474 |
| Bread Financial Holdings, Inc. | 1,317 | 80,416 |
| Capital One Financial Corp. | 2,510 | 447,583 |
| Consumer Portfolio Services, Inc. (a) | 167 | 1,814 |
| Credit Acceptance Corp. (a) | 39 | 18,309 |
| Dave, Inc. (a) | 218 | 18,949 |
| Discover Financial Services | 1,675 | 290,160 |
| Encore Capital Group, Inc. (a) | 611 | 29,187 |
| Enova International, Inc. (a) | 674 | 64,623 |
| FirstCash Holdings, Inc. | 1,023 | 105,983 |
| Green Dot Corp., Class A (a) | 1,512 | 16,088 |
| LendingClub Corp. (a) | 2,872 | 46,498 |
| LendingTree, Inc. (a) | 284 | 11,005 |
See Notes to Schedule of Investments and Notes to Financial Statements.
| State Street Total Return V.I.S. Fund | 11 |
State Street Total Return V.I.S. Fund
Schedule of Investments, continued — December 31, 2024
| | Number
of Shares | Fair
Value |
| Medallion Financial Corp. | 468 | $4,395 |
| Moneylion, Inc. (a) | 239 | 20,556 |
| Navient Corp. | 2,062 | 27,404 |
| Nelnet, Inc., Class A | 373 | 39,840 |
| NerdWallet, Inc., Class A (a) | 1,005 | 13,366 |
| OneMain Holdings, Inc. | 600 | 31,278 |
| OppFi, Inc. | 510 | 3,907 |
| PRA Group, Inc. (a) | 1,004 | 20,974 |
| PROG Holdings, Inc. | 1,095 | 46,275 |
| Regional Management Corp. | 226 | 7,679 |
| SLM Corp. | 1,200 | 33,096 |
| SoFi Technologies, Inc. (a) | 6,800 | 104,720 |
| Synchrony Financial | 2,542 | 165,230 |
| Upstart Holdings, Inc. (a) | 2,042 | 125,726 |
| World Acceptance Corp. (a) | 101 | 11,356 |
| | | 2,934,239 |
| Consumer Staples Merchandise Retail - 0.6% |
| BJ's Wholesale Club Holdings, Inc. (a) | 800 | 71,480 |
| Costco Wholesale Corp. | 2,887 | 2,645,272 |
| Dollar General Corp. | 1,537 | 116,535 |
| Dollar Tree, Inc. (a) | 1,326 | 99,370 |
| PriceSmart, Inc. | 662 | 61,017 |
| Target Corp. | 2,974 | 402,025 |
| Walmart, Inc. | 28,275 | 2,554,646 |
| | | 5,950,345 |
| Copper - 0.0%* |
| Freeport-McMoRan, Inc. | 9,198 | 350,260 |
| Data Center REITs - 0.1% |
| Digital Realty Trust, Inc. | 2,171 | 384,983 |
| Equinix, Inc. | 638 | 601,564 |
| | | 986,547 |
| Data Processing & Outsourced Services - 0.1% |
| Broadridge Financial Solutions, Inc. | 747 | 168,889 |
| Concentrix Corp. | 452 | 19,558 |
| Conduent, Inc. (a) | 4,178 | 16,879 |
| CSG Systems International, Inc. | 778 | 39,763 |
| ExlService Holdings, Inc. (a) | 4,171 | 185,109 |
| Genpact Ltd. | 1,200 | 51,540 |
| IBEX Holdings Ltd. (a) | 222 | 4,771 |
| Maximus, Inc. | 1,589 | 118,619 |
| SS&C Technologies Holdings, Inc. | 1,400 | 106,092 |
| | Number
of Shares | Fair
Value |
| TTEC Holdings, Inc. | 439 | $2,191 |
| Verra Mobility Corp. (a) | 4,355 | 105,304 |
| | | 818,715 |
| Distillers & Vintners - 0.0%* |
| Brown-Forman Corp., Class A | 200 | 7,538 |
| Brown-Forman Corp., Class B | 1,135 | 43,107 |
| Constellation Brands, Inc., Class A | 1,008 | 222,768 |
| MGP Ingredients, Inc. | 361 | 14,213 |
| | | 287,626 |
| Distributors - 0.0%* |
| A-Mark Precious Metals, Inc. | 505 | 13,837 |
| Genuine Parts Co. | 900 | 105,084 |
| LKQ Corp. | 1,446 | 53,140 |
| Pool Corp. | 253 | 86,258 |
| Weyco Group, Inc. | 160 | 6,008 |
| | | 264,327 |
| Diversified Banks - 1.0% |
| Bank of America Corp. | 43,481 | 1,910,990 |
| Citigroup, Inc. | 12,410 | 873,540 |
| Comerica, Inc. | 964 | 59,623 |
| Fifth Third Bancorp | 4,633 | 195,883 |
| First Citizens BancShares, Inc., Class A | 81 | 171,154 |
| JPMorgan Chase & Co. | 18,353 | 4,399,398 |
| KeyCorp | 5,851 | 100,286 |
| PNC Financial Services Group, Inc. | 2,615 | 504,303 |
| U.S. Bancorp | 10,100 | 483,083 |
| Wells Fargo & Co. | 21,791 | 1,530,600 |
| | | 10,228,860 |
| Diversified Capital Markets - 0.0%* |
| Forge Global Holdings, Inc. (a) | 3,177 | 2,957 |
| Diversified Chemicals - 0.0%* |
| Chemours Co. | 1,400 | 23,660 |
| Huntsman Corp. | 1,211 | 21,834 |
| LSB Industries, Inc. (a) | 1,335 | 10,133 |
| | | 55,627 |
| Diversified Financial Services - 0.1% |
| Alerus Financial Corp. | 654 | 12,583 |
| Apollo Global Management, Inc. | 3,454 | 570,463 |
| Corebridge Financial, Inc. | 1,751 | 52,407 |
See Notes to Schedule of Investments and Notes to Financial Statements.
| 12 | State Street Total Return V.I.S. Fund |
State Street Total Return V.I.S. Fund
Schedule of Investments, continued — December 31, 2024
| | Number
of Shares | Fair
Value |
| Equitable Holdings, Inc. | 2,100 | $99,057 |
| Jackson Financial, Inc., Class A | 1,982 | 172,593 |
| NewtekOne, Inc. | 704 | 8,990 |
| Voya Financial, Inc. | 700 | 48,181 |
| | | 964,274 |
| Diversified Metals & Mining - 0.0%* |
| Compass Minerals International, Inc. | 864 | 9,720 |
| Contango ORE, Inc. (a) | 349 | 3,497 |
| Ferroglobe PLC (a)(e)** | 1,316 | — |
| Ivanhoe Electric, Inc. (a) | 2,164 | 16,338 |
| Materion Corp. | 544 | 53,791 |
| MP Materials Corp. (a) | 800 | 12,480 |
| Piedmont Lithium, Inc. (a) | 521 | 4,553 |
| | | 100,379 |
| Diversified Real Estate Activities - 0.0%* |
| RMR Group, Inc., Class A | 468 | 9,660 |
| St. Joe Co. | 950 | 42,683 |
| Tejon Ranch Co. (a) | 635 | 10,097 |
| | | 62,440 |
| Diversified REITs - 0.1% |
| Alexander & Baldwin, Inc. | 1,908 | 33,848 |
| Alpine Income Property Trust, Inc. | 359 | 6,028 |
| American Assets Trust, Inc. | 1,254 | 32,930 |
| Armada Hoffler Properties, Inc. | 2,083 | 21,309 |
| Broadstone Net Lease, Inc. | 5,001 | 79,316 |
| CTO Realty Growth, Inc. | 650 | 12,812 |
| Empire State Realty Trust, Inc., Class A | 3,514 | 36,265 |
| Essential Properties Realty Trust, Inc. | 4,651 | 145,483 |
| Gladstone Commercial Corp. | 1,027 | 16,678 |
| Global Net Lease, Inc. | 5,270 | 38,471 |
| NexPoint Diversified Real Estate Trust | 943 | 5,752 |
| One Liberty Properties, Inc. | 397 | 10,814 |
| WP Carey, Inc. | 1,331 | 72,513 |
| | | 512,219 |
| Diversified Support Services - 0.1% |
| ACV Auctions, Inc., Class A (a) | 3,921 | 84,694 |
| Bridger Aerospace Group Holdings, Inc. (a) | 509 | 1,084 |
| | Number
of Shares | Fair
Value |
| Cintas Corp. | 2,252 | $411,440 |
| Copart, Inc. (a) | 5,696 | 326,893 |
| Driven Brands Holdings, Inc. (a) | 1,556 | 25,114 |
| Healthcare Services Group, Inc. (a) | 1,905 | 22,127 |
| Liquidity Services, Inc. (a) | 567 | 18,308 |
| Matthews International Corp., Class A | 763 | 21,120 |
| OPENLANE, Inc. (a) | 2,833 | 56,207 |
| UniFirst Corp. | 399 | 68,265 |
| Vestis Corp. | 550 | 8,382 |
| Viad Corp. (a) | 530 | 22,530 |
| VSE Corp. | 465 | 44,222 |
| | | 1,110,386 |
| Drug Retail - 0.0%* |
| Guardian Pharmacy Services, Inc., Class A (a) | 227 | 4,599 |
| Walgreens Boots Alliance, Inc. | 5,287 | 49,328 |
| | | 53,927 |
| Education Services - 0.1% |
| Adtalem Global Education, Inc. (a) | 994 | 90,305 |
| American Public Education, Inc. (a) | 419 | 9,038 |
| Bright Horizons Family Solutions, Inc. (a) | 391 | 43,342 |
| Chegg, Inc. (a) | 2,651 | 4,268 |
| Coursera, Inc. (a) | 3,575 | 30,388 |
| Duolingo, Inc. (a) | 200 | 64,846 |
| Graham Holdings Co., Class B | 84 | 73,241 |
| Grand Canyon Education, Inc. (a) | 200 | 32,760 |
| KinderCare Learning Cos., Inc. (a) | 736 | 13,101 |
| Laureate Education, Inc. (a) | 3,442 | 62,954 |
| Lincoln Educational Services Corp. (a) | 690 | 10,916 |
| Nerdy, Inc. (a) | 2,003 | 3,245 |
| Perdoceo Education Corp. | 1,722 | 45,581 |
| Strategic Education, Inc. | 586 | 54,744 |
| Stride, Inc. (a) | 1,127 | 117,129 |
| Udemy, Inc. (a) | 2,405 | 19,793 |
| Universal Technical Institute, Inc. (a) | 1,019 | 26,199 |
| | | 701,850 |
See Notes to Schedule of Investments and Notes to Financial Statements.
| State Street Total Return V.I.S. Fund | 13 |
State Street Total Return V.I.S. Fund
Schedule of Investments, continued — December 31, 2024
| | Number
of Shares | Fair
Value |
| Electric Utilities - 0.5% |
| ALLETE, Inc. | 1,542 | $99,922 |
| Alliant Energy Corp. | 1,656 | 97,936 |
| American Electric Power Co., Inc. | 3,488 | 321,698 |
| Constellation Energy Corp. | 2,107 | 471,357 |
| Duke Energy Corp. | 5,088 | 548,181 |
| Edison International | 2,511 | 200,478 |
| Entergy Corp. | 2,768 | 209,870 |
| Evergy, Inc. | 1,387 | 85,370 |
| Eversource Energy | 2,214 | 127,150 |
| Exelon Corp. | 6,388 | 240,444 |
| FirstEnergy Corp. | 3,628 | 144,322 |
| Genie Energy Ltd., Class B | 372 | 5,799 |
| Hawaiian Electric Industries, Inc. (a) | 4,353 | 42,355 |
| IDACORP, Inc. | 300 | 32,784 |
| MGE Energy, Inc. | 968 | 90,953 |
| NextEra Energy, Inc. | 13,357 | 957,563 |
| NRG Energy, Inc. | 1,261 | 113,767 |
| OGE Energy Corp. | 1,550 | 63,938 |
| Otter Tail Corp. | 1,097 | 81,003 |
| PG&E Corp. | 13,900 | 280,502 |
| Pinnacle West Capital Corp. | 684 | 57,983 |
| Portland General Electric Co. | 2,691 | 117,381 |
| PPL Corp. | 4,900 | 159,054 |
| Southern Co. | 7,207 | 593,280 |
| TXNM Energy, Inc. | 2,383 | 117,172 |
| Xcel Energy, Inc. | 3,873 | 261,505 |
| | | 5,521,767 |
| Electrical Components & Equipment - 0.4% |
| Acuity Brands, Inc. | 200 | 58,426 |
| Allient, Inc. | 395 | 9,591 |
| American Superconductor Corp. (a) | 914 | 22,512 |
| AMETEK, Inc. | 1,527 | 275,257 |
| Array Technologies, Inc. (a) | 4,035 | 24,371 |
| Atkore, Inc. | 947 | 79,027 |
| Blink Charging Co. (a) | 2,861 | 3,977 |
| ChargePoint Holdings, Inc. (a) | 11,595 | 12,407 |
| Eaton Corp. PLC | 2,618 | 868,836 |
| Emerson Electric Co. | 3,729 | 462,135 |
| EnerSys | 1,062 | 98,161 |
| Enovix Corp. (a) | 4,024 | 43,741 |
| Fluence Energy, Inc. (a) | 1,592 | 25,281 |
| FuelCell Energy, Inc. (a) | 465 | 4,204 |
| Generac Holdings, Inc. (a) | 398 | 61,710 |
| GrafTech International Ltd. (a) | 6,547 | 11,326 |
| | Number
of Shares | Fair
Value |
| Hubbell, Inc. | 359 | $150,381 |
| LSI Industries, Inc. | 757 | 14,701 |
| NEXTracker, Inc., Class A (a) | 3,823 | 139,654 |
| nVent Electric PLC | 1,000 | 68,160 |
| Plug Power, Inc. (a) | 21,072 | 44,883 |
| Powell Industries, Inc. | 248 | 54,969 |
| Preformed Line Products Co. | 73 | 9,329 |
| Regal Rexnord Corp. | 467 | 72,446 |
| Rockwell Automation, Inc. | 722 | 206,340 |
| Schneider Electric SE | 3,532 | 881,064 |
| Sensata Technologies Holding PLC | 1,000 | 27,400 |
| SES AI Corp. (a) | 3,153 | 6,905 |
| Shoals Technologies Group, Inc., Class A (a) | 4,453 | 24,625 |
| Stem, Inc. (a) | 5,829 | 3,515 |
| Sunrun, Inc. (a) | 5,770 | 53,372 |
| Thermon Group Holdings, Inc. (a) | 866 | 24,915 |
| Ultralife Corp. (a) | 299 | 2,227 |
| Vertiv Holdings Co., Class A | 2,293 | 260,508 |
| Vicor Corp. (a) | 597 | 28,847 |
| | | 4,135,203 |
| Electronic Components - 0.1% |
| Amphenol Corp., Class A | 7,698 | 534,626 |
| Bel Fuse, Inc., Class A | 44 | 3,964 |
| Bel Fuse, Inc., Class B | 273 | 22,514 |
| Belden, Inc. | 1,074 | 120,943 |
| Coherent Corp. (a) | 773 | 73,226 |
| Corning, Inc. | 4,917 | 233,656 |
| Knowles Corp. (a) | 2,286 | 45,560 |
| Lightwave Logic, Inc. (a) | 3,611 | 7,583 |
| Littelfuse, Inc. | 100 | 23,565 |
| Rogers Corp. (a) | 495 | 50,297 |
| Vishay Intertechnology, Inc. | 3,334 | 56,478 |
| | | 1,172,412 |
| Electronic Equipment & Instruments - 0.2% |
| 908 Devices, Inc. (a) | 943 | 2,075 |
| Advanced Energy Industries, Inc. | 989 | 114,358 |
| Aeva Technologies, Inc. (a) | 630 | 2,992 |
| Arlo Technologies, Inc. (a) | 2,478 | 27,729 |
| Badger Meter, Inc. | 780 | 165,454 |
| Cognex Corp. | 1,300 | 46,618 |
| Crane NXT Co. | 300 | 17,466 |
| Daktronics, Inc. (a) | 938 | 15,815 |
See Notes to Schedule of Investments and Notes to Financial Statements.
| 14 | State Street Total Return V.I.S. Fund |
State Street Total Return V.I.S. Fund
Schedule of Investments, continued — December 31, 2024
| | Number
of Shares | Fair
Value |
| Evolv Technologies Holdings, Inc. (a) | 3,678 | $14,528 |
| FARO Technologies, Inc. (a) | 532 | 13,492 |
| Itron, Inc. (a) | 1,194 | 129,645 |
| Keysight Technologies, Inc. (a) | 1,173 | 188,419 |
| MicroVision, Inc. (a) | 6,767 | 8,865 |
| Mirion Technologies, Inc. (a) | 5,293 | 92,363 |
| Napco Security Technologies, Inc. | 922 | 32,786 |
| nLight, Inc. (a) | 1,350 | 14,161 |
| Novanta, Inc. (a) | 951 | 145,284 |
| OSI Systems, Inc. (a) | 419 | 70,153 |
| Ouster, Inc. (a) | 1,229 | 15,018 |
| PAR Technology Corp. (a) | 889 | 64,604 |
| Powerfleet, Inc. NJ (a) | 2,385 | 15,884 |
| SmartRent, Inc. (a) | 5,783 | 10,120 |
| Teledyne Technologies, Inc. (a) | 325 | 150,842 |
| Trimble, Inc. (a) | 1,532 | 108,251 |
| Vishay Precision Group, Inc. (a) | 317 | 7,440 |
| Vontier Corp. | 1,199 | 43,728 |
| Zebra Technologies Corp., Class A (a) | 359 | 138,653 |
| | | 1,656,743 |
| Electronic Manufacturing Services - 0.1% |
| Benchmark Electronics, Inc. | 939 | 42,631 |
| CTS Corp. | 792 | 41,762 |
| IPG Photonics Corp. (a) | 300 | 21,816 |
| Jabil, Inc. | 714 | 102,744 |
| Kimball Electronics, Inc. (a) | 647 | 12,118 |
| Methode Electronics, Inc. | 1,034 | 12,191 |
| Plexus Corp. (a) | 708 | 110,788 |
| Sanmina Corp. (a) | 1,427 | 107,981 |
| TTM Technologies, Inc. (a) | 2,669 | 66,058 |
| | | 518,089 |
| Environmental & Facilities Services - 0.2% |
| ABM Industries, Inc. | 1,678 | 85,880 |
| Aris Water Solutions, Inc., Class A | 753 | 18,034 |
| BrightView Holdings, Inc. (a) | 1,514 | 24,209 |
| Casella Waste Systems, Inc., Class A (a) | 1,638 | 173,317 |
| CECO Environmental Corp. (a) | 773 | 23,368 |
| Clean Harbors, Inc. (a) | 300 | 69,042 |
| Enviri Corp. (a) | 2,013 | 15,500 |
| | Number
of Shares | Fair
Value |
| GFL Environmental, Inc. | 1,507 | $67,145 |
| LanzaTech Global, Inc. (a) | 3,324 | 4,554 |
| Montrose Environmental Group, Inc. (a) | 840 | 15,582 |
| Perma-Fix Environmental Services, Inc. (a) | 498 | 5,513 |
| Quest Resource Holding Corp. (a) | 513 | 3,335 |
| Republic Services, Inc. | 1,290 | 259,522 |
| Rollins, Inc. | 1,878 | 87,045 |
| Tetra Tech, Inc. | 1,600 | 63,744 |
| Veralto Corp. | 1,570 | 159,905 |
| Waste Management, Inc. | 2,609 | 526,470 |
| | | 1,602,165 |
| Fertilizers & Agricultural Chemicals - 0.0%* |
| American Vanguard Corp. | 730 | 3,380 |
| CF Industries Holdings, Inc. | 1,282 | 109,380 |
| Corteva, Inc. | 4,502 | 256,434 |
| FMC Corp. | 934 | 45,402 |
| Intrepid Potash, Inc. (a) | 294 | 6,445 |
| Mosaic Co. | 1,747 | 42,941 |
| Scotts Miracle-Gro Co. | 262 | 17,381 |
| | | 481,363 |
| Financial Exchanges & Data - 0.4% |
| Cboe Global Markets, Inc. | 652 | 127,401 |
| CME Group, Inc. | 2,322 | 539,238 |
| Coinbase Global, Inc., Class A (a) | 1,300 | 322,790 |
| Donnelley Financial Solutions, Inc. (a) | 678 | 42,531 |
| FactSet Research Systems, Inc. | 258 | 123,912 |
| Intercontinental Exchange, Inc. | 3,663 | 545,824 |
| MarketAxess Holdings, Inc. | 222 | 50,181 |
| MarketWise, Inc. | 991 | 562 |
| Moody's Corp. | 996 | 471,477 |
| Morningstar, Inc. | 200 | 67,352 |
| MSCI, Inc. | 499 | 299,405 |
| Nasdaq, Inc. | 2,638 | 203,944 |
| Open Lending Corp. (a) | 2,600 | 15,522 |
| S&P Global, Inc. | 2,039 | 1,015,483 |
| Tradeweb Markets, Inc., Class A | 773 | 101,201 |
| Value Line, Inc. | 20 | 1,056 |
| | | 3,927,879 |
See Notes to Schedule of Investments and Notes to Financial Statements.
| State Street Total Return V.I.S. Fund | 15 |
State Street Total Return V.I.S. Fund
Schedule of Investments, continued — December 31, 2024
| | Number
of Shares | Fair
Value |
| Food Distributors - 0.1% |
| Andersons, Inc. | 857 | $34,725 |
| Chefs' Warehouse, Inc. (a) | 918 | 45,276 |
| HF Foods Group, Inc. (a) | 1,048 | 3,364 |
| Performance Food Group Co. (a) | 1,100 | 93,005 |
| SpartanNash Co. | 859 | 15,737 |
| Sysco Corp. | 3,218 | 246,048 |
| U.S. Foods Holding Corp. (a) | 1,400 | 94,444 |
| United Natural Foods, Inc. (a) | 1,535 | 41,921 |
| | | 574,520 |
| Food Retail - 0.1% |
| Albertsons Cos., Inc., Class A | 3,100 | 60,884 |
| Casey's General Stores, Inc. | 278 | 110,152 |
| Grocery Outlet Holding Corp. (a) | 900 | 14,049 |
| Ingles Markets, Inc., Class A | 377 | 24,294 |
| Kroger Co. | 4,239 | 259,215 |
| Maplebear, Inc. (a) | 1,200 | 49,704 |
| Natural Grocers by Vitamin Cottage, Inc. | 270 | 10,724 |
| Sprouts Farmers Market, Inc. (a) | 2,662 | 338,260 |
| Village Super Market, Inc., Class A | 235 | 7,494 |
| Weis Markets, Inc. | 430 | 29,120 |
| | | 903,896 |
| Footwear - 0.1% |
| Crocs, Inc. (a) | 400 | 43,812 |
| Deckers Outdoor Corp. (a) | 940 | 190,905 |
| NIKE, Inc., Class B | 7,771 | 588,031 |
| Rocky Brands, Inc. | 215 | 4,902 |
| Skechers USA, Inc., Class A (a) | 700 | 47,068 |
| Steven Madden Ltd. | 1,922 | 81,723 |
| Wolverine World Wide, Inc. | 2,088 | 46,354 |
| | | 1,002,795 |
| Forest Products - 0.0%* |
| Louisiana-Pacific Corp. | 500 | 51,775 |
| Gas Utilities - 0.1% |
| Atmos Energy Corp. | 1,034 | 144,005 |
| Chesapeake Utilities Corp. | 585 | 70,990 |
| MDU Resources Group, Inc. | 1,500 | 27,030 |
| National Fuel Gas Co. | 600 | 36,408 |
| New Jersey Resources Corp. | 2,602 | 121,383 |
| Northwest Natural Holding Co. | 996 | 39,402 |
| | Number
of Shares | Fair
Value |
| ONE Gas, Inc. | 1,496 | $103,598 |
| RGC Resources, Inc. | 210 | 4,212 |
| Southwest Gas Holdings, Inc. | 1,613 | 114,055 |
| Spire, Inc. | 1,508 | 102,288 |
| UGI Corp. | 1,300 | 36,699 |
| | | 800,070 |
| Gold - 0.0%* |
| Coeur Mining, Inc. (a) | 10,446 | 59,751 |
| Dakota Gold Corp. (a) | 1,635 | 3,597 |
| Newmont Corp. | 7,417 | 276,061 |
| Perpetua Resources Corp. (a) | 964 | 10,286 |
| Royal Gold, Inc. | 463 | 61,046 |
| | | 410,741 |
| Health Care REITs - 0.1% |
| Alexandria Real Estate Equities, Inc. | 1,192 | 116,280 |
| American Healthcare REIT, Inc. | 4,018 | 114,191 |
| CareTrust REIT, Inc. | 4,907 | 132,734 |
| Community Healthcare Trust, Inc. | 718 | 13,793 |
| Diversified Healthcare Trust | 6,320 | 14,536 |
| Global Medical REIT, Inc. | 1,537 | 11,866 |
| Healthcare Realty Trust, Inc. | 2,600 | 44,070 |
| Healthpeak Properties, Inc. | 4,436 | 89,918 |
| LTC Properties, Inc. | 1,129 | 39,007 |
| Medical Properties Trust, Inc. | 3,500 | 13,825 |
| National Health Investors, Inc. | 1,110 | 76,923 |
| Omega Healthcare Investors, Inc. | 1,836 | 69,493 |
| Sabra Health Care REIT, Inc. | 6,150 | 106,518 |
| Strawberry Fields REIT, Inc. | 242 | 2,551 |
| Universal Health Realty Income Trust | 326 | 12,130 |
| Ventas, Inc. | 2,723 | 160,357 |
| Welltower, Inc. | 4,114 | 518,487 |
| | | 1,536,679 |
| Healthcare Distributors - 0.1% |
| AdaptHealth Corp. (a) | 2,648 | 25,209 |
| Cardinal Health, Inc. | 1,545 | 182,727 |
| Cencora, Inc. | 1,108 | 248,946 |
| Henry Schein, Inc. (a) | 772 | 53,422 |
| McKesson Corp. | 847 | 482,714 |
| Owens & Minor, Inc. (a) | 1,959 | 25,604 |
| Patterson Cos., Inc. | 2,070 | 63,880 |
| | | 1,082,502 |
See Notes to Schedule of Investments and Notes to Financial Statements.
| 16 | State Street Total Return V.I.S. Fund |
State Street Total Return V.I.S. Fund
Schedule of Investments, continued — December 31, 2024
| | Number
of Shares | Fair
Value |
| Healthcare Equipment - 0.8% |
| Abbott Laboratories | 11,270 | $1,274,750 |
| Accuray, Inc. (a) | 2,707 | 5,360 |
| Alphatec Holdings, Inc. (a) | 2,665 | 24,465 |
| AngioDynamics, Inc. (a) | 1,110 | 10,168 |
| Artivion, Inc. (a) | 1,035 | 29,591 |
| AtriCure, Inc. (a) | 1,246 | 38,078 |
| Axogen, Inc. (a) | 1,078 | 17,765 |
| Baxter International, Inc. | 3,117 | 90,892 |
| Becton Dickinson & Co. | 1,845 | 418,575 |
| Boston Scientific Corp. (a) | 9,629 | 860,062 |
| Ceribell, Inc. (a) | 325 | 8,411 |
| CONMED Corp. | 815 | 55,778 |
| CVRx, Inc. (a) | 306 | 3,877 |
| Dexcom, Inc. (a) | 2,700 | 209,979 |
| Edwards Lifesciences Corp. (a) | 3,771 | 279,167 |
| Enovis Corp. (a) | 333 | 14,612 |
| Envista Holdings Corp. (a) | 1,100 | 21,219 |
| Fractyl Health, Inc. (a) | 1,015 | 2,091 |
| GE HealthCare Technologies, Inc. | 3,049 | 238,371 |
| Glaukos Corp. (a) | 1,298 | 194,622 |
| Globus Medical, Inc., Class A (a) | 800 | 66,168 |
| Hologic, Inc. (a) | 1,500 | 108,135 |
| IDEXX Laboratories, Inc. (a) | 569 | 235,247 |
| Inari Medical, Inc. (a) | 1,401 | 71,521 |
| Inmode Ltd. (a) | 1,901 | 31,747 |
| Inogen, Inc. (a) | 686 | 6,291 |
| Inspire Medical Systems, Inc. (a) | 165 | 30,588 |
| Insulet Corp. (a) | 468 | 122,181 |
| Integer Holdings Corp. (a) | 883 | 117,015 |
| Integra LifeSciences Holdings Corp. (a) | 1,779 | 40,348 |
| Intuitive Surgical, Inc. (a) | 2,302 | 1,201,552 |
| iRadimed Corp. | 202 | 11,110 |
| iRhythm Technologies, Inc. (a) | 827 | 74,570 |
| LeMaitre Vascular, Inc. | 535 | 49,295 |
| LivaNova PLC (a) | 1,444 | 66,872 |
| Masimo Corp. (a) | 276 | 45,623 |
| Medtronic PLC | 8,301 | 663,084 |
| NeuroPace, Inc. (a) | 451 | 5,047 |
| Nevro Corp. (a) | 1,101 | 4,096 |
| Novocure Ltd. (a) | 2,814 | 83,857 |
| Omnicell, Inc. (a) | 1,205 | 53,647 |
| Orchestra BioMed Holdings, Inc. (a) | 748 | 2,992 |
| Orthofix Medical, Inc. (a) | 856 | 14,946 |
| | Number
of Shares | Fair
Value |
| Paragon 28, Inc. (a) | 1,179 | $12,179 |
| Penumbra, Inc. (a) | 200 | 47,496 |
| PROCEPT BioRobotics Corp. (a) | 1,177 | 94,772 |
| Pulmonx Corp. (a) | 1,136 | 7,713 |
| Pulse Biosciences, Inc. (a) | 484 | 8,426 |
| QuidelOrtho Corp. (a) | 600 | 26,730 |
| ResMed, Inc. | 959 | 219,314 |
| Semler Scientific, Inc. (a) | 131 | 7,074 |
| SI-BONE, Inc. (a) | 1,088 | 15,254 |
| Sight Sciences, Inc. (a) | 1,094 | 3,982 |
| Stereotaxis, Inc. (a) | 1,813 | 4,134 |
| STERIS PLC | 660 | 135,669 |
| Stryker Corp. | 2,403 | 865,200 |
| Surmodics, Inc. (a) | 348 | 13,781 |
| Tactile Systems Technology, Inc. (a) | 625 | 10,706 |
| Tandem Diabetes Care, Inc. (a) | 1,707 | 61,486 |
| Teleflex, Inc. | 310 | 55,174 |
| TransMedics Group, Inc. (a) | 850 | 52,997 |
| Treace Medical Concepts, Inc. (a) | 1,398 | 10,401 |
| Varex Imaging Corp. (a) | 984 | 14,356 |
| Zimmer Biomet Holdings, Inc. | 1,406 | 148,516 |
| Zimvie, Inc. (a) | 790 | 11,020 |
| Zynex, Inc. (a) | 411 | 3,292 |
| | | 8,733,437 |
| Healthcare Facilities - 0.1% |
| Acadia Healthcare Co., Inc. (a) | 700 | 27,755 |
| Ardent Health Partners, Inc. (a) | 360 | 6,149 |
| Brookdale Senior Living, Inc. (a) | 4,961 | 24,954 |
| Community Health Systems, Inc. (a) | 3,185 | 9,523 |
| Concentra Group Holdings Parent, Inc. | 2,909 | 57,540 |
| Encompass Health Corp. | 600 | 55,410 |
| Ensign Group, Inc. | 1,473 | 195,703 |
| HCA Healthcare, Inc. | 1,263 | 379,089 |
| Joint Corp. (a) | 324 | 3,444 |
| National HealthCare Corp. | 328 | 35,280 |
| PACS Group, Inc. (a) | 1,021 | 13,385 |
| Select Medical Holdings Corp. | 2,876 | 54,213 |
| Sonida Senior Living, Inc. (a) | 113 | 2,608 |
| Surgery Partners, Inc. (a) | 2,029 | 42,954 |
| Tenet Healthcare Corp. (a) | 600 | 75,738 |
See Notes to Schedule of Investments and Notes to Financial Statements.
| State Street Total Return V.I.S. Fund | 17 |
State Street Total Return V.I.S. Fund
Schedule of Investments, continued — December 31, 2024
| | Number
of Shares | Fair
Value |
| U.S. Physical Therapy, Inc. | 392 | $34,774 |
| Universal Health Services, Inc., Class B | 420 | 75,356 |
| | | 1,093,875 |
| Healthcare Services - 0.2% |
| Accolade, Inc. (a) | 2,163 | 7,397 |
| Addus HomeCare Corp. (a) | 460 | 57,661 |
| agilon health, Inc. (a) | 8,744 | 16,614 |
| AirSculpt Technologies, Inc. (a) | 496 | 2,574 |
| Amedisys, Inc. (a) | 300 | 27,237 |
| AMN Healthcare Services, Inc. (a) | 986 | 23,585 |
| Astrana Health, Inc. (a) | 1,136 | 35,818 |
| Aveanna Healthcare Holdings, Inc. (a) | 1,405 | 6,421 |
| BrightSpring Health Services, Inc. (a) | 1,401 | 23,859 |
| Castle Biosciences, Inc. (a) | 665 | 17,722 |
| Chemed Corp. | 95 | 50,331 |
| Cigna Group | 1,770 | 488,768 |
| CorVel Corp. (a) | 705 | 78,438 |
| Cross Country Healthcare, Inc. (a) | 812 | 14,746 |
| CVS Health Corp. | 8,189 | 367,604 |
| DaVita, Inc. (a) | 387 | 57,876 |
| DocGo, Inc. (a) | 2,525 | 10,706 |
| Enhabit, Inc. (a) | 1,240 | 9,684 |
| Fulgent Genetics, Inc. (a) | 608 | 11,230 |
| GeneDx Holdings Corp. (a) | 351 | 26,978 |
| Guardant Health, Inc. (a) | 3,123 | 95,408 |
| Hims & Hers Health, Inc. (a) | 5,033 | 121,698 |
| InfuSystem Holdings, Inc. (a) | 591 | 4,994 |
| Innovage Holding Corp. (a) | 473 | 1,859 |
| Labcorp Holdings, Inc. | 587 | 134,611 |
| LifeStance Health Group, Inc. (a) | 3,625 | 26,716 |
| ModivCare, Inc. (a) | 374 | 4,428 |
| National Research Corp. | 446 | 7,867 |
| NeoGenomics, Inc. (a) | 3,363 | 55,422 |
| OPKO Health, Inc. (a) | 8,215 | 12,076 |
| Option Care Health, Inc. (a) | 4,555 | 105,676 |
| Pediatrix Medical Group, Inc. (a) | 2,208 | 28,969 |
| Pennant Group, Inc. (a) | 809 | 21,455 |
| Performant Healthcare, Inc. (a) | 1,920 | 5,798 |
| Premier, Inc., Class A | 600 | 12,720 |
| Privia Health Group, Inc. (a) | 2,694 | 52,668 |
| | Number
of Shares | Fair
Value |
| Quest Diagnostics, Inc. | 729 | $109,977 |
| Quipt Home Medical Corp. (a) | 1,002 | 3,056 |
| RadNet, Inc. (a) | 1,752 | 122,360 |
| Talkspace, Inc. (a) | 3,063 | 9,465 |
| Viemed Healthcare, Inc. (a) | 1,002 | 8,036 |
| | | 2,280,508 |
| Healthcare Supplies - 0.1% |
| Alcon AG | 3,273 | 277,908 |
| Align Technology, Inc. (a) | 459 | 95,706 |
| Avanos Medical, Inc. (a) | 1,177 | 18,738 |
| Bioventus, Inc., Class A (a) | 941 | 9,880 |
| Cerus Corp. (a) | 5,555 | 8,555 |
| Cooper Cos., Inc. (a) | 1,220 | 112,155 |
| Dentsply Sirona, Inc. | 1,367 | 25,946 |
| Embecta Corp. | 1,501 | 30,996 |
| Haemonetics Corp. (a) | 1,334 | 104,159 |
| ICU Medical, Inc. (a) | 569 | 88,292 |
| Lantheus Holdings, Inc. (a) | 1,826 | 163,354 |
| Merit Medical Systems, Inc. (a) | 1,517 | 146,724 |
| Neogen Corp. (a) | 5,788 | 70,266 |
| OraSure Technologies, Inc. (a) | 2,196 | 7,927 |
| OrthoPediatrics Corp. (a) | 490 | 11,358 |
| RxSight, Inc. (a) | 943 | 32,420 |
| Sanara Medtech, Inc. (a) | 119 | 3,951 |
| Solventum Corp. (a) | 748 | 49,413 |
| STAAR Surgical Co. (a) | 1,298 | 31,528 |
| UFP Technologies, Inc. (a) | 192 | 46,946 |
| Utah Medical Products, Inc. | 99 | 6,085 |
| | | 1,342,307 |
| Healthcare Technology - 0.1% |
| Certara, Inc. (a) | 1,400 | 14,910 |
| Definitive Healthcare Corp. (a) | 1,406 | 5,779 |
| Doximity, Inc., Class A (a) | 800 | 42,712 |
| Evolent Health, Inc., Class A (a) | 3,036 | 34,155 |
| Health Catalyst, Inc. (a) | 1,686 | 11,920 |
| HealthStream, Inc. | 684 | 21,751 |
| LifeMD, Inc. (a) | 1,054 | 5,217 |
| OptimizeRx Corp. (a) | 625 | 3,037 |
| Phreesia, Inc. (a) | 1,444 | 36,331 |
| Schrodinger, Inc. (a) | 1,447 | 27,913 |
| Simulations Plus, Inc. | 398 | 11,100 |
| Teladoc Health, Inc. (a) | 4,474 | 40,669 |
| Veeva Systems, Inc., Class A (a) | 979 | 205,835 |
See Notes to Schedule of Investments and Notes to Financial Statements.
| 18 | State Street Total Return V.I.S. Fund |
State Street Total Return V.I.S. Fund
Schedule of Investments, continued — December 31, 2024
| | Number
of Shares | Fair
Value |
| Waystar Holding Corp. (a) | 1,130 | $41,471 |
| | | 502,800 |
| Heavy Electrical Equipment - 0.1% |
| Bloom Energy Corp., Class A (a) | 5,271 | 117,069 |
| Energy Vault Holdings, Inc. (a) | 2,378 | 5,422 |
| GE Vernova, Inc. | 1,737 | 571,351 |
| NANO Nuclear Energy, Inc. (a) | 167 | 4,158 |
| Net Power, Inc. (a) | 492 | 5,210 |
| NuScale Power Corp. (a) | 2,085 | 37,384 |
| TPI Composites, Inc. (a) | 1,371 | 2,591 |
| | | 743,185 |
| Home Building - 0.2% |
| Beazer Homes USA, Inc. (a) | 772 | 21,199 |
| Cavco Industries, Inc. (a) | 219 | 97,724 |
| Century Communities, Inc. | 739 | 54,213 |
| Champion Homes, Inc. (a) | 1,422 | 125,278 |
| DR Horton, Inc. | 1,940 | 271,251 |
| Dream Finders Homes, Inc., Class A (a) | 723 | 16,824 |
| Green Brick Partners, Inc. (a) | 821 | 46,378 |
| Hovnanian Enterprises, Inc., Class A (a) | 129 | 17,263 |
| Installed Building Products, Inc. | 635 | 111,284 |
| KB Home | 1,718 | 112,907 |
| Landsea Homes Corp. (a) | 506 | 4,296 |
| Legacy Housing Corp. (a) | 335 | 8,268 |
| Lennar Corp., Class A | 1,605 | 218,874 |
| LGI Homes, Inc. (a) | 551 | 49,259 |
| M/I Homes, Inc. (a) | 708 | 94,129 |
| Meritage Homes Corp. | 953 | 146,591 |
| NVR, Inc. (a) | 18 | 147,220 |
| PulteGroup, Inc. | 1,318 | 143,530 |
| Taylor Morrison Home Corp. (a) | 2,715 | 166,185 |
| Toll Brothers, Inc. | 715 | 90,054 |
| TopBuild Corp. (a) | 244 | 75,967 |
| Tri Pointe Homes, Inc. (a) | 2,448 | 88,765 |
| United Homes Group, Inc. (a) | 215 | 909 |
| | | 2,108,368 |
| Home Furnishing Retail - 0.0%* |
| Arhaus, Inc. | 1,477 | 13,884 |
| Beyond, Inc. (a) | 1,371 | 6,759 |
| Haverty Furniture Cos., Inc. | 388 | 8,637 |
| | Number
of Shares | Fair
Value |
| RH (a) | 70 | $27,551 |
| Sleep Number Corp. (a) | 536 | 8,168 |
| Wayfair, Inc., Class A (a) | 600 | 26,592 |
| Williams-Sonoma, Inc. | 810 | 149,996 |
| | | 241,587 |
| Home Furnishings - 0.0%* |
| Ethan Allen Interiors, Inc. | 584 | 16,416 |
| Flexsteel Industries, Inc. | 123 | 6,684 |
| Hooker Furnishings Corp. | 291 | 4,077 |
| La-Z-Boy, Inc. | 1,113 | 48,494 |
| Leggett & Platt, Inc. | 700 | 6,720 |
| Lovesac Co. (a) | 358 | 8,470 |
| Mohawk Industries, Inc. (a) | 400 | 47,652 |
| Purple Innovation, Inc. (a) | 2,199 | 1,715 |
| Tempur Sealy International, Inc. | 1,200 | 68,028 |
| | | 208,256 |
| Home Improvement Retail - 0.3% |
| Floor & Decor Holdings, Inc., Class A (a) | 600 | 59,820 |
| GrowGeneration Corp. (a) | 1,354 | 2,288 |
| Home Depot, Inc. | 6,462 | 2,513,653 |
| Lowe's Cos., Inc. | 3,723 | 918,837 |
| Tile Shop Holdings, Inc. (a) | 823 | 5,703 |
| | | 3,500,301 |
| Hotel & Resort REITs - 0.1% |
| Apple Hospitality REIT, Inc. | 6,049 | 92,852 |
| Braemar Hotels & Resorts, Inc. | 1,929 | 5,787 |
| Chatham Lodging Trust | 1,205 | 10,785 |
| DiamondRock Hospitality Co. | 5,544 | 50,062 |
| Host Hotels & Resorts, Inc. | 4,646 | 81,398 |
| Park Hotels & Resorts, Inc. | 1,200 | 16,884 |
| Pebblebrook Hotel Trust | 3,133 | 42,452 |
| RLJ Lodging Trust | 3,997 | 40,810 |
| Ryman Hospitality Properties, Inc. | 1,556 | 162,353 |
| Service Properties Trust | 4,644 | 11,796 |
| Summit Hotel Properties, Inc. | 2,688 | 18,413 |
| Sunstone Hotel Investors, Inc. | 5,369 | 63,569 |
| Xenia Hotels & Resorts, Inc. | 2,676 | 39,765 |
| | | 636,926 |
| Hotels, Resorts & Cruise Lines - 0.3% |
| Airbnb, Inc., Class A (a) | 2,800 | 367,948 |
| Booking Holdings, Inc. | 222 | 1,102,989 |
See Notes to Schedule of Investments and Notes to Financial Statements.
| State Street Total Return V.I.S. Fund | 19 |
State Street Total Return V.I.S. Fund
Schedule of Investments, continued — December 31, 2024
| | Number
of Shares | Fair
Value |
| Carnival Corp. (a) | 6,449 | $160,709 |
| Choice Hotels International, Inc. | 200 | 28,396 |
| Expedia Group, Inc. (a) | 778 | 144,965 |
| Global Business Travel Group I (a) | 3,268 | 30,327 |
| Hilton Grand Vacations, Inc. (a) | 1,889 | 73,576 |
| Hilton Worldwide Holdings, Inc. | 1,636 | 404,354 |
| Hyatt Hotels Corp., Class A | 300 | 47,094 |
| Lindblad Expeditions Holdings, Inc. (a) | 952 | 11,291 |
| Marriott International, Inc., Class A | 1,503 | 419,247 |
| Marriott Vacations Worldwide Corp. | 155 | 13,919 |
| Norwegian Cruise Line Holdings Ltd. (a) | 2,500 | 64,325 |
| Royal Caribbean Cruises Ltd. | 1,500 | 346,035 |
| Sabre Corp. (a) | 9,848 | 35,945 |
| Target Hospitality Corp. (a) | 947 | 9,153 |
| Travel & Leisure Co. | 500 | 25,225 |
| Vacasa, Inc., Class A (a) | 484 | 2,372 |
| Wyndham Hotels & Resorts, Inc. | 400 | 40,316 |
| | | 3,328,186 |
| Household Appliances - 0.0%* |
| Cricut, Inc., Class A | 1,371 | 7,815 |
| Hamilton Beach Brands Holding Co., Class A | 226 | 3,803 |
| Helen of Troy Ltd. (a) | 598 | 35,778 |
| iRobot Corp. (a) | 856 | 6,634 |
| SharkNinja, Inc. (a) | 400 | 38,944 |
| Traeger, Inc. (a) | 767 | 1,833 |
| Whirlpool Corp. | 358 | 40,984 |
| Worthington Enterprises, Inc. | 824 | 33,051 |
| | | 168,842 |
| Household Products - 0.4% |
| Central Garden & Pet Co. (a) | 254 | 9,855 |
| Central Garden & Pet Co., Class A (a) | 1,372 | 45,345 |
| Church & Dwight Co., Inc. | 1,528 | 159,997 |
| Clorox Co. | 847 | 137,561 |
| Colgate-Palmolive Co. | 5,295 | 481,368 |
| Energizer Holdings, Inc. | 1,900 | 66,291 |
| Kimberly-Clark Corp. | 2,198 | 288,026 |
| Oil-Dri Corp. of America | 129 | 11,306 |
| | Number
of Shares | Fair
Value |
| Procter & Gamble Co. | 15,394 | $2,580,804 |
| Reynolds Consumer Products, Inc. | 200 | 5,398 |
| Spectrum Brands Holdings, Inc. | 200 | 16,898 |
| WD-40 Co. | 362 | 87,850 |
| | | 3,890,699 |
| Housewares & Specialties - 0.0%* |
| Lifetime Brands, Inc. | 509 | 3,008 |
| Newell Brands, Inc. | 1,870 | 18,625 |
| | | 21,633 |
| Human Resource & Employment Services - 0.2% |
| Alight, Inc., Class A | 11,240 | 77,781 |
| Asure Software, Inc. (a) | 684 | 6,436 |
| Automatic Data Processing, Inc. | 2,729 | 798,860 |
| Barrett Business Services, Inc. | 667 | 28,974 |
| Dayforce, Inc. (a) | 1,105 | 80,267 |
| DLH Holdings Corp. (a) | 280 | 2,248 |
| First Advantage Corp. (a) | 1,535 | 28,751 |
| Heidrick & Struggles International, Inc. | 532 | 23,573 |
| HireQuest, Inc. | 187 | 2,648 |
| Insperity, Inc. | 951 | 73,712 |
| Kelly Services, Inc., Class A | 774 | 10,790 |
| Kforce, Inc. | 487 | 27,613 |
| Korn Ferry | 1,379 | 93,014 |
| ManpowerGroup, Inc. | 279 | 16,104 |
| Paychex, Inc. | 2,128 | 298,388 |
| Paycom Software, Inc. | 335 | 68,665 |
| Paycor HCM, Inc. (a) | 100 | 1,857 |
| Paylocity Holding Corp. (a) | 300 | 59,841 |
| Robert Half, Inc. | 775 | 54,607 |
| TriNet Group, Inc. | 847 | 76,882 |
| TrueBlue, Inc. (a) | 925 | 7,770 |
| Upwork, Inc. (a) | 3,283 | 53,677 |
| | | 1,892,458 |
| Independent Power Producers & Energy Traders - 0.0%* |
| AES Corp. | 4,900 | 63,063 |
| Vistra Corp. | 2,300 | 317,101 |
| | | 380,164 |
| Industrial Conglomerates - 0.1% |
| 3M Co. | 3,592 | 463,691 |
| Honeywell International, Inc. | 4,254 | 960,936 |
| | | 1,424,627 |
See Notes to Schedule of Investments and Notes to Financial Statements.
| 20 | State Street Total Return V.I.S. Fund |
State Street Total Return V.I.S. Fund
Schedule of Investments, continued — December 31, 2024
| | Number
of Shares | Fair
Value |
| Industrial Gases - 0.2% |
| Air Products & Chemicals, Inc. | 1,406 | $407,796 |
| Linde PLC | 3,131 | 1,310,856 |
| | | 1,718,652 |
| Industrial Machinery & Supplies & Components - 0.5% |
| 374Water, Inc. (a) | 2,496 | 1,704 |
| 3D Systems Corp. (a) | 3,192 | 10,470 |
| Albany International Corp., Class A | 825 | 65,975 |
| Barnes Group, Inc. | 1,225 | 57,894 |
| Chart Industries, Inc. (a) | 1,141 | 217,748 |
| Columbus McKinnon Corp. | 738 | 27,483 |
| Crane Co. | 300 | 45,525 |
| Donaldson Co., Inc. | 800 | 53,880 |
| Dover Corp. | 874 | 163,962 |
| Eastern Co. | 129 | 3,424 |
| Energy Recovery, Inc. (a) | 1,480 | 21,756 |
| Enerpac Tool Group Corp. | 1,439 | 59,129 |
| Enpro, Inc. | 555 | 95,710 |
| Esab Corp. | 433 | 51,934 |
| ESCO Technologies, Inc. | 687 | 91,515 |
| Flowserve Corp. | 800 | 46,016 |
| Fortive Corp. | 2,350 | 176,250 |
| Franklin Electric Co., Inc. | 1,205 | 117,427 |
| Gates Industrial Corp. PLC (a) | 1,500 | 30,855 |
| Gencor Industries, Inc. (a) | 296 | 5,224 |
| Gorman-Rupp Co. | 542 | 20,553 |
| Graco, Inc. | 1,039 | 87,577 |
| Graham Corp. (a) | 282 | 12,541 |
| Helios Technologies, Inc. | 874 | 39,015 |
| Hillenbrand, Inc. | 1,854 | 57,066 |
| Hillman Solutions Corp. (a) | 5,187 | 50,521 |
| Hyster-Yale, Inc. | 292 | 14,872 |
| IDEX Corp. | 457 | 95,646 |
| Illinois Tool Works, Inc. | 1,902 | 482,271 |
| Ingersoll Rand, Inc. | 2,621 | 237,096 |
| ITT, Inc. | 600 | 85,728 |
| John Bean Technologies Corp. | 1,243 | 157,985 |
| Kadant, Inc. | 312 | 107,637 |
| Kennametal, Inc. | 2,093 | 50,274 |
| L.B. Foster Co., Class A (a) | 233 | 6,268 |
| Lincoln Electric Holdings, Inc. | 400 | 74,988 |
| Mayville Engineering Co., Inc. (a) | 342 | 5,376 |
| Middleby Corp. (a) | 310 | 41,990 |
| Mueller Industries, Inc. | 2,968 | 235,541 |
| | Number
of Shares | Fair
Value |
| Mueller Water Products, Inc., Class A | 4,126 | $92,835 |
| NN, Inc. (a) | 1,161 | 3,796 |
| Nordson Corp. | 335 | 70,095 |
| Omega Flex, Inc. | 90 | 3,777 |
| Otis Worldwide Corp. | 2,604 | 241,156 |
| Parker-Hannifin Corp. | 835 | 531,085 |
| Park-Ohio Holdings Corp. | 250 | 6,568 |
| Pentair PLC | 1,000 | 100,640 |
| Proto Labs, Inc. (a) | 666 | 26,034 |
| RBC Bearings, Inc. (a) | 200 | 59,828 |
| Snap-on, Inc. | 325 | 110,331 |
| SPX Technologies, Inc. (a) | 1,195 | 173,896 |
| Standex International Corp. | 307 | 57,406 |
| Stanley Black & Decker, Inc. | 1,087 | 87,275 |
| Taylor Devices, Inc. (a) | 58 | 2,414 |
| Tennant Co. | 499 | 40,683 |
| Timken Co. | 500 | 35,685 |
| Watts Water Technologies, Inc., Class A | 726 | 147,596 |
| Xylem, Inc. | 1,543 | 179,019 |
| | | 5,176,945 |
| Industrial REITs - 0.1% |
| Americold Realty Trust, Inc. | 2,000 | 42,800 |
| EastGroup Properties, Inc. | 300 | 48,147 |
| First Industrial Realty Trust, Inc. | 1,000 | 50,130 |
| Industrial Logistics Properties Trust | 1,806 | 6,592 |
| Innovative Industrial Properties, Inc. | 747 | 49,780 |
| Lineage, Inc. | 500 | 29,285 |
| LXP Industrial Trust | 7,694 | 62,475 |
| Plymouth Industrial REIT, Inc. | 1,029 | 18,316 |
| Prologis, Inc. | 5,953 | 629,232 |
| Rexford Industrial Realty, Inc. | 1,548 | 59,846 |
| STAG Industrial, Inc. | 1,200 | 40,584 |
| Terreno Realty Corp. | 2,533 | 149,802 |
| | | 1,186,989 |
| Insurance Brokers - 0.2% |
| Aon PLC, Class A | 1,243 | 446,436 |
| Arthur J Gallagher & Co. | 1,607 | 456,147 |
| Baldwin Insurance Group, Inc. (a) | 1,745 | 67,636 |
| Brown & Brown, Inc. | 1,500 | 153,030 |
| Crawford & Co., Class A | 375 | 4,335 |
| GoHealth, Inc., Class A (a) | 137 | 1,835 |
See Notes to Schedule of Investments and Notes to Financial Statements.
| State Street Total Return V.I.S. Fund | 21 |
State Street Total Return V.I.S. Fund
Schedule of Investments, continued — December 31, 2024
| | Number
of Shares | Fair
Value |
| Goosehead Insurance, Inc., Class A (a) | 595 | $63,796 |
| Hippo Holdings, Inc. (a) | 555 | 14,857 |
| Marsh & McLennan Cos., Inc. | 3,227 | 685,447 |
| Ryan Specialty Holdings, Inc. | 700 | 44,912 |
| Selectquote, Inc. (a) | 3,589 | 13,351 |
| Willis Towers Watson PLC | 624 | 195,462 |
| | | 2,147,244 |
| Integrated Oil & Gas - 0.6% |
| BP PLC | 104,351 | 513,608 |
| Chevron Corp. | 11,271 | 1,632,492 |
| Exxon Mobil Corp. | 29,308 | 3,152,661 |
| Occidental Petroleum Corp. | 4,239 | 209,449 |
| Shell PLC | 40,087 | 1,243,075 |
| | | 6,751,285 |
| Integrated Telecommunication Services - 0.2% |
| AT&T, Inc. | 46,740 | 1,064,270 |
| ATN International, Inc. | 310 | 5,211 |
| Frontier Communications Parent, Inc. (a) | 1,772 | 61,488 |
| IDT Corp., Class B | 397 | 18,866 |
| Shenandoah Telecommunications Co. | 1,243 | 15,674 |
| Verizon Communications, Inc. | 27,372 | 1,094,606 |
| | | 2,260,115 |
| Interactive Home Entertainment - 0.1% |
| Electronic Arts, Inc. | 1,761 | 257,634 |
| Golden Matrix Group, Inc. (a) | 916 | 1,814 |
| Playstudios, Inc. (a) | 2,171 | 4,038 |
| ROBLOX Corp., Class A (a) | 3,427 | 198,286 |
| Take-Two Interactive Software, Inc. (a) | 1,083 | 199,359 |
| | | 661,131 |
| Interactive Media & Services - 2.1% |
| Alphabet, Inc., Class A | 38,375 | 7,264,387 |
| Alphabet, Inc., Class C | 31,666 | 6,030,473 |
| Bumble, Inc., Class A (a) | 2,539 | 20,667 |
| Cargurus, Inc. (a) | 2,292 | 83,750 |
| Cars.com, Inc. (a) | 1,721 | 29,825 |
| EverQuote, Inc., Class A (a) | 722 | 14,433 |
| fuboTV, Inc. (a) | 8,652 | 10,901 |
| Getty Images Holdings, Inc. (a) | 2,781 | 6,007 |
| IAC, Inc. (a) | 600 | 25,884 |
| Match Group, Inc. (a) | 1,563 | 51,126 |
| | Number
of Shares | Fair
Value |
| MediaAlpha, Inc., Class A (a) | 888 | $10,026 |
| Meta Platforms, Inc., Class A | 14,270 | 8,355,228 |
| Nextdoor Holdings, Inc. (a) | 4,964 | 11,765 |
| Outbrain, Inc. (a) | 1,092 | 7,841 |
| Pinterest, Inc., Class A (a) | 3,997 | 115,913 |
| QuinStreet, Inc. (a) | 1,375 | 31,721 |
| Shutterstock, Inc. | 645 | 19,576 |
| System1, Inc. (a) | 863 | 775 |
| TripAdvisor, Inc. (a) | 700 | 10,339 |
| TrueCar, Inc. (a) | 2,581 | 9,627 |
| Trump Media & Technology Group Corp. (a) | 500 | 17,050 |
| Vimeo, Inc. (a) | 3,852 | 24,653 |
| Yelp, Inc. (a) | 1,733 | 67,067 |
| Ziff Davis, Inc. (a) | 1,166 | 63,360 |
| ZipRecruiter, Inc., Class A (a) | 2,066 | 14,958 |
| ZoomInfo Technologies, Inc. (a) | 2,000 | 21,020 |
| | | 22,318,372 |
| Internet Services & Infrastructure - 0.1% |
| Akamai Technologies, Inc. (a) | 1,014 | 96,989 |
| Applied Digital Corp. (a) | 5,066 | 38,704 |
| Backblaze, Inc., Class A (a) | 1,055 | 6,351 |
| BigCommerce Holdings, Inc. (a) | 1,886 | 11,542 |
| Cloudflare, Inc., Class A (a) | 1,885 | 202,977 |
| Core Scientific, Inc. (a) | 4,726 | 66,400 |
| Couchbase, Inc. (a) | 1,126 | 17,554 |
| DigitalOcean Holdings, Inc. (a) | 1,736 | 59,146 |
| Fastly, Inc., Class A (a) | 3,338 | 31,511 |
| GoDaddy, Inc., Class A (a) | 900 | 177,633 |
| MongoDB, Inc. (a) | 437 | 101,738 |
| Okta, Inc. (a) | 1,061 | 83,607 |
| Rackspace Technology, Inc. (a) | 1,848 | 4,084 |
| Snowflake, Inc., Class A (a) | 2,008 | 310,055 |
| Tucows, Inc., Class A (a) | 223 | 3,822 |
| Twilio, Inc., Class A (a) | 1,047 | 113,160 |
| VeriSign, Inc. (a) | 507 | 104,929 |
| | | 1,430,202 |
| Investment Banking & Brokerage - 0.4% |
| B Riley Financial, Inc. | 645 | 2,961 |
| BGC Group, Inc., Class A | 9,677 | 87,674 |
| Charles Schwab Corp. | 9,681 | 716,491 |
| Evercore, Inc., Class A | 266 | 73,732 |
| Goldman Sachs Group, Inc. | 2,002 | 1,146,385 |
| Houlihan Lokey, Inc. | 300 | 52,098 |
See Notes to Schedule of Investments and Notes to Financial Statements.
| 22 | State Street Total Return V.I.S. Fund |
State Street Total Return V.I.S. Fund
Schedule of Investments, continued — December 31, 2024
| | Number
of Shares | Fair
Value |
| Interactive Brokers Group, Inc., Class A | 700 | $123,669 |
| Jefferies Financial Group, Inc. | 1,109 | 86,946 |
| Lazard, Inc. | 600 | 30,888 |
| LPL Financial Holdings, Inc. | 503 | 164,234 |
| Moelis & Co., Class A | 1,873 | 138,377 |
| Morgan Stanley | 7,580 | 952,958 |
| Perella Weinberg Partners | 1,375 | 32,780 |
| Piper Sandler Cos. | 460 | 137,977 |
| PJT Partners, Inc., Class A | 616 | 97,211 |
| Raymond James Financial, Inc. | 1,192 | 185,153 |
| Robinhood Markets, Inc., Class A (a) | 4,261 | 158,765 |
| Stifel Financial Corp. | 700 | 74,256 |
| StoneX Group, Inc. (a) | 725 | 71,028 |
| Virtu Financial, Inc., Class A | 500 | 17,840 |
| | | 4,351,423 |
| IT Consulting & Other Services - 0.2% |
| Amdocs Ltd. | 867 | 73,816 |
| ASGN, Inc. (a) | 1,141 | 95,091 |
| BigBear.ai Holdings, Inc. (a) | 2,499 | 11,121 |
| Cognizant Technology Solutions Corp., Class A | 3,202 | 246,234 |
| DXC Technology Co. (a) | 1,200 | 23,976 |
| EPAM Systems, Inc. (a) | 398 | 93,060 |
| Gartner, Inc. (a) | 491 | 237,875 |
| Globant SA (a) | 300 | 64,326 |
| Grid Dynamics Holdings, Inc. (a) | 1,488 | 33,093 |
| Hackett Group, Inc. | 652 | 20,029 |
| Information Services Group, Inc. | 1,048 | 3,500 |
| International Business Machines Corp. | 6,031 | 1,325,795 |
| Kyndryl Holdings, Inc. (a) | 1,259 | 43,561 |
| Unisys Corp. (a) | 1,650 | 10,445 |
| | | 2,281,922 |
| Leisure Facilities - 0.0%* |
| Dave & Buster's Entertainment, Inc. (a) | 846 | 24,695 |
| Life Time Group Holdings, Inc. (a) | 1,562 | 34,552 |
| Planet Fitness, Inc., Class A (a) | 600 | 59,322 |
| Six Flags Entertainment Corp. | 2,465 | 118,788 |
| United Parks & Resorts, Inc. (a) | 863 | 48,492 |
| | Number
of Shares | Fair
Value |
| Vail Resorts, Inc. | 200 | $37,490 |
| Xponential Fitness, Inc., Class A (a) | 667 | 8,971 |
| | | 332,310 |
| Leisure Products - 0.0%* |
| Acushnet Holdings Corp. | 765 | 54,376 |
| AMMO, Inc. (a) | 2,501 | 2,751 |
| Brunswick Corp. | 500 | 32,340 |
| Clarus Corp. | 748 | 3,373 |
| Escalade, Inc. | 242 | 3,456 |
| Funko, Inc., Class A (a) | 766 | 10,257 |
| Hasbro, Inc. | 1,000 | 55,910 |
| JAKKS Pacific, Inc. (a) | 205 | 5,771 |
| Johnson Outdoors, Inc., Class A | 133 | 4,389 |
| Latham Group, Inc. (a) | 1,087 | 7,566 |
| Malibu Boats, Inc., Class A (a) | 517 | 19,434 |
| Marine Products Corp. | 321 | 2,944 |
| MasterCraft Boat Holdings, Inc. (a) | 433 | 8,257 |
| Mattel, Inc. (a) | 1,759 | 31,187 |
| Peloton Interactive, Inc., Class A (a) | 9,057 | 78,796 |
| Polaris, Inc. | 400 | 23,048 |
| Revelyst, Inc. (a) | 1,542 | 29,653 |
| Smith & Wesson Brands, Inc. | 1,161 | 11,732 |
| Solo Brands, Inc., Class A (a) | 1,145 | 1,305 |
| Sturm Ruger & Co., Inc. | 417 | 14,749 |
| Topgolf Callaway Brands Corp. (a) | 3,713 | 29,184 |
| YETI Holdings, Inc. (a) | 500 | 19,255 |
| | | 449,733 |
| Life & Health Insurance - 0.2% |
| Aflac, Inc. | 3,655 | 378,073 |
| Brighthouse Financial, Inc. (a) | 270 | 12,971 |
| CNO Financial Group, Inc. | 2,798 | 104,114 |
| F&G Annuities & Life, Inc. | 491 | 20,347 |
| Genworth Financial, Inc. (a) | 11,407 | 79,735 |
| Globe Life, Inc. | 500 | 55,760 |
| Lincoln National Corp. | 1,286 | 40,779 |
| MetLife, Inc. | 3,853 | 315,484 |
| Oscar Health, Inc., Class A (a) | 5,269 | 70,815 |
| Primerica, Inc. | 200 | 54,284 |
| Principal Financial Group, Inc. | 1,500 | 116,115 |
| Prudential Financial, Inc. | 2,302 | 272,856 |
| Unum Group | 1,100 | 80,333 |
| | | 1,601,666 |
See Notes to Schedule of Investments and Notes to Financial Statements.
| State Street Total Return V.I.S. Fund | 23 |
State Street Total Return V.I.S. Fund
Schedule of Investments, continued — December 31, 2024
| | Number
of Shares | Fair
Value |
| Life Sciences Tools & Services - 0.4% |
| 10X Genomics, Inc., Class A (a) | 800 | $11,488 |
| Adaptive Biotechnologies Corp. (a) | 2,968 | 17,793 |
| Agilent Technologies, Inc. | 1,906 | 256,052 |
| Akoya Biosciences, Inc. (a) | 916 | 2,098 |
| Avantor, Inc. (a) | 4,093 | 86,239 |
| Azenta, Inc. (a) | 400 | 20,000 |
| BioLife Solutions, Inc. (a) | 935 | 24,273 |
| Bio-Rad Laboratories, Inc., Class A (a) | 61 | 20,039 |
| Bio-Techne Corp. | 962 | 69,293 |
| Bruker Corp. | 761 | 44,610 |
| Charles River Laboratories International, Inc. (a) | 328 | 60,549 |
| ChromaDex Corp. (a) | 1,238 | 6,568 |
| Codexis, Inc. (a) | 2,035 | 9,707 |
| CryoPort, Inc. (a) | 1,149 | 8,939 |
| Cytek Biosciences, Inc. (a) | 3,137 | 20,359 |
| Danaher Corp. | 4,211 | 966,635 |
| Fortrea Holdings, Inc. (a) | 587 | 10,947 |
| Harvard Bioscience, Inc. (a) | 984 | 2,076 |
| Illumina, Inc. (a) | 1,072 | 143,251 |
| IQVIA Holdings, Inc. (a) | 1,119 | 219,895 |
| Lifecore Biomedical, Inc. (a) | 672 | 4,993 |
| Maravai LifeSciences Holdings, Inc., Class A (a) | 2,803 | 15,276 |
| MaxCyte, Inc. (a) | 2,964 | 12,330 |
| Medpace Holdings, Inc. (a) | 113 | 37,542 |
| Mesa Laboratories, Inc. | 144 | 18,989 |
| Mettler-Toledo International, Inc. (a) | 144 | 176,210 |
| Nautilus Biotechnology, Inc. (a) | 1,137 | 1,910 |
| OmniAb, Inc. (a)(f) | 2,439 | 8,634 |
| OmniAb, Inc. (a)(e)(f)** | 394 | — |
| Pacific Biosciences of California, Inc. (a) | 7,707 | 14,104 |
| Qiagen NV (a) | 3,088 | 137,916 |
| Quanterix Corp. (a) | 949 | 10,088 |
| Quantum-Si, Inc. (a) | 2,978 | 8,041 |
| Repligen Corp. (a) | 406 | 58,440 |
| Revvity, Inc. | 860 | 95,985 |
| Sotera Health Co. (a) | 1,300 | 17,784 |
| Standard BioTools, Inc. (a) | 7,794 | 13,639 |
| Thermo Fisher Scientific, Inc. | 2,483 | 1,291,731 |
| Waters Corp. (a) | 352 | 130,585 |
| | Number
of Shares | Fair
Value |
| West Pharmaceutical Services, Inc. | 415 | $135,937 |
| | | 4,190,945 |
| Managed Healthcare - 0.4% |
| Alignment Healthcare, Inc. (a) | 2,619 | 29,464 |
| Centene Corp. (a) | 3,326 | 201,489 |
| Elevance Health, Inc. | 1,508 | 556,301 |
| HealthEquity, Inc. (a) | 2,248 | 215,696 |
| Humana, Inc. | 777 | 197,133 |
| Molina Healthcare, Inc. (a) | 339 | 98,666 |
| Progyny, Inc. (a) | 2,096 | 36,156 |
| UnitedHealth Group, Inc. | 5,989 | 3,029,595 |
| | | 4,364,500 |
| Marine Transportation - 0.0%* |
| Genco Shipping & Trading Ltd. | 1,187 | 16,547 |
| Kirby Corp. (a) | 400 | 42,320 |
| Matson, Inc. | 865 | 116,636 |
| Pangaea Logistics Solutions Ltd. | 1,050 | 5,628 |
| | | 181,131 |
| Metal, Glass & Plastic Containers - 0.0%* |
| AptarGroup, Inc. | 464 | 72,895 |
| Ardagh Metal Packaging SA | 4,113 | 12,380 |
| Ball Corp. | 2,092 | 115,332 |
| Berry Global Group, Inc. | 618 | 39,966 |
| Crown Holdings, Inc. | 747 | 61,770 |
| Greif, Inc., Class A | 656 | 40,095 |
| Greif, Inc., Class B | 118 | 8,006 |
| Myers Industries, Inc. | 970 | 10,709 |
| O-I Glass, Inc. (a) | 4,085 | 44,281 |
| Silgan Holdings, Inc. | 523 | 27,222 |
| TriMas Corp. | 1,058 | 26,016 |
| | | 458,672 |
| Mortgage REITs - 0.1% |
| Advanced Flower Capital, Inc. | 431 | 3,590 |
| AG Mortgage Investment Trust, Inc. | 755 | 5,021 |
| AGNC Investment Corp. | 4,789 | 44,107 |
| Angel Oak Mortgage REIT, Inc. | 437 | 4,055 |
| Annaly Capital Management, Inc. | 3,775 | 69,082 |
| Apollo Commercial Real Estate Finance, Inc. | 3,729 | 32,293 |
See Notes to Schedule of Investments and Notes to Financial Statements.
| 24 | State Street Total Return V.I.S. Fund |
State Street Total Return V.I.S. Fund
Schedule of Investments, continued — December 31, 2024
| | Number
of Shares | Fair
Value |
| Arbor Realty Trust, Inc. | 4,876 | $67,533 |
| ARES Commercial Real Estate Corp. | 1,530 | 9,012 |
| ARMOUR Residential REIT, Inc. | 1,482 | 27,951 |
| Blackstone Mortgage Trust, Inc., Class A | 4,603 | 80,138 |
| BrightSpire Capital, Inc. | 3,332 | 18,792 |
| Chicago Atlantic Real Estate Finance, Inc. | 502 | 7,741 |
| Chimera Investment Corp. | 2,103 | 29,442 |
| Claros Mortgage Trust, Inc. | 2,504 | 11,318 |
| Dynex Capital, Inc. | 1,927 | 24,377 |
| Ellington Financial, Inc. | 2,146 | 26,010 |
| Franklin BSP Realty Trust, Inc. | 2,138 | 26,811 |
| Granite Point Mortgage Trust, Inc. | 1,381 | 3,853 |
| Invesco Mortgage Capital, Inc. | 1,500 | 12,075 |
| KKR Real Estate Finance Trust, Inc. | 1,507 | 15,221 |
| Ladder Capital Corp. | 2,971 | 33,245 |
| MFA Financial, Inc. | 2,671 | 27,217 |
| New York Mortgage Trust, Inc. | 2,302 | 13,950 |
| Nexpoint Real Estate Finance, Inc. | 283 | 4,440 |
| Orchid Island Capital, Inc. | 2,129 | 16,564 |
| PennyMac Mortgage Investment Trust | 2,267 | 28,542 |
| Ready Capital Corp. | 4,204 | 28,671 |
| Redwood Trust, Inc. | 3,479 | 22,718 |
| Rithm Capital Corp. | 3,000 | 32,490 |
| Seven Hills Realty Trust | 326 | 4,264 |
| Starwood Property Trust, Inc. | 2,000 | 37,900 |
| Sunrise Realty Trust, Inc. | 168 | 2,365 |
| TPG RE Finance Trust, Inc. | 1,645 | 13,982 |
| Two Harbors Investment Corp. | 2,712 | 32,083 |
| | | 816,853 |
| Motorcycle Manufacturers - 0.0%* |
| Harley-Davidson, Inc. | 900 | 27,117 |
| Livewire Group, Inc. (a) | 432 | 2,078 |
| | | 29,195 |
| Movies & Entertainment - 0.5% |
| AMC Entertainment Holdings, Inc., Class A (a) | 8,880 | 35,342 |
| Atlanta Braves Holdings, Inc., Class A (a) | 270 | 11,016 |
| | Number
of Shares | Fair
Value |
| Atlanta Braves Holdings, Inc., Class C (a) | 1,323 | $50,618 |
| Cinemark Holdings, Inc. (a) | 2,928 | 90,709 |
| Eventbrite, Inc., Class A (a) | 2,370 | 7,963 |
| IMAX Corp. (a) | 1,115 | 28,544 |
| Liberty Media Corp.-Liberty Formula One, Class A (a) | 300 | 25,212 |
| Liberty Media Corp.-Liberty Formula One, Class C (a) | 1,299 | 120,365 |
| Liberty Media Corp.-Liberty Live, Class C (a) | 473 | 32,192 |
| Lions Gate Entertainment Corp., Class A (a) | 1,500 | 12,810 |
| Lions Gate Entertainment Corp., Class B (a) | 3,224 | 24,341 |
| Live Nation Entertainment, Inc. (a) | 1,028 | 133,126 |
| LiveOne, Inc. (a) | 2,779 | 4,085 |
| Madison Square Garden Entertainment Corp. (a) | 1,026 | 36,526 |
| Madison Square Garden Sports Corp. (a) | 100 | 22,568 |
| Marcus Corp. | 604 | 12,986 |
| Netflix, Inc. (a) | 2,786 | 2,483,218 |
| Reservoir Media, Inc. (a) | 480 | 4,344 |
| Roku, Inc. (a) | 884 | 65,717 |
| Sphere Entertainment Co. (a) | 693 | 27,942 |
| Spotify Technology SA (a) | 1,995 | 892,523 |
| TKO Group Holdings, Inc. (a) | 551 | 78,303 |
| Vivid Seats, Inc., Class A (a) | 2,289 | 10,598 |
| Walt Disney Co. | 11,933 | 1,328,740 |
| Warner Bros Discovery, Inc. (a) | 16,546 | 174,891 |
| | | 5,714,679 |
| Multi-Family Residential REITs - 0.1% |
| Apartment Investment & Management Co., Class A (a) | 3,715 | 33,769 |
| AvalonBay Communities, Inc. | 905 | 199,073 |
| BRT Apartments Corp. | 323 | 5,824 |
| Camden Property Trust | 738 | 85,638 |
| Centerspace | 396 | 26,195 |
| Clipper Realty, Inc. | 311 | 1,424 |
| Elme Communities | 2,310 | 35,274 |
| Equity Residential | 2,412 | 173,085 |
| Essex Property Trust, Inc. | 404 | 115,318 |
| Independence Realty Trust, Inc. | 5,985 | 118,742 |
| Mid-America Apartment Communities, Inc. | 724 | 111,909 |
See Notes to Schedule of Investments and Notes to Financial Statements.
| State Street Total Return V.I.S. Fund | 25 |
State Street Total Return V.I.S. Fund
Schedule of Investments, continued — December 31, 2024
| | Number
of Shares | Fair
Value |
| NexPoint Residential Trust, Inc. | 588 | $24,549 |
| UDR, Inc. | 2,047 | 88,860 |
| Veris Residential, Inc. | 2,057 | 34,208 |
| | | 1,053,868 |
| Multi-Line Insurance - 0.0%* |
| American International Group, Inc. | 4,175 | 303,940 |
| Horace Mann Educators Corp. | 1,081 | 42,408 |
| | | 346,348 |
| Multi-Sector Holdings - 0.5% |
| Berkshire Hathaway, Inc., Class B (a) | 11,992 | 5,435,734 |
| Cannae Holdings, Inc. | 1,470 | 29,194 |
| Compass Diversified Holdings | 1,749 | 40,367 |
| | | 5,505,295 |
| Multi-Utilities - 0.2% |
| Ameren Corp. | 1,751 | 156,084 |
| Avista Corp. | 2,074 | 75,971 |
| Black Hills Corp. | 1,822 | 106,623 |
| CenterPoint Energy, Inc. | 4,237 | 134,440 |
| CMS Energy Corp. | 2,000 | 133,300 |
| Consolidated Edison, Inc. | 2,339 | 208,709 |
| Dominion Energy, Inc. | 5,442 | 293,106 |
| DTE Energy Co. | 1,284 | 155,043 |
| NiSource, Inc. | 3,113 | 114,434 |
| Northwestern Energy Group, Inc. | 1,635 | 87,407 |
| Public Service Enterprise Group, Inc. | 3,299 | 278,733 |
| Sempra | 4,078 | 357,722 |
| Unitil Corp. | 422 | 22,868 |
| WEC Energy Group, Inc. | 1,974 | 185,635 |
| | | 2,310,075 |
| Office REITs - 0.1% |
| Brandywine Realty Trust | 4,478 | 25,077 |
| BXP, Inc. | 1,100 | 81,796 |
| City Office REIT, Inc. | 1,117 | 6,166 |
| COPT Defense Properties | 2,987 | 92,448 |
| Cousins Properties, Inc. | 900 | 27,576 |
| Douglas Emmett, Inc. | 4,279 | 79,418 |
| Easterly Government Properties, Inc. | 2,539 | 28,843 |
| Franklin Street Properties Corp. | 2,474 | 4,527 |
| | Number
of Shares | Fair
Value |
| Highwoods Properties, Inc. | 600 | $18,348 |
| Hudson Pacific Properties, Inc. | 3,483 | 10,554 |
| JBG SMITH Properties | 2,187 | 33,614 |
| Kilroy Realty Corp. | 822 | 33,250 |
| NET Lease Office Properties (a) | 421 | 13,139 |
| Orion Office REIT, Inc. | 1,632 | 6,055 |
| Paramount Group, Inc. | 4,875 | 24,083 |
| Peakstone Realty Trust | 913 | 10,107 |
| Piedmont Office Realty Trust, Inc., Class A | 3,227 | 29,527 |
| Postal Realty Trust, Inc., Class A | 648 | 8,456 |
| SL Green Realty Corp. | 1,863 | 126,535 |
| Vornado Realty Trust | 1,300 | 54,652 |
| | | 714,171 |
| Office Services & Supplies - 0.0%* |
| ACCO Brands Corp. | 2,377 | 12,479 |
| CompX International, Inc. | 19 | 497 |
| HNI Corp. | 1,243 | 62,610 |
| Interface, Inc. | 1,504 | 36,622 |
| MillerKnoll, Inc. | 1,834 | 41,430 |
| MSA Safety, Inc. | 200 | 33,154 |
| NL Industries, Inc. | 196 | 1,523 |
| Pitney Bowes, Inc. | 4,197 | 30,386 |
| Steelcase, Inc., Class A | 2,419 | 28,593 |
| Virco Mfg. Corp. | 328 | 3,362 |
| | | 250,656 |
| Oil & Gas Drilling - 0.0%* |
| Helmerich & Payne, Inc. | 2,564 | 82,099 |
| Nabors Industries Ltd. (a) | 235 | 13,435 |
| Noble Corp. PLC | 3,671 | 115,269 |
| Patterson-UTI Energy, Inc. | 10,319 | 85,235 |
| Transocean Ltd. (a) | 19,334 | 72,503 |
| Valaris Ltd. (a) | 1,629 | 72,067 |
| | | 440,608 |
| Oil & Gas Equipment & Services - 0.2% |
| Archrock, Inc. | 4,410 | 109,765 |
| Atlas Energy Solutions, Inc. | 1,782 | 39,525 |
| Baker Hughes Co. | 6,533 | 267,984 |
| Bristow Group, Inc. (a) | 637 | 21,849 |
| Cactus, Inc., Class A | 1,741 | 101,605 |
| ChampionX Corp. | 5,057 | 137,500 |
| Core Laboratories, Inc. | 1,219 | 21,101 |
| DMC Global, Inc. (a) | 587 | 4,314 |
See Notes to Schedule of Investments and Notes to Financial Statements.
| 26 | State Street Total Return V.I.S. Fund |
State Street Total Return V.I.S. Fund
Schedule of Investments, continued — December 31, 2024
| | Number
of Shares | Fair
Value |
| Drilling Tools International Corp. (a) | 363 | $1,187 |
| Expro Group Holdings NV (a) | 2,478 | 30,901 |
| Forum Energy Technologies, Inc. (a) | 306 | 4,740 |
| Geospace Technologies Corp. (a) | 374 | 3,747 |
| Halliburton Co. | 5,582 | 151,774 |
| Helix Energy Solutions Group, Inc. (a) | 3,780 | 35,229 |
| Innovex International, Inc. (a) | 904 | 12,629 |
| Kodiak Gas Services, Inc. | 860 | 35,114 |
| Liberty Energy, Inc. | 4,184 | 83,220 |
| Mammoth Energy Services, Inc. (a) | 547 | 1,641 |
| Natural Gas Services Group, Inc. (a) | 284 | 7,611 |
| NOV, Inc. | 2,900 | 42,340 |
| NPK International, Inc. (a) | 2,390 | 18,331 |
| Oceaneering International, Inc. (a) | 2,676 | 69,790 |
| Oil States International, Inc. (a) | 1,821 | 9,214 |
| ProFrac Holding Corp., Class A (a) | 625 | 4,850 |
| ProPetro Holding Corp. (a) | 2,263 | 21,114 |
| Ranger Energy Services, Inc., Class A | 466 | 7,214 |
| RPC, Inc. | 2,366 | 14,054 |
| Schlumberger NV | 9,250 | 354,645 |
| SEACOR Marine Holdings, Inc. (a) | 721 | 4,730 |
| Select Water Solutions, Inc. | 2,383 | 31,551 |
| Solaris Energy Infrastructure, Inc. | 691 | 19,887 |
| Tenaris SA | 2,682 | 50,615 |
| TETRA Technologies, Inc. (a) | 3,156 | 11,298 |
| Tidewater, Inc. (a) | 1,290 | 70,576 |
| Weatherford International PLC | 400 | 28,652 |
| | | 1,830,297 |
| Oil & Gas Exploration & Production - 0.4% |
| Amplify Energy Corp. (a) | 1,078 | 6,468 |
| Antero Resources Corp. (a) | 2,100 | 73,605 |
| APA Corp. | 1,900 | 43,871 |
| Berry Corp. | 2,024 | 8,359 |
| California Resources Corp. | 1,832 | 95,062 |
| Chord Energy Corp. | 400 | 46,768 |
| Civitas Resources, Inc. | 600 | 27,522 |
| CNX Resources Corp. (a) | 3,856 | 141,400 |
| | Number
of Shares | Fair
Value |
| Comstock Resources, Inc. (a) | 2,417 | $44,038 |
| ConocoPhillips | 8,537 | 846,614 |
| Coterra Energy, Inc. | 4,827 | 123,282 |
| Crescent Energy Co., Class A | 4,363 | 63,743 |
| Devon Energy Corp. | 4,329 | 141,688 |
| Diamondback Energy, Inc. | 1,231 | 201,675 |
| Diversified Energy Co. PLC | 1,196 | 20,093 |
| Empire Petroleum Corp. (a) | 548 | 4,165 |
| EOG Resources, Inc. | 3,781 | 463,475 |
| EQT Corp. | 3,702 | 170,699 |
| Evolution Petroleum Corp. | 771 | 4,032 |
| Expand Energy Corp. | 1,498 | 149,126 |
| Granite Ridge Resources, Inc. | 1,530 | 9,884 |
| Gulfport Energy Corp. (a) | 342 | 62,996 |
| Hess Corp. | 1,813 | 241,147 |
| HighPeak Energy, Inc. | 384 | 5,645 |
| Magnolia Oil & Gas Corp., Class A | 4,585 | 107,197 |
| Matador Resources Co. | 700 | 39,382 |
| Murphy Oil Corp. | 3,791 | 114,716 |
| Northern Oil & Gas, Inc. | 2,621 | 97,396 |
| Ovintiv, Inc. | 1,900 | 76,950 |
| Permian Resources Corp. | 3,900 | 56,082 |
| PrimeEnergy Resources Corp. (a) | 18 | 3,953 |
| Range Resources Corp. | 1,500 | 53,970 |
| Riley Exploration Permian, Inc. | 304 | 9,704 |
| Ring Energy, Inc. (a) | 4,878 | 6,634 |
| Sable Offshore Corp. (a) | 1,317 | 30,159 |
| SandRidge Energy, Inc. | 850 | 9,954 |
| Sitio Royalties Corp., Class A | 2,129 | 40,834 |
| SM Energy Co. | 3,023 | 117,171 |
| Talos Energy, Inc. (a) | 3,892 | 37,791 |
| Texas Pacific Land Corp. | 123 | 136,033 |
| VAALCO Energy, Inc. | 2,645 | 11,559 |
| Viper Energy, Inc. | 500 | 24,535 |
| Vital Energy, Inc. (a) | 740 | 22,881 |
| Vitesse Energy, Inc. | 640 | 16,000 |
| W&T Offshore, Inc. | 2,898 | 4,811 |
| | | 4,013,069 |
| Oil & Gas Refining & Marketing - 0.1% |
| Aemetis, Inc. (a) | 957 | 2,574 |
| Clean Energy Fuels Corp. (a) | 4,273 | 10,725 |
| CVR Energy, Inc. | 963 | 18,047 |
| Delek U.S. Holdings, Inc. | 1,654 | 30,599 |
| FutureFuel Corp. | 626 | 3,311 |
| Green Plains, Inc. (a) | 1,635 | 15,500 |
See Notes to Schedule of Investments and Notes to Financial Statements.
| State Street Total Return V.I.S. Fund | 27 |
State Street Total Return V.I.S. Fund
Schedule of Investments, continued — December 31, 2024
| | Number
of Shares | Fair
Value |
| HF Sinclair Corp. | 1,200 | $42,060 |
| Marathon Petroleum Corp. | 2,268 | 316,386 |
| Par Pacific Holdings, Inc. (a) | 1,449 | 23,749 |
| PBF Energy, Inc., Class A | 2,652 | 70,411 |
| Phillips 66 Co. | 2,691 | 306,586 |
| REX American Resources Corp. (a) | 396 | 16,509 |
| Valero Energy Corp. | 2,086 | 255,723 |
| World Kinect Corp. | 1,526 | 41,980 |
| | | 1,154,160 |
| Oil & Gas Storage & Transportation - 0.2% |
| Antero Midstream Corp. | 2,500 | 37,725 |
| Cheniere Energy, Inc. | 1,479 | 317,793 |
| DHT Holdings, Inc. | 3,535 | 32,840 |
| Dorian LPG Ltd. | 961 | 23,420 |
| DT Midstream, Inc. | 550 | 54,686 |
| Excelerate Energy, Inc., Class A | 430 | 13,008 |
| International Seaways, Inc. | 1,062 | 38,168 |
| Kinder Morgan, Inc. | 12,717 | 348,446 |
| Kinetik Holdings, Inc. | 1,010 | 57,277 |
| New Fortress Energy, Inc. | 300 | 4,536 |
| NextDecade Corp. (a) | 2,987 | 23,030 |
| Nordic American Tankers Ltd. | 5,735 | 14,338 |
| ONEOK, Inc. | 3,855 | 387,042 |
| Targa Resources Corp. | 1,447 | 258,289 |
| Williams Cos., Inc. | 8,037 | 434,962 |
| | | 2,045,560 |
| Other Specialized REITs - 0.1% |
| EPR Properties | 700 | 30,996 |
| Farmland Partners, Inc. | 1,113 | 13,089 |
| Four Corners Property Trust, Inc. | 2,426 | 65,841 |
| Gaming & Leisure Properties, Inc. | 1,511 | 72,770 |
| Gladstone Land Corp. | 888 | 9,635 |
| Iron Mountain, Inc. | 1,900 | 199,709 |
| Lamar Advertising Co., Class A | 600 | 73,044 |
| Outfront Media, Inc. | 3,993 | 70,836 |
| Safehold, Inc. | 1,344 | 24,837 |
| Uniti Group, Inc. | 6,268 | 34,474 |
| VICI Properties, Inc. | 6,559 | 191,588 |
| | | 786,819 |
| | Number
of Shares | Fair
Value |
| Other Specialty Retail - 0.1% |
| 1-800-Flowers.com, Inc., Class A (a) | 769 | $6,283 |
| Academy Sports & Outdoors, Inc. | 1,820 | 104,705 |
| BARK, Inc. (a) | 3,870 | 7,121 |
| Bath & Body Works, Inc. | 1,698 | 65,831 |
| Build-A-Bear Workshop, Inc. | 321 | 14,779 |
| Dick's Sporting Goods, Inc. | 387 | 88,561 |
| Five Below, Inc. (a) | 400 | 41,984 |
| Leslie's, Inc. (a) | 4,502 | 10,039 |
| MarineMax, Inc. (a) | 554 | 16,038 |
| National Vision Holdings, Inc. (a) | 2,057 | 21,434 |
| ODP Corp. (a) | 905 | 20,580 |
| Petco Health & Wellness Co., Inc. (a) | 2,322 | 8,847 |
| Sally Beauty Holdings, Inc. (a) | 2,697 | 28,184 |
| Signet Jewelers Ltd. | 1,134 | 91,525 |
| Tractor Supply Co. | 3,515 | 186,506 |
| Ulta Beauty, Inc. (a) | 341 | 148,311 |
| Upbound Group, Inc. | 1,412 | 41,188 |
| Warby Parker, Inc., Class A (a) | 2,294 | 55,538 |
| Winmark Corp. | 76 | 29,873 |
| | | 987,327 |
| Packaged Foods & Meats - 0.4% |
| B&G Foods, Inc. | 1,970 | 13,573 |
| Beyond Meat, Inc. (a) | 1,811 | 6,809 |
| BRC, Inc., Class A (a) | 1,589 | 5,037 |
| Calavo Growers, Inc. | 441 | 11,246 |
| Cal-Maine Foods, Inc. | 1,085 | 111,668 |
| Campbell's Co. | 1,400 | 58,632 |
| Conagra Brands, Inc. | 2,800 | 77,700 |
| Dole PLC | 1,961 | 26,552 |
| Flowers Foods, Inc. | 1,400 | 28,924 |
| Freshpet, Inc. (a) | 300 | 44,433 |
| General Mills, Inc. | 3,730 | 237,862 |
| Hain Celestial Group, Inc. (a) | 2,292 | 14,096 |
| Hershey Co. | 994 | 168,334 |
| Hormel Foods Corp. | 1,578 | 49,502 |
| J&J Snack Foods Corp. | 404 | 62,673 |
| J.M. Smucker Co. | 721 | 79,397 |
| JBS SA | 11,000 | 64,634 |
| John B Sanfilippo & Son, Inc. | 237 | 20,645 |
| Kellanova | 1,695 | 137,244 |
| Kraft Heinz Co. | 5,929 | 182,080 |
| Lamb Weston Holdings, Inc. | 886 | 59,211 |
| Lancaster Colony Corp. | 519 | 89,860 |
See Notes to Schedule of Investments and Notes to Financial Statements.
| 28 | State Street Total Return V.I.S. Fund |
State Street Total Return V.I.S. Fund
Schedule of Investments, continued — December 31, 2024
| | Number
of Shares | Fair
Value |
| Lifeway Foods, Inc. (a) | 174 | $4,315 |
| Mama's Creations, Inc. (a) | 890 | 7,084 |
| McCormick & Co., Inc. | 1,677 | 127,854 |
| Mission Produce, Inc. (a) | 1,232 | 17,704 |
| Mondelez International, Inc., Class A | 8,759 | 523,175 |
| Nestle SA | 16,931 | 1,391,065 |
| Pilgrim's Pride Corp. (a) | 303 | 13,753 |
| Post Holdings, Inc. (a) | 200 | 22,892 |
| Seaboard Corp. | 1 | 2,430 |
| Seneca Foods Corp., Class A (a) | 124 | 9,828 |
| Simply Good Foods Co. (a) | 2,420 | 94,332 |
| TreeHouse Foods, Inc. (a) | 1,258 | 44,194 |
| Tyson Foods, Inc., Class A | 1,771 | 101,726 |
| Utz Brands, Inc. | 1,695 | 26,544 |
| Vital Farms, Inc. (a) | 848 | 31,961 |
| Westrock Coffee Co. (a) | 896 | 5,752 |
| WK Kellogg Co. | 1,712 | 30,799 |
| | | 4,005,520 |
| Paper & Plastic Packaging Products & Materials - 0.1% |
| Amcor PLC | 8,800 | 82,808 |
| Avery Dennison Corp. | 542 | 101,424 |
| Graphic Packaging Holding Co. | 1,700 | 46,172 |
| International Paper Co. | 2,323 | 125,024 |
| Packaging Corp. of America | 583 | 131,251 |
| Pactiv Evergreen, Inc. | 1,035 | 18,081 |
| Ranpak Holdings Corp. (a) | 1,296 | 8,917 |
| Sealed Air Corp. | 1,005 | 33,999 |
| Smurfit WestRock PLC | 3,500 | 188,510 |
| Sonoco Products Co. | 700 | 34,195 |
| | | 770,381 |
| Paper Products - 0.0%* |
| Clearwater Paper Corp. (a) | 404 | 12,027 |
| Sylvamo Corp. | 933 | 73,726 |
| | | 85,753 |
| Passenger Airlines - 0.1% |
| Alaska Air Group, Inc. (a) | 721 | 46,685 |
| Allegiant Travel Co. | 404 | 38,025 |
| American Airlines Group, Inc. (a) | 3,700 | 64,491 |
| Blade Air Mobility, Inc. (a) | 1,615 | 6,864 |
| Delta Air Lines, Inc. | 4,248 | 257,004 |
| Frontier Group Holdings, Inc. (a) | 1,114 | 7,921 |
| | Number
of Shares | Fair
Value |
| JetBlue Airways Corp. (a) | 8,233 | $64,711 |
| Joby Aviation, Inc. (a) | 11,419 | 92,836 |
| SkyWest, Inc. (a) | 1,053 | 105,437 |
| Southwest Airlines Co. | 3,862 | 129,840 |
| Sun Country Airlines Holdings, Inc. (a) | 1,114 | 16,242 |
| United Airlines Holdings, Inc. (a) | 2,166 | 210,319 |
| Wheels Up Experience, Inc. (a) | 2,713 | 4,476 |
| | | 1,044,851 |
| Passenger Ground Transportation - 0.1% |
| Avis Budget Group, Inc. (a) | 200 | 16,122 |
| Hertz Global Holdings, Inc. (a) | 3,484 | 12,751 |
| Lyft, Inc., Class A (a) | 1,915 | 24,704 |
| Uber Technologies, Inc. (a) | 13,059 | 787,719 |
| | | 841,296 |
| Personal Care Products - 0.1% |
| Beauty Health Co. (a) | 2,040 | 3,244 |
| BellRing Brands, Inc. (a) | 800 | 60,272 |
| Coty, Inc., Class A (a) | 2,800 | 19,488 |
| Edgewell Personal Care Co. | 1,294 | 43,478 |
| elf Beauty, Inc. (a) | 400 | 50,220 |
| Estee Lauder Cos., Inc., Class A | 1,566 | 117,419 |
| Haleon PLC | 49,514 | 234,031 |
| Herbalife Ltd. (a) | 2,583 | 17,280 |
| Honest Co., Inc. (a) | 2,175 | 15,073 |
| Interparfums, Inc. | 481 | 63,256 |
| Kenvue, Inc. | 12,274 | 262,050 |
| Medifast, Inc. (a) | 286 | 5,039 |
| Nature's Sunshine Products, Inc. (a) | 369 | 5,410 |
| Nu Skin Enterprises, Inc., Class A | 1,311 | 9,033 |
| Olaplex Holdings, Inc. (a) | 3,784 | 6,546 |
| USANA Health Sciences, Inc. (a) | 284 | 10,193 |
| Veru, Inc. (a) | 3,928 | 2,555 |
| Waldencast PLC, Class A (a) | 550 | 2,211 |
| | | 926,798 |
| Pharmaceuticals - 1.3% |
| Alimera Sciences, Inc. (a) | 852 | 34 |
| Alto Neuroscience, Inc. (a) | 635 | 2,686 |
| Alumis, Inc. (a) | 394 | 3,097 |
| Amneal Pharmaceuticals, Inc. (a) | 4,171 | 33,034 |
See Notes to Schedule of Investments and Notes to Financial Statements.
| State Street Total Return V.I.S. Fund | 29 |
State Street Total Return V.I.S. Fund
Schedule of Investments, continued — December 31, 2024
| | Number
of Shares | Fair
Value |
| Amphastar Pharmaceuticals, Inc. (a) | 1,013 | $37,613 |
| ANI Pharmaceuticals, Inc. (a) | 482 | 26,645 |
| Aquestive Therapeutics, Inc. (a) | 1,962 | 6,985 |
| Arvinas, Inc. (a) | 1,690 | 32,397 |
| Atea Pharmaceuticals, Inc. (a) | 2,212 | 7,410 |
| Avadel Pharmaceuticals PLC (a) | 2,424 | 25,476 |
| Axsome Therapeutics, Inc. (a) | 966 | 81,733 |
| Biote Corp., Class A (a) | 892 | 5,513 |
| Bristol-Myers Squibb Co. | 13,239 | 748,798 |
| Cassava Sciences, Inc. (a) | 1,154 | 2,723 |
| Collegium Pharmaceutical, Inc. (a) | 847 | 24,267 |
| Contineum Therapeutics, Inc., Class A (a) | 168 | 2,461 |
| Corcept Therapeutics, Inc. (a) | 2,141 | 107,885 |
| CorMedix, Inc. (a) | 1,632 | 13,219 |
| Edgewise Therapeutics, Inc. (a) | 1,919 | 51,237 |
| Elanco Animal Health, Inc. (a) | 3,582 | 43,378 |
| Eli Lilly & Co. | 5,214 | 4,025,208 |
| Enliven Therapeutics, Inc. (a) | 913 | 20,543 |
| Esperion Therapeutics, Inc. (a) | 5,307 | 11,675 |
| Evolus, Inc. (a) | 1,460 | 16,118 |
| EyePoint Pharmaceuticals, Inc. (a) | 1,420 | 10,579 |
| Fulcrum Therapeutics, Inc. (a) | 1,780 | 8,366 |
| GSK PLC | 26,737 | 450,881 |
| Harmony Biosciences Holdings, Inc. (a) | 1,007 | 34,651 |
| Harrow, Inc. (a) | 802 | 26,907 |
| Innoviva, Inc. (a) | 1,441 | 25,001 |
| Intra-Cellular Therapies, Inc. (a) | 700 | 58,464 |
| Jazz Pharmaceuticals PLC (a) | 400 | 49,260 |
| Johnson & Johnson | 15,702 | 2,270,823 |
| Ligand Pharmaceuticals, Inc. (a) | 449 | 48,110 |
| Liquidia Corp. (a) | 1,666 | 19,592 |
| MBX Biosciences, Inc. (a) | 297 | 5,474 |
| Merck & Co., Inc. | 16,543 | 1,645,698 |
| Mind Medicine MindMed, Inc. (a) | 2,065 | 14,372 |
| Nektar Therapeutics (a) | 4,744 | 4,412 |
| Neumora Therapeutics, Inc. (a) | 2,193 | 23,246 |
| Nuvation Bio, Inc. (a) | 5,131 | 13,649 |
| Ocular Therapeutix, Inc. (a) | 4,091 | 34,937 |
| | Number
of Shares | Fair
Value |
| Omeros Corp. (a) | 1,489 | $14,711 |
| Organon & Co. | 1,890 | 28,199 |
| Pacira BioSciences, Inc. (a) | 1,181 | 22,250 |
| Perrigo Co. PLC | 1,000 | 25,710 |
| Pfizer, Inc. | 36,815 | 976,702 |
| Phathom Pharmaceuticals, Inc. (a) | 1,055 | 8,567 |
| Phibro Animal Health Corp., Class A | 599 | 12,579 |
| Pliant Therapeutics, Inc. (a) | 1,470 | 19,360 |
| Prestige Consumer Healthcare, Inc. (a) | 1,309 | 102,220 |
| Rapport Therapeutics, Inc. (a) | 276 | 4,896 |
| Revance Therapeutics, Inc. (a) | 2,886 | 8,773 |
| Roche Holding AG | 4,751 | 1,334,351 |
| Royalty Pharma PLC, Class A | 2,700 | 68,877 |
| Sanofi SA | 7,374 | 715,778 |
| scPharmaceuticals, Inc. (a) | 687 | 2,432 |
| Septerna, Inc. (a) | 491 | 11,244 |
| SIGA Technologies, Inc. | 1,410 | 8,474 |
| Supernus Pharmaceuticals, Inc. (a) | 1,322 | 47,804 |
| Tarsus Pharmaceuticals, Inc. (a) | 968 | 53,598 |
| Terns Pharmaceuticals, Inc. (a) | 1,620 | 8,975 |
| Theravance Biopharma, Inc. (a) | 970 | 9,128 |
| Third Harmonic Bio, Inc. (a) | 586 | 6,030 |
| Trevi Therapeutics, Inc. (a) | 1,451 | 5,978 |
| Ventyx Biosciences, Inc. (a) | 2,038 | 4,463 |
| Verrica Pharmaceuticals, Inc. (a) | 727 | 509 |
| Viatris, Inc. | 7,500 | 93,375 |
| WaVe Life Sciences Ltd. (a) | 2,435 | 30,121 |
| Xeris Biopharma Holdings, Inc. (a) | 3,525 | 11,950 |
| Zevra Therapeutics, Inc. (a) | 1,162 | 9,691 |
| Zoetis, Inc. | 2,992 | 487,487 |
| | | 14,208,789 |
| Property & Casualty Insurance - 0.4% |
| Allstate Corp. | 1,691 | 326,008 |
| Ambac Financial Group, Inc. (a) | 1,095 | 13,852 |
| American Coastal Insurance Corp., Class C (a) | 719 | 9,678 |
| American Financial Group, Inc. | 481 | 65,863 |
| AMERISAFE, Inc. | 503 | 25,925 |
See Notes to Schedule of Investments and Notes to Financial Statements.
| 30 | State Street Total Return V.I.S. Fund |
State Street Total Return V.I.S. Fund
Schedule of Investments, continued — December 31, 2024
| | Number
of Shares | Fair
Value |
| Arch Capital Group Ltd. | 2,300 | $212,405 |
| Assurant, Inc. | 336 | 71,642 |
| Assured Guaranty Ltd. | 400 | 36,004 |
| Axis Capital Holdings Ltd. | 600 | 53,172 |
| Bowhead Specialty Holdings, Inc. (a) | 215 | 7,637 |
| Chubb Ltd. | 2,680 | 740,484 |
| Cincinnati Financial Corp. | 1,065 | 153,040 |
| Donegal Group, Inc., Class A | 446 | 6,900 |
| Employers Holdings, Inc. | 646 | 33,095 |
| Fidelity National Financial, Inc. | 1,600 | 89,824 |
| First American Financial Corp. | 500 | 31,220 |
| Hanover Insurance Group, Inc. | 300 | 46,398 |
| Hartford Financial Services Group, Inc. | 1,950 | 213,330 |
| HCI Group, Inc. | 219 | 25,520 |
| Heritage Insurance Holdings, Inc. (a) | 604 | 7,308 |
| Investors Title Co. | 35 | 8,287 |
| James River Group Holdings Ltd. | 839 | 4,086 |
| Kemper Corp. | 300 | 19,932 |
| Kinsale Capital Group, Inc. | 137 | 63,723 |
| Lemonade, Inc. (a) | 1,399 | 51,315 |
| Loews Corp. | 1,200 | 101,628 |
| Markel Group, Inc. (a) | 89 | 153,634 |
| MBIA, Inc. (a) | 1,299 | 8,391 |
| Mercury General Corp. | 706 | 46,935 |
| NI Holdings, Inc. (a) | 206 | 3,234 |
| Old Republic International Corp. | 1,710 | 61,885 |
| Palomar Holdings, Inc. (a) | 647 | 68,317 |
| ProAssurance Corp. (a) | 1,317 | 20,953 |
| Progressive Corp. | 3,867 | 926,572 |
| RLI Corp. | 300 | 49,449 |
| Root, Inc., Class A (a) | 242 | 17,567 |
| Safety Insurance Group, Inc. | 384 | 31,642 |
| Selective Insurance Group, Inc. | 1,607 | 150,287 |
| Skyward Specialty Insurance Group, Inc. (a) | 978 | 49,428 |
| Stewart Information Services Corp. | 713 | 48,120 |
| Tiptree, Inc. | 666 | 13,893 |
| Travelers Cos., Inc. | 1,491 | 359,167 |
| Trupanion, Inc. (a) | 867 | 41,789 |
| United Fire Group, Inc. | 531 | 15,107 |
| Universal Insurance Holdings, Inc. | 606 | 12,762 |
| | Number
of Shares | Fair
Value |
| W.R. Berkley Corp. | 2,046 | $119,732 |
| White Mountains Insurance Group Ltd. | 14 | 27,231 |
| | | 4,644,371 |
| Publishing - 0.0%* |
| Gannett Co., Inc. (a) | 3,999 | 20,235 |
| John Wiley & Sons, Inc., Class A | 1,055 | 46,114 |
| New York Times Co., Class A | 1,201 | 62,512 |
| News Corp., Class A | 2,594 | 71,439 |
| News Corp., Class B | 871 | 26,504 |
| Scholastic Corp. | 614 | 13,097 |
| | | 239,901 |
| Rail Transportation - 0.2% |
| CSX Corp. | 12,684 | 409,313 |
| FTAI Infrastructure, Inc. | 2,612 | 18,963 |
| Norfolk Southern Corp. | 1,438 | 337,499 |
| Union Pacific Corp. | 3,928 | 895,741 |
| | | 1,661,516 |
| Real Estate Development - 0.0%* |
| Forestar Group, Inc. (a) | 503 | 13,038 |
| Howard Hughes Holdings, Inc. (a) | 100 | 7,692 |
| Maui Land & Pineapple Co., Inc. (a) | 193 | 4,242 |
| Star Holdings (a) | 359 | 3,493 |
| Stratus Properties, Inc. (a) | 137 | 2,844 |
| | | 31,309 |
| Real Estate Operating Companies - 0.0%* |
| FRP Holdings, Inc. (a) | 352 | 10,782 |
| Kennedy-Wilson Holdings, Inc. | 2,975 | 29,720 |
| Seaport Entertainment Group, Inc. (a) | 24 | 671 |
| Transcontinental Realty Investors, Inc. (a) | 12 | 358 |
| | | 41,531 |
| Real Estate Services - 0.1% |
| Anywhere Real Estate, Inc. (a) | 2,770 | 9,141 |
| CBRE Group, Inc., Class A (a) | 1,982 | 260,217 |
| Compass, Inc., Class A (a) | 9,634 | 56,359 |
| CoStar Group, Inc. (a) | 2,628 | 188,138 |
| Cushman & Wakefield PLC (a) | 6,073 | 79,435 |
| eXp World Holdings, Inc. | 2,138 | 24,608 |
| Jones Lang LaSalle, Inc. (a) | 300 | 75,942 |
See Notes to Schedule of Investments and Notes to Financial Statements.
| State Street Total Return V.I.S. Fund | 31 |
State Street Total Return V.I.S. Fund
Schedule of Investments, continued — December 31, 2024
| | Number
of Shares | Fair
Value |
| Marcus & Millichap, Inc. | 609 | $23,300 |
| Newmark Group, Inc., Class A | 3,533 | 45,258 |
| Offerpad Solutions, Inc. (a) | 493 | 1,405 |
| Opendoor Technologies, Inc. (a) | 16,160 | 25,856 |
| RE/MAX Holdings, Inc., Class A (a) | 473 | 5,047 |
| Redfin Corp. (a) | 3,057 | 24,059 |
| Zillow Group, Inc., Class A (a) | 400 | 28,340 |
| Zillow Group, Inc., Class C (a) | 1,000 | 74,050 |
| | | 921,155 |
| Regional Banks - 0.8% |
| 1st Source Corp. | 479 | 27,964 |
| ACNB Corp. | 229 | 9,121 |
| Amalgamated Financial Corp. | 458 | 15,329 |
| Amerant Bancorp, Inc. | 978 | 21,917 |
| Ameris Bancorp | 1,750 | 109,497 |
| Ames National Corp. | 225 | 3,697 |
| Arrow Financial Corp. | 416 | 11,943 |
| Associated Banc-Corp. | 4,327 | 103,415 |
| Atlantic Union Bankshares Corp. | 2,374 | 89,927 |
| Axos Financial, Inc. (a) | 1,452 | 101,422 |
| Banc of California, Inc. | 3,671 | 56,754 |
| BancFirst Corp. | 527 | 61,754 |
| Bancorp, Inc. (a) | 1,238 | 65,156 |
| Bank First Corp. | 255 | 25,268 |
| Bank of Hawaii Corp. | 1,036 | 73,805 |
| Bank of Marin Bancorp | 418 | 9,936 |
| Bank OZK | 800 | 35,624 |
| Bank7 Corp. | 130 | 6,066 |
| BankUnited, Inc. | 1,976 | 75,424 |
| Bankwell Financial Group, Inc. | 194 | 6,043 |
| Banner Corp. | 908 | 60,627 |
| Bar Harbor Bankshares | 376 | 11,498 |
| BayCom Corp. | 284 | 7,623 |
| BCB Bancorp, Inc. | 416 | 4,925 |
| Berkshire Hills Bancorp, Inc. | 1,124 | 31,955 |
| Blue Foundry Bancorp (a) | 595 | 5,837 |
| BOK Financial Corp. | 100 | 10,645 |
| Bridgewater Bancshares, Inc. (a) | 597 | 8,065 |
| Brookline Bancorp, Inc. | 2,299 | 27,128 |
| Burke & Herbert Financial Services Corp. | 358 | 22,325 |
| Business First Bancshares, Inc. | 619 | 15,908 |
| Byline Bancorp, Inc. | 809 | 23,461 |
| Cadence Bank | 4,833 | 166,497 |
| | Number
of Shares | Fair
Value |
| California BanCorp (a) | 679 | $11,231 |
| Camden National Corp. | 373 | 15,942 |
| Capital Bancorp, Inc. | 245 | 6,983 |
| Capital City Bank Group, Inc. | 400 | 14,660 |
| Capitol Federal Financial, Inc. | 3,208 | 18,959 |
| Carter Bankshares, Inc. (a) | 655 | 11,521 |
| Cathay General Bancorp | 1,847 | 87,936 |
| Central Pacific Financial Corp. | 750 | 21,787 |
| Chemung Financial Corp. | 90 | 4,393 |
| ChoiceOne Financial Services, Inc. | 202 | 7,199 |
| Citizens & Northern Corp. | 425 | 7,905 |
| Citizens Financial Group, Inc. | 2,952 | 129,180 |
| Citizens Financial Services, Inc. | 120 | 7,597 |
| City Holding Co. | 386 | 45,733 |
| Civista Bancshares, Inc. | 453 | 9,531 |
| CNB Financial Corp. | 524 | 13,027 |
| Coastal Financial Corp. (a) | 289 | 24,539 |
| Colony Bankcorp, Inc. | 441 | 7,118 |
| Columbia Banking System, Inc. | 1,393 | 37,625 |
| Columbia Financial, Inc. (a) | 776 | 12,269 |
| Commerce Bancshares, Inc. | 922 | 57,450 |
| Community Financial System, Inc. | 1,388 | 85,612 |
| Community Trust Bancorp, Inc. | 406 | 21,530 |
| Community West Bancshares | 514 | 9,956 |
| ConnectOne Bancorp, Inc. | 958 | 21,948 |
| CrossFirst Bankshares, Inc. (a) | 1,170 | 17,725 |
| Cullen/Frost Bankers, Inc. | 400 | 53,700 |
| Customers Bancorp, Inc. (a) | 778 | 37,873 |
| CVB Financial Corp. | 3,510 | 75,149 |
| Dime Community Bancshares, Inc. | 925 | 28,430 |
| Eagle Bancorp, Inc. | 764 | 19,887 |
| East West Bancorp, Inc. | 893 | 85,514 |
| Eastern Bankshares, Inc. | 5,120 | 88,320 |
| Enterprise Bancorp, Inc. | 266 | 10,518 |
| Enterprise Financial Services Corp. | 977 | 55,103 |
| Equity Bancshares, Inc., Class A | 367 | 15,568 |
| Esquire Financial Holdings, Inc. | 187 | 14,866 |
| ESSA Bancorp, Inc. | 210 | 4,095 |
| Farmers & Merchants Bancorp, Inc. | 337 | 9,925 |
See Notes to Schedule of Investments and Notes to Financial Statements.
| 32 | State Street Total Return V.I.S. Fund |
State Street Total Return V.I.S. Fund
Schedule of Investments, continued — December 31, 2024
| | Number
of Shares | Fair
Value |
| Farmers National Banc Corp. | 925 | $13,153 |
| FB Financial Corp. | 937 | 48,265 |
| Fidelity D&D Bancorp, Inc. | 140 | 6,832 |
| Financial Institutions, Inc. | 401 | 10,943 |
| First Bancorp, Inc. | 291 | 7,959 |
| First Bancorp/Southern Pines NC | 1,054 | 46,344 |
| First Bancshares, Inc. | 793 | 27,755 |
| First Bank | 631 | 8,878 |
| First Busey Corp. | 1,397 | 32,927 |
| First Business Financial Services, Inc. | 218 | 10,091 |
| First Commonwealth Financial Corp. | 2,665 | 45,092 |
| First Community Bankshares, Inc. | 435 | 18,113 |
| First Financial Bancorp | 2,499 | 67,173 |
| First Financial Bankshares, Inc. | 3,439 | 123,976 |
| First Financial Corp. | 290 | 13,395 |
| First Financial Northwest, Inc. | 176 | 3,819 |
| First Foundation, Inc. | 1,713 | 10,638 |
| First Hawaiian, Inc. | 1,200 | 31,140 |
| First Horizon Corp. | 3,500 | 70,490 |
| First Internet Bancorp | 221 | 7,954 |
| First Interstate BancSystem, Inc., Class A | 2,100 | 68,187 |
| First Merchants Corp. | 1,542 | 61,510 |
| First Mid Bancshares, Inc. | 604 | 22,239 |
| First of Long Island Corp. | 628 | 7,335 |
| First Western Financial, Inc. (a) | 219 | 4,281 |
| Five Star Bancorp | 422 | 12,698 |
| Flagstar Financial, Inc. | 6,715 | 62,651 |
| Flushing Financial Corp. | 689 | 9,839 |
| FNB Corp. | 2,600 | 38,428 |
| FS Bancorp, Inc. | 197 | 8,089 |
| Fulton Financial Corp. | 4,820 | 92,930 |
| FVCBankcorp, Inc. (a) | 425 | 5,342 |
| German American Bancorp, Inc. | 745 | 29,964 |
| Glacier Bancorp, Inc. | 3,022 | 151,765 |
| Great Southern Bancorp, Inc. | 237 | 14,149 |
| Greene County Bancorp, Inc. | 208 | 5,766 |
| Guaranty Bancshares, Inc. | 216 | 7,474 |
| Hancock Whitney Corp. | 2,299 | 125,801 |
| Hanmi Financial Corp. | 835 | 19,723 |
| HarborOne Bancorp, Inc. | 1,013 | 11,984 |
| HBT Financial, Inc. | 349 | 7,643 |
| Heartland Financial USA, Inc. | 1,123 | 68,846 |
| | Number
of Shares | Fair
Value |
| Heritage Commerce Corp. | 1,522 | $14,276 |
| Heritage Financial Corp. | 888 | 21,756 |
| Hilltop Holdings, Inc. | 1,222 | 34,986 |
| Hingham Institution For Savings | 41 | 10,420 |
| Home Bancorp, Inc. | 195 | 9,011 |
| Home BancShares, Inc. | 4,924 | 139,349 |
| HomeStreet, Inc. (a) | 536 | 6,121 |
| HomeTrust Bancshares, Inc. | 372 | 12,529 |
| Hope Bancorp, Inc. | 3,045 | 37,423 |
| Horizon Bancorp, Inc. | 1,118 | 18,011 |
| Huntington Bancshares, Inc. | 9,246 | 150,432 |
| Independent Bank Corp. | 1,682 | 91,614 |
| Independent Bank Group, Inc. | 958 | 58,122 |
| International Bancshares Corp. | 1,435 | 90,635 |
| Investar Holding Corp. | 232 | 5,095 |
| John Marshall Bancorp, Inc. | 368 | 7,389 |
| Kearny Financial Corp. | 1,447 | 10,245 |
| Lakeland Financial Corp. | 655 | 45,038 |
| LCNB Corp. | 347 | 5,250 |
| LINKBANCORP, Inc. | 658 | 4,922 |
| Live Oak Bancshares, Inc. | 911 | 36,030 |
| M&T Bank Corp. | 1,052 | 197,787 |
| Mercantile Bank Corp. | 406 | 18,063 |
| Metrocity Bankshares, Inc. | 469 | 14,985 |
| Metropolitan Bank Holding Corp. (a) | 271 | 15,826 |
| Mid Penn Bancorp, Inc. | 374 | 10,786 |
| Middlefield Banc Corp. | 202 | 5,666 |
| Midland States Bancorp, Inc. | 522 | 12,737 |
| MidWestOne Financial Group, Inc. | 424 | 12,347 |
| MVB Financial Corp. | 337 | 6,976 |
| National Bank Holdings Corp., Class A | 971 | 41,811 |
| National Bankshares, Inc. | 161 | 4,622 |
| NB Bancorp, Inc. (a) | 999 | 18,042 |
| NBT Bancorp, Inc. | 1,216 | 58,076 |
| Nicolet Bankshares, Inc. | 349 | 36,614 |
| Northeast Bank | 168 | 15,411 |
| Northeast Community Bancorp, Inc. | 362 | 8,855 |
| Northfield Bancorp, Inc. | 1,113 | 12,933 |
| Northrim BanCorp, Inc. | 155 | 12,081 |
| Northwest Bancshares, Inc. | 3,356 | 44,266 |
| Norwood Financial Corp. | 214 | 5,822 |
| Oak Valley Bancorp | 192 | 5,616 |
| OceanFirst Financial Corp. | 1,502 | 27,186 |
| Old National Bancorp | 8,350 | 181,237 |
See Notes to Schedule of Investments and Notes to Financial Statements.
| State Street Total Return V.I.S. Fund | 33 |
State Street Total Return V.I.S. Fund
Schedule of Investments, continued — December 31, 2024
| | Number
of Shares | Fair
Value |
| Old Second Bancorp, Inc. | 1,123 | $19,967 |
| Orange County Bancorp, Inc. | 152 | 8,447 |
| Origin Bancorp, Inc. | 763 | 25,400 |
| Orrstown Financial Services, Inc. | 490 | 17,939 |
| Pacific Premier Bancorp, Inc. | 2,536 | 63,197 |
| Park National Corp. | 381 | 65,315 |
| Parke Bancorp, Inc. | 275 | 5,640 |
| Pathward Financial, Inc. | 663 | 48,784 |
| PCB Bancorp | 308 | 6,234 |
| Peapack-Gladstone Financial Corp. | 426 | 13,653 |
| Peoples Bancorp of North Carolina, Inc. | 131 | 4,094 |
| Peoples Bancorp, Inc. | 903 | 28,616 |
| Peoples Financial Services Corp. | 260 | 13,307 |
| Pinnacle Financial Partners, Inc. | 486 | 55,594 |
| Pioneer Bancorp, Inc. (a) | 424 | 4,884 |
| Plumas Bancorp | 159 | 7,514 |
| Ponce Financial Group, Inc. (a) | 545 | 7,085 |
| Preferred Bank | 324 | 27,987 |
| Premier Financial Corp. | 918 | 23,473 |
| Primis Financial Corp. | 593 | 6,914 |
| Princeton Bancorp, Inc. | 143 | 4,923 |
| Prosperity Bancshares, Inc. | 600 | 45,210 |
| Provident Bancorp, Inc. (a) | 396 | 4,514 |
| Provident Financial Services, Inc. | 3,332 | 62,875 |
| QCR Holdings, Inc. | 430 | 34,675 |
| RBB Bancorp | 430 | 8,811 |
| Red River Bancshares, Inc. | 139 | 7,503 |
| Regions Financial Corp. | 5,877 | 138,227 |
| Renasant Corp. | 1,626 | 58,129 |
| Republic Bancorp, Inc., Class A | 211 | 14,743 |
| S&T Bancorp, Inc. | 1,001 | 38,258 |
| Sandy Spring Bancorp, Inc. | 1,155 | 38,935 |
| Seacoast Banking Corp. of Florida | 2,234 | 61,502 |
| ServisFirst Bancshares, Inc. | 1,349 | 114,314 |
| Shore Bancshares, Inc. | 867 | 13,742 |
| Sierra Bancorp | 344 | 9,948 |
| Simmons First National Corp., Class A | 3,289 | 72,950 |
| SmartFinancial, Inc. | 404 | 12,516 |
| South Plains Financial, Inc. | 347 | 12,058 |
| | Number
of Shares | Fair
Value |
| Southern First Bancshares, Inc. (a) | 207 | $8,228 |
| Southern Missouri Bancorp, Inc. | 243 | 13,941 |
| Southern States Bancshares, Inc. | 225 | 7,495 |
| Southside Bancshares, Inc. | 759 | 24,106 |
| SouthState Corp. | 2,019 | 200,850 |
| Stellar Bancorp, Inc. | 1,288 | 36,515 |
| Sterling Bancorp, Inc. (a) | 504 | 2,399 |
| Stock Yards Bancorp, Inc. | 675 | 48,337 |
| Synovus Financial Corp. | 818 | 41,906 |
| Texas Capital Bancshares, Inc. (a) | 1,231 | 96,264 |
| Third Coast Bancshares, Inc. (a) | 306 | 10,389 |
| Timberland Bancorp, Inc. | 217 | 6,621 |
| Tompkins Financial Corp. | 330 | 22,384 |
| Towne Bank | 1,858 | 63,283 |
| TriCo Bancshares | 840 | 36,708 |
| Triumph Financial, Inc. (a) | 583 | 52,983 |
| Truist Financial Corp. | 8,598 | 372,981 |
| TrustCo Bank Corp. | 517 | 17,221 |
| Trustmark Corp. | 1,608 | 56,875 |
| UMB Financial Corp. | 1,189 | 134,191 |
| United Bankshares, Inc. | 3,504 | 131,575 |
| United Community Banks, Inc. | 3,175 | 102,584 |
| Unity Bancorp, Inc. | 192 | 8,373 |
| Univest Financial Corp. | 749 | 22,103 |
| USCB Financial Holdings, Inc. | 263 | 4,668 |
| Valley National Bancorp | 12,486 | 113,123 |
| Veritex Holdings, Inc. | 1,379 | 37,454 |
| Virginia National Bankshares Corp. | 119 | 4,546 |
| WaFd, Inc. | 1,766 | 56,936 |
| Washington Trust Bancorp, Inc. | 433 | 13,575 |
| Webster Financial Corp. | 972 | 53,674 |
| WesBanco, Inc. | 1,518 | 49,396 |
| West BanCorp, Inc. | 426 | 9,223 |
| Westamerica BanCorp | 674 | 35,358 |
| Western Alliance Bancorp | 600 | 50,124 |
| Wintrust Financial Corp. | 400 | 49,884 |
| WSFS Financial Corp. | 1,568 | 83,308 |
| Zions Bancorp NA | 1,075 | 58,319 |
| | | 8,878,617 |
| Reinsurance - 0.1% |
| Enstar Group Ltd. (a) | 335 | 107,887 |
| Everest Group Ltd. | 235 | 85,178 |
See Notes to Schedule of Investments and Notes to Financial Statements.
| 34 | State Street Total Return V.I.S. Fund |
State Street Total Return V.I.S. Fund
Schedule of Investments, continued — December 31, 2024
| | Number
of Shares | Fair
Value |
| Greenlight Capital Re Ltd., Class A (a) | 686 | $9,604 |
| Maiden Holdings Ltd. (a) | 2,463 | 4,162 |
| Reinsurance Group of America, Inc. | 400 | 85,452 |
| Swiss Re AG | 1,943 | 281,817 |
| | | 574,100 |
| Renewable Electricity - 0.0%* |
| Altus Power, Inc. (a) | 2,257 | 9,186 |
| Clearway Energy, Inc., Class C | 600 | 15,600 |
| Montauk Renewables, Inc. (a) | 1,960 | 7,801 |
| Ormat Technologies, Inc. | 1,525 | 103,273 |
| Sunnova Energy International, Inc. (a) | 2,870 | 9,844 |
| | | 145,704 |
| Research & Consulting Services - 0.2% |
| Amentum Holdings, Inc. (a) | 1,000 | 21,030 |
| BlackSky Technology, Inc. (a) | 663 | 7,154 |
| Booz Allen Hamilton Holding Corp. | 824 | 106,049 |
| CACI International, Inc., Class A (a) | 169 | 68,286 |
| CBIZ, Inc. (a) | 1,272 | 104,088 |
| Clarivate PLC (a) | 3,112 | 15,809 |
| CRA International, Inc. | 173 | 32,385 |
| Dun & Bradstreet Holdings, Inc. | 2,000 | 24,920 |
| Equifax, Inc. | 791 | 201,586 |
| Experian PLC | 5,922 | 255,506 |
| Exponent, Inc. | 1,345 | 119,839 |
| FiscalNote Holdings, Inc. (a) | 2,217 | 2,372 |
| Forrester Research, Inc. (a) | 345 | 5,406 |
| Franklin Covey Co. (a) | 308 | 11,575 |
| FTI Consulting, Inc. (a) | 200 | 38,226 |
| Huron Consulting Group, Inc. (a) | 464 | 57,657 |
| ICF International, Inc. | 494 | 58,890 |
| Innodata, Inc. (a) | 706 | 27,901 |
| Jacobs Solutions, Inc. | 800 | 106,896 |
| KBR, Inc. | 1,000 | 57,930 |
| Legalzoom.com, Inc. (a) | 3,386 | 25,429 |
| Leidos Holdings, Inc. | 891 | 128,357 |
| Mistras Group, Inc. (a) | 547 | 4,956 |
| NV5 Global, Inc. (a) | 1,495 | 28,166 |
| Parsons Corp. (a) | 200 | 18,450 |
| Planet Labs PBC (a) | 5,501 | 22,224 |
| Resources Connection, Inc. | 950 | 8,103 |
| | Number
of Shares | Fair
Value |
| Science Applications International Corp. | 400 | $44,712 |
| Spire Global, Inc. (a) | 600 | 8,442 |
| TransUnion | 1,189 | 110,232 |
| Verisk Analytics, Inc. | 946 | 260,557 |
| Willdan Group, Inc. (a) | 320 | 12,189 |
| | | 1,995,322 |
| Restaurants - 0.4% |
| Aramark | 1,800 | 67,158 |
| Biglari Holdings, Inc., Class B (a) | 18 | 4,577 |
| BJ's Restaurants, Inc. (a) | 483 | 16,970 |
| Bloomin' Brands, Inc. | 2,056 | 25,104 |
| Brinker International, Inc. (a) | 1,168 | 154,515 |
| Cava Group, Inc. (a) | 500 | 56,400 |
| Cheesecake Factory, Inc. | 1,275 | 60,486 |
| Chipotle Mexican Grill, Inc. (a) | 8,950 | 539,685 |
| Cracker Barrel Old Country Store, Inc. | 574 | 30,342 |
| Darden Restaurants, Inc. | 800 | 149,352 |
| Denny's Corp. (a) | 1,332 | 8,059 |
| Dine Brands Global, Inc. | 381 | 11,468 |
| Domino's Pizza, Inc. | 250 | 104,940 |
| DoorDash, Inc., Class A (a) | 2,300 | 385,825 |
| Dutch Bros, Inc., Class A (a) | 600 | 31,428 |
| El Pollo Loco Holdings, Inc. (a) | 682 | 7,870 |
| First Watch Restaurant Group, Inc. (a) | 867 | 16,135 |
| Jack in the Box, Inc. | 509 | 21,195 |
| Krispy Kreme, Inc. | 2,221 | 22,054 |
| Kura Sushi USA, Inc., Class A (a) | 150 | 13,587 |
| McDonald's Corp. | 4,731 | 1,371,470 |
| Nathan's Famous, Inc. | 80 | 6,289 |
| ONE Group Hospitality, Inc. (a) | 841 | 2,439 |
| Papa John's International, Inc. | 875 | 35,936 |
| Portillo's, Inc., Class A (a) | 1,550 | 14,570 |
| Potbelly Corp. (a) | 787 | 7,413 |
| RCI Hospitality Holdings, Inc. | 211 | 12,126 |
| Shake Shack, Inc., Class A (a) | 1,007 | 130,709 |
| Starbucks Corp. | 7,365 | 672,056 |
| Sweetgreen, Inc., Class A (a) | 2,622 | 84,061 |
| Texas Roadhouse, Inc. | 400 | 72,172 |
| Wendy's Co. | 900 | 14,670 |
| Wingstop, Inc. | 200 | 56,840 |
| Yum! Brands, Inc. | 1,881 | 252,355 |
| | | 4,460,256 |
See Notes to Schedule of Investments and Notes to Financial Statements.
| State Street Total Return V.I.S. Fund | 35 |
State Street Total Return V.I.S. Fund
Schedule of Investments, continued — December 31, 2024
| | Number
of Shares | Fair
Value |
| Retail REITs - 0.2% |
| Acadia Realty Trust | 3,096 | $74,799 |
| Agree Realty Corp. | 600 | 42,270 |
| Alexander's, Inc. | 54 | 10,803 |
| Brixmor Property Group, Inc. | 1,800 | 50,112 |
| CBL & Associates Properties, Inc. | 578 | 16,999 |
| Curbline Properties Corp. | 2,509 | 58,259 |
| Federal Realty Investment Trust | 500 | 55,975 |
| FrontView REIT, Inc. | 381 | 6,908 |
| Getty Realty Corp. | 1,299 | 39,139 |
| InvenTrust Properties Corp. | 2,048 | 61,706 |
| Kimco Realty Corp. | 4,134 | 96,860 |
| Kite Realty Group Trust | 5,757 | 145,307 |
| Macerich Co. | 6,256 | 124,619 |
| NETSTREIT Corp. | 2,032 | 28,753 |
| NNN REIT, Inc. | 1,400 | 57,190 |
| Phillips Edison & Co., Inc. | 3,252 | 121,820 |
| Realty Income Corp. | 5,616 | 299,951 |
| Regency Centers Corp. | 1,200 | 88,716 |
| Retail Opportunity Investments Corp. | 3,270 | 56,767 |
| Saul Centers, Inc. | 296 | 11,485 |
| Simon Property Group, Inc. | 2,063 | 355,269 |
| SITE Centers Corp. | 1,222 | 18,684 |
| Tanger, Inc. | 2,826 | 96,451 |
| Urban Edge Properties | 3,240 | 69,660 |
| Whitestone REIT | 1,254 | 17,769 |
| | | 2,006,271 |
| Security & Alarm Services - 0.0%* |
| Brink's Co. | 1,172 | 108,727 |
| CoreCivic, Inc. (a) | 2,918 | 63,437 |
| GEO Group, Inc. (a) | 3,294 | 92,166 |
| | | 264,330 |
| Self Storage REITs - 0.1% |
| CubeSmart | 1,300 | 55,705 |
| Extra Space Storage, Inc. | 1,354 | 202,558 |
| National Storage Affiliates Trust | 300 | 11,373 |
| Public Storage | 1,008 | 301,836 |
| | | 571,472 |
| Semiconductor Materials & Equipment - 0.3% |
| ACM Research, Inc., Class A (a) | 1,322 | 19,962 |
| Aehr Test Systems (a) | 813 | 13,520 |
| | Number
of Shares | Fair
Value |
| Amkor Technology, Inc. | 800 | $20,552 |
| Applied Materials, Inc. | 5,434 | 883,732 |
| Axcelis Technologies, Inc. (a) | 862 | 60,228 |
| Cohu, Inc. (a) | 1,210 | 32,307 |
| Enphase Energy, Inc. (a) | 946 | 64,971 |
| Entegris, Inc. | 982 | 97,277 |
| FormFactor, Inc. (a) | 2,052 | 90,288 |
| Ichor Holdings Ltd. (a) | 861 | 27,741 |
| KLA Corp. | 872 | 549,465 |
| Lam Research Corp. | 8,410 | 607,454 |
| MKS Instruments, Inc. | 500 | 52,195 |
| Onto Innovation, Inc. (a) | 300 | 50,001 |
| PDF Solutions, Inc. (a) | 809 | 21,908 |
| Photronics, Inc. (a) | 1,618 | 38,120 |
| Teradyne, Inc. | 929 | 116,980 |
| Ultra Clean Holdings, Inc. (a) | 1,162 | 41,774 |
| Veeco Instruments, Inc. (a) | 1,459 | 39,101 |
| | | 2,827,576 |
| Semiconductors - 3.4% |
| Advanced Micro Devices, Inc. (a)(b) | 10,512 | 1,269,745 |
| Alpha & Omega Semiconductor Ltd. (a) | 612 | 22,662 |
| Ambarella, Inc. (a) | 1,001 | 72,813 |
| Analog Devices, Inc. | 3,169 | 673,286 |
| Astera Labs, Inc. (a) | 700 | 92,715 |
| Broadcom, Inc. | 29,650 | 6,874,056 |
| CEVA, Inc. (a) | 596 | 18,804 |
| Cirrus Logic, Inc. (a) | 400 | 39,832 |
| Credo Technology Group Holding Ltd. (a) | 3,702 | 248,811 |
| Diodes, Inc. (a) | 1,207 | 74,436 |
| Everspin Technologies, Inc. (a) | 579 | 3,700 |
| First Solar, Inc. (a) | 711 | 125,307 |
| GLOBALFOUNDRIES, Inc. (a) | 500 | 21,455 |
| Impinj, Inc. (a) | 606 | 88,028 |
| Intel Corp. | 27,639 | 554,162 |
| Lattice Semiconductor Corp. (a) | 1,000 | 56,650 |
| MACOM Technology Solutions Holdings, Inc. (a) | 400 | 51,964 |
| Marvell Technology, Inc. | 5,621 | 620,839 |
| MaxLinear, Inc. (a) | 2,086 | 41,261 |
| Microchip Technology, Inc. | 3,338 | 191,434 |
| Micron Technology, Inc. | 7,190 | 605,110 |
| Monolithic Power Systems, Inc. | 292 | 172,776 |
See Notes to Schedule of Investments and Notes to Financial Statements.
| 36 | State Street Total Return V.I.S. Fund |
State Street Total Return V.I.S. Fund
Schedule of Investments, continued — December 31, 2024
| | Number
of Shares | Fair
Value |
| Navitas Semiconductor Corp. (a) | 3,551 | $12,677 |
| NVE Corp. | 126 | 10,260 |
| NVIDIA Corp. | 152,760 | 20,514,140 |
| ON Semiconductor Corp. (a) | 2,917 | 183,917 |
| Penguin Solutions, Inc. (a) | 1,347 | 25,849 |
| Power Integrations, Inc. | 1,502 | 92,673 |
| Qorvo, Inc. (a) | 697 | 48,741 |
| QUALCOMM, Inc. | 7,251 | 1,113,899 |
| QuickLogic Corp. (a) | 532 | 6,012 |
| Rambus, Inc. (a) | 2,823 | 149,224 |
| Rigetti Computing, Inc. (a) | 4,165 | 63,558 |
| Semtech Corp. (a) | 1,920 | 118,752 |
| Silicon Laboratories, Inc. (a) | 850 | 105,587 |
| SiTime Corp. (a) | 488 | 104,691 |
| SkyWater Technology, Inc. (a) | 754 | 10,405 |
| Skyworks Solutions, Inc. | 1,073 | 95,154 |
| Synaptics, Inc. (a) | 1,033 | 78,839 |
| Texas Instruments, Inc. | 5,940 | 1,113,809 |
| Universal Display Corp. | 287 | 41,959 |
| Wolfspeed, Inc. (a) | 779 | 5,188 |
| | | 35,815,180 |
| Silver - 0.0%* |
| Hecla Mining Co. | 15,573 | 76,463 |
| Single-Family Residential REITs - 0.0%* |
| American Homes 4 Rent, Class A | 2,000 | 74,840 |
| Equity LifeStyle Properties, Inc. | 1,302 | 86,713 |
| Invitation Homes, Inc. | 4,180 | 133,635 |
| Sun Communities, Inc. | 820 | 100,835 |
| UMH Properties, Inc. | 1,910 | 36,061 |
| | | 432,084 |
| Soft Drinks & Non-alcoholic Beverages - 0.4% |
| Celsius Holdings, Inc. (a) | 900 | 23,706 |
| Coca-Cola Co. | 25,419 | 1,582,587 |
| Coca-Cola Consolidated, Inc. | 41 | 51,660 |
| Keurig Dr. Pepper, Inc. | 7,291 | 234,187 |
| Monster Beverage Corp. (a) | 4,604 | 241,986 |
| National Beverage Corp. | 613 | 26,157 |
| PepsiCo, Inc. | 9,025 | 1,372,342 |
| Primo Brands Corp., Class A | 4,172 | 128,372 |
| Vita Coco Co., Inc. (a) | 1,028 | 37,943 |
| | | 3,698,940 |
| | Number
of Shares | Fair
Value |
| Specialized Consumer Services - 0.0%* |
| ADT, Inc. | 1,200 | $8,292 |
| Carriage Services, Inc. | 361 | 14,386 |
| European Wax Center, Inc., Class A (a) | 1,043 | 6,957 |
| Frontdoor, Inc. (a) | 2,035 | 111,254 |
| H&R Block, Inc. | 800 | 42,272 |
| Mister Car Wash, Inc. (a) | 2,505 | 18,261 |
| Service Corp. International | 878 | 70,082 |
| | | 271,504 |
| Specialized Finance - 0.0%* |
| Acacia Research Corp. (a) | 982 | 4,262 |
| Burford Capital Ltd. | 5,303 | 67,613 |
| HA Sustainable Infrastructure Capital, Inc. | 2,981 | 79,980 |
| SWK Holdings Corp. (a) | 117 | 1,856 |
| | | 153,711 |
| Specialty Chemicals - 0.3% |
| Albemarle Corp. | 737 | 63,441 |
| Arq, Inc. (a) | 735 | 5,564 |
| Ashland, Inc. | 300 | 21,438 |
| ASP Isotopes, Inc. (a) | 1,557 | 7,053 |
| Aspen Aerogels, Inc. (a) | 1,663 | 19,756 |
| Avient Corp. | 2,401 | 98,105 |
| Axalta Coating Systems Ltd. (a) | 1,400 | 47,908 |
| Balchem Corp. | 854 | 139,198 |
| Celanese Corp. | 700 | 48,447 |
| DuPont de Nemours, Inc. | 2,676 | 204,045 |
| Eastman Chemical Co. | 677 | 61,824 |
| Ecolab, Inc. | 1,622 | 380,067 |
| Ecovyst, Inc. (a) | 3,018 | 23,058 |
| Element Solutions, Inc. | 1,700 | 43,231 |
| HB Fuller Co. | 1,455 | 98,183 |
| Ingevity Corp. (a) | 958 | 39,039 |
| Innospec, Inc. | 661 | 72,750 |
| International Flavors & Fragrances, Inc. | 1,613 | 136,379 |
| Minerals Technologies, Inc. | 850 | 64,779 |
| NewMarket Corp. | 43 | 22,719 |
| Northern Technologies International Corp. | 208 | 2,806 |
| Perimeter Solutions, Inc. (a) | 3,524 | 45,037 |
| PPG Industries, Inc. | 1,491 | 178,100 |
| Quaker Chemical Corp. | 370 | 52,081 |
| Rayonier Advanced Materials, Inc. (a) | 1,870 | 15,428 |
| RPM International, Inc. | 836 | 102,878 |
See Notes to Schedule of Investments and Notes to Financial Statements.
| State Street Total Return V.I.S. Fund | 37 |
State Street Total Return V.I.S. Fund
Schedule of Investments, continued — December 31, 2024
| | Number
of Shares | Fair
Value |
| Sensient Technologies Corp. | 1,117 | $79,597 |
| Sherwin-Williams Co. | 1,538 | 522,812 |
| Stepan Co. | 562 | 36,361 |
| Valhi, Inc. | 60 | 1,403 |
| | | 2,633,487 |
| Steel - 0.1% |
| Alpha Metallurgical Resources, Inc. (a) | 291 | 58,235 |
| Arch Resources, Inc. | 466 | 65,809 |
| ATI, Inc. (a) | 700 | 38,528 |
| Carpenter Technology Corp. | 1,264 | 214,514 |
| Cleveland-Cliffs, Inc. (a) | 3,637 | 34,188 |
| Commercial Metals Co. | 3,011 | 149,346 |
| Metallus, Inc. (a) | 1,098 | 15,515 |
| Nucor Corp. | 1,493 | 174,248 |
| Olympic Steel, Inc. | 246 | 8,071 |
| Radius Recycling, Inc. | 665 | 10,121 |
| Ramaco Resources, Inc., Class A | 739 | 7,582 |
| Ramaco Resources, Inc., Class B | 240 | 2,371 |
| Reliance, Inc. | 398 | 107,166 |
| Ryerson Holding Corp. | 722 | 13,364 |
| Steel Dynamics, Inc. | 1,002 | 114,298 |
| SunCoke Energy, Inc. | 2,179 | 23,315 |
| U.S. Steel Corp. | 1,600 | 54,384 |
| Universal Stainless & Alloy Products, Inc. (a) | 241 | 10,611 |
| Warrior Met Coal, Inc. | 1,376 | 74,634 |
| Worthington Steel, Inc. | 854 | 27,174 |
| | | 1,203,474 |
| Systems Software - 2.5% |
| A10 Networks, Inc. | 1,847 | 33,985 |
| Adeia, Inc. | 2,845 | 39,773 |
| Appian Corp., Class A (a) | 1,058 | 34,893 |
| Arteris, Inc. (a) | 723 | 7,367 |
| Commvault Systems, Inc. (a) | 1,158 | 174,754 |
| Crowdstrike Holdings, Inc., Class A (a) | 1,510 | 516,662 |
| CyberArk Software Ltd. (a) | 259 | 86,286 |
| Dolby Laboratories, Inc., Class A | 457 | 35,692 |
| Fortinet, Inc. (a) | 4,155 | 392,564 |
| Gen Digital, Inc. | 3,426 | 93,804 |
| Gitlab, Inc., Class A (a) | 700 | 39,445 |
| Microsoft Corp. | 48,554 | 20,465,511 |
| Monday.com Ltd. (a) | 193 | 45,440 |
| N-able, Inc. (a) | 1,830 | 17,092 |
| | Number
of Shares | Fair
Value |
| OneSpan, Inc. (a) | 1,001 | $18,559 |
| Oracle Corp. | 10,233 | 1,705,227 |
| Palo Alto Networks, Inc. (a) | 4,268 | 776,605 |
| Progress Software Corp. | 1,125 | 73,294 |
| Qualys, Inc. (a) | 984 | 137,976 |
| Rapid7, Inc. (a) | 1,637 | 65,856 |
| SentinelOne, Inc., Class A (a) | 1,600 | 35,520 |
| ServiceNow, Inc. (a) | 1,339 | 1,419,501 |
| Silvaco Group, Inc. (a) | 180 | 1,454 |
| SolarWinds Corp. | 1,397 | 19,907 |
| Telos Corp. (a) | 1,492 | 5,103 |
| Tenable Holdings, Inc. (a) | 3,124 | 123,023 |
| Teradata Corp. (a) | 600 | 18,690 |
| UiPath, Inc., Class A (a) | 2,800 | 35,588 |
| Varonis Systems, Inc. (a) | 2,922 | 129,824 |
| Xperi, Inc. (a) | 1,340 | 13,762 |
| Zscaler, Inc. (a) | 579 | 104,457 |
| Zuora, Inc., Class A (a) | 3,655 | 36,258 |
| | | 26,703,872 |
| Technology Distributors - 0.1% |
| Arrow Electronics, Inc. (a) | 367 | 41,515 |
| Avnet, Inc. | 700 | 36,624 |
| CDW Corp. | 871 | 151,589 |
| Climb Global Solutions, Inc. | 111 | 14,069 |
| ePlus, Inc. (a) | 696 | 51,420 |
| Insight Enterprises, Inc. (a) | 719 | 109,360 |
| PC Connection, Inc. | 299 | 20,712 |
| Richardson Electronics Ltd. | 303 | 4,251 |
| ScanSource, Inc. (a) | 642 | 30,463 |
| TD SYNNEX Corp. | 500 | 58,640 |
| | | 518,643 |
| Technology Hardware, Storage & Peripherals - 2.3% |
| Apple, Inc. | 93,416 | 23,393,235 |
| CompoSecure, Inc., Class A | 732 | 11,222 |
| Corsair Gaming, Inc. (a) | 1,227 | 8,110 |
| CPI Card Group, Inc. (a) | 148 | 4,424 |
| Dell Technologies, Inc., Class C | 1,800 | 207,432 |
| Diebold Nixdorf, Inc. (a) | 657 | 28,277 |
| Eastman Kodak Co. (a) | 1,668 | 10,959 |
| Hewlett Packard Enterprise Co. | 8,184 | 174,728 |
| HP, Inc. | 6,238 | 203,546 |
| Immersion Corp. | 894 | 7,805 |
| IonQ, Inc. (a) | 5,263 | 219,836 |
| NetApp, Inc. | 1,367 | 158,681 |
| Pure Storage, Inc., Class A (a) | 2,100 | 129,003 |
See Notes to Schedule of Investments and Notes to Financial Statements.
| 38 | State Street Total Return V.I.S. Fund |
State Street Total Return V.I.S. Fund
Schedule of Investments, continued — December 31, 2024
| | Number
of Shares | Fair
Value |
| Super Micro Computer, Inc. (a) | 3,420 | $104,242 |
| Turtle Beach Corp. (a) | 456 | 7,893 |
| Western Digital Corp. (a) | 2,200 | 131,186 |
| Xerox Holdings Corp. | 3,024 | 25,492 |
| | | 24,826,071 |
| Telecom Tower REITs - 0.1% |
| American Tower Corp. | 3,034 | 556,466 |
| Crown Castle, Inc. | 2,805 | 254,582 |
| SBA Communications Corp. | 715 | 145,717 |
| | | 956,765 |
| Timber REITs - 0.0%* |
| PotlatchDeltic Corp. | 2,106 | 82,660 |
| Rayonier, Inc. | 1,000 | 26,100 |
| Weyerhaeuser Co. | 4,993 | 140,553 |
| | | 249,313 |
| Tires & Rubber - 0.0%* |
| Goodyear Tire & Rubber Co. (a) | 7,541 | 67,869 |
| Tobacco - 0.2% |
| Altria Group, Inc. | 11,207 | 586,014 |
| Ispire Technology, Inc. (a) | 522 | 2,626 |
| Philip Morris International, Inc. | 10,091 | 1,214,452 |
| Turning Point Brands, Inc. | 444 | 26,684 |
| Universal Corp. | 628 | 34,439 |
| | | 1,864,215 |
| Trading Companies & Distributors - 0.3% |
| Air Lease Corp. | 800 | 38,568 |
| Alta Equipment Group, Inc. | 798 | 5,219 |
| Applied Industrial Technologies, Inc. | 1,016 | 243,301 |
| Beacon Roofing Supply, Inc. (a) | 1,638 | 166,388 |
| BlueLinx Holdings, Inc. (a) | 216 | 22,067 |
| Boise Cascade Co. | 1,029 | 122,307 |
| Core & Main, Inc., Class A (a) | 1,200 | 61,092 |
| Custom Truck One Source, Inc. (a) | 1,485 | 7,143 |
| Distribution Solutions Group, Inc. (a) | 277 | 9,529 |
| DNOW, Inc. (a) | 2,768 | 36,012 |
| DXP Enterprises, Inc. (a) | 323 | 26,686 |
| EVI Industries, Inc. | 126 | 2,060 |
| Fastenal Co. | 3,737 | 268,728 |
| | Number
of Shares | Fair
Value |
| Ferguson Enterprises, Inc. | 1,300 | $225,641 |
| FTAI Aviation Ltd. | 2,684 | 386,603 |
| GATX Corp. | 946 | 146,592 |
| Global Industrial Co. | 407 | 10,089 |
| GMS, Inc. (a) | 1,043 | 88,478 |
| H&E Equipment Services, Inc. | 850 | 41,616 |
| Herc Holdings, Inc. | 747 | 141,429 |
| Hudson Technologies, Inc. (a) | 1,350 | 7,533 |
| Karat Packaging, Inc. | 181 | 5,477 |
| McGrath RentCorp | 646 | 72,236 |
| MRC Global, Inc. (a) | 2,190 | 27,988 |
| MSC Industrial Direct Co., Inc., Class A | 298 | 22,258 |
| Rush Enterprises, Inc., Class A | 1,615 | 88,486 |
| Rush Enterprises, Inc., Class B | 222 | 12,086 |
| SiteOne Landscape Supply, Inc. (a) | 300 | 39,531 |
| Titan Machinery, Inc. (a) | 635 | 8,972 |
| Transcat, Inc. (a) | 239 | 25,272 |
| United Rentals, Inc. | 431 | 303,614 |
| Watsco, Inc. | 234 | 110,890 |
| WESCO International, Inc. | 300 | 54,288 |
| Willis Lease Finance Corp. | 75 | 15,566 |
| WW Grainger, Inc. | 285 | 300,404 |
| Xometry, Inc., Class A (a) | 1,101 | 46,969 |
| | | 3,191,118 |
| Transaction & Payment Processing Services - 0.9% |
| Affirm Holdings, Inc. (a) | 1,346 | 81,971 |
| AvidXchange Holdings, Inc. (a) | 4,574 | 47,295 |
| Block, Inc. (a) | 3,632 | 308,684 |
| Cantaloupe, Inc. (a) | 1,543 | 14,674 |
| Cass Information Systems, Inc. | 345 | 14,114 |
| Corpay, Inc. (a) | 398 | 134,691 |
| Euronet Worldwide, Inc. (a) | 300 | 30,852 |
| Fidelity National Information Services, Inc. | 3,668 | 296,264 |
| Fiserv, Inc. (a) | 3,747 | 769,709 |
| Flywire Corp. (a) | 3,196 | 65,902 |
| Global Payments, Inc. | 1,713 | 191,959 |
| I3 Verticals, Inc., Class A (a) | 575 | 13,248 |
| International Money Express, Inc. (a) | 812 | 16,914 |
| Jack Henry & Associates, Inc. | 438 | 76,781 |
| Marqeta, Inc., Class A (a) | 12,282 | 46,549 |
| Mastercard, Inc., Class A | 5,294 | 2,787,662 |
See Notes to Schedule of Investments and Notes to Financial Statements.
| State Street Total Return V.I.S. Fund | 39 |
State Street Total Return V.I.S. Fund
Schedule of Investments, continued — December 31, 2024
| | Number
of Shares | Fair
Value |
| NCR Atleos Corp. (a) | 1,904 | $64,584 |
| Payoneer Global, Inc. (a) | 7,500 | 75,300 |
| PayPal Holdings, Inc. (a) | 6,703 | 572,101 |
| Paysafe Ltd. (a) | 903 | 15,441 |
| Paysign, Inc. (a) | 1,138 | 3,437 |
| Priority Technology Holdings, Inc. (a) | 486 | 5,710 |
| Remitly Global, Inc. (a) | 3,894 | 87,888 |
| Repay Holdings Corp. (a) | 2,334 | 17,808 |
| Sezzle, Inc. (a) | 64 | 16,371 |
| Shift4 Payments, Inc., Class A (a) | 300 | 31,134 |
| Toast, Inc., Class A (a) | 2,900 | 105,705 |
| Visa, Inc., Class A | 10,293 | 3,253,000 |
| Western Union Co. | 2,700 | 28,620 |
| WEX, Inc. (a) | 292 | 51,193 |
| | | 9,225,561 |
| Water Utilities - 0.0%* |
| American States Water Co. | 988 | 76,787 |
| American Water Works Co., Inc. | 1,232 | 153,372 |
| Cadiz, Inc. (a) | 1,253 | 6,516 |
| California Water Service Group | 1,533 | 69,491 |
| Consolidated Water Co. Ltd. | 397 | 10,278 |
| Essential Utilities, Inc. | 1,900 | 69,008 |
| Global Water Resources, Inc. | 286 | 3,289 |
| Middlesex Water Co. | 461 | 24,262 |
| Pure Cycle Corp. (a) | 548 | 6,949 |
| SJW Group | 866 | 42,624 |
| York Water Co. | 362 | 11,845 |
| | | 474,421 |
| Wireless Telecommunication Services - 0.1% |
| Gogo, Inc. (a) | 1,637 | 13,243 |
| Spok Holdings, Inc. | 548 | 8,795 |
| Telephone & Data Systems, Inc. | 2,614 | 89,164 |
| T-Mobile U.S., Inc. | 3,115 | 687,574 |
| | | 798,776 |
Total Common Stock
(Cost $325,128,178) | | 428,061,429 |
| Warrants - 0.0%* |
| Healthcare Equipment - 0.0%* |
| Pulse Biosciences, Inc. (expiring 06/26/29) (a) | 75 | 241 |
| | Number
of Shares | Fair
Value |
| Pulse Biosciences, Inc. (expiring 06/27/29) (a) | 75 | $240 |
| | | 481 |
| Specialty Chemicals - 0.0%* |
| Danimer Scientific, Inc. (expiring 07/15/25) (a) | 1,168 | 42 |
Total Warrants
(Cost $0) | | 523 |
Total Domestic Equity
(Cost $325,128,178) | | 428,061,952 |
| Foreign Equity - 20.6% |
| Common Stock - 20.4% |
| Advertising - 0.0%* |
| Dentsu Group, Inc. | 1,300 | 31,277 |
| Focus Media Information Technology Co. Ltd., Class A | 10,900 | 10,437 |
| Gambling.com Group Ltd. (a) | 444 | 6,252 |
| Informa PLC | 8,809 | 88,083 |
| Innovid Corp. (a) | 2,732 | 8,442 |
| Publicis Groupe SA | 1,469 | 156,678 |
| WPP PLC | 7,099 | 73,562 |
| | | 374,731 |
| Aerospace & Defense - 0.3% |
| AECC Aero-Engine Control Co. Ltd., Class A | 1,300 | 3,938 |
| AECC Aviation Power Co. Ltd., Class A | 2,100 | 11,857 |
| Airbus SE | 3,836 | 614,814 |
| Aselsan Elektronik Sanayi Ve Ticaret AS | 16,191 | 33,197 |
| AviChina Industry & Technology Co. Ltd., Class H | 35,000 | 17,392 |
| BAE Systems PLC | 19,468 | 280,024 |
| Bharat Electronics Ltd. | 46,095 | 157,834 |
| CAE, Inc. (a) | 2,094 | 53,143 |
| Dassault Aviation SA | 121 | 24,708 |
| Elbit Systems Ltd. | 165 | 43,156 |
| Embraer SA (a) | 10,700 | 97,321 |
| Hanwha Aerospace Co. Ltd. | 458 | 100,983 |
| Hindustan Aeronautics Ltd. | 2,880 | 140,557 |
| Kongsberg Gruppen ASA | 579 | 65,291 |
| Korea Aerospace Industries Ltd. | 957 | 35,564 |
| Kuang-Chi Technologies Co. Ltd., Class A | 3,100 | 20,184 |
See Notes to Schedule of Investments and Notes to Financial Statements.
| 40 | State Street Total Return V.I.S. Fund |
State Street Total Return V.I.S. Fund
Schedule of Investments, continued — December 31, 2024
| | Number
of Shares | Fair
Value |
| Leonardo SpA | 2,664 | $71,647 |
| Melrose Industries PLC | 8,488 | 58,871 |
| MTU Aero Engines AG | 354 | 118,194 |
| Rheinmetall AG | 280 | 178,834 |
| Rolls-Royce Holdings PLC (a) | 54,842 | 390,538 |
| Saab AB, Class B | 2,108 | 44,595 |
| Safran SA | 2,343 | 514,592 |
| Singapore Technologies Engineering Ltd. | 9,600 | 32,793 |
| Thales SA | 610 | 87,579 |
| | | 3,197,606 |
| Agricultural & Farm Machinery - 0.0%* |
| Kubota Corp. | 6,200 | 71,910 |
| Agricultural Products & Services - 0.0%* |
| Charoen Pokphand Indonesia Tbk. PT | 85,300 | 25,227 |
| IOI Corp. Bhd. | 38,700 | 33,581 |
| Kuala Lumpur Kepong Bhd. | 7,037 | 34,307 |
| New Hope Liuhe Co. Ltd., Class A (a) | 3,200 | 3,914 |
| SD Guthrie Bhd. | 22,100 | 24,465 |
| Wilmar International Ltd. | 11,806 | 26,828 |
| | | 148,322 |
| Air Freight & Logistics - 0.1% |
| Deutsche Post AG | 6,564 | 231,646 |
| DSV AS | 1,316 | 280,169 |
| Hyundai Glovis Co. Ltd. | 514 | 41,002 |
| InPost SA (a) | 1,221 | 20,874 |
| JD Logistics, Inc. (a)(d) | 23,600 | 38,888 |
| SAL Saudi Logistics Services | 483 | 32,471 |
| SF Holding Co. Ltd., Class A | 3,300 | 18,115 |
| SG Holdings Co. Ltd. | 1,900 | 18,184 |
| YTO Express Group Co. Ltd., Class A | 2,700 | 5,219 |
| ZTO Express Cayman, Inc. | 6,059 | 118,014 |
| | | 804,582 |
| Airport Services - 0.1% |
| Aena SME SA (d) | 494 | 100,977 |
| Aeroports de Paris SA | 213 | 24,637 |
| Airports of Thailand PCL NVDR | 59,386 | 103,313 |
| Auckland International Airport Ltd. | 9,532 | 46,461 |
| GMR Airports Ltd. (a) | 47,157 | 43,272 |
| Grupo Aeroportuario del Centro Norte SAB de CV | 3,500 | 30,208 |
| | Number
of Shares | Fair
Value |
| Grupo Aeroportuario del Pacifico SAB de CV, Class B | 5,520 | $97,308 |
| Grupo Aeroportuario del Sureste SAB de CV, Class B | 2,530 | 65,058 |
| Malaysia Airports Holdings Bhd. | 10,643 | 25,182 |
| Shanghai International Airport Co. Ltd., Class A | 1,300 | 6,047 |
| | | 542,463 |
| Alternative Carriers - 0.0%* |
| Liberty Global Ltd., Class A (a) | 900 | 11,484 |
| Liberty Global Ltd., Class C (a) | 1,600 | 21,024 |
| Liberty Latin America Ltd., Class A (a) | 1,002 | 6,372 |
| Liberty Latin America Ltd., Class C (a) | 3,361 | 21,309 |
| | | 60,189 |
| Aluminum - 0.0%* |
| Aluminum Corp. of China Ltd., Class A | 21,600 | 21,625 |
| Aluminum Corp. of China Ltd., Class H | 48,000 | 27,745 |
| China Hongqiao Group Ltd. | 37,000 | 56,015 |
| Hindalco Industries Ltd. | 19,262 | 135,543 |
| Norsk Hydro ASA | 8,805 | 48,545 |
| Press Metal Aluminium Holdings Bhd. | 53,900 | 59,065 |
| Shandong Nanshan Aluminum Co. Ltd., Class A | 14,700 | 7,829 |
| United Co. RUSAL International PJSC (a)(e)** | 55,670 | — |
| Yunnan Aluminium Co. Ltd., Class A | 4,900 | 9,030 |
| | | 365,397 |
| Apparel Retail - 0.1% |
| Fast Retailing Co. Ltd. | 1,259 | 425,213 |
| H & M Hennes & Mauritz AB, Class B | 3,728 | 50,316 |
| Industria de Diseno Textil SA | 7,034 | 361,563 |
| Pepkor Holdings Ltd. (d) | 31,319 | 48,049 |
| Trent Ltd. | 2,454 | 204,181 |
| Zalando SE (a)(d) | 1,272 | 42,538 |
| ZOZO, Inc. | 800 | 24,667 |
| | | 1,156,527 |
See Notes to Schedule of Investments and Notes to Financial Statements.
| State Street Total Return V.I.S. Fund | 41 |
State Street Total Return V.I.S. Fund
Schedule of Investments, continued — December 31, 2024
| | Number
of Shares | Fair
Value |
| Apparel, Accessories & Luxury Goods - 0.3% |
| adidas AG | 1,043 | $256,454 |
| Amer Sports, Inc. (a) | 200 | 5,592 |
| ANTA Sports Products Ltd. | 18,276 | 183,161 |
| Bosideng International Holdings Ltd. | 56,000 | 27,971 |
| Cie Financiere Richemont SA, Class A | 3,469 | 525,523 |
| FF Group (a)(e)** | 1,860 | — |
| Gildan Activewear, Inc. | 845 | 39,747 |
| Hermes International SCA | 204 | 490,504 |
| Kalyan Jewellers India Ltd. | 7,261 | 64,986 |
| Kering SA | 490 | 120,887 |
| Li Ning Co. Ltd. | 34,319 | 72,721 |
| LPP SA | 16 | 60,195 |
| LVMH Moet Hennessy Louis Vuitton SE | 1,777 | 1,169,373 |
| Moncler SpA | 1,537 | 81,112 |
| Page Industries Ltd. | 87 | 48,284 |
| Pandora AS | 540 | 98,763 |
| Shenzhou International Group Holdings Ltd. | 11,900 | 94,980 |
| Swatch Group AG | 434 | 34,416 |
| Titan Co. Ltd. | 4,978 | 189,154 |
| | | 3,563,823 |
| Application Software - 0.3% |
| Beijing Kingsoft Office Software, Inc., Class A | 441 | 17,203 |
| Constellation Software, Inc. | 130 | 401,779 |
| Dassault Systemes SE | 4,400 | 152,633 |
| Descartes Systems Group, Inc. (a) | 563 | 63,965 |
| D-Wave Quantum, Inc. (a) | 2,614 | 21,958 |
| Hundsun Technologies, Inc., Class A | 1,456 | 5,551 |
| Hut 8 Corp. (a) | 2,135 | 43,746 |
| Iflytek Co. Ltd., Class A | 1,500 | 9,873 |
| Kingdee International Software Group Co. Ltd. (a) | 33,000 | 36,237 |
| Nemetschek SE | 380 | 36,901 |
| Nice Ltd. (a) | 414 | 70,582 |
| Open Text Corp. | 1,748 | 49,443 |
| Oracle Financial Services Software Ltd. | 230 | 34,359 |
| Sage Group PLC | 6,629 | 105,686 |
| SAP SE | 6,749 | 1,659,519 |
| Sapiens International Corp. NV | 813 | 21,845 |
| | Number
of Shares | Fair
Value |
| Shanghai Baosight Software Co. Ltd., Class A | 2,246 | $8,951 |
| Shanghai Baosight Software Co. Ltd., Class B | 10,524 | 16,891 |
| Temenos AG | 368 | 26,040 |
| WiseTech Global Ltd. | 1,211 | 90,770 |
| Xero Ltd. (a) | 955 | 99,668 |
| Yonyou Network Technology Co. Ltd., Class A (a) | 2,600 | 3,800 |
| | | 2,977,400 |
| Asset Management & Custody Banks - 0.2% |
| 3i Group PLC | 6,270 | 279,865 |
| Amundi SA (d) | 377 | 25,063 |
| Brookfield Asset Management Ltd., Class A | 2,337 | 126,681 |
| Brookfield Corp. | 8,821 | 506,738 |
| CVC Capital Partners PLC (a)(d) | 1,399 | 30,799 |
| EQT AB | 2,451 | 67,844 |
| Hargreaves Lansdown PLC | 2,195 | 30,184 |
| HDFC Asset Management Co. Ltd. (d) | 1,229 | 60,278 |
| IGM Financial, Inc. | 521 | 16,631 |
| Julius Baer Group Ltd. | 1,361 | 88,416 |
| Onex Corp. | 400 | 31,228 |
| Partners Group Holding AG | 149 | 202,676 |
| Patria Investments Ltd., Class A | 1,408 | 16,375 |
| Reinet Investments SCA | 2,142 | 50,759 |
| Schroders PLC | 4,889 | 19,814 |
| | | 1,553,351 |
| Automobile Manufacturers - 0.5% |
| Bayerische Motoren Werke AG | 1,908 | 156,002 |
| BYD Co. Ltd., Class A | 1,400 | 53,902 |
| BYD Co. Ltd., Class H | 15,000 | 514,808 |
| Chongqing Changan Automobile Co. Ltd., Class A | 12,314 | 22,409 |
| Ferrari NV | 813 | 346,789 |
| Ford Otomotiv Sanayi AS | 1,006 | 26,658 |
| Geely Automobile Holdings Ltd. | 88,000 | 167,890 |
| Great Wall Motor Co. Ltd., Class A | 800 | 2,869 |
| Great Wall Motor Co. Ltd., Class H | 33,533 | 58,968 |
| Guangzhou Automobile Group Co. Ltd., Class A | 10,000 | 12,722 |
See Notes to Schedule of Investments and Notes to Financial Statements.
| 42 | State Street Total Return V.I.S. Fund |
State Street Total Return V.I.S. Fund
Schedule of Investments, continued — December 31, 2024
| | Number
of Shares | Fair
Value |
| Honda Motor Co. Ltd. | 28,924 | $275,704 |
| Hyundai Motor Co. | 1,806 | 256,399 |
| Isuzu Motors Ltd. | 3,400 | 46,306 |
| Kia Corp. | 3,520 | 238,197 |
| Li Auto, Inc., Class A (a) | 17,200 | 208,027 |
| Mahindra & Mahindra Ltd. | 12,626 | 443,476 |
| Maruti Suzuki India Ltd. | 1,751 | 222,080 |
| Mercedes-Benz Group AG | 4,822 | 268,744 |
| NIO, Inc., Class A (a) | 19,043 | 85,312 |
| Nissan Motor Co. Ltd. | 15,500 | 47,064 |
| Renault SA | 1,265 | 61,631 |
| SAIC Motor Corp. Ltd., Class A | 6,300 | 17,815 |
| Seres Group Co. Ltd., Class A | 1,400 | 25,437 |
| Subaru Corp. | 3,500 | 62,262 |
| Suzuki Motor Corp. | 10,300 | 115,541 |
| Tata Motors Ltd. | 26,576 | 229,755 |
| Toyota Motor Corp. | 66,361 | 1,297,239 |
| XPeng, Inc., Class A (a) | 16,800 | 100,891 |
| Zhejiang Leapmotor Technology Co. Ltd. (a)(d) | 4,400 | 18,437 |
| | | 5,383,334 |
| Automotive Parts & Equipment - 0.1% |
| Aisin Corp. | 3,000 | 33,556 |
| Aptiv PLC (a) | 1,791 | 108,320 |
| Bharat Forge Ltd. | 3,496 | 53,065 |
| Bosch Ltd. | 117 | 46,601 |
| Changzhou Xingyu Automotive Lighting Systems Co. Ltd., Class A | 300 | 5,454 |
| Continental AG | 724 | 48,769 |
| Denso Corp. | 12,460 | 171,988 |
| Fuyao Glass Industry Group Co. Ltd., Class A | 900 | 7,650 |
| Fuyao Glass Industry Group Co. Ltd., Class H (d) | 9,356 | 67,388 |
| Huayu Automotive Systems Co. Ltd., Class A | 1,768 | 4,241 |
| Huizhou Desay Sv Automotive Co. Ltd., Class A | 200 | 3,000 |
| Hyundai Mobis Co. Ltd. | 892 | 141,861 |
| Magna International, Inc. | 1,796 | 75,027 |
| Ningbo Tuopu Group Co. Ltd., Class A | 1,160 | 7,742 |
| Samvardhana Motherson International Ltd. | 39,416 | 71,877 |
| Sona Blw Precision Forgings Ltd. (d) | 5,573 | 38,718 |
| | Number
of Shares | Fair
Value |
| Sumitomo Electric Industries Ltd. | 4,666 | $83,514 |
| Tube Investments of India Ltd. | 1,528 | 63,828 |
| | | 1,032,599 |
| Automotive Retail - 0.0%* |
| Abu Dhabi National Oil Co. for Distribution PJSC | 42,932 | 41,143 |
| Empresas Copec SA | 5,414 | 33,116 |
| Hotai Motor Co. Ltd. | 3,940 | 74,391 |
| Vibra Energia SA | 15,800 | 45,626 |
| Zhongsheng Group Holdings Ltd. | 17,000 | 30,551 |
| | | 224,827 |
| Biotechnology - 0.1% |
| ADC Therapeutics SA (a) | 2,678 | 5,329 |
| Akeso, Inc. (a)(d) | 8,000 | 62,513 |
| Alteogen, Inc. (a) | 605 | 125,682 |
| Argenx SE (a) | 385 | 239,200 |
| Artiva Biotherapeutics, Inc. (a) | 418 | 4,213 |
| Aurinia Pharmaceuticals, Inc. (a) | 3,499 | 31,421 |
| BeiGene Ltd. (a) | 9,800 | 137,766 |
| Beijing Wantai Biological Pharmacy Enterprise Co. Ltd., Class A | 112 | 1,075 |
| Celltrion, Inc. | 2,282 | 287,576 |
| Chongqing Zhifei Biological Products Co. Ltd., Class A | 3,150 | 11,284 |
| Fennec Pharmaceuticals, Inc. (a) | 762 | 4,816 |
| Genmab AS (a) | 415 | 86,641 |
| Grifols SA (a) | 1,793 | 16,985 |
| Hualan Biological Engineering, Inc., Class A | 2,038 | 4,678 |
| Imeik Technology Development Co. Ltd., Class A | 420 | 10,441 |
| Innovent Biologics, Inc. (a)(d) | 17,000 | 80,098 |
| PharmaEssentia Corp. (a) | 3,000 | 56,277 |
| Prothena Corp. PLC (a) | 1,094 | 15,152 |
| Shanghai RAAS Blood Products Co. Ltd., Class A | 5,500 | 5,409 |
| SK Bioscience Co. Ltd. (a) | 153 | 5,209 |
| Swedish Orphan Biovitrum AB (a) | 1,209 | 34,730 |
| Zealand Pharma AS (a) | 400 | 39,777 |
| Zura Bio Ltd. (a) | 1,528 | 3,820 |
| | | 1,270,092 |
See Notes to Schedule of Investments and Notes to Financial Statements.
| State Street Total Return V.I.S. Fund | 43 |
State Street Total Return V.I.S. Fund
Schedule of Investments, continued — December 31, 2024
| | Number
of Shares | Fair
Value |
| Brewers - 0.1% |
| Ambev SA | 58,200 | $110,600 |
| Anadolu Efes Biracilik Ve Malt Sanayii AS | 4,458 | 24,155 |
| Anheuser-Busch InBev SA | 5,789 | 289,235 |
| Asahi Group Holdings Ltd. | 9,500 | 99,779 |
| Carlsberg AS, Class B | 629 | 60,391 |
| China Resources Beer Holdings Co. Ltd. | 23,500 | 76,388 |
| Chongqing Brewery Co. Ltd., Class A | 100 | 858 |
| Heineken Holding NV | 853 | 51,098 |
| Heineken NV | 1,896 | 134,879 |
| Kirin Holdings Co. Ltd. | 5,100 | 66,297 |
| Tsingtao Brewery Co. Ltd., Class A | 800 | 8,818 |
| Tsingtao Brewery Co. Ltd., Class H | 8,924 | 65,253 |
| | | 987,751 |
| Broadline Retail - 0.6% |
| Alibaba Group Holding Ltd. | 224,800 | 2,384,608 |
| Allegro.eu SA (a)(d) | 9,220 | 60,413 |
| Canadian Tire Corp. Ltd., Class A | 343 | 36,065 |
| Central Retail Corp. PCL NVDR | 36,775 | 36,416 |
| Coupang, Inc. (a) | 7,300 | 160,454 |
| Dollarama, Inc. | 1,806 | 176,155 |
| Falabella SA (a) | 12,015 | 42,445 |
| Global-e Online Ltd. (a) | 600 | 32,718 |
| GoTo Gojek Tokopedia Tbk. PT (a) | 9,447,100 | 40,778 |
| JD.com, Inc., Class A | 33,926 | 593,971 |
| MINISO Group Holding Ltd. ADR | 1,400 | 33,446 |
| Naspers Ltd., N Shares | 2,322 | 513,525 |
| Next PLC | 784 | 93,259 |
| Pan Pacific International Holdings Corp. | 2,500 | 67,997 |
| PDD Holdings, Inc. ADR (a) | 9,557 | 926,933 |
| Prosus NV | 8,819 | 350,215 |
| Rakuten Group, Inc. (a) | 9,900 | 53,399 |
| Vipshop Holdings Ltd. ADR | 5,234 | 70,502 |
| Wesfarmers Ltd. | 7,313 | 323,877 |
| Woolworths Holdings Ltd. | 14,667 | 48,462 |
| Zhejiang China Commodities City Group Co. Ltd., Class A | 9,800 | 17,901 |
| | | 6,063,539 |
| | Number
of Shares | Fair
Value |
| Building Products - 0.1% |
| AGC, Inc. | 1,300 | $38,019 |
| Assa Abloy AB, Class B | 6,444 | 190,583 |
| Astral Ltd. | 2,345 | 45,256 |
| Beijing New Building Materials PLC, Class A | 1,600 | 6,606 |
| Cie de Saint-Gobain SA | 2,921 | 259,216 |
| Daikin Industries Ltd. | 1,652 | 192,984 |
| Geberit AG | 220 | 124,946 |
| Kingspan Group PLC | 1,021 | 74,483 |
| Nibe Industrier AB, Class B | 8,600 | 33,653 |
| Rockwool AS, Class B | 57 | 20,276 |
| TOTO Ltd. | 900 | 21,586 |
| | | 1,007,608 |
| Cargo Ground Transportation - 0.0%* |
| TFI International, Inc. | 529 | 71,446 |
| Casinos & Gaming - 0.1% |
| Aristocrat Leisure Ltd. | 3,728 | 157,788 |
| Entain PLC | 4,168 | 35,872 |
| Evolution AB (d) | 1,115 | 86,098 |
| Galaxy Entertainment Group Ltd. | 13,000 | 55,227 |
| Genting Bhd. | 23,100 | 19,941 |
| Genting Malaysia Bhd. | 54,700 | 27,646 |
| Genting Singapore Ltd. | 36,800 | 20,636 |
| La Francaise des Jeux SACA (d) | 624 | 24,050 |
| Lottery Corp. Ltd. | 14,650 | 44,808 |
| OPAP SA | 2,455 | 39,912 |
| Sands China Ltd. (a) | 14,800 | 39,820 |
| Super Group SGHC Ltd. | 3,877 | 24,154 |
| | | 575,952 |
| Coal & Consumable Fuels - 0.1% |
| Alamtri Resources Indonesia Tbk. PT | 172,900 | 26,036 |
| Cameco Corp. | 2,864 | 147,183 |
| China Coal Energy Co. Ltd., Class H | 29,000 | 34,682 |
| China Shenhua Energy Co. Ltd., Class A | 7,500 | 44,419 |
| China Shenhua Energy Co. Ltd., Class H | 41,990 | 181,626 |
| Coal India Ltd. | 27,753 | 124,528 |
| Encore Energy Corp. (a) | 5,103 | 17,401 |
| Exxaro Resources Ltd. | 3,784 | 31,674 |
| Inner Mongolia Dian Tou Energy Corp. Ltd., Class A | 3,800 | 10,135 |
See Notes to Schedule of Investments and Notes to Financial Statements.
| 44 | State Street Total Return V.I.S. Fund |
State Street Total Return V.I.S. Fund
Schedule of Investments, continued — December 31, 2024
| | Number
of Shares | Fair
Value |
| Inner Mongolia Yitai Coal Co. Ltd., Class B | 16,500 | $34,040 |
| Shaanxi Coal Industry Co. Ltd., Class A | 8,900 | 28,198 |
| Shanxi Coking Coal Energy Group Co. Ltd., Class A | 3,800 | 4,265 |
| Shanxi Lu'an Environmental Energy Development Co. Ltd., Class A | 5,200 | 10,171 |
| United Tractors Tbk. PT | 26,500 | 44,084 |
| Yankuang Energy Group Co. Ltd., Class A | 4,485 | 8,657 |
| Yankuang Energy Group Co. Ltd., Class H | 42,900 | 49,428 |
| | | 796,527 |
| Commercial Printing - 0.0%* |
| Cimpress PLC (a) | 453 | 32,489 |
| Dai Nippon Printing Co. Ltd. | 2,400 | 33,625 |
| TOPPAN Holdings, Inc. | 1,500 | 39,839 |
| | | 105,953 |
| Commodity Chemicals - 0.1% |
| Advanced Petrochemical Co. (a) | 1,511 | 12,909 |
| Asahi Kasei Corp. | 8,300 | 57,256 |
| Barito Pacific Tbk. PT | 343,388 | 19,527 |
| Chandra Asri Pacific Tbk. PT | 103,400 | 48,183 |
| Enchem Co. Ltd. (a) | 147 | 13,132 |
| Formosa Chemicals & Fibre Corp. | 50,000 | 41,636 |
| Formosa Plastics Corp. | 54,000 | 58,473 |
| Guangzhou Tinci Materials Technology Co. Ltd., Class A | 1,860 | 4,996 |
| Hengli Petrochemical Co. Ltd., Class A | 7,500 | 15,681 |
| Huafon Chemical Co. Ltd., Class A | 4,900 | 5,460 |
| Jiangsu Eastern Shenghong Co. Ltd., Class A | 4,600 | 5,144 |
| Kumho Petrochemical Co. Ltd. | 181 | 11,084 |
| LB Group Co. Ltd., Class A | 2,100 | 5,054 |
| LG Chem Ltd. | 720 | 120,623 |
| Lotte Chemical Corp. | 184 | 7,433 |
| Mesaieed Petrochemical Holding Co. | 65,734 | 26,990 |
| Mitsui Chemicals, Inc. | 1,000 | 21,855 |
| Nan Ya Plastics Corp. | 68,000 | 62,017 |
| Orica Ltd. | 3,204 | 32,891 |
| Orion SA | 1,496 | 23,622 |
| | Number
of Shares | Fair
Value |
| Petronas Chemicals Group Bhd. | 36,200 | $41,855 |
| PTT Global Chemical PCL NVDR | 35,138 | 25,040 |
| Rongsheng Petrochemical Co. Ltd., Class A | 13,350 | 16,457 |
| Sahara International Petrochemical Co. | 5,604 | 37,107 |
| Sasa Polyester Sanayi AS (a) | 120,688 | 13,891 |
| Satellite Chemical Co. Ltd., Class A | 3,525 | 9,022 |
| Saudi Aramco Base Oil Co. | 696 | 20,709 |
| Saudi Basic Industries Corp. | 11,548 | 205,918 |
| Saudi Industrial Investment Group | 6,465 | 28,734 |
| Saudi Kayan Petrochemical Co. (a) | 11,878 | 22,192 |
| SKC Co. Ltd. (a) | 278 | 19,567 |
| Solar Industries India Ltd. | 367 | 41,938 |
| Supreme Industries Ltd. | 1,101 | 60,449 |
| Tongkun Group Co. Ltd., Class A | 3,400 | 5,465 |
| Toray Industries, Inc. | 9,100 | 57,688 |
| Yanbu National Petrochemical Co. | 3,867 | 38,903 |
| Yunnan Energy New Material Co. Ltd., Class A | 500 | 2,179 |
| Zhejiang Juhua Co. Ltd., Class A | 500 | 1,643 |
| | | 1,242,723 |
| Communications Equipment - 0.1% |
| Accton Technology Corp. | 7,000 | 165,048 |
| BYD Electronic International Co. Ltd. | 10,020 | 54,241 |
| Guangzhou Haige Communications Group, Inc. Co., Class A | 12,900 | 19,293 |
| Nokia OYJ | 34,207 | 151,261 |
| Telefonaktiebolaget LM Ericsson, Class B | 18,283 | 148,260 |
| Yealink Network Technology Corp. Ltd., Class A | 1,540 | 8,097 |
| Zhongji Innolight Co. Ltd., Class A | 700 | 11,776 |
| ZTE Corp., Class A | 6,900 | 37,970 |
| ZTE Corp., Class H | 10,000 | 31,347 |
| | | 627,293 |
See Notes to Schedule of Investments and Notes to Financial Statements.
| State Street Total Return V.I.S. Fund | 45 |
State Street Total Return V.I.S. Fund
Schedule of Investments, continued — December 31, 2024
| | Number
of Shares | Fair
Value |
| Construction & Engineering - 0.2% |
| ACS Actividades de Construccion y Servicios SA | 1,149 | $57,633 |
| Bouygues SA | 1,255 | 37,089 |
| Budimex SA | 173 | 19,553 |
| China Communications Services Corp. Ltd., Class H | 45,733 | 26,847 |
| China Energy Engineering Corp. Ltd., Class A | 34,900 | 10,886 |
| China National Chemical Engineering Co. Ltd., Class A | 10,700 | 12,082 |
| China Railway Group Ltd., Class A | 24,800 | 21,586 |
| China Railway Group Ltd., Class H | 43,000 | 21,921 |
| China State Construction Engineering Corp. Ltd., Class A | 41,900 | 34,244 |
| China State Construction International Holdings Ltd. | 32,000 | 50,505 |
| Eiffage SA | 484 | 42,460 |
| Gamuda Bhd. | 58,208 | 61,703 |
| Kajima Corp. | 2,500 | 45,340 |
| Larsen & Toubro Ltd. | 8,943 | 376,846 |
| Metallurgical Corp. of China Ltd., Class A | 24,100 | 10,833 |
| Obayashi Corp. | 4,300 | 56,686 |
| Power Construction Corp. of China Ltd., Class A | 21,000 | 15,618 |
| Rail Vikas Nigam Ltd. | 7,434 | 36,704 |
| Samsung E&A Co. Ltd. (a) | 2,064 | 23,007 |
| Sichuan Road & Bridge Group Co. Ltd., Class A | 9,800 | 9,718 |
| Skanska AB, Class B | 2,240 | 47,164 |
| Stantec, Inc. | 700 | 54,892 |
| Taisei Corp. | 1,100 | 46,143 |
| Vinci SA | 3,224 | 332,977 |
| Voltas Ltd. | 2,396 | 50,094 |
| WSP Global, Inc. | 864 | 151,966 |
| | | 1,654,497 |
| Construction Machinery & Heavy Transportation Equipment - 0.2% |
| Alstom SA (a) | 2,278 | 50,857 |
| Ashok Leyland Ltd. | 21,250 | 54,730 |
| China CSSC Holdings Ltd., Class A | 4,000 | 19,593 |
| CRRC Corp. Ltd., Class A | 30,500 | 34,814 |
| CRRC Corp. Ltd., Class H | 50,000 | 32,248 |
| Cummins India Ltd. | 2,012 | 76,942 |
| | Number
of Shares | Fair
Value |
| Daimler Truck Holding AG | 3,250 | $124,440 |
| Doosan Bobcat, Inc. | 610 | 17,110 |
| Epiroc AB, Class A | 4,337 | 75,683 |
| Epiroc AB, Class B | 2,212 | 34,555 |
| Hanwha Ocean Co. Ltd. (a) | 1,048 | 26,320 |
| HD Hyundai Heavy Industries Co. Ltd. (a) | 392 | 75,917 |
| HD Korea Shipbuilding & Offshore Engineering Co. Ltd. (a) | 620 | 95,350 |
| Hitachi Construction Machinery Co. Ltd. | 600 | 13,314 |
| Hyundai Rotem Co. Ltd. (a) | 1,335 | 44,784 |
| Knorr-Bremse AG | 478 | 34,682 |
| Komatsu Ltd. | 5,814 | 158,573 |
| Metso OYJ | 4,104 | 38,194 |
| Samsung Heavy Industries Co. Ltd. (a) | 9,725 | 74,197 |
| Sany Heavy Industry Co. Ltd., Class A | 5,300 | 11,897 |
| Sinotruk Hong Kong Ltd. | 8,000 | 23,481 |
| Toyota Industries Corp. | 1,100 | 88,572 |
| Volvo AB, Class A | 1,234 | 30,200 |
| Volvo AB, Class B | 10,227 | 248,867 |
| Weichai Power Co. Ltd., Class H | 31,401 | 48,023 |
| XCMG Construction Machinery Co. Ltd., Class A | 9,300 | 10,046 |
| Yangzijiang Shipbuilding Holdings Ltd. | 17,000 | 37,260 |
| Zhuzhou CRRC Times Electric Co. Ltd., Class H | 7,200 | 30,402 |
| Zoomlion Heavy Industry Science & Technology Co. Ltd., Class A | 8,700 | 8,568 |
| | | 1,619,619 |
| Construction Materials - 0.1% |
| Ambuja Cements Ltd. | 8,726 | 54,610 |
| Anhui Conch Cement Co. Ltd., Class A | 2,769 | 8,969 |
| Anhui Conch Cement Co. Ltd., Class H | 19,581 | 50,112 |
| Asia Cement Corp. | 35,000 | 43,130 |
| Cemex SAB de CV | 216,000 | 121,335 |
| China Jushi Co. Ltd., Class A | 4,114 | 6,383 |
| China National Building Material Co. Ltd., Class H | 59,243 | 26,998 |
| Grasim Industries Ltd. | 3,772 | 107,621 |
| Heidelberg Materials AG | 899 | 111,046 |
| Shree Cement Ltd. | 110 | 33,013 |
See Notes to Schedule of Investments and Notes to Financial Statements.
| 46 | State Street Total Return V.I.S. Fund |
State Street Total Return V.I.S. Fund
Schedule of Investments, continued — December 31, 2024
| | Number
of Shares | Fair
Value |
| Siam Cement PCL NVDR (b) | 10,598 | $52,060 |
| TCC Group Holdings Co. Ltd. | 95,595 | 92,433 |
| UltraTech Cement Ltd. | 1,651 | 220,349 |
| | | 928,059 |
| Consumer Electronics - 0.1% |
| Dixon Technologies India Ltd. | 406 | 85,058 |
| LG Electronics, Inc. | 1,500 | 84,276 |
| Panasonic Holdings Corp. | 15,300 | 156,559 |
| Sony Group Corp. | 40,345 | 851,294 |
| | | 1,177,187 |
| Consumer Finance - 0.1% |
| Bajaj Finance Ltd. | 3,652 | 291,047 |
| Cholamandalam Investment & Finance Co. Ltd. | 6,102 | 84,527 |
| Krungthai Card PCL | 18,400 | 26,983 |
| Muthoot Finance Ltd. | 1,581 | 39,448 |
| Qifu Technology, Inc. ADR | 1,500 | 57,570 |
| SBI Cards & Payment Services Ltd. | 3,309 | 25,658 |
| Shriram Finance Ltd. | 4,071 | 137,381 |
| Sundaram Finance Ltd. | 1,179 | 57,063 |
| | | 719,677 |
| Consumer Staples Merchandise Retail - 0.0%* |
| Aeon Co. Ltd. | 4,275 | 100,167 |
| Carrefour SA | 3,402 | 48,368 |
| Cencosud SA | 15,092 | 33,371 |
| Wal-Mart de Mexico SAB de CV | 68,286 | 180,266 |
| | | 362,172 |
| Copper - 0.0%* |
| Amman Mineral Internasional PT (a) | 93,100 | 48,831 |
| Antofagasta PLC | 2,595 | 51,675 |
| First Quantum Minerals Ltd. (a) | 4,667 | 60,130 |
| Jiangxi Copper Co. Ltd., Class A | 300 | 843 |
| Jiangxi Copper Co. Ltd., Class H | 16,782 | 26,919 |
| KGHM Polska Miedz SA | 1,925 | 53,631 |
| Lundin Mining Corp. | 4,344 | 37,363 |
| MAC Copper Ltd., Class A (a) | 1,423 | 15,112 |
| Southern Copper Corp. | 1,727 | 157,382 |
| | Number
of Shares | Fair
Value |
| Tongling Nonferrous Metals Group Co. Ltd., Class A | 7,200 | $3,168 |
| | | 455,054 |
| Data Processing & Outsourced Services - 0.0%* |
| Computershare Ltd. | 3,490 | 73,360 |
| Teleperformance SE | 357 | 30,727 |
| WNS Holdings Ltd. (a) | 1,135 | 53,788 |
| | | 157,875 |
| Distillers & Vintners - 0.1% |
| Anhui Gujing Distillery Co. Ltd., Class A | 400 | 9,442 |
| Anhui Gujing Distillery Co. Ltd., Class B | 1,900 | 27,397 |
| Davide Campari-Milano NV | 4,054 | 25,363 |
| Diageo PLC | 14,351 | 456,070 |
| Jiangsu King's Luck Brewery JSC Ltd., Class A | 1,400 | 8,625 |
| Jiangsu Yanghe Distillery Co. Ltd., Class A | 1,700 | 19,342 |
| Kweichow Moutai Co. Ltd., Class A | 1,100 | 228,346 |
| Luzhou Laojiao Co. Ltd., Class A | 1,500 | 25,581 |
| Pernod Ricard SA | 1,334 | 150,568 |
| Shanxi Xinghuacun Fen Wine Factory Co. Ltd., Class A | 1,040 | 26,095 |
| Treasury Wine Estates Ltd. | 5,368 | 37,656 |
| United Spirits Ltd. | 4,104 | 77,918 |
| Wuliangye Yibin Co. Ltd., Class A | 3,300 | 62,948 |
| | | 1,155,351 |
| Distributors - 0.0%* |
| D'ieteren Group | 133 | 22,132 |
| GigaCloud Technology, Inc., Class A (a) | 674 | 12,482 |
| | | 34,614 |
| Diversified Banks - 3.2% |
| ABN AMRO Bank NV (d) | 2,874 | 44,313 |
| Absa Group Ltd. | 11,873 | 119,391 |
| Abu Dhabi Commercial Bank PJSC | 40,850 | 115,887 |
| Abu Dhabi Islamic Bank PJSC | 21,200 | 79,766 |
| Agricultural Bank of China Ltd., Class A | 91,347 | 66,443 |
| Agricultural Bank of China Ltd., Class H | 367,717 | 209,706 |
See Notes to Schedule of Investments and Notes to Financial Statements.
| State Street Total Return V.I.S. Fund | 47 |
State Street Total Return V.I.S. Fund
Schedule of Investments, continued — December 31, 2024
| | Number
of Shares | Fair
Value |
| AIB Group PLC | 11,423 | $63,046 |
| Akbank TAS | 45,252 | 82,991 |
| Al Rajhi Bank | 26,610 | 669,960 |
| Alinma Bank | 17,726 | 136,575 |
| Alior Bank SA | 1,528 | 31,817 |
| Alpha Services & Holdings SA | 31,696 | 53,072 |
| AMMB Holdings Bhd. | 37,400 | 45,835 |
| ANZ Group Holdings Ltd. | 19,201 | 339,292 |
| Arab National Bank | 9,282 | 52,074 |
| Axis Bank Ltd. | 30,726 | 382,111 |
| Banco Bilbao Vizcaya Argentaria SA | 37,153 | 363,637 |
| Banco BPM SpA | 8,477 | 68,612 |
| Banco Bradesco SA | 18,367 | 31,633 |
| Banco de Chile | 661,610 | 75,195 |
| Banco de Credito e Inversiones SA | 1,327 | 36,813 |
| Banco de Sabadell SA | 35,807 | 69,596 |
| Banco do Brasil SA | 18,800 | 73,552 |
| Banco Santander Chile | 908,860 | 43,204 |
| Banco Santander SA | 99,961 | 462,119 |
| Bancolombia SA | 3,113 | 26,569 |
| Bank AlBilad | 9,206 | 95,676 |
| Bank Al-Jazira (a) | 8,423 | 41,920 |
| Bank Central Asia Tbk. PT | 750,200 | 450,959 |
| Bank Hapoalim BM | 8,397 | 101,447 |
| Bank Leumi Le-Israel BM | 9,924 | 118,070 |
| Bank Mandiri Persero Tbk. PT | 529,200 | 186,280 |
| Bank Negara Indonesia Persero Tbk. PT | 227,100 | 61,119 |
| Bank of Baroda | 14,528 | 40,819 |
| Bank of Beijing Co. Ltd., Class A | 31,600 | 26,471 |
| Bank of China Ltd., Class A | 42,794 | 32,118 |
| Bank of China Ltd., Class H | 957,868 | 489,542 |
| Bank of Communications Co. Ltd., Class A | 29,600 | 31,328 |
| Bank of Communications Co. Ltd., Class H | 123,127 | 101,286 |
| Bank of Ireland Group PLC | 6,407 | 58,423 |
| Bank of Montreal | 4,706 | 456,628 |
| Bank of Nova Scotia | 7,981 | 428,350 |
| Bank of NT Butterfield & Son Ltd. | 1,173 | 42,873 |
| Bank of Shanghai Co. Ltd., Class A | 9,900 | 12,339 |
| Bank of the Philippine Islands | 26,292 | 55,452 |
| Bank Polska Kasa Opieki SA | 2,492 | 83,291 |
| Bank Rakyat Indonesia Persero Tbk. PT | 945,509 | 238,692 |
| | Number
of Shares | Fair
Value |
| Banque Saudi Fransi | 17,167 | $72,371 |
| Barclays PLC | 93,632 | 314,445 |
| BDO Unibank, Inc. | 33,772 | 83,544 |
| BNP Paribas SA | 6,562 | 402,397 |
| BOC Hong Kong Holdings Ltd. | 24,500 | 78,692 |
| Boubyan Bank KSCP | 21,162 | 38,508 |
| BPER Banca SpA | 6,550 | 41,761 |
| CaixaBank SA | 26,310 | 142,650 |
| Canadian Imperial Bank of Commerce | 6,081 | 384,470 |
| Canara Bank | 34,018 | 39,782 |
| Capitec Bank Holdings Ltd. | 1,242 | 206,298 |
| Chang Hwa Commercial Bank Ltd. | 71,542 | 38,952 |
| China CITIC Bank Corp. Ltd., Class H | 116,881 | 80,800 |
| China Common Rich Renewable Energy Investments Ltd. (a)(e)** | 64,000 | — |
| China Construction Bank Corp., Class A | 3,400 | 4,071 |
| China Construction Bank Corp., Class H | 1,338,000 | 1,116,155 |
| China Everbright Bank Co. Ltd., Class A | 34,220 | 18,039 |
| China Everbright Bank Co. Ltd., Class H | 46,883 | 18,227 |
| China Merchants Bank Co. Ltd., Class A | 17,100 | 91,539 |
| China Merchants Bank Co. Ltd., Class H | 56,000 | 288,364 |
| China Minsheng Banking Corp. Ltd., Class A | 46,100 | 25,934 |
| China Minsheng Banking Corp. Ltd., Class H | 65,700 | 29,095 |
| China Zheshang Bank Co. Ltd., Class A | 23,140 | 9,172 |
| CIMB Group Holdings Bhd. | 99,294 | 182,089 |
| Commercial Bank PSQC | 43,434 | 51,892 |
| Commercial International Bank - Egypt (CIB) | 24,801 | 38,302 |
| Commerzbank AG | 6,238 | 102,409 |
| Commonwealth Bank of Australia | 10,812 | 1,025,894 |
| Credicorp Ltd. | 1,000 | 183,320 |
| Credit Agricole SA | 6,964 | 95,837 |
| CTBC Financial Holding Co. Ltd. | 227,000 | 270,729 |
| Danske Bank AS | 4,540 | 128,678 |
| DBS Group Holdings Ltd. | 12,841 | 411,529 |
| DNB Bank ASA | 5,894 | 117,940 |
See Notes to Schedule of Investments and Notes to Financial Statements.
| 48 | State Street Total Return V.I.S. Fund |
State Street Total Return V.I.S. Fund
Schedule of Investments, continued — December 31, 2024
| | Number
of Shares | Fair
Value |
| Dubai Islamic Bank PJSC | 40,434 | $78,049 |
| E.Sun Financial Holding Co. Ltd. | 180,626 | 148,481 |
| Emirates NBD Bank PJSC | 26,659 | 155,684 |
| Erste Group Bank AG | 2,216 | 137,115 |
| Eurobank Ergasias Services & Holdings SA, Class A | 36,727 | 84,809 |
| FinecoBank Banca Fineco SpA | 4,021 | 70,154 |
| First Abu Dhabi Bank PJSC | 55,739 | 208,506 |
| First Financial Holding Co. Ltd. | 165,164 | 136,526 |
| Grupo Financiero Banorte SAB de CV, Class O | 35,900 | 231,308 |
| Grupo Financiero Inbursa SAB de CV, Class O (a) | 26,000 | 54,256 |
| Gulf Bank KSCP | 29,631 | 31,332 |
| Haci Omer Sabanci Holding AS | 10,499 | 28,504 |
| Hana Financial Group, Inc. | 3,984 | 152,441 |
| Hang Seng Bank Ltd. | 5,000 | 61,503 |
| HDFC Bank Ltd. | 77,648 | 1,607,899 |
| Hong Leong Bank Bhd. | 9,800 | 45,060 |
| HSBC Holdings PLC | 117,613 | 1,156,735 |
| Hua Nan Financial Holdings Co. Ltd. | 123,309 | 98,355 |
| Huaxia Bank Co. Ltd., Class A | 22,200 | 24,221 |
| ICICI Bank Ltd. | 71,241 | 1,066,488 |
| IDFC First Bank Ltd. (a) | 53,047 | 39,122 |
| IndusInd Bank Ltd. | 4,200 | 47,103 |
| Industrial & Commercial Bank of China Ltd., Class A | 67,200 | 63,342 |
| Industrial & Commercial Bank of China Ltd., Class H | 936,505 | 628,118 |
| Industrial Bank Co. Ltd., Class A | 21,300 | 55,589 |
| Industrial Bank of Korea | 3,268 | 31,681 |
| ING Groep NV | 21,288 | 333,522 |
| Inter & Co., Inc., Class A | 3,900 | 16,458 |
| Intesa Sanpaolo SpA | 94,295 | 378,072 |
| Israel Discount Bank Ltd., Class A | 8,184 | 55,973 |
| Japan Post Bank Co. Ltd. | 9,500 | 89,896 |
| KakaoBank Corp. | 2,013 | 28,442 |
| Kasikornbank PCL | 9,700 | 44,240 |
| KB Financial Group, Inc. | 5,055 | 284,652 |
| KBC Group NV | 1,511 | 116,628 |
| Komercni Banka AS | 1,151 | 40,222 |
| Kotak Mahindra Bank Ltd. | 15,299 | 319,163 |
| Krung Thai Bank PCL NVDR (b) | 63,077 | 38,809 |
| Kuwait Finance House KSCP | 142,861 | 345,684 |
| | Number
of Shares | Fair
Value |
| Lloyds Banking Group PLC | 403,688 | $276,956 |
| Malayan Banking Bhd. | 68,189 | 156,157 |
| Masraf Al Rayan QSC | 85,716 | 57,984 |
| mBank SA (a) | 258 | 34,308 |
| Mediobanca Banca di Credito Finanziario SpA | 3,289 | 48,016 |
| Mega Financial Holding Co. Ltd. | 155,795 | 183,906 |
| Metropolitan Bank & Trust Co. | 25,640 | 31,750 |
| Mitsubishi UFJ Financial Group, Inc. | 71,682 | 837,851 |
| Mizrahi Tefahot Bank Ltd. | 1,020 | 44,118 |
| Mizuho Financial Group, Inc. | 15,600 | 381,284 |
| Moneta Money Bank AS (d) | 6,354 | 32,356 |
| National Australia Bank Ltd. | 19,832 | 455,550 |
| National Bank of Canada | 2,189 | 199,448 |
| National Bank of Greece SA | 11,109 | 88,116 |
| National Bank of Kuwait SAKP | 110,821 | 322,075 |
| NatWest Group PLC | 46,464 | 233,988 |
| Nedbank Group Ltd. | 6,277 | 93,709 |
| Nordea Bank Abp | 20,301 | 221,432 |
| NU Holdings Ltd., Class A (a) | 60,860 | 630,510 |
| OTP Bank Nyrt | 3,027 | 165,401 |
| Oversea-Chinese Banking Corp. Ltd. | 21,830 | 267,074 |
| Ping An Bank Co. Ltd., Class A | 20,300 | 32,352 |
| Piraeus Financial Holdings SA | 15,242 | 60,765 |
| Postal Savings Bank of China Co. Ltd., Class A | 34,100 | 26,383 |
| Postal Savings Bank of China Co. Ltd., Class H (d) | 97,675 | 57,589 |
| Powszechna Kasa Oszczednosci Bank Polski SA | 10,998 | 159,199 |
| Public Bank Bhd. | 209,200 | 213,340 |
| Punjab National Bank | 29,593 | 35,527 |
| Qatar International Islamic Bank QSC | 14,405 | 43,124 |
| Qatar Islamic Bank QPSC | 25,837 | 151,573 |
| Qatar National Bank QPSC | 58,423 | 277,433 |
| RHB Bank Bhd. | 27,771 | 40,245 |
| Riyad Bank | 19,133 | 145,634 |
| Royal Bank of Canada | 9,142 | 1,101,718 |
| Santander Bank Polska SA | 547 | 60,715 |
| Saudi Awwal Bank | 14,327 | 128,308 |
| Saudi Investment Bank | 9,608 | 37,078 |
| Saudi National Bank | 39,604 | 352,045 |
| Sberbank of Russia PJSC (e)** | 192,160 | — |
See Notes to Schedule of Investments and Notes to Financial Statements.
| State Street Total Return V.I.S. Fund | 49 |
State Street Total Return V.I.S. Fund
Schedule of Investments, continued — December 31, 2024
| | Number
of Shares | Fair
Value |
| SCB X PCL NVDR | 13,396 | $46,117 |
| Shanghai Commercial & Savings Bank Ltd. | 54,565 | 65,908 |
| Shanghai Pudong Development Bank Co. Ltd., Class A | 23,100 | 32,377 |
| Shanghai Rural Commercial Bank Co. Ltd., Class A | 18,800 | 21,792 |
| Shinhan Financial Group Co. Ltd. | 6,110 | 198,128 |
| SinoPac Financial Holdings Co. Ltd. | 153,669 | 107,338 |
| Skandinaviska Enskilda Banken AB, Class A | 10,445 | 143,328 |
| Societe Generale SA | 4,741 | 133,337 |
| Standard Bank Group Ltd. | 18,972 | 222,959 |
| Standard Chartered PLC | 13,831 | 171,245 |
| State Bank of India | 23,303 | 216,376 |
| Sumitomo Mitsui Financial Group, Inc. | 24,099 | 579,062 |
| Sumitomo Mitsui Trust Group, Inc. | 4,300 | 100,564 |
| Svenska Handelsbanken AB, Class A | 9,600 | 99,251 |
| Swedbank AB, Class A | 5,588 | 110,486 |
| Taishin Financial Holding Co. Ltd. | 159,652 | 84,733 |
| Taiwan Business Bank | 102,731 | 46,533 |
| Taiwan Cooperative Financial Holding Co. Ltd. | 158,634 | 117,580 |
| TCS Group Holding PLC GDR (a)(e)** | 500 | — |
| TMBThanachart Bank PCL | 400,000 | 21,821 |
| Toronto-Dominion Bank | 11,281 | 600,289 |
| Turkiye Is Bankasi AS, Class C | 109,873 | 42,072 |
| UniCredit SpA | 9,499 | 380,291 |
| Union Bank of India Ltd. | 17,524 | 24,638 |
| United Overseas Bank Ltd. | 8,100 | 215,711 |
| VTB Bank PJSC (a)(e)** | 14,053 | — |
| Westpac Banking Corp. | 22,179 | 443,823 |
| Woori Financial Group, Inc. | 7,116 | 74,144 |
| Yapi ve Kredi Bankasi AS | 44,636 | 38,652 |
| Yes Bank Ltd. (a) | 190,554 | 43,602 |
| | | 33,631,493 |
| Diversified Capital Markets - 0.1% |
| Banco BTG Pactual SA | 16,608 | 73,122 |
| Deutsche Bank AG | 12,187 | 210,239 |
| Macquarie Group Ltd. | 2,368 | 324,971 |
| | Number
of Shares | Fair
Value |
| Mirae Asset Securities Co. Ltd. | 2,723 | $14,678 |
| UBS Group AG | 21,235 | 651,079 |
| | | 1,274,089 |
| Diversified Chemicals - 0.1% |
| BASF SE | 5,874 | 257,494 |
| Mitsubishi Chemical Group Corp. | 8,900 | 45,004 |
| Ningxia Baofeng Energy Group Co. Ltd., Class A | 11,000 | 25,232 |
| Pidilite Industries Ltd. | 2,242 | 76,055 |
| Sasol Ltd. | 9,951 | 43,912 |
| SRF Ltd. | 2,365 | 61,821 |
| | | 509,518 |
| Diversified Financial Services - 0.1% |
| Bajaj Finserv Ltd. | 5,397 | 98,851 |
| FirstRand Ltd. | 71,383 | 287,348 |
| Jio Financial Services Ltd. (a) | 40,838 | 142,481 |
| M&G PLC | 14,917 | 36,962 |
| Meritz Financial Group, Inc. | 1,456 | 102,293 |
| ORIX Corp. | 7,600 | 163,470 |
| Yuanta Financial Holding Co. Ltd. | 148,280 | 153,778 |
| | | 985,183 |
| Diversified Metals & Mining - 0.3% |
| Anglo American PLC | 8,179 | 242,154 |
| BHP Group Ltd. | 32,769 | 802,427 |
| Boliden AB | 1,800 | 50,710 |
| China Northern Rare Earth Group High-Tech Co. Ltd., Class A | 2,000 | 5,781 |
| China Rare Earth Resources & Technology Co. Ltd., Class A | 500 | 1,910 |
| CMOC Group Ltd., Class A | 14,500 | 13,134 |
| CMOC Group Ltd., Class H | 57,000 | 38,524 |
| Critical Metals Corp. (a) | 242 | 1,643 |
| Glencore PLC (a) | 66,818 | 295,735 |
| GMK Norilskiy Nickel PAO (a)(e)** | 30,500 | — |
| Grupo Mexico SAB de CV | 43,042 | 204,790 |
| Henan Shenhuo Coal Industry & Electricity Power Co. Ltd., Class A | 4,000 | 9,208 |
| Ivanhoe Mines Ltd., Class A (a) | 4,890 | 58,005 |
| Korea Zinc Co. Ltd. | 70 | 47,413 |
See Notes to Schedule of Investments and Notes to Financial Statements.
| 50 | State Street Total Return V.I.S. Fund |
State Street Total Return V.I.S. Fund
Schedule of Investments, continued — December 31, 2024
| | Number
of Shares | Fair
Value |
| Lifezone Metals Ltd. (a) | 965 | $6,707 |
| Merdeka Copper Gold Tbk. PT (a) | 198,993 | 19,932 |
| Mineral Resources Ltd. | 1,161 | 24,620 |
| MMC Norilsk Nickel PJSC ADR (a)(e)** | 8,131 | — |
| MMG Ltd. (a) | 96,000 | 31,638 |
| Rio Tinto Ltd. | 2,457 | 178,686 |
| Rio Tinto PLC | 7,272 | 430,145 |
| Saudi Arabian Mining Co. (a) | 17,134 | 229,371 |
| South32 Ltd. | 29,805 | 62,743 |
| Sumitomo Metal Mining Co. Ltd. | 1,600 | 36,521 |
| Teck Resources Ltd., Class B | 2,998 | 121,488 |
| Vedanta Ltd. | 19,712 | 102,332 |
| Western Mining Co. Ltd., Class A | 1,400 | 3,065 |
| Yunnan Tin Co. Ltd., Class A | 1,000 | 1,911 |
| | | 3,020,593 |
| Diversified Real Estate Activities - 0.1% |
| Aldar Properties PJSC | 54,631 | 114,228 |
| Ayala Land, Inc. | 94,900 | 42,714 |
| Barwa Real Estate Co. | 31,838 | 24,746 |
| Daito Trust Construction Co. Ltd. | 400 | 44,771 |
| Daiwa House Industry Co. Ltd. | 3,800 | 116,802 |
| DLF Ltd. | 10,611 | 102,239 |
| Hainan Airport Infrastructure Co. Ltd., Class A (a) | 9,000 | 4,634 |
| Mitsubishi Estate Co. Ltd. | 7,100 | 98,676 |
| Mitsui Fudosan Co. Ltd. | 17,100 | 136,915 |
| Phoenix Mills Ltd. | 2,078 | 39,660 |
| Sumitomo Realty & Development Co. Ltd. | 2,000 | 62,271 |
| Sun Hung Kai Properties Ltd. | 9,500 | 91,295 |
| Wharf Holdings Ltd. | 6,000 | 16,877 |
| | | 895,828 |
| Diversified REITs - 0.0%* |
| Covivio SA | 337 | 17,015 |
| Fibra Uno Administracion SA de CV | 40,600 | 40,458 |
| GPT Group | 12,641 | 34,203 |
| Land Securities Group PLC | 4,666 | 34,127 |
| Mirvac Group | 25,990 | 30,172 |
| Stockland | 15,712 | 46,695 |
| | | 202,670 |
| | Number
of Shares | Fair
Value |
| Diversified Support Services - 0.0%* |
| Brambles Ltd. | 9,167 | $109,202 |
| Element Fleet Management Corp. | 2,584 | 52,212 |
| Indian Railway Catering & Tourism Corp. Ltd. | 3,671 | 33,741 |
| RB Global, Inc. | 2,348 | 211,813 |
| | | 406,968 |
| Drug Retail - 0.0%* |
| Alibaba Health Information Technology Ltd. (a) | 64,000 | 27,353 |
| Clicks Group Ltd. | 3,394 | 67,106 |
| JD Health International, Inc. (a)(d) | 14,100 | 51,006 |
| MatsukiyoCocokara & Co. | 2,100 | 30,610 |
| Nahdi Medical Co. | 553 | 17,308 |
| Raia Drogasil SA | 18,324 | 65,254 |
| | | 258,637 |
| Education Services - 0.0%* |
| New Oriental Education & Technology Group, Inc. | 20,200 | 127,291 |
| Pearson PLC | 3,946 | 63,356 |
| TAL Education Group ADR (a) | 6,400 | 64,128 |
| | | 254,775 |
| Electric Utilities - 0.3% |
| Acciona SA | 150 | 16,884 |
| BKW AG | 129 | 21,403 |
| Centrais Eletricas Brasileiras SA | 17,727 | 97,934 |
| CEZ AS | 2,290 | 90,142 |
| Chubu Electric Power Co., Inc. | 3,700 | 38,863 |
| CK Infrastructure Holdings Ltd. | 4,000 | 29,738 |
| CLP Holdings Ltd. | 11,000 | 92,470 |
| CPFL Energia SA | 2,500 | 12,784 |
| EDP SA | 20,654 | 66,108 |
| Elia Group SA | 178 | 13,713 |
| Emera, Inc. | 1,898 | 70,908 |
| Endesa SA | 2,102 | 45,208 |
| Enel Americas SA | 79,240 | 6,960 |
| Enel Chile SA | 508,946 | 29,426 |
| Enel SpA | 52,437 | 374,073 |
| Energisa SA | 4,267 | 25,196 |
| Equatorial Energia SA | 16,258 | 72,107 |
| Fortis, Inc. | 3,294 | 136,803 |
| Fortum OYJ | 2,953 | 41,327 |
| Hydro One Ltd. (d) | 2,170 | 66,796 |
See Notes to Schedule of Investments and Notes to Financial Statements.
| State Street Total Return V.I.S. Fund | 51 |
State Street Total Return V.I.S. Fund
Schedule of Investments, continued — December 31, 2024
| | Number
of Shares | Fair
Value |
| Iberdrola SA | 39,017 | $537,348 |
| Inter RAO UES PJSC (e)** | 467,243 | — |
| Interconexion Electrica SA ESP | 8,314 | 31,516 |
| Kansai Electric Power Co., Inc. | 6,100 | 67,691 |
| Korea Electric Power Corp. (a) | 3,729 | 50,516 |
| Manila Electric Co. | 4,030 | 33,998 |
| Mercury NZ Ltd. | 4,340 | 14,224 |
| Origin Energy Ltd. | 11,339 | 76,524 |
| PGE Polska Grupa Energetyczna SA (a) | 10,086 | 14,851 |
| Power Assets Holdings Ltd. | 8,500 | 59,308 |
| Power Grid Corp. of India Ltd. | 64,839 | 233,792 |
| Public Power Corp. SA | 3,076 | 39,305 |
| Redeia Corp. SA | 2,671 | 45,636 |
| Saudi Electricity Co. | 10,865 | 48,868 |
| SSE PLC | 7,085 | 142,327 |
| Tata Power Co. Ltd. | 20,998 | 96,242 |
| Tenaga Nasional Bhd. | 37,000 | 123,623 |
| Terna - Rete Elettrica Nazionale | 9,261 | 73,154 |
| Tokyo Electric Power Co. Holdings, Inc. (a) | 8,700 | 26,036 |
| Torrent Power Ltd. | 2,511 | 43,582 |
| Verbund AG | 449 | 32,546 |
| | | 3,139,930 |
| Electrical Components & Equipment - 0.2% |
| ABB Ltd. | 10,208 | 552,007 |
| CG Power & Industrial Solutions Ltd. | 8,878 | 75,492 |
| CNGR Advanced Material Co. Ltd., Class A | 280 | 1,378 |
| Contemporary Amperex Technology Co. Ltd., Class A | 3,800 | 137,683 |
| Ecopro BM Co. Ltd. (a) | 697 | 51,035 |
| Ecopro Co. Ltd. (a) | 1,423 | 54,560 |
| Ecopro Materials Co. Ltd. (a) | 208 | 9,063 |
| Eve Energy Co. Ltd., Class A | 2,500 | 15,916 |
| Fortune Electric Co. Ltd. | 2,200 | 37,780 |
| Freyr Battery, Inc. (a) | 2,663 | 6,871 |
| Fuji Electric Co. Ltd. | 800 | 42,820 |
| Fujikura Ltd. | 1,700 | 69,485 |
| GEM Co. Ltd., Class A | 7,800 | 6,938 |
| Ginlong Technologies Co. Ltd., Class A | 300 | 2,496 |
| Goneo Group Co. Ltd., Class A | 580 | 5,549 |
| | Number
of Shares | Fair
Value |
| Gotion High-tech Co. Ltd., Class A | 1,800 | $5,203 |
| Havells India Ltd. | 3,576 | 69,967 |
| Jiangsu Zhongtian Technology Co. Ltd., Class A | 4,400 | 8,582 |
| L&F Co. Ltd. (a) | 299 | 16,164 |
| Legrand SA | 1,684 | 163,985 |
| LG Energy Solution Ltd. (a) | 603 | 140,822 |
| LS Electric Co. Ltd. | 240 | 25,977 |
| NIDEC Corp. | 5,500 | 98,905 |
| Polycab India Ltd. | 626 | 53,175 |
| POSCO Future M Co. Ltd. | 444 | 41,948 |
| Prysmian SpA | 1,799 | 115,090 |
| Sungrow Power Supply Co. Ltd., Class A | 2,660 | 26,750 |
| Sunwoda Electronic Co. Ltd., Class A | 800 | 2,431 |
| TBEA Co. Ltd., Class A | 5,460 | 9,475 |
| Voltronic Power Technology Corp. | 1,000 | 56,734 |
| Walsin Lihwa Corp. | 39,000 | 28,193 |
| WEG SA | 23,946 | 204,542 |
| Zhejiang Chint Electrics Co. Ltd., Class A | 1,800 | 5,740 |
| Zhejiang Huayou Cobalt Co. Ltd., Class A | 1,530 | 6,098 |
| | | 2,148,854 |
| Electronic Components - 0.2% |
| AUO Corp. | 97,200 | 43,435 |
| Avary Holding Shenzhen Co. Ltd., Class A | 2,900 | 14,410 |
| BOE Technology Group Co. Ltd., Class A | 28,600 | 17,102 |
| Chaozhou Three-Circle Group Co. Ltd., Class A | 2,200 | 11,540 |
| Delta Electronics Thailand PCL NVDR | 44,745 | 198,298 |
| Delta Electronics, Inc. | 27,000 | 354,543 |
| E Ink Holdings, Inc. | 12,000 | 99,925 |
| Innolux Corp. | 110,293 | 48,276 |
| Kyocera Corp. | 8,500 | 84,349 |
| Largan Precision Co. Ltd. | 1,000 | 81,593 |
| Lens Technology Co. Ltd., Class A | 4,960 | 14,796 |
| LG Display Co. Ltd. (a) | 4,924 | 30,050 |
| LG Innotek Co. Ltd. | 236 | 25,544 |
| Lingyi iTech Guangdong Co., Class A | 8,000 | 8,718 |
| Luxshare Precision Industry Co. Ltd., Class A | 5,600 | 31,091 |
See Notes to Schedule of Investments and Notes to Financial Statements.
| 52 | State Street Total Return V.I.S. Fund |
State Street Total Return V.I.S. Fund
Schedule of Investments, continued — December 31, 2024
| | Number
of Shares | Fair
Value |
| Maxscend Microelectronics Co. Ltd., Class A | 128 | $1,564 |
| Murata Manufacturing Co. Ltd. | 10,900 | 173,130 |
| Omron Corp. | 997 | 33,610 |
| Samsung Electro-Mechanics Co. Ltd. | 814 | 67,516 |
| Samsung SDI Co. Ltd. (a) | 784 | 129,586 |
| Shengyi Technology Co. Ltd., Class A | 1,400 | 4,586 |
| Shennan Circuits Co. Ltd., Class A | 800 | 13,621 |
| Sunny Optical Technology Group Co. Ltd. | 9,200 | 81,543 |
| TDK Corp. | 12,500 | 161,172 |
| Unimicron Technology Corp. | 20,000 | 86,016 |
| Yageo Corp. | 6,143 | 101,370 |
| Zhen Ding Technology Holding Ltd. | 9,665 | 35,376 |
| | | 1,952,760 |
| Electronic Equipment & Instruments - 0.1% |
| Halma PLC | 2,499 | 84,159 |
| Hexagon AB, Class B | 13,665 | 130,638 |
| Keyence Corp. | 1,282 | 521,710 |
| Shimadzu Corp. | 1,600 | 44,834 |
| SUPCON Technology Co. Ltd., Class A | 1,570 | 10,622 |
| TCL Technology Group Corp., Class A | 14,329 | 9,817 |
| Wuhan Guide Infrared Co. Ltd., Class A | 4,550 | 4,605 |
| Yokogawa Electric Corp. | 1,500 | 31,942 |
| Zhejiang Dahua Technology Co. Ltd., Class A | 2,800 | 6,102 |
| | | 844,429 |
| Electronic Manufacturing Services - 0.1% |
| AAC Technologies Holdings, Inc. | 9,000 | 43,448 |
| Fabrinet (a) | 968 | 212,844 |
| Foxconn Industrial Internet Co. Ltd., Class A | 10,800 | 31,628 |
| GoerTek, Inc., Class A | 2,448 | 8,606 |
| Hon Hai Precision Industry Co. Ltd. | 173,000 | 970,947 |
| Wingtech Technology Co. Ltd., Class A | 1,200 | 6,339 |
| | | 1,273,812 |
| | Number
of Shares | Fair
Value |
| Environmental & Facilities Services - 0.0%* |
| Rentokil Initial PLC | 16,681 | $83,732 |
| Zhejiang Weiming Environment Protection Co. Ltd., Class A | 2,300 | 6,777 |
| | | 90,509 |
| Fertilizers & Agricultural Chemicals - 0.0%* |
| ICL Group Ltd. | 4,659 | 23,016 |
| Nutrien Ltd. | 3,174 | 141,949 |
| PhosAgro PJSC (a)(e)** | 13 | — |
| PhosAgro PJSC GDR (a)(e)** | 1,956 | — |
| PI Industries Ltd. | 1,191 | 51,272 |
| Qinghai Salt Lake Industry Co. Ltd., Class A (a) | 3,300 | 7,399 |
| SABIC Agri-Nutrients Co. | 3,397 | 100,353 |
| Shandong Hualu Hengsheng Chemical Co. Ltd., Class A | 2,470 | 7,271 |
| UPL Ltd. (f) | 5,686 | 33,274 |
| UPL Ltd. (a)(f) | 710 | 1,871 |
| Yara International ASA | 1,016 | 26,957 |
| Zangge Mining Co. Ltd., Class A | 900 | 3,399 |
| | | 396,761 |
| Financial Exchanges & Data - 0.2% |
| ASX Ltd. | 1,276 | 51,416 |
| B3 SA - Brasil Bolsa Balcao | 80,800 | 134,975 |
| BSE Ltd. | 1,136 | 70,662 |
| Deutsche Boerse AG | 1,213 | 279,328 |
| East Money Information Co. Ltd., Class A | 16,188 | 56,933 |
| Euronext NV (d) | 515 | 57,755 |
| Hithink RoyalFlush Information Network Co. Ltd., Class A | 500 | 19,580 |
| Hong Kong Exchanges & Clearing Ltd. | 7,783 | 295,371 |
| Japan Exchange Group, Inc. | 6,500 | 72,205 |
| London Stock Exchange Group PLC | 3,084 | 435,872 |
| Moscow Exchange MICEX-RTS PJSC (e)** | 17,461 | — |
| Saudi Tadawul Group Holding Co. | 719 | 41,486 |
| Singapore Exchange Ltd. | 5,636 | 52,634 |
| TMX Group Ltd. | 1,828 | 56,281 |
| | | 1,624,498 |
| Food Distributors - 0.0%* |
| Bid Corp. Ltd. | 4,193 | 95,675 |
See Notes to Schedule of Investments and Notes to Financial Statements.
| State Street Total Return V.I.S. Fund | 53 |
State Street Total Return V.I.S. Fund
Schedule of Investments, continued — December 31, 2024
| | Number
of Shares | Fair
Value |
| CP Axtra PCL | 38,142 | $30,484 |
| | | 126,159 |
| Food Retail - 0.2% |
| Alimentation Couche-Tard, Inc. | 4,884 | 270,722 |
| Avenue Supermarts Ltd. (a)(d) | 1,963 | 81,668 |
| BIM Birlesik Magazalar AS | 6,661 | 99,556 |
| Coles Group Ltd. | 8,822 | 103,180 |
| CP ALL PCL NVDR | 82,277 | 134,131 |
| Dino Polska SA (a)(d) | 680 | 64,171 |
| Empire Co. Ltd., Class A | 828 | 25,268 |
| Endeavour Group Ltd. | 10,019 | 26,054 |
| George Weston Ltd. | 388 | 60,307 |
| Grupo Comercial Chedraui SA de CV | 5,400 | 32,541 |
| J Sainsbury PLC | 10,976 | 37,610 |
| Jeronimo Martins SGPS SA | 1,860 | 35,535 |
| Kesko OYJ, Class B | 1,691 | 31,894 |
| Kobe Bussan Co. Ltd. | 900 | 19,697 |
| Koninklijke Ahold Delhaize NV | 6,145 | 200,376 |
| Loblaw Cos. Ltd. | 1,000 | 131,532 |
| Marks & Spencer Group PLC | 13,499 | 63,483 |
| Metro, Inc. | 1,415 | 88,696 |
| President Chain Store Corp. | 6,000 | 48,132 |
| Seven & i Holdings Co. Ltd. | 14,251 | 223,685 |
| Shoprite Holdings Ltd. | 7,041 | 109,887 |
| Sumber Alfaria Trijaya Tbk. PT | 242,800 | 42,993 |
| Tesco PLC | 44,054 | 203,203 |
| Woolworths Group Ltd. | 7,837 | 147,946 |
| | | 2,282,267 |
| Footwear - 0.0%* |
| Asics Corp. | 4,500 | 87,888 |
| Birkenstock Holding PLC (a) | 400 | 22,664 |
| Feng TAY Enterprise Co. Ltd. | 9,600 | 38,945 |
| Pou Chen Corp. | 32,000 | 36,017 |
| Puma SE | 649 | 29,832 |
| | | 215,346 |
| Forest Products - 0.0%* |
| Svenska Cellulosa AB SCA, Class B | 3,992 | 50,700 |
| West Fraser Timber Co. Ltd. | 340 | 29,444 |
| | | 80,144 |
| Gas Utilities - 0.1% |
| AltaGas Ltd. | 1,960 | 45,627 |
| APA Group | 7,256 | 31,313 |
| | Number
of Shares | Fair
Value |
| Beijing Enterprises Holdings Ltd. | 6,500 | $22,342 |
| Brookfield Infrastructure Corp., Class A | 3,171 | 126,872 |
| China Gas Holdings Ltd. | 43,000 | 37,476 |
| China Resources Gas Group Ltd. | 13,600 | 53,836 |
| ENN Energy Holdings Ltd. | 11,400 | 81,964 |
| ENN Natural Gas Co. Ltd., Class A | 5,300 | 15,651 |
| GAIL India Ltd. | 32,533 | 72,572 |
| Hong Kong & China Gas Co. Ltd. | 73,650 | 58,879 |
| Kunlun Energy Co. Ltd. | 56,000 | 60,556 |
| Osaka Gas Co. Ltd. | 2,400 | 52,554 |
| Petronas Gas Bhd. | 10,349 | 40,919 |
| Snam SpA | 13,272 | 58,812 |
| Tokyo Gas Co. Ltd. | 2,100 | 58,252 |
| | | 817,625 |
| Gold - 0.2% |
| Agnico Eagle Mines Ltd. | 3,244 | 253,664 |
| Anglogold Ashanti PLC | 6,510 | 145,242 |
| Barrick Gold Corp. | 11,265 | 174,591 |
| Caledonia Mining Corp. PLC | 465 | 4,376 |
| Cia de Minas Buenaventura SAA ADR | 2,800 | 32,256 |
| Endeavour Mining PLC | 1,117 | 19,935 |
| Franco-Nevada Corp. | 1,234 | 144,936 |
| Gold Fields Ltd. | 11,410 | 149,412 |
| Harmony Gold Mining Co. Ltd. | 8,044 | 64,233 |
| i-80 Gold Corp. (a) | 10,158 | 4,927 |
| Kinross Gold Corp. | 8,121 | 75,383 |
| Northern Star Resources Ltd. | 7,593 | 72,587 |
| Novagold Resources, Inc. (a) | 6,292 | 20,952 |
| Polyus PJSC GDR (a)(e)** | 977 | — |
| Polyus PJSC (a)(e)** | 122 | — |
| Shandong Gold Mining Co. Ltd., Class H (d) | 14,250 | 23,041 |
| SSR Mining, Inc. (a) | 5,287 | 36,797 |
| Wheaton Precious Metals Corp. | 2,914 | 163,935 |
| Zhaojin Mining Industry Co. Ltd., Class H | 18,000 | 25,397 |
| Zhongjin Gold Corp. Ltd., Class A | 4,900 | 8,029 |
| Zijin Mining Group Co. Ltd., Class A | 22,900 | 47,163 |
See Notes to Schedule of Investments and Notes to Financial Statements.
| 54 | State Street Total Return V.I.S. Fund |
State Street Total Return V.I.S. Fund
Schedule of Investments, continued — December 31, 2024
| | Number
of Shares | Fair
Value |
| Zijin Mining Group Co. Ltd., Class H | 67,119 | $122,177 |
| | | 1,589,033 |
| Healthcare Distributors - 0.0%* |
| Amplifon SpA | 759 | 19,551 |
| Guangzhou Baiyunshan Pharmaceutical Holdings Co. Ltd., Class A | 900 | 3,484 |
| Huadong Medicine Co. Ltd., Class A | 1,700 | 8,012 |
| Shanghai Pharmaceuticals Holding Co. Ltd., Class A | 1,700 | 4,863 |
| Shanghai Pharmaceuticals Holding Co. Ltd., Class H | 9,000 | 14,622 |
| Sinopharm Group Co. Ltd., Class H | 18,400 | 50,453 |
| | | 100,985 |
| Healthcare Equipment - 0.1% |
| BioMerieux | 255 | 27,329 |
| Carl Zeiss Meditec AG | 239 | 11,185 |
| Cochlear Ltd. | 431 | 77,356 |
| Demant AS (a) | 609 | 22,407 |
| DiaSorin SpA | 120 | 12,373 |
| Fisher & Paykel Healthcare Corp. Ltd. | 3,870 | 83,258 |
| Getinge AB, Class B | 1,408 | 23,127 |
| Jiangsu Yuyue Medical Equipment & Supply Co. Ltd., Class A | 600 | 2,982 |
| Koninklijke Philips NV (a) | 5,259 | 132,875 |
| Olympus Corp. | 7,800 | 116,593 |
| Shanghai United Imaging Healthcare Co. Ltd., Class A | 832 | 14,325 |
| Shenzhen Mindray Bio-Medical Electronics Co. Ltd., Class A | 1,100 | 38,207 |
| Siemens Healthineers AG (d) | 1,856 | 97,976 |
| Smith & Nephew PLC | 5,755 | 71,456 |
| Sonova Holding AG | 334 | 109,378 |
| Straumann Holding AG | 738 | 93,093 |
| Sysmex Corp. | 3,300 | 60,576 |
| Terumo Corp. | 8,600 | 166,225 |
| | | 1,160,721 |
| Healthcare Facilities - 0.1% |
| Aier Eye Hospital Group Co. Ltd., Class A | 10,282 | 18,557 |
| Apollo Hospitals Enterprise Ltd. | 1,378 | 117,439 |
| | Number
of Shares | Fair
Value |
| Bangkok Dusit Medical Services PCL NVDR | 115,920 | $83,203 |
| Bumrungrad Hospital PCL NVDR | 8,260 | 48,223 |
| Dallah Healthcare Co. | 522 | 20,839 |
| Dr. Sulaiman Al Habib Medical Services Group Co. | 1,211 | 90,372 |
| IHH Healthcare Bhd. | 22,100 | 36,079 |
| Max Healthcare Institute Ltd. | 11,058 | 145,713 |
| Mouwasat Medical Services Co. | 1,444 | 32,705 |
| Ramsay Health Care Ltd. | 1,221 | 26,112 |
| Rede D'Or Sao Luiz SA (d) | 13,200 | 54,314 |
| | | 673,556 |
| Healthcare Services - 0.0%* |
| Fresenius Medical Care AG | 1,352 | 61,537 |
| Fresenius SE & Co. KGaA (a) | 2,780 | 96,464 |
| Nano-X Imaging Ltd. (a) | 1,523 | 10,965 |
| Sonic Healthcare Ltd. | 3,004 | 50,237 |
| | | 219,203 |
| Healthcare Supplies - 0.1% |
| Coloplast AS, Class B | 830 | 90,906 |
| EssilorLuxottica SA | 1,918 | 467,923 |
| HLB, Inc. (a) | 1,676 | 82,283 |
| Hoya Corp. | 2,200 | 273,355 |
| Shandong Weigao Group Medical Polymer Co. Ltd., Class H | 36,400 | 21,555 |
| Shenzhen New Industries Biomedical Engineering Co. Ltd., Class A | 800 | 7,721 |
| | | 943,743 |
| Healthcare Technology - 0.0%* |
| M3, Inc. | 2,700 | 23,423 |
| Pro Medicus Ltd. | 376 | 58,228 |
| | | 81,651 |
| Heavy Electrical Equipment - 0.1% |
| ABB India Ltd. | 766 | 61,845 |
| Bharat Heavy Electricals Ltd. | 15,462 | 41,430 |
| Dongfang Electric Corp. Ltd., Class A | 4,000 | 8,658 |
| Doosan Enerbility Co. Ltd. (a) | 6,533 | 76,808 |
| Goldwind Science & Technology Co. Ltd., Class A | 2,800 | 3,940 |
| HD Hyundai Electric Co. Ltd. | 373 | 95,901 |
See Notes to Schedule of Investments and Notes to Financial Statements.
| State Street Total Return V.I.S. Fund | 55 |
State Street Total Return V.I.S. Fund
Schedule of Investments, continued — December 31, 2024
| | Number
of Shares | Fair
Value |
| Mitsubishi Electric Corp. | 12,200 | $206,248 |
| NARI Technology Co. Ltd., Class A | 6,355 | 21,831 |
| Shanghai Electric Group Co. Ltd., Class A (a) | 15,400 | 17,012 |
| Siemens Energy AG (a) | 4,113 | 218,210 |
| Suzlon Energy Ltd. (a) | 121,840 | 88,547 |
| Vestas Wind Systems AS (a) | 6,640 | 91,050 |
| | | 931,480 |
| Highways & Railtracks - 0.0%* |
| Bangkok Expressway & Metro PCL NVDR | 86,474 | 17,965 |
| CCR SA | 12,700 | 20,907 |
| Getlink SE | 1,990 | 31,744 |
| Jiangsu Expressway Co. Ltd., Class H | 26,000 | 28,718 |
| Promotora y Operadora de Infraestructura SAB de CV | 3,155 | 26,801 |
| Taiwan High Speed Rail Corp. | 28,000 | 23,743 |
| Transurban Group | 19,923 | 165,170 |
| Zhejiang Expressway Co. Ltd., Class H | 22,080 | 15,889 |
| | | 330,937 |
| Home Building - 0.0%* |
| Barratt Redrow PLC | 9,072 | 50,003 |
| Berkeley Group Holdings PLC | 677 | 33,067 |
| Persimmon PLC | 1,811 | 27,172 |
| Sekisui House Ltd. | 3,958 | 94,486 |
| Taylor Wimpey PLC | 20,099 | 30,735 |
| | | 235,463 |
| Home Furnishing Retail - 0.0%* |
| Nitori Holdings Co. Ltd. | 500 | 59,316 |
| Home Furnishings - 0.0%* |
| Nien Made Enterprise Co. Ltd. | 2,000 | 22,358 |
| Oppein Home Group, Inc., Class A | 500 | 4,695 |
| | | 27,053 |
| Home Improvement Retail - 0.0%* |
| Home Product Center PCL NVDR | 95,609 | 26,191 |
| Kingfisher PLC | 10,443 | 32,527 |
| Mr. DIY Group M Bhd. (d) | 42,900 | 17,749 |
| | | 76,467 |
| | Number
of Shares | Fair
Value |
| Hotels, Resorts & Cruise Lines - 0.1% |
| Accor SA | 1,283 | $62,495 |
| Amadeus IT Group SA | 2,897 | 204,589 |
| Despegar.com Corp. (a) | 1,593 | 30,665 |
| H World Group Ltd. ADR | 2,900 | 95,787 |
| Hanjin Kal Corp. | 490 | 24,866 |
| Indian Hotels Co. Ltd. | 12,318 | 126,261 |
| InterContinental Hotels Group PLC | 1,048 | 130,648 |
| Minor International PCL NVDR | 47,077 | 35,744 |
| Tongcheng Travel Holdings Ltd. | 18,800 | 44,048 |
| TravelSky Technology Ltd., Class H | 10,000 | 13,388 |
| Trip.com Group Ltd. (a) | 8,450 | 587,414 |
| Whitbread PLC | 1,022 | 37,707 |
| | | 1,393,612 |
| Household Appliances - 0.0%* |
| Coway Co. Ltd. | 967 | 43,631 |
| Ecovacs Robotics Co. Ltd., Class A | 400 | 2,561 |
| Gree Electric Appliances, Inc. of Zhuhai, Class A | 4,100 | 25,382 |
| Haier Smart Home Co. Ltd., Class A | 5,200 | 20,165 |
| Haier Smart Home Co. Ltd., Class H | 35,200 | 124,615 |
| Hisense Home Appliances Group Co. Ltd., Class H | 2,000 | 6,321 |
| Midea Group Co. Ltd. (a) | 5,800 | 56,410 |
| Midea Group Co. Ltd., Class A | 3,100 | 31,762 |
| SEB SA | 147 | 13,319 |
| | | 324,166 |
| Household Products - 0.1% |
| Essity AB, Class B | 4,014 | 107,423 |
| Henkel AG & Co. KGaA | 684 | 52,696 |
| Kimberly-Clark de Mexico SAB de CV, Class A | 24,500 | 34,642 |
| Reckitt Benckiser Group PLC | 4,548 | 275,283 |
| Unicharm Corp. | 6,900 | 56,951 |
| Unilever Indonesia Tbk. PT | 125,600 | 14,720 |
| | | 541,715 |
| Human Resource & Employment Services - 0.1% |
| Adecco Group AG | 1,110 | 27,459 |
| Randstad NV | 669 | 28,202 |
| Recruit Holdings Co. Ltd. | 9,037 | 628,883 |
| | | 684,544 |
See Notes to Schedule of Investments and Notes to Financial Statements.
| 56 | State Street Total Return V.I.S. Fund |
State Street Total Return V.I.S. Fund
Schedule of Investments, continued — December 31, 2024
| | Number
of Shares | Fair
Value |
| Independent Power Producers & Energy Traders - 0.1% |
| ACWA Power Co. | 2,018 | $215,581 |
| Adani Power Ltd. (a) | 10,377 | 64,173 |
| CGN Power Co. Ltd., Class H (d) | 127,000 | 46,595 |
| China National Nuclear Power Co. Ltd., Class A | 16,500 | 23,441 |
| China Power International Development Ltd. | 66,000 | 26,934 |
| China Resources Power Holdings Co. Ltd. | 28,000 | 68,054 |
| GD Power Development Co. Ltd., Class A | 10,800 | 6,738 |
| Gulf Energy Development PCL NVDR | 37,215 | 64,691 |
| Huadian Power International Corp. Ltd., Class A | 16,100 | 12,303 |
| Huaneng Power International, Inc., Class A | 7,700 | 7,101 |
| Huaneng Power International, Inc., Class H | 62,000 | 34,161 |
| JSW Energy Ltd. | 5,376 | 40,354 |
| NTPC Ltd. | 60,654 | 236,165 |
| RWE AG | 4,161 | 124,220 |
| SDIC Power Holdings Co. Ltd., Class A | 5,600 | 12,678 |
| Shenzhen Energy Group Co. Ltd., Class A | 5,900 | 5,208 |
| Zhejiang Zheneng Electric Power Co. Ltd., Class A | 11,500 | 8,866 |
| | | 997,263 |
| Industrial Conglomerates - 0.3% |
| Alfa SAB de CV, Class A | 47,178 | 34,239 |
| Astra International Tbk. PT | 283,700 | 86,240 |
| Ayala Corp. | 3,680 | 37,915 |
| Bidvest Group Ltd. | 4,638 | 64,807 |
| Brookfield Business Corp., Class A | 726 | 17,613 |
| CITIC Ltd. | 92,000 | 109,079 |
| CK Hutchison Holdings Ltd. | 17,500 | 93,493 |
| DCC PLC | 655 | 42,165 |
| Far Eastern New Century Corp. | 37,000 | 35,663 |
| Fosun International Ltd. | 31,000 | 18,118 |
| Grupo Carso SAB de CV | 9,860 | 54,666 |
| GS Holdings Corp. (a) | 672 | 17,825 |
| Hikari Tsushin, Inc. | 100 | 21,731 |
| Hitachi Ltd. | 29,970 | 734,831 |
| Industries Qatar QSC | 20,836 | 75,939 |
| Investment AB Latour, Class B | 908 | 22,679 |
| | Number
of Shares | Fair
Value |
| Jardine Matheson Holdings Ltd. | 1,000 | $40,970 |
| JG Summit Holdings, Inc. | 46,990 | 16,609 |
| Keppel Ltd. | 9,600 | 48,134 |
| KOC Holding AS | 11,062 | 55,872 |
| LG Corp. | 1,326 | 64,249 |
| Lifco AB, Class B | 1,323 | 38,397 |
| Metlen Energy & Metals SA | 1,258 | 43,665 |
| Multiply Group PJSC (a) | 63,884 | 36,003 |
| Samsung C&T Corp. | 1,189 | 91,873 |
| Sekisui Chemical Co. Ltd. | 2,500 | 42,856 |
| Siemens AG | 4,909 | 956,905 |
| Siemens Ltd. | 1,080 | 82,451 |
| Sime Darby Bhd. | 56,158 | 29,639 |
| SK Square Co. Ltd. (a) | 1,412 | 74,155 |
| SK, Inc. | 522 | 46,336 |
| SM Investments Corp. | 3,230 | 49,889 |
| Smiths Group PLC | 2,268 | 48,827 |
| Sunway Bhd. | 31,900 | 34,172 |
| Swire Pacific Ltd., Class A | 2,500 | 22,673 |
| Turkiye Sise ve Cam Fabrikalari AS | 13,770 | 16,169 |
| | | 3,306,847 |
| Industrial Gases - 0.1% |
| Air Liquide SA | 3,733 | 606,577 |
| Nippon Sanso Holdings Corp. | 1,100 | 30,559 |
| | | 637,136 |
| Industrial Machinery & Supplies & Components - 0.2% |
| Airtac International Group | 2,364 | 60,858 |
| Alfa Laval AB | 1,904 | 79,797 |
| Atlas Copco AB, A Shares | 17,298 | 264,345 |
| Atlas Copco AB, B Shares | 10,263 | 138,847 |
| Daifuku Co. Ltd. | 2,000 | 41,138 |
| FANUC Corp. | 6,200 | 162,153 |
| GEA Group AG | 1,021 | 50,699 |
| Haitian International Holdings Ltd. | 9,655 | 26,226 |
| Hoshizaki Corp. | 700 | 27,556 |
| Indutrade AB | 1,554 | 38,990 |
| Jiangsu Hengli Hydraulic Co. Ltd., Class A | 900 | 6,469 |
| Kone OYJ, Class B | 2,237 | 109,017 |
| Luxfer Holdings PLC | 778 | 10,184 |
| Makita Corp. | 1,500 | 45,667 |
| Minebea Mitsumi, Inc. | 2,100 | 33,678 |
| Mitsubishi Heavy Industries Ltd. | 20,670 | 288,561 |
See Notes to Schedule of Investments and Notes to Financial Statements.
| State Street Total Return V.I.S. Fund | 57 |
State Street Total Return V.I.S. Fund
Schedule of Investments, continued — December 31, 2024
| | Number
of Shares | Fair
Value |
| Ningbo Deye Technology Co. Ltd., Class A | 504 | $5,822 |
| Rational AG | 32 | 27,399 |
| Sandvik AB | 7,018 | 126,009 |
| Schindler Holding AG | 423 | 116,495 |
| Shenzhen Inovance Technology Co. Ltd., Class A | 1,750 | 13,964 |
| SKF AB, Class B | 2,254 | 42,362 |
| SMC Corp. | 340 | 132,185 |
| Spirax Group PLC | 417 | 35,800 |
| Techtronic Industries Co. Ltd. | 9,000 | 118,757 |
| Thermax Ltd. | 458 | 21,611 |
| Trelleborg AB, B Shares | 1,402 | 48,041 |
| VAT Group AG (d) | 178 | 67,401 |
| Wartsila OYJ Abp | 3,310 | 58,642 |
| Yaskawa Electric Corp. | 1,400 | 35,770 |
| | | 2,234,443 |
| Industrial REITs - 0.0%* |
| CapitaLand Ascendas REIT | 24,600 | 46,344 |
| Goodman Group | 11,075 | 244,386 |
| Prologis Property Mexico SA de CV | 11,500 | 32,029 |
| Segro PLC | 8,489 | 74,549 |
| Warehouses De Pauw CVA | 1,103 | 21,701 |
| | | 419,009 |
| Insurance Brokers - 0.0%* |
| PB Fintech Ltd. (a) | 4,740 | 116,756 |
| Integrated Oil & Gas - 0.3% |
| Cenovus Energy, Inc. | 9,030 | 136,812 |
| China Petroleum & Chemical Corp., Class A | 37,300 | 33,939 |
| China Petroleum & Chemical Corp., Class H | 336,000 | 192,483 |
| Eni SpA | 15,133 | 206,924 |
| Equinor ASA | 5,514 | 131,087 |
| Galp Energia SGPS SA | 3,059 | 50,523 |
| Gazprom PJSC ADR (a)(e)** | 77,360 | — |
| Gazprom PJSC (a)(e)** | 56,590 | — |
| Guanghui Energy Co. Ltd., Class A | 8,300 | 7,609 |
| Imperial Oil Ltd. | 1,206 | 74,287 |
| LUKOIL PJSC (e)** | 7,480 | — |
| MOL Hungarian Oil & Gas PLC | 6,069 | 41,765 |
| Novatek PJSC GDR (a)(e)** | 1,641 | — |
| Oil & Natural Gas Corp. Ltd. | 41,898 | 117,085 |
| | Number
of Shares | Fair
Value |
| OMV AG | 974 | $37,761 |
| PetroChina Co. Ltd., Class A | 24,900 | 30,322 |
| PetroChina Co. Ltd., Class H | 282,000 | 221,811 |
| Petroleo Brasileiro SA | 52,600 | 335,548 |
| PTT PCL NVDR | 139,976 | 130,505 |
| Repsol SA | 8,005 | 96,900 |
| Rosneft Oil Co. PJSC (e)** | 20,586 | — |
| Saudi Arabian Oil Co. (d) | 79,290 | 591,921 |
| Suncor Energy, Inc. | 8,129 | 290,015 |
| Surgutneftegas PJSC ADR (a)(e)** | 9,978 | — |
| Surgutneftegas PJSC (e)** | 31,000 | — |
| TotalEnergies SE | 13,935 | 770,113 |
| | | 3,497,410 |
| Integrated Telecommunication Services - 0.3% |
| BCE, Inc. | 434 | 10,055 |
| BT Group PLC | 42,590 | 76,836 |
| Cellnex Telecom SA (a)(d) | 3,487 | 110,165 |
| China Tower Corp. Ltd., Class H (d) | 634,000 | 91,411 |
| Chunghwa Telecom Co. Ltd. | 49,071 | 184,852 |
| Deutsche Telekom AG | 22,537 | 675,050 |
| Elisa OYJ | 807 | 34,930 |
| Emirates Telecommunications Group Co. PJSC | 41,798 | 185,716 |
| Hellenic Telecommunications Organization SA | 2,621 | 40,385 |
| HKT Trust & HKT Ltd. | 23,815 | 29,432 |
| Indus Towers Ltd. (a) | 19,527 | 77,958 |
| Infrastrutture Wireless Italiane SpA (d) | 2,054 | 20,858 |
| Koninklijke KPN NV | 25,596 | 93,164 |
| LG Uplus Corp. | 2,052 | 14,348 |
| Nippon Telegraph & Telephone Corp. | 192,125 | 192,133 |
| Ooredoo QPSC | 12,728 | 40,376 |
| Operadora De Sites Mexicanos SAB de CV, Class A-1 | 26,500 | 15,791 |
| Orange SA | 12,256 | 122,190 |
| Quebecor, Inc., Class B | 966 | 21,158 |
| Saudi Telecom Co. | 27,738 | 295,289 |
| Singapore Telecommunications Ltd. | 48,900 | 110,403 |
| Swisscom AG | 170 | 94,750 |
| Tata Communications Ltd. | 1,426 | 28,372 |
| Telecom Italia SpA (a) | 59,083 | 15,095 |
| Telefonica Brasil SA | 5,487 | 41,540 |
| Telefonica SA | 26,124 | 106,501 |
See Notes to Schedule of Investments and Notes to Financial Statements.
| 58 | State Street Total Return V.I.S. Fund |
State Street Total Return V.I.S. Fund
Schedule of Investments, continued — December 31, 2024
| | Number
of Shares | Fair
Value |
| Telekom Malaysia Bhd. | 15,397 | $22,898 |
| Telenor ASA | 4,053 | 45,324 |
| Telia Co. AB | 15,528 | 43,217 |
| Telkom Indonesia Persero Tbk. PT | 702,300 | 117,555 |
| Telstra Group Ltd. | 26,617 | 66,084 |
| TELUS Corp. | 3,240 | 43,907 |
| True Corp. PCL NVDR (a) | 169,442 | 55,003 |
| | | 3,122,746 |
| Interactive Home Entertainment - 0.2% |
| 37 Interactive Entertainment Network Technology Group Co. Ltd., Class A | 3,000 | 6,391 |
| Capcom Co. Ltd. | 2,300 | 50,092 |
| CD Projekt SA | 649 | 30,098 |
| International Games System Co. Ltd. | 3,000 | 89,128 |
| Kingsoft Corp. Ltd. | 13,200 | 57,181 |
| Konami Group Corp. | 600 | 56,208 |
| Krafton, Inc. (a) | 417 | 87,872 |
| NCSoft Corp. | 236 | 29,142 |
| NetEase, Inc. | 26,670 | 475,174 |
| Netmarble Corp. (a)(d) | 252 | 8,762 |
| Nexon Co. Ltd. | 2,200 | 32,764 |
| Nintendo Co. Ltd. | 6,733 | 392,604 |
| Sea Ltd. ADR (a) | 2,400 | 254,640 |
| | | 1,570,056 |
| Interactive Media & Services - 0.6% |
| Auto Trader Group PLC (d) | 5,890 | 58,497 |
| Autohome, Inc. ADR | 1,200 | 31,140 |
| Baidu, Inc., Class A (a) | 31,250 | 332,697 |
| Bilibili, Inc., Class Z (a) | 3,180 | 58,131 |
| CAR Group Ltd. | 2,485 | 55,435 |
| Grindr, Inc. (a) | 668 | 11,917 |
| Info Edge India Ltd. | 1,031 | 104,496 |
| Kakao Corp. | 4,466 | 114,447 |
| Kanzhun Ltd. ADR (a) | 3,300 | 45,540 |
| Kuaishou Technology (a)(d) | 36,400 | 193,763 |
| LY Corp. | 18,796 | 49,757 |
| NAVER Corp. (a) | 1,885 | 251,515 |
| REA Group Ltd. | 348 | 50,270 |
| Scout24 SE (d) | 495 | 43,664 |
| SEEK Ltd. | 2,207 | 30,841 |
| Tencent Holdings Ltd. | 89,875 | 4,824,680 |
| VK IPJSC GDR (a)(e)** | 1,600 | — |
| | Number
of Shares | Fair
Value |
| Webtoon Entertainment, Inc. (a) | 450 | $6,111 |
| | | 6,262,901 |
| Internet Services & Infrastructure - 0.1% |
| Shopify, Inc., Class A (a) | 7,831 | 833,031 |
| Wix.com Ltd. (a) | 348 | 74,663 |
| | | 907,694 |
| Investment Banking & Brokerage - 0.1% |
| China Galaxy Securities Co. Ltd., Class A | 2,700 | 5,601 |
| China Galaxy Securities Co. Ltd., Class H | 58,500 | 53,394 |
| China International Capital Corp. Ltd., Class A | 1,200 | 5,507 |
| China International Capital Corp. Ltd., Class H (d) | 22,800 | 37,629 |
| China Merchants Securities Co. Ltd., Class A | 5,600 | 14,615 |
| CITIC Securities Co. Ltd., Class A | 10,590 | 42,077 |
| CITIC Securities Co. Ltd., Class H | 19,925 | 54,763 |
| CSC Financial Co. Ltd., Class A | 4,000 | 14,030 |
| Daiwa Securities Group, Inc. | 8,800 | 58,137 |
| Everbright Securities Co. Ltd., Class A | 3,600 | 8,881 |
| Founder Securities Co. Ltd., Class A | 17,500 | 19,856 |
| Futu Holdings Ltd. ADR | 400 | 31,996 |
| GF Securities Co. Ltd., Class A | 3,200 | 7,066 |
| Guosen Securities Co. Ltd., Class A | 6,800 | 10,374 |
| Guotai Junan Securities Co. Ltd., Class A | 4,100 | 10,415 |
| Haitong Securities Co. Ltd., Class A | 14,800 | 22,417 |
| Haitong Securities Co. Ltd., Class H | 16,000 | 14,109 |
| Huatai Securities Co. Ltd., Class A | 4,600 | 11,022 |
| Huatai Securities Co. Ltd., Class H (d) | 20,000 | 33,780 |
| Industrial Securities Co. Ltd., Class A | 7,500 | 6,395 |
| Korea Investment Holdings Co. Ltd. | 519 | 24,887 |
| NH Investment & Securities Co. Ltd. | 1,122 | 10,562 |
See Notes to Schedule of Investments and Notes to Financial Statements.
| State Street Total Return V.I.S. Fund | 59 |
State Street Total Return V.I.S. Fund
Schedule of Investments, continued — December 31, 2024
| | Number
of Shares | Fair
Value |
| Nomura Holdings, Inc. | 19,800 | $115,012 |
| Orient Securities Co. Ltd., Class A | 8,192 | 11,783 |
| SBI Holdings, Inc. | 1,800 | 45,262 |
| SDIC Capital Co. Ltd., Class A | 14,100 | 14,443 |
| Shenwan Hongyuan Group Co. Ltd., Class A | 13,700 | 9,984 |
| SooChow Securities Co. Ltd., Class A | 2,100 | 2,231 |
| XP, Inc., Class A | 7,600 | 90,060 |
| Zheshang Securities Co. Ltd., Class A | 5,400 | 9,003 |
| Zhongtai Securities Co. Ltd., Class A | 7,200 | 6,443 |
| | | 801,734 |
| IT Consulting & Other Services - 0.5% |
| Accenture PLC, Class A | 4,081 | 1,435,655 |
| Arabian Internet & Communications Services Co. | 348 | 25,007 |
| Bechtle AG | 495 | 15,870 |
| Capgemini SE | 1,022 | 167,367 |
| CGI, Inc. | 1,340 | 146,541 |
| Elm Co. | 350 | 103,862 |
| Fujitsu Ltd. | 10,600 | 186,425 |
| HCL Technologies Ltd. | 13,480 | 301,897 |
| Infosys Ltd. | 45,712 | 1,003,794 |
| LTIMindtree Ltd. (d) | 862 | 56,242 |
| Mphasis Ltd. | 1,316 | 43,765 |
| NEC Corp. | 1,640 | 140,512 |
| Nomura Research Institute Ltd. | 2,460 | 72,314 |
| NTT Data Group Corp. | 4,200 | 79,956 |
| Obic Co. Ltd. | 2,000 | 59,587 |
| Otsuka Corp. | 1,500 | 34,345 |
| Persistent Systems Ltd. | 1,508 | 113,746 |
| Posco DX Co. Ltd. | 441 | 5,614 |
| Samsung SDS Co. Ltd. | 570 | 49,049 |
| SCSK Corp. | 900 | 18,859 |
| Tata Consultancy Services Ltd. | 12,387 | 592,455 |
| Tech Mahindra Ltd. | 7,751 | 154,470 |
| TIS, Inc. | 1,300 | 30,742 |
| Wipro Ltd. | 38,140 | 134,471 |
| | | 4,972,545 |
| Leisure Facilities - 0.0%* |
| Oriental Land Co. Ltd. | 7,000 | 151,071 |
| | Number
of Shares | Fair
Value |
| Leisure Products - 0.0%* |
| Bandai Namco Holdings, Inc. | 3,900 | $93,106 |
| Shimano, Inc. | 452 | 60,873 |
| | | 153,979 |
| Life & Health Insurance - 0.4% |
| Aegon Ltd. | 8,887 | 52,638 |
| AIA Group Ltd. | 70,589 | 511,610 |
| Bupa Arabia for Cooperative Insurance Co. | 1,114 | 61,372 |
| Cathay Financial Holding Co. Ltd. | 133,529 | 278,181 |
| China Life Insurance Co. Ltd., Class A | 3,900 | 22,269 |
| China Life Insurance Co. Ltd., Class H | 95,000 | 179,533 |
| China Taiping Insurance Holdings Co. Ltd. | 13,200 | 19,746 |
| Co. for Cooperative Insurance | 876 | 34,411 |
| Dai-ichi Life Holdings, Inc. | 5,800 | 154,731 |
| Discovery Ltd. | 7,115 | 73,439 |
| Fubon Financial Holding Co. Ltd. | 111,087 | 305,972 |
| Great-West Lifeco, Inc. | 1,839 | 60,955 |
| HDFC Life Insurance Co. Ltd. (d) | 13,885 | 100,074 |
| iA Financial Corp., Inc. | 618 | 57,288 |
| ICICI Prudential Life Insurance Co. Ltd. (d) | 4,194 | 32,079 |
| Japan Post Holdings Co. Ltd. | 12,700 | 119,746 |
| Japan Post Insurance Co. Ltd. | 1,200 | 22,068 |
| KGI Financial Holding Co. Ltd. | 229,120 | 120,205 |
| Legal & General Group PLC | 38,815 | 111,710 |
| Manulife Financial Corp. | 11,338 | 348,134 |
| Medibank Pvt Ltd. | 18,126 | 42,534 |
| New China Life Insurance Co. Ltd., Class A | 1,600 | 10,832 |
| New China Life Insurance Co. Ltd., Class H | 13,500 | 41,015 |
| NN Group NV | 1,782 | 77,630 |
| Old Mutual Ltd. | 63,990 | 42,423 |
| Phoenix Group Holdings PLC | 4,329 | 27,650 |
| Ping An Insurance Group Co. of China Ltd., Class A | 9,300 | 66,695 |
| Ping An Insurance Group Co. of China Ltd., Class H | 90,500 | 536,503 |
| Poste Italiane SpA (d) | 3,019 | 42,683 |
| Power Corp. of Canada | 3,698 | 115,296 |
| Prudential PLC | 17,743 | 141,550 |
| Samsung Life Insurance Co. Ltd. | 1,137 | 72,758 |
See Notes to Schedule of Investments and Notes to Financial Statements.
| 60 | State Street Total Return V.I.S. Fund |
State Street Total Return V.I.S. Fund
Schedule of Investments, continued — December 31, 2024
| | Number
of Shares | Fair
Value |
| Sanlam Ltd. | 24,834 | $114,339 |
| SBI Life Insurance Co. Ltd. (d) | 6,439 | 104,572 |
| Shin Kong Financial Holding Co. Ltd. (a) | 191,931 | 69,081 |
| Sun Life Financial, Inc. | 3,801 | 225,570 |
| Swiss Life Holding AG | 184 | 142,264 |
| T&D Holdings, Inc. | 3,200 | 58,641 |
| | | 4,598,197 |
| Life Sciences Tools & Services - 0.1% |
| Bachem Holding AG | 203 | 13,001 |
| Divi's Laboratories Ltd. | 1,670 | 118,965 |
| Eurofins Scientific SE | 769 | 39,266 |
| Genscript Biotech Corp. (a) | 18,000 | 22,801 |
| Hangzhou Tigermed Consulting Co. Ltd., Class A | 500 | 3,720 |
| Lonza Group AG | 475 | 280,765 |
| Pharmaron Beijing Co. Ltd., Class A | 675 | 2,363 |
| Samsung Biologics Co. Ltd. (a)(d) | 263 | 168,522 |
| Sartorius Stedim Biotech | 193 | 37,712 |
| WuXi AppTec Co. Ltd., Class A | 3,420 | 25,640 |
| WuXi AppTec Co. Ltd., Class H (d) | 2,608 | 18,969 |
| Wuxi Biologics Cayman, Inc. (a)(d) | 56,500 | 127,722 |
| | | 859,446 |
| Managed Healthcare - 0.0%* |
| Hapvida Participacoes e Investimentos SA (a)(d) | 69,240 | 24,993 |
| Marine Ports & Services - 0.0%* |
| Adani Ports & Special Economic Zone Ltd. | 8,133 | 116,950 |
| China Merchants Port Holdings Co. Ltd. | 24,353 | 43,389 |
| International Container Terminal Services, Inc. | 14,340 | 95,691 |
| | | 256,030 |
| Marine Transportation - 0.1% |
| AP Moller - Maersk AS, Class A | 18 | 28,950 |
| AP Moller - Maersk AS, Class B | 30 | 49,896 |
| COSCO SHIPPING Holdings Co. Ltd., Class A | 6,010 | 12,689 |
| | Number
of Shares | Fair
Value |
| COSCO SHIPPING Holdings Co. Ltd., Class H | 39,182 | $64,564 |
| Costamare, Inc. | 1,236 | 15,883 |
| Evergreen Marine Corp. Taiwan Ltd. | 14,400 | 98,827 |
| Golden Ocean Group Ltd. | 3,190 | 28,582 |
| Himalaya Shipping Ltd. (a) | 872 | 4,238 |
| HMM Co. Ltd. | 3,879 | 46,336 |
| Kawasaki Kisen Kaisha Ltd. | 2,600 | 37,033 |
| Kuehne & Nagel International AG | 318 | 73,068 |
| MISC Bhd. | 16,775 | 28,512 |
| Mitsui OSK Lines Ltd. | 2,300 | 80,130 |
| Nippon Yusen KK | 2,700 | 89,971 |
| Orient Overseas International Ltd. | 1,500 | 22,226 |
| Safe Bulkers, Inc. | 1,605 | 5,730 |
| SITC International Holdings Co. Ltd. | 8,000 | 21,318 |
| Wan Hai Lines Ltd. | 7,670 | 18,974 |
| Yang Ming Marine Transport Corp. | 25,000 | 57,726 |
| | | 784,653 |
| Metal, Glass & Plastic Containers - 0.0%* |
| CCL Industries, Inc., Class B | 985 | 50,647 |
| Motorcycle Manufacturers - 0.0%* |
| Bajaj Auto Ltd. | 968 | 99,482 |
| Eicher Motors Ltd. | 1,957 | 110,221 |
| Hero MotoCorp Ltd. | 1,730 | 84,073 |
| TVS Motor Co. Ltd. | 3,418 | 94,559 |
| Yadea Group Holdings Ltd. (d) | 16,753 | 27,908 |
| Yamaha Motor Co. Ltd. | 6,100 | 53,809 |
| | | 470,052 |
| Movies & Entertainment - 0.0%* |
| Bollore SE | 4,375 | 26,910 |
| China Ruyi Holdings Ltd. (a) | 104,000 | 32,802 |
| CTS Eventim AG & Co. KGaA | 411 | 34,732 |
| HYBE Co. Ltd. (a) | 287 | 37,450 |
| Mango Excellent Media Co. Ltd., Class A | 1,600 | 5,860 |
| Tencent Music Entertainment Group ADR | 10,500 | 119,175 |
| Toho Co. Ltd. | 700 | 27,388 |
| Universal Music Group NV | 5,418 | 138,688 |
| | | 423,005 |
See Notes to Schedule of Investments and Notes to Financial Statements.
| State Street Total Return V.I.S. Fund | 61 |
State Street Total Return V.I.S. Fund
Schedule of Investments, continued — December 31, 2024
| | Number
of Shares | Fair
Value |
| Multi-Family Residential REITs - 0.0%* |
| Canadian Apartment Properties REIT | 494 | $14,643 |
| Multi-Line Insurance - 0.3% |
| Ageas SA | 1,052 | 51,090 |
| Al Rajhi Co. for Co-operative Insurance (a) | 595 | 27,174 |
| Allianz SE | 2,530 | 777,365 |
| ASR Nederland NV | 1,043 | 49,444 |
| Aviva PLC | 17,620 | 103,451 |
| AXA SA | 11,355 | 403,538 |
| Baloise Holding AG | 272 | 49,358 |
| BB Seguridade Participacoes SA | 9,403 | 55,068 |
| Caixa Seguridade Participacoes SA | 9,500 | 21,913 |
| China Pacific Insurance Group Co. Ltd., Class A | 7,800 | 36,208 |
| China Pacific Insurance Group Co. Ltd., Class H | 33,689 | 109,290 |
| Generali | 6,198 | 175,294 |
| Gjensidige Forsikring ASA | 1,212 | 21,450 |
| Helvetia Holding AG | 244 | 40,302 |
| Powszechny Zaklad Ubezpieczen SA | 8,155 | 90,577 |
| Talanx AG | 399 | 33,924 |
| Unipol Gruppo SpA | 2,597 | 32,422 |
| Zurich Insurance Group AG | 945 | 562,860 |
| | | 2,640,728 |
| Multi-Sector Holdings - 0.1% |
| Bajaj Holdings & Investment Ltd. | 380 | 52,760 |
| Eurazeo SE | 277 | 20,638 |
| EXOR NV | 655 | 60,059 |
| Groupe Bruxelles Lambert NV | 469 | 32,077 |
| Industrivarden AB, Class A | 743 | 23,517 |
| Industrivarden AB, Class C | 1,035 | 32,734 |
| Infratil Ltd. | 6,044 | 42,665 |
| Investor AB, Class B | 11,151 | 295,746 |
| L E Lundbergforetagen AB, Class B | 464 | 21,053 |
| Remgro Ltd. | 6,904 | 56,747 |
| Sofina SA | 94 | 21,258 |
| Washington H Soul Pattinson & Co. Ltd. | 1,544 | 32,713 |
| | | 691,967 |
| | Number
of Shares | Fair
Value |
| Multi-Utilities - 0.1% |
| Canadian Utilities Ltd., Class A | 805 | $19,506 |
| Centrica PLC | 33,939 | 56,787 |
| E.ON SE | 14,424 | 167,955 |
| Engie SA | 11,737 | 186,073 |
| National Grid PLC | 31,500 | 374,781 |
| Power & Water Utility Co. for Jubail & Yanbu | 1,409 | 20,550 |
| Qatar Electricity & Water Co. QSC | 5,469 | 23,582 |
| Sembcorp Industries Ltd. | 5,400 | 21,850 |
| Veolia Environnement SA | 4,631 | 130,003 |
| YTL Corp. Bhd. | 60,900 | 36,364 |
| YTL Power International Bhd. | 48,400 | 47,843 |
| | | 1,085,294 |
| Office REITs - 0.0%* |
| Gecina SA | 284 | 26,600 |
| Japan Real Estate Investment Corp. | 40 | 27,479 |
| Nippon Building Fund, Inc. | 50 | 38,941 |
| | | 93,020 |
| Office Services & Supplies - 0.0%* |
| Shanghai M&G Stationery, Inc., Class A | 1,000 | 4,120 |
| Oil & Gas Drilling - 0.0%* |
| Ades Holding Co. | 6,751 | 31,191 |
| ADNOC Drilling Co. PJSC | 51,427 | 74,626 |
| Borr Drilling Ltd. (a) | 6,264 | 24,430 |
| China Oilfield Services Ltd., Class H | 32,000 | 29,001 |
| Seadrill Ltd. (a) | 1,814 | 70,619 |
| | | 229,867 |
| Oil & Gas Equipment & Services - 0.0%* |
| TechnipFMC PLC | 2,900 | 83,926 |
| Yantai Jereh Oilfield Services Group Co. Ltd., Class A | 500 | 2,519 |
| | | 86,445 |
| Oil & Gas Exploration & Production - 0.1% |
| Aker BP ASA | 1,793 | 35,328 |
| ARC Resources Ltd. | 3,901 | 70,714 |
| BKV Corp. (a) | 380 | 9,036 |
| Canadian Natural Resources Ltd. | 13,631 | 420,626 |
| Inpex Corp. | 5,400 | 68,020 |
See Notes to Schedule of Investments and Notes to Financial Statements.
| 62 | State Street Total Return V.I.S. Fund |
State Street Total Return V.I.S. Fund
Schedule of Investments, continued — December 31, 2024
| | Number
of Shares | Fair
Value |
| Kosmos Energy Ltd. (a) | 12,309 | $42,097 |
| MEG Energy Corp. | 1,800 | 29,537 |
| Oil India Ltd. | 7,077 | 35,607 |
| PRIO SA (a) | 11,700 | 76,039 |
| PTT Exploration & Production PCL NVDR | 19,883 | 69,888 |
| Santos Ltd. | 21,459 | 88,753 |
| Tatneft PJSC ADR (a)(e)** | 3,383 | — |
| Tatneft PJSC (e)** | 4,926 | — |
| Tourmaline Oil Corp. | 2,322 | 107,398 |
| Woodside Energy Group Ltd. | 12,201 | 185,834 |
| | | 1,238,877 |
| Oil & Gas Refining & Marketing - 0.2% |
| Bharat Petroleum Corp. Ltd. | 22,274 | 76,086 |
| Cosan SA | 16,336 | 21,578 |
| ENEOS Holdings, Inc. | 18,000 | 94,542 |
| HD Hyundai Co. Ltd. | 512 | 27,453 |
| Hindustan Petroleum Corp. Ltd. | 11,341 | 54,146 |
| Idemitsu Kosan Co. Ltd. | 6,000 | 39,569 |
| Indian Oil Corp. Ltd. | 41,199 | 65,643 |
| Neste OYJ | 2,406 | 30,438 |
| ORLEN SA | 6,697 | 76,758 |
| Parkland Corp. | 850 | 19,214 |
| Petronas Dagangan Bhd. | 2,800 | 12,098 |
| Qatar Fuel QSC | 8,184 | 33,716 |
| Reliance Industries Ltd. | 83,269 | 1,182,162 |
| SK Innovation Co. Ltd. (a) | 835 | 63,123 |
| S-Oil Corp. | 695 | 25,952 |
| Thai Oil PCL NVDR | 14,308 | 11,912 |
| Turkiye Petrol Rafinerileri AS | 14,299 | 57,381 |
| | | 1,891,771 |
| Oil & Gas Storage & Transportation - 0.1% |
| Ardmore Shipping Corp. | 1,165 | 14,155 |
| China Merchants Energy Shipping Co. Ltd., Class A | 10,900 | 9,517 |
| COSCO SHIPPING Energy Transportation Co. Ltd., Class A | 3,600 | 5,688 |
| COSCO SHIPPING Energy Transportation Co. Ltd., Class H | 18,000 | 14,413 |
| Enbridge, Inc. | 14,054 | 596,186 |
| FLEX LNG Ltd. | 784 | 17,985 |
| Golar LNG Ltd. | 2,627 | 111,175 |
| Keyera Corp. | 1,508 | 46,093 |
| Pembina Pipeline Corp. | 3,819 | 141,028 |
| Petronet LNG Ltd. | 11,577 | 46,814 |
| | Number
of Shares | Fair
Value |
| Qatar Gas Transport Co. Ltd. | 42,816 | $48,790 |
| Scorpio Tankers, Inc. | 1,178 | 58,535 |
| SFL Corp. Ltd. | 3,109 | 31,774 |
| TC Energy Corp. | 6,685 | 311,381 |
| Teekay Corp. Ltd. | 1,617 | 11,206 |
| Teekay Tankers Ltd., Class A | 620 | 24,670 |
| Ultrapar Participacoes SA | 10,600 | 27,247 |
| | | 1,516,657 |
| Other Specialty Retail - 0.0%* |
| Avolta AG | 554 | 22,272 |
| China Tourism Group Duty Free Corp. Ltd., Class A | 2,100 | 19,168 |
| Chow Tai Fook Jewellery Group Ltd. | 28,400 | 24,605 |
| Jarir Marketing Co. | 9,820 | 33,087 |
| JD Sports Fashion PLC | 15,921 | 19,122 |
| Jumbo SA | 1,648 | 43,618 |
| Pop Mart International Group Ltd. (d) | 7,200 | 83,095 |
| | | 244,967 |
| Packaged Foods & Meats - 0.2% |
| Ajinomoto Co., Inc. | 3,010 | 122,684 |
| Almarai Co. JSC | 5,443 | 82,860 |
| Angel Yeast Co. Ltd., Class A | 500 | 2,455 |
| Associated British Foods PLC | 2,197 | 56,214 |
| Barry Callebaut AG | 20 | 26,667 |
| BRF SA | 3,800 | 15,599 |
| Britannia Industries Ltd. | 1,513 | 84,169 |
| Charoen Pokphand Foods PCL NVDR | 53,869 | 35,972 |
| China Feihe Ltd. (d) | 51,568 | 36,180 |
| China Huishan Dairy Holdings Co. Ltd. (a)(e)** | 55,000 | — |
| China Mengniu Dairy Co. Ltd. | 46,000 | 103,986 |
| Chocoladefabriken Lindt & Spruengli AG | 7 | 176,704 |
| CJ CheilJedang Corp. | 105 | 18,084 |
| Danone SA | 4,212 | 284,023 |
| Forafric Global PLC (a) | 183 | 1,876 |
| Foshan Haitian Flavouring & Food Co. Ltd., Class A | 3,984 | 24,908 |
| Gruma SAB de CV, Class B | 2,625 | 41,144 |
| Grupo Bimbo SAB de CV | 18,581 | 49,364 |
| Guangdong Haid Group Co. Ltd., Class A | 1,000 | 6,681 |
| Henan Shuanghui Investment & Development Co. Ltd., Class A | 3,185 | 11,262 |
See Notes to Schedule of Investments and Notes to Financial Statements.
| State Street Total Return V.I.S. Fund | 63 |
State Street Total Return V.I.S. Fund
Schedule of Investments, continued — December 31, 2024
| | Number
of Shares | Fair
Value |
| Indofood CBP Sukses Makmur Tbk. PT | 24,200 | $17,103 |
| Indofood Sukses Makmur Tbk. PT | 65,636 | 31,401 |
| Inner Mongolia Yili Industrial Group Co. Ltd., Class A | 7,700 | 31,654 |
| JDE Peet's NV | 728 | 12,461 |
| Kerry Group PLC, Class A | 1,021 | 98,588 |
| Kikkoman Corp. | 4,500 | 50,028 |
| Lotus Bakeries NV | 3 | 33,488 |
| Marico Ltd. | 7,274 | 54,334 |
| MEIJI Holdings Co. Ltd. | 1,500 | 30,552 |
| Mowi ASA | 3,063 | 52,615 |
| Muyuan Foods Co. Ltd., Class A | 4,720 | 24,714 |
| Nestle India Ltd. | 3,945 | 99,994 |
| Nestle Malaysia Bhd. | 939 | 20,995 |
| Nissin Foods Holdings Co. Ltd. | 1,300 | 31,443 |
| Orion Corp. | 377 | 26,042 |
| Orkla ASA | 4,629 | 40,138 |
| PPB Group Bhd. | 10,487 | 29,082 |
| QL Resources Bhd. | 20,382 | 21,697 |
| Salmar ASA | 399 | 19,008 |
| Saputo, Inc. | 1,679 | 29,174 |
| SunOpta, Inc. (a) | 2,347 | 18,072 |
| Tata Consumer Products Ltd. | 8,698 | 92,930 |
| Tingyi Cayman Islands Holding Corp. | 30,000 | 39,084 |
| Uni-President Enterprises Corp. | 66,000 | 162,863 |
| Universal Robina Corp. | 12,740 | 17,331 |
| Want Want China Holdings Ltd. | 71,000 | 41,679 |
| Wens Foodstuff Group Co. Ltd., Class A | 8,800 | 19,790 |
| WH Group Ltd. (d) | 54,666 | 42,295 |
| Yakult Honsha Co. Ltd. | 1,600 | 30,343 |
| Yihai Kerry Arawana Holdings Co. Ltd., Class A | 1,000 | 4,442 |
| | | 2,404,172 |
| Paper & Plastic Packaging Products & Materials - 0.0%* |
| Klabin SA | 12,320 | 46,266 |
| SIG Group AG | 1,732 | 34,296 |
| | | 80,562 |
| Paper Products - 0.0%* |
| Empresas CMPC SA | 13,235 | 20,772 |
| Holmen AB, Class B | 458 | 16,822 |
| | Number
of Shares | Fair
Value |
| Indah Kiat Pulp & Paper Tbk. PT | 24,100 | $10,156 |
| Mondi PLC | 2,512 | 37,501 |
| Stora Enso OYJ, R Shares | 3,309 | 33,291 |
| Suzano SA | 8,400 | 84,002 |
| UPM-Kymmene OYJ | 3,509 | 96,463 |
| | | 299,007 |
| Passenger Airlines - 0.1% |
| Air Canada (a) | 1,016 | 15,725 |
| Air China Ltd., Class A (a) | 12,700 | 13,683 |
| ANA Holdings, Inc. | 1,000 | 18,171 |
| China Airlines Ltd. | 34,000 | 26,601 |
| China Eastern Airlines Corp. Ltd., Class A (a) | 12,400 | 6,756 |
| China Southern Airlines Co. Ltd., Class A (a) | 11,600 | 10,255 |
| Deutsche Lufthansa AG | 3,645 | 23,417 |
| Eva Airways Corp. | 42,000 | 56,817 |
| InterGlobe Aviation Ltd. (a)(d) | 2,299 | 122,296 |
| Japan Airlines Co. Ltd. | 814 | 12,847 |
| Korean Air Lines Co. Ltd. | 2,121 | 32,272 |
| Latam Airlines Group SA | 2,068,675 | 28,552 |
| Pegasus Hava Tasimaciligi AS (a) | 3,348 | 20,167 |
| Qantas Airways Ltd. (a) | 5,124 | 28,458 |
| Singapore Airlines Ltd. | 9,800 | 46,263 |
| Spring Airlines Co. Ltd., Class A | 600 | 4,713 |
| Turk Hava Yollari AO (a) | 8,076 | 64,178 |
| | | 531,171 |
| Passenger Ground Transportation - 0.0%* |
| Grab Holdings Ltd., Class A (a) | 13,900 | 65,608 |
| Localiza Rent a Car SA | 13,201 | 68,806 |
| | | 134,414 |
| Personal Care Products - 0.2% |
| Amorepacific Corp. | 448 | 31,704 |
| Beiersdorf AG | 653 | 83,846 |
| Bloomage Biotechnology Corp. Ltd., Class A | 1,087 | 7,557 |
| Colgate-Palmolive India Ltd. | 1,723 | 53,949 |
| Dabur India Ltd. | 8,772 | 51,947 |
| Giant Biogene Holding Co. Ltd. (d) | 5,800 | 37,258 |
| Godrej Consumer Products Ltd. | 5,872 | 74,215 |
See Notes to Schedule of Investments and Notes to Financial Statements.
| 64 | State Street Total Return V.I.S. Fund |
State Street Total Return V.I.S. Fund
Schedule of Investments, continued — December 31, 2024
| | Number
of Shares | Fair
Value |
| Hengan International Group Co. Ltd. | 9,980 | $28,843 |
| Hindustan Unilever Ltd. | 10,564 | 287,113 |
| Kao Corp. | 3,100 | 125,578 |
| LG H&H Co. Ltd. | 123 | 25,300 |
| L'Oreal SA | 1,550 | 548,678 |
| Natura & Co. Holding SA | 12,300 | 25,405 |
| Shiseido Co. Ltd. | 2,300 | 40,719 |
| Unilever PLC | 16,035 | 913,340 |
| | | 2,335,452 |
| Pharmaceuticals - 0.8% |
| Alkem Laboratories Ltd. | 284 | 18,689 |
| Aspen Pharmacare Holdings Ltd. | 5,357 | 46,799 |
| Astellas Pharma, Inc. | 11,900 | 115,694 |
| AstraZeneca PLC | 10,018 | 1,313,372 |
| Asymchem Laboratories Tianjin Co. Ltd., Class A | 232 | 2,405 |
| Aurobindo Pharma Ltd. | 3,856 | 60,105 |
| Bayer AG | 6,296 | 125,720 |
| Beijing Tong Ren Tang Co. Ltd., Class A | 1,700 | 9,399 |
| Changchun High-Tech Industry Group Co. Ltd., Class A | 300 | 4,063 |
| China Resources Pharmaceutical Group Ltd. (d) | 17,000 | 12,474 |
| China Resources Sanjiu Medical & Pharmaceutical Co. Ltd., Class A | 2,080 | 12,562 |
| Chugai Pharmaceutical Co. Ltd. | 4,300 | 189,772 |
| Cipla Ltd. | 7,510 | 134,123 |
| CSPC Pharmaceutical Group Ltd. | 134,000 | 82,457 |
| Daiichi Sankyo Co. Ltd. | 11,314 | 309,952 |
| Dong-E-E-Jiao Co. Ltd., Class A | 400 | 3,417 |
| Dr. Reddy's Laboratories Ltd. | 8,275 | 134,206 |
| Eisai Co. Ltd. | 1,700 | 46,345 |
| Galderma Group AG (a) | 548 | 60,856 |
| Hanmi Pharm Co. Ltd. | 82 | 15,507 |
| Hansoh Pharmaceutical Group Co. Ltd. (d) | 18,000 | 40,041 |
| Hikma Pharmaceuticals PLC | 1,018 | 25,410 |
| Humanwell Healthcare Group Co. Ltd., Class A | 2,200 | 7,006 |
| Hypera SA | 6,200 | 18,155 |
| Ipsen SA | 232 | 26,594 |
| | Number
of Shares | Fair
Value |
| Jiangsu Hengrui Pharmaceuticals Co. Ltd., Class A | 6,820 | $42,640 |
| Kalbe Farma Tbk. PT | 246,000 | 20,787 |
| Kyowa Kirin Co. Ltd. | 1,700 | 25,595 |
| Lupin Ltd. | 3,040 | 83,647 |
| Mankind Pharma Ltd. (a) | 1,825 | 61,401 |
| MediWound Ltd. (a) | 198 | 3,524 |
| Merck KGaA | 851 | 123,798 |
| Novartis AG | 12,735 | 1,241,623 |
| Novo Nordisk AS, Class B | 20,819 | 1,795,703 |
| Ono Pharmaceutical Co. Ltd. | 2,500 | 26,059 |
| Orion OYJ, Class B | 669 | 29,636 |
| Otsuka Holdings Co. Ltd. | 2,900 | 157,945 |
| Recordati Industria Chimica e Farmaceutica SpA | 690 | 36,161 |
| Richter Gedeon Nyrt | 1,975 | 51,724 |
| Sandoz Group AG | 2,695 | 110,633 |
| Scilex Holding Co. (a) | 1,832 | 781 |
| Shanghai Fosun Pharmaceutical Group Co. Ltd., Class A | 1,500 | 5,077 |
| Shijiazhuang Yiling Pharmaceutical Co. Ltd., Class A | 3,300 | 7,196 |
| Shionogi & Co. Ltd. | 5,000 | 70,208 |
| Sino Biopharmaceutical Ltd. | 155,000 | 63,852 |
| SK Biopharmaceuticals Co. Ltd. (a) | 359 | 26,809 |
| Sun Pharmaceutical Industries Ltd. | 13,526 | 298,022 |
| Takeda Pharmaceutical Co. Ltd. | 10,211 | 270,627 |
| Teva Pharmaceutical Industries Ltd. ADR (a) | 7,500 | 165,300 |
| Torrent Pharmaceuticals Ltd. | 1,395 | 54,749 |
| UCB SA | 811 | 161,408 |
| Yuhan Corp. | 917 | 73,882 |
| Yunnan Baiyao Group Co. Ltd., Class A | 1,400 | 11,432 |
| Zhangzhou Pientzehuang Pharmaceutical Co. Ltd., Class A | 400 | 11,687 |
| Zhejiang Huahai Pharmaceutical Co. Ltd., Class A | 2,600 | 6,329 |
| Zydus Lifesciences Ltd. | 4,497 | 51,040 |
| | | 7,904,398 |
| Precious Metals & Minerals - 0.0%* |
| Alrosa PJSC (e)** | 46,308 | — |
See Notes to Schedule of Investments and Notes to Financial Statements.
| State Street Total Return V.I.S. Fund | 65 |
State Street Total Return V.I.S. Fund
Schedule of Investments, continued — December 31, 2024
| | Number
of Shares | Fair
Value |
| Anglo American Platinum Ltd. | 1,435 | $43,267 |
| Impala Platinum Holdings Ltd. (a) | 12,364 | 57,495 |
| Industrias Penoles SAB de CV (a) | 2,700 | 34,567 |
| Sibanye Stillwater Ltd. (a) | 38,119 | 30,261 |
| | | 165,590 |
| Property & Casualty Insurance - 0.2% |
| Admiral Group PLC | 1,714 | 56,757 |
| DB Insurance Co. Ltd. | 657 | 45,649 |
| Fairfax Financial Holdings Ltd. | 133 | 184,953 |
| Fidelis Insurance Holdings Ltd. | 1,357 | 24,602 |
| Hamilton Insurance Group Ltd., Class B (a) | 1,015 | 19,315 |
| ICICI Lombard General Insurance Co. Ltd. (d) | 3,503 | 73,148 |
| Insurance Australia Group Ltd. | 15,600 | 81,713 |
| Intact Financial Corp. | 1,147 | 208,736 |
| Kingsway Financial Services, Inc. (a) | 371 | 3,105 |
| MS&AD Insurance Group Holdings, Inc. | 8,300 | 179,470 |
| OUTsurance Group Ltd. | 11,429 | 40,277 |
| People's Insurance Co. Group of China Ltd., Class A | 10,900 | 11,314 |
| People's Insurance Co. Group of China Ltd., Class H | 142,000 | 70,745 |
| PICC Property & Casualty Co. Ltd., Class H | 98,000 | 154,671 |
| QBE Insurance Group Ltd. | 9,908 | 117,783 |
| Sampo OYJ, A Shares | 3,257 | 132,987 |
| Samsung Fire & Marine Insurance Co. Ltd. | 440 | 106,522 |
| Sompo Holdings, Inc. | 5,900 | 153,051 |
| Suncorp Group Ltd. | 8,374 | 98,562 |
| Tokio Marine Holdings, Inc. | 12,169 | 437,237 |
| Tryg AS | 2,231 | 47,046 |
| | | 2,247,643 |
| Publishing - 0.0%* |
| China Literature Ltd. (a)(d) | 4,000 | 12,976 |
| Saudi Research & Media Group (a) | 633 | 46,329 |
| | | 59,305 |
| Rail Transportation - 0.1% |
| Beijing-Shanghai High Speed Railway Co. Ltd., Class A | 33,600 | 28,193 |
| | Number
of Shares | Fair
Value |
| Canadian National Railway Co. | 3,449 | $350,056 |
| Canadian Pacific Kansas City Ltd. | 6,019 | 435,584 |
| Central Japan Railway Co. | 5,100 | 95,817 |
| Container Corp. of India Ltd. | 3,305 | 30,420 |
| Daqin Railway Co. Ltd., Class A | 12,900 | 11,913 |
| East Japan Railway Co. | 6,000 | 106,390 |
| Hankyu Hanshin Holdings, Inc. | 1,500 | 39,143 |
| MTR Corp. Ltd. | 9,614 | 33,540 |
| Rumo SA | 18,600 | 53,712 |
| Tokyu Corp. | 3,300 | 35,209 |
| West Japan Railway Co. | 2,900 | 51,425 |
| | | 1,271,402 |
| Real Estate Development - 0.1% |
| C&D International Investment Group Ltd. | 4,940 | 8,305 |
| China Merchants Shekou Industrial Zone Holdings Co. Ltd., Class A | 11,200 | 15,622 |
| China Overseas Land & Investment Ltd. | 53,000 | 84,604 |
| China Resources Land Ltd. | 45,500 | 132,084 |
| China Vanke Co. Ltd., Class A (a) | 12,500 | 12,361 |
| China Vanke Co. Ltd., Class H (a) | 26,700 | 18,183 |
| CK Asset Holdings Ltd. | 12,586 | 51,686 |
| Dar Al Arkan Real Estate Development Co. (a) | 8,773 | 35,256 |
| Emaar Properties PJSC | 94,081 | 329,138 |
| Godrej Properties Ltd. (a) | 1,691 | 55,038 |
| Henderson Land Development Co. Ltd. | 9,000 | 27,343 |
| Longfor Group Holdings Ltd. (d) | 27,837 | 35,836 |
| Macrotech Developers Ltd. (d) | 4,996 | 81,079 |
| Oberoi Realty Ltd. | 1,266 | 34,181 |
| Poly Developments & Holdings Group Co. Ltd., Class A | 14,400 | 17,379 |
| Prestige Estates Projects Ltd. | 3,115 | 61,635 |
| Ruentex Development Co. Ltd. | 26,550 | 34,742 |
| Sino Land Co. Ltd. | 23,480 | 23,728 |
| | | 1,058,200 |
See Notes to Schedule of Investments and Notes to Financial Statements.
| 66 | State Street Total Return V.I.S. Fund |
State Street Total Return V.I.S. Fund
Schedule of Investments, continued — December 31, 2024
| | Number
of Shares | Fair
Value |
| Real Estate Operating Companies - 0.1% |
| Azrieli Group Ltd. | 253 | $20,893 |
| CapitaLand Investment Ltd. | 13,200 | 25,351 |
| Central Pattana PCL NVDR | 28,273 | 47,176 |
| China Resources Mixc Lifestyle Services Ltd. (d) | 7,400 | 27,531 |
| Fastighets AB Balder, Class B (a) | 4,357 | 30,364 |
| Hongkong Land Holdings Ltd. | 6,700 | 29,815 |
| Hulic Co. Ltd. | 3,000 | 26,088 |
| LEG Immobilien SE | 423 | 35,866 |
| NEPI Rockcastle NV | 9,469 | 69,244 |
| Sagax AB, Class B | 1,448 | 29,755 |
| SM Prime Holdings, Inc. | 140,200 | 60,550 |
| Swiss Prime Site AG | 509 | 55,558 |
| Vonovia SE | 4,753 | 144,646 |
| Wharf Real Estate Investment Co. Ltd. | 10,000 | 25,567 |
| | | 628,404 |
| Real Estate Services - 0.0%* |
| FirstService Corp. | 267 | 48,341 |
| KE Holdings, Inc. ADR | 9,200 | 169,464 |
| Real Brokerage, Inc. (a) | 2,732 | 12,567 |
| | | 230,372 |
| Regional Banks - 0.1% |
| AU Small Finance Bank Ltd. (d) | 4,104 | 26,801 |
| Bank of Chengdu Co. Ltd., Class A | 2,100 | 4,894 |
| Bank of Hangzhou Co. Ltd., Class A | 5,547 | 11,039 |
| Bank of Jiangsu Co. Ltd., Class A | 21,100 | 28,223 |
| Bank of Nanjing Co. Ltd., Class A | 8,300 | 12,041 |
| Bank of Ningbo Co. Ltd., Class A | 3,556 | 11,775 |
| Banque Cantonale Vaudoise | 181 | 16,690 |
| Chiba Bank Ltd. | 3,200 | 24,694 |
| Concordia Financial Group Ltd. | 6,900 | 37,991 |
| Dukhan Bank | 19,912 | 20,207 |
| First BanCorp | 4,294 | 79,826 |
| OFG Bancorp | 1,213 | 51,334 |
| Popular, Inc. | 552 | 51,921 |
| Resona Holdings, Inc. | 13,800 | 99,598 |
| Shizuoka Financial Group, Inc. | 2,700 | 21,923 |
| | | 498,957 |
| | Number
of Shares | Fair
Value |
| Reinsurance - 0.1% |
| Hannover Rueck SE | 397 | $99,383 |
| Muenchener Rueckversicherungs-Gesellschaft AG in Muenchen | 863 | 435,290 |
| RenaissanceRe Holdings Ltd. | 300 | 74,643 |
| SiriusPoint Ltd. (a) | 2,484 | 40,713 |
| | | 650,029 |
| Renewable Electricity - 0.0%* |
| Adani Green Energy Ltd. (a) | 2,392 | 29,077 |
| Brookfield Renewable Corp. | 1,519 | 42,015 |
| China Longyuan Power Group Corp. Ltd., Class H | 46,000 | 38,136 |
| China Three Gorges Renewables Group Co. Ltd., Class A | 25,500 | 15,179 |
| China Yangtze Power Co. Ltd., Class A | 20,600 | 82,916 |
| EDP Renovaveis SA | 1,928 | 20,044 |
| Engie Brasil Energia SA | 3,733 | 21,451 |
| Meridian Energy Ltd. | 8,264 | 27,363 |
| NHPC Ltd. | 46,387 | 43,719 |
| Orsted AS (a)(d) | 1,085 | 48,976 |
| Sichuan Chuantou Energy Co. Ltd., Class A | 7,500 | 17,622 |
| | | 386,498 |
| Research & Consulting Services - 0.1% |
| Bureau Veritas SA | 2,091 | 63,528 |
| Intertek Group PLC | 1,062 | 62,885 |
| RELX PLC | 12,025 | 546,531 |
| SGS SA | 998 | 100,260 |
| Thomson Reuters Corp. | 1,011 | 162,258 |
| Wolters Kluwer NV | 1,570 | 260,768 |
| | | 1,196,230 |
| Restaurants - 0.3% |
| Americana Restaurants International PLC - Foreign Co. | 42,922 | 25,825 |
| Compass Group PLC | 10,940 | 364,727 |
| Delivery Hero SE (a)(d) | 1,145 | 32,155 |
| Haidilao International Holding Ltd. (d) | 22,000 | 45,031 |
| Jollibee Foods Corp. | 5,580 | 25,877 |
| Jubilant Foodworks Ltd. | 6,468 | 54,251 |
| McDonald's Holdings Co. Japan Ltd. | 500 | 19,664 |
See Notes to Schedule of Investments and Notes to Financial Statements.
| State Street Total Return V.I.S. Fund | 67 |
State Street Total Return V.I.S. Fund
Schedule of Investments, continued — December 31, 2024
| | Number
of Shares | Fair
Value |
| Meituan, Class B (a)(d) | 68,407 | $1,335,918 |
| Restaurant Brands International, Inc. | 1,971 | 128,399 |
| Sodexo SA | 582 | 47,942 |
| Yum China Holdings, Inc. | 5,500 | 264,935 |
| Zensho Holdings Co. Ltd. | 600 | 34,020 |
| Zomato Ltd. (a) | 92,026 | 298,875 |
| | | 2,677,619 |
| Retail REITs - 0.0%* |
| CapitaLand Integrated Commercial Trust | 38,367 | 54,280 |
| Klepierre SA | 1,416 | 40,762 |
| Link REIT | 16,968 | 71,756 |
| Scentre Group | 34,237 | 72,709 |
| Unibail-Rodamco-Westfield (a) | 780 | 58,735 |
| Vicinity Ltd. | 25,452 | 33,093 |
| | | 331,335 |
| Security & Alarm Services - 0.0%* |
| Secom Co. Ltd. | 2,800 | 95,200 |
| Securitas AB, Class B | 3,237 | 40,075 |
| | | 135,275 |
| Semiconductor Materials & Equipment - 0.3% |
| Advanced Micro-Fabrication Equipment, Inc. China, Class A | 339 | 8,735 |
| Advantest Corp. | 4,900 | 278,936 |
| ASM International NV | 301 | 174,170 |
| ASML Holding NV | 2,583 | 1,815,317 |
| BE Semiconductor Industries NV | 507 | 69,457 |
| Disco Corp. | 626 | 166,259 |
| Flat Glass Group Co. Ltd., Class A | 1,700 | 4,559 |
| GCL Technology Holdings Ltd. (a) | 298,000 | 41,432 |
| Globalwafers Co. Ltd. | 4,000 | 46,546 |
| Hangzhou First Applied Material Co. Ltd., Class A | 1,920 | 3,871 |
| Hanmi Semiconductor Co. Ltd. | 631 | 34,590 |
| Kokusai Electric Corp. | 1,000 | 13,119 |
| Kulicke & Soffa Industries, Inc. | 1,428 | 66,631 |
| Lasertec Corp. | 538 | 50,494 |
| National Silicon Industry Group Co. Ltd., Class A | 5,161 | 13,230 |
| NAURA Technology Group Co. Ltd., Class A | 400 | 21,304 |
| SCREEN Holdings Co. Ltd. | 500 | 29,553 |
| | Number
of Shares | Fair
Value |
| Suzhou Maxwell Technologies Co. Ltd., Class A | 256 | $3,667 |
| TCL Zhonghuan Renewable Energy Technology Co. Ltd., Class A | 5,500 | 6,645 |
| Tokyo Electron Ltd. | 2,888 | 434,633 |
| Xinjiang Daqo New Energy Co. Ltd., Class A | 4,082 | 13,422 |
| Xinyi Solar Holdings Ltd. | 65,985 | 26,673 |
| Zhejiang Jingsheng Mechanical & Electrical Co. Ltd., Class A | 1,900 | 8,256 |
| | | 3,331,499 |
| Semiconductors - 1.4% |
| Alchip Technologies Ltd. | 1,000 | 100,047 |
| Allegro MicroSystems, Inc. (a) | 700 | 15,302 |
| ASE Technology Holding Co. Ltd. | 45,000 | 222,361 |
| Cambricon Technologies Corp. Ltd., Class A (a) | 348 | 31,190 |
| China Resources Microelectronics Ltd., Class A | 1,955 | 12,566 |
| eMemory Technology, Inc. | 1,000 | 102,335 |
| GigaDevice Semiconductor, Inc., Class A (a) | 560 | 8,147 |
| Global Unichip Corp. | 1,000 | 41,483 |
| Hangzhou Silan Microelectronics Co. Ltd., Class A (a) | 1,100 | 3,899 |
| Hua Hong Semiconductor Ltd. (d) | 10,000 | 27,871 |
| Hygon Information Technology Co. Ltd., Class A | 2,341 | 47,764 |
| Inari Amertron Bhd. | 56,500 | 38,665 |
| indie Semiconductor, Inc., Class A (a) | 4,234 | 17,148 |
| Infineon Technologies AG | 8,411 | 274,457 |
| Ingenic Semiconductor Co. Ltd., Class A | 600 | 5,574 |
| JA Solar Technology Co. Ltd., Class A | 4,268 | 7,994 |
| JCET Group Co. Ltd., Class A | 2,000 | 11,131 |
| Jentech Precision Industrial Co. Ltd. | 1,000 | 46,516 |
| Jinko Solar Co. Ltd., Class A | 15,683 | 15,189 |
| LONGi Green Energy Technology Co. Ltd., Class A | 7,836 | 16,768 |
| MediaTek, Inc. | 21,000 | 906,374 |
See Notes to Schedule of Investments and Notes to Financial Statements.
| 68 | State Street Total Return V.I.S. Fund |
State Street Total Return V.I.S. Fund
Schedule of Investments, continued — December 31, 2024
| | Number
of Shares | Fair
Value |
| Montage Technology Co. Ltd., Class A | 361 | $3,339 |
| Nanya Technology Corp. (a) | 15,000 | 13,383 |
| Novatek Microelectronics Corp. | 7,886 | 120,751 |
| Realtek Semiconductor Corp. | 7,040 | 121,970 |
| Renesas Electronics Corp. (a) | 11,100 | 140,636 |
| Sanan Optoelectronics Co. Ltd., Class A | 10,900 | 18,069 |
| SG Micro Corp., Class A | 195 | 2,172 |
| Silergy Corp. | 4,888 | 60,160 |
| SK Hynix, Inc. | 7,493 | 858,625 |
| STMicroelectronics NV | 4,498 | 113,065 |
| Taiwan Semiconductor Manufacturing Co. Ltd. | 341,557 | 11,199,615 |
| Tianshui Huatian Technology Co. Ltd., Class A | 700 | 1,107 |
| Tongwei Co. Ltd., Class A | 3,300 | 9,938 |
| Trina Solar Co. Ltd., Class A | 1,600 | 4,206 |
| Unigroup Guoxin Microelectronics Co. Ltd., Class A | 419 | 3,674 |
| United Microelectronics Corp. | 151,000 | 198,281 |
| Vanguard International Semiconductor Corp. | 12,366 | 37,681 |
| Will Semiconductor Co. Ltd. Shanghai, Class A | 1,840 | 26,168 |
| | | 14,885,621 |
| Silver - 0.0%* |
| Pan American Silver Corp. | 2,389 | 48,305 |
| Soft Drinks & Non-alcoholic Beverages - 0.1% |
| Arca Continental SAB de CV | 7,800 | 64,800 |
| Coca-Cola Europacific Partners PLC | 1,400 | 107,534 |
| Coca-Cola Femsa SAB de CV | 7,265 | 56,599 |
| Coca-Cola HBC AG | 1,430 | 48,928 |
| Coca-Cola Icecek AS | 13,728 | 23,274 |
| Eastroc Beverage Group Co. Ltd., Class A | 130 | 4,401 |
| Fomento Economico Mexicano SAB de CV | 22,800 | 194,855 |
| Nongfu Spring Co. Ltd., Class H (d) | 28,200 | 123,249 |
| Suntory Beverage & Food Ltd. | 900 | 28,628 |
| Varun Beverages Ltd. | 16,122 | 120,237 |
| | | 772,505 |
| Specialized Consumer Services - 0.0%* |
| OneSpaWorld Holdings Ltd. | 2,647 | 52,675 |
| | Number
of Shares | Fair
Value |
| Specialized Finance - 0.0%* |
| Banco Latinoamericano de Comercio Exterior SA | 723 | $25,717 |
| Chailease Holding Co. Ltd. | 22,938 | 79,062 |
| Far East Horizon Ltd. | 23,000 | 16,788 |
| Mitsubishi HC Capital, Inc. | 5,300 | 34,969 |
| Power Finance Corp. Ltd. | 21,365 | 111,924 |
| REC Ltd. | 19,055 | 111,440 |
| | | 379,900 |
| Specialty Chemicals - 0.2% |
| Akzo Nobel NV | 1,124 | 67,460 |
| Arcadium Lithium PLC (a) | 28,722 | 147,344 |
| Arkema SA | 316 | 24,067 |
| Asian Paints Ltd. | 5,483 | 146,105 |
| Clariant AG | 1,301 | 14,542 |
| Covestro AG (a) | 1,084 | 65,104 |
| Croda International PLC | 753 | 31,922 |
| DSM-Firmenich AG | 1,224 | 123,855 |
| EMS-Chemie Holding AG | 46 | 31,084 |
| Evonik Industries AG | 1,685 | 29,279 |
| Ganfeng Lithium Group Co. Ltd., Class A | 940 | 4,483 |
| Givaudan SA | 59 | 258,282 |
| Hoshine Silicon Industry Co. Ltd., Class A | 200 | 1,514 |
| Nippon Paint Holdings Co. Ltd. | 5,400 | 34,906 |
| Nitto Denko Corp. | 4,700 | 78,671 |
| Novonesis (Novozymes) B, Class B | 2,319 | 131,366 |
| Shanghai Putailai New Energy Technology Co. Ltd., Class A | 1,798 | 3,896 |
| Shenzhen Capchem Technology Co. Ltd., Class A | 180 | 918 |
| Shin-Etsu Chemical Co. Ltd. | 11,612 | 382,916 |
| Sika AG | 1,003 | 239,666 |
| Syensqo SA | 489 | 35,729 |
| Symrise AG | 874 | 93,200 |
| Tianqi Lithium Corp., Class A | 700 | 3,146 |
| Wanhua Chemical Group Co. Ltd., Class A | 3,300 | 32,072 |
| Zhejiang NHU Co. Ltd., Class A | 2,592 | 7,757 |
| | | 1,989,284 |
| Steel - 0.2% |
| APL Apollo Tubes Ltd. | 2,056 | 37,661 |
See Notes to Schedule of Investments and Notes to Financial Statements.
| State Street Total Return V.I.S. Fund | 69 |
State Street Total Return V.I.S. Fund
Schedule of Investments, continued — December 31, 2024
| | Number
of Shares | Fair
Value |
| ArcelorMittal SA | 3,087 | $71,700 |
| Baoshan Iron & Steel Co. Ltd., Class A | 26,900 | 25,649 |
| BlueScope Steel Ltd. | 2,489 | 28,803 |
| China Steel Corp. | 164,000 | 98,296 |
| Cia Siderurgica Nacional SA | 12,100 | 17,353 |
| Eregli Demir ve Celik Fabrikalari TAS | 44,106 | 30,435 |
| Fortescue Ltd. | 11,146 | 125,944 |
| Inner Mongolia BaoTou Steel Union Co. Ltd., Class A (a) | 42,400 | 10,742 |
| JFE Holdings, Inc. | 3,300 | 37,202 |
| Jindal Stainless Ltd. | 5,001 | 40,843 |
| Jindal Steel & Power Ltd. | 5,210 | 56,637 |
| JSW Steel Ltd. | 8,644 | 91,020 |
| Kumba Iron Ore Ltd. | 1,082 | 18,707 |
| Nippon Steel Corp. | 5,800 | 116,692 |
| NMDC Ltd. | 37,929 | 29,204 |
| Novolipetsk Steel PJSC GDR (a)(e)** | 2,290 | — |
| Novolipetsk Steel PJSC (e)** | 4,980 | — |
| Pangang Group Vanadium Titanium & Resources Co. Ltd., Class A (a) | 10,100 | 3,962 |
| POSCO Holdings, Inc. | 912 | 155,572 |
| Severstal PAO GDR (a)(e)** | 3,070 | — |
| Severstal PAO (e)** | 695 | — |
| Tata Steel Ltd. | 106,716 | 172,077 |
| Vale SA | 46,240 | 408,296 |
| | | 1,576,795 |
| Systems Software - 0.0%* |
| 360 Security Technology, Inc., Class A | 4,700 | 6,626 |
| Check Point Software Technologies Ltd. (a) | 579 | 108,099 |
| Oracle Corp. Japan | 237 | 22,709 |
| Tata Elxsi Ltd. | 550 | 43,663 |
| TOTVS SA | 9,138 | 39,568 |
| Trend Micro, Inc. | 800 | 43,181 |
| | | 263,846 |
| Technology Distributors - 0.0%* |
| Synnex Technology International Corp. | 21,178 | 45,735 |
| Unisplendour Corp. Ltd., Class A | 3,100 | 11,751 |
| WPG Holdings Ltd. | 25,938 | 54,116 |
| | | 111,602 |
| | Number
of Shares | Fair
Value |
| Technology Hardware, Storage & Peripherals - 0.5% |
| Acer, Inc. | 43,000 | $52,201 |
| Advantech Co. Ltd. | 6,599 | 69,745 |
| Asia Vital Components Co. Ltd. | 5,000 | 95,014 |
| Asustek Computer, Inc. | 10,053 | 188,890 |
| Brother Industries Ltd. | 1,400 | 23,710 |
| Canon, Inc. | 6,000 | 195,119 |
| Catcher Technology Co. Ltd. | 7,000 | 41,422 |
| Compal Electronics, Inc. | 62,225 | 71,460 |
| FUJIFILM Holdings Corp. | 7,145 | 148,001 |
| Gigabyte Technology Co. Ltd. | 7,000 | 58,183 |
| IEIT Systems Co. Ltd., Class A | 2,700 | 19,080 |
| Inventec Corp. | 39,249 | 59,979 |
| Lenovo Group Ltd. | 116,000 | 150,526 |
| Lite-On Technology Corp. | 28,693 | 87,082 |
| Logitech International SA | 1,001 | 82,747 |
| Micro-Star International Co. Ltd. | 10,000 | 55,972 |
| Ninestar Corp., Class A (a) | 1,200 | 4,605 |
| Pegatron Corp. | 29,251 | 81,995 |
| Quanta Computer, Inc. | 37,507 | 328,341 |
| Ricoh Co. Ltd. | 3,400 | 38,658 |
| Samsung Electronics Co. Ltd. | 65,725 | 2,345,515 |
| Seiko Epson Corp. | 1,800 | 32,516 |
| Shenzhen Transsion Holdings Co. Ltd., Class A | 725 | 9,382 |
| Wistron Corp. | 38,000 | 120,545 |
| Wiwynn Corp. | 1,000 | 79,916 |
| Xiaomi Corp., Class B (a)(d) | 211,800 | 940,673 |
| | | 5,381,277 |
| Textiles - 0.0%* |
| Eclat Textile Co. Ltd. | 3,000 | 46,577 |
| Tires & Rubber - 0.0%* |
| Balkrishna Industries Ltd. | 1,229 | 41,775 |
| Bridgestone Corp. | 3,796 | 127,746 |
| Cheng Shin Rubber Industry Co. Ltd. | 33,000 | 49,372 |
| Cie Generale des Etablissements Michelin SCA | 4,397 | 144,788 |
| Hankook Tire & Technology Co. Ltd. | 820 | 21,173 |
| MRF Ltd. | 38 | 57,983 |
| Sailun Group Co. Ltd., Class A | 2,300 | 4,489 |
See Notes to Schedule of Investments and Notes to Financial Statements.
| 70 | State Street Total Return V.I.S. Fund |
State Street Total Return V.I.S. Fund
Schedule of Investments, continued — December 31, 2024
| | Number
of Shares | Fair
Value |
| Shandong Linglong Tyre Co. Ltd., Class A | 1,500 | $3,686 |
| | | 451,012 |
| Tobacco - 0.1% |
| British American Tobacco PLC | 12,853 | 463,596 |
| Imperial Brands PLC | 5,280 | 168,822 |
| ITC Ltd. | 42,346 | 239,221 |
| Japan Tobacco, Inc. | 7,707 | 197,939 |
| KT&G Corp. | 1,445 | 104,558 |
| Smoore International Holdings Ltd. (d) | 32,000 | 54,789 |
| | | 1,228,925 |
| Trading Companies & Distributors - 0.2% |
| Adani Enterprises Ltd. | 2,302 | 67,991 |
| AddTech AB, Class B | 1,624 | 44,309 |
| AerCap Holdings NV | 1,266 | 121,156 |
| Ashtead Group PLC | 2,878 | 178,959 |
| Beijer Ref AB | 2,381 | 35,185 |
| BOC Aviation Ltd. (d) | 2,700 | 20,977 |
| Brenntag SE | 855 | 51,401 |
| Bunzl PLC | 2,211 | 91,268 |
| IMCD NV | 375 | 55,723 |
| ITOCHU Corp. | 7,709 | 379,532 |
| Marubeni Corp. | 9,400 | 141,247 |
| Mitsubishi Corp. | 21,546 | 352,945 |
| Mitsui & Co. Ltd. | 16,308 | 338,612 |
| MonotaRO Co. Ltd. | 1,500 | 25,521 |
| Posco International Corp. | 924 | 24,545 |
| Reece Ltd. | 1,380 | 19,122 |
| Rexel SA | 1,484 | 37,802 |
| SGH Ltd. | 1,259 | 35,943 |
| Sumitomo Corp. | 7,000 | 151,666 |
| Toromont Industries Ltd. | 539 | 42,589 |
| Toyota Tsusho Corp. | 4,200 | 74,362 |
| | | 2,290,855 |
| Transaction & Payment Processing Services - 0.1% |
| Adyen NV (a)(d) | 140 | 208,322 |
| Edenred SE | 1,424 | 46,817 |
| EVERTEC, Inc. | 1,703 | 58,805 |
| Nexi SpA (a)(d) | 3,615 | 20,115 |
| Pagseguro Digital Ltd., Class A (a) | 4,951 | 30,993 |
| StoneCo Ltd., Class A (a) | 11,089 | 88,379 |
| Wise PLC, Class A (a) | 4,045 | 54,003 |
| | | 507,434 |
| | Number
of Shares | Fair
Value |
| Water Utilities - 0.0%* |
| Beijing Enterprises Water Group Ltd. | 50,000 | $16,156 |
| Cia de Saneamento Basico do Estado de Sao Paulo SABESP | 5,800 | 83,087 |
| Guangdong Investment Ltd. | 48,000 | 41,463 |
| Severn Trent PLC | 1,778 | 55,847 |
| United Utilities Group PLC | 4,488 | 59,103 |
| | | 255,656 |
| Wireless Telecommunication Services - 0.3% |
| Advanced Info Service PCL NVDR | 16,772 | 140,722 |
| America Movil SAB de CV | 253,400 | 182,195 |
| Axiata Group Bhd. | 36,600 | 20,381 |
| Bharti Airtel Ltd. | 34,583 | 641,359 |
| CelcomDigi Bhd. | 44,700 | 36,188 |
| China United Network Communications Ltd., Class A | 33,400 | 24,158 |
| Etihad Etisalat Co. | 5,628 | 79,985 |
| Far EasTone Telecommunications Co. Ltd. | 25,000 | 68,172 |
| Intouch Holdings PCL NVDR | 5,700 | 16,173 |
| Intouch Holdings PCL | 6,833 | 19,440 |
| KDDI Corp. | 9,857 | 314,321 |
| Maxis Bhd. | 22,600 | 18,448 |
| Mobile Telecommunications Co. KSCP | 33,002 | 50,204 |
| Mobile Telecommunications Co. Saudi Arabia | 8,107 | 22,137 |
| Mobile TeleSystems PJSC (e)** | 3,970 | — |
| MTN Group Ltd. | 24,275 | 118,339 |
| PLDT, Inc. | 960 | 21,460 |
| Rogers Communications, Inc., Class B | 2,359 | 72,482 |
| SK Telecom Co. Ltd. | 1,020 | 38,222 |
| SoftBank Corp. | 184,100 | 232,670 |
| SoftBank Group Corp. | 6,115 | 349,858 |
| Taiwan Mobile Co. Ltd. | 24,946 | 86,363 |
| Tele2 AB, Class B | 3,537 | 34,972 |
| TIM SA | 11,600 | 27,189 |
| Turkcell Iletisim Hizmetleri AS | 18,445 | 48,407 |
| Vodacom Group Ltd. | 8,348 | 44,841 |
| Vodafone Group PLC | 146,232 | 125,085 |
| Vodafone Idea Ltd. (a) | 327,703 | 30,392 |
| | | 2,864,163 |
See Notes to Schedule of Investments and Notes to Financial Statements.
| State Street Total Return V.I.S. Fund | 71 |
State Street Total Return V.I.S. Fund
Schedule of Investments, continued — December 31, 2024
| | Number
of Shares | Fair
Value |
Total Common Stock
(Cost $212,965,904) | | 216,297,478 |
| Preferred Stock - 0.2% |
| Automobile Manufacturers - 0.0%* |
| Bayerische Motoren Werke AG 8.30% (b) | 362 | $27,110 |
| Dr. Ing hc F Porsche AG 3.96% (b)(d) | 750 | 45,434 |
| Hyundai Motor Co. 9.30% (b) | 452 | 47,432 |
| Hyundai Motor Co. 9.47% (b) | 349 | 35,819 |
| Porsche Automobil Holding SE 7.02% (b) | 867 | 32,658 |
| Volkswagen AG 10.17% (b) | 1,357 | 125,161 |
| | | 313,614 |
| Commodity Chemicals - 0.0%* |
| LG Chem Ltd. 2.24% (b) | 83 | 8,874 |
| Diversified Banks - 0.1% |
| Banco Bradesco SA 7.10% | 78,921 | 147,677 |
| Bancolombia SA 10.05% (b) | 6,273 | 50,092 |
| Itau Unibanco Holding SA 7.85% | 68,000 | 338,247 |
| Itausa SA 7.21% (b) | 76,977 | 110,023 |
| | | 646,039 |
| Diversified Capital Markets - 0.0%* |
| Banco BTG Pactual SA 4.10% (b) | 4 | 5 |
| Electric Utilities - 0.0%* |
| Centrais Eletricas Brasileiras SA 9.64% (b) | 2,800 | 17,150 |
| Cia Energetica de Minas Gerais 11.96% (b) | 26,707 | 48,029 |
| Cia Paranaense de Energia - Copel 4.64% (b) | 20,200 | 29,918 |
| | | 95,097 |
| Household Products - 0.0%* |
| Henkel AG & Co. KGaA 2.19% (b) | 1,114 | 97,705 |
| Integrated Oil & Gas - 0.1% |
| Petroleo Brasileiro SA 16.78% (b) | 59,700 | 349,730 |
| Surgutneftegas PJSC (e)** | 115,200 | — |
| | | 349,730 |
| | Number
of Shares | Fair
Value |
| Life Sciences Tools & Services - 0.0%* |
| Sartorius AG 0.35% (b) | 148 | $32,880 |
| Specialty Chemicals - 0.0%* |
| Sociedad Quimica y Minera de Chile SA 2.15% (b) | 2,053 | 75,457 |
| Steel - 0.0%* |
| Gerdau SA 4.32% (b) | 19,596 | 57,540 |
| Technology Hardware, Storage & Peripherals - 0.0%* |
| Samsung Electronics Co. Ltd. 3.27% | 11,742 | 348,760 |
Total Preferred Stock
(Cost $2,554,601) | | 2,025,701 |
| Warrant - 0.0% |
| Application Software - 0.0% |
| Constellation Software, Inc. (expiring 03/31/40) (a)(e)** | 238 | — |
Total Foreign Equity
(Cost $215,520,505) | | 218,323,179 |
| | Principal
Amount | |
| Bonds and Notes - 5.0% |
| U.S. Treasuries - 5.0% |
| U.S. Treasury Inflation-Indexed Bonds | | |
| 0.13% 02/15/51 - 02/15/52 | $1,221,044 | 667,173 |
| 0.25% 02/15/50 | 669,135 | 390,594 |
| 0.63% 02/15/43 | 679,600 | 498,073 |
| 0.75% 02/15/42 - 02/15/45 | 1,780,069 | 1,322,584 |
| 0.88% 02/15/47 | 575,357 | 416,404 |
| 1.00% 02/15/46 - 02/15/49 | 1,697,799 | 1,254,760 |
| 1.38% 02/15/44 | 812,634 | 676,359 |
| 1.50% 02/15/53 | 748,632 | 600,163 |
| 1.75% 01/15/28 | 791,028 | 785,713 |
| 2.00% 01/15/26 | 795,185 | 795,356 |
| 2.13% 02/15/40 - 02/15/54 | 1,773,274 | 1,685,264 |
| 2.38% 01/15/27 | 766,963 | 774,303 |
| 2.50% 01/15/29 | 588,080 | 598,854 |
| 3.38% 04/15/32 | 444,580 | 481,727 |
| 3.63% 04/15/28 | 741,608 | 778,659 |
| 3.88% 04/15/29 | 624,033 | 669,775 |
| U.S. Treasury Inflation-Indexed Notes | | |
| 0.13% 04/15/26 - 01/15/32 | 14,437,020 | 13,289,163 |
| 0.25% 07/15/29 | 1,258,690 | 1,166,378 |
| 0.38% 01/15/27 - 07/15/27 | 3,344,811 | 3,233,888 |
| 0.50% 01/15/28 | 1,433,242 | 1,370,957 |
See Notes to Schedule of Investments and Notes to Financial Statements.
| 72 | State Street Total Return V.I.S. Fund |
State Street Total Return V.I.S. Fund
Schedule of Investments, continued — December 31, 2024
| | Principal
Amount | Fair
Value |
| 0.63% 01/15/26 - 07/15/32 | $2,679,477 | $2,457,913 |
| 0.75% 07/15/28 | 1,521,575 | 1,462,168 |
| 0.88% 01/15/29 | 1,368,859 | 1,307,956 |
| 1.13% 01/15/33 | 1,986,900 | 1,829,035 |
| 1.25% 04/15/28 | 1,783,733 | 1,738,652 |
| 1.38% 07/15/33 | 2,021,497 | 1,892,390 |
| 1.63% 10/15/27 - 10/15/29 | 3,377,432 | 3,338,777 |
| 1.75% 01/15/34 | 2,146,180 | 2,058,991 |
| 1.88% 07/15/34 | 2,062,215 | 1,999,463 |
| 2.13% 04/15/29 | 1,811,405 | 1,814,589 |
| 2.38% 10/15/28 | 1,648,880 | 1,675,127 |
Total Bonds and Notes
(Cost $57,011,711) | | 53,031,208 |
| | Number
of Shares | |
| Exchange Traded & Mutual Funds - 25.5% |
| SPDR Bloomberg High Yield Bond ETF (g) | 1,076,703 | 102,792,835 |
| SPDR Portfolio Aggregate Bond ETF (g) | 6,657,752 | 166,377,223 |
Total Exchange Traded & Mutual Funds
(Cost $272,236,815) | | 269,170,058 |
Total Investments in Securities
(Cost $869,897,209) | | 968,586,397 |
| | Number
of Shares | Fair
Value |
| Short-Term Investments - 8.2% |
State Street Institutional U.S. Government Money Market Fund - Class G Shares 4.47% (g)(h)
(Cost $87,067,707) | 87,067,707 | $87,067,707 |
Total Investments
(Cost $956,964,916) | | 1,055,654,104 |
| Other Assets and Liabilities, net - 0.2% | | 2,549,127 |
| NET ASSETS - 100.0% | | $1,058,203,231 |
Other Information:
| The Fund had the following long futures contracts open at December 31, 2024: |
| Description | Expiration
Date | Number of
Contracts | Notional
Amount | Value | Unrealized
Appreciation
(Depreciation) |
| S&P/Toronto Stock Exchange 60 Index | March 2025 | 2 | $425,250 | $413,065 | $(12,185) |
| MSCI Emerging Markets Index Futures | March 2025 | 17 | 945,464 | 912,730 | (32,734) |
| MSCI EAFE Mini Index Futures | March 2025 | 27 | 3,168,023 | 3,061,125 | (106,898) |
| E-mini Russell 1000 Index Futures | March 2025 | 14 | 2,340,804 | 2,273,950 | (66,854) |
| E-mini Russell 2000 Index Futures | March 2025 | 4 | 481,771 | 449,960 | (31,811) |
| | | | | | $(250,482) |
During the year ended December 31, 2024, the average notional value related to long futures contracts was $10,566,389.
See Notes to Schedule of Investments and Notes to Financial Statements.
| State Street Total Return V.I.S. Fund | 73 |
State Street Total Return V.I.S. Fund
Schedule of Investments, continued — December 31, 2024
Notes to Schedule of Investments
The views expressed in this document reflect our judgment as of the publication date and are subject to change at any time without notice. The securities cited may not be representative of the Fund’s future investments and should not be construed as a recommendation to purchase or sell a particular security. See the Fund’s summary prospectus and statutory prospectus for complete descriptions of investment objectives, policies, risks and permissible investments.
| (a) | Non-income producing security. |
| (b) | At December 31, 2024, all or a portion of this security was pledged to cover collateral requirements for futures contracts. |
| (c) | State Street Corporation is the parent company of SSGA Funds Management, Inc., the Fund's investment adviser and administrator, and State Street Bank & Trust Co., the Fund’s sub-administrator, custodian and accounting agent. |
| (d) | Pursuant to Rule 144A of the Securities Act of 1933, as amended, these securities may be resold in transactions exempt from registration, normally to qualified institutional buyers. At December 31, 2024, these securities amounted to $7,002,052 or 0.66% of the net assets of the State Street Total Return V.I.S. Fund. These securities have been determined to be liquid using procedures established by the Fund's Board of Directors. |
| (e) | Security is fair valued by the Valuation Committee, in accordance with the procedures approved by the Fund's Board of Directors. Security value is determined based on level 3 inputs. |
| (f) | Reflects separate holdings of the issuer's common stock traded on different securities exchanges. |
| (g) | Sponsored by SSGA Funds Management, Inc., the Fund’s investment adviser and administrator, and an affiliate of State Street Bank & Trust Co., the Fund’s sub-administrator, custodian and accounting agent. |
| (h) | Coupon amount represents effective yield. |
| † | Percentages are based on net assets as of December 31, 2024. |
| * | Less than 0.05%. |
| ** | Amount is less than $0.50. |
| Abbreviations: |
| ADR - American Depositary Receipt |
| GDR - Global Depositary Receipt |
| NVDR - Non-Voting Depositary Receipt |
| REIT - Real Estate Investment Trust |
| SPDR - Standard and Poor's Depositary Receipt |
The following table presents the Fund’s investments measured at fair value on a recurring basis at December 31, 2024:
| Investments | Level 1 | | Level 2 | | Level 3 | | Total |
| Investments in Securities | | | | | | | |
| Domestic Equity | $424,167,093 | | $3,894,859 | | $0(a) | | $428,061,952 |
| Foreign Equity | 155,286,020 | | 63,037,159 | | 0(a) | | 218,323,179 |
| U.S. Treasuries | — | | 53,031,208 | | — | | 53,031,208 |
| Exchange Traded & Mutual Funds | 269,170,058 | | — | | — | | 269,170,058 |
| Short-Term Investments | 87,067,707 | | — | | — | | 87,067,707 |
| Total Investments in Securities | $935,690,878 | | $119,963,226 | | $— | | $1,055,654,104 |
| Other Financial Instruments | | | | | | | |
| Long Futures Contracts - Unrealized Depreciation | $(250,482) | | $— | | $— | | $(250,482) |
| Total Other Financial Instruments | $(250,482) | | $— | | $— | | $(250,482) |
| (a) | The Fund held Level 3 securities that were valued at $0 at December 31, 2024. |
See Notes to Schedule of Investments and Notes to Financial Statements.
| 74 | State Street Total Return V.I.S. Fund |
State Street Total Return V.I.S. Fund
Schedule of Investments, continued — December 31, 2024
The Fund was invested in the following countries/territories at December 31, 2024 (Unaudited):
| Country/Territory | Percentage (based on
Fair Value) |
| United States | 79.32% |
| China | 2.85% |
| Japan | 2.26% |
| Taiwan | 2.14% |
| India | 1.96% |
| Canada | 1.30% |
| United Kingdom | 1.13% |
| Republic of Korea | 0.92% |
| France | 0.91% |
| Germany | 0.91% |
| Australia | 0.73% |
| Switzerland | 0.62% |
| Brazil | 0.45% |
| Saudi Arabia | 0.42% |
| Sweden | 0.31% |
| South Africa | 0.29% |
| Denmark | 0.29% |
| Italy | 0.26% |
| Spain | 0.26% |
| Netherlands | 0.24% |
| Mexico | 0.20% |
| Ireland | 0.19% |
| Hong Kong | 0.19% |
| Singapore | 0.18% |
| Thailand | 0.17% |
| Malaysia | 0.15% |
| Indonesia | 0.15% |
| United Arab Emirates | 0.13% |
| Finland | 0.10% |
| Israel | 0.09% |
| Qatar | 0.08% |
| Poland | 0.08% |
| Belgium | 0.08% |
| Kuwait | 0.07% |
| Norway | 0.07% |
| Turkey | 0.07% |
| Country/Territory | Percentage (based on
Fair Value) |
| Philippines | 0.05% |
| Chile | 0.05% |
| Greece | 0.05% |
| New Zealand | 0.03% |
| Puerto Rico | 0.03% |
| Hungary | 0.02% |
| Austria | 0.02% |
| Peru | 0.02% |
| Luxembourg | 0.02% |
| Argentina | 0.02% |
| Czech Republic | 0.02% |
| Bermuda | 0.01% |
| Portugal | 0.01% |
| Cameroon | 0.01% |
| Colombia | 0.01% |
| UAE | 0.01% |
| Macau | 0.01% |
| Monaco | 0.01% |
| Romania | 0.01% |
| Zambia | 0.01% |
| Bahamas | 0.01% |
| Ghana | 0.00%*** |
| Egypt | 0.00%*** |
| Panama | 0.00%*** |
| Jordan | 0.00%*** |
| Guernsey | 0.00%*** |
| Burkina Faso | 0.00%*** |
| Cayman Islands | 0.00%*** |
| Isle Of Man | 0.00%*** |
| Malta | 0.00%*** |
| Gibraltar | 0.00%*** |
| Russian Federation | 0.00%*** |
| | 100.00% |
The Fund’s % share of investment in the various categories, based on Fair Value, is as follows at December 31, 2024 (Unaudited):
| Industry | Domestic | Foreign | Total |
| Exchange Traded Funds | 25.50% | 0.00% | 25.50% |
| Semiconductors | 3.39% | 1.41% | 4.80% |
| Diversified Banks | 0.97% | 3.25% | 4.22% |
| Technology Hardware, Storage & Peripherals | 2.35% | 0.54% | 2.89% |
| Interactive Media & Services | 2.11% | 0.59% | 2.70% |
| Systems Software | 2.53% | 0.03% | 2.56% |
| Pharmaceuticals | 1.35% | 0.75% | 2.10% |
| Broadline Retail | 1.31% | 0.57% | 1.88% |
| Application Software | 1.41% | 0.28% | 1.69% |
| Automobile Manufacturers | 0.79% | 0.54% | 1.33% |
See Notes to Schedule of Investments and Notes to Financial Statements.
| State Street Total Return V.I.S. Fund | 75 |
State Street Total Return V.I.S. Fund
Schedule of Investments, continued — December 31, 2024
| Industry | Domestic | Foreign | Total |
| Biotechnology | 1.19% | 0.12% | 1.31% |
| Aerospace & Defense | 0.71% | 0.30% | 1.01% |
| Integrated Oil & Gas | 0.64% | 0.36% | 1.00% |
| Healthcare Equipment | 0.83% | 0.11% | 0.94% |
| Transaction & Payment Processing Services | 0.87% | 0.05% | 0.92% |
| Regional Banks | 0.84% | 0.05% | 0.89% |
| Electric Utilities | 0.52% | 0.31% | 0.83% |
| Industrial Machinery & Supplies & Components | 0.49% | 0.21% | 0.70% |
| IT Consulting & Other Services | 0.22% | 0.47% | 0.69% |
| Restaurants | 0.42% | 0.25% | 0.67% |
| Property & Casualty Insurance | 0.44% | 0.21% | 0.65% |
| Asset Management & Custody Banks | 0.46% | 0.15% | 0.61% |
| Packaged Foods & Meats | 0.38% | 0.23% | 0.61% |
| Life & Health Insurance | 0.15% | 0.44% | 0.59% |
| Electrical Components & Equipment | 0.39% | 0.20% | 0.59% |
| Semiconductor Materials & Equipment | 0.27% | 0.32% | 0.59% |
| Consumer Staples Merchandise Retail | 0.56% | 0.03% | 0.59% |
| Multi-Sector Holdings | 0.52% | 0.07% | 0.59% |
| Movies & Entertainment | 0.54% | 0.04% | 0.58% |
| Trading Companies & Distributors | 0.30% | 0.22% | 0.52% |
| Financial Exchanges & Data | 0.37% | 0.15% | 0.52% |
| Integrated Telecommunication Services | 0.21% | 0.30% | 0.51% |
| Oil & Gas Exploration & Production | 0.38% | 0.12% | 0.50% |
| Investment Banking & Brokerage | 0.41% | 0.08% | 0.49% |
| Life Sciences Tools & Services | 0.40% | 0.08% | 0.48% |
| Specialty Chemicals | 0.25% | 0.20% | 0.45% |
| Hotels, Resorts & Cruise Lines | 0.32% | 0.13% | 0.45% |
| Industrial Conglomerates | 0.13% | 0.31% | 0.44% |
| Household Products | 0.37% | 0.06% | 0.43% |
| Apparel, Accessories & Luxury Goods | 0.09% | 0.34% | 0.43% |
| Soft Drinks & Non-alcoholic Beverages | 0.35% | 0.07% | 0.42% |
| Building Products | 0.31% | 0.10% | 0.41% |
| Construction Machinery & Heavy Transportation Equipment | 0.26% | 0.15% | 0.41% |
| Managed Healthcare | 0.41% | 0.00% | 0.41% |
| Communications Equipment | 0.34% | 0.06% | 0.40% |
| Construction & Engineering | 0.21% | 0.16% | 0.37% |
| Consumer Finance | 0.28% | 0.07% | 0.35% |
| Wireless Telecommunication Services | 0.08% | 0.27% | 0.35% |
| Home Improvement Retail | 0.33% | 0.01% | 0.34% |
| Oil & Gas Storage & Transportation | 0.19% | 0.14% | 0.33% |
| Multi-Utilities | 0.22% | 0.10% | 0.32% |
| Apparel Retail | 0.21% | 0.11% | 0.32% |
| Personal Care Products | 0.09% | 0.22% | 0.31% |
| Food Retail | 0.09% | 0.22% | 0.31% |
| Electronic Components | 0.11% | 0.19% | 0.30% |
| Research & Consulting Services | 0.19% | 0.11% | 0.30% |
| Diversified Metals & Mining | 0.01% | 0.29% | 0.30% |
| Tobacco | 0.18% | 0.12% | 0.30% |
| Oil & Gas Refining & Marketing | 0.11% | 0.18% | 0.29% |
| Multi-Line Insurance | 0.03% | 0.25% | 0.28% |
| Rail Transportation | 0.16% | 0.12% | 0.28% |
| Steel | 0.11% | 0.16% | 0.27% |
| Human Resource & Employment Services | 0.18% | 0.07% | 0.25% |
| Construction Materials | 0.16% | 0.09% | 0.25% |
See Notes to Schedule of Investments and Notes to Financial Statements.
| 76 | State Street Total Return V.I.S. Fund |
State Street Total Return V.I.S. Fund
Schedule of Investments, continued — December 31, 2024
| Industry | Domestic | Foreign | Total |
| Healthcare Services | 0.22% | 0.02% | 0.24% |
| Electronic Equipment & Instruments | 0.16% | 0.08% | 0.24% |
| Internet Services & Infrastructure | 0.14% | 0.09% | 0.23% |
| Healthcare Supplies | 0.13% | 0.09% | 0.22% |
| Retail REITs | 0.19% | 0.03% | 0.22% |
| Industrial Gases | 0.16% | 0.06% | 0.22% |
| Home Building | 0.20% | 0.02% | 0.22% |
| Air Freight & Logistics | 0.13% | 0.08% | 0.21% |
| Interactive Home Entertainment | 0.06% | 0.15% | 0.21% |
| Insurance Brokers | 0.20% | 0.01% | 0.21% |
| Commodity Chemicals | 0.07% | 0.12% | 0.19% |
| Gold | 0.04% | 0.15% | 0.19% |
| Oil & Gas Equipment & Services | 0.17% | 0.01% | 0.18% |
| Diversified Financial Services | 0.09% | 0.09% | 0.18% |
| Automotive Parts & Equipment | 0.08% | 0.10% | 0.18% |
| Automotive Retail | 0.16% | 0.02% | 0.18% |
| Electronic Manufacturing Services | 0.05% | 0.12% | 0.17% |
| Environmental & Facilities Services | 0.15% | 0.01% | 0.16% |
| Gas Utilities | 0.08% | 0.08% | 0.16% |
| Healthcare Facilities | 0.10% | 0.06% | 0.16% |
| Heavy Electrical Equipment | 0.07% | 0.09% | 0.16% |
| Passenger Airlines | 0.10% | 0.05% | 0.15% |
| Diversified Support Services | 0.11% | 0.04% | 0.15% |
| Industrial REITs | 0.11% | 0.04% | 0.15% |
| Health Care REITs | 0.15% | 0.00% | 0.15% |
| Distillers & Vintners | 0.03% | 0.11% | 0.14% |
| Independent Power Producers & Energy Traders | 0.04% | 0.09% | 0.13% |
| Cable & Satellite | 0.13% | 0.00% | 0.13% |
| Casinos & Gaming | 0.08% | 0.05% | 0.13% |
| Consumer Electronics | 0.02% | 0.11% | 0.13% |
| Diversified Capital Markets | 0.00% | 0.12% | 0.12% |
| Healthcare Distributors | 0.10% | 0.01% | 0.11% |
| Real Estate Services | 0.09% | 0.02% | 0.11% |
| Reinsurance | 0.05% | 0.06% | 0.11% |
| Footwear | 0.09% | 0.02% | 0.11% |
| Other Specialty Retail | 0.09% | 0.02% | 0.11% |
| Advertising | 0.07% | 0.04% | 0.11% |
| Coal & Consumable Fuels | 0.03% | 0.08% | 0.11% |
| Agricultural & Farm Machinery | 0.09% | 0.01% | 0.10% |
| Cargo Ground Transportation | 0.09% | 0.01% | 0.10% |
| Multi-Family Residential REITs | 0.10% | 0.00% | 0.10% |
| Brewers | 0.01% | 0.09% | 0.10% |
| Data Processing & Outsourced Services | 0.08% | 0.02% | 0.10% |
| Diversified Real Estate Activities | 0.01% | 0.09% | 0.10% |
| Real Estate Development | 0.00% | 0.10% | 0.10% |
| Telecom Tower REITs | 0.09% | 0.00% | 0.09% |
| Fertilizers & Agricultural Chemicals | 0.05% | 0.04% | 0.09% |
| Passenger Ground Transportation | 0.08% | 0.01% | 0.09% |
| Data Center REITs | 0.09% | 0.00% | 0.09% |
| Marine Transportation | 0.02% | 0.07% | 0.09% |
| Education Services | 0.07% | 0.02% | 0.09% |
| Mortgage REITs | 0.08% | 0.00% | 0.08% |
| Paper & Plastic Packaging Products & Materials | 0.07% | 0.01% | 0.08% |
| Office REITs | 0.07% | 0.01% | 0.08% |
See Notes to Schedule of Investments and Notes to Financial Statements.
| State Street Total Return V.I.S. Fund | 77 |
State Street Total Return V.I.S. Fund
Schedule of Investments, continued — December 31, 2024
| Industry | Domestic | Foreign | Total |
| Commercial & Residential Mortgage Finance | 0.08% | 0.00% | 0.08% |
| Copper | 0.03% | 0.04% | 0.07% |
| Other Specialized REITs | 0.07% | 0.00% | 0.07% |
| Diversified REITs | 0.05% | 0.02% | 0.07% |
| Water Utilities | 0.04% | 0.02% | 0.06% |
| Technology Distributors | 0.05% | 0.01% | 0.06% |
| Healthcare Technology | 0.05% | 0.01% | 0.06% |
| Hotel & Resort REITs | 0.06% | 0.00% | 0.06% |
| Food Distributors | 0.05% | 0.01% | 0.06% |
| Diversified Chemicals | 0.01% | 0.05% | 0.06% |
| Oil & Gas Drilling | 0.04% | 0.02% | 0.06% |
| Real Estate Operating Companies | 0.00% | 0.06% | 0.06% |
| Self Storage REITs | 0.05% | 0.00% | 0.05% |
| Alternative Carriers | 0.04% | 0.01% | 0.05% |
| Renewable Electricity | 0.01% | 0.04% | 0.05% |
| Household Appliances | 0.02% | 0.03% | 0.05% |
| Specialized Finance | 0.01% | 0.04% | 0.05% |
| Leisure Products | 0.04% | 0.01% | 0.05% |
| Tires & Rubber | 0.01% | 0.04% | 0.05% |
| Airport Services | 0.00% | 0.05% | 0.05% |
| Agricultural Products & Services | 0.03% | 0.01% | 0.04% |
| Metal, Glass & Plastic Containers | 0.04% | 0.00% | 0.04% |
| Aluminum | 0.01% | 0.03% | 0.04% |
| Single-Family Residential REITs | 0.04% | 0.00% | 0.04% |
| Paper Products | 0.01% | 0.03% | 0.04% |
| Security & Alarm Services | 0.03% | 0.01% | 0.04% |
| Specialized Consumer Services | 0.03% | 0.01% | 0.04% |
| Leisure Facilities | 0.03% | 0.01% | 0.04% |
| Motorcycle Manufacturers | 0.00% | 0.04% | 0.04% |
| Drug Retail | 0.01% | 0.02% | 0.03% |
| Broadcasting | 0.03% | 0.00% | 0.03% |
| Home Furnishing Retail | 0.02% | 0.01% | 0.03% |
| Publishing | 0.02% | 0.01% | 0.03% |
| Highways & Railtracks | 0.00% | 0.03% | 0.03% |
| Office Services & Supplies | 0.02% | 0.00% | 0.02% |
| Timber REITs | 0.02% | 0.00% | 0.02% |
| Computer & Electronics Retail | 0.02% | 0.00% | 0.02% |
| Home Furnishings | 0.02% | 0.00% | 0.02% |
| Distributors | 0.02% | 0.00% | 0.02% |
| Precious Metals & Minerals | 0.00% | 0.02% | 0.02% |
| Marine Ports & Services | 0.00% | 0.02% | 0.02% |
| Silver | 0.01% | 0.00% | 0.01% |
| Forest Products | 0.00% | 0.01% | 0.01% |
| Commercial Printing | 0.00% | 0.01% | 0.01% |
| Housewares & Specialties | 0.00% | 0.00% | 0.00%*** |
| Textiles | 0.00% | 0.00% | 0.00%*** |
| | | | 86.73% |
| Sector | Percentage (based
on Fair Value) |
| U.S. Treasuries | | | 5.02% |
| Sector | Percentage (based
on Fair Value) |
| Short-Term Investments | | | 8.25% |
| | | | 100.00% |
See Notes to Schedule of Investments and Notes to Financial Statements.
| 78 | State Street Total Return V.I.S. Fund |
State Street Total Return V.I.S. Fund
Schedule of Investments, continued — December 31, 2024
| | Number
of Shares
Held at
12/31/23 | Value at
12/31/23 | | Cost of
Purchases | | Proceeds
from
Shares
Sold | | Realized
Gain
(Loss) | | Change in
Unrealized
Appreciation
(Depreciation) | Number of
Shares
Held at
12/31/24 | Value at
12/31/24 | | Dividend
Income |
| SPDR Bloomberg High Yield Bond ETF | 426,678 | $40,419,207 | | $173,483,975 | | $110,323,298 | | $545,215 | | $(1,332,264) | 1,076,703 | $102,792,835 | | $5,820,816 |
| SPDR Bloomberg International Treasury Bond ETF | 1,184,244 | 27,450,776 | | 14,409,396 | | 40,748,644 | | 1,099,456 | | (2,210,984) | — | — | | 57,032 |
| SPDR Gold Shares | 142,453 | 27,232,740 | | 409,989 | | 31,255,469 | | 5,549,925 | | (1,937,185) | — | — | | — |
| SPDR Portfolio Aggregate Bond ETF | 2,899,192 | 74,335,283 | | 445,233,530 | | 350,277,572 | | 3,436,440 | | (6,350,458) | 6,657,752 | 166,377,223 | | 3,872,279 |
| SPDR Portfolio Long Term Treasury ETF | 713,771 | 20,713,634 | | 53,172,123 | | 74,439,874 | | 1,492,726 | | (938,609) | — | — | | 253,012 |
| State Street Corp. | 3,361 | 260,343 | | 40,205 | | 156,466 | | 4,105 | | 34,470 | 1,861 | 182,657 | | 5,260 |
| State Street Institutional U.S. Government Money Market Fund - Class G Shares | 30,259,029 | 30,259,029 | | 552,986,411 | | 496,177,733 | | — | | — | 87,067,707 | 87,067,707 | | 3,486,128 |
| TOTAL | | $220,671,012 | | $1,239,735,629 | | $1,103,379,056 | | $12,127,867 | | $(12,735,030) | | $356,420,422 | | $13,494,527 |
See Notes to Schedule of Investments and Notes to Financial Statements.
| State Street Total Return V.I.S. Fund | 79 |
State Street Total Return V.I.S. Fund
Financial Highlights
Selected data based on a share outstanding throughout the fiscal years indicated
| | Class 1 |
| | 12/31/24 | | 12/31/23 | | 12/31/22 | | 12/31/21 | | 12/31/20 |
| Inception date | | | 7/1/85 |
| Net asset value, beginning of period | $14.76 | | $13.06 | | $16.06 | | $16.63 | | $15.91 |
| Income/(loss) from investment operations: | | | | | | | | | |
| Net investment income(a) | 0.35 | | 0.30 | | 0.29 | | 0.40 | | 0.27 |
| Net realized and unrealized gains/(losses) on investments | 1.32 | | 1.73 | | (2.94) | | 1.84 | | 0.75 |
| Total income/(loss) from investment operations | 1.67 | | 2.03 | | (2.65) | | 2.24 | | 1.02 |
| Contribution from advisor | — | | — | | — | | 0.00(b) | | — |
| Contribution from affiliate | — | | — | | — | | 0.00(b) | | — |
| Less distributions from: | | | | | | | | | |
| Net investment income | (0.76) | | (0.33) | | (0.13) | | (0.39) | | (0.30) |
| Net realized gains | (0.00)(b) | | — | | (0.22) | | (2.42) | | — |
| Total distributions | (0.76) | | (0.33) | | (0.35) | | (2.81) | | (0.30) |
| Net asset value, end of period | $15.67 | | $14.76 | | $13.06 | | $16.06 | | $16.63 |
| Total Return(c) | 11.31% | | 15.48% | | (16.51)% | | 13.45%(d) | | 6.44% |
| Ratios/Supplemental Data: | | | | | | | | | |
| Net assets, end of period (in thousands) | $618,289 | | $614,415 | | $588,132 | | $768,504 | | $743,820 |
| Ratios to average net assets: | | | | | | | | | |
| Gross expenses | 0.60% | | 0.59% | | 0.64% | | 0.62% | | 0.60% |
| Net investment income | 2.21% | | 2.12% | | 2.02% | | 2.22% | | 1.77% |
| Portfolio turnover rate | 77% | | 72%(e) | | 109%(e) | | 118%(e) | | 92%(e) |
| Notes to Financial Highlights |
| (a) | Per share values have been calculated using the average shares method. |
| (b) | Rounds to less than $0.005. |
| (c) | Total returns are historical and assume changes in share price, reinvestment of dividends and capital gains distributions and do not include the effect of insurance contract charges. Past performance does not guarantee future results. |
| (d) | The contribution from an Affiliate and the Adviser had no impact on total return. |
| (e) | The portfolio turnover calculated for the fiscal years ended 12/31/24, 12/31/23, 12/31/22, 12/31/21 and 12/31/20 did not include To-Be-Announced transactions and, if it had, the portfolio turnover would have been 79%, 76%, 127%, 144% and 103%, respectively. |
The accompanying Notes are an integral part of these financial statements.
State Street Total Return V.I.S. Fund
Financial Highlights, continued
Selected data based on a share outstanding throughout the fiscal years indicated
| | Class 3 |
| | 12/31/24 | | 12/31/23 | | 12/31/22 | | 12/31/21 | | 12/31/20 |
| Inception date | | | 5/1/06 |
| Net asset value, beginning of period | $14.75 | | $13.05 | | $16.00 | | $16.57 | | $15.86 |
| Income/(loss) from investment operations: | | | | | | | | | |
| Net investment income(a) | 0.30 | | 0.26 | | 0.25 | | 0.35 | | 0.23 |
| Net realized and unrealized gains/(losses) on investments | 1.32 | | 1.73 | | (2.92) | | 1.84 | | 0.74 |
| Total income/(loss) from investment operations | 1.62 | | 1.99 | | (2.67) | | 2.19 | | 0.97 |
| Contribution from advisor | — | | — | | — | | 0.00(b) | | — |
| Contribution from affiliate | — | | — | | — | | 0.00(b) | | — |
| Less distributions from: | | | | | | | | | |
| Net investment income | (0.70) | | (0.29) | | (0.06) | | (0.34) | | (0.26) |
| Net realized gains | (0.00)(b) | | — | | (0.22) | | (2.42) | | — |
| Total distributions | (0.70) | | (0.29) | | (0.28) | | (2.76) | | (0.26) |
| Net asset value, end of period | $15.67 | | $14.75 | | $13.05 | | $16.00 | | $16.57 |
| Total Return(c) | 11.06% | | 15.21% | | (16.72)% | | 13.20%(d) | | 6.14% |
| Ratios/Supplemental Data: | | | | | | | | | |
| Net assets, end of period (in thousands) | $439,914 | | $750,510 | | $748,657 | | $1,035,137 | | $1,063,931 |
| Ratios to average net assets: | | | | | | | | | |
| Gross expenses | 0.85% | | 0.84% | | 0.89% | | 0.87% | | 0.85% |
| Net investment income | 1.92% | | 1.87% | | 1.77% | | 1.95% | | 1.52% |
| Portfolio turnover rate | 77% | | 72%(e) | | 109%(e) | | 118%(e) | | 92%(e) |
| Notes to Financial Highlights |
| (a) | Per share values have been calculated using the average shares method. |
| (b) | Rounds to less than $0.005. |
| (c) | Total returns are historical and assume changes in share price, reinvestment of dividends and capital gains distributions and do not include the effect of insurance contract charges. Past performance does not guarantee future results. |
| (d) | The contribution from an Affiliate and the Adviser had no impact on total return. |
| (e) | The portfolio turnover calculated for the fiscal years ended 12/31/24, 12/31/23, 12/31/22, 12/31/21 and 12/31/20 did not include To-Be-Announced transactions and, if it had, the portfolio turnover would have been 79%, 76%, 127%, 144% and 103%, respectively. |
The accompanying Notes are an integral part of these financial statements.
State Street Total Return V.I.S. Fund
Statement of Assets and Liabilities — December 31, 2024
| Assets | |
| Investments in unaffiliated securities, at fair value (cost $597,519,396) | $699,233,682 |
| Investments in affiliated securities, at fair value (cost $359,445,520) | 356,420,422 |
| Cash | 114,282 |
| Net cash collateral on deposit with broker for future contracts | 544,677 |
| Foreign currency (cost $1,483,376) | 1,759,991 |
| Receivable for investments sold | 882,309 |
| Income receivables | 1,694,442 |
| Income receivable from affiliated investments | 327,584 |
| Other assets | 6,799 |
| Total assets | 1,060,984,188 |
| Liabilities | |
| Payable for investments purchased | 495,134 |
| Payable for fund shares redeemed | 211,146 |
| Payable for accumulated variation margin on futures contracts | 250,318 |
| Payable to the Adviser | 321,368 |
| Payable for custody, fund accounting and sub-administration fees | 151,345 |
| Accrued other expenses | 140,753 |
| Distribution and service fees | 652,326 |
| Accrued foreign capital gains tax | 558,567 |
| Total liabilities | 2,780,957 |
|
| Net Assets | $1,058,203,231 |
| Net Assets Consist of: | |
| Capital paid in | $985,301,669 |
| Total distributable earnings (loss) | 72,901,562 |
| Net Assets | $1,058,203,231 |
|
| Class 1: | |
| Net Assets | $618,289,241 |
| Shares outstanding ($0.01 par value, unlimited shares authorized) | 39,460,024 |
| Net asset value, offering and redemption price per share | $15.67 |
|
| Class 3: | |
| Net Assets | $439,913,990 |
| Shares outstanding ($0.01 par value, unlimited shares authorized) | 28,066,424 |
| Net asset value per share | $15.67 |
The accompanying Notes are an integral part of these financial statements.
| 82 | Statement of Assets and Liabilities |
State Street Total Return V.I.S. Fund
Statement of Operations — For the year ended December 31, 2024
| Investment Income | |
| Income | |
| Dividend | $15,359,101 |
| Interest | 4,986,071 |
| Income from affiliated investments | 13,494,527 |
| Less: Foreign taxes withheld | (909,631) |
| Total income | 32,930,068 |
| Expenses | |
| Advisory and administration fees | 4,125,737 |
| Distribution and service fees | |
| Class 1 | 1,249,590 |
| Class 3 | 2,492,829 |
| Directors' fees | 28,584 |
| Custody, fund accounting and sub-administration fees | 417,477 |
| Professional fees | 87,478 |
| Registration fees | 767 |
| Other expenses | 45,221 |
| Total expenses | 8,447,683 |
| Net investment income (loss) | $24,482,385 |
| Net Realized and Unrealized Gain (Loss) on Investments | |
| Realized gain (loss) on: | |
| Unaffiliated investments | $91,062,661 |
| Affiliated investments | 12,127,867 |
| Futures | 1,141,971 |
| Foreign currency transactions | (283,421) |
| Increase (decrease) in unrealized appreciation/depreciation on: | |
| Unaffiliated investments | 5,434,420 |
| Affiliated investments | (12,735,030) |
| Futures | (775,876) |
| Foreign currency translations | (7,383) |
| Net realized and unrealized gain (loss) on investments | 95,965,209 |
| Net Increase (Decrease) in Net Assets Resulting from Operations | $120,447,594 |
The accompanying Notes are an integral part of these financial statements.
| Statement of Operations | 83 |
State Street Total Return V.I.S. Fund
Statements of Changes in Net Assets
| | Year Ended
December 31,
2024 | | Year Ended
December 31,
2023 |
| Increase (Decrease) in Net Assets | | | |
| Operations: | | | |
| Net investment income (loss) | $24,482,385 | | $26,567,297 |
| Net realized gain (loss) on investments, futures and foreign currency transactions | 104,049,078 | | (22,347,739) |
| Net increase (decrease) in unrealized appreciation/depreciation on investments, futures and foreign currency translations | (8,083,869) | | 187,563,300 |
| Net increase (decrease) from operations | 120,447,594 | | 191,782,858 |
| Distributions to shareholders: | | | |
| Total distributions | | | |
| Class 1 | (28,757,603) | | (13,520,779) |
| Class 3 | (18,982,757) | | (14,685,388) |
| Total distributions | (47,740,360) | | (28,206,167) |
| Increase (decrease) in assets from operations and distributions | 72,707,234 | | 163,576,691 |
| Share transactions: | | | |
| Proceeds from sale of shares | | | |
| Class 1 | 650,360 | | 2,733,621 |
| Class 3 | 6,385,314 | | 12,013,475 |
| Value of distributions reinvested | | | |
| Class 1 | 28,757,603 | | 13,520,779 |
| Class 3 | 18,982,757 | | 14,685,388 |
| Cost of shares redeemed | | | |
| Class 1 | (63,694,735) | | (62,632,529) |
| Class 3 | (370,510,483) | | (115,760,740) |
| Net increase (decrease) from share transactions | (379,429,184) | | (135,440,006) |
| Total increase (decrease) in net assets | (306,721,950) | | 28,136,685 |
| Net Assets | | | |
| Beginning of year | 1,364,925,181 | | 1,336,788,496 |
| End of year | $1,058,203,231 | | $1,364,925,181 |
| Changes in Fund Shares | | | |
| Class 1 | | | |
| Shares sold | 40,632 | | 198,196 |
| Issued for distributions reinvested | 1,824,721 | | 918,531 |
| Shares redeemed | (4,035,300) | | (4,504,249) |
| Net increase (decrease) in fund shares | (2,169,947) | | (3,387,522) |
| Class 3 | | | |
| Shares sold | 415,456 | | 868,314 |
| Issued for distributions reinvested | 1,203,726 | | 998,327 |
| Shares redeemed | (24,448,690) | | (8,325,107) |
| Net increase (decrease) in fund shares | (22,829,508) | | (6,458,466) |
The accompanying Notes are an integral part of these financial statements.
| 84 | Statements of Changes in Net Assets |
State Street Total Return V.I.S. Fund
Notes to Financial Statements — December 31, 2024
1.Organization of the Company
State Street Variable Insurance Series Funds, Inc. (the “Company”) was incorporated under the laws of the Commonwealth of Virginia on May 14, 1984 and is registered under the Investment Company Act of 1940, as amended (the “1940 Act”), as an open-end management investment company. The Company is currently composed of the following seven investment portfolios (collectively, the “Funds”): State Street U.S. Equity V.I.S. Fund, State Street S&P 500 Index V.I.S. Fund, State Street Premier Growth Equity V.I.S. Fund, State Street Small-Cap Equity V.I.S. Fund, State Street Total Return V.I.S. Fund (the “Fund”), State Street Income V.I.S. Fund and State Street Real Estate Securities V.I.S. Fund. Each Fund is a diversified investment company within the meaning of the 1940 Act, except for the State Street Premier Growth Equity V.I.S. Fund, which is a non-diversified investment company.
Shares of the Funds of the Company are offered only to insurance company separate accounts that fund certain variable life insurance contracts and variable annuity contracts.
The Company currently offers two share classes of the Fund as investment options for variable life insurance and variable annuity contracts — Class 1 and Class 3. Class 3 shares were first offered on May 1, 2006, and Fund shares outstanding prior to May 1, 2006 were designated as Class 1 shares. Each class of shares has different fees and expenses, and as a result, each class of shares will have different share price and performance. Not all variable contracts offer each class of the Fund’s shares.
Under the Company’s organizational documents, its officers and directors are indemnified against certain liabilities arising out of the performance of their duties to the Company. Additionally, in the normal course of business, the Company enters into contracts with service providers that contain general indemnification clauses. The Company’s maximum exposure under these arrangements is unknown as this would involve future claims that may be made against the Company that have not yet occurred.
2.Segment Reporting
The Fund has one reportable segment. Business activities are managed on a consolidated basis and revenues are derived primarily through the Fund’s investments in accordance with its investment objective. The Fund’s chief operating decision maker (“CODM”) is the President of the Company. The CODM assesses performance based on the Fund’s Total Return as reported in the Financial Highlights, and the same accounting policies are applied as described in the summary of significant accounting policies. The Fund’s Total Return is utilized by the CODM to compare results, including the impact of the Fund’s costs, to the Fund’s competitors and to the Fund’s benchmark index.
3.Summary of Significant Accounting Policies
The following is a summary of significant accounting policies followed by the Company in the preparation of its financial statements:
The preparation of financial statements in accordance with U.S. generally accepted accounting principles (“U.S. GAAP”) requires management to make estimates and assumptions that affect the reported amounts and disclosures in the financial statements. Actual results could differ from those estimates. The Fund is an investment company under U.S. GAAP and follows the accounting and reporting guidance applicable to investment companies.
Security Valuation The Fund’s investments are valued at fair value each day that the New York Stock Exchange (“NYSE”) is open and, for financial reporting purposes, as of the report date should the reporting period end on a day that the NYSE is not open. Fair value is generally defined as the price a fund would receive to sell an asset or pay to transfer a liability in an orderly transaction between market participants at the measurement date. By its nature, a fair value price is a good faith estimate of the valuation in a current sale and may not reflect an actual market price. The investments of the Fund are valued pursuant to the policy and procedures developed by the Oversight Committee (the “Committee”) and approved by the Company's Board of Directors (the “Board”). The
| Notes to Financial Statements | 85 |
State Street Total Return V.I.S. Fund
Notes to Financial Statements, continued — December 31, 2024
Committee provides oversight of the valuation of investments for the Fund. The Board has responsibility for overseeing the determination of the fair value of investments.
Valuation techniques used to value the Fund’s investments by major category are as follows:
| • | Equity investments (including preferred stocks and registered investment companies that are exchange-traded funds) traded on a recognized securities exchange for which market quotations are readily available are valued at the last sale price or official closing price, as applicable, on the primary market or exchange on which they trade. Equity investments traded on a recognized exchange for which there were no sales on that day are valued at the last published sale price or at fair value. |
| • | Investments in registered investment companies (including money market funds) or other unitized pooled investment vehicles that are not traded on an exchange are valued at that day’s published net asset value (“NAV”) per share or unit. |
| • | Government and municipal fixed income securities are generally valued using quotations from independent pricing services or brokers. Certain government inflation-indexed securities may require a calculated fair valuation as the cumulative inflation is contained within the price provided by the pricing service or broker. For these securities, the inflation component of the price is “cleaned” from the pricing service or broker price utilizing the published inflation factors in order to ensure proper accrual of income. |
| • | Debt obligations (including short term investments and convertible debt securities) are valued using quotations from independent pricing services or brokers or are generally valued at the last reported evaluated prices. |
| • | Exchange-traded futures contracts are valued at the closing settlement price on the primary market on which they are traded most extensively. Exchange-traded futures contracts traded on a recognized exchange for which there were no sales on that day are valued at the last reported sale price obtained from independent pricing services or brokers or at fair value. |
| • | Rights and warrants are valued at the last reported sale price obtained from independent pricing services or brokers on the valuation date. If no price is obtained from pricing services or brokers, valuation will be based upon the intrinsic value pursuant to the valuation policy and procedures approved by the Board. |
In the event prices or quotations are not readily available or that the application of these valuation methods results in a price for an investment that is deemed to be not representative of the fair value of such investment, fair value will be determined in good faith by the Committee, in accordance with the valuation policy and procedures approved by the Board.
A “significant event” is an event that the Board believes, with a reasonably high degree of certainty, has caused the closing market prices of the Fund’s portfolio securities to no longer reflect their value at the time of the Fund’s NAV calculation. Fair value may be determined using an independent fair value service under valuation procedures approved by the Board. The independent fair value service takes into account multiple factors including, but not limited to, movements in the U.S. securities markets, certain depositary receipts, futures contracts and foreign currency exchange rates that have occurred subsequent to the close of foreign securities exchanges. The use of the independent fair value service or alternative fair valuation methods would result in the investments being classified within Level 2 of the fair value hierarchy.
The Fund values its assets and liabilities at fair value using a fair value hierarchy consisting of three broad levels that prioritize the inputs to valuation techniques giving the highest priority to readily available unadjusted quoted prices in active markets for identical assets or liabilities (Level 1 measurements) and the lowest priority to unobservable inputs (Level 3 measurements) when market prices are not readily available or reliable. The categorization of a value determined for an investment within the hierarchy is based upon the pricing transparency of the investment and is not necessarily an indication of the risk associated with investing in it.
The three levels of the fair value hierarchy are as follows:
| • | Level 1 — Unadjusted quoted prices in active markets for an identical asset or liability; |
| 86 | Notes to Financial Statements |
State Street Total Return V.I.S. Fund
Notes to Financial Statements, continued — December 31, 2024
| • | Level 2 — Inputs other than quoted prices included within Level 1 that are observable for the asset or liability either directly or indirectly, including quoted prices for similar assets or liabilities in active markets, quoted prices for identical or similar assets or liabilities in markets that are not considered to be active, inputs other than quoted prices that are observable for the asset or liability (such as exchange rates, financing terms, interest rates, yield curves, volatilities, prepayment speeds, loss severities, credit risks and default rates) or other market-corroborated inputs; and |
| • | Level 3 — Unobservable inputs for the asset or liability, including the Committee’s assumptions used in determining the fair value of investments. |
The value of the Fund’s investments according to the fair value hierarchy as of December 31, 2024 is disclosed in the Fund’s Schedule of Investments.
Investment Transactions and Income Recognition Investment transactions are accounted for on trade date for financial reporting purposes. Realized gains and losses from the sale or disposition of investments and foreign exchange transactions, if any, are determined using the identified cost method.
Dividend income and capital gain distributions, if any, are recognized on the ex-dividend date, net of any foreign taxes withheld at source, if any.
Interest income is recorded daily on an accrual basis. All premiums and discounts are amortized/accreted for financial reporting purposes.
Non-cash dividends received in the form of stock are recorded as dividend income at fair value.
The Fund invests in real estate investment trusts (“REITs”). REITs determine the tax character of their distributions annually and may characterize a portion of their distributions as a return of capital or capital gain. The Fund’s policy is to record all REIT distributions initially as dividend income and re-designate a portion to return of capital or capital gain distributions at year-end based on information provided by the REIT and/or SSGA Funds Management, Inc.’s (the “Adviser” or “SSGA FM”) estimates of such re-designations for which actual information has not yet been reported.
Expenses Certain expenses, which are directly identifiable to a specific Fund, are applied to the Fund within the Company. Other expenses which cannot be attributed to a specific Fund are allocated in such a manner as deemed equitable, taking into consideration the nature and type of expense and the relative net assets of the Fund within the Company.
Foreign Currency Translation The accounting records of the Fund are maintained in U.S. dollars. Foreign currencies as well as investment securities and other assets and liabilities denominated in a foreign currency are translated to U.S. dollars using exchange rates at period end. Purchases and sales of securities, income receipts and expense payments denominated in foreign currencies are translated into U.S. dollars at the prevailing exchange rate on the respective dates of the transactions.
The effects of exchange rate fluctuations on investments are included with the net realized and unrealized gain (loss) on investment securities. Other foreign currency transactions resulting in realized and unrealized gain (loss) are disclosed separately.
Foreign Taxes The Fund may be subject to foreign taxes (a portion of which may be reclaimable) on income, stock dividends, realized and unrealized capital gains on investments or certain foreign currency transactions. Foreign taxes are recorded in accordance with SSGA FM's understanding of the applicable foreign tax regulations and rates that exist in the foreign jurisdictions in which the Fund invests. These foreign taxes, if any, are paid by the Fund and are reflected in the Statement of Operations, if applicable. Foreign taxes payable or deferred as of December 31, 2024, if any, are disclosed in the Fund’s Statement of Assets and Liabilities.
Distributions The Fund declares and pays any dividends from net investment income annually.
Net realized capital gains, if any, are distributed annually, unless additional distributions are required for compliance with applicable tax regulations. The amount and character of income and capital gains to be
| Notes to Financial Statements | 87 |
State Street Total Return V.I.S. Fund
Notes to Financial Statements, continued — December 31, 2024
distributed are determined in accordance with applicable tax regulations which may differ from net investment income and realized gains recognized for U.S. GAAP purposes.
4.Securities and Other Investments
Delayed Delivery Transactions and When-Issued Securities During the fiscal year ended December 31, 2024, the Fund transacted in securities on a delayed delivery or when-issued basis. Payment and delivery may take place after the customary settlement period for that security. The price of the underlying securities and the date when the securities will be delivered and paid for are fixed at the time the transaction is negotiated. The securities purchased on a delayed delivery or when-issued basis are identified as such in the Fund’s Schedule of Investments. The Fund may receive compensation for interest forgone in the purchase of a delayed delivery or when-issued security. With respect to such purchase commitments, the Fund identifies securities as segregated in its records with a value at least equal to the amount of the commitment. Losses may arise due to changes in the value of the underlying securities or if the counterparty does not perform under the contract’s terms, or if the issuer does not issue the securities due to political, economic or other factors.
To-Be-Announced Transactions The Fund may seek to obtain exposure to U.S. agency mortgage pass-through securities through the use of “to-be-announced” or “TBA transactions.” “TBA” refers to a commonly used mechanism for the forward settlement of U.S. agency mortgage pass-through securities. In a TBA transaction, the buyer and seller decide on general trade parameters, such as agency, settlement date, coupon, and price.
The Fund may use TBA transactions to “roll over” such agreements prior to the settlement date. This type of TBA transaction is sometimes known as a “TBA roll.” In a TBA roll, the Fund generally will sell the obligation to purchase the pools stipulated in the TBA agreement prior to the settlement date and will enter into a new TBA agreement for future delivery of pools of mortgage pass-through securities. The Fund may also enter into TBA agreements and settle such transactions on the stipulated settlement date by accepting actual receipt or delivery of the pools of mortgage pass-through securities.
Default by or bankruptcy of a counterparty to a TBA transaction would expose the Fund to possible loss because of adverse market action, expenses or delays in connection with the purchase or sale of the pools of mortgage pass-through securities specified in the TBA transaction. To minimize this risk, the Fund will enter into TBA transactions only with established counterparties. The Fund’s use of “TBA rolls” may impact portfolio turnover, transaction costs and capital gain distributions to shareholders.
5.Derivative Financial Instruments
Futures Contracts The Fund may enter into futures contracts to meet the Fund’s objectives. A futures contract is a standardized, exchange-traded agreement to buy or sell a financial instrument at a set price on a future date. Upon entering into a futures contract, the Fund is required to deposit with the broker, cash or securities in an amount equal to the minimum initial margin requirements of the clearing house. Securities deposited, if any, are designated on the Schedule of Investments and cash deposited, if any, is shown as Net cash collateral on deposit with broker for future contracts on the Statement of Assets and Liabilities. Subsequent payments are made or received by the Fund equal to the daily change in the contract value, accumulated, exchange rates, and/or other transactional fees. The accumulation of those payments are recorded as variation margin receivable or payable with a corresponding offset to unrealized gains or losses. The Fund recognizes a realized gain or loss when the contract is closed.
Losses may arise if the value of a futures contract decreases due to unfavorable changes in the market rates or values of the underlying instrument during the term of the contract or if the counterparty does not perform under the contract. The use of futures contracts also involves the risk that the movements in the price of the futures contracts do not correlate with the movement of the assets underlying such contracts.
For the fiscal year ended December 31, 2024, the Fund entered into futures contracts for cash equitization.
| 88 | Notes to Financial Statements |
State Street Total Return V.I.S. Fund
Notes to Financial Statements, continued — December 31, 2024
The following tables summarize the value of the Fund’s derivative instruments as of December 31, 2024 and the related location in the accompanying Statement of Assets and Liabilities and Statement of Operations, presented by primary underlying risk exposure:
| Liability Derivatives |
| | Interest
Rate
Risk | Foreign
Exchange
Risk | Credit
Risk | Equity
Risk | Commodity
Risk | Total |
| State Street Total Return V.I.S. Fund | | | | | | |
| Futures Contracts | $— | $— | $— | $250,318 | $— | $250,318 |
| Realized Gain (Loss) |
| | Interest
Rate
Risk | Foreign
Exchange
Risk | Credit
Risk | Equity
Risk | Commodity
Risk | Total |
| State Street Total Return V.I.S. Fund | | | | | | |
| Futures Contracts | $— | $— | $— | 1,141,971 | $— | $1,141,971 |
| Net Change in Unrealized Appreciation/Depreciation |
| | Interest
Rate
Risk | Foreign
Exchange
Risk | Credit
Risk | Equity
Risk | Commodity
Risk | Total |
| State Street Total Return V.I.S. Fund | | | | | | |
| Futures Contracts | $— | $— | $— | $(775,876) | $— | $(775,876) |
6.Fees and Transactions with Affiliates
Advisory Fee SSGA FM, a registered investment adviser, was retained by the Board to act as investment adviser and administrator of the Fund. SSGA FM’s compensation for investment advisory and administrative services (“Management Fee”) is paid monthly based on the average daily net assets of the Fund at an annualized rate of 0.35%.
Investor Service Plan — Class 1 and Class 3 Shares The Company adopted an Investor Service Plan (the “Service Plan”) on December 9, 2005 for Class 1 shares and on May 1, 2009 for Class 3 shares of the Fund. The Service Plan was not adopted pursuant to Rule 12b-1 under the 1940 Act. Each Service Plan provides that during any fiscal year, the amount of compensation paid under the Service Plan by the Fund Class 1 or Class 3 shares may not exceed the annual rate of 0.20% of the average daily net assets of the Fund attributable to each such share class.
Distribution and Shareholder Service (12b-1) Fees The Company has adopted a Distribution and Service (12b-1) Plan (the “12b-1 Plan”) pursuant to Rule 12b-1 under the 1940 Act with respect to each of Class 1 and Class 3 shares of the Fund. Under the 12b-1 Plan for Class 1 shares that became effective May 1, 2009, payments made under the Class 1 Investor Service Plan are covered in the event that any portion of compensation paid pursuant to the Class 1 Investor Service Plan is determined to be an indirect use of the assets attributable to the Class 1 shares to finance distribution of such shares. Under the 12b-1 Plan for Class 3 shares, the Company, on behalf of the Fund, may have compensated State Street Global Advisors Funds Distributors, LLC (“SSGA FD”), the distributor of the shares of the Fund, for certain sales services provided by SSGA FD or other broker dealers and investor services provided by SSGA FD or other service providers relating to the Fund’s Class 3 shares, including services to owners or prospective owners of variable contracts issued by insurance companies that offer Class 3 shares as an investment option under such variable contracts. The amount of compensation paid under the 12b-1 Plan for Class 3 shares may not exceed 0.25% of the average daily net assets of the Fund attributable to such
| Notes to Financial Statements | 89 |
State Street Total Return V.I.S. Fund
Notes to Financial Statements, continued — December 31, 2024
share class. The 12b-1 Plan continues in effect from year to year for so long as such continuance is approved annually by the Board, including by those Directors who are not interested persons of the Company and who have no direct or indirect financial interest in the operation of the 12b-1 Plan or in any agreement related to it. In addition, the Class 3 12b-1 Plan covers payments made under the Class 3 Investor Service Plan in the event that any portion of compensation paid pursuant to the Class 3 Investor Service Plan is determined to be an indirect use of the assets attributable to the Class 3 shares to finance distribution of such shares.
Custody, Fund Accounting and Sub-Administration Fees State Street Bank and Trust Company (“State Street”) serves as the custodian, fund accountant and sub-administrator to the Fund. Amounts paid by the Fund to State Street for performing such services are included as custody, fund accounting and sub-administration fees in the Statement of Operations.
Other Transactions with Affiliates The Fund may invest in affiliated entities, including securities issued by State Street Corporation, affiliated funds, or entities deemed to be affiliates as a result of the Fund owning more than five percent of the entity’s voting securities or outstanding shares. Amounts relating to these transactions during the fiscal year ended December 31, 2024 are disclosed in the Schedule of Investments.
7.Directors' Fees
The fees and expenses of the Company’s directors who are not “interested persons” of the Company, as defined in the 1940 Act (“Independent Directors”), are paid directly by the Fund. The Independent Directors are reimbursed for travel and other out-of-pocket expenses in connection with meeting attendance and industry seminars.
8.Investment Transactions
Purchases and sales of investments (excluding in-kind transactions, short term investments and derivative contracts) for the fiscal year ended December 31, 2024 were as follows:
| U.S. Government Securities |
| Purchases | Sales |
| $31,196,589 | $152,254,495 |
| Non-U.S. Government Securities |
| Purchases | Sales |
| $819,050,152 | $1,159,059,990 |
9.Income Taxes
The Fund has qualified and intends to continue to qualify as a regulated investment company under Subchapter M of the Internal Revenue Code of 1986, as amended. The Fund will not be subject to federal income taxes to the extent it distributes its taxable income, including any net realized capital gains, for each fiscal year. Therefore, no provision for federal income tax is required.
The Fund files federal and various state and local tax returns as required. No income tax returns are currently under examination. Generally, the federal returns are subject to examination by the Internal Revenue Service for a period of three years from date of filing, while the state returns may remain open for an additional year depending upon jurisdiction. SSGA FM has analyzed the Fund's tax positions taken on tax returns for all open years and does not believe there are any uncertain tax positions that would require recognition of a tax liability.
Distributions to shareholders are recorded on ex-dividend date. Income dividends and gain distributions are determined in accordance with income tax rules and regulations, which may differ from generally accepted accounting principles. Certain capital accounts in the financial statements have been adjusted for permanent book-tax differences. These adjustments have no impact on NAVs or results of operations. Temporary book-tax differences will reverse in the future. These book-tax differences are primarily due to capital loss carryforwards, nontaxable dividend adjustments to income, foreign currencies, foreign capital gains taxes, REITs, grantor trusts,
| 90 | Notes to Financial Statements |
State Street Total Return V.I.S. Fund
Notes to Financial Statements, continued — December 31, 2024
premium amortization, investments in futures, investments in partnerships, passive foreign investment company gains and losses, paydown gains and losses, and wash sale loss deferrals.
The tax character of distributions paid during the fiscal year ended December 31, 2024 were as follows:
Ordinary
Income | Long-Term
Capital Gains | Total |
| $47,520,616 | $219,744 | $47,740,360 |
The tax character of distributions paid during the fiscal year ended December 31, 2023 was as follows:
Ordinary
Income | Long-Term
Capital Gains | Total |
| $28,206,167 | $— | $28,206,167 |
At December 31, 2024, the components of distributable earnings on a tax basis were as follows:
Undistributed
Ordinary
Income | Tax Exempt
Income | Capital Loss
Carryforwards | Undistributed
long term
gain | Net
Unrealized
Gains
(Losses) | Qualified
Late-Year
Losses | Total |
| $835,019 | $— | $— | $6,109,790 | $65,956,753 | $— | $72,901,562 |
As of December 31, 2024, gross unrealized appreciation and gross unrealized depreciation of investments and other financial instruments based on cost for federal income tax purposes were as follows:
Tax
Cost | Gross
Unrealized
Appreciation | Gross
Unrealized
Depreciation | Net
Unrealized
Appreciation
(Depreciation) |
| $989,101,392 | $119,960,013 | $53,657,783 | $66,302,230 |
10.Line of Credit
The Fund and other affiliated funds (each, a “Participant” and collectively, the “Participants”) have access to $194.29 million of a $1.36 billion ($180 million of $1.26 billion prior to November 1, 2024 and $180 million of $960 million prior to October 3, 2024) credit facility provided by a syndication of banks under which the Participants may borrow to fund shareholder redemptions. This agreement expires in October 2025 unless extended or renewed.
The Participants are charged an annual commitment fee which is calculated based on the unused portion of the shared credit line. Commitment fees are allocated among each of the Participants based on relative net assets. Commitment fees are ordinary fund operating expenses. A Participant incurs and pays the interest expense related to its borrowing. Interest is calculated at a rate per annum equal to the sum of 1.00% plus the greater of the New York Fed Bank Rate and the one-month SOFR Rate.
The Fund had no outstanding loans as of December 31, 2024.
11.Risks
Concentration Risk As a result of the Fund's ability to invest a large percentage of its assets in obligations of issuers within the same country, state, region, currency or economic sector, an adverse economic, business or political development may affect the value of the Fund's investments more than if the Fund was more broadly diversified.
Interest Rate Risk The risk that fixed income securities will decline in value because of changes in interest rates. Bond prices generally rise when interest rates decline and generally decline when interest rates rise. Changes in governmental policy, including changes in central bank monetary policy, could cause interest rates to rise rapidly, or cause investors to expect a rapid rise in interest rates. This could lead to heightened levels of interest rate, volatility and liquidity risks for the fixed income markets generally and could have a substantial and immediate
| Notes to Financial Statements | 91 |
State Street Total Return V.I.S. Fund
Notes to Financial Statements, continued — December 31, 2024
effect on the values of the Fund’s investments. High levels of inflation and/or a significantly changing interest rate environment can lead to heightened levels of volatility and reduced liquidity.
Foreign and Emerging Markets Risk Investing in foreign markets involves risks and considerations not typically associated with investing in the U.S. Foreign securities may be subject to risk of loss because of government regulation, economic, political and social instability in the countries in which the Fund invests. Foreign markets may be less liquid than investments in the U.S. and may be subject to the risks of currency fluctuations. To the extent that the Fund invests in securities of issuers located in emerging markets, these risks may be even more pronounced.
Credit Risk The Fund may be exposed to credit risk in the event that an issuer or guarantor fails to perform or that an institution or entity with which the Fund has unsettled or open transactions defaults.
Market Risk The Fund’s investments are subject to changes in general economic conditions, and general market fluctuations and the risks inherent in investment in securities markets. Investment markets can be volatile and prices of investments can change substantially due to various factors including, but not limited to, economic growth or recession, changes in interest rates, changes in the actual or perceived creditworthiness of issuers, and general market liquidity. The Fund is subject to the risk that geopolitical events will disrupt securities markets and adversely affect global economies and markets. Local, regional or global events such as war, acts of terrorism, the spread of infectious illness, such as COVID-19, or other public health issues, or other events could have a significant impact on the Fund and its investments.
Russian Sanctions Risk Sanctions threatened or imposed by a number of jurisdictions, including the United States, the European Union and the United Kingdom, and other intergovernmental actions that have been or may be undertaken in the future, against Russia, Russian entities or Russian individuals, may result in the devaluation of Russian currency, a downgrade in the country’s credit rating, an immediate freeze of Russian assets, a decline in the value and liquidity of Russian securities, property or interests, and/or other adverse consequences to the Russian economy or a Fund. The scope and scale of sanctions in place at a particular time may be expanded or otherwise modified in a way that have negative effects on a Fund. Sanctions, or the threat of new or modified sanctions, could impair the ability of a Fund to buy, sell, hold, receive, deliver or otherwise transact in certain affected securities or other investment instruments. Sanctions could also result in Russia taking counter measures or other actions in response, which may further impair the value and liquidity of Russian securities. These sanctions, and the resulting disruption of the Russian economy, may cause volatility in other regional and global markets and may negatively impact the performance of various sectors and industries, as well as companies in other countries, which could have a negative effect on the performance of a Fund, even if a Fund does not have direct exposure to securities of Russian issuers. As a collective result of the imposition of sanctions, Russian government countermeasures and the impact that they have had on the trading markets for Russian securities, certain Funds have used, and may in the future use, fair valuation procedures approved by the Fund’s Board to value certain Russian securities, which could result in such securities being deemed to have a zero value.
12.Subsequent Events
Management has evaluated the impact of all subsequent events on the Fund through the date on which the financial statements were available to be issued and has determined that there were no subsequent events requiring adjustment or disclosure in the financial statements.
| 92 | Notes to Financial Statements |
State Street Total Return V.I.S. Fund
Report of Independent Registered Public Accounting Firm
To the Shareholders of State Street Total Return V.I.S. Fund and the Board of Directors of State Street Variable Insurance Series Funds, Inc.
Opinion on the Financial Statements and Schedule of Investments in Securities
We have audited the accompanying statement of assets and liabilities of State Street Total Return V.I.S. Fund (the “Fund”) (one of the series constituting State Street Variable Insurance Series Funds, Inc. (the “Company”)), including the summary schedule of investments, as of December 31, 2024, and the related statement of operations for the year then ended, the statements of changes in net assets for each of the two years in the period then ended, the financial highlights for each of the five years in the period then ended and the related notes (collectively referred to as the “financial statements”). In our opinion, the financial statements and schedule of investments in securities present fairly, in all material respects, the financial position of the Fund (one of the series constituting State Street Variable Insurance Series Funds, Inc.) at December 31, 2024, the results of its operations for the year then ended, the changes in its net assets for each of the two years in the period then ended and its financial highlights for each of the five years in the period then ended, in conformity with U.S. generally accepted accounting principles.
Basis for Opinion
These financial statements are the responsibility of the Trust’s management. Our responsibility is to express an opinion on the Fund’s financial statements based on our audits. We are a public accounting firm registered with the Public Company Accounting Oversight Board (United States) (“PCAOB”) and are required to be independent with respect to the Trust in accordance with the U.S. federal securities laws and the applicable rules and regulations of the Securities and Exchange Commission and the PCAOB.
We conducted our audits in accordance with the standards of the PCAOB. Those standards require that we plan and perform the audit to obtain reasonable assurance about whether the financial statements are free of material misstatement, whether due to error or fraud. The Trust is not required to have, nor were we engaged to perform, an audit of the Trust’s internal control over financial reporting. As part of our audits we are required to obtain an understanding of internal control over financial reporting, but not for the purpose of expressing an opinion on the effectiveness of the Trust’s internal control over financial reporting. Accordingly, we express no such opinion.
Our audits included performing procedures to assess the risks of material misstatement of the financial statements, whether due to error or fraud, and performing procedures that respond to those risks. Such procedures included examining, on a test basis, evidence regarding the amounts and disclosures in the financial statements. Our procedures included confirmation of securities owned as of December 31, 2024, by correspondence with the custodian, brokers and others; when replies were not received from brokers and others, we performed other auditing procedures. Our audits also included evaluating the accounting principles used and significant estimates made by management, as well as evaluating the overall presentation of the financial statements. We believe that our audits provide a reasonable basis for our opinion.
We have served as the auditor of one or more State Street Global Advisors investment companies since 2000.
Boston, Massachusetts
February 18, 2025
| Report of Independent Registered Public Accounting Firm | 93 |
State Street Total Return V.I.S. Fund
Other Information — December 31, 2024
Tax Information
For federal income tax purposes, the following information is furnished with respect to the distributions of the Fund for its fiscal year ended December 31, 2024.
Dividends Received Deduction
The Fund reports the maximum amount allowable of its net taxable income as eligible for the corporate dividends received deduction.
Interest Dividends
The Fund reports the maximum amount allowable as Section 163(j) Interest Dividend.
Long Term Capital Gain Distributions
Long term capital gains dividends were paid from the Fund during the year ended December 31, 2024 in the amount of $219,744.
State Street Total Return V.I.S. Fund
Proxy Disclosure for Open-End Management Investment Companies — December 31, 2024 (Unaudited)
Shareholder Meeting Results
Rule 30e-1 under the Investment Company Act of 1940, as amended, requires registered management companies to report on all subject matters put to the vote of shareholders and provide final results. Shareholders were asked to participate in a special meeting of shareholders on December 6, 2024 (the “Shareholder Meeting”). The final results of the Shareholder Meeting are reported in the table below.
All Funds
Proposal 1: To elect the following as Directors of the Company:
| Proposed Director | Shares For | Shares Withheld |
| Patrick J. Riley | 73,750,198.987 | 1,759,144.984 |
| Donna M. Rapaccioli | 73,872,469.845 | 1,636,874.126 |
| Margaret K. McLaughlin | 73,959,592.918 | 1,549,751.053 |
| George M. Pereira | 73,932,719.109 | 1,576,624.862 |
| Mark E. Swanson | 73,862,069.730 | 1,647,274.241 |
| Jeanne LaPorta | 73,881,354.092 | 1,627,989.879 |
Item 8. Changes in and Disagreements with Accountants for Open-End Management Investment Companies
Not applicable.
Item 9. Proxy Disclosures for Open-End Management Investment Companies
Proxy Disclosures for Open-End Management Investment Companies are included as part of the Financial Statements filed under Item 7(a) of this Form.
Item 10. Remuneration Paid to Directors, Officers, and Others of Open-End Management Investment Companies
Renumeration Paid to Directors, Officers, and Others of Open-End Investment Companies is included as part of the Financial Statements filed under Item 7(a) of this Form.
Item 11. Statement Regarding Basis for Approval of Investment Advisory Contract.
Not applicable to this filing.
Item 12. Disclosure of Proxy Voting Policies and Procedures for Closed-End Management Investment Companies.
Not applicable to the Registrant.
Item 13. Portfolio Managers of Closed-End Management Investment Companies.
Not applicable to the Registrant.
Item 14. Purchases of Equity Securities by Closed-End Management Investment Company and Affiliated Purchasers.
Not applicable to the Registrant.
Item 15. Submission of Matters to a Vote of Security Holders.
There were no material changes to the procedures by which shareholders may recommend nominees to the Registrant’s Board of Trustees.
Item 16. Controls and Procedures.
(a) The Registrant’s principal executive officer and principal financial officer have concluded that the Registrant’s disclosure controls and procedures (as defined in Rule 30a-3(c) under the Investment Company Act of 1940, as amended (the “1940 Act”)) are effective to provide reasonable assurance that information required to be disclosed by the Registrant on Form N-CSR is recorded, processed, summarized and reported as of a date within 90 days of the filing date of this report, based on their evaluation of these controls and procedures required by Rule 30a-3(b) under the 1940 Act and Rules 13a-15(b) or 15d-15(b) under the Securities Exchange Act of 1934, as amended.
(b) There were no changes in the Registrant’s internal control over financial reporting (as defined in Rule 30a-3(d) under the 1940 Act) that occurred during the period covered by this report that have materially affected, or are reasonably likely to materially affect, the Registrant’s internal control over financial reporting.
Item 17. Disclosure of Securities Lending Activities for Closed-End Management Investment Companies.
| (a) | Not applicable to the Registrant. |
| (b) | Not applicable to the Registrant. |
Item 18. Recovery of Erroneously Awarded Compensation
Not applicable to the Registrant.
Item 19. Exhibits.
(b) Certifications of principal executive officer and principal financial and accounting officer of the Registrant as required by Rule 30a-2(b) under the 1940 Act and Section 906 of the Sarbanes-Oxley Act of 2002 are attached hereto.
(101) Inline Interactive Data File—the instance document does not appear in the Interactive Data File because its XBRL tags are embedded within the inline XBRL document.
SIGNATURES
Pursuant to the requirements of the Securities Exchange Act of 1934 and the Investment Company Act of 1940, the Registrant has duly caused this report to be signed on its behalf by the undersigned, thereunto duly authorized.
STATE STREET VARIABLE INSURANCE SERIES FUNDS, INC.
| | |
| By: | | /s/ Ann M. Carpenter |
| | Ann M. Carpenter |
| | President (Principal Executive Officer) |
| |
| Date: | | February 28, 2025 |
Pursuant to the requirements of the Securities Exchange Act of 1934 and the Investment Company Act of 1940, this report has been signed below by the following persons on behalf of the Registrant and in the capacities and on the dates indicated.
| | |
| By: | | /s/ Ann M. Carpenter |
| | Ann M. Carpenter |
| | President (Principal Executive Officer) |
| |
| Date: | | February 28, 2025 |
| | |
| By: | | /s/ Bruce S. Rosenberg |
| | Bruce S. Rosenberg |
| | Treasurer (Principal Financial and Accounting Officer) |
| |
| Date: | | February 28, 2025 |