UNITED STATES
SECURITIES AND EXCHANGE COMMISSION
Washington, D.C. 20549
FORM N-CSR
CERTIFIED SHAREHOLDER REPORT OF REGISTERED
MANAGEMENT INVESTMENT COMPANIES
Investment Company Act file number: 811-04041
STATE STREET VARIABLE INSURANCE SERIES FUNDS, INC.
(Exact name of registrant as specified in charter)
One Iron Street
Boston, Massachusetts 02210
(Address of principal executive offices)(Zip code)
(Name and Address of Agent for Service)
Sean O’Malley, Esq.
Senior Vice President and Deputy General Counsel
c/o SSGA Funds Management, Inc.
One Iron Street
Boston, Massachusetts 02210
Copy to:
Timothy W. Diggins, Esq.
Ropes & Gray LLP
Prudential Tower
800 Boylston Street
Boston, Massachusetts 02199-3600
Registrant’s telephone number, including area code: 800-242-0134
Date of fiscal year end: December 31
Date of reporting period: December 31, 2021
Item 1. Shareholder Reports.
| (a) | The Report to Shareholders is attached herewith. |
Annual Report
December 31, 2021
| State Street U.S. Equity V.I.S. Fund |
State Street U.S. Equity V.I.S. Fund
Annual Report
December 31, 2021
| | Page |
| 1 |
| 2 |
| Financial Statements | |
| 10 |
| 11 |
| 12 |
| 13 |
| 14 |
| 20 |
| 21 |
This report is prepared for Policyholders of certain variable contracts and may be distributed to others only if preceded or accompanied by the variable contract’s current prospectus and the current summary prospectus of the Fund available for investments thereunder.
[This page intentionally left blank]
State Street U.S. Equity V.I.S. Fund
Notes to Performance — December 31, 2021 (Unaudited)
The information provided on the performance pages relates to the State Street U.S. Equity V.I.S. Fund (the “Fund”).
Total return performance shown in this report for the Fund takes into account changes in share price and assumes reinvestment of dividends and capital gains distributions, if any. Total returns shown are net of Fund fees and expenses but do not reflect fees and charges associated with the variable contracts such as administrative fees, account charges and surrender charges, which, if reflected, would reduce the Fund’s total returns for all periods shown.
The performance data quoted represents past performance; past performance does not guarantee future results. Investment return and principal value will fluctuate so your shares, when redeemed, may be worth more or less than their original cost. Current performance may be higher or lower than the performance data quoted. Periods less than one year are not annualized. Please call toll-free (800) 242-0134 or visit the Fund’s website at http://www.ssga.com/ geam for the most recent month-end performance data.
An investment in the Fund is not a deposit of any bank and is not insured or guaranteed by the Federal Deposit Insurance Corporation (“FDIC”) or any other government agency. An investment in the Fund is subject to risk, including possible loss of principal invested.
The S&P 500® Index is an unmanaged, market capitalization-weighted index of stocks of 500 large U.S. companies, which is widely used as a measure of large-cap U.S. stock market performance. The results shown for the foregoing index assume the reinvestment of net dividends or interest and do not reflect fees, expenses, or taxes. As such, the index returns do not reflect the actual cost of investing in the instruments that comprise the index.
The views expressed in this document reflect our judgment as of the publication date and are subject to change at any time without notice.
State Street Global Advisors Funds Distributors, LLC, member of FINRA & SIPC is the principal underwriter and distributor of the State Street U.S. Equity V.I.S. Fund and an indirect wholly-owned subsidiary of State Street Corporation. References to State Street may include State Street Corporation and its affiliates. The Funds pay State Street Bank and Trust Company for its services as custodian and Fund Accounting agent, and pay SSGA Funds Management, Inc. ("SSGA FM" or the "Adviser") for investment advisory and administrative services.
State Street U.S. Equity V.I.S. Fund
Management's Discussion of Fund Performance — December 31, 2021 (Unaudited)
The State Street U.S. Equity V.I.S. Fund (the “Fund”) seeks to provide long-term growth of capital. The Fund’s benchmark is the S&P 500 Index (the “Index”).
For the 12-month period ended December 31, 2021 (the “Reporting Period”), the total return for the Fund was 25.49%, and the Index was 28.71%. The Fund and Index returns reflect the reinvestment of dividends and other income. The Fund’s performance reflects the expenses of managing the Fund, including brokerage and advisory expenses. The Index is unmanaged and Index returns do not reflect fees and expenses of any kind, which would have a negative impact on returns.
Positions in payments companies, healthcare, and semiconductors were primary drivers of Fund performance during the Reporting Period relative to the Index.
The Fund’s positions in payments companies such as Visa detracted from relative performance in 2021 as travel, and international travel in particular, suffered due to a resurgent COVID-19. In our view these companies have long-term secular growth prospects and strong market positions and may benefit as COVID-19 starts to fade and travel resumes. A second detractor was stock selection in healthcare, most notably Merck, which has been ignored by the market during the pandemic. In our view, Merck is a dominant player in an industry with high barriers to entry. It has benefited from strong cash flow and diversified high margin businesses with further scope for growth. It has a strong oncology business, and its vaccine and animal health businesses give it less exposure to patent cliffs than some competitors. But despite all of these advantages, Merck lagged in the Reporting Period because of no clear near-term catalyst or direct COVID-19 treatments.
On the positive side, the Fund has benefitted significantly from both an overweight and outperformance in the semiconductor space. We believe semiconductors have become less cyclical in recent years as chip technology has proliferated throughout the economy. This long-term view has led to overweights in a number of very strong players in the space. Most notable among these has been Applied Materials, a semiconductor equipment manufacturer with enormous competitive advantages driven by its proprietary technology. The company’s stock was up more than 80% during the Reporting Period.
The Fund used futures in order to efficiently manage cash flows during the Reporting Period. The Fund’s use of futures contributed modestly to Fund performance relative to the Index.
On an individual security level, the top positive contributors to the Fund’s performance on an absolute basis during the Reporting Period were Microsoft, Alphabet and Apple. The top negative contributors to the Fund’s performance on an absolute basis during the Reporting Period were Fidelity National Information Services, Walt Disney and PayPal Holdings.
The views expressed above reflect those of the Fund’s portfolio manager only through the Reporting Period, and do not necessarily represent the views of the Adviser as a whole. Any such views are subject to change at any time based upon market or other conditions and the Adviser disclaims any responsibility to update such views. These views may not be relied on as investment advice and, because investment decisions for a fund are based on numerous factors, may not be relied on as an indication of trading intent on behalf of any fund.
| 2 | State Street U.S. Equity V.I.S. Fund |
State Street U.S. Equity V.I.S. Fund
Performance Summary — December 31, 2021 (Unaudited)
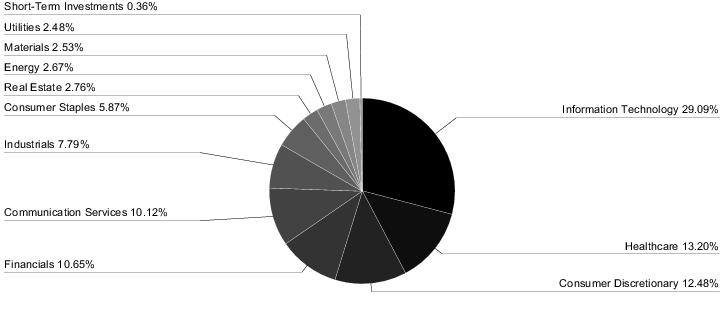
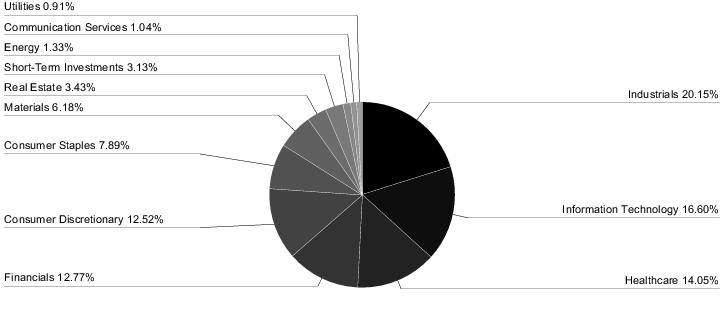
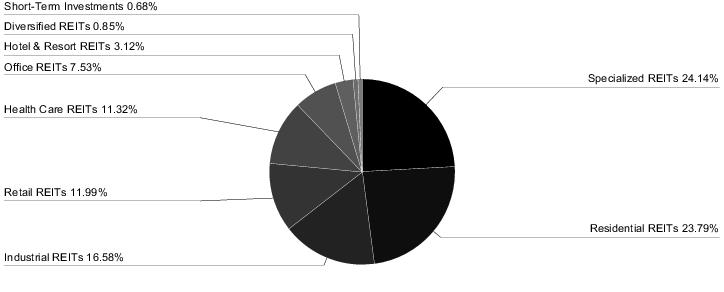
| Sector Allocation |
| Portfolio composition as a % of Fair Value of $29,620 (in thousands) as of December 31, 2021 (a)(b) |
| Top Ten Largest Holdings |
| as of December 31, 2021 (as a % of Fair Value) (a)(b) |
| Microsoft Corp. | 6.82% |
| Apple Inc. | 5.57% |
| Amazon.com Inc. | 4.45% |
| Alphabet Inc., Class A | 3.60% |
| Meta Platforms Inc., Class A | 2.67% |
| Visa Inc., Class A | 2.29% |
| QUALCOMM Inc. | 2.20% |
| JPMorgan Chase & Co. | 2.11% |
| UnitedHealth Group Inc. | 2.10% |
| Lowe's Companies Inc. | 1.96% |
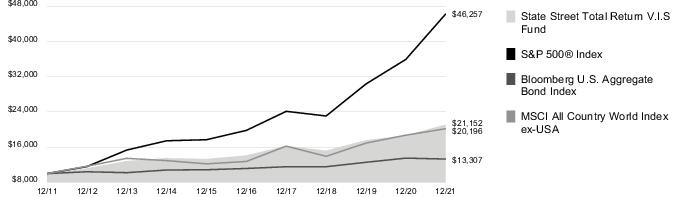
| Average Annual Total Return for the years ended December 31, 2021 |
| Class 1 Shares (Inception date 1/3/95) |
| | One Year | | Five Year | | Ten Year | | Ending Value
of a $10,000
Investment |
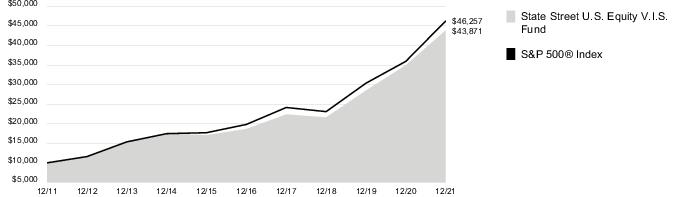
| State Street U.S. Equity V.I.S. Fund | 25.49% | | 18.63% | | 15.94% | | $43,871 |
| S&P 500® Index | 28.71% | | 18.48% | | 16.55% | | $46,257 |
|
| (a) | Fair Value basis is inclusive of a short-term investment in the State Street Institutional U.S. Government Money Market Fund Class G Shares. |
| (b) | The securities information regarding holdings, allocations and other characteristics is presented to illustrate examples of securities that the Fund has bought and the diversity of areas in which the Fund may invest as of a particular date. It may not be representative of the Fund’s current or future investments and should not be construed as a recommendation to purchase or sell a particular security. |
| State Street U.S. Equity V.I.S. Fund | 3 |
State Street U.S. Equity V.I.S. Fund
Performance Summary, continued — December 31, 2021 (Unaudited)
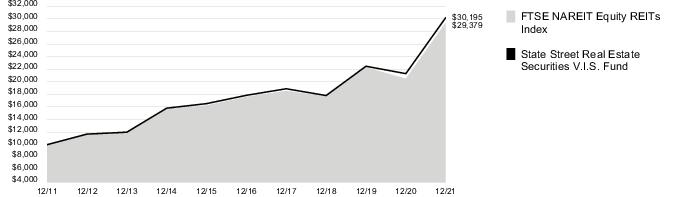
Change in Value of a $10,000 Investment
Yearly periods ended December 31
See Notes to Performance beginning on page 1 for further information.
Past performance does not predict future performance. The performance shown in the graphs and tables does not reflect the deduction of taxes that a shareholder would pay on Fund distributions or the redemption of Fund shares and does not reflect the fees or changes that would be associated with variable contracts through which shares of the Fund are offered.
| 4 | State Street U.S. Equity V.I.S. Fund |
State Street U.S. Equity V.I.S. Fund
Understanding Your Fund’s Expenses — December 31, 2021 (Unaudited)
As a shareholder of the Fund, you incur ongoing costs. Ongoing costs include portfolio management fees, professional fees, administrative fees and other Fund expenses. The following example is intended to help you understand your ongoing costs (in dollars) of investing in the Fund and to compare these costs with the ongoing costs of investing in other mutual funds.
To illustrate these ongoing costs, we have provided an example and calculated the expenses paid by investors of the Fund during the period. The information in the following table is based on an investment of $1,000, which is invested at the beginning of the period and held for the entire six-month period ended December 31, 2021.
Actual Expenses
The first section of the table provides information about actual account values and actual expenses. You may use the information in this section, together with the amount you invested, to estimate the expenses that you paid over the period. To do so, simply divide your account value by $1,000 (for example, an $8,600 account value divided by $1,000 = 8.6), then multiply the result by the number given under the heading “Expenses paid during the period” to estimate the expenses you paid on your account during the period.
Hypothetical Example for Comparison Purposes
The second section of the table provides information about hypothetical account values and hypothetical expenses based on the Fund’s actual expense ratio and an assumed rate of return of 5% per year before expenses, which is not the Fund’s actual return. The hypothetical account values and expenses may not be used to estimate the actual ending account balance or expenses you paid for the period. You may use this information to compare the ongoing costs of investing in the Fund and other funds. To do so, compare this 5% hypothetical example with the 5% hypothetical examples that appear in the shareholder reports of other funds.
Please note that the expenses shown in the table are meant to highlight and help you compare ongoing costs only and do not reflect transaction costs, such as sales charges or redemption fees, if any. Therefore, the second section of the table is useful in comparing ongoing costs only, and will not help you determine the relative total costs of owning different funds. Additionally, the expenses shown do not reflect the fees or charges associated with variable contracts through which shares of the Fund are offered.
| | Actual
Fund Return | | Hypothetical
5% Return
(2.5% for
the period) |
Beginning Account Value
July 1, 2021 | $1,000.00 | | $1,000.00 |
Ending Account value
December 31, 2021 | $1,088.80 | | $1,021.10 |
| Expenses Paid During Period* | $ 4.26 | | $ 4.13 |
| * | Expenses are equal to the Fund's annualized expense ratio of 0.81%** (for the period July 1, 2021 - December 31, 2021), multiplied by the average account value over the period, multiplied by 184/365 (to reflect the one-half year period). |
| ** | May differ from expense ratio disclosed in the financial highlights, which is calculated based on the entire fiscal year's data. |
| State Street U.S. Equity V.I.S. Fund | 5 |
State Street U.S. Equity V.I.S. Fund
Schedule of Investments — December 31, 2021
| | Number
of Shares | Fair
Value |
| Common Stock - 97.6% † |
| Aerospace & Defense - 0.5% |
| Raytheon Technologies Corp. | 1,809 | $ 155,683 |
| Apparel Retail - 1.4% |
| Ross Stores Inc. | 3,581 | 409,237 |
| Application Software - 2.6% |
| Adobe Inc. (a) | 320 | 181,459 |
| Intuit Inc. | 115 | 73,970 |
| salesforce.com Inc. (a) | 1,275 | 324,016 |
| Splunk Inc. (a) | 1,658 | 191,864 |
| | | 771,309 |
| Asset Management & Custody Banks - 0.2% |
| Blackstone Inc. | 490 | 63,401 |
| Auto Parts & Equipment - 0.8% |
| Magna International Inc. | 3,029 | 245,167 |
| Automotive Retail - 0.6% |
| O'Reilly Automotive Inc. (a) | 267 | 188,563 |
| Biotechnology - 1.3% |
| BioMarin Pharmaceutical Inc. (a) | 1,388 | 122,630 |
| Vertex Pharmaceuticals Inc. (a) | 1,229 | 269,888 |
| | | 392,518 |
| Building Products - 0.9% |
| Allegion plc | 593 | 78,537 |
| Trane Technologies PLC | 850 | 171,725 |
| | | 250,262 |
| Cable & Satellite - 1.5% |
| Charter Communications Inc., Class A (a) | 140 | 91,276 |
| Comcast Corp., Class A | 6,847 | 344,609 |
| | | 435,885 |
| Communications Equipment - 0.2% |
| Cisco Systems Inc. | 1,067 | 67,616 |
| Construction Materials - 0.3% |
| Martin Marietta Materials Inc. | 187 | 82,377 |
| Data Processing & Outsourced Services - 5.8% |
| Fidelity National Information Services Inc. | 3,015 | 329,087 |
| | Number
of Shares | Fair
Value |
| Mastercard Inc., Class A | 1,523 | $ 547,245 |
| PayPal Holdings Inc. (a) | 919 | 173,305 |
| Visa Inc., Class A | 3,134 | 679,169 |
| | | 1,728,806 |
| Diversified Banks - 2.1% |
| JPMorgan Chase & Co. | 3,947 | 625,007 |
| Diversified Support Services - 1.0% |
| Cintas Corp. | 268 | 118,769 |
| IAA Inc. (a) | 3,451 | 174,690 |
| | | 293,459 |
| Electric Utilities - 0.9% |
| NextEra Energy Inc. | 2,806 | 261,968 |
| Electronic Components - 1.5% |
| Amphenol Corp., Class A | 3,331 | 291,329 |
| Corning Inc. | 4,064 | 151,303 |
| | | 442,632 |
| Environmental & Facilities Services - 0.8% |
| Waste Management Inc. | 1,479 | 246,845 |
| Financial Exchanges & Data - 1.0% |
| CME Group Inc. | 567 | 129,537 |
| S&P Global Inc. | 333 | 157,153 |
| | | 286,690 |
| Footwear - 0.4% |
| NIKE Inc., Class B | 653 | 108,836 |
| Healthcare Equipment - 3.2% |
| Becton Dickinson & Co. | 550 | 138,314 |
| Boston Scientific Corp. (a) | 7,888 | 335,082 |
| Edwards Lifesciences Corp. (a) | 796 | 103,122 |
| Medtronic PLC | 2,077 | 214,866 |
| Zimmer Biomet Holdings Inc. | 1,287 | 163,500 |
| | | 954,884 |
| Healthcare Services - 0.7% |
| Cigna Corp. | 837 | 192,200 |
| Home Improvement Retail - 2.3% |
| Lowe's Companies Inc. | 2,238 | 578,478 |
| The Home Depot Inc. | 266 | 110,393 |
| | | 688,871 |
See Notes to Schedule of Investments and Notes to Financial Statements.
| 6 | State Street U.S. Equity V.I.S. Fund |
State Street U.S. Equity V.I.S. Fund
Schedule of Investments, continued — December 31, 2021
| | Number
of Shares | Fair
Value |
| Hotels, Resorts & Cruise Lines - 1.1% |
| Marriott International Inc., Class A (a) | 1,918 | $ 316,930 |
| Household Products - 1.4% |
| Colgate-Palmolive Co. | 1,213 | 103,517 |
| The Procter & Gamble Co. | 1,900 | 310,802 |
| | | 414,319 |
| Hypermarkets & Super Centers - 0.3% |
| Walmart Inc. | 690 | 99,836 |
| Industrial Conglomerates - 1.4% |
| Honeywell International Inc. | 1,941 | 404,718 |
| Industrial Gases - 1.4% |
| Air Products & Chemicals Inc. | 1,398 | 425,356 |
| Industrial Machinery - 1.6% |
| Parker-Hannifin Corp. | 1,141 | 362,975 |
| Xylem Inc. | 790 | 94,737 |
| | | 457,712 |
| Insurance Brokers - 0.3% |
| Marsh & McLennan Companies Inc. | 483 | 83,955 |
| Integrated Oil & Gas - 0.6% |
| Chevron Corp. | 1,528 | 179,311 |
| Interactive Home Entertainment - 0.2% |
| Activision Blizzard Inc. | 840 | 55,885 |
| Interactive Media & Services - 7.9% |
| Alphabet Inc., Class C (a)(b) | 165 | 477,442 |
| Alphabet Inc., Class A (a) | 368 | 1,066,111 |
| Meta Platforms Inc., Class A (a) | 2,352 | 791,095 |
| | | 2,334,648 |
| Internet & Direct Marketing Retail - 4.5% |
| Amazon.com Inc. (a)(b) | 395 | 1,317,064 |
| Investment Banking & Brokerage - 1.3% |
| The Charles Schwab Corp. | 4,437 | 373,152 |
| IT Consulting & Other Services - 0.4% |
| Accenture PLC, Class A | 313 | 129,754 |
| | Number
of Shares | Fair
Value |
| Life & Health Insurance - 0.1% |
| Lincoln National Corp. | 608 | $ 41,502 |
| Life Sciences Tools & Services - 0.3% |
| IQVIA Holdings Inc. (a) | 319 | 90,003 |
| Managed Healthcare - 2.6% |
| Humana Inc. | 331 | 153,538 |
| UnitedHealth Group Inc. | 1,242 | 623,658 |
| | | 777,196 |
| Movies & Entertainment - 1.8% |
| Netflix Inc. (a) | 422 | 254,229 |
| The Walt Disney Co. (a) | 1,811 | 280,506 |
| | | 534,735 |
| Multi-Line Insurance - 0.3% |
| American International Group Inc. | 1,468 | 83,470 |
| Multi-Sector Holdings - 1.1% |
| Berkshire Hathaway Inc., Class B (a) | 1,111 | 332,189 |
| Multi-Utilities - 1.3% |
| Sempra Energy | 2,973 | 393,268 |
| Oil & Gas Equipment & Services - 0.4% |
| Schlumberger N.V. | 4,324 | 129,504 |
| Oil & Gas Exploration & Production - 1.5% |
| ConocoPhillips | 4,143 | 299,042 |
| Pioneer Natural Resources Co. | 734 | 133,500 |
| | | 432,542 |
| Packaged Foods & Meats - 1.5% |
| Mondelez International Inc., Class A | 6,551 | 434,397 |
| Personal Products - 0.3% |
| The Estee Lauder Companies Inc., Class A | 254 | 94,031 |
| Pharmaceuticals - 4.4% |
| AstraZeneca PLC, ADR | 1,314 | 76,540 |
| Bristol-Myers Squibb Co. | 2,676 | 166,849 |
| Elanco Animal Health Inc. (a) | 2,291 | 65,019 |
| Johnson & Johnson | 3,078 | 526,553 |
| Merck & Company Inc. | 5,595 | 428,801 |
See Notes to Schedule of Investments and Notes to Financial Statements.
| State Street U.S. Equity V.I.S. Fund | 7 |
State Street U.S. Equity V.I.S. Fund
Schedule of Investments, continued — December 31, 2021
| | Number
of Shares | Fair
Value |
| Viatris Inc. | 3,492 | $ 47,247 |
| | | 1,311,009 |
| Property & Casualty Insurance - 1.2% |
| Chubb Ltd. | 1,748 | 337,906 |
| Railroads - 0.6% |
| Union Pacific Corp. | 747 | 188,192 |
| Regional Banks - 2.9% |
| First Republic Bank | 1,160 | 239,552 |
| Regions Financial Corp. | 18,330 | 399,594 |
| SVB Financial Group (a) | 322 | 218,393 |
| | | 857,539 |
| Restaurants - 0.6% |
| McDonald's Corp. | 689 | 184,700 |
| Semiconductor Equipment - 1.5% |
| Applied Materials Inc. | 2,724 | 428,649 |
| Semiconductors - 5.5% |
| Advanced Micro Devices Inc. (a) | 1,326 | 190,811 |
| NVIDIA Corp. | 1,258 | 369,990 |
| QUALCOMM Inc. | 3,566 | 652,115 |
| Texas Instruments Inc. | 2,203 | 415,200 |
| | | 1,628,116 |
| Soft Drinks - 0.9% |
| PepsiCo Inc. | 1,485 | 257,959 |
| Specialized REITs - 1.1% |
| American Tower Corp. | 1,076 | 314,730 |
| Specialty Chemicals - 0.7% |
| DuPont de Nemours Inc. | 1,022 | 82,557 |
| | Number
of Shares | Fair
Value |
| Ecolab Inc. | 228 | $ 53,487 |
| PPG Industries Inc. | 444 | 76,563 |
| | | 212,607 |
| Systems Software - 7.7% |
| Microsoft Corp. | 6,005 | 2,019,601 |
| Oracle Corp. | 1,184 | 103,257 |
| ServiceNow Inc. (a) | 252 | 163,576 |
| | | 2,286,434 |
| Technology Hardware, Storage & Peripherals - 5.6% |
| Apple Inc. | 9,286 | 1,648,915 |
| Trading Companies & Distributors - 1.0% |
| United Rentals Inc. (a) | 897 | 298,064 |
| Trucking - 0.1% |
| Lyft Inc., Class A (a) | 753 | 32,176 |
| Wireless Telecommunication Services - 0.2% |
| T-Mobile US Inc. (a) | 550 | 63,789 |
Total Common Stock
(Cost $16,440,253) | | 28,878,478 |
| Short-Term Investments - 2.5% |
State Street Institutional U.S. Government Money Market Fund - Class G Shares 0.03% (c)(d)
(Cost $742,013) | 742,013 | 742,013 |
Total Investments
(Cost $17,182,266) | | 29,620,491 |
| Liabilities in Excess of Other Assets, net - (0.1)% | | (25,326) |
| NET ASSETS - 100.0% | | $ 29,595,165 |
Other Information:
| The Fund had the following long futures contracts open at December 31, 2021: |
| Description | Expiration
Date | Number of
Contracts | Notional
Amount | Value | Unrealized
Appreciation
(Depreciation) |
| S&P 500 Emini Index Futures | March 2022 | 2 | $ 470,302 | $ 475,850 | $ 5,548 |
During the year ended December 31, 2021, the average notional value related to long futures contracts was $426,423.
See Notes to Schedule of Investments and Notes to Financial Statements.
| 8 | State Street U.S. Equity V.I.S. Fund |
State Street U.S. Equity V.I.S. Fund
Schedule of Investments, continued — December 31, 2021
Notes to Schedule of Investments
The views expressed in this document reflect our judgment as of the publication date and are subject to change at any time without notice. The securities cited may not be representative of the Fund’s future investments and should not be construed as a recommendation to purchase or sell a particular security. See the Fund’s summary prospectus and statutory prospectus for complete descriptions of investment objectives, policies, risks and permissible investments.
| (a) | Non-income producing security. |
| (b) | At December 31, 2021, all or a portion of this security was pledged to cover collateral requirements for futures. |
| (c) | Sponsored by SSGA Funds Management, Inc., the Fund’s investment adviser and administrator, and an affiliate of State Street Bank & Trust Co., the Fund’s sub-administrator, custodian and accounting agent. |
| (d) | Coupon amount represents effective yield. |
| † | Percentages are based on net assets as of December 31, 2021. |
| Abbreviations: |
| ADR - American Depositary Receipt |
| REIT - Real Estate Investment Trust |
The following table presents the Fund’s investments measured at fair value on a recurring basis at December 31, 2021:
| Investments | Level 1 | | Level 2 | | Level 3 | | Total |
| Investments in Securities | | | | | | | |
| Common Stock | $ 28,878,478 | | $ — | | $ — | | $ 28,878,478 |
| Short-Term Investments | 742,013 | | — | | — | | 742,013 |
| Total Investments in Securities | $ 29,620,491 | | $ — | | $ — | | $ 29,620,491 |
| Other Financial Instruments | | | | | | | |
| Long Futures Contracts - Unrealized Appreciation | $ 5,548 | | $ — | | $ — | | $ 5,548 |
| Total Other Financial Instruments | $ 5,548 | | $ — | | $ — | | $ 5,548 |
| | Number
of Shares
Held at
12/31/20 | Value at
12/31/20 | Cost of
Purchases | Proceeds
from
Shares
Sold | Realized
Gain
(Loss) | Change in
Unrealized
Appreciation
(Depreciation) | Number of
Shares
Held at
12/31/21 | Value at
12/31/21 | Dividend
Income |
| State Street Institutional U.S. Government Money Market Fund - Class G Shares | 582,660 | $582,660 | $6,505,965 | $6,346,612 | $— | $— | 742,013 | $742,013 | $168 |
See Notes to Schedule of Investments and Notes to Financial Statements.
| State Street U.S. Equity V.I.S. Fund | 9 |
State Street U.S. Equity V.I.S. Fund
Financial Highlights
Selected data based on a share outstanding throughout the fiscal years indicated
| | 12/31/21 | | 12/31/20 | | 12/31/19 | | 12/31/18 | | 12/31/17 |
| Inception date | | | 1/3/95 |
| Net asset value, beginning of period | $ 53.28 | | $ 46.97 | | $ 38.07 | | $ 44.20 | | $ 42.02 |
| Income/(loss) from investment operations: | | | | | | | | | |
| Net investment income(a) | 0.18 | | 0.27 | | 0.33 | | 0.37 | | 0.35 |
| Net realized and unrealized gains/(losses) on investments | 13.47 | | 10.34 | | 11.78 | | (1.90) | | 8.03 |
| Total income/(loss) from investment operations | 13.65 | | 10.61 | | 12.11 | | (1.53) | | 8.38 |
| Less distributions from: | | | | | | | | | |
| Net investment income | 0.22 | | 0.27 | | 0.32 | | 0.41 | | 0.38 |
| Net realized gains | 10.16 | | 4.03 | | 2.89 | | 4.19 | | 5.82 |
| Total distributions | 10.38 | | 4.30 | | 3.21 | | 4.60 | | 6.20 |
| Net asset value, end of period | $ 56.55 | | $ 53.28 | | $ 46.97 | | $ 38.07 | | $ 44.20 |
| Total Return(b) | 25.49% | | 22.64% | | 31.77% | | (3.40)% | | 19.91% |
| Ratios/Supplemental Data: | | | | | | | | | |
| Net assets, end of period (in thousands) | $29,595 | | $27,729 | | $25,951 | | $23,473 | | $28,308 |
| Ratios to average net assets: | | | | | | | | | |
| Net expenses | 0.82% | | 0.86% | | 0.88% | | 0.80% | | 0.85% |
| Gross expenses | 0.82% | | 0.86% | | 0.88% | | 0.80% | | 0.85% |
| Net investment income | 0.30% | | 0.56% | | 0.74% | | 0.81% | | 0.75% |
| Portfolio turnover rate | 32% | | 38% | | 31% | | 41% | | 80% |
| Notes to Financial Highlights |
| (a) | Per share values have been calculated using the average shares method. |
| (b) | Total returns are historical and assume changes in share price, reinvestment of dividends and capital gains distributions and do not include the effect of insurance contract charges. Past performance does not guarantee future results. |
The accompanying Notes are an integral part of these financial statements.
State Street U.S. Equity V.I.S. Fund
Statement of Assets and Liabilities — December 31, 2021
| Assets | |
| Investments in securities, at fair value (cost $16,440,253) | $ 28,878,478 |
| Short-term affiliated investments, at fair value | 742,013 |
| Cash | 534 |
| Net cash collateral on deposit with broker for future contracts | 18,330 |
| Receivable for investments sold | 12,584 |
| Income receivables | 25,836 |
| Receivable for fund shares sold | 353 |
| Income receivable from affiliated investments | 18 |
| Receivable for accumulated variation margin on futures contracts | 5,553 |
| Other assets | 168 |
| Total assets | 29,683,867 |
| Liabilities | |
| Payable for fund shares redeemed | 35,955 |
| Payable to the Adviser | 13,591 |
| Payable for custody, fund accounting and sub-administration fees | 3,535 |
| Accrued other expenses | 35,621 |
| Total liabilities | 88,702 |
|
| Net Assets | $ 29,595,165 |
| Net Assets Consist of: | |
| Capital paid in | $ 16,473,941 |
| Total distributable earnings (loss) | 13,121,224 |
| Net Assets | $ 29,595,165 |
| Shares outstanding ($0.01 par value; unlimited shares authorized) | 523,303 |
| Net asset value per share | $ 56.55 |
The accompanying Notes are an integral part of these financial statements.
| Statement of Assets and Liabilities | 11 |
State Street U.S. Equity V.I.S. Fund
Statement of Operations — For the year ended December 31, 2021
| Investment Income | |
| Income | |
| Dividend | $ 326,096 |
| Income from affiliated investments | 168 |
| Less: Foreign taxes withheld | (373) |
| Total income | 325,891 |
| Expenses | |
| Advisory and administration fees | 159,621 |
| Directors' fees | 18,698 |
| Custody, fund accounting and sub-administration fees | 21,016 |
| Professional fees | 31,109 |
| Printing and shareholder reports | 4,821 |
| Other expenses | 3,069 |
| Total expenses | 238,334 |
| Net investment income | $ 87,557 |
| Net Realized and Unrealized Gain (Loss) on Investments | |
| Realized gain (loss) on: | |
| Unaffiliated investments | $ 4,796,945 |
| Futures | 83,657 |
| Increase (decrease) in unrealized appreciation/depreciation on: | |
| Unaffiliated investments | 1,617,345 |
| Futures | (203) |
| Net realized and unrealized gain (loss) on investments | 6,497,744 |
| Net Increase in Net Assets Resulting from Operations | $ 6,585,301 |
The accompanying Notes are an integral part of these financial statements.
| 12 | Statement of Operations |
State Street U.S. Equity V.I.S. Fund
Statements of Changes in Net Assets
| | Year Ended
December 31,
2021 | | Year Ended
December 31,
2020 |
| Increase (Decrease) in Net Assets | | | |
| Operations: | | | |
| Net investment income | $ 87,557 | | $ 138,985 |
| Net realized gain (loss) on investments and futures | 4,880,602 | | 1,936,160 |
| Net increase (decrease) in unrealized appreciation/depreciation on investments and futures | 1,617,142 | | 3,106,788 |
| Net increase (decrease) from operations | 6,585,301 | | 5,181,933 |
| Distributions to shareholders: | | | |
| Total distributions | (4,601,794) | | (2,081,342) |
| Increase (decrease) in assets from operations and distributions | 1,983,507 | | 3,100,591 |
| Share transactions: | | | |
| Proceeds from sale of shares | 312,618 | | 476,265 |
| Value of distributions reinvested | 4,601,794 | | 2,081,342 |
| Cost of shares redeemed | (5,031,745) | | (3,879,729) |
| Net increase (decrease) from share transactions | (117,333) | | (1,322,122) |
| Total increase (decrease) in net assets | 1,866,174 | | 1,778,469 |
| Net Assets | | | |
| Beginning of year | 27,728,991 | | 25,950,522 |
| End of year | $ 29,595,165 | | $ 27,728,991 |
| Changes in Fund Shares | | | |
| Shares sold | 5,112 | | 10,541 |
| Issued for distributions reinvested | 80,875 | | 39,308 |
| Shares redeemed | (83,113) | | (81,944) |
| Net increase (decrease) in fund shares | 2,874 | | (32,095) |
The accompanying Notes are an integral part of these financial statements.
| Statements of Changes in Net Assets | 13 |
State Street U.S. Equity V.I.S. Fund
Notes to Financial Statements — December 31, 2021
1. Organization of the Company
State Street Variable Insurance Series Funds, Inc. (the “Company”) was incorporated under the laws of the Commonwealth of Virginia on May 14, 1984 and is registered under the Investment Company Act of 1940, as amended (the “1940 Act”), as an open-end management investment company. The Company is currently composed of the following seven investment portfolios (collectively, the “Funds”): State Street U.S. Equity V.I.S. Fund (the “Fund”), State Street S&P 500 Index V.I.S. Fund, State Street Premier Growth Equity V.I.S. Fund, State Street Small-Cap Equity V.I.S. Fund, State Street Total Return V.I.S. Fund, State Street Income V.I.S. Fund and State Street Real Estate Securities V.I.S. Fund. Each Fund is a diversified investment company within the meaning of the 1940 Act, except for the State Street Premier Growth Equity V.I.S. Fund, which is a non-diversified investment company.
Shares of the Funds of the Company are offered only to insurance company separate accounts that fund certain variable life insurance contracts and variable annuity contracts.
The Company currently offers one share class (Class 1) of the Fund as an investment option for variable life insurance and variable annuity contracts.
Under the Company’s organizational documents, its officers and directors are indemnified against certain liabilities arising out of the performance of their duties to the Company. Additionally, in the normal course of business, the Company enters into contracts with service providers that contain general indemnification clauses. The Company’s maximum exposure under these arrangements is unknown as this would involve future claims that may be made against the Company that have not yet occurred.
2.Summary of Significant Accounting Policies
The following is a summary of significant accounting policies followed by the Company in the preparation of its financial statements:
The preparation of financial statements in accordance with U.S. generally accepted accounting principles (“U.S. GAAP”) requires management to make estimates and assumptions that affect the reported amounts and disclosures in the financial statements. Actual results could differ from those estimates. The Fund is an investment company under U.S. GAAP and follows the accounting and reporting guidance applicable to investment companies.
Security Valuation The Fund’s investments are valued at fair value each day that the New York Stock Exchange (“NYSE”) is open and, for financial reporting purposes, as of the report date should the reporting period end on a day that the NYSE is not open. Fair value is generally defined as the price a fund would receive to sell an asset or pay to transfer a liability in an orderly transaction between market participants at the measurement date. By its nature, a fair value price is a good faith estimate of the valuation in a current sale and may not reflect an actual market price. The investments of the Fund are valued pursuant to the policy and procedures developed by the Oversight Committee (the “Committee”) and approved by the Company's Board of Directors (the “Board”). The Committee provides oversight of the valuation of investments for the Fund. The Board has responsibility for overseeing the determination of the fair value of investments.
Valuation techniques used to value the Fund’s investments by major category are as follows:
| • | Equity investments traded on a recognized securities exchange for which market quotations are readily available are valued at the last sale price or official closing price, as applicable, on the primary market or exchange on which they trade. Equity investments traded on a recognized exchange for which there were no sales on that day are valued at the last published sale price or at fair value. |
| • | Exchange-traded futures contracts are valued at the closing settlement price on the primary market on which they are traded most extensively. Exchange-traded futures contracts traded on a recognized exchange for which there were no sales on that day are valued at the last reported sale price obtained from independent pricing services or brokers or at fair value. |
| 14 | Notes to Financial Statements |
State Street U.S. Equity V.I.S. Fund
Notes to Financial Statements, continued — December 31, 2021
| • | Investments in registered investment companies (including money market funds) or other unitized pooled investment vehicles that are not traded on an exchange are valued at that day’s published net asset value (“NAV”) per share or unit. |
In the event prices or quotations are not readily available or that the application of these valuation methods results in a price for an investment that is deemed to be not representative of the fair value of such investment, fair value will be determined in good faith by the Committee, in accordance with the valuation policy and procedures approved by the Board.
The Fund values its assets and liabilities at fair value using a fair value hierarchy consisting of three broad levels that prioritize the inputs to valuation techniques giving the highest priority to readily available unadjusted quoted prices in active markets for identical assets or liabilities (Level 1 measurements) and the lowest priority to unobservable inputs (Level 3 measurements) when market prices are not readily available or reliable. The categorization of a value determined for an investment within the hierarchy is based upon the pricing transparency of the investment and is not necessarily an indication of the risk associated with investing in it.
The three levels of the fair value hierarchy are as follows:
| • | Level 1 — Unadjusted quoted prices in active markets for identical asset or liability; |
| • | Level 2 — Inputs other than quoted prices included within Level 1 that are observable for the asset or liability either directly or indirectly, including quoted prices for similar assets or liabilities in active markets, quoted prices for identical or similar assets or liabilities in markets that are not considered to be active, inputs other than quoted prices that are observable for the asset or liability (such as exchange rates, financing terms, interest rates, yield curves, volatilities, prepayment speeds, loss severities, credit risks and default rates) or other market-corroborated inputs; and |
| • | Level 3 — Unobservable inputs for the asset or liability, including the Committee’s assumptions used in determining the fair value of investments. |
The value of the Fund’s investments according to the fair value hierarchy as of December 31, 2021 is disclosed in the Fund’s Schedule of Investments.
Investment Transactions and Income Recognition Investment transactions are accounted for on trade date for financial reporting purposes. Realized gains and losses from the sale or disposition of investments and foreign exchange transactions, if any, are determined using the identified cost method.
Dividend income and capital gain distributions, if any, are recognized on the ex-dividend date, net of any foreign taxes withheld at source, if any.
Interest income is recorded daily on an accrual basis. All premiums and discounts are amortized/accreted for financial reporting purposes.
Non-cash dividends received in the form of stock are recorded as dividend income at fair value.
The Fund invests in real estate investment trusts (“REITs”). REITs determine the tax character of their distributions annually and may characterize a portion of their distributions as return of capital or capital gain. The Fund’s policy is to record all REIT distributions initially as dividend income and re-designate a portion to return of capital or capital gain distributions at year-end based on information provided by the REIT and/or SSGA Funds Management, Inc’s (the “Adviser” or “SSGA FM”) estimates of such re-designations for which actual information has not yet been reported. Non-cash dividends received in the form of stock are recorded as dividend income at fair value.
Expenses Certain expenses, which are directly identifiable to a specific Fund, are applied to the Fund within the Company. Other expenses which cannot be attributed to a specific Fund are allocated in such a manner as deemed equitable, taking into consideration the nature and type of expense and the relative net assets of the Fund within the Company.
| Notes to Financial Statements | 15 |
State Street U.S. Equity V.I.S. Fund
Notes to Financial Statements, continued — December 31, 2021
Foreign Currency Translation The accounting records of the Fund are maintained in U.S. dollars. Foreign currencies as well as investment securities and other assets and liabilities denominated in a foreign currency are translated to U.S. dollars using exchange rates at period end. Purchases and sales of securities, income receipts and expense payments denominated in foreign currencies are translated into U.S. dollars at the prevailing exchange rate on the respective dates of the transactions.
The effects of exchange rate fluctuations on investments are included with the net realized and unrealized gain (loss) on investment securities. Other foreign currency transactions resulting in realized and unrealized gain (loss) are disclosed separately.
Foreign Taxes The Fund may be subject to foreign taxes (a portion of which may be reclaimable) on income, stock dividends, realized and unrealized capital gains on investments or certain foreign currency transactions. Foreign taxes are recorded in accordance with SSGA FM's understanding of the applicable foreign tax regulations and rates that exist in the foreign jurisdictions in which the Fund invests. These foreign taxes, if any, are paid by the Fund and are reflected in the Statement of Operations, if applicable. Foreign taxes payable or deferred as of December 31, 2021, if any, are disclosed in the Fund’s Statement of Assets and Liabilities.
Distributions The Fund declares and pays any dividends from net investment income annually.
Net realized capital gains, if any, are distributed annually, unless additional distributions are required for compliance with applicable tax regulations. The amount and character of income and capital gains to be distributed are determined in accordance with applicable tax regulations which may differ from net investment income and realized gains recognized for U.S. GAAP purposes.
3.Derivative Financial Instruments
Futures Contracts The Fund may enter into futures contracts to meet the Fund’s objectives. A futures contract is a standardized, exchange-traded agreement to buy or sell a financial instrument at a set price on a future date. Upon entering into a futures contract, the Fund is required to deposit with the broker, cash or securities in an amount equal to the minimum initial margin requirements of the clearing house. Securities deposited, if any, are designated on the Schedule of Investments and cash deposited, if any, is included in Net cash collateral on deposit with broker for future contracts on the Statement of Assets and Liabilities. Subsequent payments are made or received by the Fund equal to the daily change in the contract value, accumulated, exchange rates, and/or other transactional fees. The accumulation of those payments are recorded as variation margin receivable or payable with a corresponding offset to unrealized gains or losses. The Fund recognizes a realized gain or loss when the contract is closed.
Losses may arise if the value of a futures contract decreases due to unfavorable changes in the market rates or values of the underlying instrument during the term of the contract or if the counterparty does not perform under the contract. The use of futures contracts also involves the risk that the movements in the price of the futures contracts do not correlate with the movement of the assets underlying such contracts.
For the fiscal year ended December 31, 2021, the Fund entered into futures contracts for cash equitization.
The following tables summarize the value of the Fund’s derivative instruments as of December 31, 2021 and the related location in the accompanying Statement of Assets and Liabilities and Statement of Operations, presented by primary underlying risk exposure:
| Asset Derivatives |
| | Interest
Rate
Risk | Foreign
Exchange
Risk | Credit
Risk | Equity
Risk | Commodity
Risk | Total |
| State Street U.S. Equity V.I.S. Fund | | | | | | |
| Futures Contracts | $ — | $ — | $ — | $ 5,553 | $ — | $ 5,553 |
| 16 | Notes to Financial Statements |
State Street U.S. Equity V.I.S. Fund
Notes to Financial Statements, continued — December 31, 2021
| Realized Gain/Loss |
| | Interest
Rate
Risk | Foreign
Exchange
Risk | Credit
Risk | Equity
Risk | Commodity
Risk | Total |
| State Street U.S. Equity V.I.S. Fund | | | | | | |
| Futures Contracts | $ — | $ — | $ — | $ 83,657 | $ — | $ 83,657 |
| Net Change in Unrealized Appreciation (Depreciation) |
| | Interest
Rate
Risk | Foreign
Exchange
Risk | Credit
Risk | Equity
Risk | Commodity
Risk | Total |
| State Street U.S. Equity V.I.S. Fund | | | | | | |
| Futures Contracts | $ — | $ — | $ — | $ (203) | $ — | $ (203) |
4.Fees and Transactions with Affiliates
Advisory Fee SSGA FM, a registered investment adviser, was retained by the Board to act as investment adviser and administrator of the Fund. SSGA FM’s compensation for investment advisory and administrative services (“Management Fee”) is paid monthly based on the average daily net assets of the Fund at an annualized rate of 0.55%.
Custody, Fund Accounting and Sub-Administration Fees State Street Bank and Trust Company (“State Street”) serves as the custodian, fund accountant and sub-administrator to the Fund. Amounts paid by the Fund to State Street for performing such services are included as custody, fund accounting and sub-administration fees in the Statement of Operations.
Other Transactions with Affiliates The Fund may invest in affiliated entities, including securities issued by State Street Corporation, affiliated funds, or entities deemed to be affiliates as a result of the Fund owning more than five percent of the entity’s voting securities or outstanding shares. Amounts relating to these transactions during the fiscal year ended December 31, 2021 are disclosed in the Schedule of Investments.
5.Directors’ Fees
The fees and expenses of the Company’s directors who are not “interested persons” of the Company, as defined in the 1940 Act (“Independent Directors”), are paid directly by the Fund. The Independent Directors are reimbursed for travel and other out-of-pocket expenses in connection with meeting attendance and industry seminars.
6.Investment Transactions
Purchases and sales of investments (excluding in-kind transactions, short term investments and derivative contracts) for the fiscal year ended December 31, 2021 were as follows:
| Non-U.S. Government Securities |
| Purchases | Sales |
| $ 9,144,676 | $ 13,808,833 |
7.Income Taxes
The Fund has qualified and intends to continue to qualify as a regulated investment company under Subchapter M of the Internal Revenue Code of 1986, as amended. The Fund will not be subject to federal income taxes to the extent it distributes its taxable income, including any net realized capital gains, for each fiscal year. Therefore, no provision for federal income tax is required.
The Fund files federal and various state and local tax returns as required. No income tax returns are currently under examination. Generally, the federal returns are subject to examination by the Internal Revenue Service for a period of three years from date of filing, while the state returns may remain open for an additional year depending
| Notes to Financial Statements | 17 |
State Street U.S. Equity V.I.S. Fund
Notes to Financial Statements, continued — December 31, 2021
upon jurisdiction. SSGA FM has analyzed the Fund’s tax positions taken on tax returns for all open years and does not believe there are any uncertain tax positions that would require recognition of a tax liability.
Distributions to shareholders are recorded on ex-dividend date. Income dividends and gain distributions are determined in accordance with income tax rules and regulations, which may differ from generally accepted accounting principles. Certain capital accounts in the financial statements have been adjusted for permanent book-tax differences. These adjustments have no impact on net asset values or results of operations. Temporary book-tax differences will reverse in the future. These book-tax differences are primarily due to futures contracts, Non-REIT return of capital open basis adjustments received and wash sale loss deferrals.
The tax character of distributions paid during the fiscal year ended December 31, 2021 were as follows:
Ordinary
Income | Long-Term
Capital Gains | Total |
| $ 437,996 | $ 4,163,798 | $ 4,601,794 |
The tax character of distributions paid during the year ended December 31, 2020 was as follows:
Ordinary
Income | Long-Term
Capital Gains | Total |
| $ 324,922 | $ 1,756,420 | $ 2,081,342 |
At December 31, 2021, the components of distributable earnings on a tax basis were as follows:
Undistributed
Ordinary
Income | Tax Exempt
Income | Capital Loss
Carryforwards | Undistributed
long term
gain | Net
Unrealized
Gains
(Losses) | Qualified
Late-Year
Losses | Total |
| $ 40,429 | $ — | $ — | $ 756,110 | $ 12,324,685 | $ — | $ 13,121,224 |
As of December 31, 2021, gross unrealized appreciation and gross unrealized depreciation of investments and other financial instruments based on cost for federal income tax purposes were as follows:
Tax
Cost | Gross
Unrealized
Appreciation | Gross
Unrealized
Depreciation | Net
Unrealized
Appreciation
(Depreciation) |
| $ 17,301,354 | $ 12,559,130 | $ 234,445 | $ 12,324,685 |
8.Line of Credit
The Fund and other affiliated funds (each, a “Participant” and collectively, the “Participants”) have access to $200 million of a $1.1 billion revolving credit facility provided by a syndication of banks under which the Participants may borrow to fund shareholder redemptions. This agreement expires in October 2022 unless extended or renewed.
The Participants are charged an annual commitment fee which is calculated based on the unused portion of the shared credit line. Commitment fees are allocated among each of the Participants based on relative net assets. Commitment fees are ordinary fund operating expenses. A Participant incurs and pays the interest expense related to its borrowing. Interest is calculated at a rate per annum equal to the sum of 1.00% plus the greater of the New York Fed Bank Rate and the one-month SOFR Rate.
Prior to October 7, 2021 the Fund had access to $200 million of a $500 million revolving credit facility and interest was calculated at a rate per annum equal to the sum of 1.25% plus the New York Fed Bank Rate.
The Fund had no outstanding loans as of December 31, 2021.
| 18 | Notes to Financial Statements |
State Street U.S. Equity V.I.S. Fund
Notes to Financial Statements, continued — December 31, 2021
9.Risks
Concentration Risk As a result of the Fund's ability to invest a large percentage of its assets in obligations of issuers within the same country, state, region, currency or economic sector, an adverse economic, business or political development may affect the value of the Fund's investments more than if the Fund was more broadly diversified.
Credit Risk The Fund may be exposed to credit risk in the event that an issuer or guarantor fails to perform or that an institution or entity with which the Fund has unsettled or open transactions defaults.
Market Risk The Fund’s investments are subject to changes in general economic conditions, and general market fluctuations and the risks inherent in investment in securities markets. Investment markets can be volatile and prices of investments can change substantially due to various factors including, but not limited to, economic growth or recession, changes in interest rates, changes in the actual or perceived creditworthiness of issuers, and general market liquidity. The Fund is subject to the risk that geopolitical events will disrupt securities markets and adversely affect global economies and markets. Local, regional or global events such as war, acts of terrorism, the spread of infectious illness or other public health issues, or other events could have a significant impact on the Fund and its investments.
An outbreak of a respiratory disease caused by a novel coronavirus (known as COVID-19) first detected in China in December 2019 has resulted in a global pandemic and major disruptions to economies and markets around the world, including the United States. Financial markets have experienced and may continue to experience extreme volatility and severe losses, and trading in many instruments was and may continue to be disrupted as a result. Liquidity for many instruments was and may continue to be greatly reduced for periods of time. Some interest rates are very low and in some cases yields are negative. Governments and central banks, including the Federal Reserve in the United States, have taken extraordinary and unprecedented actions to support local and global economies and the financial markets. The impact of these measures, and whether they will be effective to mitigate the economic and market disruption, will not be known for some time. In addition, the outbreak of COVID-19, and measures taken to mitigate its effects, could result in disruptions to the services provided to the Fund by its service providers.
10.Subsequent Events
Management has evaluated the impact of all subsequent events on the Fund through the date on which the financial statements were available to be issued and has determined that there were no subsequent events requiring adjustment or disclosure in the financial statements.
| Notes to Financial Statements | 19 |
State Street U.S. Equity V.I.S. Fund
Report of Independent Registered Public Accounting Firm
To the Shareholders of State Street U.S. Equity V.I.S. Fund and the Board of Directors of State Street Variable Insurance Series Funds, Inc.
Opinion on the Financial Statements
We have audited the accompanying statement of assets and liabilities of State Street U.S. Equity V.I.S. Fund (the “Fund”) (one of the series constituting State Street Variable Insurance Series Funds, Inc. (the “Company”)), including the schedule of investments, as of December 31, 2021, and the related statement of operations for the year then ended, the statements of changes in net assets for each of the two years in the period then ended, the financial highlights for each of the five years in the period then ended and the related notes (collectively referred to as the “financial statements”). In our opinion, the financial statements present fairly, in all material respects, the financial position of the Fund (one of the series constituting State Street Variable Insurance Series Funds, Inc.) at December 31, 2021, the results of its operations for the year then ended, the changes in its net assets for each of the two years in the period then ended and its financial highlights for each of the five years in the period then ended, in conformity with U.S. generally accepted accounting principles.
Basis for Opinion
These financial statements are the responsibility of the Company’s management. Our responsibility is to express an opinion on the Fund’s financial statements based on our audits. We are a public accounting firm registered with the Public Company Accounting Oversight Board (United States) (“PCAOB”) and are required to be independent with respect to the Company in accordance with the U.S. federal securities laws and the applicable rules and regulations of the Securities and Exchange Commission and the PCAOB.
We conducted our audits in accordance with the standards of the PCAOB. Those standards require that we plan and perform the audit to obtain reasonable assurance about whether the financial statements are free of material misstatement, whether due to error or fraud. The Company is not required to have, nor were we engaged to perform, an audit of the Company’s internal control over financial reporting. As part of our audits we are required to obtain an understanding of internal control over financial reporting, but not for the purpose of expressing an opinion on the effectiveness of the Company’s internal control over financials reporting. Accordingly, we express no such opinion.
Our audits included performing procedures to assess the risks of material misstatement of the financial statements, whether due to error or fraud, and performing procedures that respond to those risks. Such procedures included examining, on a test basis, evidence regarding the amounts and disclosures in the financial statements. Our procedures included confirmation of securities owned as of December 31, 2021, by correspondence with the custodian, brokers and others or by other appropriate auditing procedures where replies from brokers and others were not received. Our audits also included evaluating the accounting principles used and significant estimates made by management, as well as evaluating the overall presentation of the financial statements. We believe that our audits provide a reasonable basis for our opinion.
We have served as the auditor of one or more State Street Global Advisors investment companies since 2000.
Boston, Massachusetts
February 17, 2022
| 20 | Report of Independent Registered Public Accounting Firm |
State Street U.S. Equity V.I.S. Fund
Other Information — December 31, 2021 (Unaudited)
Tax Information
For federal income tax purposes, the following information is furnished with respect to the distributions of the Fund for its fiscal year ended December 31, 2021.
Dividends Received Deduction
The Fund reports the maximum amount allowable of its net taxable income as eligible for the corporate dividends received deduction.
Long Term Capital Gain Distributions
Long term capital gains dividends were paid from the Fund during the year ended December 31, 2021 in the amount of $4,163,798.
Liquidity Risk Management Program
Pursuant to Rule 22e-4 under the 1940 Act, the Fund has adopted and implemented a liquidity risk management program (the “Program”). SSGA FM has been designated by the Board to administer the Fund's Program. The Program’s principal objectives include assessing, managing and periodically reviewing each Fund’s liquidity risk, based on factors specific to the circumstances of the Fund. Liquidity risk is defined as the risk that a Fund could not meet redemption requests without significant dilution of remaining investors’ interests in the Fund. During the fiscal year, SSGA FM provided the Board with a report addressing the operations of the Program and assessing its adequacy and the effectiveness of the Program’s implementation for the period September 2020 through June 2021. As reported to the Board, the Program supported each Fund’s ability to honor redemption requests timely and SSGA FM’s management of each Fund’s liquidity profile, including during periods of market volatility. SSGA FM reported that the Program operated adequately to meet the requirements of Rule 22e-4 and that the implementation of the Program has been effective.
There can be no assurance that the Program will achieve its objectives in the future. Please refer to your Fund’s prospectus for more information regarding the Fund’s exposure to liquidity risk and other principal risks to which an investment in the Fund may be subject.
Proxy Voting Policies and Procedures and Record
The Fund has adopted the proxy voting policies of the Adviser. A description of the Fund's proxy voting policies and procedures that are used by the Adviser to vote proxies relating to the Fund’s portfolios of securities are available (i) without charge, upon request by calling 1-800-242-0134 (toll free) and (ii) on the SEC's website at www.sec.gov. Information regarding how the Fund voted for the prior 12-months period ended June 30 is available by August 31 of each year by calling the same number, on the SEC’s website at www.sec.gov, and on the Fund's website at www.ssga.com.
Quarterly Portfolio Schedule
Following the Fund's first and third fiscal quarter-ends, a complete Schedule of Investments is filed with the SEC as an exhibit to its reports on Form N-PORT, which can be found on the SEC’s website at www.sec.gov, and on the Fund's website at www.ssga.com. The Fund's Schedules of Investments are available upon request, without charge, by calling 1-800-242-0134.
State Street U.S. Equity V.I.S. Fund
Other Information, continued — December 31, 2021 (Unaudited)
Name,
Address, and
Year of Birth | Position(s) Held
with Fund | Term of
Office and
Length of
Time Served | Principal Occupation
During Past Five Years
and Relevant Experience | Number
of
Funds
in Fund
Complex
Overseen
by
Director† | Other Directorships
Held by Director
During Past Five Years |
| INDEPENDENT DIRECTORS |
Michael F. Holland
c/o SSGA Funds
Management, Inc.
One Iron Street Boston,
MA 02210
YOB: 1944 | Director
and
Co-Chairperson
of the Board | Term:
Indefinite
Elected: 1/19 | Chairman, Holland &
Company L.L.C.
(investment adviser)
(1995 – present). | 63 | Director, the Holland Series
Fund, Inc.; Director, The China
Fund, Inc. (1992 – 2017);
Director, The Taiwan Fund,
Inc. (2007 – 2017); Director,
Reaves Utility Income Fund,
Inc.; and Director, Blackstone/
GSO Loans (and Real Estate)
Funds. |
| | | | | | |
Patrick J. Riley
c/o SSGA Funds
Management, Inc.
One Iron Street
Boston, MA 02210
YOB: 1948 | Director
and
Co-Chairperson
of the Board | Term:
Indefinite
Appointed: 4/16
Elected: 1/19 | 2002 to May 2010, Associate
Justice of the Superior Court,
Commonwealth of
Massachusetts; 1985 to 2002,
Partner, Riley, Burke
& Donahue, L.L.P. (law firm);
1998 to present, Independent
Director, State Street Global
Advisers Ireland, Ltd.
(investment company); 1998 to
present, Independent Director,
SSGA Liquidity plc (formerly,
SSGA Cash Management
Fund plc); January 2009 to
present, Independent Director,
SSGA Fixed Income plc; and
January 2009 – 2019,
Independent Director, SSGA
Qualified Funds PLC. | 63 | Board Director and Chairman,
SPDR Europe 1PLC Board
(2011 – present); Board
Director and Chairman, SPDR
Europe II, PLC (2013 –
present). |
State Street U.S. Equity V.I.S. Fund
Other Information, continued — December 31, 2021 (Unaudited)
Name,
Address, and
Year of Birth | Position(s) Held
with Fund | Term of
Office and
Length of
Time Served | Principal Occupation
During Past Five Years
and Relevant Experience | Number
of
Funds
in Fund
Complex
Overseen
by
Director† | Other Directorships
Held by Director
During Past Five Years |
| INDEPENDENT DIRECTORS (continued) |
| | | | | |
John R. Costantino
c/o SSGA Funds
Management, Inc.
One Iron Street
Boston, MA 02210
YOB: 1946 | Director
and
Chairperson of
the Qualified Legal
Compliance
Committee | Term:
Indefinite
Elected: 1997 | Senior Advisor to NGN Capital
LLC (January 2019 –
present); Managing General
Partner, NGN Capital LLC
(2006 – December 2019). | 63 | Director of Kleinfeld Bridal
Corp. (January 2016 – present);
Trustee of Neuroscience
Research Institute (1986 – 2017); Trustee of Fordham
University (1989 – 1995 and
2001 – 2007) and Trustee
Emeritus (2007 – present);
Trustee and Independent Chairperson of GE Funds (1993 – February 2011); Director, Muscular Dystrophy Association (since 2019);
Trustee of Gregorian
University Foundation (1992 –
2007); Chairman of the Board of Directors, Vivaldi Biosciences Inc. (May 2017 – present); Chairman of the Supervisory Board, Vivaldi Biosciences AG. (May 2017 – present); Trustee, Gallim Dance (December 2021 – present). |
| | | | | | |
Donna M. Rapaccioli
c/o SSGA Funds
Management, Inc.
One Iron Street
Boston, MA 02210
YOB: 1962 | Director
and
Chairperson of
the Audit Committee | Term:
Indefinite
Appointed: 1/12
Elected: 6/16 | Dean of the Gabelli School of
Business (2007 – present) and
Accounting Professor (1987 –
present) at Fordham
University. | 63 | Director- Graduate
Management Admissions
Council (2015 – present);
Trustee of Emmanuel College
(2010 – 2019). |
| | | | | | |
Richard D. Shirk
c/o SSGA Funds
Management, Inc.
One Iron Street
Boston, MA 02210
YOB: 1945 | Director
and
Chairperson
of the Nominating Committee
Chairperson of the Governance
Committee | Term:
Indefinite
Elected: 1/19 | March 2001 to April 2002,
Chairman (1996 to March
2001, President and Chief
Executive Officer), Cerulean
Companies, Inc. (holding
company) (Retired); 1992 to
March 2001, President and
Chief Executive Officer, Blue
Cross Blue Shield of Georgia
(health insurer,
managed healthcare). | 63 | 1998 to December 2008,
Chairman, Board Member and
December 2008 to present,
Investment Committee
Member, Healthcare Georgia
Foundation (private
foundation); September 2002
to 2012, Lead Director and
Board Member, Amerigroup
Corp. (managed health care);
1999 to 2013, Board Member
and (2001 to 2017) Investment
Committee Member, Woodruff
Arts Center; and 2003 to 2009,
Trustee, Gettysburg College;
Board member, Aerocare
Holdings (2003 – January 2021), Regenesis
Biomedical Inc. (April 2012 – present). |
State Street U.S. Equity V.I.S. Fund
Other Information, continued — December 31, 2021 (Unaudited)
Name,
Address, and
Year of Birth | Position(s) Held
with Fund | Term of
Office and
Length of
Time Served | Principal Occupation
During Past Five Years
and Relevant Experience | Number
of
Funds
in Fund
Complex
Overseen
by
Director† | Other Directorships
Held by Director
During Past Five Years |
| INDEPENDENT DIRECTORS (continued) |
| | | | | |
Michael A. Jessee
c/o SSGA Funds
Management, Inc.
One Iron Street
Boston, MA 02210
YOB: 1946 | Director
and
Chairperson of the
Valuation Committee | Term:
Indefinite
Elected: 1/19 | Retired; formerly, President
and Chief Executive Officer of
the Federal Home Loan Bank
of Boston (1989 – 2009);
Trustee, Randolph-Macon
College (2004 – 2016). | 63 | None. |
| INTERESTED DIRECTORS(1) |
Ellen M. Needham(2)
SSGA Funds
Management, Inc.
One Iron Street
Boston, MA 02210
YOB: 1967 | Director and
President | Term:
Indefinite
Elected: 1/19 | Chairman, SSGA Funds
Management, Inc. (March
2020 – present); President and
Director, SSGA Funds
Management, Inc. (2001 –
present)*; Senior Managing
Director, State Street Global
Advisors (1992 – present)*;
Manager, State Street Global
Advisors Funds Distributors,
LLC (May 2017 – present). | 63 | Board Director, SSGA
SPDR ETFs Europe 1 plc
(May 2020 – present); Board Director, SSGA SPDR ETFs Europe II plc (May 2020 – present). |
| | | | | |
| (1) | The individual listed above is a Director who is an “interested person,” as defined in the 1940 Act, of the Company (“Interested Director”). |
| (2) | Ms. Needham is an Interested Director because of her employment by SSGA FM, an affiliate of the Company. |
| * | Served in various capacities and/or with various affiliated entities during noted time period. |
| † | For the purpose of determining the number of portfolios overseen by the Directors, “Fund Complex” comprises registered investment companies for which SSGA FM serves as investment adviser. |
State Street U.S. Equity V.I.S. Fund
Other Information, continued — December 31, 2021 (Unaudited)
The following lists the principal officers for the Company, as well as their mailing addresses and ages, positions with the Company and length of time served, and present and principal occupations:
Name,
Address, and
Year of Birth | Position(s) Held
with Funds | Term of
Office and
Length of
Time Served | Principal Occupation
During Past Five Years |
| OFFICERS: |
Ellen M. Needham
SSGA Funds Management, Inc.
One Iron Street
Boston, MA 02210
YOB: 1967 | President and
Director | Term:
Indefinite
Elected:
4/20 | Chairman, SSGA Funds Management, Inc. (March 2020 – present); President and Director, SSGA Funds Management, Inc. (2001 – present)*; Senior Managing Director, State Street Global Advisors (1992 – present)*; Manager, State Street Global Advisors Funds Distributors, LLC (May 2017 – present). |
| | | | |
Bruce S. Rosenberg
SSGA Funds Management, Inc.
One Iron Street
Boston, MA 02210
YOB: 1961 | Treasurer | Term:
Indefinite
Elected: 4/19 | Managing Director, State Street Global Advisors and SSGA Funds Management, Inc. (July 2015 – present); Director, Credit Suisse (April 2008 – July 2015). |
| | | | |
Ann M. Carpenter
SSGA Funds Management, Inc.
One Iron Street
Boston, MA 02210
YOB: 1966 | Vice President
and Deputy
Treasurer | Term:
Indefinite
Elected: 4/19 | Chief Operating Officer, SSGA Funds Management, Inc. (April 2005 – present)*; Managing Director, State Street Global Advisors (2005 – present).* |
| | | | |
Chad C. Hallett
SSGA Funds Management, Inc.
One Iron Street
Boston, MA 02210
YOB: 1969 | Deputy
Treasurer | Term:
Indefinite
Elected: 4/19 | Vice President, State Street Global Advisors and SSGA Funds Management, Inc. (November 2014 – present); Vice President, State Street Bank and Trust Company (2001 – November 2014).* |
| | | | |
Darlene Anderson-Vasquez
SSGA Funds Management, Inc.
One Iron Street
Boston, MA 02210
YOB: 1968 | Deputy
Treasurer | Term:
Indefinite
Elected: 4/19 | Managing Director, State Street Global Advisors and SSGA Funds Management, Inc. (May 2016 – present); Senior Vice President, John Hancock Investments (September 2007 – May 2016). |
| | | | |
Arthur A. Jensen
SSGA Funds Management, Inc.
1600 Summer Street
Stamford, CT 06905
YOB: 1966 | Deputy
Treasurer | Term:
Indefinite
Elected: 4/19 | Vice President, State Street Global Advisors and SSGA Funds Management, Inc. (July 2016 – present); Controller of GE Asset Management Incorporated (April 2011 – July 2016). |
| | | | |
David K. Lancaster
SSGA Funds Management, Inc.
One Iron Street
Boston, MA 02210
YOB: 1971 | Assistant Treasurer | Term:
Indefinite
Elected: 11/20 | Vice President, State Street Global Advisors and SSGA Funds Management, Inc. (July 2017 – present); Assistant Vice President, State Street Bank and Trust Company (November 2011 – July 2017).* |
State Street U.S. Equity V.I.S. Fund
Other Information, continued — December 31, 2021 (Unaudited)
Name,
Address, and
Year of Birth | Position(s) Held
with Funds | Term of
Office and
Length of
Time Served | Principal Occupation
During Past Five Years |
| OFFICERS: (continued) |
| | | |
Brian Harris
SSGA Funds Management, Inc.
One Iron Street
Boston, MA 02210
YOB: 1973 | Chief Compliance
Officer, Anti-Money
Laundering Officer
and Code of Ethics
Compliance Officer | Term:
Indefinite Elected: 6/16
Term:
Indefinite Elected: 4/19 | Managing Director, State Street Global Advisors and SSGA Funds Management, Inc. (June 2013 – present).* |
| | | | |
Sean O’Malley
SSGA Funds Management, Inc.
One Iron Street
Boston, MA 02210
YOB: 1969 | Chief Legal Officer | Term:
Indefinite
Elected: 8/19 | Senior Vice President and Deputy General Counsel, State Street Global Advisors (November 2013 – present). |
| | | | |
David Barr
SSGA Funds Management, Inc.
One Iron Street
Boston, MA 02210
YOB: 1974 | Secretary | Term:
Indefinite
Elected: 9/20 | Vice President and Senior Counsel, State Street Global Advisors (October 2019 – present); Vice President and Counsel, Eaton Vance Corp. (October 2010 – October 2019). |
| | | | |
Timothy Collins
SSGA Funds Management, Inc.
One Iron Street
Boston, MA 02210
YOB: 1967 | Assistant
Secretary | Term:
Indefinite
Elected: 9/21 | Vice President and Senior Counsel, State Street Global Advisors (August 2021 – present); Vice President and Managing Counsel, State Street Corporation (March 2020 – August 2021); Vice President and Senior Counsel (April 2018 – March 2020); Counsel, Sutton Place Investments (January 2010 – March 2018). |
| | | | |
David Urman
SSGA Funds Management, Inc.
One Iron Street
Boston, MA 02210
YOB: 1985 | Assistant
Secretary | Term:
Indefinite
Elected: 8/19 | Vice President and Senior Counsel, State Street Global Advisors (April 2019 – present); Vice President and Counsel, State Street Global Advisors (August 2015 – April 2019); Associate, Ropes & Gray LLP (November 2012 – August 2015). |
| | | |
| * | Served in various capacities and/or with various affiliated entities during noted time period. |
[This page intentionally left blank]
Directors
Michael F. Holland, Co-Chairperson
Patrick J. Riley, Co-Chairperson
John R. Costantino
Donna M. Rapaccioli
Michael A. Jessee
Richard D. Shirk
Ellen M. Needham
Officers
Ellen M. Needham, President
Brian Harris, Chief Compliance Officer, Anti-Money Laundering Officer and Code of Ethics Compliance Officer
Sean O’Malley, Chief Legal Officer
Bruce S. Rosenberg, Treasurer
Ann M. Carpenter, Vice President and Deputy Treasurer
Chad C. Hallett, Deputy Treasurer
Arthur A. Jensen, Deputy Treasurer
Darlene Anderson-Vasquez, Deputy Treasurer
David Lancaster, Assistant Treasurer
David Barr, Secretary
Timothy Collins, Assistant Secretary
David Urman, Assistant Secretary
Investment Adviser and Administrator
SSGA Funds Management, Inc.
One Iron Street
Boston, Massachusetts 02210
Custodian and Sub-Administrator
State Street Bank and Trust Company
One Lincoln Street
Boston, Massachusetts 02111
Distributor
State Street Global Advisors Funds Distributors, LLC
One Iron Street
Boston, Massachusetts 02210
Independent Registered Public Accounting Firm
Ernst & Young LLP
200 Clarendon Street
Boston, Massachusetts 02116
Annual Report
December 31, 2021
| State Street Premier Growth Equity V.I.S. Fund |
State Street Premier Growth Equity V.I.S. Fund
Annual Report
December 31, 2021
| | Page |
| 1 |
| 2 |
| Financial Statements | |
| 9 |
| 10 |
| 11 |
| 12 |
| 13 |
| 19 |
| 20 |
This report is prepared for Policyholders of certain variable contracts and may be distributed to others only if preceded or accompanied by the variable contract’s current prospectus and the current summary prospectus of the Fund available for investments thereunder.
[This page intentionally left blank]
State Street Premier Growth Equity V.I.S. Fund
Notes to Performance — December 31, 2021 (Unaudited)
The information provided on the performance pages relates to the State Street Premier Growth Equity V.I.S. Fund (the “Fund”).
Total return performance shown in this report for the Fund takes into account changes in share price and assumes reinvestment of dividends and capital gains distributions, if any. Total returns shown are net of Fund fees and expenses but do not reflect fees and charges associated with the variable contracts such as administrative fees, account charges and surrender charges, which, if reflected, would reduce the Fund’s total returns for all periods shown.
The performance data quoted represents past performance; past performance does not guarantee future results. Investment return and principal value will fluctuate so your shares, when redeemed, may be worth more or less than their original cost. Current performance may be higher or lower than the performance data quoted. Periods less than one year are not annualized. Please call toll-free (800) 242-0134 or visit the Fund’s website at ssga.com for the most recent month-end performance data.
An investment in the Fund is not a deposit of any bank and is not insured or guaranteed by the Federal Deposit Insurance Corporation (“FDIC”) or any other government agency. An investment in the Fund is subject to risk, including possible loss of principal invested.
The S&P 500® Index is an unmanaged, market capitalization-weighted index of stocks of 500 large U.S. companies, which is widely used as a measure of large-cap U.S. stock market performance.
The Russell 1000® Growth Index is an unmanaged index that measures the performance of the large-cap growth segment of the U.S. equity universe. It includes those Russell 1000® companies with higher price-to-book ratios and higher forecasted growth values. It is a subset of the Russell 3000® Index and includes approximately 1,000 of the largest securities based on a combination of their market cap and current index membership.
The results shown for the foregoing indices assume the reinvestment of net dividends or interest and do not reflect fees, expenses, or taxes. As such, the index returns do not reflect the actual cost of investing in the instruments that comprise each index.
The views expressed in this document reflect our judgment as of the publication date and are subject to change at any time without notice.
State Street Global Advisors Funds Distributors, LLC, member of FINRA & SIPC is the principal underwriter and distributor of the State Street Premier Growth Equity V.I.S. Fund and an indirect wholly-owned subsidiary of State Street Corporation. References to State Street may include State Street Corporation and its affiliates. The Funds pay State Street Bank and Trust Company for its services as custodian and Fund Accounting agent, and pay SSGA Funds Management, Inc. ("SSGA FM" or the "Adviser") for investment advisory and administrative services.
State Street Premier Growth Equity V.I.S. Fund
Management's Discussion of Fund Performance — December 31, 2021 (Unaudited)
The State Street Premier Growth Equity V.I.S. Fund (the “Fund”) seeks to provide long-term growth of capital and future income rather than current income. The Fund’s benchmarks are the Russell 1000 Growth Index and S&P 500 Index (the “Indices”).
For the 12-month period ended December 31, 2021 (the “Reporting Period”), the total return for the Fund was 24.97%, and the returns for the Russell 1000 Growth Index was 27.60% and the S&P 500 Index was 28.71%. The Fund and Index returns reflect the reinvestment of dividends and other income. The Fund’s performance reflects the expenses of managing the Fund, including brokerage and advisory expenses. The Index is unmanaged and Index returns do not reflect fees and expenses of any kind, which would have a negative impact on returns.
Consumer discretionary, payments companies, and semiconductor companies were the primary drivers of Fund performance during the Reporting Period relative to the Index.
The Fund benefitted from an underweight to the consumer discretionary sector, which was relatively weak in 2021, but negative stock selection within the segment offset this benefit. In consumer discretionary, the Fund saw strength in Lowes, which rose more than 60% during the year, but China internet platform company Alibaba and retailer Ross Stores were weak in 2021. Alibaba, which trades in the U.S., is a company with very large competitive advantages, strong ongoing growth across a range of business lines, and a very compelling valuation. However, it has been hit by concerns over China’s ongoing anti-trust and regulatory actions, as well as more general geopolitical tensions between the U.S. and China. Ross Stores lagged due to supply chain issues and consumer weakness as COVID-19 resurged during the year. We believe these issues will pass leaving Ross well-positioned for a recovery.
The Fund’s positions in payments companies such as Visa detracted from relative performance in 2021 as travel, and international travel in particular, suffered due to a resurgent COVID-19. In our view these companies have long-term secular growth prospects and strong market positions and may benefit as COVID-19 starts to fade and travel resumes.
On the positive side, the Fund has benefitted significantly from both an overweight and outperformance in the semiconductor space. We believe semiconductors have become less cyclical in recent years as chip technology has proliferated throughout the economy. This long-term view has led to overweights in a number of very strong players in the space. Most notable among these has been Applied Materials, a semiconductor equipment manufacturer with competitive advantages driven by its proprietary technology. The company’s stock was up more than 80% during the Reporting Period.
The Fund used futures in order to efficiently manage cash flows during the Reporting Period. The Fund’s use of futures contributed modestly to Fund performance relative to the Index.
On an individual security level, the top positive contributors to the Fund’s performance on an absolute basis during the Reporting Period were Microsoft, Alphabet and Nvidia. The top negative contributors to the Fund’s performance on an absolute basis during the Reporting Period were Alibaba, PayPal and Splunk.
The views expressed above reflect those of the Fund’s portfolio manager only through the Reporting Period, and do not necessarily represent the views of the Adviser as a whole. Any such views are subject to change at any time based upon market or other conditions and the Adviser disclaims any responsibility to update
| 2 | State Street Premier Growth Equity V.I.S. Fund |
State Street Premier Growth Equity V.I.S. Fund
Performance Summary — December 31, 2021 (Unaudited)
| Sector Allocation |
| Portfolio composition as a % of Fair Value of $41,898 (in thousands) as of December 31, 2021 (a)(b) |
| Top Ten Largest Holdings |
| as of December 31, 2021 (as a % of Fair Value) (a)(b) |
| Microsoft Corp. | 11.43% |
| Apple Inc. | 10.05% |
| Amazon.com Inc. | 7.41% |
| Alphabet Inc., Class C | 6.11% |
| Meta Platforms Inc., Class A | 5.16% |
| Visa Inc., Class A | 3.93% |
| QUALCOMM Inc. | 3.62% |
| Lowe's Companies Inc. | 2.80% |
| Mastercard Inc., Class A | 2.68% |
| ServiceNow Inc. | 2.30% |
| Average Annual Total Return for the years ended December 31, 2021 |
| Class 1 shares (Inception date 12/12/97) |
| | One Year | | Five Year | | Ten Year | | Ending Value
of a $10,000
Investment |
| State Street Premier Growth Equity V.I.S. Fund | 24.97% | | 23.43% | | 18.88% | | $56,386 |
| S&P 500® Index | 28.71% | | 18.48% | | 16.55% | | $46,257 |
| Russell 1000® Growth Index | 27.60% | | 25.32% | | 19.79% | | $60,825 |
|
| (a) | Fair Value basis is inclusive of a short-term investment in the State Street Institutional U.S. Government Money Market Fund Class G Shares. |
| (b) | The securities information regarding holdings, allocations and other characteristics is presented to illustrate examples of securities that the Fund has bought and the diversity of areas in which the Fund may invest as of a particular date. It may not be representative of the Fund’s current or future investments and should not be construed as a recommendation to purchase or sell a particular security. |
| State Street Premier Growth Equity V.I.S. Fund | 3 |
State Street Premier Growth Equity V.I.S. Fund
Performance Summary, continued — December 31, 2021 (Unaudited)
Change in Value of a $10,000 Investment
Yearly periods ended December 31
See Notes to Performance beginning on page 1 for further information.
Past performance does not predict future performance. The performance shown in the graphs and tables does not reflect the deduction of taxes that a shareholder would pay on Fund distributions or the redemption of Fund shares and does not reflect the fees or charges that would be associated with variable contracts through which shares of the Fund are offered.
| 4 | State Street Premier Growth Equity V.I.S. Fund |
State Street Premier Growth Equity V.I.S. Fund
Understanding Your Fund’s Expenses — December 31, 2021 (Unaudited)
As a shareholder of the Fund, you incur ongoing costs. Ongoing costs include portfolio management fees, professional fees, administrative fees and other Fund expenses. The following example is intended to help you understand your ongoing costs (in dollars) of investing in the Fund and to compare these costs with the ongoing costs of investing in other mutual funds.
To illustrate these ongoing costs, we have provided an example and calculated the expenses paid by investors of the Fund during the period. The information in the following table is based on an investment of $1,000, which is invested at the beginning of the period and held for the entire six-month period ended December 31, 2021.
Actual Expenses
The first section of the table provides information about actual account values and actual expenses. You may use the information in this section, together with the amount you invested, to estimate the expenses that you paid over the period. To do so, simply divide your account value by $1,000 (for example, an $8,600 account value divided by $1,000 = 8.6), then multiply the result by the number given under the heading “Expenses paid during the period” to estimate the expenses you paid on your account during the period.
Hypothetical Example for Comparison Purposes
The second section of the table provides information about hypothetical account values and hypothetical expenses based on the Fund’s actual expense ratio and an assumed rate of return of 5% per year before expenses, which is not the Fund’s actual return. The hypothetical account values and expenses may not be used to estimate the actual ending account balance or expenses you paid for the period. You may use this information to compare the ongoing costs of investing in the Fund and other funds. To do so, compare this 5% hypothetical example with the 5% hypothetical examples that appear in the shareholder reports of other funds.
Please note that the expenses shown in the table are meant to highlight and help you compare ongoing costs only and do not reflect transaction costs, such as sales charges or redemption fees, if any. Therefore, the second section of the table is useful in comparing ongoing costs only, and will not help you determine the relative total costs of owning different funds. Additionally, the expenses shown do not reflect the fees or charges associated with variable contracts through which shares of the Fund are offered.
| | Actual
Fund Return | | Hypothetical
5% Return
(2.5% for
the period) |
Beginning Account Value
July 1, 2021 | $1,000.00 | | $1,000.00 |
Ending Account value
December 31, 2021 | $1,086.00 | | $1,020.70 |
| Expenses Paid During Period* | $ 4.73 | | $ 4.58 |
| * | Expenses are equal to the Fund's annualized expense ratio of 0.90%** (for the period July 1, 2021 - December 31, 2021), multiplied by the average account value over the period, multiplied by 184/365 (to reflect the one-half year period). |
| ** | May differ from expense ratio disclosed in the financial highlights, which is calculated based on the entire fiscal year's data. |
| State Street Premier Growth Equity V.I.S. Fund | 5 |
State Street Premier Growth Equity V.I.S. Fund
Schedule of Investments — December 31, 2021
| | Number
of Shares | Fair
Value |
| Common Stock - 97.9% † |
| Apparel Retail - 2.2% |
| Ross Stores Inc. | 7,970 | $ 910,812 |
| Application Software - 3.9% |
| Adobe Inc. (a) | 455 | 258,012 |
| salesforce.com Inc. (a) | 2,855 | 725,541 |
| Splunk Inc. (a) | 5,830 | 674,648 |
| | | 1,658,201 |
| Biotechnology - 2.6% |
| BioMarin Pharmaceutical Inc. (a) | 6,006 | 530,630 |
| Vertex Pharmaceuticals Inc. (a) | 2,495 | 547,902 |
| | | 1,078,532 |
| Cable & Satellite - 1.7% |
| Charter Communications Inc., Class A (a) | 1,067 | 695,652 |
| Data Processing & Outsourced Services - 10.2% |
| Fidelity National Information Services Inc. | 5,426 | 592,248 |
| Mastercard Inc., Class A | 3,119 | 1,120,719 |
| PayPal Holdings Inc. (a) | 4,866 | 917,630 |
| Visa Inc., Class A | 7,596 | 1,646,129 |
| | | 4,276,726 |
| Financial Exchanges & Data - 1.3% |
| S&P Global Inc. | 1,205 | 568,676 |
| Healthcare Equipment - 1.6% |
| Boston Scientific Corp. (a) | 16,147 | 685,924 |
| Home Improvement Retail - 2.8% |
| Lowe's Companies Inc. (b) | 4,545 | 1,174,792 |
| Industrial Conglomerates - 1.4% |
| Honeywell International Inc. | 2,735 | 570,275 |
| Industrial Gases - 0.9% |
| Air Products & Chemicals Inc. | 1,233 | 375,152 |
| Industrial Machinery - 1.7% |
| Parker-Hannifin Corp. | 2,241 | 712,907 |
| Interactive Media & Services - 13.4% |
| Alphabet Inc., Class C (a)(b) | 885 | 2,560,827 |
| Alphabet Inc., Class A (a) | 316 | 915,465 |
| | Number
of Shares | Fair
Value |
| Meta Platforms Inc., Class A (a) | 6,426 | $ 2,161,385 |
| | | 5,637,677 |
| Internet & Direct Marketing Retail - 9.2% |
| Alibaba Group Holding Ltd. ADR (a) | 2,849 | 338,433 |
| Amazon.com Inc. (a) | 931 | 3,104,270 |
| Chewy Inc., Class A (a) | 6,834 | 403,001 |
| | | 3,845,704 |
| Investment Banking & Brokerage - 1.7% |
| The Charles Schwab Corp. | 8,575 | 721,157 |
| Managed Healthcare - 1.7% |
| UnitedHealth Group Inc. | 1,385 | 695,464 |
| Movies & Entertainment - 1.0% |
| The Walt Disney Co. (a) | 2,620 | 405,812 |
| Pharmaceuticals - 1.2% |
| Elanco Animal Health Inc. (a) | 17,505 | 496,792 |
| Regional Banks - 1.0% |
| First Republic Bank | 2,062 | 425,824 |
| Semiconductor Equipment - 2.2% |
| Applied Materials Inc. | 5,874 | 924,333 |
| Semiconductors - 7.3% |
| Advanced Micro Devices Inc. (a) | 5,109 | 735,185 |
| NVIDIA Corp. | 2,808 | 825,861 |
| QUALCOMM Inc. | 8,294 | 1,516,724 |
| | | 3,077,770 |
| Soft Drinks - 1.1% |
| PepsiCo Inc. | 2,586 | 449,214 |
| Specialized REITs - 1.7% |
| American Tower Corp. | 2,386 | 697,905 |
| Systems Software - 13.7% |
| Microsoft Corp. | 14,234 | 4,787,179 |
| ServiceNow Inc. (a) | 1,488 | 965,875 |
| | | 5,753,054 |
| Technology Hardware, Storage & Peripherals - 10.0% |
| Apple Inc. | 23,712 | 4,210,540 |
See Notes to Schedule of Investments and Notes to Financial Statements.
| 6 | State Street Premier Growth Equity V.I.S. Fund |
State Street Premier Growth Equity V.I.S. Fund
Schedule of Investments, continued — December 31, 2021
| | Number
of Shares | Fair
Value |
| Trading Companies & Distributors - 1.4% |
| United Rentals Inc. (a) | 1,801 | $ 598,454 |
| Trucking - 1.0% |
| Lyft Inc., Class A (a) | 10,078 | 430,633 |
Total Common Stock
(Cost $19,113,181) | | 41,077,982 |
| Short-Term Investments - 2.0% |
State Street Institutional U.S. Government Money Market Fund - Class G Shares 0.03% (c)(d)
(Cost $820,187) | 820,187 | 820,187 |
Total Investments
(Cost $19,933,368) | | 41,898,169 |
| Other Assets and Liabilities, net - 0.1% | | 62,816 |
| NET ASSETS - 100.0% | | $ 41,960,985 |
Other Information:
| The Fund had the following long futures contracts open at December 31, 2021: |
| Description | Expiration
Date | Number of
Contracts | Notional
Amount | Value | Unrealized
Appreciation
(Depreciation) |
| S&P 500 Emini Index Futures | March 2022 | 3 | $ 705,467 | $ 713,775 | $ 8,308 |
During the year ended December 31, 2021, the average notional value related to long futures contracts was $572,461.
Notes to Schedule of Investments
The views expressed in this document reflect our judgment as of the publication date and are subject to change at any time without notice. The securities cited may not be representative of the Fund’s future investments and should not be construed as a recommendation to purchase or sell a particular security. See the Fund’s summary prospectus and statutory prospectus for complete descriptions of investment objectives, policies, risks and permissible investments.
| (a) | Non-income producing security. |
| (b) | At December 31, 2021, all or a portion of this security was pledged to cover collateral requirements for futures. |
| (c) | Sponsored by SSGA Funds Management, Inc., the Fund’s investment adviser and administrator, and an affiliate of State Street Bank & Trust Co., the Fund’s sub-administrator, custodian and accounting agent. |
| (d) | Coupon amount represents effective yield. |
| † | Percentages are based on net assets as of December 31, 2021. |
| Abbreviations: |
| ADR - American Depositary Receipt |
| REIT - Real Estate Investment Trust |
See Notes to Schedule of Investments and Notes to Financial Statements.
| State Street Premier Growth Equity V.I.S. Fund | 7 |
State Street Premier Growth Equity V.I.S. Fund
Schedule of Investments, continued — December 31, 2021
The following table presents the Fund’s investments measured at fair value on a recurring basis at December 31, 2021:
| Investments | Level 1 | | Level 2 | | Level 3 | | Total |
| Investments in Securities | | | | | | | |
| Common Stock | $ 41,077,982 | | $ — | | $ — | | $ 41,077,982 |
| Short-Term Investments | 820,187 | | — | | — | | 820,187 |
| Total Investments in Securities | $ 41,898,169 | | $ — | | $ — | | $ 41,898,169 |
| Other Financial Instruments | | | | | | | |
| Long Futures Contracts - Unrealized Appreciation | $ 8,308 | | $ — | | $ — | | $ 8,308 |
| Total Other Financial Instruments | $ 8,308 | | $ — | | $ — | | $ 8,308 |
| | Number
of Shares
Held at
12/31/20 | Value at
12/31/20 | | Cost of
Purchases | | Proceeds
from
Shares
Sold | | Realized
Gain
(Loss) | | Change in
Unrealized
Appreciation
(Depreciation) | Number of
Shares
Held at
12/31/21 | Value at
12/31/21 | | Dividend
Income |
| State Street Institutional U.S. Government Money Market Fund - Class G Shares | 873,386 | $ 873,386 | | $7,734,396 | | $7,787,595 | | $ — | | $ — | 820,187 | $820,187 | | $ 224 |
| The Consumer Discretionary Select Sector SPDR Fund | 1,097 | 176,376 | | 733,534 | | 961,021 | | 98,851 | | (47,740) | — | — | | 2,794 |
| The Technology Select Sector SPDR Fund | 759 | 98,685 | | 249,629 | | 383,727 | | 46,559 | | (11,146) | — | — | | 1,971 |
| TOTAL | | $1,148,447 | | $8,717,559 | | $9,132,343 | | $145,410 | | $(58,886) | | $820,187 | | $4,989 |
See Notes to Schedule of Investments and Notes to Financial Statements.
| 8 | State Street Premier Growth Equity V.I.S. Fund |
State Street Premier Growth Equity V.I.S. Fund
Financial Highlights
Selected data based on a share outstanding throughout the fiscal years indicated
| | 12/31/21 | | 12/31/20 | | 12/31/19 | | 12/31/18 | | 12/31/17 |
| Inception date | | | 12/12/97 |
| Net asset value, beginning of period | $122.96 | | $100.89 | | $ 82.51 | | $ 99.23 | | $ 86.08 |
| Income/(loss) from investment operations: | | | | | | | | | |
| Net investment income (loss) | (0.44) (a) | | (0.22) (a) | | 0.03 (a) | | 0.12 (a) | | 0.32 (a) |
| Net realized and unrealized gains/(losses) on investments | 31.51 | | 34.12 | | 30.84 | | (2.88) | | 24.10 |
| Total income/(loss) from investment operations | 31.07 | | 33.90 | | 30.87 | | (2.76) | | 24.42 |
| Less distributions from: | | | | | | | | | |
| Net investment income | — | | 0.04 | | — | | 0.15 | | 0.34 |
| Net realized gains | 27.27 | | 11.79 | | 12.49 | | 13.81 | | 10.93 |
| Total distributions | 27.27 | | 11.83 | | 12.49 | | 13.96 | | 11.27 |
| Net asset value, end of period | $126.76 | | $122.96 | | $100.89 | | $ 82.51 | | $ 99.23 |
| Total Return(b) | 24.97% | | 33.61% | | 37.33% | | (2.66)% | | 28.34% |
| Ratios/Supplemental Data: | | | | | | | | | |
| Net assets, end of period (in thousands) | $41,961 | | $39,144 | | $35,502 | | $30,369 | | $36,404 |
| Ratios to average net assets: | | | | | | | | | |
| Net expenses | 0.88% | | 0.89% | | 0.91% | | 0.87% | | 0.85% |
| Gross expenses | 0.88% | | 0.89% | | 0.91% | | 0.87% | | 0.85% |
| Net investment income (loss) | (0.32)% | | (0.19)% | | 0.03% | | 0.11% | | 0.31% |
| Portfolio turnover rate | 30% | | 22% | | 22% | | 27% | | 21% |
| Notes to Financial Highlights |
| (a) | Per share values have been calculated using the average shares method. |
| (b) | Total returns are historical and assume changes in share price, reinvestment of dividends and capital gains distributions and do not include the effect of insurance contract charges. Past performance does not guarantee future results. |
The accompanying Notes are an integral part of these financial statements.
State Street Premier Growth Equity V.I.S. Fund
Statement of Assets and Liabilities — December 31, 2021
| Assets | |
| Investments in securities, at fair value (cost $19,113,181) | $ 41,077,982 |
| Short-term affiliated investments, at fair value | 820,187 |
| Net cash collateral on deposit with broker for future contracts | 27,540 |
| Income receivables | 7,946 |
| Receivable for fund shares sold | 83,351 |
| Income receivable from affiliated investments | 20 |
| Receivable for accumulated variation margin on futures contracts | 8,315 |
| Other assets | 228 |
| Total assets | 42,025,569 |
| Liabilities | |
| Payable for fund shares redeemed | 181 |
| Payable to the Adviser | 21,864 |
| Payable for custody, fund accounting and sub-administration fees | 4,028 |
| Accrued other expenses | 38,511 |
| Total liabilities | 64,584 |
|
| Net Assets | $ 41,960,985 |
| Net Assets Consist of: | |
| Capital paid in | $ 18,372,251 |
| Total distributable earnings (loss) | 23,588,734 |
| Net Assets | $ 41,960,985 |
| Shares outstanding ($0.01 par value; unlimited shares authorized) | 331,032 |
| Net asset value per share | $ 126.76 |
The accompanying Notes are an integral part of these financial statements.
| 10 | Statement of Assets and Liabilities |
State Street Premier Growth Equity V.I.S. Fund
Statement of Operations — For the year ended December 31, 2021
| Investment Income | |
| Income | |
| Dividend | $ 221,444 |
| Income from affiliated investments | 4,989 |
| Total income | 226,433 |
| Expenses | |
| Advisory and administration fees | 261,084 |
| Directors' fees | 18,765 |
| Custody, fund accounting and sub-administration fees | 22,452 |
| Professional fees | 35,431 |
| Printing and shareholder reports | 11,743 |
| Other expenses | 5,314 |
| Total expenses | 354,789 |
| Net investment income | $ (128,356) |
| Net Realized and Unrealized Gain (Loss) on Investments | |
| Realized gain (loss) on: | |
| Unaffiliated investments | $ 8,187,200 |
| Affiliated investments | 145,410 |
| Futures | 68,364 |
| Increase (decrease) in unrealized appreciation/depreciation on: | |
| Unaffiliated investments | 716,026 |
| Affiliated investments | (58,886) |
| Futures | (1,031) |
| Net realized and unrealized gain (loss) on investments | 9,057,083 |
| Net Increase in Net Assets Resulting from Operations | $ 8,928,727 |
The accompanying Notes are an integral part of these financial statements.
| Statement of Operations | 11 |
State Street Premier Growth Equity V.I.S. Fund
Statements of Changes in Net Assets
| | Year Ended
December 31,
2021 | | Year Ended
December 31,
2020 |
| Increase (Decrease) in Net Assets | | | |
| Operations: | | | |
| Net investment loss | $ (128,356) | | $ (68,704) |
| Net realized gain (loss) on investments and futures | 8,400,974 | | 4,078,990 |
| Net increase (decrease) in unrealized appreciation/depreciation on investments and futures | 656,109 | | 6,384,631 |
| Net increase (decrease) from operations | 8,928,727 | | 10,394,917 |
| Distributions to shareholders: | | | |
| Total distributions | (7,449,942) | | (3,437,485) |
| Increase (decrease) in assets from operations and distributions | 1,478,785 | | 6,957,432 |
| Share transactions: | | | |
| Proceeds from sale of shares | 621,030 | | 818,632 |
| Value of distributions reinvested | 7,449,942 | | 3,437,485 |
| Cost of shares redeemed | (6,732,576) | | (7,572,232) |
| Net increase (decrease) from share transactions | 1,338,396 | | (3,316,115) |
| Total increase (decrease) in net assets | 2,817,181 | | 3,641,317 |
| Net Assets | | | |
| Beginning of year | 39,143,804 | | 35,502,487 |
| End of year | $ 41,960,985 | | $ 39,143,804 |
| Changes in Fund Shares | | | |
| Shares sold | 4,534 | | 7,511 |
| Issued for distributions reinvested | 57,976 | | 27,995 |
| Shares redeemed | (49,819) | | (69,065) |
| Net increase (decrease) in fund shares | 12,691 | | (33,559) |
The accompanying Notes are an integral part of these financial statements.
| 12 | Statement of Operations |
State Street Premier Growth Equity V.I.S. Fund
Notes to Financial Statements — December 31, 2021
1. Organization of the Company
State Street Variable Insurance Series Funds, Inc. (the “Company”) was incorporated under the laws of the Commonwealth of Virginia on May 14, 1984 and is registered under the Investment Company Act of 1940, as amended (the “1940 Act”), as an open-end management investment company. The Company is currently composed of the following seven investment portfolios (collectively, the “Funds”): State Street U.S. Equity V.I.S. Fund, State Street S&P 500 Index V.I.S. Fund, State Street Premier Growth Equity V.I.S. Fund (the "Fund"), State Street Small-Cap Equity V.I.S. Fund, State Street Total Return V.I.S. Fund, State Street Income V.I.S. Fund and State Street Real Estate Securities V.I.S. Fund. Each Fund is a diversified investment company within the meaning of the 1940 Act, except for the State Street Premier Growth Equity V.I.S. Fund, which is a non-diversified investment company
Shares of the Funds of the Company are offered only to insurance company separate accounts that fund certain variable life insurance contracts and variable annuity contracts.
The Company currently offers one share class (Class 1) of the Fund as an investment option for variable life insurance and variable annuity contracts.
Under the Company’s organizational documents, its officers and directors are indemnified against certain liabilities arising out of the performance of their duties to the Company. Additionally, in the normal course of business, the Company enters into contracts with service providers that contain general indemnification clauses. The Company’s maximum exposure under these arrangements is unknown as this would involve future claims that may be made against the Company that have not yet occurred.
2.Summary of Significant Accounting Policies
The following is a summary of significant accounting policies followed by the Company in the preparation of its financial statements:
The preparation of financial statements in accordance with U.S. generally accepted accounting principles (“U.S. GAAP”) requires management to make estimates and assumptions that affect the reported amounts and disclosures in the financial statements. Actual results could differ from those estimates. The Fund is an investment company under U.S. GAAP and follows the accounting and reporting guidance applicable to investment companies.
Security Valuation The Fund’s investments are valued at fair value each day that the New York Stock Exchange (“NYSE”) is open and, for financial reporting purposes, as of the report date should the reporting period end on a day that the NYSE is not open. Fair value is generally defined as the price a fund would receive to sell an asset or pay to transfer a liability in an orderly transaction between market participants at the measurement date. By its nature, a fair value price is a good faith estimate of the valuation in a current sale and may not reflect an actual market price. The investments of the Fund are valued pursuant to the policy and procedures developed by the Oversight Committee (the “Committee”) and approved by the Company's Board of Directors (the “Board”). The Committee provides oversight of the valuation of investments for the Fund. The Board has responsibility for overseeing the determination of the fair value of investments.
Valuation techniques used to value the Fund’s investments by major category are as follows:
| • | Equity investments traded on a recognized securities exchange for which market quotations are readily available are valued at the last sale price or official closing price, as applicable, on the primary market or exchange on which they trade. Equity investments traded on a recognized exchange for which there were no sales on that day are valued at the last published sale price or at fair value. |
| • | Investments in registered investment companies (including money market funds) or other unitized pooled investment vehicles that are not traded on an exchange are valued at that day’s published net asset value (“NAV”) per share or unit. |
| Notes to Financial Statements | 13 |
State Street Premier Growth Equity V.I.S. Fund
Notes to Financial Statements, continued — December 31, 2021
In the event prices or quotations are not readily available or that the application of these valuation methods results in a price for an investment that is deemed to be not representative of the fair value of such investment, fair value will be determined in good faith by the Committee, in accordance with the valuation policy and procedures approved by the Board.
The Fund values its assets and liabilities at fair value using a fair value hierarchy consisting of three broad levels that prioritize the inputs to valuation techniques giving the highest priority to readily available unadjusted quoted prices in active markets for identical assets or liabilities (Level 1 measurements) and the lowest priority to unobservable inputs (Level 3 measurements) when market prices are not readily available or reliable. The categorization of a value determined for an investment within the hierarchy is based upon the pricing transparency of the investment and is not necessarily an indication of the risk associated with investing in it.
The three levels of the fair value hierarchy are as follows:
| • | Level 1 — Unadjusted quoted prices in active markets for an identical asset or liability; |
| • | Level 2 — Inputs other than quoted prices included within Level 1 that are observable for the asset or liability either directly or indirectly, including quoted prices for similar assets or liabilities in active markets, quoted prices for identical or similar assets or liabilities in markets that are not considered to be active, inputs other than quoted prices that are observable for the asset or liability (such as exchange rates, financing terms, interest rates, yield curves, volatilities, prepayment speeds, loss severities, credit risks and default rates) or other market-corroborated inputs; and |
| • | Level 3 — Unobservable inputs for the asset or liability, including the Committee’s assumptions used in determining the fair value of investments. |
The value of the Fund’s investments according to the fair value hierarchy as of December 31, 2021 is disclosed in the Fund’s Schedule of Investments.
Investment Transactions and Income Recognition Investment transactions are accounted for on trade date for financial reporting purposes. Realized gains and losses from the sale or disposition of investments and foreign exchange transactions, if any, are determined using the identified cost method.
Dividend income and capital gain distributions, if any, are recognized on the ex-dividend date, net of any foreign taxes withheld at source, if any.
Interest income is recorded daily on an accrual basis. All premiums and discounts are amortized/accreted for financial reporting purposes.
Non-cash dividends received in the form of stock are recorded as dividend income at fair value.
The Fund invests in real estate investment trusts (“REITs”). REITs determine the tax character of their distributions annually and may characterize a portion of their distributions as a return of capital or capital gain. The Fund’s policy is to record all REIT distributions initially as dividend income and re-designate a portion to return of capital or capital gain distributions at year end based on information provided by the REIT and/or SSGA Funds Management, Inc.’s (the “Adviser” or “SSGA FM”) estimates of such re-designations for which actual information has not yet been reported. Non-cash dividends received in the form of stock are recorded as dividend income at fair value.
Expenses Certain expenses, which are directly identifiable to a specific Fund, are applied to the Fund within the Company. Other expenses which cannot be attributed to a specific Fund are allocated in such a manner as deemed equitable, taking into consideration the nature and type of expense and the relative net assets of the Fund within the Company.
Distributions The Fund declares and pays any dividends from net investment income annually.
Net realized capital gains, if any, are distributed annually, unless additional distributions are required for compliance with applicable tax regulations. The amount and character of income and capital gains to be
| 14 | Notes to Financial Statements |
State Street Premier Growth Equity V.I.S. Fund
Notes to Financial Statements, continued — December 31, 2021
distributed are determined in accordance with applicable tax regulations which may differ from net investment income and realized gains recognized for U.S. GAAP purposes.
3.Derivative Financial Instruments
Futures Contracts The Fund may enter into futures contracts to meet the Fund’s objectives. A futures contract is a standardized, exchange-traded agreement to buy or sell a financial instrument at a set price on a future date. Upon entering into a futures contract, the Fund is required to deposit with the broker, cash or securities in an amount equal to the minimum initial margin requirements of the clearing house. Securities deposited, if any, are designated on the Schedule of Investments and cash deposited, if any, is shown as Net cash collateral on deposit with broker for future contracts on the Statement of Assets and Liabilities. Subsequent payments are made or received by the Fund equal to the daily change in the contract value, accumulated, exchange rates, and/or other transactional fees. The accumulation of those payments are recorded as variation margin receivable or payable with a corresponding offset to unrealized gains or losses. The Fund recognizes a realized gain or loss when the contract is closed.
Losses may arise if the value of a futures contract decreases due to unfavorable changes in the market rates or values of the underlying instrument during the term of the contract or if the counterparty does not perform under the contract. The use of futures contracts also involves the risk that the movements in the price of the futures contracts do not correlate with the movement of the assets underlying such contracts.
For the fiscal year ended December 31, 2021, the Fund entered into futures contracts for cash equitization.
The following tables summarize the value of the Fund’s derivative instruments as of December 31, 2021 and the related location in the accompanying Statement of Assets and Liabilities and Statement of Operations, presented by primary underlying risk exposure:
| Asset Derivatives |
| | Interest
Rate
Risk | Foreign
Exchange
Risk | Credit
Risk | Equity
Risk | Commodity
Risk | Total |
| State Street Premier Growth Equity V.I.S. Fund | | | | | | |
| Futures Contracts | $ — | $ — | $ — | $ 8,315 | $ — | $ 8,315 |
| Realized Gain/Loss |
| | Interest
Rate
Risk | Foreign
Exchange
Risk | Credit
Risk | Equity
Risk | Commodity
Risk | Total |
| State Street Premier Growth Equity V.I.S. Fund | | | | | | |
| Futures Contracts | $ — | $ — | $ — | $ 68,364 | $ — | $ 68,364 |
| Net Change in Unrealized Appreciation (Depreciation) |
| | Interest
Rate
Risk | Foreign
Exchange
Risk | Credit
Risk | Equity
Risk | Commodity
Risk | Total |
| State Street Premier Growth Equity V.I.S. Fund | | | | | | |
| Futures Contracts | $ — | $ — | $ — | $ (1,031) | $ — | $ (1,031) |
| Notes to Financial Statements | 15 |
State Street Premier Growth Equity V.I.S. Fund
Notes to Financial Statements, continued — December 31, 2021
4.Fees and Transactions with Affiliates
Advisory Fee SSGA FM, a registered investment adviser, was retained by the Board to act as investment adviser and administrator of the Fund. SSGA FM’s compensation for investment advisory and administrative services (“Management Fee”) is paid monthly based on the average daily net assets of the Fund at an annualized rate of 0.65%.
Custody, Fund Accounting and Sub-Administration Fees State Street Bank and Trust Company (“State Street”) serves as the custodian, fund accountant and sub-administrator to the Fund. Amounts paid by the Fund to State Street for performing such services are included as custody, fund accounting and sub-administration fees in the Statement of Operations.
Other Transactions with Affiliates The Fund may invest in affiliated entities, including securities issued by State Street Corporation, affiliated funds, or entities deemed to be affiliates as a result of the Fund owning more than five percent of the entity’s voting securities or outstanding shares. Amounts relating to these transactions during the fiscal year ended December 31, 2021 are disclosed in the Schedule of Investments.
5.Directors' Fees
The fees and expenses of the Company’s directors who are not “interested persons” of the Company, as defined in the 1940 Act (“Independent Directors”), are paid directly by the Fund. The Independent Directors are reimbursed for travel and other out-of-pocket expenses in connection with meeting attendance and industry seminars.
6.Investment Transactions
Purchases and sales of investments (excluding in-kind transactions, short term investments and derivative contracts) for the fiscal year ended December 31, 2021 were as follows:
| Non-U.S. Government Securities |
| Purchases | Sales |
| $ 11,693,597 | $ 17,875,978 |
7.Income Taxes
The Fund has qualified and intends to continue to qualify as a regulated investment company under Subchapter M of the Internal Revenue Code of 1986, as amended. The Fund will not be subject to federal income taxes to the extent it distributes its taxable income, including any net realized capital gains, for each fiscal year. Therefore, no provision for federal income tax is required.
The Fund files federal and various state and local tax returns as required. No income tax returns are currently under examination. Generally, the federal returns are subject to examination by the Internal Revenue Service for a period of three years from date of filing, while the state returns may remain open for an additional year depending upon jurisdiction. SSGA FM has analyzed the Fund’s tax positions taken on tax returns for all open years and does not believe there are any uncertain tax positions that would require recognition of a tax liability.
Distributions to shareholders are recorded on ex-dividend date. Income dividends and gain distributions are determined in accordance with income tax rules and regulations, which may differ from generally accepted accounting principles. Certain capital accounts in the financial statements have been adjusted for permanent book-tax differences. These adjustments have no impact on net asset values or results of operations. Temporary book-tax differences will reverse in the future. These book-tax differences are primarily due to futures contracts and wash sale loss deferrals.
The tax character of distributions paid during the fiscal year ended December 31, 2021 were as follows:
Ordinary
Income | Long-Term
Capital Gains | Total |
| $ 22,377 | $ 7,427,565 | $ 7,449,942 |
| 16 | Notes to Financial Statements |
State Street Premier Growth Equity V.I.S. Fund
Notes to Financial Statements, continued — December 31, 2021
The tax character of distributions paid during the fiscal year ended December 31, 2020 was as follows:
Ordinary
Income | Long-Term
Capital Gains | Total |
| $ 39,610 | $ 3,397,875 | $ 3,437,485 |
At December 31, 2021, the components of distributable earnings on a tax basis were as follows:
Undistributed
Ordinary
Income | Tax Exempt
Income | Capital Loss
Carryforwards | Undistributed
long term
gain | Net
Unrealized
Gains
(Losses) | Qualified
Late-Year
Losses | Total |
| $ — | $ — | $ — | $ 1,820,946 | $ 21,767,788 | $ — | $ 23,588,734 |
As of December 31, 2021, gross unrealized appreciation and gross unrealized depreciation of investments and other financial instruments based on cost for federal income tax purposes were as follows:
Tax
Cost | Gross
Unrealized
Appreciation | Gross
Unrealized
Depreciation | Net
Unrealized
Appreciation
(Depreciation) |
| $ 20,138,689 | $ 22,556,848 | $ 789,060 | $ 21,767,788 |
8.Line of Credit
The Fund and other affiliated funds (each, a “Participant” and collectively, the “Participants”) have access to $200 million of a $1.1 billion revolving credit facility provided by a syndication of banks under which the Participants may borrow to fund shareholder redemptions. This agreement expires in October 2022 unless extended or renewed.
The Participants are charged an annual commitment fee which is calculated based on the unused portion of the shared credit line. Commitment fees are allocated among each of the Participants based on relative net assets. Commitment fees are ordinary fund operating expenses. A Participant incurs and pays the interest expense related to its borrowing. Interest is calculated at a rate per annum equal to the sum of 1.00% plus the greater of the New York Fed Bank Rate and the one-month SOFR Rate.
Prior to October 7, 2021 the Fund had access to $200 million of a $500 million revolving credit facility and interest was calculated at a rate per annum equal to the sum of 1.25% plus the New York Fed Bank Rate.
The Fund had no outstanding loans as of December 31, 2021.
9.Risks
Concentration Risk As a result of the Fund's ability to invest a large percentage of its assets in obligations of issuers within the same country, state, region, currency or economic sector, an adverse economic, business or political development may affect the value of the Fund's investments more than if the Fund was more broadly diversified.
Credit Risk The Fund may be exposed to credit risk in the event that an issuer or guarantor fails to perform or that an institution or entity with which the Fund has unsettled or open transactions defaults.
Market Risk The Fund’s investments are subject to changes in general economic conditions, and general market fluctuations and the risks inherent in investment in securities markets. Investment markets can be volatile and prices of investments can change substantially due to various factors including, but not limited to, economic growth or recession, changes in interest rates, changes in the actual or perceived creditworthiness of issuers, and general market liquidity. The Fund is subject to the risk that geopolitical events will disrupt securities markets and adversely affect global economies and markets. Local, regional or global events such as war, acts of terrorism, the spread of infectious illness or other public health issues, or other events could have a significant impact on the Fund and its investments.
| Notes to Financial Statements | 17 |
State Street Premier Growth Equity V.I.S. Fund
Notes to Financial Statements, continued — December 31, 2021
An outbreak of a respiratory disease caused by a novel coronavirus (known as COVID-19) first detected in China in December 2019 has resulted in a global pandemic and major disruptions to economies and markets around the world, including the United States. Financial markets have experienced and may continue to experience extreme volatility and severe losses, and trading in many instruments was and may continue to be disrupted as a result. Liquidity for many instruments was and may continue to be greatly reduced for periods of time. Some interest rates are very low and in some cases yields are negative. Governments and central banks, including the Federal Reserve in the United States, have taken extraordinary and unprecedented actions to support local and global economies and the financial markets. The impact of these measures, and whether they will be effective to mitigate the economic and market disruption, will not be known for some time. In addition, the outbreak of COVID-19, and measures taken to mitigate its effects, could result in disruptions to the services provided to the Fund by its service providers.
10.Subsequent Events
Management has evaluated the impact of all subsequent events on the Fund through the date on which the financial statements were available to be issued and has determined that there were no other subsequent events requiring adjustment or disclosure in the financial statements.
| 18 | Notes to Financial Statements |
State Street Premier Growth Equity V.I.S. Fund
Report of Independent Registered Public Accounting Firm
To the Shareholders of State Street Premier Growth Equity V.I.S. Fund and the Board of Directors of State Street Variable Insurance Series Funds, Inc.
Opinion on the Financial Statements
We have audited the accompanying statement of assets and liabilities of State Street Premier Growth Equity V.I.S. Fund (the “Fund”) (one of the series constituting State Street Variable Insurance Series Funds, Inc. (the “Company”)), including the schedule of investments, as of December 31, 2021, and the related statement of operations for the year then ended, the statements of changes in net assets for each of the two years in the period then ended, the financial highlights for each of the five years in the period then ended and the related notes (collectively referred to as the “financial statements”). In our opinion, the financial statements present fairly, in all material respects, the financial position of the Fund (one of the series constituting State Street Variable Insurance Series Funds, Inc.) at December 31, 2021, the results of its operations for the year then ended, the changes in its net assets for each of the two years in the period then ended and its financial highlights for each of the five years in the period then ended, in conformity with U.S. generally accepted accounting principles.
Basis for Opinion
These financial statements are the responsibility of the Company’s management. Our responsibility is to express an opinion on the Fund’s financial statements based on our audits. We are a public accounting firm registered with the Public Company Accounting Oversight Board (United States) (“PCAOB”) and are required to be independent with respect to the Company in accordance with the U.S. federal securities laws and the applicable rules and regulations of the Securities and Exchange Commission and the PCAOB.
We conducted our audits in accordance with the standards of the PCAOB. Those standards require that we plan and perform the audit to obtain reasonable assurance about whether the financial statements are free of material misstatement, whether due to error or fraud. The Company is not required to have, nor were we engaged to perform, an audit of the Company’s internal control over financial reporting. As part of our audits we are required to obtain an understanding of internal control over financial reporting, but not for the purpose of expressing an opinion on the effectiveness of the Company’s internal control over financials reporting. Accordingly, we express no such opinion.
Our audits included performing procedures to assess the risks of material misstatement of the financial statements, whether due to error or fraud, and performing procedures that respond to those risks. Such procedures included examining, on a test basis, evidence regarding the amounts and disclosures in the financial statements. Our procedures included confirmation of securities owned as of December 31, 2021, by correspondence with the custodian, brokers and others or by other appropriate auditing procedures where replies from brokers and others were not received. Our audits also included evaluating the accounting principles used and significant estimates made by management, as well as evaluating the overall presentation of the financial statements. We believe that our audits provide a reasonable basis for our opinion.
We have served as the auditor of one or more State Street Global Advisors investment companies since 2000.
Boston, Massachusetts
February 17, 2022
State Street Premier Growth Equity V.I.S. Fund
Other Information — December 31, 2021 (Unaudited)
Tax Information
For federal income tax purposes, the following information is furnished with respect to the distributions of the Fund for its fiscal year ended December 31, 2021.
Dividends Received Deduction
The Fund reports the maximum amount allowable of its net taxable income as eligible for the corporate dividends received deduction.
Long Term Capital Gain Distributions
Long term capital gains dividends were paid from the Fund during the year ended December 31, 2021 in the amount of $7,427,565.
Liquidity Risk Management Program
Pursuant to Rule 22e-4 under the 1940 Act, the Fund has adopted and implemented a liquidity risk management program (the “Program”). SSGA FM has been designated by the Board to administer the Fund's Program. The Program’s principal objectives include assessing, managing and periodically reviewing each Fund’s liquidity risk, based on factors specific to the circumstances of the Fund. Liquidity risk is defined as the risk that a Fund could not meet redemption requests without significant dilution of remaining investors’ interests in the Fund. During the fiscal year, SSGA FM provided the Board with a report addressing the operations of the Program and assessing its adequacy and the effectiveness of the Program’s implementation for the period September 2020 through June 2021. As reported to the Board, the Program supported each Fund’s ability to honor redemption requests timely and SSGA FM’s management of each Fund’s liquidity profile, including during periods of market volatility. SSGA FM reported that the Program operated adequately to meet the requirements of Rule 22e-4 and that the implementation of the Program has been effective.
There can be no assurance that the Program will achieve its objectives in the future. Please refer to your Fund’s prospectus for more information regarding the Fund’s exposure to liquidity risk and other principal risks to which an investment in the Fund may be subject.
Proxy Voting Policies and Procedures and Record
The Fund has adopted the proxy voting policies of the Adviser. A description of the Fund's proxy voting policies and procedures that are used by the Adviser to vote proxies relating to the Fund’s portfolios of securities are available (i) without charge, upon request by calling 1-800-242-0134 (toll free) and (ii) on the SEC's website at www.sec.gov. Information regarding how the Fund voted for the prior 12-months period ended June 30 is available by August 31 of each year by calling the same number, on the SEC’s website at www.sec.gov, and on the Fund's website at www.ssga.com.
Special Meeting of Shareholders — Voting Results
A special meeting of shareholders of State Street Premier Growth Equity V.I.S. Fund (the “Fund”), a series of State Street Variable Insurance Series Funds, Inc., was held on September 29, 2021 to approve a change in the sub-classification of the Fund from “diversified” to “non-diversified” and the elimination of a related fundamental investment restriction. At the meeting the following votes were recorded:
| Shares For | 253,036.804 |
| Shares Against | 22,125.715 |
| Shares Abstained | 7,675.452 |
State Street Premier Growth Equity V.I.S. Fund
Other Information, continued — December 31, 2021 (Unaudited)
Quarterly Portfolio Schedule
Following the Fund's first and third fiscal quarter-ends, a complete Schedule of Investments is filed with the SEC as an exhibit to its reports on Form N-PORT, which can be found on the SEC’s website at www.sec.gov, and on the Fund's website at www.ssga.com. The Fund's Schedules of Investments are available upon request, without charge, by calling 1-800-242-0134.
State Street Premier Growth Equity V.I.S. Fund
Other Information, continued — December 31, 2021 (Unaudited)
Name,
Address, and
Year of Birth | Position(s) Held
with Fund | Term of
Office and
Length of
Time Served | Principal Occupation
During Past Five Years
and Relevant Experience | Number
of
Funds
in Fund
Complex
Overseen
by
Director† | Other Directorships
Held by Director
During Past Five Years |
| INDEPENDENT DIRECTORS |
Michael F. Holland
c/o SSGA Funds
Management, Inc.
One Iron Street Boston,
MA 02210
YOB: 1944 | Director
and
Co-Chairperson
of the Board | Term:
Indefinite
Elected: 1/19 | Chairman, Holland &
Company L.L.C.
(investment adviser)
(1995 – present). | 63 | Director, the Holland Series
Fund, Inc.; Director, The China
Fund, Inc. (1992 – 2017);
Director, The Taiwan Fund,
Inc. (2007 – 2017); Director,
Reaves Utility Income Fund,
Inc.; and Director, Blackstone/
GSO Loans (and Real Estate)
Funds. |
| | | | | | |
Patrick J. Riley
c/o SSGA Funds
Management, Inc.
One Iron Street
Boston, MA 02210
YOB: 1948 | Director
and
Co-Chairperson
of the Board | Term:
Indefinite
Appointed: 4/16
Elected: 1/19 | 2002 to May 2010, Associate
Justice of the Superior Court,
Commonwealth of
Massachusetts; 1985 to 2002,
Partner, Riley, Burke
& Donahue, L.L.P. (law firm);
1998 to present, Independent
Director, State Street Global
Advisers Ireland, Ltd.
(investment company); 1998 to
present, Independent Director,
SSGA Liquidity plc (formerly,
SSGA Cash Management
Fund plc); January 2009 to
present, Independent Director,
SSGA Fixed Income plc; and
January 2009 – 2019,
Independent Director, SSGA
Qualified Funds PLC. | 63 | Board Director and Chairman,
SPDR Europe 1PLC Board
(2011 – present); Board
Director and Chairman, SPDR
Europe II, PLC (2013 –
present). |
State Street Premier Growth Equity V.I.S. Fund
Other Information, continued — December 31, 2021 (Unaudited)
Name,
Address, and
Year of Birth | Position(s) Held
with Fund | Term of
Office and
Length of
Time Served | Principal Occupation
During Past Five Years
and Relevant Experience | Number
of
Funds
in Fund
Complex
Overseen
by
Director† | Other Directorships
Held by Director
During Past Five Years |
| INDEPENDENT DIRECTORS (continued) |
| | | | | |
John R. Costantino
c/o SSGA Funds
Management, Inc.
One Iron Street
Boston, MA 02210
YOB: 1946 | Director
and
Chairperson of
the Qualified Legal
Compliance
Committee | Term:
Indefinite
Elected: 1997 | Senior Advisor to NGN Capital
LLC (January 2019 –
present); Managing General
Partner, NGN Capital LLC
(2006 – December 2019). | 63 | Director of Kleinfeld Bridal
Corp. (January 2016 – present);
Trustee of Neuroscience
Research Institute (1986 – 2017); Trustee of Fordham
University (1989 – 1995 and
2001 – 2007) and Trustee
Emeritus (2007 – present);
Trustee and Independent Chairperson of GE Funds (1993 – February 2011); Director, Muscular Dystrophy Association (since 2019);
Trustee of Gregorian
University Foundation (1992 –
2007); Chairman of the Board of Directors, Vivaldi Biosciences Inc. (May 2017 – present); Chairman of the Supervisory Board, Vivaldi Biosciences AG. (May 2017 – present); Trustee, Gallim Dance (December 2021 – present). |
| | | | | | |
Donna M. Rapaccioli
c/o SSGA Funds
Management, Inc.
One Iron Street
Boston, MA 02210
YOB: 1962 | Director
and
Chairperson of
the Audit Committee | Term:
Indefinite
Appointed: 1/12
Elected: 6/16 | Dean of the Gabelli School of
Business (2007 – present) and
Accounting Professor (1987 –
present) at Fordham
University. | 63 | Director- Graduate
Management Admissions
Council (2015 – present);
Trustee of Emmanuel College
(2010 – 2019). |
| | | | | | |
Richard D. Shirk
c/o SSGA Funds
Management, Inc.
One Iron Street
Boston, MA 02210
YOB: 1945 | Director
and
Chairperson
of the Nominating Committee
Chairperson of the Governance
Committee | Term:
Indefinite
Elected: 1/19 | March 2001 to April 2002,
Chairman (1996 to March
2001, President and Chief
Executive Officer), Cerulean
Companies, Inc. (holding
company) (Retired); 1992 to
March 2001, President and
Chief Executive Officer, Blue
Cross Blue Shield of Georgia
(health insurer,
managed healthcare). | 63 | 1998 to December 2008,
Chairman, Board Member and
December 2008 to present,
Investment Committee
Member, Healthcare Georgia
Foundation (private
foundation); September 2002
to 2012, Lead Director and
Board Member, Amerigroup
Corp. (managed health care);
1999 to 2013, Board Member
and (2001 to 2017) Investment
Committee Member, Woodruff
Arts Center; and 2003 to 2009,
Trustee, Gettysburg College;
Board member, Aerocare
Holdings (2003 – January 2021), Regenesis
Biomedical Inc. (April 2012 – present). |
State Street Premier Growth Equity V.I.S. Fund
Other Information, continued — December 31, 2021 (Unaudited)
Name,
Address, and
Year of Birth | Position(s) Held
with Fund | Term of
Office and
Length of
Time Served | Principal Occupation
During Past Five Years
and Relevant Experience | Number
of
Funds
in Fund
Complex
Overseen
by
Director† | Other Directorships
Held by Director
During Past Five Years |
| INDEPENDENT DIRECTORS (continued) |
| | | | | |
Michael A. Jessee
c/o SSGA Funds
Management, Inc.
One Iron Street
Boston, MA 02210
YOB: 1946 | Director
and
Chairperson of the
Valuation Committee | Term:
Indefinite
Elected: 1/19 | Retired; formerly, President
and Chief Executive Officer of
the Federal Home Loan Bank
of Boston (1989 – 2009);
Trustee, Randolph-Macon
College (2004 – 2016). | 63 | None. |
| INTERESTED DIRECTORS(1) |
Ellen M. Needham(2)
SSGA Funds
Management, Inc.
One Iron Street
Boston, MA 02210
YOB: 1967 | Director and
President | Term:
Indefinite
Elected: 1/19 | Chairman, SSGA Funds
Management, Inc. (March
2020 – present); President and
Director, SSGA Funds
Management, Inc. (2001 –
present)*; Senior Managing
Director, State Street Global
Advisors (1992 – present)*;
Manager, State Street Global
Advisors Funds Distributors,
LLC (May 2017 – present). | 63 | Board Director, SSGA
SPDR ETFs Europe 1 plc
(May 2020 – present); Board Director, SSGA SPDR ETFs Europe II plc (May 2020 – present). |
| | | | | |
| (1) | The individual listed above is a Director who is an “interested person,” as defined in the 1940 Act, of the Company (“Interested Director”). |
| (2) | Ms. Needham is an Interested Director because of her employment by SSGA FM, an affiliate of the Company. |
| * | Served in various capacities and/or with various affiliated entities during noted time period. |
| † | For the purpose of determining the number of portfolios overseen by the Directors, “Fund Complex” comprises registered investment companies for which SSGA FM serves as investment adviser. |
State Street Premier Growth Equity V.I.S. Fund
Other Information, continued — December 31, 2021 (Unaudited)
The following lists the principal officers for the Company, as well as their mailing addresses and ages, positions with the Company and length of time served, and present and principal occupations:
Name,
Address, and
Year of Birth | Position(s) Held
with Funds | Term of
Office and
Length of
Time Served | Principal Occupation
During Past Five Years |
| OFFICERS: |
Ellen M. Needham
SSGA Funds Management, Inc.
One Iron Street
Boston, MA 02210
YOB: 1967 | President and
Director | Term:
Indefinite
Elected:
4/20 | Chairman, SSGA Funds Management, Inc. (March 2020 – present); President and Director, SSGA Funds Management, Inc. (2001 – present)*; Senior Managing Director, State Street Global Advisors (1992 – present)*; Manager, State Street Global Advisors Funds Distributors, LLC (May 2017 – present). |
| | | | |
Bruce S. Rosenberg
SSGA Funds Management, Inc.
One Iron Street
Boston, MA 02210
YOB: 1961 | Treasurer | Term:
Indefinite
Elected: 4/19 | Managing Director, State Street Global Advisors and SSGA Funds Management, Inc. (July 2015 – present); Director, Credit Suisse (April 2008 – July 2015). |
| | | | |
Ann M. Carpenter
SSGA Funds Management, Inc.
One Iron Street
Boston, MA 02210
YOB: 1966 | Vice President
and Deputy
Treasurer | Term:
Indefinite
Elected: 4/19 | Chief Operating Officer, SSGA Funds Management, Inc. (April 2005 – present)*; Managing Director, State Street Global Advisors (2005 – present).* |
| | | | |
Chad C. Hallett
SSGA Funds Management, Inc.
One Iron Street
Boston, MA 02210
YOB: 1969 | Deputy
Treasurer | Term:
Indefinite
Elected: 4/19 | Vice President, State Street Global Advisors and SSGA Funds Management, Inc. (November 2014 – present); Vice President, State Street Bank and Trust Company (2001 – November 2014).* |
| | | | |
Darlene Anderson-Vasquez
SSGA Funds Management, Inc.
One Iron Street
Boston, MA 02210
YOB: 1968 | Deputy
Treasurer | Term:
Indefinite
Elected: 4/19 | Managing Director, State Street Global Advisors and SSGA Funds Management, Inc. (May 2016 – present); Senior Vice President, John Hancock Investments (September 2007 – May 2016). |
| | | | |
Arthur A. Jensen
SSGA Funds Management, Inc.
1600 Summer Street
Stamford, CT 06905
YOB: 1966 | Deputy
Treasurer | Term:
Indefinite
Elected: 4/19 | Vice President, State Street Global Advisors and SSGA Funds Management, Inc. (July 2016 – present); Controller of GE Asset Management Incorporated (April 2011 – July 2016). |
| | | | |
David K. Lancaster
SSGA Funds Management, Inc.
One Iron Street
Boston, MA 02210
YOB: 1971 | Assistant Treasurer | Term:
Indefinite
Elected: 11/20 | Vice President, State Street Global Advisors and SSGA Funds Management, Inc. (July 2017 – present); Assistant Vice President, State Street Bank and Trust Company (November 2011 – July 2017).* |
State Street Premier Growth Equity V.I.S. Fund
Other Information, continued — December 31, 2021 (Unaudited)
Name,
Address, and
Year of Birth | Position(s) Held
with Funds | Term of
Office and
Length of
Time Served | Principal Occupation
During Past Five Years |
| OFFICERS: (continued) |
| | | |
Brian Harris
SSGA Funds Management, Inc.
One Iron Street
Boston, MA 02210
YOB: 1973 | Chief Compliance
Officer, Anti-Money
Laundering Officer
and Code of Ethics
Compliance Officer | Term:
Indefinite Elected: 6/16
Term:
Indefinite Elected: 4/19 | Managing Director, State Street Global Advisors and SSGA Funds Management, Inc. (June 2013 – present).* |
| | | | |
Sean O’Malley
SSGA Funds Management, Inc.
One Iron Street
Boston, MA 02210
YOB: 1969 | Chief Legal Officer | Term:
Indefinite
Elected: 8/19 | Senior Vice President and Deputy General Counsel, State Street Global Advisors (November 2013 – present). |
| | | | |
David Barr
SSGA Funds Management, Inc.
One Iron Street
Boston, MA 02210
YOB: 1974 | Secretary | Term:
Indefinite
Elected: 9/20 | Vice President and Senior Counsel, State Street Global Advisors (October 2019 – present); Vice President and Counsel, Eaton Vance Corp. (October 2010 – October 2019). |
| | | | |
Timothy Collins
SSGA Funds Management, Inc.
One Iron Street
Boston, MA 02210
YOB: 1967 | Assistant
Secretary | Term:
Indefinite
Elected: 9/21 | Vice President and Senior Counsel, State Street Global Advisors (August 2021 – present); Vice President and Managing Counsel, State Street Corporation (March 2020 – August 2021); Vice President and Senior Counsel (April 2018 – March 2020); Counsel, Sutton Place Investments (January 2010 – March 2018). |
| | | | |
David Urman
SSGA Funds Management, Inc.
One Iron Street
Boston, MA 02210
YOB: 1985 | Assistant
Secretary | Term:
Indefinite
Elected: 8/19 | Vice President and Senior Counsel, State Street Global Advisors (April 2019 – present); Vice President and Counsel, State Street Global Advisors (August 2015 – April 2019); Associate, Ropes & Gray LLP (November 2012 – August 2015). |
| | | |
| * | Served in various capacities and/or with various affiliated entities during noted time period. |
[This page intentionally left blank]
Directors
Michael F. Holland, Co-Chairperson
Patrick J. Riley, Co-Chairperson
John R. Costantino
Donna M. Rapaccioli
Michael A. Jessee
Richard D. Shirk
Ellen M. Needham
Officers
Ellen M. Needham, President
Brian Harris, Chief Compliance Officer, Anti-Money Laundering Officer and Code of Ethics Compliance Officer
Sean O’Malley, Chief Legal Officer
Bruce S. Rosenberg, Treasurer
Ann M. Carpenter, Vice President and Deputy Treasurer
Chad C. Hallett, Deputy Treasurer
Arthur A. Jensen, Deputy Treasurer
Darlene Anderson-Vasquez, Deputy Treasurer
David Lancaster, Assistant Treasurer
David Barr, Secretary
Timothy Collins, Assistant Secretary
David Urman, Assistant Secretary
Investment Adviser and Administrator
SSGA Funds Management, Inc.
One Iron Street
Boston, Massachusetts 02210
Custodian and Sub-Administrator
State Street Bank and Trust Company
One Lincoln Street
Boston, Massachusetts 02111
Distributor
State Street Global Advisors Funds Distributors, LLC
One Iron Street
Boston, Massachusetts 02210
Independent Registered Public Accounting Firm
Ernst & Young LLP
200 Clarendon Street
Boston, Massachusetts 02116
Annual Report
December 31, 2021
| State Street S&P 500 Index V.I.S. Fund |
State Street S&P 500 Index V.I.S. Fund
Annual Report
December 31, 2021
| | Page |
| 1 |
| 2 |
| Financial Statements | |
| 17 |
| 18 |
| 19 |
| 20 |
| 21 |
| 27 |
| 28 |
This report is prepared for Policyholders of certain variable contracts and may be distributed to others only if preceded or accompanied by the variable contract’s current prospectus and the current summary prospectus of the Fund available for investments thereunder.
[This page intentionally left blank]
State Street S&P 500 Index V.I.S. Fund
Notes to Performance — December 31, 2021 (Unaudited)
The information provided on the performance page relates to the State Street S&P 500 Index V.I.S. Fund (the “Fund”).
Total return performance shown in this report for the Fund takes into account changes in share price and assumes reinvestment of dividends and capital gains distributions, if any. Total returns shown are net of Fund fees and expenses but do not reflect fees and charges associated with the variable contracts such as administrative fees, account charges and surrender charges, which, if reflected, would reduce the Fund’s total returns for all periods shown.
The performance data quoted represents past performance; past performance does not guarantee future results. Investment return and principal value will fluctuate so your shares, when redeemed, may be worth more or less than their original cost. Current performance may be higher or lower than the performance data quoted. Periods less than one year are not annualized. Please call toll-free (800) 242-0134 or visit the Fund’s website at http://www.ssga.com. for the most recent month-end performance data.
An investment in the Fund is not a deposit of any bank and is not insured or guaranteed by the Federal Deposit Insurance Corporation (“FDIC”) or any other government agency. An investment in the Fund is subject to risk, including possible loss of principal invested.
The S&P 500® Index is an unmanaged, market capitalization-weighted index of stocks of 500 large U.S. companies, which is widely used as a measure of large-cap U.S. stock market performance.
The Fund is not sponsored, endorsed, sold or promoted by S&P Global Ratings (“S&P”), and S&P makes no representation or warranty, express or implied, to the investors of the Fund or any member of the public regarding the advisability of investing in the securities generally or in this Fund particularly or the ability of the Fund to track general stock market performance.
The results shown for the foregoing index assume the reinvestment of net dividends or interest and do not reflect fees, expenses, or taxes. As such, the index returns do not reflect the actual cost of investing in the instruments that comprise the index.
The views expressed in this document reflect our judgement as of the publication date and are subject to change at any time without notice.
State Street Global Advisors Funds Distributors, LLC, member of FINRA & SIPC is the principal underwriter and distributor of the State Street S&P 500 Index V.I.S. Fund and an indirect wholly-owned subsidiary of State Street Corporation. References to State Street may include State Street Corporation and its affiliates. The Funds pay State Street Bank and Trust Company for its services as custodian and Fund Accounting agent, and pay SSGA Funds Management, Inc. ("SSGA FM" or the "Adviser") for investment advisory and administrative services.
State Street S&P 500 Index V.I.S. Fund
Management's Discussion of Fund Performance — December 31, 2021 (Unaudited)
The State Street S&P 500 Index V.I.S Fund (the “Fund”) seeks to provide growth of capital and accumulation of income that corresponds to the investment return of the S&P 500 Index. The Fund’s benchmark is S&P 500 Index (the “Index”).
For the 12-month period ended December 31, 2021 (the “Reporting Period”), the total return for the Fund was 28.27%, and the Index was 28.71%. The Fund and Index returns reflect the reinvestment of dividends and other income. The Fund’s performance reflects the expenses of managing the Fund, including brokerage and advisory expenses. The Index is unmanaged and Index returns do not reflect fees and expenses of any kind, which would have a negative impact on returns.
The S&P 500 Index had a very prosperous year with substantial gains in three out of the four quarters (Q1 +6.17%, Q2 +8.55%, Q4 +11.03%) while still managing a modest gain of 0.58% during a challenging Q3. Overall, the Index gained 28.71% for the calendar year of 2021. The consistent storyline in the U.S., as well as most of the developed world, was economic recovery as vaccine distribution became widespread and the country learned how to adapt to a new way of life. Many features introduced during the height of the COVID-19 pandemic a year earlier were permanently adopted changing the overall business landscape. Remote working arrangements, curbside store pickups, virtual healthcare, and contactless delivery helped lead the economy through this uncertain terrain. The hiccup during Q3, caused by continued supply chain disruptions and the unfortunate reality of a new COVID-19 variant on the horizon, subsided as the last quarter began and the season of spending (in the form of both consumer holiday shopping and U.S. government infrastructure investing) signaled economic health in the U.S..
Information Technology, Financial and Health Care were the best contributing sectors to the Fund’s performance during the Reporting Period. Utilities, Materials and Consumer Staples were the weakest contributors.
The Fund used index futures in order to equitize cash and receivables during the Reporting Period. The Fund’s use of the index futures contributed to Fund performance relative to the Index
On an individual security level, the top positive contributors to the Fund’s performance on an absolute basis during the Reporting Period were PayPal Holdings, Inc., Global Payments Inc. and Walt Disney Company. The top negative contributors to the Fund’s performance on an absolute basis during the Reporting Period were Microsoft Corporation, Apple Inc. and NVIDIA Corporation.
The views expressed above reflect those of the Fund’s portfolio manager only through the Reporting Period, and do not necessarily represent the views of the Adviser as a whole. Any such views are subject to change at any time based upon market or other conditions and the Adviser disclaims any responsibility to update such views. These views may not be relied on as investment advice and, because investment decisions for a fund are based on numerous factors, may not be relied on as an indication of trading intent on behalf of any fund.
| 2 | State Street S&P 500 Index V.I.S. Fund |
State Street S&P 500 Index V.I.S. Fund
Performance Summary — December 31, 2021 (Unaudited)
| Sector Allocation |
| Portfolio composition as a % of Fair Value of $208,456 (in thousands) as of December 31, 2021 (a)(b) |
| Top Ten Largest Holdings |
| as of December 31, 2021 (as a % of Fair Value) (a)(b) |
| Apple Inc. | 6.84% |
| Microsoft Corp. | 6.24% |
| Amazon.com Inc. | 3.59% |
| Alphabet Inc., Class A | 2.15% |
| Tesla Inc. | 2.11% |
| Alphabet Inc., Class C | 2.00% |
| Meta Platforms Inc., Class A | 1.97% |
| NVIDIA Corp. | 1.82% |
| Berkshire Hathaway Inc., Class B | 1.36% |
| UnitedHealth Group Inc. | 1.16% |
| Average Annual Total Return for the years ended December 31, 2021 |
| Class 1 Shares (Inception date 4/15/85) |
| | One Year | | Five Year | | Ten Year | | Ending Value
of a $10,000
Investment |
| State Street S&P 500 Index V.I.S. Fund | 28.27% | | 18.07% | | 16.17% | | $44,772 |
| S&P 500® Index | 28.71% | | 18.48% | | 16.55% | | $46,257 |
|
| (a) | Fair Value basis is inclusive of a short-term investment in the State Street Institutional Liquid Reserve Fund, Premier Class. |
| (b) | The securities information regarding holdings, allocations and other characteristics is presented to illustrate examples of securities that the Fund has bought and the diversity of areas in which the Fund may invest as of a particular date. It may not be representative of the Fund’s current or future investments and should not be construed as a recommendation to purchase or sell a particular security. |
| State Street S&P 500 Index V.I.S. Fund | 3 |
State Street S&P 500 Index V.I.S. Fund
Performance Summary, continued — December 31, 2021 (Unaudited)
Change in Value of a $10,000 Investment
Yearly periods ended December 31
See Notes to Performance beginning on page 1 for further information.
Past performance does not predict future performance. The performance shown in the graphs and tables does not reflect the deduction of taxes that a shareholder would pay on Fund distributions or the redemption of Fund shares and does not reflect the fees or charges that would be associated with variable contracts through which shares of the Fund are offered.
| 4 | State Street S&P 500 Index V.I.S. Fund |
State Street S&P 500 Index V.I.S. Fund
Understanding Your Fund’s Expenses — December 31, 2021 (Unaudited)
As a shareholder of the Fund, you incur ongoing costs. Ongoing costs include portfolio management fees, professional fees, administrative fees and other Fund expenses. The following example is intended to help you understand your ongoing costs (in dollars) of investing in the Fund and to compare these costs with the ongoing costs of investing in other mutual funds.
To illustrate these ongoing costs, we have provided an example and calculated the expenses paid by investors of the Fund during the period. The information in the following table is based on an investment of $1,000, which is invested at the beginning of the period and held for the entire six-month period ended December 31, 2021.
Actual Expenses
The first section of the table provides information about actual account values and actual expenses. You may use the information in this section, together with the amount you invested, to estimate the expenses that you paid over the period. To do so, simply divide your account value by $1,000 (for example, an $8,600 account value divided by $1,000 = 8.6), then multiply the result by the number given under the heading “Expenses paid during the period” to estimate the expenses you paid on your account during the period.
Hypothetical Example for Comparison Purposes
The second section of the table provides information about hypothetical account values and hypothetical expenses based on the Fund’s actual expense ratio and an assumed rate of return of 5% per year before expenses, which is not the Fund’s actual return. The hypothetical account values and expenses may not be used to estimate the actual ending account balance or expenses you paid for the period. You may use this information to compare the ongoing costs of investing in the Fund and other funds. To do so, compare this 5% hypothetical example with the 5% hypothetical examples that appear in the shareholder reports of other funds.
Please note that the expenses shown in the table are meant to highlight and help you compare ongoing costs only and do not reflect transaction costs, such as sales charges or redemption fees, if any. Therefore, the second section of the table is useful in comparing ongoing costs only, and will not help you determine the relative total costs of owning different funds. Additionally, the expenses shown do not reflect the fees or charges associated with variable contracts through which shares of the Fund are offered.
| | Actual
Fund Return | | Hypothetical
5% Return
(2.5% for
the period) |
Beginning Account Value
July 1, 2021 | $1,000.00 | | $1,000.00 |
Ending Account value
December 31, 2021 | $1,114.50 | | $1,023.60 |
| Expenses Paid During Period* | $ 1.65 | | $ 1.58 |
| * | Expenses are equal to the Fund's annualized expense ratio of 0.31%** (for the period July 1, 2021 - December 31, 2021), multiplied by the average account value over the period, multiplied by 184/365 (to reflect the one-half year period). |
| ** | May differ from expense ratio disclosed in the financial highlights, which is calculated based on the entire fiscal year's data. |
| State Street S&P 500 Index V.I.S. Fund | 5 |
State Street S&P 500 Index V.I.S. Fund
Schedule of Investments — December 31, 2021
| | Number
of Shares | Fair
Value |
| Common Stock - 99.6% † |
| Advertising - 0.1% |
| Omnicom Group Inc. | 1,023 | $ 74,955 |
| The Interpublic Group of Companies Inc. | 2,061 | 77,185 |
| | | 152,140 |
| Aerospace & Defense - 1.3% |
| General Dynamics Corp. | 1,181 | 246,203 |
| Howmet Aerospace Inc. | 2,272 | 72,318 |
| Huntington Ingalls Industries Inc. | 200 | 37,348 |
| L3Harris Technologies Inc. | 968 | 206,416 |
| Lockheed Martin Corp. | 1,273 | 452,437 |
| Northrop Grumman Corp. | 795 | 307,721 |
| Raytheon Technologies Corp. | 7,577 | 652,077 |
| Textron Inc. | 1,011 | 78,049 |
| The Boeing Co. (a) | 2,788 | 561,280 |
| TransDigm Group Inc. (a) | 270 | 171,795 |
| | | 2,785,644 |
| Agricultural & Farm Machinery - 0.2% |
| Deere & Co. | 1,422 | 487,590 |
| Agricultural Products - 0.1% |
| Archer-Daniels-Midland Co. | 2,896 | 195,741 |
| Air Freight & Logistics - 0.6% |
| CH Robinson Worldwide Inc. | 587 | 63,179 |
| Expeditors International of Washington Inc. | 832 | 111,729 |
| FedEx Corp. | 1,208 | 312,437 |
| United Parcel Service Inc., Class B | 3,725 | 798,417 |
| | | 1,285,762 |
| Airlines - 0.2% |
| Alaska Air Group Inc. (a) | 700 | 36,470 |
| American Airlines Group Inc. (a) | 3,511 | 63,057 |
| Delta Air Lines Inc. (a) | 3,506 | 137,014 |
| Southwest Airlines Co. (a) | 3,202 | 137,174 |
| United Airlines Holdings Inc. (a) | 1,811 | 79,286 |
| | | 453,001 |
| Alternative Carriers - 0.0%* |
| Lumen Technologies Inc. | 4,737 | 59,449 |
| | Number
of Shares | Fair
Value |
| Apparel Retail - 0.3% |
| Ross Stores Inc. | 1,730 | $ 197,704 |
| The Gap Inc. | 1,215 | 21,445 |
| The TJX Companies Inc. | 6,179 | 469,110 |
| | | 688,259 |
| Apparel, Accessories & Luxury Goods - 0.1% |
| PVH Corp. | 407 | 43,407 |
| Ralph Lauren Corp. | 270 | 32,092 |
| Tapestry Inc. | 1,589 | 64,513 |
| Under Armour Inc., Class A (a) | 500 | 10,595 |
| Under Armour Inc., Class C (a) | 1,012 | 18,257 |
| VF Corp. | 1,741 | 127,476 |
| | | 296,340 |
| Application Software - 2.4% |
| Adobe Inc. (a) | 2,450 | 1,389,297 |
| ANSYS Inc. (a) | 471 | 188,928 |
| Autodesk Inc. (a) | 1,093 | 307,341 |
| Cadence Design Systems Inc. (a) | 1,443 | 268,903 |
| Ceridian HCM Holding Inc. (a) | 666 | 69,570 |
| Citrix Systems Inc. | 707 | 66,875 |
| Intuit Inc. | 1,416 | 910,800 |
| Paycom Software Inc. (a) | 250 | 103,797 |
| PTC Inc. (a) | 600 | 72,690 |
| salesforce.com Inc. (a) | 5,026 | 1,277,257 |
| Synopsys Inc. (a) | 788 | 290,378 |
| Tyler Technologies Inc. (a) | 200 | 107,590 |
| | | 5,053,426 |
| Asset Management & Custody Banks - 0.8% |
| Ameriprise Financial Inc. | 576 | 173,756 |
| BlackRock Inc. | 738 | 675,683 |
| Franklin Resources Inc. | 1,491 | 49,934 |
| Invesco Ltd. | 2,050 | 47,191 |
| Northern Trust Corp. | 992 | 118,653 |
| State Street Corp. (b) | 1,906 | 177,258 |
| T Rowe Price Group Inc. | 1,203 | 236,558 |
| The Bank of New York Mellon Corp. | 3,719 | 216,000 |
| | | 1,695,033 |
| Auto Parts & Equipment - 0.1% |
| Aptiv PLC (a) | 1,387 | 228,786 |
| BorgWarner Inc. | 1,447 | 65,216 |
| | | 294,002 |
See Notes to Schedule of Investments and Notes to Financial Statements.
| 6 | State Street S&P 500 Index V.I.S. Fund |
State Street S&P 500 Index V.I.S. Fund
Schedule of Investments, continued — December 31, 2021
| | Number
of Shares | Fair
Value |
| Automobile Manufacturers - 2.5% |
| Ford Motor Co. | 20,537 | $ 426,553 |
| General Motors Co. (a) | 7,649 | 448,461 |
| Tesla Inc. (a) | 4,172 | 4,408,886 |
| | | 5,283,900 |
| Automotive Retail - 0.3% |
| Advance Auto Parts Inc. | 304 | 72,923 |
| AutoZone Inc. (a) | 112 | 234,796 |
| CarMax Inc. (a) | 834 | 108,612 |
| O'Reilly Automotive Inc. (a) | 354 | 250,005 |
| | | 666,336 |
| Biotechnology - 1.8% |
| AbbVie Inc. | 9,018 | 1,221,037 |
| Amgen Inc. | 2,911 | 654,888 |
| Biogen Inc. (a) | 800 | 191,936 |
| Gilead Sciences Inc. | 6,555 | 475,959 |
| Incyte Corp. (a) | 820 | 60,188 |
| Moderna Inc. (a) | 1,765 | 448,275 |
| Regeneron Pharmaceuticals Inc. (a) | 541 | 341,652 |
| Vertex Pharmaceuticals Inc. (a) | 1,312 | 288,115 |
| | | 3,682,050 |
| Brewers - 0.0%* |
| Molson Coors Beverage Co., Class B | 1,078 | 49,965 |
| Broadcasting - 0.1% |
| Discovery Inc., Class A (a) | 806 | 18,973 |
| Discovery Inc., Class C (a) | 1,640 | 37,556 |
| Fox Corp., Class A | 1,530 | 56,457 |
| Fox Corp., Class B | 740 | 25,360 |
| ViacomCBS Inc., Class B | 3,236 | 97,663 |
| | | 236,009 |
| Building Products - 0.5% |
| A O Smith Corp. | 798 | 68,508 |
| Allegion plc | 533 | 70,590 |
| Carrier Global Corp. | 4,270 | 231,605 |
| Fortune Brands Home & Security Inc. | 599 | 64,033 |
| Johnson Controls International PLC | 3,783 | 307,596 |
| Masco Corp. | 1,282 | 90,022 |
| Trane Technologies PLC | 1,257 | 253,952 |
| | | 1,086,306 |
| | Number
of Shares | Fair
Value |
| Cable & Satellite - 0.8% |
| Charter Communications Inc., Class A (a) | 638 | $ 415,957 |
| Comcast Corp., Class A | 23,657 | 1,190,657 |
| DISH Network Corp., Class A (a) | 1,098 | 35,619 |
| | | 1,642,233 |
| Casinos & Gaming - 0.2% |
| Caesars Entertainment Inc. (a) | 1,071 | 100,171 |
| Las Vegas Sands Corp. (a) | 1,739 | 65,456 |
| MGM Resorts International | 1,997 | 89,625 |
| Penn National Gaming Inc. (a) | 755 | 39,147 |
| Wynn Resorts Ltd. (a) | 481 | 40,904 |
| | | 335,303 |
| Commodity Chemicals - 0.2% |
| Dow Inc. | 3,848 | 218,258 |
| LyondellBasell Industries N.V., Class A | 1,338 | 123,404 |
| | | 341,662 |
| Communications Equipment - 0.9% |
| Arista Networks Inc. (a) | 1,128 | 162,150 |
| Cisco Systems Inc. | 21,640 | 1,371,327 |
| F5 Inc. (a) | 353 | 86,383 |
| Juniper Networks Inc. | 1,889 | 67,456 |
| Motorola Solutions Inc. | 825 | 224,152 |
| | | 1,911,468 |
| Computer & Electronics Retail - 0.1% |
| Best Buy Company Inc. | 1,117 | 113,487 |
| Construction & Engineering - 0.0%* |
| Quanta Services Inc. | 784 | 89,893 |
| Construction Machinery & Heavy Trucks - 0.5% |
| Caterpillar Inc. | 2,815 | 581,973 |
| Cummins Inc. | 742 | 161,860 |
| PACCAR Inc. | 1,844 | 162,751 |
| Westinghouse Air Brake Technologies Corp. | 1,025 | 94,413 |
| | | 1,000,997 |
| Construction Materials - 0.1% |
| Martin Marietta Materials Inc. | 327 | 144,050 |
| Vulcan Materials Co. | 695 | 144,268 |
| | | 288,318 |
See Notes to Schedule of Investments and Notes to Financial Statements.
| State Street S&P 500 Index V.I.S. Fund | 7 |
State Street S&P 500 Index V.I.S. Fund
Schedule of Investments, continued — December 31, 2021
| | Number
of Shares | Fair
Value |
| Consumer Electronics - 0.1% |
| Garmin Ltd. | 800 | $ 108,936 |
| Consumer Finance - 0.6% |
| American Express Co. | 3,210 | 525,156 |
| Capital One Financial Corp. | 2,170 | 314,845 |
| Discover Financial Services | 1,577 | 182,238 |
| Synchrony Financial | 2,866 | 132,954 |
| | | 1,155,193 |
| Copper - 0.2% |
| Freeport-McMoRan Inc. | 7,421 | 309,678 |
| Data Processing & Outsourced Services - 3.1% |
| Automatic Data Processing Inc. | 2,136 | 526,695 |
| Broadridge Financial Solutions Inc. | 562 | 102,745 |
| Fidelity National Information Services Inc. | 3,224 | 351,900 |
| Fiserv Inc. (a) | 3,025 | 313,965 |
| FleetCor Technologies Inc. (a) | 439 | 98,266 |
| Global Payments Inc. | 1,496 | 202,229 |
| Jack Henry & Associates Inc. | 437 | 72,975 |
| Mastercard Inc., Class A | 4,480 | 1,609,753 |
| Paychex Inc. | 1,735 | 236,827 |
| PayPal Holdings Inc. (a) | 6,107 | 1,151,658 |
| Visa Inc., Class A | 8,643 | 1,873,024 |
| | | 6,540,037 |
| Distillers & Vintners - 0.1% |
| Brown-Forman Corp., Class B | 994 | 72,423 |
| Constellation Brands Inc., Class A | 872 | 218,846 |
| | | 291,269 |
| Distributors - 0.1% |
| Genuine Parts Co. | 797 | 111,739 |
| LKQ Corp. | 1,164 | 69,875 |
| Pool Corp. | 200 | 113,200 |
| | | 294,814 |
| Diversified Banks - 2.9% |
| Bank of America Corp. | 36,937 | 1,643,327 |
| Citigroup Inc. | 10,042 | 606,436 |
| JPMorgan Chase & Co. | 15,232 | 2,411,987 |
| U.S. Bancorp | 6,960 | 390,943 |
| Wells Fargo & Co. | 20,326 | 975,242 |
| | | 6,027,935 |
| | Number
of Shares | Fair
Value |
| Diversified Support Services - 0.2% |
| Cintas Corp. | 448 | $ 198,540 |
| Copart Inc. (a) | 1,066 | 161,627 |
| | | 360,167 |
| Drug Retail - 0.1% |
| Walgreens Boots Alliance Inc. | 3,882 | 202,485 |
| Electric Utilities - 1.6% |
| Alliant Energy Corp. | 1,400 | 86,058 |
| American Electric Power Company Inc. | 2,666 | 237,194 |
| Duke Energy Corp. | 4,015 | 421,173 |
| Edison International | 1,870 | 127,628 |
| Entergy Corp. | 947 | 106,680 |
| Evergy Inc. | 1,088 | 74,648 |
| Eversource Energy | 1,739 | 158,214 |
| Exelon Corp. | 4,834 | 279,212 |
| FirstEnergy Corp. | 2,670 | 111,045 |
| NextEra Energy Inc. | 10,121 | 944,897 |
| NRG Energy Inc. | 1,018 | 43,855 |
| Pinnacle West Capital Corp. | 700 | 49,413 |
| PPL Corp. | 3,931 | 118,166 |
| The Southern Co. | 5,352 | 367,040 |
| Xcel Energy Inc. | 2,897 | 196,127 |
| | | 3,321,350 |
| Electrical Components & Equipment - 0.6% |
| AMETEK Inc. | 1,249 | 183,653 |
| Eaton Corporation PLC | 2,056 | 355,318 |
| Emerson Electric Co. | 3,066 | 285,046 |
| Generac Holdings Inc. (a) | 324 | 114,022 |
| Rockwell Automation Inc. | 584 | 203,728 |
| | | 1,141,767 |
| Electronic Components - 0.2% |
| Amphenol Corp., Class A | 3,089 | 270,164 |
| Corning Inc. | 3,947 | 146,947 |
| | | 417,111 |
| Electronic Equipment & Instruments - 0.3% |
| Keysight Technologies Inc. (a) | 1,000 | 206,510 |
| Teledyne Technologies Inc. (a) | 252 | 110,096 |
| Trimble Inc. (a) | 1,400 | 122,066 |
| Zebra Technologies Corp., Class A (a) | 250 | 148,800 |
| | | 587,472 |
See Notes to Schedule of Investments and Notes to Financial Statements.
| 8 | State Street S&P 500 Index V.I.S. Fund |
State Street S&P 500 Index V.I.S. Fund
Schedule of Investments, continued — December 31, 2021
| | Number
of Shares | Fair
Value |
| Electronic Manufacturing Services - 0.1% |
| IPG Photonics Corp. (a) | 179 | $ 30,813 |
| TE Connectivity Ltd. | 1,687 | 272,181 |
| | | 302,994 |
| Environmental & Facilities Services - 0.3% |
| Republic Services Inc. | 1,117 | 155,766 |
| Rollins Inc. | 1,200 | 41,052 |
| Waste Management Inc. | 2,006 | 334,801 |
| | | 531,619 |
| Fertilizers & Agricultural Chemicals - 0.2% |
| CF Industries Holdings Inc. | 1,250 | 88,475 |
| Corteva Inc. | 3,589 | 169,688 |
| FMC Corp. | 558 | 61,318 |
| The Mosaic Co. | 1,554 | 61,057 |
| | | 380,538 |
| Financial Exchanges & Data - 1.1% |
| Cboe Global Markets Inc. | 577 | 75,241 |
| CME Group Inc. | 1,838 | 419,909 |
| FactSet Research Systems Inc. | 200 | 97,202 |
| Intercontinental Exchange Inc. | 2,801 | 383,093 |
| MarketAxess Holdings Inc. | 206 | 84,721 |
| Moody's Corp. | 821 | 320,666 |
| MSCI Inc. | 433 | 265,295 |
| Nasdaq Inc. | 576 | 120,966 |
| S&P Global Inc. | 1,262 | 595,576 |
| | | 2,362,669 |
| Food Distributors - 0.1% |
| Sysco Corp. | 2,638 | 207,215 |
| Food Retail - 0.1% |
| The Kroger Co. | 3,456 | 156,419 |
| Footwear - 0.5% |
| NIKE Inc., Class B | 6,599 | 1,099,855 |
| Gas Utilities - 0.0%* |
| Atmos Energy Corp. | 700 | 73,339 |
| General Merchandise Stores - 0.5% |
| Dollar General Corp. | 1,150 | 271,205 |
| Dollar Tree Inc. (a) | 1,149 | 161,457 |
| Target Corp. | 2,540 | 587,858 |
| | | 1,020,520 |
| | Number
of Shares | Fair
Value |
| Gold - 0.1% |
| Newmont Corp. | 4,048 | $ 251,057 |
| Health Care REITs - 0.2% |
| Healthpeak Properties Inc. | 2,669 | 96,324 |
| Ventas Inc. | 2,129 | 108,834 |
| Welltower Inc. | 2,123 | 182,090 |
| | | 387,248 |
| Healthcare Distributors - 0.2% |
| AmerisourceBergen Corp. | 813 | 108,040 |
| Cardinal Health Inc. | 1,281 | 65,959 |
| Henry Schein Inc. (a) | 663 | 51,402 |
| McKesson Corp. | 816 | 202,833 |
| | | 428,234 |
| Healthcare Equipment - 2.7% |
| Abbott Laboratories | 9,054 | 1,274,260 |
| ABIOMED Inc. (a) | 238 | 85,482 |
| Baxter International Inc. | 2,423 | 207,990 |
| Becton Dickinson & Co. | 1,438 | 361,628 |
| Boston Scientific Corp. (a) | 7,245 | 307,768 |
| Dexcom Inc. (a) | 512 | 274,918 |
| Edwards Lifesciences Corp. (a) | 3,164 | 409,896 |
| Hologic Inc. (a) | 1,277 | 97,767 |
| IDEXX Laboratories Inc. (a) | 452 | 297,624 |
| Intuitive Surgical Inc. (a) | 1,844 | 662,549 |
| Medtronic PLC | 6,962 | 720,219 |
| ResMed Inc. | 695 | 181,034 |
| STERIS PLC | 500 | 121,705 |
| Stryker Corp. | 1,737 | 464,509 |
| Teleflex Inc. | 260 | 85,405 |
| Zimmer Biomet Holdings Inc. | 1,087 | 138,093 |
| | | 5,690,847 |
| Healthcare Facilities - 0.2% |
| HCA Healthcare Inc. | 1,236 | 317,553 |
| Universal Health Services Inc., Class B | 364 | 47,196 |
| | | 364,749 |
| Healthcare Services - 0.7% |
| Cigna Corp. | 1,741 | 399,786 |
| CVS Health Corp. | 6,767 | 698,084 |
| DaVita Inc. (a) | 358 | 40,726 |
| Laboratory Corporation of America Holdings (a) | 429 | 134,796 |
See Notes to Schedule of Investments and Notes to Financial Statements.
| State Street S&P 500 Index V.I.S. Fund | 9 |
State Street S&P 500 Index V.I.S. Fund
Schedule of Investments, continued — December 31, 2021
| | Number
of Shares | Fair
Value |
| Quest Diagnostics Inc. | 618 | $ 106,920 |
| | | 1,380,312 |
| Healthcare Supplies - 0.2% |
| Align Technology Inc. (a) | 394 | 258,929 |
| DENTSPLY SIRONA Inc. | 1,277 | 71,244 |
| The Cooper Companies Inc. | 257 | 107,667 |
| | | 437,840 |
| Healthcare Technology - 0.1% |
| Cerner Corp. | 1,630 | 151,378 |
| Home Building - 0.3% |
| D.R. Horton Inc. | 1,775 | 192,499 |
| Lennar Corp., Class A | 1,444 | 167,735 |
| NVR Inc. (a) | 17 | 100,451 |
| PulteGroup Inc. | 1,135 | 64,876 |
| | | 525,561 |
| Home Furnishings - 0.0%* |
| Mohawk Industries Inc. (a) | 331 | 60,302 |
| Home Improvement Retail - 1.5% |
| Lowe's Companies Inc. | 3,576 | 924,324 |
| The Home Depot Inc. | 5,453 | 2,263,050 |
| | | 3,187,374 |
| Hotel & Resort REITs - 0.0%* |
| Host Hotels & Resorts Inc. (a) | 3,617 | 62,900 |
| Hotels, Resorts & Cruise Lines - 0.6% |
| Booking Holdings Inc. (a) | 215 | 515,834 |
| Carnival Corp. (a) | 4,167 | 83,840 |
| Expedia Group Inc. (a) | 764 | 138,070 |
| Hilton Worldwide Holdings Inc. (a) | 1,415 | 220,726 |
| Marriott International Inc., Class A (a) | 1,382 | 228,362 |
| Norwegian Cruise Line Holdings Ltd. (a) | 2,096 | 43,471 |
| Royal Caribbean Cruises Ltd. (a) | 1,063 | 81,745 |
| | | 1,312,048 |
| Household Appliances - 0.0%* |
| Whirlpool Corp. | 259 | 60,777 |
| Household Products - 1.4% |
| Church & Dwight Company Inc. | 1,223 | 125,358 |
| | Number
of Shares | Fair
Value |
| Colgate-Palmolive Co. | 4,426 | $ 377,715 |
| Kimberly-Clark Corp. | 1,802 | 257,542 |
| The Clorox Co. | 684 | 119,262 |
| The Procter & Gamble Co. | 12,437 | 2,034,444 |
| | | 2,914,321 |
| Housewares & Specialties - 0.0%* |
| Newell Brands Inc. | 2,334 | 50,975 |
| Human Resource & Employment Services - 0.0%* |
| Robert Half International Inc. | 575 | 64,124 |
| Hypermarkets & Super Centers - 1.1% |
| Costco Wholesale Corp. | 2,259 | 1,282,434 |
| Walmart Inc. | 7,384 | 1,068,391 |
| | | 2,350,825 |
| Independent Power Producers & Energy Traders - 0.0%* |
| The AES Corp. | 3,256 | 79,121 |
| Industrial Conglomerates - 1.0% |
| 3M Co. | 2,937 | 521,700 |
| General Electric Co. | 5,758 | 543,958 |
| Honeywell International Inc. | 3,530 | 736,040 |
| Roper Technologies Inc. | 551 | 271,015 |
| | | 2,072,713 |
| Industrial Gases - 0.6% |
| Air Products & Chemicals Inc. | 1,154 | 351,116 |
| Linde PLC (a) | 2,665 | 923,236 |
| | | 1,274,352 |
| Industrial Machinery - 0.8% |
| Dover Corp. | 706 | 128,210 |
| Fortive Corp. | 1,849 | 141,060 |
| IDEX Corp. | 411 | 97,127 |
| Illinois Tool Works Inc. | 1,455 | 359,094 |
| Ingersoll Rand Inc. | 2,211 | 136,795 |
| Otis Worldwide Corp. | 2,060 | 179,364 |
| Parker-Hannifin Corp. | 698 | 222,048 |
| Pentair PLC | 953 | 69,598 |
| Snap-on Inc. | 282 | 60,737 |
| Stanley Black & Decker Inc. | 874 | 164,854 |
| Xylem Inc. | 895 | 107,328 |
| | | 1,666,215 |
| Industrial REITs - 0.4% |
| Duke Realty Corp. | 1,853 | 121,631 |
See Notes to Schedule of Investments and Notes to Financial Statements.
| 10 | State Street S&P 500 Index V.I.S. Fund |
State Street S&P 500 Index V.I.S. Fund
Schedule of Investments, continued — December 31, 2021
| | Number
of Shares | Fair
Value |
| Prologis Inc. | 3,712 | $ 624,952 |
| | | 746,583 |
| Insurance Brokers - 0.6% |
| Aon PLC, Class A | 1,153 | 346,546 |
| Arthur J Gallagher & Co. | 1,027 | 174,251 |
| Brown & Brown Inc. | 1,145 | 80,470 |
| Marsh & McLennan Companies Inc. | 2,596 | 451,237 |
| Willis Towers Watson PLC | 647 | 153,656 |
| | | 1,206,160 |
| Integrated Oil & Gas - 1.3% |
| Chevron Corp. | 9,987 | 1,171,974 |
| Exxon Mobil Corp. | 21,741 | 1,330,332 |
| Occidental Petroleum Corp. | 4,649 | 134,775 |
| | | 2,637,081 |
| Integrated Telecommunication Services - 1.0% |
| AT&T Inc. | 36,348 | 894,161 |
| Verizon Communications Inc. | 21,131 | 1,097,967 |
| | | 1,992,128 |
| Interactive Home Entertainment - 0.3% |
| Activision Blizzard Inc. | 3,928 | 261,330 |
| Electronic Arts Inc. | 1,498 | 197,586 |
| Take-Two Interactive Software Inc. (a) | 626 | 111,253 |
| | | 570,169 |
| Interactive Media & Services - 6.3% |
| Alphabet Inc., Class C (a) | 1,443 | 4,175,450 |
| Alphabet Inc., Class A (a)(c) | 1,548 | 4,484,618 |
| Match Group Inc. (a) | 1,443 | 190,837 |
| Meta Platforms Inc., Class A (a) | 12,211 | 4,107,170 |
| Twitter Inc. (a) | 4,151 | 179,406 |
| | | 13,137,481 |
| Internet & Direct Marketing Retail - 3.8% |
| Amazon.com Inc. (a) | 2,241 | 7,472,256 |
| eBay Inc. | 3,236 | 215,194 |
| Etsy Inc. (a) | 600 | 131,364 |
| | | 7,818,814 |
| Internet Services & Infrastructure - 0.1% |
| Akamai Technologies Inc. (a) | 794 | 92,930 |
| | Number
of Shares | Fair
Value |
| VeriSign Inc. (a) | 443 | $ 112,442 |
| | | 205,372 |
| Investment Banking & Brokerage - 1.0% |
| Morgan Stanley | 7,471 | 733,353 |
| Raymond James Financial Inc. | 1,020 | 102,408 |
| The Charles Schwab Corp. | 7,670 | 645,047 |
| The Goldman Sachs Group Inc. | 1,711 | 654,543 |
| | | 2,135,351 |
| IT Consulting & Other Services - 1.2% |
| Accenture PLC, Class A | 3,240 | 1,343,142 |
| Cognizant Technology Solutions Corp., Class A | 2,706 | 240,076 |
| DXC Technology Co. (a) | 1,457 | 46,901 |
| EPAM Systems Inc. (a) | 300 | 200,535 |
| Gartner Inc. (a) | 437 | 146,098 |
| International Business Machines Corp. | 4,556 | 608,955 |
| | | 2,585,707 |
| Leisure Products - 0.0%* |
| Hasbro Inc. | 692 | 70,432 |
| Life & Health Insurance - 0.4% |
| Aflac Inc. | 3,266 | 190,702 |
| Globe Life Inc. | 457 | 42,830 |
| Lincoln National Corp. | 863 | 58,908 |
| MetLife Inc. | 3,799 | 237,399 |
| Principal Financial Group Inc. | 1,311 | 94,825 |
| Prudential Financial Inc. | 2,005 | 217,021 |
| | | 841,685 |
| Life Sciences Tools & Services - 2.0% |
| Agilent Technologies Inc. | 1,542 | 246,180 |
| Bio-Rad Laboratories Inc., Class A (a) | 100 | 75,557 |
| Bio-Techne Corp. | 200 | 103,468 |
| Charles River Laboratories International Inc. (a) | 272 | 102,484 |
| Danaher Corp. | 3,246 | 1,067,967 |
| Illumina Inc. (a) | 762 | 289,895 |
| IQVIA Holdings Inc. (a) | 1,003 | 282,986 |
| Mettler-Toledo International Inc. (a) | 120 | 203,665 |
| PerkinElmer Inc. | 541 | 108,774 |
| Thermo Fisher Scientific Inc. | 2,037 | 1,359,168 |
| Waters Corp. (a) | 315 | 117,369 |
See Notes to Schedule of Investments and Notes to Financial Statements.
| State Street S&P 500 Index V.I.S. Fund | 11 |
State Street S&P 500 Index V.I.S. Fund
Schedule of Investments, continued — December 31, 2021
| | Number
of Shares | Fair
Value |
| West Pharmaceutical Services Inc. | 360 | $ 168,844 |
| | | 4,126,357 |
| Managed Healthcare - 1.7% |
| Anthem Inc. | 1,258 | 583,133 |
| Centene Corp. (a) | 2,895 | 238,548 |
| Humana Inc. | 654 | 303,365 |
| UnitedHealth Group Inc. | 4,835 | 2,427,847 |
| | | 3,552,893 |
| Metal & Glass Containers - 0.1% |
| Ball Corp. | 1,658 | 159,616 |
| Movies & Entertainment - 1.4% |
| Live Nation Entertainment Inc. (a) | 639 | 76,482 |
| Netflix Inc. (a) | 2,285 | 1,376,575 |
| The Walt Disney Co. (a) | 9,391 | 1,454,572 |
| | | 2,907,629 |
| Multi-Line Insurance - 0.2% |
| American International Group Inc. | 4,463 | 253,766 |
| Assurant Inc. | 339 | 52,837 |
| The Hartford Financial Services Group Inc. | 1,631 | 112,604 |
| | | 419,207 |
| Multi-Sector Holdings - 1.4% |
| Berkshire Hathaway Inc., Class B (a) | 9,454 | 2,826,746 |
| Multi-Utilities - 0.7% |
| Ameren Corp. | 1,442 | 128,352 |
| CenterPoint Energy Inc. | 2,964 | 82,725 |
| CMS Energy Corp. | 1,449 | 94,258 |
| Consolidated Edison Inc. | 1,879 | 160,316 |
| Dominion Energy Inc. | 4,007 | 314,790 |
| DTE Energy Co. | 1,080 | 129,103 |
| NiSource Inc. | 1,717 | 47,406 |
| Public Service Enterprise Group Inc. | 2,733 | 182,373 |
| Sempra Energy | 1,700 | 224,876 |
| WEC Energy Group Inc. | 1,635 | 158,710 |
| | | 1,522,909 |
| Office REITs - 0.1% |
| Alexandria Real Estate Equities Inc. | 700 | 156,072 |
| | Number
of Shares | Fair
Value |
| Boston Properties Inc. | 798 | $ 91,914 |
| Vornado Realty Trust | 811 | 33,948 |
| | | 281,934 |
| Oil & Gas Equipment & Services - 0.2% |
| Baker Hughes Co. | 3,481 | 83,753 |
| Halliburton Co. | 4,615 | 105,545 |
| Schlumberger N.V. | 7,104 | 212,765 |
| | | 402,063 |
| Oil & Gas Exploration & Production - 0.7% |
| APA Corp. | 1,648 | 44,315 |
| ConocoPhillips | 6,772 | 488,803 |
| Coterra Energy Inc. | 4,280 | 81,320 |
| Devon Energy Corp. | 2,912 | 128,273 |
| Diamondback Energy Inc. | 905 | 97,604 |
| EOG Resources Inc. | 2,969 | 263,736 |
| Hess Corp. | 1,531 | 113,340 |
| Marathon Oil Corp. | 4,302 | 70,639 |
| Pioneer Natural Resources Co. | 1,209 | 219,893 |
| | | 1,507,923 |
| Oil & Gas Refining & Marketing - 0.3% |
| Marathon Petroleum Corp. | 3,227 | 206,496 |
| Phillips 66 | 2,327 | 168,614 |
| Valero Energy Corp. | 2,188 | 164,341 |
| | | 539,451 |
| Oil & Gas Storage & Transportation - 0.2% |
| Kinder Morgan Inc. | 10,356 | 164,246 |
| ONEOK Inc. | 2,408 | 141,494 |
| The Williams Companies Inc. | 6,455 | 168,088 |
| | | 473,828 |
| Packaged Foods & Meats - 0.8% |
| Campbell Soup Co. | 1,076 | 46,763 |
| Conagra Brands Inc. | 2,363 | 80,696 |
| General Mills Inc. | 3,199 | 215,549 |
| Hormel Foods Corp. | 1,608 | 78,487 |
| Kellogg Co. | 1,286 | 82,844 |
| Lamb Weston Holdings Inc. | 868 | 55,014 |
| McCormick & Company Inc. | 1,310 | 126,559 |
| Mondelez International Inc., Class A | 7,103 | 471,000 |
| The Hershey Co. | 789 | 152,648 |
| The J M Smucker Co. | 453 | 61,526 |
| The Kraft Heinz Co. | 3,328 | 119,475 |
See Notes to Schedule of Investments and Notes to Financial Statements.
| 12 | State Street S&P 500 Index V.I.S. Fund |
State Street S&P 500 Index V.I.S. Fund
Schedule of Investments, continued — December 31, 2021
| | Number
of Shares | Fair
Value |
| Tyson Foods Inc., Class A | 1,466 | $ 127,777 |
| | | 1,618,338 |
| Paper Packaging - 0.2% |
| Amcor PLC | 7,103 | 85,307 |
| Avery Dennison Corp. | 438 | 94,858 |
| International Paper Co. | 1,815 | 85,269 |
| Packaging Corporation of America | 498 | 67,803 |
| Sealed Air Corp. | 631 | 42,573 |
| Westrock Co. | 1,358 | 60,241 |
| | | 436,051 |
| Personal Products - 0.2% |
| The Estee Lauder Companies Inc., Class A | 1,142 | 422,768 |
| Pharmaceuticals - 3.7% |
| Bristol-Myers Squibb Co. | 11,389 | 710,104 |
| Catalent Inc. (a) | 902 | 115,483 |
| Eli Lilly & Co. | 4,121 | 1,138,303 |
| Johnson & Johnson | 13,606 | 2,327,579 |
| Merck & Company Inc. | 12,908 | 989,269 |
| Organon & Co. | 1,403 | 42,721 |
| Pfizer Inc. | 28,700 | 1,694,735 |
| Viatris Inc. | 5,612 | 75,930 |
| Zoetis Inc. | 2,406 | 587,136 |
| | | 7,681,260 |
| Property & Casualty Insurance - 0.6% |
| Chubb Ltd. | 2,256 | 436,107 |
| Cincinnati Financial Corp. | 723 | 82,372 |
| Loews Corp. | 1,024 | 59,146 |
| The Allstate Corp. | 1,482 | 174,357 |
| The Progressive Corp. | 2,977 | 305,589 |
| The Travelers Companies Inc. | 1,324 | 207,113 |
| WR Berkley Corp. | 678 | 55,861 |
| | | 1,320,545 |
| Publishing - 0.0%* |
| News Corp., Class A | 2,096 | 46,762 |
| News Corp., Class B | 748 | 16,830 |
| | | 63,592 |
| Railroads - 0.8% |
| CSX Corp. | 11,465 | 431,084 |
| Norfolk Southern Corp. | 1,236 | 367,969 |
| Union Pacific Corp. | 3,331 | 839,179 |
| | | 1,638,232 |
| | Number
of Shares | Fair
Value |
| Real Estate Services - 0.1% |
| CBRE Group Inc., Class A (a) | 1,816 | $ 197,054 |
| Regional Banks - 1.1% |
| Citizens Financial Group Inc. | 2,100 | 99,225 |
| Comerica Inc. | 648 | 56,376 |
| Fifth Third Bancorp | 3,525 | 153,514 |
| First Republic Bank | 936 | 193,293 |
| Huntington Bancshares Inc. | 8,076 | 124,532 |
| KeyCorp | 4,352 | 100,662 |
| M&T Bank Corp. | 690 | 105,970 |
| People's United Financial Inc. | 2,459 | 43,819 |
| Regions Financial Corp. | 5,202 | 113,404 |
| Signature Bank | 300 | 97,041 |
| SVB Financial Group (a) | 300 | 203,472 |
| The PNC Financial Services Group Inc. | 2,222 | 445,556 |
| Truist Financial Corp. | 6,868 | 402,121 |
| Zions Bancorp NA | 700 | 44,212 |
| | | 2,183,197 |
| Reinsurance - 0.0%* |
| Everest Re Group Ltd. | 200 | 54,784 |
| Research & Consulting Services - 0.4% |
| Equifax Inc. | 644 | 188,557 |
| IHS Markit Ltd. | 2,027 | 269,429 |
| Jacobs Engineering Group Inc. | 664 | 92,449 |
| Leidos Holdings Inc. | 800 | 71,120 |
| Nielsen Holdings PLC | 1,428 | 29,288 |
| Verisk Analytics Inc. | 795 | 181,840 |
| | | 832,683 |
| Residential REITs - 0.3% |
| AvalonBay Communities Inc. | 755 | 190,705 |
| Equity Residential | 1,730 | 156,565 |
| Essex Property Trust Inc. | 337 | 118,702 |
| Mid-America Apartment Communities Inc. | 600 | 137,664 |
| UDR Inc. | 1,239 | 74,328 |
| | | 677,964 |
| Restaurants - 1.2% |
| Chipotle Mexican Grill Inc. (a) | 142 | 248,251 |
| Darden Restaurants Inc. | 708 | 106,653 |
| Domino's Pizza Inc. | 200 | 112,866 |
| McDonald's Corp. | 3,838 | 1,028,853 |
| Starbucks Corp. | 6,076 | 710,710 |
See Notes to Schedule of Investments and Notes to Financial Statements.
| State Street S&P 500 Index V.I.S. Fund | 13 |
State Street S&P 500 Index V.I.S. Fund
Schedule of Investments, continued — December 31, 2021
| | Number
of Shares | Fair
Value |
| Yum! Brands Inc. | 1,550 | $ 215,233 |
| | | 2,422,566 |
| Retail REITs - 0.3% |
| Federal Realty Investment Trust | 394 | 53,710 |
| Kimco Realty Corp. | 3,332 | 82,134 |
| Realty Income Corp. | 2,900 | 207,611 |
| Regency Centers Corp. | 820 | 61,787 |
| Simon Property Group Inc. | 1,670 | 266,816 |
| | | 672,058 |
| Semiconductor Equipment - 0.9% |
| Applied Materials Inc. | 4,648 | 731,410 |
| Enphase Energy Inc. (a) | 700 | 128,058 |
| KLA Corp. | 801 | 344,518 |
| Lam Research Corp. | 714 | 513,473 |
| SolarEdge Technologies Inc. (a) | 200 | 56,114 |
| Teradyne Inc. | 836 | 136,711 |
| | | 1,910,284 |
| Semiconductors - 5.4% |
| Advanced Micro Devices Inc. (a) | 6,158 | 886,136 |
| Analog Devices Inc. | 2,716 | 477,391 |
| Broadcom Inc. | 2,126 | 1,414,662 |
| Intel Corp. | 20,879 | 1,075,268 |
| Microchip Technology Inc. | 2,902 | 252,648 |
| Micron Technology Inc. | 5,681 | 529,185 |
| Monolithic Power Systems Inc. | 236 | 116,426 |
| NVIDIA Corp. | 12,869 | 3,784,902 |
| NXP Semiconductors N.V. | 1,321 | 300,897 |
| Qorvo Inc. (a) | 600 | 93,834 |
| QUALCOMM Inc. | 5,791 | 1,059,000 |
| Skyworks Solutions Inc. | 904 | 140,247 |
| Texas Instruments Inc. | 4,808 | 906,164 |
| Xilinx Inc. | 1,305 | 276,699 |
| | | 11,313,459 |
| Soft Drinks - 1.3% |
| Monster Beverage Corp. (a) | 2,033 | 195,250 |
| PepsiCo Inc. | 7,144 | 1,240,984 |
| The Coca-Cola Co. | 19,910 | 1,178,871 |
| | | 2,615,105 |
| Specialized REITs - 1.3% |
| American Tower Corp. | 2,360 | 690,300 |
| | Number
of Shares | Fair
Value |
| Crown Castle International Corp. | 2,256 | $ 470,917 |
| Digital Realty Trust Inc. | 1,455 | 257,346 |
| Equinix Inc. | 470 | 397,545 |
| Extra Space Storage Inc. | 664 | 150,549 |
| Iron Mountain Inc. | 1,483 | 77,605 |
| Public Storage | 802 | 300,397 |
| SBA Communications Corp. | 539 | 209,682 |
| Weyerhaeuser Co. | 3,967 | 163,361 |
| | | 2,717,702 |
| Specialty Chemicals - 0.8% |
| Albemarle Corp. | 610 | 142,600 |
| Celanese Corp. | 526 | 88,400 |
| DuPont de Nemours Inc. | 2,738 | 221,176 |
| Eastman Chemical Co. | 617 | 74,601 |
| Ecolab Inc. | 1,247 | 292,534 |
| International Flavors & Fragrances Inc. | 1,299 | 195,694 |
| PPG Industries Inc. | 1,278 | 220,378 |
| The Sherwin-Williams Co. | 1,255 | 441,961 |
| | | 1,677,344 |
| Specialty Stores - 0.2% |
| Bath & Body Works Inc. | 1,457 | 101,684 |
| Tractor Supply Co. | 545 | 130,037 |
| Ulta Beauty Inc. (a) | 292 | 120,403 |
| | | 352,124 |
| Steel - 0.1% |
| Nucor Corp. | 1,476 | 168,485 |
| Systems Software - 7.1% |
| Fortinet Inc. (a) | 700 | 251,580 |
| Microsoft Corp. | 38,687 | 13,011,212 |
| NortonLifeLock Inc. | 2,772 | 72,017 |
| Oracle Corp. | 8,343 | 727,593 |
| ServiceNow Inc. (a) | 1,001 | 649,759 |
| | | 14,712,161 |
| Technology Distributors - 0.1% |
| CDW Corp. | 744 | 152,356 |
| Technology Hardware, Storage & Peripherals - 7.2% |
| Apple Inc. | 80,325 | 14,263,310 |
| Hewlett Packard Enterprise Co. | 6,633 | 104,602 |
| HP Inc. | 6,153 | 231,784 |
| NetApp Inc. | 1,158 | 106,525 |
See Notes to Schedule of Investments and Notes to Financial Statements.
| 14 | State Street S&P 500 Index V.I.S. Fund |
State Street S&P 500 Index V.I.S. Fund
Schedule of Investments, continued — December 31, 2021
| | Number
of Shares | Fair
Value |
| Seagate Technology Holdings PLC | 1,002 | $ 113,206 |
| Western Digital Corp. (a) | 1,658 | 108,118 |
| | | 14,927,545 |
| Tobacco - 0.6% |
| Altria Group Inc. | 9,267 | 439,163 |
| Philip Morris International Inc. | 8,079 | 767,505 |
| | | 1,206,668 |
| Trading Companies & Distributors - 0.2% |
| Fastenal Co. | 3,100 | 198,586 |
| United Rentals Inc. (a) | 391 | 129,925 |
| WW Grainger Inc. | 242 | 125,414 |
| | | 453,925 |
| Trucking - 0.1% |
| JB Hunt Transport Services Inc. | 452 | 92,389 |
| Old Dominion Freight Line Inc. | 476 | 170,589 |
| | | 262,978 |
| | Number
of Shares | Fair
Value |
| Water Utilities - 0.1% |
| American Water Works Company Inc. | 921 | $ 173,940 |
| Wireless Telecommunication Services - 0.2% |
| T-Mobile US Inc. (a) | 2,942 | 341,213 |
Total Common Stock
(Cost $52,151,939) | | 207,714,869 |
| Short-Term Investments - 0.4% |
State Street Institutional Liquid Reserves Fund - Premier Class 0.04% (d)(e)
(Cost $741,514) | 741,439 | 741,513 |
Total Investments
(Cost $52,893,453) | | 208,456,382 |
| Other Assets and Liabilities, net - 0.0%* | | 78,433 |
| NET ASSETS - 100.0% | | $ 208,534,815 |
Other Information:
| The Fund had the following long futures contracts open at December 31, 2021: |
| Description | Expiration
Date | Number of
Contracts | Notional
Amount | Value | Unrealized
Appreciation
(Depreciation) |
| S&P 500 Emini Index Futures | March 2022 | 4 | $ 940,635 | $ 951,691 | $ 11,056 |
During the year ended December 31, 2021, the average notional value related to long futures contracts was $1,480,379.
Notes to Schedule of Investments
The views expressed in this document reflect our judgment as of the publication date and are subject to change at any time without notice. The securities cited may not be representative of the Fund’s future investments and should not be construed as a recommendation to purchase or sell a particular security. See the Fund’s summary prospectus and statutory prospectus for complete descriptions of investment objectives, policies, risks and permissible investments.
| (a) | Non-income producing security. |
| (b) | State Street Corporation is the parent company of SSGA Funds Management, Inc., the Fund's investment adviser and administrator, and State Street Bank & Trust Co., the Fund’s sub-administrator, custodian and accounting agent. |
| (c) | At December 31, 2021, all or a portion of this security was pledged to cover collateral requirements for futures. |
| (d) | Sponsored by SSGA Funds Management, Inc., the Fund’s investment adviser and administrator, and an affiliate of State Street Bank & Trust Co., the Fund’s sub-administrator, custodian and accounting agent. |
| (e) | Coupon amount represents effective yield. |
See Notes to Schedule of Investments and Notes to Financial Statements.
| State Street S&P 500 Index V.I.S. Fund | 15 |
State Street S&P 500 Index V.I.S. Fund
Schedule of Investments, continued — December 31, 2021
| † | Percentages are based on net assets as of December 31, 2021. |
| * | Less than 0.05%. |
| Abbreviations: |
| REIT - Real Estate Investment Trust |
The following table presents the Fund’s investments measured at fair value on a recurring basis at December 31, 2021:
| Investments | Level 1 | | Level 2 | | Level 3 | | Total |
| Investments in Securities | | | | | | | |
| Common Stock | $ 207,714,869 | | $ — | | $ — | | $ 207,714,869 |
| Short-Term Investments | 741,513 | | — | | — | | 741,513 |
| Total Investments in Securities | $ 208,456,382 | | $ — | | $ — | | $ 208,456,382 |
| Other Financial Instruments | | | | | | | |
| Long Futures Contracts - Unrealized Appreciation | $ 11,056 | | $ — | | $ — | | $ 11,056 |
| Total Other Financial Instruments | $ 11,056 | | $ — | | $ — | | $ 11,056 |
| | Number
of Shares
Held at
12/31/20 | Value at
12/31/20 | | Cost of
Purchases | | Proceeds
from
Shares
Sold | | Realized
Gain
(Loss) | | Change in
Unrealized
Appreciation
(Depreciation) | Number of
Shares
Held at
12/31/21 | Value at
12/31/21 | | Dividend
Income |
| State Street Corp. | 1,906 | $ 138,719 | | $ — | | $ — | | $ — | | $38,539 | 1,906 | $177,258 | | $4,155 |
| State Street Institutional Liquid Reserves Fund, Premier Class | 1,280,065 | 1,280,321 | | 24,429,761 | | 24,967,429 | | (1,139) | | (1) | 741,439 | 741,513 | | 744 |
| TOTAL | | $1,419,040 | | $24,429,761 | | $24,967,429 | | $(1,139) | | $38,538 | | $918,771 | | $4,899 |
See Notes to Schedule of Investments and Notes to Financial Statements.
| 16 | State Street S&P 500 Index V.I.S. Fund |
State Street S&P 500 Index V.I.S. Fund
Financial Highlights
Selected data based on a share outstanding throughout the fiscal years indicated
| | 12/31/21 | | 12/31/20 | | 12/31/19 | | 12/31/18 | | 12/31/17 |
| Inception date | | | 4/15/85 |
| Net asset value, beginning of period | $ 49.96 | | $ 46.61 | | $ 38.13 | | $ 44.09 | | $ 38.22 |
| Income/(loss) from investment operations: | | | | | | | | | |
| Net investment income(a) | 0.60 | | 0.72 | | 0.75 | | 0.74 | | 0.71 |
| Net realized and unrealized gains/(losses) on investments | 13.56 | | 7.61 | | 11.09 | | (2.86) | | 7.52 |
| Total income/(loss) from investment operations | 14.16 | | 8.33 | | 11.84 | | (2.12) | | 8.23 |
| Less distributions from: | | | | | | | | | |
| Net investment income | 0.66 | | 0.88 | | 0.62 | | 0.80 | | 0.79 |
| Net realized gains | 5.88 | | 4.10 | | 2.74 | | 3.04 | | 1.57 |
| Total distributions | 6.54 | | 4.98 | | 3.36 | | 3.84 | | 2.36 |
| Net asset value, end of period | $ 57.58 | | $ 49.96 | | $ 46.61 | | $ 38.13 | | $ 44.09 |
| Total Return(b) | 28.27% | | 17.92% | | 31.05% | | (4.73)% | | 21.50% |
| Ratios/Supplemental Data: | | | | | | | | | |
| Net assets, end of period (in thousands) | $208,535 | | $184,164 | | $186,771 | | $160,902 | | $194,117 |
| Ratios to average net assets: | | | | | | | | | |
| Net expenses | 0.31% | | 0.31% | | 0.34% | | 0.33% | | 0.32% |
| Gross expenses | 0.31% | | 0.31% | | 0.34% | | 0.33% | | 0.32% |
| Net investment income | 1.06% | | 1.54% | | 1.67% | | 1.62% | | 1.69% |
| Portfolio turnover rate | 2% | | 3% | | 2% | | 2% | | 2% |
| Notes to Financial Highlights |
| (a) | Per share values have been calculated using the average shares method. |
| (b) | Total returns are historical and assume changes in share price, reinvestment of dividends and capital gains distributions and do not include the effect of insurance contract charges. Past performance does not guarantee future results. |
The accompanying Notes are an integral part of these financial statements.
State Street S&P 500 Index V.I.S. Fund
Statement of Assets and Liabilities — December 31, 2021
| Assets | |
| Investments in securities, at fair value (cost $52,054,179) | $ 207,537,611 |
| Investments in affiliated securities, at fair value (cost $839,274) | 918,771 |
| Cash | 8,740 |
| Net cash collateral on deposit with broker for future contracts | 49,383 |
| Income receivables | 124,147 |
| Receivable for fund shares sold | 7,149 |
| Income receivable from affiliated investments | 1,086 |
| Receivable for accumulated variation margin on futures contracts | 11,065 |
| Other assets | 1,126 |
| Total assets | 208,659,078 |
| Liabilities | |
| Payable for fund shares redeemed | 16,767 |
| Payable to the Adviser | 43,357 |
| Payable for custody, fund accounting and sub-administration fees | 8,163 |
| Accrued other expenses | 55,976 |
| Total liabilities | 124,263 |
|
| Net Assets | $ 208,534,815 |
| Net Assets Consist of: | |
| Capital paid in | $ 53,833,272 |
| Total distributable earnings (loss) | 154,701,543 |
| Net Assets | $ 208,534,815 |
| Shares outstanding ($0.01 par value; unlimited shares authorized) | 3,621,629 |
| Net asset value per share | $ 57.58 |
The accompanying Notes are an integral part of these financial statements.
| 18 | Statement of Assets and Liabilities |
State Street S&P 500 Index V.I.S. Fund
Statement of Operations — For the year ended December 31, 2021
| Investment Income | |
| Income | |
| Dividend | $ 2,724,214 |
| Income from affiliated investments | 4,899 |
| Less: Foreign taxes withheld | (359) |
| Total income | 2,728,754 |
| Expenses | |
| Advisory and administration fees | 495,903 |
| Directors' fees | 19,679 |
| Custody, fund accounting and sub-administration fees | 41,171 |
| Professional fees | 30,965 |
| Printing and shareholder reports | 19,682 |
| Other expenses | 16,007 |
| Total expenses | 623,407 |
| Net investment income | $ 2,105,347 |
| Net Realized and Unrealized Gain (Loss) on Investments | |
| Realized gain (loss) on: | |
| Unaffiliated investments | $ 16,437,930 |
| Affiliated investments | (1,139) |
| Futures | 458,957 |
| Increase (decrease) in unrealized appreciation/depreciation on: | |
| Unaffiliated investments | 30,219,818 |
| Affiliated investments | 38,538 |
| Futures | (36,326) |
| Net realized and unrealized gain (loss) on investments | 47,117,778 |
| Net Increase in Net Assets Resulting from Operations | $ 49,223,125 |
The accompanying Notes are an integral part of these financial statements.
| Statement of Operations | 19 |
State Street S&P 500 Index V.I.S. Fund
Statements of Changes in Net Assets
| | Year Ended
December 31,
2021 | | Year Ended
December 31,
2020 |
| Increase (Decrease) in Net Assets | | | |
| Operations: | | | |
| Net investment income | $ 2,105,347 | | $ 2,627,581 |
| Net realized gain (loss) on investments and futures | 16,895,748 | | 18,145,054 |
| Net increase (decrease) in unrealized appreciation/depreciation on investments and futures | 30,222,030 | | 6,136,361 |
| Net increase (decrease) from operations | 49,223,125 | | 26,908,996 |
| Distributions to shareholders: | | | |
| Total distributions | (21,320,690) | | (16,701,378) |
| Increase (decrease) in assets from operations and distributions | 27,902,435 | | 10,207,618 |
| Share transactions: | | | |
| Proceeds from sale of shares | 3,950,579 | | 3,703,237 |
| Value of distributions reinvested | 21,320,690 | | 16,701,377 |
| Cost of shares redeemed | (28,802,954) | | (33,218,777) |
| Net increase (decrease) from share transactions | (3,531,685) | | (12,814,163) |
| Total increase (decrease) in net assets | 24,370,750 | | (2,606,545) |
| Net Assets | | | |
| Beginning of year | 184,164,065 | | 186,770,610 |
| End of year | $ 208,534,815 | | $ 184,164,065 |
| Changes in Fund Shares | | | |
| Shares sold | 71,717 | | 82,249 |
| Issued for distributions reinvested | 368,360 | | 336,247 |
| Shares redeemed | (504,853) | | (739,201) |
| Net decrease in fund shares | (64,776) | | (320,705) |
The accompanying Notes are an integral part of these financial statements.
| 20 | Statements of Changes in Net Assets |
State Street S&P 500 Index V.I.S. Fund
Notes to Financial Statements — December 31, 2021
1. Organization of the Company
State Street Variable Insurance Series Funds, Inc. (the “Company”) was incorporated under the laws of the Commonwealth of Virginia on May 14, 1984 and is registered under the Investment Company Act of 1940, as amended (the “1940 Act”), as an open-end management investment company. The Company is currently composed of the following seven investment portfolios (collectively, the “Funds”): State Street U.S. Equity V.I.S. Fund, State Street S&P 500 Index V.I.S. Fund (the “Fund”), State Street Premier Growth Equity V.I.S. Fund, State Street Small-Cap Equity V.I.S. Fund, State Street Total Return V.I.S. Fund, State Street Income V.I.S. Fund and State Street Real Estate Securities V.I.S. Fund. Each Fund is a diversified investment company within the meaning of the 1940 Act, except for the State Street Premier Growth Equity V.I.S. Fund, which is a non-diversified investment company.
Shares of the Funds of the Company are offered only to insurance company separate accounts that fund certain variable life insurance contracts and variable annuity contracts.
The Company currently offers one share class (Class 1) of the Fund as an investment option for variable life insurance and variable annuity contracts.
Under the Company’s organizational documents, its officers and directors are indemnified against certain liabilities arising out of the performance of their duties to the Company. Additionally, in the normal course of business, the Company enters into contracts with service providers that contain general indemnification clauses. The Company’s maximum exposure under these arrangements is unknown as this would involve future claims that may be made against the Company that have not yet occurred.
2.Summary of Significant Accounting Policies
The following is a summary of significant accounting policies followed by the Company in the preparation of its financial statements:
The preparation of financial statements in accordance with U.S. generally accepted accounting principles (“U.S. GAAP”) requires management to make estimates and assumptions that affect the reported amounts and disclosures in the financial statements. Actual results could differ from those estimates. The Fund is an investment company under U.S. GAAP and follows the accounting and reporting guidance applicable to investment companies.
Security Valuation The Fund’s investments are valued at fair value each day that the New York Stock Exchange (“NYSE”) is open and, for financial reporting purposes, as of the report date should the reporting period end on a day that the NYSE is not open. Fair value is generally defined as the price a fund would receive to sell an asset or pay to transfer a liability in an orderly transaction between market participants at the measurement date. By its nature, a fair value price is a good faith estimate of the valuation in a current sale and may not reflect an actual market price. The investments of the Fund are valued pursuant to the policy and procedures developed by the Oversight Committee (the “Committee”) and approved by the Company's Board of Directors (the “Board”). The Committee provides oversight of the valuation of investments for the Fund. The Board has responsibility for overseeing the determination of the fair value of investments.
Valuation techniques used to value the Fund’s investments by major category are as follows:
| • | Equity investments traded on a recognized securities exchange for which market quotations are readily available are valued at the last sale price or official closing price, as applicable, on the primary market or exchange on which they trade. Equity investments traded on a recognized exchange for which there were no sales on that day are valued at the last published sale price or at fair value. |
| • | Rights and warrants are valued at the last reported sale price obtained from independent pricing services or brokers on the valuation date. If no price is obtained from pricing services or brokers, valuation will be based upon the intrinsic value pursuant to the valuation policy and procedures approved by the Board. |
| Notes to Financial Statements | 21 |
State Street S&P 500 Index V.I.S. Fund
Notes to Financial Statements, continued — December 31, 2021
| • | Investments in registered investment companies (including money market funds) or other unitized pooled investment vehicles that are not traded on an exchange are valued at that day’s published net asset value (“NAV”) per share or unit. |
| • | Exchange-traded futures contracts are valued at the closing settlement price on the primary market on which they are traded most extensively. Exchange-traded futures contracts traded on a recognized exchange for which there were no sales on that day are valued at the last reported sale price obtained from independent pricing services or brokers or at fair value. |
In the event prices or quotations are not readily available or that the application of these valuation methods results in a price for an investment that is deemed to be not representative of the fair value of such investment, fair value will be determined in good faith by the Committee, in accordance with the valuation policy and procedures approved by the Board.
The Fund values its assets and liabilities at fair value using a fair value hierarchy consisting of three broad levels that prioritize the inputs to valuation techniques giving the highest priority to readily available unadjusted quoted prices in active markets for identical assets or liabilities (Level 1 measurements) and the lowest priority to unobservable inputs (Level 3 measurements) when market prices are not readily available or reliable. The categorization of a value determined for an investment within the hierarchy is based upon the pricing transparency of the investment and is not necessarily an indication of the risk associated with investing in it.
The three levels of the fair value hierarchy are as follows:
| • | Level 1 — Unadjusted quoted prices in active markets for an identical asset or liability; |
| • | Level 2 — Inputs other than quoted prices included within Level 1 that are observable for the asset or liability either directly or indirectly, including quoted prices for similar assets or liabilities in active markets, quoted prices for identical or similar assets or liabilities in markets that are not considered to be active, inputs other than quoted prices that are observable for the asset or liability (such as exchange rates, financing terms, interest rates, yield curves, volatilities, prepayment speeds, loss severities, credit risks and default rates) or other market-corroborated inputs; and |
| • | Level 3 — Unobservable inputs for the asset or liability, including the Committee’s assumptions used in determining the fair value of investments. |
The value of the Fund’s investments according to the fair value hierarchy as of December 31, 2021 is disclosed in the Fund’s Schedule of Investments.
Investment Transactions and Income Recognition Investment transactions are accounted for on trade date for financial reporting purposes. Realized gains and losses from the sale or disposition of investments and foreign exchange transactions, if any, are determined using the identified cost method.
Dividend income and capital gain distributions, if any, are recognized on the ex-dividend date, net of any foreign taxes withheld at source, if any.
Interest income is recorded daily on an accrual basis. All premiums and discounts are amortized/accreted for financial reporting purposes.
Non-cash dividends received in the form of stock are recorded as dividend income at fair value.
The Fund invests in real estate investment trusts (“REITs”). REITs determine the tax character of their distributions annually and may characterize a portion of their distributions as a return of capital or capital gain. The Fund’s policy is to record all REIT distributions initially as dividend income and re-designate a portion to return of capital or capital gain distributions at year-end based on information provided by the REIT and/or SSGA Funds Management, Inc.’s (the “Adviser” or “SSGA FM”) estimates of such re-designations for which actual information has not yet been reported.
| 22 | Notes to Financial Statements |
State Street S&P 500 Index V.I.S. Fund
Notes to Financial Statements, continued — December 31, 2021
Expenses Certain expenses, which are directly identifiable to a specific Fund, are applied to the Fund within the Company. Other expenses which cannot be attributed to a specific Fund are allocated in such a manner as deemed equitable, taking into consideration the nature and type of expense and the relative net assets of the Fund within the Company.
Distributions The Fund declares and pays any dividends from net investment income annually.
Net realized capital gains, if any, are distributed annually, unless additional distributions are required for compliance with applicable tax regulations. The amount and character of income and capital gains to be distributed are determined in accordance with applicable tax regulations which may differ from net investment income and realized gains recognized for U.S. GAAP purposes.
3.Derivative Financial Instruments
Futures Contracts The Fund may enter into futures contracts to meet the Fund’s objectives. A futures contract is a standardized, exchange-traded agreement to buy or sell a financial instrument at a set price on a future date. Upon entering into a futures contract, the Fund is required to deposit with the broker, cash or securities in an amount equal to the minimum initial margin requirements of the clearing house. Securities deposited, if any, are designated on the Schedule of Investments and cash deposited, if any, is included in Net cash collateral on deposit with broker for future contracts on the Statement of Assets and Liabilities. Subsequent payments are made or received by the Fund equal to the daily change in the contract value, accumulated, exchange rates, and/or other transactional fees. The accumulation of those payments are recorded as variation margin receivable or payable with a corresponding offset to unrealized gains or losses. The Fund recognizes a realized gain or loss when the contract is closed.
Losses may arise if the value of a futures contract decreases due to unfavorable changes in the market rates or values of the underlying instrument during the term of the contract or if the counterparty does not perform under the contract. The use of futures contracts also involves the risk that the movements in the price of the futures contracts do not correlate with the movement of the assets underlying such contracts.
For the fiscal year ended December 31, 2021, the Fund entered into futures contracts for cash equitization.
The following tables summarize the value of the Fund’s derivative instruments as of December 31, 2021 and the related location in the accompanying Statement of Assets and Liabilities and Statement of Operations, presented by primary underlying risk exposure:
| Asset Derivatives |
| | Interest
Rate
Risk | Foreign
Exchange
Risk | Credit
Risk | Equity
Risk | Commodity
Risk | Total |
| State Street S&P 500 Index V.I.S. Fund | | | | | | |
| Futures Contracts | $ — | $ — | $ — | $ 11,065 | $ — | $ 11,065 |
| Realized Gain/Loss |
| | Interest
Rate
Risk | Foreign
Exchange
Risk | Credit
Risk | Equity
Risk | Commodity
Risk | Total |
| State Street S&P 500 Index V.I.S. Fund | | | | | | |
| Futures Contracts | $ — | $ — | $ — | $ 458,957 | $ — | $ 458,957 |
| Notes to Financial Statements | 23 |
State Street S&P 500 Index V.I.S. Fund
Notes to Financial Statements, continued — December 31, 2021
| Net Change in Unrealized Appreciation (Depreciation) |
| | Interest
Rate
Risk | Foreign
Exchange
Risk | Credit
Risk | Equity
Risk | Commodity
Risk | Total |
| State Street S&P 500 Index V.I.S. Fund | | | | | | |
| Futures Contracts | $ — | $ — | $ — | $ (36,326) | $ — | $ (36,326) |
4.Fees and Transactions with Affiliates
Advisory Fee SSGA Funds Management, Inc. (the “Adviser” or “SSGA FM”), a registered investment adviser, was retained by the Board to act as investment adviser and administrator of the Fund. SSGA FM’s compensation for investment advisory and administrative services (“Management Fee”) is paid monthly based on the average daily net assets of the Fund at an annualized rate of 0.25%.
Custody, Fund Accounting and Sub-Administration Fees State Street Bank and Trust Company (“State Street”) serves as the custodian, fund accountant and sub-administrator to the Fund. Amounts paid by the Fund to State Street for performing such services are included as custody, fund accounting and sub-administration fees in the Statement of Operations.
Other Transactions with Affiliates The Fund may invest in affiliated entities, including securities issued by State Street Corporation, affiliated funds, or entities deemed to be affiliates as a result of the Fund owning more than five percent of the entity’s voting securities or outstanding shares. Amounts relating to these transactions during the fiscal year ended December 31, 2021 are disclosed in the Schedule of Investments.
5.Directors’ Fees
The fees and expenses of the Company’s directors who are not “interested persons” of the Company, as defined in the 1940 Act (“Independent Directors”), are paid directly by the Fund. The Independent Directors are reimbursed for travel and other out-of-pocket expenses in connection with meeting attendance and industry seminars.
6.Investment Transactions
Purchases and sales of investments (excluding in-kind transactions, short term investments and derivative contracts) for the fiscal year ended December 31, 2021 were as follows:
| Non-U.S. Government Securities |
| Purchases | Sales |
| $ 4,033,040 | $ 25,038,986 |
7.Income Taxes
The Fund has qualified and intends to continue to qualify as a regulated investment company under Subchapter M of the Internal Revenue Code of 1986, as amended. The Fund will not be subject to federal income taxes to the extent it distributes its taxable income, including any net realized capital gains, for each fiscal year. Therefore, no provision for federal income tax is required.
The Fund files federal and various state and local tax returns as required. No income tax returns are currently under examination. Generally, the federal returns are subject to examination by the Internal Revenue Service for a period of three years from date of filing, while the state returns may remain open for an additional year depending upon jurisdiction. SSGA FM has analyzed the Fund's tax positions taken on tax returns for all open years and does not believe there are any uncertain tax positions that would require recognition of a tax liability.
Distributions to shareholders are recorded on ex-dividend date. Income dividends and gain distributions are determined in accordance with income tax rules and regulations, which may differ from generally accepted accounting principles. Certain capital accounts in the financial statements have been adjusted for permanent book-tax differences. These adjustments have no impact on NAVs or results of operations. Temporary book-tax
| 24 | Notes to Financial Statements |
State Street S&P 500 Index V.I.S. Fund
Notes to Financial Statements, continued — December 31, 2021
differences will reverse in the future. These book-tax differences are primarily due to differing treatments for character of distributions, REIT basis adjustments, corporate actions, future contracts.
The tax character of distributions paid during the year ended December 31, 2021 was as follows:
Ordinary
Income | Long-Term
Capital Gains | Total |
| $ 2,490,921 | $ 18,829,769 | $ 21,320,690 |
The tax character of distributions paid during the year ended December 31, 2020 was as follows:
Ordinary
Income | Long-Term
Capital Gains | Total |
| $ 3,111,510 | $ 13,589,868 | $ 16,701,378 |
At December 31, 2021, the components of distributable earnings on a tax basis were as follows:
Undistributed
Ordinary
Income | Tax Exempt
Income | Capital Loss
Carryforwards | Undistributed
long term
gain | Net
Unrealized
Gains
(Losses) | Qualified
Late-Year
Losses | Total |
| $ 637,404 | $ — | $ — | $ 2,055,065 | $ 152,009,074 | $ — | $ 154,701,543 |
As of December 31, 2021, gross unrealized appreciation and gross unrealized depreciation of investments and other financial instruments based on cost for federal income tax purposes were as follows:
Tax
Cost | Gross
Unrealized
Appreciation | Gross
Unrealized
Depreciation | Net
Unrealized
Appreciation
(Depreciation) |
| $ 56,458,363 | $ 153,860,687 | $ 1,851,612 | $ 152,009,075 |
8.Line of Credit
The Fund and other affiliated funds (each, a “Participant” and collectively, the “Participants”) have access to $200 million of a $1.1 billion revolving credit facility provided by a syndication of banks under which the Participants may borrow to fund shareholder redemptions. This agreement expires in October 2022 unless extended or renewed.
The Participants are charged an annual commitment fee which is calculated based on the unused portion of the shared credit line. Commitment fees are allocated among each of the Participants based on relative net assets. Commitment fees are ordinary fund operating expenses. A Participant incurs and pays the interest expense related to its borrowing. Interest is calculated at a rate per annum equal to the sum of 1.00% plus the greater of the New York Fed Bank Rate and the one-month SOFR Rate.
Prior to October 7, 2021 the Fund had access to $200 million of a $500 million revolving credit facility and interest was calculated at a rate per annum equal to the sum of 1.25% plus the New York Fed Bank Rate.
The Fund had no outstanding loans as of December 31, 2021.
9.Risks
Concentration Risk As a result of the Fund's ability to invest a large percentage of its assets in obligations of issuers within the same country, state, region, currency or economic sector, an adverse economic, business or political development may affect the value of the Fund's investments more than if the Fund was more broadly diversified.
Credit Risk The Fund may be exposed to credit risk in the event that an issuer or guarantor fails to perform or that an institution or entity with which the Fund has unsettled or open transactions defaults.
| Notes to Financial Statements | 25 |
State Street S&P 500 Index V.I.S. Fund
Notes to Financial Statements, continued — December 31, 2021
Market Risk The Fund’s investments are subject to changes in general economic conditions, and general market fluctuations and the risks inherent in investment in securities markets. Investment markets can be volatile and prices of investments can change substantially due to various factors including, but not limited to, economic growth or recession, changes in interest rates, changes in the actual or perceived creditworthiness of issuers, and general market liquidity. The Fund is subject to the risk that geopolitical events will disrupt securities markets and adversely affect global economies and markets. Local, regional or global events such as war, acts of terrorism, the spread of infectious illness or other public health issues, or other events could have a significant impact on the Fund and its investments.
An outbreak of a respiratory disease caused by a novel coronavirus (known as COVID-19) first detected in China in December 2019 has resulted in a global pandemic and major disruptions to economies and markets around the world, including the United States. Financial markets experienced and may continue to experience extreme volatility and severe losses, and trading in many instruments was and may continue to be disrupted as a result. Liquidity for many instruments was and may continue to be greatly reduced for periods of time. Some interest rates are very low and in some cases yields are negative. Governments and central banks, including the Federal Reserve in the United States, have taken extraordinary and unprecedented actions to support local and global economies and the financial markets. The impact of these measures, and whether they will be effective to mitigate the economic and market disruption, will not be known for some time. In addition, the outbreak of COVID-19, and measures taken to mitigate its effects, could result in disruptions to the services provided to the Fund by its service providers.
10.Subsequent Events
Management has evaluated the impact of all subsequent events on the Fund through the date on which the financial statements were available to be issued and has determined that there were no subsequent events requiring adjustment or disclosure in the financial statements.
| 26 | Notes to Financial Statements |
State Street S&P 500 Index V.I.S. Fund
Report of Independent Registered Public Accounting Firm
To the Shareholders of State Street S&P 500 Index V.I.S. Fund and the Board of Directors of State Street Variable Insurance Series Funds, Inc.
Opinion on the Financial Statements
We have audited the accompanying statement of assets and liabilities of State Street S&P 500 Index V.I.S. Fund (the “Fund”) (one of the series constituting State Street Variable Insurance Series Funds, Inc. (the “Company”)), including the schedule of investments, as of December 31, 2021, and the related statement of operations for the year then ended, the statements of changes in net assets for each of the two years in the period then ended, the financial highlights for each of the five years in the period then ended and the related notes (collectively referred to as the “financial statements”). In our opinion, the financial statements present fairly, in all material respects, the financial position of the Fund (one of the series constituting State Street Variable Insurance Series Funds, Inc.) at December 31, 2021, the results of its operations for the year then ended, the changes in its net assets for each of the two years in the period then ended and its financial highlights for each of the five years in the period then ended, in conformity with U.S. generally accepted accounting principles.
Basis for Opinion
These financial statements are the responsibility of the Company’s management. Our responsibility is to express an opinion on the Fund’s financial statements based on our audits. We are a public accounting firm registered with the Public Company Accounting Oversight Board (United States) (“PCAOB”) and are required to be independent with respect to the Company in accordance with the U.S. federal securities laws and the applicable rules and regulations of the Securities and Exchange Commission and the PCAOB
We conducted our audits in accordance with the standards of the PCAOB. Those standards require that we plan and perform the audit to obtain reasonable assurance about whether the financial statements are free of material misstatement, whether due to error or fraud. The Company is not required to have, nor were we engaged to perform, an audit of the Company’s internal control over financial reporting. As part of our audits we are required to obtain an understanding of internal control over financial reporting, but not for the purpose of expressing an opinion on the effectiveness of the Company’s internal control over financials reporting. Accordingly, we express no such opinion.
Our audits included performing procedures to assess the risks of material misstatement of the financial statements, whether due to error or fraud, and performing procedures that respond to those risks. Such procedures included examining, on a test basis, evidence regarding the amounts and disclosures in the financial statements. Our procedures included confirmation of securities owned as of December 31, 2021, by correspondence with the custodian, brokers and others or by other appropriate auditing procedures where replies from brokers and others were not received. Our audits also included evaluating the accounting principles used and significant estimates made by management, as well as evaluating the overall presentation of the financial statements. We believe that our audits provide a reasonable basis for our opinion.
To the Shareholders of State Street S&P 500 Index V.I.S. Fund and the Board of Directors of State Street Variable Insurance Series Funds, Inc.
We have served as the auditor of one or more State Street Global Advisors investment companies since 2000.
Boston, Massachusetts
February 17, 2022
| Report of Independent Registered Public Accounting Firm | 27 |
State Street S&P 500 Index V.I.S. Fund
Other Information — December 31, 2021 (Unaudited)
Tax Information
For federal income tax purposes, the following information is furnished with respect to the distributions of the Fund for its fiscal year ended December 31, 2021.
Dividends Received Deduction
The Fund reports the maximum amount allowable of its net taxable income as eligible for the corporate dividends received deduction.
Long Term Capital Gain Distributions
Long term capital gains dividends were paid from the Fund during the year ended December 31, 2021 in the amount of $18,829,769.
Liquidity Risk Management Program
Pursuant to Rule 22e-4 under the 1940 Act, the Fund has adopted and implemented a liquidity risk management program (the “Program”). SSGA FM has been designated by the Board to administer the Fund's Program. The Program’s principal objectives include assessing, managing and periodically reviewing Fund’s liquidity risk, based on factors specific to the circumstances of the Fund. Liquidity risk is defined as the risk that a Fund could not meet redemption requests without significant dilution of remaining investors’ interests in the Fund. During the fiscal year, SSGA FM provided the Board with a report addressing the operations of the Program and assessing its adequacy and the effectiveness of the Program’s implementation for the period September 2020 through June 2021. As reported to the Board, the Program supported Fund’s ability to honor redemption requests timely and SSGA FM’s management of Fund’s liquidity profile, including during periods of market volatility. SSGA FM reported that the Program operated adequately to meet the requirements of Rule 22e-4 and that the implementation of the Program has been effective.
There can be no assurance that the Program will achieve its objectives in the future. Please refer to your Fund’s prospectus for more information regarding the Fund’s exposure to liquidity risk and other principal risks to which an investment in the Fund may be subject.
Proxy Voting Policies and Procedures and Record
The Fund has adopted the proxy voting policies of the Adviser. A description of the Fund's proxy voting policies and procedures that are used by the Adviser to vote proxies relating to the Fund’s portfolios of securities are available (i) without charge, upon request by calling 1-800-242-0134 (toll free) and (ii) on the SEC's website at www.sec.gov. Information regarding how the Fund voted for the prior 12-months period ended June 30 is available by August 31 of each year by calling the same number, on the SEC’s website at www.sec.gov, and on the Fund's website at www.ssga.com.
Quarterly Portfolio Schedule
Following the Fund's first and third fiscal quarter-ends, a complete Schedule of Investments is filed with the SEC as an exhibit to its reports on Form N-PORT, which can be found on the SEC’s website at www.sec.gov, and on the Fund's website at www.ssga.com. The Fund's Schedules of Investments are available upon request, without charge, by calling 1-800-242-0134.
State Street S&P 500 Index V.I.S. Fund
Other Information, continued — December 31, 2021 (Unaudited)
Name,
Address, and
Year of Birth | Position(s) Held
with Fund | Term of
Office and
Length of
Time Served | Principal Occupation
During Past Five Years
and Relevant Experience | Number
of
Funds
in Fund
Complex
Overseen
by
Director† | Other Directorships
Held by Director
During Past Five Years |
| INDEPENDENT DIRECTORS |
Michael F. Holland
c/o SSGA Funds
Management, Inc.
One Iron Street Boston,
MA 02210
YOB: 1944 | Director
and
Co-Chairperson
of the Board | Term:
Indefinite
Elected: 1/19 | Chairman, Holland &
Company L.L.C.
(investment adviser)
(1995 – present). | 63 | Director, the Holland Series
Fund, Inc.; Director, The China
Fund, Inc. (1992 – 2017);
Director, The Taiwan Fund,
Inc. (2007 – 2017); Director,
Reaves Utility Income Fund,
Inc.; and Director, Blackstone/
GSO Loans (and Real Estate)
Funds. |
| | | | | | |
Patrick J. Riley
c/o SSGA Funds
Management, Inc.
One Iron Street
Boston, MA 02210
YOB: 1948 | Director
and
Co-Chairperson
of the Board | Term:
Indefinite
Appointed: 4/16
Elected: 1/19 | 2002 to May 2010, Associate
Justice of the Superior Court,
Commonwealth of
Massachusetts; 1985 to 2002,
Partner, Riley, Burke
& Donahue, L.L.P. (law firm);
1998 to present, Independent
Director, State Street Global
Advisers Ireland, Ltd.
(investment company); 1998 to
present, Independent Director,
SSGA Liquidity plc (formerly,
SSGA Cash Management
Fund plc); January 2009 to
present, Independent Director,
SSGA Fixed Income plc; and
January 2009 – 2019,
Independent Director, SSGA
Qualified Funds PLC. | 63 | Board Director and Chairman,
SPDR Europe 1PLC Board
(2011 – present); Board
Director and Chairman, SPDR
Europe II, PLC (2013 –
present). |
State Street S&P 500 Index V.I.S. Fund
Other Information, continued — December 31, 2021 (Unaudited)
Name,
Address, and
Year of Birth | Position(s) Held
with Fund | Term of
Office and
Length of
Time Served | Principal Occupation
During Past Five Years
and Relevant Experience | Number
of
Funds
in Fund
Complex
Overseen
by
Director† | Other Directorships
Held by Director
During Past Five Years |
| INDEPENDENT DIRECTORS (continued) |
| | | | | |
John R. Costantino
c/o SSGA Funds
Management, Inc.
One Iron Street
Boston, MA 02210
YOB: 1946 | Director
and
Chairperson of
the Qualified Legal
Compliance
Committee | Term:
Indefinite
Elected: 1997 | Senior Advisor to NGN Capital
LLC (January 2019 –
present); Managing General
Partner, NGN Capital LLC
(2006 – December 2019). | 63 | Director of Kleinfeld Bridal
Corp. (January 2016 – present);
Trustee of Neuroscience
Research Institute (1986 – 2017); Trustee of Fordham
University (1989 – 1995 and
2001 – 2007) and Trustee
Emeritus (2007 – present);
Trustee and Independent Chairperson of GE Funds (1993 – February 2011); Director, Muscular Dystrophy Association (since 2019);
Trustee of Gregorian
University Foundation (1992 –
2007); Chairman of the Board of Directors, Vivaldi Biosciences Inc. (May 2017 – present); Chairman of the Supervisory Board, Vivaldi Biosciences AG. (May 2017 – present); Trustee, Gallim Dance (December 2021 – present). |
| | | | | | |
Donna M. Rapaccioli
c/o SSGA Funds
Management, Inc.
One Iron Street
Boston, MA 02210
YOB: 1962 | Director
and
Chairperson of
the Audit Committee | Term:
Indefinite
Appointed: 1/12
Elected: 6/16 | Dean of the Gabelli School of
Business (2007 – present) and
Accounting Professor (1987 –
present) at Fordham
University. | 63 | Director- Graduate
Management Admissions
Council (2015 – present);
Trustee of Emmanuel College
(2010 – 2019). |
| | | | | | |
Richard D. Shirk
c/o SSGA Funds
Management, Inc.
One Iron Street
Boston, MA 02210
YOB: 1945 | Director
and
Chairperson
of the Nominating Committee
Chairperson of the Governance
Committee | Term:
Indefinite
Elected: 1/19 | March 2001 to April 2002,
Chairman (1996 to March
2001, President and Chief
Executive Officer), Cerulean
Companies, Inc. (holding
company) (Retired); 1992 to
March 2001, President and
Chief Executive Officer, Blue
Cross Blue Shield of Georgia
(health insurer,
managed healthcare). | 63 | 1998 to December 2008,
Chairman, Board Member and
December 2008 to present,
Investment Committee
Member, Healthcare Georgia
Foundation (private
foundation); September 2002
to 2012, Lead Director and
Board Member, Amerigroup
Corp. (managed health care);
1999 to 2013, Board Member
and (2001 to 2017) Investment
Committee Member, Woodruff
Arts Center; and 2003 to 2009,
Trustee, Gettysburg College;
Board member, Aerocare
Holdings (2003 – January 2021), Regenesis
Biomedical Inc. (April 2012 – present). |
State Street S&P 500 Index V.I.S. Fund
Other Information, continued — December 31, 2021 (Unaudited)
Name,
Address, and
Year of Birth | Position(s) Held
with Fund | Term of
Office and
Length of
Time Served | Principal Occupation
During Past Five Years
and Relevant Experience | Number
of
Funds
in Fund
Complex
Overseen
by
Director† | Other Directorships
Held by Director
During Past Five Years |
| INDEPENDENT DIRECTORS (continued) |
| | | | | |
Michael A. Jessee
c/o SSGA Funds
Management, Inc.
One Iron Street
Boston, MA 02210
YOB: 1946 | Director
and
Chairperson of the
Valuation Committee | Term:
Indefinite
Elected: 1/19 | Retired; formerly, President
and Chief Executive Officer of
the Federal Home Loan Bank
of Boston (1989 – 2009);
Trustee, Randolph-Macon
College (2004 – 2016). | 63 | None. |
| INTERESTED DIRECTORS(1) |
Ellen M. Needham(2)
SSGA Funds
Management, Inc.
One Iron Street
Boston, MA 02210
YOB: 1967 | Director and
President | Term:
Indefinite
Elected: 1/19 | Chairman, SSGA Funds
Management, Inc. (March
2020 – present); President and
Director, SSGA Funds
Management, Inc. (2001 –
present)*; Senior Managing
Director, State Street Global
Advisors (1992 – present)*;
Manager, State Street Global
Advisors Funds Distributors,
LLC (May 2017 – present). | 63 | Board Director, SSGA
SPDR ETFs Europe 1 plc
(May 2020 – present); Board Director, SSGA SPDR ETFs Europe II plc (May 2020 – present). |
| | | | | |
| (1) | The individual listed above is a Director who is an “interested person,” as defined in the 1940 Act, of the Company (“Interested Director”). |
| (2) | Ms. Needham is an Interested Director because of her employment by SSGA FM, an affiliate of the Company. |
| * | Served in various capacities and/or with various affiliated entities during noted time period. |
| † | For the purpose of determining the number of portfolios overseen by the Directors, “Fund Complex” comprises registered investment companies for which SSGA FM serves as investment adviser. |
State Street S&P 500 Index V.I.S. Fund
Other Information, continued — December 31, 2021 (Unaudited)
The following lists the principal officers for the Company, as well as their mailing addresses and ages, positions with the Company and length of time served, and present and principal occupations:
Name,
Address, and
Year of Birth | Position(s) Held
with Funds | Term of
Office and
Length of
Time Served | Principal Occupation
During Past Five Years |
| OFFICERS: |
Ellen M. Needham
SSGA Funds Management, Inc.
One Iron Street
Boston, MA 02210
YOB: 1967 | President and
Director | Term:
Indefinite
Elected:
4/20 | Chairman, SSGA Funds Management, Inc. (March 2020 – present); President and Director, SSGA Funds Management, Inc. (2001 – present)*; Senior Managing Director, State Street Global Advisors (1992 – present)*; Manager, State Street Global Advisors Funds Distributors, LLC (May 2017 – present). |
| | | | |
Bruce S. Rosenberg
SSGA Funds Management, Inc.
One Iron Street
Boston, MA 02210
YOB: 1961 | Treasurer | Term:
Indefinite
Elected: 4/19 | Managing Director, State Street Global Advisors and SSGA Funds Management, Inc. (July 2015 – present); Director, Credit Suisse (April 2008 – July 2015). |
| | | | |
Ann M. Carpenter
SSGA Funds Management, Inc.
One Iron Street
Boston, MA 02210
YOB: 1966 | Vice President
and Deputy
Treasurer | Term:
Indefinite
Elected: 4/19 | Chief Operating Officer, SSGA Funds Management, Inc. (April 2005 – present)*; Managing Director, State Street Global Advisors (2005 – present).* |
| | | | |
Chad C. Hallett
SSGA Funds Management, Inc.
One Iron Street
Boston, MA 02210
YOB: 1969 | Deputy
Treasurer | Term:
Indefinite
Elected: 4/19 | Vice President, State Street Global Advisors and SSGA Funds Management, Inc. (November 2014 – present); Vice President, State Street Bank and Trust Company (2001 – November 2014).* |
| | | | |
Darlene Anderson-Vasquez
SSGA Funds Management, Inc.
One Iron Street
Boston, MA 02210
YOB: 1968 | Deputy
Treasurer | Term:
Indefinite
Elected: 4/19 | Managing Director, State Street Global Advisors and SSGA Funds Management, Inc. (May 2016 – present); Senior Vice President, John Hancock Investments (September 2007 – May 2016). |
| | | | |
Arthur A. Jensen
SSGA Funds Management, Inc.
1600 Summer Street
Stamford, CT 06905
YOB: 1966 | Deputy
Treasurer | Term:
Indefinite
Elected: 4/19 | Vice President, State Street Global Advisors and SSGA Funds Management, Inc. (July 2016 – present); Controller of GE Asset Management Incorporated (April 2011 – July 2016). |
| | | | |
David K. Lancaster
SSGA Funds Management, Inc.
One Iron Street
Boston, MA 02210
YOB: 1971 | Assistant Treasurer | Term:
Indefinite
Elected: 11/20 | Vice President, State Street Global Advisors and SSGA Funds Management, Inc. (July 2017 – present); Assistant Vice President, State Street Bank and Trust Company (November 2011 – July 2017).* |
State Street S&P 500 Index V.I.S. Fund
Other Information, continued — December 31, 2021 (Unaudited)
Name,
Address, and
Year of Birth | Position(s) Held
with Funds | Term of
Office and
Length of
Time Served | Principal Occupation
During Past Five Years |
| OFFICERS: (continued) |
| | | |
Brian Harris
SSGA Funds Management, Inc.
One Iron Street
Boston, MA 02210
YOB: 1973 | Chief Compliance
Officer, Anti-Money
Laundering Officer
and Code of Ethics
Compliance Officer | Term:
Indefinite Elected: 6/16
Term:
Indefinite Elected: 4/19 | Managing Director, State Street Global Advisors and SSGA Funds Management, Inc. (June 2013 – present).* |
| | | | |
Sean O’Malley
SSGA Funds Management, Inc.
One Iron Street
Boston, MA 02210
YOB: 1969 | Chief Legal Officer | Term:
Indefinite
Elected: 8/19 | Senior Vice President and Deputy General Counsel, State Street Global Advisors (November 2013 – present). |
| | | | |
David Barr
SSGA Funds Management, Inc.
One Iron Street
Boston, MA 02210
YOB: 1974 | Secretary | Term:
Indefinite
Elected: 9/20 | Vice President and Senior Counsel, State Street Global Advisors (October 2019 – present); Vice President and Counsel, Eaton Vance Corp. (October 2010 – October 2019). |
| | | | |
Timothy Collins
SSGA Funds Management, Inc.
One Iron Street
Boston, MA 02210
YOB: 1967 | Assistant
Secretary | Term:
Indefinite
Elected: 9/21 | Vice President and Senior Counsel, State Street Global Advisors (August 2021 – present); Vice President and Managing Counsel, State Street Corporation (March 2020 – August 2021); Vice President and Senior Counsel (April 2018 – March 2020); Counsel, Sutton Place Investments (January 2010 – March 2018). |
| | | | |
David Urman
SSGA Funds Management, Inc.
One Iron Street
Boston, MA 02210
YOB: 1985 | Assistant
Secretary | Term:
Indefinite
Elected: 8/19 | Vice President and Senior Counsel, State Street Global Advisors (April 2019 – present); Vice President and Counsel, State Street Global Advisors (August 2015 – April 2019); Associate, Ropes & Gray LLP (November 2012 – August 2015). |
| | | |
| * | Served in various capacities and/or with various affiliated entities during noted time period. |
[This page intentionally left blank]
[This page intentionally left blank]
Directors
Michael F. Holland, Co-Chairperson
Patrick J. Riley, Co-Chairperson
John R. Costantino
Donna M. Rapaccioli
Michael A. Jessee
Richard D. Shirk
Ellen M. Needham
Officers
Ellen M. Needham, President
Brian Harris, Chief Compliance Officer, Anti-Money Laundering Officer and Code of Ethics Compliance Officer
Sean O’Malley, Chief Legal Officer
Bruce S. Rosenberg, Treasurer
Ann M. Carpenter, Vice President and Deputy Treasurer
Chad C. Hallett, Deputy Treasurer
Arthur A. Jensen, Deputy Treasurer
Darlene Anderson-Vasquez, Deputy Treasurer
David Lancaster, Assistant Treasurer
David Barr, Secretary
Timothy Collins, Assistant Secretary
David Urman, Assistant Secretary
Investment Adviser and Administrator
SSGA Funds Management, Inc.
One Iron Street
Boston, Massachusetts 02210
Custodian and Sub-Administrator
State Street Bank and Trust Company
One Lincoln Street
Boston, Massachusetts 02111
Distributor
State Street Global Advisors Funds Distributors, LLC
One Iron Street
Boston, Massachusetts 02210
Independent Registered Public Accounting Firm
Ernst & Young LLP
200 Clarendon Street
Boston, Massachusetts 02116
Annual Report
December 31, 2021
| State Street Small-Cap Equity V.I.S. Fund |
State Street Small-Cap Equity V.I.S. Fund
Annual Report
December 31, 2021
| | Page |
| 1 |
| 2 |
| Financial Statements | |
| 14 |
| 15 |
| 16 |
| 17 |
| 18 |
| 24 |
| 25 |
This report is prepared for Policyholders of certain variable contracts and may be distributed to others only if preceded or accompanied by the variable contract’s current prospectus and the current summary prospectus of the Fund available for investments thereunder.
[This page intentionally left blank]
State Street Small-Cap Equity V.I.S. Fund
Notes to Performance — December 31, 2021 (Unaudited)
The information provided on the performance page relates to the State Street Small-Cap Equity V.I.S. Fund (the “Fund”).
Total return performance shown in this report for the Fund takes into account changes in share price and assumes reinvestment of dividends and capital gains distributions, if any. Total returns shown are net of Fund fees and expenses but do not reflect fees and charges associated with the variable contracts such as administrative fees, account charges and surrender charges, which, if reflected, would reduce the Fund’s total returns for all periods shown.
The performance data quoted represents past performance; past performance does not guarantee future results. Investment return and principal value will fluctuate so your shares, when redeemed, may be worth more or less than their original cost. Current performance may be higher or lower than the performance data quoted. Periods less than one year are not annualized. Please call toll-free (800) 242-0134 or visit the Fund’s website at www.ssga.com for the most recent month-end performance data.
An investment in the Fund is not a deposit of any bank and is not insured or guaranteed by the Federal Deposit Insurance Corporation (“FDIC”) or any other government agency. An investment in the Fund is subject to risk, including possible loss of principal invested.
The Russell 2000® Index is an unmanaged market capitalization-weighted index consisting of 2,000 of the smallest U.S.-domiciled publicly traded common stocks that are included in the Russell 3000® Index. The Russell 3000® Index is comprised of the 3,000 largest U.S. domiciled companies.
Russell Investment Group owns the Russell Index data, including all applicable trademarks and copyrights, used by SSGA Funds Management, Inc. (“SSGA FM”) in these materials. Any unauthorized use or redistribution of such Russell Index data is strictly prohibited. Russell Investment Group is not responsible for the configuration of this material or for any inaccuracy in SSGA FM’s presentation thereof.
The results shown for the foregoing index assume the reinvestment of net dividends or interest and do not reflect fees, expenses, or taxes. As such, the index returns do not reflect the actual cost of investing in the instruments that comprise the index.
The views expressed in this document reflect our judgment as of the publication date and are subject to change at any time without notice.
State Street Global Advisors Funds Distributors, LLC, member of FINRA & SIPC is the principal underwriter and distributor of the State Street Small-Cap Equity V.I.S. Fund and an indirect wholly-owned subsidiary of State Street Corporation. References to State Street may include State Street Corporation and its affiliates. The Funds pay State Street Bank and Trust Company for its services as custodian and Fund Accounting agent, and pay SSGA Funds Management, Inc. ("SSGA FM" or the "Adviser") for investment advisory and administrative services.
State Street Small-Cap Equity V.I.S. Fund
Management's Discussion of Fund Performance — December 31, 2021 (Unaudited)
The State Street Small-Cap Equity V.I.S. Fund (the “Fund”) seeks long-term growth of capital by investing at least 80% of its net assets under normal circumstances in common and preferred stocks and other types of equity securities of small-cap companies. The Fund’s benchmark is the Russell 2000 Index (the “Index”).
For the 12-month period ended December 31, 2021 (the “Reporting Period”), the total return for the Fund was 20.53%, and the Index was 14.82%. The Fund and Index returns reflect the reinvestment of dividends and other income. The Fund’s performance reflects the expenses of managing the Fund, including brokerage and advisory expenses. The Index is unmanaged and Index returns do not reflect fees and expenses of any kind, which would have a negative impact on returns.
Kennedy, Palisade and SouthernSun were the primary drivers of Fund performance during the Reporting Period relative to the Index. Kennedy, the dedicated value manager in the portfolio of managers had an outstanding year relative to the Index, outperforming by 27.49%. Both Palisade and SouthernSun also had strong relative years, outperforming the Index by 6.05% and 8.76%, respectively. Champlain’s growth-at-a-reasonable-price portfolio detracted slightly from relative performance. Riverbridge, the dedicated growth manager also detracted slightly as both managers (Champlain and Riverbridge) struggled in selecting technology names. The Fund’s lower beta/higher quality profile was a contributor for the year relative to the Index, while its marginally positive momentum exposure detracted.
The Fund used e-mini Russell 2000 Index futures in order to equitize cash in the liquidity sleeve of the Fund to manage daily flows and to maintain market exposure on the cash during the Reporting Period. The Fund’s use of e-mini Russell 2000 Index futures are meant to match the Index and not to speculate in either direction.
On an individual security level, the top positive contributors to the Fund’s performance on an absolute basis during the Reporting Period were MGP Ingredients, Inc., Western Alliance Bancorp and New Relic, Inc. The top negative contributors to the Fund’s performance on an absolute basis during the Reporting Period were Cardiovascular Systems, Inc., Emergent BioSolutions Inc. and Q2 Holdings, Inc.
The views expressed above reflect those of the Fund’s portfolio manager only through the Reporting Period, and do not necessarily represent the views of the Adviser as a whole. Any such views are subject to change at any time based upon market or other conditions and the Adviser disclaims any responsibility to update such views. These views may not be relied on as investment advice and, because investment decisions for a fund are based on numerous factors, may not be relied on as an indication of trading intent on behalf of any fund.
| 2 | State Street Small-Cap Equity V.I.S. Fund |
State Street Small-Cap Equity V.I.S. Fund
Performance Summary — December 31, 2021 (Unaudited)
| Sector Allocation |
| Portfolio composition as a % of Fair Value of $36,760 (in thousands) as of December 31, 2021 (a)(b) |
| Top Ten Largest Holdings |
| as of December 31, 2021 (as a % of Fair Value) (a)(b) |
| MGP Ingredients Inc. | 1.50% |
| Darling Ingredients Inc. | 1.27% |
| Ingevity Corp. | 1.10% |
| New Relic Inc. | 1.02% |
| Ritchie Bros Auctioneers Inc. | 1.01% |
| Altra Industrial Motion Corp. | 1.00% |
| Dycom Industries Inc. | 1.00% |
| The Timken Co. | 0.99% |
| John Wiley & Sons Inc., Class A | 0.99% |
| Thor Industries Inc. | 0.97% |
| Average Annual Total Return for the years ended December 31, 2021 |
| Class 1 Shares (Inception date 4/28/00) |
| | One Year | | Five Year | | Ten Year | | Ending Value
of a $10,000
Investment |
| State Street Small-Cap Equity V.I.S. Fund | 20.53% | | 12.12% | | 13.09% | | $34,221 |
| Russell 2000 Index | 14.82% | | 12.02% | | 13.24% | | $34,652 |
|
| (a) | Fair Value basis is inclusive of a short-term investment in the State Street Institutional U.S. Government Money Market Fund Class G Shares. |
| (b) | The securities information regarding holdings, allocations and other characteristics is presented to illustrate examples of securities that the Fund has bought and the diversity of areas in which the Fund may invest as of a particular date. It may not be representative of the Fund’s current or future investments and should not be construed as a recommendation to purchase or sell a particular security. |
| State Street Small-Cap Equity V.I.S. Fund | 3 |
State Street Small-Cap Equity V.I.S. Fund
Performance Summary, continued — December 31, 2021 (Unaudited)
Change in Value of a $10,000 Investment
Yearly periods ended December 31
See Notes to Performance beginning on page 1 for further information.
Past performance does not predict future performance. The performance shown in the graphs and tables does not reflect the deduction of taxes that a shareholder would pay on Fund distributions or the redemption of Fund shares and does not reflect the fees or charges that would be associated with variable contracts through which shares of the Fund are offered.
| 4 | State Street Small-Cap Equity V.I.S. Fund |
State Street Small-Cap Equity V.I.S. Fund
Understanding Your Fund’s Expenses — December 31, 2021 (Unaudited)
As a shareholder of the Fund, you incur ongoing costs. Ongoing costs include portfolio management fees, professional fees, administrative fees and other Fund expenses. The following example is intended to help you understand your ongoing costs (in dollars) of investing in the Fund and to compare these costs with the ongoing costs of investing in other mutual funds.
To illustrate these ongoing costs, we have provided an example and calculated the expenses paid by investors of the Fund during the period. The information in the following table is based on an investment of $1,000, which is invested at the beginning of the period and held for the entire six-month period ended December 31, 2021.
Actual Expenses
The first section of the table provides information about actual account values and actual expenses. You may use the information in this section, together with the amount you invested, to estimate the expenses that you paid over the period. To do so, simply divide your account value by $1,000 (for example, an $8,600 account value divided by $1,000 = 8.6), then multiply the result by the number given under the heading “Expenses paid during the period” to estimate the expenses you paid on your account during the period.
Hypothetical Example for Comparison Purposes
The second section of the table provides information about hypothetical account values and hypothetical expenses based on the Fund’s actual expense ratio and an assumed rate of return of 5% per year before expenses, which is not the Fund’s actual return. The hypothetical account values and expenses may not be used to estimate the actual ending account balance or expenses you paid for the period. You may use this information to compare the ongoing costs of investing in the Fund and other funds. To do so, compare this 5% hypothetical example with the 5% hypothetical examples that appear in the shareholder reports of other funds.
Please note that the expenses shown in the table are meant to highlight and help you compare ongoing costs only and do not reflect transaction costs, such as sales charges or redemption fees, if any. Therefore, the second section of the table is useful in comparing ongoing costs only, and will not help you determine the relative total costs of owning different funds. Additionally, the expenses shown do not reflect the fees or charges associated with variable contracts through which shares of the Fund are offered.
| | Actual
Fund Return | | Hypothetical
5% Return
(2.5% for
the period) |
Beginning Account Value
July 1, 2021 | $1,000.00 | | $1,000.00 |
Ending Account value
December 31, 2021 | $1,037.00 | | $1,019.10 |
| Expenses Paid During Period* | $ 6.21 | | $ 6.16 |
| * | Expenses are equal to the Fund's annualized expense ratio of 1.21%** (for the period July 1, 2021 - December 31, 2021), multiplied by the average account value over the period, multiplied by 184/365 (to reflect the one-half year period). |
| ** | May differ from expense ratio disclosed in the financial highlights, which is calculated based on the entire fiscal year's data. |
| State Street Small-Cap Equity V.I.S. Fund | 5 |
State Street Small-Cap Equity V.I.S. Fund
Schedule of Investments — December 31, 2021
| | Number
of Shares | Fair
Value |
| Common Stock - 96.5% † |
| Agricultural & Farm Machinery - 0.8% |
| AGCO Corp. | 2,638 | $ 306,061 |
| Agricultural Products - 1.3% |
| Darling Ingredients Inc. (a) | 6,728 | 466,183 |
| Airlines - 0.1% |
| Allegiant Travel Co. (a) | 217 | 40,588 |
| Aluminum - 0.2% |
| Alcoa Corp. | 1,415 | 84,306 |
| Apparel Retail - 0.4% |
| American Eagle Outfitters Inc. | 2,622 | 66,389 |
| The Buckle Inc. | 2,275 | 96,255 |
| | | 162,644 |
| Application Software - 7.0% |
| ACI Worldwide Inc. (a) | 4,329 | 150,216 |
| Alarm.com Holdings Inc. (a) | 965 | 81,842 |
| Altair Engineering Inc., Class A (a) | 1,622 | 125,413 |
| Asana Inc., Class A (a) | 590 | 43,984 |
| Blackbaud Inc. (a) | 3,500 | 276,430 |
| Blackline Inc. (a) | 2,456 | 254,294 |
| Cerence Inc. (a) | 1,706 | 130,748 |
| Envestnet Inc. (a) | 1,270 | 100,762 |
| Model N Inc. (a) | 1,137 | 34,144 |
| New Relic Inc. (a) | 3,400 | 373,864 |
| Paylocity Holding Corp. (a) | 356 | 84,073 |
| Pegasystems Inc. | 664 | 74,248 |
| PROS Holdings Inc. (a) | 675 | 23,281 |
| Q2 Holdings Inc. (a) | 2,550 | 202,572 |
| SPS Commerce Inc. (a) | 731 | 104,058 |
| Sumo Logic Inc. (a) | 6,080 | 82,445 |
| The Descartes Systems Group Inc. (a) | 622 | 51,427 |
| Vertex Inc., Class A (a) | 1,966 | 31,200 |
| Workiva Inc. (a) | 1,832 | 239,058 |
| Yext Inc. (a) | 10,890 | 108,029 |
| | | 2,572,088 |
| Auto Parts & Equipment - 1.3% |
| Dana Inc. | 2,388 | 54,494 |
| Dorman Products Inc. (a) | 2,966 | 335,188 |
| Gentex Corp. | 1,077 | 37,534 |
| LCI Industries | 328 | 51,125 |
| | | 478,341 |
| | Number
of Shares | Fair
Value |
| Automobile Manufacturers - 1.0% |
| Thor Industries Inc. | 3,435 | $ 356,450 |
| Automotive Retail - 1.3% |
| America's Car-Mart Inc. (a) | 466 | 47,718 |
| Group 1 Automotive Inc. | 816 | 159,300 |
| Monro Inc. | 808 | 47,082 |
| Murphy USA Inc. | 1,173 | 233,709 |
| | | 487,809 |
| Biotechnology - 1.1% |
| Avid Bioservices Inc. (a) | 3,320 | 96,878 |
| Emergent BioSolutions Inc. (a) | 1,994 | 86,679 |
| Halozyme Therapeutics Inc. (a) | 967 | 38,883 |
| Heron Therapeutics Inc. (a) | 11,563 | 105,570 |
| Veracyte Inc. (a) | 2,100 | 86,520 |
| | | 414,530 |
| Building Products - 1.1% |
| CSW Industrials Inc. | 855 | 103,335 |
| Gibraltar Industries Inc. (a) | 2,929 | 195,306 |
| Insteel Industries Inc. | 655 | 26,076 |
| UFP Industries Inc. | 938 | 86,305 |
| | | 411,022 |
| Commodity Chemicals - 0.6% |
| Hawkins Inc. | 962 | 37,951 |
| Koppers Holdings Inc. (a) | 5,553 | 173,809 |
| | | 211,760 |
| Communications Equipment - 0.3% |
| Extreme Networks Inc. (a) | 3,683 | 57,823 |
| Plantronics Inc. (a) | 1,909 | 56,010 |
| | | 113,833 |
| Computer & Electronics Retail - 0.1% |
| Rent-A-Center Inc. | 820 | 39,393 |
| Construction & Engineering - 1.5% |
| Dycom Industries Inc. (a) | 3,908 | 366,414 |
| IES Holdings Inc. (a) | 431 | 21,826 |
| Valmont Industries Inc. | 391 | 97,946 |
| WillScot Mobile Mini Holdings Corp. (a) | 1,667 | 68,080 |
| | | 554,266 |
See Notes to Schedule of Investments and Notes to Financial Statements.
| 6 | State Street Small-Cap Equity V.I.S. Fund |
State Street Small-Cap Equity V.I.S. Fund
Schedule of Investments, continued — December 31, 2021
| | Number
of Shares | Fair
Value |
| Construction Machinery & Heavy Trucks - 1.0% |
| Alamo Group Inc. | 345 | $ 50,777 |
| Astec Industries Inc. | 1,457 | 100,926 |
| Meritor Inc. (a) | 3,252 | 80,585 |
| The Greenbrier Companies Inc. | 1,476 | 67,734 |
| The Manitowoc Company Inc. (a) | 1,351 | 25,115 |
| Wabash National Corp. | 3,089 | 60,297 |
| | | 385,434 |
| Construction Materials - 0.1% |
| Eagle Materials Inc. | 294 | 48,939 |
| Consumer Finance - 0.4% |
| PRA Group Inc. (a) | 793 | 39,817 |
| PROG Holdings Inc. (a) | 2,355 | 106,234 |
| | | 146,051 |
| Data Processing & Outsourced Services - 0.7% |
| Cass Information Systems Inc. | 280 | 11,010 |
| CSG Systems International Inc. | 2,229 | 128,435 |
| Verra Mobility Corp. (a) | 6,893 | 106,359 |
| | | 245,804 |
| Distillers & Vintners - 1.5% |
| MGP Ingredients Inc. | 6,496 | 552,095 |
| Distributors - 0.7% |
| LKQ Corp. | 4,049 | 243,061 |
| Diversified Metals & Mining - 0.3% |
| Compass Minerals International Inc. | 1,279 | 65,331 |
| Materion Corp. | 331 | 30,432 |
| | | 95,763 |
| Diversified REITs - 0.3% |
| Alpine Income Property Trust Inc. | 1,826 | 36,593 |
| American Assets Trust Inc. | 1,491 | 55,957 |
| Essential Properties Realty Trust Inc. | 985 | 28,398 |
| | | 120,948 |
| | Number
of Shares | Fair
Value |
| Diversified Support Services - 1.7% |
| Healthcare Services Group Inc. | 5,677 | $ 100,994 |
| IAA Inc. (a) | 1,201 | 60,795 |
| Matthews International Corp., Class A | 1,839 | 67,436 |
| Ritchie Bros Auctioneers Inc. | 6,039 | 369,647 |
| UniFirst Corp. | 197 | 41,449 |
| | | 640,321 |
| Education Services - 0.5% |
| 2U Inc. (a) | 1,229 | 24,666 |
| Grand Canyon Education Inc. (a) | 900 | 77,139 |
| Stride Inc. (a) | 2,924 | 97,457 |
| | | 199,262 |
| Electric Utilities - 0.8% |
| ALLETE Inc. | 385 | 25,545 |
| IDACORP Inc. | 2,334 | 264,465 |
| | | 290,010 |
| Electrical Components & Equipment - 0.4% |
| Acuity Brands Inc. | 178 | 37,686 |
| Atkore Inc. (a) | 116 | 12,898 |
| Regal Rexnord Corp. | 464 | 78,964 |
| | | 129,548 |
| Electronic Components - 1.5% |
| Belden Inc. | 3,623 | 238,140 |
| II-VI Inc. (a) | 769 | 52,546 |
| Littelfuse Inc. | 674 | 212,094 |
| Rogers Corp. (a) | 201 | 54,873 |
| | | 557,653 |
| Electronic Equipment & Instruments - 0.4% |
| National Instruments Corp. | 3,586 | 156,601 |
| Electronic Manufacturing Services - 0.3% |
| Methode Electronics Inc. | 911 | 44,794 |
| Plexus Corp. (a) | 594 | 56,958 |
| | | 101,752 |
| Environmental & Facilities Services - 0.5% |
| Clean Harbors Inc. (a) | 1,487 | 148,358 |
| Montrose Environmental Group Inc. (a) | 635 | 44,774 |
| | | 193,132 |
See Notes to Schedule of Investments and Notes to Financial Statements.
| State Street Small-Cap Equity V.I.S. Fund | 7 |
State Street Small-Cap Equity V.I.S. Fund
Schedule of Investments, continued — December 31, 2021
| | Number
of Shares | Fair
Value |
| Food Distributors - 0.3% |
| Performance Food Group Co. (a) | 2,509 | $ 115,138 |
| Footwear - 0.6% |
| Deckers Outdoor Corp. (a) | 250 | 91,577 |
| Wolverine World Wide Inc. | 4,655 | 134,111 |
| | | 225,688 |
| General Merchandise Stores - 0.1% |
| Ollie's Bargain Outlet Holdings Inc. (a) | 494 | 25,288 |
| Health Care REITs - 0.2% |
| Community Healthcare Trust Inc. | 1,321 | 62,444 |
| Healthcare Distributors - 0.7% |
| AdaptHealth Corp. (a) | 4,180 | 102,243 |
| Covetrus Inc. (a) | 7,164 | 143,065 |
| | | 245,308 |
| Healthcare Equipment - 4.4% |
| AtriCure Inc. (a) | 1,440 | 100,123 |
| Axonics Inc. (a) | 840 | 47,040 |
| Cardiovascular Systems Inc. (a) | 4,120 | 77,374 |
| CONMED Corp. | 1,770 | 250,915 |
| Envista Holdings Corp. (a) | 960 | 43,258 |
| Glaukos Corp. (a) | 503 | 22,353 |
| Globus Medical Inc., Class A (a) | 2,085 | 150,537 |
| Heska Corp. (a) | 268 | 48,907 |
| Integra LifeSciences Holdings Corp. (a) | 3,480 | 233,125 |
| IntriCon Corp. (a) | 1,818 | 29,397 |
| LeMaitre Vascular Inc. | 626 | 31,444 |
| Masimo Corp. (a) | 175 | 51,237 |
| Outset Medical Inc. (a) | 2,210 | 101,859 |
| Penumbra Inc. (a) | 555 | 159,463 |
| SI-BONE Inc. (a) | 2,400 | 53,304 |
| STERIS PLC | 630 | 153,348 |
| Tactile Systems Technology Inc. (a) | 2,105 | 40,058 |
| Vapotherm Inc. (a) | 1,810 | 37,485 |
| | | 1,631,227 |
| Healthcare Facilities - 1.0% |
| Acadia Healthcare Company Inc. (a) | 2,948 | 178,943 |
| | Number
of Shares | Fair
Value |
| Hanger Inc. (a) | 3,794 | $ 68,785 |
| The Ensign Group Inc. | 883 | 74,137 |
| The Pennat Group Inc. (a) | 1,165 | 26,888 |
| U.S. Physical Therapy Inc. | 343 | 32,774 |
| | | 381,527 |
| Healthcare Services - 1.2% |
| Addus HomeCare Corp. (a) | 588 | 54,984 |
| Amedisys Inc. (a) | 542 | 87,739 |
| AMN Healthcare Services Inc. (a) | 794 | 97,130 |
| Castle Biosciences Inc. (a) | 1,326 | 56,846 |
| Chemed Corp. | 89 | 47,084 |
| MEDNAX Inc. (a) | 2,464 | 67,045 |
| Privia Health Group Inc. (a) | 1,615 | 41,780 |
| | | 452,608 |
| Healthcare Supplies - 0.9% |
| Avanos Medical Inc. (a) | 1,520 | 52,698 |
| BioLife Solutions Inc. (a) | 2,226 | 82,963 |
| ICU Medical Inc. (a) | 196 | 46,519 |
| Neogen Corp. (a) | 979 | 44,456 |
| OrthoPediatrics Corp. (a) | 468 | 28,015 |
| Pulmonx Corp. (a) | 2,510 | 80,496 |
| | | 335,147 |
| Healthcare Technology - 1.4% |
| Certara Inc. (a) | 1,373 | 39,020 |
| Health Catalyst Inc. (a) | 977 | 38,709 |
| Inspire Medical Systems Inc. (a) | 795 | 182,897 |
| NextGen Healthcare Inc. (a) | 2,929 | 52,107 |
| Omnicell Inc. (a) | 845 | 152,472 |
| Phreesia Inc. (a) | 795 | 33,120 |
| | | 498,325 |
| Home Building - 0.8% |
| Cavco Industries Inc. (a) | 220 | 69,883 |
| Green Brick Partners Inc. (a) | 1,171 | 35,516 |
| Taylor Morrison Home Corp. (a) | 3,604 | 125,996 |
| TopBuild Corp. (a) | 232 | 64,011 |
| | | 295,406 |
| Home Furnishing Retail - 0.3% |
| The Aaron's Company Inc. | 3,826 | 94,311 |
| Home Furnishings - 0.2% |
| La-Z-Boy Inc. | 1,674 | 60,783 |
See Notes to Schedule of Investments and Notes to Financial Statements.
| 8 | State Street Small-Cap Equity V.I.S. Fund |
State Street Small-Cap Equity V.I.S. Fund
Schedule of Investments, continued — December 31, 2021
| | Number
of Shares | Fair
Value |
| Home Improvement Retail - 0.1% |
| Floor & Decor Holdings Inc., Class A (a) | 336 | $ 43,683 |
| Hotel & Resort REITs - 0.4% |
| RLJ Lodging Trust | 8,790 | 122,445 |
| Sunstone Hotel Investors Inc. (a) | 3,100 | 36,363 |
| | | 158,808 |
| Household Appliances - 0.1% |
| Helen of Troy Ltd. (a) | 142 | 34,715 |
| Household Products - 0.3% |
| Central Garden & Pet Co., Class A (a) | 2,095 | 100,246 |
| Industrial Machinery - 7.8% |
| Albany International Corp., Class A | 640 | 56,608 |
| Altra Industrial Motion Corp. (b) | 7,153 | 368,880 |
| Barnes Group Inc. | 6,536 | 304,512 |
| Crane Co. | 3,020 | 307,225 |
| Enerpac Tool Group Corp. | 11,871 | 240,744 |
| ESCO Technologies Inc. | 1,230 | 110,688 |
| Evoqua Water Technologies Corp. (a) | 5,680 | 265,540 |
| John Bean Technologies Corp. | 2,070 | 317,869 |
| Kadant Inc. | 206 | 47,479 |
| Kornit Digital Ltd. (a) | 686 | 104,443 |
| Mueller Industries Inc. | 2,864 | 170,007 |
| Proto Labs Inc. (a) | 186 | 9,551 |
| RBC Bearings Inc. (a) | 240 | 48,473 |
| Standex International Corp. | 785 | 86,868 |
| The Timken Co. | 5,272 | 365,297 |
| Woodward Inc. | 599 | 65,567 |
| | | 2,869,751 |
| Industrial REITs - 0.8% |
| EastGroup Properties Inc. | 1,209 | 275,471 |
| Innovative Industrial Properties Inc. | 105 | 27,605 |
| | | 303,076 |
| Insurance Brokers - 0.4% |
| BRP Group Inc., Class A (a) | 3,180 | 114,830 |
| | Number
of Shares | Fair
Value |
| Goosehead Insurance Inc., Class A | 348 | $ 45,268 |
| | | 160,098 |
| Interactive Media & Services - 0.0%* |
| Vimeo Inc. (a) | 1,008 | 18,104 |
| Internet & Direct Marketing Retail - 0.5% |
| Fiverr International Ltd. (a) | 341 | 38,772 |
| Overstock.com Inc. (a) | 613 | 36,173 |
| Porch Group Inc. (a) | 2,120 | 33,051 |
| Revolve Group Inc. (a) | 983 | 55,087 |
| ThredUp Inc., Class A (a) | 2,058 | 26,260 |
| | | 189,343 |
| Internet Services & Infrastructure - 0.2% |
| Squarespace Inc., Class A (a) | 1,074 | 31,683 |
| Switch Inc., Class A | 1,468 | 42,043 |
| | | 73,726 |
| Investment Banking & Brokerage - 1.0% |
| Piper Sandler Cos. | 499 | 89,076 |
| Raymond James Financial Inc. | 1,914 | 192,166 |
| Stifel Financial Corp. | 1,174 | 82,673 |
| | | 363,915 |
| IT Consulting & Other Services - 0.9% |
| Globant S.A. (a) | 409 | 128,463 |
| Grid Dynamics Holdings Inc. (a) | 1,722 | 65,384 |
| Unisys Corp. (a) | 7,292 | 149,997 |
| | | 343,844 |
| Leisure Products - 1.6% |
| Malibu Boats Inc., Class A (a) | 3,945 | 271,140 |
| Polaris Inc. | 3,001 | 329,840 |
| | | 600,980 |
| Life & Health Insurance - 0.4% |
| American Equity Investment Life Holding Co. | 1,584 | 61,649 |
| Trupanion Inc. (a) | 746 | 98,495 |
| | | 160,144 |
| Life Sciences Tools & Services - 3.0% |
| Bruker Corp. | 2,510 | 210,614 |
| ICON PLC (a) | 710 | 219,887 |
| Medpace Holdings Inc. (a) | 266 | 57,892 |
See Notes to Schedule of Investments and Notes to Financial Statements.
| State Street Small-Cap Equity V.I.S. Fund | 9 |
State Street Small-Cap Equity V.I.S. Fund
Schedule of Investments, continued — December 31, 2021
| | Number
of Shares | Fair
Value |
| Repligen Corp. (a) | 1,061 | $ 280,996 |
| Syneos Health Inc. (a) | 3,234 | 332,067 |
| | | 1,101,456 |
| Managed Healthcare - 0.1% |
| Progyny Inc. (a) | 741 | 37,309 |
| Marine - 0.1% |
| Kirby Corp. (a) | 773 | 45,932 |
| Metal & Glass Containers - 0.4% |
| TriMas Corp. | 4,100 | 151,700 |
| Multi-Line Insurance - 0.2% |
| Horace Mann Educators Corp. | 2,082 | 80,573 |
| Multi-Utilities - 0.1% |
| Avista Corp. | 1,029 | 43,722 |
| Office REITs - 0.9% |
| Corporate Office Properties Trust | 1,287 | 35,998 |
| Cousins Properties Inc. | 4,244 | 170,948 |
| Easterly Government Properties Inc. | 4,871 | 111,643 |
| | | 318,589 |
| Office Services & Supplies - 1.0% |
| HNI Corp. | 896 | 37,677 |
| MSA Safety Inc. | 2,074 | 313,091 |
| | | 350,768 |
| Oil & Gas Drilling - 0.1% |
| Helmerich & Payne Inc. | 1,927 | 45,670 |
| Oil & Gas Equipment & Services - 0.3% |
| ChampionX Corp. (a) | 1,748 | 35,327 |
| Oil States International Inc. (a) | 12,012 | 59,700 |
| | | 95,027 |
| Oil & Gas Exploration & Production - 0.9% |
| Denbury Inc. (a) | 619 | 47,409 |
| Northern Oil & Gas Inc. | 3,931 | 80,900 |
| PDC Energy Inc. | 3,978 | 194,047 |
| Southwestern Energy Co. (a) | 5,516 | 25,705 |
| | | 348,061 |
| Packaged Foods & Meats - 3.7% |
| Calavo Growers Inc. | 627 | 26,585 |
| | Number
of Shares | Fair
Value |
| Freshpet Inc. (a) | 472 | $ 44,967 |
| Hostess Brands Inc. (a) | 11,500 | 234,830 |
| J&J Snack Foods Corp. | 705 | 111,362 |
| Lancaster Colony Corp. | 1,265 | 209,484 |
| Sanderson Farms Inc. | 1,863 | 355,982 |
| The Simply Good Foods Co. (a) | 6,360 | 264,385 |
| Utz Brands Inc. | 6,710 | 107,025 |
| | | 1,354,620 |
| Paper Packaging - 0.1% |
| UFP Technologies Inc. (a) | 406 | 28,525 |
| Personal Products - 0.5% |
| BellRing Brands Inc., Class A (a) | 998 | 28,473 |
| elf Beauty Inc. (a) | 3,660 | 121,549 |
| The Honest Company Inc. (a) | 3,060 | 24,755 |
| | | 174,777 |
| Pharmaceuticals - 0.2% |
| Prestige Consumer Healthcare Inc. (a) | 1,005 | 60,953 |
| Property & Casualty Insurance - 1.8% |
| AMERISAFE Inc. | 1,234 | 66,426 |
| Argo Group International Holdings Ltd. | 3,250 | 188,858 |
| James River Group Holdings Ltd. | 2,310 | 66,551 |
| Palomar Holdings Inc. (a) | 995 | 64,446 |
| RLI Corp. | 1,063 | 119,162 |
| Selective Insurance Group Inc. | 1,800 | 147,492 |
| | | 652,935 |
| Publishing - 1.0% |
| John Wiley & Sons Inc., Class A | 6,378 | 365,268 |
| Regional Banks - 7.8% |
| 1st Source Corp. | 1,111 | 55,106 |
| Atlantic Union Bankshares Corp. | 997 | 37,178 |
| Bank OZK | 1,385 | 64,444 |
| BankUnited Inc. | 637 | 26,951 |
| Banner Corp. | 455 | 27,605 |
| Bryn Mawr Bank Corp. | 1,205 | 54,237 |
| Cadence Bank | 2,111 | 62,887 |
| Community Bank System Inc. | 1,170 | 87,142 |
See Notes to Schedule of Investments and Notes to Financial Statements.
| 10 | State Street Small-Cap Equity V.I.S. Fund |
State Street Small-Cap Equity V.I.S. Fund
Schedule of Investments, continued — December 31, 2021
| | Number
of Shares | Fair
Value |
| Cullen/Frost Bankers Inc. | 998 | $ 125,818 |
| CVB Financial Corp. | 3,860 | 82,643 |
| Enterprise Financial Services Corp. | 1,066 | 50,198 |
| Equity Bancshares Inc., Class A | 997 | 33,828 |
| FB Financial Corp. | 574 | 25,153 |
| First Interstate BancSystem Inc., Class A | 719 | 29,242 |
| Fulton Financial Corp. | 6,010 | 102,170 |
| German American Bancorp Inc. | 1,650 | 64,317 |
| Great Western Bancorp Inc. | 1,643 | 55,796 |
| HomeStreet Inc. | 1,050 | 54,600 |
| Independent Bank Corp. | 3,633 | 296,198 |
| Meta Financial Group Inc. | 763 | 45,521 |
| National Bank Holdings Corp., Class A | 978 | 42,973 |
| Origin Bancorp Inc. | 1,436 | 61,633 |
| PacWest Bancorp | 1,743 | 78,731 |
| Peapack-Gladstone Financial Corp. | 1,175 | 41,595 |
| Pinnacle Financial Partners Inc. | 560 | 53,480 |
| Prosperity Bancshares Inc. | 3,383 | 244,591 |
| Renasant Corp. | 4,195 | 159,200 |
| Sandy Spring Bancorp Inc. | 1,030 | 49,522 |
| Stock Yards Bancorp Inc. | 915 | 58,450 |
| Texas Capital Bancshares Inc. (a) | 944 | 56,876 |
| UMB Financial Corp. | 1,660 | 176,143 |
| United Community Banks Inc. | 1,233 | 44,314 |
| Washington Trust Bancorp Inc. | 890 | 50,169 |
| Westamerica BanCorp | 1,821 | 105,126 |
| Western Alliance Bancorp | 1,649 | 177,515 |
| Wintrust Financial Corp. | 911 | 82,737 |
| | | 2,864,089 |
| Research & Consulting Services - 0.4% |
| Exponent Inc. | 508 | 59,299 |
| Resources Connection Inc. | 5,160 | 92,054 |
| | | 151,353 |
| Residential REITs - 0.3% |
| NexPoint Residential Trust Inc. | 1,231 | 103,195 |
| Restaurants - 1.2% |
| Brinker International Inc. (a) | 888 | 32,492 |
| | Number
of Shares | Fair
Value |
| Cracker Barrel Old Country Store Inc. | 321 | $ 41,293 |
| Shake Shack Inc., Class A (a) | 960 | 69,273 |
| Texas Roadhouse Inc. | 1,117 | 99,726 |
| The Cheesecake Factory Inc. (a) | 1,464 | 57,316 |
| Wingstop Inc. | 780 | 134,784 |
| | | 434,884 |
| Retail REITs - 0.2% |
| Kite Realty Group Trust | 3,066 | 66,778 |
| The Macerich Co. | 1,429 | 24,693 |
| | | 91,471 |
| Security & Alarm Services - 1.0% |
| The Brink's Co. | 5,399 | 354,012 |
| Semiconductor Equipment - 1.9% |
| Brooks Automation Inc. | 1,303 | 134,352 |
| CMC Materials Inc. | 1,833 | 351,368 |
| Ichor Holdings Ltd. (a) | 1,117 | 51,416 |
| Onto Innovation Inc. (a) | 1,706 | 172,698 |
| | | 709,834 |
| Semiconductors - 1.2% |
| Diodes Inc. (a) | 519 | 56,991 |
| MaxLinear Inc. (a) | 721 | 54,356 |
| Power Integrations Inc. | 593 | 55,084 |
| Semtech Corp. (a) | 2,359 | 209,786 |
| SMART Global Holdings Inc. (a) | 887 | 62,968 |
| | | 439,185 |
| Soft Drinks - 0.4% |
| Primo Water Corp. | 7,001 | 123,428 |
| Zevia PBC, Class A (a) | 2,290 | 16,144 |
| | | 139,572 |
| Specialized Consumer Services - 1.0% |
| European Wax Center Inc., Class A (a) | 125 | 3,793 |
| OneSpaWorld Holdings Ltd. (a) | 4,543 | 45,521 |
| Terminix Global Holdings Inc. (a) | 6,795 | 307,338 |
| | | 356,652 |
See Notes to Schedule of Investments and Notes to Financial Statements.
| State Street Small-Cap Equity V.I.S. Fund | 11 |
State Street Small-Cap Equity V.I.S. Fund
Schedule of Investments, continued — December 31, 2021
| | Number
of Shares | Fair
Value |
| Specialized REITs - 0.3% |
| National Storage Affiliates Trust | 584 | $ 40,413 |
| PotlatchDeltic Corp. | 1,047 | 63,050 |
| | | 103,463 |
| Specialty Chemicals - 4.0% |
| Avient Corp. | 4,442 | 248,530 |
| Chase Corp. | 330 | 32,855 |
| Danimer Scientific Inc. (a) | 2,187 | 18,633 |
| HB Fuller Co. | 417 | 33,777 |
| Ingevity Corp. (a) | 5,651 | 405,177 |
| Innospec Inc. | 1,175 | 106,150 |
| Minerals Technologies Inc. | 379 | 27,724 |
| Quaker Chemical Corp. | 657 | 151,622 |
| Sensient Technologies Corp. | 1,225 | 122,573 |
| Stepan Co. | 2,707 | 336,453 |
| | | 1,483,494 |
| Specialty Stores - 0.8% |
| Dick's Sporting Goods Inc. | 369 | 42,431 |
| Five Below Inc. (a) | 466 | 96,411 |
| National Vision Holdings Inc. (a) | 911 | 43,719 |
| Sally Beauty Holdings Inc. (a) | 5,390 | 99,499 |
| | | 282,060 |
| Steel - 0.4% |
| Carpenter Technology Corp. | 890 | 25,979 |
| Commercial Metals Co. | 2,784 | 101,031 |
| Steel Dynamics Inc. | 611 | 37,925 |
| | | 164,935 |
| Systems Software - 1.3% |
| Ping Identity Holding Corp. (a) | 5,580 | 127,670 |
| Sailpoint Technologies Holdings Inc. (a) | 3,630 | 175,474 |
| Tenable Holdings Inc. (a) | 3,195 | 175,949 |
| | | 479,093 |
| | Number
of Shares | Fair
Value |
| Technology Hardware, Storage & Peripherals - 0.8% |
| Pure Storage Inc., Class A (a) | 9,480 | $ 308,574 |
| Thrifts & Mortgage Finance - 0.7% |
| Flagstar Bancorp Inc. | 544 | 26,079 |
| Premier Financial Corp. | 1,292 | 39,936 |
| Washington Federal Inc. | 980 | 32,712 |
| WSFS Financial Corp. | 3,239 | 162,339 |
| | | 261,066 |
| Trading Companies & Distributors - 1.9% |
| Applied Industrial Technologies Inc. | 2,702 | 277,495 |
| Boise Cascade Co. | 459 | 32,681 |
| McGrath RentCorp. | 462 | 37,080 |
| Transcat Inc. (a) | 390 | 36,048 |
| Univar Solutions Inc. (a) | 11,622 | 329,484 |
| | | 712,788 |
| Trucking - 0.7% |
| Marten Transport Ltd. | 2,337 | 40,103 |
| Saia Inc. (a) | 665 | 224,125 |
| | | 264,228 |
Total Common Stock
(Cost $24,138,989) | | 35,609,114 |
| Short-Term Investments - 3.1% |
State Street Institutional U.S. Government Money Market Fund - Class G Shares 0.03% (b)(c)(d)
(Cost $1,150,765) | 1,150,765 | 1,150,765 |
Total Investments
(Cost $25,289,754) | | 36,759,879 |
| Other Assets and Liabilities, net - 0.4% | | 130,068 |
| NET ASSETS - 100.0% | | $ 36,889,947 |
See Notes to Schedule of Investments and Notes to Financial Statements.
| 12 | State Street Small-Cap Equity V.I.S. Fund |
State Street Small-Cap Equity V.I.S. Fund
Schedule of Investments, continued — December 31, 2021
Other Information:
| The Fund had the following long futures contracts open at December 31, 2021: |
| Description | Expiration
Date | Number of
Contracts | Notional
Amount | Value | Unrealized
Appreciation
(Depreciation) |
| E-mini Russell 2000 Index Futures | March 2022 | 5 | $ 543,361 | $ 560,700 | $ 17,339 |
During the year ended December 31, 2021, the average notional value related to long futures contracts was $619,413.
Notes to Schedule of Investments
The views expressed in this document reflect our judgment as of the publication date and are subject to change at any time without notice. The securities cited may not be representative of the Fund’s future investments and should not be construed as a recommendation to purchase or sell a particular security. See the Fund’s summary prospectus and statutory prospectus for complete descriptions of investment objectives, policies, risks and permissible investments.
| (a) | Non-income producing security. |
| (b) | At December 31, 2021, all or a portion of this security was pledged to cover collateral requirements for futures. |
| (c) | Sponsored by SSGA Funds Management, Inc., the Fund’s investment adviser and administrator, and an affiliate of State Street Bank & Trust Co., the Fund’s sub-administrator, custodian and accounting agent. |
| (d) | Coupon amount represents effective yield. |
| † | Percentages are based on net assets as of December 31, 2021. |
| * | Less than 0.05%. |
| Abbreviations: |
| REIT - Real Estate Investment Trust |
The following table presents the Fund’s investments measured at fair value on a recurring basis at December 31, 2021:
| Investments | Level 1 | | Level 2 | | Level 3 | | Total |
| Investments in Securities | | | | | | | |
| Common Stock | $ 35,609,114 | | $ — | | $ — | | $ 35,609,114 |
| Short-Term Investments | 1,150,765 | | — | | — | | 1,150,765 |
| Total Investments in Securities | $ 36,759,879 | | $ — | | $ — | | $ 36,759,879 |
| Other Financial Instruments | | | | | | | |
| Long Futures Contracts - Unrealized Appreciation | $ 17,339 | | $ — | | $ — | | $ 17,339 |
| Total Other Financial Instruments | $ 17,339 | | $ — | | $ — | | $ 17,339 |
| | Number
of Shares
Held at
12/31/20 | Value at
12/31/20 | Cost of
Purchases | Proceeds
from
Shares
Sold | Realized
Gain
(Loss) | Change in
Unrealized
Appreciation
(Depreciation) | Number of
Shares
Held at
12/31/21 | Value at
12/31/21 | Dividend
Income |
| State Street Institutional U.S. Government Money Market Fund - Class G Shares | 1,478,369 | $1,478,369 | $12,251,075 | $12,578,679 | $— | $— | 1,150,765 | $1,150,765 | $445 |
See Notes to Schedule of Investments and Notes to Financial Statements.
| State Street Small-Cap Equity V.I.S. Fund | 13 |
State Street Small-Cap Equity V.I.S. Fund
Financial Highlights
Selected data based on a share outstanding throughout the fiscal years indicated
| | 12/31/21 | | 12/31/20 | | 12/31/19 | | 12/31/18 | | 12/31/17 |
| Inception date | | | 4/28/00 |
| Net asset value, beginning of period | $ 14.66 | | $ 13.16 | | $ 11.24 | | $ 14.73 | | $ 14.40 |
| Income/(loss) from investment operations: | | | | | | | | | |
| Net investment loss(a) | (0.04) | | (0.01) | | (0.00) (b) | | (0.02) | | (0.02) |
| Net realized and unrealized gains/(losses) on investments | 3.06 | | 1.92 | | 2.94 | | (1.43) | | 1.86 |
| Total income/(loss) from investment operations | 3.02 | | 1.91 | | 2.94 | | (1.45) | | 1.84 |
| Less distributions from: | | | | | | | | | |
| Net investment income | — | | — | | — | | — | | — |
| Net realized gains | 2.75 | | 0.41 | | 1.02 | | 2.04 | | 1.51 |
| Total distributions | 2.75 | | 0.41 | | 1.02 | | 2.04 | | 1.51 |
| Net asset value, end of period | $ 14.93 | | $ 14.66 | | $ 13.16 | | $ 11.24 | | $ 14.73 |
| Total Return(c) | 20.53% | | 14.53% | | 26.12% | | (9.70)% | | 12.71% |
| Ratios/Supplemental Data: | | | | | | | | | |
| Net assets, end of period (in thousands) | $36,890 | | $34,621 | | $33,600 | | $30,781 | | $40,711 |
| Ratios to average net assets: | | | | | | | | | |
| Net expenses | 1.21% | | 1.27% | | 1.240% | | 1.20% | | 1.25% |
| Gross expenses | 1.21% | | 1.27% | | 1.24% | | 1.20% | | 1.25% |
| Net investment loss | (0.22)% | | (0.06)% | | (0.02)% | | (0.13)% | | (0.13)% |
| Portfolio turnover rate | 39% | | 37% | | 29% | | 33% | | 32% |
| Notes to Financial Highlights |
| (a) | Per share values have been calculated using the average shares method. |
| (b) | Rounds to less than $0.01. |
| (c) | Total returns are historical and assume changes in share price, reinvestment of dividends and capital gains distributions and do not include the effect of insurance contract charges. Past performance does not guarantee future results. |
The accompanying Notes are an integral part of these financial statements.
State Street Small-Cap Equity V.I.S. Fund
Statement of Assets and Liabilities — December 31, 2021
| Assets | |
| Investments in securities, at fair value (cost $24,138,989) | $ 35,609,114 |
| Short-term affiliated investments, at fair value | 1,150,765 |
| Net cash collateral on deposit with broker for future contracts | 133,653 |
| Receivable for investments sold | 53,941 |
| Income receivables | 20,418 |
| Receivable for fund shares sold | 79 |
| Income receivable from affiliated investments | 27 |
| Receivable for accumulated variation margin on futures contracts | 17,350 |
| Other assets | 213 |
| Total assets | 36,985,560 |
| Liabilities | |
| Due to custodian | 849 |
| Payable for investments purchased | 19,258 |
| Payable for fund shares redeemed | 1,381 |
| Payable to the Adviser | 29,101 |
| Payable for custody, fund accounting and sub-administration fees | 5,367 |
| Accrued other expenses | 39,657 |
| Total liabilities | 95,613 |
|
| Net Assets | $ 36,889,947 |
| Net Assets Consist of: | |
| Capital paid in | $ 24,914,468 |
| Total distributable earnings (loss) | 11,975,479 |
| Net Assets | $ 36,889,947 |
| Shares outstanding ($0.01 par value; unlimited shares authorized) | 2,470,466 |
| Net asset value per share | $ 14.93 |
The accompanying Notes are an integral part of these financial statements.
| Statement of Assets and Liabilities | 15 |
State Street Small-Cap Equity V.I.S. Fund
Statement of Operations — For the year ended December 31, 2021
| Investment Income | |
| Income | |
| Dividend | $ 375,285 |
| Income from affiliated investments | 445 |
| Less: Foreign taxes withheld | (1,068) |
| Total income | 374,662 |
| Expenses | |
| Advisory and administration fees | 358,204 |
| Directors' fees | 19,029 |
| Custody, fund accounting and sub-administration fees | 31,821 |
| Professional fees | 35,374 |
| Other expenses | 11,307 |
| Total expenses | 455,735 |
| Net investment income | $ (81,073) |
| Net Realized and Unrealized Gain (Loss) on Investments | |
| Realized gain (loss) on: | |
| Unaffiliated investments | $ 5,911,697 |
| Futures | 40,097 |
| Increase (decrease) in unrealized appreciation/depreciation on: | |
| Unaffiliated investments | 1,018,162 |
| Futures | 15,477 |
| Net realized and unrealized gain (loss) on investments | 6,985,433 |
| Net Increase in Net Assets Resulting from Operations | $ 6,904,360 |
The accompanying Notes are an integral part of these financial statements.
| 16 | Statement of Operations |
State Street Small-Cap Equity V.I.S. Fund
Statements of Changes in Net Assets
| | Year Ended
December 31,
2021 | | Year Ended
December 31,
2020 |
| Increase (Decrease) in Net Assets | | | |
| Operations: | | | |
| Net investment loss | $ (81,073) | | $ (18,350) |
| Net realized gain (loss) on investments and futures | 5,951,794 | | 1,136,469 |
| Net increase (decrease) in unrealized appreciation/depreciation on investments and futures | 1,033,639 | | 2,867,844 |
| Net increase (decrease) from operations | 6,904,360 | | 3,985,963 |
| Distributions to shareholders: | | | |
| Total distributions | (5,746,437) | | (954,197) |
| Increase (decrease) in assets from operations and distributions | 1,157,923 | | 3,031,766 |
| Share transactions: | | | |
| Proceeds from sale of shares | 1,272,737 | | 2,233,175 |
| Value of distributions reinvested | 5,746,438 | | 954,197 |
| Cost of shares redeemed | (5,908,523) | | (5,197,324) |
| Net increase (decrease) from share transactions | 1,110,652 | | (2,009,952) |
| Total increase (decrease) in net assets | 2,268,575 | | 1,021,814 |
| Net Assets | | | |
| Beginning of year | 34,621,372 | | 33,599,558 |
| End of year | $ 36,889,947 | | $ 34,621,372 |
| Changes in Fund Shares | | | |
| Shares sold | 75,094 | | 196,772 |
| Issued for distributions reinvested | 384,120 | | 64,911 |
| Shares redeemed | (351,122) | | (452,260) |
| Net increase (decrease) in fund shares | 108,092 | | (190,577) |
The accompanying Notes are an integral part of these financial statements.
| Statements of Changes in Net Assets | 17 |
State Street Small-Cap Equity V.I.S. Fund
Notes to Financial Statements — December 31, 2021
1. Organization of the Company
State Street Variable Insurance Series Funds, Inc. (the “Company”) was incorporated under the laws of the Commonwealth of Virginia on May 14, 1984 and is registered under the Investment Company Act of 1940, as amended (the “1940 Act”), as an open-end management investment company. The Company is currently composed of the following seven investment portfolios (collectively, the “Funds”): State Street U.S. Equity V.I.S. Fund, State Street S&P 500 Index V.I.S. Fund, State Street Premier Growth Equity V.I.S. Fund, State Street Small-Cap Equity V.I.S. Fund (the “Fund”), State Street Total Return V.I.S. Fund, State Street Income V.I.S. Fund and State Street Real Estate Securities V.I.S. Fund. Each Fund is a diversified investment company within the meaning of the 1940 Act, except for the State Street Premier Growth Equity V.I.S. Fund, which is a non-diversified investment company.
Shares of the Funds of the Company are offered only to insurance company separate accounts that fund certain variable life insurance contracts and variable annuity contracts.
The Company currently offers one share class (Class 1) of the Fund as an investment option for variable life insurance and variable annuity contracts.
Under the Company’s organizational documents, its officers and directors are indemnified against certain liabilities arising out of the performance of their duties to the Company. Additionally, in the normal course of business, the Company enters into contracts with service providers that contain general indemnification clauses. The Company’s maximum exposure under these arrangements is unknown as this would involve future claims that may be made against the Company that have not yet occurred.
2.Summary of Significant Accounting Policies
The following is a summary of significant accounting policies followed by the Company in the preparation of its financial statements:
The preparation of financial statements in accordance with U.S. generally accepted accounting principles (“U.S. GAAP”) requires management to make estimates and assumptions that affect the reported amounts and disclosures in the financial statements. Actual results could differ from those estimates. The Fund is an investment company under U.S. GAAP and follows the accounting and reporting guidance applicable to investment companies.
Security Valuation The Fund’s investments are valued at fair value each day that the New York Stock Exchange (“NYSE”) is open and, for financial reporting purposes, as of the report date should the reporting period end on a day that the NYSE is not open. Fair value is generally defined as the price a fund would receive to sell an asset or pay to transfer a liability in an orderly transaction between market participants at the measurement date. By its nature, a fair value price is a good faith estimate of the valuation in a current sale and may not reflect an actual market price. The investments of the Fund are valued pursuant to the policy and procedures developed by the Oversight Committee (the “Committee”) and approved by the Company's Board of Directors (the “Board”). The Committee provides oversight of the valuation of investments for the Fund. The Board has responsibility for overseeing the determination of the fair value of investments.
Valuation techniques used to value the Fund’s investments by major category are as follows:
| • | Equity investments traded on a recognized securities exchange for which market quotations are readily available are valued at the last sale price or official closing price, as applicable, on the primary market or exchange on which they trade. Equity investments traded on a recognized exchange for which there were no sales on that day are valued at the last published sale price or at fair value. |
| • | Investments in registered investment companies (including money market funds) or other unitized pooled investment vehicles that are not traded on an exchange are valued at that day’s published net asset value (“NAV”) per share or unit. |
| 18 | Notes to Financial Statements |
State Street Small-Cap Equity V.I.S. Fund
Notes to Financial Statements, continued — December 31, 2021
| • | Exchange-traded futures contracts are valued at the closing settlement price on the primary market on which they are traded most extensively. Exchange-traded futures contracts traded on a recognized exchange for which there were no sales on that day are valued at the last reported sale price obtained from independent pricing services or brokers or at fair value. |
In the event prices or quotations are not readily available or that the application of these valuation methods results in a price for an investment that is deemed to be not representative of the fair value of such investment, fair value will be determined in good faith by the Committee, in accordance with the valuation policy and procedures approved by the Board.
The Fund values its assets and liabilities at fair value using a fair value hierarchy consisting of three broad levels that prioritize the inputs to valuation techniques giving the highest priority to readily available unadjusted quoted prices in active markets for identical assets or liabilities (Level 1 measurements) and the lowest priority to unobservable inputs (Level 3 measurements) when market prices are not readily available or reliable. The categorization of a value determined for an investment within the hierarchy is based upon the pricing transparency of the investment and is not necessarily an indication of the risk associated with investing in it.
The three levels of the fair value hierarchy are as follows:
| • | Level 1 — Unadjusted quoted prices in active markets for an identical asset or liability; |
| • | Level 2 — Inputs other than quoted prices included within Level 1 that are observable for the asset or liability either directly or indirectly, including quoted prices for similar assets or liabilities in active markets, quoted prices for identical or similar assets or liabilities in markets that are not considered to be active, inputs other than quoted prices that are observable for the asset or liability (such as exchange rates, financing terms, interest rates, yield curves, volatilities, prepayment speeds, loss severities, credit risks and default rates) or other market-corroborated inputs; and |
| • | Level 3 — Unobservable inputs for the asset or liability, including the Committee’s assumptions used in determining the fair value of investments. |
The value of the Fund’s investments according to the fair value hierarchy as of December 31, 2021 is disclosed in the Fund’s Schedule of Investments.
Investment Transactions and Income Recognition Investment transactions are accounted for on trade date for financial reporting purposes. Realized gains and losses from the sale or disposition of investments and foreign exchange transactions, if any, are determined using the identified cost method.
Dividend income and capital gain distributions, if any, are recognized on the ex-dividend date, net of any foreign taxes withheld at source, if any.
Interest income is recorded daily on an accrual basis. All premiums and discounts are amortized/accreted for financial reporting purposes.
Non-cash dividends received in the form of stock are recorded as dividend income at fair value.
The Fund invests in real estate investment trusts (“REITs”). REITs determine the tax character of their distributions annually and may characterize a portion of their distributions as a return of capital or capital gain. The Fund’s policy is to record all REIT distributions initially as dividend income and re-designate a portion to return of capital or capital gain distributions at year end based on information provided by the REIT and/or SSGA Funds Management, Inc.’s (the “Adviser” or “SSGA FM”) estimates of such re-designations for which actual information has not yet been reported.
Expenses Certain expenses, which are directly identifiable to a specific Fund, are applied to the Fund within the Company. Other expenses which cannot be attributed to a specific Fund are allocated in such a manner as deemed equitable, taking into consideration the nature and type of expense and the relative net assets of the Fund within the Company.
| Notes to Financial Statements | 19 |
State Street Small-Cap Equity V.I.S. Fund
Notes to Financial Statements, continued — December 31, 2021
Foreign Taxes The Fund may be subject to foreign taxes (a portion of which may be reclaimable) on income, stock dividends, realized and unrealized capital gains on investments or certain foreign currency transactions. Foreign taxes are recorded in accordance with SSGA FM's understanding of the applicable foreign tax regulations and rates that exist in the foreign jurisdictions in which the Fund invests. These foreign taxes, if any, are paid by the Fund and are reflected in the Statement of Operations, if applicable. Foreign taxes payable or deferred as of December 31, 2021, if any, are disclosed in the Fund’s Statement of Assets and Liabilities.
Distributions The Fund declares and pays any dividends from net investment income annually.
Net realized capital gains, if any, are distributed annually, unless additional distributions are required for compliance with applicable tax regulations. The amount and character of income and capital gains to be distributed are determined in accordance with applicable tax regulations which may differ from net investment income and realized gains recognized for U.S. GAAP purposes.
3.Derivative Financial Instruments
Futures Contracts The Fund may enter into futures contracts to meet the Fund’s objectives. A futures contract is a standardized, exchange-traded agreement to buy or sell a financial instrument at a set price on a future date. Upon entering into a futures contract, the Fund is required to deposit with the broker, cash or securities in an amount equal to the minimum initial margin requirements of the clearing house. Securities deposited, if any, are designated on the Schedule of Investments and cash deposited, if any, is included in Net cash collateral on deposit with broker for future contracts on the Statement of Assets and Liabilities. Subsequent payments are made or received by the Fund equal to the daily change in the contract value, accumulated, exchange rates, and/or other transactional fees. The accumulation of those payments are recorded as variation margin receivable or payable with a corresponding offset to unrealized gains or losses. The Fund recognizes a realized gain or loss when the contract is closed.
Losses may arise if the value of a futures contract decreases due to unfavorable changes in the market rates or values of the underlying instrument during the term of the contract or if the counterparty does not perform under the contract. The use of futures contracts also involves the risk that the movements in the price of the futures contracts do not correlate with the movement of the assets underlying such contracts.
For the fiscal year ended December 31, 2021, the Fund entered into futures contracts for cash equitization.
The following tables summarize the value of the Fund’s derivative instruments as of December 31, 2021 and the related location in the accompanying Statement of Assets and Liabilities and Statement of Operations, presented by primary underlying risk exposure:
| Asset Derivatives |
| | Interest
Rate
Risk | Foreign
Exchange
Risk | Credit
Risk | Equity
Risk | Commodity
Risk | Total |
| State Street Small-Cap Equity V.I.S. Fund | | | | | | |
| Futures Contracts | $ — | $ — | $ — | $ 17,350 | $ — | $ 17,350 |
| Realized Gain/Loss |
| | Interest
Rate
Risk | Foreign
Exchange
Risk | Credit
Risk | Equity
Risk | Commodity
Risk | Total |
| State Street Small-Cap Equity V.I.S. Fund | | | | | | |
| Futures Contracts | $ — | $ — | $ — | $ 40,097 | $ — | $ 40,097 |
| 20 | Notes to Financial Statements |
State Street Small-Cap Equity V.I.S. Fund
Notes to Financial Statements, continued — December 31, 2021
| Net Change in Unrealized Appreciation (Depreciation) |
| | Interest
Rate
Risk | Foreign
Exchange
Risk | Credit
Risk | Equity
Risk | Commodity
Risk | Total |
| State Street Small-Cap Equity V.I.S. Fund | | | | | | |
| Futures Contracts | $ — | $ — | $ — | $ 15,477 | $ — | $ 15,477 |
4.Fees and Transactions with Affiliates
Advisory Fee SSGA FM, a registered investment adviser, was retained by the Board to act as investment adviser and administrator of the Fund. SSGA FM’s compensation for investment advisory and administrative services (“Management Fee”) is paid monthly based on the average daily net assets of the Fund at an annualized rate of 0.95%.
Custody, Fund Accounting and Sub-Administration Fees State Street Bank and Trust Company (“State Street”) serves as the custodian, fund accountant and sub-administrator to the Fund. Amounts paid by the Fund to State Street for performing such services are included as custody, fund accounting and sub-administration fees in the Statement of Operations.
Due to Custodian In certain circumstances, the Fund may have a cash overdraft with the custodian due to expense payments, capital transactions, trading of securities, investment operations or derivative transactions. The Due to custodian amount, if any, reflects cash overdrawn with State Street, as custodian, who is an affiliate of the Fund.
Other Transactions with Affiliates The Fund may invest in affiliated entities, including securities issued by State Street Corporation, affiliated funds, or entities deemed to be affiliates as a result of the Fund owning more than five percent of the entity’s voting securities or outstanding shares. Amounts relating to these transactions during the fiscal year ended December 31, 2021 are disclosed in the of Investments.
5.Sub-Advisory Fees
Pursuant to investment sub-advisory agreements with SSGA FM, the assets of the Fund are allocated to and managed by each of the following sub-advisers: (i) Palisade Capital Management, L.L.C.; (ii) Champlain Investment Partners, LLC; (iii) Riverbridge Partners, LLC; (iv) Kennedy Capital Management, Inc.; and (v) SouthernSun Asset Management, LLC. SSGA FM is responsible for allocating the Fund’s assets among the sub-advisers in its discretion (“Allocated Assets”), and for managing the Fund’s cash position, while each sub-adviser is responsible for the day-to-day management of their portion of the Allocated Assets, under the general supervision and oversight of SSGA FM and the Board. For their services, SSGA FM pays each sub-adviser an investment sub-advisory fee, which is calculated as a percentage of the average daily net assets of the respective Allocated Assets that it manages.
Riverbridge Partners, LLC replaced GlobeFlex Capital, L.P. as a sub-adviser effective July 1, 2021.
6.Directors' Fees
The fees and expenses of the Company’s directors who are not “interested persons” of the Company, as defined in the 1940 Act (“Independent Directors”), are paid directly by the Fund. The Independent Directors are reimbursed for travel and other out-of-pocket expenses in connection with meeting attendance and industry seminars.
| Notes to Financial Statements | 21 |
State Street Small-Cap Equity V.I.S. Fund
Notes to Financial Statements, continued — December 31, 2021
7.Investment Transactions
Purchases and sales of investments (excluding in-kind transactions, short term investments and derivative contracts) for the fiscal year ended December 31, 2021 were as follows:
| Non-U.S. Government Securities |
| Purchases | Sales |
| $ 13,765,621 | $ 17,713,811 |
8.Income Taxes
The Fund has qualified and intends to continue to qualify as a regulated investment company under Subchapter M of the Internal Revenue Code of 1986, as amended. The Fund will not be subject to federal income taxes to the extent it distributes its taxable income, including any net realized capital gains, for each fiscal year. Therefore, no provision for federal income tax is required.
The Fund files federal and various state and local tax returns as required. No income tax returns are currently under examination. Generally, the federal returns are subject to examination by the Internal Revenue Service for a period of three years from date of filing, while the state returns may remain open for an additional year depending upon jurisdiction. SSGA FM has analyzed the Fund's tax positions taken on tax returns for all open years and does not believe there are any uncertain tax positions that would require recognition of a tax liability.
Distributions to shareholders are recorded on ex-dividend date. Income dividends and gain distributions are determined in accordance with income tax rules and regulations, which may differ from generally accepted accounting principles. Certain capital accounts in the financial statements have been adjusted for permanent book-tax differences. These adjustments have no impact on NAVs or results of operations. Temporary book-tax differences will reverse in the future. These book-tax differences are primarily due to futures contracts, non-REIT return of capital adjustments and wash sale loss deferrals.
The tax character of distributions paid during the fiscal year ended December 31, 2021 were as follows:
Ordinary
Income | Long-Term
Capital Gains | Total |
| $ 1,548,523 | $ 4,197,914 | $ 5,746,437 |
The tax character of distributions paid during the fiscal year ended December 31, 2020 was as follows:
Ordinary
Income | Long-Term
Capital Gains | Total |
| $ — | $ 954,197 | $ 954,197 |
At December 31, 2021, the components of distributable earnings on a tax basis were as follows:
Undistributed
Ordinary
Income | Tax Exempt
Income | Capital Loss
Carryforwards | Undistributed
long term
gain | Net
Unrealized
Gains
(Losses) | Qualified
Late-Year
Losses | Total |
| $ 34,132 | $ — | $ — | $ 944,599 | $ 10,996,748 | $ — | $ 11,975,479 |
As of December 31, 2021, gross unrealized appreciation and gross unrealized depreciation of investments and other financial instruments based on cost for federal income tax purposes were as follows:
Tax
Cost | Gross
Unrealized
Appreciation | Gross
Unrealized
Depreciation | Net
Unrealized
Appreciation
(Depreciation) |
| $ 25,780,470 | $ 12,136,105 | $ 1,139,357 | $ 10,996,748 |
| 22 | Notes to Financial Statements |
State Street Small-Cap Equity V.I.S. Fund
Notes to Financial Statements, continued — December 31, 2021
9.Line of Credit
The Fund and other affiliated funds (each, a “Participant” and collectively, the “Participants”) have access to $200 million of a $1.1 billion revolving credit facility provided by a syndication of banks under which the Participants may borrow to fund shareholder redemptions. This agreement expires in October 2022 unless extended or renewed.
The Participants are charged an annual commitment fee which is calculated based on the unused portion of the shared credit line. Commitment fees are allocated among each of the Participants based on relative net assets. Commitment fees are ordinary fund operating expenses. A Participant incurs and pays the interest expense related to its borrowing. Interest is calculated at a rate per annum equal to the sum of 1.00% plus the greater of the New York Fed Bank Rate and the one-month SOFR Rate.
Prior to October 7, 2021 the Fund had access to $200 million of a $500 million revolving credit facility and interest was calculated at a rate per annum equal to the sum of 1.25% plus the New York Fed Bank Rate.
The Fund had no outstanding loans as of December 31, 2021.
10.Risks
Concentration Risk As a result of the Fund's ability to invest a large percentage of its assets in obligations of issuers within the same country, state, region, currency or economic sector, an adverse economic, business or political development may affect the value of the Fund's investments more than if the Fund were more broadly diversified.
Credit Risk The Fund may be exposed to credit risk in the event that an issuer or guarantor fails to perform or that an institution or entity with which the Fund has unsettled or open transactions defaults.
Market Risk The Fund’s investments are subject to changes in general economic conditions, and general market fluctuations and the risks inherent in investment in securities markets. Investment markets can be volatile and prices of investments can change substantially due to various factors including, but not limited to, economic growth or recession, changes in interest rates, changes in the actual or perceived creditworthiness of issuers, and general market liquidity. The Fund is subject to the risk that geopolitical events will disrupt securities markets and adversely affect global economies and markets. Local, regional or global events such as war, acts of terrorism, the spread of infectious illness or other public health issues, or other events could have a significant impact on the Fund and its investments.
An outbreak of a respiratory disease caused by a novel coronavirus (known as COVID-19) first detected in China in December 2019 has resulted in a global pandemic and major disruptions to economies and markets around the world, including the United States. Financial markets have experienced and may continue to experience extreme volatility and severe losses, and trading in many instruments was and may continue to be disrupted as a result. Liquidity for many instruments was and may continue to be greatly reduced for periods of time. Some interest rates are very low and in some cases yields are negative. Governments and central banks, including the Federal Reserve in the United States, have taken extraordinary and unprecedented actions to support local and global economies and the financial markets. The impact of these measures, and whether they will be effective to mitigate the economic and market disruption, will not be known for some time. In addition, the outbreak of COVID-19, and measures taken to mitigate its effects, could result in disruptions to the services provided to the Fund by its service providers.
11.Subsequent Events
Management has evaluated the impact of all subsequent events on the Fund through the date on which the financial statements were available to be issued and has determined that there were no subsequent events requiring adjustment or disclosure in the financial statements.
| Notes to Financial Statements | 23 |
State Street Small-Cap Equity V.I.S. Fund
Report of Independent Registered Public Accounting Firm
To the Shareholders of State Street Small-Cap Equity V.I.S. Fund and the Board of Directors of State Street Variable Insurance Series Funds, Inc.
Opinion on the Financial Statements
We have audited the accompanying statement of assets and liabilities of State Street Small-Cap Equity V.I.S. Fund (the “Fund”) (one of the series constituting State Street Variable Insurance Series Funds, Inc. (the “Company”)), including the schedule of investments, as of December 31, 2021, and the related statement of operations for the year then ended, the statements of changes in net assets for each of the two years in the period then ended, the financial highlights for each of the five years in the period then ended and the related notes (collectively referred to as the “financial statements”). In our opinion, the financial statements present fairly, in all material respects, the financial position of the Fund (one of the series constituting State Street Variable Insurance Series Funds, Inc.) at December 31, 2021, the results of its operations for the year then ended, the changes in its net assets for each of the two years in the period then ended and its financial highlights for each of the five years in the period then ended, in conformity with U.S. generally accepted accounting principles.
Basis for Opinion
These financial statements are the responsibility of the Company’s management. Our responsibility is to express an opinion on the Fund’s financial statements based on our audits. We are a public accounting firm registered with the Public Company Accounting Oversight Board (United States) (“PCAOB”) and are required to be independent with respect to the Company in accordance with the U.S. federal securities laws and the applicable rules and regulations of the Securities and Exchange Commission and the PCAOB.
We conducted our audits in accordance with the standards of the PCAOB. Those standards require that we plan and perform the audit to obtain reasonable assurance about whether the financial statements are free of material misstatement, whether due to error or fraud. The Company is not required to have, nor were we engaged to perform, an audit of the Company’s internal control over financial reporting. As part of our audits we are required to obtain an understanding of internal control over financial reporting, but not for the purpose of expressing an opinion on the effectiveness of the Company’s internal control over financials reporting. Accordingly, we express no such opinion.
Our audits included performing procedures to assess the risks of material misstatement of the financial statements, whether due to error or fraud, and performing procedures that respond to those risks. Such procedures included examining, on a test basis, evidence regarding the amounts and disclosures in the financial statements. Our procedures included confirmation of securities owned as of December 31, 2021, by correspondence with the custodian, brokers and others or by other appropriate auditing procedures where replies from brokers and others were not received. Our audits also included evaluating the accounting principles used and significant estimates made by management, as well as evaluating the overall presentation of the financial statements. We believe that our audits provide a reasonable basis for our opinion.
We have served as the auditor of one or more State Street Global Advisors investment companies since 2000.
Boston, Massachusetts
February 17, 2022
| 24 | Report of Independent Registered Public Accounting Firm |
State Street Small-Cap Equity V.I.S. Fund
Other Information — December 31, 2021 (Unaudited)
Tax Information
For federal income tax purposes, the following information is furnished with respect to the distributions of the Trust for their fiscal year ended December 31, 2021.
Dividends Received Deduction
The Fund reports the maximum amount allowable of its net taxable income as eligible for the corporate dividends received deduction.
Long Term Capital Gain Distributions
Long term capital gains dividends were paid from the Fund during the year ended December 31, 2021 in the amount of $4,197,914.
Liquidity Risk Management Program
Pursuant to Rule 22e-4 under the 1940 Act, the Fund has adopted and implemented a liquidity risk management program (the “Program”). SSGA FM has been designated by the Board to administer the Fund's Program. The Program’s principal objectives include assessing, managing and periodically reviewing each Fund’s liquidity risk, based on factors specific to the circumstances of the Fund. Liquidity risk is defined as the risk that a Fund could not meet redemption requests without significant dilution of remaining investors’ interests in the Fund. During the fiscal year, SSGA FM provided the Board with a report addressing the operations of the Program and assessing its adequacy and the effectiveness of the Program’s implementation for the period September 2020 through June 2021. As reported to the Board, the Program supported each Fund’s ability to honor redemption requests timely and SSGA FM’s management of each Fund’s liquidity profile, including during periods of market volatility. SSGA FM reported that the Program operated adequately to meet the requirements of Rule 22e-4 and that the implementation of the Program has been effective.
There can be no assurance that the Program will achieve its objectives in the future. Please refer to your Fund’s prospectus for more information regarding the Fund’s exposure to liquidity risk and other principal risks to which an investment in the Fund may be subject.
Proxy Voting Policies and Procedures and Record
The Fund has adopted the proxy voting policies of the Adviser. A description of the Fund's proxy voting policies and procedures that are used by the Adviser to vote proxies relating to the Fund’s portfolios of securities are available (i) without charge, upon request by calling 1-800-242-0134 (toll free) and (ii) on the SEC's website at www.sec.gov. Information regarding how the Fund voted for the prior 12-months period ended June 30 is available by August 31 of each year by calling the same number, on the SEC’s website at www.sec.gov, and on the Fund's website at www.ssga.com.
Quarterly Portfolio Schedule
Following the Fund's first and third fiscal quarter-ends, a complete Schedule of Investments is filed with the SEC as an exhibit to its reports on Form N-PORT, which can be found on the SEC’s website at www.sec.gov, and on the Fund's website at www.ssga.com. The Fund's Schedules of Investments are available upon request, without charge, by calling 1-800-242-0134.
State Street Small-Cap Equity V.I.S. Fund
Other Information, continued — December 31, 2021 (Unaudited)
Name,
Address, and
Year of Birth | Position(s) Held
with Fund | Term of
Office and
Length of
Time Served | Principal Occupation
During Past Five Years
and Relevant Experience | Number
of
Funds
in Fund
Complex
Overseen
by
Director† | Other Directorships
Held by Director
During Past Five Years |
| INDEPENDENT DIRECTORS |
Michael F. Holland
c/o SSGA Funds
Management, Inc.
One Iron Street Boston,
MA 02210
YOB: 1944 | Director
and
Co-Chairperson
of the Board | Term:
Indefinite
Elected: 1/19 | Chairman, Holland &
Company L.L.C.
(investment adviser)
(1995 – present). | 63 | Director, the Holland Series
Fund, Inc.; Director, The China
Fund, Inc. (1992 – 2017);
Director, The Taiwan Fund,
Inc. (2007 – 2017); Director,
Reaves Utility Income Fund,
Inc.; and Director, Blackstone/
GSO Loans (and Real Estate)
Funds. |
| | | | | | |
Patrick J. Riley
c/o SSGA Funds
Management, Inc.
One Iron Street
Boston, MA 02210
YOB: 1948 | Director
and
Co-Chairperson
of the Board | Term:
Indefinite
Appointed: 4/16
Elected: 1/19 | 2002 to May 2010, Associate
Justice of the Superior Court,
Commonwealth of
Massachusetts; 1985 to 2002,
Partner, Riley, Burke
& Donahue, L.L.P. (law firm);
1998 to present, Independent
Director, State Street Global
Advisers Ireland, Ltd.
(investment company); 1998 to
present, Independent Director,
SSGA Liquidity plc (formerly,
SSGA Cash Management
Fund plc); January 2009 to
present, Independent Director,
SSGA Fixed Income plc; and
January 2009 – 2019,
Independent Director, SSGA
Qualified Funds PLC. | 63 | Board Director and Chairman,
SPDR Europe 1PLC Board
(2011 – present); Board
Director and Chairman, SPDR
Europe II, PLC (2013 –
present). |
State Street Small-Cap Equity V.I.S. Fund
Other Information, continued — December 31, 2021 (Unaudited)
Name,
Address, and
Year of Birth | Position(s) Held
with Fund | Term of
Office and
Length of
Time Served | Principal Occupation
During Past Five Years
and Relevant Experience | Number
of
Funds
in Fund
Complex
Overseen
by
Director† | Other Directorships
Held by Director
During Past Five Years |
| INDEPENDENT DIRECTORS (continued) |
| | | | | |
John R. Costantino
c/o SSGA Funds
Management, Inc.
One Iron Street
Boston, MA 02210
YOB: 1946 | Director
and
Chairperson of
the Qualified Legal
Compliance
Committee | Term:
Indefinite
Elected: 1997 | Senior Advisor to NGN Capital
LLC (January 2019 –
present); Managing General
Partner, NGN Capital LLC
(2006 – December 2019). | 63 | Director of Kleinfeld Bridal
Corp. (January 2016 – present);
Trustee of Neuroscience
Research Institute (1986 – 2017); Trustee of Fordham
University (1989 – 1995 and
2001 – 2007) and Trustee
Emeritus (2007 – present);
Trustee and Independent Chairperson of GE Funds (1993 – February 2011); Director, Muscular Dystrophy Association (since 2019);
Trustee of Gregorian
University Foundation (1992 –
2007); Chairman of the Board of Directors, Vivaldi Biosciences Inc. (May 2017 – present); Chairman of the Supervisory Board, Vivaldi Biosciences AG. (May 2017 – present); Trustee, Gallim Dance (December 2021 – present). |
| | | | | | |
Donna M. Rapaccioli
c/o SSGA Funds
Management, Inc.
One Iron Street
Boston, MA 02210
YOB: 1962 | Director
and
Chairperson of
the Audit Committee | Term:
Indefinite
Appointed: 1/12
Elected: 6/16 | Dean of the Gabelli School of
Business (2007 – present) and
Accounting Professor (1987 –
present) at Fordham
University. | 63 | Director- Graduate
Management Admissions
Council (2015 – present);
Trustee of Emmanuel College
(2010 – 2019). |
| | | | | | |
Richard D. Shirk
c/o SSGA Funds
Management, Inc.
One Iron Street
Boston, MA 02210
YOB: 1945 | Director
and
Chairperson
of the Nominating Committee
Chairperson of the Governance
Committee | Term:
Indefinite
Elected: 1/19 | March 2001 to April 2002,
Chairman (1996 to March
2001, President and Chief
Executive Officer), Cerulean
Companies, Inc. (holding
company) (Retired); 1992 to
March 2001, President and
Chief Executive Officer, Blue
Cross Blue Shield of Georgia
(health insurer,
managed healthcare). | 63 | 1998 to December 2008,
Chairman, Board Member and
December 2008 to present,
Investment Committee
Member, Healthcare Georgia
Foundation (private
foundation); September 2002
to 2012, Lead Director and
Board Member, Amerigroup
Corp. (managed health care);
1999 to 2013, Board Member
and (2001 to 2017) Investment
Committee Member, Woodruff
Arts Center; and 2003 to 2009,
Trustee, Gettysburg College;
Board member, Aerocare
Holdings (2003 – January 2021), Regenesis
Biomedical Inc. (April 2012 – present). |
State Street Small-Cap Equity V.I.S. Fund
Other Information, continued — December 31, 2021 (Unaudited)
Name,
Address, and
Year of Birth | Position(s) Held
with Fund | Term of
Office and
Length of
Time Served | Principal Occupation
During Past Five Years
and Relevant Experience | Number
of
Funds
in Fund
Complex
Overseen
by
Director† | Other Directorships
Held by Director
During Past Five Years |
| INDEPENDENT DIRECTORS (continued) |
| | | | | |
Michael A. Jessee
c/o SSGA Funds
Management, Inc.
One Iron Street
Boston, MA 02210
YOB: 1946 | Director
and
Chairperson of the
Valuation Committee | Term:
Indefinite
Elected: 1/19 | Retired; formerly, President
and Chief Executive Officer of
the Federal Home Loan Bank
of Boston (1989 – 2009);
Trustee, Randolph-Macon
College (2004 – 2016). | 63 | None. |
| INTERESTED DIRECTORS(1) |
Ellen M. Needham(2)
SSGA Funds
Management, Inc.
One Iron Street
Boston, MA 02210
YOB: 1967 | Director and
President | Term:
Indefinite
Elected: 1/19 | Chairman, SSGA Funds
Management, Inc. (March
2020 – present); President and
Director, SSGA Funds
Management, Inc. (2001 –
present)*; Senior Managing
Director, State Street Global
Advisors (1992 – present)*;
Manager, State Street Global
Advisors Funds Distributors,
LLC (May 2017 – present). | 63 | Board Director, SSGA
SPDR ETFs Europe 1 plc
(May 2020 – present); Board Director, SSGA SPDR ETFs Europe II plc (May 2020 – present). |
| | | | | |
| (1) | The individual listed above is a Director who is an “interested person,” as defined in the 1940 Act, of the Company (“Interested Director”). |
| (2) | Ms. Needham is an Interested Director because of her employment by SSGA FM, an affiliate of the Company. |
| * | Served in various capacities and/or with various affiliated entities during noted time period. |
| † | For the purpose of determining the number of portfolios overseen by the Directors, “Fund Complex” comprises registered investment companies for which SSGA FM serves as investment adviser. |
State Street Small-Cap Equity V.I.S. Fund
Other Information, continued — December 31, 2021 (Unaudited)
The following lists the principal officers for the Company, as well as their mailing addresses and ages, positions with the Company and length of time served, and present and principal occupations:
Name,
Address, and
Year of Birth | Position(s) Held
with Funds | Term of
Office and
Length of
Time Served | Principal Occupation
During Past Five Years |
| OFFICERS: |
Ellen M. Needham
SSGA Funds Management, Inc.
One Iron Street
Boston, MA 02210
YOB: 1967 | President and
Director | Term:
Indefinite
Elected:
4/20 | Chairman, SSGA Funds Management, Inc. (March 2020 – present); President and Director, SSGA Funds Management, Inc. (2001 – present)*; Senior Managing Director, State Street Global Advisors (1992 – present)*; Manager, State Street Global Advisors Funds Distributors, LLC (May 2017 – present). |
| | | | |
Bruce S. Rosenberg
SSGA Funds Management, Inc.
One Iron Street
Boston, MA 02210
YOB: 1961 | Treasurer | Term:
Indefinite
Elected: 4/19 | Managing Director, State Street Global Advisors and SSGA Funds Management, Inc. (July 2015 – present); Director, Credit Suisse (April 2008 – July 2015). |
| | | | |
Ann M. Carpenter
SSGA Funds Management, Inc.
One Iron Street
Boston, MA 02210
YOB: 1966 | Vice President
and Deputy
Treasurer | Term:
Indefinite
Elected: 4/19 | Chief Operating Officer, SSGA Funds Management, Inc. (April 2005 – present)*; Managing Director, State Street Global Advisors (2005 – present).* |
| | | | |
Chad C. Hallett
SSGA Funds Management, Inc.
One Iron Street
Boston, MA 02210
YOB: 1969 | Deputy
Treasurer | Term:
Indefinite
Elected: 4/19 | Vice President, State Street Global Advisors and SSGA Funds Management, Inc. (November 2014 – present); Vice President, State Street Bank and Trust Company (2001 – November 2014).* |
| | | | |
Darlene Anderson-Vasquez
SSGA Funds Management, Inc.
One Iron Street
Boston, MA 02210
YOB: 1968 | Deputy
Treasurer | Term:
Indefinite
Elected: 4/19 | Managing Director, State Street Global Advisors and SSGA Funds Management, Inc. (May 2016 – present); Senior Vice President, John Hancock Investments (September 2007 – May 2016). |
| | | | |
Arthur A. Jensen
SSGA Funds Management, Inc.
1600 Summer Street
Stamford, CT 06905
YOB: 1966 | Deputy
Treasurer | Term:
Indefinite
Elected: 4/19 | Vice President, State Street Global Advisors and SSGA Funds Management, Inc. (July 2016 – present); Controller of GE Asset Management Incorporated (April 2011 – July 2016). |
| | | | |
David K. Lancaster
SSGA Funds Management, Inc.
One Iron Street
Boston, MA 02210
YOB: 1971 | Assistant Treasurer | Term:
Indefinite
Elected: 11/20 | Vice President, State Street Global Advisors and SSGA Funds Management, Inc. (July 2017 – present); Assistant Vice President, State Street Bank and Trust Company (November 2011 – July 2017).* |
State Street Small-Cap Equity V.I.S. Fund
Other Information, continued — December 31, 2021 (Unaudited)
Name,
Address, and
Year of Birth | Position(s) Held
with Funds | Term of
Office and
Length of
Time Served | Principal Occupation
During Past Five Years |
| OFFICERS: (continued) |
| | | |
Brian Harris
SSGA Funds Management, Inc.
One Iron Street
Boston, MA 02210
YOB: 1973 | Chief Compliance
Officer, Anti-Money
Laundering Officer
and Code of Ethics
Compliance Officer | Term:
Indefinite Elected: 6/16
Term:
Indefinite Elected: 4/19 | Managing Director, State Street Global Advisors and SSGA Funds Management, Inc. (June 2013 – present).* |
| | | | |
Sean O’Malley
SSGA Funds Management, Inc.
One Iron Street
Boston, MA 02210
YOB: 1969 | Chief Legal Officer | Term:
Indefinite
Elected: 8/19 | Senior Vice President and Deputy General Counsel, State Street Global Advisors (November 2013 – present). |
| | | | |
David Barr
SSGA Funds Management, Inc.
One Iron Street
Boston, MA 02210
YOB: 1974 | Secretary | Term:
Indefinite
Elected: 9/20 | Vice President and Senior Counsel, State Street Global Advisors (October 2019 – present); Vice President and Counsel, Eaton Vance Corp. (October 2010 – October 2019). |
| | | | |
Timothy Collins
SSGA Funds Management, Inc.
One Iron Street
Boston, MA 02210
YOB: 1967 | Assistant
Secretary | Term:
Indefinite
Elected: 9/21 | Vice President and Senior Counsel, State Street Global Advisors (August 2021 – present); Vice President and Managing Counsel, State Street Corporation (March 2020 – August 2021); Vice President and Senior Counsel (April 2018 – March 2020); Counsel, Sutton Place Investments (January 2010 – March 2018). |
| | | | |
David Urman
SSGA Funds Management, Inc.
One Iron Street
Boston, MA 02210
YOB: 1985 | Assistant
Secretary | Term:
Indefinite
Elected: 8/19 | Vice President and Senior Counsel, State Street Global Advisors (April 2019 – present); Vice President and Counsel, State Street Global Advisors (August 2015 – April 2019); Associate, Ropes & Gray LLP (November 2012 – August 2015). |
| | | |
| * | Served in various capacities and/or with various affiliated entities during noted time period. |
[This page intentionally left blank]
Directors
Michael F. Holland, Co-Chairperson
Patrick J. Riley, Co-Chairperson
John R. Costantino
Donna M. Rapaccioli
Michael A. Jessee
Richard D. Shirk
Ellen M. Needham
Officers
Ellen M. Needham, President
Brian Harris, Chief Compliance Officer, Anti-Money Laundering Officer and Code of Ethics Compliance Officer
Sean O’Malley, Chief Legal Officer
Bruce S. Rosenberg, Treasurer
Ann M. Carpenter, Vice President and Deputy Treasurer
Chad C. Hallett, Deputy Treasurer
Arthur A. Jensen, Deputy Treasurer
Darlene Anderson-Vasquez, Deputy Treasurer
David Lancaster, Assistant Treasurer
David Barr, Secretary
Timothy Collins, Assistant Secretary
David Urman, Assistant Secretary
Investment Adviser and Administrator
SSGA Funds Management, Inc.
One Iron Street
Boston, Massachusetts 02210
Custodian and Sub-Administrator
State Street Bank and Trust Company
One Lincoln Street
Boston, Massachusetts 02111
Distributor
State Street Global Advisors Funds Distributors, LLC
One Iron Street
Boston, Massachusetts 02210
Independent Registered Public Accounting Firm
Ernst & Young LLP
200 Clarendon Street
Boston, Massachusetts 02116
Annual Report
December 31, 2021
| State Street Income V.I.S. Fund |
State Street Income V.I.S. Fund
Annual Report
December 31, 2021
| | Page |
| 1 |
| 2 |
| Financial Statements | |
| 26 |
| 27 |
| 28 |
| 29 |
| 30 |
| 39 |
| 40 |
This report is prepared for Policyholders of certain variable contracts and may be distributed to others only if preceded or accompanied by the variable contract’s current prospectus and the current summary prospectus of the Fund available for investments thereunder.
[This page intentionally left blank]
State Street Income V.I.S. Fund
Notes to Performance — December 31, 2021 (Unaudited)
The information provided on the performance pages relates to the State Street Income V.I.S. Fund (the “Fund”).
Total return performance shown in this report for the Fund takes into account changes in share price and assumes reinvestment of dividends and capital gains distributions, if any. Total returns shown are net of Fund fees and expenses but do not reflect fees and charges associated with the variable contracts such as administrative fees, account charges and surrender charges, which, if reflected, would reduce the Fund’s total returns for all periods shown.
The performance data quoted represents past performance; past performance does not guarantee future results. Investment return and principal value will fluctuate so your shares, when redeemed, may be worth more or less than their original cost. Current performance may be higher or lower than the performance data quoted. Periods less than one year are not annualized. Please call toll-free (800) 242-0134 or visit the Fund’s website at www.ssga.com for the most recent month-end performance data.
An investment in the Fund is not a deposit of any bank and is not insured or guaranteed by the Federal Deposit Insurance Corporation (“FDIC”) or any other government agency. An investment in the Fund is subject to risk, including possible loss of principal invested.
The Bloomberg U.S. Aggregate Bond Index is an unmanaged market value-weighted index of taxable investment grade debt issues, including government, corporate, asset-backed and mortgage-backed securities, with maturities of one year or more. This index is designed to represent the performance of the U.S. investment-grade first rate bond market.
The results shown for the foregoing index assume the reinvestment of net dividends or interest and do not reflect fees, expenses, or taxes. As such, the index returns do not reflect the actual cost of investing in the instruments that comprise the index.
The views expressed in this document reflect our judgment as of the publication date and are subject to change at any time without notice.
State Street Global Advisors Funds Distributors, LLC, member of FINRA & SIPC is the principal underwriter and distributor of the State Street Income V.I.S. Fund and an indirect wholly-owned subsidiary of State Street Corporation. References to State Street may include State Street Corporation and its affiliates. The Funds pay State Street Bank and Trust Company for its services as custodian and Fund Accounting agent, and pay SSGA Funds Management, Inc. ("SSGA FM" or the "Adviser") for investment advisory and administrative services.
State Street Income V.I.S. Fund
Management's Discussion of Fund Performance — December 31, 2021 (Unaudited)
The State Street Income V.I.S. Fund (the “Fund”) seeks to provide the maximum income consistent with prudent investment management and the preservation of capital by investing at least 80% of its net assets under normal circumstances in debt securities. The Fund’s benchmark is the Bloomberg U.S. Aggregate Bond Index (the “Index”)*.
For the 12-month period ended December 31, 2021 (the “Reporting Period”), the total return for the Fund was -1.81% and the Index was -1.54%. The Fund and Index returns reflect the reinvestment of dividends and other income. The Fund’s performance reflects the expenses of managing the Fund, including brokerage and advisory expenses. The Index is unmanaged and Index returns do not reflect fees and expenses of any kind, which would have a negative impact on returns.
On a gross-of-fees basis, asset allocation and security selection, which each had a positive impact, were the primary drivers of Fund performance during the Reporting Period relative to the Index. Duration had a limited impact on the Fund’s relative performance to the Index, but, an increase in interest rates during the Reporting Period, where the ten-year Treasury yield increased 59bps, explains the negative absolute return for both the Fund and the Index. On a net-of-fees basis, the above performance drivers were not enough to offset the Fund’s small size and high fee structure.
Our view in the first quarter of 2021 was that the economic recovery from COVID-19 would continue due to emergency economic U.S. fiscal and monetary stimulus, which was expected to persist throughout the Reporting Period, and the announcement of several effective COVID-19 vaccines announced during the previous Reporting Period. As a function of our positive outlook and the perception that credit spreads were on the cheap side of long-term fair value, the Fund maintained an over-weight allocation to credit sectors, with an emphasis on investment-grade rated credit. Credit performance versus duration-equivalent treasuries was positive over the Reporting Period, with investment-grade-credit and high-yield out-performing risk-free assets during the Reporting Period. The Fund’s asset allocation over-weight to investment-grade credit, high yield, and commercial mortgage-backed securities generated positive excess returns to the Index.
Security selection in the commercial mortgage-backed securities and investment-grade credit allocations generated positive excess returns as our bottom-up fundamental underwriting assisted our portfolio construction process to select higher value securities.
The Fund used treasury futures and index credit default swaps in order to actively manage duration and credit spread duration during the Reporting Period. The Fund’s use of treasury futures and index credit default swaps contributed to Fund performance relative to the Index.
The views expressed above reflect those of the Fund’s portfolio manager only through the Reporting Period, and do not necessarily represent the views of the Adviser as a whole. Any such views are subject to change at any time based upon market or other conditions and the Adviser disclaims any responsibility to update such views. These views may not be relied on as investment advice and, because investment decisions for a fund are based on numerous factors, may not be relied on as an indication of trading intent on behalf of any fund.
*Effective November 1, 2021, Barclays was removed from both the Fund and Index name. The principal investment strategy of the Fund did not change due to the name change.
| 2 | State Street Income V.I.S. Fund |
State Street Income V.I.S. Fund
Performance Summary — December 31, 2021 (Unaudited)
| Sector Allocation |
| Portfolio composition as a % of Fair Value of $15,968 (in thousands) as of December 31, 2021 (a)(b) |
| Quality Ratings |
| as of December 31, 2021 as a % of Fair Value (a)(b) |
| Moody’s / S&P / Rating* | | Percentage of
Fair Value |
| Aaa / AAA | | 4.77% |
| Aa / AA | | 56.82% |
| A / A | | 6.16% |
| Baa / BBB | | 19.25% |
| Ba / BB and lower | | 2.21% |
| NR / Other | | 10.79% |
| | | 100.00% |
| Average Annual Total Return for the years ended December 31, 2021 |
| Class 1 Shares (Inception date 1/3/95) |
| | One Year | | Five Year | | Ten Year | | Ending Value
of a $10,000
Investment |
| State Street Income V.I.S. Fund | (1.81)% | | 3.04% | | 2.70% | | $13,058 |
| Bloomberg U.S. Aggregate Bond Index | (1.54)% | | 3.57% | | 2.90% | | $13,307 |
|
| (a) | Fair Value basis is inclusive of a short-term investment in the State Street Institutional U.S. Government Money Market Fund Class G Shares. |
| (b) | The securities information regarding holdings, allocations and other characteristics is presented to illustrate examples of securities that the Fund has bought and the diversity of areas in which the Fund may invest as of a particular date. It may not be representative of the Fund’s current or future investments and should not be construed as a recommendation to purchase or sell a particular security. |
| * | Moody’s Investors Services, Inc. (“Moody’s”) and S&P Global Ratings (“S&P”) are nationally recognized statistical rating organizations. The quality ratings represent the lower of Moody’s or S&P credit ratings. When a rating from only one of the rating agencies is available, that rating is used. Securities not rated by Moody’s or S&P are categorized as not rated. Credit quality measures a bond issuer’s ability to repay interest and principal in a timely manner. Credit quality ratings assigned by a rating agency are subject to change periodically and are not absolute standard of quality. In formulating investment decisions for the Fund, SSGA Funds Management, Inc. (“SSGA FM”) develops its own analysis of the credit quality and risks associated with individual debt instruments, rather than relying exclusively on rating agency ratings. |
| State Street Income V.I.S. Fund | 3 |
State Street Income V.I.S. Fund
Performance Summary, continued — December 31, 2021 (Unaudited)
Change in Value of a $10,000 Investment
Yearly periods ended December 31
See Notes to Performance beginning on page 1 for further information.
Past performance does not predict future performance. The performance shown in the graphs and tables does not reflect the deduction of taxes that a shareholder would pay on Fund distributions or the redemption of Fund shares and does not reflect the fees or charges that would be associated with variable contracts through which shares of the Fund are offered.
| 4 | State Street Income V.I.S. Fund |
State Street Income V.I.S. Fund
Understanding Your Fund’s Expenses — December 31, 2021 (Unaudited)
As a shareholder of the Fund, you incur ongoing costs. Ongoing costs include portfolio management fees, professional fees, administrative fees and other Fund expenses. The following example is intended to help you understand your ongoing costs (in dollars) of investing in the Fund and to compare these costs with the ongoing costs of investing in other mutual funds.
To illustrate these ongoing costs, we have provided an example and calculated the expenses paid by investors of the Fund during the period. The information in the following table is based on an investment of $1,000, which is invested at the beginning of the period and held for the entire six-month period ended December 31, 2021.
Actual Expenses
The first section of the table provides information about actual account values and actual expenses. You may use the information in this section, together with the amount you invested, to estimate the expenses that you paid over the period. To do so, simply divide your account value by $1,000 (for example, an $8,600 account value divided by $1,000 = 8.6), then multiply the result by the number given under the heading “Expenses paid during the period” to estimate the expenses you paid on your account during the period.
Hypothetical Example for Comparison Purposes
The second section of the table provides information about hypothetical account values and hypothetical expenses based on the Fund’s actual expense ratio and an assumed rate of return of 5% per year before expenses, which is not the Fund’s actual return. The hypothetical account values and expenses may not be used to estimate the actual ending account balance or expenses you paid for the period. You may use this information to compare the ongoing costs of investing in the Fund and other funds. To do so, compare this 5% hypothetical example with the 5% hypothetical examples that appear in the shareholders reports of other funds.
Please note that the expenses shown in the table are meant to highlight and help you compare ongoing costs only and do not reflect transaction costs, such as sales charges or redemption fees, if any. Therefore, the second section of the table is useful in comparing ongoing costs only, and will not help you determine the relative total costs of owning different funds.
| | Actual
Fund Return | | Hypothetical
5% Return
(2.5% for
the period) |
Beginning Account Value
July 1, 2021 | $1,000.00 | | $1,000.00 |
Ending Account value
December 31, 2021 | $ 995.40 | | $1,019.90 |
| Expenses Paid During Period* | $ 5.33 | | $ 5.40 |
| * | Expenses are equal to the Fund's annualized net expense ratio of 1.06%** (for the period July 1, 2021 - December 31, 2021), multiplied by the average account value over the period, multiplied by 184/365 (to reflect the one-half year period). |
| ** | May differ from expense ratio disclosed in the financial highlights, which is calculated based on the entire fiscal year's data. |
| State Street Income V.I.S. Fund | 5 |
State Street Income V.I.S. Fund
Schedule of Investments — December 31, 2021
| | Principal
Amount | Fair
Value |
| Bonds and Notes - 96.8% † |
| U.S. Treasuries - 33.4% |
| U.S. Treasury Bonds | | |
| 1.13%, 05/15/40 (a) | $ 184,000 | $ 161,834 |
| 1.88%, 02/15/41 | 75,000 | 74,461 |
| 1.88%, 02/15/51 (a) | 80,000 | 79,538 |
| 2.25%, 08/15/46 (a) | 247,000 | 262,167 |
| 3.00%, 08/15/48 (a) | 325,000 | 399,344 |
| 4.75%, 02/15/37 (a) | 276,000 | 392,092 |
| U.S. Treasury Notes | | |
| 0.25%, 07/31/25 (a) | 532,900 | 517,080 |
| 0.63%, 10/15/24 (a) | 5,000 | 4,961 |
| 0.75%, 04/30/26 - 01/31/28 (a) | 1,716,000 | 1,669,460 |
| 1.38%, 01/31/22 (a) | 475,000 | 475,427 |
| 1.63%, 05/15/31 (a) | 886,000 | 898,459 |
| | | 4,934,823 |
| Agency Mortgage Backed - 25.7% |
| Federal Home Loan Mortgage Corp. | | |
| 3.00%, 04/01/43 - 10/01/49 (a) | 373,850 | 392,138 |
| 4.50%, 06/01/33 - 02/01/35 (a) | 2,327 | 2,555 |
| 5.00%, 07/01/35 (a) | 20,875 | 23,487 |
| 5.50%, 01/01/38 (a) | 20,507 | 23,349 |
| 6.00%, 04/01/29 - 11/01/37 (a) | 65,801 | 74,129 |
| 6.50%, 02/01/29 (a) | 27 | 30 |
| 6.93%, 06/01/26 (a)(b) | 60,000 | 74,185 |
| 7.00%, 12/01/29 - 08/01/36 (a) | 16,042 | 18,350 |
| 7.50%, 01/01/30 - 09/01/33 (a) | 3,385 | 3,770 |
| 8.00%, 11/01/30 (a) | 3,231 | 3,612 |
| 8.50%, 04/01/30 (a) | 2,951 | 3,637 |
| Federal National Mortgage Assoc. | | |
| 2.50%, 02/01/51 - 03/01/51 (a) | 543,682 | 556,937 |
| 3.00%, 03/01/50 (a) | 69,895 | 72,494 |
| 3.50%, 08/01/45 - 01/01/48 (a) | 131,496 | 141,319 |
| 4.00%, 01/01/41 - 01/01/50 (a) | 217,718 | 235,528 |
| 4.50%, 07/01/33 - 12/01/48 (a) | 92,372 | 100,986 |
| 5.00%, 03/01/34 - 08/01/35 (a) | 22,684 | 25,485 |
| | Principal
Amount | Fair
Value |
| 5.50%, 12/01/32 - 01/01/39 (a) | $ 76,140 | $ 85,483 |
| 6.00%, 02/01/33 - 07/01/35 (a) | 93,816 | 106,274 |
| 6.50%, 01/01/29 - 08/01/34 (a) | 15,389 | 17,017 |
| 7.00%, 10/01/32 - 02/01/34 (a) | 4,625 | 5,117 |
| 7.50%, 11/01/22 - 03/01/33 (a) | 8,891 | 9,644 |
| 8.00%, 08/01/25 - 10/01/31 (a) | 4,242 | 4,644 |
| 9.00%, 12/01/22 (a) | 22 | 22 |
| Federal National Mortgage Assoc. 1.60% + 12 month USD LIBOR | | |
| 1.85%, 04/01/37 (a) | 777 | 798 |
| Federal National Mortgage Assoc. TBA | | |
| 2.50%, 02/01/52 (c) | 203,439 | 207,196 |
| 3.00%, 01/01/52 (c) | 721,309 | 747,435 |
| Government National Mortgage Assoc. | | |
| 3.00%, 12/20/42 - 05/20/45 (a) | 324,096 | 341,658 |
| 3.50%, 08/20/48 (a) | 64,432 | 67,614 |
| 4.00%, 01/20/41 - 04/20/43 (a) | 57,590 | 62,867 |
| 4.50%, 08/15/33 - 03/20/41 (a) | 44,500 | 49,538 |
| 6.00%, 04/15/27 - 04/15/34 (a) | 52,043 | 58,837 |
| 6.50%, 03/15/24 - 08/15/34 (a) | 20,421 | 22,666 |
| 7.00%, 01/15/28 - 10/15/36 (a) | 17,174 | 18,575 |
| Government National Mortgage Assoc. 1.50% + 1 year CMT Rate | | |
| 2.00%, 02/20/23 - 02/20/26 (a) | 410 | 411 |
| 2.13%, 12/20/24 (a) | 294 | 296 |
| Government National Mortgage Assoc. TBA | | |
| 2.50%, 01/01/52 (c) | 50,000 | 51,239 |
| 3.00%, 01/01/52 (c) | 180,280 | 186,597 |
| | | 3,795,919 |
| Agency Collateralized Mortgage Obligations - 1.0% |
| Federal Home Loan Mortgage Corp. | | |
| 0.08%, 09/25/43 (d)(e) | 306,688 | 1,407 |
See Notes to Schedule of Investments and Notes to Financial Statements.
| 6 | State Street Income V.I.S. Fund |
State Street Income V.I.S. Fund
Schedule of Investments, continued — December 31, 2021
| | Principal
Amount | Fair
Value |
| 2.51%, 07/25/29 (a) | $ 55,000 | $ 58,004 |
| 4.05%, 09/25/28 (a)(e) | 31,000 | 35,641 |
| Federal Home Loan Mortgage Corp. REMIC | | |
| 3.50%, 11/15/30 (d) | 5,700 | 116 |
| 5.50%, 06/15/33 (d) | 10,121 | 1,531 |
| 7.50%, 07/15/27 (d) | 854 | 113 |
| Federal Home Loan Mortgage Corp. STRIPS | | |
| 0.00%, 08/01/27 | 112 | 107 |
| 8.00%, 02/01/23 - 07/01/24 (d) | 184 | 13 |
| Federal National Mortgage Assoc. REMIC | | |
| 1.12%, 12/25/42 (d)(e) | 16,422 | 504 |
| 5.00%, 09/25/40 (d) | 6,016 | 633 |
| Federal National Mortgage Assoc. REMIC 6.00% - 1 month USD LIBOR | | |
| 5.90%, 07/25/38 (d) | 3,418 | 467 |
| Federal National Mortgage Assoc. REMIC 6.55% - 1 month USD LIBOR | | |
| 6.45%, 11/25/41 (d) | 158,226 | 29,916 |
| Federal National Mortgage Assoc. STRIPS | | |
| 0.01%, 12/25/34 | 8,389 | 7,542 |
| 4.50%, 08/25/35 - 01/25/36 (d) | 9,583 | 1,343 |
| 5.00%, 03/25/38 - 05/25/38 (d) | 6,151 | 1,143 |
| 5.50%, 12/25/33 (d) | 2,660 | 491 |
| 6.00%, 01/25/35 (d) | 4,714 | 806 |
| 7.50%, 11/25/23 (d) | 577 | 25 |
| 8.00%, 08/25/23 - 07/25/24 (d) | 346 | 25 |
| | | 139,827 |
| Asset Backed - 0.5% |
| CarMax Auto Owner Trust 2018-3 | | |
| 3.13%, 06/15/23 | 1,328 | 1,332 |
| Ford Credit Auto Owner Trust 2020-B | | |
| 0.56%, 10/15/24 | 59,422 | 59,396 |
| Santander Retail Auto Lease Trust 2019-B | | |
| 2.30%, 01/20/23 (f) | 15,464 | 15,489 |
| | | 76,217 |
| | Principal
Amount | Fair
Value |
| Corporate Notes - 29.0% |
| 3M Co. | | |
| 3.13%, 09/19/46 (a) | $ 2,000 | $ 2,108 |
| 7-Eleven Inc. | | |
| 0.95%, 02/10/26 (a)(f) | 7,000 | 6,777 |
| Abbott Laboratories | | |
| 3.75%, 11/30/26 (a) | 6,000 | 6,629 |
| 4.90%, 11/30/46 (a) | 8,000 | 10,980 |
| AbbVie Inc. | | |
| 2.60%, 11/21/24 (a) | 7,000 | 7,260 |
| 2.95%, 11/21/26 (a) | 5,000 | 5,267 |
| 3.20%, 05/14/26 - 11/21/29 (a) | 12,000 | 12,796 |
| 3.25%, 10/01/22 (a) | 6,000 | 6,076 |
| 3.45%, 03/15/22 (a) | 9,000 | 9,010 |
| 4.05%, 11/21/39 (a) | 3,000 | 3,439 |
| 4.25%, 11/21/49 (a) | 6,000 | 7,204 |
| 4.63%, 10/01/42 (a) | 2,000 | 2,439 |
| 4.88%, 11/14/48 (a) | 3,000 | 3,883 |
| Advance Auto Parts Inc. | | |
| 3.90%, 04/15/30 (a) | 7,000 | 7,661 |
| AEP Texas Inc. | | |
| 3.45%, 05/15/51 (a) | 8,000 | 8,161 |
| Aetna Inc. | | |
| 3.50%, 11/15/24 (a) | 8,000 | 8,451 |
| Aircastle Ltd. | | |
| 4.25%, 06/15/26 (a) | 5,000 | 5,361 |
| Alexandria Real Estate Equities Inc. | | |
| 1.88%, 02/01/33 (a) | 5,000 | 4,697 |
| 4.70%, 07/01/30 (a) | 3,000 | 3,514 |
| Ally Financial Inc. | | |
| 2.20%, 11/02/28 (a) | 7,000 | 6,956 |
| 5.75%, 11/20/25 (a) | 3,000 | 3,385 |
| Altria Group Inc. | | |
| 3.40%, 02/04/41 (a) | 6,000 | 5,532 |
| 4.00%, 02/04/61 (a) | 2,000 | 1,918 |
| 4.25%, 08/09/42 (a) | 2,000 | 2,032 |
| 4.45%, 05/06/50 (a) | 3,000 | 3,123 |
| 4.50%, 05/02/43 (a) | 3,000 | 3,129 |
| Amazon.com Inc. | | |
| 1.50%, 06/03/30 (a) | 2,000 | 1,941 |
| 2.50%, 06/03/50 (a) | 3,000 | 2,855 |
| 2.70%, 06/03/60 (a) | 3,000 | 2,888 |
| 2.88%, 05/12/41 (a) | 4,000 | 4,131 |
| 3.15%, 08/22/27 (a) | 2,000 | 2,162 |
| 3.25%, 05/12/61 (a) | 5,000 | 5,392 |
| 4.05%, 08/22/47 (a) | 3,000 | 3,652 |
See Notes to Schedule of Investments and Notes to Financial Statements.
| State Street Income V.I.S. Fund | 7 |
State Street Income V.I.S. Fund
Schedule of Investments, continued — December 31, 2021
| | Principal
Amount | Fair
Value |
| Ameren Corp. | | |
| 3.65%, 02/15/26 (a) | $ 5,000 | $ 5,328 |
| American Campus Communities Operating Partnership LP | | |
| 4.13%, 07/01/24 (a) | 4,000 | 4,276 |
| American Electric Power Company Inc. | | |
| 2.30%, 03/01/30 (a) | 3,000 | 2,951 |
| 3.25%, 03/01/50 (a) | 3,000 | 2,977 |
| American International Group Inc. | | |
| 4.25%, 03/15/29 (a) | 6,000 | 6,852 |
| 4.50%, 07/16/44 (a) | 5,000 | 6,163 |
| American Tower Corp. | | |
| 1.50%, 01/31/28 (a) | 6,000 | 5,746 |
| 2.90%, 01/15/30 (a) | 6,000 | 6,155 |
| 3.70%, 10/15/49 (a) | 3,000 | 3,217 |
| 3.80%, 08/15/29 (a) | 6,000 | 6,533 |
| American Water Capital Corp. | | |
| 2.95%, 09/01/27 (a) | 8,000 | 8,454 |
| Amgen Inc. | | |
| 2.00%, 01/15/32 (a) | 8,000 | 7,736 |
| 2.45%, 02/21/30 (a) | 2,000 | 2,036 |
| 3.00%, 01/15/52 (a) | 6,000 | 5,849 |
| 3.15%, 02/21/40 (a) | 5,000 | 5,117 |
| Anheuser-Busch Companies LLC/Anheuser-Busch InBev Worldwide Inc. | | |
| 4.70%, 02/01/36 (a) | 7,000 | 8,456 |
| 4.90%, 02/01/46 (a) | 8,000 | 10,133 |
| Anheuser-Busch InBev Worldwide Inc. | | |
| 3.50%, 06/01/30 (a) | 5,000 | 5,478 |
| 4.00%, 04/13/28 (a) | 4,000 | 4,447 |
| 4.35%, 06/01/40 (a) | 5,000 | 5,880 |
| 4.38%, 04/15/38 (a) | 8,000 | 9,351 |
| 4.50%, 06/01/50 (a) | 3,000 | 3,705 |
| 4.75%, 04/15/58 (a) | 6,000 | 7,554 |
| 5.55%, 01/23/49 (a) | 2,000 | 2,766 |
| Anthem Inc. | | |
| 2.88%, 09/15/29 (a) | 3,000 | 3,138 |
| 3.30%, 01/15/23 (a) | 6,000 | 6,162 |
| 3.60%, 03/15/51 (a) | 3,000 | 3,336 |
| 3.70%, 09/15/49 (a) | 3,000 | 3,350 |
| Aon Corp./Aon Global Holdings PLC | | |
| 2.90%, 08/23/51 (a) | 6,000 | 5,786 |
| | Principal
Amount | Fair
Value |
| Apollo Management Holdings LP | | |
| 2.65%, 06/05/30 (a)(f) | $ 6,000 | $ 6,054 |
| Apollo Management Holdings LP (4.95% fixed rate until 12/17/24; 3.27% + 5 year CMT Rate thereafter) | | |
| 4.95%, 01/14/50 (a)(e)(f) | 7,000 | 7,175 |
| Apple Inc. | | |
| 2.20%, 09/11/29 (a) | 5,000 | 5,119 |
| 2.65%, 02/08/51 (a) | 5,000 | 4,912 |
| 2.80%, 02/08/61 (a) | 4,000 | 3,954 |
| 2.95%, 09/11/49 (a) | 3,000 | 3,102 |
| 3.35%, 02/09/27 (a) | 5,000 | 5,434 |
| 3.45%, 02/09/45 (a) | 6,000 | 6,700 |
| Applied Materials Inc. | | |
| 4.35%, 04/01/47 (a) | 4,000 | 5,098 |
| Aptiv PLC | | |
| 4.40%, 10/01/46 (a) | 5,000 | 5,874 |
| Archer-Daniels-Midland Co. | | |
| 2.50%, 08/11/26 (a) | 4,000 | 4,171 |
| Ares Capital Corp. | | |
| 2.88%, 06/15/28 (a) | 5,000 | 4,987 |
| Arthur J Gallagher & Co. | | |
| 3.50%, 05/20/51 (a) | 5,000 | 5,264 |
| Ascension Health | | |
| 4.85%, 11/15/53 (a) | 7,000 | 9,955 |
| Astrazeneca Finance LLC | | |
| 1.75%, 05/28/28 (a) | 8,000 | 7,949 |
| AstraZeneca PLC | | |
| 3.00%, 05/28/51 (a) | 5,000 | 5,260 |
| 4.00%, 01/17/29 (a) | 3,000 | 3,382 |
| 4.38%, 08/17/48 (a) | 2,000 | 2,580 |
| AT&T Inc. | | |
| 1.70%, 03/25/26 (a) | 12,000 | 11,951 |
| 2.30%, 06/01/27 (a) | 9,000 | 9,172 |
| 2.75%, 06/01/31 (a) | 6,000 | 6,118 |
| 3.30%, 02/01/52 (a) | 5,000 | 4,898 |
| 3.85%, 06/01/60 (a) | 6,000 | 6,267 |
| 4.35%, 03/01/29 (a) | 2,000 | 2,250 |
| 4.50%, 05/15/35 (a) | 5,000 | 5,771 |
| 4.55%, 03/09/49 (a) | 2,000 | 2,358 |
| 4.75%, 05/15/46 (a) | 2,000 | 2,418 |
| 4.80%, 06/15/44 (a) | 2,000 | 2,381 |
| 4.85%, 03/01/39 (a) | 4,000 | 4,779 |
| 5.25%, 03/01/37 (a) | 3,000 | 3,711 |
| 5.35%, 12/15/43 (a) | 6,000 | 7,325 |
| 5.45%, 03/01/47 (a) | 2,000 | 2,622 |
| Athene Holding Ltd. | | |
| 4.13%, 01/12/28 (a) | 4,000 | 4,379 |
See Notes to Schedule of Investments and Notes to Financial Statements.
| 8 | State Street Income V.I.S. Fund |
State Street Income V.I.S. Fund
Schedule of Investments, continued — December 31, 2021
| | Principal
Amount | Fair
Value |
| 6.15%, 04/03/30 (a) | $ 7,000 | $ 8,660 |
| Avangrid Inc. | | |
| 3.15%, 12/01/24 (a) | 6,000 | 6,285 |
| Bain Capital Specialty Finance Inc. | | |
| 2.95%, 03/10/26 (a) | 8,000 | 7,982 |
| Bank of America Corp. | | |
| 4.18%, 11/25/27 (a) | 6,000 | 6,568 |
| 4.25%, 10/22/26 (a) | 6,000 | 6,624 |
| Bank of America Corp. (2.09% fixed rate until 06/14/28; 1.06% + SOFR thereafter) | | |
| 2.09%, 06/14/29 (a)(e) | 5,000 | 4,971 |
| Bank of America Corp. (2.59% fixed rate until 04/29/30; 2.15% + SOFR thereafter) | | |
| 2.59%, 04/29/31 (a)(e) | 24,000 | 24,233 |
| Bank of America Corp. (2.97% fixed rate until 07/21/51; 1.56% + SOFR thereafter) | | |
| 2.97%, 07/21/52 (a)(e) | 6,000 | 6,025 |
| Bank of America Corp. (3.37% fixed rate until 01/23/25; 0.81% + 3 month USD LIBOR thereafter) | | |
| 3.37%, 01/23/26 (a)(e) | 2,000 | 2,105 |
| Bank of America Corp. (3.71% fixed rate until 04/24/27; 1.51% + 3 month USD LIBOR thereafter) | | |
| 3.71%, 04/24/28 (a)(e) | 6,000 | 6,515 |
| Bank of America Corp. (3.95% fixed rate until 01/23/48; 1.19% + 3 month USD LIBOR thereafter) | | |
| 3.95%, 01/23/49 (a)(e) | 6,000 | 7,000 |
| Bank of America Corp. (4.30% fixed rate until 01/28/25; 2.66% + 3 month USD LIBOR thereafter) | | |
| 4.30%, 12/31/99 (a)(e) | 7,000 | 7,099 |
| Barrick North America Finance LLC | | |
| 5.70%, 05/30/41 (a) | 3,000 | 4,071 |
| BAT Capital Corp. | | |
| 2.73%, 03/25/31 (a) | 4,000 | 3,885 |
| 4.39%, 08/15/37 (a) | 5,000 | 5,276 |
| 4.54%, 08/15/47 (a) | 2,000 | 2,091 |
| 4.70%, 04/02/27 (a) | 5,000 | 5,510 |
| 4.91%, 04/02/30 (a) | 4,000 | 4,500 |
| | Principal
Amount | Fair
Value |
| BAT International Finance PLC | | |
| 1.67%, 03/25/26 (a) | $ 5,000 | $ 4,914 |
| Baxter International Inc. | | |
| 1.92%, 02/01/27 (c)(f) | 11,000 | 11,043 |
| 2.27%, 12/01/28 (c)(f) | 11,000 | 11,088 |
| 2.54%, 02/01/32 (c)(f) | 11,000 | 11,113 |
| 3.13%, 12/01/51 (c)(f) | 6,000 | 6,190 |
| Becton Dickinson & Co. | | |
| 3.70%, 06/06/27 (a) | 7,000 | 7,633 |
| 4.67%, 06/06/47 (a) | 3,000 | 3,781 |
| 4.69%, 12/15/44 (a) | 2,000 | 2,515 |
| Berkshire Hathaway Energy Co. | | |
| 3.25%, 04/15/28 (a) | 2,000 | 2,146 |
| 3.70%, 07/15/30 (a) | 3,000 | 3,331 |
| 3.80%, 07/15/48 (a) | 3,000 | 3,349 |
| 4.25%, 10/15/50 (a) | 2,000 | 2,442 |
| 6.13%, 04/01/36 (a) | 3,000 | 4,094 |
| Berkshire Hathaway Finance Corp. | | |
| 2.85%, 10/15/50 (a) | 2,000 | 1,976 |
| 4.25%, 01/15/49 (a) | 4,000 | 4,909 |
| Berry Global Inc. | | |
| 4.88%, 07/15/26 (a)(f) | 8,000 | 8,283 |
| Biogen Inc. | | |
| 2.25%, 05/01/30 (a) | 3,000 | 2,956 |
| Block Financial LLC | | |
| 2.50%, 07/15/28 (a) | 5,000 | 5,011 |
| 3.88%, 08/15/30 (a) | 3,000 | 3,212 |
| Boardwalk Pipelines LP | | |
| 4.80%, 05/03/29 (a) | 6,000 | 6,726 |
| Boston Scientific Corp. | | |
| 4.70%, 03/01/49 (a) | 2,000 | 2,540 |
| BP Capital Markets America Inc. | | |
| 3.00%, 02/24/50 (a) | 4,000 | 3,940 |
| 3.02%, 01/16/27 (a) | 8,000 | 8,448 |
| 3.38%, 02/08/61 (a) | 7,000 | 7,225 |
| BP Capital Markets PLC (4.38% fixed rate until 06/22/25; 4.04% + 5 year CMT Rate thereafter) | | |
| 4.38%, 12/31/99 (a)(e) | 8,000 | 8,357 |
| BP Capital Markets PLC (4.88% fixed rate until 03/22/30; 4.40% + 5 year CMT Rate thereafter) | | |
| 4.88%, 12/31/99 (a)(e) | 7,000 | 7,628 |
See Notes to Schedule of Investments and Notes to Financial Statements.
| State Street Income V.I.S. Fund | 9 |
State Street Income V.I.S. Fund
Schedule of Investments, continued — December 31, 2021
| | Principal
Amount | Fair
Value |
| Bristol-Myers Squibb Co. | | |
| 1.45%, 11/13/30 (a) | $ 2,000 | $ 1,904 |
| 2.35%, 11/13/40 (a) | 2,000 | 1,894 |
| 3.20%, 06/15/26 (a) | 3,000 | 3,221 |
| 3.40%, 07/26/29 (a) | 5,000 | 5,469 |
| 3.45%, 11/15/27 (a) | 2,000 | 2,187 |
| 4.13%, 06/15/39 (a) | 3,000 | 3,548 |
| 4.25%, 10/26/49 (a) | 3,000 | 3,711 |
| 4.55%, 02/20/48 (a) | 2,000 | 2,556 |
| 5.00%, 08/15/45 (a) | 2,000 | 2,663 |
| Brixmor Operating Partnership LP | | |
| 2.25%, 04/01/28 (a) | 8,000 | 7,986 |
| Broadcom Inc. | | |
| 3.14%, 11/15/35 (a)(f) | 3,000 | 3,016 |
| 3.42%, 04/15/33 (a)(f) | 4,000 | 4,176 |
| 3.47%, 04/15/34 (a)(f) | 2,000 | 2,087 |
| 4.15%, 11/15/30 (a) | 8,000 | 8,872 |
| 4.30%, 11/15/32 (a) | 4,000 | 4,505 |
| Brown-Forman Corp. | | |
| 4.00%, 04/15/38 (a) | 2,000 | 2,326 |
| Brunswick Corp. | | |
| 2.40%, 08/18/31 (a) | 10,000 | 9,640 |
| Bunge Limited Finance Corp. | | |
| 3.75%, 09/25/27 (a) | 3,000 | 3,265 |
| Burlington Northern Santa Fe LLC | | |
| 4.15%, 12/15/48 (a) | 4,000 | 4,902 |
| 4.55%, 09/01/44 (a) | 7,000 | 8,803 |
| Canadian Natural Resources Ltd. | | |
| 3.85%, 06/01/27 (a) | 5,000 | 5,376 |
| 4.95%, 06/01/47 (a) | 2,000 | 2,479 |
| Canadian Pacific Railway Co. | | |
| 1.75%, 12/02/26 (c) | 5,000 | 5,022 |
| 2.45%, 12/02/31 (c) | 5,000 | 5,089 |
| Cantor Fitzgerald LP | | |
| 4.88%, 05/01/24 (a)(f) | 7,000 | 7,484 |
| Capital One Financial Corp. | | |
| 3.75%, 07/28/26 (a) | 7,000 | 7,500 |
| Cardinal Health Inc. | | |
| 3.08%, 06/15/24 (a) | 4,000 | 4,148 |
| Carlisle Companies Inc. | | |
| 2.20%, 03/01/32 (a) | 7,000 | 6,736 |
| Carrier Global Corp. | | |
| 2.72%, 02/15/30 (a) | 3,000 | 3,065 |
| 3.58%, 04/05/50 (a) | 3,000 | 3,191 |
| Caterpillar Inc. | | |
| 3.25%, 09/19/49 (a) | 5,000 | 5,502 |
| | Principal
Amount | Fair
Value |
| Cenovus Energy Inc. | | |
| 2.65%, 01/15/32 (a) | $ 5,000 | $ 4,897 |
| 3.75%, 02/15/52 (a) | 5,000 | 5,037 |
| Centene Corp. | | |
| 3.00%, 10/15/30 (a) | 6,000 | 6,105 |
| 3.38%, 02/15/30 (a) | 14,000 | 14,300 |
| 4.25%, 12/15/27 (a) | 23,000 | 24,060 |
| CenterPoint Energy Inc. | | |
| 2.65%, 06/01/31 (a) | 5,000 | 5,060 |
| Charter Communications Operating LLC/Charter Communications Operating Capital | | |
| 3.50%, 06/01/41 (a) | 4,000 | 3,899 |
| 3.70%, 04/01/51 (a) | 7,000 | 6,766 |
| 4.80%, 03/01/50 (a) | 7,000 | 7,847 |
| 4.91%, 07/23/25 (a) | 5,000 | 5,507 |
| 5.05%, 03/30/29 (a) | 8,000 | 9,195 |
| 5.75%, 04/01/48 (a) | 5,000 | 6,243 |
| Cheniere Corpus Christi Holdings LLC | | |
| 5.88%, 03/31/25 (a) | 7,000 | 7,768 |
| Chevron USA Inc. | | |
| 3.85%, 01/15/28 (a) | 4,000 | 4,444 |
| 3.90%, 11/15/24 (a) | 4,000 | 4,291 |
| Choice Hotels International Inc. | | |
| 3.70%, 01/15/31 (a) | 3,000 | 3,177 |
| Chubb INA Holdings Inc. | | |
| 4.35%, 11/03/45 (a) | 6,000 | 7,456 |
| Church & Dwight Company Inc. | | |
| 2.30%, 12/15/31 | 5,000 | 5,035 |
| Cigna Corp. | | |
| 2.40%, 03/15/30 (a) | 3,000 | 3,021 |
| 3.25%, 04/15/25 (a) | 7,000 | 7,375 |
| 3.40%, 03/01/27 (a) | 5,000 | 5,380 |
| 3.75%, 07/15/23 (a) | 2,000 | 2,082 |
| 3.88%, 10/15/47 (a) | 2,000 | 2,220 |
| 4.13%, 11/15/25 (a) | 5,000 | 5,474 |
| 4.38%, 10/15/28 (a) | 3,000 | 3,410 |
| 4.80%, 08/15/38 (a) | 3,000 | 3,687 |
| Cisco Systems Inc. | | |
| 5.90%, 02/15/39 (a) | 3,000 | 4,317 |
| Citigroup Inc. | | |
| 4.13%, 07/25/28 (a) | 11,000 | 12,091 |
| 4.45%, 09/29/27 (a) | 4,000 | 4,460 |
| 4.65%, 07/23/48 (a) | 6,000 | 7,730 |
See Notes to Schedule of Investments and Notes to Financial Statements.
| 10 | State Street Income V.I.S. Fund |
State Street Income V.I.S. Fund
Schedule of Investments, continued — December 31, 2021
| | Principal
Amount | Fair
Value |
| Citigroup Inc. (1.68% fixed rate until 05/15/23; 1.67% + SOFR thereafter) | | |
| 1.68%, 05/15/24 (a)(e) | $ 11,000 | $ 11,120 |
| Citigroup Inc. (2.56% fixed rate until 05/01/31; 1.17% + SOFR thereafter) | | |
| 2.56%, 05/01/32 (a)(e) | 5,000 | 5,028 |
| Citigroup Inc. (2.98% fixed rate until 11/05/29; 1.42% + SOFR thereafter) | | |
| 2.98%, 11/05/30 (a)(e) | 11,000 | 11,430 |
| Citigroup Inc. (3.88% fixed rate until 01/24/38; 1.17% + 3 month USD LIBOR thereafter) | | |
| 3.88%, 01/24/39 (a)(e) | 6,000 | 6,805 |
| Citigroup Inc. (4.70% fixed rate until 01/30/25; 3.23% + SOFR thereafter) | | |
| 4.70%, 12/31/99 (a)(e) | 6,000 | 6,101 |
| CME Group Inc. | | |
| 3.75%, 06/15/28 (a) | 2,000 | 2,221 |
| CMS Energy Corp. | | |
| 4.88%, 03/01/44 (a) | 7,000 | 8,813 |
| CNH Industrial Capital LLC | | |
| 1.95%, 07/02/23 (a) | 7,000 | 7,091 |
| CNOOC Petroleum North America ULC | | |
| 6.40%, 05/15/37 (a) | 7,000 | 9,241 |
| Comcast Corp. | | |
| 2.65%, 08/15/62 (a) | 2,000 | 1,776 |
| 2.80%, 01/15/51 (a) | 3,000 | 2,860 |
| 2.89%, 11/01/51 (a)(f) | 3,000 | 2,902 |
| 2.94%, 11/01/56 (a)(f) | 2,000 | 1,905 |
| 2.99%, 11/01/63 (a)(f) | 3,000 | 2,851 |
| 3.20%, 07/15/36 (a) | 5,000 | 5,323 |
| 3.25%, 11/01/39 (a) | 5,000 | 5,266 |
| 3.97%, 11/01/47 (a) | 3,000 | 3,435 |
| 4.15%, 10/15/28 (a) | 5,000 | 5,674 |
| CommonSpirit Health | | |
| 4.35%, 11/01/42 | 16,000 | 18,301 |
| Conagra Brands Inc. | | |
| 5.30%, 11/01/38 (a) | 3,000 | 3,793 |
| 5.40%, 11/01/48 (a) | 2,000 | 2,704 |
| ConocoPhillips | | |
| 3.75%, 10/01/27 (a)(f) | 3,000 | 3,283 |
| 4.88%, 10/01/47 (a)(f) | 4,000 | 5,281 |
| ConocoPhillips Co. | | |
| 4.30%, 11/15/44 (a) | 4,000 | 4,817 |
| | Principal
Amount | Fair
Value |
| Consolidated Edison Company of New York Inc. | | |
| 3.35%, 04/01/30 (a) | $ 3,000 | $ 3,227 |
| 3.88%, 06/15/47 (a) | 2,000 | 2,196 |
| 3.95%, 04/01/50 (a) | 3,000 | 3,445 |
| Constellation Brands Inc. | | |
| 3.15%, 08/01/29 (a) | 4,000 | 4,214 |
| 3.70%, 12/06/26 (a) | 4,000 | 4,337 |
| 4.50%, 05/09/47 (a) | 4,000 | 4,778 |
| Continental Resources Inc. | | |
| 2.88%, 04/01/32 (f) | 5,000 | 4,893 |
| 3.80%, 06/01/24 (a) | 17,000 | 17,745 |
| 4.50%, 04/15/23 (a) | 7,000 | 7,227 |
| Corning Inc. | | |
| 4.38%, 11/15/57 (a) | 4,000 | 4,789 |
| Corporate Office Properties LP | | |
| 2.00%, 01/15/29 (a) | 5,000 | 4,814 |
| 2.25%, 03/15/26 (a) | 5,000 | 5,052 |
| 2.75%, 04/15/31 (a) | 5,000 | 4,973 |
| Crown Castle International Corp. | | |
| 3.30%, 07/01/30 (a) | 11,000 | 11,624 |
| 5.20%, 02/15/49 (a) | 4,000 | 5,145 |
| CSX Corp. | | |
| 4.50%, 03/15/49 - 08/01/54 (a) | 10,000 | 12,589 |
| CubeSmart LP | | |
| 2.50%, 02/15/32 | 5,000 | 4,990 |
| 4.38%, 02/15/29 (a) | 5,000 | 5,667 |
| CVS Health Corp. | | |
| 3.00%, 08/15/26 (a) | 4,000 | 4,213 |
| 3.25%, 08/15/29 (a) | 3,000 | 3,198 |
| 3.63%, 04/01/27 (a) | 3,000 | 3,254 |
| 3.75%, 04/01/30 (a) | 3,000 | 3,294 |
| 4.25%, 04/01/50 (a) | 3,000 | 3,623 |
| 4.78%, 03/25/38 (a) | 3,000 | 3,655 |
| 5.00%, 12/01/24 (a) | 6,000 | 6,555 |
| 5.13%, 07/20/45 (a) | 2,000 | 2,601 |
| 5.30%, 12/05/43 (a) | 4,000 | 5,272 |
| Danaher Corp. | | |
| 2.80%, 12/10/51 | 9,000 | 8,904 |
| Dell International LLC/EMC Corp. | | |
| 4.00%, 07/15/24 (a) | 6,000 | 6,371 |
| 5.45%, 06/15/23 (a) | 2,000 | 2,112 |
| 6.02%, 06/15/26 (a) | 3,000 | 3,476 |
| Devon Energy Corp. | | |
| 5.00%, 06/15/45 (a) | 4,000 | 4,862 |
See Notes to Schedule of Investments and Notes to Financial Statements.
| State Street Income V.I.S. Fund | 11 |
State Street Income V.I.S. Fund
Schedule of Investments, continued — December 31, 2021
| | Principal
Amount | Fair
Value |
| DH Europe Finance II Sarl | | |
| 2.60%, 11/15/29 (a) | $ 2,000 | $ 2,065 |
| 3.25%, 11/15/39 (a) | 3,000 | 3,195 |
| 3.40%, 11/15/49 (a) | 3,000 | 3,269 |
| Diamondback Energy Inc. | | |
| 2.88%, 12/01/24 (a) | 7,000 | 7,267 |
| 3.13%, 03/24/31 (a) | 4,000 | 4,124 |
| 3.25%, 12/01/26 (a) | 3,000 | 3,167 |
| 3.50%, 12/01/29 (a) | 3,000 | 3,180 |
| 4.40%, 03/24/51 (a) | 3,000 | 3,443 |
| Digital Realty Trust LP | | |
| 3.60%, 07/01/29 (a) | 8,000 | 8,691 |
| Discovery Communications LLC | | |
| 2.95%, 03/20/23 (a) | 5,000 | 5,114 |
| 3.95%, 03/20/28 (a) | 6,000 | 6,517 |
| 4.95%, 05/15/42 (a) | 2,000 | 2,355 |
| 5.00%, 09/20/37 (a) | 3,000 | 3,581 |
| Dollar General Corp. | | |
| 3.50%, 04/03/30 (a) | 4,000 | 4,328 |
| 4.13%, 04/03/50 (a) | 4,000 | 4,622 |
| Dollar Tree Inc. | | |
| 4.00%, 05/15/25 (a) | 7,000 | 7,523 |
| Dominion Energy Inc. | | |
| 3.07%, 08/15/24 (a)(b) | 5,000 | 5,181 |
| 3.38%, 04/01/30 (a) | 6,000 | 6,391 |
| Dover Corp. | | |
| 2.95%, 11/04/29 (a) | 3,000 | 3,168 |
| DTE Energy Co. | | |
| 2.85%, 10/01/26 (a) | 7,000 | 7,307 |
| Duke Energy Carolinas LLC | | |
| 3.95%, 03/15/48 (a) | 3,000 | 3,479 |
| Duke Energy Corp. | | |
| 2.55%, 06/15/31 (a) | 6,000 | 5,997 |
| 3.30%, 06/15/41 (a) | 7,000 | 7,123 |
| 3.50%, 06/15/51 (a) | 7,000 | 7,277 |
| 3.75%, 09/01/46 (a) | 5,000 | 5,357 |
| Duke Energy Corp. (4.88% fixed rate until 09/16/24; 3.39% + 5 year CMT Rate thereafter) | | |
| 4.88%, 12/31/99 (a)(e) | 9,000 | 9,391 |
| Duke Energy Progress LLC | | |
| 4.15%, 12/01/44 (a) | 9,000 | 10,591 |
| Duke Realty LP | | |
| 3.05%, 03/01/50 (a) | 5,000 | 4,938 |
| 3.25%, 06/30/26 (a) | 4,000 | 4,258 |
| Duquesne Light Holdings Inc. | | |
| 3.62%, 08/01/27 (a)(f) | 7,000 | 7,426 |
| | Principal
Amount | Fair
Value |
| Eastman Chemical Co. | | |
| 4.65%, 10/15/44 (a) | $ 4,000 | $ 4,768 |
| Eaton Corp. | | |
| 3.10%, 09/15/27 (a) | 2,000 | 2,138 |
| Ecolab Inc. | | |
| 1.30%, 01/30/31 (a) | 3,000 | 2,807 |
| Edison International | | |
| 4.95%, 04/15/25 (a) | 8,000 | 8,723 |
| EI du Pont de Nemours & Co. | | |
| 2.30%, 07/15/30 (a) | 6,000 | 6,031 |
| Electronic Arts Inc. | | |
| 1.85%, 02/15/31 (a) | 3,000 | 2,871 |
| Emera US Finance LP | | |
| 2.64%, 06/15/31 | 8,000 | 7,928 |
| Emerson Electric Co. | | |
| 1.80%, 10/15/27 (a) | 2,000 | 2,008 |
| 2.75%, 10/15/50 (a) | 2,000 | 1,930 |
| Empower Finance 2020 LP | | |
| 1.36%, 09/17/27 (a)(f) | 8,000 | 7,758 |
| 1.78%, 03/17/31 (a)(f) | 8,000 | 7,696 |
| Enbridge Energy Partners LP | | |
| 5.50%, 09/15/40 (a) | 2,000 | 2,566 |
| Enbridge Inc. | | |
| 1.60%, 10/04/26 (a) | 7,000 | 6,911 |
| Enbridge Inc. (5.75% fixed rate until 04/15/30; 5.31% + 5 year CMT Rate thereafter) | | |
| 5.75%, 07/15/80 (a)(e) | 9,000 | 9,999 |
| Energy Transfer LP | | |
| 4.25%, 03/15/23 (a) | 8,000 | 8,230 |
| 4.50%, 04/15/24 (a) | 2,000 | 2,123 |
| 4.95%, 06/15/28 (a) | 4,000 | 4,511 |
| 5.30%, 04/01/44 - 04/15/47 (a) | 7,000 | 8,045 |
| 5.35%, 05/15/45 (a) | 4,000 | 4,623 |
| 6.50%, 02/01/42 (a) | 4,000 | 5,136 |
| Energy Transfer LP (6.75% fixed rate until 05/15/25; 5.13% + 5 year CMT Rate thereafter) | | |
| 6.75%, 12/31/99 (a)(e) | 19,000 | 19,162 |
| Energy Transfer LP/Regency Energy Finance Corp. | | |
| 4.50%, 11/01/23 (a) | 4,000 | 4,196 |
| Enstar Group Ltd. | | |
| 3.10%, 09/01/31 (a) | 5,000 | 4,895 |
| Enterprise Products Operating LLC | | |
| 4.25%, 02/15/48 (a) | 6,000 | 6,837 |
See Notes to Schedule of Investments and Notes to Financial Statements.
| 12 | State Street Income V.I.S. Fund |
State Street Income V.I.S. Fund
Schedule of Investments, continued — December 31, 2021
| | Principal
Amount | Fair
Value |
| Enterprise Products Operating LLC (5.25% fixed rate until 08/16/27; 3.03% + 3 month USD LIBOR thereafter) | | |
| 5.25%, 08/16/77 (a)(e) | $ 5,000 | $ 5,114 |
| EOG Resources Inc. | | |
| 4.38%, 04/15/30 (a) | 3,000 | 3,468 |
| 4.95%, 04/15/50 (a) | 3,000 | 4,074 |
| 5.10%, 01/15/36 (a) | 2,000 | 2,439 |
| Equinix Inc. | | |
| 1.25%, 07/15/25 (a) | 7,000 | 6,880 |
| 2.15%, 07/15/30 (a) | 6,000 | 5,830 |
| Equinor ASA | | |
| 3.25%, 11/18/49 (a) | 4,000 | 4,252 |
| ERP Operating LP | | |
| 4.50%, 07/01/44 (a) | 8,000 | 10,096 |
| Everest Reinsurance Holdings Inc. | | |
| 3.13%, 10/15/52 (a) | 7,000 | 6,860 |
| Eversource Energy | | |
| 3.45%, 01/15/50 (a) | 5,000 | 5,295 |
| Exelon Corp. | | |
| 3.50%, 06/01/22 (a) | 7,000 | 7,063 |
| 4.05%, 04/15/30 (a) | 5,000 | 5,572 |
| 4.45%, 04/15/46 (a) | 5,000 | 6,034 |
| 4.70%, 04/15/50 (a) | 4,000 | 5,043 |
| Exxon Mobil Corp. | | |
| 2.61%, 10/15/30 (a) | 6,000 | 6,227 |
| 3.45%, 04/15/51 (a) | 6,000 | 6,511 |
| FedEx Corp. | | |
| 4.10%, 02/01/45 (a) | 8,000 | 8,956 |
| Fidelity National Financial Inc. | | |
| 3.20%, 09/17/51 (a) | 7,000 | 6,717 |
| Fidelity National Information Services Inc. | | |
| 1.15%, 03/01/26 (a) | 4,000 | 3,903 |
| 1.65%, 03/01/28 (a) | 3,000 | 2,905 |
| FirstEnergy Transmission LLC | | |
| 4.55%, 04/01/49 (a)(f) | 7,000 | 8,028 |
| Fiserv Inc. | | |
| 3.50%, 07/01/29 (a) | 3,000 | 3,227 |
| 4.40%, 07/01/49 (a) | 3,000 | 3,578 |
| Florida Power & Light Co. | | |
| 2.85%, 04/01/25 (a) | 7,000 | 7,325 |
| 4.13%, 02/01/42 (a) | 6,000 | 7,168 |
| Flowers Foods Inc. | | |
| 2.40%, 03/15/31 (a) | 3,000 | 2,956 |
| Flowserve Corp. | | |
| 2.80%, 01/15/32 (a) | 7,000 | 6,819 |
| | Principal
Amount | Fair
Value |
| Ford Motor Co. | | |
| 4.35%, 12/08/26 (a) | $ 6,000 | $ 6,543 |
| Fox Corp. | | |
| 3.50%, 04/08/30 (a) | 4,000 | 4,314 |
| GA Global Funding Trust | | |
| 1.63%, 01/15/26 (a)(f) | 5,000 | 4,961 |
| General Dynamics Corp. | | |
| 4.25%, 04/01/50 (a) | 7,000 | 8,968 |
| General Mills Inc. | | |
| 3.00%, 02/01/51 | 5,000 | 5,008 |
| General Motors Co. | | |
| 5.20%, 04/01/45 (a) | 3,000 | 3,712 |
| 5.40%, 04/01/48 (a) | 2,000 | 2,555 |
| 6.13%, 10/01/25 (a) | 6,000 | 6,899 |
| 6.80%, 10/01/27 (a) | 3,000 | 3,689 |
| General Motors Financial Company Inc. | | |
| 1.25%, 01/08/26 (a) | 2,000 | 1,956 |
| 2.35%, 01/08/31 (a) | 4,000 | 3,884 |
| 3.45%, 04/10/22 (a) | 6,000 | 6,018 |
| 5.25%, 03/01/26 (a) | 8,000 | 8,973 |
| Georgia-Pacific LLC | | |
| 1.75%, 09/30/25 (a)(f) | 6,000 | 6,031 |
| 3.60%, 03/01/25 (a)(f) | 9,000 | 9,541 |
| Gilead Sciences Inc. | | |
| 1.65%, 10/01/30 (a) | 3,000 | 2,876 |
| 2.60%, 10/01/40 (a) | 2,000 | 1,918 |
| 2.80%, 10/01/50 (a) | 4,000 | 3,873 |
| 3.50%, 02/01/25 (a) | 4,000 | 4,233 |
| 3.65%, 03/01/26 (a) | 2,000 | 2,157 |
| 4.15%, 03/01/47 (a) | 5,000 | 5,894 |
| GlaxoSmithKline Capital Inc. | | |
| 3.38%, 05/15/23 (a) | 7,000 | 7,250 |
| 3.63%, 05/15/25 (a) | 6,000 | 6,457 |
| GlaxoSmithKline Capital PLC | | |
| 3.38%, 06/01/29 (a) | 5,000 | 5,448 |
| Glencore Finance Canada Ltd. | | |
| 4.25%, 10/25/22 (a)(f) | 8,000 | 8,220 |
| Glencore Funding LLC | | |
| 3.88%, 04/27/51 (a)(f) | 4,000 | 4,194 |
| Graphic Packaging International LLC | | |
| 1.51%, 04/15/26 (a)(f) | 6,000 | 5,896 |
| Gray Oak Pipeline LLC | | |
| 2.00%, 09/15/23 (a)(f) | 7,000 | 7,078 |
| 2.60%, 10/15/25 (a)(f) | 8,000 | 8,122 |
| Halliburton Co. | | |
| 5.00%, 11/15/45 (a) | 4,000 | 4,824 |
See Notes to Schedule of Investments and Notes to Financial Statements.
| State Street Income V.I.S. Fund | 13 |
State Street Income V.I.S. Fund
Schedule of Investments, continued — December 31, 2021
| | Principal
Amount | Fair
Value |
| HCA Inc. | | |
| 3.50%, 09/01/30 - 07/15/51 (a) | $ 21,000 | $ 21,993 |
| 5.38%, 02/01/25 (a) | 10,000 | 10,988 |
| Health Care Service Corp. | | |
| 2.20%, 06/01/30 (a)(f) | 5,000 | 4,927 |
| 3.20%, 06/01/50 (a)(f) | 4,000 | 4,073 |
| Healthcare Trust of America Holdings LP | | |
| 2.00%, 03/15/31 (a) | 5,000 | 4,746 |
| Helmerich & Payne Inc. | | |
| 2.90%, 09/29/31 (a)(f) | 5,000 | 4,935 |
| Hess Corp. | | |
| 5.60%, 02/15/41 (a) | 2,000 | 2,470 |
| 5.80%, 04/01/47 (a) | 2,000 | 2,572 |
| Hewlett Packard Enterprise Co. | | |
| 6.35%, 10/15/45 (a) | 3,000 | 4,017 |
| Highwoods Realty LP | | |
| 4.13%, 03/15/28 (a) | 5,000 | 5,518 |
| 4.20%, 04/15/29 (a) | 6,000 | 6,644 |
| Hill-Rom Holdings Inc. | | |
| 4.38%, 09/15/27 (f) | 20,000 | 20,936 |
| Honeywell International Inc. | | |
| 1.75%, 09/01/31 (a) | 7,000 | 6,815 |
| 2.70%, 08/15/29 (a) | 2,000 | 2,095 |
| Hormel Foods Corp. | | |
| 1.80%, 06/11/30 (a) | 7,000 | 6,865 |
| Humana Inc. | | |
| 1.35%, 02/03/27 (a) | 7,000 | 6,810 |
| 2.15%, 02/03/32 (a) | 5,000 | 4,843 |
| Huntington Bancshares Inc. | | |
| 2.55%, 02/04/30 (a) | 7,000 | 7,113 |
| Huntington Ingalls Industries Inc. | | |
| 2.04%, 08/16/28 (a)(f) | 9,000 | 8,817 |
| Hyundai Capital America | | |
| 1.30%, 01/08/26 (a)(f) | 8,000 | 7,783 |
| 3.10%, 04/05/22 (a)(f) | 7,000 | 7,038 |
| Indiana Michigan Power Co. | | |
| 3.25%, 05/01/51 (a) | 5,000 | 5,195 |
| Ingredion Inc. | | |
| 3.90%, 06/01/50 (a) | 2,000 | 2,278 |
| Intel Corp. | | |
| 2.00%, 08/12/31 (a) | 6,000 | 5,961 |
| 2.45%, 11/15/29 (a) | 8,000 | 8,275 |
| 2.60%, 05/19/26 (a) | 6,000 | 6,298 |
| 2.80%, 08/12/41 (a) | 5,000 | 4,985 |
| 2.88%, 05/11/24 (a) | 3,000 | 3,123 |
| 3.10%, 02/15/60 (a) | 5,000 | 5,038 |
| | Principal
Amount | Fair
Value |
| Intercontinental Exchange Inc. | | |
| 1.85%, 09/15/32 (a) | $ 2,000 | $ 1,919 |
| 2.65%, 09/15/40 (a) | 2,000 | 1,943 |
| International Paper Co. | | |
| 4.40%, 08/15/47 (a) | 5,000 | 6,191 |
| Interstate Power & Light Co. | | |
| 3.40%, 08/15/25 (a) | 8,000 | 8,452 |
| ITC Holdings Corp. | | |
| 2.95%, 05/14/30 (a)(f) | 6,000 | 6,138 |
| Jabil Inc. | | |
| 3.95%, 01/12/28 (a) | 2,000 | 2,185 |
| John Deere Capital Corp. | | |
| 2.45%, 01/09/30 (a) | 9,000 | 9,275 |
| Johnson & Johnson | | |
| 3.63%, 03/03/37 (a) | 3,000 | 3,454 |
| Johnson Controls International PLC | | |
| 4.50%, 02/15/47 (a) | 3,000 | 3,651 |
| JPMorgan Chase & Co. (2.96% fixed rate until 05/13/30; 2.52% + SOFR thereafter) | | |
| 2.96%, 05/13/31 (a)(e) | 10,000 | 10,349 |
| JPMorgan Chase & Co. (3.11% fixed rate until 04/22/50; 2.44% + SOFR thereafter) | | |
| 3.11%, 04/22/51 (a)(e) | 7,000 | 7,223 |
| JPMorgan Chase & Co. (3.16% fixed rate until 04/22/41; 1.46% + SOFR thereafter) | | |
| 3.16%, 04/22/42 (a)(e) | 4,000 | 4,165 |
| JPMorgan Chase & Co. (3.88% fixed rate until 07/24/37; 1.36% + 3 month USD LIBOR thereafter) | | |
| 3.88%, 07/24/38 (a)(e) | 2,000 | 2,266 |
| JPMorgan Chase & Co. (3.90% fixed rate until 01/23/48; 1.22% + 3 month USD LIBOR thereafter) | | |
| 3.90%, 01/23/49 (a)(e) | 8,000 | 9,271 |
| JPMorgan Chase & Co. (4.01% fixed rate until 04/23/28; 1.12% + 3 month USD LIBOR thereafter) | | |
| 4.01%, 04/23/29 (a)(e) | 4,000 | 4,419 |
See Notes to Schedule of Investments and Notes to Financial Statements.
| 14 | State Street Income V.I.S. Fund |
State Street Income V.I.S. Fund
Schedule of Investments, continued — December 31, 2021
| | Principal
Amount | Fair
Value |
| JPMorgan Chase & Co. (4.03% fixed rate until 07/24/47; 1.46% + 3 month USD LIBOR thereafter) | | |
| 4.03%, 07/24/48 (a)(e) | $ 5,000 | $ 5,910 |
| JPMorgan Chase & Co. (4.49% fixed rate until 03/24/30; 3.79% + SOFR thereafter) | | |
| 4.49%, 03/24/31 (a)(e) | 4,000 | 4,631 |
| JPMorgan Chase & Co. (4.60% fixed rate until 02/01/25; 3.13% + SOFR thereafter) | | |
| 4.60%, 12/31/99 (a)(e) | 6,000 | 6,133 |
| JPMorgan Chase & Co. (6.10% fixed rate until 10/01/24; 3.33% + 3 month USD LIBOR thereafter) | | |
| 6.10%, 10/29/49 (a)(e) | 7,000 | 7,417 |
| Kaiser Foundation Hospitals | | |
| 3.00%, 06/01/51 (a) | 5,000 | 5,155 |
| Kansas City Southern | | |
| 3.50%, 05/01/50 (a) | 3,000 | 3,205 |
| Keurig Dr Pepper Inc. | | |
| 3.20%, 05/01/30 (a) | 3,000 | 3,175 |
| 3.80%, 05/01/50 (a) | 2,000 | 2,214 |
| Kinder Morgan Energy Partners LP | | |
| 4.70%, 11/01/42 (a) | 2,000 | 2,255 |
| 5.00%, 03/01/43 (a) | 2,000 | 2,327 |
| 6.38%, 03/01/41 (a) | 4,000 | 5,292 |
| Kinder Morgan Inc. | | |
| 1.75%, 11/15/26 (a) | 10,000 | 9,975 |
| 5.05%, 02/15/46 (a) | 8,000 | 9,579 |
| KLA Corp. | | |
| 3.30%, 03/01/50 (a) | 3,000 | 3,206 |
| 4.65%, 11/01/24 (a) | 6,000 | 6,506 |
| Kyndryl Holdings Inc. | | |
| 2.05%, 10/15/26 (a)(f) | 7,000 | 6,826 |
| 2.70%, 10/15/28 (a)(f) | 7,000 | 6,783 |
| L3Harris Technologies Inc. | | |
| 3.85%, 12/15/26 (a) | 4,000 | 4,352 |
| Lear Corp. | | |
| 4.25%, 05/15/29 (a) | 5,000 | 5,526 |
| Leidos Inc. | | |
| 2.95%, 05/15/23 (a) | 8,000 | 8,192 |
| 3.63%, 05/15/25 (a) | 5,000 | 5,308 |
| 4.38%, 05/15/30 (a) | 7,000 | 7,809 |
| Liberty Mutual Group Inc. | | |
| 3.95%, 05/15/60 (a)(f) | 3,000 | 3,321 |
| | Principal
Amount | Fair
Value |
| Life Storage LP | | |
| 2.20%, 10/15/30 (a) | $ 8,000 | $ 7,866 |
| Lincoln National Corp. | | |
| 4.35%, 03/01/48 (a) | 5,000 | 6,018 |
| Lockheed Martin Corp. | | |
| 4.50%, 05/15/36 (a) | 5,000 | 6,109 |
| Lowe's Companies Inc. | | |
| 1.30%, 04/15/28 (a) | 3,000 | 2,878 |
| 1.70%, 09/15/28 - 10/15/30 (a) | 10,000 | 9,708 |
| 3.00%, 10/15/50 (a) | 5,000 | 4,938 |
| 3.50%, 04/01/51 (a) | 5,000 | 5,387 |
| 4.05%, 05/03/47 (a) | 4,000 | 4,618 |
| LYB International Finance III LLC | | |
| 1.25%, 10/01/25 (a) | 5,000 | 4,927 |
| 3.63%, 04/01/51 (a) | 3,000 | 3,187 |
| 3.80%, 10/01/60 (a) | 3,000 | 3,171 |
| Marsh & McLennan Companies Inc. | | |
| 2.38%, 12/15/31 | 5,000 | 5,047 |
| 2.90%, 12/15/51 | 5,000 | 4,998 |
| Marvell Technology Inc. | | |
| 1.65%, 04/15/26 (a) | 9,000 | 8,902 |
| 2.45%, 04/15/28 (a) | 8,000 | 8,122 |
| Masco Corp. | | |
| 3.50%, 11/15/27 (a) | 2,000 | 2,149 |
| McCormick & Company Inc. | | |
| 1.85%, 02/15/31 (a) | 3,000 | 2,873 |
| 3.25%, 11/15/25 (a) | 9,000 | 9,519 |
| McDonald's Corp. | | |
| 3.60%, 07/01/30 (a) | 7,000 | 7,741 |
| 3.63%, 09/01/49 (a) | 3,000 | 3,318 |
| 4.88%, 12/09/45 (a) | 7,000 | 9,014 |
| Medtronic Inc. | | |
| 4.63%, 03/15/45 (a) | 2,000 | 2,624 |
| Memorial Sloan-Kettering Cancer Center | | |
| 4.13%, 07/01/52 (a) | 7,000 | 8,798 |
| Merck & Company Inc. | | |
| 1.70%, 06/10/27 | 10,000 | 10,067 |
| 1.90%, 12/10/28 | 10,000 | 10,044 |
| 2.15%, 12/10/31 | 5,000 | 5,015 |
| 2.45%, 06/24/50 (a) | 3,000 | 2,832 |
| 2.75%, 02/10/25 (a) | 7,000 | 7,328 |
| 2.75%, 12/10/51 | 5,000 | 4,975 |
| 4.00%, 03/07/49 (a) | 2,000 | 2,434 |
| MetLife Inc. | | |
| 4.72%, 12/15/44 (a) | 7,000 | 9,074 |
See Notes to Schedule of Investments and Notes to Financial Statements.
| State Street Income V.I.S. Fund | 15 |
State Street Income V.I.S. Fund
Schedule of Investments, continued — December 31, 2021
| | Principal
Amount | Fair
Value |
| Microchip Technology Inc. | | |
| 2.67%, 09/01/23 (a) | $ 8,000 | $ 8,176 |
| Micron Technology Inc. | | |
| 3.37%, 11/01/41 (a) | 5,000 | 5,135 |
| 3.48%, 11/01/51 (a) | 5,000 | 5,100 |
| Microsoft Corp. | | |
| 2.40%, 08/08/26 (a) | 4,000 | 4,186 |
| 2.68%, 06/01/60 (a) | 3,000 | 2,987 |
| 2.92%, 03/17/52 (a) | 7,000 | 7,412 |
| 3.04%, 03/17/62 (a) | 5,000 | 5,383 |
| 3.45%, 08/08/36 (a) | 3,000 | 3,441 |
| 3.50%, 02/12/35 (a) | 3,000 | 3,436 |
| Mid-America Apartments LP | | |
| 2.88%, 09/15/51 (a) | 5,000 | 4,927 |
| Molson Coors Beverage Co. | | |
| 4.20%, 07/15/46 (a) | 4,000 | 4,441 |
| Morgan Stanley (1.51% fixed rate until 07/20/26; 0.86% + SOFR thereafter) | | |
| 1.51%, 07/20/27 (a)(e) | 6,000 | 5,905 |
| Morgan Stanley (2.48% fixed rate until 09/16/31; 1.36% + SOFR thereafter) | | |
| 2.48%, 09/16/36 (a)(e) | 15,000 | 14,439 |
| Morgan Stanley (2.80% fixed rate until 01/25/51; 1.43% + SOFR thereafter) | | |
| 2.80%, 01/25/52 (a)(e) | 7,000 | 6,873 |
| Morgan Stanley (3.62% fixed rate until 04/01/30; 3.12% + SOFR thereafter) | | |
| 3.62%, 04/01/31 (a)(e) | 11,000 | 11,999 |
| Morgan Stanley (3.97% fixed rate until 07/22/37; 1.46% + 3 month USD LIBOR thereafter) | | |
| 3.97%, 07/22/38 (a)(e) | 7,000 | 7,967 |
| MPLX LP | | |
| 2.65%, 08/15/30 (a) | 3,000 | 2,995 |
| 3.38%, 03/15/23 (a) | 5,000 | 5,128 |
| Mylan Inc. | | |
| 5.20%, 04/15/48 (a) | 3,000 | 3,715 |
| National Retail Properties Inc. | | |
| 4.00%, 11/15/25 (a) | 4,000 | 4,340 |
| NewMarket Corp. | | |
| 2.70%, 03/18/31 (a) | 5,000 | 4,985 |
| Newmont Corp. | | |
| 4.88%, 03/15/42 (a) | 5,000 | 6,267 |
| | Principal
Amount | Fair
Value |
| NextEra Energy Capital Holdings Inc. (5.65% fixed rate until 05/01/29; 3.16% + 3 month USD LIBOR thereafter) | | |
| 5.65%, 05/01/79 (a)(e) | $ 5,000 | $ 5,673 |
| NGPL PipeCo LLC | | |
| 3.25%, 07/15/31 (a)(f) | 8,000 | 8,141 |
| NIKE Inc. | | |
| 3.38%, 03/27/50 (a) | 2,000 | 2,264 |
| NiSource Inc. | | |
| 3.60%, 05/01/30 (a) | 5,000 | 5,401 |
| 3.95%, 03/30/48 (a) | 2,000 | 2,254 |
| Norfolk Southern Corp. | | |
| 3.95%, 10/01/42 (a) | 4,000 | 4,576 |
| NOV Inc. | | |
| 3.60%, 12/01/29 (a) | 5,000 | 5,237 |
| Novant Health Inc. | | |
| 3.32%, 11/01/61 (a) | 5,000 | 5,386 |
| Novartis Capital Corp. | | |
| 2.20%, 08/14/30 (a) | 4,000 | 4,061 |
| 3.00%, 11/20/25 (a) | 3,000 | 3,180 |
| Nutrien Ltd. | | |
| 4.90%, 06/01/43 (a) | 4,000 | 5,085 |
| NVIDIA Corp. | | |
| 2.85%, 04/01/30 (a) | 6,000 | 6,366 |
| 3.50%, 04/01/50 (a) | 2,000 | 2,283 |
| NXP BV/NXP Funding LLC/NXP USA Inc. | | |
| 3.25%, 11/30/51 (f) | 5,000 | 5,002 |
| Oklahoma Gas & Electric Co. | | |
| 3.25%, 04/01/30 (a) | 3,000 | 3,192 |
| Oncor Electric Delivery Company LLC | | |
| 3.80%, 09/30/47 (a) | 2,000 | 2,321 |
| ONEOK Inc. | | |
| 4.35%, 03/15/29 (a) | 4,000 | 4,389 |
| Oracle Corp. | | |
| 1.65%, 03/25/26 (a) | 8,000 | 7,934 |
| 2.30%, 03/25/28 (a) | 2,000 | 1,991 |
| 2.40%, 09/15/23 (a) | 4,000 | 4,079 |
| 2.65%, 07/15/26 (a) | 5,000 | 5,144 |
| 2.88%, 03/25/31 (a) | 5,000 | 5,025 |
| 2.95%, 04/01/30 (a) | 7,000 | 7,075 |
| 3.60%, 04/01/50 (a) | 4,000 | 3,917 |
| 3.65%, 03/25/41 (a) | 5,000 | 5,063 |
| 3.80%, 11/15/37 (a) | 3,000 | 3,126 |
| 3.95%, 03/25/51 (a) | 5,000 | 5,203 |
| 4.00%, 07/15/46 - 11/15/47 (a) | 9,000 | 9,348 |
See Notes to Schedule of Investments and Notes to Financial Statements.
| 16 | State Street Income V.I.S. Fund |
State Street Income V.I.S. Fund
Schedule of Investments, continued — December 31, 2021
| | Principal
Amount | Fair
Value |
| 4.10%, 03/25/61 (a) | $ 5,000 | $ 5,220 |
| Otis Worldwide Corp. | | |
| 2.06%, 04/05/25 (a) | 5,000 | 5,096 |
| 2.57%, 02/15/30 (a) | 3,000 | 3,042 |
| 3.36%, 02/15/50 (a) | 3,000 | 3,170 |
| Ovintiv Exploration Inc. | | |
| 5.63%, 07/01/24 (a) | 11,000 | 12,121 |
| Owens Corning | | |
| 4.40%, 01/30/48 (a) | 3,000 | 3,515 |
| Pacific Gas & Electric Co. | | |
| 2.10%, 08/01/27 (a) | 3,000 | 2,901 |
| 2.50%, 02/01/31 (a) | 4,000 | 3,811 |
| 3.00%, 06/15/28 (a) | 5,000 | 5,010 |
| 3.30%, 08/01/40 (a) | 4,000 | 3,722 |
| 3.50%, 08/01/50 (a) | 3,000 | 2,805 |
| 4.30%, 03/15/45 (a) | 5,000 | 5,056 |
| PacifiCorp | | |
| 2.70%, 09/15/30 (a) | 3,000 | 3,098 |
| 2.90%, 06/15/52 (a) | 8,000 | 7,895 |
| 6.25%, 10/15/37 (a) | 2,000 | 2,781 |
| Packaging Corp. of America | | |
| 3.05%, 10/01/51 (a) | 5,000 | 4,976 |
| Parker-Hannifin Corp. | | |
| 3.25%, 06/14/29 (a) | 3,000 | 3,177 |
| PartnerRe Finance B LLC (4.50% fixed rate until 04/01/30; 3.82% + 5 year CMT Rate thereafter) | | |
| 4.50%, 10/01/50 (a)(e) | 4,000 | 4,240 |
| PayPal Holdings Inc. | | |
| 2.65%, 10/01/26 (a) | 6,000 | 6,311 |
| 3.25%, 06/01/50 (a) | 2,000 | 2,144 |
| PepsiCo Inc. | | |
| 1.63%, 05/01/30 (a) | 3,000 | 2,922 |
| 2.63%, 07/29/29 (a) | 6,000 | 6,310 |
| 2.75%, 10/21/51 (a) | 7,000 | 7,207 |
| Petroleos Mexicanos | | |
| 6.70%, 02/16/32 | 19,001 | 19,135 |
| 7.69%, 01/23/50 (a) | 10,000 | 9,646 |
| Pfizer Inc. | | |
| 2.70%, 05/28/50 (a) | 8,000 | 8,057 |
| 3.45%, 03/15/29 (a) | 2,000 | 2,206 |
| 3.60%, 09/15/28 (a) | 5,000 | 5,558 |
| 3.90%, 03/15/39 (a) | 3,000 | 3,510 |
| 4.40%, 05/15/44 (a) | 2,000 | 2,504 |
| Philip Morris International Inc. | | |
| 1.50%, 05/01/25 (a) | 4,000 | 4,013 |
| 2.10%, 05/01/30 (a) | 3,000 | 2,945 |
| 4.13%, 03/04/43 (a) | 2,000 | 2,213 |
| | Principal
Amount | Fair
Value |
| Phillips 66 | | |
| 2.15%, 12/15/30 (a) | $ 8,000 | $ 7,703 |
| 3.30%, 03/15/52 | 5,000 | 5,012 |
| Phillips 66 Partners LP | | |
| 3.15%, 12/15/29 (a) | 8,000 | 8,281 |
| 3.75%, 03/01/28 (a) | 3,000 | 3,223 |
| 4.68%, 02/15/45 (a) | 4,000 | 4,691 |
| Pioneer Natural Resources Co. | | |
| 1.13%, 01/15/26 (a) | 9,000 | 8,754 |
| 2.15%, 01/15/31 (a) | 5,000 | 4,828 |
| Plains All American Pipeline LP/PAA Finance Corp. | | |
| 3.55%, 12/15/29 (a) | 3,000 | 3,120 |
| 3.65%, 06/01/22 (a) | 8,000 | 8,037 |
| Precision Castparts Corp. | | |
| 4.38%, 06/15/45 (a) | 6,000 | 7,423 |
| Prospect Capital Corp. | | |
| 3.36%, 11/15/26 (a) | 7,000 | 6,968 |
| Prudential Financial Inc. | | |
| 3.94%, 12/07/49 (a) | 5,000 | 5,855 |
| Prudential Financial Inc. (5.70% fixed rate until 09/15/28; 2.67% + 3 month USD LIBOR thereafter) | | |
| 5.70%, 09/15/48 (a)(e) | 7,000 | 7,876 |
| Public Service Company of Colorado | | |
| 3.70%, 06/15/28 (a) | 5,000 | 5,498 |
| Public Service Electric & Gas Co. | | |
| 2.38%, 05/15/23 (a) | 8,000 | 8,142 |
| PVH Corp. | | |
| 4.63%, 07/10/25 (a) | 7,000 | 7,632 |
| QUALCOMM Inc. | | |
| 1.30%, 05/20/28 (a) | 3,000 | 2,907 |
| 4.30%, 05/20/47 (a) | 3,000 | 3,769 |
| Quanta Services Inc. | | |
| 2.35%, 01/15/32 (a) | 5,000 | 4,864 |
| 3.05%, 10/01/41 (a) | 5,000 | 4,892 |
| Raytheon Technologies Corp. | | |
| 1.90%, 09/01/31 (a) | 7,000 | 6,751 |
| 2.82%, 09/01/51 (a) | 5,000 | 4,833 |
| 3.13%, 05/04/27 (a) | 7,000 | 7,455 |
| 3.50%, 03/15/27 (a) | 3,000 | 3,235 |
| 3.95%, 08/16/25 (a) | 2,000 | 2,168 |
| 4.15%, 05/15/45 (a) | 3,000 | 3,507 |
| 4.45%, 11/16/38 (a) | 2,000 | 2,409 |
See Notes to Schedule of Investments and Notes to Financial Statements.
| State Street Income V.I.S. Fund | 17 |
State Street Income V.I.S. Fund
Schedule of Investments, continued — December 31, 2021
| | Principal
Amount | Fair
Value |
| Realty Income Corp. | | |
| 2.85%, 12/15/32 | $ 5,000 | $ 5,201 |
| 3.00%, 01/15/27 (a) | 5,000 | 5,279 |
| 3.25%, 01/15/31 (a) | 5,000 | 5,372 |
| Regeneron Pharmaceuticals Inc. | | |
| 1.75%, 09/15/30 (a) | 6,000 | 5,678 |
| Republic Services Inc. | | |
| 2.38%, 03/15/33 (a) | 7,000 | 6,964 |
| Reynolds American Inc. | | |
| 4.45%, 06/12/25 (a) | 4,000 | 4,319 |
| Rio Tinto Finance Ltd. | | |
| 2.75%, 11/02/51 (a) | 9,000 | 8,934 |
| Rio Tinto Finance USA PLC | | |
| 4.13%, 08/21/42 (a) | 4,000 | 4,794 |
| Rockwell Automation Inc. | | |
| 4.20%, 03/01/49 (a) | 4,000 | 5,017 |
| Rogers Communications Inc. | | |
| 5.00%, 03/15/44 (a) | 2,000 | 2,465 |
| Roper Technologies Inc. | | |
| 2.95%, 09/15/29 (a) | 2,000 | 2,072 |
| Ross Stores Inc. | | |
| 4.70%, 04/15/27 (a) | 3,000 | 3,383 |
| Royalty Pharma PLC | | |
| 0.75%, 09/02/23 (a) | 5,000 | 4,968 |
| 1.20%, 09/02/25 (a) | 5,000 | 4,911 |
| 1.75%, 09/02/27 (a) | 3,000 | 2,950 |
| 2.15%, 09/02/31 (a) | 5,000 | 4,771 |
| 2.20%, 09/02/30 (a) | 3,000 | 2,905 |
| 3.35%, 09/02/51 (a) | 5,000 | 4,807 |
| RPM International Inc. | | |
| 3.75%, 03/15/27 (a) | 2,000 | 2,180 |
| Ryder System Inc. | | |
| 2.90%, 12/01/26 (a) | 7,000 | 7,323 |
| Sabine Pass Liquefaction LLC | | |
| 4.20%, 03/15/28 (a) | 2,000 | 2,196 |
| 4.50%, 05/15/30 (a) | 3,000 | 3,390 |
| 5.00%, 03/15/27 (a) | 2,000 | 2,251 |
| 5.88%, 06/30/26 (a) | 7,000 | 8,033 |
| Salesforce.com Inc. | | |
| 1.95%, 07/15/31 (a) | 8,000 | 7,924 |
| 2.70%, 07/15/41 (a) | 5,000 | 4,987 |
| Schlumberger Holdings Corp. | | |
| 3.90%, 05/17/28 (a)(f) | 4,000 | 4,326 |
| Sealed Air Corp. | | |
| 1.57%, 10/15/26 (a)(f) | 17,000 | 16,492 |
| Selective Insurance Group Inc. | | |
| 5.38%, 03/01/49 (a) | 5,000 | 6,627 |
| | Principal
Amount | Fair
Value |
| Sempra Energy | | |
| 3.80%, 02/01/38 (a) | $ 2,000 | $ 2,200 |
| 4.00%, 02/01/48 (a) | 4,000 | 4,472 |
| Sempra Energy (4.13% fixed rate until 01/04/27; 2.87% + 5 year CMT Rate thereafter) | | |
| 4.13%, 04/01/52 (e) | 7,000 | 7,074 |
| Shell International Finance BV | | |
| 3.13%, 11/07/49 (a) | 6,000 | 6,186 |
| 3.75%, 09/12/46 (a) | 6,000 | 6,754 |
| 4.13%, 05/11/35 (a) | 7,000 | 8,188 |
| Shire Acquisitions Investments Ireland DAC | | |
| 2.88%, 09/23/23 (a) | 3,000 | 3,085 |
| 3.20%, 09/23/26 (a) | 3,000 | 3,183 |
| Simon Property Group LP | | |
| 3.38%, 06/15/27 (a) | 4,000 | 4,295 |
| SLM Corp. | | |
| 3.13%, 11/02/26 (a) | 9,000 | 8,951 |
| South Jersey Industries Inc. | | |
| 5.02%, 04/15/31 (a) | 9,000 | 9,868 |
| Southern California Edison Co. | | |
| 2.40%, 02/01/22 (a) | 8,000 | 8,011 |
| 4.00%, 04/01/47 (a) | 9,000 | 9,939 |
| 4.20%, 03/01/29 (a) | 8,000 | 8,934 |
| Southern Company Gas Capital Corp. | | |
| 3.95%, 10/01/46 (a) | 4,000 | 4,425 |
| 4.40%, 05/30/47 (a) | 2,000 | 2,329 |
| Southwest Airlines Co. | | |
| 2.63%, 02/10/30 (a) | 7,000 | 6,999 |
| Southwestern Electric Power Co. | | |
| 2.75%, 10/01/26 (a) | 5,000 | 5,177 |
| Spectra Energy Partners LP | | |
| 3.38%, 10/15/26 (a) | 2,000 | 2,123 |
| 4.50%, 03/15/45 (a) | 3,000 | 3,456 |
| Spirit Realty LP | | |
| 4.00%, 07/15/29 (a) | 8,000 | 8,788 |
| Starbucks Corp. | | |
| 4.00%, 11/15/28 (a) | 4,000 | 4,476 |
| Stryker Corp. | | |
| 1.95%, 06/15/30 (a) | 7,000 | 6,843 |
| 2.90%, 06/15/50 (a) | 3,000 | 3,029 |
| Suncor Energy Inc. | | |
| 4.00%, 11/15/47 (a) | 3,000 | 3,361 |
| Sysco Corp. | | |
| 3.25%, 07/15/27 (a) | 2,000 | 2,125 |
See Notes to Schedule of Investments and Notes to Financial Statements.
| 18 | State Street Income V.I.S. Fund |
State Street Income V.I.S. Fund
Schedule of Investments, continued — December 31, 2021
| | Principal
Amount | Fair
Value |
| Tampa Electric Co. | | |
| 2.40%, 03/15/31 (a) | $ 8,000 | $ 8,089 |
| 3.45%, 03/15/51 (a) | 5,000 | 5,497 |
| 4.35%, 05/15/44 (a) | 6,000 | 7,186 |
| Target Corp. | | |
| 2.50%, 04/15/26 (a) | 3,000 | 3,146 |
| Teck Resources Ltd. | | |
| 3.90%, 07/15/30 (a) | 6,000 | 6,456 |
| 5.40%, 02/01/43 (a) | 2,000 | 2,452 |
| Texas Instruments Inc. | | |
| 3.88%, 03/15/39 (a) | 4,000 | 4,722 |
| The Allstate Corp. | | |
| 4.20%, 12/15/46 (a) | 3,000 | 3,615 |
| The Allstate Corp. (5.75% fixed rate until 08/15/23; 2.94% + 3 month USD LIBOR thereafter) | | |
| 5.75%, 08/15/53 (a)(e) | 9,000 | 9,361 |
| The Bank of New York Mellon Corp. (4.63% fixed rate until 09/20/26; 3.13% + 3 month USD LIBOR thereafter) | | |
| 4.63%, 12/29/49 (a)(e) | 5,000 | 5,258 |
| The Bank of Nova Scotia (4.65% fixed rate until 10/12/22; 2.65% + 3 month USD LIBOR thereafter) | | |
| 4.65%, 12/31/99 (a)(e) | 8,000 | 7,953 |
| The Boeing Co. | | |
| 2.20%, 02/04/26 (a) | 7,000 | 6,999 |
| 2.70%, 02/01/27 (a) | 6,000 | 6,117 |
| 2.95%, 02/01/30 (a) | 6,000 | 6,076 |
| 3.25%, 03/01/28 (a) | 3,000 | 3,101 |
| 3.75%, 02/01/50 (a) | 2,000 | 2,072 |
| 5.04%, 05/01/27 (a) | 7,000 | 7,905 |
| 5.15%, 05/01/30 (a) | 7,000 | 8,167 |
| 5.81%, 05/01/50 (a) | 5,000 | 6,769 |
| The Charles Schwab Corp. (4.00% fixed rate until 12/01/30; 3.08% + 10 year CMT Rate thereafter) | | |
| 4.00%, 12/31/99 (a)(e) | 8,000 | 8,072 |
| The Cleveland Electric Illuminating Co. | | |
| 4.55%, 11/15/30 (a)(f) | 6,000 | 6,898 |
| The Clorox Co. | | |
| 1.80%, 05/15/30 (a) | 6,000 | 5,821 |
| The Coca-Cola Co. | | |
| 2.60%, 06/01/50 (a) | 3,000 | 2,950 |
| 2.75%, 06/01/60 (a) | 3,000 | 2,980 |
| | Principal
Amount | Fair
Value |
| The Dow Chemical Co. | | |
| 2.10%, 11/15/30 (a) | $ 7,000 | $ 6,885 |
| 3.60%, 11/15/50 (a) | 3,000 | 3,253 |
| 4.25%, 10/01/34 (a) | 3,000 | 3,462 |
| 5.55%, 11/30/48 (a) | 2,000 | 2,819 |
| The Estee Lauder Companies Inc. | | |
| 2.38%, 12/01/29 (a) | 3,000 | 3,072 |
| The George Washington University | | |
| 4.13%, 09/15/48 (a) | 8,000 | 9,719 |
| The Goldman Sachs Group Inc. | | |
| 3.50%, 04/01/25 - 11/16/26 (a) | 12,000 | 12,757 |
| 3.85%, 01/26/27 (a) | 6,000 | 6,460 |
| 4.25%, 10/21/25 (a) | 2,000 | 2,182 |
| 5.15%, 05/22/45 (a) | 5,000 | 6,489 |
| The Goldman Sachs Group Inc. (1.54% fixed rate until 09/10/26; 0.82% + SOFR thereafter) | | |
| 1.54%, 09/10/27 (a)(e) | 8,000 | 7,842 |
| The Goldman Sachs Group Inc. (1.99% fixed rate until 01/27/31; 1.09% + SOFR thereafter) | | |
| 1.99%, 01/27/32 (a)(e) | 8,000 | 7,657 |
| The Goldman Sachs Group Inc. (2.38% fixed rate until 07/21/31; 1.25% + SOFR thereafter) | | |
| 2.38%, 07/21/32 (a)(e) | 5,000 | 4,924 |
| The Goldman Sachs Group Inc. (2.91% fixed rate until 06/05/22; 1.05% + 3 month USD LIBOR thereafter) | | |
| 2.91%, 06/05/23 (a)(e) | 8,000 | 8,067 |
| The Goldman Sachs Group Inc. (2.91% fixed rate until 07/21/41; 1.47% + SOFR thereafter) | | |
| 2.91%, 07/21/42 (a)(e) | 5,000 | 4,969 |
| The Goldman Sachs Group Inc. (3.21% fixed rate until 04/22/41; 1.51% + SOFR thereafter) | | |
| 3.21%, 04/22/42 (a)(e) | 5,000 | 5,177 |
See Notes to Schedule of Investments and Notes to Financial Statements.
| State Street Income V.I.S. Fund | 19 |
State Street Income V.I.S. Fund
Schedule of Investments, continued — December 31, 2021
| | Principal
Amount | Fair
Value |
| The Goldman Sachs Group Inc. (3.81% fixed rate until 04/23/28; 1.16% + 3 month USD LIBOR thereafter) | | |
| 3.81%, 04/23/29 (a)(e) | $ 4,000 | $ 4,354 |
| The Goldman Sachs Group Inc. (4.02% fixed rate until 10/31/37; 1.37% + 3 month USD LIBOR thereafter) | | |
| 4.02%, 10/31/38 (a)(e) | 4,000 | 4,575 |
| The Goldman Sachs Group Inc. (4.22% fixed rate until 05/01/28; 1.30% + 3 month USD LIBOR thereafter) | | |
| 4.22%, 05/01/29 (a)(e) | 4,000 | 4,445 |
| The Hartford Financial Services Group Inc. (2.28% fixed rate until 01/31/22; 2.13% + 3 month USD LIBOR thereafter) | | |
| 2.28%, 02/12/47 (a)(f) | 8,000 | 7,573 |
| The Home Depot Inc. | | |
| 2.70%, 04/15/30 (a) | 2,000 | 2,101 |
| 3.35%, 04/15/50 (a) | 3,000 | 3,280 |
| 3.50%, 09/15/56 (a) | 5,000 | 5,644 |
| 3.90%, 12/06/28 (a) | 4,000 | 4,516 |
| 4.50%, 12/06/48 (a) | 2,000 | 2,593 |
| The Kroger Co. | | |
| 2.20%, 05/01/30 (a) | 2,000 | 1,991 |
| 4.65%, 01/15/48 (a) | 2,000 | 2,485 |
| The Northwestern Mutual Life Insurance Co. | | |
| 3.45%, 03/30/51 (a)(f) | 10,000 | 10,696 |
| The Toronto-Dominion Bank (3.63% fixed rate until 09/15/26; 2.21% + USD 5 year Swap Rate thereafter) | | |
| 3.63%, 09/15/31 (a)(e) | 8,000 | 8,593 |
| The Travelers Companies Inc. | | |
| 2.55%, 04/27/50 (a) | 12,000 | 11,444 |
| The Walt Disney Co. | | |
| 2.65%, 01/13/31 (a) | 6,000 | 6,237 |
| 3.38%, 11/15/26 (a) | 3,000 | 3,227 |
| 3.60%, 01/13/51 (a) | 2,000 | 2,263 |
| 4.75%, 11/15/46 (a) | 2,000 | 2,575 |
| 6.65%, 11/15/37 (a) | 4,000 | 5,929 |
| The Williams Companies Inc. | | |
| 3.75%, 06/15/27 (a) | 3,000 | 3,241 |
| 4.85%, 03/01/48 (a) | 5,000 | 6,087 |
| | Principal
Amount | Fair
Value |
| 4.90%, 01/15/45 (a) | $ 4,000 | $ 4,789 |
| 5.40%, 03/04/44 (a) | 2,000 | 2,482 |
| Thermo Fisher Scientific Inc. | | |
| 2.80%, 10/15/41 (a) | 5,000 | 5,049 |
| Time Warner Cable LLC | | |
| 6.55%, 05/01/37 (a) | 3,000 | 3,930 |
| T-Mobile USA Inc. | | |
| 3.50%, 04/15/25 (a) | 7,000 | 7,418 |
| 3.75%, 04/15/27 (a) | 6,000 | 6,497 |
| 3.88%, 04/15/30 (a) | 9,000 | 9,848 |
| Total Capital International S.A. | | |
| 3.46%, 02/19/29 (a) | 5,000 | 5,438 |
| Trane Technologies Luxembourg Finance S.A. | | |
| 3.55%, 11/01/24 (a) | 7,000 | 7,408 |
| 3.80%, 03/21/29 (a) | 4,000 | 4,371 |
| TransCanada PipeLines Ltd. | | |
| 4.25%, 05/15/28 (a) | 7,000 | 7,817 |
| 4.88%, 01/15/26 (a) | 3,000 | 3,347 |
| Transcanada Trust (5.63% fixed rate until 05/20/25; 3.53% + 3 month USD LIBOR thereafter) | | |
| 5.63%, 05/20/75 (a)(e) | 9,000 | 9,453 |
| Transcontinental Gas Pipe Line Company LLC | | |
| 4.00%, 03/15/28 (a) | 4,000 | 4,384 |
| Truist Financial Corp. (4.80% fixed rate until 09/01/24; 3.00% + 5 year CMT Rate thereafter) | | |
| 4.80%, 12/31/99 (a)(e) | 9,000 | 9,408 |
| TWDC Enterprises 18 Corp. | | |
| 4.13%, 06/01/44 (a) | 4,000 | 4,749 |
| Tyco Electronics Group S.A. | | |
| 3.13%, 08/15/27 (a) | 3,000 | 3,203 |
| Tyson Foods Inc. | | |
| 4.00%, 03/01/26 (a) | 5,000 | 5,425 |
| 4.55%, 06/02/47 (a) | 2,000 | 2,479 |
| UDR Inc. | | |
| 2.10%, 08/01/32 (a) | 5,000 | 4,781 |
| 3.00%, 08/15/31 (a) | 5,000 | 5,212 |
| Union Pacific Corp. | | |
| 3.55%, 05/20/61 (a) | 4,000 | 4,427 |
| 3.80%, 04/06/71 (a) | 5,000 | 5,796 |
| 4.10%, 09/15/67 (a) | 5,000 | 6,084 |
| UnitedHealth Group Inc. | | |
| 2.00%, 05/15/30 (a) | 8,000 | 7,941 |
| 4.45%, 12/15/48 (a) | 4,000 | 5,114 |
| 4.75%, 07/15/45 (a) | 6,000 | 7,851 |
See Notes to Schedule of Investments and Notes to Financial Statements.
| 20 | State Street Income V.I.S. Fund |
State Street Income V.I.S. Fund
Schedule of Investments, continued — December 31, 2021
| | Principal
Amount | Fair
Value |
| Utah Acquisition Sub Inc. | | |
| 3.95%, 06/15/26 (a) | $ 2,000 | $ 2,157 |
| Valero Energy Corp. | | |
| 2.85%, 04/15/25 (a) | 7,000 | 7,272 |
| 4.00%, 04/01/29 (a) | 2,000 | 2,181 |
| Ventas Realty LP | | |
| 3.25%, 10/15/26 (a) | 7,000 | 7,412 |
| Verizon Communications Inc. | | |
| 2.10%, 03/22/28 (a) | 8,000 | 8,024 |
| 2.36%, 03/15/32 (a)(f) | 8,000 | 7,890 |
| 2.55%, 03/21/31 (a) | 8,000 | 8,081 |
| 3.00%, 03/22/27 (a) | 14,000 | 14,772 |
| 3.40%, 03/22/41 (a) | 4,000 | 4,198 |
| 3.55%, 03/22/51 (a) | 3,000 | 3,233 |
| 3.70%, 03/22/61 (a) | 5,000 | 5,412 |
| 4.40%, 11/01/34 (a) | 5,000 | 5,821 |
| 4.86%, 08/21/46 (a) | 2,000 | 2,576 |
| 5.25%, 03/16/37 (a) | 3,000 | 3,908 |
| ViacomCBS Inc. | | |
| 2.90%, 01/15/27 (a) | 5,000 | 5,219 |
| 3.70%, 06/01/28 (a) | 2,000 | 2,166 |
| 5.25%, 04/01/44 (a) | 3,000 | 3,746 |
| Virginia Electric & Power Co. | | |
| 4.00%, 11/15/46 (a) | 5,000 | 5,818 |
| Visa Inc. | | |
| 2.70%, 04/15/40 (a) | 4,000 | 4,084 |
| Vistra Operations Company LLC | ��� | |
| 3.55%, 07/15/24 (a)(f) | 6,000 | 6,187 |
| Vodafone Group PLC | | |
| 4.38%, 05/30/28 (a) | 5,000 | 5,633 |
| 5.25%, 05/30/48 (a) | 2,000 | 2,612 |
| Vontier Corp. | | |
| 2.40%, 04/01/28 (a)(f) | 8,000 | 7,796 |
| 2.95%, 04/01/31 (a)(f) | 6,000 | 5,910 |
| Vornado Realty LP | | |
| 2.15%, 06/01/26 (a) | 8,000 | 8,017 |
| 3.40%, 06/01/31 (a) | 5,000 | 5,152 |
| 3.50%, 01/15/25 (a) | 4,000 | 4,195 |
| Vulcan Materials Co. | | |
| 3.90%, 04/01/27 (a) | 2,000 | 2,190 |
| Walmart Inc. | | |
| 1.80%, 09/22/31 (a) | 5,000 | 4,951 |
| 2.50%, 09/22/41 (a) | 5,000 | 5,051 |
| Waste Connections Inc. | | |
| 2.20%, 01/15/32 (a) | 5,000 | 4,904 |
| 2.95%, 01/15/52 (a) | 5,000 | 4,918 |
| WEC Energy Group Inc. | | |
| 3.55%, 06/15/25 (a) | 2,000 | 2,119 |
| | Principal
Amount | Fair
Value |
| Wells Fargo & Co. | | |
| 4.15%, 01/24/29 (a) | $ 7,000 | $ 7,827 |
| 4.75%, 12/07/46 (a) | 2,000 | 2,488 |
| Wells Fargo & Co. (2.19% fixed rate until 04/30/25; 2.00% + SOFR thereafter) | | |
| 2.19%, 04/30/26 (a)(e) | 8,000 | 8,151 |
| Wells Fargo & Co. (2.39% fixed rate until 06/02/27; 2.10% + SOFR thereafter) | | |
| 2.39%, 06/02/28 (a)(e) | 23,000 | 23,381 |
| Wells Fargo & Co. (3.07% fixed rate until 04/30/40; 2.53% + SOFR thereafter) | | |
| 3.07%, 04/30/41 (a)(e) | 7,000 | 7,162 |
| Wells Fargo & Co. (3.20% fixed rate until 06/17/26; 1.17% + 3 month USD LIBOR thereafter) | | |
| 3.20%, 06/17/27 (a)(e) | 20,000 | 21,122 |
| Wells Fargo & Co. (5.88% fixed rate until 06/15/25; 3.99% + 3 month USD LIBOR thereafter) | | |
| 5.88%, 12/29/49 (a)(e) | 7,000 | 7,598 |
| Westlake Chemical Corp. | | |
| 2.88%, 08/15/41 (a) | 5,000 | 4,830 |
| 3.13%, 08/15/51 (a) | 3,000 | 2,895 |
| 3.38%, 08/15/61 (a) | 2,000 | 1,924 |
| Westpac Banking Corp. (2.89% fixed rate until 02/04/25; 1.35% + 5 year CMT Rate thereafter) | | |
| 2.89%, 02/04/30 (a)(e) | 7,000 | 7,147 |
| Westpac Banking Corp. (4.11% fixed rate until 07/24/29; 2.00% + 5 year CMT Rate thereafter) | | |
| 4.11%, 07/24/34 (a)(e) | 5,000 | 5,393 |
| Willis North America Inc. | | |
| 3.88%, 09/15/49 (a) | 4,000 | 4,348 |
| WPP Finance 2010 | | |
| 3.75%, 09/19/24 (a) | 8,000 | 8,468 |
| Xcel Energy Inc. | | |
| 3.40%, 06/01/30 (a) | 3,000 | 3,230 |
| Yamana Gold Inc. | | |
| 2.63%, 08/15/31 (a)(f) | 6,000 | 5,792 |
| Zoetis Inc. | | |
| 3.00%, 09/12/27 (a) | 3,000 | 3,172 |
| 3.90%, 08/20/28 (a) | 4,000 | 4,448 |
| | | 4,279,833 |
See Notes to Schedule of Investments and Notes to Financial Statements.
| State Street Income V.I.S. Fund | 21 |
State Street Income V.I.S. Fund
Schedule of Investments, continued — December 31, 2021
| | Principal
Amount | Fair
Value |
| Non-Agency Collateralized Mortgage Obligations - 6.0% |
| BANK 2017-BNK7 | | |
| 3.18%, 09/15/60 (a) | $ 158,000 | $ 167,391 |
| BANK 2018-BNK15 | | |
| 4.41%, 11/15/61 (a)(e) | 66,000 | 75,375 |
| Cantor Commercial Real Estate Lending 2019-CF3 | | |
| 3.01%, 01/15/53 (a) | 34,000 | 35,998 |
| CD 2019-CD8 Mortgage Trust | | |
| 2.91%, 08/15/57 (a) | 63,000 | 66,222 |
| Citigroup Commercial Mortgage Trust 2015-GC35 | | |
| 4.46%, 11/10/48 (a)(e) | 33,000 | 31,204 |
| Citigroup Commercial Mortgage Trust 2016-P6 | | |
| 4.03%, 12/10/49 (a)(e) | 31,273 | 33,648 |
| COMM 2014-CR14 Mortgage Trust | | |
| 4.53%, 02/10/47 (a)(e) | 25,000 | 26,332 |
| GS Mortgage Securities Trust 2014-GC22 | | |
| 4.69%, 06/10/47 (a)(e) | 20,000 | 20,503 |
| GS Mortgage Securities Trust 2015-GS1 | | |
| 4.42%, 11/10/48 (a)(e) | 25,000 | 21,937 |
| GS Mortgage Securities Trust 2018-GS9 | | |
| 4.14%, 03/10/51 (a)(e) | 25,000 | 27,471 |
| GS Mortgage Securities Trust 2019-GC42 | | |
| 2.75%, 09/01/52 (a) | 105,000 | 107,856 |
| GS Mortgage Securities Trust 2019-GSA1 | | |
| 3.05%, 11/10/52 (a) | 56,000 | 59,336 |
| JPMBB Commercial Mortgage Securities Trust 2013-C12 | | |
| 4.04%, 07/15/45 (a)(e) | 15,000 | 15,455 |
| JPMBB Commercial Mortgage Securities Trust 2015-C32 | | |
| 4.65%, 11/15/48 (a)(e) | 20,000 | 16,244 |
| MASTR Alternative Loan Trust 2003-5 | | |
| 5.00%, 08/25/18 (d) | 725 | 8 |
| Morgan Stanley Bank of America Merrill Lynch Trust 2015-C21 | | |
| 0.86%, 03/15/48 (a)(d)(e) | 334,913 | 7,341 |
| UBS-Barclays Commercial Mortgage Trust 2013-C6 | | |
| 3.88%, 04/10/46 (a)(e)(f) | 62,000 | 62,601 |
| | Principal
Amount | Fair
Value |
| Wells Fargo Commercial Mortgage Trust 2014-LC16 | | |
| 4.32%, 08/15/50 (a) | $ 28,250 | $ 26,331 |
| WFRBS Commercial Mortgage Trust 2013-C17 | | |
| 4.26%, 12/15/46 (a) | 25,000 | 26,127 |
| WFRBS Commercial Mortgage Trust 2014-LC14 | | |
| 4.35%, 03/15/47 (a)(e) | 58,000 | 60,786 |
| | | 888,166 |
| Sovereign Bonds - 0.6% |
| Government of Mexico | | |
| 4.00%, 10/02/23 (a) | 2,000 | 2,106 |
| 4.75%, 03/08/44 (a) | 20,000 | 21,863 |
| Government of Peru | | |
| 1.86%, 12/01/32 (a) | 10,000 | 9,133 |
| 2.78%, 12/01/60 (a) | 15,000 | 13,235 |
| 5.63%, 11/18/50 (a) | 11,000 | 15,487 |
| Government of Uruguay | | |
| 5.10%, 06/18/50 (a) | 14,040 | 18,622 |
| | | 80,446 |
| Municipal Bonds and Notes - 0.6% |
| American Municipal Power Inc. | | |
| 6.27%, 02/15/50 | 15,000 | 21,436 |
| Board of Regents of the University of Texas System | | |
| 3.35%, 08/15/47 | 10,000 | 11,638 |
| Port Authority of New York & New Jersey | | |
| 4.46%, 10/01/62 | 25,000 | 33,137 |
| State of California | | |
| 4.60%, 04/01/38 | 15,000 | 17,267 |
| State of Illinois | | |
| 5.10%, 06/01/33 | 10,000 | 11,559 |
| | | 95,037 |
Total Bonds and Notes
(Cost $13,907,293) | | 14,290,268 |
See Notes to Schedule of Investments and Notes to Financial Statements.
| 22 | State Street Income V.I.S. Fund |
State Street Income V.I.S. Fund
Schedule of Investments, continued — December 31, 2021
| | Number
of Shares | Fair
Value |
| Domestic Equity - 0.1% |
| Preferred Stock - 0.1% |
Wells Fargo & Co. 5.85%, (3.09% + 3 month USD LIBOR)
(Cost $15,066) (e) | 932 | $ 24,968 |
Total Investments in Securities
(Cost $13,922,359) | | 14,315,236 |
| Short-Term Investments - 11.2% |
State Street Institutional U.S. Government Money Market Fund - Class G Shares 0.03% (a)(g)(h)
(Cost $1,652,318) | 1,652,318 | 1,652,318 |
Total Investments
(Cost $15,574,677) | | 15,967,554 |
| Liabilities in Excess of Other Assets, net - (8.1)% | | (1,201,610) |
| NET ASSETS - 100.0% | | $ 14,765,944 |
Other Information:
| Centrally Cleared Credit Default Swaps |
| Reference Entity | Counterparty | Notional
Amount
(000s
omitted) | Contract
Annual
Fixed Rate/
Payment
Frequency | Termination
Date | Market
Value | Unamortized
Upfront
Payments
Received (Paid) | Unrealized
Appreciation
(Depreciation) |
| Buy Protection | | | | | | | |
| Markit CDX North America High Yield Index | Intercontinental Exchange | $338 | 5.00%/
Quarterly | 06/20/26 | $30,704 | $31,076 | $ (372) |
| Sell Protection | | | | | | | |
| Markit CDX North America High Yield Index | Intercontinental Exchange | 278 | 1.00%/
Quarterly | 12/20/26 | (6,782) | (5,511) | (1,271) |
| | | | | | | | $(1,643) |
| The Fund had the following long futures contracts open at December 31, 2021: |
| Description | Expiration
Date | Number of
Contracts | Notional
Amount | Value | Unrealized
Appreciation
(Depreciation) |
| 5 Yr. U.S. Treasury Notes Futures | March 2022 | 7 | $ 847,287 | $ 846,869 | $ (418) |
| 2 Yr. U.S. Treasury Notes Futures | March 2022 | 8 | 1,748,327 | 1,745,375 | (2,952) |
| | | | | | $ (3,370) |
See Notes to Schedule of Investments and Notes to Financial Statements.
| State Street Income V.I.S. Fund | 23 |
State Street Income V.I.S. Fund
Schedule of Investments, continued — December 31, 2021
| The Fund had the following short futures contracts open at December 31, 2021: |
| Description | Expiration
date | Number of
Contracts | Notional
Amount | Value | Unrealized
Appreciation
(Depreciation) |
| 10 Yr. U.S. Treasury Notes Futures | March 2022 | 1 | $ (128,891) | $ (130,469) | $ (1,578) |
| U.S. Long Bond Futures | March 2022 | 1 | (159,156) | (160,437) | (1,281) |
| 10 Yr. U.S. Treasury Ultra Futures | March 2022 | 4 | (578,564) | (585,750) | (7,186) |
| | | | | | $ (10,045) |
| | | | | | $ (13,415) |
| During the fiscal year ended December 31, 2021, average notional values related to derivative contracts were as follows: |
| | Long
Futures
Contracts | Short
Futures
Contracts | Credit
Default
Swap
Contracts |
| Average Notional Value | $2,259,225 | $1,297,103 | $350,530 |
Notes to Schedule of Investments
The views expressed in this document reflect our judgment as of the publication date and are subject to change at any time without notice. The securities cited may not be representative of the Fund’s future investments and should not be construed as a recommendation to purchase or sell a particular security. See the Fund’s summary prospectus and statutory prospectus for complete descriptions of investment objectives, policies, risks and permissible investments.
| (a) | At December 31, 2021, all or a portion of this security was pledged to cover collateral requirements for futures, swaps and/or TBAs. |
| (b) | Step coupon bond. |
| (c) | Settlement is on a delayed delivery or when-issued basis with final maturity to be announced ("TBA") in the future. |
| (d) | Interest only security. These securities represent the right to receive the monthly interest payments on an underlying pool of mortgages. Payments of principal on the pool reduce the value of the "interest only" holding. |
| (e) | Variable Rate Security - Interest rate shown is rate in effect at December 31, 2021. For securities based on a published reference rate and spread, the reference rate and spread are indicated in the description above. |
| (f) | Pursuant to Rule 144A of the Securities Act of 1933, as amended, these securities may be resold in transactions exempt from registration, normally to qualified institutional buyers. At December 31, 2021, these securities amounted to $442,922 or 3.00% of the net assets of the State Street Income V.I.S. Fund. These securities have been determined to be liquid using procedures established by the Fund's Board of Directors. |
| (g) | Sponsored by SSGA Funds Management, Inc., the Fund’s investment adviser and administrator, and an affiliate of State Street Bank & Trust Co., the Fund’s sub-administrator, custodian and accounting agent. |
| (h) | Coupon amount represents effective yield. |
| † | Percentages are based on net assets as of December 31, 2021. |
| Abbreviations: |
| CMT - Constant Maturity Treasury |
| LIBOR - London Interbank Offered Rate |
| REMIC - Real Estate Mortgage Investment Conduit |
| SOFR - Secured Overnight Financing Rate |
| STRIPS - Separate Trading of Registered Interest and Principal of Security |
| TBA - To Be Announced |
See Notes to Schedule of Investments and Notes to Financial Statements.
| 24 | State Street Income V.I.S. Fund |
State Street Income V.I.S. Fund
Schedule of Investments, continued — December 31, 2021
The following table presents the Fund’s investments measured at fair value on a recurring basis at December 31, 2021:
| Investments | Level 1 | | Level 2 | | Level 3 | | Total |
| Investments in Securities | | | | | | | |
| U.S. Treasuries | $ — | | $ 4,934,823 | | $ — | | $ 4,934,823 |
| Agency Mortgage Backed | — | | 3,795,919 | | — | | 3,795,919 |
| Agency Collateralized Mortgage Obligations | — | | 139,827 | | — | | 139,827 |
| Asset Backed | — | | 76,217 | | — | | 76,217 |
| Corporate Notes | — | | 4,279,833 | | — | | 4,279,833 |
| Non-Agency Collateralized Mortgage Obligations | — | | 888,166 | | — | | 888,166 |
| Sovereign Bonds | — | | 80,446 | | — | | 80,446 |
| Municipal Bonds and Notes | — | | 95,037 | | — | | 95,037 |
| Preferred Stock | 24,968 | | — | | — | | 24,968 |
| Short-Term Investments | 1,652,318 | | — | | — | | 1,652,318 |
| Total Investments in Securities | $ 1,677,286 | | $ 14,290,268 | | $ — | | $ 15,967,554 |
| Other Financial Instruments | | | | | | | |
| Credit Default Swap Contracts - Unrealized Depreciation | $ — | | $ (1,643) | | $ — | | $ (1,643) |
| Long Futures Contracts - Unrealized Depreciation | (3,370) | | — | | — | | (3,370) |
| Short Futures Contracts - Unrealized Depreciation | (10,045) | | — | | — | | (10,045) |
| Total Other Financial Instruments | $ (13,415) | | $ (1,643) | | $ — | | $ (15,058) |
| | Number
of Shares
Held at
12/31/20 | Value at
12/31/20 | Cost of
Purchases | Proceeds
from
Shares
Sold | Realized
Gain
(Loss) | Change in
Unrealized
Appreciation
(Depreciation) | Number of
Shares
Held at
12/31/21 | Value at
12/31/21 | Dividend
Income |
| State Street Institutional U.S. Government Money Market Fund - Class G Shares | 2,270,043 | $2,270,043 | $9,027,995 | $9,645,720 | $— | $— | 1,652,318 | $1,652,318 | $516 |
See Notes to Schedule of Investments and Notes to Financial Statements.
| State Street Income V.I.S. Fund | 25 |
State Street Income V.I.S. Fund
Financial Highlights
Selected data based on a share outstanding throughout the fiscal years indicated
| | 12/31/21 | | 12/31/20 | | 12/31/19 | | 12/31/18 | | 12/31/17 |
| Inception date | | | 1/3/95 |
| Net asset value, beginning of period | $ 12.48 | | $ 12.00 | | $ 11.07 | | $ 11.49 | | $ 11.37 |
| Income/(loss) from investment operations: | | | | | | | | | |
| Net investment income(a) | 0.12 | | 0.19 | | 0.24 | | 0.25 | | 0.19 |
| Net realized and unrealized gains/(losses) on investments | (0.35) | | 0.65 | | 0.71 | | (0.41) | | 0.18 |
| Total income/(loss) from investment operations | (0.23) | | 0.84 | | 0.95 | | (0.16) | | 0.37 |
| Less distributions from: | | | | | | | | | |
| Net investment income | 0.28 | | 0.32 | | 0.02 | | 0.26 | | 0.25 |
| Net realized gains | 0.11 | | 0.04 | | — | | — | | — |
| Total distributions | 0.39 | | 0.36 | | 0.02 | | 0.26 | | 0.25 |
| Net asset value, end of period | $ 11.86 | | $ 12.48 | | $ 12.00 | | $ 11.07 | | $ 11.49 |
| Total Return(b) | (1.81)% | | 7.03% | | 8.62% | | (1.42)% | | 3.25% |
| Ratios/Supplemental Data: | | | | | | | | | |
| Net assets, end of period (in thousands) | $14,766 | | $17,435 | | $17,112 | | $18,685 | | $21,847 |
| Ratios to average net assets: | | | | | | | | | |
| Net expenses | 1.06% | | 1.06% | | 1.06% | | 1.00% | | 1.36% |
| Gross expenses | 1.06% | | 1.06% | | 1.06% | | 1.00% | | 1.36% |
| Net investment income | 1.01% | | 1.50% | | 2.05% | | 2.25% | | 1.62% |
| Portfolio turnover rate | 81% (c) | | 120% (c) | | 90% | | 182% | | 255% |
| Notes to Financial Highlights |
| (a) | Per share values have been calculated using the average shares method. |
| (b) | Total returns are historical and assume changes in share price, reinvestment of dividends and capital gains distributions and do not include the effect of insurance contract charges. Past performance does not guarantee future results. |
| (c) | The portfolio turnover calculated for the fiscal years ended 12/31/21 and 12/31/20 did not include To-Be-Announced transactions and, if it had, the portfolio turnover would have been 183% and 277%, respectively. |
The accompanying Notes are an integral part of these financial statements.
State Street Income V.I.S. Fund
Statement of Assets and Liabilities — December 31, 2021
| Assets | |
| Investments in securities, at fair value (cost $13,922,359) | $ 14,315,236 |
| Short-term affiliated investments, at fair value | 1,652,318 |
| Net cash collateral on deposit with broker for future contracts | 12,944 |
| Receivable for investments sold | 559,253 |
| Income receivables | 69,006 |
| Receivable for fund shares sold | 1,004 |
| Income receivable from affiliated investments | 38 |
| Receivable for accumulated variation margin on swap contracts | 24,393 |
| Other assets | 90 |
| Total assets | 16,634,282 |
| Liabilities | |
| Net cash collateral on swap contracts due to broker | 18,937 |
| Payable for investments purchased | 1,781,679 |
| Payable for fund shares redeemed | 35 |
| Payable for accumulated variation margin on futures contracts | 13,408 |
| Payable to the Adviser | 6,215 |
| Payable for custody, fund accounting and sub-administration fees | 9,113 |
| Accrued other expenses | 38,951 |
| Total liabilities | 1,868,338 |
|
| Net Assets | $ 14,765,944 |
| Net Assets Consist of: | |
| Capital paid in | $ 14,109,461 |
| Total distributable earnings (loss) | 656,483 |
| Net Assets | $ 14,765,944 |
| Shares outstanding ($0.01 par value; unlimited shares authorized) | 1,245,465 |
| Net asset value per share | $ 11.86 |
The accompanying Notes are an integral part of these financial statements.
| Statement of Assets and Liabilities | 27 |
State Street Income V.I.S. Fund
Statement of Operations — For the year ended December 31, 2021
| Investment Income | |
| Income | |
| Dividend | $ 1,363 |
| Interest | 331,830 |
| Income from affiliated investments | 516 |
| Total income | 333,709 |
| Expenses | |
| Advisory and administration fees | 80,669 |
| Directors' fees | 18,626 |
| Custody, fund accounting and sub-administration fees | 30,160 |
| Professional fees | 34,855 |
| Printing and shareholder reports | 4,674 |
| Other expenses | 2,280 |
| Total expenses before waivers | 171,264 |
| Less: Fees waived by the adviser | (613) |
| Net expenses | 170,651 |
| Net investment income | $ 163,058 |
| Net Realized and Unrealized Gain (Loss) on Investments | |
| Realized gain (loss) on: | |
| Unaffiliated investments | $ 156,881 |
| Futures | 33,359 |
| Swap contracts | 66,120 |
| Increase (decrease) in unrealized appreciation/depreciation on: | |
| Unaffiliated investments | (671,442) |
| Futures | (13,573) |
| Swap contracts | (55,893) |
| Net realized and unrealized gain (loss) on investments | (484,548) |
| Net Decrease in Net Assets Resulting from Operations | $ (321,490) |
The accompanying Notes are an integral part of these financial statements.
| 28 | Statement of Operations |
State Street Income V.I.S. Fund
Statements of Changes in Net Assets
| | Year Ended
December 31,
2021 | | Year Ended
December 31,
2020 |
| Increase (Decrease) in Net Assets | | | |
| Operations: | | | |
| Net investment income | $ 163,058 | | $ 242,241 |
| Net realized gain (loss) on investments, futures and swap contracts | 256,360 | | 385,265 |
| Net increase (decrease) in unrealized appreciation/depreciation on investments, futures and swap contracts | (740,908) | | 484,875 |
| Net increase (decrease) from operations | (321,490) | | 1,112,381 |
| Distributions to shareholders: | | | |
| Total distributions | (474,316) | | (445,767) |
| Increase (decrease) in assets from operations and distributions | (795,806) | | 666,614 |
| Share transactions: | | | |
| Proceeds from sale of shares | 295,880 | | 2,272,897 |
| Value of distributions reinvested | 474,316 | | 445,767 |
| Cost of shares redeemed | (2,643,394) | | (3,062,021) |
| Net increase (decrease) from share transactions | (1,873,198) | | (343,357) |
| Total increase (decrease) in net assets | (2,669,004) | | 323,257 |
| Net Assets | | | |
| Beginning of year | 17,434,948 | | 17,111,691 |
| End of year | $ 14,765,944 | | $ 17,434,948 |
| Changes in Fund Shares | | | |
| Shares sold | 24,117 | | 183,078 |
| Issued for distributions reinvested | 40,027 | | 35,776 |
| Shares redeemed | (215,390) | | (248,669) |
| Net decrease in fund shares | (151,246) | | (29,815) |
The accompanying Notes are an integral part of these financial statements.
| Statements of Changes in Net Assets | 29 |
State Street Income V.I.S. Fund
Notes to Financial Statements — December 31, 2021
1. Organization of the Company
State Street Variable Insurance Series Funds, Inc. (the “Company”) was incorporated under the laws of the Commonwealth of Virginia on May 14, 1984 and is registered under the Investment Company Act of 1940, as amended (the “1940 Act”), as an open-end management investment company. The Company is currently composed of the following seven investment portfolios (collectively, the “Funds”): State Street U.S. Equity V.I.S. Fund, State Street S&P 500 Index V.I.S. Fund, State Street Premier Growth Equity V.I.S. Fund, State Street Small-Cap Equity V.I.S. Fund, State Street Total Return V.I.S. Fund, State Street Income V.I.S. Fund (the “Fund”) and State Street Real Estate Securities V.I.S. Fund. Each Fund is a diversified investment company within the meaning of the 1940 Act, except for the State Street Premier Growth Equity V.I.S. Fund, which is a non-diversified investment company.
Shares of the Funds of the Company are offered only to insurance company separate accounts that fund certain variable life insurance contracts and variable annuity contracts.
The Company currently offers one share class (Class 1) of the Fund as an investment option for variable life insurance and variable annuity contracts.
Under the Company’s organizational documents, its officers and directors are indemnified against certain liabilities arising out of the performance of their duties to the Company. Additionally, in the normal course of business, the Company enters into contracts with service providers that contain general indemnification clauses. The Company’s maximum exposure under these arrangements is unknown as this would involve future claims that may be made against the Company that have not yet occurred.
2.Summary of Significant Accounting Policies
The following is a summary of significant accounting policies followed by the Company in the preparation of its financial statements:
The preparation of financial statements in accordance with U.S. generally accepted accounting principles (“U.S. GAAP”) requires management to make estimates and assumptions that affect the reported amounts and disclosures in the financial statements. Actual results could differ from those estimates. The Fund is an investment company under U.S. GAAP and follows the accounting and reporting guidance applicable to investment companies.
Security Valuation The Fund’s investments are valued at fair value each day that the New York Stock Exchange (“NYSE”) is open and, for financial reporting purposes, as of the report date should the reporting period end on a day that the NYSE is not open. Fair value is generally defined as the price a fund would receive to sell an asset or pay to transfer a liability in an orderly transaction between market participants at the measurement date. By its nature, a fair value price is a good faith estimate of the valuation in a current sale and may not reflect an actual market price. The investments of the Fund are valued pursuant to the policy and procedures developed by the Oversight Committee (the “Committee”) and approved by the Company's Board of Directors (the “Board”). The Committee provides oversight of the valuation of investments for the Fund. The Board has responsibility for overseeing the determination of the fair value of investments.
Valuation techniques used to value the Fund’s investments by major category are as follows:
| • | Equity investments traded on a recognized securities exchange for which market quotations are readily available are valued at the last sale price or official closing price, as applicable, on the primary market or exchange on which they trade. Equity investments traded on a recognized exchange for which there were no sales on that day are valued at the last published sale price or at fair value. |
| • | Government and municipal fixed income securities are generally valued using quotations from independent pricing services or brokers. Certain government inflation-indexed securities may require a calculated fair |
| 30 | Notes to Financial Statements |
State Street Income V.I.S. Fund
Notes to Financial Statements, continued — December 31, 2021
| | valuation as the cumulative inflation is contained within the price provided by the pricing service or broker. For these securities, the inflation component of the price is “cleaned” from the pricing service or broker price utilizing the published inflation factors in order to ensure proper accrual of income. |
| • | Debt obligations (including short term investments and convertible debt securities) are valued using quotations from independent pricing services or brokers or are generally valued at the last reported evaluated prices. |
| • | Exchange-traded futures contracts are valued at the closing settlement price on the primary market on which they are traded most extensively. Exchange-traded futures contracts traded on a recognized exchange for which there were no sales on that day are valued at the last reported sale price obtained from independent pricing services or brokers or at fair value. |
| • | Swap agreements are valued daily based upon prices supplied by Board approved pricing vendors or through brokers. Depending on the product and terms of the transaction, the value of agreements is determined using a series of techniques including valuation models that incorporate a number of market data factors, such as discounted cash flows, yields, curves, trades and values of the underlying reference instruments. In the event SSGA Funds Management, Inc. (the “Adviser” or “SSGA FM”) is unable to obtain an independent, third-party valuation the agreements will be fair valued. |
In the event prices or quotations are not readily available or that the application of these valuation methods results in a price for an investment that is deemed to be not representative of the fair value of such investment, fair value will be determined in good faith by the Committee, in accordance with the valuation policy and procedures approved by the Board.
The Fund values its assets and liabilities at fair value using a fair value hierarchy consisting of three broad levels that prioritize the inputs to valuation techniques giving the highest priority to readily available unadjusted quoted prices in active markets for identical assets or liabilities (Level 1 measurements) and the lowest priority to unobservable inputs (Level 3 measurements) when market prices are not readily available or reliable. The categorization of a value determined for an investment within the hierarchy is based upon the pricing transparency of the investment and is not necessarily an indication of the risk associated with investing in it.
The three levels of the fair value hierarchy are as follows:
| • | Level 1 — Unadjusted quoted prices in active markets for an identical asset or liability; |
| • | Level 2 — Inputs other than quoted prices included within Level 1 that are observable for the asset or liability either directly or indirectly, including quoted prices for similar assets or liabilities in active markets, quoted prices for identical or similar assets or liabilities in markets that are not considered to be active, inputs other than quoted prices that are observable for the asset or liability (such as exchange rates, financing terms, interest rates, yield curves, volatilities, prepayment speeds, loss severities, credit risks and default rates) or other market-corroborated inputs; and |
| • | Level 3 — Unobservable inputs for the asset or liability, including the Committee’s assumptions used in determining the fair value of investments. |
The value of the Fund’s investments according to the fair value hierarchy as of December 31, 2021 is disclosed in the Fund’s Schedule of Investments.
Investment Transactions and Income Recognition Investment transactions are accounted for on trade date for financial reporting purposes. Realized gains and losses from the sale or disposition of investments and foreign exchange transactions, if any, are determined using the identified cost method.
Dividend income and capital gain distributions, if any, are recognized on the ex-dividend date, net of any foreign taxes withheld at source, if any.
Interest income is recorded daily on an accrual basis. All premiums and discounts are amortized/accreted for financial reporting purposes.
| Notes to Financial Statements | 31 |
State Street Income V.I.S. Fund
Notes to Financial Statements, continued — December 31, 2021
Non-cash dividends received in the form of stock are recorded as dividend income at fair value.
Expenses Certain expenses, which are directly identifiable to a specific Fund, are applied to the Fund within the Company. Other expenses which cannot be attributed to a specific Fund are allocated in such a manner as deemed equitable, taking into consideration the nature and type of expense and the relative net assets of the Fund within the Company.
Foreign Currency Translation The accounting records of the Fund are maintained in U.S. dollars. Foreign currencies as well as investment securities and other assets and liabilities denominated in a foreign currency are translated to U.S. dollars using exchange rates at period end. Purchases and sales of securities, income receipts and expense payments denominated in foreign currencies are translated into U.S. dollars at the prevailing exchange rate on the respective dates of the transactions.
The effects of exchange rate fluctuations on investments are included with the net realized and unrealized gain (loss) on investment securities. Other foreign currency transactions resulting in realized and unrealized gain (loss) are disclosed separately.
Foreign Taxes The Fund may be subject to foreign taxes (a portion of which may be reclaimable) on income, stock dividends, realized and unrealized capital gains on investments or certain foreign currency transactions. Foreign taxes are recorded in accordance with SSGA FM's understanding of the applicable foreign tax regulations and rates that exist in the foreign jurisdictions in which the Fund invests. These foreign taxes, if any, are paid by the Fund and are reflected in the Statement of Operations, if applicable. Foreign taxes payable or deferred as of December 31, 2021, if any, are disclosed in the Fund’s Statement of Assets and Liabilities.
Distributions The Fund declares and pays any dividends from net investment income annually.
Net realized capital gains, if any, are distributed annually, unless additional distributions are required for compliance with applicable tax regulations. The amount and character of income and capital gains to be distributed are determined in accordance with applicable tax regulations which may differ from net investment income and realized gains recognized for U.S. GAAP purposes.
3.Securities and Other Investments
Delayed Delivery Transactions and When-Issued Securities During the fiscal year ended December 31, 2021, the Fund transacted in securities on a delayed delivery or when-issued basis. Payment and delivery may take place after the customary settlement period for that security. The price of the underlying securities and the date when the securities will be delivered and paid for are fixed at the time the transaction is negotiated. The securities purchased on a delayed delivery or when-issued basis are identified as such in the Fund’s Schedule of Investments. The Fund may receive compensation for interest forgone in the purchase of a delayed delivery or when-issued security. With respect to such purchase commitments, the Fund identifies securities as segregated in its records with a value at least equal to the amount of the commitment. Losses may arise due to changes in the value of the underlying securities or if the counterparty does not perform under the contract’s terms, or if the issuer does not issue the securities due to political, economic or other factors.
To-Be-Announced Transactions The Fund may seek to obtain exposure to U.S. agency mortgage pass-through securities through the use of “to-be-announced” or “TBA transactions.” “TBA” refers to a commonly used mechanism for the forward settlement of U.S. agency mortgage pass-through securities. In a TBA transaction, the buyer and seller decide on general trade parameters, such as agency, settlement date, coupon, and price.
The Fund may use TBA transactions to “roll over” such agreements prior to the settlement date. This type of TBA transaction is sometimes known as a “TBA roll.” In a TBA roll, the Fund generally will sell the obligation to purchase the pools stipulated in the TBA agreement prior to the settlement date and will enter into a new TBA agreement for future delivery of pools of mortgage pass-through securities. The Fund may also enter into TBA agreements and settle such transactions on the stipulated settlement date by accepting actual receipt or delivery of the pools of mortgage pass-through securities.
| 32 | Notes to Financial Statements |
State Street Income V.I.S. Fund
Notes to Financial Statements, continued — December 31, 2021
Default by or bankruptcy of a counterparty to a TBA transaction would expose the Fund to possible loss because of adverse market action, expenses or delays in connection with the purchase or sale of the pools of mortgage pass-through securities specified in the TBA transaction. To minimize this risk, the Fund will enter into TBA transactions only with established counterparties. The Fund’s use of “TBA rolls” may impact portfolio turnover, transaction costs and capital gain distributions to shareholders.
4.Derivative Financial Instruments
Futures Contracts The Fund may enter into futures contracts to meet the Fund’s objectives. A futures contract is a standardized, exchange-traded agreement to buy or sell a financial instrument at a set price on a future date. Upon entering into a futures contract, the Fund is required to deposit with the broker, cash or securities in an amount equal to the minimum initial margin requirements of the clearing house. Securities deposited, if any, are designated on the Schedule of Investments and cash deposited, if any, is included in Net cash collateral on deposit with broker for future contracts on the Statement of Assets and Liabilities. Subsequent payments are made or received by the Fund equal to the daily change in the contract value, accumulated, exchange rates, and/or other transactional fees. The accumulation of those payments are recorded as variation margin receivable or payable with a corresponding offset to unrealized gains or losses. The Fund recognizes a realized gain or loss when the contract is closed.
Losses may arise if the value of a futures contract decreases due to unfavorable changes in the market rates or values of the underlying instrument during the term of the contract or if the counterparty does not perform under the contract. The use of futures contracts also involves the risk that the movements in the price of the futures contracts do not correlate with the movement of the assets underlying such contracts.
For the fiscal year ended December 31, 2021, the Fund entered into futures contracts to manage interest rate risk.
Credit Default Swaps During the fiscal year ended December 31, 2021, the Fund engaged in credit default swaps to manage credit risk. When the Fund is the buyer in a credit default swap contract, the Fund is entitled to receive the par (or other agreed upon) value (full notional value) of a referenced debt obligation (or basket of debt obligations) from the counterparty (or central clearing party (“CCP”) in the case of a centrally cleared swap) to the contract if a credit event by a third party, such as a U.S. or foreign corporate issuer or sovereign issuer, on the debt obligation occurs. In return, the Fund pays the counterparty a periodic stream of payments over the term of the contract provided that no credit event has occurred. If no credit event occurs, the Fund loses its investment and recovers nothing. However, if a credit event occurs, the Fund receives full notional value for a referenced debt obligation that may have little or no value. When the Fund is the seller of a credit default swap, it receives a fixed rate of income throughout the term of the contract, provided there is no credit event. If a credit event occurs, the Fund is obligated to pay the notional amount of the swap and in certain instances take delivery of securities of the reference entity upon the occurrence of a credit event, as defined under the terms of that particular swap agreement. Credit events are contract specific but may include bankruptcy, failure to pay, restructuring, obligation acceleration and repudiation/moratorium. If the Fund is a seller of protection and a credit event occurs, the maximum potential amount of future payments that the Fund could be required to make would be an amount equal to the notional amount of the agreement. This potential amount would be partially offset by any recovery value of the respective referenced obligation, or net amount received from the settlement of a buy protection credit default swap agreement entered into by the Fund for the same referenced obligation.
As the seller, the Fund may create economic leverage to its portfolio because, in addition to its total net assets, the Fund is subject to investment exposure on the notional amount of the swap. The interest fee paid or received on the swap, which is based on a specified interest rate on a fixed notional amount, is accrued daily as a component of unrealized appreciation (depreciation) and is recorded as realized gain upon receipt or realized loss upon payment. The Fund also records an increase or decrease to unrealized appreciation (depreciation) in an amount equal to the daily valuation. For centrally cleared swaps, the daily change in valuation is recorded as a receivable or payable for variation margin and settled in cash with the CCP daily. All upfront payments, if any, are amortized over the life of the swap as realized gains or losses. Those upfront payments that are paid or received, typically for non-centrally cleared swaps, are recorded as other assets or other liabilities, respectively, net of amortization. For
| Notes to Financial Statements | 33 |
State Street Income V.I.S. Fund
Notes to Financial Statements, continued — December 31, 2021
financial reporting purposes, unamortized upfront payments, if any, are netted with unrealized appreciation or depreciation on swaps to determine the market value of swaps. The Fund segregates assets in the form of cash or liquid securities in an amount equal to the notional amount of the credit default swaps of which it is the seller. The Fund segregates assets in the form of cash or liquid securities in an amount equal to any unrealized depreciation of the credit default swaps of which it is the buyer, marked to market on a daily basis. Credit default swaps involve greater risks than if the Fund had invested in the referenced debt obligation directly. If the Fund is a buyer of a credit default swap and no credit event occurs, the Fund will not earn any return on its investment. If the Fund is a seller of a credit default swap, the Fund’s risk of loss may be the entire notional amount of the swap. Swaps may also subject the Fund to the risk that the counterparty to the transaction may not fulfill its its obligation. In the case of centrally cleared swaps, counterparty risk is minimal due to protections provided by the CCP.
The following tables summarize the value of the Fund’s derivative instruments as of December 31, 2021 and the related location in the accompanying Statement of Assets and Liabilities and Statement of Operations, presented by primary underlying risk exposure:
| Asset Derivatives |
| | Interest
Rate
Risk | Foreign
Exchange
Risk | Credit
Risk | Equity
Risk | Commodity
Risk | Total |
| State Street Income V.I.S. Fund | | | | | | |
| Swap Contracts | $ — | $ — | $ 24,393 | $ — | $ — | $ 24,393 |
| Liability Derivatives |
| | Interest
Rate
Risk | Foreign
Exchange
Risk | Credit
Risk | Equity
Risk | Commodity
Risk | Total |
| State Street Income V.I.S. Fund | | | | | | |
| Futures Contracts | $ 13,408 | $ — | $ — | $ — | $ — | $ 13,408 |
| Realized Gain/Loss |
| | Interest
Rate
Risk | Foreign
Exchange
Risk | Credit
Risk | Equity
Risk | Commodity
Risk | Total |
| State Street Income V.I.S. Fund | | | | | | |
| Futures Contracts | $ 33,359 | $ — | $ — | $ — | $ — | $ 33,359 |
| Swap Contracts | — | — | 66,120 | — | — | 66,120 |
| Net Change in Unrealized Appreciation (Depreciation) |
| | Interest
Rate
Risk | Foreign
Exchange
Risk | Credit
Risk | Equity
Risk | Commodity
Risk | Total |
| State Street Income V.I.S. Fund | | | | | | |
| Futures Contracts | $ (13,573) | $ — | $ — | $ — | $ — | $ (13,573) |
| Swap Contracts | — | — | (55,893) | — | — | (55,893) |
5.Fees and Transactions with Affiliates
Advisory Fee SSGA Funds Management, Inc. (the "Adviser" or "SSGA FM"), a registered investment adviser, was retained by the Board to act as investment adviser and administrator of the Fund. SSGA FM’s compensation for investment advisory and administrative services (“Management Fee”) is paid monthly based on the average daily net assets of the Fund at an annualized rate of 0.50%. SSGA FM is contractually obligated until May 1, 2022 to waive its management fee and/or reimburse certain expenses for the Fund, in an amount equal to any acquired fund fees and expenses (“AFFEs”), excluding AFFEs derived from the Fund’s holdings in acquired funds for cash
| 34 | Notes to Financial Statements |
State Street Income V.I.S. Fund
Notes to Financial Statements, continued — December 31, 2021
management purposes, if any. This fee waiver and/or expense reimbursement arrangement may not be terminated prior to May 1, 2022 except with approval of the Board.
Custody, Fund Accounting and Sub-Administration Fees State Street Bank and Trust Company (“State Street”) serves as the custodian, fund accountant and sub-administrator to the Fund. Amounts paid by the Fund to State Street for performing such services are included as custody, fund accounting and sub-administration fees in the Statement of Operations.
Other Transactions with Affiliates The Fund may invest in affiliated entities, including securities issued by State Street Corporation, affiliated funds, or entities deemed to be affiliates as a result of the Fund owning more than five percent of the entity’s voting securities or outstanding shares. Amounts relating to these transactions during the fiscal year ended December 31, 2021 are disclosed in the Schedule of Investments.
6.Directors’ Fees
The fees and expenses of the Company’s directors who are not “interested persons” of the Company, as defined in the 1940 Act (“Independent Directors”), are paid directly by the Fund. The Independent Directors are reimbursed for travel and other out-of-pocket expenses in connection with meeting attendance and industry seminars.
7.Investment Transactions
Purchases and sales of investments (excluding in-kind transactions, short term investments and derivative contracts) for the fiscal year ended December 31, 2021 were as follows:
| U.S. Government Securities |
| Purchases | Sales |
| $ 25,482,497 | $ 24,000,446 |
| Non-U.S. Government Securities |
| Purchases | Sales |
| $ 2,286,101 | $ 5,256,920 |
8.Income Taxes
The Fund has qualified and intends to continue to qualify as a regulated investment company under Subchapter M of the Internal Revenue Code of 1986, as amended. The Fund will not be subject to federal income taxes to the extent it distributes its taxable income, including any net realized capital gains, for each fiscal year. Therefore, no provision for federal income tax is required.
The Fund files federal and various state and local tax returns as required. No income tax returns are currently under examination. Generally, the federal returns are subject to examination by the Internal Revenue Service for a period of three years from date of filing, while the state returns may remain open for an additional year depending upon jurisdiction. SSGA FM has analyzed the Fund’s tax positions taken on tax returns for all open years and does not believe there are any uncertain tax positions that would require recognition of a tax liability.
Distributions to shareholders are recorded on ex-dividend date. Income dividends and gain distributions are determined in accordance with income tax rules and regulations, which may differ from generally accepted accounting principles. Certain capital accounts in the financial statements have been adjusted for permanent book-tax differences. These adjustments have no impact on net asset values or results of operations. Temporary book-tax differences will reverse in the future. These book-tax differences are primarily due to futures contracts, open straddle adjustments, premium amortization, contingent payment debt instruments and wash sale loss deferrals.
| Notes to Financial Statements | 35 |
State Street Income V.I.S. Fund
Notes to Financial Statements, continued — December 31, 2021
The tax character of distributions paid during the fiscal year ended December 31, 2021 were as follows:
Ordinary
Income | Long-Term
Capital Gains | Total |
| $ 474,316 | $ — | $ 474,316 |
The tax character of distributions paid during the fiscal year ended December 31, 2020 was as follows:
Ordinary
Income | Long-Term
Capital Gains | Total |
| $ 445,767 | $ — | $ 445,767 |
At December 31, 2021, the components of distributable earnings on a tax basis were as follows:
Undistributed
Ordinary
Income | Tax Exempt
Income | Capital Loss
Carryforwards | Undistributed
long term
gain | Net
Unrealized
Gains
(Losses) | Qualified
Late-Year
Losses | Total |
| $ 310,911 | $ — | $ — | $ 135,909 | $ 209,663 | $ — | $ 656,483 |
As of December 31, 2021, gross unrealized appreciation and gross unrealized depreciation of investments and other financial instruments based on cost for federal income tax purposes were as follows:
Tax
Cost | Gross
Unrealized
Appreciation | Gross
Unrealized
Depreciation | Net
Unrealized
Appreciation
(Depreciation) |
| $ 15,742,832 | $ 313,326 | $ 103,662 | $ 209,664 |
9.Line of Credit
The Fund and other affiliated funds (each, a “Participant” and collectively, the “Participants”) have access to $200 million of a $1.1 billion revolving credit facility provided by a syndication of banks under which the Participants may borrow to fund shareholder redemptions. This agreement expires in October 2022 unless extended or renewed.
The Participants are charged an annual commitment fee which is calculated based on the unused portion of the shared credit line. Commitment fees are allocated among each of the Participants based on relative net assets. Commitment fees are ordinary fund operating expenses. A Participant incurs and pays the interest expense related to its borrowing. Interest is calculated at a rate per annum equal to the sum of 1.00% plus the greater of the New York Fed Bank Rate and the one-month SOFR Rate.
Prior to October 7, 2021 the Fund had access to $200 million of a $500 million revolving credit facility and interest was calculated at a rate per annum equal to the sum of 1.25% plus the New York Fed Bank Rate.
The Fund had no outstanding loans as of December 31, 2021.
10.Risks
Concentration Risk As a result of the Fund's ability to invest a large percentage of its assets in obligations of issuers within the same country, state, region, currency or economic sector, an adverse economic, business or political development may affect the value of the Fund's investments more than if the Fund was more broadly diversified.
Interest Rate Risk Is the risk that fixed income securities will decline in value because of changes in interest rates. Bond prices generally rise when interest rates decline and generally decline when interest rates rise. Changes in governmental policy, including changes in central bank monetary policy, could cause interest rates to rise rapidly, or cause investors to expect a rapid rise in interest rates. This could lead to heightened levels of interest rate, volatility and liquidity risks for the fixed income markets generally and could have a substantial and immediate effect on the values of the Fund’s investments.
| 36 | Notes to Financial Statements |
State Street Income V.I.S. Fund
Notes to Financial Statements, continued — December 31, 2021
Foreign and Emerging Markets Risk Investing in foreign markets involves risks and considerations not typically associated with investing in the U.S. Foreign securities may be subject to risk of loss because of government regulation, economic, political and social instability in the countries in which the Fund invests. Foreign markets may be less liquid than investments in the U.S. and may be subject to the risks of currency fluctuations. To the extent that the Fund invests in securities of issuers located in emerging markets, these risks may be even more pronounced.
Credit Risk The Fund may be exposed to credit risk in the event that an issuer or guarantor fails to perform or that an institution or entity with which the Fund has unsettled or open transactions defaults.
Market Risk The Fund’s investments are subject to changes in general economic conditions, and general market fluctuations and the risks inherent in investment in securities markets. Investment markets can be volatile and prices of investments can change substantially due to various factors including, but not limited to, economic growth or recession, changes in interest rates, changes in the actual or perceived creditworthiness of issuers, and general market liquidity. The Fund is subject to the risk that geopolitical events will disrupt securities markets and adversely affect global economies and markets. Local, regional or global events such as war, acts of terrorism, the spread of infectious illness or other public health issues, or other events could have a significant impact on the Fund and its investments.
An outbreak of a respiratory disease caused by a novel coronavirus (known as COVID-19) first detected in China in December 2019 has resulted in a global pandemic and major disruptions to economies and markets around the world, including the United States. Financial markets have experienced and may continue to experience extreme volatility and severe losses, and trading in many instruments was and may continue to be disrupted as a result. Liquidity for many instruments was and may continue to be greatly reduced for periods of time. Some interest rates are very low and in some cases yields are negative. Governments and central banks, including the Federal Reserve in the United States, have taken extraordinary and unprecedented actions to support local and global economies and the financial markets. The impact of these measures, and whether they will be effective to mitigate the economic and market disruption, will not be known for some time. In addition, the outbreak of COVID-19, and measures taken to mitigate its effects, could result in disruptions to the services provided to the Fund by its service providers.
11.Recent Accounting Pronouncement
In March 2020, the Financial Accounting Standards Board (“FASB”) issued Accounting Standards Update No. 2020-04 (“ASU 2020-04”), “Reference Rate Reform (Topic 848)”. In response to concerns about structural risks of interbank offered rates, and particularly the risk of cessation of LIBOR, regulators have undertaken reference rate reform initiatives to identify alternative reference rates that are more observable or transaction based and less susceptible to manipulation. ASU 2020-04 provides optional guidance for a limited period of time to ease the potential burden in accounting for (or recognizing the effects of) reference rate reform on financial reporting. ASU 2020-04 is elective and applies to all entities, subject to meeting certain criteria, that have contracts, hedging relationships, and other transactions that reference LIBOR or another reference rate expected to be discontinued because of reference rate reform. The relief provided is temporary and generally cannot be applied to contract modifications that occur after December 31, 2022, or hedging relationships entered into or evaluated after that date. However, the FASB has indicated that it will revisit the sunset date in Topic 848 after the LIBOR administrator makes a final decision on a phaseout date. On November 30, 2020, the LIBOR administrator proposed extending the publication of the overnight and the one-, three-, six- and 12-month USD LIBOR settings through June 30, 2023, when many existing contracts that reference LIBOR will have expired. Management is currently evaluating the impact of the guidance.
This change in accounting policy has been made to comply with the newly issued accounting standard and had no impact on total accumulated earnings (loss) or the NAV of each Fund. With respect to each Fund’s results of operations, amortization of premium to first call date accelerates amortization with the intent of more closely aligning the recognition of income on such bonds with the economics of the instrument.
| Notes to Financial Statements | 37 |
State Street Income V.I.S. Fund
Notes to Financial Statements, continued — December 31, 2021
12.Subsequent Events
Management has evaluated the impact of all subsequent events on the Fund through the date on which the financial statements were available to be issued and has determined that there were no subsequent events requiring adjustment or disclosure in the financial statements.
| 38 | Notes to Financial Statements |
State Street Income V.I.S. Fund
Report of Independent Registered Public Accounting Firm
To the Shareholders of State Street Income V.I.S. Fund and the Board of Directors of State Street Variable Insurance Series Funds, Inc.
Opinion on the Financial Statements
We have audited the accompanying statement of assets and liabilities of State Street Income V.I.S. Fund (the “Fund”) (one of the series constituting State Street Variable Insurance Series Funds, Inc. (the “Company”)), including the schedule of investments, as of December 31, 2021, and the related statement of operations for the year then ended, the statements of changes in net assets for each of the two years in the period then ended, the financial highlights for each of the five years in the period then ended and the related notes (collectively referred to as the “financial statements”). In our opinion, the financial statements present fairly, in all material respects, the financial position of the Fund (one of the series constituting State Street Variable Insurance Series Funds, Inc.) at December 31, 2021, the results of its operations for the year then ended, the changes in its net assets for each of the two years in the period then ended and its financial highlights for each of the five years in the period then ended, in conformity with U.S. generally accepted accounting principles.
Basis for Opinion
These financial statements are the responsibility of the Company’s management. Our responsibility is to express an opinion on the Fund’s financial statements based on our audits. We are a public accounting firm registered with the Public Company Accounting Oversight Board (United States) (“PCAOB”) and are required to be independent with respect to the Company in accordance with the U.S. federal securities laws and the applicable rules and regulations of the Securities and Exchange Commission and the PCAOB.
We conducted our audits in accordance with the standards of the PCAOB. Those standards require that we plan and perform the audit to obtain reasonable assurance about whether the financial statements are free of material misstatement, whether due to error or fraud. The Company is not required to have, nor were we engaged to perform, an audit of the Company’s internal control over financial reporting. As part of our audits we are required to obtain an understanding of internal control over financial reporting, but not for the purpose of expressing an opinion on the effectiveness of the Company’s internal control over financial reporting. Accordingly, we express no such opinion.
Our audits included performing procedures to assess the risks of material misstatement of the financial statements, whether due to error or fraud, and performing procedures that respond to those risks. Such procedures included examining, on a test basis, evidence regarding the amounts and disclosures in the financial statements. Our procedures included confirmation of securities owned as of December 31, 2021, by correspondence with the custodian, brokers and others or by other appropriate auditing procedures where replies from brokers and others were not received. Our audits also included evaluating the accounting principles used and significant estimates made by management, as well as evaluating the overall presentation of the financial statements. We believe that our audits provide a reasonable basis for our opinion.
We have served as the auditor of one or more State Street Global Advisors investment companies since 2000.
Boston, Massachusetts
February 17, 2022
| Report of Independent Registered Public Accounting Firm | 39 |
State Street Income V.I.S. Fund
Other Information — December 31, 2021 (Unaudited)
Tax Information
For federal income tax purposes, the following information is furnished with respect to the distributions of the Fund for its fiscal year ended December 31, 2021.
Interest Dividends
The Fund reports the maximum amount allowable as Section 163(j) Interest Dividends.
Liquidity Risk Management Program
Pursuant to Rule 22e-4 under the 1940 Act, the Fund has adopted and implemented a liquidity risk management program (the “Program”). SSGA FM has been designated by the Board to administer the Fund's Program. The Program’s principal objectives include assessing, managing and periodically reviewing each Fund’s liquidity risk, based on factors specific to the circumstances of the Fund. Liquidity risk is defined as the risk that a Fund could not meet redemption requests without significant dilution of remaining investors’ interests in the Fund. During the fiscal year, SSGA FM provided the Board with a report addressing the operations of the Program and assessing its adequacy and the effectiveness of the Program’s implementation for the period September 2020 through June 2021. As reported to the Board, the Program supported each Fund’s ability to honor redemption requests timely and SSGA FM’s management of each Fund’s liquidity profile, including during periods of market volatility. SSGA FM reported that the Program operated adequately to meet the requirements of Rule 22e-4 and that the implementation of the Program has been effective.
There can be no assurance that the Program will achieve its objectives in the future. Please refer to your Fund’s prospectus for more information regarding the Fund’s exposure to liquidity risk and other principal risks to which an investment in the Fund may be subject.
Proxy Voting Policies and Procedures and Record
The Fund has adopted the proxy voting policies of the Adviser. A description of the Fund's proxy voting policies and procedures that are used by the Adviser to vote proxies relating to the Fund’s portfolios of securities are available (i) without charge, upon request by calling 1-800-242-0134 (toll free) and (ii) on the SEC's website at www.sec.gov. Information regarding how the Fund voted for the prior 12-months period ended June 30 is available by August 31 of each year by calling the same number, on the SEC’s website at www.sec.gov, and on the Fund's website at www.ssga.com.
Quarterly Portfolio Schedule
Following the Fund's first and third fiscal quarter-ends, a complete Schedule of Investments is filed with the SEC as an exhibit to its reports on Form N-PORT, which can be found on the SEC’s website at www.sec.gov, and on the Fund's website at www.ssga.com. The Fund's Schedules of Investments are available upon request, without charge, by calling 1-800-242-0134.
State Street Income V.I.S. Fund
Other Information, continued — December 31, 2021 (Unaudited)
Name,
Address, and
Year of Birth | Position(s) Held
with Fund | Term of
Office and
Length of
Time Served | Principal Occupation
During Past Five Years
and Relevant Experience | Number
of
Funds
in Fund
Complex
Overseen
by
Director† | Other Directorships
Held by Director
During Past Five Years |
| INDEPENDENT DIRECTORS |
Michael F. Holland
c/o SSGA Funds
Management, Inc.
One Iron Street Boston,
MA 02210
YOB: 1944 | Director
and
Co-Chairperson
of the Board | Term:
Indefinite
Elected: 1/19 | Chairman, Holland &
Company L.L.C.
(investment adviser)
(1995 – present). | 63 | Director, the Holland Series
Fund, Inc.; Director, The China
Fund, Inc. (1992 – 2017);
Director, The Taiwan Fund,
Inc. (2007 – 2017); Director,
Reaves Utility Income Fund,
Inc.; and Director, Blackstone/
GSO Loans (and Real Estate)
Funds. |
| | | | | | |
Patrick J. Riley
c/o SSGA Funds
Management, Inc.
One Iron Street
Boston, MA 02210
YOB: 1948 | Director
and
Co-Chairperson
of the Board | Term:
Indefinite
Appointed: 4/16
Elected: 1/19 | 2002 to May 2010, Associate
Justice of the Superior Court,
Commonwealth of
Massachusetts; 1985 to 2002,
Partner, Riley, Burke
& Donahue, L.L.P. (law firm);
1998 to present, Independent
Director, State Street Global
Advisers Ireland, Ltd.
(investment company); 1998 to
present, Independent Director,
SSGA Liquidity plc (formerly,
SSGA Cash Management
Fund plc); January 2009 to
present, Independent Director,
SSGA Fixed Income plc; and
January 2009 – 2019,
Independent Director, SSGA
Qualified Funds PLC. | 63 | Board Director and Chairman,
SPDR Europe 1PLC Board
(2011 – present); Board
Director and Chairman, SPDR
Europe II, PLC (2013 –
present). |
State Street Income V.I.S. Fund
Other Information, continued — December 31, 2021 (Unaudited)
Name,
Address, and
Year of Birth | Position(s) Held
with Fund | Term of
Office and
Length of
Time Served | Principal Occupation
During Past Five Years
and Relevant Experience | Number
of
Funds
in Fund
Complex
Overseen
by
Director† | Other Directorships
Held by Director
During Past Five Years |
| INDEPENDENT DIRECTORS (continued) |
| | | | | |
John R. Costantino
c/o SSGA Funds
Management, Inc.
One Iron Street
Boston, MA 02210
YOB: 1946 | Director
and
Chairperson of
the Qualified Legal
Compliance
Committee | Term:
Indefinite
Elected: 1997 | Senior Advisor to NGN Capital
LLC (January 2019 –
present); Managing General
Partner, NGN Capital LLC
(2006 – December 2019). | 63 | Director of Kleinfeld Bridal
Corp. (January 2016 – present);
Trustee of Neuroscience
Research Institute (1986 – 2017); Trustee of Fordham
University (1989 – 1995 and
2001 – 2007) and Trustee
Emeritus (2007 – present);
Trustee and Independent Chairperson of GE Funds (1993 – February 2011); Director, Muscular Dystrophy Association (since 2019);
Trustee of Gregorian
University Foundation (1992 –
2007); Chairman of the Board of Directors, Vivaldi Biosciences Inc. (May 2017 – present); Chairman of the Supervisory Board, Vivaldi Biosciences AG. (May 2017 – present); Trustee, Gallim Dance (December 2021 – present). |
| | | | | | |
Donna M. Rapaccioli
c/o SSGA Funds
Management, Inc.
One Iron Street
Boston, MA 02210
YOB: 1962 | Director
and
Chairperson of
the Audit Committee | Term:
Indefinite
Appointed: 1/12
Elected: 6/16 | Dean of the Gabelli School of
Business (2007 – present) and
Accounting Professor (1987 –
present) at Fordham
University. | 63 | Director- Graduate
Management Admissions
Council (2015 – present);
Trustee of Emmanuel College
(2010 – 2019). |
| | | | | | |
Richard D. Shirk
c/o SSGA Funds
Management, Inc.
One Iron Street
Boston, MA 02210
YOB: 1945 | Director
and
Chairperson
of the Nominating Committee
Chairperson of the Governance
Committee | Term:
Indefinite
Elected: 1/19 | March 2001 to April 2002,
Chairman (1996 to March
2001, President and Chief
Executive Officer), Cerulean
Companies, Inc. (holding
company) (Retired); 1992 to
March 2001, President and
Chief Executive Officer, Blue
Cross Blue Shield of Georgia
(health insurer,
managed healthcare). | 63 | 1998 to December 2008,
Chairman, Board Member and
December 2008 to present,
Investment Committee
Member, Healthcare Georgia
Foundation (private
foundation); September 2002
to 2012, Lead Director and
Board Member, Amerigroup
Corp. (managed health care);
1999 to 2013, Board Member
and (2001 to 2017) Investment
Committee Member, Woodruff
Arts Center; and 2003 to 2009,
Trustee, Gettysburg College;
Board member, Aerocare
Holdings (2003 – January 2021), Regenesis
Biomedical Inc. (April 2012 – present). |
State Street Income V.I.S. Fund
Other Information, continued — December 31, 2021 (Unaudited)
Name,
Address, and
Year of Birth | Position(s) Held
with Fund | Term of
Office and
Length of
Time Served | Principal Occupation
During Past Five Years
and Relevant Experience | Number
of
Funds
in Fund
Complex
Overseen
by
Director† | Other Directorships
Held by Director
During Past Five Years |
| INDEPENDENT DIRECTORS (continued) |
| | | | | |
Michael A. Jessee
c/o SSGA Funds
Management, Inc.
One Iron Street
Boston, MA 02210
YOB: 1946 | Director
and
Chairperson of the
Valuation Committee | Term:
Indefinite
Elected: 1/19 | Retired; formerly, President
and Chief Executive Officer of
the Federal Home Loan Bank
of Boston (1989 – 2009);
Trustee, Randolph-Macon
College (2004 – 2016). | 63 | None. |
| INTERESTED DIRECTORS(1) |
Ellen M. Needham(2)
SSGA Funds
Management, Inc.
One Iron Street
Boston, MA 02210
YOB: 1967 | Director and
President | Term:
Indefinite
Elected: 1/19 | Chairman, SSGA Funds
Management, Inc. (March
2020 – present); President and
Director, SSGA Funds
Management, Inc. (2001 –
present)*; Senior Managing
Director, State Street Global
Advisors (1992 – present)*;
Manager, State Street Global
Advisors Funds Distributors,
LLC (May 2017 – present). | 63 | Board Director, SSGA
SPDR ETFs Europe 1 plc
(May 2020 – present); Board Director, SSGA SPDR ETFs Europe II plc (May 2020 – present). |
| | | | | |
| (1) | The individual listed above is a Director who is an “interested person,” as defined in the 1940 Act, of the Company (“Interested Director”). |
| (2) | Ms. Needham is an Interested Director because of her employment by SSGA FM, an affiliate of the Company. |
| * | Served in various capacities and/or with various affiliated entities during noted time period. |
| † | For the purpose of determining the number of portfolios overseen by the Directors, “Fund Complex” comprises registered investment companies for which SSGA FM serves as investment adviser. |
State Street Income V.I.S. Fund
Other Information, continued — December 31, 2021 (Unaudited)
The following lists the principal officers for the Company, as well as their mailing addresses and ages, positions with the Company and length of time served, and present and principal occupations:
Name,
Address, and
Year of Birth | Position(s) Held
with Funds | Term of
Office and
Length of
Time Served | Principal Occupation
During Past Five Years |
| OFFICERS: |
Ellen M. Needham
SSGA Funds Management, Inc.
One Iron Street
Boston, MA 02210
YOB: 1967 | President and
Director | Term:
Indefinite
Elected:
4/20 | Chairman, SSGA Funds Management, Inc. (March 2020 – present); President and Director, SSGA Funds Management, Inc. (2001 – present)*; Senior Managing Director, State Street Global Advisors (1992 – present)*; Manager, State Street Global Advisors Funds Distributors, LLC (May 2017 – present). |
| | | | |
Bruce S. Rosenberg
SSGA Funds Management, Inc.
One Iron Street
Boston, MA 02210
YOB: 1961 | Treasurer | Term:
Indefinite
Elected: 4/19 | Managing Director, State Street Global Advisors and SSGA Funds Management, Inc. (July 2015 – present); Director, Credit Suisse (April 2008 – July 2015). |
| | | | |
Ann M. Carpenter
SSGA Funds Management, Inc.
One Iron Street
Boston, MA 02210
YOB: 1966 | Vice President
and Deputy
Treasurer | Term:
Indefinite
Elected: 4/19 | Chief Operating Officer, SSGA Funds Management, Inc. (April 2005 – present)*; Managing Director, State Street Global Advisors (2005 – present).* |
| | | | |
Chad C. Hallett
SSGA Funds Management, Inc.
One Iron Street
Boston, MA 02210
YOB: 1969 | Deputy
Treasurer | Term:
Indefinite
Elected: 4/19 | Vice President, State Street Global Advisors and SSGA Funds Management, Inc. (November 2014 – present); Vice President, State Street Bank and Trust Company (2001 – November 2014).* |
| | | | |
Darlene Anderson-Vasquez
SSGA Funds Management, Inc.
One Iron Street
Boston, MA 02210
YOB: 1968 | Deputy
Treasurer | Term:
Indefinite
Elected: 4/19 | Managing Director, State Street Global Advisors and SSGA Funds Management, Inc. (May 2016 – present); Senior Vice President, John Hancock Investments (September 2007 – May 2016). |
| | | | |
Arthur A. Jensen
SSGA Funds Management, Inc.
1600 Summer Street
Stamford, CT 06905
YOB: 1966 | Deputy
Treasurer | Term:
Indefinite
Elected: 4/19 | Vice President, State Street Global Advisors and SSGA Funds Management, Inc. (July 2016 – present); Controller of GE Asset Management Incorporated (April 2011 – July 2016). |
| | | | |
David K. Lancaster
SSGA Funds Management, Inc.
One Iron Street
Boston, MA 02210
YOB: 1971 | Assistant Treasurer | Term:
Indefinite
Elected: 11/20 | Vice President, State Street Global Advisors and SSGA Funds Management, Inc. (July 2017 – present); Assistant Vice President, State Street Bank and Trust Company (November 2011 – July 2017).* |
State Street Income V.I.S. Fund
Other Information, continued — December 31, 2021 (Unaudited)
Name,
Address, and
Year of Birth | Position(s) Held
with Funds | Term of
Office and
Length of
Time Served | Principal Occupation
During Past Five Years |
| OFFICERS: (continued) |
| | | |
Brian Harris
SSGA Funds Management, Inc.
One Iron Street
Boston, MA 02210
YOB: 1973 | Chief Compliance
Officer, Anti-Money
Laundering Officer
and Code of Ethics
Compliance Officer | Term:
Indefinite Elected: 6/16
Term:
Indefinite Elected: 4/19 | Managing Director, State Street Global Advisors and SSGA Funds Management, Inc. (June 2013 – present).* |
| | | | |
Sean O’Malley
SSGA Funds Management, Inc.
One Iron Street
Boston, MA 02210
YOB: 1969 | Chief Legal Officer | Term:
Indefinite
Elected: 8/19 | Senior Vice President and Deputy General Counsel, State Street Global Advisors (November 2013 – present). |
| | | | |
David Barr
SSGA Funds Management, Inc.
One Iron Street
Boston, MA 02210
YOB: 1974 | Secretary | Term:
Indefinite
Elected: 9/20 | Vice President and Senior Counsel, State Street Global Advisors (October 2019 – present); Vice President and Counsel, Eaton Vance Corp. (October 2010 – October 2019). |
| | | | |
Timothy Collins
SSGA Funds Management, Inc.
One Iron Street
Boston, MA 02210
YOB: 1967 | Assistant
Secretary | Term:
Indefinite
Elected: 9/21 | Vice President and Senior Counsel, State Street Global Advisors (August 2021 – present); Vice President and Managing Counsel, State Street Corporation (March 2020 – August 2021); Vice President and Senior Counsel (April 2018 – March 2020); Counsel, Sutton Place Investments (January 2010 – March 2018). |
| | | | |
David Urman
SSGA Funds Management, Inc.
One Iron Street
Boston, MA 02210
YOB: 1985 | Assistant
Secretary | Term:
Indefinite
Elected: 8/19 | Vice President and Senior Counsel, State Street Global Advisors (April 2019 – present); Vice President and Counsel, State Street Global Advisors (August 2015 – April 2019); Associate, Ropes & Gray LLP (November 2012 – August 2015). |
| | | |
| * | Served in various capacities and/or with various affiliated entities during noted time period. |
[This page intentionally left blank]
[This page intentionally left blank]
Directors
Michael F. Holland, Co-Chairperson
Patrick J. Riley, Co-Chairperson
John R. Costantino
Donna M. Rapaccioli
Michael A. Jessee
Richard D. Shirk
Ellen M. Needham
Officers
Ellen M. Needham, President
Brian Harris, Chief Compliance Officer, Anti-Money Laundering Officer and Code of Ethics Compliance Officer
Sean O’Malley, Chief Legal Officer
Bruce S. Rosenberg, Treasurer
Ann M. Carpenter, Vice President and Deputy Treasurer
Chad C. Hallett, Deputy Treasurer
Arthur A. Jensen, Deputy Treasurer
Darlene Anderson-Vasquez, Deputy Treasurer
David Lancaster, Assistant Treasurer
David Barr, Secretary
Timothy Collins, Assistant Secretary
David Urman, Assistant Secretary
Investment Adviser and Administrator
SSGA Funds Management, Inc.
One Iron Street
Boston, Massachusetts 02210
Custodian and Sub-Administrator
State Street Bank and Trust Company
One Lincoln Street
Boston, Massachusetts 02111
Distributor
State Street Global Advisors Funds Distributors, LLC
One Iron Street
Boston, Massachusetts 02210
Independent Registered Public Accounting Firm
Ernst & Young LLP
200 Clarendon Street
Boston, Massachusetts 02116
Annual Report
December 31, 2021
| State Street Real Estate Securities V.I.S. Fund |
State Street Real Estate Securities V.I.S. Fund
Annual Report
December 31, 2021
| | Page |
| 1 |
| 2 |
| Financial Statements | |
| 8 |
| 9 |
| 10 |
| 11 |
| 12 |
| 18 |
| 19 |
This report is prepared for Policyholders of certain variable contracts and may be distributed to others only if preceded or accompanied by the variable contract’s current prospectus and the current summary prospectus of the Fund available for investments thereunder.
[This page intentionally left blank]
State Street Real Estate Securities V.I.S. Fund
Notes to Performance — December 31, 2021 (Unaudited)
The information provided on the performance page relates to the State Street Real Estate Securities V.I.S Fund (the “Fund”).
Total return performance shown in this report for the Fund takes into account changes in share price and assumes reinvestment of dividends and capital gains distributions, if any. Total returns shown are net of Fund fees and expenses but do not reflect fees and charges associated with the variable contracts such as administrative fees, account charges and surrender charges, which, if reflected, would reduce the Fund’s total returns for all periods shown.
The performance data quoted represents past performance; past performance does not guarantee future results. Investment return and principal value will fluctuate so your shares, when redeemed, may be worth more or less than their original cost. Current performance may be higher or lower than the performance data quoted. Periods less than one year are not annualized. Please call toll-free (800) 242-0134 or visit the Fund’s website at www.ssga.com for the most recent month-end performance data.
An investment in the Fund is not a deposit of any bank and is not insured or guaranteed by the Federal Deposit Insurance Corporation (“FDIC”) or any other government agency. An investment in the Fund is subject to risk, including possible loss of principal invested.
FTSE NAREIT Equity REITs Index is an unmanaged index of all tax-qualified equity real estate investment trusts (“REITs”) listed on the New York Stock Exchange, NYSE Amex and NASDAQ which have 75% or more of their gross invested book assets invested directly or indirectly in the equity ownership of real estate. The returns of the index do not reflect the actual cost of investing in the instruments that comprise the index.
The views expressed in this document reflect our judgment as of the publication date and are subject to change at any time without notice.
State Street Global Advisors Funds Distributors, LLC, member of FINRA & SIPC is the principal underwriter and distributor of the State Street Real Estate Securities V.I.S. Fund and an indirect wholly-owned subsidiary of State Street Corporation. References to State Street may include State Street Corporation and its affiliates. The Funds pay State Street Bank and Trust Company for its services as custodian and Fund Accounting agent, and pay SSGA Funds Management, Inc. ("SSGA FM" or the "Adviser") for investment advisory and administrative services.
State Street Real Estate Securities V.I.S. Fund
Management's Discussion of Fund Performance — December 31, 2021 (Unaudited)
The State Street Real Estate Securities V.I.S. Fund (the “Fund”) seeks maximum total return through current income and capital appreciation by investing at least 80% of its net assets under normal circumstances in common and preferred stocks and other types of equity securities and debt securities of U.S. issuers that are principally engaged in or related to the real estate industry, including those that own significant real estate assets. The Fund’s benchmark is the FTSE NAREIT Equity REITs Index (the “Index”).
For the year ended December 31, 2021 (the “Reporting Period”), the total return for the Fund was 41.80%, and the Index was 43.24%. The Fund and Index returns reflect the reinvestment of dividends and other income. The Fund’s performance reflects the expenses of managing the Fund, including brokerage and advisory expenses. The Index is unmanaged and Index returns do not reflect fees and expenses of any kind, which would have a negative impact on returns.
The U.S. REIT market had its highest absolute total return year ever in 2021 and outperformed the broad equities benchmark in each quarter of the year. The re-opening trade early in the year following the COVID-19 vaccine news and distribution led to a rapidly improving economic environment. As the Delta wave of the pandemic ebbed and the early evidence from the Omicron variant began to suggest a far less virulent though far more contagious phase of the illness, investor focus returned to the strong economic growth and recovery. The correspondingly sharp rebound of commercial real estate operating trends of rising occupancy and rental rates proved highly beneficial for REIT stock prices in 2021.
All property sectors and over three quarters of all REITs produced double digit total returns during the year. REIT sector total returns were led by regional malls, shopping centers, apartments, which first saw their fortunes turn early in the year and then continued to rise throughout the year. Regional malls, the leading property sector in 2021 returned more than 90%. Residential REITs in all forms, including apartments, single family rentals, or manufactured housing posted above-average returns. Economic reopening and a boom in household formation after the worst of the pandemic drove demand for living arrangements among white-collar professionals, boosting rents and occupancy rates. The pandemic-triggered changes in living patterns also continued to drive demand for the self-storage sector which returned nearly 80%.
Sector selection was a positive contributor to Fund performance in the Reporting Period. Sector selection outperformance was generated by an overweight to shopping centers and alternative housing, and an underweight to the net lease and healthcare sectors. This was partially offset by an underweight to regional malls and an overweight to towers. Stock selection was a detractor of relative performance.
Stock selection within the health care, data center and office sectors dragged on relative performance. The largest positive individual stock contributors to the Fund’s absolute total return were Prologis, Invitation Homes, and Life Storage. The top negative contributors to absolute performance were Sabra Healthcare, Americold Realty Trust, and Hudson Pacific Properties.
The Fund did not invest in derivatives during the Reporting Period.
The views expressed above reflect those of the Fund’s portfolio manager only through the Reporting Period, and do not necessarily represent the views of the Adviser as a whole. Any such views are subject to change at any time based upon market or other conditions and the Adviser disclaims any responsibility to update such views. These views may not be relied on as investment advice and, because investment decisions for a fund are based on numerous factors, may not be relied on as an indication of trading intent on behalf of any fund.
| 2 | State Street Real Estate Securities V.I.S. Fund |
State Street Real Estate Securities V.I.S. Fund
Performance Summary — December 31, 2021 (Unaudited)
| Sector Allocation |
| Portfolio composition as a % of Fair Value of $45,735 (in thousands) as of December 31, 2021 (a)(b) |
| Top Ten Largest Holdings |
| as of December 31, 2021 (as a % of Fair Value) (a)(b) |
| Prologis Inc. | 8.52% |
| Equinix Inc. | 6.55% |
| Invitation Homes Inc. | 4.75% |
| Public Storage | 4.54% |
| AvalonBay Communities Inc. | 4.19% |
| Equity Residential | 3.50% |
| Digital Realty Trust Inc. | 3.34% |
| Ventas Inc. | 3.26% |
| UDR Inc. | 3.18% |
| Sun Communities Inc. | 3.12% |
| Average Annual Total Return for the years ended December 31, 2021 |
| Class 1 Shares (Inception date 5/1/95) |
| | One Year | | Five Year | | Ten Year | | Ending Value
of a $10,000
Investment |
| State Street Real Estate Securities V.I.S. Fund | 41.80% | | 11.09% | | 11.68% | | $30,195 |
| FTSE NAREIT Equity REITs Index | 43.24% | | 10.75% | | 11.38% | | $29,379 |
|
| (a) | Fair Value basis is inclusive of a short-term investment in the State Street Institutional U.S. Government Money Market Fund Class G Shares. |
| (b) | The securities information regarding holdings, allocations and other characteristics is presented to illustrate examples of securities that the Fund has bought and the diversity of areas in which the Fund may invest as of a particular date. It may not be representative of the Fund’s current or future investments and should not be construed as a recommendation to purchase or sell a particular security. |
| State Street Real Estate Securities V.I.S. Fund | 3 |
State Street Real Estate Securities V.I.S. Fund
Performance Summary, continued — December 31, 2021 (Unaudited)
Change in Value of a $10,000 Investment
Yearly periods ended December 31
See Notes to Performance beginning on page 1 for further information.
Past performance does not predict future performance. The performance shown in the graphs and tables does not reflect the deduction of taxes that a shareholder would pay on Fund distributions or the redemption of Fund shares and does not reflect the fees or charges that would be associated with variable contracts through which shares of the Fund are offered.
| 4 | State Street Real Estate Securities V.I.S. Fund |
State Street Real Estate Securities V.I.S. Fund
Understanding Your Fund’s Expenses — December 31, 2021 (Unaudited)
As a shareholder of the Fund, you incur ongoing costs. Ongoing costs include portfolio management fees, professional fees, administrative fees and other Fund expenses. The following example is intended to help you understand your ongoing costs (in dollars) of investing in the Fund and to compare these costs with the ongoing costs of investing in other mutual funds.
To illustrate these ongoing costs, we have provided an example and calculated the expenses paid by investors of the Fund during the period. The information in the following table is based on an investment of $1,000, which is invested at the beginning of the period and held for the entire six-month period ended December 31, 2021.
Actual Expenses
The first section of the table provides information about actual account values and actual expenses. You may use the information in this section, together with the amount you invested, to estimate the expenses that you paid over the period. To do so, simply divide your account value by $1,000 (for example, an $8,600 account value divided by $1,000 = 8.6), then multiply the result by the number given under the heading “Expenses paid during the period” to estimate the expenses you paid on your account during the period.
Hypothetical Example for Comparison Purposes
The second section of the table provides information about hypothetical account values and hypothetical expenses based on the Fund’s actual expense ratio and an assumed rate of return of 5% per year before expenses, which is not the Fund’s actual return. The hypothetical account values and expenses may not be used to estimate the actual ending account balance or expenses you paid for the period. You may use this information to compare the ongoing costs of investing in the Fund and other funds. To do so, compare this 5% hypothetical example with the 5% hypothetical examples that appear in the shareholder reports of other funds.
Please note that the expenses shown in the table are meant to highlight and help you compare ongoing costs only and do not reflect transaction costs, such as sales charges or redemption fees, if any. Therefore, the second section of the table is useful in comparing ongoing costs only, and will not help you determine the relative total costs of owning different funds. Additionally, the expenses shown do not reflect the fees or charges associated with variable contracts through which shares of the Fund are offered.
| | Actual
Fund Return | | Hypothetical
5% Return
(2.5% for
the period) |
Beginning Account Value
July 1, 2021 | $1,000.00 | | $1,000.00 |
Ending Account value
December 31, 2021 | $1,166.70 | | $1,019.90 |
| Expenses Paid During Period* | $ 5.79 | | $ 5.40 |
| * | Expenses are equal to the Fund's annualized expense ratio of 1.06%** (for the period July 1, 2021 - December 31, 2021), multiplied by the average account value over the period, multiplied by 184/365 (to reflect the one-half year period). |
| ** | May differ from expense ratio disclosed in the financial highlights, which is calculated based on the entire fiscal year's data. |
| State Street Real Estate Securities V.I.S. Fund | 5 |
State Street Real Estate Securities V.I.S. Fund
Schedule of Investments — December 31, 2021
| | Number
of Shares | Fair
Value |
| Common Stock (REITs) - 99.3% † |
| Alternate Housing - 9.8% |
| American Campus Communities Inc. | 15,681 | $ 898,365 |
| Invitation Homes Inc. | 47,953 | 2,174,189 |
| Sun Communities Inc. | 6,794 | 1,426,536 |
| | | 4,499,090 |
| Data Center - 9.9% |
| Digital Realty Trust Inc. | 8,630 | 1,526,388 |
| Equinix Inc. | 3,545 | 2,998,503 |
| | | 4,524,891 |
| Diversified - 0.8% |
| Veris Residential Inc. (a) | 20,881 | 383,793 |
| Healthcare - 11.3% |
| Diversified Healthcare Trust | 27,081 | 83,680 |
| Healthpeak Properties Inc. | 24,488 | 883,772 |
| Medical Properties Trust Inc. | 42,899 | 1,013,704 |
| Omega Healthcare Investors Inc. | 7,280 | 215,415 |
| Sabra Health Care REIT Inc. | 33,156 | 448,932 |
| Ventas Inc. | 29,167 | 1,491,017 |
| Welltower Inc. | 12,100 | 1,037,817 |
| | | 5,174,337 |
| Hotel - 3.1% |
| Apple Hospitality REIT Inc. | 8,527 | 137,711 |
| Host Hotels & Resorts Inc. (a) | 33,570 | 583,782 |
| Park Hotels & Resorts Inc. (a) | 14,585 | 275,365 |
| Xenia Hotels & Resorts Inc. (a) | 23,759 | 430,275 |
| | | 1,427,133 |
| Industrial - 16.6% |
| Americold Realty Trust | 17,786 | 583,203 |
| Duke Realty Corp. | 21,609 | 1,418,415 |
| First Industrial Realty Trust Inc. | 9,282 | 614,468 |
| Prologis Inc. | 23,140 | 3,895,850 |
| Rexford Industrial Realty Inc. | 13,210 | 1,071,463 |
| | | 7,583,399 |
| Multifamily - 13.9% |
| AvalonBay Communities Inc. | 7,586 | 1,916,148 |
| Equity Residential | 17,698 | 1,601,669 |
| Essex Property Trust Inc. | 904 | 318,416 |
| Independence Realty Trust Inc. | 12,080 | 312,026 |
| Mid-America Apartment Communities Inc. | 3,400 | 780,096 |
| | Number
of Shares | Fair
Value |
| UDR Inc. | 24,214 | $ 1,452,598 |
| | | 6,380,953 |
| Net Lease - 4.9% |
| Agree Realty Corp. | 15,010 | 1,071,114 |
| Four Corners Property Trust Inc. | 8,573 | 252,132 |
| Realty Income Corp. | 9,268 | 663,496 |
| STORE Capital Corp. | 7,365 | 253,356 |
| | | 2,240,098 |
| Office - 7.0% |
| Alexandria Real Estate Equities Inc. | 1,860 | 414,706 |
| Cousins Properties Inc. | 14,640 | 589,699 |
| Empire State Realty Trust Inc., Class A | 14,993 | 133,438 |
| Hudson Pacific Properties Inc. | 20,100 | 496,671 |
| JBG SMITH Properties | 17,646 | 506,617 |
| Kilroy Realty Corp. | 11,720 | 778,911 |
| SL Green Realty Corp. | 3,050 | 218,685 |
| WeWork Inc. (a) | 6,334 | 54,472 |
| | | 3,193,199 |
| Regional Malls - 3.0% |
| Simon Property Group Inc. | 8,580 | 1,370,826 |
| Self Storage - 8.7% |
| Extra Space Storage Inc. | 2,560 | 580,429 |
| Life Storage Inc. | 8,472 | 1,297,741 |
| Public Storage | 5,550 | 2,078,808 |
| | | 3,956,978 |
| Shopping Centers - 5.2% |
| Acadia Realty Trust | 21,750 | 474,802 |
| Brixmor Property Group Inc. | 46,499 | 1,181,540 |
| Kite Realty Group Trust | 12,390 | 269,854 |
| Phillips Edison & Company Inc. | 5,619 | 185,652 |
| RPT Realty | 19,810 | 265,058 |
| | | 2,376,906 |
| Specialty - 5.1% |
| American Tower Corp. | 962 | 281,385 |
| EPR Properties | 6,370 | 302,511 |
| MGM Growth Properties LLC, Class A | 16,400 | 669,940 |
| Outfront Media Inc. | 11,818 | 316,959 |
| VICI Properties Inc. | 24,580 | 740,104 |
| | | 2,310,899 |
See Notes to Schedule of Investments and Notes to Financial Statements.
| 6 | State Street Real Estate Securities V.I.S. Fund |
State Street Real Estate Securities V.I.S. Fund
Schedule of Investments, continued — December 31, 2021
| | Number
of Shares | Fair
Value |
Total Common Stock (REITs)
(Cost $34,334,258) | | 45,422,502 |
| Short-Term Investments - 0.7% |
State Street Institutional U.S. Government Money Market Fund - Class G Shares 0.03% (b)(c)
(Cost $312,731) | 312,731 | $ 312,731 |
Total Investments
(Cost $34,646,989) | | 45,735,233 |
| Other Assets and Liabilities, net - 0.0% | | 12,618 |
| NET ASSETS - 100.0% | | $ 45,747,851 |
Notes to Schedule of Investments
The views expressed in this document reflect our judgment as of the publication date and are subject to change at any time without notice. The securities cited
may not be representative of the Fund’s future investments and should not be construed as a recommendation to purchase or sell a particular security. See the Fund’s summary prospectus and statutory prospectus for complete descriptions of investment objectives, policies, risks and permissible investments.
| (a) | Non-income producing security. |
| (b) | Sponsored by SSGA Funds Management, Inc., the Fund’s investment adviser and administrator, and an affiliate of State Street Bank & Trust Co., the Fund’s sub-administrator, custodian and accounting agent. |
| (c) | Coupon amount represents effective yield. |
| † | Percentages are based on net assets as of December 31, 2021. |
| Abbreviations: |
| REIT - Real Estate Investment Trust |
The following table presents the Fund’s investments measured at fair value on a recurring basis at December 31, 2021:
| Investments | Level 1 | | Level 2 | | Level 3 | | Total |
| Investments in Securities | | | | | | | |
| Common Stock | $ 45,422,502 | | $ — | | $ — | | $ 45,422,502 |
| Short-Term Investments | 312,731 | | — | | — | | 312,731 |
| Total Investments in Securities | $ 45,735,233 | | $ — | | $ — | | $ 45,735,233 |
| | Number
of Shares
Held at
12/31/20 | Value at
12/31/20 | Cost of
Purchases | Proceeds
from
Shares
Sold | Realized
Gain
(Loss) | Change in
Unrealized
Appreciation
(Depreciation) | Number of
Shares
Held at
12/31/21 | Value at
12/31/21 | Dividend
Income |
| State Street Institutional U.S. Government Money Market Fund - Class G Shares | 140,904 | $140,904 | $18,525,516 | $18,353,689 | $— | $— | 312,731 | $312,731 | $78 |
See Notes to Schedule of Investments and Notes to Financial Statements.
| State Street Real Estate Securities V.I.S. Fund | 7 |
State Street Real Estate Securities V.I.S. Fund
Financial Highlights
Selected data based on a share outstanding throughout the fiscal years indicated
| | 12/31/21 | | 12/31/20 | | 12/31/19 | | 12/31/18 | | 12/31/17 |
| Inception date | | | 5/1/95 |
| Net asset value, beginning of period | $ 12.02 | | $ 12.92 | | $ 11.14 | | $ 12.32 | | $ 12.37 |
| Income/(loss) from investment operations: | | | | | | | | | |
| Net investment income | 0.13 (a) | | 0.17 (a) | | 0.25 (a) | | 0.25 (a) | | 0.15 (a) |
| Net realized and unrealized gains/(losses) on investments | 4.85 | | (0.85) | | 2.65 | | (0.95) | | 0.57 |
| Total income/(loss) from investment operations | 4.98 | | (0.68) | | 2.90 | | (0.70) | | 0.72 |
| Less distributions from: | | | | | | | | | |
| Net investment income | 0.34 | | 0.06 | | 0.19 | | 0.28 | | 0.22 |
| Net realized gains | 2.77 | | 0.16 | | 0.93 | | 0.16 | | 0.55 |
| Return of capital | — | | — | | — | | 0.04 | | — |
| Total distributions | 3.11 | | 0.22 | | 1.12 | | 0.48 | | 0.77 |
| Net asset value, end of period | $ 13.89 | | $ 12.02 | | $ 12.92 | | $ 11.14 | | $ 12.32 |
| Total Return(b) | 41.80% | | (5.23)% | | 26.15% | | (5.71)% | | 5.84% |
| Ratios/Supplemental Data: | | | | | | | | | |
| Net assets, end of period (in thousands) | $45,748 | | $47,588 | | $55,266 | | $50,360 | | $61,685 |
| Ratios to average net assets: | | | | | | | | | |
| Net expenses | 1.04% | | 1.04% | | 1.04% | | 1.05% | | 1.01% |
| Gross expenses | 1.04% | | 1.04% | | 1.04% | | 1.05% | | 1.01% |
| Net investment income | 0.93% | | 1.49% | | 1.91% | | 2.11% | | 1.16% |
| Portfolio turnover rate | 85% | | 108% | | 72% | | 59% | | 73% |
| Notes to Financial Highlights |
| (a) | Per share values have been calculated using the average shares method. |
| (b) | Total returns are historical and assume changes in share price, reinvestment of dividends and capital gains distributions and do not include the effect of insurance contract charges. Past performance does not guarantee future results. |
The accompanying Notes are an integral part of these financial statements.
State Street Real Estate Securities V.I.S. Fund
Statement of Assets and Liabilities — December 31, 2021
| Assets | |
| Investments in securities, at fair value (cost $34,334,258) | $ 45,422,502 |
| Short-term affiliated investments, at fair value | 312,731 |
| Receivable for investments sold | 219,559 |
| Income receivables | 137,175 |
| Receivable for fund shares sold | 17,066 |
| Income receivable from affiliated investments | 5 |
| Other assets | 281 |
| Total assets | 46,109,319 |
| Liabilities | |
| Payable for investments purchased | 283,025 |
| Payable for fund shares redeemed | 97 |
| Payable to the Adviser | 31,479 |
| Payable for custody, fund accounting and sub-administration fees | 4,075 |
| Accrued other expenses | 42,792 |
| Total liabilities | 361,468 |
|
| Net Assets | $ 45,747,851 |
| Net Assets Consist of: | |
| Capital paid in | $ 33,310,616 |
| Total distributable earnings (loss) | 12,437,235 |
| Net Assets | $ 45,747,851 |
| Shares outstanding ($0.01 par value, unlimited shares authorized) | 3,293,911 |
| Net asset value per share | $ 13.89 |
The accompanying Notes are an integral part of these financial statements.
| Statement of Assets and Liabilities | 9 |
State Street Real Estate Securities V.I.S. Fund
Statement of Operations — For the year ended December 31, 2021
| Investment Income | |
| Income | |
| Dividend | $ 864,474 |
| Income from affiliated investments | 78 |
| Total income | 864,552 |
| Expenses | |
| Advisory and administration fees | 372,948 |
| Directors' fees | 18,806 |
| Custody, fund accounting and sub-administration fees | 22,204 |
| Professional fees | 31,368 |
| Printing and shareholder reports | 4,869 |
| Other expenses | 7,780 |
| Total expenses | 457,975 |
| Net investment income | $ 406,577 |
| Net Realized and Unrealized Gain (Loss) on Investments | |
| Realized gain (loss) on investments | $ 11,695,794 |
| Increase (decrease) in unrealized appreciation/(depreciation) on investments | 4,246,157 |
| Net realized and unrealized gain (loss) on investments | 15,941,951 |
| Net Increase in Net Assets Resulting from Operations | $ 16,348,528 |
The accompanying Notes are an integral part of these financial statements.
| 10 | Statement of Operations |
State Street Real Estate Securities V.I.S. Fund
Statements of Changes in Net Assets
| | Year Ended
December 31,
2021 | | Year Ended
December 31,
2020 |
| Increase (Decrease) in Net Assets | | | |
| Operations: | | | |
| Net investment income | $ 406,577 | | $ 694,365 |
| Net realized gain (loss) on investments | 11,695,794 | | (2,776,009) |
| Net increase (decrease) in unrealized appreciation/depreciation on investments | 4,246,157 | | (227,369) |
| Net increase (decrease) from operations | 16,348,528 | | (2,309,013) |
| Distributions to shareholders: | | | |
| Total distributions | (8,362,555) | | (867,566) |
| Increase (decrease) in assets from operations and distributions | 7,985,973 | | (3,176,579) |
| Share transactions: | | | |
| Proceeds from sale of shares | 11,353,657 | | 3,618,392 |
| Value of distributions reinvested | 8,362,555 | | 867,566 |
| Cost of shares redeemed | (29,542,653) | | (8,986,932) |
| Net increase (decrease) from share transactions | (9,826,441) | | (4,500,974) |
| Total increase (decrease) in net assets | (1,840,468) | | (7,677,553) |
| Net Assets | | | |
| Beginning of year | 47,588,319 | | 55,265,872 |
| End of year | $ 45,747,851 | | $ 47,588,319 |
| Changes in Fund Shares | | | |
| Shares sold | 725,416 | | 369,554 |
| Issued for distributions reinvested | 612,193 | | 72,782 |
| Shares redeemed | (2,003,348) | | (761,607) |
| Net decrease in fund shares | (665,739) | | (319,271) |
The accompanying Notes are an integral part of these financial statements.
| Statements of Changes in Net Assets | 11 |
State Street Real Estate Securities V.I.S. Fund
Notes to Financial Statements — December 31, 2021
1. Organization of the Company
State Street Variable Insurance Series Funds, Inc. (the “Company”) was incorporated under the laws of the Commonwealth of Virginia on May 14, 1984 and is registered under the Investment Company Act of 1940, as amended (the “1940 Act”), as an open-end management investment company. The Company is currently composed of the following seven investment portfolios (collectively, the “Funds”): State Street U.S. Equity V.I.S. Fund, State Street S&P 500 Index V.I.S. Fund, State Street Premier Growth Equity V.I.S. Fund, State Street Small-Cap Equity V.I.S. Fund, State Street Total Return V.I.S. Fund, State Street Income V.I.S. Fund and State Street Real Estate Securities V.I.S. Fund (the “Fund”). Each Fund is a diversified investment company within the meaning of the 1940 Act, except for the State Street Premier Growth Equity V.I.S. Fund, which is a non-diversified company.
Shares of the Funds of the Company are offered only to insurance company separate accounts that fund certain variable life insurance contracts and variable annuity contracts.
The Company currently offers one share class (Class 1) of the Fund as an investment option for variable life insurance and variable annuity contracts.
Under the Company’s organizational documents, its officers and directors are indemnified against certain liabilities arising out of the performance of their duties to the Company. Additionally, in the normal course of business, the Company enters into contracts with service providers that contain general indemnification clauses. The Company’s maximum exposure under these arrangements is unknown as this would involve future claims that may be made against the Company that have not yet occurred.
2.Summary of Significant Accounting Policies
The following is a summary of significant accounting policies followed by the Company in the preparation of its financial statements:
The preparation of financial statements in accordance with U.S. generally accepted accounting principles (“U.S. GAAP”) requires management to make estimates and assumptions that affect the reported amounts and disclosures in the financial statements. Actual results could differ from those estimates. The Fund is an investment company under U.S. GAAP and follows the accounting and reporting guidance applicable to investment companies.
Security Valuation The Fund’s investments are valued at fair value each day that the New York Stock Exchange (“NYSE”) is open and, for financial reporting purposes, as of the report date should the reporting period end on a day that the NYSE is not open. Fair value is generally defined as the price a fund would receive to sell an asset or pay to transfer a liability in an orderly transaction between market participants at the measurement date. By its nature, a fair value price is a good faith estimate of the valuation in a current sale and may not reflect an actual market price. The investments of the Fund are valued pursuant to the policy and procedures developed by the Oversight Committee (the “Committee”) and approved by the Company's Board of Directors (the “Board”). The Committee provides oversight of the valuation of investments for the Fund. The Board has responsibility for overseeing the determination of the fair value of investments.
Valuation techniques used to value the Fund’s investments by major category are as follows:
| • | Equity investments traded on a recognized securities exchange for which market quotations are readily available are valued at the last sale price or official closing price, as applicable, on the primary market or exchange on which they trade. Equity investments traded on a recognized exchange for which there were no sales on that day are valued at the last published sale price or at fair value. |
| • | Investments in registered investment companies (including money market funds) or other unitized pooled investment vehicles that are not traded on an exchange are valued at that day’s published net asset value (“NAV”) per share or unit. |
| 12 | Notes to Financial Statements |
State Street Real Estate Securities V.I.S. Fund
Notes to Financial Statements, continued — December 31, 2021
In the event prices or quotations are not readily available or that the application of these valuation methods results in a price for an investment that is deemed to be not representative of the fair value of such investment, fair value will be determined in good faith by the Committee, in accordance with the valuation policy and procedures approved by the Board.
The Fund values its assets and liabilities at fair value using a fair value hierarchy consisting of three broad levels that prioritize the inputs to valuation techniques giving the highest priority to readily available unadjusted quoted prices in active markets for identical assets or liabilities (Level 1 measurements) and the lowest priority to unobservable inputs (Level 3 measurements) when market prices are not readily available or reliable. The categorization of a value determined for an investment within the hierarchy is based upon the pricing transparency of the investment and is not necessarily an indication of the risk associated with investing in it.
The three levels of the fair value hierarchy are as follows:
| • | Level 1 — Unadjusted quoted prices in active markets for an identical asset or liability; |
| • | Level 2 — Inputs other than quoted prices included within Level 1 that are observable for the asset or liability either directly or indirectly, including quoted prices for similar assets or liabilities in active markets, quoted prices for identical or similar assets or liabilities in markets that are not considered to be active, inputs other than quoted prices that are observable for the asset or liability (such as exchange rates, financing terms, interest rates, yield curves, volatilities, prepayment speeds, loss severities, credit risks and default rates) or other market-corroborated inputs; and |
| • | Level 3 — Unobservable inputs for the asset or liability, including the Committee’s assumptions used in determining the fair value of investments. |
The value of the Fund’s investments according to the fair value hierarchy as of December 31, 2021 is disclosed in the Fund’s Schedule of Investments.
Investment Transactions and Income Recognition Investment transactions are accounted for on trade date for financial reporting purposes. Realized gains and losses from the sale or disposition of investments and foreign exchange transactions, if any, are determined using the identified cost method.
Dividend income and capital gain distributions, if any, are recognized on the ex-dividend date, net of any foreign taxes withheld at source, if any.
Interest income is recorded daily on an accrual basis. All premiums and discounts are amortized/accreted for financial reporting purposes.
Non-cash dividends received in the form of stock are recorded as dividend income at fair value.
The Fund invests in real estate investment trusts (“REITs”). REITs determine the tax character of their distributions annually and may characterize a portion of their distributions as a return of capital or capital gain. The Fund’s policy is to record all REIT distributions initially as dividend income and re-designate a portion to return of capital or capital gain distributions at year-end based on information provided by the REIT and/or SSGA Funds Management, Inc.’s (the “Adviser” or “SSGA FM”) estimates of such re-designations for which actual information has not yet been reported. Non-cash dividends received in the form of stock are recorded as dividend income at fair value
Expenses Certain expenses, which are directly identifiable to a specific Fund, are applied to the Fund within the Company. Other expenses which cannot be attributed to a specific Fund are allocated in such a manner as deemed equitable, taking into consideration the nature and type of expense and the relative net assets of the Fund within the Company.
Foreign Currency Translation The accounting records of the Fund are maintained in U.S. dollars. Foreign currencies as well as investment securities and other assets and liabilities denominated in a foreign currency are translated to U.S. dollars using exchange rates at period end. Purchases and sales of securities, income receipts
| Notes to Financial Statements | 13 |
State Street Real Estate Securities V.I.S. Fund
Notes to Financial Statements, continued — December 31, 2021
and expense payments denominated in foreign currencies are translated into U.S. dollars at the prevailing exchange rate on the respective dates of the transactions.
The effects of exchange rate fluctuations on investments are included with the net realized and unrealized gain (loss) on investment securities. Other foreign currency transactions resulting in realized and unrealized gain (loss) are disclosed separately.
Foreign Taxes The Fund may be subject to foreign taxes (a portion of which may be reclaimable) on income, stock dividends, realized and unrealized capital gains on investments or certain foreign currency transactions. Foreign taxes are recorded in accordance with SSGA FM's understanding of the applicable foreign tax regulations and rates that exist in the foreign jurisdictions in which the Fund invests. These foreign taxes, if any, are paid by the Fund and are reflected in the Statement of Operations, if applicable. Foreign taxes payable or deferred as of December 31, 2021, if any, are disclosed in the Fund’s Statement of Assets and Liabilities.
Distributions The Fund declares and pays any dividends from net investment income annually.
Net realized capital gains, if any, are distributed annually, unless additional distributions are required for compliance with applicable tax regulations. The amount and character of income and capital gains to be distributed are determined in accordance with applicable tax regulations which may differ from net investment income and realized gains recognized for U.S. GAAP purposes.
3.Fees and Transactions with Affiliates
Advisory Fee SSGA FM, a registered investment adviser, was retained by the Board to act as investment adviser and administrator of the Fund. SSGA FM’s compensation for investment advisory and administrative services (“Management Fee”) is paid monthly based on the average daily net assets of the Fund. The Management Fee is stated in the following schedule:
Average Daily
Net Assets of the Fund | Management Fee |
| First $100 million | 0.85% |
| Next $100 million | 0.80% |
| Over $200 million | 0.75% |
Custody, Fund Accounting and Sub-Administration Fees State Street Bank and Trust Company (“State Street”) serves as the custodian, fund accountant and sub-administrator to the Fund. Amounts paid by the Fund to State Street for performing such services are included as custody, fund accounting and sub-administration fees in the Statement of Operations.
Other Transactions with Affiliates The Fund may invest in affiliated entities, including securities issued by State Street Corporation, affiliated funds, or entities deemed to be affiliates as a result of the Fund owning more than five percent of the entity’s voting securities or outstanding shares. Amounts relating to these transactions during the fiscal year ended December 31, 2021 are disclosed in the Schedule of Investments.
4.Sub-Advisory Fees
Pursuant to an investment sub-advisory agreement with SSGA FM, CenterSquare Investment Management LLC (“CenterSquare”) is the sub-adviser to the Fund. CenterSquare is responsible for the day-to-day portfolio management of the assets of the Fund, including the responsibility for making decisions to buy, sell or hold a particular security, under the general supervision of SSGA FM and the Board. For its services, SSGA FM pays CenterSquare monthly sub-advisory fees which are calculated as a percentage of the average daily net assets of the Fund.
| 14 | Notes to Financial Statements |
State Street Real Estate Securities V.I.S. Fund
Notes to Financial Statements, continued — December 31, 2021
5.Directors’ Fees
The fees and expenses of the Company’s directors who are not “interested persons” of the Company, as defined in the 1940 Act (“Independent Directors”), are paid directly by the Fund. The Independent Directors are reimbursed for travel and other out-of-pocket expenses in connection with meeting attendance and industry seminars.
6.Investment Transactions
Purchases and sales of investments (excluding in-kind transactions, short term investments and derivative contracts) for the fiscal year ended December 31, 2021 were as follows:
| Non-U.S. Government Securities |
| Purchases | Sales |
| $ 36,830,967 | $ 54,250,838 |
7.Income Taxes
The Fund has qualified and intends to continue to qualify as a regulated investment company under Subchapter M of the Internal Revenue Code of 1986, as amended. The Fund will not be subject to federal income taxes to the extent it distributes its taxable income, including any net realized capital gains, for each fiscal year. Therefore, no provision for federal income tax is required.
The Fund files federal and various state and local tax returns as required. No income tax returns are currently under examination. Generally, the federal returns are subject to examination by the Internal Revenue Service for a period of three years from date of filing, while the state returns may remain open for an additional year depending upon jurisdiction. SSGA FM has analyzed the Fund’s tax positions taken on tax returns for all open years and does not believe there are any uncertain tax positions that would require recognition of a tax liability.
Distributions to shareholders are recorded on ex-dividend date. Income dividends and gain distributions are determined in accordance with income tax rules and regulations, which may differ from generally accepted accounting principles. Certain capital accounts in the financial statements have been adjusted for permanent book-tax differences. These adjustments have no impact on NAVs or results of operations. Temporary book-tax differences will reverse in the future. These book-tax differences are primarily due to differing treatments for wash sale loss deferrals.
The tax character of distributions paid during the fiscal year ended December 31, 2021 were as follows:
Ordinary
Income | Long-Term
Capital Gains | Total |
| $ 2,814,660 | $ 5,547,895 | $ 8,362,555 |
The tax character of distributions paid during the fiscal year ended December 31, 2020 was as follows:
Ordinary
Income | Long-Term
Capital Gains | Total |
| $ 281,496 | $ 586,070 | $ 867,566 |
At December 31, 2021, the components of distributable earnings on a tax basis were as follows:
Undistributed
Ordinary
Income | Tax Exempt
Income | Capital Loss
Carryforwards | Undistributed
long term
gain | Net
Unrealized
Gains
(Losses) | Qualified
Late-Year
Losses | Total |
| $ 466,504 | $ — | $ — | $ 1,302,055 | $ 10,668,676 | $ — | $ 12,437,235 |
| Notes to Financial Statements | 15 |
State Street Real Estate Securities V.I.S. Fund
Notes to Financial Statements, continued — December 31, 2021
As of December 31, 2021, gross unrealized appreciation and gross unrealized depreciation of investments and other financial instruments based on cost for federal income tax purposes were as follows:
Tax
Cost | Gross
Unrealized
Appreciation | Gross
Unrealized
Depreciation | Net
Unrealized
Appreciation
(Depreciation) |
| $ 35,066,557 | $ 11,020,462 | $ 351,786 | $ 10,668,676 |
8.Line of Credit
The Fund and other affiliated funds (each, a “Participant” and collectively, the “Participants”) have access to $200 million of a $1.1 billion revolving credit facility provided by a syndication of banks under which the Participants may borrow to fund shareholder redemptions. This agreement expires in October 2022 unless extended or renewed.
The Participants are charged an annual commitment fee which is calculated based on the unused portion of the shared credit line. Commitment fees are allocated among each of the Participants based on relative net assets. Commitment fees are ordinary fund operating expenses. A Participant incurs and pays the interest expense related to its borrowing. Interest is calculated at a rate per annum equal to the sum of 1.00% plus the greater of the New York Fed Bank Rate and the one-month SOFR Rate.
Prior to October 7, 2021 the Fund had access to $200 million of a $500 million revolving credit facility and interest was calculated at a rate per annum equal to the sum of 1.25% plus the New York Fed Bank Rate.
The Fund had no outstanding loans as of December 31, 2021.
9.Risks
Concentration Risk As a result of the Fund’s ability to invest a large percentage of its assets in obligations of issuers within the same country, state, region, currency or economic sector, an adverse economic, business or political development may affect the value of the Fund’s investments more than if the Fund were more broadly diversified.
Credit Risk The Fund may be exposed to credit risk in the event that an issuer or guarantor fails to perform or that an institution or entity with which the Fund has unsettled or open transactions defaults.
Market Risk The Fund’s investments are subject to changes in general economic conditions, and general market fluctuations and the risks inherent in investment in securities markets. Investment markets can be volatile and prices of investments can change substantially due to various factors including, but not limited to, economic growth or recession, changes in interest rates, changes in the actual or perceived creditworthiness of issuers, and general market liquidity. The Fund is subject to the risk that geopolitical events will disrupt securities markets and adversely affect global economies and markets. Local, regional or global events such as war, acts of terrorism, the spread of infectious illness or other public health issues, or other events could have a significant impact on the Fund and its investments.
An outbreak of a respiratory disease caused by a novel coronavirus (known as COVID-19) first detected in China in December 2019 has resulted in a global pandemic and major disruptions to economies and markets around the world, including the United States. Financial markets experienced and may continue to experience extreme volatility and severe losses, and trading in many instruments was and may continue to be disrupted as a result. Liquidity for many instruments was and may continue to be greatly reduced for periods of time. Some interest rates are very low and in some cases yields are negative. Governments and central banks, including the Federal Reserve in the United States, have taken extraordinary and unprecedented actions to support local and global economies and the financial markets. The impact of these measures, and whether they will be effective to mitigate the economic and market disruption, will not be known for some time. In addition, the outbreak of COVID-19, and measures taken to mitigate its effects, could result in disruptions to the services provided to the Fund by its service providers.
| 16 | Notes to Financial Statements |
State Street Real Estate Securities V.I.S. Fund
Notes to Financial Statements, continued — December 31, 2021
10.Subsequent Events
Management has evaluated the impact of all subsequent events on the Fund through the date on which the financial statements were available to be issued and has determined that there were no subsequent events requiring adjustment or disclosure in the financial statements.
| Notes to Financial Statements | 17 |
State Street Real Estate Securities V.I.S. Fund
Report of Independent Registered Public Accounting Firm
To the Shareholders of State Street Real Estate Securities V.I.S. Fund and the Board of Directors of State Street Variable Insurance Series Funds, Inc.
Opinion on the Financial Statements
We have audited the accompanying statement of assets and liabilities of State Street Real Estate Securities V.I.S. Fund (the “Fund”) (one of the series constituting State Street Variable Insurance Series Funds, Inc. (the “Company”)), including the schedule of investments, as of December 31, 2021, and the related statement of operations for the year then ended, the statements of changes in net assets for each of the two years in the period then ended, the financial highlights for each of the five years in the period then ended and the related notes (collectively referred to as the “financial statements”). In our opinion, the financial statements present fairly, in all material respects, the financial position of the Fund (one of the series constituting State Street Variable Insurance Series Funds, Inc.) at December 31, 2021, the results of its operations for the year then ended, the changes in its net assets for each of the two years in the period then ended and its financial highlights for each of the five years in the period then ended, in conformity with U.S. generally accepted accounting principles.
Basis for Opinion
These financial statements are the responsibility of the Company’s management. Our responsibility is to express an opinion on the Fund’s financial statements based on our audits. We are a public accounting firm registered with the Public Company Accounting Oversight Board (United States) (“PCAOB”) and are required to be independent with respect to the Company in accordance with the U.S. federal securities laws and the applicable rules and regulations of the Securities and Exchange Commission and the PCAOB.
We conducted our audits in accordance with the standards of the PCAOB. Those standards require that we plan and perform the audit to obtain reasonable assurance about whether the financial statements are free of material misstatement, whether due to error or fraud. The Company is not required to have, nor were we engaged to perform, an audit of the Company’s internal control over financial reporting. As part of our audits we are required to obtain an understanding of internal control over financial reporting, but not for the purpose of expressing an opinion on the effectiveness of the Company’s internal control over financials reporting. Accordingly, we express no such opinion.
Our audits included performing procedures to assess the risks of material misstatement of the financial statements, whether due to error or fraud, and performing procedures that respond to those risks. Such procedures included examining, on a test basis, evidence regarding the amounts and disclosures in the financial statements. Our procedures included confirmation of securities owned as of December 31, 2021, by correspondence with the custodian, brokers and others or by other appropriate auditing procedures where replies from brokers and others were not received. Our audits also included evaluating the accounting principles used and significant estimates made by management, as well as evaluating the overall presentation of the financial statements. We believe that our audits provide a reasonable basis for our opinion.
We have served as the auditor of one or more State Street Global Advisors investment companies since 2000.
Boston, Massachusetts
February 17, 2022
| 18 | Report of Independent Registered Public Accounting Firm |
State Street Real Estate Securities V.I.S. Fund
Other Information — December 31, 2021 (Unaudited)
Tax Information
For federal income tax purposes, the following information is furnished with respect to the distributions of the Fund for its fiscal year ended December 31, 2021.
Dividends Received Deduction
The Fund reports the maximum amount allowable of its net taxable income as eligible for the corporate dividends received deduction.
Long Term Capital Gain Distributions
Long term capital gains dividends were paid from the Fund during the year ended December 31, 2021 in the amount of $5,547,895.
Liquidity Risk Management Program
Pursuant to Rule 22e-4 under the 1940 Act, the Fund has adopted and implemented a liquidity risk management program (the “Program”). SSGA FM has been designated by the Board to administer the Fund's Program. The Program’s principal objectives include assessing, managing and periodically reviewing Fund’s liquidity risk, based on factors specific to the circumstances of the Fund. Liquidity risk is defined as the risk that a Fund could not meet redemption requests without significant dilution of remaining investors’ interests in the Fund. During the fiscal year, SSGA FM provided the Board with a report addressing the operations of the Program and assessing its adequacy and the effectiveness of the Program’s implementation for the period September 2020 through June 2021. As reported to the Board, the Program supported Fund’s ability to honor redemption requests timely and SSGA FM’s management of Fund’s liquidity profile, including during periods of market volatility. SSGA FM reported that the Program operated adequately to meet the requirements of Rule 22e-4 and that the implementation of the Program has been effective.
There can be no assurance that the Program will achieve its objectives in the future. Please refer to your Fund’s prospectus for more information regarding the Fund’s exposure to liquidity risk and other principal risks to which an investment in the Fund may be subject.
Proxy Voting Policies and Procedures and Record
The Fund has adopted the proxy voting policies of the Adviser. A description of the Fund's proxy voting policies and procedures that are used by the Adviser to vote proxies relating to the Fund’s portfolios of securities are available (i) without charge, upon request by calling 1-800-242-0134 (toll free) and (ii) on the SEC's website at www.sec.gov. Information regarding how the Fund voted for the prior 12-months period ended June 30 is available by August 31 of each year by calling the same number, on the SEC’s website at www.sec.gov, and on the Fund's website at www.ssga.com.
Quarterly Portfolio Schedule
Following the Fund's first and third fiscal quarter-ends, a complete Schedule of Investments is filed with the SEC as an exhibit to its reports on Form N-PORT, which can be found on the SEC’s website at www.sec.gov, and on the Fund's website at www.ssga.com. The Fund's Schedules of Investments are available upon request, without charge, by calling 1-800-242-0134.
State Street Real Estate Securities V.I.S. Fund
Other Information, continued — December 31, 2021 (Unaudited)
Name,
Address, and
Year of Birth | Position(s) Held
with Fund | Term of
Office and
Length of
Time Served | Principal Occupation
During Past Five Years
and Relevant Experience | Number
of
Funds
in Fund
Complex
Overseen
by
Director† | Other Directorships
Held by Director
During Past Five Years |
| INDEPENDENT DIRECTORS |
Michael F. Holland
c/o SSGA Funds
Management, Inc.
One Iron Street Boston,
MA 02210
YOB: 1944 | Director
and
Co-Chairperson
of the Board | Term:
Indefinite
Elected: 1/19 | Chairman, Holland &
Company L.L.C.
(investment adviser)
(1995 – present). | 63 | Director, the Holland Series
Fund, Inc.; Director, The China
Fund, Inc. (1992 – 2017);
Director, The Taiwan Fund,
Inc. (2007 – 2017); Director,
Reaves Utility Income Fund,
Inc.; and Director, Blackstone/
GSO Loans (and Real Estate)
Funds. |
| | | | | | |
Patrick J. Riley
c/o SSGA Funds
Management, Inc.
One Iron Street
Boston, MA 02210
YOB: 1948 | Director
and
Co-Chairperson
of the Board | Term:
Indefinite
Appointed: 4/16
Elected: 1/19 | 2002 to May 2010, Associate
Justice of the Superior Court,
Commonwealth of
Massachusetts; 1985 to 2002,
Partner, Riley, Burke
& Donahue, L.L.P. (law firm);
1998 to present, Independent
Director, State Street Global
Advisers Ireland, Ltd.
(investment company); 1998 to
present, Independent Director,
SSGA Liquidity plc (formerly,
SSGA Cash Management
Fund plc); January 2009 to
present, Independent Director,
SSGA Fixed Income plc; and
January 2009 – 2019,
Independent Director, SSGA
Qualified Funds PLC. | 63 | Board Director and Chairman,
SPDR Europe 1PLC Board
(2011 – present); Board
Director and Chairman, SPDR
Europe II, PLC (2013 –
present). |
State Street Real Estate Securities V.I.S. Fund
Other Information, continued — December 31, 2021 (Unaudited)
Name,
Address, and
Year of Birth | Position(s) Held
with Fund | Term of
Office and
Length of
Time Served | Principal Occupation
During Past Five Years
and Relevant Experience | Number
of
Funds
in Fund
Complex
Overseen
by
Director† | Other Directorships
Held by Director
During Past Five Years |
| INDEPENDENT DIRECTORS (continued) |
| | | | | |
John R. Costantino
c/o SSGA Funds
Management, Inc.
One Iron Street
Boston, MA 02210
YOB: 1946 | Director
and
Chairperson of
the Qualified Legal
Compliance
Committee | Term:
Indefinite
Elected: 1997 | Senior Advisor to NGN Capital
LLC (January 2019 –
present); Managing General
Partner, NGN Capital LLC
(2006 – December 2019). | 63 | Director of Kleinfeld Bridal
Corp. (January 2016 – present);
Trustee of Neuroscience
Research Institute (1986 – 2017); Trustee of Fordham
University (1989 – 1995 and
2001 – 2007) and Trustee
Emeritus (2007 – present);
Trustee and Independent Chairperson of GE Funds (1993 – February 2011); Director, Muscular Dystrophy Association (since 2019);
Trustee of Gregorian
University Foundation (1992 –
2007); Chairman of the Board of Directors, Vivaldi Biosciences Inc. (May 2017 – present); Chairman of the Supervisory Board, Vivaldi Biosciences AG. (May 2017 – present); Trustee, Gallim Dance (December 2021 – present). |
| | | | | | |
Donna M. Rapaccioli
c/o SSGA Funds
Management, Inc.
One Iron Street
Boston, MA 02210
YOB: 1962 | Director
and
Chairperson of
the Audit Committee | Term:
Indefinite
Appointed: 1/12
Elected: 6/16 | Dean of the Gabelli School of
Business (2007 – present) and
Accounting Professor (1987 –
present) at Fordham
University. | 63 | Director- Graduate
Management Admissions
Council (2015 – present);
Trustee of Emmanuel College
(2010 – 2019). |
| | | | | | |
Richard D. Shirk
c/o SSGA Funds
Management, Inc.
One Iron Street
Boston, MA 02210
YOB: 1945 | Director
and
Chairperson
of the Nominating Committee
Chairperson of the Governance
Committee | Term:
Indefinite
Elected: 1/19 | March 2001 to April 2002,
Chairman (1996 to March
2001, President and Chief
Executive Officer), Cerulean
Companies, Inc. (holding
company) (Retired); 1992 to
March 2001, President and
Chief Executive Officer, Blue
Cross Blue Shield of Georgia
(health insurer,
managed healthcare). | 63 | 1998 to December 2008,
Chairman, Board Member and
December 2008 to present,
Investment Committee
Member, Healthcare Georgia
Foundation (private
foundation); September 2002
to 2012, Lead Director and
Board Member, Amerigroup
Corp. (managed health care);
1999 to 2013, Board Member
and (2001 to 2017) Investment
Committee Member, Woodruff
Arts Center; and 2003 to 2009,
Trustee, Gettysburg College;
Board member, Aerocare
Holdings (2003 – January 2021), Regenesis
Biomedical Inc. (April 2012 – present). |
State Street Real Estate Securities V.I.S. Fund
Other Information, continued — December 31, 2021 (Unaudited)
Name,
Address, and
Year of Birth | Position(s) Held
with Fund | Term of
Office and
Length of
Time Served | Principal Occupation
During Past Five Years
and Relevant Experience | Number
of
Funds
in Fund
Complex
Overseen
by
Director† | Other Directorships
Held by Director
During Past Five Years |
| INDEPENDENT DIRECTORS (continued) |
| | | | | |
Michael A. Jessee
c/o SSGA Funds
Management, Inc.
One Iron Street
Boston, MA 02210
YOB: 1946 | Director
and
Chairperson of the
Valuation Committee | Term:
Indefinite
Elected: 1/19 | Retired; formerly, President
and Chief Executive Officer of
the Federal Home Loan Bank
of Boston (1989 – 2009);
Trustee, Randolph-Macon
College (2004 – 2016). | 63 | None. |
| INTERESTED DIRECTORS(1) |
Ellen M. Needham(2)
SSGA Funds
Management, Inc.
One Iron Street
Boston, MA 02210
YOB: 1967 | Director and
President | Term:
Indefinite
Elected: 1/19 | Chairman, SSGA Funds
Management, Inc. (March
2020 – present); President and
Director, SSGA Funds
Management, Inc. (2001 –
present)*; Senior Managing
Director, State Street Global
Advisors (1992 – present)*;
Manager, State Street Global
Advisors Funds Distributors,
LLC (May 2017 – present). | 63 | Board Director, SSGA
SPDR ETFs Europe 1 plc
(May 2020 – present); Board Director, SSGA SPDR ETFs Europe II plc (May 2020 – present). |
| | | | | |
| (1) | The individual listed above is a Director who is an “interested person,” as defined in the 1940 Act, of the Company (“Interested Director”). |
| (2) | Ms. Needham is an Interested Director because of her employment by SSGA FM, an affiliate of the Company. |
| * | Served in various capacities and/or with various affiliated entities during noted time period. |
| † | For the purpose of determining the number of portfolios overseen by the Directors, “Fund Complex” comprises registered investment companies for which SSGA FM serves as investment adviser. |
State Street Real Estate Securities V.I.S. Fund
Other Information, continued — December 31, 2021 (Unaudited)
The following lists the principal officers for the Company, as well as their mailing addresses and ages, positions with the Company and length of time served, and present and principal occupations:
Name,
Address, and
Year of Birth | Position(s) Held
with Funds | Term of
Office and
Length of
Time Served | Principal Occupation
During Past Five Years |
| OFFICERS: |
Ellen M. Needham
SSGA Funds Management, Inc.
One Iron Street
Boston, MA 02210
YOB: 1967 | President and
Director | Term:
Indefinite
Elected:
4/20 | Chairman, SSGA Funds Management, Inc. (March 2020 – present); President and Director, SSGA Funds Management, Inc. (2001 – present)*; Senior Managing Director, State Street Global Advisors (1992 – present)*; Manager, State Street Global Advisors Funds Distributors, LLC (May 2017 – present). |
| | | | |
Bruce S. Rosenberg
SSGA Funds Management, Inc.
One Iron Street
Boston, MA 02210
YOB: 1961 | Treasurer | Term:
Indefinite
Elected: 4/19 | Managing Director, State Street Global Advisors and SSGA Funds Management, Inc. (July 2015 – present); Director, Credit Suisse (April 2008 – July 2015). |
| | | | |
Ann M. Carpenter
SSGA Funds Management, Inc.
One Iron Street
Boston, MA 02210
YOB: 1966 | Vice President
and Deputy
Treasurer | Term:
Indefinite
Elected: 4/19 | Chief Operating Officer, SSGA Funds Management, Inc. (April 2005 – present)*; Managing Director, State Street Global Advisors (2005 – present).* |
| | | | |
Chad C. Hallett
SSGA Funds Management, Inc.
One Iron Street
Boston, MA 02210
YOB: 1969 | Deputy
Treasurer | Term:
Indefinite
Elected: 4/19 | Vice President, State Street Global Advisors and SSGA Funds Management, Inc. (November 2014 – present); Vice President, State Street Bank and Trust Company (2001 – November 2014).* |
| | | | |
Darlene Anderson-Vasquez
SSGA Funds Management, Inc.
One Iron Street
Boston, MA 02210
YOB: 1968 | Deputy
Treasurer | Term:
Indefinite
Elected: 4/19 | Managing Director, State Street Global Advisors and SSGA Funds Management, Inc. (May 2016 – present); Senior Vice President, John Hancock Investments (September 2007 – May 2016). |
| | | | |
Arthur A. Jensen
SSGA Funds Management, Inc.
1600 Summer Street
Stamford, CT 06905
YOB: 1966 | Deputy
Treasurer | Term:
Indefinite
Elected: 4/19 | Vice President, State Street Global Advisors and SSGA Funds Management, Inc. (July 2016 – present); Controller of GE Asset Management Incorporated (April 2011 – July 2016). |
| | | | |
David K. Lancaster
SSGA Funds Management, Inc.
One Iron Street
Boston, MA 02210
YOB: 1971 | Assistant Treasurer | Term:
Indefinite
Elected: 11/20 | Vice President, State Street Global Advisors and SSGA Funds Management, Inc. (July 2017 – present); Assistant Vice President, State Street Bank and Trust Company (November 2011 – July 2017).* |
State Street Real Estate Securities V.I.S. Fund
Other Information, continued — December 31, 2021 (Unaudited)
Name,
Address, and
Year of Birth | Position(s) Held
with Funds | Term of
Office and
Length of
Time Served | Principal Occupation
During Past Five Years |
| OFFICERS: (continued) |
| | | |
Brian Harris
SSGA Funds Management, Inc.
One Iron Street
Boston, MA 02210
YOB: 1973 | Chief Compliance
Officer, Anti-Money
Laundering Officer
and Code of Ethics
Compliance Officer | Term:
Indefinite Elected: 6/16
Term:
Indefinite Elected: 4/19 | Managing Director, State Street Global Advisors and SSGA Funds Management, Inc. (June 2013 – present).* |
| | | | |
Sean O’Malley
SSGA Funds Management, Inc.
One Iron Street
Boston, MA 02210
YOB: 1969 | Chief Legal Officer | Term:
Indefinite
Elected: 8/19 | Senior Vice President and Deputy General Counsel, State Street Global Advisors (November 2013 – present). |
| | | | |
David Barr
SSGA Funds Management, Inc.
One Iron Street
Boston, MA 02210
YOB: 1974 | Secretary | Term:
Indefinite
Elected: 9/20 | Vice President and Senior Counsel, State Street Global Advisors (October 2019 – present); Vice President and Counsel, Eaton Vance Corp. (October 2010 – October 2019). |
| | | | |
Timothy Collins
SSGA Funds Management, Inc.
One Iron Street
Boston, MA 02210
YOB: 1967 | Assistant
Secretary | Term:
Indefinite
Elected: 9/21 | Vice President and Senior Counsel, State Street Global Advisors (August 2021 – present); Vice President and Managing Counsel, State Street Corporation (March 2020 – August 2021); Vice President and Senior Counsel (April 2018 – March 2020); Counsel, Sutton Place Investments (January 2010 – March 2018). |
| | | | |
David Urman
SSGA Funds Management, Inc.
One Iron Street
Boston, MA 02210
YOB: 1985 | Assistant
Secretary | Term:
Indefinite
Elected: 8/19 | Vice President and Senior Counsel, State Street Global Advisors (April 2019 – present); Vice President and Counsel, State Street Global Advisors (August 2015 – April 2019); Associate, Ropes & Gray LLP (November 2012 – August 2015). |
| | | |
| * | Served in various capacities and/or with various affiliated entities during noted time period. |
[This page intentionally left blank]
[This page intentionally left blank]
[This page intentionally left blank]
Directors
Michael F. Holland, Co-Chairperson
Patrick J. Riley, Co-Chairperson
John R. Costantino
Donna M. Rapaccioli
Michael A. Jessee
Richard D. Shirk
Ellen M. Needham
Officers
Ellen M. Needham, President
Brian Harris, Chief Compliance Officer, Anti-Money Laundering Officer and Code of Ethics Compliance Officer
Sean O’Malley, Chief Legal Officer
Bruce S. Rosenberg, Treasurer
Ann M. Carpenter, Vice President and Deputy Treasurer
Chad C. Hallett, Deputy Treasurer
Arthur A. Jensen, Deputy Treasurer
Darlene Anderson-Vasquez, Deputy Treasurer
David Lancaster, Assistant Treasurer
David Barr, Secretary
Timothy Collins, Assistant Secretary
David Urman, Assistant Secretary
Investment Adviser and Administrator
SSGA Funds Management, Inc.
One Iron Street
Boston, Massachusetts 02210
Custodian and Sub-Administrator
State Street Bank and Trust Company
One Lincoln Street
Boston, Massachusetts 02111
Distributor
State Street Global Advisors Funds Distributors, LLC
One Iron Street
Boston, Massachusetts 02210
Independent Registered Public Accounting Firm
Ernst & Young LLP
200 Clarendon Street
Boston, Massachusetts 02116
Annual Report
December 31, 2021
| State Street Total Return V.I.S. Fund |
State Street Total Return V.I.S. Fund
Annual Report
December 31, 2021
| | Page |
| 1 |
| 2 |
| Financial Statements | |
| 114 |
| 116 |
| 117 |
| 118 |
| 119 |
| 128 |
| 129 |
This report is prepared for Policyholders of certain variable contracts and may be distributed to others only if preceded or accompanied by the variable contract’s current prospectus and the current summary prospectus of the Fund available for investments thereunder.
[This page intentionally left blank]
State Street Total Return V.I.S. Fund
Notes to Performance — December 31, 2021 (Unaudited)
The information provided on the performance page relates to the State Street Total Return V.I.S Fund (the “Fund”).
Total return performance shown in this report for the Fund takes into account changes in share price and assumes reinvestment of dividends and capital gains distributions, if any. Total returns shown are net of Fund fees and expenses but do not reflect fees and charges associated with the variable contracts such as administrative fees, account charges and surrender charges, which, if reflected, would reduce the Fund’s total returns for all periods shown.
The performance data quoted represents past performance; past performance does not guarantee future results. Investment return and principal value will fluctuate so your shares, when redeemed, may be worth more or less than their original cost. Current performance may be higher or lower than the performance data quoted. Periods less than one year are not annualized. Please call toll-free (800) 242-0134 or visit the Fund’s website at www.ssga.com for the most recent month-end performance data.
An investment in the Fund is not a deposit of any bank and is not insured or guaranteed by the Federal Deposit Insurance Corporation (“FDIC”) or any other government agency. An investment in the Fund is subject to risk, including possible loss of principal invested.
The S&P 500® Index is an unmanaged, market capitalization-weighted index of stocks of 500 large U.S. companies, which is widely used as a measure of large-cap U.S. stock market performance.
The MSCI All Country World Index ex-U.S. (“MSCI® ACWI ex-U.S.”) is a market-capitalization weighted index designed to provide a broad measure of stock performance throughout the world, with the exception of U.S.-based companies. The MSCI® ACWI ex-U.S. Index includes both developed and emerging markets.
The Bloomberg U.S. Aggregate Bond Index is an unmanaged market value-weighted index of taxable investment grade debt issues, including government, corporate, asset-backed and mortgage-backed securities, with maturities of one year or more. This index is designed to represent the performance of the U.S. investment-grade first rate bond market.
The results shown for the foregoing indices assume the reinvestment of net dividends or interest and do not reflect fees, expenses, or taxes. As such, the index returns do not reflect the actual cost of investing in the instruments that comprise each index.
The views expressed in this document reflect our judgment as of the publication date and are subject to change at any time without notice.
State Street Global Advisors Funds Distributors, LLC, member of FINRA & SIPC is the principal underwriter and distributor of the State Street Total Return V.I.S. Fund and an indirect wholly-owned subsidiary of State Street Corporation. References to State Street may include State Street Corporation and its affiliates. The Funds pay State Street Bank and Trust Company for its services as custodian and Fund Accounting agent, and pay SSGA Funds Management, Inc. ("SSGA FM" or the "Adviser") for investment advisory and administrative services.
State Street Total Return V.I.S. Fund
Management's Discussion of Fund Performance — December 31, 2021 (Unaudited)
The State Street Total Return V.I.S. Fund (the “Fund”) seek the highest total return, composed of current income and capital appreciation, as is consistent with prudent investment risk. The Fund’s benchmarks are the S&P 500 Index, MSCI ACWI ex-U.S. Index, Bloomberg U.S. Aggregate Bond Index (the “Indices”).
For the 12-month period ended December 31, 2021 (the “Reporting Period”), the total return for the Fund’s Class 1 and Class 3 Shares were 13.45% and 13.20%, respectively. The total return for the S&P 500 Index was 28.71%. The total return for the MSCI ACWI ex-U.S. Index was 7.82%. The total return for the Bloomberg U.S. Aggregate Bond Index was -1.54%. The Fund and Indices’ returns reflect the reinvestment of dividends and other income. The Fund’s performance reflects the expenses of managing the Fund, including brokerage and advisory expenses. The Indices are unmanaged and Index returns do not reflect fees and expenses of any kind, which would have a negative impact on returns.
Asset allocation decisions and performance of the investment options across asset classes were the primary drivers of Fund performance during the Reporting Period relative to the Index. The Fund’s Principle Investment Strategy is to construct a broadly diversified portfolio across various investment asset classes. The results of the enhanced diversification were mixed but, on balance, positive with commodities, REITS, inflation linked bonds and high yield bonds adding value, while emerging market and U.S. small cap equities along with non-U.S. government bonds underperformed. The Fund employed factor based equity strategies within the first three months of the year transitioning to index based equity strategies by the end of the first quarter. The factor based strategies are designed to provide exposure to various investment style premia including value, quality, low-volatility, momentum and market capitalization. These factors performed well over the Reporting Period within all regions except non-U.S. developed markets. Finally, the Fund also employed tactical asset allocation during the year which performed well driven in large part by periodic overweights within certain equity markets and commodities versus underweights to investment grade bonds. An underweight to REITS detracted value.
The Fund used equity futures contracts in order to equitize cash in the portfolio during the Reporting Period. The Fund’s use of futures contracts did not have a material impact on Fund performance.
The views expressed above reflect those of the Fund’s portfolio manager only through the Reporting Period, and do not necessarily represent the views of the Adviser as a whole. Any such views are subject to change at any time based upon market or other conditions and the Adviser disclaims any responsibility to update such views. These views may not be relied on as investment advice and, because investment decisions for a fund are based on numerous factors, may not be relied on as an indication of trading intent on behalf of any fund.
| 2 | State Street Total Return V.I.S. Fund |
State Street Total Return V.I.S. Fund
Performance Summary — December 31, 2021 (Unaudited)
| Sector Allocation |
| Portfolio composition as a % of Fair Value of $1,815,108 (in thousands) as of December 31, 2021 (a)(b) |
| Top Ten Largest Holdings |
| as of December 31, 2021 (as a % of Fair Value) (a)(b) |
| Vanguard FTSE Europe ETF | 4.99% |
| SPDR Portfolio Long Term Corporate Bond ETF | 3.90% |
| SPDR Portfolio Long Term Treasury ETF | 3.85% |
| Invesco Optimum Yield Diversified Commodity Strategy No K-1 ETF | 1.82% |
| Apple Inc. | 1.72% |
| Microsoft Corp. | 1.59% |
| SPDR Bloomberg High Yield Bond ETF | 0.97% |
| Amazon.com Inc. | 0.91% |
| Alphabet Inc., Class A | 0.55% |
| Tesla Inc. | 0.54% |
| Average Annual Total Return for the years ended December 31, 2021 |
| Class 1 Shares (Inception date: 7/1/85 |
| | One Year | | Five Year | | Ten Year | | Ending Value
of a $10,000
Investment |
| State Street Total Return V.I.S. Fund | 13.45% | | 8.65% | | 8.05% | | $21,685 |
| S&P 500® Index | 28.71% | | 18.48% | | 16.55% | | $46,257 |
| Bloomberg U.S. Aggregate Bond Index | (1.54)% | | 3.57% | | 2.90% | | $13,307 |
| MSCI All Country World ex.-U.S. | 7.82% | | 9.61% | | 7.28% | | $20,196 |
| Class 3 Shares (Inception date: 5/1/06 |
| | One Year | | Five Year | | Ten Year | | Ending Value
of a $10,000
Investment |
| State Street Total Return V.I.S. Fund | 13.20% | | 8.37% | | 7.78% | | $21,152 |
| S&P 500® Index | 28.71% | | 18.48% | | 16.55% | | $46,257 |
| Bloomberg U.S. Aggregate Bond Index | (1.54)% | | 3.57% | | 2.90% | | $13,307 |
| MSCI All Country World ex.-U.S. | 7.82% | | 9.61% | | 7.28% | | $20,196 |
|
| (a) | Fair Value basis is inclusive of a short-term investment in the State Street Institutional U.S. Government Money Market Fund Class G Shares. |
| (b) | The securities information regarding holdings, allocations and other characteristics is presented to illustrate examples of securities that the Fund has bought and the diversity of areas in which the Fund may invest as of a particular date. It may not be representative of the Fund’s current or future investments and should not be construed as a recommendation to purchase or sell a particular security. |
| State Street Total Return V.I.S. Fund | 3 |
State Street Total Return V.I.S. Fund
Performance Summary, continued — December 31, 2021 (Unaudited)
Class 1 Shares
Change in Value of a $10,000 Investment
Yearly periods ended December 31
Class 3 Shares
Change in Value of a $10,000 Investment
Yearly periods ended December 31
See Notes to Performance beginning on page 1 for further information.
Past performance does not predict future performance. The performance shown in the graphs and tables does not reflect the deduction of taxes that a shareholder would pay on Fund distributions or the redemption of Fund shares and does not reflect the fees or charges that would be associated with variable contracts through which shares of the Fund are offered
| 4 | State Street Total Return V.I.S. Fund |
State Street Total Return V.I.S. Fund
Understanding Your Fund’s Expenses — December 31, 2021 (Unaudited)
As a shareholder of the Fund, you incur ongoing costs. Ongoing costs include portfolio management fees, professional fees, administrative fees and other Fund expenses. The following example is intended to help you understand your ongoing costs (in dollars) of investing in the Fund and to compare these costs with the ongoing costs of investing in other mutual funds.
To illustrate these ongoing costs, we have provided an example and calculated the expenses paid by investors of the Fund during the period. The information in the following table is based on an investment of $1,000, which is invested at the beginning of the period and held for the entire six-month period ended December 31, 2021.
Actual Expenses
The first section of the table provides information about actual account values and actual expenses. You may use the information in this section, together with the amount you invested, to estimate the expenses that you paid over the period. To do so, simply divide your account value by $1,000 (for example, an $8,600 account value divided by $1,000 = 8.6), then multiply the result by the number given under the heading “Expenses paid during the period” to estimate the expenses you paid on your account during the period.
Hypothetical Example for Comparison Purposes
The second section of the table provides information about hypothetical account values and hypothetical expenses based on the Fund’s actual expense ratio and an assumed rate of return of 5% per year before expenses, which is not the Fund’s actual return. The hypothetical account values and expenses may not be used to estimate the actual ending account balance or expenses you paid for the period. You may use this information to compare the ongoing costs of investing in the Fund and other funds. To do so, compare this 5% hypothetical example with the 5% hypothetical examples that appear in the shareholder reports of other funds.
Please note that the expenses shown in the table are meant to highlight and help you compare ongoing costs only and do not reflect transaction costs, such as sales charges or redemption fees, if any. Therefore, the second section of the table is useful in comparing ongoing costs only, and will not help you determine the relative total costs of owning different funds. Additionally, the expenses shown do not reflect the fees or charges associated with variable contracts through which shares of the Fund are offered.
| Class 1 | | Actual
Fund Return | | Hypothetical
5% Return
(2.5% for
the period) |
Begining Account Value
July 1, 2021 | | $1,000.00 | | $1,000.00 |
Ending Account Value
December 31, 2021 | | $1,028.70 | | $1,022.00 |
| Expenses Paid During Period* | | $ 3.22 | | $ 3.21 |
| Class 3 | | Actual
Fund Return | | Hypothetical
5% Return
(2.5% for
the period) |
Begining Account Value
July 1, 2021 | | $1,000.00 | | $1,000.00 |
Ending Account Value
December 31, 2021 | | $1,027.80 | | $1,020.80 |
| Expenses Paid During Period* | | $ 4.50 | | $ 4.48 |
| * | Expenses are equal to the Fund's annualized expense ratio of 0.63%** for Class 1 and 0.88%** for Class 3 (for the period July 1, 2021 - December 31, 2021), multiplied by the average account value over the period, multiplied by 184/365 (to reflect the one-half year period). |
| ** | May differ from expense ratio disclosed in the financial highlights, which is calculated based on the entire fiscal year's data. |
| State Street Total Return V.I.S. Fund | 5 |
State Street Total Return V.I.S. Fund
Schedule of Investments — December 31, 2021
| | Number
of Shares | Fair
Value |
| Domestic Equity - 35.1% † |
| Common Stock - 35.1% |
| Advertising - 0.1% |
| Advantage Solutions Inc. (a) | 3,700 | $ 29,674 |
| Boston Omaha Corp., Class A (a) | 800 | 22,984 |
| Cardlytics Inc. (a) | 1,567 | 103,563 |
| Clear Channel Outdoor Holdings Inc. (a) | 17,800 | 58,918 |
| comScore Inc. (a) | 2,198 | 7,341 |
| Fluent Inc. (a) | 400 | 796 |
| Integral Ad Science Holding Corp. (a) | 1,000 | 22,210 |
| Loyalty Ventures Inc. (a) | 280 | 8,420 |
| Magnite Inc. (a) | 5,889 | 103,057 |
| National CineMedia Inc. | 4,200 | 11,802 |
| Omnicom Group Inc. | 2,400 | 175,848 |
| Stagwell Inc. (a) | 2,534 | 21,970 |
| TechTarget Inc. (a) | 1,250 | 119,575 |
| The Interpublic Group of Companies Inc. | 4,597 | 172,158 |
| Thryv Holdings Inc. (a) | 261 | 10,735 |
| | | 869,051 |
| Aerospace & Defense - 0.4% |
| AAR Corp. (a) | 1,600 | 62,448 |
| Aerojet Rocketdyne Holdings Inc. | 3,411 | 159,498 |
| Aerovironment Inc. (a) | 999 | 61,968 |
| AerSale Corp. (a) | 496 | 8,799 |
| Astronics Corp. (a) | 1,400 | 16,800 |
| Axon Enterprise Inc. (a) | 800 | 125,600 |
| BWX Technologies Inc. | 1,000 | 47,880 |
| Byrna Technologies Inc. (a) | 1,000 | 13,350 |
| Curtiss-Wright Corp. | 400 | 55,468 |
| Ducommun Inc. (a) | 600 | 28,062 |
| General Dynamics Corp. | 2,900 | 604,563 |
| HEICO Corp. | 500 | 72,110 |
| HEICO Corp., Class A | 800 | 102,816 |
| Hexcel Corp. (a) | 800 | 41,440 |
| Howmet Aerospace Inc. | 4,400 | 140,052 |
| Huntington Ingalls Industries Inc. | 500 | 93,370 |
| Kaman Corp. | 1,335 | 57,605 |
| Kratos Defense & Security Solutions Inc. (a) | 5,566 | 107,980 |
| L3Harris Technologies Inc. | 2,300 | 490,452 |
| Lockheed Martin Corp. | 2,801 | 995,503 |
| Maxar Technologies Inc. | 3,521 | 103,975 |
| Mercury Systems Inc. (a) | 800 | 44,048 |
| | Number
of Shares | Fair
Value |
| Moog Inc., Class A | 1,312 | $ 106,233 |
| National Presto Industries Inc. | 290 | 23,789 |
| Northrop Grumman Corp. | 1,700 | 658,019 |
| PAE Inc. (a) | 3,500 | 34,755 |
| Park Aerospace Corp. | 1,253 | 16,540 |
| Parsons Corp. (a) | 1,300 | 43,745 |
| Raytheon Technologies Corp. | 17,131 | 1,474,294 |
| Spirit AeroSystems Holdings Inc., Class A | 1,100 | 47,399 |
| Textron Inc. | 2,500 | 193,000 |
| The Boeing Co. (a) | 6,082 | 1,224,428 |
| TransDigm Group Inc. (a) | 570 | 362,680 |
| Triumph Group Inc. (a) | 2,795 | 51,791 |
| Vectrus Inc. (a) | 472 | 21,604 |
| Virgin Galactic Holdings Inc. (a) | 2,100 | 28,098 |
| | | 7,720,162 |
| Agricultural & Farm Machinery - 0.1% |
| AGCO Corp. | 703 | 81,562 |
| AgEagle Aerial Systems Inc. (a) | 3,400 | 5,338 |
| Deere & Co. | 3,182 | 1,091,076 |
| Hydrofarm Holdings Group Inc. (a) | 1,710 | 48,376 |
| Lindsay Corp. | 481 | 73,112 |
| The Toro Co. | 1,200 | 119,892 |
| Titan International Inc. (a) | 2,500 | 27,400 |
| | | 1,446,756 |
| Agricultural Products - 0.1% |
| AppHarvest Inc. (a) | 2,400 | 9,336 |
| Archer-Daniels-Midland Co. | 6,357 | 429,670 |
| Bunge Ltd. | 1,500 | 140,040 |
| Darling Ingredients Inc. (a) | 1,700 | 117,793 |
| Fresh Del Monte Produce Inc. | 1,677 | 46,285 |
| Ingredion Inc. | 844 | 81,564 |
| Limoneira Co. | 1,000 | 15,000 |
| | | 839,688 |
| Air Freight & Logistics - 0.2% |
| Air Transport Services Group Inc. (a) | 2,831 | 83,175 |
| Atlas Air Worldwide Holdings Inc. (a) | 1,307 | 123,015 |
| CH Robinson Worldwide Inc. | 1,369 | 147,345 |
| Expeditors International of Washington Inc. | 1,987 | 266,834 |
| FedEx Corp. | 2,784 | 720,054 |
| Forward Air Corp. | 1,220 | 147,730 |
See Notes to Schedule of Investments and Notes to Financial Statements.
| 6 | State Street Total Return V.I.S. Fund |
State Street Total Return V.I.S. Fund
Schedule of Investments, continued — December 31, 2021
| | Number
of Shares | Fair
Value |
| GXO Logistics Inc. (a) | 1,100 | $ 99,913 |
| Hub Group Inc., Class A (a) | 1,504 | 126,697 |
| Radiant Logistics Inc. (a) | 1,883 | 13,727 |
| United Parcel Service Inc., Class B | 8,230 | 1,764,018 |
| | | 3,492,508 |
| Airlines - 0.1% |
| Alaska Air Group Inc. (a) | 1,400 | 72,940 |
| Allegiant Travel Co. (a) | 697 | 130,367 |
| American Airlines Group Inc. (a) | 7,000 | 125,720 |
| Delta Air Lines Inc. (a) | 7,600 | 297,008 |
| Frontier Group Holdings Inc. (a) | 1,700 | 23,069 |
| Hawaiian Holdings Inc. (a) | 2,525 | 46,384 |
| JetBlue Airways Corp. (a) | 3,200 | 45,568 |
| Mesa Air Group Inc. (a) | 2,000 | 11,200 |
| SkyWest Inc. (a) | 2,253 | 88,543 |
| Southwest Airlines Co. (a) | 6,500 | 278,460 |
| Spirit Airlines Inc. (a) | 4,455 | 97,342 |
| Sun Country Airlines Holdings Inc. (a) | 1,300 | 35,425 |
| United Airlines Holdings Inc. (a) | 3,700 | 161,986 |
| | | 1,414,012 |
| Alternative Carriers - 0.0% * |
| Anterix Inc. (a) | 479 | 28,146 |
| Bandwidth Inc., Class A (a) | 1,023 | 73,410 |
| Cogent Communications Holdings Inc. | 1,941 | 142,042 |
| EchoStar Corp., Class A (a) | 1,790 | 47,167 |
| Globalstar Inc. (a) | 29,800 | 34,568 |
| Iridium Communications Inc. (a) | 5,392 | 222,636 |
| Liberty Latin America Ltd., Class A (a) | 1,695 | 19,764 |
| Liberty Latin America Ltd., Class C (a) | 6,976 | 79,526 |
| Lumen Technologies Inc. | 11,300 | 141,815 |
| | | 789,074 |
| Aluminum - 0.0% * |
| Alcoa Corp. | 2,100 | 125,118 |
| Arconic Corp. (a) | 4,866 | 160,627 |
| Century Aluminum Co. (a) | 2,141 | 35,455 |
| Kaiser Aluminum Corp. | 698 | 65,570 |
| | | 386,770 |
| | Number
of Shares | Fair
Value |
| Apparel Retail - 0.2% |
| Abercrombie & Fitch Co., Class A (a) | 2,807 | $ 97,768 |
| American Eagle Outfitters Inc. | 6,931 | 175,493 |
| Boot Barn Holdings Inc. (a) | 1,331 | 163,779 |
| Burlington Stores Inc. (a) | 700 | 204,057 |
| Caleres Inc. | 1,577 | 35,766 |
| Chico's FAS Inc. (a) | 5,052 | 27,180 |
| Citi Trends Inc. (a) | 368 | 34,868 |
| Designer Brands Inc., Class A (a) | 2,800 | 39,788 |
| Foot Locker Inc. | 1,215 | 53,010 |
| Genesco Inc. (a) | 700 | 44,919 |
| Guess? Inc. | 1,800 | 42,624 |
| Ross Stores Inc. | 4,000 | 457,120 |
| Shoe Carnival Inc. | 734 | 28,685 |
| The Buckle Inc. | 1,303 | 55,130 |
| The Cato Corp., Class A | 912 | 15,650 |
| The Children's Place Inc. (a) | 614 | 48,684 |
| The Gap Inc. | 2,747 | 48,484 |
| The TJX Companies Inc. | 13,776 | 1,045,874 |
| Tilly's Inc., Class A | 852 | 13,726 |
| Torrid Holdings Inc. (a) | 662 | 6,541 |
| Urban Outfitters Inc. (a) | 3,103 | 91,104 |
| Victoria's Secret & Co. (a) | 739 | 41,044 |
| Zumiez Inc. (a) | 943 | 45,255 |
| | | 2,816,549 |
| Apparel, Accessories & Luxury Goods - 0.1% |
| Carter's Inc. | 400 | 40,488 |
| Columbia Sportswear Co. | 500 | 48,720 |
| Fossil Group Inc. (a) | 1,977 | 20,343 |
| G-III Apparel Group Ltd. (a) | 2,100 | 58,044 |
| Hanesbrands Inc. | 3,800 | 63,536 |
| Kontoor Brands Inc. | 2,355 | 120,694 |
| Movado Group Inc. | 749 | 31,331 |
| Oxford Industries Inc. | 707 | 71,775 |
| PLBY Group Inc. (a) | 1,382 | 36,816 |
| PVH Corp. | 800 | 85,320 |
| Ralph Lauren Corp. | 500 | 59,430 |
| Superior Group of Companies Inc. | 599 | 13,142 |
| Tapestry Inc. | 3,100 | 125,860 |
| Under Armour Inc., Class A (a) | 1,400 | 29,666 |
| Under Armour Inc., Class C (a) | 3,200 | 57,728 |
| Vera Bradley Inc. (a) | 908 | 7,727 |
| VF Corp. | 3,800 | 278,236 |
| | | 1,148,856 |
See Notes to Schedule of Investments and Notes to Financial Statements.
| State Street Total Return V.I.S. Fund | 7 |
State Street Total Return V.I.S. Fund
Schedule of Investments, continued — December 31, 2021
| | Number
of Shares | Fair
Value |
| Application Software - 1.3% |
| 8x8 Inc. (a) | 5,446 | $ 91,275 |
| ACI Worldwide Inc. (a) | 5,378 | 186,617 |
| Adobe Inc. (a) | 5,403 | 3,063,825 |
| Agilysys Inc. (a) | 849 | 37,747 |
| Alarm.com Holdings Inc. (a) | 2,155 | 182,766 |
| Alkami Technology Inc. (a) | 1,364 | 27,362 |
| Altair Engineering Inc., Class A (a) | 2,105 | 162,759 |
| Alteryx Inc., Class A (a) | 800 | 48,400 |
| American Software Inc., Class A | 1,350 | 35,329 |
| Anaplan Inc. (a) | 1,600 | 73,360 |
| ANSYS Inc. (a) | 1,000 | 401,120 |
| Appfolio Inc., Class A (a) | 918 | 111,133 |
| Asana Inc., Class A (a) | 3,254 | 242,586 |
| Aspen Technology Inc. (a) | 800 | 121,760 |
| Autodesk Inc. (a) | 2,500 | 702,975 |
| Avalara Inc. (a) | 1,000 | 129,110 |
| Avaya Holdings Corp. (a) | 4,062 | 80,428 |
| AvidXchange Holdings Inc. (a) | 1,214 | 18,283 |
| Benefitfocus Inc. (a) | 1,198 | 12,771 |
| Bentley Systems Inc., Class B | 1,500 | 72,495 |
| Bill.com Holdings Inc. (a) | 992 | 247,157 |
| Black Knight Inc. (a) | 1,724 | 142,902 |
| Blackbaud Inc. (a) | 2,183 | 172,413 |
| Blackline Inc. (a) | 2,477 | 256,469 |
| Bottomline Technologies de Inc. (a) | 2,038 | 115,086 |
| Box Inc., Class A (a) | 6,360 | 166,568 |
| BTRS Holdings Inc., Class A (a) | 3,170 | 24,789 |
| C3.ai Inc., Class A (a) | 800 | 25,000 |
| Cadence Design Systems Inc. (a) | 3,100 | 577,685 |
| CDK Global Inc. | 1,300 | 54,262 |
| Cerence Inc. (a) | 1,719 | 131,744 |
| Ceridian HCM Holding Inc. (a) | 1,500 | 156,690 |
| ChannelAdvisor Corp. (a) | 1,227 | 30,282 |
| Citrix Systems Inc. | 1,400 | 132,426 |
| Cleanspark Inc. (a) | 1,600 | 15,232 |
| Consensus Cloud Solutions Inc. (a) | 766 | 44,328 |
| Couchbase Inc. (a) | 380 | 9,485 |
| Coupa Software Inc. (a) | 800 | 126,440 |
| CS Disco Inc. (a) | 368 | 13,156 |
| Datadog Inc., Class A (a) | 2,900 | 516,519 |
| Digimarc Corp. (a) | 700 | 27,636 |
| Digital Turbine Inc. (a) | 4,147 | 252,926 |
| DocuSign Inc. (a) | 2,200 | 335,082 |
| | Number
of Shares | Fair
Value |
| Domo Inc., Class B (a) | 1,230 | $ 61,008 |
| DoubleVerify Holdings Inc. (a) | 600 | 19,968 |
| Dropbox Inc., Class A (a) | 3,500 | 85,890 |
| Duck Creek Technologies Inc. (a) | 1,100 | 33,121 |
| Dynatrace Inc. (a) | 2,400 | 144,840 |
| E2open Parent Holdings Inc. (a) | 9,537 | 107,387 |
| Ebix Inc. | 1,100 | 33,440 |
| eGain Corp. (a) | 1,072 | 10,699 |
| Elastic N.V. (a) | 900 | 110,781 |
| Enfusion Inc., Class A (a) | 1,044 | 21,861 |
| EngageSmart Inc. (a) | 769 | 18,548 |
| Envestnet Inc. (a) | 2,479 | 196,684 |
| Everbridge Inc. (a) | 500 | 33,665 |
| EverCommerce Inc. (a) | 614 | 9,671 |
| Fair Isaac Corp. (a) | 270 | 117,091 |
| Five9 Inc. (a) | 800 | 109,856 |
| GTY Technology Holdings Inc. (a) | 1,668 | 11,176 |
| Guidewire Software Inc. (a) | 900 | 102,177 |
| HubSpot Inc. (a) | 470 | 309,800 |
| Informatica Inc., Class A (a) | 400 | 14,792 |
| Instructure Holdings Inc. (a) | 606 | 14,532 |
| Intapp Inc. (a) | 501 | 12,605 |
| Intelligent Systems Corp. (a) | 348 | 13,502 |
| InterDigital Inc. | 1,402 | 100,425 |
| Intuit Inc. | 3,042 | 1,956,675 |
| Jamf Holding Corp. (a) | 800 | 30,408 |
| Kaltura Inc. (a) | 200 | 674 |
| LivePerson Inc. (a) | 2,984 | 106,588 |
| Manhattan Associates Inc. (a) | 700 | 108,843 |
| Marathon Digital Holdings Inc. (a) | 4,344 | 142,744 |
| MeridianLink Inc. (a) | 462 | 9,970 |
| MicroStrategy Inc., Class A (a) | 386 | 210,173 |
| Mimecast Ltd. (a) | 2,780 | 221,205 |
| Mitek Systems Inc. (a) | 1,803 | 32,003 |
| Model N Inc. (a) | 1,700 | 51,051 |
| Momentive Global Inc. (a) | 5,894 | 124,658 |
| nCino Inc. (a) | 700 | 38,402 |
| NCR Corp. (a) | 1,400 | 56,280 |
| New Relic Inc. (a) | 500 | 54,980 |
| Nuance Communications Inc. (a) | 3,132 | 173,262 |
| Nutanix Inc., Class A (a) | 2,200 | 70,092 |
| ON24 Inc. (a) | 1,066 | 18,495 |
| PagerDuty Inc. (a) | 3,733 | 129,722 |
| Palantir Technologies Inc., Class A (a) | 18,700 | 340,527 |
See Notes to Schedule of Investments and Notes to Financial Statements.
| 8 | State Street Total Return V.I.S. Fund |
State Street Total Return V.I.S. Fund
Schedule of Investments, continued — December 31, 2021
| | Number
of Shares | Fair
Value |
| Paycom Software Inc. (a) | 600 | $ 249,114 |
| Paycor HCM Inc. (a) | 500 | 14,405 |
| Paylocity Holding Corp. (a) | 400 | 94,464 |
| Pegasystems Inc. | 400 | 44,728 |
| Procore Technologies Inc. (a) | 700 | 55,979 |
| PROS Holdings Inc. (a) | 1,741 | 60,047 |
| PTC Inc. (a) | 1,200 | 145,380 |
| Q2 Holdings Inc. (a) | 2,494 | 198,123 |
| Rekor Systems Inc. (a) | 1,600 | 10,480 |
| Rimini Street Inc. (a) | 1,614 | 9,636 |
| RingCentral Inc., Class A (a) | 900 | 168,615 |
| Riot Blockchain Inc. (a) | 4,129 | 92,201 |
| salesforce.com Inc. (a) | 10,663 | 2,709,788 |
| ShotSpotter Inc. (a) | 500 | 14,760 |
| Smartsheet Inc., Class A (a) | 1,400 | 108,430 |
| Smith Micro Software Inc. (a) | 2,071 | 10,189 |
| Splunk Inc. (a) | 1,900 | 219,868 |
| Sprout Social Inc., Class A (a) | 2,062 | 187,003 |
| SPS Commerce Inc. (a) | 1,647 | 234,450 |
| SS&C Technologies Holdings Inc. | 2,600 | 213,148 |
| Sumo Logic Inc. (a) | 3,758 | 50,958 |
| Synopsys Inc. (a) | 1,719 | 633,451 |
| The Trade Desk Inc., Class A (a) | 4,920 | 450,869 |
| Tyler Technologies Inc. (a) | 500 | 268,975 |
| Unity Software Inc. (a) | 1,700 | 243,083 |
| Upland Software Inc. (a) | 1,300 | 23,322 |
| Verint Systems Inc. (a) | 2,933 | 154,012 |
| Veritone Inc. (a) | 1,210 | 27,201 |
| Viant Technology Inc., Class A (a) | 600 | 5,823 |
| VirnetX Holding Corp. (a) | 3,900 | 10,140 |
| Vonage Holdings Corp. (a) | 11,038 | 229,480 |
| Workday Inc., Class A (a) | 2,200 | 600,996 |
| Workiva Inc. (a) | 1,956 | 255,238 |
| Yext Inc. (a) | 5,565 | 55,205 |
| Zendesk Inc. (a) | 1,300 | 135,577 |
| Zoom Video Communications Inc., Class A (a) | 2,492 | 458,304 |
| | | 23,390,091 |
| Asset Management & Custody Banks - 0.4% |
| Affiliated Managers Group Inc. | 500 | 82,255 |
| Ameriprise Financial Inc. | 1,300 | 392,158 |
| Apollo Global Management Inc. | 2,300 | 166,589 |
| Ares Management Corp., Class A | 1,600 | 130,032 |
| | Number
of Shares | Fair
Value |
| Artisan Partners Asset Management Inc., Class A | 2,659 | $ 126,675 |
| AssetMark Financial Holdings Inc. (a) | 1,000 | 26,210 |
| BlackRock Inc. | 1,628 | 1,490,532 |
| Blackstone Inc. | 7,800 | 1,009,242 |
| Blucora Inc. (a) | 2,404 | 41,637 |
| Brightsphere Investment Group Inc. | 2,855 | 73,088 |
| Cohen & Steers Inc. | 1,127 | 104,259 |
| Diamond Hill Investment Group Inc. | 126 | 24,473 |
| Federated Hermes Inc. | 4,240 | 159,339 |
| Focus Financial Partners Inc., Class A (a) | 2,713 | 162,020 |
| Franklin Resources Inc. | 3,500 | 117,215 |
| GAMCO Investors Inc., Class A | 288 | 7,194 |
| GCM Grosvenor Inc., Class A | 2,000 | 21,000 |
| Hamilton Lane Inc., Class A | 1,588 | 164,548 |
| Invesco Ltd. | 3,500 | 80,570 |
| KKR & Company Inc. | 6,400 | 476,800 |
| Northern Trust Corp. | 2,400 | 287,064 |
| Pzena Investment Management Inc., Class A | 300 | 2,841 |
| Sculptor Capital Management Inc. | 1,100 | 23,485 |
| SEI Investments Co. | 1,300 | 79,222 |
| State Street Corp. (b) | 4,200 | 390,600 |
| StepStone Group Inc., Class A | 1,994 | 82,891 |
| T Rowe Price Group Inc. | 2,615 | 514,214 |
| The Bank of New York Mellon Corp. | 8,700 | 505,296 |
| The Carlyle Group Inc. | 1,800 | 98,820 |
| Virtus Investment Partners Inc. | 350 | 103,985 |
| WisdomTree Investments Inc. | 5,800 | 35,496 |
| | | 6,979,750 |
| Auto Parts & Equipment - 0.1% |
| American Axle & Manufacturing Holdings Inc. (a) | 5,641 | 52,631 |
| BorgWarner Inc. | 2,700 | 121,689 |
| Cooper-Standard Holdings Inc. (a) | 1,000 | 22,410 |
| Dana Inc. | 6,614 | 150,932 |
| Dorman Products Inc. (a) | 1,200 | 135,612 |
| Fox Factory Holding Corp. (a) | 1,932 | 328,633 |
| Gentex Corp. | 2,558 | 89,146 |
| Gentherm Inc. (a) | 1,511 | 131,306 |
See Notes to Schedule of Investments and Notes to Financial Statements.
| State Street Total Return V.I.S. Fund | 9 |
State Street Total Return V.I.S. Fund
Schedule of Investments, continued — December 31, 2021
| | Number
of Shares | Fair
Value |
| LCI Industries | 1,129 | $ 175,977 |
| Lear Corp. | 700 | 128,065 |
| Modine Manufacturing Co. (a) | 2,100 | 21,189 |
| Motorcar Parts of America Inc. (a) | 1,100 | 18,777 |
| Patrick Industries Inc. | 1,100 | 88,759 |
| QuantumScape Corp. (a) | 3,000 | 66,570 |
| Standard Motor Products Inc. | 900 | 47,151 |
| Stoneridge Inc. (a) | 1,080 | 21,319 |
| Tenneco Inc., Class A (a) | 3,500 | 39,550 |
| Visteon Corp. (a) | 1,263 | 140,370 |
| XL Fleet Corp. (a) | 1,085 | 3,591 |
| XPEL Inc. (a) | 900 | 61,452 |
| | | 1,845,129 |
| Automobile Manufacturers - 0.7% |
| Canoo Inc. (a) | 4,700 | 36,284 |
| Fisker Inc. (a) | 7,421 | 116,732 |
| Ford Motor Co. | 44,665 | 927,692 |
| General Motors Co. (a) | 15,649 | 917,501 |
| Lordstown Motors Corp., Class A (a) | 7,444 | 25,682 |
| Rivian Automotive Inc., Class A (a) | 1,700 | 176,273 |
| Tesla Inc. (a) | 9,215 | 9,738,228 |
| Thor Industries Inc. | 634 | 65,790 |
| Winnebago Industries Inc. | 1,466 | 109,833 |
| Workhorse Group Inc. (a) | 6,100 | 26,596 |
| | | 12,140,611 |
| Automotive Retail - 0.2% |
| Advance Auto Parts Inc. | 700 | 167,916 |
| America's Car-Mart Inc. (a) | 313 | 32,051 |
| Arko Corp. (a) | 5,900 | 51,743 |
| Asbury Automotive Group Inc. (a) | 1,056 | 182,403 |
| AutoNation Inc. (a) | 382 | 44,637 |
| AutoZone Inc. (a) | 241 | 505,230 |
| Camping World Holdings Inc., Class A | 1,883 | 76,073 |
| CarLotz Inc. (a) | 4,400 | 9,988 |
| CarMax Inc. (a) | 1,900 | 247,437 |
| Carvana Co. (a) | 900 | 208,611 |
| Group 1 Automotive Inc. | 800 | 156,176 |
| Lazydays Holdings Inc. (a) | 406 | 8,745 |
| Lithia Motors Inc., Class A | 300 | 89,085 |
| Monro Inc. | 1,500 | 87,405 |
| Murphy USA Inc. | 1,104 | 219,961 |
| OneWater Marine Inc., Class A | 492 | 29,997 |
| | Number
of Shares | Fair
Value |
| O'Reilly Automotive Inc. (a) | 720 | $ 508,486 |
| Penske Automotive Group Inc. | 270 | 28,949 |
| Shift Technologies Inc. (a) | 3,000 | 10,230 |
| Sonic Automotive Inc., Class A | 1,106 | 54,692 |
| TravelCenters of America Inc. (a) | 599 | 30,920 |
| Vroom Inc. (a) | 1,500 | 16,185 |
| | | 2,766,920 |
| Biotechnology - 1.2% |
| 2seventy bio Inc. (a) | 1,100 | 28,193 |
| 4D Molecular Therapeutics Inc. (a) | 1,200 | 26,328 |
| 89bio Inc. (a) | 100 | 1,307 |
| AbbVie Inc. | 20,135 | 2,726,279 |
| ACADIA Pharmaceuticals Inc. (a) | 5,448 | 127,156 |
| Adagio Therapeutics Inc. (a) | 1,100 | 7,986 |
| Adicet Bio Inc. (a) | 1,115 | 19,501 |
| Adverum Biotechnologies Inc. (a) | 5,332 | 9,384 |
| Aeglea BioTherapeutics Inc. (a) | 2,800 | 13,300 |
| Aerovate Therapeutics Inc. (a) | 437 | 5,152 |
| Agenus Inc. (a) | 9,800 | 31,556 |
| Agios Pharmaceuticals Inc. (a) | 2,638 | 86,711 |
| Akebia Therapeutics Inc. (a) | 8,700 | 19,662 |
| Akero Therapeutics Inc. (a) | 1,100 | 23,265 |
| Akouos Inc. (a) | 1,500 | 12,750 |
| Albireo Pharma Inc. (a) | 1,000 | 23,290 |
| Aldeyra Therapeutics Inc. (a) | 2,400 | 9,600 |
| Alector Inc. (a) | 2,558 | 52,823 |
| Aligos Therapeutics Inc. (a) | 1,300 | 15,431 |
| Allakos Inc. (a) | 1,613 | 15,791 |
| Allogene Therapeutics Inc. (a) | 2,966 | 44,253 |
| Allovir Inc. (a) | 1,229 | 15,903 |
| Alnylam Pharmaceuticals Inc. (a) | 1,300 | 220,454 |
| Alpine Immune Sciences Inc. (a) | 639 | 8,850 |
| Altimmune Inc. (a) | 1,600 | 14,656 |
| ALX Oncology Holdings Inc. (a) | 756 | 16,246 |
| Amgen Inc. | 6,445 | 1,449,932 |
| Amicus Therapeutics Inc. (a) | 11,959 | 138,126 |
| AnaptysBio Inc. (a) | 805 | 27,974 |
| Anavex Life Sciences Corp. (a) | 2,814 | 48,795 |
| Anika Therapeutics Inc. (a) | 800 | 28,664 |
See Notes to Schedule of Investments and Notes to Financial Statements.
| 10 | State Street Total Return V.I.S. Fund |
State Street Total Return V.I.S. Fund
Schedule of Investments, continued — December 31, 2021
| | Number
of Shares | Fair
Value |
| Annexon Inc. (a) | 1,600 | $ 18,384 |
| Apellis Pharmaceuticals Inc. (a) | 3,254 | 153,849 |
| Applied Molecular Transport Inc. (a) | 1,024 | 14,316 |
| Applied Therapeutics Inc. (a) | 1,000 | 8,950 |
| AquaBounty Technologies Inc. (a) | 3,200 | 6,720 |
| Arcturus Therapeutics Holdings Inc. (a) | 891 | 32,976 |
| Arcus Biosciences Inc. (a) | 2,150 | 87,011 |
| Arcutis Biotherapeutics Inc. (a) | 1,400 | 29,036 |
| Ardelyx Inc. (a) | 4,600 | 5,060 |
| Arena Pharmaceuticals Inc. (a) | 2,823 | 262,370 |
| Arrowhead Pharmaceuticals Inc. (a) | 4,636 | 307,367 |
| Atara Biotherapeutics Inc. (a) | 3,700 | 58,312 |
| Athenex Inc. (a) | 4,400 | 5,984 |
| Athersys Inc. (a) | 11,100 | 10,019 |
| Atossa Genetics Inc. (a) | 5,700 | 9,120 |
| Atreca Inc., Class A (a) | 1,800 | 5,454 |
| Avid Bioservices Inc. (a) | 2,681 | 78,232 |
| Avidity Biosciences Inc. (a) | 1,800 | 42,786 |
| Avita Therapeutics Inc. (a) | 1,200 | 14,376 |
| Avrobio Inc. (a) | 2,200 | 8,470 |
| Beam Therapeutics Inc. (a) | 2,335 | 186,076 |
| Beyondspring Inc. (a) | 828 | 3,751 |
| BioAtla Inc. (a) | 700 | 13,741 |
| BioCryst Pharmaceuticals Inc. (a) | 8,168 | 113,127 |
| Biogen Inc. (a) | 1,700 | 407,864 |
| Biohaven Pharmaceutical Holding Company Ltd. (a) | 2,548 | 351,140 |
| BioMarin Pharmaceutical Inc. (a) | 2,000 | 176,700 |
| Biomea Fusion Inc. (a) | 1,040 | 7,748 |
| Bioxcel Therapeutics Inc. (a) | 797 | 16,203 |
| Black Diamond Therapeutics Inc. (a) | 1,100 | 5,863 |
| Bluebird Bio Inc. (a) | 3,300 | 32,967 |
| Blueprint Medicines Corp. (a) | 2,675 | 286,519 |
| Bolt Biotherapeutics Inc. (a) | 800 | 3,920 |
| Bridgebio Pharma Inc. (a) | 4,841 | 80,748 |
| Brooklyn ImmunoTherapeutics Inc. (a) | 1,300 | 5,421 |
| C4 Therapeutics Inc. (a) | 1,707 | 54,965 |
| Cardiff Oncology Inc. (a) | 2,500 | 15,025 |
| CareDx Inc. (a) | 2,293 | 104,286 |
| Caribou Biosciences Inc. (a) | 900 | 13,581 |
| | Number
of Shares | Fair
Value |
| Catalyst Pharmaceuticals Inc. (a) | 3,980 | $ 26,945 |
| Celcuity Inc. (a) | 700 | 9,233 |
| Celldex Therapeutics Inc. (a) | 2,078 | 80,294 |
| CEL-SCI Corp. (a) | 2,100 | 14,910 |
| Century Therapeutics Inc. (a) | 566 | 8,977 |
| Cerevel Therapeutics Holdings Inc. (a) | 1,900 | 61,598 |
| ChemoCentryx Inc. (a) | 2,500 | 91,025 |
| Chimerix Inc. (a) | 3,500 | 22,505 |
| Chinook Therapeutics Inc. (a) | 1,577 | 25,721 |
| Clene Inc. (a) | 1,600 | 6,560 |
| Clovis Oncology Inc. (a) | 5,000 | 13,550 |
| Codiak Biosciences Inc. (a) | 1,000 | 11,140 |
| Cogent Biosciences Inc. (a) | 2,200 | 18,876 |
| Coherus Biosciences Inc. (a) | 2,771 | 44,225 |
| Contra Aduro Biotech (a) | 4,580 | 595 |
| Cortexyme Inc. (a) | 1,000 | 12,620 |
| Crinetics Pharmaceuticals Inc. (a) | 2,210 | 62,786 |
| Cue Biopharma Inc. (a) | 1,475 | 16,682 |
| Cullinan Oncology Inc. (a) | 1,061 | 16,371 |
| Curis Inc. (a) | 4,200 | 19,992 |
| Cyteir Therapeutics Inc. (a) | 470 | 5,344 |
| Cytokinetics Inc. (a) | 3,608 | 164,453 |
| CytomX Therapeutics Inc. (a) | 3,800 | 16,454 |
| Day One Biopharmaceuticals Inc. (a) | 386 | 6,504 |
| Deciphera Pharmaceuticals Inc. (a) | 1,900 | 18,563 |
| Denali Therapeutics Inc. (a) | 4,149 | 185,045 |
| DermTech Inc. (a) | 1,200 | 18,960 |
| Design Therapeutics Inc. (a) | 1,275 | 27,298 |
| Dynavax Technologies Corp. (a) | 4,758 | 66,945 |
| Dyne Therapeutics Inc. (a) | 1,200 | 14,268 |
| Eagle Pharmaceuticals Inc. (a) | 600 | 30,552 |
| Editas Medicine Inc. (a) | 3,097 | 82,225 |
| Eiger BioPharmaceuticals Inc. (a) | 2,100 | 10,899 |
| Emergent BioSolutions Inc. (a) | 2,220 | 96,503 |
| Enanta Pharmaceuticals Inc. (a) | 900 | 67,302 |
| Epizyme Inc. (a) | 5,400 | 13,500 |
| Erasca Inc. (a) | 1,200 | 18,696 |
| Evelo Biosciences Inc. (a) | 2,000 | 12,140 |
| Exact Sciences Corp. (a) | 2,000 | 155,660 |
| Exelixis Inc. (a) | 3,600 | 65,808 |
| Fate Therapeutics Inc. (a) | 3,705 | 216,780 |
| FibroGen Inc. (a) | 4,200 | 59,220 |
See Notes to Schedule of Investments and Notes to Financial Statements.
| State Street Total Return V.I.S. Fund | 11 |
State Street Total Return V.I.S. Fund
Schedule of Investments, continued — December 31, 2021
| | Number
of Shares | Fair
Value |
| Finch Therapeutics Group Inc. (a) | 349 | $ 3,480 |
| Foghorn Therapeutics Inc. (a) | 1,023 | 23,396 |
| Forma Therapeutics Holdings Inc. (a) | 1,401 | 19,922 |
| Forte Biosciences Inc. (a) | 600 | 1,284 |
| Fortress Biotech Inc. (a) | 4,058 | 10,145 |
| Frequency Therapeutics Inc. (a) | 1,030 | 5,284 |
| G1 Therapeutics Inc. (a) | 2,000 | 20,420 |
| Generation Bio Co. (a) | 2,181 | 15,441 |
| Geron Corp. (a) | 17,400 | 21,228 |
| Gilead Sciences Inc. | 14,370 | 1,043,406 |
| Global Blood Therapeutics Inc. (a) | 2,971 | 86,961 |
| Gossamer Bio Inc. (a) | 2,628 | 29,723 |
| Graphite Bio Inc. (a) | 779 | 9,683 |
| Greenwich Lifesciences Inc. (a) | 107 | 2,603 |
| Gritstone Oncology Inc. (a) | 1,800 | 23,148 |
| GT Biopharma Inc. (a) | 1,400 | 4,270 |
| Halozyme Therapeutics Inc. (a) | 6,324 | 254,288 |
| Harpoon Therapeutics Inc. (a) | 900 | 6,795 |
| Heron Therapeutics Inc. (a) | 4,400 | 40,172 |
| Homology Medicines Inc. (a) | 2,100 | 7,644 |
| Hookipa Pharma Inc. (a) | 1,300 | 3,029 |
| Horizon Therapeutics PLC (a) | 2,400 | 258,624 |
| Humanigen Inc. (a) | 2,200 | 8,184 |
| iBio Inc. (a) | 12,800 | 7,027 |
| Icosavax Inc. (a) | 600 | 13,728 |
| Ideaya Biosciences Inc. (a) | 1,376 | 32,529 |
| IGM Biosciences Inc. (a) | 400 | 11,732 |
| Imago Biosciences Inc. (a) | 326 | 7,729 |
| Immuneering Corp., Class A (a) | 284 | 4,592 |
| Immunic Inc. (a) | 1,016 | 9,723 |
| ImmunityBio Inc. (a) | 3,373 | 20,508 |
| ImmunoGen Inc. (a) | 9,200 | 68,264 |
| Immunovant Inc. (a) | 2,200 | 18,744 |
| Incyte Corp. (a) | 2,200 | 161,480 |
| Infinity Pharmaceuticals Inc. (a) | 5,800 | 13,050 |
| Inhibrx Inc. (a) | 1,400 | 61,138 |
| Inovio Pharmaceuticals Inc. (a) | 9,038 | 45,100 |
| Inozyme Pharma Inc. (a) | 1,000 | 6,820 |
| Insmed Inc. (a) | 5,615 | 152,953 |
| Instil Bio Inc. (a) | 2,593 | 44,366 |
| Intellia Therapeutics Inc. (a) | 3,192 | 377,422 |
| | Number
of Shares | Fair
Value |
| Intercept Pharmaceuticals Inc. (a) | 1,198 | $ 19,515 |
| Invitae Corp. (a) | 9,124 | 139,324 |
| Ionis Pharmaceuticals Inc. (a) | 1,400 | 42,602 |
| Iovance Biotherapeutics Inc. (a) | 2,100 | 40,089 |
| Ironwood Pharmaceuticals Inc. (a) | 6,435 | 75,032 |
| iTeos Therapeutics Inc. (a) | 969 | 45,117 |
| IVERIC bio Inc. (a) | 5,100 | 85,272 |
| Janux Therapeutics Inc. (a) | 800 | 15,784 |
| Jounce Therapeutics Inc. (a) | 900 | 7,515 |
| KalVista Pharmaceuticals Inc. (a) | 1,100 | 14,553 |
| Karuna Therapeutics Inc. (a) | 1,008 | 132,048 |
| Karyopharm Therapeutics Inc. (a) | 2,939 | 18,898 |
| Keros Therapeutics Inc. (a) | 800 | 46,808 |
| Kezar Life Sciences Inc. (a) | 1,696 | 28,357 |
| Kiniksa Pharmaceuticals Ltd., Class A (a) | 1,600 | 18,832 |
| Kinnate Biopharma Inc. (a) | 1,248 | 22,115 |
| Kodiak Sciences Inc. (a) | 1,523 | 129,120 |
| Kronos Bio Inc. (a) | 2,000 | 27,180 |
| Krystal Biotech Inc. (a) | 826 | 57,779 |
| Kura Oncology Inc. (a) | 3,100 | 43,400 |
| Kymera Therapeutics Inc. (a) | 1,554 | 98,663 |
| Lexicon Pharmaceuticals Inc. (a) | 3,100 | 12,214 |
| Ligand Pharmaceuticals Inc. (a) | 684 | 105,651 |
| Lineage Cell Therapeutics Inc. (a) | 6,100 | 14,945 |
| Lyell Immunopharma Inc. (a) | 855 | 6,618 |
| MacroGenics Inc. (a) | 3,009 | 48,294 |
| Madrigal Pharmaceuticals Inc. (a) | 500 | 42,370 |
| Magenta Therapeutics Inc. (a) | 1,500 | 6,645 |
| MannKind Corp. (a) | 10,706 | 46,785 |
| MEI Pharma Inc. (a) | 6,700 | 17,889 |
| MeiraGTx Holdings PLC (a) | 1,500 | 35,610 |
| Mersana Therapeutics Inc. (a) | 3,174 | 19,742 |
| MiMedx Group Inc. (a) | 5,500 | 33,220 |
| Mirati Therapeutics Inc. (a) | 500 | 73,345 |
| Moderna Inc. (a) | 3,900 | 990,522 |
| Molecular Templates Inc. (a) | 1,600 | 6,272 |
| Monte Rosa Therapeutics Inc. (a) | 800 | 16,336 |
| Morphic Holding Inc. (a) | 1,000 | 47,380 |
| Mustang Bio Inc. (a) | 3,206 | 5,322 |
See Notes to Schedule of Investments and Notes to Financial Statements.
| 12 | State Street Total Return V.I.S. Fund |
State Street Total Return V.I.S. Fund
Schedule of Investments, continued — December 31, 2021
| | Number
of Shares | Fair
Value |
| Myriad Genetics Inc. (a) | 3,808 | $ 105,101 |
| Natera Inc. (a) | 900 | 84,051 |
| Neoleukin Therapeutics Inc. (a) | 2,000 | 9,640 |
| Neurocrine Biosciences Inc. (a) | 1,000 | 85,170 |
| NexImmune Inc. (a) | 1,600 | 7,376 |
| Nkarta Inc. (a) | 500 | 7,675 |
| Novavax Inc. (a) | 800 | 114,456 |
| Nurix Therapeutics Inc. (a) | 1,400 | 40,530 |
| Nuvalent Inc., Class A (a) | 600 | 11,424 |
| Ocugen Inc. (a) | 9,000 | 40,950 |
| Olema Pharmaceuticals Inc. (a) | 1,047 | 9,800 |
| Omega Therapeutics Inc. (a) | 410 | 4,645 |
| Oncocyte Corp. (a) | 4,300 | 9,331 |
| Oncorus Inc. (a) | 1,500 | 7,905 |
| Oncternal Therapeutics Inc. (a) | 3,800 | 8,626 |
| OPKO Health Inc. (a) | 17,605 | 84,680 |
| Organogenesis Holdings Inc. (a) | 1,500 | 13,860 |
| ORIC Pharmaceuticals Inc. (a) | 1,400 | 20,580 |
| Outlook Therapeutics Inc. (a) | 7,100 | 9,656 |
| Oyster Point Pharma Inc. (a) | 512 | 9,349 |
| Passage Bio Inc. (a) | 1,700 | 10,795 |
| PMV Pharmaceuticals Inc. (a) | 1,400 | 32,340 |
| Poseida Therapeutics Inc. (a) | 2,000 | 13,620 |
| Praxis Precision Medicines Inc. (a) | 1,351 | 26,615 |
| Precigen Inc. (a) | 4,200 | 15,582 |
| Precision BioSciences Inc. (a) | 2,800 | 20,720 |
| Prelude Therapeutics Inc. (a) | 600 | 7,470 |
| Prometheus Biosciences Inc. (a) | 1,437 | 56,819 |
| Protagonist Therapeutics Inc. (a) | 2,013 | 68,845 |
| PTC Therapeutics Inc. (a) | 3,157 | 125,743 |
| Puma Biotechnology Inc. (a) | 1,900 | 5,776 |
| Radius Health Inc. (a) | 1,994 | 13,798 |
| RAPT Therapeutics Inc. (a) | 900 | 33,057 |
| Recursion Pharmaceuticals Inc., Class A (a) | 5,528 | 94,695 |
| Regeneron Pharmaceuticals Inc. (a) | 1,170 | 738,878 |
| REGENXBIO Inc. (a) | 1,773 | 57,977 |
| Relay Therapeutics Inc. (a) | 3,356 | 103,063 |
| Replimune Group Inc. (a) | 1,400 | 37,940 |
| REVOLUTION Medicines Inc. (a) | 2,632 | 66,247 |
| | Number
of Shares | Fair
Value |
| Rhythm Pharmaceuticals Inc. (a) | 2,300 | $ 22,954 |
| Rigel Pharmaceuticals Inc. (a) | 8,194 | 21,714 |
| Rocket Pharmaceuticals Inc. (a) | 1,782 | 38,901 |
| Rubius Therapeutics Inc. (a) | 2,100 | 20,328 |
| Sage Therapeutics Inc. (a) | 800 | 34,032 |
| Sana Biotechnology Inc. (a) | 3,822 | 59,165 |
| Sangamo Therapeutics Inc. (a) | 5,923 | 44,423 |
| Sarepta Therapeutics Inc. (a) | 900 | 81,045 |
| Scholar Rock Holding Corp. (a) | 1,500 | 37,260 |
| Seagen Inc. (a) | 1,500 | 231,900 |
| Selecta Biosciences Inc. (a) | 4,600 | 14,996 |
| Sensei Biotherapeutics Inc. (a) | 500 | 2,900 |
| Seres Therapeutics Inc. (a) | 3,400 | 28,322 |
| Sesen Bio Inc. (a) | 8,400 | 6,846 |
| Shattuck Labs Inc. (a) | 1,500 | 12,765 |
| Silverback Therapeutics Inc. (a) | 800 | 5,328 |
| Solid Biosciences Inc. (a) | 4,800 | 8,400 |
| Sorrento Therapeutics Inc. (a) | 13,697 | 63,691 |
| Spectrum Pharmaceuticals Inc. (a) | 8,800 | 11,176 |
| Spero Therapeutics Inc. (a) | 1,400 | 22,414 |
| SpringWorks Therapeutics Inc. (a) | 1,322 | 81,938 |
| SQZ Biotechnologies Co. (a) | 1,400 | 12,502 |
| Stoke Therapeutics Inc. (a) | 800 | 19,192 |
| Summit Therapeutics Inc. (a) | 1,264 | 3,400 |
| Surface Oncology Inc. (a) | 1,500 | 7,170 |
| Sutro Biopharma Inc. (a) | 1,900 | 28,272 |
| Syndax Pharmaceuticals Inc. (a) | 1,896 | 41,503 |
| Syros Pharmaceuticals Inc. (a) | 2,900 | 9,454 |
| Talaris Therapeutics Inc. (a) | 1,022 | 15,626 |
| Taysha Gene Therapies Inc. (a) | 1,100 | 12,815 |
| TCR2 Therapeutics Inc. (a) | 1,700 | 7,922 |
| Tenaya Therapeutics Inc. (a) | 536 | 10,157 |
| TG Therapeutics Inc. (a) | 5,790 | 110,010 |
| Tonix Pharmaceuticals Holding Corp. (a) | 18,200 | 6,510 |
| Travere Therapeutics Inc. (a) | 2,667 | 82,784 |
| Trevena Inc. (a) | 10,100 | 5,883 |
| Turning Point Therapeutics Inc. (a) | 2,083 | 99,359 |
| Twist Bioscience Corp. (a) | 2,152 | 166,543 |
| Tyra Biosciences Inc. (a) | 583 | 8,203 |
See Notes to Schedule of Investments and Notes to Financial Statements.
| State Street Total Return V.I.S. Fund | 13 |
State Street Total Return V.I.S. Fund
Schedule of Investments, continued — December 31, 2021
| | Number
of Shares | Fair
Value |
| Ultragenyx Pharmaceutical Inc. (a) | 700 | $ 58,863 |
| United Therapeutics Corp. (a) | 511 | 110,417 |
| UroGen Pharma Ltd. (a) | 1,200 | 11,412 |
| Vanda Pharmaceuticals Inc. (a) | 2,500 | 39,225 |
| Vaxart Inc. (a) | 6,145 | 38,529 |
| Vaxcyte Inc. (a) | 2,013 | 47,889 |
| VBI Vaccines Inc. (a) | 10,793 | 25,256 |
| Vera Therapeutics Inc. (a) | 383 | 10,234 |
| Veracyte Inc. (a) | 3,066 | 126,319 |
| Verastem Inc. (a) | 8,267 | 16,947 |
| Vericel Corp. (a) | 2,101 | 82,569 |
| Vertex Pharmaceuticals Inc. (a) | 2,900 | 636,840 |
| Verve Therapeutics Inc. (a) | 800 | 29,496 |
| Viking Therapeutics Inc. (a) | 4,000 | 18,400 |
| Vincerx Pharma Inc. (a) | 713 | 7,265 |
| Vir Biotechnology Inc. (a) | 2,810 | 117,655 |
| Viracta Therapeutics Inc. (a) | 1,800 | 6,570 |
| VistaGen Therapeutics Inc. (a) | 10,700 | 20,865 |
| Vor BioPharma Inc. (a) | 700 | 8,134 |
| Werewolf Therapeutics Inc. (a) | 1,267 | 15,090 |
| XBiotech Inc. | 857 | 9,538 |
| Xencor Inc. (a) | 2,563 | 102,828 |
| XOMA Corp. (a) | 400 | 8,340 |
| Y-mAbs Therapeutics Inc. (a) | 1,739 | 28,189 |
| Zentalis Pharmaceuticals Inc. (a) | 1,658 | 139,372 |
| ZIOPHARM Oncology Inc. (a) | 12,700 | 13,843 |
| | | 21,261,350 |
| Brewers - 0.0% * |
| Molson Coors Beverage Co., Class B | 2,200 | 101,970 |
| The Boston Beer Company Inc., Class A (a) | 124 | 62,632 |
| | | 164,602 |
| Broadcasting - 0.1% |
| AMC Networks Inc., Class A (a) | 1,400 | 48,216 |
| Discovery Inc., Class A (a) | 1,400 | 32,956 |
| Discovery Inc., Class C (a) | 3,400 | 77,860 |
| Entercom Communications Corp. (a) | 6,900 | 17,733 |
| Entravision Co.mmunications Co.rp, Class A | 2,964 | 20,096 |
| Fox Corp., Class A | 3,300 | 121,770 |
| Fox Corp., Class B | 1,900 | 65,113 |
| | Number
of Shares | Fair
Value |
| Gray Television Inc. | 4,200 | $ 84,672 |
| Hemisphere Media Group Inc. (a) | 200 | 1,454 |
| iHeartMedia Inc., Class A (a) | 5,075 | 106,778 |
| Media General Inc. (a) | 2,076 | 208 |
| Nexstar Broadcasting Group Inc., Class A | 500 | 75,490 |
| Sinclair Broadcast Group Inc., Class A | 2,306 | 60,947 |
| TEGNA Inc. | 10,087 | 187,215 |
| The EW Scripps., Class A | 2,858 | 55,302 |
| ViacomCBS Inc., Class B | 6,400 | 193,152 |
| ViacomCBS Inc., Class A | 200 | 6,674 |
| | | 1,155,636 |
| Building Products - 0.3% |
| A O Smith Corp. | 1,506 | 129,290 |
| AAON Inc. | 1,909 | 151,632 |
| Advanced Drainage Systems Inc. | 700 | 95,291 |
| American Woodmark Corp. (a) | 729 | 47,531 |
| Apogee Enterprises Inc. | 1,097 | 52,821 |
| Armstrong World Industries Inc. | 500 | 58,060 |
| Builders FirstSource Inc. (a) | 2,200 | 188,562 |
| Carlisle Companies Inc. | 600 | 148,872 |
| Carrier Global Corp. | 9,900 | 536,976 |
| Cornerstone Building Brands Inc. (a) | 2,600 | 45,344 |
| CSW Industrials Inc. | 700 | 84,602 |
| Fortune Brands Home & Security Inc. | 1,635 | 174,781 |
| Gibraltar Industries Inc. (a) | 1,487 | 99,153 |
| Griffon Corp. | 2,024 | 57,644 |
| Insteel Industries Inc. | 787 | 31,330 |
| JELD-WEN Holding Inc. (a) | 4,119 | 108,577 |
| Johnson Controls International PLC | 8,200 | 666,742 |
| Lennox International Inc. | 400 | 129,744 |
| Masco Corp. | 2,900 | 203,638 |
| Masonite International Corp. (a) | 1,082 | 127,622 |
| Owens Corning | 1,200 | 108,600 |
| PGT Innovations Inc. (a) | 2,800 | 62,972 |
| Quanex Building Products Corp. | 1,500 | 37,170 |
| Resideo Technologies Inc. (a) | 6,586 | 171,434 |
| Simpson Manufacturing Company Inc. | 1,991 | 276,888 |
| The AZEK Company Inc. (a) | 1,400 | 64,736 |
See Notes to Schedule of Investments and Notes to Financial Statements.
| 14 | State Street Total Return V.I.S. Fund |
State Street Total Return V.I.S. Fund
Schedule of Investments, continued — December 31, 2021
| | Number
of Shares | Fair
Value |
| Trex Company Inc. (a) | 1,300 | $ 175,539 |
| UFP Industries Inc. | 2,750 | 253,027 |
| View Inc. (a) | 6,692 | 26,166 |
| Zurn Water Solutions Corp. | 5,535 | 201,474 |
| | | 4,516,218 |
| Cable & Satellite - 0.2% |
| Altice USA Inc., Class A (a) | 2,600 | 42,068 |
| Cable One Inc. | 64 | 112,861 |
| Charter Communications Inc., Class A (a) | 1,468 | 957,092 |
| Comcast Corp., Class A | 52,042 | 2,619,274 |
| DISH Network Corp., Class A (a) | 2,700 | 87,588 |
| Liberty Broadband Corp., Class A (a) | 300 | 48,270 |
| Liberty Broadband Corp., Class C (a) | 1,600 | 257,760 |
| Liberty Media Corp-Liberty SiriusXM, Class A (a) | 1,200 | 61,020 |
| Liberty Media Corp-Liberty SiriusXM, Class C (a) | 1,800 | 91,530 |
| Sirius XM Holdings Inc. | 11,200 | 71,120 |
| WideOpenWest Inc. (a) | 2,250 | 48,420 |
| | | 4,397,003 |
| Casinos & Gaming - 0.1% |
| Accel Entertainment Inc. (a) | 3,000 | 39,060 |
| Bally's Corp. (a) | 1,600 | 60,896 |
| Boyd Gaming Corp. (a) | 1,000 | 65,570 |
| Caesars Entertainment Inc. (a) | 2,300 | 215,119 |
| Century Casinos Inc. (a) | 1,057 | 12,874 |
| Churchill Downs Inc. | 400 | 96,360 |
| DraftKings Inc., Class A (a) | 3,800 | 104,386 |
| Esports Technologies Inc. (a) | 411 | 8,450 |
| Everi Holdings Inc. (a) | 3,792 | 80,959 |
| Full House Resorts Inc. (a) | 1,217 | 14,738 |
| Golden Entertainment Inc. (a) | 729 | 36,837 |
| Golden Nugget Online Gaming Inc. (a) | 1,700 | 16,915 |
| International Game Technology PLC | 4,542 | 131,309 |
| Las Vegas Sands Corp. (a) | 3,600 | 135,504 |
| MGM Resorts International | 4,600 | 206,448 |
| Monarch Casino & Resort Inc. (a) | 584 | 43,187 |
| Penn National Gaming Inc. (a) | 1,800 | 93,330 |
| PlayAGS Inc. (a) | 900 | 6,111 |
| Red Rock Resorts Inc., Class A | 2,713 | 149,242 |
| | Number
of Shares | Fair
Value |
| Rush Street Interactive Inc. (a) | 2,600 | $ 42,900 |
| Scientific Games Co.rp, Class A (a) | 4,394 | 293,651 |
| Wynn Resorts Ltd. (a) | 1,200 | 102,048 |
| | | 1,955,894 |
| Coal & Consumable Fuels - 0.0% * |
| Arch Resources Inc. | 679 | 62,006 |
| Centrus Energy Corp., Class A (a) | 462 | 23,058 |
| CONSOL Energy Inc. (a) | 1,453 | 32,998 |
| Energy Fuels Inc. (a) | 6,700 | 51,121 |
| Peabody Energy Corp. (a) | 3,700 | 37,259 |
| Ur-Energy Inc. (a) | 6,886 | 8,401 |
| | | 214,843 |
| Commercial Printing - 0.0% * |
| Brady Corp., Class A | 2,141 | 115,400 |
| Deluxe Corp. | 2,000 | 64,220 |
| Ennis Inc. | 1,022 | 19,960 |
| RR Donnelley & Sons Co. (a) | 3,405 | 38,340 |
| | | 237,920 |
| Commodity Chemicals - 0.1% |
| AdvanSix Inc. | 1,193 | 56,369 |
| Cabot Corp. | 2,552 | 143,422 |
| Dow Inc. | 8,500 | 482,120 |
| Hawkins Inc. | 802 | 31,639 |
| Koppers Holdings Inc. (a) | 863 | 27,012 |
| Kronos Worldwide Inc. | 1,068 | 16,031 |
| LyondellBasell Industries N.V., Class A | 3,000 | 276,690 |
| Olin Corp. | 1,590 | 91,457 |
| PureCycle Technologies Inc. (a) | 2,561 | 24,509 |
| Tredegar Corp. | 1,600 | 18,912 |
| Trinseo PLC | 1,761 | 92,382 |
| Valvoline Inc. | 2,100 | 78,309 |
| Westlake Chemical Corp. | 300 | 29,139 |
| Zymergen Inc. (a) | 3,845 | 25,723 |
| | | 1,393,714 |
| Communications Equipment - 0.3% |
| ADTRAN Inc. | 2,068 | 47,212 |
| Arista Networks Inc. (a) | 2,780 | 399,625 |
| Aviat Networks Inc. (a) | 600 | 19,248 |
| CalAmp Corp. (a) | 2,000 | 14,120 |
| Calix Inc. (a) | 2,513 | 200,965 |
| Cambium Networks Corp. (a) | 500 | 12,815 |
See Notes to Schedule of Investments and Notes to Financial Statements.
| State Street Total Return V.I.S. Fund | 15 |
State Street Total Return V.I.S. Fund
Schedule of Investments, continued — December 31, 2021
| | Number
of Shares | Fair
Value |
| Casa Systems Inc. (a) | 1,900 | $ 10,773 |
| Ciena Corp. (a) | 1,700 | 130,849 |
| Cisco Systems Inc. | 48,019 | 3,042,964 |
| Clearfield Inc. (a) | 477 | 40,268 |
| CommScope Holding Company Inc. (a) | 2,900 | 32,016 |
| Comtech Telecommunications Corp. | 1,400 | 33,166 |
| Digi International Inc. (a) | 1,737 | 42,678 |
| DZS Inc. (a) | 1,132 | 18,361 |
| EMCORE Corp. (a) | 1,752 | 12,229 |
| Extreme Networks Inc. (a) | 6,189 | 97,167 |
| F5 Inc. (a) | 700 | 171,297 |
| Harmonic Inc. (a) | 3,820 | 44,923 |
| Infinera Corp. (a) | 8,261 | 79,223 |
| Inseego Corp. (a) | 4,200 | 24,486 |
| Juniper Networks Inc. | 3,600 | 128,556 |
| KVH Industries Inc. (a) | 835 | 7,674 |
| Lumentum Holdings Inc. (a) | 900 | 95,193 |
| Motorola Solutions Inc. | 1,900 | 516,230 |
| NETGEAR Inc. (a) | 1,400 | 40,894 |
| NetScout Systems Inc. (a) | 3,182 | 105,261 |
| Plantronics Inc. (a) | 1,837 | 53,898 |
| Ribbon Communications Inc. (a) | 4,000 | 24,200 |
| Ubiquiti Inc. | 100 | 30,670 |
| ViaSat Inc. (a) | 900 | 40,086 |
| Viavi Solutions Inc. (a) | 11,153 | 196,516 |
| | | 5,713,563 |
| Computer & Electronics Retail - 0.0% * |
| Best Buy Company Inc. | 2,803 | 284,785 |
| Conn's Inc. (a) | 771 | 18,134 |
| GameStop Corp., Class A (a) | 700 | 103,873 |
| Rent-A-Center Inc. | 3,000 | 144,120 |
| | | 550,912 |
| Construction & Engineering - 0.1% |
| AECOM (a) | 1,700 | 131,495 |
| Ameresco Inc., Class A (a) | 1,402 | 114,179 |
| API Group Corp. (a) | 9,211 | 237,368 |
| Arcosa Inc. | 2,198 | 115,835 |
| Argan Inc. | 619 | 23,949 |
| Comfort Systems USA Inc. | 1,623 | 160,580 |
| Concrete Pumping Holdings Inc. (a) | 1,512 | 12,398 |
| Construction Partners Inc., Class A (a) | 1,264 | 37,174 |
| Dycom Industries Inc. (a) | 1,337 | 125,357 |
| | Number
of Shares | Fair
Value |
| EMCOR Group Inc. | 2,437 | $ 310,449 |
| Fluor Corp. (a) | 6,468 | 160,212 |
| Granite Construction Inc. | 2,066 | 79,954 |
| Great Lakes Dredge & Dock Corp. (a) | 3,000 | 47,160 |
| IES Holdings Inc. (a) | 415 | 21,016 |
| Infrastructure and Energy Alternatives Inc. (a) | 1,600 | 14,720 |
| INNOVATE Corp. (a) | 2,489 | 9,209 |
| MasTec Inc. (a) | 700 | 64,596 |
| Matrix Service Co. (a) | 1,600 | 12,032 |
| MYR Group Inc. (a) | 746 | 82,470 |
| Northwest Pipe Co. (a) | 597 | 18,985 |
| NV5 Global Inc. (a) | 596 | 82,320 |
| Primoris Services Corp. | 2,349 | 56,329 |
| Quanta Services Inc. | 1,638 | 187,813 |
| Sterling Construction Company Inc. (a) | 1,172 | 30,824 |
| Tutor Perini Corp. (a) | 2,000 | 24,740 |
| Valmont Industries Inc. | 200 | 50,100 |
| WillScot Mobile Mini Holdings Corp. (a) | 9,680 | 395,331 |
| | | 2,606,595 |
| Construction Machinery & Heavy Trucks - 0.2% |
| Alamo Group Inc. | 447 | 65,790 |
| Allison Transmission Holdings Inc. | 1,100 | 39,985 |
| Astec Industries Inc. | 1,021 | 70,725 |
| Blue Bird Corp. (a) | 900 | 14,076 |
| Caterpillar Inc. | 6,159 | 1,273,312 |
| Commercial Vehicle Group Inc. (a) | 1,537 | 12,388 |
| Cummins Inc. | 1,637 | 357,095 |
| Douglas Dynamics Inc. | 1,100 | 42,966 |
| Federal Signal Corp. | 2,735 | 118,535 |
| Hyliion Holdings Corp. (a) | 5,800 | 35,960 |
| Ideanomics Inc. (a) | 20,000 | 24,000 |
| Meritor Inc. (a) | 3,200 | 79,296 |
| Miller Industries Inc. | 532 | 17,769 |
| Nikola Corp. (a) | 11,029 | 108,856 |
| Oshkosh Corp. | 800 | 90,168 |
| PACCAR Inc. | 3,900 | 344,214 |
| REV Group Inc. | 1,600 | 22,640 |
| Terex Corp. | 3,111 | 136,729 |
| The Greenbrier Companies Inc. | 1,434 | 65,806 |
| The Manitowoc Company Inc. (a) | 1,443 | 26,825 |
| The Shyft Group Inc. | 1,563 | 76,790 |
See Notes to Schedule of Investments and Notes to Financial Statements.
| 16 | State Street Total Return V.I.S. Fund |
State Street Total Return V.I.S. Fund
Schedule of Investments, continued — December 31, 2021
| | Number
of Shares | Fair
Value |
| Trinity Industries Inc. | 3,706 | $ 111,921 |
| Wabash National Corp. | 2,123 | 41,441 |
| Westinghouse Air Brake Technologies Corp. | 2,000 | 184,220 |
| | | 3,361,507 |
| Construction Materials - 0.1% |
| Eagle Materials Inc. | 400 | 66,584 |
| Forterra Inc. (a) | 1,419 | 33,744 |
| Martin Marietta Materials Inc. | 700 | 308,364 |
| Summit Materials Inc., Class A (a) | 5,419 | 217,519 |
| U.S. Lime & Minerals Inc. | 80 | 10,321 |
| Vulcan Materials Co. | 1,500 | 311,370 |
| | | 947,902 |
| Consumer Electronics - 0.0% * |
| GoPro Inc., Class A (a) | 6,307 | 65,025 |
| Snap One Holdings Corp. (a) | 450 | 9,486 |
| Sonos Inc. (a) | 5,477 | 163,215 |
| Universal Electronics Inc. (a) | 609 | 24,817 |
| VOXX International Corp. (a) | 1,143 | 11,624 |
| Vuzix Corp. (a) | 2,900 | 25,143 |
| | | 299,310 |
| Consumer Finance - 0.2% |
| Ally Financial Inc. | 3,900 | 185,679 |
| American Express Co. | 7,208 | 1,179,229 |
| Atlanticus Holdings Corp. (a) | 265 | 18,900 |
| Capital One Financial Corp. | 4,816 | 698,753 |
| Credit Acceptance Corp. (a) | 61 | 41,948 |
| Curo Group Holdings Corp. | 1,200 | 19,212 |
| Discover Financial Services | 3,300 | 381,348 |
| Encore Capital Group Inc. (a) | 1,399 | 86,892 |
| Enova International Inc. (a) | 1,700 | 69,632 |
| Ezcorp Inc., Class A (a) | 1,880 | 13,856 |
| FirstCash Holdings Inc. | 1,803 | 134,882 |
| Green Dot Corp., Class A (a) | 2,418 | 87,628 |
| LendingClub Corp. (a) | 4,781 | 115,605 |
| LendingTree Inc. (a) | 513 | 62,894 |
| Navient Corp. | 7,202 | 152,826 |
| Nelnet Inc., Class A | 766 | 74,823 |
| OneMain Holdings Inc. | 1,400 | 70,056 |
| Oportun Financial Corp. (a) | 1,200 | 24,300 |
| PRA Group Inc. (a) | 2,074 | 104,136 |
| PROG Holdings Inc. | 2,164 | 97,618 |
| Regional Management Corp. | 368 | 21,145 |
| Santander Consumer USA Holdings Inc. | 600 | 25,212 |
| | Number
of Shares | Fair
Value |
| SLM Corp. | 3,900 | $ 76,713 |
| Synchrony Financial | 6,300 | 292,257 |
| Upstart Holdings Inc. (a) | 500 | 75,650 |
| World Acceptance Corp. (a) | 200 | 49,086 |
| | | 4,160,280 |
| Copper - 0.0% * |
| Freeport-McMoRan Inc. | 16,700 | 696,891 |
| Data Processing & Outsourced Services - 0.9% |
| Alliance Data Systems Corp. | 700 | 46,599 |
| Automatic Data Processing Inc. | 4,800 | 1,183,584 |
| Broadridge Financial Solutions Inc. | 1,300 | 237,666 |
| Cantaloupe Inc. (a) | 2,900 | 25,752 |
| Cass Information Systems Inc. | 600 | 23,592 |
| Concentrix Corp. | 538 | 96,098 |
| Conduent Inc. (a) | 8,374 | 44,717 |
| CSG Systems International Inc. | 1,472 | 84,817 |
| Euronet Worldwide Inc. (a) | 500 | 59,585 |
| Evo Payments Inc., Class A (a) | 2,362 | 60,467 |
| ExlService Holdings Inc. (a) | 1,498 | 216,865 |
| Fidelity National Information Services Inc. | 6,960 | 759,684 |
| Fiserv Inc. (a) | 6,800 | 705,772 |
| FleetCor Technologies Inc. (a) | 900 | 201,456 |
| Flywire Corp. (a) | 3,021 | 114,979 |
| Genpact Ltd. | 2,300 | 122,084 |
| Global Payments Inc. | 3,300 | 446,094 |
| GreenBox POS (a) | 1,500 | 6,300 |
| I3 Verticals Inc., Class A (a) | 1,100 | 25,069 |
| International Money Express Inc. (a) | 1,700 | 27,132 |
| Jack Henry & Associates Inc. | 845 | 141,107 |
| Mastercard Inc., Class A | 9,958 | 3,578,109 |
| Maximus Inc. | 2,799 | 222,996 |
| MoneyGram International Inc. (a) | 3,700 | 29,193 |
| Paya Holdings Inc. (a) | 4,000 | 25,360 |
| Paychex Inc. | 3,700 | 505,050 |
| PayPal Holdings Inc. (a) | 13,391 | 2,525,275 |
| Remitly Global Inc. (a) | 589 | 12,145 |
| Repay Holdings Corp. (a) | 4,277 | 78,141 |
| Sabre Corp. (a) | 4,800 | 41,232 |
| Shift4 Payments Inc., Class A (a) | 600 | 34,758 |
| Square Inc., Class A (a) | 4,498 | 726,472 |
See Notes to Schedule of Investments and Notes to Financial Statements.
| State Street Total Return V.I.S. Fund | 17 |
State Street Total Return V.I.S. Fund
Schedule of Investments, continued — December 31, 2021
| | Number
of Shares | Fair
Value |
| The Western Union Co. | 5,000 | $ 89,200 |
| TTEC Holdings Inc. | 900 | 81,495 |
| Verra Mobility Corp. (a) | 6,903 | 106,513 |
| Visa Inc., Class A | 19,239 | 4,169,284 |
| WEX Inc. (a) | 526 | 73,845 |
| | | 16,928,487 |
| Department Stores - 0.0% * |
| Dillard's Inc., Class A | 280 | 68,606 |
| Kohl's Corp. | 1,600 | 79,024 |
| Macy's Inc. | 14,373 | 376,285 |
| Nordstrom Inc. (a) | 1,600 | 36,192 |
| | | 560,107 |
| Distillers & Vintners - 0.0% * |
| Brown-Forman Corp., Class B | 2,100 | 153,006 |
| Brown-Forman Corp., Class A | 500 | 33,895 |
| Constellation Brands Inc., Class A | 1,800 | 451,746 |
| MGP Ingredients Inc. | 705 | 59,918 |
| The Duckhorn Portfolio Inc. (a) | 1,721 | 40,168 |
| | | 738,733 |
| Distributors - 0.0% * |
| Funko Inc., Class A (a) | 1,400 | 26,320 |
| Genuine Parts Co. | 1,600 | 224,320 |
| LKQ Corp. | 3,100 | 186,093 |
| Pool Corp. | 460 | 260,360 |
| | | 697,093 |
| Diversified Banks - 0.7% |
| Bank of America Corp. | 82,100 | 3,652,629 |
| Citigroup Inc. | 22,666 | 1,368,800 |
| JPMorgan Chase & Co. | 33,454 | 5,297,441 |
| U.S. Bancorp | 15,300 | 859,401 |
| Wells Fargo & Co. | 45,622 | 2,188,943 |
| | | 13,367,214 |
| Diversified Chemicals - 0.0% * |
| Huntsman Corp. | 2,400 | 83,712 |
| The Chemours Co. | 1,800 | 60,408 |
| | | 144,120 |
| Diversified Metals & Mining - 0.0% * |
| Compass Minerals International Inc. | 1,527 | 77,999 |
| Ferroglobe PLC (a)(c)** | 1,316 | — |
| Materion Corp. | 921 | 84,677 |
| | Number
of Shares | Fair
Value |
| MP Materials Corp. (a) | 3,563 | $ 161,831 |
| | | 324,507 |
| Diversified Real Estate Activities - 0.0% * |
| Tejon Ranch Co. (a) | 999 | 19,061 |
| The RMR Group Inc., Class A | 732 | 25,386 |
| The St Joe Co. | 1,503 | 78,231 |
| | | 122,678 |
| Diversified REITs - 0.1% |
| Alexander & Baldwin Inc. | 3,500 | 87,815 |
| American Assets Trust Inc. | 2,256 | 84,668 |
| Armada Hoffler Properties Inc. | 2,575 | 39,191 |
| Broadstone Net Lease Inc. | 7,173 | 178,034 |
| CTO Realty Growth Inc. | 280 | 17,198 |
| DigitalBridge Group Inc. (a) | 22,119 | 184,251 |
| Empire State Realty Trust Inc., Class A | 6,273 | 55,830 |
| Essential Properties Realty Trust Inc. | 5,716 | 164,792 |
| Gladstone Commercial Corp. | 1,773 | 45,690 |
| Global Net Lease Inc. | 5,003 | 76,446 |
| iStar Inc. | 3,221 | 83,198 |
| One Liberty Properties Inc. | 650 | 22,932 |
| PS Business Parks Inc. | 915 | 168,516 |
| STORE Capital Corp. | 2,900 | 99,760 |
| Washington Real Estate Investment Trust | 3,837 | 99,186 |
| WP Carey Inc. | 2,100 | 172,305 |
| | | 1,579,812 |
| Diversified Support Services - 0.1% |
| Cintas Corp. | 1,000 | 443,170 |
| Copart Inc. (a) | 2,400 | 363,888 |
| Driven Brands Holdings Inc. (a) | 300 | 10,086 |
| Healthcare Services Group Inc. | 3,700 | 65,823 |
| IAA Inc. (a) | 1,600 | 80,992 |
| KAR Auction Services Inc. (a) | 5,841 | 91,236 |
| Matthews International Corp., Class A | 1,500 | 55,005 |
| UniFirst Corp. | 686 | 144,334 |
| Viad Corp. (a) | 900 | 38,511 |
| VSE Corp. | 508 | 30,958 |
| | | 1,324,003 |
| Drug Retail - 0.0% * |
| Rite Aid Corp. (a) | 2,600 | 38,194 |
See Notes to Schedule of Investments and Notes to Financial Statements.
| 18 | State Street Total Return V.I.S. Fund |
State Street Total Return V.I.S. Fund
Schedule of Investments, continued — December 31, 2021
| | Number
of Shares | Fair
Value |
| Walgreens Boots Alliance Inc. | 8,200 | $ 427,712 |
| | | 465,906 |
| Education Services - 0.1% |
| 2U Inc. (a) | 3,177 | 63,762 |
| Adtalem Global Education Inc. (a) | 2,180 | 64,441 |
| American Public Education Inc. (a) | 900 | 20,025 |
| Bright Horizons Family Solutions Inc. (a) | 700 | 88,116 |
| Chegg Inc. (a) | 1,800 | 55,260 |
| Coursera Inc. (a) | 3,503 | 85,613 |
| Graham Holdings Co., Class B | 173 | 108,961 |
| Grand Canyon Education Inc. (a) | 400 | 34,284 |
| Houghton Mifflin Harcourt Co. (a) | 5,753 | 92,623 |
| Laureate Education Inc., Class A | 5,000 | 61,200 |
| Perdoceo Education Corp. (a) | 2,943 | 34,610 |
| PowerSchool Holdings Inc., Class A (a) | 2,200 | 36,234 |
| Strategic Eduction Inc. | 1,200 | 69,408 |
| Stride Inc. (a) | 2,000 | 66,660 |
| Udemy Inc. (a) | 667 | 13,033 |
| | | 894,230 |
| Electric Utilities - 0.5% |
| ALLETE Inc. | 2,391 | 158,643 |
| Alliant Energy Corp. | 3,000 | 184,410 |
| American Electric Power Company Inc. | 5,700 | 507,129 |
| Avangrid Inc. | 498 | 24,840 |
| Duke Energy Corp. | 8,786 | 921,651 |
| Edison International | 4,200 | 286,650 |
| Entergy Corp. | 2,200 | 247,830 |
| Evergy Inc. | 2,500 | 171,525 |
| Eversource Energy | 3,841 | 349,454 |
| Exelon Corp. | 11,168 | 645,064 |
| FirstEnergy Corp. | 6,400 | 266,176 |
| Hawaiian Electric Industries Inc. | 1,100 | 45,650 |
| IDACORP Inc. | 600 | 67,986 |
| MGE Energy Inc. | 1,656 | 136,206 |
| NextEra Energy Inc. | 22,286 | 2,080,621 |
| NRG Energy Inc. | 2,700 | 116,316 |
| OGE Energy Corp. | 2,300 | 88,274 |
| Otter Tail Corp. | 1,870 | 133,555 |
| PG&E Corp. (a) | 17,600 | 213,664 |
| | Number
of Shares | Fair
Value |
| Pinnacle West Capital Corp. | 1,352 | $ 95,438 |
| PNM Resources Inc. | 3,903 | 178,016 |
| Portland General Electric Co. | 4,109 | 217,448 |
| PPL Corp. | 8,600 | 258,516 |
| The Southern Co. | 11,964 | 820,491 |
| Via Renewables Inc. | 671 | 7,670 |
| Xcel Energy Inc. | 6,175 | 418,048 |
| | | 8,641,271 |
| Electrical Components & Equipment - 0.3% |
| Acuity Brands Inc. | 400 | 84,688 |
| Advent Technologies Holdings Inc. (a) | 725 | 5,082 |
| Allied Motion Technologies Inc. | 600 | 21,894 |
| American Superconductor Corp. (a) | 1,600 | 17,408 |
| AMETEK Inc. | 2,600 | 382,304 |
| Array Technologies Inc. (a) | 5,781 | 90,704 |
| Atkore Inc. (a) | 2,105 | 234,055 |
| Beam Global (a) | 400 | 7,440 |
| Blink Charging Co. (a) | 1,800 | 47,718 |
| ChargePoint Holdings Inc. (a) | 2,400 | 45,720 |
| Eaton Corporation PLC | 4,534 | 783,566 |
| Emerson Electric Co. | 6,800 | 632,196 |
| Encore Wire Corp. | 947 | 135,516 |
| EnerSys | 1,952 | 154,325 |
| Eos Energy Enterprises Inc. (a) | 1,721 | 12,942 |
| FTC Solar Inc. (a) | 574 | 4,339 |
| FuelCell Energy Inc. (a) | 17,734 | 92,217 |
| Generac Holdings Inc. (a) | 738 | 259,717 |
| GrafTech International Ltd. | 9,090 | 107,535 |
| Hubbell Inc. | 600 | 124,962 |
| Plug Power Inc. (a) | 6,000 | 169,380 |
| Powell Industries Inc. | 437 | 12,887 |
| Preformed Line Products Co. | 163 | 10,546 |
| Regal Rexnord Corp. | 758 | 128,997 |
| Rockwell Automation Inc. | 1,344 | 468,854 |
| Romeo Power Inc. (a) | 7,300 | 26,645 |
| Sensata Technologies Holding plc (a) | 1,900 | 117,211 |
| Shoals Technologies Group Inc., Class A (a) | 1,300 | 31,590 |
| Stem Inc. (a) | 5,469 | 103,747 |
| Sunrun Inc. (a) | 2,200 | 75,460 |
| Thermon Group Holdings Inc. (a) | 1,353 | 22,906 |
| Vertiv Holdings Co. | 3,600 | 89,892 |
See Notes to Schedule of Investments and Notes to Financial Statements.
| State Street Total Return V.I.S. Fund | 19 |
State Street Total Return V.I.S. Fund
Schedule of Investments, continued — December 31, 2021
| | Number
of Shares | Fair
Value |
| Vicor Corp. (a) | 958 | $ 121,647 |
| | | 4,624,090 |
| Electronic Components - 0.1% |
| Akoustis Technologies Inc. (a) | 2,200 | 14,696 |
| Amphenol Corp., Class A | 6,700 | 585,982 |
| Belden Inc. | 2,010 | 132,117 |
| Corning Inc. | 8,575 | 319,247 |
| II-VI Inc. (a) | 4,846 | 331,127 |
| Knowles Corp. (a) | 4,300 | 100,405 |
| Littelfuse Inc. | 300 | 94,404 |
| Rogers Corp. (a) | 855 | 233,415 |
| Vishay Intertechnology Inc. | 6,059 | 132,511 |
| | | 1,943,904 |
| Electronic Equipment & Instruments - 0.2% |
| 908 Devices Inc. (a) | 600 | 15,522 |
| Advanced Energy Industries Inc. | 1,717 | 156,350 |
| Aeva Technologies Inc. (a) | 5,069 | 38,322 |
| Arlo Technologies Inc. (a) | 4,050 | 42,485 |
| Badger Meter Inc. | 1,328 | 141,512 |
| Cognex Corp. | 2,000 | 155,520 |
| Coherent Inc. (a) | 300 | 79,962 |
| Daktronics Inc. (a) | 800 | 4,040 |
| FARO Technologies Inc. (a) | 900 | 63,018 |
| Identiv Inc. (a) | 855 | 24,060 |
| Iteris Inc. (a) | 3,100 | 12,400 |
| Itron Inc. (a) | 2,056 | 140,877 |
| Keysight Technologies Inc. (a) | 2,100 | 433,671 |
| Luna Innovations Inc. (a) | 1,800 | 15,192 |
| MicroVision Inc. (a) | 7,220 | 36,172 |
| Napco Security Technologies Inc. (a) | 603 | 30,138 |
| National Instruments Corp. | 1,400 | 61,138 |
| nLight Inc. (a) | 2,200 | 52,690 |
| Novanta Inc. (a) | 1,613 | 284,420 |
| OSI Systems Inc. (a) | 764 | 71,205 |
| Ouster Inc. (a) | 7,512 | 39,062 |
| PAR Technology Corp. (a) | 1,200 | 63,324 |
| Teledyne Technologies Inc. (a) | 543 | 237,231 |
| Trimble Inc. (a) | 2,800 | 244,132 |
| Velodyne Lidar Inc. (a) | 3,500 | 16,240 |
| Vishay Precision Group Inc. (a) | 491 | 18,226 |
| Vontier Corp. | 1,699 | 52,210 |
| | Number
of Shares | Fair
Value |
| Zebra Technologies Corp., Class A (a) | 640 | $ 380,928 |
| | | 2,910,047 |
| Electronic Manufacturing Services - 0.0% * |
| Benchmark Electronics Inc. | 1,700 | 46,070 |
| CTS Corp. | 1,485 | 54,529 |
| IPG Photonics Corp. (a) | 400 | 68,856 |
| Jabil Inc. | 1,600 | 112,560 |
| Kimball Electronics Inc. (a) | 1,155 | 25,133 |
| Methode Electronics Inc. | 1,688 | 82,999 |
| Plexus Corp. (a) | 1,270 | 121,780 |
| Sanmina Corp. (a) | 2,883 | 119,529 |
| TTM Technologies Inc. (a) | 4,704 | 70,090 |
| | | 701,546 |
| Environmental & Facilities Services - 0.1% |
| ABM Industries Inc. | 3,061 | 125,042 |
| Aris Water Solution Inc., Class A (a) | 933 | 12,082 |
| BrightView Holdings Inc. (a) | 1,701 | 23,950 |
| Casella Waste Systems Inc., Class A (a) | 2,244 | 191,683 |
| CECO Environmental Corp. (a) | 2,200 | 13,706 |
| Clean Harbors Inc. (a) | 600 | 59,862 |
| Harsco Corp. (a) | 3,930 | 65,670 |
| Heritage-Crystal Clean Inc. (a) | 749 | 23,983 |
| Montrose Environmental Group Inc. (a) | 1,256 | 88,561 |
| Republic Services Inc. | 2,419 | 337,330 |
| Rollins Inc. | 2,778 | 95,035 |
| SP Plus Corp. (a) | 972 | 27,430 |
| Stericycle Inc. (a) | 1,100 | 65,604 |
| Team Inc. (a) | 1,900 | 2,071 |
| Tetra Tech Inc. | 2,469 | 419,236 |
| US Ecology Inc. (a) | 1,500 | 47,910 |
| Waste Management Inc. | 4,800 | 801,120 |
| | | 2,400,275 |
| Fertilizers & Agricultural Chemicals - 0.1% |
| American Vanguard Corp. | 1,407 | 23,061 |
| CF Industries Holdings Inc. | 2,500 | 176,950 |
| Corteva Inc. | 8,400 | 397,152 |
| FMC Corp. | 1,364 | 149,890 |
| Intrepid Potash Inc. (a) | 478 | 20,425 |
| The Mosaic Co. | 4,000 | 157,160 |
| The Scotts Miracle-Gro Co. | 477 | 76,797 |
| | | 1,001,435 |
See Notes to Schedule of Investments and Notes to Financial Statements.
| 20 | State Street Total Return V.I.S. Fund |
State Street Total Return V.I.S. Fund
Schedule of Investments, continued — December 31, 2021
| | Number
of Shares | Fair
Value |
| Financial Exchanges & Data - 0.3% |
| Cboe Global Markets Inc. | 1,200 | $ 156,480 |
| CME Group Inc. | 4,100 | 936,686 |
| Donnelley Financial Solutions Inc. (a) | 1,290 | 60,810 |
| FactSet Research Systems Inc. | 400 | 194,404 |
| Intercontinental Exchange Inc. | 6,357 | 869,447 |
| MarketAxess Holdings Inc. | 400 | 164,508 |
| Moody's Corp. | 1,900 | 742,102 |
| Morningstar Inc. | 200 | 68,398 |
| MSCI Inc. | 871 | 533,653 |
| Nasdaq Inc. | 1,315 | 276,163 |
| Open Lending Corp., Class A (a) | 4,729 | 106,308 |
| S&P Global Inc. | 2,760 | 1,302,527 |
| Tradeweb Markets Inc., Class A | 1,200 | 120,168 |
| | | 5,531,654 |
| Food Distributors - 0.1% |
| HF Foods Group Inc. (a) | 1,737 | 14,695 |
| Performance Food Group Co. (a) | 6,931 | 318,064 |
| SpartanNash Co. | 1,521 | 39,181 |
| Sysco Corp. | 5,900 | 463,445 |
| The Andersons Inc. | 1,364 | 52,800 |
| The Chefs' Warehouse Inc. (a) | 1,568 | 52,214 |
| U.S. Foods Holding Corp. (a) | 2,700 | 94,041 |
| United Natural Foods Inc. (a) | 2,536 | 124,467 |
| | | 1,158,907 |
| Food Retail - 0.1% |
| Albertsons Companies Inc., Class A | 1,700 | 51,323 |
| Casey's General Stores Inc. | 378 | 74,598 |
| Grocery Outlet Holding Corp. (a) | 1,100 | 31,108 |
| Ingles Markets Inc., Class A | 605 | 52,236 |
| Natural Grocers by Vitamin Cottage Inc. | 425 | 6,056 |
| Sprouts Farmers Market Inc. (a) | 5,135 | 152,407 |
| The Kroger Co. | 8,523 | 385,751 |
| Village Super Market Inc., Class A | 536 | 12,537 |
| Weis Markets Inc. | 818 | 53,890 |
| | | 819,906 |
| | Number
of Shares | Fair
Value |
| Footwear - 0.2% |
| Crocs Inc. (a) | 2,666 | $ 341,835 |
| Deckers Outdoor Corp. (a) | 300 | 109,893 |
| NIKE Inc., Class B | 14,097 | 2,349,547 |
| Rocky Brands Inc. | 400 | 15,920 |
| Skechers U.S.A. Inc., Class A (a) | 1,500 | 65,100 |
| Steven Madden Ltd. | 3,675 | 170,777 |
| Wolverine World Wide Inc. | 3,900 | 112,359 |
| | | 3,165,431 |
| Forest Products - 0.0% * |
| Louisiana-Pacific Corp. | 1,000 | 78,350 |
| Gas Utilities - 0.1% |
| Atmos Energy Corp. | 1,500 | 157,155 |
| Chesapeake Utilities Corp. | 782 | 114,023 |
| National Fuel Gas Co. | 1,000 | 63,940 |
| New Jersey Resources Corp. | 4,405 | 180,869 |
| Northwest Natural Holding Co. | 1,400 | 68,292 |
| ONE Gas Inc. | 2,405 | 186,604 |
| South Jersey Industries Inc. | 4,680 | 122,242 |
| Southwest Gas Holdings Inc. | 2,757 | 193,128 |
| Spire Inc. | 2,308 | 150,528 |
| UGI Corp. | 2,200 | 101,002 |
| | | 1,337,783 |
| General Merchandise Stores - 0.1% |
| Big Lots Inc. | 1,511 | 68,071 |
| Dollar General Corp. | 2,615 | 616,695 |
| Dollar Tree Inc. (a) | 2,500 | 351,300 |
| Franchise Group Inc. | 1,300 | 67,808 |
| Ollie's Bargain Outlet Holdings Inc. (a) | 800 | 40,952 |
| Target Corp. | 5,532 | 1,280,326 |
| | | 2,425,152 |
| Gold - 0.0% * |
| Coeur Mining Inc. (a) | 12,600 | 63,504 |
| Newmont Corp. | 9,097 | 564,196 |
| Perpetua Resources Corp. (a) | 1,489 | 7,073 |
| Royal Gold Inc. | 800 | 84,168 |
| | | 718,941 |
| Health Care REITs - 0.1% |
| CareTrust REIT Inc. | 4,372 | 99,813 |
| Community Healthcare Trust Inc. | 1,179 | 55,731 |
| Diversified Healthcare Trust | 11,758 | 36,332 |
See Notes to Schedule of Investments and Notes to Financial Statements.
| State Street Total Return V.I.S. Fund | 21 |
State Street Total Return V.I.S. Fund
Schedule of Investments, continued — December 31, 2021
| | Number
of Shares | Fair
Value |
| Global Medical REIT Inc. | 2,600 | $ 46,150 |
| Healthcare Realty Trust Inc. | 6,734 | 213,064 |
| Healthcare Trust of America Inc., Class A | 2,600 | 86,814 |
| Healthpeak Properties Inc. | 5,900 | 212,931 |
| LTC Properties Inc. | 1,795 | 61,281 |
| Medical Properties Trust Inc. | 6,900 | 163,047 |
| National Health Investors Inc. | 1,986 | 114,135 |
| Omega Healthcare Investors Inc. | 2,600 | 76,934 |
| Physicians Realty Trust | 10,053 | 189,298 |
| Sabra Health Care REIT Inc. | 10,779 | 145,948 |
| Universal Health Realty Income Trust REIT | 600 | 35,682 |
| Ventas Inc. | 4,600 | 235,152 |
| Welltower Inc. | 4,900 | 420,273 |
| | | 2,192,585 |
| Healthcare Distributors - 0.1% |
| AdaptHealth Corp. (a) | 3,170 | 77,538 |
| AmerisourceBergen Corp. | 1,708 | 226,976 |
| Cardinal Health Inc. | 3,200 | 164,768 |
| Covetrus Inc. (a) | 4,679 | 93,440 |
| Henry Schein Inc. (a) | 1,600 | 124,048 |
| McKesson Corp. | 1,716 | 426,546 |
| Owens & Minor Inc. | 3,300 | 143,550 |
| Patterson Companies Inc. | 3,888 | 114,113 |
| PetIQ Inc. (a) | 1,400 | 31,794 |
| | | 1,402,773 |
| Healthcare Equipment - 0.8% |
| Abbott Laboratories | 19,800 | 2,786,652 |
| ABIOMED Inc. (a) | 500 | 179,585 |
| Accelerate Diagnostics Inc. (a) | 2,200 | 11,484 |
| Accuray Inc. (a) | 4,322 | 20,616 |
| Acutus Medical Inc. (a) | 508 | 1,732 |
| Alphatec Holdings Inc. (a) | 3,700 | 42,291 |
| AngioDynamics Inc. (a) | 1,600 | 44,128 |
| Apyx Medical Corp. (a) | 1,234 | 15,820 |
| Asensus Surgical Inc. (a) | 11,500 | 12,765 |
| Aspira Women's Health Inc. (a) | 5,100 | 9,027 |
| AtriCure Inc. (a) | 2,037 | 141,633 |
| AxoGen Inc. (a) | 2,200 | 20,614 |
| Axonics Inc. (a) | 2,078 | 116,368 |
| Baxter International Inc. | 5,800 | 497,872 |
| Becton Dickinson & Co. | 3,300 | 829,884 |
| Boston Scientific Corp. (a) | 16,300 | 692,424 |
| Butterfly Network Inc. (a) | 5,989 | 40,066 |
| | Number
of Shares | Fair
Value |
| Cardiovascular Systems Inc. (a) | 1,800 | $ 33,804 |
| ClearPoint Neuro Inc. (a) | 1,000 | 11,220 |
| CONMED Corp. | 1,324 | 187,690 |
| CryoLife Inc. (a) | 1,610 | 32,764 |
| CryoPort Inc. (a) | 1,839 | 108,814 |
| Cue Health Inc. (a) | 699 | 9,374 |
| Cutera Inc. (a) | 741 | 30,618 |
| CytoSorbents Corp. (a) | 2,500 | 10,475 |
| DarioHealth Corp. (a) | 800 | 10,376 |
| Dexcom Inc. (a) | 1,100 | 590,645 |
| Eargo Inc. (a) | 1,100 | 5,610 |
| Edwards Lifesciences Corp. (a) | 7,100 | 919,805 |
| Envista Holdings Corp. (a) | 1,800 | 81,108 |
| Glaukos Corp. (a) | 2,200 | 97,768 |
| Globus Medical Inc., Class A (a) | 800 | 57,760 |
| Heska Corp. (a) | 433 | 79,018 |
| Hologic Inc. (a) | 2,900 | 222,024 |
| IDEXX Laboratories Inc. (a) | 930 | 612,368 |
| Inari Medical Inc. (a) | 1,565 | 142,838 |
| Inogen Inc. (a) | 1,061 | 36,074 |
| Insulet Corp. (a) | 700 | 186,249 |
| Integer Holdings Corp. (a) | 1,493 | 127,786 |
| Integra LifeSciences Holdings Corp. (a) | 800 | 53,592 |
| Intersect ENT Inc. (a) | 1,417 | 38,698 |
| Intuitive Surgical Inc. (a) | 4,000 | 1,437,200 |
| Invacare Corp. (a) | 2,052 | 5,581 |
| iRadimed Corp. (a) | 214 | 9,889 |
| iRhythm Technologies Inc. (a) | 1,343 | 158,058 |
| LeMaitre Vascular Inc. | 812 | 40,787 |
| Masimo Corp. (a) | 576 | 168,641 |
| Mesa Laboratories Inc. | 224 | 73,492 |
| Natus Medical Inc. (a) | 1,400 | 33,222 |
| Neuronetics Inc. (a) | 1,100 | 4,906 |
| Nevro Corp. (a) | 1,573 | 127,523 |
| NuVasive Inc. (a) | 2,351 | 123,380 |
| Ortho Clinical Diagnostics Holdings PLC (a) | 5,432 | 116,190 |
| Orthofix Medical Inc. (a) | 783 | 24,343 |
| Outset Medical Inc. (a) | 2,244 | 103,426 |
| PAVmed Inc. (a) | 4,300 | 10,578 |
| Penumbra Inc. (a) | 400 | 114,928 |
| PROCEPT BioRobotics Corp. (a) | 347 | 8,678 |
| Pulse Biosciences Inc. (a) | 900 | 13,329 |
| ResMed Inc. | 1,600 | 416,768 |
| SeaSpine Holdings Corp. (a) | 1,600 | 21,792 |
See Notes to Schedule of Investments and Notes to Financial Statements.
| 22 | State Street Total Return V.I.S. Fund |
State Street Total Return V.I.S. Fund
Schedule of Investments, continued — December 31, 2021
| | Number
of Shares | Fair
Value |
| Senseonics Holdings Inc. (a) | 21,300 | $ 56,871 |
| Shockwave Medical Inc. (a) | 1,542 | 274,985 |
| SI-BONE Inc. (a) | 1,700 | 37,757 |
| Sight Sciences Inc. (a) | 389 | 6,835 |
| Stereotaxis Inc. (a) | 2,800 | 17,360 |
| STERIS PLC | 936 | 227,832 |
| Stryker Corp. | 4,000 | 1,069,680 |
| Surmodics Inc. (a) | 569 | 27,397 |
| Tactile Systems Technology Inc. (a) | 900 | 17,127 |
| Talis Biomedical Corp. (a) | 300 | 1,203 |
| Tandem Diabetes Care Inc. (a) | 700 | 105,364 |
| Teleflex Inc. | 500 | 164,240 |
| TransMedics Group Inc. (a) | 1,096 | 20,999 |
| Treace Medical Concepts Inc. (a) | 1,443 | 26,898 |
| Vapotherm Inc. (a) | 1,200 | 24,852 |
| Varex Imaging Corp. (a) | 1,911 | 60,292 |
| ViewRay Inc. (a) | 7,200 | 39,672 |
| Zimmer Biomet Holdings Inc. | 2,400 | 304,896 |
| Zynex Inc. (a) | 1,107 | 11,037 |
| | | 14,657,447 |
| Healthcare Facilities - 0.1% |
| Acadia Healthcare Company Inc. (a) | 1,000 | 60,700 |
| Brookdale Senior Living Inc. (a) | 9,285 | 47,911 |
| Community Health Systems Inc. (a) | 5,942 | 79,088 |
| Encompass Health Corp. | 1,200 | 78,312 |
| Hanger Inc. (a) | 1,600 | 29,008 |
| HCA Healthcare Inc. | 2,800 | 719,376 |
| National HealthCare Corp. | 557 | 37,842 |
| Select Medical Holdings Corp. | 5,027 | 147,794 |
| Surgery Partners Inc. (a) | 1,565 | 83,587 |
| Tenet Healthcare Corp. (a) | 4,860 | 397,013 |
| The Ensign Group Inc. | 2,396 | 201,168 |
| The Joint Corp. (a) | 603 | 39,611 |
| The Pennat Group Inc. (a) | 1,200 | 27,696 |
| U.S. Physical Therapy Inc. | 600 | 57,330 |
| Universal Health Services Inc., Class B | 800 | 103,728 |
| | | 2,110,164 |
| Healthcare Services - 0.3% |
| 1Life Healthcare Inc. (a) | 5,274 | 92,664 |
| Accolade Inc. (a) | 2,233 | 58,862 |
| Addus HomeCare Corp. (a) | 762 | 71,255 |
| | Number
of Shares | Fair
Value |
| Agiliti Inc. (a) | 1,100 | $ 25,476 |
| agilon health Inc. (a) | 1,600 | 43,200 |
| Amedisys Inc. (a) | 400 | 64,752 |
| AMN Healthcare Services Inc. (a) | 2,154 | 263,499 |
| Apollo Medical Holdings Inc. (a) | 1,711 | 125,724 |
| Apria Inc. (a) | 900 | 29,340 |
| Aveanna Healthcare Holdings Inc. (a) | 2,000 | 14,800 |
| Castle Biosciences Inc. (a) | 1,000 | 42,870 |
| Chemed Corp. | 169 | 89,408 |
| Cigna Corp. | 3,700 | 849,631 |
| CorVel Corp. (a) | 398 | 82,784 |
| Cross Country Healthcare Inc. (a) | 1,528 | 42,417 |
| CVS Health Corp. | 15,000 | 1,547,400 |
| DaVita Inc. (a) | 828 | 94,193 |
| Fulgent Genetics Inc. (a) | 946 | 95,158 |
| Guardant Health Inc. (a) | 1,000 | 100,020 |
| InfuSystem Holdings Inc. (a) | 916 | 15,599 |
| Innovage Holding Corp. (a) | 1,000 | 5,000 |
| Laboratory Corporation of America Holdings (a) | 1,100 | 345,631 |
| LHC Group Inc. (a) | 1,392 | 191,024 |
| LifeStance Health Group Inc. (a) | 2,400 | 22,848 |
| MEDNAX Inc. (a) | 3,446 | 93,766 |
| ModivCare Inc. (a) | 561 | 83,191 |
| National Research Corp. | 671 | 27,860 |
| Oak Street Health Inc. (a) | 900 | 29,826 |
| Ontrak Inc. (a) | 600 | 3,774 |
| Option Care Health Inc. (a) | 7,250 | 206,190 |
| Premier Inc., Class A | 1,300 | 53,521 |
| Privia Health Group Inc. (a) | 774 | 20,023 |
| Quest Diagnostics Inc. | 1,400 | 242,214 |
| R1 RCM Inc. (a) | 5,401 | 137,672 |
| RadNet Inc. (a) | 1,994 | 60,039 |
| Sharps Compliance Corp. (a) | 956 | 6,816 |
| Signify Health Inc., Class A (a) | 1,100 | 15,642 |
| SOC Telemed Inc. (a) | 4,600 | 5,888 |
| Tivity Health Inc. (a) | 2,197 | 58,089 |
| Viemed Healthcare Inc. (a) | 2,160 | 11,275 |
| | | 5,369,341 |
| Healthcare Supplies - 0.1% |
| Align Technology Inc. (a) | 860 | 565,175 |
| Atrion Corp. | 60 | 42,294 |
| Avanos Medical Inc. (a) | 2,170 | 75,234 |
| BioLife Solutions Inc. (a) | 498 | 18,560 |
See Notes to Schedule of Investments and Notes to Financial Statements.
| State Street Total Return V.I.S. Fund | 23 |
State Street Total Return V.I.S. Fund
Schedule of Investments, continued — December 31, 2021
| | Number
of Shares | Fair
Value |
| Bioventus Inc., Class A (a) | 1,333 | $ 19,315 |
| Cerus Corp. (a) | 8,382 | 57,081 |
| DENTSPLY SIRONA Inc. | 2,600 | 145,054 |
| Figs Inc., Class A (a) | 1,200 | 33,072 |
| Haemonetics Corp. (a) | 2,291 | 121,515 |
| ICU Medical Inc. (a) | 200 | 47,468 |
| Lantheus Holdings Inc. (a) | 3,046 | 87,999 |
| Meridian Bioscience Inc. (a) | 1,795 | 36,618 |
| Merit Medical Systems Inc. (a) | 2,335 | 145,471 |
| Neogen Corp. (a) | 4,914 | 223,145 |
| OraSure Technologies Inc. (a) | 2,984 | 25,931 |
| OrthoPediatrics Corp. (a) | 592 | 35,437 |
| Pulmonx Corp. (a) | 1,300 | 41,691 |
| Quidel Corp. (a) | 400 | 53,996 |
| Retractable Technologies Inc. (a) | 771 | 5,343 |
| Sientra Inc. (a) | 3,100 | 11,377 |
| Silk Road Medical Inc. (a) | 1,504 | 64,085 |
| STAAR Surgical Co. (a) | 2,168 | 197,938 |
| The Cooper Companies Inc. | 600 | 251,364 |
| Utah Medical Products Inc. | 164 | 16,400 |
| | | 2,321,563 |
| Healthcare Technology - 0.1% |
| Allscripts Healthcare Solutions Inc. (a) | 5,511 | 101,678 |
| American Well Corp., Class A (a) | 9,100 | 54,964 |
| Castlight Health Inc., Class B (a) | 7,800 | 12,012 |
| Cerner Corp. | 3,300 | 306,471 |
| Certara Inc. (a) | 1,400 | 39,788 |
| Change Healthcare Inc. (a) | 2,700 | 57,726 |
| Computer Programs & Systems Inc. (a) | 769 | 22,532 |
| Evolent Health Inc., Class A (a) | 3,760 | 104,039 |
| Forian Inc. (a) | 1,400 | 12,628 |
| Health Catalyst Inc. (a) | 2,469 | 97,822 |
| HealthStream Inc. (a) | 1,051 | 27,704 |
| iCAD Inc. (a) | 1,200 | 8,640 |
| Inspire Medical Systems Inc. (a) | 1,229 | 282,744 |
| Multiplan Corp. (a) | 18,265 | 80,914 |
| NantHealth Inc. (a) | 1,700 | 1,793 |
| NextGen Healthcare Inc. (a) | 2,400 | 42,696 |
| Omnicell Inc. (a) | 2,003 | 361,421 |
| OptimizeRx Corp. (a) | 756 | 46,955 |
| Phreesia Inc. (a) | 2,392 | 99,651 |
| Schrodinger Inc. (a) | 2,024 | 70,496 |
| | Number
of Shares | Fair
Value |
| Simulations Plus Inc. | 647 | $ 30,603 |
| Tabula Rasa HealthCare Inc. (a) | 1,078 | 16,170 |
| Teladoc Health Inc. (a) | 1,700 | 156,094 |
| Veeva Systems Inc., Class A (a) | 1,600 | 408,768 |
| Vocera Communications Inc. (a) | 1,563 | 101,345 |
| | | 2,545,654 |
| Heavy Electrical Equipment - 0.0% * |
| AZZ Inc. | 1,200 | 66,348 |
| Babcock & Wilcox Enterprises Inc. (a) | 2,400 | 21,648 |
| Bloom Energy Corp., Class A (a) | 6,796 | 149,036 |
| TPI Composites Inc. (a) | 1,566 | 23,428 |
| | | 260,460 |
| Home Building - 0.2% |
| Beazer Homes USA Inc. (a) | 1,405 | 32,624 |
| Cavco Industries Inc. (a) | 420 | 133,413 |
| Century Communities Inc. | 1,361 | 111,316 |
| D.R. Horton Inc. | 3,776 | 409,507 |
| Green Brick Partners Inc. (a) | 1,292 | 39,187 |
| Hovnanian Enterprises Inc., Class A (a) | 249 | 31,695 |
| Installed Building Products Inc. | 1,080 | 150,898 |
| KB Home | 3,618 | 161,833 |
| Legacy Housing Corp. (a) | 426 | 11,276 |
| Lennar Corp., Class A | 3,223 | 374,384 |
| LGI Homes Inc. (a) | 983 | 151,854 |
| M/I Homes Inc. (a) | 1,289 | 80,150 |
| MDC Holdings Inc. | 2,600 | 145,158 |
| Meritage Homes Corp. (a) | 1,685 | 205,671 |
| NVR Inc. (a) | 36 | 212,719 |
| PulteGroup Inc. | 2,900 | 165,764 |
| Skyline Champion Corp. (a) | 2,394 | 189,078 |
| Taylor Morrison Home Corp. (a) | 5,454 | 190,672 |
| Toll Brothers Inc. | 1,315 | 95,193 |
| TopBuild Corp. (a) | 400 | 110,364 |
| Tri Pointe Homes Inc. (a) | 5,074 | 141,514 |
| | | 3,144,270 |
| Home Furnishing Retail - 0.0% * |
| Bed Bath & Beyond Inc. (a) | 4,582 | 66,806 |
| Haverty Furniture Companies Inc. | 793 | 24,242 |
See Notes to Schedule of Investments and Notes to Financial Statements.
| 24 | State Street Total Return V.I.S. Fund |
State Street Total Return V.I.S. Fund
Schedule of Investments, continued — December 31, 2021
| | Number
of Shares | Fair
Value |
| Kirkland's Inc. (a) | 528 | $ 7,883 |
| RH (a) | 170 | 91,110 |
| Sleep Number Corp. (a) | 1,062 | 81,349 |
| The Aaron's Company Inc. | 1,579 | 38,922 |
| Williams-Sonoma Inc. | 863 | 145,959 |
| | | 456,271 |
| Home Furnishings - 0.0% * |
| Bassett Furniture Industries Inc. | 258 | 4,327 |
| Casper Sleep Inc. (a) | 1,338 | 8,938 |
| Ethan Allen Interiors Inc. | 1,081 | 28,419 |
| Flexsteel Industries Inc. | 203 | 5,453 |
| Hooker Furniture Corp. | 700 | 16,296 |
| La-Z-Boy Inc. | 2,000 | 72,620 |
| Leggett & Platt Inc. | 1,500 | 61,740 |
| Mohawk Industries Inc. (a) | 600 | 109,308 |
| Purple Innovation Inc. (a) | 3,000 | 39,810 |
| Tempur Sealy International Inc. | 1,900 | 89,357 |
| The Lovesac Co. (a) | 600 | 39,756 |
| | | 476,024 |
| Home Improvement Retail - 0.4% |
| Floor & Decor Holdings Inc., Class A (a) | 1,200 | 156,012 |
| GrowGeneration Corp. (a) | 2,364 | 30,850 |
| Lowe's Companies Inc. | 7,900 | 2,041,992 |
| Lumber Liquidators Holdings Inc. (a) | 1,374 | 23,454 |
| The Home Depot Inc. | 12,160 | 5,046,522 |
| | | 7,298,830 |
| Hotel & Resort REITs - 0.1% |
| Apple Hospitality REIT Inc. | 9,760 | 157,624 |
| Ashford Hospitality Trust Inc. (a) | 540 | 5,184 |
| Braemar Hotels & Resorts Inc. (a) | 1,878 | 9,578 |
| Chatham Lodging Trust (a) | 1,973 | 27,069 |
| CorePoint Lodging Inc. (a) | 1,887 | 29,626 |
| DiamondRock Hospitality Co. (a) | 9,900 | 95,139 |
| Hersha Hospitality Trust (a) | 2,000 | 18,340 |
| Host Hotels & Resorts Inc. (a) | 8,000 | 139,120 |
| Park Hotels & Resorts Inc. (a) | 2,400 | 45,312 |
| Pebblebrook Hotel Trust | 5,905 | 132,095 |
| RLJ Lodging Trust | 7,493 | 104,377 |
| Ryman Hospitality Properties Inc. (a) | 2,454 | 225,670 |
| | Number
of Shares | Fair
Value |
| Service Properties Trust | 7,271 | $ 63,912 |
| Summit Hotel Properties Inc. (a) | 4,976 | 48,566 |
| Sunstone Hotel Investors Inc. (a) | 9,879 | 115,881 |
| Xenia Hotels & Resorts Inc. (a) | 5,155 | 93,357 |
| | | 1,310,850 |
| Hotels, Resorts & Cruise Lines - 0.2% |
| Bluegreen Vacations Holding Corp. (a) | 596 | 20,920 |
| Booking Holdings Inc. (a) | 466 | 1,118,041 |
| Carnival Corp. (a) | 10,100 | 203,212 |
| Choice Hotels International Inc. | 400 | 62,396 |
| Expedia Group Inc. (a) | 1,700 | 307,224 |
| Hilton Grand Vacations Inc. (a) | 3,901 | 203,281 |
| Hilton Worldwide Holdings Inc. (a) | 3,100 | 483,569 |
| Hyatt Hotels Corp., Class A (a) | 500 | 47,950 |
| Lindblad Expeditions Holdings Inc. (a) | 1,500 | 23,400 |
| Marriott International Inc., Class A (a) | 3,100 | 512,244 |
| Marriott Vacations Worldwide Corp. | 500 | 84,490 |
| Norwegian Cruise Line Holdings Ltd. (a) | 4,600 | 95,404 |
| Royal Caribbean Cruises Ltd. (a) | 2,600 | 199,940 |
| Travel + Leisure Co. | 900 | 49,743 |
| Wyndham Hotels & Resorts Inc. | 1,100 | 98,615 |
| | | 3,510,429 |
| Household Appliances - 0.0% * |
| Aterian Inc. (a) | 1,200 | 4,932 |
| Hamilton Beach Brands Holding Co., Class A | 342 | 4,911 |
| Helen of Troy Ltd. (a) | 1,102 | 269,406 |
| iRobot Corp. (a) | 1,287 | 84,788 |
| Traeger Inc. (a) | 1,100 | 13,376 |
| Weber Inc., Class A | 784 | 10,137 |
| Whirlpool Corp. | 644 | 151,121 |
| | | 538,671 |
| Household Products - 0.4% |
| Central Garden & Pet Co., Class A (a) | 1,957 | 93,642 |
See Notes to Schedule of Investments and Notes to Financial Statements.
| State Street Total Return V.I.S. Fund | 25 |
State Street Total Return V.I.S. Fund
Schedule of Investments, continued — December 31, 2021
| | Number
of Shares | Fair
Value |
| Central Garden & Pet Co. (a) | 399 | $ 20,999 |
| Church & Dwight Company Inc. | 2,900 | 297,250 |
| Colgate-Palmolive Co. | 9,531 | 813,376 |
| Energizer Holdings Inc. | 3,092 | 123,989 |
| Kimberly-Clark Corp. | 3,900 | 557,388 |
| Oil-Dri Corporation of America | 281 | 9,197 |
| Reynolds Consumer Products Inc. | 400 | 12,560 |
| Spectrum Brands Holdings Inc. | 400 | 40,688 |
| The Clorox Co. | 1,447 | 252,299 |
| The Procter & Gamble Co. | 27,403 | 4,482,583 |
| WD-40 Co. | 622 | 152,166 |
| | | 6,856,137 |
| Housewares & Specialties - 0.0% * |
| Lifetime Brands Inc. | 772 | 12,329 |
| Newell Brands Inc. | 4,700 | 102,648 |
| Tupperware Brands Corp. (a) | 2,300 | 35,167 |
| | | 150,144 |
| Human Resource & Employment Services - 0.1% |
| ASGN Inc. (a) | 2,326 | 287,028 |
| Barrett Business Services Inc. | 300 | 20,718 |
| First Advantage Corp. (a) | 2,640 | 50,266 |
| Heidrick & Struggles International Inc. | 887 | 38,789 |
| HireQuest Inc. | 294 | 5,927 |
| HireRight Holdings Corp. (a) | 1,076 | 17,216 |
| Insperity Inc. | 1,657 | 195,708 |
| Kelly Services Inc., Class A | 1,471 | 24,669 |
| Kforce Inc. | 913 | 68,676 |
| Korn Ferry | 2,456 | 185,993 |
| ManpowerGroup Inc. | 679 | 66,087 |
| Robert Half International Inc. | 1,200 | 133,824 |
| Sterling Check Corp. (a) | 795 | 16,305 |
| TriNet Group Inc. (a) | 1,847 | 175,945 |
| TrueBlue Inc. (a) | 1,600 | 44,272 |
| Upwork Inc. (a) | 5,379 | 183,747 |
| | | 1,515,170 |
| Hypermarkets & Super Centers - 0.3% |
| BJ's Wholesale Club Holdings Inc. (a) | 6,275 | 420,237 |
| Costco Wholesale Corp. | 5,060 | 2,872,562 |
| PriceSmart Inc. | 1,100 | 80,487 |
| Walmart Inc. | 16,296 | 2,357,868 |
| | | 5,731,154 |
| | Number
of Shares | Fair
Value |
| Independent Power Producers & Energy Traders - 0.0% * |
| Clearway Energy Inc., Class A | 1,672 | $ 55,978 |
| Clearway Energy Inc., Class C | 3,730 | 134,392 |
| The AES Corp. | 7,800 | 189,540 |
| Vistra Corp. | 5,200 | 118,404 |
| | | 498,314 |
| Industrial Conglomerates - 0.3% |
| 3M Co. | 6,600 | 1,172,358 |
| General Electric Co. | 12,517 | 1,182,481 |
| Honeywell International Inc. | 7,900 | 1,647,229 |
| Roper Technologies Inc. | 1,170 | 575,476 |
| | | 4,577,544 |
| Industrial Gases - 0.0% * |
| Air Products & Chemicals Inc. | 2,500 | 760,650 |
| Industrial Machinery - 0.5% |
| Albany International Corp., Class A | 1,398 | 123,653 |
| Altra Industrial Motion Corp. | 2,948 | 152,028 |
| Barnes Group Inc. | 2,144 | 99,889 |
| Chart Industries Inc. (a) | 1,669 | 266,189 |
| CIRCOR International Inc. (a) | 760 | 20,657 |
| Colfax Corp. (a) | 1,300 | 59,761 |
| Columbus McKinnon Corp. | 1,398 | 64,671 |
| Crane Co. | 500 | 50,865 |
| Desktop Metal Inc., Class A (a) | 8,517 | 42,159 |
| Donaldson Company Inc. | 1,500 | 88,890 |
| Dover Corp. | 1,600 | 290,560 |
| Energy Recovery Inc. (a) | 1,801 | 38,703 |
| Enerpac Tool Group Corp. | 3,000 | 60,840 |
| EnPro Industries Inc. | 935 | 102,915 |
| ESCO Technologies Inc. | 1,160 | 104,388 |
| Evoqua Water Technologies Corp. (a) | 5,285 | 247,074 |
| Flowserve Corp. | 1,300 | 39,780 |
| Fortive Corp. | 3,700 | 282,273 |
| Franklin Electric Company Inc. | 2,115 | 199,994 |
| Gates Industrial Corp. plc (a) | 400 | 6,364 |
| Graco Inc. | 1,933 | 155,838 |
| Helios Technologies Inc. | 1,471 | 154,705 |
| Hillenbrand Inc. | 3,324 | 172,815 |
| Hyster-Yale Materials Handling Inc. | 560 | 23,016 |
| IDEX Corp. | 900 | 212,688 |
| Illinois Tool Works Inc. | 3,600 | 888,480 |
| Ingersoll Rand Inc. | 4,700 | 290,789 |
See Notes to Schedule of Investments and Notes to Financial Statements.
| 26 | State Street Total Return V.I.S. Fund |
State Street Total Return V.I.S. Fund
Schedule of Investments, continued — December 31, 2021
| | Number
of Shares | Fair
Value |
| ITT Inc. | 900 | $ 91,971 |
| John Bean Technologies Corp. | 1,432 | 219,898 |
| Kadant Inc. | 523 | 120,541 |
| Kennametal Inc. | 3,801 | 136,494 |
| Lincoln Electric Holdings Inc. | 700 | 97,629 |
| Mayville Engineering Company Inc. (a) | 504 | 7,515 |
| Mueller Industries Inc. | 2,557 | 151,784 |
| Mueller Water Products Inc., Class A | 7,136 | 102,758 |
| NN Inc. (a) | 2,700 | 11,070 |
| Nordson Corp. | 700 | 178,689 |
| Omega Flex Inc. | 126 | 15,996 |
| Otis Worldwide Corp. | 4,900 | 426,643 |
| Parker-Hannifin Corp. | 1,400 | 445,368 |
| Park-Ohio Holdings Corp. | 600 | 12,702 |
| Proto Labs Inc. (a) | 1,250 | 64,188 |
| RBC Bearings Inc. (a) | 1,277 | 257,916 |
| Snap-on Inc. | 625 | 134,613 |
| SPX Corp. (a) | 1,990 | 118,763 |
| SPX FLOW Inc. | 1,894 | 163,793 |
| Standex International Corp. | 529 | 58,539 |
| Stanley Black & Decker Inc. | 1,800 | 339,516 |
| Tennant Co. | 900 | 72,936 |
| The Gorman-Rupp Co. | 1,058 | 47,134 |
| The Middleby Corp. (a) | 600 | 118,056 |
| The Timken Co. | 600 | 41,574 |
| Watts Water Technologies Inc., Class A | 1,256 | 243,878 |
| Welbilt Inc. (a) | 5,949 | 141,408 |
| Woodward Inc. | 600 | 65,676 |
| Xylem Inc. | 2,100 | 251,832 |
| | | 8,378,864 |
| Industrial REITs - 0.2% |
| Americold Realty Trust | 2,900 | 95,091 |
| Duke Realty Corp. | 4,376 | 287,241 |
| EastGroup Properties Inc. | 1,850 | 421,522 |
| First Industrial Realty Trust Inc. | 1,400 | 92,680 |
| Indus Realty Trust Inc. | 227 | 18,401 |
| Industrial Logistics Properties Trust | 2,864 | 71,743 |
| Innovative Industrial Properties Inc. | 1,083 | 284,731 |
| Lexington Realty Trust | 12,750 | 199,155 |
| Monmouth Real Estate Investment Corp. | 4,313 | 90,616 |
| Plymouth Industrial REIT Inc. | 1,500 | 48,000 |
| | Number
of Shares | Fair
Value |
| Prologis Inc. | 8,475 | $ 1,426,851 |
| Rexford Industrial Realty Inc. | 1,700 | 137,887 |
| STAG Industrial Inc. | 8,072 | 387,133 |
| Terreno Realty Corp. | 3,371 | 287,513 |
| | | 3,848,564 |
| Insurance Brokers - 0.2% |
| Aon PLC, Class A | 2,500 | 751,400 |
| Arthur J Gallagher & Co. | 2,300 | 390,241 |
| Brown & Brown Inc. | 2,800 | 196,784 |
| BRP Group Inc., Class A (a) | 2,073 | 74,856 |
| Crawford & Co., Class A | 200 | 1,498 |
| eHealth Inc. (a) | 1,300 | 33,150 |
| Goosehead Insurance Inc., Class A | 867 | 112,779 |
| Marsh & McLennan Companies Inc. | 5,731 | 996,162 |
| Selectquote Inc. (a) | 6,761 | 61,255 |
| | | 2,618,125 |
| Integrated Oil & Gas - 0.3% |
| Chevron Corp. | 22,087 | 2,591,909 |
| Exxon Mobil Corp. | 48,350 | 2,958,537 |
| Occidental Petroleum Corp. | 9,500 | 275,405 |
| | | 5,825,851 |
| Integrated Telecommunication Services - 0.3% |
| AT&T Inc. | 81,298 | 1,999,931 |
| ATN International Inc. | 442 | 17,658 |
| Consolidated Communications Holdings Inc. (a) | 2,995 | 22,403 |
| IDT Corp., Class B (a) | 868 | 38,331 |
| Ooma Inc. (a) | 1,056 | 21,585 |
| Radius Global Infrastructure Inc., Class A (a) | 2,533 | 40,781 |
| Verizon Communications Inc. | 47,137 | 2,449,238 |
| | | 4,589,927 |
| Interactive Home Entertainment - 0.1% |
| Activision Blizzard Inc. | 8,800 | 585,464 |
| Electronic Arts Inc. | 3,200 | 422,080 |
| Skillz Inc. (a) | 4,100 | 30,504 |
| Take-Two Interactive Software Inc. (a) | 1,300 | 231,036 |
| Zynga Inc., Class A (a) | 10,600 | 67,840 |
| | | 1,336,924 |
See Notes to Schedule of Investments and Notes to Financial Statements.
| State Street Total Return V.I.S. Fund | 27 |
State Street Total Return V.I.S. Fund
Schedule of Investments, continued — December 31, 2021
| | Number
of Shares | Fair
Value |
| Interactive Media & Services - 1.7% |
| Alphabet Inc., Class C (a) | 3,206 | $ 9,276,849 |
| Alphabet Inc., Class A (a) | 3,419 | 9,904,980 |
| Cargurus Inc. (a) | 4,342 | 146,065 |
| Cars.com Inc. (a) | 3,388 | 54,513 |
| Eventbrite Inc., Class A (a) | 3,308 | 57,691 |
| EverQuote Inc., Class A (a) | 800 | 12,528 |
| fuboTV Inc. (a) | 6,437 | 99,902 |
| IAC/InterActiveCorp (a) | 900 | 117,639 |
| Liberty TripAdvisor Holdings Inc., Class A (a) | 4,300 | 9,331 |
| Match Group Inc. (a) | 3,200 | 423,200 |
| MediaAlpha Inc., Class A (a) | 1,000 | 15,440 |
| Meta Platforms Inc., Class A (a) | 26,933 | 9,058,915 |
| Outbrain Inc. (a) | 372 | 5,208 |
| Pinterest Inc., Class A (a) | 6,597 | 239,801 |
| QuinStreet Inc. (a) | 2,089 | 37,999 |
| TripAdvisor Inc. (a) | 1,500 | 40,890 |
| TrueCar Inc. (a) | 4,572 | 15,545 |
| Twitter Inc. (a) | 8,900 | 384,658 |
| Vimeo Inc. (a) | 1,785 | 32,059 |
| Yelp Inc. (a) | 3,249 | 117,744 |
| Ziff Davis Inc. (a) | 1,984 | 219,946 |
| | | 30,270,903 |
| Internet & Direct Marketing Retail - 1.0% |
| 1-800-Flowers.com Inc., Class A (a) | 1,136 | 26,548 |
| Amazon.com Inc. (a) | 4,945 | 16,488,311 |
| CarParts.com Inc. (a) | 2,047 | 22,926 |
| DoorDash Inc., Class A (a) | 1,700 | 253,130 |
| Duluth Holdings Inc., Class B (a) | 650 | 9,867 |
| eBay Inc. | 7,100 | 472,150 |
| Etsy Inc. (a) | 1,400 | 306,516 |
| Groupon Inc. (a) | 1,100 | 25,476 |
| Lands' End Inc. (a) | 800 | 15,704 |
| Liquidity Services Inc. (a) | 1,272 | 28,086 |
| Overstock.com Inc. (a) | 1,953 | 115,247 |
| PetMed Express Inc. | 885 | 22,355 |
| Porch Group Inc. (a) | 3,406 | 53,100 |
| Quotient Technology Inc. (a) | 4,200 | 31,164 |
| Qurate Retail Inc., Series A | 3,434 | 26,098 |
| Rent the Runway Inc., Class A (a) | 823 | 6,707 |
| Revolve Group Inc. (a) | 1,625 | 91,065 |
| Shutterstock Inc. | 1,062 | 117,755 |
| Stitch Fix Inc., Class A (a) | 3,906 | 73,902 |
| The RealReal Inc. (a) | 3,389 | 39,346 |
| | Number
of Shares | Fair
Value |
| Wayfair Inc., Class A (a) | 900 | $ 170,973 |
| Xometry Inc., Class A (a) | 400 | 20,500 |
| | | 18,416,926 |
| Internet Services & Infrastructure - 0.2% |
| Akamai Technologies Inc. (a) | 1,900 | 222,376 |
| BigCommerce Holdings Inc. (a) | 2,168 | 76,682 |
| Brightcove Inc. (a) | 1,700 | 17,374 |
| Cloudflare Inc., Class A (a) | 3,000 | 394,500 |
| DigitalOcean Holdings Inc. (a) | 2,313 | 185,803 |
| Fastly Inc., Class A (a) | 1,095 | 38,818 |
| GoDaddy Inc., Class A (a) | 2,000 | 169,720 |
| Limelight Networks Inc. (a) | 5,380 | 18,454 |
| MongoDB Inc. (a) | 700 | 370,545 |
| Okta Inc. (a) | 1,400 | 313,838 |
| Rackspace Technology Inc. (a) | 2,300 | 30,981 |
| Snowflake Inc., Class A (a) | 2,300 | 779,125 |
| SolarWinds Corp. | 600 | 8,514 |
| Switch Inc., Class A | 1,000 | 28,640 |
| Twilio Inc., Class A (a) | 1,900 | 500,346 |
| VeriSign Inc. (a) | 1,100 | 279,202 |
| | | 3,434,918 |
| Investment Banking & Brokerage - 0.3% |
| B. Riley Financial Inc. | 999 | 88,771 |
| BGC Partners Inc., Class A | 15,172 | 70,550 |
| Cowen Inc., Class A | 1,265 | 45,667 |
| Evercore Inc., Class A | 466 | 63,306 |
| Greenhill & Company Inc. | 667 | 11,959 |
| Houlihan Lokey Inc. | 2,333 | 241,512 |
| Interactive Brokers Group Inc., Class A | 800 | 63,536 |
| Jefferies Financial Group Inc. | 2,309 | 89,589 |
| Lazard Ltd., Class A | 1,000 | 43,630 |
| LPL Financial Holdings Inc. | 900 | 144,081 |
| Moelis & Co., Class A | 2,788 | 174,278 |
| Morgan Stanley | 15,300 | 1,501,848 |
| Oppenheimer Holdings Inc., Class A | 524 | 24,298 |
| Piper Sandler Cos. | 796 | 142,094 |
| PJT Partners Inc., Class A | 1,067 | 79,054 |
| Raymond James Financial Inc. | 2,150 | 215,860 |
| Stifel Financial Corp. | 1,100 | 77,462 |
| Stonex Group Inc. (a) | 804 | 49,245 |
| The Charles Schwab Corp. | 17,200 | 1,446,520 |
| The Goldman Sachs Group Inc. | 3,760 | 1,438,388 |
See Notes to Schedule of Investments and Notes to Financial Statements.
| 28 | State Street Total Return V.I.S. Fund |
State Street Total Return V.I.S. Fund
Schedule of Investments, continued — December 31, 2021
| | Number
of Shares | Fair
Value |
| Virtu Financial Inc., Class A | 1,000 | $ 28,830 |
| | | 6,040,478 |
| IT Consulting & Other Services - 0.2% |
| Amdocs Ltd. | 1,447 | 108,293 |
| Cognizant Technology Solutions Corp., Class A | 5,989 | 531,344 |
| DXC Technology Co. (a) | 3,100 | 99,789 |
| EPAM Systems Inc. (a) | 653 | 436,498 |
| Gartner Inc. (a) | 900 | 300,888 |
| Grid Dynamics Holdings Inc. (a) | 2,076 | 78,826 |
| International Business Machines Corp. | 10,196 | 1,362,797 |
| Kyndryl Holdings Inc. (a) | 2,359 | 42,698 |
| LiveRamp Holdings Inc. (a) | 3,006 | 144,138 |
| Perficient Inc. (a) | 1,484 | 191,866 |
| The Hackett Group Inc. | 990 | 20,325 |
| Thoughtworks Holding Inc. (a) | 500 | 13,405 |
| Unisys Corp. (a) | 3,200 | 65,824 |
| | | 3,396,691 |
| Leisure Facilities - 0.0% * |
| Drive Shack Inc. (a) | 2,649 | 3,788 |
| F45 Training Holdings Inc. (a) | 758 | 8,255 |
| Hall of Fame Resort & Entertainment Co. (a) | 4,600 | 6,992 |
| Life Time Group Holdings Inc. (a) | 1,866 | 32,114 |
| Planet Fitness Inc., Class A (a) | 1,000 | 90,580 |
| RCI Hospitality Holdings Inc. | 457 | 35,591 |
| SeaWorld Entertainment Inc. (a) | 2,344 | 152,032 |
| Six Flags Entertainment Corp. (a) | 1,100 | 46,838 |
| Vail Resorts Inc. | 400 | 131,160 |
| Xponential Fitness Inc., Class A (a) | 489 | 9,995 |
| | | 517,345 |
| Leisure Products - 0.1% |
| Acushnet Holdings Corp. | 1,548 | 82,168 |
| American Outdoor Brands Inc. (a) | 800 | 15,944 |
| AMMO Inc. (a) | 3,200 | 17,440 |
| Brunswick Corp. | 800 | 80,584 |
| Callaway Golf Co. (a) | 5,262 | 144,389 |
| Clarus Corp. | 1,009 | 27,969 |
| Escalade Inc. | 595 | 9,395 |
| | Number
of Shares | Fair
Value |
| Genius Brands International Inc. (a) | 13,900 | $ 14,595 |
| Hasbro Inc. | 1,500 | 152,670 |
| Johnson Outdoors Inc., Class A | 240 | 22,486 |
| Latham Group Inc. (a) | 1,531 | 38,321 |
| Malibu Boats Inc., Class A (a) | 910 | 62,544 |
| MasterCraft Boat Holdings Inc. (a) | 902 | 25,554 |
| Mattel Inc. (a) | 4,100 | 88,396 |
| Nautilus Inc. (a) | 1,815 | 11,126 |
| Peloton Interactive Inc., Class A (a) | 3,072 | 109,855 |
| Polaris Inc. | 700 | 76,937 |
| Smith & Wesson Brands Inc. | 2,060 | 36,668 |
| Solo Brands Inc., Class A (a) | 562 | 8,784 |
| Sturm Ruger & Company Inc. | 761 | 51,763 |
| Vista Outdoor Inc. (a) | 2,608 | 120,151 |
| YETI Holdings Inc. (a) | 1,000 | 82,830 |
| | | 1,280,569 |
| Life & Health Insurance - 0.2% |
| Aflac Inc. | 7,500 | 437,925 |
| American Equity Investment Life Holding Co. | 3,763 | 146,456 |
| Bright Health Group Inc. (a) | 2,800 | 9,632 |
| Brighthouse Financial Inc. (a) | 970 | 50,246 |
| Citizens Inc. (a) | 3,100 | 16,461 |
| CNO Financial Group Inc. | 5,595 | 133,385 |
| Genworth Financial Inc., Class A (a) | 22,947 | 92,935 |
| Globe Life Inc. | 1,100 | 103,092 |
| Independence Holding Co. | 248 | 14,057 |
| Lincoln National Corp. | 2,100 | 143,346 |
| MetLife Inc. | 8,100 | 506,169 |
| National Western Life Group Inc., Class A | 105 | 22,516 |
| Primerica Inc. | 500 | 76,635 |
| Principal Financial Group Inc. | 3,000 | 216,990 |
| Prudential Financial Inc. | 4,290 | 464,350 |
| Trupanion Inc. (a) | 1,743 | 230,128 |
| Unum Group | 1,600 | 39,312 |
| | | 2,703,635 |
| Life Sciences Tools & Services - 0.6% |
| 10X Genomics Inc., Class A (a) | 1,000 | 148,960 |
| Absci Corp. (a) | 767 | 6,289 |
| Adaptive Biotechnologies Corp. (a) | 1,000 | 28,060 |
See Notes to Schedule of Investments and Notes to Financial Statements.
| State Street Total Return V.I.S. Fund | 29 |
State Street Total Return V.I.S. Fund
Schedule of Investments, continued — December 31, 2021
| | Number
of Shares | Fair
Value |
| Agilent Technologies Inc. | 3,400 | $ 542,810 |
| Akoya Biosciences Inc. (a) | 644 | 9,860 |
| Alpha Teknova Inc. (a) | 378 | 7,742 |
| Avantor Inc. (a) | 6,800 | 286,552 |
| Berkeley Lights Inc. (a) | 2,105 | 38,269 |
| Bionano Genomics Inc. (a) | 13,600 | 40,664 |
| Bio-Rad Laboratories Inc., Class A (a) | 235 | 177,559 |
| Bio-Techne Corp. | 400 | 206,936 |
| Bruker Corp. | 1,200 | 100,692 |
| Charles River Laboratories International Inc. (a) | 586 | 220,793 |
| ChromaDex Corp. (a) | 2,400 | 8,976 |
| Codexis Inc. (a) | 2,719 | 85,023 |
| Cytek Biosciences Inc. (a) | 900 | 14,688 |
| Danaher Corp. | 7,190 | 2,365,582 |
| Fluidigm Corp. (a) | 4,400 | 17,248 |
| Harvard Bioscience Inc. (a) | 1,998 | 14,086 |
| Illumina Inc. (a) | 1,680 | 639,139 |
| Inotiv Inc. (a) | 700 | 29,449 |
| IQVIA Holdings Inc. (a) | 2,200 | 620,708 |
| Maravai LifeSciences Holdings Inc., Class A (a) | 1,400 | 58,660 |
| MaxCyte Inc. (a) | 4,602 | 46,894 |
| Medpace Holdings Inc. (a) | 1,325 | 288,373 |
| Mettler-Toledo International Inc. (a) | 257 | 436,183 |
| NanoString Technologies Inc. (a) | 2,021 | 85,347 |
| NeoGenomics Inc. (a) | 5,168 | 176,332 |
| Pacific Biosciences of California Inc. (a) | 8,866 | 181,398 |
| PerkinElmer Inc. | 1,400 | 281,484 |
| Personalis Inc. (a) | 1,600 | 22,832 |
| Quanterix Corp. (a) | 1,500 | 63,600 |
| Repligen Corp. (a) | 600 | 158,904 |
| Seer Inc. (a) | 1,826 | 41,651 |
| Singular Genomics Systems Inc. (a) | 645 | 7,456 |
| Sotera Health Co. (a) | 1,300 | 30,615 |
| Syneos Health Inc. (a) | 1,200 | 123,216 |
| Thermo Fisher Scientific Inc. | 4,460 | 2,975,891 |
| Waters Corp. (a) | 700 | 260,820 |
| West Pharmaceutical Services Inc. | 809 | 379,429 |
| | | 11,229,170 |
| Managed Healthcare - 0.5% |
| Alignment Healthcare Inc. (a) | 3,805 | 53,498 |
| Anthem Inc. | 2,812 | 1,303,474 |
| | Number
of Shares | Fair
Value |
| Centene Corp. (a) | 6,600 | $ 543,840 |
| HealthEquity Inc. (a) | 3,724 | 164,750 |
| Humana Inc. | 1,470 | 681,874 |
| Magellan Health Inc. (a) | 1,076 | 102,209 |
| Molina Healthcare Inc. (a) | 619 | 196,892 |
| Progyny Inc. (a) | 2,933 | 147,677 |
| UnitedHealth Group Inc. | 10,746 | 5,395,996 |
| | | 8,590,210 |
| Marine - 0.0% * |
| Eagle Bulk Shipping Inc. | 427 | 19,428 |
| Genco Shipping & Trading Ltd. | 1,300 | 20,800 |
| Kirby Corp. (a) | 600 | 35,652 |
| Matson Inc. | 1,893 | 170,427 |
| | | 246,307 |
| Metal & Glass Containers - 0.1% |
| AptarGroup Inc. | 753 | 92,228 |
| Ball Corp. | 3,600 | 346,572 |
| Berry Global Group Inc. (a) | 1,618 | 119,376 |
| Crown Holdings Inc. | 1,484 | 164,160 |
| Greif Inc., Class A | 1,139 | 68,762 |
| Greif Inc., Class B | 312 | 18,651 |
| Myers Industries Inc. | 1,500 | 30,015 |
| O-I Glass Inc. (a) | 7,138 | 85,870 |
| Silgan Holdings Inc. | 1,223 | 52,393 |
| TriMas Corp. | 1,945 | 71,965 |
| | | 1,049,992 |
| Mortgage REITs - 0.1% |
| AFC Gamma Inc. | 595 | 13,542 |
| AGNC Investment Corp. | 5,938 | 89,308 |
| Angel Oak Mortgage Inc. | 200 | 3,276 |
| Annaly Capital Management Inc. | 17,000 | 132,940 |
| Apollo Commercial Real Estate Finance Inc. | 6,341 | 83,448 |
| Arbor Realty Trust Inc. | 6,657 | 121,956 |
| Ares Commercial Real Estate Corp. | 1,886 | 27,422 |
| ARMOUR Residential REIT Inc. | 3,800 | 37,278 |
| Blackstone Mortgage Trust Inc., Class A | 7,181 | 219,882 |
| BrightSpire Capital Inc. | 3,567 | 36,597 |
| Broadmark Realty Capital Inc. | 6,200 | 58,466 |
| Chimera Investment Corp. | 10,731 | 161,824 |
| Dynex Capital Inc. | 1,551 | 25,917 |
See Notes to Schedule of Investments and Notes to Financial Statements.
| 30 | State Street Total Return V.I.S. Fund |
State Street Total Return V.I.S. Fund
Schedule of Investments, continued — December 31, 2021
| | Number
of Shares | Fair
Value |
| Ellington Financial Inc. | 2,400 | $ 41,016 |
| Franklin BSP Realty Trust Inc. | 1,445 | 21,588 |
| Granite Point Mortgage Trust Inc. | 2,294 | 26,863 |
| Great Ajax Corp. | 791 | 10,410 |
| Hannon Armstrong Sustainable Infrastructure Capital Inc. | 3,496 | 185,708 |
| Invesco Mortgage Capital Inc. | 13,900 | 38,642 |
| KKR Real Estate Finance Trust Inc. | 1,686 | 35,119 |
| Ladder Capital Corp. | 5,300 | 63,547 |
| MFA Financial Inc. | 20,036 | 91,364 |
| New Residential Investment Corp. | 4,500 | 48,195 |
| New York Mortgage Trust Inc. | 18,600 | 69,192 |
| Orchid Island Capital Inc. | 5,092 | 22,914 |
| PennyMac Mortgage Investment Trust | 4,424 | 76,668 |
| Ready Capital Corp. | 2,715 | 42,435 |
| Redwood Trust Inc. | 5,692 | 75,078 |
| Starwood Property Trust Inc. | 3,200 | 77,760 |
| TPG RE Finance Trust Inc. | 2,529 | 31,157 |
| Two Harbors Investment Corp. | 15,424 | 88,997 |
| | | 2,058,509 |
| Motorcycle Manufacturers - 0.0% * |
| Arcimoto Inc. (a) | 1,100 | 8,558 |
| Harley-Davidson Inc. | 1,700 | 64,073 |
| | | 72,631 |
| Movies & Entertainment - 0.4% |
| AMC Entertainment Holdings Inc., Class A (a) | 23,661 | 643,579 |
| Chicken Soup For The Soul Entertainment Inc. (a) | 600 | 8,304 |
| Cinemark Holdings Inc. (a) | 4,817 | 77,650 |
| CuriosityStream Inc. (a) | 1,300 | 7,709 |
| Liberty Media Corp., Class A (a) | 100 | 5,934 |
| Liberty Media Corp-Liberty Braves, Class A (a) | 600 | 17,250 |
| Liberty Media Corp-Liberty Braves, Class C (a) | 1,672 | 46,983 |
| Liberty Media Corp-Liberty Media, Class C (a) | 2,300 | 145,452 |
| Lions Gate Entertainment Corp., Class A (a) | 2,793 | 46,476 |
| Lions Gate Entertainment Corp., Class B (a) | 5,331 | 82,044 |
| | Number
of Shares | Fair
Value |
| Live Nation Entertainment Inc. (a) | 1,500 | $ 179,535 |
| LiveOne Inc. (a) | 1,100 | 1,408 |
| Madison Square Garden Entertainment Corp. (a) | 1,162 | 81,735 |
| Madison Square Garden Sports Corp. (a) | 200 | 34,746 |
| Netflix Inc. (a) | 4,945 | 2,979,066 |
| Roku Inc. (a) | 1,300 | 296,660 |
| The Marcus Corp. (a) | 1,300 | 23,218 |
| The Walt Disney Co. (a) | 20,701 | 3,206,378 |
| World Wrestling Entertainment Inc., Class A | 300 | 14,802 |
| | | 7,898,929 |
| Multi-Line Insurance - 0.1% |
| American International Group Inc. | 9,600 | 545,856 |
| American National Group Inc. | 326 | 61,562 |
| Assurant Inc. | 692 | 107,855 |
| Horace Mann Educators Corp. | 1,900 | 73,530 |
| The Hartford Financial Services Group Inc. | 3,800 | 262,352 |
| | | 1,051,155 |
| Multi-Sector Holdings - 0.4% |
| Berkshire Hathaway Inc., Class B (a) | 20,874 | 6,241,326 |
| Cannae Holdings Inc. (a) | 3,852 | 135,398 |
| | | 6,376,724 |
| Multi-Utilities - 0.2% |
| Ameren Corp. | 2,971 | 264,449 |
| Avista Corp. | 3,219 | 136,775 |
| Black Hills Corp. | 2,920 | 206,064 |
| CenterPoint Energy Inc. | 6,600 | 184,206 |
| CMS Energy Corp. | 3,400 | 221,170 |
| Consolidated Edison Inc. | 4,000 | 341,280 |
| Dominion Energy Inc. | 9,191 | 722,045 |
| DTE Energy Co. | 2,100 | 251,034 |
| MDU Resources Group Inc. | 2,300 | 70,932 |
| NiSource Inc. | 4,100 | 113,201 |
| NorthWestern Corp. | 2,403 | 137,356 |
| Public Service Enterprise Group Inc. | 5,700 | 380,361 |
| Sempra Energy | 3,700 | 489,436 |
| Unitil Corp. | 700 | 32,193 |
| WEC Energy Group Inc. | 3,585 | 347,996 |
| | | 3,898,498 |
See Notes to Schedule of Investments and Notes to Financial Statements.
| State Street Total Return V.I.S. Fund | 31 |
State Street Total Return V.I.S. Fund
Schedule of Investments, continued — December 31, 2021
| | Number
of Shares | Fair
Value |
| Office REITs - 0.1% |
| Alexandria Real Estate Equities Inc. | 1,800 | $ 401,328 |
| Boston Properties Inc. | 1,800 | 207,324 |
| Brandywine Realty Trust | 7,694 | 103,254 |
| Corporate Office Properties Trust | 5,140 | 143,766 |
| Cousins Properties Inc. | 1,600 | 64,448 |
| Douglas Emmett Inc. | 1,900 | 63,650 |
| Easterly Government Properties Inc. | 3,910 | 89,617 |
| Equity Commonwealth (a) | 5,336 | 138,202 |
| Franklin Street Properties Corp. | 4,871 | 28,982 |
| Highwoods Properties Inc. | 1,200 | 53,508 |
| Hudson Pacific Properties Inc. | 1,500 | 37,065 |
| JBG SMITH Properties | 1,800 | 51,678 |
| Kilroy Realty Corp. | 1,300 | 86,398 |
| Office Properties Income Trust | 2,086 | 51,816 |
| Orion Office REIT Inc. (a) | 665 | 12,416 |
| Paramount Group Inc. | 9,200 | 76,728 |
| Piedmont Office Realty Trust Inc., Class A | 5,621 | 103,314 |
| Postal Realty Trust Inc., Class A | 553 | 10,949 |
| SL Green Realty Corp. | 800 | 57,360 |
| Veris Residential Inc. (a) | 3,963 | 72,840 |
| Vornado Realty Trust | 2,100 | 87,906 |
| | | 1,942,549 |
| Office Services & Supplies - 0.0% * |
| ACCO Brands Corp. | 3,950 | 32,627 |
| Herman Miller Inc. | 3,377 | 132,345 |
| HNI Corp. | 1,966 | 82,670 |
| Interface Inc. | 2,684 | 42,810 |
| Kimball International Inc., Class B | 1,732 | 17,718 |
| MSA Safety Inc. | 400 | 60,384 |
| Pitney Bowes Inc. | 8,200 | 54,366 |
| Steelcase Inc., Class A | 4,429 | 51,908 |
| | | 474,828 |
| Oil & Gas Drilling - 0.0% * |
| Helmerich & Payne Inc. | 4,779 | 113,262 |
| Nabors Industries Ltd. (a) | 339 | 27,490 |
| Patterson-UTI Energy Inc. | 8,700 | 73,515 |
| | | 214,267 |
| Oil & Gas Equipment & Services - 0.1% |
| Archrock Inc. | 6,749 | 50,483 |
| | Number
of Shares | Fair
Value |
| Aspen Aerogels Inc. (a) | 960 | $ 47,798 |
| Baker Hughes Co. | 8,600 | 206,916 |
| Bristow Group Inc. (a) | 1,007 | 31,892 |
| Cactus Inc., Class A | 2,679 | 102,150 |
| ChampionX Corp. (a) | 9,250 | 186,942 |
| DMC Global Inc. (a) | 1,000 | 39,610 |
| Dril-Quip Inc. (a) | 1,400 | 27,552 |
| Expro Group Holdings N.V. (a) | 2,229 | 31,986 |
| FTS International Inc., Class A (a) | 410 | 10,763 |
| Halliburton Co. | 10,400 | 237,848 |
| Helix Energy Solutions Group Inc. (a) | 6,865 | 21,419 |
| Liberty Oilfield Services Inc., Class A (a) | 4,378 | 42,467 |
| National Energy Services Reunited Corp. (a) | 1,500 | 14,175 |
| Newpark Resources Inc. (a) | 5,800 | 17,052 |
| NexTier Oilfield Solutions Inc. (a) | 8,296 | 29,451 |
| NOV Inc. | 4,300 | 58,265 |
| Oceaneering International Inc. (a) | 4,824 | 54,559 |
| Oil States International Inc. (a) | 3,500 | 17,395 |
| ProPetro Holding Corp. (a) | 4,139 | 33,526 |
| RPC Inc. (a) | 3,400 | 15,436 |
| Schlumberger N.V. | 15,800 | 473,210 |
| Select Energy Services Inc., Class A (a) | 3,600 | 22,428 |
| Solaris Oilfield Infrastructure Inc., Class A | 1,700 | 11,135 |
| TETRA Technologies Inc. (a) | 5,400 | 15,336 |
| Tidewater Inc. (a) | 1,968 | 21,077 |
| U.S. Silica Holdings Inc. (a) | 3,108 | 29,215 |
| | | 1,850,086 |
| Oil & Gas Exploration & Production - 0.4% |
| Antero Resources Corp. (a) | 13,065 | 228,637 |
| APA Corp. | 4,000 | 107,560 |
| Berry Corp. | 2,804 | 23,610 |
| Brigham Minerals Inc., Class A | 1,879 | 39,628 |
| California Resources Corp. | 3,692 | 157,685 |
| Callon Petroleum Co. (a) | 2,280 | 107,730 |
| Centennial Resource Development Inc., Class A (a) | 8,900 | 53,222 |
| Chesapeake Energy Corp. | 4,801 | 309,761 |
| Civitas Resources Inc. | 2,085 | 102,102 |
| CNX Resources Corp. (a) | 9,538 | 131,147 |
| Comstock Resources Inc. (a) | 4,500 | 36,405 |
See Notes to Schedule of Investments and Notes to Financial Statements.
| 32 | State Street Total Return V.I.S. Fund |
State Street Total Return V.I.S. Fund
Schedule of Investments, continued — December 31, 2021
| | Number
of Shares | Fair
Value |
| ConocoPhillips | 15,200 | $ 1,097,136 |
| Continental Resources Inc. | 800 | 35,808 |
| Coterra Energy Inc. | 8,721 | 165,699 |
| Crescent Energy Inc., Class A (a) | 1,360 | 17,245 |
| Denbury Inc. (a) | 2,298 | 176,004 |
| Devon Energy Corp. | 7,500 | 330,375 |
| Diamondback Energy Inc. | 2,100 | 226,485 |
| Earthstone Energy Inc., Class A (a) | 1,104 | 12,078 |
| EOG Resources Inc. | 6,700 | 595,161 |
| EQT Corp. (a) | 3,302 | 72,017 |
| Falcon Minerals Corp. | 2,071 | 10,086 |
| Hess Corp. | 3,100 | 229,493 |
| Kosmos Energy Ltd. (a) | 21,521 | 74,463 |
| Laredo Petroleum Inc. (a) | 600 | 36,078 |
| Magnolia Oil & Gas Corp., Class A | 6,807 | 128,448 |
| Marathon Oil Corp. | 9,100 | 149,422 |
| Matador Resources Co. | 5,048 | 186,372 |
| Murphy Oil Corp. | 6,676 | 174,310 |
| Northern Oil & Gas Inc. | 2,500 | 51,450 |
| Oasis Petroleum Inc. | 900 | 113,391 |
| Ovintiv Inc. | 11,996 | 404,265 |
| PDC Energy Inc. | 4,449 | 217,022 |
| Pioneer Natural Resources Co. | 2,500 | 454,700 |
| Range Resources Corp. (a) | 10,908 | 194,490 |
| Ranger Oil Corp., Class A (a) | 1,018 | 27,405 |
| SM Energy Co. | 5,462 | 161,020 |
| Southwestern Energy Co. (a) | 46,373 | 216,098 |
| Talos Energy Inc. (a) | 1,800 | 17,640 |
| Tellurian Inc. (a) | 17,700 | 54,516 |
| Texas Pacific Land Corp. | 67 | 83,674 |
| W&T Offshore Inc. (a) | 5,600 | 18,088 |
| Whiting Petroleum Corp. (a) | 1,788 | 115,648 |
| | | 7,143,574 |
| Oil & Gas Refining & Marketing - 0.1% |
| Aemetis Inc. (a) | 1,500 | 18,450 |
| Alto Ingredients Inc. (a) | 3,600 | 17,316 |
| Clean Energy Fuels Corp. (a) | 6,795 | 41,654 |
| CVR Energy Inc. | 1,700 | 28,577 |
| Delek US Holdings Inc. (a) | 3,178 | 47,638 |
| Gevo Inc. (a) | 9,600 | 41,088 |
| Green Plains Inc. (a) | 2,120 | 73,691 |
| HollyFrontier Corp. | 1,600 | 52,448 |
| Marathon Petroleum Corp. | 7,000 | 447,930 |
| Par Pacific Holdings Inc. (a) | 2,400 | 39,576 |
| | Number
of Shares | Fair
Value |
| PBF Energy Inc., Class A (a) | 4,500 | $ 58,365 |
| Phillips 66 | 5,000 | 362,300 |
| Renewable Energy Group Inc. (a) | 2,025 | 85,941 |
| REX American Resources Corp. (a) | 255 | 24,480 |
| Valero Energy Corp. | 4,600 | 345,506 |
| World Fuel Services Corp. | 3,000 | 79,410 |
| | | 1,764,370 |
| Oil & Gas Storage & Transportation - 0.1% |
| Altus Midstream Co., Class A | 149 | 9,135 |
| Antero Midstream Corp. | 4,300 | 41,624 |
| Cheniere Energy Inc. | 2,600 | 263,692 |
| Dorian LPG Ltd. | 1,197 | 15,190 |
| DTE Midstream LLC (a) | 950 | 45,581 |
| Equitrans Midstream Corp. | 18,651 | 192,851 |
| International Seaways Inc. | 2,452 | 35,996 |
| Kinder Morgan Inc. | 22,100 | 350,506 |
| New Fortress Energy Inc. | 600 | 14,484 |
| ONEOK Inc. | 5,000 | 293,800 |
| Targa Resources Corp. | 2,600 | 135,824 |
| The Williams Companies Inc. | 13,900 | 361,956 |
| | | 1,760,639 |
| Other Diversified Financial Services - 0.0% * |
| Alerus Financial Corp. | 723 | 21,169 |
| Equitable Holdings Inc. | 4,400 | 144,276 |
| Voya Financial Inc. | 1,400 | 92,834 |
| | | 258,279 |
| Packaged Foods & Meats - 0.3% |
| B&G Foods Inc. | 2,899 | 89,086 |
| Beyond Meat Inc. (a) | 500 | 32,580 |
| Calavo Growers Inc. | 800 | 33,920 |
| Cal-Maine Foods Inc. | 1,800 | 66,582 |
| Campbell Soup Co. | 2,400 | 104,304 |
| Conagra Brands Inc. | 5,500 | 187,825 |
| Flowers Foods Inc. | 2,100 | 57,687 |
| Freshpet Inc. (a) | 400 | 38,108 |
| General Mills Inc. | 7,008 | 472,199 |
| Hormel Foods Corp. | 3,296 | 160,878 |
| Hostess Brands Inc. (a) | 6,419 | 131,076 |
| J&J Snack Foods Corp. | 669 | 105,675 |
| John B Sanfilippo & Son Inc. | 373 | 33,630 |
| Kellogg Co. | 2,900 | 186,818 |
| Lamb Weston Holdings Inc. | 1,600 | 101,408 |
| Lancaster Colony Corp. | 864 | 143,079 |
| Landec Corp. (a) | 1,254 | 13,919 |
See Notes to Schedule of Investments and Notes to Financial Statements.
| State Street Total Return V.I.S. Fund | 33 |
State Street Total Return V.I.S. Fund
Schedule of Investments, continued — December 31, 2021
| | Number
of Shares | Fair
Value |
| McCormick & Company Inc. | 2,900 | $ 280,169 |
| Mission Produce Inc. (a) | 1,800 | 28,260 |
| Mondelez International Inc., Class A | 15,934 | 1,056,584 |
| Pilgrim's Pride Corp. (a) | 300 | 8,460 |
| Post Holdings Inc. (a) | 700 | 78,911 |
| Sanderson Farms Inc. | 926 | 176,940 |
| Seneca Foods Corp., Class A (a) | 294 | 14,097 |
| Sovos Brands Inc. (a) | 1,234 | 18,572 |
| Tattooed Chef Inc. (a) | 2,300 | 35,742 |
| The Hain Celestial Group Inc. (a) | 900 | 38,349 |
| The Hershey Co. | 1,700 | 328,899 |
| The J M Smucker Co. | 1,176 | 159,724 |
| The Kraft Heinz Co. | 8,100 | 290,790 |
| The Simply Good Foods Co. (a) | 3,876 | 161,125 |
| Tootsie Roll Industries Inc. | 623 | 22,571 |
| TreeHouse Foods Inc. (a) | 2,355 | 95,448 |
| Tyson Foods Inc., Class A | 3,200 | 278,912 |
| Utz Brands Inc. | 2,900 | 46,255 |
| Vital Farms Inc. (a) | 1,400 | 25,284 |
| Whole Earth Brands Inc. (a) | 1,600 | 17,184 |
| | | 5,121,050 |
| Paper Packaging - 0.1% |
| Avery Dennison Corp. | 900 | 194,913 |
| Graphic Packaging Holding Co. | 3,000 | 58,500 |
| International Paper Co. | 4,251 | 199,712 |
| Packaging Corporation of America | 1,096 | 149,220 |
| Pactiv Evergreen Inc. | 2,300 | 29,164 |
| Ranpak Holdings Corp. (a) | 1,687 | 63,398 |
| Sealed Air Corp. | 1,600 | 107,952 |
| Sonoco Products Co. | 1,100 | 63,679 |
| UFP Technologies Inc. (a) | 332 | 23,326 |
| Westrock Co. | 3,200 | 141,952 |
| | | 1,031,816 |
| Paper Products - 0.0% * |
| Clearwater Paper Corp. (a) | 679 | 24,899 |
| Glatfelter Corp. | 1,844 | 31,717 |
| Neenah Inc. | 718 | 33,229 |
| Schweitzer-Mauduit International Inc. | 1,529 | 45,717 |
| Sylvamo Corp. (a) | 522 | 14,558 |
| | Number
of Shares | Fair
Value |
| Verso Corp., Class A | 1,280 | $ 34,586 |
| | | 184,706 |
| Personal Products - 0.1% |
| BellRing Brands Inc., Class A (a) | 1,854 | 52,895 |
| Coty Inc., Class A (a) | 4,300 | 45,150 |
| Edgewell Personal Care Co. | 2,465 | 112,675 |
| elf Beauty Inc. (a) | 2,113 | 70,173 |
| Herbalife Nutrition Ltd. (a) | 1,300 | 53,209 |
| Inter Parfums Inc. | 807 | 86,268 |
| Medifast Inc. | 522 | 109,322 |
| Nature's Sunshine Products Inc. | 546 | 10,101 |
| Nu Skin Enterprises Inc., Class A | 2,256 | 114,492 |
| Olaplex Holdings Inc. (a) | 600 | 17,478 |
| The Beauty Health Co. (a) | 3,891 | 94,007 |
| The Estee Lauder Companies Inc., Class A | 2,600 | 962,520 |
| The Honest Company Inc. (a) | 4,080 | 33,007 |
| USANA Health Sciences Inc. (a) | 575 | 58,190 |
| Veru Inc. (a) | 3,200 | 18,848 |
| | | 1,838,335 |
| Pharmaceuticals - 1.1% |
| 9 Meters Biopharma Inc. (a) | 7,734 | 7,569 |
| Aclaris Therapeutics Inc. (a) | 2,100 | 30,534 |
| Aerie Pharmaceuticals Inc. (a) | 2,200 | 15,444 |
| Amneal Pharmaceuticals Inc. (a) | 4,782 | 22,906 |
| Amphastar Pharmaceuticals Inc. (a) | 1,548 | 36,053 |
| Ampio Pharmaceuticals Inc. (a) | 10,700 | 6,099 |
| Angion Biomedica Corp. (a) | 300 | 870 |
| ANI Pharmaceuticals Inc. (a) | 600 | 27,648 |
| Antares Pharma Inc. (a) | 6,881 | 24,565 |
| Arvinas Inc. (a) | 2,146 | 176,272 |
| Atea Pharmaceuticals Inc. (a) | 3,200 | 28,608 |
| Athira Pharma Inc. (a) | 1,581 | 20,600 |
| Axsome Therapeutics Inc. (a) | 1,400 | 52,892 |
| Bausch Health Companies Inc. (a) | 5,100 | 141,071 |
| BioDelivery Sciences International Inc. (a) | 5,500 | 17,050 |
| Bristol-Myers Squibb Co. | 25,370 | 1,581,820 |
| Cara Therapeutics Inc. (a) | 1,900 | 23,142 |
| Cassava Sciences Inc. (a) | 1,721 | 75,208 |
See Notes to Schedule of Investments and Notes to Financial Statements.
| 34 | State Street Total Return V.I.S. Fund |
State Street Total Return V.I.S. Fund
Schedule of Investments, continued — December 31, 2021
| | Number
of Shares | Fair
Value |
| Catalent Inc. (a) | 1,900 | $ 243,257 |
| Citius Pharmaceuticals Inc. (a) | 6,400 | 9,856 |
| Collegium Pharmaceutical Inc. (a) | 1,655 | 30,915 |
| Corcept Therapeutics Inc. (a) | 4,332 | 85,774 |
| CorMedix Inc. (a) | 2,100 | 9,555 |
| Cymabay Therapeutics Inc. (a) | 4,200 | 14,196 |
| DICE Therapeutics Inc. (a) | 668 | 16,907 |
| Durect Corp. (a) | 13,500 | 13,310 |
| Edgewise Therapeutics Inc. (a) | 1,856 | 28,360 |
| Elanco Animal Health Inc. (a) | 5,000 | 141,900 |
| Eli Lilly & Co. | 9,678 | 2,673,257 |
| Esperion Therapeutics Inc. (a) | 1,600 | 8,000 |
| Evolus Inc. (a) | 1,600 | 10,416 |
| EyePoint Pharmaceuticals Inc. (a) | 1,054 | 12,901 |
| Fulcrum Therapeutics Inc. (a) | 1,318 | 23,315 |
| Harmony Biosciences Holdings Inc. (a) | 1,075 | 45,838 |
| Ikena Oncology Inc. (a) | 1,329 | 16,666 |
| Innoviva Inc. (a) | 2,100 | 36,225 |
| Intra-Cellular Therapies Inc. (a) | 3,217 | 168,378 |
| Johnson & Johnson | 29,990 | 5,130,389 |
| Kala Pharmaceuticals Inc. (a) | 2,900 | 3,509 |
| KemPharm Inc. (a) | 1,600 | 13,936 |
| Marinus Pharmaceuticals Inc. (a) | 1,800 | 21,384 |
| Merck & Company Inc. | 28,885 | 2,213,746 |
| Mind Medicine MindMed Inc. (a) | 15,800 | 21,804 |
| Nektar Therapeutics (a) | 2,600 | 35,126 |
| NGM Biopharmaceuticals Inc. (a) | 1,500 | 26,565 |
| Nuvation Bio Inc. (a) | 7,624 | 64,804 |
| Ocular Therapeutix Inc. (a) | 3,801 | 26,493 |
| Omeros Corp. (a) | 2,367 | 15,220 |
| Oramed Pharmaceuticals Inc. (a) | 1,600 | 22,848 |
| Organon & Co. | 3,190 | 97,136 |
| Pacira Pharmaceuticals Inc. (a) | 2,006 | 120,701 |
| Paratek Pharmaceuticals Inc. (a) | 2,700 | 12,123 |
| Pfizer Inc. | 63,625 | 3,757,056 |
| Phathom Pharmaceuticals Inc. (a) | 992 | 19,513 |
| Phibro Animal Health Corp., Class A | 1,200 | 24,504 |
| Pliant Therapeutics Inc. (a) | 1,400 | 18,900 |
| | Number
of Shares | Fair
Value |
| Prestige Consumer Healthcare Inc. (a) | 2,278 | $ 138,161 |
| Provention Bio Inc. (a) | 3,200 | 17,984 |
| Rain Therapeutics Inc. (a) | 763 | 9,827 |
| Reata Pharmaceuticals Inc., Class A (a) | 1,231 | 32,461 |
| Relmada Therapeutics Inc. (a) | 900 | 20,277 |
| Revance Therapeutics Inc. (a) | 3,367 | 54,949 |
| Royalty Pharma PLC, Class A | 3,900 | 155,415 |
| Seelos Therapeutics Inc. (a) | 6,800 | 11,084 |
| SIGA Technologies Inc. (a) | 2,314 | 17,401 |
| Supernus Pharmaceuticals Inc. (a) | 2,300 | 67,068 |
| Tarsus Pharmaceuticals Inc. (a) | 440 | 9,900 |
| TherapeuticsMD Inc. (a) | 20,300 | 7,217 |
| Ventyx Biosciences Inc. (a) | 501 | 9,950 |
| Verrica Pharmaceuticals Inc. (a) | 603 | 5,524 |
| Viatris Inc. | 14,400 | 194,832 |
| WaVe Life Sciences Ltd. (a) | 2,500 | 7,850 |
| Zoetis Inc. | 5,400 | 1,317,762 |
| Zogenix Inc. (a) | 2,784 | 45,240 |
| | | 19,646,036 |
| Property & Casualty Insurance - 0.2% |
| Ambac Financial Group Inc. (a) | 1,917 | 30,768 |
| American Financial Group Inc. | 800 | 109,856 |
| AMERISAFE Inc. | 832 | 44,787 |
| Arch Capital Group Ltd. (a) | 4,400 | 195,580 |
| Assured Guaranty Ltd. | 500 | 25,100 |
| Axis Capital Holdings Ltd. | 800 | 43,576 |
| Cincinnati Financial Corp. | 1,700 | 193,681 |
| CNA Financial Corp. | 200 | 8,816 |
| Donegal Group Inc., Class A | 729 | 10,417 |
| Employers Holdings Inc. | 1,252 | 51,808 |
| Erie Indemnity Co., Class A | 264 | 50,862 |
| Fidelity National Financial Inc. | 3,200 | 166,976 |
| First American Financial Corp. | 1,300 | 101,699 |
| HCI Group Inc. | 302 | 25,229 |
| Heritage Insurance Holdings Inc. | 1,600 | 9,408 |
| Investors Title Co. | 47 | 9,266 |
| Kemper Corp. | 600 | 35,274 |
| Kinsale Capital Group Inc. | 982 | 233,608 |
| Lemonade Inc. (a) | 500 | 21,055 |
| Loews Corp. | 2,200 | 127,072 |
| Markel Corp. (a) | 158 | 194,972 |
| MBIA Inc. (a) | 2,007 | 31,690 |
See Notes to Schedule of Investments and Notes to Financial Statements.
| State Street Total Return V.I.S. Fund | 35 |
State Street Total Return V.I.S. Fund
Schedule of Investments, continued — December 31, 2021
| | Number
of Shares | Fair
Value |
| Mercury General Corp. | 500 | $ 26,530 |
| MetroMile Inc. (a) | 2,000 | 4,380 |
| NI Holdings Inc. (a) | 588 | 11,119 |
| Old Republic International Corp. | 3,374 | 82,933 |
| Palomar Holdings Inc. (a) | 1,095 | 70,923 |
| ProAssurance Corp. | 2,600 | 65,780 |
| RLI Corp. | 1,826 | 204,695 |
| Safety Insurance Group Inc. | 686 | 58,331 |
| Selective Insurance Group Inc. | 2,713 | 222,303 |
| State Auto Financial Corp. | 752 | 38,871 |
| Stewart Information Services Corp. | 1,208 | 96,314 |
| The Allstate Corp. | 3,232 | 380,245 |
| The Hanover Insurance Group Inc. | 500 | 65,530 |
| The Progressive Corp. | 6,610 | 678,516 |
| The Travelers Companies Inc. | 2,803 | 438,473 |
| Tiptree Inc. | 1,127 | 15,586 |
| Trean Insurance Group Inc. (a) | 1,000 | 8,910 |
| United Fire Group Inc. | 1,009 | 23,399 |
| United Insurance Holdings Corp. | 300 | 1,302 |
| Universal Insurance Holdings Inc. | 1,300 | 22,100 |
| White Mountains Insurance Group Ltd. | 39 | 39,542 |
| WR Berkley Corp. | 1,612 | 132,813 |
| | | 4,410,095 |
| Publishing - 0.0% * |
| Daily Journal Corp. (a) | 50 | 17,837 |
| Gannett Company Inc. (a) | 5,944 | 31,682 |
| John Wiley & Sons Inc., Class A | 1,957 | 112,077 |
| News Corp., Class A | 5,194 | 115,878 |
| News Corp., Class B | 874 | 19,665 |
| Scholastic Corp. | 1,265 | 50,549 |
| The New York Times., Class A | 2,000 | 96,600 |
| | | 444,288 |
| Railroads - 0.2% |
| CSX Corp. | 25,350 | 953,160 |
| Norfolk Southern Corp. | 2,800 | 833,588 |
| Union Pacific Corp. | 7,333 | 1,847,403 |
| | | 3,634,151 |
| | Number
of Shares | Fair
Value |
| Real Estate Development - 0.0% * |
| Forestar Group Inc. (a) | 1,000 | $ 21,750 |
| The Howard Hughes Corp. (a) | 400 | 40,712 |
| | | 62,462 |
| Real Estate Operating Companies - 0.0% * |
| FRP Holdings Inc. (a) | 320 | 18,496 |
| Kennedy-Wilson Holdings Inc. | 5,399 | 128,928 |
| Rafael Holdings Inc., Class B (a) | 600 | 3,060 |
| | | 150,484 |
| Real Estate Services - 0.1% |
| CBRE Group Inc., Class A (a) | 3,800 | 412,338 |
| Cushman & Wakefield PLC (a) | 6,307 | 140,268 |
| Douglas Elliman Inc. (a) | 3,259 | 37,484 |
| eXp World Holdings Inc. | 2,844 | 95,814 |
| Fathom Holdings Inc. (a) | 238 | 4,869 |
| Jones Lang LaSalle Inc. (a) | 600 | 161,604 |
| Marcus & Millichap Inc. (a) | 1,184 | 60,929 |
| Newmark Group Inc., Class A | 6,768 | 126,562 |
| Opendoor Technologies Inc. (a) | 5,500 | 80,355 |
| Realogy Holdings Corp. (a) | 5,208 | 87,547 |
| Redfin Corp. (a) | 4,705 | 180,625 |
| REX Holdings Inc., Class A | 888 | 27,075 |
| Zillow Group Inc., Class A (a) | 600 | 37,332 |
| Zillow Group Inc., Class C (a) | 2,100 | 134,085 |
| | | 1,586,887 |
| Regional Banks - 1.0% |
| 1st Source Corp. | 700 | 34,720 |
| Allegiance Bancshares Inc. | 804 | 33,937 |
| Amalgamated Financial Corp. | 704 | 11,806 |
| Amerant Bancorp Inc. | 1,240 | 42,842 |
| American National Bankshares Inc. | 501 | 18,878 |
| Ameris Bancorp. | 3,026 | 150,332 |
| Arrow Financial Corp. | 663 | 23,357 |
| Associated Banc-Corp. | 6,768 | 152,889 |
| Atlantic Capital Bancshares Inc. (a) | 802 | 23,074 |
| Atlantic Union Bankshares Corp. | 3,429 | 127,867 |
| Banc of California Inc. | 2,600 | 51,012 |
| BancFirst Corp. | 824 | 58,141 |
| Bank First Corp. | 316 | 22,828 |
| Bank of Hawaii Corp. | 600 | 50,256 |
| Bank of Marin Bancorp | 775 | 28,853 |
See Notes to Schedule of Investments and Notes to Financial Statements.
| 36 | State Street Total Return V.I.S. Fund |
State Street Total Return V.I.S. Fund
Schedule of Investments, continued — December 31, 2021
| | Number
of Shares | Fair
Value |
| Bank OZK | 1,300 | $ 60,489 |
| BankUnited Inc. | 4,055 | 171,567 |
| Banner Corp. | 1,544 | 93,674 |
| Bar Harbor Bankshares | 708 | 20,482 |
| Berkshire Hills Bancorp Inc. | 2,138 | 60,783 |
| Blue Ridge Bankshares Inc. | 636 | 11,384 |
| BOK Financial Corp. | 300 | 31,647 |
| Brookline Bancorp Inc. | 3,500 | 56,665 |
| Bryn Mawr Bank Corp. | 895 | 40,284 |
| Business First Bancshares Inc. | 772 | 21,855 |
| Byline Bancorp Inc. | 1,196 | 32,711 |
| Cadence Bank | 8,590 | 255,896 |
| Cambridge Bancorp | 321 | 30,042 |
| Camden National Corp. | 617 | 29,715 |
| Capital Bancorp Inc. | 409 | 10,716 |
| Capital City Bank Group Inc. | 800 | 21,120 |
| Capstar Financial Holdings Inc. | 1,000 | 21,030 |
| Carter Bankshares Inc. (a) | 1,400 | 21,546 |
| Cathay General Bancorp | 3,373 | 145,005 |
| CBTX Inc. | 1,000 | 29,000 |
| Central Pacific Financial Corp. | 1,163 | 32,762 |
| CIT Group Inc. | 4,534 | 232,776 |
| Citizens & Northern Corp. | 799 | 20,870 |
| Citizens Financial Group Inc. | 5,100 | 240,975 |
| City Holding Co. | 661 | 54,063 |
| Civista Bancshares Inc. | 712 | 17,373 |
| CNB Financial Corp. | 900 | 23,850 |
| Coastal Financial Corp. (a) | 364 | 18,426 |
| Columbia Banking System Inc. | 3,555 | 116,320 |
| Comerica Inc. | 1,500 | 130,500 |
| Commerce Bancshares Inc. | 1,365 | 93,830 |
| Community Bank System Inc. | 2,441 | 181,806 |
| Community Trust Bancorp Inc. | 648 | 28,259 |
| ConnectOne Bancorp Inc. | 1,868 | 61,102 |
| CrossFirst Bankshares Inc. (a) | 1,947 | 30,393 |
| Cullen/Frost Bankers Inc. | 600 | 75,642 |
| Customers Bancorp Inc. (a) | 1,350 | 88,249 |
| CVB Financial Corp. | 5,874 | 125,762 |
| Dime Community Bancshares Inc. | 1,732 | 60,897 |
| Eagle Bancorp Inc. | 1,429 | 83,368 |
| East West Bancorp Inc. | 1,600 | 125,888 |
| Eastern Bankshares Inc. | 7,824 | 157,810 |
| Enterprise Bancorp Inc. | 445 | 19,989 |
| Enterprise Financial Services Corp. | 1,598 | 75,250 |
| Equity Bancshares Inc., Class A | 533 | 18,085 |
| | Number
of Shares | Fair
Value |
| Farmers National Banc Corp. | 1,600 | $ 29,680 |
| FB Financial Corp. | 1,465 | 64,196 |
| Fidelity D&D Bancorp Inc. | 228 | 13,452 |
| Fifth Third Bancorp | 7,800 | 339,690 |
| Financial Institutions Inc. | 628 | 19,970 |
| First Bancorp Inc. | 600 | 18,840 |
| First Bancorp/Southern Pines NC | 1,515 | 69,266 |
| First Bank | 500 | 7,255 |
| First Busey Corp. | 2,259 | 61,264 |
| First Citizens BancShares Inc., Class A | 60 | 49,790 |
| First Commonwealth Financial Corp. | 4,500 | 72,405 |
| First Community Bancshares Inc. | 690 | 23,060 |
| First Financial Bancorp. | 4,447 | 108,418 |
| First Financial Bankshares Inc. | 5,938 | 301,888 |
| First Financial Corp. | 468 | 21,196 |
| First Foundation Inc. | 1,718 | 42,709 |
| First Hawaiian Inc. | 1,500 | 40,995 |
| First Horizon Corp. | 5,600 | 91,448 |
| First Internet Bancorp | 446 | 20,980 |
| First Interstate BancSystem Inc., Class A | 2,000 | 81,340 |
| First Merchants Corp. | 2,655 | 111,218 |
| First Mid Bancshares Inc. | 866 | 37,056 |
| First Midwest Bancorp Inc. | 5,165 | 105,779 |
| First Republic Bank | 2,000 | 413,020 |
| Five Star Bancorp | 598 | 17,940 |
| Flushing Financial Corp. | 1,231 | 29,913 |
| FNB Corp. | 1,600 | 19,408 |
| Fulton Financial Corp. | 7,220 | 122,740 |
| German American Bancorp Inc. | 1,200 | 46,776 |
| Glacier Bancorp Inc. | 5,038 | 285,655 |
| Great Southern Bancorp Inc. | 494 | 29,270 |
| Great Western Bancorp Inc. | 2,503 | 85,002 |
| Guaranty Bancshares Inc. | 450 | 16,911 |
| Hancock Whitney Corp. | 3,945 | 197,329 |
| Hanmi Financial Corp. | 1,275 | 30,192 |
| HarborOne Bancorp Inc. | 2,077 | 30,823 |
| HBT Financial Inc. | 627 | 11,744 |
| Heartland Financial USA Inc. | 1,824 | 92,313 |
| Heritage Commerce Corp. | 2,437 | 29,098 |
| Heritage Financial Corp. | 1,600 | 39,104 |
| Hilltop Holdings Inc. | 2,969 | 104,331 |
| Home BancShares Inc. | 6,949 | 169,208 |
| HomeStreet Inc. | 970 | 50,440 |
See Notes to Schedule of Investments and Notes to Financial Statements.
| State Street Total Return V.I.S. Fund | 37 |
State Street Total Return V.I.S. Fund
Schedule of Investments, continued — December 31, 2021
| | Number
of Shares | Fair
Value |
| HomeTrust Bancshares Inc. | 717 | $ 22,213 |
| Hope Bancorp Inc. | 5,554 | 81,699 |
| Horizon Bancorp Inc. | 1,817 | 37,884 |
| Howard Bancorp Inc. (a) | 470 | 10,241 |
| Huntington Bancshares Inc. | 16,506 | 254,523 |
| Independent Bank Corp. | 3,173 | 196,076 |
| Independent Bank Group Inc. | 1,710 | 123,376 |
| International Bancshares Corp. | 2,600 | 110,214 |
| Investors Bancorp Inc. | 10,415 | 157,787 |
| KeyCorp | 10,400 | 240,552 |
| Lakeland Bancorp Inc. | 2,100 | 39,879 |
| Lakeland Financial Corp. | 1,103 | 88,394 |
| Live Oak Bancshares Inc. | 1,448 | 126,396 |
| M&T Bank Corp. | 1,500 | 230,370 |
| Macatawa Bank Corp. | 1,260 | 11,113 |
| Mercantile Bank Corp. | 633 | 22,174 |
| Meta Financial Group Inc. | 1,500 | 89,490 |
| Metrocity Bankshares Inc. | 756 | 20,813 |
| Metropolitan Bank Holding Corp. (a) | 400 | 42,612 |
| Mid Penn Bancorp Inc. | 654 | 20,758 |
| Midland States Bancorp Inc. | 1,018 | 25,236 |
| MidWestOne Financial Group Inc. | 682 | 22,076 |
| MVB Financial Corp. | 489 | 20,303 |
| National Bank Holdings Corp., Class A | 1,304 | 57,298 |
| NBT Bancorp Inc. | 1,900 | 73,188 |
| Nicolet Bankshares Inc. (a) | 578 | 49,564 |
| Northrim BanCorp Inc. | 367 | 15,950 |
| OceanFirst Financial Corp. | 2,600 | 57,720 |
| Old National Bancorp | 7,514 | 136,154 |
| Old Second Bancorp Inc. | 1,331 | 16,757 |
| Origin Bancorp Inc. | 1,000 | 42,920 |
| Orrstown Financial Services Inc. | 644 | 16,229 |
| Pacific Premier Bancorp Inc. | 4,271 | 170,968 |
| PacWest Bancorp | 1,300 | 58,721 |
| Park National Corp. | 651 | 89,389 |
| Peapack-Gladstone Financial Corp. | 977 | 34,586 |
| Peoples Bancorp Inc. | 1,300 | 41,353 |
| Peoples Financial Services Corp. | 400 | 21,076 |
| People's United Financial Inc. | 5,100 | 90,882 |
| Pinnacle Financial Partners Inc. | 900 | 85,950 |
| Preferred Bank | 590 | 42,356 |
| Primis Financial Corp. | 925 | 13,912 |
| | Number
of Shares | Fair
Value |
| Prosperity Bancshares Inc. | 900 | $ 65,070 |
| QCR Holdings Inc. | 656 | 36,736 |
| RBB Bancorp | 536 | 14,043 |
| Red River Bancshares Inc. | 217 | 11,610 |
| Regions Financial Corp. | 11,400 | 248,520 |
| Reliant Bancorp Inc. | 738 | 26,199 |
| Renasant Corp. | 2,476 | 93,964 |
| Republic Bancorp Inc., Class A | 380 | 19,319 |
| Republic First Bancorp Inc. (a) | 2,460 | 9,151 |
| S&T Bancorp Inc. | 1,800 | 56,736 |
| Sandy Spring Bancorp Inc. | 2,027 | 97,458 |
| Seacoast Banking Corporation of Florida | 2,497 | 88,369 |
| ServisFirst Bancshares Inc. | 2,277 | 193,408 |
| Sierra Bancorp | 673 | 18,272 |
| Signature Bank | 700 | 226,429 |
| Silvergate Capital Corp., Class A (a) | 1,254 | 185,843 |
| Simmons First National Corp., Class A | 5,246 | 155,177 |
| SmartFinancial Inc. | 664 | 18,167 |
| South Plains Financial Inc. | 503 | 13,988 |
| South State Corp. | 3,191 | 255,631 |
| Southern First Bancshares Inc. (a) | 400 | 24,996 |
| Southside Bancshares Inc. | 1,500 | 62,730 |
| Spirit of Texas Bancshares Inc. | 614 | 17,671 |
| Sterling Bancorp | 2,100 | 54,159 |
| Stock Yards Bancorp Inc. | 1,189 | 75,953 |
| Summit Financial Group Inc. | 700 | 19,215 |
| SVB Financial Group (a) | 700 | 474,768 |
| Synovus Financial Corp. | 1,700 | 81,379 |
| Texas Capital Bancshares Inc. (a) | 2,306 | 138,936 |
| The Bancorp Inc. (a) | 2,348 | 59,428 |
| The First Bancshares Inc. | 859 | 33,175 |
| The First of Long Island Corp. | 1,098 | 23,706 |
| The PNC Financial Services Group Inc. | 4,900 | 982,548 |
| Tompkins Financial Corp. | 700 | 58,506 |
| TowneBank | 3,200 | 101,088 |
| TriCo Bancshares | 1,300 | 55,848 |
| TriState Capital Holdings Inc. (a) | 1,229 | 37,190 |
| Triumph Bancorp Inc. (a) | 1,069 | 127,297 |
| Truist Financial Corp. | 15,400 | 901,670 |
| Trustmark Corp. | 2,814 | 91,342 |
| UMB Financial Corp. | 1,998 | 212,008 |
See Notes to Schedule of Investments and Notes to Financial Statements.
| 38 | State Street Total Return V.I.S. Fund |
State Street Total Return V.I.S. Fund
Schedule of Investments, continued — December 31, 2021
| | Number
of Shares | Fair
Value |
| Umpqua Holdings Corp. | 2,600 | $ 50,024 |
| United Bankshares Inc. | 6,020 | 218,406 |
| United Community Banks Inc. | 4,253 | 152,853 |
| Univest Corporation of Pennsylvania | 1,229 | 36,772 |
| Valley National Bancorp | 18,297 | 251,584 |
| Veritex Holdings Inc. | 2,149 | 85,487 |
| Washington Trust Bancorp Inc. | 733 | 41,319 |
| Webster Financial Corp. | 1,000 | 55,840 |
| WesBanco Inc. | 2,943 | 102,976 |
| West Bancorporation Inc. | 649 | 20,164 |
| Westamerica BanCorp | 1,173 | 67,717 |
| Western Alliance Bancorp | 1,100 | 118,415 |
| Wintrust Financial Corp. | 800 | 72,656 |
| Zions Bancorp NA | 1,700 | 107,372 |
| | | 17,622,200 |
| Reinsurance - 0.0% * |
| Alleghany Corp. (a) | 150 | 100,138 |
| Reinsurance Group of America Inc. | 800 | 87,592 |
| | | 187,730 |
| Renewable Electricity - 0.0% * |
| Brookfield Renewable Corp., Class A | 3,000 | 110,528 |
| Ormat Technologies Inc. | 2,064 | 163,675 |
| Sunnova Energy International Inc. (a) | 3,900 | 108,888 |
| | | 383,091 |
| Research & Consulting Services - 0.2% |
| Acacia Research Corp. (a) | 2,900 | 14,877 |
| Atlas Technical Consultants Inc. (a) | 393 | 3,309 |
| Booz Allen Hamilton Holding Corp. | 1,500 | 127,185 |
| CACI International Inc., Class A (a) | 300 | 80,763 |
| CBIZ Inc. (a) | 2,216 | 86,690 |
| CoStar Group Inc. (a) | 4,400 | 347,732 |
| CRA International Inc. | 293 | 27,354 |
| Dun & Bradstreet Holdings Inc. (a) | 2,100 | 43,029 |
| Equifax Inc. | 1,400 | 409,906 |
| Exponent Inc. | 2,374 | 277,117 |
| Forrester Research Inc. (a) | 467 | 27,427 |
| Franklin Covey Co. (a) | 505 | 23,412 |
| FTI Consulting Inc. (a) | 400 | 61,368 |
| | Number
of Shares | Fair
Value |
| Huron Consulting Group Inc. (a) | 1,100 | $ 54,890 |
| ICF International Inc. | 836 | 85,732 |
| Jacobs Engineering Group Inc. | 1,500 | 208,845 |
| KBR Inc. | 6,465 | 307,863 |
| Leidos Holdings Inc. | 1,600 | 142,240 |
| ManTech International Corp., Class A | 1,240 | 90,433 |
| Mistras Group Inc. (a) | 1,092 | 8,114 |
| Nielsen Holdings PLC | 3,800 | 77,938 |
| Resources Connection Inc. | 1,285 | 22,924 |
| Science Applications International Corp. | 600 | 50,154 |
| TransUnion | 2,100 | 249,018 |
| Verisk Analytics Inc. | 1,800 | 411,714 |
| Willdan Group Inc. (a) | 600 | 21,120 |
| | | 3,261,154 |
| Residential REITs - 0.2% |
| American Campus Communities Inc. | 1,700 | 97,393 |
| American Homes 4 Rent, Class A | 3,100 | 135,191 |
| Apartment Income REIT Corp. | 1,800 | 98,406 |
| Apartment Investment & Management Co., Class A (a) | 7,300 | 56,356 |
| AvalonBay Communities Inc. | 1,600 | 404,144 |
| BRT Apartments Corp. | 637 | 15,282 |
| Camden Property Trust | 1,100 | 196,548 |
| Centerspace | 695 | 77,075 |
| Equity LifeStyle Properties Inc. | 2,100 | 184,086 |
| Equity Residential | 4,200 | 380,100 |
| Essex Property Trust Inc. | 800 | 281,784 |
| Independence Realty Trust Inc. | 4,774 | 123,312 |
| Invitation Homes Inc. | 7,000 | 317,380 |
| Mid-America Apartment Communities Inc. | 1,300 | 298,272 |
| NexPoint Residential Trust Inc. | 1,000 | 83,830 |
| Preferred Apartment Communities Inc. | 2,315 | 41,809 |
| Sun Communities Inc. | 1,300 | 272,961 |
| UDR Inc. | 3,400 | 203,966 |
| UMH Properties Inc. | 1,896 | 51,818 |
| | | 3,319,713 |
See Notes to Schedule of Investments and Notes to Financial Statements.
| State Street Total Return V.I.S. Fund | 39 |
State Street Total Return V.I.S. Fund
Schedule of Investments, continued — December 31, 2021
| | Number
of Shares | Fair
Value |
| Restaurants - 0.4% |
| Aramark | 2,800 | $ 103,180 |
| Biglari Holdings Inc., Class B (a) | 20 | 2,851 |
| BJ's Restaurants Inc. (a) | 1,000 | 34,550 |
| Bloomin' Brands Inc. (a) | 4,000 | 83,920 |
| Brinker International Inc. (a) | 2,015 | 73,729 |
| Carrols Restaurant Group Inc. | 2,900 | 8,584 |
| Chipotle Mexican Grill Inc. (a) | 319 | 557,692 |
| Chuy's Holdings Inc. (a) | 1,100 | 33,132 |
| Cracker Barrel Old Country Store Inc. | 1,079 | 138,803 |
| Darden Restaurants Inc. | 1,500 | 225,960 |
| Dave & Buster's Entertainment Inc. (a) | 1,905 | 73,152 |
| Del Taco Restaurants Inc. | 1,432 | 17,828 |
| Denny's Corp. (a) | 2,800 | 44,800 |
| Dine Brands Global Inc. | 797 | 60,421 |
| Domino's Pizza Inc. | 390 | 220,089 |
| El Pollo Loco Holdings Inc. (a) | 1,129 | 16,020 |
| Fiesta Restaurant Group Inc. (a) | 847 | 9,325 |
| First Watch Restaurant Group Inc. (a) | 526 | 8,816 |
| Jack in the Box Inc. | 972 | 85,031 |
| Krispy Kreme Inc. | 1,077 | 20,377 |
| Kura Sushi USA Inc., Class A (a) | 203 | 16,411 |
| McDonald's Corp. | 8,534 | 2,287,709 |
| Nathan's Famous Inc. | 154 | 8,992 |
| Noodles & Co. (a) | 1,800 | 16,326 |
| Papa John's International Inc. | 1,509 | 201,406 |
| Portillo's Inc., Class A (a) | 1,128 | 42,345 |
| Red Robin Gourmet Burgers Inc. (a) | 900 | 14,877 |
| Ruth's Hospitality Group Inc. (a) | 1,582 | 31,482 |
| Shake Shack Inc., Class A (a) | 1,700 | 122,672 |
| Starbucks Corp. | 13,407 | 1,568,217 |
| Texas Roadhouse Inc. | 3,199 | 285,607 |
| The Cheesecake Factory Inc. (a) | 2,081 | 81,471 |
| The ONE Group Hospitality Inc. (a) | 940 | 11,853 |
| The Wendy's Co. | 1,800 | 42,930 |
| Wingstop Inc. | 1,363 | 235,526 |
| Yum! Brands Inc. | 3,300 | 458,238 |
| | | 7,244,322 |
| | Number
of Shares | Fair
Value |
| Retail REITs - 0.2% |
| Acadia Realty Trust | 4,200 | $ 91,686 |
| Agree Realty Corp. | 3,143 | 224,285 |
| Alexander's Inc. | 100 | 26,030 |
| American Finance Trust Inc. | 5,901 | 53,876 |
| Brixmor Property Group Inc. | 3,500 | 88,935 |
| Federal Realty Investment Trust | 900 | 122,688 |
| Getty Realty Corp. | 1,737 | 55,740 |
| Kimco Realty Corp. | 6,834 | 168,458 |
| Kite Realty Group Trust | 9,904 | 215,709 |
| National Retail Properties Inc. | 2,100 | 100,947 |
| NETSTREIT Corp. | 1,695 | 38,816 |
| Phillips Edison & Company Inc. | 900 | 29,736 |
| Realty Income Corp. | 6,356 | 455,026 |
| Regency Centers Corp. | 2,000 | 150,700 |
| Retail Opportunity Investments Corp. | 5,389 | 105,624 |
| Retail Value Inc. | 1,000 | 6,420 |
| RPT Realty | 3,849 | 51,500 |
| Saul Centers Inc. | 567 | 30,062 |
| Seritage Growth Properties, Class A (a) | 2,000 | 26,540 |
| Simon Property Group Inc. | 3,700 | 591,149 |
| SITE Centers Corp. | 7,868 | 124,550 |
| Spirit Realty Capital Inc. | 1,200 | 57,828 |
| Tanger Factory Outlet Centers Inc. | 4,627 | 89,209 |
| The Macerich Co. | 9,740 | 168,307 |
| Urban Edge Properties | 5,243 | 99,617 |
| Urstadt Biddle Properties Inc., Class A | 1,223 | 26,050 |
| Whitestone REIT | 2,400 | 24,312 |
| | | 3,223,800 |
| Security & Alarm Services - 0.0% * |
| ADT Inc. | 2,465 | 20,731 |
| CoreCivic Inc. (a) | 5,192 | 51,764 |
| The Brink's Co. | 2,187 | 143,401 |
| | | 215,896 |
| Semiconductor Equipment - 0.3% |
| Amkor Technology Inc. | 4,628 | 114,728 |
| Applied Materials Inc. | 10,300 | 1,620,808 |
| Atomera Inc. (a) | 1,100 | 22,132 |
| Axcelis Technologies Inc. (a) | 1,509 | 112,511 |
| AXT Inc. (a) | 2,300 | 20,263 |
| Brooks Automation Inc. | 900 | 92,799 |
| CMC Materials Inc. | 1,297 | 248,622 |
See Notes to Schedule of Investments and Notes to Financial Statements.
| 40 | State Street Total Return V.I.S. Fund |
State Street Total Return V.I.S. Fund
Schedule of Investments, continued — December 31, 2021
| | Number
of Shares | Fair
Value |
| Cohu Inc. (a) | 2,165 | $ 82,465 |
| Enphase Energy Inc. (a) | 1,500 | 274,410 |
| Entegris Inc. | 1,535 | 212,720 |
| FormFactor Inc. (a) | 3,540 | 161,849 |
| Ichor Holdings Ltd. (a) | 1,210 | 55,696 |
| KLA Corp. | 1,770 | 761,295 |
| Lam Research Corp. | 1,646 | 1,183,721 |
| MKS Instruments Inc. | 600 | 104,502 |
| Onto Innovation Inc. (a) | 2,222 | 224,933 |
| PDF Solutions Inc. (a) | 1,243 | 39,515 |
| Photronics Inc. (a) | 2,552 | 48,105 |
| Teradyne Inc. | 1,901 | 310,871 |
| Ultra Clean Holdings Inc. (a) | 2,013 | 115,466 |
| Veeco Instruments Inc. (a) | 2,358 | 67,132 |
| | | 5,874,543 |
| Semiconductors - 1.6% |
| Advanced Micro Devices Inc. (a) | 13,800 | 1,985,820 |
| Allegro MicroSystems Inc. (a) | 200 | 7,236 |
| Alpha & Omega Semiconductor Ltd. (a) | 901 | 54,565 |
| Ambarella Inc. (a) | 1,616 | 327,870 |
| Analog Devices Inc. | 6,159 | 1,082,567 |
| Broadcom Inc. | 4,528 | 3,012,976 |
| CEVA Inc. (a) | 1,120 | 48,429 |
| Cirrus Logic Inc. (a) | 600 | 55,212 |
| Diodes Inc. (a) | 1,989 | 218,412 |
| First Solar Inc. (a) | 1,200 | 104,592 |
| GLOBALFOUNDRIES Inc. (a) | 400 | 25,988 |
| Impinj Inc. (a) | 922 | 81,781 |
| Intel Corp. | 46,066 | 2,372,399 |
| Kopin Corp. (a) | 3,800 | 15,542 |
| Lattice Semiconductor Corp. (a) | 6,214 | 478,851 |
| MACOM Technology Solutions Holdings Inc. (a) | 2,218 | 173,669 |
| Marvell Technology Inc. | 9,326 | 815,932 |
| MaxLinear Inc. (a) | 3,240 | 244,264 |
| Meta Materials Inc. (a) | 9,481 | 23,323 |
| Microchip Technology Inc. | 6,200 | 539,772 |
| Micron Technology Inc. | 12,800 | 1,192,320 |
| Monolithic Power Systems Inc. | 473 | 233,345 |
| NeoPhotonics Corp. (a) | 2,163 | 33,245 |
| NVE Corp. | 229 | 15,641 |
| NVIDIA Corp. | 27,306 | 8,030,968 |
| ON Semiconductor Corp. (a) | 4,800 | 326,016 |
| Parade Technologies Ltd. | 1,000 | 76,445 |
| Power Integrations Inc. | 2,758 | 256,191 |
| | Number
of Shares | Fair
Value |
| Qorvo Inc. (a) | 1,300 | $ 203,307 |
| QUALCOMM Inc. | 12,888 | 2,356,829 |
| Rambus Inc. (a) | 4,934 | 145,010 |
| Semtech Corp. (a) | 2,955 | 262,788 |
| Silicon Laboratories Inc. (a) | 1,825 | 376,717 |
| SiTime Corp. (a) | 726 | 212,384 |
| SkyWater Technology Inc. (a) | 372 | 6,034 |
| Skyworks Solutions Inc. | 1,873 | 290,577 |
| SMART Global Holdings Inc. (a) | 752 | 53,384 |
| SunPower Corp. (a) | 3,900 | 81,393 |
| Synaptics Inc. (a) | 1,795 | 519,670 |
| Texas Instruments Inc. | 10,497 | 1,978,370 |
| Universal Display Corp. | 500 | 82,515 |
| Wolfspeed Inc. (a) | 1,300 | 145,301 |
| Xilinx Inc. | 2,800 | 593,684 |
| | | 29,141,334 |
| Silver - 0.0% * |
| Gatos Silver Inc. (a) | 1,926 | 19,992 |
| Hecla Mining Co. | 24,154 | 126,084 |
| | | 146,076 |
| Soft Drinks - 0.4% |
| Celsius Holdings Inc. (a) | 2,457 | 183,218 |
| Coca-Cola Consolidated Inc. | 214 | 132,507 |
| Keurig Dr Pepper Inc. | 7,800 | 287,508 |
| Monster Beverage Corp. (a) | 4,200 | 403,368 |
| National Beverage Corp. | 1,100 | 49,863 |
| NewAge Inc. (a) | 6,100 | 6,283 |
| PepsiCo Inc. | 15,748 | 2,735,585 |
| Primo Water Corp. | 7,146 | 125,984 |
| The Coca-Cola Co. | 44,177 | 2,615,720 |
| | | 6,540,036 |
| Specialized Consumer Services - 0.0% * |
| Carriage Services Inc. | 695 | 44,786 |
| European Wax Center Inc., Class A (a) | 635 | 19,272 |
| Frontdoor Inc. (a) | 800 | 29,320 |
| H&R Block Inc. | 1,900 | 44,764 |
| Mister Car Wash Inc. (a) | 900 | 16,389 |
| Regis Corp. (a) | 1,400 | 2,436 |
| Service Corporation International | 1,800 | 127,782 |
| Terminix Global Holdings Inc. (a) | 1,400 | 63,322 |
| Vivint Smart Home Inc. (a) | 3,896 | 38,103 |
See Notes to Schedule of Investments and Notes to Financial Statements.
| State Street Total Return V.I.S. Fund | 41 |
State Street Total Return V.I.S. Fund
Schedule of Investments, continued — December 31, 2021
| | Number
of Shares | Fair
Value |
| WW International Inc. (a) | 2,269 | $ 36,599 |
| | | 422,773 |
| Specialized Finance - 0.0% * |
| A-Mark Precious Metals Inc. | 335 | 20,469 |
| Marlin Business Services Corp. | 244 | 5,680 |
| | | 26,149 |
| Specialized REITs - 0.4% |
| American Tower Corp. | 5,142 | 1,504,035 |
| CatchMark Timber Trust Inc., Class A | 2,346 | 20,434 |
| Crown Castle International Corp. | 4,900 | 1,022,826 |
| CubeSmart | 2,200 | 125,202 |
| CyrusOne Inc. | 1,500 | 134,580 |
| Digital Realty Trust Inc. | 3,200 | 565,984 |
| EPR Properties | 700 | 33,243 |
| Equinix Inc. | 988 | 835,690 |
| Extra Space Storage Inc. | 1,500 | 340,095 |
| Farmland Partners Inc. | 1,612 | 19,263 |
| Four Corners Property Trust Inc. | 3,732 | 109,758 |
| Gaming & Leisure Properties Inc. | 2,500 | 121,650 |
| Gladstone Land Corp. | 1,305 | 44,057 |
| Iron Mountain Inc. | 3,400 | 177,922 |
| Lamar Advertising Co., Class A | 900 | 109,170 |
| Life Storage Inc. | 900 | 137,862 |
| National Storage Affiliates Trust | 3,711 | 256,801 |
| Outfront Media Inc. | 6,629 | 177,790 |
| PotlatchDeltic Corp. | 3,009 | 181,202 |
| Public Storage | 1,771 | 663,346 |
| Rayonier Inc. | 1,500 | 60,540 |
| Safehold Inc. | 997 | 79,611 |
| SBA Communications Corp. | 1,200 | 466,824 |
| The GEO Group Inc. | 5,087 | 39,424 |
| Uniti Group Inc. | 8,928 | 125,081 |
| VICI Properties Inc. | 6,800 | 204,748 |
| Weyerhaeuser Co. | 8,400 | 345,912 |
| | | 7,903,050 |
| Specialty Chemicals - 0.3% |
| Albemarle Corp. | 1,317 | 307,875 |
| Amyris Inc. (a) | 7,608 | 41,159 |
| Ashland Global Holdings Inc. | 600 | 64,596 |
| Avient Corp. | 4,156 | 232,528 |
| | Number
of Shares | Fair
Value |
| Axalta Coating Systems Ltd. (a) | 2,400 | $ 79,488 |
| Balchem Corp. | 1,473 | 248,348 |
| Celanese Corp. | 1,300 | 218,478 |
| Chase Corp. | 328 | 32,656 |
| Danimer Scientific Inc. (a) | 4,344 | 37,011 |
| DuPont de Nemours Inc. | 6,000 | 484,680 |
| Eastman Chemical Co. | 1,523 | 184,146 |
| Ecolab Inc. | 2,800 | 656,852 |
| ECOVYST Inc. | 2,300 | 23,552 |
| Element Solutions Inc. | 2,400 | 58,272 |
| Ferro Corp. (a) | 4,000 | 87,320 |
| FutureFuel Corp. | 1,590 | 12,148 |
| GCP Applied Technologies Inc. (a) | 2,300 | 72,818 |
| HB Fuller Co. | 2,378 | 192,618 |
| Ingevity Corp. (a) | 1,806 | 129,490 |
| Innospec Inc. | 1,111 | 100,368 |
| International Flavors & Fragrances Inc. | 2,895 | 436,132 |
| Kraton Corp. (a) | 1,376 | 63,736 |
| Livent Corp. (a) | 7,383 | 179,997 |
| Minerals Technologies Inc. | 1,505 | 110,091 |
| NewMarket Corp. | 100 | 34,272 |
| PPG Industries Inc. | 2,700 | 465,588 |
| Quaker Chemical Corp. | 614 | 141,699 |
| Rayonier Advanced Materials Inc. (a) | 3,700 | 21,127 |
| RPM International Inc. | 1,400 | 141,400 |
| Sensient Technologies Corp. | 1,929 | 193,016 |
| Stepan Co. | 979 | 121,680 |
| The Sherwin-Williams Co. | 2,789 | 982,174 |
| | | 6,155,315 |
| Specialty Stores - 0.1% |
| Academy Sports & Outdoors Inc. (a) | 3,535 | 155,187 |
| Barnes & Noble Education Inc. (a) | 2,400 | 16,344 |
| Bath & Body Works Inc. | 2,719 | 189,759 |
| Big 5 Sporting Goods Corp. | 1,000 | 19,010 |
| Dick's Sporting Goods Inc. | 687 | 78,998 |
| Five Below Inc. (a) | 600 | 124,134 |
| Hibbett Sports Inc. | 712 | 51,214 |
| JOANN Inc. | 289 | 3,000 |
| Leslie's Inc. (a) | 1,400 | 33,124 |
| MarineMax Inc. (a) | 985 | 58,154 |
| National Vision Holdings Inc. (a) | 3,720 | 178,523 |
| Party City Holdco Inc. (a) | 5,400 | 30,078 |
See Notes to Schedule of Investments and Notes to Financial Statements.
| 42 | State Street Total Return V.I.S. Fund |
State Street Total Return V.I.S. Fund
Schedule of Investments, continued — December 31, 2021
| | Number
of Shares | Fair
Value |
| Petco Health & Wellness Company Inc. (a) | 300 | $ 5,937 |
| Sally Beauty Holdings Inc. (a) | 5,102 | 94,183 |
| Signet Jewelers Ltd. | 2,411 | 209,829 |
| Sportsman's Warehouse Holdings Inc. (a) | 1,970 | 23,246 |
| The Container Store Group Inc. (a) | 1,900 | 18,962 |
| The ODP Corp. (a) | 2,212 | 86,887 |
| Tractor Supply Co. | 1,292 | 308,271 |
| Ulta Beauty Inc. (a) | 600 | 247,404 |
| Winmark Corp. | 165 | 40,968 |
| | | 1,973,212 |
| Steel - 0.1% |
| Allegheny Technologies Inc. (a) | 5,764 | 91,820 |
| Carpenter Technology Corp. | 2,200 | 64,218 |
| Cleveland-Cliffs Inc. (a) | 5,300 | 115,381 |
| Commercial Metals Co. | 5,476 | 198,724 |
| Haynes International Inc. | 700 | 28,231 |
| Nucor Corp. | 3,300 | 376,695 |
| Olympic Steel Inc. | 600 | 14,100 |
| Reliance Steel & Aluminum Co. | 749 | 121,503 |
| Ryerson Holding Corp. | 654 | 17,037 |
| Schnitzer Steel Industries Inc., Class A | 1,300 | 67,496 |
| Steel Dynamics Inc. | 2,200 | 136,554 |
| SunCoke Energy Inc. | 3,988 | 26,281 |
| TimkenSteel Corp. (a) | 1,918 | 31,647 |
| United States Steel Corp. | 2,900 | 69,049 |
| Warrior Met Coal Inc. | 2,229 | 57,308 |
| Worthington Industries Inc. | 1,491 | 81,498 |
| | | 1,497,542 |
| Systems Software - 2.0% |
| A10 Networks Inc. | 2,577 | 42,727 |
| Appian Corp. (a) | 1,787 | 116,530 |
| CommVault Systems Inc. (a) | 2,085 | 143,698 |
| Crowdstrike Holdings Inc., Class A (a) | 2,200 | 450,450 |
| Dolby Laboratories Inc., Class A | 757 | 72,082 |
| Fortinet Inc. (a) | 1,500 | 539,100 |
| Mandiant Inc. (a) | 2,400 | 42,096 |
| McAfee Corp., Class A | 800 | 20,632 |
| Microsoft Corp. | 85,859 | 28,876,099 |
| N-Able Inc. (a) | 600 | 6,660 |
| NortonLifeLock Inc. | 5,997 | 155,802 |
| | Number
of Shares | Fair
Value |
| OneSpan Inc. (a) | 1,400 | $ 23,702 |
| Oracle Corp. | 18,811 | 1,640,507 |
| Palo Alto Networks Inc. (a) | 1,100 | 612,436 |
| Ping Identity Holding Corp. (a) | 2,734 | 62,554 |
| Progress Software Corp. | 1,991 | 96,106 |
| Qualys Inc. (a) | 1,556 | 213,514 |
| Rapid7 Inc. (a) | 2,573 | 302,816 |
| Sailpoint Technologies Holdings Inc. (a) | 4,174 | 201,771 |
| SecureWorks Corp., Class A (a) | 300 | 4,791 |
| ServiceNow Inc. (a) | 2,230 | 1,447,515 |
| Telos Corp. (a) | 1,900 | 29,298 |
| Tenable Holdings Inc. (a) | 4,216 | 232,175 |
| Teradata Corp. (a) | 1,100 | 46,717 |
| Varonis Systems Inc. (a) | 4,889 | 238,486 |
| VMware Inc., Class A | 2,586 | 299,666 |
| Xperi Holding Corp. | 4,752 | 89,860 |
| Zscaler Inc. (a) | 900 | 289,197 |
| Zuora Inc., Class A (a) | 5,051 | 94,353 |
| | | 36,391,340 |
| Technology Distributors - 0.0% * |
| Arrow Electronics Inc. (a) | 867 | 116,412 |
| Avnet Inc. | 1,000 | 41,230 |
| CDW Corp. | 1,500 | 307,170 |
| ePlus Inc. (a) | 1,196 | 64,441 |
| Insight Enterprises Inc. (a) | 1,571 | 167,469 |
| PC Connection Inc. | 447 | 19,279 |
| ScanSource Inc. (a) | 1,078 | 37,816 |
| SYNNEX Corp. | 400 | 45,744 |
| | | 799,561 |
| Technology Hardware, Storage & Peripherals - 1.8% |
| 3D Systems Corp. (a) | 5,937 | 127,883 |
| Apple Inc. | 175,851 | 31,225,862 |
| Avid Technology Inc. (a) | 1,555 | 50,647 |
| Corsair Gaming Inc. (a) | 1,400 | 29,414 |
| Dell Technologies Inc., Class C (a) | 3,000 | 168,510 |
| Diebold Nixdorf Inc. (a) | 3,545 | 32,082 |
| Eastman Kodak Co. (a) | 2,100 | 9,828 |
| Hewlett Packard Enterprise Co. | 15,500 | 244,435 |
| HP Inc. | 13,200 | 497,244 |
| NetApp Inc. | 2,500 | 229,975 |
| Pure Storage Inc., Class A (a) | 2,900 | 94,395 |
| Quantum Corp. (a) | 2,600 | 14,352 |
| Super Micro Computer Inc. (a) | 2,122 | 93,262 |
See Notes to Schedule of Investments and Notes to Financial Statements.
| State Street Total Return V.I.S. Fund | 43 |
State Street Total Return V.I.S. Fund
Schedule of Investments, continued — December 31, 2021
| | Number
of Shares | Fair
Value |
| Turtle Beach Corp. (a) | 800 | $ 17,808 |
| Western Digital Corp. (a) | 3,600 | 234,756 |
| Xerox Holdings Corp. | 1,400 | 31,696 |
| | | 33,102,149 |
| Textiles - 0.0% * |
| Unifi Inc. (a) | 800 | 18,520 |
| Thrifts & Mortgage Finance - 0.1% |
| Axos Financial Inc. (a) | 2,595 | 145,086 |
| Blue Foundry Bancorp (a) | 1,344 | 19,663 |
| Bridgewater Bancshares Inc. (a) | 1,010 | 17,867 |
| Capitol Federal Financial Inc. | 5,850 | 66,281 |
| Columbia Financial Inc. (a) | 2,000 | 41,720 |
| Enact Holdings Inc. | 709 | 14,655 |
| Essent Group Ltd. | 4,945 | 225,146 |
| Federal Agricultural Mortgage Corp., Class C | 398 | 49,324 |
| Finance Of America Companies Inc., Class A (a) | 887 | 3,521 |
| Flagstar Bancorp Inc. | 2,365 | 113,378 |
| FS Bancorp Inc. | 342 | 11,501 |
| Hingham Institution for Savings | 60 | 25,193 |
| Home Bancorp Inc. | 359 | 14,902 |
| Kearny Financial Corp. | 3,300 | 43,725 |
| Luther Burbank Corp. | 741 | 10,404 |
| Merchants Bancorp | 540 | 25,558 |
| MGIC Investment Corp. | 3,600 | 51,912 |
| Mr Cooper Group Inc. (a) | 2,968 | 123,498 |
| New York Community Bancorp Inc. | 5,200 | 63,492 |
| NMI Holdings Inc., Class A (a) | 3,791 | 82,833 |
| Northfield Bancorp Inc. | 2,100 | 33,936 |
| Northwest Bancshares Inc. | 5,525 | 78,234 |
| Ocwen Financial Corp. (a) | 295 | 11,791 |
| PCSB Financial Corp. | 617 | 11,748 |
| PennyMac Financial Services Inc. | 1,499 | 104,600 |
| Pioneer Bancorp Inc. (a) | 646 | 7,313 |
| Premier Financial Corp. | 1,605 | 49,611 |
| Provident Bancorp Inc. | 555 | 10,323 |
| Provident Financial Services Inc. | 3,500 | 84,770 |
| Radian Group Inc. | 8,210 | 173,477 |
| Rocket Companies Inc., Class A | 1,600 | 22,400 |
| Southern Missouri Bancorp Inc. | 305 | 15,912 |
| | Number
of Shares | Fair
Value |
| TFS Financial Corp. | 400 | $ 7,148 |
| TrustCo Bank Corp. | 784 | 26,115 |
| Walker & Dunlop Inc. | 1,334 | 201,274 |
| Washington Federal Inc. | 3,115 | 103,979 |
| Waterstone Financial Inc. | 857 | 18,734 |
| WSFS Financial Corp. | 2,132 | 106,856 |
| | | 2,217,880 |
| Tires & Rubber - 0.0% * |
| The Goodyear Tire & Rubber Co. (a) | 12,626 | 269,186 |
| Tobacco - 0.2% |
| 22nd Century Group Inc. (a) | 7,400 | 22,866 |
| Altria Group Inc. | 21,100 | 999,929 |
| Philip Morris International Inc. | 17,800 | 1,691,000 |
| Turning Point Brands Inc. | 700 | 26,446 |
| Universal Corp. | 1,048 | 57,556 |
| Vector Group Ltd. | 6,519 | 74,838 |
| | | 2,872,635 |
| Trading Companies & Distributors - 0.2% |
| Air Lease Corp. | 1,200 | 53,076 |
| Alta Equipment Group Inc. (a) | 690 | 10,102 |
| Applied Industrial Technologies Inc. | 1,751 | 179,828 |
| Beacon Roofing Supply Inc. (a) | 2,538 | 145,554 |
| BlueLinx Holdings Inc. (a) | 442 | 42,326 |
| Boise Cascade Co. | 1,788 | 127,305 |
| Custom Truck One Source Inc. (a) | 2,600 | 20,800 |
| DXP Enterprises Inc. (a) | 1,000 | 25,670 |
| EVI Industries Inc. (a) | 303 | 9,463 |
| Fastenal Co. | 6,614 | 423,693 |
| GATX Corp. | 1,609 | 167,642 |
| Global Industrial Co. | 700 | 28,630 |
| GMS Inc. (a) | 1,939 | 116,553 |
| H&E Equipment Services Inc. | 1,500 | 66,405 |
| Herc Holdings Inc. | 1,138 | 178,154 |
| Lawson Products Inc. (a) | 219 | 11,990 |
| McGrath RentCorp. | 1,092 | 87,644 |
| MRC Global Inc. (a) | 3,939 | 27,100 |
| MSC Industrial Direct Company Inc., Class A | 498 | 41,862 |
| NOW Inc. (a) | 4,900 | 41,846 |
| Rush Enterprises Inc., Class A | 1,914 | 106,495 |
| Rush Enterprises Inc., Class B | 302 | 16,299 |
| SiteOne Landscape Supply Inc. (a) | 500 | 121,140 |
See Notes to Schedule of Investments and Notes to Financial Statements.
| 44 | State Street Total Return V.I.S. Fund |
State Street Total Return V.I.S. Fund
Schedule of Investments, continued — December 31, 2021
| | Number
of Shares | Fair
Value |
| Textainer Group Holdings Ltd. | 2,300 | $ 82,133 |
| Titan Machinery Inc. (a) | 795 | 26,783 |
| Transcat Inc. (a) | 293 | 27,082 |
| United Rentals Inc. (a) | 800 | 265,832 |
| Univar Solutions Inc. (a) | 1,800 | 51,030 |
| Veritiv Corp. (a) | 653 | 80,038 |
| Watsco Inc. | 320 | 100,122 |
| WESCO International Inc. (a) | 2,034 | 267,654 |
| WW Grainger Inc. | 500 | 259,120 |
| | | 3,209,371 |
| Trucking - 0.2% |
| AMERCO | 60 | 43,574 |
| ArcBest Corp. | 1,150 | 137,827 |
| Avis Budget Group Inc. (a) | 1,892 | 392,344 |
| Covenant Transportation Group Inc. (a) | 700 | 18,501 |
| Daseke Inc. (a) | 1,540 | 15,462 |
| Heartland Express Inc. | 2,226 | 37,441 |
| HyreCar Inc. (a) | 900 | 4,239 |
| JB Hunt Transport Services Inc. | 1,000 | 204,400 |
| Knight-Swift Transportation Holdings Inc. | 1,922 | 117,127 |
| Landstar System Inc. | 444 | 79,485 |
| Lyft Inc., Class A (a) | 3,300 | 141,009 |
| Marten Transport Ltd. | 3,007 | 51,600 |
| Old Dominion Freight Line Inc. | 1,200 | 430,056 |
| PAM Transportation Services Inc. (a) | 185 | 13,137 |
| Ryder System Inc. | 594 | 48,963 |
| Saia Inc. (a) | 1,214 | 409,154 |
| Schneider National Inc., Class B | 300 | 8,073 |
| TuSimple Holdings Inc., Class A (a) | 1,500 | 53,775 |
| Uber Technologies Inc. (a) | 18,406 | 771,764 |
| Universal Logistics Holdings Inc. | 100 | 1,886 |
| US Xpress Enterprises Inc., Class A (a) | 1,276 | 7,490 |
| Werner Enterprises Inc. | 2,805 | 133,686 |
| XPO Logistics Inc. (a) | 1,100 | 85,173 |
| Yellow Corp. (a) | 2,050 | 25,810 |
| | | 3,231,976 |
| Water Utilities - 0.1% |
| American States Water Co. | 1,681 | 173,883 |
| American Water Works Company Inc. | 2,041 | 385,463 |
| | Number
of Shares | Fair
Value |
| Artesian Resources Corp., Class A | 390 | $ 18,069 |
| Cadiz Inc. (a) | 1,600 | 6,176 |
| California Water Service Group | 2,396 | 172,176 |
| Essential Utilities Inc. | 2,800 | 150,332 |
| Global Water Resources Inc. | 607 | 10,380 |
| Middlesex Water Co. | 782 | 94,074 |
| Pure Cycle Corp. (a) | 694 | 10,132 |
| SJW Group | 1,253 | 91,720 |
| The York Water Co. | 537 | 26,732 |
| | | 1,139,137 |
| Wireless Telecommunication Services - 0.1% |
| Gogo Inc. (a) | 2,516 | 34,042 |
| Shenandoah Telecommunications Co. | 2,400 | 61,200 |
| Telephone & Data Systems Inc. | 4,574 | 92,166 |
| T-Mobile US Inc. (a) | 6,736 | 781,241 |
| United States Cellular Corp. (a) | 800 | 25,216 |
| | | 993,865 |
Total Common Stock
(Cost $528,300,017) | | 632,004,397 |
Total Domestic Equity
(Cost $528,300,017) | | 632,004,397 |
| Foreign Equity - 23.4% |
| Common Stock - 23.2% |
| Advertising - 0.1% |
| Cheil Worldwide Inc. | 793 | 15,243 |
| CyberAgent Inc. | 6,800 | 113,023 |
| Dentsu Group Inc. | 3,700 | 131,735 |
| Focus Media Information Technology Company Ltd., Class A | 10,900 | 14,038 |
| Hakuhodo DY Holdings Inc. | 2,800 | 46,588 |
| Informa PLC (a) | 25,224 | 176,495 |
| Publicis Groupe S.A. | 3,488 | 234,820 |
| WPP PLC | 18,280 | 277,181 |
| | | 1,009,123 |
| Aerospace & Defense - 0.2% |
| AECC Aviation Power Company Ltd., Class A | 2,100 | 20,957 |
| Airbus SE (a) | 9,111 | 1,164,165 |
| Aselsan Elektronik Sanayi Ve Ticaret AS | 7,417 | 11,662 |
See Notes to Schedule of Investments and Notes to Financial Statements.
| State Street Total Return V.I.S. Fund | 45 |
State Street Total Return V.I.S. Fund
Schedule of Investments, continued — December 31, 2021
| | Number
of Shares | Fair
Value |
| AviChina Industry & Technology Company Ltd. H Shares | 35,000 | $ 24,198 |
| BAE Systems PLC | 49,429 | 368,086 |
| Bharat Electronics Ltd. | 17,990 | 50,810 |
| CAE Inc. (a) | 5,300 | 133,890 |
| Dassault Aviation S.A. | 320 | 34,571 |
| Elbit Systems Ltd. | 344 | 59,573 |
| Korea Aerospace Industries Ltd. | 1,353 | 36,934 |
| Kuang-Chi Technologies Company Ltd., Class A (a) | 3,100 | 11,705 |
| MTU Aero Engines AG | 895 | 182,592 |
| Rolls-Royce Holdings PLC (a) | 127,757 | 212,632 |
| Safran S.A. | 5,272 | 645,456 |
| Singapore Technologies Engineering Ltd. | 19,900 | 55,501 |
| Thales S.A. | 1,794 | 152,602 |
| | | 3,165,334 |
| Agricultural & Farm Machinery - 0.0% * |
| CNH Industrial N.V. | 15,696 | 304,691 |
| Husqvarna AB B Shares | 7,092 | 113,463 |
| Kubota Corp. | 15,800 | 350,356 |
| | | 768,510 |
| Agricultural Products - 0.0% * |
| Beijing Dabeinong Technology Group Company Ltd. A Shares | 7,600 | 12,537 |
| Charoen Pokphand Indonesia Tbk PT | 106,200 | 44,336 |
| IOI Corp. Bhd | 35,700 | 31,964 |
| Jiangxi Zhengbang Technology Company Ltd., Class A | 4,100 | 6,228 |
| Kuala Lumpur Kepong Bhd | 6,000 | 31,368 |
| New Hope Liuhe Company Ltd. A Shares (a) | 3,200 | 7,654 |
| Sime Darby Plantation Bhd | 30,400 | 27,437 |
| Tongwei Company Ltd. A Shares | 3,500 | 24,746 |
| Wilmar International Ltd. | 32,606 | 100,129 |
| | | 286,399 |
| Air Freight & Logistics - 0.1% |
| Agility Public Warehousing Co. KSC | 18,679 | 58,401 |
| Deutsche Post AG | 15,314 | 984,649 |
| DSV Panalpina A/S | 3,148 | 735,227 |
| | Number
of Shares | Fair
Value |
| Hyundai Glovis Company Ltd. | 269 | $ 38,017 |
| InPost S.A. (a) | 2,639 | 31,805 |
| SF Holding Company Ltd. A Shares | 4,000 | 43,352 |
| SG Holdings Company Ltd. | 5,400 | 126,284 |
| Yamato Holdings Company Ltd. | 4,900 | 115,016 |
| Yunda Holding Company Ltd., Class A | 3,600 | 11,583 |
| ZTO Express Cayman Inc. ADR | 6,109 | 172,396 |
| | | 2,316,730 |
| Airlines - 0.0% * |
| Air Canada (a) | 2,100 | 35,129 |
| Air China Ltd. H Shares (a) | 20,000 | 13,955 |
| Air China Ltd. A Shares (a) | 11,400 | 16,367 |
| ANA Holdings Inc. (a) | 1,900 | 39,673 |
| China Eastern Airlines Corp. Ltd., Class A (a) | 12,400 | 10,062 |
| China Southern Airlines Company Ltd., Class H (a) | 14,000 | 8,386 |
| China Southern Airlines Company Ltd., Class A (a) | 11,600 | 12,423 |
| Copa Holdings S.A., Class A (a) | 300 | 24,798 |
| Deutsche Lufthansa AG (a) | 7,814 | 54,916 |
| InterGlobe Aviation Ltd. (a)(d) | 1,210 | 32,841 |
| Japan Airlines Company Ltd. (a) | 1,914 | 36,500 |
| Korean Air Lines Company Ltd. (a) | 2,443 | 60,317 |
| Qantas Airways Ltd. (a) | 11,989 | 43,670 |
| Singapore Airlines Ltd. (a) | 17,700 | 65,514 |
| | | 454,551 |
| Airport Services - 0.0% * |
| Aena SME S.A. (a)(d) | 1,143 | 180,415 |
| Aeroports de Paris (a) | 355 | 45,740 |
| Airports of Thailand PCL NVDR (a) | 61,672 | 112,618 |
| Auckland International Airport Ltd. (a) | 21,206 | 111,794 |
| Beijing Capital International Airport Company Ltd. H Shares (a) | 20,000 | 12,237 |
| Grupo Aeroportuario del Pacifico SAB de C.V. B Shares | 5,300 | 73,073 |
See Notes to Schedule of Investments and Notes to Financial Statements.
| 46 | State Street Total Return V.I.S. Fund |
State Street Total Return V.I.S. Fund
Schedule of Investments, continued — December 31, 2021
| | Number
of Shares | Fair
Value |
| Grupo Aeroportuario del Sureste SAB de CV, Class B | 2,955 | $ 61,043 |
| Malaysia Airports Holdings Bhd (a) | 11,400 | 16,364 |
| Shanghai International Airport Company Ltd., Class A (a) | 1,300 | 9,545 |
| Sydney Airport (a) | 22,296 | 140,705 |
| | | 763,534 |
| Alternative Carriers - 0.0% * |
| Telesat Corp. (a) | 529 | 15,166 |
| Aluminum - 0.0% * |
| Aluminum Corp. of China Ltd. H Shares (a) | 48,000 | 26,536 |
| Aluminum Corp. of China Ltd. A Shares (a) | 17,600 | 16,855 |
| China Hongqiao Group Ltd. | 32,000 | 33,780 |
| Constellium SE (a) | 6,022 | 107,854 |
| Hindalco Industries Ltd. | 22,412 | 143,377 |
| Norsk Hydro ASA | 22,595 | 178,130 |
| Press Metal Aluminium Holdings Bhd | 47,800 | 66,319 |
| Shandong Nanshan Aluminum Company Ltd., Class A | 14,700 | 10,888 |
| Yunnan Aluminium Company Ltd. A Shares (a) | 4,900 | 8,607 |
| | | 592,346 |
| Apparel Retail - 0.1% |
| Fast Retailing Company Ltd. | 900 | 510,434 |
| Hennes & Mauritz AB, Class B | 11,161 | 219,526 |
| Industria de Diseno Textil S.A. | 16,813 | 545,486 |
| Mr Price Group Ltd. | 3,810 | 47,625 |
| Topsports International Holdings Ltd. (d) | 21,000 | 21,252 |
| | | 1,344,323 |
| Apparel, Accessories & Luxury Goods - 0.6% |
| adidas AG | 2,941 | 846,829 |
| Bosideng International Holdings Ltd. | 46,000 | 28,970 |
| Burberry Group PLC | 6,793 | 167,224 |
| Capri Holdings Ltd. (a) | 1,700 | 110,347 |
| Cie Financiere Richemont S.A. | 8,069 | 1,212,808 |
| Essilor International Cie Generale d'Optique S.A. | 4,436 | 944,554 |
| F&F Company Ltd. (a) | 26 | 20,669 |
| FF Group (a)(c)** | 1,860 | — |
| | Number
of Shares | Fair
Value |
| Gildan Activewear Inc. | 3,300 | $ 140,109 |
| Hermes International | 489 | 854,155 |
| Kering S.A. | 1,159 | 931,705 |
| Li Ning Company Ltd. | 31,319 | 342,865 |
| LPP S.A. | 15 | 64,014 |
| lululemon athletica Inc. (a) | 1,353 | 529,632 |
| LVMH Moet Hennessy Louis Vuitton SE | 4,299 | 3,554,173 |
| Moncler S.p.A. | 3,140 | 228,603 |
| Page Industries Ltd. | 81 | 44,045 |
| Pandora A/S | 1,525 | 190,128 |
| Shenzhou International Group Holdings Ltd. | 11,600 | 223,034 |
| The Swatch Group AG | 1,172 | 189,058 |
| Titan Company Ltd. | 4,970 | 168,645 |
| | | 10,791,567 |
| Application Software - 0.3% |
| Agora Inc. ADR (a) | 700 | 11,347 |
| Atlassian Corp. plc, Class A (a) | 1,560 | 594,812 |
| AVEVA Group PLC | 2,054 | 94,701 |
| Beijing Kingsoft Office Software Inc. A Shares | 192 | 8,001 |
| China Youzan Ltd. (a) | 220,000 | 15,238 |
| Constellation Software Inc. | 310 | 575,982 |
| Dassault Systemes SE | 10,253 | 609,919 |
| Hundsun Technologies Inc., Class A | 1,120 | 10,946 |
| Iflytek Company Ltd. A Shares | 1,900 | 15,689 |
| Kingdee International Software Group Company Ltd. (a) | 36,000 | 110,822 |
| Lightspeed Commerce Inc. (a) | 1,800 | 72,789 |
| Nemetschek SE | 976 | 125,198 |
| Nice Ltd. (a) | 968 | 295,992 |
| Open Text Corp. | 4,500 | 213,894 |
| SAP SE | 16,163 | 2,295,732 |
| Sapiens International Corp. N.V. | 1,568 | 54,018 |
| Shanghai Baosight Software Company Ltd., Class A | 1,200 | 11,479 |
| Sinch AB (a)(d) | 8,854 | 112,559 |
| Temenos AG | 1,130 | 156,326 |
| The Sage Group PLC | 16,060 | 185,462 |
| Thunder Software Technology Company Ltd., Class A | 500 | 10,884 |
| Weimob Inc. (a)(d) | 25,000 | 25,301 |
| WiseTech Global Ltd. | 2,493 | 106,178 |
| Xero Ltd. (a) | 2,042 | 209,987 |
See Notes to Schedule of Investments and Notes to Financial Statements.
| State Street Total Return V.I.S. Fund | 47 |
State Street Total Return V.I.S. Fund
Schedule of Investments, continued — December 31, 2021
| | Number
of Shares | Fair
Value |
| Yonyou Network Technology Company Ltd., Class A | 2,600 | $ 14,670 |
| | | 5,937,926 |
| Asset Management & Custody Banks - 0.2% |
| 3i Group PLC | 14,928 | 292,977 |
| Abrdn PLC | 36,888 | 120,361 |
| Amundi S.A. (d) | 803 | 66,251 |
| Bangkok Commercial Asset Management PCL NVDR | 36,429 | 23,555 |
| Brookfield Asset Management Inc., Class A | 21,800 | 1,318,372 |
| China Cinda Asset Management Company Ltd. H Shares | 104,556 | 19,044 |
| China Huarong Asset Management Company Ltd. H Shares (a)(c)(d) | 82,000 | 5,364 |
| EQT AB | 4,533 | 246,831 |
| Hargreaves Lansdown PLC | 6,037 | 110,796 |
| HDFC Asset Management Company Ltd. (d) | 986 | 32,445 |
| IGM Financial Inc. | 1,077 | 38,897 |
| Janus Henderson Group PLC | 1,900 | 79,686 |
| Julius Baer Group Ltd. | 3,383 | 227,155 |
| Magellan Financial Group Ltd. | 1,867 | 28,831 |
| Noah Holdings Ltd. (a) | 600 | 18,414 |
| Onex Corp. | 1,300 | 102,176 |
| Partners Group Holding AG | 350 | 580,996 |
| Reinet Investments SCA | 1,963 | 35,180 |
| Schroders PLC | 2,114 | 101,934 |
| St. James's Place PLC | 8,229 | 187,639 |
| | | 3,636,904 |
| Auto Parts & Equipment - 0.2% |
| Adient PLC (a) | 4,320 | 206,842 |
| Aisin Seiki Company Ltd. | 2,000 | 76,592 |
| Aptiv PLC (a) | 3,100 | 511,345 |
| Bharat Forge Ltd. | 3,331 | 31,271 |
| Changzhou Xingyu Automotive Lighting Systems Company Ltd., Class A | 300 | 9,636 |
| Continental AG (a) | 1,676 | 177,463 |
| Denso Corp. | 6,700 | 554,421 |
| Faurecia S.A. | 1,566 | 74,493 |
| Fuyao Glass Industry Group Company Ltd. H Shares (d) | 9,356 | 48,362 |
| Fuyao Glass Industry Group Company Ltd., Class A | 1,100 | 8,154 |
| | Number
of Shares | Fair
Value |
| Hanon Systems | 2,623 | $ 29,678 |
| Huayu Automotive Systems Company Ltd. A Shares | 1,068 | 4,753 |
| Hyundai Mobis Company Ltd. | 915 | 195,893 |
| Koito Manufacturing Company Ltd. | 1,800 | 95,193 |
| Magna International Inc. | 4,435 | 359,357 |
| Mianyang Fulin Precision Company Ltd. A Shares (a) | 500 | 2,312 |
| Minth Group Ltd. | 12,000 | 52,871 |
| Motherson Sumi Systems Ltd. | 17,903 | 53,780 |
| Ningbo Tuopu Group Company Ltd. A Shares | 800 | 6,668 |
| Stanley Electric Company Ltd. | 1,500 | 37,502 |
| Sumitomo Electric Industries Ltd. | 12,666 | 164,931 |
| Valeo | 3,883 | 117,370 |
| | | 2,818,887 |
| Automobile Manufacturers - 0.6% |
| Astra International Tbk PT | 278,100 | 111,220 |
| Bayerische Motoren Werke AG | 5,102 | 513,418 |
| BYD Company Ltd. H Shares | 10,500 | 359,055 |
| BYD Company Ltd. A Shares | 1,700 | 71,678 |
| Chongqing Changan Automobile Company Ltd. A Shares | 3,857 | 9,213 |
| Daimler AG | 13,227 | 1,016,671 |
| Dongfeng Motor Group Company Ltd. H Shares | 40,000 | 33,247 |
| Ferrari N.V. | 1,942 | 502,421 |
| Ford Otomotiv Sanayi A/S | 1,078 | 19,328 |
| Geely Automobile Holdings Ltd. | 82,000 | 224,029 |
| Great Wall Motor Company Ltd. H Shares | 42,033 | 144,490 |
| Great Wall Motor Company Ltd., Class A | 2,600 | 19,846 |
| Guangzhou Automobile Group Company Ltd. H Shares | 42,000 | 41,427 |
| Honda Motor Company Ltd. | 25,200 | 706,839 |
| Hyundai Motor Co. | 1,887 | 331,763 |
| Isuzu Motors Ltd. | 9,800 | 121,782 |
| Kia Motors Corp. | 3,627 | 250,801 |
| Li Auto Inc. ADR (a) | 7,600 | 243,960 |
| Mahindra & Mahindra Ltd. | 12,179 | 137,157 |
| Maruti Suzuki India Ltd. | 1,872 | 187,021 |
| Mazda Motor Corp. (a) | 7,500 | 57,640 |
| NIO Inc. ADR (a) | 18,723 | 593,145 |
See Notes to Schedule of Investments and Notes to Financial Statements.
| 48 | State Street Total Return V.I.S. Fund |
State Street Total Return V.I.S. Fund
Schedule of Investments, continued — December 31, 2021
| | Number
of Shares | Fair
Value |
| Nissan Motor Company Ltd. (a) | 35,400 | $ 170,859 |
| Renault S.A. (a) | 3,258 | 113,169 |
| SAIC Motor Corp. Ltd. A Shares | 8,800 | 28,549 |
| Stellantis N.V. | 31,389 | 595,616 |
| Subaru Corp. | 9,400 | 167,911 |
| Suzuki Motor Corp. | 5,600 | 215,383 |
| Tata Motors Ltd. (a) | 23,084 | 149,803 |
| Toyota Motor Corp. | 164,200 | 3,002,241 |
| Volkswagen AG | 545 | 160,150 |
| XPeng Inc. ADR (a) | 5,400 | 271,782 |
| | | 10,571,614 |
| Automotive Retail - 0.0% * |
| Abu Dhabi National Oil Co for Distribution PJSC | 36,063 | 41,924 |
| China Meidong Auto Holdings Ltd. | 8,000 | 41,250 |
| Hotai Motor Company Ltd. | 3,863 | 85,730 |
| PTT Oil & Retail Business PCL NVDR | 42,408 | 34,277 |
| USS Company Ltd. | 2,900 | 45,229 |
| Vibra Energia S.A. | 15,900 | 61,088 |
| Zhongsheng Group Holdings Ltd. | 8,500 | 66,288 |
| | | 375,786 |
| Biotechnology - 0.2% |
| 3SBio Inc. (a)(d) | 22,500 | 18,759 |
| Affimed N.V. (a) | 5,000 | 27,600 |
| Akeso Inc. (a)(d) | 4,000 | 17,444 |
| Alkermes PLC (a) | 7,311 | 170,054 |
| Alteogen Inc. (a) | 335 | 21,333 |
| Arbutus Biopharma Corp. (a) | 3,853 | 14,988 |
| Argenx SE (a) | 701 | 251,350 |
| BeiGene Ltd. ADR (a) | 600 | 162,558 |
| Beijing Tiantan Biological Products Corporation Ltd., Class A | 1,500 | 6,831 |
| Beijing Wantai Biological Pharmacy Enterprise Company Ltd. A Shares | 400 | 13,933 |
| BGI Genomics Company Ltd., Class A | 800 | 11,046 |
| Biocon Ltd. (a) | 5,557 | 27,260 |
| Celltrion Inc. | 1,379 | 229,688 |
| Chongqing Zhifei Biological Products Company Ltd., Class A | 1,500 | 29,391 |
| | Number
of Shares | Fair
Value |
| CSL Ltd. | 7,408 | $ 1,565,814 |
| CureVac N.V. (a) | 800 | 27,448 |
| Genmab A/S (a) | 1,010 | 406,146 |
| Green Cross Corp. | 80 | 14,671 |
| Grifols S.A. | 4,001 | 76,780 |
| Hualan Biological Engineering Inc. A Shares | 2,038 | 9,339 |
| I-Mab ADR (a) | 500 | 23,695 |
| Imeik Technology Development Company Ltd. A Shares | 100 | 8,431 |
| Innovent Biologics Inc. (a)(d) | 16,500 | 102,116 |
| Prothena Corporation PLC (a) | 1,734 | 85,659 |
| Seegene Inc. | 451 | 23,143 |
| Shanghai RAAS Blood Products Company Ltd., Class A | 17,600 | 18,876 |
| Shenzhen Kangtai Biological Products Company Ltd., Class A | 500 | 7,748 |
| SK Bioscience Company Ltd. (a) | 285 | 53,943 |
| Walvax Biotechnology Company Ltd., Class A | 1,400 | 12,373 |
| Zai Lab Ltd. ADR (a) | 1,100 | 69,135 |
| | | 3,507,552 |
| Brewers - 0.1% |
| AMBEV S.A. | 65,000 | 179,946 |
| Anheuser-Busch InBev S.A. | 11,760 | 711,067 |
| Asahi Group Holdings Ltd. | 7,000 | 271,964 |
| Budweiser Brewing Company APAC Ltd. (d) | 21,900 | 57,445 |
| Carlsberg A/S, Class B | 1,538 | 265,612 |
| China Resources Beer Holdings Company Ltd. | 20,000 | 163,796 |
| Chongqing Brewery Company Ltd., Class A (a) | 600 | 14,278 |
| Cia Cervecerias Unidas S.A. | 2,774 | 22,563 |
| Heineken Holding N.V. | 1,933 | 178,384 |
| Heineken N.V. | 3,991 | 448,682 |
| Kirin Holdings Company Ltd. | 12,600 | 202,095 |
| Tsingtao Brewery Company Ltd. H Shares | 6,924 | 64,832 |
| Tsingtao Brewery Company Ltd., Class A | 800 | 12,455 |
| | | 2,593,119 |
| Broadcasting - 0.0% * |
| Vivendi SE | 13,017 | 176,007 |
See Notes to Schedule of Investments and Notes to Financial Statements.
| State Street Total Return V.I.S. Fund | 49 |
State Street Total Return V.I.S. Fund
Schedule of Investments, continued — December 31, 2021
| | Number
of Shares | Fair
Value |
| Building Products - 0.2% |
| AGC Inc. | 3,200 | $ 152,560 |
| Allegion plc | 1,000 | 132,440 |
| Assa Abloy AB, Class B | 15,434 | 470,835 |
| Beijing New Building Materials PLC, Class A | 1,600 | 9,015 |
| Caesarstone Ltd. | 1,400 | 15,876 |
| China Lesso Group Holdings Ltd. | 16,494 | 23,695 |
| Cie de Saint-Gobain | 7,797 | 548,586 |
| Daikin Industries Ltd. | 3,800 | 860,944 |
| Geberit AG | 552 | 451,463 |
| Guangdong Kinlong Hardware Products Company Ltd., Class A | 200 | 5,711 |
| Kingspan Group PLC | 2,361 | 281,918 |
| Lixil Corp. | 4,500 | 119,773 |
| Nibe Industrier AB B Shares | 21,892 | 330,658 |
| ROCKWOOL International A/S B Shares | 113 | 49,414 |
| TOTO Ltd. | 2,400 | 110,251 |
| Trane Technologies PLC | 2,727 | 550,936 |
| Xinyi Glass Holdings Ltd. | 24,000 | 60,028 |
| | | 4,174,103 |
| Cable & Satellite - 0.0% * |
| Cyfrowy Polsat S.A. | 3,840 | 33,080 |
| Grupo Televisa SAB | 33,400 | 62,916 |
| Megacable Holdings SAB de C.V. | 2,930 | 9,987 |
| MultiChoice Group | 5,902 | 45,126 |
| Quebecor Inc., Class B | 2,200 | 49,725 |
| Shaw Communications Inc., Class B | 6,900 | 209,707 |
| | | 410,541 |
| Casinos & Gaming - 0.1% |
| Aristocrat Leisure Ltd. | 9,244 | 292,828 |
| Crown Resorts Ltd. (a) | 4,846 | 42,138 |
| Entain PLC (a) | 8,938 | 203,745 |
| Evolution Gaming Group AB (d) | 2,644 | 375,610 |
| Flutter Entertainment PLC (a) | 2,562 | 404,977 |
| Galaxy Entertainment Group Ltd. (a) | 36,000 | 186,550 |
| GAN Ltd. (a) | 1,900 | 17,461 |
| Genting Bhd | 33,700 | 37,777 |
| Genting Malaysia Bhd | 50,800 | 35,119 |
| Genting Singapore Ltd. | 79,100 | 45,472 |
| Kangwon Land Inc. (a) | 1,337 | 27,049 |
| | Number
of Shares | Fair
Value |
| La Francaise des Jeux SAEM (d) | 1,257 | $ 55,663 |
| Melco Resorts & Entertainment Ltd. ADR (a) | 2,800 | 28,504 |
| NEOGAMES S.A. (a) | 496 | 13,779 |
| OPAP S.A. | 2,688 | 38,118 |
| Sands China Ltd. (a) | 32,800 | 76,401 |
| Tabcorp Holdings Ltd. | 37,435 | 136,630 |
| | | 2,017,821 |
| Coal & Consumable Fuels - 0.0% * |
| Adaro Energy Tbk PT | 205,600 | 32,457 |
| Cameco Corp. | 6,700 | 146,290 |
| China Shenhua Energy Company Ltd. H Shares | 45,490 | 106,660 |
| China Shenhua Energy Company Ltd., Class A | 7,500 | 26,561 |
| Coal India Ltd. | 22,001 | 43,226 |
| Exxaro Resources Ltd. | 3,343 | 32,020 |
| Shaanxi Coal Industry Company Ltd., Class A | 6,700 | 12,854 |
| Shanxi Coking Coal Energy Group Company Ltd., Class A | 3,800 | 4,942 |
| United Tractors Tbk PT | 21,200 | 32,947 |
| Uranium Energy Corp. (a) | 11,600 | 38,860 |
| Washington H Soul Pattinson & Company Ltd. | 2,988 | 64,326 |
| Yanzhou Coal Mining Company Ltd. H Shares | 22,000 | 43,739 |
| Yanzhou Coal Mining Company Ltd., Class A | 2,300 | 8,511 |
| | | 593,393 |
| Commercial Printing - 0.0% * |
| Cimpress PLC (a) | 742 | 53,135 |
| Dai Nippon Printing Company Ltd. | 3,000 | 75,368 |
| Toppan Printing Company Ltd. | 3,500 | 65,529 |
| | | 194,032 |
| Commodity Chemicals - 0.2% |
| Advanced Petrochemical Co. | 1,361 | 25,521 |
| Asahi Kasei Corp. | 19,100 | 179,298 |
| Barito Pacific Tbk PT | 363,200 | 21,788 |
| Berger Paints India Ltd. | 3,118 | 32,371 |
| Do-Fluoride New Materials Company Ltd., Class A | 400 | 2,830 |
| Formosa Chemicals & Fibre Corp. | 49,000 | 143,102 |
See Notes to Schedule of Investments and Notes to Financial Statements.
| 50 | State Street Total Return V.I.S. Fund |
State Street Total Return V.I.S. Fund
Schedule of Investments, continued — December 31, 2021
| | Number
of Shares | Fair
Value |
| Formosa Plastics Corp. | 53,000 | $ 199,227 |
| Guangzhou Tinci Materials Technology Company Ltd., Class A | 930 | 16,767 |
| Hanwha Solutions Corp. (a) | 1,814 | 54,172 |
| Hengli Petrochemical Company Ltd., Class A | 4,500 | 16,255 |
| Hengyi Petrochemical Company Ltd., Class A | 4,700 | 7,849 |
| Huafon Chemical Company Ltd., Class A | 4,900 | 8,045 |
| Hubei Xingfa Chemicals Group Company Ltd. | 600 | 3,574 |
| Indorama Ventures PCL NVDR | 20,600 | 26,671 |
| Inner Mongolia Yuan Xing Energy Company Ltd. (a) | 2,700 | 3,100 |
| Jiangsu Eastern Shenghong Company Ltd., Class A | 3,800 | 11,557 |
| Kingfa Sci & Tech Company Ltd. A Shares | 7,000 | 13,848 |
| Kumho Petrochemical Company Ltd. | 277 | 38,681 |
| LB Group Company Ltd. A Shares | 2,100 | 9,441 |
| LG Chem Ltd. | 633 | 327,483 |
| Lotte Chemical Corp. | 251 | 45,819 |
| Mesaieed Petrochemical Holding Co. | 44,246 | 25,398 |
| Mitsui Chemicals Inc. | 3,100 | 83,184 |
| Nan Ya Plastics Corp. | 71,000 | 219,156 |
| National Industrialization Co. (a) | 3,424 | 18,203 |
| National Petrochemical Co. | 2,261 | 24,089 |
| Orbia Advance Corp. SAB de C.V. | 15,100 | 38,567 |
| Orica Ltd. | 7,017 | 69,842 |
| Orion Engineered Carbons S.A. (a) | 2,800 | 51,408 |
| Petronas Chemicals Group Bhd | 33,300 | 71,300 |
| PTT Global Chemical PCL NVDR | 33,158 | 58,316 |
| Rongsheng Petrochemical Company Ltd., Class A | 10,750 | 30,700 |
| Sahara International Petrochemical Co. | 5,043 | 56,415 |
| Satellite Chemical Company Ltd., Class A | 1,800 | 11,331 |
| Saudi Basic Industries Corp. | 12,517 | 386,739 |
| Saudi Industrial Investment Group | 3,017 | 25,032 |
| | Number
of Shares | Fair
Value |
| Saudi Kayan Petrochemical Co. (a) | 11,027 | $ 49,989 |
| Shenzhen Senior Technology Material Company Ltd., Class A | 400 | 2,310 |
| Sinoma Science & Technology Company Ltd., Class A | 2,800 | 14,980 |
| SK Chemicals Company Ltd. | 130 | 16,294 |
| SKC Company Ltd. | 294 | 43,157 |
| Skshu Paint Company Ltd., Class A | 400 | 8,753 |
| Tongkun Group Company Ltd. A Shares | 3,400 | 11,324 |
| Toray Industries Inc. | 23,300 | 137,953 |
| Tosoh Corp. | 3,482 | 51,585 |
| Tronox Holdings PLC, Class A | 5,203 | 125,028 |
| Yanbu National Petrochemical Co. | 3,655 | 66,881 |
| | | 2,885,333 |
| Communications Equipment - 0.1% |
| Accton Technology Corp. | 7,000 | 65,782 |
| BYD Electronic International Company Ltd. | 11,020 | 40,355 |
| China Zhenhua Group Science & Technology Company Ltd., Class A | 200 | 3,909 |
| Nokia Oyj (a) | 83,081 | 526,630 |
| Shenzhen Sunway Communication Company Ltd., Class A | 2,400 | 9,556 |
| Telefonaktiebolaget LM Ericsson, Class B | 44,962 | 495,564 |
| Tianjin 712 Communication & Broadcasting Company Ltd., Class A | 1,900 | 12,937 |
| Yealink Network Technology Corporation Ltd., Class A | 1,100 | 14,089 |
| ZTE Corp. H Shares | 10,000 | 27,385 |
| ZTE Corp., Class A | 4,400 | 23,180 |
| | | 1,219,387 |
| Computer & Electronics Retail - 0.0% * |
| GOME Retail Holdings Ltd. (a) | 143,000 | 12,106 |
| Hikari Tsushin Inc. | 300 | 46,138 |
| Suning.com Company Ltd. A Shares (a) | 9,200 | 5,960 |
| | | 64,204 |
See Notes to Schedule of Investments and Notes to Financial Statements.
| State Street Total Return V.I.S. Fund | 51 |
State Street Total Return V.I.S. Fund
Schedule of Investments, continued — December 31, 2021
| | Number
of Shares | Fair
Value |
| Construction & Engineering - 0.2% |
| ACS Actividades de Construccion y Servicios S.A. | 4,165 | $ 111,638 |
| Bouygues S.A. | 3,856 | 138,085 |
| China Communications Services Corp. Ltd. H Shares | 23,733 | 11,568 |
| China Conch Venture Holdings Ltd. | 23,000 | 112,399 |
| China National Chemical Engineering Company Ltd., Class A | 7,200 | 13,587 |
| China Railway Group Ltd. H Shares | 53,000 | 28,008 |
| China Railway Group Ltd. A Shares | 19,600 | 17,846 |
| China State Construction Engineering Corp. Ltd., Class A | 46,900 | 36,877 |
| China State Construction International Holdings Ltd. | 30,000 | 37,287 |
| Eiffage S.A. | 1,404 | 144,431 |
| Ferrovial S.A. | 7,424 | 232,677 |
| GS Engineering & Construction Corp. | 896 | 29,848 |
| Hyundai Engineering & Construction Company Ltd. | 1,150 | 43,001 |
| Kajima Corp. | 6,000 | 68,829 |
| Larsen & Toubro Ltd. | 9,669 | 246,604 |
| Metallurgical Corp. of China Ltd., Class A | 20,200 | 12,166 |
| Obayashi Corp. | 8,600 | 66,467 |
| Power Construction Corp. of China Ltd., Class A | 16,300 | 20,711 |
| Samsung Engineering Company Ltd. (a) | 2,257 | 43,479 |
| Shimizu Corp. | 6,600 | 40,865 |
| Skanska AB, Class B | 5,728 | 148,169 |
| Taisei Corp. | 3,200 | 97,121 |
| Vinci S.A. | 8,306 | 877,589 |
| WSP Global Inc. | 1,800 | 261,674 |
| | | 2,840,926 |
| Construction Machinery & Heavy Trucks - 0.1% |
| Alstom S.A. | 5,310 | 188,523 |
| China CSSC Holdings Ltd., Class A | 4,900 | 19,102 |
| Daimler Truck Holding AG (a) | 7,062 | 259,318 |
| Doosan Bobcat Inc. (a) | 628 | 21,528 |
| Epiroc AB A Shares | 10,092 | 255,481 |
| | Number
of Shares | Fair
Value |
| Epiroc AB B Shares | 6,572 | $ 139,151 |
| Hino Motors Ltd. | 3,587 | 29,529 |
| Hitachi Construction Machinery Company Ltd. | 1,300 | 37,536 |
| Hyundai Heavy Industries Company Ltd. (a) | 588 | 46,793 |
| KION Group AG | 1,216 | 133,416 |
| Knorr-Bremse AG | 1,225 | 121,058 |
| Komatsu Ltd. | 13,400 | 313,429 |
| Samsung Heavy Industries Company Ltd. (a) | 8,098 | 38,625 |
| Sany Heavy Equipment International Holdings Company Ltd. | 13,000 | 12,573 |
| Sany Heavy Industry Company Ltd. A Shares | 9,000 | 32,269 |
| Sinotruk Hong Kong Ltd. | 12,500 | 19,240 |
| Toyota Industries Corp. | 2,200 | 175,572 |
| Volvo AB B Shares | 22,022 | 509,939 |
| Volvo AB A Shares | 2,659 | 62,438 |
| Weichai Power Company Ltd. H Shares | 28,401 | 55,590 |
| Weichai Power Company Ltd., Class A | 7,800 | 21,944 |
| XCMG Construction Machinery Company Ltd., Class A | 9,300 | 8,760 |
| Zoomlion Heavy Industry Science & Technology Company Ltd. H Shares | 14,748 | 9,288 |
| Zoomlion Heavy Industry Science & Technology Company Ltd., Class A | 8,700 | 9,809 |
| | | 2,520,911 |
| Construction Materials - 0.2% |
| ACC Ltd. | 1,086 | 32,371 |
| Ambuja Cements Ltd. | 10,245 | 52,027 |
| Anhui Conch Cement Company Ltd. H Shares | 18,081 | 90,332 |
| Anhui Conch Cement Company Ltd. A Shares | 2,769 | 17,548 |
| Asia Cement Corp. | 29,000 | 46,434 |
| Cemex SAB de C.V. (a) | 213,900 | 146,223 |
| China Jushi Company Ltd. A Shares | 4,114 | 11,775 |
| China National Building Material Company Ltd. H Shares | 55,243 | 67,740 |
| China Resources Cement Holdings Ltd. | 34,000 | 25,687 |
| CRH PLC | 12,015 | 635,624 |
See Notes to Schedule of Investments and Notes to Financial Statements.
| 52 | State Street Total Return V.I.S. Fund |
State Street Total Return V.I.S. Fund
Schedule of Investments, continued — December 31, 2021
| | Number
of Shares | Fair
Value |
| Grasim Industries Ltd. | 3,673 | $ 80,157 |
| HeidelbergCement AG | 2,495 | 168,877 |
| Indocement Tunggal Prakarsa Tbk PT | 18,100 | 15,367 |
| James Hardie Industries PLC | 6,824 | 274,365 |
| LafargeHolcim Ltd. | 8,054 | 411,120 |
| POSCO Chemical Company Ltd. | 437 | 52,936 |
| Saudi Cement Co. | 1,423 | 20,770 |
| Semen Indonesia Persero Tbk PT | 38,500 | 19,584 |
| Shree Cement Ltd. | 163 | 59,177 |
| Taiwan Cement Corp. | 69,000 | 119,709 |
| The Siam Cement PCL NVDR | 11,063 | 127,835 |
| UltraTech Cement Ltd. | 1,440 | 147,051 |
| | | 2,622,709 |
| Consumer Electronics - 0.2% |
| Garmin Ltd. | 1,748 | 238,025 |
| LG Electronics Inc. (a) | 1,491 | 173,088 |
| NavInfo Company Ltd. A Shares (a) | 4,600 | 11,516 |
| Panasonic Corp. | 34,000 | 373,496 |
| Sharp Corp. | 2,800 | 32,120 |
| Sony Corp. | 19,500 | 2,451,153 |
| TCL Technology Group Corp. A Shares | 13,027 | 12,640 |
| | | 3,292,038 |
| Consumer Finance - 0.0% * |
| 360 Finance Inc. | 1,000 | 22,930 |
| Bajaj Finance Ltd. | 3,782 | 354,986 |
| Cholamandalam Investment & Finance Company Ltd. | 5,814 | 40,702 |
| Krungthai Card PCL NVDR | 11,056 | 19,610 |
| Muangthai Capital PCL NVDR | 13,200 | 23,215 |
| Muthoot Finance Ltd. | 1,609 | 32,373 |
| SBI Cards & Payment Services Ltd. (a) | 3,465 | 43,264 |
| Shriram Transport Finance Company Ltd. | 2,924 | 47,871 |
| Srisawad Corp. PCL NVDR | 7,600 | 14,049 |
| | | 599,000 |
| Copper - 0.0% * |
| Antofagasta PLC | 6,659 | 120,723 |
| First Quantum Minerals Ltd. | 9,000 | 215,675 |
| Jiangxi Copper Company Ltd. H Shares | 14,782 | 23,662 |
| KGHM Polska Miedz S.A. | 2,111 | 73,014 |
| | Number
of Shares | Fair
Value |
| Lundin Mining Corp. | 8,900 | $ 69,613 |
| Southern Copper Corp. | 2,090 | 128,974 |
| | | 631,661 |
| Data Processing & Outsourced Services - 0.1% |
| Adyen N.V. (a)(d) | 306 | 804,363 |
| Afterpay Ltd. (a) | 3,322 | 200,491 |
| Amadeus IT Group S.A. (a) | 6,935 | 470,350 |
| Computershare Ltd. | 9,172 | 133,370 |
| Edenred | 3,803 | 175,456 |
| EVERTEC Inc. | 2,754 | 137,645 |
| Fawry for Banking & Payment Technology Services S.A.E. (a) | 14,097 | 11,495 |
| GMO Payment Gateway Inc. | 700 | 87,230 |
| Nexi S.p.A. (a)(d) | 7,899 | 125,668 |
| Nuvei Corp. (a)(d) | 1,000 | 64,917 |
| Paysafe Ltd. (a) | 4,400 | 17,204 |
| StoneCo Ltd. A Shares (a) | 3,000 | 50,580 |
| TravelSky Technology Ltd. H Shares | 17,000 | 28,608 |
| Worldline S.A. (a)(d) | 3,642 | 202,984 |
| | | 2,510,361 |
| Department Stores - 0.0% * |
| Central Retail Corp. PCL NVDR | 21,729 | 20,815 |
| Lojas Renner S.A. | 14,432 | 63,324 |
| Lotte Shopping Company Ltd. | 146 | 10,710 |
| Next PLC | 2,032 | 224,308 |
| SACI Falabella | 9,370 | 30,562 |
| Trent Ltd. | 2,174 | 31,147 |
| Woolworths Holdings Ltd. | 15,382 | 49,982 |
| | | 430,848 |
| Distillers & Vintners - 0.2% |
| Anhui Gujing Distillery Company Ltd., Class B | 2,000 | 28,475 |
| Anhui Gujing Distillery Company Ltd., Class A | 400 | 15,348 |
| Becle SAB de C.V. | 9,900 | 24,846 |
| Beijing Shunxin Agriculture Company Ltd., Class A | 1,400 | 8,406 |
| Davide Campari-Milano N.V. | 8,816 | 128,878 |
| Diageo PLC | 36,116 | 1,974,303 |
| Jiangsu King's Luck Brewery JSC Ltd., Class A | 1,400 | 11,977 |
| Jiangsu Yanghe Brewery Joint-Stock Company Ltd., Class A | 1,300 | 33,676 |
See Notes to Schedule of Investments and Notes to Financial Statements.
| State Street Total Return V.I.S. Fund | 53 |
State Street Total Return V.I.S. Fund
Schedule of Investments, continued — December 31, 2021
| | Number
of Shares | Fair
Value |
| JiuGui Liquor Company Ltd. A Shares | 400 | $ 13,367 |
| Kweichow Moutai Company Ltd. A Shares | 1,100 | 354,613 |
| Luzhou Laojiao Company Ltd. A Shares | 1,300 | 51,899 |
| Pernod Ricard S.A. | 3,235 | 778,075 |
| Remy Cointreau S.A. | 388 | 94,424 |
| Shanghai Bairun Investment Holding Group Company Ltd., Class A | 700 | 6,586 |
| Shanxi Xinghuacun Fen Wine Factory Company Ltd., Class A | 1,040 | 51,645 |
| Sichuan Swellfun Company Ltd. A Shares | 600 | 11,321 |
| Treasury Wine Estates Ltd. | 12,260 | 110,351 |
| United Spirits Ltd. (a) | 4,124 | 49,833 |
| Wuliangye Yibin Company Ltd. A Shares | 3,400 | 119,050 |
| | | 3,867,073 |
| Diversified Banks - 2.5% |
| ABN AMRO Group N.V. (d) | 7,182 | 105,490 |
| Absa Group Ltd. | 9,810 | 93,767 |
| Abu Dhabi Commercial Bank PJSC | 39,867 | 92,584 |
| Abu Dhabi Islamic Bank PJSC | 26,861 | 50,240 |
| Agricultural Bank of China Ltd. H Shares | 331,717 | 114,029 |
| Agricultural Bank of China Ltd. A Shares | 82,747 | 38,257 |
| Akbank T.A.S. | 35,619 | 19,312 |
| Al Rajhi Bank | 17,067 | 644,604 |
| Alinma Bank | 14,586 | 93,086 |
| Alpha Services & Holdings S.A. (a) | 33,072 | 40,505 |
| AMMB Holdings Bhd (a) | 32,400 | 24,654 |
| Arab National Bank | 8,394 | 51,110 |
| Australia & New Zealand Banking Group Ltd. | 43,973 | 879,511 |
| Axis Bank Ltd. (a) | 31,452 | 287,100 |
| Banco Bilbao Vizcaya Argentaria S.A. | 102,821 | 613,872 |
| Banco Bradesco S.A. | 13,071 | 380 |
| Banco de Chile | 825,722 | 64,507 |
| Banco de Credito e Inversiones S.A. | 463 | 13,526 |
| Banco do Brasil S.A. | 9,700 | 50,241 |
| Banco Inter S.A. | 6,685 | 34,289 |
| Banco Santander Brasil S.A. | 4,300 | 23,144 |
| | Number
of Shares | Fair
Value |
| Banco Santander Chile | 705,020 | $ 28,341 |
| Banco Santander S.A. | 267,813 | 895,550 |
| Bancolombia S.A. | 2,846 | 24,264 |
| Bank AlBilad (a) | 5,453 | 67,320 |
| Bank Al-Jazira | 7,456 | 38,329 |
| Bank Central Asia Tbk PT | 754,100 | 386,243 |
| Bank Hapoalim BM | 17,314 | 178,569 |
| Bank Leumi Le-Israel BM | 22,227 | 238,881 |
| Bank Mandiri Persero Tbk PT | 264,100 | 130,174 |
| Bank Negara Indonesia Persero Tbk PT | 110,300 | 52,238 |
| Bank of Beijing Company Ltd., Class A | 24,600 | 17,176 |
| Bank of China Ltd. H Shares | 1,070,868 | 385,970 |
| Bank of China Ltd. A Shares | 20,994 | 10,069 |
| Bank of Communications Company Ltd. H Shares | 114,127 | 68,948 |
| Bank of Communications Company Ltd., Class A | 31,400 | 22,763 |
| Bank of Montreal | 10,000 | 1,078,178 |
| Bank of Shanghai Company Ltd., Class A | 16,500 | 18,500 |
| Bank of the Philippine Islands | 23,360 | 42,215 |
| Bank Polska Kasa Opieki S.A. | 2,586 | 78,278 |
| Bank Rakyat Indonesia Persero Tbk PT | 939,809 | 271,013 |
| Banque Saudi Fransi | 7,977 | 100,392 |
| Barclays PLC | 261,122 | 661,375 |
| BDO Unibank Inc. | 35,820 | 84,786 |
| BNP Paribas S.A. | 17,386 | 1,201,505 |
| BOC Hong Kong Holdings Ltd. | 56,500 | 185,162 |
| Boubyan Bank KSCP (a) | 9,348 | 24,433 |
| CaixaBank S.A. | 67,575 | 185,507 |
| Canadian Imperial Bank of Commerce | 6,900 | 805,451 |
| Capitec Bank Holdings Ltd. | 1,116 | 142,633 |
| Chang Hwa Commercial Bank Ltd. | 60,770 | 37,340 |
| China Bohai Bank Company Ltd. H Shares (d) | 26,500 | 10,197 |
| China CITIC Bank Corp. Ltd. H Shares | 122,881 | 53,274 |
| China Common Rich Renewable Energy Investments Ltd. (a)(c)** | 64,000 | — |
| China Construction Bank Corp. H Shares | 1,295,000 | 896,964 |
| China Construction Bank Corp., Class A | 7,400 | 6,819 |
| China Everbright Bank Company Ltd. H Shares | 46,883 | 16,597 |
See Notes to Schedule of Investments and Notes to Financial Statements.
| 54 | State Street Total Return V.I.S. Fund |
State Street Total Return V.I.S. Fund
Schedule of Investments, continued — December 31, 2021
| | Number
of Shares | Fair
Value |
| China Everbright Bank Company Ltd. A Shares | 26,920 | $ 14,055 |
| China Merchants Bank Company Ltd. H Shares | 52,500 | 407,742 |
| China Merchants Bank Company Ltd., Class A | 18,900 | 144,773 |
| China Minsheng Banking Corp. Ltd. H Shares | 77,200 | 29,508 |
| China Minsheng Banking Corporation Ltd., Class A | 40,100 | 24,593 |
| China Zheshang Bank Company Ltd., Class A | 17,800 | 9,797 |
| CIMB Group Holdings Bhd | 92,230 | 120,656 |
| Commercial International Bank Egypt S.A.E. (a) | 16,486 | 55,607 |
| Commerzbank AG (a) | 16,921 | 128,713 |
| Commonwealth Bank of Australia | 27,454 | 2,016,004 |
| Credicorp Ltd. | 900 | 109,863 |
| Credit Agricole S.A. | 18,953 | 270,495 |
| CTBC Financial Holding Company Ltd. | 254,000 | 238,237 |
| Danske Bank A/S | 10,512 | 181,542 |
| DBS Group Holdings Ltd. | 27,910 | 676,142 |
| DNB BANK ASA | 14,281 | 327,134 |
| Dubai Islamic Bank PJSC | 24,182 | 35,420 |
| E.Sun Financial Holding Company Ltd. | 168,633 | 170,967 |
| Emirates NBD Bank PJSC | 35,482 | 130,894 |
| Erste Group Bank AG | 5,263 | 247,483 |
| Eurobank Ergasias Services & Holdings S.A., Class A (a) | 38,674 | 39,204 |
| FinecoBank Banca Fineco S.p.A. | 10,213 | 179,266 |
| First Abu Dhabi Bank PJSC | 60,786 | 311,787 |
| First Financial Holding Company Ltd. | 140,454 | 124,376 |
| Grupo Financiero Banorte SAB de C.V., Class O | 35,800 | 232,696 |
| Grupo Financiero Inbursa SAB de CV, Class O (a) | 32,600 | 39,059 |
| Hana Financial Group Inc. | 4,077 | 144,217 |
| Hang Seng Bank Ltd. | 11,700 | 214,152 |
| Hong Leong Bank Bhd | 9,600 | 42,907 |
| Hong Leong Financial Group Bhd | 2,087 | 8,687 |
| HSBC Holdings PLC | 316,072 | 1,920,688 |
| Hua Nan Financial Holdings Company Ltd. | 122,930 | 94,196 |
| Huaxia Bank Company Ltd., Class A | 13,700 | 12,065 |
| | Number
of Shares | Fair
Value |
| ICICI Bank Ltd. | 70,634 | $ 703,293 |
| Industrial & Commercial Bank of China Ltd. H Shares | 750,505 | 423,563 |
| Industrial & Commercial Bank of China Ltd., Class A | 69,200 | 50,384 |
| Industrial Bank Company Ltd. A Shares | 19,200 | 57,488 |
| Industrial Bank of Korea (a) | 2,926 | 25,353 |
| ING Groep N.V. | 60,288 | 839,305 |
| Intesa Sanpaolo S.p.A. | 254,791 | 658,888 |
| Israel Discount Bank Ltd. A Shares | 19,649 | 132,197 |
| Japan Post Bank Company Ltd. | 5,300 | 48,556 |
| KakaoBank Corp. (a) | 971 | 48,193 |
| KB Financial Group Inc. | 5,407 | 250,166 |
| KBC Group N.V. | 3,839 | 329,436 |
| Komercni banka A/S | 1,164 | 49,805 |
| Kotak Mahindra Bank Ltd. | 7,777 | 187,908 |
| Krung Thai Bank PCL NVDR | 46,577 | 18,405 |
| Kuwait Finance House KSCP | 67,961 | 187,075 |
| Lloyds Banking Group PLC | 1,095,262 | 709,102 |
| Malayan Banking Bhd | 53,733 | 107,053 |
| Masraf Al Rayan QSC | 56,076 | 71,462 |
| mBank S.A. (a) | 39 | 4,192 |
| Mediobanca Banca di Credito Finanziario S.p.A. | 10,499 | 120,708 |
| Mega Financial Holding Company Ltd. | 150,276 | 193,093 |
| Metropolitan Bank & Trust Co. | 10,500 | 11,469 |
| Mitsubishi UFJ Financial Group Inc. | 188,900 | 1,025,085 |
| Mizrahi Tefahot Bank Ltd. | 2,398 | 92,456 |
| Mizuho Financial Group Inc. | 37,200 | 472,612 |
| Moneta Money Bank A/S (d) | 4,117 | 17,663 |
| National Australia Bank Ltd. | 50,894 | 1,067,152 |
| National Bank of Canada | 5,200 | 397,014 |
| National Bank of Kuwait SAKP | 98,441 | 324,717 |
| National Commercial Bank | 30,222 | 518,404 |
| Natwest Group PLC | 88,265 | 269,826 |
| Nedbank Group Ltd. | 6,210 | 68,100 |
| Nordea Bank Abp | 49,961 | 609,762 |
| OTP Bank Nyrt (a) | 3,222 | 165,028 |
| Oversea-Chinese Banking Corporation Ltd. | 52,130 | 440,813 |
| Ping An Bank Company Ltd. A Shares | 17,600 | 45,612 |
| Postal Savings Bank of China Company Ltd. H Shares (d) | 102,675 | 72,038 |
| Postal Savings Bank of China Company Ltd., Class A | 30,400 | 24,381 |
See Notes to Schedule of Investments and Notes to Financial Statements.
| State Street Total Return V.I.S. Fund | 55 |
State Street Total Return V.I.S. Fund
Schedule of Investments, continued — December 31, 2021
| | Number
of Shares | Fair
Value |
| Powszechna Kasa Oszczednosci Bank Polski S.A. (a) | 12,360 | $ 137,787 |
| Public Bank Bhd | 203,000 | 202,708 |
| Qatar International Islamic Bank QSC | 9,351 | 23,654 |
| Qatar Islamic Bank SAQ | 17,164 | 86,409 |
| Qatar National Bank QPSC | 63,288 | 350,943 |
| Raiffeisen Bank International AG | 1,930 | 56,801 |
| RHB Bank Bhd | 24,035 | 30,981 |
| Riyad Bank | 18,953 | 136,806 |
| Royal Bank of Canada | 22,012 | 2,339,478 |
| Santander Bank Polska S.A. | 464 | 40,121 |
| Sberbank of Russia PJSC ADR | 37,269 | 598,167 |
| Shanghai Pudong Development Bank Company Ltd., Class A | 30,100 | 40,376 |
| Shinhan Financial Group Company Ltd. | 5,795 | 179,395 |
| SinoPac Financial Holdings Company Ltd. | 130,633 | 76,254 |
| Skandinaviska Enskilda Banken AB, Class A | 25,008 | 347,615 |
| Societe Generale S.A. | 12,474 | 428,471 |
| Standard Bank Group Ltd. | 17,005 | 149,177 |
| Standard Chartered PLC | 40,281 | 244,641 |
| State Bank of India | 24,794 | 153,579 |
| Sumitomo Mitsui Financial Group Inc. | 20,200 | 691,664 |
| Sumitomo Mitsui Trust Holdings Inc. | 5,200 | 173,537 |
| Svenska Handelsbanken AB, Class A | 22,322 | 241,271 |
| Swedbank AB A Shares | 13,885 | 279,269 |
| Taishin Financial Holding Company Ltd | 144,950 | 99,281 |
| Taiwan Cooperative Financial Holding Company Ltd. | 132,231 | 121,635 |
| TCS Group Holding PLC GDR | 1,671 | 140,899 |
| The Bank of Nova Scotia | 18,800 | 1,332,811 |
| The Bank of NT Butterfield & Son Ltd. | 2,269 | 86,472 |
| The Commercial Bank PQSC | 28,609 | 53,030 |
| The Saudi British Bank | 11,732 | 103,121 |
| The Shanghai Commercial & Savings Bank Ltd. | 51,000 | 87,098 |
| The Siam Commercial Bank PCL NVDR | 12,498 | 47,515 |
| The Toronto-Dominion Bank | 28,200 | 2,165,092 |
| | Number
of Shares | Fair
Value |
| Turkiye Garanti Bankasi A/S | 20,019 | $ 16,989 |
| Turkiye Is Bankasi AS C Shares | 14,872 | 8,052 |
| UniCredit S.p.A. | 32,835 | 505,732 |
| United Overseas Bank Ltd. | 18,100 | 361,154 |
| VTB Bank PJSC GDR | 21,532 | 27,130 |
| Westpac Banking Corp. | 56,662 | 879,537 |
| Woori Financial Group Inc. | 7,293 | 77,915 |
| Yes Bank Ltd. (a) | 119,031 | 21,937 |
| | | 44,464,848 |
| Diversified Capital Markets - 0.2% |
| Banco BTG Pactual S.A. | 16,108 | 60,731 |
| Credit Suisse Group AG | 40,772 | 397,003 |
| Deutsche Bank AG (a) | 31,794 | 398,368 |
| Macquarie Group Ltd. | 5,410 | 807,908 |
| Mirae Asset Daewoo Company Ltd. | 3,940 | 28,670 |
| UBS Group AG | 54,345 | 979,361 |
| | | 2,672,041 |
| Diversified Chemicals - 0.1% |
| Arkema S.A. | 1,033 | 145,490 |
| BASF SE | 14,192 | 997,076 |
| LANXESS AG | 1,100 | 68,175 |
| Mitsubishi Chemical Holdings Corp. | 21,500 | 159,073 |
| Mitsubishi Gas Chemical Companies Inc. | 2,037 | 34,459 |
| Ningxia Baofeng Energy Group Company Ltd., Class A | 7,200 | 19,656 |
| Nissan Chemical Corp. | 2,100 | 121,818 |
| Pidilite Industries Ltd. | 2,160 | 71,562 |
| Sasol Ltd. (a) | 7,902 | 128,234 |
| Solvay S.A. | 1,247 | 144,929 |
| SRF Ltd. | 455 | 14,813 |
| Sumitomo Chemical Company Ltd. | 25,200 | 118,609 |
| | | 2,023,894 |
| Diversified Metals & Mining - 0.4% |
| African Rainbow Minerals Ltd. | 1,464 | 21,210 |
| Anglo American PLC | 19,953 | 815,084 |
| BHP Billiton Ltd. | 45,625 | 1,376,624 |
| BHP Group PLC | 32,632 | 972,144 |
| Boliden AB | 4,589 | 177,400 |
| China Minmetals Rare Earth Company Ltd., Class A | 500 | 3,068 |
See Notes to Schedule of Investments and Notes to Financial Statements.
| 56 | State Street Total Return V.I.S. Fund |
State Street Total Return V.I.S. Fund
Schedule of Investments, continued — December 31, 2021
| | Number
of Shares | Fair
Value |
| China Molybdenum Company Ltd. H Shares | 48,000 | $ 25,304 |
| China Molybdenum Company Ltd. A Shares | 22,300 | 19,568 |
| China Northern Rare Earth Group High-Tech Company Ltd., Class A | 3,700 | 26,649 |
| Ganfeng Lithium Company Ltd. A Shares | 1,100 | 24,710 |
| Ganfeng Lithium Company Ltd. H Shares (d) | 3,600 | 56,658 |
| GEM Company Ltd. A Shares | 7,800 | 12,695 |
| Glencore PLC | 154,163 | 782,918 |
| Grupo Mexico SAB de C.V. Series B | 43,942 | 191,722 |
| Ivanhoe Mines Ltd., Class A (a) | 7,900 | 64,543 |
| Korea Zinc Company Ltd. | 121 | 52,013 |
| Merdeka Copper Gold Tbk PT (a) | 155,900 | 42,551 |
| MMC Norilsk Nickel PJSC ADR | 8,795 | 272,029 |
| MMG Ltd. (a) | 36,000 | 11,544 |
| Rio Tinto Ltd. | 5,711 | 415,675 |
| Rio Tinto PLC | 17,361 | 1,150,335 |
| Saudi Arabian Mining Co. (a) | 6,191 | 129,446 |
| Shenghe Resources Holding Company Ltd., Class A | 4,000 | 12,342 |
| South32 Ltd. | 71,400 | 208,165 |
| Sumitomo Metal Mining Company Ltd. | 3,800 | 143,546 |
| Teck Resources Ltd., Class B | 7,200 | 207,652 |
| Tibet Summit Resources Company Ltd., Class A | 500 | 2,961 |
| Vedanta Ltd. | 15,509 | 71,186 |
| Zhejiang Huayou Cobalt Company Ltd., Class A | 1,100 | 19,082 |
| | | 7,308,824 |
| Diversified Real Estate Activities - 0.1% |
| Aldar Properties PJSC | 55,733 | 60,542 |
| Ayala Land Inc. | 133,000 | 95,722 |
| Barwa Real Estate Co. | 35,703 | 30,006 |
| Capitaland Investment Ltd. (a) | 44,700 | 113,064 |
| City Developments Ltd. | 5,200 | 26,267 |
| Daito Trust Construction Company Ltd. | 1,100 | 125,804 |
| Daiwa House Industry Company Ltd. | 8,700 | 249,921 |
| DLF Ltd. | 7,407 | 38,905 |
| ESR Cayman Ltd. (a)(d) | 33,800 | 114,238 |
| | Number
of Shares | Fair
Value |
| Lendlease Corporation Ltd. | 9,191 | $ 71,434 |
| Mitsubishi Estate Company Ltd. | 18,100 | 250,623 |
| Mitsui Fudosan Company Ltd. | 14,100 | 278,988 |
| New World Development Company Ltd. | 26,000 | 102,882 |
| Nomura Real Estate Holdings Inc. | 1,496 | 34,388 |
| Shanghai Lujiazui Finance & Trade Zone Development Company Ltd., Class B | 21,200 | 19,313 |
| Sumitomo Realty & Development Company Ltd. | 5,200 | 152,765 |
| Sun Hung Kai Properties Ltd. | 20,000 | 242,679 |
| Swire Pacific Ltd., Class A | 6,500 | 36,976 |
| The Wharf Holdings Ltd. | 20,000 | 61,439 |
| UOL Group Ltd. | 5,900 | 31,028 |
| | | 2,136,984 |
| Diversified REITs - 0.1% |
| Daiwa House REIT Investment Corp. | 30 | 90,791 |
| Fibra Uno Administracion S.A. de C.V. | 47,800 | 50,544 |
| Gecina S.A. | 780 | 109,014 |
| Growthpoint Properties Ltd. | 50,458 | 48,593 |
| Land Securities Group PLC | 11,910 | 125,245 |
| Mirvac Group | 66,405 | 140,494 |
| Nomura Real Estate Master Fund Inc. | 72 | 101,165 |
| Stockland | 40,308 | 124,257 |
| The British Land Company PLC | 14,943 | 107,472 |
| The GPT Group | 32,372 | 127,565 |
| | | 1,025,140 |
| Diversified Support Services - 0.0% * |
| Brambles Ltd. | 21,964 | 169,750 |
| Indian Railway Catering & Tourism Corporation Ltd. | 2,500 | 27,973 |
| Ritchie Bros Auctioneers Inc. | 1,900 | 116,438 |
| | | 314,161 |
| Drug Retail - 0.0% * |
| Clicks Group Ltd. | 3,581 | 70,797 |
| Cosmos Pharmaceutical Corp. | 300 | 44,106 |
| Raia Drogasil S.A. | 15,100 | 65,876 |
| Tsuruha Holdings Inc. | 500 | 47,935 |
See Notes to Schedule of Investments and Notes to Financial Statements.
| State Street Total Return V.I.S. Fund | 57 |
State Street Total Return V.I.S. Fund
Schedule of Investments, continued — December 31, 2021
| | Number
of Shares | Fair
Value |
| Welcia Holdings Company Ltd. | 1,244 | $ 38,782 |
| | | 267,496 |
| Education Services - 0.0% * |
| China Education Group Holdings Ltd. | 15,000 | 24,358 |
| China Yuhua Education Corporation Ltd. (d) | 14,000 | 5,010 |
| IDP Education Ltd. | 2,744 | 69,127 |
| New Oriental Education & Technology Group Inc. ADR (a) | 22,200 | 46,620 |
| TAL Education Group ADR (a) | 6,100 | 23,973 |
| | | 169,088 |
| Electric Utilities - 0.4% |
| Adani Transmission Ltd. (a) | 3,733 | 87,422 |
| AusNet Services | 24,041 | 44,921 |
| Centrais Eletricas Brasileiras S.A. | 4,100 | 24,593 |
| CEZ A/S | 2,329 | 88,143 |
| Chubu Electric Power Company Inc. | 10,900 | 114,722 |
| CK Infrastructure Holdings Ltd. | 8,500 | 54,131 |
| CLP Holdings Ltd. | 25,000 | 252,524 |
| EDP - Energias de Portugal S.A. | 42,476 | 233,404 |
| Electricite de France S.A. | 8,014 | 94,143 |
| Elia Group S.A. | 400 | 52,630 |
| Emera Inc. | 3,900 | 195,193 |
| Endesa S.A. | 5,370 | 123,357 |
| Enel Americas S.A. | 348,937 | 38,088 |
| Enel Chile S.A. | 262,988 | 9,198 |
| Enel S.p.A. | 125,667 | 1,006,933 |
| Energisa S.A. | 2,000 | 15,932 |
| Equatorial Energia S.A. | 12,800 | 51,958 |
| Fortis Inc. | 7,231 | 349,371 |
| Fortum Oyj | 6,787 | 208,314 |
| HK Electric Investments & HK Electric Investments Ltd. | 33,869 | 33,233 |
| Hydro One Ltd. (d) | 5,498 | 143,244 |
| Iberdrola S.A. | 88,530 | 1,048,040 |
| Inter Rao UES PJSC (a) | 467,243 | 26,665 |
| Interconexion Electrica S.A. ESP | 5,883 | 32,378 |
| Korea Electric Power Corp. (a) | 3,603 | 66,983 |
| Manila Electric Co. | 2,420 | 14,010 |
| Mercury NZ Ltd. | 8,826 | 36,981 |
| | Number
of Shares | Fair
Value |
| Origin Energy Ltd. | 29,884 | $ 113,850 |
| Orsted A/S (d) | 2,909 | 371,484 |
| PGE Polska Grupa Energetyczna S.A. (a) | 9,640 | 19,283 |
| Power Assets Holdings Ltd. | 23,500 | 146,493 |
| Power Grid Corporation of India Ltd. | 43,774 | 120,365 |
| Public Power Corp. S.A. (a) | 353 | 3,773 |
| Red Electrica Corporacion S.A. | 7,275 | 157,396 |
| Saudi Electricity Co. | 11,799 | 75,362 |
| SSE PLC | 16,032 | 358,073 |
| Tenaga Nasional Bhd | 32,500 | 72,864 |
| Terna Rete Elettrica Nazionale S.p.A. | 21,437 | 173,426 |
| The Kansai Electric Power Company Inc. | 11,900 | 110,986 |
| The Tata Power Company Ltd. | 14,265 | 42,400 |
| Tokyo Electric Power Company Holdings Inc. (a) | 20,200 | 52,099 |
| Verbund AG | 1,150 | 129,339 |
| | | 6,393,704 |
| Electrical Components & Equipment - 0.3% |
| ABB Ltd. | 25,377 | 972,021 |
| Ballard Power Systems Inc. (a) | 3,100 | 38,997 |
| Contemporary Amperex Technology Company Ltd., Class A | 2,000 | 184,933 |
| Ecopro BM Company Ltd. | 155 | 65,299 |
| Eve Energy Company Ltd. A Shares | 1,500 | 27,877 |
| Fuji Electric Company Ltd. | 2,100 | 114,524 |
| Ginlong Technologies Company Ltd. | 200 | 7,282 |
| Gotion High-tech Company Ltd. A Shares (a) | 1,800 | 14,507 |
| Havells India Ltd. | 4,012 | 75,398 |
| Legrand S.A. | 4,119 | 481,997 |
| Nidec Corp. | 6,900 | 810,108 |
| nVent Electric plc | 1,800 | 68,400 |
| Prysmian S.p.A. | 4,276 | 161,003 |
| Schneider Electric SE | 8,362 | 1,639,968 |
| Sungrow Power Supply Company Ltd. A Shares | 1,300 | 29,806 |
| Sunwoda Electronic Company Ltd., Class A | 800 | 5,304 |
| Suzhou Maxwell Technologies Company Ltd., Class A | 100 | 10,101 |
| TBEA Company Ltd., Class A | 4,200 | 13,982 |
See Notes to Schedule of Investments and Notes to Financial Statements.
| 58 | State Street Total Return V.I.S. Fund |
State Street Total Return V.I.S. Fund
Schedule of Investments, continued — December 31, 2021
| | Number
of Shares | Fair
Value |
| WEG S.A. | 23,646 | $ 140,008 |
| Youngy Company Ltd., Class A (a) | 200 | 4,093 |
| Zhejiang Chint Electrics Company Ltd., Class A | 1,800 | 15,254 |
| Zhuzhou CRRC Times Electric Company Ltd. H Shares | 7,900 | 45,751 |
| | | 4,926,613 |
| Electronic Components - 0.2% |
| AU Optronics Corp. | 117,000 | 96,841 |
| Beijing Yuanliu Hongyuan Electronic Technology Company Ltd., Class A | 500 | 14,109 |
| BOE Technology Group Company Ltd., Class A | 36,100 | 28,669 |
| Chaozhou Three-Circle Group Company Ltd., Class A | 2,200 | 15,430 |
| Delta Electronics Inc. | 27,000 | 268,370 |
| Delta Electronics Thailand PCL NVDR | 4,382 | 54,045 |
| Guangzhou Shiyuan Electronic Technology Company Ltd, Class A | 800 | 10,241 |
| Hamamatsu Photonics KK | 2,100 | 133,854 |
| Hirose Electric Company Ltd. | 474 | 79,607 |
| Ibiden Company Ltd. | 1,800 | 106,917 |
| Iljin Materials Company Ltd. | 188 | 21,350 |
| Innolux Corp. | 132,000 | 93,512 |
| Kingboard Holdings Ltd. | 9,500 | 46,243 |
| Kingboard Laminates Holdings Ltd. | 13,549 | 23,044 |
| Kyocera Corp. | 4,900 | 305,817 |
| L&F Company Ltd. (a) | 287 | 53,694 |
| Largan Precision Company Ltd. | 1,000 | 89,095 |
| Lens Technology Company Ltd. A Shares | 4,960 | 17,924 |
| LG Display Company Ltd. (a) | 3,484 | 72,098 |
| LG Innotek Company Ltd. | 205 | 62,772 |
| Lingyi iTech Guangdong Co., Class A (a) | 8,000 | 9,259 |
| Luxshare Precision Industry Company Ltd., Class A | 6,100 | 47,196 |
| Maxscend Microelectronics Company Ltd., Class A | 380 | 19,529 |
| Murata Manufacturing Company Ltd. | 8,900 | 707,718 |
| Nan Ya Printed Circuit Board Corp. | 3,000 | 62,023 |
| Omron Corp. | 2,897 | 288,304 |
| | Number
of Shares | Fair
Value |
| Samsung Electro-Mechanics Company Ltd. | 783 | $ 130,088 |
| Samsung SDI Company Ltd. (a) | 771 | 424,820 |
| Sunny Optical Technology Group Company Ltd. | 10,000 | 316,304 |
| TDK Corp. | 6,000 | 233,946 |
| Unimicron Technology Corp. | 17,000 | 141,938 |
| Yageo Corp. | 5,000 | 86,656 |
| Zhen Ding Technology Holding Ltd. | 10,665 | 38,741 |
| | | 4,100,154 |
| Electronic Equipment & Instruments - 0.2% |
| Azbil Corp. | 2,100 | 95,558 |
| Halma PLC | 5,812 | 251,906 |
| Hexagon AB B Shares | 30,335 | 481,300 |
| Keyence Corp. | 3,000 | 1,883,027 |
| Shimadzu Corp. | 3,600 | 151,778 |
| Westone Information Industry Inc., Class A | 400 | 3,519 |
| Wuhan Guide Infrared Company Ltd., Class A | 2,500 | 9,518 |
| Yokogawa Electric Corp. | 3,000 | 54,032 |
| Zhejiang Dahua Technology Company Ltd., Class A | 2,800 | 10,339 |
| | | 2,940,977 |
| Electronic Manufacturing Services - 0.1% |
| AAC Technologies Holdings Inc. | 10,500 | 41,481 |
| Fabrinet (a) | 1,686 | 199,740 |
| Foxconn Industrial Internet Company Ltd., Class A | 8,600 | 16,121 |
| Foxconn Technology Company Ltd. | 16,000 | 37,532 |
| GoerTek Inc. A Shares | 2,248 | 19,125 |
| Hon Hai Precision Industry Company Ltd. | 175,000 | 657,823 |
| Venture Corporation Ltd. | 3,600 | 48,894 |
| Wingtech Technology Company Ltd. A Shares | 1,200 | 24,400 |
| Wuxi Lead Intelligent Equipment Company Ltd., Class A | 640 | 7,485 |
| | | 1,052,601 |
| Environmental & Facilities Services - 0.0% * |
| China Everbright International Ltd. | 53,000 | 42,556 |
| GFL Environmental Inc. | 2,700 | 102,238 |
See Notes to Schedule of Investments and Notes to Financial Statements.
| State Street Total Return V.I.S. Fund | 59 |
State Street Total Return V.I.S. Fund
Schedule of Investments, continued — December 31, 2021
| | Number
of Shares | Fair
Value |
| Rentokil Initial PLC | 28,405 | $ 224,683 |
| | | 369,477 |
| Fertilizers & Agricultural Chemicals - 0.1% |
| ICL Group Ltd | 11,961 | 115,329 |
| Nutrien Ltd. | 8,800 | 662,395 |
| PhosAgro PJSC GDR | 1,969 | 42,491 |
| PI Industries Ltd. | 1,212 | 49,471 |
| SABIC Agri-Nutrients Co. | 2,992 | 140,738 |
| Shandong Hualu Hengsheng Chemical Company Ltd., Class A | 2,470 | 12,158 |
| Sichuan New Energy Power Company Ltd. (a) | 800 | 3,337 |
| UPL Ltd. | 7,047 | 70,825 |
| Yara International ASA | 2,788 | 140,691 |
| | | 1,237,435 |
| Financial Exchanges & Data - 0.2% |
| ASX Ltd. | 2,956 | 199,657 |
| B3 S.A. - Brasil Bolsa Balcao | 86,100 | 172,200 |
| Deutsche Boerse AG | 2,926 | 489,467 |
| East Money Information Company Ltd., Class A | 9,320 | 54,389 |
| Euronext N.V. (d) | 1,442 | 149,636 |
| Hithink RoyalFlush Information Network Company Ltd., Class A | 500 | 11,368 |
| Hong Kong Exchanges & Clearing Ltd. | 18,600 | 1,086,469 |
| Japan Exchange Group Inc. | 8,500 | 185,863 |
| London Stock Exchange Group PLC | 5,066 | 475,512 |
| Moscow Exchange Micex Pj (a) | 17,461 | 35,643 |
| Singapore Exchange Ltd. | 10,736 | 74,061 |
| TMX Group Ltd. | 1,000 | 101,532 |
| | | 3,035,797 |
| Food Distributors - 0.0% * |
| Bid Corporation Ltd. | 4,535 | 92,754 |
| The SPAR Group Ltd. | 2,566 | 26,869 |
| | | 119,623 |
| Food Retail - 0.3% |
| Alimentation Couche-Tard Inc. | 12,600 | 528,678 |
| Avenue Supermarts Ltd. (a)(d) | 2,245 | 141,082 |
| BGF retail Company Ltd. | 77 | 9,425 |
| BIM Birlesik Magazalar A/S | 8,123 | 37,496 |
| CP ALL PCL NVDR | 83,191 | 146,932 |
| | Number
of Shares | Fair
Value |
| Dino Polska S.A. (a)(d) | 696 | $ 63,428 |
| Empire Company Ltd. | 2,200 | 67,124 |
| Endeavour Group Ltd. | 22,732 | 111,394 |
| Etablissements Franz Colruyt N.V. | 706 | 29,915 |
| George Weston Ltd. | 1,269 | 147,339 |
| HelloFresh SE (a) | 2,522 | 193,706 |
| ICA Gruppen AB | 377 | 22,252 |
| J Sainsbury PLC | 29,640 | 110,722 |
| Jeronimo Martins SGPS S.A. | 4,802 | 109,763 |
| Kesko Oyj B Shares | 4,595 | 153,314 |
| Kobe Bussan Company Ltd. | 1,800 | 69,637 |
| Koninklijke Ahold Delhaize N.V. | 16,120 | 552,425 |
| Lawson Inc. | 600 | 28,397 |
| Loblaw Companies Ltd. | 2,619 | 214,886 |
| Magnit PJSC GDR | 4,801 | 72,015 |
| Metro Inc. | 3,776 | 201,243 |
| Ocado Group PLC (a) | 7,436 | 169,003 |
| President Chain Store Corp. | 8,000 | 79,083 |
| Seven & I Holdings Company Ltd. | 11,600 | 509,310 |
| Shoprite Holdings Ltd. | 7,170 | 93,839 |
| Tesco plc | 119,053 | 467,468 |
| Woolworths Group Ltd. | 19,538 | 539,936 |
| X5 Retail Group N.V. GDR | 1,834 | 48,546 |
| | | 4,918,358 |
| Footwear - 0.0% * |
| ANTA Sports Products Ltd. | 15,276 | 229,053 |
| Feng TAY Enterprise Company Ltd. | 6,000 | 50,204 |
| Pou Chen Corp. | 35,000 | 41,936 |
| Puma SE | 1,611 | 196,943 |
| | | 518,136 |
| Forest Products - 0.0% * |
| Chengxin Lithium Group Company Ltd., Class A (a) | 500 | 4,557 |
| Svenska Cellulosa AB SCA B Shares | 10,161 | 180,407 |
| West Fraser Timber Company Ltd. | 1,598 | 152,671 |
| | | 337,635 |
| Gas Utilities - 0.1% |
| Adani Gas Ltd. | 3,752 | 86,906 |
| AltaGas Ltd. | 4,800 | 103,779 |
| APA Group | 19,878 | 145,390 |
See Notes to Schedule of Investments and Notes to Financial Statements.
| 60 | State Street Total Return V.I.S. Fund |
State Street Total Return V.I.S. Fund
Schedule of Investments, continued — December 31, 2021
| | Number
of Shares | Fair
Value |
| Beijing Enterprises Holdings Ltd. | 6,500 | $ 22,427 |
| Brookfield Infrastructure Corp., Class A | 2,816 | 192,220 |
| China Gas Holdings Ltd. | 42,800 | 88,934 |
| China Resources Gas Group Ltd. | 14,000 | 79,102 |
| Enagas S.A. | 4,234 | 98,224 |
| ENN Energy Holdings Ltd. | 11,200 | 210,890 |
| GAIL India Ltd. | 22,988 | 39,955 |
| Hong Kong & China Gas Company Ltd. | 171,650 | 267,285 |
| Indraprastha Gas Ltd. | 3,071 | 19,433 |
| Kunlun Energy Company Ltd. | 56,000 | 52,507 |
| Naturgy Energy Group S.A. | 3,303 | 107,539 |
| Osaka Gas Company Ltd. | 6,400 | 105,652 |
| Petronas Gas Bhd | 10,949 | 47,307 |
| Snam S.p.A. | 30,751 | 185,341 |
| Tokyo Gas Company Ltd. | 6,300 | 112,810 |
| | | 1,965,701 |
| General Merchandise Stores - 0.1% |
| Canadian Tire Corporation Ltd., Class A | 900 | 129,277 |
| Dollarama Inc. | 4,400 | 220,531 |
| Don Quijote Holdings Company Ltd. | 7,000 | 96,470 |
| Magazine Luiza S.A. | 40,524 | 52,528 |
| Ryohin Keikaku Company Ltd. | 3,300 | 50,264 |
| Wesfarmers Ltd. | 17,503 | 754,626 |
| | | 1,303,696 |
| Gold - 0.2% |
| Agnico Eagle Mines Ltd. | 4,041 | 214,951 |
| Aneka Tambang Tbk | 160,400 | 25,322 |
| AngloGold Ashanti Ltd. | 5,786 | 119,164 |
| Barrick Gold Corp. | 27,400 | 521,688 |
| Cia de Minas Buenaventura S.A.A. ADR (a) | 3,800 | 27,816 |
| Evolution Mining Ltd. | 31,306 | 92,410 |
| Franco-Nevada Corp. | 2,911 | 403,159 |
| Gold Fields Ltd. | 12,333 | 134,566 |
| Harmony Gold Mining Company Ltd. | 6,485 | 27,061 |
| Kinross Gold Corp. | 21,300 | 123,771 |
| Kirkland Lake Gold Ltd. | 4,100 | 172,063 |
| Newcrest Mining Ltd. | 12,494 | 222,370 |
| Northern Star Resources Ltd. | 18,691 | 127,875 |
| Novagold Resources Inc. (a) | 10,700 | 73,402 |
| Polymetal International PLC | 5,386 | 95,675 |
| | Number
of Shares | Fair
Value |
| Polyus PJSC GDR | 977 | $ 86,220 |
| Shandong Gold Mining Company Ltd., Class A | 3,000 | 8,879 |
| Shandong Gold Mining Company Ltd. H Shares (d) | 5,250 | 8,983 |
| Wheaton Precious Metals Corp. | 6,864 | 294,959 |
| Zijin Mining Group Company Ltd. H Shares | 81,119 | 96,557 |
| Zijin Mining Group Company Ltd. A Shares | 15,700 | 23,949 |
| | | 2,900,840 |
| Healthcare Distributors - 0.0% * |
| Amplifon S.p.A. | 2,115 | 114,126 |
| Celltrion Healthcare Company Ltd. | 1,152 | 77,720 |
| Huadong Medicine Company Ltd. A Shares | 1,700 | 10,747 |
| Medipal Holdings Corp. | 2,405 | 45,007 |
| Shanghai Pharmaceuticals Holding Company Ltd., Class H | 9,000 | 17,062 |
| Shanghai Pharmaceuticals Holding Company Ltd., Class A | 4,200 | 13,124 |
| Sinopharm Group Company Ltd. H Shares | 19,200 | 41,767 |
| | | 319,553 |
| Healthcare Equipment - 0.3% |
| Ambu A/S, Class B | 2,220 | 58,723 |
| BioMerieux | 554 | 78,688 |
| Carl Zeiss Meditec AG | 679 | 142,733 |
| Cochlear Ltd. | 1,103 | 173,314 |
| DiaSorin S.p.A. | 338 | 64,363 |
| Fisher & Paykel Healthcare Corporation Ltd. | 8,798 | 197,332 |
| Getinge AB B Shares | 3,838 | 167,486 |
| GN Store Nord AS | 2,102 | 132,190 |
| Inmode Ltd. (a) | 700 | 49,406 |
| Jafron Biomedical Company Ltd. A Shares | 600 | 5,029 |
| Jiangsu Yuyue Medical Equipment & Supply Company Ltd., Class A | 2,100 | 12,483 |
| Koninklijke Philips N.V. | 14,135 | 526,675 |
| Lepu Medical Technology Beijing Company Ltd., Class A | 2,300 | 8,185 |
| LivaNova PLC (a) | 2,439 | 213,242 |
See Notes to Schedule of Investments and Notes to Financial Statements.
| State Street Total Return V.I.S. Fund | 61 |
State Street Total Return V.I.S. Fund
Schedule of Investments, continued — December 31, 2021
| | Number
of Shares | Fair
Value |
| Medtronic PLC | 15,300 | $ 1,582,785 |
| Microport Scientific Corp. | 8,607 | 31,353 |
| Novocure Ltd. (a) | 1,100 | 82,588 |
| Olympus Corp. | 17,000 | 391,138 |
| Shenzhen Mindray Bio-Medical Electronics Company Ltd., Class A | 1,000 | 59,883 |
| Siemens Healthineers AG (d) | 4,330 | 324,103 |
| Smith & Nephew PLC | 13,449 | 235,624 |
| Sonova Holding AG | 840 | 329,860 |
| Straumann Holding AG | 159 | 338,016 |
| Sysmex Corp. | 2,600 | 351,092 |
| Terumo Corp. | 9,900 | 417,819 |
| Venus MedTech Hangzhou Inc. H Shares (a)(d) | 2,500 | 9,492 |
| William Demant Holding A/S (a) | 1,439 | 73,729 |
| | | 6,057,331 |
| Healthcare Facilities - 0.0% * |
| Aier Eye Hospital Group Company Ltd., Class A | 4,549 | 30,245 |
| Apollo Hospitals Enterprise Ltd. | 1,395 | 94,083 |
| Bangkok Dusit Medical Services PCL NVDR | 136,372 | 93,895 |
| Bumrungrad Hospital PCL NVDR | 6,664 | 28,128 |
| Dr Sulaiman Al Habib Medical Services Group Co. | 735 | 31,597 |
| Hygeia Healthcare Holdings Company Ltd. (d) | 3,400 | 21,282 |
| IHH Healthcare Bhd | 23,300 | 41,052 |
| Mouwasat Medical Services Co. | 687 | 31,803 |
| Orpea S.A. | 690 | 69,129 |
| Ramsay Health Care Ltd. | 3,079 | 160,059 |
| Rede D'Or Sao Luiz SA (d) | 5,400 | 43,462 |
| Ryman Healthcare Ltd. | 5,655 | 47,428 |
| | | 692,163 |
| Healthcare Services - 0.0% * |
| Fresenius Medical Care AG & Company KGaA | 3,131 | 203,451 |
| Fresenius SE & Company KGaA | 6,416 | 258,288 |
| Guangzhou Kingmed Diagnostics Group Company Ltd., Class A | 500 | 8,757 |
| | Number
of Shares | Fair
Value |
| Jinxin Fertility Group Ltd. (a)(d) | 16,500 | $ 18,434 |
| Meinian Onehealth Healthcare Holdings Company Ltd., Class A (a) | 4,500 | 5,555 |
| Ping An Healthcare & Technology Company Ltd. (a)(d) | 5,800 | 21,091 |
| Sonic Healthcare Ltd. | 6,947 | 235,519 |
| Topchoice Medical Corp., Class A (a) | 300 | 9,388 |
| | | 760,483 |
| Healthcare Supplies - 0.1% |
| Alcon Inc. | 7,710 | 683,208 |
| Asahi Intecc Company Ltd. | 2,800 | 60,083 |
| Autobio Diagnostics Company Ltd. A Shares | 631 | 5,464 |
| Coloplast A/S, Class B | 1,824 | 321,001 |
| Hartalega Holdings Bhd | 26,900 | 36,999 |
| Hoya Corp. | 5,700 | 846,919 |
| Intco Medical Technology Company Ltd., Class A | 600 | 5,457 |
| Ovctek China Inc., Class A | 600 | 5,413 |
| Quotient Ltd. (a) | 4,900 | 12,691 |
| SD Biosensor Inc. (a) | 94 | 4,420 |
| Shandong Weigao Group Medical Polymer Company Ltd. H Shares | 34,800 | 43,431 |
| Sri Trang Gloves Thailand PCL NVDR | 8,400 | 7,607 |
| Top Glove Corporation Bhd | 82,100 | 51,042 |
| | | 2,083,735 |
| Healthcare Technology - 0.0% * |
| Alibaba Health Information Technology Ltd. (a) | 54,000 | 45,645 |
| M3 Inc. | 6,800 | 342,081 |
| Winning Health Technology Group Company Ltd., Class A | 4,200 | 11,070 |
| | | 398,796 |
| Heavy Electrical Equipment - 0.1% |
| Doosan Heavy Industries & Construction Company Ltd. (a) | 3,808 | 65,349 |
| Ming Yang Smart Energy Group Ltd., Class A | 600 | 2,463 |
| Mitsubishi Electric Corp. | 28,100 | 355,902 |
See Notes to Schedule of Investments and Notes to Financial Statements.
| 62 | State Street Total Return V.I.S. Fund |
State Street Total Return V.I.S. Fund
Schedule of Investments, continued — December 31, 2021
| | Number
of Shares | Fair
Value |
| NARI Technology Company Ltd. A Shares | 4,080 | $ 25,683 |
| Shanghai Electric Group Company Ltd., Class A | 15,400 | 11,770 |
| Siemens Energy AG (a) | 6,699 | 171,331 |
| Siemens Gamesa Renewable Energy S.A. (a) | 4,051 | 97,065 |
| Titan Wind Energy Suzhou Company Ltd., Class A | 900 | 2,744 |
| Vestas Wind Systems A/S | 15,552 | 475,578 |
| Xinjiang Goldwind Science & Technology Company Ltd. H Shares | 7,400 | 14,446 |
| Xinjiang Goldwind Science & Technology Company Ltd., Class A | 7,300 | 18,907 |
| | | 1,241,238 |
| Highways & Railtracks - 0.1% |
| Atlantia S.p.A. (a) | 8,324 | 165,230 |
| Bangkok Expressway & Metro PCL NVDR | 87,300 | 22,083 |
| CCR S.A. | 17,500 | 36,414 |
| Getlink | 7,447 | 123,305 |
| Jiangsu Expressway Company Ltd. H Shares | 24,000 | 24,596 |
| Promotora y Operadora de Infraestructura SAB de C.V. | 2,755 | 21,539 |
| Shenzhen International Holdings Ltd. | 15,725 | 16,338 |
| Taiwan High Speed Rail Corp. | 29,000 | 31,026 |
| Transurban Group | 46,963 | 471,876 |
| Zhejiang Expressway Company Ltd. H Shares | 28,000 | 24,961 |
| | | 937,368 |
| Home Building - 0.1% |
| Barratt Developments PLC | 17,106 | 173,306 |
| Berkeley Group Holdings PLC | 1,901 | 122,947 |
| Iida Group Holdings Company Ltd. | 1,738 | 40,388 |
| Open House Company Ltd. | 1,100 | 57,505 |
| Persimmon PLC | 4,865 | 188,193 |
| Sekisui Chemical Company Ltd. | 6,400 | 106,819 |
| Sekisui House Ltd. | 9,458 | 202,786 |
| Taylor Wimpey PLC | 61,448 | 146,066 |
| | | 1,038,010 |
| Home Furnishing Retail - 0.0% * |
| Nitori Holdings Company Ltd. | 1,300 | 194,455 |
| | Number
of Shares | Fair
Value |
| Home Furnishings - 0.0% * |
| Nien Made Enterprise Company Ltd. | 2,000 | $ 29,819 |
| Oppein Home Group Inc., Class A | 500 | 11,598 |
| | | 41,417 |
| Home Improvement Retail - 0.0% * |
| Home Product Center PCL NVDR | 78,900 | 34,248 |
| Kingfisher PLC | 35,460 | 162,481 |
| Via S/A (a) | 19,900 | 18,757 |
| | | 215,486 |
| Hotels, Resorts & Cruise Lines - 0.0% * |
| Accor S.A. (a) | 2,272 | 73,507 |
| Asset World Corp. PCL NVDR (a) | 101,200 | 14,057 |
| Huazhu Group Ltd. ADR (a) | 2,500 | 93,350 |
| InterContinental Hotels Group PLC (a) | 3,067 | 198,607 |
| Minor International PCL NVDR (a) | 43,034 | 37,037 |
| Shanghai Jinjiang International Hotels Company Ltd., Class A | 900 | 8,294 |
| Tongcheng-Elong Holdings Ltd. (a) | 13,200 | 24,449 |
| Trip.com Group Ltd. ADR (a) | 7,100 | 174,802 |
| Whitbread PLC (a) | 3,406 | 138,167 |
| | | 762,270 |
| Household Appliances - 0.0% * |
| Beijing Roborock Technology Company Ltd. A Shares | 64 | 8,182 |
| Coway Company Ltd. | 794 | 49,694 |
| Ecovacs Robotics Company Ltd. A Shares | 400 | 9,495 |
| Electrolux AB, Class B | 3,010 | 72,974 |
| Haier Smart Home Company Ltd. A Shares | 6,300 | 29,613 |
| Haier Smart Home Company Ltd. H Shares | 31,000 | 131,017 |
| Hang Zhou Great Star Industrial Company Ltd., Class A (a) | 1,800 | 8,636 |
| Rinnai Corp. | 462 | 41,645 |
| SEB S.A. | 362 | 56,357 |
| | | 407,613 |
See Notes to Schedule of Investments and Notes to Financial Statements.
| State Street Total Return V.I.S. Fund | 63 |
State Street Total Return V.I.S. Fund
Schedule of Investments, continued — December 31, 2021
| | Number
of Shares | Fair
Value |
| Household Products - 0.1% |
| Essity AB, Class B | 9,340 | $ 304,736 |
| Henkel AG & Company KGaA | 1,751 | 136,798 |
| Kimberly-Clark de Mexico SAB de C.V., Class A | 21,700 | 32,881 |
| Lion Corp. | 2,600 | 34,703 |
| Reckitt Benckiser Group PLC | 11,034 | 947,812 |
| Unicharm Corp. | 6,200 | 269,149 |
| Unilever Indonesia Tbk PT | 101,800 | 29,356 |
| Vinda International Holdings Ltd. | 3,000 | 7,311 |
| | | 1,762,746 |
| Human Resource & Employment Services - 0.1% |
| 51job Inc. ADR (a) | 400 | 19,572 |
| Adecco Group AG | 2,614 | 133,691 |
| Benefit One Inc. | 1,100 | 47,141 |
| Persol Holdings Company Ltd. | 3,000 | 87,013 |
| Randstad N.V. | 2,016 | 137,647 |
| Recruit Holdings Company Ltd. | 21,000 | 1,271,434 |
| | | 1,696,498 |
| Hypermarkets & Super Centers - 0.1% |
| Abdullah Al Othaim Markets Co. | 496 | 14,294 |
| Aeon Company Ltd. | 9,975 | 234,660 |
| Atacadao S.A. | 5,900 | 16,154 |
| Berli Jucker PCL NVDR | 9,100 | 8,445 |
| Carrefour S.A. | 9,606 | 175,930 |
| Cencosud S.A. | 18,988 | 31,758 |
| Coles Group Ltd. | 20,440 | 266,605 |
| E-MART Inc. (a) | 268 | 34,042 |
| Sun Art Retail Group Ltd. | 36,000 | 14,453 |
| Wal-Mart de Mexico SAB de C.V. | 72,286 | 268,763 |
| | | 1,065,104 |
| Independent Power Producers & Energy Traders - 0.0% * |
| AC Energy Corp. | 70,200 | 15,144 |
| B Grimm Power PCL NVDR | 8,800 | 10,669 |
| CGN Power Company Ltd. H Shares (d) | 152,000 | 46,207 |
| China National Nuclear Power Company Ltd., Class A | 11,500 | 15,010 |
| China Power International Development Ltd. | 56,000 | 37,710 |
| China Resources Power Holdings Company Ltd. | 26,000 | 87,041 |
| | Number
of Shares | Fair
Value |
| Electricity Generating PCL NVDR | 2,800 | $ 14,711 |
| Global Power Synergy PCL NVDR | 8,700 | 23,114 |
| Gulf Energy Development PCL NVDR | 42,978 | 58,861 |
| Huaneng Power International Inc., Class H | 48,000 | 32,077 |
| Huaneng Power International Inc., Class A | 7,700 | 11,733 |
| NTPC Ltd. | 67,630 | 113,178 |
| Ratch Group PCL NVDR | 6,100 | 8,217 |
| SDIC Power Holdings Company Ltd., Class A | 7,400 | 13,348 |
| Shenzhen Energy Group Company Ltd., Class A | 5,900 | 7,515 |
| Uniper SE | 1,197 | 56,899 |
| | | 551,434 |
| Industrial Conglomerates - 0.3% |
| Aboitiz Equity Ventures Inc. | 20,800 | 22,210 |
| Ayala Corp. | 3,270 | 53,290 |
| China Baoan Group Company Ltd., Class A | 1,200 | 2,723 |
| CITIC Ltd. | 79,000 | 78,024 |
| CJ Corp. | 187 | 13,120 |
| CK Hutchison Holdings Ltd. | 41,000 | 264,523 |
| DCC PLC | 1,664 | 136,355 |
| Far Eastern New Century Corp. | 44,000 | 46,597 |
| Fosun International Ltd. | 37,000 | 39,913 |
| Grupo Carso SAB de C.V. | 7,900 | 25,551 |
| GT Capital Holdings Inc. | 1,070 | 11,331 |
| HAP Seng Consolidated Bhd | 11,200 | 20,701 |
| Hitachi Ltd. | 15,000 | 811,515 |
| Industries Qatar QSC | 20,920 | 89,000 |
| Investment AB Latour B Shares | 1,958 | 79,736 |
| Jardine Matheson Holdings Ltd. | 3,600 | 198,036 |
| JG Summit Holdings Inc. | 36,620 | 38,062 |
| Keppel Corporation Ltd. | 19,300 | 73,297 |
| KOC Holding A/S | 3,897 | 8,328 |
| LG Corp. | 1,210 | 82,346 |
| Lifco AB | 3,950 | 118,101 |
| Melrose Industries PLC | 73,531 | 159,251 |
| Samsung C&T Corp. | 1,188 | 118,925 |
| Siemens AG | 11,838 | 2,055,404 |
| Siemens Ltd. | 1,001 | 31,798 |
| Sime Darby Bhd | 30,658 | 17,073 |
See Notes to Schedule of Investments and Notes to Financial Statements.
| 64 | State Street Total Return V.I.S. Fund |
State Street Total Return V.I.S. Fund
Schedule of Investments, continued — December 31, 2021
| | Number
of Shares | Fair
Value |
| SK Inc. | 443 | $ 93,538 |
| SM Investments Corp. | 2,720 | 50,301 |
| Smiths Group PLC | 6,679 | 142,887 |
| The Bidvest Group Ltd. | 4,477 | 53,143 |
| Toshiba Corp. | 6,300 | 258,773 |
| Turkiye Sise ve Cam Fabrikalari AS | 13,683 | 13,786 |
| | | 5,207,638 |
| Industrial Gases - 0.1% |
| Air Liquide S.A. | 7,325 | 1,277,154 |
| Taiyo Nippon Sanso Corp. | 2,000 | 43,645 |
| | | 1,320,799 |
| Industrial Machinery - 0.4% |
| Airtac International Group | 2,364 | 87,154 |
| Alfa Laval AB | 4,798 | 193,110 |
| Atlas Copco AB B Shares | 5,995 | 352,396 |
| Atlas Copco AB A Shares A Shares | 10,362 | 716,219 |
| Daifuku Company Ltd. | 1,700 | 138,769 |
| FANUC Corp. | 3,000 | 635,144 |
| GEA Group AG | 2,585 | 141,368 |
| Haitian International Holdings Ltd. | 9,655 | 26,812 |
| Hiwin Technologies Corp. | 3,090 | 34,232 |
| Hoshizaki Corp. | 700 | 52,581 |
| Hyundai Heavy Industries Holdings Company Ltd. | 678 | 30,628 |
| Jiangsu Hengli Hydraulic Company Ltd., Class A | 900 | 11,577 |
| Kone Oyj B Shares | 5,226 | 374,647 |
| Kornit Digital Ltd. (a) | 800 | 121,800 |
| Kurita Water Industries Ltd. | 1,307 | 61,971 |
| Luoyang Xinqianglian Slewing Bearing Company Ltd., Class A | 100 | 2,807 |
| Luxfer Holdings PLC | 1,133 | 21,878 |
| Makita Corp. | 3,400 | 144,173 |
| MINEBEA MITSUMI Inc. | 6,100 | 172,954 |
| MISUMI Group Inc. | 4,300 | 176,249 |
| Mitsubishi Heavy Industries Ltd. | 5,400 | 124,689 |
| Miura Company Ltd. | 1,200 | 41,266 |
| NGK Insulators Ltd. | 3,300 | 55,709 |
| North Industries Group Red Arrow Company Ltd., Class A (a) | 600 | 2,516 |
| Pentair PLC | 1,900 | 138,757 |
| Rational AG | 69 | 70,652 |
| | Number
of Shares | Fair
Value |
| Sandvik AB | 17,384 | $ 485,009 |
| Schindler Holding AG | 949 | 255,376 |
| Shenzhen Inovance Technology Company Ltd., Class A | 1,950 | 21,036 |
| SKF AB B Shares | 6,427 | 152,266 |
| SMC Corp. | 900 | 606,409 |
| Spirax-Sarco Engineering PLC | 1,129 | 245,432 |
| Techtronic Industries Company Ltd. | 21,000 | 418,044 |
| VAT Group AG (d) | 412 | 205,469 |
| Wartsila Oyj Abp | 8,021 | 112,741 |
| Wuxi Shangji Automation Company Ltd., Class A | 200 | 5,252 |
| Yaskawa Electric Corp. | 3,700 | 181,217 |
| Zhejiang Sanhua Intelligent Controls Company Ltd. A Shares | 1,605 | 6,386 |
| | | 6,624,695 |
| Industrial REITs - 0.1% |
| Ascendas Real Estate Investment Trust | 56,700 | 124,070 |
| GLP J-Reit | 72 | 124,361 |
| Goodman Group | 25,613 | 493,481 |
| Mapletree Logistics Trust | 54,936 | 77,423 |
| Nippon Prologis REIT Inc. | 35 | 123,703 |
| Segro PLC | 18,443 | 358,840 |
| | | 1,301,878 |
| Insurance Brokers - 0.0% * |
| Willis Towers Watson PLC | 1,400 | 332,486 |
| Integrated Oil & Gas - 0.6% |
| BP PLC | 311,174 | 1,392,957 |
| Cenovus Energy Inc. | 20,023 | 245,859 |
| China Petroleum & Chemical Corp. H Shares | 338,000 | 157,375 |
| China Petroleum & Chemical Corp., Class A | 34,000 | 22,617 |
| Ecopetrol S.A. | 54,990 | 36,345 |
| Eni S.p.A. | 38,901 | 540,591 |
| Equinor ASA | 15,035 | 402,204 |
| Galp Energia SGPS S.A. | 6,696 | 64,877 |
| Gazprom PJSC ADR | 82,945 | 766,412 |
| Guanghui Energy Company Ltd., Class A (a) | 8,300 | 8,536 |
| Imperial Oil Ltd. | 4,100 | 148,076 |
| LUKOIL PJSC ADR | 5,804 | 519,579 |
See Notes to Schedule of Investments and Notes to Financial Statements.
| State Street Total Return V.I.S. Fund | 65 |
State Street Total Return V.I.S. Fund
Schedule of Investments, continued — December 31, 2021
| | Number
of Shares | Fair
Value |
| MOL Hungarian Oil & Gas PLC | 6,359 | $ 49,444 |
| Oil & Natural Gas Corporation Ltd. | 35,532 | 68,066 |
| OMV AG | 2,480 | 140,872 |
| PetroChina Company Ltd. H Shares | 288,000 | 128,184 |
| PetroChina Company Ltd., Class A | 25,000 | 19,303 |
| Petroleo Brasileiro S.A. | 49,800 | 274,481 |
| Polskie Gornictwo Naftowe i Gazownictwo S.A. | 23,679 | 37,013 |
| PTT PCL NVDR | 131,145 | 149,184 |
| Repsol S.A. | 22,228 | 263,798 |
| Rosneft Oil Company PJSC GDR | 16,569 | 133,248 |
| Royal Dutch Shell PLC A Shares | 63,423 | 1,393,179 |
| Royal Dutch Shell PLC B Shares | 56,926 | 1,250,926 |
| Saudi Arabian Oil Co. (d) | 25,877 | 246,750 |
| Suncor Energy Inc. | 22,900 | 573,792 |
| Surgutneftegas PJSC ADR | 9,978 | 53,332 |
| TOTAL SE | 38,816 | 1,970,037 |
| | | 11,057,037 |
| Integrated Telecommunication Services - 0.4% |
| BCE Inc. | 1,247 | 64,969 |
| BT Group PLC | 137,030 | 314,685 |
| Cellnex Telecom S.A. (d) | 7,843 | 456,477 |
| China Tower Corp Ltd. H Shares (d) | 574,000 | 63,317 |
| Chunghwa Telecom Company Ltd. | 53,071 | 223,471 |
| Deutsche Telekom AG | 51,494 | 954,511 |
| Elisa Oyj | 2,394 | 147,339 |
| Emirates Telecommunications Group Co. PJSC | 35,472 | 306,139 |
| Hellenic Telecommunications Organization S.A. | 2,744 | 50,723 |
| HKT Trust & HKT Ltd. | 49,815 | 66,963 |
| Indus Towers Ltd. | 7,535 | 25,169 |
| Infrastrutture Wireless Italiane S.p.A. (d) | 4,386 | 53,269 |
| Koninklijke KPN N.V. | 56,429 | 175,187 |
| LG Uplus Corp. | 2,853 | 32,640 |
| Nippon Telegraph & Telephone Corp. | 19,809 | 541,864 |
| Ooredoo QPSC | 7,473 | 14,408 |
| Orange Polska S.A. (a) | 10,421 | 21,848 |
| Orange S.A. | 30,641 | 327,995 |
| | Number
of Shares | Fair
Value |
| Proximus SADP | 1,964 | $ 38,282 |
| Sarana Menara Nusantara Tbk PT | 425,200 | 33,563 |
| Saudi Telecom Co. | 8,508 | 254,714 |
| Singapore Telecommunications Ltd. | 126,300 | 217,347 |
| Spark New Zealand Ltd. | 31,777 | 98,338 |
| Swisscom AG | 396 | 223,653 |
| Telecom Italia S.p.A. | 130,382 | 64,379 |
| Telefonica Brasil S.A. | 6,987 | 60,449 |
| Telefonica Deutschland Holding AG | 13,264 | 36,820 |
| Telefonica S.A. | 87,396 | 382,838 |
| Telekom Malaysia Bhd | 21,200 | 27,988 |
| Telenor ASA | 11,730 | 184,364 |
| Telesites SAB de C.V. | 23,900 | 24,478 |
| Telia Company AB | 44,570 | 174,291 |
| Telkom Indonesia Persero Tbk PT | 704,900 | 199,810 |
| Telstra Corporation Ltd. | 63,516 | 193,030 |
| TELUS Corp. | 7,500 | 176,879 |
| Tower Bersama Infrastructure Tbk PT | 147,900 | 30,613 |
| True Corporation PCL NVDR | 95,700 | 13,694 |
| United Internet AG | 1,263 | 50,184 |
| | | 6,326,688 |
| Interactive Home Entertainment - 0.2% |
| Beijing Kunlun Tech Company Ltd. A Shares | 2,800 | 10,193 |
| Bilibili Inc. ADR (a) | 2,300 | 106,720 |
| Capcom Company Ltd. | 2,300 | 54,087 |
| CD Projekt S.A. | 1,051 | 50,302 |
| Embracer Group AB (a) | 8,668 | 92,397 |
| Kakao Games Corp. (a) | 264 | 20,209 |
| Kingsoft Corporation Ltd. | 13,600 | 59,746 |
| Koei Tecmo Holdings Company Ltd. | 790 | 31,043 |
| Konami Holdings Corp. | 1,600 | 76,697 |
| Krafton Inc. (a) | 268 | 103,706 |
| NCSoft Corp. | 231 | 124,949 |
| NetEase Inc. | 27,970 | 565,047 |
| Netmarble Corp. (d) | 299 | 31,441 |
| Nexon Company Ltd. | 8,300 | 160,299 |
| Nintendo Company Ltd. | 1,700 | 792,019 |
| Pearl Abyss Corp. (a) | 415 | 48,281 |
| Perfect World Company Ltd. A Shares | 3,300 | 10,540 |
| Playtika Holding Corp. (a) | 1,200 | 20,748 |
| Sea Ltd. ADR (a) | 2,100 | 469,791 |
See Notes to Schedule of Investments and Notes to Financial Statements.
| 66 | State Street Total Return V.I.S. Fund |
State Street Total Return V.I.S. Fund
Schedule of Investments, continued — December 31, 2021
| | Number
of Shares | Fair
Value |
| Square Enix Holdings Company Ltd. | 1,100 | $ 56,359 |
| UbiSoft Entertainment S.A. (a) | 1,236 | 60,538 |
| Wuhu Sanqi Interactive Entertainment Network Technology Group Company Ltd. A Shares | 3,000 | 12,747 |
| Zhejiang Century Huatong Group Company Ltd., Class A (a) | 8,600 | 11,347 |
| | | 2,969,206 |
| Interactive Media & Services - 0.4% |
| Adevinta ASA (a) | 3,612 | 48,046 |
| Auto Trader Group PLC (d) | 16,104 | 161,409 |
| Autohome Inc. ADR | 1,200 | 35,376 |
| Baidu Inc. ADR (a) | 3,800 | 565,402 |
| Hello Group Inc. ADR | 2,200 | 19,756 |
| Info Edge India Ltd. | 1,074 | 80,572 |
| JOYY Inc. ADR | 800 | 36,344 |
| Kakaku.com Inc. | 1,700 | 45,322 |
| Kakao Corp. (a) | 4,328 | 409,590 |
| Kanzhun Ltd. (a) | 500 | 17,440 |
| Kuaishou Technology (a)(d) | 5,600 | 51,753 |
| Mail.Ru Group Ltd. GDR (a) | 1,600 | 18,544 |
| NAVER Corp. | 1,714 | 545,740 |
| REA Group Ltd. | 897 | 109,329 |
| Scout24 SE (d) | 1,198 | 83,676 |
| Seek Ltd. | 5,659 | 134,869 |
| Tencent Holdings Ltd. | 78,975 | 4,627,295 |
| Weibo Corp. ADR (a) | 900 | 27,882 |
| Yandex N.V. A Shares (a) | 3,397 | 203,894 |
| Yandex NV, Class A (a) | 865 | 52,333 |
| Z Holdings Corp. | 40,996 | 237,599 |
| | | 7,512,171 |
| Internet & Direct Marketing Retail - 0.5% |
| Alibaba Group Holding Ltd. (a) | 208,200 | 3,175,222 |
| Allegro.eu S.A. (a)(d) | 5,078 | 48,961 |
| Americanas S.A. (a) | 7,088 | 40,187 |
| CJ ENM Company Ltd. | 130 | 15,179 |
| Dada Nexus Ltd. ADR (a) | 900 | 11,844 |
| Delivery Hero SE (a)(d) | 2,482 | 276,608 |
| Fiverr International Ltd. (a) | 400 | 45,480 |
| HengTen Networks Group Ltd. (a) | 40,000 | 15,135 |
| JD Health International Inc. (a)(d) | 5,200 | 40,986 |
| JD.com Inc. ADR (a) | 11,914 | 834,814 |
| | Number
of Shares | Fair
Value |
| Just Eat Takeaway.com N.V. (a)(d) | 3,023 | $ 166,628 |
| Meituan, Class B (a)(d) | 56,100 | 1,621,915 |
| Mercari Inc. (a) | 1,800 | 91,598 |
| momo.com Inc. | 1,000 | 58,734 |
| Naspers Ltd., Class N | 2,984 | 462,183 |
| OZON HOLDINGS PLC ADR (a) | 500 | 14,805 |
| Pinduoduo Inc. ADR (a) | 6,057 | 353,123 |
| Prosus N.V. | 14,425 | 1,206,194 |
| Rakuten Inc. (a) | 14,600 | 146,311 |
| Start Today Company Ltd. | 1,700 | 52,998 |
| Vipshop Holdings Ltd. ADR (a) | 6,234 | 52,366 |
| Zalando SE (a)(d) | 3,408 | 275,709 |
| Zomato Ltd. (a) | 12,102 | 22,369 |
| | | 9,029,349 |
| Internet Services & Infrastructure - 0.2% |
| Chindata Group Holdings Ltd. ADR (a) | 500 | 3,295 |
| GDS Holdings Ltd. ADR (a) | 1,300 | 61,308 |
| Kingsoft Cloud Holdings Ltd. ADR (a) | 1,000 | 15,750 |
| Shopify Inc., Class A (a) | 1,753 | 2,417,118 |
| Tucows Inc., Class A (a) | 400 | 33,528 |
| Vnet Group Inc. ADR (a) | 1,700 | 15,351 |
| Wix.com Ltd. (a) | 1,500 | 236,685 |
| | | 2,783,035 |
| Investment Banking & Brokerage - 0.1% |
| China Galaxy Securities Company Ltd. H Shares | 42,000 | 24,135 |
| China Galaxy Securities Company Ltd., Class A | 9,200 | 16,189 |
| China International Capital Corp. Ltd. A Shares | 1,200 | 9,252 |
| China International Capital Corporation Ltd. H Shares (d) | 20,000 | 55,154 |
| China Merchants Securities Company Ltd., Class A | 5,100 | 14,155 |
| CITIC Securities Company Ltd. H Shares | 29,500 | 77,001 |
| CITIC Securities Company Ltd., Class A | 12,100 | 50,253 |
| CSC Financial Company Ltd. A Shares | 4,000 | 18,399 |
| Daiwa Securities Group Inc. | 24,300 | 136,889 |
| Everbright Securities Company Ltd., Class A | 3,600 | 8,452 |
See Notes to Schedule of Investments and Notes to Financial Statements.
| State Street Total Return V.I.S. Fund | 67 |
State Street Total Return V.I.S. Fund
Schedule of Investments, continued — December 31, 2021
| | Number
of Shares | Fair
Value |
| Founder Securities Company Ltd. A Shares | 7,100 | $ 8,753 |
| Futu Holdings Ltd. ADR (a) | 700 | 30,310 |
| GF Securities Company Ltd. H Shares | 14,200 | 27,066 |
| GF Securities Company Ltd., Class A | 7,000 | 27,068 |
| Guosen Securities Company Ltd., Class A | 6,800 | 12,276 |
| Guotai Junan Securities Company Ltd., Class A | 8,600 | 24,194 |
| Haitong Securities Company Ltd. H Shares | 36,400 | 32,262 |
| Haitong Securities Company Ltd. A Shares | 11,500 | 22,172 |
| Huatai Securities Company Ltd H Shares (d) | 19,400 | 32,299 |
| Huatai Securities Company Ltd. A Shares | 10,700 | 29,884 |
| Industrial Securities Company Ltd., Class A | 7,500 | 11,653 |
| Korea Investment Holdings Company Ltd. | 619 | 42,022 |
| Meritz Securities Company Ltd. | 3,415 | 14,795 |
| NH Investment & Securities Company Ltd. | 2,645 | 27,813 |
| Nomura Holdings Inc. | 47,000 | 204,767 |
| Orient Securities Company Ltd., Class A | 6,400 | 14,835 |
| Samsung Securities Company Ltd. | 803 | 30,330 |
| SBI Holdings Inc. | 4,100 | 111,619 |
| SDIC Capital Company Ltd., Class A | 7,900 | 10,212 |
| Shenwan Hongyuan Group Company Ltd., Class A | 26,200 | 21,095 |
| Zheshang Securities Company Ltd. A Shares | 4,800 | 9,949 |
| Zhongtai Securities Company Ltd., Class A | 7,200 | 11,288 |
| | | 1,166,541 |
| IT Consulting & Other Services - 0.5% |
| Accenture PLC, Class A | 7,206 | 2,987,247 |
| Bechtle AG | 1,101 | 78,804 |
| Capgemini SE | 2,472 | 605,805 |
| CGI Inc. (a) | 3,400 | 301,065 |
| Chinasoft International Ltd. | 38,000 | 49,521 |
| Fujitsu Ltd. | 3,000 | 514,003 |
| Globant S.A. (a) | 400 | 125,636 |
| | Number
of Shares | Fair
Value |
| HCL Technologies Ltd. | 15,106 | $ 268,059 |
| Infosys Ltd. | 47,485 | 1,205,879 |
| Itochu Techno-Solutions Corp. | 1,232 | 39,585 |
| Larsen & Toubro Infotech Ltd. (d) | 704 | 69,438 |
| Mindtree Ltd. | 486 | 31,251 |
| Mphasis Ltd. | 439 | 20,060 |
| NEC Corp. | 3,740 | 172,458 |
| Nomura Research Institute Ltd. | 5,160 | 221,133 |
| NTT Data Corp. | 9,600 | 205,580 |
| Obic Company Ltd. | 1,100 | 206,331 |
| Otsuka Corp. | 1,500 | 71,512 |
| Samsung SDS Company Ltd. | 495 | 65,167 |
| SCSK Corp. | 1,800 | 35,780 |
| Tata Consultancy Services Ltd. | 12,836 | 645,524 |
| Tech Mahindra Ltd. | 8,835 | 212,812 |
| TIS Inc. | 3,800 | 113,022 |
| Wipro Ltd. | 18,940 | 182,264 |
| | | 8,427,936 |
| Leisure Facilities - 0.0% * |
| Oriental Land Company Ltd. | 3,100 | 522,118 |
| Shenzhen Overseas Chinese Town Company Ltd., Class A | 7,300 | 8,082 |
| Songcheng Performance Development Company Ltd. A Shares | 2,387 | 5,375 |
| | | 535,575 |
| Leisure Products - 0.0% * |
| Bandai Namco Holdings Inc. | 3,100 | 242,121 |
| Giant Manufacturing Company Ltd. | 4,000 | 49,879 |
| HLB Inc. (a) | 1,211 | 35,451 |
| Shimano Inc. | 1,100 | 292,875 |
| Yamaha Corp. | 2,300 | 113,247 |
| | | 733,573 |
| Life & Health Insurance - 0.5% |
| Aegon N.V. | 30,101 | 150,376 |
| AIA Group Ltd. | 187,200 | 1,887,295 |
| Athene Holding Ltd., Class A (a) | 1,268 | 105,662 |
| Bupa Arabia for Cooperative Insurance Co. | 784 | 27,439 |
| Cathay Financial Holding Company Ltd. | 111,000 | 250,750 |
See Notes to Schedule of Investments and Notes to Financial Statements.
| 68 | State Street Total Return V.I.S. Fund |
State Street Total Return V.I.S. Fund
Schedule of Investments, continued — December 31, 2021
| | Number
of Shares | Fair
Value |
| China Development Financial Holding Corp. | 234,392 | $ 142,748 |
| China Life Insurance Company Ltd. H Shares | 99,000 | 164,062 |
| China Life Insurance Company Ltd., Class A | 3,900 | 18,454 |
| China Taiping Insurance Holdings Company Ltd. | 22,800 | 31,292 |
| CNP Assurances | 2,193 | 54,242 |
| Dai-ichi Life Holdings Inc. | 15,400 | 310,996 |
| Discovery Ltd. (a) | 5,989 | 53,875 |
| Fubon Financial Holding Company Ltd. | 105,364 | 290,573 |
| Great-West Lifeco Inc. | 4,681 | 140,673 |
| HDFC Life Insurance Company Ltd. (d) | 11,492 | 100,418 |
| iA Financial Corporation Inc. | 1,798 | 103,028 |
| ICICI Prudential Life Insurance Company Ltd. (d) | 4,609 | 34,771 |
| Japan Post Holdings Company Ltd. | 37,600 | 292,820 |
| Japan Post Insurance Company Ltd. | 2,600 | 41,770 |
| Legal & General Group PLC | 91,756 | 369,730 |
| Manulife Financial Corp. | 29,900 | 570,707 |
| Medibank Private Ltd. | 46,656 | 113,636 |
| New China Life Insurance Company Ltd. H Shares | 12,600 | 33,697 |
| New China Life Insurance Company Ltd., Class A | 1,600 | 9,783 |
| NN Group N.V. | 4,131 | 223,661 |
| Old Mutual Ltd. | 59,183 | 48,578 |
| Phoenix Group Holdings PLC | 11,059 | 97,842 |
| Ping An Insurance Group Company of China Ltd. H Shares | 86,000 | 619,384 |
| Ping An Insurance Group Company of China Ltd., Class A | 10,100 | 80,066 |
| Poste Italiane S.p.A. (d) | 8,847 | 116,102 |
| Power Corporation of Canada | 8,580 | 283,928 |
| Prudential PLC | 40,364 | 696,782 |
| Rand Merchant Investment Holdings Ltd. | 9,249 | 26,176 |
| Samsung Life Insurance Company Ltd. | 840 | 45,295 |
| Sanlam Ltd. | 24,658 | 91,710 |
| SBI Life Insurance Company Ltd. (d) | 6,361 | 102,343 |
| Shin Kong Financial Holding Company Ltd. | 182,263 | 72,794 |
| Sun Life Financial Inc. | 8,990 | 501,117 |
| | Number
of Shares | Fair
Value |
| Swiss Life Holding AG | 484 | $ 296,939 |
| T&D Holdings Inc. | 9,100 | 116,323 |
| | | 8,717,837 |
| Life Sciences Tools & Services - 0.2% |
| Bachem Holding AG | 81 | 63,651 |
| Divi's Laboratories Ltd. | 1,851 | 116,490 |
| Eurofins Scientific SE | 2,045 | 253,022 |
| Genscript Biotech Corp. (a) | 16,000 | 70,803 |
| Hangzhou Tigermed Consulting Company Ltd., Class A | 500 | 10,049 |
| Hangzhou Tigermed Consulting Company Ltd. H Shares (d) | 1,500 | 19,047 |
| Joinn Laboratories China Company Ltd., Class A | 560 | 10,165 |
| Lonza Group AG | 1,151 | 962,083 |
| Pharmaron Beijing Company Ltd. H Shares (d) | 1,600 | 24,689 |
| Pharmaron Beijing Company Ltd. A Shares | 800 | 17,772 |
| QIAGEN N.V. (a) | 6,187 | 344,332 |
| Samsung Biologics Company Ltd. (a)(d) | 230 | 174,713 |
| Sartorius Stedim Biotech | 423 | 232,052 |
| WuXi AppTec Company Ltd. H Shares (d) | 4,108 | 71,134 |
| WuXi AppTec Company Ltd. A Shares | 2,820 | 52,586 |
| Wuxi Biologics Cayman Inc. (a)(d) | 50,500 | 599,486 |
| | | 3,022,074 |
| Managed Healthcare - 0.0% * |
| Hapvida Participacoes e Investimentos S.A. (d) | 16,035 | 29,882 |
| Notre Dame Intermedica Participacoes S.A. | 7,300 | 79,094 |
| Triple-S Management Corp. B Shares (a) | 960 | 34,253 |
| | | 143,229 |
| Marine - 0.1% |
| AP Moller - Maersk A/S, Class B | 89 | 319,109 |
| AP Moller - Maersk A/S, Class A | 53 | 176,498 |
| COSCO SHIPPING Holdings Company Ltd. H Shares (a) | 42,682 | 82,777 |
See Notes to Schedule of Investments and Notes to Financial Statements.
| State Street Total Return V.I.S. Fund | 69 |
State Street Total Return V.I.S. Fund
Schedule of Investments, continued — December 31, 2021
| | Number
of Shares | Fair
Value |
| COSCO SHIPPING Holdings Company Ltd., Class A (a) | 13,910 | $ 40,883 |
| Costamare Inc. | 2,856 | 36,128 |
| Evergreen Marine Corporation Taiwan Ltd. | 35,000 | 180,269 |
| Hyundai Merchant Marine Company Ltd. (a) | 3,495 | 79,088 |
| Kuehne + Nagel International AG | 832 | 268,826 |
| MISC Bhd | 19,075 | 32,280 |
| Nippon Yusen KK | 2,500 | 190,178 |
| Pan Ocean Company Ltd. | 2,918 | 13,280 |
| Safe Bulkers Inc. (a) | 3,039 | 11,457 |
| SITC International Holdings Company Ltd. | 18,000 | 65,108 |
| Wan Hai Lines Ltd. | 8,800 | 63,136 |
| Yang Ming Marine Transport Corp. (a) | 22,000 | 96,216 |
| | | 1,655,233 |
| Marine Ports & Services - 0.0% * |
| Adani Ports & Special Economic Zone Ltd. | 7,151 | 70,254 |
| China Merchants Port Holdings Company Ltd. | 22,000 | 40,070 |
| COSCO SHIPPING Ports Ltd. | 32,000 | 27,788 |
| International Container Terminal Services Inc. | 10,850 | 42,555 |
| Shanghai International Port Group Company Ltd., Class A | 13,900 | 11,979 |
| Westports Holdings Bhd | 16,088 | 15,640 |
| | | 208,286 |
| Metal & Glass Containers - 0.0% * |
| CCL Industries Inc., Class B | 2,500 | 134,248 |
| Motorcycle Manufacturers - 0.0% * |
| Bajaj Auto Ltd. | 983 | 42,967 |
| Eicher Motors Ltd. | 1,959 | 68,306 |
| Hero MotoCorp Ltd. | 1,723 | 57,068 |
| Yadea Group Holdings Ltd. (d) | 16,000 | 31,194 |
| Yamaha Motor Company Ltd. | 5,000 | 119,795 |
| | | 319,330 |
| Movies & Entertainment - 0.1% |
| Alibaba Pictures Group Ltd. (a) | 140,000 | 12,750 |
| Beijing Enlight Media Company Ltd., Class A | 5,600 | 11,316 |
| Bollore S.A. | 11,741 | 65,691 |
| | Number
of Shares | Fair
Value |
| Eros STX Global Corp. (a) | 9,900 | $ 2,373 |
| HYBE Company Ltd. (a) | 189 | 55,488 |
| IMAX Corp. (a) | 2,200 | 39,248 |
| iQIYI Inc. ADR (a) | 4,000 | 18,240 |
| Mango Excellent Media Company Ltd., Class A | 1,600 | 14,397 |
| Spotify Technology S.A. (a) | 1,500 | 351,045 |
| Tencent Music Entertainment Group ADR (a) | 9,100 | 62,335 |
| Toho Company Ltd. | 1,500 | 64,153 |
| Universal Music Group N.V. | 11,136 | 313,810 |
| | | 1,010,846 |
| Multi-Line Insurance - 0.3% |
| Ageas | 2,891 | 149,752 |
| Allianz SE | 6,377 | 1,505,862 |
| Assicurazioni Generali S.p.A. | 17,013 | 360,438 |
| Aviva PLC | 60,074 | 333,931 |
| AXA S.A. | 29,895 | 890,201 |
| Baloise Holding AG | 784 | 128,293 |
| BB Seguridade Participacoes S.A. | 8,703 | 32,421 |
| China Pacific Insurance Group Company Ltd. H Shares | 37,689 | 102,244 |
| China Pacific Insurance Group Company Ltd., Class A | 5,500 | 23,456 |
| Fairfax Financial Holdings Ltd. | 395 | 194,581 |
| Gjensidige Forsikring ASA | 2,550 | 61,883 |
| Powszechny Zaklad Ubezpieczen S.A. | 8,645 | 75,824 |
| Sampo Oyj, Class A | 7,670 | 384,305 |
| The Co. for Cooperative Insurance | 1,160 | 23,945 |
| Zurich Insurance Group AG | 2,325 | 1,021,709 |
| | | 5,288,845 |
| Multi-Sector Holdings - 0.1% |
| Eurazeo S.E. | 513 | 44,804 |
| EXOR N.V. | 1,820 | 163,424 |
| Groupe Bruxelles Lambert S.A. | 1,723 | 192,334 |
| Industrivarden AB A Shares | 2,300 | 73,264 |
| Industrivarden AB C Shares | 2,115 | 66,367 |
| Investor AB B Shares | 28,114 | 707,209 |
| Investor AB A Shares | 7,611 | 200,576 |
| Kinnevik AB, Class B (a) | 4,075 | 145,265 |
| L E Lundbergforetagen AB, Class B | 967 | 54,257 |
| Metro Pacific Investments Corp. | 108,000 | 8,260 |
See Notes to Schedule of Investments and Notes to Financial Statements.
| 70 | State Street Total Return V.I.S. Fund |
State Street Total Return V.I.S. Fund
Schedule of Investments, continued — December 31, 2021
| | Number
of Shares | Fair
Value |
| Remgro Ltd. | 8,414 | $ 69,141 |
| Sofina S.A. | 260 | 127,730 |
| Wendel S.A. | 350 | 41,951 |
| | | 1,894,582 |
| Multi-Utilities - 0.2% |
| Algonquin Power & Utilities Corp. | 11,292 | 163,326 |
| Canadian Utilities Ltd., Class A | 1,500 | 43,570 |
| E.ON SE | 34,575 | 479,373 |
| Engie S.A. | 28,107 | 415,970 |
| National Grid PLC | 55,850 | 801,697 |
| Qatar Electricity & Water Co. QSC | 4,143 | 18,889 |
| RWE AG | 9,882 | 401,414 |
| Suez S.A. | 5,931 | 133,613 |
| Veolia Environnement S.A. | 10,077 | 369,685 |
| | | 2,827,537 |
| Office REITs - 0.0% * |
| City Office REIT Inc. | 1,799 | 35,477 |
| Covivio | 664 | 54,518 |
| Dexus | 18,104 | 146,367 |
| Japan Real Estate Investment Corp. | 21 | 119,083 |
| Nippon Building Fund Inc. | 25 | 145,456 |
| Orix JREIT Inc. | 35 | 54,648 |
| | | 555,549 |
| Office Services & Supplies - 0.0% * |
| Shanghai M&G Stationery Inc., Class A | 1,000 | 10,145 |
| Oil & Gas Drilling - 0.0% * |
| China Oilfield Services Ltd. H Shares | 22,000 | 19,273 |
| Oil & Gas Equipment & Services - 0.0% * |
| Dialog Group Bhd | 57,900 | 36,413 |
| Offshore Oil Engineering Company Ltd., Class A | 14,500 | 10,512 |
| Tenaris S.A. | 6,241 | 65,366 |
| Yantai Jereh Oilfield Services Group Company Ltd., Class A | 1,900 | 11,951 |
| | | 124,242 |
| Oil & Gas Exploration & Production - 0.1% |
| Aker BP ASA | 1,657 | 51,035 |
| | Number
of Shares | Fair
Value |
| Canadian Natural Resources Ltd. | 18,300 | $ 774,362 |
| Inpex Corp. | 17,200 | 149,662 |
| Lundin Petroleum AB | 3,374 | 120,928 |
| Novatek PJSC GDR | 1,284 | 300,713 |
| PTT Exploration & Production PCL NVDR | 19,895 | 70,277 |
| Santos Ltd. | 52,601 | 241,317 |
| Tatneft PJSC ADR | 3,383 | 140,428 |
| Tourmaline Oil Corp. | 5,200 | 168,126 |
| Woodside Petroleum Ltd. | 14,747 | 235,129 |
| | | 2,251,977 |
| Oil & Gas Refining & Marketing - 0.2% |
| Ampol Ltd. | 3,161 | 68,165 |
| Bharat Petroleum Corporation Ltd. | 11,557 | 59,926 |
| Cosan S.A. | 13,636 | 53,100 |
| Empresas COPEC S.A. | 4,928 | 38,094 |
| ENEOS Holdings Inc. | 46,800 | 174,878 |
| Formosa Petrochemical Corp. | 16,000 | 55,459 |
| GS Holdings Corp. | 866 | 28,484 |
| Hindustan Petroleum Corporation Ltd. | 9,532 | 37,488 |
| Idemitsu Kosan Company Ltd. | 3,600 | 91,817 |
| Indian Oil Corporation Ltd. | 25,059 | 37,587 |
| Neste Oyj | 6,497 | 320,360 |
| Parkland Corp. | 2,600 | 71,569 |
| Petronas Dagangan Bhd | 2,000 | 9,890 |
| Polski Koncern Naftowy ORLEN S.A. | 4,301 | 79,331 |
| Qatar Fuel QSC | 8,983 | 45,100 |
| Rabigh Refining & Petrochemical Co. (a) | 3,096 | 17,070 |
| Reliance Industries Ltd. | 39,080 | 1,244,992 |
| SK Innovation Company Ltd. (a) | 713 | 143,050 |
| S-Oil Corp. | 648 | 46,716 |
| Thai Oil PCL NVDR | 14,900 | 22,079 |
| Tupras Turkiye Petrol Rafinerileri A/S (a) | 2,355 | 27,381 |
| | | 2,672,536 |
| Oil & Gas Storage & Transportation - 0.1% |
| China Suntien Green Energy Corp. Ltd. H Shares | 15,000 | 11,698 |
| DHT Holdings Inc. | 6,528 | 33,880 |
| Enbridge Inc. | 31,300 | 1,224,346 |
| Frontline Ltd. (a) | 5,500 | 38,885 |
| Golar LNG Ltd. (a) | 5,017 | 62,161 |
See Notes to Schedule of Investments and Notes to Financial Statements.
| State Street Total Return V.I.S. Fund | 71 |
State Street Total Return V.I.S. Fund
Schedule of Investments, continued — December 31, 2021
| | Number
of Shares | Fair
Value |
| Keyera Corp. | 2,900 | $ 65,501 |
| Nordic American Tankers Ltd. | 8,800 | 14,872 |
| Pembina Pipeline Corp. | 8,400 | 255,162 |
| Petronet LNG Ltd. | 9,742 | 28,360 |
| Qatar Gas Transport Company Ltd. | 29,709 | 26,927 |
| Scorpio Tankers Inc. | 2,247 | 28,784 |
| SFL Corporation Ltd. | 5,600 | 45,640 |
| TC Energy Corp. | 15,100 | 703,268 |
| Teekay Corp. (a) | 3,616 | 11,354 |
| Teekay Tankers Ltd., Class A (a) | 1,500 | 16,350 |
| Ultrapar Participacoes S.A. | 10,200 | 26,626 |
| | | 2,593,814 |
| Other Diversified Financial Services - 0.1% |
| Bajaj Finserv Ltd. | 534 | 117,856 |
| FirstRand Ltd. | 68,984 | 262,796 |
| M&G PLC | 43,995 | 118,880 |
| ORIX Corp. | 18,800 | 383,249 |
| Yuanta Financial Holding Company Ltd. | 139,000 | 127,108 |
| | | 1,009,889 |
| Packaged Foods & Meats - 0.6% |
| Ajinomoto Company Inc. | 7,100 | 215,611 |
| Almarai Co. JSC | 3,789 | 49,199 |
| Associated British Foods PLC | 5,986 | 162,803 |
| Barry Callebaut AG | 60 | 145,925 |
| BRF S.A. (a) | 9,200 | 37,196 |
| Britannia Industries Ltd. | 1,480 | 71,794 |
| Charoen Pokphand Foods PCL NVDR | 57,573 | 43,949 |
| China Feihe Ltd. (d) | 49,568 | 66,504 |
| China Huishan Dairy Holdings Company Ltd. (a)(c)** | 55,000 | — |
| China Mengniu Dairy Company Ltd. | 44,000 | 249,452 |
| Chocoladefabriken Lindt & Spruengli AG | 18 | 490,018 |
| CJ CheilJedang Corp. | 117 | 38,139 |
| Dali Foods Group Company Ltd. (d) | 20,617 | 10,789 |
| Danone S.A. | 10,077 | 625,577 |
| Foshan Haitian Flavouring & Food Company Ltd., Class A | 3,040 | 50,249 |
| Gruma SAB de CV, Class B | 2,925 | 37,521 |
| Grupo Bimbo SAB de CV | 22,581 | 69,481 |
| | Number
of Shares | Fair
Value |
| Guangdong Haid Group Company Ltd., Class A | 1,800 | $ 20,748 |
| Henan Shuanghui Investment & Development Company Ltd., Class A | 3,185 | 15,802 |
| Indofood CBP Sukses Makmur Tbk PT | 44,100 | 26,920 |
| Indofood Sukses Makmur Tbk PT | 55,136 | 24,468 |
| Inner Mongolia Yili Industrial Group Company Ltd., Class A | 6,500 | 42,379 |
| JBS S.A. | 12,000 | 81,759 |
| JDE Peet's N.V. | 1,760 | 54,240 |
| Kerry Group PLC, Class A | 2,444 | 314,758 |
| Kikkoman Corp. | 2,400 | 201,537 |
| MEIJI Holdings Company Ltd. | 2,100 | 125,101 |
| Monde Nissin Corp. (a)(d) | 9,100 | 2,891 |
| Mowi ASA | 7,374 | 174,518 |
| Muyuan Foods Company Ltd. A Shares | 4,620 | 38,767 |
| Nestle India Ltd. | 469 | 124,328 |
| Nestle Malaysia Bhd | 939 | 30,248 |
| Nestle S.A. | 43,606 | 6,099,049 |
| Nisshin Seifun Group Inc. | 2,500 | 35,995 |
| Nissin Foods Holdings Company Ltd. | 1,100 | 80,144 |
| Orion Corp. | 335 | 29,167 |
| Orkla ASA | 12,698 | 127,235 |
| PPB Group Bhd | 8,687 | 35,657 |
| QL Resources Bhd | 12,588 | 13,809 |
| Saputo Inc. | 4,200 | 94,763 |
| Tata Consumer Products Ltd. | 8,404 | 84,051 |
| Thai Union Group PCL NVDR | 53,200 | 31,055 |
| The Savola Group | 4,793 | 40,789 |
| Tiger Brands Ltd. | 2,152 | 24,406 |
| Tingyi Cayman Islands Holding Corp. | 28,000 | 57,535 |
| Toyo Suisan Kaisha Ltd. | 1,190 | 50,378 |
| Uni-President China Holdings Ltd. | 24,000 | 23,273 |
| Uni-President Enterprises Corp. | 67,000 | 166,126 |
| Universal Robina Corp. | 12,120 | 30,423 |
| Want Want China Holdings Ltd. | 69,000 | 63,369 |
| Wens Foodstuffs Group Company Ltd., Class A (a) | 3,800 | 11,509 |
| WH Group Ltd. (d) | 115,166 | 72,235 |
| Yakult Honsha Company Ltd. | 2,200 | 114,628 |
| Yihai International Holding Ltd. | 7,364 | 34,051 |
See Notes to Schedule of Investments and Notes to Financial Statements.
| 72 | State Street Total Return V.I.S. Fund |
State Street Total Return V.I.S. Fund
Schedule of Investments, continued — December 31, 2021
| | Number
of Shares | Fair
Value |
| Yihai Kerry Arawana Holdings Company Ltd., Class A | 1,000 | $ 9,896 |
| | | 10,972,214 |
| Paper Packaging - 0.0% * |
| Amcor PLC | 18,000 | 216,180 |
| Klabin S.A. | 10,500 | 48,372 |
| SCG Packaging PCL NVDR | 18,432 | 38,210 |
| Smurfit Kappa Group PLC | 3,758 | 207,013 |
| Yunnan Energy New Material Company Ltd., Class A | 800 | 31,502 |
| | | 541,277 |
| Paper Products - 0.1% |
| Empresas CMPC S.A. | 9,056 | 15,178 |
| Indah Kiat Pulp & Paper Corp. Tbk PT | 33,200 | 18,228 |
| Lee & Man Paper Manufacturing Ltd. | 20,310 | 14,120 |
| Mondi PLC | 7,404 | 183,118 |
| Nine Dragons Paper Holdings Ltd. | 25,310 | 27,173 |
| Oji Holdings Corp. | 10,700 | 51,755 |
| Stora Enso Oyj R Shares | 9,750 | 178,955 |
| Suzano Papel e Celulose S.A. (a) | 10,700 | 115,472 |
| UPM-Kymmene Oyj | 8,191 | 311,673 |
| | | 915,672 |
| Personal Products - 0.3% |
| Amorepacific Corp. | 436 | 61,251 |
| AMOREPACIFIC Group | 542 | 20,221 |
| Beiersdorf AG | 1,690 | 173,698 |
| By-health Company Ltd., Class A | 2,900 | 12,295 |
| Colgate-Palmolive India Ltd. | 1,632 | 32,521 |
| Dabur India Ltd. | 9,349 | 72,951 |
| Godrej Consumer Products Ltd. (a) | 4,793 | 62,437 |
| Hengan International Group Company Ltd. | 9,480 | 48,821 |
| Hindustan Unilever Ltd. | 11,522 | 365,822 |
| Kao Corp. | 7,300 | 381,561 |
| Kobayashi Pharmaceutical Company Ltd. | 700 | 54,952 |
| Kose Corp. | 600 | 67,995 |
| LG Household & Health Care Ltd. | 134 | 123,658 |
| L'Oreal S.A. | 3,883 | 1,841,146 |
| Marico Ltd. | 7,676 | 52,937 |
| | Number
of Shares | Fair
Value |
| Natura & Co. Holding S.A. (a) | 12,200 | $ 55,700 |
| Pola Orbis Holdings Inc. | 1,200 | 19,977 |
| Proya Cosmetics Company Ltd., Class A | 200 | 6,552 |
| Shiseido Company Ltd. | 6,100 | 339,763 |
| Unilever PLC | 40,164 | 2,146,357 |
| | | 5,940,615 |
| Pharmaceuticals - 1.3% |
| Aspen Pharmacare Holdings Ltd. | 5,553 | 78,090 |
| Astellas Pharma Inc. | 28,700 | 466,183 |
| AstraZeneca PLC | 23,982 | 2,818,825 |
| Asymchem Laboratories Tianjin Company Ltd. A Shares | 166 | 11,355 |
| Aurobindo Pharma Ltd. | 4,517 | 44,623 |
| Bayer AG | 15,170 | 810,812 |
| Betta Pharmaceuticals Company Ltd., Class A | 600 | 7,532 |
| Canopy Growth Corp. (a) | 3,100 | 27,094 |
| CanSino Biologics Inc. H Shares (a)(d) | 1,145 | 26,465 |
| CanSino Biologics Inc. A Shares (a) | 114 | 5,370 |
| Celltrion Pharm Inc. (a) | 216 | 22,604 |
| Changchun High & New Technology Industry Group Inc., Class A | 300 | 12,804 |
| China Medical System Holdings Ltd. | 19,000 | 31,730 |
| China Traditional Chinese Medicine Holdings Company Ltd. | 52,000 | 34,483 |
| Chugai Pharmaceutical Company Ltd. | 10,300 | 334,076 |
| Cipla Ltd. | 6,698 | 85,068 |
| CSPC Pharmaceutical Group Ltd. | 128,000 | 139,061 |
| Daiichi Sankyo Company Ltd. | 27,000 | 685,815 |
| Dong-E-E-Jiao Company Ltd. A Shares | 1,800 | 13,799 |
| Dr Reddy's Laboratories Ltd. | 1,652 | 109,051 |
| Eisai Company Ltd. | 3,600 | 204,174 |
| Endo International PLC (a) | 10,800 | 40,608 |
| GlaxoSmithKline PLC | 77,845 | 1,693,954 |
| Hanmi Pharm Company Ltd. | 78 | 18,110 |
| Hansoh Pharmaceutical Group Company Ltd. (d) | 18,000 | 43,867 |
| Hikma Pharmaceuticals PLC | 2,293 | 68,917 |
See Notes to Schedule of Investments and Notes to Financial Statements.
| State Street Total Return V.I.S. Fund | 73 |
State Street Total Return V.I.S. Fund
Schedule of Investments, continued — December 31, 2021
| | Number
of Shares | Fair
Value |
| Humanwell Healthcare Group Company Ltd., Class A | 2,200 | $ 7,791 |
| Hutchison China MediTech Ltd. ADR (a) | 1,200 | 42,096 |
| Hypera S.A. | 5,100 | 25,885 |
| Ipsen S.A. | 494 | 45,223 |
| Jazz Pharmaceuticals PLC (a) | 600 | 76,440 |
| Jiangsu Hengrui Medicine Company Ltd., Class A | 5,820 | 46,411 |
| Kalbe Farma Tbk PT | 254,200 | 28,804 |
| Kyowa Hakko Kirin Company Ltd. | 4,600 | 125,231 |
| Lupin Ltd. | 3,340 | 42,718 |
| Merck KGaA | 1,991 | 513,965 |
| Nippon Shinyaku Company Ltd. | 600 | 41,735 |
| Novartis AG | 33,922 | 2,988,814 |
| Novo Nordisk A/S B Shares | 26,073 | 2,930,111 |
| Oneness Biotech Company Ltd. (a) | 3,000 | 31,174 |
| Ono Pharmaceutical Company Ltd. | 6,200 | 153,768 |
| Orion Oyj, Class B | 1,349 | 56,025 |
| Otsuka Holdings Company Ltd. | 6,000 | 217,220 |
| Perrigo Company PLC | 1,600 | 62,240 |
| Recordati Industria Chimica e Farmaceutica SpA | 1,772 | 113,854 |
| Richter Gedeon Nyrt | 2,006 | 54,003 |
| Roche Holding AG | 11,370 | 4,746,629 |
| Sanofi | 17,593 | 1,772,198 |
| Santen Pharmaceutical Company Ltd. | 4,800 | 58,648 |
| Shanghai Fosun Pharmaceutical Group Company Ltd. H Shares | 5,500 | 24,233 |
| Shanghai Fosun Pharmaceutical Group Company Ltd., Class A | 3,000 | 23,088 |
| Shin Poong Pharmaceutical Company Ltd. | 464 | 12,471 |
| Shionogi & Company Ltd. | 4,100 | 289,284 |
| Sino Biopharmaceutical Ltd. | 144,000 | 100,848 |
| SK Biopharmaceuticals Company Ltd. (a) | 382 | 31,235 |
| Sumitomo Dainippon Pharma Company Ltd. | 2,300 | 26,464 |
| Sun Pharmaceutical Industries Ltd. | 11,841 | 134,712 |
| Taisho Pharmaceutical Holdings Company Ltd. | 500 | 22,969 |
| | Number
of Shares | Fair
Value |
| Takeda Pharmaceutical Company Ltd. | 24,400 | $ 664,694 |
| Teva Pharmaceutical Industries Ltd. ADR (a) | 18,500 | 148,185 |
| Theravance Biopharma Inc. (a) | 2,800 | 30,940 |
| Torrent Pharmaceuticals Ltd. | 677 | 29,858 |
| UCB S.A. | 1,933 | 220,590 |
| Vifor Pharma AG | 827 | 147,265 |
| Yuhan Corp. | 704 | 368 |
| Yunnan Baiyao Group Company Ltd. A Shares | 1,000 | 16,457 |
| Zhangzhou Pientzehuang Pharmaceutical Company Ltd., Class A | 500 | 34,372 |
| Zhejiang Huahai Pharmaceutical Company Ltd., Class A | 2,600 | 8,856 |
| Zhejiang NHU Company Ltd. A Shares | 2,160 | 10,571 |
| | | 23,992,913 |
| Precious Metals & Minerals - 0.0% * |
| Alrosa PJSC (a) | 46,308 | 75,636 |
| Anglo American Platinum Ltd. | 757 | 86,171 |
| Impala Platinum Holdings Ltd. | 11,238 | 158,431 |
| Industrias Penoles SAB de C.V. | 1,800 | 20,719 |
| Northam Platinum Holdings Ltd. (a) | 3,318 | 43,554 |
| Sibanye Stillwater Ltd. | 37,582 | 115,619 |
| | | 500,130 |
| Property & Casualty Insurance - 0.2% |
| Admiral Group PLC | 3,257 | 139,269 |
| Argo Group International Holdings Ltd. | 1,432 | 83,214 |
| Chubb Ltd. | 4,908 | 948,765 |
| DB Insurance Company Ltd. | 648 | 29,436 |
| ICICI Lombard General Insurance Company Ltd. (d) | 3,270 | 61,640 |
| Insurance Australia Group Ltd. | 41,596 | 128,833 |
| Intact Financial Corp. | 2,717 | 353,663 |
| James River Group Holdings Ltd. | 1,841 | 53,039 |
| MS&AD Insurance Group Holdings Inc. | 6,800 | 209,571 |
| People's Insurance Company Group of China Ltd. H Shares | 111,000 | 33,601 |
See Notes to Schedule of Investments and Notes to Financial Statements.
| 74 | State Street Total Return V.I.S. Fund |
State Street Total Return V.I.S. Fund
Schedule of Investments, continued — December 31, 2021
| | Number
of Shares | Fair
Value |
| PICC Property & Casualty Company Ltd. H Shares | 96,000 | $ 78,437 |
| QBE Insurance Group Ltd. | 22,502 | 185,687 |
| Samsung Fire & Marine Insurance Company Ltd. | 425 | 72,219 |
| Sompo Holdings Inc. | 4,900 | 206,757 |
| Suncorp Group Ltd. | 21,530 | 173,283 |
| The People's Insurance Company Group of China Ltd., Class A | 10,900 | 8,056 |
| Tokio Marine Holdings Inc. | 9,700 | 538,426 |
| Tryg A/S | 6,054 | 149,493 |
| ZhongAn Online P&C Insurance Company Ltd. H Shares (a)(d) | 6,100 | 21,204 |
| | | 3,474,593 |
| Publishing - 0.0% * |
| China Literature Ltd. (a)(d) | 5,800 | 36,453 |
| Pearson PLC | 12,855 | 106,767 |
| Schibsted ASA, Class A | 952 | 36,716 |
| Schibsted ASA A Shares | 1,169 | 39,372 |
| | | 219,308 |
| Railroads - 0.2% * |
| Aurizon Holdings Ltd. | 24,595 | 62,408 |
| Beijing-Shanghai High Speed Railway Company Ltd., Class A | 45,600 | 34,635 |
| BTS Group Holdings PCL NVDR | 97,600 | 27,318 |
| Canadian National Railway Co. | 10,900 | 1,340,808 |
| Canadian Pacific Railway Ltd. | 14,400 | 1,037,179 |
| Central Japan Railway Co. | 2,200 | 293,161 |
| Container Corporation of India Ltd. | 3,216 | 26,587 |
| East Japan Railway Co. | 4,600 | 282,539 |
| Hankyu Hanshin Holdings Inc. | 3,900 | 110,577 |
| Keio Corp. | 1,400 | 61,639 |
| Keisei Electric Railway Company Ltd. | 2,200 | 59,416 |
| Kintetsu Group Holdings Company Ltd. (a) | 2,300 | 64,214 |
| MTR Corporation Ltd. | 26,000 | 139,566 |
| Odakyu Electric Railway Company Ltd. | 4,000 | 74,196 |
| Rumo S.A. (a) | 18,400 | 58,669 |
| Tobu Railway Company Ltd. | 2,400 | 54,646 |
| Tokyu Corp. | 8,400 | 111,460 |
| | Number
of Shares | Fair
Value |
| West Japan Railway Co. | 3,600 | $ 150,371 |
| | | 3,989,389 |
| Real Estate Development - 0.1% |
| Agile Group Holdings Ltd. | 16,000 | 8,681 |
| China Evergrande Group | 17,000 | 3,467 |
| China Jinmao Holdings Group Ltd. | 70,000 | 21,638 |
| China Merchants Shekou Industrial Zone Holdings Company Ltd., Class A | 9,300 | 19,510 |
| China Overseas Land & Investment Ltd. | 53,000 | 125,493 |
| China Resources Land Ltd. | 44,000 | 185,113 |
| China Vanke Company Ltd. H Shares | 22,500 | 52,352 |
| China Vanke Company Ltd. A Shares | 10,500 | 32,628 |
| CIFI Holdings Group Company Ltd. | 42,000 | 25,266 |
| CK Asset Holdings Ltd. | 30,586 | 192,823 |
| Country Garden Holdings Company Ltd. | 108,298 | 96,125 |
| Dar Al Arkan Real Estate Development Co. (a) | 4,187 | 11,219 |
| Emaar Economic City (a) | 4,029 | 12,813 |
| Emaar Properties PJSC | 50,981 | 67,872 |
| Godrej Properties Ltd. (a) | 892 | 22,461 |
| Greentown China Holdings Ltd. | 8,000 | 12,888 |
| Guangzhou R&F Properties Company Ltd. H Shares | 22,400 | 8,332 |
| Henderson Land Development Company Ltd. | 25,000 | 106,461 |
| Hopson Development Holdings Ltd. | 11,220 | 23,401 |
| KWG Group Holdings Ltd. | 19,936 | 13,041 |
| Land & Houses PCL NVDR | 105,731 | 27,853 |
| Logan Group Company Ltd | 18,000 | 13,760 |
| Longfor Group Holdings Ltd. (d) | 25,968 | 122,241 |
| Poly Developments & Holdings Group Company Ltd., Class A | 12,800 | 31,461 |
| Powerlong Real Estate Holdings Ltd. | 28,000 | 14,653 |
| Ruentex Development Company Ltd. | 14,000 | 32,284 |
| Seazen Group Ltd. | 26,000 | 17,575 |
| Seazen Holdings Company Ltd. A Shares | 1,400 | 6,413 |
See Notes to Schedule of Investments and Notes to Financial Statements.
| State Street Total Return V.I.S. Fund | 75 |
State Street Total Return V.I.S. Fund
Schedule of Investments, continued — December 31, 2021
| | Number
of Shares | Fair
Value |
| Shimao Group Holdings Ltd. | 16,102 | $ 10,533 |
| Sino Land Company Ltd. | 58,000 | 72,237 |
| Sunac China Holdings Ltd. | 34,000 | 51,373 |
| Yuexiu Property Company Ltd. | 18,063 | 15,917 |
| | | 1,457,884 |
| Real Estate Operating Companies - 0.1% |
| A-Living Smart City Services Company Ltd. H Shares (d) | 10,055 | 17,153 |
| Aroundtown S.A. | 16,961 | 102,613 |
| Azrieli Group Ltd. | 548 | 52,293 |
| Central Pattana PCL NVDR | 27,300 | 46,174 |
| China Resources Mixc Lifestyle Services Ltd. (d) | 7,600 | 35,435 |
| CIFI Ever Sunshine Services Group Ltd. | 14,000 | 21,692 |
| Country Garden Services Holdings Company Ltd. | 21,715 | 130,073 |
| Fastighets AB Balder B Shares (a) | 1,774 | 127,713 |
| Greentown Service Group Company Ltd. | 20,000 | 18,470 |
| Hang Lung Properties Ltd. | 27,000 | 55,550 |
| Hongkong Land Holdings Ltd. | 19,800 | 102,960 |
| Hulic Company Ltd. | 5,300 | 50,259 |
| LEG Immobilien SE | 1,222 | 170,511 |
| Mabanee Co. KPSC | 7,558 | 19,830 |
| NEPI Rockcastle PLC | 6,015 | 39,949 |
| Sagax AB | 2,734 | 92,101 |
| Shimao Services Holdings Ltd. (d) | 11,000 | 7,647 |
| SM Prime Holdings Inc. | 165,400 | 109,959 |
| Sunac Services Holdings Ltd. (a)(d) | 11,000 | 11,217 |
| Swire Properties Ltd. | 15,200 | 38,096 |
| Swiss Prime Site AG | 1,283 | 126,237 |
| Vonovia SE | 11,381 | 627,710 |
| Wharf Real Estate Investment Company Ltd. | 28,000 | 142,221 |
| | | 2,145,863 |
| Real Estate Services - 0.0% * |
| China Overseas Property Holdings Ltd. | 15,000 | 15,911 |
| FirstService Corp. | 600 | 118,086 |
| KE Holdings Inc. ADR (a) | 5,000 | 100,600 |
| | | 234,597 |
| Regional Banks - 0.0% * |
| Bandhan Bank Ltd. (d) | 8,880 | 30,187 |
| | Number
of Shares | Fair
Value |
| Bank of Hangzhou Company Ltd. A Shares | 5,547 | $ 11,183 |
| Bank of Jiangsu Company Ltd., Class A | 17,200 | 15,769 |
| Bank of Nanjing Company Ltd., Class A | 11,600 | 16,345 |
| Bank of Ningbo Company Ltd. A Shares | 4,856 | 29,232 |
| Concordia Financial Group Ltd. | 14,400 | 52,270 |
| First Bancorp | 9,208 | 126,886 |
| OFG Bancorp | 2,353 | 62,496 |
| Popular Inc. | 900 | 73,836 |
| Resona Holdings Inc. | 34,700 | 134,816 |
| The Chiba Bank Ltd. | 6,900 | 39,487 |
| The Shizuoka Bank Ltd. | 5,900 | 42,115 |
| | | 634,622 |
| Reinsurance - 0.1% |
| Enstar Group Ltd. (a) | 565 | 139,888 |
| Everest Re Group Ltd. | 400 | 109,568 |
| Greenlight Capital Re Ltd., Class A (a) | 1,260 | 9,879 |
| Hannover Rueck SE | 919 | 174,686 |
| Maiden Holdings Ltd. (a) | 3,334 | 10,202 |
| Muenchener Rueckversicherungs-Gesellschaft AG | 2,161 | 640,176 |
| RenaissanceRe Holdings Ltd. | 500 | 84,665 |
| SiriusPoint Ltd. (a) | 3,758 | 30,553 |
| Swiss Re AG | 4,645 | 460,141 |
| | | 1,659,758 |
| Renewable Electricity - 0.0% * |
| Adani Green Energy Ltd. (a) | 5,467 | 97,833 |
| China Longyuan Power Group Corporation Ltd. H Shares | 47,000 | 109,719 |
| China Yangtze Power Company Ltd. A Shares | 21,300 | 76,035 |
| EDP Renovaveis SA | 4,869 | 121,261 |
| Energy Absolute PCL NVDR | 22,203 | 63,807 |
| Engie Brasil Energia S.A. | 3,233 | 22,294 |
| Meridian Energy Ltd. | 17,382 | 57,718 |
| Northland Power Inc. | 3,823 | 114,858 |
| | | 663,525 |
| Research & Consulting Services - 0.2% |
| Bureau Veritas S.A. | 4,938 | 163,860 |
| Clarivate PLC (a) | 5,000 | 117,600 |
| Experian PLC | 14,226 | 699,829 |
See Notes to Schedule of Investments and Notes to Financial Statements.
| 76 | State Street Total Return V.I.S. Fund |
State Street Total Return V.I.S. Fund
Schedule of Investments, continued — December 31, 2021
| | Number
of Shares | Fair
Value |
| IHS Markit Ltd. | 4,300 | $ 571,556 |
| Intertek Group PLC | 2,462 | 187,741 |
| Nihon M&A Center Holdings Inc. | 5,100 | 124,937 |
| RELX PLC | 29,876 | 971,982 |
| SGS S.A. | 92 | 307,660 |
| Teleperformance | 903 | 402,541 |
| Thomson Reuters Corp. | 2,618 | 313,522 |
| Wolters Kluwer N.V. | 4,120 | 485,393 |
| | | 4,346,621 |
| Residential REITs - 0.0% * |
| Canadian Apartment Properties REIT | 1,100 | 52,216 |
| Restaurants - 0.1% |
| Compass Group PLC (a) | 27,508 | 615,133 |
| Domino's Pizza Enterprises Ltd. | 1,032 | 88,560 |
| Haidilao International Holding Ltd. (d) | 15,000 | 33,862 |
| Jiumaojiu International Holdings Ltd. (d) | 10,000 | 17,572 |
| Jollibee Foods Corp. | 4,260 | 18,078 |
| Jubilant Foodworks Ltd. | 1,140 | 55,073 |
| McDonald's Holdings Company Japan Ltd. | 1,400 | 61,882 |
| Restaurant Brands International Inc. | 4,400 | 267,173 |
| Sodexo SA | 1,493 | 130,836 |
| Yum China Holdings Inc. | 10,900 | 543,256 |
| | | 1,831,425 |
| Retail REITs - 0.1% |
| CapitaLand Integrated Commercial Trust | 82,059 | 124,170 |
| Japan Retail Fund Investment Corp. | 119 | 102,409 |
| Klepierre S.A. | 2,749 | 65,181 |
| Link REIT | 32,074 | 282,426 |
| Mapletree Commercial Trust | 27,946 | 41,458 |
| RioCan Real Estate Investment Trust | 2,000 | 36,322 |
| Scentre Group | 79,112 | 181,758 |
| Unibail-Rodamco-Westfield (a) | 2,098 | 147,016 |
| Vicinity Centres | 51,270 | 62,996 |
| | | 1,043,736 |
| Security & Alarm Services - 0.0% * |
| S-1 Corp. | 184 | 11,439 |
| | Number
of Shares | Fair
Value |
| Secom Company Ltd. | 3,200 | $ 221,920 |
| Securitas AB, Class B | 4,187 | 57,645 |
| Sohgo Security Services Company Ltd. | 900 | 35,717 |
| | | 326,721 |
| Semiconductor Equipment - 0.5% |
| Advanced Micro-Fabrication Equipment Inc. China A Shares (a) | 339 | 6,749 |
| Advantest Corp. | 3,100 | 293,431 |
| ASM International N.V. | 719 | 317,819 |
| ASML Holding N.V. | 6,402 | 5,145,025 |
| Daqo New Energy Corp. ADR (a) | 800 | 32,256 |
| Disco Corp. | 400 | 122,096 |
| Flat Glass Group Company Ltd. H Shares | 5,000 | 25,397 |
| Flat Glass Group Company Ltd., Class A | 1,700 | 15,489 |
| Globalwafers Company Ltd. | 3,000 | 96,288 |
| Hangzhou First Applied Material Company Ltd., Class A | 700 | 14,371 |
| Kulicke & Soffa Industries Inc. | 2,789 | 168,846 |
| Lasertec Corp. | 1,200 | 367,748 |
| NAURA Technology Group Company Ltd., Class A | 500 | 27,285 |
| Shenzhen SC New Energy Technology Corp., Class A | 100 | 1,797 |
| SUMCO Corp. | 5,600 | 114,232 |
| Tianjin Zhonghuan Semiconductor Company Ltd., Class A | 2,300 | 15,101 |
| Tokyo Electron Ltd. | 2,300 | 1,323,816 |
| Xinyi Solar Holdings Ltd. | 67,985 | 115,281 |
| Zhejiang Jingsheng Mechanical & Electrical Company Ltd., Class A | 1,400 | 15,301 |
| | | 8,218,328 |
| Semiconductors - 0.7% |
| ASE Technology Holding Company Ltd. | 47,000 | 180,920 |
| eMemory Technology Inc. | 1,000 | 79,156 |
| Gigadevice Semiconductor Beijing Inc., Class A | 560 | 15,486 |
| Hangzhou Silan Microelectronics Company Ltd., Class A | 1,100 | 9,376 |
See Notes to Schedule of Investments and Notes to Financial Statements.
| State Street Total Return V.I.S. Fund | 77 |
State Street Total Return V.I.S. Fund
Schedule of Investments, continued — December 31, 2021
| | Number
of Shares | Fair
Value |
| Hua Hong Semiconductor Ltd. (a)(d) | 8,000 | $ 44,124 |
| Infineon Technologies AG | 20,173 | 935,064 |
| Ingenic Semiconductor Company Ltd., Class A | 600 | 12,643 |
| JA Solar Technology Company Ltd., Class A | 1,500 | 21,866 |
| JCET Group Company Ltd. A Shares | 2,000 | 9,756 |
| LONGi Green Energy Technology Company Ltd., Class A | 4,740 | 64,253 |
| MediaTek Inc. | 21,000 | 903,242 |
| Nanya Technology Corp. | 13,000 | 36,697 |
| Novatek Microelectronics Corp. | 7,886 | 153,633 |
| NXP Semiconductors N.V. | 3,000 | 683,340 |
| Realtek Semiconductor Corp. | 6,040 | 126,620 |
| Renesas Electronics Corp. (a) | 19,200 | 237,259 |
| Rohm Company Ltd. | 1,500 | 136,381 |
| SG Micro Corp., Class A | 300 | 14,578 |
| Silergy Corp. | 1,222 | 221,945 |
| SK Hynix Inc. (a) | 7,611 | 838,731 |
| SK Square Company Ltd. (a) | 263 | 14,690 |
| StarPower Semiconductor Ltd. A Shares | 200 | 11,983 |
| STMicroelectronics N.V. | 10,521 | 518,899 |
| Taiwan Semiconductor Manufacturing Company Ltd. | 337,557 | 7,503,436 |
| Unigroup Guoxin Microelectronics Company Ltd., Class A | 700 | 24,768 |
| United Microelectronics Corp. | 166,000 | 389,995 |
| Vanguard International Semiconductor Corp. | 13,330 | 76,125 |
| Will Semiconductor Ltd. A Shares | 800 | 39,096 |
| Win Semiconductors Corp. | 4,000 | 54,144 |
| Winbond Electronics Corp. | 34,000 | 41,783 |
| | | 13,399,989 |
| Silver - 0.0% * |
| Pan American Silver Corp. | 2,800 | 69,958 |
| Soft Drinks - 0.1% |
| Arca Continental SAB de CV | 5,900 | 37,628 |
| Carabao Group PCL NVDR | 5,700 | 20,391 |
| Coca-Cola European Partners PLC | 3,400 | 190,162 |
| | Number
of Shares | Fair
Value |
| Coca-Cola Femsa SAB de C.V. | 8,810 | $ 48,086 |
| Coca-Cola HBC AG | 3,401 | 117,696 |
| Fomento Economico Mexicano SAB de C.V. | 27,100 | 210,973 |
| Fraser & Neave Holdings Bhd | 935 | 5,552 |
| Ito En Ltd. | 700 | 36,716 |
| Nongfu Spring Company Ltd. H Shares (d) | 17,000 | 112,188 |
| Osotspa PCL NVDR | 12,991 | 13,320 |
| Suntory Beverage & Food Ltd. | 1,900 | 68,638 |
| | | 861,350 |
| Specialized Consumer Services - 0.0% * |
| OneSpaWorld Holdings Ltd. (a) | 2,700 | 27,054 |
| Specialized Finance - 0.0% * |
| Banco Latinoamericano de Comercio Exterior SA, Class E | 1,487 | 24,684 |
| Chailease Holding Company Ltd. | 18,100 | 172,384 |
| Far East Horizon Ltd. | 31,000 | 27,516 |
| Mitsubishi UFJ Lease & Finance Company Ltd. | 7,700 | 38,047 |
| Piramal Enterprises Ltd. | 1,445 | 51,394 |
| Tokyo Century Corp. | 500 | 24,228 |
| | | 338,253 |
| Specialty Chemicals - 0.3% |
| Akzo Nobel N.V. | 2,878 | 315,831 |
| Asian Paints Ltd. | 5,364 | 244,111 |
| Chr Hansen Holding A/S | 1,778 | 140,114 |
| Clariant AG | 2,824 | 58,888 |
| Covestro AG (d) | 2,944 | 181,457 |
| Croda International PLC | 2,140 | 293,331 |
| Dongyue Group Ltd. | 19,000 | 29,635 |
| EMS-Chemie Holding AG | 119 | 133,347 |
| Evonik Industries AG | 3,553 | 115,032 |
| Givaudan S.A. | 143 | 752,078 |
| Hoshine Silicon Industry Company Ltd., Class A | 200 | 4,151 |
| Huabao International Holdings Ltd. | 14,000 | 25,858 |
| Johnson Matthey PLC | 2,602 | 72,107 |
| JSR Corp. | 3,461 | 131,491 |
| Kansai Paint Company Ltd. | 2,300 | 49,933 |
| Koninklijke DSM N.V. | 2,695 | 606,821 |
See Notes to Schedule of Investments and Notes to Financial Statements.
| 78 | State Street Total Return V.I.S. Fund |
State Street Total Return V.I.S. Fund
Schedule of Investments, continued — December 31, 2021
| | Number
of Shares | Fair
Value |
| Nippon Paint Holdings Company Ltd. | 12,000 | $ 130,676 |
| Nitto Denko Corp. | 2,200 | 169,841 |
| Novozymes A/S B Shares | 3,147 | 258,487 |
| Shanghai Putailai New Energy Technology Company Ltd., Class A | 620 | 15,659 |
| Shenzhen Capchem Technology Company Ltd., Class A | 100 | 1,777 |
| Shin-Etsu Chemical Company Ltd. | 5,500 | 951,413 |
| Sika AG | 2,190 | 913,832 |
| SK IE Technology Company Ltd. (a)(d) | 241 | 34,059 |
| Symrise AG | 1,974 | 292,502 |
| Umicore S.A. | 3,308 | 134,486 |
| Wanhua Chemical Group Company Ltd., Class A | 2,800 | 44,472 |
| Zhejiang Longsheng Group Company Ltd., Class A | 4,500 | 8,938 |
| Zhejiang Yongtai Technology Company Ltd., Class A (a) | 600 | 4,832 |
| | | 6,115,159 |
| Specialty Stores - 0.0% * |
| China Tourism Group Duty Free Corp. Ltd., Class A | 1,700 | 58,656 |
| Chow Tai Fook Jewellery Group Ltd. | 26,600 | 47,835 |
| Hotel Shilla Company Ltd. | 430 | 28,215 |
| Jarir Marketing Co. | 816 | 42,773 |
| JD Sports Fashion PLC | 43,506 | 128,342 |
| JUMBO S.A. | 1,247 | 17,868 |
| | | 323,689 |
| Steel - 0.2% |
| ArcelorMittal S.A. | 10,314 | 330,115 |
| Baoshan Iron & Steel Company Ltd., Class A | 20,800 | 23,420 |
| BlueScope Steel Ltd. | 8,503 | 129,206 |
| China Steel Corp. | 168,000 | 214,653 |
| Cia Siderurgica Nacional S.A. | 10,200 | 45,763 |
| Eregli Demir ve Celik Fabrikalari TAS | 16,267 | 34,495 |
| Evraz PLC | 8,789 | 71,616 |
| Fortescue Metals Group Ltd. | 26,030 | 363,551 |
| Hitachi Metals Ltd. (a) | 2,600 | 48,114 |
| Hyundai Steel Co. | 1,296 | 44,699 |
| | Number
of Shares | Fair
Value |
| Inner Mongolia BaoTou Steel Union Company Ltd., Class A (a) | 42,400 | $ 18,603 |
| JFE Holdings Inc. | 8,300 | 105,737 |
| JSW Steel Ltd. | 11,690 | 103,154 |
| Kumba Iron Ore Ltd. | 875 | 25,224 |
| Nippon Steel & Sumitomo Metal Corp. | 13,100 | 213,698 |
| Novolipetsk Steel PJSC GDR | 2,290 | 67,601 |
| POSCO | 1,031 | 238,073 |
| Severstal PAO GDR | 3,070 | 66,128 |
| Shanxi Meijin Energy Company Ltd., Class A (a) | 3,500 | 8,933 |
| Shanxi Taigang Stainless Steel Company Ltd., Class A | 6,700 | 7,417 |
| Tata Steel Ltd. | 10,224 | 152,867 |
| Vale S.A. | 55,240 | 773,162 |
| voestalpine AG | 1,551 | 56,441 |
| YongXing Special Materials Technology Company Ltd., Class A | 200 | 4,655 |
| | | 3,147,325 |
| Systems Software - 0.0% * |
| 360 Security Technology Inc., Class A (a) | 4,700 | 9,401 |
| BlackBerry Ltd. (a) | 9,200 | 86,089 |
| Check Point Software Technologies Ltd. (a) | 1,603 | 186,846 |
| CyberArk Software Ltd. (a) | 600 | 103,968 |
| Douzone Bizon Company Ltd. | 342 | 21,002 |
| JFrog Ltd. (a) | 2,347 | 69,706 |
| Ming Yuan Cloud Group Holdings Ltd. | 5,000 | 11,390 |
| Oracle Corporation Japan | 537 | 40,757 |
| Sangfor Technologies Inc., Class A | 300 | 9,011 |
| Totvs S.A. | 8,338 | 42,873 |
| Trend Micro Inc. (a) | 2,300 | 127,628 |
| | | 708,671 |
| Technology Distributors - 0.0% * |
| Synnex Technology International Corp. | 18,178 | 43,496 |
| Unisplendour Corporation Ltd., Class A | 3,100 | 11,139 |
| WPG Holdings Ltd. | 21,938 | 41,708 |
| | | 96,343 |
See Notes to Schedule of Investments and Notes to Financial Statements.
| State Street Total Return V.I.S. Fund | 79 |
State Street Total Return V.I.S. Fund
Schedule of Investments, continued — December 31, 2021
| | Number
of Shares | Fair
Value |
| Technology Hardware, Storage & Peripherals - 0.4% |
| Acer Inc. | 42,000 | $ 46,225 |
| Advantech Company Ltd. | 6,000 | 85,987 |
| Asustek Computer Inc. | 10,053 | 136,622 |
| Brother Industries Ltd. | 3,100 | 59,521 |
| Canon Inc. | 15,400 | 374,585 |
| Catcher Technology Company Ltd. | 10,000 | 56,566 |
| Compal Electronics Inc. | 58,225 | 50,929 |
| FUJIFILM Holdings Corp. | 5,515 | 408,327 |
| Inventec Corp. | 35,249 | 31,787 |
| Lenovo Group Ltd. | 102,000 | 117,225 |
| Lite-On Technology Corp. | 30,693 | 70,778 |
| Logitech International S.A. | 2,648 | 223,430 |
| Micro-Star International Company Ltd. | 10,000 | 58,011 |
| Ninestar Corp., Class A | 1,200 | 9,013 |
| Pegatron Corp. | 29,251 | 73,056 |
| Quanta Computer Inc. | 40,507 | 138,649 |
| Ricoh Company Ltd. | 11,400 | 106,026 |
| Samsung Electronics Company Ltd. | 65,424 | 4,309,316 |
| Seiko Epson Corp. | 3,700 | 66,542 |
| Shenzhen Transsion Holdings Company Ltd., Class A | 312 | 7,698 |
| Wistron Corp. | 36,896 | 38,874 |
| Wiwynn Corp. | 1,000 | 40,301 |
| Xiaomi Corp., Class B (a)(d) | 199,000 | 482,421 |
| | | 6,991,889 |
| Textiles - 0.0% * |
| Eclat Textile Company Ltd. | 3,000 | 68,421 |
| Suzhou TA&A Ultra Clean Technology Company Ltd., Class A | 400 | 5,095 |
| | | 73,516 |
| Thrifts & Mortgage Finance - 0.1% |
| Housing Development Finance Corporation Ltd. | 23,537 | 818,951 |
| Tires & Rubber - 0.1% |
| Balkrishna Industries Ltd. | 1,117 | 34,912 |
| Bridgestone Corp. | 8,796 | 378,025 |
| Cheng Shin Rubber Industry Company Ltd. | 25,000 | 32,620 |
| Cie Generale des Etablissements Michelin SCA | 2,607 | 427,359 |
| | Number
of Shares | Fair
Value |
| Hankook Tire & Technology Company Ltd. | 1,075 | $ 35,901 |
| MRF Ltd. | 35 | 34,530 |
| Sailun Group Company Ltd. A Shares | 2,300 | 5,349 |
| Shandong Linglong Tyre Company Ltd., Class A | 1,500 | 8,622 |
| | | 957,318 |
| Tobacco - 0.1% |
| British American Tobacco PLC | 33,705 | 1,247,890 |
| Gudang Garam Tbk PT | 5,500 | 11,809 |
| Imperial Brands PLC | 14,529 | 318,108 |
| ITC Ltd. | 41,559 | 121,906 |
| Japan Tobacco Inc. | 18,500 | 373,117 |
| KT&G Corp. (a) | 1,633 | 108,523 |
| RLX Technology Inc. ADR (a) | 8,100 | 31,590 |
| Smoore International Holdings Ltd. (d) | 25,000 | 127,464 |
| Swedish Match AB | 24,102 | 191,722 |
| | | 2,532,129 |
| Trading Companies & Distributors - 0.3% |
| Adani Enterprises Ltd. | 3,785 | 87,041 |
| Ashtead Group PLC | 6,898 | 555,161 |
| BOC Aviation Ltd. (d) | 2,800 | 20,507 |
| Brenntag AG | 2,360 | 213,576 |
| Bunzl PLC | 5,151 | 201,280 |
| Ferguson PLC | 3,428 | 608,472 |
| IMCD N.V. | 869 | 192,408 |
| ITOCHU Corp. | 18,305 | 559,220 |
| Marubeni Corp. | 23,900 | 232,348 |
| Mitsubishi Corp. | 19,500 | 618,419 |
| Mitsui & Company Ltd. | 24,100 | 569,983 |
| MonotaRO Company Ltd. | 3,400 | 61,206 |
| Reece Ltd. | 3,826 | 75,189 |
| Sumitomo Corp. | 17,300 | 255,470 |
| Toromont Industries Ltd. | 1,400 | 126,750 |
| Toyota Tsusho Corp. | 3,200 | 147,280 |
| Triton International Ltd. | 3,042 | 183,220 |
| | | 4,707,530 |
| Trucking - 0.0% * |
| CJ Logistics Corp. (a) | 172 | 18,231 |
| DiDi Global Inc. (a) | 4,300 | 21,414 |
| Localiza Rent a Car S.A. | 8,500 | 80,880 |
| Nippon Express Company Ltd. (a) | 1,000 | 59,181 |
See Notes to Schedule of Investments and Notes to Financial Statements.
| 80 | State Street Total Return V.I.S. Fund |
State Street Total Return V.I.S. Fund
Schedule of Investments, continued — December 31, 2021
| | Number
of Shares | Fair
Value |
| TFI International Inc. | 1,400 | $ 157,240 |
| | | 336,946 |
| Water Utilities - 0.0% * |
| Beijing Enterprises Water Group Ltd. | 84,000 | 32,646 |
| Cia de Saneamento Basico do Estado de Sao Paulo | 4,900 | 35,347 |
| Guangdong Investment Ltd. | 42,000 | 53,387 |
| Severn Trent PLC | 4,202 | 167,726 |
| United Utilities Group PLC | 11,441 | 168,754 |
| | | 457,860 |
| Wireless Telecommunication Services - 0.3% |
| Advanced Info Service PCL NVDR | 16,981 | 116,918 |
| America Movil SAB de C.V. Series L | 477,200 | 505,764 |
| Axiata Group Bhd | 35,700 | 35,649 |
| Bharti Airtel Ltd. (a) | 34,517 | 317,516 |
| China United Network Communications Ltd., Class A | 33,600 | 20,765 |
| DiGi.Com Bhd | 43,700 | 45,735 |
| Etihad Etisalat Co. | 5,690 | 47,210 |
| Far EasTone Telecommunications Company Ltd. | 21,000 | 49,033 |
| Globe Telecom Inc. | 385 | 25,082 |
| Intouch Holdings PCL NVDR | 12,700 | 30,510 |
| Intouch Holdings PCL, Class F | 6,200 | 14,894 |
| KDDI Corp. | 24,908 | 727,200 |
| Maxis Bhd | 33,700 | 39,233 |
| Mobile Telecommunications Co. KSCP | 32,131 | 63,252 |
| Mobile Telecommunications Co. Saudi Arabia (a) | 4,528 | 14,521 |
| Mobile TeleSystems PJSC ADR | 6,600 | 52,470 |
| MTN Group Ltd. (a) | 23,695 | 253,444 |
| PLDT Inc. | 950 | 33,758 |
| Rogers Communications Inc., Class B | 5,400 | 257,485 |
| SK Telecom Company Ltd. | 406 | 19,775 |
| Softbank Corp. | 44,300 | 559,544 |
| SoftBank Group Corp. | 18,600 | 877,707 |
| Taiwan Mobile Company Ltd. | 21,946 | 79,322 |
| Tele2 AB B Shares | 8,465 | 120,703 |
| TIM S.A. | 11,500 | 27,150 |
| Turkcell Iletisim Hizmetleri A/S | 17,641 | 24,522 |
| | Number
of Shares | Fair
Value |
| Vodacom Group Ltd. | 9,185 | $ 77,474 |
| Vodafone Group PLC | 426,673 | 648,759 |
| | | 5,085,395 |
Total Common Stock
(Cost $397,362,268) | | 418,727,453 |
| Preferred Stock - 0.2% |
| Automobile Manufacturers - 0.1% |
| Bayerische Motoren Werke AG | 987 | 82,273 |
| Hyundai Motor Co. | 511 | 43,416 |
| Hyundai Motor Co. | 297 | 24,610 |
| Porsche Automobil Holding SE | 2,342 | 222,228 |
| Volkswagen AG | 2,861 | 577,436 |
| | | 949,963 |
| Commodity Chemicals - 0.0% * |
| Braskem S.A. (a) | 2,900 | 30,005 |
| FUCHS PETROLUB SE | 903 | 40,993 |
| LG Chem Ltd. | 106 | 25,592 |
| | | 96,590 |
| Diversified Banks - 0.0% * |
| Banco Bradesco S.A. | 69,610 | 240,073 |
| Banco Inter S.A. (d) | 1 | 2 |
| Bancolombia S.A. | 4,950 | 38,919 |
| Itau Unibanco Holding S.A. | 65,700 | 247,112 |
| Itausa S.A. | 62,580 | 100,330 |
| | | 626,436 |
| Electric Utilities - 0.0% * |
| Centrais Eletricas Brasileiras SA | 3,800 | 22,520 |
| Cia Energetica de Minas Gerais | 14,715 | 34,635 |
| | | 57,155 |
| Fertilizers & Agricultural Chemicals - 0.0% * |
| Sociedad Quimica y Minera de Chile SA | 1,996 | 101,883 |
| Footwear - 0.0% * |
| Alpargatas S.A. | 3,500 | 23,262 |
| Healthcare Equipment - 0.0% * |
| Sartorius AG | 402 | 272,098 |
See Notes to Schedule of Investments and Notes to Financial Statements.
| State Street Total Return V.I.S. Fund | 81 |
State Street Total Return V.I.S. Fund
Schedule of Investments, continued — December 31, 2021
| | Number
of Shares | Fair
Value |
| Household Products - 0.0% * |
| Henkel AG & Company KGaA | 2,725 | $ 220,454 |
| Integrated Oil & Gas - 0.0% * |
| Petroleo Brasileiro S.A. | 66,000 | 337,110 |
| Personal Products - 0.0% * |
| LG Household & Health Care Ltd. | 21 | 10,882 |
| Steel - 0.0% * |
| Gerdau S.A. | 15,800 | 77,326 |
| Technology Hardware, Storage & Peripherals - 0.1% |
| Samsung Electronics Company Ltd. | 11,312 | 677,530 |
Total Preferred Stock
(Cost $3,771,512) | | 3,450,689 |
| Rights - 0.0% * |
| Heavy Electrical Equipment - 0.0% * |
| Doosan Heavy Industries & Construction Co. Ltd.(expiring 22/02/11) (a) | 485 | 1,793 |
| Real Estate Services - 0.0% * |
| Seazen Group Ltd.(expiring 22/01/19) (a)** | 1,238 | — |
Total Rights
(Cost $0) | | 1,793 |
| Warrants - 0.0% * |
| Hotels, Resorts & Cruise Lines - 0.0% * |
| BTS W8 R(expiring 07/22/22) (a) | 19,520 | 292 |
| Minor International PCL (expiring 2/15/24) (a) | 1,300 | 124 |
| | | 416 |
| Railroads - 0.0% * |
| BTS Group Holdings PCL(expiring 09/05/22) (a) | 4,880 | 105 |
| BTS Group Holdings PCL(expiring 11/07/24) (a) | 9,760 | 187 |
| | | 292 |
Total Warrants
(Cost $0) | | 708 |
Total Foreign Equity
(Cost $401,133,780) | | 422,180,643 |
| | Principal
Amount | Fair
Value |
| Bonds and Notes - 22.0% |
| U.S. Treasuries - 11.4% |
| U.S. Treasury Bonds | | |
| 1.13% 05/15/40 - 08/15/40 | $ 1,225,000 | $ 1,074,707 |
| 1.25% 08/15/31 - 05/15/50 | 3,600,000 | 3,342,804 |
| 1.38% 11/15/31 - 08/15/50 | 1,475,000 | 1,371,168 |
| 1.63% 11/15/50 | 1,400,000 | 1,310,312 |
| 1.88% 02/15/41 - 11/15/51 | 1,350,000 | 1,342,266 |
| 2.00% 11/15/41 - 08/15/51 | 2,525,000 | 2,576,891 |
| 2.25% 05/15/41 - 08/15/49 | 800,000 | 848,375 |
| 2.38% 11/15/49 - 05/15/51 | 1,490,000 | 1,649,110 |
| 2.50% 02/15/45 - 05/15/46 | 810,000 | 897,044 |
| 2.75% 08/15/42 - 11/15/47 | 1,925,000 | 2,215,153 |
| 2.88% 05/15/43 - 05/15/49 | 2,900,000 | 3,411,969 |
| 3.00% 05/15/42 - 02/15/49 | 2,050,000 | 2,484,476 |
| 3.13% 02/15/43 - 05/15/48 | 1,100,000 | 1,356,234 |
| 3.38% 05/15/44 - 11/15/48 | 900,000 | 1,172,406 |
| 3.63% 08/15/43 - 02/15/44 | 1,140,000 | 1,484,750 |
| 3.75% 08/15/41 | 100,000 | 131,016 |
| 4.25% 05/15/39 - 11/15/40 | 200,000 | 275,890 |
| 4.38% 02/15/38 - 05/15/40 | 400,000 | 558,672 |
| 4.50% 02/15/36 | 100,000 | 137,594 |
| 4.63% 02/15/40 | 100,000 | 143,906 |
| 5.25% 02/15/29 | 200,000 | 251,813 |
| 5.50% 08/15/28 | 200,000 | 251,406 |
| 6.00% 02/15/26 | 427,000 | 509,665 |
| 6.13% 08/15/29 | 200,000 | 268,125 |
| 6.25% 08/15/23 | 1,650,000 | 1,798,629 |
| 6.38% 08/15/27 | 200,000 | 254,734 |
| 7.63% 02/15/25 | 200,000 | 240,781 |
| U.S. Treasury Inflation Indexed Bonds | | |
| 0.13% 02/15/51 | 934,639 | 1,107,874 |
| 0.25% 02/15/50 | 1,075,540 | 1,301,806 |
| 0.63% 02/15/43 | 938,114 | 1,166,377 |
| 0.75% 02/15/42 - 02/15/45 | 2,654,595 | 3,388,970 |
| 0.88% 02/15/47 | 939,310 | 1,268,659 |
| 1.00% 02/15/46 - 02/15/49 | 2,151,775 | 2,994,998 |
| 1.38% 02/15/44 | 1,222,054 | 1,743,090 |
| 1.75% 01/15/28 | 1,055,928 | 1,268,374 |
| 2.00% 01/15/26 | 1,393,180 | 1,613,745 |
| 2.13% 02/15/40 - 02/15/41 | 1,459,579 | 2,249,772 |
| 2.38% 01/15/25 - 01/15/27 | 3,113,992 | 3,626,371 |
| 2.50% 01/15/29 | 1,287,920 | 1,647,927 |
| 3.38% 04/15/32 | 389,458 | 579,689 |
| 3.63% 04/15/28 | 906,104 | 1,205,527 |
| 3.88% 04/15/29 | 1,093,326 | 1,524,243 |
See Notes to Schedule of Investments and Notes to Financial Statements.
| 82 | State Street Total Return V.I.S. Fund |
State Street Total Return V.I.S. Fund
Schedule of Investments, continued — December 31, 2021
| | Principal
Amount | Fair
Value |
| U.S. Treasury Inflation Indexed Notes | | |
| 0.13% 01/15/23 - 07/15/31 | $ 23,385,595 | $ 25,383,177 |
| 0.25% 01/15/25 - 07/15/29 | 4,577,603 | 4,996,724 |
| 0.38% 07/15/23 - 07/15/27 | 9,896,308 | 10,738,608 |
| 0.50% 04/15/24 - 01/15/28 | 3,951,261 | 4,359,070 |
| 0.63% 04/15/23 - 01/15/26 | 8,997,581 | 9,608,066 |
| 0.75% 07/15/28 | 2,186,636 | 2,507,410 |
| 0.88% 01/15/29 | 1,861,670 | 2,155,485 |
| U.S. Treasury Notes | | |
| 0.13% 02/28/23 - 01/15/24 | 5,950,000 | 5,910,566 |
| 0.25% 04/15/23 - 10/31/25 | 4,500,000 | 4,391,648 |
| 0.38% 10/31/23 - 01/31/26 | 3,700,000 | 3,613,656 |
| 0.50% 03/15/23 - 10/31/27 | 2,200,000 | 2,133,282 |
| 0.63% 07/31/26 - 08/15/30 | 3,500,000 | 3,301,875 |
| 0.75% 11/15/24 - 01/31/28 | 5,000,000 | 4,899,922 |
| 0.88% 11/15/30 | 1,450,000 | 1,380,445 |
| 1.13% 02/28/25 - 02/15/31 | 3,825,000 | 3,749,954 |
| 1.25% 08/31/24 - 06/30/28 | 3,450,000 | 3,439,517 |
| 1.38% 01/31/25 - 08/31/26 | 1,350,000 | 1,361,398 |
| 1.50% 01/15/23 - 02/15/30 | 2,150,000 | 2,175,168 |
| 1.63% 02/15/26 - 05/15/31 | 5,215,000 | 5,299,942 |
| 1.75% 05/15/23 - 11/15/29 | 1,350,000 | 1,378,250 |
| 1.88% 06/30/26 - 07/31/26 | 1,400,000 | 1,440,016 |
| 2.00% 02/15/23 - 11/15/26 | 6,644,000 | 6,831,833 |
| 2.13% 11/30/23 - 05/31/26 | 1,350,000 | 1,393,395 |
| 2.25% 04/30/24 - 11/15/27 | 6,440,000 | 6,716,443 |
| 2.38% 01/31/23 - 05/15/29 | 6,800,000 | 7,114,043 |
| 2.50% 03/31/23 - 05/15/24 | 3,850,000 | 3,971,992 |
| 2.63% 02/28/23 - 02/15/29 | 2,000,000 | 2,097,009 |
| 2.75% 04/30/23 - 02/15/28 | 5,300,000 | 5,571,837 |
| 2.88% 09/30/23 - 08/15/28 | 4,900,000 | 5,214,337 |
| 3.00% 09/30/25 - 10/31/25 | 2,300,000 | 2,460,335 |
| 3.13% 11/15/28 | 1,150,000 | 1,279,195 |
| | | 204,921,916 |
| Agency Mortgage Backed - 5.2% |
| Federal Farm Credit Banks Funding Corp. | | |
| 0.25% 02/26/24 | 1,060,000 | 1,048,107 |
| Federal Home Loan Banks | | |
| 0.13% 03/17/23 | 245,000 | 243,873 |
| 1.88% 09/11/26 | 500,000 | 513,555 |
| 3.25% 11/16/28 | 125,000 | 139,577 |
| Federal Home Loan Mortgage Corp. | | |
| 0.13% 10/16/23 | 380,000 | 376,303 |
| 0.38% 07/21/25 | 500,000 | 487,175 |
| | Principal
Amount | Fair
Value |
| 1.50% 05/01/51 - 10/01/51 (e) | $ 826,716 | $ 800,400 |
| 1.50% 11/01/51 | 198,538 | 192,219 |
| 2.00% 07/01/41 - 09/01/51 (e) | 4,385,105 | 4,414,445 |
| 2.00% 11/01/51 | 1,389,721 | 1,387,077 |
| 2.50% 01/01/28 - 11/01/51 (e) | 3,715,407 | 3,800,997 |
| 2.50% 12/01/51 | 846,998 | 865,539 |
| 3.00% 07/01/30 - 06/01/51 (e) | 2,421,564 | 2,539,316 |
| 3.50% 03/01/26 - 11/01/49 (e) | 1,485,151 | 1,581,070 |
| 4.00% 06/01/42 - 08/01/48 (e) | 524,232 | 566,880 |
| 4.50% 05/01/42 - 11/01/48 (e) | 112,166 | 121,171 |
| 5.50% 01/01/38 - 04/01/39 (e) | 188,629 | 215,044 |
| 6.00% 06/01/37 - 11/01/37 (e) | 178,521 | 206,405 |
| 6.25% 07/15/32 | 250,000 | 360,387 |
| Federal National Mortgage Assoc. | | |
| 0.25% 07/10/23 | 455,000 | 452,607 |
| 0.50% 11/07/25 | 750,000 | 731,355 |
| 1.50% 04/01/36 - 10/01/51 (e) | 1,959,579 | 1,920,193 |
| 1.50% 11/01/51 | 745,772 | 722,031 |
| 1.75% 07/02/24 | 225,000 | 229,925 |
| 2.00% 11/01/35 - 11/01/51 (e) | 11,531,979 | 11,562,018 |
| 2.00% 01/01/52 | 1,000,000 | 998,097 |
| 2.13% 04/24/26 | 200,000 | 207,500 |
| 2.50% 09/01/28 - 09/01/51 (e) | 7,067,398 | 7,231,953 |
| 2.50% 02/01/35 | 582,049 | 603,541 |
| 3.00% 04/01/30 - 07/01/50 (e) | 4,648,462 | 4,860,087 |
| 3.00% 09/01/51 | 502,533 | 521,623 |
| 3.50% 01/01/27 - 06/01/50 (e) | 3,009,525 | 3,184,372 |
| 4.00% 10/01/41 - 02/01/50 (e) | 3,775,109 | 4,083,826 |
| 4.50% 01/01/27 - 09/01/49 (e) | 566,666 | 615,842 |
| 4.50% 02/01/50 | 498,408 | 533,702 |
| 5.00% 12/01/39 - 05/01/41 (e) | 109,296 | 122,827 |
| 5.50% 12/01/35 - 04/01/38 (e) | 622,416 | 705,217 |
See Notes to Schedule of Investments and Notes to Financial Statements.
| State Street Total Return V.I.S. Fund | 83 |
State Street Total Return V.I.S. Fund
Schedule of Investments, continued — December 31, 2021
| | Principal
Amount | Fair
Value |
| 6.00% 03/01/34 - 08/01/37 (e) | $ 761,779 | $ 876,900 |
| Federal National Mortgage Assoc. TBA | | |
| 1.50% 01/01/37 (f) | 1,725,000 | 1,730,434 |
| 2.00% 01/01/37 - 01/01/52 (f) | 4,450,000 | 4,496,454 |
| 2.50% 01/01/37 - 01/01/52 (f) | 2,925,000 | 2,993,167 |
| 3.00% 01/01/52 (f) | 1,500,000 | 1,554,330 |
| 3.50% 01/01/52 (f) | 750,000 | 789,675 |
| Government National Mortgage Assoc. | | |
| 2.00% 10/20/50 - 07/20/51 (e) | 2,015,398 | 2,036,651 |
| 2.00% 12/20/51 | 850,000 | 858,862 |
| 2.50% 05/20/45 - 08/20/51 (e) | 1,794,253 | 1,840,397 |
| 2.50% 11/20/51 | 498,484 | 511,308 |
| 3.00% 10/15/42 - 12/20/50 (e) | 2,896,854 | 3,020,877 |
| 3.00% 01/20/46 | 263,385 | 276,329 |
| 3.50% 11/20/43 - 08/20/49 (e) | 2,910,958 | 3,080,670 |
| 4.00% 12/20/40 - 03/20/47 (e) | 1,599,233 | 1,727,083 |
| 4.50% 05/20/40 - 01/20/49 (e) | 376,524 | 405,710 |
| 5.00% 08/15/41 (e) | 583,739 | 655,573 |
| Government National Mortgage Assoc. TBA | | |
| 2.00% 01/01/52 (f) | 1,425,000 | 1,438,594 |
| 2.50% 01/01/52 (f) | 1,925,000 | 1,972,701 |
| Tennessee Valley Authority | | |
| 3.50% 12/15/42 | 100,000 | 116,873 |
| U.S. Treasury Bonds | | |
| 1.38% 12/31/28 | 650,000 | 647,664 |
| U.S. Treasury Inflation Indexed Notes | | |
| 0.13% 01/15/31 | 2,687,442 | 3,009,847 |
| | | 93,186,355 |
| Agency Collateralized Mortgage Obligations - 0.1% |
| Federal Home Loan Mortgage Corp. | | |
| 1.48% 04/25/30 | 69,643 | 68,272 |
| 1.56% 04/25/30 | 40,000 | 39,479 |
| 1.87% 03/25/53 | 58,333 | 58,929 |
| 2.02% 03/25/31 | 450,000 | 458,721 |
| 3.30% 04/25/23 (g) | 100,000 | 102,812 |
| 3.39% 03/25/24 | 200,000 | 209,224 |
| | Principal
Amount | Fair
Value |
| 3.41% 12/25/26 | $ 450,000 | $ 490,114 |
| 3.78% 08/25/28 | 184,793 | 201,340 |
| 3.90% 04/25/28 | 100,000 | 113,161 |
| Federal National Mortgage Assoc. | | |
| 1.27% 07/25/30 | 80,000 | 76,636 |
| 1.46% 03/25/31 (g) | 145,000 | 140,736 |
| 1.74% 10/25/31 (g) | 250,000 | 248,161 |
| 3.07% 06/25/27 (g) | 219,272 | 236,197 |
| | | 2,443,782 |
| Asset Backed - 0.0%* |
| American Express Credit Account Master Trust | | |
| 0.90% 11/15/26 | 184,000 | 182,644 |
| BA Credit Card Trust | | |
| 0.44% 09/15/26 | 9,000 | 8,883 |
| Discover Card Execution Note Trust | | |
| 1.03% 09/15/28 | 81,000 | 79,356 |
| Drive Auto Receivables Trust 2021-3 | | |
| 0.79% 10/15/25 | 43,000 | 42,871 |
| Honda Auto Receivables Owner Trust | | |
| 0.33% 08/15/25 | 150,000 | 148,613 |
| Hyundai Auto Receivables Trust 2021-C | | |
| 0.74% 05/15/26 | 100,000 | 99,349 |
| Santander Drive Auto Receivables Trust | | |
| 0.95% 09/15/27 | 69,000 | 68,757 |
| Toyota Auto Receivables 2020-C Owner Trust | | |
| 0.57% 10/15/25 | 250,000 | 247,613 |
| Verizon Owner Trust | | |
| 0.47% 02/20/25 | 100,000 | 99,729 |
| World Omni Auto Receivables Trust 2021-B | | |
| 0.42% 06/15/26 | 100,000 | 99,035 |
| | | 1,076,850 |
| Corporate Notes - 4.7% |
| 3M Co. | | |
| 3.00% 08/07/25 | 40,000 | 42,380 |
| 3.38% 03/01/29 | 50,000 | 54,553 |
| 3.63% 09/14/28 | 25,000 | 27,803 |
| 4.00% 09/14/48 | 55,000 | 66,403 |
| Abbott Laboratories | | |
| 3.75% 11/30/26 | 57,000 | 62,979 |
See Notes to Schedule of Investments and Notes to Financial Statements.
| 84 | State Street Total Return V.I.S. Fund |
State Street Total Return V.I.S. Fund
Schedule of Investments, continued — December 31, 2021
| | Principal
Amount | Fair
Value |
| 4.90% 11/30/46 | $ 100,000 | $ 137,256 |
| AbbVie Inc. | | |
| 2.60% 11/21/24 | 50,000 | 51,859 |
| 3.20% 05/14/26 - 11/21/29 | 155,000 | 165,304 |
| 3.80% 03/15/25 | 100,000 | 106,676 |
| 4.25% 11/14/28 - 11/21/49 | 60,000 | 70,969 |
| 4.30% 05/14/36 | 100,000 | 117,524 |
| 4.70% 05/14/45 | 50,000 | 61,827 |
| 4.75% 03/15/45 | 50,000 | 62,140 |
| 4.88% 11/14/48 | 25,000 | 32,362 |
| Adobe Inc. | | |
| 3.25% 02/01/25 | 70,000 | 74,080 |
| Advocate Health & Hospitals Corp. | | |
| 3.39% 10/15/49 | 25,000 | 27,712 |
| AEP Texas Inc. | | |
| 3.45% 05/15/51 | 35,000 | 35,704 |
| AerCap Ireland Capital DAC/AerCap Global Aviation Trust | | |
| 1.65% 10/29/24 | 150,000 | 149,802 |
| 2.45% 10/29/26 | 150,000 | 151,126 |
| 3.30% 01/30/32 | 150,000 | 152,970 |
| African Development Bank | | |
| 0.75% 04/03/23 | 100,000 | 100,201 |
| 0.88% 03/23/26 | 100,000 | 98,414 |
| Agilent Technologies Inc. | | |
| 2.75% 09/15/29 | 25,000 | 25,846 |
| Air Lease Corp. | | |
| 3.88% 07/03/23 | 50,000 | 51,816 |
| 4.25% 02/01/24 | 100,000 | 105,405 |
| Air Products & Chemicals Inc. | | |
| 2.05% 05/15/30 | 10,000 | 10,061 |
| 2.70% 05/15/40 | 25,000 | 25,202 |
| 2.80% 05/15/50 | 20,000 | 20,379 |
| Aircastle Ltd. | | |
| 4.13% 05/01/24 | 20,000 | 20,922 |
| 5.00% 04/01/23 | 20,000 | 20,890 |
| Alabama Power Co. | | |
| 3.45% 10/01/49 | 50,000 | 53,382 |
| Alexandria Real Estate Equities Inc. | | |
| 4.00% 02/01/50 | 25,000 | 29,136 |
| 4.85% 04/15/49 | 125,000 | 161,827 |
| Alibaba Group Holding Ltd. | | |
| 3.15% 02/09/51 | 100,000 | 93,172 |
| 4.00% 12/06/37 | 100,000 | 108,392 |
| Allegion PLC | | |
| 3.50% 10/01/29 | 15,000 | 15,964 |
| | Principal
Amount | Fair
Value |
| Allina Health System | | |
| 2.90% 11/15/51 | $ 10,000 | $ 10,003 |
| Alphabet Inc. | | |
| 2.05% 08/15/50 | 100,000 | 89,670 |
| 3.38% 02/25/24 | 50,000 | 52,765 |
| Altria Group Inc. | | |
| 3.40% 02/04/41 | 100,000 | 92,205 |
| 4.80% 02/14/29 | 40,000 | 45,175 |
| 5.38% 01/31/44 | 70,000 | 80,942 |
| 5.80% 02/14/39 | 15,000 | 18,058 |
| 5.95% 02/14/49 | 40,000 | 50,099 |
| Amazon.com Inc. | | |
| 0.40% 06/03/23 | 105,000 | 104,681 |
| 1.65% 05/12/28 | 50,000 | 49,962 |
| 3.15% 08/22/27 | 100,000 | 108,087 |
| 4.05% 08/22/47 | 150,000 | 182,608 |
| 4.25% 08/22/57 | 100,000 | 128,264 |
| Amcor Flexibles North America Inc. | | |
| 2.69% 05/25/31 | 65,000 | 65,770 |
| America Movil SAB de C.V. | | |
| 6.13% 03/30/40 | 100,000 | 138,347 |
| American Airlines Pass Through Trust | | |
| 3.15% 08/15/33 | 68,904 | 69,595 |
| American Campus Communities Operating Partnership LP | | |
| 3.63% 11/15/27 | 30,000 | 32,090 |
| American Express Co. | | |
| 0.75% 11/03/23 | 50,000 | 49,899 |
| 3.40% 02/27/23 | 100,000 | 102,887 |
| 3.63% 12/05/24 | 50,000 | 53,435 |
| American Financial Group Inc. | | |
| 3.50% 08/15/26 | 65,000 | 69,435 |
| American Honda Finance Corp. | | |
| 0.75% 08/09/24 | 35,000 | 34,628 |
| 2.40% 06/27/24 | 225,000 | 231,912 |
| American International Group Inc. | | |
| 2.50% 06/30/25 | 100,000 | 103,204 |
| 4.50% 07/16/44 | 50,000 | 61,626 |
| American Tower Corp. | | |
| 3.10% 06/15/50 | 100,000 | 97,248 |
| 3.50% 01/31/23 | 50,000 | 51,355 |
| 3.95% 03/15/29 | 100,000 | 109,193 |
| American Water Capital Corp. | ��� | |
| 3.25% 06/01/51 | 50,000 | 52,214 |
| 3.45% 06/01/29 | 125,000 | 134,925 |
See Notes to Schedule of Investments and Notes to Financial Statements.
| State Street Total Return V.I.S. Fund | 85 |
State Street Total Return V.I.S. Fund
Schedule of Investments, continued — December 31, 2021
| | Principal
Amount | Fair
Value |
| AmerisourceBergen Corp. | | |
| 3.45% 12/15/27 | $ 100,000 | $ 107,741 |
| Amgen Inc. | | |
| 3.15% 02/21/40 | 75,000 | 76,753 |
| 3.20% 11/02/27 | 100,000 | 107,614 |
| 4.56% 06/15/48 | 50,000 | 61,915 |
| 4.66% 06/15/51 | 105,000 | 133,669 |
| Amphenol Corp. | | |
| 4.35% 06/01/29 | 25,000 | 28,406 |
| Analog Devices Inc. | | |
| 1.70% 10/01/28 | 50,000 | 49,696 |
| Anheuser-Busch Companies LLC/Anheuser-Busch InBev Worldwide Inc. | | |
| 4.70% 02/01/36 | 150,000 | 181,191 |
| 4.90% 02/01/46 | 120,000 | 152,000 |
| Anheuser-Busch InBev Worldwide Inc. | | |
| 4.00% 04/13/28 | 55,000 | 61,152 |
| 4.60% 04/15/48 | 85,000 | 104,029 |
| 4.75% 04/15/58 | 50,000 | 62,948 |
| 5.45% 01/23/39 | 35,000 | 45,896 |
| 5.55% 01/23/49 | 65,000 | 89,902 |
| 5.80% 01/23/59 | 25,000 | 36,191 |
| Anthem Inc. | | |
| 3.30% 01/15/23 | 100,000 | 102,705 |
| 4.38% 12/01/47 | 65,000 | 79,667 |
| 4.65% 01/15/43 | 100,000 | 124,861 |
| Aon Corp./Aon Global Holdings PLC | | |
| 2.05% 08/23/31 | 50,000 | 48,614 |
| 2.60% 12/02/31 | 35,000 | 35,622 |
| Apple Inc. | | |
| 0.75% 05/11/23 | 100,000 | 100,363 |
| 1.20% 02/08/28 | 200,000 | 194,248 |
| 1.70% 08/05/31 | 200,000 | 195,312 |
| 2.40% 01/13/23 - 05/03/23 | 150,000 | 153,209 |
| 2.70% 08/05/51 | 100,000 | 99,229 |
| 2.75% 01/13/25 | 50,000 | 52,275 |
| 2.85% 08/05/61 | 50,000 | 50,279 |
| 3.00% 11/13/27 | 50,000 | 53,686 |
| 3.25% 02/23/26 | 60,000 | 64,198 |
| 3.75% 11/13/47 | 50,000 | 58,767 |
| 4.38% 05/13/45 | 65,000 | 82,226 |
| 4.65% 02/23/46 | 85,000 | 111,664 |
| Applied Materials Inc. | | |
| 3.90% 10/01/25 | 60,000 | 65,257 |
| Arch Capital Finance LLC | | |
| 5.03% 12/15/46 | 50,000 | 64,818 |
| | Principal
Amount | Fair
Value |
| Ares Capital Corp. | | |
| 3.88% 01/15/26 | $ 100,000 | $ 105,533 |
| 4.20% 06/10/24 | 65,000 | 68,689 |
| Arizona Public Service Co. | | |
| 4.25% 03/01/49 | 25,000 | 29,205 |
| Arrow Electronics Inc. | | |
| 4.00% 04/01/25 | 40,000 | 42,652 |
| Asian Development Bank | | |
| 0.25% 07/14/23 | 135,000 | 134,201 |
| 0.75% 10/08/30 | 100,000 | 93,424 |
| 1.00% 04/14/26 | 50,000 | 49,479 |
| 1.50% 03/04/31 | 200,000 | 198,800 |
| 1.75% 09/19/29 | 50,000 | 50,774 |
| 2.75% 03/17/23 | 195,000 | 200,152 |
| 3.13% 09/26/28 | 25,000 | 27,621 |
| Assurant Inc. | | |
| 4.90% 03/27/28 | 50,000 | 57,187 |
| AstraZeneca PLC | | |
| 0.70% 04/08/26 | 50,000 | 48,361 |
| 3.50% 08/17/23 | 25,000 | 26,078 |
| 4.00% 01/17/29 | 20,000 | 22,547 |
| 6.45% 09/15/37 | 50,000 | 73,720 |
| AT&T Inc. | | |
| 0.90% 03/25/24 | 100,000 | 99,602 |
| 1.65% 02/01/28 | 45,000 | 44,069 |
| 2.25% 02/01/32 | 110,000 | 106,433 |
| 2.75% 06/01/31 | 100,000 | 101,975 |
| 3.50% 09/15/53 | 150,000 | 151,612 |
| 3.55% 09/15/55 | 136,000 | 136,252 |
| 3.65% 06/01/51 - 09/15/59 | 300,000 | 305,667 |
| 4.30% 02/15/30 | 20,000 | 22,533 |
| 4.35% 03/01/29 - 06/15/45 | 150,000 | 169,096 |
| 4.50% 05/15/35 | 95,000 | 109,640 |
| 4.75% 05/15/46 | 50,000 | 60,442 |
| Athene Holding Ltd. | | |
| 3.50% 01/15/31 | 10,000 | 10,554 |
| Atmos Energy Corp. | | |
| 4.30% 10/01/48 | 100,000 | 122,389 |
| Australia & New Zealand Banking Group Ltd. | | |
| 3.70% 11/16/25 | 50,000 | 54,304 |
| Autodesk Inc. | | |
| 2.40% 12/15/31 | 100,000 | 99,853 |
| Automatic Data Processing Inc. | | |
| 1.70% 05/15/28 | 20,000 | 19,956 |
| AutoZone Inc. | | |
| 3.75% 04/18/29 | 100,000 | 109,436 |
See Notes to Schedule of Investments and Notes to Financial Statements.
| 86 | State Street Total Return V.I.S. Fund |
State Street Total Return V.I.S. Fund
Schedule of Investments, continued — December 31, 2021
| | Principal
Amount | Fair
Value |
| AvalonBay Communities Inc. | | |
| 1.90% 12/01/28 | $ 50,000 | $ 49,592 |
| 2.05% 01/15/32 | 35,000 | 34,565 |
| 3.20% 01/15/28 | 40,000 | 42,820 |
| Avangrid Inc. | | |
| 3.80% 06/01/29 | 50,000 | 54,659 |
| AXA S.A. | | |
| 8.60% 12/15/30 | 100,000 | 144,878 |
| Baidu Inc. | | |
| 3.08% 04/07/25 | 100,000 | 103,760 |
| 4.38% 03/29/28 | 100,000 | 110,827 |
| Bain Capital Specialty Finance Inc. | | |
| 2.55% 10/13/26 | 50,000 | 48,571 |
| Baker Hughes Holdings LLC/Baker Hughes Co-Obligor Inc. | | |
| 2.77% 12/15/22 | 50,000 | 50,987 |
| 4.08% 12/15/47 | 50,000 | 57,005 |
| Banco Santander S.A. | | |
| 3.13% 02/23/23 | 100,000 | 102,382 |
| 3.80% 02/23/28 | 100,000 | 108,321 |
| Bank of America Corp. | | |
| 3.95% 04/21/25 | 55,000 | 58,808 |
| 4.18% 11/25/27 | 100,000 | 109,468 |
| 5.00% 01/21/44 | 150,000 | 197,115 |
| 6.11% 01/29/37 | 100,000 | 134,600 |
| Bank of America Corp. (1.32% fixed rate until 06/19/25; 1.15% + SOFR thereafter) | | |
| 1.32% 06/19/26 (g) | 150,000 | 148,438 |
| Bank of America Corp. (1.49% fixed rate until 05/19/23; 1.46% + SOFR thereafter) | | |
| 1.49% 05/19/24 (g) | 100,000 | 100,733 |
| Bank of America Corp. (1.53% fixed rate until 12/06/24; 0.65% + SOFR thereafter) | | |
| 1.53% 12/06/25 (g) | 150,000 | 150,382 |
| Bank of America Corp. (1.66% fixed rate until 03/11/26; 0.91% + SOFR thereafter) | | |
| 1.66% 03/11/27 (g) | 100,000 | 99,299 |
| Bank of America Corp. (2.57% fixed rate until 10/20/31; 1.21% + SOFR thereafter) | | |
| 2.57% 10/20/32 (g) | 100,000 | 100,484 |
| Bank of America Corp. (2.59% fixed rate until 04/29/30; 2.15% + SOFR thereafter) | | |
| 2.59% 04/29/31 (g) | 75,000 | 75,727 |
| | Principal
Amount | Fair
Value |
| Bank of America Corp. (2.88% fixed rate until 10/22/29; 1.19% + 3 month USD LIBOR thereafter) | | |
| 2.88% 10/22/30 (g) | $ 100,000 | $ 103,209 |
| Bank of America Corp. (3.19% fixed rate until 07/23/29; 1.18% + 3 month USD LIBOR thereafter) | | |
| 3.19% 07/23/30 (g) | 50,000 | 52,726 |
| Bank of America Corp. (3.42% fixed rate until 12/20/27; 1.04% + 3 month USD LIBOR thereafter) | | |
| 3.42% 12/20/28 (g) | 107,000 | 114,347 |
| Bank of America Corp. (3.46% fixed rate until 03/15/24; 0.97% + 3 month USD LIBOR thereafter) | | |
| 3.46% 03/15/25 (g) | 100,000 | 104,600 |
| Bank of America Corp. (3.55% fixed rate until 03/05/23; 0.78% + 3 month USD LIBOR thereafter) | | |
| 3.55% 03/05/24 (g) | 100,000 | 102,986 |
| Bank of America Corp. (3.56% fixed rate until 04/23/26; 1.06% + 3 month USD LIBOR thereafter) | | |
| 3.56% 04/23/27 (g) | 100,000 | 107,001 |
| Bank of America Corp. (3.95% fixed rate until 01/23/48; 1.19% + 3 month USD LIBOR thereafter) | | |
| 3.95% 01/23/49 (g) | 100,000 | 116,668 |
| Bank of America Corp. (3.97% fixed rate until 03/05/28; 1.07% + 3 month USD LIBOR thereafter) | | |
| 3.97% 03/05/29 (g) | 100,000 | 109,496 |
| Bank of America Corp. (4.24% fixed rate until 04/24/37; 1.81% + 3 month USD LIBOR thereafter) | | |
| 4.24% 04/24/38 (g) | 50,000 | 58,582 |
| Bank of America Corp. (4.33% fixed rate until 03/15/49; 1.52% + 3 month USD LIBOR thereafter) | | |
| 4.33% 03/15/50 (g) | 100,000 | 123,794 |
See Notes to Schedule of Investments and Notes to Financial Statements.
| State Street Total Return V.I.S. Fund | 87 |
State Street Total Return V.I.S. Fund
Schedule of Investments, continued — December 31, 2021
| | Principal
Amount | Fair
Value |
| Bank of Montreal (0.95% fixed rate until 01/22/26; 0.60% + SOFR thereafter) | | |
| 0.95% 01/22/27 (g) | $ 100,000 | $ 97,052 |
| Banner Health | | |
| 2.34% 01/01/30 | 75,000 | 75,942 |
| Barclays PLC | | |
| 3.65% 03/16/25 | 50,000 | 52,867 |
| Barclays PLC (1.01% fixed rate until 12/10/23; 0.80% + 1 year CMT Rate thereafter) | | |
| 1.01% 12/10/24 (g) | 100,000 | 99,264 |
| Barclays PLC (3.56% fixed rate until 09/23/30; 2.90% + 5 year CMT Rate thereafter) | | |
| 3.56% 09/23/35 (g) | 100,000 | 102,391 |
| Barclays PLC (4.97% fixed rate until 05/16/28; 1.90% + 3 month USD LIBOR thereafter) | | |
| 4.97% 05/16/29 (g) | 100,000 | 114,427 |
| BAT Capital Corp. | | |
| 2.79% 09/06/24 | 100,000 | 103,047 |
| 3.56% 08/15/27 | 100,000 | 104,970 |
| 3.98% 09/25/50 | 200,000 | 193,410 |
| Baxalta Inc. | | |
| 4.00% 06/23/25 | 30,000 | 32,318 |
| BBVA USA | | |
| 3.88% 04/10/25 | 50,000 | 53,589 |
| Becton Dickinson & Co. | | |
| 3.70% 06/06/27 | 66,000 | 71,968 |
| Bell Canada Inc. | | |
| 4.30% 07/29/49 | 30,000 | 36,496 |
| Berkshire Hathaway Energy Co. | | |
| 2.85% 05/15/51 | 275,000 | 264,489 |
| Berkshire Hathaway Finance Corp. | | |
| 2.50% 01/15/51 | 200,000 | 186,130 |
| 4.20% 08/15/48 | 100,000 | 121,449 |
| Best Buy Company Inc. | | |
| 4.45% 10/01/28 | 25,000 | 28,380 |
| Biogen Inc. | | |
| 2.25% 05/01/30 | 85,000 | 83,764 |
| Black Hills Corp. | | |
| 3.88% 10/15/49 | 25,000 | 27,678 |
| 4.35% 05/01/33 | 30,000 | 34,073 |
| BlackRock Inc. | | |
| 2.40% 04/30/30 | 20,000 | 20,544 |
| 3.25% 04/30/29 | 60,000 | 65,323 |
| | Principal
Amount | Fair
Value |
| Blackstone Private Credit Fund | | |
| 2.63% 12/15/26 (d) | $ 100,000 | $ 97,577 |
| Blackstone Secured Lending Fund | | |
| 2.75% 09/16/26 | 50,000 | 49,973 |
| Boardwalk Pipelines LP | | |
| 4.80% 05/03/29 | 20,000 | 22,422 |
| Booking Holdings Inc. | | |
| 3.55% 03/15/28 | 100,000 | 109,058 |
| Boston Properties LP | | |
| 3.40% 06/21/29 | 50,000 | 53,093 |
| Boston Scientific Corp. | | |
| 4.55% 03/01/39 | 50,000 | 59,788 |
| BP Capital Markets America Inc. | | |
| 2.77% 11/10/50 | 100,000 | 94,127 |
| 3.94% 09/21/28 | 100,000 | 111,001 |
| 4.23% 11/06/28 | 50,000 | 56,662 |
| BPCE S.A. | | |
| 4.00% 04/15/24 | 50,000 | 53,233 |
| Brandywine Operating Partnership LP | | |
| 4.55% 10/01/29 | 25,000 | 27,861 |
| Brighthouse Financial Inc. | | |
| 3.85% 12/22/51 | 50,000 | 49,610 |
| Bristol-Myers Squibb Co. | | |
| 2.55% 11/13/50 | 30,000 | 28,451 |
| 2.75% 02/15/23 | 50,000 | 51,064 |
| 3.40% 07/26/29 | 55,000 | 60,158 |
| 3.45% 11/15/27 | 50,000 | 54,676 |
| 4.13% 06/15/39 | 15,000 | 17,742 |
| 4.25% 10/26/49 | 40,000 | 49,478 |
| 4.35% 11/15/47 | 50,000 | 61,992 |
| 5.00% 08/15/45 | 38,000 | 50,604 |
| British Telecommunications PLC | | |
| 9.63% 12/15/30 | 50,000 | 73,524 |
| Broadcom Inc. | | |
| 3.15% 11/15/25 | 140,000 | 146,993 |
| 3.50% 02/15/41 (d) | 100,000 | 101,827 |
| 4.30% 11/15/32 | 130,000 | 146,411 |
| 4.75% 04/15/29 | 100,000 | 113,915 |
| Brookfield Finance Inc. | | |
| 3.90% 01/25/28 | 100,000 | 109,787 |
| Bunge Limited Finance Corp. | | |
| 1.63% 08/17/25 | 50,000 | 49,934 |
| 4.35% 03/15/24 | 50,000 | 53,158 |
See Notes to Schedule of Investments and Notes to Financial Statements.
| 88 | State Street Total Return V.I.S. Fund |
State Street Total Return V.I.S. Fund
Schedule of Investments, continued — December 31, 2021
| | Principal
Amount | Fair
Value |
| Burlington Northern Santa Fe LLC | | |
| 3.55% 02/15/50 | $ 50,000 | $ 56,271 |
| 5.75% 05/01/40 | 100,000 | 138,749 |
| California Institute of Technology | | |
| 3.65% 09/01/19 | 20,000 | 23,408 |
| Camden Property Trust | | |
| 3.35% 11/01/49 | 10,000 | 10,993 |
| 4.10% 10/15/28 | 10,000 | 11,279 |
| Campbell Soup Co. | | |
| 2.38% 04/24/30 | 15,000 | 14,909 |
| 3.65% 03/15/23 | 15,000 | 15,463 |
| 4.15% 03/15/28 | 50,000 | 55,526 |
| Canadian Imperial Bank of Commerce | | |
| 1.00% 10/18/24 | 50,000 | 49,549 |
| 1.25% 06/22/26 | 125,000 | 121,920 |
| Canadian National Railway Co. | | |
| 2.95% 11/21/24 | 55,000 | 57,385 |
| Canadian Natural Resources Ltd. | | |
| 2.05% 07/15/25 | 150,000 | 151,594 |
| Canadian Pacific Railway Co. | | |
| 2.05% 03/05/30 | 20,000 | 19,766 |
| 2.90% 02/01/25 | 50,000 | 52,098 |
| Capital One Financial Co. (2.62% fixed rate until 11/02/31; 1.27% + SOFR thereafter) | | |
| 2.62% 11/02/32 (g) | 25,000 | 24,897 |
| Capital One Financial Corp. | | |
| 3.90% 01/29/24 | 125,000 | 131,669 |
| 4.20% 10/29/25 | 90,000 | 97,860 |
| Cardinal Health Inc. | | |
| 3.20% 03/15/23 | 50,000 | 51,288 |
| Carlisle Companies Inc. | | |
| 2.20% 03/01/32 | 50,000 | 48,117 |
| Carrier Global Corp. | | |
| 2.24% 02/15/25 | 15,000 | 15,368 |
| 2.49% 02/15/27 | 15,000 | 15,399 |
| 3.58% 04/05/50 | 25,000 | 26,595 |
| Caterpillar Financial Services Corp. | | |
| 0.25% 03/01/23 | 65,000 | 64,646 |
| 3.45% 05/15/23 | 100,000 | 103,652 |
| Caterpillar Inc. | | |
| 3.25% 04/09/50 | 100,000 | 110,522 |
| | Principal
Amount | Fair
Value |
| CDW LLC/CDW Finance Corp. | | |
| 2.67% 12/01/26 | $ 70,000 | $ 71,831 |
| Celulosa Arauco y Constitucion S.A. | | |
| 3.88% 11/02/27 | 100,000 | 106,258 |
| Cenovus Energy Inc. | | |
| 6.80% 09/15/37 | 150,000 | 203,439 |
| CenterPoint Energy Houston Electric LLC | | |
| 4.50% 04/01/44 | 50,000 | 62,921 |
| Charter Communications Operating LLC/Charter Communications Operating Capital | | |
| 2.80% 04/01/31 | 65,000 | 64,448 |
| 3.70% 04/01/51 | 105,000 | 101,494 |
| 4.80% 03/01/50 | 95,000 | 106,493 |
| 6.48% 10/23/45 | 150,000 | 205,072 |
| Cheniere Corpus Christi Holdings LLC | | |
| 2.74% 12/31/39 (d) | 55,000 | 53,810 |
| Chevron Corp. | | |
| 2.90% 03/03/24 | 50,000 | 52,033 |
| 2.95% 05/16/26 | 50,000 | 53,007 |
| Chevron USA Inc. | | |
| 3.25% 10/15/29 | 100,000 | 108,520 |
| Chubb INA Holdings Inc. | | |
| 2.85% 12/15/51 | 15,000 | 15,089 |
| 4.35% 11/03/45 | 100,000 | 124,272 |
| CI Financial Corp. | | |
| 4.10% 06/15/51 | 50,000 | 54,231 |
| Cigna Corp. | | |
| 2.38% 03/15/31 | 60,000 | 60,247 |
| 2.40% 03/15/30 | 15,000 | 15,104 |
| 3.75% 07/15/23 | 20,000 | 20,816 |
| 4.38% 10/15/28 | 40,000 | 45,472 |
| 4.50% 02/25/26 | 50,000 | 55,402 |
| 4.80% 08/15/38 | 30,000 | 36,874 |
| 4.90% 12/15/48 | 130,000 | 167,861 |
| Cisco Systems Inc. | | |
| 5.90% 02/15/39 | 100,000 | 143,896 |
| Citigroup Inc. | | |
| 3.88% 03/26/25 | 50,000 | 53,302 |
| 4.30% 11/20/26 | 100,000 | 110,658 |
| 6.13% 08/25/36 | 155,000 | 210,995 |
| Citigroup Inc. (0.98% fixed rate until 05/01/24; 0.67% + SOFR thereafter) | | |
| 0.98% 05/01/25 (g) | 100,000 | 99,282 |
See Notes to Schedule of Investments and Notes to Financial Statements.
| State Street Total Return V.I.S. Fund | 89 |
State Street Total Return V.I.S. Fund
Schedule of Investments, continued — December 31, 2021
| | Principal
Amount | Fair
Value |
| Citigroup Inc. (1.28% fixed rate until 11/03/24; 0.53% + SOFR thereafter) | | |
| 1.28% 11/03/25 (g) | $ 15,000 | $ 14,968 |
| Citigroup Inc. (2.52% fixed rate until 11/03/31; 1.18% + SOFR thereafter) | | |
| 2.52% 11/03/32 (g) | 35,000 | 35,012 |
| Citigroup Inc. (3.11% fixed rate until 04/08/25; 2.84% + SOFR thereafter) | | |
| 3.11% 04/08/26 (g) | 100,000 | 104,843 |
| Citigroup Inc. (3.35% fixed rate until 04/24/24; 0.90% + 3 month USD LIBOR thereafter) | | |
| 3.35% 04/24/25 (g) | 100,000 | 104,460 |
| Citigroup Inc. (3.52% fixed rate until 10/27/27; 1.15% + 3 month USD LIBOR thereafter) | | |
| 3.52% 10/27/28 (g) | 100,000 | 107,229 |
| Citigroup Inc. (4.08% fixed rate until 04/23/28; 1.19% + 3 month USD LIBOR thereafter) | | |
| 4.08% 04/23/29 (g) | 150,000 | 165,393 |
| Citigroup Inc. (5.32% fixed rate until 03/26/40; 4.55% + SOFR thereafter) | | |
| 5.32% 03/26/41 (g) | 150,000 | 197,569 |
| Citrix Systems Inc. | | |
| 3.30% 03/01/30 | 25,000 | 25,365 |
| CME Group Inc. | | |
| 3.00% 03/15/25 | 50,000 | 52,564 |
| CNH Industrial Capital LLC | | |
| 1.95% 07/02/23 | 65,000 | 65,850 |
| CNH Industrial N.V. | | |
| 3.85% 11/15/27 | 15,000 | 16,371 |
| CNOOC Finance 2014 ULC | | |
| 4.25% 04/30/24 | 100,000 | 106,275 |
| CNOOC Petroleum North America ULC | | |
| 6.40% 05/15/37 | 100,000 | 132,011 |
| Comcast Corp. | | |
| 2.65% 02/01/30 | 35,000 | 36,253 |
| 2.94% 11/01/56 (d) | 100,000 | 95,255 |
| 3.38% 08/15/25 | 100,000 | 106,709 |
| 3.45% 02/01/50 | 135,000 | 144,233 |
| 3.55% 05/01/28 | 100,000 | 109,485 |
| 3.97% 11/01/47 | 100,000 | 114,511 |
| | Principal
Amount | Fair
Value |
| 4.00% 03/01/48 | $ 50,000 | $ 57,486 |
| 4.15% 10/15/28 | 45,000 | 51,066 |
| 4.60% 10/15/38 | 130,000 | 157,943 |
| 4.70% 10/15/48 | 40,000 | 51,191 |
| Comerica Inc. | | |
| 4.00% 02/01/29 | 50,000 | 55,923 |
| Commonwealth Edison Co. | | |
| 4.60% 08/15/43 | 150,000 | 186,871 |
| Conagra Brands Inc. | | |
| 4.30% 05/01/24 | 5,000 | 5,326 |
| 5.30% 11/01/38 | 60,000 | 75,863 |
| ConocoPhillips | | |
| 6.50% 02/01/39 | 100,000 | 145,562 |
| Consolidated Edison Company of New York Inc. | | |
| 3.88% 06/15/47 | 100,000 | 109,806 |
| 4.13% 05/15/49 | 50,000 | 57,540 |
| Constellation Brands Inc. | | |
| 3.50% 05/09/27 | 100,000 | 107,796 |
| 3.75% 05/01/50 | 5,000 | 5,472 |
| 5.25% 11/15/48 | 15,000 | 19,683 |
| Consumers Energy Co. | | |
| 4.05% 05/15/48 | 50,000 | 59,924 |
| Continental Resources Inc. | | |
| 3.80% 06/01/24 | 110,000 | 114,822 |
| Cooperatieve Rabobank UA | | |
| 0.38% 01/12/24 | 150,000 | 148,146 |
| Corning Inc. | | |
| 3.90% 11/15/49 | 50,000 | 56,353 |
| Corp. Andina de Fomento | | |
| 1.25% 10/26/24 | 68,000 | 67,687 |
| Council Of Europe Development Bank | | |
| 2.63% 02/13/23 | 120,000 | 122,720 |
| Credit Suisse AG | | |
| 0.50% 02/02/24 | 140,000 | 138,314 |
| 3.63% 09/09/24 | 50,000 | 53,039 |
| Credit Suisse Group AG | | |
| 4.88% 05/15/45 | 50,000 | 63,239 |
| Crown Castle International Corp. | | |
| 3.15% 07/15/23 | 55,000 | 56,670 |
| 3.80% 02/15/28 | 100,000 | 108,695 |
| 5.20% 02/15/49 | 50,000 | 64,307 |
| CSX Corp. | | |
| 4.10% 03/15/44 | 68,000 | 79,033 |
| 4.25% 03/15/29 | 50,000 | 56,504 |
| 4.75% 11/15/48 | 65,000 | 84,365 |
See Notes to Schedule of Investments and Notes to Financial Statements.
| 90 | State Street Total Return V.I.S. Fund |
State Street Total Return V.I.S. Fund
Schedule of Investments, continued — December 31, 2021
| | Principal
Amount | Fair
Value |
| CubeSmart LP | | |
| 2.00% 02/15/31 | $ 50,000 | $ 48,372 |
| 4.38% 02/15/29 | 15,000 | 17,001 |
| Cummins Inc. | | |
| 1.50% 09/01/30 | 100,000 | 94,776 |
| CVS Health Corp. | | |
| 2.63% 08/15/24 | 100,000 | 103,583 |
| 3.38% 08/12/24 | 50,000 | 52,551 |
| 3.88% 07/20/25 | 50,000 | 53,781 |
| 4.10% 03/25/25 | 13,000 | 14,014 |
| 4.30% 03/25/28 | 43,000 | 48,287 |
| 4.78% 03/25/38 | 95,000 | 115,755 |
| 5.05% 03/25/48 | 265,000 | 346,739 |
| CyrusOne LP/CyrusOne Finance Corp. | | |
| 2.90% 11/15/24 | 25,000 | 25,860 |
| D.R. Horton Inc. | | |
| 1.30% 10/15/26 | 55,000 | 53,683 |
| Darden Restaurants Inc. | | |
| 4.55% 02/15/48 | 15,000 | 17,353 |
| Dell International LLC/EMC Corp. | | |
| 3.38% 12/15/41 (d) | 25,000 | 24,753 |
| 6.02% 06/15/26 | 175,000 | 202,781 |
| 6.20% 07/15/30 | 100,000 | 126,407 |
| Delmarva Power & Light Co. | | |
| 4.15% 05/15/45 | 100,000 | 117,196 |
| Deutsche Bank AG (2.22% fixed rate until 09/18/23; 2.16% + SOFR thereafter) | | |
| 2.22% 09/18/24 (g) | 100,000 | 101,318 |
| Deutsche Bank AG (3.55% fixed rate until 09/18/30; 3.04% + SOFR thereafter) | | |
| 3.55% 09/18/31 (g) | 100,000 | 105,435 |
| Deutsche Bank AG (3.96% fixed rate until 11/26/24; 2.58% + SOFR thereafter) | | |
| 3.96% 11/26/25 (g) | 50,000 | 52,884 |
| Deutsche Telekom International Finance BV | | |
| 8.75% 06/15/30 | 50,000 | 72,699 |
| Devon Energy Corp. | | |
| 5.00% 06/15/45 | 50,000 | 60,776 |
| DH Europe Finance II Sarl | | |
| 3.40% 11/15/49 | 100,000 | 108,963 |
| Diageo Capital PLC | | |
| 2.13% 04/29/32 | 100,000 | 99,238 |
| Diamondback Energy Inc. | | |
| 3.50% 12/01/29 | 50,000 | 52,997 |
| | Principal
Amount | Fair
Value |
| 4.75% 05/31/25 | $ 65,000 | $ 71,214 |
| Digital Realty Trust LP | | |
| 4.45% 07/15/28 | 50,000 | 56,538 |
| Discovery Communications LLC | | |
| 3.90% 11/15/24 | 50,000 | 53,140 |
| 4.65% 05/15/50 | 100,000 | 117,672 |
| Dollar Tree Inc. | | |
| 4.00% 05/15/25 | 50,000 | 53,738 |
| Dominion Energy Inc. | | |
| 1.45% 04/15/26 | 40,000 | 39,598 |
| 4.25% 06/01/28 | 50,000 | 55,930 |
| DTE Electric Co. | | |
| 2.95% 03/01/50 | 25,000 | 25,369 |
| 3.70% 03/15/45 | 45,000 | 50,146 |
| Duke Energy Carolinas LLC | | |
| 3.05% 03/15/23 | 50,000 | 51,278 |
| 3.95% 03/15/48 | 50,000 | 57,976 |
| Duke Energy Corp. (3.25% fixed rate until 01/15/27; 2.32% + 5 year CMT Rate thereafter) | | |
| 3.25% 01/15/82 (g) | 100,000 | 97,609 |
| Duke Energy Florida LLC | | |
| 3.80% 07/15/28 | 50,000 | 55,160 |
| Duke Energy Indiana LLC | | |
| 2.75% 04/01/50 | 100,000 | 94,332 |
| Duke Energy Ohio Inc. | | |
| 3.65% 02/01/29 | 100,000 | 108,735 |
| 4.30% 02/01/49 | 100,000 | 120,487 |
| Duke Realty LP | | |
| 2.25% 01/15/32 | 50,000 | 48,960 |
| DuPont de Nemours Inc. | | |
| 4.21% 11/15/23 | 50,000 | 52,873 |
| 5.32% 11/15/38 | 15,000 | 19,291 |
| 5.42% 11/15/48 | 40,000 | 55,924 |
| Eagle Materials Inc. | | |
| 2.50% 07/01/31 | 25,000 | 24,672 |
| eBay Inc. | | |
| 1.90% 03/11/25 | 40,000 | 40,475 |
| Ecolab Inc. | | |
| 2.13% 02/01/32 | 25,000 | 24,804 |
| 3.25% 12/01/27 | 70,000 | 75,879 |
| Edison International | | |
| 4.13% 03/15/28 | 50,000 | 53,109 |
| Eli Lilly & Co. | | |
| 2.25% 05/15/50 | 50,000 | 46,009 |
| 2.75% 06/01/25 | 22,000 | 23,036 |
| 3.38% 03/15/29 | 13,000 | 14,263 |
See Notes to Schedule of Investments and Notes to Financial Statements.
| State Street Total Return V.I.S. Fund | 91 |
State Street Total Return V.I.S. Fund
Schedule of Investments, continued — December 31, 2021
| | Principal
Amount | Fair
Value |
| Emera US Finance LP | | |
| 3.55% 06/15/26 | $ 60,000 | $ 63,822 |
| Emerson Electric Co. | | |
| 2.20% 12/21/31 | 100,000 | 99,585 |
| 2.63% 02/15/23 | 100,000 | 101,664 |
| Emory University | | |
| 2.14% 09/01/30 | 65,000 | 65,803 |
| 2.97% 09/01/50 | 65,000 | 68,579 |
| Enable Midstream Partners LP | | |
| 4.95% 05/15/28 | 60,000 | 66,727 |
| Enbridge Energy Partners LP | | |
| 5.88% 10/15/25 | 75,000 | 85,548 |
| Enbridge Inc. | | |
| 2.50% 08/01/33 | 100,000 | 98,378 |
| Enel Chile S.A. | | |
| 4.88% 06/12/28 | 50,000 | 55,121 |
| Energy Transfer LP | | |
| 5.88% 01/15/24 | 100,000 | 107,910 |
| 6.00% 06/15/48 | 50,000 | 62,531 |
| 6.25% 04/15/49 | 50,000 | 65,386 |
| 6.50% 02/01/42 | 150,000 | 192,612 |
| Enstar Group Ltd. | | |
| 3.10% 09/01/31 | 10,000 | 9,790 |
| Entergy Louisiana LLC | | |
| 3.10% 06/15/41 | 50,000 | 51,372 |
| 4.05% 09/01/23 | 50,000 | 52,026 |
| Entergy Texas Inc. | | |
| 4.00% 03/30/29 | 100,000 | 110,606 |
| Enterprise Products Operating LLC | | |
| 3.90% 02/15/24 | 75,000 | 78,839 |
| 4.20% 01/31/50 | 35,000 | 39,577 |
| 4.25% 02/15/48 | 25,000 | 28,489 |
| 4.45% 02/15/43 | 92,000 | 105,625 |
| 4.80% 02/01/49 | 25,000 | 30,504 |
| Enterprise Products Operating LLC (5.38% fixed rate until 02/15/28; 2.57% + 3 month USD LIBOR thereafter) | | |
| 5.38% 02/15/78 (g) | 50,000 | 50,318 |
| EOG Resources Inc. | | |
| 4.38% 04/15/30 | 100,000 | 115,607 |
| EPR Properties | | |
| 3.60% 11/15/31 | 65,000 | 64,655 |
| Equifax Inc. | | |
| 2.60% 12/01/24 | 50,000 | 51,743 |
| Equinix Inc. | | |
| 2.15% 07/15/30 | 115,000 | 111,751 |
| 2.63% 11/18/24 | 65,000 | 67,055 |
| | Principal
Amount | Fair
Value |
| Equinor ASA | | |
| 2.65% 01/15/24 | $ 225,000 | $ 232,204 |
| 3.95% 05/15/43 | 50,000 | 58,306 |
| ERP Operating LP | | |
| 1.85% 08/01/31 | 100,000 | 96,991 |
| Essential Utilities Inc. | | |
| 2.70% 04/15/30 | 100,000 | 101,455 |
| European Bank for Reconstruction & Development | | |
| 1.63% 09/27/24 | 100,000 | 101,781 |
| European Investment Bank | | |
| 0.25% 09/15/23 | 100,000 | 99,231 |
| 0.38% 12/15/25 | 100,000 | 96,768 |
| 0.75% 10/26/26 | 56,000 | 54,524 |
| 2.25% 06/24/24 | 250,000 | 258,385 |
| 2.63% 03/15/24 | 285,000 | 296,226 |
| Evergy Metro Inc. | | |
| 4.20% 06/15/47 | 100,000 | 119,276 |
| Eversource Energy | | |
| 2.90% 10/01/24 | 100,000 | 103,722 |
| Exelon Generation Company LLC | | |
| 3.25% 06/01/25 | 95,000 | 99,766 |
| Expedia Group Inc. | | |
| 3.25% 02/15/30 | 35,000 | 35,777 |
| 4.63% 08/01/27 | 90,000 | 100,578 |
| Exxon Mobil Corp. | | |
| 2.71% 03/06/25 | 50,000 | 52,120 |
| 2.99% 03/19/25 | 100,000 | 105,187 |
| 3.04% 03/01/26 | 150,000 | 158,865 |
| 3.10% 08/16/49 | 25,000 | 25,367 |
| 4.23% 03/19/40 | 100,000 | 118,119 |
| Fairfax Financial Holdings Ltd. | | |
| 4.63% 04/29/30 | 25,000 | 28,014 |
| Federal Realty Investment Trust | | |
| 3.20% 06/15/29 | 50,000 | 52,894 |
| FedEx Corp. | | |
| 4.05% 02/15/48 | 100,000 | 112,946 |
| Fidelity National Financial Inc. | | |
| 4.50% 08/15/28 | 25,000 | 28,278 |
| Fifth Third Bancorp (1.71% fixed rate until 11/01/26; 0.69% + SOFR thereafter) | | |
| 1.71% 11/01/27 (g) | 65,000 | 64,280 |
| Fiserv Inc. | | |
| 3.50% 07/01/29 | 45,000 | 48,398 |
| 3.80% 10/01/23 | 25,000 | 26,146 |
| 4.20% 10/01/28 | 30,000 | 33,626 |
See Notes to Schedule of Investments and Notes to Financial Statements.
| 92 | State Street Total Return V.I.S. Fund |
State Street Total Return V.I.S. Fund
Schedule of Investments, continued — December 31, 2021
| | Principal
Amount | Fair
Value |
| Flex Ltd. | | |
| 4.88% 06/15/29 | $ 25,000 | $ 28,424 |
| Florida Power & Light Co. | | |
| 2.88% 12/04/51 | 50,000 | 50,994 |
| 4.13% 02/01/42 | 100,000 | 119,462 |
| Fomento Economico Mexicano SAB de C.V. | | |
| 3.50% 01/16/50 | 150,000 | 157,531 |
| Fortune Brands Home & Security Inc. | | |
| 3.25% 09/15/29 | 50,000 | 52,865 |
| Fox Corp. | | |
| 4.03% 01/25/24 | 125,000 | 132,032 |
| FS KKR Capital Corp. | | |
| 4.13% 02/01/25 | 25,000 | 26,184 |
| GATX Corp. | | |
| 3.50% 03/15/28 | 100,000 | 107,123 |
| GE Capital International Funding Company Unlimited Co. | | |
| 4.42% 11/15/35 | 150,000 | 179,902 |
| General Dynamics Corp. | | |
| 3.38% 05/15/23 | 50,000 | 51,746 |
| 3.75% 05/15/28 | 55,000 | 60,899 |
| General Mills Inc. | | |
| 3.65% 02/15/24 | 50,000 | 52,395 |
| General Motors Co. | | |
| 5.40% 10/02/23 | 100,000 | 107,097 |
| 6.80% 10/01/27 | 55,000 | 67,633 |
| General Motors Financial Company Inc. | | |
| 1.20% 10/15/24 | 95,000 | 94,293 |
| 2.35% 01/08/31 | 100,000 | 97,111 |
| 4.35% 01/17/27 | 100,000 | 110,146 |
| 5.25% 03/01/26 | 55,000 | 61,687 |
| Georgia Power Co. | | |
| 2.65% 09/15/29 | 100,000 | 101,849 |
| Georgia-Pacific LLC | | |
| 8.88% 05/15/31 | 50,000 | 77,449 |
| Gilead Sciences Inc. | | |
| 3.65% 03/01/26 | 100,000 | 107,845 |
| 3.70% 04/01/24 | 50,000 | 52,529 |
| 4.80% 04/01/44 | 150,000 | 189,604 |
| GlaxoSmithKline Capital Inc. | | |
| 3.63% 05/15/25 | 55,000 | 59,193 |
| GlaxoSmithKline Capital PLC | | |
| 3.38% 06/01/29 | 175,000 | 190,675 |
| Global Payments Inc. | | |
| 3.20% 08/15/29 | 150,000 | 156,181 |
| | Principal
Amount | Fair
Value |
| GLP Capital LP/GLP Financing II Inc. | | |
| 4.00% 01/15/31 | $ 50,000 | $ 53,367 |
| 5.25% 06/01/25 | 10,000 | 10,988 |
| 5.38% 11/01/23 - 04/15/26 | 30,000 | 32,959 |
| 5.75% 06/01/28 | 10,000 | 11,559 |
| Halliburton Co. | | |
| 3.50% 08/01/23 | 6,000 | 6,198 |
| 5.00% 11/15/45 | 50,000 | 60,300 |
| Hasbro Inc. | | |
| 3.00% 11/19/24 | 50,000 | 52,120 |
| HCA Inc. | | |
| 4.50% 02/15/27 | 30,000 | 33,109 |
| 4.75% 05/01/23 | 30,000 | 31,436 |
| 5.00% 03/15/24 | 50,000 | 53,790 |
| 5.25% 04/15/25 - 06/15/26 | 70,000 | 78,147 |
| 5.50% 06/15/47 | 35,000 | 45,934 |
| Hewlett Packard Enterprise Co. | | |
| 6.35% 10/15/45 | 150,000 | 200,869 |
| Highwoods Realty LP | | |
| 4.20% 04/15/29 | 25,000 | 27,683 |
| Honeywell International Inc. | | |
| 2.70% 08/15/29 | 30,000 | 31,432 |
| 3.35% 12/01/23 | 50,000 | 52,316 |
| 5.38% 03/01/41 | 100,000 | 138,541 |
| Host Hotels & Resorts LP | | |
| 3.38% 12/15/29 | 100,000 | 102,288 |
| HP Inc. | | |
| 6.00% 09/15/41 | 162,000 | 215,799 |
| HSBC Holdings PLC | | |
| 3.90% 05/25/26 | 50,000 | 54,010 |
| 4.95% 03/31/30 | 200,000 | 234,520 |
| 5.25% 03/14/44 | 100,000 | 130,271 |
| HSBC Holdings PLC (2.36% fixed rate until 08/18/30; 1.95% + SOFR thereafter) | | |
| 2.36% 08/18/31 (g) | 100,000 | 97,698 |
| HSBC Holdings PLC (3.80% fixed rate until 03/11/24; 1.21% + 3 month USD LIBOR thereafter) | | |
| 3.80% 03/11/25 (g) | 100,000 | 105,005 |
| HSBC Holdings PLC (3.95% fixed rate until 05/18/23; 0.99% + 3 month USD LIBOR thereafter) | | |
| 3.95% 05/18/24 (g) | 100,000 | 103,747 |
See Notes to Schedule of Investments and Notes to Financial Statements.
| State Street Total Return V.I.S. Fund | 93 |
State Street Total Return V.I.S. Fund
Schedule of Investments, continued — December 31, 2021
| | Principal
Amount | Fair
Value |
| HSBC Holdings PLC (3.97% fixed rate until 05/22/29; 1.61% + 3 month USD LIBOR thereafter) | | |
| 3.97% 05/22/30 (g) | $ 100,000 | $ 108,721 |
| HSBC Holdings PLC (4.29% fixed rate until 09/12/25; 1.35% + 3 month USD LIBOR thereafter) | | |
| 4.29% 09/12/26 (g) | 100,000 | 107,984 |
| Hubbell Inc. | | |
| 3.50% 02/15/28 | 50,000 | 53,842 |
| Huntsman International LLC | | |
| 4.50% 05/01/29 | 20,000 | 22,211 |
| Hyatt Hotels Corp. | | |
| 5.75% 04/23/30 | 25,000 | 29,874 |
| IDEX Corp. | | |
| 3.00% 05/01/30 | 10,000 | 10,412 |
| Illinois Tool Works Inc. | | |
| 2.65% 11/15/26 | 100,000 | 105,153 |
| Indiana Michigan Power Co. | | |
| 3.85% 05/15/28 | 25,000 | 27,636 |
| Indiana University Health Inc. Obligated Group | | |
| 2.85% 11/01/51 | 15,000 | 15,110 |
| ING Groep N.V. | | |
| 3.95% 03/29/27 | 100,000 | 109,621 |
| Intel Corp. | | |
| 3.10% 02/15/60 | 35,000 | 35,265 |
| 3.15% 05/11/27 | 200,000 | 214,530 |
| 3.75% 03/25/27 | 100,000 | 110,075 |
| 4.95% 03/25/60 | 100,000 | 140,406 |
| Inter-American Development Bank | | |
| 0.50% 09/23/24 | 150,000 | 148,149 |
| 0.63% 07/15/25 | 50,000 | 49,114 |
| 1.13% 01/13/31 | 225,000 | 216,758 |
| 2.13% 01/15/25 | 200,000 | 206,596 |
| 2.38% 07/07/27 | 100,000 | 105,076 |
| 2.63% 01/16/24 | 100,000 | 103,741 |
| Intercontinental Exchange Inc. | | |
| 2.65% 09/15/40 | 50,000 | 48,584 |
| 3.00% 06/15/50 | 15,000 | 15,157 |
| 3.45% 09/21/23 | 90,000 | 93,592 |
| International Bank for Reconstruction & Development | | |
| 0.63% 04/22/25 | 200,000 | 197,028 |
| 0.75% 11/24/27 | 185,000 | 177,726 |
| 1.13% 09/13/28 | 160,000 | 156,299 |
| | Principal
Amount | Fair
Value |
| 1.25% 02/10/31 | $ 150,000 | $ 145,966 |
| 1.50% 08/28/24 | 100,000 | 101,512 |
| 1.63% 11/03/31 | 300,000 | 300,141 |
| 2.50% 07/29/25 | 150,000 | 157,056 |
| International Business Machines Corp. | | |
| 3.50% 05/15/29 | 130,000 | 141,225 |
| 4.00% 06/20/42 | 150,000 | 172,381 |
| International Finance Corp. | | |
| 0.50% 03/20/23 | 200,000 | 199,702 |
| International Flavors & Fragrances Inc. | | |
| 5.00% 09/26/48 | 15,000 | 19,283 |
| Intuit Inc. | | |
| 0.65% 07/15/23 | 65,000 | 64,836 |
| Invitation Homes Operating Partnership LP | | |
| 2.30% 11/15/28 | 15,000 | 14,849 |
| 2.70% 01/15/34 | 15,000 | 14,713 |
| Jefferies Group LLC | | |
| 2.75% 10/15/32 | 85,000 | 84,438 |
| John Deere Capital Corp. | | |
| 1.45% 01/15/31 | 70,000 | 66,630 |
| 2.70% 01/06/23 | 100,000 | 102,047 |
| 3.45% 06/07/23 - 03/13/25 | 75,000 | 79,314 |
| Johnson & Johnson | | |
| 1.30% 09/01/30 | 100,000 | 96,284 |
| 2.25% 09/01/50 | 50,000 | 46,633 |
| 2.45% 03/01/26 | 75,000 | 78,182 |
| 3.40% 01/15/38 | 25,000 | 27,983 |
| 3.50% 01/15/48 | 30,000 | 34,484 |
| 4.38% 12/05/33 | 50,000 | 61,460 |
| Johnson Controls International PLC | | |
| 3.63% 07/02/24 (h) | 75,000 | 78,937 |
| JPMorgan Chase & Co. | | |
| 3.88% 09/10/24 | 275,000 | 292,666 |
| 6.40% 05/15/38 | 100,000 | 145,608 |
| JPMorgan Chase & Co. (0.70% fixed rate until 03/16/23; 0.58% + SOFR thereafter) | | |
| 0.70% 03/16/24 (g) | 100,000 | 99,803 |
| JPMorgan Chase & Co. (0.77% fixed rate until 08/09/24; 0.49% + SOFR thereafter) | | |
| 0.77% 08/09/25 (g) | 100,000 | 98,519 |
See Notes to Schedule of Investments and Notes to Financial Statements.
| 94 | State Street Total Return V.I.S. Fund |
State Street Total Return V.I.S. Fund
Schedule of Investments, continued — December 31, 2021
| | Principal
Amount | Fair
Value |
| JPMorgan Chase & Co. (1.05% fixed rate until 11/19/25; 0.80% + SOFR thereafter) | | |
| 1.05% 11/19/26 (g) | $ 150,000 | $ 146,119 |
| JPMorgan Chase & Co. (1.56% fixed rate until 12/10/24; 0.61% + SOFR thereafter) | | |
| 1.56% 12/10/25 (g) | 200,000 | 200,356 |
| JPMorgan Chase & Co. (2.55% fixed rate until 11/08/31; 1.18% + SOFR thereafter) | | |
| 2.55% 11/08/32 (g) | 125,000 | 125,846 |
| JPMorgan Chase & Co. (2.58% fixed rate until 04/22/31; 1.25% + SOFR thereafter) | | |
| 2.58% 04/22/32 (g) | 75,000 | 75,934 |
| JPMorgan Chase & Co. (2.96% fixed rate until 05/13/30; 2.52% + SOFR thereafter) | | |
| 2.96% 05/13/31 (g) | 35,000 | 36,221 |
| JPMorgan Chase & Co. (3.16% fixed rate until 04/22/41; 1.46% + SOFR thereafter) | | |
| 3.16% 04/22/42 (g) | 50,000 | 52,063 |
| JPMorgan Chase & Co. (3.54% fixed rate until 05/01/27; 1.38% + 3 month USD LIBOR thereafter) | | |
| 3.54% 05/01/28 (g) | 50,000 | 53,810 |
| JPMorgan Chase & Co. (3.70% fixed rate until 05/06/29; 1.16% + 3 month USD LIBOR thereafter) | | |
| 3.70% 05/06/30 (g) | 75,000 | 81,809 |
| JPMorgan Chase & Co. (3.80% fixed rate until 07/23/23; 0.89% + 3 month USD LIBOR thereafter) | | |
| 3.80% 07/23/24 (g) | 100,000 | 104,221 |
| JPMorgan Chase & Co. (3.88% fixed rate until 07/24/37; 1.36% + 3 month USD LIBOR thereafter) | | |
| 3.88% 07/24/38 (g) | 50,000 | 56,643 |
| | Principal
Amount | Fair
Value |
| JPMorgan Chase & Co. (3.90% fixed rate until 01/23/48; 1.22% + 3 month USD LIBOR thereafter) | | |
| 3.90% 01/23/49 (g) | $ 100,000 | $ 115,884 |
| JPMorgan Chase & Co. (3.96% fixed rate until 01/29/26; 1.25% + 3 month USD LIBOR thereafter) | | |
| 3.96% 01/29/27 (g) | 100,000 | 108,258 |
| JPMorgan Chase & Co. (3.96% fixed rate until 11/15/47; 1.38% + 3 month USD LIBOR thereafter) | | |
| 3.96% 11/15/48 (g) | 100,000 | 117,075 |
| JPMorgan Chase & Co. (4.02% fixed rate until 12/05/23; 1.00% + 3 month USD LIBOR thereafter) | | |
| 4.02% 12/05/24 (g) | 50,000 | 52,667 |
| JPMorgan Chase & Co. (4.45% fixed rate until 12/05/28; 1.33% + 3 month USD LIBOR thereafter) | | |
| 4.45% 12/05/29 (g) | 50,000 | 56,743 |
| Kaiser Foundation Hospitals | | |
| 2.81% 06/01/41 | 65,000 | 65,307 |
| 3.00% 06/01/51 | 70,000 | 72,166 |
| Kansas City Southern | | |
| 4.70% 05/01/48 | 50,000 | 62,602 |
| Kennametal Inc. | | |
| 4.63% 06/15/28 | 25,000 | 28,076 |
| Kentucky Utilities Co. | | |
| 4.38% 10/01/45 | 40,000 | 47,652 |
| Keurig Dr Pepper Inc. | | |
| 4.99% 05/25/38 | 125,000 | 154,497 |
| KeyBank NA | | |
| 3.90% 04/13/29 | 100,000 | 110,096 |
| Keysight Technologies Inc. | | |
| 3.00% 10/30/29 | 25,000 | 26,025 |
| Kilroy Realty LP | | |
| 3.45% 12/15/24 | 50,000 | 52,471 |
| Kimberly Clark Corp. | | |
| 2.00% 11/02/31 | 50,000 | 49,849 |
| Kimberly-Clark Corp. | | |
| 1.05% 09/15/27 | 25,000 | 24,232 |
| Kimco Realty Corp. | | |
| 3.70% 10/01/49 | 50,000 | 53,588 |
| Kinder Morgan Energy Partners LP | | |
| 5.00% 08/15/42 | 50,000 | 58,180 |
See Notes to Schedule of Investments and Notes to Financial Statements.
| State Street Total Return V.I.S. Fund | 95 |
State Street Total Return V.I.S. Fund
Schedule of Investments, continued — December 31, 2021
| | Principal
Amount | Fair
Value |
| Kinder Morgan Inc. | | |
| 1.75% 11/15/26 | $ 30,000 | $ 29,926 |
| 3.60% 02/15/51 | 25,000 | 25,281 |
| 5.05% 02/15/46 | 50,000 | 59,871 |
| 5.30% 12/01/34 | 100,000 | 120,546 |
| KLA Corp. | | |
| 4.65% 11/01/24 | 115,000 | 124,690 |
| Kreditanstalt fuer Wiederaufbau | | |
| 0.38% 07/18/25 | 200,000 | 194,728 |
| 0.50% 09/20/24 | 100,000 | 98,782 |
| 0.75% 09/30/30 | 250,000 | 233,720 |
| 2.00% 05/02/25 | 150,000 | 154,410 |
| 2.88% 04/03/28 | 175,000 | 189,989 |
| L3Harris Technologies Inc. | | |
| 3.83% 04/27/25 | 50,000 | 53,376 |
| 4.85% 04/27/35 | 40,000 | 48,673 |
| Laboratory Corporation of America Holdings | | |
| 4.00% 11/01/23 | 100,000 | 104,567 |
| Lam Research Corp. | | |
| 3.80% 03/15/25 | 115,000 | 123,186 |
| Landwirtschaftliche Rentenbank | | |
| 2.50% 11/15/27 | 100,000 | 105,716 |
| Las Vegas Sands Corp. | | |
| 2.90% 06/25/25 | 65,000 | 65,079 |
| 3.90% 08/08/29 | 40,000 | 40,230 |
| Lear Corp. | | |
| 4.25% 05/15/29 | 25,000 | 27,633 |
| 5.25% 05/15/49 | 25,000 | 31,609 |
| Leggett & Platt Inc. | | |
| 4.40% 03/15/29 | 100,000 | 111,891 |
| Lexington Realty Trust | | |
| 2.38% 10/01/31 | 15,000 | 14,382 |
| Life Storage LP | | |
| 4.00% 06/15/29 | 50,000 | 55,435 |
| Linde Inc. | | |
| 2.00% 08/10/50 | 150,000 | 130,885 |
| Lloyds Banking Group PLC | | |
| 4.65% 03/24/26 | 50,000 | 55,080 |
| Lloyds Banking Group PLC (0.70% fixed rate until 05/11/23; 0.55% + 1 year CMT Rate thereafter) | | |
| 0.70% 05/11/24 (g) | 200,000 | 199,132 |
| Lockheed Martin Corp. | | |
| 4.70% 05/15/46 | 50,000 | 64,914 |
| Loews Corp. | | |
| 2.63% 05/15/23 | 100,000 | 102,066 |
| | Principal
Amount | Fair
Value |
| Lowe's Companies Inc. | | |
| 1.70% 10/15/30 | $ 45,000 | $ 42,750 |
| 2.50% 04/15/26 | 80,000 | 83,334 |
| 2.63% 04/01/31 | 100,000 | 102,332 |
| 3.00% 10/15/50 | 30,000 | 29,629 |
| 3.38% 09/15/25 | 30,000 | 31,999 |
| LYB International Finance BV | | |
| 4.88% 03/15/44 | 100,000 | 124,235 |
| Magellan Midstream Partners LP | | |
| 3.95% 03/01/50 | 125,000 | 132,967 |
| Marathon Petroleum Corp. | | |
| 4.50% 04/01/48 | 25,000 | 28,436 |
| Markel Corp. | | |
| 3.50% 11/01/27 | 50,000 | 53,646 |
| Marriott International Inc. | | |
| 4.63% 06/15/30 | 90,000 | 101,687 |
| 5.75% 05/01/25 | 40,000 | 45,046 |
| Marsh & McLennan Companies Inc. | | |
| 3.30% 03/14/23 | 150,000 | 153,868 |
| 4.38% 03/15/29 | 25,000 | 28,552 |
| 4.90% 03/15/49 | 15,000 | 20,202 |
| Martin Marietta Materials Inc. | | |
| 3.20% 07/15/51 | 35,000 | 35,450 |
| 3.50% 12/15/27 | 50,000 | 53,849 |
| Massachusetts Institute of Technology | | |
| 3.89% 07/01/16 | 126,000 | 157,951 |
| Mastercard Inc. | | |
| 2.00% 03/03/25 | 100,000 | 102,498 |
| 2.95% 11/21/26 | 100,000 | 106,470 |
| McCormick & Company Inc. | | |
| 0.90% 02/15/26 | 100,000 | 96,549 |
| McDonald's Corp. | | |
| 3.50% 07/01/27 | 100,000 | 108,640 |
| 3.63% 09/01/49 | 55,000 | 60,822 |
| 3.70% 02/15/42 | 50,000 | 55,429 |
| 3.80% 04/01/28 | 50,000 | 54,955 |
| MDC Holdings Inc. | | |
| 3.97% 08/06/61 | 100,000 | 95,884 |
| Medtronic Inc. | | |
| 4.63% 03/15/45 | 82,000 | 107,564 |
| Memorial Sloan-Kettering Cancer Center | | |
| 4.13% 07/01/52 | 95,000 | 119,398 |
| Merck & Company Inc. | | |
| 1.90% 12/10/28 | 25,000 | 25,109 |
| 2.75% 12/10/51 | 25,000 | 24,875 |
| 3.40% 03/07/29 | 75,000 | 81,775 |
See Notes to Schedule of Investments and Notes to Financial Statements.
| 96 | State Street Total Return V.I.S. Fund |
State Street Total Return V.I.S. Fund
Schedule of Investments, continued — December 31, 2021
| | Principal
Amount | Fair
Value |
| 4.00% 03/07/49 | $ 115,000 | $ 139,954 |
| Mercy Health | | |
| 4.30% 07/01/28 | 100,000 | 112,407 |
| MetLife Inc. | | |
| 4.13% 08/13/42 | 50,000 | 59,170 |
| 6.50% 12/15/32 | 50,000 | 69,555 |
| Micron Technology Inc. | | |
| 4.66% 02/15/30 | 100,000 | 115,021 |
| Microsoft Corp. | | |
| 2.40% 08/08/26 | 100,000 | 104,655 |
| 2.53% 06/01/50 | 100,000 | 98,138 |
| 2.88% 02/06/24 | 50,000 | 52,022 |
| 3.04% 03/17/62 | 100,000 | 107,666 |
| 3.30% 02/06/27 | 100,000 | 108,867 |
| 3.45% 08/08/36 | 48,000 | 55,054 |
| 3.50% 02/12/35 | 65,000 | 74,439 |
| MidAmerican Energy Co. | | |
| 4.25% 07/15/49 | 100,000 | 123,569 |
| Mitsubishi UFJ Financial Group Inc. | | |
| 2.76% 09/13/26 | 50,000 | 51,918 |
| 3.96% 03/02/28 | 50,000 | 55,435 |
| 4.05% 09/11/28 | 100,000 | 111,690 |
| 4.15% 03/07/39 | 70,000 | 82,894 |
| Mitsubishi UFJ Financial Group Inc. (1.64% fixed rate until 10/13/26; 0.67% + 1 year CMT Rate thereafter) | | |
| 1.64% 10/13/27 (g) | 200,000 | 197,214 |
| Mizuho Financial Group Inc. | | |
| 4.02% 03/05/28 | 100,000 | 111,105 |
| Mizuho Financial Group Inc. (2.84% fixed rate until 07/16/24; 1.24% + SOFR thereafter) | | |
| 2.84% 07/16/25 (g) | 100,000 | 103,407 |
| Moody's Corp. | | |
| 3.25% 05/20/50 | 50,000 | 52,427 |
| Morgan Stanley | | |
| 3.95% 04/23/27 | 50,000 | 54,984 |
| 4.00% 07/23/25 | 95,000 | 103,039 |
| 4.35% 09/08/26 | 50,000 | 55,381 |
| Morgan Stanley (0.73% fixed rate until 04/05/23; 0.62% + SOFR thereafter) | | |
| 0.73% 04/05/24 (g) | 95,000 | 94,697 |
| Morgan Stanley (0.99% fixed rate until 12/10/25; 0.72% + SOFR thereafter) | | |
| 0.99% 12/10/26 (g) | 100,000 | 97,007 |
| | Principal
Amount | Fair
Value |
| Morgan Stanley (1.16% fixed rate until 10/21/24; 0.56% + SOFR thereafter) | | |
| 1.16% 10/21/25 (g) | $ 75,000 | $ 74,344 |
| Morgan Stanley (1.59% fixed rate until 05/04/26; 2.53% - SOFR thereafter) | | |
| 1.59% 05/04/27 (g) | 95,000 | 94,026 |
| Morgan Stanley (2.18% fixed rate until 04/28/25; 1.99% + SOFR thereafter) | | |
| 2.19% 04/28/26 (g) | 100,000 | 101,955 |
| Morgan Stanley (2.51% fixed rate until 10/20/31; 1.20% + SOFR thereafter) | | |
| 2.51% 10/20/32 (g) | 75,000 | 74,927 |
| Morgan Stanley (2.72% fixed rate until 07/22/24; 1.15% + SOFR thereafter) | | |
| 2.72% 07/22/25 (g) | 190,000 | 195,852 |
| Morgan Stanley (2.80% fixed rate until 01/25/51; 1.43% + SOFR thereafter) | | |
| 2.80% 01/25/52 (g) | 100,000 | 98,180 |
| Morgan Stanley (3.22% fixed rate until 04/22/41; 1.49% + SOFR thereafter) | | |
| 3.22% 04/22/42 (g) | 55,000 | 57,683 |
| Morgan Stanley (3.74% fixed rate until 04/24/23; 0.85% + 3 month USD LIBOR thereafter) | | |
| 3.74% 04/24/24 (g) | 110,000 | 113,848 |
| Morgan Stanley (3.77% fixed rate until 01/24/28; 1.14% + 3 month USD LIBOR thereafter) | | |
| 3.77% 01/24/29 (g) | 100,000 | 108,884 |
| Morgan Stanley (4.46% fixed rate until 04/22/38; 1.43% + 3 month USD LIBOR thereafter) | | |
| 4.46% 04/22/39 (g) | 100,000 | 119,910 |
| MPLX LP | | |
| 4.00% 03/15/28 | 35,000 | 38,047 |
| 4.25% 12/01/27 | 35,000 | 38,774 |
| 4.70% 04/15/48 | 25,000 | 29,113 |
| 4.80% 02/15/29 | 70,000 | 80,027 |
| 5.50% 02/15/49 | 70,000 | 89,519 |
| Mylan Inc. | | |
| 4.55% 04/15/28 | 100,000 | 112,017 |
See Notes to Schedule of Investments and Notes to Financial Statements.
| State Street Total Return V.I.S. Fund | 97 |
State Street Total Return V.I.S. Fund
Schedule of Investments, continued — December 31, 2021
| | Principal
Amount | Fair
Value |
| Nasdaq Inc. | | |
| 3.25% 04/28/50 | $ 20,000 | $ 20,362 |
| National Bank of Canada (0.55% fixed rate until 11/15/23; 0.40% + 1 year CMT Rate thereafter) | | |
| 0.55% 11/15/24 (g) | 150,000 | 148,317 |
| National Fuel Gas Co. | | |
| 4.75% 09/01/28 | 50,000 | 55,125 |
| National Retail Properties Inc. | | |
| 3.60% 12/15/26 | 100,000 | 106,995 |
| National Rural Utilities Cooperative Finance Corp. | | |
| 1.35% 03/15/31 | 125,000 | 115,436 |
| 4.40% 11/01/48 | 10,000 | 12,513 |
| Natwest Group PLC | | |
| 3.88% 09/12/23 | 100,000 | 104,273 |
| Natwest Group PLC (4.89% fixed rate until 05/18/28; 1.75% + 3 month USD LIBOR thereafter) | | |
| 4.89% 05/18/29 (g) | 100,000 | 114,391 |
| Newmont Corp. | | |
| 2.60% 07/15/32 | 50,000 | 50,133 |
| NextEra Energy Capital Holdings Inc. | | |
| 3.50% 04/01/29 | 100,000 | 107,715 |
| NIKE Inc. | | |
| 2.40% 03/27/25 | 100,000 | 103,569 |
| 3.25% 03/27/40 | 50,000 | 54,433 |
| NiSource Inc. | | |
| 4.38% 05/15/47 | 100,000 | 118,994 |
| Nomura Holdings Inc. | | |
| 1.85% 07/16/25 | 100,000 | 100,071 |
| Nordic Investment Bank | | |
| 0.38% 09/11/25 | 150,000 | 145,677 |
| Norfolk Southern Corp. | | |
| 3.80% 08/01/28 | 30,000 | 33,119 |
| 3.94% 11/01/47 | 60,000 | 69,394 |
| 4.10% 05/15/21 | 25,000 | 28,483 |
| Northern Trust Corp. | | |
| 1.95% 05/01/30 | 90,000 | 89,185 |
| Northrop Grumman Corp. | | |
| 2.93% 01/15/25 | 50,000 | 52,185 |
| 4.03% 10/15/47 | 75,000 | 88,552 |
| Northwell Healthcare Inc. | | |
| 3.81% 11/01/49 | 50,000 | 55,289 |
| Northwestern University | | |
| 3.66% 12/01/57 | 10,000 | 12,482 |
| | Principal
Amount | Fair
Value |
| NOV Inc. | | |
| 3.60% 12/01/29 | $ 100,000 | $ 104,743 |
| Novartis Capital Corp. | | |
| 3.00% 11/20/25 | 50,000 | 52,994 |
| 4.40% 05/06/44 | 50,000 | 64,074 |
| Nucor Corp. | | |
| 2.00% 06/01/25 | 35,000 | 35,716 |
| Nutrien Ltd. | | |
| 5.00% 04/01/49 | 50,000 | 67,242 |
| NVIDIA Corp. | | |
| 0.58% 06/14/24 | 40,000 | 39,644 |
| 1.55% 06/15/28 | 50,000 | 49,359 |
| 2.00% 06/15/31 | 50,000 | 49,653 |
| NXP BV/NXP Funding LLC | | |
| 5.55% 12/01/28 (d) | 100,000 | 119,723 |
| Oesterreichische Kontrollbank AG | | |
| 0.50% 09/16/24 | 175,000 | 172,721 |
| Office Properties Income Trust | | |
| 4.50% 02/01/25 | 100,000 | 105,514 |
| Ohio Power Co. | | |
| 1.63% 01/15/31 | 100,000 | 94,231 |
| OhioHealth Corp. | | |
| 2.83% 11/15/41 | 25,000 | 25,507 |
| Oklahoma Gas & Electric Co. | | |
| 3.30% 03/15/30 | 50,000 | 53,380 |
| Oncor Electric Delivery Company LLC | | |
| 3.80% 06/01/49 | 100,000 | 116,332 |
| ONE Gas Inc. | | |
| 1.10% 03/11/24 | 100,000 | 99,204 |
| 4.50% 11/01/48 | 20,000 | 24,631 |
| ONEOK Inc. | | |
| 4.35% 03/15/29 | 50,000 | 54,856 |
| ONEOK Partners LP | | |
| 6.13% 02/01/41 | 162,000 | 205,189 |
| Oracle Corp. | | |
| 2.50% 04/01/25 | 100,000 | 102,430 |
| 2.65% 07/15/26 | 100,000 | 102,877 |
| 2.95% 11/15/24 | 250,000 | 260,052 |
| 3.25% 05/15/30 | 50,000 | 51,658 |
| 3.60% 04/01/40 | 50,000 | 50,262 |
| 3.95% 03/25/51 | 80,000 | 83,245 |
| 4.00% 07/15/46 | 100,000 | 103,979 |
| 4.10% 03/25/61 | 100,000 | 104,404 |
| 4.30% 07/08/34 | 100,000 | 110,896 |
| Orange S.A. | | |
| 9.00% 03/01/31 | 50,000 | 76,590 |
See Notes to Schedule of Investments and Notes to Financial Statements.
| 98 | State Street Total Return V.I.S. Fund |
State Street Total Return V.I.S. Fund
Schedule of Investments, continued — December 31, 2021
| | Principal
Amount | Fair
Value |
| ORIX Corp. | | |
| 4.05% 01/16/24 | $ 100,000 | $ 105,480 |
| Owens Corning | | |
| 3.88% 06/01/30 | 50,000 | 54,629 |
| Owl Rock Capital Corp. | | |
| 3.40% 07/15/26 | 100,000 | 101,865 |
| PACCAR Financial Corp. | | |
| 0.80% 06/08/23 | 70,000 | 69,994 |
| Pacific Gas & Electric Co. | | |
| 1.37% 03/10/23 | 135,000 | 134,201 |
| 1.70% 11/15/23 | 15,000 | 14,992 |
| 3.25% 06/01/31 | 110,000 | 110,499 |
| 4.20% 06/01/41 | 115,000 | 116,843 |
| PacifiCorp | | |
| 4.15% 02/15/50 | 50,000 | 59,291 |
| 6.25% 10/15/37 | 53,000 | 73,706 |
| Packaging Corp. of America | | |
| 3.05% 10/01/51 | 45,000 | 44,784 |
| Parker-Hannifin Corp. | | |
| 4.00% 06/14/49 | 20,000 | 23,386 |
| PayPal Holdings Inc. | | |
| 2.40% 10/01/24 | 35,000 | 36,217 |
| 2.85% 10/01/29 | 30,000 | 31,603 |
| PeaceHealth Obligated Group | | |
| 3.22% 11/15/50 | 25,000 | 25,839 |
| PepsiCo Inc. | | |
| 2.25% 03/19/25 | 100,000 | 103,456 |
| 2.75% 03/01/23 | 50,000 | 51,225 |
| 2.88% 10/15/49 | 25,000 | 26,210 |
| 3.00% 10/15/27 | 100,000 | 107,463 |
| 3.38% 07/29/49 | 35,000 | 39,476 |
| 3.45% 10/06/46 | 50,000 | 56,470 |
| PerkinElmer Inc. | | |
| 2.25% 09/15/31 | 35,000 | 34,089 |
| 3.30% 09/15/29 | 15,000 | 15,967 |
| Pfizer Inc. | | |
| 1.75% 08/18/31 | 100,000 | 97,806 |
| 4.00% 12/15/36 | 100,000 | 118,559 |
| 4.30% 06/15/43 | 100,000 | 122,986 |
| Philip Morris International Inc. | | |
| 3.13% 03/02/28 | 50,000 | 53,011 |
| 3.38% 08/15/29 | 50,000 | 53,938 |
| 3.88% 08/21/42 | 92,000 | 99,249 |
| Phillips 66 | | |
| 3.70% 04/06/23 | 100,000 | 103,428 |
| 4.88% 11/15/44 | 45,000 | 56,904 |
| Phillips 66 Partners LP | | |
| 3.15% 12/15/29 | 50,000 | 51,757 |
| 3.75% 03/01/28 | 10,000 | 10,744 |
| | Principal
Amount | Fair
Value |
| 4.68% 02/15/45 | $ 10,000 | $ 11,728 |
| Pioneer Natural Resources Co. | | |
| 2.15% 01/15/31 | 150,000 | 144,835 |
| Plains All American Pipeline LP/PAA Finance Corp. | | |
| 3.80% 09/15/30 | 50,000 | 52,634 |
| PNC Bank NA | | |
| 3.10% 10/25/27 | 100,000 | 107,057 |
| PPL Capital Funding Inc. | | |
| 3.10% 05/15/26 | 50,000 | 52,443 |
| President & Fellows of Harvard College | | |
| 3.15% 07/15/46 | 50,000 | 56,800 |
| Principal Financial Group Inc. | | |
| 3.40% 05/15/25 | 50,000 | 52,844 |
| Prologis LP | | |
| 4.38% 02/01/29 | 65,000 | 74,615 |
| Providence St Joseph Health Obligated Group | | |
| 3.93% 10/01/48 | 20,000 | 23,569 |
| Prudential Financial Inc. (3.70% fixed rate until 07/01/30; 3.04% + 5 year CMT Rate thereafter) | | |
| 3.70% 10/01/50 (g) | 80,000 | 80,931 |
| Prudential Financial Inc. (5.70% fixed rate until 09/15/28; 2.67% + 3 month USD LIBOR thereafter) | | |
| 5.70% 09/15/48 (g) | 100,000 | 112,510 |
| Public Service Company of Colorado | | |
| 3.70% 06/15/28 | 50,000 | 54,983 |
| 4.10% 06/15/48 | 30,000 | 35,783 |
| Public Service Electric & Gas Co. | | |
| 3.20% 08/01/49 | 90,000 | 95,461 |
| 3.65% 09/01/28 | 25,000 | 27,495 |
| Public Service Enterprise Group Inc. | | |
| 2.88% 06/15/24 | 15,000 | 15,531 |
| Public Storage | | |
| 3.39% 05/01/29 | 30,000 | 32,723 |
| Puget Energy Inc. | | |
| 3.65% 05/15/25 | 50,000 | 52,865 |
| QUALCOMM Inc. | | |
| 3.25% 05/20/50 | 115,000 | 126,326 |
| Quest Diagnostics Inc. | | |
| 4.25% 04/01/24 | 50,000 | 52,884 |
See Notes to Schedule of Investments and Notes to Financial Statements.
| State Street Total Return V.I.S. Fund | 99 |
State Street Total Return V.I.S. Fund
Schedule of Investments, continued — December 31, 2021
| | Principal
Amount | Fair
Value |
| Raytheon Technologies Corp. | | |
| 3.95% 08/16/25 | $ 15,000 | $ 16,262 |
| 4.45% 11/16/38 | 60,000 | 72,266 |
| 4.50% 06/01/42 | 158,000 | 195,305 |
| 4.63% 11/16/48 | 15,000 | 19,206 |
| Realty Income Corp. | | |
| 3.40% 01/15/28 | 100,000 | 107,933 |
| 4.60% 02/06/24 | 20,000 | 21,266 |
| Regency Centers LP | | |
| 4.13% 03/15/28 | 50,000 | 55,632 |
| Regeneron Pharmaceuticals Inc. | | |
| 1.75% 09/15/30 | 70,000 | 66,243 |
| Reliance Steel & Aluminum Co. | | |
| 1.30% 08/15/25 | 105,000 | 103,515 |
| RELX Capital Inc. | | |
| 3.50% 03/16/23 | 30,000 | 30,890 |
| 4.00% 03/18/29 | 25,000 | 27,723 |
| RenaissanceRe Holdings Ltd. | | |
| 3.60% 04/15/29 | 25,000 | 27,132 |
| Republic Services Inc. | | |
| 2.38% 03/15/33 | 100,000 | 99,490 |
| Rio Tinto Finance USA Ltd. | | |
| 5.20% 11/02/40 | 150,000 | 199,639 |
| Rockwell Automation Inc. | | |
| 3.50% 03/01/29 | 45,000 | 49,384 |
| Rogers Communications Inc. | | |
| 3.00% 03/15/23 | 50,000 | 50,946 |
| Roper Technologies Inc. | | |
| 3.80% 12/15/26 | 100,000 | 109,735 |
| Royal Bank of Canada | | |
| 0.50% 10/26/23 | 100,000 | 99,319 |
| 0.88% 01/20/26 | 100,000 | 97,348 |
| 1.60% 04/17/23 | 80,000 | 80,890 |
| Royalty Pharma PLC | | |
| 3.30% 09/02/40 | 50,000 | 49,849 |
| RPM International Inc. | | |
| 4.25% 01/15/48 | 50,000 | 57,559 |
| Ryder System Inc. | | |
| 1.75% 09/01/26 | 15,000 | 14,941 |
| 3.40% 03/01/23 | 50,000 | 51,349 |
| Sabine Pass Liquefaction LLC | | |
| 5.63% 03/01/25 | 135,000 | 149,935 |
| Sabra Health Care LP | | |
| 3.90% 10/15/29 | 25,000 | 26,124 |
| Safehold Operating Partnership LP | | |
| 2.85% 01/15/32 | 25,000 | 24,470 |
| | Principal
Amount | Fair
Value |
| salesforce.com Inc. | | |
| 0.63% 07/15/24 | $ 55,000 | $ 54,518 |
| Salesforce.com Inc. | | |
| 3.05% 07/15/61 | 25,000 | 25,745 |
| San Diego Gas & Electric Co. | | |
| 3.60% 09/01/23 | 100,000 | 103,646 |
| Santander Holdings USA Inc. | | |
| 3.40% 01/18/23 | 50,000 | 51,103 |
| Santander UK Group Holdings PLC (1.53% fixed rate until 08/21/25; 1.25% + 1 year CMT Rate thereafter) | | |
| 1.53% 08/21/26 (g) | 100,000 | 98,436 |
| Santander UK Group Holdings PLC (3.37% fixed rate until 01/05/23; 1.08% + 3 month USD LIBOR thereafter) | | |
| 3.37% 01/05/24 (g) | 100,000 | 102,172 |
| Sempra Energy | | |
| 3.80% 02/01/38 | 50,000 | 54,997 |
| Shell International Finance BV | | |
| 3.50% 11/13/23 | 90,000 | 94,328 |
| 4.00% 05/10/46 | 50,000 | 58,305 |
| 4.38% 05/11/45 | 100,000 | 121,860 |
| 6.38% 12/15/38 | 100,000 | 146,265 |
| Simon Property Group LP | | |
| 2.45% 09/13/29 | 100,000 | 101,428 |
| 3.25% 09/13/49 | 100,000 | 102,791 |
| Snap-on Inc. | | |
| 3.10% 05/01/50 | 15,000 | 15,822 |
| Southern California Edison Co. | | |
| 3.60% 02/01/45 | 125,000 | 127,502 |
| 4.20% 03/01/29 | 100,000 | 111,679 |
| Southern California Gas Co. | | |
| 2.55% 02/01/30 | 50,000 | 51,374 |
| Southwest Airlines Co. | | |
| 3.00% 11/15/26 | 100,000 | 104,853 |
| Southwestern Electric Power Co. | | |
| 3.25% 11/01/51 | 50,000 | 49,822 |
| Southwestern Public Service Co. | | |
| 3.15% 05/01/50 | 50,000 | 52,255 |
| Spectra Energy Partners LP | | |
| 3.50% 03/15/25 | 50,000 | 52,715 |
| Spirit Realty LP | | |
| 2.70% 02/15/32 | 55,000 | 54,559 |
| SSM Health Care Corp. | | |
| 3.69% 06/01/23 | 10,000 | 10,315 |
See Notes to Schedule of Investments and Notes to Financial Statements.
| 100 | State Street Total Return V.I.S. Fund |
State Street Total Return V.I.S. Fund
Schedule of Investments, continued — December 31, 2021
| | Principal
Amount | Fair
Value |
| Stanley Black & Decker Inc. | | |
| 2.30% 03/15/30 | $ 50,000 | $ 50,554 |
| Starbucks Corp. | | |
| 3.10% 03/01/23 | 50,000 | 51,268 |
| 3.35% 03/12/50 | 15,000 | 15,643 |
| 3.75% 12/01/47 | 35,000 | 38,501 |
| Stryker Corp. | | |
| 4.63% 03/15/46 | 100,000 | 128,268 |
| Sumitomo Mitsui Financial Group Inc. | | |
| 2.14% 09/23/30 | 100,000 | 96,147 |
| 2.70% 07/16/24 | 100,000 | 103,331 |
| 3.01% 10/19/26 | 100,000 | 105,180 |
| 3.35% 10/18/27 | 50,000 | 53,624 |
| 4.31% 10/16/28 | 100,000 | 113,166 |
| Suncor Energy Inc. | | |
| 3.10% 05/15/25 | 75,000 | 78,487 |
| 6.85% 06/01/39 | 50,000 | 72,019 |
| Suzano Austria GmbH | | |
| 3.75% 01/15/31 | 55,000 | 55,947 |
| Synchrony Financial | | |
| 3.95% 12/01/27 | 100,000 | 107,519 |
| 4.38% 03/19/24 | 35,000 | 36,978 |
| Sysco Corp. | | |
| 6.60% 04/01/40 | 100,000 | 145,698 |
| Takeda Pharmaceutical Company Ltd. | | |
| 5.00% 11/26/28 | 250,000 | 293,715 |
| Tampa Electric Co. | | |
| 4.30% 06/15/48 | 50,000 | 61,445 |
| Tapestry Inc. | | |
| 3.05% 03/15/32 | 25,000 | 25,102 |
| Target Corp. | | |
| 2.25% 04/15/25 | 100,000 | 103,183 |
| Teck Resources Ltd. | | |
| 6.25% 07/15/41 | 100,000 | 133,158 |
| Telefonica Emisiones S.A. | | |
| 7.05% 06/20/36 | 50,000 | 71,608 |
| TELUS Corp. | | |
| 4.60% 11/16/48 | 50,000 | 63,883 |
| Texas Instruments Inc. | | |
| 3.88% 03/15/39 | 100,000 | 118,055 |
| Textron Inc. | | |
| 3.90% 09/17/29 | 50,000 | 54,882 |
| The Allstate Corp. | | |
| 4.20% 12/15/46 | 100,000 | 120,497 |
| | Principal
Amount | Fair
Value |
| The Allstate Corp. (5.75% fixed rate until 08/15/23; 2.94% + 3 month USD LIBOR thereafter) | | |
| 5.75% 08/15/53 (g) | $ 50,000 | $ 52,005 |
| The Asian Infrastructure Investment Bank | | |
| 0.25% 09/29/23 | 135,000 | 133,869 |
| The Bank of New York Mellon Corp. | | |
| 0.85% 10/25/24 | 50,000 | 49,628 |
| 3.00% 02/24/25 | 105,000 | 110,302 |
| 3.50% 04/28/23 | 100,000 | 103,637 |
| The Bank of Nova Scotia | | |
| 1.30% 09/15/26 | 25,000 | 24,557 |
| 2.70% 08/03/26 | 100,000 | 104,353 |
| The Boeing Co. | | |
| 1.43% 02/04/24 | 65,000 | 64,930 |
| 2.20% 02/04/26 | 200,000 | 199,968 |
| 3.20% 03/01/29 | 50,000 | 51,697 |
| 3.75% 02/01/50 | 50,000 | 51,811 |
| 5.71% 05/01/40 | 100,000 | 128,500 |
| 5.81% 05/01/50 | 100,000 | 135,372 |
| The Charles Schwab Corp. | | |
| 1.95% 12/01/31 | 100,000 | 98,221 |
| 3.85% 05/21/25 | 50,000 | 53,887 |
| The Coca-Cola Co. | | |
| 2.25% 01/05/32 | 50,000 | 50,795 |
| 2.50% 06/01/40 - 03/15/51 | 170,000 | 166,574 |
| The Dayton Power & Light Co. | | |
| 3.95% 06/15/49 | 15,000 | 17,112 |
| The Dow Chemical Co. | | |
| 3.60% 11/15/50 | 100,000 | 108,429 |
| The Estee Lauder Companies Inc. | | |
| 1.95% 03/15/31 | 45,000 | 44,401 |
| 2.38% 12/01/29 | 20,000 | 20,477 |
| 3.13% 12/01/49 | 30,000 | 32,770 |
| The Georgetown University | | |
| 2.94% 04/01/50 | 10,000 | 10,049 |
| The Goldman Sachs Group Inc. | | |
| 2.60% 02/07/30 | 95,000 | 96,584 |
| 3.50% 04/01/25 | 100,000 | 105,840 |
| 3.63% 02/20/24 | 100,000 | 104,889 |
| 4.80% 07/08/44 | 100,000 | 127,575 |
| 6.25% 02/01/41 | 50,000 | 72,626 |
| 6.75% 10/01/37 | 100,000 | 141,792 |
See Notes to Schedule of Investments and Notes to Financial Statements.
| State Street Total Return V.I.S. Fund | 101 |
State Street Total Return V.I.S. Fund
Schedule of Investments, continued — December 31, 2021
| | Principal
Amount | Fair
Value |
| The Goldman Sachs Group Inc. (0.66% fixed rate until 09/10/23; 0.51% + SOFR thereafter) | | |
| 0.66% 09/10/24 (g) | $ 150,000 | $ 148,833 |
| The Goldman Sachs Group Inc. (0.93% fixed rate until 10/21/23; 0.49% + SOFR thereafter) | | |
| 0.93% 10/21/24 (g) | 35,000 | 34,851 |
| The Goldman Sachs Group Inc. (1.09% fixed rate until 12/09/25; 0.79% + SOFR thereafter) | | |
| 1.09% 12/09/26 (g) | 100,000 | 97,430 |
| The Goldman Sachs Group Inc. (2.65% fixed rate until 10/21/31; 1.26% + SOFR thereafter) | | |
| 2.65% 10/21/32 (g) | 30,000 | 30,199 |
| The Goldman Sachs Group Inc. (3.69% fixed rate until 06/05/27; 1.51% + SOFR thereafter) | | |
| 3.69% 06/05/28 (g) | 150,000 | 161,889 |
| The Goldman Sachs Group Inc. (4.22% fixed rate until 05/01/28; 1.30% + 3 month USD LIBOR thereafter) | | |
| 4.22% 05/01/29 (g) | 250,000 | 277,812 |
| The Hershey Co. | | |
| 3.38% 05/15/23 | 50,000 | 51,698 |
| The Home Depot Inc. | | |
| 1.50% 09/15/28 | 50,000 | 49,281 |
| 1.88% 09/15/31 | 20,000 | 19,677 |
| 2.38% 03/15/51 | 50,000 | 46,075 |
| 2.75% 09/15/51 | 50,000 | 49,636 |
| 3.30% 04/15/40 | 100,000 | 108,318 |
| 3.90% 12/06/28 | 100,000 | 112,890 |
| 4.20% 04/01/43 | 50,000 | 60,240 |
| The Interpublic Group of Companies Inc. | | |
| 4.65% 10/01/28 | 10,000 | 11,484 |
| The JM Smucker Co. | | |
| 3.38% 12/15/27 | 100,000 | 107,679 |
| The Kroger Co. | | |
| 4.50% 01/15/29 | 50,000 | 57,536 |
| The New York & Presbyterian Hospital | | |
| 2.26% 08/01/40 | 25,000 | 23,685 |
| 3.95% 08/01/19 | 35,000 | 42,275 |
| | Principal
Amount | Fair
Value |
| The PNC Financial Services Group Inc. | | |
| 3.45% 04/23/29 | $ 100,000 | $ 108,836 |
| The Procter & Gamble Co. | | |
| 2.45% 11/03/26 | 100,000 | 104,879 |
| The Sherwin-Williams Co. | | |
| 2.20% 03/15/32 | 15,000 | 14,833 |
| 2.90% 03/15/52 | 15,000 | 14,666 |
| 3.95% 01/15/26 | 100,000 | 108,698 |
| The Southern Co. | | |
| 4.25% 07/01/36 | 200,000 | 226,010 |
| The Timken Co. | | |
| 4.50% 12/15/28 | 20,000 | 22,327 |
| The Toronto-Dominion Bank | | |
| 0.75% 09/11/25 | 100,000 | 97,435 |
| 3.25% 03/11/24 | 100,000 | 104,718 |
| The Travelers Companies Inc. | | |
| 4.00% 05/30/47 | 100,000 | 119,862 |
| The Walt Disney Co. | | |
| 2.65% 01/13/31 | 60,000 | 62,368 |
| 3.35% 03/24/25 | 100,000 | 106,563 |
| 3.38% 11/15/26 | 100,000 | 107,576 |
| 6.65% 11/15/37 | 79,000 | 117,103 |
| The Williams Companies Inc. | | |
| 2.60% 03/15/31 | 150,000 | 149,556 |
| 3.70% 01/15/23 | 10,000 | 10,217 |
| 4.55% 06/24/24 | 40,000 | 42,865 |
| 5.75% 06/24/44 | 15,000 | 19,531 |
| Thermo Fisher Scientific Inc. | | |
| 1.75% 10/15/28 | 20,000 | 19,873 |
| 2.00% 10/15/31 | 35,000 | 34,501 |
| 2.80% 10/15/41 | 20,000 | 20,196 |
| Time Warner Cable LLC | | |
| 4.50% 09/15/42 | 150,000 | 163,054 |
| T-Mobile USA Inc. | | |
| 2.25% 11/15/31 | 100,000 | 97,022 |
| 2.40% 03/15/29 (d) | 15,000 | 15,144 |
| 2.55% 02/15/31 | 40,000 | 39,814 |
| 2.70% 03/15/32 (d) | 30,000 | 30,211 |
| 3.40% 10/15/52 (d) | 50,000 | 49,857 |
| 3.60% 11/15/60 | 45,000 | 44,826 |
| 3.75% 04/15/27 | 50,000 | 54,140 |
| 3.88% 04/15/30 | 175,000 | 191,497 |
| Total Capital International S.A. | | |
| 3.46% 02/19/29 | 100,000 | 108,754 |
| TotalEnergies Capital International S.A. | | |
| 3.39% 06/29/60 | 125,000 | 133,225 |
See Notes to Schedule of Investments and Notes to Financial Statements.
| 102 | State Street Total Return V.I.S. Fund |
State Street Total Return V.I.S. Fund
Schedule of Investments, continued — December 31, 2021
| | Principal
Amount | Fair
Value |
| Toyota Motor Credit Corp. | | |
| 0.45% 01/11/24 | $ 100,000 | $ 99,132 |
| 2.70% 01/11/23 | 100,000 | 102,158 |
| 3.65% 01/08/29 | 100,000 | 111,404 |
| Trane Technologies Luxembourg Finance S.A. | | |
| 4.50% 03/21/49 | 50,000 | 62,082 |
| TransCanada PipeLines Ltd. | | |
| 1.00% 10/12/24 | 30,000 | 29,791 |
| 5.10% 03/15/49 | 50,000 | 66,340 |
| 7.63% 01/15/39 | 50,000 | 77,847 |
| Transcontinental Gas Pipe Line Company LLC | | |
| 3.95% 05/15/50 | 50,000 | 56,162 |
| Truist Bank | | |
| 3.00% 02/02/23 | 100,000 | 102,243 |
| 3.20% 04/01/24 | 50,000 | 52,347 |
| Truist Financial Corp. | | |
| 1.95% 06/05/30 | 85,000 | 83,946 |
| Tucson Electric Power Co. | | |
| 4.85% 12/01/48 | 50,000 | 64,735 |
| TWDC Enterprises 18 Corp. | | |
| 3.00% 07/30/46 | 60,000 | 61,294 |
| 4.13% 06/01/44 | 100,000 | 118,732 |
| Tyson Foods Inc. | | |
| 4.00% 03/01/26 | 15,000 | 16,275 |
| 4.88% 08/15/34 | 70,000 | 85,183 |
| U.S. Bancorp | | |
| 3.95% 11/17/25 | 100,000 | 109,334 |
| U.S. Bancorp (2.49% fixed rate until 11/03/31; 0.95% + 5 year CMT Rate thereafter) | | |
| 2.49% 11/03/36 (g) | 100,000 | 99,717 |
| U.S. Bank NA | | |
| 2.80% 01/27/25 | 50,000 | 52,189 |
| UDR Inc. | | |
| 4.40% 01/26/29 | 50,000 | 56,532 |
| Unilever Capital Corp. | | |
| 0.38% 09/14/23 | 100,000 | 99,362 |
| 2.90% 05/05/27 | 100,000 | 106,109 |
| Union Electric Co. | | |
| 2.95% 06/15/27 | 100,000 | 105,426 |
| 3.50% 03/15/29 | 25,000 | 27,178 |
| 3.65% 04/15/45 | 35,000 | 39,027 |
| Union Pacific Corp. | | |
| 2.38% 05/20/31 | 20,000 | 20,422 |
| 2.89% 04/06/36 | 95,000 | 99,424 |
| 2.97% 09/16/62 | 15,000 | 14,817 |
| 3.50% 06/08/23 | 50,000 | 51,800 |
| 3.55% 08/15/39 | 15,000 | 16,603 |
| | Principal
Amount | Fair
Value |
| 3.84% 03/20/60 | $ 105,000 | $ 123,458 |
| 3.95% 08/15/59 | 20,000 | 23,742 |
| United Airlines 2020-1 Class A Pass Through Trust | | |
| 5.88% 04/15/29 | 153,561 | 167,853 |
| United Parcel Service Inc. | | |
| 3.05% 11/15/27 | 50,000 | 53,906 |
| 3.75% 11/15/47 | 50,000 | 59,480 |
| 3.90% 04/01/25 | 100,000 | 108,029 |
| UnitedHealth Group Inc. | | |
| 2.88% 08/15/29 | 75,000 | 79,384 |
| 3.10% 03/15/26 | 50,000 | 53,451 |
| 3.50% 02/15/24 | 10,000 | 10,531 |
| 3.70% 12/15/25 - 08/15/49 | 75,000 | 85,928 |
| 3.75% 10/15/47 | 100,000 | 114,957 |
| 3.88% 12/15/28 | 15,000 | 16,831 |
| 4.45% 12/15/48 | 10,000 | 12,784 |
| 4.63% 07/15/35 | 45,000 | 55,974 |
| 6.88% 02/15/38 | 100,000 | 153,480 |
| University of Notre Dame du Lac | | |
| 3.39% 02/15/48 | 25,000 | 29,138 |
| Unum Group | | |
| 4.50% 12/15/49 | 30,000 | 32,134 |
| Vale Overseas Ltd. | | |
| 6.25% 08/10/26 | 100,000 | 116,095 |
| 6.88% 11/10/39 | 100,000 | 134,285 |
| Valero Energy Corp. | | |
| 2.85% 04/15/25 | 25,000 | 25,972 |
| 6.63% 06/15/37 | 50,000 | 67,627 |
| Valero Energy Partners LP | | |
| 4.38% 12/15/26 | 52,000 | 57,389 |
| Ventas Realty LP | | |
| 4.00% 03/01/28 | 50,000 | 55,316 |
| VeriSign Inc. | | |
| 2.70% 06/15/31 | 80,000 | 80,542 |
| Verisk Analytics Inc. | | |
| 4.13% 03/15/29 | 60,000 | 66,902 |
| Verizon Communications Inc. | | |
| 0.75% 03/22/24 | 35,000 | 34,890 |
| 1.75% 01/20/31 | 100,000 | 94,648 |
| 2.63% 08/15/26 | 100,000 | 104,168 |
| 2.85% 09/03/41 | 150,000 | 148,105 |
| 3.38% 02/15/25 | 100,000 | 106,288 |
| 3.70% 03/22/61 | 145,000 | 156,961 |
| 3.88% 02/08/29 | 5,000 | 5,546 |
| 4.02% 12/03/29 | 100,000 | 112,089 |
| 4.33% 09/21/28 | 109,000 | 123,968 |
| 4.40% 11/01/34 | 50,000 | 58,211 |
See Notes to Schedule of Investments and Notes to Financial Statements.
| State Street Total Return V.I.S. Fund | 103 |
State Street Total Return V.I.S. Fund
Schedule of Investments, continued — December 31, 2021
| | Principal
Amount | Fair
Value |
| 4.81% 03/15/39 | $ 89,000 | $ 111,717 |
| 4.86% 08/21/46 | 150,000 | 193,222 |
| VF Corp. | | |
| 2.95% 04/23/30 | 30,000 | 31,136 |
| ViacomCBS Inc. | | |
| 4.00% 01/15/26 | 50,000 | 54,047 |
| 5.85% 09/01/43 | 100,000 | 135,163 |
| Virginia Electric & Power Co. | | |
| 2.88% 07/15/29 | 150,000 | 158,269 |
| 4.60% 12/01/48 | 60,000 | 76,840 |
| Visa Inc. | | |
| 4.30% 12/14/45 | 100,000 | 125,858 |
| VMware Inc. | | |
| 4.50% 05/15/25 | 100,000 | 109,022 |
| Vodafone Group PLC | | |
| 4.38% 05/30/28 | 55,000 | 61,967 |
| 5.00% 05/30/38 | 100,000 | 124,388 |
| 5.25% 05/30/48 | 50,000 | 65,296 |
| Vornado Realty LP | | |
| 3.50% 01/15/25 | 50,000 | 52,441 |
| Vulcan Materials Co. | | |
| 4.70% 03/01/48 | 50,000 | 63,020 |
| Walgreens Boots Alliance Inc. | | |
| 0.95% 11/17/23 | 50,000 | 49,958 |
| Walmart Inc. | | |
| 1.80% 09/22/31 | 200,000 | 198,056 |
| 3.25% 07/08/29 | 40,000 | 44,090 |
| 3.40% 06/26/23 | 50,000 | 52,044 |
| Waste Connections Inc. | | |
| 3.50% 05/01/29 | 50,000 | 54,127 |
| Waste Management Inc. | | |
| 2.00% 06/01/29 | 25,000 | 24,862 |
| WEC Energy Group Inc. | | |
| 2.20% 12/15/28 | 100,000 | 99,988 |
| Wells Fargo & Co. | | |
| 4.15% 01/24/29 | 100,000 | 111,811 |
| 4.40% 06/14/46 | 50,000 | 59,183 |
| 4.65% 11/04/44 | 50,000 | 60,581 |
| 4.75% 12/07/46 | 100,000 | 124,382 |
| 5.61% 01/15/44 | 69,000 | 93,149 |
| Wells Fargo & Co. (2.16% fixed rate until 02/11/25; 0.75% + 3 month USD LIBOR thereafter) | | |
| 2.16% 02/11/26 (g) | 165,000 | 167,727 |
| Wells Fargo & Co. (2.19% fixed rate until 04/30/25; 2.00% + SOFR thereafter) | | |
| 2.19% 04/30/26 (g) | 50,000 | 50,945 |
| | Principal
Amount | Fair
Value |
| Wells Fargo & Co. (2.39% fixed rate until 06/02/27; 2.10% + SOFR thereafter) | | |
| 2.39% 06/02/28 (g) | $ 120,000 | $ 121,990 |
| Wells Fargo & Co. (2.41% fixed rate until 10/30/24; 1.09% + SOFR thereafter) | | |
| 2.41% 10/30/25 (g) | 90,000 | 92,224 |
| Wells Fargo & Co. (2.88% fixed rate until 10/30/29; 1.43% + SOFR thereafter) | | |
| 2.88% 10/30/30 (g) | 100,000 | 103,967 |
| Wells Fargo & Co. (3.07% fixed rate until 04/30/40; 2.53% + SOFR thereafter) | | |
| 3.07% 04/30/41 (g) | 65,000 | 66,500 |
| Welltower Inc. | | |
| 2.75% 01/15/32 | 100,000 | 101,206 |
| 3.63% 03/15/24 | 25,000 | 26,293 |
| Western Digital Corp. | | |
| 3.10% 02/01/32 | 55,000 | 55,396 |
| Westinghouse Air Brake Technologies Corp. | | |
| 3.45% 11/15/26 | 100,000 | 106,085 |
| Westlake Chemical Corp. | | |
| 4.38% 11/15/47 | 50,000 | 58,907 |
| Westpac Banking Corp. | | |
| 1.95% 11/20/28 | 25,000 | 24,906 |
| 3.30% 02/26/24 | 250,000 | 262,410 |
| Westpac Banking Corp. (4.32% fixed rate until 11/23/26; 2.24% + 5 Year US ISDA thereafter) | | |
| 4.32% 11/23/31 (g) | 100,000 | 108,188 |
| Whirlpool Corp. | | |
| 3.70% 05/01/25 | 50,000 | 53,584 |
| Willis North America Inc. | | |
| 4.50% 09/15/28 | 50,000 | 55,931 |
| Wisconsin Electric Power Co. | | |
| 4.30% 10/15/48 | 10,000 | 12,248 |
| Wisconsin Public Service Corp. | | |
| 3.30% 09/01/49 | 20,000 | 21,505 |
| WP Carey Inc. | | |
| 3.85% 07/15/29 | 50,000 | 55,275 |
| WR Berkley Corp. | | |
| 4.00% 05/12/50 | 20,000 | 23,040 |
| Xcel Energy Inc. | | |
| 0.50% 10/15/23 | 80,000 | 79,454 |
| 3.30% 06/01/25 | 50,000 | 52,534 |
See Notes to Schedule of Investments and Notes to Financial Statements.
| 104 | State Street Total Return V.I.S. Fund |
State Street Total Return V.I.S. Fund
Schedule of Investments, continued — December 31, 2021
| | Principal
Amount | Fair
Value |
| Xilinx Inc. | | |
| 2.38% 06/01/30 | $ 50,000 | $ 50,654 |
| Zoetis Inc. | | |
| 3.00% 05/15/50 | 70,000 | 73,136 |
| | | 84,421,731 |
| Non-Agency Collateralized Mortgage Obligations - 0.2% |
| BANK 2017-BNK5 | | |
| 3.13% 06/15/60 | 250,000 | 263,900 |
| BANK 2019-BNK20 | | |
| 3.01% 09/15/62 | 50,000 | 53,165 |
| BANK 2019-BNK22 | | |
| 2.98% 11/15/62 | 50,000 | 53,050 |
| BBCMS Mortgage Trust | | |
| 4.31% 12/15/51 | 50,000 | 56,827 |
| BBCMS Mortgage Trust 2021-C12 | | |
| 2.69% 11/15/54 | 150,000 | 154,944 |
| Benchmark Mortgage Trust | | |
| 2.58% 04/15/54 | 150,000 | 154,962 |
| 4.51% 05/15/53 (g) | 200,000 | 230,088 |
| CD 2017-CD6 Mortgage Trust | | |
| 3.46% 11/13/50 | 150,000 | 162,093 |
| Citigroup Commercial Mortgage Trust | | |
| 4.03% 05/10/47 | 100,000 | 104,622 |
| Comm 2014-UBS2 Mortgage Trust | | |
| 3.96% 03/10/47 | 400,000 | 419,273 |
| COMM 2015-LC19 Mortgage Trust | | |
| 3.18% 02/10/48 | 150,000 | 156,171 |
| CSAIL 2021-C20 Commercial Mortgage Trust | | |
| 2.80% 03/15/54 | 250,000 | 261,575 |
| GS Mortgage Securities Trust | | |
| 2.78% 10/10/49 | 67,849 | 69,838 |
| 3.97% 02/10/52 | 50,000 | 55,905 |
| JPMBB Commercial Mortgage Securities Trust | | |
| 3.41% 03/15/50 | 143,741 | 151,275 |
| 3.80% 09/15/47 | 75,000 | 79,056 |
| Morgan Stanley Bank of America Merrill Lynch Trust | | |
| 2.86% 09/15/49 | 250,000 | 259,939 |
| Morgan Stanley Capital I Trust | | |
| 3.60% 12/15/49 | 150,000 | 161,167 |
| UBS Commercial Mortgage Trust | | |
| 4.07% 12/15/51 | 100,000 | 109,040 |
| | Principal
Amount | Fair
Value |
| Wells Fargo Commercial Mortgage Trust | | |
| 2.34% 08/15/54 | $ 350,000 | $ 353,482 |
| 3.73% 05/15/52 | 175,000 | 193,244 |
| WFRBS Commercial Mortgage Trust | | |
| 4.02% 12/15/46 | 35,000 | 36,597 |
| WF-RBS COMMERCIAL MORTGAGE TRUST | | |
| 3.75% 09/15/57 | 250,000 | 263,029 |
| | | 3,803,242 |
| Sovereign Bonds - 0.3% |
| Export Development Canada | | |
| 2.50% 01/24/23 | 100,000 | 102,081 |
| Export-Import Bank of Korea | | |
| 1.13% 12/29/26 | 200,000 | 196,096 |
| FMS Wertmanagement | | |
| 2.75% 01/30/24 | 100,000 | 103,970 |
| Government of Canada | | |
| 0.75% 05/19/26 | 200,000 | 195,598 |
| Government of Chile | | |
| 3.50% 01/25/50 | 100,000 | 104,218 |
| Government of Hungary | | |
| 5.38% 03/25/24 | 100,000 | 108,713 |
| Government of Indonesia | | |
| 3.05% 03/12/51 | 100,000 | 99,165 |
| 4.75% 02/11/29 | 100,000 | 116,473 |
| Government of Israel | | |
| 3.88% 07/03/50 | 100,000 | 117,269 |
| Government of Italy | | |
| 2.88% 10/17/29 | 100,000 | 102,213 |
| 5.38% 06/15/33 | 150,000 | 185,821 |
| Government of Mexico | | |
| 4.35% 01/15/47 | 100,000 | 104,081 |
| 4.75% 03/08/44 | 102,000 | 111,502 |
| 5.75% 10/12/10 | 172,000 | 198,517 |
| 6.05% 01/11/40 | 130,000 | 162,250 |
| Government of Panama | | |
| 3.75% 03/16/25 | 100,000 | 105,953 |
| 6.70% 01/26/36 | 150,000 | 200,958 |
| Government of Peru | | |
| 3.00% 01/15/34 | 29,000 | 28,942 |
| 3.55% 03/10/51 | 25,000 | 26,119 |
| 3.60% 01/15/72 | 25,000 | 24,545 |
| 6.55% 03/14/37 | 47,000 | 64,062 |
| 7.35% 07/21/25 | 100,000 | 119,129 |
| Government of Philippines | | |
| 2.46% 05/05/30 | 200,000 | 206,432 |
See Notes to Schedule of Investments and Notes to Financial Statements.
| State Street Total Return V.I.S. Fund | 105 |
State Street Total Return V.I.S. Fund
Schedule of Investments, continued — December 31, 2021
| | Principal
Amount | Fair
Value |
| 2.95% 05/05/45 | $ 100,000 | $ 99,101 |
| 3.70% 03/01/41 | 100,000 | 109,707 |
| Government of Uruguay | | |
| 4.38% 01/23/31 | 100,000 | 115,197 |
| 4.50% 08/14/24 | 100,000 | 105,913 |
| 5.10% 06/18/50 | 100,000 | 132,635 |
| Japan Bank for International Cooperation | | |
| 0.50% 04/15/24 | 200,000 | 197,908 |
| 2.88% 07/21/27 | 100,000 | 106,775 |
| Korea International Bond | | |
| 1.75% 10/15/31 | 100,000 | 100,449 |
| 2.50% 06/19/29 | 100,000 | 106,007 |
| Province of Alberta Canada | | |
| 2.95% 01/23/24 | 150,000 | 156,311 |
| Province of Manitoba Canada | | |
| 1.50% 10/25/28 | 115,000 | 113,632 |
| Province of Ontario Canada | | |
| 0.63% 01/21/26 | 100,000 | 97,234 |
| 1.80% 10/14/31 | 150,000 | 148,860 |
| 3.05% 01/29/24 | 150,000 | 156,719 |
| Province of Quebec Canada | | |
| 0.60% 07/23/25 | 200,000 | 195,624 |
| Svensk Exportkredit AB | | |
| 0.50% 11/10/23 | 225,000 | 223,690 |
| The Korea Development Bank | | |
| 2.13% 10/01/24 | 100,000 | 102,969 |
| | | 5,052,838 |
| Municipal Bonds and Notes - 0.1% |
| Board of Regents of the University of Texas System | | |
| 4.79% 08/15/46 | 100,000 | 135,135 |
| Chicago O'Hare International Airport | | |
| 4.47% 01/01/49 | 100,000 | 131,591 |
| Chicago Transit Authority Sales & Transfer Tax Receipts Revenue | | |
| 6.90% 12/01/40 | 75,000 | 105,631 |
| Commonwealth of Massachusetts | | |
| 4.50% 08/01/31 | 100,000 | 118,838 |
| Dallas Area Rapid Transit | | |
| 5.02% 12/01/48 | 75,000 | 105,020 |
| East Bay Municipal Utility District | | |
| 5.87% 06/01/40 | 100,000 | 143,110 |
| | Principal
Amount | Fair
Value |
| Los Angeles Department of Water & Power | | |
| 6.60% 07/01/50 | $ 90,000 | $ 152,810 |
| Los Angeles Unified School District | | |
| 5.76% 07/01/29 | 110,000 | 132,699 |
| Municipal Electric Authority of Georgia | | |
| 6.64% 04/01/57 | 122,000 | 185,739 |
| New York City Water & Sewer System | | |
| 6.01% 06/15/42 | 50,000 | 75,404 |
| New York State Dormitory Authority | | |
| 3.14% 07/01/43 | 50,000 | 51,633 |
| New York State Urban Development Corp. | | |
| 3.90% 03/15/33 | 25,000 | 27,471 |
| North Texas Tollway Authority | | |
| 6.72% 01/01/49 | 100,000 | 168,964 |
| Port Authority of New York & New Jersey | | |
| 5.31% 08/01/46 | 200,000 | 218,896 |
| Sales Tax Securitization Corp. | | |
| 4.64% 01/01/40 | 25,000 | 30,074 |
| South Carolina State Public Service Authority | | |
| 6.45% 01/01/50 | 50,000 | 79,270 |
| State of California | | |
| 2.50% 10/01/29 | 100,000 | 104,616 |
| 7.60% 11/01/40 | 100,000 | 172,381 |
| Texas Transportation Commission | | |
| 2.56% 04/01/42 | 80,000 | 79,327 |
| University of California | | |
| 4.60% 05/15/31 | 100,000 | 116,419 |
| 6.58% 05/15/49 | 100,000 | 154,013 |
| | | 2,489,041 |
Total Bonds and Notes
(Cost $381,988,220) | | 397,395,755 |
| | Number
of Shares | |
| Exchange Traded & Mutual Funds - 15.6% |
| Invesco Optimum Yield Diversified Commodity Strategy No K-1 ETF | 2,342,691 | 32,938,236 |
| SPDR Bloomberg High Yield Bond ETF (i) | 162,526 | 17,645,448 |
| SPDR Portfolio Long Term Corporate Bond ETF (i) | 2,247,586 | 70,754,007 |
See Notes to Schedule of Investments and Notes to Financial Statements.
| 106 | State Street Total Return V.I.S. Fund |
State Street Total Return V.I.S. Fund
Schedule of Investments, continued — December 31, 2021
| | Number
of Shares | Fair
Value |
| SPDR Portfolio Long Term Treasury ETF (i) | 1,659,803 | $ 69,960,696 |
| Vanguard FTSE Europe ETF | 1,328,226 | 90,638,142 |
Total Exchange Traded & Mutual Funds
(Cost $282,380,318) | | 281,936,529 |
Total Investments in Securities
(Cost $1,593,802,335) | | 1,733,517,324 |
| Short-Term Investments - 4.5% |
State Street Institutional U.S. Government Money Market Fund - Class G Shares 0.03% (i)(j)
(Cost $81,590,671) | 81,590,671 | 81,590,671 |
Total Investments
(Cost $1,675,393,006) | | 1,815,107,995 |
| Liabilities in Excess of Other Assets, net - (0.6)% | | (11,467,030) |
| NET ASSETS - 100.0% | | $ 1,803,640,965 |
Other Information:
| The Fund had the following long futures contracts open at December 31, 2021: |
| Description | Expiration
Date | Number of
Contracts | Notional
Amount | Value | Unrealized
Appreciation
(Depreciation) |
| E-mini Russell 2000 Index Futures | March 2022 | 10 | $ 1,103,118 | $ 1,121,400 | $ 18,282 |
| S&P 500 Emini Index Futures | March 2022 | 5 | 1,150,921 | 1,189,625 | 38,704 |
| MSCI EAFE Mini Index Futures | March 2022 | 90 | 10,296,709 | 10,448,100 | 151,391 |
| MSCI Emerging Markets Index Futures | March 2022 | 13 | 798,067 | 797,095 | (972) |
| S&P/Toronto Stock Exchange 60 Index | March 2022 | 5 | 993,383 | 1,014,052 | 20,669 |
| | | | | | $ 228,074 |
During the year ended December 31, 2021, the average notional value related to long futures contracts was $10,893,009.
Notes to Schedule of Investments
The views expressed in this document reflect our judgment as of the publication date and are subject to change at any time without notice. The securities cited may not be representative of the Fund’s future investments and should not be construed as a recommendation to purchase or sell a particular security. See the Fund’s summary prospectus and statutory
prospectus for complete descriptions of investment objectives, policies, risks and permissible investments.
| (a) | Non-income producing security. |
| (b) | State Street Corporation is the parent company of SSGA Funds Management, Inc., the Fund's investment adviser and administrator, and State Street Bank & Trust Co., the Fund’s sub-administrator, custodian and accounting agent. |
See Notes to Schedule of Investments and Notes to Financial Statements.
| State Street Total Return V.I.S. Fund | 107 |
State Street Total Return V.I.S. Fund
Schedule of Investments, continued — December 31, 2021
| (c) | Security is fair valued by the Valuation Committee, in accordance with the procedures approved by the Fund's Board of Directors. Security value is determined based on level 3 inputs. |
| (d) | Pursuant to Rule 144A of the Securities Act of 1933, as amended, these securities may be resold in transactions exempt from registration, normally to qualified institutional buyers. At December 31, 2021, these securities amounted to $11,545,760 or 0.64% of the net assets of the State Street Total Return V.I.S. Fund. These securities have been determined to be liquid using procedures established by the Fund's Board of Directors. |
| (e) | At December 31, 2021, all or a portion of this security was pledged to cover collateral requirements for futures and/or TBAs. |
| (f) | Settlement is on a delayed delivery or when-issued basis with final maturity to be announced ("TBA") in the future. |
| (g) | Variable Rate Security - Interest rate shown is rate in effect at December 31, 2021. For securities based on a published reference rate and spread, the reference rate and spread are indicated in the description above. |
| (h) | Step coupon bond. |
| (i) | Sponsored by SSGA Funds Management, Inc., the Fund’s investment adviser and administrator, and an affiliate of State Street Bank & Trust Co., the Fund’s sub-administrator, custodian and accounting agent. |
| (j) | Coupon amount represents effective yield. |
| † | Percentages are based on net assets as of December 31, 2021. |
| * | Less than 0.05%. |
| ** | Amount is less than $0.50. |
| Abbreviations: |
| ADR - American Depositary Receipt |
| CMT - Constant Maturity Treasury |
| GDR - Global Depositary Receipt |
| ISDA - International Swaps and Derivatives Association |
| LIBOR - London Interbank Offered Rate |
| NVDR - Non-Voting Depositary Receipt |
| REIT - Real Estate Investment Trust |
| SOFR - Secured Overnight Financing Rate |
| SPDR - Standard and Poor's Depositary Receipt |
| TBA - To Be Announced |
The following table presents the Fund’s investments measured at fair value on a recurring basis at December 31, 2021:
| Investments | Level 1 | | Level 2 | | Level 3 | | Total |
| Investments in Securities | | | | | | | |
| Domestic Equity | $ 632,003,594 | | $ 803 | | $ —(a) | | $ 632,004,397 |
| Foreign Equity | 422,158,224 | | 17,055 | | 5,364 | | 422,180,643 |
| U.S. Treasuries | — | | 204,921,916 | | — | | 204,921,916 |
| Agency Mortgage Backed | — | | 93,186,355 | | — | | 93,186,355 |
| Agency Collateralized Mortgage Obligations | — | | 2,443,782 | | — | | 2,443,782 |
| Asset Backed | — | | 1,076,850 | | — | | 1,076,850 |
| Corporate Notes | — | | 84,421,731 | | — | | 84,421,731 |
| Non-Agency Collateralized Mortgage Obligations | — | | 3,803,242 | | — | | 3,803,242 |
| Sovereign Bonds | — | | 5,052,838 | | — | | 5,052,838 |
| Municipal Bonds and Notes | — | | 2,489,041 | | — | | 2,489,041 |
| Exchange Traded & Mutual Funds | 281,936,529 | | — | | — | | 281,936,529 |
| Short-Term Investments | 81,590,671 | | — | | — | | 81,590,671 |
| Total Investments in Securities | $ 1,417,689,018 | | $ 397,413,613 | | $ 5,364 | | $ 1,815,107,995 |
| Other Financial Instruments | | | | | | | |
| Long Futures Contracts - Unrealized Appreciation | $ 229,046 | | $ — | | $ — | | $ 229,046 |
| Long Futures Contracts - Unrealized Depreciation | (972) | | — | | — | | (972) |
| Total Other Financial Instruments | $ 228,074 | | $ — | | $ — | | $ 228,074 |
| (a) | The Fund held Level 3 securities that were valued at $0 at December 31, 2021. |
See Notes to Schedule of Investments and Notes to Financial Statements.
| 108 | State Street Total Return V.I.S. Fund |
State Street Total Return V.I.S. Fund
Schedule of Investments, continued — December 31, 2021
The Fund was invested in the following countries/territories at December 31, 2021 (Unaudited)
| Country/Territory | Percentage (based on
Fair Value) |
| United States | 75.53% |
| Japan | 3.42% |
| United Kingdom | 2.14% |
| Canada | 2.00% |
| China | 1.82% |
| Switzerland | 1.71% |
| France | 1.60% |
| Germany | 1.36% |
| Australia | 1.12% |
| Netherlands | 1.04% |
| Taiwan | 0.94% |
| South Korea | 0.78% |
| India | 0.74% |
| Sweden | 0.59% |
| Ireland | 0.55% |
| Hong Kong | 0.52% |
| Denmark | 0.40% |
| Spain | 0.36% |
| Italy | 0.32% |
| Supranational | 0.25% |
| Brazil | 0.24% |
| Russian Federation | 0.20% |
| Saudi Arabia | 0.20% |
| Finland | 0.19% |
| Singapore | 0.19% |
| South Africa | 0.18% |
| Mexico | 0.17% |
| Israel | 0.13% |
| Norway | 0.12% |
| Belgium | 0.12% |
| Thailand | 0.11% |
| Indonesia | 0.10% |
| Malaysia | 0.08% |
| Bermuda | 0.08% |
| Country/Territory | Percentage (based on
Fair Value) |
| Philippines | 0.07% |
| UAE | 0.06% |
| Luxembourg | 0.06% |
| Austria | 0.05% |
| Poland | 0.05% |
| Qatar | 0.05% |
| Chile | 0.04% |
| New Zealand | 0.04% |
| Cayman Islands | 0.04% |
| Kuwait | 0.04% |
| Peru | 0.03% |
| Uruguay | 0.03% |
| Puerto Rico | 0.02% |
| Portugal | 0.02% |
| Hungary | 0.02% |
| Panama | 0.02% |
| Cyprus | 0.01% |
| Turkey | 0.01% |
| Isle Of Man | 0.01% |
| Greece | 0.01% |
| Czech | 0.01% |
| Colombia | 0.01% |
| Jersey | 0.00% |
| Macau | 0.00% |
| Monaco | 0.00% |
| Jordan | 0.00% |
| Egypt | 0.00% |
| Guernsey | 0.00% |
| Romania | 0.00% |
| Bahamas | 0.00% |
| Republic of Korea | 0.00% |
| | 100.00% |
The Fund’s % share of investment in the various categories, based on Fair Value, is as follows at December 31, 2021 (unaudited):
| Industry | Domestic | Foreign | Total |
| Exchange Traded Funds | 15.53% | 0.00% | 15.53% |
| Diversified Banks | 0.74% | 2.48% | 3.22% |
| Pharmaceuticals | 1.08% | 1.32% | 2.40% |
| Semiconductors | 1.61% | 0.74% | 2.35% |
| Technology Hardware, Storage & Peripherals | 1.82% | 0.43% | 2.25% |
| Interactive Media & Services | 1.67% | 0.41% | 2.08% |
| Systems Software | 2.01% | 0.04% | 2.05% |
| Application Software | 1.29% | 0.33% | 1.62% |
| Internet & Direct Marketing Retail | 1.01% | 0.50% | 1.51% |
| Biotechnology | 1.17% | 0.19% | 1.36% |
| Automobile Manufacturers | 0.67% | 0.63% | 1.30% |
| Healthcare Equipment | 0.81% | 0.35% | 1.16% |
See Notes to Schedule of Investments and Notes to Financial Statements.
| State Street Total Return V.I.S. Fund | 109 |
State Street Total Return V.I.S. Fund
Schedule of Investments, continued — December 31, 2021
| Industry | Domestic | Foreign | Total |
| Data Processing & Outsourced Services | 0.93% | 0.14% | 1.07% |
| Regional Banks | 0.97% | 0.04% | 1.01% |
| Integrated Oil & Gas | 0.32% | 0.63% | 0.95% |
| Packaged Foods & Meats | 0.28% | 0.60% | 0.88% |
| Electric Utilities | 0.48% | 0.35% | 0.83% |
| Industrial Machinery | 0.46% | 0.37% | 0.83% |
| Life Sciences Tools & Services | 0.62% | 0.17% | 0.79% |
| Semiconductor Equipment | 0.32% | 0.45% | 0.77% |
| Specialty Chemicals | 0.34% | 0.34% | 0.68% |
| Apparel, Accessories & Luxury Goods | 0.06% | 0.59% | 0.65% |
| IT Consulting & Other Services | 0.19% | 0.46% | 0.65% |
| Life & Health Insurance | 0.15% | 0.48% | 0.63% |
| Integrated Telecommunication Services | 0.25% | 0.35% | 0.60% |
| Aerospace & Defense | 0.43% | 0.17% | 0.60% |
| Asset Management & Custody Banks | 0.38% | 0.20% | 0.58% |
| Industrial Conglomerates | 0.25% | 0.29% | 0.54% |
| Electrical Components & Equipment | 0.34% | 0.18% | 0.52% |
| Oil & Gas Exploration & Production | 0.39% | 0.12% | 0.51% |
| Restaurants | 0.40% | 0.10% | 0.50% |
| Movies & Entertainment | 0.44% | 0.06% | 0.50% |
| Household Products | 0.38% | 0.11% | 0.49% |
| Managed Healthcare | 0.47% | 0.01% | 0.48% |
| Building Products | 0.25% | 0.23% | 0.48% |
| Financial Exchanges & Data | 0.31% | 0.17% | 0.48% |
| Multi-Sector Holdings | 0.35% | 0.10% | 0.45% |
| Trading Companies & Distributors | 0.18% | 0.26% | 0.44% |
| Specialized REITs | 0.44% | 0.00% | 0.44% |
| Property & Casualty Insurance | 0.23% | 0.20% | 0.43% |
| Personal Products | 0.10% | 0.33% | 0.43% |
| Diversified Metals & Mining | 0.02% | 0.40% | 0.42% |
| Railroads | 0.20% | 0.22% | 0.42% |
| Research & Consulting Services | 0.18% | 0.24% | 0.42% |
| Home Improvement Retail | 0.40% | 0.01% | 0.41% |
| Soft Drinks | 0.36% | 0.05% | 0.41% |
| Investment Banking & Brokerage | 0.33% | 0.06% | 0.39% |
| Communications Equipment | 0.32% | 0.07% | 0.39% |
| Hypermarkets & Super Centers | 0.32% | 0.06% | 0.38% |
| Multi-Utilities | 0.22% | 0.16% | 0.38% |
| Multi-Line Insurance | 0.06% | 0.29% | 0.35% |
| Internet Services & Infrastructure | 0.19% | 0.15% | 0.34% |
| Healthcare Services | 0.30% | 0.04% | 0.34% |
| Wireless Telecommunication Services | 0.05% | 0.28% | 0.33% |
| Electronic Components | 0.11% | 0.23% | 0.34% |
| Construction Machinery & Heavy Trucks | 0.19% | 0.14% | 0.33% |
| Electronic Equipment & Instruments | 0.16% | 0.16% | 0.32% |
| Air Freight & Logistics | 0.19% | 0.13% | 0.32% |
| Food Retail | 0.05% | 0.27% | 0.32% |
| Construction & Engineering | 0.14% | 0.16% | 0.30% |
| Tobacco | 0.16% | 0.14% | 0.30% |
| Industrial REITs | 0.21% | 0.07% | 0.28% |
| Cable & Satellite | 0.24% | 0.02% | 0.26% |
| Consumer Finance | 0.23% | 0.03% | 0.26% |
| Steel | 0.08% | 0.17% | 0.25% |
| Auto Parts & Equipment | 0.11% | 0.15% | 0.26% |
See Notes to Schedule of Investments and Notes to Financial Statements.
| 110 | State Street Total Return V.I.S. Fund |
State Street Total Return V.I.S. Fund
Schedule of Investments, continued — December 31, 2021
| Industry | Domestic | Foreign | Total |
| Distillers & Vintners | 0.04% | 0.21% | 0.25% |
| Oil & Gas Refining & Marketing | 0.10% | 0.15% | 0.25% |
| Healthcare Supplies | 0.13% | 0.11% | 0.24% |
| Commodity Chemicals | 0.08% | 0.17% | 0.25% |
| Oil & Gas Storage & Transportation | 0.10% | 0.14% | 0.24% |
| Interactive Home Entertainment | 0.07% | 0.16% | 0.23% |
| Hotels, Resorts & Cruise Lines | 0.19% | 0.04% | 0.23% |
| Retail REITs | 0.18% | 0.06% | 0.24% |
| Home Building | 0.17% | 0.06% | 0.23% |
| Apparel Retail | 0.16% | 0.07% | 0.23% |
| Casinos & Gaming | 0.11% | 0.11% | 0.22% |
| General Merchandise Stores | 0.13% | 0.07% | 0.20% |
| Footwear | 0.17% | 0.03% | 0.20% |
| Gold | 0.04% | 0.16% | 0.20% |
| Consumer Electronics | 0.02% | 0.18% | 0.20% |
| Construction Materials | 0.05% | 0.14% | 0.19% |
| Trucking | 0.18% | 0.02% | 0.20% |
| Residential REITs | 0.18% | 0.00% | 0.18% |
| Gas Utilities | 0.07% | 0.11% | 0.18% |
| Human Resource & Employment Services | 0.08% | 0.09% | 0.17% |
| Automotive Retail | 0.15% | 0.02% | 0.17% |
| Thrifts & Mortgage Finance | 0.12% | 0.05% | 0.17% |
| Insurance Brokers | 0.14% | 0.02% | 0.16% |
| Healthcare Technology | 0.14% | 0.02% | 0.16% |
| Healthcare Facilities | 0.12% | 0.04% | 0.16% |
| Environmental & Facilities Services | 0.13% | 0.02% | 0.15% |
| Brewers | 0.01% | 0.14% | 0.15% |
| Diversified Capital Markets | 0.00% | 0.15% | 0.15% |
| Diversified REITs | 0.09% | 0.06% | 0.15% |
| Office REITs | 0.11% | 0.03% | 0.14% |
| Fertilizers & Agricultural Chemicals | 0.06% | 0.08% | 0.14% |
| Specialty Stores | 0.11% | 0.02% | 0.13% |
| Real Estate Operating Companies | 0.01% | 0.12% | 0.13% |
| Diversified Real Estate Activities | 0.01% | 0.12% | 0.13% |
| Agricultural & Farm Machinery | 0.08% | 0.04% | 0.12% |
| Health Care REITs | 0.12% | 0.00% | 0.12% |
| Diversified Chemicals | 0.01% | 0.11% | 0.12% |
| Industrial Gases | 0.04% | 0.07% | 0.11% |
| Mortgage REITs | 0.11% | 0.00% | 0.11% |
| Leisure Products | 0.07% | 0.04% | 0.11% |
| Oil & Gas Equipment & Services | 0.10% | 0.01% | 0.11% |
| Marine | 0.01% | 0.09% | 0.10% |
| Advertising | 0.05% | 0.06% | 0.11% |
| Airlines | 0.08% | 0.03% | 0.11% |
| Reinsurance | 0.01% | 0.09% | 0.10% |
| Real Estate Services | 0.09% | 0.01% | 0.10% |
| Electronic Manufacturing Services | 0.04% | 0.06% | 0.10% |
| Healthcare Distributors | 0.08% | 0.02% | 0.10% |
| Diversified Support Services | 0.07% | 0.02% | 0.09% |
| Water Utilities | 0.06% | 0.03% | 0.09% |
| Paper Packaging | 0.06% | 0.03% | 0.09% |
| Real Estate Development | 0.00% | 0.08% | 0.08% |
| Heavy Electrical Equipment | 0.01% | 0.07% | 0.08% |
| Broadcasting | 0.06% | 0.01% | 0.07% |
See Notes to Schedule of Investments and Notes to Financial Statements.
| State Street Total Return V.I.S. Fund | 111 |
State Street Total Return V.I.S. Fund
Schedule of Investments, continued — December 31, 2021
| Industry | Domestic | Foreign | Total |
| Copper | 0.04% | 0.04% | 0.08% |
| Hotel & Resort REITs | 0.07% | 0.00% | 0.07% |
| Food Distributors | 0.06% | 0.01% | 0.07% |
| Other Diversified Financial Services | 0.01% | 0.06% | 0.07% |
| Tires & Rubber | 0.02% | 0.05% | 0.07% |
| Metal & Glass Containers | 0.06% | 0.01% | 0.07% |
| Agricultural Products | 0.05% | 0.02% | 0.07% |
| Paper Products | 0.01% | 0.05% | 0.06% |
| Education Services | 0.05% | 0.01% | 0.06% |
| Leisure Facilities | 0.03% | 0.03% | 0.06% |
| Independent Power Producers & Energy Traders | 0.03% | 0.03% | 0.06% |
| Renewable Electricity | 0.02% | 0.04% | 0.06% |
| Department Stores | 0.03% | 0.02% | 0.05% |
| Aluminum | 0.02% | 0.03% | 0.05% |
| Household Appliances | 0.03% | 0.02% | 0.05% |
| Highways & Railtracks | 0.00% | 0.05% | 0.05% |
| Technology Distributors | 0.04% | 0.01% | 0.05% |
| Coal & Consumable Fuels | 0.01% | 0.03% | 0.04% |
| Alternative Carriers | 0.04% | 0.00% | 0.04% |
| Airport Services | 0.00% | 0.04% | 0.04% |
| Drug Retail | 0.03% | 0.01% | 0.04% |
| Distributors | 0.04% | 0.00% | 0.04% |
| Publishing | 0.02% | 0.01% | 0.03% |
| Home Furnishing Retail | 0.03% | 0.01% | 0.04% |
| Computer & Electronics Retail | 0.03% | 0.00% | 0.03% |
| Security & Alarm Services | 0.01% | 0.02% | 0.03% |
| Home Furnishings | 0.03% | 0.00% | 0.03% |
| Precious Metals & Minerals | 0.00% | 0.03% | 0.03% |
| Office Services & Supplies | 0.03% | 0.00% | 0.03% |
| Specialized Consumer Services | 0.02% | 0.00% | 0.02% |
| Commercial Printing | 0.01% | 0.01% | 0.02% |
| Forest Products | 0.00% | 0.02% | 0.02% |
| Motorcycle Manufacturers | 0.00% | 0.02% | 0.02% |
| Specialized Finance | 0.00% | 0.02% | 0.02% |
| Oil & Gas Drilling | 0.01% | 0.00% | 0.01% |
| Silver | 0.01% | 0.00% | 0.01% |
| Marine Ports & Services | 0.00% | 0.01% | 0.01% |
| Housewares & Specialties | 0.01% | 0.00% | 0.01% |
| Textiles | 0.00% | 0.00% | 0.00%*** |
| | | | 73.61% |
| Sector | Percentage (based
on Fair Value) |
| U.S. Treasuries | | | 11.29% |
| Agency Mortgage Backed | | | 5.13% |
| Corporate Notes | | | 4.65% |
| Sovereign Bonds | | | 0.28% |
| Non-Agency Collateralized Mortgage Obligations | | | 0.21% |
| Municipal Bonds and Notes | | | 0.14% |
| Agency Collateralized Mortgage Obligations | | | 0.13% |
| Sector | Percentage (based
on Fair Value) |
| Asset Backed | | | 0.06% |
| | | | 21.89% |
| Short-Term Investments | | | 4.50% |
| | | | 100.00% |
See Notes to Schedule of Investments and Notes to Financial Statements.
| 112 | State Street Total Return V.I.S. Fund |
State Street Total Return V.I.S. Fund
Schedule of Investments, continued — December 31, 2021
| | Number
of Shares
Held at
12/31/20 | Value at
12/31/20 | | Cost of
Purchases | | Proceeds
from
Shares
Sold | | Realized
Gain
(Loss) | | Change in
Unrealized
Appreciation
(Depreciation) | Number of
Shares
Held at
12/31/21 | Value at
12/31/21 | | Dividend
Income |
| SPDR Bloomberg High Yield Bond ETF | 829,249 | $ 90,338,386 | | $141,555,881 | | $213,400,443 | | $3,297,077 | | $(4,145,453) | 162,526 | $ 17,645,448 | | $2,529,692 |
| SPDR Bloomberg International Treasury Bond ETF | 1,143,138 | 35,700,200 | | 1,194,104 | | 36,212,733 | | 558,734 | | (1,240,305) | — | — | | 26,409 |
| SPDR Dow Jones REIT ETF | 54,355 | 4,712,578 | | — | | 5,854,498 | | 1,550,420 | | (408,500) | — | — | | 74,268 |
| SPDR Portfolio Long Term Corporate Bond ETF | 546,231 | 18,080,246 | | 62,279,602 | | 8,435,394 | | (162,468) | | (1,007,979) | 2,247,586 | 70,754,007 | | 1,177,811 |
| SPDR Portfolio Long Term Treasury ETF | — | — | | 89,747,841 | | 23,487,320 | | 1,172,919 | | 2,527,256 | 1,659,803 | 69,960,696 | | 621,518 |
| State Street Institutional U.S. Government Money Market Fund - Class G Shares | 84,964,250 | 84,964,250 | | 619,738,584 | | 623,112,163 | | — | | — | 81,590,671 | 81,590,671 | | 12,277 |
| TOTAL | | $233,795,660 | | $914,516,012 | | $910,502,551 | | $6,416,682 | | $(4,274,981) | | $239,950,822 | | $4,441,975 |
See Notes to Schedule of Investments and Notes to Financial Statements.
| State Street Total Return V.I.S. Fund | 113 |
State Street Total Return V.I.S. Fund
Financial Highlights
Selected data based on a share outstanding throughout the fiscal years indicated
| | | Class 1 |
| | | 12/31/21 | | 12/31/20 | | 12/31/19 | | 12/31/18 | | 12/31/17 |
| Inception date | | | | 7/1/85 |
| Net asset value, beginning of period | | $ 16.63 | | $ 15.91 | | $ 14.06 | | $ 19.94 | | $ 18.08 |
| Income/(loss) from investment operations: | | | | | | | | | | |
| Net investment income | | 0.40 (a) | | 0.27 (a) | | 0.34 (a) | | 0.40 (a) | | 0.36 (a) |
| Net realized and unrealized gains/(losses) on investments | | 1.84 | | 0.75 | | 1.88 | | (1.69) | | 2.46 |
| Total income/(loss) from investment operations | | 2.24 | | 1.02 | | 2.22 | | (1.29) | | 2.82 |
| Contribution from Advisor | | 0.00 (b) | | — | | — | | — | | — |
| Contribution from Affiliate | | 0.00 (b) | | — | | — | | — | | — |
| Less distributions from: | | | | | | | | | | |
| Net investment income | | 0.39 | | 0.30 | | 0.37 | | 0.45 | | 0.41 |
| Net realized gains | | 2.42 | | — | | — | | 4.14 | | 0.55 |
| Total distributions | | 2.81 | | 0.30 | | 0.37 | | 4.59 | | 0.96 |
| Net asset value, end of period | | $ 16.06 | | $ 16.63 | | $ 15.91 | | $ 14.06 | | $ 19.94 |
| Total Return(c) | | 13.45% (d) | | 6.44% | | 15.81% | | (6.34)% | | 15.58% |
| Ratios/Supplemental Data: | | | | | | | | | | |
| Net assets, end of period (in thousands) | | $768,504 | | $743,820 | | $764,667 | | $733,417 | | $856,665 |
| Ratios to average net assets: | | | | | | | | | | |
| Net expenses | | 0.62% | | 0.60% | | 0.61% | | 0.62% | | 0.62% |
| Gross expenses | | 0.62% | | 0.60% | | 0.61% | | 0.62% | | 0.62% |
| Net investment income | | 2.22% | | 1.77% | | 2.24% | | 2.01% | | 1.83% |
| Portfolio turnover rate | | 118% (e) | | 92% (e) | | 81% | | 97% | | 15% |
| Notes to Financial Highlights |
| (a) | Per share values have been calculated using the average shares method. |
| (b) | Rounds to less than $0.005. |
| (c) | Total returns are historical and assume changes in share price, reinvestment of dividends and capital gains distributions and do not include the effect of insurance contract charges. Past performance does not guarantee future results. |
| (d) | The contribution from an Affiliate and the Adviser had no impact on total return. |
| (e) | The portfolio turnover calculated for the years ended 12/31/21 and 12/31/20 did not include To-Be-Announced transactions and, if it had, the portfolio turnover would have been 144% and 103%, respectively. |
The accompanying Notes are an integral part of these financial statements.
State Street Total Return V.I.S. Fund
Financial Highlights, continued
Selected data based on a share outstanding throughout the fiscal years indicated
| | | Class 3 |
| | | 12/31/21 | | 12/31/20 | | 12/31/19 | | 12/31/18 | | 12/31/17 |
| Inception date | | | | 5/1/06 |
| Net asset value, beginning of period | | $ 16.57 | | $ 15.86 | | $ 14.01 | | $ 19.88 | | $ 18.03 |
| Income/(loss) from investment operations: | | | | | | | | | | |
| Net investment income | | 0.35 (a) | | 0.23 (a) | | 0.30 (a) | | 0.35 (a) | | 0.31 (a) |
| Net realized and unrealized gains/(losses) on investments | | 1.84 | | 0.74 | | 1.88 | | (1.69) | | 2.44 |
| Total income/(loss) from investment operations | | 2.19 | | 0.97 | | 2.18 | | (1.34) | | 2.75 |
| Contribution from Advisor | | 0.00 (b) | | — | | — | | — | | — |
| Contribution from Affiliate | | 0.00 (b) | | — | | — | | — | | — |
| Less distributions from: | | | | | | | | | | |
| Net investment income | | 0.34 | | 0.26 | | 0.33 | | 0.39 | | 0.35 |
| Net realized gains | | 2.42 | | — | | — | | 4.14 | | 0.55 |
| Total distributions | | 2.76 | | 0.26 | | 0.33 | | 4.53 | | 0.90 |
| Net asset value, end of period | | $ 16.00 | | $ 16.57 | | $ 15.86 | | $ 14.01 | | $ 19.88 |
| Total Return(c) | | 13.20% (d) | | 6.14% | | 15.57% | | (6.61)% | | 15.26% |
| Ratios/Supplemental Data: | | | | | | | | | | |
| Net assets, end of period (in thousands) | | $1,035,137 | | $1,063,931 | | $1,156,437 | | $1,165,809 | | $1,464,061 |
| Ratios to average net assets: | | | | | | | | | | |
| Net expenses | | 0.87% | | 0.85% | | 0.86% | | 0.87% | | 0.87% |
| Gross expenses | | 0.87% | | 0.85% | | 0.86% | | 0.87% | | 0.87% |
| Net investment income | | 1.95% | | 1.52% | | 1.99% | | 1.76% | | 1.59% |
| Portfolio turnover rate | | 118% (e) | | 92% (e) | | 81% | | 97% | | 15% |
| Notes to Financial Highlights |
| (a) | Per share values have been calculated using the average shares method. |
| (b) | Rounds to less than $0.005. |
| (c) | Total returns are historical and assume changes in share price, reinvestment of dividends and capital gains distributions and do not include the effect of insurance contract charges. Past performance does not guarantee future results. |
| (d) | The contribution from an Affiliate and the Adviser had no impact on total return. |
| (e) | The portfolio turnover calculated for the years ended 12/31/21 and 12/31/20 did not include To-Be-Announced transactions and, if it had, the portfolio turnover would have been 144% and 103%, respectively. |
The accompanying Notes are an integral part of these financial statements.
State Street Total Return V.I.S. Fund
Statement of Assets and Liabilities — December 31, 2021
| Assets | |
| Investments in securities, at fair value (cost $1,437,174,971) | $ 1,575,157,173 |
| Investments in affiliated securities, at fair value (cost $156,627,364) | 158,360,151 |
| Short-term affiliated investments, at fair value | 81,590,671 |
| Net cash collateral on deposit with broker for future contracts | 557,672 |
| Foreign currency (cost $1,068,670) | 1,076,748 |
| Receivable for investments sold | 20,601,906 |
| Income receivables | 3,928,708 |
| Receivable for fund shares sold | 19,828 |
| Income receivable from affiliated investments | 1,195 |
| Receivable for accumulated variation margin on futures contracts | 228,408 |
| Other assets | 10,485 |
| Total assets | 1,841,532,945 |
| Liabilities | |
| Due to custodian | 17,707 |
| Payable for investments purchased | 35,295,621 |
| Payable for fund shares redeemed | 259,338 |
| Payable to the Adviser | 528,874 |
| Payable for custody, fund accounting and sub-administration fees | 133,452 |
| Accrued other expenses | 236,212 |
| Distribution and service fees | 1,131,567 |
| Accrued foreign capital gains tax | 289,209 |
| Total liabilities | 37,891,980 |
|
| Net Assets | $ 1,803,640,965 |
| Net Assets Consist of: | |
| Capital paid in | $ 1,645,256,730 |
| Total distributable earnings (loss) | 158,384,235 |
| Net Assets | $ 1,803,640,965 |
|
| Class 1: | |
| Net Assets | $ 768,503,962 |
| Shares outstanding ($0.01 par value, unlimited shares authorized) | 47,843,178 |
| Net asset value, offering and redemption price per share | $ 16.06 |
|
| Class 3: | |
| Net Assets | $ 1,035,137,003 |
| Shares outstanding ($0.01 par value, unlimited shares authorized) | 64,685,913 |
| Net asset value per share | $ 16.00 |
The accompanying Notes are an integral part of these financial statements.
| 116 | Statement of Assets and Liabilities |
State Street Total Return V.I.S. Fund
Statement of Operations — For the year ended December 31, 2021
| Investment Income | |
| Income | |
| Dividend | $ 37,489,183 |
| Interest | 11,077,462 |
| Income from affiliated investments | 4,441,975 |
| Less: Foreign taxes withheld | (1,165,022) |
| Total income | 51,843,598 |
| Expenses | |
| Advisory and administration fees | 6,423,070 |
| Distribution and service fees | |
| Class 1 | 1,536,058 |
| Class 3 | 4,802,103 |
| Directors' fees | 29,544 |
| Custody, fund accounting and sub-administration fees | 795,374 |
| Professional fees | 103,687 |
| Interest expense on forward sale commitments | 1,108 |
| Other expenses | 302,013 |
| Total expenses | 13,992,957 |
| Net investment income | $ 37,850,641 |
| Net Realized and Unrealized Gain (Loss) on Investments | |
| Realized gain (loss) on: | |
| Unaffiliated investments | $ 259,452,466(a) |
| Affiliated investments | 6,416,682 |
| Futures | 1,110,359 |
| Foreign currency transactions | (338,845) |
| Increase (decrease) in unrealized appreciation/depreciation on: | |
| Unaffiliated investments | (70,783,403) (b) |
| Affiliated investments | (4,274,981) |
| Futures | 16,226 |
| Foreign currency translations | (73,137) |
| Net realized and unrealized gain (loss) on investments | 191,525,367 |
| Net Increase in Net Assets Resulting from Operations | $ 229,376,008 |
| (a) | Includes $(231,511) of net realized gains from foreign capital tax gain. |
| (b) | Includes change in deferred foreign capital gains tax amounted to $(121,197). |
The accompanying Notes are an integral part of these financial statements.
| Statement of Operations | 117 |
State Street Total Return V.I.S. Fund
Statements of Changes in Net Assets
| | Year Ended
December 31,
2021 | | Year Ended
December 31,
2020 |
| Increase (Decrease) in Net Assets | | | |
| Operations: | | | |
| Net investment income | $ 37,850,641 | | $ 27,665,107 |
| Net realized gain (loss) on investments, futures and foreign currency transactions | 266,640,662 | | 2,332,524 |
| Net increase (decrease) in unrealized appreciation/depreciation on investments, futures and foreign currency translations | (75,115,295) | | 68,395,776 |
| Net increase (decrease) from operations | 229,376,008 | | 98,393,407 |
| Distributions to shareholders: | | | |
| Total distributions | | | |
| Class 1 | (114,700,350) | | (13,378,166) |
| Class 3 | (152,682,537) | | (16,628,981) |
| Total distributions | (267,382,887) | | (30,007,147) |
| Increase (decrease) in assets from operations and distributions | (38,006,879) | | 68,386,260 |
| Share transactions: | | | |
| Proceeds from sale of shares | | | |
| Class 1 | 2,179,160 | | 4,111,457 |
| Class 3 | 12,802,243 | | 18,262,784 |
| Value of distributions reinvested | | | |
| Class 1 | 114,663,018 | | 13,378,166 |
| Class 3 | 152,719,869 | | 16,628,981 |
| Cost of shares redeemed | | | |
| Class 1 | (74,103,725) | | (67,099,035) |
| Class 3 | (174,367,829) | | (167,021,825) |
| Net increase (decrease) from share transactions | 33,892,736 | | (181,739,472) |
| Contribution from Advisor | 2,165 | | — |
| Contribution from Affiliate | 2,165 | | — |
| Total increase (decrease) in net assets | (4,109,813) | | (113,353,212) |
| Net Assets | | | |
| Beginning of year | 1,807,750,778 | | 1,921,103,990 |
| End of year | $ 1,803,640,965 | | $ 1,807,750,778 |
| Changes in Fund Shares | | | |
| Class 1 | | | |
| Shares sold | 116,074 | | 270,371 |
| Issued for distributions reinvested | 7,126,353 | | 806,886 |
| Shares redeemed | (4,126,451) | | (4,414,312) |
| Net increase (decrease) in fund shares | 3,115,976 | | (3,337,055) |
| Class 3 | | | |
| Shares sold | 719,039 | | 1,247,259 |
| Issued for distributions reinvested | 9,527,128 | | 1,006,597 |
| Shares redeemed | (9,749,748) | | (10,989,224) |
| Net increase (decrease) in fund shares | 496,419 | | (8,735,368) |
The accompanying Notes are an integral part of these financial statements.
| 118 | Statements of Changes in Net Assets |
State Street Total Return V.I.S. Fund
Notes to Financial Statements — December 31, 2021
1. Organization of the Company
State Street Variable Insurance Series Funds, Inc. (the “Company”) was incorporated under the laws of the Commonwealth of Virginia on May 14, 1984 and is registered under the Investment Company Act of 1940, as amended (the “1940 Act”), as an open-end management investment company. The Company is currently composed of the following seven investment portfolios (collectively, the “Funds”): State Street U.S. Equity V.I.S. Fund, State Street S&P 500 Index V.I.S. Fund, State Street Premier Growth Equity V.I.S. Fund, State Street Small-Cap Equity V.I.S. Fund, State Street Total Return V.I.S. Fund (the “Fund”), State Street Income V.I.S. Fund and State Street Real Estate Securities V.I.S. Fund. Each Fund is a diversified investment company within the meaning of the 1940 Act, except for the State Street Premier Growth Equity V.I.S. Fund, which is a non-diversified investment company.
Shares of the Funds of the Company are offered only to insurance company separate accounts that fund certain variable life insurance contracts and variable annuity contracts.
The Company currently offers two share classes of the Fund as investment options for variable life insurance and variable annuity contracts — Class 1 and Class 3. Class 3 shares were first offered on May 1, 2006, and Fund shares outstanding prior to May 1, 2006 were designated as Class 1 shares. Each class of shares has different fees and expenses, and as a result, each class of shares will have different share price and performance. Not all variable contracts offer each class of the Fund’s shares.
Under the Company’s organizational documents, its officers and directors are indemnified against certain liabilities arising out of the performance of their duties to the Company. Additionally, in the normal course of business, the Company enters into contracts with service providers that contain general indemnification clauses. The Company’s maximum exposure under these arrangements is unknown as this would involve future claims that may be made against the Company that have not yet occurred.
2.Summary of Significant Accounting Policies
The following is a summary of significant accounting policies followed by the Company in the preparation of its financial statements:
The preparation of financial statements in accordance with U.S. generally accepted accounting principles (“U.S. GAAP”) requires management to make estimates and assumptions that affect the reported amounts and disclosures in the financial statements. Actual results could differ from those estimates. The Fund is an investment company under U.S. GAAP and follows the accounting and reporting guidance applicable to investment companies.
Security Valuation The Fund’s investments are valued at fair value each day that the New York Stock Exchange (“NYSE”) is open and, for financial reporting purposes, as of the report date should the reporting period end on a day that the NYSE is not open. Fair value is generally defined as the price a fund would receive to sell an asset or pay to transfer a liability in an orderly transaction between market participants at the measurement date. By its nature, a fair value price is a good faith estimate of the valuation in a current sale and may not reflect an actual market price. The investments of the Fund are valued pursuant to the policy and procedures developed by the Oversight Committee (the “Committee”) and approved by the Company's Board of Directors (the “Board”). The Committee provides oversight of the valuation of investments for the Fund. The Board has responsibility for overseeing the determination of the fair value of investments.
Valuation techniques used to value the Fund’s investments by major category are as follows:
| • | Equity investments (including preferred stocks and registered investment companies that are exchange-traded funds) traded on a recognized securities exchange for which market quotations are readily available are valued at the last sale price or official closing price, as applicable, on the primary market or exchange on which they trade. Equity investments traded on a recognized exchange for which there were no sales on that day are valued at the last published sale price or at fair value. |
| Notes to Financial Statements | 119 |
State Street Total Return V.I.S. Fund
Notes to Financial Statements, continued — December 31, 2021
| • | Investments in registered investment companies (including money market funds) or other unitized pooled investment vehicles that are not traded on an exchange are valued at that day’s published net asset value (“NAV”) per share or unit. |
| • | Government and municipal fixed income securities are generally valued using quotations from independent pricing services or brokers. Certain government inflation-indexed securities may require a calculated fair valuation as the cumulative inflation is contained within the price provided by the pricing service or broker. For these securities, the inflation component of the price is “cleaned” from the pricing service or broker price utilizing the published inflation factors in order to ensure proper accrual of income. |
| • | Debt obligations (including short term investments and convertible debt securities) are valued using quotations from independent pricing services or brokers or are generally valued at the last reported evaluated prices. |
| • | Exchange-traded futures contracts are valued at the closing settlement price on the primary market on which they are traded most extensively. Exchange-traded futures contracts traded on a recognized exchange for which there were no sales on that day are valued at the last reported sale price obtained from independent pricing services or brokers or at fair value. |
In the event prices or quotations are not readily available or that the application of these valuation methods results in a price for an investment that is deemed to be not representative of the fair value of such investment, fair value will be determined in good faith by the Committee, in accordance with the valuation policy and procedures approved by the Board.
A “significant event” is an event that the Board believes, with a reasonably high degree of certainty, has caused the closing market prices of the Fund’s portfolio securities to no longer reflect their value at the time of the Fund’s NAV calculation. Fair value may be determined using an independent fair value service under valuation procedures approved by the Board. The independent fair value service takes into account multiple factors including, but not limited to, movements in the U.S. securities markets, certain depositary receipts, futures contracts and foreign currency exchange rates that have occurred subsequent to the close of foreign securities exchanges. The use of the independent fair value service or alternative fair valuation methods would result in the investments being classified within Level 2 of the fair value hierarchy.
The Fund values its assets and liabilities at fair value using a fair value hierarchy consisting of three broad levels that prioritize the inputs to valuation techniques giving the highest priority to readily available unadjusted quoted prices in active markets for identical assets or liabilities (Level 1 measurements) and the lowest priority to unobservable inputs (Level 3 measurements) when market prices are not readily available or reliable. The categorization of a value determined for an investment within the hierarchy is based upon the pricing transparency of the investment and is not necessarily an indication of the risk associated with investing in it.
The three levels of the fair value hierarchy are as follows:
| • | Level 1 — Unadjusted quoted prices in active markets for an identical asset or liability; |
| • | Level 2 — Inputs other than quoted prices included within Level 1 that are observable for the asset or liability either directly or indirectly, including quoted prices for similar assets or liabilities in active markets, quoted prices for identical or similar assets or liabilities in markets that are not considered to be active, inputs other than quoted prices that are observable for the asset or liability (such as exchange rates, financing terms, interest rates, yield curves, volatilities, prepayment speeds, loss severities, credit risks and default rates) or other market-corroborated inputs; and |
| • | Level 3 — Unobservable inputs for the asset or liability, including the Committee’s assumptions used in determining the fair value of investments. |
The value of the Fund’s investments according to the fair value hierarchy as of December 31, 2021 is disclosed in the Fund’s Schedule of Investments.
| 120 | Notes to Financial Statements |
State Street Total Return V.I.S. Fund
Notes to Financial Statements, continued — December 31, 2021
Investment Transactions and Income Recognition Investment transactions are accounted for on trade date for financial reporting purposes. Realized gains and losses from the sale or disposition of investments and foreign exchange transactions, if any, are determined using the identified cost method.
Dividend income and capital gain distributions, if any, are recognized on the ex-dividend date, net of any foreign taxes withheld at source, if any.
Interest income is recorded daily on an accrual basis. All premiums and discounts are amortized/accreted for financial reporting purposes.
Non-cash dividends received in the form of stock are recorded as dividend income at fair value.
The Fund invests in real estate investment trusts (“REITs”). REITs determine the tax character of their distributions annually and may characterize a portion of their distributions as a return of capital or capital gain. The Fund’s policy is to record all REIT distributions initially as dividend income and re-designate a portion to return of capital or capital gain distributions at year end based on information provided by the REIT and/or SSGA Funds Management, Inc.’s (the “Adviser” or “SSGA FM”) estimates of such re-designations for which actual information has not yet been reported. Non-cash dividends received in the form of stock are recorded as dividend income at fair value.
Expenses Certain expenses, which are directly identifiable to a specific Fund, are applied to the Fund within the Company. Other expenses which cannot be attributed to a specific Fund are allocated in such a manner as deemed equitable, taking into consideration the nature and type of expense and the relative net assets of the Fund within the Company.
Foreign Currency Translation The accounting records of the Fund are maintained in U.S. dollars. Foreign currencies as well as investment securities and other assets and liabilities denominated in a foreign currency are translated to U.S. dollars using exchange rates at period end. Purchases and sales of securities, income receipts and expense payments denominated in foreign currencies are translated into U.S. dollars at the prevailing exchange rate on the respective dates of the transactions.
The effects of exchange rate fluctuations on investments are included with the net realized and unrealized gain (loss) on investment securities. Other foreign currency transactions resulting in realized and unrealized gain (loss) are disclosed separately.
Foreign Taxes The Fund may be subject to foreign taxes (a portion of which may be reclaimable) on income, stock dividends, realized and unrealized capital gains on investments or certain foreign currency transactions. Foreign taxes are recorded in accordance with SSGA FM's understanding of the applicable foreign tax regulations and rates that exist in the foreign jurisdictions in which the Fund invests. These foreign taxes, if any, are paid by the Fund and are reflected in the Statement of Operations, if applicable. Foreign taxes payable or deferred as of December 31, 2021, if any, are disclosed in the Fund’s Statement of Assets and Liabilities.
Distributions The Fund declares and pays any dividends from net investment income annually.
Net realized capital gains, if any, are distributed annually, unless additional distributions are required for compliance with applicable tax regulations. The amount and character of income and capital gains to be distributed are determined in accordance with applicable tax regulations which may differ from net investment income and realized gains recognized for U.S. GAAP purposes.
3.Securities and Other Investments
Delayed Delivery Transactions and When-Issued Securities During the fiscal year ended December 31, 2021, the Fund transacted in securities on a delayed delivery or when-issued basis. Payment and delivery may take place after the customary settlement period for that security. The price of the underlying securities and the date when the securities will be delivered and paid for are fixed at the time the transaction is negotiated. The securities purchased on a delayed delivery or when-issued basis are identified as such in the Fund’s Schedule of Investments. The Fund may receive compensation for interest forgone in the purchase of a delayed delivery or
| Notes to Financial Statements | 121 |
State Street Total Return V.I.S. Fund
Notes to Financial Statements, continued — December 31, 2021
when-issued security. With respect to such purchase commitments, the Fund identifies securities as segregated in its records with a value at least equal to the amount of the commitment. Losses may arise due to changes in the value of the underlying securities or if the counterparty does not perform under the contract’s terms, or if the issuer does not issue the securities due to political, economic or other factors.
To-Be-Announced Transactions The Fund may seek to obtain exposure to U.S. agency mortgage pass-through securities through the use of “to-be-announced” or “TBA transactions.” “TBA” refers to a commonly used mechanism for the forward settlement of U.S. agency mortgage pass-through securities. In a TBA transaction, the buyer and seller decide on general trade parameters, such as agency, settlement date, coupon, and price.
The Fund may use TBA transactions to “roll over” such agreements prior to the settlement date. This type of TBA transaction is sometimes known as a “TBA roll.” In a TBA roll, the Fund generally will sell the obligation to purchase the pools stipulated in the TBA agreement prior to the settlement date and will enter into a new TBA agreement for future delivery of pools of mortgage pass-through securities. The Fund may also enter into TBA agreements and settle such transactions on the stipulated settlement date by accepting actual receipt or delivery of the pools of mortgage pass-through securities.
Default by or bankruptcy of a counterparty to a TBA transaction would expose the Fund to possible loss because of adverse market action, expenses or delays in connection with the purchase or sale of the pools of mortgage pass-through securities specified in the TBA transaction. To minimize this risk, the Fund will enter into TBA transactions only with established counterparties. The Fund’s use of “TBA rolls” may impact portfolio turnover, transaction costs and capital gain distributions to shareholders.
4.Derivative Financial Instruments
Futures Contracts The Fund may enter into futures contracts to meet the Fund’s objectives. A futures contract is a standardized, exchange-traded agreement to buy or sell a financial instrument at a set price on a future date. Upon entering into a futures contract, the Fund is required to deposit with the broker, cash or securities in an amount equal to the minimum initial margin requirements of the clearing house. Securities deposited, if any, are designated on the Schedule of Investments and cash deposited, if any, is shown as Net cash collateral on deposit with broker for future contracts on the Statement of Assets and Liabilities. Subsequent payments are made or received by the Fund equal to the daily change in the contract value, accumulated, exchange rates, and/or other transactional fees. The accumulation of those payments are recorded as variation margin receivable or payable with a corresponding offset to unrealized gains or losses. The Fund recognizes a realized gain or loss when the contract is closed.
Losses may arise if the value of a futures contract decreases due to unfavorable changes in the market rates or values of the underlying instrument during the term of the contract or if the counterparty does not perform under the contract. The use of futures contracts also involves the risk that the movements in the price of the futures contracts do not correlate with the movement of the assets underlying such contracts.
For the fiscal year ended December 31, 2021, the Fund entered into futures contracts for cash equitization.
The following tables summarize the value of the Fund’s derivative instruments as of December 31, 2021 and the related location in the accompanying Statement of Assets and Liabilities and Statement of Operations, presented by primary underlying risk exposure:
| Asset Derivatives |
| | Interest
Rate
Risk | Foreign
Exchange
Risk | Credit
Risk | Equity
Risk | Commodity
Risk | Total |
| State Street Total Return V.I.S. Fund | | | | | | |
| Futures Contracts | $ — | $ — | $ — | $ 228,408 | $ — | $ 228,408 |
| 122 | Notes to Financial Statements |
State Street Total Return V.I.S. Fund
Notes to Financial Statements, continued — December 31, 2021
| Realized Gain/Loss |
| | Interest
Rate
Risk | Foreign
Exchange
Risk | Credit
Risk | Equity
Risk | Commodity
Risk | Total |
| State Street Total Return V.I.S. Fund | | | | | | |
| Futures Contracts | $ — | $ — | $ — | 1,110,359 | $ — | $ 1,110,359 |
| Net Change in Unrealized Appreciation (Depreciation) |
| | Interest
Rate
Risk | Foreign
Exchange
Risk | Credit
Risk | Equity
Risk | Commodity
Risk | Total |
| State Street Total Return V.I.S. Fund | | | | | | |
| Futures Contracts | $ — | $ — | $ — | $ 16,226 | $ — | $ 16,226 |
5.Fees and Transactions with Affiliates
Advisory Fee SSGA FM, a registered investment adviser, was retained by the Board to act as investment adviser and administrator of the Fund. SSGA FM’s compensation for investment advisory and administrative services (“Management Fee”) is paid monthly based on the average daily net assets of the Fund at an annualized rate of 0.35%.
Investor Service Plan — Class 1 and Class 3 Shares The Company adopted an Investor Service Plan (the “Service Plan”) on December 9, 2005 for Class 1 shares and on May 1, 2009 for Class 3 shares of the Fund. The Service Plan was not adopted pursuant to Rule 12b-1 under the 1940 Act. Each Service Plan provides that during any fiscal year, the amount of compensation paid under the Service Plan by the Fund Class 1 or Class 3 shares may not exceed the annual rate of 0.20% of the average daily net assets of the Fund attributable to each such share class.
Distribution and Shareholder Service (12b-1) Fees The Company has adopted a Distribution and Service (12b-1) Plan (the “12b-1 Plan”) pursuant to Rule 12b-1 under the 1940 Act with respect to each of Class 1 and Class 3 shares of the Fund. Under the 12b-1 Plan for Class 1 shares that became effective May 1, 2009, payments made under the Class 1 Investor Service Plan are covered in the event that any portion of compensation paid pursuant to the Class 1 Investor Service Plan is determined to be an indirect use of the assets attributable to the Class 1 shares to finance distribution of such shares. Under the 12b-1 Plan for Class 3 shares, the Company, on behalf of the Fund, may have compensated State Street Global Advisors Funds Distributors, LLC (“SSGA FD”), the distributor of the shares of the Fund, for certain sales services provided by SSGA FD or other broker dealers and investor services provided by SSGA FD or other service providers relating to the Fund’s Class 3 shares, including services to owners or prospective owners of variable contracts issued by insurance companies that offer Class 3 shares as an investment option under such variable contracts. The amount of compensation paid under the 12b-1 Plan for Class 3 shares may not exceed 0.25% of the average daily net assets of the Fund attributable to such share class. The 12b-1 Plan continues in effect from year to year for so long as such continuance is approved annually by the Board, including by those Directors who are not interested persons of the Company and who have no direct or indirect financial interest in the operation of the 12b-1 Plan or in any agreement related to it. In addition, the Class 3 12b-1 Plan covers payments made under the Class 3 Investor Service Plan in the event that any portion of compensation paid pursuant to the Class 3 Investor Service Plan is determined to be an indirect use of the assets attributable to the Class 3 shares to finance distribution of such shares.
Custody, Fund Accounting and Sub-Administration Fees State Street Bank and Trust Company (“State Street”) serves as the custodian, fund accountant and sub-administrator to the Fund. Amounts paid by the Fund to State Street for performing such services are included as custody, fund accounting and sub-administration fees in the Statement of Operations.
| Notes to Financial Statements | 123 |
State Street Total Return V.I.S. Fund
Notes to Financial Statements, continued — December 31, 2021
Other Transactions with Affiliates The Fund may invest in affiliated entities, including securities issued by State Street Corporation, affiliated funds, or entities deemed to be affiliates as a result of the Fund owning more than five percent of the entity’s voting securities or outstanding shares. Amounts relating to these transactions during the fiscal year ended December 31, 2021 are disclosed in the Schedule of Investments.
The Adviser and State Street each reimbursed the Fund $2,165 for a total amount of $4,330 during the fiscal year related to a trading matter.
6.Directors' Fees
The fees and expenses of the Company’s directors who are not “interested persons” of the Company, as defined in the 1940 Act (“Independent Directors”), are paid directly by the Fund. The Independent Directors are reimbursed for travel and other out-of-pocket expenses in connection with meeting attendance and industry seminars.
7.Investment Transactions
Purchases and sales of investments (excluding in-kind transactions, short term investments and derivative contracts) for the fiscal year ended December 31, 2021 were as follows:
| U.S. Government Securities |
| Purchases | Sales |
| $ 707,063,685 | $ 649,710,152 |
| Non-U.S. Government Securities |
| Purchases | Sales |
| $ 1,877,248,826 | $ 2,117,841,475 |
8.Income Tax Information
The Fund has qualified and intends to continue to qualify as a regulated investment company under Subchapter M of the Internal Revenue Code of 1986, as amended. The Fund will not be subject to federal income taxes to the extent it distributes its taxable income, including any net realized capital gains, for each fiscal year. Therefore, no provision for federal income tax is required.
The Fund files federal and various state and local tax returns as required. No income tax returns are currently under examination. Generally, the federal returns are subject to examination by the Internal Revenue Service for a period of three years from date of filing, while the state returns may remain open for an additional year depending upon jurisdiction. SSGA FM has analyzed the Fund's tax positions taken on tax returns for all open years and does not believe there are any uncertain tax positions that would require recognition of a tax liability.
Distributions to shareholders are recorded on ex-dividend date. Income dividends and gain distributions are determined in accordance with income tax rules and regulations, which may differ from generally accepted accounting principles. Certain capital accounts in the financial statements have been adjusted for permanent book-tax differences. These adjustments have no impact on NAVs or results of operations. Temporary book-tax differences will reverse in the future. These book-tax differences are primarily due to nontaxable dividend adjustments to income, foreign currencies, REITs, TIPS adjustments, premium amortization, contributions from the advisor, investments in futures, passive foreign investment company gains and losses, paydown gains and losses and wash sale loss deferrals.
The tax character of distributions paid during the fiscal year ended December 31, 2021 were as follows:
Ordinary
Income | Long-Term
Capital Gains | Total |
| $ 118,609,316 | $ 148,773,571 | $ 267,382,887 |
| 124 | Notes to Financial Statements |
State Street Total Return V.I.S. Fund
Notes to Financial Statements, continued — December 31, 2021
The tax character of distributions paid during the fiscal year ended December 31, 2020 was as follows:
Ordinary
Income | Long-Term
Capital Gains | Total |
| $ 30,007,147 | $ — | $ 30,007,147 |
At December 31, 2021, the components of distributable earnings on a tax basis were as follows:
Undistributed
Ordinary
Income | Tax Exempt
Income | Capital Loss
Carryforwards | Undistributed
long term
gain | Net
Unrealized
Gains
(Losses) | Qualified
Late-Year
Losses | Total |
| $ 12,739,937 | $ — | $ — | $ 14,086,307 | $ 131,557,991 | $ — | $ 158,384,235 |
As of December 31, 2021, gross unrealized appreciation and gross unrealized depreciation of investments and other financial instruments based on cost for federal income tax purposes were as follows:
Tax
Cost | Gross
Unrealized
Appreciation | Gross
Unrealized
Depreciation | Net
Unrealized
Appreciation
(Depreciation) |
| $ 1,683,751,826 | $ 188,872,844 | $ 57,288,601 | $ 131,584,243 |
9.Line of Credit
The Fund and other affiliated funds (each, a “Participant” and collectively, the “Participants”) have access to $200 million of a $1.1 billion revolving credit facility provided by a syndication of banks under which the Participants may borrow to fund shareholder redemptions. This agreement expires in October 2022 unless extended or renewed.
The Participants are charged an annual commitment fee which is calculated based on the unused portion of the shared credit line. Commitment fees are allocated among each of the Participants based on relative net assets. Commitment fees are ordinary fund operating expenses. A Participant incurs and pays the interest expense related to its borrowing. Interest is calculated at a rate per annum equal to the sum of 1.00% plus the greater of the New York Fed Bank Rate and the one-month SOFR Rate.
Prior to October 7, 2021 the Fund had access to $200 million of a $500 million revolving credit facility and interest was calculated at a rate per annum equal to the sum of 1.25% plus the New York Fed Bank Rate.
The Fund had no outstanding loans as of December 31, 2021.
10.Risks
Concentration Risk As a result of the Fund's ability to invest a large percentage of its assets in obligations of issuers within the same country, state, region, currency or economic sector, an adverse economic, business or political development may affect the value of the Fund's investments more than if the Fund was more broadly diversified.
Interest Rate Risk Is the risk that fixed income securities will decline in value because of changes in interest rates. Bond prices generally rise when interest rates decline and generally decline when interest rates rise. Changes in governmental policy, including changes in central bank monetary policy, could cause interest rates to rise rapidly, or cause investors to expect a rapid rise in interest rates. This could lead to heightened levels of interest rate, volatility and liquidity risks for the fixed income markets generally and could have a substantial and immediate effect on the values of the Fund’s investments.
Foreign and Emerging Markets Risk Investing in foreign markets involves risks and considerations not typically associated with investing in the U.S. Foreign securities may be subject to risk of loss because of government regulation, economic, political and social instability in the countries in which the Fund invests. Foreign markets
| Notes to Financial Statements | 125 |
State Street Total Return V.I.S. Fund
Notes to Financial Statements, continued — December 31, 2021
may be less liquid than investments in the U.S. and may be subject to the risks of currency fluctuations. To the extent that the Fund invests in securities of issuers located in emerging markets, these risks may be even more pronounced.
Credit Risk The Fund may be exposed to credit risk in the event that an issuer or guarantor fails to perform or that an institution or entity with which the Fund has unsettled or open transactions defaults.
Market Risk The Fund’s investments are subject to changes in general economic conditions, and general market fluctuations and the risks inherent in investment in securities markets. Investment markets can be volatile and prices of investments can change substantially due to various factors including, but not limited to, economic growth or recession, changes in interest rates, changes in the actual or perceived creditworthiness of issuers, and general market liquidity. The Fund is subject to the risk that geopolitical events will disrupt securities markets and adversely affect global economies and markets. Local, regional or global events such as war, acts of terrorism, the spread of infectious illness or other public health issues, or other events could have a significant impact on the Fund and its investments.
An outbreak of a respiratory disease caused by a novel coronavirus (known as COVID-19) first detected in China in December 2019 has resulted in a global pandemic and major disruptions to economies and markets around the world, including the United States. Financial markets have experienced and may continue to experience extreme volatility and severe losses, and trading in many instruments was and may continue to be disrupted as a result. Liquidity for many instruments was and may continue to be greatly reduced for periods of time. Some interest rates are very low and in some cases yields are negative. Governments and central banks, including the Federal Reserve in the United States, have taken extraordinary and unprecedented actions to support local and global economies and the financial markets. The impact of these measures, and whether they will be effective to mitigate the economic and market disruption, will not be known for some time. In addition, the outbreak of COVID-19, and measures taken to mitigate its effects, could result in disruptions to the services provided to the Fund by its service providers.
11.Recent Accounting Pronouncement
In March 2020, the Financial Accounting Standards Board (“FASB”) issued Accounting Standards Update No. 2020-04 (“ASU 2020-04”), “Reference Rate Reform (Topic 848)”. In response to concerns about structural risks of interbank offered rates, and particularly the risk of cessation of LIBOR, regulators have undertaken reference rate reform initiatives to identify alternative reference rates that are more observable or transaction based and less susceptible to manipulation. ASU 2020-04 provides optional guidance for a limited period of time to ease the potential burden in accounting for (or recognizing the effects of) reference rate reform on financial reporting. ASU 2020-04 is elective and applies to all entities, subject to meeting certain criteria, that have contracts, hedging relationships, and other transactions that reference LIBOR or another reference rate expected to be discontinued because of reference rate reform. The relief provided is temporary and generally cannot be applied to contract modifications that occur after December 31, 2022, or hedging relationships entered into or evaluated after that date. However, the FASB has indicated that it will revisit the sunset date in Topic 848 after the LIBOR administrator makes a final decision on a phaseout date. On November 30, 2020, the LIBOR administrator proposed extending the publication of the overnight and the one-, three-, six- and 12-month USD LIBOR settings through June 30, 2023, when many existing contracts that reference LIBOR will have expired. Management is currently evaluating the impact of the guidance.
This change in accounting policy has been made to comply with the newly issued accounting standard and had no impact on total accumulated earnings (loss) or the NAV of each Fund. With respect to each Fund’s results of operations, amortization of premium to first call date accelerates amortization with the intent of more closely aligning the recognition of income on such bonds with the economics of the instrument.
| 126 | Notes to Financial Statements |
State Street Total Return V.I.S. Fund
Notes to Financial Statements, continued — December 31, 2021
12.Subsequent Events
Management has evaluated the impact of all subsequent events on the Fund through the date on which the financial statements were available to be issued and has determined that there were no subsequent events requiring adjustment or disclosure in the financial statements.
| Notes to Financial Statements | 127 |
State Street Total Return V.I.S. Fund
Report of Independent Registered Public Accounting Firm
To the Shareholders of State Street Total Return V.I.S. Fund and the Board of Directors of State Street Variable Insurance Series Funds, Inc.
Opinion on the Financial Statements and Schedule of Investments in Securities
We have audited the accompanying statement of assets and liabilities of State Street Total Return V.I.S. Fund (the “Fund”) (one of the series constituting State Street Variable Insurance Series Funds, Inc. (the “Company”)), including the summary schedule of investments, as of December 31, 2021, and the related statement of operations for the year then ended, the statements of changes in net assets for each of the two years in the period then ended, the financial highlights for each of the five years in the period then ended and the related notes (collectively referred to as the “financial statements”). In our opinion, the financial statements and schedule of investments in securities present fairly, in all material respects, the financial position of the Fund (one of the series constituting State Street Variable Insurance Series Funds, Inc.) at December 31, 2021, the results of its operations for the year then ended, the changes in its net assets for each of the two years in the period then ended and its financial highlights for each of the five years in the period then ended, in conformity with U.S. generally accepted accounting principles.
Basis for Opinion
These financial statements are the responsibility of the Company’s management. Our responsibility is to express an opinion on the Fund’s financial statements and schedule of investments in securities based on our audits. We are a public accounting firm registered with the Public Company Accounting Oversight Board (United States) (“PCAOB”) and are required to be independent with respect to the Company in accordance with the U.S. federal securities laws and the applicable rules and regulations of the Securities and Exchange Commission and the PCAOB.
We conducted our audits in accordance with the standards of the PCAOB. Those standards require that we plan and perform the audit to obtain reasonable assurance about whether the financial statements and schedule of investments in securities are free of material misstatement, whether due to error or fraud. The Company is not required to have, nor were we engaged to perform, an audit of the Company’s internal control over financial reporting. As part of our audits we are required to obtain an understanding of internal control over financial reporting, but not for the purpose of expressing an opinion on the effectiveness of the Company’s internal control over financials reporting. Accordingly, we express no such opinion.
Our audits included performing procedures to assess the risks of material misstatement of the financial statements and schedule of investments in securities, whether due to error or fraud, and performing procedures that respond to those risks. Such procedures included examining, on a test basis, evidence regarding the amounts and disclosures in the financial statements and schedule of investments in securities. Our procedures included confirmation of securities owned as of December 31, 2021, by correspondence with the custodian, brokers and others or by other appropriate auditing procedures where replies from brokers and others were not received. Our audits also included evaluating the accounting principles used and significant estimates made by management, as well as evaluating the overall presentation of the financial statements and schedule of investments in securities. We believe that our audits provide a reasonable basis for our opinion.
To the Shareholders of State Street Total Return V.I.S. Fund and the Board of Directors of State Street Variable Insurance Series Funds, Inc.
We have served as the auditor of one or more State Street Global Advisors investment companies since 2000.
Boston, Massachusetts
February 17, 2022
| 128 | Report of Independent Registered Public Accounting Firm |
State Street Total Return V.I.S. Fund
Other Information — December 31, 2021 (Unaudited)
Tax Information
For federal income tax purposes, the following information is furnished with respect to the distributions of the Fund for its fiscal year ended December 31, 2021.
Dividends Received Deduction
The Fund reports the maximum amount allowable of its net taxable income as eligible for the corporate dividends received deduction.
Interest Dividends
The Fund reports the maximum amount allowable as Section 163(j) Interest Dividend.
Long Term Capital Gain Distributions
Long term capital gains dividends were paid from the Fund during the year ended December 31, 2021 in the amount of $148,773,571.
Liquidity Risk Management Program
Pursuant to Rule 22e-4 under the 1940 Act, the Fund has adopted and implemented a liquidity risk management program (the “Program”). SSGA FM has been designated by the Board to administer the Fund's Program. The Program’s principal objectives include assessing, managing and periodically reviewing Fund’s liquidity risk, based on factors specific to the circumstances of the Fund. Liquidity risk is defined as the risk that a Fund could not meet redemption requests without significant dilution of remaining investors’ interests in the Fund. During the fiscal year, SSGA FM provided the Board with a report addressing the operations of the Program and assessing its adequacy and the effectiveness of the Program’s implementation for the period September 2020 through June 2021. As reported to the Board, the Program supported Fund’s ability to honor redemption requests timely and SSGA FM’s management of Fund’s liquidity profile, including during periods of market volatility. SSGA FM reported that the Program operated adequately to meet the requirements of Rule 22e-4 and that the implementation of the Program has been effective.
There can be no assurance that the Program will achieve its objectives in the future. Please refer to your Fund’s prospectus for more information regarding the Fund’s exposure to liquidity risk and other principal risks to which an investment in the Fund may be subject.
Proxy Voting Policies and Procedures and Record
The Fund has adopted the proxy voting policies of the Adviser. A description of the Fund's proxy voting policies and procedures that are used by the Adviser to vote proxies relating to the Fund’s portfolios of securities are available (i) without charge, upon request by calling 1-800-242-0134 (toll free) and (ii) on the SEC's website at www.sec.gov. Information regarding how the Fund voted for the prior 12-months period ended June 30 is available by August 31 of each year by calling the same number, on the SEC’s website at www.sec.gov, and on the Fund's website at www.ssga.com.
Quarterly Portfolio Schedule
Following the Fund's first and third fiscal quarter-ends, a complete Schedule of Investments is filed with the SEC as an exhibit to its reports on Form N-PORT, which can be found on the SEC’s website at www.sec.gov, and on the Fund's website at www.ssga.com. The Fund's Schedules of Investments are available upon request, without charge, by calling 1-800-242-0134.
State Street Total Return V.I.S. Fund
Other Information, continued — December 31, 2021 (Unaudited)
Name,
Address, and
Year of Birth | Position(s) Held
with Fund | Term of
Office and
Length of
Time Served | Principal Occupation
During Past Five Years
and Relevant Experience | Number
of
Funds
in Fund
Complex
Overseen
by
Director† | Other Directorships
Held by Director
During Past Five Years |
| INDEPENDENT DIRECTORS |
Michael F. Holland
c/o SSGA Funds
Management, Inc.
One Iron Street Boston,
MA 02210
YOB: 1944 | Director
and
Co-Chairperson
of the Board | Term:
Indefinite
Elected: 1/19 | Chairman, Holland &
Company L.L.C.
(investment adviser)
(1995 – present). | 63 | Director, the Holland Series
Fund, Inc.; Director, The China
Fund, Inc. (1992 – 2017);
Director, The Taiwan Fund,
Inc. (2007 – 2017); Director,
Reaves Utility Income Fund,
Inc.; and Director, Blackstone/
GSO Loans (and Real Estate)
Funds. |
| | | | | | |
Patrick J. Riley
c/o SSGA Funds
Management, Inc.
One Iron Street
Boston, MA 02210
YOB: 1948 | Director
and
Co-Chairperson
of the Board | Term:
Indefinite
Appointed: 4/16
Elected: 1/19 | 2002 to May 2010, Associate
Justice of the Superior Court,
Commonwealth of
Massachusetts; 1985 to 2002,
Partner, Riley, Burke
& Donahue, L.L.P. (law firm);
1998 to present, Independent
Director, State Street Global
Advisers Ireland, Ltd.
(investment company); 1998 to
present, Independent Director,
SSGA Liquidity plc (formerly,
SSGA Cash Management
Fund plc); January 2009 to
present, Independent Director,
SSGA Fixed Income plc; and
January 2009 – 2019,
Independent Director, SSGA
Qualified Funds PLC. | 63 | Board Director and Chairman,
SPDR Europe 1PLC Board
(2011 – present); Board
Director and Chairman, SPDR
Europe II, PLC (2013 –
present). |
State Street Total Return V.I.S. Fund
Other Information, continued — December 31, 2021 (Unaudited)
Name,
Address, and
Year of Birth | Position(s) Held
with Fund | Term of
Office and
Length of
Time Served | Principal Occupation
During Past Five Years
and Relevant Experience | Number
of
Funds
in Fund
Complex
Overseen
by
Director† | Other Directorships
Held by Director
During Past Five Years |
| INDEPENDENT DIRECTORS (continued) |
| | | | | |
John R. Costantino
c/o SSGA Funds
Management, Inc.
One Iron Street
Boston, MA 02210
YOB: 1946 | Director
and
Chairperson of
the Qualified Legal
Compliance
Committee | Term:
Indefinite
Elected: 1997 | Senior Advisor to NGN Capital
LLC (January 2019 –
present); Managing General
Partner, NGN Capital LLC
(2006 – December 2019). | 63 | Director of Kleinfeld Bridal
Corp. (January 2016 – present);
Trustee of Neuroscience
Research Institute (1986 – 2017); Trustee of Fordham
University (1989 – 1995 and
2001 – 2007) and Trustee
Emeritus (2007 – present);
Trustee and Independent Chairperson of GE Funds (1993 – February 2011); Director, Muscular Dystrophy Association (since 2019);
Trustee of Gregorian
University Foundation (1992 –
2007); Chairman of the Board of Directors, Vivaldi Biosciences Inc. (May 2017 – present); Chairman of the Supervisory Board, Vivaldi Biosciences AG. (May 2017 – present); Trustee, Gallim Dance (December 2021 – present). |
| | | | | | |
Donna M. Rapaccioli
c/o SSGA Funds
Management, Inc.
One Iron Street
Boston, MA 02210
YOB: 1962 | Director
and
Chairperson of
the Audit Committee | Term:
Indefinite
Appointed: 1/12
Elected: 6/16 | Dean of the Gabelli School of
Business (2007 – present) and
Accounting Professor (1987 –
present) at Fordham
University. | 63 | Director- Graduate
Management Admissions
Council (2015 – present);
Trustee of Emmanuel College
(2010 – 2019). |
| | | | | | |
Richard D. Shirk
c/o SSGA Funds
Management, Inc.
One Iron Street
Boston, MA 02210
YOB: 1945 | Director
and
Chairperson
of the Nominating Committee
Chairperson of the Governance
Committee | Term:
Indefinite
Elected: 1/19 | March 2001 to April 2002,
Chairman (1996 to March
2001, President and Chief
Executive Officer), Cerulean
Companies, Inc. (holding
company) (Retired); 1992 to
March 2001, President and
Chief Executive Officer, Blue
Cross Blue Shield of Georgia
(health insurer,
managed healthcare). | 63 | 1998 to December 2008,
Chairman, Board Member and
December 2008 to present,
Investment Committee
Member, Healthcare Georgia
Foundation (private
foundation); September 2002
to 2012, Lead Director and
Board Member, Amerigroup
Corp. (managed health care);
1999 to 2013, Board Member
and (2001 to 2017) Investment
Committee Member, Woodruff
Arts Center; and 2003 to 2009,
Trustee, Gettysburg College;
Board member, Aerocare
Holdings (2003 – January 2021), Regenesis
Biomedical Inc. (April 2012 – present). |
State Street Total Return V.I.S. Fund
Other Information, continued — December 31, 2021 (Unaudited)
Name,
Address, and
Year of Birth | Position(s) Held
with Fund | Term of
Office and
Length of
Time Served | Principal Occupation
During Past Five Years
and Relevant Experience | Number
of
Funds
in Fund
Complex
Overseen
by
Director† | Other Directorships
Held by Director
During Past Five Years |
| INDEPENDENT DIRECTORS (continued) |
| | | | | |
Michael A. Jessee
c/o SSGA Funds
Management, Inc.
One Iron Street
Boston, MA 02210
YOB: 1946 | Director
and
Chairperson of the
Valuation Committee | Term:
Indefinite
Elected: 1/19 | Retired; formerly, President
and Chief Executive Officer of
the Federal Home Loan Bank
of Boston (1989 – 2009);
Trustee, Randolph-Macon
College (2004 – 2016). | 63 | None. |
| INTERESTED DIRECTORS(1) |
Ellen M. Needham(2)
SSGA Funds
Management, Inc.
One Iron Street
Boston, MA 02210
YOB: 1967 | Director and
President | Term:
Indefinite
Elected: 1/19 | Chairman, SSGA Funds
Management, Inc. (March
2020 – present); President and
Director, SSGA Funds
Management, Inc. (2001 –
present)*; Senior Managing
Director, State Street Global
Advisors (1992 – present)*;
Manager, State Street Global
Advisors Funds Distributors,
LLC (May 2017 – present). | 63 | Board Director, SSGA
SPDR ETFs Europe 1 plc
(May 2020 – present); Board Director, SSGA SPDR ETFs Europe II plc (May 2020 – present). |
| | | | | |
| (1) | The individual listed above is a Director who is an “interested person,” as defined in the 1940 Act, of the Company (“Interested Director”). |
| (2) | Ms. Needham is an Interested Director because of her employment by SSGA FM, an affiliate of the Company. |
| * | Served in various capacities and/or with various affiliated entities during noted time period. |
| † | For the purpose of determining the number of portfolios overseen by the Directors, “Fund Complex” comprises registered investment companies for which SSGA FM serves as investment adviser. |
State Street Total Return V.I.S. Fund
Other Information, continued — December 31, 2021 (Unaudited)
The following lists the principal officers for the Company, as well as their mailing addresses and ages, positions with the Company and length of time served, and present and principal occupations:
Name,
Address, and
Year of Birth | Position(s) Held
with Funds | Term of
Office and
Length of
Time Served | Principal Occupation
During Past Five Years |
| OFFICERS: |
Ellen M. Needham
SSGA Funds Management, Inc.
One Iron Street
Boston, MA 02210
YOB: 1967 | President and
Director | Term:
Indefinite
Elected:
4/20 | Chairman, SSGA Funds Management, Inc. (March 2020 – present); President and Director, SSGA Funds Management, Inc. (2001 – present)*; Senior Managing Director, State Street Global Advisors (1992 – present)*; Manager, State Street Global Advisors Funds Distributors, LLC (May 2017 – present). |
| | | | |
Bruce S. Rosenberg
SSGA Funds Management, Inc.
One Iron Street
Boston, MA 02210
YOB: 1961 | Treasurer | Term:
Indefinite
Elected: 4/19 | Managing Director, State Street Global Advisors and SSGA Funds Management, Inc. (July 2015 – present); Director, Credit Suisse (April 2008 – July 2015). |
| | | | |
Ann M. Carpenter
SSGA Funds Management, Inc.
One Iron Street
Boston, MA 02210
YOB: 1966 | Vice President
and Deputy
Treasurer | Term:
Indefinite
Elected: 4/19 | Chief Operating Officer, SSGA Funds Management, Inc. (April 2005 – present)*; Managing Director, State Street Global Advisors (2005 – present).* |
| | | | |
Chad C. Hallett
SSGA Funds Management, Inc.
One Iron Street
Boston, MA 02210
YOB: 1969 | Deputy
Treasurer | Term:
Indefinite
Elected: 4/19 | Vice President, State Street Global Advisors and SSGA Funds Management, Inc. (November 2014 – present); Vice President, State Street Bank and Trust Company (2001 – November 2014).* |
| | | | |
Darlene Anderson-Vasquez
SSGA Funds Management, Inc.
One Iron Street
Boston, MA 02210
YOB: 1968 | Deputy
Treasurer | Term:
Indefinite
Elected: 4/19 | Managing Director, State Street Global Advisors and SSGA Funds Management, Inc. (May 2016 – present); Senior Vice President, John Hancock Investments (September 2007 – May 2016). |
| | | | |
Arthur A. Jensen
SSGA Funds Management, Inc.
1600 Summer Street
Stamford, CT 06905
YOB: 1966 | Deputy
Treasurer | Term:
Indefinite
Elected: 4/19 | Vice President, State Street Global Advisors and SSGA Funds Management, Inc. (July 2016 – present); Controller of GE Asset Management Incorporated (April 2011 – July 2016). |
| | | | |
David K. Lancaster
SSGA Funds Management, Inc.
One Iron Street
Boston, MA 02210
YOB: 1971 | Assistant Treasurer | Term:
Indefinite
Elected: 11/20 | Vice President, State Street Global Advisors and SSGA Funds Management, Inc. (July 2017 – present); Assistant Vice President, State Street Bank and Trust Company (November 2011 – July 2017).* |
State Street Total Return V.I.S. Fund
Other Information, continued — December 31, 2021 (Unaudited)
Name,
Address, and
Year of Birth | Position(s) Held
with Funds | Term of
Office and
Length of
Time Served | Principal Occupation
During Past Five Years |
| OFFICERS: (continued) |
| | | |
Brian Harris
SSGA Funds Management, Inc.
One Iron Street
Boston, MA 02210
YOB: 1973 | Chief Compliance
Officer, Anti-Money
Laundering Officer
and Code of Ethics
Compliance Officer | Term:
Indefinite Elected: 6/16
Term:
Indefinite Elected: 4/19 | Managing Director, State Street Global Advisors and SSGA Funds Management, Inc. (June 2013 – present).* |
| | | | |
Sean O’Malley
SSGA Funds Management, Inc.
One Iron Street
Boston, MA 02210
YOB: 1969 | Chief Legal Officer | Term:
Indefinite
Elected: 8/19 | Senior Vice President and Deputy General Counsel, State Street Global Advisors (November 2013 – present). |
| | | | |
David Barr
SSGA Funds Management, Inc.
One Iron Street
Boston, MA 02210
YOB: 1974 | Secretary | Term:
Indefinite
Elected: 9/20 | Vice President and Senior Counsel, State Street Global Advisors (October 2019 – present); Vice President and Counsel, Eaton Vance Corp. (October 2010 – October 2019). |
| | | | |
Timothy Collins
SSGA Funds Management, Inc.
One Iron Street
Boston, MA 02210
YOB: 1967 | Assistant
Secretary | Term:
Indefinite
Elected: 9/21 | Vice President and Senior Counsel, State Street Global Advisors (August 2021 – present); Vice President and Managing Counsel, State Street Corporation (March 2020 – August 2021); Vice President and Senior Counsel (April 2018 – March 2020); Counsel, Sutton Place Investments (January 2010 – March 2018). |
| | | | |
David Urman
SSGA Funds Management, Inc.
One Iron Street
Boston, MA 02210
YOB: 1985 | Assistant
Secretary | Term:
Indefinite
Elected: 8/19 | Vice President and Senior Counsel, State Street Global Advisors (April 2019 – present); Vice President and Counsel, State Street Global Advisors (August 2015 – April 2019); Associate, Ropes & Gray LLP (November 2012 – August 2015). |
| | | |
| * | Served in various capacities and/or with various affiliated entities during noted time period. |
[This page intentionally left blank]
Directors
Michael F. Holland, Co-Chairperson
Patrick J. Riley, Co-Chairperson
John R. Costantino
Donna M. Rapaccioli
Michael A. Jessee
Richard D. Shirk
Ellen M. Needham
Officers
Ellen M. Needham, President
Brian Harris, Chief Compliance Officer, Anti-Money Laundering Officer and Code of Ethics Compliance Officer
Sean O’Malley, Chief Legal Officer
Bruce S. Rosenberg, Treasurer
Ann M. Carpenter, Vice President and Deputy Treasurer
Chad C. Hallett, Deputy Treasurer
Arthur A. Jensen, Deputy Treasurer
Darlene Anderson-Vasquez, Deputy Treasurer
David Lancaster, Assistant Treasurer
David Barr, Secretary
Timothy Collins, Assistant Secretary
David Urman, Assistant Secretary
Investment Adviser and Administrator
SSGA Funds Management, Inc.
One Iron Street
Boston, Massachusetts 02210
Custodian and Sub-Administrator
State Street Bank and Trust Company
One Lincoln Street
Boston, Massachusetts 02111
Distributor
State Street Global Advisors Funds Distributors, LLC
One Iron Street
Boston, Massachusetts 02210
Independent Registered Public Accounting Firm
Ernst & Young LLP
200 Clarendon Street
Boston, Massachusetts 02116
(b) Not applicable.
Item 2. Code of Ethics.
As of the end of the period covered by this report, State Street Variable Insurance Series Funds, Inc. (the “Company,” “Fund Entity” or “Registrant”) has adopted a code of ethics, as defined in Item 2(b) of Form N-CSR, that applies to the Registrant’s principal executive officer, principal financial officer, principal accounting officer or controller, or persons performing similar functions, regardless of whether these individuals are employed by the Registrant or a third party (the “Code”). That Code comprises written standards that are reasonably designed to deter wrongdoing and to promote: (1) honest and ethical conduct, including the ethical handling of actual or apparent conflicts of interest between personal and professional relationships; (2) full, fair, accurate, timely and understandable disclosure in reports and documents that the Registrant files with, or submits to, the U.S. Securities Exchange Commission (the “SEC”) and in other public communications made by the Registrant; (3) compliance with applicable laws and governmental rules and regulations; (4) the prompt internal reporting to an appropriate person or persons identified in the Code of violations of the Code; and (5) accountability for adherence to the Code. For the period covered by the report, the Code was combined with other mutual funds advised by SSGA Funds Management, Inc. (“SSGA FM” or the “Adviser”). The Registrant has not made any amendments to the Code that relates to any element of the code of ethics definition set forth in Item 2(b) of Form N-CSR during the covered period. The Registrant has not granted any waivers from any provisions of the Code during the covered period. A copy of the Code is filed as Exhibit 13(a)(1) to this Form N-CSR.
Item 3. Audit Committee Financial Expert.
The Company’s Board of Directors (the “Board”) has determined that the Company has the following “audit committee financial experts” as defined in Item 3(b) of Form N-CSR serving on its audit committee (the “Audit Committee”): Messrs. Michael F. Holland, Richard D. Shirk and John R. Costantino and Ms. Donna M. Rapaccioli. Each of the “audit committee financial experts” is “independent” as that term is defined in Item 3(a)(2) of Form N-CSR.
An “audit committee financial expert” is not an “expert” for any purpose, including for purposes of Section 11 of the Securities Act of 1933, as amended, as a result of being designated as an “audit committee financial expert.” Further, the designation of a person as an “audit committee financial expert” does not mean that the person has any greater duties, obligations, or liability than those imposed on the person without the “audit committee financial expert” designation. Similarly, the designation of a person as an “audit committee financial expert” does not affect the duties, obligations, or liability of any other member of the Audit Committee or the Board.
Item 4. Principal Accountant Fees and Services.
For the fiscal years ended December 31, 2021 and December 31, 2020, the aggregate audit fees billed for professional services rendered by Ernst & Young LLP (“E&Y”), the Company’s principal accountant, for the audit of the Company’s annual financial statements or services normally provided by E&Y in connection with the Company’s statutory and regulatory filings and engagements were $190,678 and $190,678, respectively.
For the fiscal years ended December 31, 2021 and December 31, 2020, there were no fees for assurance and related services by E&Y reasonably related to the performance of the audit of the Company’s financial statements that were not reported under paragraph (a) of this Item.
For the fiscal years ended December 31, 2021 and December 31, 2020, the aggregate tax fees billed for professional services rendered by E&Y for tax compliance, tax advice, and tax planning in the form of preparation of excise filings and income tax returns were $33,513 and $47,874, respectively.
For the fiscal years ended December 31, 2021 and December 31, 2020, there were no fees billed for professional services rendered by E&Y for products and services provided by E&Y to the Company, other than the services reported in paragraphs (a) through (c).
For the fiscal years ended December 31, 2021 and December 31, 2020, the aggregate fees for professional services rendered by E&Y for products and services provided by E&Y to the Adviser and any entity controlling, controlled by, or under common control with the Adviser that provides ongoing services to the Company that (i) relate directly to the operations and financial reporting of the Company and (ii) were pre-approved by the Audit Committee were approximately $8,904,469 and $7,019,005, respectively.
| | (e)(1) | Audit Committee Pre-Approval Policies and Procedures |
The Company’s Audit Committee Charter states the following with respect to pre-approval procedures:
The Audit Committee shall have the following duties and powers:
| | • | | To pre-approve engagements by a Fund Entity’s independent auditor for non-audit services to be rendered to the Fund’s investment adviser (not |
| | including any subadviser whose role is primarily portfolio management and is subcontracted with or overseen by another investment adviser), and any entity controlling, controlled by, or under common control with the investment adviser that provides ongoing services to the Fund, if the engagement relates directly to the operations and financial reporting of the Fund; |
| | • | | To establish, if deemed necessary or appropriate as an alternative to Audit Committee pre-approval of services to be provided by the independent auditor as required by paragraph (b) above, policies and procedures to permit such services to be pre-approved by other means, such as by action of a designated member or members of the Audit Committee, subject to the requirement that the decision of any member to whom authority is delegated to pre-approve an activity shall be presented to the full Audit Committee at its next scheduled meeting; |
Alternate Pre-Approval Procedure:
| | • | | The Chairperson, or a Co-Chairperson, of the Audit Committee is authorized to pre-approve any engagement involving the Fund Entity’s independent auditors to the same extent as the Audit Committee. Any pre-approval decision by the Chairperson, or a Co-Chairperson, under the foregoing authority shall be presented to the Audit Committee at its next scheduled meeting. |
| | (e)(2) | Percentages of Services |
None of the services described in paragraphs (b) through (d) of this Item were performed in reliance on paragraph (c)(7)(i)(C) of Rule 2-01 of Regulation S-X during the period of time for which such rule was effective.
| | (g) | Total Fees Paid By Adviser and Certain Affiliates |
For the fiscal years ended December 31, 2021 and December 31, 2020, the aggregate non-audit fees billed by E&Y for services rendered to the Company and the Adviser and any entity controlling, controlled by, or under common control with the Adviser that provided ongoing services to the Company were approximately $38,000,000 and $36,534,447, respectively.
| | (h) | E&Y notified the Company’s Audit Committee of all non-audit services that were rendered by E&Y to the Adviser and any entity controlling, controlled by, or under common control with the Adviser that provides services to the Company, which services were not required to be pre-approved pursuant to paragraph (c)(7)(ii) of Rule 2-01 of Regulation S-X, allowing the Company’s Audit Committee to consider whether such services were compatible with maintaining E&Y’s independence. |
Item 5. Audit Committee of Listed Registrants.
Not applicable to the Registrant.
Item 6. Investments.
| (a) | Schedules of Investments are included as part of the reports to shareholders filed under Item 1 of this Form N-CSR. |
| (b) | Not applicable to the Registrant. |
Item 7. Disclosure of Proxy Voting Policies and Procedures for Closed-End Management Investment Companies.
Not applicable to the Registrant.
Item 8. Portfolio Managers of Closed-End Management Investment Companies.
Not applicable to the Registrant.
Item 9. Purchases of Equity Securities by Closed-End Management Investment Company and Affiliated Purchasers.
Not applicable to the Registrant.
Item 10. Submission of Matters to a Vote of Security Holders.
There were no material changes to the procedures by which shareholders may recommend nominees to the Board.
Item 11. Controls and Procedures.
(a) The Registrant’s principal executive officer and principal financial officer have concluded that the Registrant’s disclosure controls and procedures (as defined in Rule 30a-3(c) under the Investment Company Act of 1940, as amended (the “1940 Act”)) are effective to provide reasonable assurance that information required to be disclosed by the Registrant on Form N-CSR is recorded, processed, summarized and reported as of a date within 90 days of the filing date of this report, based on their evaluation of these controls and procedures required by Rule 30a-3(b) under the 1940 Act and Rules 13a-15(b) or 15d-15(b) under the Securities Exchange Act of 1934, as amended.
(b) There were no changes in the Registrant’s internal control over financial reporting (as defined in Rule 30a-3(d) under the 1940 Act) that occurred during the period covered by this report that have materially affected, or are reasonably likely to materially affect, the Registrant’s internal control over financial reporting.
Item 12. Disclosure of Securities Lending Activities for Closed-End Management Investment Companies.
(a) Not applicable to the Registrant.
(b) Not applicable to the Registrant.
Item 13. Exhibits.
SIGNATURES
Pursuant to the requirements of the Securities Exchange Act of 1934 and the Investment Company Act of 1940, the Registrant has duly caused this report to be signed on its behalf by the undersigned, thereunto duly authorized.
| Registrant: | STATE STREET VARIABLE INSURANCE SERIES FUNDS, INC. |
| | |
| By: | | /s/ Ellen M. Needham |
| | Ellen M. Needham |
| | President |
| |
| Date: | | February 25, 2022 |
Pursuant to the requirements of the Securities Exchange Act of 1934 and the Investment Company Act of 1940, this report has been signed below by the following persons on behalf of the Registrant and in the capacities and on the dates indicated.
| | |
| By: | | /s/ Ellen M. Needham |
| | Ellen M. Needham |
| | President (Principal Executive Officer) |
| |
| Date: | | February 25, 2022 |
| |
| By: | | /s/ Bruce S. Rosenberg |
| | Bruce S. Rosenberg |
| | Treasurer (Principal Financial and Accounting Officer) |
| |
| Date: | | February 25, 2022 |