UNITED STATES
SECURITIES AND EXCHANGE COMMISSION
Washington, D.C. 20549
FORMN-CSR
CERTIFIED SHAREHOLDER REPORT OF REGISTERED
MANAGEMENT INVESTMENT COMPANIES
Investment Company Act file number:811-04041
STATE STREET VARIABLE INSURANCE SERIES FUNDS, INC.
(Exact name of registrant as specified in charter)
One Iron Street
Boston, Massachusetts 02210
(Address of principal executive offices)(Zip code)
| | |
| (Name and Address of Agent for Service) | | Copy to: |
| |
Sean O’Malley, Esq. Senior Vice President and Deputy General Counsel c/o SSGA Funds Management, Inc. One Iron Street Boston, Massachusetts 02210 | | Timothy W. Diggins, Esq. Ropes & Gray LLP Prudential Tower 800 Boylston Street Boston, Massachusetts 02199-3600 |
Registrant’s telephone number, including area code:800-242-0134
Date of fiscal year end: December 31
Date of reporting period: December 31, 2019
Item 1. Shareholder Reports.
Annual Report
December 31, 2019
State Street S&P 500 Index V.I.S. Fund
Beginning on January 1, 2021, as permitted by regulations adopted by the U.S. Securities and Exchange Commission, paper copies of a Fund’s annual and semi-annual shareholder reports will no longer be sent by mail, unless you specifically request paper copies of the reports. Instead, the reports will be made available on a Fund’s website (www.ssga.com/geam), and you will be notified by mail each time a report is posted, and provided with a website link to access the report. If you already elected to receive shareholder reports electronically, you will not be affected by this change and you need not take any action.
You may elect to receive all future reports in paper free of charge. To do so, contact your Insurance Provider. Your election to receive reports in paper will apply to all funds held in your account.

State Street S&P 500 Index V.I.S. Fund
Annual Report
December 31, 2019
Table of Contents
This report is prepared for Policyholders of certain variable contracts and may be distributed to others only if preceded or accompanied by the variable contract’s current prospectus and the current summary prospectus of the Fund available for investments thereunder.
State Street S&P 500 Index V.I.S. Fund
Notes to Performance — December 31, 2019 (Unaudited)
The information provided on the performance page relates to the State Street S&P 500 Index V.I.S. Fund (the “Fund”).
Total return performance shown in this report for the Fund takes into account changes in share price and assumes reinvestment of dividends and capital gains distributions, if any. Total returns shown are net of Fund fees and expenses but do not reflect fees and charges associated with the variable contracts such as administrative fees, account charges and surrender charges, which, if reflected, would reduce the Fund’s total returns for all periods shown.
The performance data quoted represents past performance; past performance does not guarantee future results. Investment return and principal value will fluctuate so your shares, when redeemed, may be worth more or less than their original cost. Current performance may be higher or lower than the performance data quoted. Periods less than one year are not annualized. Please call toll-free (800) 242-0134 or visit the Fund’s website at http://www.ssga.com/geam for the most recent month-end performance data.
An investment in the Fund is not a deposit of any bank and is not insured or guaranteed by the Federal Deposit Insurance Corporation (“FDIC”) or any other government agency. An investment in the Fund is subject to risk, including possible loss of principal invested.
The S&P 500® Index is an unmanaged, market capitalization-weighted index of stocks of 500 large U.S. companies, which is widely used as a measure of large-cap U.S. stock market performance.
The Fund is not sponsored, endorsed, sold or promoted by S&P Global Ratings (“S&P”), and S&P makes no representation or warranty, express or implied, to the investors of the Fund or any member of the public regarding the advisability of investing in the securities generally or in this Fund particularly or the ability of the Fund to track general stock market performance.
The results shown for the foregoing index assume the reinvestment of net dividends or interest and do not reflect fees, expenses, or taxes. As such, the index returns do not reflect the actual cost of investing in the instruments that comprise the index.
The views expressed in this document reflect our judgement as of the publication date and are subject to change at any time without notice.
State Street Global Advisors Funds Distributors, LLC, member of FINRA & SIPC is the principal underwriter and distributor of the State Street V.I.S. Funds and an indirect wholly-owned subsidiary of State Street Corporation. References to State Street may include State Street Corporation and its affiliates. The Funds pay State Street Bank and Trust Company for its services as custodian and Fund Accounting agent, and pay SSGA Funds Management, Inc. for investment advisory and administrative services.
State Street S&P 500 Index V.I.S. Fund
Management’s Discussion of Fund Performance (Unaudited)
The State Street S&P 500 Index V.I.S. Fund (the “Fund”) seeks growth of capital and accumulation of income that corresponds to the investment return of the Standard & Poor’s 500 Stock Index. The Fund seeks to replicate the return of the S&P 500 Index while holding transaction costs low and minimizing portfolio turnover. The Fund’s benchmark is S&P 500 Index (the “Index”).
For the 12-month period ended December 31, 2019 (the “Reporting Period”), the total return for the Fund was 31.05%, and the Index was 31.49%. The Fund and Index returns reflect the reinvestment of dividends and other income. The Fund’s performance reflects the expenses of managing the Fund, including brokerage and advisory expenses. The Index is unmanaged and Index returns do not reflect fees and expenses of any kind, which would have a negative impact on returns. Fees, cash drag and cumulative effect of security misweights contributed to the difference between the Fund’s performance and that of the Index
The Index started the new year just a hair above 2,500 in terms of price index levels. As the recovery in stocks took shape amid expectations for easing monetary conditions, technical strategists noted that a level of 2,600 was likely to provide some resistance. Right around mid-January the Index overtook that psychological level, amid some encouraging early signs from fourth-quarter earnings. The progression of both economic data points and earnings releases provided a reasonable amount of fodder for both bulls and bears to latch onto, but a temporary measure to end the US government shutdown and a dovish turn from the Federal Reserve helped the Index eclipse 2,700 by the end of January. This meant the Index returned over 8% for the month. The next two months of Q1 posted positive returns, albeit at a decelerating pace, to end the quarter up 13.65%.
April marked another solid month for growth assets as investors embraced optimism about trade policy between the United States and China, and earnings results continued to outpace analyst estimates. The Index closed the month at a new all-time high. As quickly as the monthly calendar turned, investors were met with increasingly uncomfortable developments. On the very first day of May, Federal Reserve Chair Jerome Powell pushed back on market expectations for interest rate cuts by suggesting that recent low levels of inflation were likely transitory. From there, trade conflict between the United States and the rest of the world took center stage, battering equity markets. As May turned to June, liquidity returned and sent the Index to new all-time highs. The Index after the first six months closed with a positive 18.54% return.
Markets entered the third quarter with a sense of cautious optimism following the G20 summit in Japan, where the United States and China reached a truce on the ongoing trade conflict and also agreed to restart trade negotiations. The favorable sentiment would prevail for much of July, as the Index eclipsed 3,000 for the first time ever. However, as the calendar shifted into August and September the market flattened and barely posted any gain over the next two months.
Apart from some modest hiccups at the beginning of October and end of November, US equities made mostly uninterrupted progress during the fourth quarter. Markets started out with some back and forth price action as investors balanced weak manufacturing data and the likelihood of lower interest rates with third-quarter earnings expectations that were relatively downbeat. An apparent truce in the US/China trade conflict helped lift sentiment in US equities as the US agreed to delay a tariff hike that was scheduled for the middle of October. Turning to November, the S&P 500 Index advanced nearly 1% on the first day of month. US stocks then hit a modest soft patch amidst some negative trade headlines and the passage of the Hong Kong Human Rights and Democracy Act in the US House of Representatives. Equity markets recovered right up until the end of November when news that President Trump had signed that same bill led to a risk-off environment. US markets were still a little jittery in early December as President Trump announced the re-imposition of steel and aluminum tariffs on Brazil and Argentina, but the announcement later in the month of a Phase One trade deal with China carried equity markets into a strong close for 2019. The Index rallied 9.07% in the fourth quarter and added 31.49% for the Reporting Period overall.
The Fund used futures in order to obtain full equity exposure and equitize cash and income receivable. The Fund’s use of futures helped the Fund track the Index.
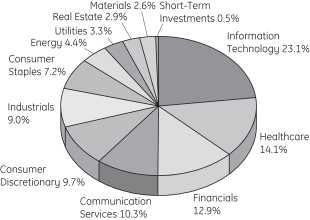
On a sector level, the top positive contributors to the Fund’s performance during the Reporting Period were Information Technology and Financials. The top negative contributors to the Fund’s performance during the Reporting Period were Energy and Materials.
On an individual security level, the top positive contributors to the Fund’s performance during the Reporting Period were Apple Inc., Facebook, Inc. Class A, and Microsoft Corporation. The top negative contributors to the Fund’s performance during the Reporting Period were Occidental Petroleum Corporation, Pfizer Inc., and AbbVie Inc.
The views expressed above reflect those of the Fund’s portfolio manager only through the Reporting Period, and do not necessarily represent the views of the Adviser as a whole. Any such views are subject to change at any time based upon market or other conditions and the Adviser disclaims any responsibility to update such views. These views may not be relied on as investment advice and, because investment decisions for a fund are based on numerous factors, may not be relied on as an indication of trading intent on behalf of any fund.
| | |
| 2 | | State Street S&P 500 Index V.I.S. Fund |
State Street S&P 500 Index V.I.S. Fund
Understanding Your Fund’s Expenses — December 31, 2019 (Unaudited)
As a shareholder of the Fund, you incur ongoing costs. Ongoing costs include portfolio management fees, professional fees, administrative fees and other Fund expenses. The following example is intended to help you understand your ongoing costs (in dollars) of investing in the Fund and to compare these costs with the ongoing costs of investing in other mutual funds.
To illustrate these ongoing costs, we have provided an example and calculated the expenses paid by investors in the Fund during the period. The information in the following table is based on an investment of $1,000, which is invested at the beginning of the period and held for the entiresix-month period ended December 31, 2019.
Actual Expenses
The first section of the table provides information about actual account values and actual expenses. You may use the information in this section, together with the amount you invested, to estimate the expenses that you paid over the period. To do so, simply divide your account value by $1,000 (for example, an $8,600 account value divided by $1,000 = 8.6), then multiply the result by the number given under the heading “Expenses paid during the period” to estimate the expenses you paid on your account during the period.
Hypothetical Example for Comparison Purposes
The second section of the table provides information about hypothetical account values and hypothetical expenses based on the Fund’s actual expense ratio and an assumed rate of return of 5% per year before expenses, which is not the Fund’s actual return. The hypothetical account values and expenses may not be used to estimate the actual ending account balance or expenses you paid for the period. You may use this information to compare the ongoing costs of investing in the Fund and other funds. To do so, compare this 5% hypothetical example with the 5% hypothetical examples that appear in the shareholder reports of other funds.
Please note that the expenses shown in the table are meant to highlight and help you compare ongoing costs only and do not reflect transaction costs, such as sales charges or redemption fees, if any. Therefore, the second section of the table is useful in comparing ongoing costs only, and will not help you determine the relative total costs of owning different funds. Additionally, the expenses shown do not reflect the fees or charges associated with variable contracts through which shares of the Fund are offered.
| | | | | | | | |
| | | Actual
Fund Return | | | Hypothetical
5% Return
(2.5% for
the period) | |
Actual Fund Return | | | | | | | | |
Beginning Account Value July 1, 2019 | | $ | 1,000.00 | | | $ | 1,000.00 | |
Ending Account Value December 31, 2019 | | $ | 1,107.40 | | | $ | 1,023.49 | |
Expenses Paid During the Period* | | $ | 1.81 | | | $ | 1.73 | |
| * | Expenses are equal to the Fund’s annualized expense ratio of 0.34% (for the period July 1, 2019 - December 31, 2019), multiplied by the average account value over the period, multiplied by 184/365 (to reflect theone-half year period). |
| | | | |
| State Street S&P 500 Index V.I.S. Fund | | | 3 | |
State Street S&P 500 Index V.I.S. Fund
Performance Summary — December 31, 2019 (Unaudited)
Top Ten Largest Holdings
as of December 31, 2019 (as a % of Fair Value)(a)(b)
| | | | |
Apple Inc. | | | 4.56 | % |
| |
Microsoft Corp. | | | 4.47 | % |
| |
Amazon.com Inc. | | | 2.86 | % |
| |
Facebook Inc., Class A | | | 1.84 | % |
| |
Berkshire Hathaway Inc., Class B | | | 1.65 | % |
| |
JPMorgan Chase & Co. | | | 1.63 | % |
| |
Alphabet Inc., Class A | | | 1.50 | % |
| |
Alphabet Inc., Class C | | | 1.49 | % |
| |
Johnson & Johnson | | | 1.43 | % |
| |
Visa Inc., Class A | | | 1.19 | % |
Sector Allocation as of December 31, 2019
Portfolio composition as a % of Fair Value of $186,613 (in thousands) as of December 31, 2019(a)(b)
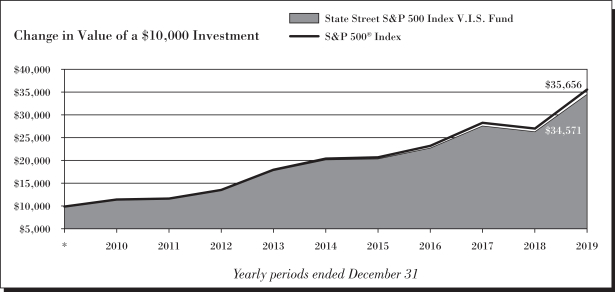
Average Annual Total Return for the periods ended December 31, 2019
Class 1 Shares (Inception date: 4/15/85)
| | | | | | | | | | | | | | | | |
| | | One Year | | | Five Year | | | Ten Year | | | Ending Value
of a $10,000
Investment | |
State Street S&P 500 Index V.I.S. Fund | | | 31.05 | % | | | 11.34 | % | | | 13.21 | % | | $ | 34,571 | |
| | | | |
S&P 500® Index | | | 31.49 | % | | | 11.70 | % | | | 13.56 | % | | $ | 35,656 | |
| (a) | Fair Value basis is inclusive of short-term investment in State Street Institutional Liquid Reserves Fund — Premier Class. |
| (b) | The securities information regarding holdings, allocations and other characteristics is presented to illustrate examples of securities that the Fund has bought and the diversity of areas in which the Fund may invest as of a particular date. It may not be representative of the Fund’s current or future investments and should not be construed as a recommendation to purchase or sell a particular security. |
| | |
| 4 | | State Street S&P 500 Index V.I.S. Fund |
State Street S&P 500 Index V.I.S. Fund
Performance Summary, continued — December 31, 2019 (Unaudited)
See Notes to Performance beginning on page 1 for further information.
Past performance does not predict future performance. The performance shown in the graphs and tables does not reflect the deduction of taxes that a shareholder would pay on Fund distributions or the redemption of Fund shares and does not reflect the fees or charges that would be associated with variable contracts through which shares of the Fund are offered.
| | | | |
| State Street S&P 500 Index V.I.S. Fund | | | 5 | |
State Street S&P 500 Index V.I.S. Fund
Schedule of Investments — December 31, 2019
| | | | | | | | |
| | | Number
of Shares | | | Fair
Value $ | |
| | | | | | | | |
|
| Common Stock - 99.4% † | |
Advertising - 0.1% | |
Omnicom Group Inc. | | | 1,543 | | | | 125,014 | |
The Interpublic Group of Companies Inc. | | | 2,720 | | | | 62,832 | |
| | | | | | | | |
| | | | 187,846 | |
| | | | | | | | |
|
Aerospace & Defense - 2.4% | |
Arconic Inc. | | | 2,788 | | | | 85,787 | |
General Dynamics Corp. | | | 1,612 | | | | 284,276 | |
Huntington Ingalls Industries Inc. | | | 300 | | | | 75,264 | |
L3Harris Technologies Inc. | | | 1,565 | | | | 309,667 | |
Lockheed Martin Corp. | | | 1,731 | | | | 674,017 | |
Northrop Grumman Corp. | | | 1,097 | | | | 377,335 | |
Raytheon Co. | | | 1,961 | | | | 430,910 | |
Textron Inc. | | | 1,525 | | | | 68,015 | |
The Boeing Co. | | | 3,689 | | | | 1,201,729 | |
TransDigm Group Inc. | | | 333 | | | | 186,480 | |
United Technologies Corp. | | | 5,552 | | | | 831,467 | |
| | | | | | | | |
| | | | 4,524,947 | |
| | | | | | | | |
|
Agricultural & Farm Machinery - 0.2% | |
Deere & Co. | | | 2,226 | | | | 385,677 | |
| | | | | | | | |
|
Agricultural Products - 0.1% | |
Archer-Daniels-Midland Co. | | | 3,924 | | | | 181,877 | |
| | | | | | | | |
|
Air Freight & Logistics - 0.5% | |
CH Robinson Worldwide Inc. | | | 1,029 | | | | 80,468 | |
Expeditors International of Washington Inc. | | | 1,199 | | | | 93,546 | |
FedEx Corp. | | | 1,688 | | | | 255,242 | |
United Parcel Service Inc., Class B | | | 4,776 | | | | 559,079 | |
| | | | | | | | |
| | | | 988,335 | |
| | | | | | | | |
|
Airlines - 0.4% | |
Alaska Air Group Inc. (a) | | | 1,000 | | | | 67,750 | |
American Airlines Group Inc. | | | 2,398 | | | | 68,775 | |
Delta Air Lines Inc. | | | 3,906 | | | | 228,423 | |
Southwest Airlines Co. | | | 3,334 | | | | 179,969 | |
United Airlines Holdings Inc. (b) | | | 1,450 | | | | 127,730 | |
| | | | | | | | |
| | | | 672,647 | |
| | | | | | | | |
|
Alternative Carriers - 0.1% | |
CenturyLink Inc. | | | 7,333 | | | | 96,869 | |
| | | | | | | | |
|
Apparel Retail - 0.5% | |
L Brands Inc. | | | 1,488 | | | | 26,962 | |
Ross Stores Inc. | | | 2,577 | | | | 300,014 | |
The Gap Inc. | | | 1,676 | | | | 29,632 | |
The TJX Companies Inc. | | | 8,495 | | | | 518,705 | |
| | | | | | | | |
| | | | 875,313 | |
| | | | | | | | |
| | | | | | | | |
| | | Number
of Shares | | | Fair
Value $ | |
Apparel, Accessories & Luxury Goods - 0.3% | |
Capri Holdings Ltd. (b) | | | 1,222 | | | | 46,619 | |
Hanesbrands Inc. | | | 2,400 | | | | 35,640 | |
PVH Corp. | | | 518 | | | | 54,468 | |
Ralph Lauren Corp. | | | 400 | | | | 46,888 | |
Tapestry Inc. | | | 2,289 | | | | 61,735 | |
Under Armour Inc., Class A (b) | | | 1,700 | | | | 36,720 | |
Under Armour Inc., Class C (b) | | | 1,712 | | | | 32,836 | |
VF Corp. | | | 2,202 | | | | 219,451 | |
| | | | | | | | |
| | | | 534,357 | |
| | | | | | | | |
|
Application Software - 1.8% | |
Adobe Inc. (a)(b) | | | 3,309 | | | | 1,091,341 | |
ANSYS Inc. (b) | | | 600 | | | | 154,446 | |
Autodesk Inc. (b) | | | 1,548 | | | | 283,996 | |
Cadence Design Systems Inc. (b) | | | 1,900 | | | | 131,784 | |
Citrix Systems Inc. | | | 907 | | | | 100,586 | |
Intuit Inc. | | | 1,787 | | | | 468,069 | |
salesforce.com Inc. (b) | | | 6,112 | | | | 994,056 | |
Synopsys Inc. (b) | | | 999 | | | | 139,061 | |
| | | | | | | | |
| | | | 3,363,339 | |
| | | | | | | | |
|
Asset Management & Custody Banks - 0.8% | |
Ameriprise Financial Inc. | | | 905 | | | | 150,755 | |
BlackRock Inc. | | | 809 | | | | 406,684 | |
Franklin Resources Inc. | | | 2,000 | | | | 51,960 | |
Invesco Ltd. | | | 2,050 | | | | 36,859 | |
Northern Trust Corp. | | | 1,496 | | | | 158,935 | |
State Street Corp. (c) | | | 2,611 | | | | 206,530 | |
T Rowe Price Group Inc. | | | 1,540 | | | | 187,634 | |
The Bank of New York Mellon Corp. | | | 5,837 | | | | 293,776 | |
| | | | | | | | |
| | | | 1,493,133 | |
| | | | | | | | |
|
Auto Parts & Equipment - 0.1% | |
Aptiv PLC | | | 1,856 | | | | 176,264 | |
BorgWarner Inc. | | | 1,347 | | | | 58,433 | |
| | | | | | | | |
| | | | 234,697 | |
| | | | | | | | |
|
Automobile Manufacturers - 0.3% | |
Ford Motor Co. | | | 27,626 | | | | 256,922 | |
General Motors Co. | | | 8,886 | | | | 325,227 | |
| | | | | | | | |
| | | | 582,149 | |
| | | | | | | | |
|
Automotive Retail - 0.3% | |
Advance Auto Parts Inc. (a) | | | 522 | | | | 83,604 | |
AutoZone Inc. (b) | | | 166 | | | | 197,757 | |
CarMax Inc. (b) | | | 1,190 | | | | 104,327 | |
O’Reilly Automotive Inc. (b) | | | 549 | | | | 240,605 | |
| | | | | | | | |
| | | | 626,293 | |
| | | | | | | | |
See Notes to Schedule of Investments and Notes to Financial Statements.
| | |
| 6 | | State Street S&P 500 Index V.I.S. Fund |
State Street S&P 500 Index V.I.S. Fund
Schedule of Investments, continued — December 31, 2019
| | | | | | | | |
| | | Number
of Shares | | | Fair
Value $ | |
| | | | | | | | |
Biotechnology - 2.0% | |
AbbVie Inc. (a) | | | 10,163 | | | | 899,832 | |
Alexion Pharmaceuticals Inc. (a)(b) | | | 1,601 | | | | 173,148 | |
Amgen Inc. | | | 4,164 | | | | 1,003,816 | |
Biogen Inc. (b) | | | 1,258 | | | | 373,286 | |
Gilead Sciences Inc. | | | 8,751 | | | | 568,640 | |
Incyte Corp. (b) | | | 1,200 | | | | 104,784 | |
Regeneron Pharmaceuticals Inc. (b) | | | 550 | | | | 206,514 | |
Vertex Pharmaceuticals Inc. (b) | | | 1,800 | | | | 394,110 | |
| | | | | | | | |
| | | | 3,724,130 | |
| | | | | | | | |
|
Brewers - 0.0%* | |
Molson Coors Brewing Co., Class B | | | 1,298 | | | | 69,962 | |
| | | | | | | | |
|
Broadcasting - 0.2% | |
Discovery Inc., Class A (b) | | | 1,106 | | | | 36,210 | |
Discovery Inc., Class C (b) | | | 2,636 | | | | 80,372 | |
Fox Corp., Class A | | | 2,615 | | | | 96,938 | |
Fox Corp., Class B (b) | | | 1,130 | | | | 41,132 | |
ViacomCBS Inc., Class B | | | 3,494 | | | | 146,643 | |
| | | | | | | | |
| | | | 401,295 | |
| | | | | | | | |
|
Building Products - 0.3% | |
Allegion PLC | | | 733 | | | | 91,288 | |
AO Smith Corp. (a) | | | 972 | | | | 46,306 | |
Fortune Brands Home & Security Inc. | | | 1,000 | | | | 65,340 | |
Johnson Controls International PLC | | | 5,142 | | | | 209,331 | |
Masco Corp. | | | 1,824 | | | | 87,533 | |
| | | | | | | | |
| | | | 499,798 | |
| | | | | | | | |
|
Cable & Satellite - 1.1% | |
Charter Communications Inc., Class A (b) | | | 1,105 | | | | 536,014 | |
Comcast Corp., Class A | | | 31,431 | | | | 1,413,452 | |
DISH Network Corp., Class A (b) | | | 1,581 | | | | 56,078 | |
| | | | | | | | |
| | | | 2,005,544 | |
| | | | | | | | |
|
Casinos & Gaming - 0.2% | |
Las Vegas Sands Corp. | | | 2,400 | | | | 165,696 | |
MGM Resorts International | | | 3,500 | | | | 116,445 | |
Wynn Resorts Ltd. | | | 657 | | | | 91,238 | |
| | | | | | | | |
| | | | 373,379 | |
| | | | | | | | |
|
Commodity Chemicals - 0.2% | |
Dow Inc. (b) | | | 5,284 | | | | 289,193 | |
LyondellBasell Industries N.V., Class A | | | 1,762 | | | | 166,474 | |
| | | | | | | | |
| | | | 455,667 | |
| | | | | | | | |
| | | | | | | | |
| | | Number
of Shares | | | Fair
Value $ | |
Communications Equipment - 1.0% | |
Arista Networks Inc. (b) | | | 350 | | | | 71,190 | |
Cisco Systems Inc. | | | 29,399 | | | | 1,409,976 | |
F5 Networks Inc. (b) | | | 400 | | | | 55,860 | |
Juniper Networks Inc. | | | 2,247 | | | | 55,344 | |
Motorola Solutions Inc. | | | 1,144 | | | | 184,344 | |
| | | | | | | | |
| | | | | | | 1,776,714 | |
| | | | | | | | |
|
Computer & Electronics Retail - 0.1% | |
Best Buy Company Inc. | | | 1,559 | | | | 136,880 | |
| | | | | | | | |
|
Construction & Engineering - 0.1% | |
Jacobs Engineering Group Inc. | | | 850 | | | | 76,355 | |
Quanta Services Inc. | | | 1,200 | | | | 48,852 | |
| | | | | | | | |
| | | | | | | 125,207 | |
| | | | | | | | |
|
Construction Machinery & Heavy Trucks - 0.6% | |
Caterpillar Inc. | | | 3,908 | | | | 577,133 | |
Cummins Inc. | | | 1,056 | | | | 188,982 | |
PACCAR Inc. | | | 2,403 | | | | 190,077 | |
Westinghouse Air Brake Technologies Corp. | | | 1,297 | | | | 100,907 | |
| | | | | | | | |
| | | | | | | 1,057,099 | |
| | | | | | | | |
|
Construction Materials - 0.1% | |
Martin Marietta Materials Inc. | | | 400 | | | | 111,856 | |
Vulcan Materials Co. | | | 973 | | | | 140,102 | |
| | | | | | | | |
| | | | | | | 251,958 | |
| | | | | | | | |
|
Consumer Electronics - 0.0%* | |
Garmin Ltd. | | | 800 | | | | 78,048 | |
| | | | | | | | |
|
Consumer Finance - 0.7% | |
American Express Co. | | | 4,642 | | | | 577,883 | |
Capital One Financial Corp. | | | 3,295 | | | | 339,088 | |
Discover Financial Services | | | 2,277 | | | | 193,135 | |
Synchrony Financial | | | 4,277 | | | | 154,015 | |
| | | | | | | | |
| | | | | | | 1,264,121 | |
| | | | | | | | |
|
Copper - 0.1% | |
Freeport-McMoRan Inc. | | | 10,498 | | | | 137,734 | |
| | | | | | | | |
|
Data Processing & Outsourced Services - 4.1% | |
Alliance Data Systems Corp. (a) | | | 325 | | | | 36,465 | |
Automatic Data Processing Inc. | | | 3,053 | | | | 520,537 | |
Broadridge Financial Solutions Inc. | | | 800 | | | | 98,832 | |
Fidelity National Information Services Inc. | | | 4,300 | | | | 598,087 | |
Fiserv Inc. (b) | | | 4,058 | | | | 469,227 | |
FleetCor Technologies Inc. (b) | | | 600 | | | | 172,632 | |
Global Payments Inc. | | | 2,088 | | | | 381,185 | |
See Notes to Schedule of Investments and Notes to Financial Statements.
| | | | |
| State Street S&P 500 Index V.I.S. Fund | | | 7 | |
State Street S&P 500 Index V.I.S. Fund
Schedule of Investments, continued — December 31, 2019
| | | | | | | | |
| | | Number
of Shares | | | Fair
Value $ | |
| | | | | | | | |
Jack Henry & Associates Inc. | | | 600 | | | | 87,402 | |
Mastercard Inc., Class A | | | 6,144 | | | | 1,834,537 | |
Paychex Inc. | | | 2,334 | | | | 198,530 | |
PayPal Holdings Inc. (b) | | | 8,243 | | | | 891,645 | |
The Western Union Co. | | | 3,224 | | | | 86,339 | |
Visa Inc., Class A | | | 11,827 | | | | 2,222,293 | |
| | | | | | | | |
| | | | | | | 7,597,711 | |
| | | | | | | | |
|
Department Stores - 0.1% | |
Kohl’s Corp. | | | 1,273 | | | | 64,859 | |
Macy’s Inc. | | | 2,334 | | | | 39,678 | |
Nordstrom Inc. | | | 592 | | | | 24,231 | |
| | | | | | | | |
| | | | | | | 128,768 | |
| | | | | | | | |
|
Distillers & Vintners - 0.2% | |
Brown-Forman Corp., Class B | | | 1,294 | | | | 87,475 | |
Constellation Brands Inc., Class A | | | 1,179 | | | | 223,715 | |
| | | | | | | | |
| | | | | | | 311,190 | |
| | | | | | | | |
|
Distributors - 0.1% | |
Genuine Parts Co. | | | 945 | | | | 100,387 | |
LKQ Corp. (b) | | | 1,952 | | | | 69,687 | |
| | | | | | | | |
| | | | | | | 170,074 | |
| | | | | | | | |
|
Diversified Banks - 4.4% | |
Bank of America Corp. | | | 56,026 | | | | 1,973,236 | |
Citigroup Inc. | | | 15,032 | | | | 1,200,907 | |
JPMorgan Chase & Co. | | | 21,781 | | | | 3,036,271 | |
U.S. Bancorp | | | 9,749 | | | | 578,018 | |
Wells Fargo & Co. | | | 26,599 | | | | 1,431,026 | |
| | | | | | | | |
| | | | | | | 8,219,458 | |
| | | | | | | | |
|
Diversified Chemicals - 0.0%* | |
Eastman Chemical Co. | | | 918 | | | | 72,761 | |
| | | | | | | | |
|
Diversified Support Services - 0.1% | |
Cintas Corp. | | | 564 | | | | 151,761 | |
Copart Inc. (b) | | | 1,300 | | | | 118,222 | |
| | | | | | | | |
| | | | | | | 269,983 | |
| | | | | | | | |
|
Drug Retail - 0.2% | |
Walgreens Boots Alliance Inc. | | | 5,313 | | | | 313,254 | |
| | | | | | | | |
|
Electric Utilities - 2.0% | |
Alliant Energy Corp. (a) | | | 1,600 | | | | 87,552 | |
American Electric Power Company Inc. | | | 3,483 | | | | 329,178 | |
Duke Energy Corp. | | | 5,082 | | | | 463,529 | |
Edison International | | | 2,442 | | | | 184,151 | |
Entergy Corp. | | | 1,253 | | | | 150,109 | |
Evergy Inc. | | | 1,599 | | | | 104,079 | |
Eversource Energy | | | 2,330 | | | | 198,213 | |
| | | | | | | | |
| | | Number
of Shares | | | Fair
Value $ | |
Exelon Corp. | | | 6,934 | | | | 316,121 | |
FirstEnergy Corp. | | | 3,854 | | | | 187,305 | |
NextEra Energy Inc. | | | 3,402 | | | | 823,828 | |
Pinnacle West Capital Corp. | | | 700 | | | | 62,951 | |
PPL Corp. | | | 5,037 | | | | 180,728 | |
The Southern Co. | | | 7,258 | | | | 462,335 | |
Xcel Energy Inc. | | | 3,606 | | | | 228,945 | |
| | | | | | | | |
| | | | | | | 3,779,024 | |
| | | | | | | | |
|
Electrical Components & Equipment - 0.5% | |
AMETEK Inc. | | | 1,600 | | | | 159,584 | |
Eaton Corporation PLC | | | 2,800 | | | | 265,216 | |
Emerson Electric Co. | | | 4,230 | | | | 322,580 | |
Rockwell Automation Inc. | | | 819 | | | | 165,987 | |
| | | | | | | | |
| | | | | | | 913,367 | |
| | | | | | | | |
|
Electronic Components - 0.2% | |
Amphenol Corp., Class A | | | 2,000 | | | | 216,460 | |
Corning Inc. | | | 5,134 | | | | 149,451 | |
| | | | | | | | |
| | | | | | | 365,911 | |
| | | | | | | | |
|
Electronic Equipment & Instruments - 0.1% | |
FLIR Systems Inc. | | | 1,100 | | | | 57,277 | |
Keysight Technologies Inc. (b) | | | 1,400 | | | | 143,682 | |
Zebra Technologies Corp., Class A (b) | | | 300 | | | | 76,632 | |
| | | | | | | | |
| | | | | | | 277,591 | |
| | | | | | | | |
|
Electronic Manufacturing Services - 0.1% | |
IPG Photonics Corp. (b) | | | 300 | | | | 43,476 | |
TE Connectivity Ltd. | | | 2,254 | | | | 216,023 | |
| | | | | | | | |
| | | | | | | 259,499 | |
| | | | | | | | |
|
Environmental & Facilities Services - 0.3% | |
Republic Services Inc. | | | 1,415 | | | | 126,826 | |
Rollins Inc. | | | 1,200 | | | | 39,792 | |
Waste Management Inc. | | | 2,703 | | | | 308,034 | |
| | | | | | | | |
| | | | | | | 474,652 | |
| | | | | | | | |
|
Fertilizers & Agricultural Chemicals - 0.2% | |
CF Industries Holdings Inc. | | | 1,685 | | | | 80,442 | |
Corteva Inc. (b) | | | 5,417 | | | | 160,127 | |
FMC Corp. | | | 981 | | | | 97,923 | |
The Mosaic Co. | | | 2,500 | | | | 54,100 | |
| | | | | | | | |
| | | | | | | 392,592 | |
| | | | | | | | |
|
Financial Exchanges & Data - 1.1% | |
Cboe Global Markets Inc. | | | 800 | | | | 96,000 | |
CME Group Inc. | | | 2,519 | | | | 505,614 | |
Intercontinental Exchange Inc. | | | 3,813 | | | | 352,893 | |
MarketAxess Holdings Inc. | | | 250 | | | | 94,778 | |
Moody’s Corp. | | | 1,156 | | | | 274,446 | |
See Notes to Schedule of Investments and Notes to Financial Statements.
| | |
| 8 | | State Street S&P 500 Index V.I.S. Fund |
State Street S&P 500 Index V.I.S. Fund
Schedule of Investments, continued — December 31, 2019
| | | | | | | | |
| | | Number
of Shares | | | Fair
Value $ | |
| | | | | | | | |
MSCI Inc. | | | 600 | | | | 154,908 | |
Nasdaq Inc. | | | 834 | | | | 89,321 | |
S&P Global Inc. | | | 1,657 | | | | 452,444 | |
| | | | | | | | |
| | | | | | | 2,020,404 | |
| | | | | | | | |
| | |
Food Distributors - 0.2% | | | | | | | | |
Sysco Corp. | | | 3,618 | | | | 309,484 | |
| | | | | | | | |
|
Food Retail - 0.1% | |
The Kroger Co. | | | 5,490 | | | | 159,155 | |
| | | | | | | | |
|
Footwear - 0.5% | |
NIKE Inc., Class B | | | 8,642 | | | | 875,521 | |
| | | | | | | | |
|
Gas Utilities - 0.1% | |
Atmos Energy Corp. | | | 900 | | | | 100,674 | |
| | | | | | | | |
|
General Merchandise Stores - 0.5% | |
Dollar General Corp. | | | 1,812 | | | | 282,636 | |
Dollar Tree Inc. (b) | | | 1,692 | | | | 159,132 | |
Target Corp. | | | 3,495 | | | | 448,094 | |
| | | | | | | | |
| | | | 889,862 | |
| | | | | | | | |
|
Gold - 0.1% | |
Newmont Goldcorp Corp. | | | 5,411 | | | | 235,108 | |
| | | | | | | | |
|
Health Care REITs - 0.3% | |
Healthpeak Properties Inc. | | | 3,274 | | | | 112,855 | |
Ventas Inc. | | | 2,629 | | | | 151,798 | |
Welltower Inc. | | | 2,800 | | | | 228,984 | |
| | | | | | | | |
| | | | 493,637 | |
| | | | | | | | |
|
Healthcare Distributors - 0.2% | |
AmerisourceBergen Corp. | | | 1,061 | | | | 90,206 | |
Cardinal Health Inc. | | | 1,868 | | | | 94,483 | |
Henry Schein Inc. (b) | | | 1,098 | | | | 73,259 | |
McKesson Corp. | | | 1,189 | | | | 164,463 | |
| | | | | | | | |
| | | | 422,411 | |
| | | | | | | | |
|
Healthcare Equipment - 3.3% | |
Abbott Laboratories (a) | | | 12,214 | | | | 1,060,908 | |
ABIOMED Inc. (a)(b) | | | 300 | | | | 51,177 | |
Baxter International Inc. | | | 3,377 | | | | 282,385 | |
Becton Dickinson and Co. | | | 1,883 | | | | 512,120 | |
Boston Scientific Corp. (b) | | | 9,799 | | | | 443,111 | |
Danaher Corp. | | | 4,400 | | | | 675,312 | |
Edwards Lifesciences Corp. (b) | | | 1,400 | | | | 326,606 | |
Hologic Inc. (b) | | | 1,900 | | | | 99,199 | |
IDEXX Laboratories Inc. (b) | | | 622 | | | | 162,423 | |
Intuitive Surgical Inc. (b) | | | 796 | | | | 470,555 | |
Medtronic PLC | | | 9,247 | | | | 1,049,072 | |
ResMed Inc. | | | 986 | | | | 152,801 | |
STERIS PLC | | | 500 | | | | 76,210 | |
Stryker Corp. | | | 2,181 | | | | 457,879 | |
| | | | | | | | |
| | | Number
of Shares | | | Fair
Value $ | |
Teleflex Inc. | | | 300 | | | | 112,932 | |
Varian Medical Systems Inc. (b) | | | 634 | | | | 90,034 | |
Zimmer Biomet Holdings Inc. | | | 1,337 | | | | 200,122 | |
| | | | | | | | |
| | | | 6,222,846 | |
| | | | | | | | |
|
Healthcare Facilities - 0.2% | |
HCA Healthcare Inc. | | | 1,891 | | | | 279,509 | |
Universal Health Services Inc., Class B | | | 558 | | | | 80,050 | �� |
| | | | | | | | |
| | | | 359,559 | |
| | | | | | | | |
|
Healthcare Services - 0.8% | |
Cigna Corp. (b) | | | 2,565 | | | | 524,517 | |
CVS Health Corp. | | | 9,141 | | | | 679,085 | |
DaVita Inc. (b) | | | 558 | | | | 41,866 | |
Laboratory Corporation of America Holdings (b) | | | 700 | | | | 118,419 | |
Quest Diagnostics Inc. | | | 1,000 | | | | 106,790 | |
| | | | | | | | |
| | | | 1,470,677 | |
| | | | | | | | |
|
Healthcare Supplies - 0.2% | |
Align Technology Inc. (a)(b) | | | 461 | | | | 128,638 | |
DENTSPLY SIRONA Inc. | | | 1,532 | | | | 86,696 | |
The Cooper Companies Inc. | | | 315 | | | | 101,206 | |
| | | | | | | | |
| | | | 316,540 | |
| | | | | | | | |
|
Healthcare Technology - 0.1% | |
Cerner Corp. | | | 2,100 | | | | 154,119 | |
| | | | | | | | |
|
Home Building - 0.2% | |
D.R. Horton Inc. | | | 2,400 | | | | 126,600 | |
Lennar Corp., Class A | | | 2,100 | | | | 117,159 | |
NVR Inc. (b) | | | 20 | | | | 76,168 | |
PulteGroup Inc. | | | 1,535 | | | | 59,558 | |
| | | | | | | | |
| | | | 379,485 | |
| | | | | | | | |
|
Home Furnishings - 0.1% | |
Leggett & Platt Inc. | | | 1,000 | | | | 50,830 | |
Mohawk Industries Inc. (b) | | | 400 | | | | 54,552 | |
| | | | | | | | |
| | | | 105,382 | |
| | | | | | | | |
|
Home Improvement Retail - 1.2% | |
Lowe’s Companies Inc. | | | 5,331 | | | | 638,440 | |
The Home Depot Inc. | | | 7,589 | | | | 1,657,286 | |
| | | | | | | | |
| | | | 2,295,726 | |
| | | | | | | | |
|
Hotel & Resort REITs - 0.0%* | |
Host Hotels & Resorts Inc. | | | 4,517 | | | | 83,790 | |
| | | | | | | | |
|
Hotels, Resorts & Cruise Lines - 0.5% | |
Carnival Corp. | | | 2,900 | | | | 147,407 | |
Hilton Worldwide Holdings Inc. | | | 1,900 | | | | 210,729 | |
See Notes to Schedule of Investments and Notes to Financial Statements.
| | | | |
| State Street S&P 500 Index V.I.S. Fund | | | 9 | |
State Street S&P 500 Index V.I.S. Fund
Schedule of Investments, continued — December 31, 2019
| | | | | | | | |
| | | Number
of Shares | | | Fair
Value $ | |
| | | | | | | | |
Marriott International Inc., Class A | | | 1,882 | | | | 284,991 | |
Norwegian Cruise Line Holdings Ltd. (b) | | | 1,500 | | | | 87,615 | |
Royal Caribbean Cruises Ltd. | | | 1,263 | | | | 168,623 | |
| | | | | | | | |
| | | | 899,365 | |
| | | | | | | | |
|
Household Appliances - 0.0%* | |
Whirlpool Corp. | | | 462 | | | | 68,159 | |
| | | | | | | | |
|
Household Products - 1.7% | |
Church & Dwight Company Inc. | | | 1,838 | | | | 129,285 | |
Colgate-Palmolive Co. | | | 5,853 | | | | 402,920 | |
Kimberly-Clark Corp. | | | 2,412 | | | | 331,771 | |
The Clorox Co. | | | 859 | | | | 131,891 | |
The Procter & Gamble Co. | | | 17,251 | | | | 2,154,650 | |
| | | | | | | | |
| | | | 3,150,517 | |
| | | | | | | | |
|
Housewares & Specialties - 0.0%* | |
Newell Brands Inc. | | | 2,334 | | | | 44,859 | |
| | | | | | | | |
|
Human Resource & Employment Services - 0.0%* | |
Robert Half International Inc. | | | 875 | | | | 55,256 | |
| | | | | | | | |
|
Hypermarkets & Super Centers - 1.1% | |
Costco Wholesale Corp. | | | 2,998 | | | | 881,172 | |
Walmart Inc. | | | 9,848 | | | | 1,170,336 | |
| | | | | | | | |
| | | | 2,051,508 | |
| | | | | | | | |
|
Independent Power Producers & Energy Traders - 0.1% | |
AES Corp. (a) | | | 4,826 | | | | 96,037 | |
NRG Energy Inc. | | | 1,738 | | | | 69,086 | |
| | | | | | | | |
| | | | 165,123 | |
| | | | | | | | |
|
Industrial Conglomerates - 1.3% | |
3M Co. (a) | | | 4,006 | | | | 706,739 | |
General Electric Co. | | | 59,994 | | | | 669,533 | |
Honeywell International Inc. | | | 4,949 | | | | 875,973 | |
Roper Technologies Inc. | | | 728 | | | | 257,879 | |
| | | | | | | | |
| | | | 2,510,124 | |
| | | | | | | | |
|
Industrial Gases - 0.6% | |
Air Products & Chemicals Inc. (a) | | | 1,541 | | | | 362,119 | |
Linde PLC | | | 3,722 | | | | 792,414 | |
| | | | | | | | |
| | | | 1,154,533 | |
| | | | | | | | |
|
Industrial Machinery - 0.8% | |
Dover Corp. | | | 1,009 | | | | 116,297 | |
Flowserve Corp. | | | 900 | | | | 44,793 | |
Fortive Corp. | | | 2,149 | | | | 164,162 | |
IDEX Corp. | | | 500 | | | | 86,000 | |
Illinois Tool Works Inc. | | | 1,960 | | | | 352,075 | |
Ingersoll-Rand PLC | | | 1,600 | | | | 212,672 | |
| | | | | | | | |
| | | Number
of Shares | | | Fair
Value $ | |
Parker-Hannifin Corp. | | | 934 | | | | 192,236 | |
Pentair PLC | | | 1,146 | | | | 52,567 | |
Snap-on Inc. | | | 409 | | | | 69,285 | |
Stanley Black & Decker Inc. | | | 1,099 | | | | 182,148 | |
Xylem Inc. | | | 1,281 | | | | 100,930 | |
| | | | | | | | |
| | | | 1,573,165 | |
| | | | | | | | |
|
Industrial REITs - 0.3% | |
Duke Realty Corp. | | | 2,500 | | | | 86,675 | |
Prologis Inc. REIT | | | 4,457 | | | | 397,297 | |
| | | | | | | | |
| | | | 483,972 | |
| | | | | | | | |
|
Insurance Brokers - 0.5% | |
Aon PLC | | | 1,634 | | | | 340,346 | |
Arthur J Gallagher & Co. | | | 1,227 | | | | 116,847 | |
Marsh & McLennan Companies Inc. | | | 3,526 | | | | 392,832 | |
Willis Towers Watson PLC | | | 858 | | | | 173,264 | |
| | | | | | | | |
| | | | 1,023,289 | |
| | | | | | | | |
|
Integrated Oil & Gas - 2.1% | |
Chevron Corp. | | | 13,193 | | | | 1,589,889 | |
Exxon Mobil Corp. | | | 29,339 | | | | 2,047,275 | |
Occidental Petroleum Corp. | | | 6,029 | | | | 248,455 | |
| | | | | | | | |
| | | | 3,885,619 | |
| | | | | | | | |
|
Integrated Telecommunication Services - 2.0% | |
AT&T Inc. | | | 50,766 | | | | 1,983,935 | |
Verizon Communications Inc. | | | 28,692 | | | | 1,761,689 | |
| | | | | | | | |
| | | | 3,745,624 | |
| | | | | | | | |
|
Interactive Home Entertainment - 0.3% | |
Activision Blizzard Inc. (a) | | | 5,400 | | | | 320,868 | |
Electronic Arts Inc. (b) | | | 2,105 | | | | 226,309 | |
Take-Two Interactive Software Inc. (b) | | | 800 | | | | 97,944 | |
| | | | | | | | |
| | | | 645,121 | |
| | | | | | | | |
|
Interactive Media & Services - 4.9% | |
Alphabet Inc., Class A (a)(b) | | | 2,086 | | | | 2,793,968 | |
Alphabet Inc., Class C (b) | | | 2,072 | | | | 2,770,305 | |
Facebook Inc., Class A (b) | | | 16,749 | | | | 3,437,732 | |
Twitter Inc. (b) | | | 5,100 | | | | 163,455 | |
| | | | | | | | |
| | | | 9,165,460 | |
| | | | | | | | |
|
Internet & Direct Marketing Retail - 3.3% | |
Amazon.com Inc. (b) | | | 2,889 | | | | 5,338,410 | |
Booking Holdings Inc. (b) | | | 293 | | | | 601,743 | |
eBay Inc. | | | 5,260 | | | | 189,938 | |
Expedia Group Inc. | | | 850 | | | | 91,919 | |
| | | | | | | | |
| | | | 6,222,010 | |
| | | | | | | | |
See Notes to Schedule of Investments and Notes to Financial Statements.
| | |
| 10 | | State Street S&P 500 Index V.I.S. Fund |
State Street S&P 500 Index V.I.S. Fund
Schedule of Investments, continued — December 31, 2019
| | | | | | | | |
| | | Number
of Shares | | | Fair
Value $ | |
| | | | | | | | |
Internet Services & Infrastructure - 0.1% | |
Akamai Technologies Inc. (a)(b) | | | 1,133 | | | | 97,869 | |
VeriSign Inc. (b) | | | 724 | | | | 139,500 | |
| | | | | | | | |
| | | | 237,369 | |
| | | | | | | | |
|
Investment Banking & Brokerage - 0.8% | |
E*TRADE Financial Corp. | | | 1,640 | | | | 74,407 | |
Morgan Stanley | | | 8,329 | | | | 425,778 | |
Raymond James Financial Inc. | | | 904 | | | | 80,872 | |
The Charles Schwab Corp. | | | 7,911 | | | | 376,247 | |
The Goldman Sachs Group Inc. | | | 2,203 | | | | 506,536 | |
| | | | | | | | |
| | | | 1,463,840 | |
| | | | | | | | |
|
IT Consulting & Other Services - 1.2% | |
Accenture PLC, Class A (a) | | | 4,445 | | | | 935,984 | |
Cognizant Technology Solutions Corp., Class A | | | 3,976 | | | | 246,592 | |
DXC Technology Co. | | | 1,824 | | | | 68,564 | |
Gartner Inc. (b) | | | 600 | | | | 92,460 | |
International Business Machines Corp. | | | 6,111 | | | | 819,118 | |
Leidos Holdings Inc. | | | 1,000 | | | | 97,890 | |
| | | | | | | | |
| | | | 2,260,608 | |
| | | | | | | | |
|
Leisure Products - 0.0%* | |
Hasbro Inc. | | | 796 | | | | 84,066 | |
| | | | | | | | |
|
Life & Health Insurance - 0.6% | |
Aflac Inc. (a) | | | 5,226 | | | | 276,455 | |
Globe Life Inc. | | | 666 | | | | 70,097 | |
Lincoln National Corp. | | | 1,560 | | | | 92,056 | |
MetLife Inc. | | | 5,560 | | | | 283,393 | |
Principal Financial Group Inc. | | | 1,711 | | | | 94,105 | |
Prudential Financial Inc. | | | 2,801 | | | | 262,566 | |
Unum Group | | | 1,589 | | | | 46,335 | |
| | | | | | | | |
| | | | 1,125,007 | |
| | | | | | | | |
|
Life Sciences Tools & Services - 1.0% | |
Agilent Technologies Inc. (a) | | | 2,022 | | | | 172,497 | |
Illumina Inc. (b) | | | 1,001 | | | | 332,072 | |
IQVIA Holdings Inc. (b) | | | 1,300 | | | | 200,863 | |
Mettler-Toledo International Inc. (b) | | | 179 | | | | 141,997 | |
PerkinElmer Inc. | | | 711 | | | | 69,038 | |
Thermo Fisher Scientific Inc. | | | 2,728 | | | | 886,245 | |
Waters Corp. (b) | | | 484 | | | | 113,087 | |
| | | | | | | | |
| | | | 1,915,799 | |
| | | | | | | | |
|
Managed Healthcare - 1.7% | |
Anthem Inc. | | | 1,775 | | | | 536,103 | |
Centene Corp. (b) | | | 3,027 | | | | 190,308 | |
Humana Inc. | | | 927 | | | | 339,764 | |
| | | | | | | | |
| | | Number
of Shares | | | Fair
Value $ | |
UnitedHealth Group Inc. | | | 6,600 | | | | 1,940,268 | |
WellCare Health Plans Inc. (b) | | | 300 | | | | 99,063 | |
| | | | | | | | |
| | | | 3,105,506 | |
| | | | | | | | |
|
Metal & Glass Containers - 0.1% | |
Ball Corp. | | | 2,382 | | | | 154,044 | |
| | | | | | | | |
|
Motorcycle Manufacturers - 0.0%* | |
Harley-Davidson Inc. | | | 1,135 | | | | 42,211 | |
| | | | | | | | |
|
Movies & Entertainment - 1.5% | |
Live Nation Entertainment Inc. (b) | | | 800 | | | | 57,176 | |
Netflix Inc. (b) | | | 2,990 | | | | 967,474 | |
The Walt Disney Co. | | | 12,527 | | | | 1,811,780 | |
| | | | | | | | |
| | | | 2,836,430 | |
| | | | | | | | |
|
Multi-Line Insurance - 0.3% | |
American International Group Inc. | | | 6,229 | | | | 319,735 | |
Assurant Inc. | | �� | 339 | | | | 44,436 | |
The Hartford Financial Services Group Inc. | | | 2,544 | | | | 154,599 | |
| | | | | | | | |
| | | | 518,770 | |
| | | | | | | | |
|
Multi-Sector Holdings - 1.6% | |
Berkshire Hathaway Inc., Class B (b) | | | 13,596 | | | | 3,079,494 | |
| | | | | | | | |
|
Multi-Utilities - 1.0% | |
Ameren Corp. | | | 1,642 | | | | 126,106 | |
CenterPoint Energy Inc. | | | 3,718 | | | | 101,390 | |
CMS Energy Corp. | | | 2,000 | | | | 125,680 | |
Consolidated Edison Inc. | | | 2,255 | | | | 204,010 | |
Dominion Energy Inc. | | | 5,717 | | | | 473,482 | |
DTE Energy Co. | | | 1,280 | | | | 166,233 | |
NiSource Inc. | | | 2,515 | | | | 70,018 | |
Public Service Enterprise Group Inc. | | | 3,492 | | | | 206,202 | |
Sempra Energy | | | 1,800 | | | | 272,664 | |
WEC Energy Group Inc. | | | 2,209 | | | | 203,736 | |
| | | | | | | | |
| | | | 1,949,521 | |
| | | | | | | | |
|
Office REITs - 0.2% | |
Alexandria Real Estate Equities Inc. (a) | | | 800 | | | | 129,264 | |
Boston Properties Inc. | | | 898 | | | | 123,798 | |
SL Green Realty Corp. | | | 600 | | | | 55,128 | |
Vornado Realty Trust | | | 1,211 | | | | 80,532 | |
| | | | | | | | |
| | | | 388,722 | |
| | | | | | | | |
See Notes to Schedule of Investments and Notes to Financial Statements.
| | | | |
| State Street S&P 500 Index V.I.S. Fund | | | 11 | |
State Street S&P 500 Index V.I.S. Fund
Schedule of Investments, continued — December 31, 2019
| | | | | | | | |
| | | Number
of Shares | | | Fair
Value $ | |
| | | | | | | | |
Oil & Gas Drilling - 0.0%* | |
Helmerich & Payne Inc. | | | 900 | | | | 40,887 | |
| | | | | | | | |
|
Oil & Gas Equipment & Services - 0.4% | |
Baker Hughes Co. | | | 3,481 | | | | 89,218 | |
Halliburton Co. | | | 6,458 | | | | 158,027 | |
National Oilwell Varco Inc. | | | 2,846 | | | | 71,292 | |
Schlumberger Ltd. | | | 9,384 | | | | 377,237 | |
TechnipFMC PLC | | | 2,686 | | | | 57,588 | |
| | | | | | | | |
| | | | 753,362 | |
| | | | | | | | |
|
Oil & Gas Exploration & Production - 1.0% | |
Apache Corp. | | | 2,948 | | | | 75,439 | |
Cabot Oil & Gas Corp. | | | 3,135 | | | | 54,580 | |
Cimarex Energy Co. | | | 700 | | | | 36,743 | |
Concho Resources Inc. | | | 1,500 | | | | 131,355 | |
ConocoPhillips | | | 7,635 | | | | 496,504 | |
Devon Energy Corp. | | | 2,992 | | | | 77,702 | |
Diamondback Energy Inc. | | | 1,100 | | | | 102,146 | |
EOG Resources Inc. | | | 4,100 | | | | 343,416 | |
Hess Corp. | | | 1,818 | | | | 121,461 | |
Marathon Oil Corp. | | | 5,742 | | | | 77,977 | |
Noble Energy Inc. | | | 3,700 | | | | 91,908 | |
Pioneer Natural Resources Co. | | | 1,200 | | | | 181,644 | |
| | | | | | | | |
| | | | 1,790,875 | |
| | | | | | | | |
|
Oil & Gas Refining & Marketing - 0.5% | |
HollyFrontier Corp. | | | 900 | | | | 45,639 | |
Marathon Petroleum Corp. | | | 4,576 | | | | 275,704 | |
Phillips 66 | | | 3,161 | | | | 352,167 | |
Valero Energy Corp. | | | 2,828 | | | | 264,842 | |
| | | | | | | | |
| | | | 938,352 | |
| | | | | | | | |
|
Oil & Gas Storage & Transportation - 0.4% | |
Kinder Morgan Inc. | | | 13,304 | | | | 281,646 | |
ONEOK Inc. | | | 3,000 | | | | 227,010 | |
The Williams Companies Inc. | | | 8,571 | | | | 203,304 | |
| | | | | | | | |
| | | | 711,960 | |
| | | | | | | | |
|
Packaged Foods & Meats - 1.1% | |
Campbell Soup Co. | | | 1,215 | | | | 60,045 | |
Conagra Brands Inc. | | | 3,254 | | | | 111,417 | |
General Mills Inc. | | | 4,136 | | | | 221,524 | |
Hormel Foods Corp. | | | 1,800 | | | | 81,198 | |
Kellogg Co. | | | 1,701 | | | | 117,641 | |
Lamb Weston Holdings Inc. | | | 1,100 | | | | 94,633 | |
McCormick & Company Inc. | | | 900 | | | | 152,757 | |
Mondelez International Inc., Class A | | | 10,136 | | | | 558,291 | |
The Hershey Co. | | | 1,016 | | | | 149,332 | |
The JM Smucker Co. | | | 847 | | | | 88,198 | |
| | | | | | | | |
| | | Number
of Shares | | | Fair
Value $ | |
The Kraft Heinz Co. | | | 4,395 | | | | 141,211 | |
Tyson Foods Inc., Class A | | | 2,166 | | | | 197,193 | |
| | | | | | | | |
| | | | 1,973,440 | |
| | | | | | | | |
| | |
Paper Packaging - 0.3% | | | | | | | | |
Amcor PLC (b) | | | 11,782 | | | | 127,717 | |
Avery Dennison Corp. | | | 492 | | | | 64,363 | |
International Paper Co. | | | 2,530 | | | | 116,507 | |
Packaging Corporation of America | | | 685 | | | | 76,713 | |
Sealed Air Corp. | | | 931 | | | | 37,082 | |
WestRock Co. | | | 1,775 | | | | 76,165 | |
| | | | | | | | |
| | | | 498,547 | |
| | | | | | | | |
|
Personal Products - 0.2% | |
Coty Inc., Class A | | | 1,910 | | | | 21,487 | |
The Estee Lauder Companies Inc., Class A | | | 1,579 | | | | 326,127 | |
| | | | | | | | |
| | | | 347,614 | |
| | | | | | | | |
|
Pharmaceuticals - 4.6% | |
Allergan PLC | | | 2,249 | | | | 429,941 | |
Bristol-Myers Squibb Co. | | | 16,244 | | | | 1,042,702 | |
Eli Lilly & Co. | | | 5,842 | | | | 767,814 | |
Johnson & Johnson | | | 18,327 | | | | 2,673,360 | |
Merck & Company Inc. | | | 17,568 | | | | 1,597,810 | |
Mylan N.V. (b) | | | 3,904 | | | | 78,470 | |
Perrigo Company PLC | | | 975 | | | | 50,369 | |
Pfizer Inc. | | | 38,535 | | | | 1,509,801 | |
Zoetis Inc. | | | 3,346 | | | | 442,843 | |
| | | | | | | | |
| | | | 8,593,110 | |
| | | | | | | | |
|
Property & Casualty Insurance - 0.8% | |
Chubb Ltd. | | | 3,161 | | | | 492,041 | |
Cincinnati Financial Corp. | | | 1,092 | | | | 114,824 | |
Loews Corp. | | | 1,862 | | | | 97,736 | |
The Allstate Corp. (a) | | | 2,186 | | | | 245,816 | |
The Progressive Corp. | | | 4,103 | | | | 297,016 | |
The Travelers Companies Inc. | | | 1,867 | | | | 255,686 | |
WR Berkley Corp. | | | 1,000 | | | | 69,100 | |
| | | | | | | | |
| | | | 1,572,219 | |
| | | | | | | | |
|
Publishing - 0.0%* | |
News Corp., Class A | | | 2,596 | | | | 36,707 | |
| | | | | | | | |
|
Railroads - 0.9% | |
CSX Corp. | | | 5,400 | | | | 390,744 | |
Kansas City Southern | | | 700 | | | | 107,212 | |
Norfolk Southern Corp. | | | 1,845 | | | | 358,170 | |
Union Pacific Corp. | | | 4,808 | | | | 869,238 | |
| | | | | | | | |
| | | | 1,725,364 | |
| | | | | | | | |
See Notes to Schedule of Investments and Notes to Financial Statements.
| | |
| 12 | | State Street S&P 500 Index V.I.S. Fund |
State Street S&P 500 Index V.I.S. Fund
Schedule of Investments, continued — December 31, 2019
| | | | | | | | |
| | | Number
of Shares | | | Fair
Value $ | |
| | | | | | | | |
Real Estate Services - 0.1% | |
CBRE Group Inc., Class A (b) | | | 2,321 | | | | 142,254 | |
| | | | | | | | |
|
Regional Banks - 1.2% | |
Citizens Financial Group Inc. | | | 3,000 | | | | 121,830 | |
Comerica Inc. | | | 1,148 | | | | 82,369 | |
Fifth Third Bancorp | | | 4,735 | | | | 145,554 | |
First Republic Bank | | | 1,200 | | | | 140,940 | |
Huntington Bancshares Inc. | | | 6,934 | | | | 104,565 | |
KeyCorp | | | 6,928 | | | | 140,223 | |
M&T Bank Corp. | | | 890 | | | | 151,077 | |
People’s United Financial Inc. | | | 3,200 | | | | 54,080 | |
Regions Financial Corp. | | | 7,168 | | | | 123,003 | |
SVB Financial Group (b) | | | 400 | | | | 100,416 | |
The PNC Financial Services Group Inc. | | | 3,039 | | | | 485,115 | |
Truist Financial Corp. | | | 9,118 | | | | 513,526 | |
Zions Bancorp NA | | | 1,000 | | | | 51,920 | |
| | | | | | | | |
| | | | 2,214,618 | |
| | | | | | | | |
|
Reinsurance - 0.0%* | |
Everest Re Group Ltd. | | | 300 | | | | 83,052 | |
| | | | | | | | |
|
Research & Consulting Services - 0.3% | |
Equifax Inc. | | | 846 | | | | 118,542 | |
IHS Markit Ltd. (b) | | | 2,800 | | | | 210,980 | |
Nielsen Holdings PLC | | | 2,328 | | | | 47,258 | |
Verisk Analytics Inc. | | | 1,200 | | | | 179,208 | |
| | | | | | | | |
| | | | 555,988 | |
| | | | | | | | |
|
Residential REITs - 0.4% | |
Apartment Investment & Management Co., Class A | | | 977 | | | | 50,462 | |
AvalonBay Communities Inc. | | | 972 | | | | 203,829 | |
Equity Residential | | | 2,508 | | | | 202,947 | |
Essex Property Trust Inc. | | | 450 | | | | 135,387 | |
Mid-America Apartment Communities Inc. | | | 800 | | | | 105,488 | |
UDR Inc. | | | 1,900 | | | | 88,730 | |
| | | | | | | | |
| | | | 786,843 | |
| | | | | | | | |
|
Restaurants - 1.2% | |
Chipotle Mexican Grill Inc. (b) | | | 160 | | | | 133,937 | |
Darden Restaurants Inc. | | | 886 | | | | 96,583 | |
McDonald’s Corp. | | | 5,267 | | | | 1,040,812 | |
Starbucks Corp. | | | 8,200 | | | | 720,944 | |
Yum! Brands Inc. | | | 2,174 | | | | 218,987 | |
| | | | | | | | |
| | | | 2,211,263 | |
| | | | | | | | |
|
Retail REITs - 0.4% | |
Federal Realty Investment Trust | | | 500 | | | | 64,365 | |
Kimco Realty Corp. | | | 3,097 | | | | 64,139 | |
Realty Income Corp. | | | 2,000 | | | | 147,260 | |
| | | | | | | | |
| | | Number
of Shares | | | Fair
Value $ | |
Regency Centers Corp. | | | 1,299 | | | | 81,954 | |
Simon Property Group Inc. | | | 2,179 | | | | 324,584 | |
| | | | | | | | |
| | | | 682,302 | |
| | | | | | | | |
| |
Semiconductor Equipment - 0.5% | | | | | |
Applied Materials Inc. | | | 6,438 | | | | 392,976 | |
KLA Corp. | | | 1,078 | | | | 192,067 | |
Lam Research Corp. | | | 1,031 | | | | 301,464 | |
| | | | | | | | |
| | | | 886,507 | |
| | | | | | | | |
|
Semiconductors - 3.7% | |
Advanced Micro Devices Inc. (a)(b) | | | 7,600 | | | | 348,536 | |
Analog Devices Inc. | | | 2,587 | | | | 307,439 | |
Broadcom Inc. | | | 2,768 | | | | 874,743 | |
Intel Corp. | | | 30,101 | | | | 1,801,545 | |
Maxim Integrated Products Inc. | | | 1,800 | | | | 110,718 | |
Microchip Technology Inc. | | | 1,600 | | | | 167,552 | |
Micron Technology Inc. (b) | | | 7,668 | | | | 412,385 | |
NVIDIA Corp. | | | 4,238 | | | | 997,201 | |
Qorvo Inc. (b) | | | 900 | | | | 104,607 | |
QUALCOMM Inc. | | | 7,968 | | | | 703,017 | |
Skyworks Solutions Inc. | | | 1,196 | | | | 144,572 | |
Texas Instruments Inc. | | | 6,409 | | | | 822,211 | |
Xilinx Inc. | | | 1,787 | | | | 174,715 | |
| | | | | | | | |
| | | | 6,969,241 | |
| | | | | | | | |
|
Soft Drinks - 1.6% | |
Monster Beverage Corp. (b) | | | 2,756 | | | | 175,144 | |
PepsiCo Inc. | | | 9,682 | | | | 1,323,239 | |
The Coca-Cola Co. | | | 26,669 | | | | 1,476,129 | |
| | | | | | | | |
| | | | 2,974,512 | |
| | | | | | | | |
|
Specialized Consumer Services - 0.0%* | |
H&R Block Inc. | | | 1,579 | | | | 37,075 | |
| | | | | | | | |
|
Specialized REITs - 1.3% | |
American Tower Corp. | | | 3,081 | | | | 708,075 | |
Crown Castle International Corp. | | | 2,923 | | | | 415,505 | |
Digital Realty Trust Inc. | | | 1,500 | | | | 179,610 | |
Equinix Inc. | | | 596 | | | | 347,885 | |
Extra Space Storage Inc. | | | 800 | | | | 84,496 | |
Iron Mountain Inc. | | | 1,886 | | | | 60,107 | |
Public Storage | | | 1,030 | | | | 219,349 | |
SBA Communications Corp. | | | 733 | | | | 176,646 | |
Weyerhaeuser Co. | | | 4,967 | | | | 150,003 | |
| | | | | | | | |
| | | | 2,341,676 | |
| | | | | | | | |
|
Specialty Chemicals - 0.8% | |
Albemarle Corp. (a) | | | 769 | | | | 56,168 | |
Celanese Corp. | | | 900 | | | | 110,808 | |
DuPont de Nemours Inc. | | | 5,117 | | | | 328,511 | |
See Notes to Schedule of Investments and Notes to Financial Statements.
| | | | |
| State Street S&P 500 Index V.I.S. Fund | | | 13 | |
State Street S&P 500 Index V.I.S. Fund
Schedule of Investments, continued — December 31, 2019
| | | | | | | | |
| | | Number
of Shares | | | Fair
Value $ | |
| | | | | | | | |
Ecolab Inc. | | | 1,702 | | | | 328,469 | |
International Flavors & Fragrances Inc. | | | 647 | | | | 83,476 | |
PPG Industries Inc. | | | 1,659 | | | | 221,460 | |
The Sherwin-Williams Co. | | | 563 | | | | 328,533 | |
| | | | | | | | |
| | | | 1,457,425 | |
| | | | | | | | |
| |
Specialty Stores - 0.1% | | | | | |
Tiffany & Co. | | | 704 | | | | 94,090 | |
Tractor Supply Co. | | | 837 | | | | 78,209 | |
Ulta Salon Cosmetics & Fragrance Inc. (b) | | | 400 | | | | 101,256 | |
| | | | | | | | |
| | | | 273,555 | |
| | | | | | | | |
|
Steel - 0.1% | |
Nucor Corp. | | | 2,259 | | | | 127,137 | |
| | | | | | | | |
|
Systems Software - 5.2% | |
Fortinet Inc. (b) | | | 900 | | | | 96,084 | |
Microsoft Corp. | | | 52,935 | | | | 8,347,850 | |
Nortonlifelock Inc. | | | 3,572 | | | | 91,157 | |
Oracle Corp. | | | 15,213 | | | | 805,985 | |
ServiceNow Inc. (b) | | | 1,300 | | | | 367,016 | |
| | | | | | | | |
| | | | 9,708,092 | |
| | | | | | | | |
|
Technology Distributors - 0.1% | |
CDW Corp. | | | 1,000 | | | | 142,840 | |
| | | | | | | | |
|
Technology Hardware, Storage & Peripherals - 4.9% | |
Apple Inc. | | | 28,981 | | | | 8,510,271 | |
Hewlett Packard Enterprise Co. | | | 9,619 | | | | 152,557 | |
HP Inc. | | | 10,254 | | | | 210,720 | |
NetApp Inc. | | | 1,470 | | | | 91,507 | |
Seagate Technology PLC | | | 1,732 | | | | 103,054 | |
Western Digital Corp. | | | 2,077 | | | | 131,827 | |
Xerox Holdings Corp. (b) | | | 1,211 | | | | 44,650 | |
| | | | | | | | |
| | | | 9,244,586 | |
| | | | | | | | |
| | | | | | | | |
| | | Number
of Shares | | | Fair
Value $ | |
Tobacco - 0.8% | |
Altria Group Inc. | | | 12,839 | | | | 640,795 | |
Philip Morris International Inc. | | | 10,737 | | | | 913,611 | |
| | | | | | | | |
| | | | 1,554,406 | |
| | | | | | | | |
|
Trading Companies & Distributors - 0.2% | |
Fastenal Co. | | | 3,900 | | | | 144,105 | |
United Rentals Inc. (b) | | | 564 | | | | 94,058 | |
WW Grainger Inc. | | | 282 | | | | 95,463 | |
| | | | | | | | |
| | | | 333,626 | |
| | | | | | | | |
|
Trucking - 0.1% | |
JB Hunt Transport Services Inc. | | | 520 | | | | 60,726 | |
Old Dominion Freight Line Inc. | | | 400 | | | | 75,912 | |
| | | | | | | | |
| | | | 136,638 | |
| | | | | | | | |
|
Water Utilities - 0.1% | |
American Water Works Company Inc. | | | 1,200 | | | | 147,420 | |
| | | | | | | | |
|
Wireless Telecommunication Services - 0.1% | |
T-Mobile US Inc. (b) | | | 2,200 | | | | 172,524 | |
| | | | | | | | |
| |
Total Common Stock
(Cost $66,522,351) | | | | 185,716,338 | |
| | | | | | | | |
|
| Short-Term Investments - 0.5% | |
State Street Institutional Liquid Reserves Fund - Premier Class 1.73% (d)(e)
(Cost $896,950) | | | 896,863 | | | | 896,953 | |
| | | | | | | | |
| |
Total Investments
(Cost $67,419,301) | | | | 186,613,291 | |
| | | | | | | | |
| |
| Other Assets and Liabilities, net - 0.1% | | | | 157,319 | |
| | | | | | | | |
| |
| NET ASSETS - 100.0% | | | | 186,770,610 | |
| | | | | | | | |
Other Information:
The Fund had the following long futures contracts open at December 31, 2019:
| | | | | | | | | | | | | | | | | | | | |
| Description | | Expiration
date | | | Number of
Contracts | | | Notional
Amount | | | Value | | | Unrealized
Appreciation | |
S&P 500 Emini Index Futures | | | March 2020 | | | | 9 | | | $ | 1,432,370 | | | $ | 1,453,974 | | | $ | 21,604 | |
| | | | | | | | | | | | | | | | | | | | |
During the period ended December 31, 2019, average notional value related to long futures contracts was $2,660,500.
See Notes to Schedule of Investments and Notes to Financial Statements.
| | |
| 14 | | State Street S&P 500 Index V.I.S. Fund |
State Street S&P 500 Index V.I.S. Fund
Notes to Schedule of Investments — December 31, 2019
The views expressed in this document reflect our judgment as of the publication date and are subject to change at any time without notice. The securities cited may not be representative of the Fund’s future investments and should not be construed as a recommendation to purchase or sell a particular security. See the Fund’s summary prospectus and statutory prospectus for complete descriptions of investment objectives, policies, risks and permissible investments.
| (a) | At December 31, 2019, all or a portion of this security was pledged to cover collateral requirements for futures. |
| (b) | Non-income producing security. |
| (c) | State Street Corp. is the parent company of State Street Bank & Trust Co., the Fund’ssub-administrator, custodian and accounting agent. |
| (d) | Sponsored by SSGA Funds Management, Inc., the Fund’s investment adviser and administrator, and an affiliate of State Street Bank & Trust Co., the Fund’ssub-administrator, custodian and accounting agent. |
| (e) | Coupon amount represents effective yield. |
| † | Percentages are based on net assets as of December 31, 2019. |
Abbreviations:
REIT - Real Estate Investment Trust
The following table presents the Fund’s investments measured at fair value on a recurring basis at December 31, 2019:
| | | | | | | | | | | | | | | | |
Investments | | Level 1 | | | Level 2 | | | Level 3 | | | Total | |
Investments in Securities | | | | | | | | | | | | | | | | |
Common Stock | | $ | 185,716,338 | | | $ | — | | | $ | — | | | $ | 185,716,338 | |
Short-Term Investments | | | 896,953 | | | | — | | | | — | | | | 896,953 | |
| | | | | | | | | | | | | | | | |
Total Investments in Securities | | $ | 186,613,291 | | | $ | — | | | $ | — | | | $ | 186,613,291 | |
| | | | | | | | | | | | | | | | |
Other Financial Instruments | | | | | | | | | | | | | | | | |
| | | | | | | | | | | | | | | | |
Long Futures Contracts - Unrealized Appreciation | | $ | 21,604 | | | $ | — | | | $ | — | | | $ | 21,604 | |
| | | | | | | | | | | | | | | | |
Affiliate Table
| | | | | | | | | | | | | | | | | | | | | | | | | | | | | | | | | | | | |
| | | Number
of Shares
Held at
12/31/18 | | | Value At
12/31/18 | | | Cost of
Purchases | | | Proceeds
from
Shares Sold | | | Realized
Gain
(Loss) | | | Change in
Unrealized
Appreciation/
Depreciation | | | Number
of Shares
Held at
12/31/19 | | | Value at
12/31/19 | | | Dividend
Income | |
State Street Corp. | | | 2,911 | | | $ | 183,597 | | | $ | — | | | $ | 20,585 | | | $ | (661 | ) | | $ | 44,179 | | | | 2,611 | | | $ | 206,530 | | | $ | 5,311 | |
State Street Institutional Liquid Reserves Fund, Premier Class | | | — | | | | — | | | | 7,978,660 | | | | 7,081,710 | | | | — | | | | 3 | | | | 896,863 | | | | 896,953 | | | | 19,139 | |
State Street Institutional U.S. Government Money Market Fund, Class G Shares | | | 1,781,046 | | | | 1,781,046 | | | | 13,864,380 | | | | 15,645,426 | | | | — | | | | — | | | | — | | | | — | | | | 32,838 | |
| | | | | | | | | | | | | | | | | | | | | | | | | | | | | | | | | | | | |
| | | | | | | | | |
TOTAL | | | | | | $ | 1,964,643 | | | $ | 21,843,040 | | | $ | 22,747,721 | | | $ | (661 | ) | | $ | 44,182 | | | | | | | $ | 1,103,483 | | | $ | 57,288 | |
| | | | | | | | | | | | | | | | | | | | | | | | | | | | | | | | | | | | |
| | | | |
See Notes to Schedule of Investments and Notes to Financial Statements. | |
| State Street S&P 500 Index V.I.S. Fund | | | 15 | |
State Street S&P 500 Index V.I.S. Fund
Financial Highlights
Selected data based on a share outstanding throughout the fiscal years indicated
| | | | | | | | | | | | | | | | | | | | |
| | | 12/31/19 | | | 12/31/18 | | | 12/31/17 | | | 12/31/16 | | | 12/31/15* | |
| Inception date | | | | | | | | | | | | | | | | | | | 4/15/85 | |
| | | | | |
Net asset value, beginning of period | | $ | 38.13 | | | $ | 44.09 | | | $ | 38.22 | | | $ | 36.16 | | | $ | 36.60 | |
| | | | | | | | | | | | | | | | | | | | |
| | | | |
Income/(loss) from investment operations: | | | | | | | | | | | | | | | | | |
Net investment income | | | 0.75 | (a) | | | 0.74 | (a) | | | 0.71 | (a) | | | 0.72 | | | | 0.69 | |
Net realized and unrealized gains/(losses) on investments | | | 11.09 | | | | (2.86 | ) | | | 7.52 | | | | 3.49 | | | | (0.28 | ) |
| | | | | | | | | | | | | | | | | | | | |
Total income/(loss) from investment operations | | | 11.84 | | | | (2.12 | ) | | | 8.23 | | | | 4.21 | | | | 0.41 | |
| | | | | | | | | | | | | | | | | | | | |
| | | | | |
Less distributions from: | | | | | | | | | | | | | | | | | | | | |
Net investment income | | | 0.62 | | | | 0.80 | | | | 0.79 | | | | 0.73 | | | | 0.85 | |
Net realized gains | | | 2.74 | | | | 3.04 | | | | 1.57 | | | | 1.42 | | | | — | |
| | | | | | | | | | | | | | | | | | | | |
Total distributions | | | 3.36 | | | | 3.84 | | | | 2.36 | | | | 2.15 | | | | 0.85 | |
| | | | | | | | | | | | | | | | | | | | |
Net asset value, end of period | | $ | 46.61 | | | $ | 38.13 | | | $ | 44.09 | | | $ | 38.22 | | | $ | 36.16 | |
| | | | | | | | | | | | | | | | | | | | |
Total Return(b) | | | 31.05 | % | | | (4.73 | )% | | | 21.50 | % | | | 11.61 | % | | | 1.07 | % |
| | | | | |
Ratios/Supplemental Data: | | | | | | | | | | | | | | | | | | | | |
Net assets, end of period (in thousands) | | $ | 186,771 | | | $ | 160,902 | | | $ | 194,117 | | | $ | 180,761 | | | $ | 179,395 | |
| | | | | |
Ratios to average net assets: | | | | | | | | | | | | | | | | | | | | |
Net expenses | | | 0.34 | % | | | 0.33 | % | | | 0.32 | % | | | 0.34 | %(c) | | | 0.37 | %(c) |
Gross expenses | | | 0.34 | % | | | 0.33 | % | | | 0.32 | % | | | 0.37 | % | | | 0.42 | % |
Net investment income | | | 1.67 | % | | | 1.62 | % | | | 1.69 | % | | | 1.86 | % | | | 1.72 | % |
Portfolio turnover rate | | | 2 | % | | | 2 | % | | | 2 | % | | | 2 | % | | | 2 | % |
Notes to Financial Highlights
| (a) | | Per share values have been calculated using the average shares method. |
| (b) | | Total returns are historical and assume changes in share price, reinvestment of dividends and capital gains distributions and do not include the effect of insurance contract charges. Past performance does not guarantee future results. |
| (c) | | Reflects a contractual arrangement with GE Asset Management Incorporated, the Fund’s investment adviser and administrator prior to July 1, 2016, to limit the advisory and administrative fee charged to the Fund to 0.30% of the average daily net assets of the Fund. |
| * | | Beginning with the year ended December 31, 2016, the Fund was audited by Ernst & Young LLP. The previous years were audited by another independent registered public accounting firm. |
The accompanying Notes are an integral part of these financial statements.
State Street S&P 500 Index V.I.S. Fund
Statement of Assets and Liabilities — December 31, 2019
| | | | |
Assets | | | | |
Investments in securities, at fair value (cost $66,375,203) | | $ | 185,509,808 | |
Investments in affiliated securities, at fair value (cost $1,044,098) | | | 1,103,483 | |
Net cash collateral on deposit with broker for future contracts | | | 38,511 | |
Receivable for investments sold | | | 208,085 | |
Income receivables | | | 186,975 | |
Receivable for fund shares sold | | | 8,218 | |
Income receivable from affiliated investments | | | 3,173 | |
Receivable for accumulated variation margin on futures contracts | | | 21,625 | |
Other assets | | | 985 | |
| | | | |
| |
Total assets | | | 187,080,863 | |
| | | | |
| |
Liabilities | | | | |
Due to custodian | | | 1,885 | |
Payable for fund shares redeemed | | | 223,158 | |
Payable to the Adviser | | | 39,204 | |
Payable for custody, fund accounting andsub-administration fees | | | 4,465 | |
Accrued other expenses | | | 41,541 | |
| | | | |
| |
Total liabilities | | | 310,253 | |
| | | | |
| | | | |
| |
Net Assets | | $ | 186,770,610 | |
| | | | |
| |
Net Assets Consist of: | | | | |
Capital paid in | | $ | 70,181,874 | |
Total distributable earnings (loss) | | | 116,588,736 | |
| | | | |
| |
Net Assets | | $ | 186,770,610 | |
| | | | |
| | | | |
Shares outstanding ($0.01 par value; unlimited shares authorized) | | | 4,007,110 | |
Net asset value per share | | $ | 46.61 | |
The accompanying Notes are an integral part of these financial statements.
| | | | |
| Statement of Assets and Liabilities | | | 17 | |
State Street S&P 500 Index V.I.S. Fund
Statement of Operations — For the fiscal year ended December 31, 2019
| | | | |
Investment Income | |
Income | |
Dividend | | $ | 3,503,339 | |
Income from affiliated investments | | | 57,288 | |
| | | | |
Total income | | | 3,560,627 | |
| | | | |
|
Expenses | |
Advisory and administration fees | | | 441,437 | |
Directors’ fees | | | 19,212 | |
Custody, fund accounting andsub-administration fees | | | 37,980 | |
Professional fees | | | 38,753 | |
Printing and shareholder reports | | | 24,946 | |
Other expenses | | | 42,488 | |
| | | | |
Total Expenses | | | 604,816 | |
| | | | |
Net investment income | | $ | 2,955,811 | |
| | | | |
|
Net Realized and Unrealized Gain (Loss) on Investments | |
Realized gain (loss) on: | |
Unaffiliated investments | | $ | 10,201,466 | |
Affiliated investments | | | (661 | ) |
Futures | | | 492,014 | |
Increase (decrease) in unrealized appreciation/depreciation on: | |
Unaffiliated investments | | | 33,538,216 | |
Affiliated investments | | | 44,182 | |
Futures | | | 111,735 | |
| | | | |
| |
Net realized and unrealized gain (loss) on investments | | | 44,386,952 | |
| | | | |
| |
Net Increase in Net Assets Resulting from Operations | | $ | 47,342,763 | |
| | | | |
The accompanying Notes are an integral part of these financial statements.
| | |
| 18 | | Statement of Operations |
State Street S&P 500 Index V.I.S. Fund
Statements of Changes in Net Assets
| | | | | | | | |
| | | Year Ended December 31,
2019 | | | Year Ended December 31,
2018 | |
Increase (Decrease) in Net Assets | |
|
Operations: | |
Net investment income | | $ | 2,955,811 | | | $ | 3,026,780 | |
Net realized gain (loss) on investments and futures | | | 10,692,819 | | | | 13,212,356 | |
Net increase (decrease) in unrealized appreciation/depreciation on investments and futures | | | 33,694,133 | | | | (23,393,093 | ) |
| | | | | | | | |
Net increase (decrease) from operations | | | 47,342,763 | | | | (7,153,957 | ) |
| | | | | | | | |
|
Distributions to shareholders: | |
Total distributions | | | (12,616,644 | ) | | | (14,751,301 | ) |
| | | | | | | | |
Increase (decrease) in assets from operations and distributions | | | 34,726,119 | | | | (21,905,258 | ) |
| | | | | | | | |
|
Share transactions: | |
Proceeds from sale of shares | | | 4,643,425 | | | | 2,837,356 | |
Value of distributions reinvested | | | 12,616,644 | | | | 14,751,301 | |
Cost of shares redeemed | | | (26,117,849 | ) | | | (28,898,496 | ) |
| | | | | | | | |
Net increase (decrease) from share transactions | | | (8,857,780 | ) | | | (11,309,839 | ) |
| | | | | | | | |
| | |
Total increase (decrease) in net assets | | | 25,868,339 | | | | (33,215,097 | ) |
Net Assets | |
Beginning of year | | | 160,902,271 | | | | 194,117,368 | |
| | | | | | | | |
| | |
End of year | | $ | 186,770,610 | | | $ | 160,902,271 | |
| | | | | | | | |
|
Changes in Fund Shares | |
Shares sold | | | 103,613 | | | | 61,494 | |
Issued for distributions reinvested | | | 269,932 | | | | 389,731 | |
Shares redeemed | | | (586,550 | ) | | | (634,062 | ) |
| | | | | | | | |
Net decrease in fund shares | | | (213,005 | ) | | | (182,837 | ) |
| | | | | | | | |
The accompanying Notes are an integral part of these financial statements.
| | | | |
| Statements of Changes in Net Assets | | | 19 | |
State Street S&P 500 Index V.I.S. Fund
Notes to Financial Statements — December 31, 2019
| 1. | | Organization of the Company |
State Street Variable Insurance Series Funds, Inc. (the “Company”) was incorporated under the laws of the Commonwealth of Virginia on May 14, 1984 and is registered under the Investment Company Act of 1940, as amended (the “1940 Act”), as anopen-end management investment company. The Company is currently composed of the following seven investment portfolios (collectively, the “Funds”): State Street U.S. Equity V.I.S. Fund, State Street S&P 500 Index V.I.S. Fund (the “Fund”), State Street Premier Growth Equity V.I.S. Fund, State StreetSmall-Cap Equity V.I.S. Fund, State Street Total Return V.I.S. Fund, State Street Income V.I.S. Fund and State Street Real Estate Securities V.I.S. Fund. Each Fund is a diversified investment company within the meaning of the 1940 Act.
Shares of the Funds of the Company are offered only to insurance company separate accounts that fund certain variable life insurance contracts and variable annuity contracts.
The Company currently offers one share class (Class 1) of the Fund as an investment option for variable life insurance and variable annuity contracts.
Under the Company’s organizational documents, its officers and directors are indemnified against certain liabilities arising out of the performance of their duties to the Company. Additionally, in the normal course of business, the Company enters into contracts with service providers that contain general indemnification clauses. The Company’s maximum exposure under these arrangements is unknown as this would involve future claims that may be made against the Company that have not yet occurred.
| 2. | | Summary of Significant Accounting Policies |
The following is a summary of significant accounting policies followed by the Company in the preparation of its financial statements:
The preparation of financial statements in accordance with U.S. generally accepted accounting principles (“U.S. GAAP”) requires management to make estimates and assumptions that affect the reported amounts and disclosures in the financial statements. Actual results could differ from those estimates. The Fund is an investment company under U.S. GAAP and follows the accounting and reporting guidance applicable to investment companies.
Security Valuation The Fund’s investments are valued at fair value each day that the New York Stock Exchange (“NYSE”) is open and, for financial reporting purposes, as of the report date should the reporting period end on a day that the NYSE is not open. Fair value is generally defined as the price a fund would receive to sell an asset or pay to transfer a liability in an orderly transaction between market participants at the measurement date. By its nature, a fair value price is a good faith estimate of the valuation in a current sale and may not reflect an actual market price. The investments of the Fund are valued pursuant to the policy and procedures developed by the Oversight Committee (the “Committee”) and approved by the Company’s Board of Directors (the “Board”). The Committee provides oversight of the valuation of investments for the Fund. The Board has responsibility for overseeing the determination of the fair value of investments.
Valuation techniques used to value the Fund’s investments by major category are as follows:
| | • | | Equity investments traded on a recognized securities exchange for which market quotations are readily available are valued at the last sale price or official closing price, as applicable, on the primary market or exchange on which they trade. Equity investments traded on a recognized exchange for which there were no sales on that day are valued at the last published sale price or at fair value. |
| | • | | Investments in registered investment companies (including money market funds) or other unitized pooled investment vehicles that are not traded on an exchange are valued at that day’s published net asset value (“NAV”) per share or unit. |
| | • | | Exchange-traded futures contracts are valued at the closing settlement price on the primary market on which they are traded most extensively. Exchange-traded futures contracts traded on a recognized exchange for which there were no sales on that day are valued at the last reported sale price obtained from independent pricing services or brokers or at fair value. |
| | |
| 20 | | Notes to Financial Statements |
State Street S&P 500 Index V.I.S. Fund
Notes to Financial Statements, continued — December 31, 2019
In the event prices or quotations are not readily available or that the application of these valuation methods results in a price for an investment that is deemed to be not representative of the fair value of such investment, fair value will be determined in good faith by the Committee, in accordance with the valuation policy and procedures approved by the Board.
The Fund values its assets and liabilities at fair value using a fair value hierarchy consisting of three broad levels that prioritize the inputs to valuation techniques giving the highest priority to readily available unadjusted quoted prices in active markets for identical assets or liabilities (Level 1 measurements) and the lowest priority to unobservable inputs (Level 3 measurements) when market prices are not readily available or reliable. The categorization of a value determined for an investment within the hierarchy is based upon the pricing transparency of the investment and is not necessarily an indication of the risk associated with investing in it.
The three levels of the fair value hierarchy are as follows:
| | • | | Level 1 — Unadjusted quoted prices in active markets for an identical asset or liability; |
| | • | | Level 2 — Inputs other than quoted prices included within Level 1 that are observable for the asset or liability either directly or indirectly, including quoted prices for similar assets or liabilities in active markets, quoted prices for identical or similar assets or liabilities in markets that are not considered to be active, inputs other than quoted prices that are observable for the asset or liability (such as exchange rates, financing terms, interest rates, yield curves, volatilities, prepayment speeds, loss severities, credit risks and default rates) or other market-corroborated inputs; and |
| | • | | Level 3 — Unobservable inputs for the asset or liability, including the Committee’s assumptions used in determining the fair value of investments. |
The value of the Fund’s investments according to the fair value hierarchy as of December 31, 2019 is disclosed in the Fund’s Schedule of Investments.
Investment Transactions and Income Recognition Investment transactions are accounted for on trade date for financial reporting purposes. Realized gains and losses from the sale or disposition of investments and foreign exchange transactions, if any, are determined using the identified cost method.
Dividend income and capital gain distributions, if any, are recognized on theex-dividend date, net of any foreign taxes withheld at source, if any.
Interest income is recorded daily on an accrual basis. All premiums and discounts are amortized/accreted for financial reporting purposes.
Non-cash dividends received in the form of stock are recorded as dividend income at fair value.
Expenses Certain expenses, which are directly identifiable to a specific Fund, are applied to the Fund within the Company. Other expenses which cannot be attributed to a specific Fund are allocated in such a manner as deemed equitable, taking into consideration the nature and type of expense and the relative net assets of the Fund within the Company.
Distributions The Fund declares and pays any dividends from net investment income annually.
Net realized capital gains, if any, are distributed annually, unless additional distributions are required for compliance with applicable tax regulations. The amount and character of income and capital gains to be distributed are determined in accordance with applicable tax regulations which may differ from net investment income and realized gains recognized for U.S. GAAP purposes.
| 3. | | Derivative Financial Instruments |
Futures Contracts The Fund may enter into futures contracts to meet the Fund’s objectives. A futures contract is a standardized, exchange-traded agreement to buy or sell a financial instrument at a set price on a future date. Upon entering into a futures contract, the Fund is required to deposit with the broker, cash or securities in an amount equal to the minimum initial margin requirements of the clearing house. Subsequent payments are made or received by the Fund equal to the daily change in the contract value, accumulated, exchange rates, and or other transactional fees. The accumulation of those payments are recorded as variation margin receivable or payable with a corresponding offset to unrealized gains or losses. The Fund recognizes a realized gain or loss when the contract is closed.
| | | | |
| Notes to Financial Statements | | | 21 | |
State Street S&P 500 Index V.I.S. Fund
Notes to Financial Statements, continued — December 31, 2019
Losses may arise if the value of a futures contract decreases due to unfavorable changes in the market rates or values of the underlying instrument during the term of the contract or if the counterparty does not perform under the contract. The use of futures contracts also involves the risk that the movements in the price of the futures contracts do not correlate with the movement of the assets underlying such contracts.
For the fiscal year ended December 31, 2019, the Fund entered into futures contracts for cash equitization.
The following tables summarize the value of the Fund’s derivative instruments as of December 31, 2019 and the related location in the accompanying Statement of Assets and Liabilities and Statement of Operations, presented by primary underlying risk exposure:
Asset Derivatives
| | | | | | | | | | | | | | | | | | | | | | | | |
| | | Interest
Rate
Contracts
Risk | | | Foreign
Exchange
Contracts
Risk | | | Credit
Contracts
Risk | | | Equity
Contracts
Risk | | | Commodity
Contracts
Risk | | | Total | |
State Street S&P 500 Index V.I.S. Fund | |
Futures Contracts | | $ | — | | | $ | — | | | $ | — | | | $ | 21,625 | | | $ | — | | | $ | 21,625 | |
Realized Gain/Loss
| | | | | | | | | | | | | | | | | | | | | | | | |
| | | Interest
Rate
Contracts
Risk | | | Foreign
Exchange
Contracts
Risk | | | Credit
Contracts
Risk | | | Equity
Contracts
Risk | | | Commodity
Contracts
Risk | | | Total | |
State Street S&P 500 Index V.I.S. Fund | |
Futures Contracts | | $ | — | | | $ | — | | | $ | — | | | $ | 492,014 | | | $ | — | | | $ | 492,014 | |
Net Change in Unrealized Appreciation (Depreciation)
| | | | | | | | | | | | | | | | | | | | | | | | |
| | | Interest
Rate
Contracts
Risk | | | Foreign
Exchange
Contracts
Risk | | | Credit
Contracts
Risk | | | Equity
Contracts
Risk | | | Commodity
Contracts
Risk | | | Total | |
State Street S&P 500 Index V.I.S. Fund | |
Futures Contracts | | $ | — | | | $ | — | | | $ | — | | | $ | 111,735 | | | $ | — | | | $ | 111,735 | |
| 4. | | Fees and Transactions with Affiliates |
Advisory Fee SSGA Funds Management, Inc. (the “Adviser” or “SSGA FM”), a registered investment adviser, was retained by the Board to act as investment adviser and administrator of the Fund. SSGA FM’s compensation for investment advisory and administrative services (“Management Fee”) is paid monthly based on the average daily net assets of the Fund at an annualized rate of 0.25%.
Custody, Fund Accounting andSub-Administration Fees State Street Bank and Trust Company (“State Street”) serves as the custodian, fund accountant andsub-administrator to the Fund. Amounts paid by the Fund to State Street for performing such services are included as custody, fund accounting andsub-administration fees in the Statement of Operations.
Other Transactions with Affiliates The Fund may invest in affiliated entities, including securities issued by State Street Corporation, affiliated funds, or entities deemed to be affiliates as a result of the Fund owning more than five percent of the entity’s voting securities or outstanding shares. Amounts relating to these transactions during the fiscal year ended December 31, 2019 are disclosed in the Schedule of Investments.
Due to Custodian In certain circumstances, the Fund may have cash overdrafts with the custodian due to expense payments, capital transactions, trading of securities, investment operations or derivative transactions. The Due to custodian amount, if any, reflects cash overdrawn with State Street, as custodian, who is an affiliate of the Fund.
| | |
| 22 | | Notes to Financial Statements |
State Street S&P 500 Index V.I.S. Fund
Notes to Financial Statements, continued — December 31, 2019
The fees and expenses of the Company’s directors who are not “interested persons” of the Company, as defined in the 1940 Act (“Independent Directors”), are paid directly by the Fund. The Independent Directors are reimbursed for travel and otherout-of-pocket expenses in connection with meeting attendance and industry seminars.
| 6. | | Investment Transactions |
Purchases and sales of investments (excludingin-kind transactions, short term investments and derivative contracts) for the year ended, December 31, 2019 were as follows:
| | | | | | | | |
| Non-U.S. Government Securities |
| Purchases | | Sales |
| | $ | 2,944,618 | | | | $ | 19,442,921 | |
The Fund has qualified and intends to continue to qualify as a regulated investment company under Subchapter M of the Internal Revenue Code of 1986, as amended. The Fund will not be subject to federal income taxes to the extent it distributes its taxable income, including any net realized capital gains, for each fiscal year. Therefore, no provision for federal income tax is required.
The Fund files federal and various state and local tax returns as required. No income tax returns are currently under examination. Generally, the federal returns are subject to examination by the Internal Revenue Service for a period of three years from date of filing, while the state returns may remain open for an additional year depending upon jurisdiction. SSGA FM has analyzed the Fund’s tax positions taken on tax returns for all open years and does not believe there are any uncertain tax positions that would require recognition of a tax liability.
Distributions to shareholders are recorded onex-dividend date. Income dividends and gain distributions are determined in accordance with income tax rules and regulations, which may differ from generally accepted accounting principles. Certain capital accounts in the financial statements have been adjusted for permanentbook-tax differences. These adjustments have no impact on net asset values or results of operations. Temporarybook-tax differences will reverse in the future. These book tax differences are primarily due to REIT basis adjustments, corporate actions, futures contracts, passive foreign investment company inclusions, return of capital distributions received and wash sale loss deferrals.
The tax character of distributions paid during the fiscal year ended December 31, 2019 was as follows:
| | | | | | | | | | | | | |
Ordinary
Income | | Long-Term
Capital Gains | | Total |
| | $ | 2,536,339 | | | | $ | 10,080,305 | | | | $ | 12,616,644 | |
The tax character of distributions paid during the fiscal year ended December 31, 2018 was as follows:
| | | | | | | | | | | | | |
Ordinary
Income | | Long-Term
Capital Gains | | Total |
| | $ | 3,385,045 | | | | $ | 11,366,256 | | | | $ | 14,751,301 | |
At December 31, 2019, the components of distributable earnings on a tax basis were as follows:
| | | | | | | | | | | | | | | | | | | | | | | | | | | | |
Undistributed
Ordinary
Income | | Capital Loss
Carryforwards | | Undistributed
long term gain | | Net Unrealized
Gains (Losses) | | Qualified
Late-Year
Losses | | Total |
| | $ | 695,615 | | | | $ | — | | | | $ | 1,525,335 | | | | $ | 114,367,786 | | | | $ | — | | | | $ | 116,588,736 | |
| | | | |
| Notes to Financial Statements | | | 23 | |
State Street S&P 500 Index V.I.S. Fund
Notes to Financial Statements, continued — December 31, 2019
As of December 31, 2019, gross unrealized appreciation and gross unrealized depreciation of investments and other financial instruments based on cost for federal income tax purposes were as follows:
| | | | | | | | | | | | | | | | | | |
Tax
Cost | | Gross
Unrealized
Appreciation | | Gross
Unrealized
Depreciation | | Net Unrealized
Appreciation
(Depreciation) |
| | $ | 72,267,110 | | | | $ | 117,555,370 | | | | $ | 3,187,585 | | | | $ | 114,367,785 | |
The Fund and other affiliated funds (each, a “Participant” and collectively, the “Participants”) have access to $200 million of a $500 million revolving credit facility, provided by a syndication of banks under which the Participants may borrow to fund shareholder redemptions.
The Participants are charged an annual commitment fee which is calculated based on the unused portion of the shared credit line. Commitment fees are allocated among each of the Participants based on relative net assets. Commitment fees are ordinary fund operating expenses. A Participant incurs and pays the interest expense related to its borrowing. Interest is calculated at a rate per annum equal to the sum of 1% plus the greater of the New York Fed Bank Rate and1-month LIBOR rate.
The Fund had no outstanding loans as of December 31, 2019.
Concentration Risk As a result of the Fund’s ability to invest a large percentage of its assets in obligations of issuers within the same country, state, region, currency or economic sector, an adverse economic, business or political development may affect the value of the Fund’s investments more than if the Fund were more broadly diversified.
Market and Credit Risk In the normal course of business, the Fund trades financial instruments and enters into financial transactions where risk of potential loss exists due to changes in the general economic conditions and fluctuations of the market (market risk). Additionally, the Fund may also be exposed to credit risk in the event that an issuer or guarantor fails to perform or that an institution or entity with which the Fund has unsettled or open transactions defaults.
Management has evaluated the impact of all subsequent events on the Fund through the date on which the financial statements were available to be issued and has determined that there were no subsequent events requiring adjustment or disclosure in the financial statements.
| | |
| 24 | | Notes to Financial Statements |
State Street S&P 500 Index V.I.S. Fund
Report of Independent Registered Public Accounting Firm
To the Shareholders of State Street S&P 500 Index V.I.S. Fund and the Board of Directors of State Street Variable Insurance Series Funds, Inc.
Opinion on the Financial Statements
We have audited the accompanying statement of assets and liabilities of State Street S&P 500 Index V.I.S. Fund (the “Fund”) (one of the funds constituting State Street Variable Insurance Series Funds, Inc. (the “Company”)), including the schedule of investments, as of December 31, 2019, and the related statement of operations for the year then ended, the statements of changes in net assets for each of the two years in the period then ended, the financial highlights for each of the four years in the period then ended and the related notes (collectively referred to as the “financial statements”). In our opinion, the financial statements present fairly, in all material respects, the financial position of the Fund (one of the funds constituting State Street Variable Insurance Series Funds, Inc.) at December 31, 2019, the results of its operations for the year then ended, the changes in its net assets for each of the two years in the period then ended and its financial highlights for each of the four years in the period then ended, in conformity with U.S. generally accepted accounting principles. The financial highlights for the year ended December 31, 2015 were audited by another independent registered public accounting firm whose report, dated February 19, 2016, expressed an unqualified opinion on those financial highlights.
Basis for Opinion
These financial statements are the responsibility of the Company’s management. Our responsibility is to express an opinion on the Fund’s financial statements based on our audits. We are a public accounting firm registered with the Public Company Accounting Oversight Board (United States) (“PCAOB”) and are required to be independent with respect to the Company in accordance with the U.S. federal securities laws and the applicable rules and regulations of the Securities and Exchange Commission and the PCAOB.
We conducted our audits in accordance with the standards of the PCAOB. Those standards require that we plan and perform the audit to obtain reasonable assurance about whether the financial statements are free of material misstatement, whether due to error or fraud. The Company is not required to have, nor were we engaged to perform, an audit of the Company’s internal control over financial reporting. As part of our audits we are required to obtain an understanding of internal control over financial reporting, but not for the purpose of expressing an opinion on the effectiveness of the Company’s internal control over financials reporting. Accordingly, we express no such opinion.
Our audits included performing procedures to assess the risks of material misstatement of the financial statements, whether due to error or fraud, and performing procedures that respond to those risks. Such procedures included examining, on a test basis, evidence regarding the amounts and disclosures in the financial statements. Our procedures included confirmation of securities owned as of December 31, 2019, by correspondence with the custodian, brokers and others. Our audits also included evaluating the accounting principles used and significant estimates made by management, as well as evaluating the overall presentation of the financial statements. We believe that our audits provide a reasonable basis for our opinion.

We have served as the auditor of one or more State Street Global Advisors investment companies since 2000.
Boston, Massachusetts
February 19, 2020
| | | | |
| Report of Independent Registered Public Accounting Firm | | | 25 | |
State Street S&P 500 Index V.I.S. Fund
Tax Information — December 31, 2019 (Unaudited)
For federal income tax purposes, the following information is furnished with respect to the distributions of the Fund for its fiscal year ended December 31, 2019.
Dividends Received Deduction
The Fund reports the maximum amount allowable of its net taxable income as eligible for the corporate dividends received deduction.
Long Term Capital Gain Distributions
Long term capital gains dividends were paid from the Fund during the year ended December 31, 2019 in the amount of $10,080,305.
State Street S&P 500 Index V.I.S. Fund
Other Information — December 31, 2019 (Unaudited)
Liquidity Risk Management Program
Pursuant to Rule 22e-4 under the 1940 Act, the Funds have adopted a liquidity risk management program. SSGA FM has been designated by the Board to administer the Funds’ liquidity risk management program. The program’s principal objectives include assessing, managing and periodically reviewing each Fund’s liquidity risk, based on factors specific to the circumstances of the Fund. Liquidity risk is defined as the risk that a Fund could not meet redemption requests without significant dilution of remaining investors’ interests in the Fund. During the fiscal year, SSGA FM provided the Board with a report addressing the operations of the program and assessing its adequacy and effectiveness of implementation.
During the period covered by the liquidity program report to the Board, the program supported each Fund’s ability to honor redemption requests timely and SSGA FM’s management of each Fund’s liquidity profile, including during periods of market volatility and net redemptions. SSGA FM reported that the program operated adequately and that the implementation of the program was effective to manage the Fund’s liquidity risk.
There can be no assurance that the program will achieve its objectives in the future. Please refer to your Fund’s prospectus for more information regarding the Fund’s exposure to liquidity risk and other principal risks to which an investment in the Fund may be subject.
Proxy Voting Policies and Procedures and Record
The Fund has adopted the proxy voting policies of SSGA FM. A description of the policies and procedures that the Fund has adopted to determine how to vote proxies relating to portfolio securities is available (i) without charge, upon request, by calling1-800-242-0134, (ii) on the Fund’s website at http://www.ssga.com/geam, or (iii) on the SEC’s website at www.sec.gov. Information regarding how the Fund voted proxies, if any, during the most recent12-month period ended June 30 is available by August 31 of each year without charge (1) by calling1-800-242-0134 (toll free), and (2) on the website of the SEC at www.sec.gov.
Quarterly Portfolio Schedule
Following the Fund’s first and third fiscal quarter-ends, a complete schedule of investments is filed with the SEC as an exhibit to its reports onForm N-PORT, which can be found on the SEC’s website at www.sec.gov. The Fund’s schedule of investments are available upon request, without charge, by calling 1-800-242-0134.
State Street S&P 500 Index V.I.S. Fund
Other Information, continued — December 31, 2019 (Unaudited)
| | | | | | | | | | | | |
| | | | | | |
Name, Address, and Year of Birth | | Position(s) Held with Fund | | Term of Office and Length of Time Served | | Principal Occupation During Past Five Years and Relevant Experience | | Number of Funds
in Fund Complex Overseen by Director† | | | Other Directorships Held by Director During Past Five Years |
INDEPENDENT DIRECTORS |
Michael F. Holland c/o SSGA Funds Management, Inc. One Iron Street Boston, MA 02210 YOB: 1944 | | Director and Co-Chairperson of the Board | | Term: Until successor is elected and qualified Served: Since January 2019 | | Chairman, Holland & Company L.L.C. (investment adviser) (1995 – present). | | | 68 | | | Director, the Holland Series Fund, Inc.; Director, Reaves Utility Income Fund, Inc.; and Director, Blackstone/GSO Loans (and Real Estate) Funds. |
| |
Patrick J. Riley c/o SSGA Funds Management, Inc. One Iron Street Boston, MA 02210 YOB: 1948 | | Director and Co-Chairperson of the Board | | Term: Until successor is elected and qualified Served: Since January 2019 | | 2002 to May 2010, Associate Justice of the Superior Court, Commonwealth of Massachusetts; 1985 to 2002, Partner, Riley, Burke & Donahue, L.L.P. (law firm); 1998 to Present, Independent Director, State Street Global Advisers Ireland, Ltd. (investment company); 1998 to Present, Independent Director, SSGA Liquidity plc (formerly, SSGA Cash Management Fund plc); January 2009 to Present, Independent Director, SSGA Fixed Income plc; and January 2009 – 2019, Independent Director, SSGA Qualified Funds PLC. | | | 68 | | | Board Director and Chairman, SPDR Europe 1PLC Board (2011 – Present); Board Director and Chairman, SPDR Europe II, PLC (2013- Present). |
| |
John R. Costantino c/o SSGA Funds Management, Inc. One Iron Street Boston, MA 02210 YOB: 1946 | | Director and Co-Chairperson of the Qualified Legal Compliance Committee | | Term: Until successor is elected and qualified Served: Since 1997 | | Senior Advisor to NGN Capital LLC (December 2019 – Present); Managing General Partner, NGN Capital LLC (2006 – December 2019); and Managing Director, Vice President of Walden Capital Management (1996 – present). | | | 68 | | | Director of Kleinfeld Bridal Corp. (March 2016 – present); Trustee of Neuroscience Research Institute (1986 – 2018); Trustee of Fordham University (1989 – 1995 and 2001 – 2007) and Trustee Emeritus (2007 – present); Director, Muscular Dystrophy Association (since 2019); Trustee of GE Funds (1993 – February 2011); and Trustee of Gregorian University Foundation (1992 – 2007). |
| |
Donna M. Rapaccioli c/o SSGA Funds Management, Inc. One Iron Street Boston, MA 02210 YOB: 1962 | | Director and Co-Chairperson of the Audit Committee | | Term: Until successor is elected and qualified Served: Since January 2012 | | Dean of the Gabelli School of Business (2007 – present) and Accounting Professor (1987 – present) at Fordham University. | | | 68 | | | Director-Graduate Management Admissions Council (2015 – present). |
State Street S&P 500 Index V.I.S. Fund
Other Information, continued — December 31, 2019 (Unaudited)
| | | | | | | | | | | | |
| | | | | | |
Name, Address, and Year of Birth | | Position(s) Held with Fund | | Term of Office and Length of Time Served | | Principal Occupation During Past Five Years and Relevant Experience | | Number of Funds
in Fund Complex Overseen by Director† | | | Other Directorships Held by Director During Past Five Years |
INDEPENDENT DIRECTORS (continued) |
Richard D. Shirk c/o SSGA Funds Management, Inc. One Iron Street Boston, MA 02210 YOB: 1945 | | Director and Co-Chairperson of the Qualified Legal Compliance Committee | | Term: Until successor is elected and qualified Served: Since January 2019 | | March 2001 to April 2002, Chairman (1996 to March 2001, President and Chief Executive Officer), Cerulean Companies, Inc. (holding company) (Retired); 1992 to March 2001, President and Chief Executive Officer, Blue Cross Blue Shield of Georgia (health insurer, managed healthcare). | | | 68 | | | 1998 to December 2008, Chairman, Board Member and December 2008 to Present, Investment Committee Member, Healthcare Georgia Foundation (private foundation); September 2002 to 2012, Lead Director and Board Member, Amerigroup Corp. (managed health care); 1999 to 2013, Board Member and (since 2001) Investment Committee Member, Woodruff Arts Center; and 2003 to 2009, Trustee, Gettysburg College; Board member, Aerocare Holdings, Regenesis Biomedical Inc. |
| |
Rina K. Spence c/o SSGA Funds Management, Inc. One Iron Street Boston, MA 02210 YOB: 1948 | | Director and Co-Chairperson of the Audit Committee, Chairperson of the Nominating Committee and Chairperson of the Governance Committee | | Term: Until successor is elected and qualified Served: Since January 2019 | | President of SpenceCare International LLC (international healthcare consulting) (1999 – present); Chief Executive Officer, IEmily.com (health internet company) (2000 – 2001); Chief Executive Officer of Consensus Pharmaceutical, Inc. (1998 – 1999); Founder, President and Chief Executive Officer of Spence Center for Women’s Health (1994 – 1998); President and CEO, Emerson Hospital (1984 – 1994); Honorary Consul for Monaco in Boston (2015 – present). | | | 68 | | | None |
| |
Michael A. Jessee c/o SSGA Funds Management, Inc. One Iron Street Boston, MA 02210 YOB: 1946 | | Director and Chairperson of the Valuation Committee | | Term: Until successor is elected and qualified
Served: Since January 2019 | | Retired; formerly, President and Chief Executive Officer of the Federal Home Loan Bank of Boston (1989 – 2009); Trustee, Randolph-Macon College (2004 – 2016). | | | 68 | | | None |
| |
INTERESTED DIRECTORS(1) |
Ellen M. Needham(2) SSGA Funds Management, Inc. One Iron Street Boston, MA 02210 YOB: 1967 | | Director | | Term: Until successor is elected and qualified Served: Since January 2019 | | President and Director, SSGA Funds Management, Inc. (2001 – present)*; Senior Managing Director, State Street Global Advisors (1992 – present)*; Director, State Street Global Advisors Funds Distributors, LLC (May 2017 – present). | | | 68 | | | None |
State Street S&P 500 Index V.I.S. Fund
Other Information, continued — December 31, 2019 (Unaudited)
| | | | | | | | | | | | |
| | | | | | |
Name, Address, and Year of Birth | | Position(s) Held with Fund | | Term of Office and Length of Time Served | | Principal Occupation During Past Five Years and Relevant Experience | | Number of Funds
in Fund Complex Overseen by Director† | | | Other Directorships Held by Director During Past Five Years |
INTERESTED DIRECTORS (continued) |
Jeanne La Porta(3) c/o SSGA Funds Management, Inc. 1600 Summer St. Stamford, CT 06905 YOB: 1965 | | Director & President | | Term: Until successor is elected and qualified Served: Since 2014 | | Senior Managing Director at State Street Global Advisors (July 2016 – present); Director of State Street Global Advisors Funds Distributors, LLC (May 2017 – present); President of GE Retirement Savings Plan Funds (July 2016 – September 2018); Senior Vice President and Commercial Operations Leader at GE Asset Management Incorporated (“GEAM”) (March 2014 – July 2016); President of State Street Institutional Funds and State Street Variable Insurance Series Funds, Inc. (April 2014 – present); President and Trustee of GEAM’s UCITs Funds (March 2014 – November 2014); Senior Vice President and Commercial Administrative Officer at GEAM (April 2010 – March 2014); Vice President of State Street Institutional Funds (July 2003 – April 2014); Vice President of Elfun Funds and GE Retirement Savings Plan Funds (October 2003 – July 2016). | | | 18 | | | None |
| † | | For the purpose of determining the number of portfolios overseen by the Directors, “Fund Complex” comprises registered investment companies for which SSGA FM serves as investment adviser. |
| (1) | | The individuals listed below are Directors who are “interested persons,” as defined in the 1940 Act, of the Company (“Interested Directors”). |
| (2) | | Ms. Needham is an Interested Director because of her employment by SSGA FM, an affiliate of the Company. |
| (3) | | Ms. La Porta is an Interested Director because of her employment by SSGA, an affiliate of the Company. |
| * | | Served in various capacities and/or with various affiliated entities during noted time period. |
State Street S&P 500 Index V.I.S. Fund
Other Information, continued — December 31, 2019 (Unaudited)
| | | | | | |
| | | | |
Name, Address, and Year of Birth | | Position(s) Held with Fund | | Term of Office and Length of Time Served | | Principal Occupation During Past Five Years |
OFFICERS: | | | | | | |
Jeanne M. La Porta SSGA Funds Management, Inc. 1600 Summer St. Stamford, CT 06905 YOB: 1965 | | President and Director | | Term: Indefinite Elected: 3/14 | | Senior Managing Director at State Street Global Advisors (July 2016 – present); Director of State Street Global Advisors Funds Distributors, LLC (May 2017 – present); President of GE Retirement Savings Plan Funds (July 2016 – September 2018); Senior Vice President and Commercial Operations Leader at GEAM (March 2014 – July 2016); President of State Street Institutional Funds and State Street Variable Insurance Series Funds, Inc. (April 2014 – present); President and Trustee of GEAM’s UCITs Funds (March 2014 – November 2014); Senior Vice President and Commercial Administrative Officer at GEAM (April 2010 – March 2014); Vice President of State Street Institutional Funds (July 2003 – April 2014); Vice President of Elfun Funds and GE Retirement Savings Plan Funds (October 2003 – July 2016); Secretary of GE Funds (July 2007 – September 2010) and Vice President (July 2007 – February 2011); Senior Vice President and Deputy General Counsel of GEAM (October 2007 – April 2010); Vice President and Assistant Secretary of Elfun Funds and GE Retirement Savings Plan Funds (July 2003 – June 2010); and Vice President and Associate General Counsel – Marketing and Client Services (formerly Asset Management Services) at GEAM (May 1997 – October 2007). |
| |
Bruce S. Rosenberg SSGA Funds Management, Inc. One Iron Street Boston, MA 02210 YOB: 1961 | | Treasurer | | Term: Indefinite Elected: 4/19 | | Managing Director, State Street Global Advisors and SSGA Funds Management, Inc. (July 2015 – present); Director, Credit Suisse (April 2008 – July 2015). |
| |
Ann M. Carpenter SSGA Funds Management, Inc. One Iron Street Boston, MA 02210 YOB: 1966 | | Vice President and Deputy Treasurer | | Term: Indefinite Elected: 4/19 | | Chief Operating Officer, SSGA Funds Management, Inc. (April 2005 – present)*; Managing Director, State Street Global Advisors. (2005 – present).* |
| |
Chad C. Hallett SSGA Funds Management, Inc. One Iron Street Boston, MA 02210 YOB: 1969 | | Deputy Treasurer | | Term: Indefinite Elected: 4/19 | | Vice President, State Street Global Advisors and SSGA Funds Management, Inc. (November 2014 – present); Vice President, State Street Bank and Trust Company (2001 – November 2014).* |
| |
Darlene Anderson-Vasquez SSGA Funds Management, Inc. One Iron Street Boston, MA 02210 YOB: 1968 | | Deputy Treasurer | | Term: Indefinite Elected: 4/19 | | Managing Director, State Street Global Advisors and SSGA Funds Management, Inc. (May 2016 – present); Senior Vice President, John Hancock Investments (September 2007 – May 2016). |
State Street S&P 500 Index V.I.S. Fund
Other Information, continued — December 31, 2019 (Unaudited)
| | | | | | |
| | | | |
Name, Address, and Year of Birth | | Position(s) Held with Fund | | Term of Office and Length of Time Served | | Principal Occupation During Past Five Years |
OFFICERS (continued): | | | | | | |
Arthur A. Jensen SSGA Funds Management, Inc. 1600 Summer Street Stamford, CT 06905 YOB: 1966 | | Deputy Treasurer | | Term: Indefinite Elected: 4/19 | | Vice President State Street Global Advisors and SSGA Funds Management, Inc. (July 2016 – present); Deputy Treasurer of Elfun Funds (July 2016 – present); Treasurer of State Street Institutional Funds, State Street Variable Insurance Series Funds, Inc. and GE Retirement Savings Plan Funds (June 2011 – present); Treasurer of Elfun Funds (June 2011– July 2016); Mutual Funds Controller of GE Asset Management Incorporated (April 2011 – July 2016). |
| |
Sujata Upreti SSGA Funds Management, Inc. One Iron Street Boston, MA 02210 YOB: 1974 | | Assistant Treasurer | | Term: Indefinite Elected: 4/19 | | Vice President, State Street Global Advisors and SSGA Funds Management, Inc. (May 2015 – present); Assistant Director, Cambridge Associates, LLC (July 2014 – January 2015); Vice President, Bank of New York Mellon (July 2012 – August 2013); Manager, PricewaterhouseCoopers, LLP (September 2003 – July 2012). |
| |
Daniel Foley SSGA Funds Management, Inc. One Iron Street Boston, MA 02210 YOB: 1972 | | Assistant Treasurer | | Term: Indefinite Elected: 4/19 | | Vice President, State Street Global Advisors and SSGA Funds Management, Inc. (April 2007 – present).* |
| |
Daniel G. Plourde SSGA Funds Management, Inc. One Iron Street Boston, MA 02210 YOB: 1980 | | Assistant Treasurer | | Term: Indefinite Elected: 6/17 | | Vice President, State Street Global Advisors and SSGA Funds Management, Inc. (May 2015 – present); Officer, State Street Bank and Trust Company (March 2009 – May 2015). |
| |
Brian Harris SSGA Funds Management, Inc. One Iron Street Boston, MA 02210 YOB: 1973 | | Chief Compliance Officer, Anti-Money Laundering Officer and Code of Ethics Compliance Officer | | Term: Indefinite Elected: 7/16 Term: Indefinite Elected: 4/19 | | Managing Director, State Street Global Advisors and SSGA Funds Management, Inc. (June 2013 – Present)*; Senior Vice President and Global Head of Investment Compliance, BofA Global Capital Management (September 2010 – May 2013). |
| |
Sean O’Malley SSGA Funds Management, Inc. One Iron Street Boston, MA 02210 YOB: 1969 | | Chief Legal Officer | | Term: Indefinite Elected: 8/19 | | Senior Vice President and Deputy General Counsel, State Street Global Advisors (November 2013 – present). |
| |
Andrew DeLorme SSGA Funds Management, Inc. One Iron Street Boston, MA 02210 YOB: 1975 | | Secretary | | Term: Indefinite Elected: 8/19 | | Vice President and Senior Counsel, State Street Global Advisors (April 2016 – present); Vice President and Counsel, State Street Global Advisors (August 2014 – March 2016). |
State Street S&P 500 Index V.I.S. Fund
Other Information, continued — December 31, 2019 (Unaudited)
| | | | | | |
| | | | |
Name, Address, and Year of Birth | | Position(s) Held with Fund | | Term of Office and Length of Time Served | | Principal Occupation During Past Five Years |
OFFICERS (continued): | | | | | | |
Kevin Morris SSGA Funds Management, Inc. One Iron Street Boston, MA 02210 YOB: 1982 | | Assistant Secretary | | Term: Indefinite Elected: 8/19 | | Vice President and Senior Counsel, State Street Global Advisors (April 2019 – present); Vice President and Counsel, State Street Global Advisors (January 2016 – April 2019); Director, Asset Management Compliance, Fidelity Investments (June 2015 – January 2016); Senior Compliance Advisor, Asset Management Compliance, Fidelity Investments (June 2012 – June 2015). |
| |
David Urman SSGA Funds Management, Inc. One Iron Street Boston, MA 02210 YOB: 1985 | | Assistant Secretary | | Term: Indefinite Elected: 8/19 | | Vice President and Senior Counsel, State Street Global Advisors (April 2019 – present); Vice President and Counsel, State Street Global Advisors (August 2015 – April 2019); Associate, Ropes & Gray LLP (November 2012 – August 2015). |
| * | Served in various capacities and/or with various affiliated entities during noted time period. |
Directors
Michael F. Holland, Co-Chairperson
Patrick J. Riley, Co-Chairperson
John R. Costantino
Donna M. Rapaccioli
Michael A. Jessee
Richard D. Shirk
Rina K. Spence
Jeanne M. La Porta
Ellen M. Needham
Officers
Jeanne M. La Porta, President
Brian Harris, Chief Compliance Officer, Anti-Money Laundering Officer and Code of Ethics Compliance Officer
Sean O’Malley, Chief Legal Officer
Bruce S. Rosenberg, Treasurer
Ann M. Carpenter, Vice President and Deputy Treasurer
Chad C. Hallett, Deputy Treasurer
Arthur A. Jensen, Deputy Treasurer
Darlene Anderson-Vasquez, Deputy Treasurer
Sujata Upreti, Assistant Treasurer
Daniel Foley, Assistant Treasurer
Daniel G. Plourde, Assistant Treasurer
Andrew DeLorme, Secretary
Kevin Morris, Assistant Secretary
David Urman, Assistant Secretary
Investment Adviser and Administrator
SSGA Funds Management, Inc.
One Iron Street
Boston, MA 02210
Custodian andSub-Administrator
State Street Bank and Trust Company
One Lincoln Street
Boston, Massachusetts 02111
Distributor
State Street Global Advisors Funds Distributors, LLC
One Iron Street
Boston, MA 02210
Independent Registered Public Accounting Firm
Ernst & Young LLP
200 Clarendon Street
Boston, Massachusetts 02116
Annual Report
December 31, 2019
State StreetSmall-Cap Equity V.I.S. Fund
Beginning on January 1, 2021, as permitted by regulations adopted by the U.S. Securities and Exchange Commission, paper copies of a Fund’s annual and semi-annual shareholder reports will no longer be sent by mail, unless you specifically request paper copies of the reports. Instead, the reports will be made available on a Fund’s website (www.ssga.com/geam), and you will be notified by mail each time a report is posted, and provided with a website link to access the report. If you already elected to receive shareholder reports electronically, you will not be affected by this change and you need not take any action.
You may elect to receive all future reports in paper free of charge. To do so, contact your Insurance Provider. Your election to receive reports in paper will apply to all funds held in your account.

State StreetSmall-Cap Equity V.I.S. Fund
Annual Report
December 31, 2019
Table of Contents
This report is prepared for Policyholders of certain variable contracts and may be distributed to others only if preceded or accompanied by the variable contract’s current prospectus and the current summary prospectus of the Fund available for investments thereunder.
State StreetSmall-Cap Equity V.I.S. Fund
Notes to Performance — December 31, 2019 (Unaudited)
The information provided on the performance page relates to the State Street Small-Cap Equity V.I.S. Fund (the “Fund”).
Total return performance shown in this report for the Fund takes into account changes in share price and assumes reinvestment of dividends and capital gains distributions, if any. Total returns shown are net of Fund fees and expenses but do not reflect fees and charges associated with the variable contracts such as administrative fees, account charges and surrender charges, which, if reflected, would reduce the Fund’s total returns for all periods shown.
The performance data quoted represents past performance; past performance does not guarantee future results. Investment return and principal value will fluctuate so your shares, when redeemed, may be worth more or less than their original cost. Current performance may be higher or lower than the performance data quoted. Periods less than one year are not annualized. Please call toll-free(800) 242-0134 or visit the Fund’s website at http://www.ssga.com/geam for the most recent month-end performance data.
An investment in the Fund is not a deposit of any bank and is not insured or guaranteed by the Federal Deposit Insurance Corporation (“FDIC”) or any other government agency. An investment in the Fund is subject to risk, including possible loss of principal invested.
The Russell 2000® Index is an unmanaged market capitalization-weighted index consisting of 2,000 of the smallest U.S.-domiciled publicly traded common stocks that are included in the Russell 3000® Index. The Russell 3000® Index is comprised of the 3,000 largest U.S. domiciled companies.
Russell Investment Group owns the Russell Index data, including all applicable trademarks and copyrights, used by SSGA Funds Management, Inc. (“SSGA FM”) in these materials. Any unauthorized use or redistribution of such Russell Index data is strictly prohibited. Russell Investment Group is not responsible for the configuration of this material or for any inaccuracy in SSGA FM’s presentation thereof.
The results shown for the foregoing index assume the reinvestment of net dividends or interest and do not reflect fees, expenses, or taxes. As such, the index returns do not reflect the actual cost of investing in the instruments that comprise each index.
The views expressed in this document reflect our judgment as of the publication date and are subject to change at any time without notice.
State Street Global Advisors Funds Distributors, LLC, member of FINRA & SIPC is the principal underwriter and distributor of the State Street V.I.S. Funds and an indirect wholly-owned subsidiary of State Street Corporation. References to State Street may include State Street Corporation and its affiliates. The Funds pay State Street Bank and Trust Company for its services as custodian and Fund Accounting agent, and pay SSGA Funds Management, Inc. for investment advisory and administrative services.
State Street Small-Cap Equity V.I.S. Fund
Management Discussion of Fund Performance — December 31, 2019 (Unaudited)
The State Street Small-Cap Equity V.I.S. Fund (the “Fund”) seeks to provide long-term growth of capital. The Fund’s benchmark is the Russell 2000 Index (the “Index”).
For the 12-month period ended December 31, 2019 (the “Reporting Period”), the total return for the Fund was 26.12% and the Index was 25.52%. The Fund and Index returns reflect the reinvestment of dividends and other income. The Fund’s performance reflects the expenses of managing the Fund, including brokerage and advisory expenses. The Index is unmanaged and Index returns do not reflect fees and expenses of any kind, which would have a negative impact on returns.
Allocations by sub-advisers SouthernSun, Champlain and GlobeFlex were primary drivers of Fund performance during the Reporting Period relative to the Index. The performance of assets allocated to SouthernSun rebounded in 2019 off of a weak 2018, returning approximately11% more than the Russell 2000 Index. This was driven by the concentrated, deeper value nature of tis allocation and its investment thesis playing out in the market generating outsized returns. With an agriculture and industrial bias in SouthernSun’s allocation, the trade war with China helped domestic producers of steel and industrial goods which propelled its allocation forward. Champlain’s allocation was also a strong contributor, outperforming the index by almost 1.5%. Champlain’s allocation had a heavy technology bias which was additive to returns throughout the year particularly in cloud computing and software-as-a-service holdings. GlobeFlex’s allocation was the only laggard in the portfolio, underperforming the Russell 2000 Index by more than 4%. Despite a market backdrop of growth outperforming, GlobeFlex’s focus on higher quality growth stocks was not rewarded. The largest detractor from performance in GlobeFlex’s allocation was Biotech.
Derivatives did not meaningfully add or detract from returns and are only used to neutralize the cash in the liquidity sleeve of the account to manage daily flows. The only derivative contracts used were the Russell 2000 e-Mini Futures to match the benchmark and not to speculate in either direction.
On an individual security level, the top positive contributors to the Fund’s performance on an absolute basis during the Reporting Period were Koppers Holdings, Sanderson Farms Inc., and Insulet Corp. The top negative contributors to the Fund’s performance on an absolute basis during the Reporting Period were Thor Industries Inc., New Relic Inc., and Extended Stay America Units, Inc.
The views expressed above reflect those of the Fund’s portfolio manager only through the Reporting Period, and do not necessarily represent the views of the Adviser as a whole. Any such views are subject to change at any time based upon market or other conditions and the Adviser disclaims any responsibility to update such views. These views may not be relied on as investment advice and, because investment decisions for a fund are based on numerous factors, may not be relied on as an indication of trading intent on behalf of any fund.
| | |
| 2 | | State Street Small-Cap Equity V.I.S. Fund |
State StreetSmall-Cap Equity V.I.S. Fund
Understanding Your Fund’s Expenses — December 31, 2019 (Unaudited)
As a shareholder of the Fund, you incur ongoing costs. Ongoing costs include portfolio management fees, professional fees, administrative fees and other Fund expenses. The following example is intended to help you understand your ongoing costs (in dollars) of investing in the Fund and to compare these costs with the ongoing costs of investing in other mutual funds.
To illustrate these ongoing costs, we have provided an example and calculated the expenses paid by investors in the Fund during the period. The information in the following table is based on an investment of $1,000, which is invested at the beginning of the period and held for the entiresix-month period ended December 31, 2019.
Actual Expenses
The first section of the table provides information about actual account values and actual expenses. You may use the information in this section, together with the amount you invested, to estimate the expenses that you paid over the period. To do so, simply divide your account value by $1,000 (for example, an $8,600 account value divided by $1,000 = 8.6), then multiply the result by the number given under the heading “Expenses paid during the period” to estimate the expenses you paid on your account during the period.
Hypothetical Example for Comparison Purposes
The second section of the table provides information about hypothetical account values and hypothetical expenses based on the Fund’s actual expense ratio and an assumed rate of return of 5% per year before expenses, which is not the Fund’s actual return. The hypothetical account values and expenses may not be used to estimate the actual ending account balance or expenses you paid for the period. You may use this information to compare the ongoing costs of investing in the Fund and other funds. To do so, compare this 5% hypothetical example with the 5% hypothetical examples that appear in the shareholder reports of other funds.
Please note that the expenses shown in the table are meant to highlight and help you compare ongoing costs only and do not reflect transaction costs, such as sales charges or redemption fees, if any. Therefore, the second section of the table is useful in comparing ongoing costs only, and will not help you determine the relative total costs of owning different funds. Additionally, the expenses shown do not reflect the fees or charges associated with variable contracts through which shares of the Fund are offered.
| | | | | | | | |
| | | Actual
Fund Return | | | Hypothetical
5% Return
(2.5% for
the period) | |
Actual Fund Return | | | | | | | | |
Beginning Account Value July 1, 2019 | | $ | 1,000.00 | | | $ | 1,000.00 | |
Ending Account Value December 31, 2019 | | $ | 1,070.70 | | | $ | 1,019.01 | |
Expenses Paid During the Period* | | $ | 6.42 | | | $ | 6.26 | |
| * | Expenses are equal to the Fund’s annualized expense ratio of 1.23%** (for the period July 1, 2019-December 31, 2019), multiplied by the average account value over the period, multiplied by 184/365 (to reflect theone-half year period). |
| ** | May differ from expense ratio disclosed in the financial highlights, which is calculated based on the entire fiscal year’s data. |
| | | | |
| State Street Small-Cap Equity V.I.S. Fund | | | 3 | |
State Street Small-Cap Equity V.I.S. Fund
Performance Summary — December 31, 2019 (Unaudited)
Top Ten Largest Holdings
as of December 31, 2019 (as a % of Fair Value)(a)(b)
| | | | |
Darling Ingredients Inc. | | | 1.29 | % |
| |
Dycom Industries Inc. | | | 1.12 | % |
| |
The Brink’s Co. | | | 1.08 | % |
| |
The Timken Co. | | | 1.05 | % |
| |
Koppers Holdings Inc. | | | 1.00 | % |
| |
MSA Safety Inc. | | | 0.98 | % |
| |
Barnes Group Inc. | | | 0.97 | % |
| |
John Wiley & Sons Inc., Class A | | | 0.94 | % |
| |
Extended Stay America Inc. | | | 0.93 | % |
| |
Belden Inc. | | | 0.88 | % |
Sector Allocation as of December 31, 2019
Portfolio composition as a % of Fair Value of $33,616 (in thousands) as of December 31, 2019(a)(b)
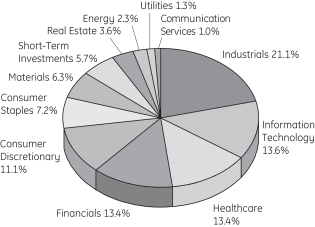
Average Annual Total Return for the periods ended December 31, 2019
Class 1 Shares (Inception Date 4/28/00)
| | | | | | | | | | | | | | | | |
| | | One Year | | | Five Year | | | Ten Year | | | Ending Value
of a $10,000
Investment | |
State Street Small-Cap Equity V.I.S. Fund | | | 26.12 | % | | | 8.78 | % | | | 12.54 | % | | $ | 32,588 | |
| | | | |
Russell 2000 Index | | | 25.52 | % | | | 8.23 | % | | | 11.83 | % | | $ | 30,582 | |
| (a) | Fair Value basis is inclusive of short-term investment in State Street Institutional U.S. Government Money Market Fund Class G Shares. |
| (b) | The securities information regarding holdings, allocations and other characteristics is presented to illustrate examples of securities that the Fund has bought and the diversity of areas in which the Fund may invest as of a particular date. It may not be representative of the Fund’s current or future investments and should not be construed as a recommendation to purchase or sell a particular security. |
| | |
| 4 | | State Street Small-Cap Equity V.I.S. Fund |
State Street Small-Cap Equity V.I.S. Fund
Performance Summary, continued — December 31, 2019 (Unaudited)
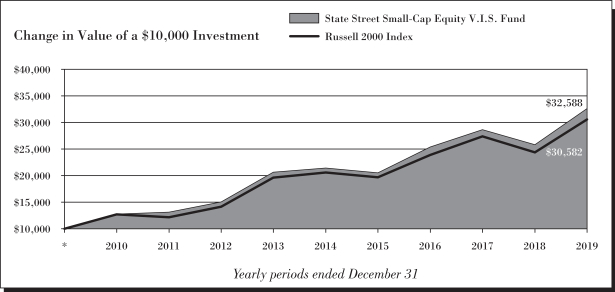
See Notes to Performance beginning on page 1 for further information.
Past performance does not predict future performance. The performance shown in the graphs and tables does not reflect the deduction of taxes that a shareholder would pay on Fund distributions or the redemption of Fund shares and does not reflect the fees or charges that would be associated with variable contracts through which shares of the Fund are offered.
| | | | |
| State Street Small-Cap Equity V.I.S. Fund | | | 5 | |
State StreetSmall-Cap Equity V.I.S. Fund
Schedule of Investments — December 31, 2019
| | | | | | | | |
| | | Number
of Shares | | | Fair
Value $ | |
| | | | | | | | |
|
| Common Stock - 94.3%† | |
Aerospace & Defense - 0.6% | |
Teledyne Technologies Inc. (a) | | | 594 | | | | 205,845 | |
| | | | | | | | |
|
Agricultural & Farm Machinery - 0.8% | |
AGCO Corp. | | | 3,272 | | | | 252,762 | |
| | | | | | | | |
|
Agricultural Products - 1.3% | |
Darling Ingredients Inc. (a) | | | 15,404 | | | | 432,544 | |
| | | | | | | | |
|
Air Freight & Logistics - 0.2% | |
Echo Global Logistics Inc. (a) | | | 911 | | | | 18,858 | |
Forward Air Corp. | | | 356 | | | | 24,902 | |
Hub Group Inc., Class A (a) | | | 402 | | | | 20,618 | |
| | | | | | | | |
| | | | | | | 64,378 | |
| | | | | | | | |
|
Airlines - 0.0%* | |
Hawaiian Holdings Inc. | | | 404 | | | | 11,833 | |
| | | | | | | | |
|
Apparel Retail - 0.8% | |
American Eagle Outfitters Inc. | | | 3,604 | | | | 52,979 | |
Burlington Stores Inc. (a) | | | 447 | | | | 101,929 | |
Chico’s FAS Inc. | | | 5,306 | | | | 20,216 | |
The Buckle Inc. | | | 3,448 | | | | 93,234 | |
| | | | | | | | |
| | | | | | | 268,358 | |
| | | | | | | | |
|
Apparel, Accessories & Luxury Goods - 0.4% | |
G-III Apparel Group Ltd. (a) | | | 3,542 | | | | 118,657 | |
| | | | | | | | |
|
Application Software - 5.0% | |
ACI Worldwide Inc. (a) | | | 5,427 | | | | 205,602 | |
Altair Engineering Inc., Class A (a) | | | 1,640 | | | | 58,892 | |
Blackbaud Inc. | | | 2,843 | | | | 226,303 | |
Blackline Inc. (a) | | | 3,353 | | | | 172,881 | |
Cornerstone OnDemand Inc. (a) | | | 1,611 | | | | 94,324 | |
Digital Turbine Inc. (a) | | | 2,124 | | | | 15,144 | |
Envestnet Inc. (a) | | | 1,850 | | | | 128,816 | |
LogMeIn Inc. | | | 217 | | | | 18,606 | |
Mitek Systems Inc. (a) | | | 1,989 | | | | 15,216 | |
New Relic Inc. (a) | | | 2,695 | | | | 177,088 | |
Q2 Holdings Inc. (a) | | | 2,900 | | | | 235,132 | |
RealPage Inc. (a) | | | 1,474 | | | | 79,228 | |
SPS Commerce Inc. (a) | | | 134 | | | | 7,426 | |
Verint Systems Inc. (a) | | | 856 | | | | 47,388 | |
Yext Inc. (a) | | | 12,800 | | | | 184,576 | |
Zix Corp. (a) | | | 3,780 | | | | 25,628 | |
| | | | | | | | |
| | | | | | | 1,692,250 | |
| | | | | | | | |
|
Asset Management & Custody Banks - 0.1% | |
Brightsphere Investment Group Inc. (a) | | | 1,307 | | | | 13,357 | |
| | | | | | | | |
| | | Number
of Shares | | | Fair
Value $ | |
Cohen & Steers Inc. | | | 364 | | | | 22,845 | |
| | | | | | | | |
| | | | | | | 36,202 | |
| | | | | | | | |
|
Auto Parts & Equipment - 0.5% | |
Dana Inc. | | | 1,492 | | | | 27,154 | |
Gentherm Inc. (a) | | | 252 | | | | 11,186 | |
LCI Industries | | | 522 | | | | 55,922 | |
Modine Manufacturing Co. (a) | | | 2,166 | | | | 16,678 | |
Standard Motor Products Inc. | | | 1,317 | | | | 70,091 | |
| | | | | | | | |
| | | | | | | 181,031 | |
| | | | | | | | |
|
Automobile Manufacturers - 0.9% | |
Thor Industries Inc. | | | 3,609 | | | | 268,113 | |
Winnebago Industries Inc. | | | 433 | | | | 22,940 | |
| | | | | | | | |
| | | | | | | 291,053 | |
| | | | | | | | |
|
Automotive Retail - 1.4% | |
America’sCar-Mart Inc. (a) | | | 678 | | | | 74,350 | |
Group 1 Automotive Inc. | | | 1,518 | | | | 151,800 | |
Lithia Motors Inc., Class A | | | 107 | | | | 15,729 | |
Monro Inc. | | | 782 | | | | 61,152 | |
Murphy USA Inc. (a) | | | 1,507 | | | | 176,319 | |
| | | | | | | | |
| | | | | | | 479,350 | |
| | | | | | | | |
|
Biotechnology - 0.4% | |
Emergent BioSolutions Inc. (a) | | | 638 | | | | 34,420 | |
Heron Therapeutics Inc. (a) | | | 3,025 | | | | 71,088 | |
Ironwood Pharmaceuticals Inc. (a) | | | 1,165 | | | | 15,506 | |
Vanda Pharmaceuticals Inc. (a) | | | 885 | | | | 14,523 | |
| | | | | | | | |
| | | | | | | 135,537 | |
| | | | | | | | |
|
Brewers - 0.2% | |
The Boston Beer Company Inc., Class A (a) | | | 155 | | | | 58,567 | |
| | | | | | | | |
|
Building Products - 0.7% | |
American Woodmark Corp. (a) | | | 428 | | | | 44,730 | |
Apogee Enterprises Inc. | | | 659 | | | | 21,418 | |
Builders FirstSource Inc. (a) | | | 1,166 | | | | 29,628 | |
CSW Industrials Inc. | | | 575 | | | | 44,275 | |
Patrick Industries Inc. | | | 359 | | | | 18,822 | |
Universal Forest Products Inc. | | | 1,648 | | | | 78,610 | |
| | | | | | | | |
| | | | | | | 237,483 | |
| | | | | | | | |
|
Casinos & Gaming - 0.0%* | |
Everi Holdings Inc. (a) | | | 1,063 | | | | 14,276 | |
| | | | | | | | |
|
Commodity Chemicals - 1.1% | |
AdvanSix Inc. (a) | | | 795 | | | | 15,868 | |
Koppers Holdings Inc. (a) | | | 8,810 | | | | 336,718 | |
| | | | | | | | |
| | | | | | | 352,586 | |
| | | | | | | | |
See Notes to Schedule of Investments and Notes to Financial Statements.
| | |
| 6 | | State Street Small-Cap Equity V.I.S. Fund |
State StreetSmall-Cap Equity V.I.S. Fund
Schedule of Investments, continued — December 31, 2019
| | | | | | | | |
| | | Number
of Shares | | | Fair
Value $ | |
| | | | | | | | |
Communications Equipment - 0.7% | |
Extreme Networks Inc. (a) | | | 9,238 | | | | 68,084 | |
Infinera Corp. (a) | | | 2,140 | | | | 16,992 | |
Lumentum Holdings Inc. (a) | | | 981 | | | | 77,793 | |
NETGEAR Inc. (a) | | | 898 | | | | 22,010 | |
Plantronics Inc. | | | 1,540 | | | | 42,104 | |
| | | | | | | | |
| | | | | | | 226,983 | |
| | | | | | | | |
|
Computer & Electronics Retail - 0.0%* | |
Rent-A-Center Inc. | | | 561 | | | | 16,179 | |
| | | | | | | | |
|
Construction & Engineering - 2.1% | |
Aegion Corp. (a) | | | 9,764 | | | | 218,421 | |
Comfort Systems USA Inc. | | | 284 | | | | 14,157 | |
Dycom Industries Inc. (a) | | | 7,960 | | | | 375,314 | |
EMCOR Group Inc. | | | 298 | | | | 25,717 | |
Great Lakes Dredge & Dock Corp. (a) | | | 2,363 | | | | 26,773 | |
MasTec Inc. (a) | | | 355 | | | | 22,777 | |
Valmont Industries Inc. | | | 167 | | | | 25,013 | |
| | | | | | | | |
| | | | | | | 708,172 | |
| | | | | | | | |
|
Construction Machinery & Heavy Trucks - 1.4% | |
Alamo Group Inc. | | | 583 | | | | 73,196 | |
Astec Industries Inc. | | | 1,173 | | | | 49,266 | |
The Greenbrier Companies Inc. | | | 1,084 | | | | 35,154 | |
The Manitowoc Company Inc. (a) | | | 2,465 | | | | 43,137 | |
Trinity Industries Inc. | | | 11,252 | | | | 249,232 | |
Wabash National Corp. | | | 2,144 | | | | 31,495 | |
| | | | | | | | |
| | | | | | | 481,480 | |
| | | | | | | | |
|
Construction Materials - 0.2% | |
Eagle Materials Inc. | | | 394 | | | | 35,720 | |
Summit Materials Inc., Class A (a) | | | 1,624 | | | | 38,814 | |
| | | | | | | | |
| | | | | | | 74,534 | |
| | | | | | | | |
|
Consumer Electronics - 0.0%* | |
Universal Electronics Inc. (a) | | | 255 | | | | 13,326 | |
| | | | | | | | |
|
Consumer Finance - 0.2% | |
Curo Group Holdings Corp. (a) | | | 963 | | | | 11,729 | |
Enova International Inc. (a) | | | 1,543 | | | | 37,125 | |
Green Dot Corp., Class A (a) | | | 542 | | | | 12,629 | |
| | | | | | | | |
| | | | | | | 61,483 | |
| | | | | | | | |
|
Data Processing & Outsourced Services - 1.8% | |
Broadridge Financial Solutions Inc. | | | 1,459 | | | | 180,245 | |
Cass Information Systems Inc. | | | 194 | | | | 11,202 | |
CoreLogic Inc. (a) | | | 3,566 | | | | 155,870 | |
CSG Systems International Inc. | | | 1,768 | | | | 91,547 | |
EVERTEC Inc. | | | 967 | | | | 32,917 | |
| | | | | | | | |
| | | Number
of Shares | | | Fair
Value $ | |
I3 Verticals Inc. Class A (a) | | | 801 | | | | 22,628 | |
MAXIMUS Inc. | | | 350 | | | | 26,036 | |
NIC Inc. | | | 4,200 | | | | 93,870 | |
| | | | | | | | |
| | | | | | | 614,315 | |
| | | | | | | | |
|
Distillers & Vintners - 0.3% | |
MGP Ingredients Inc. | | | 2,290 | | | | 110,951 | |
| | | | | | | | |
|
Distributors - 0.6% | |
Core-Mark Holding Company Inc. | | | 614 | | | | 16,695 | |
LKQ Corp. (a) | | | 4,890 | | | | 174,573 | |
| | | | | | | | |
| | | | | | | 191,268 | |
| | | | | | | | |
|
Diversified Metals & Mining - 0.4% | |
Compass Minerals International Inc. | | | 1,804 | | | | 109,972 | |
Materion Corp. | | | 381 | | | | 22,650 | |
| | | | | | | | |
| | | | | | | 132,622 | |
| | | | | | | | |
|
Diversified REITs - 0.2% | |
American Assets Trust Inc. | | | 1,050 | | | | 48,195 | |
Essential Properties Realty Trust Inc. | | | 1,324 | | | | 32,848 | |
| | | | | | | | |
| | | | | | | 81,043 | |
| | | | | | | | |
|
Diversified Support Services - 1.3% | |
Healthcare Services Group Inc. | | | 4,798 | | | | 116,687 | |
Ritchie Bros Auctioneers Inc. | | | 6,496 | | | | 279,003 | |
UniFirst Corp. | | | 227 | | | | 45,850 | |
| | | | | | | | |
| | | | | | | 441,540 | |
| | | | | | | | |
|
Education Services - 0.2% | |
K12 Inc. (a) | | | 3,575 | | | | 72,751 | |
| | | | | | | | |
|
Electric Utilities - 0.9% | |
ALLETE Inc. | | | 471 | | | | 38,231 | |
IDACORP Inc. | | | 2,481 | | | | 264,971 | |
| | | | | | | | |
| | | | | | | 303,202 | |
| | | | | | | | |
|
Electrical Components & Equipment - 0.6% | |
Atkore International Group Inc. (a) | | | 822 | | | | 33,258 | |
EnerSys | | | 185 | | | | 13,844 | |
Generac Holdings Inc. (a) | | | 607 | | | | 61,058 | |
GrafTech International Ltd. | | | 1,713 | | | | 19,905 | |
Regal Beloit Corp. | | | 691 | | | | 59,156 | |
| | | | | | | | |
| | | | | | | 187,221 | |
| | | | | | | | |
|
Electronic Components - 1.3% | |
Belden Inc. | | | 5,356 | | | | 294,580 | |
Littelfuse Inc. | | | 816 | | | | 156,101 | |
| | | | | | | | |
| | | | | | | 450,681 | |
| | | | | | | | |
See Notes to Schedule of Investments and Notes to Financial Statements.
| | | | |
| State Street Small-Cap Equity V.I.S. Fund | | | 7 | |
State StreetSmall-Cap Equity V.I.S. Fund
Schedule of Investments, continued — December 31, 2019
| | | | | | | | |
| | | Number
of Shares | | | Fair
Value $ | |
| | | | | | | | |
Electronic Equipment & Instruments - 0.9% | |
Itron Inc. (a) | | | 308 | | | | 25,857 | |
National Instruments Corp. | | | 1,595 | | | | 67,532 | |
Novanta Inc. (a) | | | 300 | | | | 26,532 | |
OSI Systems Inc. (a) | | | 66 | | | | 6,649 | |
Zebra Technologies Corp., Class A (a) | | | 685 | | | | 174,976 | |
| | | | | | | | |
| | | | | | | 301,546 | |
| | | | | | | | |
|
Electronic Manufacturing Services - 0.7% | |
Fabrinet (a) | | | 423 | | | | 27,427 | |
Methode Electronics Inc. | | | 1,556 | | | | 61,229 | |
Plexus Corp. (a) | | | 799 | | | | 61,475 | |
Sanmina Corp. (a) | | | 676 | | | | 23,146 | |
TTM Technologies Inc. (a) | | | 3,331 | | | | 50,132 | |
| | | | | | | | |
| | | | | | | 223,409 | |
| | | | | | | | |
|
Environmental & Facilities Services - 0.9% | |
Clean Harbors Inc. (a) | | | 3,227 | | | | 276,715 | |
Harsco Corp. (a) | | | 594 | | | | 13,668 | |
| | | | | | | | |
| | | | | | | 290,383 | |
| | | | | | | | |
|
Food Distributors - 0.6% | |
Performance Food Group Co. (a) | | | 3,679 | | | | 189,395 | |
| | | | | | | | |
|
Food Retail - 0.1% | |
Casey’s General Stores Inc. | | | 141 | | | | 22,418 | |
Sprouts Farmers Market Inc. (a) | | | 1,166 | | | | 22,562 | |
| | | | | | | | |
| | | | | | | 44,980 | |
| | | | | | | | |
|
Footwear - 0.8% | |
Deckers Outdoor Corp. (a) | | | 632 | | | | 106,720 | |
Wolverine World Wide Inc. | | | 4,410 | | | | 148,793 | |
| | | | | | | | |
| | | | | | | 255,513 | |
| | | | | | | | |
|
Forest Products - 0.1% | |
Boise Cascade Co. | | | 675 | | | | 24,658 | |
| | | | | | | | |
|
Gas Utilities - 0.3% | |
Chesapeake Utilities Corp. | | | 210 | | | | 20,124 | |
South Jersey Industries Inc. | | | 1,101 | | | | 36,311 | |
Spire Inc. | | | 585 | | | | 48,737 | |
| | | | | | | | |
| | | | | | | 105,172 | |
| | | | | | | | |
|
Health Care REITs - 0.3% | |
National Health Investors Inc. | | | 542 | | | | 44,162 | |
Physicians Realty Trust | | | 2,588 | | | | 49,017 | |
| | | | | | | | |
| | | | | | | 93,179 | |
| | | | | | | | |
|
Healthcare Distributors - 0.2% | |
Covetrus Inc. (a) | | | 4,359 | | | | 57,539 | |
| | | | | | | | |
| | | | | | | | |
| | | Number
of Shares | | | Fair
Value $ | |
Healthcare Equipment - 4.7% | |
AtriCure Inc. (a) | | | 2,120 | | | | 68,921 | |
Cantel Medical Corp. | | | 2,580 | | | | 182,922 | |
Cardiovascular Systems Inc. (a) | | | 4,065 | | | | 197,518 | |
CONMED Corp. | | | 1,830 | | | | 204,649 | |
Hill-Rom Holdings Inc. | | | 2,513 | | | | 285,301 | |
Integer Holdings Corp. (a) | | | 305 | | | | 24,531 | |
Integra LifeSciences Holdings Corp. (a) | | | 4,550 | | | | 265,174 | |
IntriCon Corp. (a) | | | 2,195 | | | | 39,510 | |
LeMaitre Vascular Inc. | | | 985 | | | | 35,411 | |
LivaNova PLC (a) | | | 345 | | | | 26,023 | |
Masimo Corp. (a) | | | 570 | | | | 90,094 | |
NuVasive Inc. (a) | | | 650 | | | | 50,271 | |
Orthofix Medical Inc. (a) | | | 880 | | | | 40,639 | |
Penumbra Inc. (a) | | | 445 | | | | 73,100 | |
| | | | | | | | |
| | | | | | | 1,584,064 | |
| | | | | | | | |
|
Healthcare Facilities - 0.7% | |
Acadia Healthcare Company Inc. (a) | | | 3,980 | | | | 132,216 | |
Hanger Inc. (a) | | | 925 | | | | 25,539 | |
Select Medical Holdings Corp. (a) | | | 1,132 | | | | 26,421 | |
Tenet Healthcare Corp. (a) | | | 432 | | | | 16,429 | |
The Ensign Group Inc. | | | 415 | | | | 18,828 | |
| | | | | | | | |
| | | | | | | 219,433 | |
| | | | | | | | |
|
Healthcare Services - 1.1% | |
Amedisys Inc. (a) | | | 182 | | | | 30,379 | |
AMN Healthcare Services Inc. (a) | | | 1,359 | | | | 84,679 | |
BioTelemetry Inc. (a) | | | 2,099 | | | | 97,184 | |
Chemed Corp. | | | 68 | | | | 29,870 | |
MEDNAX Inc. (a) | | | 4,170 | | | | 115,884 | |
R1 RCM Inc. (a) | | | 1,724 | | | | 22,378 | |
| | | | | | | | |
| | | | | | | 380,374 | |
| | | | | | | | |
|
Healthcare Supplies - 0.7% | |
Avanos Medical Inc. (a) | | | 5,640 | | | | 190,068 | |
Haemonetics Corp. (a) | | | 52 | | | | 5,975 | |
Lantheus Holdings Inc. (a) | | | 1,154 | | | | 23,668 | |
| | | | | | | | |
| | | | | | | 219,711 | |
| | | | | | | | |
|
Healthcare Technology - 1.4% | |
Computer Programs & Systems Inc. | | | 629 | | | | 16,606 | |
HMS Holdings Corp. (a) | | | 5,252 | | | | 155,459 | |
Inspire Medical Systems Inc. (a) | | | 1,100 | | | | 81,631 | |
NextGen Healthcare Inc. (a) | | | 1,080 | | | | 17,355 | |
Omnicell Inc. (a) | | | 462 | | | | 37,755 | |
Teladoc Health Inc. (a) | | | 2,060 | | | | 172,463 | |
| | | | | | | | |
| | | | | | | 481,269 | |
| | | | | | | | |
See Notes to Schedule of Investments and Notes to Financial Statements.
| | |
| 8 | | State Street Small-Cap Equity V.I.S. Fund |
State StreetSmall-Cap Equity V.I.S. Fund
Schedule of Investments, continued — December 31, 2019
| | | | | | | | |
| | | Number
of Shares | | | Fair
Value $ | |
| | | | | | | | |
Home Building - 0.7% | |
Cavco Industries Inc. (a) | | | 194 | | | | 37,904 | |
LGI Homes Inc. (a) | | | 711 | | | | 50,232 | |
Meritage Homes Corp. (a) | | | 219 | | | | 13,383 | |
Skyline Champion Corp. (a) | | | 1,643 | | | | 52,083 | |
TopBuild Corp. (a) | | | 658 | | | | 67,827 | |
| | | | | | | | |
| | | | | | | 221,429 | |
| | | | | | | | |
|
Home Furnishing Retail - 0.7% | |
Aaron’s Inc. | | | 2,916 | | | | 166,533 | |
RH (a) | | | 170 | | | | 36,295 | |
Sleep Number Corp. (a) | | | 374 | | | | 18,416 | |
| | | | | | | | |
| | | | | | | 221,244 | |
| | | | | | | | |
|
Hotel & Resort REITs - 0.5% | |
Pebblebrook Hotel Trust | | | 1,694 | | | | 45,416 | |
RLJ Lodging Trust | | | 6,404 | | | | 113,479 | |
| | | | | | | | |
| | | | | | | 158,895 | |
| | | | | | | | |
|
Hotels, Resorts & Cruise Lines - 1.0% | |
Extended Stay America Inc. | | | 21,114 | | | | 313,754 | |
Hilton Grand Vacations Inc. (a) | | | 358 | | | | 12,312 | |
| | | | | | | | |
| | | | | | | 326,066 | |
| | | | | | | | |
|
Household Appliances - 0.1% | |
Helen of Troy Ltd. (a) | | | 169 | | | | 30,385 | |
| | | | | | | | |
|
Human Resource & Employment Services - 0.5% | |
ASGN Inc. (a) | | | 447 | | | | 31,723 | |
Barrett Business Services Inc. | | | 217 | | | | 19,630 | |
Heidrick & Struggles International Inc. | | | 448 | | | | 14,560 | |
Insperity Inc. | | | 348 | | | | 29,942 | |
Kforce Inc. | | | 768 | | | | 30,490 | |
Korn Ferry | | | 493 | | | | 20,903 | |
TriNet Group Inc. (a) | | | 111 | | | | 6,284 | |
| | | | | | | | |
| | | | | | | 153,532 | |
| | | | | | | | |
|
Hypermarkets & Super Centers - 0.1% | |
BJ’s Wholesale Club Holdings Inc. (a) | | | 941 | | | | 21,398 | |
| | | | | | | | |
|
Industrial Machinery - 7.9% | |
Actuant Corp., Class A | | | 9,259 | | | | 241,012 | |
Altra Industrial Motion Corp. | | | 7,434 | | | | 269,185 | |
Barnes Group Inc. | | | 5,271 | | | | 326,591 | |
Crane Co. | | | 3,350 | | | | 289,373 | |
Evoqua Water Technologies Corp. (a) | | | 2,315 | | | | 43,869 | |
Franklin Electric Company Inc. | | | 458 | | | | 26,252 | |
Hillenbrand Inc. | | | 489 | | | | 16,289 | |
John Bean Technologies Corp. | | | 2,180 | | | | 245,599 | |
| | | | | | | | |
| | | Number
of Shares | | | Fair
Value $ | |
Kennametal Inc. | | | 665 | | | | 24,532 | |
LB Foster Co., Class A (a) | | | 1,278 | | | | 24,768 | |
Lydall Inc. (a) | | | 1,170 | | | | 24,008 | |
Mueller Industries Inc. | | | 4,105 | | | | 130,334 | |
Standex International Corp. | | | 1,325 | | | | 105,139 | |
The Timken Co. | | | 6,289 | | | | 354,133 | |
TriMas Corp. (a) | | | 2,780 | | | | 87,320 | |
Watts Water Technologies Inc., Class A | | | 1,122 | | | | 111,931 | |
Welbilt Inc. (a) | | | 12,800 | | | | 199,808 | |
Woodward Inc. | | | 1,063 | | | | 125,902 | |
| | | | | | | | |
| | | | | | | 2,646,045 | |
| | | | | | | | |
|
Industrial REITs - 0.7% | |
EastGroup Properties Inc. | | | 1,205 | | | | 159,867 | |
Innovative Industrial Properties Inc. | | | 264 | | | | 20,030 | |
Monmouth Real Estate Investment Corp. | | | 3,184 | | | | 46,104 | |
Rexford Industrial Realty Inc. | | | 538 | | | | 24,571 | |
| | | | | | | | |
| | | | | | | 250,572 | |
| | | | | | | | |
|
Interactive Home Entertainment - 0.1% | |
Glu Mobile Inc. (a) | | | 2,997 | | | | 18,132 | |
| | | | | | | | |
|
Interactive Media & Services - 0.0%* | |
The Meet Group Inc. (a) | | | 2,148 | | | | 10,761 | |
| | | | | | | | |
|
Internet & Direct Marketing Retail - 0.1% | |
1-800-Flowers.com Inc., Class A (a) | | | 1,274 | | | | 18,473 | |
| | | | | | | | |
|
Investment Banking & Brokerage - 0.9% | |
Evercore Inc., Class A | | | 294 | | | | 21,979 | |
Greenhill & Company Inc. | | | 1,175 | | | | 20,069 | |
Houlihan Lokey Inc. | | | 635 | | | | 31,033 | |
Piper Sandler Cos. | | | 668 | | | | 53,400 | |
Raymond James Financial Inc. | | | 1,542 | | | | 137,947 | |
Stifel Financial Corp. | | | 809 | | | | 49,066 | |
| | | | | | | | |
| | | | | | | 313,494 | |
| | | | | | | | |
|
IT Consulting & Other Services - 0.2% | |
Perficient Inc. (a) | | | 627 | | | | 28,886 | |
Virtusa Corp. (a) | | | 747 | | | | 33,861 | |
| | | | | | | | |
| | | | | | | 62,747 | |
| | | | | | | | |
|
Leisure Facilities - 0.1% | |
SeaWorld Entertainment Inc. (a) | | | 588 | | | | 18,645 | |
| | | | | | | | |
|
Leisure Products - 0.9% | |
Callaway Golf Co. | | | 1,252 | | | | 26,542 | |
Malibu Boats Inc., Class A (a) | | | 628 | | | | 25,717 | |
See Notes to Schedule of Investments and Notes to Financial Statements.
| | | | |
| State Street Small-Cap Equity V.I.S. Fund | | | 9 | |
State StreetSmall-Cap Equity V.I.S. Fund
Schedule of Investments, continued — December 31, 2019
| | | | | | | | |
| | | Number
of Shares | | | Fair
Value $ | |
| | | | | | | | |
MasterCraft Boat Holdings Inc. (a) | | | 986 | | | | 15,529 | |
Polaris Inc. | | | 2,434 | | | | 247,538 | |
| | | | | | | | |
| | | | | | | 315,326 | |
| | | | | | | | |
|
Life & Health Insurance - 0.2% | |
Trupanion Inc. (a) | | | 1,408 | | | | 52,744 | |
| | | | | | | | |
|
Life Sciences Tools & Services - 2.6% | |
Bruker Corp. | | | 3,074 | | | | 156,682 | |
ICON PLC (a) | | | 1,329 | | | | 228,894 | |
Medpace Holdings Inc. (a) | | | 356 | | | | 29,925 | |
PRA Health Sciences Inc. (a) | | | 289 | | | | 32,122 | |
Repligen Corp. (a) | | | 2,090 | | | | 193,325 | |
Syneos Health Inc. (a) | | | 3,636 | | | | 216,251 | |
| | | | | | | | |
| | | | | | | 857,199 | |
| | | | | | | | |
|
Managed Healthcare - 0.1% | |
Magellan Health Inc. (a) | | | 269 | | | | 21,049 | |
| | | | | | | | |
|
Metal & Glass Containers - 0.0%* | |
Silgan Holdings Inc. | | | 218 | | | | 6,775 | |
| | | | | | | | |
|
Mortgage REITs - 0.2% | |
Blackstone Mortgage Trust Inc., Class A | | | 651 | | | | 24,230 | |
Redwood Trust Inc. | | | 2,245 | | | | 37,133 | |
| | | | | | | | |
| | | | | | | 61,363 | |
| | | | | | | | |
|
Multi-Line Insurance - 0.4% | |
Horace Mann Educators Corp. | | | 2,534 | | | | 110,634 | |
National General Holdings Corp. | | | 807 | | | | 17,835 | |
| | | | | | | | |
| | | | | | | 128,469 | |
| | | | | | | | |
|
Multi-Utilities - 0.1% | |
Black Hills Corp. | | | 456 | | | | 35,814 | |
| | | | | | | | |
|
Office REITs - 1.0% | |
Corporate Office Properties Trust | | | 1,727 | | | | 50,739 | |
Cousins Properties Inc. | | | 5,589 | | | | 230,267 | |
Easterly Government Properties Inc. | | | 2,599 | | | | 61,674 | |
| | | | | | | | |
| | | | | | | 342,680 | |
| | | | | | | | |
|
Office Services & Supplies - 1.4% | |
Herman Miller Inc. | | | 614 | | | | 25,573 | |
HNI Corp. | | | 1,027 | | | | 38,472 | |
Knoll Inc. | | | 1,000 | | | | 25,260 | |
MSA Safety Inc. | | | 2,594 | | | | 327,778 | |
Steelcase Inc., Class A | | | 2,205 | | | | 45,114 | |
| | | | | | | | |
| | | | | | | 462,197 | |
| | | | | | | | |
|
Oil & Gas Drilling - 0.1% | |
Nabors Industries Ltd. | | | 9,797 | | | | 28,215 | |
| | | | | | | | |
| | | | | | | | |
| | | Number
of Shares | | | Fair
Value $ | |
Oil & Gas Equipment & Services - 0.7% | |
Apergy Corp. (a) | | | 817 | | | | 27,598 | |
Natural Gas Services Group Inc. (a) | | | 1,268 | | | | 15,546 | |
Oil States International Inc. (a) | | | 9,171 | | | | 149,579 | |
ProPetro Holding Corp. (a) | | | 4,699 | | | | 52,864 | |
| | | | | | | | |
| | | | | | | 245,587 | |
| | | | | | | | |
|
Oil & Gas Exploration & Production - 1.3% | |
Callon Petroleum Co. (a) | | | 22,970 | | | | 110,947 | |
Encana Corp. | | | 30,013 | | | | 140,761 | |
Gulfport Energy Corp. (a) | | | 2,332 | | | | 7,089 | |
PDC Energy Inc. (a) | | | 1,889 | | | | 49,435 | |
Range Resources Corp. | | | 7,818 | | | | 37,917 | |
SM Energy Co. | | | 7,858 | | | | 88,324 | |
| | | | | | | | |
| | | | | | | 434,473 | |
| | | | | | | | |
|
Oil & Gas Refining & Marketing - 0.1% | |
Delek US Holdings Inc. | | | 1,491 | | | | 49,993 | |
| | | | | | | | |
|
Packaged Foods & Meats - 4.0% | |
B&G Foods Inc. | | | 5,400 | | | | 96,822 | |
Freshpet Inc. (a) | | | 2,220 | | | | 131,180 | |
Hostess Brands Inc. (a) | | | 16,550 | | | | 240,637 | |
J&J Snack Foods Corp. | | | 220 | | | | 40,539 | |
Lancaster Colony Corp. | | | 1,320 | | | | 211,332 | |
Sanderson Farms Inc. | | | 1,671 | | | | 294,464 | |
The Simply Good Foods Co. (a) | | | 6,590 | | | | 188,078 | |
TreeHouse Foods Inc. (a) | | | 2,950 | | | | 143,075 | |
| | | | | | | | |
| | | | | | | 1,346,127 | |
| | | | | | | | |
|
Paper Products - 0.1% | |
Neenah Inc. | | | 534 | | | | 37,610 | |
| | | | | | | | |
|
Personal Products - 0.3% | |
elf Beauty Inc. (a) | | | 5,920 | | | | 95,490 | |
Medifast Inc. | | | 178 | | | | 19,505 | |
| | | | | | | | |
| | | | | | | 114,995 | |
| | | | | | | | |
|
Pharmaceuticals - 1.6% | |
ANI Pharmaceuticals Inc. (a) | | | 404 | | | | 24,915 | |
Catalent Inc. (a) | | | 3,487 | | | | 196,318 | |
Collegium Pharmaceutical Inc. (a) | | | 1,098 | | | | 22,597 | |
Endo International PLC (a) | | | 1,166 | | | | 5,469 | |
Horizon Therapeutics PLC (a) | | | 1,306 | | | | 47,277 | |
Prestige Consumer Healthcare Inc. (a) | | | 6,031 | | | | 244,255 | |
Supernus Pharmaceuticals Inc. (a) | | | 538 | | | | 12,761 | |
| | | | | | | | |
| | | | | | | 553,592 | |
| | | | | | | | |
|
Property & Casualty Insurance - 1.9% | |
AMERISAFE Inc. | | | 1,690 | | | | 111,591 | |
Argo Group International Holdings Ltd. | | | 3,520 | | | | 231,440 | |
See Notes to Schedule of Investments and Notes to Financial Statements.
| | |
| 10 | | State Street Small-Cap Equity V.I.S. Fund |
State StreetSmall-Cap Equity V.I.S. Fund
Schedule of Investments, continued — December 31, 2019
| | | | | | | | |
| | | Number
of Shares | | | Fair
Value $ | |
| | | | | | | | |
James River Group Holdings Ltd. | | | 2,070 | | | | 85,305 | |
Kemper Corp. | | | 193 | | | | 14,957 | |
Palomar Holdings Inc. (a) | | | 585 | | | | 29,537 | |
RLI Corp. | | | 1,280 | | | | 115,226 | |
Selective Insurance Group Inc. | | | 312 | | | | 20,339 | |
Stewart Information Services Corp. | | | 333 | | | | 13,583 | |
| | | | | | | | |
| | | | | | | 621,978 | |
| | | | | | | | |
|
Publishing - 0.9% | |
John Wiley & Sons Inc., Class A | | | 6,546 | | | | 317,612 | |
| | | | | | | | |
|
Real Estate Services - 0.0%* | |
Newmark Group Inc., Class A | | | 837 | | | | 11,262 | |
| | | | | | | | |
|
Regional Banks - 8.7% | |
1st Source Corp. | | | 1,013 | | | | 52,554 | |
Atlantic Union Bankshares Corp. | | | 1,339 | | | | 50,279 | |
BankUnited Inc. | | | 694 | | | | 25,373 | |
Banner Corp. | | | 1,076 | | | | 60,891 | |
Bryn Mawr Bank Corp. | | | 1,745 | | | | 71,964 | |
Cadence BanCorp | | | 2,902 | | | | 52,613 | |
Camden National Corp. | | | 696 | | | | 32,058 | |
Columbia Banking System Inc. | | | 915 | | | | 37,227 | |
Community Bank System Inc. | | | 1,650 | | | | 117,051 | |
Cullen/Frost Bankers Inc. | | | 1,287 | | | | 125,843 | |
CVB Financial Corp. | | | 4,140 | | | | 89,341 | |
Enterprise Financial Services Corp. | | | 1,221 | | | | 58,864 | |
Equity Bancshares Inc., Class A (a) | | | 1,681 | | | | 51,892 | |
First Interstate BancSystem Inc., Class A | | | 1,215 | | | | 50,933 | |
Franklin Financial Network Inc. | | | 838 | | | | 28,769 | |
Fulton Financial Corp. | | | 7,259 | | | | 126,524 | |
German American Bancorp Inc. | | | 1,980 | | | | 70,528 | |
Hancock Whitney Corp. | | | 853 | | | | 37,430 | |
HBT Financial Inc. (a) | | | 935 | | | | 17,756 | |
Home BancShares Inc. | | | 1,774 | | | | 34,877 | |
IBERIABANK Corp. | | | 2,243 | | | | 167,844 | |
Independent Bank Corp. | | | 1,990 | | | | 165,668 | |
Investors Bancorp Inc. | | | 2,124 | | | | 25,307 | |
Lakeland Financial Corp. | | | 502 | | | | 24,563 | |
Origin Bancorp Inc. | | | 1,352 | | | | 51,160 | |
Pinnacle Financial Partners Inc. | | | 412 | | | | 26,368 | |
Prosperity Bancshares Inc. | | | 3,606 | | | | 259,235 | |
Renasant Corp. | | | 5,063 | | | | 179,331 | |
Sandy Spring Bancorp Inc. | | | 1,094 | | | | 41,441 | |
Stock Yards Bancorp Inc. | | | 1,640 | | | | 67,338 | |
UMB Financial Corp. | | | 2,880 | | | | 197,683 | |
United Community Banks Inc. | | | 1,656 | | | | 51,137 | |
Valley National Bancorp | | | 1,115 | | | | 12,767 | |
Washington Trust Bancorp Inc. | | | 1,390 | | | | 74,768 | |
Westamerica Bancorporation | | | 2,200 | | | | 149,094 | |
| | | | | | | | |
| | | Number
of Shares | | | Fair
Value $ | |
Western Alliance Bancorp | | | 3,274 | | | | 186,618 | |
Wintrust Financial Corp. | | | 893 | | | | 63,314 | |
| | | | | | | | |
| | | | | | | 2,936,403 | |
| | | | | | | | |
|
Research & Consulting Services - 0.3% | |
Resources Connection Inc. | | | 6,871 | | | | 112,203 | |
| | | | | | | | |
|
Residential REITs - 0.1% | |
NexPoint Residential Trust Inc. | | | 887 | | | | 39,915 | |
| | | | | | | | |
|
Restaurants - 1.0% | |
Bloomin’ Brands Inc. | | | 448 | | | | 9,887 | |
Brinker International Inc. | | | 562 | | | | 23,604 | |
Cracker Barrel Old Country Store Inc. | | | 387 | | | | 59,498 | |
Dave & Buster’s Entertainment Inc. | | | 359 | | | | 14,421 | |
Ruth’s Hospitality Group Inc. | | | 1,655 | | | | 36,021 | |
Texas Roadhouse Inc. | | | 2,462 | | | | 138,660 | |
The Cheesecake Factory Inc. | | | 1,643 | | | | 63,847 | |
| | | | | | | | |
| | | | | | | 345,938 | |
| | | | | | | | |
|
Retail REITs - 0.1% | |
Retail Opportunity Investments Corp. | | | 1,844 | | | | 32,565 | |
| | | | | | | | |
|
Security & Alarm Services - 1.1% | |
The Brink’s Co. | | | 3,990 | | | | 361,813 | |
| | | | | | | | |
|
Semiconductor Equipment - 0.4% | |
ACM Research Inc., Class A (a) | | | 480 | | | | 8,856 | |
Brooks Automation Inc. | | | 868 | | | | 36,421 | |
Ichor Holdings Ltd. (a) | | | 802 | | | | 26,682 | |
Onto Innovation Inc. (a) | | | 2,090 | | | | 76,369 | |
| | | | | | | | |
| | | | | | | 148,328 | |
| | | | | | | | |
|
Semiconductors - 0.5% | |
Diodes Inc. (a) | | | 567 | | | | 31,962 | |
Semtech Corp. (a) | | | 2,845 | | | | 150,500 | |
| | | | | | | | |
| | | | | | | 182,462 | |
| | | | | | | | |
|
Soft Drinks - 0.3% | |
Cott Corp. | | | 6,560 | | | | 89,741 | |
| | | | | | | | |
|
Specialized Consumer Services - 0.0%* | |
WW International Inc. (a) | | | 357 | | | | 13,641 | |
| | | | | | | | |
|
Specialized REITs - 0.6% | |
CoreSite Realty Corp. | | | 745 | | | | 83,530 | |
National Storage Affiliates Trust | | | 1,007 | | | | 33,855 | |
PotlatchDeltic Corp. | | | 1,131 | | | | 48,938 | |
QTS Realty Trust Inc., Class A | | | 506 | | | | 27,461 | |
| | | | | | | | |
| | | | | | | 193,784 | |
| | | | | | | | |
See Notes to Schedule of Investments and Notes to Financial Statements.
| | | | |
| State Street Small-Cap Equity V.I.S. Fund | | | 11 | |
State StreetSmall-Cap Equity V.I.S. Fund
Schedule of Investments, continued — December 31, 2019
| | | | | | | | |
| | | Number
of Shares | | | Fair
Value $ | |
| | | | | | | | |
Specialty Chemicals - 4.0% | |
Chase Corp. | | | 390 | | | | 46,207 | |
HB Fuller Co. | | | 3,439 | | | | 177,349 | |
Ingevity Corp. (a) | | | 2,091 | | | | 182,712 | |
Innospec Inc. | | | 1,080 | | | | 111,715 | |
Minerals Technologies Inc. | | | 598 | | | | 34,463 | |
PolyOne Corp. | | | 4,574 | | | | 168,278 | |
Quaker Chemical Corp. | | | 937 | | | | 154,155 | |
Sensient Technologies Corp. | | | 4,298 | | | | 284,055 | |
Stepan Co. | | | 1,853 | | | | 189,821 | |
| | | | | | | | |
| | | | | | | 1,348,755 | |
| | | | | | | | |
|
Specialty Stores - 0.8% | |
Hudson Ltd., Class A (a) | | | 977 | | | | 14,987 | |
National Vision Holdings Inc. (a) | | | 2,780 | | | | 90,155 | |
Sally Beauty Holdings Inc. (a) | | | 9,198 | | | | 167,864 | |
| | | | | | | | |
| | | | | | | 273,006 | |
| | | | | | | | |
|
Steel - 0.4% | |
Carpenter Technology Corp. | | | 880 | | | | 43,806 | |
Commercial Metals Co. | | | 4,163 | | | | 92,710 | |
| | | | | | | | |
| | | | | | | 136,516 | |
| | | | | | | | |
|
Systems Software - 1.1% | |
CommVault Systems Inc. (a) | | | 266 | | | | 11,874 | |
Progress Software Corp. | | | 693 | | | | 28,794 | |
Qualys Inc. (a) | | | 510 | | | | 42,519 | |
SailPoint Technologies Holding Inc. (a) | | | 6,230 | | | | 147,028 | |
Tenable Holdings Inc. (a) | | | 6,350 | | | | 152,146 | |
| | | | | | | | |
| | | | | | | 382,361 | |
| | | | | | | | |
|
Technology Distributors - 0.2% | |
ePlus Inc. (a) | | | 171 | | | | 14,413 | |
Insight Enterprises Inc. (a) | | | 448 | | | | 31,490 | |
SYNNEX Corp. | | | 206 | | | | 26,533 | |
| | | | | | | | |
| | | | | | | 72,436 | |
| | | | | | | | |
|
Technology Hardware, Storage & Peripherals - 0.7% | |
Pure Storage Inc., Class A (a) | | | 13,260 | | | | 226,879 | |
| | | | | | | | |
|
Thrifts & MortgageFinance - 0.8% | |
Axos Financial Inc. (a) | | | 1,136 | | | | 34,398 | |
Essent Group Ltd. | | | 494 | | | | 25,683 | |
| | | | | | | | |
| | | Number
of Shares | | | Fair
Value $ | |
Flagstar Bancorp Inc. | | | 275 | | | | 10,519 | |
FS Bancorp Inc. | | | 237 | | | | 15,118 | |
HomeStreet Inc. (a) | | | 1,271 | | | | 43,214 | |
Kearny Financial Corp. | | | 565 | | | | 7,814 | |
NMI Holdings Inc., Class A (a) | | | 856 | | | | 28,402 | |
WSFS Financial Corp. | | | 2,538 | | | | 111,647 | |
| | | | | | | | |
| | | | | | | 276,795 | |
| | | | | | | | |
|
Tires & Rubber - 0.2% | |
Cooper Tire & Rubber Co. | | | 1,798 | | | | 51,693 | |
| | | | | | | | |
|
Trading Companies & Distributors - 0.9% | |
Applied Industrial Technologies Inc. | | | 3,260 | | | | 217,409 | |
BMC Stock Holdings Inc. (a) | | | 998 | | | | 28,633 | |
Foundation Building Materials Inc. (a) | | | 1,042 | | | | 20,163 | |
GMS Inc. (a) | | | 840 | | | | 22,747 | |
Herc Holdings Inc. (a) | | | 530 | | | | 25,938 | |
| | | | | | | | |
| | | | | | | 314,890 | |
| | | | | | | | |
| | |
Trucking - 0.5% | | | | | | | | |
ArcBest Corp. | | | 448 | | | | 12,365 | |
Avis Budget Group Inc. (a) | | | 538 | | | | 17,345 | |
Marten Transport Ltd. | | | 1,706 | | | | 36,662 | |
PAM Transportation Services Inc. (a) | | | 103 | | | | 5,944 | |
Saia Inc. (a) | | | 1,111 | | | | 103,456 | |
| | | | | | | | |
| | | | | | | 175,772 | |
| | | | | | | | |
| |
Total Common Stock
(Cost $24,118,938) | | | | 31,703,862 | |
| | | | | | | | |
|
| Short-Term Investments - 5.7% | |
State Street Institutional U.S. Government Money Market Fund - Class G Shares 1.57%
(Cost $1,912,318) (b)(c)(d) | | | 1,912,318 | | | | 1,912,318 | |
| | | | | | | | |
| |
Total Investments
(Cost $26,031,256) | | | | 33,616,180 | |
| |
| Liabilities in Excess of Other Assets,net - (0.0)%* | | | | (16,622 | ) |
| | | | | | | | |
| |
| NET ASSETS - 100.0% | | | | 33,599,558 | |
| | | | | | | | |
Other Information:
The Fund had the following long futures contracts open at December 31, 2019:
| | | | | | | | | | | | | | | | | | | | |
| Description | | Expiration
date | | | Number of
Contracts | | | Notional
Amount | | | Value | | | Unrealized
Appreciation | |
E-mini Russell 2000 Index Futures | | | March 2020 | | | | 5 | | | $ | 416,593 | | | $ | 417,650 | | | $ | 1,057 | |
| | | | | | | | | | | | | | | | | | | | |
During the year ended December 31, 2019, average notional value related to long futures contracts was $531,460.
See Notes to Schedule of Investments and Notes to Financial Statements.
| | |
| 12 | | State Street Small-Cap Equity V.I.S. Fund |
State StreetSmall-Cap Equity V.I.S. Fund
Notes to Schedule of Investments — December 31, 2019
The views expressed in this document reflect our judgment as of the publication date and are subject to change at any time without notice. The securities cited may not be representative of the Fund’s future investments and should not be construed as a recommendation to purchase or sell a particular security. See the Fund’s summary prospectus and statutory prospectus for complete descriptions of investment objectives, policies, risks and permissible investments.
| (a) | Non-income producing security. |
| (b) | At December 31, 2019, all or a portion of this security was pledged to cover collateral requirements for futures. |
| (c) | Sponsored by SSGA Funds Management, Inc., the Fund’s investment adviser and administrator, and an affiliate of State Street Bank & Trust Co., the Fund’ssub-administrator, custodian and accounting agent. |
| (d) | Coupon amount represents effective yield. |
| † | Percentages are based on net assets as of December 31, 2019. |
Abbreviations:
REIT - Real Estate Investment Trust
The following table presents the Fund’s investments measured at fair value on a recurring basis at December 31, 2019:
| | | | | | | | | | | | | | | | |
| Investments | | Level 1 | | | Level 2 | | | Level 3 | | | Total | |
Investments in Securities | | | | | | | | | | | | | | | | |
Common Stock | | $ | 31,703,862 | | | $ | — | | | $ | — | | | $ | 31,703,862 | |
Short-Term Investments | | | 1,912,318 | | | | — | | | | — | | | | 1,912,318 | |
| | | | | | | | | | | | | | | | |
Total Investments in Securities | | $ | 33,616,180 | | | $ | — | | | $ | — | | | $ | 33,616,180 | |
| | | | | | | | | | | | | | | | |
Other Financial Instruments | | | | | | | | | | | | | | | | |
Long Futures Contracts - Unrealized Appreciation | | $ | 1,057 | | | $ | — | | | $ | — | | | $ | 1,057 | |
| | | | | | | | | | | | | | | | |
Affiliate Table
| | | | | | | | | | | | | | | | | | | | | | | | | | | | | | | | | | | | |
| | | Number
of Shares
Held at
12/31/18 | | | Value At
12/31/18 | | | Cost of
Purchases | | | Proceeds
from
Shares
Sold | | | Realized
Gain
(Loss) | | | Change in
Unrealized
Appreciation/
Depreciation | | | Number
of Shares
Held at
12/31/19 | | | Value at
12/31/19 | | | Dividend
Income | |
State Street Institutional U.S. Government Money Market Fund, Class G Shares | | | 1,256,107 | | | $ | 1,256,107 | | | $ | 10,636,912 | | | $ | 9,980,701 | | | $ | — | | | $ | — | | | | 1,912,318 | | | $ | 1,912,318 | | | $ | 39,736 | |
| | | | | | | | | | | | | | | | | | | | | | | | | | | | | | | | | | | | |
| | | | | | | | | |
TOTAL | | | | | | $ | 1,256,107 | | | $ | 10,636,912 | | | $ | 9,980,701 | | | $ | — | | | $ | — | | | | | | | $ | 1,912,318 | | | $ | 39,736 | |
| | | | | | | | | | | | | | | | | | | | | | | | | | | | | | | | | | | | |
See Notes to Schedule of Investments and Notes to Financial Statements.
| | | | |
| State Street Small-Cap Equity V.I.S. Fund | | | 13 | |
State StreetSmall-Cap Equity V.I.S. Fund
Financial Highlights
Selected data based on a share outstanding throughout the fiscal years indicated
| | | | | | | | | | | | | | | | | | | | |
| | | 12/31/19 | | | 12/31/18 | | | 12/31/17 | | | 12/31/16 | | | 12/31/15* | |
| Inception date | | | | | | | | | | | | | | | | | | | 4/28/00 | |
| | | | | |
Net asset value, beginning of period | | $ | 11.24 | | | $ | 14.73 | | | $ | 14.40 | | | $ | 12.20 | | | $ | 14.39 | |
| | | | | | | | | | | | | | | | | | | | |
|
Income/(loss) from investment operations: | |
Net investment income (loss) | | | (0.00 | )(a)†† | | | (0.02 | )(a) | | | (0.02 | )(a) | | | (0.03 | ) | | | (0.04 | ) |
Net realized and unrealized gains/(losses) on investments | | | 2.94 | | | | (1.43 | ) | | | 1.86 | | | | 2.93 | | | | (0.52 | ) |
| | | | | | | | | | | | | | | | | | | | |
Total income/(loss) from investment operations | | | 2.94 | | | | (1.45 | ) | | | 1.84 | | | | 2.90 | | | | (0.56 | ) |
| | | | | | | | | | | | | | | | | | | | |
|
Less distributions from: | |
Net investment income | | | — | | | | — | | | | — | | | | — | | | | — | |
Net realized gains | | | 1.02 | | | | 2.04 | | | | 1.51 | | | | 0.70 | | | | 1.63 | |
| | | | | | | | | | | | | | | | | | | | |
Total distributions | | | 1.02 | | | | 2.04 | | | | 1.51 | | | | 0.70 | | | | 1.63 | |
| | | | | | | | | | | | | | | | | | | | |
Net asset value, end of period | | $ | 13.16 | | | $ | 11.24 | | | $ | 14.73 | | | $ | 14.40 | | | $ | 12.20 | |
| | | | | | | | | | | | | | | | | | | | |
Total Return(b) | | | 26.12 | % | | | (9.70 | )% | | | 12.71 | % | | | 23.77 | % | | | (4.12 | )% |
|
Ratios/Supplemental Data: | |
Net assets, end of period (in thousands) | | $ | 33,600 | | | $ | 30,781 | | | $ | 40,711 | | | $ | 42,320 | | | $ | 38,359 | |
|
Ratios to average net assets: | |
Net expenses | | | 1.24 | % | | | 1.20 | % | | | 1.25 | % | | | 1.40 | % | | | 1.36 | % |
Gross expenses | | | 1.24 | % | | | 1.20 | % | | | 1.25 | % | | | 1.40 | % | | | 1.36 | % |
Net investment loss | | | (0.02 | )% | | | (0.13 | )% | | | (0.13 | )% | | | (0.22 | )% | | | (0.30 | )% |
Portfolio turnover rate | | | 29 | % | | | 33 | % | | | 32 | % | | | 36 | % | | | 42 | % |
Notes to Financial Highlights
| (a) | | Per share values have been calculated using the average shares method. |
| (b) | | Total returns are historical and assume changes in share price, reinvestment of dividends and capital gains distributions and do not include the effect of insurance contract charges. Past performance does not guarantee future results. |
| * | | Beginning with the year ended December 31, 2016, the Fund was audited by Ernst & Young LLP. The previous years were audited by another independent registered public accounting firm. |
| †† | | Rounds to less than $0.01. |
The accompanying Notes are an integral part of these financial statements.
State StreetSmall-Cap Equity V.I.S. Fund
Statement of Assets and Liabilities — December 31, 2019
| | | | |
Assets | | | | |
Investments in securities, at fair value (cost $24,118,938) | | $ | 31,703,862 | |
Short-term affiliated investments, at fair value | | | 1,912,318 | |
Cash | | | 695 | |
Net cash collateral on deposit with broker for future contracts | | | 51,435 | |
Receivable for investments sold | | | 41,712 | |
Income receivables | | | 28,249 | |
Receivable for fund shares sold | | | 2,183 | |
Income receivable from affiliated investments | | | 2,723 | |
Receivable for accumulated variation margin on futures contracts | | | 1,068 | |
Other assets | | | 184 | |
| | | | |
| |
Total assets | | �� | 33,744,429 | |
| | | | |
| |
Liabilities | | | | |
Payable for investments purchased | | | 75,759 | |
Payable for fund shares redeemed | | | 31,137 | |
Payable to the Adviser | | | 27,055 | |
Payable for custody, fund accounting andsub-administration fees | | | 2,610 | |
Accrued other expenses | | | 8,310 | |
| | | | |
| |
Total liabilities | | | 144,871 | |
| | | | |
| | | | |
| |
Net Assets | | $ | 33,599,558 | |
| | | | |
| |
Net Assets Consist of: | | | | |
Capital paid in | | $ | 25,850,050 | |
Total distributable earnings (loss) | | | 7,749,508 | |
| | | | |
| |
Net Assets | | $ | 33,599,558 | |
| | | | |
Shares outstanding ($0.01 par value; unlimited shares authorized) | | | 2,552,951 | |
Net asset value per share | | $ | 13.16 | |
The accompanying Notes are an integral part of these financial statements.
| | | | |
| Statement of Assets and Liabilities | | | 15 | |
State StreetSmall-Cap Equity V.I.S. Fund
Statement of Operations — For the fiscal year ended December 31, 2019
| | | | |
Investment Income | |
Income | |
Dividend | | $ | 367,737 | |
Income from affiliated investments | | | 39,736 | |
Less: Foreign taxes withheld | | | (1,602 | ) |
| | | | |
Total income | | | 405,871 | |
| | | | |
|
Expenses | |
Advisory and administration fees | | | 314,862 | |
Directors’ fees | | | 16,819 | |
Custody, fund accounting andsub-administration fees | | | 31,064 | |
Professional fees | | | 37,503 | |
Other expenses | | | 11,899 | |
| | | | |
Total Expenses | | | 412,147 | |
| | | | |
Net investment loss | | $ | (6,276 | ) |
| | | | |
|
Net Realized and Unrealized Gain (Loss) on Investments | |
Realized gain (loss) on: | |
Unaffiliated investments | | $ | 2,717,609 | |
Futures | | | 105,036 | |
Increase (decrease) in unrealized appreciation/depreciation on: | |
Unaffiliated investments | | | 4,800,116 | |
Futures | | | 19,239 | |
| | | | |
| |
Net realized and unrealized gain (loss) on investments | | | 7,642,000 | |
| | | | |
| |
Net Increase in Net Assets Resulting from Operations | | $ | 7,635,724 | |
| | | | |
The accompanying Notes are an integral part of these financial statements.
| | |
| 16 | | Statement of Operations |
State StreetSmall-Cap Equity V.I.S. Fund
Statements of Changes in Net Assets
| | | | | | | | |
| | | Year Ended December 31,
2019 | | | Year Ended December 31,
2018 | |
Increase (Decrease) in Net Assets | |
|
Operations: | |
Net investment loss | | $ | (6,276 | ) | | $ | (46,009 | ) |
Net realized gain (loss) on investments and futures | | | 2,822,645 | | | | 4,440,893 | |
Net increase (decrease) in unrealized appreciation/depreciation on investments and futures | | | 4,819,355 | | | | (7,508,138 | ) |
| | | | | | | | |
Net increase (decrease) from operations | | | 7,635,724 | | | | (3,113,254 | ) |
| | | | | | | | |
|
Distributions to shareholders: | |
Total distributions | | | (2,413,108 | ) | | | (4,717,857 | ) |
| | | | | | | | |
Increase (decrease) in assets from operations and distributions | | | 5,222,616 | | | | (7,831,111 | ) |
| | | | | | | | |
|
Share transactions: | |
Proceeds from sale of shares | | | 346,157 | | | | 513,653 | |
Value of distributions reinvested | | | 2,413,108 | | | | 4,717,857 | |
Cost of shares redeemed | | | (5,163,732 | ) | | | (7,330,360 | ) |
| | | | | | | | |
Net increase (decrease) from share transactions | | | (2,404,467 | ) | | | (2,098,850 | ) |
| | | | | | | | |
| | |
Total increase (decrease) in net assets | | | 2,818,149 | | | | (9,929,961 | ) |
|
Net Assets | |
Beginning of year | | | 30,781,409 | | | | 40,711,370 | |
| | | | | | | | |
| | |
End of year | | $ | 33,599,558 | | | $ | 30,781,409 | |
| | | | | | | | |
|
Changes in Fund Shares | |
Shares sold | | | 26,431 | | | | 34,303 | |
Issued for distributions reinvested | | | 183,506 | | | | 425,032 | |
Shares redeemed | | | (396,476 | ) | | | (482,858 | ) |
| | | | | | | | |
Net decrease in fund shares | | | (186,539 | ) | | | (23,523 | ) |
| | | | | | | | |
The accompanying Notes are an integral part of these financial statements.
| | | | |
| Statements of Changes in Net Assets | | | 17 | |
State StreetSmall-Cap Equity V.I.S. Fund
Notes to Financial Statements — December 31, 2019
| 1. | | Organization of the Company |
State Street Variable Insurance Series Funds, Inc. (the “Company”) was incorporated under the laws of the Commonwealth of Virginia on May 14, 1984 and is registered under the Investment Company Act of 1940, as amended (the “1940 Act”), as anopen-end management investment company. The Company is currently composed of the following seven investment portfolios (collectively, the “Funds”): State Street U.S. Equity V.I.S. Fund, State Street S&P 500 Index V.I.S. Fund, State Street Premier Growth Equity V.I.S. Fund, State StreetSmall-Cap Equity V.I.S. Fund (the “Fund”), State Street Total Return V.I.S. Fund, State Street Income V.I.S. Fund and State Street Real Estate Securities V.I.S. Fund. Each Fund is a diversified investment company within the meaning of the 1940 Act.
Shares of the Funds of the Company are offered only to insurance company separate accounts that fund certain variable life insurance contracts and variable annuity contracts.
The Company currently offers one share class (Class 1) of the Fund as an investment option for variable life insurance and variable annuity contracts.
Under the Company’s organizational documents, its officers and directors are indemnified against certain liabilities arising out of the performance of their duties to the Company. Additionally, in the normal course of business, the Company enters into contracts with service providers that contain general indemnification clauses. The Company’s maximum exposure under these arrangements is unknown as this would involve future claims that may be made against the Company that have not yet occurred.
| 2. | | Summary of Significant Accounting Policies |
The following is a summary of significant accounting policies followed by the Company in the preparation of its financial statements:
The preparation of financial statements in accordance with U.S. generally accepted accounting principles (“U.S. GAAP”) requires management to make estimates and assumptions that affect the reported amounts and disclosures in the financial statements. Actual results could differ from those estimates. The Fund is an investment company under U.S. GAAP and follows the accounting and reporting guidance applicable to investment companies.
Security Valuation The Fund’s investments are valued at fair value each day that the New York Stock Exchange (“NYSE”) is open and, for financial reporting purposes, as of the report date should the reporting period end on a day that the NYSE is not open. Fair value is generally defined as the price a fund would receive to sell an asset or pay to transfer a liability in an orderly transaction between market participants at the measurement date. By its nature, a fair value price is a good faith estimate of the valuation in a current sale and may not reflect an actual market price. The investments of the Fund are valued pursuant to the policy and procedures developed by the Oversight Committee (the “Committee”) and approved by the Company’s Board of Directors (the “Board”). The Committee provides oversight of the valuation of investments for the Fund. The Board has responsibility for overseeing the determination of the fair value of investments.
Valuation techniques used to value the Fund’s investments by major category are as follows:
| | • | | Equity investments traded on a recognized securities exchange for which market quotations are readily available are valued at the last sale price or official closing price, as applicable, on the primary market or exchange on which they trade. Equity investments traded on a recognized exchange for which there were no sales on that day are valued at the last published sale price or at fair value. |
| | • | | Investments in registered investment companies (including money market funds) or other unitized pooled investment vehicles that are not traded on an exchange are valued at that day’s published net asset value (“NAV”) per share or unit. |
| | • | | Exchange-traded futures contracts are valued at the closing settlement price on the primary market on which they are traded most extensively. Exchange-traded futures contracts traded on a recognized exchange for which there were no sales on that day are valued at the last reported sale price obtained from independent pricing services or brokers or at fair value. |
In the event prices or quotations are not readily available or that the application of these valuation methods results in a price for an investment that is deemed to be not representative of the fair value of such investment, fair value will be determined in good faith by the Committee, in accordance with the valuation policy and procedures approved by the Board.
| | |
| 18 | | Notes to Financial Statements |
State StreetSmall-Cap Equity V.I.S. Fund
Notes to Financial Statements, continued — December 31, 2019
The Fund values its assets and liabilities at fair value using a fair value hierarchy consisting of three broad levels that prioritize the inputs to valuation techniques giving the highest priority to readily available unadjusted quoted prices in active markets for identical assets or liabilities (Level 1 measurements) and the lowest priority to unobservable inputs (Level 3 measurements) when market prices are not readily available or reliable. The categorization of a value determined for an investment within the hierarchy is based upon the pricing transparency of the investment and is not necessarily an indication of the risk associated with investing in it.
The three levels of the fair value hierarchy are as follows:
| | • | | Level 1 — Unadjusted quoted prices in active markets for an identical asset or liability; |
| | • | | Level 2 — Inputs other than quoted prices included within Level 1 that are observable for the asset or liability either directly or indirectly, including quoted prices for similar assets or liabilities in active markets, quoted prices for identical or similar assets or liabilities in markets that are not considered to be active, inputs other than quoted prices that are observable for the asset or liability (such as exchange rates, financing terms, interest rates, yield curves, volatilities, prepayment speeds, loss severities, credit risks and default rates) or other market-corroborated inputs; and |
| | • | | Level 3 — Unobservable inputs for the asset or liability, including the Committee’s assumptions used in determining the fair value of investments. |
The value of the Fund’s investments according to the fair value hierarchy as of December 31, 2019 is disclosed in the Fund’s Schedule of Investments.
Investment Transactions and Income Recognition Investment transactions are accounted for on trade date for financial reporting purposes. Realized gains and losses from the sale or disposition of investments and foreign exchange transactions, if any, are determined using the identified cost method.
Dividend income and capital gain distributions, if any, are recognized on theex-dividend date, net of any foreign taxes withheld at source, if any.
Interest income is recorded daily on an accrual basis. All premiums and discounts are amortized/accreted for financial reporting purposes.
Non-cash dividends received in the form of stock are recorded as dividend income at fair value.
Expenses Certain expenses, which are directly identifiable to a specific Fund, are applied to the Fund within the Company. Other expenses which cannot be attributed to a specific Fund are allocated in such a manner as deemed equitable, taking into consideration the nature and type of expense and the relative net assets of the Fund within the Company.
Foreign Taxes The Fund may be subject to foreign taxes (a portion of which may be reclaimable) on income, stock dividends, realized and unrealized capital gains on investments or certain foreign currency transactions. Foreign taxes are recorded in accordance with SSGA Funds Management, Inc.’s (the “Adviser” or “SSGA FM”) understanding of the applicable foreign tax regulations and rates that exist in the foreign jurisdictions in which the Fund invests. These foreign taxes, if any, are paid by the Fund and are reflected in the Statement of Operations, if applicable. Foreign taxes payable or deferred as of December 31, 2019, if any, are disclosed in the Fund’s Statement of Assets and Liabilities.
Distributions The Fund declares and pays any dividends from net investment income annually.
Net realized capital gains, if any, are distributed annually, unless additional distributions are required for compliance with applicable tax regulations. The amount and character of income and capital gains to be distributed are determined in accordance with applicable tax regulations which may differ from net investment income and realized gains recognized for U.S. GAAP purposes.
| 3. | | Derivative Financial Instruments |
Futures Contracts The Fund may enter into futures contracts to meet the Fund’s objectives. A futures contract is a standardized, exchange-traded agreement to buy or sell a financial instrument at a set price on a future date. Upon entering into a futures contract, the Fund is required to deposit with the broker, cash or securities in an amount equal to the minimum
| | | | |
| Notes to Financial Statements | | | 19 | |
State StreetSmall-Cap Equity V.I.S. Fund
Notes to Financial Statements, continued — December 31, 2019
initial margin requirements of the clearing house. Subsequent payments are made or received by the Fund equal to the daily change in the contract value, accumulated, exchange rates, and or other transactional fees. The accumulation of those payments are recorded as variation margin receivable or payable with a corresponding offset to unrealized gains or losses. The Fund recognizes a realized gain or loss when the contract is closed.
Losses may arise if the value of a futures contract decreases due to unfavorable changes in the market rates or values of the underlying instrument during the term of the contract or if the counterparty does not perform under the contract. The use of futures contracts also involves the risk that the movements in the price of the futures contracts do not correlate with the movement of the assets underlying such contracts.
For the fiscal year ended December 31, 2019, the Fund entered into futures contracts for cash equitization.
The following tables summarize the value of the Fund’s derivative instruments as of December 31, 2019 and the related location in the accompanying Statement of Assets and Liabilities and Statement of Operations, presented by primary underlying risk exposure:
Asset Derivatives
| | | | | | | | | | | | | | | | | | | | | | | | |
| | | Interest
Rate
Contracts
Risk | | | Foreign
Exchange
Contracts
Risk | | | Credit
Contracts
Risk | | | Equity
Contracts
Risk | | | Commodity
Contracts
Risk | | | Total | |
State StreetSmall-Cap Equity V.I.S. Fund | | | | | | | | | | | | | | | | | | | | | | | | |
Futures Contracts | | $ | — | | | $ | — | | | $ | — | | | $ | 1,068 | | | $ | — | | | $ | 1,068 | |
Realized Gain/Loss
| | | | | | | | | | | | | | | | | | | | | | | | |
| | | Interest
Rate
Contracts
Risk | | | Foreign
Exchange
Contracts
Risk | | | Credit
Contracts
Risk | | | Equity
Contracts
Risk | | | Commodity
Contracts
Risk | | | Total | |
State StreetSmall-Cap Equity V.I.S. Fund | | | | | | | | | | | | | | | | | | | | | | | | |
Futures Contracts | | $ | — | | | $ | — | | | $ | — | | | $ | 105,036 | | | $ | — | | | $ | 105,036 | |
Net Change in Unrealized Appreciation (Depreciation)
| | | | | | | | | | | | | | | | | | | | | | | | |
| | | Interest
Rate
Contracts
Risk | | | Foreign
Exchange
Contracts
Risk | | | Credit
Contracts
Risk | | | Equity
Contracts
Risk | | | Commodity
Contracts
Risk | | | Total | |
State StreetSmall-Cap Equity V.I.S. Fund | | | | | | | | | | | | | | | | | | | | | | | | |
Futures Contracts | | $ | — | | | $ | — | | | $ | — | | | $ | 19,239 | | | $ | — | | | $ | 19,239 | |
| 4. | | Fees and Transactions with Affiliates |
Advisory FeeSSGA FM, a registered investment adviser, was retained by the Board to act as investment adviser and administrator of the Fund. SSGA FM’s compensation for investment advisory and administrative services (“Management Fee”) is paid monthly based on the average daily net assets of the Fund at an annualized rate of 0.95%.
Custody, Fund Accounting andSub-Administration FeesState Street Bank and Trust Company (“State Street”) serves as the custodian, fund accountant andsub-administrator to the Fund. Amounts paid by the Fund to State Street for performing such services are included as custody, fund accounting andsub-administration fees in the Statement of Operations.
Other Transactions with AffiliatesThe Fund may invest in affiliated entities, including securities issued by State Street Corporation, affiliated funds, or entities deemed to be affiliates as a result of the Fund owning more than five percent of the entity’s voting securities or outstanding shares. Amounts relating to these transactions during the fiscal year ended December 31, 2019 are disclosed in the Schedule of Investments.
| | |
| 20 | | Notes to Financial Statements |
State StreetSmall-Cap Equity V.I.S. Fund
Notes to Financial Statements, continued — December 31, 2019
Pursuant to investmentsub-advisory agreements with SSGA FM, the assets of the Fund are allocated to and managed by each of the followingsub-advisers: (i) Palisade Capital Management, L.L.C.; (ii) Champlain Investment Partners, LLC; (iii) GlobeFlex Capital, L.P.; (iv) Kennedy Capital Management, Inc.; and (v) SouthernSun Asset Management, LLC. SSGA FM is responsible for allocating the Fund’s assets among thesub-advisers in its discretion (“Allocated Assets”), and for managing the Fund’s cash position, while eachsub-adviser is responsible for theday-to-day management of their portion of the Allocated Assets, under the general supervision and oversight of SSGA FM and the Board. For their services, SSGA FM pays eachsub-adviser an investmentsub-advisory fee, which is calculated as a percentage of the average daily net assets of the respective Allocated Assets that it manages.
The fees and expenses of the Company’s directors who are not “interested persons” of the Company, as defined in the 1940 Act (“Independent Directors”), are paid directly by the Fund. The Independent Directors are reimbursed for travel and otherout-of-pocket expenses in connection with meeting attendance and industry seminars.
| 7. | | Investment Transactions |
Purchases and sales of investments (excludingin-kind transactions, short term investments and derivative contracts) for the fiscal year ended December 31, 2019 were as follows:
| | | | | | | | |
| Non-U.S. Government Securities |
| Purchases | | Sales |
| | $ | 8,904,733 | | | | $ | 14,254,078 | |
The Fund has qualified and intends to continue to qualify as a regulated investment company under Subchapter M of the Internal Revenue Code of 1986, as amended. The Fund will not be subject to federal income taxes to the extent it distributes its taxable income, including any net realized capital gains, for each fiscal year. Therefore, no provision for federal income tax is required.
The Fund files federal and various state and local tax returns as required. No income tax returns are currently under examination. Generally, the federal returns are subject to examination by the Internal Revenue Service for a period of three years from date of filing, while the state returns may remain open for an additional year depending upon jurisdiction. SSGA FM has analyzed the Fund’s tax positions taken on tax returns for all open years and does not believe there are any uncertain tax positions that would require recognition of a tax liability.
Distributions to shareholders are recorded onex-dividend date. Income dividends and gain distributions are determined in accordance with income tax rules and regulations, which may differ from generally accepted accounting principles. Certain capital accounts in the financial statements have been adjusted for permanentbook-tax differences. These adjustments have no impact on net asset values or results of operations. Temporarybook-tax differences will reverse in the future. These book tax differences are primarily due to differing treatments for futures contracts, net operating losses, REIT basis adjustments, Non-REIT return of capital open basis adjustments and wash sale loss deferrals.
The tax character of distributions paid during the fiscal year ended December 31, 2019 was as follows:
| | | | | | | | | | | | | |
Ordinary
Income | | Long-Term
Capital Gains | | Total |
| | $ | — | | | | $ | 2,413,108 | | | | $ | 2,413,108 | |
The tax character of distributions paid during the year ended December 31, 2018 was as follows:
| | | | | | | | | | | | | |
Ordinary
Income | | Long-Term
Capital Gains | | Total |
| | $ | 102,739 | | | | $ | 4,615,118 | | | | $ | 4,717,857 | |
| | | | |
| Notes to Financial Statements | | | 21 | |
State StreetSmall-Cap Equity V.I.S. Fund
Notes to Financial Statements, continued — December 31, 2019
At December 31, 2019, the components of distributable earnings on a tax basis were as follows:
| | | | | | | | | | | | | | | | | | | | | | | | | | | | |
Undistributed
Ordinary
Income | | Capital Loss
Carryforwards | | Undistributed
long term gain | | Net Unrealized
Gains (Losses) | | Qualified
Late-Year
Losses | | Total |
| | $ | — | | | | $ | — | | | | $ | 651,511 | | | | $ | 7,097,997 | | | | | | | | | $ | 7,749,508 | |
As of December 31, 2019, gross unrealized appreciation and gross unrealized depreciation of investments and other financial instruments based on cost for federal income tax purposes were as follows:
| | | | | | | | | | | | | | | | | | |
Tax
Cost | | Gross
Unrealized
Appreciation | | Gross
Unrealized
Depreciation | | Net
Unrealized
Appreciation
(Depreciation) |
| | | | | | | | | | | | | | | | | | | |
| | $ | 26,519,240 | | | | $ | 8,277,657 | | | | $ | 1,179,660 | | | | $ | 7,097,997 | |
The Fund and other affiliated funds (each, a “Participant” and collectively, the “Participants”) have access to $200 million of a $500 million revolving credit facility, provided by a syndication of banks under which the Participants may borrow to fund shareholder redemptions.
The Participants are charged an annual commitment fee which is calculated based on the unused portion of the shared credit line. Commitment fees are allocated among each of the Participants based on relative net assets. Commitment fees are ordinary fund operating expenses. A Participant incurs and pays the interest expense related to its borrowing. Interest is calculated at a rate per annum equal to the sum of 1% plus the greater of the New York Fed Bank Rate and1-month LIBOR rate.
The Fund had no outstanding loans as of December 31, 2019.
Concentration Risk As a result of the Fund’s ability to invest a large percentage of its assets in obligations of issuers within the same country, state, region, currency or economic sector, an adverse economic, business or political development may affect the value of the Fund’s investments more than if the Fund were more broadly diversified.
Market and Credit Risk In the normal course of business, the Fund trades financial instruments and enters into financial transactions where risk of potential loss exists due to changes in the general economic conditions and fluctuations of the market (market risk). Additionally, the Fund may also be exposed to credit risk in the event that an issuer or guarantor fails to perform or that an institution or entity with which the Fund has unsettled or open transactions defaults.
Management has evaluated the impact of all subsequent events on the Fund through the date on which the financial statements were available to be issued and has determined that there were no subsequent events requiring adjustment or disclosure in the financial statements.
| | |
| 22 | | Notes to Financial Statements |
State Street Small-Cap Equity V.I.S. Fund
Report of Independent Registered Public Accounting Firm
To the Shareholders of State StreetSmall-Cap Equity V.I.S. Fund and the Board of Directors of State Street Variable Insurance Series Funds, Inc.
Opinion on the Financial Statements
We have audited the accompanying statement of assets and liabilities of State StreetSmall-Cap Equity V.I.S. Fund (the “Fund”) (one of the funds constituting State Street Variable Insurance Series Funds, Inc. (the “Company”)), including the schedule of investments, as of December 31, 2019, and the related statement of operations for the year then ended, the statements of changes in net assets for each of the two years in the period then ended, the financial highlights for each of the four years in the period then ended and the related notes (collectively referred to as the “financial statements”). In our opinion, the financial statements present fairly, in all material respects, the financial position of the Fund (one of the funds constituting State Street Variable Insurance Series Funds, Inc.) at December 31, 2019, the results of its operations for the year then ended, the changes in its net assets for each of the two years in the period then ended and its financial highlights for each of the four years in the period then ended, in conformity with U.S. generally accepted accounting principles. The financial highlights for the year ended December 31, 2015 were audited by another independent registered public accounting firm whose report, dated February 19, 2016, expressed an unqualified opinion on those financial highlights.
Basis for Opinion
These financial statements are the responsibility of the Company’s management. Our responsibility is to express an opinion on the Fund’s financial statements based on our audits. We are a public accounting firm registered with the Public Company Accounting Oversight Board (United States) (“PCAOB”) and are required to be independent with respect to the Company in accordance with the U.S. federal securities laws and the applicable rules and regulations of the Securities and Exchange Commission and the PCAOB.
We conducted our audits in accordance with the standards of the PCAOB. Those standards require that we plan and perform the audit to obtain reasonable assurance about whether the financial statements are free of material misstatement, whether due to error or fraud. The Company is not required to have, nor were we engaged to perform, an audit of the Company’s internal control over financial reporting. As part of our audits we are required to obtain an understanding of internal control over financial reporting, but not for the purpose of expressing an opinion on the effectiveness of the Company’s internal control over financials reporting. Accordingly, we express no such opinion.
Our audits included performing procedures to assess the risks of material misstatement of the financial statements, whether due to error or fraud, and performing procedures that respond to those risks. Such procedures included examining, on a test basis, evidence regarding the amounts and disclosures in the financial statements. Our procedures included confirmation of securities owned as of December 31, 2019, by correspondence with the custodian, brokers and others or by other appropriate auditing procedures where replies from brokers and others were not received. Our audits also included evaluating the accounting principles used and significant estimates made by management, as well as evaluating the overall presentation of the financial statements. We believe that our audits provide a reasonable basis for our opinion.

We have served as the auditor of one or more State Street Global Advisors investment companies since 2000.
Boston, Massachusetts
February 19, 2020
| | | | |
| Report of Independent Registered Public Accounting Firm | | | 23 | |
State Street Small-Cap Equity V.I.S. Fund
Tax Information — December 31, 2019 (Unaudited)
For federal income tax purposes, the following information is furnished with respect to the distributions of the Fund for its fiscal year ended December 31, 2019.
Dividends Received Deduction
The Fund reports the maximum amount allowable of its net taxable income as eligible for the corporate dividends received deduction.
Long Term Capital Gain Distributions
Long term capital gains dividends were paid from the Fund during the year ended December 31, 2019 in the amount of $2,413,108.
State Street Small-Cap Equity V.I.S. Fund
Other Information — December 31, 2019 (Unaudited)
Liquidity Risk Management Program
Pursuant to Rule 22e-4 under the 1940 Act, the Funds have adopted a liquidity risk management program. SSGA FM has been designated by the Board to administer the Funds’ liquidity risk management program. The program’s principal objectives include assessing, managing and periodically reviewing each Fund’s liquidity risk, based on factors specific to the circumstances of the Fund. Liquidity risk is defined as the risk that a Fund could not meet redemption requests without significant dilution of remaining investors’ interests in the Fund. During the fiscal year, SSGA FM provided the Board with a report addressing the operations of the program and assessing its adequacy and effectiveness of implementation.
During the period covered by the liquidity program report to the Board, the program supported each Fund’s ability to honor redemption requests timely and SSGA FM’s management of each Fund’s liquidity profile, including during periods of market volatility and net redemptions. SSGA FM reported that the program operated adequately and that the implementation of the program was effective to manage the Fund’s liquidity risk.
There can be no assurance that the program will achieve its objectives in the future. Please refer to your Fund’s prospectus for more information regarding the Fund’s exposure to liquidity risk and other principal risks to which an investment in the Fund may be subject.
Proxy Voting Policies and Procedures and Record
The Fund has adopted the proxy voting policies of SSGA FM. A description of the policies and procedures that the Fund has adopted to determine how to vote proxies relating to portfolio securities is available (i) without charge, upon request, by calling1-800-242-0134, (ii) on the Fund’s website at http://www.ssga.com/geam, or (iii) on the SEC’s website at www.sec.gov. Information regarding how the Fund voted proxies, if any, during the most recent 12-month period ended June 30 is available by August 31 of each year without charge (1) by calling 1-800-242-0134 (toll free), and (2) on the website of the SEC at www.sec.gov.
Quarterly Portfolio Schedule
Following the Fund’s first and third fiscal quarter-ends, a complete schedule of investments is filed with the SEC as an exhibit to its reports on Form N-PORT, which can be found on the SEC’s website at www.sec.gov. The Fund’s schedule of investments are available upon request, without charge, by calling 1-800-242-0134.
State Street Small-Cap Equity V.I.S. Fund
Other Information — December 31, 2019 (Unaudited)
| | | | | | | | | | | | |
| | | | | | |
Name, Address, and Year of Birth | | Position(s) Held with Fund | | Term of
Office and
Length of Time Served | | Principal Occupation
During Past Five Years
and Relevant Experience | | Number of
Funds in
Fund
Complex
Overseen
by Director† | | | Other Directorships
Held by Director During Past Five Years |
INDEPENDENT DIRECTORS |
Michael F. Holland c/o SSGA Funds
Management, Inc. One Iron Street Boston, MA 02210 YOB: 1944 | | Director andCo-Chairperson of the Board | | Term: Until successor is elected and qualified Served: Since January 2019 | | Chairman, Holland & Company L.L.C. (investment adviser) (1995 – present). | | | 68 | | | Director, the Holland Series Fund, Inc.; Director, Reaves Utility Income Fund, Inc.; and Director, Blackstone/GSO Loans (and Real Estate) Funds. |
| | | | | | | | | | | | | |
Patrick J. Riley c/o SSGA Funds
Management, Inc. One Iron Street
Boston, MA 02210 YOB: 1948 | | Director andCo-Chairperson of the Board | | Term: Until successor is elected and qualified Served: Since January 2019 | | 2002 to May 2010, Associate Justice of the Superior Court, Commonwealth of Massachusetts; 1985 to 2002, Partner, Riley, Burke & Donahue, L.L.P. (law firm); 1998 to Present, Independent Director, State Street Global Advisers Ireland, Ltd. (investment company); 1998 to Present, Independent Director, SSGA Liquidity plc (formerly, SSGA Cash Management Fund plc); January 2009 to Present, Independent Director, SSGA Fixed Income plc; and January 2009 – 2019, Independent Director, SSGA Qualified Funds PLC. | | | 68 | | | Board Director and Chairman, SPDR Europe 1PLC Board (2011 – Present); Board Director and Chairman, SPDR Europe II, PLC (2013 – Present). |
| | | | | | | | | | | | | |
John R. Costantino c/o SSGA Funds
Management, Inc. One Iron Street Boston, MA 02210 YOB: 1946 | | Director andCo-Chairperson of the Qualified Legal Compliance Committee | | Term: Until successor is elected and qualified Served: Since 1997 | | Senior Advisor to NGN Capital LLC (December 2019 – Present); Managing General Partner, NGN Capital LLC (2006 – December 2019); and Managing Director, Vice President of Walden Capital Management (1996 – present). | | | 68 | | | Director of Kleinfeld Bridal Corp. (March 2016 – present); Trustee of Neuroscience Research Institute (1986 – 2018); Trustee of Fordham University (1989 – 1995 and 2001 – 2007) and Trustee Emeritus (2007 – present); Director, Muscular Dystrophy Association (since 2019); Trustee of GE Funds (1993 – February 2011); and Trustee of Gregorian University Foundation (1992 – 2007). |
| | | | | | | | | | | | | |
Donna M. Rapaccioli c/o SSGA Funds
Management, Inc. One Iron Street Boston, MA 02210 YOB: 1962 | | Director andCo-Chairperson of the Audit Committee | | Term: Until successor is elected and qualified Served: Since January 2012 | | Dean of the Gabelli School of Business (2007 – present) and Accounting Professor (1987 – present) at Fordham University. | | | 68 | | | Director-Graduate Management Admissions Council (2015 – present). |
State Street Small-Cap Equity V.I.S. Fund
Other Information, continued — December 31, 2019 (Unaudited)
| | | | | | | | | | | | |
| | | | | | |
Name, Address, and Year of Birth | | Position(s) Held with Fund | | Term of
Office and
Length of Time Served | | Principal Occupation
During Past Five Years
and Relevant Experience | | Number of
Funds in
Fund
Complex
Overseen
by Director† | | | Other Directorships
Held by Director During Past Five Years |
INDEPENDENT DIRECTORS (continued) |
Richard D. Shirk c/o SSGA Funds
Management, Inc. One Iron Street Boston, MA 02210 YOB: 1945 | | Director andCo-Chairperson of the Qualified Legal Compliance Committee | | Term: Until successor is elected and qualified Served: Since January 2019 | | March 2001 to April 2002, Chairman (1996 to March 2001, President and Chief Executive Officer), Cerulean Companies, Inc. (holding company) (Retired); 1992 to March 2001, President and Chief Executive Officer, Blue Cross Blue Shield of Georgia (health insurer, managed healthcare). | | | 68 | | | 1998 to December 2008, Chairman, Board Member and December 2008 to Present, Investment Committee Member, Healthcare Georgia Foundation (private foundation); September 2002 to 2012, Lead Director and Board Member, Amerigroup Corp. (managed health care); 1999 to 2013, Board Member and (since 2001) Investment Committee Member, Woodruff Arts Center; and 2003 to 2009, Trustee, Gettysburg College; Board member, Aerocare Holdings, Regenesis Biomedical Inc. |
| | | | | | | | | | | | | |
Rina K. Spence c/o SSGA Funds
Management, Inc. One Iron Street Boston, MA 02210 YOB: 1948 | | Director andCo-Chairperson of the Audit Committee, Chairperson of the Nominating Committee and Chairperson of the Governance Committee | | Term: Until successor is elected and qualified Served: Since January 2019 | | President of SpenceCare International LLC (international healthcare consulting) (1999 – present); Chief Executive Officer, IEmily.com (health internet company) (2000 – 2001); Chief Executive Officer of Consensus Pharmaceutical, Inc. (1998 – 1999); Founder, President and Chief Executive Officer of Spence Center for Women’s Health (1994 – 1998); President and CEO, Emerson Hospital (1984 – 1994); Honorary Consul for Monaco in Boston (2015 – present). | | | 68 | | | None |
| | | | | | | | | | | | | |
Michael A. Jessee c/o SSGA Funds
Management, Inc. One Iron Street Boston, MA 02210 YOB: 1946 | | Director and Chairperson of the Valuation Committee | | Term: Until successor is elected and qualified Served: Since January 2019 | | Retired; formerly, President and Chief Executive Officer of the Federal Home Loan Bank of Boston (1989 – 2009); Trustee, Randolph-Macon College (2004 – 2016). | | | 68 | | | None |
State Street Small-Cap Equity V.I.S. Fund
Other Information, continued — December 31, 2019 (Unaudited)
| | | | | | | | | | | | |
| | | | | | |
Name, Address, and Year of Birth | | Position(s) Held with Fund | | Term of
Office and
Length of Time Served | | Principal Occupation
During Past Five Years
and Relevant Experience | | Number of
Funds in
Fund
Complex
Overseen
by Director† | | | Other Directorships
Held by Director During Past Five Years |
INTERESTED DIRECTORS(1) | | | | | | | | | | |
Ellen M. Needham(2) SSGA Funds Management, Inc. One Iron Street
Boston, MA 02210 YOB: 1967 | | Director | | Term: Until successor is elected and qualified Served: Since January 2019 | | President and Director, SSGA Funds Management, Inc. (2001 – present)*; Senior Managing Director, State Street Global Advisors (1992 – present)*; Director, State Street Global Advisors Funds Distributors, LLC (May 2017 – present). | | | 68 | | | None |
| | | | | | | | | | | | | |
Jeanne La Porta(3) c/o SSGA Funds
Management, Inc. 1600 Summer St. Stamford, CT 06905 YOB: 1965 | | Director & President | | Term: Until successor is elected and qualified Served: Since 2014 | | Senior Managing Director at State Street Global Advisors (July 2016 – present); Director of State Street Global Advisors Funds Distributors, LLC (May 2017 – present); President of GE Retirement Savings Plan Funds (July 2016 – September 2018); Senior Vice President and Commercial Operations Leader at GE Asset Management Incorporated (“GEAM”) (March 2014 – July 2016); President of State Street Institutional Funds and State Street Variable Insurance Series Funds, Inc. (April 2014 – present); President and Trustee of GEAM’s UCITs Funds (March 2014 – November 2014); Senior Vice President and Commercial Administrative Officer at GEAM (April 2010 – March 2014); Vice President of State Street Institutional Funds (July 2003 – April 2014); Vice President of Elfun Funds and GE Retirement Savings Plan Funds (October 2003 – July 2016). | | | 18 | | | None |
| † | | For the purpose of determining the number of portfolios overseen by the Directors, “Fund Complex” comprises registered investment companies for which SSGA FM serves as investment adviser. |
| (1) | | The individuals listed below are Directors who are “interested persons,” as defined in the 1940 Act, of the Company (“Interested Directors”). |
| (2) | | Ms. Needham is an Interested Director because of her employment by SSGA FM, an affiliate of the Company. |
| (3) | | Ms. La Porta is an Interested Director because of her employment by SSGA, an affiliate of the Company. |
| * | | Served in various capacities and/or with various affiliated entities during noted time period. |
State Street Small-Cap Equity V.I.S. Fund
Other Information, continued — December 31, 2019 (Unaudited)
| | | | | | |
| | | | |
Name, Address, and
Year of Birth | | Position(s) Held
with Fund | | Term of
Office and
Length of
Time Served | | Principal Occupation During Past Five Years |
OFFICERS: | | | | | | |
Jeanne M. La Porta SSGA Funds Management, Inc. 1600 Summer St. Stamford, CT 06905 YOB: 1965 | | President and Director | | Term: Indefinite Elected: 3/14 | | Senior Managing Director at State Street Global Advisors (July 2016 – present); Director of State Street Global Advisors Funds Distributors, LLC (May 2017 – present); President of GE Retirement Savings Plan Funds (July 2016 – September 2018); Senior Vice President and Commercial Operations Leader at GEAM (March 2014 – July 2016); President of State Street Institutional Funds and State Street Variable Insurance Series Funds, Inc. (April 2014 – present); President and Trustee of GEAM’s UCITs Funds (March 2014 – November 2014); Senior Vice President and Commercial Administrative Officer at GEAM (April 2010 – March 2014); Vice President of State Street Institutional Funds (July 2003 – April 2014); Vice President of Elfun Funds and GE Retirement Savings Plan Funds (October 2003 – July 2016); Secretary of GE Funds (July 2007 – September 2010) and Vice President (July 2007 – February 2011); Senior Vice President and Deputy General Counsel of GEAM (October 2007 – April 2010); Vice President and Assistant Secretary of Elfun Funds and GE Retirement Savings Plan Funds (July 2003 – June 2010); and Vice President and Associate General Counsel – Marketing and Client Services (formerly Asset Management Services) at GEAM (May 1997 – October 2007). |
| | | | | | | |
Bruce S. Rosenberg SSGA Funds Management, Inc. One Iron Street Boston, MA 02210 YOB: 1961 | | Treasurer | | Term: Indefinite Elected: 4/19 | | Managing Director, State Street Global Advisors and SSGA Funds Management, Inc. (July 2015 – present); Director, Credit Suisse (April 2008 – July 2015). |
| | | | | | | |
Ann M. Carpenter SSGA Funds Management, Inc. One Iron Street Boston, MA 02210 YOB: 1966 | | Vice President and Deputy Treasurer | | Term: Indefinite Elected: 4/19 | | Chief Operating Officer, SSGA Funds Management, Inc. (April 2005 – present)*; Managing Director, State Street Global Advisors. (2005 – present).* |
| | | | | | | |
Chad C. Hallett SSGA Funds Management, Inc. One Iron Street Boston, MA 02210 YOB: 1969 | | Deputy Treasurer | | Term: Indefinite Elected: 4/19 | | Vice President, State Street Global Advisors and SSGA Funds Management, Inc. (November 2014 – present); Vice President, State Street Bank and Trust Company (2001 – November 2014).* |
| | | | | | | |
Darlene Anderson-Vasquez SSGA Funds Management, Inc. One Iron Street Boston, MA 02210 YOB: 1968 | | Deputy Treasurer | | Term: Indefinite Elected: 4/19 | | Managing Director, State Street Global Advisors and SSGA Funds Management, Inc. (May 2016 – present); Senior Vice President, John Hancock Investments (September 2007 – May 2016). |
State Street Small-Cap Equity V.I.S. Fund
Other Information, continued — December 31, 2019 (Unaudited)
| | | | | | |
| | | | |
Name, Address, and
Year of Birth | | Position(s) Held
with Fund | | Term of
Office and
Length of
Time Served | | Principal Occupation During Past Five Years |
OFFICERS: (continued) | | | | | | |
Arthur A. Jensen SSGA Funds Management, Inc. 1600 Summer Street Stamford, CT 06905 YOB: 1966 | | Deputy Treasurer | | Term: Indefinite Elected: 4/19 | | Vice President State Street Global Advisors and SSGA Funds Management, Inc. (July 2016 – present); Deputy Treasurer of Elfun Funds (July 2016 – present); Treasurer of State Street Institutional Funds, State Street Variable Insurance Series Funds, Inc. and GE Retirement Savings Plan Funds (June 2011 – present); Treasurer of Elfun Funds (June 2011 – July 2016); Mutual Funds Controller of GE Asset Management Incorporated (April 2011 – July 2016). |
| | | | | | | |
Sujata Upreti SSGA Funds Management, Inc. One Iron Street Boston, MA 02210 YOB: 1974 | | Assistant Treasurer | | Term: Indefinite Elected: 4/19 | | Vice President, State Street Global Advisors and SSGA Funds Management, Inc. (May 2015 – present); Assistant Director, Cambridge Associates, LLC (July 2014 – January 2015); Vice President, Bank of New York Mellon (July 2012 – August 2013); Manager, PricewaterhouseCoopers, LLP (September 2003 – July 2012). |
| | | | | | | |
Daniel Foley SSGA Funds Management, Inc. One Iron Street Boston, MA 02210 YOB: 1972 | | Assistant Treasurer | | Term: Indefinite Elected: 4/19 | | Vice President, State Street Global Advisors and SSGA Funds Management, Inc. (April 2007 – present).* |
| | | | | | | |
Daniel G. Plourde SSGA Funds Management, Inc. One Iron Street Boston, MA 02210 YOB: 1980 | | Assistant Treasurer | | Term: Indefinite Elected: 6/17 | | Vice President, State Street Global Advisors and SSGA Funds Management, Inc. (May 2015 – present); Officer, State Street Bank and Trust Company (March 2009 – May 2015). |
| | | | | | | |
Brian Harris SSGA Funds Management, Inc. One Iron Street Boston, MA 02210 YOB: 1973 | | Chief Compliance Officer, Anti-Money Laundering Officer and Code of Ethics Compliance Officer | | Term: Indefinite Elected: 7/16 Term: Indefinite Elected: 4/19 | | Managing Director, State Street Global Advisors and SSGA Funds Management, Inc. (June 2013 – Present)*; Senior Vice President and Global Head of Investment Compliance, BofA Global Capital Management (September 2010 – May 2013). |
| | | | | | | |
Sean O’Malley SSGA Funds Management, Inc. One Iron Street Boston, MA 02210 YOB: 1969 | | Chief Legal Officer | | Term: Indefinite Elected: 8/19 | | Senior Vice President and Deputy General Counsel, State Street Global Advisors (November 2013 – present). |
| | | | | | | |
Andrew DeLorme SSGA Funds Management, Inc. One Iron Street Boston, MA 02210 YOB: 1975 | | Secretary | | Term: Indefinite Elected: 8/19 | | Vice President and Senior Counsel, State Street Global Advisors (April 2016 – present); Vice President and Counsel, State Street Global Advisors (August 2014 – March 2016). |
State Street Small-Cap Equity V.I.S. Fund
Other Information, continued — December 31, 2019 (Unaudited)
| | | | | | |
| | | | |
Name, Address, and
Year of Birth | | Position(s) Held
with Fund | | Term of
Office and
Length of
Time Served | | Principal Occupation During Past Five Years |
OFFICERS: (continued) | | | | | | |
Kevin Morris SSGA Funds Management, Inc. One Iron Street Boston, MA 02210 YOB: 1982 | | Assistant Secretary | | Term: Indefinite Elected: 8/19 | | Vice President and Senior Counsel, State Street Global Advisors (April 2019 – present); Vice President and Counsel, State Street Global Advisors (January 2016 – April 2019); Director, Asset Management Compliance, Fidelity Investments (June 2015 – January 2016); Senior Compliance Advisor, Asset Management Compliance, Fidelity Investments (June 2012 – June 2015). |
| | | | | | | |
David Urman SSGA Funds Management, Inc. One Iron Street Boston, MA 02210 YOB: 1985 | | Assistant Secretary | | Term: Indefinite Elected: 8/19 | | Vice President and Senior Counsel, State Street Global Advisors (April 2019 – present); Vice President and Counsel, State Street Global Advisors (August 2015 – April 2019); Associate, Ropes & Gray LLP (November 2012 – August 2015). |
| * | | Served in various capacities and/or with various affiliated entities during noted time period. |
Directors
Michael F. Holland, Co-Chairperson
Patrick J. Riley, Co-Chairperson
John R. Costantino
Donna M. Rapaccioli
Michael A. Jessee
Richard D. Shirk
Rina K. Spence
Jeanne M. La Porta
Ellen M. Needham
Officers
Jeanne M. La Porta, President
Brian Harris, Chief Compliance Officer, Anti-Money Laundering Officer and Code of Ethics Compliance Officer
Sean O’Malley, Chief Legal Officer
Bruce S. Rosenberg, Treasurer
Ann M. Carpenter, Vice President and Deputy Treasurer
Chad C. Hallett, Deputy Treasurer
Arthur A. Jensen, Deputy Treasurer
Darlene Anderson-Vasquez, Deputy Treasurer
Sujata Upreti, Assistant Treasurer
Daniel Foley, Assistant Treasurer
Daniel G. Plourde, Assistant Treasurer
Andrew DeLorme, Secretary
Kevin Morris, Assistant Secretary
David Urman, Assistant Secretary
Investment Adviser and Administrator
SSGA Funds Management, Inc.
One Iron Street
Boston, MA 02210
Custodian and Sub-Administrator
State Street Bank and Trust Company
One Lincoln Street
Boston, Massachusetts 02111
Distributor
State Street Global Advisors Funds Distributors, LLC
One Iron Street
Boston, MA 02210
Independent Registered Public Accounting Firm
Ernst & Young LLP
200 Clarendon Street
Boston, Massachusetts 02116
Annual Report
December 31, 2019
State Street U.S. Equity V.I.S. Fund
Beginning on January 1, 2021, as permitted by regulations adopted by the U.S. Securities and Exchange Commission, paper copies of a Fund’s annual and semi-annual shareholder reports will no longer be sent by mail, unless you specifically request paper copies of the reports. Instead, the reports will be made available on a Fund’s website (www.ssga.com/geam), and you will be notified by mail each time a report is posted, and provided with a website link to access the report. If you already elected to receive shareholder reports electronically, you will not be affected by this change and you need not take any action.
You may elect to receive all future reports in paper free of charge. To do so, contact your Insurance Provider. Your election to receive reports in paper will apply to all funds held in your account.

State Street U.S. Equity V.I.S Fund
Annual Report
December 31, 2019
Table of Contents
This report is prepared for Policyholders of certain variable contracts and may be distributed to others only if preceded or accompanied by the variable contract’s current prospectus and the current summary prospectus of the Fund available for investments thereunder.
State Street U.S. Equity V.I.S. Fund
Notes to Performance — December 31, 2019 (Unaudited)
The information provided on the performance pages relates to the State Street U.S. Equity V.I.S. Fund (the “Fund”).
Total return performance shown in this report for the Fund takes into account changes in share price and assumes reinvestment of dividends and capital gains distributions, if any. Total returns shown are net of Fund fees and expenses but do not reflect fees and charges associated with the variable contracts such as administrative fees, account charges and surrender charges, which, if reflected, would reduce the Fund’s total returns for all periods shown.
The performance data quoted represents past performance; past performance does not guarantee future results. Investment return and principal value will fluctuate so your shares, when redeemed, may be worth more or less than their original cost. Current performance may be higher or lower than the performance data quoted. Periods less than one year are not annualized. Please call toll-free (800) 242-0134 or visit the Fund’s website at http://www.ssga.com/geam for the most recentmonth-end performance data.
An investment in the Fund is not a deposit of any bank and is not insured or guaranteed by the Federal Deposit Insurance Corporation (“FDIC”) or any other government agency. An investment in the Fund is subject to risk, including possible loss of principal invested.
The S&P 500® Index is an unmanaged, market capitalization-weighted index of stocks of 500 large U.S. companies, which is widely used as a measure of large-cap U.S. stock market performance. The results shown for the foregoing index assume the reinvestment of net dividends or interest and do not reflect fees, expenses, or taxes. As such, the index returns do not reflect the actual cost of investing in the instruments that comprise the index.
The views expressed in this document reflect our judgment as of the publication date and are subject to change at any time without notice.
State Street Global Advisors Funds Distributors, LLC, member of FINRA & SIPC is the principal underwriter and distributor of the State Street V.I.S. Funds and an indirect wholly-owned subsidiary of State Street Corporation. References to State Street may include State Street Corporation and its affiliates. The Funds pay State Street Bank and Trust Company for its services as custodian and Fund Accounting agent, and pay SSGA Funds Management, Inc. for investment advisory and administrative services.
State Street U.S. Equity V.I.S. Fund
Management Discussion of Fund Performance — December 31, 2019 (Unaudited)
The State Street U.S. Equity V.I.S. Fund (the “Fund”) seeks to provide long-term growth of capital. The Fund’s benchmark is the S&P 500 Index (the “Index”).
For the12-month period ended December 31, 2019 (the “Reporting Period”), the total return for the Fund was 31.77% and the Index was 31.49%. The Fund and Index returns reflect the reinvestment of dividends and other income. The Fund’s performance reflects the expenses of managing the Fund, including brokerage and advisory expenses. The Index is unmanaged and Index returns do not reflect fees and expenses of any kind, which would have a negative impact on returns.
Broad-based outperformance in the technology, communications services, consumer staples, real estate, and industrial sectors were primary drivers of Fund performance during the Reporting Period relative to the Index. The Fund benefitted from an overweight to the information technology sector, which was the best performing sector in the Index. In addition, the Fund’s holdings in the sector outperformed with strong performance from a rebound in semiconductor stocks (e.g. Applied Materials & ASML), IT services (Visa), and software (e.g. ServiceNow & Microsoft). In communication services, Charter Communications surged as it has continued to realize synergistic benefit from its 2016 acquisition of Time Warner Cable and strength in its broadband business. Underperformance within the healthcare sector detracted from the Fund’s relative performance. Mylan NV fell in the first half of 2019 amid declining prices for generic drugs and some manufacturing issues. The stock was largely range-bound during the rest of the year as it announced a merger with a unit of Pfizer. Other detractors such as Gilead and UnitedHealth Group were up during the year but couldn’t keep up with the strength of the broader market.
On an individual security level, the top positive contributors to the Fund’s performance on an absolute basis during the Reporting Period were Apple, Microsoft, and Visa. The top negative contributors to the Fund’s performance on an absolute basis during the Reporting Period were Lyft, Mylan, and Abiomed.
The views expressed above reflect those of the Fund’s portfolio manager only through the Reporting Period, and do not necessarily represent the views of the Adviser as a whole. Any such views are subject to change at any time based upon market or other conditions and the Adviser disclaims any responsibility to update such views. These views may not be relied on as investment advice and, because investment decisions for a fund are based on numerous factors, may not be relied on as an indication of trading intent on behalf of any fund.
| | |
| 2 | | State Street U.S. Equity V.I.S. Fund |
State Street U.S. Equity V.I.S. Fund
Understanding Your Fund’s Expenses — December 31, 2019 (Unaudited)
As a shareholder of the Fund, you incur ongoing costs. Ongoing costs include portfolio management fees, professional fees, administrative fees and other Fund expenses. The following example is intended to help you understand your ongoing costs (in dollars) of investing in the Fund and to compare these costs with the ongoing costs of investing in other mutual funds.
To illustrate these ongoing costs, we have provided an example and calculated the expenses paid by investors in the Fund during the period. The information in the following table is based on an investment of $1,000, which is invested at the beginning of the period and held for the entiresix-month period ended December 31, 2019.
Actual Expenses
The first section of the table provides information about actual account values and actual expenses. You may use the information in this section, together with the amount you invested, to estimate the expenses that you paid over the period. To do so, simply divide your account value by $1,000 (for example, an $8,600 account value divided by $1,000 = 8.6), then multiply the result by the number given under the heading “Expenses paid during the period” to estimate the expenses you paid on your account during the period.
Hypothetical Example for Comparison Purposes
The second section of the table provides information about hypothetical account values and hypothetical expenses based on the Fund’s actual expense ratio and an assumed rate of return of 5% per year before expenses, which is not the Fund’s actual return. The hypothetical account values and expenses may not be used to estimate the actual ending account balance or expenses you paid for the period. You may use this information to compare the ongoing costs of investing in the Fund and other funds. To do so, compare this 5% hypothetical example with the 5% hypothetical examples that appear in the shareholder reports of other funds.
Please note that the expenses shown in the table are meant to highlight and help you compare ongoing costs only and do not reflect transaction costs, such as sales charges or redemption fees, if any. Therefore, the second section of the table is useful in comparing ongoing costs only, and will not help you determine the relative total costs of owning different funds. Additionally, the expenses shown do not reflect the fees or charges associated with variable contracts through which shares of the Fund are offered.
| | | | | | | | |
| | | Actual
Fund Return | | | Hypothetical
5% Return
(2.5% for
the period) | |
Actual Fund Return | | | | | | | | |
Beginning Account Value July 1, 2019 | | $ | 1,000.00 | | | $ | 1,000.00 | |
Ending Account Value December 31, 2019 | | $ | 1,102.30 | | | $ | 1,020.82 | |
Expenses Paid During Period* | | $ | 4.61 | | | $ | 4.43 | |
| * | | Expenses are equal to the Fund’s annualized expense ratio of 0.87%** (for the period July 1, 2019-December 31, 2019), multiplied by the average account value over the period, multiplied by 184/365 (to reflect theone-half year period). |
| ** | | May differ from expense ratio disclosed in the financial highlights, which is calculated based on the entire fiscal year’s data. |
| | | | |
| State Street U.S. Equity V.I.S. Fund | | | 3 | |
State Street U.S. Equity V.I.S. Fund
Performance Summary — December 31, 2019 (Unaudited)
Top Ten Largest Holdings
as of December 31, 2019 (as a % of Fair Value)(a)(b)
| | | | |
Microsoft Corp. | | | 5.00 | % |
| |
Apple Inc. | | | 4.65 | % |
| |
Amazon.com Inc. | | | 3.60 | % |
| |
JPMorgan Chase & Co. | | | 3.34 | % |
| |
Alphabet Inc., Class A | | | 2.69 | % |
| |
Visa Inc., Class A | | | 2.64 | % |
| |
Merck & Company Inc. | | | 2.36 | % |
| |
UnitedHealth Group Inc. | | | 1.96 | % |
| |
Facebook Inc., Class A | | | 1.90 | % |
| |
The Walt Disney Co. | | | 1.84 | % |
Sector Allocation as of December 31, 2019
Portfolio Composition as a % of Fair Value of $25,920 (in thousands) as of December 31, 2019(a)(b)
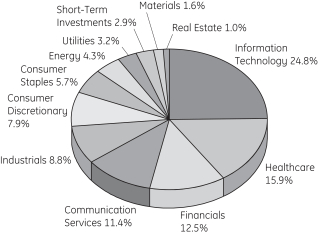
Average Annual Total Return for the periods ended December 31, 2019
Class I Shares (Inception date 1/3/95)
| | | | | | | | | | | | | | | | |
| | | One Year | | | Five Year | | | Ten Year | | | Ending Value
of a $10,000
Investment | |
State Street U.S. Equity V.I.S. Fund | | | 31.77 | % | | | 10.27 | % | | | 11.80 | % | | $ | 30,517 | |
| | | | |
S&P 500® Index | | | 31.49 | % | | | 11.70 | % | | | 13.56 | % | | $ | 35,666 | |
| (a) | Fair Value basis is inclusive of short-term investment in State Street Institutional U.S. Government Money Market Fund - Class G Shares. |
| (b) | The securities information regarding holdings, allocations and other characteristics is presented to illustrate examples of securities that the Fund has bought and the diversity of areas in which the Fund may invest as of a particular date. It may not be representative of the Fund’s current or future investments and should not be construed as a recommendation to purchase or sell a particular security. |
| | |
| 4 | | State Street U.S. Equity V.I.S. Fund |
State Street U.S. Equity V.I.S. Fund
Performance Summary, continued — December 31, 2019 (Unaudited)
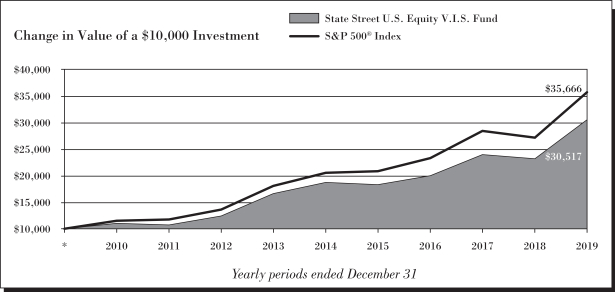
See Notes to Performance beginning on page 1 for further information.
Past performance does not predict future performance. The performance shown in the graphs and tables does not reflect the deduction of taxes that a shareholder would pay on Fund distributions or the redemption of Fund shares and does not reflect the fees or charges that would be associated with variable contracts through which shares of the Fund are offered.
| | | | |
| State Street U.S. Equity V.I.S. Fund | | | 5 | |
State Street U.S. Equity V.I.S. Fund
Schedule of Investments — December 31, 2019
| | | | | | | | |
| | | Number
of Shares | | | Fair
Value
$ | |
| | | | | | | | |
|
| Common Stock - 97.0%† | |
Aerospace & Defense - 1.1% | |
Hexcel Corp. | | | 924 | | | | 67,738 | |
Raytheon Co. | | | 620 | | | | 136,239 | |
The Boeing Co. | | | 256 | | | | 83,395 | |
| | | | | | | | |
| | | | | | | 287,372 | |
| | | | | | | | |
|
Air Freight & Logistics - 0.3% | |
United Parcel Service Inc., Class B | | | 771 | | | | 90,253 | |
| | | | | | | | |
|
Application Software - 2.4% | |
Adobe Inc. (a) | | | 489 | | | | 161,277 | |
Intuit Inc. | | | 164 | | | | 42,957 | |
salesforce.com Inc. (a) | | | 2,513 | | | | 408,714 | |
| | | | | | | | |
| | | | | | | 612,948 | |
| | | | | | | | |
|
Asset Management & Custody Banks - 0.3% | |
The Blackstone Group Inc., Class A | | | 1,645 | | | | 92,021 | |
| | | | | | | | |
|
Auto Parts & Equipment - 0.2% | |
Aptiv PLC | | | 462 | | | | 43,876 | |
| | | | | | | | |
|
Automotive Retail - 0.5% | |
O’Reilly Automotive Inc. (a) | | | 295 | | | | 129,287 | |
| | | | | | | | |
|
Biotechnology - 3.0% | |
Alexion Pharmaceuticals Inc. (a) | | | 907 | | | | 98,092 | |
BioMarin Pharmaceutical Inc. (a) | | | 1,052 | | | | 88,947 | |
Gilead Sciences Inc. | | | 6,443 | | | | 418,666 | |
Vertex Pharmaceuticals Inc. (a) | | | 769 | | | | 168,372 | |
| | | | | | | | |
| | | | | | | 774,077 | |
| | | | | | | | |
|
Building Products - 0.2% | |
Allegion PLC | | | 409 | | | | 50,937 | |
| | | | | | | | |
|
Cable & Satellite - 1.9% | |
Charter Communications Inc., Class A (a) | | | 646 | | | | 313,362 | |
Comcast Corp., Class A | | | 4,116 | | | | 185,096 | |
| | | | | | | | |
| | | | | | | 498,458 | |
| | | | | | | | |
|
Commodity Chemicals - 0.1% | |
Dow Inc. (a) | | | 546 | | | | 29,883 | |
| | | | | | | | |
|
Communications Equipment - 0.6% | |
Cisco Systems Inc. | | | 3,214 | | | | 154,143 | |
| | | | | | | | |
|
Construction Materials - 0.1% | |
Vulcan Materials Co. | | | 155 | | | | 22,318 | |
| | | | | | | | |
| | | | | | | | |
| | | Number
of Shares | | | Fair
Value
$ | |
Data Processing & Outsourced Services - 4.0% | |
Fidelity National Information Services Inc. | | | 648 | | | | 90,130 | |
Mastercard Inc., Class A | | | 847 | | | | 252,906 | |
Visa Inc., Class A | | | 3,638 | | | | 683,580 | |
| | | | | | | | |
| | | | | | | 1,026,616 | |
| | | | | | | | |
|
Diversified Banks - 3.3% | |
JPMorgan Chase & Co. | | | 6,219 | | | | 866,929 | |
| | | | | | | | |
|
Diversified Support Services - 0.2% | |
Cintas Corp. | | | 170 | | | | 45,744 | |
| | | | | | | | |
|
Electric Utilities - 1.4% | |
American Electric Power Company Inc. | | | 739 | | | | 69,843 | |
Duke Energy Corp. | | | 635 | | | | 57,918 | |
Exelon Corp. | | | 1,617 | | | | 73,719 | |
NextEra Energy Inc. | | | 655 | | | | 158,615 | |
| | | | | | | | |
| | | | | | | 360,095 | |
| | | | | | | | |
|
Electrical Components & Equipment - 0.5% | |
Emerson Electric Co. | | | 1,555 | | | | 118,584 | |
| | | | | | | | |
|
Electronic Components - 2.5% | |
Amphenol Corp., Class A | | | 2,797 | | | | 302,719 | |
Corning Inc. | | | 11,931 | | | | 347,312 | |
| | | | | | | | |
| | | | | | | 650,031 | |
| | | | | | | | |
|
Environmental & Facilities Services - 0.6% | |
Republic Services Inc. | | | 524 | | | | 46,966 | |
Waste Connections Inc. | | | 230 | | | | 20,882 | |
Waste Management Inc. | | | 782 | | | | 89,117 | |
| | | | | | | | |
| | | | | | | 156,965 | |
| | | | | | | | |
|
Fertilizers & Agricultural Chemicals - 0.2% | |
Corteva Inc. (a) | | | 1,536 | | | | 45,404 | |
| | | | | | | | |
|
Financial Exchanges & Data - 3.0% | |
CME Group Inc. | | | 1,707 | | | | 342,629 | |
MSCI Inc. | | | 315 | | | | 81,326 | |
S&P Global Inc. | | | 1,078 | | | | 294,348 | |
Tradeweb Markets Inc., Class A | | | 1,422 | | | | 65,910 | |
| | | | | | | | |
| | | | | | | 784,213 | |
| | | | | | | | |
|
Footwear - 0.7% | |
NIKE Inc., Class B | | | 1,852 | | | | 187,626 | |
| | | | | | | | |
|
General Merchandise Stores - 0.3% | |
Dollar Tree Inc. (a) | | | 795 | | | | 74,770 | |
| | | | | | | | |
See Notes to Schedule of Investments and Notes to Financial Statements.
| | |
| 6 | | State Street U.S. Equity V.I.S. Fund |
State Street U.S. Equity V.I.S. Fund
Schedule of Investments, continued — December 31, 2019
| | | | | | | | |
| | | Number
of Shares | | | Fair
Value
$ | |
| | | | | | | | |
Gold - 0.1% | |
Newmont Goldcorp Corp. | | | 683 | | | | 29,676 | |
| | | | | | | | |
|
Healthcare Equipment - 2.7% | |
ABIOMED Inc. (a) | | | 318 | | | | 54,247 | |
Becton Dickinson and Co. | | | 378 | | | | 102,805 | |
Boston Scientific Corp. (a) | | | 6,633 | | | | 299,944 | |
IDEXX Laboratories Inc. (a) | | | 39 | | | | 10,184 | |
Intuitive Surgical Inc. (a) | | | 146 | | | | 86,308 | |
Medtronic PLC | | | 1,331 | | | | 151,002 | |
| | | | | | | | |
| | | | | | | 704,490 | |
| | | | | | | | |
|
Healthcare Services - 1.1% | |
Cigna Corp. (a) | | | 947 | | | | 193,652 | |
Quest Diagnostics Inc. | | | 792 | | | | 84,578 | |
| | | | | | | | |
| | | | | | | 278,230 | |
| | | | | | | | |
|
Home Improvement Retail - 0.5% | |
Lowe’s Companies Inc. | | | 435 | | | | 52,095 | |
The Home Depot Inc. | | | 365 | | | | 79,709 | |
| | | | | | | | |
| | | | | | | 131,804 | |
| | | | | | | | |
|
Hotels, Resorts & Cruise Lines - 0.3% | |
Marriott International Inc., Class A | | | 529 | | | | 80,106 | |
| | | | | | | | |
|
Household Products - 1.2% | |
Colgate-Palmolive Co. | | | 1,088 | | | | 74,898 | |
The Procter & Gamble Co. | | | 1,950 | | | | 243,555 | |
| | | | | | | | |
| | | | | | | 318,453 | |
| | | | | | | | |
|
Hypermarkets & Super Centers - 0.3% | |
Walmart Inc. | | | 688 | | | | 81,762 | |
| | | | | | | | |
|
Industrial Conglomerates - 1.9% | |
Honeywell International Inc. | | | 2,100 | | | | 371,700 | |
Roper Technologies Inc. | | | 325 | | | | 115,125 | |
| | | | | | | | |
| | | | | | | 486,825 | |
| | | | | | | | |
|
Industrial Gases - 0.6% | |
Air Products & Chemicals Inc. | | | 482 | | | | 113,265 | |
Linde PLC | | | 149 | | | | 31,722 | |
| | | | | | | | |
| | | | | | | 144,987 | |
| | | | | | | | |
|
Industrial Machinery - 2.2% | |
Ingersoll-Rand PLC | | | 2,525 | | | | 335,623 | |
Xylem Inc. | | | 2,883 | | | | 227,152 | |
| | | | | | | | |
| | | | | | | 562,775 | |
| | | | | | | | |
|
Insurance Brokers - 0.4% | |
Marsh & McLennan Companies Inc. | | | 829 | | | | 92,359 | |
| | | | | | | | |
| | | | | | | | |
| | | Number
of Shares | | | Fair
Value
$ | |
Integrated Oil & Gas - 2.3% | |
Chevron Corp. | | | 3,284 | | | | 395,755 | |
Exxon Mobil Corp. | | | 2,734 | | | | 190,778 | |
| | | | | | | | |
| | | | | | | 586,533 | |
| | | | | | | | |
|
Integrated Telecommunication Services - 0.7% | |
AT&T Inc. | | | 1,442 | | | | 56,353 | |
Verizon Communications Inc. | | | 1,854 | | | | 113,836 | |
| | | | | | | | |
| | | | | | | 170,189 | |
| | | | | | | | |
|
Interactive Home Entertainment - 0.3% | |
Activision Blizzard Inc. | | | 664 | | | | 39,455 | |
Electronic Arts Inc. (a) | | | 338 | | | | 36,338 | |
| | | | | | | | |
| | | | | | | 75,793 | |
| | | | | | | | |
|
Interactive Media & Services - 6.0% | |
Alphabet Inc., Class A (a) | | | 521 | | | | 697,822 | |
Alphabet Inc., Class C (a) | | | 267 | | | | 356,984 | |
Facebook Inc., Class A (a) | | | 2,402 | | | | 493,011 | |
| | | | | | | | |
| | | | | | | 1,547,817 | |
| | | | | | | | |
|
Internet & Direct Marketing Retail - 4.2% | |
Amazon.com Inc. (a)(b) | | | 505 | | | | 933,159 | |
Booking Holdings Inc. (a) | | | 78 | | | | 160,191 | |
| | | | | | | | |
| | | | | | | 1,093,350 | |
| | | | | | | | |
|
Investment Banking & Brokerage - 0.1% | |
The Charles Schwab Corp. | | | 810 | | | | 38,524 | |
| | | | | | | | |
|
IT Consulting & Other Services - 0.7% | |
Accenture PLC, Class A | | | 444 | | | | 93,493 | |
International Business Machines Corp. | | | 616 | | | | 82,569 | |
| | | | | | | | |
| | | | | | | 176,062 | |
| | | | | | | | |
|
Life & Health Insurance - 0.2% | |
Lincoln National Corp. | | | 746 | | | | 44,021 | |
| | | | | | | | |
|
Life Sciences Tools & Services - 1.7% | |
Avantor Inc. (a) | | | 2,281 | | | | 41,400 | |
Illumina Inc. (a) | | | 464 | | | | 153,928 | |
IQVIA Holdings Inc. (a) | | | 1,563 | | | | 241,499 | |
| | | | | | | | |
| | | | | | | 436,827 | |
| | | | | | | | |
|
Managed Healthcare - 1.9% | |
UnitedHealth Group Inc. | | | 1,724 | | | | 506,822 | |
| | | | | | | | |
|
Movies & Entertainment - 2.3% | |
Netflix Inc. (a) | | | 366 | | | | 118,427 | |
The Walt Disney Co. | | | 3,304 | | | | 477,857 | |
| | | | | | | | |
| | | | | | | 596,284 | |
| | | | | | | | |
See Notes to Schedule of Investments and Notes to Financial Statements.
| | | | |
| State Street U.S. Equity V.I.S. Fund | | | 7 | |
State Street U.S. Equity V.I.S. Fund
Schedule of Investments, continued — December 31, 2019
| | | | | | | | |
| | | Number
of Shares | | | Fair
Value
$ | |
| | | | | | | | |
Multi-Line Insurance - 0.4% | |
American International Group Inc. | | | 1,075 | | | | 55,180 | |
The Hartford Financial Services Group Inc. | | | 684 | | | | 41,566 | |
| | | | | | | | |
| | | | | | | 96,746 | |
| | | | | | | | |
|
Multi-Sector Holdings - 1.3% | |
Berkshire Hathaway Inc., Class B (a) | | | 1,451 | | | | 328,652 | |
| | | | | | | | |
|
Multi-Utilities - 1.8% | |
CMS Energy Corp. | | | 570 | | | | 35,819 | |
Dominion Energy Inc. | | | 858 | | | | 71,060 | |
Sempra Energy | | | 2,361 | | | | 357,644 | |
| | | | | | | | |
| | | | | | | 464,523 | |
| | | | | | | | |
|
Oil & Gas Equipment & Services - 0.9% | |
Schlumberger Ltd. | | | 5,866 | | | | 235,813 | |
| | | | | | | | |
|
Oil & Gas Exploration & Production - 0.8% | |
Concho Resources Inc. | | | 111 | | | | 9,720 | |
ConocoPhillips | | | 1,261 | | | | 82,003 | |
Diamondback Energy Inc. | | | 515 | | | | 47,823 | |
EOG Resources Inc. | | | 434 | | | | 36,352 | |
Pioneer Natural Resources Co. | | | 225 | | | | 34,058 | |
| | | | | | | | |
| | | | | | | 209,956 | |
| | | | | | | | |
|
Oil & Gas Refining & Marketing - 0.3% | |
Marathon Petroleum Corp. | | | 1,204 | | | | 72,541 | |
| | | | | | | | |
|
Packaged Foods & Meats - 1.5% | |
General Mills Inc. | | | 1,085 | | | | 58,112 | |
Mondelez International Inc., Class A | | | 6,084 | | | | 335,107 | |
| | | | | | | | |
| | | | | | | 393,219 | |
| | | | | | | | |
|
Personal Products - 0.5% | |
The Estee Lauder Companies Inc., Class A | | | 650 | | | | 134,251 | |
| | | | | | | | |
|
Pharmaceuticals - 5.5% | |
Allergan PLC (b) | | | 1,785 | | | | 341,238 | |
Bristol-Myers Squibb Co. | | | 2,611 | | | | 167,600 | |
Elanco Animal Health Inc. (a) | | | 3,090 | | | | 91,001 | |
Johnson & Johnson | | | 794 | | | | 115,821 | |
Merck & Company Inc. | | | 6,737 | | | | 612,730 | |
Mylan N.V. (a) | | | 4,549 | | | | 91,435 | |
| | | | | | | | |
| | | | | | | 1,419,825 | |
| | | | | | | | |
|
Property & Casualty Insurance - 0.5% | |
Chubb Ltd. | | | 498 | | | | 77,519 | |
| | | | | | | | |
| | | Number
of Shares | | | Fair
Value
$ | |
The Progressive Corp. | | | 746 | | | | 54,003 | |
| | | | | | | | |
| | | | | | | 131,522 | |
| | | | | | | | |
|
Railroads - 0.5% | |
Union Pacific Corp. | | | 727 | | | | 131,434 | |
| | | | | | | | |
|
Regional Banks - 2.9% | |
First Republic Bank | | | 3,927 | | | | 461,226 | |
Regions Financial Corp. | | | 8,127 | | | | 139,459 | |
SVB Financial Group (a) | | | 636 | | | | 159,662 | |
| | | | | | | | |
| | | | | | | 760,347 | |
| | | | | | | | |
|
Restaurants - 0.8% | |
Domino’s Pizza Inc. | | | 135 | | | | 39,660 | |
McDonald’s Corp. | | | 906 | | | | 179,035 | |
| | | | | | | | |
| | | | | | | 218,695 | |
| | | | | | | | |
|
Semiconductor Equipment - 2.2% | |
Applied Materials Inc. | | | 7,181 | | | | 438,328 | |
ASML Holding N.V. | | | 293 | | | | 86,711 | |
Lam Research Corp. | | | 151 | | | | 44,152 | |
| | | | | | | | |
| | | | | | | 569,191 | |
| | | | | | | | |
|
Semiconductors - 2.0% | |
Broadcom Inc. | | | 334 | | | | 105,551 | |
Intel Corp. | | | 2,090 | | | | 125,087 | |
NVIDIA Corp. | | | 918 | | | | 216,005 | |
QUALCOMM Inc. | | | 692 | | | | 61,055 | |
| | | | | | | | |
| | | | | | | 507,698 | |
| | | | | | | | |
|
Soft Drinks - 1.6% | |
PepsiCo Inc. | | | 3,115 | | | | 425,727 | |
| | | | | | | | |
|
Specialized REITs - 1.0% | |
American Tower Corp. | | | 557 | | | | 128,010 | |
Extra Space Storage Inc. | | | 1,245 | | | | 131,497 | |
| | | | | | | | |
| | | | | | | 259,507 | |
| | | | | | | | |
|
Specialty Chemicals - 0.6% | |
Albemarle Corp. (b) | | | 339 | | | | 24,761 | |
DuPont de Nemours Inc. | | | 932 | | | | 59,834 | |
PPG Industries Inc. | | | 510 | | | | 68,080 | |
| | | | | | | | |
| | | | | | | 152,675 | |
| | | | | | | | |
|
Specialty Stores - 0.3% | |
Ulta Salon Cosmetics & Fragrance Inc. (a) | | | 334 | | | | 84,549 | |
| | | | | | | | |
|
Systems Software - 5.9% | |
Microsoft Corp. | | | 8,210 | | | | 1,294,717 | |
See Notes to Schedule of Investments and Notes to Financial Statements.
| | |
| 8 | | State Street U.S. Equity V.I.S. Fund |
State Street U.S. Equity V.I.S. Fund
Schedule of Investments, continued — December 31, 2019
| | | | | | | | |
| | | Number
of Shares | | | Fair
Value
$ | |
| | | | | | | | |
Oracle Corp. | | | 2,384 | | | | 126,305 | |
ServiceNow Inc. (a) | | | 404 | | | | 114,057 | |
| | | | | | | | |
| | | | | | | 1,535,079 | |
| | | | | | | | |
|
Technology Hardware, Storage & Peripherals - 4.6% | |
Apple Inc. | | | 4,103 | | | | 1,204,846 | |
| | | | | | | | |
|
Tobacco - 0.5% | |
Philip Morris International Inc. | | | 1,470 | | | | 125,082 | |
| | | | | | | | |
|
Trading Companies & Distributors - 1.0% | |
United Rentals Inc. (a) | | | 1,638 | | | | 273,169 | |
| | | | | | | | |
|
Trucking - 0.3% | |
Lyft Inc., Class A (a) | | | 1,990 | | | | 85,610 | |
| | | | | | | | |
| | | | | | | | |
| | | Number
of Shares | | | Fair
Value
$ | |
Wireless Telecommunication Services - 0.2% | |
T-Mobile US Inc. (a) | | | 667 | | | | 52,306 | |
| | | | | | | | |
| |
Total Common Stock
(Cost $17,449,627) | | | | 25,159,202 | |
| | | | | | | | |
|
| Short-Term Investments - 2.9% | |
State Street Institutional U.S. Government Money Market Fund - Class G Shares 1.57% (Cost $760,740) (c)(d) | | | 760,740 | | | | 760,740 | |
| | | | | | | | |
| |
Total Investments
(Cost $18,210,367) | | | | 25,919,942 | |
| |
| Other Assets and Liabilities, net - 0.1% | | | | 30,580 | |
| | | | | | | | |
| |
| NET ASSETS - 100.0% | | | | 25,950,522 | |
| | | | | | | | |
Other Information:
The Fund had the following long futures contracts open at December 31, 2019:
| | | | | | | | | | | | | | | | | | | | |
| Description | | Expiration
date | | | Number
of
Contracts | | | Notional
Amount | | | Value | | | Unrealized
Appreciation | |
S&P 500 Emini Index Futures | | | March 2020 | | | | 3 | | | $ | 474,397 | | | $ | 484,665 | | | $ | 10,268 | |
| | | | | | | | | | | | | | | | | | | | |
During the year ended December 31, 2019, average notional value related to long futures contracts and short futures contracts was $210,725 and $34,602, respectively.
See Notes to Schedule of Investments and Notes to Financial Statements.
| | | | |
| State Street U.S. Equity V.I.S. Fund | | | 9 | |
State Street U.S. Equity V.I.S. Fund
Notes to Schedule of Investments — December 31, 2019
The views expressed in this document reflect our judgment as of the publication date and are subject to change at any time without notice. The securities cited may not be representative of the Fund’s future investments and should not be construed as a recommendation to purchase or sell a particular security. See the Fund’s summary prospectus and statutory prospectus for complete descriptions of investment objectives, policies, risks and permissible investments.
| (a) | Non-income producing security. |
| (b) | At December 31, 2019, all or a portion of this security was pledged to cover collateral requirements for futures. |
| (c) | Sponsored by SSGA Funds Management, Inc., the Fund’s investment adviser and administrator, and an affiliate of State Street Bank & Trust Co., the Fund’ssub-administrator, custodian and accounting agent. |
| (d) | Coupon amount represents effective yield. |
| † | Percentages are based on net assets as of December 31, 2019. |
Abbreviations:
REIT - Real Estate Investment Trust
The following table presents the Fund���s investments measured at fair value on a recurring basis at December 31, 2019:
| | | | | | | | | | | | | | | | |
| Investments | | Level 1 | | | Level 2 | | | Level 3 | | | Total | |
Investments in Securities | | | | | | | | | | | | | | | | |
Common Stock | | $ | 25,159,202 | | | $ | — | | | $ | — | | | $ | 25,159,202 | |
Short-Term Investments | | | 760,740 | | | | — | | | | — | | | | 760,740 | |
| | | | | | | | | | | | | | | | |
Total Investments in Securities | | $ | 25,919,942 | | | $ | — | | | $ | — | | | $ | 25,919,942 | |
| | | | | | | | | | | | | | | | |
Other Financial Instruments | |
Long Futures Contracts - Unrealized Appreciation | | $ | 10,268 | | | $ | — | | | $ | — | | | $ | 10,268 | |
| | | | | | | | | | | | | | | | |
Affiliate Table
| | | | | | | | | | | | | | | | | | | | | | | | | | | | | | | | | | | | |
| | | Number
of Shares
Held at
12/31/18 | | | Value At
12/31/18 | | | Cost of
Purchases | | | Proceeds
from
Shares
Sold | | | Realized
Gain
(Loss) | | | Change in
Unrealized
Appreciation/
Depreciation | | | Number
of Shares
Held at
12/31/19 | | | Value at
12/31/19 | | | Dividend
Income | |
State Street Institutional U.S. Government Money Market Fund, Class G Shares | | | 743,662 | | | $ | 743,662 | | | $ | 5,719,155 | | | $ | 5,702,077 | | | | — | | | | — | | | | 760,740 | | | $ | 760,740 | | | $ | 11,844 | |
See Notes to Schedule of Investments and Notes to Financial Statements.
| | |
| 10 | | State Street U.S. Equity V.I.S. Fund |
State Street U.S. Equity V.I.S. Fund
Financial Highlights
Selected data based on a share outstanding throughout the fiscal years indicated
| | | | | | | | | | | | | | | | | | | | |
| | | 12/31/19 | | | 12/31/18 | | | 12/31/17 | | | 12/31/16 | | | 12/31/15* | |
| Inception date | | | | | | | | | | | | | | | | | | | 1/3/95 | |
| | | | | |
Net asset value, beginning of period | | $ | 38.07 | | | $ | 44.20 | | | $ | 42.02 | | | $ | 42.25 | | | $ | 48.44 | |
| | | | | | | | | | | | | | | | | | | | |
| | | |
Income/(loss) from investment operations: | | | | | | | | | | | | | |
Net investment income | | | 0.33 | (a) | | | 0.37 | (a) | | | 0.35 | (a) | | | 0.55 | | | | 0.53 | |
Net realized and unrealized gains/(losses) on investments | | | 11.78 | | | | (1.90 | ) | | | 8.03 | | | | 3.41 | | | | (1.56 | ) |
| | | | | | | | | | | | | | | | | | | | |
Total income/(loss) from investment operations | | | 12.11 | | | | (1.53 | ) | | | 8.38 | | | | 3.96 | | | | (1.03 | ) |
| | | | | | | | | | | | | | | | | | | | |
| | | | | |
Less distributions from: | | | | | | | | | | | | | | | | | | | | |
Net investment income | | | 0.32 | | | | 0.41 | | | | 0.38 | | | | 0.54 | | | | 0.53 | |
Net realized gains | | | 2.89 | | | | 4.19 | | | | 5.82 | | | | 3.65 | | | | 4.63 | |
| | | | | | | | | | | | | | | | | | | | |
Total distributions | | | 3.21 | | | | 4.60 | | | | 6.20 | | | | 4.19 | | | | 5.16 | |
| | | | | | | | | | | | | | | | | | | | |
Net asset value, end of period | | $ | 46.97 | | | $ | 38.07 | | | $ | 44.20 | | | $ | 42.02 | | | $ | 42.25 | |
| | | | | | | | | | | | | | | | | | | | |
Total Return(b) | | | 31.77 | % | | | (3.40 | )% | | | 19.91 | % | | | 9.31 | % | | | (2.30 | )% |
| | | | | |
Ratios/Supplemental Data: | | | | | | | | | | | | | | | | | | | | |
Net assets, end of period (in thousands) | | $ | 25,951 | | | $ | 23,473 | | | $ | 28,308 | | | $ | 27,336 | | | $ | 31,405 | |
| | | | | |
Ratios to average net assets: | | | | | | | | | | | | | | | | | | | | |
Net expenses | | | 0.88 | % | | | 0.80 | % | | | 0.85 | % | | | 0.83 | % | | | 0.76 | % |
Gross expenses | | | 0.88 | % | | | 0.80 | % | | | 0.85 | % | | | 0.83 | % | | | 0.76 | % |
Net investment income | | | 0.74 | % | | | 0.81 | % | | | 0.75 | % | | | 1.16 | % | | | 1.04 | % |
Portfolio turnover rate | | | 31 | % | | | 41 | % | | | 80 | % | | | 37 | % | | | 37 | % |
Notes to Financial Highlights
| (a) | | Per share values have been calculated using the average shares method. |
| (b) | | Total returns are historical and assume changes in share price, reinvestment of dividends and capital gains distributions and do not include the effect of insurance contract charges. Past performance does not guarantee future results. |
| * | | Beginning with the year ended December 31, 2016, the Fund was audited by Ernst & Young LLP. The previous years were audited by another independent registered public accounting firm. |
The accompanying Notes are an integral part of these financial statements.
State Street U.S. Equity V.I.S. Fund
Statement of Assets and Liabilities — December 31, 2019
| | | | |
Assets | | | | |
Investments in securities, at fair value (cost $17,449,627) | | $ | 25,159,202 | |
Short-term affiliated investments, at fair value | | | 760,740 | |
Cash | | | 1,396 | |
Net cash collateral on deposit with broker for future contracts | | | 11,636 | |
Income receivables | | | 29,074 | |
Receivable for fund shares sold | | | 404 | |
Income receivable from affiliated investments | | | 1,039 | |
Receivable for accumulated variation margin on futures contracts | | | 10,275 | |
Other assets | | | 145 | |
| | | | |
| |
Total assets | | | 25,973,911 | |
| | | | |
| |
Liabilities | | | | |
Payable for fund shares redeemed | | | 3,972 | |
Payable to the Adviser | | | 11,996 | |
Payable for custody, fund accounting andsub-administration fees | | | 1,728 | |
Accrued other expenses | | | 5,693 | |
| | | | |
| |
Total liabilities | | | 23,389 | |
| | | | |
| | | | |
| |
Net Assets | | $ | 25,950,522 | |
| | | | |
| |
Net Assets Consist of: | | | | |
Capital paid in | | $ | 17,913,396 | |
Total distributable earnings (loss) | | | 8,037,126 | |
| | | | |
| |
Net Assets | | $ | 25,950,522 | |
| | | | |
| | | | |
Shares outstanding ($0.01 par value; unlimited shares authorized) | | | 552,524 | |
Net asset value per share | | $ | 46.97 | |
The accompanying Notes are an integral part of these financial statements.
| | |
| 12 | | Statement of Assets and Liabilities |
State Street U.S. Equity V.I.S. Fund
Statement of Operations — For the fiscal year ended December 31, 2019
| | | | |
Investment Income | |
Income | |
Dividend | | $ | 403,182 | |
Income from affiliated investments | | | 11,844 | |
Less: Foreign taxes withheld | | | (259 | ) |
| | | | |
Total income | | | 414,767 | |
| | | | |
|
Expenses | |
Advisory and administration fees | | | 140,543 | |
Directors’ fees | | | 16,676 | |
Custody, fund accounting andsub-administration fees | | | 20,631 | |
Professional fees | | | 32,900 | |
Printing and shareholder reports | | | 13,440 | |
Other expenses | | | 1,267 | |
| | | | |
Total Expenses | | | 225,457 | |
| | | | |
Net investment income | | $ | 189,310 | |
| | | | |
|
Net Realized and Unrealized Gain (Loss) on Investments | |
Realized gain (loss) on: | |
Unaffiliated investments | | $ | 1,675,651 | |
Futures | | | 21,955 | |
Increase (decrease) in unrealized appreciation/depreciation on: | |
Unaffiliated investments | | | 5,049,408 | |
Futures | | | 20,288 | |
| | | | |
| |
Net realized and unrealized gain (loss) on investments | | | 6,767,302 | |
| | | | |
| |
Net Increase in Net Assets Resulting from Operations | | $ | 6,956,612 | |
| | | | |
The accompanying Notes are an integral part of these financial statements.
| | | | |
| Statement of Operations | | | 13 | |
State Street U.S. Equity V.I.S. Fund
Statements of Changes in Net Assets
| | | | | | | | |
| | | Year Ended December 31,
2019 | | | Year Ended December 31,
2018 | |
Increase (Decrease) in Net Assets | |
|
Operations: | |
Net investment income | | $ | 189,310 | | | $ | 224,719 | |
Net realized gain (loss) on investments and futures | | | 1,697,606 | | | | 2,185,851 | |
Net increase (decrease) in unrealized appreciation/depreciation on investments and futures | | | 5,069,696 | | | | (3,055,035 | ) |
| | | | | | | | |
Net increase (decrease) from operations | | | 6,956,612 | | | | (644,465 | ) |
| | | | | | | | |
| | |
Distributions to shareholders: | | | | | | | | |
Total distributions | | | (1,660,269 | ) | | | (2,528,893 | ) |
| | | | | | | | |
Increase (decrease) in assets from operations and distributions | | | 5,296,343 | | | | (3,173,358 | ) |
| | | | | | | | |
| | |
Share transactions: | | | | | | | | |
Proceeds from sale of shares | | | 499,825 | | | | 241,533 | |
Value of distributions reinvested | | | 1,660,269 | | | | 2,528,893 | |
Cost of shares redeemed | | | (4,979,288 | ) | | | (4,431,611 | ) |
| | | | | | | | |
Net increase (decrease) from share transactions | | | (2,819,194 | ) | | | (1,661,185 | ) |
| | | | | | | | |
| | |
Total increase (decrease) in net assets | | | 2,477,149 | | | | (4,834,543 | ) |
| | |
Net Assets | | | | | | | | |
Beginning of year | | | 23,473,373 | | | | 28,307,916 | |
| | | | | | | | |
| | |
End of year | | $ | 25,950,522 | | | $ | 23,473,373 | |
| | | | | | | | |
| | |
Changes in Fund Shares | | | | | | | | |
Shares sold | | | 11,190 | | | | 5,408 | |
Issued for distributions reinvested | | | 35,227 | | | | 66,920 | |
Shares redeemed | | | (110,556 | ) | | | (96,095 | ) |
| | | | | | | | |
Net decrease in fund shares | | | (64,139 | ) | | | (23,767 | ) |
| | | | | | | | |
The accompanying Notes are an integral part of these financial statements.
| | |
| 14 | | Statements of Changes in Net Assets |
State Street U.S. Equity V.I.S. Fund
Notes to Financial Statements — December 31, 2019
| 1. | | Organization of the Company |
State Street Variable Insurance Series Funds, Inc. (the “Company”) was incorporated under the laws of the Commonwealth of Virginia on May 14, 1984 and is registered under the Investment Company Act of 1940, as amended (the “1940 Act”), as anopen-end management investment company. The Company is currently composed of the following seven investment portfolios (collectively, the “Funds”): State Street U.S. Equity V.I.S. Fund (the “Fund”), State Street S&P 500 Index V.I.S. Fund, State Street Premier Growth Equity V.I.S. Fund, State StreetSmall-Cap Equity V.I.S. Fund, State Street Total Return V.I.S. Fund, State Street Income V.I.S. Fund and State Street Real Estate Securities V.I.S. Fund. Each Fund is a diversified investment company within the meaning of the 1940 Act.
Shares of the Funds of the Company are offered only to insurance company separate accounts that fund certain variable life insurance contracts and variable annuity contracts.
The Company currently offers one share class (Class 1) of the Fund as an investment option for variable life insurance and variable annuity contracts.
Under the Company’s organizational documents, its officers and directors are indemnified against certain liabilities arising out of the performance of their duties to the Company. Additionally, in the normal course of business, the Company enters into contracts with service providers that contain general indemnification clauses. The Company’s maximum exposure under these arrangements is unknown as this would involve future claims that may be made against the Company that have not yet occurred.
| 2. | | Summary of Significant Accounting Policies |
The following is a summary of significant accounting policies followed by the Company in the preparation of its financial statements:
The preparation of financial statements in accordance with U.S. generally accepted accounting principles (“U.S. GAAP”) requires management to make estimates and assumptions that affect the reported amounts and disclosures in the financial statements. Actual results could differ from those estimates. The Fund is an investment company under U.S. GAAP and follows the accounting and reporting guidance applicable to investment companies.
Security Valuation The Fund’s investments are valued at fair value each day that the New York Stock Exchange (“NYSE”) is open and, for financial reporting purposes, as of the report date should the reporting period end on a day that the NYSE is not open. Fair value is generally defined as the price a fund would receive to sell an asset or pay to transfer a liability in an orderly transaction between market participants at the measurement date. By its nature, a fair value price is a good faith estimate of the valuation in a current sale and may not reflect an actual market price. The investments of the Fund are valued pursuant to the policy and procedures developed by the Oversight Committee (the “Committee”) and approved by the Company’s Board of Directors (the “Board”). The Committee provides oversight of the valuation of investments for the Fund. The Board has responsibility for overseeing the determination of the fair value of investments.
Valuation techniques used to value the Fund’s investments by major category are as follows:
| | • | | Equity investments (including preferred stocks) traded on a recognized securities exchange for which market quotations are readily available are valued at the last sale price or official closing price, as applicable, on the primary market or exchange on which they trade. Equity investments traded on a recognized exchange for which there were no sales on that day are valued at the last published sale price or at fair value. |
| | • | | Exchange-traded futures contracts are valued at the closing settlement price on the primary market on which they are traded most extensively. Exchange-traded futures contracts traded on a recognized exchange for which there were no sales on that day are valued at the last reported sale price obtained from independent pricing services or brokers or at fair value. |
| | • | | Investments in registered investment companies (including money market funds) or other unitized pooled investment vehicles that are not traded on an exchange are valued at that day’s published net asset value (“NAV”) per share or unit. |
In the event prices or quotations are not readily available or that the application of these valuation methods results in a price for an investment that is deemed to be not representative of the fair value of such investment, fair value will be determined in good faith by the Committee, in accordance with the valuation policy and procedures approved by the Board.
| | | | |
| Notes to Financial Statements | | | 15 | |
State Street U.S. Equity V.I.S. Fund
Notes to Financial Statements, continued — December 31, 2019
The Fund values its assets and liabilities at fair value using a fair value hierarchy consisting of three broad levels that prioritize the inputs to valuation techniques giving the highest priority to readily available unadjusted quoted prices in active markets for identical assets or liabilities (Level 1 measurements) and the lowest priority to unobservable inputs (Level 3 measurements) when market prices are not readily available or reliable. The categorization of a value determined for an investment within the hierarchy is based upon the pricing transparency of the investment and is not necessarily an indication of the risk associated with investing in it.
The three levels of the fair value hierarchy are as follows:
| | • | | Level 1 — Unadjusted quoted prices in active markets for an identical asset or liability; |
| | • | | Level 2 — Inputs other than quoted prices included within Level 1 that are observable for the asset or liability either directly or indirectly, including quoted prices for similar assets or liabilities in active markets, quoted prices for identical or similar assets or liabilities in markets that are not considered to be active, inputs other than quoted prices that are observable for the asset or liability (such as exchange rates, financing terms, interest rates, yield curves, volatilities, prepayment speeds, loss severities, credit risks and default rates) or other market-corroborated inputs; and |
| | • | | Level 3 — Unobservable inputs for the asset or liability, including the Committee’s assumptions used in determining the fair value of investments. |
The value of the Fund’s investments according to the fair value hierarchy as of December 31, 2019 is disclosed in the Fund’s Schedule of Investments.
Investment Transactions and Income Recognition Investment transactions are accounted for on trade date for financial reporting purposes. Realized gains and losses from the sale or disposition of investments and foreign exchange transactions, if any, are determined using the identified cost method.
Dividend income and capital gain distributions, if any, are recognized on theex-dividend date, net of any foreign taxes withheld at source, if any.
Interest income is recorded daily on an accrual basis. All premiums and discounts are amortized/accreted for financial reporting purposes.
Non-cash dividends received in the form of stock are recorded as dividend income at fair value.
Expenses Certain expenses, which are directly identifiable to a specific Fund, are applied to the Fund within the Company. Other expenses which cannot be attributed to a specific Fund are allocated in such a manner as deemed equitable, taking into consideration the nature and type of expense and the relative net assets of the Fund within the Company.
Foreign Currency Translation The accounting records of the Fund are maintained in U.S. dollars. Foreign currencies as well as investment securities and other assets and liabilities denominated in a foreign currency are translated to U.S. dollars using exchange rates at period end. Purchases and sales of securities, income receipts and expense payments denominated in foreign currencies are translated into U.S. dollars at the prevailing exchange rate on the respective dates of the transactions.
The effects of exchange rate fluctuations on investments are included with the net realized and unrealized gain (loss) on investment securities. Other foreign currency transactions resulting in realized and unrealized gain (loss) are disclosed separately.
Foreign Taxes The Fund may be subject to foreign taxes (a portion of which may be reclaimable) on income, stock dividends, realized and unrealized capital gains on investments or certain foreign currency transactions. Foreign taxes are recorded in accordance with SSGA Funds Management, Inc.’s (the “Adviser” or “SSGA FM”) understanding of the applicable foreign tax regulations and rates that exist in the foreign jurisdictions in which the Fund invests. These foreign taxes, if any, are paid by the Fund and are reflected in the Statement of Operations, if applicable. Foreign taxes payable or deferred as of December 31, 2019, if any, are disclosed in the Fund’s Statement of Assets and Liabilities.
Distributions The Fund declares and pays any dividends from net investment income annually.
| | |
| 16 | | Notes to Financial Statements |
State Street U.S. Equity V.I.S. Fund
Notes to Financial Statements, continued — December 31, 2019
Net realized capital gains, if any, are distributed annually, unless additional distributions are required for compliance with applicable tax regulations. The amount and character of income and capital gains to be distributed are determined in accordance with applicable tax regulations which may differ from net investment income and realized gains recognized for U.S. GAAP purposes.
| 3. | | Derivative Financial Instruments |
Futures Contracts The Fund may enter into futures contracts to meet the Fund’s objectives. A futures contract is a standardized, exchange-traded agreement to buy or sell a financial instrument at a set price on a future date. Upon entering into a futures contract, the Fund is required to deposit with the broker, cash or securities in an amount equal to the minimum initial margin requirements of the clearing house. Subsequent payments are made or received by the Fund equal to the daily change in the contract value, accumulated, exchange rates, and or other transactional fees. The accumulation of those payments are recorded as variation margin receivable or payable with a corresponding offset to unrealized gains or losses. The Fund recognizes a realized gain or loss when the contract is closed.
Losses may arise if the value of a futures contract decreases due to unfavorable changes in the market rates or values of the underlying instrument during the term of the contract or if the counterparty does not perform under the contract. The use of futures contracts also involves the risk that the movements in the price of the futures contracts do not correlate with the movement of the assets underlying such contracts.
For the fiscal year ended December 31, 2019, the Fund entered into futures contracts for cash equitization.
The following tables summarize the value of the Fund’s derivative instruments as of December 31, 2019 and the related location in the accompanying Statement of Assets and Liabilities and Statement of Operations, presented by primary underlying risk exposure:
Asset Derivatives
| | | | | | | | | | | | | | | | | | | | | | | | |
| | | Interest
Rate
Contracts
Risk | | | Foreign
Exchange
Contracts
Risk | | | Credit
Contracts
Risk | | | Equity
Contracts
Risk | | | Commodity
Contracts
Risk | | | Total | |
State Street U.S. Equity V.I.S. Fund | | | | | | | | | | | | | | | | | | | | | | | | |
Futures Contracts | | $ | — | | | $ | — | | | $ | — | | | $ | 10,275 | | | $ | — | | | $ | 10,275 | |
Realized Gain/Loss
| | | | | | | | | | | | | | | | | | | | | | | | |
| | | Interest
Rate
Contracts
Risk | | | Foreign
Exchange
Contracts
Risk | | | Credit
Contracts
Risk | | | Equity
Contracts
Risk | | | Commodity
Contracts
Risk | | | Total | |
State Street U.S. Equity V.I.S. Fund | | | | | | | | | | | | | | | | | | | | | | | | |
Futures Contracts | | $ | — | | | $ | — | | | $ | — | | | $ | 21,955 | | | $ | — | | | $ | 21,955 | |
Net Change in Unrealized Appreciation (Depreciation)
| | | | | | | | | | | | | | | | | | | | | | | | |
| | | Interest
Rate
Contracts
Risk | | | Foreign
Exchange
Contracts
Risk | | | Credit
Contracts
Risk | | | Equity
Contracts
Risk | | | Commodity
Contracts
Risk | | | Total | |
State Street U.S. Equity V.I.S. Fund | | | | | | | | | | | | | | | | | | | | | | | | |
Futures Contracts | | $ | — | | | $ | — | | | $ | — | | | $ | 20,288 | | | $ | — | | | $ | 20,288 | |
| 4. | | Fees and Transactions with Affiliates |
Advisory Fee SSGA FM, a registered investment adviser, was retained by the Board to act as investment adviser and administrator of the Fund. SSGA FM’s compensation for investment advisory and administrative services (“Management Fee”) is paid monthly based on the average daily net assets of the Fund at an annualized rate of 0.55%.
Custody, Fund Accounting andSub-Administration Fees State Street Bank and Trust Company (“State Street”) serves as the custodian, fund accountant andsub-administrator to the Fund. Amounts paid by the Fund to State Street for performing such services are included as custody, fund accounting andsub-administration fees in the Statement of Operations.
| | | | |
| Notes to Financial Statements | | | 17 | |
State Street U.S. Equity V.I.S. Fund
Notes to Financial Statements, continued — December 31, 2019
Other Transactions with Affiliates The Fund may invest in affiliated entities, including securities issued by State Street Corporation, affiliated funds, or entities deemed to be affiliates as a result of the Fund owning more than five percent of the entity’s voting securities or outstanding shares. Amounts relating to these transactions during the fiscal year ended December 31, 2019 are disclosed in the Schedule of Investments.
The fees and expenses of the Company’s directors who are not “interested persons” of the Company, as defined in the 1940 Act (“Independent Directors”), are paid directly by the Fund. The Independent Directors are reimbursed for travel and otherout-of-pocket expenses in connection with meeting attendance and industry seminars.
| 6. | | Investment Transactions |
Purchases and sales of investments (excludingin-kind transactions, short term investments and derivative contracts) for the fiscal year ended December 31, 2019 were as follows:
| | | | | | | | |
| Non-U.S. Government Securities |
| Purchases | | Sales |
| | $ | 7,626,480 | | | | $ | 11,912,985 | |
The Fund has qualified and intends to continue to qualify as a regulated investment company under Subchapter M of the Internal Revenue Code of 1986, as amended. The Fund will not be subject to federal income taxes to the extent it distributes its taxable income, including any net realized capital gains, for each fiscal year. Therefore, no provision for federal income tax is required.
The Fund files federal and various state and local tax returns as required. No income tax returns are currently under examination. Generally, the federal returns are subject to examination by the Internal Revenue Service for a period of three years from date of filing, while the state returns may remain open for an additional year depending upon jurisdiction. SSGA FM has analyzed the Fund’s tax positions taken on tax returns for all open years and does not believe there are any uncertain tax positions that would require recognition of a tax liability.
Distributions to shareholders are recorded onex-dividend date. Income dividends and gain distributions are determined in accordance with income tax rules and regulations, which may differ from generally accepted accounting principles. Certain capital accounts in the financial statements have been adjusted for permanentbook-tax differences. These adjustments have no impact on net asset values or results of operations. Temporarybook-tax differences will reverse in the future. These book tax differences are primarily due to futures contracts, return of capital distributions received and wash sale loss deferrals.
The tax character of distributions paid during the fiscal year ended December 31, 2019 was as follows:
| | | | | | | | | | | | | |
Ordinary
Income | | Long-Term
Capital Gains | | Total |
| | $ | 176,836 | | | | $ | 1,483,433 | | | | $ | 1,660,269 | |
The tax character of distributions paid during the year ended December 31, 2018 was as follows:
| | | | | | | | | | | | | |
Ordinary
Income | | Long-Term
Capital Gains | | Total |
| | $ | 235,762 | | | | $ | 2,293,131 | | | | $ | 2,528,893 | |
At December 31, 2019, the components of distributable earnings on a tax basis were as follows:
| | | | | | | | | | | | | | | | | | | | | | | | | | | | |
Undistributed
Ordinary
Income | | Tax Exempt
Income | | Capital Loss
Carryforwards | | Undistributed
Long Term Gain | | Net Unrealized
Gain (Losses) | | Total |
| | $ | 74,542 | | | | $ | — | | | | $ | — | | | | $ | 453,600 | | | | $ | 7,508,984 | | | | $ | 8,037,126 | |
| | |
| 18 | | Notes to Financial Statements |
State Street U.S. Equity V.I.S. Fund
Notes to Financial Statements, continued — December 31, 2019
As of December 31, 2019, gross unrealized appreciation and gross unrealized depreciation of investments and other financial instruments based on cost for federal income tax purposes were as follows:
| | | | | | | | | | | | | | | | | | |
Tax
Cost | | Gross
Unrealized
Appreciation | | Gross
Unrealized
Depreciation | | Net Unrealized
Appreciation
(Depreciation) |
| | $ | 18,421,226 | | | | $ | 7,933,723 | | | | $ | 424,739 | | | | $ | 7,508,984 | |
The Fund and other affiliated funds (each, a “Participant” and collectively, the “Participants”) have access to $200 million of a $500 million revolving credit facility provided by a syndication of banks under which the Participants may borrow to fund shareholder redemptions. This agreement expires in October 2020 unless otherwise extended or renewed.
The Participants are charged an annual commitment fee which is calculated based on the unused portion of the shared credit line. Commitment fees are allocated among each of the Participants based on relative net assets. Commitment fees are ordinary fund operating expenses. A Participant incurs and pays the interest expense related to its borrowing. Interest is calculated at a rate per annum equal to the sum of 1% plus the greater of the New York Fed Bank Rate and1-month LIBOR rate.
The Fund had no outstanding loans as of December 31, 2019.
Concentration Risk As a result of the Fund’s ability to invest a large percentage of its assets in obligations of issuers within the same country, state, region, currency or economic sector, an adverse economic, business or political development may affect the value of the Fund’s investments more than if the Fund were more broadly diversified.
Market and Credit Risk In the normal course of business, the Fund trades financial instruments and enters into financial transactions where risk of potential loss exists due to changes in the general economic conditions and fluctuations of the market (market risk). Additionally, the Fund may also be exposed to credit risk in the event that an issuer or guarantor fails to perform or that an institution or entity with which the Fund has unsettled or open transactions defaults.
Management has evaluated the impact of all subsequent events on the Fund through the date on which the financial statements were available to be issued and has determined that there were no subsequent events requiring adjustment or disclosure in the financial statements.
| | | | |
| Notes to Financial Statements | | | 19 | |
State Street U.S. Equity V.I.S. Fund
Report of Independent Registered Public Accounting Firm
To the Shareholders of State Street U.S. Equity V.I.S. Fund and the Board of Directors of State Street Variable Insurance Series Funds, Inc.
Opinion on the Financial Statements
We have audited the accompanying statement of assets and liabilities of State Street U.S. Equity V.I.S. Fund (the “Fund”) (one of the funds constituting State Street Variable Insurance Series Funds, Inc. (the “Company”)), including the schedule of investments, as of December 31, 2019, and the related statement of operations for the year then ended, the statements of changes in net assets for each of the two years in the period then ended, the financial highlights for each of the four years in the period then ended and the related notes (collectively referred to as the “financial statements”). In our opinion, the financial statements present fairly, in all material respects, the financial position of the Fund (one of the funds constituting State Street Variable Insurance Series Funds, Inc.) at December 31, 2019, the results of its operations for the year then ended, the changes in its net assets for each of the two years in the period then ended and its financial highlights for each of the four years in the period then ended, in conformity with U.S. generally accepted accounting principles. The financial highlights for the year ended December 31, 2015 were audited by another independent registered public accounting firm whose report, dated February 19, 2016, expressed an unqualified opinion on those financial highlights.
Basis for Opinion
These financial statements are the responsibility of the Company’s management. Our responsibility is to express an opinion on the Fund’s financial statements based on our audits. We are a public accounting firm registered with the Public Company Accounting Oversight Board (United States) (“PCAOB”) and are required to be independent with respect to the Company in accordance with the U.S. federal securities laws and the applicable rules and regulations of the Securities and Exchange Commission and the PCAOB.
We conducted our audits in accordance with the standards of the PCAOB. Those standards require that we plan and perform the audit to obtain reasonable assurance about whether the financial statements are free of material misstatement, whether due to error or fraud. The Company is not required to have, nor were we engaged to perform, an audit of the Company’s internal control over financial reporting. As part of our audits we are required to obtain an understanding of internal control over financial reporting, but not for the purpose of expressing an opinion on the effectiveness of the Company’s internal control over financials reporting. Accordingly, we express no such opinion.
Our audits included performing procedures to assess the risks of material misstatement of the financial statements, whether due to error or fraud, and performing procedures that respond to those risks. Such procedures included examining, on a test basis, evidence regarding the amounts and disclosures in the financial statements. Our procedures included confirmation of securities owned as of December 31, 2019, by correspondence with the custodian, brokers and others or by other appropriate auditing procedures where replies from brokers and others were not received. Our audits also included evaluating the accounting principles used and significant estimates made by management, as well as evaluating the overall presentation of the financial statements. We believe that our audits provide a reasonable basis for our opinion.

We have served as the auditor of one or more State Street Global Advisors investment companies since 2000.
Boston, Massachusetts
February 19, 2020
| | |
| 20 | | Report of Independent Registered Public Accounting Firm |
State Street U.S. Equity V.I.S. Fund
Tax Information — December 31, 2019 (Unaudited)
For federal income tax purposes, the following information is furnished with respect to the distributions of the Fund for its fiscal year ended December 31, 2019.
Dividends Received Deduction
The Fund reports the maximum amount allowable of its net taxable income as eligible for the corporate dividends received deduction.
Long Term Capital Gain Distributions
Long term capital gains dividends were paid from the Fund during the year ended December 31, 2019 in the amount of $1,483,433.
State Street U.S. Equity V.I.S. Fund
Other Information — December 31, 2019 (Unaudited)
Liquidity Risk Management Program
Pursuant to Rule 22e-4 under the 1940 Act, the Funds have adopted a liquidity risk management program. SSGA FM has been designated by the Board to administer the Funds’ liquidity risk management program. The program’s principal objectives include assessing, managing and periodically reviewing each Fund’s liquidity risk, based on factors specific to the circumstances of the Fund. Liquidity risk is defined as the risk that a Fund could not meet redemption requests without significant dilution of remaining investors’ interests in the Fund. During the fiscal year, SSGA FM provided the Board with a report addressing the operations of the program and assessing its adequacy and effectiveness of implementation.
During the period covered by the liquidity program report to the Board, the program supported each Fund’s ability to honor redemption requests timely and SSGA FM’s management of each Fund’s liquidity profile, including during periods of market volatility and net redemptions. SSGA FM reported that the program operated adequately and that the implementation of the program was effective to manage the Fund’s liquidity risk.
There can be no assurance that the program will achieve its objectives in the future. Please refer to your Fund’s prospectus for more information regarding the Fund’s exposure to liquidity risk and other principal risks to which an investment in the Fund may be subject.
Proxy Voting Policies and Procedures and Record
The Fund has adopted the proxy voting policies of SSGA FM. A description of the policies and procedures that the Fund has adopted to determine how to vote proxies relating to portfolio securities is available (i) without charge, upon request, by calling1-800-242-0134, (ii) on the Fund’s website at http://www.ssga.com/geam, or (iii) on the SEC’s website at www.sec.gov. Information regarding how the Fund voted proxies, if any, during the most recent 12-month period ended June 30 is available by August 31 of each year without charge (1) by calling 1-800-242-0134 (toll free), and (2) on the website of the SEC at www.sec.gov.
Quarterly Portfolio Schedule
Following the Fund’s first and third fiscal quarter-ends, a complete schedule of investments is filed with the SEC as an exhibit to its reports on Form N-PORT, which can be found on the SEC’s website at www.sec.gov. The Fund’s schedules of investments are available upon request, without charge, by calling 1-800-242-0134.
State Street U.S. Equity V.I.S. Fund
Other Information, continued — December 31, 2019 (Unaudited)
| | | | | | | | | | | | |
| | | | | | |
Name,
Address, and Year
of Birth | | Position(s) Held
with Fund | | Term of Office and Length of Time Served | | Principal Occupation During Past Five Years and Relevant Experience | | Number of Funds
in Fund Complex Overseen by Director† | | | Other Directorships Held by Director During Past Five Years |
INDEPENDENT DIRECTORS |
Michael F. Holland c/o SSGA Funds
Management, Inc.
One Iron Street
Boston, MA 02210 YOB: 1944 | | Director and Co-Chairperson of the Board | | Term: Until successor is elected and qualified Served: Since January 2019 | | Chairman, Holland & Company L.L.C. (investment adviser) (1995 – present). | | | 68 | | | Director, the Holland Series Fund, Inc.; Director, Reaves Utility Income Fund, Inc.; and Director, Blackstone/GSO Loans (and Real Estate) Funds. |
| |
Patrick J. Riley c/o SSGA Funds
Management, Inc.
One Iron Street
Boston, MA 02210 YOB: 1948 | | Director and Co-Chairperson of the Board | | Term: Until successor is elected and qualified Served: Since January 2019 | | 2002 to May 2010, Associate Justice of the Superior Court, Commonwealth of Massachusetts; 1985 to 2002, Partner, Riley, Burke & Donahue, L.L.P. (law firm); 1998 to Present, Independent Director, State Street Global Advisers Ireland, Ltd. (investment company); 1998 to Present, Independent Director, SSGA Liquidity plc (formerly, SSGA Cash Management Fund plc); January 2009 to Present, Independent Director, SSGA Fixed Income plc; and January 2009 – 2019, Independent Director, SSGA Qualified Funds PLC. | | | 68 | | | Board Director and Chairman, SPDR Europe 1PLC Board (2011 – Present); Board Director and Chairman, SPDR Europe II, PLC (2013 – Present). |
| |
John R. Costantino c/o SSGA Funds
Management, Inc.
One Iron Street
Boston, MA 02210 YOB: 1946 | | Director and Co-Chairperson of the Qualified Legal Compliance Committee | | Term: Until successor is elected and qualified Served: Since 1997 | | Senior Advisor to NGN Capital LLC (December 2019 – Present); Managing General Partner, NGN Capital LLC (2006 – December 2019); and Managing Director, Vice President of Walden Capital Management (1996 – present). | | | 68 | | | Director of Kleinfeld Bridal Corp. (March 2016 – present); Trustee of Neuroscience Research Institute (1986 – 2018); Trustee of Fordham University (1989 – 1995 and 2001 – 2007) and Trustee Emeritus (2007 – present); Director, Muscular Dystrophy Association (since 2019); Trustee of GE Funds (1993 – February 2011); and Trustee of Gregorian University Foundation (1992 – 2007). |
| |
Donna M. Rapaccioli c/o SSGA Funds
Management, Inc.
One Iron Street
Boston, MA 02210 YOB: 1962 | | Director and Co-Chairperson of the Audit Committee | | Term: Until successor is elected and qualified Served: Since January 2012 | | Dean of the Gabelli School of Business (2007 – present) and Accounting Professor (1987 – present) at Fordham University. | | | 68 | | | Director-Graduate Management Admissions Council (2015 – present). |
State Street U.S. Equity V.I.S. Fund
Other Information, continued — December 31, 2019 (Unaudited)
| | | | | | | | | | | | |
| | | | | | |
Name,
Address, and Year
of Birth | | Position(s) Held
with Fund | | Term of Office and Length of Time Served | | Principal Occupation During Past Five Years and Relevant Experience | | Number of Funds
in Fund Complex Overseen by Director† | | | Other Directorships Held by Director During Past Five Years |
INDEPENDENT DIRECTORS (continued) | | | | | | | | |
Richard D. Shirk c/o SSGA Funds
Management, Inc.
One Iron Street
Boston, MA 02210 YOB: 1945 | | Director and Co-Chairperson of the Qualified Legal Compliance Committee | | Term: Until successor is elected and qualified Served: Since January 2019 | | March 2001 to April 2002, Chairman (1996 to March 2001, President and Chief Executive Officer), Cerulean Companies, Inc. (holding company) (Retired); 1992 to March 2001, President and Chief Executive Officer, Blue Cross Blue Shield of Georgia (health insurer, managed healthcare). | | | 68 | | | 1998 to December 2008, Chairman, Board Member and December 2008 to Present, Investment Committee Member, Healthcare Georgia Foundation (private foundation); September 2002 to 2012, Lead Director and Board Member, Amerigroup Corp. (managed health care); 1999 to 2013, Board Member and (since 2001) Investment Committee Member, Woodruff Arts Center; and 2003 to 2009, Trustee, Gettysburg College; Board member, Aerocare Holdings, Regenesis Biomedical Inc. |
| | | | | | | | | | | | | |
Rina K. Spence c/o SSGA Funds
Management, Inc.
One Iron Street
Boston, MA 02210 YOB: 1948 | | Director and Co-Chairperson of the Audit Committee, Chairperson of the Nominating Committee and Chairperson of the Governance Committee | | Term: Until successor is elected and qualified Served: Since January 2019 | | President of SpenceCare International LLC (international healthcare consulting) (1999 –present); Chief Executive Officer, IEmily.com (health internet company) (2000 – 2001); Chief Executive Officer of Consensus Pharmaceutical, Inc. (1998 –1999); Founder, President and Chief Executive Officer of Spence Center for Women’s Health (1994 – 1998); President and CEO, Emerson Hospital (1984 – 1994); Honorary Consul for Monaco in Boston (2015 – present). | | | 68 | | | None |
| |
Michael A. Jessee c/o SSGA Funds
Management, Inc.
One Iron Street
Boston, MA 02210 YOB: 1946 | | Director and Chairperson of the Valuation Committee | | Term: Until successor is elected and qualified
Served: Since January 2019 | | Retired; formerly, President and Chief Executive Officer of the Federal Home Loan Bank of Boston (1989 – 2009); Trustee, Randolph-Macon College (2004 – 2016). | | | 68 | | | None |
State Street U.S. Equity V.I.S. Fund
Other Information, continued — December 31, 2019 (Unaudited)
| | | | | | | | | | | | |
| | | | | | |
Name,
Address, and Year
of Birth | | Position(s) Held
with Fund | | Term of Office and Length of Time Served | | Principal Occupation During Past Five Years and Relevant Experience | | Number of Funds
in Fund Complex Overseen by Director† | | | Other Directorships Held by Director During Past Five Years |
INTERESTED DIRECTORS(1) | | | | | | | | | | |
Ellen M. Needham(2) SSGA Funds
Management, Inc.
One Iron Street
Boston, MA 02210 YOB: 1967 | | Director | | Term: Until successor is elected and qualified Served: Since January 2019 | | President and Director, SSGA Funds Management, Inc. (2001 – present)*; Senior Managing Director, State Street Global Advisors (1992 – present)*; Director, State Street Global Advisors Funds Distributors, LLC (May 2017 – present). | | | 68 | | | None |
| |
Jeanne La Porta(3) c/o SSGA Funds
Management, Inc.
1600 Summer St.
Stamford, CT 06905 YOB: 1965 | | Director & President | | Term: Until successor is elected and qualified Served: Since 2014 | | Senior Managing Director at State Street Global Advisors (July 2016 – present); Director of State Street Global Advisors Funds Distributors, LLC (May 2017 – present); President of GE Retirement Savings Plan Funds (July 2016 – September 2018); Senior Vice President and Commercial Operations Leader at GE Asset Management Incorporated (“GEAM”) (March 2014 – July 2016); President of State Street Institutional Funds and State Street Variable Insurance Series Funds, Inc. (April 2014 – present); President and Trustee of GEAM’s UCITs Funds (March 2014 – November 2014); Senior Vice President and Commercial Administrative Officer at GEAM (April 2010 – March 2014); Vice President of State Street Institutional Funds (July 2003 – April 2014); Vice President of Elfun Funds and GE Retirement Savings Plan Funds (October 2003 – July 2016). | | | 18 | | | None |
| † | | For the purpose of determining the number of portfolios overseen by the Directors, “Fund Complex” comprises registered investment companies for which SSGA FM serves as investment adviser. |
| (1) | | The individuals listed below are Directors who are “interested persons,” as defined in the 1940 Act, of the Company (“Interested Directors”). |
| (2) | | Ms. Needham is an Interested Director because of her employment by SSGA FM, an affiliate of the Company. |
| (3) | | Ms. La Porta is an Interested Director because of her employment by SSGA, an affiliate of the Company. |
| * | | Served in various capacities and/or with various affiliated entities during noted time period. |
State Street U.S. Equity V.I.S. Fund
Other Information, continued — December 31, 2019 (Unaudited)
| | | | | | |
| | | | |
Name,
Address, and
Year of Birth | | Position(s) Held
with Fund | | Term of
Office and
Length of
Time Served | | Principal Occupation
During Past Five Years |
OFFICERS: | | | | | | |
Jeanne M. La Porta SSGA Funds Management, Inc. 1600 Summer St. Stamford, CT 06905 YOB: 1965 | | President and Director | | Term: Indefinite Elected: 3/14 | | Senior Managing Director at State Street Global Advisors (July 2016 – present); Director of State Street Global Advisors Funds Distributors, LLC (May 2017 – present); President of GE Retirement Savings Plan Funds (July 2016 – September 2018); Senior Vice President and Commercial Operations Leader at GEAM (March 2014 – July 2016); President of State Street Institutional Funds and State Street Variable Insurance Series Funds, Inc. (April 2014 – present); President and Trustee of GEAM’s UCITs Funds (March 2014 – November 2014); Senior Vice President and Commercial Administrative Officer at GEAM (April 2010 – March 2014); Vice President of State Street Institutional Funds (July 2003 – April 2014); Vice President of Elfun Funds and GE Retirement Savings Plan Funds (October 2003 – July 2016); Secretary of GE Funds (July 2007 – September 2010) and Vice President (July 2007 – February 2011); Senior Vice President and Deputy General Counsel of GEAM (October 2007 – April 2010); Vice President and Assistant Secretary of Elfun Funds and GE Retirement Savings Plan Funds (July 2003 – June 2010); and Vice President and Associate General Counsel – Marketing and Client Services (formerly Asset Management Services) at GEAM (May 1997 – October 2007). |
| | | | | | | |
Bruce S. Rosenberg SSGA Funds Management, Inc. One Iron Street Boston, MA 02210 YOB: 1961 | | Treasurer | | Term: Indefinite Elected: 4/19 | | Managing Director, State Street Global Advisors and SSGA Funds Management, Inc. (July 2015 – present); Director, Credit Suisse (April 2008 – July 2015). |
| | | | | | | |
Ann M. Carpenter SSGA Funds Management, Inc. One Iron Street Boston, MA 02210 YOB: 1966 | | Vice President and Deputy Treasurer | | Term: Indefinite Elected: 4/19 | | Chief Operating Officer, SSGA Funds Management, Inc. (April 2005 – present)*; Managing Director, State Street Global Advisors. (2005 – present).* |
| | | | | | | |
Chad C. Hallett SSGA Funds Management, Inc. One Iron Street Boston, MA 02210 YOB: 1969 | | Deputy Treasurer | | Term: Indefinite Elected: 4/19 | | Vice President, State Street Global Advisors and SSGA Funds Management, Inc. (November 2014 – present); Vice President, State Street Bank and Trust Company (2001 – November 2014).* |
| | | | | | | |
Darlene Anderson-Vasquez SSGA Funds Management, Inc. One Iron Street Boston, MA 02210 YOB: 1968 | | Deputy Treasurer | | Term: Indefinite Elected: 4/19 | | Managing Director, State Street Global Advisors and SSGA Funds Management, Inc. (May 2016 – present); Senior Vice President, John Hancock Investments (September 2007 – May 2016). |
| |
State Street U.S. Equity V.I.S. Fund
Other Information, continued — December 31, 2019 (Unaudited)
| | | | | | |
| | | | |
Name,
Address, and
Year of Birth | | Position(s) Held
with Fund | | Term of
Office and
Length of
Time Served | | Principal Occupation
During Past Five Years |
OFFICERS (continued): | | | | | | |
Arthur A. Jensen SSGA Funds Management, Inc. 1600 Summer Street Stamford, CT 06905 YOB: 1966 | | Deputy Treasurer | | Term: Indefinite Elected: 4/19 | | Vice President State Street Global Advisors and SSGA Funds Management, Inc. (July 2016 – present); Deputy Treasurer of Elfun Funds (July 2016 – present); Treasurer of State Street Institutional Funds, State Street Variable Insurance Series Funds, Inc. and GE Retirement Savings Plan Funds (June 2011 – present); Treasurer of Elfun Funds (June 2011– July 2016); Mutual Funds Controller of GE Asset Management Incorporated (April 2011 – July 2016). |
| |
Sujata Upreti SSGA Funds Management, Inc. One Iron Street Boston, MA 02210 YOB: 1974 | | Assistant Treasurer | | Term: Indefinite Elected: 4/19 | | Vice President, State Street Global Advisors and SSGA Funds Management, Inc. (May 2015 – present); Assistant Director, Cambridge Associates, LLC (July 2014 – January 2015); Vice President, Bank of New York Mellon (July 2012 – August 2013); Manager, PricewaterhouseCoopers, LLP (September 2003 – July 2012). |
| |
Daniel Foley SSGA Funds Management, Inc. One Iron Street Boston, MA 02210 YOB: 1972 | | Assistant Treasurer | | Term: Indefinite Elected: 4/19 | | Vice President, State Street Global Advisors and SSGA Funds Management, Inc. (April 2007 – present).* |
| |
Daniel G. Plourde SSGA Funds Management, Inc. One Iron Street Boston, MA 02210 YOB: 1980 | | Assistant Treasurer | | Term: Indefinite Elected: 6/17 | | Vice President, State Street Global Advisors and SSGA Funds Management, Inc. (May 2015 – present); Officer, State Street Bank and Trust Company (March 2009 – May 2015). |
| |
Brian Harris SSGA Funds Management, Inc. One Iron Street Boston, MA 02210 YOB: 1973 | | Chief Compliance Officer, Anti-Money Laundering Officer and Code of Ethics Compliance Officer | | Term: Indefinite Elected: 7/16 Term: Indefinite Elected: 4/19 | | Managing Director, State Street Global Advisors and SSGA Funds Management, Inc. (June 2013 – Present)*; Senior Vice President and Global Head of Investment Compliance, BofA Global Capital Management (September 2010 – May 2013). |
| | | | | | | |
Sean O’Malley SSGA Funds Management, Inc. One Iron Street Boston, MA 02210 YOB: 1969 | | Chief Legal Officer | | Term: Indefinite Elected: 8/19 | | Senior Vice President and Deputy General Counsel, State Street Global Advisors (November 2013 – present). |
| | | | | | | |
Andrew DeLorme SSGA Funds Management, Inc. One Iron Street Boston, MA 02210 YOB: 1975 | | Secretary | | Term: Indefinite Elected: 8/19 | | Vice President and Senior Counsel, State Street Global Advisors (April 2016 – present); Vice President and Counsel, State Street Global Advisors (August 2014 – March 2016). |
| | | | | | | |
State Street U.S. Equity V.I.S. Fund
Other Information, continued — December 31, 2019 (Unaudited)
| | | | | | |
| | | | |
Name,
Address, and
Year of Birth | | Position(s) Held
with Fund | | Term of
Office and
Length of
Time Served | | Principal Occupation
During Past Five Years |
OFFICERS (continued): | | | | | | |
Kevin Morris SSGA Funds Management, Inc. One Iron Street Boston, MA 02210 YOB: 1982 | | Assistant Secretary | | Term: Indefinite Elected: 8/19 | | Vice President and Senior Counsel, State Street Global Advisors (April 2019 – present); Vice President and Counsel, State Street Global Advisors (January 2016 – April 2019); Director, Asset Management Compliance, Fidelity Investments (June 2015 – January 2016); Senior Compliance Advisor, Asset Management Compliance, Fidelity Investments (June 2012 – June 2015). |
| | | | | | | |
David Urman SSGA Funds Management, Inc. One Iron Street Boston, MA 02210 YOB: 1985 | | Assistant Secretary | | Term: Indefinite Elected: 8/19 | | Vice President and Senior Counsel, State Street Global Advisors (April 2019 – present); Vice President and Counsel, State Street Global Advisors (August 2015 – April 2019); Associate, Ropes & Gray LLP (November 2012 – August 2015). |
| * | Served in various capacities and/or with various affiliated entities during noted time period. |
Directors
Michael F. Holland, Co-Chairperson
Patrick J. Riley, Co-Chairperson
John R. Costantino
Donna M. Rapaccioli
Michael A. Jessee
Richard D. Shirk
Rina K. Spence
Jeanne M. La Porta
Ellen M. Needham
Officers
Jeanne M. La Porta, President
Brian Harris, Chief Compliance Officer, Anti-Money Laundering Officer and Code of Ethics Compliance Officer
Sean O’Malley, Chief Legal Officer
Bruce S. Rosenberg, Treasurer
Ann M. Carpenter, Vice President and Deputy Treasurer
Chad C. Hallett, Deputy Treasurer
Arthur A. Jensen, Deputy Treasurer
Darlene Anderson-Vasquez, Deputy Treasurer
Sujata Upreti, Assistant Treasurer
Daniel Foley, Assistant Treasurer
Daniel G. Plourde, Assistant Treasurer
Andrew DeLorme, Secretary
Kevin Morris, Assistant Secretary
David Urman, Assistant Secretary
Investment Adviser and Administrator
SSGA Funds Management, Inc.
One Iron Street
Boston, MA 02210
Custodian and Sub-Administrator
State Street Bank and Trust Company
One Lincoln Street
Boston, Massachusetts 02111
Distributor
State Street Global Advisors Funds Distributors, LLC
One Iron Street
Boston, MA 02210
Independent Registered Public Accounting Firm
Ernst & Young LLP
200 Clarendon Street
Boston, Massachusetts 02116
Annual Report
December 31, 2019
State Street Premier Growth Equity V.I.S. Fund
Beginning on January 1, 2021, as permitted by regulations adopted by the U.S. Securities and Exchange Commission, paper copies of a Fund’s annual and semi-annual shareholder reports will no longer be sent by mail, unless you specifically request paper copies of the reports. Instead, the reports will be made available on a Fund’s website (www.ssga.com/geam), and you will be notified by mail each time a report is posted, and provided with a website link to access the report. If you already elected to receive shareholder reports electronically, you will not be affected by this change and you need not take any action.
You may elect to receive all future reports in paper free of charge. To do so, contact your Insurance Provider. Your election to receive reports in paper will apply to all funds held in your account.

State Street Premier Growth Equity V.I.S. Fund
Annual Report
December 31, 2019
Table of Contents
This report is prepared for Policyholders of certain variable contracts and may be distributed to others only if preceded or accompanied by the variable contract’s current prospectus and the current summary prospectus of the Fund available for investments thereunder.
State Street Premier Growth Equity V.I.S. Fund
Notes to Performance — December 31, 2019 (Unaudited)
The information provided on the performance pages relates to the State Street Premier Growth Equity V.I.S. Fund (the “Fund”).
Total return performance shown in this report for the Fund takes into account changes in share price and assumes reinvestment of dividends and capital gains distributions, if any. Total returns shown are net of Fund fees and expenses but do not reflect fees and charges associated with the variable contracts such as administrative fees, account charges and surrender charges, which, if reflected, would reduce the Fund’s total returns for all periods shown.
The performance data quoted represents past performance; past performance does not guarantee future results. Investment return and principal value will fluctuate so your shares, when redeemed, may be worth more or less than their original cost. Current performance may be higher or lower than the performance data quoted. Periods less than one year are not annualized. Please call toll-free (800) 242-0134 or visit the Fund’s website at http://www.ssga.com/geam for the most recent month-end performance data.
An investment in the Fund is not a deposit of any bank and is not insured or guaranteed by the Federal Deposit Insurance Corporation (“FDIC”) or any other government agency. An investment in the Fund is subject to risk, including possible loss of principal invested.
The S&P 500® Index is an unmanaged, market capitalization-weighted index of stocks of 500 large U.S. companies, which is widely used as a measure of large-cap U.S. stock market performance.
The Russell 1000® Growth Index measures the performance of the large-cap growth segment of the U.S. equity universe. It includes those companies in the Russell 1000® Index (which measures the entire U.S. equity large-cap segment) with higher price-to-book ratios and higher forecasted growth values. It is a subset of the Russell 3000® Index and includes approximately 1,000 of the largest securities based on a combination of their market cap and current index membership.
The results shown for the foregoing indices assume the reinvestment of net dividends or interest and do not reflect fees, expenses, or taxes. As such, the index returns do not reflect the actual cost of investing in the instruments that comprise each index.
The views expressed in this document reflect our judgment as of the publication date and are subject to change at any time without notice.
State Street Global Advisors Funds Distributors, LLC, member of FINRA & SIPC is the principal underwriter and distributor of the State Street V.I.S. Funds and an indirect wholly-owned subsidiary of State Street Corporation. References to State Street may include State Street Corporation and its affiliates. The Funds pay State Street Bank and Trust Company for its services as custodian and Fund Accounting agent, and pay SSGA Funds Management, Inc. for investment advisory and administrative services.
State Street Premier Growth Equity V.I.S. Fund
Management Discussion of Fund Performance — December 31, 2019 (Unaudited)
The State Street Premier Growth Equity V.I.S. Fund (the “Fund”) seeks to provide long-term growth of capital and future income rather than current income. The Fund’s benchmarks are the Russell 1000 Growth Index and the S&P 500 Index (the “Indices”).
For the 12-month period ended December 31, 2019 (the “Reporting Period”), the total return for the Fund was 37.33% and the returns for the Russell 1000 Growth Index and the S&P 500 Index were 36.39% and 31.49%, respectively. The Fund and Index returns reflect the reinvestment of dividends and other income. The Fund’s performance reflects the expenses of managing the Fund, including brokerage and advisory expenses. The Indices are unmanaged and Index returns do not reflect fees and expenses of any kind, which would have a negative impact on returns.
Broad-based outperformance in the technology, communications services, industrial, real estate, and consumer sectors were primary drivers of Fund performance during the Reporting Period relative to the Indices. The Fund outperformed significantly in IT, with strong performance from a rebound in semiconductor stocks (e.g. Applied Materials & ASML), software (e.g. ServiceNow & Microsoft), and IT services (Visa). In communication services, Charter Communications, among the Fund’s largest overweights, surged as it continued to realize synergistic benefits from its 2016 acquisition of Time Warner Cable and strength in its broadband business. On the negative side, the Fund’s holdings in financials were up more than 26% for the year but this was well behind the broader market. Some of the lagging stocks in this sector included CME Group and Charles Schwab. Both companies fell behind as interest rates declined during the year.
On an individual security level, the top positive contributors to the Fund’s performance on an absolute basis during the Reporting Period were Apple, Microsoft, and Applied Materials. The top negative contributors to the Fund’s performance on an absolute basis during the Reporting Period were Lyft, Albemarle Corp, and Elanco Animal Health.
The views expressed above reflect those of the Fund’s portfolio manager only through the Reporting Period, and do not necessarily represent the views of the Adviser as a whole. Any such views are subject to change at any time based upon market or other conditions and the Adviser disclaims any responsibility to update such views. These views may not be relied on as investment advice and, because investment decisions for a fund are based on numerous factors, may not be relied on as an indication of trading intent on behalf of any fund.
| | |
| 2 | | State Street Premier Growth Equity V.I.S. Fund |
State Street Premier Growth Equity V.I.S. Fund
Understanding Your Fund’s Expenses — December 31, 2019 (Unaudited)
As a shareholder of the Fund, you incur ongoing costs. Ongoing costs include portfolio management fees, professional fees, administrative fees and other Fund expenses. The following example is intended to help you understand your ongoing costs (in dollars) of investing in the Fund and to compare these costs with the ongoing costs of investing in other mutual funds.
To illustrate these ongoing costs, we have provided an example and calculated the expenses paid by investors in the Fund during the period. The information in the following table is based on an investment of $1,000, which is invested at the beginning of the period and held for the entire six-month period ended December 31, 2019.
Actual Expenses
The first section of the table provides information about actual account values and actual expenses. You may use the information in this section, together with the amount you invested, to estimate the expenses that you paid over the period. To do so, simply divide your account value by $1,000 (for example, an $8,600 account value divided by $1,000 = 8.6), then multiply the result by the number given under the heading “Expenses paid during the period” to estimate the expenses you paid on your account during the period.
Hypothetical Example for Comparison Purposes
The second section of the table provides information about hypothetical account values and hypothetical expenses based on the Fund’s actual expense ratio and an assumed rate of return of 5% per year before expenses, which is not the Fund’s actual return. The hypothetical account values and expenses may not be used to estimate the actual ending account balance or expenses you paid for the period. You may use this information to compare the ongoing costs of investing in the Fund and other funds. To do so, compare this 5% hypothetical example with the 5% hypothetical examples that appear in the shareholder reports of other funds.
Please note that the expenses shown in the table are meant to highlight and help you compare ongoing costs only and do not reflect transaction costs, such as sales charges or redemption fees, if any. Therefore, the second section of the table is useful in comparing ongoing costs only, and will not help you determine the relative total costs of owning different funds. Additionally, the expenses shown do not reflect the fees or charges associated with variable contracts through which shares of the Fund are offered.
| | | | | | | | |
| | | Actual
Fund Return | | | Hypothetical
5% Return
(2.5% for
the period) | |
Account Value at the | | | | | | | | |
Beginning of the Period July 1, 2019 | | $ | 1,000.00 | | | $ | 1,000.00 | |
Account Value at the End of the Period December 31, 2019 | | $ | 1,130.20 | | | $ | 1,020.67 | |
Expenses Paid During the Period* | | $ | 4.83 | | | $ | 4.58 | |
| * | Expenses are equal to the Fund’s annualized expense ratio of 0.90%** (for the period July 1, 2019-December 31, 2019), multiplied by the average account value over the period, multiplied by 184/365 (to reflect the one-half year period). |
| ** | May differ from expense ratio disclosed in the financial highlights, which is calculated based on the entire fiscal year’s data. |
| | | | |
| State Street Premier Growth Equity V.I.S. Fund | | | 3 | |
State Street Premier Growth Equity V.I.S. Fund
Performance Summary — December 31, 2019 (Unaudited)
Top Ten Largest Holdings
as of December 31, 2019 (as a % of Fair Value)(a)(b)
| | | | |
Microsoft Corp. | | | 8.78 | % |
| |
Apple Inc. | | | 7.61 | % |
| |
Amazon.com Inc. | | | 4.98 | % |
| |
Alphabet Inc., Class C | | | 4.84 | % |
| |
Visa Inc., Class A | | | 4.67 | % |
| |
Facebook Inc., Class A | | | 3.94 | % |
| |
Saleforce.com Inc. | | | 3.51 | % |
| |
UnitedHealth Group Inc. | | | 3.17 | % |
| |
Allergan PLC | | | 2.95 | % |
| |
Applied Materials Inc. | | | 2.80 | % |
Sector Allocation as of December 31, 2019
Portfolio composition as a % of Fair Value of $35,470 December 31, 2019(a)(b)
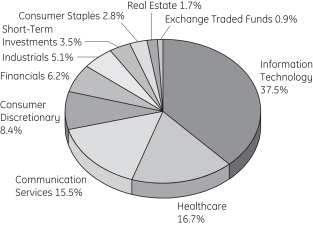
Average Annual Total Return for the periods ended December 31, 2019
Class 1 Shares (Inception date: 12/12/97)
| | | | | | | | | | | | | | | | |
| | | One Year | | | Five Year | | | Ten Year | | | Ending Value
of a $10,000
Investment | |
State Street Premier Growth Equity V.I.S. Fund | | | 37.33 | % | | | 12.67 | % | | | 14.24 | % | | $ | 37,865 | |
S&P 500® Index | | | 31.49 | % | | | 11.70 | % | | | 13.56 | % | | $ | 35,666 | |
| | | | |
Russell 1000® Growth Index | | | 36.39 | % | | | 14.63 | % | | | 15.22 | % | | $ | 41,234 | |
| (a) | Fair Value basis is inclusive of short-term investment in State Street Institutional U.S. Government Money Market Fund Class G Shares. |
| (b) | The securities information regarding holdings, allocations and other characteristics is presented to illustrate examples of securities that the Fund has bought and the diversity of areas in which the Fund may invest as of a particular date. It may not be representative of the Fund’s current or future investments and should not be construed as a recommendation to purchase or sell a particular security. |
| | |
| 4 | | State Street Premier Growth Equity V.I.S. Fund |
State Street Premier Growth Equity V.I.S. Fund
Performance Summary, continued — December 31, 2019 (Unaudited)

See Notes to Performance beginning on page 1 for further information, including an explanation of Morningstar peer categories.
Past performance does not predict future performance. The performance shown in the graphs and tables does not reflect the deduction of taxes that a shareholder would pay on Fund distributions or the redemption of Fund shares and does not reflect the fees or charges that would be associated with variable contracts through which shares of the Fund are offered.
| | | | |
| State Street Premier Growth Equity V.I.S. Fund | | | 5 | |
State Street Premier Growth Equity V.I.S. Fund
Schedule of Investments — December 31, 2019
| | | | | | | | |
| | | Number of Shares | | | Fair
Value $ | |
| | | | | | | | |
|
| Common Stock - 95.5%† | |
Application Software - 3.5% | |
salesforce.com Inc. (a) | | | 7,660 | | | | 1,245,822 | |
| | | | | | | | |
|
Biotechnology - 4.2% | |
Alexion Pharmaceuticals Inc. (a) | | | 6,973 | | | | 754,130 | |
Vertex Pharmaceuticals Inc. (a) | | | 3,457 | | | | 756,910 | |
| | | | | | | | |
| | | | 1,511,040 | |
| | | | | | | | |
|
Cable & Satellite - 2.4% | |
Charter Communications Inc., Class A (a) | | | 1,770 | | | | 858,592 | |
| | | | | | | | |
|
Data Processing & Outsourced Services - 8.2% | |
Fidelity National Information Services Inc. | | | 4,671 | | | | 649,689 | |
Mastercard Inc., Class A | | | 1,988 | | | | 593,597 | |
Visa Inc., Class A | | | 8,822 | | | | 1,657,654 | |
| | | | | | | | |
| | | | 2,900,940 | |
| | | | | | | | |
|
Electronic Components - 1.6% | |
Corning Inc. | | | 19,055 | | | | 554,691 | |
| | | | | | | | |
|
Financial Exchanges & Data - 4.7% | |
CME Group Inc. | | | 3,764 | | | | 755,510 | |
S&P Global Inc. | | | 3,365 | | | | 918,813 | |
| | | | | | | | |
| | | | 1,674,323 | |
| | | | | | | | |
|
Healthcare Equipment - 5.2% | |
Abbott Laboratories | | | 3,920 | | | | 340,491 | |
Boston Scientific Corp. (a) | | | 19,676 | | | | 889,749 | |
Intuitive Surgical Inc. (a) | | | 1,036 | | | | 612,431 | |
| | | | | | | | |
| | | | 1,842,671 | |
| | | | | | | | |
|
Industrial Conglomerates - 1.6% | |
Honeywell International Inc. | | | 3,275 | | | | 579,675 | |
| | | | | | | | |
|
Interactive Media & Services - 10.5% | |
Alphabet Inc., Class A (a) | | | 458 | | | | 613,441 | |
Alphabet Inc., Class C (a) | | | 1,283 | | | | 1,715,397 | |
Facebook Inc., Class A (a) | | | 6,809 | | | | 1,397,547 | |
| | | | | | | | |
| | | | 3,726,385 | |
| | | | | | | | |
|
Internet & Direct Marketing Retail - 8.4% | |
Alibaba Group Holding Ltd.
ADR (a)(b) | | | 2,871 | | | | 608,939 | |
Amazon.com Inc. (a) | | | 955 | | | | 1,764,687 | |
Booking Holdings Inc. (a)(b) | | | 302 | | | | 620,227 | |
| | | | | | | | |
| | | | 2,993,853 | |
| | | | | | | | |
|
Managed Healthcare - 3.2% | |
UnitedHealth Group Inc. | | | 3,828 | | | | 1,125,355 | |
| | | | | | | | |
| | | | | | | | |
| | | Number of Shares | | | Fair
Value $ | |
Movies & Entertainment - 2.6% | |
The Walt Disney Co. | | | 6,406 | | | | 926,500 | |
| | | | | | | | |
|
Oil & Gas Equipment & Services - 0.8% | |
Schlumberger Ltd. (b) | | | 6,786 | | | | 272,797 | |
| | | | | | | | |
|
Pharmaceuticals - 4.1% | |
Allergan PLC | | | 5,481 | | | | 1,047,803 | |
Elanco Animal Health Inc. (a) | | | 13,701 | | | | 403,494 | |
| | | | | | | | |
| | | | 1,451,297 | |
| | | | | | | | |
|
Regional Banks - 1.5% | |
First Republic Bank | | | 4,532 | | | | 532,283 | |
| | | | | | | | |
|
Semiconductor Equipment - 4.0% | |
Applied Materials Inc. | | | 16,273 | | | | 993,304 | |
ASML Holding N.V. | | | 1,451 | | | | 429,409 | |
| | | | | | | | |
| | | | 1,422,713 | |
| | | | | | | | |
|
Semiconductors - 1.4% | |
NVIDIA Corp. | | | 2,102 | | | | 494,601 | |
| | | | | | | | |
|
Soft Drinks - 2.8% | |
PepsiCo Inc. | | | 7,192 | | | | 982,931 | |
| | | | | | | | |
|
Specialized REITs - 1.7% | |
American Tower Corp. | | | 2,667 | | | | 612,930 | |
| | | | | | | | |
|
Specialty Chemicals - 0.9% | |
Albemarle Corp. | | | 4,373 | | | | 319,404 | |
| | | | | | | | |
|
Systems Software - 11.2% | |
Microsoft Corp. | | | 19,756 | | | | 3,115,521 | |
ServiceNow Inc. (a) | | | 3,027 | | | | 854,583 | |
| | | | | | | | |
| | | | 3,970,104 | |
| | | | | | | | |
|
Technology Hardware, Storage & Peripherals - 7.6% | |
Apple Inc. | | | 9,186 | | | | 2,697,469 | |
| | | | | | | | |
|
Trading Companies & Distributors - 2.7% | |
United Rentals Inc. (a) | | | 5,698 | | | | 950,256 | |
| | | | | | | | |
|
Trucking - 0.7% | |
Lyft Inc., Class A (a) | | | 6,265 | | | | 269,520 | |
| | | | | | | | |
| |
Total Common Stock
(Cost $19,006,272) | | | | 33,916,152 | |
| | | | | | | | |
|
| Exchange Traded & Mutual Funds - 0.9% | |
Consumer Discretionary Select Sector SPDR Fund
(Cost $315,498) (b)(c) | | | 2,634 | | | | 330,356 | |
| | | | | | | | |
| |
Total Investments in Securities
(Cost $19,321,770) | | | | 34,246,508 | |
| | | | | | | | |
See Notes to Schedule of Investments and Notes to Financial Statements.
| | |
| 6 | | State Street Premier Growth Equity V.I.S. Fund |
State Street Premier Growth Equity V.I.S. Fund
Schedule of Investments, continued — December 31, 2019
| | | | | | | | |
| | | Number of Shares | | | Fair
Value $ | |
|
| Short-Term Investments - 3.5% | |
State Street Institutional U.S. Government Money Market Fund - Class G Shares 1.57%
(Cost $1,223,418) (c)(d) | | | 1,223,418 | | | | 1,223,418 | |
| | | | | | | | |
| |
Total Investments
(Cost $20,545,188) | | | | 35,469,926 | |
| |
| Other Assets and Liabilities, net - 0.1% | | | | 32,561 | |
| | | | | | | | |
| |
| NET ASSETS - 100.0% | | | | 35,502,487 | |
| | | | | | | | |
Other Information:
The Fund had the following long futures contracts open at December 31, 2019:
| | | | | | | | | | | | | | | | | | | | |
| Description | | Expiration
date | | | Number of
Contracts | | | Notional
Amount | | | Value | | | Unrealized
Appreciation | |
S&P 500 Emini Index Futures | | | March 2020 | | | | 3 | | | $ | 477,034 | | | $ | 484,665 | | | $ | 7,631 | |
| | | | | | | | | | | | | | | | | | | | |
During the year ended December 31, 2019, average notional values related to long and short futures contracts was $249,981 and $43,475, respectively.
See Notes to Schedule of Investments and Notes to Financial Statements.
| | | | |
| State Street Premier Growth Equity V.I.S. Fund | | | 7 | |
State Street Premier Growth Equity V.I.S. Fund
Notes to Schedule of Investments — December 31, 2019
The views expressed in this document reflect our judgment as of the publication date and are subject to change at any time without notice. The securities cited may not be representative of the Fund’s future investments and should not be construed as a recommendation to purchase or sell a particular security. See the Fund’s summary prospectus and statutory prospectus for complete descriptions of investment objectives, policies, risks and permissible investments.
| (a) | Non-income producing security. |
| (b) | At December 31, 2019, all or a portion of this security was pledged to cover collateral requirements for futures. |
| (c) | Sponsored by SSGA Funds Management, Inc., the Fund’s investment adviser and administrator, and an affiliate of State Street Bank & Trust Co., the Fund’ssub-administrator, custodian and accounting agent. |
| (d) | Coupon amount represents effective yield. |
| † | Percentages are based on net assets as of December 31, 2019. |
Abbreviations:
ADR - American Depositary Receipt
REIT - Real Estate Investment Trust
SPDR - Standard and Poor’s Depositary Receipt
The following table presents the Fund’s investments measured at fair value on a recurring basis at December 31, 2019:
| | | | | | | | | | | | | | | | |
Investments | | Level 1 | | | Level 2 | | | Level 3 | | | Total | |
Investments in Securities | | | | | | | | | | | | | | | | |
Common Stock | | $ | 33,916,152 | | | $ | — | | | $ | — | | | $ | 33,916,152 | |
Exchange Traded & Mutual Funds | | | 330,356 | | | | — | | | | — | | | | 330,356 | |
Short-Term Investments | | | 1,223,418 | | | | — | | | | — | | | | 1,223,418 | |
| | | | | | | | | | | | | | | | |
Total Investments in Securities | | $ | 35,469,926 | | | $ | — | | | $ | — | | | $ | 35,469,926 | |
| | | | | | | | | | | | | | | | |
Other Financial Instruments | | | | | | | | | | | | | | | | |
Long Futures Contracts - Unrealized Appreciation | | $ | 7,631 | | | $ | — | | | $ | — | | | $ | 7,631 | |
| | | | | | | | | | | | | | | | |
Affiliate Table
| | | | | | | | | | | | | | | | | | | | | | | | | | | | | | | | | | | | |
| | | Number
of Shares
Held at
12/31/18 | | | Value At
12/31/18 | | | Cost of
Purchases | | | Proceeds
from
Shares
Sold | | | Realized
Gain
(Loss) | | | Change in
Unrealized
Appreciation/
Depreciation | | | Number
of Shares
Held at
12/31/19 | | | Value at
12/31/19 | | | Dividend
Income | |
Consumer Discretionary Select Sector SPDR Fund | | | — | | | | — | | | | 397,565 | | | | 83,435 | | | | 1,368 | | | | 14,858 | | | | 2,634 | | | $ | 330,356 | | | | 1,824 | |
State Street Institutional U.S. Government Money Market Fund, Class G Shares | | | 311,364 | | | | 311,364 | | | | 7,873,158 | | | | 6,961,104 | | | | — | | | | — | | | | 1,223,418 | | | | 1,223,418 | | | | 17,998 | |
| | | | | | | | | | | | | | | | | | | | | | | | | | | | | | | | | | | | |
| | | | | | | | | |
TOTAL | | | | | | $ | 311,364 | | | $ | 8,270,723 | | | $ | 7,044,539 | | | $ | 1,368 | | | $ | 14,858 | | | | | | | $ | 1,553,774 | | | $ | 19,822 | |
| | | | | | | | | | | | | | | | | | | | | | | | | | | | | | | | | | | | |
See Notes to Schedule of Investments and Notes to Financial Statements.
| | |
| 8 | | State Street Premier Growth Equity V.I.S. Fund |
State Street Premier Growth Equity V.I.S. Fund
Financial Highlights
Selected data based on a share outstanding throughout the fiscal years indicated
| | | | | | | | | | | | | | | | | | | | |
| | | 12/31/19 | | | 12/31/18 | | | 12/31/17 | | | 12/31/16 | | | 12/31/15* | |
| Inception date | | | | | | | | | | | | | | | | | | | 12/12/97 | |
| | | | | |
Net asset value, beginning of period | | $ | 82.51 | | | $ | 99.23 | | | $ | 86.08 | | | $ | 94.07 | | | $ | 106.58 | |
| | | | | | | | | | | | | | | | | | | | |
| | | |
Income/(loss) from investment operations: | | | | | | | | | | | | | |
Net investment income | | | 0.03 | (a) | | | 0.12 | (a) | | | 0.32 | (a) | | | 0.50 | | | | 0.52 | |
Net realized and unrealized gains/(losses) on investments | | | 30.84 | | | | (2.88 | ) | | | 24.10 | | | | 1.90 | | | | 3.25 | |
| | | | | | | | | | | | | | | | | | | | |
Total income/(loss) from investment operations | | | 30.87 | | | | (2.76 | ) | | | 24.42 | | | | 2.40 | | | | 3.77 | |
| | | | | | | | | | | | | | | | | | | | |
| | | | | |
Less distributions from: | | | | | | | | | | | | | | | | | | | | |
Net investment income | | | — | | | | 0.15 | | | | 0.34 | | | | 0.48 | | | | 0.53 | |
Net realized gains | | | 12.49 | | | | 13.81 | | | | 10.93 | | | | 9.91 | | | | 15.75 | |
| | | | | | | | | | | | | | | | | | | | |
Total distributions | | | 12.49 | | | | 13.96 | | | | 11.27 | | | | 10.39 | | | | 16.28 | |
| | | | | | | | | | | | | | | | | | | | |
Net asset value, end of period | | $ | 100.89 | | | $ | 82.51 | | | $ | 99.23 | | | $ | 86.08 | | | $ | 94.07 | |
| | | | | | | | | | | | | | | | | | | | |
Total Return(b) | | | 37.33 | % | | | (2.66 | )% | | | 28.34 | % | | | 2.47 | % | | | 3.30 | % |
| | | | | |
Ratios/Supplemental Data: | | | | | | | | | | | | | | | | | | | | |
Net assets, end of period (in thousands) | | $ | 35,502 | | | $ | 30,369 | | | $ | 36,404 | | | $ | 33,219 | | | $ | 36,858 | |
| | | | | |
Ratios to average net assets: | | | | | | | | | | | | | | | | | | | | |
Net expenses | | | 0.91 | % | | | 0.87 | % | | | 0.85 | % | | | 0.84 | % | | | 0.81 | % |
Gross expenses | | | 0.91 | % | | | 0.87 | % | | | 0.85 | % | | | 0.84 | % | | | 0.81 | % |
Net investment income | | | 0.03 | % | | | 0.11 | % | | | 0.31 | % | | | 0.52 | % | | | 0.46 | % |
Portfolio turnover rate | | | 22 | % | | | 27 | % | | | 21 | % | | | 22 | % | | | 19 | % |
Notes to Financial Highlights
| (a) | | Per share values have been calculated using the average share method. |
| (b) | | Total returns are historical and assume changes in share price, reinvestment of dividends and capital gains distributions and do not include the effect of insurance contract charges. Past performance does not guarantee future results. |
| * | | Beginning with the year ended December 31, 2016, the Fund was audited by Ernst & Young LLP. The previous years were audited by another independent registered public accounting firm. |
The accompanying Notes are an integral part of these financial statements.
State Street Premier Growth Equity V.I.S. Fund
Statement of Assets and Liabilities — December 31, 2019
| | | | |
Assets | | | | |
Investments in securities, at fair value (cost $19,006,272) | | $ | 33,916,152 | |
Investments in affiliated securities, at fair value (cost $315,498) | | | 330,356 | |
Short-term affiliated investments, at fair value | | | 1,223,418 | |
Net cash collateral on deposit with broker for future contracts | | | 14,286 | |
Receivable for investments sold | | | 34,575 | |
Income receivables | | | 29,609 | |
Receivable for fund shares sold | | | 123 | |
Income receivable from affiliated investments | | | 1,881 | |
Receivable for accumulated variation margin on futures contracts | | | 7,638 | |
Other assets | | | 190 | |
| | | | |
| |
Total assets | | | 35,558,228 | |
| | | | |
| |
Liabilities | | | | |
Payable for fund shares redeemed | | | 29,734 | |
Payable to the Adviser | | | 18,372 | |
Payable for custody, fund accounting andsub-administration fees | | | 1,959 | |
Accrued other expenses | | | 5,676 | |
| | | | |
| |
Total liabilities | | | 55,741 | |
| | | | |
| | | | |
| |
Net Assets | | $ | 35,502,487 | |
| | | | |
| |
Net Assets Consist of: | | | | |
Capital paid in | | $ | 20,364,118 | |
Total distributable earnings (loss) | | | 15,138,369 | |
| | | | |
| |
Net Assets | | $ | 35,502,487 | |
| | | | |
| | | | |
Shares outstanding ($0.01 par value; unlimited shares authorized) | | | 351,900 | |
Net asset value per share | | $ | 100.89 | |
The accompanying Notes are an integral part of these financial statements.
| | |
| 10 | | Statement of Assets and Liabilities |
State Street Premier Growth Equity V.I.S. Fund
Statement of Operations — For the fiscal year ended December 31, 2019
| | | | |
Investment Income | |
Income | |
Dividend | | $ | 296,244 | |
Income from affiliated investments | | | 19,822 | |
Less: Foreign taxes withheld | | | (754 | ) |
| | | | |
Total income | | | 315,312 | |
| | | | |
| |
Expenses | | | | |
Advisory and administration fees | | | 217,733 | |
Directors’ fees | | | 16,808 | |
Custody, fund accounting andsub-administration fees | | | 21,340 | |
Professional fees | | | 33,396 | |
Printing and shareholder reports | | | 11,278 | |
Other expenses | | | 4,182 | |
| | | | |
Total Expenses | | | 304,737 | |
| | | | |
Net investment income | | $ | 10,575 | |
| | | | |
| |
Net Realized and Unrealized Gain (Loss) on Investments | | | | |
Realized gain (loss) on: | | | | |
Unaffiliated investments | | $ | 4,003,350 | |
Affiliated investments | | | 1,368 | |
Futures | | | (12,719 | ) |
Increase (decrease) in unrealized appreciation/depreciation on: | |
Unaffiliated investments | | | 6,495,047 | |
Affiliated investments | | | 14,858 | |
Futures | | | 8,481 | |
| | | | |
| |
Net realized and unrealized gain (loss) on investments | | | 10,510,385 | |
| | | | |
| |
Net Increase in Net Assets Resulting from Operations | | $ | 10,520,960 | |
| | | | |
The accompanying Notes are an integral part of these financial statements.
| | | | |
| Statement of Operations | | | 11 | |
State Street Premier Growth Equity V.I.S. Fund
Statements of Changes in Net Assets
| | | | | | | | |
| | | Year Ended December 31,
2019 | | | Year Ended December 31,
2018 | |
Increase (Decrease) in Net Assets | |
|
Operations: | |
Net investment income | | $ | 10,575 | | | $ | 40,859 | |
Net realized gain (loss) on investments and futures | | | 3,991,999 | | | | 4,399,877 | |
Net increase (decrease) in unrealized appreciation/depreciation on investments and futures | | | 6,518,386 | | | | (4,978,924 | ) |
| | | | | | | | |
Net increase (decrease) from operations | | | 10,520,960 | | | | (538,188 | ) |
| | | | | | | | |
|
Distributions to shareholders: | |
Total distributions | | | (3,931,647 | ) | | | (4,400,219 | ) |
| | | | | | | | |
Increase (decrease) in assets from operations and distributions | | | 6,589,313 | | | | (4,938,407 | ) |
| | | | | | | | |
|
Share transactions: | |
Proceeds from sale of shares | | | 356,759 | | | | 175,763 | |
Value of distributions reinvested | | | 3,931,647 | | | | 4,400,219 | |
Cost of shares redeemed | | | (5,743,877 | ) | | | (5,672,877 | ) |
| | | | | | | | |
Net increase (decrease) from share transactions | | | (1,455,471 | ) | | | (1,096,895 | ) |
| | | | | | | | |
| | |
Total increase (decrease) in net assets | | | 5,133,842 | | | | (6,035,302 | ) |
|
Net Assets | |
Beginning of year | | | 30,368,645 | | | | 36,403,947 | |
| | | | | | | | |
| | |
End of year | | $ | 35,502,487 | | | $ | 30,368,645 | |
| | | | | | | | |
|
Changes in Fund Shares | |
Shares sold | | | 3,443 | | | | 1,683 | |
Issued for distributions reinvested | | | 38,755 | | | | 53,766 | |
Shares redeemed | | | (58,360 | ) | | | (54,267 | ) |
| | | | | | | | |
Net increase (decrease) in fund shares | | | (16,162 | ) | | | 1,182 | |
| | | | | | | | |
The accompanying Notes are an integral part of these financial statements.
| | |
| 12 | | Statements of Changes in Net Assets |
State Street Premier Growth Equity V.I.S. Fund
Notes to Financial Statements — December 31, 2019
| 1. | | Organization of the Company |
State Street Variable Insurance Series Funds, Inc. (the “Company”) was incorporated under the laws of the Commonwealth of Virginia on May 14, 1984 and is registered under the Investment Company Act of 1940, as amended (the “1940 Act”), as anopen-end management investment company. The Company is currently composed of the following seven investment portfolios (collectively, the “Funds”): State Street U.S. Equity V.I.S. Fund, State Street S&P 500 Index V.I.S. Fund, State Street Premier Growth Equity V.I.S. Fund (the “Fund”), State StreetSmall-Cap Equity V.I.S. Fund, State Street Total Return V.I.S. Fund, State Street Income V.I.S. Fund and State Street Real Estate Securities V.I.S. Fund. Each Fund is a diversified investment company within the meaning of the 1940 Act.
Shares of the Funds of the Company are offered only to insurance company separate accounts that fund certain variable life insurance contracts and variable annuity contracts.
The Company currently offers one share class (Class 1) of the Fund as an investment option for variable life insurance and variable annuity contracts.
Under the Company’s organizational documents, its officers and directors are indemnified against certain liabilities arising out of the performance of their duties to the Company. Additionally, in the normal course of business, the Company enters into contracts with service providers that contain general indemnification clauses. The Company’s maximum exposure under these arrangements is unknown as this would involve future claims that may be made against the Company that have not yet occurred.
| 2. | | Summary of Significant Accounting Policies |
The following is a summary of significant accounting policies followed by the Company in the preparation of its financial statements:
The preparation of financial statements in accordance with U.S. generally accepted accounting principles (“U.S. GAAP”) requires management to make estimates and assumptions that affect the reported amounts and disclosures in the financial statements. Actual results could differ from those estimates. The Fund is an investment company under U.S. GAAP and follows the accounting and reporting guidance applicable to investment companies.
Security Valuation The Fund’s investments are valued at fair value each day that the New York Stock Exchange (“NYSE”) is open and, for financial reporting purposes, as of the report date should the reporting period end on a day that the NYSE is not open. Fair value is generally defined as the price a fund would receive to sell an asset or pay to transfer a liability in an orderly transaction between market participants at the measurement date. By its nature, a fair value price is a good faith estimate of the valuation in a current sale and may not reflect an actual market price. The investments of the Fund are valued pursuant to the policy and procedures developed by the Oversight Committee (the “Committee”) and approved by the Company’s Board of Directors (the “Board”). The Committee provides oversight of the valuation of investments for the Fund. The Board has responsibility for overseeing the determination of the fair value of investments.
Valuation techniques used to value the Fund’s investments by major category are as follows:
| | • | | Equity investments (including preferred stocks) traded on a recognized securities exchange for which market quotations are readily available are valued at the last sale price or official closing price, as applicable, on the primary market or exchange on which they trade. Equity investments traded on a recognized exchange for which there were no sales on that day are valued at the last published sale price or at fair value. |
| | • | | Investments in registered investment companies (including money market funds) or other unitized pooled investment vehicles that are not traded on an exchange are valued at that day’s published net asset value (“NAV”) per share or unit. |
| | • | | Exchange-traded futures contracts are valued at the closing settlement price on the primary market on which they are traded most extensively. Exchange-traded futures contracts traded on a recognized exchange for which there were no sales on that day are valued at the last reported sale price obtained from independent pricing services or brokers or at fair value. |
| | | | |
| Notes to Financial Statements | | | 13 | |
State Street Premier Growth Equity V.I.S. Fund
Notes to Financial Statements, continued — December 31, 2019
In the event prices or quotations are not readily available or that the application of these valuation methods results in a price for an investment that is deemed to be not representative of the fair value of such investment, fair value will be determined in good faith by the Committee, in accordance with the valuation policy and procedures approved by the Board.
The Fund values its assets and liabilities at fair value using a fair value hierarchy consisting of three broad levels that prioritize the inputs to valuation techniques giving the highest priority to readily available unadjusted quoted prices in active markets for identical assets or liabilities (Level 1 measurements) and the lowest priority to unobservable inputs (Level 3 measurements) when market prices are not readily available or reliable. The categorization of a value determined for an investment within the hierarchy is based upon the pricing transparency of the investment and is not necessarily an indication of the risk associated with investing in it.
The three levels of the fair value hierarchy are as follows:
| | • | | Level 1 — Unadjusted quoted prices in active markets for an identical asset or liability; |
| | • | | Level 2 — Inputs other than quoted prices included within Level 1 that are observable for the asset or liability either directly or indirectly, including quoted prices for similar assets or liabilities in active markets, quoted prices for identical or similar assets or liabilities in markets that are not considered to be active, inputs other than quoted prices that are observable for the asset or liability (such as exchange rates, financing terms, interest rates, yield curves, volatilities, prepayment speeds, loss severities, credit risks and default rates) or other market-corroborated inputs; and |
| | • | | Level 3 — Unobservable inputs for the asset or liability, including the Committee’s assumptions used in determining the fair value of investments. |
The value of the Fund’s investments according to the fair value hierarchy as of December 31, 2019 is disclosed in the Fund’s Schedule of Investments.
Investment Transactions and Income Recognition Investment transactions are accounted for on trade date for financial reporting purposes. Realized gains and losses from the sale or disposition of investments and foreign exchange transactions, if any, are determined using the identified cost method.
Dividend income and capital gain distributions, if any, are recognized on theex-dividend date, net of any foreign taxes withheld at source, if any.
Interest income is recorded daily on an accrual basis. All premiums and discounts are amortized/accreted for financial reporting purposes.
Non-cash dividends received in the form of stock are recorded as dividend income at fair value.
Expenses Certain expenses, which are directly identifiable to a specific Fund, are applied to the Fund within the Company. Other expenses which cannot be attributed to a specific Fund are allocated in such a manner as deemed equitable, taking into consideration the nature and type of expense and the relative net assets of the Fund within the Company.
Distributions The Fund declares and pays any dividends from net investment income annually.
Net realized capital gains, if any, are distributed annually, unless additional distributions are required for compliance with applicable tax regulations. The amount and character of income and capital gains to be distributed are determined in accordance with applicable tax regulations which may differ from net investment income and realized gains recognized for U.S. GAAP purposes.
| 3. | | Derivative Financial Instruments |
Futures Contracts The Fund may enter into futures contracts to meet the Fund’s objectives. A futures contract is a standardized, exchange-traded agreement to buy or sell a financial instrument at a set price on a future date. Upon entering into a futures contract, the Fund is required to deposit with the broker, cash or securities in an amount equal to the minimum initial margin requirements of the clearing house. Subsequent payments are made or received by the Fund equal to the daily change in the contract value, accumulated, exchange rates, and or other transactional fees. The accumulation of those payments are recorded as variation margin receivable or payable with a corresponding offset to unrealized gains or losses. The Fund recognizes a realized gain or loss when the contract is closed.
| | |
| 14 | | Notes to Financial Statements |
State Street Premier Growth Equity V.I.S. Fund
Notes to Financial Statements, continued — December 31, 2019
Losses may arise if the value of a futures contract decreases due to unfavorable changes in the market rates or values of the underlying instrument during the term of the contract or if the counterparty does not perform under the contract. The use of futures contracts also involves the risk that the movements in the price of the futures contracts do not correlate with the movement of the assets underlying such contracts.
For the fiscal year ended December 31, 2019, the Fund entered into futures contracts for cash equitization.
The following tables summarize the value of the Fund’s derivative instruments as of December 31, 2019 and the related location in the accompanying Statement of Assets and Liabilities and Statement of Operations, presented by primary underlying risk exposure:
Asset Derivatives
| | | | | | | | | | | | | | | | | | | | | | | | |
| | | Interest
Rate
Contracts
Risk | | | Foreign
Exchange
Contracts
Risk | | | Credit
Contracts
Risk | | | Equity
Contracts
Risk | | | Commodity
Contracts
Risk | | | Total | |
State Street Premier Growth Equity V.I.S. Fund | | | | | | | | | | | | | | | | | | | | | | | | |
Futures Contracts | | $ | — | | | $ | — | | | $ | — | | | $ | 7,638 | | | $ | — | | | $ | 7,638 | |
Realized Gain/Loss
| | | | | | | | | | | | | | | | | | | | | | | | |
| | | Interest
Rate
Contracts
Risk | | | Foreign
Exchange
Contracts
Risk | | | Credit
Contracts
Risk | | | Equity
Contracts
Risk | | | Commodity
Contracts
Risk | | | Total | |
State Street Premier Growth Equity V.I.S. Fund | | | | | | | | | | | | | | | | | | | | | | | | |
Futures Contracts | | $ | — | | | $ | — | | | $ | — | | | $ | (12,719 | ) | | $ | — | | | $ | (12,719 | ) |
Net Change in Unrealized Appreciation (Depreciation)
| | | | | | | | | | | | | | | | | | | | | | | | |
| | | Interest
Rate
Contracts
Risk | | | Foreign
Exchange
Contracts
Risk | | | Credit
Contracts
Risk | | | Equity
Contracts
Risk | | | Commodity
Contracts
Risk | | | Total | |
State Street Premier Growth Equity V.I.S. Fund | | | | | | | | | | | | | | | | | | | | | | | | |
Futures Contracts | | $ | — | | | $ | — | | | $ | — | | | $ | 8,481 | | | $ | — | | | $ | 8,481 | |
| 4. | | Fees and Transactions with Affiliates |
Advisory Fee SSGA Funds Management, Inc. (the “Adviser” or “SSGA FM”), a registered investment adviser, was retained by the Board to act as investment adviser and administrator of the Fund. SSGA FM’s compensation for investment advisory and administrative services (“Management Fee”) is paid monthly based on the average daily net assets of the Fund at an annualized rate of 0.65%.
Custody, Fund Accounting andSub-Administration Fees State Street Bank and Trust Company (“State Street”) serves as the custodian, fund accountant andsub-administrator to the Fund. Amounts paid by the Fund to State Street for performing such services are included as custody, fund accounting andsub-administration fees in the Statement of Operations.
Other Transactions with Affiliates The Fund may invest in affiliated entities, including securities issued by State Street Corporation, affiliated funds, or entities deemed to be affiliates as a result of the Fund owning more than five percent of the entity’s voting securities or outstanding shares. Amounts relating to these transactions during the fiscal year ended December 31, 2019 are disclosed in the Schedule of Investments.
| | | | |
| Notes to Financial Statements | | | 15 | |
State Street Premier Growth Equity V.I.S. Fund
Notes to Financial Statements, continued — December 31, 2019
The fees and expenses of the Company’s directors who are not “interested persons” of the Company, as defined in the 1940 Act (“Independent Directors”), are paid directly by the Fund. The Independent Directors are reimbursed for travel and otherout-of-pocket expenses in connection with meeting attendance and industry seminars.
| 6. | | Investment Transactions |
Purchases and sales of investments (excludingin-kind transactions, short term investments and derivative contracts) for the fiscal year ended December 31, 2019 were as follows:
| | | | | | | | |
| Non-U.S. Government Securities |
| Purchases | | Sales |
| | $ | 7,174,374 | | | | $ | 13,526,988 | |
The Fund has qualified and intends to continue to qualify as a regulated investment company under Subchapter M of the Internal Revenue Code of 1986, as amended. The Fund will not be subject to federal income taxes to the extent it distributes its taxable income, including any net realized capital gains, for each fiscal year. Therefore, no provision for federal income tax is required.
The Fund files federal and various state and local tax returns as required. No income tax returns are currently under examination. Generally, the federal returns are subject to examination by the Internal Revenue Service for a period of three years from date of filing, while the state returns may remain open for an additional year depending upon jurisdiction. SSGA FM has analyzed the Fund’s tax positions taken on tax returns for all open years and does not believe there are any uncertain tax positions that would require recognition of a tax liability.
Distributions to shareholders are recorded onex-dividend date. Income dividends and gain distributions are determined in accordance with income tax rules and regulations, which may differ from generally accepted accounting principles. Certain capital accounts in the financial statements have been adjusted for permanentbook-tax differences. These adjustments have no impact on net asset values or results of operations. Temporary booktax differences will reverse in the future. These book tax differences are primarily due to futures contracts and wash sale loss deferrals.
The tax character of distributions paid during the fiscal year ended December 31, 2019 was as follows:
| | | | | | | | | | | | | |
Ordinary
Income | | Long-Term
Capital Gains | | Total |
| | $ | 186,046 | | | | $ | 3,745,601 | | | | $ | 3,931,647 | |
The tax character of distributions paid during the fiscal year ended December 31, 2018 was as follows:
| | | | | | | | | | | | | |
Ordinary
Income | | Long-Term
Capital Gains | | Total |
| | $ | 95,684 | | | | $ | 4,304,535 | | | | $ | 4,400,219 | |
At December 31, 2019, the components of distributable earnings on a tax basis were as follows:
| | | | | | | | | | | | | | | | | | | | | | | | | | | | |
| | | Undistributed
Ordinary
Income | | | Tax
Exempt
Income | | | Capital Loss
Carryforwards | | | Undistributed
long term gain | | | Net Unrealized
Gains (Losses) | | | Qualified
Late-Year
Losses | | | Total | |
| State Street Premier Growth Equity V.I.S. Fund | | $ | 39,609 | | | $ | — | | | $ | — | | | $ | 503,628 | | | $ | 14,595,132 | | | $ | — | | | $ | 15,138,369 | |
| | |
| 16 | | Notes to Financial Statements |
State Street Premier Growth Equity V.I.S. Fund
Notes to Financial Statements, continued — December 31, 2019
As of December 31, 2019, gross unrealized appreciation and gross unrealized depreciation of investments and other financial instruments based on cost for federal income tax purposes were as follows:
| | | | | | | | | | | | | | | | | | |
Tax
Cost | | Gross
Unrealized
Appreciation | | Gross
Unrealized
Depreciation | | Net Unrealized
Appreciation
(Depreciation) |
| | $ | 20,882,425 | | | | $ | 15,222,778 | | | | $ | 627,646 | | | | $ | 14,595,132 | |
The Fund and other affiliated funds (each, a “Participant” and collectively, the “Participants”) have access to $200 million of a $500 million revolving credit facility provided by a syndication of banks under which the Participants may borrow to fund shareholder redemptions. This agreement expires in October 2020 unless otherwise extended or renewed.
The Participants are charged an annual commitment fee which is calculated based on the unused portion of the shared credit line. Commitment fees are allocated among each of the Participants based on relative net assets. Commitment fees are ordinary fund operating expenses. A Participant incurs and pays the interest expense related to its borrowing. Interest is calculated at a rate per annum equal to the sum of 1% plus the greater of the New York Fed Bank Rate and1-month LIBOR rate.
The Fund had no outstanding loans as of December 31, 2019.
Concentration Risk As a result of the Fund’s ability to invest a large percentage of its assets in obligations of issuers within the same country, state, region, currency or economic sector, an adverse economic, business or political development may affect the value of the Fund’s investments more than if the Fund were more broadly diversified.
Market and Credit Risk In the normal course of business, the Fund trades financial instruments and enters into financial transactions where risk of potential loss exists due to changes in the general economic conditions and fluctuations of the market (market risk). Additionally, the Fund may also be exposed to credit risk in the event that an issuer or guarantor fails to perform or that an institution or entity with which the Fund has unsettled or open transactions defaults.
Management has evaluated the impact of all subsequent events on the Fund through the date on which the financial statements were available to be issued and has determined that there were no subsequent events requiring adjustment or disclosure in the financial statements.
| | | | |
| Notes to Financial Statements | | | 17 | |
State Street Premier Growth Equity V.I.S. Fund
Report of Independent Registered Public Accounting Firm
To the Shareholders of State Street Premier Growth Equity V.I.S. Fund and the Board of Directors of State Street Variable Insurance Series Funds, Inc.
Opinion on the Financial Statements
We have audited the accompanying statement of assets and liabilities of State Street Premier Growth Equity V.I.S. Fund (the “Fund”) (one of the funds constituting (the “Company”)), including the schedule of investments, as of December 31, 2019, and the related statement of operations for the year then ended, the statements of changes in net assets for each of the two years in the period then ended, the financial highlights for each of the four years in the period then ended and the related notes (collectively referred to as the “financial statements”). In our opinion, the financial statements present fairly, in all material respects, the financial position of the Fund (one of the funds constituting State Street Variable Insurance Series Funds, Inc.) at December 31, 2019, the results of its operations for the year then ended, the changes in its net assets for each of the two years in the period then ended and its financial highlights for each of the four years in the period then ended, in conformity with U.S. generally accepted accounting principles. The financial highlights for the year ended December 31, 2015 were audited by another independent registered public accounting firm whose report, dated February 19, 2016, expressed an unqualified opinion on those financial highlights.
Basis for Opinion
These financial statements are the responsibility of the Company’s management. Our responsibility is to express an opinion on the Fund’s financial statements based on our audits. We are a public accounting firm registered with the Public Company Accounting Oversight Board (United States) (“PCAOB”) and are required to be independent with respect to the Company in accordance with the U.S. federal securities laws and the applicable rules and regulations of the Securities and Exchange Commission and the PCAOB.
We conducted our audits in accordance with the standards of the PCAOB. Those standards require that we plan and perform the audit to obtain reasonable assurance about whether the financial statements are free of material misstatement, whether due to error or fraud. The Company is not required to have, nor were we engaged to perform, an audit of the Company’s internal control over financial reporting. As part of our audits we are required to obtain an understanding of internal control over financial reporting, but not for the purpose of expressing an opinion on the effectiveness of the Company’s internal control over financials reporting. Accordingly, we express no such opinion.
Our audits included performing procedures to assess the risks of material misstatement of the financial statements, whether due to error or fraud, and performing procedures that respond to those risks. Such procedures included examining, on a test basis, evidence regarding the amounts and disclosures in the financial statements. Our procedures included confirmation of securities owned as of December 31, 2019, by correspondence with the custodian, brokers and others or by other appropriate auditing procedures where replies from brokers and others were not received. Our audits also included evaluating the accounting principles used and significant estimates made by management, as well as evaluating the overall presentation of the financial statements. We believe that our audits provide a reasonable basis for our opinion.

We have served as the auditor of one or more State Street Global Advisors investment companies since 2000.
Boston, Massachusetts
February 19, 2020
| | |
| 18 | | Report of Independent Registered Public Accounting Firm |
State Street Premier Growth Equity V.I.S. Fund
Tax Information — December 31, 2019 (Unaudited)
For federal income tax purposes, the following information is furnished with respect to the distributions of the Fund for its fiscal year ended December 31, 2019.
Dividends Received Deduction
The Fund reports the maximum amount allowable of its net taxable income as eligible for the corporate dividends received
deduction.
Long Term Capital Gain Distributions
Long term capital gains dividends were paid from the Fund during the fiscal year ended December 31, 2019 in the amount of
$3,745,601.
State Street Premier Growth Equity V.I.S. Fund
Other Information — December 31, 2019 (Unaudited)
Liquidity Risk Management Program
Pursuant to Rule 22e-4 under the 1940 Act, the Funds have adopted a liquidity risk management program. SSGA FM has been designated by the Board to administer the Funds’ liquidity risk management program. The program’s principal objectives include assessing, managing and periodically reviewing each Fund’s liquidity risk, based on factors specific to the circumstances of the Fund. Liquidity risk is defined as the risk that a Fund could not meet redemption requests without significant dilution of remaining investors’ interests in the Fund. During the fiscal year, SSGA FM provided the Board with a report addressing the operations of the program and assessing its adequacy and effectiveness of implementation.
During the period covered by the liquidity program report to the Board, the program supported each Fund’s ability to honor redemption requests timely and SSGA FM’s management of each Fund’s liquidity profile, including during periods of market volatility and net redemptions. SSGA FM reported that the program operated adequately and that the implementation of the program was effective to manage the Fund’s liquidity risk.
There can be no assurance that the program will achieve its objectives in the future. Please refer to your Fund’s prospectus for more information regarding the Fund’s exposure to liquidity risk and other principal risks to which an investment in the Fund may be subject.
Proxy Voting Policies and Procedures and Record
The Fund has adopted the proxy voting policies of SSGA FM. A description of the policies and procedures that the Fund has adopted to determine how to vote proxies relating to portfolio securities is available (i) without charge, upon request, by calling1-800-242-0134, (ii) on the Fund’s website at http://www.ssga.com/geam or (iii) on the SEC’s website at www.sec.gov. Information regarding how the Fund voted proxies, if any, during the most recent12-month period ended June 30 is available by August 31 of each year without charge (1) by calling1-800-242-0134 (toll free), and (2) on the website of the SEC at www.sec.gov.
Quarterly Portfolio Schedule
Following the Fund’s first and third fiscal quarter-ends, a complete schedule of investments is filed with the SEC as an exhibit to its reports on Form N-PORT, which can be found on the SEC’s website at www.sec.gov. The Fund’s schedule of investments are available upon request, without charge, by calling 1-800-242-0134.
State Street Premier Growth Equity V.I.S. Fund
Other Information — December 31, 2019 (Unaudited)
| | | | | | | | | | | | |
| | | | | | |
Name,
Address, and Year
of Birth | | Position(s) Held
with Fund | | Term of
Office and
Length of Time Served | | Principal Occupation
During Past Five Years and Relevant Experience | | Number of
Funds
in Fund
Complex
Overseen
by Director† | | | Other Directorships Held by Director During Past Five Years |
INDEPENDENT DIRECTORS | | | | | | |
Michael F. Holland c/o SSGA Funds Management, Inc. One Iron Street Boston, MA 02210 YOB: 1944 | | Director and Co-Chairperson of the Board | | Term: Until successor is elected and qualified Served: Since January 2019 | | Chairman, Holland & Company L.L.C. (investment adviser) (1995 – present). | | | 68 | | | Director, the Holland Series Fund, Inc.; Director, Reaves Utility Income Fund, Inc.; and Director, Blackstone/GSO Loans (and Real Estate) Funds. |
| |
Patrick J. Riley c/o SSGA Funds Management, Inc. One Iron Street Boston, MA 02210 YOB: 1948 | | Director and Co-Chairperson of the Board | | Term: Until successor is elected and qualified Served: Since January 2019 | | 2002 to May 2010, Associate Justice of the Superior Court, Commonwealth of Massachusetts; 1985 to 2002, Partner, Riley, Burke & Donahue, L.L.P. (law firm); 1998 to Present, Independent Director, State Street Global Advisers Ireland, Ltd. (investment company); 1998 to Present, Independent Director, SSGA Liquidity plc (formerly, SSGA Cash Management Fund plc); January 2009 to Present, Independent Director, SSGA Fixed Income plc; and January 2009-2019, Independent Director, SSGA Qualified Funds PLC. | | | 68 | | | Board Director and Chairman, SPDR Europe 1PLC Board (2011-Present); Board Director and Chairman, SPDR Europe II, PLC (2013- Present). |
| |
John R. Costantino c/o SSGA Funds Management, Inc. One Iron Street Boston, MA 02210 YOB: 1946 | | Director and Co-Chairperson of the Qualified Legal Compliance Committee | | Term: Until successor is elected and qualified Served: Since 1997 | | Senior Advisor to NGN Capital LLC (December 2019 – Present); Managing General Partner, NGN Capital LLC (2006 – December 2019); and Managing Director, Vice President of Walden Capital Management (1996 – present). | | | 68 | | | Director of Kleinfeld Bridal Corp. (March 2016 – present); Trustee of Neuroscience Research Institute (1986 – 2018); Trustee of Fordham University (1989 – 1995 and 2001 – 2007) and Trustee Emeritus (2007 – present); Director, Muscular Dystrophy Association (since 2019); Trustee of GE Funds (1993 – February 2011); and Trustee of Gregorian University Foundation (1992 – 2007). |
| |
Donna M. Rapaccioli c/o SSGA Funds Management, Inc. One Iron Street Boston, MA 02210 YOB: 1962 | | Director and Co-Chairperson of the Audit Committee | | Term: Until successor is elected and qualified Served: Since January 2012 | | Dean of the Gabelli School of Business (2007 – present) and Accounting Professor (1987 – present) at Fordham University. | | | 68 | | | Director-Graduate Management Admissions Council (2015 – present). |
State Street Premier Growth Equity V.I.S. Fund
Other Information, continued — December 31, 2019 (Unaudited)
| | | | | | | | | | | | |
| | | | | | |
Name,
Address, and Year
of Birth | | Position(s) Held
with Fund | | Term of
Office and
Length of Time Served | | Principal Occupation
During Past Five Years and Relevant Experience | | Number of
Funds
in Fund
Complex
Overseen
by Director† | | | Other Directorships Held by Director During Past Five Years |
INDEPENDENT DIRECTORS (continued) |
Richard D. Shirk c/o SSGA Funds Management, Inc. One Iron Street Boston, MA 02210 YOB: 1945 | | Director and Co-Chairperson of the Qualified Legal Compliance Committee | | Term: Until successor is elected and qualified Served: Since January 2019 | | March 2001 to April 2002, Chairman (1996 to March 2001, President and Chief Executive Officer), Cerulean Companies, Inc. (holding company) (Retired); 1992 to March 2001, President and Chief Executive Officer, Blue Cross Blue Shield of Georgia (health insurer, managed healthcare). | | | 68 | | | 1998 to December 2008, Chairman, Board Member and December 2008 to Present, Investment Committee Member, Healthcare Georgia Foundation (private foundation); September 2002 to 2012, Lead Director and Board Member, Amerigroup Corp. (managed health care); 1999 to 2013, Board Member and (since 2001) Investment Committee Member, Woodruff Arts Center; and 2003 to 2009, Trustee, Gettysburg College; Board member, Aerocare Holdings, Regenesis Biomedical Inc. |
| |
Rina K. Spence c/o SSGA Funds Management, Inc. One Iron Street Boston, MA 02210 YOB: 1948 | | Director and Co-Chairperson of the Audit Committee, Chairperson of the Nominating Committee and Chairperson of the Governance Committee | | Term: Until successor is elected and qualified Served: Since January 2019 | | President of SpenceCare International LLC (international healthcare consulting) (1999 – present); Chief Executive Officer, IEmily.com (health internet company) (2000 – 2001); Chief Executive Officer of Consensus Pharmaceutical, Inc. (1998 – 1999); Founder, President and Chief Executive Officer of Spence Center for Women’s Health (1994 – 1998); President and CEO, Emerson Hospital (1984 – 1994); Honorary Consul for Monaco in Boston (2015 – present). | | | 68 | | | None |
| |
Michael A. Jessee c/o SSGA Funds Management, Inc. One Iron Street Boston, MA 02210 YOB: 1946 | | Director and Chairperson of the Valuation Committee | | Term: Until successor is elected and qualified
Served: Since January 2019 | | Retired; formerly, President and Chief Executive Officer of the Federal Home Loan Bank of Boston (1989 – 2009); Trustee, Randolph-Macon College (2004 – 2016). | | | 68 | | | None |
INTERESTED DIRECTORS(1) |
Ellen M. Needham(2) SSGA Funds Management, Inc. One Iron Street Boston, MA 02210 YOB: 1967 | | Director | | Term: Until successor is elected and qualified Served: Since January 2019 | | President and Director, SSGA Funds Management, Inc. (2001 – present)*; Senior Managing Director, State Street Global Advisors (1992 – present)*; Director, State Street Global Advisors Funds Distributors, LLC (May 2017 – present). | | | 68 | | | None |
State Street Premier Growth Equity V.I.S. Fund
Other Information, continued — December 31, 2019 (Unaudited)
| | | | | | | | | | | | |
| | | | | | |
Name,
Address, and Year
of Birth | | Position(s) Held
with Fund | | Term of
Office and
Length of Time Served | | Principal Occupation
During Past Five Years and Relevant Experience | | Number of
Funds
in Fund
Complex
Overseen
by Director† | | | Other Directorships Held by Director During Past Five Years |
INTERESTED DIRECTORS(1) (continued) |
Jeanne La Porta(3) c/o SSGA Funds Management, Inc. 1600 Summer St. Stamford, CT 06905 YOB: 1965 | | Director & President | | Term: Until successor is elected and qualified Served:
Since 2014 | | Senior Managing Director at State Street Global Advisors (July 2016 – present); Director of State Street Global Advisors Funds Distributors, LLC (May 2017 – present); President of GE Retirement Savings Plan Funds (July 2016 – September 2018); Senior Vice President and Commercial Operations Leader at GE Asset Management Incorporated (“GEAM”) (March 2014 – July 2016); President of State Street Institutional Funds and State Street Variable Insurance Series Funds, Inc. (April 2014 – present); President and Trustee of GEAM’s UCITs Funds (March 2014 – November 2014); Senior Vice President and Commercial Administrative Officer at GEAM (April 2010 –March 2014); Vice President of State Street Institutional Funds (July 2003 – April 2014); Vice President of Elfun Funds and GE Retirement Savings Plan Funds (October 2003 – July 2016). | | | 18 | | | None |
| † | | For the purpose of determining the number of portfolios overseen by the Directors, “Fund Complex” comprises registered investment companies for which SSGA FM serves as investment adviser. |
| (1) | | The individuals listed below are Directors who are “interested persons,” as defined in the 1940 Act, of the Company (“Interested Directors”). |
| (2) | | Ms. Needham is an Interested Director because of her employment by SSGA FM, an affiliate of the Company. |
| (3) | | Ms. La Porta is an Interested Director because of her employment by SSGA, an affiliate of the Company. |
| * | | Served in various capacities and/or with various affiliated entities during noted time period. |
State Street Premier Growth Equity V.I.S. Fund
Other Information, continued — December 31, 2019 (Unaudited)
| | | | | | |
| | | | |
Name, Address, and Year of Birth | | Position(s) Held with Fund | | Term of Office and Length of Time Served | | Principal Occupation During Past Five Years |
OFFICERS: | | | | | | |
Jeanne M. La Porta SSGA Funds Management, Inc. 1600 Summer St. Stamford, CT 06905 YOB: 1965 | | President and Director | | Term: Indefinite Elected: 3/14 | | Senior Managing Director at State Street Global Advisors (July 2016 – present); Director of State Street Global Advisors Funds Distributors, LLC (May 2017 – present); President of GE Retirement Savings Plan Funds (July 2016 – September 2018); Senior Vice President and Commercial Operations Leader at GEAM (March 2014 – July 2016); President of State Street Institutional Funds and State Street Variable Insurance Series Funds, Inc. (April 2014 – present); President and Trustee of GEAM’s UCITs Funds (March 2014 – November 2014); Senior Vice President and Commercial Administrative Officer at GEAM (April 2010 – March 2014); Vice President of State Street Institutional Funds (July 2003 – April 2014); Vice President of Elfun Funds and GE Retirement Savings Plan Funds (October 2003 – July 2016); Secretary of GE Funds (July 2007 – September 2010) and Vice President (July 2007 – February 2011); Senior Vice President and Deputy General Counsel of GEAM (October 2007 – April 2010); Vice President and Assistant Secretary of Elfun Funds and GE Retirement Savings Plan Funds (July 2003 – June 2010); and Vice President and Associate General Counsel – Marketing and Client Services (formerly Asset Management Services) at GEAM (May 1997 – October 2007). |
| |
Bruce S. Rosenberg SSGA Funds Management, Inc. One Iron Street Boston, MA 02210 YOB: 1961 | | Treasurer | | Term: Indefinite Elected: 4/19 | | Managing Director, State Street Global Advisors and SSGA Funds Management, Inc. (July 2015 – present); Director, Credit Suisse (April 2008 – July 2015). |
| |
Ann M. Carpenter SSGA Funds Management, Inc. One Iron Street Boston, MA 02210 YOB: 1966 | | Vice President and Deputy Treasurer | | Term: Indefinite Elected: 4/19 | | Chief Operating Officer, SSGA Funds Management, Inc. (April 2005 – present)*; Managing Director, State Street Global Advisors. (2005 – present).* |
| |
Chad C. Hallett SSGA Funds Management, Inc. One Iron Street Boston, MA 02210 YOB: 1969 | | Deputy Treasurer | | Term: Indefinite Elected: 4/19 | | Vice President, State Street Global Advisors and SSGA Funds Management, Inc. (November 2014 – present); Vice President, State Street Bank and Trust Company (2001 – November 2014).* |
| |
Darlene Anderson-Vasquez SSGA Funds Management, Inc. One Iron Street Boston, MA 02210 YOB: 1968 | | Deputy Treasurer | | Term: Indefinite Elected: 4/19 | | Managing Director, State Street Global Advisors and SSGA Funds Management, Inc. (May 2016 – present); Senior Vice President, John Hancock Investments (September 2007 – May 2016). |
State Street Premier Growth Equity V.I.S. Fund
Other Information, continued — December 31, 2019 (Unaudited)
| | | | | | |
| | | | |
Name, Address, and Year of Birth | | Position(s) Held with Fund | | Term of Office and Length of Time Served | | Principal Occupation During Past Five Years |
OFFICERS (continued): |
Arthur A. Jensen SSGA Funds Management, Inc. 1600 Summer Street Stamford, CT 06905 YOB: 1966 | | Deputy Treasurer | | Term: Indefinite Elected: 4/19 | | Vice President State Street Global Advisors and SSGA Funds Management, Inc. (July 2016 – present); Deputy Treasurer of Elfun Funds (July 2016 – present); Treasurer of State Street Institutional Funds, State Street Variable Insurance Series Funds, Inc. and GE Retirement Savings Plan Funds (June 2011 – present); Treasurer of Elfun Funds (June 2011– July 2016); Mutual Funds Controller of GE Asset Management Incorporated (April 2011 – July 2016). |
| |
Sujata Upreti SSGA Funds Management, Inc. One Iron Street Boston, MA 02210 YOB: 1974 | | Assistant Treasurer | | Term: Indefinite Elected: 4/19 | | Vice President, State Street Global Advisors and SSGA Funds Management, Inc. (May 2015 – present); Assistant Director, Cambridge Associates, LLC (July 2014 – January 2015); Vice President, Bank of New York Mellon (July 2012 – August 2013); Manager, PricewaterhouseCoopers, LLP (September 2003 – July 2012). |
| |
Daniel Foley SSGA Funds Management, Inc. One Iron Street Boston, MA 02210 YOB: 1972 | | Assistant Treasurer | | Term: Indefinite Elected: 4/19 | | Vice President, State Street Global Advisors and SSGA Funds Management, Inc. (April 2007 – present).* |
| |
Daniel G. Plourde SSGA Funds Management, Inc. One Iron Street Boston, MA 02210 YOB: 1980 | | Assistant Treasurer | | Term: Indefinite Elected: 6/17 | | Vice President, State Street Global Advisors and SSGA Funds Management, Inc. (May 2015 – present); Officer, State Street Bank and Trust Company (March 2009 – May 2015). |
| |
Brian Harris SSGA Funds Management, Inc. One Iron Street Boston, MA 02210 YOB: 1973 | | Chief
Compliance Officer, Anti-Money Laundering Officer and Code of Ethics Compliance Officer | | Term: Indefinite Elected: 7/16 Term: Indefinite Elected: 4/19 | | Managing Director, State Street Global Advisors and SSGA Funds Management, Inc. (June 2013 – Present)*; Senior Vice President and Global Head of Investment Compliance, BofA Global Capital Management (September 2010 – May 2013). |
| |
Sean O’Malley SSGA Funds Management, Inc. One Iron Street Boston, MA 02210 YOB: 1969 | | Chief Legal Officer | | Term: Indefinite Elected: 8/19 | | Senior Vice President and Deputy General Counsel, State Street Global Advisors (November 2013 – present). |
| |
Andrew DeLorme SSGA Funds Management, Inc. One Iron Street Boston, MA 02210 YOB: 1975 | | Secretary | | Term: Indefinite Elected: 8/19 | | Vice President and Senior Counsel, State Street Global Advisors (April 2016 – present); Vice President and Counsel, State Street Global Advisors (August 2014 – March 2016). |
State Street Premier Growth Equity V.I.S. Fund
Other Information, continued — December 31, 2019 (Unaudited)
| | | | | | |
| | | | |
Name, Address, and Year of Birth | | Position(s) Held with Fund | | Term of Office and Length of Time Served | | Principal Occupation During Past Five Years |
OFFICERS (continued): |
Kevin Morris SSGA Funds Management, Inc. One Iron Street Boston, MA 02210 YOB: 1982 | | Assistant Secretary | | Term: Indefinite Elected: 8/19 | | Vice President and Senior Counsel, State Street Global Advisors (April 2019 – present); Vice President and Counsel, State Street Global Advisors (January 2016 – April 2019); Director, Asset Management Compliance, Fidelity Investments (June 2015 – January 2016); Senior Compliance Advisor, Asset Management Compliance, Fidelity Investments (June 2012 – June 2015). |
| |
David Urman SSGA Funds Management, Inc. One Iron Street Boston, MA 02210 YOB: 1985 | | Assistant Secretary | | Term: Indefinite Elected: 8/19 | | Vice President and Senior Counsel, State Street Global Advisors (April 2019 – present); Vice President and Counsel, State Street Global Advisors (August 2015 – April 2019); Associate, Ropes & Gray LLP (November 2012 – August 2015). |
| * | Served in various capacities and/or with various affiliated entities during noted time period. |
Directors
Michael F. Holland, Co-Chairperson
Patrick J. Riley, Co-Chairperson
John R. Costantino
Donna M. Rapaccioli
Michael A. Jessee
Richard D. Shirk
Rina K. Spence
Jeanne M. La Porta
Ellen M. Needham
Officers
Jeanne M. La Porta, President
Brian Harris, Chief Compliance Officer, Anti-Money Laundering Officer and Code of Ethics Compliance Officer
Sean O’Malley, Chief Legal Officer
Bruce S. Rosenberg, Treasurer
Ann M. Carpenter, Vice President and Deputy Treasurer
Chad C. Hallett, Deputy Treasurer
Arthur A. Jensen, Deputy Treasurer
Darlene Anderson-Vasquez, Deputy Treasurer
Sujata Upreti, Assistant Treasurer
Daniel Foley, Assistant Treasurer
Daniel G. Plourde, Assistant Treasurer
Andrew DeLorme, Secretary
Kevin Morris, Assistant Secretary
David Urman, Assistant Secretary
Investment Adviser and Administrator
SSGA Funds Management, Inc.
One Iron Street
Boston, MA 02210
Custodian andSub-Administrator
State Street Bank and Trust Company
One Lincoln Street
Boston, Massachusetts 02111
Distributor
State Street Global Advisors Funds Distributors, LLC
One Iron Street
Boston, MA 02210
Independent Registered Public Accounting Firm
Ernst & Young LLP
200 Clarendon Street
Boston, Massachusetts 02116
Annual Report
December 31, 2019
State Street Income V.I.S. Fund
Beginning on January 1, 2021, as permitted by regulations adopted by the U.S. Securities and Exchange Commission, paper copies of a Fund’s annual and semi- annual shareholder reports will no longer be sent by mail, unless you specifically request paper copies of the reports. Instead, the reports will be made available on a Fund’s website (www.ssga.com/geam), and you will be notified by mail each time a report is posted, and provided with a website link to access the report. If you already elected to receive shareholder reports electronically, you will not be affected by this change and you need not take any action.
You may elect to receive all future reports in paper free of charge. To do so, contact your Insurance Provider. Your election to receive reports in paper will apply to all funds held in your account.

State Street Income V.I.S. Fund
Annual Report
December 31, 2019
Table of Contents
This report is prepared for Policyholders of certain variable contracts and may be distributed to others only if preceded or accompanied by the variable contract’s current prospectus and the current summary prospectus of the Fund available for investments thereunder.
State Street Income V.I.S. Fund
Notes to Performance — December 31, 2019 (Unaudited)
The information provided on the performance pages relates to the State Street Income V.I.S. Fund (the “Fund”).
Total return performance shown in this report for the Fund takes into account changes in share price and assumes reinvestment of dividends and capital gains distributions, if any. Total returns shown are net of Fund fees and expenses but do not reflect fees and charges associated with the variable contracts such as administrative fees, account charges and surrender charges, which, if reflected, would reduce the Fund’s total returns for all periods shown.
The performance data quoted represents past performance; past performance does not guarantee future results. Investment return and principal value will fluctuate so your shares, when redeemed, may be worth more or less than their original cost. Current performance may be higher or lower than the performance data quoted. Periods less than one year are not annualized. Please call toll-free (800) 242-0134 or visit the Fund’s website at http://www.ssga.com/geam for the most recent month-end performance data.
An investment in the Fund is not a deposit of any bank and is not insured or guaranteed by the Federal Deposit Insurance Corporation (“FDIC”) or any other government agency. An investment in the Fund is subject to risk, including possible loss of principal invested.
The Bloomberg Barclays U.S. Aggregate Bond Index is an unmanaged market value-weighted index of taxable investment grade debt issues, including government, corporate, asset-backed and mortgage-backed securities, with maturities of one year or more. This index is designed to represent the performance of the U.S. investment-grade first rate bond market.
The results shown for the foregoing index assume the reinvestment of net dividends or interest and do not reflect fees, expenses, or taxes. As such, the index returns do not reflect the actual cost of investing in the instruments that comprise the index.
The views expressed in this document reflect our judgment as of the publication date and are subject to change at any time without notice.
State Street Global Advisors Funds Distributors, LLC, member of FINRA & SIPC is the principal underwriter and distributor of the State Street V.I.S. Funds and an indirect wholly-owned subsidiary of State Street Corporation. References to State Street may include State Street Corporation and its affiliates. The Funds pay State Street Bank and Trust Company for its services as custodian and Fund Accounting agent, and pay SSGA Funds Management, Inc. for investment advisory and administrative services.
State Street Income V.I.S. Fund
Management Discussion of Fund Performance — December 31, 2019 (Unaudited)
The State Street Income V.I.S. Fund (the “Fund”) seeks to provide the maximum income consistent with prudent investment management and the preservation of capital. The Fund’s benchmark is the Bloomberg Barclays U.S. Aggregate Bond Index (the “Index”).
For the 12-month period ended December 31, 2019 (the “Reporting Period”), the total return for the Fund was 8.62% and the Index was 8.72%. The Fund and Index returns reflect the reinvestment of dividends and other income. The Fund’s performance reflects the expenses of managing the Fund, including brokerage and advisory expenses. The Index is unmanaged and Index returns do not reflect fees and expenses of any kind, which would have a negative impact on returns.
Asset allocation and duration, which each had a positive impact, and security selection, which had a negative impact, were the primary drivers of Fund performance during the Reporting Period relative to the Index.
Reflecting our view that the credit and economic cycle would persist, which was bolstered by a new round of monetary stimulus, the Fund maintained an over-weight asset allocation to credit sectors during the Reporting Period. Largely in response to renewed monetary policy stimulus, credit spreads tightened over the Reporting Period. Credit performance versus duration-equivalent treasuries was positive over the Reporting Period, with investment-grade credit and high-yield strongly out-performing risk-free assets. As such, the Fund’s allocation to credit generated positive excess returns relative to the Index.
Over the course of the Reporting Period, the ten-year government interest rate decreased from 2.69% to 1.92%. During the third quarter of 2019, we felt that long-term rates were nearing a cyclical low, which turned out to be the case, as the ten-year government interest rate hit a low of 1.46%. During that period, we established a short duration position relative to the Index, positively impacting the Fund’s performance relative to the Index.
Security selection in the investment-grade credit allocation generated positive excess returns relative to the Index, which was offset by security selection in the agency MBS and treasury allocations, with each generating negative excess returns relative to the Index.
The Fund used treasury futures, interest rate swaps, options on treasury futures and index credit default swaps in order to actively manage duration and credit spread duration during the Reporting Period. The Fund’s use of treasury futures contributed to Fund performance relative to the Index, while its use of interest rate swaps, options on treasury futures and index credit default swaps detracted from Fund performance relative to the Index.
The views expressed above reflect those of the Fund’s portfolio manager only through the Reporting Period, and do not necessarily represent the views of the Adviser as a whole. Any such views are subject to change at any time based upon market or other conditions and the Adviser disclaims any responsibility to update such views. These views may not be relied on as investment advice and, because investment decisions for a fund are based on numerous factors, may not be relied on as an indication of trading intent on behalf of any fund.
| | |
| 2 | | State Street Income V.I.S. Fund |
State Street Income V.I.S. Fund
Understanding Your Fund’s Expenses — December 31, 2019 (Unaudited)
As a shareholder of the Fund, you incur ongoing costs. Ongoing costs include portfolio management fees, professional fees, administrative fees and other Fund expenses. The following example is intended to help you understand your ongoing costs (in dollars) of investing in the Fund and to compare these costs with the ongoing costs of investing in other mutual funds.
To illustrate these ongoing costs, we have provided an example and calculated the expenses paid by investors in the Fund during the period. The information in the following table is based on an investment of $1,000, which is invested at the beginning of the period and held for the entiresix-month period ended December 31, 2019.
Actual Expenses
The first section of the table provides information about actual account values and actual expenses. You may use the information in this section, together with the amount you invested, to estimate the expenses that you paid over the period. To do so, simply divide your account value by $1,000 (for example, an $8,600 account value divided by $1,000 = 8.6), then multiply the result by the number given under the heading “Expenses paid during the period” to estimate the expenses you paid on your account during the period.
Hypothetical Example for Comparison Purposes
The second section of the table provides information about hypothetical account values and hypothetical expenses based on the Fund’s actual expense ratio and an assumed rate of return of 5% per year before expenses, which is not the Fund’s actual return. The hypothetical account values and expenses may not be used to estimate the actual ending account balance or expenses you paid for the period. You may use this information to compare the ongoing costs of investing in the Fund and other funds. To do so, compare this 5% hypothetical example with the 5% hypothetical examples that appear in the shareholder reports of other funds.
Please note that the expenses shown in the table are meant to highlight and help you compare ongoing costs only and do not reflect transaction costs, such as sales charges or redemption fees, if any. Therefore, the second section of the table is useful in comparing ongoing costs only, and will not help you determine the relative total costs of owning different funds. Additionally, the expenses shown do not reflect the fees or charges associated with variable contracts through which shares of the Fund are offered.
| | | | | | | | |
| | | Actual
Fund Return | | | Hypothetical
5% Return
(2.5% for
the period) | |
Actual Fund Return | | | | | | | | |
Beginning Account Value July 1, 2019 | | $ | 1,000.00 | | | $ | 1,000.00 | |
Ending Account Value December 31, 2019 | | $ | 1,021.60 | | | $ | 1,019.76 | |
Expenses Paid During Period* | | $ | 5.50 | | | $ | 5.50 | |
| * | Expenses are equal to the Fund’s annualized expense ratio of 1.08%** (for the period July 1, 2019-December 31, 2019), multiplied by the average account value over the period, multiplied by 184/365 (to reflect theone-half year period). |
| ** | May differ from expense ratio disclosed in the financial highlights, which is calculated based on the entire fiscal year’s data. |
| | | | |
| State Street Income V.I.S. Fund | | | 3 | |
State Street Income V.I.S. Fund
Performance Summary — December 31, 2019 (Unaudited)
Quality Ratings
as of December 31, 2019 as a % of Fair Value(a)(b)
| | | | |
Moody’s / S&P /Rating* | | Percentage of
Fair Value | |
Aaa / AAA | | | 4.1 | % |
Aa / AA | | | 73.1 | % |
A / A | | | 5.3 | % |
Baa / BBB | | | 15.4 | % |
Ba / BB and lower | | | 1.6 | % |
NR / Other | | | 0.5 | % |
| | | | |
| | | 100.0 | % |
| | | | |
Sector Allocation
Portfolio composition as a % of Fair Value of $19,766 (in thousands) as of December 31, 2019(a)(b)
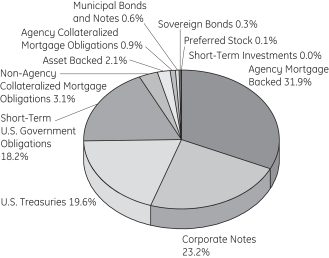
Average Annual Total Return for the periods ended December 31, 2019
Class 1 Shares (Inception date: 1/03/95)
| | | | | | | | | | | | | | | | |
| | | One Year | | | Five Year | | | Ten Year | | | Ending Value
of a $10,000
Investment | |
State Street Income V.I.S. Fund | | | 8.62 | % | | | 2.54 | % | | | 3.66 | % | | $ | 14,329 | |
Bloomberg Barclays U.S. Aggregate Bond Index | | | 8.72 | % | | | 3.05 | % | | | 3.75 | % | | $ | 14,445 | |
| (a) | Fair Value basis is inclusive of short-term investment in State Street Institutional U.S. Government Money Market Fund Class G Shares. |
| (b) | The securities information regarding holdings, allocations and other characteristics is presented to illustrate examples of securities that the Fund has bought and the diversity of areas in which the Fund may invest as of a particular date. It may not be representative of the Fund’s current or future investments and should not be construed as a recommendation to purchase or sell a particular security. |
| * | Moody’s Investors Services, Inc. (“Moody’s”) and S&P Global Ratings (“S&P”) are nationally recognized statistical rating organizations. The quality ratings represent the lower of Moody’s or S&P credit ratings. When a rating from only one of the rating agencies is available, that rating is used. Securities not rated by Moody’s or S&P are categorized as not rated. Credit quality measures a bond issuer’s ability to repay interest and principal in a timely manner. Credit quality ratings assigned by a rating agency are subject to change periodically and are not absolute standards of quality. In formulating investment decisions for the Fund, SSGA Funds Management, Inc. develops its own analysis of the credit quality and risks associated with individual debt instruments, rather than relying exclusively on rating agency ratings. |
| | |
| 4 | | State Street Income V.I.S. Fund |
State Street Income V.I.S. Fund
Performance Summary, continued — December 31, 2019 (Unaudited)
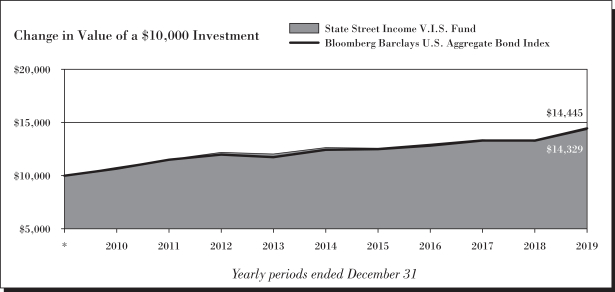
See Notes to Performance beginning on page 1 for further information.
Past performance does not predict future performance. The performance shown in the graphs and tables does not reflect the deduction of taxes that a shareholder would pay on Fund distributions or the redemption of Fund shares and does not reflect the fees or charges that would be associated with variable contracts through which shares of the Fund are offered.
| | | | |
| State Street Income V.I.S. Fund | | | 5 | |
State Street Income V.I.S. Fund
Schedule of Investments — December 31, 2019
| | | | | | | | |
| | | Principal
Amount ($) | | | Fair
Value $ | |
| | | | | | | | |
|
| Bonds and Notes - 92.8%† | |
U.S. Treasuries - 21.0% | | | | | | | | |
U.S. Treasury Bonds | | | | | | | | |
2.25%, 08/15/46 (a) | | | 135,000 | | | | 131,541 | |
3.00%, 08/15/48 (a) | | | 753,400 | | | | 850,871 | |
U.S. Treasury Notes
1.63%, 02/15/26 (a) | | | 465,300 | | | | 461,156 | |
1.88%, 06/30/20 - 12/15/20 (a) | | | 1,319,600 | | | | 1,321,867 | |
2.25%, 03/31/20 (a) | | | 805,000 | | | | 806,195 | |
2.63%, 02/15/29 (a) | | | 27,000 | | | | 28,633 | |
| | | | | | | | |
| | | | | | | 3,600,263 | |
| | | | | | | | |
|
Agency Mortgage Backed - 36.9% | |
Federal Home Loan Mortgage Corp. | |
3.00%, 03/01/43 (a) | | | 274,606 | | | | 282,520 | |
4.00%, 01/01/48 (a) | | | 376,680 | | | | 396,253 | |
4.05%, 09/25/28 (a)(b) | | | 31,000 | | | | 34,611 | |
4.50%, 06/01/33 - 02/01/35 (a) | | | 3,657 | | | | 3,920 | |
5.00%, 07/01/35 (a) | | | 30,965 | | | | 34,319 | |
5.50%, 05/01/20 - 01/01/38 (a) | | | 31,360 | | | | 35,058 | |
6.00%, 04/01/29 - 11/01/37 (a) | | | 95,518 | | | | 106,984 | |
6.50%, 02/01/29 (a) | | | 44 | | | | 50 | |
6.93%, 06/01/26 (a)(c) | | | 60,000 | | | | 77,797 | |
7.00%, 06/01/29 - 08/01/36 (a) | | | 21,369 | | | | 24,383 | |
7.50%, 01/01/30 - 09/01/33 (a) | | | 3,898 | | | | 4,280 | |
8.00%, 11/01/30 (a) | | | 4,359 | | | | 4,924 | |
8.50%, 04/01/30 (a) | | | 3,754 | | | | 4,765 | |
Federal National Mortgage Assoc. | | | | | | | | |
3.50%, 06/01/44 - 07/01/47 (a) | | | 560,951 | | | | 590,962 | |
4.00%, 01/01/41 - 10/01/47 (a) | | | 420,313 | | | | 444,483 | |
4.50%, 02/01/20 - 02/01/40 (a) | | | 32,724 | | | | 35,312 | |
5.00%, 03/01/34 - 08/01/35 (a) | | | 39,336 | | | | 43,514 | |
5.50%, 06/01/20 - 01/01/39 (a) | | | 123,726 | | | | 138,305 | |
6.00%, 02/01/20 - 07/01/35 (a) | | | 147,204 | | | | 166,001 | |
6.50%, 10/01/28 - 08/01/34 (a) | | | 22,682 | | | | 24,797 | |
7.00%, 10/01/32 - 02/01/34 (a) | | | 5,325 | | | | 5,758 | |
7.50%, 11/01/22 - 03/01/33 (a) | | | 15,286 | | | | 16,287 | |
8.00%, 08/01/25 - 10/01/31 (a) | | | 7,004 | | | | 7,751 | |
9.00%, 12/01/22 (a) | | | 148 | | | | 151 | |
Federal National Mortgage Assoc. 1.60% + 12 month USD LIBOR
4.47%, 04/01/37 (a)(b) | | | 905 | | | | 930 | |
Federal National Mortgage Assoc. TBA | | | | | | | | |
2.50% TBA (d) | | | 622,000 | | | | 627,623 | |
3.50% TBA (d) | | | 130,000 | | | | 133,709 | |
4.00% TBA (a)(d) | | | 1,410,325 | | | | 1,471,110 | |
4.00% TBA (d) | | | 452,000 | | | | 470,071 | |
| | | | | | | | |
| | | Principal
Amount ($) | | | Fair
Value $ | |
Government National Mortgage Assoc. | | | | | | | | |
3.00%, 12/20/42 (a) | | | 355,585 | | | | 368,323 | |
3.50%, 05/20/45 (a) | | | 375,300 | | | | 391,727 | |
4.00%, 01/20/41 - 04/20/43 (a) | | | 116,090 | | | | 123,834 | |
4.50%, 08/15/33 - 03/20/41 (a) | | | 84,077 | | | | 90,390 | |
6.00%, 04/15/27 - 04/15/34 (a) | | | 74,521 | | | | 83,219 | |
6.50%, 03/15/24 - 08/15/34 (a) | | | 31,702 | | | | 34,753 | |
7.00%, 01/15/28 - 10/15/36 (a) | | | 23,519 | | | | 25,313 | |
7.50%, 11/15/31 (a) | | | 135 | | | | 135 | |
9.00%, 12/15/21 (a) | | | 61 | | | | 63 | |
Government National Mortgage Assoc. 1.50% + 1 year CMT
4.00%, 02/20/23 - 02/20/26 (a)(b) | | | 1,330 | | | | 1,346 | |
4.13%, 12/20/24 (a)(b) | | | 612 | | | | 620 | |
| | | | | | | | |
| | | | | | | 6,306,351 | |
| | | | | | | | |
|
Agency Collateralized Mortgage Obligations - 1.1% | |
Federal Home Loan Mortgage Corp.
0.08%, 09/25/43 (a)(b)(e) | | | 395,212 | | | | 1,338 | |
2.43%, 08/25/29 (a) | | | 102,000 | | | | 101,993 | |
2.51%, 07/25/29 (a) | | | 55,000 | | | | 55,384 | |
Federal Home Loan Mortgage Corp. REMIC | | | | | | | | |
3.50%, 09/15/29 - 11/15/30 (a)(e) | | | 27,285 | | | | 1,400 | |
5.50%, 06/15/33 (a)(e) | | | 16,996 | | | | 3,057 | |
7.50%, 07/15/27 (a)(e) | | | 1,645 | | | | 245 | |
Federal Home Loan Mortgage Corp. REMIC 6.60% - 1 month USD LIBOR
4.86%, 08/15/25 (a)(b)(e) | | | 11,151 | | | | 468 | |
Federal Home Loan Mortgage Corp. STRIPS
1.47%, 08/01/27 (a)(f)(g) | | | 191 | | | | 170 | |
8.00%, 02/01/23 - 07/01/24 (a)(e) | | | 480 | | | | 58 | |
Federal National Mortgage Assoc. REMIC
1.09%, 12/25/42 (a)(b)(e) | | | 20,730 | | | | 820 | |
5.00%, 09/25/40 (a)(e) | | | 13,388 | | | | 1,454 | |
7.00%, 09/25/20 (a) | | | 10 | | | | 10 | |
Federal National Mortgage Assoc. REMIC 6.00% - 1 month USD LIBOR
4.21%, 07/25/38 (a)(b)(e) | | | 5,853 | | | | 846 | |
Federal National Mortgage Assoc. STRIPS
1.87%, 12/25/34 (a)(f)(g) | | | 13,909 | | | | 11,994 | |
4.50%, 08/25/35 - 01/25/36 (a)(e) | | | 17,462 | | | | 2,679 | |
5.00%, 03/25/38 - 05/25/38 (a)(e) | | | 9,646 | | | | 1,620 | |
5.50%, 12/25/33 (a)(e) | | | 4,297 | | | | 854 | |
6.00%, 01/25/35 (a)(e) | | | 7,250 | | | | 1,383 | |
See Notes to Schedule of Investments and Notes to Financial Statements.
| | |
| 6 | | State Street Income V.I.S. Fund |
State Street Income V.I.S. Fund
Schedule of Investments, continued — December 31, 2019
| | | | | | | | |
| | | Principal
Amount ($) | | | Fair
Value $ | |
| | | | | | | | |
7.50%, 11/25/23 (a)(e) | | | 2,041 | | | | 203 | |
8.00%, 08/25/23 - 07/25/24 (a)(e) | | | 1,000 | | | | 121 | |
8.50%, 07/25/22 (a)(e) | | | 9 | | | | 1 | |
9.00%, 05/25/22 (a)(e) | | | 9 | | | | 1 | |
Government National Mortgage Assoc. REMIC
4.50%, 08/16/39 (a)(e) | | | 7,771 | | | | 237 | |
5.00%, 09/20/38 (a)(e) | | | 794 | | | | 3 | |
| | | | | | | | |
| | | | | | | 186,339 | |
| | | | | | | | |
|
Asset Backed - 2.5% | |
American Express Credit Account Master Trust 0.24% + 1 month USD LIBOR
1.98%, 04/15/24 (a)(b) | | | 100,000 | | | | 100,078 | |
American Express Credit Account Master Trust2018-8
3.18%, 04/15/24 (a) | | | 104,000 | | | | 106,330 | |
BA Credit Card Trust2018-A1
2.70%, 07/17/23 (a) | | | 44,000 | | | | 44,417 | |
GMF Floorplan Owner Revolving Trust 0.32% + 1 month USD LIBOR
2.06%, 09/15/22 (a)(b)(h) | | | 124,000 | | | | 124,016 | |
Nissan Auto Lease Trust2019-A
2.76%, 03/15/22 (a) | | | 45,000 | | | | 45,418 | |
| | | | | | | | |
| | | | | | | 420,259 | |
| | | | | | | | |
|
Corporate Notes - 26.7% | |
3M Co.
3.13%, 09/19/46 (a) | | | 9,000 | | | | 8,569 | |
Abbott Laboratories
3.75%, 11/30/26 (a) | | | 6,000 | | | | 6,558 | |
4.90%, 11/30/46 (a) | | | 8,000 | | | | 10,490 | |
AbbVie Inc.
2.60%, 11/21/24 (a)(h) | | | 10,000 | | | | 10,087 | |
2.95%, 11/21/26 (a)(h) | | | 15,000 | | | | 15,252 | |
3.20%, 05/14/26 (a) | | | 4,000 | | | | 4,142 | |
3.20%, 11/21/29 (a)(h) | | | 10,000 | | | | 10,205 | |
4.05%, 11/21/39 (a)(h) | | | 5,000 | | | | 5,249 | |
4.25%, 11/21/49 (a)(h) | | | 5,000 | | | | 5,303 | |
4.45%, 05/14/46 (a) | | | 11,000 | | | | 11,865 | |
4.88%, 11/14/48 (a) | | | 3,000 | | | | 3,461 | |
Aetna Inc.
3.50%, 11/15/24 (a) | | | 8,000 | | | | 8,380 | |
Aflac Inc.
4.00%, 10/15/46 (a) | | | 3,000 | | | | 3,280 | |
Aircastle Ltd.
4.25%, 06/15/26 (a) | | | 7,000 | | | | 7,390 | |
Albemarle Wodgina Pty Ltd.
3.45%, 11/15/29 (a)(h) | | | 15,000 | | | | 15,033 | |
| | | | | | | | |
| | | Principal
Amount ($) | | | Fair
Value $ | |
Alexandria Real Estate Equities Inc.
4.70%, 07/01/30 (a) | | | 3,000 | | | | 3,449 | |
Alimentation Couche-Tard Inc.
2.70%, 07/26/22 (a)(h) | | | 8,000 | | | | 8,093 | |
Allegion PLC
3.50%, 10/01/29 (a) | | | 5,000 | | | | 5,112 | |
Allergan Finance LLC
3.25%, 10/01/22 (a) | | | 6,000 | | | | 6,135 | |
4.63%, 10/01/42 (a) | | | 2,000 | | | | 2,084 | |
Allergan Funding SCS | | | | | | | | |
3.00%, 03/12/20 (a) | | | 9,000 | | | | 9,007 | |
3.45%, 03/15/22 (a) | | | 8,000 | | | | 8,186 | |
Allergan Sales LLC
5.00%, 12/15/21 (a)(h) | | | 9,000 | | | | 9,416 | |
Ally Financial Inc.
5.75%, 11/20/25 (a) | | | 6,000 | | | | 6,729 | |
Altria Group Inc.
2.95%, 05/02/23 (a) | | | 5,000 | | | | 5,130 | |
3.80%, 02/14/24 (a) | | | 4,000 | | | | 4,210 | |
4.25%, 08/09/42 (a) | | | 2,000 | | | | 1,979 | |
4.50%, 05/02/43 (a) | | | 3,000 | | | | 3,055 | |
4.80%, 02/14/29 (a) | | | 7,000 | | | | 7,793 | |
Amazon.com Inc.
2.80%, 08/22/24 (a) | | | 5,000 | | | | 5,176 | |
3.15%, 08/22/27 (a) | | | 4,000 | | | | 4,236 | |
3.88%, 08/22/37 (a) | | | 2,000 | | | | 2,270 | |
4.05%, 08/22/47 (a) | | | 5,000 | | | | 5,901 | |
Ameren Corp.
2.50%, 09/15/24 (a) | | | 15,000 | | | | 15,055 | |
3.65%, 02/15/26 (a) | | | 5,000 | | | | 5,231 | |
American Campus Communities Operating Partnership LP
4.13%, 07/01/24 (a) | | | 4,000 | | | | 4,273 | |
American Express Co.
3.00%, 10/30/24 (a) | | | 8,000 | | | | 8,273 | |
American International Group Inc.
4.25%, 03/15/29 (a) | | | 8,000 | | | | 8,906 | |
4.50%, 07/16/44 (a) | | | 7,000 | | | | 8,073 | |
6.40%, 12/15/20 (a) | | | 7,000 | | | | 7,290 | |
American Tower Corp.
3.70%, 10/15/49 (a) | | | 3,000 | | | | 3,002 | |
3.80%, 08/15/29 (a) | | | 10,000 | | | | 10,691 | |
American Water Capital Corp.
2.95%, 09/01/27 (a) | | | 9,000 | | | | 9,181 | |
Amgen Inc.
2.65%, 05/11/22 (a) | | | 9,000 | | | | 9,134 | |
3.20%, 11/02/27 (a) | | | 5,000 | | | | 5,263 | |
4.66%, 06/15/51 (a) | | | 3,000 | | | | 3,532 | |
See Notes to Schedule of Investments and Notes to Financial Statements.
| | | | |
| State Street Income V.I.S. Fund | | | 7 | |
State Street Income V.I.S. Fund
Schedule of Investments, continued — December 31, 2019
| | | | | | | | |
| | | Principal
Amount ($) | | | Fair
Value $ | |
| | | | | | | | |
Anheuser-Busch Companies LLC/Anheuser-Busch InBev Worldwide Inc.
4.70%, 02/01/36 (a) | | | 8,000 | | | | 9,256 | |
4.90%, 02/01/46 (a) | | | 9,000 | | | | 10,707 | |
Anheuser-Busch InBev Worldwide Inc.
4.00%, 04/13/28 (a) | | | 4,000 | | | | 4,397 | |
4.38%, 04/15/38 (a) | | | 13,000 | | | | 14,626 | |
4.75%, 04/15/58 (a) | | | 7,000 | | | | 8,177 | |
5.55%, 01/23/49 (a) | | | 6,000 | | | | 7,796 | |
Anthem Inc.
2.88%, 09/15/29 (a) | | | 3,000 | | | | 2,998 | |
3.30%, 01/15/23 (a) | | | 6,000 | | | | 6,206 | |
3.70%, 09/15/49 (a) | | | 3,000 | | | | 2,990 | |
Apache Corp.
4.38%, 10/15/28 (a) | | | 3,000 | | | | 3,138 | |
5.10%, 09/01/40 (a) | | | 7,000 | | | | 7,120 | |
Apollo Management Holdings LP (4.95% fixed rate until 12/17/24; 3.27% + 5 year CMT Rate thereafter)
4.95%, 01/14/50 (a)(b)(h) | | | 10,000 | | | | 10,137 | |
Apple Inc.
2.20%, 09/11/29 (a) | | | 7,000 | | | | 6,879 | |
2.85%, 05/11/24 (a) | | | 7,000 | | | | 7,240 | |
2.95%, 09/11/49 (a) | | | 5,000 | | | | 4,883 | |
3.35%, 02/09/27 (a) | | | 7,000 | | | | 7,468 | |
3.45%, 02/09/45 (a) | | | 10,000 | | | | 10,586 | |
Applied Materials Inc.
4.35%, 04/01/47 (a) | | | 6,000 | | | | 7,241 | |
Aptiv PLC
4.40%, 10/01/46 (a) | | | 7,000 | | | | 6,767 | |
Archer-Daniels-Midland Co.
2.50%, 08/11/26 (a) | | | 6,000 | | | | 6,104 | |
Ascension Health
4.85%, 11/15/53 (a) | | | 10,000 | | | | 12,622 | |
AstraZeneca PLC
3.50%, 08/17/23 (a) | | | 6,000 | | | | 6,281 | |
4.00%, 01/17/29 (a) | | | 3,000 | | | | 3,333 | |
4.38%, 08/17/48 (a) | | | 2,000 | | | | 2,374 | |
AT&T Inc.
4.35%, 03/01/29 (a) | | | 4,000 | | | | 4,443 | |
4.45%, 04/01/24 (a) | | | 7,000 | | | | 7,580 | |
4.50%, 05/15/35 (a) | | | 12,000 | | | | 13,375 | |
4.55%, 03/09/49 (a) | | | 4,000 | | | | 4,442 | |
4.75%, 05/15/46 (a) | | | 4,000 | | | | 4,523 | |
4.80%, 06/15/44 (a) | | | 7,000 | | | | 7,987 | |
4.85%, 03/01/39 (a) | | | 8,000 | | | | 9,242 | |
5.15%, 11/15/46 (a) | | | 2,000 | | | | 2,389 | |
5.25%, 03/01/37 (a) | | | 5,000 | | | | 5,984 | |
5.35%, 12/15/43 (a) | | | 7,000 | | | | 8,240 | |
5.45%, 03/01/47 (a) | | | 7,000 | | | | 8,670 | |
| | | | | | | | |
| | | Principal
Amount ($) | | | Fair
Value $ | |
Athene Holding Ltd.
4.13%, 01/12/28 (a) | | | 4,000 | | | | 4,123 | |
Avangrid Inc.
3.15%, 12/01/24 (a) | | | 9,000 | | | | 9,291 | |
Bank of America Corp.
3.95%, 04/21/25 (a) | | | 7,000 | | | | 7,467 | |
4.18%, 11/25/27 (a) | | | 11,000 | | | | 11,942 | |
4.25%, 10/22/26 (a) | | | 11,000 | | | | 12,005 | |
Bank of America Corp. (3.12% fixed rate until 01/20/22; 1.16% + 3 month USD LIBOR thereafter)
3.12%, 01/20/23 (a)(b) | | | 8,000 | | | | 8,159 | |
Bank of America Corp. (3.37% fixed rate until 01/23/25; 0.81% + 3 month USD LIBOR thereafter)
3.37%, 01/23/26 (a)(b) | | | 2,000 | | | | 2,094 | |
Bank of America Corp. (3.56% fixed rate until 04/23/26; 1.06% + 3 month USD LIBOR thereafter)
3.56%, 04/23/27 (a)(b) | | | 15,000 | | | | 15,855 | |
Bank of America Corp. (3.95% fixed rate until 01/23/48; 1.19% + 3 month USD LIBOR thereafter)
3.95%, 01/23/49 (a)(b) | | | 3,000 | | | | 3,418 | |
Bank of America Corp. (4.27% fixed rate until 07/23/28; 1.31% + 3 month USD LIBOR thereafter)
4.27%, 07/23/29 (a)(b) | | | 3,000 | | | | 3,335 | |
Bank of America Corp. (4.33% fixed rate until 03/15/49; 1.52% + 3 month USD LIBOR thereafter)
4.33%, 03/15/50 (a)(b) | | | 5,000 | | | | 6,007 | |
Bank of America Corp. (4.44% fixed rate until 01/20/47; 1.99% + 3 month USD LIBOR thereafter)
4.44%, 01/20/48 (a)(b) | | | 3,000 | | | | 3,668 | |
Bank of Montreal (4.34% fixed rate until 10/05/23; 1.28% + USD 5 year Swap Rate thereafter)
4.34%, 10/05/28 (a)(b) | | | 9,000 | | | | 9,498 | |
Barrick North America Finance LLC
5.70%, 05/30/41 (a) | | | 3,000 | | | | 3,708 | |
BAT Capital Corp.
2.76%, 08/15/22 (a) | | | 7,000 | | | | 7,105 | |
See Notes to Schedule of Investments and Notes to Financial Statements.
| | |
| 8 | | State Street Income V.I.S. Fund |
State Street Income V.I.S. Fund
Schedule of Investments, continued — December 31, 2019
| | | | | | | | |
| | | Principal
Amount ($) | | | Fair
Value $ | |
| | | | | | | | |
3.56%, 08/15/27 (a) | | | 5,000 | | | | 5,110 | |
4.39%, 08/15/37 (a) | | | 7,000 | | | | 7,107 | |
4.54%, 08/15/47 (a) | | | 4,000 | | | | 4,016 | |
Becton Dickinson and Co.
2.89%, 06/06/22 (a) | | | 11,000 | | | | 11,182 | |
3.70%, 06/06/27 (a) | | | 10,000 | | | | 10,644 | |
3.73%, 12/15/24 (a) | | | 2,000 | | | | 2,124 | |
4.67%, 06/06/47 (a) | | | 3,000 | | | | 3,571 | |
4.69%, 12/15/44 (a) | | | 2,000 | | | | 2,327 | |
Berkshire Hathaway Energy Co.
3.25%, 04/15/28 (a) | | | 4,000 | | | | 4,229 | |
3.80%, 07/15/48 (a) | | | 5,000 | | | | 5,404 | |
6.13%, 04/01/36 (a) | | | 5,000 | | | | 6,869 | |
Berkshire Hathaway Finance Corp.
4.25%, 01/15/49 (a) | | | 6,000 | | | | 7,138 | |
Boardwalk Pipelines LP
4.80%, 05/03/29 (a) | | | 10,000 | | | | 10,652 | |
Boston Scientific Corp.
4.70%, 03/01/49 (a) | | | 4,000 | | | | 4,859 | |
BP Capital Markets America Inc.
3.02%, 01/16/27 (a) | | | 11,000 | | | | 11,397 | |
3.22%, 11/28/23 (a) | | | 8,000 | | | | 8,323 | |
Brighthouse Financial Inc.
3.70%, 06/22/27 (a) | | | 2,000 | | | | 1,994 | |
Bristol-Myers Squibb Co.
3.20%, 06/15/26 (a)(h) | | | 7,000 | | | | 7,355 | |
3.40%, 07/26/29 (a)(h) | | | 7,000 | | | | 7,499 | |
3.45%, 11/15/27 (a)(h) | | | 2,000 | | | | 2,134 | |
4.13%, 06/15/39 (a)(h) | | | 5,000 | | | | 5,764 | |
4.25%, 10/26/49 (a)(h) | | | 5,000 | | | | 5,941 | |
4.55%, 02/20/48 (a)(h) | | | 7,000 | | | | 8,580 | |
5.00%, 08/15/45 (a)(h) | | | 5,000 | | | | 6,410 | |
Broadcom Corp./Broadcom Cayman Finance Ltd.
2.65%, 01/15/23 (a) | | | 3,000 | | | | 3,017 | |
3.00%, 01/15/22 (a) | | | 6,000 | | | | 6,090 | |
3.13%, 01/15/25 (a) | | | 3,000 | | | | 3,043 | |
3.88%, 01/15/27 (a) | | | 2,000 | | | | 2,078 | |
Brown-Forman Corp.
4.00%, 04/15/38 (a) | | | 2,000 | | | | 2,239 | |
Bunge Limited Finance Corp.
3.75%, 09/25/27 (a) | | | 3,000 | | | | 3,068 | |
Burlington Northern Santa Fe LLC
4.15%, 12/15/48 (a) | | | 8,000 | | | | 9,251 | |
4.55%, 09/01/44 (a) | | | 11,000 | | | | 13,123 | |
Cameron LNG LLC
3.30%, 01/15/35 (a)(h) | | | 6,000 | | | | 6,102 | |
3.70%, 01/15/39 (a)(h) | | | 2,000 | | | | 2,052 | |
Campbell Soup Co.
3.30%, 03/15/21 (a) | | | 11,000 | | | | 11,163 | |
| | | | | | | | |
| | | Principal
Amount ($) | | | Fair
Value $ | |
Canadian Natural Resources Ltd.
3.85%, 06/01/27 (a) | | | 7,000 | | | | 7,465 | |
4.95%, 06/01/47 (a) | | | 2,000 | | | | 2,447 | |
Cantor Fitzgerald LP
4.88%, 05/01/24 (a)(h) | | | 10,000 | | | | 10,671 | |
Capital One Financial Corp.
3.75%, 07/28/26 (a) | | | 9,000 | | | | 9,477 | |
4.75%, 07/15/21 (a) | | | 12,000 | | | | 12,496 | |
Cardinal Health Inc.
2.62%, 06/15/22 (a) | | | 6,000 | | | | 6,062 | |
3.08%, 06/15/24 (a) | | | 4,000 | | | | 4,119 | |
Caterpillar Inc.
3.25%, 09/19/49 (a) | | | 7,000 | | | | 7,028 | |
3.80%, 08/15/42 (a) | | | 4,000 | | | | 4,466 | |
Cenovus Energy Inc.
4.25%, 04/15/27 (a) | | | 2,000 | | | | 2,117 | |
5.25%, 06/15/37 (a) | | | 3,000 | | | | 3,314 | |
5.40%, 06/15/47 (a) | | | 3,000 | | | | 3,481 | |
Centene Corp.
4.25%, 12/15/27 (a)(h) | | | 15,000 | | | | 15,447 | |
4.63%, 12/15/29 (a)(h) | | | 5,000 | | | | 5,265 | |
CenterPoint Energy Inc.
2.50%, 09/01/22 (a) | | | 13,000 | | | | 13,115 | |
3.60%, 11/01/21 (a) | | | 8,000 | | | | 8,213 | |
Charter Communications Operating LLC/Charter Communications Operating Capital
4.46%, 07/23/22 (a) | | | 11,000 | | | | 11,563 | |
4.91%, 07/23/25 (a) | | | 5,000 | | | | 5,511 | |
5.05%, 03/30/29 (a) | | | 12,000 | | | | 13,589 | |
5.75%, 04/01/48 (a) | | | 10,000 | | | | 11,692 | |
6.38%, 10/23/35 (a) | | | 3,000 | | | | 3,788 | |
Cheniere Corpus Christi Holdings LLC
5.88%, 03/31/25 (a) | | | 12,000 | | | | 13,512 | |
Chevron Corp.
3.19%, 06/24/23 (a) | | | 4,000 | | | | 4,169 | |
Chubb INA Holdings Inc.
4.35%, 11/03/45 (a) | | | 8,000 | | | | 9,718 | |
Cigna Corp.
3.25%, 04/15/25 (a)(h) | | | 7,000 | | | | 7,261 | |
3.40%, 09/17/21 (a) | | | 7,000 | | | | 7,165 | |
3.40%, 03/01/27 (a)(h) | | | 5,000 | | | | 5,192 | |
3.75%, 07/15/23 (a) | | | 6,000 | | | | 6,299 | |
3.88%, 10/15/47 (a)(h) | | | 6,000 | | | | 6,139 | |
4.13%, 11/15/25 (a) | | | 7,000 | | | | 7,600 | |
4.38%, 10/15/28 (a) | | | 3,000 | | | | 3,329 | |
4.80%, 08/15/38 (a) | | | 3,000 | | | | 3,498 | |
4.90%, 12/15/48 (a) | | | 3,000 | | | | 3,587 | |
Cisco Systems Inc.
5.90%, 02/15/39 (a) | | | 5,000 | | | | 7,017 | |
See Notes to Schedule of Investments and Notes to Financial Statements.
| | | | |
| State Street Income V.I.S. Fund | | | 9 | |
State Street Income V.I.S. Fund
Schedule of Investments, continued — December 31, 2019
| | | | | | | | |
| | | Principal
Amount ($) | | | Fair
Value $ | |
| | | | | | | | |
Citigroup Inc.
2.70%, 10/27/22 (a) | | | 8,000 | | | | 8,132 | |
4.40%, 06/10/25 (a) | | | 5,000 | | | | 5,437 | |
4.45%, 09/29/27 (a) | | | 4,000 | | | | 4,408 | |
4.65%, 07/23/48 (a) | | | 13,000 | | | | 16,255 | |
4.75%, 05/18/46 (a) | | | 9,000 | | | | 10,785 | |
5.50%, 09/13/25 (a) | | | 10,000 | | | | 11,445 | |
Citigroup Inc. (2.88% fixed rate until 07/24/22; 0.95% + 3 month USD LIBOR thereafter)
2.88%, 07/24/23 (a)(b) | | | 7,000 | | | | 7,117 | |
Citigroup Inc. (2.98% fixed rate until 11/05/29; 1.42% + SOFR thereafter)
2.98%, 11/05/30 (a)(b) | | | 9,000 | | | | 9,139 | |
Citigroup Inc. (3.88% fixed rate until 01/24/38; 1.17% + 3 month USD LIBOR thereafter)
3.88%, 01/24/39 (a)(b) | | | 7,000 | | | | 7,720 | |
Citigroup Inc. (5.88% fixed rate until 03/27/20; 4.06% + 3 month USD LIBOR thereafter)
5.88%, 12/29/49 (a)(b) | | | 23,000 | | | | 23,180 | |
CME Group Inc.
3.75%, 06/15/28 (a) | | | 2,000 | | | | 2,215 | |
CMS Energy Corp.
4.88%, 03/01/44 (a) | | | 11,000 | | | | 13,110 | |
CNA Financial Corp.
3.45%, 08/15/27 (a) | | | 5,000 | | | | 5,200 | |
3.90%, 05/01/29 (a) | | | 10,000 | | | | 10,751 | |
CNH Industrial Capital LLC
4.38%, 11/06/20 (a) | | | 7,000 | | | | 7,136 | |
4.88%, 04/01/21 (a) | | | 8,000 | | | | 8,258 | |
Comcast Corp.
3.20%, 07/15/36 (a) | | | 7,000 | | | | 7,163 | |
3.25%, 11/01/39 (a) | | | 9,000 | | | | 9,136 | |
3.38%, 08/15/25 (a) | | | 5,000 | | | | 5,304 | |
3.45%, 02/01/50 (a) | | | 5,000 | | | | 5,134 | |
3.97%, 11/01/47 (a) | | | 6,000 | | | | 6,612 | |
4.15%, 10/15/28 (a) | | | 7,000 | | | | 7,881 | |
4.60%, 08/15/45 (a) | | | 3,000 | | | | 3,599 | |
4.70%, 10/15/48 (a) | | | 4,000 | | | | 4,935 | |
CommonSpirit Health
4.35%, 11/01/42 (a) | | | 16,000 | | | | 16,345 | |
Conagra Brands Inc.
3.80%, 10/22/21 (a) | | | 11,000 | | | | 11,346 | |
5.30%, 11/01/38 (a) | | | 3,000 | | | | 3,563 | |
5.40%, 11/01/48 (a) | | | 4,000 | | | | 4,893 | |
Conagra Brands Inc. 0.75% + 3 month USD LIBOR
2.70%, 10/22/20 (a)(b) | | | 9,000 | | | | 9,006 | |
Concho Resources Inc.
3.75%, 10/01/27 (a) | | | 3,000 | | | | 3,157 | |
| | | | | | | | |
| | | Principal
Amount ($) | | | Fair
Value $ | |
4.88%, 10/01/47 (a) | | | 4,000 | | | | 4,637 | |
ConocoPhillips Co.
4.30%, 11/15/44 (a) | | | 8,000 | | | | 9,394 | |
Consolidated Edison Company of New York Inc.
2.90%, 12/01/26 (a) | | | 12,000 | | | | 12,309 | |
3.88%, 06/15/47 (a) | | | 4,000 | | | | 4,352 | |
Constellation Brands Inc.
3.15%, 08/01/29 (a) | | | 8,000 | | | | 8,103 | |
3.70%, 12/06/26 (a) | | | 6,000 | | | | 6,374 | |
4.50%, 05/09/47 (a) | | | 8,000 | | | | 8,772 | |
Continental Resources Inc.
4.50%, 04/15/23 (a) | | | 12,000 | | | | 12,574 | |
Corning Inc.
4.38%, 11/15/57 (a) | | | 6,000 | | | | 6,147 | |
Crown Castle International Corp.
5.20%, 02/15/49 (a) | | | 6,000 | | | | 7,412 | |
CSX Corp.
4.50%, 03/15/49 - 08/01/54 (a) | | | 14,000 | | | | 16,269 | |
CubeSmart LP
4.38%, 02/15/29 (a) | | | 7,000 | | | | 7,679 | |
CVS Health Corp.
3.00%, 08/15/26 (a) | | | 6,000 | | | | 6,124 | |
3.25%, 08/15/29 (a) | | | 5,000 | | | | 5,101 | |
3.35%, 03/09/21 (a) | | | 6,000 | | | | 6,096 | |
4.30%, 03/25/28 (a) | | | 2,000 | | | | 2,188 | |
4.78%, 03/25/38 (a) | | | 3,000 | | | | 3,413 | |
5.00%, 12/01/24 (a) | | | 6,000 | | | | 6,643 | |
5.05%, 03/25/48 (a) | | | 8,000 | | | | 9,490 | |
Dell International LLC/EMC Corp.
4.00%, 07/15/24 (a)(h) | | | 9,000 | | | | 9,432 | |
4.42%, 06/15/21 (a)(h) | | | 11,000 | | | | 11,320 | |
5.30%, 10/01/29 (a)(h) | | | 7,000 | | | | 7,882 | |
5.45%, 06/15/23 (a)(h) | | | 5,000 | | | | 5,424 | |
6.02%, 06/15/26 (a)(h) | | | 5,000 | | | | 5,773 | |
8.10%, 07/15/36 (a)(h) | | | 2,000 | | | | 2,627 | |
8.35%, 07/15/46 (a)(h) | | | 4,000 | | | | 5,475 | |
Deutsche Bank AG
2.70%, 07/13/20 (a) | | | 12,000 | | | | 12,009 | |
Devon Energy Corp.
5.00%, 06/15/45 (a) | | | 6,000 | | | | 7,007 | |
DH Europe Finance II Sarl
2.60%, 11/15/29 (a) | | | 4,000 | | | | 3,993 | |
3.25%, 11/15/39 (a) | | | 3,000 | | | | 3,037 | |
3.40%, 11/15/49 (a) | | | 3,000 | | | | 3,076 | |
Diamondback Energy Inc.
2.88%, 12/01/24 (a) | | | 10,000 | | | | 10,117 | |
3.25%, 12/01/26 (a) | | | 5,000 | | | | 5,058 | |
3.50%, 12/01/29 (a) | | | 5,000 | | | | 5,092 | |
5.38%, 05/31/25 (a) | | | 18,000 | | | | 18,908 | |
Digital Realty Trust LP
3.60%, 07/01/29 (a) | | | 10,000 | | | | 10,449 | |
See Notes to Schedule of Investments and Notes to Financial Statements.
| | |
| 10 | | State Street Income V.I.S. Fund |
State Street Income V.I.S. Fund
Schedule of Investments, continued — December 31, 2019
| | | | | | | | |
| | | Principal
Amount ($) | | | Fair
Value $ | |
| | | | | | | | |
Discovery Communications LLC
2.95%, 03/20/23 (a) | | | 9,000 | | | | 9,183 | |
3.95%, 03/20/28 (a) | | | 5,000 | | | | 5,345 | |
4.95%, 05/15/42 (a) | | | 2,000 | | | | 2,217 | |
5.00%, 09/20/37 (a) | | | 3,000 | | | | 3,400 | |
Dollar Tree Inc.
4.00%, 05/15/25 (a) | | | 7,000 | | | | 7,485 | |
4.20%, 05/15/28 (a) | | | 4,000 | | | | 4,297 | |
Dominion Energy Inc.
2.58%, 07/01/20 (a) | | | 9,000 | | | | 9,023 | |
3.07%, 08/15/24 (a)(c) | | | 5,000 | | | | 5,117 | |
Dover Corp.
2.95%, 11/04/29 (a) | | | 5,000 | | | | 5,037 | |
DTE Energy Co.
2.85%, 10/01/26 (a) | | | 8,000 | | | | 8,047 | |
3.85%, 12/01/23 (a) | | | 7,000 | | | | 7,345 | |
Duke Energy Carolinas LLC
3.95%, 03/15/48 (a) | | | 5,000 | | | | 5,589 | |
Duke Energy Corp.
1.80%, 09/01/21 (a) | | | 7,000 | | | | 6,988 | |
3.55%, 09/15/21 (a) | | | 6,000 | | | | 6,136 | |
3.75%, 09/01/46 (a) | | | 3,000 | | | | 3,094 | |
Duke Energy Corp.
(4.88% fixed rate until 09/16/24; 3.39% + 5 year CMT Rate thereafter) | | | | | | | | |
4.88%, 12/31/99 (a)(b) | | | 9,000 | | | | 9,439 | |
Duke Energy Progress LLC
4.15%, 12/01/44 (a) | | | 11,000 | | | | 12,413 | |
Duke Realty LP
3.25%, 06/30/26 (a) | | | 4,000 | | | | 4,144 | |
3.38%, 12/15/27 (a) | | | 3,000 | | | | 3,131 | |
DuPont de Nemours Inc.
5.32%, 11/15/38 (a) | | | 3,000 | | | | 3,576 | |
5.42%, 11/15/48 (a) | | | 3,000 | | | | 3,696 | |
Duquesne Light Holdings Inc.
3.62%, 08/01/27 (a)(h) | | | 11,000 | | | | 11,008 | |
Eastman Chemical Co.
3.50%, 12/01/21 (a) | | | 8,000 | | | | 8,192 | |
3.60%, 08/15/22 (a) | | | 7,000 | | | | 7,246 | |
4.50%, 01/15/21 - 12/01/28 (a) | | | 15,000 | | | | 15,812 | |
Eaton Corp.
3.10%, 09/15/27 (a) | | | 4,000 | | | | 4,162 | |
Ecolab Inc.
3.25%, 12/01/27 (a) | | | 2,000 | | | | 2,108 | |
3.95%, 12/01/47 (a) | | | 4,000 | | | | 4,484 | |
Edison International
2.40%, 09/15/22 (a) | | | 18,000 | | | | 17,915 | |
Eli Lilly & Co.
3.95%, 03/15/49 (a) | | | 8,000 | | | | 9,248 | |
Emera US Finance LP
4.75%, 06/15/46 (a) | | | 3,000 | | | | 3,468 | |
| | | | | | | | |
| | | Principal
Amount ($) | | | Fair
Value $ | |
Enbridge Energy Partners LP
5.50%, 09/15/40 (a) | | | 4,000 | | | | 4,767 | |
Enbridge Inc.
4.00%, 11/15/49 (a) | | | 4,000 | | | | 4,195 | |
Energy Transfer Operating LP
4.25%, 03/15/23 (a) | | | 8,000 | | | | 8,347 | |
4.50%, 04/15/24 (a) | | | 2,000 | | | | 2,129 | |
4.95%, 06/15/28 (a) | | | 4,000 | | | | 4,388 | |
6.50%, 02/01/42 (a) | | | 8,000 | | | | 9,513 | |
Energy Transfer Partners LP/Regency Energy Finance Corp.
4.50%, 11/01/23 (a) | | | 4,000 | | | | 4,229 | |
Entergy Louisiana LLC
3.05%, 06/01/31 (a) | | | 10,000 | | | | 10,320 | |
4.00%, 03/15/33 (a) | | | 3,000 | | | | 3,380 | |
Enterprise Products Operating LLC
4.25%, 02/15/48 (a) | | | 7,000 | | | | 7,593 | |
Enterprise Products Operating LLC (5.25% fixed rate until 08/16/27; 3.03% + 3 month USD LIBOR thereafter) | | | | | | | | |
5.25%, 08/16/77 (a)(b) | | | 7,000 | | | | 7,051 | |
EOG Resources Inc.
5.10%, 01/15/36 (a) | | | 4,000 | | | | 4,904 | |
EPR Properties
4.95%, 04/15/28 (a) | | | 4,000 | | | | 4,378 | |
EQM Midstream Partners LP
4.75%, 07/15/23 (a) | | | 2,000 | | | | 2,006 | |
5.50%, 07/15/28 (a) | | | 2,000 | | | | 1,965 | |
Equinor ASA
3.25%, 11/18/49 (a) | | | 5,000 | | | | 5,045 | |
ERP Operating LP
4.50%, 07/01/44 (a) | | | 9,000 | | | | 10,702 | |
Exelon Corp.
3.50%, 06/01/22 (a) | | | 9,000 | | | | 9,239 | |
4.45%, 04/15/46 (a) | | | 7,000 | | | | 7,868 | |
FedEx Corp.
3.10%, 08/05/29 (a) | | | 3,000 | | | | 3,001 | |
4.10%, 02/01/45 (a) | | | 12,000 | | | | 11,678 | |
Fifth Third Bancorp
3.65%, 01/25/24 (a) | | | 12,000 | | | | 12,660 | |
FirstEnergy Corp.
3.90%, 07/15/27 (a) | | | 2,000 | | | | 2,141 | |
FirstEnergy Transmission LLC
4.55%, 04/01/49 (a)(h) | | | 7,000 | | | | 8,038 | |
Fiserv Inc.
3.50%, 07/01/29 (a) | | | 5,000 | | | | 5,263 | |
4.40%, 07/01/49 (a) | | | 5,000 | | | | 5,687 | |
Florida Power & Light Co.
4.13%, 02/01/42 (a) | | | 13,000 | | | | 14,872 | |
Ford Motor Co.
4.35%, 12/08/26 (a) | | | 6,000 | | | | 6,180 | |
See Notes to Schedule of Investments and Notes to Financial Statements.
| | | | |
| State Street Income V.I.S. Fund | | | 11 | |
State Street Income V.I.S. Fund
Schedule of Investments, continued — December 31, 2019
| | | | | | | | |
| | | Principal
Amount ($) | | | Fair
Value $ | |
| | | | | | | | |
General Mills Inc.
3.70%, 10/17/23 (a) | | | 5,000 | | | | 5,265 | |
4.55%, 04/17/38 (a) | | | 2,000 | | | | 2,319 | |
4.70%, 04/17/48 (a) | | | 3,000 | | | | 3,600 | |
General Motors Co.
5.20%, 04/01/45 (a) | | | 3,000 | | | | 3,033 | |
5.40%, 04/01/48 (a) | | | 2,000 | | | | 2,069 | |
General Motors Financial Company Inc.
3.45%, 01/14/22 - 04/10/22 (a) | | | 19,000 | | | | 19,429 | |
3.55%, 04/09/21 (a) | | | 7,000 | | | | 7,117 | |
4.20%, 11/06/21 (a) | | | 4,000 | | | | 4,143 | |
5.25%, 03/01/26 (a) | | | 8,000 | | | | 8,875 | |
Georgia-Pacific LLC
3.60%, 03/01/25 (a)(h) | | | 11,000 | | | | 11,609 | |
Gilead Sciences Inc.
2.95%, 03/01/27 (a) | | | 3,000 | | | | 3,117 | |
3.50%, 02/01/25 (a) | | | 4,000 | | | | 4,245 | |
3.65%, 03/01/26 (a) | | | 2,000 | | | | 2,152 | |
4.15%, 03/01/47 (a) | | | 9,000 | | | | 10,014 | |
GlaxoSmithKline Capital Inc.
3.38%, 05/15/23 (a) | | | 7,000 | | | | 7,308 | |
3.63%, 05/15/25 (a) | | | 6,000 | | | | 6,430 | |
GlaxoSmithKline Capital PLC
3.38%, 06/01/29 (a) | | | 9,000 | | | | 9,653 | |
Glencore Finance Canada Ltd.
4.95%, 11/15/21 (a)(h) | | | 7,000 | | | | 7,319 | |
Glencore Funding LLC
4.88%, 03/12/29 (a)(h) | | | 7,000 | | | | 7,635 | |
Halliburton Co.
3.80%, 11/15/25 (a) | | | 5,000 | | | | 5,335 | |
5.00%, 11/15/45 (a) | | | 6,000 | | | | 6,847 | |
Hasbro Inc.
3.00%, 11/19/24 (a) | | | 18,000 | | | | 18,092 | |
HCA Inc.
4.13%, 06/15/29 (a) | | | 5,000 | | | | 5,311 | |
Hess Corp.
5.60%, 02/15/41 (a) | | | 4,000 | | | | 4,711 | |
5.80%, 04/01/47 (a) | | | 2,000 | | | | 2,449 | |
Hewlett Packard Enterprise Co.
6.35%, 10/15/45 (a) | | | 5,000 | | | | 6,044 | |
Highwoods Realty LP
4.13%, 03/15/28 (a) | | | 7,000 | | | | 7,488 | |
4.20%, 04/15/29 (a) | | | 11,000 | | | | 11,842 | |
Honeywell International Inc.
2.70%, 08/15/29 (a) | | | 8,000 | | | | 8,204 | |
HSBC Holdings PLC
(6.50% fixed rate until 03/23/28; 3.61% + USD 5 yearMid-Market Swap Rate thereafter)
6.50%, 12/31/99 (a)(b) | | | 15,000 | | | | 16,505 | |
| | | | | | | | |
| | | Principal
Amount ($) | | | Fair
Value $ | |
Hyundai Capital America
3.10%, 04/05/22 (a)(h) | | | 7,000 | | | | 7,092 | |
Ingersoll-Rand Luxembourg Finance S.A.
3.50%, 03/21/26 (a) | | | 11,000 | | | | 11,518 | |
3.55%, 11/01/24 (a) | | | 7,000 | | | | 7,336 | |
3.80%, 03/21/29 (a) | | | 11,000 | | | | 11,853 | |
Intel Corp.
2.45%, 11/15/29 (a) | | | 18,000 | | | | 17,976 | |
2.60%, 05/19/26 (a) | | | 8,000 | | | | 8,177 | |
2.88%, 05/11/24 (a) | | | 3,000 | | | | 3,112 | |
International Paper Co.
4.40%, 08/15/47 (a) | | | 7,000 | | | | 7,491 | |
Interstate Power & Light Co.
3.40%, 08/15/25 (a) | | | 8,000 | | | | 8,220 | |
Jabil Inc.
3.95%, 01/12/28 (a) | | | 4,000 | | | | 4,106 | |
Jefferies Group LLC
5.13%, 01/20/23 (a) | | | 10,000 | | | | 10,813 | |
Johnson & Johnson
3.63%, 03/03/37 (a) | | | 5,000 | | | | 5,522 | |
Johnson Controls International PLC
4.50%, 02/15/47 (a) | | | 5,000 | | | | 5,409 | |
JPMorgan Chase & Co.
3.30%, 04/01/26 (a) | | | 11,000 | | | | 11,570 | |
3.63%, 12/01/27 (a) | | | 5,000 | | | | 5,282 | |
JPMorgan Chase & Co. (3.51% fixed rate until 01/23/28; 0.95% + 3 month USD LIBOR thereafter)
3.51%, 01/23/29 (a)(b) | | | 7,000 | | | | 7,430 | |
JPMorgan Chase & Co. (3.88% fixed rate until 07/24/37; 1.36% + 3 month USD LIBOR thereafter)
3.88%, 07/24/38 (a)(b) | | | 2,000 | | | | 2,213 | |
JPMorgan Chase & Co. (3.90% fixed rate until 01/23/48; 1.22% + 3 month USD LIBOR thereafter)
3.90%, 01/23/49 (a)(b) | | | 10,000 | | | | 11,236 | |
JPMorgan Chase & Co. (3.96% fixed rate until 01/29/26; 1.25% + 3 month USD LIBOR thereafter)
3.96%, 01/29/27 (a)(b) | | | 12,000 | | | | 13,019 | |
JPMorgan Chase & Co. (4.01% fixed rate until 04/23/28; 1.12% + 3 month USD LIBOR thereafter)
4.01%, 04/23/29 (a)(b) | | | 4,000 | | | | 4,390 | |
See Notes to Schedule of Investments and Notes to Financial Statements.
| | |
| 12 | | State Street Income V.I.S. Fund |
State Street Income V.I.S. Fund
Schedule of Investments, continued — December 31, 2019
| | | | | | | | |
| | | Principal
Amount ($) | | | Fair
Value $ | |
| | | | | | | | |
JPMorgan Chase & Co. (4.03% fixed rate until 07/24/47; 1.46% + 3 month USD LIBOR thereafter)
4.03%, 07/24/48 (a)(b) | | | 7,000 | | | | 7,990 | |
JPMorgan Chase & Co. (6.10% fixed rate until 10/01/24; 3.33% + 3 month USD LIBOR thereafter)
6.10%, 10/29/49 (a)(b) | | | 7,000 | | | | 7,656 | |
JPMorgan Chase & Co.
3.47% + 3 month USD LIBOR 5.41%, 12/29/49 (a)(b) | | | 8,000 | | | | 8,070 | |
Keurig Dr Pepper Inc.
4.50%, 11/15/45 (a) | | | 3,000 | | | | 3,311 | |
Kinder Morgan Energy Partners LP
3.50%, 03/01/21 (a) | | | 11,000 | | | | 11,157 | |
4.70%, 11/01/42 (a) | | | 2,000 | | | | 2,114 | |
5.00%, 03/01/43 (a) | | | 2,000 | | | | 2,191 | |
5.30%, 09/15/20 (a) | | | 7,000 | | | | 7,160 | |
6.38%, 03/01/41 (a) | | | 4,000 | | | | 4,968 | |
Kinder Morgan Inc.
5.05%, 02/15/46 (a) | | | 9,000 | | | | 10,115 | |
KLA Corp.
4.65%, 11/01/24 (a) | | | 15,000 | | | | 16,539 | |
Kraft Heinz Foods Co.
2.80%, 07/02/20 (a) | | | 2,000 | | | | 2,004 | |
4.38%, 06/01/46 (a) | | | 10,000 | | | | 9,855 | |
L3Harris Technologies Inc.
3.85%, 12/15/26 (a)(h) | | | 6,000 | | | | 6,424 | |
Lam Research Corp.
4.00%, 03/15/29 (a) | | | 11,000 | | | | 12,109 | |
Las Vegas Sands Corp.
3.50%, 08/18/26 (a) | | | 5,000 | | | | 5,172 | |
Lear Corp.
4.25%, 05/15/29 (a) | | | 10,000 | | | | 10,347 | |
5.25%, 05/15/49 (a) | | | 5,000 | | | | 5,207 | |
Liberty Property LP
4.38%, 02/01/29 (a) | | | 8,000 | | | | 9,102 | |
Lincoln National Corp.
3.63%, 12/12/26 (a) | | | 4,000 | | | | 4,226 | |
4.35%, 03/01/48 (a) | | | 7,000 | | | | 7,707 | |
Lockheed Martin Corp.
4.50%, 05/15/36 (a) | | | 7,000 | | | | 8,312 | |
Lowe’s Companies Inc.
4.05%, 05/03/47 (a) | | | 4,000 | | | | 4,321 | |
4.55%, 04/05/49 (a) | | | 7,000 | | | | 8,243 | |
LYB International Finance BV
4.88%, 03/15/44 (a) | | | 5,000 | | | | 5,688 | |
Marathon Oil Corp.
3.85%, 06/01/25 (a) | | | 7,000 | | | | 7,406 | |
| | | | | | | | |
| | | Principal
Amount ($) | | | Fair
Value $ | |
Marsh & McLennan Companies Inc.
3.50%, 03/10/25 (a) | | | 7,000 | | | | 7,394 | |
4.90%, 03/15/49 (a) | | | 6,000 | | | | 7,607 | |
Masco Corp.
3.50%, 11/15/27 (a) | | | 2,000 | | | | 2,068 | |
McDonald’s Corp.
3.63%, 09/01/49 (a) | | | 3,000 | | | | 3,066 | |
3.70%, 01/30/26 (a) | | | 5,000 | | | | 5,373 | |
3.80%, 04/01/28 (a) | | | 9,000 | | | | 9,804 | |
4.88%, 12/09/45 (a) | | | 8,000 | | | | 9,685 | |
McKesson Corp.
3.65%, 11/30/20 (a) | | | 8,000 | | | | 8,116 | |
Medtronic Inc.
4.63%, 03/15/45 (a) | | | 2,000 | | | | 2,513 | |
Memorial Sloan-Kettering Cancer Center
4.13%, 07/01/52 (a) | | | 17,000 | | | | 19,345 | |
Merck & Company Inc.
2.75%, 02/10/25 (a) | | | 7,000 | | | | 7,257 | |
3.40%, 03/07/29 (a) | | | 8,000 | | | | 8,667 | |
4.00%, 03/07/49 (a) | | | 6,000 | | | | 7,023 | |
MetLife Inc.
4.05%, 03/01/45 (a) | | | 3,000 | | | | 3,477 | |
4.72%, 12/15/44 (a) | | | 10,000 | | | | 12,172 | |
Microsoft Corp.
2.40%, 08/08/26 (a) | | | 6,000 | | | | 6,077 | |
3.45%, 08/08/36 (a) | | | 5,000 | | | | 5,482 | |
3.50%, 02/12/35 (a) | | | 3,000 | | | | 3,311 | |
3.70%, 08/08/46 (a) | | | 11,000 | | | | 12,413 | |
3.95%, 08/08/56 (a) | | | 5,000 | | | | 5,906 | |
4.10%, 02/06/37 (a) | | | 4,000 | | | | 4,724 | |
4.50%, 02/06/57 (a) | | | 3,000 | | | | 3,889 | |
Molson Coors Brewing Co.
2.10%, 07/15/21 (a) | | | 7,000 | | | | 7,005 | |
4.20%, 07/15/46 (a) | | | 6,000 | | | | 5,983 | |
Morgan Stanley
3.70%, 10/23/24 (a) | | | 7,000 | | | | 7,434 | |
3.95%, 04/23/27 (a) | | | 5,000 | | | | 5,355 | |
4.35%, 09/08/26 (a) | | | 12,000 | | | | 13,123 | |
Morgan Stanley (2.72% fixed rate until 07/22/24; 1.15% + SOFR thereafter)
2.72%, 07/22/25 (a)(b) | | | 12,000 | | | | 12,169 | |
Morgan Stanley (3.97% fixed rate until 07/22/37; 1.46% + 3 month USD LIBOR thereafter)
3.97%, 07/22/38 (a)(b) | | | 10,000 | | | | 11,139 | |
Morgan Stanley (4.43% fixed rate until 01/23/29; 1.63% + 3 month USD LIBOR thereafter)
4.43%, 01/23/30 (a)(b) | | | 7,000 | | | | 7,915 | |
See Notes to Schedule of Investments and Notes to Financial Statements.
| | | | |
| State Street Income V.I.S. Fund | | | 13 | |
State Street Income V.I.S. Fund
Schedule of Investments, continued — December 31, 2019
| | | | | | | | |
| | | Principal
Amount ($) | | | Fair
Value $ | |
| | | | | | | | |
MPLX LP
3.38%, 03/15/23 (a) | | | 5,000 | | | | 5,135 | |
5.20%, 12/01/47 (a)(h) | | | 3,000 | | | | 3,226 | |
5.25%, 01/15/25 (a)(h) | | | 14,000 | | | | 14,698 | |
6.25%, 10/15/22 (a)(h) | | | 10,000 | | | | 10,151 | |
MPLX LP 1.10% + 3 month USD LIBOR
2.99%, 09/09/22 (a)(b) | | | 10,000 | | | | 10,028 | |
Mylan Inc.
5.20%, 04/15/48 (a) | | | 5,000 | | | | 5,564 | |
Mylan N.V.
3.15%, 06/15/21 (a) | | | 7,000 | | | | 7,090 | |
3.95%, 06/15/26 (a) | | | 2,000 | | | | 2,079 | |
National Oilwell Varco Inc.
3.60%, 12/01/29 (a) | | | 9,000 | | | | 9,039 | |
National Retail Properties Inc.
4.00%, 11/15/25 (a) | | | 6,000 | | | | 6,444 | |
Newfield Exploration Co.
5.63%, 07/01/24 (a) | | | 30,000 | | | | 33,089 | |
Newmont Goldcorp Corp.
4.88%, 03/15/42 (a) | | | 7,000 | | | | 8,185 | |
Nexen Inc.
6.40%, 05/15/37 (a) | | | 7,000 | | | | 9,581 | |
NextEra Energy Capital Holdings Inc.
3.25%, 04/01/26 (a) | | | 11,000 | | | | 11,458 | |
NextEra Energy Capital Holdings Inc. (5.65% fixed rate until 05/01/29; 3.16% + 3 month USD LIBOR thereafter)
5.65%, 05/01/79 (a)(b) | | | 7,000 | | | | 7,773 | |
Noble Energy Inc.
3.85%, 01/15/28 (a) | | | 6,000 | | | | 6,330 | |
3.90%, 11/15/24 (a) | | | 4,000 | | | | 4,234 | |
4.20%, 10/15/49 (a) | | | 6,000 | | | | 6,093 | |
5.05%, 11/15/44 (a) | | | 3,000 | | | | 3,319 | |
Nordstrom Inc.
4.38%, 04/01/30 (a) | | | 5,000 | | | | 5,097 | |
5.00%, 01/15/44 (a) | | | 2,000 | | | | 1,960 | |
Norfolk Southern Corp.
3.95%, 10/01/42 (a) | | | 6,000 | | | | 6,451 | |
Northrop Grumman Corp.
2.55%, 10/15/22 (a) | | | 5,000 | | | | 5,075 | |
3.85%, 04/15/45 (a) | | | 4,000 | | | | 4,302 | |
4.03%, 10/15/47 (a) | | | 3,000 | | | | 3,349 | |
Novartis Capital Corp.
3.00%, 11/20/25 (a) | | | 3,000 | | | | 3,157 | |
Nucor Corp.
3.95%, 05/01/28 (a) | | | 6,000 | | | | 6,527 | |
Nutrien Ltd.
4.00%, 12/15/26 (a) | | | 3,000 | | | | 3,201 | |
4.90%, 06/01/43 (a) | | | 6,000 | | | | 6,753 | |
| | | | | | | | |
| | | Principal
Amount ($) | | | Fair
Value $ | |
Occidental Petroleum Corp.
2.70%, 08/15/22 (a) | | | 5,000 | | | | 5,055 | |
2.90%, 08/15/24 (a) | | | 4,000 | | | | 4,063 | |
3.50%, 08/15/29 (a) | | | 5,000 | | | | 5,099 | |
4.10%, 02/15/47 (a) | | | 6,000 | | | | 5,828 | |
4.85%, 03/15/21 (a) | | | 3,000 | | | | 3,090 | |
6.20%, 03/15/40 (a) | | | 5,000 | | | | 5,973 | |
Omnicom Group Inc./Omnicom Capital Inc.
3.63%, 05/01/22 (a) | | | 7,000 | | | | 7,248 | |
Oncor Electric Delivery Company LLC
3.80%, 09/30/47 (a) | | | 2,000 | | | | 2,200 | |
ONEOK Inc.
4.35%, 03/15/29 (a) | | | 6,000 | | | | 6,516 | |
5.20%, 07/15/48 (a) | | | 8,000 | | | | 9,122 | |
Oracle Corp.
2.40%, 09/15/23 (a) | | | 4,000 | | | | 4,064 | |
2.65%, 07/15/26 (a) | | | 7,000 | | | | 7,165 | |
3.80%, 11/15/37 (a) | | | 3,000 | | | | 3,274 | |
4.00%, 07/15/46 - 11/15/47 (a) | | | 15,000 | | | | 16,694 | |
Oshkosh Corp.
5.38%, 03/01/25 (a) | | | 6,000 | | | | 6,209 | |
Owens Corning
4.40%, 01/30/48 (a) | | | 5,000 | | | | 4,830 | |
PacifiCorp
6.25%, 10/15/37 (a) | | | 4,000 | | | | 5,597 | |
Packaging Corp. of America
3.00%, 12/15/29 (a) | | | 10,000 | | | | 10,083 | |
Parker-Hannifin Corp.
3.25%, 06/14/29 (a) | | | 5,000 | | | | 5,215 | |
Patterson-UTI Energy Inc.
5.15%, 11/15/29 (a) | | | 4,000 | | | | 4,087 | |
PayPal Holdings Inc.
2.65%, 10/01/26 (a) | | | 10,000 | | | | 10,135 | |
2.85%, 10/01/29 (a) | | | 5,000 | | | | 5,040 | |
PepsiCo Inc.
2.63%, 07/29/29 (a) | | | 10,000 | | | | 10,222 | |
3.45%, 10/06/46 (a) | | | 6,000 | | | | 6,359 | |
Petroleos Mexicanos
5.35%, 02/12/28 (a) | | | 10,000 | | | | 9,949 | |
5.63%, 01/23/46 (a) | | | 10,000 | | | | 9,013 | |
6.35%, 02/12/48 (a) | | | 10,000 | | | | 9,655 | |
6.50%, 03/13/27 (a) | | | 15,000 | | | | 15,890 | |
7.69%, 01/23/50 (a)(h) | | | 10,000 | | | | 10,934 | |
Pfizer Inc.
3.45%, 03/15/29 (a) | | | 4,000 | | | | 4,305 | |
3.60%, 09/15/28 (a) | | | 7,000 | | | | 7,663 | |
3.90%, 03/15/39 (a) | | | 5,000 | | | | 5,637 | |
4.40%, 05/15/44 (a) | | | 4,000 | | | | 4,778 | |
Philip Morris International Inc.
3.38%, 08/15/29 (a) | | | 7,000 | | | | 7,341 | |
4.13%, 03/04/43 (a) | | | 7,000 | | | | 7,555 | |
See Notes to Schedule of Investments and Notes to Financial Statements.
| | |
| 14 | | State Street Income V.I.S. Fund |
State Street Income V.I.S. Fund
Schedule of Investments, continued — December 31, 2019
| | | | | | | | |
| | | Principal
Amount ($) | | | Fair
Value $ | |
| | | | | | | | |
Phillips 66
3.90%, 03/15/28 (a) | | | 7,000 | | | | 7,640 | |
Phillips 66 Partners LP
3.75%, 03/01/28 (a) | | | 3,000 | | | | 3,130 | |
4.68%, 02/15/45 (a) | | | 6,000 | | | | 6,476 | |
Plains All American Pipeline LP/PAA Finance Corp.
3.55%, 12/15/29 (a) | | | 15,000 | | | | 14,782 | |
3.65%, 06/01/22 (a) | | | 11,000 | | | | 11,294 | |
PPL Capital Funding Inc.
3.10%, 05/15/26 (a) | | | 12,000 | | | | 12,222 | |
Precision Castparts Corp.
4.38%, 06/15/45 (a) | | | 10,000 | | | | 11,664 | |
Prudential Financial Inc.
(5.70% fixed rate until 09/15/28; 2.67% + 3 month USD LIBOR thereafter)
5.70%, 09/15/48 (a)(b) | | | 12,000 | | | | 13,740 | |
Public Service Company of Colorado
3.70%, 06/15/28 (a) | | | 7,000 | | | | 7,632 | |
Public Service Electric & Gas Co.
2.38%, 05/15/23 (a) | | | 12,000 | | | | 12,157 | |
QUALCOMM Inc.
2.90%, 05/20/24 (a) | | | 2,000 | | | | 2,064 | |
3.00%, 05/20/22 (a) | | | 5,000 | | | | 5,125 | |
3.25%, 05/20/27 (a) | | | 2,000 | | | | 2,104 | |
4.30%, 05/20/47 (a) | | | 3,000 | | | | 3,437 | |
Realty Income Corp.
3.00%, 01/15/27 (a) | | | 5,000 | | | | 5,149 | |
Reynolds American Inc.
4.45%, 06/12/25 (a) | | | 4,000 | | | | 4,308 | |
Rio Tinto Finance USA PLC
4.13%, 08/21/42 (a) | | | 6,000 | | | | 6,879 | |
Rockwell Automation Inc.
4.20%, 03/01/49 (a) | | | 6,000 | | | | 6,987 | |
Rockwell Collins Inc.
3.50%, 03/15/27 (a) | | | 3,000 | | | | 3,190 | |
Rogers Communications Inc.
5.00%, 03/15/44 (a) | | | 4,000 | | | | 4,860 | |
Roper Technologies Inc.
2.95%, 09/15/29 (a) | | | 9,000 | | | | 9,091 | |
RPM International Inc.
3.75%, 03/15/27 (a) | | | 2,000 | | | | 2,067 | |
Ryder System Inc.
2.50%, 09/01/24 (a) | | | 15,000 | | | | 15,103 | |
2.90%, 12/01/26 (a) | | | 15,000 | | | | 15,159 | |
3.65%, 03/18/24 (a) | | | 8,000 | | | | 8,403 | |
Sabine Pass Liquefaction LLC
4.20%, 03/15/28 (a) | | | 4,000 | | | | 4,244 | |
5.00%, 03/15/27 (a) | | | 2,000 | | | | 2,205 | |
Santander Holdings USA Inc.
3.70%, 03/28/22 (a) | | | 12,000 | | | | 12,337 | |
4.40%, 07/13/27 (a) | | | 4,000 | | | | 4,324 | |
| | | | | | | | |
| | | Principal
Amount ($) | | | Fair
Value $ | |
Schlumberger Holdings Corp.
3.90%, 05/17/28 (a)(h) | | | 8,000 | | | | 8,513 | |
Selective Insurance Group Inc.
5.38%, 03/01/49 (a) | | | 8,000 | | | | 9,409 | |
Sempra Energy
3.80%, 02/01/38 (a) | | | 2,000 | | | | 2,089 | |
4.00%, 02/01/48 (a) | | | 4,000 | | | | 4,189 | |
Shell International Finance BV
2.38%, 08/21/22 (a) | | | 11,000 | | | | 11,155 | |
3.13%, 11/07/49 (a) | | | 12,000 | | | | 11,835 | |
3.75%, 09/12/46 (a) | | | 7,000 | | | | 7,674 | |
4.13%, 05/11/35 (a) | | | 8,000 | | | | 9,321 | |
Shire Acquisitions Investments Ireland DAC
2.40%, 09/23/21 (a) | | | 7,000 | | | | 7,040 | |
2.88%, 09/23/23 (a) | | | 3,000 | | | | 3,060 | |
3.20%, 09/23/26 (a) | | | 3,000 | | | | 3,092 | |
Simon Property Group LP
3.38%, 06/15/27 (a) | | | 4,000 | | | | 4,236 | |
Southern California Edison Co.
2.40%, 02/01/22 (a) | | | 10,000 | | | | 10,054 | |
2.90%, 03/01/21 (a) | | | 11,000 | | | | 11,096 | |
4.00%, 04/01/47 (a) | | | 12,000 | | | | 12,622 | |
4.20%, 03/01/29 (a) | | | 11,000 | | | | 12,118 | |
Southern Company Gas Capital Corp.
4.40%, 05/30/47 (a) | | | 2,000 | | | | 2,209 | |
Southern Copper Corp.
5.88%, 04/23/45 (a) | | | 8,000 | | | | 10,001 | |
Southwestern Electric Power Co.
2.75%, 10/01/26 (a) | | | 7,000 | | | | 6,982 | |
Spectra Energy Partners LP
3.38%, 10/15/26 (a) | | | 2,000 | | | | 2,070 | |
4.50%, 03/15/45 (a) | | | 3,000 | | | | 3,291 | |
Spirit Realty LP
4.00%, 07/15/29 (a) | | | 10,000 | | | | 10,519 | |
Starbucks Corp.
4.00%, 11/15/28 (a) | | | 6,000 | | | | 6,656 | |
Steel Dynamics Inc.
2.80%, 12/15/24 (a) | | | 5,000 | | | | 5,043 | |
3.45%, 04/15/30 (a) | | | 5,000 | | | | 5,069 | |
4.13%, 09/15/25 (a) | | | 25,000 | | | | 25,713 | |
Sumitomo Mitsui Financial Group Inc.
2.78%, 07/12/22 (a) | | | 11,000 | | | | 11,192 | |
Suncor Energy Inc.
4.00%, 11/15/47 (a) | | | 3,000 | | | | 3,275 | |
Sunoco Logistics Partners Operations LP
| | | | | | | | |
5.30%, 04/01/44 (a) | | | 5,000 | | | | 5,292 | |
Sysco Corp.
3.25%, 07/15/27 (a) | | | 4,000 | | | | 4,187 | |
See Notes to Schedule of Investments and Notes to Financial Statements.
| | | | |
| State Street Income V.I.S. Fund | | | 15 | |
State Street Income V.I.S. Fund
Schedule of Investments, continued — December 31, 2019
| | | | | | | | |
| | | Principal
Amount ($) | | | Fair
Value $ | |
| | | | | | | | |
Tampa Electric Co.
4.35%, 05/15/44 (a) | | | 13,000 | | | | 14,841 | |
Target Corp.
2.50%, 04/15/26 (a) | | | 5,000 | | | | 5,115 | |
Teck Resources Ltd.
5.40%, 02/01/43 (a) | | | 7,000 | | | | 7,396 | |
Texas Instruments Inc.
3.88%, 03/15/39 (a) | | | 6,000 | | | | 6,817 | |
The Allstate Corp.
4.20%, 12/15/46 (a) | | | 3,000 | | | | 3,501 | |
The Allstate Corp. (5.75% fixed rate until 08/15/23; 2.94% + 3 month USD LIBOR thereafter)
5.75%, 08/15/53 (a)(b) | | | 11,000 | | | | 11,842 | |
The Bank of New York Mellon Corp. (4.63% fixed rate until 09/20/26; 3.13% + 3 month USD LIBOR thereafter)
4.63%, 12/29/49 (a)(b) | | | 6,000 | | | | 6,317 | |
The Bank of Nova Scotia (4.65% fixed rate until 10/12/22; 2.65% + 3 month USD LIBOR thereafter)
4.65%, 12/31/99 (a)(b) | | | 8,000 | | | | 8,120 | |
The Boeing Co.
2.70%, 02/01/27 (a) | | | 10,000 | | | | 10,122 | |
2.95%, 02/01/30 (a) | | | 7,000 | | | | 7,144 | |
3.25%, 03/01/28 (a) | | | 3,000 | | | | 3,127 | |
3.75%, 02/01/50 (a) | | | 4,000 | | | | 4,253 | |
The Cleveland Electric Illuminating Co.
4.55%, 11/15/30 (a)(h) | | | 14,000 | | | | 15,716 | |
The Dow Chemical Co.
4.25%, 10/01/34 (a) | | | 5,000 | | | | 5,520 | |
5.55%, 11/30/48 (a) | | | 4,000 | | | | 5,019 | |
The Estee Lauder Companies Inc.
2.38%, 12/01/29 (a) | | | 5,000 | | | | 4,999 | |
3.13%, 12/01/49 (a) | | | 5,000 | | | | 5,008 | |
The George Washington University
4.13%, 09/15/48 (a) | | | 8,000 | | | | 9,213 | |
The Goldman Sachs Group Inc.
3.50%, 11/16/26 (a) | | | 12,000 | | | | 12,630 | |
3.85%, 01/26/27 (a) | | | 4,000 | | | | 4,258 | |
4.25%, 10/21/25 (a) | | | 2,000 | | | | 2,174 | |
5.15%, 05/22/45 (a) | | | 5,000 | | | | 6,159 | |
The Goldman Sachs Group Inc. (2.88% fixed rate until 10/31/21; 0.82% + 3 month USD LIBOR thereafter)
2.88%, 10/31/22 (a)(b) | | | 7,000 | | | | 7,093 | |
| | | | | | | | |
| | | Principal
Amount ($) | | | Fair
Value $ | |
The Goldman Sachs Group Inc. (2.91% fixed rate until 06/05/22; 1.05% + 3 month USD LIBOR thereafter)
2.91%, 06/05/23 (a)(b) | | | 11,000 | | | | 11,179 | |
The Goldman Sachs Group Inc. (3.81% fixed rate until 04/23/28; 1.16% + 3 month USD LIBOR thereafter)
3.81%, 04/23/29 (a)(b) | | | 4,000 | | | | 4,288 | |
The Goldman Sachs Group Inc. (4.02% fixed rate until 10/31/37; 1.37% + 3 month USD LIBOR thereafter)
4.02%, 10/31/38 (a)(b) | | | 6,000 | | | | 6,524 | |
The Goldman Sachs Group Inc. (4.22% fixed rate until 05/01/28; 1.30% + 3 month USD LIBOR thereafter)
4.22%, 05/01/29 (a)(b) | | | 6,000 | | | | 6,615 | |
The Hartford Financial Services Group Inc.
2.80%, 08/19/29 (a) | | | 15,000 | | | | 15,196 | |
The Hartford Financial Services Group Inc. 2.13% + 3 month USD LIBOR
4.03%, 02/12/47 (a)(b)(h) | | | 10,000 | | | | 9,328 | |
The Home Depot Inc.
3.50%, 09/15/56 (a) | | | 7,000 | | | | 7,357 | |
3.90%, 12/06/28 (a) | | | 6,000 | | | | 6,727 | |
4.50%, 12/06/48 (a) | | | 4,000 | | | | 4,942 | |
The Interpublic Group of Companies Inc.
3.75%, 10/01/21 (a) | | | 10,000 | | | | 10,275 | |
The Kroger Co.
2.95%, 11/01/21 (a) | | | 7,000 | | | | 7,118 | |
4.65%, 01/15/48 (a) | | | 4,000 | | | | 4,373 | |
The Mosaic Co.
5.63%, 11/15/43 (a) | | | 3,000 | | | | 3,550 | |
The Sherwin-Williams Co.
2.75%, 06/01/22 (a) | | | 4,000 | | | | 4,069 | |
The Southern Co.
4.40%, 07/01/46 (a) | | | 4,000 | | | | 4,440 | |
The Toronto-Dominion Bank (3.63% fixed rate until 09/15/26; 2.21% + USD 5 year Swap Rate thereafter)
3.63%, 09/15/31 (a)(b) | | | 10,000 | | | | 10,489 | |
The Walt Disney Co.
3.38%, 11/15/26 (a) | | | 5,000 | | | | 5,355 | |
4.75%, 11/15/46 (a) | | | 4,000 | | | | 5,129 | |
6.65%, 11/15/37 (a) | | | 8,000 | | | | 11,884 | |
See Notes to Schedule of Investments and Notes to Financial Statements.
| | |
| 16 | | State Street Income V.I.S. Fund |
State Street Income V.I.S. Fund
Schedule of Investments, continued — December 31, 2019
| | | | | | | | |
| | | Principal
Amount ($) | | | Fair
Value $ | |
| | | | | | | | |
The Williams Companies Inc.
3.75%, 06/15/27 (a) | | | 3,000 | | | | 3,130 | |
4.85%, 03/01/48 (a) | | | 7,000 | | | | 7,676 | |
5.40%, 03/04/44 (a) | | | 4,000 | | | | 4,501 | |
Time Warner Cable LLC
4.50%, 09/15/42 (a) | | | 3,000 | | | | 3,071 | |
6.55%, 05/01/37 (a) | | | 5,000 | | | | 6,188 | |
Total Capital International S.A.
3.46%, 02/19/29 (a) | | | 12,000 | | | | 13,004 | |
TransCanada PipeLines Ltd.
4.25%, 05/15/28 (a) | | | 12,000 | | | | 13,333 | |
4.88%, 01/15/26 (a) | | | 3,000 | | | | 3,365 | |
Transcontinental Gas Pipe Line Company LLC
4.00%, 03/15/28 (a) | | | 6,000 | | | | 6,371 | |
Trinity Health Corp.
3.43%, 12/01/48 (a) | | | 2,000 | | | | 1,990 | |
Truist Bank (3.50% fixed rate until 08/02/21; 0.59% + 3 month USD LIBOR thereafter)
3.50%, 08/02/22 (a)(b) | | | 6,000 | | | | 6,129 | |
Truist Financial Corp. (4.80% fixed rate until 09/01/24; 3.00% + 5 year CMT Rate thereafter)
4.80%, 12/31/99 (a)(b) | | | 17,000 | | | | 17,500 | |
TWDC Enterprises 18 Corp.
4.13%, 06/01/44 (a) | | | 6,000 | | | | 7,115 | |
Tyco Electronics Group S.A.
3.13%, 08/15/27 (a) | | | 5,000 | | | | 5,152 | |
Tyson Foods Inc.
4.00%, 03/01/26 (a) | | | 12,000 | | | | 12,993 | |
4.55%, 06/02/47 (a) | | | 2,000 | | | | 2,292 | |
U.S. Bancorp
3.15%, 04/27/27 (a) | | | 10,000 | | | | 10,506 | |
U.S. Bancorp (5.13% fixed rate until 01/15/21; 3.49% + 3 month USD LIBOR thereafter)
5.13%, 12/29/49 (a)(b) | | | 26,000 | | | | 26,713 | |
UDR Inc.
3.00%, 08/15/31 (a) | | | 5,000 | | | | 4,998 | |
Union Pacific Corp.
3.50%, 06/08/23 (a) | | | 12,000 | | | | 12,571 | |
3.60%, 09/15/37 (a) | | | 3,000 | | | | 3,117 | |
4.10%, 09/15/67 (a) | | | 5,000 | | | | 5,161 | |
4.30%, 03/01/49 (a) | | | 5,000 | | | | 5,781 | |
United Technologies Corp.
3.13%, 05/04/27 (a) | | | 10,000 | | | | 10,479 | |
3.65%, 08/16/23 (a) | | | 7,000 | | | | 7,382 | |
3.95%, 08/16/25 (a) | | | 2,000 | | | | 2,182 | |
4.13%, 11/16/28 (a) | | | 2,000 | | | | 2,252 | |
4.15%, 05/15/45 (a) | | | 5,000 | | | | 5,729 | |
4.45%, 11/16/38 (a) | | | 4,000 | | | | 4,728 | |
4.50%, 06/01/42 (a) | | | 4,000 | | | | 4,801 | |
| | | | | | | | |
| | | Principal
Amount ($) | | | Fair
Value $ | |
UnitedHealth Group Inc.
4.45%, 12/15/48 (a) | | | 6,000 | | | | 7,170 | |
4.75%, 07/15/45 (a) | | | 8,000 | | | | 9,840 | |
Vale S.A.
5.63%, 09/11/42 (a) | | | 5,000 | | | | 5,870 | |
Valero Energy Corp.
4.00%, 04/01/29 (a) | | | 7,000 | | | | 7,549 | |
Valero Energy Partners LP
4.38%, 12/15/26 (a) | | | 8,000 | | | | 8,731 | |
Ventas Realty LP
3.25%, 10/15/26 (a) | | | 10,000 | | | | 10,273 | |
Verizon Communications Inc.
4.33%, 09/21/28 (a) | | | 7,000 | | | | 7,948 | |
4.40%, 11/01/34 (a) | | | 7,000 | | | | 8,142 | |
4.52%, 09/15/48 (a) | | | 6,000 | | | | 7,185 | |
4.67%, 03/15/55 (a) | | | 3,000 | | | | 3,703 | |
4.86%, 08/21/46 (a) | | | 6,000 | | | | 7,450 | |
5.25%, 03/16/37 (a) | | | 5,000 | | | | 6,275 | |
ViacomCBS Inc.
2.90%, 01/15/27 (a) | | | 5,000 | | | | 5,005 | |
3.45%, 10/04/26 (a) | | | 7,000 | | | | 7,149 | |
3.70%, 06/01/28 (a) | | | 4,000 | | | | 4,193 | |
4.38%, 03/15/43 (a) | | | 5,000 | | | | 5,296 | |
5.25%, 04/01/44 (a) | | | 3,000 | | | | 3,489 | |
Virginia Electric & Power Co.
4.00%, 11/15/46 (a) | | | 7,000 | | | | 7,744 | |
Visa Inc.
3.15%, 12/14/25 (a) | | | 4,000 | | | | 4,232 | |
4.30%, 12/14/45 (a) | | | 7,000 | | | | 8,626 | |
Vistra Operations Company LLC
3.55%, 07/15/24 (a)(h) | | | 9,000 | | | | 9,154 | |
Vodafone Group PLC
4.38%, 05/30/28 (a) | | | 8,000 | | | | 8,867 | |
5.25%, 05/30/48 (a) | | | 4,000 | | | | 4,812 | |
Vornado Realty LP
3.50%, 01/15/25 (a) | | | 4,000 | | | | 4,174 | |
Vulcan Materials Co.
3.90%, 04/01/27 (a) | | | 4,000 | | | | 4,228 | |
Walmart Inc.
3.63%, 12/15/47 (a) | | | 6,000 | | | | 6,648 | |
3.70%, 06/26/28 (a) | | | 7,000 | | | | 7,716 | |
3.95%, 06/28/38 (a) | | | 3,000 | | | | 3,487 | |
4.05%, 06/29/48 (a) | | | 7,000 | | | | 8,315 | |
WEC Energy Group Inc.
3.55%, 06/15/25 (a) | | | 10,000 | | | | 10,616 | |
Wells Fargo & Co.
3.90%, 05/01/45 (a) | | | 3,000 | | | | 3,405 | |
4.15%, 01/24/29 (a) | | | 8,000 | | | | 8,937 | |
4.75%, 12/07/46 (a) | | | 2,000 | | | | 2,408 | |
Wells Fargo & Co. (2.88% fixed rate until 10/30/29; 1.17% + 3 month USD LIBOR thereafter)
2.88%, 10/30/30 (a)(b) | | | 3,000 | | | | 3,023 | |
See Notes to Schedule of Investments and Notes to Financial Statements.
| | | | |
| State Street Income V.I.S. Fund | | | 17 | |
State Street Income V.I.S. Fund
Schedule of Investments, continued — December 31, 2019
| | | | | | | | |
| | | Principal
Amount ($) | | | Fair
Value $ | |
| | | | | | | | |
Wells Fargo & Co. (3.20% fixed rate until 06/17/26; 1.17% +
3 month USD LIBOR thereafter)
3.20%, 06/17/27 (a)(b) | | | 9,000 | | | | 9,335 | |
Wells Fargo & Co. (5.88% fixed rate until 06/15/25; 3.99% + 3 month USD LIBOR thereafter)
5.88%, 12/29/49 (a)(b) | | | 9,000 | | | | 10,080 | |
Wells Fargo & Co. 3.77% + 3 month USD LIBOR
5.66%, 03/29/49 (a)(b) | | | 9,000 | | | | 9,123 | |
Western Midstream Operating LP
4.00%, 07/01/22 (a) | | | 11,000 | | | | 11,304 | |
5.38%, 06/01/21 (a) | | | 10,000 | | | | 10,292 | |
Westpac Banking Corp. (4.11% fixed rate until 07/24/29; 2.00% + 5 year CMT Rate thereafter)
4.11%, 07/24/34 (a)(b) | | | 7,000 | | | | 7,356 | |
Willis North America Inc.
3.60%, 05/15/24 (a) | | | 6,000 | | | | 6,278 | |
WPP Finance 2010
3.75%, 09/19/24 (a) | | | 10,000 | | | | 10,541 | |
WRKCo Inc.
3.00%, 09/15/24 (a) | | | 4,000 | | | | 4,083 | |
Xilinx Inc.
2.95%, 06/01/24 (a) | | | 5,000 | | | | 5,142 | |
Zoetis Inc.
3.00%, 09/12/27 (a) | | | 3,000 | | | | 3,080 | |
3.90%, 08/20/28 (a) | | | 6,000 | | | | 6,508 | |
| | | | | | | | |
| | | | | | | 4,577,750 | |
| | | | | | | | |
|
Non-Agency Collateralized Mortgage Obligations – 3.6% | |
Banc of America Commercial Mortgage Trust 2016-UBS10
4.91%, 07/15/49 (a)(b) | | | 23,000 | | | | 24,635 | |
BANK 2018-BNK11
4.36%, 03/15/61 (a)(b) | | | 12,000 | | | | 13,110 | |
BANK 2019-BNK17
4.52%, 04/15/52 (a)(b) | | | 10,000 | | | | 10,712 | |
Cantor Commercial Real Estate Lending2019-CF3
3.01%, 01/15/53 (a) | | | 68,000 | | | | 69,771 | |
CD2019-CD8 Mortgage Trust
2.91%, 08/15/57 (a) | | | 63,000 | | | | 64,265 | |
Citigroup Commercial Mortgage Trust2016-P6
4.03%, 12/10/49 (a)(b) | | | 31,273 | | | | 33,546 | |
Citigroup Commercial Mortgage Trust2018-C5
4.51%, 06/10/51 (a)(b) | | | 21,000 | | | | 22,955 | |
COMM 2014-CR14 Mortgage Trust
4.53%, 02/10/47 (a)(b) | | | 25,000 | | | | 26,794 | |
| | | | | | | | |
| | | Principal
Amount ($) | | | Fair
Value $ | |
GS Mortgage Securities Trust2016-GS3
2.85%, 10/10/49 (a) | | | 33,000 | | | | 33,777 | |
GS Mortgage Securities Trust2017-GS8
3.47%, 11/10/50 (a) | | | 63,977 | | | | 67,588 | |
GS Mortgage Securities Trust2018-GS9
4.14%, 03/10/51 (a)(b) | | | 25,000 | | | | 26,964 | |
JPMBB Commercial Mortgage Securities Trust2013-C12
4.04%, 07/15/45 (a)(b) | | | 15,000 | | | | 15,761 | |
JPMBB Commercial Mortgage Securities Trust2015-C32
4.67%, 11/15/48 (a)(b) | | | 20,000 | | | | 21,020 | |
MASTR Alternative Loan Trust2003-5
5.00%, 08/25/18 (a)(e) | | | 740 | | | | 24 | |
Morgan Stanley Bank of America Merrill Lynch Trust2015-C21
0.90%, 03/15/48 (a)(b)(e) | | | 369,528 | | | | 13,328 | |
Morgan Stanley Capital I Trust 2006-IQ11
6.07%, 10/15/42 (a)(b) | | | 40,337 | | | | 41,129 | |
UBS Commercial Mortgage Trust2018-C12
4.79%, 08/15/51 (a)(b) | | | 17,000 | | | | 18,788 | |
Wells Fargo Commercial Mortgage Trust2019-C50
4.35%, 05/15/52 (a) | | | 15,000 | | | | 15,713 | |
WFRBS Commercial Mortgage Trust2013-C17
4.26%, 12/15/46 (a) | | | 25,000 | | | | 26,504 | |
WFRBS Commercial Mortgage Trust 2014-LC14
4.35%, 03/15/47 (a)(b) | | | 58,000 | | | | 62,043 | |
| | | | | | | | |
| | | | | | | 608,427 | |
| | | | | | | | |
|
Sovereign Bonds - 0.4% | |
Government of Mexico
4.00%, 10/02/23 (a) | | | 12,000 | | | | 12,646 | |
4.75%, 03/08/44 (a) | | | 20,000 | | | | 22,118 | |
Government of Peru
5.63%, 11/18/50 (a) | | | 11,000 | | | | 16,085 | |
Government of Uruguay
5.10%, 06/18/50 (a) | | | 14,040 | | | | 16,885 | |
| | | | | | | | |
| | | | | | | 67,734 | |
| | | | | | | | |
|
Municipal Bonds and Notes - 0.6% | |
American Municipal Power Inc.
6.27%, 02/15/50 (a) | | | 15,000 | | | | 20,038 | |
See Notes to Schedule of Investments and Notes to Financial Statements.
| | |
| 18 | | State Street Income V.I.S. Fund |
State Street Income V.I.S. Fund
Schedule of Investments, continued — December 31, 2019
| | | | | | | | |
| | | Principal
Amount ($) | | | Fair
Value $ | |
| | | | | | | | |
Commonwealth of Massachusetts
2.90%, 09/01/49 (a) | | | 5,000 | | | | 4,719 | |
New Jersey Transportation Trust Fund Authority
6.88%, 12/15/39 (a) | | | 15,000 | | | | 15,040 | |
Port Authority of New York & New Jersey
4.46%, 10/01/62 (a) | | | 25,000 | | | | 30,640 | |
State of California
4.60%, 04/01/38 (a) | | | 15,000 | | | | 16,620 | |
State of Illinois
5.10%, 06/01/33 (a) | | | 10,000 | | | | 10,780 | |
The University of Texas System
3.35%, 08/15/47 (a) | | | 10,000 | | | | 10,416 | |
| | | | | | | | |
| | | | | | | 108,253 | |
| | | | | | | | |
| | |
Total Bonds and Notes
(Cost $15,236,169) | | | | | | | 15,875,376 | |
| | | | | | | | |
| | | | | | | | |
| | |
| | | Numberof
Shares | | | Fair
Value | |
| | |
| Domestic Equity - 0.1% | | | | | | | | |
Preferred Stock - 0.1% | | | | | | | | |
Wells Fargo & Co. 3.09%, + 3 month USD LIBOR
(Cost $23,300) (a)(b) | | | 932 | | | | 25,528 | |
| | | | | | | | |
| |
Total Investments in Securities
(Cost $15,259,469) | | | | 15,900,904 | |
| | | | | | | | |
|
| Short-Term Investments - 22.6% | |
State Street Institutional U.S. Government Money Market Fund - Class G Shares 1.57% (a)(g)(i) | | | 2,365,049 | | | | 2,365,049 | |
U.S. Treasury Bills 1.47% (a)(g) | | | 1,500,000 | | | | 1,499,715 | |
Total Short-Term Investments
(Cost $3,864,686) | | | | | | | 3,864,764 | |
| | | | | | | | |
| | |
Total Investments
(Cost $19,124,155) | | | | | | | 19,765,668 | |
| |
Liabilities in Excess of Other Assets,
net - (15.5)% | | | | (2,653,977 | ) |
| | | | | | | | |
| | |
| NET ASSETS - 100.0% | | | | | | | 17,111,691 | |
| | | | | | | | |
Other Information:
Centrally Cleared Credit Default Swaps
| | | | | | | | | | | | | | | | | | | | | | | | | | |
Reference
Entity | | Counterparty | | Notional
Amount
(000s omitted) | | | Contract
Annual
Fixed Rate/
Payment
Frequency | | | Termination
Date | | | Market
Value | | | Unamortized
Upfront
Payments
Received
(Paid) | | | Unrealized
Appreciation
(Depreciation) | |
Buy Protection | |
Markit CDX North America Investment Grade Index | | Intercontinental
Exchange | | $ | 245 | | |
| 1.00%/
Quarterly |
| | | 06/20/24 | | | $ | (6,377 | ) | | $ | (4,015 | ) | | $ | (2,362 | ) |
Sell Protection | |
Markit CDX North America High Yield Index | | Intercontinental Exchange | | $ | 591 | | |
| 5.00%/
Quarterly |
| | | 06/20/24 | | | $ | 58,417 | | | $ | 33,517 | | | $ | 24,900 | |
| | | | | | | | | | | | | | | | | | | | | | | | | | |
| | | $ | 22,538 | |
| | | | | | | | | | | | | | | | | | | | | | | | | | |
See Notes to Schedule of Investments and Notes to Financial Statements.
| | | | |
| State Street Income V.I.S. Fund | | | 19 | |
State Street Income V.I.S. Fund
Schedule of Investments, continued — December 31, 2019
Centrally Cleared Interest Rate Swaps
| | | | | | | | | | | | | | | | | | | | | | | | | | | | | | | | |
| Counterparty | | Notional
Amount
(000s
omitted) | | | Fund
Pays/
Receives
Fixed
Rate/
Payment
Frequency | | | Floating Rate | | | Contract
Annual
Fixed
Rate | | | Termination
Date | | | Market
Value | | | Unamortized
Upfront
Payments
Received | | | Unrealized
Depreciation | |
CME Group, Inc. | | $ | 883 | | |
| Pays/
Quarterly |
| |
| 3 Month U.S. Dollar
LIBOR |
| | | 3.05% | | | | 11/19/21 | | | $ | (22,211 | ) | | $ | — | | | $ | (22,211 | ) |
CME Group, Inc. | | | 884 | | |
| Pays/
Quarterly |
| |
| 3 Month U.S. Dollar
LIBOR |
| | | 3.06% | | | | 11/19/21 | | | | (22,290 | ) | | | — | | | | (22,290 | ) |
| | | | | | | | | | | | | | | | | | | | | | | | | | | | | | | | |
| | | | | | | | | | | | | | | | | | | | | | | | | | | | | | $ | (44,501 | ) |
| | | | | | | | | | | | | | | | | | | | | | | | | | | | | | | | |
The Fund had the following long futures contracts open at December 31, 2019:
| | | | | | | | | | | | | | | | | | | | |
| Description | | Expiration
date | | | Number of
Contracts | | | Notional
Amount | | | Value | | | Unrealized
Appreciation
(Depreciation) | |
2 Yr. U.S. Treasury Notes Futures | | | March 2020 | | | | 16 | | | $ | 3,446,276 | | | $ | 3,448,000 | | | $ | 1,724 | |
5 Yr. U.S. Treasury Notes Futures | | | March 2020 | | | | 9 | | | | 1,067,078 | | | | 1,067,484 | | | | 406 | |
10 Yr. U.S. Treasury Notes Futures | | | March 2020 | | | | 4 | | | | 516,719 | | | | 513,688 | | | | (3,031 | ) |
| | | | | | | | | | | | | | | | | | | | |
| | | | | | | | | | | | | | | | | | $ | (901 | ) |
| | | | | | | | | | | | | | | | | | | | |
The Fund had the following short futures contracts open at December 31, 2019:
| | | | | | | | | | | | | | | | | | | | |
| Description | | Expiration
date | | | Number of
Contracts | | | Notional
Amount | | | Value | | | Unrealized
Appreciation | |
Ultra Long-Term U.S. Treasury Bond Futures | | | March 2020 | | | | 1 | | | $ | (183,824 | ) | | $ | (181,656 | ) | | $ | 2,168 | |
U.S. Long Bond Futures | | | March 2020 | | | | 2 | | | | (318,168 | ) | | | (311,813 | ) | | | 6,355 | |
10 Yr. U.S. Treasury Ultra Futures | | | March 2020 | | | | 4 | | | | (569,493 | ) | | | (562,813 | ) | | | 6,680 | |
| | | | | | | | | | | | | | | | | | | | |
| | | | | | | | | | | | | | | | | | $ | 15,203 | |
| | | | | | | | | | | | | | | | | | | | |
| | | | | | | | | | | | | | | | | | $ | 14,302 | |
| | | | | | | | | | | | | | | | | | | | |
During the period ended December 31, 2019, average notional values related to derivative contracts were as follows:
| | | | | | | | | | | | | | | | | | | | | | | | | | | | | | | | |
| | | Purchased Put Options | | | Purchased Call Options | | | Written Put Options | | | Written Call Options | | | Long Futures Contracts | | | Short Futures Contracts | | | Credit Default Swap Contracts | | | Interest Rate Swap Contracts | |
Average Notional Value | | $ | 288 | | | $ | — | | | $ | 29 | | | $ | — | | | $ | 5,366,185 | | | $ | 972,460 | | | $ | 681,331 | | | $ | 1,766,945 | |
See Notes to Schedule of Investments and Notes to Financial Statements.
| | |
| 20 | | State Street Income V.I.S. Fund |
State Street Income V.I.S. Fund
Schedule of Investments — December 31, 2019
The views expressed in this document reflect our judgment as of the publication date and are subject to change at any time without notice. The securities cited may not be representative of the Fund’s future investments and should not be construed as a recommendation to purchase or sell a particular security. See the Fund’s summary prospectus and statutory prospectus for complete descriptions of investment objectives, policies, risks and permissible investments.
| (a) | At December 31, 2019, all or a portion of this security was pledged to cover collateral requirements for futures, swaps, and/or TBA’s. |
| (b) | Variable Rate Security - Interest rate shown is rate in effect at December 31, 2019. For securities based on a published reference rate and spread, the reference rate and spread are indicated in the description above. |
| (d) | Settlement is on a delayed delivery or when-issued basis with final maturity to be announced (“TBA”) in the future. |
| (e) | Interest only security. These securities represent the right to receive the monthly interest payments on an underlying pool of mortgages. Payments of principal on the pool reduce the value of the “interest only” holding. |
| (f) | Principal only security. These securities represent the right to receive the monthly principal payments on an underlying pool of mortgages. No payments of interest on the pool are passed through to the “principal only” holder. |
| (g) | Coupon amount represents effective yield. |
| (h) | Pursuant to Rule 144A of the Securities Act of 1933, as amended, these securities may be resold in transactions exempt from registration, normally to qualified institutional buyers. At December 31, 2019, these securities amounted to $503,381 or 2.94% of the net assets of the State Street Income V.I.S. Fund. These securities have been determined to be liquid using procedures established by the Fund’s Board of Directors. |
| (i) | Sponsored by SSGA Funds Management, Inc., the Fund’s investment adviser and administrator, and an affiliate of State Street Bank & Trust Co., the Fund’ssub-administrator, custodian and accounting agent. |
| † | Percentages are based on net assets as of December 31, 2019. |
Abbreviations:
CMT - Constant Maturity Treasury
LIBOR - London Interbank Offered Rate
REMIC - Real Estate Mortgage Investment Conduit
SOFR - Secured Overnight Financing Rate
STRIPS - Separate Trading of Registered Interest and Principal of Security
TBA - To Be Announced
The following table presents the Fund’s investments measured at fair value on a recurring basis at December 31, 2019:
| | | | | | | | | | | | | | | | |
| Investments | | Level 1 | | | Level 2 | | | Level 3 | | | Total | |
Investments in Securities | | | | | | | | | | | | | | | | |
U.S. Treasuries | | $ | — | | | $ | 3,600,263 | | | $ | — | | | $ | 3,600,263 | |
Agency Mortgage Backed | | | — | | | | 6,306,351 | | | | — | | | | 6,306,351 | |
Agency Collateralized Mortgage Obligations | | | — | | | | 186,339 | | | | — | | | | 186,339 | |
Asset Backed | | | — | | | | 420,259 | | | | — | | | | 420,259 | |
Corporate Notes | | | — | | | | 4,577,750 | | | | — | | | | 4,577,750 | |
Non-Agency Collateralized Mortgage Obligations | | | — | | | | 608,427 | | | | — | | | | 608,427 | |
Sovereign Bonds | | | — | | | | 67,734 | | | | — | | | | 67,734 | |
Municipal Bonds and Notes | | | — | | | | 108,253 | | | | — | | | | 108,253 | |
Preferred Stock | | | 25,528 | | | | — | | | | — | | | | 25,528 | |
Short-Term Investments | | | 2,365,049 | | | | 1,499,715 | | | | — | | | | 3,864,764 | |
| | | | | | | | | | | | | | | | |
Total Investments in Securities | | $ | 2,390,577 | | | $ | 17,375,091 | | | $ | — | | | $ | 19,765,668 | |
| | | | | | | | | | | | | | | | |
See Notes to Schedule of Investments and Notes to Financial Statements.
| | | | |
| State Street Income V.I.S. Fund | | | 21 | |
State Street Income V.I.S. Fund
Notes to Schedule of Investments, continued — December 31, 2019
| | | | | | | | | | | | | | | | |
| Investments | | Level 1 | | | Level 2 | | | Level 3 | | | Total | |
Other Financial Instruments | | | | | | | | | | | | | | | | |
Credit Default Swap Contracts - Unrealized Appreciation | | $ | — | | | $ | 24,900 | | | $ | — | | | $ | 24,900 | |
Credit Default Swap Contracts - Unrealized Depreciation | | | — | | | | (2,362 | ) | | | — | | | | (2,362 | ) |
Interest Rate Swap Contracts - Unrealized Depreciation | | | — | | | | (44,501 | ) | | | — | | | | (44,501 | ) |
Long Futures Contracts - Unrealized Appreciation | | | 2,130 | | | | — | | | | — | | | | 2,130 | |
Long Futures Contracts - Unrealized Depreciation | | | (3,031 | ) | | | — | | | | — | | | | (3,031 | ) |
Short Futures Contracts - Unrealized Appreciation | | | 15,203 | | | | — | | | | — | | | | 15,203 | |
| | | | | | | | | | | | | | | | |
Total Other Financial Instruments | | $ | 14,302 | | | $ | (21,963 | ) | | $ | — | | | $ | (7,661 | ) |
| | | | | | | | | | | | | | | | |
Affiliate Table
| | | | | | | | | | | | | | | | | | | | | | | | | | | | | | | | | | | | |
| | | Number
of Shares
Held at
12/31/18 | | | Value At
12/31/18 | | | Cost of
Purchases | | | Proceeds
from
Shares
Sold | | | Realized
Gain
(Loss) | | | Change in
Unrealized
Appreciation/
Depreciation | | | Number
of Shares
Held at
12/31/19 | | | Value at
12/31/19 | | | Dividend
Income | |
State Street Institutional
U.S. Government Money Market Fund,
Class G Shares | | | 3,131,172 | | | $ | 3,131,172 | | | $ | 10,597,098 | | | $ | 11,363,221 | | | $ | — | | | $ | — | | | | 2,365,049 | | | $ | 2,365,049 | | | $ | 80,448 | |
See Notes to Schedule of Investments and Notes to Financial Statements.
| | |
| 22 | | State Street Income V.I.S. Fund |
State Street Income V.I.S. Fund
Financial Highlights
Selected data based on a share outstanding throughout the fiscal years indicated
| | | | | | | | | | | | | | | | | | | | |
| | | 12/31/19 | | | 12/31/18 | | | 12/31/17 | | | 12/31/16 | | | 12/31/15* | |
| Inception date | | | | | | | | | | | | | | | | | | | 1/3/95 | |
| | | | | |
Net asset value, beginning of period | | $ | 11.07 | | | $ | 11.49 | | | $ | 11.37 | | | $ | 11.25 | | | $ | 11.56 | |
| | | | | | | | | | | | | | | | | | | | |
|
Income/(loss) from investment operations: | |
Net investment income | | | 0.24 | (a) | | | 0.25 | (a) | | | 0.19 | (a) | | | 0.24 | | | | 0.25 | |
Net realized and unrealized gains/(losses) on investments | | | 0.71 | | | | (0.41 | ) | | | 0.18 | | | | 0.09 | | | | (0.30 | ) |
| | | | | | | | | | | | | | | | | | | | |
Total income/(loss) from investment operations | | | 0.95 | | | | (0.16 | ) | | | 0.37 | | | | 0.33 | | | | (0.05 | ) |
| | | | | | | | | | | | | | | | | | | | |
| | | | | |
Less distributions from: | | | | | | | | | | | | | | | | | | | | |
Net investment income | | | 0.02 | | | | 0.26 | | | | 0.25 | | | | 0.21 | | | | 0.26 | |
| | | | | | | | | | | | | | | | | | | | |
Total distributions | | | 0.02 | | | | 0.26 | | | | 0.25 | | | | 0.21 | | | | 0.26 | |
| | | | | | | | | | | | | | | | | | | | |
Net asset value, end of period | | $ | 12.00 | | | $ | 11.07 | | | $ | 11.49 | | | $ | 11.37 | | | $ | 11.25 | |
| | | | | | | | | | | | | | | | | | | | |
Total Return(b) | | | 8.62 | % | | | (1.42 | )% | | | 3.25 | % | | | 2.98 | % | | | (0.42 | )% |
| | | | | |
Ratios/Supplemental Data: | | | | | | | | | | | | | | | | | | | | |
Net assets, end of period (in thousands) | | $ | 17,112 | | | $ | 18,685 | | | $ | 21,847 | | | $ | 25,582 | | | $ | 28,375 | |
Ratios to average net assets: | | | | | | | | | | | | | | | | | | | | |
Net expenses | | | 1.06 | % | | | 1.00 | % | | | 1.36 | % | | | 1.15 | % | | | 1.06 | %(c) |
Gross expenses | | | 1.06 | % | | | 1.00 | % | | | 1.36 | % | | | 1.15 | % | | | 1.11 | % |
Net investment income | | | 2.05 | % | | | 2.25 | % | | | 1.62 | % | | | 1.98 | % | | | 2.06 | % |
Portfolio turnover rate | | | 90 | % | | | 182 | % | | | 255 | % | | | 220 | % | | | 241 | % |
Notes to Financial Highlights
| (a) | | Per share values have been calculated using the average share method. |
| (b) | | Total returns are historical and assume changes in share price, reinvestment of dividends and capital gains distributions and do not include the effect of insurance contract charges. Past performance does not guarantee future results. |
| (c) | | Reflects a voluntary reimbursement of other operating expenses by GE Asset Management, Inc., the Fund’s investment adviser and administrator prior to July 1, 2016. |
| * | | Beginning with the year ended December 31, 2016, the Fund was audited by Ernst & Young LLP. The previous years were audited by another independent registered public accounting firm. |
The accompanying Notes are an integral part of these financial statements.
State Street Income V.I.S. Fund
Statement of Assets and Liabilities — December 31, 2019
| | | | |
Assets | | | | |
Investments in securities, at fair value (cost $15,259,469) | | $ | 15,900,904 | |
Short-term investments (cost $1,499,638) | | | 1,499,715 | |
Short-term affiliated investments, at fair value | | | 2,365,049 | |
Receivable for investments sold | | | 990,773 | |
Income receivables | | | 82,418 | |
Receivable for fund shares sold | | | 238 | |
Income receivable from affiliated investments | | | 3,645 | |
Receivable for accumulated variation margin on swap contracts | | | 59,402 | |
Receivable for accumulated variation margin on futures contracts | | | 14,331 | |
Other assets | | | 97 | |
| | | | |
| |
Total assets | | | 20,916,572 | |
| | | | |
| |
Liabilities | | | | |
Net cash collateral on futures contracts due to broker | | | 11,592 | |
Net cash collateral on swap contracts due to broker | | | 6,601 | |
Payable for investments purchased | | | 3,703,804 | |
Payable for fund shares redeemed | | | 8,020 | |
Payable for accumulated variation margin on swap contracts | | | 53,086 | |
Payable to the Adviser | | | 7,146 | |
Payable for custody, fund accounting andsub-administration fees | | | 6,354 | |
Accrued other expenses | | | 8,278 | |
| | | | |
| |
Total liabilities | | | 3,804,881 | |
| | | | |
| | | | |
| |
Net Assets | | $ | 17,111,691 | |
| | | | |
| |
Net Assets Consist of: | | | | |
Capital paid in | | $ | 16,326,017 | |
Total distributable earnings (loss) | | | 785,674 | |
| | | | |
| |
Net Assets | | $ | 17,111,691 | |
| | | | |
| | | | |
Shares outstanding ($0.01 par value; unlimited shares authorized) | | | 1,426,526 | |
Net asset value per share | | $ | 12.00 | |
The accompanying Notes are an integral part of these financial statements.
| | |
| 24 | | Statement of Assets and Liabilities |
State Street Income V.I.S. Fund
Statement of Operations — For the year ended December 31, 2019
| | | | |
Investment Income | | | | |
Income | | | | |
Dividend | | $ | 1,527 | |
Interest | | | 475,921 | |
Income from affiliated investments | | | 80,448 | |
| | | | |
Total income | | | 557,896 | |
| | | | |
| |
Expenses | | | | |
Advisory and administration fees | | | 89,518 | |
Directors’ fees | | | 16,555 | |
Custody, fund accounting andsub-administration fees | | | 27,581 | |
Professional fees | | | 36,634 | |
Printing and shareholder reports | | | 18,713 | |
Other expenses | | | 1,211 | |
| | | | |
Total expenses before waivers | | | 190,212 | |
| | | | |
Less: Fees waived by the adviser | | | (146 | ) |
| | | | |
Net expenses | | | 190,066 | |
| | | | |
Net investment income | | $ | 367,830 | |
| | | | |
| |
Net Realized and Unrealized Gain (Loss) on Investments | | | | |
Realized gain (loss) on: | | | | |
Unaffiliated investments | | $ | 354,814 | |
Futures | | | 99,730 | |
Written options | | | 248 | |
Swap contracts | | | (2,785 | ) |
Increase (decrease) in unrealized appreciation/depreciation on: | | | | |
Unaffiliated investments | | | 715,000 | |
Futures | | | (51,068 | ) |
Swap contracts | | | 8,238 | |
| | | | |
| |
Net realized and unrealized gain (loss) on investments | | | 1,124,177 | |
| | | | |
| |
Net Increase in Net Assets Resulting from Operations | | $ | 1,492,007 | |
| | | | |
The accompanying Notes are an integral part of these financial statements.
| | | | |
| Statement of Operations | | | 25 | |
State Street Income V.I.S. Fund
Statements of Changes in Net Assets
| | | | | | | | |
| | | Year Ended December 31,
2019 | | | Year Ended December 31,
2018 | |
Increase (Decrease) in Net Assets | | | | | |
| | |
Operations: | | | | | | | | |
Net investment income | | $ | 367,830 | | | $ | 446,877 | |
Net realized gain (loss) on investments, futures, written options and swap contracts | | | 452,007 | | | | (470,496 | ) |
Net increase (decrease) in unrealized appreciation/depreciation on investments, futures and swap contracts | | | 672,170 | | | | (306,952 | ) |
| | | | | | | | |
Net increase (decrease) from operations | | | 1,492,007 | | | | (330,571 | ) |
| | | | | | | | |
| |
Distributions to shareholders: | | | | | |
Total distributions | | | (34,589 | ) | | | (420,122 | ) |
| | | | | | | | |
Increase (decrease) in assets from operations and distributions | | | 1,457,418 | | | | (750,693 | ) |
| | | | | | | | |
| | |
Share transactions: | | | | | | | | |
Proceeds from sale of shares | | | 215,396 | | | | 412,104 | |
Value of distributions reinvested | | | 34,589 | | | | 420,122 | |
Cost of shares redeemed | | | (3,281,191 | ) | | | (3,243,066 | ) |
| | | | | | | | |
Net increase (decrease) from share transactions | | | (3,031,206 | ) | | | (2,410,840 | ) |
| | | | | | | | |
| | |
Total increase (decrease) in net assets | | | (1,573,788 | ) | | | (3,161,533 | ) |
| | |
Net Assets | | | | | | | | |
Beginning of year | | | 18,685,479 | | | | 21,847,012 | |
| | | | | | | | |
| | |
End of year | | $ | 17,111,691 | | | $ | 18,685,479 | |
| | | | | | | | |
| | |
Changes in Fund Shares | | | | | | | | |
Shares sold | | | 18,533 | | | | 36,818 | |
Issued for distributions reinvested | | | 2,880 | | | | 38,089 | |
Shares redeemed | | | (283,071 | ) | | | (288,624 | ) |
| | | | | | | | |
Net decrease in fund shares | | | (261,658 | ) | | | (213,717 | ) |
| | | | | | | | |
The accompanying Notes are an integral part of these financial statements.
| | |
| 26 | | Statements of Changes in Net Assets |
State Street Income V.I.S. Fund
Notes to Financial Statements — December 31, 2019
| 1. | | Organization of the Company |
State Street Variable Insurance Series Funds, Inc. (the “Company”) was incorporated under the laws of the Commonwealth of Virginia on May 14, 1984 and is registered under the Investment Company Act of 1940, as amended (the “1940 Act”), as anopen-end management investment company. The Company is currently composed of the following seven investment portfolios (collectively, the “Funds”): State Street U.S. Equity V.I.S. Fund, State Street S&P 500 Index V.I.S. Fund, State Street Premier Growth Equity V.I.S. Fund, State StreetSmall-Cap Equity V.I.S. Fund, State Street Total Return V.I.S. Fund, State Street Income V.I.S. Fund (the “Fund”) and State Street Real Estate Securities V.I.S. Fund. Each Fund is a diversified investment company within the meaning of the 1940 Act.
Shares of the Funds of the Company are offered only to insurance company separate accounts that fund certain variable life insurance contracts and variable annuity contracts.
The Company currently offers one share class (Class 1) of the Fund as an investment option for variable life insurance and variable annuity contracts.
Under the Company’s organizational documents, its officers and directors are indemnified against certain liabilities arising out of the performance of their duties to the Company. Additionally, in the normal course of business, the Company enters into contracts with service providers that contain general indemnification clauses. The Company’s maximum exposure under these arrangements is unknown as this would involve future claims that may be made against the Company that have not yet occurred.
| 2. | | Summary of Significant Accounting Policies |
The following is a summary of significant accounting policies followed by the Company in the preparation of its financial statements:
The preparation of financial statements in accordance with U.S. generally accepted accounting principles (“U.S. GAAP”) requires management to make estimates and assumptions that affect the reported amounts and disclosures in the financial statements. Actual results could differ from those estimates. The Fund is an investment company under U.S. GAAP and follows the accounting and reporting guidance applicable to investment companies.
Security Valuation The Fund’s investments are valued at fair value each day that the New York Stock Exchange (“NYSE”) is open and, for financial reporting purposes, as of the report date should the reporting period end on a day that the NYSE is not open. Fair value is generally defined as the price a fund would receive to sell an asset or pay to transfer a liability in an orderly transaction between market participants at the measurement date. By its nature, a fair value price is a good faith estimate of the valuation in a current sale and may not reflect an actual market price. The investments of the Fund are valued pursuant to the policy and procedures developed by the Oversight Committee (the “Committee”) and approved by the Company’s Board of Directors (the “Board”). The Committee provides oversight of the valuation of investments for the Fund. The Board has responsibility for overseeing the determination of the fair value of investments.
Valuation techniques used to value the Fund’s investments by major category are as follows:
| | • | | Equity investments (including preferred stocks) traded on a recognized securities exchange for which market quotations are readily available are valued at the last sale price or official closing price, as applicable, on the primary market or exchange on which they trade. Equity investments traded on a recognized exchange for which there were no sales on that day are valued at the last published sale price or at fair value. |
| | • | | Government and municipal fixed income securities are generally valued using quotations from independent pricing services or brokers. Certain government inflation-indexed securities may require a calculated fair valuation as the cumulative inflation is contained within the price provided by the pricing service or broker. For these securities, the inflation component of the price is “cleaned” from the pricing service or broker price utilizing the published inflation factors in order to ensure proper accrual of income. |
| | • | | Debt obligations (including short term investments and convertible debt securities) are valued using quotations from independent pricing services or brokers or are generally valued at the last reported evaluated prices. |
| | | | |
| Notes to Financial Statements | | | 27 | |
State Street Income V.I.S. Fund
Notes to Financial Statements, continued — December 31, 2019
| | • | | Exchange-traded futures contracts are valued at the closing settlement price on the primary market on which they are traded most extensively. Exchange-traded futures contracts traded on a recognized exchange for which there were no sales on that day are valued at the last reported sale price obtained from independent pricing services or brokers or at fair value. |
| | • | | Swap agreements are valued daily based upon prices supplied by Board approved pricing vendors or through brokers. Depending on the product and terms of the transaction, the value of agreements is determined using a series of techniques including valuation models that incorporate a number of market data factors, such as discounted cash flows, yields, curves, trades and values of the underlying reference instruments. In the event SSGA Funds Management, Inc. (the “Adviser” or “SSGA FM”) is unable to obtain an independent, third-party valuation the agreements will be fair valued. |
| | • | | Options on futures are priced at their last sale price on the principal market on which they are traded on the valuation date. If there were no sales on that day, options on futures are valued at either the last reported sale or official closing price on their primary exchange determined in accordance with the valuation policy and procedures approved by the Board. |
In the event prices or quotations are not readily available or that the application of these valuation methods results in a price for an investment that is deemed to be not representative of the fair value of such investment, fair value will be determined in good faith by the Committee, in accordance with the valuation policy and procedures approved by the Board.
The Fund values its assets and liabilities at fair value using a fair value hierarchy consisting of three broad levels that prioritize the inputs to valuation techniques giving the highest priority to readily available unadjusted quoted prices in active markets for identical assets or liabilities (Level 1 measurements) and the lowest priority to unobservable inputs (Level 3 measurements) when market prices are not readily available or reliable. The categorization of a value determined for an investment within the hierarchy is based upon the pricing transparency of the investment and is not necessarily an indication of the risk associated with investing in it.
The three levels of the fair value hierarchy are as follows:
| | • | | Level 1 — Unadjusted quoted prices in active markets for an identical asset or liability; |
| | • | | Level 2 — Inputs other than quoted prices included within Level 1 that are observable for the asset or liability either directly or indirectly, including quoted prices for similar assets or liabilities in active markets, quoted prices for identical or similar assets or liabilities in markets that are not considered to be active, inputs other than quoted prices that are observable for the asset or liability (such as exchange rates, financing terms, interest rates, yield curves, volatilities, prepayment speeds, loss severities, credit risks and default rates) or other market-corroborated inputs; and |
| | • | | Level 3 — Unobservable inputs for the asset or liability, including the Committee’s assumptions used in determining the fair value of investments. |
The value of the Fund’s investments according to the fair value hierarchy as of December 31, 2019 is disclosed in the Fund’s Schedule of Investments.
Investment Transactions and Income Recognition Investment transactions are accounted for on trade date for financial reporting purposes. Realized gains and losses from the sale or disposition of investments and foreign exchange transactions, if any, are determined using the identified cost method.
Dividend income and capital gain distributions, if any, are recognized on theex-dividend date, net of any foreign taxes withheld at source, if any.
Interest income is recorded daily on an accrual basis. All premiums and discounts are amortized/accreted for financial reporting purposes.
Non-cash dividends received in the form of stock are recorded as dividend income at fair value.
Expenses Certain expenses, which are directly identifiable to a specific Fund, are applied to the Fund within the Company. Other expenses which cannot be attributed to a specific Fund are allocated in such a manner as deemed equitable, taking into consideration the nature and type of expense and the relative net assets of the Fund within the Company.
Foreign Currency Translation The accounting records of the Fund are maintained in U.S. dollars. Foreign currencies as well as investment securities and other assets and liabilities denominated in a foreign currency are translated to U.S. dollars
| | |
| 28 | | Notes to Financial Statements |
State Street Income V.I.S. Fund
Notes to Financial Statements, continued — December 31, 2019
using exchange rates at period end. Purchases and sales of securities, income receipts and expense payments denominated in foreign currencies are translated into U.S. dollars at the prevailing exchange rate on the respective dates of the transactions.
The effects of exchange rate fluctuations on investments are included with the net realized and unrealized gain (loss) on investment securities. Other foreign currency transactions resulting in realized and unrealized gain (loss) are disclosed separately.
Foreign Taxes The Fund may be subject to foreign taxes (a portion of which may be reclaimable) on income, stock dividends, realized and unrealized capital gains on investments or certain foreign currency transactions. Foreign taxes are recorded in accordance with SSGA FM’s understanding of the applicable foreign tax regulations and rates that exist in the foreign jurisdictions in which the Fund invests. These foreign taxes, if any, are paid by the Fund and are reflected in the Statement of Operations, if applicable. Foreign taxes payable or deferred as of December 31, 2019, if any, are disclosed in the Fund’s Statement of Assets and Liabilities.
Distributions The Fund declares and pays any dividends from net investment income annually.
Net realized capital gains, if any, are distributed annually, unless additional distributions are required for compliance with applicable tax regulations. The amount and character of income and capital gains to be distributed are determined in accordance with applicable tax regulations which may differ from net investment income and realized gains recognized for U.S. GAAP purposes.
| 3. | | Securities and Other Investments |
Delayed Delivery Transactions and When-Issued Securities During the fiscal year ended December 31, 2019, the Fund transacted in securities on a delayed delivery or when-issued basis. Payment and delivery may take place after the customary settlement period for that security. The price of the underlying securities and the date when the securities will be delivered and paid for are fixed at the time the transaction is negotiated. The securities purchased on a delayed delivery or when-issued basis are identified as such in the Fund’s Schedule of Investments. The Fund may receive compensation for interest forgone in the purchase of a delayed delivery or when-issued security. With respect to such purchase commitments, the Fund identifies securities as segregated in its records with a value at least equal to the amount of the commitment. Losses may arise due to changes in the value of the underlying securities or if the counterparty does not perform under the contract’s terms, or if the issuer does not issue the securities due to political, economic or other factors.
To-Be-Announced Transactions The Fund may seek to obtain exposure to U.S. agency mortgage pass-through securities through the use of“to-be-announced” or “TBA transactions.” “TBA” refers to a commonly used mechanism for the forward settlement of U.S. agency mortgage pass-through securities. In a TBA transaction, the buyer and seller decide on general trade parameters, such as agency, settlement date, coupon, and price.
The Fund may use TBA transactions to “roll over” such agreements prior to the settlement date. This type of TBA transaction is sometimes known as a “TBA roll.” In a TBA roll, the Fund generally will sell the obligation to purchase the pools stipulated in the TBA agreement prior to the settlement date and will enter into a new TBA agreement for future delivery of pools of mortgage pass-through securities. The Fund may also enter into TBA agreements and settle such transactions on the stipulated settlement date by accepting actual receipt or delivery of the pools of mortgage pass-through securities.
Default by or bankruptcy of a counterparty to a TBA transaction would expose the Fund to possible loss because of adverse market action, expenses or delays in connection with the purchase or sale of the pools of mortgage pass-through securities specified in the TBA transaction. To minimize this risk, the Fund will enter into TBA transactions only with established counterparties. The Fund’s use of “TBA rolls” may impact portfolio turnover, transaction costs and capital gain distributions to shareholders.
| 4. | | Derivative Financial Instruments |
Futures Contracts The Fund may enter into futures contracts to meet the Fund’s objectives. A futures contract is a standardized, exchange-traded agreement to buy or sell a financial instrument at a set price on a future date. Upon entering into a futures contract, the Fund is required to deposit with the broker, cash or securities in an amount equal to the minimum
| | | | |
| Notes to Financial Statements | | | 29 | |
State Street Income V.I.S. Fund
Notes to Financial Statements, continued — December 31, 2019
initial margin requirements of the clearing house. Subsequent payments are made or received by the Fund equal to the daily change in the contract value, accumulated, exchange rates, and or other transactional fees. The accumulation of those payments are recorded as variation margin receivable or payable with a corresponding offset to unrealized gains or losses. The Fund recognizes a realized gain or loss when the contract is closed.
Losses may arise if the value of a futures contract decreases due to unfavorable changes in the market rates or values of the underlying instrument during the term of the contract or if the counterparty does not perform under the contract. The use of futures contracts also involves the risk that the movements in the price of the futures contracts do not correlate with the movement of the assets underlying such contracts.
For the fiscal year ended December 31, 2019, the Fund entered into futures contracts to manage interest rate risk.
Options on Futures Contracts The Fund may purchase and write options, including options on futures contracts, subject to certain limitations. Writing puts and buying calls tend to increase the Fund’s exposure to the underlying instrument while buying puts and writing calls tend to decrease the Fund’s exposure to the underlying instrument. The Fund will not enter into a transaction involving options for speculative purposes. The Fund’s risks in using these contracts include changes in the value of the underlying instruments,non-performance of the counterparties under the contracts’ terms and changes in the liquidity of the secondary market for the contracts.
When the Fund writes an option, the amount of the premium received is recorded as a liability and is subsequently adjusted to the current fair value of the option written. Premiums received from writing options that expire unexercised are treated by the Fund on the expiration date as realized gain from investments. The difference between the premium and the amount paid on effecting a closing purchase transaction, including brokerage commissions, is also treated as a realized gain, or if the premium is less than the amount paid for the closing purchase, as a realized loss. When an option is exercised, the proceeds from the sale of the underlying instrument or the cost basis of the securities purchased is adjusted by the original premium received or paid. In return for a premium paid, call and put options on futures contracts give the holder the right, but not the obligation, to purchase or sell, respectively, a position in a particular futures contract at a specified exercise price.
For the fiscal year ended December 31, 2019, the Fund purchased and wrote options in order to manage interest rate risk.
Credit Default Swaps During the fiscal year ended December 31, 2019, the Fund engaged in credit default swaps to manage credit risk. When the Fund is the buyer in a credit default swap contract, the Fund is entitled to receive the par (or other agreed upon) value (full notional value) of a referenced debt obligation (or basket of debt obligations) from the counterparty (or central clearing party (“CCP”) in the case of a centrally cleared swap) to the contract if a credit event by a third party, such as a U.S. or foreign corporate issuer or sovereign issuer, on the debt obligation occurs. In return, the Fund pays the counterparty a periodic stream of payments over the term of the contract provided that no credit event has occurred. If no credit event occurs, the Fund loses its investment and recovers nothing. However, if a credit event occurs, the Fund receives full notional value for a referenced debt obligation that may have little or no value. When the Fund is the seller of a credit default swap, it receives a fixed rate of income throughout the term of the contract, provided there is no credit event. If a credit event occurs, the Fund is obligated to pay the notional amount of the swap and in certain instances take delivery of securities of the reference entity upon the occurrence of a credit event, as defined under the terms of that particular swap agreement. Credit events are contract specific but may include bankruptcy, failure to pay, restructuring, obligation acceleration and repudiation/moratorium. If the Fund is a seller of protection and a credit event occurs, the maximum potential amount of future payments that the Fund could be required to make would be an amount equal to the notional amount of the agreement. This potential amount would be partially offset by any recovery value of the respective referenced obligation, or net amount received from the settlement of a buy protection credit default swap agreement entered into by the Fund for the same referenced obligation.
As the seller, the Fund may create economic leverage to its portfolio because, in addition to its total net assets, the Fund is subject to investment exposure on the notional amount of the swap. The interest fee paid or received on the swap, which is based on a specified interest rate on a fixed notional amount, is accrued daily as a component of unrealized appreciation (depreciation) and is recorded as realized gain upon receipt or realized loss upon payment. The Fund also records an increase or decrease to unrealized appreciation (depreciation) in an amount equal to the daily valuation. For centrally cleared swaps, the daily change in valuation is recorded as a receivable or payable for variation margin and settled in cash with the CCP daily. All upfront payments, if any, are amortized over the life of the swap as realized gains or losses. Those upfront payments that are paid or received, typically fornon-centrally cleared swaps, are recorded as other assets or other liabilities, respectively, net of amortization. For financial
| | |
| 30 | | Notes to Financial Statements |
State Street Income V.I.S. Fund
Notes to Financial Statements, continued — December 31, 2019
reporting purposes, unamortized upfront payments, if any, are netted with unrealized appreciation or depreciation on swaps to determine the market value of swaps. The Fund segregates assets in the form of cash or liquid securities in an amount equal to the notional amount of the credit default swaps of which it is the seller. The Fund segregates assets in the form of cash or liquid securities in an amount equal to any unrealized depreciation of the credit default swaps of which it is the buyer, marked to market on a daily basis. Credit default swaps involve greater risks than if the Fund had invested in the referenced debt obligation directly. If the Fund is a buyer of a credit default swap and no credit event occurs, the Fund will not earn any return on its investment. If the Fund is a seller of a credit default swap, the Fund’s risk of loss may be the entire notional amount of the swap. Swaps may also subject the Fund to the risk that the counterparty to the transaction may not fulfill its obligation. In the case of centrally cleared swaps, counterparty risk is minimal due to protections provided by the CCP.
Interest Rate Swaps Interest rate swaps involve the exchange by the Fund with another party of their respective commitments to pay or receive interest, such as an exchange of fixed rate payments for floating rate payments.
During the fiscal year ended December 31, 2019, the Fund entered into interest rate swaps in order to manage interest rate risk.
The following tables summarize the value of the Fund’s derivative instruments as of December 31, 2019 and the related location in the accompanying Statement of Assets and Liabilities and Statement of Operations, presented by primary underlying risk exposure:
Asset Derivatives
| | | | | | | | | | | | | | | | | | | | | | | | |
| | | Interest
Rate
Contracts
Risk | | | Foreign
Exchange
Contracts
Risk | | | Credit
Contracts
Risk | | | Equity
Contracts
Risk | | | Commodity
Contracts
Risk | | | Total | |
State Street Income V.I.S. Fund | | | | | | | | | | | | | | | | | | | | | |
Futures Contracts | | $ | 14,331 | | | $ | — | | | $ | — | | | $ | — | | | $ | — | | | $ | 14,331 | |
Swap Contracts | | | — | | | | — | | | | 59,402 | | | | — | | | | — | | | | 59,402 | |
Liability Derivatives
| | | | | | | | | | | | | | | | | | | | | | | | |
| | | Interest
Rate
Contracts
Risk | | | Foreign
Exchange
Contracts
Risk | | | Credit
Contracts
Risk | | | Equity
Contracts
Risk | | | Commodity
Contracts
Risk | | | Total | |
State Street Income V.I.S. Fund | | | | | | | | | | | | | | | | | | | | | |
Swap Contracts | | $ | (46,628 | ) | | $ | — | | | $ | (6,458 | ) | | $ | — | | | $ | — | | | $ | (53,086 | ) |
Realized Gain (Loss)
| | | | | | | | | | | | | | | | | | | | | | | | |
| | | Interest
Rate
Contracts
Risk | | | Foreign
Exchange
Contracts
Risk | | | Credit
Contracts
Risk | | | Equity
Contracts
Risk | | | Commodity
Contracts
Risk | | | Total | |
State Street Income V.I.S. Fund | | | | | | | | | | | | | | | | | | | | | |
Futures Contracts | | $ | 99,730 | | | $ | — | | | $ | — | | | $ | — | | | $ | — | | | $ | 99,730 | |
Swap Contracts | | | (10,991 | ) | | | — | | | | 8,206 | | | | — | | | | — | | | | (2,785 | ) |
Purchased Option Contracts(a) | | | (2,099 | ) | | | — | | | | — | | | | — | | | | — | | | | (2,099 | ) |
Written Option Contracts | | | 248 | | | | — | | | | — | | | | — | | | | — | | | | 248 | |
| | (a) | Purchased options are included in net realized gain (loss) from investments. |
Net Change in Unrealized Appreciation (Depreciation)
| | | | | | | | | | | | | | | | | | | | | | | | |
| | | Interest
Rate
Contracts
Risk | | | Foreign
Exchange
Contracts
Risk | | | Credit
Contracts
Risk | | | Equity
Contracts
Risk | | | Commodity
Contracts
Risk | | | Total | |
State Street Income V.I.S. Fund | |
Futures Contracts | | $ | (51,068 | ) | | $ | — | | | $ | — | | | $ | — | | | $ | — | | | $ | (51,068 | ) |
Swap Contracts | | | (21,627 | ) | | | — | | | | 29,865 | | | | — | | | | — | | | | 8,238 | |
| | | | |
| Notes to Financial Statements | | | 31 | |
State Street Income V.I.S. Fund
Notes to Financial Statements, continued — December 31, 2019
| 5. | | Fees and Transactions with Affiliates |
Advisory Fee SSGA FM, a registered investment adviser, was retained by the Board to act as investment adviser and administrator of the Fund. SSGA FM’s compensation for investment advisory and administrative services (“Management Fee”) is paid monthly based on the average daily net assets of the Fund at an annualized rate of 0.50%. Effective May 1, 2019, with respect to the State Street Income V.I.S. Fund, SSGA FM is contractually obligated until May 1, 2020 to waive its management fee and/or reimburse certain expenses for the Fund, in an amount equal to any acquired fund fees and expenses (“AFFEs”), excluding AFFEs derived from the Fund’s holdings in acquired funds for cash management purpose, if any. This fee waiver and/or expense reimbursement arrangement may not be terminated prior to May 1, 2020 except with approval of the Board.
Custody, Fund Accounting andSub-Administration Fees State Street Bank and Trust Company (“State Street”) serves as the custodian, fund accountant andsub-administrator to the Fund. Amounts paid by the Fund to State Street for performing such services are included as custody, fund accounting andsub-administration fees in the Statement of Operations.
Other Transactions with Affiliates The Fund may invest in affiliated entities, including securities issued by State Street Corporation, affiliated funds, or entities deemed to be affiliates as a result of the Fund owning more than five percent of the entity’s voting securities or outstanding shares. Amounts relating to these transactions during the fiscal year ended December 31, 2019 are disclosed in the Schedule of Investments.
The fees and expenses of the Company’s directors who are not “interested persons” of the Company, as defined in the 1940 Act (“Independent Directors”), are paid directly by the Fund. The Independent Directors are reimbursed for travel and otherout-of-pocket expenses in connection with meeting attendance and industry seminars.
| 7. | | Investment Transactions |
Purchases and sales of investments (excludingin-kind transactions, short term investments and derivative contracts) for the fiscal year ended December 31, 2019 were as follows:
| | | | | | | | |
| U.S. Government Securities |
| Purchases | | Sales |
| | $ | 61,736,753 | | | | $ | 62,067,726 | |
| | | | | | | | |
| Non-U.S. Government Securities |
| Purchases | | Sales |
| | $ | 3,523,585 | | | | $ | 7,043,471 | |
The Fund has qualified and intends to continue to qualify as a regulated investment company under Subchapter M of the Internal Revenue Code of 1986, as amended. The Fund will not be subject to federal income taxes to the extent it distributes its taxable income, including any net realized capital gains, for each fiscal year. Therefore, no provision for federal income tax is required.
The Fund files federal and various state and local tax returns as required. No income tax returns are currently under examination. Generally, the federal returns are subject to examination by the Internal Revenue Service for a period of three years from date of filing, while the state returns may remain open for an additional year depending upon jurisdiction. SSGA FM has analyzed the Fund’s tax positions taken on tax returns for all open years and does not believe there are any uncertain tax positions that would require recognition of a tax liability.
Distributions to shareholders are recorded onex-dividend date. Income dividends and gain distributions are determined in accordance with income tax rules and regulations, which may differ from generally accepted accounting principles. Certain capital accounts in the financial statements have been adjusted for permanentbook-tax differences. These adjustments have no impact on net asset values or results of operations. Temporarybook-tax differences will reverse in the future. These book tax differences are primarily due to differing treatment for paydown losses, swap contracts, futures contracts, open straddle adjustments, amortization and accretion of premium and discount for financial statement purposes and wash sale loss deferrals.
| | |
| 32 | | Notes to Financial Statements |
State Street Income V.I.S. Fund
Notes to Financial Statements, continued — December 31, 2019
The tax character of distributions paid during the fiscal year ended December 31, 2019 was as follows:
| | | | | | | | | | | | | |
Ordinary
Income | | Long-Term
Capital Gains | | Total |
| | $ | 34,589 | | | | $ | — | | | | $ | 34,589 | |
The tax character of distributions paid during the fiscal year ended December 31, 2018 was as follows:
| | | | | | | | | | | | | |
Ordinary
Income | | Long-Term
Capital Gains | | Total |
| | $ | 420,122 | | | | $ | — | | | | $ | 420,122 | |
At December 31, 2019, the components of distributable earnings on a tax basis were as follows:
| | | | | | | | | | | | | | | | | | | | | | | | | | | | | | | | | |
Undistributed
Ordinary
Income | | Tax
Exempt
Income | | Capital Loss
Carryforwards | | Undistributed
long term gain | | Net Unrealized
Gains (Losses) | | Qualified
Late-Year
Losses* | | Total |
| | $ | 393,632 | | | | $ | — | | | | $ | (78,543 | ) | | | $ | — | | | | $ | 470,585 | | | | $ | — | | | | $ | 785,674 | |
As of December 31, 2019, the Fund had capital loss carryforwards available to offset future realized capital gains through the indicated expiration dates as follows:
| | | | | | | | |
Non-Expiring Short-Term | | Non-Expiring Long-Term |
| | $ | — | | | | $ | 78,543 | |
As of December 31, 2019, gross unrealized appreciation and gross unrealized depreciation of investments and other financial instruments based on cost for federal income tax purposes were as follows:
| | | | | | | | | | | | | | | | | | |
Tax
Cost | | Gross
Unrealized
Appreciation | | Gross
Unrealized
Depreciation | | Net
Unrealized
Appreciation
(Depreciation) |
| | $ | 19,150,059 | | | | $ | 674,476 | | | | $ | 66,528 | | | | $ | 607,948 | |
The Fund and other affiliated funds (each, a “Participant” and collectively, the “Participants”) have access to $200 million of a $500 million revolving credit facility provided by a syndication of banks under which the Participants may borrow to fund shareholder redemptions. This agreement expires in October 2020 unless otherwise extended or renewed.
The Participants are charged an annual commitment fee which is calculated based on the unused portion of the shared credit line. Commitment fees are allocated among each of the Participants based on relative net assets. Commitment fees are ordinary fund operating expenses. A Participant incurs and pays the interest expense related to its borrowing. Interest is calculated at a rate per annum equal to the sum of 1% plus the greater of the New York Fed Bank Rate and1-month LIBOR rate.
The Fund had no outstanding loans as of December 31, 2019.
Concentration Risk As a result of the Fund’s ability to invest a large percentage of its assets in obligations of issuers within the same country, state, region, currency or economic sector, an adverse economic, business or political development may affect the value of the Fund’s investments more than if the Fund was more broadly diversified.
Interest Rate Risk Is the risk that fixed income securities will decline in value because of changes in interest rates. Bond prices generally rise when interest rates decline and generally decline when interest rates rise. Changes in governmental policy, including changes in central bank monetary policy, could cause interest rates to rise rapidly, or cause investors to expect a rapid rise in interest rates. This could lead to heightened levels of interest rate, volatility and liquidity risks for the fixed income markets generally and could have a substantial and immediate effect on the values of the Fund’s investments.
| | | | |
| Notes to Financial Statements | | | 33 | |
State Street Income V.I.S. Fund
Notes to Financial Statements, continued — December 31, 2019
Foreign and Emerging Markets Risk Investing in foreign markets involves risks and considerations not typically associated with investing in the U.S. Foreign securities may be subject to risk of loss because of government regulation, economic, political and social instability in the countries in which the Fund invests. Foreign markets may be less liquid than investments in the U.S. and may be subject to the risks of currency fluctuations. To the extent that the Fund invests in securities of issuers located in emerging markets, these risks may be even more pronounced.
Market and Credit Risk In the normal course of business, the Fund trades financial instruments and enters into financial transactions where risk of potential loss exists due to changes in the general economic conditions and fluctuations of the market (market risk). Additionally, the Fund may also be exposed to credit risk in the event that an issuer or guarantor fails to perform or that an institution or entity with which the Fund has unsettled or open transactions defaults.
| 11. | | Change in Accounting Principle |
In March 2017, the Financial Accounting Standards Board issued Accounting Standards Update 2017-08, Receivables —Nonrefundable Fees and Other Costs (Subtopic 310-20) — Premium Amortization on Purchased Callable Debt Securities (“ASU 2017-08”). For callable debt securities held at a premium that have explicit, non-contingent call features and that are callable at fixed prices on preset dates, ASU 2017-08 requires the premium to be amortized to the earliest call date. The adoption resulted in a change in accounting principle, since the Fund had historically amortized such premiums to maturity for U.S. GAAP. Accordingly, the Fund has adopted ASU 2017-08 to amend the premium amortization period for certain purchased callable debt securities with non-contingent call features to the earliest call date. In accordance with the transition provisions of the standard, the Fund applied the amendments on a modified retrospective basis by recognizing a cumulative effect adjustment that decreased the beginning of period cost of investments and increased the unrealized appreciation on investments by $8,663.
This change in accounting policy has been made to comply with the newly issued accounting standard and had no impact on total accumulated earnings (loss) or the net asset value of the Fund. With respect to the Fund’s results of operations, amortization of premium to first call date accelerates amortization with the intent of more closely aligning the recognition of income on such bonds with the economics of the instrument.
Management has evaluated the impact of all subsequent events on the Fund through the date on which the financial statements were available to be issued and has determined that there were no subsequent events requiring adjustment or disclosure in the financial statements.
| | |
| 34 | | Notes to Financial Statements |
State Street Income V.I.S. Fund
Report of Independent Registered Public Accounting Firm
To the Shareholders of State Street Income V.I.S. Fund and the Board of Directors of State Street Variable Insurance Series Funds, Inc.
Opinion on the Financial Statements
We have audited the accompanying statement of assets and liabilities of State Street Income V.I.S. Fund (the “Fund”) (one of the funds constituting State Street Variable Insurance Series Funds, Inc. (the “Company”)), including the schedule of investments, as of December 31, 2019, and the related statement of operations for the year then ended, the statements of changes in net assets for each of the two years in the period then ended, the financial highlights for each of the four years in the period then ended and the related notes (collectively referred to as the “financial statements”). In our opinion, the financial statements present fairly, in all material respects, the financial position of the Fund (one of the funds constituting State Street Variable Insurance Series Funds, Inc.) at December 31, 2019, the results of its operations for the year then ended, the changes in its net assets for each of the two years in the period then ended and its financial highlights for each of the four years in the period then ended, in conformity with U.S. generally accepted accounting principles. The financial highlights for year ended December 31, 2015 were audited by another independent registered public accounting firm whose report, dated February 19, 2016, expressed an unqualified opinion on those financial highlights.
Basis for Opinion
These financial statements are the responsibility of the Company’s management. Our responsibility is to express an opinion on the Fund’s financial statements based on our audits. We are a public accounting firm registered with the Public Company Accounting Oversight Board (United States) (“PCAOB”) and are required to be independent with respect to the Company in accordance with the U.S. federal securities laws and the applicable rules and regulations of the Securities and Exchange Commission and the PCAOB.
We conducted our audits in accordance with the standards of the PCAOB. Those standards require that we plan and perform the audit to obtain reasonable assurance about whether the financial statements are free of material misstatement, whether due to error or fraud. The Company is not required to have, nor were we engaged to perform, an audit of the Company’s internal control over financial reporting. As part of our audits we are required to obtain an understanding of internal control over financial reporting, but not for the purpose of expressing an opinion on the effectiveness of the Company’s internal control over financials reporting. Accordingly, we express no such opinion.
Our audits included performing procedures to assess the risks of material misstatement of the financial statements, whether due to error or fraud, and performing procedures that respond to those risks. Such procedures included examining, on a test basis, evidence regarding the amounts and disclosures in the financial statements. Our procedures included confirmation of securities owned as of December 31, 2019, by correspondence with the custodian, brokers and others or by other appropriate auditing procedures where replies from brokers and others were not received. Our audits also included evaluating the accounting principles used and significant estimates made by management, as well as evaluating the overall presentation of the financial statements. We believe that our audits provide a reasonable basis for our opinion.

We have served as the auditor of one or more State Street Global Advisors investment companies since 2000.
Boston, Massachusetts
February 19, 2020
| | | | |
| Report of Independent Registered Public Accounting Firm | | | 35 | |
State Street Income V.I.S. Fund
Other Information — December 31, 2019 (Unaudited)
Liquidity Risk Management Program
Pursuant to Rule 22e-4 under the 1940 Act, the Funds have adopted a liquidity risk management program. SSGA FM has been designated by the Board to administer the Funds’ liquidity risk management program. The program’s principal objectives include assessing, managing and periodically reviewing each Fund’s liquidity risk, based on factors specific to the circumstances of the Fund. Liquidity risk is defined as the risk that a Fund could not meet redemption requests without significant dilution of remaining investors’ interests in the Fund. During the fiscal year, SSGA FM provided the Board with a report addressing the operations of the program and assessing its adequacy and effectiveness of implementation.
During the period covered by the liquidity program report to the Board, the program supported each Fund’s ability to honor redemption requests timely and SSGA FM’s management of each Fund’s liquidity profile, including during periods of market volatility and net redemptions. SSGA FM reported that the program operated adequately and that the implementation of the program was effective to manage the Fund’s liquidity risk.
There can be no assurance that the program will achieve its objectives in the future. Please refer to your Fund’s prospectus for more information regarding the Fund’s exposure to liquidity risk and other principal risks to which an investment in the Fund may be subject.
Proxy Voting Policies and Procedures and Record
The Fund has adopted the proxy voting policies of SSGA FM. A description of the policies and procedures that the Fund has adopted to determine how to vote proxies relating to portfolio securities is available (i) without charge, upon request, by calling1-800-242-0134, (ii) on the Fund’s website at http://www.ssga.com/geam, or (iii) on the SEC’s website at www.sec.gov. Information regarding how the Fund voted proxies, if any, during the most recent12-month period ended June 30 is available by August 31 of each year without charge (1) by calling1-800-242-0134 (toll free), and (2) on the website of the SEC at www.sec.gov.
Quarterly Portfolio Schedule
Following the Fund’s first and third fiscal quarter-ends, a complete schedule of investments is filed with the SEC as an exhibit to its reports on Form N-PORT, which can be found on the SEC’s website at www.sec.gov. The Fund’s schedule of investments are available upon request, without charge, by calling 1-800-242-0134.
State Street Income V.I.S. Fund
Other Information — December 31, 2019
| | | | | | | | | | | | |
| | | | | | |
Name,
Address,
and Year of Birth | | Position(s) Held with Fund | | Term of Office and Length of Time Served | | Principal Occupation
During Past Five Years
and Relevant Experience | | Number of
Funds in Fund
Complex
Overseen
by Director† | | | Other Directorships Held by Director During Past Five Years |
INDEPENDENT DIRECTORS | | | | | | |
Michael F. Holland c/o SSGA Funds Management, Inc. One Iron Street Boston, MA 02210 YOB: 1944 | | Director and Co-Chairperson of the Board | | Term: Until successor is elected and qualified Served: Since January 2019 | | Chairman, Holland & Company L.L.C. (investment adviser) (1995 – present). | | | 68 | | | Director, the Holland Series Fund, Inc.; Director, Reaves Utility Income Fund, Inc.; and Director, Blackstone/GSO Loans (and Real Estate) Funds. |
| |
Patrick J. Riley c/o SSGA Funds Management, Inc. One Iron Street Boston, MA 02210 YOB: 1948 | | Director and Co-Chairperson of the Board | | Term: Until successor is elected and qualified Served: Since January 2019 | | 2002 to May 2010, Associate Justice of the Superior Court, Commonwealth of Massachusetts; 1985 to 2002, Partner, Riley, Burke & Donahue, L.L.P. (law firm); 1998 to Present, Independent Director, State Street Global Advisers Ireland, Ltd. (investment company); 1998 to Present, Independent Director, SSGA Liquidity plc (formerly, SSGA Cash Management Fund plc); January 2009 to Present, Independent Director, SSGA Fixed Income plc; and January 2009 – 2019, Independent Director, SSGA Qualified Funds PLC. | | | 68 | | | Board Director and Chairman, SPDR Europe 1PLC Board (2011 – Present); Board Director and Chairman, SPDR Europe II, PLC (2013 – Present). |
| |
John R. Costantino c/o SSGA Funds Management, Inc. One Iron Street Boston, MA 02210 YOB: 1946 | | Director and Co-Chairperson of the Qualified Legal Compliance Committee | | Term: Until successor is elected and qualified Served: Since 1997 | | Senior Advisor to NGN Capital LLC (December 2019 – Present); Managing General Partner, NGN Capital LLC (2006 – December 2019); and Managing Director, Vice President of Walden Capital Management (1996 – present). | | | 68 | | | Director of Kleinfeld Bridal Corp. (March 2016 – present); Trustee of Neuroscience Research Institute (1986 – 2018); Trustee of Fordham University (1989 – 1995 and 2001 – 2007) and Trustee Emeritus (2007 – present); Director, Muscular Dystrophy Association (since 2019); Trustee of GE Funds (1993 – February 2011); and Trustee of Gregorian University Foundation
(1992 – 2007). |
| |
Donna M. Rapaccioli c/o SSGA Funds Management, Inc. One Iron Street Boston, MA 02210 YOB: 1962 | | Director and Co-Chairperson of the Audit Committee | | Term: Until successor is elected and qualified Served: Since January 2012 | | Dean of the Gabelli School of Business (2007 – present) and Accounting Professor (1987 – present) at Fordham University. | | | 68 | | | Director-Graduate Management Admissions Council
(2015 – present). |
State Street Income V.I.S. Fund
Other Information, continued — December 31, 2019
| | | | | | | | | | | | |
| | | | | | |
Name,
Address,
and Year of Birth | | Position(s) Held with Fund | | Term of Office and Length of Time Served | | Principal Occupation
During Past Five Years
and Relevant Experience | | Number of
Funds in Fund
Complex
Overseen
by Director† | | | Other Directorships Held by Director During Past Five Years |
INDEPENDENT DIRECTORS (continued) |
Richard D. Shirk c/o SSGA Funds Management, Inc. One Iron Street Boston, MA 02210 YOB: 1945 | | Director and Co-Chairperson of the Qualified Legal Compliance Committee | | Term: Until successor is elected and qualified Served: Since January 2019 | | March 2001 to April 2002, Chairman (1996 to March 2001, President and Chief Executive Officer), Cerulean Companies, Inc. (holding company) (Retired); 1992 to March 2001, President and Chief Executive Officer, Blue Cross Blue Shield of Georgia (health insurer, managed healthcare). | | | 68 | | | 1998 to December 2008, Chairman, Board Member and December 2008 to Present, Investment Committee Member, Healthcare Georgia Foundation (private foundation); September 2002 to 2012, Lead Director and Board Member, Amerigroup Corp. (managed health care); 1999 to 2013, Board Member and (since 2001) Investment Committee Member, Woodruff Arts Center; and 2003 to 2009, Trustee, Gettysburg College; Board member, Aerocare Holdings, Regenesis Biomedical Inc. |
| |
Rina K. Spence c/o SSGA Funds Management, Inc. One Iron Street Boston, MA 02210 YOB: 1948 | | Director and Co-Chairperson of the Audit Committee, Chairperson of the Nominating Committee and Chairperson of the Governance Committee | | Term: Until successor is elected and qualified Served: Since January 2019 | | President of SpenceCare International LLC (international healthcare consulting) (1999 – present); Chief Executive Officer, IEmily.com (health internet company) (2000 – 2001); Chief Executive Officer of Consensus Pharmaceutical, Inc. (1998 – 1999); Founder, President and Chief Executive Officer of Spence Center for Women’s Health (1994 – 1998); President and CEO, Emerson Hospital (1984 – 1994); Honorary Consul for Monaco in Boston (2015 – present). | | | 68 | | | None |
| |
Michael A. Jessee c/o SSGA Funds Management, Inc. One Iron Street Boston, MA 02210 YOB: 1946 | | Director and Chairperson of the Valuation Committee | | Term: Until successor is elected and qualified
Served: Since January 2019 | | Retired; formerly, President and Chief Executive Officer of the Federal Home Loan Bank of Boston (1989 – 2009); Trustee, Randolph-Macon College
(2004 – 2016). | | | 68 | | | None |
| |
INTERESTED DIRECTORS(1) |
Ellen M. Needham(2) SSGA Funds Management, Inc. One Iron Street Boston, MA 02210 YOB: 1967 | | Director | | Term: Until successor is elected and qualified Served: Since January 2019 | | President and Director, SSGA Funds Management, Inc. (2001 – present)*; Senior Managing Director, State Street Global Advisors (1992 – present)*; Director, State Street Global Advisors Funds Distributors, LLC (May 2017 – present). | | | 68 | | | None |
State Street Income V.I.S. Fund
Other Information, continued — December 31, 2019
| | | | | | | | | | | | |
| | | | | | |
Name,
Address,
and Year of Birth | | Position(s) Held with Fund | | Term of Office and Length of Time Served | | Principal Occupation
During Past Five Years
and Relevant Experience | | Number of
Funds in Fund
Complex
Overseen
by Director† | | | Other Directorships Held by Director During Past Five Years |
INDEPENDENT DIRECTORS (continued) |
Jeanne La Porta(3) c/o SSGA Funds Management, Inc. 1600 Summer St. Stamford, CT 06905 YOB: 1965 | | Director & President | | Term: Until successor is elected and qualified Served: Since 2014 | | Senior Managing Director at State Street Global Advisors (July 2016 – present); Director of State Street Global Advisors Funds Distributors, LLC (May 2017 – present); President of GE Retirement Savings Plan Funds (July 2016 – September 2018); Senior Vice President and Commercial Operations Leader at GE Asset Management Incorporated (“GEAM”) (March 2014 – July 2016); President of State Street Institutional Funds and State Street Variable Insurance Series Funds, Inc. (April 2014 – present); President and Trustee of GEAM’s UCITs Funds (March 2014 – November 2014); Senior Vice President and Commercial Administrative Officer at GEAM (April 2010 – March 2014); Vice President of State Street Institutional Funds (July 2003 – April 2014); Vice President of Elfun Funds and GE Retirement Savings Plan Funds (October 2003 – July 2016). | | | 18 | | | None |
| † | | For the purpose of determining the number of portfolios overseen by the Directors, “Fund Complex” comprises registered investment companies for which SSGA FM serves as investment adviser. |
| (1) | | The individuals listed below are Directors who are “interested persons,” as defined in the 1940 Act, of the Company (“Interested Directors”). |
| (2) | | Ms. Needham is an Interested Director because of her employment by SSGA FM, an affiliate of the Company. |
| (3) | | Ms. La Porta is an Interested Director because of her employment by SSGA, an affiliate of the Company. |
| * | | Served in various capacities and/or with various affiliated entities during noted time period. |
State Street Income V.I.S. Fund
Other Information, continued — December 31, 2019
| | | | | | |
| | | | |
Name,
Address,
and Year
of Birth | | Position(s) Held
with Fund | | Term of Office and Length of Time Served | | Principal Occupation During Past Five Years |
OFFICERS: | | | | | | |
Jeanne M. La Porta SSGA Funds Management, Inc. 1600 Summer St. Stamford, CT 06905 YOB: 1965 | | President and Director | | Term: Indefinite Elected: 3/14 | | Senior Managing Director at State Street Global Advisors (July 2016 – present); Director of State Street Global Advisors Funds Distributors, LLC (May 2017 – present); President of GE Retirement Savings Plan Funds (July 2016 – September 2018); Senior Vice President and Commercial Operations Leader at GEAM (March 2014 – July 2016); President of State Street Institutional Funds and State Street Variable Insurance Series Funds, Inc. (April 2014 – present); President and Trustee of GEAM’s UCITs Funds (March 2014 – November 2014); Senior Vice President and Commercial Administrative Officer at GEAM (April 2010 – March 2014); Vice President of State Street Institutional Funds (July 2003 – April 2014); Vice President of Elfun Funds and GE Retirement Savings Plan Funds (October 2003 – July 2016); Secretary of GE Funds (July 2007 – September 2010) and Vice President (July 2007 – February 2011); Senior Vice President and Deputy General Counsel of GEAM (October 2007 – April 2010); Vice President and Assistant Secretary of Elfun Funds and GE Retirement Savings Plan Funds (July 2003 – June 2010); and Vice President and Associate General Counsel – Marketing and Client Services (formerly Asset Management Services) at GEAM (May 1997 – October 2007). |
| | | | | | | |
Bruce S. Rosenberg SSGA Funds Management, Inc. One Iron Street Boston,
MA 02210 YOB: 1961 | | Treasurer | | Term: Indefinite Elected: 4/19 | | Managing Director, State Street Global Advisors and SSGA Funds Management, Inc. (July 2015 – present); Director, Credit Suisse (April 2008 – July 2015). |
| | | | | | | |
Ann M. Carpenter SSGA Funds Management, Inc. One Iron Street Boston,
MA 02210 YOB: 1966 | | Vice President and Deputy Treasurer | | Term: Indefinite Elected: 4/19 | | Chief Operating Officer, SSGA Funds Management, Inc. (April 2005 – present)*; Managing Director, State Street Global Advisors. (2005 – present).* |
| | | | | | | |
Chad C. Hallett SSGA Funds Management, Inc. One Iron Street Boston,
MA 02210 YOB: 1969 | | Deputy Treasurer | | Term: Indefinite Elected: 4/19 | | Vice President, State Street Global Advisors and SSGA Funds Management, Inc. (November 2014 – present); Vice President, State Street Bank and Trust Company (2001 – November 2014).* |
| | | | | | | |
Darlene Anderson-Vasquez SSGA Funds Management, Inc. One Iron Street Boston,
MA 02210 YOB: 1968 | | Deputy Treasurer | | Term: Indefinite Elected: 4/19 | | Managing Director, State Street Global Advisors and SSGA Funds Management, Inc. (May 2016 – present); Senior Vice President, John Hancock Investments (September 2007 – May 2016). |
| | | | | | | |
Arthur A. Jensen SSGA Funds Management, Inc. 1600 Summer Street Stamford, CT 06905 YOB: 1966 | | Deputy Treasurer | | Term: Indefinite Elected: 4/19 | | Vice President State Street Global Advisors and SSGA Funds Management, Inc. (July 2016 – present); Deputy Treasurer of Elfun Funds (July 2016 – present); Treasurer of State Street Institutional Funds, State Street Variable Insurance Series Funds, Inc. and GE Retirement Savings Plan Funds (June 2011 – present); Treasurer of Elfun Funds (June 2011– July 2016); Mutual Funds Controller of GE Asset Management Incorporated (April 2011 – July 2016). |
| | | | | | | |
Sujata Upreti SSGA Funds Management, Inc. One Iron Street Boston,
MA 02210 YOB: 1974 | | Assistant Treasurer | | Term: Indefinite Elected: 4/19 | | Vice President, State Street Global Advisors and SSGA Funds Management, Inc. (May 2015 – present); Assistant Director, Cambridge Associates, LLC (July 2014 – January 2015); Vice President, Bank of New York Mellon (July 2012 – August 2013); Manager, PricewaterhouseCoopers, LLP (September 2003 – July 2012). |
State Street Income V.I.S. Fund
Other Information, continued — December 31, 2019
| | | | | | |
| | | | |
Name,
Address,
and Year
of Birth | | Position(s) Held
with Fund | | Term of Office and Length of Time Served | | Principal Occupation During Past Five Years |
OFFICERS (continued): | | | | | | |
Daniel Foley SSGA Funds Management, Inc. One Iron Street Boston,
MA 02210 YOB: 1972 | | Assistant Treasurer | | Term: Indefinite Elected: 4/19 | | Vice President, State Street Global Advisors and SSGA Funds Management, Inc. (April 2007 – present).* |
| | | | | | | |
Daniel G. Plourde SSGA Funds Management, Inc. One Iron Street Boston,
MA 02210 YOB: 1980 | | Assistant Treasurer | | Term: Indefinite Elected: 6/17 | | Vice President, State Street Global Advisors and SSGA Funds Management, Inc. (May 2015 – present); Officer, State Street Bank and Trust Company (March 2009 – May 2015). |
| | | | | | | |
Brian Harris SSGA Funds Management, Inc. One Iron Street Boston,
MA 02210 YOB: 1973 | | Chief Compliance Officer, Anti-Money Laundering Officer and Code of Ethics Compliance Officer | | Term: Indefinite Elected: 7/16 Term: Indefinite Elected: 4/19 | | Managing Director, State Street Global Advisors and SSGA Funds Management, Inc. (June 2013 – Present)*; Senior Vice President and Global Head of Investment Compliance, BofA Global Capital Management (September 2010 – May 2013). |
| | | | | | | |
Sean O’Malley SSGA Funds Management, Inc. One Iron Street Boston,
MA 02210 YOB: 1969 | | Chief Legal Officer | | Term: Indefinite Elected: 8/19 | | Senior Vice President and Deputy General Counsel, State Street Global Advisors (November 2013 – present). |
| | | | | | | |
Andrew DeLorme SSGA Funds Management, Inc. One Iron Street Boston,
MA 02210 YOB: 1975 | | Secretary | | Term: Indefinite Elected: 8/19 | | Vice President and Senior Counsel, State Street Global Advisors (April 2016 – present); Vice President and Counsel, State Street Global Advisors (August 2014 – March 2016). |
| | | | | | | |
Kevin Morris SSGA Funds Management, Inc. One Iron Street Boston,
MA 02210 YOB: 1982 | | Assistant Secretary | | Term: Indefinite Elected: 8/19 | | Vice President and Senior Counsel, State Street Global Advisors (April 2019 – present); Vice President and Counsel, State Street Global Advisors (January 2016 – April 2019); Director, Asset Management Compliance, Fidelity Investments (June 2015 – January 2016); Senior Compliance Advisor, Asset Management Compliance, Fidelity Investments (June 2012 – June 2015). |
| | | | | | | |
David Urman SSGA Funds Management, Inc. One Iron Street Boston,
MA 02210 YOB: 1985 | | Assistant Secretary | | Term: Indefinite Elected: 8/19 | | Vice President and Senior Counsel, State Street Global Advisors (April 2019 – present); Vice President and Counsel, State Street Global Advisors (August 2015 – April 2019); Associate, Ropes & Gray LLP (November 2012 – August 2015). |
| * | Served in various capacities and/or with various affiliated entities during noted time period. |
Directors
Michael F. Holland, Co-Chairperson
Patrick J. Riley, Co-Chairperson
John R. Costantino
Donna M. Rapaccioli
Michael A. Jessee
Richard D. Shirk
Rina K. Spence
Jeanne M. La Porta
Ellen M. Needham
Officers
Jeanne M. La Porta, President
Brian Harris, Chief Compliance Officer, Anti-Money Laundering Officer and Code of Ethics Compliance Officer
Sean O’Malley, Chief Legal Officer
Bruce S. Rosenberg, Treasurer
Ann M. Carpenter, Vice President and Deputy Treasurer
Chad C. Hallett, Deputy Treasurer
Arthur A. Jensen, Deputy Treasurer
Darlene Anderson-Vasquez, Deputy Treasurer
Sujata Upreti, Assistant Treasurer
Daniel Foley, Assistant Treasurer
Daniel G. Plourde, Assistant Treasurer
Andrew DeLorme, Secretary
Kevin Morris, Assistant Secretary
David Urman, Assistant Secretary
Investment Adviser and Administrator
SSGA Funds Management, Inc.
One Iron Street
Boston, MA 02210
Custodian andSub-Administrator
State Street Bank and Trust Company
One Lincoln Street
Boston, Massachusetts 02111
Distributor
State Street Global Advisors Funds Distributors, LLC
One Iron Street
Boston, MA 02210
Independent Registered Public Accounting Firm
Ernst & Young LLP
200 Clarendon Street
Boston, Massachusetts 02116
Annual Report
December 31, 2019
State Street Real Estate Securities V.I.S. Fund
Beginning on January 1, 2021, as permitted by regulations adopted by the U.S. Securities and Exchange Commission, paper copies of a Fund’s annual and semi-annual shareholder reports will no longer be sent by mail, unless you specifically request paper copies of the reports. Instead, the reports will be made available on a Fund’s website (www.ssga.com/geam), and you will be notified by mail each time a report is posted, and provided with a website link to access the report. If you already elected to receive shareholder reports electronically, you will not be affected by this change and you need not take any action.
You may elect to receive all future reports in paper free of charge. To do so, contact your Insurance Provider. Your election to receive reports in paper will apply to all funds held in your account.

State Street Real Estate Securities V.I.S. Fund
Annual Report
December 31, 2019
Table of Contents
This report is prepared for Policyholders of certain variable contracts and may be distributed to others only if preceded or accompanied by the variable contract’s current prospectus and the current summary prospectus of the Fund available for investments thereunder.
State Street Real Estate Securities V.I.S. Fund
Notes to Performance — December 31, 2019 (Unaudited)
The information provided on the performance page relates to the State Street Real Estate Securities V.I.S Fund (the “Fund”).
Total return performance shown in this report for the Fund takes into account changes in share price and assumes reinvestment of dividends and capital gains distributions, if any. Total returns shown are net of Fund fees and expenses but do not reflect fees and charges associated with the variable contracts such as administrative fees, account charges and surrender charges, which, if reflected, would reduce the Fund’s total returns for all periods shown.
The performance data quoted represents past performance; past performance does not guarantee future results. Investment return and principal value will fluctuate so your shares, when redeemed, may be worth more or less than their original cost. Current performance may be higher or lower than the performance data quoted. Periods less than one year are not annualized. Please call toll-free
(800) 242-0134 or visit the Fund’s website at http://www.ssga.com/geam for the most recent month-end performance data.
An investment in the Fund is not a deposit of any bank and is not insured or guaranteed by the Federal Deposit Insurance Corporation (“FDIC”) or any other government agency. An investment in the Fund is subject to risk, including possible loss of principal invested.
FTSE NAREIT Equity REITs Index is an unmanaged index of all tax-qualified equity real estate investment trusts (“REITs”) (except Timber REITs or Infrastructure REITs) listed on the New York Stock Exchange, American Stock Exchange and NASDAQ which have 75% or more of their gross invested book assets invested directly or indirectly in the equity ownership of real estate. The results shown for the foregoing index assume the reinvestment of net dividends or interest and do not reflect fees, expenses, or taxes. As such, the index returns do not reflect the actual cost of investing in the instruments that comprise the index.
The views expressed in this document reflect our judgment as of the publication date and are subject to change at any time without notice.
State Street Global Advisors Funds Distributors, LLC, member of FINRA & SIPC is the principal underwriter and distributor of the State Street V.I.S. Funds and an indirect wholly-owned subsidiary of State Street Corporation. References to State Street may include State Street Corporation and its affiliates. The Funds pay State Street Bank and Trust Company for its services as custodian and Fund Accounting agent, and pay SSGA Funds Management, Inc. for investment advisory and administrative services.
State Street Real Estate Securities V.I.S. Fund
Management Discussion of Fund Performance — December 31, 2019 (Unaudited)
The State Street Real Estate Securities V.I.S. Fund (the “Fund”) seeks to provide the maximum total return through current income and capital appreciation. The Fund’s benchmark is the FTSE NAREIT Equity REITs Index (the “Index”).
For the 12-month period ended December 31, 2019 (the “Reporting Period”), the total return for the Fund was 26.15% and the Index was 26.00%. The Fund and Index returns reflect the reinvestment of dividends and other income. The Fund’s performance reflects the expenses of managing the Fund, including brokerage and advisory expenses. The Index is unmanaged and Index returns do not reflect fees and expenses of any kind, which would have a negative impact on returns.
The year 2019 was an exceptional year from a stock total return perspective across all asset classes. The REIT market in particular benefitted from the decline in interest rates, lower forward interest rate expectations and heightened concern about a global economic slowdown. The REIT market was on pace to outperform the broader equity markets up until November, when a ‘‘risk-on’’ investor sentiment took hold of markets following improving economic and geo-political conditions, specifically, the removal of uncertainty in the UK/Europe surrounding Brexit, the cooling of protests in the Hong Kong region and a phase-one trade deal between the United States and China. Also improving conditions for both REITs and broader equity markets was the continuation of accommodative monetary policy across the globe, with the Federal Reserve issuing three 25bp rate cuts in 2019, and with the Japanese and German bond yields remaining in negative territory.
Within the portfolio, stock selection within data centers, stock selection within net lease, and both our overweight to and positioning within alternative housing were primary drivers of Fund performance during the Reporting Period relative to the Index. In the data center sector, performance was driven by the portfolio’s overweight position in Equinix and underweight in Digital Realty. Within the net lease sector, the portfolio’s overweight to Vereit contributed meaningfully to alpha, as the renewed low interest rate environment toward the middle of the year boosted the net lease sector broadly. In alternative housing, the portfolio’s overweight to the sector contributed alpha, and was driven by our belief in affordable housing as a strong long term thematic based on the increasing demand for single family rentals (in particular by millennials, the largest demographic cohort in the US, with the peak of this group now entering their 30’s). Within alternative housing, our position in Sun Communities contributed to alpha, while the underweight to American Campus Communities, the weakest performer in the sector, also served the portfolio well.
The Fund did not invest in derivatives during the Reporting Period.
The major detractor for the year was positioning within regional malls, driven by overweights to Macerich and Taubman. In addition, the increased appetite for risk during the fourth quarter led to junk rally in the sector, which we were not exposed to.
On an individual security level, the top positive contributors to the Fund’s performance on an absolute basis during the Reporting Period were Prologis, Equinix, and Sun Communities. The top negative contributors to the Fund’s performance on an absolute basis during the Reporting Period were Macerich, Taubman, and Simon Property Group. Given the strong absolute returns in the sector, performance was also negatively impacted by the small (<1%) cash position maintained for liquidity purposes.
The views expressed above reflect those of the Fund’s portfolio manager only through the Reporting Period, and do not necessarily represent the views of the Adviser as a whole. Any such views are subject to change at any time based upon market or other conditions and the Adviser disclaims any responsibility to update such views. These views may not be relied on as investment advice and, because investment decisions for a fund are based on numerous factors, may not be relied on as an indication of trading intent on behalf of any fund.
| | |
| 2 | | State Street Real Estate Securities V.I.S. Fund |
State Street Real Estate Securities V.I.S. Fund
Understanding Your Fund’s Expenses — December 31, 2019 (Unaudited)
As a shareholder of the Fund, you incur ongoing costs. Ongoing costs include portfolio management fees, professional fees, administrative fees and other Fund expenses. The following example is intended to help you understand your ongoing costs (in dollars) of investing in the Fund and to compare these costs with the ongoing costs of investing in other mutual funds.
To illustrate these ongoing costs, we have provided an example and calculated the expenses paid by investors in the Fund during the period. The information in the following table is based on an investment of $1,000, which is invested at the beginning of the period and held for the entire six-month period ended December 31, 2019.
Actual Expenses
The first section of the table provides information about actual account values and actual expenses. You may use the information in this section, together with the amount you invested, to estimate the expenses that you paid over the period. To do so, simply divide your account value by $1,000 (for example, an $8,600 account value divided by $1,000 = 8.6), then multiply the result by the number given under the heading “Expenses paid during the period” to estimate the expenses you paid on your account during the period.
Hypothetical Example for Comparison Purposes
The second section of the table provides information about hypothetical account values and hypothetical expenses based on the Fund’s actual expense ratio and an assumed rate of return of 5% per year before expenses, which is not the Fund’s actual return. The hypothetical account values and expenses may not be used to estimate the actual ending account balance or expenses you paid for the period. You may use this information to compare the ongoing costs of investing in the Fund and other funds. To do so, compare this 5% hypothetical example with the 5% hypothetical examples that appear in the shareholder reports of other funds.
Please note that the expenses shown in the table are meant to highlight and help you compare ongoing costs only and do not reflect transaction costs, such as sales charges or redemption fees, if any. Therefore, the second section of the table is useful in comparing ongoing costs only, and will not help you determine the relative total costs of owning different funds. Additionally, the expenses shown do not reflect the fees or charges associated with variable contracts through which shares of the Fund are offered.
July 1, 2019 - December 31, 2019
| | | | | | | | |
| | | Actual
Fund Return | | | Hypothetical
5% Return
(2.5% for
the period) | |
Actual Fund Return | | | | | | | | |
Beginning Account Value July 1, 2019 | | $ | 1,000.00 | | | $ | 1,000.00 | |
Ending Account Value December 31, 2019 | | $ | 1,067.10 | | | $ | 1,020.06 | |
Expenses Paid During Period* | | $ | 5.31 | | | $ | 5.19 | |
| * | Expenses are equal to the Fund’s annualized expense ratio of 1.02%** (for the period July 1, 2019 - December 31, 2019), multiplied by the average account value over the period, multiplied by 184/365 (to reflect the one-half year period). |
| ** | May differ from expense ratio disclosed in the financial highlights, which is calculated based on the entire fiscal year’s data. |
| | | | |
| State Street Real Estate Securities V.I.S. Fund | | | 3 | |
State Street Real Estate Securities V.I.S. Fund
Performance Summary — December 31, 2019 (Unaudited)
Top Ten Largest Holdings
as of December 31, 2019 (as a % of Fair Value)(a)(b)
| | | | |
Prologis Inc. REIT | | | 7.01 | % |
| |
Equinix Inc. | | | 6.07 | % |
| |
Healthpeak Properties Inc. | | | 4.19 | % |
| |
Equity Residential | | | 3.98 | % |
| |
Realty Income Corp. | | | 3.81 | % |
| |
Ventas Inc. | | | 3.46 | % |
| |
Simon Property Group Inc. | | | 3.18 | % |
| |
Sun Communities Inc. | | | 3.02 | % |
| |
Host Hotels & Resorts Inc. | | | 2.97 | % |
| |
UDR Inc. | | | 2.94 | % |
Sector Allocation as of December 31, 2019
Portfolio composition as a % of Fair Value of $55,141 (in thousands) as of December 31, 2019(a)(b)
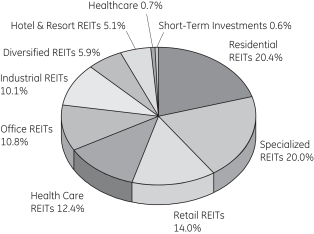
Average Annual Total Return for the periods ended December 31, 2019
Class 1 Shares (Inception date: 5/01/95)
| | | | | | | | | | | | | | | | |
| | | One Year | | | Five Year | | | Ten Year | | | Ending Value
of a $10,000
Investment | |
State Street Real Estate Securities V.I.S. Fund | | | 26.15 | % | | | 7.29 | % | | | 12.27 | % | | $ | 31,827 | |
| | | | |
FTSE NAREIT Equity REITs Index | | | 26.00 | % | | | 7.21 | % | | | 11.94 | % | | $ | 30,894 | |
| (a) | Fair Value basis is inclusive of short-term investment in State Street Institutional U.S. Government Money Market Fund - Class G Shares. |
| (b) | The securities information regarding holdings, allocations and other characteristics is presented to illustrate examples of securities that the Fund has bought and the diversity of areas in which the Fund may invest as of a particular date. It may not be representative of the Fund’s current or future investments and should not be construed as a recommendation to purchase or sell a particular security. |
| | |
| 4 | | State Street Real Estate Securities V.I.S. Fund |
State Street Real Estate Securities V.I.S. Fund
Performance Summary, continued — December 31, 2019 (Unaudited)
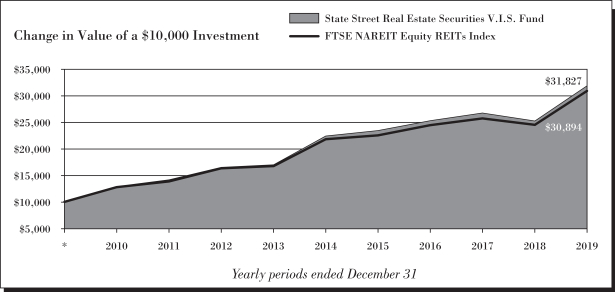
See Notes to Performance beginning on page 1 for further information.
Past performance does not predict future performance. The performance shown in the graphs and tables does not reflect the deduction of taxes that a shareholder would pay on Fund distributions or the redemption of Fund shares and does not reflect the fees or charges that would be associated with variable contracts through which shares of the Fund are offered.
| | | | |
| State Street Real Estate Securities V.I.S. Fund | | | 5 | |
State Street Real Estate Securities V.I.S. Fund
Schedule of Investments — December 31, 2019
| | | | | | | | |
| | | Number
of Shares | | | Fair
Value $ | |
| | | | | | | | |
|
| Common Stock (REITs) - 99.0%† | |
Alternate Housing - 7.3% | |
American Homes 4 Rent, Class A | | | 37,640 | | | | 986,544 | |
Invitation Homes Inc. | | | 46,911 | | | | 1,405,923 | |
Sun Communities Inc. | | | 11,110 | | | | 1,667,610 | |
| | | | | | | | |
| | | | 4,060,077 | |
| | | | | | | | |
|
Data Center - 9.7% | |
CyrusOne Inc. | | | 12,392 | | | | 810,809 | |
Digital Realty Trust Inc. | | | 10,080 | | | | 1,206,979 | |
Equinix Inc. | | | 5,730 | | | | 3,344,601 | |
| | | | | | | | |
| | | | 5,362,389 | |
| | | | | | | | |
|
Healthcare - 12.9% | |
CareTrust REIT Inc. | | | 28,890 | | | | 596,001 | |
Diversified Healthcare Trust | | | 37,860 | | | | 319,538 | |
Healthcare Trust of America Inc., Class A | | | 24,348 | | | | 737,258 | |
Healthpeak Properties Inc. | | | 67,020 | | | | 2,310,179 | |
Medical Properties Trust Inc. | | | 26,670 | | | | 563,004 | |
Omega Healthcare Investors Inc. | | | 16,837 | | | | 713,047 | |
Ventas Inc. | | | 33,010 | | | | 1,905,997 | |
| | | | | | | | |
| | | | 7,145,024 | |
| | | | | | | | |
|
Hotel - 5.1% | |
DiamondRock Hospitality Co. | | | 35,180 | | | | 389,794 | |
Host Hotels & Resorts Inc. | | | 88,390 | | | | 1,639,635 | |
Park Hotels & Resorts Inc. | | | 30,791 | | | | 796,563 | |
| | | | | | | | |
| | | | 2,825,992 | |
| | | | | | | | |
|
Industrial - 11.7% | |
Americold Realty Trust | | | 21,140 | | | | 741,168 | |
Industrial Logistics Properties Trust | | | 15,533 | | | | 348,250 | |
Liberty Property Trust | | | 14,160 | | | | 850,308 | |
Prologis Inc. REIT | | | 43,340 | | | | 3,863,328 | |
Rexford Industrial Realty Inc. | | | 13,895 | | | | 634,585 | |
| | | | | | | | |
| | | | 6,437,639 | |
| | | | | | | | |
|
Multifamily - 13.0% | |
Apartment Investment & Management Co., Class A | | | 19,096 | | | | 986,308 | |
AvalonBay Communities Inc. | | | 6,010 | | | | 1,260,297 | |
Equity Residential | | | 27,130 | | | | 2,195,360 | |
Mid-America Apartment Communities Inc. | | | 8,428 | | | | 1,111,316 | |
UDR Inc. | | | 34,770 | | | | 1,623,759 | |
| | | | | | | | |
| | | | 7,177,040 | |
| | | | | | | | |
Net Lease - 8.4% | |
National Retail Properties Inc. | | | 14,456 | | | | 775,131 | |
Realty Income Corp. | | | 28,539 | | | | 2,101,326 | |
STORE Capital Corp. | | | 17,240 | | | | 642,018 | |
| | | | | | | | |
| | | Number
of Shares | | | Fair
Value $ | |
VEREIT Inc. | | | 120,100 | | | | 1,109,724 | |
| | | | | | | | |
| | | | 4,628,199 | |
| | | | | | | | |
|
Office - 11.9% | |
Boston Properties Inc. | | | 7,110 | | | | 980,185 | |
Brandywine Realty Trust | | | 29,010 | | | | 456,907 | |
Columbia Property Trust Inc. | | | 36,850 | | | | 770,533 | |
Cousins Properties Inc. | | | 13,530 | | | | 557,436 | |
Empire State Realty Trust Inc., Class A | | | 45,460 | | | | 634,622 | |
Hudson Pacific Properties Inc. | | | 15,160 | | | | 570,774 | |
JBG SMITH Properties | | | 34,840 | | | | 1,389,768 | |
Kilroy Realty Corp. | | | 14,580 | | | | 1,223,262 | |
| | | | | | | | |
| | | | 6,583,487 | |
| | | | | | | | |
|
Regional Malls - 3.9% | |
Simon Property Group Inc. | | | 11,770 | | | | 1,753,259 | |
Taubman Centers Inc. | | | 13,125 | | | | 408,056 | |
| | | | | | | | |
| | | | 2,161,315 | |
| | | | | | | | |
|
Self Storage - 5.4% | |
Extra Space Storage Inc. | | | 10,600 | | | | 1,119,572 | |
Life Storage Inc. | | | 5,342 | | | | 578,432 | |
Public Storage | | | 6,103 | | | | 1,299,695 | |
| | | | | | | | |
| | | | 2,997,699 | |
| | | | | | | | |
|
Shopping Centers - 4.9% | |
Brixmor Property Group Inc. | | | 24,260 | | | | 524,259 | |
Regency Centers Corp. | | | 12,302 | | | | 776,133 | |
Retail Opportunity Investments Corp. | | | 37,591 | | | | 663,857 | |
Retail Properties of America Inc., Class A | | | 54,719 | | | | 733,234 | |
| | | | | | | | |
| | | | 2,697,483 | |
| | | | | | | | |
|
Specialty - 4.8% | |
Iron Mountain Inc. | | | 32,830 | | | | 1,046,292 | |
SBA Communications Corp. | | | 3,110 | | | | 749,479 | |
VICI Properties Inc. | | | 33,330 | | | | 851,582 | |
| | | | | | | | |
| | | | 2,647,353 | |
| | | | | | | | |
| |
Total Common Stock (REITs)
(Cost $47,654,241) | | | | 54,723,697 | |
| | | | | | | | |
|
| Short-Term Investments - 0.8% | |
State Street Institutional U.S. Government Money Market Fund - Class G Shares 1.57%
(Cost $417,366) (a)(b) | | | 417,366 | | | | 417,366 | |
| | | | | | | | |
| |
Total Investments
(Cost $48,071,607) | | | | 55,141,063 | |
| |
| Other Assets and Liabilities, net - 0.2% | | | | 124,809 | |
| | | | | | | | |
| |
| NET ASSETS - 100.0% | | | | 55,265,872 | |
| | | | | | | | |
See Notes to Schedule of Investments and Notes to Financial Statements.
| | |
| 6 | | State Street Real Estate Securities V.I.S. Fund |
State Street Real Estate Securities V.I.S. Fund
Schedule of Investments, continued — December 31, 2019
The views expressed in this document reflect our judgment as of the publication date and are subject to change at any time without notice. The securities cited may not be representative of the Fund’s future investments and should not be construed as a recommendation to purchase or sell a particular security. See the Fund’s summary prospectus and statutory prospectus for complete descriptions of investment objectives, policies, risks and permissible investments.
| (a) | Coupon amount represents effective yield. |
| (b) | Sponsored by SSGA Funds Management, Inc., the Fund’s investment adviser and administrator, and an affiliate of State Street Bank & Trust Co., the Fund’ssub-administrator, custodian and accounting agent. |
| † | Percentages are based on net assets as of December 31, 2019. |
Abbreviations:
REIT - Real Estate Investment Trust
The following table presents the Fund’s investments measured at fair value on a recurring basis at December 31, 2019:
| | | | | | | | | | | | | | | | | | |
| Fund | | Investments | | Level 1 | | | Level 2 | | | Level 3 | | | Total | |
| | | | | |
| Investments in Securities | | | | | | | | | | | | | | | | | | |
| | | | | |
| | Common Stock | | $ | 54,723,697 | | | $ | — | | | $ | — | | | $ | 54,723,697 | |
| | | | | |
| | Short-Term Investments | | | 417,366 | | | | — | | | | — | | | | 417,366 | |
| | | | | | | | | | | | | | | | | | |
| | | | |
| Total Investments in Securities | | $ | 55,141,063 | | | $ | — | | | $ | — | | | $ | 55,141,063 | |
| | | | | | | | | | | | | | | | | | |
Affiliate Table
| | | | | | | | | | | | | | | | | | | | | | | | | | | | | | | | | | | | |
| | | Number of Shares
Held at
12/31/18 | | | Value At
12/31/18 | | | Cost of
Purchases | | | Proceeds
from
Shares Sold | | | Realized
Gain
(Loss) | | | Change in
Unrealized
Appreciation/ Depreciation | | | Number
of Shares
Held at
12/31/19 | | | Value at
12/31/19 | | | Dividend
Income | |
| | | | | | | | | | | | | | | | | | | | | | | | | | | | | | | | | | | | |
State Street Institutional U.S. Government Money Market Fund, Class G Shares | | | 66,693 | | | $ | 66,693 | | | $ | 7,276,033 | | | $ | 6,925,360 | | | | — | | | | — | | | | 417,366 | | | $ | 417,366 | | | $ | 3,650 | |
See Notes to Schedule of Investments and Notes to Financial Statements.
| | | | |
| State Street Real Estate Securities V.I.S. Fund | | | 7 | |
State Street Real Estate Securities V.I.S. Fund
Financial Highlights
Selected data based on a share outstanding throughout the fiscal years indicated
| | | | | | | | | | | | | | | | | | | | |
| | | 12/31/19 | | | 12/31/18 | | | 12/31/17 | | | 12/31/16 | | | 12/31/15* | |
| Inception date | | | | | | | | | | | | | | | | | | | 5/1/95 | |
| | | | | |
Net asset value, beginning of period | | $ | 11.14 | | | $ | 12.32 | | | $ | 12.37 | | | $ | 13.30 | | | $ | 14.74 | |
| | | | | | | | | | | | | | | | | | | | |
|
Income/(loss) from investment operations: | |
Net investment income | | | 0.25 | (a) | | | 0.25 | (a) | | | 0.15 | (a) | | | 0.31 | | | | 0.29 | |
Net realized and unrealized gains/(losses) on investments | | | 2.65 | | | | (0.95 | ) | | | 0.57 | | | | 0.71 | | | | 0.41 | |
| | | | | | | | | | | | | | | | | | | | |
Total income/(loss) from investment operations | | | 2.90 | | | | (0.70 | ) | | | 0.72 | | | | 1.02 | | | | 0.70 | |
| | | | | | | | | | | | | | | | | | | | |
|
Less distributions from: | |
Net investment income | | | 0.19 | | | | 0.28 | | | | 0.22 | | | | 0.35 | | | | 0.28 | |
Net realized gains | | | 0.93 | | | | 0.16 | | | | 0.55 | | | | 1.60 | | | | 1.86 | |
Return of capital | | | — | | | | 0.04 | | | | — | | | | — | | | | — | |
| | | | | | | | | | | | | | | | | | | | |
Total distributions | | | 1.12 | | | | 0.48 | | | | 0.77 | | | | 1.95 | | | | 2.14 | |
| | | | | | | | | | | | | | | | | | | | |
Net asset value, end of period | | $ | 12.92 | | | $ | 11.14 | | | $ | 12.32 | | | $ | 12.37 | | | $ | 13.30 | |
| | | | | | | | | | | | | | | | | | | | |
Total Return(b) | | | 26.15 | % | | | (5.71 | )% | | | 5.84 | % | | | 8.00 | % | | | 4.56 | % |
|
Ratios/Supplemental Data: | |
Net assets, end of period (in thousands) | | $ | 55,266 | | | $ | 50,360 | | | $ | 61,685 | | | $ | 72,483 | | | $ | 78,912 | |
|
Ratios to average net assets: | |
Net expenses | | | 1.04 | % | | | 1.05 | % | | | 1.01 | % | | | 0.97 | % | | | 0.95 | % |
Gross expenses | | | 1.04 | % | | | 1.05 | % | | | 1.01 | % | | | 0.97 | % | | | 0.95 | % |
Net investment income | | | 1.91 | % | | | 2.11 | % | | | 1.16 | % | | | 1.95 | % | | | 1.80 | % |
Portfolio turnover rate | | | 72 | % | | | 59 | % | | | 73 | % | | | 67 | % | | | 57 | % |
Notes to Financial Highlights
| (a) | | Per share values have been calculated using the average shares method. |
| (b) | | Total returns are historical and assume changes in share price, reinvestment of dividends and capital gains distributions and do not include the effect of insurance contract charges. Past performance does not guarantee future results. |
| * | | Beginning with the year ended December 31, 2016, the Fund was audited by Ernst & Young LLP. The previous years were audited by another independent registered public accounting firm. |
The accompanying Notes are an integral part of these financial statements.
State Street Real Estate Securities V.I.S. Fund
Statement of Assets and Liabilities — December 31, 2019
| | | | |
Assets | | | | |
Investments in securities, at fair value (cost $47,654,241) | | $ | 54,723,697 | |
Short-term affiliated investments, at fair value | | | 417,366 | |
Receivable for investments sold | | | 33,959 | |
Income receivables | | | 250,281 | |
Receivable for fund shares sold | | | 295 | |
Income receivable from affiliated investments | | | 448 | |
Other assets | | | 307 | |
| | | | |
| |
Total assets | | | 55,426,353 | |
| | | | |
| |
Liabilities | | | | |
Payable for investments purchased | | | 47,471 | |
Payable for fund shares redeemed | | | 59,922 | |
Payable to the Adviser | | | 39,237 | |
Payable for custody, fund accounting andsub-administration fees | | | 2,502 | |
Accrued other expenses | | | 11,349 | |
| | | | |
| |
Total liabilities | | | 160,481 | |
| | | | |
| | | | |
| |
Net Assets | | $ | 55,265,872 | |
| | | | |
| |
Net Assets Consist of: | | | | |
Capital paid in | | $ | 47,638,036 | |
Total distributable earnings (loss) | | | 7,627,836 | |
| | | | |
| |
Net Assets | | $ | 55,265,872 | |
| | | | |
| | | | |
Shares outstanding ($0.01 par value; unlimited shares authorized) | | | 4,278,921 | |
Net asset value per share | | $ | 12.92 | |
The accompanying Notes are an integral part of these financial statements.
| | | | |
| Statement of Assets and Liabilities | | | 9 | |
State Street Real Estate Securities V.I.S. Fund
Statement of Operations — For the fiscal year ended December 31, 2019
| | | | |
Investment Income | |
Income | | | | |
Dividend | | $ | 1,632,343 | |
Income from affiliated investments | | | 3,650 | |
| | | | |
Total income | | | 1,635,993 | |
| | | | |
|
Expenses | |
Advisory and administration fees | | | 471,132 | |
Directors’ fees | | | 17,176 | |
Custody, fund accounting andsub-administration fees | | | 23,573 | |
Professional fees | | | 34,974 | |
Printing and shareholder reports | | | 26,801 | |
Other expenses | | | 2,468 | |
| | | | |
Total Expenses | | | 576,124 | |
| | | | |
Net investment income | | $ | 1,059,869 | |
| | | | |
|
Net Realized and Unrealized Gain (Loss) on Investments | |
Realized gain (loss) on investments | | $ | 4,952,822 | |
Increase (decrease) in unrealized appreciation/(depreciation) on investments | | | 6,699,615 | |
| | | | |
| |
Net realized and unrealized gain (loss) on investments | | | 11,652,437 | |
| | | | |
| |
Net Increase in Net Assets Resulting from Operations | | $ | 12,712,306 | |
| | | | |
The accompanying Notes are an integral part of these financial statements.
| | |
| 10 | | Statement of Operations |
State Street Real Estate Securities V.I.S. Fund
Statements of Changes in Net Assets
| | | | | | | | |
| | | Year Ended December 31,
2019 | | | Year Ended December 31,
2018 | |
Increase (Decrease) in Net Assets | |
| | |
Operations: | | | | | | | | |
Net investment income | | $ | 1,059,869 | | | $ | 1,195,948 | |
Net realized gain (loss) on investments | | | 4,952,822 | | | | (571,497 | ) |
Net increase (decrease) in unrealized appreciation/depreciation on investments | | | 6,699,615 | | | | (3,874,624 | ) |
| | | | | | | | |
Net increase (decrease) from operations | | | 12,712,306 | | | | (3,250,173 | ) |
| | | | | | | | |
|
Distributions to shareholders: | |
Distributions to shareholders | | | (4,417,061 | ) | | | (1,861,401 | ) |
Return of capital | | | — | | | | (188,993 | ) |
| | | | | | | | |
Total distributions | | | (4,417,061 | ) | | | (2,050,394 | ) |
| | | | | | | | |
Increase (decrease) in assets from operations and distributions | | | 8,295,245 | | | | (5,300,567 | ) |
| | | | | | | | |
|
Share transactions: | |
Proceeds from sale of shares | | | 1,937,025 | | | | 5,027,170 | |
Value of distributions reinvested | | | 4,417,061 | | | | 2,050,394 | |
Cost of shares redeemed | | | (9,743,533 | ) | | | (13,101,821 | ) |
| | | | | | | | |
Net increase (decrease) from share transactions | | | (3,389,447 | ) | | | (6,024,257 | ) |
| | | | | | | | |
| | |
Total increase (decrease) in net assets | | | 4,905,798 | | | | (11,324,824 | ) |
|
Net Assets | |
Beginning of year | | | 50,360,074 | | | | 61,684,898 | |
| | | | | | | | |
| | |
End of year | | $ | 55,265,872 | | | $ | 50,360,074 | |
| | | | | | | | |
|
Changes in Fund Shares | |
Shares sold | | | 147,090 | | | | 419,885 | |
Issued for distributions reinvested | | | 345,083 | | | | 185,388 | |
Shares redeemed | | | (734,446 | ) | | | (1,090,576 | ) |
| | | | | | | | |
Net decrease in fund shares | | | (242,273 | ) | | | (485,303 | ) |
| | | | | | | | |
The accompanying Notes are an integral part of these financial statements.
| | | | |
| Statements of Changes in Net Assets | | | 11 | |
State Street Real Estate Securities V.I.S. Fund
Notes to Financial Statements — December 31, 2019
| 1. | | Organization of the Company |
State Street Variable Insurance Series Funds, Inc. (the “Company”) was incorporated under the laws of the Commonwealth of Virginia on May 14, 1984 and is registered under the Investment Company Act of 1940, as amended (the “1940 Act”), as anopen-end management investment company. The Company is currently composed of the following seven investment portfolios (collectively, the “Funds”): State Street U.S. Equity V.I.S. Fund, State Street S&P 500 Index V.I.S. Fund, State Street Premier Growth Equity V.I.S. Fund, State StreetSmall-Cap Equity V.I.S. Fund, State Street Total Return V.I.S. Fund, State Street Income V.I.S. Fund and State Street Real Estate Securities V.I.S. Fund (the “Fund”). Each Fund is a diversified investment company within the meaning of the 1940 Act.
Shares of the Funds of the Company are offered only to insurance company separate accounts that fund certain variable life insurance contracts and variable annuity contracts.
The Company currently offers one share class (Class 1) of the Fund as an investment option for variable life insurance and variable annuity contracts.
Under the Company’s organizational documents, its officers and directors are indemnified against certain liabilities arising out of the performance of their duties to the Company. Additionally, in the normal course of business, the Company enters into contracts with service providers that contain general indemnification clauses. The Company’s maximum exposure under these arrangements is unknown as this would involve future claims that may be made against the Company that have not yet occurred.
| 2. | | Summary of Significant Accounting Policies |
The following is a summary of significant accounting policies followed by the Company in the preparation of its financial statements:
The preparation of financial statements in accordance with U.S. generally accepted accounting principles (“U.S. GAAP”) requires management to make estimates and assumptions that affect the reported amounts and disclosures in the financial statements. Actual results could differ from those estimates. The Fund is an investment company under U.S. GAAP and follows the accounting and reporting guidance applicable to investment companies.
Security Valuation The Fund’s investments are valued at fair value each day that the New York Stock Exchange (“NYSE”) is open and, for financial reporting purposes, as of the report date should the reporting period end on a day that the NYSE is not open. Fair value is generally defined as the price a fund would receive to sell an asset or pay to transfer a liability in an orderly transaction between market participants at the measurement date. By its nature, a fair value price is a good faith estimate of the valuation in a current sale and may not reflect an actual market price. The investments of the Fund are valued pursuant to the policy and procedures developed by the Oversight Committee (the “Committee”) and approved by the Company’s Board of Directors (the “Board”). The Committee provides oversight of the valuation of investments for the Fund. The Board has responsibility for overseeing the determination of the fair value of investments.
Valuation techniques used to value the Fund’s investments by major category are as follows:
| | • | | Equity investments traded on a recognized securities exchange for which market quotations are readily available are valued at the last sale price or official closing price, as applicable, on the primary market or exchange on which they trade. Equity investments traded on a recognized exchange for which there were no sales on that day are valued at the last published sale price or at fair value. |
| | • | | Investments in registered investment companies (including money market funds) or other unitized pooled investment vehicles that are not traded on an exchange are valued at that day’s published net asset value (“NAV”) per share or unit. |
In the event prices or quotations are not readily available or that the application of these valuation methods results in a price for an investment that is deemed to be not representative of the fair value of such investment, fair value will be determined in good faith by the Committee, in accordance with the valuation policy and procedures approved by the Board.
The Fund values its assets and liabilities at fair value using a fair value hierarchy consisting of three broad levels that prioritize the inputs to valuation techniques giving the highest priority to readily available unadjusted quoted prices in active
| | |
| 12 | | Notes to Financial Statements |
State Street Real Estate Securities V.I.S. Fund
Notes to Financial Statements, continued — December 31, 2019
markets for identical assets or liabilities (Level 1 measurements) and the lowest priority to unobservable inputs (Level 3 measurements) when market prices are not readily available or reliable. The categorization of a value determined for an investment within the hierarchy is based upon the pricing transparency of the investment and is not necessarily an indication of the risk associated with investing in it.
The three levels of the fair value hierarchy are as follows:
| | • | | Level 1 — Unadjusted quoted prices in active markets for an identical asset or liability; |
| | • | | Level 2 — Inputs other than quoted prices included within Level 1 that are observable for the asset or liability either directly or indirectly, including quoted prices for similar assets or liabilities in active markets, quoted prices for identical or similar assets or liabilities in markets that are not considered to be active, inputs other than quoted prices that are observable for the asset or liability (such as exchange rates, financing terms, interest rates, yield curves, volatilities, prepayment speeds, loss severities, credit risks and default rates) or other market-corroborated inputs; and |
| | • | | Level 3 — Unobservable inputs for the asset or liability, including the Committee’s assumptions used in determining the fair value of investments. |
The value of the Fund’s investments according to the fair value hierarchy as of December 31, 2019 is disclosed in the Fund’s Schedule of Investments.
Investment Transactions and Income Recognition Investment transactions are accounted for on trade date for financial reporting purposes. Realized gains and losses from the sale or disposition of investments and foreign exchange transactions, if any, are determined using the identified cost method.
Dividend income and capital gain distributions, if any, are recognized on theex-dividend date, net of any foreign taxes withheld at source, if any.
Interest income is recorded daily on an accrual basis. All premiums and discounts are amortized/accreted for financial reporting purposes.
Non-cash dividends received in the form of stock are recorded as dividend income at fair value.
Expenses Certain expenses, which are directly identifiable to a specific Fund, are applied to the Fund within the Company. Other expenses which cannot be attributed to a specific Fund are allocated in such a manner as deemed equitable, taking into consideration the nature and type of expense and the relative net assets of the Fund within the Company.
Foreign Currency Translation The accounting records of the Fund are maintained in U.S. dollars. Foreign currencies as well as investment securities and other assets and liabilities denominated in a foreign currency are translated to U.S. dollars using exchange rates at period end. Purchases and sales of securities, income receipts and expense payments denominated in foreign currencies are translated into U.S. dollars at the prevailing exchange rate on the respective dates of the transactions.
The effects of exchange rate fluctuations on investments are included with the net realized and unrealized gain (loss) on investment securities. Other foreign currency transactions resulting in realized and unrealized gain (loss) are disclosed separately.
Foreign Taxes The Fund may be subject to foreign taxes (a portion of which may be reclaimable) on income, stock dividends, realized and unrealized capital gains on investments or certain foreign currency transactions. Foreign taxes are recorded in accordance with SSGA Funds Management, Inc.’s (the “Adviser” or “SSGA FM”) understanding of the applicable foreign tax regulations and rates that exist in the foreign jurisdictions in which the Fund invests. These foreign taxes, if any, are paid by the Fund and are reflected in the Statement of Operations, if applicable. Foreign taxes payable or deferred as of December 31, 2019, if any, are disclosed in the Fund’s Statement of Assets and Liabilities.
Distributions The Fund declares and pays any dividends from net investment income annually.
Net realized capital gains, if any, are distributed annually, unless additional distributions are required for compliance with applicable tax regulations. The amount and character of income and capital gains to be distributed are determined in accordance with applicable tax regulations which may differ from net investment income and realized gains recognized for U.S. GAAP purposes.
| | | | |
| Notes to Financial Statements | | | 13 | |
State Street Real Estate Securities V.I.S. Fund
Notes to Financial Statements, continued — December 31, 2019
| 3. | | Fees and Transactions with Affiliates |
Advisory Fee SSGA FM, a registered investment adviser, was retained by the Board to act as investment adviser and administrator of the Fund. SSGA FM’s compensation for investment advisory and administrative services (“Management Fee”) is paid monthly based on the average daily net assets of the Fund. The Management Fee is stated in the following schedule:
| | | | | | | | |
Average Daily
Net Assets of the Fund | | Management Fees |
| | First $ | 100 million | | | | | 0.85 | % |
| | Next $ | 100 million | | | | | 0.80 | % |
| | Over $ | 200 million | | | | | 0.75 | % |
Custody, Fund Accounting andSub-Administration Fees State Street Bank and Trust Company (“State Street”) serves as the custodian, fund accountant andsub-administrator to the Fund. Amounts paid by the Fund to State Street for performing such services are included as custody, fund accounting andsub-administration fees in the Statement of Operations.
Other Transactions with Affiliates The Fund may invest in affiliated entities, including securities issued by State Street Corporation, affiliated funds, or entities deemed to be affiliates as a result of the Fund owning more than five percent of the entity’s voting securities or outstanding shares. Amounts relating to these transactions during the fiscal year ended December 31, 2019 are disclosed in the Schedule of Investments.
Pursuant to an investmentsub-advisory agreement with SSGA FM, CenterSquare Investment Management LLC (“CenterSquare”) is thesub-adviser to the Fund. CenterSquare is responsible for theday-to-day portfolio management of the assets of the Fund, including the responsibility for making decisions to buy, sell or hold a particular security, under the general supervision of SSGA FM and the Board. For its services, SSGA FM pays CenterSquare monthlysub-advisory fees which are calculated as a percentage of the average daily net assets of the Fund.
The fees and expenses of the Company’s directors who are not “interested persons” of the Company, as defined in the 1940 Act (“Independent Directors”), are paid directly by the Fund. The Independent Directors are reimbursed for travel and otherout-of-pocket expenses in connection with meeting attendance and industry seminars.
| 6. | | Investment Transactions |
Purchases and sales of investments (excludingin-kind transactions, short term investments and derivative contracts) for the fiscal year ended December 31, 2019 were as follows:
| | | | | | | | |
| Non-U.S. Government Securities |
| Purchases | | Sales |
| | | | | | | | | |
| | $ | 39,564,960 | | | | $ | 46,063,562 | |
The Fund has qualified and intends to continue to qualify as a regulated investment company under Subchapter M of the Internal Revenue Code of 1986, as amended. The Fund will not be subject to federal income taxes to the extent it distributes its taxable income, including any net realized capital gains, for each fiscal year. Therefore, no provision for federal income tax is required.
The Fund files federal and various state and local tax returns as required. No income tax returns are currently under examination. Generally, the federal returns are subject to examination by the Internal Revenue Service for a period of three years from date of filing, while the state returns may remain open for an additional year depending upon jurisdiction. SSGA FM has analyzed the Fund’s tax positions taken on tax returns for all open years and does not believe there are any uncertain tax positions that would require recognition of a tax liability.
| | |
| 14 | | Notes to Financial Statements |
State Street Real Estate Securities V.I.S. Fund
Notes to Financial Statements, continued — December 31, 2019
Distributions to shareholders are recorded onex-dividend date. Income dividends and gain distributions are determined in accordance with income tax rules and regulations, which may differ from generally accepted accounting principles. Certain capital accounts in the financial statements have been adjusted for permanentbook-tax differences. These adjustments have no impact on net asset values or results of operations. Temporarybook-tax differences will reverse in the future. These book tax differences are primarily due to differing treatments for wash sale loss deferrals.
The tax character of distributions paid during the fiscal year ended December 31, 2019 was as follows:
| | | | | | | | | | | | | |
Ordinary
Income | | Long-Term
Capital Gains | | Total |
| | $ | 1,411,368 | | | | $ | 3,005,693 | | | | $ | 4,417,061 | |
The tax character of distributions paid during the year ended December 31, 2018 was as follows:
| | | | | | | | | | | | | | | | | | |
Ordinary
Income | | Long Term
Capital Gains | | Tax Return of Capital | | Total |
| | $ | 1,250,834 | | | | $ | 610,567 | | | | $ | 188,993 | | | | $ | 2,050,394 | |
At December 31, 2019, the components of distributable earnings on a tax basis were as follows:
| | | | | | | | | | | | | | | | | | | | | | | | | | | | | | | | | |
Undistributed
Ordinary
Income | | Tax Exempt
Income | | Capital Loss
Carryforwards | | Undistributed
long term
gain | | Net
Unrealized
Gains
(Losses) | | Qualified
Late-Year
Losses | | Total |
| | $ | 312,030 | | | | $ | — | | | | $ | — | | | | $ | 593,056 | | | | $ | 6,722,750 | | | | $ | — | | | | $ | 7,627,836 | |
As of December 31, 2019, gross unrealized appreciation and gross unrealized depreciation of investments and other financial instruments based on cost for federal income tax purposes were as follows:
| | | | | | | | | | | | | | | | | | |
Tax
Cost | | Gross
Unrealized
Appreciation | | Gross
Unrealized
Depreciation | | Net Unrealized
Appreciation
(Depreciation) |
| | $ | 48,418,313 | | | | $ | 7,445,943 | | | | $ | 723,193 | | | | $ | 6,722,750 | |
The Fund and other affiliated funds (each, a “Participant” and collectively, the “Participants”) have access to $200 million of a $500 million revolving credit facility provided by a syndication of banks under which the Participants may borrow to fund shareholder redemptions. This agreement expires in October 2020 unless otherwise extended or renewed.
The Participants are charged an annual commitment fee which is calculated based on the unused portion of the shared credit line. Commitment fees are allocated among each of the Participants based on relative net assets. Commitment fees are ordinary fund operating expenses. A Participant incurs and pays the interest expense related to its borrowing. Interest is calculated at a rate per annum equal to the sum of 1% plus the greater of the New York Fed Bank Rate and1-month LIBOR rate.
The Fund had no outstanding loans as of December 31, 2019.
Concentration Risk As a result of the Fund’s ability to invest a large percentage of its assets in obligations of issuers within the same country, state, region, currency or economic sector, an adverse economic, business or political development may affect the value of the Fund’s investments more than if the Fund were more broadly diversified.
Market and Credit Risk In the normal course of business, the Fund trades financial instruments and enters into financial transactions where risk of potential loss exists due to changes in the general economic conditions and fluctuations of the market (market risk). Additionally, the Fund may also be exposed to credit risk in the event that an issuer or guarantor fails to perform or that an institution or entity with which the Fund has unsettled or open transactions defaults.
| | | | |
| Notes to Financial Statements | | | 15 | |
State Street Real Estate Securities V.I.S. Fund
Notes to Financial Statements, continued — December 31, 2019
Management has evaluated the impact of all subsequent events on the Fund through the date on which the financial statements were available to be issued and has determined that there were no subsequent events requiring adjustment or disclosure in the financial statements.
| | |
| 16 | | Notes to Financial Statements |
State Street Real Estate Securities V.I.S. Fund
Report of Independent Registered Public Accounting Firm
To the Shareholders of State Street Real Estate Securities V.I.S. Fund and the Board of Directors of State Street Variable Insurance Series Funds, Inc.
Opinion on the Financial Statements
We have audited the accompanying statement of assets and liabilities of State Street Real Estate Securities V.I.S. Fund (the “Fund”) (one of the funds constituting State Street Variable Insurance Series Funds, Inc. (the “Company”)), including the schedule of investments, as of December 31, 2019, and the related statement of operations for the year then ended, the statements of changes in net assets for each of the two years in the period then ended, the financial highlights for each of the four years in the period then ended and the related notes (collectively referred to as the “financial statements”). In our opinion, the financial statements present fairly, in all material respects, the financial position of the Fund (one of the funds constituting State Street Variable Insurance Series Funds, Inc.) at December 31, 2019, the results of its operations for the year then ended, the changes in its net assets for each of the two years in the period then ended and its financial highlights for each of the four years in the period then ended, in conformity with U.S. generally accepted accounting principles. The financial highlights for the year ended December 31, 2015 were audited by another independent registered public accounting firm whose report, dated February 19, 2016, expressed an unqualified opinion on those financial highlights.
Basis for Opinion
These financial statements are the responsibility of the Company’s management. Our responsibility is to express an opinion on the Fund’s financial statements based on our audits. We are a public accounting firm registered with the Public Company Accounting Oversight Board (United States) (“PCAOB”) and are required to be independent with respect to the Company in accordance with the U.S. federal securities laws and the applicable rules and regulations of the Securities and Exchange Commission and the PCAOB.
We conducted our audits in accordance with the standards of the PCAOB. Those standards require that we plan and perform the audit to obtain reasonable assurance about whether the financial statements are free of material misstatement, whether due to error or fraud. The Company is not required to have, nor were we engaged to perform, an audit of the Company’s internal control over financial reporting. As part of our audits we are required to obtain an understanding of internal control over financial reporting, but not for the purpose of expressing an opinion on the effectiveness of the Company’s internal control over financials reporting. Accordingly, we express no such opinion.
Our audits included performing procedures to assess the risks of material misstatement of the financial statements, whether due to error or fraud, and performing procedures that respond to those risks. Such procedures included examining, on a test basis, evidence regarding the amounts and disclosures in the financial statements. Our procedures included confirmation of securities owned as of December 31, 2019, by correspondence with the custodian, brokers and others or by other appropriate auditing procedures where replies from brokers and others were not received. Our audits also included evaluating the accounting principles used and significant estimates made by management, as well as evaluating the overall presentation of the financial statements. We believe that our audits provide a reasonable basis for our opinion.

We have served as the auditor of one or more State Street Global Advisors investment companies since 2000.
Boston, Massachusetts
February 19, 2020
| | | | |
| Report of Independent Registered Public Accounting Firm | | | 17 | |
State Street Real Estate Securities V.I.S. Fund
Tax Information — December 31, 2019 (Unaudited)
For federal income tax purposes, the following information is furnished with respect to the distributions of the Fund for its fiscal year ended December 31, 2019.
Dividends Received Deduction
The Fund reports the maximum amount allowable of its net taxable income as eligible for the corporate dividends received deduction.
Long Term Capital Gain Distributions
Long term capital gains dividends were paid from the Fund during the year ended December 31, 2019 in the amount of $3,005,693.
State Street Real Estate Securities V.I.S. Fund
Other Information — December 31, 2019 (Unaudited)
Liquidity Risk Management Program
Pursuant to Rule 22e-4 under the 1940 Act, the Funds have adopted a liquidity risk management program. SSGA FM has been designated by the Board to administer the Funds’ liquidity risk management program. The program’s principal objectives include assessing, managing and periodically reviewing each Fund’s liquidity risk, based on factors specific to the circumstances of the Fund. Liquidity risk is defined as the risk that a Fund could not meet redemption requests without significant dilution of remaining investors’ interests in the Fund. During the fiscal year, SSGA FM provided the Board with a report addressing the operations of the program and assessing its adequacy and effectiveness of implementation.
During the period covered by the liquidity program report to the Board, the program supported each Fund’s ability to honor redemption requests timely and SSGA FM’s management of each Fund’s liquidity profile, including during periods of market volatility and net redemptions. SSGA FM reported that the program operated adequately and that the implementation of the program was effective to manage the Fund’s liquidity risk.
There can be no assurance that the program will achieve its objectives in the future. Please refer to your Fund’s prospectus for more information regarding the Fund’s exposure to liquidity risk and other principal risks to which an investment in the Fund may be subject.
Proxy Voting Policies and Procedures and Record
The Fund has adopted the proxy voting policies of SSGA FM. A description of the policies and procedures that the Fund has adopted to determine how to vote proxies relating to portfolio securities is available (i) without charge, upon request, by calling1-800-242-0134, (ii) on the Fund’s website at http://www.ssga.com/geam, or (iii) on the SEC’s website at www.sec.gov. Information regarding how the Fund voted proxies, if any, during the most recent 12-month period ended June 30 is available by August 31 of each year without charge (1) by calling 1-800-242-0134 (toll free), and (2) on the website of the SEC at www.sec.gov.
Quarterly Portfolio Schedule
Following the Fund’s first and third fiscal quarter-ends, a complete schedule of investments is filed with the SEC as an exhibit to its reports on Form N-PORT, which can be found on the SEC’s website at www.sec.gov. The Fund’s schedule of investments are available upon request, without charge, by calling 1-800-242-0134.
State Street Real Estate Securities V.I.S. Fund
Other Information, continued — December 31, 2019 (Unaudited)
| | | | | | | | | | | | |
| | | | | | |
Name,
Address,
and Year of Birth | | Position(s) Held
with Fund | | Term of
Office and
Length of
Time Served | | Principal Occupation
During Past Five Years and Relevant Experience | | Number of
Funds in Fund
Complex
Overseen
by Director† | | | Other Directorships
Held by Director During Past Five Years |
INDEPENDENT DIRECTORS |
Michael F. Holland c/o SSGA Funds Management, Inc. One Iron Street Boston, MA 02210 YOB: 1944 | | Director and Co-Chairperson of the Board | | Term: Until successor is elected and qualified Served: Since January 2019 | | Chairman, Holland & Company L.L.C. (investment adviser) (1995 – present). | | | 68 | | | Director, the Holland Series Fund, Inc.; Director, Reaves Utility Income Fund, Inc.; and Director, Blackstone/GSO Loans (and Real Estate) Funds. |
| | | | | | | | | | | | | |
Patrick J. Riley c/o SSGA Funds Management, Inc. One Iron Street Boston, MA 02210 YOB: 1948 | | Director andCo-Chairperson of the Board | | Term: Until successor is elected and qualified Served: Since January 2019 | | 2002 to May 2010, Associate Justice of the Superior Court, Commonwealth of Massachusetts; 1985 to 2002, Partner, Riley, Burke & Donahue, L.L.P. (law firm); 1998 to Present, Independent Director, State Street Global Advisers Ireland, Ltd. (investment company); 1998 to Present, Independent Director, SSGA Liquidity plc (formerly, SSGA Cash Management Fund plc); January 2009 to Present, Independent Director, SSGA Fixed Income plc; and January 2009 – 2019, Independent Director, SSGA Qualified Funds PLC. | | | 68 | | | Board Director and Chairman, SPDR Europe 1PLC Board(2011-Present); Board Director and Chairman, SPDR Europe II, PLC (2013 – Present). |
| | | | | | | | | | | | | |
John R. Costantino c/o SSGA Funds Management, Inc. One Iron Street Boston, MA 02210 YOB: 1946 | | Director and Co-Chairperson of the Qualified Legal Compliance Committee | | Term: Until successor is elected and qualified Served: Since 1997 | | Senior Advisor to NGN Capital LLC (December 2019 – Present); Managing General Partner, NGN Capital LLC (2006 – December 2019); and Managing Director, Vice President of Walden Capital Management (1996 – present). | | | 68 | | | Director of Kleinfeld Bridal Corp. (March 2016 – present); Trustee of Neuroscience Research Institute (1986 – 2018); Trustee of Fordham University (1989 – 1995 and 2001 – 2007) and Trustee Emeritus (2007 – present); Director, Muscular Dystrophy Association (since 2019); Trustee of GE Funds (1993 – February 2011); and Trustee of Gregorian University Foundation (1992 – 2007). |
| | | | | | | | | | | | | |
Donna M. Rapaccioli c/o SSGA Funds Management, Inc. One Iron Street Boston, MA 02210 YOB: 1962 | | Director and Co-Chairperson of the Audit Committee | | Term: Until successor is elected and qualified Served: Since January 2012 | | Dean of the Gabelli School of Business (2007 – present) and Accounting Professor (1987 – present) at Fordham University. | | | 68 | | | Director-Graduate Management Admissions Council (2015 – present). |
State Street Real Estate Securities V.I.S. Fund
Other Information, continued — December 31, 2019 (Unaudited)
| | | | | | | | | | | | |
| | | | | | |
Name,
Address,
and Year of Birth | | Position(s) Held
with Fund | | Term of
Office and
Length of
Time Served | | Principal Occupation
During Past Five Years and Relevant Experience | | Number of
Funds
in Fund
Complex
Overseen
by Director† | | | Other Directorships
Held by Director During Past Five Years |
INDEPENDENT DIRECTORS (continued) |
Richard D. Shirk c/o SSGA Funds Management, Inc. One Iron Street Boston, MA 02210 YOB: 1945 | | Director and Co-Chairperson of the Qualified Legal Compliance Committee | | Term: Until successor is elected and qualified Served: Since January 2019 | | March 2001 to April 2002, Chairman (1996 to March 2001, President and Chief Executive Officer), Cerulean Companies, Inc. (holding company) (Retired); 1992 to March 2001, President and Chief Executive Officer, Blue Cross Blue Shield of Georgia (health insurer, managed healthcare). | | | 68 | | | 1998 to December 2008, Chairman, Board Member and December 2008 to Present, Investment Committee Member, Healthcare Georgia Foundation (private foundation); September 2002 to 2012, Lead Director and Board Member, Amerigroup Corp. (managed health care); 1999 to 2013, Board Member and (since 2001) Investment Committee Member, Woodruff Arts Center; and 2003 to 2009, Trustee, Gettysburg College; Board member, Aerocare Holdings, Regenesis Biomedical Inc. |
| | | | | | | | | | | | | |
Rina K. Spence c/o SSGA Funds Management, Inc. One Iron Street Boston, MA 02210 YOB: 1948 | | Director and Co-Chairperson of the Audit Committee, Chairperson of the Nominating Committee and Chairperson of the Governance Committee | | Term: Until successor is elected and qualified Served: Since January 2019 | | President of SpenceCare International LLC (international healthcare consulting) (1999 – present); Chief Executive Officer, IEmily.com (health internet company) (2000 – 2001); Chief Executive Officer of Consensus Pharmaceutical, Inc. (1998 – 1999); Founder, President and Chief Executive Officer of Spence Center for Women’s Health (1994 – 1998); President and CEO, Emerson Hospital (1984 – 1994); Honorary Consul for Monaco in Boston (2015 – present). | | | 68 | | | None |
| | | | | | | | | | | | | |
Michael A. Jessee c/o SSGA Funds Management, Inc. One Iron Street Boston, MA 02210 YOB: 1946 | | Director and Chairperson of the Valuation Committee | | Term: Until successor is elected and qualified
Served: Since January 2019 | | Retired; formerly, President and Chief Executive Officer of the Federal Home Loan Bank of Boston (1989 – 2009); Trustee, Randolph-Macon College (2004 – 2016). | | | 68 | | | None |
| |
INTERESTED DIRECTORS(1) |
Ellen M. Needham(2) SSGA Funds Management, Inc. One Iron Street Boston, MA 02210 YOB: 1967 | | Director | | Term: Until successor is elected and qualified Served: Since January 2019 | | President and Director, SSGA Funds Management, Inc. (2001 – present)*; Senior Managing Director, State Street Global Advisors (1992 – present)*; Director, State Street Global Advisors Funds Distributors, LLC (May 2017 – present). | | | 68 | | | None |
State Street Real Estate Securities V.I.S. Fund
Other Information, continued — December 31, 2019 (Unaudited)
| | | | | | | | | | | | |
| | | | | | |
Name,
Address,
and Year of Birth | | Position(s) Held
with Fund | | Term of
Office and
Length of
Time Served | | Principal Occupation
During Past Five Years and Relevant Experience | | Number of
Funds
in Fund
Complex
Overseen
by Director† | | | Other Directorships
Held by Director During Past Five Years |
INTERESTED DIRECTORS(1) (continued) |
Jeanne La Porta(3) c/o SSGA Funds Management, Inc. 1600 Summer St. Stamford, CT 06905 YOB: 1965 | | Director & President | | Term: Until successor is elected and qualified Served: Since 2014 | | Senior Managing Director at State Street Global Advisors (July 2016 – present); Director of State Street Global Advisors Funds Distributors, LLC (May 2017 – present); President of GE Retirement Savings Plan Funds (July 2016 – September 2018); Senior Vice President and Commercial Operations Leader at GE Asset Management Incorporated (“GEAM”) (March 2014 – July 2016); President of State Street Institutional Funds and State Street Variable Insurance Series Funds, Inc. (April 2014 – present); President and Trustee of GEAM’s UCITs Funds (March 2014 – November 2014); Senior Vice President and Commercial Administrative Officer at GEAM (April 2010 – March 2014); Vice President of State Street Institutional Funds (July 2003 – April 2014); Vice President of Elfun Funds and GE Retirement Savings Plan Funds (October 2003 – July 2016). | | | 18 | | | None |
| | † | For the purpose of determining the number of portfolios overseen by the Directors, “Fund Complex” comprises registered investment companies for which SSGA FM serves as investment adviser. |
| | (1) | The individuals listed below are Directors who are “interested persons,” as defined in the 1940 Act, of the Company (“Interested Directors”). |
| | (2) | Ms. Needham is an Interested Director because of her employment by SSGA FM, an affiliate of the Company. |
| | (3) | Ms. La Porta is an Interested Director because of her employment by SSGA, an affiliate of the Company. |
| | * | Served in various capacities and/or with various affiliated entities during noted time period. |
State Street Real Estate Securities V.I.S. Fund
Other Information, continued — December 31, 2019 (Unaudited)
| | | | | | |
| | | | |
Name,
Address, and
Year of Birth | | Position(s) Held
with Fund | | Term of
Office and
Length of
Time Served | | Principal Occupation
During Past Five Years |
OFFICERS: | | | | | | |
Jeanne M. La Porta SSGA Funds Management, Inc. 1600 Summer St. Stamford, CT 06905 YOB: 1965 | | President and Director | | Term: Indefinite Elected: 3/14 | | Senior Managing Director at State Street Global Advisors (July 2016 – present); Director of State Street Global Advisors Funds Distributors, LLC (May 2017 – present); President of GE Retirement Savings Plan Funds (July 2016 – September 2018); Senior Vice President and Commercial Operations Leader at GEAM (March 2014 – July 2016); President of State Street Institutional Funds and State Street Variable Insurance Series Funds, Inc. (April 2014 – present); President and Trustee of GEAM’s UCITs Funds (March 2014 – November 2014); Senior Vice President and Commercial Administrative Officer at GEAM (April 2010 – March 2014); Vice President of State Street Institutional Funds (July 2003 – April 2014); Vice President of Elfun Funds and GE Retirement Savings Plan Funds (October 2003 – July 2016); Secretary of GE Funds (July 2007 – September 2010) and Vice President (July 2007 – February 2011); Senior Vice President and Deputy General Counsel of GEAM (October 2007 – April 2010); Vice President and Assistant Secretary of Elfun Funds and GE Retirement Savings Plan Funds (July 2003 – June 2010); and Vice President and Associate General Counsel – Marketing and Client Services (formerly Asset Management Services) at GEAM (May 1997 – October 2007). |
| | | | | | | |
Bruce S. Rosenberg SSGA Funds Management, Inc. One Iron Street Boston, MA 02210 YOB: 1961 | | Treasurer | | Term: Indefinite Elected: 4/19 | | Managing Director, State Street Global Advisors and SSGA Funds Management, Inc. (July 2015 – present); Director, Credit Suisse (April 2008 – July 2015). |
| | | | | | | |
Ann M. Carpenter SSGA Funds Management, Inc. One Iron Street Boston, MA 02210 YOB: 1966 | | Vice President and Deputy Treasurer | | Term: Indefinite Elected: 4/19 | | Chief Operating Officer, SSGA Funds Management, Inc. (April 2005 – present)*; Managing Director, State Street Global Advisors. (2005 – present).* |
Chad C. Hallett SSGA Funds Management, Inc. One Iron Street Boston, MA 02210 YOB: 1969 | | Deputy Treasurer | | Term: Indefinite Elected: 4/19 | | Vice President, State Street Global Advisors and SSGA Funds Management, Inc. (November 2014 – present); Vice President, State Street Bank and Trust Company (2001 – November 2014).* |
| | | | | | | |
Darlene Anderson-Vasquez SSGA Funds Management, Inc. One Iron Street Boston, MA 02210 YOB: 1968 | | Deputy Treasurer | | Term: Indefinite Elected: 4/19 | | Managing Director, State Street Global Advisors and SSGA Funds Management, Inc. (May 2016 – present); Senior Vice President, John Hancock Investments (September 2007 – May 2016). |
State Street Real Estate Securities V.I.S. Fund
Other Information, continued — December 31, 2019 (Unaudited)
| | | | | | |
| | | | |
Name,
Address, and
Year of Birth | | Position(s) Held
with Fund | | Term of
Office and
Length of
Time Served | | Principal Occupation
During Past Five Years |
OFFICERS: (continued) | | | | | | |
Arthur A. Jensen SSGA Funds Management, Inc. 1600 Summer Street Stamford, CT 06905 YOB: 1966 | | Deputy Treasurer | | Term: Indefinite Elected: 4/19 | | Vice President State Street Global Advisors and SSGA Funds Management, Inc. (July 2016 – present); Deputy Treasurer of Elfun Funds (July 2016 – present); Treasurer of State Street Institutional Funds, State Street Variable Insurance Series Funds, Inc. and GE Retirement Savings Plan Funds (June 2011 – present); Treasurer of Elfun Funds (June 2011– July 2016); Mutual Funds Controller of GE Asset Management Incorporated (April 2011 – July 2016). |
| | | | | | | |
Sujata Upreti SSGA Funds Management, Inc. One Iron Street Boston, MA 02210 YOB: 1974 | | Assistant Treasurer | | Term: Indefinite Elected: 4/19 | | Vice President, State Street Global Advisors and SSGA Funds Management, Inc. (May 2015 – present); Assistant Director, Cambridge Associates, LLC (July 2014 – January 2015); Vice President, Bank of New York Mellon (July 2012 – August 2013); Manager, PricewaterhouseCoopers, LLP (September 2003 – July 2012). |
| | | | | | | |
Daniel Foley SSGA Funds Management, Inc. One Iron Street Boston, MA 02210 YOB: 1972 | | Assistant Treasurer | | Term: Indefinite Elected: 4/19 | | Vice President, State Street Global Advisors and SSGA Funds Management, Inc. (April 2007 – present).* |
| | | | | | | |
Daniel G. Plourde SSGA Funds Management, Inc. One Iron Street Boston, MA 02210 YOB: 1980 | | Assistant Treasurer | | Term: Indefinite Elected: 6/17 | | Vice President, State Street Global Advisors and SSGA Funds Management, Inc. (May 2015 – present); Officer, State Street Bank and Trust Company (March 2009 – May 2015). |
| | | | | | | |
Brian Harris SSGA Funds Management, Inc. One Iron Street Boston, MA 02210 YOB: 1973 | | Chief
Compliance Officer, Anti-Money Laundering Officer and Code of Ethics Compliance Officer | | Term: Indefinite Elected: 7/16 Term: Indefinite Elected: 4/19 | | Managing Director, State Street Global Advisors and SSGA Funds Management, Inc. (June 2013 – Present)*; Senior Vice President and Global Head of Investment Compliance, BofA Global Capital Management (September 2010 – May 2013). |
| | | | | | | |
Sean O’Malley SSGA Funds Management, Inc. One Iron Street Boston, MA 02210 YOB: 1969 | | Chief Legal Officer | | Term: Indefinite Elected: 8/19 | | Senior Vice President and Deputy General Counsel, State Street Global Advisors (November 2013 – present). |
| | | | | | | |
Andrew DeLorme SSGA Funds Management, Inc. One Iron Street Boston, MA 02210 YOB: 1975 | | Secretary | | Term: Indefinite Elected: 8/19 | | Vice President and Senior Counsel, State Street Global Advisors (April 2016 – present); Vice President and Counsel, State Street Global Advisors (August 2014 – March 2016). |
State Street Real Estate Securities V.I.S. Fund
Other Information, continued — December 31, 2019 (Unaudited)
| | | | | | |
| | | | |
Name,
Address, and
Year of Birth | | Position(s) Held
with Fund | | Term of
Office and
Length of
Time Served | | Principal Occupation
During Past Five Years |
OFFICERS: (continued) | | | | | | |
Kevin Morris SSGA Funds Management, Inc. One Iron Street Boston, MA 02210 YOB: 1982 | | Assistant Secretary | | Term: Indefinite Elected: 8/19 | | Vice President and Senior Counsel, State Street Global Advisors (April 2019 – present); Vice President and Counsel, State Street Global Advisors (January 2016 – April 2019); Director, Asset Management Compliance, Fidelity Investments (June 2015 – January 2016); Senior Compliance Advisor, Asset Management Compliance, Fidelity Investments (June 2012 – June 2015). |
| | | | | | | |
David Urman SSGA Funds Management, Inc. One Iron Street Boston, MA 02210 YOB: 1985 | | Assistant Secretary | | Term: Indefinite Elected: 8/19 | | Vice President and Senior Counsel, State Street Global Advisors (April 2019 – present); Vice President and Counsel, State Street Global Advisors (August 2015 – April 2019); Associate, Ropes & Gray LLP (November 2012 – August 2015). |
| | * | Served in various capacities and/or with various affiliated entities during noted time period. |
Directors
Michael F. Holland, Co-Chairperson
Patrick J. Riley, Co-Chairperson
John R. Costantino
Donna M. Rapaccioli
Michael A. Jessee
Richard D. Shirk
Rina K. Spence
Jeanne M. La Porta
Ellen M. Needham
Officers
Jeanne M. La Porta, President
Brian Harris, Chief Compliance Officer, Anti-Money Laundering Officer and Code of Ethics Compliance Officer
Sean O’Malley, Chief Legal Officer
Bruce S. Rosenberg, Treasurer
Ann M. Carpenter, Vice President and Deputy Treasurer
Chad C. Hallett, Deputy Treasurer
Arthur A. Jensen, Deputy Treasurer
Darlene Anderson-Vasquez, Deputy Treasurer
Sujata Upreti, Assistant Treasurer
Daniel Foley, Assistant Treasurer
Daniel G. Plourde, Assistant Treasurer
Andrew DeLorme, Secretary
Kevin Morris, Assistant Secretary
David Urman, Assistant Secretary
Investment Adviser and Administrator
SSGA Funds Management, Inc.
One Iron Street
Boston, MA 02210
Custodian and Sub-Administrator
State Street Bank and Trust Company
One Lincoln Street
Boston, Massachusetts 02111
Distributor
State Street Global Advisors Funds Distributors, LLC
One Iron Street
Boston, MA 02210
Independent Registered Public Accounting Firm
Ernst & Young LLP
200 Clarendon Street
Boston, Massachusetts 02116
Annual Report
December 31, 2019
State Street Total Return V.I.S. Fund
Beginning on January 1, 2021, as permitted by regulations adopted by the U.S. Securities and Exchange Commission, paper copies of a Fund’s annual and semi-annual shareholder reports will no longer be sent by mail, unless you specifically request paper copies of the reports. Instead, the reports will be made available on a Fund’s website (www.ssga.com/geam), and you will be notified by mail each time a report is posted, and provided with a website link to access the report. If you already elected to receive shareholder reports electronically, you will not be affected by this change and you need not take any action.
You may elect to receive all future reports in paper free of charge. To do so, contact your Insurance Provider. Your election to receive reports in paper will apply to all funds held in your account.

State Street Total Return V.I.S Fund
Annual Report
December 31, 2019
Table of Contents
This report is prepared for Policyholders of certain variable contracts and may be distributed to others only if preceded or accompanied by the variable contract’s current prospectus and the current summary prospectus of the Fund available for investments thereunder.
State Street Total Return V.I.S. Fund
Notes to Performance — December 31, 2019 (Unaudited)
The information provided on the performance page relates to the State Street Total Return V.I.S Fund (the “Fund”).
Total return performance shown in this report for the Fund takes into account changes in share price and assumes reinvestment of dividends and capital gains distributions, if any. Total returns shown are net of Fund fees and expenses but do not reflect fees and charges associated with the variable contracts such as administrative fees, account charges and surrender charges, which, if reflected, would reduce the Fund’s total returns for all periods shown.
The performance data quoted represents past performance; past performance does not guarantee future results. Investment return and principal value will fluctuate so your shares, when redeemed, may be worth more or less than their original cost. Current performance may be higher or lower than the performance data quoted. Periods less than one year are not annualized. Please call toll-free (800) 242-0134 or visit the Fund’s website at http://www.ssga.com/geam for the most recent month-end performance data.
An investment in the Fund is not a deposit of any bank and is not insured or guaranteed by the Federal Deposit Insurance Corporation (“FDIC”) or any other government agency. An investment in the Fund is subject to risk, including possible loss of principal invested.
The S&P 500® Index is an unmanaged, market capitalization-weighted index of stocks of 500 large U.S. companies, which is widely used as a measure of large-cap U.S. stock market performance.
The MSCI All Country WorldIndex ex-U.S. (“MSCI® ACWI ex-U.S.”) is amarket-capitalization weighted index designed to provide a broad measure of stock performance throughout the world, with the exception of U.S.-based companies. The MSCI® ACWI ex-U.S. Index includes both developed and emerging markets.
The Bloomberg Barclays U.S. Aggregate Bond Index is an unmanaged market value-weighted index of taxable investment grade debt issues, including government, corporate, asset-backed and mortgage-backed securities, with maturities of one year or more. This index is designed to represent the performance of the U.S. investment-grade first rate bond market.
The results shown for the foregoing indices assume the reinvestment of net dividends or interest and do not reflect fees, expenses, or taxes. As such, the index returns do not reflect the actual cost of investing in the instruments that comprise each index.
The views expressed in this document reflect our judgment as of the publication date and are subject to change at any time without notice.
State Street Global Advisors Funds Distributors, LLC, member of FINRA & SIPC is the principal underwriter and distributor of the State Street V.I.S. Funds and an indirect wholly-owned subsidiary of State Street Corporation. References to State Street may include State Street Corporation and its affiliates. The Funds pay State Street Bank and Trust Company for its services as custodian and Fund Accounting agent, and pay SSGA Funds Management, Inc. for investment advisory and administrative services.
State Street Total Return V.I.S. Fund
Management’s Discussion of Fund Performance — December 31, 2019 (Unaudited)
The State Street Total Return V.I.S. Fund (the “Fund”) seeks the highest total return, composed of current income and capital appreciation, as is consistent with prudent investment risk. The Fund’s benchmarks are the S&P 500 Index, the MSCI All Country Worldex-U.S. Index, and the Bloomberg Barclays U.S. Aggregate Bond Index (the “Indices”).
For the12-month period ended December 31, 2019 (the “Reporting Period”), the total return for the Fund’s Class 1 and Class 3 Shares was 15.81% and 15.57%, respectively. The total return for S&P 500 Index was 31.49%. The total return for MSCI All Country Worldex-U.S. Index was 21.51%. The total return for Bloomberg Barclays U.S. Aggregate Bond Index was 8.72%. The Fund and Indices’ returns reflect the reinvestment of dividends and other income. The Fund’s performance reflects the expenses of managing the Fund, including brokerage and advisory expenses. The Indices are unmanaged and index returns do not reflect fees and expenses of any kind, which would have a negative impact on returns.
Asset allocation decisions and performance of the investment options across asset classes were primary drivers of Fund performance during the Reporting Period relative to the Index. Diversifying investments in emerging market equity, commodities and fixed income securities within the Fund all contributed negatively to benchmark relative returns when compared to the S&P 500 Index of large cap domestic equities. Across regional investment options within equities, US large cap stocks enjoyed a higher rate of return overall — as noted by the S&P 500 Index returns referenced above. In addition to the asset allocation decisions, the Fund’s factor based strategies underperformed when compared against their respective marketcap-weighted indices. The factor based strategies are designed to provide exposure to various investment style premia including value, quality, volatility, momentum and size. With the exception of favorable performance from the quality factor, all of the other factors underperformed for the Reporting Period. On the positive side, the decision to position the fixed income assets at the low end of their given strategic target allocation range proved beneficial for performance overall. Fixed income securities, particularly US aggregate bonds, provided positive returns overall but still trailed equities for the Reporting Period. Offsetting some of the benefit of investing in a lower allocation to fixed income was an overweight to cash relative to its given strategic target allocation for approximately half of the Reporting Period. The allocation to cash detracted from results given the strong performance generated by both equity and fixed income asset classes.
The Fund used equity futures contracts in order to equitize cash in the portfolio during the Reporting Period. The Fund’s use of futures contracts did not have a material impact on Fund performance.
The views expressed above reflect those of the Fund’s portfolio manager only through the Reporting Period, and do not necessarily represent the views of the Adviser as a whole. Any such views are subject to change at any time based upon market or other conditions and the Adviser disclaims any responsibility to update such views. These views may not be relied on as investment advice and, because investment decisions for a fund are based on numerous factors, may not be relied on as an indication of trading intent on behalf of any fund.
| | |
| 2 | | State Street Total Return V.I.S. Fund |
State Street Total Return V.I.S. Fund
Understanding Your Fund’s Expenses — December 31, 2019 (Unaudited)
As a shareholder of the Fund, you incur ongoing costs. Ongoing costs include portfolio management fees, professional fees, administrative fees and other Fund expenses. The following example is intended to help you understand your ongoing costs (in dollars) of investing in the Fund and to compare these costs with the ongoing costs of investing in other mutual funds.
To illustrate these ongoing costs, we have provided an example and calculated the expenses paid by investors in the Fund during the period. The information in the following table is based on an investment of $1,000, which is invested at the beginning of the period and held for the entiresix-month period ended December 31, 2019.
Actual Expenses
The first section of the table provides information about actual account values and actual expenses. You may use the information in this section, together with the amount you invested, to estimate the expenses that you paid over the period. To do so, simply divide your account value by $1,000 (for example, an $8,600 account value divided by $1,000 = 8.6), then multiply the result by the number given under the heading “Expenses paid during the period” to estimate the expenses you paid on your account during the period.
Hypothetical Example for Comparison Purposes
The second section of the table provides information about hypothetical account values and hypothetical expenses based on the Fund’s actual expense ratio and an assumed rate of return of 5% per year before expenses, which is not the Fund’s actual return. The hypothetical account values and expenses may not be used to estimate the actual ending account balance or expenses you paid for the period. You may use this information to compare the ongoing costs of investing in the Fund and other funds. To do so, compare this 5% hypothetical example with the 5% hypothetical examples that appear in the shareholder reports of other funds.
Please note that the expenses shown in the table are meant to highlight and help you compare ongoing costs only and do not reflect transaction costs, such as sales charges or redemption fees, if any. Therefore, the second section of the table is useful in comparing ongoing costs only, and will not help you determine the relative total costs of owning different funds. Additionally, the expenses shown do not reflect the fees or charges associated with variable contracts through which shares of the Fund are offered.
| | | | | | | | |
Class 1 | | Actual
Fund Return | | | Hypothetical
5% Return
(2.5% for
the period) | |
Actual Fund Return | | | | | | | | |
Beginning Account Value July 1, 2019 | | $ | 1,000.00 | | | $ | 1,000.00 | |
Ending Account Value December 31, 2019 | | $ | 1,043.80 | | | $ | 1,022.20 | |
Expenses Paid During Period* | | $ | 3.04 | | | $ | 3.01 | |
| | |
Class 3 | | Actual
Fund Return | | | Hypothetical
5% Return
(2.5% for
the period) | |
Actual Fund Return | | | | | | | | |
Beginning Account Value July 1, 2019 | | $ | 1,000.00 | | | $ | 1,000.00 | |
Ending Account Value December 31, 2019 | | $ | 1,042.60 | | | $ | 1,020.97 | |
Expenses Paid During Period* | | $ | 4.32 | | | $ | 4.28 | |
| * | Expenses are equal to the Fund’s annualized expense ratio of 0.59%** for Class 1 and 0.84%** for Class 3 (for the period July 1, 2019-December 31, 2019), multiplied by the average account value over the period, multiplied by 184/365 (to reflect theone-half year period). |
| ** | May differ from expense ratio disclosed in the financial highlights, which is calculated based on the entire fiscal year’s data. |
| | | | |
| State Street Total Return V.I.S. Fund | | | 3 | |
State Street Total Return V.I.S. Fund
Performance Summary — December 31, 2019 (Unaudited)
Top Ten Largest Equity Holdings
as of December 31, 2019 (as a % of Fair Value) (a)(b)
| | | | |
Berkshire Hathaway Inc., Class B | | | 1.13 | % |
Johnson & Johnson | | | 0.95 | % |
Accenture PLC, Class A | | | 0.88 | % |
Honeywell International Inc | | | 0.78 | % |
Danaher Corp. | | | 0.75 | % |
Costco Wholesale Corp. | | | 0.70 | % |
Target Corp. | | | 0.65 | % |
Intuit Inc. | | | 0.62 | % |
The Proctor & Gamble Co. | | | 0.61 | % |
The TJX Companies, Inc. | | | 0.59 | % |
Sector Allocation
Portfolio Composition as a % of Fair Value of $1,938,218 (in thousands) as of December 31, 2019(a)(b)
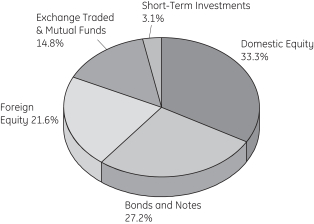
Average Annual Total Return for the periods ended December 31, 2019
Class 1 Shares (Inception date: 7/01/85)
| | | | | | | | | | | | | | |
| | | One Year | | Five Year | | | Ten Year | | | Ending Value
of a $10,000
Investment | |
State Street Total Return V.I.S Fund | | 15.81% | | | 5.68 | % | | | 6.70 | % | | $ | 19,127 | |
S&P 500® Index | | 31.49% | | | 11.70 | % | | | 13.56 | % | | $ | 35,666 | |
Bloomberg Barclays U.S. Aggregate Bond Index | | 8.72% | | | 3.05 | % | | | 3.75 | % | | $ | 14,445 | |
MSCI All Country Worldex.-U.S. | | 21.51% | | | 5.51 | % | | | 4.97 | % | | $ | 16,236 | |
Class 3 Shares (Inception date: 5/01/06)
| | | | | | | | | | | | | | |
| | | One Year | | Five Year | | | Ten Year | | | Ending Value
of a $10,000
Investment | |
State Street Total Return V.I.S Fund | | 15.57% | | | 5.42 | % | | | 6.43 | % | | $ | 18,657 | |
S&P 500® Index | | 31.49% | | | 11.70 | % | | | 13.56 | % | | $ | 35,666 | |
Bloomberg Barclays U.S. Aggregate Bond Index | | 8.72% | | | 3.05 | % | | | 3.75 | % | | $ | 14,445 | |
MSCI All Country Worldex-U.S. | | 21.51% | | | 5.51 | % | | | 4.97 | % | | $ | 16,236 | |
| (a) | Fair Value basis is inclusive of short-term investment in State Street Institutional U.S. Government Money Market Fund Class G Shares. |
| (b) | The securities information regarding holdings, allocations and other characteristics is presented to illustrate examples of securities that the Fund has bought and the diversity of areas in which the Fund may invest as of a particular date. It may not be representative of the Fund’s current or future investments and should not be construed as a recommendation to purchase or sell a particular security. |
| | |
| 4 | | State Street Total Return V.I.S. Fund |
State Street Total Return V.I.S. Fund
Performance Summary, continued — December 31, 2019 (Unaudited)
Class 1 Shares
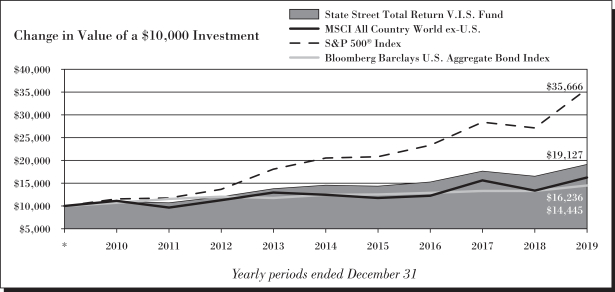
Class 3 Shares
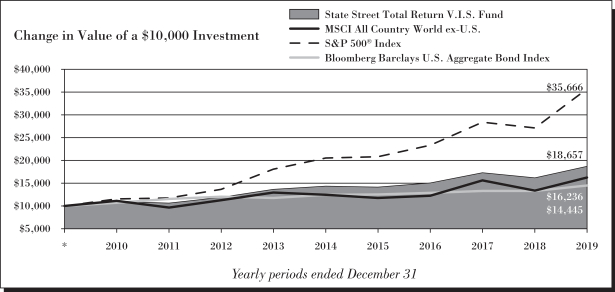
See Notes to Performance beginning on page 1 for further information, including an explanation of Morningstar peer categories.
Past performance does not predict future performance. The performance shown in the graphs and tables does not reflect the deduction of taxes that a shareholder would pay on Fund distributions or the redemption of Fund shares and does not reflect the fees or charges that would be associated with variable contracts through which shares of the Fund are offered.
| | | | |
| State Street Total Return V.I.S. Fund | | | 5 | |
State Street Total Return V.I.S. Fund
Summary Schedule of Investments — December 31, 2019
| | | | | | | | |
| | | Number
of Shares | | | Fair
Value
$ | |
| | | | | | | | |
|
| Equity Securities - 55.3%† | |
Communication Services - 3.1% | |
AT&T Inc. | | | 118,300 | | | | 4,623,164 | |
Nippon Telegraph & Telephone Corp. | | | 243,200 | | | | 6,169,794 | |
The Walt Disney Co. | | | 74,857 | | | | 10,826,568 | |
Other Securities | | | | | | | 37,651,401 | |
| | | | | | | | |
| | | | | | | 59,270,927 | |
| | | | | | | | |
|
Consumer Discretionary - 7.7% | |
AutoZone Inc. (a) | | | 4,617 | | | | 5,500,278 | |
FF Group (a)(c) | | | 1,860 | | | | 1,002 | |
Ford Motor Co. | | | 768,114 | | | | 7,143,460 | |
General Motors Co. | | | 194,027 | | | | 7,101,388 | |
Starbucks Corp. | | | 119,512 | | | | 10,507,495 | |
Target Corp. | | | 97,900 | | | | 12,551,759 | |
The TJX Companies Inc. | | | 187,548 | | | | 11,451,681 | |
Wesfarmers Ltd. | | | 214,789 | | | | 6,250,819 | |
Other Securities | | | | | | | 87,225,691 | |
| | | | | | | | |
| | | | | | | 147,733,573 | |
| | | | | | | | |
|
Consumer Staples - 3.6% | |
China Huishan Dairy Holdings Company Ltd. (c) | | | 55,000 | | | | — | |
Costco Wholesale Corp. | | | 46,095 | | | | 13,548,242 | |
L’Oreal S.A. | | | 26,423 | | | | 7,830,188 | |
The Procter & Gamble Co. | | | 95,326 | | | | 11,906,217 | |
Tyson Foods Inc., Class A | | | 56,478 | | | | 5,141,757 | |
Other Securities | | | | | | | 30,921,383 | |
| | | | | | | | |
| | | | | | | 69,347,787 | |
| | | | | | | | |
|
Energy - 1.9% | |
Phillips 66 | | | 83,016 | | | | 9,248,813 | |
Valero Energy Corp. | | | 67,272 | | | | 6,300,023 | |
Other Securities | | | | | | | 21,490,915 | |
| | | | | | | | |
| | | | | | | 37,039,751 | |
| | | | | | | | |
|
Financials - 11.5% | |
Aflac Inc. | | | 142,682 | | | | 7,547,878 | |
Allianz SE | | | 29,731 | | | | 7,288,670 | |
Assicurazioni Generali S.p.A. | | | 209,201 | | | | 4,319,661 | |
Berkshire Hathaway Inc., Class B (a) | | | 96,307 | | | | 21,813,535 | |
China Common Rich Renewable Energy Investments Ltd. (c) | | | 64,000 | | | | — | |
Chubb Ltd. | | | 63,937 | | | | 9,952,433 | |
Muenchener Rueckversicherungs-Gesellschaft AG | | | 26,084 | | | | 7,700,450 | |
Royal Bank of Canada | | | 74,819 | | | | 5,928,400 | |
| | | | | | | | |
| | | Number
of Shares | | | Fair
Value
$ | |
Synchrony Financial | | | 126,700 | | | | 4,562,467 | |
The Allstate Corp. | | | 50,953 | | | | 5,729,665 | |
Zurich Insurance Group AG | | | 21,819 | | | | 8,947,514 | |
Other Securities | | | | | | | 137,866,073 | |
| | | | | | | | |
| | | | | | | 221,656,746 | |
| | | | | | | | |
|
Healthcare - 4.4% | |
Danaher Corp. | | | 95,035 | | | | 14,585,972 | |
HCA Healthcare Inc. | | | 35,240 | | | | 5,208,824 | |
Johnson & Johnson | | | 126,929 | | | | 18,515,133 | |
Roche Holding AG | | | 21,820 | | | | 7,075,417 | |
Other Securities | | | | | | | 40,138,187 | |
| | | | | | | | |
| | | | | | | 85,523,533 | |
| | | | | | | | |
|
Industrials - 6.4% | |
Cummins Inc. | | | 29,403 | | | | 5,261,961 | |
Honeywell International Inc. | | | 85,347 | | | | 15,106,419 | |
Ingersoll-Rand PLC | | | 39,338 | | | | 5,228,807 | |
Other Securities | | | | | | | 96,949,503 | |
| | | | | | | | |
| | | | | | | 122,546,690 | |
| | | | | | | | |
|
Information Technology - 8.4% | |
Accenture PLC, Class A | | | 80,668 | | | | 16,986,261 | |
Apple Inc. | | | 37,736 | | | | 11,081,176 | |
Applied Materials Inc. | | | 181,200 | | | | 11,060,448 | |
Intel Corp. | | | 145,529 | | | | 8,709,911 | |
Intuit Inc. | | | 46,075 | | | | 12,068,425 | |
KLA Corp. | | | 31,250 | | | | 5,567,812 | |
Lam Research Corp. | | | 28,293 | | | | 8,272,873 | |
Microsoft Corp. | | | 55,292 | | | | 8,719,548 | |
Paychex Inc. | | | 63,035 | | | | 5,361,757 | |
Other Securities | | | | | | | 73,068,709 | |
| | | | | | | | |
| | | | | | | 160,896,920 | |
| | | | | | | | |
|
Materials - 2.5% | |
Air Products & Chemicals Inc. | | | 43,268 | | | | 10,167,547 | |
Ferroglobe PLC (c) | | | 1,316 | | | | — | |
Linde PLC | | | 41,473 | | | | 8,829,602 | |
Other Securities | | | | | | | 28,588,162 | |
| | | | | | | | |
| | | | | | | 47,585,311 | |
| | | | | | | | |
|
Real Estate - 2.8% | |
Other Securities | | | | | | | 54,591,626 | |
| | | | | | | | |
| | |
Utilities - 2.7% | | | | | | | | |
Eversource Energy | | | 63,589 | | | | 5,409,516 | |
Xcel Energy Inc. | | | 102,942 | | | | 6,535,788 | |
Other Securities | | | | | | | 39,032,979 | |
| | | | | | | | |
| | | | | | | 50,978,283 | |
| | | | | | | | |
See Notes to Schedule of Investments and Notes to Financial Statements.
| | |
| 6 | | State Street Total Return V.I.S. Fund |
State Street Total Return V.I.S. Fund
Summary Schedule of Investments, continued — December 31, 2019
| | | | | | | | |
| | | Principal
Amount ($) or Number
of Shares | | | Fair
Value
$ | |
| | | | | | | | |
|
| Preferred Stock - 0.3% | |
Other Securities | | | | | | | 54,591,626 | |
| | | | | | | | |
| | |
Total Equity Securities
(Cost $940,508,817) | | | | | | | 1,063,095,731 | |
| | | | | | | | |
|
| Bonds and Notes - 27.4% | |
U.S. Treasuries - 12.8% | |
U.S. Treasury Bonds | | | | | | | | |
2.25% 08/15/46 - 08/15/49 | | | 1,300,000 | | | | 1,265,688 | |
2.38% 11/15/49 | | | 300,000 | | | | 299,953 | |
2.50% 02/15/45 - 05/15/46 | | | 2,710,000 | | | | 2,773,023 | |
2.75% 11/15/42 - 11/15/47 | | | 2,000,000 | | | | 2,147,422 | |
2.88% 05/15/43 - 05/15/49 | | | 2,600,000 | | | | 2,857,125 | |
3.00% 05/15/42 - 02/15/49 | | | 7,150,000 | | | | 8,035,180 | |
3.13% 08/15/44 - 05/15/48 | | | 1,500,000 | | | | 1,719,000 | |
3.38% 05/15/44 - 11/15/48 | | | 2,000,000 | | | | 2,397,968 | |
3.63% 08/15/43 - 02/15/44 | | | 1,540,000 | | | | 1,895,278 | |
3.75% 11/15/43 | | | 800,000 | | | | 1,002,500 | |
4.25% 05/15/39 - 11/15/40 | | | 900,000 | | | | 1,187,734 | |
4.38% 02/15/38 - 05/15/40 | | | 1,500,000 | | | | 2,001,890 | |
4.50% 02/15/36 | | | 1,700,000 | | | | 2,257,547 | |
4.63% 02/15/40 | | | 300,000 | | | | 415,359 | |
5.25% 02/15/29 | | | 200,000 | | | | 255,875 | |
5.50% 08/15/28 | | | 200,000 | | | | 257,469 | |
6.00% 02/15/26 | | | 427,000 | | | | 531,482 | |
6.13% 08/15/29 | | | 200,000 | | | | 274,250 | |
6.38% 08/15/27 | | | 200,000 | | | | 264,625 | |
7.63% 11/15/22 - 02/15/25 | | | 500,000 | | | | 608,336 | |
7.88% 02/15/21 | | | 1,000,000 | | | | 1,068,320 | |
U.S. Treasury Inflation Indexed Bonds | | | | | |
0.63% 02/15/43 | | | 1,287,138 | | | | 1,304,827 | |
0.75% 02/15/42 - 02/15/45 | | | 3,609,635 | | | | 3,755,120 | |
0.88% 02/15/47 | | | 1,385,813 | | | | 1,487,683 | |
1.00% 02/15/46 - 02/15/49 | | | 3,507,871 | | | | 3,884,035 | |
1.38% 02/15/44 | | | 1,766,608 | | | | 2,086,996 | |
1.75% 01/15/28 | | | 982,648 | | | | 1,104,507 | |
2.00% 01/15/26 | | | 648,255 | | | | 721,115 | |
2.13% 02/15/40 - 02/15/41 | | | 1,117,857 | | | | 1,474,579 | |
2.38% 01/15/25 - 01/15/27 | | | 3,835,676 | | | | 4,328,011 | |
2.50% 01/15/29 | | | 1,558,102 | | | | 1,878,948 | |
3.38% 04/15/32 | | | 579,892 | | | | 797,554 | |
3.63% 04/15/28 | | | 604,576 | | | | 773,954 | |
3.88% 04/15/29 | | | 2,347,965 | | | | 3,136,799 | |
U.S. Treasury Inflation Indexed Notes | | | | | |
0.13% 04/15/21 - 07/15/26 | | | 24,697,694 | | | | 24,751,381 | |
0.25% 01/15/25 - 07/15/29 | | | 7,657,453 | | | | 7,731,749 | |
0.38% 07/15/23 - 07/15/27 | | | 12,093,774 | | | | 12,305,677 | |
0.50% 04/15/24 - 01/15/28 | | | 4,191,793 | | | | 4,287,853 | |
0.63% 07/15/21 - 01/15/26 | | | 10,527,142 | | | | 10,713,755 | |
0.75% 07/15/28 | | | 2,547,473 | | | | 2,681,625 | |
0.88% 01/15/29 | | | 2,649,686 | | | | 2,815,060 | |
1.13% 01/15/21 | | | 2,705,582 | | | | 2,731,824 | |
| | | | | | | | |
| | | Principal
Amount ($) | | | Fair
Value
$ | |
U.S. Treasury Notes | | | | | | | | |
1.13% 06/30/21 - 09/30/21 | | | 3,200,000 | | | | 3,175,395 | |
1.25% 10/31/21 - 08/31/24 | | | 2,500,000 | | | | 2,465,390 | |
1.38% 01/31/21 - 08/31/26 | | | 2,400,000 | | | | 2,380,938 | |
1.50% 09/30/21 - 08/15/26 | | | 6,100,000 | | | | 6,067,078 | |
1.63% 08/31/22 - 08/15/29 | | | 7,840,000 | | | | 7,770,063 | |
1.75% 11/30/21 - 11/15/29 | | | 6,700,000 | | | | 6,716,282 | |
1.88% 01/31/22 - 07/31/26 | | | 12,700,000 | | | | 12,784,625 | |
2.00% 02/28/21 - 11/15/26 | | | 8,194,000 | | | | 8,289,507 | |
2.13% 01/31/21 - 05/31/26 | | | 11,200,000 | | | | 11,363,188 | |
2.25% 03/31/21 - 11/15/27 | | | 9,890,000 | | | | 10,111,855 | |
2.38% 01/31/23 - 05/15/29 | | | 4,900,000 | | | | 5,058,485 | |
2.50% 02/28/21 - 01/31/25 | | | 7,000,000 | | | | 7,198,164 | |
2.63% 02/28/23 - 02/15/29 | | | 7,500,000 | | | | 7,808,944 | |
2.75% 09/15/21 - 02/15/28 | | | 12,400,000 | | | | 12,946,359 | |
2.88% 10/15/21 - 08/15/28 | | | 9,700,000 | | | | 10,204,539 | |
3.00% 10/31/25 | | | 500,000 | | | | 534,414 | |
3.13% 05/15/21 - 11/15/28 | | | 1,900,000 | | | | 2,050,812 | |
3.63% 02/15/21 | | | 700,000 | | | | 715,258 | |
| | | | | | | | |
| | | | | | | 245,910,372 | |
| | | | | | | | |
|
U.S. Government Sponsored Agency - 0.0%* | |
Tennessee Valley Authority | | | 500,000 | | | | 558,355 | |
| | | | | | | | |
|
Agency Collateralized Mortgage Obligations - 0.2% | |
Federal Home Loan Mortgage Corp. | | | | | |
2.75% 01/25/26 | | | 300,000 | | | | 308,284 | |
3.06% 07/25/23 (e) | | | 600,000 | | | | 619,800 | |
3.18% 11/25/28 | | | 302,372 | | | | 315,715 | |
3.30% 04/25/23 (e) | | | 100,000 | | | | 103,893 | |
3.39% 03/25/24 | | | 200,000 | | | | 210,059 | |
3.49% 01/25/24 | | | 300,000 | | | | 315,485 | |
3.78% 08/25/28 | | | 195,545 | | | | 210,332 | |
Federal National Mortgage Assoc. | | | | | |
3.08% 06/25/27 (e) | | | 261,000 | | | | 274,799 | |
3.38% 07/25/28 (e) | | | 500,000 | | | | 534,247 | |
3.64% 08/25/30 (e) | | | 200,000 | | | | 218,745 | |
Freddie Mac Multifamily Structured Pass Through Certificates | | | 385,000 | | | | 389,945 | |
| | | | | | | | |
| | | | | | | 3,501,304 | |
| | | | | | | | |
|
Agency Mortgage Backed - 6.9% | |
Federal Home Loan Banks | | | | | |
1.63% 12/20/21 | | | 395,000 | | | | 395,099 | |
1.88% 07/07/21 | | | 925,000 | | | | 928,672 | |
2.50% 02/13/24 | | | 440,000 | | | | 453,754 | |
3.25% 11/16/28 | | | 125,000 | | | | 136,837 | |
Federal Home Loan Mortgage Corp. | | | | | |
1.13% 08/12/21 | | | 637,000 | | | | 632,114 | |
2.38% 01/13/22 | | | 1,100,000 | | | | 1,116,159 | |
See Notes to Schedule of Investments and Notes to Financial Statements.
| | | | |
| State Street Total Return V.I.S. Fund | | | 7 | |
State Street Total Return V.I.S. Fund
Summary Schedule of Investments, continued — December 31, 2019
| | | | | | | | |
| | | Principal
Amount ($) | | | Fair
Value
$ | |
| | | | | | | | |
2.50% 01/01/28 - 02/01/32 | | | 1,834,897 | | | | 1,858,537 | |
2.51% 11/25/22 | | | 300,000 | | | | 303,781 | |
3.00% 07/01/30 - 10/01/49 | | | 9,547,221 | | | | 9,810,856 | |
3.50% 03/01/26 - 04/01/48 | | | 8,287,866 | | | | 8,682,775 | |
4.00% 06/01/42 - 03/01/49 | | | 4,857,274 | | | | 5,136,086 | |
4.50% 05/01/42 - 03/01/49 | | | 1,307,643 | | | | 1,383,917 | |
5.00% 06/01/41 | | | 1,247,119 | | | | 1,383,616 | |
5.50% 01/01/38 - 04/01/39 | | | 274,468 | | | | 307,163 | |
6.00% 06/01/37 - 11/01/37 | | | 288,114 | | | | 331,750 | |
6.25% 07/15/32 | | | 250,000 | | | | 359,717 | |
Federal National Mortgage Assoc. | | | | | |
1.75% 07/02/24 | | | 225,000 | | | | 225,252 | |
1.88% 09/24/26 | | | 1,000,000 | | | | 998,370 | |
2.13% 04/24/26 | | | 700,000 | | | | 710,612 | |
2.25% 04/12/22 | | | 425,000 | | | | 431,307 | |
2.50% 09/01/28 - 10/01/31 | | | 1,691,743 | | | | 1,713,090 | |
2.63% 01/11/22 | | | 500,000 | | | | 510,025 | |
3.00% 01/01/28 - 05/01/47 | | | 10,638,631 | | | | 10,946,942 | |
3.50% 01/01/27 - 09/01/48 | | | 14,547,812 | | | | 15,184,028 | |
4.00% 10/01/41 - 11/01/48 | | | 9,542,707 | | | | 10,122,249 | |
4.50% 01/01/27 - 09/01/49 | | | 4,463,152 | | | | 4,812,631 | |
5.00% 12/01/39 - 05/01/41 | | | 232,053 | | | | 255,967 | |
5.50% 12/01/35 - 04/01/38 | | | 1,010,064 | | | | 1,131,460 | |
6.00% 03/01/34 - 08/01/37 | | | 1,309,946 | | | | 1,499,231 | |
6.63% 11/15/30 | | | 100,000 | | | | 142,544 | |
2.50% TBA (f) | | | 2,100,000 | | | | 2,103,704 | |
3.00% TBA (f) | | | 5,600,000 | | | | 5,684,453 | |
3.50% TBA (f) | | | 4,100,000 | | | | 4,221,857 | |
4.00% TBA (f) | | | 2,500,000 | | | | 2,599,950 | |
4.50% TBA (f) | | | 350,000 | | | | 368,487 | |
Government National Mortgage Assoc. | | | | | |
2.50% 05/20/45 | | | 212,500 | | | | 214,536 | |
3.00% 10/15/42 - 12/20/49 | | | 7,120,136 | | | | 7,363,507 | |
3.50% 03/20/45 - 08/20/49 | | | 10,409,840 | | | | 10,844,619 | |
4.00% 12/20/40 - 06/20/49 | | | 5,900,457 | | | | 6,219,495 | |
4.50% 05/20/40 - 01/20/49 | | | 2,650,363 | | | | 2,808,681 | |
5.00% 08/15/41 | | | 1,637,645 | | | | 1,811,097 | |
3.00% TBA (f) | | | 1,950,000 | | | | 2,002,884 | |
3.50% TBA (f) | | | 1,950,000 | | | | 2,009,670 | |
4.00% TBA (f) | | | 1,400,000 | | | | 1,449,042 | |
4.50% TBA (f) | | | 1,000,000 | | | | 1,045,480 | |
| | | | | | | | |
| | | | | | | 132,652,003 | |
| | | | | | | | |
|
Asset Backed - 0.1% | |
Other Securities | | | | | | | 1,932,451 | |
| | | | | | | | |
|
Corporate Notes - 6.6% | |
Aflac Inc. | | | | | |
3.63% 11/15/24 | | | 150,000 | | | | 160,407 | |
Apple Inc. | | | | | |
2.25% 02/23/21 | | | 100,000 | | | | 100,567 | |
2.40% 01/13/23 | | | 50,000 | | | | 50,766 | |
| | | | | | | | |
| | | Principal
Amount ($) | | | Fair
Value
$ | |
2.50% 02/09/22 | | | 150,000 | | | | 152,304 | |
2.75% 01/13/25 | | | 50,000 | | | | 51,673 | |
3.00% 11/13/27 | | | 100,000 | | | | 104,981 | |
3.25% 02/23/26 | | | 160,000 | | | | 169,346 | |
3.75% 11/13/47 | | | 50,000 | | | | 55,762 | |
4.38% 05/13/45 | | | 165,000 | | | | 199,678 | |
4.50% 02/23/36 | | | 150,000 | | | | 183,057 | |
4.65% 02/23/46 | | | 185,000 | | | | 232,229 | |
Applied Materials Inc. | | | | | |
3.90% 10/01/25 | | | 160,000 | | | | 174,646 | |
AT&T Inc. | | | | | |
2.80% 02/17/21 | | | 100,000 | | | | 100,889 | |
3.40% 05/15/25 | | | 100,000 | | | | 104,869 | |
3.60% 07/15/25 | | | 100,000 | | | | 105,823 | |
4.10% 02/15/28 | | | 106,000 | | | | 115,316 | |
4.30% 02/15/30 | | | 20,000 | | | | 22,220 | |
4.35% 06/15/45 | | | 150,000 | | | | 161,965 | |
4.50% 05/15/35 - 03/09/48 | | | 145,000 | | | | 161,141 | |
4.75% 05/15/46 | | | 150,000 | | | | 169,620 | |
4.85% 03/01/39 | | | 150,000 | | | | 173,284 | |
5.15% 03/15/42 | | | 150,000 | | | | 176,211 | |
5.55% 08/15/41 | | | 154,000 | | | | 189,400 | |
6.10% 07/15/40 | | | 150,000 | | | | 191,281 | |
6.25% 03/29/41 | | | 100,000 | | | | 130,237 | |
AutoZone Inc. | | | | | |
3.75% 04/18/29 | | | 100,000 | | | | 107,219 | |
Costco Wholesale Corp. | | | | | |
2.15% 05/18/21 | | | 100,000 | | | | 100,534 | |
2.25% 02/15/22 | | | 85,000 | | | | 85,914 | |
3.00% 05/18/27 | | | 100,000 | | | | 105,588 | |
Eversource Energy | | | | | |
2.90% 10/01/24 | | | 100,000 | | | | 102,226 | |
3.15% 01/15/25 | | | 125,000 | | | | 128,972 | |
Ford Motor Co. | | | | | |
4.35% 12/08/26 | | | 100,000 | | | | 102,996 | |
4.75% 01/15/43 | | | 150,000 | | | | 133,371 | |
Honeywell International Inc. | | | | | |
2.70% 08/15/29 | | | 30,000 | | | | 30,763 | |
3.35% 12/01/23 | | | 50,000 | | | | 52,655 | |
5.38% 03/01/41 | | | 200,000 | | | | 267,310 | |
Intel Corp. | | | | | |
2.45% 11/15/29 | | | 100,000 | | | | 99,866 | |
2.60% 05/19/26 | | | 150,000 | | | | 153,327 | |
Johnson & Johnson | | | | | |
2.45% 12/05/21 - 03/01/26 | | | 175,000 | | | | 177,770 | |
2.90% 01/15/28 | | | 50,000 | | | | 52,218 | |
3.40% 01/15/38 | | | 25,000 | | | | 26,826 | |
3.50% 01/15/48 | | | 30,000 | | | | 32,801 | |
4.38% 12/05/33 | | | 150,000 | | | | 179,106 | |
KLA Corp. | | | | | |
4.65% 11/01/24 | | | 115,000 | | | | 126,796 | |
See Notes to Schedule of Investments and Notes to Financial Statements.
| | |
| 8 | | State Street Total Return V.I.S. Fund |
State Street Total Return V.I.S. Fund
Summary Schedule of Investments, continued — December 31, 2019
| | | | | | | | |
| | | Principal
Amount ($) | | | Fair
Value
$ | |
| | | | | | | | |
Lam Research Corp. | | | | | |
3.80% 03/15/25 | | | 115,000 | | | | 123,117 | |
Microsoft Corp. | | | | | |
1.55% 08/08/21 | | | 150,000 | | | | 149,764 | |
2.40% 02/06/22 | | | 100,000 | | | | 101,422 | |
2.88% 02/06/24 | | | 150,000 | | | | 155,670 | |
3.45% 08/08/36 | | | 200,000 | | | | 219,290 | |
3.50% 02/12/35 | | | 65,000 | | | | 71,744 | |
3.75% 05/01/43 | | | 150,000 | | | | 167,578 | |
4.10% 02/06/37 | | | 100,000 | | | | 118,093 | |
4.45% 11/03/45 | | | 125,000 | | | | 156,676 | |
Phillips 66 | | | | | |
3.90% 03/15/28 | | | 50,000 | | | | 54,572 | |
4.88% 11/15/44 | | | 45,000 | | | | 54,307 | |
Phillips 66 Partners LP | | | | | |
3.15% 12/15/29 | | | 50,000 | | | | 49,814 | |
3.75% 03/01/28 | | | 10,000 | | | | 10,433 | |
4.68% 02/15/45 | | | 10,000 | | | | 10,794 | |
Royal Bank of Canada | | | | | |
2.30% 03/22/21 | | | 150,000 | | | | 150,792 | |
2.75% 02/01/22 | | | 50,000 | | | | 50,925 | |
2.80% 04/29/22 | | | 100,000 | | | | 102,122 | |
Starbucks Corp. | | | | | |
3.10% 03/01/23 | | | 50,000 | | | | 51,615 | |
3.50% 03/01/28 | | | 50,000 | | | | 53,645 | |
3.75% 12/01/47 | | | 35,000 | | | | 36,030 | |
Synchrony Financial | | | | | |
2.85% 07/25/22 | | | 15,000 | | | | 15,200 | |
3.95% 12/01/27 | | | 100,000 | | | | 105,339 | |
4.38% 03/19/24 | | | 35,000 | | | | 37,335 | |
Target Corp. | | | | | |
3.38% 04/15/29 | | | 50,000 | | | | 54,348 | |
3.90% 11/15/47 | | | 50,000 | | | | 57,576 | |
4.00% 07/01/42 | | | 150,000 | | | | 172,293 | |
The Allstate Corp. | | | | | |
4.20% 12/15/46 | | | 100,000 | | | | 116,701 | |
The Allstate Corp. (5.75% fixed rate until 08/15/23; 2.94% + 3 month USD LIBOR thereafter) | |
5.75% 08/15/53 (e) | | | 50,000 | | | | 53,827 | |
The Procter & Gamble Co. | | | | | |
1.70% 11/03/21 | | | 100,000 | | | | 100,303 | |
2.45% 11/03/26 | | | 100,000 | | | | 103,086 | |
The Walt Disney Co. | | | | | |
3.38% 11/15/26 | | | 100,000 | | | | 107,100 | |
6.65% 11/15/37 | | | 179,000 | | | | 265,901 | |
Tyson Foods Inc. | | | | | |
4.00% 03/01/26 | | | 15,000 | | | | 16,241 | |
4.88% 08/15/34 | | | 70,000 | | | | 83,795 | |
5.10% 09/28/48 | | | 35,000 | | | | 44,010 | |
Valero Energy Corp. | | | | | |
6.63% 06/15/37 | | | 150,000 | | | | 199,156 | |
| | | | | | | | |
| | | Principal
Amount ($) or Number
of Shares | | | Fair
Value
$ | |
Xcel Energy Inc. | | | | | |
3.30% 06/01/25 | | | 50,000 | | | | 52,198 | |
4.00% 06/15/28 | | | 100,000 | | | | 109,420 | |
Other Securities | | | | | | | 117,236,041 | |
| | | | | | | | |
| | | | | | | 126,322,203 | |
| | | | | | | | |
|
Non-Agency Collateralized Mortgage Obligations - 0.3% | |
Other Securities | | | | | | | 5,931,408 | |
| | | | | | | | |
| |
Sovereign Bonds - 0.4% | | | | | |
Other Securities | | | | | | | 7,747,468 | |
| | | | | | | | |
| |
Municipal Bonds and Notes - 0.1% | | | | | |
Other Securities | | | | | | | 2,485,095 | |
| | | | | | | | |
| | |
Total Bonds and Notes
(Cost $506,659,170) | | | | | | | 527,040,659 | |
| | | | | | | | |
| |
| Exchange Traded Funds - 15.0% | | | | | |
Exchange Traded & Mutual Funds - 15.0% | |
Invesco Optimum Yield Diversified Commodity Strategy NoK-1 ETF | | | 3,527,990 | | | | 58,423,515 | |
SPDR Bloomberg Barclays High Yield Bond ETF (h) | | | 1,233,354 | | | | 135,101,597 | |
SPDR Dow Jones REIT ETF (h) | | | 917,656 | | | | 93,619,265 | |
| | | | | | | | |
| |
Total Exchange Traded Funds
(Cost $283,988,898) | | | | 287,144,377 | |
| | | | | | | | |
| |
Total Investments in Securities
(Cost $1,731,156,885) | | | | 1,877,280,767 | |
| | | | | | | | |
| |
| Short-Term Investments - 3.2% | | | | | |
State Street Institutional U.S. Government Money Market Fund - Class G Shares 1.57%
(Cost $60,902,376) (b)(h)(i) | | | 60,902,376 | | | | 60,902,376 | |
| | | | | | | | |
| | |
Total Investments
(Cost $1,792,059,261) | | | | | | | 1,938,183,143 | |
| |
| Liabilities in Excess of Other Assets, net - (0.9)% | | | | (17,079,153 | ) |
| | | | | | | | |
| | |
| NET ASSETS - 100.0% | | | | | | | 1,921,103,990 | |
| | | | | | | | |
See Notes to Schedule of Investments and Notes to Financial Statements.
| | | | |
| State Street Total Return V.I.S. Fund | | | 9 | |
State Street Total Return V.I.S. Fund
Summary Schedule of Investments, continued — December 31, 2019
Other Information:
The Fund had the following long futures contracts open at December 31, 2019:
| | | | | | | | | | | | | | | | |
| Description | | Expiration
date | | | Number of
Contracts | | | Current
Notional
Value | | | Unrealized
Appreciation | |
E-mini Russell 2000 Index Futures | | | March 2020 | | | | 6 | | | $ | 501,180 | | | $ | 8,174 | |
MSCI EAFE Mini Index Futures | | | March 2020 | | | | 15 | | | | 1,527,375 | | | | 9,814 | |
MSCI Emerging Market Mini Futures | | | March 2020 | | | | 83 | | | | 4,648,830 | | | | 244,500 | |
S&P 500 Emini Index Futures | | | March 2020 | | | | 7 | | | | 1,130,885 | | | | 18,171 | |
| | | | | | | | | | | | | | | | |
| | | | | | | | | | $ | 280,659 | |
| | | | | | | | | | | | | | | | |
During the year ended December 31, 2019, average notional values related to long futures contracts was $13,659,352.
The views expressed in this document reflect our judgment as of the publication date and are subject to change at any time without notice. The securities cited may not be representative of the Fund’s future investments and should not be construed as a recommendation to purchase or sell a particular security. See the Fund’s summary prospectus and statutory prospectus for complete descriptions of investment objectives, policies, risks and permissible investments.
| (a) | Non-income producing security. |
| (c) | Security is fair valued by the Valuation Committee, in accordance with the procedures approved by the Fund’s Board of Directors . Security value is determined based on level 3 inputs. |
| (e) | Variable Rate Security - Interest rate shown is rate in effect at December 31, 2019. For securities based on a published reference rate and spread, the reference rate and spread are indicated in the description above. |
| (f) | Settlement is on a delayed delivery or when-issued basis with final maturity to be announced (“TBA”) in the future. |
| (h) | Sponsored by SSGA Funds Management, Inc., the Fund’s investment adviser and administrator, and an affiliate of State Street Bank & Trust Co., the Fund’ssub-administrator, custodian and accounting agent. |
| (i) | Coupon amount represents effective yield. |
| † | Percentages are based on net assets as of December 31, 2019. |
Abbreviations:
LIBOR - London Interbank Offered Rate
REIT - Real Estate Investment Trust
SPDR - Standard and Poor’s Depositary Receipt
TBA - To Be Announced
The following table presents the Fund’s investments measured at fair value on a recurring basis at December 31, 2019:
| | | | | | | | | | | | | | | | | | |
| Fund | | Investments | | Level 1 | | | Level 2 | | | Level 3 | | | Total | |
| | Investments in Securities | | | | | | | | | | | | | | | | |
| | Foreign Equity | | $ | 417,940,796 | | | $ | 110,025 | | | $ | 1,002 | | | $ | 418,051,823 | |
| | Domestic Equity | | | 645,043,581 | | | | 327 | | | | — | | | | 645,043,908 | |
| | U.S. Treasuries | | | — | | | | 245,910,372 | | | | — | | | | 245,910,372 | |
| | U.S. Government Sponsored Agencies | | | — | | | | 558,355 | | | | — | | | | 558,355 | |
| | Agency Collateralized Mortgage Obligations | | | — | | | | 3,501,304 | | | | — | | | | 3,501,304 | |
| | Agency Mortgage Backed | | | — | | | | 132,652,003 | | | | — | | | | 132,652,003 | |
| | Asset Backed | | | — | | | | 1,932,451 | | | | — | | | | 1,932,451 | |
| | Corporate Notes | | | — | | | | 126,322,203 | | | | — | | | | 126,322,203 | |
| | Non-Agency Collateralized Mortgage Obligations | | | — | | | | 5,931,408 | | | | — | | | | 5,931,408 | |
| | Sovereign Bonds | | | — | | | | 7,747,468 | | | | — | | | | 7,747,468 | |
| | Municipal Bonds and Notes | | | — | | | | 2,485,095 | | | | — | | | | 2,485,095 | |
| | Exchange Traded & Mutual Funds | | | 287,144,377 | | | | — | | | | — | | | | 287,144,377 | |
| | Short-Term Investments | | | 60,902,376 | | | | — | | | | — | | | | 60,902,376 | |
| | | | | | | | | | | | | | | | | | |
| | Total Investments in Securities | | $ | 1,411,031,130 | | | $ | 527,151,011 | | | $ | 1,002 | | | $ | 1,938,183,143 | |
| | | | | | | | | | | | | | | | | | |
| | Other Financial Instruments | | | | | | | | | | | | | | | | |
| | Long Futures Contracts - Unrealized Appreciation | | $ | 280,659 | | | $ | — | | | $ | — | | | $ | 280,659 | |
| | | | | | | | | | | | | | | | | | |
See Notes to Schedule of Investments and Notes to Financial Statements.
| | |
| 10 | | State Street Total Return V.I.S. Fund |
State Street Total Return V.I.S. Fund
Summary Schedule of Investments, continued — December 31, 2019
The Fund was invested in the following countries/territories at December 31, 2019 (unaudited):
| | | | |
| Country/Territory | | Percentage
(based on
Fair Value) | |
United States | | | 75.54% | |
Japan | | | 3.21% | |
United Kingdom | | | 2.61% | |
Canada | | | 2.15% | |
Switzerland | | | 2.14% | |
France | | | 1.44% | |
Australia | | | 1.33% | |
Germany | | | 1.21% | |
China | | | 1.17% | |
Ireland | | | 0.99% | |
Hong Kong | | | 0.72% | |
Taiwan | | | 0.58% | |
Sweden | | | 0.56% | |
Netherlands | | | 0.46% | |
South Korea | | | 0.44% | |
Italy | | | 0.43% | |
India | | | 0.39% | |
Bermuda | | | 0.38% | |
Singapore | | | 0.36% | |
Supranational | | | 0.30% | |
Brazil | | | 0.30% | |
Finland | | | 0.30% | |
Spain | | | 0.28% | |
Israel | | | 0.26% | |
Russian Federation | | | 0.23% | |
Denmark | | | 0.20% | |
South Africa | | | 0.19% | |
Belgium | | | 0.15% | |
Mexico | | | 0.15% | |
New Zealand | | | 0.15% | |
Thailand | | | 0.12% | |
| | | | |
| Country/Territory | | Percentage
(based on
Fair Value) | |
Puerto Rico | | | 0.11% | |
Malaysia | | | 0.10% | |
Luxembourg | | | 0.10% | |
Norway | | | 0.09% | |
Cayman Islands | | | 0.08% | |
Colombia | | | 0.08% | |
Poland | | | 0.07% | |
Chile | | | 0.06% | |
Saudi Arabia | | | 0.06% | |
Panama | | | 0.06% | |
Turkey | | | 0.05% | |
Philippines | | | 0.05% | |
Indonesia | | | 0.05% | |
Qatar | | | 0.05% | |
Portugal | | | 0.04% | |
Hungary | | | 0.03% | |
Iraq | | | 0.03% | |
Greece | | | 0.03% | |
Uruguay | | | 0.02% | |
United Arab Emirates | | | 0.02% | |
Peru | | | 0.02% | |
Czech Republic | | | 0.02% | |
Austria | | | 0.01% | |
Czech | | | 0.01% | |
Monaco | | | 0.01% | |
Guernsey | | | 0.01% | |
Pakistan | | | 0.00% | |
UAE | | | 0.00% | |
| | | | |
| |
| | | 100.00% | |
| | | | |
The Fund’s % share of investment in the various categories, based on Fair Value, is as follows at December 31, 2019 (unaudited):
| | | | | | | | | | | | |
| Industry | | Domestic | | | Foreign | | | Total | |
Exchange Traded Funds | | | 14.81% | | | | 0.00% | | | | 14.81% | |
Property & Casualty Insurance | | | 1.96% | | | | 0.35% | | | | 2.31% | |
Multi-Line Insurance | | | 0.30% | | | | 1.38% | | | | 1.68% | |
Pharmaceuticals | | | 1.01% | | | | 0.64% | | | | 1.65% | |
Semiconductor Equipment | | | 1.47% | | | | 0.06% | | | | 1.53% | |
IT Consulting & Other Services | | | 0.32% | | | | 1.14% | | | | 1.46% | |
Electric Utilities | | | 0.88% | | | | 0.50% | | | | 1.38% | |
Multi-Sector Holdings | | | 1.13% | | | | 0.23% | | | | 1.36% | |
Life & Health Insurance | | | 0.56% | | | | 0.76% | | | | 1.32% | |
Integrated Telecommunication Services | | | 0.24% | | | | 1.04% | | | | 1.28% | |
Industrial Machinery | | | 0.59% | | | | 0.66% | | | | 1.25% | |
Healthcare Equipment | | | 0.98% | | | | 0.18% | | | | 1.16% | |
Diversified Banks | | | 0.00% | | | | 1.15% | | | | 1.15% | |
Technology Hardware, Storage & Peripherals | | | 0.65% | | | | 0.48% | | | | 1.13% | |
Application Software | | | 1.11% | | | | 0.00% | | | | 1.11% | |
Industrial Gases | | | 0.52% | | | | 0.55% | | | | 1.07% | |
Automobile Manufacturers | | | 0.74% | | | | 0.30% | | | | 1.04% | |
See Notes to Schedule of Investments and Notes to Financial Statements.
| | | | |
| State Street Total Return V.I.S. Fund | | | 11 | |
State Street Total Return V.I.S. Fund
Summary Schedule of Investments, continued — December 31, 2019
| | | | | | | | | | | | |
| Industry | | Domestic | | | Foreign | | | Total | |
Oil & Gas Refining & Marketing | | | 0.96% | | | | 0.07% | | | | 1.03% | |
General Merchandise Stores | | | 0.65% | | | | 0.34% | | | | 0.99% | |
Industrial Conglomerates | | | 0.87% | | | | 0.06% | | | | 0.93% | |
Home Building | | | 0.32% | | | | 0.53% | | | | 0.85% | |
Retail REITs | | | 0.47% | | | | 0.34% | | | | 0.81% | |
Semiconductors | | | 0.60% | | | | 0.17% | | | | 0.77% | |
Hypermarkets & Super Centers | | | 0.70% | | | | 0.06% | | | | 0.76% | |
Movies & Entertainment | | | 0.68% | | | | 0.05% | | | | 0.73% | |
Reinsurance | | | 0.10% | | | | 0.63% | | | | 0.73% | |
Apparel Retail | | | 0.67% | | | | 0.05% | | | | 0.72% | |
Packaged Foods & Meats | | | 0.44% | | | | 0.27% | | | | 0.71% | |
Mortgage REITs | | | 0.70% | | | | 0.00% | | | | 0.70% | |
Restaurants | | | 0.66% | | | | 0.01% | | | | 0.67% | |
Food Retail | | | 0.07% | | | | 0.60% | | | | 0.67% | |
Household Products | | | 0.61% | | | | 0.05% | | | | 0.66% | |
Integrated Oil & Gas | | | 0.21% | | | | 0.45% | | | | 0.66% | |
Systems Software | | | 0.57% | | | | 0.04% | | | | 0.61% | |
Data Processing & Outsourced Services | | | 0.55% | | | | 0.05% | | | | 0.60% | |
Multi-Utilities | | | 0.42% | | | | 0.18% | | | | 0.60% | |
Auto Parts & Equipment | | | 0.20% | | | | 0.39% | | | | 0.59% | |
Trading Companies & Distributors | | | 0.18% | | | | 0.39% | | | | 0.57% | |
Regional Banks | | | 0.41% | | | | 0.13% | | | | 0.54% | |
Tires & Rubber | | | 0.02% | | | | 0.46% | | | | 0.48% | |
Asset Management & Custody Banks | | | 0.17% | | | | 0.29% | | | | 0.46% | |
Construction & Engineering | | | 0.23% | | | | 0.22% | | | | 0.45% | |
Diversified REITs | | | 0.20% | | | | 0.24% | | | | 0.44% | |
Aerospace & Defense | | | 0.33% | | | | 0.11% | | | | 0.44% | |
Personal Products | | | 0.01% | | | | 0.42% | | | | 0.43% | |
Consumer Finance | | | 0.42% | | | | 0.00% | | | | 0.42% | |
Metal & Glass Containers | | | 0.41% | | | | 0.00% | | | | 0.41% | |
Automotive Retail | | | 0.36% | | | | 0.04% | | | | 0.40% | |
Technology Distributors | | | 0.36% | | | | 0.04% | | | | 0.40% | |
Gas Utilities | | | 0.13% | | | | 0.25% | | | | 0.38% | |
Healthcare Facilities | | | 0.36% | | | | 0.00% | | | | 0.36% | |
Diversified Support Services | | | 0.35% | | | | 0.00% | | | | 0.35% | |
Healthcare Distributors | | | 0.24% | | | | 0.10% | | | | 0.34% | |
Internet & Direct Marketing Retail | | | 0.18% | | | | 0.17% | | | | 0.35% | |
Construction Machinery & Heavy Trucks | | | 0.29% | | | | 0.05% | | | | 0.34% | |
Financial Exchanges & Data | | | 0.17% | | | | 0.15% | | | | 0.32% | |
Research & Consulting Services | | | 0.16% | | | | 0.14% | | | | 0.30% | |
Advertising | | | 0.24% | | | | 0.05% | | | | 0.29% | |
Environmental & Facilities Services | | | 0.29% | | | | 0.00% | | | | 0.29% | |
Steel | | | 0.10% | | | | 0.17% | | | | 0.27% | |
Biotechnology | | | 0.24% | | | | 0.01% | | | | 0.25% | |
Office REITs | | | 0.06% | | | | 0.18% | | | | 0.24% | |
Specialized REITs | | | 0.23% | | | | 0.00% | | | | 0.23% | |
Health Care REITs | | | 0.23% | | | | 0.00% | | | | 0.23% | |
Managed Healthcare | | | 0.22% | | | | 0.00% | | | | 0.22% | |
Specialty Chemicals | | | 0.04% | | | | 0.18% | | | | 0.22% | |
Electronic Manufacturing Services | | | 0.17% | | | | 0.05% | | | | 0.22% | |
Electronic Equipment & Instruments | | | 0.07% | | | | 0.15% | | | | 0.22% | |
Diversified Real Estate Activities | | | 0.00% | | | | 0.22% | | | | 0.22% | |
Industrial REITs | | | 0.01% | | | | 0.20% | | | | 0.21% | |
Healthcare Services | | | 0.12% | | | | 0.09% | | | | 0.21% | |
See Notes to Schedule of Investments and Notes to Financial Statements.
| | |
| 12 | | State Street Total Return V.I.S. Fund |
State Street Total Return V.I.S. Fund
Summary Schedule of Investments, continued — December 31, 2019
| | | | | | | | | | | | |
| Industry | | Domestic | | | Foreign | | | Total | |
Electronic Components | | | 0.03% | | | | 0.18% | | | | 0.21% | |
Cable & Satellite | | | 0.15% | | | | 0.06% | | | | 0.21% | |
Apparel, Accessories & Luxury Goods | | | 0.01% | | | | 0.19% | | | | 0.20% | |
Footwear | | | 0.14% | | | | 0.06% | | | | 0.20% | |
Specialty Stores | | | 0.17% | | | | 0.03% | | | | 0.20% | |
Independent Power Producers & Energy Traders | | | 0.08% | | | | 0.11% | | | | 0.19% | |
Trucking | | | 0.16% | | | | 0.03% | | | | 0.19% | |
Human Resource & Employment Services | | | 0.11% | | | | 0.08% | | | | 0.19% | |
Distributors | | | 0.18% | | | | 0.00% | | | | 0.18% | |
Wireless Telecommunication Services | | | 0.01% | | | | 0.17% | | | | 0.18% | |
Building Products | | | 0.12% | | | | 0.05% | | | | 0.17% | |
Air Freight & Logistics | | | 0.17% | | | | 0.00% | | | | 0.17% | |
Life Sciences Tools & Services | | | 0.10% | | | | 0.07% | | | | 0.17% | |
Broadcasting | | | 0.09% | | | | 0.07% | | | | 0.16% | |
Thrifts & Mortgage Finance | | | 0.15% | | | | 0.00% | | | | 0.15% | |
Leisure Products | | | 0.03% | | | | 0.12% | | | | 0.15% | |
Interactive Media & Services | | | 0.04% | | | | 0.10% | | | | 0.14% | |
Real Estate Development | | | 0.00% | | | | 0.14% | | | | 0.14% | |
Real Estate Operating Companies | | | 0.00% | | | | 0.14% | | | | 0.14% | |
Department Stores | | | 0.00% | | | | 0.13% | | | | 0.13% | |
Other Diversified Financial Services | | | 0.05% | | | | 0.08% | | | | 0.13% | |
Airlines | | | 0.03% | | | | 0.10% | | | | 0.13% | |
Diversified Metals & Mining | | | 0.00% | | | | 0.12% | | | | 0.12% | |
Food Distributors | | | 0.10% | | | | 0.02% | | | | 0.12% | |
Marine | | | 0.00% | | | | 0.12% | | | | 0.12% | |
Consumer Electronics | | | 0.12% | | | | 0.00% | | | | 0.12% | |
Commodity Chemicals | | | 0.01% | | | | 0.10% | | | | 0.11% | |
Insurance Brokers | | | 0.11% | | | | 0.00% | | | | 0.11% | |
Commercial Printing | | | 0.01% | | | | 0.09% | | | | 0.10% | |
Oil & Gas Storage & Transportation | | | 0.05% | | | | 0.05% | | | | 0.10% | |
Electrical Components & Equipment | | | 0.08% | | | | 0.02% | | | | 0.10% | |
Investment Banking & Brokerage | | | 0.10% | | | | 0.00% | | | | 0.10% | |
Household Appliances | | | 0.00% | | | | 0.09% | | | | 0.09% | |
Home Improvement Retail | | | 0.04% | | | | 0.05% | | | | 0.09% | |
Home Furnishing Retail | | | 0.08% | | | | 0.00% | | | | 0.08% | |
Internet Services & Infrastructure | | | 0.00% | | | | 0.08% | | | | 0.08% | |
Hotel & Resort REITs | | | 0.07% | | | | 0.00% | | | | 0.07% | |
Gold | | | 0.00% | | | | 0.07% | | | | 0.07% | |
Residential REITs | | | 0.07% | | | | 0.00% | | | | 0.07% | |
Construction Materials | | | 0.00% | | | | 0.07% | | | | 0.07% | |
Paper Packaging | | | 0.07% | | | | 0.00% | | | | 0.07% | |
Soft Drinks | | | 0.05% | | | | 0.02% | | | | 0.07% | |
Agricultural Products | | | 0.00% | | | | 0.06% | | | | 0.06% | |
Renewable Electricity | | | 0.00% | | | | 0.06% | | | | 0.06% | |
Railroads | | | 0.00% | | | | 0.06% | | | | 0.06% | |
Airport Services | | | 0.03% | | | | 0.02% | | | | 0.05% | |
Coal & Consumable Fuels | | | 0.01% | | | | 0.04% | | | | 0.05% | |
Agricultural & Farm Machinery | | | 0.05% | | | | 0.00% | | | | 0.05% | |
Interactive Home Entertainment | | | 0.05% | | | | 0.00% | | | | 0.05% | |
Hotels, Resorts & Cruise Lines | | | 0.05% | | | | 0.00% | | | | 0.05% | |
Communications Equipment | | | 0.04% | | | | 0.01% | | | | 0.05% | |
Publishing | | | 0.02% | | | | 0.02% | | | | 0.04% | |
Healthcare Supplies | | | 0.04% | | | | 0.00% | | | | 0.04% | |
Brewers | | | 0.04% | | | | 0.00% | | | | 0.04% | |
See Notes to Schedule of Investments and Notes to Financial Statements.
| | | | |
| State Street Total Return V.I.S. Fund | | | 13 | |
State Street Total Return V.I.S. Fund
Summary Schedule of Investments, continued — December 31, 2019
| | | | | | | | | | | | |
| Industry | | Domestic | | | Foreign | | | Total | |
Oil & Gas Equipment & Services | | | 0.04% | | | | 0.00% | | | | 0.04% | |
Computer & Electronics Retail | | | 0.00% | | | | 0.04% | | | | 0.04% | |
Drug Retail | | | 0.00% | | | | 0.03% | | | | 0.03% | |
Education Services | | | 0.03% | | | | 0.00% | | | | 0.03% | |
Diversified Capital Markets | | | 0.00% | | | | 0.03% | | | | 0.03% | |
Highways & Railtracks | | | 0.00% | | | | 0.03% | | | | 0.03% | |
Marine Ports & Services | | | 0.00% | | | | 0.02% | | | | 0.02% | |
Diversified Chemicals | | | 0.00% | | | | 0.02% | | | | 0.02% | |
Water Utilities | | | 0.00% | | | | 0.02% | | | | 0.02% | |
Casinos & Gaming | | | 0.00% | | | | 0.02% | | | | 0.02% | |
Oil & Gas Drilling | | | 0.02% | | | | 0.00% | | | | 0.02% | |
Office Services & Supplies | | | 0.02% | | | | 0.00% | | | | 0.02% | |
Tobacco | | | 0.02% | | | | 0.00% | | | | 0.02% | |
Real Estate Services | | | 0.02% | | | | 0.00% | | | | 0.02% | |
Security & Alarm Services | | | 0.00% | | | | 0.02% | | | | 0.02% | |
Motorcycle Manufacturers | | | 0.00% | | | | 0.02% | | | | 0.02% | |
Paper Products | | | 0.02% | | | | 0.00% | | | | 0.02% | |
Oil & Gas Exploration & Production | | | 0.01% | | | | 0.00% | | | | 0.01% | |
Precious Metals & Minerals | | | 0.00% | | | | 0.01% | | | | 0.01% | |
Fertilizers & Agricultural Chemicals | | | 0.00% | | | | 0.01% | | | | 0.01% | |
Copper | | | 0.00% | | | | 0.01% | | | | 0.01% | |
Alternative Carriers | | | 0.01% | | | | 0.00% | | | | 0.01% | |
Healthcare Technology | | | 0.01% | | | | 0.00% | | | | 0.01% | |
Specialized Finance | | | 0.00% | | | | 0.01% | | | | 0.01% | |
Textiles | | | 0.00% | | | | 0.01% | | | | 0.01% | |
Specialized Consumer Services | | | 0.00% | | | | 0.00% | | | | 0.00% | |
Home Furnishings | | | 0.00% | | | | 0.00% | | | | 0.00% | |
Aluminum | | | 0.00% | | | | 0.00% | | | | 0.00% | |
Banks | | | 0.00% | | | | 0.00% | | | | 0.00% | |
| | | | | | | | | | | | |
| | | |
| | | | | | | | | | | 69.67% | |
| | | | | | | | | | | | |
| | | | |
| Sector | | Percentage
(based on
Fair Value) | |
U.S. Treasuries | | | 12.69% | |
Agency Mortgage Backed | | | 6.84% | |
Corporate Notes | | | 6.52% | |
Sovereign Bonds | | | 0.40% | |
Non-Agency Collateralized Mortgage Obligations | | | 0.30% | |
Agency Collateralized Mortgage Obligations | | | 0.18% | |
Municipal Bonds and Notes | | | 0.13% | |
Asset Backed | | | 0.10% | |
U.S. Government Sponsored Agencies | | | 0.03% | |
| | | | |
| | | 27.19% | |
| | | | |
| | | | |
| Sector | | Percentage
(based on
Fair Value) | |
Short-Term Investments | | | | |
Short-Term Investments | | | 3.14% | |
| | | | |
| | | 3.14% | |
| | | | |
| |
| | | 100.00% | |
| | | | |
See Notes to Schedule of Investments and Notes to Financial Statements.
| | |
| 14 | | State Street Total Return V.I.S. Fund |
State Street Total Return V.I.S. Fund
Summary Schedule of Investments, continued — December 31, 2019
Affiliate Table
| | | | | | | | | | | | | | | | | | | | | | | | | | | | | | | | | | | | |
| | | Number
of Shares
Held at
12/31/18 | | | Value At
12/31/18 | | | Cost of
Purchases | | | Proceeds
from
Shares
Sold | | | Realized
Gain
(Loss) | | | Change in
Unrealized
Appreciation/
Depreciation | | | Number
of Shares
Held at
12/31/19 | | | Value at
12/31/19 | | | Dividend
Income | |
SPDR Bloomberg Barclays High Yield Bond ETF | | | 2,846,551 | | | $ | 95,615,648 | | | $ | 83,544,615 | | | $ | 52,501,879 | | | $ | (347,906 | ) | | $ | 8,791,119 | | | | 1,233,354 | | | $ | 135,101,597 | | | $ | 7,362,300 | |
SPDR Dow Jones REIT ETF | | | 410,485 | | | | 35,301,710 | | | | 110,472,890 | | | | 62,269,080 | | | | 2,020,884 | | | | 8,092,861 | | | | 917,656 | | | | 93,619,265 | | | | 3,193,298 | |
State Street Institutional U.S. Government Money Market Fund, Class G Shares | | | 90,625,489 | | | | 90,625,489 | | | | 553,501,715 | | | | 583,224,828 | | | | — | | | | — | | | | 60,902,376 | | | | 60,902,376 | | | | 1,321,374 | |
| | | | | | | | | | | | | | | | | | | | | | | | | | | | | | | | | | | | |
| | | | | | | | | |
TOTAL | | | | | | $ | 221,542,847 | | | $ | 747,519,220 | | | $ | 697,995,787 | | | $ | 1,672,978 | | | $ | 16,883,980 | | | | | | | $ | 289,623,238 | | | $ | 11,876,972 | |
| | | | | | | | | | | | | | | | | | | | | | | | | | | | | | | | | | | | |
See Notes to Schedule of Investments and Notes to Financial Statements.
| | | | |
| State Street Total Return V.I.S. Fund | | | 15 | |
State Street Total Return V.I.S. Fund
Financial Highlights
Selected data based on a share outstanding throughout the fiscal years indicated
| | | | | | | | | | | | | | | | | | | | |
| | | Class 1 | |
| | | 12/31/19 | | | 12/31/18 | | | 12/31/17 | | | 12/31/16 | | | 12/31/15* | |
| Inception date | | | | | | | | | | | | | | | | | | | 7/1/85 | |
| | | | | |
Net asset value, beginning of period | | $ | 14.06 | | | $ | 19.94 | | | $ | 18.08 | | | $ | 17.66 | | | $ | 18.81 | |
| | | | | | | | | | | | | | | | | | | | |
| | | | |
Income/(loss) from investment operations: | | | | | | | | | | | | | | | | | |
Net investment income | | | 0.34 | (a) | | | 0.40 | (a) | | | 0.36 | (a) | | | 0.35 | | | | 0.31 | |
Net realized and unrealized gains/(losses) on investments | | | 1.88 | | | | (1.69 | ) | | | 2.46 | | | | 0.77 | | | | (0.52 | ) |
| | | | | | | | | | | | | | | | | | | | |
Total income/(loss) from investment operations | | | 2.22 | | | | (1.29 | ) | | | 2.82 | | | | 1.12 | | | | (0.21 | ) |
| | | | | | | | | | | | | | | | | | | | |
| | | | | |
Less distributions from: | | | | | | | | | | | | | | | | | | | | |
Net investment income | | | 0.37 | | | | 0.45 | | | | 0.41 | | | | 0.35 | | | | 0.34 | |
Net realized gains | | | — | | | | 4.14 | | | | 0.55 | | | | 0.35 | | | | 0.60 | |
| | | | | | | | | | | | | | | | | | | | |
Total distributions | | | 0.37 | | | | 4.59 | | | | 0.96 | | | | 0.70 | | | | 0.94 | |
| | | | | | | | | | | | | | | | | | | | |
Net asset value, end of period | | $ | 15.91 | | | $ | 14.06 | | | $ | 19.94 | | | $ | 18.08 | | | $ | 17.66 | |
| | | | | | | | | | | | | | | | | | | | |
Total Return(b) | | | 15.81 | % | | | (6.34 | )% | | | 15.58 | % | | | 6.35 | % | | | (1.13 | )% |
| | | | | |
Ratios/Supplemental Data: | | | | | | | | | | | | | | | | | | | | |
Net assets, end of period (in thousands) | | $ | 764,667 | | | $ | 733,417 | | | $ | 856,665 | | | $ | 797,448 | | | $ | 807,584 | |
| | | | | |
Ratios to average net assets: | | | | | | | | | | | | | | | | | | | | |
Net expenses | | | 0.61 | % | | | 0.62 | % | | | 0.62 | % | | | 0.60 | % | | | 0.61 | % |
Gross expenses | | | 0.61 | % | | | 0.62 | % | | | 0.62 | % | | | 0.60 | % | | | 0.61 | % |
Net investment income | | | 2.24 | % | | | 2.01 | % | | | 1.83 | % | | | 1.85 | % | | | 1.56 | % |
Portfolio turnover rate | | | 81 | % | | | 97 | % | | | 15 | % | | | 45 | % | | | 70 | % |
| |
| | | Class 3 | |
| | | 12/31/19 | | | 12/31/18 | | | 12/31/17 | | | 12/31/16 | | | 12/31/15* | |
| Inception date | | | | | | | | | | | | | | | | | | | 5/1/06 | |
| | | | | |
Net asset value, beginning of period | | $ | 14.01 | | | $ | 19.88 | | | $ | 18.03 | | | $ | 17.61 | | | $ | 18.75 | |
| | | | | | | | | | | | | | | | | | | | |
| | | | | |
Income/(loss) from investment operations: | | | | | | | | | | | | | | | | | | | | |
Net investment income | | | 0.30 | (a) | | | 0.35 | (a) | | | 0.31 | (a) | | | 0.30 | | | | 0.27 | |
Net realized and unrealized gains/(losses) on investments | | | 1.88 | | | | (1.69 | ) | | | 2.44 | | | | 0.77 | | | | (0.51 | ) |
| | | | | | | | | | | | | | | | | | | | |
Total income/(loss) from investment operations | | | 2.18 | | | | (1.34 | ) | | | 2.75 | | | | 1.07 | | | | (0.24 | ) |
| | | | | | | | | | | | | | | | | | | | |
| | | | | |
Less distributions from: | | | | | | | | | | | | | | | | | | | | |
Net investment income | | | 0.33 | | | | 0.39 | | | | 0.35 | | | | 0.30 | | | | 0.30 | |
Net realized gains | | | — | | | | 4.14 | | | | 0.55 | | | | 0.35 | | | | 0.60 | |
| | | | | | | | | | | | | | | | | | | | |
Total distributions | | | 0.33 | | | | 4.53 | | | | 0.90 | | | | 0.65 | | | | 0.90 | |
| | | | | | | | | | | | | | | | | | | | |
Net asset value, end of period | | $ | 15.86 | | | $ | 14.01 | | | $ | 19.88 | | | $ | 18.03 | | | $ | 17.61 | |
| | | | | | | | | | | | | | | | | | | | |
Total Return(b) | | | 15.57 | % | | | (6.61 | )% | | | 15.26 | % | | | 6.08 | % | | | (1.34 | )% |
| | | | | |
Ratios/Supplemental Data: | | | | | | | | | | | | | | | | | | | | |
Net assets, end of period (in thousands) | | $ | 1,156,437 | | | $ | 1,165,809 | | | $ | 1,464,061 | | | $ | 1,508,428 | | | $ | 1,633,723 | |
| | | | | |
Ratios to average net assets: | | | | | | | | | | | | | | | | | | | | |
Net Expenses | | | 0.86 | % | | | 0.87 | % | | | 0.87 | % | | | 0.85 | % | | | 0.86 | % |
Gross Expenses | | | 0.86 | % | | | 0.87 | % | | | 0.87 | % | | | 0.85 | % | | | 0.86 | % |
Net investment income | | | 1.99 | % | | | 1.76 | % | | | 1.59 | % | | | 1.60 | % | | | 1.31 | % |
Portfolio turnover rate | | | 81 | % | | | 97 | % | | | 15 | % | | | 45 | % | | | 70 | % |
Notes to Financial Highlights
| (a) | | Per share values have been calculated using the average shares method. |
| (b) | | Total returns are historical and assume changes in share price, reinvestment of dividends and capital gains distributions and do not include the effect of insurance contract charges. Past performance does not guarantee future results. |
| * | | Beginning with the year ended December 31, 2016, the Fund was audited by Ernst & Young LLP. The previous years were audited by another independent registered public accounting firm. |
The accompanying Notes are an integral part of these financial statements.
State Street Total Return V.I.S. Fund
Statement of Assets and Liabilities — December 31, 2019
| | | | |
Assets | | | | |
Investments in securities, at fair value (cost $1,509,163,573) | | $ | 1,648,559,905 | |
Investments in affiliated securities, at fair value (cost $221,993,312) | | | 228,720,862 | |
Short-term affiliated investments, at fair value | | | 60,902,376 | |
Cash | | | 38,362 | |
Net cash collateral on deposit with broker for future contracts | | | 109,138 | |
Foreign currency (cost $1,151,258) | | | 1,158,097 | |
Receivable for investments sold | | | 333,466 | |
Income receivables | | | 5,082,923 | |
Receivable for fund shares sold | | | 31,327 | |
Income receivable from affiliated investments | | | 73,886 | |
Receivable for accumulated variation margin on futures contracts | | | 280,960 | |
Other assets | | | 10,897 | |
| | | | |
| |
Total assets | | | 1,945,302,199 | |
| | | | |
| |
Liabilities | | | | |
Payable for investments purchased | | | 21,849,320 | |
Payable for fund shares redeemed | | | 427,156 | |
Payable to the Adviser | | | 567,737 | |
Payable for custody, fund accounting andsub-administration fees | | | 57,046 | |
Accrued other expenses | | | 90,321 | |
Distribution and service fees | | | 1,206,629 | |
| | | | |
| |
Total liabilities | | | 24,198,209 | |
| | | | |
| | | | |
| |
Net Assets | | $ | 1,921,103,990 | |
| | | | |
| |
Net Assets Consist of: | | | | |
Capital paid in | | $ | 1,793,103,466 | |
Total distributable earnings (loss) | | | 128,000,524 | |
| | | | |
| |
Net Assets | | $ | 1,921,103,990 | |
| | | | |
| | | | |
Class 1 | | | | |
Net Assets | | $ | 764,666,966 | |
Shares outstanding ($0.01 par value, unlimited shares authorized) | | | 48,064,257 | |
Net asset value, offering and redemption price per share | | $ | 15.91 | |
| | | | |
Class 3 | | | | |
Net Assets | | $ | 1,156,437,024 | |
Shares outstanding ($0.01 par value, unlimited shares authorized) | | | 72,924,862 | |
Net asset value per share | | $ | 15.86 | |
Net asset value per share | | $ | 14.01 | |
The accompanying Notes are an integral part of these financial statements.
| | | | |
| Statement of Assets and Liabilities | | | 17 | |
State Street Total Return V.I.S. Fund
Statement of Operations — For the fiscal year ended December 31, 2019
| | | | |
Investment Income | |
Income | |
Dividend | | $ | 29,326,755 | |
Interest | | | 15,693,844 | |
Income from affiliated investments | | | 11,876,972 | |
Less: Foreign taxes withheld | | | (1,572,967 | ) |
| | | | |
Total income | | | 55,324,604 | |
| | | | |
|
Expenses | |
Advisory and administration fees | | | 6,808,860 | |
Distribution and service fees | | | | |
Class 1 | | | 1,523,127 | |
Class 3 | | | 5,327,213 | |
Directors’ fees | | | 49,752 | |
Custody, fund accounting andsub-administration fees | | | 599,666 | |
Professional fees | | | 193,993 | |
Other expenses | | | 243,189 | |
| | | | |
Total expenses | | | 14,745,800 | |
| | | | |
Net investment income | | $ | 40,578,804 | |
| | | | |
|
Net Realized and Unrealized Gain (Loss) on Investments | |
Realized gain (loss) on: | |
Unaffiliated investments | | $ | 1,943,976 | * |
Affiliated investments | | | 1,672,978 | |
Futures | | | 2,228,567 | |
Foreign currency transactions | | | (125,454 | ) |
Increase (decrease) in unrealized appreciation/depreciation on: | |
Unaffiliated investments | | | 218,396,145 | ** |
Affiliated investments | | | 16,883,980 | |
Futures | | | 600,227 | |
Foreign currency translations | | | 17,197 | |
| | | | |
| |
Net realized and unrealized gain (loss) on investments | | | 241,617,616 | |
| | | | |
| |
Net Increase in Net Assets Resulting from Operations | | $ | 282,196,420 | |
| | | | |
| * | | Includes $51,745 of net realized gains from foreign capital tax gain. |
| ** | | Includes change in accrued foreign capital gains tax of $45,596. |
The accompanying Notes are an integral part of these financial statements.
| | |
| 18 | | Statement of Operations |
State Street Total Return V.I.S. Fund
Statements of Changes in Net Assets
| | | | | | | | |
| | | Year Ended December 31,
2019 | | | Year Ended December 31,
2018 | |
Increase (Decrease) in Net Assets | |
|
Operations: | |
Net investment income | | $ | 40,578,804 | | | $ | 40,212,947 | |
Net realized gain (loss) on investments, futures and foreign currency related transactions | | | 5,720,067 | | | | 405,529,321 | |
Net increase (decrease) in unrealized appreciation/depreciation on investments, futures and foreign currency transactions | | | 235,897,549 | | | | (578,300,573 | ) |
| | | | | | | | |
Net increase (decrease) from operations | | | 282,196,420 | | | | (132,558,305 | ) |
| | | | | | | | |
|
Distributions to shareholders: | |
Total distributions | | | | | | | | |
Class 1 | | | (17,548,395 | ) | | | (180,207,716 | ) |
Class 3 | | | (23,703,106 | ) | | | (284,866,389 | ) |
| | | | | | | | |
Total distributions | | | (41,251,501 | ) | | | (465,074,105 | ) |
| | | | | | | | |
Increase (decrease) in assets from operations and distributions | | | 240,944,919 | | | | (597,632,410 | ) |
| | | | | | | | |
|
Share transactions: | |
Proceeds from sale of shares | | | | | | | | |
Class 1 | | | 10,132,130 | | | | 20,964,003 | |
Class 3 | | | 13,995,283 | | | | 30,059,171 | |
Value of distributions reinvested | | | | | | | | |
Class 1 | | | 17,548,395 | | | | 180,207,716 | |
Class 3 | | | 23,703,106 | | | | 284,866,389 | |
Cost of shares redeemed | | | | | | | | |
Class 1 | | | (90,189,216 | ) | | | (94,290,832 | ) |
Class 3 | | | (194,257,291 | ) | | | (245,672,997 | ) |
| | | | | | | | |
Net increase (decrease) from share transactions | | | (219,067,593 | ) | | | 176,133,450 | |
| | | | | | | | |
| | |
Total increase (decrease) in net assets | | | 21,877,326 | | | | (421,498,960 | ) |
|
Net Assets | |
Beginning of year | | | 1,899,226,664 | | | | 2,320,725,624 | |
| | | | | | | | |
| | |
End of year | | $ | 1,921,103,990 | | | $ | 1,899,226,664 | |
| | | | | | | | |
|
Changes in Fund Shares | |
Class 1 | |
Shares sold | | | 659,598 | | | | 1,059,253 | |
Issued for distributions reinvested | | | 1,101,594 | | | | 12,899,622 | |
Shares redeemed | | | (5,867,922 | ) | | | (4,756,048 | ) |
| | | | | | | | |
Net increase (decrease) in fund shares | | | (4,106,730 | ) | | | 9,202,827 | |
| | | | | | | | |
Class 3 | |
Shares sold | | | 912,764 | | | | 1,521,278 | |
Issued for distributions reinvested | | | 1,492,639 | | | | 20,449,848 | |
Shares redeemed | | | (12,678,384 | ) | | | (12,429,805 | ) |
| | | | | | | | |
Net increase (decrease) in fund shares | | | (10,272,981 | ) | | | 9,541,321 | |
| | | | | | | | |
The accompanying Notes are an integral part of these financial statements.
| | | | |
| Statements of Changes in Net Assets | | | 19 | |
State Street Total Return V.I.S. Fund
Notes to Financial Statements — December 31, 2019
| 1. | | Organization of the Company |
State Street Variable Insurance Series Funds, Inc. (the “Company”) was incorporated under the laws of the Commonwealth of Virginia on May 14, 1984 and is registered under the Investment Company Act of 1940, as amended (the “1940 Act”), as anopen-end management investment company. The Company is currently composed of the following seven investment portfolios (collectively, the “Funds”): State Street U.S. Equity V.I.S. Fund, State Street S&P 500 Index V.I.S. Fund, State Street Premier Growth Equity V.I.S. Fund, State StreetSmall-Cap Equity V.I.S. Fund, State Street Total Return V.I.S. Fund (the “Fund”), State Street Income V.I.S. Fund and State Street Real Estate Securities V.I.S. Fund. Each Fund is a diversified investment company within the meaning of the 1940 Act.
Shares of the Funds of the Company are offered only to insurance company separate accounts that fund certain variable life insurance contracts and variable annuity contracts.
The Company currently offers two share classes of the Fund as investment options for variable life insurance and variable annuity contracts — Class 1 and Class 3. Class 3 shares were first offered on May 1, 2006, and Fund shares outstanding prior to May 1, 2006 were designated as Class 1 shares. Each class of shares has different fees and expenses, and as a result, each class of shares will have different share price and performance. Not all variable contracts offer each class of the Fund’s shares.
Under the Company’s organizational documents, its officers and directors are indemnified against certain liabilities arising out of the performance of their duties to the Company. Additionally, in the normal course of business, the Company enters into contracts with service providers that contain general indemnification clauses. The Company’s maximum exposure under these arrangements is unknown as this would involve future claims that may be made against the Company that have not yet occurred.
| 2. | | Summary of Significant Accounting Policies |
The following is a summary of significant accounting policies followed by the Company in the preparation of its financial statements:
The preparation of financial statements in accordance with U.S. generally accepted accounting principles (“U.S. GAAP”) requires management to make estimates and assumptions that affect the reported amounts and disclosures in the financial statements. Actual results could differ from those estimates. The Fund is an investment company under U.S. GAAP and follows the accounting and reporting guidance applicable to investment companies.
Security Valuation The Fund’s investments are valued at fair value each day that the New York Stock Exchange (“NYSE”) is open and, for financial reporting purposes, as of the report date should the reporting period end on a day that the NYSE is not open. Fair value is generally defined as the price a fund would receive to sell an asset or pay to transfer a liability in an orderly transaction between market participants at the measurement date. By its nature, a fair value price is a good faith estimate of the valuation in a current sale and may not reflect an actual market price. The investments of the Fund are valued pursuant to the policy and procedures developed by the Oversight Committee (the “Committee”) and approved by the Company’s Board of Directors (the “Board”). The Committee provides oversight of the valuation of investments for the Fund. The Board has responsibility for overseeing the determination of the fair value of investments.
Valuation techniques used to value the Fund’s investments by major category are as follows:
| | • | | Equity investments (including preferred stocks and registered investment companies that are exchange-traded funds) traded on a recognized securities exchange for which market quotations are readily available are valued at the last sale price or official closing price, as applicable, on the primary market or exchange on which they trade. Equity investments traded on a recognized exchange for which there were no sales on that day are valued at the last published sale price or at fair value. |
| | • | | Investments in registered investment companies (including money market funds) or other unitized pooled investment vehicles that are not traded on an exchange are valued at that day’s published net asset value (“NAV”) per share or unit. |
| | • | | Government and municipal fixed income securities are generally valued using quotations from independent pricing services or brokers. Certain government inflation-indexed securities may require a calculated fair valuation as the cumulative inflation is contained within the price provided by the pricing service or broker. For these securities, the inflation |
| | |
| 20 | | Notes to Financial Statements |
State Street Total Return V.I.S. Fund
Notes to Financial Statements, continued — December 31, 2019
| | component of the price is “cleaned” from the pricing service or broker price utilizing the published inflation factors in order to ensure proper accrual of income. |
| | • | | Debt obligations (including short term investments and convertible debt securities) are valued using quotations from independent pricing services or brokers or are generally valued at the last reported evaluated prices. |
| | • | | Exchange-traded futures contracts are valued at the closing settlement price on the primary market on which they are traded most extensively. Exchange-traded futures contracts traded on a recognized exchange for which there were no sales on that day are valued at the last reported sale price obtained from independent pricing services or brokers or at fair value. |
In the event prices or quotations are not readily available or that the application of these valuation methods results in a price for an investment that is deemed to be not representative of the fair value of such investment, fair value will be determined in good faith by the Committee, in accordance with the valuation policy and procedures approved by the Board.
A “significant event” is an event that the Board believes, with a reasonably high degree of certainty, has caused the closing market prices of a Fund’s portfolio securities to no longer reflect their value at the time of the Fund’s NAV calculation. Fair value may be determined using an independent fair value service under valuation procedures approved by the Board. The independent fair value service takes into account multiple factors including, but not limited to, movements in the U.S. securities markets, certain depositary receipts, futures contracts and foreign currency exchange rates that have occurred subsequent to the close of foreign securities exchanges. The use of the independent fair value service or alternative fair valuation methods would result in the investments being classified within Level 2 of the fair value hierarchy.
The Fund values its assets and liabilities at fair value using a fair value hierarchy consisting of three broad levels that prioritize the inputs to valuation techniques giving the highest priority to readily available unadjusted quoted prices in active markets for identical assets or liabilities (Level 1 measurements) and the lowest priority to unobservable inputs (Level 3 measurements) when market prices are not readily available or reliable. The categorization of a value determined for an investment within the hierarchy is based upon the pricing transparency of the investment and is not necessarily an indication of the risk associated with investing in it.
The three levels of the fair value hierarchy are as follows:
| | • | | Level 1 — Unadjusted quoted prices in active markets for an identical asset or liability; |
| | • | | Level 2 — Inputs other than quoted prices included within Level 1 that are observable for the asset or liability either directly or indirectly, including quoted prices for similar assets or liabilities in active markets, quoted prices for identical or similar assets or liabilities in markets that are not considered to be active, inputs other than quoted prices that are observable for the asset or liability (such as exchange rates, financing terms, interest rates, yield curves, volatilities, prepayment speeds, loss severities, credit risks and default rates) or other market-corroborated inputs; and |
| | • | | Level 3 — Unobservable inputs for the asset or liability, including the Committee’s assumptions used in determining the fair value of investments. |
The value of the Fund’s investments according to the fair value hierarchy as of December 31, 2019 is disclosed in the Fund’s Schedule of Investments.
Investment Transactions and Income Recognition Investment transactions are accounted for on trade date for financial reporting purposes. Realized gains and losses from the sale or disposition of investments and foreign exchange transactions, if any, are determined using the identified cost method.
Dividend income and capital gain distributions, if any, are recognized on theex-dividend date, net of any foreign taxes withheld at source, if any.
Interest income is recorded daily on an accrual basis. All premiums and discounts are amortized/accreted for financial reporting purposes.
Non-cash dividends received in the form of stock are recorded as dividend income at fair value.
Expenses Certain expenses, which are directly identifiable to a specific Fund, are applied to the Fund within the Company. Other expenses which cannot be attributed to a specific Fund are allocated in such a manner as deemed equitable, taking into consideration the nature and type of expense and the relative net assets of the Fund within the Company.
| | | | |
| Notes to Financial Statements | | | 21 | |
State Street Total Return V.I.S. Fund
Notes to Financial Statements, continued — December 31, 2019
Foreign Currency Translation The accounting records of the Fund are maintained in U.S. dollars. Foreign currencies as well as investment securities and other assets and liabilities denominated in a foreign currency are translated to U.S. dollars using exchange rates at period end. Purchases and sales of securities, income receipts and expense payments denominated in foreign currencies are translated into U.S. dollars at the prevailing exchange rate on the respective dates of the transactions.
The effects of exchange rate fluctuations on investments are included with the net realized and unrealized gain (loss) on investment securities. Other foreign currency transactions resulting in realized and unrealized gain (loss) are disclosed separately.
Foreign Taxes The Fund may be subject to foreign taxes (a portion of which may be reclaimable) on income, stock dividends, realized and unrealized capital gains on investments or certain foreign currency transactions. Foreign taxes are recorded in accordance with SSGA Funds Management, Inc.’s (the “Adviser” or “SSGA FM”) understanding of the applicable foreign tax regulations and rates that exist in the foreign jurisdictions in which the Fund invests. These foreign taxes, if any, are paid by the Fund and are reflected in the Statement of Operations, if applicable. Foreign taxes payable or deferred as of December 31, 2019, if any, are disclosed in the Fund’s Statement of Assets and Liabilities.
Distributions The Fund declares and pays any dividends from net investment income annually.
Net realized capital gains, if any, are distributed annually, unless additional distributions are required for compliance with applicable tax regulations. The amount and character of income and capital gains to be distributed are determined in accordance with applicable tax regulations which may differ from net investment income and realized gains recognized for U.S. GAAP purposes.
| 3. | | Securities and Other Investments |
Delayed Delivery Transactions and When-Issued Securities During the fiscal year ended December 31, 2019, the Fund transacted in securities on a delayed delivery or when-issued basis. Payment and delivery may take place after the customary settlement period for that security. The price of the underlying securities and the date when the securities will be delivered and paid for are fixed at the time the transaction is negotiated. The securities purchased on a delayed delivery or when-issued basis are identified as such in the Fund’s Summary Schedule of Investments. The Fund may receive compensation for interest forgone in the purchase of a delayed delivery or when-issued security. With respect to such purchase commitments, the Fund identifies securities as segregated in its records with a value at least equal to the amount of the commitment. Losses may arise due to changes in the value of the underlying securities or if the counterparty does not perform under the contract’s terms, or if the issuer does not issue the securities due to political, economic or other factors.
To-Be-Announced Transactions The Fund may seek to obtain exposure to U.S. agency mortgage pass-through securities through the use of“to-be-announced” or “TBA transactions.” “TBA” refers to a commonly used mechanism for the forward settlement of U.S. agency mortgage pass-through securities. In a TBA transaction, the buyer and seller decide on general trade parameters, such as agency, settlement date, coupon, and price.
The Fund may use TBA transactions to “roll over” such agreements prior to the settlement date. This type of TBA transaction is sometimes known as a “TBA roll.” In a TBA roll, the Fund generally will sell the obligation to purchase the pools stipulated in the TBA agreement prior to the settlement date and will enter into a new TBA agreement for future delivery of pools of mortgage pass-through securities. The Fund may also enter into TBA agreements and settle such transactions on the stipulated settlement date by accepting actual receipt or delivery of the pools of mortgage pass-through securities.
Default by or bankruptcy of a counterparty to a TBA transaction would expose the Fund to possible loss because of adverse market action, expenses or delays in connection with the purchase or sale of the pools of mortgage pass-through securities specified in the TBA transaction. To minimize this risk, the Fund will enter into TBA transactions only with established counterparties. The Fund’s use of “TBA rolls” may impact portfolio turnover, transaction costs and capital gain distributions to shareholders.
| 4. | | Derivative Financial Instruments |
Futures Contracts The Fund may enter into futures contracts to meet the Fund’s objectives. A futures contract is a standardized, exchange-traded agreement to buy or sell a financial instrument at a set price on a future date. Upon entering
| | |
| 22 | | Notes to Financial Statements |
State Street Total Return V.I.S. Fund
Notes to Financial Statements, continued — December 31, 2019
into a futures contract, the Fund is required to deposit with the broker, cash or securities in an amount equal to the minimum initial margin requirements of the clearing house. Subsequent payments are made or received by the Fund equal to the daily change in the contract value, accumulated, exchange rates, and or other transactional fees. The accumulation of those payments are recorded as variation margin receivable or payable with a corresponding offset to unrealized gains or losses. The Fund recognizes a realized gain or loss when the contract is closed.
Losses may arise if the value of a futures contract decreases due to unfavorable changes in the market rates or values of the underlying instrument during the term of the contract or if the counterparty does not perform under the contract. The use of futures contracts also involves the risk that the movements in the price of the futures contracts do not correlate with the movement of the assets underlying such contracts.
For the fiscal year ended December 31, 2019, the Fund entered into futures contracts for cash equitization.
The following tables summarize the value of the Fund’s derivative instruments as of December 31, 2019 and the related location in the accompanying Statement of Assets and Liabilities and Statement of Operations, presented by primary underlying risk exposure:
Asset Derivatives
| | | | | | | | | | | | | | | | | | | | | | | | |
| | | Interest
Rate
Contracts
Risk | | | Foreign
Exchange
Contracts
Risk | | | Credit
Contracts
Risk | | | Equity
Contracts
Risk | | | Commodity
Contracts
Risk | | | Total | |
State Street Total Return V.I.S. Fund | |
Futures Contracts | | $ | — | | | $ | — | | | $ | — | | | $ | 280,960 | | | $ | — | | | $ | 280,960 | |
Realized Gain/Loss
| | | | | | | | | | | | | | | | | | | | | | | | |
| | | Interest
Rate
Contracts
Risk | | | Foreign
Exchange
Contracts
Risk | | | Credit
Contracts
Risk | | | Equity
Contracts
Risk | | | Commodity
Contracts
Risk | | | Total | |
State Street Total Return V.I.S. Fund | |
Futures Contracts | | $ | — | | | $ | — | | | $ | — | | | $ | 2,228,567 | | | $ | — | | | $ | 2,228,567 | |
Net Change in Unrealized Appreciation (Depreciation)
| | | | | | | | | | | | | | | | | | | | | | | | |
| | | Interest
Rate
Contracts
Risk | | | Foreign
Exchange
Contracts
Risk | | | Credit
Contracts
Risk | | | Equity
Contracts
Risk | | | Commodity
Contracts
Risk | | | Total | |
State Street Total Return V.I.S. Fund | |
Futures Contracts | | $ | — | | | $ | — | | | $ | — | | | $ | 600,227 | | | $ | — | | | $ | 600,227 | |
| 5. | | Fees and Transactions with Affiliates |
Advisory Fee SSGA FM, a registered investment adviser, was retained by the Board to act as investment adviser and administrator of the Fund. SSGA FM’s compensation for investment advisory and administrative services (“Management Fee”) is paid monthly based on the average daily net assets of the Fund at an annualized rate of 0.35%.
Investor Service Plan — Class 1 and Class 3 Shares The Company adopted an Investor Service Plan (the “Service Plan”) on December 9, 2005 for Class 1 shares and on May 1, 2009 for Class 3 shares of the Fund. The Service Plan was not adopted pursuant to Rule12b-1 under the 1940 Act. Each Service Plan provides that during any fiscal year, the amount of compensation paid under the Service Plan by the Fund Class 1 or Class 3 shares may not exceed the annual rate of 0.20% of the average daily net assets of the Fund attributable to each such share class.
Distribution and Shareholder Service(12b-1) Fees The Company has adopted a Distribution and Service(12b-1) Plan (the“12b-1 Plan”) pursuant to Rule12b-1 under the 1940 Act with respect to each of Class 1 and Class 3 shares of the Fund. Under the12b-1 Plan for Class 1 shares that became effective May 1, 2009, payments made under the Class 1 Investor Service Plan are covered in the event that any portion of compensation paid pursuant to the Class 1 Investor Service Plan is
| | | | |
| Notes to Financial Statements | | | 23 | |
State Street Total Return V.I.S. Fund
Notes to Financial Statements, continued — December 31, 2019
determined to be an indirect use of the assets attributable to the Class 1 shares to finance distribution of such shares. Under the12b-1 Plan for Class 3 shares, the Company, on behalf of the Fund, may have compensated State Street Global Advisors Funds Distributors, LLC (“SSGA FD”), the distributor of the shares of the Fund for certain sales services provided by SSGA FD or other broker dealers and investor services provided by SSGA FD or other service providers relating to the Fund’s Class 3 shares, including services to owners or prospective owners of variable contracts issued by insurance companies that offer Class 3 shares as an investment option under such variable contracts. The amount of compensation paid under the12b-1 Plan for Class 3 shares may not exceed 0.25% of the average daily net assets of the Fund attributable to such share class. The12b-1 Plan continues in effect from year to year for so long as such continuance is approved annually by the Board, including by those Directors who are not interested persons of the Company and who have no direct or indirect financial interest in the operation of the12b-1 Plan or in any agreement related to it. In addition, the Class 312b-1 Plan covers payments made under the Class 3 Investor Service Plan in the event that any portion of compensation paid pursuant to the Class 3 Investor Service Plan is determined to be an indirect use of the assets attributable to the Class 3 shares to finance distribution of such shares.
Custody, Fund Accounting andSub-Administration Fees State Street Bank and Trust Company (“State Street”) serves as the custodian, fund accountant andsub-administrator to the Fund. Amounts paid by the Fund to State Street for performing such services are included as custody, fund accounting andsub-administration fees in the Statement of Operations.
Other Transactions with Affiliates The Fund may invest in affiliated entities, including securities issued by State Street Corporation, affiliated funds, or entities deemed to be affiliates as a result of the Fund owning more than five percent of the entity’s voting securities or outstanding shares. Amounts relating to these transactions during the fiscal year ended December 31, 2019 are disclosed in the Summary Schedule of Investments.
The fees and expenses of the Company’s directors who are not “interested persons” of the Company, as defined in the 1940 Act (“Independent Directors”), are paid directly by the Fund. The Independent Directors are reimbursed for travel and otherout-of-pocket expenses in connection with meeting attendance and industry seminars.
| 7. | | Investment Transactions |
Purchases and sales of investments (excludingin-kind transactions, short term investments and derivative contracts) for the fiscal year ended December 31, 2019 were as follows:
| | | | | | | | |
| U.S. Government Securities |
| Purchases | | Sales |
| | $ | 297,939,422 | | | | $ | 384,040,270 | |
| | | | | | | | |
| Non-U.S. Government Securities |
| Purchases | | Sales |
| | $ | 1,233,545,843 | | | | $ | 1,322,286,793 | |
| 8. | | Income Tax Information |
The Fund has qualified and intends to continue to qualify as a regulated investment company under Subchapter M of the Internal Revenue Code of 1986, as amended. The Fund will not be subject to federal income taxes to the extent it distributes its taxable income, including any net realized capital gains, for each fiscal year. Therefore, no provision for federal income tax is required.
The Fund files federal and various state and local tax returns as required. No income tax returns are currently under examination. Generally, the federal returns are subject to examination by the Internal Revenue Service for a period of three years from date of filing, while the state returns may remain open for an additional year depending upon jurisdiction. SSGA FM has analyzed the Fund’s tax positions taken on tax returns for all open years and does not believe there are any uncertain tax positions that would require recognition of a tax liability.
Distributions to shareholders are recorded onex-dividend date. Income dividends and gain distributions are determined in accordance with income tax rules and regulations, which may differ from generally accepted accounting principles.
| | |
| 24 | | Notes to Financial Statements |
State Street Total Return V.I.S. Fund
Notes to Financial Statements, continued — December 31, 2019
Certain capital accounts in the financial statements have been adjusted for permanentbook-tax differences. These adjustments have no impact on net asset values or results of operations. Temporarybook-tax differences will reverse in the future. Thesebook-tax differences are primarily due to nontaxable dividend adjustments to income, foreign currencies, REITs, foreign capital gains taxes, investments in futures, passive foreign investment company gains and losses, paydown gains and losses and wash sale loss deferrals.
The tax character of distributions paid during the fiscal year ended December 31, 2019 was as follows:
| | | | | | | | | | | | | |
Ordinary
Income | | Long-Term
Capital Gains | | Total |
| | $ | 41,251,501 | | | | $ | — | | | | $ | 41,251,501 | |
The tax character of distributions paid during the fiscal year ended December 31, 2018 was as follows:
| | | | | | | | | | | | | |
Ordinary
Income | | Long-Term
Capital Gains | | Total |
| | $ | 42,336,791 | | | | $ | 422,737,314 | | | | $ | 465,074,105 | |
At December 31, 2019, the components of distributable earnings on a tax basis were as follows:
| | | | | | | | | | | | | | | | | | | | | | | | | | | | |
Undisributed
Ordinary Income | | Tax Exempt
Income | | Capital Loss
Carryforwards | | Undistributed
Long Term Gain | | Net Unrealized
Gain (Losses) | | Total |
| | $ | 1,714,148 | | | | $ | — | | | | $ | (14,860,172 | ) | | | $ | | | | | $ | 141,146,548 | | | | $ | 128,000,524 | |
As of December 31, 2019, the Fund had capital loss carryforwards available to offset future realized capital gains through the indicated expiration dates as follows:
| | | | | | | | |
Non-Expiring Short-Term | | Non-Expiring Long-Term |
| | $ | 14,860,172 | | | | $ | — | |
As of December 31, 2019, gross unrealized appreciation and gross unrealized depreciation of investments and other financial instruments based on cost for federal income tax purposes were as follows:
| | | | | | | | | | | | | | | | | | |
Tax
Cost | | Gross
Unrealized
Appreciation | | Gross
Unrealized
Depreciation | | Net Unrealized
Appreciation
(Depreciation) |
| | $ | 1,797,324,094 | | | | $ | 161,892,667 | | | | $ | 20,757,338 | | | | $ | 141,135,329 | |
The Fund and other affiliated funds (each, a “Participant” and collectively, the “Participants”) have access to $200 million of a $500 million revolving credit facility provided by a syndication of banks under which the Participants may borrow to fund shareholder redemptions. This agreement expires in October 2020 unless otherwise extended or renewed.
The Participants are charged an annual commitment fee which is calculated based on the unused portion of the shared credit line. Commitment fees are allocated among each of the Participants based on relative net assets. Commitment fees are ordinary fund operating expenses. A Participant incurs and pays the interest expense related to its borrowing. Interest is calculated at a rate per annum equal to the sum of 1% plus the greater of the New York Fed Bank Rate and1-month LIBOR rate.
The Fund had no outstanding loans as of December 31, 2019.
Concentration Risk As a result of the Fund’s ability to invest a large percentage of its assets in obligations of issuers within the same country, state, region, currency or economic sector, an adverse economic, business or political development may affect the value of the Fund’s investments more than if the Fund was more broadly diversified.
Interest Rate Risk Is the risk that fixed income securities will decline in value because of changes in interest rates. Bond prices generally rise when interest rates decline and generally decline when interest rates rise. Changes in governmental
| | | | |
| Notes to Financial Statements | | | 25 | |
State Street Total Return V.I.S. Fund
Notes to Financial Statements, continued — December 31, 2019
policy, including changes in central bank monetary policy, could cause interest rates to rise rapidly, or cause investors to expect a rapid rise in interest rates. This could lead to heightened levels of interest rate, volatility and liquidity risks for the fixed income markets generally and could have a substantial and immediate effect on the values of the Fund’s investments.
Foreign and Emerging Markets Risk Investing in foreign markets involves risks and considerations not typically associated with investing in the U.S. Foreign securities may be subject to risk of loss because of government regulation, economic, political and social instability in the countries in which the Fund invests. Foreign markets may be less liquid than investments in the U.S. and may be subject to the risks of currency fluctuations. To the extent that the Fund invests in securities of issuers located in emerging markets, these risks may be even more pronounced.
Market and Credit Risk In the normal course of business, the Fund trades financial instruments and enters into financial transactions where risk of potential loss exists due to changes in the general economic conditions and fluctuations of the market (market risk). Additionally, the Fund may also be exposed to credit risk in the event that an issuer or guarantor fails to perform or that an institution or entity with which the Fund has unsettled or open transactions defaults.
| 11. | | Change in Accounting Principle |
In March 2017, the Financial Accounting Standards Board issued Accounting Standards Update 2017-08, Receivables — Nonrefundable Fees and Other Costs (Subtopic 310-20) — Premium Amortization on Purchased Callable Debt Securities (“ASU 2017-08”). For callable debt securities held at a premium that have explicit, non-contingent call features and that are callable at fixed prices on preset dates, ASU 2017-08 requires the premium to be amortized to the earliest call date. The adoption resulted in a change in accounting principle, since the Fund had historically amortized such premiums to maturity for U.S. GAAP. Accordingly, the Fund has adopted ASU 2017-08 to amend the premium amortization period for certain purchased callable debt securities with non-contingent call features to the earliest call date. In accordance with the transition provisions of the standard, the Fund applied the amendments on a modified retrospective basis by recognizing a cumulative effect adjustment that decreased the beginning of period cost of investments and increased the unrealized appreciation on investments by $9,975.
This change in accounting policy has been made to comply with the newly issued accounting standard and had no impact on total accumulated earnings (loss) or the net asset value of the Fund. With respect to the Fund’s results of operations, amortization of premium to first call date accelerates amortization with the intent of more closely aligning the recognition of income on such bonds with the economics of the instrument.
Management has evaluated the impact of all subsequent events on the Fund through the date on which the financial statements were available to be issued and has determined that there were no subsequent events requiring adjustment or disclosure in the financial statements.
| | |
| 26 | | Notes to Financial Statements |
State Street Total Return V.I.S. Fund
Report of Independent Registered Public Accounting Firm
To the Shareholders of State Street Total Return V.I.S. Fund and the Board of Directors of State Street Variable Insurance Series Funds, Inc.
Opinion on the Financial Statements and Schedule of Investments in Securities
We have audited the accompanying statement of assets and liabilities of State Street Total Return V.I.S. Fund (the “Fund”) (one of the funds constituting State Street Variable Insurance Series Funds, Inc. (the “Company”)), including the summary schedule of investments, as of December 31, 2019, and the related statement of operations for the year then ended, the statements of changes in net assets for each of the two years in the period then ended, the financial highlights for each of the four years in the period then ended and the related notes (collectively referred to as the “financial statements”) (the financial statements are included in Item 1 of this FormN-CSR), and the schedule of investments in securities as of December 31, 2019 (included in Item 6 of thisForm N-CSR). In our opinion, the financial statements and schedule of investments in securities present fairly, in all material respects, the financial position of the Fund (one of the funds constituting State Street Variable Insurance Series Funds, Inc.) at December 31, 2019, the results of its operations for the year then ended, the changes in its net assets for each of the two years in the period then ended and its financial highlights for each of the four years in the period then ended, in conformity with U.S. generally accepted accounting principles. The financial highlights for the year ended December 31, 2015 were audited by another independent registered public accounting firm whose report, dated February 19, 2016, expressed an unqualified opinion on those financial highlights.
Basis for Opinion
These financial statements and schedule of investments in securities are the responsibility of the Company’s management. Our responsibility is to express an opinion on the Fund’s financial statements and schedule of investments in securities based on our audits. We are a public accounting firm registered with the Public Company Accounting Oversight Board (United States) (“PCAOB”) and are required to be independent with respect to the Company in accordance with the U.S. federal securities laws and the applicable rules and regulations of the Securities and Exchange Commission and the PCAOB.
We conducted our audits in accordance with the standards of the PCAOB. Those standards require that we plan and perform the audit to obtain reasonable assurance about whether the financial statements and schedule of investments in securities are free of material misstatement, whether due to error or fraud. The Company is not required to have, nor were we engaged to perform, an audit of the Company’s internal control over financial reporting. As part of our audits we are required to obtain an understanding of internal control over financial reporting, but not for the purpose of expressing an opinion on the effectiveness of the Company’s internal control over financials reporting. Accordingly, we express no such opinion.
Our audits included performing procedures to assess the risks of material misstatement of the financial statements and schedule of investments in securities, whether due to error or fraud, and performing procedures that respond to those risks. Such procedures included examining, on a test basis, evidence regarding the amounts and disclosures in the financial statements and schedule of investments in securities. Our procedures included confirmation of securities owned as of December 31, 2019, by correspondence with the custodian, brokers and others or by other appropriate auditing procedures where replies from brokers and others were not received. Our audits also included evaluating the accounting principles used and significant estimates made by management, as well as evaluating the overall presentation of the financial statements and schedule of investments in securities. We believe that our audits provide a reasonable basis for our opinion.

We have served as the auditor of one or more State Street Global Advisors investment companies since 2000.
Boston, Massachusetts
February 19, 2020
| | | | |
| Report of Independent Registered Public Accounting Firm | | | 27 | |
State Street Total Return V.I.S. Fund
Tax Information — December 31, 2019 (Unaudited)
For federal income tax purposes, the following information is furnished with respect to the distributions of the Fund for its fiscal year ended December 31, 2019.
Dividends Received Deduction
The Fund reports the maximum amount allowable of its net taxable income as eligible for the corporate dividends received
deduction.
State Street Total Return V.I.S. Fund
Other Information — December 31, 2019 (Unaudited)
Liquidity Risk Management Program
Pursuant to Rule 22e-4 under the 1940 Act, the Funds have adopted a liquidity risk management program. SSGA FM has been designated by the Board to administer the Funds’ liquidity risk management program. The program’s principal objectives include assessing, managing and periodically reviewing each Fund’s liquidity risk, based on factors specific to the circumstances of the Fund. Liquidity risk is defined as the risk that a Fund could not meet redemption requests without significant dilution of remaining investors’ interests in the Fund. During the fiscal year, SSGA FM provided the Board with a report addressing the operations of the program and assessing its adequacy and effectiveness of implementation.
During the period covered by the liquidity program report to the Board, the program supported each Fund’s ability to honor redemption requests timely and SSGA FM’s management of each Fund’s liquidity profile, including during periods of market volatility and net redemptions. SSGA FM reported that the program operated adequately and that the implementation of the program was effective to manage the Fund’s liquidity risk.
There can be no assurance that the program will achieve its objectives in the future. Please refer to your Fund’s prospectus for more information regarding the Fund’s exposure to liquidity risk and other principal risks to which an investment in the Fund may be subject.
Proxy Voting Policies and Procedures and Record
The Fund has adopted the proxy voting policies of SSGA FM. A description of the policies and procedures that the Fund has adopted to determine how to vote proxies relating to portfolio securities is available (i) without charge, upon request, by calling1-800-242-0134, (ii) on the Fund’s website at http://www.ssga.com/geam, or (iii) on the SEC’s website at www.sec.gov. Information regarding how the Fund voted proxies, if any, during the most recent12-month period ended June 30 is available by August 31 of each year without charge (1) by calling1-800-242-0134 (toll free), and (2) on the website of the SEC at www.sec.gov.
Quarterly Portfolio Schedule
Following the Fund’s first and third fiscal quarter-ends, a complete schedule of investments is filed with the SEC as an exhibit to its reports on Form N-PORT, which can be found on the SEC’s website at www.sec.gov. The Fund’s schedules of investments are available upon request, without charge, by calling 1-800-242-0134.
State Street Total Return V.I.S. Fund
Other Information, continued — December 31, 2019 (Unaudited)
| | | | | | | | | | | | |
| | | | | | |
Name,
Address, and
Year of Birth | | Position(s) Held
with Fund | | Term of
Office and
Length of
Time Served | | Principal Occupation
During Past Five Years and
Relevant Experience | | Number of
Funds in
Fund
Complex
Overseen
by Director† | | | Other Directorships
Held by Director
During Past Five Years |
INDEPENDENT DIRECTORS |
Michael F. Holland c/o SSGA Funds Management, Inc. One Iron Street Boston, MA 02210 YOB: 1944 | | Director and Co-Chairperson of the Board | | Term: Until successor is elected and qualified Served: Since January 2019 | | Chairman, Holland & Company L.L.C. (investment adviser) (1995 – present). | | | 68 | | | Director, the Holland Series Fund, Inc.; Director, Reaves Utility Income Fund, Inc.; and Director, Blackstone/GSO Loans (and Real Estate) Funds. |
| | | | | | | | | | | | | |
Patrick J. Riley c/o SSGA Funds Management, Inc. One Iron Street Boston, MA 02210 YOB: 1948 | | Director and Co-Chairperson of the Board | | Term: Until successor is elected and qualified Served: Since January 2019 | | 2002 to May 2010, Associate Justice of the Superior Court, Commonwealth of Massachusetts; 1985 to 2002, Partner, Riley, Burke & Donahue, L.L.P. (law firm); 1998 to Present, Independent Director, State Street Global Advisers Ireland, Ltd. (investment company); 1998 to Present, Independent Director, SSGA Liquidity plc (formerly, SSGA Cash Management Fund plc); January 2009 to Present, Independent Director, SSGA Fixed Income plc; and January 2009-2019, Independent Director, SSGA Qualified Funds PLC. | | | 68 | | | Board Director and Chairman, SPDR Europe 1PLC Board (2011-Present); Board Director and Chairman, SPDR Europe II, PLC (2013- Present). |
| | | | | | | | | | | | | |
John R. Costantino c/o SSGA Funds Management, Inc. One Iron Street Boston, MA 02210 YOB: 1946 | | Director and Co-Chairperson of the Qualified Legal Compliance Committee | | Term: Until successor is elected and qualified Served: Since 1997 | | Senior Advisor to NGN Capital LLC (December 2019 – Present); Managing General Partner, NGN Capital LLC (2006 – December 2019); and Managing Director, Vice President of Walden Capital Management (1996 – present). | | | 68 | | | Director of Kleinfeld Bridal Corp. (March 2016 – present); Trustee of Neuroscience Research Institute (1986 – 2018); Trustee of Fordham University (1989 – 1995 and 2001 – 2007) and Trustee Emeritus (2007 – present); Director, Muscular Dystrophy Association (since 2019); Trustee of GE Funds (1993 – February 2011); and Trustee of Gregorian University Foundation (1992 – 2007). |
| | | | | | | | | | | | | |
Donna M. Rapaccioli c/o SSGA Funds Management, Inc. One Iron Street Boston, MA 02210 YOB: 1962 | | Director and Co-Chairperson of the Audit Committee | | Term: Until successor is elected and qualified Served: Since January 2012 | | Dean of the Gabelli School of Business (2007 – present) and Accounting Professor (1987 – present) at Fordham University. | | | 68 | | | Director-Graduate Management Admissions Council (2015 – present). |
State Street Total Return V.I.S. Fund
Other Information, continued — December 31, 2019 (Unaudited)
| | | | | | | | | | | | |
| | | | | | |
Name,
Address, and
Year of Birth | | Position(s) Held
with Fund | | Term of
Office and
Length of
Time Served | | Principal Occupation
During Past Five Years and
Relevant Experience | | Number of
Funds in
Fund
Complex
Overseen
by Director† | | | Other Directorships
Held by Director
During Past Five Years |
INDEPENDENT DIRECTORS (continued) |
Richard D. Shirk c/o SSGA Funds Management, Inc. One Iron Street Boston, MA 02210 YOB: 1945 | | Director andCo-Chairperson of the Qualified Legal Compliance Committee | | Term: Until successor is elected and qualified Served: Since January 2019 | | March 2001 to April 2002, Chairman (1996 to March 2001, President and Chief Executive Officer), Cerulean Companies, Inc. (holding company) (Retired); 1992 to March 2001, President and Chief Executive Officer, Blue Cross Blue Shield of Georgia (health insurer, managed healthcare). | | | 68 | | | 1998 to December 2008, Chairman, Board Member and December 2008 to Present, Investment Committee Member, Healthcare Georgia Foundation (private foundation); September 2002 to 2012, Lead Director and Board Member, Amerigroup Corp. (managed health care); 1999 to 2013, Board Member and (since 2001) Investment Committee Member, Woodruff Arts Center; and 2003 to 2009, Trustee, Gettysburg College; Board member, Aerocare Holdings, Regenesis Biomedical Inc. |
| | | | | | | | | | | | | |
Rina K. Spence c/o SSGA Funds Management, Inc. One Iron Street Boston, MA 02210 YOB: 1948 | | Director andCo-Chairperson of the Audit Committee, Chairperson of the Nominating Committee and Chairperson of the Governance Committee | | Term: Until successor is elected and qualified Served: Since January 2019 | | President of SpenceCare International LLC (international healthcare consulting) (1999 – present); Chief Executive Officer, IEmily.com (health internet company) (2000 – 2001); Chief Executive Officer of Consensus Pharmaceutical, Inc. (1998 – 1999); Founder, President and Chief Executive Officer of Spence Center for Women’s Health (1994 – 1998); President and CEO, Emerson Hospital (1984 – 1994); Honorary Consul for Monaco in Boston (2015 – present). | | | 68 | | | None |
| | | | | | | | | | | | | |
Michael A. Jessee c/o SSGA Funds Management, Inc. One Iron Street Boston, MA 02210 YOB: 1946 | | Director and Chairperson of the Valuation Committee | | Term: Until successor is elected and qualified
Served: Since January 2019 | | Retired; formerly, President and Chief Executive Officer of the Federal Home Loan Bank of Boston (1989 – 2009); Trustee, Randolph-Macon College (2004 – 2016). | | | 68 | | | None |
State Street Total Return V.I.S. Fund
Other Information, continued — December 31, 2019 (Unaudited)
| | | | | | | | | | | | |
| | | | | | |
Name,
Address, and
Year of Birth | | Position(s) Held
with Fund | | Term of
Office and
Length of
Time Served | | Principal Occupation
During Past Five Years and
Relevant Experience | | Number of
Funds in
Fund
Complex
Overseen
by Director† | | | Other Directorships
Held by Director
During Past Five Years |
INTERESTED DIRECTORS(1) |
Ellen M. Needham(2) SSGA Funds Management, Inc. One Iron Street Boston, MA 02210 YOB: 1967 | | Director | | Term: Until successor is elected and qualified Served: Since January 2019 | | President and Director, SSGA Funds Management, Inc. (2001 – present)*; Senior Managing Director, State Street Global Advisors (1992 – present)*; Director, State Street Global Advisors Funds Distributors, LLC (May 2017 – present). | | | 68 | | | None |
| | | | | | | | | | | | | |
Jeanne La Porta(3) c/o SSGA Funds Management, Inc. 1600 Summer St. Stamford, CT 06905 YOB: 1965 | | Director & President | | Term: Until successor is elected and qualified Served: Since 2014 | | Senior Managing Director at State Street Global Advisors (July 2016 – present); Director of State Street Global Advisors Funds Distributors, LLC (May 2017 – present); President of GE Retirement Savings Plan Funds (July 2016 – September 2018); Senior Vice President and Commercial Operations Leader at GE Asset Management Incorporated (“GEAM”) (March 2014 – July 2016); President of State Street Institutional Funds and State Street Variable Insurance Series Funds, Inc. (April 2014 – present); President and Trustee of GEAM’s UCITs Funds (March 2014 – November 2014); Senior Vice President and Commercial Administrative Officer at GEAM (April 2010 –March 2014); Vice President of State Street Institutional Funds (July 2003 – April 2014); Vice President of Elfun Funds and GE Retirement Savings Plan Funds (October 2003 – July 2016). | | | 18 | | | None |
| † | | For the purpose of determining the number of portfolios overseen by the Directors, “Fund Complex” comprises registered investment companies for which SSGA FM serves as investment adviser. |
| (1) | | The individuals listed below are Directors who are “interested persons,” as defined in the 1940 Act, of the Company (“Interested Directors”). |
| (2) | | Ms. Needham is an Interested Director because of her employment by SSGA FM, an affiliate of the Company. |
| (3) | | Ms. La Porta is an Interested Director because of her employment by SSGA, an affiliate of the Company. |
| * | | Served in various capacities and/or with various affiliated entities during noted time period. |
State Street Total Return V.I.S. Fund
Other Information, continued — December 31, 2019 (Unaudited)
| | | | | | |
| | | | |
Name,
Address, and
Year of Birth | | Position(s) Held
with Fund | | Term of
Office and
Length of
Time Served | | Principal Occupation During Past Five Years |
OFFICERS: | | | | | | |
Jeanne M. La Porta SSGA Funds Management, Inc. 1600 Summer St. Stamford, CT 06905 YOB: 1965 | | President and Director | | Term: Indefinite Elected: 3/14 | | Senior Managing Director at State Street Global Advisors (July 2016 – present); Director of State Street Global Advisors Funds Distributors, LLC (May 2017 – present); President of GE Retirement Savings Plan Funds (July 2016 – September 2018); Senior Vice President and Commercial Operations Leader at GEAM (March 2014 – July 2016); President of State Street Institutional Funds and State Street Variable Insurance Series Funds, Inc. (April 2014 – present); President and Trustee of GEAM’s UCITs Funds (March 2014 – November 2014); Senior Vice President and Commercial Administrative Officer at GEAM (April 2010 – March 2014); Vice President of State Street Institutional Funds (July 2003 – April 2014); Vice President of Elfun Funds and GE Retirement Savings Plan Funds (October 2003 – July 2016); Secretary of GE Funds (July 2007 – September 2010) and Vice President (July 2007 – February 2011); Senior Vice President and Deputy General Counsel of GEAM (October 2007 – April 2010); Vice President and Assistant Secretary of Elfun Funds and GE Retirement Savings Plan Funds (July 2003 – June 2010); and Vice President and Associate General Counsel – Marketing and Client Services (formerly Asset Management Services) at GEAM (May 1997 – October 2007). |
| | | | | | | |
Bruce S. Rosenberg SSGA Funds Management, Inc. One Iron Street Boston, MA 02210 YOB: 1961 | | Treasurer | | Term: Indefinite Elected: 4/19 | | Managing Director, State Street Global Advisors and SSGA Funds Management, Inc. (July 2015 – present); Director, Credit Suisse (April 2008 – July 2015). |
| | | | | | | |
Ann M. Carpenter SSGA Funds Management, Inc. One Iron Street Boston, MA 02210 YOB: 1966 | | Vice President and Deputy Treasurer | | Term: Indefinite Elected: 4/19 | | Chief Operating Officer, SSGA Funds Management, Inc. (April 2005 – present)*; Managing Director, State Street Global Advisors. (2005 – present).* |
| | | | | | | |
Chad C. Hallett SSGA Funds Management, Inc. One Iron Street Boston, MA 02210 YOB: 1969 | | Deputy Treasurer | | Term: Indefinite Elected: 4/19 | | Vice President, State Street Global Advisors and SSGA Funds Management, Inc. (November 2014 – present); Vice President, State Street Bank and Trust Company (2001 – November 2014).* |
| | | | | | | |
Darlene Anderson-Vasquez SSGA Funds Management, Inc. One Iron Street Boston, MA 02210 YOB: 1968 | | Deputy Treasurer | | Term: Indefinite Elected: 4/19 | | Managing Director, State Street Global Advisors and SSGA Funds Management, Inc. (May 2016 – present); Senior Vice President, John Hancock Investments (September 2007 – May 2016). |
State Street Total Return V.I.S. Fund
Other Information, continued — December 31, 2019 (Unaudited)
| | | | | | |
| | | | |
Name,
Address, and
Year of Birth | | Position(s) Held
with Fund | | Term of
Office and
Length of
Time Served | | Principal Occupation During Past Five Years |
OFFICERS: (continued) | | | | | | |
Arthur A. Jensen SSGA Funds Management, Inc. 1600 Summer Street Stamford, CT 06905 YOB: 1966 | | Deputy Treasurer | | Term: Indefinite Elected: 4/19 | | Vice President State Street Global Advisors and SSGA Funds Management, Inc. (July 2016 – present); Deputy Treasurer of Elfun Funds (July 2016 – present); Treasurer of State Street Institutional Funds, State Street Variable Insurance Series Funds, Inc. and GE Retirement Savings Plan Funds (June 2011 – present); Treasurer of Elfun Funds (June 2011– July 2016); Mutual Funds Controller of GE Asset Management Incorporated (April 2011 – July 2016). |
| | | | | | | |
Sujata Upreti SSGA Funds Management, Inc. One Iron Street Boston, MA 02210 YOB: 1974 | | Assistant Treasurer | | Term: Indefinite Elected: 4/19 | | Vice President, State Street Global Advisors and SSGA Funds Management, Inc. (May 2015 – present); Assistant Director, Cambridge Associates, LLC (July 2014 – January 2015); Vice President, Bank of New York Mellon (July 2012 – August 2013); Manager, PricewaterhouseCoopers, LLP (September 2003 – July 2012). |
| | | | | | | |
Daniel Foley SSGA Funds Management, Inc. One Iron Street Boston, MA 02210 YOB: 1972 | | Assistant Treasurer | | Term: Indefinite Elected: 4/19 | | Vice President, State Street Global Advisors and SSGA Funds Management, Inc. (April 2007 – present).* |
| | | | | | | |
Daniel G. Plourde SSGA Funds Management, Inc. One Iron Street Boston, MA 02210 YOB: 1980 | | Assistant Treasurer | | Term: Indefinite Elected: 6/17 | | Vice President, State Street Global Advisors and SSGA Funds Management, Inc. (May 2015 – present); Officer, State Street Bank and Trust Company (March 2009 – May 2015). |
| | | | | | | |
Brian Harris SSGA Funds Management, Inc. One Iron Street Boston, MA 02210 YOB: 1973 | | Chief
Compliance Officer, Anti-Money Laundering Officer and Code of Ethics Compliance Officer | | Term: Indefinite Elected: 7/16 Term: Indefinite Elected: 4/19 | | Managing Director, State Street Global Advisors and SSGA Funds Management, Inc. (June 2013 – Present)*; Senior Vice President and Global Head of Investment Compliance, BofA Global Capital Management (September 2010 – May 2013). |
| | | | | | | |
Sean O’Malley SSGA Funds Management, Inc. One Iron Street Boston, MA 02210 YOB: 1969 | | Chief Legal Officer | | Term: Indefinite Elected: 8/19 | | Senior Vice President and Deputy General Counsel, State Street Global Advisors (November 2013 – present). |
| | | | | | | |
Andrew DeLorme SSGA Funds Management, Inc. One Iron Street Boston, MA 02210 YOB: 1975 | | Secretary | | Term: Indefinite Elected: 8/19 | | Vice President and Senior Counsel, State Street Global Advisors (April 2016 – present); Vice President and Counsel, State Street Global Advisors (August 2014 – March 2016). |
State Street Total Return V.I.S. Fund
Other Information, continued — December 31, 2019 (Unaudited)
| | | | | | |
| | | | |
Name,
Address, and
Year of Birth | | Position(s) Held
with Fund | | Term of
Office and
Length of
Time Served | | Principal Occupation During Past Five Years |
OFFICERS: (continued) | | | | | | |
Kevin Morris SSGA Funds Management, Inc. One Iron Street Boston, MA 02210 YOB: 1982 | | Assistant Secretary | | Term: Indefinite Elected: 8/19 | | Vice President and Senior Counsel, State Street Global Advisors (April 2019 – present); Vice President and Counsel, State Street Global Advisors (January 2016 – April 2019); Director, Asset Management Compliance, Fidelity Investments (June 2015 – January 2016); Senior Compliance Advisor, Asset Management Compliance, Fidelity Investments (June 2012 – June 2015). |
| | | | | | | |
David Urman SSGA Funds Management, Inc. One Iron Street Boston, MA 02210 YOB: 1985 | | Assistant Secretary | | Term: Indefinite Elected: 8/19 | | Vice President and Senior Counsel, State Street Global Advisors (April 2019 – present); Vice President and Counsel, State Street Global Advisors (August 2015 – April 2019); Associate, Ropes & Gray LLP (November 2012 – August 2015). |
| * | Served in various capacities and/or with various affiliated entities during noted time period. |
Directors
Michael F. Holland, Co-Chairperson
Patrick J. Riley, Co-Chairperson
John R. Costantino
Donna M. Rapaccioli
Michael A. Jessee
Richard D. Shirk
Rina K. Spence
Jeanne M. La Porta
Ellen M. Needham
Officers
Jeanne M. La Porta, President
Brian Harris, Chief Compliance Officer, Anti-Money Laundering Officer and Code of Ethics Compliance Officer
Sean O’Malley, Chief Legal Officer
Bruce S. Rosenberg, Treasurer
Ann M. Carpenter, Vice President and Deputy Treasurer
Chad C. Hallett, Deputy Treasurer
Arthur A. Jensen, Deputy Treasurer
Darlene Anderson-Vasquez, Deputy Treasurer
Sujata Upreti, Assistant Treasurer
Daniel Foley, Assistant Treasurer
Daniel G. Plourde, Assistant Treasurer
Andrew DeLorme, Secretary
Kevin Morris, Assistant Secretary
David Urman, Assistant Secretary
Investment Adviser and Administrator
SSGA Funds Management, Inc.
One Iron Street
Boston, MA 02210
Custodian andSub-Administrator
State Street Bank and Trust Company
One Lincoln Street
Boston, Massachusetts 02111
Distributor
State Street Global Advisors Funds Distributors, LLC
One Iron Street
Boston, MA 02210
Independent Registered Public Accounting Firm
Ernst & Young LLP
200 Clarendon Street
Boston, Massachusetts 02116
Item 2. Code of Ethics.
As of the end of the period covered by this report, State Street Variable Insurance Series Funds, Inc. (the “Company,” “Fund Entity” or “Registrant”) has adopted a code of ethics, as defined in Item 2(b) of FormN-CSR, that applies to the Registrant’s principal executive officer, principal financial officer, principal accounting officer or controller, or persons performing similar functions, regardless of whether these individuals are employed by the Registrant or a third party (the “Code”). That Code comprises written standards that are reasonably designed to deter wrongdoing and to promote: (1) honest and ethical conduct, including the ethical handling of actual or apparent conflicts of interest between personal and professional relationships; (2) full, fair, accurate, timely and understandable disclosure in reports and documents that the Registrant files with, or submits to, the U.S. Securities Exchange Commission (the “SEC”) and in other public communications made by the Registrant; (3) compliance with applicable laws and governmental rules and regulations; (4) the prompt internal reporting to an appropriate person or persons identified in the Code of violations of the Code; and (5) accountability for adherence to the Code. For the period covered by the report, the Code was combined with other mutual funds advised by SSGA Funds Management, Inc. (“SSGA FM” or the “Adviser”). The Registrant has not made any amendments to the Code that relates to any element of the code of ethics definition set forth in Item 2(b) of FormN-CSR during the covered period. The Registrant has not granted any waivers from any provisions of the Code during the covered period. A copy of the Code is filed as Exhibit 13(a)(1) to this FormN-CSR.
Item 3. Audit Committee Financial Expert.
The Company’s Board of Directors (the “Board”) has determined that the Company has the following “audit committee financial experts” as defined in Item 3(b) of FormN-CSR serving on its audit committee (the “Audit Committee”): Messrs. Michael F. Holland, Richard D. Shirk and John R. Costantino and Ms. Donna M. Rapaccioli. Each of the “audit committee financial experts” is “independent” as that term is defined in Item 3(a)(2) of FormN-CSR.
An “audit committee financial expert” is not an “expert” for any purpose, including for purposes of Section 11 of the Securities Act of 1933, as amended, as a result of being designated as an “audit committee financial expert.” Further, the designation of a person as an “audit committee financial expert” does not mean that the person has any greater duties, obligations, or liability than those imposed on the person without the “audit committee financial expert” designation. Similarly, the designation of a person as an “audit committee financial expert” does not affect the duties, obligations, or liability of any other member of the Audit Committee or the Board.
Item 4. Principal Accountant Fees and Services.
For the fiscal years ended December 31, 2019 and December 31, 2018, the aggregate audit fees billed for professional services rendered by Ernst & Young LLP (“E&Y”), the Company’s principal accountant, for the audit of the Company’s annual financial statements or services normally provided by E&Y in connection with the Company’s statutory and regulatory filings and engagements were $195,570 and $195,570, respectively.
For the fiscal years ended December 31, 2019 and December 31, 2018, there were no fees for assurance and related services by E&Y reasonably related to the performance of the audit of the Company’s financial statements that were not reported under paragraph (a) of this Item.
For the fiscal years ended December 31, 2019 and December 31, 2018, the aggregate tax fees billed for professional services rendered by E&Y for tax compliance, tax advice, and tax planning in the form of preparation of excise filings and income tax returns were $49,100 and $49,100, respectively.
For the fiscal years ended December 31, 2019 and December 31, 2018, there were no fees billed for professional services rendered by E&Y for products and services provided by E&Y to the Company, other than the services reported in paragraphs (a) through (c).
For the fiscal years ended December 31, 2019 and December 31, 2018, the aggregate fees for professional services rendered by E&Y for products and services provided by E&Y to the Adviser and any entity controlling, controlled by, or under common control with the Adviser that provides ongoing services to the Company that (i) relate directly to the operations and financial reporting of the Company and (ii) werepre-approved by the Audit Committee were approximately $6,939,666 and $6,581,832, respectively.
| | (e)(1) | Audit CommitteePre-Approval Policies and Procedures |
The Company’s Audit Committee Charter states the following with respect topre-approval procedures:
The Audit Committee shall have the following duties and powers:
| | • | | To pre-approve engagements by a Fund Entity’s independent auditor fornon-audit services to be rendered to the Fund’s investment adviser (not including any subadviser whose role is primarily portfolio management and is subcontracted with or overseen by another investment adviser), and any entity controlling, controlled by, or under common control with the investment adviser that provides ongoing services to the Fund, if the engagement relates directly to the operations and financial reporting of the Fund; |
| | • | | To establish, if deemed necessary or appropriate as an alternative to Audit Committeepre-approval of services to be provided by the independent auditor as required by paragraph (b) above, policies and procedures to permit such services to bepre-approved by other means, such as by action of a designated member or members of the Audit Committee, subject to the requirement that the decision of any member to whom authority is delegated topre-approve an activity shall be presented to the full Audit Committee at its next scheduled meeting; |
AlternatePre-Approval Procedure:
| | • | | The Chairperson, or aCo-Chairperson, of the Audit Committee is authorized topre-approve any engagement involving the Fund Entity’s independent auditors to the same extent as the Audit Committee. Anypre-approval decision by the Chairperson, or aCo-Chairperson, under the foregoing authority shall be presented to the Audit Committee at its next scheduled meeting. |
| | (e)(2) | Percentages of Services |
None of the services described in paragraphs (b) through (d) of this Item were performed in reliance on paragraph (c)(7)(i)(C) of Rule2-01 of RegulationS-X during the period of time for which such rule was effective.
| | (g) | Total Fees Paid By Adviser and Certain Affiliates |
For the fiscal years ended December 31, 2019 and December 31, 2018, the aggregatenon-audit fees billed by E&Y for services rendered to the Company and the Adviser and any entity controlling, controlled by, or under common control with the Adviser that provided ongoing services to the Company were approximately $35,152,927 and $36,297,003, respectively.
| | (h) | E&Y notified the Company’s Audit Committee of allnon-audit services that were rendered by E&Y to the Adviser and any entity controlling, controlled by, or under common control with the Adviser that provides services to the Company, which services were not required to bepre-approved pursuant to paragraph (c)(7)(ii) of Rule2-01 of RegulationS-X, allowing the Company’s Audit Committee to consider whether such services were compatible with maintaining E&Y’s independence. |
Item 5. Audit Committee of Listed Registrants.
Not applicable to the Registrant.
Item 6. Investments.
| (a) | The Schedule of Investments for the State Street Total Return V.I.S. Fund is listed below. The Schedules of Investments for the State Street U.S. Equity V.I.S. Fund, State Street S&P 500 Index V.I.S. Fund, State Street Premier Growth V.I.S. Fund, State StreetSmall-Cap Equity V.I.S. Fund, State Street Income V.I.S. Fund and State Street Real Estate Securities V.I.S. Fund and a Summary Schedule of Investments for the State Street Total Return V.I.S. Fund are included as part of the report to shareholders filed under Item 1 of this FormN-CSR. |
| | |
| State Street Total Return V.I.S. Fund | | |
| Schedule of Investments | | December 31, 2019 |
State Street Total Return V.I.S. Fund
| | | | | | | | |
| | | Number
of Shares | | | Fair
Value | |
Domestic Equity – 33.6% † | |
Common Stock – 33.6% | | | | | | | | |
Advertising – 0.3% | | | | | | | | |
Clear Channel Outdoor Holdings Inc. | | | 18,800 | | | $ | 53,768 | (a) |
Fluent Inc. | | | 20,900 | | | | 52,250 | (a) |
Marchex Inc., Class B | | | 17,900 | | | | 67,662 | (a) |
National CineMedia Inc. | | | 26,200 | | | | 190,998 | |
Omnicom Group Inc. | | | 42,327 | | | | 3,429,335 | |
The Interpublic Group of Companies Inc. | | | 45,133 | | | | 1,042,572 | |
| | | | | | | 4,836,585 | |
Aerospace & Defense – 0.3% | | | | | | | | |
HEICO Corp. | | | 7,605 | | | | 868,111 | |
HEICO Corp., Class A | | | 14,938 | | | | 1,337,399 | |
Hexcel Corp. | | | 7,905 | | | | 579,516 | |
National Presto Industries Inc. | | | 2,096 | | | | 185,265 | |
Park Aerospace Corp. | | | 8,694 | | | | 141,451 | |
Teledyne Technologies Inc. | | | 7,064 | | | | 2,447,959 | (a) |
TransDigm Group Inc. | | | 953 | | | | 533,680 | |
Vectrus Inc. | | | 4,900 | | | | 251,174 | (a) |
| | | | | | | 6,344,555 | |
Agricultural & Farm Machinery – 0.1% | |
AGCO Corp. | | | 12,238 | | | | 945,385 | |
Air Freight & Logistics – 0.2% | | | | | | | | |
Atlas Air Worldwide Holdings Inc. | | | 2,200 | | | | 60,654 | (a) |
Expeditors International of Washington Inc. | | | 33,670 | | | | 2,626,933 | |
Hub Group Inc., Class A | | | 7,572 | | | | 388,368 | (a) |
Radiant Logistics Inc. | | | 17,700 | | | | 98,589 | (a) |
| | | | | | | 3,174,544 | |
Airlines – 0.0% * | | | | | | | | |
Alaska Air Group Inc. | | | 8,734 | | | | 591,729 | |
Mesa Air Group Inc. | | | 5,400 | | | | 48,276 | (a) |
| | | | | | | 640,005 | |
Airport Services – 0.0% * | | | | | | | | |
Macquarie Infrastructure Corp. | | | 14,389 | | | | 616,425 | |
Alternative Carriers – 0.0% * | | | | | | | | |
Anterix Inc. | | | 4,000 | | | | 172,840 | |
Apparel Retail – 0.7% | | | | | | | | |
Abercrombie & Fitch Co., Class A | | | 5,647 | | | | 97,637 | |
Genesco Inc. | | | 2,500 | | | | 119,800 | (a) |
Guess? Inc. | | | 10,859 | | | | 243,024 | |
Shoe Carnival Inc. | | | 4,213 | | | | 157,061 | |
The Buckle Inc. | | | 12,509 | | | | 338,243 | |
The Cato Corp., Class A | | | 9,337 | | | | 162,464 | |
The TJX Companies Inc. | | | 187,548 | | | | 11,451,681 | |
Zumiez Inc. | | | 7,972 | | | | 275,353 | (a) |
| | | | | | | 12,845,263 | |
Apparel, Accessories & Luxury Goods – 0.0% * | |
Delta Apparel Inc. | | | 3,100 | | | | 96,410 | (a) |
Application Software – 1.1% | | | | | | | | |
American Software Inc., Class A | | | 12,928 | | | | 192,369 | |
Aspen Technology Inc. | | | 13,395 | | | | 1,619,857 | (a) |
Avalara Inc. | | | 9,216 | | | | 675,072 | (a) |
Cadence Design Systems Inc. | | | 39,715 | | | | 2,754,632 | (a) |
Digital Turbine Inc. | | | 33,900 | | | | 241,707 | (a) |
Fair Isaac Corp. | | | 5,608 | | | | 2,101,206 | (a) |
Intelligent Systems Corp. | | | 3,100 | | | | 123,814 | (a) |
Intuit Inc. | | | 46,075 | | | | 12,068,425 | |
Manhattan Associates Inc. | | | 12,459 | | | | 993,605 | (a) |
SharpSpring Inc. | | | 4,200 | | | | 48,174 | (a) |
SPS Commerce Inc. | | | 5,800 | | | | 321,436 | (a) |
Synchronoss Technologies Inc. | | | 19,100 | | | | 90,725 | (a) |
Telaria Inc. | | | 9,400 | | | | 82,814 | (a) |
| | | | | | | | |
| | | Number
of Shares | | | Fair
Value | |
Telenav Inc. | | | 16,200 | | | $ | 78,732 | (a) |
Zix Corp. | | | 23,700 | | | | 160,686 | (a) |
| | | | | | | 21,553,254 | |
Asset Management & Custody Banks – 0.2% | |
Ares Management Corp., Class A | | | 6,900 | | | | 246,261 | |
Cohen & Steers Inc. | | | 10,015 | | | | 628,541 | |
Diamond Hill Investment Group Inc. | | | 1,411 | | | | 198,189 | |
Franklin Resources Inc. | | | 54,239 | | | | 1,409,129 | |
Legg Mason Inc. | | | 17,047 | | | | 612,158 | |
Silvercrest Asset Management Group Inc., Class A | | | 4,314 | | | | 54,270 | |
Waddell & Reed Financial Inc., Class A | | | 13,194 | | | | 220,604 | |
Westwood Holdings Group Inc. | | | 3,500 | | | | 103,670 | |
| | | | | | | 3,472,822 | |
Auto Parts & Equipment – 0.2% | | | | | | | | |
American Axle & Manufacturing Holdings Inc. | | | 27,000 | | | | 290,520 | (a) |
Dorman Products Inc. | | | 7,680 | | | | 581,530 | (a) |
Fox Factory Holding Corp. | | | 700 | | | | 48,699 | (a) |
Gentex Corp. | | | 49,696 | | | | 1,440,190 | |
Lear Corp. | | | 11,961 | | | | 1,641,049 | |
| | | | | | | 4,001,988 | |
Automobile Manufacturers – 0.7% | |
Ford Motor Co. | | | 768,114 | | | | 7,143,460 | |
General Motors Co. | | | 194,027 | | | | 7,101,388 | |
| | | | | | | 14,244,848 | |
Automotive Retail – 0.4% | | | | | | | | |
America’s Car-Mart Inc. | | | 1,000 | | | | 109,660 | (a) |
AutoNation Inc. | | | 10,546 | | | | 512,852 | (a) |
AutoZone Inc. | | | 4,617 | | | | 5,500,278 | (a) |
Penske Automotive Group Inc. | | | 6,599 | | | | 331,402 | |
Sonic Automotive Inc., Class A | | | 10,622 | | | | 329,282 | |
| | | | | | | 6,783,474 | |
Biotechnology – 0.2% | | | | | | | | |
Achillion Pharmaceuticals Inc. | | | 59,200 | | | | 356,976 | (a) |
Adverum Biotechnologies Inc. | | | 24,140 | | | | 278,093 | (a) |
Anika Therapeutics Inc. | | | 5,836 | | | | 302,596 | (a) |
ArQule Inc. | | | 23,200 | | | | 463,072 | (a) |
Arrowhead Pharmaceuticals Inc. | | | 13,860 | | | | 879,140 | (a) |
Avid Bioservices Inc. | | | 21,900 | | | | 167,973 | (a) |
BioSpecifics Technologies Corp. | | | 2,800 | | | | 159,432 | (a) |
CareDx Inc. | | | 5,700 | | | | 122,949 | (a) |
Catalyst Pharmaceuticals Inc. | | | 31,600 | | | | 118,500 | (a) |
CEL-SCI Corp. | | | 5,700 | | | | 52,155 | (a) |
Chimerix Inc. | | | 23,900 | | | | 48,517 | (a) |
Enanta Pharmaceuticals Inc. | | | 600 | | | | 37,068 | (a) |
Epizyme Inc. | | | 6,200 | | | | 152,520 | (a) |
Fate Therapeutics Inc. | | | 18,610 | | | | 364,198 | (a) |
Homology Medicines Inc. | | | 2,814 | | | | 58,250 | (a) |
Invitae Corp. | | | 8,500 | | | | 137,105 | (a) |
Krystal Biotech Inc. | | | 1,500 | | | | 83,070 | (a) |
Lineage Cell Therapeutics Inc. | | | 36,700 | | | | 32,663 | |
MediciNova Inc. | | | 5,100 | | | | 34,374 | (a) |
MeiraGTx Holdings PLC | | | 2,700 | | | | 54,054 | (a) |
Molecular Templates Inc. | | | 8,400 | | | | 117,474 | (a) |
Palatin Technologies Inc. | | | 101,000 | | | | 79,002 | (a) |
PDL BioPharma Inc. | | | 51,867 | | | | 168,308 | (a) |
Protagonist Therapeutics Inc. | | | 8,500 | | | | 59,925 | (a) |
Ra Pharmaceuticals Inc. | | | 2,500 | | | | 117,325 | (a) |
Syndax Pharmaceuticals Inc. | | | 10,000 | | | | 87,800 | (a) |
Synlogic Inc. | | | 6,100 | | | | 15,738 | (a) |
Veracyte Inc. | | | 6,700 | | | | 187,064 | (a) |
| | | | | | | 4,735,341 | |
Brewers – 0.0% * | | | | | | | | |
The Boston Beer Company Inc., Class A | | | 2,150 | | | | 812,377 | (a) |
Broadcasting – 0.1% | | | | | | | | |
Cumulus Media Inc., Class A | | | 7,200 | | | | 126,504 | (a) |
Fox Corp., Class B | | | 32,020 | | | | 1,165,528 | (a) |
Media General Inc. | | | 2,076 | | | | 208 | (b,c) |
See Notes to Schedules of Investments and Notes to Financial Statements.
| | |
| State Street Total Return V.I.S. Fund | | |
| Schedule of Investments | | December 31, 2019 |
| | | | | | | | |
| | | Number
of Shares | | | Fair
Value | |
Saga Communications Inc., Class A | | | 1,700 | | | $ | 51,680 | |
Sinclair Broadcast Group Inc., Class A | | | 12,277 | | | | 409,315 | |
| | | | | | | 1,753,235 | |
Building Products – 0.1% | | | | | | | | |
AAON Inc. | | | 10,800 | | | | 533,628 | |
Fortune Brands Home & Security Inc. | | | 27,300 | | | | 1,783,782 | |
| | | | | | | 2,317,410 | |
Cable & Satellite – 0.2% | | | | | | | | |
Altice USA Inc., Class A | | | 59,184 | | | | 1,618,090 | (a) |
Cable One Inc. | | | 859 | | | | 1,278,596 | |
| | | | | | | 2,896,686 | |
Casinos & Gaming – 0.0% * | | | | | | | | |
Century Casinos Inc. | | | 8,000 | | | | 63,360 | (a) |
Coal & Consumable Fuels – 0.0% * | | | | | | | | |
Arch Coal Inc., Class A | | | 3,170 | | | | 227,416 | |
Energy Fuels Inc. | | | 23,900 | | | | 45,649 | (a) |
NACCO Industries Inc., Class A | | | 1,800 | | | | 84,294 | |
| | | | | | | 357,359 | |
Commercial Printing – 0.0% * | | | | | | | | |
Ennis Inc. | | | 10,700 | | | | 231,655 | |
RR Donnelley & Sons Co. | | | 17,700 | | | | 69,915 | |
| | | | | | | 301,570 | |
Commodity Chemicals – 0.0% * | | | | | | | | |
Hawkins Inc. | | | 3,300 | | | | 151,173 | |
Communications Equipment – 0.0% * | |
Digi International Inc. | | | 12,000 | | | | 212,640 | (a) |
NETGEAR Inc. | | | 8,099 | | | | 198,507 | (a) |
Tessco Technologies Inc. | | | 3,000 | | | | 33,660 | |
Ubiquiti Inc. | | | 1,633 | | | | 308,604 | |
| | | | | | | 753,411 | |
Computer & Electronics Retail – 0.0% * | |
GameStop Corp., Class A | | | 12,200 | | | | 74,176 | |
Construction & Engineering – 0.2% | | | | | | | | |
Argan Inc. | | | 6,100 | | | | 244,854 | |
Construction Partners Inc. | | | 5,800 | | | | 97,846 | (a) |
Great Lakes Dredge & Dock Corp. | | | 25,900 | | | | 293,447 | (a) |
IES Holdings Inc. | | | 2,800 | | | | 71,848 | (a) |
Jacobs Engineering Group Inc. | | | 25,238 | | | | 2,267,129 | |
MYR Group Inc. | | | 4,805 | | | | 156,595 | (a) |
Northwest Pipe Co. | | | 2,300 | | | | 76,613 | (a) |
Quanta Services Inc. | | | 27,725 | | | | 1,128,685 | |
Tutor Perini Corp. | | | 2,600 | | | | 33,436 | (a) |
| | | | | | | 4,370,453 | |
Construction Machinery & Heavy Trucks – 0.3% | |
Cummins Inc. | | | 29,403 | | | | 5,261,961 | |
Miller Industries Inc. | | | 4,886 | | | | 181,417 | |
The Greenbrier Companies Inc. | | | 3,200 | | | | 103,776 | |
| | | | | | | 5,547,154 | |
Construction Materials – 0.0% * | | | | | | | | |
United States Lime & Minerals Inc. | | | 957 | | | | 86,417 | |
Consumer Electronics – 0.1% | | | | | | | | |
Garmin Ltd. | | | 22,953 | | | | 2,239,295 | |
Consumer Finance – 0.4% | | | | | | | | |
Ally Financial Inc. | | | 74,626 | | | | 2,280,571 | |
Curo Group Holdings Corp. | | | 5,405 | | | | 65,833 | (a) |
Medallion Financial Corp. | | | 10,100 | | | | 73,427 | (a) |
Navient Corp. | | | 38,096 | | | | 521,153 | |
Santander Consumer USA Holdings Inc. | | | 20,103 | | | | 469,807 | |
Synchrony Financial | | | 126,700 | | | | 4,562,467 | |
World Acceptance Corp. | | | 1,500 | | | | 129,600 | (a) |
| | | | | | | 8,102,858 | |
Data Processing & Outsourced Services – 0.6% | |
Euronet Worldwide Inc. | | | 9,802 | | | | 1,544,403 | (a) |
Genpact Ltd. | | | 9,458 | | | | 398,844 | |
NIC Inc. | | | 27,519 | | | | 615,050 | |
Paychex Inc. | | | 63,035 | | | | 5,361,757 | |
Paysign Inc. | | | 8,400 | | | | 85,260 | |
| | | | | | | | |
| | | Number
of Shares | | | Fair
Value | |
Sykes Enterprises Inc. | | | 17,000 | | | $ | 628,830 | (a) |
The Western Union Co. | | | 82,200 | | | | 2,201,316 | |
| | | | | | | 10,835,460 | |
Department Stores – 0.0% * | | | | | | | | |
Dillard’s Inc., Class A | | | 870 | | | | 63,928 | |
Distributors – 0.2% | | | | | | | | |
Core-Mark Holding Company Inc. | | | 15,800 | | | | 429,602 | |
Funko Inc., Class A | | | 7,790 | | | | 133,676 | (a) |
Genuine Parts Co. | | | 27,564 | | | | 2,928,124 | |
Weyco Group Inc. | | | 2,959 | | | | 78,266 | |
| | | | | | | 3,569,668 | |
Diversified Metals & Mining – 0.0% * | |
Materion Corp. | | | 1,058 | | | | 62,898 | |
Diversified REITs – 0.2% | | | | | | | | |
Armada Hoffler Properties Inc. | | | 21,080 | | | | 386,818 | |
One Liberty Properties Inc. | | | 6,498 | | | | 176,681 | |
PS Business Parks Inc. | | | 5,610 | | | | 924,921 | |
STORE Capital Corp. | | | 38,572 | | | | 1,436,421 | |
VEREIT Inc. | | | 98,509 | | | | 910,223 | |
| | | | | | | 3,835,064 | |
Diversified Support Services – 0.4% | |
Copart Inc. | | | 39,400 | | | | 3,583,036 | (a) |
KAR Auction Services Inc. | | | 25,159 | | | | 548,215 | |
McGrath RentCorp. | | | 10,378 | | | | 794,332 | |
UniFirst Corp. | | | 6,539 | | | | 1,320,747 | |
Viad Corp. | | | 7,249 | | | | 489,307 | |
| | | | | | | 6,735,637 | |
Education Services – 0.0% * | | | | | | | | |
Graham Holdings Co., Class B | | | 857 | | | | 547,614 | |
Electric Utilities – 0.9% | | | | | | | | |
Avangrid Inc. | | | 8,190 | | | | 419,000 | |
Eversource Energy | | | 63,589 | | | | 5,409,516 | |
Genie Energy Ltd., Class B | | | 7,100 | | | | 54,883 | |
Hawaiian Electric Industries Inc. | | | 21,254 | | | | 995,963 | |
OGE Energy Corp. | | | 39,186 | | | | 1,742,601 | |
Pinnacle West Capital Corp. | | | 21,976 | | | | 1,976,302 | |
Xcel Energy Inc. | | | 102,942 | | | | 6,535,788 | |
| | | | | | | 17,134,053 | |
Electrical Components & Equipment – 0.1% | |
American Superconductor Corp. | | | 10,300 | | | | 80,855 | (a) |
Encore Wire Corp. | | | 6,948 | | | | 398,815 | |
Powell Industries Inc. | | | 3,800 | | | | 186,162 | |
Preformed Line Products Co. | | | 1,505 | | | | 90,827 | |
Regal Beloit Corp. | | | 7,959 | | | | 681,370 | |
Vivint Solar Inc. | | | 13,400 | | | | 97,284 | (a) |
| | | | | | | 1,535,313 | |
Electronic Components – 0.0% * | | | | | | | | |
Airgain Inc. | | | 3,400 | | | | 36,346 | (a) |
AVX Corp. | | | 19,725 | | | | 403,771 | |
Vishay Intertechnology Inc. | | | 11,900 | | | | 253,351 | |
| | | | | | | 693,468 | |
Electronic Equipment & Instruments – 0.1% | |
Badger Meter Inc. | | | 12,373 | | | | 803,379 | |
Napco Security Technologies Inc. | | | 5,000 | | | | 146,950 | (a) |
PAR Technology Corp. | | | 4,900 | | | | 150,626 | (a) |
Vishay Precision Group Inc. | | | 4,537 | | | | 154,258 | (a) |
| | | | | | | 1,255,213 | |
Electronic Manufacturing Services – 0.2% | |
Benchmark Electronics Inc. | | | 16,697 | | | | 573,709 | |
Jabil Inc. | | | 29,193 | | | | 1,206,547 | |
Kimball Electronics Inc. | | | 10,700 | | | | 187,785 | (a) |
Plexus Corp. | | | 12,875 | | | | 990,602 | (a) |
Sanmina Corp. | | | 10,200 | | | | 349,248 | (a) |
| | | | | | | 3,307,891 | |
Environmental & Facilities Services – 0.3% | |
ABM Industries Inc. | | | 13,800 | | | | 520,398 | |
PICO Holdings Inc. | | | 9,000 | | | | 100,080 | (a) |
See Notes to Schedules of Investments and Notes to Financial Statements.
| | |
| State Street Total Return V.I.S. Fund | | |
| Schedule of Investments | | December 31, 2019 |
| | | | | | | | |
| | | Number
of Shares | | | Fair
Value | |
Republic Services Inc. | | | 41,856 | | | $ | 3,751,553 | |
Waste Management Inc. | | | 9,457 | | | | 1,077,720 | |
| | | | | | | 5,449,751 | |
Financial Exchanges & Data – 0.2% | |
CME Group Inc. | | | 4,447 | | | | 892,602 | |
Donnelley Financial Solutions Inc. | | | 14,200 | | | | 148,674 | (a) |
MarketAxess Holdings Inc. | | | 4,245 | | | | 1,609,322 | |
Morningstar Inc. | | | 3,612 | | | | 546,532 | |
| | | | | | | 3,197,130 | |
Food Distributors – 0.1% | | | | | | | | |
United Natural Foods Inc. | | | 22,300 | | | | 195,348 | (a) |
US Foods Holding Corp. | | | 42,800 | | | | 1,792,892 | (a) |
| | | | | | | 1,988,240 | |
Food Retail – 0.1% | | | | | | | | |
Casey’s General Stores Inc. | | | 7,130 | | | | 1,133,599 | |
Natural Grocers by Vitamin Cottage Inc. | | | 4,228 | | | | 41,730 | |
Village Super Market Inc., Class A | | | 3,547 | | | | 82,290 | |
Weis Markets Inc. | | | 4,203 | | | | 170,180 | |
| | | | | | | 1,427,799 | |
Footwear – 0.1% | | | | | | | | |
Rocky Brands Inc. | | | 3,145 | | | | 92,558 | |
Skechers U.S.A. Inc., Class A | | | 25,800 | | | | 1,114,302 | (a) |
Steven Madden Ltd. | | | 35,232 | | | | 1,515,328 | |
| | | | | | | 2,722,188 | |
Gas Utilities – 0.1% | | | | | | | | |
Atmos Energy Corp. | | | 22,947 | | | | 2,566,851 | |
General Merchandise Stores – 0.7% | |
Target Corp. | | | 97,900 | | | | 12,551,759 | |
Health Care REITs – 0.2% | | | | | | | | |
Community Healthcare Trust Inc. | | | 7,527 | | | | 322,607 | |
LTC Properties Inc. | | | 12,360 | | | | 553,357 | |
Medical Properties Trust Inc. | | | 88,851 | | | | 1,875,645 | |
Omega Healthcare Investors Inc. | | | 39,904 | | | | 1,689,934 | |
| | | | | | | 4,441,543 | |
Healthcare Distributors – 0.2% | | | | | | | | |
Henry Schein Inc. | | | 28,760 | | | | 1,918,867 | (a) |
McKesson Corp. | | | 16,469 | | | | 2,277,992 | |
Patterson Companies Inc. | | | 20,600 | | | | 421,888 | |
| | | | | | | 4,618,747 | |
Healthcare Equipment – 1.0% | | | | | | | | |
Alphatec Holdings Inc. | | | 8,700 | | | | 61,727 | (a) |
Conformis Inc. | | | 31,400 | | | | 47,100 | (a) |
Danaher Corp. | | | 95,035 | | | | 14,585,972 | |
IntriCon Corp. | | | 2,300 | | | | 41,400 | (a) |
Masimo Corp. | | | 9,238 | | | | 1,460,158 | (a) |
SeaSpine Holdings Corp. | | | 6,900 | | | | 82,869 | (a) |
STERIS PLC | | | 16,457 | | | | 2,508,376 | |
Varian Medical Systems Inc. | | | 2,619 | | | | 371,924 | (a) |
Zynex Inc. | | | 7,600 | | | | 59,812 | (a) |
| | | | | | | 19,219,338 | |
Healthcare Facilities – 0.4% | | | | | | | | |
Community Health Systems Inc. | | | 37,000 | | | | 107,300 | (a) |
HCA Healthcare Inc. | | | 35,240 | | | | 5,208,824 | |
National HealthCare Corp. | | | 5,322 | | | | 459,980 | |
Tenet Healthcare Corp. | | | 2,101 | | | | 79,901 | (a) |
The Ensign Group Inc. | | | 10,700 | | | | 485,459 | |
The Joint Corp. | | | 2,600 | | | | 41,964 | (a) |
The Pennat Group Inc. | | | 5,250 | | | | 173,618 | (a) |
US Physical Therapy Inc. | | | 3,250 | | | | 371,638 | |
| | | | | | | 6,928,684 | |
Healthcare Services – 0.1% | | | | | | | | |
Addus HomeCare Corp. | | | 4,650 | | | | 452,073 | (a) |
Amedisys Inc. | | | 2,100 | | | | 350,532 | (a) |
CorVel Corp. | | | 3,873 | | | | 338,345 | (a) |
Cross Country Healthcare Inc. | | | 15,900 | | | | 184,758 | (a) |
Guardant Health Inc. | | | 7,200 | | | | 562,608 | (a) |
Premier Inc., Class A | | | 10,118 | | | | 383,270 | (a) |
| | | | | | | 2,271,586 | |
| | | | | | | | |
| | | Number
of Shares | | | Fair
Value | |
Healthcare Supplies – 0.0% * | | | | | | | | |
Atrion Corp. | | | 620 | | | $ | 465,930 | |
BioLife Solutions Inc. | | | 3,300 | | | | 53,394 | (a) |
Meridian Bioscience Inc. | | | 17,963 | | | | 175,499 | |
Utah Medical Products Inc. | | | 1,505 | | | | 162,389 | |
| | | | | | | 857,212 | |
Healthcare Technology – 0.0% * | | | | | | | | |
Simulations Plus Inc. | | | 5,272 | | | | 153,257 | |
Home Building – 0.3% | | | | | | | | |
Beazer Homes USA Inc. | | | 12,800 | | | | 180,864 | (a) |
M/I Homes Inc. | | | 11,700 | | | | 460,395 | (a) |
MDC Holdings Inc. | | | 21,100 | | | | 805,176 | |
Meritage Homes Corp. | | | 4,440 | | | | 271,328 | (a) |
NVR Inc. | | | 642 | | | | 2,444,999 | (a) |
PulteGroup Inc. | | | 49,451 | | | | 1,918,699 | |
William Lyon Homes, Class A | | | 9,100 | | | | 181,818 | (a) |
| | | | | | | 6,263,279 | |
Home Furnishing Retail – 0.1% | | | | | | | | |
Bed Bath & Beyond Inc. | | | 13,300 | | | | 230,090 | |
Haverty Furniture Companies Inc. | | | 7,900 | | | | 159,264 | |
Williams-Sonoma Inc. | | | 15,358 | | | | 1,127,892 | |
| | | | | | | 1,517,246 | |
Home Furnishings – 0.0% * | | | | | | | | |
Ethan Allen Interiors Inc. | | | 3,300 | | | | 62,898 | |
Home Improvement Retail – 0.0% * | |
Floor & Decor Holdings Inc. | | | 13,564 | | | | 689,187 | (a) |
Hotel & Resort REITs – 0.1% | | | | | | | | |
Apple Hospitality REIT Inc. | | | 41,201 | | | | 669,516 | |
Service Properties Trust | | | 31,961 | | | | 777,611 | |
| | | | | | | 1,447,127 | |
Hotels, Resorts & Cruise Lines – 0.1% | |
Wyndham Destinations Inc. | | | 17,520 | | | | 905,609 | |
Household Appliances – 0.0% * | | | | | | | | |
Hamilton Beach Brands Holding Co., Class A | | | 3,017 | | | | 57,625 | |
Household Products – 0.6% | | | | | | | | |
The Procter & Gamble Co. | | | 95,326 | | | | 11,906,217 | |
Human Resource & Employment Services – 0.1% | |
BG Staffing Inc. | | | 4,000 | | | | 87,560 | |
GP Strategies Corp. | | | 5,800 | | | | 76,734 | (a) |
Kelly Services Inc., Class A | | | 14,409 | | | | 325,355 | |
Kforce Inc. | | | 6,283 | | | | 249,435 | |
ManpowerGroup Inc. | | | 11,476 | | | | 1,114,320 | |
Robert Half International Inc. | | | 5,722 | | | | 361,344 | |
| | | | | | | 2,214,748 | |
Hypermarkets & Super Centers – 0.7% | |
Costco Wholesale Corp. | | | 46,095 | | | | 13,548,242 | |
Independent Power Producers & Energy Traders – 0.1% | |
AES Corp. | | | 77,714 | | | | 1,546,509 | |
Industrial Conglomerates – 0.9% | |
Carlisle Companies Inc. | | | 11,000 | | | | 1,780,240 | |
Honeywell International Inc. | | | 85,347 | | | | 15,106,419 | |
| | | | | | | 16,886,659 | |
Industrial Gases – 0.5% | | | | | | | | |
Air Products & Chemicals Inc. | | | 43,268 | | | | 10,167,547 | |
Industrial Machinery – 0.6% | | | | | | | | |
Gencor Industries Inc. | | | 4,500 | | | | 52,515 | (a) |
Hurco Companies Inc. | | | 2,833 | | | | 108,674 | |
Hyster-Yale Materials Handling Inc. | | | 3,300 | | | | 194,568 | |
Ingersoll-Rand PLC | | | 39,338 | | | | 5,228,807 | |
ITT Inc. | | | 17,218 | | | | 1,272,582 | |
Mueller Industries Inc. | | | 16,300 | | | | 517,525 | |
Omega Flex Inc. | | | 1,200 | | | | 128,748 | |
Snap-on Inc. | | | 10,642 | | | | 1,802,755 | |
The Eastern Co. | | | 2,734 | | | | 83,469 | |
The Gorman-Rupp Co. | | | 7,475 | | | | 280,313 | |
See Notes to Schedules of Investments and Notes to Financial Statements.
| | |
| State Street Total Return V.I.S. Fund | | |
| Schedule of Investments | | December 31, 2019 |
| | | | | | | | |
| | | Number
of Shares | | | Fair
Value | |
The Timken Co. | | | 6,131 | | | $ | 345,237 | |
Woodward Inc. | | | 10,767 | | | | 1,275,243 | |
| | | | | | | 11,290,436 | |
Industrial REITs – 0.0% * | | | | | | | | |
Innovative Industrial Properties Inc. | | | 1,969 | | | | 149,388 | |
Insurance Brokers – 0.1% | | | | | | | | |
Brown & Brown Inc. | | | 46,225 | | | | 1,824,963 | |
eHealth Inc. | | | 700 | | | | 67,256 | (a) |
Goosehead Insurance Inc., Class A | | | 4,303 | | | | 182,447 | |
| | | | | | | 2,074,666 | |
Integrated Oil & Gas – 0.2% | | | | | | | | |
Exxon Mobil Corp. | | | 57,047 | | | | 3,980,740 | |
Integrated Telecommunication Services – 0.2% | |
AT&T Inc. | | | 118,300 | | | | 4,623,164 | |
Frontier Communications Corp. | | | 30,500 | | | | 27,133 | (a) |
IDT Corp., Class B | | | 8,200 | | | | 59,122 | (a) |
Pareteum Corp. | | | 29,200 | | | | 12,769 | (a) |
| | | | | | | 4,722,188 | |
Interactive Home Entertainment – 0.1% | |
Zynga Inc., Class A | | | 154,187 | | | | 943,624 | (a) |
Interactive Media & Services – 0.1% | |
DHI Group Inc. | | | 25,100 | | | | 75,551 | (a) |
Match Group Inc. | | | 10,571 | | | | 867,985 | (a) |
| | | | | | | 943,536 | |
Internet & Direct Marketing Retail – 0.2% | |
1-800-Flowers.com Inc., Class A | | | 10,660 | | | | 154,570 | (a) |
Amazon.com Inc. | | | 1,674 | | | | 3,093,284 | (a) |
Duluth Holdings Inc., Class B | | | 3,800 | | | | 40,014 | (a) |
The Rubicon Project Inc. | | | 20,900 | | | | 170,544 | (a) |
| | | | | | | 3,458,412 | |
Investment Banking & Brokerage – 0.1% | |
Cowen Inc., Class A | | | 12,000 | | | | 189,000 | (a) |
Greenhill & Company Inc. | | | 7,700 | | | | 131,516 | |
Houlihan Lokey Inc. | | | 14,505 | | | | 708,859 | |
INTL. FCStone Inc. | | | 6,450 | | | | 314,954 | (a) |
Moelis & Co., Class A | | | 12,759 | | | | 407,267 | |
Oppenheimer Holdings Inc., Class A | | | 2,487 | | | | 68,343 | |
| | | | | | | 1,819,939 | |
IT Consulting & Other Services – 0.3% | |
Amdocs Ltd. | | | 26,615 | | | | 1,921,337 | |
Booz Allen Hamilton Holding Corp. | | | 26,720 | | | | 1,900,593 | |
CACI International Inc., Class A | | | 4,830 | | | | 1,207,452 | (a) |
ManTech International Corp., Class A | | | 11,369 | | | | 908,156 | |
Perficient Inc. | | | 3,660 | | | | 168,616 | (a) |
| | | | | | | 6,106,154 | |
Leisure Products – 0.0% * | | | | | | | | |
Escalade Inc. | | | 5,300 | | | | 52,099 | |
Johnson Outdoors Inc., Class A | | | 2,004 | | | | 153,707 | |
MasterCraft Boat Holdings Inc. | | | 8,348 | | | | 131,481 | (a) |
Sturm Ruger & Company Inc. | | | 5,400 | | | | 253,962 | |
| | | | | | | 591,249 | |
Life & Health Insurance – 0.6% | |
Aflac Inc. | | | 142,682 | | | | 7,547,878 | |
Brighthouse Financial Inc. | | | 21,194 | | | | 831,441 | (a) |
FBL Financial Group Inc., Class A | | | 2,063 | | | | 121,573 | |
Globe Life Inc. | | | 20,885 | | | | 2,198,146 | |
Independence Holding Co. | | | 1,669 | | | | 70,231 | |
National Western Life Group Inc., Class A | | | 915 | | | | 266,155 | |
| | | | | | | 11,035,424 | |
Life Sciences Tools & Services – 0.1% | |
Bruker Corp. | | | 7,033 | | | | 358,472 | |
Luminex Corp. | | | 2,465 | | | | 57,089 | |
Medpace Holdings Inc. | | | 9,350 | | | | 785,961 | (a) |
Quanterix Corp. | | | 2,265 | | | | 53,522 | (a) |
Repligen Corp. | | | 8,560 | | | | 791,800 | (a) |
| | | | | | | 2,046,844 | |
Managed Healthcare – 0.2% | | | | | | | | |
Anthem Inc. | | | 13,810 | | | | 4,171,034 | |
| | | | | | | | |
| | | Number
of Shares | | | Fair
Value | |
Metal & Glass Containers – 0.4% | | | | | | | | |
AptarGroup Inc. | | | 12,500 | | | $ | 1,445,250 | |
Ball Corp. | | | 63,390 | | | | 4,099,431 | |
Crown Holdings Inc. | | | 25,487 | | | | 1,848,827 | (a) |
Greif Inc., Class B | | | 2,000 | | | | 103,540 | |
Silgan Holdings Inc. | | | 15,282 | | | | 474,965 | |
| | | | | | | 7,972,013 | |
Mortgage REITs – 0.7% | | | | | | | | |
AG Mortgage Investment Trust Inc. | | | 12,514 | | | | 192,966 | |
AGNC Investment Corp. | | | 106,058 | | | | 1,875,105 | |
Annaly Capital Management Inc. | | | 278,667 | | | | 2,625,043 | |
Anworth Mortgage Asset Corp. | | | 42,100 | | | | 148,192 | |
Apollo Commercial Real Estate Finance Inc. | | | 66,575 | | | | 1,217,657 | |
Ares Commercial Real Estate Corp. | | | 12,007 | | | | 190,191 | |
Arlington Asset Investment Corp., Class A | | | 13,922 | | | | 77,546 | |
ARMOUR Residential REIT Inc. | | | 21,700 | | | | 387,779 | |
Blackstone Mortgage Trust Inc., Class A | | | 49,375 | | | | 1,837,737 | |
Capstead Mortgage Corp. | | | 40,653 | | | | 321,972 | |
Cherry Hill Mortgage Investment Corp. | | | 7,084 | | | | 103,356 | |
Chimera Investment Corp. | | | 36,488 | | | | 750,193 | |
Dynex Capital Inc. | | | 10,458 | | | | 177,158 | |
Ellington Financial Inc. | | | 13,200 | | | | 241,956 | |
Great Ajax Corp. | | | 6,100 | | | | 90,341 | |
MFA Financial Inc. | | | 88,007 | | | | 673,254 | |
PennyMac Mortgage Investment Trust | | | 25,800 | | | | 575,082 | |
Ready Capital Corp. | | | 7,700 | | | | 118,734 | |
Starwood Property Trust Inc. | | | 53,457 | | | | 1,328,941 | |
Two Harbors Investment Corp. | | | 49,429 | | | | 722,652 | |
| | | | | | | 13,655,855 | |
Movies & Entertainment – 0.7% | | | | | | | | |
AMC Entertainment Holdings Inc., Class A | | | 11,300 | | | | 81,812 | |
Roku Inc. | | | 16,719 | | | | 2,238,674 | (a) |
The Walt Disney Co. | | | 74,857 | | | | 10,826,568 | |
| | | | | | | 13,147,054 | |
Multi-Line Insurance – 0.3% | | | | | | | | |
American Financial Group Inc. | | | 14,438 | | | | 1,583,127 | |
Assurant Inc. | | | 10,477 | | | | 1,373,325 | |
The Hartford Financial Services Group Inc. | | | 47,600 | | | | 2,892,652 | |
| | | | | | | 5,849,104 | |
Multi-Sector Holdings – 1.1% | | | | | | | | |
Berkshire Hathaway Inc., Class B | | | 96,307 | | | | 21,813,535 | (a) |
Multi-Utilities – 0.4% | | | | | | | | |
Ameren Corp. | | | 48,052 | | | | 3,690,394 | |
Unitil Corp. | | | 5,120 | | | | 316,518 | |
WEC Energy Group Inc. | | | 43,282 | | | | 3,991,899 | |
| | | | | | | 7,998,811 | |
Office REITs – 0.1% | | | | | | | | |
Columbia Property Trust Inc. | | | 22,803 | | | | 476,811 | |
Equity Commonwealth | | | 23,616 | | | | 775,313 | |
| | | | | | | 1,252,124 | |
Office Services & Supplies – 0.0% * | | | | | | | | |
Steelcase Inc., Class A | | | 18,481 | | | | 378,121 | |
Oil & Gas Drilling – 0.0% * | | | | | | | | |
Diamond Offshore Drilling Inc. | | | 4,600 | | | | 33,074 | (a) |
Nabors Industries Ltd. | | | 88,500 | | | | 254,880 | |
Noble Corporation PLC | | | 111,716 | | | | 136,294 | (a) |
| | | | | | | 424,248 | |
Oil & Gas Equipment & Services – 0.0% * | |
Era Group Inc. | | | 9,400 | | | | 95,598 | (a) |
Frank’s International N.V. | | | 31,700 | | | | 163,889 | (a) |
Geospace Technologies Corp. | | | 6,600 | | | | 110,682 | (a) |
Liberty Oilfield Services Inc., Class A | | | 3,332 | | | | 37,052 | |
Mammoth Energy Services Inc. | | | 5,798 | | | | 12,755 | |
Matrix Service Co. | | | 11,568 | | | | 264,676 | (a) |
See Notes to Schedules of Investments and Notes to Financial Statements.
| | |
| State Street Total Return V.I.S. Fund | | |
| Schedule of Investments | | December 31, 2019 |
| | | | | | | | |
| | | Number
of Shares | | | Fair
Value | |
Smart Sand Inc. | | | 10,400 | | | $ | 26,208 | (a) |
Solaris Oilfield Infrastructure Inc., Class A | | | 7,114 | | | | 99,596 | |
| | | | 810,456 | |
Oil & Gas Exploration & Production – 0.0% * | |
Evolution Petroleum Corp. | | | 11,902 | | | | 65,104 | |
Extraction Oil & Gas Inc. | | | 18,000 | | | | 38,160 | (a) |
Gulfport Energy Corp. | | | 40,700 | | | | 123,728 | (a) |
| | | | 226,992 | |
Oil & Gas Refining & Marketing – 1.0% | |
CVR Energy Inc. | | | 7,736 | | | | 312,766 | |
PBF Energy Inc., Class A | | | 23,385 | | | | 733,587 | |
Phillips 66 | | | 83,016 | | | | 9,248,813 | |
Renewable Energy Group Inc. | | | 15,600 | | | | 420,420 | (a) |
REX American Resources Corp. | | | 2,500 | | | | 204,900 | (a) |
Valero Energy Corp. | | | 67,272 | | | | 6,300,023 | |
World Fuel Services Corp. | | | 28,700 | | | | 1,246,154 | |
| | | | 18,466,663 | |
Oil & Gas Storage & Transportation – 0.0% * | |
DHT Holdings Inc. | | | 38,500 | | | | 318,780 | |
Dorian LPG Ltd. | | | 12,300 | | | | 190,404 | (a) |
Nordic American Tankers Ltd. | | | 60,000 | | | | 295,200 | |
| | | | 804,384 | |
Other Diversified Financial Services – 0.1% | |
AXA Equitable Holdings Inc. | | | 39,837 | | | | 987,161 | |
Packaged Foods & Meats – 0.4% | |
General Mills Inc. | | | 10,200 | | | | 546,312 | |
J&J Snack Foods Corp. | | | 4,431 | | | | 816,500 | |
Lancaster Colony Corp. | | | 8,182 | | | | 1,309,938 | |
Pilgrim’s Pride Corp. | | | 10,397 | | | | 340,138 | (a) |
Tootsie Roll Industries Inc. | | | 7,111 | | | | 242,770 | |
Tyson Foods Inc., Class A | | | 56,478 | | | | 5,141,757 | |
| | | | 8,397,415 | |
Paper Packaging – 0.1% | |
Sonoco Products Co. | | | 19,508 | | | | 1,204,034 | |
UFP Technologies Inc. | | | 2,871 | | | | 142,430 | (a) |
| | | | 1,346,464 | |
Paper Products – 0.0% * | |
Domtar Corp. | | | 7,762 | | | | 296,819 | |
Personal Products – 0.0% * | |
Lifevantage Corp. | | | 6,900 | | | | 107,709 | (a) |
Pharmaceuticals – 1.0% | |
Axsome Therapeutics Inc. | | | 6,700 | | | | 692,512 | (a) |
Chiasma Inc. | | | 17,100 | | | | 84,816 | (a) |
CorMedix Inc. | | | 11,800 | | | | 85,904 | (a) |
Johnson & Johnson | | | 126,929 | | | | 18,515,133 | |
Lannett Company Inc. | | | 14,700 | | | | 129,654 | (a) |
Mallinckrodt PLC | | | 14,700 | | | | 51,303 | (a) |
Zynerba Pharmaceuticals Inc. | | | 11,400 | | | | 68,856 | (a) |
| | | | 19,628,178 | |
Property & Casualty Insurance – 2.0% | |
AMERISAFE Inc. | | | 8,224 | | | | 543,031 | |
Arch Capital Group Ltd. | | | 75,182 | | | | 3,224,556 | (a) |
Assured Guaranty Ltd. | | | 18,257 | | | | 894,958 | |
Axis Capital Holdings Ltd. | | | 16,171 | | | | 961,204 | |
Chubb Ltd. | | | 63,937 | | | | 9,952,433 | |
Cincinnati Financial Corp. | | | 29,844 | | | | 3,138,097 | |
Donegal Group Inc., Class A | | | 5,072 | | | | 75,167 | |
Employers Holdings Inc. | | | 7,600 | | | | 317,300 | |
Erie Indemnity Co., Class A | | | 4,859 | | | | 806,594 | |
Fidelity National Financial Inc. | | | 51,831 | | | | 2,350,536 | |
First American Financial Corp. | | | 21,410 | | | | 1,248,631 | |
James River Group Holdings Ltd. | | | 1,500 | | | | 61,815 | |
Kinsale Capital Group Inc. | | | 8,489 | | | | 862,992 | |
Loews Corp. | | | 50,230 | | | | 2,636,573 | |
Old Republic International Corp. | | | 55,234 | | | | 1,235,584 | |
Protective Insurance Corp., Class B | | | 4,514 | | | | 72,630 | |
Safety Insurance Group Inc. | | | 6,313 | | | | 584,142 | |
The Allstate Corp. | | | 50,953 | | | | 5,729,665 | |
| | | | | | | | |
| | | Number
of Shares | | | Fair
Value | |
The Hanover Insurance Group Inc. | | | 7,763 | | | $ | 1,060,969 | |
United Fire Group Inc. | | | 1,100 | | | | 48,103 | |
White Mountains Insurance Group Ltd. | | | 572 | | | | 638,072 | |
WR Berkley Corp. | | | 28,241 | | | | 1,951,453 | |
| | | | 38,394,505 | |
Publishing – 0.0% * | |
News Corp., Class B | | | 24,333 | | | | 353,072 | |
Scholastic Corp. | | | 1,500 | | | | 57,675 | |
| | | | 410,747 | |
Real Estate Operating Companies – 0.0% * | |
Rafael Holdings Inc., Class B | | | 5,200 | | | | 92,768 | (a) |
Real Estate Services – 0.0% * | |
Marcus & Millichap Inc. | | | 2,500 | | | | 93,125 | (a) |
Realogy Holdings Corp. | | | 23,600 | | | | 228,448 | |
| | | | 321,573 | |
Regional Banks – 0.4% | |
1st Constitution Bancorp | | | 3,776 | | | | 83,563 | |
ACNB Corp. | | | 2,967 | | | | 112,212 | |
American National Bankshares Inc. | | | 1,488 | | | | 58,880 | |
Ames National Corp. | | | 4,113 | | | | 115,411 | |
Arrow Financial Corp. | | | 5,510 | | | | 208,278 | |
Bank First Corp. | | | 900 | | | | 63,009 | |
Bank of Hawaii Corp. | | | 7,782 | | | | 740,535 | |
Bank of Marin Bancorp | | | 3,000 | | | | 135,150 | |
Baycom Corp. | | | 5,057 | | | | 114,996 | (a) |
Cambridge Bancorp | | | 1,884 | | | | 151,003 | |
Chemung Financial Corp. | | | 1,735 | | | | 73,738 | |
Citizens & Northern Corp. | | | 5,441 | | | | 153,708 | |
City Holding Co. | | | 4,236 | | | | 347,140 | |
Community Trust Bancorp Inc. | | | 5,349 | | | | 249,477 | |
Evans Bancorp Inc. | | | 1,187 | | | | 47,599 | |
Fidelity D&D Bancorp Inc. | | | 1,358 | | | | 84,481 | |
Financial Institutions Inc. | | | 4,000 | | | | 128,400 | |
First Business Financial Services Inc. | | | 2,100 | | | | 55,293 | |
First Capital Inc. | | | 1,600 | | | | 116,800 | |
First Community Bancshares Inc. | | | 6,200 | | | | 192,324 | |
First Financial Corp. | | | 5,055 | | | | 231,115 | |
First Financial Northwest Inc. | | | 3,803 | | | | 56,817 | |
First Hawaiian Inc. | | | 25,672 | | | | 740,637 | |
First Mid Bancshares Inc. | | | 5,032 | | | | 177,378 | |
First Northwest Bancorp | | | 2,900 | | | | 52,577 | |
FNB Corp. | | | 50,095 | | | | 636,206 | |
Franklin Financial Services Corp. | | | 2,100 | | | | 81,249 | |
Hawthorn Bancshares Inc. | | | 2,800 | | | | 71,400 | |
Independent Bank Corp. | | | 79 | | | | 6,577 | |
Investar Holding Corp. | | | 2,700 | | | | 64,800 | |
LCNB Corp. | | | 4,398 | | | | 84,881 | |
Level One Bancorp Inc. | | | 2,039 | | | | 51,301 | |
Mackinac Financial Corp. | | | 3,200 | | | | 55,872 | |
Metropolitan Bank Holding Corp. | | | 1,299 | | | | 62,651 | (a) |
Mid Penn Bancorp Inc. | | | 490 | | | | 14,112 | |
MutualFirst Financial Inc. | | | 2,502 | | | | 99,254 | |
National Bankshares Inc. | | | 2,886 | | | | 129,668 | |
Nicolet Bankshares Inc. | | | 3,450 | | | | 254,783 | (a) |
Northrim BanCorp Inc. | | | 2,926 | | | | 112,066 | |
Norwood Financial Corp. | | | 2,672 | | | | 103,941 | |
Oak Valley Bancorp | | | 3,274 | | | | 63,712 | |
Ohio Valley Banc Corp. | | | 2,071 | | | | 82,053 | |
Orrstown Financial Services Inc. | | | 2,744 | | | | 62,069 | |
Park National Corp. | | | 4,355 | | | | 445,865 | |
Parke Bancorp Inc. | | | 2,300 | | | | 58,397 | |
PCB Bancorp | | | 2,800 | | | | 48,384 | |
Penns Woods Bancorp Inc. | | | 2,218 | | | | 78,872 | |
Peoples Bancorp of North Carolina Inc. | | | 2,300 | | | | 75,555 | |
Premier Financial Bancorp Inc. | | | 5,592 | | | | 101,439 | |
Prosperity Bancshares Inc. | | | 13,249 | | | | 952,471 | |
Republic Bancorp Inc., Class A | | | 2,200 | | | | 102,960 | |
Select Bancorp Inc. | | | 2,769 | | | | 34,059 | (a) |
Shore Bancshares Inc. | | | 5,893 | | | | 102,302 | |
The Community Financial Corp. | | | 1,500 | | | | 53,355 | |
| | | | 8,580,775 | |
See Notes to Schedules of Investments and Notes to Financial Statements.
| | |
| State Street Total Return V.I.S. Fund | | |
| Schedule of Investments | | December 31, 2019 |
| | | | | | | | |
| | | Number
of Shares | | | Fair
Value | |
Reinsurance – 0.1% | |
Reinsurance Group of America Inc. | | | 12,302 | | | $ | 2,005,964 | |
Research & Consulting Services – 0.2% | |
CBIZ Inc. | | | 22,083 | | | | 595,358 | (a) |
CRA International Inc. | | | 3,235 | | | | 176,210 | |
Exponent Inc. | | | 22,314 | | | | 1,539,889 | |
Forrester Research Inc. | | | 4,532 | | | | 188,984 | |
ICF International Inc. | | | 3,575 | | | | 327,542 | |
Resources Connection Inc. | | | 13,014 | | | | 212,519 | |
| | | | 3,040,502 | |
Residential REITs – 0.1% | |
American Campus Communities Inc. | | | 26,094 | | | | 1,227,201 | |
Bluerock Residential Growth REIT Inc. | | | 9,600 | | | | 115,680 | |
BRT Apartments Corp. | | | 4,877 | | | | 82,763 | |
| | | | 1,425,644 | |
Restaurants – 0.7% | |
BJ’s Restaurants Inc. | | | 1,700 | | | | 64,532 | |
Brinker International Inc. | | | 16,246 | | | | 682,332 | |
Chipotle Mexican Grill Inc. | | | 828 | | | | 693,127 | (a) |
Starbucks Corp. | | | 119,512 | | | | 10,507,495 | |
The Cheesecake Factory Inc. | | | 18,190 | | | | 706,864 | |
Wingstop Inc. | | | 1,000 | | | | 86,230 | |
| | | | 12,740,580 | |
Retail REITs – 0.5% | |
Brixmor Property Group Inc. | | | 58,143 | | | | 1,256,470 | |
Getty Realty Corp. | | | 14,145 | | | | 464,946 | |
Kimco Realty Corp. | | | 79,185 | | | | 1,639,921 | |
National Retail Properties Inc. | | | 31,905 | | | | 1,710,746 | |
Realty Income Corp. | | | 15,809 | | | | 1,164,017 | |
Retail Properties of America Inc., Class A | | | 41,717 | | | | 559,008 | |
RPT Realty | | | 7,700 | | | | 115,808 | |
SITE Centers Corp. | | | 28,040 | | | | 393,121 | |
Spirit Realty Capital Inc. | | | 17,955 | | | | 883,027 | |
Weingarten Realty Investors | | | 24,001 | | | | 749,791 | |
Whitestone REIT | | | 15,900 | | | | 216,558 | |
| | | | 9,153,413 | |
Semiconductor Equipment – 1.5% | |
Amkor Technology Inc. | | | 43,200 | | | | 561,600 | (a) |
Applied Materials Inc. | | | 181,200 | | | | 11,060,448 | |
AXT Inc. | | | 11,000 | | | | 47,850 | (a) |
KLA Corp. | | | 31,250 | | | | 5,567,812 | |
Lam Research Corp. | | | 28,293 | | | | 8,272,873 | |
Photronics Inc. | | | 28,491 | | | | 449,018 | (a) |
Teradyne Inc. | | | 32,787 | | | | 2,235,746 | |
Ultra Clean Holdings Inc. | | | 3,100 | | | | 72,757 | (a) |
Xperi Corp. | | | 12,000 | | | | 222,000 | |
| | | | 28,490,104 | |
Semiconductors – 0.6% | |
Alpha & Omega Semiconductor Ltd. | | | 8,200 | | | | 111,684 | (a) |
Cirrus Logic Inc. | | | 5,100 | | | | 420,291 | (a) |
Diodes Inc. | | | 17,300 | | | | 975,201 | (a) |
DSP Group Inc. | | | 3,400 | | | | 53,516 | (a) |
Intel Corp. | | | 145,529 | | | | 8,709,911 | |
NVE Corp. | | | 2,066 | | | | 147,512 | |
SunPower Corp. | | | 3,300 | | | | 25,740 | (a) |
Universal Display Corp. | | | 5,281 | | | | 1,088,256 | |
| | | | 11,532,111 | |
Soft Drinks – 0.1% | |
Keurig Dr Pepper Inc. | | | 36,565 | | | | 1,058,557 | |
Specialized Consumer Services – 0.0% * | |
Collectors Universe Inc. | | | 3,600 | | | | 82,980 | |
Specialized Finance – 0.0% * | |
NewStar Financial Inc. | | | 492 | | | | 119 | (b,c) |
Specialized REITs – 0.2% | |
EPR Properties | | | 15,159 | | | | 1,070,832 | |
Farmland Partners Inc. | | | 13,700 | | | | 92,886 | |
Jernigan Capital Inc. | | | 8,191 | | | | 156,776 | |
Lamar Advertising Co., Class A | | | 16,652 | | | | 1,486,357 | |
| | | | | | | | |
| | | Number
of Shares | | | Fair
Value | |
Life Storage Inc. | | | 9,143 | | | $ | 990,004 | |
Outfront Media Inc. | | | 27,979 | | | | 750,397 | |
| | | | 4,547,252 | |
Specialty Chemicals – 0.0% * | |
Flotek Industries Inc. | | | 26,800 | | | | 53,600 | (a) |
FutureFuel Corp. | | | 11,200 | | | | 138,768 | |
NewMarket Corp. | | | 1,304 | | | | 634,422 | |
| | | | 826,790 | |
Specialty Stores – 0.2% | |
Dick’s Sporting Goods Inc. | | | 12,530 | | | | 620,110 | |
Hibbett Sports Inc. | | | 7,905 | | | | 221,656 | (a) |
MarineMax Inc. | | | 9,631 | | | | 160,741 | (a) |
Sally Beauty Holdings Inc. | | | 7,300 | | | | 133,225 | (a) |
Sportsman’s Warehouse Holdings Inc. | | | 13,200 | | | | 105,996 | (a) |
Tractor Supply Co. | | | 20,856 | | | | 1,948,785 | |
| | | | 3,190,513 | |
Steel – 0.1% | |
Reliance Steel & Aluminum Co. | | | 12,747 | | | | 1,526,581 | |
Warrior Met Coal Inc. | | | 18,301 | | | | 386,700 | |
| | | | 1,913,281 | |
Systems Software – 0.6% | |
Microsoft Corp. | | | 55,292 | | | | 8,719,548 | |
SecureWorks Corp., Class A | | | 4,160 | | | | 69,306 | (a) |
VMware Inc., Class A | | | 15,077 | | | | 2,288,538 | (a) |
| | | | 11,077,392 | |
Technology Distributors – 0.4% | |
Arrow Electronics Inc. | | | 15,877 | | | | 1,345,417 | (a) |
Avnet Inc. | | | 19,664 | | | | 834,540 | |
Insight Enterprises Inc. | | | 15,097 | | | | 1,061,168 | (a) |
PC Connection Inc. | | | 5,005 | | | | 248,548 | |
ScanSource Inc. | | | 10,588 | | | | 391,227 | (a) |
SYNNEX Corp. | | | 8,084 | | | | 1,041,219 | |
Tech Data Corp. | | | 16,290 | | | | 2,339,244 | (a) |
| | | | 7,261,363 | |
Technology Hardware, Storage & Peripherals – 0.7% | |
Apple Inc. | | | 37,736 | | | | 11,081,176 | |
AstroNova Inc. | | | 3,400 | | | | 46,648 | |
Diebold Nixdorf Inc. | | | 18,700 | | | | 197,472 | (a) |
Xerox Holdings Corp. | | | 35,141 | | | | 1,295,649 | (a) |
| | | | 12,620,945 | |
Thrifts & Mortgage Finance – 0.2% | |
Capitol Federal Financial Inc. | | | 56,600 | | | | 777,118 | |
ESSA Bancorp Inc. | | | 4,700 | | | | 79,665 | |
FS Bancorp Inc. | | | 1,639 | | | | 104,552 | |
Luther Burbank Corp. | | | 7,970 | | | | 91,894 | |
MMA Capital Holdings Inc. | | | 2,500 | | | | 79,500 | (a) |
NMI Holdings Inc., Class A | | | 7,300 | | | | 242,214 | (a) |
Northwest Bancshares Inc. | | | 40,990 | | | | 681,664 | |
OP Bancorp | | | 6,521 | | | | 67,623 | |
Provident Financial Holdings Inc. | | | 2,500 | | | | 54,750 | |
Territorial Bancorp Inc. | | | 3,616 | | | | 111,879 | |
Timberland Bancorp Inc. | | | 1,747 | | | | 51,956 | |
TrustCo Bank Corp. | | | 39,856 | | | | 345,551 | |
Waterstone Financial Inc. | | | 10,600 | | | | 201,718 | |
Western New England Bancorp Inc. | | | 4,900 | | | | 47,187 | |
| | | | 2,937,271 | |
Tires & Rubber – 0.0% * | |
Cooper Tire & Rubber Co. | | | 14,200 | | | | 408,250 | |
Tobacco – 0.0% * | |
Pyxus International Inc. | | | 4,100 | | | | 36,654 | (a) |
Turning Point Brands Inc. | | | 2,119 | | | | 60,603 | |
Vector Group Ltd. | | | 17,500 | | | | 234,325 | |
| | | | 331,582 | |
Trading Companies & Distributors – 0.2% | |
Aircastle Ltd. | | | 23,200 | | | | 742,632 | |
BlueLinx Holdings Inc. | | | 4,130 | | | | 58,852 | (a) |
CAI International Inc. | | | 7,400 | | | | 214,452 | (a) |
Foundation Building Materials Inc. | | | 6,953 | | | | 134,541 | (a) |
Kaman Corp. | | | 11,820 | | | | 779,174 | |
See Notes to Schedules of Investments and Notes to Financial Statements.
| | |
| State Street Total Return V.I.S. Fund | | |
| Schedule of Investments | | December 31, 2019 |
| | | | | | | | |
| | | Number
of Shares | | | Fair
Value | |
Lawson Products Inc. | | | 2,000 | | | $ | 104,200 | (a) |
NOW Inc. | | | 16,500 | | | | 185,460 | (a) |
Rush Enterprises Inc., Class A | | | 1,600 | | | | 74,400 | |
Rush Enterprises Inc., Class B | | | 2,289 | | | | 104,607 | |
Titan Machinery Inc. | | | 8,800 | | | | 130,064 | (a) |
Transcat Inc. | | | 3,300 | | | | 105,138 | (a) |
WESCO International Inc. | | | 8,209 | | | | 487,533 | (a) |
| | | | 3,121,053 | |
Trucking – 0.2% | |
AMERCO | | | 1,406 | | | | 528,403 | |
Heartland Express Inc. | | | 19,900 | | | | 418,895 | |
Landstar System Inc. | | | 2,728 | | | | 310,637 | |
Marten Transport Ltd. | | | 16,601 | | | | 356,755 | |
PAM Transportation Services Inc. | | | 1,007 | | | | 58,114 | (a) |
Ryder System Inc. | | | 10,335 | | | | 561,294 | |
US Xpress Enterprises Inc., Class A | | | 10,600 | | | | 53,318 | (a) |
Werner Enterprises Inc. | | | 19,774 | | | | 719,576 | |
| | | | 3,006,992 | |
Wireless Telecommunication Services – 0.0% * | |
Spok Holdings Inc. | | | 8,200 | | | | 100,286 | |
Total Domestic Equity
(Cost $558,975,839) | | | | | | | 645,043,910 | |
| |
Foreign Equity – 21.8% | |
| |
Common Stock – 21.5% | |
Advertising – 0.0% * | |
Cheil Worldwide Inc. | | | 2,431 | | | | 50,556 | |
Hakuhodo DY Holdings Inc. | | | 25,248 | | | | 410,752 | |
WPP PLC | | | 23,390 | | | | 330,465 | |
| | | | 791,773 | |
Aerospace & Defense – 0.1% | |
Meggitt PLC | | | 147,238 | | | | 1,281,112 | |
Singapore Technologies Engineering Ltd. | | | 295,900 | | | | 867,026 | |
| | | | 2,148,138 | |
Agricultural Products – 0.1% | |
China Agri-Industries Holdings Ltd. | | | 86,043 | | | | 45,607 | |
Wilmar International Ltd. | | | 363,994 | | | | 1,115,275 | |
| | | | 1,160,882 | |
Air Freight & Logistics – 0.0% * | |
Hyundai Glovis Company Ltd. | | | 1,056 | | | | 130,579 | |
Airlines – 0.1% | |
AirAsia Group Bhd | | | 148,500 | | | | 61,716 | |
Copa Holdings S.A. | | | 6,116 | | | | 661,018 | |
Japan Airlines Company Ltd. | | | 21,840 | | | | 682,682 | |
Singapore Airlines Ltd. | | | 68,108 | | | | 457,886 | |
| | | | 1,863,302 | |
Airport Services – 0.0% * | |
SATS Ltd. | | | 105,563 | | | | 397,240 | |
Aluminum – 0.0% * | |
China Zhongwang Holdings Ltd. | | | 152,053 | | | | 60,690 | |
Apparel Retail – 0.1% | |
ABC-Mart Inc. | | | 6,242 | | | | 427,334 | |
Hennes & Mauritz AB, Class B | | | 16,476 | | | | 335,256 | |
Shimamura Company Ltd. | | | 4,200 | | | | 321,546 | |
| | | | 1,084,136 | |
Apparel, Accessories & Luxury Goods – 0.2% | |
Bosideng International Holdings Ltd. | | | 394,000 | | | | 142,090 | |
Burberry Group PLC | | | 77,959 | | | | 2,277,241 | |
FF Group | | | 1,860 | | | | 1,002 | (a,c) |
Li Ning Company Ltd. | | | 111,500 | | | | 334,137 | |
Shenzhou International Group Holdings Ltd. | | | 38,065 | | | | 556,432 | |
The Swatch Group AG | | | 10,017 | | | | 529,116 | |
| | | | 3,840,018 | |
Asset Management & Custody Banks – 0.3% | |
3i Group PLC | | | 185,250 | | | | 2,694,603 | |
| | | | | | | | |
| | | Number
of Shares | | | Fair
Value | |
CI Financial Corp. | | | 42,871 | | | $ | 717,740 | |
HDFC Asset Management Company Ltd. | | | 5,209 | | | | 233,506 | (d) |
IGM Financial Inc. | | | 15,859 | | | | 455,927 | |
Magellan Financial Group Ltd. | | | 24,276 | | | | 971,841 | |
Schroders PLC | | | 8,999 | | | | 397,461 | |
| | | | 5,471,078 | |
Auto Parts & Equipment – 0.4% | |
Faurecia S.A. | | | 14,454 | | | | 779,268 | |
Fuyao Glass Industry Group Company Ltd., Class H | | | 61,826 | | | | 189,244 | (d) |
Magna International Inc. | | | 56,431 | | | | 3,098,428 | |
Sumitomo Electric Industries Ltd. | | | 142,841 | | | | 2,171,367 | |
Toyoda Gosei Company Ltd. | | | 12,365 | | | | 312,325 | |
Valeo S.A. | | | 25,874 | | | | 912,258 | |
| | | | 7,462,890 | |
Automobile Manufacturers – 0.2% | |
BAIC Motor Corporation Ltd., Class H | | | 200,500 | | | | 113,736 | (d) |
Dongfeng Motor Group Company Ltd.,
Class H | | | 333,138 | | | | 313,394 | |
Ford Otomotiv Sanayi A/S | | | 8,597 | | | | 102,352 | |
Great Wall Motor Company Ltd.,
Class H | | | 379,907 | | | | 280,842 | |
Guangzhou Automobile Group Company
Ltd., Class H | | | 31,015 | | | | 38,611 | |
Isuzu Motors Ltd. | | | 20 | | | | 239 | |
Kia Motors Corp. | | | 29,171 | | | | 1,117,450 | |
Mazda Motor Corp. | | | 107,697 | | | | 929,559 | |
Nissan Motor Company Ltd. | | | 37,600 | | | | 220,081 | |
Peugeot S.A. | | | 72,644 | | | | 1,736,863 | |
| | | | 4,853,127 | |
Automotive Retail – 0.1% | |
Hotai Motor Company Ltd. | | | 30,502 | | | | 694,962 | |
Petrobras Distribuidora S.A. | | | 37,363 | | | | 279,291 | |
| | | | 974,253 | |
Banks – 0.0% * | |
China Common Rich Renewable Energy Investments Ltd. | | | 64,000 | | | | — | (c) |
Biotechnology – 0.0% * | |
Affimed N.V. | | | 24,100 | | | | 66,034 | (a) |
Broadcasting – 0.1% | |
ITV PLC | | | 686,579 | | | | 1,373,414 | |
Building Products – 0.1% | |
China Lesso Group Holdings Ltd. | | | 133,000 | | | | 170,521 | |
LIXIL Group Corp. | | | 50,700 | | | | 881,273 | |
| | | | 1,051,794 | |
Cable & Satellite – 0.1% | |
Altice N.V., Class A | | | 26,744 | | | | 172,556 | (a) |
Cyfrowy Polsat S.A. | | | 30,506 | | | | 225,052 | |
Eutelsat Communications S.A. | | | 33,101 | | | | 538,388 | |
Megacable Holdings SAB de C.V. | | | 36,679 | | | | 150,414 | |
| | | | 1,086,410 | |
Casinos & Gaming – 0.0% * | |
Altus San Nicolas Corp. | | | 1,515 | | | | 155 | (a) |
Kangwon Land Inc. | | | 14,413 | | | | 368,909 | |
| | | | 369,064 | |
Coal & Consumable Fuels – 0.0% * | |
China Shenhua Energy Company Ltd., Class H | | | 285,173 | | | | 595,834 | |
Commercial Printing – 0.1% | |
Dai Nippon Printing Company Ltd. | | | 19,069 | | | | 519,386 | |
Toppan Printing Company Ltd. | | | 53,000 | | | | 1,102,673 | |
| | | | 1,622,059 | |
Commodity Chemicals – 0.1% | |
Advanced Petrochemical Co. | | | 12,993 | | | | 171,102 | |
Mesaieed Petrochemical Holding Co. | | | 406,947 | | | | 280,537 | |
Tosoh Corp. | | | 49,500 | | | | 772,050 | |
| | | | 1,223,689 | |
See Notes to Schedules of Investments and Notes to Financial Statements.
| | |
| State Street Total Return V.I.S. Fund | | |
| Schedule of Investments | | December 31, 2019 |
| | | | | | | | |
| | | Number
of Shares | | | Fair
Value | |
Communications Equipment – 0.0% * | |
KMW Company Ltd. | | | 3,165 | | | $ | 139,852 | (a) |
Computer & Electronics Retail – 0.0% * | |
Yamada Denki Company Ltd. | | | 119,100 | | | | 633,447 | |
Construction & Engineering – 0.2% | |
China Communications Services Corporation Ltd., Class H | | | 292,121 | | | | 212,948 | |
China Railway Construction Corporation Ltd., Class H | | | 162,600 | | | | 178,005 | |
Gamuda Bhd | | | 212,000 | | | | 202,127 | |
IJM Corporation Bhd | | | 50,900 | | | | 27,002 | |
Metallurgical Corporation of China Ltd., Class H | | | 283,146 | | | | 63,593 | |
Skanska AB, Class B | | | 64,758 | | | | 1,464,501 | |
Vinci S.A. | | | 20,600 | | | | 2,289,226 | |
| | | | 4,437,402 | |
Construction Machinery & Heavy Trucks – 0.1% | |
Doosan Bobcat Inc. | | | 1,064 | | | | 31,604 | (a) |
Hino Motors Ltd. | | | 54,500 | | | | 582,738 | |
Weichai Power Company Ltd., Class H | | | 118,546 | | | | 250,121 | |
Zoomlion Heavy Industry Science and Technology Company Ltd. | | | 170,000 | | | | 142,470 | |
| | | | 1,006,933 | |
Construction Materials – 0.1% | |
Anhui Conch Cement Company Ltd., Class H | | | 28,429 | | | | 207,239 | |
Saudi Cement Co. | | | 9,183 | | | | 171,601 | |
Semen Indonesia Persero Tbk PT | | | 77,138 | | | | 66,678 | |
The Siam Cement PCL | | | 2,440 | | | | 31,932 | |
The Siam Cement PCL NVDR | | | 61,329 | | | | 802,603 | |
| | | | 1,280,053 | |
Consumer Finance – 0.0% * | |
Qudian Inc. ADR | | | 18,500 | | | | 87,135 | (a) |
Copper – 0.0% * | |
Jiangxi Copper Company Ltd., Class H | | | 144,560 | | | | 198,886 | |
Data Processing & Outsourced Services – 0.0% * | |
EVERTEC Inc. | | | 26,140 | | | | 889,806 | |
Department Stores – 0.1% | |
Hyundai Department Store Company Ltd. | | | 1,720 | | | | 123,595 | |
Next PLC | | | 25,365 | | | | 2,358,210 | |
| | | | 2,481,805 | |
Diversified Banks – 1.1% | |
Absa Group Ltd. | | | 24,508 | | | | 261,669 | |
Agricultural Bank of China Ltd.,
Class H | | | 2,840,895 | | | | 1,250,580 | |
Banco de Chile | | | 1,718,825 | | | | 182,180 | |
Banco de Credito e Inversiones S.A. | | | 2,553 | | | | 115,775 | |
Bancolombia S.A. | | | 28,096 | | | | 376,725 | |
Bank Hapoalim BM | | | 203,166 | | | | 1,685,207 | |
Bank Leumi Le-Israel BM | | | 218,733 | | | | 1,592,052 | |
Bank of China Ltd., Class H | | | 147,823 | | | | 63,175 | |
Bank of Communications Company Ltd., Class H | | | 1,071,944 | | | | 762,156 | |
Bank of the Philippine Islands | | | 15,220 | | | | 26,416 | |
Bank Polska Kasa Opieki S.A. | | | 20,898 | | | | 554,275 | |
Banque Saudi Fransi | | | 10,837 | | | | 109,488 | |
China CITIC Bank Corporation Ltd., Class H | | | 1,093,953 | | | | 655,659 | |
China Everbright Bank Company Ltd., Class H | | | 388,161 | | | | 180,336 | |
China Minsheng Banking Corporation Ltd., Class H | | | 866,359 | | | | 654,901 | |
Dubai Islamic Bank PJSC | | | 48,904 | | | | 73,360 | |
First Financial Holding Company Ltd. | | | 249,134 | | | | 196,967 | |
Hong Leong Financial Group Bhd | | | 28,112 | | | | 116,145 | |
Industrial & Commercial Bank of China Ltd., Class H | | | 867,427 | | | | 667,954 | |
Industrial Bank of Korea | | | 31,692 | | | | 323,374 | (a) |
Israel Discount Bank Ltd., Class A | | | 113,870 | | | | 527,811 | |
| | | | | | | | |
| | | Number
of Shares | | | Fair
Value | |
Komercni banka A/S | | | 9,081 | | | $ | 332,708 | |
Krung Thai Bank PCL NVDR | | | 77 | | | | 42 | |
MCB Bank Ltd. | | | 18,029 | | | | 24,564 | |
Mega Financial Holding Company Ltd. | | | 570,341 | | | | 582,194 | |
Mizrahi Tefahot Bank Ltd. | | | 26,667 | | | | 710,296 | |
Moneta Money Bank A/S | | | 62,593 | | | | 234,994 | (d) |
Nedbank Group Ltd. | | | 25,912 | | | | 397,107 | |
Postal Savings Bank of China Company Ltd., Class H | | | 376,647 | | | | 256,196 | (d) |
Qatar International Islamic Bank QSC | | | 90,853 | | | | 241,543 | |
RHB Bank Bhd | | | 95,248 | | | | 134,588 | |
Royal Bank of Canada | | | 74,819 | | | | 5,928,400 | |
SinoPac Financial Holdings Company Ltd. | | | 842,381 | | | | 365,312 | |
Taiwan Business Bank | | | 506,073 | | | | 212,714 | |
Taiwan Cooperative Financial Holding Company Ltd. | | | 502,040 | | | | 347,511 | |
The Shanghai Commercial & Savings Bank Ltd. | | | 39,804 | | | | 69,047 | |
The Siam Commercial Bank PCL | | | 6,210 | | | | 25,293 | |
The Siam Commercial Bank PCL NVDR | | | 7,200 | | | | 29,325 | |
Turkiye Garanti Bankasi A/S | | | 31,282 | | | | 58,558 | (a) |
Turkiye Is Bankasi A/S, Class C | | | 192,923 | | | | 207,803 | (a) |
| | | | 20,534,400 | |
Diversified Capital Markets – 0.0% * | |
Banco BTG Pactual S.A. | | | 28,061 | | | | 531,057 | |
Diversified Chemicals – 0.0% * | |
Daicel Corp. | | | 47,100 | | | | 454,639 | |
Diversified Metals & Mining – 0.1% | |
Boliden AB | | | 52,072 | | | | 1,382,312 | |
Ferroglobe PLC | | | 1,316 | | | | — | (c) |
Korea Zinc Company Ltd. | | | 1,040 | | | | 382,204 | |
Mitsubishi Materials Corp. | | | 20,400 | | | | 558,830 | |
| | | | 2,323,346 | |
Diversified Real Estate Activities – 0.2% | |
Aldar Properties PJSC | | | 471,923 | | | | 277,515 | |
Hang Lung Properties Ltd. | | | 65,000 | | | | 142,650 | |
Kerry Properties Ltd. | | | 124,000 | | | | 393,875 | |
LendLease Group | | | 107,401 | | | | 1,328,757 | |
Pakuwon Jati Tbk PT | | | 579,800 | | | | 23,806 | |
Robinsons Land Corp. | | | 254,506 | | | | 138,447 | |
Shenzhen Investment Ltd. | | | 370,000 | | | | 148,156 | |
Swire Pacific Ltd., Class A | | | 93,929 | | | | 872,771 | |
Wheelock & Company Ltd. | | | 144,000 | | | | 960,086 | |
| | | | 4,286,063 | |
Diversified REITs – 0.2% | |
Fibra Uno Administracion S.A. de C.V. | | | 392,559 | | | | 608,878 | |
Fortress REIT Ltd., Class A | | | 26,483 | | | | 36,476 | |
Growthpoint Properties Ltd. | | | 363,921 | | | | 575,413 | |
H&R Real Estate Investment Trust | | | 26,607 | | | | 432,934 | |
Mirvac Group | | | 741,108 | | | | 1,656,659 | |
The GPT Group | | | 343,412 | | | | 1,351,849 | |
| | | | 4,662,209 | |
Drug Retail – 0.0% * | |
Clicks Group Ltd. | | | 32,103 | | | | 589,073 | |
Electric Utilities – 0.5% | |
CLP Holdings Ltd. | | | 310,437 | | | | 3,263,019 | |
Endesa S.A. | | | 60,186 | | | | 1,607,223 | |
Enel Americas S.A. | | | 639,285 | | | | 141,978 | |
Enel S.p.A. | | | 19,946 | | | | 158,338 | |
HK Electric Investments & HK Electric Investments Ltd. | | | 502,500 | | | | 495,290 | |
Hydro One Ltd. | | | 62,121 | | | | 1,201,461 | (d) |
Inter Rao UES PJSC | | | 453,516 | | | | 36,592 | (a) |
Interconexion Electrica S.A. ESP | | | 18,487 | | | | 110,421 | |
Manila Electric Co. | | | 27,616 | | | | 172,856 | |
Mercury NZ Ltd. | | | 129,680 | | | | 441,817 | |
Red Electrica Corporacion S.A. | | | 74,399 | | | | 1,496,968 | |
Terna Rete Elettrica Nazionale S.p.A. | | | 64,665 | | | | 432,179 | |
| | | | 9,558,142 | |
See Notes to Schedules of Investments and Notes to Financial Statements.
| | |
| State Street Total Return V.I.S. Fund | | |
| Schedule of Investments | | December 31, 2019 |
| | | | | | | | |
| | | Number
of Shares | | | Fair
Value | |
Electrical Components & Equipment – 0.0% * | |
WEG S.A. | | | 41,900 | | | $ | 361,015 | |
Electronic Components – 0.2% | |
Delta Electronics Inc. | | | 35,446 | | | | 179,140 | |
Hirose Electric Company Ltd. | | | 6,200 | | | | 800,423 | |
Kingboard Laminates Holdings Ltd. | | | 132,020 | | | | 163,674 | |
Omron Corp. | | | 31,300 | | | | 1,849,054 | |
Zhen Ding Technology Holding Ltd. | | | 66,263 | | | | 316,096 | |
| | | | 3,308,387 | |
Electronic Equipment & Instruments – 0.2% | |
China Railway Signal & Communication Corporation Ltd., Class H | | | 181,075 | | | | 101,091 | (d) |
Halma PLC | | | 71,935 | | | | 2,016,462 | |
Hitachi High-Technologies Corp. | | | 13,100 | | | | 933,002 | |
| | | | 3,050,555 | |
Electronic Manufacturing Services – 0.1% | |
Fabrinet | | | 15,400 | | | | 998,536 | (a) |
Environmental & Facilities Services – 0.0% * | |
A-Living Services Company Ltd. | | | 47,750 | | | | 164,850 | (d) |
Fertilizers & Agricultural Chemicals – 0.0% * | |
Saudi Arabian Fertilizer Co. | | | 10,859 | | | | 224,342 | |
Financial Exchanges & Data – 0.2% | |
ASX Ltd. | | | 36,680 | | | | 2,021,740 | |
Singapore Exchange Ltd. | | | 153,017 | | | | 1,008,241 | |
| | | | 3,029,981 | |
Food Distributors – 0.0% * | |
The SPAR Group Ltd. | | | 23,592 | | | | 333,225 | |
Food Retail – 0.6% | | | | | | | | |
BIM Birlesik Magazalar A/S | | | 37,406 | | | | 293,289 | |
Casino Guichard Perrachon S.A. | | | 10,321 | | | | 483,108 | |
Colruyt S.A. | | | 10,471 | | | | 546,312 | |
Empire Company Ltd., Class A | | | 32,874 | | | | 772,194 | |
ICA Gruppen AB | | | 17,159 | | | | 801,397 | |
Jeronimo Martins SGPS S.A. | | | 47,923 | | | | 788,882 | |
Koninklijke Ahold Delhaize N.V. | | | 145,382 | | | | 3,638,348 | |
Loblaw Companies Ltd. | | | 34,898 | | | | 1,803,097 | |
Metro Inc. | | | 48,333 | | | | 1,997,428 | |
Pick n Pay Stores Ltd. | | | 6,099 | | | | 27,866 | |
WM Morrison Supermarkets PLC | | | 179,599 | | | | 475,372 | |
| | | | 11,627,293 | |
Footwear – 0.1% | | | | | | | | |
ANTA Sports Products Ltd. | | | 74,002 | | | | 662,445 | |
Pou Chen Corp. | | | 38,515 | | | | 50,365 | |
Yue Yuen Industrial Holdings Ltd. | | | 138,000 | | | | 407,351 | |
| | | | 1,120,161 | |
Gas Utilities – 0.2% | | | | | | | | |
Enagas S.A. | | | 42,983 | | | | 1,097,169 | |
Osaka Gas Company Ltd. | | | 71,022 | | | | 1,366,524 | |
Petronas Gas Bhd | | | 54,571 | | | | 221,726 | |
Snam S.p.A. | | | 385,941 | | | | 2,030,062 | |
| | | | 4,715,481 | |
General Merchandise Stores – 0.3% | |
Harvey Norman Holdings Ltd. | | | 107,016 | | | | 306,173 | |
Wesfarmers Ltd. | | | 214,789 | | | | 6,250,819 | |
| | | | 6,556,992 | |
Gold – 0.1% | | | | | | | | |
Kirkland Lake Gold Ltd. | | | 32,362 | | | | 1,428,495 | |
Healthcare Distributors – 0.1% | |
Alfresa Holdings Corp. | | | 35,781 | | | | 733,564 | |
Medipal Holdings Corp. | | | 34,877 | | | | 774,403 | |
Suzuken Company Ltd. | | | 13,756 | | | | 565,176 | |
| | | | 2,073,143 | |
Healthcare Equipment – 0.2% | |
Fisher & Paykel Healthcare Corporation Ltd. | | | 35,325 | | | | 529,071 | |
Smith & Nephew PLC | | | 110,162 | | | | 2,674,299 | |
| | | | 3,203,370 | |
| | | | | | | | |
| | | Number
of Shares | | | Fair
Value | |
Healthcare Services – 0.1% | | | | | | | | |
Sonic Healthcare Ltd. | | | 85,744 | | | $ | 1,732,871 | |
Highways & Railtracks – 0.0% * | | | | | | | | |
Jiangsu Expressway Company Ltd., Class H | | | 149,062 | | | | 204,315 | |
Shenzhen Expressway Company Ltd. | | | 88,000 | | | | 126,266 | |
Zhejiang Expressway Company Ltd., Class H | | | 175,054 | | | | 159,512 | |
| | | | 490,093 | |
Home Building – 0.5% | | | | | | | | |
Barratt Developments PLC | | | 193,830 | | | | 1,917,093 | |
Berkeley Group Holdings PLC | | | 22,732 | | | | 1,463,251 | |
Iida Group Holdings Company Ltd. | | | 27,900 | | | | 492,662 | |
Persimmon PLC | | | 60,643 | | | | 2,165,078 | |
Sekisui House Ltd. | | | 118,340 | | | | 2,541,030 | |
Taylor Wimpey PLC | | | 624,423 | | | | 1,599,814 | |
| | | | 10,178,928 | |
Home Improvement Retail – 0.1% | |
Kingfisher PLC | | | 336,382 | | | | 967,000 | |
Household Appliances – 0.1% | | | | | | | | |
Arcelik A/S | | | 20,010 | | | | 70,074 | (a) |
Electrolux AB, Class B | | | 42,745 | | | | 1,049,783 | |
Rinnai Corp. | | | 6,300 | | | | 495,652 | |
| | | | 1,615,509 | |
Household Products – 0.0% * | |
Hindustan Unilever Ltd. | | | 29,701 | | | | 800,175 | |
Unilever Indonesia Tbk PT | | | 43,317 | | | | 131,051 | |
| | | | 931,226 | |
Human Resource & Employment Services – 0.1% | |
Randstad N.V. | | | 22,684 | | | | 1,386,194 | |
Hypermarkets & Super Centers – 0.1% | |
Carrefour S.A. | | | 22,607 | | | | 379,376 | |
METRO AG | | | 34,281 | | | | 552,194 | |
Wal-Mart de Mexico SAB de C.V. | | | 59,236 | | | | 169,860 | |
| | | | 1,101,430 | |
Independent Power Producers & Energy Traders – 0.1% | |
Aboitiz Power Corp. | | | 180,325 | | | | 121,771 | |
China Power International Development Ltd. | | | 540,724 | | | | 115,892 | |
Colbun S.A. | | | 580,237 | | | | 92,597 | |
Electricity Generating PCL NVDR | | | 35,557 | | | | 389,357 | |
Ratch Group PCL | | | 22,937 | | | | 52,645 | |
Ratch Group PCL NVDR | | | 66,000 | | | | 151,484 | |
Uniper SE | | | 38,145 | | | | 1,263,552 | |
| | | | 2,187,298 | |
Industrial Conglomerates – 0.1% | |
Grupo Carso SAB de C.V., Class A1 | | | 35,378 | | | | 130,803 | |
KOC Holding A/S | | | 27,045 | | | | 92,346 | |
NWS Holdings Ltd. | | | 296,071 | | | | 414,936 | |
Shanghai Industrial Holdings Ltd. | | | 59,525 | | | | 114,592 | |
Siemens Ltd. | | | 8,724 | | | | 182,930 | |
Sime Darby Bhd | | | 316,004 | | | | 171,502 | |
| | | | 1,107,109 | |
Industrial Gases – 0.5% | | | | | | | | |
Air Liquide S.A. | | | 6,805 | | | | 963,992 | |
Air Water Inc. | | | 28,400 | | | | 418,127 | |
Linde PLC | | | 41,473 | | | | 8,829,602 | |
Taiyo Nippon Sanso Corp. | | | 15,000 | | | | 335,128 | |
| | | | 10,546,849 | |
Industrial Machinery – 0.7% | | | | | | | | |
Amada Holdings Company Ltd. | | | 63,100 | | | | 725,788 | |
Atlas Copco AB, Class B | | | 73,933 | | | | 2,568,410 | |
JTEKT Corp. | | | 39,000 | | | | 466,887 | |
Kone Oyj, Class B | | | 64,391 | | | | 4,212,412 | |
Kurita Water Industries Ltd. | | | 18,700 | | | | 560,096 | |
Luxfer Holdings PLC | | | 12,000 | | | | 222,120 | |
Mitsubishi Heavy Industries Ltd. | | | 29,800 | | | | 1,164,853 | |
Schindler Holding AG | | | 3,814 | | | | 934,250 | |
See Notes to Schedules of Investments and Notes to Financial Statements.
| | |
| State Street Total Return V.I.S. Fund | | |
| Schedule of Investments | | December 31, 2019 |
| | | | | | | | |
| | | Number
of Shares | | | Fair
Value | |
SKF AB, Class B | | | 72,413 | | | $ | 1,465,116 | |
Sumitomo Heavy Industries Ltd. | | | 21,000 | | | | 604,831 | |
| | | | 12,924,763 | |
Industrial REITs – 0.2% | | | | | | | | |
Goodman Group | | | 147,638 | | | | 1,387,567 | |
Segro PLC | | | 208,149 | | | | 2,473,989 | |
| | | | 3,861,556 | |
Integrated Oil & Gas – 0.5% | | | | | | | | |
Gazprom PJSC ADR | | | 245,859 | | | | 2,022,928 | (e) |
Imperial Oil Ltd. | | | 6,820 | | | | 180,657 | |
LUKOIL PJSC ADR | | | 12,267 | | | | 1,216,641 | (e,f) |
LUKOIL PJSC ADR | | | 4,018 | | | | 396,617 | (e,f) |
MOL Hungarian Oil & Gas PLC | | | 50,186 | | | | 500,805 | |
Oil & Natural Gas Corporation Ltd. | | | 192,196 | | | | 346,813 | |
Royal Dutch Shell PLC, Class B | | | 55,419 | | | | 1,644,159 | |
Surgutneftegas PJSC ADR | | | 87,527 | | | | 705,905 | (e) |
Total S.A. | | | 31,162 | | | | 1,720,983 | |
| | | | 8,735,508 | |
Integrated Telecommunication Services – 1.0% | |
BCE Inc. | | | 28,920 | | | | 1,341,683 | |
Chunghwa Telecom Company Ltd. | | | 431,168 | | | | 1,582,162 | |
Elisa Oyj | | | 3,481 | | | | 192,440 | |
HKT Trust & HKT Ltd. | | | 716,427 | | | | 1,009,570 | |
Nippon Telegraph & Telephone Corp. | | | 243,200 | | | | 6,169,794 | |
PCCW Ltd. | | | 804,527 | | | | 475,997 | |
Proximus SADP | | | 28,832 | | | | 825,927 | |
Spark New Zealand Ltd. | | | 348,018 | | | | 1,016,642 | |
Swisscom AG | | | 4,908 | | | | 2,598,070 | |
Telia Company AB | | | 143,682 | | | | 617,794 | |
Telkom S.A. SOC Ltd. | | | 34,436 | | | | 85,748 | |
Telstra Corporation Ltd. | | | 788,721 | | | | 1,962,688 | |
TELUS Corp. | | | 37,564 | | | | 1,456,501 | |
| | | | 19,335,016 | |
Interactive Media & Services – 0.1% | |
Tencent Holdings Ltd. | | | 38,598 | | | | 1,860,598 | |
Internet & Direct Marketing Retail – 0.2% | |
Alibaba Group Holding Ltd. ADR | | | 11,650 | | | | 2,470,965 | (a,e) |
Vipshop Holdings Ltd. ADR | | | 53,800 | | | | 762,346 | (a,e) |
| | | | 3,233,311 | |
Internet Services & Infrastructure – 0.1% | |
Shopify Inc., Class A | | | 3,719 | | | | 1,480,717 | (a) |
Investment Banking & Brokerage – 0.0% * | |
Meritz Securities Company Ltd. | | | 15,014 | | | | 49,205 | |
IT Consulting & Other Services – 1.2% | |
Accenture PLC, Class A | | | 80,668 | | | | 16,986,261 | |
HCL Technologies Ltd. | | | 20,330 | | | | 161,807 | |
Infosys Ltd. | | | 82,791 | | | | 848,056 | |
Itochu Techno-Solutions Corp. | | | 18,200 | | | | 514,976 | |
NEC Corp. | | | 46,900 | | | | 1,950,660 | |
Nomura Research Institute Ltd. | | | 60,200 | | | | 1,295,124 | |
Wipro Ltd. | | | 139,942 | | | | 481,908 | |
| | | | 22,238,792 | |
Leisure Products – 0.1% | | | | | | | | |
Bandai Namco Holdings Inc. | | | 33,800 | | | | 2,062,367 | |
Sankyo Company Ltd. | | | 8,500 | | | | 283,529 | |
| | | | 2,345,896 | |
Life & Health Insurance – 0.8% | | | | | | | | |
Bupa Arabia for Cooperative Insurance Co. | | | 3,381 | | | | 92,292 | |
CNP Assurances | | | 32,544 | | | | 647,688 | |
Great-West Lifeco Inc. | | | 53,025 | | | | 1,360,024 | |
iA Financial Corporation Inc. | | | 20,200 | | | | 1,111,136 | |
ICICI Prudential Life Insurance Company Ltd. | | | 42,211 | | | | 285,307 | (d) |
Liberty Holdings Ltd. | | | 15,776 | | | | 124,834 | |
Medibank Private Ltd. | | | 524,316 | | | | 1,164,675 | |
Momentum Metropolitan Holdings | | | 110,057 | | | | 171,892 | |
New China Life Insurance Company Ltd., Class H | | | 32,963 | | | | 141,721 | |
| | | | | | | | |
| | | Number
of Shares | | | Fair
Value | |
Poste Italiane S.p.A. | | | 99,465 | | | $ | 1,129,892 | (d) |
Power Corporation of Canada | | | 57,338 | | | | 1,479,049 | |
Power Financial Corp. | | | 50,625 | | | | 1,364,054 | |
Sony Financial Holdings Inc. | | | 28,800 | | | | 696,447 | |
Sun Life Financial Inc. | | | 35,333 | | | | 1,613,316 | |
Swiss Life Holding AG | | | 6,396 | | | | 3,208,733 | |
| | | | 14,591,060 | |
Life Sciences Tools & Services – 0.1% | |
Divi’s Laboratories Ltd. | | | 9,755 | | | | 252,259 | |
Sartorius Stedim Biotech | | | 5,242 | | | | 869,088 | |
WuXi AppTec Company Ltd. | | | 9,400 | | | | 116,598 | (d) |
| | | | 1,237,945 | |
Managed Healthcare – 0.0% * | |
Triple-S Management Corp., Class B | | | 10,100 | | | | 186,749 | (a) |
Marine – 0.1% | | | | | | | | |
Costamare Inc. | | | 20,887 | | | | 199,053 | |
Kuehne + Nagel International AG | | | 10,281 | | | | 1,732,699 | |
MISC Bhd | | | 164,007 | | | | 334,790 | |
| | | | 2,266,542 | |
Marine Ports & Services – 0.0% * | |
Kamigumi Company Ltd. | | | 20,501 | | | | 452,559 | |
Westports Holdings Bhd | | | 27,300 | | | | 28,098 | |
| | | | 480,657 | |
Motorcycle Manufacturers – 0.0% * | |
Bajaj Auto Ltd. | | | 6,922 | | | | 308,870 | |
Movies & Entertainment – 0.1% | |
Tencent Music Entertainment Group ADR | | | 11,255 | | | | 132,134 | (a,e) |
Toho Company Ltd. | | | 21,500 | | | | 899,172 | |
| | | | 1,031,306 | |
Multi-Line Insurance – 1.4% | |
Allianz SE | | | 29,731 | | | | 7,288,670 | |
Assicurazioni Generali S.p.A. | | | 209,201 | | | | 4,319,661 | |
Baloise Holding AG | | | 9,291 | | | | 1,679,068 | |
BB Seguridade Participacoes S.A. | | | 85,782 | | | | 803,933 | |
China Pacific Insurance Group Company Ltd., Class H | | | 309,800 | | | | 1,220,624 | |
Gjensidige Forsikring ASA | | | 38,077 | | | | 798,389 | |
Mapfre S.A. | | | 205,203 | | | | 543,603 | |
Porto Seguro S.A. | | | 11,864 | | | | 185,037 | |
Sampo Oyj, Class A | | | 10,265 | | | | 448,339 | |
Sul America S.A. | | | 35,232 | | | | 524,797 | |
Watford Holdings Ltd. | | | 1,900 | | | | 47,804 | (a) |
Zurich Insurance Group AG | | | 21,819 | | | | 8,947,514 | |
| | | | 26,807,439 | |
Multi-Sector Holdings – 0.2% | |
EXOR N.V. | | | 20,647 | | | | 1,601,015 | |
Groupe Bruxelles Lambert S.A. | | | 15,288 | | | | 1,612,426 | |
Haci Omer Sabanci Holding A/S | | | 39,711 | | | | 63,661 | |
L E Lundbergforetagen AB, Class B | | | 14,469 | | | | 635,266 | |
Pargesa Holding S.A. | | | 7,290 | | | | 605,649 | |
| | | | 4,518,017 | |
Multi-Utilities – 0.2% | |
Suez | | | 64,774 | | | | 980,478 | |
Veolia Environnement S.A. | | | 101,841 | | | | 2,710,443 | |
| | | | 3,690,921 | |
Office REITs – 0.2% | |
Dexus | | | 193,771 | | | | 1,593,673 | |
Japan Prime Realty Investment Corp. | | | 149 | | | | 653,310 | |
Orix JREIT Inc. | | | 499 | | | | 1,080,421 | |
| | | | 3,327,404 | |
Oil & Gas Exploration & Production – 0.0% * | |
Oil & Gas Development Company Ltd. | | | 47,964 | | | | 44,041 | |
Oil & Gas Refining & Marketing – 0.1% | |
Bharat Petroleum Corporation Ltd. | | | 21,315 | | | | 146,787 | |
Cosan S.A. | | | 19,595 | | | | 338,883 | |
Grupa Lotos S.A. | | | 10,329 | | | | 227,946 | |
Hindustan Petroleum Corporation Ltd. | | | 69,820 | | | | 258,726 | |
See Notes to Schedules of Investments and Notes to Financial Statements.
| | |
| State Street Total Return V.I.S. Fund | | |
| Schedule of Investments | | December 31, 2019 |
| | | | | | | | |
| | | Number
of Shares | | | Fair
Value | |
Qatar Fuel QSC | | | 57,093 | | | $ | 359,085 | |
Tupras Turkiye Petrol Rafinerileri A/S | | | 6,898 | | | | 146,978 | |
| | | | 1,478,405 | |
Oil & Gas Storage & Transportation – 0.1% | |
Petronet LNG Ltd. | | | 38,204 | | | | 143,416 | |
Scorpio Tankers Inc. | | | 5,500 | | | | 216,370 | |
SFL Corporation Ltd. | | | 34,845 | | | | 506,646 | |
Teekay Tankers Ltd., Class A | | | 10,375 | | | | 248,689 | (a) |
| | | | 1,115,121 | |
Other Diversified Financial Services – 0.1% | |
M&G PLC | | | 487,325 | | | | 1,531,326 | (a) |
Packaged Foods & Meats – 0.3% | |
China Huishan Dairy Holdings Company Ltd. | | | 55,000 | | | | — | (c) |
Chocoladefabriken Lindt & Spruengli AG | | | 203 | | | | 1,575,407 | |
Dali Foods Group Company Ltd. | | | 251,604 | | | | 186,318 | (d) |
Indofood Sukses Makmur Tbk PT | | | 537,800 | | | | 307,010 | |
Mowi ASA | | | 5,998 | | | | 155,764 | |
Nestle Malaysia Bhd | | | 3,301 | | | | 118,628 | |
NH Foods Ltd. | | | 15,500 | | | | 643,248 | |
PPB Group Bhd | | | 49,749 | | | | 229,134 | |
QL Resources Bhd | | | 79,533 | | | | 158,074 | |
Toyo Suisan Kaisha Ltd. | | | 16,900 | | | | 720,009 | |
WH Group Ltd. | | | 992,000 | | | | 1,024,872 | (d) |
Yihai International Holding Ltd. | | | 55,346 | | | | 324,612 | |
| | | | 5,443,076 | |
Personal Products – 0.4% | |
Colgate-Palmolive India Ltd. | | | 7,996 | | | | 163,879 | |
Dabur India Ltd. | | | 9,402 | | | | 60,381 | |
L’Oreal S.A. | | | 26,423 | | | | 7,830,188 | |
Marico Ltd. | | | 54,453 | | | | 260,600 | |
| | | | 8,315,048 | |
Pharmaceuticals – 0.6% | | | | | | | | |
China Medical System Holdings Ltd. | | | 167,000 | | | | 240,476 | |
CSPC Pharmaceutical Group Ltd. | | | 116,000 | | | | 276,609 | |
Kalbe Farma Tbk PT | | | 2,583,870 | | | | 301,521 | |
Novo Nordisk A/S, Class B | | | 55,005 | | | | 3,194,785 | |
Orion Oyj, Class B | | | 19,883 | | | | 921,091 | |
Roche Holding AG | | | 21,820 | | | | 7,075,417 | |
Sino Biopharmaceutical Ltd. | | | 274,000 | | | | 383,300 | |
| | | | 12,393,199 | |
Precious Metals & Minerals – 0.0% * | |
Impala Platinum Holdings Ltd. | | | 22,648 | | | | 232,448 | (a) |
Property & Casualty Insurance – 0.3% | |
Admiral Group PLC | | | 35,844 | | | | 1,096,414 | |
Direct Line Insurance Group PLC | | | 260,617 | | | | 1,078,914 | |
Intact Financial Corp. | | | 26,415 | | | | 2,860,377 | |
Samsung Fire & Marine Insurance Company Ltd. | | | 3,772 | | | | 794,226 | |
Tryg A/S | | | 19,489 | | | | 578,200 | |
| | | | 6,408,131 | |
Publishing – 0.0% * | | | | | | | | |
Singapore Press Holdings Ltd. | | | 286,007 | | | | 463,686 | |
Railroads – 0.1% | | | | | | | | |
BTS Group Holdings PCL NVDR | | | 277,200 | | | | 122,156 | |
MTR Corporation Ltd. | | | 161,000 | | | | 951,520 | |
| | | | 1,073,676 | |
Real Estate Development – 0.1% | |
China Aoyuan Group Ltd. | | | 68,000 | | | | 110,834 | |
China Overseas Land & Investment Ltd. | | | 64,026 | | | | 249,389 | |
China Resources Land Ltd. | | | 92,074 | | | | 458,491 | |
China Vanke Company Ltd., Class H | | | 7,276 | | | | 31,049 | |
Land & Houses PCL NVDR | | | 393,703 | | | | 128,808 | |
Longfor Group Holdings Ltd. | | | 195,576 | | | | 916,159 | (d) |
Shimao Property Holdings Ltd. | | | 130,801 | | | | 506,968 | |
| | | | | | | | |
| | | Number
of Shares | | | Fair
Value | |
Yuexiu Property Company Ltd. | | | 853,354 | | | $ | 197,135 | |
Yuzhou Properties Company Ltd. | | | 212,727 | | | | 117,123 | |
| | | | 2,715,956 | |
Real Estate Operating Companies – 0.1% | |
Aroundtown S.A. | | | 153,685 | | | | 1,377,330 | |
Azrieli Group Ltd. | | | 2,545 | | | | 186,049 | |
Emaar Malls PJSC | | | 52,166 | | | | 25,989 | |
Multiplan Empreendimentos Imobiliarios S.A. | | | 7,795 | | | | 64,140 | |
Swire Properties Ltd. | | | 221,827 | | | | 735,931 | |
Swiss Prime Site AG | | | 1,928 | | | | 222,795 | (a) |
| | | | 2,612,234 | |
Regional Banks – 0.1% | | | | | | | | |
Bendigo & Adelaide Bank Ltd. | | | 92,283 | | | | 634,432 | |
Chongqing Rural Commercial Bank Company Ltd., Class H | | | 292,526 | | | | 149,420 | |
Popular Inc. | | | 18,704 | | | | 1,098,860 | |
| | | | 1,882,712 | |
Reinsurance – 0.6% | | | | | | | | |
China Reinsurance Group Corp.,
Class H | | | 507,788 | | | | 83,417 | |
Hannover Rueck SE | | | 11,480 | | | | 2,220,309 | |
IRB Brasil Resseguros S.A. | | | 48,659 | | | | 471,143 | |
Muenchener Rueckversicherungs-Gesellschaft AG | | | 26,084 | | | | 7,700,450 | |
RenaissanceRe Holdings Ltd. | | | 8,550 | | | | 1,675,971 | |
| | | | 12,151,290 | |
Renewable Electricity – 0.1% | |
Engie Brasil Energia S.A. | | | 25,007 | | | | 315,797 | |
Meridian Energy Ltd. | | | 243,976 | | | | 822,992 | |
| | | | 1,138,789 | |
Research & Consulting Services – 0.1% | |
Thomson Reuters Corp. | | | 37,923 | | | | 2,716,536 | |
Restaurants – 0.0% * | | | | | | | | |
Haidilao International Holding Ltd. | | | 45,000 | | | | 180,767 | (d) |
Saudi Airlines Catering Co. | | | 4,922 | | | | 134,882 | |
| | | | 315,649 | |
Retail REITs – 0.3% | | | | | | | | |
CapitaLand Mall Trust | | | 489,353 | | | | 895,258 | |
First Capital Real Estate Investment Trust | | | 33,204 | | | | 529,267 | |
Japan Retail Fund Investment Corp. | | | 497 | | | | 1,066,944 | |
Link REIT | | | 188,309 | | | | 1,993,826 | |
Mapletree Commercial Trust | | | 383,800 | | | | 682,171 | |
RioCan Real Estate Investment Trust | | | 28,310 | | | | 584,211 | |
SmartCentres Real Estate Investment Trust | | | 12,704 | | | | 305,758 | |
Vicinity Centres | | | 230,167 | | | | 402,872 | |
| | | | 6,460,307 | |
Security & Alarm Services – 0.0% * | |
S-1 Corp. | | | 2,095 | | | | 169,745 | |
Securitas AB, Class B | | | 8,342 | | | | 143,874 | |
| | | | 313,619 | |
Semiconductor Equipment – 0.1% | |
Advantest Corp. | | | 15,100 | | | | 855,910 | |
Xinyi Solar Holdings Ltd. | | | 394,722 | | | | 280,142 | |
| | | | 1,136,052 | |
Semiconductors – 0.2% | |
Nanya Technology Corp. | | | 128,000 | | | | 356,113 | |
Novatek Microelectronics Corp. | | | 71,029 | | | | 518,910 | |
Phison Electronics Corp. | | | 18,508 | | | | 210,227 | |
Realtek Semiconductor Corp. | | | 58,908 | | | | 461,800 | |
SK Hynix Inc. | | | 3,530 | | | | 287,235 | (a) |
Taiwan Semiconductor Manufacturing Company Ltd. | | | 136,962 | | | | 1,512,307 | |
Vanguard International Semiconductor Corp. | | | 52,534 | | | | 138,971 | |
| | | | 3,485,563 | |
See Notes to Schedules of Investments and Notes to Financial Statements.
| | |
| State Street Total Return V.I.S. Fund | | |
| Schedule of Investments | | December 31, 2019 |
| | | | | | | | |
| | | Number
of Shares | | | Fair
Value | |
Soft Drinks – 0.0% * | |
Fraser & Neave Holdings Bhd | | | 16,907 | | | $ | 144,002 | |
Osotspa PCL | | | 92,000 | | | | 124,392 | |
| | | | 268,394 | |
Specialized Finance – 0.0% * | |
REC Ltd. | | | 68,230 | | | | 136,789 | |
Specialty Chemicals – 0.2% | |
Evonik Industries AG | | | 17,015 | | | | 519,693 | |
Hitachi Chemical Company Ltd. | | | 19,800 | | | | 833,540 | |
Johnson Matthey PLC | | | 36,673 | | | | 1,455,534 | |
JSR Corp. | | | 36,600 | | | | 677,610 | |
| | | | 3,486,377 | |
Specialty Stores – 0.0% * | |
Jarir Marketing Co. | | | 7,203 | | | | 317,974 | |
JUMBO S.A. | | | 13,333 | | | | 277,625 | |
| | | | 595,599 | |
Steel – 0.2% | |
Fortescue Metals Group Ltd. | | | 263,782 | | | | 1,982,199 | |
Hitachi Metals Ltd. | | | 40,600 | | | | 602,602 | |
Kumba Iron Ore Ltd. | | | 7,891 | | | | 235,345 | |
Maanshan Iron & Steel Company Ltd., Class H | | | 106,000 | | | | 42,989 | |
Maruichi Steel Tube Ltd. | | | 10,642 | | | | 301,609 | |
Severstal PJSC GDR | | | 9,072 | | | | 137,350 | |
| | | | 3,302,094 | |
Systems Software – 0.0% * | |
Oracle Corporation Japan | | | 7,300 | | | | 668,369 | |
Technology Distributors – 0.0% * | | | | | | | | |
Synnex Technology International Corp. | | | 163,768 | | | | 204,867 | |
WPG Holdings Ltd. | | | 185,537 | | | | 242,002 | |
| | | | 446,869 | |
Technology Hardware, Storage & Peripherals – 0.4% | |
Asustek Computer Inc. | | | 6,561 | | | | 50,668 | |
Brother Industries Ltd. | | | 7,400 | | | | 154,639 | |
Canon Inc. | | | 25,200 | | | | 692,522 | |
Chicony Electronics Company Ltd. | | | 72,353 | | | | 214,812 | |
Compal Electronics Inc. | | | 512,693 | | | | 322,389 | |
FUJIFILM Holdings Corp. | | | 68,244 | | | | 3,284,252 | |
Inventec Corp. | | | 202,628 | | | | 154,453 | |
Lenovo Group Ltd. | | | 38,019 | | | | 25,519 | |
Lite-On Technology Corp. | | | 204,920 | | | | 337,352 | |
Quanta Computer Inc. | | | 331,635 | | | | 711,350 | |
Samsung Electronics Company Ltd. | | | 26,730 | | | | 1,289,752 | |
Wistron Corp. | | | 347,607 | | | | 328,741 | |
| | | | 7,566,449 | |
Textiles – 0.0% * | | | | | | | | |
Formosa Taffeta Company Ltd. | | | 103,043 | | | | 117,559 | |
Tires & Rubber – 0.5% | |
Bridgestone Corp. | | | 108,200 | | | | 4,052,211 | |
Cie Generale des Etablissements Michelin SCA | | | 32,535 | | | | 3,984,389 | |
Hankook Tire & Technology Company Ltd. | | | 989 | | | | 28,692 | |
Sumitomo Rubber Industries Ltd. | | | 32,600 | | | | 401,069 | |
The Yokohama Rubber Company Ltd. | | | 22,500 | | | | 441,201 | |
| | | | 8,907,562 | |
Trading Companies & Distributors – 0.4% | |
AerCap Holdings N.V. | | | 23,366 | | | | 1,436,308 | (a) |
BOC Aviation Ltd. | | | 25,511 | | | | 259,471 | (d) |
Ferguson PLC | | | 43,610 | | | | 3,957,408 | |
Marubeni Corp. | | | 296,304 | | | | 2,210,113 | |
Posco International Corp. | | | 6,045 | | | | 97,487 | |
| | | | 7,960,787 | |
Trucking – 0.0% * | |
ComfortDelGro Corporation Ltd. | | | 410,564 | | | | 726,689 | |
Water Utilities – 0.0% * | | | | | | | | |
Aguas Andinas S.A., Class A | | | 320,312 | | | | 135,886 | |
Guangdong Investment Ltd. | | | 146,057 | | | | 305,543 | |
| | | | 441,429 | |
| | | | | | | | |
| | | Number
of Shares | | | Fair
Value | |
Wireless Telecommunication Services – 0.2% | |
China Mobile Ltd. | | | 125,100 | | | $ | 1,051,625 | |
Intouch Holdings PCL | | | 274,900 | | | | 525,411 | |
KDDI Corp. | | | 9,700 | | | | 290,353 | |
SK Telecom Company Ltd. | | | 683 | | | | 140,563 | |
Taiwan Mobile Company Ltd. | | | 199,461 | | | | 745,225 | |
Vodacom Group Ltd. | | | 78,707 | | | | 648,973 | |
| | | | 3,402,150 | |
Total Common Stock
(Cost $375,995,926) | | | | 412,127,237 | |
| |
Preferred Stock – 0.3% | |
| |
Automobile Manufacturers – 0.1% | |
Bayerische Motoren Werke AG | | | 10,640 | | | | 657,484 | |
Hyundai Motor Co. | | | 2,799 | | | | 192,175 | (f) |
Hyundai Motor Co. | | | 2,834 | | | | 175,708 | (f) |
| | | | 1,025,367 | |
Commodity Chemicals – 0.0% * | | | | | | | | |
FUCHS PETROLUB SE | | | 13,232 | | | | 655,905 | |
LG Chem Ltd. | | | 502 | | | | 75,097 | |
| | | | 731,002 | |
Diversified Banks – 0.1% | |
Bancolombia S.A. | | | 20,582 | | | | 287,263 | |
Grupo Aval Acciones y Valores S.A. | | | 479,422 | | | | 213,304 | |
Itausa - Investimentos Itau S.A. | | | 338,664 | | | | 1,186,212 | |
| | | | 1,686,779 | |
Integrated Telecommunication Services – 0.0% * | |
Telefonica Brasil S.A. | | | 48,007 | | | | 691,935 | |
Technology Hardware, Storage & Peripherals – 0.1% | |
Samsung Electronics Company Ltd. | | | 45,583 | | | | 1,789,501 | |
Total Preferred Stock
(Cost $5,682,748) | | | | 5,924,584 | |
| |
Total Foreign Equity
(Cost $381,678,674) | | | | 418,051,821 | |
| | | | | | | | | | |
| | | Principal
Amount | | | Fair
Value | |
Bonds and Notes – 27.4% | |
| |
| |
U.S. Treasuries – 12.8% | |
U.S. Treasury Bonds | |
2.25% | | 08/15/46 - 08/15/49 | | $ | 1,300,000 | | | | 1,265,688 | |
2.38% | | 11/15/49 | | | 300,000 | | | | 299,953 | |
2.50% | | 02/15/45 - 05/15/46 | | | 2,710,000 | | | | 2,773,023 | |
2.75% | | 11/15/42 - 11/15/47 | | | 2,000,000 | | | | 2,147,422 | |
2.88% | | 05/15/43 - 05/15/49 | | | 2,600,000 | | | | 2,857,125 | |
3.00% | | 05/15/42 - 02/15/49 | | | 7,150,000 | | | | 8,035,180 | |
3.13% | | 08/15/44 - 05/15/48 | | | 1,500,000 | | | | 1,719,000 | |
3.38% | | 05/15/44 - 11/15/48 | | | 2,000,000 | | | | 2,397,968 | |
3.63% | | 08/15/43 - 02/15/44 | | | 1,540,000 | | | | 1,895,278 | |
3.75% | | 11/15/43 | | | 800,000 | | | | 1,002,500 | |
4.25% | | 05/15/39 - 11/15/40 | | | 900,000 | | | | 1,187,734 | |
4.38% | | 02/15/38 - 05/15/40 | | | 1,500,000 | | | | 2,001,890 | |
4.50% | | 02/15/36 | | | 1,700,000 | | | | 2,257,547 | |
4.63% | | 02/15/40 | | | 300,000 | | | | 415,359 | |
5.25% | | 02/15/29 | | | 200,000 | | | | 255,875 | |
5.50% | | 08/15/28 | | | 200,000 | | | | 257,469 | |
6.00% | | 02/15/26 | | | 427,000 | | | | 531,482 | |
6.13% | | 08/15/29 | | | 200,000 | | | | 274,250 | |
6.38% | | 08/15/27 | | | 200,000 | | | | 264,625 | |
7.63% | | 11/15/22 - 02/15/25 | | | 500,000 | | | | 608,336 | |
7.88% | | 02/15/21 | | | 1,000,000 | | | | 1,068,320 | |
U.S. Treasury Inflation Indexed Bonds | |
0.63% | | 02/15/43 | | | 1,287,138 | | | | 1,304,827 | |
0.75% | | 02/15/42 - 02/15/45 | | | 3,609,635 | | | | 3,755,120 | |
0.88% | | 02/15/47 | | | 1,385,813 | | | | 1,487,683 | |
1.00% | | 02/15/46 - 02/15/49 | | | 3,507,871 | | | | 3,884,035 | |
1.38% | | 02/15/44 | | | 1,766,608 | | | | 2,086,996 | |
See Notes to Schedules of Investments and Notes to Financial Statements.
| | |
| State Street Total Return V.I.S. Fund | | |
| Schedule of Investments | | December 31, 2019 |
| | | | | | | | | | |
| | | Principal
Amount | | | Fair
Value | |
1.75% | | 01/15/28 | | $ | 982,648 | | | $ | 1,104,507 | |
2.00% | | 01/15/26 | | | 648,255 | | | | 721,115 | |
2.13% | | 02/15/40 - 02/15/41 | | | 1,117,857 | | | | 1,474,579 | |
2.38% | | 01/15/25 - 01/15/27 | | | 3,835,676 | | | | 4,328,011 | |
2.50% | | 01/15/29 | | | 1,558,102 | | | | 1,878,948 | |
3.38% | | 04/15/32 | | | 579,892 | | | | 797,554 | |
3.63% | | 04/15/28 | | | 604,576 | | | | 773,954 | |
3.88% | | 04/15/29 | | | 2,347,965 | | | | 3,136,799 | |
U.S. Treasury Inflation Indexed Notes | |
0.13% | | 04/15/21 - 07/15/26 | | | 24,697,694 | | | | 24,751,381 | |
0.25% | | 01/15/25 - 07/15/29 | | | 7,657,453 | | | | 7,731,749 | |
0.38% | | 07/15/23 - 07/15/27 | | | 12,093,774 | | | | 12,305,677 | |
0.50% | | 04/15/24 - 01/15/28 | | | 4,191,793 | | | | 4,287,853 | |
0.63% | | 07/15/21 - 01/15/26 | | | 10,527,142 | | | | 10,713,755 | |
0.75% | | 07/15/28 | | | 2,547,473 | | | | 2,681,625 | |
0.88% | | 01/15/29 | | | 2,649,686 | | | | 2,815,060 | |
1.13% | | 01/15/21 | | | 2,705,582 | | | | 2,731,824 | |
U.S. Treasury Notes | |
1.13% | | 06/30/21 - 09/30/21 | | | 3,200,000 | | | | 3,175,395 | |
1.25% | | 10/31/21 - 08/31/24 | | | 2,500,000 | | | | 2,465,390 | |
1.38% | | 01/31/21 - 08/31/26 | | | 2,400,000 | | | | 2,380,938 | |
1.50% | | 09/30/21 - 08/15/26 | | | 6,100,000 | | | | 6,067,078 | |
1.63% | | 08/31/22 - 08/15/29 | | | 7,840,000 | | | | 7,770,063 | |
1.75% | | 11/30/21 - 11/15/29 | | | 6,700,000 | | | | 6,716,282 | |
1.88% | | 01/31/22 - 07/31/26 | | | 12,700,000 | | | | 12,784,625 | |
2.00% | | 02/28/21 - 11/15/26 | | | 8,194,000 | | | | 8,289,507 | |
2.13% | | 01/31/21 - 05/31/26 | | | 11,200,000 | | | | 11,363,188 | |
2.25% | | 03/31/21 - 11/15/27 | | | 9,890,000 | | | | 10,111,855 | |
2.38% | | 01/31/23 - 05/15/29 | | | 4,900,000 | | | | 5,058,485 | |
2.50% | | 02/28/21 - 01/31/25 | | | 7,000,000 | | | | 7,198,164 | |
2.63% | | 02/28/23 - 02/15/29 | | | 7,500,000 | | | | 7,808,944 | |
2.75% | | 09/15/21 - 02/15/28 | | | 12,400,000 | | | | 12,946,359 | |
2.88% | | 10/15/21 - 08/15/28 | | | 9,700,000 | | | | 10,204,539 | |
3.00% | | 10/31/25 | | | 500,000 | | | | 534,414 | |
3.13% | | 05/15/21 - 11/15/28 | | | 1,900,000 | | | | 2,050,812 | |
3.63% | | 02/15/21 | | | 700,000 | | | | 715,258 | |
| | | | 245,910,372 | |
Agency Mortgage Backed – 6.9% | |
Federal Home Loan Banks | |
1.63% | | 12/20/21 | | | 395,000 | | | | 395,099 | |
1.88% | | 07/07/21 | | | 925,000 | | | | 928,672 | |
2.50% | | 02/13/24 | | | 440,000 | | | | 453,754 | |
3.25% | | 11/16/28 | | | 125,000 | | | | 136,837 | |
Federal Home Loan Mortgage Corp. | |
1.13% | | 08/12/21 | | | 637,000 | | | | 632,114 | |
2.38% | | 01/13/22 | | | 1,100,000 | | | | 1,116,159 | |
2.50% | | 01/01/28 - 02/01/32 | | | 1,834,897 | | | | 1,858,537 | |
2.51% | | 11/25/22 | | | 300,000 | | | | 303,781 | |
3.00% | | 07/01/30 - 10/01/49 | | | 9,547,221 | | | | 9,810,856 | |
3.50% | | 03/01/26 - 04/01/48 | | | 8,287,866 | | | | 8,682,775 | |
4.00% | | 06/01/42 - 03/01/49 | | | 4,857,274 | | | | 5,136,086 | |
4.50% | | 05/01/42 - 03/01/49 | | | 1,307,643 | | | | 1,383,917 | |
5.00% | | 06/01/41 | | | 1,247,119 | | | | 1,383,616 | |
5.50% | | 01/01/38 - 04/01/39 | | | 274,468 | | | | 307,163 | |
6.00% | | 06/01/37 - 11/01/37 | | | 288,114 | | | | 331,750 | |
6.25% | | 07/15/32 | | | 250,000 | | | | 359,717 | |
Federal National Mortgage Assoc. | |
1.75% | | 07/02/24 | | | 225,000 | | | | 225,252 | |
1.88% | | 09/24/26 | | | 1,000,000 | | | | 998,370 | |
2.13% | | 04/24/26 | | | 700,000 | | | | 710,612 | |
2.25% | | 04/12/22 | | | 425,000 | | | | 431,307 | |
2.50% | | 09/01/28 - 10/01/31 | | | 1,691,743 | | | | 1,713,090 | |
2.63% | | 01/11/22 | | | 500,000 | | | | 510,025 | |
3.00% | | 01/01/28 - 05/01/47 | | | 10,638,631 | | | | 10,946,942 | |
3.50% | | 01/01/27 - 09/01/48 | | | 14,547,812 | | | | 15,184,028 | |
4.00% | | 10/01/41 - 11/01/48 | | | 9,542,707 | | | | 10,122,249 | |
4.50% | | 01/01/27 - 09/01/49 | | | 4,463,152 | | | | 4,812,631 | |
5.00% | | 12/01/39 - 05/01/41 | | | 232,053 | | | | 255,967 | |
5.50% | | 12/01/35 - 04/01/38 | | | 1,010,064 | | | | 1,131,460 | |
6.00% | | 03/01/34 - 08/01/37 | | | 1,309,946 | | | | 1,499,231 | |
6.63% | | 11/15/30 | | | 100,000 | | | | 142,544 | |
2.50% | | TBA | | | 2,100,000 | | | | 2,103,704 | (g) |
| | | | | | | | | | |
| | | Principal
Amount | | | Fair
Value | |
3.00% | | TBA | | $ | 5,600,000 | | | $ | 5,684,453 | (g) |
3.50% | | TBA | | | 4,100,000 | | | | 4,221,857 | (g) |
4.00% | | TBA | | | 2,500,000 | | | | 2,599,950 | (g) |
4.50% | | TBA | | | 350,000 | | | | 368,487 | (g) |
Government National Mortgage Assoc. | |
2.50% | | 05/20/45 | | | 212,500 | | | | 214,536 | |
3.00% | | 10/15/42 - 12/20/49 | | | 7,120,136 | | | | 7,363,507 | |
3.50% | | 03/20/45 - 08/20/49 | | | 10,409,840 | | | | 10,844,619 | |
4.00% | | 12/20/40 - 06/20/49 | | | 5,900,457 | | | | 6,219,495 | |
4.50% | | 05/20/40 - 01/20/49 | | | 2,650,363 | | | | 2,808,681 | |
5.00% | | 08/15/41 | | | 1,637,645 | | | | 1,811,097 | |
3.00% | | TBA | | | 1,950,000 | | | | 2,002,884 | (g) |
3.50% | | TBA | | | 1,950,000 | | | | 2,009,670 | (g) |
4.00% | | TBA | | | 1,400,000 | | | | 1,449,042 | (g) |
4.50% | | TBA | | | 1,000,000 | | | | 1,045,480 | (g) |
| | | | 132,652,003 | |
Agency Collateralized Mortgage Obligations – 0.2% | |
Federal Home Loan Mortgage Corp. | |
2.75% | | 01/25/26 | | | 300,000 | | | | 308,284 | |
3.06% | | 07/25/23 | | | 600,000 | | | | 619,800 | (h) |
3.18% | | 11/25/28 | | | 302,372 | | | | 315,715 | |
3.30% | | 04/25/23 | | | 100,000 | | | | 103,893 | (h) |
3.39% | | 03/25/24 | | | 200,000 | | | | 210,059 | |
3.49% | | 01/25/24 | | | 300,000 | | | | 315,485 | |
3.78% | | 08/25/28 | | | 195,545 | | | | 210,332 | |
Federal National Mortgage Assoc. | |
3.08% | | 06/25/27 | | | 261,000 | | | | 274,799 | (h) |
3.38% | | 07/25/28 | | | 500,000 | | | | 534,247 | (h) |
3.64% | | 08/25/30 | | | 200,000 | | | | 218,745 | (h) |
Freddie Mac Multifamily Structured Pass Through Certificates | |
2.72% | | 06/25/22 | | | 385,000 | | | | 389,945 | |
| | | | 3,501,304 | |
Asset Backed – 0.1% | | | | | |
American Express Credit Account Master Trust 2018-8 | |
3.18% | | 04/15/24 | | | 171,000 | | | | 174,832 | |
Americredit Automobile Receivables Trust 2018-1 | |
3.50% | | 01/18/24 | | | 75,000 | | | | 76,903 | |
BA Credit Card Trust | |
3.10% | | 12/15/23 | | | 200,000 | | | | 203,720 | |
Capital One Multi-Asset Execution Trust | |
1.66% | | 06/17/24 | | | 30,000 | | | | 29,902 | |
2.84% | | 12/15/24 | | | 250,000 | | | | 255,053 | |
Carmax Auto Owner Trust 2018-4 | |
3.48% | | 02/15/24 | | | 150,000 | | | | 155,458 | |
Citibank Credit Card Issuance Trust | |
3.21% | | 12/07/24 | | | 300,000 | | | | 311,224 | |
Discover Card Execution Note Trust | |
3.32% | | 03/15/24 | | | 65,000 | | | | 66,547 | |
3.04% | | 07/15/24 | | | 60,000 | | | | 61,402 | |
Drive Auto Receivables Trust 2018-2 | |
4.14% | | 08/15/24 | | | 150,000 | | | | 153,446 | |
GM Financial Automobile Leasing Trust 2019-2 | |
2.67% | | 03/21/22 | | | 25,000 | | | | 25,180 | |
GM Financial Consumer Automobile Receivables Trust 2019-3 | |
2.18% | | 04/16/24 | | | 100,000 | | | | 100,455 | |
Nissan Auto Receivables 2018-B Owner Trust | |
3.06% | | 03/15/23 | | | 115,000 | | | | 116,577 | |
Synchrony Credit Card Master Note Trust 2016-2 | |
2.21% | | 05/15/24 | | | 100,000 | | | | 100,363 | |
World Omni Auto Receivables Trust 2018-D | |
3.33% | | 04/15/24 | | | 50,000 | | | | 50,822 | |
World Omni Automobile Lease Securitization Trust 2018-B | |
3.19% | | 12/15/21 | | | 50,000 | | | | 50,567 | |
| | | | 1,932,451 | |
Corporate Notes – 6.6% | |
3M Co. | | | | | | | | | | |
3.00% | | 09/14/21 - 08/07/25 | | | 50,000 | | | | 52,200 | |
3.25% | | 02/14/24 | | | 75,000 | | | | 78,481 | |
3.38% | | 03/01/29 | | | 50,000 | | | | 53,189 | |
3.63% | | 09/14/28 | | | 25,000 | | | | 27,230 | |
4.00% | | 09/14/48 | | | 55,000 | | | | 60,533 | |
See Notes to Schedules of Investments and Notes to Financial Statements.
| | |
| State Street Total Return V.I.S. Fund | | |
| Schedule of Investments | | December 31, 2019 |
| | | | | | | | | | |
| | | Principal
Amount | | | Fair
Value | |
Abbott Laboratories | |
2.55% | | 03/15/22 | | | $130,000 | | | | $132,107 | |
3.75% | | 11/30/26 | | | 57,000 | | | | 62,305 | |
4.75% | | 11/30/36 | | | 100,000 | | | | 124,574 | |
4.90% | | 11/30/46 | | | 100,000 | | | | 131,120 | |
AbbVie Inc. | | | | | | | | | | |
2.30% | | 05/14/21 | | | 100,000 | | | | 100,362 | |
2.30% | | 11/21/22 | | | 50,000 | | | | 50,242 | (d) |
2.60% | | 11/21/24 | | | 50,000 | | | | 50,438 | (d) |
3.20% | | 11/21/29 | | | 105,000 | | | | 107,152 | (d) |
3.38% | | 11/14/21 | | | 100,000 | | | | 102,554 | |
3.75% | | 11/14/23 | | | 35,000 | | | | 36,853 | |
4.05% | | 11/21/39 | | | 35,000 | | | | 36,747 | (d) |
4.25% | | 11/14/28 | | | 15,000 | | | | 16,630 | |
4.25% | | 11/21/49 | | | 45,000 | | | | 47,726 | (d) |
4.30% | | 05/14/36 | | | 100,000 | | | | 109,861 | |
4.40% | | 11/06/42 | | | 150,000 | | | | 162,430 | |
4.50% | | 05/14/35 | | | 70,000 | | | | 78,699 | |
4.70% | | 05/14/45 | | | 150,000 | | | | 167,379 | |
4.88% | | 11/14/48 | | | 25,000 | | | | 28,841 | |
Adobe Inc. | | | | | | | | | | |
3.25% | | 02/01/25 | | | 70,000 | | | | 73,933 | |
Advocate Health & Hospitals Corp. | |
3.39% | | 10/15/49 | | | 25,000 | | | | 25,016 | |
AerCap Ireland Capital DAC/AerCap Global Aviation Trust | |
4.45% | | 10/01/25 | | | 100,000 | | | | 107,745 | |
AerCap Ireland Capital DAC/AerCap Global Aviation Trust | |
3.95% | | 02/01/22 | | | 100,000 | | | | 103,316 | |
4.45% | | 04/03/26 | | | 150,000 | | | | 160,980 | |
Aetna Inc. | | | | | | | | | | |
2.75% | | 11/15/22 | | | 50,000 | | | | 50,807 | |
Aflac Inc. | | | | | | | | | | |
3.63% | | 11/15/24 | | | 150,000 | | | | 160,407 | |
African Development Bank | |
2.13% | | 11/16/22 | | | 100,000 | | | | 101,227 | |
3.00% | | 09/20/23 | | | 150,000 | | | | 157,012 | |
Agilent Technologies Inc. | |
2.75% | | 09/15/29 | | | 25,000 | | | | 24,866 | |
Air Lease Corp. | | | | | | | | | | |
3.88% | | 04/01/21 - 07/03/23 | | | 150,000 | | | | 154,515 | |
4.25% | | 02/01/24 | | | 100,000 | | | | 107,012 | |
Aircastle Ltd. | | | | | | | | | | |
4.13% | | 05/01/24 | | | 20,000 | | | | 21,025 | |
5.00% | | 04/01/23 | | | 20,000 | | | | 21,369 | |
5.13% | | 03/15/21 | | | 20,000 | | | | 20,664 | |
5.50% | | 02/15/22 | | | 20,000 | | | | 21,255 | |
Alabama Power Co. | |
3.45% | | 10/01/49 | | | 50,000 | | | | 51,229 | |
Alexandria Real Estate Equities Inc. | |
3.45% | | 04/30/25 | | | 100,000 | | | | 105,399 | |
4.00% | | 02/01/50 | | | 25,000 | | | | 27,448 | |
4.70% | | 07/01/30 | | | 15,000 | | | | 17,247 | |
Alibaba Group Holding Ltd. | |
3.13% | | 11/28/21 | | | 100,000 | | | | 101,844 | |
4.00% | | 12/06/37 | | | 100,000 | | | | 107,176 | |
4.20% | | 12/06/47 | | | 60,000 | | | | 67,028 | |
Allegion PLC | | | | | | | | | | |
3.50% | | 10/01/29 | | | 15,000 | | | | 15,337 | |
Allergan Finance LLC | |
3.25% | | 10/01/22 | | | 50,000 | | | | 51,129 | |
Allergan Funding SCS | |
4.75% | | 03/15/45 | | | 100,000 | | | | 108,811 | |
Alphabet Inc. | | | | | | | | | | |
3.38% | | 02/25/24 | | | 125,000 | | | | 132,975 | |
Altria Group Inc. | | | | | | | | | | |
2.63% | | 09/16/26 | | | 100,000 | | | | 98,930 | |
3.80% | | 02/14/24 | | | 20,000 | | | | 21,052 | |
4.25% | | 08/09/42 | | | 113,000 | | | | 111,813 | |
4.80% | | 02/14/29 | | | 40,000 | | | | 44,532 | |
5.38% | | 01/31/44 | | | 70,000 | | | | 78,953 | |
5.80% | | 02/14/39 | | | 15,000 | | | | 17,623 | |
5.95% | | 02/14/49 | | | 40,000 | | | | 48,453 | |
| | | | | | | | | | |
| | | Principal
Amount | | | Fair
Value | |
6.20% | | 02/14/59 | | $ | 15,000 | | | $ | 17,940 | |
Amazon.com Inc. | |
3.15% | | 08/22/27 | | | 100,000 | | | | 105,905 | |
3.88% | | 08/22/37 | | | 100,000 | | | | 113,522 | |
4.25% | | 08/22/57 | | | 100,000 | | | | 121,244 | |
4.80% | | 12/05/34 | | | 150,000 | | | | 188,589 | |
America Movil SAB de C.V. | |
3.13% | | 07/16/22 | | | 150,000 | | | | 153,654 | |
6.13% | | 03/30/40 | | | 100,000 | | | | 134,347 | |
American Airlines 2019-1 Class AA Pass Through Trust | |
3.15% | | 02/15/32 | | | 75,000 | | | | 76,800 | |
American Campus Communities Operating Partnership LP | |
3.63% | | 11/15/27 | | | 30,000 | | | | 31,589 | |
American Electric Power Company Inc. | |
3.20% | | 11/13/27 | | | 100,000 | | | | 103,006 | |
American Express Co. | |
2.75% | | 05/20/22 | | | 100,000 | | | | 101,806 | |
3.00% | | 02/22/21 - 10/30/24 | | | 165,000 | | | | 169,176 | |
3.38% | | 05/17/21 | | | 50,000 | | | | 50,951 | |
3.40% | | 02/27/23 | | | 100,000 | | | | 103,775 | |
3.63% | | 12/05/24 | | | 150,000 | | | | 158,989 | |
3.70% | | 11/05/21 | | | 25,000 | | | | 25,766 | |
American Financial Group Inc. | |
3.50% | | 08/15/26 | | | 65,000 | | | | 67,049 | |
American Homes 4 Rent LP | |
4.90% | | 02/15/29 | | | 100,000 | | | | 111,942 | |
American Honda Finance Corp. | |
1.95% | | 05/20/22 | | | 15,000 | | | | 15,040 | |
2.40% | | 06/27/24 | | | 25,000 | | | | 25,313 | |
2.60% | | 11/16/22 | | | 100,000 | | | | 102,157 | |
3.38% | | 12/10/21 | | | 100,000 | | | | 102,918 | |
American International Group Inc. | |
4.25% | | 03/15/29 | | | 100,000 | | | | 111,326 | |
4.50% | | 07/16/44 | | | 150,000 | | | | 172,990 | |
4.88% | | 06/01/22 | | | 100,000 | | | | 106,767 | |
American Tower Corp. | |
3.50% | | 01/31/23 | | | 150,000 | | | | 155,442 | |
3.95% | | 03/15/29 | | | 100,000 | | | | 107,735 | |
Ameriprise Financial Inc. | |
3.00% | | 03/22/22 | | | 15,000 | | | | 15,337 | |
AmerisourceBergen Corp. | |
3.45% | | 12/15/27 | | | 100,000 | | | | 104,356 | |
Amgen Inc. | | | | | | | | | | |
3.20% | | 11/02/27 | | | 100,000 | | | | 105,264 | |
4.56% | | 06/15/48 | | | 150,000 | | | | 174,658 | |
4.66% | | 06/15/51 | | | 105,000 | | | | 123,611 | |
Amphenol Corp. | |
2.80% | | 02/15/30 | | | 50,000 | | | | 49,668 | |
4.35% | | 06/01/29 | | | 25,000 | | | | 27,993 | |
Analog Devices Inc. | | | | | | | | | | |
2.50% | | 12/05/21 | | | 100,000 | | | | 100,821 | |
Anheuser-Busch Companies LLC/Anheuser-Busch InBev Worldwide Inc. | |
4.70% | | 02/01/36 | | | 150,000 | | | | 173,553 | |
4.90% | | 02/01/46 | | | 120,000 | | | | 142,760 | |
Anheuser-Busch InBev Worldwide Inc. | |
4.00% | | 04/13/28 | | | 155,000 | | | | 170,399 | |
4.38% | | 04/15/38 | | | 215,000 | | | | 241,892 | |
4.60% | | 04/15/48 | | | 135,000 | | | | 153,951 | |
4.75% | | 01/23/29 - 04/15/58 | | | 105,000 | | | | 122,230 | |
5.45% | | 01/23/39 | | | 35,000 | | | | 44,006 | |
5.55% | | 01/23/49 | | | 165,000 | | | | 214,383 | |
5.80% | | 01/23/59 | | | 25,000 | | | | 34,179 | |
Anthem Inc. | |
3.30% | | 01/15/23 | | | 100,000 | | | | 103,435 | |
3.70% | | 08/15/21 - 09/15/49 | | | 237,000 | | | | 239,865 | |
4.38% | | 12/01/47 | | | 65,000 | | | | 71,383 | |
4.65% | | 01/15/43 | | | 100,000 | | | | 113,114 | |
Aon Corp. | | | | | | | | | | |
3.75% | | 05/02/29 | | | 25,000 | | | | 26,763 | |
4.50% | | 12/15/28 | | | 100,000 | | | | 112,741 | |
Apache Corp. | |
4.38% | | 10/15/28 | | | 25,000 | | | | 26,151 | |
See Notes to Schedules of Investments and Notes to Financial Statements.
| | |
| State Street Total Return V.I.S. Fund | | |
| Schedule of Investments | | December 31, 2019 |
| | | | | | | | | | |
| | | Principal
Amount | | | Fair
Value | |
5.10% | | 09/01/40 | | $ | 150,000 | | | $ | 152,574 | |
5.35% | | 07/01/49 | | | 50,000 | | | | 52,308 | |
Apple Inc. | |
2.25% | | 02/23/21 | | | 100,000 | | | | 100,567 | |
2.40% | | 01/13/23 | | | 50,000 | | | | 50,766 | |
2.50% | | 02/09/22 | | | 150,000 | | | | 152,304 | |
2.75% | | 01/13/25 | | | 50,000 | | | | 51,673 | |
3.00% | | 11/13/27 | | | 100,000 | | | | 104,981 | |
3.25% | | 02/23/26 | | | 160,000 | | | | 169,346 | |
3.75% | | 11/13/47 | | | 50,000 | | | | 55,762 | |
4.38% | | 05/13/45 | | | 165,000 | | | | 199,678 | |
4.50% | | 02/23/36 | | | 150,000 | | | | 183,057 | |
4.65% | | 02/23/46 | | | 185,000 | | | | 232,229 | |
Applied Materials Inc. | |
3.90% | | 10/01/25 | | | 160,000 | | | | 174,646 | |
Aptiv Corp. | |
4.15% | | 03/15/24 | | | 150,000 | | | | 159,331 | |
ArcelorMittal S.A. | | | | | | | | | | |
4.55% | | 03/11/26 | | | 100,000 | | | | 106,490 | |
6.13% | | 06/01/25 | | | 20,000 | | | | 23,008 | |
6.25% | | 02/25/22 | | | 25,000 | | | | 26,957 | |
7.00% | | 10/15/39 | | | 28,000 | | | | 34,180 | |
Arch Capital Finance LLC | |
4.01% | | 12/15/26 | | | 100,000 | | | | 110,401 | |
5.03% | | 12/15/46 | | | 100,000 | | | | 124,880 | |
Archer-Daniels-Midland Co. | |
4.02% | | 04/16/43 | | | 120,000 | | | | 133,865 | |
Ares Capital Corp. | |
4.20% | | 06/10/24 | | | 65,000 | | | | 68,378 | |
Arizona Public Service Co. | |
4.25% | | 03/01/49 | | | 25,000 | | | | 28,250 | |
Arrow Electronics Inc. | |
4.00% | | 04/01/25 | | | 40,000 | | | | 41,898 | |
Ascension Health | |
3.95% | | 11/15/46 | | | 125,000 | | | | 140,072 | |
Asian Development Bank | |
1.75% | | 09/19/29 | | | 50,000 | | | | 48,933 | |
1.88% | | 07/19/22 | | | 200,000 | | | | 201,058 | |
2.13% | | 03/19/25 | | | 200,000 | | | | 203,446 | |
2.25% | | 01/20/21 | | | 200,000 | | | | 201,208 | |
2.63% | | 01/30/24 | | | 200,000 | | | | 206,930 | |
2.75% | | 03/17/23 | | | 295,000 | | | | 304,835 | |
3.13% | | 09/26/28 | | | 25,000 | | | | 27,356 | |
Assurant Inc. | |
4.90% | | 03/27/28 | | | 50,000 | | | | 54,843 | |
AstraZeneca PLC | |
3.50% | | 08/17/23 | | | 25,000 | | | | 26,172 | |
4.00% | | 01/17/29 | | | 20,000 | | | | 22,221 | |
4.38% | | 08/17/48 | | | 20,000 | | | | 23,745 | |
6.45% | | 09/15/37 | | | 150,000 | | | | 212,212 | |
AT&T Inc. | |
2.80% | | 02/17/21 | | | 100,000 | | | | 100,889 | |
3.40% | | 05/15/25 | | | 100,000 | | | | 104,869 | |
3.60% | | 07/15/25 | | | 100,000 | | | | 105,823 | |
4.10% | | 02/15/28 | | | 106,000 | | | | 115,316 | |
4.30% | | 02/15/30 | | | 20,000 | | | | 22,220 | |
4.35% | | 06/15/45 | | | 150,000 | | | | 161,965 | |
4.50% | | 05/15/35 - 03/09/48 | | | 145,000 | | | | 161,141 | |
4.75% | | 05/15/46 | | | 150,000 | | | | 169,620 | |
4.85% | | 03/01/39 | | | 150,000 | | | | 173,284 | |
5.15% | | 03/15/42 | | | 150,000 | | | | 176,211 | |
5.55% | | 08/15/41 | | | 154,000 | | | | 189,400 | |
6.10% | | 07/15/40 | | | 150,000 | | | | 191,281 | |
6.25% | | 03/29/41 | | | 100,000 | | | | 130,237 | |
Atmos Energy Corp. | |
4.30% | | 10/01/48 | | | 100,000 | | | | 117,633 | |
Australia & New Zealand Banking Group Ltd. | |
3.70% | | 11/16/25 | | | 150,000 | | | | 161,710 | |
AutoNation Inc. | |
3.80% | | 11/15/27 | | | 50,000 | | | | 50,642 | |
AutoZone Inc. | |
3.75% | | 04/18/29 | | | 100,000 | | | | 107,219 | |
| | | | | | | | | | |
| | | Principal
Amount | | | Fair
Value | |
AvalonBay Communities Inc. | |
3.20% | | 01/15/28 | | $ | 40,000 | | | $ | 41,736 | |
3.45% | | 06/01/25 | | | 115,000 | | | | 121,618 | |
Avangrid Inc. | |
3.80% | | 06/01/29 | | | 50,000 | | | | 53,052 | |
AXA S.A. | |
8.60% | | 12/15/30 | | | 100,000 | | | | 145,805 | |
Baidu Inc. | |
4.38% | | 03/29/28 | | | 100,000 | | | | 108,383 | |
Baker Hughes a GE Company LLC/Baker Hughes Co-Obligor Inc. | |
2.77% | | 12/15/22 | | | 50,000 | | | | 51,012 | |
3.34% | | 12/15/27 | | | 50,000 | | | | 52,169 | |
4.08% | | 12/15/47 | | | 50,000 | | | | 51,401 | |
Banco Santander S.A. | |
3.13% | | 02/23/23 | | | 100,000 | | | | 101,994 | |
3.80% | | 02/23/28 | | | 100,000 | | | | 105,333 | |
4.25% | | 04/11/27 | | | 100,000 | | | | 107,752 | |
Bank of America Corp. | |
3.50% | | 04/19/26 | | | 145,000 | | | | 154,268 | |
3.88% | | 08/01/25 | | | 150,000 | | | | 161,476 | |
3.95% | | 04/21/25 | | | 155,000 | | | | 165,338 | |
4.00% | | 04/01/24 | | | 150,000 | | | | 160,633 | |
4.18% | | 11/25/27 | | | 100,000 | | | | 108,564 | |
6.11% | | 01/29/37 | | | 100,000 | | | | 135,119 | |
Bank of America Corp. (2.46% fixed rate until 10/22/24; 0.87% + 3 month USD LIBOR thereafter) | |
2.46% | | 10/22/25 | | | 100,000 | | | | 100,620 | (h) |
Bank of America Corp. (2.88% fixed rate until 10/22/29; 1.19% + 3 month USD LIBOR thereafter) | |
2.88% | | 10/22/30 | | | 100,000 | | | | 101,130 | (h) |
Bank of America Corp. (3.00% fixed rate until 12/20/22; 0.79% + 3 month USD LIBOR thereafter) | |
3.00% | | 12/20/23 | | | 100,000 | | | | 102,329 | (h) |
Bank of America Corp. (3.19% fixed rate until 07/23/29; 1.18% + 3 month USD LIBOR thereafter) | |
3.19% | | 07/23/30 | | | 50,000 | | | | 51,773 | (h) |
Bank of America Corp. (3.42% fixed rate until 12/20/27; 1.04% + 3 month USD LIBOR thereafter) | |
3.42% | | 12/20/28 | | | 107,000 | | | | 112,381 | (h) |
Bank of America Corp. (3.46% fixed rate until 03/15/24; 0.97% + 3 month USD LIBOR thereafter) | |
3.46% | | 03/15/25 | | | 100,000 | | | | 104,429 | (h) |
Bank of America Corp. (3.50% fixed rate until 05/17/21; 0.63% + 3 month USD LIBOR thereafter) | |
3.50% | | 05/17/22 | | | 100,000 | | | | 101,992 | (h) |
Bank of America Corp. (3.55% fixed rate until 03/05/23; 0.78% + 3 month USD LIBOR thereafter) | |
3.55% | | 03/05/24 | | | 100,000 | | | | 103,799 | (h) |
Bank of America Corp. (3.56% fixed rate until 04/23/26; 1.06% + 3 month USD LIBOR thereafter) | |
3.56% | | 04/23/27 | | | 100,000 | | | | 105,700 | (h) |
Bank of America Corp. (3.95% fixed rate until 01/23/48; 1.19% + 3 month USD LIBOR thereafter) | |
3.95% | | 01/23/49 | | | 100,000 | | | | 113,931 | (h) |
Bank of America Corp. (3.97% fixed rate until 03/05/28; 1.07% + 3 month USD LIBOR thereafter) | |
3.97% | | 03/05/29 | | | 100,000 | | | | 108,889 | (h) |
Bank of America Corp. (4.08% fixed rate until 04/23/39; 1.32% + 3 month USD LIBOR thereafter) | |
4.08% | | 04/23/40 | | | 150,000 | | | | 170,527 | (h) |
Bank of America Corp. (4.24% fixed rate until 04/24/37; 1.81% + 3 month USD LIBOR thereafter) | |
4.24% | | 04/24/38 | | | 150,000 | | | | 173,406 | (h) |
Bank of America Corp. (4.33% fixed rate until 03/15/49; 1.52% + 3 month USD LIBOR thereafter) | |
4.33% | | 03/15/50 | | | 100,000 | | | | 120,131 | (h) |
Bank of Montreal | |
2.05% | | 11/01/22 | | | 20,000 | | | | 20,075 | |
2.90% | | 03/26/22 | | | 50,000 | | | | 50,983 | |
3.10% | | 04/13/21 | | | 90,000 | | | | 91,465 | |
3.30% | | 02/05/24 | | | 100,000 | | | | 104,235 | |
See Notes to Schedules of Investments and Notes to Financial Statements.
| | |
| State Street Total Return V.I.S. Fund | | |
| Schedule of Investments | | December 31, 2019 |
| | | | | | | | | | |
| | | Principal
Amount | | | Fair
Value | |
Barclays PLC | |
3.65% | | 03/16/25 | | $ | 150,000 | | | $ | 156,870 | |
Barclays PLC (4.61% fixed rate until 02/15/22; 1.40% + 3 month USD LIBOR thereafter) | |
4.61% | | 02/15/23 | | | 200,000 | | | | 209,006 | (h) |
Barclays PLC (4.97% fixed rate until 05/16/28; 1.90% + 3 month USD LIBOR thereafter) | |
4.97% | | 05/16/29 | | | 100,000 | | | | 112,827 | (h) |
BAT Capital Corp. | |
2.76% | | 08/15/22 | | | 100,000 | | | | 101,493 | |
3.56% | | 08/15/27 | | | 100,000 | | | | 102,210 | |
Baxalta Inc. | |
4.00% | | 06/23/25 | | | 30,000 | | | | 32,342 | |
Baxter International Inc. | |
2.60% | | 08/15/26 | | | 130,000 | | | | 130,976 | |
BBVA USA | |
3.88% | | 04/10/25 | | | 150,000 | | | | 157,347 | |
Becton Dickinson and Co. | |
3.70% | | 06/06/27 | | | 66,000 | | | | 70,253 | |
3.73% | | 12/15/24 | | | 50,000 | | | | 53,103 | |
Bell Canada Inc. | |
4.30% | | 07/29/49 | | | 30,000 | | | | 34,057 | |
Berkshire Hathaway Energy Co. | |
4.45% | | 01/15/49 | | | 100,000 | | | | 118,752 | |
Berkshire Hathaway Finance Corp. | |
3.00% | | 05/15/22 | | | 100,000 | | | | 102,819 | |
4.20% | | 08/15/48 | | | 100,000 | | | | 118,003 | |
4.25% | | 01/15/49 | | | 100,000 | | | | 118,970 | |
Best Buy Company Inc. | |
4.45% | | 10/01/28 | | | 25,000 | | | | 27,424 | |
Biogen Inc. | |
4.05% | | 09/15/25 | | | 80,000 | | | | 87,048 | |
5.20% | | 09/15/45 | | | 150,000 | | | | 181,011 | |
Black Hills Corp. | |
3.88% | | 10/15/49 | | | 25,000 | | | | 24,953 | |
4.35% | | 05/01/33 | | | 30,000 | | | | 33,007 | |
BlackRock Inc. | |
3.25% | | 04/30/29 | | | 60,000 | | | | 64,400 | |
Boardwalk Pipelines LP | |
4.80% | | 05/03/29 | | | 20,000 | | | | 21,304 | |
Boeing Co. | |
3.10% | | 05/01/26 | | | 100,000 | | | | 103,257 | |
Booking Holdings Inc. | |
3.55% | | 03/15/28 | | | 100,000 | | | | 106,637 | |
Boston Properties LP | |
3.40% | | 06/21/29 | | | 50,000 | | | | 52,384 | |
3.85% | | 02/01/23 | | | 150,000 | | | | 157,287 | |
Boston Scientific Corp. | |
4.55% | | 03/01/39 | | | 50,000 | | | | 58,734 | |
BP Capital Markets America Inc. | |
3.41% | | 02/11/26 | | | 50,000 | | | | 53,240 | |
3.94% | | 09/21/28 | | | 100,000 | | | | 110,549 | |
4.23% | | 11/06/28 | | | 50,000 | | | | 56,571 | |
4.74% | | 03/11/21 | | | 100,000 | | | | 103,443 | |
BP Capital Markets PLC | |
2.50% | | 11/06/22 | | | 100,000 | | | | 101,887 | |
3.06% | | 03/17/22 | | | 110,000 | | | | 112,852 | |
BPCE S.A. | |
4.00% | | 04/15/24 | | | 150,000 | | | | 160,867 | |
Brandywine Operating Partnership LP | |
4.55% | | 10/01/29 | | | 25,000 | | | | 27,243 | |
Bristol-Myers Squibb Co. | |
2.00% | | 08/01/22 | | | 50,000 | | | | 50,346 | |
2.60% | | 05/16/22 | | | 50,000 | | | | 50,830 | (d) |
2.75% | | 02/15/23 | | | 50,000 | | | | 51,040 | (d) |
2.90% | | 07/26/24 | | | 55,000 | | | | 56,766 | (d) |
3.40% | | 07/26/29 | | | 55,000 | | | | 58,917 | (d) |
3.45% | | 11/15/27 | | | 50,000 | | | | 53,350 | (d) |
4.13% | | 06/15/39 | | | 15,000 | | | | 17,293 | (d) |
4.25% | | 10/26/49 | | | 40,000 | | | | 47,529 | (d) |
4.35% | | 11/15/47 | | | 50,000 | | | | 59,380 | (d) |
5.00% | | 08/15/45 | | | 150,000 | | | | 192,300 | (d) |
| | | | | | | | | | |
| | | Principal
Amount | | | Fair
Value | |
5.25% | | 08/15/43 | | $ | 120,000 | | | $ | 153,533 | (d) |
British Telecommunications PLC | |
9.63% | | 12/15/30 | | | 50,000 | | | | 76,862 | |
Brixmor Operating Partnership LP | |
4.13% | | 05/15/29 | | | 50,000 | | | | 53,728 | |
Broadcom Corp./Broadcom Cayman Finance Ltd. | |
2.65% | | 01/15/23 | | | 100,000 | | | | 100,579 | |
3.00% | | 01/15/22 | | | 100,000 | | | | 101,493 | |
Broadcom Inc. | |
3.13% | | 10/15/22 | | | 15,000 | | | | 15,300 | (d) |
4.75% | | 04/15/29 | | | 100,000 | | | | 109,351 | (d) |
Broadridge Financial Solutions Inc. | |
3.40% | | 06/27/26 | | | 80,000 | | | | 83,512 | |
Brookfield Finance Inc. | |
3.90% | | 01/25/28 | | | 100,000 | | | | 107,651 | |
Brown & Brown Inc. | |
4.50% | | 03/15/29 | | | 100,000 | | | | 110,181 | |
Brown-Forman Corp. | |
4.00% | | 04/15/38 | | | 30,000 | | | | 33,589 | |
Bunge Limited Finance Corp. | |
4.35% | | 03/15/24 | | | 50,000 | | | | 52,638 | |
Burlington Northern Santa Fe LLC | |
3.55% | | 02/15/50 | | | 100,000 | | | | 104,819 | |
5.75% | | 05/01/40 | | | 200,000 | | | | 269,606 | |
California Institute of Technology | |
3.65% | | 09/01/19 | | | 20,000 | | | | 19,456 | |
Camden Property Trust | |
3.35% | | 11/01/49 | | | 10,000 | | | | 10,003 | |
4.10% | | 10/15/28 | | | 10,000 | | | | 11,148 | |
Campbell Soup Co. | |
3.65% | | 03/15/23 | | | 50,000 | | | | 52,084 | |
4.15% | | 03/15/28 | | | 50,000 | | | | 54,233 | |
4.80% | | 03/15/48 | | | 20,000 | | | | 23,202 | |
Canadian Imperial Bank of Commerce | |
2.70% | | 02/02/21 | | | 40,000 | | | | 40,335 | |
Canadian National Railway Co. | |
2.95% | | 11/21/24 | | | 155,000 | | | | 160,130 | |
Canadian Natural Resources Ltd. | |
3.80% | | 04/15/24 | | | 150,000 | | | | 158,539 | |
3.85% | | 06/01/27 | | | 100,000 | | | | 106,638 | |
3.90% | | 02/01/25 | | | 50,000 | | | | 53,417 | |
Canadian Pacific Railway Co. | |
2.90% | | 02/01/25 | | | 150,000 | | | | 154,102 | |
Capital One Financial Corp. | |
3.75% | | 07/28/26 - 03/09/27 | | | 230,000 | | | | 243,682 | |
3.90% | | 01/29/24 | | | 125,000 | | | | 132,699 | |
4.20% | | 10/29/25 | | | 90,000 | | | | 97,128 | |
Cardinal Health Inc. | |
3.20% | | 03/15/23 | | | 150,000 | | | | 153,874 | |
Caterpillar Financial Services Corp. | |
2.55% | | 11/29/22 | | | 50,000 | | | | 50,983 | |
2.90% | | 03/15/21 | | | 100,000 | | | | 101,216 | |
3.15% | | 09/07/21 | | | 15,000 | | | | 15,327 | |
3.25% | | 12/01/24 | | | 100,000 | | | | 105,630 | |
Caterpillar Inc. | |
3.80% | | 08/15/42 | | | 100,000 | | | | 111,661 | |
Celulosa Arauco y Constitucion S.A. | |
3.88% | | 11/02/27 | | | 100,000 | | | | 101,063 | |
Cenovus Energy Inc. | |
3.00% | | 08/15/22 | | | 35,000 | | | | 35,467 | |
4.25% | | 04/15/27 | | | 100,000 | | | | 105,846 | |
CenterPoint Energy Houston Electric LLC | |
4.25% | | 02/01/49 | | | 110,000 | | | | 128,973 | |
4.50% | | 04/01/44 | | | 50,000 | | | | 59,622 | |
Charter Communications Operating LLC/Charter Communications Operating Capital | |
4.46% | | 07/23/22 | | | 100,000 | | | | 105,116 | |
4.80% | | 03/01/50 | | | 95,000 | | | | 100,187 | |
4.91% | | 07/23/25 | | | 135,000 | | | | 148,794 | |
6.48% | | 10/23/45 | | | 150,000 | | | | 186,783 | |
Cheniere Corpus Christi Holdings LLC | |
3.70% | | 11/15/29 | | | 45,000 | | | | 46,031 | (d) |
See Notes to Schedules of Investments and Notes to Financial Statements.
| | |
| State Street Total Return V.I.S. Fund | | |
| Schedule of Investments | | December 31, 2019 |
| | | | | | | | | | |
| | | Principal
Amount | | | Fair
Value | |
Chevron Corp. | |
2.10% | | 05/16/21 | | $ | 100,000 | | | $ | 100,501 | |
2.41% | | 03/03/22 | | | 45,000 | | | | 45,612 | |
2.90% | | 03/03/24 | | | 150,000 | | | | 155,496 | |
2.95% | | 05/16/26 | | | 100,000 | | | | 104,569 | |
Choice Hotels International Inc. | |
3.70% | | 12/01/29 | | | 25,000 | | | | 25,190 | |
Chubb INA Holdings Inc. | |
2.70% | | 03/13/23 | | | 150,000 | | | | 153,004 | |
4.35% | | 11/03/45 | | | 100,000 | | | | 121,470 | |
Cigna Corp. | |
3.40% | | 09/17/21 | | | 140,000 | | | | 143,294 | |
3.75% | | 07/15/23 | | | 55,000 | | | | 57,737 | |
4.38% | | 10/15/28 | | | 40,000 | | | | 44,388 | |
4.80% | | 08/15/38 | | | 30,000 | | | | 34,976 | |
4.90% | | 12/15/48 | | | 130,000 | | | | 155,427 | |
Cimarex Energy Co. | |
4.38% | | 03/15/29 | | | 150,000 | | | | 158,577 | |
Cintas Corporation No. 2 | |
3.70% | | 04/01/27 | | | 100,000 | | | | 108,636 | |
Cisco Systems Inc. | |
2.20% | | 02/28/21 | | | 100,000 | | | | 100,510 | |
2.90% | | 03/04/21 | | | 125,000 | | | | 126,622 | |
5.90% | | 02/15/39 | | | 200,000 | | | | 280,680 | |
Citibank NA | |
2.85% | | 02/12/21 | | | 150,000 | | | | 151,486 | |
3.40% | | 07/23/21 | | | 100,000 | | | | 102,133 | |
3.65% | | 01/23/24 | | | 100,000 | | | | 105,857 | |
Citigroup Inc. | |
2.70% | | 10/27/22 | | | 100,000 | | | | 101,654 | |
2.90% | | 12/08/21 | | | 100,000 | | | | 101,606 | |
3.88% | | 03/26/25 | | | 150,000 | | | | 158,820 | |
4.30% | | 11/20/26 | | | 100,000 | | | | 108,833 | |
4.45% | | 09/29/27 | | | 150,000 | | | | 165,298 | |
4.75% | | 05/18/46 | | | 50,000 | | | | 59,916 | |
5.88% | | 01/30/42 | | | 172,000 | | | | 242,044 | |
6.13% | | 08/25/36 | | | 155,000 | | | | 203,797 | |
Citigroup Inc. (2.98% fixed rate until 11/05/29; 1.42% + SOFR thereafter) | |
2.98% | | 11/05/30 | | | 50,000 | | | | 50,770 | (h) |
Citigroup Inc. (3.35% fixed rate until 04/24/24; 0.90% + 3 month USD LIBOR thereafter) | |
3.35% | | 04/24/25 | | | 100,000 | | | | 104,072 | (h) |
Citigroup Inc. (3.52% fixed rate until 10/27/27; 1.15% + 3 month USD LIBOR thereafter) | |
3.52% | | 10/27/28 | | | 100,000 | | | | 105,409 | (h) |
Citigroup Inc. (3.98% fixed rate until 03/20/29; 1.34% + 3 month USD LIBOR thereafter) | |
3.98% | | 03/20/30 | | | 100,000 | | | | 109,289 | (h) |
CME Group Inc. | |
3.00% | | 03/15/25 | | | 150,000 | | | | 156,055 | |
CNH Industrial Capital LLC | |
3.88% | | 10/15/21 | | | 15,000 | | | | 15,408 | |
4.38% | | 04/05/22 | | | 15,000 | | | | 15,667 | |
4.88% | | 04/01/21 | | | 15,000 | | | | 15,484 | |
CNH Industrial N.V. | |
3.85% | | 11/15/27 | | | 15,000 | | | | 15,634 | |
Colgate-Palmolive Co. | |
3.25% | | 03/15/24 | | | 150,000 | | | | 158,526 | |
Comcast Corp. | |
2.65% | | 02/01/30 | | | 35,000 | | | | 35,164 | |
3.15% | | 02/15/28 | | | 100,000 | | | | 104,874 | |
3.25% | | 11/01/39 | | | 50,000 | | | | 50,754 | |
3.38% | | 08/15/25 | | | 100,000 | | | | 106,089 | |
3.45% | | 10/01/21 - 02/01/50 | | | 175,000 | | | | 179,777 | |
3.55% | | 05/01/28 | | | 100,000 | | | | 107,735 | |
3.70% | | 04/15/24 | | | 55,000 | | | | 58,661 | |
3.90% | | 03/01/38 | | | 100,000 | | | | 110,863 | |
3.95% | | 10/15/25 | | | 100,000 | | | | 109,123 | |
3.97% | | 11/01/47 | | | 100,000 | | | | 110,196 | |
4.00% | | 03/01/48 | | | 50,000 | | | | 55,403 | |
4.15% | | 10/15/28 | | | 45,000 | | | | 50,663 | |
4.25% | | 01/15/33 | | | 100,000 | | | | 115,641 | |
4.60% | | 10/15/38 | | | 230,000 | | | | 274,312 | |
| | | | | | | | | | |
| | | Principal
Amount | | | Fair
Value | |
4.70% | | 10/15/48 | | $ | 40,000 | | | $ | 49,354 | |
Comerica Inc. | |
3.70% | | 07/31/23 | | | 25,000 | | | | 26,309 | |
4.00% | | 02/01/29 | | | 50,000 | | | | 54,614 | |
CommonSpirit Health | |
4.19% | | 10/01/49 | | | 100,000 | | | | 100,533 | |
Commonwealth Edison Co. | |
4.00% | | 03/01/49 | | | 100,000 | | | | 112,077 | |
4.60% | | 08/15/43 | | | 150,000 | | | | 178,785 | |
Conagra Brands Inc. | |
3.80% | | 10/22/21 | | | 10,000 | | | | 10,315 | |
4.30% | | 05/01/24 | | | 5,000 | | | | 5,381 | |
4.85% | | 11/01/28 | | | 25,000 | | | | 28,649 | |
5.30% | | 11/01/38 | | | 110,000 | | | | 130,626 | |
5.40% | | 11/01/48 | | | 20,000 | | | | 24,466 | |
Concho Resources Inc. | |
4.30% | | 08/15/28 | | | 25,000 | | | | 27,253 | |
4.85% | | 08/15/48 | | | 25,000 | | | | 28,961 | |
ConocoPhillips | |
6.50% | | 02/01/39 | | | 100,000 | | | | 145,595 | |
Consolidated Edison Company of New York Inc. | |
3.88% | | 06/15/47 | | | 100,000 | | | | 108,789 | |
3.95% | | 03/01/43 | | | 150,000 | | | | 162,583 | |
4.00% | | 12/01/28 | | | 25,000 | | | | 27,807 | |
4.13% | | 05/15/49 | | | 50,000 | | | | 56,930 | |
Constellation Brands Inc. | |
3.50% | | 05/09/27 | | | 100,000 | | | | 104,434 | |
4.75% | | 11/15/24 | | | 100,000 | | | | 110,561 | |
5.25% | | 11/15/48 | | | 15,000 | | | | 18,295 | |
Consumers Energy Co. | |
3.75% | | 02/15/50 | | | 100,000 | | | | 110,049 | |
4.05% | | 05/15/48 | | | 50,000 | | | | 57,599 | |
Continental Resources Inc. | |
3.80% | | 06/01/24 | | | 35,000 | | | | 36,210 | |
4.38% | | 01/15/28 | | | 35,000 | | | | 37,231 | |
4.50% | | 04/15/23 | | | 50,000 | | | | 52,394 | |
4.90% | | 06/01/44 | | | 25,000 | | | | 26,594 | |
5.00% | | 09/15/22 | | | 38,000 | | | | 38,292 | |
Cooperatieve Rabobank UA | |
2.50% | | 01/19/21 | | | 150,000 | | | | 150,946 | |
2.75% | | 01/10/22 | | | 100,000 | | | | 101,595 | |
3.95% | | 11/09/22 | | | 100,000 | | | | 104,523 | |
4.63% | | 12/01/23 | | | 150,000 | | | | 162,637 | |
Corning Inc. | |
2.90% | | 05/15/22 | | | 55,000 | | | | 56,122 | |
3.90% | | 11/15/49 | | | 50,000 | | | | 50,745 | |
Corporation Andina de Fomento | |
2.13% | | 09/27/21 | | | 150,000 | | | | 149,677 | |
Costco Wholesale Corp. | |
2.15% | | 05/18/21 | | | 100,000 | | | | 100,534 | |
2.25% | | 02/15/22 | | | 85,000 | | | | 85,914 | |
3.00% | | 05/18/27 | | | 100,000 | | | | 105,588 | |
Council Of Europe Development Bank | |
2.63% | | 02/13/23 | | | 120,000 | | | | 123,434 | |
Credit Suisse AG | |
3.63% | | 09/09/24 | | | 150,000 | | | | 159,370 | |
Credit Suisse Group Funding Guernsey Ltd. | |
4.88% | | 05/15/45 | | | 150,000 | | | | 189,439 | |
Crown Castle International Corp. | |
3.15% | | 07/15/23 | | | 155,000 | | | | 159,329 | |
3.80% | | 02/15/28 | | | 100,000 | | | | 106,656 | |
5.20% | | 02/15/49 | | | 50,000 | | | | 61,769 | |
CSX Corp. | |
2.60% | | 11/01/26 | | | 100,000 | | | | 101,637 | |
4.10% | | 03/15/44 | | | 68,000 | | | | 74,407 | |
4.50% | | 03/15/49 | | | 95,000 | | | | 111,254 | |
4.75% | | 11/15/48 | | | 65,000 | | | | 78,616 | |
CubeSmart LP | |
4.38% | | 02/15/29 | | | 15,000 | | | | 16,455 | |
CVS Health Corp. | |
2.63% | | 08/15/24 | | | 200,000 | | | | 202,122 | |
2.75% | | 12/01/22 | | | 150,000 | | | | 152,445 | |
See Notes to Schedules of Investments and Notes to Financial Statements.
| | |
| State Street Total Return V.I.S. Fund | | |
| Schedule of Investments | | December 31, 2019 |
| | | | | | | | | | |
| | | Principal
Amount | | | Fair
Value | |
3.35% | | 03/09/21 | | $ | 204,000 | | | $ | 207,248 | |
3.38% | | 08/12/24 | | | 150,000 | | | | 156,225 | |
3.70% | | 03/09/23 | | | 115,000 | | | | 119,736 | |
4.10% | | 03/25/25 | | | 150,000 | | | | 161,316 | |
4.30% | | 03/25/28 | | | 110,000 | | | | 120,348 | |
4.78% | | 03/25/38 | | | 145,000 | | | | 164,977 | |
5.05% | | 03/25/48 | | | 115,000 | | | | 136,419 | |
CyrusOne LP/CyrusOne Finance Corp. | |
2.90% | | 11/15/24 | | | 25,000 | | | | 25,122 | |
3.45% | | 11/15/29 | | | 30,000 | | | | 30,138 | |
Darden Restaurants Inc. | |
4.55% | | 02/15/48 | | | 15,000 | | | | 15,234 | |
Deere & Co. | | | | | | | | | | |
3.90% | | 06/09/42 | | | 71,000 | | | | 80,028 | |
Dell International LLC/EMC Corp. | |
5.30% | | 10/01/29 | | | 100,000 | | | | 112,596 | (d) |
6.02% | | 06/15/26 | | | 90,000 | | | | 103,909 | (d) |
8.10% | | 07/15/36 | | | 100,000 | | | | 131,358 | (d) |
Delmarva Power & Light Co. | |
4.15% | | 05/15/45 | | | 100,000 | | | | 112,259 | |
Delta Air Lines Inc. | | | | | | | | | | |
3.40% | | 04/19/21 | | | 100,000 | | | | 101,338 | |
3.80% | | 04/19/23 | | | 30,000 | | | | 31,139 | |
4.38% | | 04/19/28 | | | 50,000 | | | | 52,742 | |
Deutsche Bank AG | | | | | | | | | | |
3.30% | | 11/16/22 | | | 100,000 | | | | 101,032 | |
3.38% | | 05/12/21 | | | 150,000 | | | | 151,318 | |
Deutsche Bank AG (3.96% fixed rate until 11/26/24; 2.58% + SOFR thereafter) | |
3.96% | | 11/26/25 | | | 150,000 | | | | 153,043 | (h) |
Deutsche Telekom International Finance BV | |
8.75% | | 06/15/30 | | | 150,000 | | | | 219,979 | |
Devon Energy Corp. | |
5.00% | | 06/15/45 | | | 100,000 | | | | 116,784 | |
DH Europe Finance II Sarl | |
3.40% | | 11/15/49 | | | 100,000 | | | | 102,517 | |
Diageo Investment Corp. | |
2.88% | | 05/11/22 | | | 150,000 | | | | 153,180 | |
Diamondback Energy Inc. | |
2.88% | | 12/01/24 | | | 30,000 | | | | 30,350 | |
3.25% | | 12/01/26 | | | 20,000 | | | | 20,231 | |
3.50% | | 12/01/29 | | | 50,000 | | | | 50,919 | |
Digital Realty Trust LP | |
4.45% | | 07/15/28 | | | 150,000 | | | | 165,931 | |
Discover Bank | |
4.20% | | 08/08/23 | | | 150,000 | | | | 159,526 | |
Discover Financial Services | |
4.50% | | 01/30/26 | | | 100,000 | | | | 109,297 | |
Discovery Communications LLC | |
3.25% | | 04/01/23 | | | 175,000 | | | | 179,800 | |
3.45% | | 03/15/25 | | | 135,000 | | | | 140,895 | |
3.90% | | 11/15/24 | | | 150,000 | | | | 159,097 | |
Dollar General Corp. | |
4.13% | | 05/01/28 | | | 70,000 | | | | 77,066 | |
Dollar Tree Inc. | | | | | | | | | | |
3.70% | | 05/15/23 | | | 20,000 | | | | 20,844 | |
4.00% | | 05/15/25 | | | 50,000 | | | | 53,465 | |
4.20% | | 05/15/28 | | | 25,000 | | | | 26,854 | |
Dominion Energy Inc. | |
4.25% | | 06/01/28 | | | 50,000 | | | | 55,350 | |
Dominion Energy South Carolina Inc. | |
5.10% | | 06/01/65 | | | 50,000 | | | | 65,030 | |
DTE Electric Co. | | | | | | | | | | |
3.70% | | 03/15/45 | | | 45,000 | | | | 48,684 | |
DTE Energy Co. | | | | | | | | | | |
3.85% | | 12/01/23 | | | 50,000 | | | | 52,462 | |
Duke Energy Carolinas LLC | |
3.05% | | 03/15/23 | | | 50,000 | | | | 51,589 | |
3.70% | | 12/01/47 | | | 50,000 | | | | 53,860 | |
3.95% | | 03/15/48 | | | 50,000 | | | | 55,886 | |
Duke Energy Corp. | | | | | | | | | | |
3.05% | | 08/15/22 | | | 139,000 | | | | 142,232 | |
| | | | | | | | | | |
| | | Principal
Amount | | | Fair
Value | |
Duke Energy Florida LLC | |
2.50% | | 12/01/29 | | $ | 50,000 | | | $ | 49,884 | |
3.20% | | 01/15/27 | | | 100,000 | | | | 104,571 | |
3.40% | | 10/01/46 | | | 100,000 | | | | 101,299 | |
3.80% | | 07/15/28 | | | 50,000 | | | | 54,815 | |
Duke Energy Ohio Inc. | |
3.65% | | 02/01/29 | | | 100,000 | | | | 108,946 | |
4.30% | | 02/01/49 | | | 100,000 | | | | 117,179 | |
Duke Energy Progress LLC | |
3.70% | | 09/01/28 | | | 100,000 | | | | 109,170 | |
Duke Realty LP | | | | | | | | | | |
3.38% | | 12/15/27 | | | 50,000 | | | | 52,190 | |
DuPont de Nemours Inc. | |
4.21% | | 11/15/23 | | | 50,000 | | | | 53,477 | |
4.73% | | 11/15/28 | | | 50,000 | | | | 56,761 | |
5.32% | | 11/15/38 | | | 15,000 | | | | 17,881 | |
5.42% | | 11/15/48 | | | 40,000 | | | | 49,284 | |
Eaton Vance Corp. | | | | | | | | | | |
3.50% | | 04/06/27 | | | 100,000 | | | | 105,265 | |
eBay Inc. | | | | | | | | | | |
3.80% | | 03/09/22 | | | 145,000 | | | | 149,931 | |
Ecolab Inc. | | | | | | | | | | |
2.38% | | 08/10/22 | | | 100,000 | | | | 101,023 | |
3.25% | | 12/01/27 | | | 70,000 | | | | 73,768 | |
Ecopetrol S.A. | | | | | | | | | | |
4.13% | | 01/16/25 | | | 150,000 | | | | 158,008 | |
Edison International | | | | | | | | | | |
4.13% | | 03/15/28 | | | 50,000 | | | | 51,632 | |
Eli Lilly & Co. | | | | | | | | | | |
2.75% | | 06/01/25 | | | 22,000 | | | | 22,679 | |
3.38% | | 03/15/29 | | | 30,000 | | | | 32,385 | |
3.95% | | 03/15/49 | | | 50,000 | | | | 57,801 | |
4.15% | | 03/15/59 | | | 50,000 | | | | 58,893 | |
Emera US Finance LP | |
3.55% | | 06/15/26 | | | 60,000 | | | | 62,403 | |
Emerson Electric Co. | |
2.63% | | 02/15/23 | | | 100,000 | | | | 102,213 | |
Enable Midstream Partners LP | |
4.95% | | 05/15/28 | | | 60,000 | | | | 60,810 | |
Enbridge Energy Partners LP | |
5.88% | | 10/15/25 | | | 125,000 | | | | 146,017 | |
Enbridge Inc. | | | | | | | | | | |
3.50% | | 06/10/24 | | | 65,000 | | | | 68,002 | |
Enel Chile S.A. | | | | | | | | | | |
4.88% | | 06/12/28 | | | 50,000 | | | | 55,619 | |
Energy Transfer Operating LP | |
4.20% | | 09/15/23 | | | 25,000 | | | | 26,268 | |
4.50% | | 04/15/24 | | | 135,000 | | | | 143,693 | |
4.95% | | 06/15/28 | | | 75,000 | | | | 82,271 | |
5.25% | | 04/15/29 | | | 25,000 | | | | 28,120 | |
6.00% | | 06/15/48 | | | 50,000 | | | | 58,329 | |
6.25% | | 04/15/49 | | | 125,000 | | | | 151,539 | |
6.50% | | 02/01/42 | | | 150,000 | | | | 178,363 | |
Entergy Louisiana LLC | |
4.05% | | 09/01/23 | | | 50,000 | | | | 53,234 | |
Entergy Texas Inc. | | | | | | | | | | |
4.00% | | 03/30/29 | | | 100,000 | | | | 110,079 | |
4.50% | | 03/30/39 | | | 100,000 | | | | 115,421 | |
Enterprise Products Operating LLC | |
2.80% | | 02/15/21 | | | 50,000 | | | | 50,491 | |
3.50% | | 02/01/22 | | | 25,000 | | | | 25,768 | |
3.70% | | 02/15/26 | | | 35,000 | | | | 37,281 | |
3.90% | | 02/15/24 | | | 75,000 | | | | 79,684 | |
4.15% | | 10/16/28 | | | 25,000 | | | | 27,637 | |
4.20% | | 01/31/50 | | | 35,000 | | | | 37,783 | |
4.25% | | 02/15/48 | | | 25,000 | | | | 27,119 | |
4.45% | | 02/15/43 | | | 142,000 | | | | 156,108 | |
4.80% | | 02/01/49 | | | 25,000 | | | | 29,462 | |
Enterprise Products Operating LLC (5.38% fixed rate until 02/15/28; 2.57% + 3 month USD LIBOR thereafter) | |
5.38% | | 02/15/78 | | | 50,000 | | | | 49,658 | (h) |
EOG Resources Inc. | |
3.15% | | 04/01/25 | | | 80,000 | | | | 83,942 | |
See Notes to Schedules of Investments and Notes to Financial Statements.
| | |
| State Street Total Return V.I.S. Fund | | |
| Schedule of Investments | | December 31, 2019 |
| | | | | | | | | | |
| | | Principal
Amount | | | Fair
Value | |
EPR Properties | | | | | | | | | | |
4.95% | | 04/15/28 | | $ | 100,000 | | | $ | 109,451 | |
EQT Corp. | | | | | | | | | | |
3.90% | | 10/01/27 | | | 150,000 | | | | 139,572 | |
Equifax Inc. | | | | | | | | | | |
2.60% | | 12/01/24 | | | 50,000 | | | | 50,245 | |
Equinix Inc. | | | | | | | | | | |
2.63% | | 11/18/24 | | | 65,000 | | | | 65,268 | |
5.38% | | 05/15/27 | | | 30,000 | | | | 32,562 | |
5.88% | | 01/15/26 | | | 35,000 | | | | 37,223 | |
Equinor ASA | | | | | | | | | | |
2.45% | | 01/17/23 | | | 250,000 | | | | 253,962 | |
3.95% | | 05/15/43 | | | 100,000 | | | | 111,433 | |
ERP Operating LP | | | | | | | | | | |
3.00% | | 04/15/23 | | | 150,000 | | | | 155,283 | |
Essex Portfolio LP | | | | | | | | | | |
3.63% | | 05/01/27 | | | 100,000 | | | | 105,646 | |
European Bank for Reconstruction & Development | |
2.75% | | 04/26/21 | | | 450,000 | | | | 456,102 | |
European Investment Bank | |
2.00% | | 12/15/22 | | | 200,000 | | | | 201,930 | |
2.25% | | 06/24/24 | | | 250,000 | | | | 255,435 | |
2.38% | | 05/13/21 | | | 250,000 | | | | 252,425 | |
2.63% | | 03/15/24 | | | 285,000 | | | | 295,186 | |
2.88% | | 12/15/21 | | | 115,000 | | | | 117,712 | |
3.13% | | 12/14/23 | | | 200,000 | | | | 210,918 | |
Evergy Inc. | | | | | | | | | | |
4.85% | | 06/01/21 | | | 104,000 | | | | 107,272 | |
Evergy Metro Inc. | | | | | | | | | | |
4.20% | | 06/15/47 | | | 100,000 | | | | 115,355 | |
Eversource Energy | | | | | | | | | | |
2.90% | | 10/01/24 | | | 100,000 | | | | 102,226 | |
3.15% | | 01/15/25 | | | 125,000 | | | | 128,972 | |
Expedia Group Inc. | | | | | | | | | | |
3.25% | | 02/15/30 | | | 35,000 | | | | 33,767 | (d) |
Exxon Mobil Corp. | | | | | | | | | | |
1.90% | | 08/16/22 | | | 20,000 | | | | 20,122 | |
2.02% | | 08/16/24 | | | 50,000 | | | | 50,169 | |
2.22% | | 03/01/21 | | | 100,000 | | | | 100,595 | |
2.44% | | 08/16/29 | | | 50,000 | | | | 50,292 | |
2.71% | | 03/06/25 | | | 150,000 | | | | 155,010 | |
3.04% | | 03/01/26 | | | 50,000 | | | | 52,454 | |
3.10% | | 08/16/49 | | | 25,000 | | | | 24,965 | |
3.18% | | 03/15/24 | | | 150,000 | | | | 157,257 | |
Federal Realty Investment Trust | |
3.20% | | 06/15/29 | | | 50,000 | | | | 51,818 | |
FedEx Corp. | | | | | | | | | | |
3.40% | | 02/15/28 | | | 100,000 | | | | 102,118 | |
4.05% | | 02/15/48 | | | 100,000 | | | | 96,048 | |
4.75% | | 11/15/45 | | | 95,000 | | | | 100,836 | |
Fibria Overseas Finance Ltd. | |
4.00% | | 01/14/25 | | | 50,000 | | | | 51,748 | |
Fidelity National Financial Inc. | |
4.50% | | 08/15/28 | | | 25,000 | | | | 27,227 | |
Fidelity National Information Services Inc. | |
4.25% | | 05/15/28 | | | 80,000 | | | | 89,494 | |
Fifth Third Bancorp | | | | | | | | | | |
3.65% | | 01/25/24 | | | 100,000 | | | | 105,499 | |
Fifth Third Bank | | | | | | | | | | |
2.88% | | 10/01/21 | | | 80,000 | | | | 81,176 | |
FirstEnergy Corp. | | | | | | | | | | |
4.25% | | 03/15/23 | | | 30,000 | | | | 31,628 | |
7.38% | | 11/15/31 | | | 55,000 | | | | 77,559 | |
Fiserv Inc. | | | | | | | | | | |
3.50% | | 07/01/29 | | | 45,000 | | | | 47,370 | |
3.80% | | 10/01/23 | | | 25,000 | | | | 26,409 | |
4.20% | | 10/01/28 | | | 30,000 | | | | 33,182 | |
4.40% | | 07/01/49 | | | 40,000 | | | | 45,495 | |
Flex Ltd. | | | | | | | | | | |
4.88% | | 06/15/29 | | | 25,000 | | | | 27,063 | |
Florida Power & Light Co. | |
3.15% | | 10/01/49 | | | 55,000 | | | | 55,400 | |
| | | | | | | | | | |
| | | Principal
Amount | | | Fair
Value | |
4.13% | | 02/01/42 | | $ | 100,000 | | | $ | 114,401 | |
Fluor Corp. | | | | | | | | | | |
4.25% | | 09/15/28 | | | 50,000 | | | | 50,794 | |
FMC Corp. | | | | | | | | | | |
3.45% | | 10/01/29 | | | 50,000 | | | | 51,759 | |
FMS Wertmanagement | |
2.00% | | 08/01/22 | | | 200,000 | | | | 201,638 | |
2.75% | | 01/30/24 | | | 100,000 | | | | 103,839 | |
Ford Motor Co. | | | | | | | | | | |
4.35% | | 12/08/26 | | | 100,000 | | | | 102,996 | |
4.75% | | 01/15/43 | | | 150,000 | | | | 133,371 | |
Ford Motor Credit Company LLC | |
3.34% | | 03/18/21 | | | 100,000 | | | | 100,699 | |
3.35% | | 11/01/22 | | | 100,000 | | | | 101,127 | |
3.81% | | 10/12/21 | | | 100,000 | | | | 101,730 | |
5.11% | | 05/03/29 | | | 100,000 | | | | 103,074 | |
5.60% | | 01/07/22 | | | 100,000 | | | | 105,274 | |
Fortune Brands Home & Security Inc. | |
3.25% | | 09/15/29 | | | 50,000 | | | | 51,077 | |
Fox Corp. | | | | | | | | | | |
4.03% | | 01/25/24 | | | 125,000 | | | | 133,169 | (d) |
FS KKR Capital Corp. | |
4.13% | | 02/01/25 | | | 25,000 | | | | 25,384 | |
GATX Corp. | | | | | | | | | | |
3.50% | | 03/15/28 | | | 100,000 | | | | 102,087 | |
GE Capital International Funding Company Unlimited Co. | |
4.42% | | 11/15/35 | | | 100,000 | | | | 106,784 | |
General Dynamics Corp. | |
3.00% | | 05/11/21 | | | 50,000 | | | | 50,800 | |
3.38% | | 05/15/23 | | | 50,000 | | | | 52,233 | |
3.75% | | 05/15/28 | | | 55,000 | | | | 60,574 | |
General Electric Co. | |
2.70% | | 10/09/22 | | | 100,000 | | | | 101,308 | |
5.88% | | 01/14/38 | | | 100,000 | | | | 120,949 | |
6.75% | | 03/15/32 | | | 100,000 | | | | 128,364 | |
General Mills Inc. | |
3.20% | | 04/16/21 | | | 100,000 | | | | 101,640 | |
3.65% | | 02/15/24 | | | 50,000 | | | | 52,588 | |
4.55% | | 04/17/38 | | | 100,000 | | | | 115,930 | |
General Motors Financial Company Inc. | |
3.25% | | 01/05/23 | | | 50,000 | | | | 51,103 | |
3.45% | | 01/14/22 | | | 100,000 | | | | 102,205 | |
3.55% | | 04/09/21 | | | 100,000 | | | | 101,665 | |
3.70% | | 05/09/23 | | | 100,000 | | | | 103,227 | |
4.20% | | 03/01/21 | | | 100,000 | | | | 102,111 | |
4.35% | | 01/17/27 | | | 100,000 | | | | 104,774 | |
4.38% | | 09/25/21 | | | 100,000 | | | | 103,561 | |
5.25% | | 03/01/26 | | | 155,000 | | | | 171,952 | |
Georgia Power Co. | |
2.20% | | 09/15/24 | | | 100,000 | | | | 99,948 | |
2.65% | | 09/15/29 | | | 100,000 | | | | 98,679 | |
4.30% | | 03/15/42 | | | 172,000 | | | | 188,859 | |
Georgia-Pacific LLC | |
8.88% | | 05/15/31 | | | 50,000 | | | | 77,934 | |
Gilead Sciences Inc. | | | | | | | | | | |
3.70% | | 04/01/24 | | | 150,000 | | | | 159,241 | |
4.80% | | 04/01/44 | | | 150,000 | | | | 181,194 | |
GlaxoSmithKline Capital Inc. | |
3.63% | | 05/15/25 | | | 55,000 | | | | 58,940 | |
3.88% | | 05/15/28 | | | 100,000 | | | | 110,424 | |
GlaxoSmithKline Capital PLC | |
3.13% | | 05/14/21 | | | 70,000 | | | | 71,203 | |
Global Payments Inc. | |
4.45% | | 06/01/28 | | | 100,000 | | | | 110,350 | |
Globe Life Inc. | |
4.55% | | 09/15/28 | | | 25,000 | | | | 27,875 | |
GLP Capital LP/GLP Financing II Inc. | |
5.25% | | 06/01/25 | | | 10,000 | | | | 10,988 | |
5.38% | | 11/01/23 - 04/15/26 | | | 30,000 | | | | 33,041 | |
5.75% | | 06/01/28 | | | 10,000 | | | | 11,360 | |
Halliburton Co. | |
3.50% | | 08/01/23 | | | 100,000 | | | | 104,080 | |
See Notes to Schedules of Investments and Notes to Financial Statements.
| | |
| State Street Total Return V.I.S. Fund | | |
| Schedule of Investments | | December 31, 2019 |
| | | | | | | | | | |
| | | Principal
Amount | | | Fair
Value | |
5.00% | | 11/15/45 | | $ | 150,000 | | | $ | 171,168 | |
Hasbro Inc. | | | | | | | | | | |
3.00% | | 11/19/24 | | | 50,000 | | | | 50,256 | |
HCA Inc. | | | | | | | | | | |
4.50% | | 02/15/27 | | | 30,000 | | | | 32,411 | |
4.75% | | 05/01/23 | | | 30,000 | | | | 32,135 | |
5.00% | | 03/15/24 | | | 50,000 | | | | 54,681 | |
5.25% | | 04/15/25 - 06/15/26 | | | 70,000 | | | | 78,457 | |
5.50% | | 06/15/47 | | | 35,000 | | | | 40,371 | |
Healthcare Trust of America Holdings LP | |
3.50% | | 08/01/26 | | | 30,000 | | | | 31,397 | |
Healthpeak Properties Inc. | |
3.00% | | 01/15/30 | | | 50,000 | | | | 50,040 | |
3.25% | | 07/15/26 | | | 100,000 | | | | 103,720 | |
Hewlett Packard Enterprise Co. | |
3.50% | | 10/05/21 | | | 50,000 | | | | 51,192 | |
6.35% | | 10/15/45 | | | 150,000 | | | | 181,308 | |
Highwoods Realty LP | |
4.20% | | 04/15/29 | | | 25,000 | | | | 26,914 | |
Honeywell International Inc. | |
2.70% | | 08/15/29 | | | 30,000 | | | | 30,763 | |
3.35% | | 12/01/23 | | | 50,000 | | | | 52,655 | |
5.38% | | 03/01/41 | | | 200,000 | | | | 267,310 | |
Host Hotels & Resorts LP | |
3.38% | | 12/15/29 | | | 100,000 | | | | 100,925 | |
HP Inc. | | | | | | | | | | |
6.00% | | 09/15/41 | | | 162,000 | | | | 179,580 | |
HSBC Holdings PLC | |
2.65% | | 01/05/22 | | | 100,000 | | | | 101,158 | |
3.40% | | 03/08/21 | | | 100,000 | | | | 101,627 | |
3.90% | | 05/25/26 | | | 150,000 | | | | 159,948 | |
5.10% | | 04/05/21 | | | 100,000 | | | | 103,688 | |
HSBC Holdings PLC (2.63% fixed rate until 11/07/24; 1.14% + 3 month USD LIBOR thereafter) | |
2.63% | | 11/07/25 | | | 100,000 | | | | 100,162 | (h) |
HSBC Holdings PLC (3.80% fixed rate until 03/11/24; 1.21% + 3 month USD LIBOR thereafter) | |
3.80% | | 03/11/25 | | | 100,000 | | | | 105,001 | (h) |
HSBC Holdings PLC (3.95% fixed rate until 05/18/23; 0.99% + 3 month USD LIBOR thereafter) | |
3.95% | | 05/18/24 | | | 100,000 | | | | 105,073 | (h) |
HSBC Holdings PLC (3.97% fixed rate until 05/22/29; 1.61% + 3 month USD LIBOR thereafter) | |
3.97% | | 05/22/30 | | | 100,000 | | | | 107,764 | (h) |
HSBC Holdings PLC (4.29% fixed rate until 09/12/25; 1.35% + 3 month USD LIBOR thereafter) | |
4.29% | | 09/12/26 | | | 100,000 | | | | 108,249 | (h) |
Hubbell Inc. | | | | | | | | | | |
3.50% | | 02/15/28 | | | 50,000 | | | | 51,589 | |
Hudson Pacific Properties LP | |
4.65% | | 04/01/29 | | | 25,000 | | | | 27,487 | |
Humana Inc. | | | | | | | | | | |
2.90% | | 12/15/22 | | | 100,000 | | | | 101,977 | |
Huntington Bancshares Inc. | |
3.15% | | 03/14/21 | | | 150,000 | | | | 151,980 | |
Huntsman International LLC | |
4.50% | | 05/01/29 | | | 20,000 | | | | 21,304 | |
Husky Energy Inc. | | | | | | | | | | |
4.00% | | 04/15/24 | | | 100,000 | | | | 105,601 | |
IBM Credit LLC | | | | | | | | | | |
2.65% | | 02/05/21 | | | 100,000 | | | | 100,913 | |
3.60% | | 11/30/21 | | | 100,000 | | | | 103,347 | |
IHS Markit Ltd. | | | | | | | | | | |
4.25% | | 05/01/29 | | | 85,000 | | | | 91,696 | |
Illinois Tool Works Inc. | | | | | |
2.65% | | 11/15/26 | | | 100,000 | | | | 102,969 | |
3.50% | | 03/01/24 | | | 50,000 | | | | 52,954 | |
Indiana Michigan Power Co. | | | | | | | | |
3.85% | | 05/15/28 | | | 25,000 | | | | 27,189 | |
ING Groep N.V. | | | | | | | | | | |
3.95% | | 03/29/27 | | | 100,000 | | | | 107,639 | |
| | | | | | | | | | |
| | | Principal
Amount | | | Fair
Value | |
Ingersoll-Rand Global Holding Company Ltd. | |
4.25% | | 06/15/23 | | $ | 100,000 | | | $ | 106,679 | |
Ingersoll-Rand Luxembourg Finance S.A. | |
4.50% | | 03/21/49 | | | 100,000 | | | | 111,838 | |
Intel Corp. | | | | | | | | | | |
2.45% | | 11/15/29 | | | 100,000 | | | | 99,866 | |
2.60% | | 05/19/26 | | | 150,000 | | | | 153,327 | |
Inter-American Development Bank | |
1.25% | | 09/14/21 | | | 400,000 | | | | 397,372 | |
2.13% | | 01/15/25 | | | 200,000 | | | | 203,400 | |
2.38% | | 07/07/27 | | | 200,000 | | | | 206,546 | |
2.63% | | 04/19/21 | | | 100,000 | | | | 101,244 | |
3.00% | | 09/26/22 | | | 50,000 | | | | 51,774 | |
Intercontinental Exchange Inc. | |
3.45% | | 09/21/23 | | | 90,000 | | | | 94,433 | |
International Bank for Reconstruction & Development | |
1.50% | | 08/28/24 | | | 200,000 | | | | 197,802 | |
2.50% | | 03/19/24 - 07/29/25 | | | 300,000 | | | | 310,589 | |
2.75% | | 07/23/21 | | | 200,000 | | | | 203,354 | |
3.00% | | 09/27/23 | | | 150,000 | | | | 157,156 | |
International Business Machines Corp. | |
2.50% | | 01/27/22 | | | 150,000 | | | | 151,819 | |
2.85% | | 05/13/22 | | | 100,000 | | | | 102,203 | |
3.50% | | 05/15/29 | | | 130,000 | | | | 139,719 | |
4.00% | | 06/20/42 | | | 150,000 | | | | 165,081 | |
International Finance Corp. | |
2.00% | | 10/24/22 | | | 100,000 | | | | 100,953 | |
2.13% | | 04/07/26 | | | 150,000 | | | | 152,482 | |
2.25% | | 01/25/21 | | | 100,000 | | | | 100,599 | |
International Flavors & Fragrances Inc. | |
5.00% | | 09/26/48 | | | 15,000 | | | | 16,918 | |
International Paper Co. | |
3.65% | | 06/15/24 | | | 150,000 | | | | 157,981 | |
Invesco Finance PLC | |
3.13% | | 11/30/22 | | | 100,000 | | | | 102,759 | |
Jabil Inc. | | | | | | | | | | |
3.95% | | 01/12/28 | | | 100,000 | | | | 102,661 | |
4.70% | | 09/15/22 | | | 23,000 | | | | 24,293 | |
Jefferies Group LLC | |
5.13% | | 01/20/23 | | | 150,000 | | | | 162,201 | |
John Deere Capital Corp. | |
2.30% | | 06/07/21 | | | 100,000 | | | | 100,635 | |
2.35% | | 01/08/21 | | | 100,000 | | | | 100,529 | |
2.70% | | 01/06/23 | | | 100,000 | | | | 102,172 | |
2.88% | | 03/12/21 | | | 50,000 | | | | 50,632 | |
3.45% | | 06/07/23 - 03/13/25 | | | 75,000 | | | | 79,457 | |
Johnson & Johnson | |
2.45% | | 12/05/21 - 03/01/26 | | | 175,000 | | | | 177,770 | |
2.90% | | 01/15/28 | | | 50,000 | | | | 52,218 | |
3.40% | | 01/15/38 | | | 25,000 | | | | 26,826 | |
3.50% | | 01/15/48 | | | 30,000 | | | | 32,801 | |
4.38% | | 12/05/33 | | | 150,000 | | | | 179,106 | |
Johnson Controls International PLC | |
3.63% | | 07/02/24 | | | 75,000 | | | | 78,529 | (i) |
JPMorgan Chase & Co. | |
3.13% | | 01/23/25 | | | 150,000 | | | | 156,604 | |
3.25% | | 09/23/22 | | | 136,000 | | | | 140,572 | |
3.38% | | 05/01/23 | | | 150,000 | | | | 156,108 | |
4.50% | | 01/24/22 | | | 103,000 | | | | 108,263 | |
4.63% | | 05/10/21 | | | 100,000 | | | | 103,610 | |
6.40% | | 05/15/38 | | | 100,000 | | | | 145,130 | |
JPMorgan Chase & Co. (2.30% fixed rate until 10/15/24; 1.16% + SOFR thereafter) | |
2.30% | | 10/15/25 | | | 125,000 | | | | 124,857 | (h) |
JPMorgan Chase & Co. (2.74% fixed rate until 10/15/29; 1.51% + SOFR thereafter) | |
2.74% | | 10/15/30 | | | 100,000 | | | | 100,144 | (h) |
JPMorgan Chase & Co. (3.21% fixed rate until 04/01/22; 0.70% + 3 month USD LIBOR thereafter) | |
3.21% | | 04/01/23 | | | 80,000 | | | | 81,971 | (h) |
See Notes to Schedules of Investments and Notes to Financial Statements.
| | |
| State Street Total Return V.I.S. Fund | | |
| Schedule of Investments | | December 31, 2019 |
| | | | | | | | | | |
| | | Principal
Amount | | | Fair
Value | |
JPMorgan Chase & Co. (3.51% fixed rate until 06/18/21; 0.61% + 3 month USD LIBOR thereafter) | |
3.51% | | 06/18/22 | | $ | 100,000 | | | $ | 102,144 | (h) |
JPMorgan Chase & Co. (3.54% fixed rate until 05/01/27; 1.38% + 3 month USD LIBOR thereafter) | |
3.54% | | 05/01/28 | | | 150,000 | | | | 159,099 | (h) |
JPMorgan Chase & Co. (3.70% fixed rate until 05/06/29; 1.16% + 3 month USD LIBOR thereafter) | |
3.70% | | 05/06/30 | | | 175,000 | | | | 188,596 | (h) |
JPMorgan Chase & Co. (3.80% fixed rate until 07/23/23; 0.89% + 3 month USD LIBOR thereafter) | |
3.80% | | 07/23/24 | | | 100,000 | | | | 105,413 | (h) |
JPMorgan Chase & Co. (3.88% fixed rate until 07/24/37; 1.36% + 3 month USD LIBOR thereafter) | |
3.88% | | 07/24/38 | | | 150,000 | | | | 166,008 | (h) |
JPMorgan Chase & Co. (3.90% fixed rate until 01/23/48; 1.22% + 3 month USD LIBOR thereafter) | |
3.90% | | 01/23/49 | | | 100,000 | | | | 112,365 | (h) |
JPMorgan Chase & Co. (3.96% fixed rate until 01/29/26; 1.25% + 3 month USD LIBOR thereafter) | |
3.96% | | 01/29/27 | | | 100,000 | | | | 108,488 | (h) |
JPMorgan Chase & Co. (3.96% fixed rate until 11/15/47; 1.38% + 3 month USD LIBOR thereafter) | |
3.96% | | 11/15/48 | | | 100,000 | | | | 113,152 | (h) |
JPMorgan Chase & Co. (4.02% fixed rate until 12/05/23; 1.00% + 3 month USD LIBOR thereafter) | |
4.02% | | 12/05/24 | | | 150,000 | | | | 159,985 | (h) |
JPMorgan Chase & Co. (4.45% fixed rate until 12/05/28; 1.33% + 3 month USD LIBOR thereafter) | |
4.45% | | 12/05/29 | | | 150,000 | | | | 170,821 | (h) |
Juniper Networks Inc. | |
3.75% | | 08/15/29 | | | 50,000 | | | | 52,056 | |
Kansas City Southern | | | | | | | | | | |
4.70% | | 05/01/48 | | | 50,000 | | | | 58,339 | |
Kellogg Co. | | | | | | | | | | |
2.65% | | 12/01/23 | | | 84,000 | | | | 85,573 | |
Kennametal Inc. | | | | | | | | | | |
4.63% | | 06/15/28 | | | 25,000 | | | | 26,610 | |
Kentucky Utilities Co. | |
4.38% | | 10/01/45 | | | 40,000 | | | | 46,161 | |
Keurig Dr Pepper Inc. | |
3.13% | | 12/15/23 | | | 100,000 | | | | 103,106 | |
Keurig Dr Pepper Inc. | |
3.55% | | 05/25/21 | | | 100,000 | | | | 102,165 | |
4.60% | | 05/25/28 | | | 50,000 | | | | 56,316 | |
4.99% | | 05/25/38 | | | 125,000 | | | | 146,866 | |
KeyBank NA | | | | | | | | | | |
3.38% | | 03/07/23 | | | 150,000 | | | | 156,259 | |
3.90% | | 04/13/29 | | | 100,000 | | | | 107,793 | |
Keysight Technologies Inc. | |
3.00% | | 10/30/29 | | | 25,000 | | | | 25,123 | |
Kilroy Realty LP | | | | | | | | | | |
3.45% | | 12/15/24 | | | 50,000 | | | | 52,053 | |
Kimberly-Clark Corp. | |
3.20% | | 07/30/46 | | | 125,000 | | | | 125,159 | |
Kimco Realty Corp. | | | | | | | | | | |
3.70% | | 10/01/49 | | | 50,000 | | | | 48,760 | |
Kinder Morgan Energy Partners LP | |
5.00% | | 08/15/42 | | | 242,000 | | | | 264,767 | |
Kinder Morgan Inc. | | | | | | | | | | |
4.30% | | 06/01/25 | | | 115,000 | | | | 124,604 | |
5.05% | | 02/15/46 | | | 150,000 | | | | 168,576 | |
5.30% | | 12/01/34 | | | 100,000 | | | | 117,796 | |
KLA Corp. | | | | | | | | | | |
4.65% | | 11/01/24 | | | 115,000 | | | | 126,796 | |
Koninklijke Philips N.V. | |
6.88% | | 03/11/38 | | | 100,000 | | | | 143,023 | |
Kraft Heinz Foods Co. | |
3.38% | | 06/15/21 | | | 15,000 | | | | 15,272 | |
4.63% | | 01/30/29 | | | 50,000 | | | | 54,972 | |
5.00% | | 06/04/42 | | | 150,000 | | | | 160,620 | |
5.20% | | 07/15/45 | | | 150,000 | | | | 163,438 | |
| | | | | | | | | | |
| | | Principal
Amount | | | Fair
Value | |
Kreditanstalt fuer Wiederaufbau | |
1.75% | | 09/15/21 | | $ | 300,000 | | | $ | 300,492 | |
2.00% | | 09/29/22 - 05/02/25 | | | 350,000 | | | | 353,518 | |
2.50% | | 02/15/22 | | | 200,000 | | | | 203,482 | |
2.63% | | 04/12/21 - 02/28/24 | | | 375,000 | | | | 384,782 | |
2.88% | | 04/03/28 | | | 175,000 | | | | 187,547 | |
L3Harris Technologies Inc. | |
3.83% | | 04/27/25 | | | 150,000 | | | | 160,050 | |
3.85% | | 12/15/26 | | | 100,000 | | | | 107,072 | (d) |
4.85% | | 04/27/35 | | | 40,000 | | | | 47,196 | |
Laboratory Corporation of America Holdings | |
4.00% | | 11/01/23 | | | 100,000 | | | | 105,687 | |
Lam Research Corp. | | | | | | | | | | |
3.80% | | 03/15/25 | | | 115,000 | | | | 123,117 | |
Landwirtschaftliche Rentenbank | |
2.50% | | 11/15/27 | | | 100,000 | | | | 104,269 | |
Las Vegas Sands Corp. | |
2.90% | | 06/25/25 | | | 65,000 | | | | 65,792 | |
3.90% | | 08/08/29 | | | 40,000 | | | | 41,889 | |
Lazard Group LLC | | | | | | | | | | |
4.38% | | 03/11/29 | | | 150,000 | | | | 164,143 | |
Lear Corp. | | | | | | | | | | |
4.25% | | 05/15/29 | | | 25,000 | | | | 25,867 | |
Leggett & Platt Inc. | | | | | | | | | | |
3.50% | | 11/15/27 | | | 50,000 | | | | 51,570 | |
4.40% | | 03/15/29 | | | 100,000 | | | | 109,415 | |
Liberty Property LP | | | | | | | | | | |
4.38% | | 02/01/29 | | | 65,000 | | | | 73,956 | |
Life Storage LP | | | | | | | | | | |
4.00% | | 06/15/29 | | | 50,000 | | | | 53,470 | |
Lincoln National Corp. | |
3.63% | | 12/12/26 | | | 50,000 | | | | 52,826 | |
4.20% | | 03/15/22 | | | 117,000 | | | | 121,987 | |
Lloyds Banking Group PLC | |
3.00% | | 01/11/22 | | | 100,000 | | | | 101,571 | |
3.90% | | 03/12/24 | | | 100,000 | | | | 105,747 | |
4.45% | | 05/08/25 | | | 100,000 | | | | 109,174 | |
4.65% | | 03/24/26 | | | 150,000 | | | | 163,239 | |
Lloyds Banking Group PLC (2.86% fixed rate until 03/23/22; 1.25% + 3 month USD LIBOR thereafter) | |
2.86% | | 03/17/23 | | | 100,000 | | | | 101,257 | (h) |
Lockheed Martin Corp. | |
3.60% | | 03/01/35 | | | 55,000 | | | | 60,152 | |
4.70% | | 05/15/46 | | | 150,000 | | | | 190,324 | |
Loews Corp. | | | | | | | | | | |
2.63% | | 05/15/23 | | | 100,000 | | | | 101,985 | |
Lowe’s Companies Inc. | |
2.50% | | 04/15/26 | | | 130,000 | | | | 130,744 | |
3.38% | | 09/15/25 | | | 30,000 | | | | 31,695 | |
LYB International Finance BV | |
4.88% | | 03/15/44 | | | 100,000 | | | | 113,761 | |
LYB International Finance II BV | |
3.50% | | 03/02/27 | | | 100,000 | | | | 104,952 | |
LyondellBasell Industries N.V. | |
6.00% | | 11/15/21 | | | 100,000 | | | | 106,213 | |
M&T Bank Corp. | | | | | | | | | | |
3.55% | | 07/26/23 | | | 150,000 | | | | 157,807 | |
Macy’s Retail Holdings Inc. | |
3.88% | | 01/15/22 | | | 84,000 | | | | 85,759 | |
Marathon Petroleum Corp. | |
3.80% | | 04/01/28 | | | 30,000 | | | | 31,526 | |
4.50% | | 04/01/48 | | | 25,000 | | | | 26,601 | |
4.75% | | 12/15/23 | | | 50,000 | | | | 54,284 | |
5.13% | | 12/15/26 | | | 50,000 | | | | 56,697 | |
Markel Corp. | | | | | | | | | | |
3.50% | | 11/01/27 | | | 50,000 | | | | 51,738 | |
Marriott International Inc. | |
4.00% | | 04/15/28 | | | 150,000 | | | | 162,091 | |
Marsh & McLennan Companies Inc. | |
3.88% | | 03/15/24 | | | 100,000 | | | | 106,713 | |
4.38% | | 03/15/29 | | | 25,000 | | | | 28,523 | |
4.75% | | 03/15/39 | | | 100,000 | | | | 121,240 | |
See Notes to Schedules of Investments and Notes to Financial Statements.
| | |
| State Street Total Return V.I.S. Fund | | |
| Schedule of Investments | | December 31, 2019 |
| | | | | | | | | | |
| | | Principal
Amount | | | Fair
Value | |
4.90% | | 03/15/49 | | $ | 15,000 | | | $ | 19,016 | |
Martin Marietta Materials Inc. | |
3.50% | | 12/15/27 | | | 50,000 | | | | 52,347 | |
Masco Corp. | |
3.50% | | 04/01/21 | | | 60,000 | | | | 60,875 | |
4.38% | | 04/01/26 | | | 40,000 | | | | 43,188 | |
Massachusetts Institute of Technology | |
3.89% | | 07/01/16 | | | 126,000 | | | | 138,009 | |
Mastercard Inc. | | | | | | | | | | |
2.00% | | 03/03/25 | | | 100,000 | | | | 99,770 | |
2.95% | | 11/21/26 | | | 100,000 | | | | 104,373 | |
McDonald’s Corp. | |
3.63% | | 09/01/49 | | | 30,000 | | | | 30,664 | |
3.70% | | 02/15/42 | | | 150,000 | | | | 153,405 | |
3.80% | | 04/01/28 | | | 50,000 | | | | 54,467 | |
McKesson Corp. | |
3.80% | | 03/15/24 | | | 150,000 | | | | 157,839 | |
Mead Johnson Nutrition Co. | |
4.13% | | 11/15/25 | | | 110,000 | | | | 120,825 | |
Medtronic Inc. | |
4.63% | | 03/15/45 | | | 82,000 | | | | 103,044 | |
Memorial Sloan-Kettering Cancer Center | |
4.13% | | 07/01/52 | | | 95,000 | | | | 108,107 | |
Merck & Company Inc. | |
2.40% | | 09/15/22 | | | 128,000 | | | | 129,894 | |
2.75% | | 02/10/25 | | | 70,000 | | | | 72,571 | |
3.40% | | 03/07/29 | | | 25,000 | | | | 27,085 | |
3.90% | | 03/07/39 | | | 25,000 | | | | 28,579 | |
4.00% | | 03/07/49 | | | 115,000 | | | | 134,611 | |
Mercy Health | |
4.30% | | 07/01/28 | | | 100,000 | | | | 110,925 | |
Methanex Corp. | |
5.25% | | 12/15/29 | | | 25,000 | | | | 25,835 | |
MetLife Inc. | |
4.13% | | 08/13/42 | | | 150,000 | | | | 170,976 | |
6.50% | | 12/15/32 | | | 150,000 | | | | 211,258 | |
Microchip Technology Inc. | |
3.92% | | 06/01/21 | | | 100,000 | | | | 102,172 | |
Micron Technology Inc. | |
4.64% | | 02/06/24 | | | 15,000 | | | | 16,260 | |
4.66% | | 02/15/30 | | | 100,000 | | | | 110,154 | |
Microsoft Corp. | |
1.55% | | 08/08/21 | | | 150,000 | | | | 149,764 | |
2.40% | | 02/06/22 | | | 100,000 | | | | 101,422 | |
2.88% | | 02/06/24 | | | 150,000 | | | | 155,670 | |
3.45% | | 08/08/36 | | | 200,000 | | | | 219,290 | |
3.50% | | 02/12/35 | | | 65,000 | | | | 71,744 | |
3.75% | | 05/01/43 | | | 150,000 | | | | 167,578 | |
4.10% | | 02/06/37 | | | 100,000 | | | | 118,093 | |
4.45% | | 11/03/45 | | | 125,000 | | | | 156,676 | |
Mid-America Apartments LP | |
4.20% | | 06/15/28 | | | 100,000 | | | | 110,888 | |
MidAmerican Energy Co. | |
3.65% | | 04/15/29 | | | 100,000 | | | | 109,369 | |
Mitsubishi UFJ Financial Group Inc. | |
2.76% | | 09/13/26 | | | 150,000 | | | | 151,099 | |
3.22% | | 03/07/22 | | | 100,000 | | | | 102,421 | |
3.46% | | 03/02/23 | | | 100,000 | | | | 103,527 | |
3.78% | | 03/02/25 | | | 100,000 | | | | 106,536 | |
3.96% | | 03/02/28 | | | 100,000 | | | | 108,866 | |
4.05% | | 09/11/28 | | | 100,000 | | | | 110,103 | |
4.15% | | 03/07/39 | | | 70,000 | | | | 79,651 | |
Mizuho Financial Group Inc. | |
3.55% | | 03/05/23 | | | 100,000 | | | | 103,864 | |
4.02% | | 03/05/28 | | | 100,000 | | | | 109,035 | |
Mizuho Financial Group Inc. (2.84% fixed rate until 07/16/24; 0.98% + 3 month USD LIBOR thereafter) | |
2.84% | | 07/16/25 | | | 100,000 | | | | 101,231 | (h) |
Molson Coors Beverage Co. | |
3.00% | | 07/15/26 | | | 95,000 | | | | 96,073 | |
Mondelez International Inc. | |
4.13% | | 05/07/28 | | | 100,000 | | | | 110,898 | |
| | | | | | | | | | |
| | | Principal
Amount | | | Fair
Value | |
Moody’s Corp. | |
4.88% | | 02/15/24 - 12/17/48 | | $ | 150,000 | | | $ | 177,777 | |
Morgan Stanley | |
2.63% | | 11/17/21 | | | 100,000 | | | | 101,159 | |
2.75% | | 05/19/22 | | | 100,000 | | | | 101,728 | |
3.13% | | 01/23/23 | | | 100,000 | | | | 102,789 | |
3.95% | | 04/23/27 | | | 150,000 | | | | 160,639 | |
4.00% | | 07/23/25 | | | 95,000 | | | | 102,827 | |
4.10% | | 05/22/23 | | | 150,000 | | | | 158,298 | |
4.35% | | 09/08/26 | | | 150,000 | | | | 164,035 | |
4.88% | | 11/01/22 | | | 150,000 | | | | 160,881 | |
5.50% | | 07/28/21 | | | 98,000 | | | | 103,222 | |
Morgan Stanley (2.72% fixed rate until 07/22/24; 1.15% + SOFR thereafter) | |
2.72% | | 07/22/25 | | | 15,000 | | | | 15,212 | (h) |
Morgan Stanley (3.74% fixed rate until 04/24/23; 0.85% + 3 month USD LIBOR thereafter) | |
3.74% | | 04/24/24 | | | 110,000 | | | | 114,931 | (h) |
Morgan Stanley (3.77% fixed rate until 01/24/28; 1.14% + 3 month USD LIBOR thereafter) | |
3.77% | | 01/24/29 | | | 100,000 | | | | 107,589 | (h) |
Morgan Stanley (4.43% fixed rate until 01/23/29; 1.63% + 3 month USD LIBOR thereafter) | |
4.43% | | 01/23/30 | | | 100,000 | | | | 113,074 | (h) |
Morgan Stanley (4.46% fixed rate until 04/22/38; 1.43% + 3 month USD LIBOR thereafter) | |
4.46% | | 04/22/39 | | | 100,000 | | | | 117,815 | (h) |
Motorola Solutions Inc. | |
4.60% | | 02/23/28 | | | 100,000 | | | | 108,535 | |
MPLX LP | |
4.00% | | 03/15/28 | | | 35,000 | | | | 36,310 | |
4.25% | | 12/01/27 | | | 35,000 | | | | 36,855 | (d) |
4.50% | | 04/15/38 | | | 30,000 | | | | 30,592 | |
4.70% | | 04/15/48 | | | 25,000 | | | | 25,455 | |
4.80% | | 02/15/29 | | | 70,000 | | | | 76,806 | |
4.90% | | 04/15/58 | | | 25,000 | | | | 25,616 | |
5.50% | | 02/15/49 | | | 70,000 | | | | 79,414 | |
MUFG Americas Holdings Corp. | |
3.00% | | 02/10/25 | | | 120,000 | | | | 122,753 | |
MUFG Union Bank NA | |
3.15% | | 04/01/22 | | | 100,000 | | | | 102,354 | |
Mylan Inc. | |
4.55% | | 04/15/28 | | | 100,000 | | | | 107,652 | |
Mylan N.V. | |
3.15% | | 06/15/21 | | | 100,000 | | | | 101,283 | |
National Australia Bank Ltd. | |
2.80% | | 01/10/22 | | | 100,000 | | | | 101,695 | |
National Fuel Gas Co. | |
4.75% | | 09/01/28 | | | 50,000 | | | | 53,383 | |
National Oilwell Varco Inc. | |
3.60% | | 12/01/29 | | | 100,000 | | | | 100,433 | |
National Retail Properties Inc. | |
3.60% | | 12/15/26 | | | 100,000 | | | | 105,006 | |
National Rural Utilities Cooperative Finance Corp. | |
2.90% | | 03/15/21 | | | 70,000 | | | | 70,880 | |
3.40% | | 02/07/28 | | | 100,000 | | | | 106,202 | |
3.70% | | 03/15/29 | | | 50,000 | | | | 54,484 | |
4.40% | | 11/01/48 | | | 10,000 | | | | 11,892 | |
NetApp Inc. | |
3.38% | | 06/15/21 | | | 110,000 | | | | 111,879 | |
Newmont Goldcorp Corp. | |
3.50% | | 03/15/22 | | | 150,000 | | | | 153,883 | |
Nexen Inc. | |
6.40% | | 05/15/37 | | | 100,000 | | | | 136,875 | |
NextEra Energy Capital Holdings Inc. | |
2.40% | | 09/01/21 | | | 50,000 | | | | 50,371 | |
2.75% | | 11/01/29 | | | 30,000 | | | | 30,102 | |
3.15% | | 04/01/24 | | | 100,000 | | | | 103,656 | |
3.50% | | 04/01/29 | | | 100,000 | | | | 105,996 | |
NIKE Inc. | |
2.38% | | 11/01/26 | | | 150,000 | | | | 152,508 | |
NiSource Inc. | |
2.65% | | 11/17/22 | | | 40,000 | | | | 40,523 | |
See Notes to Schedules of Investments and Notes to Financial Statements.
| | |
| State Street Total Return V.I.S. Fund | | |
| Schedule of Investments | | December 31, 2019 |
| | | | | | | | | | |
| | | Principal
Amount | | | Fair
Value | |
3.65% | | 06/15/23 | | $ | 100,000 | | | $ | 104,040 | |
4.38% | | 05/15/47 | | | 100,000 | | | | 111,057 | |
Noble Energy Inc. | |
3.25% | | 10/15/29 | | | 100,000 | | | | 101,207 | |
Nordic Investment Bank | |
2.25% | | 02/01/21 | | | 200,000 | | | | 201,130 | |
Nordstrom Inc. | |
4.38% | | 04/01/30 | | | 35,000 | | | | 35,678 | |
Norfolk Southern Corp. | |
3.80% | | 08/01/28 | | | 30,000 | | | | 32,942 | |
3.94% | | 11/01/47 | | | 160,000 | | | | 171,850 | |
Northern Trust Corp. | |
3.65% | | 08/03/28 | | | 100,000 | | | | 109,461 | |
Northrop Grumman Corp. | |
2.55% | | 10/15/22 | | | 100,000 | | | | 101,503 | |
2.93% | | 01/15/25 | | | 50,000 | | | | 51,527 | |
3.25% | | 01/15/28 | | | 65,000 | | | | 67,805 | |
4.03% | | 10/15/47 | | | 75,000 | | | | 83,716 | |
Northwell Healthcare Inc. | |
3.81% | | 11/01/49 | | | 50,000 | | | | 50,398 | |
Northwestern University | |
3.66% | | 12/01/57 | | | 10,000 | | | | 11,057 | |
Novartis Capital Corp. | |
2.40% | | 09/21/22 | | | 102,000 | | | | 103,641 | |
3.00% | | 11/20/25 | | | 150,000 | | | | 157,839 | |
NSTAR Electric Co. | |
3.20% | | 05/15/27 | | | 100,000 | | | | 104,744 | |
Nutrien Ltd. | |
3.63% | | 03/15/24 | | | 150,000 | | | | 156,649 | |
4.00% | | 12/15/26 | | | 100,000 | | | | 106,710 | |
5.00% | | 04/01/49 | | | 50,000 | | | | 59,330 | |
NXP BV/NXP Funding LLC | |
5.55% | | 12/01/28 | | | 100,000 | | | | 117,082 | (d) |
O’Reilly Automotive Inc. | |
4.35% | | 06/01/28 | | | 100,000 | | | | 111,526 | |
Occidental Petroleum Corp. | |
2.70% | | 08/15/22 | | | 25,000 | | | | 25,273 | |
2.90% | | 08/15/24 | | | 30,000 | | | | 30,475 | |
3.40% | | 04/15/26 | | | 140,000 | | | | 143,322 | |
3.50% | | 08/15/29 | | | 20,000 | | | | 20,397 | |
4.10% | | 02/15/47 | | | 100,000 | | | | 97,140 | |
4.40% | | 08/15/49 | | | 15,000 | | | | 15,456 | |
6.20% | | 03/15/40 | | | 142,000 | | | | 169,636 | |
Oesterreichische Kontrollbank AG | |
2.63% | | 01/31/22 | | | 150,000 | | | | 152,758 | |
2.88% | | 09/07/21 | | | 100,000 | | | | 101,933 | |
Ohio Power Co. | |
4.15% | | 04/01/48 | | | 100,000 | | | | 114,888 | |
Oklahoma Gas & Electric Co. | |
3.30% | | 03/15/30 | | | 50,000 | | | | 52,346 | |
Omega Healthcare Investors Inc. | |
4.50% | | 04/01/27 | | | 100,000 | | | | 108,052 | |
Omnicom Group Inc./Omnicom Capital Inc. | |
3.63% | | 05/01/22 | | | 100,000 | | | | 103,548 | |
Oncor Electric Delivery Company LLC | |
2.75% | | 06/01/24 | | | 100,000 | | | | 102,348 | |
3.70% | | 11/15/28 | | | 100,000 | | | | 109,096 | |
3.80% | | 06/01/49 | | | 100,000 | | | | 109,280 | |
ONE Gas Inc. | |
4.50% | | 11/01/48 | | | 20,000 | | | | 23,950 | |
ONEOK Inc. | |
4.35% | | 03/15/29 | | | 50,000 | | | | 54,297 | |
ONEOK Partners LP | |
6.13% | | 02/01/41 | | | 162,000 | | | | 196,650 | |
Oracle Corp. | |
2.65% | | 07/15/26 | | | 100,000 | | | | 102,358 | |
3.25% | | 05/15/30 | | | 150,000 | | | | 159,922 | |
3.63% | | 07/15/23 | | | 125,000 | | | | 132,151 | |
4.00% | | 07/15/46 | | | 100,000 | | | | 111,079 | |
4.30% | | 07/08/34 | | | 100,000 | | | | 117,105 | |
Orange S.A. | |
9.00% | | 03/01/31 | | | 150,000 | | | | 232,752 | |
| | | | | | | | | | |
| | | Principal
Amount | | | Fair
Value | |
ORIX Corp. | |
4.05% | | 01/16/24 | | $ | 100,000 | | | $ | 106,407 | |
PACCAR Financial Corp. | |
3.10% | | 05/10/21 | | | 20,000 | | | | 20,306 | |
PacifiCorp | |
4.15% | | 02/15/50 | | | 50,000 | | | | 57,448 | |
6.25% | | 10/15/37 | | | 153,000 | | | | 214,084 | |
Packaging Corporation of America | |
3.40% | | 12/15/27 | | | 35,000 | | | | 36,537 | |
Parker-Hannifin Corp. | |
4.00% | | 06/14/49 | | | 20,000 | | | | 21,696 | |
4.20% | | 11/21/34 | | | 100,000 | | | | 110,156 | |
Patterson-UTI Energy Inc. | |
3.95% | | 02/01/28 | | | 100,000 | | | | 97,035 | |
PayPal Holdings Inc. | |
2.40% | | 10/01/24 | | | 35,000 | | | | 35,341 | |
2.85% | | 10/01/29 | | | 30,000 | | | | 30,240 | |
PepsiCo Inc. | |
2.00% | | 04/15/21 | | | 100,000 | | | | 100,317 | |
2.75% | | 03/01/23 | | | 150,000 | | | | 154,071 | |
2.88% | | 10/15/49 | | | 25,000 | | | | 24,168 | |
3.00% | | 10/15/27 | | | 100,000 | | | | 105,969 | |
3.38% | | 07/29/49 | | | 35,000 | | | | 36,707 | |
3.45% | | 10/06/46 | | | 50,000 | | | | 52,990 | |
PerkinElmer Inc. | |
3.30% | | 09/15/29 | | | 15,000 | | | | 15,380 | |
Petroleos Mexicanos | |
4.50% | | 01/23/26 | | | 100,000 | | | | 99,531 | |
5.50% | | 06/27/44 | | | 58,000 | | | | 51,878 | |
6.38% | | 01/23/45 | | | 150,000 | | | | 145,318 | |
6.49% | | 01/23/27 | | | 150,000 | | | | 160,032 | (d) |
6.50% | | 01/23/29 - 06/02/41 | | | 242,000 | | | | 244,693 | |
6.75% | | 09/21/47 | | | 113,000 | | | | 113,864 | |
Pfizer Inc. | |
2.80% | | 03/11/22 | | | 100,000 | | | | 102,237 | |
3.00% | | 09/15/21 | | | 120,000 | | | | 122,502 | |
3.20% | | 09/15/23 | | | 125,000 | | | | 130,440 | |
3.45% | | 03/15/29 | | | 50,000 | | | | 53,811 | |
3.60% | | 09/15/28 | | | 50,000 | | | | 54,735 | |
3.90% | | 03/15/39 | | | 125,000 | | | | 140,922 | |
4.00% | | 12/15/36 - 03/15/49 | | | 125,000 | | | | 142,436 | |
4.30% | | 06/15/43 | | | 100,000 | | | | 117,399 | |
Philip Morris International Inc. | |
2.88% | | 05/01/24 | | | 150,000 | | | | 154,192 | |
3.13% | | 03/02/28 | | | 50,000 | | | | 51,496 | |
3.38% | | 08/15/29 | | | 50,000 | | | | 52,433 | |
3.88% | | 08/21/42 | | | 92,000 | | | | 95,935 | |
Phillips 66 | |
3.90% | | 03/15/28 | | | 50,000 | | | | 54,572 | |
4.88% | | 11/15/44 | | | 45,000 | | | | 54,307 | |
Phillips 66 Partners LP | |
3.15% | | 12/15/29 | | | 50,000 | | | | 49,814 | |
3.75% | | 03/01/28 | | | 10,000 | | | | 10,433 | |
4.68% | | 02/15/45 | | | 10,000 | | | | 10,794 | |
Plains All American Pipeline LP/PAA Finance Corp. | |
3.85% | | 10/15/23 | | | 100,000 | | | | 103,449 | |
4.50% | | 12/15/26 | | | 100,000 | | | | 106,376 | |
PNC Bank NA | |
2.55% | | 12/09/21 | | | 150,000 | | | | 151,798 | |
2.95% | | 02/23/25 | | | 100,000 | | | | 103,549 | |
3.10% | | 10/25/27 | | | 100,000 | | | | 104,514 | |
PPG Industries Inc. | |
3.75% | | 03/15/28 | | | 50,000 | | | | 54,278 | |
PPL Electric Utilities Corp. | |
4.15% | | 06/15/48 | | | 100,000 | | | | 113,706 | |
President & Fellows of Harvard College | |
3.15% | | 07/15/46 | | | 50,000 | | | | 50,929 | |
Principal Financial Group Inc. | |
3.40% | | 05/15/25 | | | 150,000 | | | | 156,832 | |
Prologis LP | |
4.25% | | 08/15/23 | | | 150,000 | | | | 160,603 | |
See Notes to Schedules of Investments and Notes to Financial Statements.
| | |
| State Street Total Return V.I.S. Fund | | |
| Schedule of Investments | | December 31, 2019 |
| | | | | | | | | | |
| | | Principal
Amount | | | Fair
Value | |
Providence Saint Joseph Health Obligated Group | |
3.93% | | 10/01/48 | | $ | 20,000 | | | $ | 21,531 | |
Providence St Joseph Health Obligated Group | |
2.53% | | 10/01/29 | | | 20,000 | | | | 19,650 | |
Prudential Financial Inc. | |
3.70% | | 03/13/51 | | | 50,000 | | | | 52,645 | |
3.94% | | 12/07/49 | | | 90,000 | | | | 98,230 | |
4.35% | | 02/25/50 | | | 100,000 | | | | 115,266 | |
Prudential Financial Inc. (5.70% fixed rate until 09/15/28; 2.67% + 3 month USD LIBOR thereafter) | |
5.70% | | 09/15/48 | | | 100,000 | | | | 114,504 | (h) |
Public Service Company of Colorado | |
3.70% | | 06/15/28 | | | 50,000 | | | | 54,515 | |
4.10% | | 06/15/48 | | | 30,000 | | | | 34,518 | |
Public Service Electric & Gas Co. | |
2.38% | | 05/15/23 | | | 100,000 | | | | 101,309 | |
3.20% | | 08/01/49 | | | 90,000 | | | | 90,765 | |
3.65% | | 09/01/28 | | | 25,000 | | | | 27,233 | |
Public Service Enterprise Group Inc. | |
2.88% | | 06/15/24 | | | 15,000 | | | | 15,330 | |
Public Storage | |
3.39% | | 05/01/29 | | | 30,000 | | | | 31,895 | |
Puget Energy Inc. | |
3.65% | | 05/15/25 | | | 50,000 | | | | 51,631 | |
QUALCOMM Inc. | |
4.30% | | 05/20/47 | | | 100,000 | | | | 114,581 | |
4.65% | | 05/20/35 | | | 150,000 | | | | 178,699 | |
Quest Diagnostics Inc. | |
4.25% | | 04/01/24 | | | 150,000 | | | | 160,728 | |
Raytheon Co. | |
3.15% | | 12/15/24 | | | 90,000 | | | | 94,914 | |
Realty Income Corp. | |
4.65% | | 08/01/23 | | | 100,000 | | | | 108,250 | |
Regency Centers LP | |
4.13% | | 03/15/28 | | | 50,000 | | | | 54,022 | |
Regions Financial Corp. | |
3.80% | | 08/14/23 | | | 100,000 | | | | 105,884 | |
Reinsurance Group of America Inc. | |
3.90% | | 05/15/29 | | | 50,000 | | | | 53,668 | |
RELX Capital Inc. | |
3.50% | | 03/16/23 | | | 30,000 | | | | 31,218 | |
4.00% | | 03/18/29 | | | 25,000 | | | | 27,216 | |
RenaissanceRe Holdings Ltd. | |
3.60% | | 04/15/29 | | | 25,000 | | | | 26,381 | |
Republic Services Inc. | |
2.50% | | 08/15/24 | | | 70,000 | | | | 70,871 | |
Reynolds American Inc. | |
4.45% | | 06/12/25 | | | 100,000 | | | | 107,689 | |
Rio Tinto Finance USA Ltd. | |
5.20% | | 11/02/40 | | | 150,000 | | | | 196,623 | |
Rockwell Automation Inc. | |
3.50% | | 03/01/29 | | | 45,000 | | | | 48,470 | |
Rogers Communications Inc. | |
2.90% | | 11/15/26 | | | 100,000 | | | | 101,869 | |
3.00% | | 03/15/23 | | | 50,000 | | | | 51,315 | |
3.63% | | 12/15/25 | | | 60,000 | | | | 63,955 | |
3.70% | | 11/15/49 | | | 100,000 | | | | 101,438 | |
Roper Technologies Inc. | |
3.80% | | 12/15/26 | | | 100,000 | | | | 107,546 | |
Royal Bank of Canada | |
2.30% | | 03/22/21 | | | 150,000 | | | | 150,792 | |
2.75% | | 02/01/22 | | | 50,000 | | | | 50,925 | |
2.80% | | 04/29/22 | | | 100,000 | | | | 102,122 | |
Royal Bank of Scotland Group PLC | |
3.88% | | 09/12/23 | | | 100,000 | | | | 104,705 | |
5.13% | | 05/28/24 | | | 80,000 | | | | 86,922 | |
6.00% | | 12/19/23 | | | 75,000 | | | | 83,301 | |
6.10% | | 06/10/23 | | | 35,000 | | | | 38,542 | |
6.13% | | 12/15/22 | | | 85,000 | | | | 92,998 | |
Royal Bank of Scotland Group PLC (4.89% fixed rate until 05/18/28; 1.75% + 3 month USD LIBOR thereafter) | |
4.89% | | 05/18/29 | | | 100,000 | | | | 112,920 | (h) |
| | | | | | | | | | |
| | | Principal
Amount | | | Fair
Value | |
RPM International Inc. | |
4.25% | | 01/15/48 | | $ | 50,000 | | | $ | 49,236 | |
Ryder System Inc. | |
3.40% | | 03/01/23 | | | 150,000 | | | | 154,606 | |
S&P Global Inc. | |
4.40% | | 02/15/26 | | | 100,000 | | | | 111,053 | |
Sabine Pass Liquefaction LLC | |
5.63% | | 03/01/25 | | | 135,000 | | | | 151,764 | |
5.75% | | 05/15/24 | | | 35,000 | | | | 39,047 | |
Sabra Health Care LP | |
3.90% | | 10/15/29 | | | 25,000 | | | | 25,098 | |
San Diego Gas & Electric Co. | |
3.60% | | 09/01/23 | | | 100,000 | | | | 104,612 | |
Sanofi | |
3.63% | | 06/19/28 | | | 100,000 | | | | 110,726 | |
Santander Holdings USA Inc. | |
3.40% | | 01/18/23 | | | 50,000 | | | | 51,277 | |
4.40% | | 07/13/27 | | | 50,000 | | | | 54,053 | |
4.45% | | 12/03/21 | | | 100,000 | | | | 103,910 | |
Santander UK Group Holdings PLC (3.37% fixed rate until 01/05/23; 1.08% + 3 month USD LIBOR thereafter) | |
3.37% | | 01/05/24 | | | 100,000 | | | | 102,309 | (h) |
Santander UK PLC | |
2.88% | | 06/18/24 | | | 100,000 | | | | 102,198 | |
Seagate HDD Cayman | |
4.75% | | 06/01/23 | | | 51,000 | | | | 54,109 | |
Sempra Energy | |
3.80% | | 02/01/38 | | | 100,000 | | | | 104,436 | |
4.05% | | 12/01/23 | | | 50,000 | | | | 53,256 | |
Service Properties Trust | |
4.65% | | 03/15/24 | | | 150,000 | | | | 155,862 | |
Shell International Finance BV | |
3.13% | | 11/07/49 | | | 100,000 | | | | 98,621 | |
3.50% | | 11/13/23 | | | 140,000 | | | | 147,482 | |
4.00% | | 05/10/46 | | | 150,000 | | | | 170,829 | |
4.13% | | 05/11/35 | | | 150,000 | | | | 174,775 | |
4.38% | | 05/11/45 | | | 100,000 | | | | 119,292 | |
Shire Acquisitions Investments Ireland DAC | |
3.20% | | 09/23/26 | | | 150,000 | | | | 154,594 | |
Simon Property Group LP | |
2.00% | | 09/13/24 | | | 100,000 | | | | 99,664 | |
2.45% | | 09/13/29 | | | 100,000 | | | | 98,612 | |
2.75% | | 02/01/23 | | | 121,000 | | | | 123,707 | |
3.25% | | 09/13/49 | | | 100,000 | | | | 97,235 | |
SL Green Operating Partnership LP | |
3.25% | | 10/15/22 | | | 30,000 | | | | 30,746 | |
Southern California Edison Co. | |
3.40% | | 06/01/23 | | | 100,000 | | | | 103,264 | |
3.60% | | 02/01/45 | | | 125,000 | | | | 122,564 | |
4.20% | | 03/01/29 | | | 100,000 | | | | 110,164 | |
Southern Copper Corp. | |
5.88% | | 04/23/45 | | | 155,000 | | | | 193,764 | |
Southwest Airlines Co. | |
3.00% | | 11/15/26 | | | 100,000 | | | | 102,518 | |
Southwestern Electric Power Co. | |
3.85% | | 02/01/48 | | | 100,000 | | | | 103,393 | |
Spectra Energy Partners LP | |
3.50% | | 03/15/25 | | | 150,000 | | | | 157,090 | |
Spirit Realty LP | |
3.40% | | 01/15/30 | | | 25,000 | | | | 25,105 | |
SSM Health Care Corp. | |
3.69% | | 06/01/23 | | | 10,000 | | | | 10,398 | |
Stanley Black & Decker Inc. | |
2.90% | | 11/01/22 | | | 150,000 | | | | 153,708 | |
Starbucks Corp. | |
3.10% | | 03/01/23 | | | 50,000 | | | | 51,615 | |
3.50% | | 03/01/28 | | | 50,000 | | | | 53,645 | |
3.75% | | 12/01/47 | | | 35,000 | | | | 36,030 | |
Stryker Corp. | |
3.65% | | 03/07/28 | | | 150,000 | | | | 161,451 | |
Sumitomo Mitsui Financial Group Inc. | |
2.70% | | 07/16/24 | | | 100,000 | | | | 101,430 | |
See Notes to Schedules of Investments and Notes to Financial Statements.
| | |
| State Street Total Return V.I.S. Fund | | |
| Schedule of Investments | | December 31, 2019 |
| | | | | | | | | | |
| | | Principal
Amount | | | Fair
Value | |
2.78% | | 10/18/22 | | $ | 100,000 | | | $ | 101,934 | |
3.01% | | 10/19/26 | | | 100,000 | | | | 102,415 | |
3.35% | | 10/18/27 | | | 50,000 | | | | 52,128 | |
3.94% | | 10/16/23 | | | 100,000 | | | | 105,955 | |
4.31% | | 10/16/28 | | | 100,000 | | | | 111,759 | |
Suncor Energy Inc. | | | | | | | | | | |
6.85% | | 06/01/39 | | | 150,000 | | | | 216,730 | |
Sunoco Logistics Partners Operations LP | |
5.95% | | 12/01/25 | | | 150,000 | | | | 171,612 | |
Svensk Exportkredit AB | |
1.63% | | 11/14/22 | | | 200,000 | | | | 199,494 | |
Svenska Handelsbanken AB | |
3.35% | | 05/24/21 | | | 150,000 | | | | 152,956 | |
Synchrony Financial | | | | | | | | | | |
2.85% | | 07/25/22 | | | 15,000 | | | | 15,200 | |
3.95% | | 12/01/27 | | | 100,000 | | | | 105,339 | |
4.38% | | 03/19/24 | | | 35,000 | | | | 37,335 | |
Takeda Pharmaceutical Company Ltd. | |
4.00% | | 11/26/21 | | | 100,000 | | | | 103,471 | |
4.40% | | 11/26/23 | | | 50,000 | | | | 53,726 | |
5.00% | | 11/26/28 | | | 50,000 | | | | 58,258 | |
Tampa Electric Co. | | | | | | | | | | |
4.30% | | 06/15/48 | | | 50,000 | | | | 57,820 | |
Target Corp. | | | | | | | | | | |
3.38% | | 04/15/29 | | | 50,000 | | | | 54,348 | |
3.90% | | 11/15/47 | | | 50,000 | | | | 57,576 | |
4.00% | | 07/01/42 | | | 150,000 | | | | 172,293 | |
TC PipeLines LP | | | | | | | | | | |
3.90% | | 05/25/27 | | | 100,000 | | | | 104,270 | |
TD Ameritrade Holding Corp. | |
2.95% | | 04/01/22 | | | 150,000 | | | | 153,343 | |
Teck Resources Ltd. | | | | | | | | | | |
6.25% | | 07/15/41 | | | 100,000 | | | | 114,800 | |
Telefonica Emisiones S.A. | |
4.10% | | 03/08/27 | | | 100,000 | | | | 108,272 | |
Telefonica Emisiones S.A. | |
4.90% | | 03/06/48 | | | 150,000 | | | | 171,462 | |
TELUS Corp. | | | | | | | | | | |
4.60% | | 11/16/48 | | | 50,000 | | | | 58,929 | |
Texas Instruments Inc. | |
3.88% | | 03/15/39 | | | 100,000 | | | | 113,610 | |
Textron Inc. | | | | | | | | | | |
3.90% | | 09/17/29 | | | 50,000 | | | | 53,378 | |
The Allstate Corp. | | | | | | | | | | |
4.20% | | 12/15/46 | | | 100,000 | | | | 116,701 | |
The Allstate Corp. (5.75% fixed rate until 08/15/23; 2.94% + 3 month USD LIBOR thereafter) | |
5.75% | | 08/15/53 | | | 50,000 | | | | 53,827 | (h) |
The Bank of New York Mellon Corp. | |
2.80% | | 05/04/26 | | | 30,000 | | | | 30,838 | |
3.00% | | 02/24/25 | | | 105,000 | | | | 109,115 | |
3.45% | | 08/11/23 | | | 100,000 | | | | 105,391 | |
3.50% | | 04/28/23 | | | 100,000 | | | | 104,821 | |
3.85% | | 04/28/28 | | | 100,000 | | | | 111,847 | |
The Bank of Nova Scotia | |
2.00% | | 11/15/22 | | | 100,000 | | | | 100,178 | |
2.50% | | 01/08/21 | | | 100,000 | | | | 100,577 | |
3.13% | | 04/20/21 | | | 100,000 | | | | 101,589 | |
The Boeing Co. | | | | | | | | | | |
2.30% | | 08/01/21 | | | 15,000 | | | | 15,083 | |
2.95% | | 02/01/30 | | | 50,000 | | | | 51,028 | |
3.20% | | 03/01/29 | | | 50,000 | | | | 52,258 | |
3.38% | | 06/15/46 | | | 150,000 | | | | 148,078 | |
3.75% | | 02/01/50 | | | 50,000 | | | | 53,165 | |
The Charles Schwab Corp. | |
3.85% | | 05/21/25 | | | 150,000 | | | | 162,952 | |
The Clorox Co. | | | | | | | | | | |
3.50% | | 12/15/24 | | | 150,000 | | | | 159,732 | |
The Coca-Cola Co. | | | | | | | | | | |
2.13% | | 09/06/29 | | | 100,000 | | | | 97,548 | |
The Dayton Power & Light Co. | |
3.95% | | 06/15/49 | | | 15,000 | | | | 15,351 | (d) |
| | | | | | | | | | |
| | | Principal
Amount | | | Fair
Value | |
The Dow Chemical Co. | |
3.00% | | 11/15/22 | | $ | 137,000 | | | $ | 140,163 | |
4.38% | | 11/15/42 | | | 137,000 | | | | 146,713 | |
The Estee Lauder Companies Inc. | |
2.00% | | 12/01/24 | | | 20,000 | | | | 20,055 | |
2.38% | | 12/01/29 | | | 20,000 | | | | 19,994 | |
3.13% | | 12/01/49 | | | 30,000 | | | | 30,049 | |
The George Washington University | |
4.13% | | 09/15/48 | | | 50,000 | | | | 57,583 | |
The Goldman Sachs Group Inc. | |
3.00% | | 04/26/22 | | | 100,000 | | | | 101,215 | |
3.50% | | 11/16/26 | | | 150,000 | | | | 157,873 | |
3.63% | | 02/20/24 | | | 180,000 | | | | 188,874 | |
3.85% | | 07/08/24 | | | 150,000 | | | | 158,752 | |
4.80% | | 07/08/44 | | | 100,000 | | | | 120,590 | |
5.75% | | 01/24/22 | | | 100,000 | | | | 107,291 | |
6.25% | | 02/01/41 | | | 150,000 | | | | 210,882 | |
6.75% | | 10/01/37 | | | 100,000 | | | | 138,561 | |
The Goldman Sachs Group Inc. (2.88% fixed rate until 10/31/21; 0.82% + 3 month USD LIBOR thereafter) | |
2.88% | | 10/31/22 | | | 100,000 | | | | 101,329 | (h) |
The Goldman Sachs Group Inc. (4.02% fixed rate until 10/31/37; 1.37% + 3 month USD LIBOR thereafter) | |
4.02% | | 10/31/38 | | | 100,000 | | | | 108,728 | (h) |
The Hartford Financial Services Group Inc. | |
4.40% | | 03/15/48 | | | 100,000 | | | | 115,416 | |
The Hershey Co. | | | | | | | | | | |
3.38% | | 05/15/23 | | | 50,000 | | | | 52,314 | |
The Home Depot Inc. | |
2.13% | | 09/15/26 | | | 45,000 | | | | 44,913 | |
2.63% | | 06/01/22 | | | 190,000 | | | | 193,587 | |
3.90% | | 12/06/28 | | | 100,000 | | | | 112,123 | |
4.20% | | 04/01/43 | | | 150,000 | | | | 173,706 | |
4.40% | | 04/01/21 | | | 150,000 | | | | 153,876 | |
The Interpublic Group of Companies Inc. | |
4.65% | | 10/01/28 | | | 10,000 | | | | 11,254 | |
The JM Smucker Co. | |
3.38% | | 12/15/27 | | | 100,000 | | | | 104,296 | |
The Kroger Co. | | | | | | | | | | |
3.85% | | 08/01/23 | | | 150,000 | | | | 158,304 | |
4.50% | | 01/15/29 | | | 100,000 | | | | 112,538 | |
5.40% | | 01/15/49 | | | 100,000 | | | | 121,736 | |
The Mosaic Co. | | | | | | | | | | |
3.25% | | 11/15/22 | | | 50,000 | | | | 51,295 | |
4.05% | | 11/15/27 | | | 50,000 | | | | 52,076 | |
The New York and Presbyterian Hospital | |
3.95% | | 08/01/19 | | | 35,000 | | | | 34,997 | |
The PNC Financial Services Group Inc. | |
2.20% | | 11/01/24 | | | 50,000 | | | | 50,179 | |
3.50% | | 01/23/24 | | | 110,000 | | | | 116,032 | |
The Procter & Gamble Co. | |
1.70% | | 11/03/21 | | | 100,000 | | | | 100,303 | |
2.45% | | 11/03/26 | | | 100,000 | | | | 103,086 | |
The Progressive Corp. | |
4.35% | | 04/25/44 | | | 100,000 | | | | 117,371 | |
The Sherwin-Williams Co. | |
3.95% | | 01/15/26 | | | 100,000 | | | | 107,437 | |
4.20% | | 01/15/22 | | | 100,000 | | | | 103,652 | |
The Southern Co. (5.50% fixed rate until 03/15/22; 3.63% + 3 month USD LIBOR thereafter) | |
5.50% | | 03/15/57 | | | 100,000 | | | | 105,038 | (h) |
The Timken Co. | | | | | | | | | | |
4.50% | | 12/15/28 | | | 20,000 | | | | 21,529 | |
The Toronto-Dominion Bank | |
1.90% | | 12/01/22 | | | 25,000 | | | | 25,024 | |
2.65% | | 06/12/24 | | | 100,000 | | | | 102,383 | |
3.25% | | 06/11/21 - 03/11/24 | | | 200,000 | | | | 206,765 | |
The Travelers Companies Inc. | |
4.00% | | 05/30/47 | | | 100,000 | | | | 112,979 | |
5.35% | | 11/01/40 | | | 100,000 | | | | 130,304 | |
The Walt Disney Co. | |
3.38% | | 11/15/26 | | | 100,000 | | | | 107,100 | |
See Notes to Schedules of Investments and Notes to Financial Statements.
| | |
| State Street Total Return V.I.S. Fund | | |
| Schedule of Investments | | December 31, 2019 |
| | | | | | | | | | |
| | | Principal
Amount | | | Fair
Value | |
6.65% | | 11/15/37 | | $ | 179,000 | | | $ | 265,901 | |
The Western Union Co. | |
3.60% | | 03/15/22 | | | 150,000 | | | | 154,750 | |
The Williams Companies Inc. | |
3.70% | | 01/15/23 | | | 10,000 | | | | 10,344 | |
4.55% | | 06/24/24 | | | 40,000 | | | | 43,160 | |
4.85% | | 03/01/48 | | | 70,000 | | | | 76,758 | |
5.10% | | 09/15/45 | | | 150,000 | | | | 166,761 | |
5.75% | | 06/24/44 | | | 15,000 | | | | 17,705 | |
5.80% | | 11/15/43 | | | 150,000 | | | | 177,882 | |
Thermo Fisher Scientific Inc. | |
2.60% | | 10/01/29 | | | 150,000 | | | | 148,623 | |
4.15% | | 02/01/24 | | | 25,000 | | | | 26,831 | |
Time Warner Cable LLC | |
4.50% | | 09/15/42 | | | 150,000 | | | | 153,567 | |
Total Capital International S.A. | |
2.43% | | 01/10/25 | | | 50,000 | | | | 50,663 | |
2.75% | | 06/19/21 | | | 150,000 | | | | 152,221 | |
3.46% | | 02/19/29 | | | 100,000 | | | | 108,363 | |
Total Capital S.A. | | | | | | | | | | |
3.88% | | 10/11/28 | | | 25,000 | | | | 27,886 | |
Toyota Motor Credit Corp. | |
2.60% | | 01/11/22 | | | 100,000 | | | | 101,590 | |
2.70% | | 01/11/23 | | | 100,000 | | | | 102,160 | |
2.95% | | 04/13/21 | | | 100,000 | | | | 101,475 | |
3.05% | | 01/08/21 | | | 25,000 | | | | 25,310 | |
3.45% | | 09/20/23 | | | 50,000 | | | | 52,561 | |
3.65% | | 01/08/29 | | | 100,000 | | | | 109,799 | |
TransCanada PipeLines Ltd. | |
4.25% | | 05/15/28 | | | 50,000 | | | | 55,555 | |
5.10% | | 03/15/49 | | | 50,000 | | | | 61,177 | |
7.63% | | 01/15/39 | | | 100,000 | | | | 150,390 | |
Transcontinental Gas Pipe Line Company LLC | |
4.00% | | 03/15/28 | | | 100,000 | | | | 106,178 | |
Truist Bank | | | | | | | | | | |
2.63% | | 01/15/22 | | | 100,000 | | | | 101,352 | |
2.80% | | 05/17/22 | | | 50,000 | | | | 50,961 | |
3.00% | | 02/02/23 | | | 100,000 | | | | 102,593 | |
3.20% | | 04/01/24 | | | 50,000 | | | | 52,021 | |
Truist Financial Corp. | |
2.15% | | 02/01/21 | | | 100,000 | | | | 100,287 | |
2.85% | | 10/26/24 | | | 50,000 | | | | 51,687 | |
3.75% | | 12/06/23 | | | 100,000 | | | | 106,001 | |
4.00% | | 05/01/25 | | | 50,000 | | | | 54,189 | |
Tucson Electric Power Co. | |
4.85% | | 12/01/48 | | | 50,000 | | | | 61,041 | |
TWDC Enterprises 18 Corp. | |
2.30% | | 02/12/21 | | | 130,000 | | | | 130,772 | |
3.00% | | 07/30/46 | | | 60,000 | | | | 59,268 | |
Tyson Foods Inc. | | | | | | | | | | |
4.00% | | 03/01/26 | | | 15,000 | | | | 16,241 | |
4.88% | | 08/15/34 | | | 70,000 | | | | 83,795 | |
5.10% | | 09/28/48 | | | 35,000 | | | | 44,010 | |
U.S. Bancorp | | | | | | | | | | |
2.63% | | 01/24/22 | | | 100,000 | | | | 101,690 | |
3.00% | | 07/30/29 | | | 100,000 | | | | 102,639 | |
UDR Inc. | | | | | | | | | | |
4.40% | | 01/26/29 | | | 50,000 | | | | 55,754 | |
Unilever Capital Corp. | |
2.00% | | 07/28/26 | | | 150,000 | | | | 148,882 | |
2.75% | | 03/22/21 | | | 100,000 | | | | 101,108 | |
2.90% | | 05/05/27 | | | 100,000 | | | | 104,445 | |
Union Electric Co. | | | | | | | | | | |
2.95% | | 06/15/27 | | | 100,000 | | | | 103,099 | |
3.50% | | 03/15/29 | | | 25,000 | | | | 26,879 | |
3.65% | | 04/15/45 | | | 35,000 | | | | 36,960 | |
Union Pacific Corp. | | | | | | | | | | |
3.00% | | 04/15/27 | | | 100,000 | | | | 104,736 | |
3.20% | | 06/08/21 | | | 100,000 | | | | 101,871 | |
3.50% | | 06/08/23 | | | 50,000 | | | | 52,379 | |
3.55% | | 08/15/39 | | | 15,000 | | | | 15,554 | |
3.70% | | 03/01/29 | | | 65,000 | | | | 70,814 | |
| | | | | | | | | | |
| | | Principal
Amount | | | Fair
Value | |
3.84% | | 03/20/60 | | $ | 105,000 | | | $ | 106,602 | (d) |
3.95% | | 09/10/28 - 08/15/59 | | | 50,000 | | | | 54,083 | |
4.38% | | 09/10/38 | | | 15,000 | | | | 17,086 | |
United Airlines 2013-1 Class A Pass Through Trust | |
4.30% | | 08/15/25 | | | 188,162 | | | | 201,604 | |
United Parcel Service Inc. | |
2.05% | | 04/01/21 | | | 100,000 | | | | 100,274 | |
2.45% | | 10/01/22 | | | 175,000 | | | | 177,786 | |
3.05% | | 11/15/27 | | | 50,000 | | | | 52,580 | |
3.75% | | 11/15/47 | | | 50,000 | | | | 53,688 | |
United Technologies Corp. | |
3.35% | | 08/16/21 | | | 110,000 | | | | 112,644 | |
3.65% | | 08/16/23 | | | 20,000 | | | | 21,092 | |
3.95% | | 08/16/25 | | | 15,000 | | | | 16,368 | |
4.13% | | 11/16/28 | | | 30,000 | | | | 33,773 | |
4.45% | | 11/16/38 | | | 160,000 | | | | 189,110 | |
4.50% | | 06/01/42 | | | 158,000 | | | | 189,646 | |
4.63% | | 11/16/48 | | | 15,000 | | | | 18,768 | |
UnitedHealth Group Inc. | |
2.88% | | 08/15/29 | | | 75,000 | | | | 77,173 | |
2.95% | | 10/15/27 | | | 100,000 | | | | 103,633 | |
3.10% | | 03/15/26 | | | 150,000 | | | | 156,807 | |
3.50% | | 02/15/24 - 08/15/39 | | | 70,000 | | | | 73,706 | |
3.70% | | 12/15/25 - 08/15/49 | | | 75,000 | | | | 80,575 | |
3.75% | | 10/15/47 | | | 100,000 | | | | 107,160 | |
3.88% | | 12/15/28 | | | 15,000 | | | | 16,573 | |
4.45% | | 12/15/48 | | | 10,000 | | | | 11,949 | |
4.63% | | 07/15/35 | | | 45,000 | | | | 54,608 | |
6.88% | | 02/15/38 | | | 100,000 | | | | 148,134 | |
University of Notre Dame du Lac | |
3.39% | | 02/15/48 | | | 25,000 | | | | 26,624 | |
Unum Group | | | | | | | | | | |
4.50% | | 12/15/49 | | | 30,000 | | | | 29,412 | |
US Bancorp | | | | | | | | | | |
3.95% | | 11/17/25 | | | 100,000 | | | | 109,740 | |
US Bank NA | | | | | | | | | | |
2.80% | | 01/27/25 | | | 150,000 | | | | 155,124 | |
Vale Overseas Ltd. | | | | | | | | | | |
6.25% | | 08/10/26 | | | 100,000 | | | | 117,136 | |
6.88% | | 11/10/39 | | | 100,000 | | | | 130,394 | |
Valero Energy Corp. | | | | | | | | | | |
6.63% | | 06/15/37 | | | 150,000 | | | | 199,156 | |
Valero Energy Partners LP | |
4.38% | | 12/15/26 | | | 100,000 | | | | 109,132 | |
Ventas Realty LP | | | | | | | | | | |
4.00% | | 03/01/28 | | | 150,000 | | | | 160,557 | |
4.40% | | 01/15/29 | | | 100,000 | | | | 110,069 | |
VEREIT Operating Partnership LP | |
4.60% | | 02/06/24 | | | 20,000 | | | | 21,635 | |
4.88% | | 06/01/26 | | | 25,000 | | | | 27,623 | |
Verisk Analytics Inc. | | | | | | | | | | |
4.13% | | 03/15/29 | | | 60,000 | | | | 65,906 | |
Verizon Communications Inc. | |
2.63% | | 08/15/26 | | | 100,000 | | | | 101,680 | |
3.38% | | 02/15/25 | | | 100,000 | | | | 105,861 | |
3.85% | | 11/01/42 | | | 136,000 | | | | 146,964 | |
3.88% | | 02/08/29 | | | 5,000 | | | | 5,516 | |
4.33% | | 09/21/28 | | | 109,000 | | | | 123,755 | |
4.40% | | 11/01/34 | | | 150,000 | | | | 174,466 | |
4.52% | | 09/15/48 | | | 150,000 | | | | 179,635 | |
4.81% | | 03/15/39 | | | 189,000 | | | | 228,509 | |
5.15% | | 09/15/23 | | | 100,000 | | | | 111,055 | |
5.25% | | 03/16/37 | | | 100,000 | | | | 125,505 | |
ViacomCBS Inc. | | | | | | | | | | |
3.38% | | 03/01/22 | | | 150,000 | | | | 153,495 | |
4.00% | | 01/15/26 | | | 150,000 | | | | 160,890 | |
5.85% | | 09/01/43 | | | 100,000 | | | | 125,643 | |
Virginia Electric & Power Co. | |
3.80% | | 04/01/28 | | | 100,000 | | | | 108,762 | |
4.60% | | 12/01/48 | | | 60,000 | | | | 73,807 | |
4.65% | | 08/15/43 | | | 100,000 | | | | 120,409 | |
See Notes to Schedules of Investments and Notes to Financial Statements.
| | |
| State Street Total Return V.I.S. Fund | | |
| Schedule of Investments | | December 31, 2019 |
| | | | | | | | | | |
| | | Principal
Amount | | | Fair
Value | |
Visa Inc. | | | | | | | | | | |
2.15% | | 09/15/22 | | $ | 100,000 | | | $ | 101,133 | |
4.30% | | 12/14/45 | | | 100,000 | | | | 123,228 | |
Vodafone Group PLC | |
4.25% | | 09/17/50 | | | 55,000 | | | | 57,739 | |
4.38% | | 05/30/28- 02/19/43 | | | 205,000 | | | | 222,196 | |
5.00% | | 05/30/38 | | | 100,000 | | | | 115,650 | |
5.25% | | 05/30/48 | | | 50,000 | | | | 60,146 | |
Vornado Realty LP | |
3.50% | | 01/15/25 | | | 50,000 | | | | 52,176 | |
Vulcan Materials Co. | |
4.70% | | 03/01/48 | | | 50,000 | | | | 56,612 | |
Walgreens Boots Alliance Inc. | |
3.45% | | 06/01/26 | | | 55,000 | | | | 55,932 | |
4.50% | | 11/18/34 | | | 155,000 | | | | 160,569 | |
Walmart Inc. | |
2.35% | | 12/15/22 | | | 100,000 | | | | 101,749 | |
3.13% | | 06/23/21 | | | 50,000 | | | | 51,069 | |
3.25% | | 07/08/29 | | | 40,000 | | | | 43,020 | |
3.40% | | 06/26/23 | | | 50,000 | | | | 52,536 | |
3.63% | | 12/15/47 | | | 125,000 | | | | 138,504 | |
3.70% | | 06/26/28 | | | 100,000 | | | | 110,224 | |
3.95% | | 06/28/38 | | | 40,000 | | | | 46,490 | |
4.05% | | 06/29/48 | | | 185,000 | | | | 219,752 | |
Waste Connections Inc. | |
3.50% | | 05/01/29 | | | 50,000 | | | | 52,968 | |
Waste Management Inc. | |
2.90% | | 09/15/22 | | | 150,000 | | | | 153,516 | |
4.15% | | 07/15/49 | | | 65,000 | | | | 74,293 | |
WEC Energy Group Inc. | |
3.38% | | 06/15/21 | | | 65,000 | | | | 66,301 | |
Wells Fargo & Co. | |
2.50% | | 03/04/21 | | | 140,000 | | | | 140,958 | |
2.63% | | 07/22/22 | | | 100,000 | | | | 101,567 | |
3.75% | | 01/24/24 | | | 100,000 | | | | 105,763 | |
4.13% | | 08/15/23 | | | 150,000 | | | | 159,219 | |
4.15% | | 01/24/29 | | | 100,000 | | | | 111,712 | |
4.40% | | 06/14/46 | | | 150,000 | | | | 172,246 | |
4.65% | | 11/04/44 | | | 150,000 | | | | 176,830 | |
4.75% | | 12/07/46 | | | 100,000 | | | | 120,398 | |
5.61% | | 01/15/44 | | | 169,000 | | | | 222,483 | |
Wells Fargo & Co. (2.41% fixed rate until 10/30/24; 0.83% + 3 month USD LIBOR thereafter) | |
2.41% | | 10/30/25 | | | 90,000 | | | | 90,046 | (h) |
Wells Fargo & Co. (2.88% fixed rate until 10/30/29; 1.17% + 3 month USD LIBOR thereafter) | |
2.88% | | 10/30/30 | | | 100,000 | | | | 100,765 | (h) |
Wells Fargo Bank NA | |
3.55% | | 08/14/23 | | | 150,000 | | | | 157,167 | |
3.63% | | 10/22/21 | | | 100,000 | | | | 102,956 | |
Welltower Inc. | |
3.63% | | 03/15/24 | | | 25,000 | | | | 26,266 | |
4.25% | | 04/15/28 | | | 115,000 | | | | 126,195 | |
Western Midstream Operating LP | |
5.45% | | 04/01/44 | | | 150,000 | | | | 132,238 | |
Westinghouse Air Brake Technologies Corp. | |
3.45% | | 11/15/26 | | | 100,000 | | | | 100,976 | |
Westlake Chemical Corp. | |
4.38% | | 11/15/47 | | | 50,000 | | | | 50,425 | |
Westpac Banking Corp. | |
2.00% | | 08/19/21 | | | 100,000 | | | | 100,163 | |
2.80% | | 01/11/22 | | | 100,000 | | | | 101,638 | |
3.30% | | 02/26/24 | | | 100,000 | | | | 104,270 | |
3.35% | | 03/08/27 | | | 100,000 | | | | 105,549 | |
Westpac Banking Corp. (4.32% fixed rate until 11/23/26; 2.24% + 5 Year US ISDA thereafter) | |
4.32% | | 11/23/31 | | | 100,000 | | | | 105,641 | (h) |
Weyerhaeuser Co. | |
7.38% | | 03/15/32 | | | 100,000 | | | | 138,224 | |
Whirlpool Corp. | |
3.70% | | 05/01/25 | | | 150,000 | | | | 158,535 | |
Willis North America Inc. | |
3.88% | | 09/15/49 | | | 35,000 | | | | 35,072 | |
| | | | | | | | | | |
| | | Principal
Amount | | | Fair
Value | |
4.50% | | 09/15/28 | | $ | 50,000 | | | $ | 55,163 | |
Wisconsin Electric Power Co. | |
4.30% | | 10/15/48 | | | 10,000 | | | | 11,670 | |
Wisconsin Power & Light Co. | |
3.05% | | 10/15/27 | | | 100,000 | | | | 103,418 | |
Wisconsin Public Service Corp. | |
3.30% | | 09/01/49 | | | 20,000 | | | | 19,995 | |
WP Carey Inc. | |
3.85% | | 07/15/29 | | | 50,000 | | | | 52,823 | |
WRKCo Inc. | |
4.20% | | 06/01/32 | | | 50,000 | | | | 54,827 | |
4.65% | | 03/15/26 | | | 100,000 | | | | 110,413 | |
Xcel Energy Inc. | |
3.30% | | 06/01/25 | | | 50,000 | | | | 52,198 | |
4.00% | | 06/15/28 | | | 100,000 | | | | 109,420 | |
Zimmer Biomet Holdings Inc. | |
3.70% | | 03/19/23 | | | 75,000 | | | | 78,100 | |
Zoetis Inc. | |
4.70% | | 02/01/43 | | | 150,000 | | | | 179,124 | |
| | | | 126,322,203 | |
Non-Agency Collateralized Mortgage Obligations – 0.3% | |
BANK 2018-BNK14 | |
4.23% | | 09/15/60 | | | 191,106 | | | | 213,813 | (h) |
BANK 2019-BNK20 | |
3.01% | | 09/15/61 | | | 50,000 | | | | 51,462 | |
BANK 2019-BNK21 | |
2.85% | | 10/17/52 | | | 350,000 | | | | 355,481 | |
BANK 2019-BNK22 | |
2.98% | | 11/15/62 | | | 50,000 | | | | 51,302 | |
BBCMS Mortgage Trust 2018-C2 | |
4.31% | | 12/15/51 | | | 50,000 | | | | 56,244 | |
Benchmark 2018-B5 Mortgage Trust | |
4.21% | | 07/15/51 | | | 100,000 | | | | 111,870 | |
Benchmark 2019-B13 Mortgage Trust | |
2.95% | | 08/15/57 | | | 100,000 | | | | 102,386 | |
Benchmark Mortgage Trust | |
4.12% | | 07/15/51 | | | 100,000 | | | | 111,002 | (h) |
CD 2017-CD6 Mortgage Trust | |
3.46% | | 11/13/50 | | | 150,000 | | | | 158,972 | |
Citigroup Commercial Mortgage Trust 2014-GC21 | |
4.03% | | 05/10/47 | | | 100,000 | | | | 105,419 | |
Citigroup Commercial Mortgage Trust 2014-GC25 | |
4.02% | | 10/10/47 | | | 300,000 | | | | 316,074 | |
COMM 2012-CCRE 1 Mortgage Trust | |
3.39% | | 05/15/45 | | | 234,356 | | | | 239,719 | |
COMM 2013-CCRE12 Mortgage Trust | |
4.05% | | 10/10/46 | | | 200,000 | | | | 212,181 | |
COMM 2015-LC19 Mortgage Trust | |
3.18% | | 02/10/48 | | | 150,000 | | | | 155,554 | |
COMM 2016-DC2 Mortgage Trust | |
3.77% | | 02/10/49 | | | 190,000 | | | | 202,915 | |
CSAIL 2018-CX12 Commercial Mortgage Trust | |
4.22% | | 08/15/51 | | | 200,000 | | | | 222,616 | (h) |
GS Mortgage Securities Trust 2015-GC28 | |
3.98% | | 02/10/48 | | | 150,000 | | | | 157,008 | |
GS Mortgage Securities Trust 2016-GS3 | |
2.78% | | 10/10/49 | | | 80,000 | | | | 81,441 | |
GS Mortgage Securities Trust 2017-GS5 | |
3.67% | | 03/10/50 | | | 204,729 | | | | 219,330 | |
GS Mortgage Securities Trust 2019-GC38 | |
3.97% | | 02/10/52 | | | 50,000 | | | | 55,245 | |
JP Morgan Chase Commercial Mortgage Securities Trust 2014-C20 | |
3.80% | | 07/15/47 | | | 250,000 | | | | 265,030 | |
JPMBB Commercial Mortgage Securities Trust 2013-C14 | |
3.76% | | 08/15/46 | | | 180,258 | | | | 185,391 | (h) |
JPMBB Commercial Mortgage Securities Trust 2014-C22 | |
3.80% | | 09/15/47 | | | 75,000 | | | | 79,631 | |
JPMDB Commercial Mortgage Securities Trust 2017-C5 | |
3.41% | | 03/15/50 | | | 150,000 | | | | 157,711 | |
Morgan Stanley Bank of America Merrill Lynch Trust 2016-C29 | |
3.14% | | 05/15/49 | | | 500,000 | | | | 514,822 | |
See Notes to Schedules of Investments and Notes to Financial Statements.
| | |
| State Street Total Return V.I.S. Fund | | |
| Schedule of Investments | | December 31, 2019 |
| | | | | | | | | | |
| | | Principal
Amount | | | Fair
Value | |
Morgan Stanley Capital I Trust 2016-UBS12 | |
3.60% | | 12/15/49 | | $ | 150,000 | | | $ | 159,685 | |
UBS Commercial Mortgage Trust 2017-C4 | |
3.56% | | 10/15/50 | | | 185,000 | | | | 197,187 | |
UBS Commercial Mortgage Trust 2018-C15 | |
4.07% | | 12/15/51 | | | 100,000 | | | | 111,083 | |
Wells Fargo Commercial Mortgage Trust 2012-LC5 | |
2.92% | | 10/15/45 | | | 153,267 | | | | 155,873 | |
4.69% | | 10/15/45 | | | 220,000 | | | | 230,454 | (h) |
Wells Fargo Commercial Mortgage Trust 2017-C41 | |
3.47% | | 11/15/50 | | | 150,000 | | | | 158,960 | |
Wells Fargo Commercial Mortgage Trust 2018-C46 | |
4.15% | | 08/15/51 | | | 200,000 | | | | 222,290 | |
WFRBS Commercial Mortgage Trust 2012-C7 | |
3.43% | | 06/15/45 | | | 200,000 | | | | 205,110 | |
WFRBS Commercial Mortgage Trust 2013-C17 | |
4.02% | | 12/15/46 | | | 35,000 | | | | 37,120 | |
WFRBS Commercial Mortgage Trust 2014-C23 | |
3.65% | | 10/15/57 | | | 67,431 | | | | 71,027 | |
| | | | 5,931,408 | |
Sovereign Bonds – 0.4% | |
Export Development Canada | |
2.50% | | 01/24/23 | | | 200,000 | | | | 204,864 | |
Export-Import Bank of Korea | |
3.00% | | 11/01/22 | | | 200,000 | | | | 205,228 | |
3.63% | | 11/27/23 | | | 200,000 | | | | 210,790 | |
Government of Canada | |
2.63% | | 01/25/22 | | | 100,000 | | | | 102,018 | |
Government of Chile | |
3.13% | | 01/21/26 | | | 200,000 | | | | 208,330 | |
3.50% | | 01/25/50 | | | 200,000 | | | | 209,606 | |
Government of Colombia | |
5.00% | | 06/15/45 | | | 150,000 | | | | 174,510 | |
6.13% | | 01/18/41 | | | 150,000 | | | | 194,382 | |
Government of Hungary | |
5.38% | | 03/25/24 | | | 100,000 | | | | 112,749 | |
Government of Indonesia | |
4.75% | | 02/11/29 | | | 100,000 | | | | 114,561 | |
Government of Israel | |
2.88% | | 03/16/26 | | | 200,000 | | | | 208,802 | |
3.25% | | 01/17/28 | | | 200,000 | | | | 214,832 | |
Government of Italy | |
5.38% | | 06/15/33 | | | 150,000 | | | | 174,156 | |
Government of Mexico | |
4.00% | | 10/02/23 | | | 200,000 | | | | 210,770 | |
4.35% | | 01/15/47 | | | 100,000 | | | | 105,593 | |
4.75% | | 03/08/44 | | | 102,000 | | | | 112,804 | |
5.75% | | 10/12/10 | | | 172,000 | | | | 203,555 | |
6.05% | | 01/11/40 | | | 130,000 | | | | 169,019 | |
Government of Panama | |
3.75% | | 03/16/25 | | | 200,000 | | | | 212,448 | |
6.70% | | 01/26/36 | | | 150,000 | | | | 210,325 | |
Government of Peru | |
6.55% | | 03/14/37 | | | 147,000 | | | | 214,805 | |
7.35% | | 07/21/25 | | | 100,000 | | | | 126,119 | |
Government of Philippines | |
3.70% | | 03/01/41 | | | 100,000 | | | | 113,400 | |
3.75% | | 01/14/29 | | | 100,000 | | | | 110,483 | |
4.00% | | 01/15/21 | | | 100,000 | | | | 102,114 | |
4.20% | | 01/21/24 | | | 200,000 | | | | 215,634 | |
Government of Poland | |
3.00% | | 03/17/23 | | | 147,000 | | | | 151,498 | |
3.25% | | 04/06/26 | | | 100,000 | | | | 106,065 | |
5.00% | | 03/23/22 | | | 100,000 | | | | 106,900 | |
Government of Uruguay | |
4.50% | | 08/14/24 | | | 200,000 | | | | 216,132 | |
4.98% | | 04/20/55 | | | 200,000 | | | | 236,176 | |
Iraq Government AID Bond | |
2.15% | | 01/18/22 | | | 480,000 | | | | 484,238 | |
Japan Bank for International Cooperation | |
1.63% | | 10/17/22 | | | 200,000 | | | | 198,594 | |
2.88% | | 07/21/27 | | | 100,000 | | | | 104,622 | |
| | | | | | | | | | |
| | | Principal
Amount | | | Fair
Value | |
3.38% | | 10/31/23 | | $ | 200,000 | | | $ | 210,554 | |
Korea International Bond | |
2.50% | | 06/19/29 | | | 100,000 | | | | 101,292 | |
Province of Alberta Canada | |
2.95% | | 01/23/24 | | | 50,000 | | | | 52,047 | |
3.35% | | 11/01/23 | | | 150,000 | | | | 158,447 | |
Province of Manitoba Canada | |
2.60% | | 04/16/24 | | | 100,000 | | | | 102,862 | |
Province of Ontario Canada | |
2.55% | | 02/12/21 | | | 150,000 | | | | 151,280 | |
3.05% | | 01/29/24 | | | 250,000 | | | | 261,310 | |
3.40% | | 10/17/23 | | | 150,000 | | | | 158,642 | |
Province of Quebec Canada | |
2.38% | | 01/31/22 | | | 200,000 | | | | 202,592 | |
The Korea Development Bank | |
2.13% | | 10/01/24 | | | 100,000 | | | | 99,772 | |
2.63% | | 02/27/22 | | | 200,000 | | | | 202,548 | |
| | | | 7,747,468 | |
Municipal Bonds and Notes – 0.1% | |
American Municipal Power Inc. | |
6.27% | | 02/15/50 | | | 100,000 | | | | 133,589 | |
Chicago O’Hare International Airport | |
4.47% | | 01/01/49 | | | 100,000 | | | | 120,655 | |
Chicago Transit Authority | |
6.90% | | 12/01/40 | | | 75,000 | | | | 101,319 | |
Commonwealth of Massachusetts | |
4.50% | | 08/01/31 | | | 100,000 | | | | 115,889 | |
Dallas Area Rapid Transit | |
5.02% | | 12/01/48 | | | 75,000 | | | | 99,175 | |
East Bay Municipal Utility District | |
5.87% | | 06/01/40 | | | 100,000 | | | | 137,245 | |
Los Angeles Department of Water & Power | |
6.57% | | 07/01/45 | | | 100,000 | | | | 156,317 | |
6.60% | | 07/01/50 | | | 90,000 | | | | 144,444 | |
Los Angeles Unified School District | |
5.76% | | 07/01/29 | | | 110,000 | | | | 133,374 | |
Municipal Electric Authority of Georgia | |
6.64% | | 04/01/57 | | | 124,000 | | | | 166,963 | |
New York City Water & Sewer System | |
6.01% | | 06/15/42 | | | 50,000 | | | | 72,452 | |
New York State Dormitory Authority | |
3.14% | | 07/01/43 | | | 50,000 | | | | 49,572 | |
New York State Urban Development Corp. | |
3.90% | | 03/15/33 | | | 25,000 | | | | 26,864 | |
North Texas Tollway Authority | |
6.72% | | 01/01/49 | | | 100,000 | | | | 156,893 | |
Port Authority of New York & New Jersey | |
5.31% | | 08/01/46 | | | 200,000 | | | | 221,446 | |
Sales Tax Securitization Corp. | |
4.64% | | 01/01/40 | | | 25,000 | | | | 28,025 | |
South Carolina State Public Service Authority | |
6.45% | | 01/01/50 | | | 50,000 | | | | 73,530 | |
State of California | |
7.60% | | 11/01/40 | | | 100,000 | | | | 165,071 | |
University of California | |
4.60% | | 05/15/31 | | | 100,000 | | | | 114,276 | |
6.58% | | 05/15/49 | | | 100,000 | | | | 143,981 | |
University of Texas System | |
4.79% | | 08/15/46 | | | 100,000 | | | | 124,015 | |
| | | | 2,485,095 | |
U.S. Government Sponsored Agency – 0.0% * | |
Tennessee Valley Authority | |
3.50% | | 12/15/42 | | | 500,000 | | | | 558,355 | |
Total Bonds and Notes
(Cost $506,659,170) | | | | 527,040,659 | |
See Notes to Schedules of Investments and Notes to Financial Statements.
| | |
| State Street Total Return V.I.S. Fund | | |
| Schedule of Investments | | December 31, 2019 |
| | | | | | | | |
| | | Number
of Shares | | | Fair
Value | |
Exchange Traded & Mutual Funds – 14.9% | |
| |
Invesco Optimum Yield Diversified Commodity Strategy No K-1 ETF | | | 3,527,990 | | | $ | 58,423,515 | |
SPDR Bloomberg Barclays High Yield Bond ETF | | | 1,233,354 | | | | 135,101,597 | (j) |
SPDR Dow Jones REIT ETF | | | 917,656 | | | | 93,619,265 | (j) |
| | | | 287,144,377 | |
Total Exchange Traded & Mutual Funds
(Cost $283,988,898) | | | | 287,144,377 | |
Total Investments in Securities
(Cost $1,731,302,581) | | | | 1,877,280,767 | |
| | | | | | | | |
| | | Number
of Shares | | | Fair
Value | |
Short-Term Investments – 3.2% | |
| |
State Street Institutional U.S. Government Money Market Fund - Class G Shares 1.57%(Cost $60,902,376) | | | 60,902,376 | | | $ | 60,902,376 | (e,j,k) |
| |
Total Investments (Cost $1,792,204,957) | | | | 1,938,183,143 | |
| |
Liabilities in Excess of Other Assets,
net – (0.9)% | | | | (17,079,153 | ) |
| | | | | | | | |
NET ASSETS – 100.0% | | | $ | 1,921,103,990 | |
| | | | | | | | |
Other Information:
The Fund had the following long futures contracts open at December 31, 2019:
| | | | | | | | | | | | | | | | | | | | |
Description | | Expiration
date | | | Number
of
Contracts | | | Notional Amount | | | Value | | | Unrealized
Appreciation | |
E-mini Russell 2000 Index Futures | | | March 2020 | | | | 6 | | | $ | 493,006 | | | $ | 501,180 | | | $ | 8,174 | |
MSCI EAFE Mini Index Futures | | | March 2020 | | | | 15 | | | | 1,517,561 | | | | 1,527,375 | | | | 9,814 | |
MSCI Emerging Market Mini Futures | | | March 2020 | | | | 83 | | | | 4,404,330 | | | | 4,648,830 | | | | 244,500 | |
S&P 500 Emini Index Futures | | | March 2020 | | | | 7 | | | | 1,112,714 | | | | 1,130,885 | | | | 18,171 | |
| | | | | | | | | | | | | | | | | | $ | 280,659 | |
During the year ended December 31, 2019, average notional values related to long futures contracts was $13,456,454.
The views expressed in this document reflect our judgment as of the publication date and are subject to change at any time without notice. The securities cited may not be representative of the Fund’s future investments and should not be construed as a recommendation to purchase or sell a particular security. See the Fund’s summary prospectus and statutory prospectus for complete descriptions of investment objectives, policies, risks and permissible investments.
| (a) | Non-income producing security. |
| (b) | Security is fair valued by the Oversight Committee, in accordance with the procedures approved by the Fund’s Board of Directors. |
| (c) | Security is fair valued by the Oversight Committee, in accordance with the procedures approved by the Fund’s Board of Directors. Security value is determined based on level 3 inputs. |
| (d) | Pursuant to Rule 144A of the Securities Act of 1933, as amended, these securities may be resold in transactions exempt from registration, normally to qualified institutional buyers. At December 31, 2019, these securities amounted to $8,856,180 or 0.46% of the net assets of the State Street Total Return V.I.S. Fund. These securities have been determined to be liquid using procedures established by the Fund’s Board of Directors. |
| (e) | At December 31, 2019, all or a portion of this security was pledged to cover collateral requirements for futures and/or TBAs. |
| (f) | Security traded on different exchanges. |
| (g) | Settlement is on a delayed delivery or when-issued basis with final maturity to be announced (“TBA”) in the future. |
| (h) | Variable Rate Security - Interest rate shown is rate in effect at December 31, 2019. For securities based on a published reference rate and spread, the reference rate and spread are indicated in the description above. |
| (j) | Sponsored by SSGA Funds Management, Inc., the Fund’s investment adviser and administrator, and an affiliate of State Street Bank & Trust Co., the Fund’s sub-administrator, custodian and accounting agent. |
| (k) | Coupon amount represents effective yield. |
| † | Percentages are based on net assets as of December 31, 2019. |
| | |
| Abbreviations: |
| ADR | | American Depositary Receipt |
See Notes to Schedules of Investments and Notes to Financial Statements.
| | |
| State Street Total Return V.I.S. Fund | | |
| Schedule of Investments | | December 31, 2019 |
| | |
| GDR | | Global Depositary Receipt |
| ISDA | | International Swaps and Derivatives Association |
| LIBOR | | London Interbank Offered Rate |
| NVDR | | Non-Voting Depositary Receipt |
| REIT | | Real Estate Investment Trust |
| SOFR | | Secured Overnight Financing Rate |
| SPDR | | Standard and Poor’s Depositary Receipt |
| TBA | | To Be Announced |
The following table presents the Fund’s investments measured at fair value on a recurring basis at December 31, 2019:
| | | | | | | | | | | | | | | | | | |
Fund | | Investments | | Level 1 | | | Level 2 | | | Level 3 | | | Total | |
Investments in Securities | | | | | | | | | | | | |
| | Domestic Equity | | $ | 645,043,583 | | | $ | 327 | | | $ | — | | | $ | 645,043,910 | |
| | Foreign Equity | | | 417,940,794 | | | | 110,025 | | | | 1,002 | | | | 418,051,821 | |
| | U.S. Treasuries | | | — | | | | 245,910,372 | | | | — | | | | 245,910,372 | |
| | Agency Mortgage Backed | | | — | | | | 132,652,003 | | | | — | | | | 132,652,003 | |
| | Agency Collateralized Mortgage Obligations | | | — | | | | 3,501,304 | | | | — | | | | 3,501,304 | |
| | Asset Backed | | | — | | | | 1,932,451 | | | | — | | | | 1,932,451 | |
| | Corporate Notes | | | — | | | | 126,322,203 | | | | — | | | | 126,322,203 | |
| | Non-Agency Collateralized Mortgage Obligations | | | — | | | | 5,931,408 | | | | — | | | | 5,931,408 | |
| | Sovereign Bonds | | | — | | | | 7,747,468 | | | | — | | | | 7,747,468 | |
| | Municipal Bonds and Notes | | | — | | | | 2,485,095 | | | | — | | | | 2,485,095 | |
| | U.S. Government Sponsored Agencies | | | — | | | | 558,355 | | | | — | | | | 558,355 | |
| | Exchange Traded & Mutual Funds | | | 287,144,377 | | | | — | | | | — | | | | 287,144,377 | |
| | Short-Term Investments | | | 60,902,376 | | | | — | | | | — | | | | 60,902,376 | |
| | | | | | | | | | | | | | | | | | |
Total Investments in Securities | | $ | 1,411,031,130 | | | $ | 527,151,011 | | | $ | 1,002 | | | $ | 1,938,183,143 | |
| | | | | | | | | | | | | | | | | | |
Other Financial Instruments | | | | | | | | | | | | |
| | Long Futures Contracts - Unrealized Appreciation | | $ | 280,659 | | | $ | — | | | $ | — | | | $ | 280,659 | |
| | | | | | | | | | | | | | | | | | |
The Fund was invested in the following countries/territories at December 31, 2019 (unaudited):
| | |
Country/Territory | | Percentage (based on
Fair Value) |
United States | | 75.54% |
Japan | | 3.21% |
United Kingdom | | 2.61% |
Canada | | 2.15% |
Switzerland | | 2.14% |
France | | 1.44% |
Australia | | 1.33% |
Germany | | 1.21% |
China | | 1.17% |
Ireland | | 0.99% |
Hong Kong | | 0.72% |
Taiwan | | 0.58% |
Sweden | | 0.56% |
Netherlands | | 0.46% |
South Korea | | 0.44% |
Italy | | 0.43% |
India | | 0.39% |
Bermuda | | 0.38% |
Singapore | | 0.36% |
Supranational | | 0.30% |
Brazil | | 0.30% |
Finland | | 0.30% |
Spain | | 0.28% |
Israel | | 0.26% |
Russian Federation | | 0.23% |
Denmark | | 0.20% |
South Africa | | 0.19% |
Belgium | | 0.15% |
Mexico | | 0.15% |
New Zealand | | 0.15% |
Thailand | | 0.12% |
Puerto Rico | | 0.11% |
Malaysia | | 0.10% |
Luxembourg | | 0.10% |
Norway | | 0.09% |
See Notes to Schedules of Investments and Notes to Financial Statements.
| | |
| State Street Total Return V.I.S. Fund | | |
| Schedule of Investments | | December 31, 2019 |
| | |
Country/Territory | | Percentage (based on
Fair Value) |
Cayman Islands | | 0.08% |
Colombia | | 0.08% |
Poland | | 0.07% |
Chile | | 0.06% |
Saudi Arabia | | 0.06% |
Panama | | 0.06% |
Turkey | | 0.05% |
Philippines | | 0.05% |
Indonesia | | 0.05% |
Qatar | | 0.05% |
Portugal | | 0.04% |
Hungary | | 0.03% |
Iraq | | 0.03% |
Greece | | 0.03% |
Uruguay | | 0.02% |
United Arab Emirates | | 0.02% |
Peru | | 0.02% |
Czech Republic | | 0.02% |
Austria | | 0.01% |
Czech | | 0.01% |
Monaco | | 0.01% |
Guernsey | | 0.01% |
Pakistan | | 0.00% |
UAE | | 0.00% |
| | |
| | 100.00% |
| | |
The Fund’s % share of investment in the various categories, based on Fair Value, is as follows at December 31, 2019 (unaudited):
| | | | | | | | | | | | |
Industry | | Domestic | | | Foreign | | | Total | |
Exchange Traded Funds | | | 14.81 | % | | | 0.00 | % | | | 14.81 | % |
Property & Casualty Insurance | | | 1.96 | % | | | 0.35 | % | | | 2.31 | % |
Multi-Line Insurance | | | 0.30 | % | | | 1.38 | % | | | 1.68 | % |
Pharmaceuticals | | | 1.01 | % | | | 0.64 | % | | | 1.65 | % |
Semiconductor Equipment | | | 1.47 | % | | | 0.06 | % | | | 1.53 | % |
IT Consulting & Other Services | | | 0.32 | % | | | 1.14 | % | | | 1.46 | % |
Electric Utilities | | | 0.88 | % | | | 0.50 | % | | | 1.38 | % |
Multi-Sector Holdings | | | 1.13 | % | | | 0.23 | % | | | 1.36 | % |
Life & Health Insurance | | | 0.56 | % | | | 0.76 | % | | | 1.32 | % |
Integrated Telecommunication Services | | | 0.24 | % | | | 1.04 | % | | | 1.28 | % |
Industrial Machinery | | | 0.59 | % | | | 0.66 | % | | | 1.25 | % |
Healthcare Equipment | | | 0.98 | % | | | 0.18 | % | | | 1.16 | % |
Diversified Banks | | | 0.00 | % | | | 1.15 | % | | | 1.15 | % |
Technology Hardware, Storage & Peripherals | | | 0.65 | % | | | 0.48 | % | | | 1.13 | % |
Application Software | | | 1.11 | % | | | 0.00 | % | | | 1.11 | % |
Industrial Gases | | | 0.52 | % | | | 0.55 | % | | | 1.07 | % |
Automobile Manufacturers | | | 0.74 | % | | | 0.30 | % | | | 1.04 | % |
Oil & Gas Refining & Marketing | | | 0.96 | % | | | 0.07 | % | | | 1.03 | % |
General Merchandise Stores | | | 0.65 | % | | | 0.34 | % | | | 0.99 | % |
Industrial Conglomerates | | | 0.87 | % | | | 0.06 | % | | | 0.93 | % |
Home Building | | | 0.32 | % | | | 0.53 | % | | | 0.85 | % |
Retail REITs | | | 0.47 | % | | | 0.34 | % | | | 0.81 | % |
Semiconductors | | | 0.60 | % | | | 0.17 | % | | | 0.77 | % |
Hypermarkets & Super Centers | | | 0.70 | % | | | 0.06 | % | | | 0.76 | % |
Movies & Entertainment | | | 0.68 | % | | | 0.05 | % | | | 0.73 | % |
Reinsurance | | | 0.10 | % | | | 0.63 | % | | | 0.73 | % |
Apparel Retail | | | 0.67 | % | | | 0.05 | % | | | 0.72 | % |
Packaged Foods & Meats | | | 0.44 | % | | | 0.27 | % | | | 0.71 | % |
Mortgage REITs | | | 0.70 | % | | | 0.00 | % | | | 0.70 | % |
Restaurants | | | 0.66 | % | | | 0.01 | % | | | 0.67 | % |
Food Retail | | | 0.07 | % | | | 0.60 | % | | | 0.67 | % |
Household Products | | | 0.61 | % | | | 0.05 | % | | | 0.66 | % |
Integrated Oil & Gas | | | 0.21 | % | | | 0.45 | % | | | 0.66 | % |
Systems Software | | | 0.57 | % | | | 0.04 | % | | | 0.61 | % |
Data Processing & Outsourced Services | | | 0.55 | % | | | 0.05 | % | | | 0.60 | % |
Multi-Utilities | | | 0.42 | % | | | 0.18 | % | | | 0.60 | % |
Auto Parts & Equipment | | | 0.20 | % | | | 0.39 | % | | | 0.59 | % |
Trading Companies & Distributors | | | 0.18 | % | | | 0.39 | % | | | 0.57 | % |
Regional Banks | | | 0.41 | % | | | 0.13 | % | | | 0.54 | % |
Tires & Rubber | | | 0.02 | % | | | 0.46 | % | | | 0.48 | % |
See Notes to Schedules of Investments and Notes to Financial Statements.
| | |
| State Street Total Return V.I.S. Fund | | |
| Schedule of Investments | | December 31, 2019 |
| | | | | | | | | | | | |
Industry | | Domestic | | | Foreign | | | Total | |
Asset Management & Custody Banks | | | 0.17 | % | | | 0.29 | % | | | 0.46 | % |
Construction & Engineering | | | 0.23 | % | | | 0.22 | % | | | 0.45 | % |
Diversified REITs | | | 0.20 | % | | | 0.24 | % | | | 0.44 | % |
Aerospace & Defense | | | 0.33 | % | | | 0.11 | % | | | 0.44 | % |
Personal Products | | | 0.01 | % | | | 0.42 | % | | | 0.43 | % |
Consumer Finance | | | 0.42 | % | | | 0.00 | % | | | 0.42 | % |
Metal & Glass Containers | | | 0.41 | % | | | 0.00 | % | | | 0.41 | % |
Automotive Retail | | | 0.36 | % | | | 0.04 | % | | | 0.40 | % |
Technology Distributors | | | 0.36 | % | | �� | 0.04 | % | | | 0.40 | % |
Gas Utilities | | | 0.13 | % | | | 0.25 | % | | | 0.38 | % |
Healthcare Facilities | | | 0.36 | % | | | 0.00 | % | | | 0.36 | % |
Diversified Support Services | | | 0.35 | % | | | 0.00 | % | | | 0.35 | % |
Healthcare Distributors | | | 0.24 | % | | | 0.10 | % | | | 0.34 | % |
Internet & Direct Marketing Retail | | | 0.18 | % | | | 0.17 | % | | | 0.35 | % |
Construction Machinery & Heavy Trucks | | | 0.29 | % | | | 0.05 | % | | | 0.34 | % |
Financial Exchanges & Data | | | 0.17 | % | | | 0.15 | % | | | 0.32 | % |
Research & Consulting Services | | | 0.16 | % | | | 0.14 | % | | | 0.30 | % |
Advertising | | | 0.24 | % | | | 0.05 | % | | | 0.29 | % |
Environmental & Facilities Services | | | 0.29 | % | | | 0.00 | % | | | 0.29 | % |
Steel | | | 0.10 | % | | | 0.17 | % | | | 0.27 | % |
Biotechnology | | | 0.24 | % | | | 0.01 | % | | | 0.25 | % |
Office REITs | | | 0.06 | % | | | 0.18 | % | | | 0.24 | % |
Specialized REITs | | | 0.23 | % | | | 0.00 | % | | | 0.23 | % |
Health Care REITs | | | 0.23 | % | | | 0.00 | % | | | 0.23 | % |
Managed Healthcare | | | 0.22 | % | | | 0.00 | % | | | 0.22 | % |
Specialty Chemicals | | | 0.04 | % | | | 0.18 | % | | | 0.22 | % |
Electronic Manufacturing Services | | | 0.17 | % | | | 0.05 | % | | | 0.22 | % |
Electronic Equipment & Instruments | | | 0.07 | % | | | 0.15 | % | | | 0.22 | % |
Diversified Real Estate Activities | | | 0.00 | % | | | 0.22 | % | | | 0.22 | % |
Industrial REITs | | | 0.01 | % | | | 0.20 | % | | | 0.21 | % |
Healthcare Services | | | 0.12 | % | | | 0.09 | % | | | 0.21 | % |
Electronic Components | | | 0.03 | % | | | 0.18 | % | | | 0.21 | % |
Cable & Satellite | | | 0.15 | % | | | 0.06 | % | | | 0.21 | % |
Apparel, Accessories & Luxury Goods | | | 0.01 | % | | | 0.19 | % | | | 0.20 | % |
Footwear | | | 0.14 | % | | | 0.06 | % | | | 0.20 | % |
Specialty Stores | | | 0.17 | % | | | 0.03 | % | | | 0.20 | % |
Independent Power Producers & Energy Traders | | | 0.08 | % | | | 0.11 | % | | | 0.19 | % |
Trucking | | | 0.16 | % | | | 0.03 | % | | | 0.19 | % |
Human Resource & Employment Services | | | 0.11 | % | | | 0.08 | % | | | 0.19 | % |
Distributors | | | 0.18 | % | | | 0.00 | % | | | 0.18 | % |
Wireless Telecommunication Services | | | 0.01 | % | | | 0.17 | % | | | 0.18 | % |
Building Products | | | 0.12 | % | | | 0.05 | % | | | 0.17 | % |
Air Freight & Logistics | | | 0.17 | % | | | 0.00 | % | | | 0.17 | % |
Life Sciences Tools & Services | | | 0.10 | % | | | 0.07 | % | | | 0.17 | % |
Broadcasting | | | 0.09 | % | | | 0.07 | % | | | 0.16 | % |
Thrifts & Mortgage Finance | | | 0.15 | % | | | 0.00 | % | | | 0.15 | % |
Leisure Products | | | 0.03 | % | | | 0.12 | % | | | 0.15 | % |
Interactive Media & Services | | | 0.04 | % | | | 0.10 | % | | | 0.14 | % |
Real Estate Development | | | 0.00 | % | | | 0.14 | % | | | 0.14 | % |
Real Estate Operating Companies | | | 0.00 | % | | | 0.14 | % | | | 0.14 | % |
Department Stores | | | 0.00 | % | | | 0.13 | % | | | 0.13 | % |
Other Diversified Financial Services | | | 0.05 | % | | | 0.08 | % | | | 0.13 | % |
Airlines | | | 0.03 | % | | | 0.10 | % | | | 0.13 | % |
Diversified Metals & Mining | | | 0.00 | % | | | 0.12 | % | | | 0.12 | % |
Food Distributors | | | 0.10 | % | | | 0.02 | % | | | 0.12 | % |
Marine | | | 0.00 | % | | | 0.12 | % | | | 0.12 | % |
Consumer Electronics | | | 0.12 | % | | | 0.00 | % | | | 0.12 | % |
Commodity Chemicals | | | 0.01 | % | | | 0.10 | % | | | 0.11 | % |
Insurance Brokers | | | 0.11 | % | | | 0.00 | % | | | 0.11 | % |
Commercial Printing | | | 0.01 | % | | | 0.09 | % | | | 0.10 | % |
Oil & Gas Storage & Transportation | | | 0.05 | % | | | 0.05 | % | | | 0.10 | % |
Electrical Components & Equipment | | | 0.08 | % | | | 0.02 | % | | | 0.10 | % |
Investment Banking & Brokerage | | | 0.10 | % | | | 0.00 | % | | | 0.10 | % |
Household Appliances | | | 0.00 | % | | | 0.09 | % | | | 0.09 | % |
Home Improvement Retail | | | 0.04 | % | | | 0.05 | % | | | 0.09 | % |
Home Furnishing Retail | | | 0.08 | % | | | 0.00 | % | | | 0.08 | % |
Internet Services & Infrastructure | | | 0.00 | % | | | 0.08 | % | | | 0.08 | % |
Hotel & Resort REITs | | | 0.07 | % | | | 0.00 | % | | | 0.07 | % |
Gold | | | 0.00 | % | | | 0.07 | % | | | 0.07 | % |
Residential REITs | | | 0.07 | % | | | 0.00 | % | | | 0.07 | % |
Construction Materials | | | 0.00 | % | | | 0.07 | % | | | 0.07 | % |
Paper Packaging | | | 0.07 | % | | | 0.00 | % | | | 0.07 | % |
See Notes to Schedules of Investments and Notes to Financial Statements.
| | |
| State Street Total Return V.I.S. Fund | | |
| Schedule of Investments | | December 31, 2019 |
| | | | | | | | | | | | |
Industry | | Domestic | | | Foreign | | | Total | |
Soft Drinks | | | 0.05 | % | | | 0.02 | % | | | 0.07 | % |
Agricultural Products | | | 0.00 | % | | | 0.06 | % | | | 0.06 | % |
Renewable Electricity | | | 0.00 | % | | | 0.06 | % | | | 0.06 | % |
Railroads | | | 0.00 | % | | | 0.06 | % | | | 0.06 | % |
Airport Services | | | 0.03 | % | | | 0.02 | % | | | 0.05 | % |
Coal & Consumable Fuels | | | 0.01 | % | | | 0.04 | % | | | 0.05 | % |
Agricultural & Farm Machinery | | | 0.05 | % | | | 0.00 | % | | | 0.05 | % |
Interactive Home Entertainment | | | 0.05 | % | | | 0.00 | % | | | 0.05 | % |
Hotels, Resorts & Cruise Lines | | | 0.05 | % | | | 0.00 | % | | | 0.05 | % |
Communications Equipment | | | 0.04 | % | | | 0.01 | % | | | 0.05 | % |
Publishing | | | 0.02 | % | | | 0.02 | % | | | 0.04 | % |
Healthcare Supplies | | | 0.04 | % | | | 0.00 | % | | | 0.04 | % |
Brewers | | | 0.04 | % | | | 0.00 | % | | | 0.04 | % |
Oil & Gas Equipment & Services | | | 0.04 | % | | | 0.00 | % | | | 0.04 | % |
Computer & Electronics Retail | | | 0.00 | % | | | 0.04 | % | | | 0.04 | % |
Drug Retail | | | 0.00 | % | | | 0.03 | % | | | 0.03 | % |
Education Services | | | 0.03 | % | | | 0.00 | % | | | 0.03 | % |
Diversified Capital Markets | | | 0.00 | % | | | 0.03 | % | | | 0.03 | % |
Highways & Railtracks | | | 0.00 | % | | | 0.03 | % | | | 0.03 | % |
Marine Ports & Services | | | 0.00 | % | | | 0.02 | % | | | 0.02 | % |
Diversified Chemicals | | | 0.00 | % | | | 0.02 | % | | | 0.02 | % |
Water Utilities | | | 0.00 | % | | | 0.02 | % | | | 0.02 | % |
Casinos & Gaming | | | 0.00 | % | | | 0.02 | % | | | 0.02 | % |
Oil & Gas Drilling | | | 0.02 | % | | | 0.00 | % | | | 0.02 | % |
Office Services & Supplies | | | 0.02 | % | | | 0.00 | % | | | 0.02 | % |
Tobacco | | | 0.02 | % | | | 0.00 | % | | | 0.02 | % |
Real Estate Services | | | 0.02 | % | | | 0.00 | % | | | 0.02 | % |
Security & Alarm Services | | | 0.00 | % | | | 0.02 | % | | | 0.02 | % |
Motorcycle Manufacturers | | | 0.00 | % | | | 0.02 | % | | | 0.02 | % |
Paper Products | | | 0.02 | % | | | 0.00 | % | | | 0.02 | % |
Oil & Gas Exploration & Production | | | 0.01 | % | | | 0.00 | % | | | 0.01 | % |
Precious Metals & Minerals | | | 0.00 | % | | | 0.01 | % | | | 0.01 | % |
Fertilizers & Agricultural Chemicals | | | 0.00 | % | | | 0.01 | % | | | 0.01 | % |
Copper | | | 0.00 | % | | | 0.01 | % | | | 0.01 | % |
Alternative Carriers | | | 0.01 | % | | | 0.00 | % | | | 0.01 | % |
Healthcare Technology | | | 0.01 | % | | | 0.00 | % | | | 0.01 | % |
Specialized Finance | | | 0.00 | % | | | 0.01 | % | | | 0.01 | % |
Textiles | | | 0.00 | % | | | 0.01 | % | | | 0.01 | % |
Specialized Consumer Services | | | 0.00 | % | | | 0.00 | % | | | 0.00 | % |
Home Furnishings | | | 0.00 | % | | | 0.00 | % | | | 0.00 | % |
Aluminum | | | 0.00 | % | | | 0.00 | % | | | 0.00 | % |
Banks | | | 0.00 | % | | | 0.00 | % | | | 0.00 | % |
| | | | | | | | | | | | |
| | | | | | | | | | | 69.67 | % |
| | | | | | | | | | | | |
| | | | |
Sector | | Percentage (based on
Fair Value) | |
U.S. Treasuries | | | 12.69 | % |
Agency Mortgage Backed | | | 6.84 | % |
Corporate Notes | | | 6.52 | % |
Sovereign Bonds | | | 0.40 | % |
Non-Agency Collateralized Mortgage Obligations | | | 0.30 | % |
Agency Collateralized Mortgage Obligations | | | 0.18 | % |
Municipal Bonds and Notes | | | 0.13 | % |
Asset Backed | | | 0.10 | % |
U.S. Government Sponsored Agencies | | | 0.03 | % |
| | | | |
| | | 27.19 | % |
| | | | |
| |
Short-Term Investments | | | |
Short-Term Investments | | | 3.14 | % |
| | | | |
| | | 3.14 | % |
| | | | |
| | | 100.00 | % |
| | | | |
See Notes to Schedules of Investments and Notes to Financial Statements.
| | |
| State Street Total Return V.I.S. Fund | | |
| Schedule of Investments | | December 31, 2019 |
| | | | | | | | | | | | | | | | | | | | | | | | | | | | | | | | | | | | | | | | |
| Affiliate Table | |
| | | Number of
Shares Held
at 12/31/18 | | | Value At
12/31/18 | | | Cost of
Purchases | | | Proceeds from
Shares Sold | | | Realized Gain
(Loss) | | | Change in
Unrealized
Appreciation/
Depreciation | | | Number of
Shares Held
at 12/31/19 | | | Value at
12/31/19 | | | Dividend
Income | | | Capital Gains
Distributions | |
SPDR Bloomberg Barclays High Yield Bond ETF | | | 2,846,551 | | | | 95,615,648 | | | | 83,544,615 | | | | 52,501,879 | | | | (347,906 | ) | | | 8,791,119 | | | | 1,233,354 | | | $ | 135,101,597 | | | | 7,362,300 | | | | — | |
SPDR Dow Jones REIT ETF | | | 410,485 | | | | 35,301,710 | | | | 110,472,890 | | | | 62,269,080 | | | | 2,020,884 | | | | 8,092,861 | | | | 917,656 | | | | 93,619,265 | | | | 3,193,298 | | | | — | |
State Street Institutional U.S. Government Money Market Fund,
Class G Shares | | | 90,625,489 | | | | 90,625,489 | | | | 553,501,715 | | | | 583,224,828 | | | | — | | | | — | | | | 60,902,376 | | | | 60,902,376 | | | | 1,321,374 | | | | — | |
| | | | | | | | | | | | | | | | | | | | | | | | | | | | | | | | | | | | | | | | |
TOTAL | | | | | | $ | 221,542,847 | | | $ | 747,519,220 | | | $ | 697,995,787 | | | $ | 1,672,978 | | | $ | 16,883,980 | | | | | | | $ | 289,623,238 | | | $ | 11,876,972 | | | $ | — | |
| | | | | | | | | | | | | | | | | | | | | | | | | | | | | | | | | | | | | | | | |
See Notes to Schedules of Investments and Notes to Financial Statements.
| (b) | Not applicable to the Registrant. |
Item 7. Disclosure of Proxy Voting Policies and Procedures forClosed-End Management Investment Companies.
Not applicable to the Registrant.
Item 8. Portfolio Managers ofClosed-End Management Investment Companies.
Not applicable to the Registrant.
Item 9. Purchases of Equity Securities byClosed-End Management Investment Company and Affiliated Purchasers.
Not applicable to the Registrant.
Item 10. Submission of Matters to a Vote of Security Holders.
There were no material changes to the procedures by which shareholders may recommend nominees to the Registrant’s Board.
Item 11. Controls and Procedures.
(a) The Registrant’s principal executive officer and principal financial officer have concluded that the Registrant’s disclosure controls and procedures (as defined in Rule30a-3(c) under the Investment Company Act of 1940, as amended (the “1940 Act”)) are effective to provide reasonable assurance that information required to be disclosed by the Registrant on FormN-CSR is recorded, processed, summarized and reported as of a date within 90 days of the filing date of this report, based on their evaluation of these controls and procedures required by Rule30a-3(b) under the 1940 Act and Rules13a-15(b) or15d-15(b) under the Securities Exchange Act of 1934, as amended.
(b) There were no changes in the Registrant’s internal control over financial reporting (as defined in Rule30a-3(d) under the 1940 Act) that occurred during the period covered by this report that have materially affected, or are reasonably likely to materially affect, the Registrant’s internal control over financial reporting.
Item 12. Disclosure of Securities Lending Activities forClosed-End Management Investment Companies.
(a) Not applicable to the Registrant.
(b) Not applicable to the Registrant.
Item 13. Exhibits.
| (a)(1) | Code of Ethics pursuant to Item 2 of FormN-CSR is attached hereto. |
| (a)(2) | Certifications of principal executive officer and principal financial and accounting officer of the Registrant as required byRule 30a-2(a) under the 1940 Act are attached hereto. |
| (a)(3) | Not applicable to the Registrant. |
| (b) | Certifications of principal executive officer and principal financial and accounting officer of the Registrant as required byRule 30a-2(b) under the 1940 Act and Section 906 of the Sarbanes-Oxley Act of 2002 are attached hereto. |
SIGNATURES
Pursuant to the requirements of the Securities Exchange Act of 1934 and the Investment Company Act of 1940, the Registrant has duly caused this report to be signed on its behalf by the undersigned, thereunto duly authorized.
Registrant: STATE STREET VARIABLE INSURANCE SERIES FUNDS, INC.
| | |
| By: | | /s/ Jeanne M. La Porta |
| | Jeanne M. La Porta |
| | President |
| |
| Date: | | February 28, 2020 |
Pursuant to the requirements of the Securities Exchange Act of 1934 and the Investment Company Act of 1940, this report has been signed below by the following persons on behalf of the Registrant and in the capacities and on the dates indicated.
| | |
| By: | | /s/ Jeanne M. La Porta |
| | Jeanne M. La Porta |
| | President (Principal Executive Officer) |
| |
| Date: | | February 28, 2020 |
| |
| By: | | /s/ Bruce S. Rosenberg |
| | Bruce S. Rosenberg |
| | Treasurer (Principal Financial Officer) |
| |
| Date: | | February 28, 2020 |