UNITED STATES
SECURITIES AND EXCHANGE COMMISSION
Washington, D.C. 20549
FORM N-CSR
CERTIFIED SHAREHOLDER REPORT OF REGISTERED
MANAGEMENT INVESTMENT COMPANIES
Investment Company Act file number: 811-04041
STATE STREET VARIABLE INSURANCE SERIES FUNDS, INC.
(formerly known as GE Investments Funds, Inc.)
(Exact name of registrant as specified in charter)
1600 Summer Street
Stamford, Connecticut 06905
(Address of principal executive offices)(Zip code)
SSGA Funds Management, Inc.
1600 Summer Street
Stamford, Connecticut 06905
(Name and Address of Agent for Service)
Registrant’s telephone number, including area code: 800-242-0134
Date of fiscal year end: 12/31
Date of reporting period: 12/31/16
| Item 1. | Reports to Stockholders |
Annual Report
31 December 2016
State Street Core Value Equity V.I.S. Fund
(formerly the GE Investments Core Value Equity Fund)

State Street Core Value Equity V.I.S Fund
Annual Report
December 31, 2016
Table of Contents
This report is prepared for Policyholders of certain variable contracts and may be distributed to others only if preceded or accompanied by the variable contract’s current prospectus and the current summary prospectus of the Fund available for investments thereunder.
State Street Core Value Equity V.I.S. Fund
Notes to Performance — December 31, 2016 (Unaudited)
The information provided on the performance pages relates to the State Street Core Value Equity V.I.S. Fund (the “Fund”).
Total return performance shown in this report for the Fund takes into account changes in share price and assumes reinvestment of dividends and capital gains distributions, if any. Total returns shown are net of Fund fees and expenses but do not reflect fees and charges associated with the variable contracts such as administrative fees, account charges and surrender charges, which, if reflected, would reduce the Fund’s total returns for all periods shown.
The performance data quoted represents past performance; past performance does not guarantee future results. Investment return and principal value will fluctuate so your shares, when redeemed, may be worth more or less than their original cost. Current performance may be higher or lower than the performance data quoted. Periods less than one year are not annualized. Please call toll-free (800) 242-0134 or visit the Fund’s website at http://www.ssga.com/geam for the most recent month-end performance data.
An investment in the Fund is not a deposit of any bank and is not insured or guaranteed by the Federal Deposit Insurance Corporation (“FDIC”) or any other government agency. An investment in the Fund is subject to risk, including possible loss of principal invested.
The S&P 500 Index® is an unmanaged, market capitalization-weighted index of stocks of 500 large U.S. companies, which is widely used as a measure of large-cap U.S. stock market performance. The results shown for the foregoing index assume the reinvestment of net dividends or interest and do not reflect fees, expenses, or taxes. As such, the index returns do not reflect the actual cost of investing in the instruments that comprise the index.
The peer universe of the underlying annuity funds used for the peer group average annual total return calculation is based on a blend of Morningstar peer categories, as shown. Morningstar is an independent mutual fund rating service. The Fund’s performance may be compared to or ranked within a universe of mutual funds with investment objectives and policies similar but not necessarily identical to that of the Fund.
©2017 Morningstar, Inc. All Rights Reserved. The Morningstar information contained herein: (1) is proprietary to Morningstar and/or its content providers; (2) may not be copied or distributed; and (3) is not warranted to be accurate, complete or timely. Neither Morningstar nor its content providers are responsible for any damage or losses relating from any use of this information. Past performance is no guarantee of future results.
The views expressed in this document reflect our judgment as of the publication date and are subject to change at any time without notice.
State Street Global Markets, LLC, member of FINRA & SIPC is the principal underwriter and distributor of the State Street V.I.S. Funds and a wholly owned subsidiary of State Street Corporation. References to State Street may include State Street Corporation and its affiliates. The Funds pay State Street Bank and Trust Company for its services as custodian and Fund Accounting agent, and pay SSGA Funds Management, Inc. for investment advisory and administrative services.
State Street Core Value Equity V.I.S. Fund
Portfolio Management Discussion and Analysis — December 31, 2016 (Unaudited)
| Q. | How did the State Street Core Value Equity V.I.S. Fund perform compared to its benchmark and Morningstar peer group for the twelve-month period ended December 31, 2016? |
| A. | For the twelve-month period ended December 31, 2016, the State Street Core Value Equity V.I.S. Fund returned 10.46%. The S&P 500® Index (the “S&P 500 Index”), the Fund’s benchmark, returned 11.96% and the Fund’s Morningstar peer group of 295 U.S. Insurance Large Blend Funds returned an average of 11.08% over the same period. |
| Q.What | market conditions affected the Fund performance? |
| A. | It was a volatile year for U.S. stocks. However, the market climbed a wall of worry and turned in double-digit gains in the last 12 months. Markets rebounded from serial concerns ranging from China-driven global slowdown and recession fears in early 2016, to The United Kingdom’s astonishing referendum vote to leave the European Union in late June of 2016, to Donald Trump’s populist-tinged presidential victory in November. Despite these uncertainties, U.S. stocks ended the year near all-time highs. |
| | Early in the year, defensive stocks outperformed amid fears that a slowing China would crush global economies. However, by year-end, telecommunications (+23%) was the only defensive “bond-proxy” to hold strong leadership, while real estate (+3%) and staples (+5%) lagged. The cyclical energy (+27%) and financials (+23%) won as interest rates rose and oil prices strengthened—bolstered by OPEC’s late-year production-cut pledge. Industrials (+19%) and materials (+17%) also rallied amid hopes for fiscal stimulus and infrastructure spending in the President-elect Trump era. Health care (-3%) was the S&P 500 Index’s sole negative-returning sector, plagued by negative sentiment around drug pricing, and mixed M&A performance. |
| | The market swung from defensive leadership to cyclical leadership with segments of event-driven volatility in between, creating difficulty for the disciplined long-term investor. Growth stocks de-rated this year, which is not surprising given relative outperformance in the energy, financials, materials and industrials sectors; and small caps outperformed large capitalization stocks. In terms of size, the outlook for pro-domestic President-elect Trump policies benefitted small-cap and lower-quality stock performance. |
| Q. | What were the primary drivers of Fund performance? |
| A. | The Fund modestly underperformed, due to lagging stock selections within the utility sector, as well as an unproductive overweight in the lagging health care sector. The Fund’s biotechnology and pharmaceuticals holdings detracted most from performance against a backdrop of negative election-year rhetoric around drug pricing. In general, we have found a good combination of valuation and earnings growth potential in the health care sector. Finally, improving commodity prices and hopes for increased infrastructure spending under Trump lifted the materials sector and the Fund was light in the most economically-sensitive materials companies, including the mining companies. We believe — eight years into the business cycle — that it is too late to be especially pro-cyclically tilted in materials. |
| | On the other hand, the Fund benefited from strong stock selection in the technology sector, and strength in its industrials holdings. |
| | The Fund does not invest in derivatives securities as part of its strategy, but may hold futures contracts or exchange traded funds to equitize cash flows in advance of investment. The effect of derivatives on performance was deminimus for the year. |
| Q. | Were there any significant changes to the Fund during the period? |
| A. | There were no significant changes during the period in the portfolio management team or the team’s approach to investing. Health care has remained a key sector overweight. However, the Fund significantly reduced its industrials and consumer discretionary exposures during the year, taking profits as the global growth outlook faded on the margin. We initiated an overweight in utilities, and increased exposure to technology, trimming our underweight positioning. The Fund also increased its exposure to energy and materials, reflecting our outlook for better fundamentals and commodity prices. Finally, the Fund increased its underweights in consumer staples and telecommunications, reflecting the lack of relative value in those sectors. |
| | |
| 2 | | State Street Core Value Equity V.I.S. Fund |
State Street Core Value Equity V.I.S. Fund
Understanding Your Fund’s Expenses — December 31, 2016 (Unaudited)
As a shareholder of the Fund, you incur ongoing costs. Ongoing costs include portfolio management fees, professional fees, administrative fees and other Fund expenses. The following example is intended to help you understand your ongoing costs (in dollars) of investing in the Fund and to compare these costs with the ongoing costs of investing in other mutual funds.
To illustrate these ongoing costs, we have provided an example and calculated the expenses paid by investors in the Fund during the period. The information in the following table is based on an investment of $1,000, which is invested at the beginning of the period and held for the entire six-month period ended December 31, 2016.
Actual Expenses
The first section of the table provides information about actual account values and actual expenses. You may use the information in this section, together with the amount you invested, to estimate the expenses that you paid over the period. To do so, simply divide your account value by $1,000 (for example, an $8,600 account value divided by $1,000 = 8.6), then multiply the result by the number given under the heading “Expenses paid during the period” to estimate the expenses you paid on your account during the period.
Hypothetical Example for Comparison Purposes
The second section of the table provides information about hypothetical account values and hypothetical expenses based on the Fund’s actual expense ratio and an assumed rate of return of 5% per year before expenses, which is not the Fund’s actual return. The hypothetical account values and expenses may not be used to estimate the actual ending account balance or expenses you paid for the period. You may use this information to compare the ongoing costs of investing in the Fund and other funds. To do so, compare this 5% hypothetical example with the 5% hypothetical examples that appear in the shareholder reports of other funds.
Please note that the expenses shown in the table are meant to highlight and help you compare ongoing costs only and do not reflect transaction costs, such as sales charges or redemption fees, if any. Therefore, the second section of the table is useful in comparing ongoing costs only, and will not help you determine the relative total costs of owning different funds. Additionally, the expenses shown do not reflect the fees or charges associated with variable contracts through which shares of the Fund are offered.
| | | | | | | | |
| | | Actual
Fund Return | | | Hypothetical
5% Return
(2.5% for
the period) | |
Account value at the beginning of the period July 1, 2016 | | $ | 1,000.00 | | | $ | 1,000.00 | |
Account value at the end of the period December 31, 2016 | | $ | 1,078.40 | | | $ | 1,019.31 | |
Expenses paid during the period* | | $ | 6.06 | | | $ | 5.89 | |
| * | | Expenses are equal to the Fund’s annualized net expense ratio of 1.16%** (for the period July 1, 2016-December 31, 2016), multiplied by the average account value over the period, multiplied by 184/366 (to reflect the one-half year period). |
| ** | | May differ from expense ratio disclosed in the financial highlights, which is calculated based on the entire fiscal year’s data. |
| | | | |
| State Street Core Value Equity V.I.S. Fund | | | 3 | |
State Street Core Value Equity V.I.S. Fund
Performance Summary — December 31, 2016 (Unaudited)
Morningstar Performance Comparison
Based on average annual returns for periods ended 12/31/16
| | | | | | | | | | | | |
| | | One Year | | | Five Year | | | Ten Year | |
Number of funds in peer group | | | 295 | | | | 274 | | | | 246 | |
Peer group average annual total return | | | 11.08 | % | | | 13.15 | % | | | 5.81 | % |
Morningstar Category in peer group: U.S. Insurance Large Blend | |
Top Ten Largest Holdings
as of December 31, 2016 (as a % of Fair Value) (a)(b)
| | | | |
Bank of America Corp. | | | 3.36 | % |
Alphabet Inc., Class A | | | 3.21 | % |
Apple Inc. | | | 3.17 | % |
Wells Fargo & Co. | | | 3.04 | % |
Johnson & Johnson | | | 2.50 | % |
JPMorgan Chase & Co. | | | 2.40 | % |
Merck & Company Inc. | | | 2.35 | % |
Comcast Corp., Class A | | | 2.33 | % |
Citigroup Inc. | | | 2.31 | % |
Applied Materials Inc. | | | 2.17 | % |
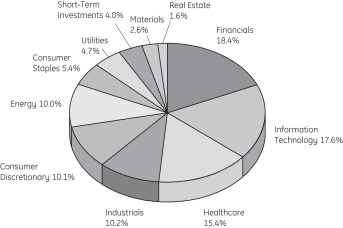
Sector Allocation as of December 31, 2016
Portfolio composition as a % of Fair Value of $13,210 (in thousands) as of December 31,2016 (a)(b)
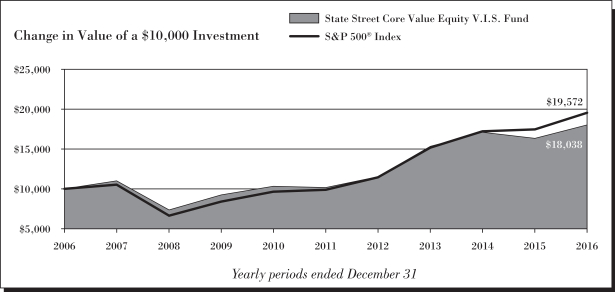
Average Annual Total Return for the periods ended December 31, 2016
Class 1 Shares (Inception date: 4/28/00)
| | | | | | | | | | | | | | | | |
| | | One
Year | | | Five
Year | | | Ten
Year | | | Ending Value
of a $10,000
Investment | |
State Street Core Value Equity V.I.S. Fund | | | 10.46 | % | | | 12.15 | % | | | 6.08 | % | | $ | 18,038 | |
S&P 500® Index | | | 11.96 | % | | | 14.66 | % | | | 6.95 | % | | $ | 19,572 | |
| | |
| 4 | | State Street Core Value Equity V.I.S. Fund |
State Street Core Value Equity V.I.S. Fund
Performance Summary, continued — December 31, 2016 (Unaudited)
| (a) | Fair Value basis is inclusive of short-term investment in State Street Institutional U.S. Government Money Market Fund Class G Shares. |
| (b) | The securities information regarding holdings, allocations and other characteristics is presented to illustrate examples of securities that the Fund has bought and the diversity of areas in which the Fund may invest as of a particular date. It may not be representative of the Fund’s current or future investments and should not be construed as a recommendation to purchase or sell a particular security. |
See Notes to performance beginning on page 1 for further information, including an explanation of Morningstar peer categories.
Past performance does not predict future performance. The Performance shown in the graphs and tables does not reflect the deduction of taxes that a shareholder would pay on Fund distributions or the redemption of Fund shares and does not reflect the fees or charges that would be associated with variable contracts through which shares of the Fund are offered.
| | | | |
| State Street Core Value Equity V.I.S. Fund | | | 5 | |
State Street Core Value Equity V.I.S. Fund
Schedule of Investments — December 31, 2016
| | | | | | | | |
| | | Number
of Shares | | | Fair
Value
$ | |
| | | | | | | | |
| Common Stock - 96.4%† | |
Aerospace & Defense - 3.0% | |
General Dynamics Corp. | | | 1,424 | | | | 245,868 | |
Hexcel Corp. | | | 2,904 | | | | 149,382 | |
| | | | | | | | |
| | | | | | | 395,250 | |
| | | | | | | | |
|
Agricultural Products - 1.1% | |
Archer-Daniels-Midland Co. | | | 3,217 | | | | 146,856 | |
| | | | | | | | |
|
Airlines - 1.6% | |
Delta Air Lines Inc. | | | 4,258 | | | | 209,451 | |
| | | | | | | | |
|
Apparel, Accessories & Luxury Goods - 1.1% | |
VF Corp. | | | 2,648 | | | | 141,271 | |
| | | | | | | | |
|
Asset Management & Custody Banks - 2.7% | |
Ameriprise Financial Inc. | | | 2,067 | | | | 229,313 | |
Invesco Ltd. | | | 4,266 | | | | 129,430 | |
| | | | | | | | |
| | | | | | | 358,743 | |
| | | | | | | | |
|
Auto Parts & Equipment - 1.6% | |
Delphi Automotive PLC | | | 3,044 | | | | 205,013 | |
| | | | | | | | |
|
Automotive Retail - 1.4% | |
Advance Auto Parts Inc. | | | 1,090 | | | | 184,341 | |
| | | | | | | | |
|
Biotechnology - 3.5% | |
Amgen Inc. | | | 1,820 | | | | 266,102 | |
Gilead Sciences Inc. | | | 2,641 | | | | 189,122 | |
| | | | | | | | |
| | | | | | | 455,224 | |
| | | | | | | | |
|
Cable & Satellite - 2.3% | |
Comcast Corp., Class A | | | 4,450 | | | | 307,273 | |
| | | | | | | | |
|
Communications Equipment - 2.0% | |
Cisco Systems Inc. | | | 8,865 | | | | 267,900 | |
| | | | | | | | |
|
Consumer Finance - 2.1% | |
Discover Financial Services | | | 3,836 | | | | 276,537 | |
| | | | | | | | |
|
Diversified Banks - 11.2% | |
Bank of America Corp. | | | 20,090 | | | | 443,989 | |
Citigroup Inc. | | | 5,139 | | | | 305,411 | |
JPMorgan Chase & Co. | | | 3,671 | | | | 316,770 | |
Wells Fargo & Co. | | | 7,291 | | | | 401,807 | |
| | | | | | | | |
| | | | | | | 1,467,977 | |
| | | | | | | | |
|
Drug Retail - 0.3% | |
CVS Health Corp. | | | 550 | | | | 43,401 | |
| | | | | | | | |
|
Electric Utilities - 2.2% | |
Exelon Corp. | | | 1,866 | | | | 66,224 | |
NextEra Energy Inc. | | | 1,841 | | | | 219,926 | |
| | | | | | | | |
| | | | | | | 286,150 | |
| | | | | | | | |
| | | | | | | | |
| | | Number
of Shares | | | Fair
Value
$ | |
General Merchandise Stores - 1.5% | |
Dollar General Corp. | | | 2,668 | | | | 197,619 | |
| | | | | | | | |
|
Gold - 0.9% | |
Newmont Mining Corp. | | | 3,552 | | | | 121,017 | |
| | | | | | | | |
|
Healthcare Equipment - 4.4% | |
Boston Scientific Corp. (a) | | | 10,546 | | | | 228,110 | |
Medtronic PLC | | | 3,070 | | | | 218,676 | |
Stryker Corp. | | | 1,102 | | | | 132,031 | |
| | | | | | | | |
| | | | | | | 578,817 | |
| | | | | | | | |
|
Home Improvement Retail - 0.9% | |
Lowe’s Companies Inc. | | | 1,710 | | | | 121,615 | |
| | | | | | | | |
|
Housewares & Specialties - 1.4% | |
Newell Brands Inc. | | | 4,095 | | | | 182,842 | |
| | | | | | | | |
|
Independent Power Producers & Energy Traders - 0.9% | |
Calpine Corp. (a) | | | 10,465 | | | | 119,615 | |
| | | | | | | | |
|
Industrial Conglomerates - 1.3% | |
Honeywell International Inc. | | | 1,471 | | | | 170,415 | |
| | | | | | | | |
|
Industrial Gases - 0.9% | |
Air Products & Chemicals Inc. | | | 834 | | | | 119,946 | |
| | | | | | | | |
|
Industrial Machinery - 1.8% | |
Ingersoll-Rand PLC | | | 3,104 | | | | 232,924 | |
| | | | | | | | |
|
Integrated Oil & Gas - 3.8% | |
Chevron Corp. | | | 1,437 | | | | 169,135 | |
Exxon Mobil Corp. | | | 1,193 | | | | 107,680 | |
Occidental Petroleum Corp. | | | 3,029 | | | | 215,756 | |
| | | | | | | | |
| | | | | | | 492,571 | |
| | | | | | | | |
|
Internet Software & Services - 3.2% | |
Alphabet Inc., Class A (a) | | | 535 | | | | 423,961 | |
| | | | | | | | |
|
Investment Banking & Brokerage - 0.8% | |
Morgan Stanley | | | 2,573 | | | | 108,709 | |
| | | | | | | | |
|
Multi-Line Insurance - 1.6% | |
The Hartford Financial Services Group Inc. | | | 4,458 | | | | 212,424 | |
| | | | | | | | |
|
Multi-Utilities - 1.6% | |
Sempra Energy | | | 2,102 | | | | 211,545 | |
| | | | | | | | |
|
Oil & Gas Equipment & Services - 0.8% | |
Schlumberger Ltd. | | | 1,267 | | | | 106,365 | |
| | | | | | | | |
|
Oil & Gas Exploration & Production - 5.5% | |
Concho Resources Inc. (a) | | | 554 | | | | 73,460 | |
See notes to schedule of investments and notes to financial statements.
| | |
| 6 | | State Street Core Value Equity V.I.S. Fund |
State Street Core Value Equity V.I.S. Fund
Schedule of Investments, continued — December 31, 2016
| | | | | | | | |
| | | Number
of Shares | | | Fair
Value
$ | |
| | | | | | | | |
ConocoPhillips | | | 4,433 | | | | 222,271 | |
Hess Corp. | | | 3,203 | | | | 199,515 | |
Noble Energy Inc. | | | 5,986 | | | | 227,827 | |
| | | | | | | | |
| | | | | | | 723,073 | |
| | | | | | | | |
|
Packaged Foods & Meats - 1.8% | |
Mondelez International Inc., Class A | | | 5,434 | | | | 240,889 | |
| | | | | | | | |
|
Paper Packaging - 0.5% | |
Packaging Corporation of America | | | 702 | | | | 59,544 | |
| | | | | | | | |
|
Pharmaceuticals - 7.6% | |
Allergan PLC (a) | | | 1,104 | | | | 231,851 | |
Johnson & Johnson | | | 2,873 | | | | 330,998 | |
Merck & Company Inc. | | | 5,267 | | | | 310,068 | |
Pfizer Inc. | | | 4,062 | | | | 131,934 | |
| | | | | | | | |
| | | | | | | 1,004,851 | |
| | | | | | | | |
|
Research & Consulting Services - 1.2% | |
Nielsen Holdings PLC | | | 3,855 | | | | 161,717 | |
| | | | | | | | |
|
Semiconductor Equipment - 2.2% | |
Applied Materials Inc. | | | 8,871 | | | | 286,267 | |
| | | | | | | | |
|
Semiconductors - 3.3% | |
NXP Semiconductors N.V. (a) | | | 1,835 | | | | 179,848 | |
QUALCOMM Inc. | | | 3,962 | | | | 258,323 | |
| | | | | | | | |
| | | | | | | 438,171 | |
| | | | | | | | |
|
Soft Drinks - 2.2% | |
PepsiCo Inc. | | | 2,706 | | | | 283,129 | |
| | | | | | | | |
| | | | | | | | |
| | | Number
of Shares | | | Fair
Value
$ | |
Specialized REITs - 1.6% | |
American Tower Corp. | | | 2,002 | | | | 211,571 | |
| | | | | | | | |
|
Specialty Chemicals - 0.3% | |
PPG Industries Inc. | | | 426 | | | | 40,368 | |
| | | | | | | | |
|
Systems Software - 2.0% | |
Oracle Corp. | | | 6,805 | | | | 261,652 | |
| | | | | | | | |
|
Technology Hardware, Storage & Peripherals - 4.9% | |
Apple Inc. | | | 3,617 | | | | 418,921 | |
Western Digital Corp. | | | 3,315 | | | | 225,254 | |
| | | | | | | | |
| | | | | | | 644,175 | |
| | | | | | | | |
|
Trading Companies & Distributors - 1.4% | |
United Rentals Inc. (a) | | | 1,692 | | | | 178,641 | |
| | | | | | | | |
| | |
Total Common Stock
(Cost $10,728,768) | | | | | | | 12,679,820 | |
| | | | | | | | |
|
| Short-Term Investments - 4.0% | |
State Street Institutional U.S. Government Money Market Fund - Class G Shares 0.46%
(Cost $530,547) (b)(c)(d) | | | 530,547 | | | | 530,547 | |
| | | | | | | | |
| | |
Total Investments
(Cost $11,259,315) | | | | | | | 13,210,367 | |
| |
| Liabilities in Excess of Other Assets, net - (0.4)% | | | | (48,753 | ) |
| | | | | | | | |
| | |
| NET ASSETS - 100.0% | | | | | | | 13,161,614 | |
| | | | | | | | |
Other Information:
The Fund had the following long futures contracts open at December 31, 2016:
| | | | | | | | | | | | | | | | |
| Description | | Expiration
date | | | Number of
Contracts | | | Current
Notional
Value | | | Unrealized
Depreciation | |
| | | | | | | | | | | | | | | | |
S&P 500 Emini Index Futures | | | March 2017 | | | | 1 | | | $ | 111,810 | | | $ | (1,605 | ) |
| | | | | | | | | | | | | | | | |
See notes to schedule of investments and notes to financial statements.
| | | | |
| State Street Core Value Equity V.I.S. Fund | | | 7 | |
State Street Core Value Equity V.I.S. Fund
Notes to Schedule of Investments — December 31, 2016
The views expressed in this document reflect our judgment as of the publication date and are subject to change at any time without notice. The securities cited may not be representative of the Fund’s future investments and should not be construed as a recommendation to purchase or sell a particular security. See the Fund’s summary prospectus and statutory prospectus for complete descriptions of investment objectives, policies, risks and permissible investments.
| (a) | Non-income producing security. |
| (b) | Sponsored by SSGA Funds Management, Inc., the Funds’ investment adviser and administrator, effective July 1, 2016, and an affiliate of State Street Bank & Trust Co., the Funds’ sub-administrator, custodian and accounting agent. |
| (c) | At December 31, 2016, all or a portion of this security was pledged to cover collateral requirements for futures. |
| (d) | Coupon amount represents effective yield. |
| † | Percentages are based on net assets as of December 31, 2016. |
Abbreviations:
REIT - Real Estate Investment Trust
SPDR - S&P Depositary Receipt
Affiliate Table
| | | | | | | | | | | | | | | | | | | | | | | | | | | | | | | | |
| | | Number of
Shares Held
at 12/31/15 | | | Value At
12/31/15 | | | Shares
Purchased | | | Shares
Sold | | | Number of
Shares Held
at 12/31/16 | | | Value at
12/31/16 | | | Dividend/
Interest
Income | | | Realized
Gain (Loss) | |
Financial Select Sector SPDR Fund | | | 1,837 | | | $ | — | | | | 200 | | | | 2,037 | | | | — | | | $ | — | | | $ | 226 | | | $ | 12,664 | |
Industrial Select Sector SPDR Fund | | | 3,312 | | | | 175,569 | | | | 983 | | | | 4,295 | | | | — | | | | — | | | | 2,205 | | | | 73,471 | |
State Street Corp. | | | 3,083 | | | | 204,588 | | | | — | | | | 3,083 | | | | — | | | | — | | | | 969 | | | | (49,013 | ) |
State Street Institutional U.S. Government Money Market Fund - Class G Shares | | | 660,241 | | | | 660,241 | | | | 4,924,479 | | | | 5,054,173 | | | | 530,547 | | | | 530,547 | | | | 1,124 | | | | — | |
| | | | | | | | | | | | | | | | | | | | | | | | | | | | | | | | |
| | | | | | $ | 1,040,398 | | | | | | | | | | | | | | | $ | 530,547 | | | $ | 4,524 | | | $ | 37,122 | |
| | | | | | | | | | | | | | | | | | | | | | | | | | | | | | | | |
| | |
| 8 | | Notes to Schedule of Investments |
State Street Core Value Equity V.I.S. Fund
Financial Highlights
Selected data based on a share outstanding throughout the fiscal years indicated
| | | | | | | | | | | | | | | | | | | | |
| | | 12/31/16 | | | 12/31/15* | | | 12/31/14* | | | 12/31/13* | | | 12/31/12* | |
Inception date | | | | | | | | | | | | | | | | | | | 4/28/00 | |
Net asset value, beginning of period | | $ | 9.46 | | | $ | 11.03 | | | $ | 11.89 | | | $ | 9.67 | | | $ | 8.63 | |
| | | | | | | | | | | | | | | | | | | | |
| | | | |
Income/(loss) from investment operations: | | | | | | | | | | | | | | | | | |
Net investment income | | | 0.11 | | | | 0.11 | | | | 0.12 | | | | 0.11 | | | | 0.12 | |
Net realized and unrealized gains/(losses) on investments | | | 0.88 | | | | (0.59 | ) | | | 1.26 | | | | 3.09 | | | | 1.04 | |
| | | | | | | | | | | | | | | | | | | | |
Total income/(loss) from investment operations | | | 0.99 | | | | (0.48 | ) | | | 1.38 | | | | 3.20 | | | | 1.16 | |
| | | | | | | | | | | | | | | | | | | | |
| | | | | |
Less distributions from: | | | | | | | | | | | | | | | | | | | | |
Net investment income | | | 0.11 | | | | 0.11 | | | | 0.11 | | | | 0.11 | | | | 0.12 | |
Net realized gains | | | 0.41 | | | | 0.98 | | | | 2.13 | | | | 0.87 | | | | — | |
| | | | | | | | | | | | | | | | | | | | |
Total distributions | | | 0.52 | | | | 1.09 | | | | 2.24 | | | | 0.98 | | | | 0.12 | |
| | | | | | | | | | | | | | | | | | | | |
Net asset value, end of period | | $ | 9.93 | | | $ | 9.46 | | | $ | 11.03 | | | $ | 11.89 | | | $ | 9.67 | |
| | | | | | | | | | | | | | | | | | | | |
Total Return(a) | | | 10.46 | % | | | (4.56 | )% | | | 11.51 | % | | | 33.08 | % | | | 13.41 | % |
| | | | | |
Ratios/Supplemental Data: | | | | | | | | | | | | | | | | | | | | |
Net assets, end of period (in thousands) | | $ | 13,162 | | | $ | 14,279 | | | $ | 17,025 | | | $ | 17,993 | | | $ | 15,523 | |
| | | | | |
Ratios to average net assets: | | | | | | | | | | | | | | | | | | | | |
Net expenses | | | 1.13 | % | | | 1.05 | % | | | 1.01 | %(b) | | | 1.02 | %(b) | | | 1.08 | %(b) |
Gross expenses | | | 1.13 | % | | | 1.05 | % | | | 1.01 | % | | | 1.02 | % | | | 1.08 | % |
Net investment income | | | 1.06 | % | | | 0.91 | % | | | 0.88 | % | | | 0.89 | % | | | 1.14 | % |
Portfolio turnover rate | | | 45 | % | | | 43 | % | | | 50 | % | | | 43 | % | | | 62 | % |
Notes to Financial Highlights
| (a) | | Total returns are historical and assume changes in share price, reinvestment of dividends and capital gains distributions and do not include the effect of insurance contract charges. Past performance does not guarantee future results. |
| (b) | | Includes contractual management fee waiver related to the Fund’s investments in the GE Institutional Money Market Fund (the “Money Market Fund”). The fee waiver agreement was terminated effective June 30, 2014 with the closure of the Money Market Fund. |
| * | | Beginning with the fiscal year ended December 31, 2016, the Fund was audited by Ernst & Young LLP. The previous years were audited by another independent registered public accounting firm. |
See accompanying notes to financial statements.
State Street Core Value Equity V.I.S. Fund
Statement of Assets and Liabilities — December 31, 2016
| | | | |
| | | | |
Assets | | | | |
Investments in securities, at fair value (cost $10,728,768) | | $ | 12,679,820 | |
Short-term affiliated investments, at fair value | | | 530,547 | |
Cash | | | 1,242 | |
Income receivable | | | 18,928 | |
Receivable for fund shares sold | | | 104 | |
Income receivable from affiliated investments | | | 158 | |
Other assets | | | 640 | |
| | | | |
Total assets | | | 13,231,439 | |
| | | | |
|
Liabilities | |
Payable for fund shares redeemed | | | 24,083 | |
Payable for variation margin on open futures contracts | | | 445 | |
Payable to the Adviser (Note 6) | | | 7,323 | |
Payable to the Custodian (Note 6) | | | 12,111 | |
Accrued other expenses | | | 25,863 | |
| | | | |
Total liabilities | | | 69,825 | |
| | | | |
| | | | |
Net Assets | | $ | 13,161,614 | |
| | | | |
|
Net Assets Consist of: | |
Capital paid in | | $ | 11,133,718 | |
Undistributed (distributions in excess of) net investment income | | | 1,057 | |
Accumulated net realized gain | | | 77,392 | |
Net unrealized appreciation (depreciation) on: | |
Investments | | | 1,951,052 | |
Futures | | | (1,605 | ) |
| | | | |
Net Assets | | $ | 13,161,614 | |
| | | | |
| | | | |
Shares outstanding ($0.01 par value; unlimited shares authorized) | | | 1,325,455 | |
Net asset value per share | | $ | 9.93 | |
See accompanying notes to financial statements.
| | |
| 10 | | Statement of Assets and Liabilities |
State Street Core Value Equity V.I.S. Fund
Statement of Operations — For the year ended December 31, 2016
| | | | |
| | | | |
Investment Income | | | | |
Income | | | | |
Dividend | | $ | 287,911 | |
Interest | | | 2,395 | |
Dividend income from affiliated investments | | | 4,524 | |
| | | | |
Total income | | | 294,830 | |
| | | | |
| |
Expenses | | | | |
Advisory and administration fees (Note 6) | | | 87,894 | |
Directors’ fees (Note 6) | | | 917 | |
Custody and accounting expenses — net (Note 6) | | | 32,577 | |
Professional fees | | | 22,045 | |
Other expenses | | | 9,124 | |
| | | | |
Total Expenses | | | 152,557 | |
| | | | |
Net investment income | | $ | 142,273 | |
| | | | |
Net Realized and Unrealized Gain (Loss) on Investments | | | | |
Realized gain (loss) on: | |
Investments | | $ | 497,372 | |
Affiliated investments | | | 37,122 | |
Futures | | | 33,266 | |
Increase (decrease) in unrealized appreciation/depreciation on: | | | | |
Investments | | | 629,374 | |
Futures | | | (6,751 | ) |
| | | | |
| |
Net realized and unrealized gain (loss) on investments | | | 1,190,383 | |
| | | | |
Net Increase in Net Assets Resulting from Operations | | $ | 1,332,656 | |
| | | | |
See accompanying notes to financial statements.
| | | | |
| Statement of Operations | | | 11 | |
State Street Core Value Equity V.I.S. Fund
Statements of Changes in Net Assets
| | | | | | | | |
| | | Year Ended
December 31, 2016 | | | Year Ended
December 31, 2015* | |
| | | | | | | | |
Increase (Decrease) in Net Assets | | | | | | | | |
| | |
Operations: | | | | | | | | |
Net investment income | | $ | 142,273 | | | $ | 143,531 | |
Net realized gain (loss) on investments and futures transactions | | | 567,760 | | | | 1,176,542 | |
Net increase (decrease) in unrealized appreciation/depreciation on investments and futures | | | 622,623 | | | | (2,027,057 | ) |
| | | | | | | | |
Net increase (decrease) from operations | | | 1,332,656 | | | | (706,984 | ) |
| | | | | | | | |
| | |
Distributions to shareholders from: | | | | | | | | |
Net investment income | | | (141,062 | ) | | | (142,667 | ) |
Net realized gains | | | (520,035 | ) | | | (1,323,704 | ) |
| | | | | | | | |
Total distributions | | | (661,097 | ) | | | (1,466,371 | ) |
| | | | | | | | |
Increase (decrease) in assets from operations and distributions | | | 671,559 | | | | (2,173,355 | ) |
| | | | | | | | |
| | |
Share transactions: | | | | | | | | |
Proceeds from sale of shares | | | 83,668 | | | | 260,975 | |
Value of distributions reinvested | | | 661,097 | | | | 1,466,371 | |
Cost of shares redeemed | | | (2,533,773 | ) | | | (2,300,168 | ) |
| | | | | | | | |
Net increase (decrease) from share transactions | | | (1,789,008 | ) | | | (572,822 | ) |
| | | | | | | | |
| | |
Total increase (decrease) in net assets | | | (1,117,449 | ) | | | (2,746,177 | ) |
| | |
Net Assets | | | | | | | | |
Beginning of year | | | 14,279,063 | | | | 17,025,240 | |
| | | | | | | | |
| | |
End of year | | $ | 13,161,614 | | | $ | 14,279,063 | |
| | | | | | | | |
| | |
Undistributed (distributions in excess of) net investment income, end of year | | $ | 1,057 | | | $ | (1 | ) |
| | |
Changes in Fund Shares | | | | | | | | |
Shares sold | | | 9,068 | | | | 24,989 | |
Issued for distributions reinvested | | | 66,242 | | | | 152,588 | |
Shares redeemed | | | (259,853 | ) | | | (210,528 | ) |
| | | | | | | | |
Net decrease in fund shares | | | (184,543 | ) | | | (32,951 | ) |
| | | | | | | | |
| * | | Beginning with the year ended December 31, 2016, the Fund was audited by Ernst & Young LLP. The previous years were audited by another independent registered public accounting firm. |
See accompanying notes to financial statements.
| | |
| 12 | | Statements of Changes in Net Assets |
State Street Core Value Equity V.I.S. Fund
Notes to Financial Statements — December 31, 2016
| 1. | | Organization of the Company |
State Street Variable Insurance Series Funds, Inc. (the “Company”) was incorporated under the laws of the Commonwealth of Virginia on May 14, 1984 and is registered under the Investment Company Act of 1940, as amended (the “1940 Act”), as an open-end management investment company. Prior to November 30, 2016, the Company was named GE Investments Funds, Inc. The Company is currently composed of the following eight investment portfolios (collectively, the “Funds”): State Street U.S. Equity V.I.S. Fund, State Street S&P 500 Index V.I.S. Fund, State Street Premier Growth Equity V.I.S. Fund, State Street Core Value Equity V.I.S. Fund (the “Fund”), State Street Small-Cap Equity V.I.S. Fund, State Street Total Return V.I.S. Fund, State Street Income V.I.S. Fund and State Street Real Estate Securities V.I.S. Fund. Each Fund is an investment company and accordingly follows the investment company accounting and reporting guidance of the Financial Accounting Standards Board (“FASB”) Accounting Standard Codification (“ASC”) Topic 946 Financial Services — Investment Companies. Each Fund is a diversified investment company within the meaning of the 1940 Act.
Effective November 30, 2016, each individual Fund changed its respective name as follows:
| | |
| Old Name | | New Name |
GE Investments U.S. Equity Fund | | State Street U.S. Equity V.I.S. Fund |
GE Investments S&P 500 Index Fund | | State Street S&P 500 Index V.I.S. Fund |
GE Investments Premier Growth Equity Fund | | State Street Premier Growth Equity V.I.S. Fund |
GE Investments Core Value Equity Fund | | State Street Core Value Equity V.I.S. Fund |
GE Investments Small-Cap Equity Fund | | State Street Small-Cap Equity V.I.S. Fund |
GE Investments Total Return Fund | | State Street Total Return V.I.S. Fund |
GE Investments Income Fund | | State Street Income V.I.S. Fund |
GE Investments Real Estate Securities Fund | | State Street Real Estate Securities V.I.S. Fund |
Shares of the Funds of the Company are offered only to insurance company separate accounts that fund certain variable life insurance contracts and variable annuity contracts. SSGA Funds Management, Inc. (“SSGA FM”) is the investment adviser and administrator of each of the Funds effective July 1, 2016. Prior to July 1, 2016, GE Asset Management Incorporated (“GEAM”) served as the investment adviser and administrator to each Fund.
The Company currently offers one share class (Class 1) of the Fund as an investment option for variable life insurance and variable annuity contracts.
| 2. | | Summary of Significant Accounting Policies |
The preparation of financial statements in conformity with U.S. generally accepted accounting principles (“GAAP”) requires management to make estimates and assumptions that affect the reported amounts of assets and liabilities and disclosure of contingent assets and liabilities at the date of the financial statements and the reported amounts of increases and decreases in net assets from operations during the reporting period. Actual results may differ from those estimates.
Subsequent events after the balance sheet date through the date the financial statements were issued have been evaluated in the preparation of the financial statements. At a meeting held on December 14, 2016, the Board of Directors of the Company approved a plan of dissolution, liquidation and termination of the Fund. As a result, the plan will be implemented to liquidate the assets of the Fund and to cease the Fund’s operations after the proceeds are paid to remaining shareholders. The liquidation of the Fund is expected to occur on or about April 28, 2017 (the “Liquidation Date”). Any shares of the Fund outstanding on the Liquidation Date will be automatically redeemed on the Liquidation Date.
The following summarizes the significant accounting policies of the Company:
Securities Valuation and Transactions All investments in securities are recorded at their estimated fair value, as described in Note 3.
Securities transactions are accounted for as of the trade date. Realized gains and losses on investments sold are recorded on the basis of identified cost for both financial statement and federal tax purposes.
Foreign Currency Accounting records of the Fund are maintained in U.S. dollars. Investment securities and other assets and liabilities denominated in a foreign currency are translated to U.S. dollars at the prevailing rates of exchange at period end. Purchases and sales of securities, income receipts and expense payments denominated in foreign currencies are translated into U.S. dollars at the prevailing exchange rate on the respective dates of such transactions.
| | | | |
| Notes to Financial Statements | | | 13 | |
State Street Core Value Equity V.I.S. Fund
Notes to Financial Statements, continued — December 31, 2016
All assets and liabilities of the Fund initially expressed in foreign currency values will be converted into U.S. dollars at the WM/Reuters exchange rate computed at 11:00 a.m., Eastern Time.
The Fund does not isolate the portion of the results of operations resulting from changes in foreign exchange rates from the fluctuations arising from changes in the market prices of securities during the year. Such fluctuations are included in the net realized or unrealized gain or loss from investments. Net realized gains or losses on foreign currency transactions represent net gains or losses on sales and maturities of foreign currency contracts, disposition of foreign currencies, the difference between the amount of net investment income and withholding taxes accrued and the U.S. dollar amount actually received or paid, and gains or losses between the trade and settlement date on purchases and sales of foreign securities. Net unrealized foreign exchange gains and losses arising from changes in the value of other assets and liabilities (including foreign currencies and open foreign currency contracts) as a result of changes in foreign exchange rates are included as increases or decreases in unrealized appreciation/depreciation on foreign currency related transactions.
Derivatives The Fund is subject to equity price risk in the normal course of pursuing its investment objectives. The Fund may enter into various types of derivative transactions (such as options, futures, and options on futures) to gain or hedge exposure to certain types of securities as an alternative to investing directly in or selling such securities.
Futures Contracts A futures contract is an agreement to buy or sell a specific amount of a commodity, financial instrument, currency or index at a particular price and future date. During the fiscal year ended December 31, 2016, the Fund invested in stock index futures contracts to gain equity exposure for accumulating and residual cash positions. Buying futures tends to increase the Fund’s exposure to the underlying instrument while selling futures tends to decrease the Fund’s exposure to the underlying instrument, or hedge other Fund investments. With futures contracts, there is minimal counterparty credit risk to the Fund since futures contracts are exchange traded and the exchange’s clearinghouse, as counterparty to all traded futures, guarantees the futures against default. The Fund’s risks in using these contracts include changes in the value of the underlying instruments, non-performance of the counterparties under the contracts’ terms and changes in the liquidity of the secondary market for the contracts. Futures contracts are valued at the settlement price established each day by the board of trade or exchange on which they principally trade.
Upon entering into a financial futures contract, the Fund is required to pledge to the broker an amount of cash and/or other assets equal to a certain percentage of the contract amount, known as initial margin deposit. Subsequent payments, known as variation margin, are made or received by the Fund each day, depending on the daily fluctuation in the fair value of the underlying security. The Fund records an unrealized gain or loss equal to the daily variation margin. Should market conditions move unexpectedly, the Fund may not achieve the anticipated benefits of the futures contracts and may incur a loss. The Fund recognizes a realized gain or loss on the expiration or closing of a futures contract.
Investment Income Corporate actions (including cash dividends) are recorded on the ex-dividend date, net of applicable withholding taxes, except for certain foreign corporate actions which are recorded as soon after the ex-dividend date as such information becomes available. Withholding taxes on foreign dividends, if any, have been provided for in accordance with the Fund’s understanding of the applicable country’s tax rules and rates.
Interest income is recorded on the accrual basis. Accretion of discounts and amortization of premiums on taxable bonds are to the call or maturity date, whichever is shorter, using the effective yield method.
Expenses Fund specific expenses are charged to the Fund that incurs such expenses. Such expenses may include custodial fees, legal and accounting fees, printing costs and registration fees. Expenses that are not fund specific are allocated pro rata across the Funds. Expenses of the Fund are generally paid directly by the Fund, however, expenses may be paid by the investment adviser and reimbursed by the Fund.
Federal Income Taxes The Fund intends to comply with all sections of the Internal Revenue Code of 1986, as amended (the “Internal Revenue Code”) applicable to regulated investment companies, including the distribution of substantially all of its taxable net investment income and net realized capital gains to its shareholders. Therefore, no provision for federal income tax has been made. The Fund is treated as a separate taxpayer for federal income tax purposes.
| | |
| 14 | | Notes to Financial Statements |
State Street Core Value Equity V.I.S. Fund
Notes to Financial Statements, continued — December 31, 2016
The Fund utilizes various methods to measure the fair value of most of its investments on a recurring basis. GAAP establishes a framework for measuring fair value and providing related disclosures. Broadly, the framework requires fair value to be determined based on the exchange price that would be received for an asset or paid to transfer a liability (an exit price) in the principal or most advantageous market for the asset or liability in an orderly transaction between market participants at the measurement date. In the absence of active markets for the identical assets or liabilities, such measurements involve developing assumptions based on market observable data and, in the absence of such data, internal information that is consistent with what market participants would use in a hypothetical transaction that occurs at the measurement date. It also establishes a three-level valuation hierarchy based upon observable and non-observable inputs.
Observable inputs reflect market data obtained from independent sources, while unobservable inputs reflect our market assumptions. Preference is given to observable inputs. These two types of inputs create the following fair value hierarchy:
| | • | | Level 1 — Quoted prices for identical investments in active markets. |
| | • | | Level 2 — Quoted prices for similar investments in active markets; quoted prices for identical or similar investments in markets that are not active; and model-derived valuations whose inputs are observable or whose significant value drivers are observable. |
| | • | | Level 3 — Significant inputs to the valuation model are unobservable. |
Policies and procedures are maintained to value investments using the best and most relevant data available. In addition, pricing vendors are utilized to assist in valuing investments. The investment adviser performs periodic reviews of the methodologies used by independent pricing services including price validation of individual securities.
Fair Value Measurement The following section describes the valuation methodologies the Fund uses to measure different financial investments at fair value.
The Fund’s portfolio securities are valued generally on the basis of market quotations. Equity securities generally are valued at the last reported sale price on the primary market in which they are traded. Portfolio securities listed on NASDAQ are valued using the NASDAQ Official Closing Price. Level 1 securities primarily include publicly-traded equity securities, which may not necessarily represent the last sales price. If no sales occurred on the exchange or NASDAQ that day, the portfolio security generally is valued using the last reported bid price. In those circumstances, the Fund typically classifies the investment securities in Level 2.
Short-term securities of sufficient credit quality with remaining maturities of sixty days or less at the time of purchase are typically valued on the basis of amortized cost which approximates fair value and these are included in Level 2. If it is determined that amortized cost does not approximate fair value, securities may be valued based on dealer supplied valuations or quotations. In these infrequent circumstances, pricing services may provide the Fund with valuations that are based on significant unobservable inputs, and in those circumstances the investment securities are classified in Level 3.
Investments in registered investment companies are valued at the published daily net asset value (“NAV”) and classified in Level 1.
If prices are not readily available for a portfolio security, or if it is believed that a price for a portfolio security does not represent its fair value, the security may be valued using procedures approved by the Company’s Board of Directors that are designed to establish its “fair” value. These securities are typically classified in Level 3. Those procedures require that the fair value of a security be established by a valuation committee of the investment adviser. The valuation committee follows different protocols for different types of investments and circumstances. The fair value procedures may be used to value any investment of the Fund in the appropriate circumstances.
Fair value determinations generally are used for securities whose value is affected by a significant event that will materially affect the value of a security and which occurs subsequent to the time of the close of the principal market on which such security trades but prior to the calculation of the Fund’s NAV.
The value established for such a portfolio security valued other than by use of a market quotation (as described above) may be different than what would be produced through the use of market quotations or another methodology. Portfolio securities that
| | | | |
| Notes to Financial Statements | | | 15 | |
State Street Core Value Equity V.I.S. Fund
Notes to Financial Statements, continued — December 31, 2016
are valued using techniques other than market quotations, including “fair valued” securities, may be subject to greater fluctuation in their value from one day to the next than would be the case if market quotations were used. In addition, there is no assurance that the Fund could sell a portfolio security for the value established for it at any time and it is possible that the Fund would incur a loss because a portfolio security is sold at a discount to its established value.
Other financial investments are derivative instruments that are not reflected in total investments, such as futures, forwards, swaps, and written options contracts, which are valued based on fair value as discussed above.
The Fund uses closing prices for derivatives included in Level 1, which are traded either on exchanges or liquid over-the-counter markets. Derivative assets and liabilities included in Level 2 primarily represent interest rate swaps, cross-currency swaps and foreign currency and commodity forward and option contracts. Derivative assets and liabilities included in Level 3 primarily represent interest rate products that contain embedded optionality or prepayment features.
The inputs or methodology used for valuing securities are not an indication of the risk associated with investing in those securities.
The following table presents the Fund’s investments measured at fair value on a recurring basis at December 31, 2016:
| | | | | | | | | | | | | | | | |
| Investments | | Level 1 | | | Level 2 | | | Level 3 | | | Total | |
| | | | | | | | | | | | | | | | |
Investments in Securities† | | | | | | | | | | | | | | | | |
Common Stock | | $ | 12,679,820 | | | $ | — | | | $ | — | | | $ | 12,679,820 | |
Short-Term Investments | | | 530,547 | | | | — | | | | — | | | | 530,547 | |
| | | | | | | | | | | | | | | | |
Total Investments in Securities | | $ | 13,210,367 | | | $ | — | | | $ | — | | | $ | 13,210,367 | |
| | | | | | | | | | | | | | | | |
| | | | |
Other Financial Instruments* | | | | | | | | | | | | | | | | |
Long Futures Contracts — Unrealized Depreciation | | $ | (1,605 | ) | | $ | — | | | $ | — | | | $ | (1,605 | ) |
| | | | | | | | | | | | | | | | |
| | † | See Schedule of Investments for Industry Classification. |
| | * | Other financial instruments include derivative instruments such as futures contracts. Amounts shown represent unrealized appreciation (depreciation), at period end. |
There were no transfers between fair value levels during the period. Transfers between fair value levels are recognized at the beginning of the period.
| 4. | | Derivatives Disclosure |
Shown below are the derivative contracts entered into by the Fund, summarized by primary risk exposure as they appear on the Statement of Assets and Liabilities, none of which are accounted for as hedging instruments under FASB ASC No. 815 Derivatives and Hedging (“ASC 815”) as of December 31, 2016.
| | | | | | | | | | | | |
| | | Asset Derivatives December 31, 2016 | | | Liability Derivatives December 31, 2016 | |
Derivatives not accounted for as
hedging instruments under ASC 815 | | Location in the Statement
of Assets and Liabilities | | Fair
Value ($) | | | Location in the Statement
of Assets and Liabilities | | Fair
Value ($) | |
| Equity Contracts | | Assets, Net Assets — Net Unrealized Appreciation/(Depreciation) on Futures | | | — | | | Liabilities, Net Assets — Net Unrealized Appreciation/(Depreciation) on Futures | | | (1,605 | ) |
Shown below are the effects of derivative instruments on the Fund’s Statement of Operations, summarized by primary risk exposure, none of which are accounted for as hedging instruments under ASC 815.
| | | | | | | | | | | | |
Derivatives not accounted
for as hedging instruments
under ASC 815 | | Location in the Statement of Operations | | Total Notional
Amount of
Futures Contracts
Purchased/(Sold) ($) | | Realized Gain (Loss)
on Derivatives
Recognized in
Income ($) | | | Change in
Unrealized
Appreciation
(Depreciation)
on Derivatives
Recognized in
Income ($) | |
| Equity Contracts | | Realized gain (loss) on Futures, Increase (decrease) in unrealized appreciation/ (depreciation) on Futures | | 2,326,814/
(2,648,644) | | | 33,266 | | | | (6,751 | ) |
| | |
| 16 | | Notes to Financial Statements |
State Street Core Value Equity V.I.S. Fund
Notes to Financial Statements, continued — December 31, 2016
During the fiscal year ended December 31, 2016, the Fund had an average notional value of $192,101 on long futures contracts. Please refer to the table following the Schedule of Investments for open futures contracts at December 31, 2016.
Prior to July 1, 2016, the Company shared a revolving credit facility of up to $150 million with a number of its affiliates. The credit facility was with the Company’s custodian bank, State Street Bank and Trust Company (“State Street”). The revolving credit facility required the payment of a commitment fee equal to 0.20% per annum on the daily unused portion of the credit facility, payable quarterly. The portion borne by each Fund generally was borne proportionally based upon net assets. Generally, borrowings under the credit facility would accrue interest at the higher of the 1-Month LIBOR plus 1.25% and the Overnight Federal Funds Rate plus 1.25% and would be borne by the borrowing Fund. The maximum amount allowed to be borrowed by any one Fund was the lesser of (i) 33.33% of its total assets or (ii) 20% of its net assets. The credit facility was not utilized by the Fund during the fiscal year ended December 31, 2016. The revolving credit facility with State Street was terminated effective June 30, 2016.
Currently, the Funds and other affiliated funds (each a “Participant” and, collectively, the “Participants”) participate in a $360 million revolving credit facility provided by a syndication of banks under which the Participants may borrow to fund shareholder redemptions. This agreement expires October 12, 2017, unless extended or renewed.
The Participants are charged an annual commitment fee which is calculated based on the unused portion of the shared credit line. Commitment fees are allocated among each of the Participants based on relative net assets. A Participant incurs and pays the interest expense related to its borrowing. Interest is calculated at a rate per annum equal to the sum of 1% plus the greater of the New York Fed Bank Rate and 1-month LIBOR rate. From July 1, 2016, the date the Funds were added to this credit facility, through October 12, 2016, interest was calculated at a rate per annum equal to the sum of the New York Fed Bank Rate plus 1%.
The credit facilities were not utilized by the Fund during the fiscal year ended December 31, 2016.
| 6. | | Compensation and Fees Paid to Affiliates |
SSGA FM, a registered investment adviser, was retained by the Company’s Board of Directors effective July 1, 2016 to act as investment adviser and administrator of the Fund. SSGA FM’s compensation for investment advisory and administrative services (“Management Fee”) is paid monthly based on the average daily net assets of the Fund at an annualized rate of 0.65%.
State Street serves as the sub-administrator and custodian to the Funds. Amounts paid by the Fund to State Street for performing such services are included in advisory and administration and custody and accounting expenses, respectively.
Prior to July 1, 2016, GEAM served as the Fund’s investment adviser and administrator and the Fund paid GEAM a Management Fee at an annualized rate of 0.65%.
Directors’ Compensation The Fund pays no compensation to its Directors who are officers or employees of SSGA FM or its affiliates. Directors who are not such officers or employees also serve in a similar capacity for other funds advised by SSGA FM. Compensation paid to non-interested Directors is reflected on the Statement of Operations. These fees are allocated pro rata across all of the mutual fund platforms served by the Directors, including the Fund, and are based upon the relative net assets of each fund within such platforms. (For additional information about Directors’ compensation, please refer to the Funds’ Statement of Additional Information.)
Other Transactions with Affiliates In December 2015, State Street announced a review of the manner in which it invoiced certain expenses to certain of its Investment Servicing clients, primarily in the United States, during an 18-year period going back to 1998 and its determination that it had incorrectly invoiced clients for certain expenses. State Street informed its clients that it will pay to them the expenses it concluded were incorrectly invoiced to them, plus interest.
| | | | |
| Notes to Financial Statements | | | 17 | |
State Street Core Value Equity V.I.S. Fund
Notes to Financial Statements, continued — December 31, 2016
The Fund within this annual report was impacted by this matter. The amounts in the table below represent the refunded expenses and interest received by the Fund for the periods in question.
| | | | | | | | | | | | | | | | | | |
Refunded
Custody
Expense* | | Interest* | | Total | | % of Net
Assets at
12/31/16 |
| | | 2,481 | | | | | 1,272 | | | | | 3,753 | | | | | 0.029 | % |
| | * | Refunded Custody Expense and Interest appear on the Statement of Operations in Custody and accounting expenses – net and Interest income, respectively. |
| 7. | | Investment Transactions |
Purchases and Sales of Securities The cost of purchases and the proceeds from sales of investments, other than short-term securities, for the fiscal year ended December 31, 2016, were as follows:
| | | | | | | | |
| Non-U.S. Government Securities |
| Purchases | | Sales |
| | | | | | | | | |
| | $ | 5,930,794 | | | | $ | 8,011,700 | |
Affiliated Investments The Fund may invest in affiliated entities, including securities issued by State Street, affiliated funds, or entities deemed to be affiliates as a result of the Fund owning more than five percent of the entity’s voting securities or outstanding shares. Amounts relating to these transactions during the fiscal year ended December 31, 2016 are disclosed in the Schedule of Investments.
The Fund is subject to ASC 740, Income Taxes (“ASC 740”). ASC 740 provides guidance for financial accounting and reporting for the effects of income taxes that result from an entity’s activities during the year. ASC 740 also provides guidance regarding how uncertain tax positions should be recognized, measured, presented and disclosed in the financial statements. ASC 740 requires evaluation of tax positions taken or expected to be taken in the course of preparing the Fund’s tax returns to determine whether the tax positions are “more likely than not” of being sustained by the applicable tax authority. There are no adjustments to the Fund’s net assets required under ASC 740. The Fund’s 2013, 2014, 2015, and 2016 fiscal year tax returns are still open to examination by the Federal and applicable state tax authorities.
At December 31, 2016, information on the tax cost of investments and distributable earnings on a tax basis was as follows:
| | | | | | | | | | | | | | | | | | | | | | | | | | | | | | | | | | | | | | |
Cost of
Investments
For Tax
Purposes | | Gross Tax | | Net Tax
Appreciation/
(Depreciation) | | Undistributed
Income | | Undistributed Accum. Capital Gain/(Loss) | | Late-Year Losses |
| | Appreciation | | Depreciation | | Investments | | Derivatives/
Currency | | | |
| | | | | | | | | | | | | | | | | | | | | | | | | | | | | | | | | | | | | | | |
| | $ | 11,331,456 | | | | $ | 2,187,389 | | | | $ | (308,478 | ) | | | $ | 1,878,911 | | | | $ | – | | | | $ | 1,057 | | | | $ | 147,930 | | | | $ | – | |
As of December 31, 2016, the Fund had no capital loss carryovers. Capital loss carryovers are available to offset future realized capital gains to the extent provided in the Internal Revenue Code and regulations thereunder. To the extent that these carryover losses are used to offset future capital gains, it is probable that the gains offset will not be distributed to shareholders because they would be taxable as ordinary income.
Any qualified late-year loss is deemed to arise on the first day of the Fund’s next tax year (if the Fund elects to defer such loss). Under this regime, generally, the Fund can elect to defer any post-October capital loss and/or any late-year ordinary loss as defined by the Internal Revenue Code.
The Fund incurred no such losses for the fiscal year ended December 31, 2016.
| | |
| 18 | | Notes to Financial Statements |
State Street Core Value Equity V.I.S. Fund
Notes to Financial Statements, continued — December 31, 2016
The tax character of distributions paid during the fiscal years ended December 31, 2016 and December 31, 2015 were as follows:
| | | | | | | | | | | | | | | | | | |
| Year | | Ordinary
Income | | Long-Term
Capital Gains | | Total |
| | | | | | | | | | | | | | | | | | | |
| | | 2016 | | | | $ | 141,062 | | | | $ | 520,035 | | | | $ | 661,097 | |
| | | 2015 | | | | | 142,090 | | | | | 1,324,281 | | | | | 1,466,371 | |
Distributions to Shareholders The Fund declares and pays any dividends from net investment income annually. The Fund declares and pays any net realized capital gains in excess of capital loss carryforwards distributions annually. The character of income and gains to be distributed is determined in accordance with income tax regulations which may differ from GAAP. These differences include (but are not limited to) distributions from Real Estate Investment Trusts, investments in futures, and losses deferred due to wash sale transactions. Reclassifications due to permanent book/tax differences are made to the Fund’s capital accounts to reflect income and gains available for distribution (or available capital loss carryovers) under income tax regulations. These reclassifications have no impact on net investment income, realized gains or losses, or the NAV of the Fund. The calculation of net investment income per share in the Financial Highlights table excludes these adjustments.
The reclassifications for the fiscal year ended December 31, 2016 were as follows:
| | | | | | | | | | | | | |
Undistributed
Net Investment
Income | | Accumulated
Net Realized
Gain (Loss) | | Capital
Paid In |
| | | | | | | | | | | | | | |
| | $ | (153 | ) | | | $ | 153 | | | | $ | — | |
KPMG LLP (“KPMG”) served as the independent registered certified public accounting firm of the Company through its resignation as of June 30, 2016. On September 9, 2016, upon recommendation by the Audit Committee of the Company, the Company’s Board of Directors selected Ernst & Young LLP (“EY”) to replace KPMG as the independent public accountant for the fiscal year ended December 31, 2016.
The reports of KPMG on the financial statements for the fiscal years ended December 31, 2014 and December 31, 2015 contained no adverse opinion or disclaimer of opinion and were not qualified or modified as to uncertainty, audit scope or accounting principles.
During the Company’s fiscal years ended December 31, 2014 and December 31, 2015 and through the period ended June 30, 2016, there were no disagreements with KPMG on any matter of accounting principles or practices, financial statement disclosure, or auditing scope or procedure, which disagreements if not resolved to the satisfaction of KPMG would have caused them to make reference thereto in their reports on the financial statements for such years or periods.
During the Company’s fiscal years ended December 31, 2014 and December 31, 2015 and through the period ended June 30, 2016, there were no reportable events (as defined in Item 304(a)(1)(v) of Regulation S-K). The Funds requested and KPMG furnished a letter addressed to the Securities and Exchange Commission stating whether or not it agreed with the above statements. A copy of such letter was filed as Exhibit 77 to Form N-SAR for the period ended December 31, 2016.
During the Company’s fiscal years ended December 31, 2014 and December 31, 2015 and through September 9, 2016, neither the Company nor anyone on its behalf has consulted EY on items which: (i) concerned the application of accounting principles to a specified transaction, either completed or proposed, or the type of audit opinion that might be rendered on the Company’s financial statements or (ii) concerned the subject of a disagreement (as defined in paragraph (a)(1)(iv) of Item 304 of Regulations S-K) or reportable events (as described in paragraph (a)(1)(v) of said Item 304).
| | | | |
| Notes to Financial Statements | | | 19 | |
State Street Core Value Equity V.I.S. Fund
Report of Independent Registered Public Accounting Firm
To the Board of Directors of State Street Variable Insurance Series Funds, Inc. and Shareholders of State Street Core Value Equity V.I.S. Fund:
We have audited the accompanying statement of assets and liabilities of the State Street Core Value Equity V.I.S. Fund (formerly GE Investments Core Value Equity Fund) (one of the funds constituting State Street Variable Insurance Series Funds, Inc. (formerly GE Investment Funds, Inc.)) (the “Fund”), including the schedule of investments, as of December 31, 2016, and the related statements of operations, changes in net assets and the financial highlights for the year then ended. These financial statements and financial highlights are the responsibility of the Fund’s management. Our responsibility is to express an opinion on these financial statements and financial highlights based on our audit. The statement of changes in net assets for the year ended December 31, 2015 and the financial highlights for periods ended prior to January 1, 2016 were audited by another independent registered public accounting firm whose report, dated February 19, 2016, expressed an unqualified opinion on that statement of changes in net assets and those financial highlights.
We conducted our audit in accordance with the standards of the Public Company Accounting Oversight Board (United States). Those standards require that we plan and perform the audit to obtain reasonable assurance about whether the financial statements and financial highlights are free of material misstatement. We were not engaged to perform an audit of the Fund’s internal control over financial reporting. Our audit included consideration of internal control over financial reporting as a basis for designing audit procedures that are appropriate in the circumstances, but not for the purpose of expressing an opinion on the effectiveness of the Fund’s internal control over financial reporting. Accordingly, we express no such opinion. An audit also includes examining, on a test basis, evidence supporting the amounts and disclosures in the financial statements and financial highlights, assessing the accounting principles used and significant estimates made by management, and evaluating the overall financial statement presentation. Our procedures included confirmation of securities owned as of December 31, 2016, by correspondence with the custodian and brokers or by other appropriate auditing procedures where replies from brokers were not received. We believe that our audit provides a reasonable basis for our opinion.
In our opinion, the financial statements and financial highlights referred to above present fairly, in all material respects, the financial position of the State Street Core Value Equity V.I.S. Fund (one of the funds constituting State Street Variable Insurance Series Funds, Inc.) at December 31, 2016, the results of its operations, changes in its net assets and the financial highlights for the year then ended, in conformity with U.S. generally accepted accounting principles.

Boston, Massachusetts
February 17, 2017
| | |
| 20 | | Report of Independent Registered Public Accounting Firm |
State Street Core Value Equity V.I.S. Fund
Tax Information — December 31, 2016 (Unaudited)
For the fiscal year ended December 31, 2016, the Fund hereby designates $520,035 as capital gain dividends, or the amount ultimately treated as capital gain net income.
The amounts presented herein may differ from amounts presented elsewhere in the financial statements due to differences between tax and financial accounting principles. Please consult a tax advisor if you have any questions about Federal or State income tax laws or on how to prepare your tax returns. If you have specific questions about your Fund account, please consult your investment representative.
State Street Core Value Equity V.I.S. Fund
Special Meeting of Shareholders — Voting Results (Unaudited)
On November 2, 2016, the State Street Variable Insurance Series Funds, Inc. (formerly known as GE Investments Funds, Inc.) (the “Company”) held a special meeting of shareholders of each series portfolio of the Company (collectively, the “Funds”), including shareholders of the State Street Core Value Equity V.I.S. Fund (formerly known as the Core Value Equity Fund) (the “Fund”). Shareholders of record on August 31, 2016 were entitled to vote on the proposals. For each proposal shareholders of all Funds voted together and not by Fund or share class. At the meeting, all proposals were approved by the Fund’s shareholders and the following votes were recorded:
Proposal 1:
Approval of an amendment to the Articles of Incorporation of the Company to change the name of the Company from GE Investments Funds, Inc. to State Street Variable Insurance Series Funds, Inc.
Company Votes:
| | | | | | | | | | | | |
| | | No. of Shares | | | % of Outstanding Shares | | | % of Shares Present | |
Affirmative | | | 129,623,837.819 | | | | 89.283 | % | | | 89.283 | % |
Against | | | 10,047,818.534 | | | | 6.921 | % | | | 6.921 | % |
Abstain | | | 5,511,041.282 | | | | 3.796 | % | | | 3.796 | % |
Total | | | 145,182,697.634 | | | | 100.000 | % | | | 100.000 | % |
Fund votes:
| | | | | | | | | | | | |
| | | No. of Shares | | | % of Outstanding Shares | | | % of Shares Present | |
Affirmative | | | 1,193,140.607 | | | | 88.388 | % | | | 88.388 | % |
Against | | | 120,609.862 | | | | 8.935 | % | | | 8.935 | % |
Abstain | | | 36,143.133 | | | | 2.677 | % | | | 2.677 | % |
Total | | | 1,349,893.601 | | | | 100.000 | % | | | 100.000 | % |
Proposal 2:
Approval of an amendment to the Articles of Incorporation of the Company to permit the Board of Directors to change the name of the Company without seeking shareholder approval.
Company votes:
| | | | | | | | | | | | |
| | | No. of Shares | | | % of Outstanding Shares | | | % of Shares Present | |
Affirmative | | | 118,220,823.871 | | | | 81.429 | % | | | 81.429 | % |
Against | | | 21,486,028.150 | | | | 14.799 | % | | | 14.799 | % |
Abstain | | | 5,475,845.611 | | | | 3.772 | % | | | 3.772 | % |
Total | | | 145,182,697.634 | | | | 100.000 | % | | | 100.000 | % |
Fund votes:
| | | | | | | | | | | | |
| | | No. of Shares | | | % of Outstanding Shares | | | % of Shares Present | |
Affirmative | | | 1,148,917.070 | | | | 85.112 | % | | | 85.112 | % |
Against | | | 160,387.498 | | | | 11.881 | % | | | 11.881 | % |
Abstain | | | 40,589.034 | | | | 3.007 | % | | | 3.007 | % |
Total | | | 1,349,893.601 | | | | 100.000 | % | | | 100.000 | % |
| | |
| 22 | | Special Meeting of Shareholders — Voting Results |
State Street Core Value Equity V.I.S. Fund
Additional Information — December 31, 2016 (Unaudited)
Information about Directors and Executive Officers:
The business and affairs of the Fund are managed under the direction of the Fund’s Board of Directors. Information pertaining to the Directors and officers of the Fund is set forth below. Matthew J. Simpson resigned as a Director of the Fund effective June 30, 2016.
| | | | | | | | | | | | |
Name,
Address,
and Age | | Position(s) Held
with Fund | | Term of
Office and
Length of
Time Served | | Principal Occupation(s)
During Past 5 Years | | Number of
Portfolios
in Fund
Complex
Overseen
by Director | | | Other Directorships Held by Director |
INTERESTED DIRECTORS AND EXECUTIVE OFFICERS |
Jeanne M. La Porta c/o SSGA FM 1600 Summer St. Stamford, CT 06905 Age 51 | | Director and President | | Until successor is elected and qualified – 2 years | | Senior Managing Director at State Street Global Advisors since July 2016; President of GE Retirement Savings Plan Funds since July 2016; Senior Vice President and Commercial Operations Leader at GEAM from March 2014 to July 2016; President of State Street Institutional Funds and State Street Variable Insurance Series Funds, Inc. since April 2014; President and Trustee of GEAM’s UCITs Funds from March 2014 to November 2014; Senior Vice President and Commercial Administrative Officer at GEAM from April 2010 to March 2014; Vice President of State Street Institutional Funds from July 2003 to April 2014; Vice President of Elfun Funds from October 2003 to July 2016; Vice President of GE Retirement Savings Plan Funds from October 2003 to July 2016; Secretary of GE Funds from July 2007 to September 2010 and Vice President from July 2007 to February 2011; Senior Vice President and Deputy General Counsel of GEAM from October 2007 to April 2010; Vice President and Assistant Secretary of Elfun Funds and GE Retirement Savings Plan Funds from July 2003 to June 2010; and Vice President and Associate General Counsel – Marketing and Client Services (formerly Asset Management Services) at GEAM from May 1997 to October 2007. | | | 22 | | | Trustee and President of State Street Institutional Funds since 2014; Trustee of Elfun Funds since 2014. |
| | | | |
| Additional Information | | | 23 | |
State Street Core Value Equity V.I.S. Fund
Additional Information, continued — December 31, 2016 (Unaudited)
| | | | | | | | | | | | |
Name,
Address,
and Age | | Position(s) Held
with Fund | | Term of
Office and
Length of
Time Served | | Principal Occupation(s)
During Past 5 Years | | Number of
Portfolios
in Fund
Complex
Overseen
by Director | | | Other Directorships Held by Director |
INTERESTED DIRECTORS AND EXECUTIVE OFFICERS (continued) |
JoonWon Choe c/o SSGA FM 1600 Summer St. Stamford, CT 06905 Age 47 | | Vice President & Secretary | | Until successor is elected and qualified – 6 years | | Managing Director and Managing Counsel at State Street Global Advisors since July 2016; Senior Vice President and Deputy General Counsel at GEAM from March 2011 to July 2016; Vice President and Secretary of State Street Institutional Funds since September 2010; Vice President and Assistant Secretary of GE Retirement Savings Plan Funds since September 2010; Vice President and Assistant Secretary of Elfun Funds from September 2010 to July 2016; Senior Vice President and Associate General Counsel at GEAM from June 2010 to March 2011; Vice President and Associate General Counsel of GEAM from November 2005 to June 2010; and Vice President and Secretary of GE Funds from September 2010 to February 2011. | | | N/A | | | N/A |
| | | | | | | | | | | | | |
Robert Herlihy c/o SSGA FM 1600 Summer St. Stamford, CT 06905 Age 49 | | Chief Compliance Officer | | Until successor is elected and qualified – 11 years | | Managing Director at State Street Global Advisors since July 2016; Deputy Chief Compliance Officer of Elfun Funds since July 2016; Chief Compliance Officer of State Street Institutional Funds and GE Retirement Savings Plan Funds since July 2005; Chief Compliance Officer of GEAM and Elfun Funds from July 2005 to July 2016; Chief Compliance Officer of GE Funds from July 2005 to February 2011; and Manager of Fund Administration at GEAM from 2002-2005. | | | N/A | | | N/A |
| | | | | | | | | | | | | |
Arthur A. Jensen c/o SSGA FM 1600 Summer St. Stamford, CT 06905 Age 50 | | Treasurer | | Until successor is elected and qualified – 6 years | | Vice President at State Street Global Advisors since July 2016; Deputy Treasurer of Elfun Funds since July 2016; Treasurer of State Street Institutional Funds and GE Retirement Savings Plan Funds since June 2011; Treasurer of Elfun Funds from June 2011 to July 2016; Mutual Funds Controller of GEAM from April 2011 to July 2016; Senior Vice President at Citigroup from 2008 to 2010; and Vice President at JPMorgan from 2005 to 2008. | | | N/A | | | N/A |
| | |
| 24 | | Additional Information |
State Street Core Value Equity V.I.S. Fund
Additional Information, continued — December 31, 2016 (Unaudited)
| | | | | | | | | | | | |
Name,
Address,
and Age | | Position(s) Held
with Fund | | Term of
Office and
Length of
Time Served | | Principal Occupation(s)
During Past 5 Years | | Number of
Portfolios
in Fund
Complex
Overseen
by Director | | | Other Directorships Held by Director |
INTERESTED DIRECTORS AND EXECUTIVE OFFICERS (continued) |
Brian Harris c/o SSGA FM State Street Financial Center One Lincoln Street Boston, MA 02111-2900 Age 43 | | Deputy Chief Compliance Officer | | Until successor is elected and qualified – less than 1 year | | Managing Director, State Street Global Advisors and SSGA Funds Management, Inc. (June 2013 – present)*; Senior Vice President and Global Head of Investment Compliance, BofA Global Capital Management (2010 – 2013); Director of Compliance, AARP Financial Inc. (2008 – 2010). | | | N/A | | | N/A |
| |
Bruce S. Rosenberg c/o SSGA FM State Street Financial Center One Lincoln Street Boston, MA 02111-2900 Age 55 | | Assistant Treasurer | | Until successor is elected and qualified – less than 1 year | | Managing Director, State Street Global Advisors and SSGA Funds Management, Inc. (July 2015 – present); Director, Credit Suisse (April 2008 – July 2015). | | | N/A | | | N/A |
| |
Ann M. Carpenter c/o SSGA FM State Street Financial Center One Lincoln Street Boston, MA 02111-2900 Age 50 | | Assistant Treasurer | | Until successor is elected and qualified – less than 1 year | | Chief Operating Officer, SSGA Funds Management, Inc. (April 2014 – present); Managing Director, State Street Global Advisors and SSGA Funds Management, Inc. (2005 – present).* | | | N/A | | | N/A |
| | | | | | | | | | | | | |
Chad C. Hallett c/o SSGA FM State Street Financial Center One Lincoln Street Boston, MA 02111-2900 Age 47 | | Assistant Treasurer | | Until successor is elected and qualified – less than 1 year | | Vice President, State Street Global Advisors and SSGA Funds Management, Inc. (November 2014 – present); Vice President, State Street Bank and Trust Company (2001 – November 2014). | | | N/A | | | N/A |
| * | | Served in various capacities and/or with various affiliated entities during noted time period. |
| | | | |
| Additional Information | | | 25 | |
State Street Core Value Equity V.I.S. Fund
Additional Information, continued — December 31, 2016 (Unaudited)
| | | | | | | | | | | | |
Name,
Address,
and Age | | Position(s) Held
with Fund | | Term of
Office and
Length of
Time Served | | Principal Occupation(s)
During Past 5 Years | | Number of
Portfolios
in Fund
Complex
Overseen
by Director | | | Other Directorships Held by Director |
NON-INTERESTED DIRECTORS |
John R. Costantino c/o SSGA FM 1600 Summer St. Stamford, CT 06905 Age 70 | | Chairman of the Board | | Until successor is elected and qualified – 20 years | | General Partner, NGN Capital LLC since 2006; and Managing Director, Vice President of Walden Capital Management since 1996. | | | 16 | | | Trustee of State Street Institutional Funds since 1997; Trustee of Fordham University from 1989 to 1995 and from 2001 to 2007 and Trustee Emeritus since 2007; Trustee of NeuroScience Research Institute since 1986; Trustee of GE Funds from 1993 to February 2011; Director of Artes Medical from 2006 to 2008; and Trustee of Gregorian University Foundation from 1992 to 2007. |
| | | | | | | | | | | | | |
R. Sheldon Johnson c/o SSGA FM 1600 Summer St. Stamford, CT 06905 Age 70 | | Director | | Until successor is elected and qualified – 6 years | | Retired, 2006 to present; Head of Global Institutional Equity Sales and Marketing at Morgan Stanley & Co., Inc. from 2002 to 2006 and Managing Director at Morgan Stanley & Co., Inc. from 1988 to 2006. | | | 16 | | | Trustee of State Street Institutional Funds since April 2011 and Trustee of St. Lawrence University since 2003. |
| | | | | | | | | | | | | |
Donna M. Rapaccioli c/o SSGA FM 1600 Summer St. Stamford, CT 06905 Age 54 | | Director | | Until successor is elected and qualified – 5 years | | Dean of the Gabelli School of Business since 2007 and Accounting professor since 1987 at Fordham University. | | | 16 | | | Trustee of State Street Institutional Funds since January 2012 and Trustee of Emmanuel College since 2010. |
The Statement of Additional Information for the Funds includes additional information about the Directors and Officers and is available, without charge, upon request by calling 1-800-242-0134.
| | |
| 26 | | Additional Information |
State Street Core Value Equity V.I.S. Fund
Investment Team (Unaudited)
Investment Adviser and Administrator
SSGA Funds Management, Inc.
Board of Directors
John R. Costantino, Chairman
R. Sheldon Johnson
Jeanne M. La Porta
Donna M. Rapaccioli
Secretary
JoonWon Choe
Chief Compliance Officer
Robert Herlihy
Deputy Chief Compliance Officer
Brian Harris
Treasurer
Arthur A. Jensen
Assistant Treasurers
Bruce S. Rosenberg
Ann M. Carpenter
Chad C. Hallett
Distributor
State Street Global Markets, LLC
Member FINRA and SIPC
Custodian
State Street Bank and Trust Company
Investment Adviser
SSGA Funds Management, Inc.
1600 Summer Street
Stamford, CT 06905
or at:
P.O. Box 7900
Stamford, CT 06904-7900
Distributor
State Street Global Markets, LLC
Member FINRA and SIPC
State Street Financial Center
One Lincoln Street
Boston, MA 02111
www.ssga.com/geam
The Fund files its complete schedule of portfolio holdings with the Securities and Exchange Commission for the first and third quarters of each fiscal year on Form N-Q. The Fund’s Forms N-Q, as well as a description of the policies and procedures that the Fund uses to determine how to vote proxies (if any) relating to portfolio securities is available without charge (i) upon request, by calling 1-800-242-0134; (ii) on the Fund’s website at http://www.ssga.com/geam; and (iii) on the Commission’s website at http://www.sec.gov. The Fund’s Forms N-Q may be reviewed and copied at the Commission’s Public Reference Room in Washington, DC — information on the operation of the Public Reference Room may be obtained by calling 1-800-SEC-0330.
Information (if any) regarding how the Fund voted proxies relating to portfolio securities during the most recently disclosed 12-month period ended June 30 is available without charge (i) through the Fund’s website at http://www.ssga/geam; and (ii) on the Commission’s website at http://www.sec.gov.
Annual Report
31 December 2016
State Street Income V.I.S. Fund
(formerly GE Investments Income Fund)

State Street Income V.I.S. Fund
Annual Report
December 31, 2016
Table of Contents
This report is prepared for Policyholders of certain variable contracts and may be distributed to others only if preceded or accompanied by the variable contract’s current prospectus and the current summary prospectus of the Fund available for investments thereunder.
State Street Income V.I.S. Fund
Notes to Performance — December 31, 2016 (Unaudited)
The information provided on the performance pages relates to the State Street Income V.I.S. Fund (the “Fund”).
Total return performance shown in this report for the Fund takes into account changes in share price and assumes reinvestment of dividends and capital gains distributions, if any. Total returns shown are net of Fund fees and expenses but do not reflect fees and charges associated with the variable contracts such as administrative fees, account charges and surrender charges, which, if reflected, would reduce the Fund’s total returns for all periods shown.
The performance data quoted represents past performance; past performance does not guarantee future results. Investment return and principal value will fluctuate so your shares, when redeemed, may be worth more or less than their original cost. Current performance may be higher or lower than the performance data quoted. Periods less than one year are not annualized. Please call toll-free (800) 242-0134 or visit the Fund’s website at http://www.ssga.com/geam for the most recent month-end performance data.
An investment in the Fund is not a deposit of any bank and is not insured or guaranteed by the Federal Deposit Insurance Corporation (“FDIC”) or any other government agency. An investment in the Fund is subject to risk, including possible loss of principal invested.
The Bloomberg Barclays U.S. Aggregate Bond Index is an unmanaged market value-weighted index of taxable investment grade debt issues, including government, corporate, asset-backed and mortgage-backed securities, with maturities of one year or more. This index is designed to represent the performance of the U.S. investment-grade first rate bond market.
The results shown for the foregoing index assume the reinvestment of net dividends or interest and do not reflect fees, expenses, or taxes. As such, the index returns do not reflect the actual cost of investing in the instruments that comprise the index.
The peer universe of the underlying annuity funds used for the peer group average annual total return calculation is based on a blend of Morningstar peer categories, as shown. Morningstar is an independent mutual fund rating service. A Fund’s performance may be compared to or ranked within a universe of mutual funds with investment objectives and policies similar but not necessarily identical to that of the Fund.
©2017 Morningstar, Inc. All Rights Reserved. The Morningstar information contained herein: (1) is proprietary to Morningstar and/or its content providers; (2) may not be copied or distributed; and (3) is not warranted to be accurate, complete or timely. Neither Morningstar nor its content providers are responsible for any damage or losses relating from any use of this information. Past performance is no guarantee of future results.
The views expressed in this document reflect our judgment as of the publication date and are subject to change at any time without notice.
State Street Global Markets, LLC, member of FINRA & SIPC is the principal underwriter and distributor of the State Street V.I.S. Funds and a wholly owned subsidiary of State Street Corporation. References to State Street may include State Street Corporation and its affiliates. The Funds pay State Street Bank and Trust Company for its services as custodian and Fund Accounting agent, and pay SSGA Funds Management, Inc. for investment advisory and administrative services.
State Street Income V.I.S. Fund
Portfolio Management Discussion and Analysis — December 31, 2016 (Unaudited)
| Q. | How did the State Street Income V.I.S. Fund perform compared to its benchmark for the twelve-month period ended December 31, 2016? |
| A. | For the twelve-month period ended December 31, 2016, the State Street Income V.I.S. Fund returned 2.98%. The Bloomberg Barclays U.S. Aggregate Bond Index, the Fund’s benchmark, returned 2.65% and the Fund’s Morningstar peer group of 220 U.S. Insurance Intermediate-Term Bond funds returned an average of 3.22% over the same period. |
| Q. | What market factors affected the Fund’s performance? |
| A. | The two primary market factors that affected the Fund’s performance were the movement in interest rates and credit spreads over the period. U.S. Treasury yields fell in the first half of 2016 as the timing of a Federal Reserve rate hike was pushed out due to slow growth expectations. The U.S. Treasury 10 year note yield hit a low of 1.35% in July of 2016 from 2.28% at the start of the year. Rates jumped higher after the November elections. President-elect Trump’s proposal for fiscal stimulus, tax cuts and regulatory reform increased investors’ growth outlook and increased the probability of a rate hike which was met in December when the Federal Open Market Committee raised its Fed Funds target to 0.50-0.75%. The 10-year treasury yield ended the year at 2.45%. Credit spreads spiked early in the year but then steadily tightened from mid-February of 2016 until year-end. The option-adjusted spread (“OAS”) on the Bloomberg Barclays US Credit Index peaked at +200 basis points (“bps”) in February and finished the year at +118 bps, down -40 bps for the year. Similarly, the OAS on the Barclays US High Yield Index reached +840 bps before dropping to +410 bps by year-end (down -220 bps for the year). |
| Q. | What were the primary drivers of Fund performance? |
| A. | The largest driver of the Fund’s outperformance versus its benchmark came from its relative sector allocation. Exposure to high yield (not in the benchmark) added over +65 bps as the Ba/B rated high yield market returned over +14%. The overweight in investment grade credit added roughly +25 bps due to tightening spreads. The Fund’s duration and curve positioning biased towards lower rates in the first half and a steeper curve in the second half contributed roughly +30 bps. Security selection in investment grade credit and commercial mortgage-backed securities (“CMBS”) added slightly to performance. The use of CDXHY (high yield credit swap) as a hedge against the cash positions detracted roughly -10 bps. |
| Q. | Were there any significant changes to the Fund during the period? |
| A. | The Fund’s duration positioning was biased long relative to the benchmark in the first half of the year then was reduced to neutral in the third quarter and maintained throughout the rest of the year. In general, the credit risk of the Fund was reduced during the year. The spread duration targets (excess above the index) for CMBS, investment grade and high-yield credit were cut nearly in half as credit spreads tightened during the year. |
| | |
| 2 | | State Street Income V.I.S. Fund |
State Street Income V.I.S. Fund
Understanding Your Fund’s Expenses — December 31, 2016 (Unaudited)
As a shareholder of the Fund, you incur ongoing costs. Ongoing costs include portfolio management fees, professional fees, administrative fees and other Fund expenses. The following example is intended to help you understand your ongoing costs (in dollars) of investing in the Fund and to compare these costs with the ongoing costs of investing in other mutual funds.
To illustrate these ongoing costs, we have provided an example and calculated the expenses paid by investors in the Fund during the period. The information in the following table is based on an investment of $1,000, which is invested at the beginning of the period and held for the entire six-month period ended December 31, 2016.
Actual Expenses
The first section of the table provides information about actual account values and actual expenses. You may use the information in this section, together with the amount you invested, to estimate the expenses that you paid over the period. To do so, simply divide your account value by $1,000 (for example, an $8,600 account value divided by $1,000 = 8.6), then multiply the result by the number given under the heading “Expenses paid during the period” to estimate the expenses you paid on your account during the period.
Hypothetical Example for Comparison Purposes
The second section of the table provides information about hypothetical account values and hypothetical expenses based on the Fund’s actual expense ratio and an assumed rate of return of 5% per year before expenses, which is not the Fund’s actual return. The hypothetical account values and expenses may not be used to estimate the actual ending account balance or expenses you paid for the period. You may use this information to compare the ongoing costs of investing in the Fund and other funds. To do so, compare this 5% hypothetical example with the 5% hypothetical examples that appear in the shareholder reports of other funds.
Please note that the expenses shown in the table are meant to highlight and help you compare ongoing costs only and do not reflect transaction costs, such as sales charges or redemption fees, if any. Therefore, the second section of the table is useful in comparing ongoing costs only, and will not help you determine the relative total costs of owning different funds. Additionally, the expenses shown do not reflect the fees or charges associated with variable contracts through which shares of the Fund are offered.
| | | | | | | | |
| | | Actual
Fund Return | | | Hypothetical
5% Return
(2.5% for
the period) | |
Account value at the beginning of the period | | $ | 1,000.00 | | | $ | 1,000.00 | |
Account value at the end of the period | | $ | 981.00 | | | $ | 1,019.36 | |
Expenses paid during the period* | | $ | 5.73 | | | $ | 5.84 | |
| * | Expenses are equal to the Fund’s annualized net expense ratio of 1.15% (for the period July 1, 2016-December 31, 2016), multiplied by the average account value over the period, multiplied by 184/366 (to reflect the one-half year period). |
| | | | |
| State Street Income V.I.S. Fund | | | 3 | |
State Street Income V.I.S. Fund
Performance Summary — December 31, 2016 (Unaudited)
Morningstar Performance Comparison
Based on average annual returns for periods ended 12/31/16
| | | | | | | | | | | | |
| | | One
Year | | | Five
Year | | | Ten
Year | |
Number of funds in peer group | | | 220 | | | | 205 | | | | 166 | |
Peer group average annual total return | | | 3.22 | % | | | 2.62 | % | | | 4.05 | % |
Morningstar Category in peer group: U.S. Insurance Intermediate-Term Bond | |
Average Annual Total Return for the periods ended December 31, 2016
Class 1 Shares (Inception date: 1/03/95)
| | | | | | | | | | | | | | | | |
| | | One Year | | | Five Year | | | Ten Year | | | Ending Value
of a $10,000
Investment | |
State Street Income V.I.S. Fund | | | 2.98 | % | | | 2.37 | % | | | 3.35 | % | | $ | 13,909 | |
Bloomberg Barclays U.S. Aggregate Bond Index | | | 2.65 | % | | | 2.23 | % | | | 4.34 | % | | $ | 15,300 | |
Quality Ratings
as of December 31, 2016 as a % of Fair Value (a)(b)
| | | | |
Moody’s / S&P /Rating* | | Percentage of
Fair Value | |
Aaa / AAA | | | 14.0 | % |
Aa / AA | | | 41.8 | % |
A / A | | | 9.4 | % |
Baa / BBB | | | 18.6 | % |
Ba / BB and lower | | | 8.7 | % |
NR / Other | | | 7.5 | % |
| | | 100.0 | % |
Sector Allocation as of December 31, 2016
Portfolio composition as a % of Fair Value of $28,934 (in thousands) as of December 31, 2016 (a)(b)
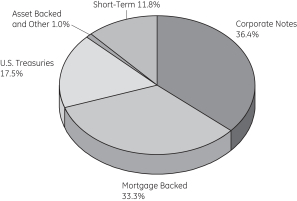
| | |
| 4 | | State Street Income V.I.S. Fund |
State Street Income V.I.S. Fund
Performance Summary, continued — December 31, 2016 (Unaudited)
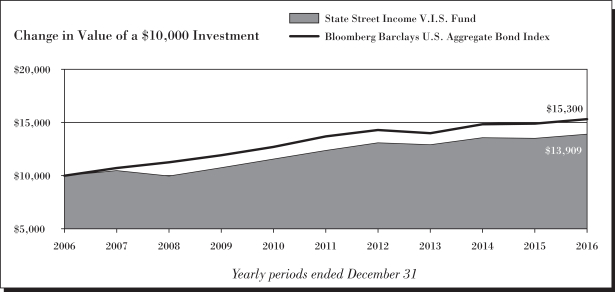
| (a) | Fair Value basis is inclusive of short-term investment in State Street Institutional U.S. Government Money Market Fund Class G Shares. |
| (b) | The securities information regarding holdings, allocations and other characteristics is presented to illustrate examples of securities that the Fund has bought and the diversity of areas in which the Fund may invest as of a particular date. It may not be representative of the Fund’s current or future investments and should not be construed as a recommendation to purchase or sell a particular security. |
| * | Moody’s Investors Services, Inc. (“Moody’s”) and S&P Global Ratings (“S&P”) are nationally recognized statistical rating organizations. The quality ratings represent the lower of Moody’s or S&P credit ratings. When a rating from only one of the rating agencies is available, that rating is used. Securities not rated by Moody’s or S&P are categorized as not rated. Credit quality measures a bond issuer’s ability to repay interest and principal in a timely manner. Credit quality ratings assigned by a rating agency are subject to change periodically and are not absolute standards of quality. In formulating investment decisions for the Fund, SSGA Funds Management, Inc. develops its own analysis of the credit quality and risks associated with individual debt instruments, rather than relying exclusively on rating agency ratings. |
See Notes to Performance beginning on page 1 for further information, including an explanation of Morningstar peer categories.
Past performance does not predict future performance. The performance shown in the graphs and tables does not reflect the deduction of taxes that a shareholder would pay on Fund distributions or the redemption of Fund shares and does not reflect the fees or charges that would be associated with variable contracts through which shares of the Fund are offered.
| | | | |
| State Street Income V.I.S. Fund | | | 5 | |
State Street Income V.I.S. Fund
Schedule of Investments — December 31, 2016
| | | | | | | | | | |
| | | Principal
Amount $ | | | Fair
Value $ | |
| | | | | | | | | | |
| Bonds and Notes - 99.7%† | |
U.S. Treasuries - 19.8% | |
U.S. Treasury Bond | |
| 2.88% | | 11/15/46 (a) | | | 588,000 | | | | 566,300 | |
| U.S. Treasury Notes | |
| 0.75% | | 09/30/18 (a) | | | 563,100 | | | | 559,199 | |
| 0.88% | | 10/15/18 - 06/15/19 (a) | | | 1,644,300 | | | | 1,634,009 | |
| 1.00% | | 10/15/19 (a) | | | 18,000 | | | | 17,799 | |
| 1.25% | | 10/31/21 (a) | | | 665,300 | | | | 644,492 | |
| 1.38% | | 08/31/23 - 09/30/23 (a) | | | 910,600 | | | | 861,536 | |
| 2.13% | | 11/30/23 (a) | | | 778,300 | | | | 772,183 | |
| | | | | | | | | | |
| | | | | | | | | 5,055,518 | |
| | | | | | | | | | |
|
Agency Mortgage Backed - 29.1% | |
| Federal Home Loan Mortgage Corp. | |
| 4.50% | | 06/01/33 - 02/01/35 (a) | | | 4,694 | | | | 5,055 | |
| 5.00% | | 07/01/35 - 06/01/41 (a) | | | 181,769 | | | | 202,016 | |
| 5.50% | | 05/01/20 - 01/01/38 | | | 66,990 | | | | 76,120 | |
| 6.00% | | 04/01/17 - 05/01/20 | | | 2,417 | | | | 2,486 | |
| 6.00% | | 04/01/29 - 11/01/37 (a) | | | 159,839 | | | | 183,646 | |
| 6.50% | | 02/01/29 (a) | | | 83 | | | | 93 | |
| 6.93% | | 06/01/26 (b) | | | 60,000 | | | | 80,703 | |
| 7.00% | | 06/01/29 - 08/01/36 (a) | | | 32,745 | | | | 36,248 | |
| 7.50% | | 01/01/30 - 09/01/33 (a) | | | 4,512 | | | | 4,806 | |
| 8.00% | | 11/01/30 (a) | | | 5,720 | | | | 6,428 | |
| 8.50% | | 04/01/30 (a) | | | 6,558 | | | | 7,835 | |
| Federal National Mortgage Assoc. | | | | | |
| 3.00% | | 02/01/43 - 10/01/46 (a) | | | 869,606 | | | | 867,859 | |
| 3.50% | | 11/01/42 - 08/01/45 (a) | | | 81,324 | | | | 83,684 | |
| 4.00% | | 05/01/19 - 06/01/19 | | | 10,849 | | | | 11,170 | |
| 4.00% | | 01/01/41 - 03/01/44 (a) | | | 457,543 | | | | 483,310 | |
| 4.50% | | 05/01/18 - 08/01/20 | | | 26,090 | | | | 26,842 | |
| 4.50% | | 07/01/33 - 01/01/41 (a) | | | 415,661 | | | | 447,844 | |
| 5.00% | | 03/01/34 - 08/01/35 (a) | | | 72,655 | | | | 80,156 | |
| 5.50% | | 06/01/20 - 11/01/35 | | | 76,060 | | | | 82,574 | |
| 5.50% | | 12/01/32 - 01/01/39 (a) | | | 180,125 | | | | 201,414 | |
| 6.00% | | 10/01/19 - 03/01/21 | | | 6,354 | | | | 6,621 | |
| 6.00% | | 02/01/33 - 07/01/35 (a) | | | 258,197 | | | | 296,316 | |
| 6.50% | | 07/01/17 - 03/01/19 | | | 2,588 | | | | 2,621 | |
| 6.50% | | 10/01/28 - 08/01/34 (a) | | | 36,830 | | | | 41,587 | |
| 7.00% | | 04/01/17 - 08/01/17 | | | 899 | | | | 904 | |
| 7.00% | | 01/01/30 - 02/01/34 (a) | | | 9,143 | | | | 9,829 | |
| 7.50% | | 11/01/22 - 12/01/33 (a) | | | 26,431 | | | | 28,280 | |
| 8.00% | | 08/01/25 - 01/01/33 (a) | | | 12,205 | | | | 13,515 | |
| 9.00% | | 12/01/17 - 12/01/22 (a) | | | 991 | | | | 1,070 | |
| Federal National Mortgage Assoc. 1.60% + 12 month USD LIBOR | |
| 2.72% | | 04/01/37 (c) | | | 1,007 | | | | 1,030 | |
| Federal National Mortgage Assoc. | | | | | |
| 2.50% | | TBA (d) | | | 290,976 | | | | 291,296 | |
| 3.00% | | TBA (d) | | | 218,232 | | | | 223,862 | |
| 3.50% | | TBA (d) | | | 1,516,372 | | | | 1,553,220 | |
| | | | | | | | | | |
| | | Principal
Amount $ | | | Fair
Value $ | |
| Government National Mortgage Assoc. | | | | | |
| 3.50% | | 05/20/43 (a) | | | 58,760 | | | | 61,320 | |
| 4.00% | | 01/20/41 - 04/20/43 (a) | | | 204,117 | | | | 218,580 | |
| 4.50% | | 08/15/33 - 03/20/41 (a) | | | 139,077 | | | | 150,262 | |
| 4.50% | | 09/15/34 | | | 13,554 | | | | 14,787 | |
| 6.00% | | 04/15/27 - 04/15/34 (a) | | | 117,463 | | | | 136,597 | |
| 6.50% | | 04/15/19 | | | 1,019 | | | | 1,049 | |
| 6.50% | | 03/15/24 - 08/15/34 (a) | | | 53,438 | | | | 60,939 | |
| 7.00% | | 01/15/28 - 10/15/36 (a) | | | 37,260 | | | | 40,502 | |
| 7.50% | | 11/15/31 (a) | | | 329 | | | | 331 | |
| 8.50% | | 10/15/17 (a) | | | 99 | | | | 99 | |
| 9.00% | | 11/15/17 - 12/15/21 | | | 346 | | | | 382 | |
| 9.00% | | 11/15/17 (a) | | | 2 | | | | 2 | |
| Government National Mortgage Assoc. 1.50% + 1 year CMT | |
| 2.00% | | 02/20/23 - 02/20/26 (c) | | | 5,185 | | | | 5,288 | |
| Government National Mortgage Assoc. | | | | | |
| 3.00% | | TBA (d) | | | 539,492 | | | | 545,858 | |
| 3.50% | | TBA (d) | | | 809,239 | | | | 840,637 | |
| | | | | | | | | | |
| | | | 7,437,073 | |
| | | | | | | | | | |
|
Agency Collateralized Mortgage Obligations - 2.0% | |
| Federal Home Loan Mortgage Corp. | | | | | |
| 0.08% | | 09/25/43 (c,e) | | | 592,924 | | | | 1,254 | |
| Federal Home Loan Mortgage Corp. REMIC | |
| 3.50% | | 09/15/29 - 11/15/30 (e) | | | 87,352 | | | | 7,646 | |
| 5.50% | | 06/15/33 (e) | | | 29,615 | | | | 5,975 | |
| 7.50% | | 07/15/27 (e) | | | 2,635 | | | | 435 | |
| Federal Home Loan Mortgage Corp. REMIC 6.00% - 1 month USD LIBOR | |
| 5.30% | | 08/15/43 (c,e) | | | 231,811 | | | | 48,255 | |
| Federal Home Loan Mortgage Corp. REMIC 6.10% - 1 month USD LIBOR | |
| 5.40% | | 06/15/41 - 08/15/46 (c,e) | | | 547,134 | | | | 83,681 | |
| Federal Home Loan Mortgage Corp. REMIC 6.20% - 1 month USD LIBOR | |
| 5.50% | | 10/15/42 (c,e) | | | 172,373 | | | | 33,545 | |
| Federal Home Loan Mortgage Corp. REMIC 6.60% - 1 month USD LIBOR | |
| 5.90% | | 08/15/25 (c,e) | | | 43,494 | | | | 4,454 | |
| Federal Home Loan Mortgage Corp. STRIPS | |
| 1.47% | | 08/01/27 (f,g) | | | 341 | | | | 275 | |
| 8.00% | | 02/01/23 - 07/01/24 (e) | | | 1,146 | | | | 207 | |
| Federal Home Loan Mortgage Corp. STRIPS 5.95% - 1 month USD LIBOR | |
| 5.25% | | 08/15/43 - 03/15/44 (c,e) | | | 380,299 | | | | 76,634 | |
| Federal National Mortgage Assoc. REMIC | |
| 0.51% | | 12/25/22 (f,g) | | | 54 | | | | 40 | |
| 1.22% | | 12/25/42 (c,e) | | | 32,846 | | | | 1,590 | |
| 5.00% | | 09/25/40 (e) | | | 43,704 | | | | 4,799 | |
| 7.00% | | 09/25/20 | | | 147 | | | | 153 | |
| 8.00% | | 05/25/22 (e) | | | 1 | | | | 23 | |
See notes to schedule of investments and notes to financial statements.
| | |
| 6 | | State Street Income V.I.S. Fund |
State Street Income V.I.S. Fund
Schedule of Investments, continued — December 31, 2016
| | | | | | | | | | |
| | | Principal
Amount
$ | | | Fair
Value
$ | |
| | | | | | | | | | |
| Federal National Mortgage Assoc. REMIC 6.00% - 1 month USD LIBOR | |
| 5.24% | | 07/25/38 - 08/25/42 (c,e) | | | 611,711 | | | | 123,106 | |
| Federal National Mortgage Assoc. REMIC 6.60% - 1 month USD LIBOR | |
| 5.84% | | 10/25/43 (c,e) | | | 160,898 | | | | 37,363 | |
| Federal National Mortgage Assoc. REMIC 7.50% - 1 month USD LIBOR | |
| 6.74% | | 05/25/18 (c,e) | | | 13,683 | | | | 409 | |
| Federal National Mortgage Assoc. STRIPS | |
| 1.87% | | 12/25/34 (f,g) | | | 25,727 | | | | 22,360 | |
| 4.50% | | 08/25/35 - 01/25/36 (e) | | | 32,919 | | | | 6,132 | |
| 5.00% | | 03/25/38 - 05/25/38 (e) | | | 18,173 | | | | 3,494 | |
| 5.50% | | 12/25/33 (e) | | | 7,571 | | | | 1,500 | |
| 6.00% | | 01/25/35 (e) | | | 12,561 | | | | 2,544 | |
| 7.50% | | 11/25/23 (e) | | | 6,135 | | | | 1,051 | |
| 8.00% | | 08/25/23 - 07/25/24 (e) | | | 2,277 | | | | 459 | |
| 8.50% | | 07/25/22 (e) | | | 43 | | | | 5 | |
| 9.00% | | 05/25/22 (e) | | | 41 | | | | 5 | |
| Government National Mortgage Assoc. | |
| 4.50% | | 10/20/37 - 08/16/39 (e) | | | 53,389 | | | | 3,502 | |
| 5.00% | | 10/20/37 - 09/20/38 (e) | | | 32,161 | | | | 1,241 | |
| Government National Mortgage Assoc. 6.25% - 1 month USD LIBOR | |
| 5.51% | | 02/20/40 (c,e) | | | 178,130 | | | | 30,100 | |
| Government National Mortgage Assoc. 6.80% - 1 month USD LIBOR | |
| 6.09% | | 01/16/40 (c,e) | | | 39,031 | | | | 6,706 | |
| | | | | | | | | | |
| | | | 508,943 | |
| | | | | | | | | | |
|
Corporate Notes - 41.2% | |
| 21st Century Fox America Inc. | |
| 3.38% | | 11/15/26 (h) | | | 25,000 | | | | 24,470 | |
| 3.70% | | 10/15/25 | | | 11,000 | | | | 11,119 | |
| 4.75% | | 11/15/46 (h) | | | 6,000 | | | | 6,006 | |
| 4.95% | | 10/15/45 | | | 5,000 | | | | 5,129 | |
| 6.65% | | 11/15/37 | | | 15,000 | | | | 18,430 | |
| ABB Finance USA Inc. | |
| 1.63% | | 05/08/17 | | | 41,000 | | | | 41,065 | |
| Abbott Laboratories | |
| 2.90% | | 11/30/21 | | | 50,000 | | | | 49,881 | |
| 3.75% | | 11/30/26 | | | 35,000 | | | | 34,739 | |
| 4.90% | | 11/30/46 | | | 15,000 | | | | 15,365 | |
| AbbVie Inc. | |
| 2.00% | | 11/06/18 | | | 31,000 | | | | 31,065 | |
| 3.20% | | 05/14/26 | | | 20,000 | | | | 19,001 | |
| 4.45% | | 05/14/46 | | | 12,000 | | | | 11,468 | |
| ACCO Brands Corp. | |
| 5.25% | | 12/15/24 (h) | | | 17,000 | | | | 17,117 | |
| 6.75% | | 04/30/20 | | | 44,000 | | | | 46,200 | |
| Actavis Funding SCS | |
| 1.30% | | 06/15/17 | | | 27,000 | | | | 26,985 | |
| 3.00% | | 03/12/20 | | | 23,000 | | | | 23,307 | |
| | | | | | | | | | |
| | | Principal
Amount
$ | | | Fair
Value $ | |
| 3.45% | | 03/15/22 | | | 32,000 | | | | 32,448 | |
| 3.80% | | 03/15/25 | | | 25,000 | | | | 24,998 | |
| 4.75% | | 03/15/45 | | | 5,000 | | | | 4,899 | |
| Aetna Inc. | |
| 2.40% | | 06/15/21 | | | 26,000 | | | | 25,859 | |
| 3.20% | | 06/15/26 | | | 26,000 | | | | 25,683 | |
| 3.50% | | 11/15/24 | | | 29,000 | | | | 29,386 | |
| Aflac Inc. | | | | | | | | |
| 4.00% | | 10/15/46 | | | 17,000 | | | | 16,166 | |
| Agrium Inc. | |
| 4.90% | | 06/01/43 | | | 17,000 | | | | 16,905 | |
| Altria Group Inc. | |
| 2.63% | | 09/16/26 | | | 16,000 | | | | 15,128 | |
| 2.95% | | 05/02/23 | | | 23,000 | | | | 22,961 | |
| 3.88% | | 09/16/46 | | | 5,000 | | | | 4,605 | |
| 4.50% | | 05/02/43 | | | 3,000 | | | | 3,043 | |
| American Axle & Manufacturing Inc. | |
| 6.25% | | 03/15/21 | | | 33,000 | | | | 34,072 | |
| 6.63% | | 10/15/22 | | | 9,000 | | | | 9,281 | |
| American Campus Communities Operating Partnership LP | |
| 4.13% | | 07/01/24 | | | 12,000 | | | | 12,289 | |
| American Electric Power Company Inc. | |
| 2.95% | | 12/15/22 | | | 36,000 | | | | 36,188 | |
| American Express Co. | |
| 3.63% | | 12/05/24 | | | 23,000 | | | | 23,067 | |
| American International Group Inc. | |
| 3.75% | | 07/10/25 | | | 5,000 | | | | 5,026 | |
| 4.50% | | 07/16/44 | | | 9,000 | | | | 8,858 | |
| 4.80% | | 07/10/45 | | | 5,000 | | | | 5,180 | |
| American Tower Corp. (REIT) | |
| 3.38% | | 10/15/26 | | | 25,000 | | | | 23,632 | |
| 3.40% | | 02/15/19 | | | 44,000 | | | | 44,949 | |
| AmeriGas Partners LP/AmeriGas Finance Corp. | |
| 5.63% | | 05/20/24 | | | 8,000 | | | | 8,180 | |
| 5.88% | | 08/20/26 | | | 12,000 | | | | 12,180 | |
| Amgen Inc. | |
| 2.20% | | 05/22/19 | | | 46,000 | | | | 46,344 | |
| 4.40% | | 05/01/45 | | | 5,000 | | | | 4,789 | |
| 4.56% | | 06/15/48 (h) | | | 17,000 | | | | 16,410 | |
| Amkor Technology Inc. | |
| 6.63% | | 06/01/21 | | | 43,000 | | | | 44,182 | |
| Anadarko Petroleum Corp. | |
| 4.85% | | 03/15/21 | | | 3,000 | | | | 3,214 | |
| 6.60% | | 03/15/46 | | | 3,000 | | | | 3,694 | |
| Anheuser-Busch InBev Finance Inc. | |
| 2.65% | | 02/01/21 | | | 20,000 | | | | 20,092 | |
| 3.65% | | 02/01/26 | | | 40,000 | | | | 40,545 | |
| 4.90% | | 02/01/46 | | | 25,000 | | | | 26,843 | |
| Anheuser-Busch InBev Worldwide Inc. | |
| 2.50% | | 07/15/22 | | | 77,000 | | | | 75,701 | |
| Anthem Inc. | |
| 3.30% | | 01/15/23 | | | 22,000 | | | | 21,940 | |
| Apache Corp. | |
| 5.10% | | 09/01/40 | | | 15,000 | | | | 15,666 | |
See notes to schedule of investments and notes to financial statements.
| | | | |
| State Street Income V.I.S. Fund | | | 7 | |
State Street Income V.I.S. Fund
Schedule of Investments, continued — December 31, 2016
| | | | | | | | | | |
| | | Principal
Amount
$ | | | Fair
Value $ | |
| | | | | | | | | | |
| Apple Inc. | |
| 3.25% | | 02/23/26 | | | 21,000 | | | | 20,981 | |
| 3.45% | | 02/09/45 | | | 16,000 | | | | 14,092 | |
| 3.85% | | 08/04/46 | | | 19,000 | | | | 18,166 | |
| Aramark Services Inc. | |
| 5.13% | | 01/15/24 (h) | | | 21,000 | | | | 21,656 | |
| 5.75% | | 03/15/20 | | | 11,000 | | | | 11,234 | |
| Archer-Daniels-Midland Co. | |
| 2.50% | | 08/11/26 | | | 40,000 | | | | 37,726 | |
| Ascension Health | |
| 4.85% | | 11/15/53 | | | 12,000 | | | | 13,056 | |
| AstraZeneca PLC | |
| 2.38% | | 11/16/20 | | | 16,000 | | | | 15,933 | |
| 3.38% | | 11/16/25 | | | 23,000 | | | | 22,809 | |
| 4.38% | | 11/16/45 | | | 9,000 | | | | 9,016 | |
| AT&T Inc. | |
| 2.45% | | 06/30/20 | | | 48,000 | | | | 47,632 | |
| 3.00% | | 06/30/22 | | | 24,000 | | | | 23,533 | |
| 4.45% | | 04/01/24 | | | 35,000 | | | | 36,445 | |
| 4.50% | | 05/15/35 | | | 23,000 | | | | 22,188 | |
| 4.75% | | 05/15/46 | | | 8,000 | | | | 7,565 | |
| 4.80% | | 06/15/44 | | | 17,000 | | | | 16,034 | |
| Bank of America Corp. | |
| 1.70% | | 08/25/17 | | | 111,000 | | | | 111,145 | |
| 2.50% | | 10/21/22 | | | 23,000 | | | | 22,219 | |
| 2.60% | | 01/15/19 | | | 38,000 | | | | 38,311 | |
| 2.63% | | 04/19/21 | | | 49,000 | | | | 48,622 | |
| 3.25% | | 10/21/27 | | | 30,000 | | | | 28,594 | |
| 3.95% | | 04/21/25 | | | 27,000 | | | | 26,844 | |
| 4.10% | | 07/24/23 | | | 40,000 | | | | 41,740 | |
| 4.18% | | 11/25/27 | | | 24,000 | | | | 23,979 | |
| 4.25% | | 10/22/26 | | | 24,000 | | | | 24,255 | |
| Barrick Gold Corp. | |
| 4.10% | | 05/01/23 | | | 8,000 | | | | 8,198 | |
| Barrick North America Finance LLC | |
| 5.70% | | 05/30/41 | | | 5,000 | | | | 5,095 | |
| Baxalta Inc. | |
| 2.88% | | 06/23/20 | | | 24,000 | | | | 23,980 | |
| Berkshire Hathaway Energy Co. | |
| 6.13% | | 04/01/36 | | | 16,000 | | | | 19,952 | |
| Berry Plastics Corp. | |
| 5.13% | | 07/15/23 | | | 25,000 | | | | 25,438 | |
| Biogen Inc. | |
| 2.90% | | 09/15/20 | | | 9,000 | | | | 9,108 | |
| BMW US Capital LLC | |
| 2.00% | | 04/11/21 (h) | | | 31,000 | | | | 30,397 | |
| 2.80% | | 04/11/26 (h) | | | 23,000 | | | | 22,116 | |
| BP Capital Markets PLC | |
| 1.38% | | 05/10/18 | | | 23,000 | | | | 22,926 | |
| 3.12% | | 05/04/26 | | | 25,000 | | | | 24,381 | |
| 3.22% | | 11/28/23 | | | 24,000 | | | | 24,212 | |
| Brixmor Operating Partnership LP | |
| 4.13% | | 06/15/26 | | | 14,000 | | | | 13,938 | |
| | | | | | | | | | |
| | | Principal
Amount
$ | | | Fair
Value $ | |
| Buckeye Partners LP | |
| 3.95% | | 12/01/26 | | | 14,000 | | | | 13,638 | |
| 5.60% | | 10/15/44 | | | 7,000 | | | | 7,076 | |
| CalAtlantic Group Inc. | |
| 5.25% | | 06/01/26 | | | 25,000 | | | | 24,375 | |
| Calpine Corp. | |
| 5.75% | | 01/15/25 | | | 27,000 | | | | 26,055 | |
| 5.88% | | 01/15/24 (h) | | | 58,000 | | | | 60,465 | |
| Capital One Financial Corp. | |
| 4.20% | | 10/29/25 | | | 45,000 | | | | 45,090 | |
| Caterpillar Inc. | |
| 4.30% | | 05/15/44 | | | 14,000 | | | | 14,488 | |
| Catholic Health Initiatives | |
| 2.60% | | 08/01/18 | | | 15,000 | | | | 15,144 | |
| 4.35% | | 11/01/42 | | | 16,000 | | | | 14,187 | |
| CBL & Associates LP | |
| 5.95% | | 12/15/26 | | | 25,000 | | | | 25,147 | |
| CBS Corp. | |
| 2.90% | | 01/15/27 | | | 25,000 | | | | 23,154 | |
| CCO Holdings LLC/CCO Holdings Capital Corp. | |
| 5.88% | | 04/01/24 (h) | | | 25,000 | | | | 26,688 | |
| Celgene Corp. | |
| 3.88% | | 08/15/25 | | | 12,000 | | | | 12,156 | |
| 5.00% | | 08/15/45 | | | 28,000 | | | | 29,057 | |
| CenturyLink Inc. | |
| 5.80% | | 03/15/22 | | | 30,000 | | | | 30,664 | |
| Cequel Communications Holdings I LLC/Cequel Capital Corp. | |
| 5.13% | | 12/15/21 (h) | | | 53,000 | | | | 53,927 | |
| Charter Communications Operating LLC/Charter Communications Operating Capital | |
| 3.58% | | 07/23/20 | | | 34,000 | | | | 34,664 | |
| 4.91% | | 07/23/25 | | | 34,000 | | | | 35,789 | |
| 6.38% | | 10/23/35 | | | 5,000 | | | | 5,701 | |
| 6.48% | | 10/23/45 | | | 9,000 | | | | 10,387 | |
| Chevron Corp. | |
| 3.19% | | 06/24/23 | | | 22,000 | | | | 22,511 | |
| Chevron Phillips Chemical Company LLC/Chevron Phillips Chemical Company LP | |
| 3.40% | | 12/01/26 (h) | | | 34,000 | | | | 33,891 | |
| Chubb INA Holdings Inc. | |
| 2.30% | | 11/03/20 | | | 10,000 | | | | 9,990 | |
| 3.35% | | 05/03/26 | | | 5,000 | | | | 5,057 | |
| 4.35% | | 11/03/45 | | | 10,000 | | | | 10,541 | |
| Cigna Corp. | |
| 3.25% | | 04/15/25 | | | 45,000 | | | | 43,770 | |
| Cinemark USA Inc. | |
| 4.88% | | 06/01/23 | | | 18,000 | | | | 18,225 | |
| Cisco Systems Inc. | |
| 2.50% | | 09/20/26 | | | 26,000 | | | | 24,690 | |
| Citigroup Inc. | |
| 1.55% | | 08/14/17 | | | 46,000 | | | | 46,031 | |
| 1.75% | | 05/01/18 | | | 47,000 | | | | 46,893 | |
| 1.85% | | 11/24/17 | | | 20,000 | | | | 20,037 | |
See notes to schedule of investments and notes to financial statements.
| | |
| 8 | | State Street Income V.I.S. Fund |
State Street Income V.I.S. Fund
Schedule of Investments, continued — December 31, 2016
| | | | | | | | | | |
| | | Principal
Amount $ | | | Fair
Value $ | |
| | | | | | | | | | |
| 2.05% | | 12/07/18 | | | 41,000 | | | | 40,987 | |
| 4.75% | | 05/18/46 | | | 15,000 | | | | 14,988 | |
| CMS Energy Corp. | |
| 4.88% | | 03/01/44 | | | 23,000 | | | | 24,610 | |
| CNA Financial Corp. | |
| 5.88% | | 08/15/20 | | | 38,000 | | | | 41,949 | |
| CNH Industrial N.V. | |
| 4.50% | | 08/15/23 | | | 25,000 | | | | 24,688 | |
| Columbia Pipeline Group Inc. | |
| 3.30% | | 06/01/20 | | | 15,000 | | | | 15,272 | |
| Comcast Corp. | |
| 3.38% | | 08/15/25 | | | 40,000 | | | | 40,188 | |
| 4.20% | | 08/15/34 | | | 22,000 | | | | 22,438 | |
| 4.60% | | 08/15/45 | | | 6,000 | | | | 6,277 | |
| ConocoPhillips Co. | |
| 5.95% | | 03/15/46 | | | 5,000 | | | | 6,176 | |
| Consolidated Edison Company of New York Inc. | |
| 2.90% | | 12/01/26 | | | 25,000 | | | | 24,529 | |
| Corporation Andina de Fomento | |
| 4.38% | | 06/15/22 | | | 71,000 | | | | 75,321 | |
| CSX Corp. | |
| 4.50% | | 08/01/54 | | | 13,000 | | | | 12,712 | |
| CVS Health Corp. | |
| 3.88% | | 07/20/25 | | | 22,000 | | | | 22,666 | |
| 5.13% | | 07/20/45 | | | 10,000 | | | | 11,123 | |
| Daimler Finance North America LLC | |
| 2.38% | | 08/01/18 (h) | | | 150,000 | | | | 151,103 | |
| Dana Financing Luxembourg Sarl | |
| 6.50% | | 06/01/26 (h) | | | 24,000 | | | | 25,080 | |
| Danaher Corp. | |
| 4.38% | | 09/15/45 | | | 11,000 | | | | 11,437 | |
| Delphi Automotive PLC | |
| 4.40% | | 10/01/46 | | | 13,000 | | | | 11,921 | |
| Deutsche Bank AG | |
| 2.85% | | 05/10/19 | | | 26,000 | | | | 25,879 | |
| Devon Energy Corp. | |
| 5.00% | | 06/15/45 | | | 10,000 | | | | 9,805 | |
| 5.85% | | 12/15/25 | | | 19,000 | | | | 21,559 | |
| Diageo Investment Corp. | |
| 2.88% | | 05/11/22 | | | 21,000 | | | | 21,104 | |
| Diamond 1 Finance Corp./Diamond 2 Finance Corp. | |
| 3.48% | | 06/01/19 (h) | | | 50,000 | | | | 51,027 | |
| 4.42% | | 06/15/21 (h) | | | 25,000 | | | | 25,847 | |
| 6.02% | | 06/15/26 (h) | | | 13,000 | | | | 14,065 | |
| 8.35% | | 07/15/46 (h) | | | 10,000 | | | | 12,294 | |
| Dollar General Corp. | |
| 1.88% | | 04/15/18 | | | 45,000 | | | | 45,051 | |
| 3.25% | | 04/15/23 | | | 19,000 | | | | 18,729 | |
| 4.15% | | 11/01/25 | | | 13,000 | | | | 13,358 | |
| Dominion Resources Inc. | |
| 3.63% | | 12/01/24 | | | 21,000 | | | | 21,106 | |
| DTE Energy Co. | |
| 2.85% | | 10/01/26 | | | 15,000 | | | | 13,914 | |
| | | | | | | | | | |
| | | Principal
Amount
$ | | | Fair
Value $ | |
| Duke Energy Corp. | |
| 3.75% | | 09/01/46 | | | 15,000 | | | | 13,474 | |
| Duke Energy Progress LLC | |
| 4.15% | | 12/01/44 | | | 15,000 | | | | 14,872 | |
| Eastman Chemical Co. | |
| 3.60% | | 08/15/22 | | | 11,000 | | | | 11,268 | |
| Ecopetrol S.A. | |
| 5.88% | | 05/28/45 | | | 11,000 | | | | 9,504 | |
| Electricite de France S.A. | |
| 2.15% | | 01/22/19 (h) | | | 46,000 | | | | 46,086 | |
| Eli Lilly & Co. | |
| 3.70% | | 03/01/45 | | | 4,000 | | | | 3,786 | |
| Emera US Finance LP | |
| 4.75% | | 06/15/46 (h) | | | 5,000 | | | | 5,032 | |
| Enbridge Inc. | |
| 4.25% | | 12/01/26 | | | 14,000 | | | | 14,314 | |
| Encana Corp. | |
| 3.90% | | 11/15/21 | | | 24,000 | | | | 24,172 | |
| Energy Transfer Equity LP | |
| 5.88% | | 01/15/24 | | | 71,000 | | | | 73,307 | |
| Energy Transfer Partners LP | |
| 6.50% | | 02/01/42 | | | 29,000 | | | | 31,282 | |
| Entergy Louisiana LLC | |
| 3.05% | | 06/01/31 | | | 14,000 | | | | 13,228 | |
| Enterprise Products Operating LLC | |
| 3.95% | | 02/15/27 | | | 64,000 | | | | 65,464 | |
| EOG Resources Inc. | |
| 4.15% | | 01/15/26 | | | 30,000 | | | | 31,353 | |
| ERP Operating LP | |
| 4.50% | | 07/01/44 | | | 9,000 | | | | 9,128 | |
| Exelon Corp. | |
| 4.45% | | 04/15/46 | | | 21,000 | | | | 20,516 | |
| Express Scripts Holding Co. | |
| 3.40% | | 03/01/27 | | | 15,000 | | | | 14,032 | |
| 4.80% | | 07/15/46 | | | 8,000 | | | | 7,645 | |
| Exxon Mobil Corp. | |
| 2.22% | | 03/01/21 | | | 26,000 | | | | 25,994 | |
| 3.04% | | 03/01/26 | | | 8,000 | | | | 7,978 | |
| FedEx Corp. | |
| 4.10% | | 02/01/45 | | | 2,000 | | | | 1,869 | |
| Florida Power & Light Co. | |
| 4.13% | | 02/01/42 | | | 21,000 | | | | 21,499 | |
| Ford Motor Co. | |
| 4.35% | | 12/08/26 | | | 48,000 | | | | 48,434 | |
| Frontier Communications Corp. | |
| 7.13% | | 03/15/19 | | | 61,000 | | | | 64,584 | |
| 11.00% | | 09/15/25 | | | 9,000 | | | | 9,293 | |
| General Dynamics Corp. | |
| 2.13% | | 08/15/26 | | | 26,000 | | | | 23,981 | |
| General Motors Co. | |
| 5.20% | | 04/01/45 | | | 5,000 | | | | 4,811 | |
| General Motors Financial Company Inc. | |
| 3.15% | | 01/15/20 | | | 32,000 | | | | 32,181 | |
See notes to schedule of investments and notes to financial statements.
| | | | |
| State Street Income V.I.S. Fund | | | 9 | |
State Street Income V.I.S. Fund
Schedule of Investments, continued — December 31, 2016
| | | | | | | | | | |
| | | Principal
Amount $ | | | Fair
Value $ | |
| | | | | | | | | | |
| 3.20% | | 07/13/20 | | | 90,000 | | | | 90,208 | |
| 5.25% | | 03/01/26 | | | 25,000 | | | | 26,292 | |
| Georgia-Pacific LLC | |
| 3.60% | | 03/01/25 (h) | | | 5,000 | | | | 5,051 | |
| Gilead Sciences Inc. | |
| 1.95% | | 03/01/22 | | | 15,000 | | | | 14,498 | |
| 3.65% | | 03/01/26 | | | 25,000 | | | | 25,313 | |
| 3.70% | | 04/01/24 | | | 24,000 | | | | 24,607 | |
| 4.15% | | 03/01/47 | | | 11,000 | | | | 10,426 | |
| Halliburton Co. | |
| 3.80% | | 11/15/25 | | | 23,000 | | | | 23,334 | |
| 5.00% | | 11/15/45 | | | 14,000 | | | | 15,154 | |
| HCA Inc. | |
| 4.75% | | 05/01/23 | | | 56,000 | | | | 57,330 | |
| 6.50% | | 02/15/20 | | | 25,000 | | | | 27,350 | |
| Hess Corp. | |
| 4.30% | | 04/01/27 | | | 13,000 | | | | 12,921 | |
| 5.60% | | 02/15/41 | | | 10,000 | | | | 10,160 | |
| 5.80% | | 04/01/47 | | | 8,000 | | | | 8,288 | |
| Honeywell International Inc. | |
| 1.40% | | 10/30/19 | | | 24,000 | | | | 23,766 | |
| 2.50% | | 11/01/26 | | | 62,000 | | | | 58,717 | |
| Hyundai Capital America | |
| 2.13% | | 10/02/17 (h) | | | 23,000 | | | | 23,043 | |
| Illinois Tool Works Inc. | |
| 3.50% | | 03/01/24 | | | 23,000 | | | | 23,859 | |
| Ingersoll-Rand Luxembourg Finance S.A. | |
| 3.55% | | 11/01/24 | | | 32,000 | | | | 32,431 | |
| Ingles Markets Inc. | |
| 5.75% | | 06/15/23 | | | 71,000 | | | | 72,952 | |
| Intel Corp. | |
| 2.60% | | 05/19/26 | | | 33,000 | | | | 31,869 | |
| International Paper Co. | |
| 4.40% | | 08/15/47 | | | 28,000 | | | | 26,407 | |
| Interstate Power & Light Co. | |
| 3.40% | | 08/15/25 | | | 10,000 | | | | 10,085 | |
| JB Poindexter & Company Inc. | |
| 9.00% | | 04/01/22 (h) | | | 13,000 | | | | 13,650 | |
| JBS USA LUX S.A./JBS USA Finance Inc. | |
| 5.75% | | 06/15/25 (h) | | | 27,000 | | | | 27,338 | |
| Jefferies Group LLC | |
| 5.13% | | 01/20/23 | | | 15,000 | | | | 15,683 | |
| 6.50% | | 01/20/43 | | | 16,000 | | | | 16,438 | |
| JPMorgan Chase & Co. | |
| 2.30% | | 08/15/21 | | | 47,000 | | | | 46,086 | |
| 2.55% | | 10/29/20 | | | 22,000 | | | | 21,967 | |
| 3.30% | | 04/01/26 | | | 24,000 | | | | 23,547 | |
| 3.63% | | 12/01/27 | | | 15,000 | | | | 14,529 | |
| JPMorgan Chase & Co. 3.32% + 3 month USD LIBOR | |
| 5.00% | | 12/29/49 (c) | | | 17,000 | | | | 16,958 | |
| JPMorgan Chase & Co. 3.33% + 3 month USD LIBOR | |
| 6.10% | | 10/29/49 (c) | | | 55,000 | | | | 55,653 | |
| | | | | | | | | | |
| | | Principal
Amount $ | | | Fair
Value $ | |
| KB Home | |
| 7.00% | | 12/15/21 | | | 45,000 | | | | 47,475 | |
| Kellogg Co. | |
| 4.50% | | 04/01/46 | | | 4,000 | | | | 3,901 | |
| Kinder Morgan Energy Partners LP | |
| 3.50% | | 09/01/23 | | | 16,000 | | | | 15,764 | |
| 6.38% | | 03/01/41 | | | 10,000 | | | | 10,831 | |
| Kinder Morgan Inc. | |
| 3.05% | | 12/01/19 | | | 9,000 | | | | 9,125 | |
| 5.05% | | 02/15/46 | | | 10,000 | | | | 9,881 | |
| 5.55% | | 06/01/45 | | | 14,000 | | | | 14,698 | |
| Kraft Heinz Foods Co. | |
| 2.80% | | 07/02/20 | | | 26,000 | | | | 26,229 | |
| 4.38% | | 06/01/46 | | | 27,000 | | | | 25,356 | |
| Kreditanstalt fuer Wiederaufbau | |
| 4.50% | | 07/16/18 | | | 85,000 | | | | 89,040 | |
| L Brands Inc. | |
| 5.63% | | 02/15/22 | | | 47,000 | | | | 50,172 | |
| Lee Enterprises Inc. | |
| 9.50% | | 03/15/22 (h) | | | 35,000 | | | | 37,100 | |
| Lennar Corp. | |
| 4.50% | | 11/15/19 | | | 36,000 | | | | 37,395 | |
| 4.75% | | 05/30/25 | | | 18,000 | | | | 17,550 | |
| Levi Strauss & Co. | |
| 5.00% | | 05/01/25 | | | 26,000 | | | | 26,000 | |
| Lincoln National Corp. | |
| 3.63% | | 12/12/26 | | | 22,000 | | | | 21,916 | |
| Lockheed Martin Corp. | |
| 4.70% | | 05/15/46 | | | 11,000 | | | | 11,941 | |
| Lowe’s Companies Inc. | |
| 3.70% | | 04/15/46 | | | 24,000 | | | | 22,355 | |
| LYB International Finance BV | |
| 4.88% | | 03/15/44 | | | 7,000 | | | | 7,236 | |
| Macy’s Retail Holdings Inc. | |
| 4.30% | | 02/15/43 | | | 14,000 | | | | 11,517 | |
| Marathon Oil Corp. | |
| 3.85% | | 06/01/25 | | | 12,000 | | | | 11,622 | |
| 5.90% | | 03/15/18 | | | 12,000 | | | | 12,528 | |
| 6.00% | | 10/01/17 | | | 49,000 | | | | 50,461 | |
| Marathon Petroleum Corp. | |
| 3.63% | | 09/15/24 | | | 21,000 | | | | 20,714 | |
| Marsh & McLennan Companies Inc. | |
| 3.50% | | 03/10/25 | | | 23,000 | | | | 23,128 | |
| McDonald’s Corp. | |
| 3.70% | | 01/30/26 | | | 29,000 | | | | 29,484 | |
| 4.88% | | 12/09/45 | | | 9,000 | | | | 9,621 | |
| Medtronic Inc. | |
| 2.50% | | 03/15/20 | | | 14,000 | | | | 14,149 | |
| 3.50% | | 03/15/25 | | | 26,000 | | | | 26,738 | |
| 4.63% | | 03/15/45 | | | 7,000 | | | | 7,555 | |
| Memorial Sloan-Kettering Cancer Center | |
| 4.13% | | 07/01/52 | | | 20,000 | | | | 19,269 | |
| Merck & Company Inc. | |
| 2.75% | | 02/10/25 | | | 45,000 | | | | 44,126 | |
See notes to schedule of investments and notes to financial statements.
| | |
| 10 | | State Street Income V.I.S. Fund |
State Street Income V.I.S. Fund
Schedule of Investments, continued — December 31, 2016
| | | | | | | | | | |
| | | Principal
Amount $ | | | Fair
Value $ | |
| | | | | | | | | | |
| MetLife Inc. | |
| 4.72% | | 12/15/44 | | | 14,000 | | | | 14,869 | |
| MGM Resorts International | |
| 4.63% | | 09/01/26 | | | 16,000 | | | | 15,400 | |
| 5.25% | | 03/31/20 | | | 26,000 | | | | 27,495 | |
| 6.63% | | 12/15/21 | | | 43,000 | | | | 48,052 | |
| Microsoft Corp. | |
| 1.55% | | 08/08/21 | | | 50,000 | | | | 48,450 | |
| 2.40% | | 08/08/26 | | | 56,000 | | | | 52,852 | |
| 3.45% | | 08/08/36 | | | 15,000 | | | | 14,231 | |
| 3.70% | | 08/08/46 | | | 15,000 | | | | 14,091 | |
| 4.00% | | 02/12/55 | | | 15,000 | | | | 14,153 | |
| Molson Coors Brewing Co. | |
| 2.10% | | 07/15/21 | | | 34,000 | | | | 33,083 | |
| 3.00% | | 07/15/26 | | | 18,000 | | | | 16,990 | |
| 4.20% | | 07/15/46 | | | 10,000 | | | | 9,304 | |
| Monsanto Co. | |
| 4.70% | | 07/15/64 | | | 5,000 | | | | 4,494 | |
| Morgan Stanley | |
| 2.45% | | 02/01/19 | | | 20,000 | | | | 20,130 | |
| 2.63% | | 11/17/21 | | | 50,000 | | | | 49,350 | |
| 2.65% | | 01/27/20 | | | 25,000 | | | | 25,102 | |
| 3.70% | | 10/23/24 | | | 12,000 | | | | 12,128 | |
| 3.95% | | 04/23/27 | | | 45,000 | | | | 44,478 | |
| 4.10% | | 05/22/23 | | | 50,000 | | | | 51,274 | |
| Morgan Stanley 1.4% + 3 month USD LIBOR | |
| 2.28% | | 10/24/23 (c) | | | 48,000 | | | | 48,533 | |
| Mylan N.V. | |
| 3.15% | | 06/15/21 (h) | | | 11,000 | | | | 10,786 | |
| 3.95% | | 06/15/26 (h) | | | 12,000 | | | | 11,214 | |
| National Retail Properties Inc. | |
| 4.00% | | 11/15/25 | | | 22,000 | | | | 22,398 | |
| NCL Corporation Ltd. | |
| 4.63% | | 11/15/20 (h) | | | 22,000 | | | | 22,385 | |
| 4.75% | | 12/15/21 (h) | | | 12,000 | | | | 11,993 | |
| Newell Brands Inc. | |
| 3.85% | | 04/01/23 | | | 26,000 | | | | 26,942 | |
| 4.20% | | 04/01/26 | | | 10,000 | | | | 10,424 | |
| 5.50% | | 04/01/46 | | | 15,000 | | | | 17,188 | |
| Newmont Mining Corp. | |
| 4.88% | | 03/15/42 | | | 17,000 | | | | 15,922 | |
| Nexen Energy ULC | |
| 6.40% | | 05/15/37 | | | 11,000 | | | | 13,037 | |
| Noble Energy Inc. | |
| 3.90% | | 11/15/24 | | | 27,000 | | | | 27,173 | |
| Northern States Power Co. | |
| 2.20% | | 08/15/20 | | | 45,000 | | | | 45,037 | |
| Northrop Grumman Corp. | |
| 3.85% | | 04/15/45 | | | 6,000 | | | | 5,680 | |
| Novartis Capital Corp. | |
| 3.00% | | 11/20/25 | | | 3,000 | | | | 2,975 | |
| 4.00% | | 11/20/45 | | | 16,000 | | | | 16,113 | |
| NRG Energy Inc. | |
| 6.25% | | 07/15/22 | | | 26,000 | | | | 26,065 | |
| | | | | | | | | | |
| | | Principal
Amount $ | | | Fair
Value $ | |
| Occidental Petroleum Corp. | |
| 3.50% | | 06/15/25 | | | 10,000 | | | | 10,128 | |
| 4.10% | | 02/15/47 | | | 12,000 | | | | 11,664 | |
| Omnicom Group Inc. | |
| 3.63% | | 05/01/22 | | | 23,000 | | | | 23,597 | |
| Oracle Corp. | |
| 1.90% | | 09/15/21 | | | 26,000 | | | | 25,383 | |
| 2.40% | | 09/15/23 | | | 18,000 | | | | 17,418 | |
| 2.65% | | 07/15/26 | | | 35,000 | | | | 33,172 | |
| 2.95% | | 05/15/25 | | | 15,000 | | | | 14,685 | |
| 4.00% | | 07/15/46 | | | 15,000 | | | | 14,317 | |
| Owens & Minor Inc. | |
| 3.88% | | 09/15/21 | | | 45,000 | | | | 45,061 | |
| Pacific Gas & Electric Co. | |
| 3.40% | | 08/15/24 | | | 68,000 | | | | 69,402 | |
| PacifiCorp | |
| 6.25% | | 10/15/37 | | | 12,000 | | | | 15,520 | |
| Penn National Gaming Inc. | |
| 5.88% | | 11/01/21 | | | 26,000 | | | | 27,105 | |
| PepsiCo Inc. | |
| 3.10% | | 07/17/22 | | | 11,000 | | | | 11,289 | |
| 3.45% | | 10/06/46 | | | 12,000 | | | | 10,908 | |
| 4.25% | | 10/22/44 | | | 13,000 | | | | 13,398 | |
| Petroleos Mexicanos | |
| 3.50% | | 01/30/23 | | | 21,000 | | | | 19,278 | |
| 4.50% | | 01/23/26 | | | 24,000 | | | | 21,864 | |
| 5.38% | | 03/13/22 (h) | | | 25,000 | | | | 25,600 | |
| 5.63% | | 01/23/46 | | | 10,000 | | | | 8,300 | |
| 6.38% | | 02/04/21 (h) | | | 20,000 | | | | 21,300 | |
| 6.38% | | 01/23/45 | | | 12,000 | | | | 10,920 | |
| 6.50% | | 03/13/27 (h) | | | 25,000 | | | | 25,788 | |
| 6.75% | | 09/21/47 (h) | | | 20,000 | | | | 18,896 | |
| PetSmart Inc. | |
| 7.13% | | 03/15/23 (h) | | | 33,000 | | | | 33,660 | |
| Pfizer Inc. | |
| 3.00% | | 12/15/26 | | | 20,000 | | | | 19,723 | |
| 4.13% | | 12/15/46 | | | 13,000 | | | | 13,196 | |
| 4.40% | | 05/15/44 | | | 15,000 | | | | 15,812 | |
| Philip Morris International Inc. | |
| 4.13% | | 03/04/43 | | | 24,000 | | | | 23,179 | |
| Plains All American Pipeline LP/PAA Finance Corp. | |
| 4.70% | | 06/15/44 | | | 10,000 | | | | 8,894 | |
| Potash Corporation of Saskatchewan Inc. | |
| 4.00% | | 12/15/26 | | | 34,000 | | | | 34,165 | |
| PPL Capital Funding Inc. | |
| 3.10% | | 05/15/26 | | | 50,000 | | | | 47,764 | |
| Precision Castparts Corp. | |
| 4.38% | | 06/15/45 | | | 14,000 | | | | 14,695 | |
| Prologis LP | |
| 3.75% | | 11/01/25 | | | 22,000 | | | | 22,513 | |
| Prudential Financial Inc. 3.03% + 3 month USD LIBOR | |
| 5.38% | | 05/15/45 (c) | | | 23,000 | | | | 23,518 | |
| Public Service Electric & Gas Co. | |
| 2.38% | | 05/15/23 | | | 48,000 | | | | 46,864 | |
See notes to schedule of investments and notes to financial statements.
| | | | |
| State Street Income V.I.S. Fund | | | 11 | |
State Street Income V.I.S. Fund
Schedule of Investments, continued — December 31, 2016
| | | | | | | | | | |
| | | Principal
Amount $ | | | Fair
Value $ | |
| | | | | | | | | | |
| PulteGroup Inc. | |
| 4.25% | | 03/01/21 | | | 10,000 | | | | 10,225 | |
| 5.50% | | 03/01/26 | | | 20,000 | | | | 19,850 | |
| QUALCOMM Inc. | |
| 4.80% | | 05/20/45 | | | 9,000 | | | | 9,599 | |
| Realty Income Corp. | |
| 3.00% | | 01/15/27 | | | 35,000 | | | | 32,901 | |
| Regency Energy Partners LP/Regency Energy Finance Corp. | |
| 4.50% | | 11/01/23 | | | 20,000 | | | | 20,274 | |
| Reynolds American Inc. | |
| 4.45% | | 06/12/25 | | | 38,000 | | | | 40,071 | |
| 5.85% | | 08/15/45 | | | 6,000 | | | | 7,092 | |
| Rio Tinto Finance USA PLC | |
| 4.13% | | 08/21/42 | | | 12,000 | | | | 11,764 | |
| Rogers Communications Inc. | |
| 5.00% | | 03/15/44 | | | 8,000 | | | | 8,542 | |
| Ryder System Inc. | |
| 2.45% | | 09/03/19 | | | 54,000 | | | | 54,275 | |
| Santander UK Group Holdings PLC | |
| 3.13% | | 01/08/21 | | | 29,000 | | | | 28,932 | |
| Schlumberger Holdings Corp. | |
| 3.00% | | 12/21/20 (h) | | | 18,000 | | | | 18,366 | |
| 4.00% | | 12/21/25 (h) | | | 12,000 | | | | 12,559 | |
| Shell International Finance BV | |
| 2.88% | | 05/10/26 | | | 24,000 | | | | 23,169 | |
| 3.40% | | 08/12/23 | | | 34,000 | | | | 34,853 | |
| Shire Acquisitions Investments Ireland DAC | |
| 2.40% | | 09/23/21 | | | 30,000 | | | | 28,952 | |
| 2.88% | | 09/23/23 | | | 30,000 | | | | 28,480 | |
| 3.20% | | 09/23/26 | | | 15,000 | | | | 13,998 | |
| Sinclair Television Group Inc. | |
| 5.38% | | 04/01/21 | | | 45,000 | | | | 46,350 | |
| Southern California Edison Co. | |
| 2.40% | | 02/01/22 | | | 20,000 | | | | 19,922 | |
| Southern Copper Corp. | |
| 5.88% | | 04/23/45 | | | 10,000 | | | | 9,801 | |
| Spectra Energy Partners LP | |
| 3.38% | | 10/15/26 | | | 24,000 | | | | 22,921 | |
| 4.50% | | 03/15/45 | | | 10,000 | | | | 9,490 | |
| Sprint Corp. | |
| 7.63% | | 02/15/25 | | | 42,000 | | | | 44,152 | |
| Standard Industries Inc. | |
| 5.38% | | 11/15/24 (h) | | | 52,000 | | | | 53,430 | |
| Statoil ASA | |
| 3.95% | | 05/15/43 | | | 11,000 | | | | 10,471 | |
| Sumitomo Mitsui Financial Group Inc. | |
| 2.63% | | 07/14/26 | | | 40,000 | | | | 37,114 | |
| Sunoco LP/Sunoco Finance Corp. | |
| 5.50% | | 08/01/20 | | | 17,000 | | | | 17,340 | |
| SUPERVALU Inc. | |
| 6.75% | | 06/01/21 | | | 43,000 | | | | 43,430 | |
| T-Mobile USA Inc. | |
| 6.63% | | 04/01/23 | | | 43,000 | | | | 45,580 | |
| | | | | | | | | | |
| | | Principal
Amount
$ | | | Fair
Value $ | |
| Tampa Electric Co. | |
| 4.35% | | 05/15/44 | | | 22,000 | | | | 21,965 | |
| Target Corp. | |
| 2.50% | | 04/15/26 | | | 25,000 | | | | 23,815 | |
| Teachers Insurance & Annuity Association of America | |
| 4.90% | | 09/15/44 (h) | | | 25,000 | | | | 26,992 | |
| Tenet Healthcare Corp. | |
| 4.75% | | 06/01/20 | | | 17,000 | | | | 17,085 | |
| 6.00% | | 10/01/20 | | | 44,000 | | | | 45,870 | |
| Tesoro Corp. | |
| 5.13% | | 12/15/26 (h) | | | 13,000 | | | | 13,148 | |
| Teva Pharmaceutical Finance Netherlands III BV | |
| 3.15% | | 10/01/26 | | | 15,000 | | | | 13,808 | |
| 4.10% | | 10/01/46 | | | 12,000 | | | | 10,262 | |
| The Allstate Corp. | |
| 3.28% | | 12/15/26 | | | 34,000 | | | | 34,061 | |
| 4.20% | | 12/15/46 | | | 10,000 | | | | 10,184 | |
| The Allstate Corp. 2.94% + 3 month USD LIBOR | |
| 5.75% | | 08/15/53 (c) | | | 25,000 | | | | 25,848 | |
| The Bank of New York Mellon Corp. | |
| 3.00% | | 10/30/28 | | | 34,000 | | | | 32,270 | |
| The Bank of New York Mellon Corp. 3.13% + 3 month USD LIBOR | |
| 4.63% | | 12/29/49 (c) | | | 50,000 | | | | 45,866 | |
| The Dow Chemical Co. | |
| 4.25% | | 10/01/34 | | | 28,000 | | | | 27,553 | |
| The Goldman Sachs Group Inc. | |
| 2.35% | | 11/15/21 | | | 50,000 | | | | 48,531 | |
| 2.38% | | 01/22/18 | | | 58,000 | | | | 58,338 | |
| 2.63% | | 04/25/21 | | | 28,000 | | | | 27,773 | |
| 2.90% | | 07/19/18 | | | 32,000 | | | | 32,437 | |
| 4.25% | | 10/21/25 | | | 7,000 | | | | 7,101 | |
| 4.80% | | 07/08/44 | | | 23,000 | | | | 24,100 | |
| 5.15% | | 05/22/45 | | | 23,000 | | | | 24,143 | |
| The Home Depot Inc. | |
| 3.35% | | 09/15/25 | | | 17,000 | | | | 17,417 | |
| 3.50% | | 09/15/56 | | | 17,000 | | | | 14,844 | |
| The Kroger Co. | |
| 2.95% | | 11/01/21 | | | 32,000 | | | | 32,168 | |
| The ServiceMaster Company LLC | |
| 5.13% | | 11/15/24 (h) | | | 4,000 | | | | 4,060 | |
| The Southern Co. | |
| 3.25% | | 07/01/26 | | | 10,000 | | | | 9,718 | |
| 4.40% | | 07/01/46 | | | 15,000 | | | | 14,807 | |
| The Southern Co. 3.63% + 3 month USD LIBOR | |
| 5.50% | | 03/15/57 (c) | | | 24,000 | | | | 24,241 | |
| The Toronto-Dominion Bank | |
| 2.50% | | 12/14/20 | | | 17,000 | | | | 17,091 | |
| The Toronto-Dominion Bank 2.21% + 5 year USD LIBOR | |
| 3.63% | | 09/15/31 (c) | | | 14,000 | | | | 13,755 | |
| The Travelers Companies Inc. | |
| 3.75% | | 05/15/46 | | | 10,000 | | | | 9,416 | |
| The Walt Disney Co. | |
| 1.85% | | 07/30/26 | | | 26,000 | | | | 23,393 | |
| 4.13% | | 06/01/44 | | | 10,000 | | | | 10,317 | |
See notes to schedule of investments and notes to financial statements.
| | |
| 12 | | State Street Income V.I.S. Fund |
State Street Income V.I.S. Fund
Schedule of Investments, continued — December 31, 2016
| | | | | | | | | | |
| | | Principal
Amount
$ | | | Fair
Value $ | |
| | | | | | | | | | |
| Time Inc. | |
| 5.75% | | 04/15/22 (h) | | | 44,000 | | | | 45,540 | |
| Time Warner Cable LLC | |
| 4.50% | | 09/15/42 | | | 5,000 | | | | 4,520 | |
| 6.55% | | 05/01/37 | | | 13,000 | | | | 14,695 | |
| Time Warner Inc. | |
| 3.80% | | 02/15/27 | | | 32,000 | | | | 31,719 | |
| 5.35% | | 12/15/43 | | | 33,000 | | | | 34,838 | |
| TransCanada PipeLines Ltd. | |
| 4.88% | | 01/15/26 | | | 10,000 | | | | 11,111 | |
| Tyco Electronics Group S.A. | |
| 2.35% | | 08/01/19 | | | 43,000 | | | | 43,109 | |
| Tyson Foods Inc. | |
| 2.65% | | 08/15/19 | | | 9,000 | | | | 9,082 | |
| U.S. Bancorp 3.49% + 3 month USD LIBOR | |
| 5.13% | | 12/29/49 (c) | | | 45,000 | | | | 45,900 | |
| United Technologies Corp. | |
| 1.95% | | 11/01/21 | | | 24,000 | | | | 23,503 | |
| 2.65% | | 11/01/26 | | | 24,000 | | | | 23,010 | |
| 3.75% | | 11/01/46 | | | 8,000 | | | | 7,597 | |
| UnitedHealth Group Inc. | |
| 2.70% | | 07/15/20 | | | 20,000 | | | | 20,286 | |
| 4.75% | | 07/15/45 | | | 29,000 | | | | 31,883 | |
| Universal Health Services Inc. | |
| 5.00% | | 06/01/26 (h) | | | 16,000 | | | | 15,600 | |
| Vale Overseas Ltd. | |
| 4.38% | | 01/11/22 | | | 14,000 | | | | 13,755 | |
| 5.88% | | 06/10/21 | | | 26,000 | | | | 27,235 | |
| 6.25% | | 08/10/26 | | | 13,000 | | | | 13,520 | |
| 6.88% | | 11/10/39 | | | 10,000 | | | | 9,725 | |
| Ventas Realty LP | |
| 3.25% | | 10/15/26 | | | 25,000 | | | | 23,684 | |
| Verizon Communications Inc. | |
| 1.75% | | 08/15/21 | | | 48,000 | | | | 46,003 | |
| 2.63% | | 08/15/26 | | | 26,000 | | | | 23,898 | |
| 4.40% | | 11/01/34 | | | 23,000 | | | | 22,666 | |
| 4.67% | | 03/15/55 | | | 16,000 | | | | 15,041 | |
| 4.86% | | 08/21/46 | | | 13,000 | | | | 13,147 | |
| 5.05% | | 03/15/34 | | | 38,000 | | | | 39,958 | |
| 5.15% | | 09/15/23 | | | 30,000 | | | | 33,138 | |
| Viacom Inc. | |
| 2.25% | | 02/04/22 | | | 25,000 | | | | 23,470 | |
| 3.45% | | 10/04/26 | | | 15,000 | | | | 13,842 | |
| Virginia Electric & Power Co. | |
| 4.00% | | 11/15/46 | | | 25,000 | | | | 24,871 | |
| Visa Inc. | |
| 3.15% | | 12/14/25 | | | 29,000 | | | | 29,087 | |
| 4.30% | | 12/14/45 | | | 13,000 | | | | 13,693 | |
| W.R. Grace & Co. | |
| 5.13% | | 10/01/21 (h) | | | 15,000 | | | | 15,638 | |
| 5.63% | | 10/01/24 (h) | | | 43,000 | | | | 45,150 | |
| Wabtec Corp. | |
| 3.45% | | 11/15/26 (h) | | | 24,000 | | | | 23,036 | |
| | | | | | | | | | |
| | | Principal
Amount
$ | | | Fair
Value $ | |
| Wal-Mart Stores Inc. | |
| 4.30% | | 04/22/44 | | | 10,000 | | | | 10,532 | |
| Walgreens Boots Alliance Inc. | |
| 4.65% | | 06/01/46 | | | 8,000 | | | | 8,102 | |
| WEC Energy Group Inc. | |
| 3.55% | | 06/15/25 | | | 19,000 | | | | 19,338 | |
| Wells Fargo & Co. | |
| 3.00% | | 10/23/26 | | | 40,000 | | | | 38,031 | |
| 3.90% | | 05/01/45 | | | 13,000 | | | | 12,305 | |
| 4.30% | | 07/22/27 | | | 17,000 | | | | 17,459 | |
| 4.40% | �� | 06/14/46 | | | 15,000 | | | | 14,327 | |
| 4.75% | | 12/07/46 | | | 24,000 | | | | 24,224 | |
| Wells Fargo & Co. 3.11% + 3 month USD LIBOR | |
| 5.90% | | 12/29/49 (c) | | | 29,000 | | | | 29,145 | |
| Wells Fargo & Co. 3.99% + 3 month USD LIBOR | |
| 5.88% | | 12/29/49 (c) | | | 32,000 | | | | 33,597 | |
| Western Digital Corp. | |
| 7.38% | | 04/01/23 (h) | | | 5,000 | | | | 5,500 | |
| Westlake Chemical Corp. | |
| 3.60% | | 08/15/26 (h) | | | 35,000 | | | | 33,615 | |
| 5.00% | | 08/15/46 (h) | | | 7,000 | | | | 6,901 | |
| Williams Partners LP | |
| 3.90% | | 01/15/25 | | | 38,000 | | | | 37,222 | |
| 4.90% | | 01/15/45 | | | 7,000 | | | | 6,458 | |
| 5.40% | | 03/04/44 | | | 4,000 | | | | 3,870 | |
| Windstream Services LLC | |
| 6.38% | | 08/01/23 | | | 47,000 | | | | 41,947 | |
| WPP Finance 2010 | |
| 3.75% | | 09/19/24 | | | 45,000 | | | | 45,234 | |
| XLIT Ltd. | |
| 5.25% | | 12/15/43 | | | 19,000 | | | | 19,599 | |
| XPO Logistics Inc. | |
| 6.50% | | 06/15/22 (h) | | | 25,000 | | | | 26,250 | |
| Zimmer Biomet Holdings Inc. | |
| 3.55% | | 04/01/25 | | | 23,000 | | | | 22,373 | |
| | | | | | | | | | |
| | | | 10,529,857 | |
| | | | | | | | | | |
|
Non-Agency Collateralized Mortgage Obligations - 6.6% | |
| American Tower Trust I (REIT) | |
| 1.55% | | 03/15/43 (h) | | | 72,000 | | | | 71,935 | |
| Banc of America Commercial Mortgage Trust 2007-1 | |
| 5.48% | | 01/15/49 (c) | | | 69,000 | | | | 68,905 | |
| Banc of America Commercial Mortgage Trust 2007-4 | |
| 5.75% | | 02/10/51 (c) | | | 18,029 | | | | 18,278 | |
| Banc of America Commercial Mortgage Trust 2008-1 | |
| 6.24% | | 02/10/51 (c) | | | 20,253 | | | | 20,775 | |
| Banc of America Merrill Lynch Commercial Mortgage Inc. 2005-1 | |
| 5.35% | | 11/10/42 (c) | | | 7,139 | | | | 7,132 | |
| Bear Stearns Commercial Mortgage Securities Trust 2007-PW18 | |
| 6.09% | | 06/11/50 (c) | | | 50,000 | | | | 51,605 | |
| CFCRE Commercial Mortgage Trust 2016-C7 | |
| 3.84% | | 12/10/54 | | | 36,036 | | | | 37,167 | |
See notes to schedule of investments and notes to financial statements.
| | | | |
| State Street Income V.I.S. Fund | | | 13 | |
State Street Income V.I.S. Fund
Schedule of Investments, continued — December 31, 2016
| | | | | | | | | | |
| | | Principal
Amount
$ | | | Fair
Value $ | |
| | | | | | | | | | |
| Citigroup Commercial Mortgage Trust 2014-GC23 | |
| 4.51% | | 07/10/47 (c,h) | | | 51,000 | | | | 42,527 | |
| Citigroup Commercial Mortgage Trust 2015-GC33 | |
| 3.17% | | 09/10/58 | | | 20,704 | | | | 14,448 | |
| Citigroup Commercial Mortgage Trust 2016-P5 | |
| 2.94% | | 10/10/49 | | | 36,994 | | | | 35,813 | |
| Citigroup Commercial Mortgage Trust 2016-P6 | |
| 3.72% | | 12/10/49 (c) | | | 72,309 | | | | 74,596 | |
| 4.03% | | 12/10/49 (c) | | | 31,273 | | | | 32,029 | |
| COMM 2014-CR14 Mortgage Trust | |
| 4.53% | | 02/10/47 (c) | | | 25,000 | | | | 26,794 | |
| COMM 2014-CR19 Mortgage Trust | |
| 4.72% | | 08/10/47 (c,h) | | | 205,000 | | | | 162,429 | |
| COMM 2015-CR23 Mortgage Trust | |
| 4.26% | | 05/10/48 (c) | | | 16,863 | | | | 15,347 | |
| COMM 2015-PC1 Mortgage Trust | |
| 4.59% | | 07/10/50 (c) | | | 19,456 | | | | 19,150 | |
| CSAIL 2015-C3 Commercial Mortgage Trust | |
| 3.36% | | 08/15/48 (c) | | | 24,827 | | | | 18,382 | |
| GS Mortgage Securities Trust 2011-GC5 | |
| 3.00% | | 08/10/44 | | | 1,090 | | | | 1,090 | |
| GS Mortgage Securities Trust 2015-GC32 | |
| 3.35% | | 07/10/48 | | | 22,783 | | | | 16,933 | |
| GS Mortgage Securities Trust 2015-GC34 | |
| 2.98% | | 10/10/48 | | | 47,000 | | | | 33,542 | |
| GS Mortgage Securities Trust 2015-GS1 | |
| 3.27% | | 11/10/48 | | | 38,688 | | | | 29,605 | |
| GS Mortgage Securities Trust 2016-GS3 | |
| 3.40% | | 10/10/49 (c) | | | 38,000 | | | | 36,671 | |
| JP Morgan Chase Commercial Mortgage Securities Trust 2007-CB18 | |
| 5.44% | | 06/12/47 | | | 13,835 | | | | 13,825 | |
| JPMBB Commercial Mortgage Securities Trust 2013-C12 | |
| 4.03% | | 07/15/45 (c) | | | 15,000 | | | | 15,776 | |
| JPMBB Commercial Mortgage Securities Trust 2015-C29 | |
| 3.70% | | 05/15/48 (c) | | | 39,943 | | | | 28,355 | |
| JPMBB Commercial Mortgage Securities Trust 2015-C30 | |
| 4.31% | | 07/15/48 (c) | | | 41,423 | | | | 36,255 | |
| LB-UBS Commercial Mortgage Trust 2007-C6 | |
| 6.11% | | 07/15/40 (c) | | | 30,127 | | | | 30,919 | |
| 6.11% | | 07/15/40 (h) | | | 60,000 | | | | 60,796 | |
| MASTR Alternative Loan Trust 2003-5 | |
| 5.00% | | 08/25/18 (e) | | | 6,306 | | | | 106 | |
| Morgan Stanley Bank of America Merrill Lynch Trust 2015-C20 | |
| 1.40% | | 02/15/48 (c,e) | | | 325,343 | | | | 24,548 | |
| Morgan Stanley Bank of America Merrill Lynch Trust 2015-C21 | |
| 0.98% | | 03/15/48 (c,e) | | | 388,108 | | | | 22,386 | |
| Morgan Stanley Bank of America Merrill Lynch Trust 2015-C22 | |
| 4.24% | | 04/15/48 (c,h) | | | 100,000 | | | | 76,833 | |
| Morgan Stanley Bank of America Merrill Lynch Trust 2016-C28 | |
| 3.00% | | 01/15/49 (h) | | | 17,470 | | | | 11,762 | |
| Morgan Stanley Capital I Trust 2006-IQ11 | |
| 6.23% | | 10/15/42 (c) | | | 50,000 | | | | 49,578 | |
| Morgan Stanley Capital I Trust 2006-T21 | |
| 5.27% | | 10/12/52 (c) | | | 12,811 | | | | 12,804 | |
| | | | | | | | | | |
| | | Principal
Amount
$ | | | Fair
Value $ | |
| Morgan Stanley Capital I Trust 2007-IQ16 | |
| 6.05% | | 12/12/49 (c) | | | 50,000 | | | | 51,289 | |
| Morgan Stanley Capital I Trust 2008-T29 | |
| 6.28% | | 01/11/43 (c) | | | 45,000 | | | | 46,528 | |
| Morgan Stanley Capital I Trust 2016-UBS9 | |
| 1.25% | | 03/15/49 (c,e) | | | 311,366 | | | | 24,333 | |
| 3.00% | | 03/15/49 (h) | | | 23,000 | | | | 17,194 | |
| Wells Fargo Commercial Mortgage Trust 2015-C29 | |
| 4.22% | | 06/15/48 (c) | | | 33,857 | | | | 25,814 | |
| Wells Fargo Commercial Mortgage Trust 2015-C30 | |
| 4.50% | | 09/15/58 (c,h) | | | 20,705 | | | | 16,183 | |
| Wells Fargo Commercial Mortgage Trust 2015-NXS2 | |
| 4.25% | | 07/15/58 (c) | | | 20,700 | | | | 15,279 | |
| Wells Fargo Commercial Mortgage Trust 2016-C33 | |
| 3.12% | | 03/15/59 (h) | | | 18,397 | | | | 12,777 | |
| WFRBS Commercial Mortgage Trust 2013-C17 | |
| 4.26% | | 12/15/46 | | | 25,000 | | | | 26,529 | |
| WFRBS Commercial Mortgage Trust 2014-C19 | |
| 4.23% | | 03/15/47 (h) | | | 41,454 | | | | 33,444 | |
| WFRBS Commercial Mortgage Trust 2014-C22 | |
| 3.91% | | 09/15/57 (c,h) | | | 54,883 | | | | 40,920 | |
| WFRBS Commercial Mortgage Trust 2014-C24 | |
| 3.69% | | 11/15/47 (h) | | | 78,708 | | | | 48,051 | |
| WFRBS Commercial Mortgage Trust 2014-C25 | |
| 3.80% | | 11/15/47 (c,h) | | | 10,000 | | | | 6,981 | |
| WFRBS Commercial Mortgage Trust 2014-LC14 | |
| 4.35% | | 03/15/47 (c) | | | 58,000 | | | | 61,516 | |
| 4.59% | | 03/15/47 (c,h) | | | 60,980 | | | | 48,386 | |
| WFRBS Commercial Mortgage Trust 2015-C31 | |
| 3.85% | | 11/15/48 | | | 10,338 | | | | 7,508 | |
| | | | | | | | | | |
| | | | 1,701,828 | |
| | | | | | | | | | |
|
Sovereign Bonds - 0.2% | |
| Government of Mexico | |
| 4.00% | | 10/02/23 | | | 14,000 | | | | 14,032 | |
| 4.75% | | 03/08/44 | | | 26,000 | | | | 23,634 | |
| Government of Peru | |
| 4.13% | | 08/25/27 | | | 13,000 | | | | 13,504 | |
| 5.63% | | 11/18/50 | | | 7,000 | | | | 7,927 | |
| | | | | | | | | | |
| | | | 59,097 | |
| | | | | | | | | | |
|
Municipal Bonds and Notes - 0.8% | |
| American Municipal Power Inc. | |
| 6.27% | | 02/15/50 | | | 25,000 | | | | 30,319 | |
| Municipal Electric Authority of Georgia | |
| 6.64% | | 04/01/57 | | | 28,000 | | | | 34,726 | |
| New Jersey Transportation Trust Fund Authority | |
| 6.88% | | 12/15/39 | | | 15,000 | | | | 16,091 | |
| Port Authority of New York & New Jersey | |
| 4.46% | | 10/01/62 | | | 40,000 | | | | 40,456 | |
| South Carolina State Public Service Authority | |
| 6.45% | | 01/01/50 | | | 15,000 | | | | 19,783 | |
See notes to schedule of investments and notes to financial statements.
| | |
| 14 | | State Street Income V.I.S. Fund |
State Street Income V.I.S. Fund
Schedule of Investments, continued — December 31, 2016
| | | | | | | | | | |
| | | Principal
Amount $ | | | Fair
Value $ | |
| | | | | | | | | | |
| State of California | |
| 5.70% | | 11/01/21 | | | 40,000 | | | | 46,125 | |
| State of Illinois | |
| 5.10% | | 06/01/33 | | | 15,000 | | | | 13,257 | |
| | | | | | | | | | |
| | | | 200,757 | |
| | | | | | | | | | |
|
FNMA (TBA) - 0.0%* | |
| Lehman | |
| 5.50% | | TBA (i,j) | | | 51,536 | | | | 1,629 | |
| | | | | | | | | | |
| |
Total Bonds and Notes
(Cost $25,472,399) | | | | 25,494,702 | |
| | | | | | | | | | |
| | | |
| | | | | Number
of Shares | | | Fair
Value $ | |
| | | | | | | | | | |
| Domestic Equity - 0.1% | | | | | | | | |
Preferred Stock - 0.1% | | | | | | | | |
Wells Fargo & Co. 3.09% + 3 month USD LIBOR
(Cost $34,875) (c) | | | 1,395 | | | | 35,210 | |
| | | | | | | | | | |
| |
Total Investments in Securities
(Cost $25,507,274) | | | | 25,529,912 | |
| | | | | | | | | | |
| | | | | | | | | | |
| | | | | Number
of Shares | | | Fair
Value $ | |
| Short-Term Investments - 13.3% | | | | | |
State Street Institutional U.S. Government Money Market Fund - Class G Shares 0.46%
(Cost $3,403,695) (a,g,k) | | | 3,403,695 | | | | 3,403,695 | |
| | | | | | | | | | |
| |
Total Investments
(Cost $28,910,969) | | | | 28,933,607 | |
| | | | | | | | | | |
| |
Liabilities in Excess of
Other Assets, net - (13.1)% | | | | (3,352,036 | ) |
| | | | | | | | | | |
| |
| NET ASSETS - 100.0% | | | $ | 25,581,571 | |
| | | | | | | | | | |
Other Information:
Centrally Cleared Credit Default Swaps - Buy Protection
| | | | | | | | | | | | | | | | | | | | | | | | | | |
| Reference Entity | | Counterparty | | Notional
Amount
(000s omitted) | | | Contract
annual
Fixed Rate | | | Termination
Date | | | Market
Value | | | Unamortized
Upfront
Payments
Paid | | | Unrealized
Depreciation | |
| | | | | | | | | | | | | | | | | | | | | | | | | | |
Markit CDX North America High Yield Index | | CME Group Inc. | | $ | 945 | | | | 5.00 | % | | | 12/20/21 | | | $ | (60,034 | ) | | $ | (39,772 | ) | | $ | (20,262 | ) |
Markit CDX North America Investment Grade Index | | CME Group Inc. | | | 693 | | | | 1.00 | | | | 12/20/21 | | | | (10,710 | ) | | | (8,770 | ) | | | (1,940 | ) |
| | | | | | | | | | | | | | | | | | | | | | | | | | |
| | | $ | (22,202 | ) |
| | | | | | | | | | | | | | | | | | | | | | | | | | |
The Fund had the following long futures contracts open at December 31, 2016:
| | | | | | | | | | | | | | | | |
| Description | | Expiration
date | | | Number of
Contracts | | | Current
Notional
Value | | | Unrealized
Depreciation | |
| | | | | | | | | | | | | | | | |
Ultra Long-Term U.S. Treasury Bond Futures | | | March 2017 | | | | 2 | | | $ | 320,500 | | | $ | (2,890 | ) |
5 Yr. U.S. Treasury Notes Futures | | | March 2017 | | | | 19 | | | | 2,235,617 | | | | (7,283 | ) |
| | | | | | | | | | | | | | | | |
| | | | | | | | | | $ | (10,173 | ) |
| | | | | | | | | | | | | | | | |
See notes to schedule of investments and notes to financial statements.
| | | | |
| State Street Income V.I.S. Fund | | | 15 | |
State Street Income V.I.S. Fund
Schedule of Investments, continued — December 31, 2016
The Fund had the following short futures contracts open at December 31, 2016:
| | | | | | | | | | | | | | | | |
| Description | | Expiration
date | | | Number of
Contracts | | | Current
Notional
Value | | | Unrealized
Appreciation
(Depreciation) | |
| | | | | | | | | | | | | | | | |
U.S. Long Bond Futures | | | March 2017 | | | | 4 | | | $ | (602,625 | ) | | $ | (583 | ) |
2 Yr. U.S. Treasury Notes Futures | | | March 2017 | | | | 1 | | | | (216,687 | ) | | | 264 | |
10 Yr. U.S. Treasury Notes Futures | | | March 2017 | | | | 9 | | | | (1,118,531 | ) | | | 2,452 | |
Ultra 10 Yr. U.S. Treasury Futures | | | March 2017 | | | | 3 | | | | (402,188 | ) | | | 1,083 | |
| | | | | | | | | | | | | | | | |
| | | | | | | | | | $ | 3,216 | |
| | | | | | | | | | | | | | | | |
| | | | | | | | | | $ | (6,957 | ) |
| | | | | | | | | | | | | | | | |
Affiliate Table
| | | | | | | | | | | | | | | | | | | | | | | | | | | | | | | | |
| | | Number of
Shares Held
at 12/31/15 | | | Value At
12/31/15 | | | Shares
Purchased | | | Shares Sold | | | Number of
Shares Held
at 12/31/16 | | | Value at
12/31/16 | | | Dividend/
Interest
Income | | | Realized
Gain (Loss) | |
State Street Institutional U.S. Government Money Market Fund - Class G Shares | | | 2,128,259 | | | $ | 2,128,259 | | | | 14,516,633 | | | | 13,241,197 | | | | 3,403,695 | | | $ | 3,403,695 | | | $ | 3,957 | | | $ | — | |
| | | | | | | | | | | | | | | | | | | | | | | | | | | | | | | | |
See notes to schedule of investments and notes to financial statements.
| | |
| 16 | | State Street Income V.I.S. Fund |
State Street Income V.I.S. Fund
Notes to Schedule of Investments — December 31, 2016
The views expressed in this document reflect our judgment as of the publication date and are subject to change at any time without notice. The securities cited may not be representative of the Fund’s future investments and should not be construed as a recommendation to purchase or sell a particular security. See the Fund’s summary prospectus and statutory prospectus for complete descriptions of investment objectives, policies, risks and permissible investments.
| (a) | At December 31, 2016, all or a portion of this security was pledged to cover collateral requirements for futures, swaps and/or TBA’s. |
| (c) | Variable or floating rate security. The stated rate represents the rate at December 31, 2016. |
| (d) | Settlement is on a delayed delivery or when-issued basis with final maturity to be announced (TBA) in the future. |
| (e) | Interest only security. These securities represent the right to receive the monthly interest payments on an underlying pool of mortgages. Payments of principal on the pool reduce the value of the “interest only” holding. |
| (f) | Principal only security. These securities represent the right to receive the monthly principal payments on an underlying pool of mortgages. No payments of interest on the pool are passed through to the “principal only” holder. |
| (g) | Coupon amount represents effective yield. |
| (h) | Pursuant to Rule 144A of the Securities Act of 1933, as amended, these securities may be resold in transactions exempt from registration, normally to qualified institutional buyers. At December 31, 2016, these securities amounted to $1,927,484 or 7.53% of the net assets of the State Street Income V.I.S. Fund. These securities have been determined to be liquid using procedures established by the State Street Variable Insurance Series Funds, Inc.’s (the “Company”) Board of Directors. |
| (i) | Security is in default. |
| (j) | Security is fair valued by the Valuation Committee, in accordance with the procedures approved by the Company’s Board of Directors. |
| (k) | Sponsored by SSGA Funds Management, Inc., the Funds’ investment adviser and administrator, effective July 1, 2016, and an affiliate of State Street Bank & Trust Co., the Funds’ sub-administrator, custodian and accounting agent. |
| † | Percentages are based on net assets as of December 31, 2016. |
Abbreviations:
CMT - Constant Maturity Treasury
LIBOR - London Interbank Offered
REIT - Real Estate Investment Trust
REMIC - Real Estate Mortgage Investment Conduit
STRIPS - Separate Trading of Registered Interest and Principal of Security
TBA - To Be Announced
| | | | |
| Notes to Schedule of Investments | | | 17 | |
State Street Income V.I.S. Fund
Financial Highlights
Selected data based on a share outstanding throughout the fiscal years indicated
| | | | | | | | | | | | | | | | | | | | |
| | | 12/31/16 | | | 12/31/15* | | | 12/31/14* | | | 12/31/13* | | | 12/31/12* | |
Inception date | | | | | | | | | | | | | | | | | | | 1/3/95 | |
Net asset value, beginning of period | | $ | 11.25 | | | $ | 11.56 | | | $ | 11.25 | | | $ | 11.71 | | | $ | 11.35 | |
| | | | | | | | | | | | | | | | | | | | |
| | | | | |
Income/(loss) from investment operations: | | | | | | | | | | | | | | | | | | | | |
Net investment income | | | 0.24 | | | | 0.25 | | | | 0.27 | | | | 0.30 | | | | 0.28 | |
Net realized and unrealized gains/(losses) on investments | | | 0.09 | | | | (0.30 | ) | | | 0.31 | | | | (0.46 | ) | | | 0.37 | |
| | | | | | | | | | | | | | | | | | | | |
Total income/(loss) from investment operations | | | 0.33 | | | | (0.05 | ) | | | 0.58 | | | | (0.16 | ) | | | 0.65 | |
| | | | | | | | | | | | | | | | | | | | |
Less distributions from: | |
Net investment income | | | 0.21 | | | | 0.26 | | | | 0.27 | | | | 0.30 | | | | 0.29 | |
| | | | | | | | | | | | | | | | | | | | |
Total distributions | | | 0.21 | | | | 0.26 | | | | 0.27 | | | | 0.30 | | | | 0.29 | |
| | | | | | | | | | | | | | | | | | | | |
Net asset value, end of period | | $ | 11.37 | | | $ | 11.25 | | | $ | 11.56 | | | $ | 11.25 | | | $ | 11.71 | |
| | | | | | | | | | | | | | | | | | | | |
Total Return(a) | | | 2.98 | % | | | (0.42 | )% | | | 5.12 | % | | | (1.34 | )% | | | 5.69 | % |
|
Ratios/Supplemental Data: | |
Net assets, end of period (in thousands) | | $ | 25,582 | | | $ | 28,375 | | | $ | 32,668 | | | $ | 34,788 | | | $ | 42,893 | |
| | | | | |
Ratios to average net assets: | | | | | | | | | | | | | | | | | | | | |
Net expenses | | | 1.15 | % | | | 1.06 | %(c) | | | 0.91 | %(b) | | | 0.79 | %(b) | | | 0.80 | %(b) |
Gross expenses | | | 1.15 | % | | | 1.11 | % | | | 0.91 | % | | | 0.80 | % | | | 0.82 | % |
Net investment income | | | 1.98 | % | | | 2.06 | % | | | 2.14 | % | | | 2.41 | % | | | 2.09 | % |
Portfolio turnover rate | | | 220 | % | | | 241 | % | | | 282 | % | | | 256 | % | | | 327 | % |
| (a) | | Total returns are historical and assume changes in share price, reinvestment of dividends and capital gains distributions and do not include the effect of insurance contract charges. Past performance does not guarantee future results. |
| (b) | | Includes contractual management fee waiver related to the Fund’s investments in the GE Institutional Money Market Fund (the “Money Market Fund”). The fee waiver agreement was terminated effective June 30, 2014 with the closure of the Money Market Fund. |
| (c) | | Reflects a voluntary reimbursement of other operating expenses by GE Asset Managerment, Inc., the Fund’s investment adviser and ad administrator prior to July 1, 2016. |
| * | | Beginning with the year ended December 31, 2016, the Fund was audited by Ernst & Young LLP. The previous years were audited by another independent registered public accounting firm. |
The accompanying notes are an integral part of these financial statements.
State Street Income V.I.S. Fund
Statement of Assets and Liabilities — December 31, 2016
| | | | |
| | | | |
Assets | | | | |
Investments in securities, at fair value (cost $25,507,274) | | $ | 25,529,912 | |
Short-term affiliated investments, at fair value | | | 3,403,695 | |
Cash | | | 30,165 | |
Income receivable | | | 153,359 | |
Receivable for fund shares sold | | | 5,431 | |
Income receivable from affiliated investments | | | 1,152 | |
Other assets | | | 1,336 | |
| | | | |
Total assets | | | 29,125,050 | |
| | | | |
| |
Liabilities | | | | |
Payable for investments purchased | | | 3,447,615 | |
Payable for fund shares redeemed | | | 45 | |
Payable for variation margin on open centrally cleared swap contracts | | | 1,015 | |
Payable for variation margin on open futures contracts | | | 3,152 | |
Payable to the Adviser (Note 6) | | | 10,874 | |
Payable to the Custodian (Note 6) | | | 49,856 | |
Accrued other expenses | | | 30,922 | |
| | | | |
Total liabilities | | | 3,543,479 | |
| | | | |
| | | | |
Net Assets | | $ | 25,581,571 | |
| | | | |
| |
Net Assets Consist of: | | | | |
Capital paid in | | $ | 32,978,434 | |
Undistributed (distributions in excess of) net investment income | | | — | |
Accumulated net realized loss | | | (7,390,342 | ) |
Net unrealized appreciation (depreciation) on: | | | | |
Investments | | | 22,638 | |
Futures | | | (6,957 | ) |
Swap contracts | | | (22,202 | ) |
| | | | |
Net Assets | | $ | 25,581,571 | |
| | | | |
Shares outstanding ($0.01 par value; unlimited shares authorized) | | | 2,250,611 | |
Net asset value per share | | $ | 11.37 | |
The accompanying notes are an integral part of these financial statements.
| | | | |
| Statement of Assets and Liabilities | | | 19 | |
State Street Income V.I.S. Fund
Statement of Operations — For the year ended December 31, 2016
| | | | |
| | | | |
Investment Income | |
Income | | | | |
Dividend | | $ | 8,827 | |
Interest | | | 844,434 | |
Income from affiliated investments | | | 3,957 | |
| | | | |
Total income | | | 857,218 | |
| | | | |
| |
Expenses | | | | |
Advisory and administration fees (Note 6) | | | 137,646 | |
Directors’ fees (Note 6) | | | 1,899 | |
Custody and accounting expenses — net (Note 6) | | | 139,735 | |
Professional fees | | | 26,496 | |
Other expenses | | | 9,798 | |
| | | | |
Total expenses | | | 315,574 | |
| | | | |
Net investment income | | $ | 541,644 | |
| | | | |
| |
Net Realized and Unrealized Gain (loss) on Investments | | | | |
Realized gain (loss) on: | | | | |
Investments | | $ | 134,216 | |
Futures | | | 24,213 | |
Swap contracts | | | (103,381 | ) |
Increase (decrease) in unrealized appreciation/depreciation on: | | | | |
Investments | | | 309,908 | |
Futures | | | (25,938 | ) |
Swap contracts | | | (27,656 | ) |
| | | | |
Net realized and unrealized gain (loss) on investments | | | 311,362 | |
| | | | |
Net increase in net assets resulting from operations | | $ | 853,006 | |
| | | | |
The accompanying notes are an integral part of these financial statements.
| | |
| 20 | | Statement of Operations |
State Street Income V.I.S. Fund
Statements of Changes in Net Assets
| | | | | | | | |
| | | Year Ended December 31, 2016 | | | Year Ended December 31, 2015* | |
| | | | | | | | |
Increase (decrease) in Net Assets | | | | | | | | |
| | |
Operations: | | | | | | | | |
Net investment income | | $ | 541,644 | | | $ | 629,026 | |
Net realized gain (loss) on investments, futures and swap contracts | | | 55,048 | | | | 22,986 | |
Net increase (decrease) in unrealized appreciation/depreciation on investments, futures and swap contracts | | | 256,314 | | | | (753,447 | ) |
| | | | | | | | |
Net increase (decrease) from operations | | | 853,006 | | | | (101,435 | ) |
| | | | | | | | |
| | |
Distributions to shareholders from: | | | | | | | | |
Net investment income | | | (475,102 | ) | | | (644,616 | ) |
| | | | | | | | |
Total distributions | | | (475,102 | ) | | | (644,616 | ) |
| | | | | | | | |
Increase (decrease) in assets from operations and distributions | | | 377,904 | | | | (746,051 | ) |
| | | | | | | | |
| | |
Share transactions: | | | | | | | | |
Proceeds from sale of shares | | | 818,231 | | | | 790,483 | |
Value of distributions reinvested | | | 475,102 | | | | 644,616 | |
Cost of shares redeemed | | | (4,465,035 | ) | | | (4,981,777 | ) |
| | | | | | | | |
Net increase (decrease) from share transactions | | | (3,171,702 | ) | | | (3,546,678 | ) |
| | | | | | | | |
| | |
Total increase (decrease) in net assets | | | (2,793,798 | ) | | | (4,292,729 | ) |
| | |
Net Assets | | | | | | | | |
Beginning of year | | | 28,375,369 | | | | 32,668,098 | |
| | | | | | | | |
| | |
End of year | | $ | 25,581,571 | | | $ | 28,375,369 | |
| | | | | | | | |
| | |
Undistributed (distributions in excess of) net investment income, end of year | | $ | — | | | $ | — | |
| | |
Changes in Fund Shares | | | | | | | | |
Shares sold | | | 70,408 | | | | 68,030 | |
Issued for distributions reinvested | | | 41,970 | | | | 57,401 | |
Shares redeemed | | | (384,334 | ) | | | (428,683 | ) |
| | | | | | | | |
Net decrease in fund shares | | | (271,956 | ) | | | (303,252 | ) |
| | | | | | | | |
| * | | Beginning with the year ended December 31, 2016, the Fund was audited by Ernst & Young LLP. The previous years were audited by another independent registered public accounting firm. |
The accompanying notes are an integral part of these financial statements.
| | | | |
| Statements of Changes in Net Assets | | | 21 | |
State Street Income V.I.S. Fund
Notes to Financial Statements — December 31, 2016
| 1. | | Organization of the Company |
State Street Variable Insurance Series Funds, Inc. (the “Company”) was incorporated under the laws of the Commonwealth of Virginia on May 14, 1984 and is registered under the Investment Company Act of 1940, as amended (the “1940 Act”), as an open-end management investment company. Prior to November 30, 2016, the Company was named GE Investments Funds, Inc. The Company is currently composed of the following eight investment portfolios (collectively, the “Funds”): State Street U.S. Equity V.I.S. Fund, State Street S&P 500 Index V.I.S. Fund, State Street Premier Growth Equity V.I.S. Fund, State Street Core Value Equity V.I.S. Fund, State Street Small-Cap Equity V.I.S. Fund, State Street Total Return V.I.S. Fund, State Street Income V.I.S. Fund (the “Fund”) and State Street Real Estate Securities V.I.S. Fund. Each Fund is an investment company and accordingly follows the investment company accounting and reporting guidance of the Financial Accounting Standards Board (“FASB”) Accounting Standard Codification (“ASC”) Topic 946 Financial Services — Investment Companies. Each Fund is a diversified investment company within the meaning of the 1940 Act.
Effective November 30, 2016, each individual Fund changed its respective name as follows:
| | |
| Old Name | | New Name |
GE Investments U.S. Equity Fund | | State Street U.S. Equity V.I.S. Fund |
GE Investments S&P 500 Index Fund | | State Street S&P 500 Index V.I.S. Fund |
GE Investments Premier Growth Equity Fund | | State Street Premier Growth Equity V.I.S. Fund |
GE Investments Core Value Equity Fund | | State Street Core Value Equity V.I.S. Fund |
GE Investments Small-Cap Equity Fund | | State Street Small-Cap Equity V.I.S. Fund |
GE Investments Total Return Fund | | State Street Total Return V.I.S. Fund |
GE Investments Income Fund | | State Street Income V.I.S. Fund |
GE Investments Real Estate Securities Fund | | State Street Real Estate Securities V.I.S. Fund |
Shares of the Funds of the Company are offered only to insurance company separate accounts that fund certain variable life insurance contracts and variable annuity contracts. SSGA Funds Management, Inc. (“SSGA FM”) is the investment adviser and administrator of each of the Funds effective July 1, 2016. Prior to July 1, 2016, GE Asset Management Incorporated (“GEAM”) served as the investment adviser and administrator to each Fund.
The Company currently offers one share class (Class 1) of the Fund as an investment option for variable life insurance and variable annuity contracts.
| 2. | | Summary of Significant Accounting Policies |
The preparation of financial statements in conformity with U.S. generally accepted accounting principles (“GAAP”) requires management to make estimates and assumptions that affect the reported amounts of assets and liabilities and disclosure of contingent assets and liabilities at the date of the financial statements and the reported amounts of increases and decreases in net assets from operations during the reporting period. Actual results may differ from those estimates.
Subsequent events after the balance sheet date through the date the financial statements were issued have been evaluated in the preparation of the financial statements. There are no items to report.
The following summarizes the significant accounting policies of the Company:
Securities Valuation and Transactions All investments in securities are recorded at their estimated fair value, as described in Note 3.
Securities transactions are accounted for as of the trade date. Realized gains and losses on investments sold are recorded on the basis of identified cost for both financial statement and federal tax purposes.
Foreign Currency Accounting records of the Fund are maintained in U.S. dollars. Investment securities and other assets and liabilities denominated in a foreign currency are translated to U.S. dollars at the prevailing rates of exchange at period end. Purchases and sales of securities, income receipts and expense payments denominated in foreign currencies are translated into U.S. dollars at the prevailing exchange rate on the respective dates of such transactions.
All assets and liabilities of the Fund initially expressed in foreign currency values will be converted into U.S. dollars at the WM/Reuters exchange rate computed at 11:00 a.m., Eastern Time.
| | |
| 22 | | Notes to Financial Statements |
State Street Income V.I.S. Fund
Notes to Financial Statements, continued — December 31, 2016
The Fund does not isolate the portion of the results of operations resulting from changes in foreign exchange rates from the fluctuations arising from changes in the market prices of securities during the year. Such fluctuations are included in the net realized or unrealized gain or loss from investments. Net realized gains or losses on foreign currency transactions represent net gains or losses on sales and maturities of foreign currency contracts, disposition of foreign currencies, the difference between the amount of net investment income and withholding taxes accrued and the U.S. dollar amount actually received or paid, and gains or losses between the trade and settlement date on purchases and sales of foreign securities. Net unrealized foreign exchange gains and losses arising from changes in the value of other assets and liabilities (including foreign currencies and open foreign currency contracts) as a result of changes in foreign exchange rates are included as increases or decreases in unrealized appreciation/depreciation on foreign currency related transactions.
Derivatives The Fund is subject to equity price risk, interest rate risk, credit risk, and foreign currency exchange rate risk in the normal course of pursuing its investment objective. The Fund may enter into various types of derivative transactions (such as options, interest rate futures, interest-only swaps, interest rate swaps, index swaps and credit default swaps) to manage yield, interest rate exposure (also known as duration) and exposure to credit quality, and to gain exposure to certain market segments.
Futures Contracts A futures contract is an agreement to buy or sell a specific amount of a commodity, financial instrument, currency or index at a particular price and future date. During the fiscal year ended December 31, 2016, the Fund invested in futures contracts on bonds and notes to manage duration of fixed income securities. Buying futures tends to increase the Fund’s exposure to the underlying instrument while selling futures tends to decrease the Fund’s exposure to the underlying instrument, or hedge other Fund investments. With futures contracts, there is minimal counterparty credit risk to the Fund since futures contracts are exchange traded and the exchange’s clearinghouse, as counterparty to all traded futures, guarantees the futures against default. The Fund’s risks in using these contracts include changes in the value of the underlying instruments, non-performance of the counterparties under the contracts’ terms and changes in the liquidity of the secondary market for the contracts. Futures contracts are valued at the settlement price established each day by the board of trade or exchange on which they principally trade.
Upon entering into a financial futures contract, the Fund is required to pledge to the broker an amount of cash and/or other assets equal to a certain percentage of the contract amount, known as initial margin deposit. Subsequent payments, known as variation margin, are made or received by the Fund each day, depending on the daily fluctuation in the fair value of the underlying security. The Fund records an unrealized gain or loss equal to the daily variation margin. Should market conditions move unexpectedly, the Fund may not achieve the anticipated benefits of the futures contracts and may incur a loss. The Fund recognizes a realized gain or loss on the expiration or closing of a futures contract.
Credit Default Swaps During the fiscal year ended December 31, 2016, the Fund engaged in credit default swaps to manage credit risk. When the Fund is the buyer in a credit default swap contract, the Fund is entitled to receive the par (or other agreed upon) value (full notional value) of a referenced debt obligation (or basket of debt obligations) from the counterparty (or central clearing party (“CCP”) in the case of a centrally cleared swap) to the contract if a credit event by a third party, such as a U.S. or foreign corporate issuer or sovereign issuer, on the debt obligation occurs. In return, the Fund pays the counterparty a periodic stream of payments over the term of the contract provided that no credit event has occurred. If no credit event occurs, the Fund loses its investment and recovers nothing. However, if a credit event occurs, the Fund receives full notional value for a referenced debt obligation that may have little or no value. When the Fund is the seller of a credit default swap, it receives a fixed rate of income throughout the term of the contract, provided there is no credit event. If a credit event occurs, the Fund is obligated to pay the notional amount of the swap and in certain instances take delivery of securities of the reference entity upon the occurrence of a credit event, as defined under the terms of that particular swap agreement. Credit events are contract specific but may include bankruptcy, failure to pay, restructuring, obligation acceleration and repudiation/moratorium. If the Fund is a seller of protection and a credit event occurs, the maximum potential amount of future payments that the Fund could be required to make would be an amount equal to the notional amount of the agreement. This potential amount would be partially offset by any recovery value of the respective referenced obligation, or net amount received from the settlement of a buy protection credit default swap agreement entered into by the Fund for the same referenced obligation. As the seller, the Fund may create economic leverage to its portfolio because, in addition to its total net assets, the Fund is subject to investment exposure on the notional amount of the swap. The interest fee paid or received on the swap, which is based on a specified interest rate on a fixed notional amount, is accrued daily as a component of unrealized appreciation (depreciation) and is
| | | | |
| Notes to Financial Statements | | | 23 | |
State Street Income V.I.S. Fund
Notes to Financial Statements, continued — December 31, 2016
recorded as realized gain upon receipt or realized loss upon payment. The Fund also records an increase or decrease to unrealized appreciation (depreciation) in an amount equal to the daily valuation. For centrally cleared swaps, the daily change in valuation is recorded as a receivable or payable for variation margin and settled in cash with the CCP daily. All upfront payments, if any, are amortized over the life of the swap as realized gains or losses. Those upfront payments that are paid or received, typically for non-centrally cleared swaps, are recorded as other assets or other liabilities, respectively, net of amortization. For financial reporting purposes, unamortized upfront payments, if any, are netted with unrealized appreciation or depreciation on swaps to determine the market value of swaps. The Fund segregates assets in the form of cash or liquid securities in an amount equal to the notional amount of the credit default swaps of which it is the seller. The Fund segregates assets in the form of cash or liquid securities in an amount equal to any unrealized depreciation of the credit default swaps of which it is the buyer, marked to market on a daily basis. Credit default swaps involve greater risks than if the Fund had invested in the referenced debt obligation directly. If the Fund is a buyer of a credit default swap and no credit event occurs, the Fund will not earn any return on its investment. If the Fund is a seller of a credit default swap, the Fund’s risk of loss may be the entire notional amount of the swap. Swaps may also subject the Fund to the risk that the counterparty to the transaction may not fulfill its obligation. In the case of centrally cleared swaps, counterparty risk is minimal due to protections provided by the CCP.
When-Issued Securities and Forward Commitments The Fund may purchase or sell securities on a when issued or forward commitment basis. These transactions are arrangements in which the Fund purchases and sells securities with payment and delivery scheduled a month or more after entering into the transaction. The price of the underlying securities and the date when these securities will be delivered and paid for are fixed at the time the transaction is negotiated. Losses may arise due to changes in the market value of the underlying securities or if the counterparty does not perform under the commitments. In connection with such purchases, the Fund maintains cash or liquid assets in an amount equal to the purchase commitments for such underlying securities until settlement date and for sales commitments the Fund maintains equivalent deliverable securities as “cover” for the transaction. Unsettled commitments are valued at the current market value of the underlying security. Daily fluctuations in the value of such commitments are recorded as unrealized gains or losses. The Fund will not enter into such commitments for the purpose of investment leverage.
Investments in Foreign Markets Investments in foreign markets involve special risks and considerations not typically associated with investing in the United States. These risks include revaluation of currencies, high rates of inflation, restrictions on repatriation of income and capital, and adverse political and economic developments. Moreover, securities issued in these markets may be less liquid, subject to government ownership controls, tariffs and taxes, subject to delays in settlements, and their prices may be more volatile.
The Fund may be subject to capital gains and repatriation taxes imposed by certain countries in which it invests. Such taxes are generally based upon income and/or capital gains earned or repatriated. Taxes are accrued based on net investment income, net realized gains and net unrealized appreciation as income and/or capital gains are earned. These foreign taxes, if any, are paid by the Funds and are reflected in the Statements of Operations, if applicable. Foreign taxes payable or deferred as of December 31, 2016, if any, are disclosed in the Funds’ Statements of Assets and Liabilities.
Investment Income Corporate actions (including cash dividends) are recorded on the ex-dividend date, net of applicable withholding taxes, except for certain foreign corporate actions which are recorded as soon after the ex-dividend date as such information becomes available. Withholding taxes on foreign dividends, if any, have been provided for in accordance with the Fund’s understanding of the applicable country’s tax rules and rates.
Interest income is recorded on the accrual basis. Accretion of discounts and amortization of premiums on taxable bonds are to the call or maturity date, whichever is shorter, using the effective yield method.
Expenses Fund specific expenses are charged to the Fund that incurs such expenses. Such expenses may include custodial fees, legal and accounting fees, printing costs and registration fees. Expenses that are not fund specific are allocated pro rata across the Funds. Expenses of the Fund are generally paid directly by the Fund, however, expenses may be paid by the investment adviser and reimbursed by the Fund.
| | |
| 24 | | Notes to Financial Statements |
State Street Income V.I.S. Fund
Notes to Financial Statements, continued — December 31, 2016
Federal Income Taxes The Fund intends to comply with all sections of the Internal Revenue Code of 1986, as amended (the “Internal Revenue Code”) applicable to regulated investment companies, including the distribution of substantially all of its taxable net investment income and net realized capital gains to its shareholders. Therefore, no provision for federal income tax has been made. The Fund is treated as a separate taxpayer for federal income tax purposes.
The Fund utilizes various methods to measure the fair value of most of its investments on a recurring basis. GAAP establishes a framework for measuring fair value and providing related disclosures. Broadly, the framework requires fair value to be determined based on the exchange price that would be received for an asset or paid to transfer a liability (an exit price) in the principal or most advantageous market for the asset or liability in an orderly transaction between market participants at the measurement date. In the absence of active markets for the identical assets or liabilities, such measurements involve developing assumptions based on market observable data and, in the absence of such data, internal information that is consistent with what market participants would use in a hypothetical transaction that occurs at the measurement date. It also establishes a three-level valuation hierarchy based upon observable and non-observable inputs.
Observable inputs reflect market data obtained from independent sources, while unobservable inputs reflect our market assumptions. Preference is given to observable inputs. These two types of inputs create the following fair value hierarchy:
| | • | | Level 1 — Quoted prices for identical investments in active markets. |
| | • | | Level 2 — Quoted prices for similar investments in active markets; quoted prices for identical or similar investments in markets that are not active; and model-derived valuations whose inputs are observable or whose significant value drivers are observable. |
| | • | | Level 3 — Significant inputs to the valuation model are unobservable. |
Policies and procedures are maintained to value investments using the best and most relevant data available. In addition, pricing vendors are utilized to assist in valuing investments. The investment adviser performs periodic reviews of the methodologies used by independent pricing services including price validation of individual securities.
Fair Value Measurement The following section describes the valuation methodologies the Fund uses to measure different financial investments at fair value.
Debt securities (other than short-term securities described below) generally are valued at an evaluated bid price as reported by independent pricing services. The pricing services use various pricing models for each asset class. The inputs and assumptions to the model of the pricing services are derived from market observable sources, which may include: benchmark yields, reported trades, broker/dealer quotes, issuer spreads, benchmark securities, bids, offers, and other market related data. Since many fixed income securities do not trade on a daily basis, the methodology of the pricing service may also use other available information as applicable such as benchmark curves, benchmarking of similar securities, sector groupings and matrix pricing. Thus, certain securities may not be priced using quoted prices, but rather determined from market observable information. These investments are included in Level 2 and are primarily comprised of corporate fixed income, government, mortgage and asset-backed securities. In the absence of a reliable bid price from such a pricing service, debt securities may be valued based on broker or dealer supplied valuations or quotations. In these infrequent circumstances, pricing services may provide the Fund with valuations that are based on significant unobservable inputs, and in those circumstances the investment securities are classified as Level 3.
The Fund may use non-binding broker or dealer quotes for valuation when there is limited or no relevant market activity for a specific investment or for other investments that share similar characteristics and a price is not provided by a pricing service or is deemed not to be reliable. The Fund has not adjusted the prices obtained. Investment securities priced using non-binding broker or dealer quotes are included in Level 3.
Short-term securities of sufficient credit quality with remaining maturities of sixty days or less at the time of purchase are typically valued on the basis of amortized cost which approximates fair value and these are included in Level 2. If it is determined that amortized cost does not approximate fair value, securities may be valued based on dealer supplied valuations or quotations. In these infrequent circumstances, pricing services may provide the Fund with valuations that are based on significant unobservable inputs, and in those circumstances the investment securities are classified in Level 3.
| | | | |
| Notes to Financial Statements | | | 25 | |
State Street Income V.I.S. Fund
Notes to Financial Statements, continued — December 31, 2016
Investments in registered investment companies are valued at the published daily net asset value (“NAV”) and classified in Level 1.
If prices are not readily available for a portfolio security, or if it is believed that a price for a portfolio security does not represent its fair value, the security may be valued using procedures approved by the Company’s Board of Directors that are designed to establish its “fair” value. These securities are typically classified in Level 3. Those procedures require that the fair value of a security be established by a valuation committee of the investment adviser. The valuation committee follows different protocols for different types of investments and circumstances. The fair value procedures may be used to value any investment of the Fund in the appropriate circumstances.
Fair value determinations generally are used for securities whose value is affected by a significant event that will materially affect the value of a security and which occurs subsequent to the time of the close of the principal market on which such security trades but prior to the calculation of the Fund’s NAV.
The value established for such a portfolio security valued other than by use of a market quotation (as described above) may be different than what would be produced through the use of market quotations or another methodology. Portfolio securities that are valued using techniques other than market quotations, including “fair valued” securities, may be subject to greater fluctuation in their value from one day to the next than would be the case if market quotations were used. In addition, there is no assurance that the Fund could sell a portfolio security for the value established for it at any time and it is possible that the Fund would incur a loss because a portfolio security is sold at a discount to its established value.
Other financial investments are derivative instruments that are not reflected in total investments, such as futures, forwards, swaps, and written options contracts, which are valued based on fair value as discussed above.
The Fund uses closing prices for derivatives included in Level 1, which are traded either on exchanges or liquid over-the-counter markets. Derivative assets and liabilities included in Level 2 primarily represent interest rate swaps, cross-currency swaps, credit default swaps and foreign currency and commodity forward and option contracts. Derivative assets and liabilities included in Level 3 primarily represent interest rate products that contain embedded optionality or prepayment features.
The inputs or methodology used for valuing securities are not an indication of the risk associated with investing in those securities.
The following table presents the Fund’s investments measured at fair value on a recurring basis at December 31, 2016:
| | | | | | | | | | | | | | | | |
| Investments | | Level 1 | | | Level 2 | | | Level 3 | | | Total | |
| Investments in Securities† | | | | | | | | | | | | | | | | |
U.S. Treasuries | | $ | — | | | $ | 5,055,518 | | | $ | — | | | $ | 5,055,518 | |
Agency Mortgage Backed | | | — | | | | 7,437,073 | | | | — | | | | 7,437,073 | |
Agency Collateralized Mortgage Obligations | | | — | | | | 508,943 | | | | — | | | | 508,943 | |
Corporate Notes | | | — | | | | 10,529,857 | | | | — | | | | 10,529,857 | |
Non-Agency Collateralized Mortgage Obligations | | | — | | | | 1,701,828 | | | | — | | | | 1,701,828 | |
Sovereign Bonds | | | — | | | | 59,097 | | | | — | | | | 59,097 | |
Municipal Bonds and Notes | | | — | | | | 200,757 | | | | — | | | | 200,757 | |
FNMA (TBA) | | | — | | | | — | | | | 1,629 | | | | 1,629 | |
Preferred Stock | | | 35,210 | | | | — | | | | — | | | | 35,210 | |
Short-Term Investments | | | 3,403,695 | | | | — | | | | — | | | | 3,403,695 | |
| | | | | | | | | | | | | | | | |
Total Investments in Securities | | $ | 3,438,905 | | | $ | 25,493,073 | | | $ | 1,629 | | | $ | 28,933,607 | |
| | | | | | | | | | | | | | | | |
Other Financial Instruments* | | | | | | | | | | | | | | | | |
Credit Default Swap Contracts — Unrealized Depreciation | | $ | — | | | $ | (22,202 | ) | | $ | — | | | $ | (22,202 | ) |
Long Futures Contracts — Unrealized Depreciation | | | (10,173 | ) | | | — | | | | — | | | | (10,173 | ) |
Short Futures Contracts — Unrealized Appreciation | | | 3,799 | | | | — | | | | — | | | | 3,799 | |
Short Futures Contracts — Unrealized Depreciation | | | (583 | ) | | | — | | | | — | | | | (583 | ) |
| | | | | | | | | | | | | | | | |
Total Other Financial Instruments | | $ | (6,957 | ) | | $ | (22,202 | ) | | $ | — | | | $ | (29,159 | ) |
| | | | | | | | | | | | | | | | |
| | † | See Schedule of Investments for Industry Classification. |
| | * | Other financial instruments include derivative instruments such as futures contracts and credit default swaps. Amounts shown represent unrealized appreciation (depreciation), at period end. |
| | |
| 26 | | Notes to Financial Statements |
State Street Income V.I.S. Fund
Notes to Financial Statements, continued — December 31, 2016
There were no significant transfers between fair value levels during the period. Transfers between fair value levels are considered to occur at the beginning of the period.
Level 3 investments at the beginning and/or end of the period in relation to net assets were not significant and, accordingly, a reconciliation of Level 3 assets for the fiscal year ended December 31, 2016 is not presented.
| 4. | | Derivatives Disclosure |
Shown below are the derivative contracts entered into by the Fund, summarized by primary risk exposure as they appear on the Statement of Assets and Liabilities, none of which are accounted for as hedging instruments under FASB ASC No. 815 Derivatives and Hedging (“ASC 815”) as of December 31, 2016.
| | | | | | | | | | | | |
| | | Asset Derivatives December 31, 2016 | | | Liability Derivatives December 31, 2016 | |
Derivatives not accounted for as
hedging instruments under ASC 815 | | Location inthe Statement
of Assetsand Liabilities | | Fair
Value ($) | | | Location in the Statement
of Assets and Liabilities | | Fair
Value ($) | |
| Interest Rate Contracts | | Assets, Net Assets — Net Unrealized Appreciation/ (Depreciation) on Futures | | | 3,799 | * | | Liabilities, Net Assets — Net Unrealized Appreciation/ (Depreciation) on Futures | | | (10,756 | )* |
| Credit Risk Contracts | | Assets, Net Assets — Net Unrealized Appreciation/ (Depreciation) on Swap Contracts | | | — | | | Liabilites, Net Assets — Net Unrealized Appreciation/ (Depreciation) on Swap Contracts | | | (22,202 | )* |
| | * | Includes cumulative unrealized appreciation/(depreciation) of futures contracts and credit default swaps as reported in the Schedule of Investments and within the components of the net assets section of the Statement of Assets and Liabilities. Only the current day’s variation margin is reported within the Assets and/or Liabilities section on the Statement of Assets and Liabilities. |
Shown below are the effects of derivative instruments on the Fund’s Statement of Operations, summarized by primary risk exposure, none of which are accounted for as hedging instruments under ASC 815.
| | | | | | | | | | | | |
Derivatives not accounted
for as hedging instruments
under ASC 815 | | Location in the Statement of Operations | | Total Notional
Amount of Futures Contracts
Purchased/(Sold) ($) | | Realized Gain (Loss)
on Derivatives
Recognized in
Income ($) | | | Change in
Unrealized
Appreciation
(Depreciation)
on Derivatives
Recognized in
Income ($) | |
| Interest Rate Contracts | | Realized gain/(loss) on futures, Increase/(decrease) in unrealized appreciation/ (depreciation) on Futures | | 88,937,295/(88,623,965) | | | 24,213 | | | | (25,938 | ) |
| Credit Risk Contracts | | Realized gain/(loss) on credit default swaps Increase/ (decrease) in unrealized appreciation/(depreciation) on swap contracts | | —/— | | | (103,381 | ) | | | (27,656 | ) |
During the fiscal year ended December 31, 2016, the Fund had an average notional value of $3,317,829 and $3,658,869 on long and short futures contracts, respectively. The Fund had an average notional value of $1,451,661 on credit default swaps. Please refer to the tables following the Schedule of Investments for open credit default swaps and futures contracts at December 31, 2016.
Prior to July 1, 2016, the Company shared a revolving credit facility of up to $150 million with a number of its affiliates. The credit facility was with the Company’s custodian bank, State Street Bank and Trust Company (“State Street”). The revolving credit facility required the payment of a commitment fee equal to 0.20% per annum on the daily unused portion of the credit facility, payable quarterly. The portion borne by each Fund generally was borne proportionally based upon net assets. Generally, borrowings under the credit facility would accrue interest at the higher of the 1-Month LIBOR plus 1.25% and the Overnight Federal Funds Rate plus 1.25% and would be borne by the borrowing Fund. The maximum amount allowed to be borrowed by any one Fund was the lesser of (i) 33.33% of its total assets or (ii) 20% of its net assets. The credit facility was not utilized by the Fund during the fiscal year ended December 31, 2016. The revolving credit facility with State Street was terminated effective June 30, 2016.
| | | | |
| Notes to Financial Statements | | | 27 | |
State Street Income V.I.S. Fund
Notes to Financial Statements, continued — December 31, 2016
Currently, the Funds and other affiliated funds (each a “Participant” and, collectively, the “Participants”) participate in a $360 million revolving credit facility provided by a syndication of banks under which the Participants may borrow to fund shareholder redemptions. This agreement expires October 12, 2017, unless extended or renewed.
The Participants are charged an annual commitment fee which is calculated based on the unused portion of the shared credit line. Commitment fees are allocated among each of the Participants based on relative net assets. A Participant incurs and pays the interest expense related to its borrowing. Interest is calculated at a rate per annum equal to the sum of 1% plus the greater of the New York Fed Bank Rate and 1-month LIBOR rate. From July 1, 2016, the date the Funds were added to this credit facility, through October 12, 2016, interest was calculated at a rate per annum equal to the sum of the New York Fed Bank Rate plus 1%.
The credit facilities were not utilized by the Fund during the year ended December 31, 2016.
| 6. | | Compensation and Fees Paid to Affiliates |
SSGA FM, a registered investment adviser, was retained by the Company’s Board of Directors effective July 1, 2016 to act as investment adviser and administrator of the Fund. SSGA FM’s compensation for investment advisory and administrative services (“Management Fee”) is paid monthly based on the average daily net assets of the Fund at an annualized rate of 0.50%.
State Street serves as the sub-administrator and custodian to the Funds. Amounts paid by the Fund to State Street for performing such services are included in advisory and administration and custody and accounting expenses, respectively.
Prior to July 1, 2016, GEAM served as the Fund’s investment adviser and administrator and the Fund paid GEAM a Management Fee at an annualized rate of 0.50%.
Directors’ Compensation The Fund pays no compensation to its Directors who are officers or employees of SSGA FM or its affiliates. Directors who are not such officers or employees also serve in a similar capacity for other funds advised by SSGA FM. Compensation paid to non-interested Directors is reflected on the Statement of Operations. These fees are allocated pro rata across all of the mutual fund platforms served by the Directors, including the Fund, and are based upon the relative net assets of each fund within such platforms. (For additional information about Directors’ compensation, please refer to the Funds’ Statement of Additional Information.)
Other Transactions with Affiliates In December 2015, State Street announced a review of the manner in which it invoiced certain expenses to certain of its Investment Servicing clients, primarily in the United States, during an 18-year period going back to 1998 and its determination that it had incorrectly invoiced clients for certain expenses. State Street informed its clients that it will pay to them the expenses it concluded were incorrectly invoiced to them, plus interest.
The Fund was impacted by this matter. The amounts in the table below represent the refunded expenses and interest received by the Fund for the periods in question.
| | | | | | | | | | | | |
| Refunded Custody Expense* | | Interest* | | | Total | | | % of Net Assets
at 12/31/16 | |
$6,644 | | $ | 4,077 | | | $ | 10,721 | | | | 0.042 | % |
| | * | Refunded Custody Expense and Interest appear on the Statements of Operations in Custody and accounting expenses — net and Interest income, respectively. |
| 7. | | Investment Transactions |
Purchases and Sales of Securities The cost of purchases and the proceeds from sales of investments, other than short-term securities, for the fiscal year ended December 31, 2016, were as follows:
| | | | | | | | | | | | | | | | | | |
| U.S. Government Securities | | Non-U.S. Government Securities |
| Purchases | | Sales | | Purchases | | Sales |
| | $ | 8,457,376 | | | | $ | 12,227,932 | | | | $ | 50,546,557 | | | | $ | 48,836,641 | |
| | |
| 28 | | Notes to Financial Statements |
State Street Income V.I.S. Fund
Notes to Financial Statements, continued — December 31, 2016
Affiliated Investments The Fund may invest in affiliated entities, including securities issued by State Street, affiliated funds, or entities deemed to be affiliates as a result of the Fund owning more than five percent of the entity’s voting securities or outstanding shares. Amounts relating to these transactions during the fiscal year ended December 31, 2016 are disclosed in the Schedule of Investments.
The Fund is subject to ASC 740, Income Taxes (“ASC 740”). ASC 740 provides guidance for financial accounting and reporting for the effects of income taxes that result from an entity’s activities during the year. ASC 740 also provides guidance regarding how uncertain tax positions should be recognized, measured, presented and disclosed in the financial statements. ASC 740 requires evaluation of tax positions taken or expected to be taken in the course of preparing the Fund’s tax returns to determine whether the tax positions are “more likely than not” of being sustained by the applicable tax authority. There are no adjustments to the Fund’s net assets required under ASC 740. The Fund’s 2013, 2014, 2015, and 2016 fiscal year tax returns are still open to examination by the Federal and applicable state tax authorities.
At December 31, 2016, information on the tax cost of investments and distributable earnings on a tax basis was as follows:
| | | | | | | | | | | | | | | | | | | | | | | | | | | | | | | | | | | | | | |
Cost of Investments For Tax Purposes | | Gross Tax | | Net Tax
Appreciation/
(Depreciation) | | Undistributed
Income | | Undistributed
Accum.
Capital
Gain/(Loss) | | Late-Year
Losses |
| | Appreciation | | Depreciation | | Investments | | Derivatives/
Currency | | | |
| | | | | | | | | | | | | | | | | | | | | | | | | | | | | | | | | | | | | | | |
| | $ | 28,931,083 | | | | $ | 457,443 | | | | $ | (454,919 | ) | | | $ | 2,524 | | | | $ | (20,396 | ) | | | $ | — | | | | $ | (7,203,408 | ) | | | $ | (175,582 | ) |
Capital loss carryovers are available to offset future realized capital gains to the extent provided in the Internal Revenue Code and regulations thereunder. To the extent that these carryover losses are used to offset future capital gains, it is probable that the gains offset will not be distributed to shareholders because they would be taxable as ordinary income.
As of December 31, 2016, the Fund had capital loss carryovers as follows:
| | | | | | | | | | | | | |
| Amount |
| Short-Term | | Long-Term | | Expires |
| | | | | | | | | | | | | | |
| | $ | 7,203,408 | | | | $ | — | | | | | 12/31/2017 | |
These amounts will be available to offset future taxable capital gains. Under the Regulated Investment Company Modernization Act of 2010, the Fund is permitted to carry forward capital losses incurred in taxable years beginning after December 22, 2010 for an unlimited period. However, any losses incurred during those future years will be required to be utilized prior to the losses incurred in pre-enactment tax years. As a result of this ordering rule, pre-enactment capital loss carryforwards may be more likely to expire unused. Additionally, post-enactment capital losses that are carried forward will retain their character as either short-term or long-term capital losses rather than being considered all short-term as under previous law.
During the fiscal year ended December 31, 2016, the Fund utilized $261,704 of prior year capital loss carryovers.
Any qualified late-year loss is deemed to arise on the first day of the Fund’s next tax year (if the Fund elects to defer such loss). Under this regime, generally, the Fund can elect to defer any post-October capital loss and/or any late-year ordinary loss as defined by the Internal Revenue Code.
The Fund incurred $175,582 of late-year capital losses for the fiscal year ended December 31, 2016.
The tax character of distributions paid during the fiscal years ended December 31, 2016 and December 31, 2015 were as follows:
| | | | | | | | | | | | | | | | | | |
| Year | | Ordinary
Income | | Long-Term
Capital Gains | | Total |
| | | | | | | | | | | | | | | | | | | |
| | | 2016 | | | | $ | 475,102 | | | | $ | — | | | | $ | 475,102 | |
| | | 2015 | | | | | 644,616 | | | | | — | | | | | 644,616 | |
| | | | |
| Notes to Financial Statements | | | 29 | |
State Street Income V.I.S. Fund
Notes to Financial Statements, continued — December 31, 2016
Distributions to Shareholders The Fund declares and pays any dividends from net investment income annually. The Fund declares and pays any net realized capital gains in excess of capital loss carryforwards distributions annually. The character of income and gains to be distributed is determined in accordance with income tax regulations which may differ from GAAP. These differences include (but are not limited to) investments in futures and swaps, defaulted bonds, distributions in excess of earnings and losses due to wash sale transactions. Reclassifications due to permanent book/tax differences are made to the Fund’s capital accounts to reflect income and gains available for distribution (or available capital loss carryovers) under income tax regulations. These reclassifications have no impact on net investment income, realized gains or losses, or the NAV of the Fund. The calculation of net investment income per share in the Financial Highlights table excludes these adjustments.
The reclassifications for the fiscal year ended December 31, 2016 were as follows:
| | | | | | | | | | | | | |
Undistributed
Net Investment
Income | | Accumulated
Net Realized
Gain (Loss) | | Capital Paid In |
| | | | | | | | | | | | | | |
| | | $ (66,542) | | | | $ | 70,109 | | | | $ | (3,567 | ) |
KPMG LLP (“KPMG”) served as the independent registered certified public accounting firm of the Company through its resignation as of June 30, 2016. On September 9, 2016, upon recommendation by the Audit Committee of the Company, the Company’s Board of Directors selected Ernst & Young LLP (“EY”) to replace KPMG as the independent public accountant for the fiscal year ended December 31, 2016.
The reports of KPMG on the financial statements for the fiscal years ended December 31, 2014 and December 31, 2015 contained no adverse opinion or disclaimer of opinion and were not qualified or modified as to uncertainty, audit scope or accounting principles.
During the Company’s fiscal years ended December 31, 2014 and December 31, 2015 and through the period ended June 30, 2016, there were no disagreements with KPMG on any matter of accounting principles or practices, financial statement disclosure, or auditing scope or procedure, which disagreements if not resolved to the satisfaction of KPMG would have caused them to make reference thereto in their reports on the financial statements for such years or periods.
During the Company’s fiscal years ended December 31, 2014 and December 31, 2015 and through the period ended June 30, 2016, there were no reportable events (as defined in Item 304(a)(1)(v) of Regulation S-K). The Funds requested and KPMG furnished a letter addressed to the Securities and Exchange Commission stating whether or not it agreed with the above statements. A copy of such letter was filed as Exhibit 77 to Form N-SAR for the period ended December 31, 2016.
During the Company’s fiscal years ended December 31, 2014 and December 31, 2015 and through September 9, 2016, neither the Company nor anyone on its behalf has consulted EY on items which: (i) concerned the application of accounting principles to a specified transaction, either completed or proposed, or the type of audit opinion that might be rendered on the Company’s financial statements or (ii) concerned the subject of a disagreement (as defined in paragraph (a)(1)(iv) of Item 304 of Regulations S-K) or reportable events (as described in paragraph (a)(1)(v) of said Item 304).
| | |
| 30 | | Notes to Financial Statements |
State Street Income V.I.S. Fund
Report of Independent Registered Public Accounting Firm
To the Board of Directors of State Street Variable Insurance Series Funds, Inc. and Shareholders of State Street Income V.I.S. Fund:
We have audited the accompanying statement of assets and liabilities of the State Street Income V.I.S. Fund (formerly GE Investments Income Fund) (one of the funds constituting State Street Variable Insurance Series Funds, Inc. (formerly GE Investment Funds, Inc.)) (the “Fund”), including the schedule of investments, as of December 31, 2016, and the related statements of operations, changes in net assets and the financial highlights for the year then ended. These financial statements and financial highlights are the responsibility of the Fund’s management. Our responsibility is to express an opinion on these financial statements and financial highlights based on our audit. The statement of changes in net assets for the year ended December 31, 2015 and the financial highlights for periods ended prior to January 1, 2016 were audited by another independent registered public accounting firm whose report, dated February 19, 2016, expressed an unqualified opinion on that statement of changes in net assets and those financial highlights.
We conducted our audit in accordance with the standards of the Public Company Accounting Oversight Board (United States). Those standards require that we plan and perform the audit to obtain reasonable assurance about whether the financial statements and financial highlights are free of material misstatement. We were not engaged to perform an audit of the Fund’s internal control over financial reporting. Our audit included consideration of internal control over financial reporting as a basis for designing audit procedures that are appropriate in the circumstances, but not for the purpose of expressing an opinion on the effectiveness of the Fund’s internal control over financial reporting. Accordingly, we express no such opinion. An audit also includes examining, on a test basis, evidence supporting the amounts and disclosures in the financial statements and financial highlights, assessing the accounting principles used and significant estimates made by management, and evaluating the overall financial statement presentation. Our procedures included confirmation of securities owned as of December 31, 2016, by correspondence with the custodian and brokers or by other appropriate auditing procedures where replies from brokers were not received. We believe that our audit provides a reasonable basis for our opinion.
In our opinion, the financial statements and financial highlights referred to above present fairly, in all material respects, the financial position of the State Street Income V.I.S. Fund (one of the funds constituting State Street Variable Insurance Series Funds, Inc.) at December 31, 2016, the results of its operations, changes in its net assets and the financial highlights for the year then ended, in conformity with U.S. generally accepted accounting principles.

Boston, Massachusetts
February 17, 2017
| | | | |
| Report of Independent Registered Public Accounting Firm | | | 31 | |
State Street Income V.I.S. Funds
Tax Information (Unaudited)
The amounts presented herein may differ from amounts presented elsewhere in the financial statements due to differences between tax and financial accounting principles. Please consult a tax advisor if you have any questions about Federal or State income tax laws or on how to prepare your tax returns. If you have specific questions about your Fund account, please consult your investment representative.
State Street Income V.I.S. Fund
Special Meeting of Shareholders — Voting Results (Unaudited)
On November 2, 2016, the State Street Variable Insurance Series Funds, Inc. (formerly known as GE Investments Funds, Inc.) (the “Company”) held a special meeting of shareholders of each series portfolio of the Company (collectively, the “Funds”), including shareholders of the State Street Income V.I.S. Fund (formerly known as the Income Fund) (the “Fund”). Shareholders of record on August 31, 2016 were entitled to vote on the proposals. For each proposal shareholders of all Funds voted together and not by Fund or share class. At the meeting, all proposals were approved by the Fund’s shareholders and the following votes were recorded:
Proposal 1:
Approval of an amendment to the Articles of Incorporation of the Company to change the name of the Company from GE Investments Funds, Inc. to State Street Variable Insurance Series Funds, Inc.
Company Votes:
| | | | | | | | | | | | |
| | | No. of Shares | | | % of Outstanding Shares | | | % of Shares Present | |
Affirmative | | | 129,623,837.819 | | | | 89.283 | % | | | 89.283 | % |
Against | | | 10,047,818.534 | | | | 6.921 | % | | | 6.921 | % |
Abstain | | | 5,511,041.282 | | | | 3.796 | % | | | 3.796 | % |
Total | | | 145,182,697.634 | | | | 100.000 | % | | | 100.000 | % |
Fund votes:
| | | | | | | | | | | | |
| | | No. of Shares | | | % of Outstanding Shares | | | % of Shares Present | |
Affirmative | | | 2,046,311.445 | | | | 89.677 | % | | | 89.677 | % |
Against | | | 179,289.814 | | | | 7.857 | % | | | 7.857 | % |
Abstain | | | 56,262.950 | | | | 2.466 | % | | | 2.466 | % |
Total | | | 2,281,864.208 | | | | 100.000 | % | | | 100.000 | % |
Proposal 2:
Approval of an amendment to the Articles of Incorporation of the Company to permit the Board of Directors to change the name of the Company without seeking shareholder approval.
Company votes:
| | | | | | | | | | | | |
| | | No. of Shares | | | % of Outstanding Shares | | | % of Shares Present | |
Affirmative | | | 118,220,823.871 | | | | 81.429 | % | | | 81.429 | % |
Against | | | 21,486,028.150 | | | | 14.799 | % | | | 14.799 | % |
Abstain | | | 5,475,845.611 | | | | 3.772 | % | | | 3.772 | % |
Total | | | 145,182,697.634 | | | | 100.000 | % | | | 100.000 | % |
Fund votes:
| | | | | | | | | | | | |
| | | No. of Shares | | | % of Outstanding Shares | | | % of Shares Present | |
Affirmative | | | 1,896,357.832 | | | | 83.106 | % | | | 83.106 | % |
Against | | | 317,399.029 | | | | 13.910 | % | | | 13.910 | % |
Abstain | | | 68,107.347 | | | | 2.985 | % | | | 2.985 | % |
Total | | | 2,281,864.208 | | | | 100.000 | % | | | 100.000 | % |
| | | | |
| Special Meeting of Shareholders — Voting Results | | | 33 | |
State Street Income V.I.S. Fund
Additional Information — December 31, 2016 (Unaudited)
Information about Directors and Executive Officers:
The business and affairs of the Fund are managed under the direction of the Fund’s Board of Directors. Information pertaining to the Directors and officers of the Fund is set forth below. Matthew J. Simpson resigned as a Director of the Fund effective June 30, 2016.
| | | | | | | | | | | | |
Name,
Address,
and Age | | Position(s) Held
with Fund | | Term of
Office and
Length of
Time Served | | Principal Occupation(s)
During Past 5 Years | | Number of
Portfolios
in Fund
Complex
Overseen
by Director | | | Other Directorships Held by Director |
INTERESTED DIRECTORS AND EXECUTIVE OFFICERS |
Jeanne M. La Porta c/o SSGA FM 1600 Summer St. Stamford, CT 06905 Age 51 | | Director and President | | Until successor is elected and qualified – 2 years | | Senior Managing Director at State Street Global Advisors since July 2016; President of GE Retirement Savings Plan Funds since July 2016; Senior Vice President and Commercial Operations Leader at GEAM from March 2014 to July 2016; President of State Street Institutional Funds and State Street Variable Insurance Series Funds, Inc. since April 2014; President and Trustee of GEAM’s UCITs Funds from March 2014 to November 2014; Senior Vice President and Commercial Administrative Officer at GEAM from April 2010 to March 2014; Vice President of State Street Institutional Funds from July 2003 to April 2014; Vice President of Elfun Funds from October 2003 to July 2016; Vice President of GE Retirement Savings Plan Funds from October 2003 to July 2016; Secretary of GE Funds from July 2007 to September 2010 and Vice President from July 2007 to February 2011; Senior Vice President and Deputy General Counsel of GEAM from October 2007 to April 2010; Vice President and Assistant Secretary of Elfun Funds and GE Retirement Savings Plan Funds from July 2003 to June 2010; and Vice President and Associate General Counsel – Marketing and Client Services (formerly Asset Management Services) at GEAM from May 1997 to October 2007. | | | 22 | | | Trustee and President of State Street Institutional Funds since 2014; Trustee of Elfun Funds since 2014. |
| | |
| 34 | | Additional Information |
State Street Income V.I.S. Fund
Additional Information, continued — December 31, 2016 (Unaudited)
| | | | | | | | | | | | |
Name,
Address,
and Age | | Position(s) Held
with Fund | | Term of
Office and
Length of
Time Served | | Principal Occupation(s)
During Past 5 Years | | Number of
Portfolios
in Fund
Complex
Overseen
by Director | | | Other Directorships Held by Director |
INTERESTED DIRECTORS AND EXECUTIVE OFFICERS (continued) |
JoonWon Choe c/o SSGA FM 1600 Summer St. Stamford, CT 06905 Age 47 | | Vice President & Secretary | | Until successor is elected and qualified –6 years | | Managing Director and Managing Counsel at State Street Global Advisors since July 2016; Senior Vice President and Deputy General Counsel at GEAM from March 2011 to July 2016; Vice President and Secretary of State Street Institutional Funds since September 2010; Vice President and Assistant Secretary of GE Retirement Savings Plan Funds since September 2010; Vice President and Assistant Secretary of Elfun Funds from September 2010 to July 2016; Senior Vice President and Associate General Counsel at GEAM from June 2010 to March 2011; Vice President and Associate General Counsel of GEAM from November 2005 to June 2010; and Vice President and Secretary of GE Funds from September 2010 to February 2011. | | | N/A | | | N/A |
| | | | | | | | | | | | | |
Robert Herlihy c/o SSGA FM 1600 Summer St. Stamford, CT 06905 Age 49 | | Chief Compliance Officer | | Until successor is elected and qualified –11 years | | Managing Director at State Street Global Advisors since July 2016; Deputy Chief Compliance Officer of Elfun Funds since July 2016; Chief Compliance Officer of State Street Institutional Funds and GE Retirement Savings Plan Funds since July 2005; Chief Compliance Officer of GEAM and Elfun Funds from July 2005 to July 2016; Chief Compliance Officer of GE Funds from July 2005 to February 2011; and Manager of Fund Administration at GEAM from 2002-2005. | | | N/A | | | N/A |
| | | | | | | | | | | | | |
Arthur A. Jensen c/o SSGA FM 1600 Summer St. Stamford, CT 06905 Age 50 | | Treasurer | | Until successor is elected and qualified –5 years | | Vice President at State Street Global Advisors since July 2016; Deputy Treasurer of Elfun Funds since July 2016; Treasurer of State Street Institutional Funds and GE Retirement Savings Plan Funds since June 2011; Treasurer of Elfun Funds from June 2011 to July 2016; Mutual Funds Controller of GEAM from April 2011 to July 2016; Senior Vice President at Citigroup from 2008 to 2010; and Vice President at JPMorgan from 2005 to 2008. | | | N/A | | | N/A |
| | | | |
| Additional Information | | | 35 | |
State Street Income V.I.S. Fund
Additional Information, continued — December 31, 2016 (Unaudited)
| | | | | | | | | | | | |
Name,
Address,
and Age | | Position(s) Held
with Fund | | Term of
Office and
Length of
Time Served | | Principal Occupation(s)
During Past 5 Years | | Number of
Portfolios
in Fund
Complex
Overseen
by Director | | | Other Directorships Held by Director |
INTERESTED DIRECTORS AND EXECUTIVE OFFICERS (continued) |
Brian Harris c/o SSGA FM State Street Financial Center
One Lincoln Street Boston, MA 02111-2900 Age 43 | | Deputy Chief Compliance Officer | | Until successor is elected and qualified – less than 1 year | | Managing Director, State Street Global Advisors and SSGA Funds Management, Inc. (June 2013 – present)*; Senior Vice President and Global Head of Investment Compliance, BofA Global Capital Management (2010-2013); Director of Compliance, AARP Financial Inc. (2008-2010). | | | N/A | | | N/A |
| |
Bruce S. Rosenberg c/o SSGA FM State Street Financial Center
One Lincoln Street Boston, MA 02111-2900 Age 55 | | Assistant Treasurer | | Until successor is elected and qualified – less than 1 year | | Managing Director, State Street Global Advisors and SSGA Funds Management, Inc. (July 2015 – present); Director, Credit Suisse (April 2008 – July 2015). | | | N/A | | | N/A |
| |
Ann M. Carpenter c/o SSGA FM State Street Financial Center
One Lincoln Street Boston, MA 02111-2900 Age 50 | | Assistant Treasurer | | Until successor is elected and qualified – less than 1 year | | Chief Operating Officer, SSGA Funds Management, Inc. (April 2014 – present); Managing Director, State Street Global Advisors and SSGA Funds Management, Inc. (2005 – present).* | | | N/A | | | N/A |
| | | | | | | | | | | | | |
Chad C. Hallett c/o SSGA FM State Street Financial Center
One Lincoln Street Boston, MA 02111-2900 Age 47 | | Assistant Treasurer | | Until successor is elected and qualified – less than 1 year | | Vice President, State Street Global Advisors and SSGA Funds Management, Inc. (November 2014 – present); Vice President, State Street Bank and Trust Company (2001 – November 2014). | | | N/A | | | N/A |
| * | | Served in various capacities and/or with various affiliated entities during noted time period. |
| | |
| 36 | | Additional Information |
State Street Income V.I.S. Fund
Additional Information, continued — December 31, 2016 (Unaudited)
| | | | | | | | | | | | |
Name,
Address,
and Age | | Position(s) Held
with Fund | | Term of
Office and
Length of
Time Served | | Principal Occupation(s)
During Past 5 Years | | Number of
Portfolios
in Fund
Complex
Overseen
by Director | | | Other Directorships Held by Director |
NON-INTERESTED DIRECTORS |
John R. Costantino c/o SSGA FM 1600 Summer St. Stamford, CT 06905 Age 70 | | Chairman of the Board | | Until successor is elected and qualified – 20 years | | General Partner, NGN Capital LLC since 2006; and Managing Director, Vice President of Walden Capital Management since 1996. | | | 16 | | | Trustee of State Street Institutional Funds since 1997; Trustee of Fordham University from 1989 to 1995 and from 2001 to 2007 and Trustee Emeritus since 2007; Trustee of NeuroScience Research Institute since 1986; Trustee of GE Funds from 1993 to February 2011; Director of Artes Medical from 2006 to 2008; and Trustee of Gregorian University Foundation from 1992 to 2007. |
| | | | | | | | | | | | | |
R. Sheldon Johnson c/o SSGA FM 1600 Summer St. Stamford, CT 06905 Age 70 | | Director | | Until successor is elected and qualified – 5 years | | Retired, 2006 to present; Head of Global Institutional Equity Sales and Marketing at Morgan Stanley & Co., Inc. from 2002 to 2006 and Managing Director at Morgan Stanley & Co., Inc. from 1988 to 2006. | | | 16 | | | Trustee of State Street Institutional Funds since April 2011 and Trustee of St. Lawrence University since 2003. |
| | | | | | | | | | | | | |
Donna M. Rapaccioli c/o SSGA FM 1600 Summer St. Stamford, CT 06905 Age 54 | | Director | | Until successor is elected and qualified – 5 years | | Dean of the Gabelli School of Business since 2007 and Accounting professor since 1987 at Fordham University. | | | 16 | | | Trustee of State Street Institutional Funds since January 2012 and Trustee of Emmanuel College since 2010. |
The Statement of Additional Information for the Funds includes additional information about the Directors and Officers and is available, without charge, upon request by calling 1-800-242-0134.
| | | | |
| Additional Information | | | 37 | |
State Street Income V.I.S. Fund
Investment Team (Unaudited)
Investment Adviser and Administrator
SSGA Funds Management, Inc.
Board of Directors
John R. Costantino, Chairman
R. Sheldon Johnson
Jeanne M. La Porta
Donna M. Rapaccioli
Secretary
JoonWon Choe
Robert Herlihy as CCO and
Brian Harris as Deputy CCO
Chief Compliance Officer
Robert Herlihy
Deputy Chief Compliance Officer
Brian Harris
Treasurer
Arthur A. Jensen
Assistant Treasurers
Bruce S. Rosenberg
Ann M. Carpenter
Chad C. Hallett
Distributor
State Street Global Markets, LLC
Member FINRA and SIPC
Custodian
State Street Bank and Trust Company
Investment Adviser
SSGA Funds Management, Inc.
1600 Summer Street
Stamford, CT 06905
or at:
P.O. Box 7900
Stamford, CT 06904-7900
Distributor
State Street Global Markets, LLC
Member FINRA and SIPC
State Street Financial Center
One Lincoln Street
Boston, MA 02111
www.ssga.com/geam
The Fund files its complete schedule of portfolio holdings with the Securities and Exchange Commission for the first and third quarters of each fiscal year on Form N-Q. The Fund’s Forms N-Q, as well as a description of the policies and procedures that the Fund uses to determine how to vote proxies (if any) relating to portfolio securities is available without charge (i) upon request, by calling 1-800-242-0134; (ii) on the Fund’s website at http://www.ssga.com/geam; and (iii) on the Commission’s website at http://www.sec.gov. The Fund’s Forms N-Q may be reviewed and copied at the Commission’s Public Reference Room in Washington, DC — information on the operation of the Public Reference Room may be obtained by calling 1-800-SEC-0330.
Information (if any) regarding how the Fund voted proxies relating to portfolio securities during the most recently disclosed 12-month period ended June 30 is available without charge (i) through the Fund’s website at http://www.ssga.com/geam; and (ii) on the Commission’s website at http://www.sec.gov.
IBG-22840
Annual Report
31 December 2016
State Street U.S. Equity V.I.S. Fund
(formerly the GE Investments U.S. Equity Fund)

State Street U.S. Equity V.I.S Fund
Annual Report
December 31, 2016
Table of Contents
This report is prepared for Policyholders of certain variable contracts and may be distributed to others only if preceded or accompanied by the variable contract’s current prospectus and the current summary prospectus of the Fund available for investments thereunder.
State Street U.S. Equity V.I.S. Fund
Notes to Performance — December 31, 2016 (Unaudited)
The information provided on the performance pages relates to the State Street U.S. Equity V.I.S. Fund (the “Fund”).
Total return performance shown in this report for the Fund takes into account changes in share price and assumes reinvestment of dividends and capital gains distributions, if any. Total returns shown are net of Fund fees and expenses but do not reflect fees and charges associated with the variable contracts such as administrative fees, account charges and surrender charges, which, if reflected, would reduce the Fund’s total returns for all periods shown.
The performance data quoted represents past performance; past performance does not guarantee future results. Investment return and principal value will fluctuate so your shares, when redeemed, may be worth more or less than their original cost. Current performance may be higher or lower than the performance data quoted. Periods less than one year are not annualized. Please call toll-free (800) 242-0134 or visit the Fund’s website at http://www.ssga.com/geam for the most recent month-end performance data.
An investment in the Fund is not a deposit of any bank and is not insured or guaranteed by the Federal Deposit Insurance Corporation (“FDIC”) or any other government agency. An investment in the Fund is subject to risk, including possible loss of principal invested.
The S&P 500® Index is an unmanaged, market capitalization-weighted index of stocks of 500 large U.S. companies, which is widely used as a measure of large-cap U.S. stock market performance. The results shown for the foregoing index assume the reinvestment of net dividends or interest and do not reflect fees, expenses, or taxes. As such, the index returns do not reflect the actual cost of investing in the instruments that comprise the index.
The peer universe of the underlying annuity funds used for the peer group average annual total return calculation is based on a blend of Morningstar peer categories, as shown. Morningstar is an independent mutual fund rating service. The Fund’s performance may be compared to or ranked within a universe of mutual funds with investment objectives and policies similar but not necessarily identical to that of the Fund.
©2017 Morningstar, Inc. All Rights Reserved. The Morningstar information contained herein: (1) is proprietary to Morningstar and/or its content providers; (2) may not be copied or distributed; and (3) is not warranted to be accurate, complete or timely. Neither Morningstar nor its content providers are responsible for any damage or losses relating from any use of this information. Past performance is no guarantee of future results.
The views expressed in this document reflect our judgment as of the publication date and are subject to change at any time without notice.
State Street Global Markets, LLC, member of FINRA & SIPC is the principal underwriter and distributor of the State Street V.I.S. Funds and a wholly owned subsidiary of State Street Corporation. References to State Street may include State Street Corporation and its affiliates. The Funds pay State Street Bank and Trust Company for its services as custodian and Fund Accounting agent, and pay SSGA Funds Management, Inc. for investment advisory and administrative services.
State Street U.S. Equity V.I.S. Fund
Portfolio Management Discussion and Analysis — December 31, 2016 (Unaudited)
| Q. | How did the State Street U.S. Equity V.I.S. Fund perform compared to its benchmark and Morningstar peer group for the twelve-month period ended December 31, 2016? |
| A. | For the twelve-month period ended December 31, 2016, the State Street U.S. Equity V.I.S. Fund returned 9.31%. The S&P 500® Index (the “S&P 500 Index”), the Fund’s benchmark, returned 11.96% and the Fund’s Morningstar peer group of 295 U.S. Insurance Large Blend Funds returned an average of 11.08% over the same period. |
| Q. | What market factors affected the Fund’s performance? |
| A. | 2016 was a year of rotating market regimes and mixed sector performance which posed challenges for the long-term fundamental investor. Issues buffeting U.S. equities ranged from China currency and growth concerns, to a growing wave of populism leading to the twin surprises of the United Kingdom’s June 2016 referendum vote to withdraw from the European Union and Donald Trump’s presidential victory. |
| | Early in the year, defensive stocks outperformed amid fears that a slowing China would crush global economies. However by year-end, telecommunications (+23%) was the only defensive “bond-proxy” to hold strong leadership, while real estate (+3%) and staples (+5%) lagged. Energy (+27%) and financials (+23%) won as interest rates rose and oil prices strengthened — bolstered by OPEC’s late-year production-cut pledge. Industrials (+19%) and materials (+17%) also rallied amid hopes for fiscal stimulus and infrastructure spending in the President-elect Trump era. Health care (-3%) was the index’s sole negative-returning sector, plagued by negative sentiment around drug pricing, and mixed M&A performance. In our opinion, the health care sector continues to offer the best combination of earnings growth (+8% for the next 12 months) and valuation at the low-end of its historical range. On a fundamental basis we continue to find attractive investment opportunities in the health care, and have added to core positions at low valuations this year. |
| | The market de-rated growth stocks this year, which is not surprising given relative outperformance in the energy, financials, materials and industrials sectors. The value style of investing beat growth across all market capitalization buckets — by significant margins; and small caps outperformed large capitalization stocks. In terms of size, the outlook for pro-domestic President-elect Trump policies benefitted small-cap and lower-quality stock performance. |
| Q. | What were the primary drivers of Fund performance? |
| A. | The Fund’s overweight in the lagging health care sector weighed on results. Our biotechnology and pharmaceuticals holdings detracted most from performance against a backdrop of negative election-year rhetoric around drug pricing. One pharmaceutical holding was involved in a large M&A transaction that broke, causing a significant negative effect. We maintained conviction in its prospects as a standalone specialty pharma company, and added to the position on weakness. In general, we have found a good combination of valuation and earnings growth potential in the health care sector, and believe the negative pricing rhetoric has been overly discounted. Finally, improving commodity prices and hopes for increased infrastructure spending under President-elect Trump lifted the materials sector and the Fund was light in the most economically-sensitive materials companies, including the mining companies. We believe — eight years into the business cycle — that it is too late to be especially pro-cyclically tilted in materials. |
| | On the other hand, strong stock selection in consumer discretionary and Information technology (“IT”) bolstered returns. Among consumer cyclicals, several of the Fund’s U.S. media holdings demonstrated strong results, seemingly immune to economic growth fears early in the year. Broad-based stock selection strength benefited our IT holdings — the Fund’s communications equipment, semiconductor, storage and IT services holdings outperformed. Finally, the Fund benefited from strong stock selection in industrials, as economic fundamentals improved and the Trump victory fueled hopes for more growth ahead. |
| | The Fund does not invest in derivatives securities as part of its strategy, but may hold futures contracts or exchange traded funds to equitize cash flows in advance of investment. The effect of derivatives on performance was deminimus for the year. |
| Q. | Were there any significant changes in the Fund during the period? |
| A. | There were no changes during the period in the portfolio management team or their fundamental, bottom-up approach to investing. Health care and financials remained key sector overweights, and we increased our financials exposure somewhat as the Federal Reserve’s path of rate normalization came into focus. The Fund maintains a modest cyclical tilted eight years into the business cycle. We are comfortable with our moderate pro-cyclical positioning as we think this business cycle may even reach extra innings due to the slow growth of this recovery, and potential growth from the new administration’s fiscal policies. |
| | |
| 2 | | State Street U.S. Equity V.I.S. Fund |
State Street U.S. Equity V.I.S. Fund
Understanding Your Fund’s Expenses — December 31, 2016 (Unaudited)
As a shareholder of the Fund, you incur ongoing costs. Ongoing costs include portfolio management fees, professional fees, administrative fees and other Fund expenses. The following example is intended to help you understand your ongoing costs (in dollars) of investing in the Fund and to compare these costs with the ongoing costs of investing in other mutual funds.
To illustrate these ongoing costs, we have provided an example and calculated the expenses paid by investors in the Fund during the period. The information in the following table is based on an investment of $1,000, which is invested at the beginning of the period and held for the entire six-month period ended December 31, 2016.
Actual Expenses
The first section of the table provides information about actual account values and actual expenses. You may use the information in this section, together with the amount you invested, to estimate the expenses that you paid over the period. To do so, simply divide your account value by $1,000 (for example, an $8,600 account value divided by $1,000 = 8.6), then multiply the result by the number given under the heading “Expenses paid during the period” to estimate the expenses you paid on your account during the period.
Hypothetical Example for Comparison Purposes
The second section of the table provides information about hypothetical account values and hypothetical expenses based on the Fund’s actual expense ratio and an assumed rate of return of 5% per year before expenses, which is not the Fund’s actual return. The hypothetical account values and expenses may not be used to estimate the actual ending account balance or expenses you paid for the period. You may use this information to compare the ongoing costs of investing in the Fund and other funds. To do so, compare this 5% hypothetical example with the 5% hypothetical examples that appear in the shareholder reports of other funds.
Please note that the expenses shown in the table are meant to highlight and help you compare ongoing costs only and do not reflect transaction costs, such as sales charges or redemption fees, if any. Therefore, the second section of the table is useful in comparing ongoing costs only, and will not help you determine the relative total costs of owning different funds. Additionally, the expenses shown do not reflect the fees or charges associated with variable contracts through which shares of the Fund are offered.
| | | | | | | | |
| | | Actual
Fund Return | | | Hypothetical
5% Return
(2.5% for
the period) | |
Account value at the beginning of the period July 1, 2016 | | $ | 1,000.00 | | | $ | 1,000.00 | |
Account value at the end of the period December 31, 2016 | | $ | 1,081.80 | | | $ | 1,020.86 | |
Expenses paid during the period* | | $ | 4.45 | | | $ | 4.32 | |
| * | Expenses are equal to the Fund’s annualized net expense ratio of 0.85%** (for the period July 1, 2016 — December 31, 2016), multiplied by the average account value over the period, multiplied by 184/366 (to reflect the one-half year period). |
| ** | May differ from expense ratio disclosed in the financial highlights, which is calculated based on the entire fiscal year’s data. |
| | | | |
| State Street U.S. Equity V.I.S. Fund | | | 3 | |
State Street U.S. Equity V.I.S. Fund
Performance Summary — December 31, 2016 (Unaudited)
Morningstar Performance Comparison
Based on average annual returns for periods ended 12/31/16
| | | | | | | | | | | | |
| | | One
Year | | | Five
Year | | | Ten
Year | |
Number of funds in peer group | | | 295 | | | | 274 | | | | 246 | |
Peer group average annual total return | | | 11.08 | % | | | 13.15 | % | | | 5.81 | % |
Morningstar Category in peer group: U.S. Insurance Large Blend | |
Top Ten Largest Holdings
as of December 31, 2016 (as a % of Fair Value) (a)(b)
| | | | |
Apple Inc. | | | 2.86 | % |
Allergan PLC | | | 2.83 | % |
Wells Fargo & Co. | | | 2.77 | % |
Medtronic PLC | | | 2.60 | % |
QUALCOMM Inc. | | | 2.38 | % |
Citigroup Inc. | | | 2.37 | % |
Johnson & Johnson | | | 2.09 | % |
PepsiCo Inc. | | | 2.06 | % |
Cisco Systems Inc. | | | 1.99 | % |
Bank of America Corp. | | | 1.98 | % |
Sector Allocation as of December 31, 2016
Portfolio composition as a % of Investments of $27,297 (in thousands) on December 31, 2016 (a)(b)
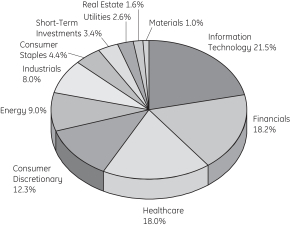
Average Annual Total Return For the Periods Ended December 31, 2016
Class I Shares (Inception date 1/3/95)
| | | | | | | | | | | | | | | | |
| | | One Year | | | Five Year | | | Ten Year | | | Ending Value
of a $10,000
Investment | |
State Street U.S. Equity V.I.S. Fund | | | 9.31 | % | | | 13.31 | % | | | 6.16 | % | | $ | 18,176 | |
S&P 500® Index | | | 11.96 | % | | | 14.66 | % | | | 6.95 | % | | $ | 19,572 | |
| | |
| 4 | | State Street U.S. Equity V.I.S. Fund |
State Street U.S. Equity V.I.S. Fund
Performance Summary, continued — December 31, 2016 (Unaudited)
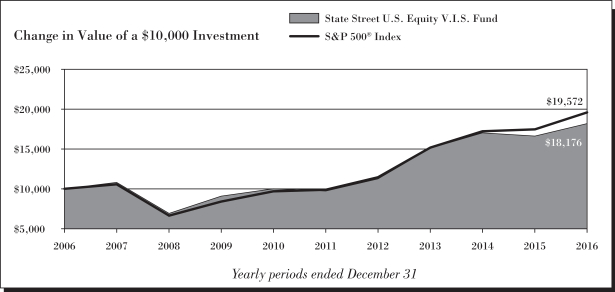
| (a) | Fair Value basis is inclusive of short-term investment in State Street Institutional U.S. Government Money Market Fund Class G Shares. |
| (b) | The securities information regarding holdings, allocations and other characteristics is presented to illustrate examples of securities that the Fund has bought and the diversity of areas in which the Fund may invest as of a particular date. It may not be representative of the Fund’s current or future investments and should not be construed as a recommendation to purchase or sell a particular security. |
See Notes to Performance beginning on page 1 for further information, including an explanation of Morningstar peer categories.
Past performance does not predict future performance. The performance shown in the graphs and tables does not reflect the deduction of taxes that a shareholder would pay on Fund distributions or the redemption of Fund shares and does not reflect the fees or charges that would be associated with variable contracts through which shares of the Fund are offered.
| | | | |
| State Street U.S. Equity V.I.S. Fund | | | 5 | |
State Street U.S. Equity V.I.S. Fund
Schedule of Investments — December 31, 2016
| | | | | | | | |
| | | Number of Shares | | | Fair Value $ | |
| | | | | | | | |
| Common Stock - 96.4%† | |
Aerospace & Defense - 2.1% | |
General Dynamics Corp. | | | 2,085 | | | | 359,996 | |
Hexcel Corp. | | | 4,047 | | | | 208,178 | |
| | | | | | | | |
| | | | | | | 568,174 | |
| | | | | | | | |
|
Agricultural Products - 0.4% | |
Archer-Daniels-Midland Co. | | | 2,612 | | | | 119,238 | |
| | | | | | | | |
|
Airlines - 1.5% | |
Delta Air Lines Inc. | | | 8,103 | | | | 398,587 | |
| | | | | | | | |
|
Apparel, Accessories & Luxury Goods - 0.7% | |
Ralph Lauren Corp. | | | 866 | | | | 78,217 | |
VF Corp. | | | 2,150 | | | | 114,703 | |
| | | | | | | | |
| | | | | | | 192,920 | |
| | | | | | | | |
|
Application Software - 1.2% | |
Intuit Inc. | | | 1,689 | | | | 193,576 | |
salesforce.com Inc. (a) | | | 2,006 | | | | 137,331 | |
| | | | | | | | |
| | | | | | | 330,907 | |
| | | | | | | | |
|
Asset Management & Custody Banks - 1.4% | |
Ameriprise Financial Inc. | | | 2,480 | | | | 275,131 | |
Invesco Ltd. | | | 3,464 | | | | 105,098 | |
| | | | | | | | |
| | | | | | | 380,229 | |
| | | | | | | | |
|
Auto Parts & Equipment - 1.0% | |
Delphi Automotive PLC | | | 4,108 | | | | 276,674 | |
| | | | | | | | |
|
Automotive Retail - 0.5% | |
Advance Auto Parts Inc. | | | 885 | | | | 149,671 | |
| | | | | | | | |
|
Biotechnology - 4.6% | |
Alexion Pharmaceuticals Inc. (a) | | | 1,520 | | | | 185,972 | |
Amgen Inc. | | | 3,230 | | | | 472,258 | |
Gilead Sciences Inc. | | | 7,318 | | | | 524,042 | |
Vertex Pharmaceuticals Inc. (a) | | | 1,204 | | | | 88,699 | |
| | | | | | | | |
| | | | | | | 1,270,971 | |
| | | | | | | | |
|
Building Products - 0.0%* | |
Allegion PLC | | | 71 | | | | 4,544 | |
| | | | | | | | |
|
Cable & Satellite - 4.9% | |
Charter Communications Inc., Class A (a) | | | 1,837 | | | | 528,909 | |
Comcast Corp., Class A | | | 5,830 | | | | 402,561 | |
Liberty Global PLC, Class C (a) | | | 8,975 | | | | 266,558 | |
Sirius XM Holdings Inc. | | | 33,787 | | | | 150,352 | |
| | | | | | | | |
| | | | | | | 1,348,380 | |
| | | | | | | | |
|
Communications Equipment - 2.0% | |
Cisco Systems Inc. | | | 17,967 | | | | 542,963 | |
| | | | | | | | |
| | | | | | | | |
| | | Number of Shares | | | Fair Value $ | |
Consumer Finance - 1.9% | |
Discover Financial Services | | | 7,127 | | | | 513,785 | |
| | | | | | | | |
|
Data Processing & Outsourced Services - 2.0% | |
PayPal Holdings Inc. (a) | | | 4,329 | | | | 170,866 | |
Visa Inc., Class A | | | 4,752 | | | | 370,751 | |
| | | | | | | | |
| | | | | | | 541,617 | |
| | | | | | | | |
|
Diversified Banks - 8.1% | |
Bank of America Corp. | | | 24,442 | | | | 540,168 | |
Citigroup Inc. | | | 10,877 | | | | 646,420 | |
JPMorgan Chase & Co. | | | 2,981 | | | | 257,230 | |
Wells Fargo & Co. | | | 13,734 | | | | 756,881 | |
| | | | | | | | |
| | | | | | | 2,200,699 | |
| | | | | | | | |
|
Drug Retail - 0.1% | |
CVS Health Corp. | | | 447 | | | | 35,273 | |
| | | | | | | | |
|
Electric Utilities - 0.9% | |
Exelon Corp. | | | 1,515 | | | | 53,767 | |
NextEra Energy Inc. | | | 1,495 | | | | 178,593 | |
| | | | | | | | |
| | | | | | | 232,360 | |
| | | | | | | | |
|
Financial Exchanges & Data - 2.3% | |
CME Group Inc. | | | 3,104 | | | | 358,046 | |
S&P Global Inc. | | | 2,640 | | | | 283,906 | |
| | | | | | | | |
| | | | | | | 641,952 | |
| | | | | | | | |
|
General Merchandise Stores - 0.6% | |
Dollar General Corp. | | | 2,166 | | | | 160,436 | |
| | | | | | | | |
|
Gold - 0.4% | |
Newmont Mining Corp. | | | 2,884 | | | | 98,258 | |
| | | | | | | | |
| | |
Healthcare Equipment - 4.7% | | | | | | | | |
Abbott Laboratories | | | 3,590 | | | | 137,892 | |
Boston Scientific Corp. (a) | | | 15,321 | | | | 331,393 | |
Medtronic PLC | | | 9,979 | | | | 710,804 | |
Stryker Corp. | | | 895 | | | | 107,230 | |
| | | | | | | | |
| | | | | | | 1,287,319 | |
| | | | | | | | |
|
Healthcare Supplies - 0.6% | |
The Cooper Companies Inc. | | | 866 | | | | 151,489 | |
| | | | | | | | |
|
Home Improvement Retail - 1.2% | |
Lowe’s Companies Inc. | | | 4,661 | | | | 331,490 | |
| | | | | | | | |
|
Housewares & Specialties - 1.1% | |
Newell Brands Inc. | | | 7,021 | | | | 313,488 | |
| | | | | | | | |
|
Hypermarkets & Super Centers - 0.5% | |
Wal-Mart Stores Inc. | | | 2,006 | | | | 138,655 | |
| | | | | | | | |
See notes to schedule of investments and notes to financial statements.
| | |
| 6 | | State Street U.S. Equity V.I.S. Fund |
State Street U.S. Equity V.I.S. Fund
Schedule of Investments, continued — December 31, 2016
| | | | | | | | |
| | | Number of Shares | | | Fair Value $ | |
| | | | | | | | |
Independent Power Producers & Energy Traders - 0.4% | |
Calpine Corp. (a) | | | 8,497 | | | | 97,121 | |
| | | | | | | | |
|
Industrial Conglomerates - 0.5% | |
Honeywell International Inc. | | | 1,194 | | | | 138,325 | |
| | | | | | | | |
|
Industrial Gases - 0.4% | |
Air Products & Chemicals Inc. | | | 677 | | | | 97,366 | |
| | | | | | | | |
|
Industrial Machinery - 1.6% | |
Ingersoll-Rand PLC | | | 5,719 | | | | 429,154 | |
| | | | | | | | |
|
Integrated Oil & Gas - 4.5% | |
Chevron Corp. | | | 3,764 | | | | 443,023 | |
Exxon Mobil Corp. | | | 5,298 | | | | 478,197 | |
Occidental Petroleum Corp. | | | 4,148 | | | | 295,462 | |
| | | | | | | | |
| | | | | | | 1,216,682 | |
| | | | | | | | |
|
Internet & Direct Marketing Retail - 1.3% | |
Amazon.com Inc. (a) | | | 486 | | | | 364,437 | |
| | | | | | | | |
|
Internet Software & Services - 4.3% | |
Alibaba Group Holding Ltd. ADR (a) | | | 845 | | | | 74,199 | |
Alphabet Inc., Class A (a) | | | 477 | | | | 377,999 | |
Alphabet Inc., Class C (a) | | | 528 | | | | 407,521 | |
Facebook Inc., Class A (a) | | | 2,640 | | | | 303,732 | |
| | | | | | | | |
| | | | | | | 1,163,451 | |
| | | | | | | | |
|
Investment Banking & Brokerage - 2.3% | |
Morgan Stanley | | | 5,679 | | | | 239,938 | |
The Charles Schwab Corp. | | | 9,503 | | | | 375,083 | |
| | | | | | | | |
| | | | | | | 615,021 | |
| | | | | | | | |
|
Life & Health Insurance - 0.5% | |
Prudential Financial Inc. | | | 1,373 | | | | 142,874 | |
| | | | | | | | |
|
Movies & Entertainment - 0.8% | |
The Walt Disney Co. | | | 2,154 | | | | 224,490 | |
| | | | | | | | |
|
Multi-Line Insurance - 1.1% | |
American International Group Inc. | | | 1,795 | | | | 117,232 | |
The Hartford Financial Services Group Inc. | | | 3,619 | | | | 172,445 | |
| | | | | | | | |
| | | | | | | 289,677 | |
| | | | | | | | |
|
Multi-Utilities - 1.3% | |
Sempra Energy | | | 3,660 | | | | 368,342 | |
| | | | | | | | |
|
Oil & Gas Equipment & Services - 1.0% | |
Schlumberger Ltd. | | | 3,352 | | | | 281,400 | |
| | | | | | | | |
| | | | | | | | |
| | | Number of Shares | | | Fair Value $ | |
Oil & Gas Exploration & Production - 3.5% | |
Concho Resources Inc. (a) | | | 450 | | | | 59,670 | |
ConocoPhillips | | | 6,239 | | | | 312,824 | |
Hess Corp. | | | 4,818 | | | | 300,113 | |
Noble Energy Inc. | | | 7,818 | | | | 297,553 | |
| | | | | | | | |
| | | | | | | 970,160 | |
| | | | | | | | |
|
Packaged Foods & Meats - 1.3% | |
Mondelez International Inc., Class A | | | 8,002 | | | | 354,729 | |
| | | | | | | | |
|
Paper Packaging - 0.2% | |
Packaging Corporation of America | | | 570 | | | | 48,347 | |
| | | | | | | | |
|
Pharmaceuticals - 8.0% | |
Allergan PLC (a) | | | 3,684 | | | | 773,677 | |
Johnson & Johnson | | | 4,940 | | | | 569,138 | |
Merck & Company Inc. | | | 8,605 | | | | 506,576 | |
Pfizer Inc. | | | 10,584 | | | | 343,768 | |
| | | | | | | | |
| | | | | | | 2,193,159 | |
| | | | | | | | |
|
Property & Casualty Insurance - 0.6% | |
Chubb Ltd. | | | 1,320 | | | | 174,398 | |
| | | | | | | | |
|
Research & Consulting Services - 0.9% | |
Nielsen Holdings PLC | | | 5,875 | | | | 246,456 | |
| | | | | | | | |
|
Semiconductor Equipment - 1.8% | |
Applied Materials Inc. | | | 14,911 | | | | 481,178 | |
| | | | | | | | |
|
Semiconductors - 2.9% | |
NXP Semiconductors N.V. (a) | | | 1,490 | | | | 146,035 | |
QUALCOMM Inc. | | | 9,974 | | | | 650,305 | |
| | | | | | | | |
| | | | | | | 796,340 | |
| | | | | | | | |
|
Soft Drinks - 2.1% | |
PepsiCo Inc. | | | 5,365 | | | | 561,340 | |
| | | | | | | | |
|
Specialized REITs - 1.6% | |
American Tower Corp. | | | 4,265 | | | | 450,725 | |
| | | | | | | | |
|
Specialty Chemicals - 0.1% | |
PPG Industries Inc. | | | 346 | | | | 32,787 | |
| | | | | | | | |
|
Systems Software - 2.3% | |
Microsoft Corp. | | | 6,863 | | | | 426,467 | |
Oracle Corp. | | | 5,526 | | | | 212,474 | |
| | | | | | | | |
| | | | | | | 638,941 | |
| | | | | | | | |
|
Technology Hardware, Storage & Peripherals - 5.0% | |
Apple Inc. | | | 6,737 | | | | 780,279 | |
Hewlett Packard Enterprise Co. | | | 6,018 | | | | 139,257 | |
See notes to schedule of investments and notes to financial statements.
| | | | |
| State Street U.S. Equity V.I.S. Fund | | | 7 | |
State Street U.S. Equity V.I.S. Fund
Schedule of Investments, continued — December 31, 2016
| | | | | | | | |
| | | Number of Shares | | | Fair Value $ | |
| | | | | | | | |
Western Digital Corp. | | | 6,493 | | | | 441,199 | |
| | | | | | | | |
| | | | | | | 1,360,735 | |
| | | | | | | | |
|
Trading Companies & Distributors - 1.4% | |
United Rentals Inc. (a) | | | 3,696 | | | | 390,224 | |
| | | | | | | | |
| |
Total Common Stock
(Cost $22,082,131) | | | | 26,357,938 | |
| | | | | | | | |
|
| Short-Term Investments - 3.5% | |
State Street Institutional U.S. Government Money Market Fund -Class G Shares 0.46%
(Cost $938,819) (b)(c)(d) | | | 938,819 | | | | 938,819 | |
| | | | | | | | |
| | |
Total Investments
(Cost $23,020,950) | | | | | | | 27,296,757 | |
| |
| Other Assets and Liabilities, net - 0.1% | | | | 39,554 | |
| | | | | | | | |
| |
| NET ASSETS - 100.0% | | | | 27,336,311 | |
| | | | | | | | |
Other Information:
The Fund had the following long futures contracts open at December 31, 2016:
| | | | | | | | | | | | | | | | |
| Description | | Expiration date | | | Number of Contracts | | | Current Notional Value | | | Unrealized Depreciation | |
| | | | | | | | | | | | | | | | |
S&P 500 Emini Index Futures | | | March 2017 | | | | 2 | | | $ | 223,620 | | | $ | (3,209 | ) |
| | | | | | | | | | | | | | | | |
See notes to schedule of investments and notes to financial statements.
| | |
| 8 | | State Street U.S. Equity V.I.S. Fund |
State Street U.S. Equity V.I.S. Fund
Notes to Schedule of Investments — December 31, 2016
The views expressed in this document reflect our judgment as of the publication date and are subject to change at any time without notice. The securities cited may not be representative of the Fund’s future investments and should not be construed as a recommendation to purchase or sell a particular security. See the Fund’s summary prospectus and statutory prospectus for complete descriptions of investment objectives, policies, risks and permissible investments.
| (a) | Non-income producing security. |
| (b) | Sponsored by SSGA Funds Management, Inc., the Funds’ investment adviser and administrator, effective July 1, 2016, and an affiliate of State Street Bank & Trust Co., the Funds’ sub-administrator, custodian and accounting agent. |
| (c) | Coupon amount represents effective yield. |
| (d) | At December 31, 2016, all or a portion of this security was pledged to cover collateral requirements for futures. |
| † | Percentages are based on net assets as of December 31, 2016. |
Abbreviations:
ADR - American Depositary Receipt
REIT - Real Estate Investment Trust
SPDR - S&P Depositary Receipt
Affiliate Table
| | | | | | | | | | | | | | | | | | | | | | | | | | | | | | | | |
| | | Number of Shares Held at 12/31/15 | | | Value At 12/31/15 | | | Shares Purchased | | | Shares Sold | | | Number of Shares Held at 12/31/16 | | | Value at
12/31/16 | | | Dividend/
Interest Income | | | Realized Gain (Loss) | |
Financial Select Sector SPDR Fund | | | 3,899 | | | $ | — | | | | — | | | | 3,899 | | | | — | | | $ | — | | | $ | 472 | | | $ | 17,629 | |
Industrial Select Sector SPDR Fund | | | 6,971 | | | | 369,533 | | | | 1,520 | | | | 8,491 | | | | — | | | | — | | | | 4,208 | | | | 161,914 | |
State Street Corp. | | | 6,686 | | | | 443,683 | | | | — | | | | 6,686 | | | | — | | | | — | | | | 2,020 | | | | (39,378 | ) |
State Street Institutional U.S. Government Money Market Fund - Class G Shares | | | 825,035 | | | | 825,035 | | | | 7,367,559 | | | | 7,253,775 | | | | 938,819 | | | | 938,819 | | | | 2,183 | | | | — | |
| | | | | | | | | | | | | | | | | | | | | | | | | | | | | | | | |
| | | | | | $ | 1,638,251 | | | | | | | | | | | | | | | $ | 938,819 | | | $ | 8,883 | | | $ | 140,164 | |
| | | | | | | | | | | | | | | | | | | | | | | | | | | | | | | | |
| | | | |
| Notes to Schedule of Investments | | | 9 | |
State Street U.S. Equity V.I.S. Fund
Financial Highlights
Selected data based on a share outstanding throughout the fiscal years indicated
| | | | | | | | | | | | | | | | | | | | |
| | | 12/31/16 | | | 12/31/15* | | | 12/31/14* | | | 12/31/13* | | | 12/31/12* | |
Inception date | | | | | | | | | | | | | | | | | | | 1/3/95 | |
| | | | | |
Net asset value, beginning of period | | $ | 42.25 | | | $ | 48.44 | | | $ | 46.63 | | | $ | 35.14 | | | $ | 30.74 | |
| | | | | | | | | | | | | | | | | | | | |
| | | | | |
Income/(loss) from investment operations: | | | | | | | | | | | | | | | | | | | | |
Net investment income | | | 0.55 | | | | 0.53 | | | | 0.50 | | | | 0.42 | | | | 0.45 | |
Net realized and unrealized gains/(losses) on investments | | | 3.41 | | | | (1.56 | ) | | | 5.48 | | | | 11.49 | | | | 4.40 | |
| | | | | | | | | | | | | | | | | | | | |
Total income/(loss) from investment operations | | | 3.96 | | | | (1.03 | ) | | | 5.98 | | | | 11.91 | | | | 4.85 | |
| | | | | | | | | | | | | | | | | | | | |
| | | | | |
Less distributions from: | | | | | | | | | | | | | | | | | | | | |
Net investment income | | | 0.54 | | | | 0.53 | | | | 0.46 | | | | 0.42 | | | | 0.45 | |
Net realized gains | | | 3.65 | | | | 4.63 | | | | 3.71 | | | | — | | | | — | |
| | | | | | | | | | | | | | | | | | | | |
Total distributions | | | 4.19 | | | | 5.16 | | | | 4.17 | | | | 0.42 | | | | 0.45 | |
| | | | | | | | | | | | | | | | | | | | |
Net asset value, end of period | | $ | 42.02 | | | $ | 42.25 | | | $ | 48.44 | | | $ | 46.63 | | | $ | 35.14 | |
| | | | | | | | | | | | | | | | | | | | |
Total return(a) | | | 9.31 | % | | | (2.30 | )% | | | 12.77 | % | | | 33.91 | % | | | 15.80 | % |
| | | | | |
Ratios/Supplemental Data: | | | | | | | | | | | | | | | | | | | | |
Net assets, end of period (in thousands) | | $ | 27,336 | | | $ | 31,405 | | | $ | 35,178 | | | $ | 34,234 | | | $ | 29,924 | |
| | | | | |
Ratios to average net assets: | | | | | | | | | | | | | | | | | | | | |
Net expenses | | | 0.83 | % | | | 0.76 | % | | | 0.77 | %(b) | | | 0.80 | %(b) | | | 0.80 | %(b) |
Gross expenses | | | 0.83 | % | | | 0.76 | % | | | 0.77 | % | | | 0.80 | % | | | 0.81 | % |
Net investment income | | | 1.16 | % | | | 1.04 | % | | | 0.99 | % | | | 0.95 | % | | | 1.22 | % |
Portfolio turnover rate | | | 37 | % | | | 37 | % | | | 43 | % | | | 40 | % | | | 66 | % |
Notes to Financial Highlights
| (a) | | Total returns are historical and assume changes in share price, reinvestment of dividends and capital gains distributions and do not include the effect of insurance contract charges. Past performance does not guarantee future results. |
| (b) | | Includes contractual management fee waiver related to the Fund’s investments in the GE Institutional Money Market Fund (the “Money Market Fund”). The fee waiver agreement was terminated effective June 30, 2014 with the closure of the Money Market Fund. |
| * | | Beginning with the year ended December 31, 2016, the Fund was audited by Ernst & Young LLP. The previous years were audited by another independent registered public accounting firm. |
The accompanying notes are an integral part of these financial statements.
State Street U.S. Equity V.I.S. Fund
Statement of Assets and Liabilities — December 31, 2016
| | | | |
| | | | |
Assets | | | | |
Investments in securities, at fair value (cost $22,082,131) | | $ | 26,357,938 | |
Short-term affiliated investments, at fair value | | | 938,819 | |
Cash | | | 2,500 | |
Restricted cash(1) | | | 45,000 | |
Income receivable | | | 46,251 | |
Receivable for fund shares sold | | | 1,232 | |
Income receivable from affiliated investments | | | 326 | |
Other assets | | | 1,334 | |
| | | | |
Total assets | | | 27,393,400 | |
| | | | |
| |
Liabilities | | | | |
Payable for fund shares redeemed | | | 2,315 | |
Payable for variation margin on open futures contracts | | | 890 | |
Payable to the Adviser (Note 6) | | | 12,831 | |
Payable to the Custodian (Note 6) | | | 14,715 | |
Accrued other expenses | | | 26,338 | |
| | | | |
Total liabilities | | | 57,089 | |
| | | | |
| | | | |
Net Assets | | $ | 27,336,311 | |
| | | | |
| |
Net Assets Consist of: | | | | |
Capital paid in | | $ | 23,077,478 | |
Undistributed (distributions in excess of) net investment income | | | 2,483 | |
Accumulated net realized gain (loss) | | | (16,248 | ) |
Net unrealized appreciation (depreciation) on: | | | | |
Investments | | | 4,275,807 | |
Futures | | | (3,209 | ) |
| | | | |
Net Assets | | $ | 27,336,311 | |
| | | | |
| | | | |
Shares outstanding ($0.01 par value; unlimited shares authorized) | | | 650,608 | |
Net asset value per share | | $ | 42.02 | |
(1) Deposits at broker for futures contracts. | | | | |
The accompanying notes are an integral part of these financial statements.
| | | | |
| Statement of Assets and Liabilities | | | 11 | |
State Street U.S. Equity V.I.S. Fund
Statement of Operations — For the year ended December 31, 2016
| | | | |
| | | | |
Investment Income | | | | |
Income | | | | |
Dividend | | $ | 546,977 | |
Interest | | | 2,212 | |
Income from affiliated investments | | | 8,883 | |
| | | | |
Total income | | | 558,072 | |
| | | | |
| |
Expenses | | | | |
Advisory and administration fees (Note 6) | | | 155,360 | |
Directors’ fees (Note 6) | | | 1,939 | |
Custody and accounting expenses — net (Note 6) | | | 40,097 | |
Professional fees | | | 22,505 | |
Other expenses | | | 12,868 | |
| | | | |
Total Expenses | | | 232,769 | |
| | | | |
Net investment income | | $ | 325,303 | |
| | | | |
| |
Net Realized and Unrealized Gain (Loss) on Investments | | | | |
Realized gain (loss) on: | | | | |
Investments | | $ | 1,648,108 | |
Affiliated investments | | | 140,164 | |
Futures | | | 28,083 | |
Increase (decrease) in unrealized appreciation/depreciation on: | |
Investments | | | 215,901 | |
Futures | | | (5,568 | ) |
| | | | |
| |
Net realized and unrealized gain (loss) on investments | | | 2,026,688 | |
| | | | |
Net increase in net assets resulting from operations | | $ | 2,351,991 | |
| | | | |
The accompanying notes are an integral part of these financial statements.
| | |
| 12 | | Statement of Operations |
State Street U.S. Equity V.I.S. Fund
Statements of Changes in Net Assets
| | | | | | | | |
| | | Year Ended December 31, 2016 | | | Year Ended December 31, 2015* | |
| | | | | | | | |
Increase (Decrease) in Net Assets | | | | | | | | |
| | |
Operations: | | | | | | | | |
Net investment income | | $ | 325,303 | | | $ | 352,176 | |
Net realized gain (loss) on investments and futures transactions | | | 1,816,355 | | | | 2,975,903 | |
Net increase (decrease) in unrealized appreciation/depreciation on investments and futures | | | 210,333 | | | | (4,065,358 | ) |
| | | | | | | | |
Net increase (decrease) from operations | | | 2,351,991 | | | | (737,279 | ) |
| | | | | | | | |
| | |
Distributions to shareholders from: | | | | | | | | |
Net investment income | | | (320,358 | ) | | | (351,298 | ) |
Net realized gains | | | (2,161,189 | ) | | | (3,071,206 | ) |
| | | | | | | | |
Total distributions | | | (2,481,547 | ) | | | (3,422,504 | ) |
| | | | | | | | |
Increase (decrease) in assets from operations and distributions | | | (129,556 | ) | | | (4,159,783 | ) |
| | | | | | | | |
| | |
Share transactions: | | | | | | | | |
Proceeds from sale of shares | | | 100,913 | | | | 1,115,357 | |
Value of distributions reinvested | | | 2,481,547 | | | | 3,422,504 | |
Cost of shares redeemed | | | (6,521,940 | ) | | | (4,150,957 | ) |
| | | | | | | | |
Net increase (decrease) from share transactions | | | (3,939,480 | ) | | | 386,904 | |
| | | | | | | | |
| | |
Total increase (decrease) in net assets | | | (4,069,036 | ) | | | (3,772,879 | ) |
| | |
Net Assets | | | | | | | | |
Beginning of year | | | 31,405,347 | | | | 35,178,226 | |
| | | | | | | | |
| | |
End of year | | $ | 27,336,311 | | | $ | 31,405,347 | |
| | | | | | | | |
| | |
Undistributed (distributions in excess of) net investment income, end of year | | $ | 2,483 | | | $ | (2 | ) |
| | |
Changes in Fund Shares | | | | | | | | |
Shares sold | | | 2,392 | | | | 22,912 | |
Issued for distributions reinvested | | | 58,707 | | | | 79,723 | |
Shares redeemed | | | (153,785 | ) | | | (85,580 | ) |
| | | | | | | | |
Net increase (decrease) in fund shares | | | (92,686 | ) | | | 17,055 | |
| | | | | | | | |
| * | | Beginning with the year ended December 31, 2016, the Fund was audited by Ernst & Young LLP. The previous years were audited by another independent registered public accounting firm. |
The accompanying notes are an integral part of these financial statements.
| | | | |
| Statements of Changes in Net Assets | | | 13 | |
State Street U.S. Equity V.I.S. Fund
Notes to Financial Statements — December 31, 2016
| 1. | | Organization of the Company |
State Street Variable Insurance Series Funds, Inc. (the “Company”) was incorporated under the laws of the Commonwealth of Virginia on May 14, 1984 and is registered under the Investment Company Act of 1940, as amended (the “1940 Act”), as an open-end management investment company. Prior to November 30, 2016, the Company was named GE Investments Funds, Inc. The Company is currently composed of the following eight investment portfolios (collectively, the “Funds”): State Street U.S. Equity V.I.S. Fund (the “Fund”), State Street S&P 500 Index V.I.S. Fund, State Street Premier Growth Equity V.I.S. Fund, State Street Core Value Equity V.I.S. Fund, State Street Small-Cap Equity V.I.S. Fund, State Street Total Return V.I.S. Fund, State Street Income V.I.S. Fund and State Street Real Estate Securities V.I.S. Fund. Each Fund is an investment company and accordingly follows the investment company accounting and reporting guidance of the Financial Accounting Standards Board (“FASB”) Accounting Standard Codification (“ASC”) Topic 946 Financial Services — Investment Companies. Each Fund is a diversified investment company within the meaning of the 1940 Act.
Effective November 30, 2016, each individual Fund changed its respective name as follows:
| | |
| Old Name | | New Name |
GE Investments U.S. Equity Fund GE Investments S&P 500 Index Fund GE Investments Premier Growth Equity Fund GE Investments Core Value Equity Fund GE Investments Small-Cap Equity Fund GE Investments Total Return Fund GE Investments Income Fund GE Investments Real Estate Securities Fund | | State Street U.S. Equity V.I.S. Fund State Street S&P 500 Index V.I.S. Fund State Street Premier Growth Equity V.I.S. Fund State Street Core Value Equity V.I.S. Fund State Street Small-Cap Equity V.I.S. Fund State Street Total Return V.I.S. Fund State Street Income V.I.S. Fund State Street Real Estate Securities V.I.S. Fund |
Shares of the Funds of the Company are offered only to insurance company separate accounts that fund certain variable life insurance contracts and variable annuity contracts. SSGA Funds Management, Inc. (“SSGA FM”) is the investment adviser and administrator of each of the Funds effective July 1, 2016. Prior to July 1, 2016, GE Asset Management Incorporated (“GEAM”) served as the investment adviser and administrator to each Fund.
The Company currently offers one share class (Class 1) of the Fund as an investment option for variable life insurance and variable annuity contracts.
| 2. | | Summary of Significant Accounting Policies |
The preparation of financial statements in conformity with U.S. generally accepted accounting principles (“GAAP”) requires management to make estimates and assumptions that affect the reported amounts of assets and liabilities and disclosure of contingent assets and liabilities at the date of the financial statements and the reported amounts of increases and decreases in net assets from operations during the reporting period. Actual results may differ from those estimates.
Subsequent events after the balance sheet date through the date the financial statements were issued have been evaluated in the preparation of the financial statements. There are no items to report.
The following summarizes the significant accounting policies of the Company:
Securities Valuation and Transactions All investments in securities are recorded at their estimated fair value, as described in Note 3.
Securities transactions are accounted for as of the trade date. Realized gains and losses on investments sold are recorded on the basis of identified cost for both financial statement and federal tax purposes.
Derivatives The Fund is subject to equity price risk in the normal course of pursuing its investment objectives. The Fund may enter into various types of derivative transactions (such as options, futures, and options on futures) to gain or hedge exposure to certain types of securities as an alternative to investing directly in or selling such securities.
Foreign Currency Accounting records of the Fund are maintained in U.S. dollars. Investment securities and other assets and liabilities denominated in a foreign currency are translated to U.S. dollars at the prevailing rates of exchange at period end. Purchases and sales of securities, income receipts and expense payments denominated in foreign currencies are translated into U.S. dollars at the prevailing exchange rate on the respective dates of such transactions.
| | |
| 14 | | Notes to Financial Statements |
State Street U.S. Equity V.I.S. Fund
Notes to Financial Statements, continued — December 31, 2016
All assets and liabilities of the Fund initially expressed in foreign currency values will be converted into U.S. dollars at the WM/Reuters exchange rate computed at 11:00 a.m., Eastern Time.
The Fund does not isolate the portion of the results of operations resulting from changes in foreign exchange rates from the fluctuations arising from changes in the market prices of securities during the year. Such fluctuations are included in the net realized or unrealized gain or loss from investments. Net realized gains or losses on foreign currency transactions represent net gains or losses on sales and maturities of foreign currency contracts, disposition of foreign currencies, the difference between the amount of net investment income and withholding taxes accrued and the U.S. dollar amount actually received or paid, and gains or losses between the trade and settlement date on purchases and sales of foreign securities. Net unrealized foreign exchange gains and losses arising from changes in the value of other assets and liabilities (including foreign currencies and open foreign currency contracts) as a result of changes in foreign exchange rates are included as increases or decreases in unrealized appreciation/depreciation on foreign currency related transactions.
Futures Contracts A futures contract is an agreement to buy or sell a specific amount of a commodity, financial instrument, currency or index at a particular price and future date. During the fiscal year ended December 31, 2016, the Fund invested in stock index futures contracts to gain equity exposure for accumulating and residual cash positions. Buying futures tends to increase the Fund’s exposure to the underlying instrument while selling futures tends to decrease the Fund’s exposure to the underlying instrument, or hedge other Fund investments. With futures contracts, there is minimal counterparty credit risk to the Fund since futures contracts are exchange traded and the exchange’s clearinghouse, as counterparty to all traded futures, guarantees the futures against default. The Fund’s risks in using these contracts include changes in the value of the underlying instruments, non-performance of the counterparties under the contracts’ terms and changes in the liquidity of the secondary market for the contracts. Futures contracts are valued at the settlement price established each day by the board of trade or exchange on which they principally trade.
Upon entering into a financial futures contract, the Fund is required to pledge to the broker an amount of cash and/or other assets equal to a certain percentage of the contract amount, known as initial margin deposit. Subsequent payments, known as variation margin, are made or received by the Fund each day, depending on the daily fluctuation in the fair value of the underlying security. The Fund records an unrealized gain or loss equal to the daily variation margin. Should market conditions move unexpectedly, the Fund may not achieve the anticipated benefits of the futures contracts and may incur a loss. The Fund recognizes a realized gain or loss on the expiration or closing of a futures contract.
Investment Income Corporate actions (including cash dividends) are recorded on the ex-dividend date, net of applicable withholding taxes, except for certain foreign corporate actions which are recorded as soon after the ex-dividend date as such information becomes available. Withholding taxes on foreign dividends, if any, have been provided for in accordance with the Fund’s understanding of the applicable country’s tax rules and rates.
Interest income is recorded on the accrual basis. Accretion of discounts and amortization of premiums on taxable bonds are to the call or maturity date, whichever is shorter, using the effective yield method.
Expenses Fund specific expenses are charged to the Fund that incurs such expenses. Such expenses may include custodial fees, legal and accounting fees, printing costs and registration fees. Expenses that are not fund specific are allocated pro rata across the Funds. Expenses of the Fund are generally paid directly by the Fund, however, expenses may be paid by the investment adviser and reimbursed by the Fund.
Federal Income Taxes The Fund intends to comply with all sections of the Internal Revenue Code of 1986, as amended (the “Internal Revenue Code”) applicable to regulated investment companies, including the distribution of substantially all of its taxable net investment income and net realized capital gains to its shareholders. Therefore, no provision for federal income tax has been made. The Fund is treated as a separate taxpayer for federal income tax purposes.
The Fund utilizes various methods to measure the fair value of most of its investments on a recurring basis. GAAP establishes a framework for measuring fair value and providing related disclosures. Broadly, the framework requires fair value to be determined based on the exchange price that would be received for an asset or paid to transfer a liability (an exit price) in the principal or most advantageous market for the asset or liability in an orderly transaction between market participants at the
| | | | |
| Notes to Financial Statements | | | 15 | |
State Street U.S. Equity V.I.S. Fund
Notes to Financial Statements, continued — December 31, 2016
measurement date. In the absence of active markets for the identical assets or liabilities, such measurements involve developing assumptions based on market observable data and, in the absence of such data, internal information that is consistent with what market participants would use in a hypothetical transaction that occurs at the measurement date. It also establishes a three-level valuation hierarchy based upon observable and non-observable inputs.
Observable inputs reflect market data obtained from independent sources, while unobservable inputs reflect our market assumptions. Preference is given to observable inputs. These two types of inputs create the following fair value hierarchy:
| | • | | Level 1 — Quoted prices for identical investments in active markets. |
| | • | | Level 2 — Quoted prices for similar investments in active markets; quoted prices for identical or similar investments in markets that are not active; and model-derived valuations whose inputs are observable or whose significant value drivers are observable. |
| | • | | Level 3 — Significant inputs to the valuation model are unobservable. |
Policies and procedures are maintained to value investments using the best and most relevant data available. In addition, pricing vendors are utilized to assist in valuing investments. The investment adviser performs periodic reviews of the methodologies used by independent pricing services including price validation of individual securities.
Fair Value Measurement The following section describes the valuation methodologies the Fund uses to measure different financial investments at fair value.
The Fund’s portfolio securities are valued generally on the basis of market quotations. Equity securities generally are valued at the last reported sale price on the primary market in which they are traded. Portfolio securities listed on NASDAQ are valued using the NASDAQ Official Closing Price. Level 1 securities primarily include publicly-traded equity securities, which may not necessarily represent the last sales price. If no sales occurred on the exchange or NASDAQ that day, the portfolio security generally is valued using the last reported bid price. In those circumstances, the Fund typically classifies the investment securities in Level 2.
Short-term securities of sufficient credit quality with remaining maturities of sixty days or less at the time of purchase are typically valued on the basis of amortized cost which approximates fair value and these are included in Level 2. If it is determined that amortized cost does not approximate fair value, securities may be valued based on dealer supplied valuations or quotations. In these infrequent circumstances, pricing services may provide the Fund with valuations that are based on significant unobservable inputs, and in those circumstances the investment securities are classified in Level 3.
Investments in registered investment companies are valued at the published daily net asset value (“NAV”) and classified in Level 1.
If prices are not readily available for a portfolio security, or if it is believed that a price for a portfolio security does not represent its fair value, the security may be valued using procedures approved by the Company’s Board of Directors that are designed to establish its “fair” value. These securities are typically classified in Level 3. Those procedures require that the fair value of a security be established by a valuation committee of the investment adviser. The valuation committee follows different protocols for different types of investments and circumstances. The fair value procedures may be used to value any investment of the Fund in the appropriate circumstances.
Fair value determinations generally are used for securities whose value is affected by a significant event that will materially affect the value of a security and which occurs subsequent to the time of the close of the principal market on which such security trades but prior to the calculation of the Fund’s NAV.
The value established for such a portfolio security valued other than by use of a market quotation (as described above) may be different than what would be produced through the use of market quotations or another methodology. Portfolio securities that are valued using techniques other than market quotations, including “fair valued” securities, may be subject to greater fluctuation in their value from one day to the next than would be the case if market quotations were used. In addition, there is no assurance that the Fund could sell a portfolio security for the value established for it at any time and it is possible that the Fund would incur a loss because a portfolio security is sold at a discount to its established value.
| | |
| 16 | | Notes to Financial Statements |
State Street U.S. Equity V.I.S. Fund
Notes to Financial Statements, continued — December 31, 2016
Other financial investments are derivative instruments that are not reflected in total investments, such as futures, forwards, swaps, and written options contracts, which are valued based on fair value as discussed above.
The Fund uses closing prices for derivatives included in Level 1, which are traded either on exchanges or liquid over-the-counter markets. Derivative assets and liabilities included in Level 2 primarily represent interest rate swaps, cross-currency swaps and foreign currency and commodity forward and option contracts. Derivative assets and liabilities included in Level 3 primarily represent interest rate products that contain embedded optionality or prepayment features.
The inputs or methodology used for valuing securities are not an indication of the risk associated with investing in those securities.
The following table presents the Fund’s investments measured at fair value on a recurring basis at December 31, 2016:
| | | | | | | | | | | | | | | | |
| Investments | | Level 1 | | | Level 2 | | | Level 3 | | | Total | |
Investments in Securities† | | | | | | | | | | | | | | | | |
Common Stock | | $ | 26,357,938 | | | $ | — | | | $ | — | | | $ | 26,357,938 | |
Short-Term Investments | | | 938,819 | | | | — | | | | — | | | | 938,819 | |
| | | | | | | | | | | | | | | | |
Total Investments in Securities | | $ | 27,296,757 | | | $ | — | | | $ | — | | | $ | 27,296,757 | |
| | | | | | | | | | | | | | | | |
| | | | |
Other Financial Instruments* | | | | | | | | | | | | | | | | |
Long Futures Contracts — Unrealized Depreciation | | $ | (3,209 | ) | | $ | — | | | $ | — | | | $ | (3,209 | ) |
| | | | | | | | | | | | | | | | |
| | † | See Schedule of Investments for Industry Classification. |
| | * | Other financial instruments include derivative instruments such as futures contracts. Amounts shown represent unrealized appreciation (depreciation), at period end. |
There were no transfers between fair value levels during the period. Transfers between fair value levels are recognized at the beginning of the period.
| 4. | | Derivatives Disclosure |
Shown below are the derivative contracts entered into by the Fund, summarized by primary risk exposure as they appear on the Statement of Assets and Liabilities, none of which are accounted for as hedging instruments under FASB ASC No. 815 Derivatives and Hedging (“ASC 815”) as of December 31, 2016.
| | | | | | | | | | | | |
| | | Asset Derivatives December 31, 2016 | | | Liability Derivatives December 31, 2016 | |
Derivatives not accounted for as
hedging instruments under ASC 815 | | Location in the Statement of Assets and Liabilities | | Fair
Value ($) | | | Location in the Statement of Assets and Liabilities | | Fair
Value ($) | |
| Equity Contracts | | Assets, Net Assets — Net Unrealized Appreciation/ (Depreciation) on Futures | | | — | | | Liabilities, Net Assets — Net Unrealized Appreciation/ (Depreciation) on Futures | | | (3,209 | ) |
Shown below are the effects of derivative instruments on the Fund’s Statement of Operations, summarized by primary risk exposure, none of which are accounted for as hedging instruments under ASC 815.
| | | | | | | | | | | | |
Derivatives not accounted
for as hedging instruments
under ASC 815 | | Location in the Statement of Operations | | Total Notional
Amount of Futures Contracts
Purchased/(Sold) ($) | | Realized Gain (Loss)
on Derivatives
Recognized in
Income ($) | | | Change in
Unrealized
Appreciation
(Depreciation)
on Derivatives
Recognized in Income ($) | |
| Equity Contracts | | Realized gain (loss) on Futures, Increase (decrease) in unrealized appreciation/ (depreciation) on Futures | | 6,470,318/
(6,485,021) | | | 28,083 | | | | (5,568 | ) |
During the fiscal year ended December 31, 2016, the Fund had an average notional value of $334,870 and $16,678 on long and short futures contracts, respectively. Please refer to the table following the Schedule of Investments for open futures contracts at December 31, 2016.
| | | | |
| Notes to Financial Statements | | | 17 | |
State Street U.S. Equity V.I.S. Fund
Notes to Financial Statements, continued — December 31, 2016
Prior to July 1, 2016, the Company shared a revolving credit facility of up to $150 million with a number of its affiliates. The credit facility was with the Company’s custodian bank, State Street Bank and Trust Company (“State Street”). The revolving credit facility required the payment of a commitment fee equal to 0.20% per annum on the daily unused portion of the credit facility, payable quarterly. The portion borne by each Fund generally was borne proportionally based upon net assets. Generally, borrowings under the credit facility would accrue interest at the higher of the 1-Month LIBOR plus 1.25% and the Overnight Federal Funds Rate plus 1.25% and would be borne by the borrowing Fund. The maximum amount allowed to be borrowed by any one Fund was the lesser of (i) 33.33% of its total assets or (ii) 20% of its net assets. The credit facility was not utilized by the Fund during the fiscal year ended December 31, 2016. The revolving credit facility with State Street was terminated effective June 30, 2016.
Currently, the Funds and other affiliated funds (each a “Participant” and, collectively, the “Participants”) participate in a $360 million revolving credit facility provided by a syndication of banks under which the Participants may borrow to fund shareholder redemptions. This agreement expires October 12, 2017, unless extended or renewed.
The Participants are charged an annual commitment fee which is calculated based on the unused portion of the shared credit line. Commitment fees are allocated among each of the Participants based on relative net assets. A Participant incurs and pays the interest expense related to its borrowing. Interest is calculated at a rate per annum equal to the sum of 1% plus the greater of the New York Fed Bank Rate and 1-month LIBOR rate. From July 1, 2016, the date the Funds were added to this credit facility, through October 12, 2016, interest was calculated at a rate per annum equal to the sum of the New York Fed Bank Rate plus 1%.
The credit facilities were not utilized by the Fund during the fiscal year ended December 31, 2016.
| 6. | | Compensation and Fees Paid to Affiliates |
SSGA FM, a registered investment adviser, was retained by the Company’s Board of Directors effective July 1, 2016 to act as investment adviser and administrator of the Fund. SSGA FM’s compensation for investment advisory and administrative services (“Management Fee”) is paid monthly based on the average daily net assets of the Fund at an annualized rate of 0.55%.
State Street serves as sub-administrator and custodian to the funds. Amounts paid by the Fund to State Street for performing such services are included in the advisory and administration and custody and accounting expenses, respectively.
Prior to July 1, 2016, GEAM served as the Fund’s investment adviser and administrator and the Fund paid GEAM a Management Fee at an annualized rate of 0.55%.
Directors’ Compensation The Fund pays no compensation to its Directors who are officers or employees of SSGA FM or its affiliates. Directors who are not such officers or employees also serve in a similar capacity for other funds advised by SSGA FM. Compensation paid to non-interested Directors is reflected on the Statement of Operations. These fees are allocated pro rata across all of the mutual fund platforms served by the Directors, including the Fund, and are based upon the relative net assets of each fund within such platforms. (For additional information about Directors’ compensation, please refer to the Funds’ Statement of Additional Information.)
Other Transactions with Affiliates In December 2015, State Street announced a review of the manner in which it invoiced certain expenses to certain of its Investment Servicing clients, primarily in the United States, during an 18-year period going back to 1998 and its determination that it had incorrectly invoiced clients for certain expenses. State Street informed its clients that it will pay to them the expenses it concluded were incorrectly invoiced to them, plus interest.
The Fund was impacted by this matter. The amounts in the table below represent the refunded expenses and interest received by the Fund for the periods in question.
| | | | | | | | | | | | | | | | | | |
Refunded
Custody
Expense* | | Interest* | | Total | | % of Net
Assets at
12/31/16 |
| | | | | | | | | | | | | | | | | | | |
| | $ | 3,612 | | | | $ | 2,212 | | | | $ | 5,824 | | | | | 0.021% | |
| | * | Refunded Custody Expense and Interest appear on the Statements of Operations in Custody and Accounting expenses — net and Interest income, respectively. |
| | |
| 18 | | Notes to Financial Statements |
State Street U.S. Equity V.I.S. Fund
Notes to Financial Statements, continued — December 31, 2016
| 7. | | Investment Transactions |
Purchases and Sales of Securities The cost of purchases and the proceeds from sales of investments, other than short-term securities, for the fiscal year ended December 31, 2016, were as follows:
| | | | | | | | |
| Non-U.S. Government Securities |
| Purchases | | Sales |
| | | | | | | | | |
| | $ | 10,159,191 | | | | $ | 16,355,629 | |
Affiliated Investments The Fund may invest in affiliated entities, including securities issued by State Street, affiliated funds, or entities deemed to be affiliates as a result of the Fund owning more than five percent of the entity’s voting securities or outstanding shares. Amounts relating to these transactions during the fiscal year ended December 31, 2016 are disclosed in the Schedule of Investments.
The Fund is subject to ASC 740, Income Taxes (“ASC 740”). ASC 740 provides guidance for financial accounting and reporting for the effects of income taxes that result from an entity’s activities during the year. ASC 740 also provides guidance regarding how uncertain tax positions should be recognized, measured, presented and disclosed in the financial statements. ASC 740 requires evaluation of tax positions taken or expected to be taken in the course of preparing the Fund’s tax returns to determine whether the tax positions are “more likely than not” of being sustained by the applicable tax authority. There are no adjustments to the Fund’s net assets required under ASC 740. The Fund’s 2013, 2014, 2015, and 2016 fiscal year tax returns are still open to examination by the Federal and applicable state tax authorities.
At December 31, 2016, information on the tax cost of investments and distributable earnings on a tax basis was as follows:
| | | | | | | | | | | | | | | | | | | | | | | | | | | | | | | | | | | | | | |
Cost of
Investments
For Tax
Purposes | | Gross Tax | | Net Tax
Appreciation/
(Depreciation) | | Undistributed
Income | | Undistributed
Accum.
Capital
Gain/(Loss) | | Late-Year
Losses |
| | Appreciation | | Depreciation | | Investments | | Derivatives/
Currency | | | |
| | | | | | | | | | | | | | | | | | | | | | | | | | | | | | | | | | | | | | | |
| | $ | 23,323,894 | | | | $ | 4,543,572 | | | | $ | (570,709 | ) | | | $ | 3,972,863 | | | | $ | — | | | | $ | 2,483 | | | | $ | 283,485 | | | | $ | — | |
As of December 31, 2016, the Fund had no capital loss carryovers. Capital loss carryovers are available to offset future realized capital gains to the extent provided in the Internal Revenue Code and regulations thereunder. To the extent that these carryover losses are used to offset future capital gains, it is probable that the gains offset will not be distributed to shareholders because they would be taxable as ordinary income.
Any qualified late-year loss is deemed to arise on the first day of the Fund’s next tax year (if the Fund elects to defer such loss). Under this regime, generally, the Fund can elect to defer any post-October capital loss and/or any late-year ordinary loss as defined by the Internal Revenue Code.
The Fund incurred no such losses for the fiscal year ended December 31, 2016.
The tax character of distributions paid during the years ended December 31, 2016 and December 31, 2015 were as follows:
| | | | | | | | | | | | | | | | | | |
| Year | | Ordinary
Income | | Long-Term
Capital Gains | | Total |
| | | 2016 | | | | $ | 320,358 | | | | $ | 2,161,189 | | | | $ | 2,481,547 | |
| | | 2015 | | | | | 349,409 | | | | | 3,073,095 | | | | | 3,422,504 | |
Distributions to Shareholders The Fund declares and pays any dividends from net investment income annually. The Fund declares and pays any net realized capital gains in excess of capital loss carryforwards distributions annually. The character of income and gains to be distributed is determined in accordance with income tax regulations which may differ from GAAP. These differences include (but are not limited to) distributions from Real Estate Investment Trusts, return of capital from securities, losses deferred due to wash sales transactions and investments in futures. Reclassifications due to permanent book/tax differences are made to the Fund’s capital accounts to reflect income and gains available for distribution (or available capital loss carryovers) under income tax regulations. These reclassifications have no impact on net investment income, realized gains or losses, or the NAV of the Fund. The calculation of net investment income per share in the Financial Highlights table excludes these adjustments.
| | | | |
| Notes to Financial Statements | | | 19 | |
State Street U.S. Equity V.I.S. Fund
Notes to Financial Statements, continued — December 31, 2016
The reclassifications for the fiscal year ended December 31, 2016 were as follows:
| | | | | | | | | | | | | |
Undistributed
Net Investment
Income | | Accumulated
Net Realized
Gain (Loss) | | Capital
Paid In |
| | | | | | | | | | | | | | |
| | $ | (2,460 | ) | | | $ | 2,460 | | | | $ | — | |
KPMG LLP (“KPMG”) served as the independent registered certified public accounting firm of the Company through its resignation as of June 30, 2016. On September 9, 2016, upon recommendation by the Audit Committee of the Company, the Company’s Board of Directors selected Ernst & Young LLP (“EY”) to replace KPMG as the independent public accountant for the fiscal year ended December 31, 2016.
The reports of KPMG on the financial statements for the fiscal years ended December 31, 2014 and December 31, 2015 contained no adverse opinion or disclaimer of opinion and were not qualified or modified as to uncertainty, audit scope or accounting principles.
During the Company’s fiscal years ended December 31, 2014 and December 31, 2015 and through the period ended June 30, 2016, there were no disagreements with KPMG on any matter of accounting principles or practices, financial statement disclosure, or auditing scope or procedure, which disagreements if not resolved to the satisfaction of KPMG would have caused them to make reference thereto in their reports on the financial statements for such years or periods.
During the Company’s fiscal years ended December 31, 2014 and December 31, 2015 and through the period ended June 30, 2016, there were no reportable events (as defined in Item 304(a)(1)(v) of Regulation S-K). The Funds requested and KPMG furnished a letter addressed to the Securities and Exchange Commission stating whether or not it agreed with the above statements. A copy of such letter was filed as Exhibit 77 to Form N-SAR for the period ended December 31, 2016.
During the Company’s fiscal years ended December 31, 2014 and December 31, 2015 and through September 9, 2016, neither the Company nor anyone on its behalf has consulted EY on items which: (i) concerned the application of accounting principles to a specified transaction, either completed or proposed, or the type of audit opinion that might be rendered on the Company’s financial statements or (ii) concerned the subject of a disagreement (as defined in paragraph (a)(1)(iv) of Item 304 of Regulations S-K) or reportable events (as described in paragraph (a)(1)(v) of said Item 304).
| | |
| 20 | | Notes to Financial Statements |
State Street U.S. Equity V.I.S. Fund
Report of Independent Registered Public Accounting Firm
To the Board of Directors of State Street Variable Insurance Series Funds, Inc. and Shareholders of State Street U.S. Equity V.I.S. Fund:
We have audited the accompanying statement of assets and liabilities of the State Street U.S. Equity V.I.S. Fund (formerly GE Investments U.S. Equity Fund) (one of the funds constituting State Street Variable Insurance Series Funds, Inc. (formerly GE Investment Funds, Inc.)) (the “Fund”), including the schedule of investments, as of December 31, 2016, and the related statements of operations, changes in net assets and the financial highlights for the year then ended. These financial statements and financial highlights are the responsibility of the Fund’s management. Our responsibility is to express an opinion on these financial statements and financial highlights based on our audit. The statement of changes in net assets for the year ended December 31, 2015 and the financial highlights for periods ended prior to January 1, 2016 were audited by another independent registered public accounting firm whose report, dated February 19, 2016, expressed an unqualified opinion on that statement of changes in net assets and those financial highlights.
We conducted our audit in accordance with the standards of the Public Company Accounting Oversight Board (United States). Those standards require that we plan and perform the audit to obtain reasonable assurance about whether the financial statements and financial highlights are free of material misstatement. We were not engaged to perform an audit of the Fund’s internal control over financial reporting. Our audit included consideration of internal control over financial reporting as a basis for designing audit procedures that are appropriate in the circumstances, but not for the purpose of expressing an opinion on the effectiveness of the Fund’s internal control over financial reporting. Accordingly, we express no such opinion. An audit also includes examining, on a test basis, evidence supporting the amounts and disclosures in the financial statements and financial highlights, assessing the accounting principles used and significant estimates made by management, and evaluating the overall financial statement presentation. Our procedures included confirmation of securities owned as of December 31, 2016, by correspondence with the custodian and brokers or by other appropriate auditing procedures where replies from brokers were not received. We believe that our audit provides a reasonable basis for our opinion.
In our opinion, the financial statements and financial highlights referred to above present fairly, in all material respects, the financial position of the State Street U.S. Equity V.I.S. Fund (one of the funds constituting State Street Variable Insurance Series Funds, Inc.) at December 31, 2016, the results of its operations, changes in its net assets and the financial highlights for the year then ended, in conformity with U.S. generally accepted accounting principles.

Boston, Massachusetts
February 17, 2017
| | | | |
| Report of Independent Registered Public Accounting Firm | | | 21 | |
State Street U.S. Equity V.I.S. Fund
Tax Information — December 31, 2016 (Unaudited)
For the year ended December 31, 2016, the Fund hereby designates $2,161,189 as capital gain dividends, or the amount ultimately treated as capital gain net income.
The amounts presented herein may differ from amounts presented elsewhere in the financial statements due to differences between tax and financial accounting principles. Please consult a tax advisor if you have any questions about Federal or State income tax laws or on how to prepare your tax returns. If you have specific questions about your Fund account, please consult your investment representative.
State Street U.S. Equity V.I.S. Fund
Special Meeting of Shareholders — Voting Results (Unaudited)
On November 2, 2016, the State Street Variable Insurance Series Funds, Inc. (formerly known as GE Investments Funds, Inc.) (the “Company”) held a special meeting of shareholders of each series portfolio of the Company (collectively, the “Funds”), including shareholders of the State Street U.S. Equity V.I.S. Fund (formerly known as the U.S. Equity Fund) (the “Fund”). Shareholders of record on August 31, 2016 were entitled to vote on the proposals. For each proposal shareholders of all Funds voted together and not by Fund or share class. At the meeting, all proposals were approved by the Fund’s shareholders and the following votes were recorded:
Proposal 1:
Approval of an amendment to the Articles of Incorporation of the Company to change the name of the Company from GE Investments Funds, Inc. to State Street Variable Insurance Series Funds, Inc.
Company Votes:
| | | | | | | | | | | | |
| | | No. of Shares | | | % of Outstanding Shares | | | % of Shares Present | |
Affirmative | | | 129,623,837.819 | | | | 89.283 | % | | | 89.283 | % |
Against | | | 10,047,818.534 | | | | 6.921 | % | | | 6.921 | % |
Abstain | | | 5,511,041.282 | | | | 3.796 | % | | | 3.796 | % |
Total | | | 145,182,697.634 | | | | 100.000 | % | | | 100.000 | % |
Fund votes:
| | | | | | | | | | | | |
| | | No. of Shares | | | % of Outstanding Shares | | | % of Shares Present | |
Affirmative | | | 517,361.484 | | | | 83.142 | % | | | 83.142 | % |
Against | | | 94,510.958 | | | | 15.188 | % | | | 15.188 | % |
Abstain | | | 10,391.856 | | | | 1.670 | % | | | 1.670 | % |
Total | | | 622,264.299 | | | | 100.000 | % | | | 100.000 | % |
Proposal 2:
Approval of an amendment to the Articles of Incorporation of the Company to permit the Board of Directors to change the name of the Company without seeking shareholder approval.
Company votes:
| | | | | | | | | | | | |
| | | No. of Shares | | | % of Outstanding Shares | | | % of Shares Present | |
Affirmative | | | 118,220,823.871 | | | | 81.429 | % | | | 81.429 | % |
Against | | | 21,486,028.150 | | | | 14.799 | % | | | 14.799 | % |
Abstain | | | 5,475,845.611 | | | | 3.772 | % | | | 3.772 | % |
Total | | | 145,182,697.634 | | | | 100.000 | % | | | 100.000 | % |
Fund votes:
| | | | | | | | | | | | |
| | | No. of Shares | | | % of Outstanding Shares | | | % of Shares Present | |
Affirmative | | | 472,318.444 | | | | 75.903 | % | | | 75.903 | % |
Against | | | 139,115.018 | | | | 22.356 | % | | | 22.356 | % |
Abstain | | | 10,830.836 | | | | 1.741 | % | | | 1.741 | % |
Total | | | 622,264.299 | | | | 100.000 | % | | | 100.000 | % |
| | | | |
| Special Meeting of Shareholders — Voting Results | | | 23 | |
State Street U.S. Equity V.I.S. Fund
Additional Information — December 31, 2016 (Unaudited)
Information about Directors and Executive Officers:
The business and affairs of the Fund are managed under the direction of the Fund’s Board of Directors. Information pertaining to the Directors and officers of the Fund is set forth below. Matthew J. Simpson resigned as a Director of the Fund effective June 30, 2016.
| | | | | | | | | | | | |
Name,
Address,
and Age | | Position(s) Held
with Fund | | Term of
Office and
Length of
Time Served | | Principal Occupation(s)
During Past 5 Years | | Number of
Portfolios
in Fund
Complex
Overseen
by Director | | | Other Directorships Held by Director |
INTERESTED DIRECTORS AND EXECUTIVE OFFICERS |
Jeanne M. La Porta c/o SSGA FM 1600 Summer St. Stamford, CT 06905 Age 51 | | Director and President | | Until successor is elected and qualified – 2 years | | Senior Managing Director at State Street Global Advisors since July 2016; President of GE Retirement Savings Plan Funds since July 2016; Senior Vice President and Commercial Operations Leader at GEAM from March 2014 to July 2016; President of State Street Institutional Funds and State Street Variable Insurance Series Funds, Inc. since April 2014; President and Trustee of GEAM’s UCITs Funds from March 2014 to November 2014; Senior Vice President and Commercial Administrative Officer at GEAM from April 2010 to March 2014; Vice President of State Street Institutional Funds from July 2003 to April 2014; Vice President of Elfun Funds from October 2003 to July 2016; Vice President of GE Retirement Savings Plan Funds from October 2003 to July 2016; Secretary of GE Funds from July 2007 to September 2010 and Vice President from July 2007 to February 2011; Senior Vice President and Deputy General Counsel of GEAM from October 2007 to April 2010; Vice President and Assistant Secretary of Elfun Funds and GE Retirement Savings Plan Funds from July 2003 to June 2010; and Vice President and Associate General Counsel – Marketing and Client Services (formerly Asset Management Services) at GEAM from May 1997 to October 2007. | | | 22 | | | Trustee and President of State Street Institutional Funds since 2014; Trustee of Elfun Funds since 2014. |
| | |
| 24 | | Additional Information |
State Street U.S. Equity V.I.S. Fund
Additional Information, continued — December 31, 2016 (Unaudited)
| | | | | | | | | | | | |
Name,
Address,
and Age | | Position(s) Held
with Fund | | Term of
Office and
Length of
Time Served | | Principal Occupation(s)
During Past 5 Years | | Number of
Portfolios
in Fund
Complex
Overseen
by Director | | | Other Directorships Held by Director |
INTERESTED DIRECTORS AND EXECUTIVE OFFICERS (continued) |
JoonWon Choe c/o SSGA FM 1600 Summer St. Stamford, CT 06905 Age 47 | | Vice President & Secretary | | Until successor is elected and qualified – 6 years | | Managing Director and Managing Counsel at State Street Global Advisors since July 2016; Senior Vice President and Deputy General Counsel at GEAM from March 2011 to July 2016; Vice President and Secretary of State Street Institutional Funds since September 2010; Vice President and Assistant Secretary of GE Retirement Savings Plan Funds since September 2010; Vice President and Assistant Secretary of Elfun Funds from September 2010 to July 2016; Senior Vice President and Associate General Counsel at GEAM from June 2010 to March 2011; Vice President and Associate General Counsel of GEAM from November 2005 to June 2010; and Vice President and Secretary of GE Funds from September 2010 to February 2011. | | | N/A | | | N/A |
| | | | | | | | | | | | | |
Robert Herlihy c/o SSGA FM 1600 Summer St. Stamford, CT 06905 Age 49 | | Chief Compliance Officer | | Until successor is elected and qualified – 11 years | | Managing Director at State Street Global Advisors since July 2016; Deputy Chief Compliance Officer of Elfun Funds since July 2016; Chief Compliance Officer of State Street Institutional Funds and GE Retirement Savings Plan Funds since July 2005; Chief Compliance Officer of GEAM and Elfun Funds from July 2005 to July 2016; Chief Compliance Officer of GE Funds from July 2005 to February 2011; and Manager of Fund Administration at GEAM from 2002-2005. | | | N/A | | | N/A |
| |
Arthur A. Jensen c/o SSGA FM 1600 Summer St. Stamford, CT 06905 Age 50 | | Treasurer | | Until successor is elected and qualified – 5 years | | Vice President at State Street Global Advisors since July 2016; Deputy Treasurer of Elfun Funds since July 2016; Treasurer of State Street Institutional Funds and GE Retirement Savings Plan Funds since June 2011; Treasurer of Elfun Funds from June 2011 to July 2016; Mutual Funds Controller of GEAM from April 2011 to July 2016; Senior Vice President at Citigroup from 2008 to 2010; and Vice President at JPMorgan from 2005 to 2008. | | | N/A | | | N/A |
| | | | |
| Additional Information | | | 25 | |
State Street U.S. Equity V.I.S. Fund
Additional Information, continued — December 31, 2016 (Unaudited)
| | | | | | | | | | | | |
Name,
Address,
and Age | | Position(s) Held
with Fund | | Term of
Office and
Length of
Time Served | | Principal Occupation(s)
During Past 5 Years | | Number of
Portfolios
in Fund
Complex
Overseen
by Director | | | Other Directorships Held by Director |
INTERESTED DIRECTORS AND EXECUTIVE OFFICERS (continued) |
Brian Harris c/o SSGA FM State Street Financial Center
One Lincoln Street Boston, MA 02111-2900 Age 43 | | Deputy Chief Compliance Officer | | Until successor is elected and qualified – less than 1 year | | Managing Director, State Street Global Advisors and SSGA Funds Management, Inc. (June 2013 – present)*; Senior Vice President and Global Head of Investment Compliance, BofA Global Capital Management (2010-2013); Director of Compliance, AARP Financial Inc. (2008-2010). | | | N/A | | | N/A |
| | | | | | | | | | | | | |
Bruce S. Rosenberg c/o SSGA FM State Street Financial Center
One Lincoln Street Boston, MA 02111-2900 Age 55 | | Assistant Treasurer | | Until successor is elected and qualified – less than 1 year | | Managing Director, State Street Global Advisors and SSGA Funds Management, Inc. (July 2015 – present); Director, Credit Suisse (April 2008 – July 2015). | | | N/A | | | N/A |
| |
Ann M. Carpenter c/o SSGA FM State Street Financial Center
One Lincoln Street Boston, MA 02111-2900 Age 50 | | Assistant Treasurer | | Until successor is elected and qualified – less than 1 year | | Chief Operating Officer, SSGA Funds Management, Inc. (April 2014 – present); Managing Director, State Street Global Advisors and SSGA Funds Management, Inc. (2005 – present).* | | | N/A | | | N/A |
| |
Chad C. Hallett c/o SSGA FM State Street Financial Center
One Lincoln Street Boston, MA 02111-2900 Age 47 | | Assistant Treasurer | | Until successor is elected and qualified – less than 1 year | | Vice President, State Street Global Advisors and SSGA Funds Management, Inc. (November 2014 – present); Vice President, State Street Bank and Trust Company (2001 – November 2014). | | | N/A | | | N/A |
| |
NON-INTERESTED DIRECTORS |
John R. Costantino c/o SSGA FM 1600 Summer St. Stamford, CT 06905 Age 70 | | Chairman of the Board | | Until successor is elected and qualified – 20 years | | General Partner, NGN Capital LLC since 2006; and Managing Director, Vice President of Walden Capital Management since 1996. | | | 16 | | | Trustee of State Street Institutional Funds since 1997; Trustee of Fordham University from 1989 to 1995 and from 2001 to 2007 and Trustee Emeritus since 2007; Trustee of NeuroScience Research Institute since 1986; Trustee of GE Funds from 1993 to February 2011; Director of Artes Medical from 2006 to 2008; and Trustee of Gregorian University Foundation from 1992 to 2007. |
| * | Served in various capacities and/or with various affiliated entities during noted time period. |
| | |
| 26 | | Additional Information |
State Street U.S. Equity V.I.S. Fund
Additional Information, continued — December 31, 2016 (Unaudited)
| | | | | | | | | | | | |
Name,
Address,
and Age | | Position(s) Held
with Fund | | Term of
Office and
Length of
Time Served | | Principal Occupation(s)
During Past 5 Years | | Number of
Portfolios
in Fund
Complex
Overseen
by Director | | | Other Directorships Held by Director |
NON-INTERESTED DIRECTORS (continued) |
R. Sheldon Johnson c/o SSGA FM 1600 Summer St. Stamford, CT 06905 Age 70 | | Director | | Until successor is elected and qualified – 5 years | | Retired, 2006 to present; Head of Global Institutional Equity Sales and Marketing at Morgan Stanley & Co., Inc. from 2002 to 2006 and Managing Director at Morgan Stanley & Co., Inc. from 1988 to 2006. | | | 16 | | | Trustee of State Street Institutional Funds since April 2011 and Trustee of St. Lawrence University since 2003. |
| | | | | | | | | | | | | |
Donna M. Rapaccioli c/o SSGA FM 1600 Summer St. Stamford, CT 06905 Age 54 | | Director | | Until successor is elected and qualified – 5 years | | Dean of the Gabelli School of Business since 2007 and Accounting professor since 1987 at Fordham University. | | | 16 | | | Trustee of State Street Institutional Funds since January 2012 and Trustee of Emmanuel College since 2010. |
The Statement of Additional Information for the Funds includes additional information about the Directors and Officers and is available, without charge, upon request by calling 1-800-242-0134.
| | | | |
| Additional Information | | | 27 | |
State Street U.S. Equity V.I.S. Fund
Investment Team (Unaudited)
Investment Adviser and Administrator
SSGA Funds Management, Inc.
Board of Directors
John R. Costantino, Chairman
R. Sheldon Johnson
Jeanne M. La Porta
Donna M. Rapaccioli
Secretary
JoonWon Choe
Chief Compliance Officer
Robert Herlihy
Deputy Chief Compliance Officer
Brian Harris
Treasurer
Arthur A. Jensen
Assistant Treasurers
Bruce S. Rosenberg
Ann M. Carpenter
Chad C. Hallett
Distributor
State Street Global Markets, LLC
Member FINRA and SIPC
Custodian
State Street Bank and Trust Company
Investment Adviser
SSGA Funds Management, Inc.
1600 Summer Street
Stamford, CT 06905
or at:
P.O. Box 7900
Stamford, CT 06904-7900
Distributor
State Street Global Markets, LLC
Member FINRA and SIPC
State Street Financial Center
One Lincoln Street
Boston, MA 02111
www.ssga.com/geam
The Fund files its complete schedule of portfolio holdings with the Securities and Exchange Commission for the first and third quarters of each fiscal year on Form N-Q. The Fund’s Forms N-Q, as well as a description of the policies and procedures that the Fund uses to determine how to vote proxies (if any) relating to portfolio securities is available without charge (i) upon request, by calling 1-800-242-0134; (ii) on the Fund’s website at http://www.ssga.com/geam; and (iii) on the Commission’s website at http://www.sec.gov. The Fund’s Forms N-Q may be reviewed and copied at the Commission’s Public Reference Room in Washington, DC — information on the operation of the Public Reference Room may be obtained by calling 1-800-SEC-0330.
Information (if any) regarding how the Fund voted proxies relating to portfolio securities during the most recently disclosed 12-month period ended June 30 is available without charge (i) through the Fund’s website at http://www.ssga.com/geam; and (ii) on the Commission’s website at http://www.sec.gov.
IBG-22839
Annual Report
December 31, 2016
State Street Total Return V.I.S. Fund
(formerly the GE Investments Total Return Fund)

State Street Total Return V.I.S Fund
Annual Report
December 31, 2016
Table of Contents
This report is prepared for Policyholders of certain variable contracts and may be distributed to others only if preceded or accompanied by the variable contract’s current prospectus and the current summary prospectus of the Fund available for investments thereunder.
State Street Total Return V.I.S. Fund
Notes to Performance — December 31, 2016 (Unaudited)
The information provided on the performance page relates to the State Street Total Return V.I.S Fund (the “Fund”).
Total return performance shown in this report for the Fund takes into account changes in share price and assumes reinvestment of dividends and capital gains distributions, if any. Total returns shown are net of Fund fees and expenses but do not reflect fees and charges associated with the variable contracts such as administrative fees, account charges and surrender charges, which, if reflected, would reduce the Fund’s total returns for all periods shown.
The performance data quoted represents past performance; past performance does not guarantee future results. Investment return and principal value will fluctuate so your shares, when redeemed, may be worth more or less than their original cost. Current performance may be higher or lower than the performance data quoted. Periods less than one year are not annualized. Please call toll-free (800) 242-0134 or visit the Fund’s website at http://www.ssga.com/geam for the most recent month-end performance data.
An investment in the Fund is not a deposit of any bank and is not insured or guaranteed by the Federal Deposit Insurance Corporation (“FDIC”) or any other government agency. An investment in the Fund is subject to risk, including possible loss of principal invested.
The S&P 500® Index is an unmanaged, market capitalization-weighted index of stocks of 500 large U.S. companies, which is widely used as a measure of large-cap U.S. stock market performance.
The Morgan Stanley Capital International All Country World Index ex-U.S. (“MSCI® ACWI ex-U.S.”) is a market-capitalization weighted index designed to provide a broad measure of stock performance throughout the world, with the exception of U.S.-based companies. The MSCI® ACWI ex-U.S. Index includes both developed and emerging markets.
The Bloomberg Barclays U.S. Aggregate Bond Index is an unmanaged market value-weighted index of taxable investment grade debt issues, including government, corporate, asset-backed and mortgage-backed securities, with maturities of one year or more. This index is designed to represent the performance of the U.S. investment-grade first rate bond market.
The results shown for the foregoing indices assume the reinvestment of net dividends or interest and do not reflect fees, expenses, or taxes. As such, the index returns do not reflect the actual cost of investing in the instruments that comprise each index.
The peer universe of the underlying annuity funds used for the peer group average annual total return calculation is based on a blend of Morningstar peer categories, as shown. Morningstar is an independent mutual fund rating service. The Fund’s performance may be compared to or ranked within a universe of mutual funds with investment objectives and policies similar but not necessarily identical to that of the Fund.
©2017 Morningstar, Inc. All Rights Reserved. The Morningstar information contained herein: (1) is proprietary to Morningstar and/or its content providers; (2) may not be copied or distributed; and (3) is not warranted to be accurate, complete or timely. Neither Morningstar nor its content providers are responsible for any damage or losses relating from any use of this information. Past performance is no guarantee of future results.
The views expressed in this document reflect our judgment as of the publication date and are subject to change at any time without notice.
State Street Global Markets, LLC, member of FINRA & SIPC is the principal underwriter and distributor of the State Street V.I.S. Funds and a wholly owned subsidiary of State Street Corporation. References to State Street may include State Street Corporation and its affiliates. The Funds pay State Street Bank and Trust Company for its services as custodian and Fund Accounting agent, and pay SSGA Funds Management, Inc. for investment advisory and administrative services.
State Street Total Return V.I.S. Fund
Portfolio Management Discussion and Analysis — December 31, 2016 (Unaudited)
| Q. | How did the State Street Total Return V.I.S. Fund perform compared to its benchmark and Morningstar peer group for the twelve-month period ended December 31, 2016? |
| A. | For the twelve-month period ended December 31, 2016, the State Street Total Return V.I.S. Fund returned 6.35% for Class 1 shares and 6.08% for Class 3 shares. The Fund’s broad based benchmarks, the S&P 500® Index (the “S&P 500 Index”), the MSCI® All Country World ex-U.S. Index, and the Bloomberg Barclays U.S. Aggregate Bond Index returned 11.96%, 4.50% and 2.65%, respectively. The Fund’s Morningstar peer group of 348 U.S. Insurance Fund Moderate Allocation funds returned an average of 6.47% over the same period. |
| Q. | What market factors affected the Fund’s performance? |
| A. | 2016 presented a range of challenges and opportunities for investors. After starting the year with considerable weakness in January and February, risk asset markets rebounded sharply. The growth fears that dominated those early weeks gave way to expectations for a more stable, though still subdued macro backdrop. For bond markets this led to continued declines in government bond yields, while equity markets were generally well supported by growth as well as accommodative central bank expectations. |
| | As the year progressed, two main events dominated returns and the macro backdrop — the United Kingdom’s June 2016 referendum vote to withdraw from the European Union (the “BREXIT Vote”) and the U.S. presidential election. In the end, both events produced short-term spikes in market volatility. Following the BREXIT Vote, equity markets were weak for a short time before recovering. However, the weakness in British Pound and, to a lesser extent, the euro was longer lasting given the political and economic uncertainty that followed. |
| | Following the U.S. presidential election, equity market weakness was confined to a few hours before giving way to a strong positive move through the end of the year driven by stronger growth expectations. Forecasts for more favorable fiscal policy courtesy of increased spending and tax cuts plus less regulation played a large role in this move, which also drove substantial outperformance of U.S. equities relative to international markets. Moreover, a sharp appreciation of the dollar through that time contributed to U.S. dollar-based outperformance. Finally, stronger growth and inflation expectations, alongside a related rise in expectations for tighter Federal Reserve policy in 2017 resulted in a sharp rise in U.S. Treasury yields in the fourth quarter. In the end, rates were not much changed for the year, but did experience a big move in the fourth quarter while U.S. equities posted a solid gain for all of 2016. |
| Q. | What were the primary drivers of Fund performance? |
| A. | For the year as a whole, the biggest positive driver of returns came from U.S. equities which rose more than 10%, with solid gains in the fourth quarter. While a smaller allocation in the overall fund, mid-cap equity markets rose more than 20% in 2016, with a gain of over 7% in the fourth quarter. Fixed income markets produced modest gains of less than 3% in 2016. However, the fourth quarter was much to blame for the full year result, with a decline of over 3% in the quarter on the back of rising interest rates. Finally, international equity markets lagged the U.S. considerably for the year, leading to a modest positive return in the aggregate for the asset class. |
| | Relative to our strategic benchmark, our underweight allocation to fixed income was a positive to performance given the weak returns in the asset class. Moreover, our overweight allocation to US equities was a positive contributor. Our overweight allocation to cash acted as a drag on performance, though only modestly given the corresponding underweight position in fixed income. |
| | Within tactical overlay positions, a short U.S. equity futures position late in the year to protect against market volatility acted as a modest detractor to overall returns. Meanwhile a tactical position to U.S. high yield bonds yielded a positive contribution for the fourth quarter and for the year as a whole. |
| Q. | Were there any significant changes to the Fund during the period? |
| A. | There were no major changes to the Fund in the year. Allocation shifts within and across asset classes were consistent with historical moves. In the fourth quarter, we did modestly add to our fixed income allocation in response to higher interest rates, though we remain substantially underweight. |
| | |
| 2 | | State Street Total Return V.I.S. Fund |
State Street Total Return V.I.S. Fund
Understanding Your Fund’s Expenses — December 31, 2016 (Unaudited)
As a shareholder of the Fund, you incur ongoing costs. Ongoing costs include portfolio management fees, distribution and service fees, professional fees, administrative fees and other Fund expenses. The following example is intended to help you understand your ongoing costs (in dollars) of investing in the Fund and to compare these costs with the ongoing costs of investing in other mutual funds.
To illustrate these ongoing costs, we have provided an example and calculated the expenses paid by investors in each share class of the Fund during the period. The information in the following table is based on an investment of $1,000, which is invested at the beginning of the period and held for the entire six-month period ended December 31, 2016.
Actual Expenses
The first section of the table provides information about actual account values and actual expenses. You may use the information in this section, together with the amount you invested, to estimate the expenses that you paid over the period. To do so, simply divide your account value by $1,000 (for example, an $8,600 account value divided by $1,000 = 8.6), then multiply the result by the number given under the heading “Expenses paid during the period” to estimate the expenses you paid on your account during the period.
Hypothetical Example for Comparison Purposes
The second section of the table provides information about hypothetical account values and hypothetical expenses based on the Fund’s actual expense ratio and an assumed rate of return of 5% per year before expenses, which is not the Fund’s actual return. The hypothetical account values and expenses may not be used to estimate the actual ending account balance or expenses you paid for the period. You may use this information to compare the ongoing costs of investing in the Fund and other funds. To do so, compare this 5% hypothetical example with the 5% hypothetical examples that appear in the shareholder reports of other funds.
Please note that the expenses shown in the table are meant to highlight and help you compare ongoing costs only and do not reflect transaction costs, such as sales charges or redemption fees, if any. Therefore, the second section of the table is useful in comparing ongoing costs only, and will not help you determine the relative total costs of owning different funds. Additionally, the expenses shown do not reflect the fees or charges associated with variable contracts through which shares of the Fund are offered.
| | | | | | | | |
Class 1 | | Actual
Fund Return | | | Hypothetical
5% Return
(2.5% for
the period) | |
Account value at the | | | | | | | | |
beginning of the period July 1, 2016 | | $ | 1,000.00 | | | $ | 1,000.00 | |
Account value at the end of the period December 31, 2016 | | $ | 1,032.50 | | | $ | 1,022.27 | |
Expenses paid during the period* | | $ | 2.91 | | | $ | 2.90 | |
| | | | | | | | |
Class 3 | | Actual
Fund Return | | | Hypothetical
5% Return
(2.5% for
the period) | |
Account value at the | | | | | | | | |
beginning of the period July 1, 2016 | | $ | 1,000.00 | | | $ | 1,000.00 | |
Account value at the end of the period December 31, 2016 | | $ | 1,031.50 | | | $ | 1,021.01 | |
Expenses paid during the period* | | $ | 4.19 | | | $ | 4.17 | |
| * | Expenses are equal to the Fund’s annualized net expense ratios of 0.57%** for Class 1 and 0.82%** for Class 3 (for the period July 1, 2016 – December 31, 2016), multiplied by the average account value over the period, multiplied by 184/366 (to reflect the one-half year period). |
| ** | May differ from expense ratio disclosed in the financial highlights, which is calculated based on the entire fiscal year’s data. |
| | | | |
| State Street Total Return V.I.S. Fund | | | 3 | |
State Street Total Return V.I.S. Fund
Performance Summary — December 31, 2016 (Unaudited)
Morningstar Performance Comparison
Based on average annual returns for periods ended 12/31/16
| | | | | | | | | | | | |
| | | One Year | | | Five Year | | | Ten Year | |
Number of funds in peer group | | | 348 | | | | 275 | | | | 187 | |
Peer group average annual total return | | | 6.47 | % | | | 8.03 | % | | | 4.58 | % |
Morningstar Category in peer group: U.S. Insurance Allocation — 50% to 70% Equity | |
Top Ten Largest Equity Holdings
as of December 31, 2016 (as a % of Fair Value) (a)(b)
| | | | |
Apple Inc. | | | 1.19 | % |
Microsoft Corp. | | | 0.93 | % |
Exxon Mobil Corp. | | | 0.72 | % |
Johnson & Johnson | | | 0.60 | % |
Berkshire Hathaway Inc., Class B | | | 0.60 | % |
JPMorgan Chase & Co. | | | 0.60 | % |
Amazon.com Inc. | | | 0.57 | % |
General Electric Co. | | | 0.54 | % |
Facebook Inc., Class A | | | 0.52 | % |
AT&T Inc. | | | 0.50 | %�� |
Sector Allocation
Portfolio Composition as a % of Fair Value of $2,324,332 (in thousands) as of December 31, 2016 (a)(b)
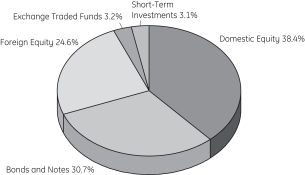
Average Annual Total Return for the Periods Ended December 31, 2016
Class 1 Shares (Inception date: 7/01/85)
| | | | | | | | | | | | | | | | |
| | | One Year | | | Five Year | | | Ten Year | | | Ending Value
of a $10,000
Investment | |
State Street Total Return V.I.S. Fund | | | 6.35 | % | | | 7.45 | % | | | 3.83 | % | | $ | 14,557 | |
S&P 500® Index | | | 11.96 | % | | | 14.66 | % | | | 6.95 | % | | $ | 19,572 | |
Bloomberg Barclays U.S. Aggregate Bond Index | | | 2.65 | % | | | 2.23 | % | | | 4.35 | % | | $ | 15,300 | |
MSCI® All Country World ex-U.S. | | | 4.50 | % | | | 5.00 | % | | | 0.96 | % | | $ | 11,005 | |
Class 3 Shares (Inception date: 5/01/06)
| | | | | | | | | | | | | | | | |
| | | One Year | | | Five Year | | | Ten Year | | | Ending Value
of a $10,000
Investment | |
State Street Total Return V.I.S. Fund | | | 6.08 | % | | | 7.19 | % | | | 3.60 | % | | $ | 14,248 | |
S&P 500® Index | | | 11.96 | % | | | 14.66 | % | | | 6.95 | % | | $ | 19,572 | |
Bloomberg Barclays U.S. Aggregate Bond Index | | | 2.65 | % | | | 2.23 | % | | | 4.35 | % | | $ | 15,300 | |
MSCI® All Country World ex-U.S. | | | 4.50 | % | | | 5.00 | % | | | 0.96 | % | | $ | 11,005 | |
| | |
| 4 | | State Street Total Return V.I.S. Fund |
State Street Total Return V.I.S. Fund
Performance Summary, continued — December 31, 2016 (Unaudited)
Class 1 Shares
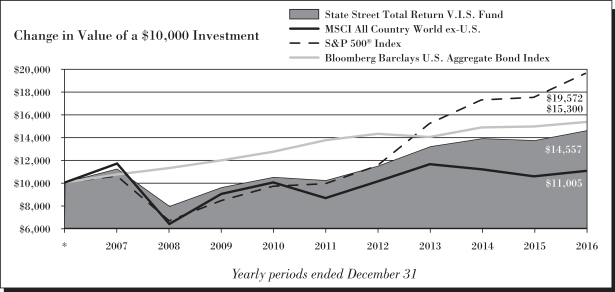
Class 3 Shares
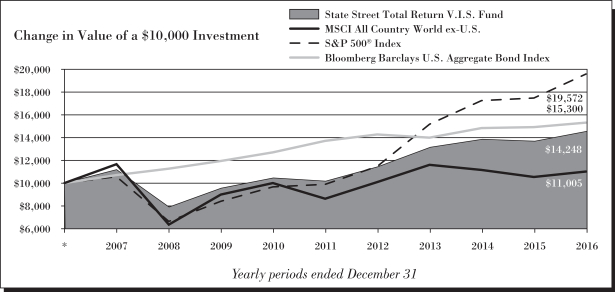
| (a) | Fair Value basis is inclusive of short-term investment in State Street Institutional U.S. Government Money Market Fund Class G Shares. |
| (b) | The securities information regarding holdings, allocations and other characteristics is presented to illustrate examples of securities that the Fund has bought and the diversity of areas in which the Fund may invest as of a particular date. It may not be representative of the Fund’s current or future investments and should not be construed as a recommendation to purchase or sell a particular security. |
See Notes to Performance beginning on page 1 for further information, including an explanation of Morningstar peer categories.
Past performance does not predict future performance. The performance shown in the graphs and tables does not reflect the deduction of taxes that a shareholder would pay on Fund distributions or the redemption of Fund shares and does not reflect the fees or charges that would be associated with variable contracts through which shares of the Fund are offered.
| | | | |
| State Street Total Return V.I.S. Fund | | | 5 | |
State Street Total Return V.I.S. Fund
Summary Schedule of Investments — December 31, 2016
| | | | | | | | |
| | |
Number
of Shares | | | Fair
Value
$ | |
| | | | | | | | |
| Equity Securities - 63.5%† | |
Consumer Discretionary - 7.5% | |
Amazon.com Inc. (a) | | | 17,625 | | | | 13,216,459 | |
Comcast Corp., Class A | | | 106,747 | | | | 7,370,880 | |
The Home Depot Inc. | | | 54,607 | | | | 7,321,707 | |
The Walt Disney Co. | | | 65,605 | | | | 6,837,353 | |
Other Securities | | | 8,464,003 | | | | 138,209,438 | |
| | | | | | | | |
| | | | | | | 172,955,837 | |
| | | | | | | | |
|
Consumer Staples - 6.0% | |
Altria Group Inc. | | | 87,439 | | | | 5,912,625 | |
Nestle S.A. | | | 99,269 | | | | 7,134,944 | |
PepsiCo Inc. | | | 64,308 | | | | 6,728,546 | |
Philip Morris International Inc. | | | 69,445 | | | | 6,353,523 | |
The Coca-Cola Co. | | | 173,911 | | | | 7,210,350 | |
The Procter & Gamble Co. | | | 119,880 | | | | 10,079,510 | |
Other Securities | | | 5,629,439 | | | | 93,726,984 | |
| | | | | | | | |
| | | | | | | 137,146,482 | |
| | | | | | | | |
|
Energy - 4.6% | |
Chevron Corp. | | | 84,508 | | | | 9,946,592 | |
Exxon Mobil Corp. | | | 185,667 | | | �� | 16,758,303 | |
Schlumberger Ltd. | | | 62,265 | | | | 5,227,147 | |
Other Securities | | | 7,637,628 | | | | 74,969,625 | |
| | | | | | | | |
| | | | | | | 106,901,667 | |
| | | | | | | | |
|
Financials - 11.6% | |
Bank of America Corp. | | | 452,519 | | | | 10,000,670 | |
Berkshire Hathaway Inc., Class B (a) | | | 85,043 | | | | 13,860,308 | |
Citigroup Inc. | | | 127,653 | | | | 7,586,418 | |
JPMorgan Chase & Co. | | | 160,258 | | | | 13,828,663 | |
Wells Fargo & Co. | | | 202,406 | | | | 11,154,595 | |
State Street Corp. (b) | | | 16,264 | | | | 1,264,038 | |
Other Securities | | | 43,728,057 | | | | 209,111,254 | |
| | | | | | | | |
| | | | | | | 266,805,946 | |
| | | | | | | | |
|
Healthcare - 7.3% | |
Johnson & Johnson | | | 121,823 | | | | 14,035,228 | |
Merck & Company Inc. | | | 123,512 | | | | 7,271,151 | |
Pfizer Inc. | | | 271,645 | | | | 8,823,030 | |
UnitedHealth Group Inc. | | | 42,621 | | | | 6,821,065 | |
Other Securities | | | 3,982,230 | | | | 130,776,549 | |
| | | | | | | | |
| | | | | | | 167,727,023 | |
| | | | | | | | |
|
Industrials - 6.9% | |
General Electric Co. (c) | | | 396,151 | | | | 12,518,372 | |
Other Securities | | | 11,080,874 | | | | 147,610,652 | |
| | | | | | | | |
| | | | | | | 160,129,024 | |
| | | | | | | | |
| | | | | | | | |
| | | Number
of Shares
or Principal
Amount ($) | | | Fair
Value
$ | |
Information Technology - 10.4% | |
Alphabet Inc., Class A (a) | | | 13,276 | | | | 10,520,566 | |
Alphabet Inc., Class C (a) | | | 13,235 | | | | 10,215,038 | |
Apple Inc. | | | 238,817 | | | | 27,659,785 | |
Cisco Systems Inc. | | | 225,034 | | | | 6,800,527 | |
Facebook Inc., Class A (a) | | | 104,862 | | | | 12,064,373 | |
Intel Corp. | | | 211,740 | | | | 7,679,810 | |
International Business Machines Corp. | | | 38,717 | | | | 6,426,635 | |
Microsoft Corp. | | | 348,195 | | | | 21,636,837 | |
Visa Inc., Class A | | | 83,577 | | | | 6,520,678 | |
Other Securities | | | 7,868,729 | | | | 129,715,070 | |
| | | | | | | | |
| | | | | | | 239,239,319 | |
| | | | | | | | |
|
Materials - 3.1% | |
Other Securities | | | 6,234,904 | | | | 71,864,566 | |
| | | | | | | | |
| | | | | | | 71,864,566 | |
| | | | | | | | |
|
Real Estate - 2.0% | |
Other Securities | | | 5,943,521 | | | | 46,908,942 | |
| | | | | | | | |
| | | | | | | 46,908,942 | |
| | | | | | | | |
|
Telecommunication Services - 2.1% | |
AT&T Inc. | | | 275,057 | | | | 11,698,174 | |
Verizon Communications Inc. | | | 182,550 | | | | 9,744,519 | |
Other Securities | | | 8,372,169 | | | | 27,597,185 | |
| | | | | | | | |
| | | | | | | 49,039,878 | |
| | | | | | | | |
|
Utilities - 2.0% | |
Other Securities | | | 7,194,992 | | | | 46,175,410 | |
| | | | | | | | |
| | | | | | | 46,175,410 | |
| | | | | | | | |
| |
Total Equity Securities
(Cost $1,198,345,483) | | | | 1,464,894,094 | |
| | | | | | | | |
|
| Bonds and Notes - 31.0% | |
U.S. Treasuries - 10.5% | |
U.S. Treasury Bonds | | | | | | | | |
2.25% 08/15/46 (d) | | | 600,000 | | | | 503,203 | |
2.50% 02/15/45 - 05/15/46 (d) | | | 4,510,000 | | | | 4,000,138 | |
2.75% 11/15/42 (d) | | | 650,000 | | | | 612,614 | |
2.88% 08/15/45 - 11/15/46 (d) | | | 1,800,000 | | | | 1,728,705 | |
3.00% 05/15/42 - 11/15/45 (d) | | | 12,800,000 | | | | 12,636,740 | |
3.13% 08/15/44 (d) | | | 2,000,000 | | | | 2,019,738 | |
3.38% 05/15/44 (d) | | | 2,900,000 | | | | 3,068,603 | |
3.63% 08/15/43 - 02/15/44 (d) | | | 1,740,000 | | | | 1,924,836 | |
3.75% 11/15/43 (d) | | | 1,400,000 | | | | 1,584,006 | |
4.38% 11/15/39 (d) | | | 500,000 | | | | 616,118 | |
4.50% 02/15/36 (d) | | | 3,000,000 | | | | 3,789,252 | |
4.63% 02/15/40 (d) | | | 500,000 | | | | 637,843 | |
5.25% 02/15/29 (d) | | | 200,000 | | | | 255,219 | |
See Notes to Summary Schedule of Investments and Notes to Financial Statements.
| | |
| 6 | | State Street Total Return V.I.S. Fund |
State Street Total Return V.I.S. Fund
Summary Schedule of Investments, continued — December 31, 2016
| | | | | | | | |
| | |
Principal
Amount ($) | | | Fair
Value
$ | |
| | | | | | | | |
5.50% 08/15/28(d) | | | 1,450,000 | | | | 1,874,286 | |
6.00% 02/15/26(d) | | | 1,827,000 | | | | 2,359,293 | |
6.38% 08/15/27(d) | | | 200,000 | | | | 271,868 | |
7.63% 11/15/22 - 02/15/25(d) | | | 500,000 | | | | 669,921 | |
7.88% 02/15/21(d) | | | 2,000,000 | | | | 2,479,170 | |
8.75% 05/15/20(d) | | | 3,000,000 | | | | 3,699,801 | |
9.00% 11/15/18(d) | | | 3,000,000 | | | | 3,433,533 | |
U.S. Treasury Notes | | | | | | | | |
0.63% 04/30/18 | | | 3,000,000 | | | | 2,985,063 | |
0.75% 01/31/18 - 03/31/18 | | | 4,000,000 | | | | 3,989,708 | |
0.88% 01/31/18 - 03/31/18 | | | 3,000,000 | | | | 2,997,019 | |
1.00% 03/15/18 - 10/15/19 | | | 11,300,000 | | | | 11,258,468 | |
1.13% 12/31/19 - 09/30/21 | | | 22,000,000 | | | | 21,633,761 | |
1.25% 10/31/18 - 10/31/21 | | | 17,500,000 | | | | 17,329,581 | |
1.38% 07/31/18 - 05/31/21 | | | 17,700,000 | | | | 17,580,301 | |
1.50% 11/30/19 - 08/15/26 | | | 16,900,000 | | | | 16,529,183 | |
1.63% 04/30/19 - 05/15/26 | | | 17,240,000 | | | | 16,987,424 | |
1.75% 10/31/20 - 09/30/22 | | | 12,600,000 | | | | 12,563,238 | |
2.00% 07/31/20 - 08/15/25 | | | 26,844,000 | | | | 26,541,747 | |
2.13% 08/31/20 - 12/31/22 | | | 7,100,000 | | | | 7,163,185 | |
2.25% 03/31/21 - 11/15/25 | | | 13,890,000 | | | | 13,809,711 | |
2.38% 05/31/18 - 08/15/24 | | | 11,200,000 | | | | 11,361,911 | |
2.50% 05/15/24 | | | 2,500,000 | | | | 2,534,190 | |
2.63% 08/15/20 - 11/15/20 | | | 3,885,000 | | | | 4,013,079 | |
3.13% 05/15/21 | | | 4,000,000 | | | | 4,211,472 | |
3.63% 02/15/21 | �� | | 700,000 | | | | 750,789 | |
| | | | | | | | |
| | | | | | | 242,404,717 | |
| | | | | | | | |
|
U.S. Government Sponsored Agency - 0.1% | |
Other Securities | | | 1,000,000 | | | | 975,166 | |
| | | | | | | | |
|
Agency Collateralized Mortgage Obligations - 0.2% | |
Federal Home Loan Mortgage Corp. | | | | | | | | |
2.37% 05/25/22 | | | 600,000 | | | | 600,363 | |
2.60% 10/25/23 | | | 127,260 | | | | 129,251 | |
2.75% 01/25/26 | | | 300,000 | | | | 295,728 | |
2.79% 10/25/20 | | | 38,259 | | | | 38,876 | |
2.87% 12/25/21 | | | 800,000 | | | | 819,776 | |
3.06% 07/25/23(e) | | | 600,000 | | | | 618,450 | |
3.30% 04/25/23(e) | | | 100,000 | | | | 104,509 | |
3.39% 03/25/24 | | | 200,000 | | | | 209,247 | |
3.40% 07/25/19 | | | 106,767 | | | | 109,241 | |
3.41% 05/25/19 | | | 180,378 | | | | 184,852 | |
3.49% 01/25/24 | | | 300,000 | | | | 315,855 | |
3.53% 07/25/23(e) | | | 800,000 | | | | 846,363 | |
3.97% 01/25/21(e) | | | 200,000 | | | | 213,587 | |
4.25% 01/25/20 | | | 100,000 | | | | 105,798 | |
5.09% 03/25/19 | | | 100,000 | | | | 106,097 | |
Federal National Mortgage Assoc. | | | | | | | | |
2.78% 06/25/21(e) | | | 483,374 | | | | 493,187 | |
| | | | | | | | |
| | | | | | | 5,191,180 | |
| | | | | | | | |
| | | | | | | | |
| | |
Principal
Amount ($) | | | Fair
Value
$ | |
Agency Mortgage Backed - 9.3% | |
Federal Home Loan Banks | | | | | | | | |
1.25% 01/16/19 | | | 1,800,000 | | | | 1,798,322 | |
1.38% 11/15/19 | | | 1,200,000 | | | | 1,194,620 | |
Federal Home Loan Mortgage Corp. | | | | | | | | |
0.88% 03/07/18 | | | 2,000,000 | | | | 1,997,136 | |
1.13% 08/12/21 | | | 1,137,000 | | | | 1,093,611 | |
1.25% 10/02/19 | | | 1,500,000 | | | | 1,490,511 | |
2.38% 01/13/22 | | | 2,100,000 | | | | 2,132,298 | |
2.50% 07/01/28 - 01/01/30 | | | 2,982,266 | | | | 2,989,122 | |
2.51% 11/25/22 | | | 300,000 | | | | 300,754 | |
3.00% 05/01/30 - 12/01/46 | | | 12,460,390 | | | | 12,551,868 | |
3.50% 10/01/42 - 11/01/46 | | | 12,179,401 | | | | 12,490,981 | |
4.00% 06/01/42 - 05/01/46 | | | 7,261,725 | | | | 7,636,971 | |
4.50% 05/01/42 - 01/01/45 | | | 120,349 | | | | 129,640 | |
4.88% 06/13/18 | | | 2,000,000 | | | | 2,106,244 | |
5.00% 12/01/22 - 06/01/41 | | | 2,999,783 | | | | 3,276,583 | |
5.50% 01/01/38 - 04/01/39 | | | 553,241 | | | | 632,423 | |
6.00% 06/01/37 - 11/01/37 | | | 524,429 | | | | 607,390 | |
6.25% 07/15/32 | | | 250,000 | | | | 343,622 | |
Federal Home Loan Mortgage Corp. 1.50% + 12 month USD LIBOR | | | | | | | | |
1.80% 06/01/43(e) | | | 227,492 | | | | 232,524 | |
Federal Home Loan Mortgage Corp. 1.60% + 12 month USD LIBOR | | | | | | | | |
2.52% 08/01/43(e) | | | 267,338 | | | | 270,874 | |
Federal Home Loan Mortgage Corp. 1.65% + 12 month USD LIBOR | | | | | | | | |
2.45% 05/01/43(e) | | | 710,299 | | | | 718,277 | |
2.50% TBA(f) | | | 1,500,000 | | | | 1,502,100 | |
3.00% TBA(f) | | | 2,050,000 | | | | 2,047,575 | |
3.50% TBA(f) | | | 1,000,000 | | | | 1,032,950 | |
Federal National Mortgage Assoc. | | | | | | | | |
0.88% 05/21/18 | | | 900,000 | | | | 897,341 | |
1.88% 09/24/26 | | | 1,000,000 | | | | 917,434 | |
2.13% 04/24/26 | | | 700,000 | | | | 660,975 | |
2.50% 02/01/28 - 11/01/31 | | | 7,435,945 | | | | 7,453,510 | |
2.68% 05/25/21(e) | | | 100,000 | | | | 101,103 | |
3.00% 01/01/28 - 12/01/46 | | | 19,255,741 | | | | 19,415,814 | |
3.50% 01/01/27 - 08/01/46 | | | 22,830,970 | | | | 23,497,997 | |
4.00% 10/01/41 - 09/01/46 | | | 13,670,903 | | | | 14,407,734 | |
4.50% 11/01/18 - 04/01/41 | | | 9,802,130 | | | | 10,552,926 | |
5.00% 12/01/39 - 06/01/41 | | | 2,582,673 | | | | 2,862,650 | |
5.50% 12/01/35 - 04/01/38 | | | 3,624,371 | | | | 4,061,118 | |
6.00% 03/01/34 - 08/01/37 | | | 2,622,728 | | | | 2,990,718 | |
6.63% 11/15/30 | | | 100,000 | | | | 138,858 | |
See Notes to Summary Schedule of Investments and Notes to Financial Statements.
| | | | |
| State Street Total Return V.I.S. Fund | | | 7 | |
State Street Total Return V.I.S. Fund
Summary Schedule of Investments, continued — December 31, 2016
| | | | | | | | |
| | |
Principal
Amount ($) | | | Fair
Value
$ | |
| | | | | | | | |
Federal National Mortgage Assoc. 1.53% + 12 month USD LIBOR | | | | | | | | |
1.90% 04/01/43(e) | | | 450,629 | | | | 463,749 | |
2.50% TBA(f) | | | 250,000 | | | | 250,275 | |
3.00% TBA(f) | | | 9,825,000 | | | | 9,756,588 | |
3.50% TBA(f) | | | 900,000 | | | | 921,870 | |
4.50% TBA(f) | | | 300,000 | | | | 322,560 | |
Government National Mortgage Assoc. | | | | | | | | |
2.50% 05/20/45 | | | 320,737 | | | | 311,401 | |
3.00% 10/15/42 -11/20/46 | | | 10,019,549 | | | | 10,156,265 | |
3.50% 03/20/45 -10/20/46 | | | 17,640,188 | | | | 18,346,626 | |
4.00% 12/20/40 -09/20/46 | | | 7,875,287 | | | | 8,400,799 | |
4.50% 05/20/40 | | | 1,982,625 | | | | 2,134,919 | |
5.00% 08/15/41 | | | 3,060,598 | | | | 3,376,061 | |
3.00% TBA(f) | | | 6,000,000 | | | | 6,070,800 | |
3.50% TBA(f) | | | 7,600,000 | | | | 7,896,080 | |
4.00% TBA(f) | | | 400,000 | | | | 424,560 | |
| | | | | | | | |
| | | | | | | 215,367,127 | |
| | | | | | | | |
|
Asset Backed - 0.2% | |
Other Securities | | | 4,010,000 | | | | 3,985,983 | |
| | | | | | | | |
| | |
Corporate Notes - 9.7% | | | | | | | | |
Apple Inc. | | | | | | | | |
1.00% 05/03/18 | | | 250,000 | | | | 249,027 | |
1.10% 08/02/19 | | | 250,000 | | | | 246,154 | |
1.70% 02/22/19 | | | 200,000 | | | | 200,333 | |
2.25% 02/23/21 | | | 200,000 | | | | 199,867 | |
3.25% 02/23/26 | | | 160,000 | | | | 159,856 | |
4.38% 05/13/45 | | | 465,000 | | | | 476,738 | |
4.50% 02/23/36 | | | 300,000 | | | | 319,873 | |
4.65% 02/23/46 | | | 185,000 | | | | 199,370 | |
Microsoft Corp. | |
1.10% 08/08/19 | | | 200,000 | | | | 197,221 | |
1.30% 11/03/18 | | | 200,000 | | | | 199,801 | |
1.55% 08/08/21 | | | 500,000 | | | | 484,500 | |
2.40% 08/08/26 | | | 200,000 | | | | 188,757 | |
3.45% 08/08/36 | | | 200,000 | | | | 189,743 | |
3.50% 02/12/35 | | | 65,000 | | | | 62,465 | |
| | | | | | | | |
| | | Principal
Amount ($)
or Number
of Shares | | | Fair
Value
$ | |
3.75% 05/01/43 | | | 300,000 | | | | 283,021 | |
4.45% 11/03/45 | | | 425,000 | | | | 451,881 | |
Other Securities | | | 212,411,539 | | | | 218,551,239 | |
| | | | | | | | |
| | | | | | | 222,659,846 | |
| | | | | | | | |
|
Non-Agency Collateralized Mortgage Obligations - 0.3% | |
Other Securities | | | 6,590,000 | | | | 6,870,449 | |
| | | | | | | | |
|
Sovereign Bonds - 0.4% | |
Other Securities | | | 9,072,000 | | | | 9,421,018 | |
| | | | | | | | |
|
Municipal Bonds and Notes - 0.3% | |
Other Securities | | | 5,650,000 | | | | 6,697,509 | |
| | | | | | | | |
|
FNMA (TBA) - 0.0%* | |
Lehman | | | | | | | | |
5.50% TBA (i) | | | 384,555 | | | | 12,152 | |
| | | | | | | | |
| |
Total Bonds and Notes
(Cost $716,413,089) | | | | 713,585,147 | |
| | | | | | | | |
|
| Exchange Traded Fund - 3.2% | |
SPDR Bloomberg Barclays High Yield Bond ETF(g)
(Cost $72,006,250) | | | 2,022,863 | | | | 73,733,356 | |
| | | | | | | | |
| |
Total Investments in Securities
(Cost $1,986,764,822) | | | | 2,252,212,597 | |
| | | | | | | | |
|
| Short-Term Investments - 3.1% | |
State Street Institutional U.S. Government Money Market Fund - Class G Shares 0.46%(d,g,h)
(Cost $72,119,782) | | | 72,119,782 | | | | 72,119,782 | |
| | | | | | | | |
| |
Total Investments
(Cost $2,058,884,604) | | | | 2,324,332,379 | |
| |
| Liabilities in Excess of Other Assets, net - (0.8)% | | | | (18,455,886 | ) |
| | | | | | | | |
| | |
| NET ASSETS -100.0% | | | | | | | 2,305,876,493 | |
| | | | | | | | |
See Notes to Summary Schedule of Investments and Notes to Financial Statements.
| | |
| 8 | | State Street Total Return V.I.S. Fund |
State Street Total Return V.I.S. Fund
Summary Schedule of Investments, continued — December 31, 2016
Other Information:
The Fund had the following long futures contracts open at December 31, 2016:
| | | | | | | | | | | | | | | | |
| Description | | Expiration
date | | | Number of
Contracts | | | Current
Notional
Value | | | Unrealized
Depreciation | |
MSCI EAFE Mini Index Futures | | | March 2017 | | | | 41 | | | $ | 3,434,980 | | | $ | (10,287 | ) |
MSCI Emerging Market Mini Futures | | | March 2017 | | | | 23 | | | | 987,735 | | | | (28,112 | ) |
Russell 2000 Mini Index Futures | | | March 2017 | | | | 12 | | | | 814,140 | | | | (10,826 | ) |
S&P Mid 400 Emini Index Futures | | | March 2017 | | | | 1 | | | | 165,910 | | | | (2,647 | ) |
S&P 500 Emini Index Futures | | | March 2017 | | | | 41 | | | | 4,584,210 | | | | (27,431 | ) |
| | | | | | | | | | | | | | | | |
| | | | | | | | | | | | | | $ | (79,303 | ) |
| | | | | | | | | | | | | | | | |
The Fund had the following short futures contracts open at December 31, 2016:
| | | | | | | | | | | | | | | | |
| Description | | Expiration
date | | | Number of
Contracts | | | Current
Notional
Value | | | Unrealized
Appreciation | |
S&P 500 Emini Index Futures | | | March 2017 | | | | 470 | | | $ | (52,550,700 | ) | | $ | 368,522 | |
| | | | | | | | | | | | | | | | |
| | | | | | | | | | | | | | $ | 289,219 | |
| | | | | | | | | | | | | | | | |
The Fund was invested in the following countries/territories at December 31, 2016 (unaudited):
| | | | |
| Country/Territory | | Percentage
(based on
Fair Value) | |
United States | | | 72.51% | |
Japan | | | 4.17% | |
United Kingdom | | | 3.44% | |
Canada | | | 2.05% | |
Germany | | | 1.82% | |
Switzerland | | | 1.79% | |
France | | | 1.75% | |
China | | | 1.41% | |
Australia | | | 1.35% | |
South Korea | | | 0.80% | |
Netherlands | | | 0.80% | |
Taiwan | | | 0.66% | |
Spain | | | 0.58% | |
Hong Kong | | | 0.58% | |
Supranational | | | 0.54% | |
Ireland | | | 0.52% | |
Sweden | | | 0.47% | |
India | | | 0.44% | |
Brazil | | | 0.43% | |
South Africa | | | 0.40% | |
Mexico | | | 0.38% | |
Singapore | | | 0.34% | |
Italy | | | 0.34% | |
Denmark | | | 0.28% | |
Russian Federation | | | 0.24% | |
Belgium | | | 0.20% | |
Finland | | | 0.16% | |
Norway | | | 0.15% | |
Indonesia | | | 0.14% | |
Malaysia | | | 0.14% | |
| | | | |
| Country/Territory, continued | | Percentage
(based on
Fair Value) | |
Philippines | | | 0.12% | |
Thailand | | | 0.12% | |
Israel | | | 0.11% | |
Poland | | | 0.10% | |
Colombia | | | 0.09% | |
Chile | | | 0.08% | |
Turkey | | | 0.06% | |
Qatar | | | 0.05% | |
Luxembourg | | | 0.04% | |
United Arab Emirates | | | 0.04% | |
Austria | | | 0.04% | |
Peru | | | 0.04% | |
Bermuda | | | 0.03% | |
Hungary | | | 0.03% | |
Cayman Islands | | | 0.03% | |
New Zealand | | | 0.03% | |
Portugal | | | 0.03% | |
Uruguay | | | 0.02% | |
Greece | | | 0.02% | |
Panama | | | 0.01% | |
Guernsey | | | 0.01% | |
Czech Republic | | | 0.01% | |
Egypt | | | 0.01% | |
Malta | | | 0.00% | ** |
Puerto Rico | | | 0.00% | ** |
Monaco | | | 0.00% | ** |
United States Virgin Islands | | | 0.00% | ** |
Jersey | | | 0.00% | ** |
| | | | |
| | | 100.00% | |
| | | | |
See Notes to Summary Schedule of Investments and Notes to Financial Statements.
| | | | |
| State Street Total Return V.I.S. Fund | | | 9 | |
State Street Total Return V.I.S. Fund
Summary Schedule of Investments, continued — December 31, 2016
The Fund’s % share of investment in the various categories, based on Fair Value, is as follows at December 31, 2016 (unaudited):
| | | | | | | | | | | | |
| Industry | | Domestic | | | Foreign | | | Total | |
Diversified Banks | | | 2.02% | | | | 3.38% | | | | 5.40% | |
Pharmaceuticals | | | 1.86% | | | | 1.47% | | | | 3.33% | |
Exchange Traded Funds | | | 3.17% | | | | 0.00% | | | | 3.17% | |
Integrated Oil & Gas | | | 1.26% | | | | 1.08% | | | | 2.34% | |
Internet Software & Services | | | 1.57% | | | | 0.50% | | | | 2.07% | |
Technology Hardware, Storage & Peripherals | | | 1.37% | | | | 0.44% | | | | 1.81% | |
Integrated Telecommunication Services | | | 0.96% | | | | 0.57% | | | | 1.53% | |
Semiconductors | | | 1.01% | | | | 0.52% | | | | 1.53% | |
Industrial Conglomerates | | | 0.96% | | | | 0.39% | | | | 1.35% | |
Biotechnology | | | 1.02% | | | | 0.25% | | | | 1.27% | |
Systems Software | | | 1.22% | | | | 0.04% | | | | 1.26% | |
Packaged Foods & Meats | | | 0.55% | | | | 0.67% | | | | 1.22% | |
Electric Utilities | | | 0.75% | | | | 0.37% | | | | 1.12% | |
Aerospace & Defense | | | 0.83% | | | | 0.22% | | | | 1.05% | |
Healthcare Equipment | | | 0.68% | | | | 0.32% | | | | 1.00% | |
Oil & Gas Exploration & Production | | | 0.72% | | | | 0.26% | | | | 0.98% | |
Automobile Manufacturers | | | 0.18% | | | | 0.78% | | | | 0.96% | |
Data Processing & Outsourced Services | | | 0.88% | | | | 0.08% | | | | 0.96% | |
Life & Health Insurance | | | 0.35% | | | | 0.58% | | | | 0.93% | |
Tobacco | | | 0.61% | | | | 0.32% | | | | 0.93% | |
Internet & Direct Marketing Retail | | | 0.85% | | | | 0.07% | | | | 0.92% | |
Household Products | | | 0.67% | | | | 0.19% | | | | 0.86% | |
Regional Banks | | | 0.54% | | | | 0.27% | | | | 0.81% | |
Soft Drinks | | | 0.67% | | | | 0.06% | | | | 0.73% | |
Multi-Sector Holdings | | | 0.61% | | | | 0.11% | | | | 0.72% | |
IT Consulting & Other Services | | | 0.37% | | | | 0.32% | | | | 0.69% | |
Industrial Machinery | | | 0.28% | | | | 0.41% | | | | 0.69% | |
Managed Healthcare | | | 0.59% | | | | 0.02% | | | | 0.61% | |
Multi-Utilities | | | 0.38% | | | | 0.22% | | | | 0.60% | |
Multi-Line Insurance | | | 0.19% | | | | 0.40% | | | | 0.59% | |
Cable & Satellite | | | 0.44% | | | | 0.15% | | | | 0.59% | |
Railroads | | | 0.30% | | | | 0.29% | | | | 0.59% | |
Movies & Entertainment | | | 0.54% | | | | 0.05% | | | | 0.59% | |
Restaurants | | | 0.44% | | | | 0.14% | | | | 0.58% | |
Asset Management & Custody Banks | | | 0.42% | | | | 0.14% | | | | 0.56% | |
Application Software | | | 0.29% | | | | 0.26% | | | | 0.55% | |
Property & Casualty Insurance | | | 0.18% | | | | 0.37% | | | | 0.55% | |
Wireless Telecommunication Services | | | 0.00% | | | | 0.53% | | | | 0.53% | |
Investment Banking & Brokerage | | | 0.40% | | | | 0.10% | | | | 0.50% | |
Diversified Chemicals | | | 0.26% | | | | 0.23% | | | | 0.49% | |
Communications Equipment | | | 0.38% | | | | 0.11% | | | | 0.49% | |
Specialty Chemicals | | | 0.19% | | | | 0.28% | | | | 0.47% | |
Oil & Gas Equipment & Services | | | 0.41% | | | | 0.06% | | | | 0.47% | |
Hypermarkets & Super Centers | | | 0.33% | | | | 0.13% | | | | 0.46% | |
Home Improvement Retail | | | 0.44% | | | | 0.01% | | | | 0.45% | |
Apparel, Accessories & Luxury Goods | | | 0.11% | | | | 0.33% | | | | 0.44% | |
Retail REITs | | | 0.23% | | | | 0.19% | | | | 0.42% | |
Electrical Components & Equipment | | | 0.20% | | | | 0.20% | | | | 0.40% | |
Diversified Metals & Mining | | | 0.00% | | | | 0.40% | | | | 0.40% | |
Personal Products | | | 0.05% | | | | 0.34% | | | | 0.39% | |
Specialized REITs | | | 0.39% | | | | 0.00% | | | | 0.39% | |
Food Retail | | | 0.08% | | | | 0.30% | | | | 0.38% | |
See Notes to Summary Schedule of Investments and Notes to Financial Statements.
| | |
| 10 | | State Street Total Return V.I.S. Fund |
State Street Total Return V.I.S. Fund
Summary Schedule of Investments, continued — December 31, 2016
The Fund’s % share of investment in the various categories, based on Fair Value, is as follows at December 31, 2016 (unaudited) (continued):
| | | | | | | | | | | | | | | |
| Industry | | Domestic | | Foreign | | Total |
Financial Exchanges & Data | | | | 0.23% | | | | | 0.15% | | | | | 0.38% | |
Oil & Gas Storage & Transportation | | | | 0.20% | | | | | 0.18% | | | | | 0.38% | |
Apparel Retail | | | | 0.21% | | | | | 0.15% | | | | | 0.36% | |
Air Freight & Logistics | | | | 0.28% | | | | | 0.08% | | | | | 0.36% | |
Oil & Gas Refining & Marketing | | | | 0.20% | | | | | 0.15% | | | | | 0.35% | |
Consumer Finance | | | | 0.31% | | | | | 0.04% | | | | | 0.35% | |
Trading Companies & Distributors | | | | 0.07% | | | | | 0.25% | | | | | 0.32% | |
Construction Machinery & Heavy Trucks | | | | 0.18% | | | | | 0.13% | | | | | 0.31% | |
Drug Retail | | | | 0.30% | | | | | 0.00% | | | | | 0.30% | |
Airlines | | | | 0.24% | | | | | 0.05% | | | | | 0.29% | |
Building Products | | | | 0.11% | | | | | 0.17% | | | | | 0.28% | |
Auto Parts & Equipment | | | | 0.02% | | | | | 0.26% | | | | | 0.28% | |
Life Sciences Tools & Services | | | | 0.23% | | | | | 0.04% | | | | | 0.27% | |
Electronic Components | | | | 0.08% | | | | | 0.19% | | | | | 0.27% | |
Brewers | | | | 0.03% | | | | | 0.24% | | | | | 0.27% | |
Healthcare Services | | | | 0.16% | | | | | 0.11% | | | | | 0.27% | |
Fertilizers & Agricultural Chemicals | | | | 0.14% | | | | | 0.12% | | | | | 0.26% | |
Construction Materials | | | | 0.06% | | | | | 0.19% | | | | | 0.25% | |
Construction & Engineering | | | | 0.04% | | | | | 0.21% | | | | | 0.25% | |
Diversified Real Estate Activities | | | | 0.00% | | | | | 0.25% | | | | | 0.25% | |
Steel | | | | 0.04% | | | | | 0.20% | | | | | 0.24% | |
Industrial Gases | | | | 0.12% | | | | | 0.11% | | | | | 0.23% | |
Semiconductor Equipment | | | | 0.12% | | | | | 0.11% | | | | | 0.23% | |
Research & Consulting Services | | | | 0.09% | | | | | 0.14% | | | | | 0.23% | |
Commodity Chemicals | | | | 0.06% | | | | | 0.17% | | | | | 0.23% | |
Distillers & Vintners | | | | 0.07% | | | | | 0.13% | | | | | 0.20% | |
General Merchandise Stores | | | | 0.16% | | | | | 0.04% | | | | | 0.20% | |
Hotels, Resorts & Cruise Lines | | | | 0.14% | | | | | 0.05% | | | | | 0.19% | |
Residential REITs | | | | 0.18% | | | | | 0.01% | | | | | 0.19% | |
Diversified Capital Markets | | | | 0.00% | | | | | 0.19% | | | | | 0.19% | |
Healthcare Distributors | | | | 0.15% | | | | | 0.04% | | | | | 0.19% | |
Insurance Brokers | | | | 0.09% | | | | | 0.08% | | | | | 0.17% | |
Gold | | | | 0.04% | | | | | 0.13% | | | | | 0.17% | |
Automotive Retail | | | | 0.14% | | | | | 0.03% | | | | | 0.17% | |
Footwear | | | | 0.13% | | | | | 0.03% | | | | | 0.16% | |
Office REITs | | | | 0.09% | | | | | 0.07% | | | | | 0.16% | |
Broadcasting | | | | 0.09% | | | | | 0.06% | | | | | 0.15% | |
Home Entertainment Software | | | | 0.10% | | | | | 0.05% | | | | | 0.15% | |
Electronic Equipment & Instruments | | | | 0.01% | | | | | 0.13% | | | | | 0.14% | |
Advertising | | | | 0.06% | | | | | 0.08% | | | | | 0.14% | |
Health Care REITs | | | | 0.14% | | | | | 0.00% | | | | | 0.14% | |
Gas Utilities | | | | 0.00% | | | | | 0.13% | | | | | 0.13% | |
Healthcare Supplies | | | | 0.05% | | | | | 0.08% | | | | | 0.13% | |
Electronic Manufacturing Services | | | | 0.00% | | | | | 0.13% | | | | | 0.13% | |
Paper Packaging | | | | 0.09% | | | | | 0.04% | | | | | 0.13% | |
Consumer Electronics | | | | 0.02% | | | | | 0.11% | | | | | 0.13% | |
Casinos & Gaming | | | | 0.01% | | | | | 0.11% | | | | | 0.12% | |
Reinsurance | | | | 0.00% | | | | | 0.12% | | | | | 0.12% | |
Department Stores | | | | 0.05% | | | | | 0.07% | | | | | 0.12% | |
Specialty Stores | | | | 0.09% | | | | | 0.02% | | | | | 0.11% | |
Healthcare Facilities | | | | 0.06% | | | | | 0.05% | | | | | 0.11% | |
Diversified REITs | | | | 0.00% | | | | | 0.11% | | | | | 0.11% | |
Home Building | | | | 0.05% | | | | | 0.06% | | | | | 0.11% | |
Environmental & Facilities Services | | | | 0.09% | | | | | 0.02% | | | | | 0.11% | |
See Notes to Summary Schedule of Investments and Notes to Financial Statements.
| | | | |
| State Street Total Return V.I.S. Fund | | | 11 | |
State Street Total Return V.I.S. Fund
Summary Schedule of Investments, continued — December 31, 2016
The Fund’s % share of investment in the various categories, based on Fair Value, is as follows at December 31, 2016 (unaudited) (continued):
| | | | | | | | | | | | | | | |
| Industry | | Domestic | | Foreign | | Total |
Tires & Rubber | | | | 0.02% | | | | | 0.08% | | | | | 0.10% | |
Industrial REITs | | | | 0.05% | | | | | 0.05% | | | | | 0.10% | |
Real Estate Development | | | | 0.00% | | | | | 0.10% | | | | | 0.10% | |
Agricultural & Farm Machinery | | | | 0.06% | | | | | 0.04% | | | | | 0.10% | |
Real Estate Operating Companies | | | | 0.00% | | | | | 0.10% | | | | | 0.10% | |
Other Diversified Financial Services | | | | 0.00% | | | | | 0.09% | | | | | 0.09% | |
Thrifts & Mortgage Finance | | | | 0.00% | | | | | 0.09% | | | | | 0.09% | |
Leisure Products | | | | 0.04% | | | | | 0.05% | | | | | 0.09% | |
Agricultural Products | | | | 0.05% | | | | | 0.03% | | | | | 0.08% | |
Human Resource & Employment Services | | | | 0.01% | | | | | 0.07% | | | | | 0.08% | |
Diversified Support Services | | | | 0.02% | | | | | 0.05% | | | | | 0.07% | |
Food Distributors | | | | 0.05% | | | | | 0.02% | | | | | 0.07% | |
Water Utilities | | | | 0.02% | | | | | 0.05% | | | | | 0.07% | |
Highways & Railtracks | | | | 0.00% | | | | | 0.07% | | | | | 0.07% | |
Paper Products | | | | 0.00% | | | | | 0.06% | | | | | 0.06% | |
Heavy Electrical Equipment | | | | 0.00% | | | | | 0.06% | | | | | 0.06% | |
Home Furnishings | | | | 0.03% | | | | | 0.03% | | | | | 0.06% | |
Household Appliances | | | | 0.03% | | | | | 0.03% | | | | | 0.06% | |
Trucking | | | | 0.03% | | | | | 0.03% | | | | | 0.06% | |
Independent Power Producers & Energy Traders | | | | 0.02% | | | | | 0.04% | | | | | 0.06% | |
Copper | | | | 0.04% | | | | | 0.02% | | | | | 0.06% | |
Distributors | | | | 0.05% | | | | | 0.01% | | | | | 0.06% | |
Airport Services | | | | 0.00% | | | | | 0.06% | | | | | 0.06% | |
Alternative Carriers | | | | 0.03% | | | | | 0.02% | | | | | 0.05% | |
Hotel & Resort REITs | | | | 0.05% | | | | | 0.00% | | | | | 0.05% | |
Publishing | | | | 0.01% | | | | | 0.04% | | | | | 0.05% | |
Housewares & Specialties | | | | 0.04% | | | | | 0.00% | | | | | 0.04% | |
Marine | | | | 0.00% | | | | | 0.04% | | | | | 0.04% | |
Metal & Glass Containers | | | | 0.03% | | | | | 0.01% | | | | | 0.04% | |
Healthcare Technology | | | | 0.03% | | | | | 0.01% | | | | | 0.04% | |
Security & Alarm Services | | | | 0.00% | | | | | 0.04% | | | | | 0.04% | |
Oil & Gas Drilling | | | | 0.02% | | | | | 0.02% | | | | | 0.04% | |
Computer & Electronics Retail | | | | 0.02% | | | | | 0.02% | | | | | 0.04% | |
Coal & Consumable Fuels | | | | 0.00% | | | | | 0.04% | | | | | 0.04% | |
Motorcycle Manufacturers | | | | 0.02% | | | | | 0.02% | | | | | 0.04% | |
Home Furnishing Retail | | | | 0.01% | | | | | 0.02% | | | | | 0.03% | |
Education Services | | | | 0.00% | | | | | 0.03% | | | | | 0.03% | |
Marine Ports & Services | | | | 0.00% | | | | | 0.03% | | | | | 0.03% | |
Office Services & Supplies | | | | 0.01% | | | | | 0.02% | | | | | 0.03% | |
Leisure Facilities | | | | 0.00% | | | | | 0.03% | | | | | 0.03% | |
Aluminum | | | | 0.00% | | | | | 0.02% | | | | | 0.02% | |
Real Estate Services | | | | 0.02% | | | | | 0.00% | | | | | 0.02% | |
Technology Distributors | | | | 0.00% | | | | | 0.02% | | | | | 0.02% | |
Commercial Printing | | | | 0.00% | | | | | 0.02% | | | | | 0.02% | |
Mortgage REITs | | | | 0.02% | | | | | 0.00% | | | | | 0.02% | |
Specialized Consumer Services | | | | 0.02% | | | | | 0.00% | | | | | 0.02% | |
Renewable Electricity | | | | 0.00% | | | | | 0.02% | | | | | 0.02% | |
Silver | | | | 0.00% | | | | | 0.01% | | | | | 0.01% | |
Precious Metals & Minerals | | | | 0.00% | | | | | 0.01% | | | | | 0.01% | |
Forest Products | | | | 0.00% | | | | | 0.01% | | | | | 0.01% | |
Specialized Finance | | | | 0.00% | | | | | 0.01% | | | | | 0.01% | |
Textiles | | | | 0.00% | | | | | 0.01% | | | | | 0.01% | |
| | | | | | | | | | | | | | | |
| | | | | | | | | | | | | | 66.20% | |
| | | | | | | | | | | | | | | |
See Notes to Summary Schedule of Investments and Notes to Financial Statements.
| | |
| 12 | | State Street Total Return V.I.S. Fund |
State Street Total Return V.I.S. Fund
Summary Schedule of Investments, continued — December 31, 2016
The Fund’s % share of investment in the various categories, based on Fair Value, is as follows at December 31, 2016 (unaudited) (continued):
| | | | |
| Sector | | Percentage
(based on
Fair Value) | |
U.S. Treasuries | | | 10.43% | |
Corporate Notes | | | 9.58% | |
Agency Mortgage Backed | | | 9.27% | |
Sovereign Bonds | | | 0.40% | |
Non-Agency Collateralized Mortgage Obligations | | | 0.30% | |
Municipal Bonds and Notes | | | 0.29% | |
Agency Collateralized Mortgage Obligations | | | 0.22% | |
Asset Backed | | | 0.17% | |
U.S. Government Sponsored Agencies | | | 0.04% | |
FNMA (TBA) | | | 0.00% | ** |
| | | | |
| | | 30.70% | |
| | | | |
| |
Short-Term Investments | | | | |
Short-Term Investments | | | 3.10% | |
| | | | |
| | | 3.10% | |
| | | | |
| | | 100.00% | |
| | | | |
Affiliate Table
| | | | | | | | | | | | | | | | | | | | | | | | | | | | | | | | |
| | | Number of
Shares Held
at 12/31/15 | | | Value At
12/31/15 | | | Shares
Purchased | | | Shares
Sold | | | Number of
Shares Held
at 12/31/16 | | | Value at
12/31/16 | | | Dividend/
Interest
Income | | | Realized
Gain (Loss) | |
General Electric Co.* | | | 453,781 | | | $ | 14,135,278 | | | | — | | | | 57,630 | | | | 396,151 | | | $ | 12,518,372 | | | $ | 390,904 | | | $ | 492,454 | |
SPDR Bloomberg Barclays High Yield Bond ETF | | | — | | | | — | | | | 2,022,863 | | | | — | | | | 2,022,863 | | | | 73,733,356 | | | | 2,745,181 | | | | — | |
State Street Corp., Common Stock | | | 19,513 | | | | 1,294,883 | | | | — | | | | 3,249 | | | | 16,264 | | | | 1,264,038 | | | | 25,110 | | | | 81,684 | |
State Street Corp., Corporate Notes | | | 370,000 | | | | 382,216 | | | | — | | | | 370,000 | | | | — | | | | — | | | | 11,979 | | | | 17,131 | |
State Street Institutional U.S. Government Money Market Fund - Class G Shares | | | 188,563,850 | | | | 188,563,850 | | | | 327,638,660 | | | | 444,082,728 | | | | 72,119,782 | | | | 72,119,782 | | | | 419,527 | | | | — | |
| | | | | | | | | | | | | | | | | | | | | | | | | | | | | | | | |
| | | | | | $ | 204,376,227 | | | | | | | | | | | | | | | $ | 159,635,548 | | | $ | 3,592,701 | | | $ | 591,269 | |
| | | | | | | | | | | | | | | | | | | | | | | | | | | | | | | | |
| * | Non-affiliated investment as of December 31, 2016. |
See Notes to Summary Schedule of Investments and Notes to Financial Statements.
| | | | |
| State Street Total Return V.I.S. Fund | | | 13 | |
State Street Total Return V.I.S. Fund
Notes to Summary Schedule of Investments — December 31, 2016
The Summary Schedule of Investments does not reflect the complete portfolio holdings. It includes the Fund’s 50 largest holdings and each investment of any issuer that exceeds 1% of the Fund’s net assets. “Other Securities” represent all issues not required to be disclosed under the rules adopted by the U.S. Securities and Exchange Commission (“SEC”). In certain instances, securities for which footnotes listed above may otherwise apply are included in the Other Securities caption. The complete schedule of portfolio holdings is available (i) without charge, upon request, by calling (800) 242-0134; and ii) on the SEC’s website at http://www.sec.gov.
| (a) | Non-income producing security. |
| (b) | State Street Corp. is the parent company of SSGA Funds Management, Inc., the Fund’s investment adviser and administrator effective July 1, 2016, and State Street Bank & Trust Co., the Fund’s sub-administrator, custodian and accounting agent. |
| (c) | General Electric Co. is the parent company of GE Asset Management Incorporated, the Fund’s investment adviser prior to July 1, 2016. |
| (d) | At December 31, 2016, all or a portion of this security was pledged to cover collateral requirements for futures and/or TBA’s. |
| (e) | Variable or floating rate security. The stated rate represents the rate at December 31, 2016. |
| (f) | Settlement is on a delayed delivery or when-issued basis with final maturity to be announced (TBA) in the future. |
| (g) | Sponsored by SSGA Funds Management, Inc., the Funds’ investment adviser and administrator, effective July 1, 2016, and an affiliate of State Street Bank & Trust Co., the Funds’ sub-administrator, custodian and accounting agent. |
| (h) | Coupon amount represents effective yield. |
| (i) | Security is fair valued by the Valuation Committee, in accordance with the procedures approved by the State Street Variable Insurance Series Funds, Inc.’s (the “Company”) Board of Directors. |
| † | Percentages are based on net assets as of December 31, 2016. |
Abbreviations:
LIBOR - London Interbank Offered Rate
TBA - To Be Announced
| | |
| 14 | | Notes to Summary Schedule of Investments |
State Street Total Return V.I.S. Fund
Financial Highlights
Selected data for a share outstanding throughout each period
| | | | | | | | | | | | | | | | | | | | |
| | | Class 1 | |
| | | 12/31/16 | | | 12/31/15* | | | 12/31/14* | | | 12/31/13* | | | 12/31/12* | |
| Inception date | | | | | | | | | | | | | | 7/1/85 | |
| | | | | |
Net asset value, beginning of period | | $ | 17.66 | | | $ | 18.81 | | | $ | 18.71 | | | $ | 17.35 | | | $ | 15.66 | |
| | | | | | | | | | | | | | | | | | | | |
| | | | | |
Income/(loss) from investment operations: | | | | | | | | | | | | | | | | | | | | |
Net investment income | | | 0.35 | | | | 0.31 | | | | 0.35 | | | | 0.29 | | | | 0.28 | |
Net realized and unrealized gains/(losses) on investments | | | 0.77 | | | | (0.52 | ) | | | 0.65 | | | | 2.29 | | | | 1.68 | |
| | | | | | | | | | | | | | | | | | | | |
Total income/(loss) from investment operations | | | 1.12 | | | | (0.21 | ) | | | 1.00 | | | | 2.58 | | | | 1.96 | |
| | | | | | | | | | | | | | | | | | | | |
| | | | | |
Less distributions from: | | | | | | | | | | | | | | | | | | | | |
Net investment income | | | 0.35 | | | | 0.34 | | | | 0.34 | | | | 0.29 | | | | 0.27 | |
Net realized gains | | | 0.35 | | | | 0.60 | | | | 0.56 | | | | 0.93 | | | | — | |
| | | | | | | | | | | | | | | | | | | | |
Total distributions | | | 0.70 | | | | 0.94 | | | | 0.90 | | | | 1.22 | | | | 0.27 | |
| | | | | | | | | | | | | | | | | | | | |
Net asset value, end of period | | $ | 18.08 | | | $ | 17.66 | | | $ | 18.81 | | | $ | 18.71 | | | $ | 17.35 | |
| | | | | | | | | | | | | | | | | | | | |
Total Return(a) | | | 6.35 | % | | | (1.13 | )% | | | 5.32 | % | | | 14.93 | % | | | 12.55 | % |
| | | | | |
Ratios/Supplemental Data: | | | | | | | | | | | | | | | | | | | | |
Net assets, end of period (in thousands) | | $ | 797,448 | | | $ | 807,584 | | | $ | 941,344 | | | $ | 1,046,388 | | | $ | 1,015,136 | |
| | | | | |
Ratios to average net assets: | | | | | | | | | | | | | | | | | | | | |
Net expenses | | | 0.60 | % | | | 0.61 | % | | | 0.62 | %(b) | | | 0.60 | %(b) | | | 0.73 | %(b) |
Gross expenses | | | 0.60 | % | | | 0.61 | % | | | 0.62 | % | | | 0.61 | % | | | 0.74 | % |
Net investment income | | | 1.85 | % | | | 1.56 | % | | | 1.66 | % | | | 1.50 | % | | | 1.45 | % |
Portfolio turnover rate | | | 45 | % | | | 70 | % | | | 78 | % | | | 175 | % | | | 168 | % |
| |
| | | Class 3 | |
| | | 12/31/16 | | | 12/31/15* | | | 12/31/14* | | | 12/31/13* | | | 12/31/12* | |
| Inception date | | — | | | — | | | — | | | — | | | 5/1/06 | |
| | | | | |
Net asset value, beginning of period | | $ | 17.61 | | | $ | 18.75 | | | $ | 18.65 | | | $ | 17.30 | | | $ | 15.62 | |
| | | | | | | | | | | | | | | | | | | | |
| | | | | |
Income/(loss) from investment operations: | | | | | | | | | | | | | | | | | | | | |
Net investment income | | | 0.30 | | | | 0.27 | | | | 0.28 | | | | 0.24 | | | | 0.20 | |
Net realized and unrealized gains/(losses) on investments | | | 0.77 | | | | (0.51 | ) | | | 0.67 | | | | 2.28 | | | | 1.71 | |
| | | | | | | | | | | | | | | | | | | | |
Total income/(loss) from investment operations | | | 1.07 | | | | (0.24 | ) | | | 0.95 | | | | 2.52 | | | | 1.91 | |
| | | | | | | | | | | | | | | | | | | | |
| | | | | |
Less distributions from: | | | | | | | | | | | | | | | | | | | | |
Net investment income | | | 0.30 | | | | 0.30 | | | | 0.29 | | | | 0.24 | | | | 0.23 | |
Net realized gains | | | 0.35 | | | | 0.60 | | | | 0.56 | | | | 0.93 | | | | — | |
| | | | | | | | | | | | | | | | | | | | |
Total distributions | | | 0.65 | | | | 0.90 | | | | 0.85 | | | | 1.17 | | | | 0.23 | |
| | | | | | | | | | | | | | | | | | | | |
Net asset value, end of period | | $ | 18.03 | | | $ | 17.61 | | | $ | 18.75 | | | $ | 18.65 | | | $ | 17.30 | |
| | | | | | | | | | | | | | | | | | | | |
Total Return(a) | | | 6.08 | % | | | (1.34 | )% | | | 5.07 | % | | | 14.64 | % | | | 12.25 | % |
| | | | | |
Ratios/Supplemental Data: | | | | | | | | | | | | | | | | | | | | |
Net assets, end of period (in thousands) | | $ | 1,508,428 | | | $ | 1,633,723 | | | $ | 1,842,997 | | | $ | 1,937,910 | | | $ | 1,769,140 | |
| | | | | |
Ratios to average net assets: | | | | | | | | | | | | | | | | | | | | |
Net Expenses | | | 0.85 | % | | | 0.86 | % | | | 0.87 | %(b) | | | 0.85 | %(b) | | | 0.98 | %(b) |
Gross Expenses | | | 0.85 | % | | | 0.86 | % | | | 0.87 | % | | | 0.86 | % | | | 0.99 | % |
Net investment income | | | 1.60 | % | | | 1.31 | % | | | 1.40 | % | | | 1.25 | % | | | 1.20 | % |
Portfolio turnover rate | | | 45 | % | | | 70 | % | | | 78 | % | | | 175 | % | | | 168 | % |
| (a) | | Total returns are historical and assume changes in share price, reinvestment of dividends and capital gains distributions and do not include the effect of insurance contract charges. Past performance does not guarantee future results. |
| (b) | | Includes contractual management fee waiver related to the Fund’s investments in the GE Institutional Money Market Fund (the “Money Market Fund”). The fee waiver agreement was terminated effective June 30, 2014 with the closure of the Money Market Fund. |
| * | | Beginning with the year ended December 31, 2016, the Fund was audited by Ernst & Young LLP. The previous years were audited by another independent registered public accounting firm. |
The accompanying Notes are an integral part of these financial statements.
State Street Total Return V.I.S. Fund
Statements of Assets and Liabilities — December 31, 2016
| | | | |
Assets | | | | |
| | | | |
Investments in securities, at fair value (cost $1,914,101,985) | | $ | 2,177,215,203 | |
Investments in affiliated securities, at fair value (cost $72,662,837) | | | 74,997,394 | |
Short-term affiliated investments, at fair value | | | 72,119,782 | |
Restricted cash(1) | | | 3,159,902 | |
Foreign currency (cost $1,567,457) | | | 1,556,520 | |
Receivable for investments sold | | | 8,493,198 | |
Income receivable | | | 6,847,157 | |
Receivable for fund shares sold | | | 327,976 | |
Income receivable from affiliated investments | | | 401,870 | |
Receivable for variation margin on open futures contracts | | | 149,074 | |
Other assets | | | 113,380 | |
| | | | |
Total assets | | | 2,345,381,456 | |
| | | | |
| |
Liabilities | | | | |
Payable for investments purchased | | | 36,130,055 | |
Payable for fund shares redeemed | | | 463,157 | |
Payable to the Adviser (Note 6) | | | 684,092 | |
Payable to the Custodian (Note 6) | | | 276,350 | |
Distribution and service fees (Note 6) | | | 320,318 | |
Due to custodian | | | 222,595 | |
Accrued other expenses | | | 1,408,396 | |
| | | | |
Total liabilities | | | 39,504,963 | |
| | | | |
| | | | |
Net Assets | | $ | 2,305,876,493 | |
| | | | |
| |
Net Assets Consist of: | | | | |
Capital paid in | | $ | 2,051,855,310 | |
Undistributed (distributions in excess of) net investment income | | | (2,090,380 | ) |
Accumulated net realized loss | | | (9,551,113 | ) |
Net unrealized appreciation (depreciation) on: | | | | |
Investments | | | 265,447,775 | |
Futures | | | 289,219 | |
Foreign currency related transactions | | | (74,318 | ) |
| | | | |
Net Assets | | $ | 2,305,876,493 | |
| | | | |
| | | | |
Class 1 | | | | |
Net Assets | | $ | 797,448,286 | |
Shares outstanding ($0.01 par value, unlimited shares authorized) | | | 44,106,340 | |
Net asset value per share | | $ | 18.08 | |
| | | | |
Class 3 | | | | |
Net Assets | | $ | 1,508,428,207 | |
Shares outstanding ($0.01 par value, unlimited shares authorized) | | | 83,681,666 | |
Net asset value per share | | $ | 18.03 | |
(1) Deposits at broker for futures contracts. | | | | |
The accompanying Notes are an integral part of these financial statements.
| | |
| 16 | | Statements of Assets and Liabilities |
State Street Total Return V.I.S. Fund
Statements of Operations — For the year ended December 31, 2016
| | | | |
Investment Income | | | | |
| | | | |
Income | | | | |
Dividend | | $ | 39,164,196 | |
Interest | | | 17,079,380 | |
Dividend income from affiliated investments | | | 3,189,818 | |
Interest income from affiliated investments | | | 11,979 | |
Less: Foreign taxes withheld | | | (1,750,993 | ) |
| | | | |
Total income | | | 57,694,380 | |
| | | | |
| |
Expenses | | | | |
Advisory and administration fees (Note 6) | | | 8,325,387 | |
Distribution and service (Note 6): | | | | |
Class 1 | | | 1,585,079 | |
Class 3 | | | 7,040,819 | |
Directors’ fees (Note 6) | | | 161,835 | |
Custody and accounting expenses — net (Note 6) | | | 496,728 | |
Professional fees | | | 144,395 | |
Other expenses | | | 259,867 | |
| | | | |
Total Expenses | | | 18,014,110 | |
| | | | |
Net investment income | | $ | 39,680,270 | |
| | | | |
| |
Net Realized and Unrealized Gain (Loss) on Investments | | | | |
Realized gain (loss) on: | | | | |
Investments | | $ | 32,740,116 | |
Affiliated investments | | | 98,815 | |
Futures | | | 11,347 | |
Foreign currency transactions | | | (138,907 | ) |
Increase (decrease) in unrealized appreciation/depreciation on: | | | | |
Investments | | | 65,958,985 | |
Futures | | | 1,081,412 | |
Foreign currency translations | | | (2,037 | ) |
| | | | |
| |
Net realized and unrealized gain (loss) on investments | | | 99,749,731 | |
| | | | |
Net Increase in Net Assets Resulting from Operations | | $ | 139,430,001 | |
| | | | |
The accompanying Notes are an integral part of these financial statements.
| | | | |
| Statements of Operations | | | 17 | |
State Street Total Return V.I.S. Fund
Statements of Changes in Net Assets
| | | | | | | | |
| | | Year Ended December 31, 2016 | | | Year Ended December 31, 2015* | |
| | | | | | | | |
Increase (Decrease) in Net Assets | | | | | | | | |
| | |
Operations: | | | | | | | | |
Net investment income | | $ | 39,680,270 | | | $ | 36,869,155 | |
Net realized gain (loss) on investments, futures and foreign currency related transactions | | | 32,711,371 | | | | 71,600,751 | |
Net increase (decrease) in unrealized appreciation/depreciation on investments, TBA Sale Commitments, futures and foreign currency transactions | | | 67,038,360 | | | | (137,265,756 | ) |
| | | | | | | | |
Net increase (decrease) from operations | | | 139,430,001 | | | | (28,795,850 | ) |
| | | | | | | | |
| | |
Distributions to shareholders from: | | | | | | | | |
Net investment income | | | | | | | | |
Class 1 | | | (14,840,025 | ) | | | (14,866,449 | ) |
Class 3 | | | (24,277,209 | ) | | | (25,948,829 | ) |
Net realized gains | | | | | | | | |
Class 1 | | | (14,759,944 | ) | | | (26,109,147 | ) |
Class 3 | | | (28,143,917 | ) | | | (53,172,873 | ) |
| | | | | | | | |
Total distributions | | | (82,021,095 | ) | | | (120,097,298 | ) |
| | | | | | | | |
Increase (decrease) in assets from operations and distributions | | | 57,408,906 | | | | (148,893,148 | ) |
| | | | | | | | |
| | |
Share transactions: | | | | | | | | |
Proceeds from sale of shares | | | | | | | | |
Class 1 | | | 24,722,908 | | | | 34,958,688 | |
Class 3 | | | 14,430,513 | | | | 34,605,587 | |
Value of distributions reinvested | | | | | | | | |
Class 1 | | | 29,599,969 | | | | 40,975,596 | |
Class 3 | | | 52,421,126 | | | | 79,121,702 | |
Cost of shares redeemed | | | | | | | | |
Class 1 | | | (83,008,379 | ) | | | (161,103,239 | ) |
Class 3 | | | (231,006,331 | ) | | | (222,699,174 | ) |
| | | | | | | | |
Net increase (decrease) from share transactions | | | (192,840,194 | ) | | | (194,140,840 | ) |
| | | | | | | | |
| | |
Total increase (decrease) in net assets | | | (135,431,288 | ) | | | (343,033,988 | ) |
| | |
Net Assets | | | | | | | | |
Beginning of year | | | 2,441,307,781 | | | | 2,784,341,769 | |
| | | | | | | | |
| | |
End of year | | $ | 2,305,876,493 | | | $ | 2,441,307,781 | |
| | | | | | | | |
| | |
Undistributed (distributions in excess of) net investment income, end of year | | $ | (2,090,380 | ) | | $ | (2,295,946 | ) |
| | |
Changes in Fund Shares | | | | | | | | |
Class 1 | | | | | | | | |
Shares sold | | | 1,379,965 | | | | 1,839,621 | |
Issued for distributions reinvested | | | 1,641,707 | | | | 2,302,000 | |
Shares redeemed | | | (4,633,537 | ) | | | (8,469,377 | ) |
| | | | | | | | |
Net increase (decrease) in fund shares | | | (1,611,865 | ) | | | (4,327,756 | ) |
| | | | | | | | |
| | |
Class 3 | | | | | | | | |
Shares sold | | | 800,556 | | | | 1,843,228 | |
Issued for distributions reinvested | | | 2,915,525 | | | | 4,457,561 | |
Shares redeemed | | | (12,806,048 | ) | | | (11,810,905 | ) |
| | | | | | | | |
Net decrease in fund shares | | | (9,089,967 | ) | | | (5,510,116 | ) |
| | | | | | | | |
| * | | Beginning with the year ended December 31, 2016, the Fund was audited by Ernst & Young LLP. The previous years were audited by another independent registered public accounting firm. |
The accompanying Notes are an integral part of these financial statements.
| | |
| 18 | | Statements of Changes in Net Assets |
State Street Total Return V.I.S. Fund
Notes to Financial Statements — December 31, 2016
| 1. | | Organization of the Company |
State Street Variable Insurance Series Funds, Inc. (the “Company”) was incorporated under the laws of the Commonwealth of Virginia on May 14, 1984 and is registered under the Investment Company Act of 1940, as amended (the “1940 Act”), as an open-end management investment company. Prior to November 30, 2016, the Company was named GE Investments Funds, Inc. The Company is currently composed of the following eight investment portfolios (collectively the “Funds”): State Street U.S. Equity V.I.S. Fund, State Street S&P 500 Index V.I.S. Fund, State Street Premier Growth Equity V.I.S. Fund, State Street Core Value Equity V.I.S. Fund, State Street Small-Cap Equity V.I.S. Fund, State Street Total Return V.I.S. Fund (the “Fund”), State Street Income V.I.S. Fund and State Street Real Estate Securities V.I.S. Fund. Each Fund is an investment company and accordingly follows the investment company accounting and reporting guidance of the Financial Accounting Standards Board (“FASB”) Accounting Standard Codification (“ASC”) Topic 946 Financial Services — Investment Companies. Each Fund is a diversified investment company within the meaning of the 1940 Act.
Effective November 30, 2016, each individual Fund changed its respective name as follows:
| | |
| Old Name | | New Name |
GE Investments U.S. Equity Fund | | State Street U.S. Equity V.I.S. Fund |
GE Investments S&P 500 Index Fund | | State Street S&P 500 Index V.I.S. Fund |
GE Investments Premier Growth Equity Fund | | State Street Premier Growth Equity V.I.S. Fund |
GE Investments Core Value Equity Fund | | State Street Core Value Equity V.I.S. Fund |
GE Investments Small-Cap Equity Fund | | State Street Small-Cap Equity V.I.S. Fund |
GE Investments Total Return Fund | | State Street Total Return V.I.S. Fund |
GE Investments Income Fund | | State Street Income V.I.S. Fund |
GE Investments Real Estate Securities Fund | | State Street Real Estate Securities V.I.S. Fund |
Shares of the Funds of the Company are offered only to insurance company separate accounts that fund certain variable life insurance contracts and variable annuity contracts. SSGA Funds Management, Inc. (“SSGA FM”) is the investment adviser and administrator of each of the Funds effective July 1, 2016. Prior to July 1, 2016, GE Asset Management Incorporated (“GEAM”) served as the investment adviser and administrator to each Fund.
The Company currently offers two share classes of the Fund as investment options for variable life insurance and variable annuity contracts — Class 1 and Class 3. Class 3 shares were first offered on May 1, 2006, and Fund shares outstanding prior to May 1, 2006 were designated as Class 1 shares. Each class of shares has different fees and expenses, and as a result, each class of shares will have different share price and performance. Not all variable contracts offer every class of the Fund’s shares.
| 2. | | Summary of Significant Accounting Policies |
The preparation of financial statements in conformity with U.S. generally accepted accounting principles (“GAAP”) requires management to make estimates and assumptions that affect the reported amounts of assets and liabilities and disclosure of contingent assets and liabilities at the date of the financial statements and the reported amounts of increases and decreases in net assets from operations during the reporting period. Actual results may differ from those estimates.
Subsequent events after the balance sheet date through the date the financial statements were issued have been evaluated in the preparation of the financial statements. There are no items to report.
The following summarizes the significant accounting policies of the Company:
Securities Valuation and Transactions All investments in securities are recorded at their estimated fair value, as described in Note 3.
Securities transactions are accounted for as of the trade date. Realized gains and losses on investments sold are recorded on the basis of identified cost for both financial statement and federal tax purposes.
Each Fund’s income, expenses (other than distribution and service fees) and realized and unrealized gains and losses are allocated proportionally each day among the share classes based upon the relative net assets of each class.
| | | | |
| Notes to Financial Statements | | | 19 | |
State Street Total Return V.I.S. Fund
Notes to Financial Statements, continued — December 31, 2016
Foreign Currency Accounting records of the Fund are maintained in U.S. dollars. Investment securities and other assets and liabilities denominated in a foreign currency are translated to U.S. dollars at the prevailing rates of exchange at period end. Purchases and sales of securities, income receipts and expense payments denominated in foreign currencies are translated into U.S. dollars at the prevailing exchange rate on the respective dates of such transactions.
All assets and liabilities of the Fund initially expressed in foreign currency values will be converted into U.S. dollars at the WM/Reuters exchange rate computed at 11:00 a.m., Eastern Time.
The Fund does not isolate the portion of the results of operations resulting from changes in foreign exchange rates from the fluctuations arising from changes in the market prices of securities during the year. Such fluctuations are included in the net realized or unrealized gain or loss from investments. Net realized gains or losses on foreign currency transactions represent net gains or losses on sales and maturities of foreign currency contracts, disposition of foreign currencies, the difference between the amount of net investment income and withholding taxes accrued and the U.S. dollar amount actually received or paid, and gains or losses between the trade and settlement date on purchases and sales of foreign securities. Net unrealized foreign exchange gains and losses arising from changes in the value of other assets and liabilities (including foreign currencies and open foreign currency contracts) as a result of changes in foreign exchange rates are included as increases or decreases in unrealized appreciation/depreciation on foreign currency related transactions.
Derivatives The Fund is subject to equity price risk, interest rate risk, credit risk, and foreign currency exchange rate risk in the normal course of pursuing its investment objective. The Fund may enter into various types of derivative transactions (such as options, futures, options on futures, interest rate swaps and credit default swaps) to gain or hedge exposure to a certain type of broad-based index as an alternative to investing directly in or selling the securities representing such index.
Futures Contracts A futures contract is an agreement to buy or sell a specific amount of a commodity, financial instrument, currency or index at a particular price and future date. During the fiscal year ended December 31, 2016, the Fund invested in futures contracts on various stock indices to gain equity exposure. Buying futures tends to increase the Fund’s exposure to the underlying instrument while selling futures tends to decrease the Fund’s exposure to the underlying instrument, or hedge other Fund investments. With futures contracts, there is minimal counterparty credit risk to the Fund since futures contracts are exchange traded and the exchange’s clearinghouse, as counterparty to all traded futures, guarantees the futures against default. The Fund’s risks in using these contracts include changes in the value of the underlying instruments, non-performance of the counterparties under the contracts’ terms and changes in the liquidity of the secondary market for the contracts. Futures contracts are valued at the settlement price established each day by the board of trade or exchange on which they principally trade.
Upon entering into a financial futures contract, the Fund is required to pledge to the broker an amount of cash and/or other assets equal to a certain percentage of the contract amount, known as initial margin deposit. Subsequent payments, known as variation margin, are made or received by the Fund each day, depending on the daily fluctuation in the fair value of the underlying security. The Fund records an unrealized gain or loss equal to the daily variation margin. Should market conditions move unexpectedly, the Fund may not achieve the anticipated benefits of the futures contracts and may incur a loss. The Fund recognizes a realized gain or loss on the expiration or closing of a futures contract.
When-Issued Securities and Forward Commitments The Fund may purchase or sell securities on a when issued or forward commitment basis. These transactions are arrangements in which the Fund purchases and sells securities with payment and delivery scheduled a month or more after entering into the transaction. The price of the underlying securities and the date when these securities will be delivered and paid for are fixed at the time the transaction is negotiated. Losses may arise due to changes in the market value of the underlying securities or if the counterparty does not perform under the commitments. In connection with such purchases, the Fund maintains cash or liquid assets in an amount equal to the purchase commitments for such underlying securities until settlement date and for sales commitments the Fund maintains equivalent deliverable securities as “cover” for the transaction. Unsettled commitments are valued at the current market value of the underlying security. Daily fluctuations in the value of such commitments are recorded as unrealized gains or losses. The Fund will not enter into such commitments for the purpose of investment leverage.
Forward Foreign Currency Exchange Contracts The Fund may enter into forward foreign currency exchange contracts to facilitate transactions in foreign denominated securities and to manage the Fund’s currency exposure. Forward foreign
| | |
| 20 | | Notes to Financial Statements |
State Street Total Return V.I.S. Fund
Notes to Financial Statements, continued — December 31, 2016
currency exchange contracts are valued at the mean between the bid and the offered forward rates as last quoted by a recognized dealer. The aggregate principal amounts of the contracts are not recorded in the Fund’s financial statements. Such amounts appear under the caption Forward Foreign Currency Contracts in the Schedule of Investments. Fluctuations in the value of the contracts are recorded in the Statements of Assets and Liabilities as an asset (or liability) and in the Statements of Operations as unrealized appreciation (depreciation) until the contracts are closed, when they are recorded as realized gains or losses on foreign currency related transactions. The Fund’s risks in using these contracts include changes in the value of foreign currency or the possibility that the counterparties do not perform under the contracts’ terms. When the Fund enters into a forward foreign currency exchange contract, it is required to segregate cash or liquid securities with its custodian in an amount equal to the value of the Fund’s total assets committed to the consummation of the forward contract. If the value of the segregated securities declines, additional cash or securities are segregated so that the value of the account will equal the amount of the Fund’s commitment with respect to the contract.
Investments in Foreign Markets Investments in foreign markets involve special risks and considerations not typically associated with investing in the United States. These risks include revaluation of currencies, high rates of inflation, restrictions on repatriation of income and capital, and adverse political and economic developments. Moreover, securities issued in these markets may be less liquid, subject to government ownership controls, tariffs and taxes, subject to delays in settlements, and their prices may be more volatile.
The Fund may be subject to capital gains and repatriation taxes imposed by certain countries in which it invests. Such taxes are generally based upon income and/or capital gains earned or repatriated. Taxes are accrued based on net investment income, net realized gains and net unrealized appreciation as income and/or capital gains are earned. These foreign taxes, if any, are paid by the Funds and are reflected in the Statements of Operations, if applicable. Foreign taxes payable or deferred as of December 31, 2016, if any, are disclosed in the Funds’ Statements of Assets and Liabilities.
Investment Income Corporate actions (including cash dividends) are recorded on the ex-dividend date, net of applicable withholding taxes, except for certain foreign corporate actions which are recorded as soon after the ex-dividend date as such information becomes available. Withholding taxes on foreign dividends, if any, have been provided for in accordance with the Fund’s understanding of the applicable country’s tax rules and rates.
Interest income is recorded on the accrual basis. Accretion of discounts and amortization of premiums on taxable bonds are to the call or maturity date, whichever is shorter, using the effective yield method.
Expenses Fund specific expenses are charged to the Fund that incurs such expenses. Such expenses may include custodial fees, legal and accounting fees, printing costs and registration fees. Expenses that are not fund specific are allocated pro rata across the Funds. Certain class specific expenses (such as distribution fees) are allocated to the class that incurs such expense. Expenses of the Fund are generally paid directly by the Fund, however, expenses may be paid by the investment adviser and reimbursed by the Fund.
Federal Income Taxes The Fund intends to comply with all sections of the Internal Revenue Code of 1986, as amended (the “Internal Revenue Code”) applicable to regulated investment companies, including the distribution of substantially all of its taxable net investment income and net realized capital gains to its shareholders. Therefore, no provision for federal income tax has been made. The Fund is treated as a separate taxpayer for federal income tax purposes.
The Fund utilizes various methods to measure the fair value of most of its investments on a recurring basis. GAAP establishes a framework for measuring fair value and providing related disclosures. Broadly, the framework requires fair value to be determined based on the exchange price that would be received for an asset or paid to transfer a liability (an exit price) in the principal or most advantageous market for the asset or liability in an orderly transaction between market participants at the measurement date. In the absence of active markets for the identical assets or liabilities, such measurements involve developing assumptions based on market observable data and, in the absence of such data, internal information that is consistent with what market participants would use in a hypothetical transaction that occurs at the measurement date. It also establishes a three-level valuation hierarchy based upon observable and non-observable inputs.
| | | | |
| Notes to Financial Statements | | | 21 | |
State Street Total Return V.I.S. Fund
Notes to Financial Statements, continued — December 31, 2016
Observable inputs reflect market data obtained from independent sources, while unobservable inputs reflect our market assumptions. Preference is given to observable inputs. These two types of inputs create the following fair value hierarchy:
| | • | | Level 1 — Quoted prices for identical investments in active markets. |
| | • | | Level 2 — Quoted prices for similar investments in active markets; quoted prices for identical or similar investments in markets that are not active; and model-derived valuations whose inputs are observable or whose significant value drivers are observable. |
| | • | | Level 3 — Significant inputs to the valuation model are unobservable. |
Policies and procedures are maintained to value investments using the best and most relevant data available. In addition, pricing vendors are utilized to assist in valuing investments. The investment adviser performs periodic reviews of the methodologies used by independent pricing services including price validation of individual securities.
Fair Value Measurement The following section describes the valuation methodologies the Fund uses to measure different financial investments at fair value.
The Fund’s portfolio securities are valued generally on the basis of market quotations. Equity securities generally are valued at the last reported sale price on the primary market in which they are traded. Portfolio securities listed on NASDAQ are valued using the NASDAQ Official Closing Price. Level 1 securities primarily include publicly-traded equity securities, which may not necessarily represent the last sales price. If no sales occurred on the exchange or NASDAQ that day, the portfolio security generally is valued using the last reported bid price. In those circumstances the Fund typically classifies the investment securities in Level 2.
Debt securities (other than short-term securities described below) generally are valued at an evaluated bid price as reported by independent pricing services. The pricing services use various pricing models for each asset class. The inputs and assumptions to the model of the pricing services are derived from market observable sources, which may include: benchmark yields, reported trades, broker/dealer quotes, issuer spreads, benchmark securities, bids, offers, and other market related data. Since many fixed income securities do not trade on a daily basis, the methodology of the pricing service may also use other available information such as benchmark curves, benchmarking of similar securities, sector groupings, and matrix pricing, as applicable. Thus, certain securities may not be priced using quoted prices, but rather determined from market observable information. These investments are included in Level 2 and are primarily comprised of corporate fixed income, government, mortgage and asset-backed securities. In the absence of a reliable bid price from such a pricing service, debt securities may be valued based on broker or dealer supplied valuations or quotations. In these infrequent circumstances, pricing services may provide the Fund with valuations that are based on significant unobservable inputs, and in those circumstances the investment securities are classified as Level 3.
The Fund may use non-binding broker or dealer quotes for valuation when there is limited or no relevant market activity for a specific investment or for other investments that share similar characteristics and a price is not provided by a pricing service or is deemed not to be reliable. The Fund has not adjusted the prices obtained. Investment securities priced using non-binding broker or dealer quotes are included in Level 3.
Short-term securities of sufficient credit quality with remaining maturities of sixty days or less at the time of purchase are typically valued on the basis of amortized cost which approximates fair value and these are included in Level 2. If it is determined that amortized cost does not approximate fair value, securities may be valued based on dealer supplied valuations or quotations. In these infrequent circumstances, pricing services may provide the Fund with valuations that are based on significant unobservable inputs, and in those circumstances the investment securities are classified in Level 3.
Investments in registered investment companies are valued at the published daily net asset value (“NAV”) and classified in Level 1.
If prices are not readily available for a portfolio security, or if it is believed that a price for a portfolio security does not represent its fair value, the security may be valued using procedures approved by the Company’s Board of Directors that are designed to establish its “fair” value. These securities are typically classified in Level 3. Those procedures require that the fair value of a security be established by a valuation committee of the investment adviser. The valuation committee follows different protocols for different types of investments and circumstances. The fair value procedures may be used to value any investment of the Fund in the appropriate circumstances.
| | |
| 22 | | Notes to Financial Statements |
State Street Total Return V.I.S. Fund
Notes to Financial Statements, continued — December 31, 2016
Foreign securities may be valued with the assistance of an independent fair value pricing service in circumstances where it is believed that they have been or would be materially affected by events occurring after the close of the portfolio security’s primary market and before the close of regular trading on the New York Stock Exchange (“NYSE”). In these circumstances the Fund classifies the investment securities in Level 2. This independent fair value pricing service uses a proprietary model to identify affected securities, taking into consideration various factors, and the fair value of such securities may be something other than the last available quotation or other market price.
All assets and liabilities of the Fund initially expressed in foreign currency values will be converted into U.S. dollars at the WM/Reuters exchange rate computed at 11:00 a.m. Eastern time.
Fair value determinations generally are used for securities whose value is affected by a significant event that will materially affect the value of a security and which occurs subsequent to the time of the close of the principal market on which such security trades but prior to the calculation of the Fund’s NAV.
The value established for such a portfolio security valued other than by use of a market quotation (as described above) may be different than what would be produced through the use of market quotations or another methodology. Portfolio securities that are valued using techniques other than market quotations, including “fair valued” securities, may be subject to greater fluctuation in their value from one day to the next than would be the case if market quotations were used. In addition, there is no assurance that the Fund could sell a portfolio security for the value established for it at any time and it is possible that the Fund would incur a loss because a portfolio security is sold at a discount to its established value.
Other financial investments are derivative instruments that are not reflected in total investments, such as futures, forwards, swaps, and written options contracts, which are valued based on fair value as discussed above.
The Fund uses closing prices for derivatives included in Level 1, which are traded either on exchanges or liquid over-the-counter markets. Derivative assets and liabilities included in Level 2 primarily represent interest rate swaps, cross-currency swaps and foreign currency and commodity forward and option contracts. Derivative assets and liabilities included in Level 3 primarily represent interest rate products that contain embedded optionality or prepayment features.
The inputs or methodology used for valuing securities are not an indication of the risk associated with investing in those securities.
| | | | |
| Notes to Financial Statements | | | 23 | |
State Street Total Return V.I.S. Fund
Notes to Financial Statements, continued — December 31, 2016
The following table presents the Fund’s investments measured at fair value on a recurring basis at December 31, 2016:
| | | | | | | | | | | | | | | | |
| Investments | | Level 1 | | | Level 2 | | | Level 3 | | | Total | |
| | | | | | | | | | | | | | | | |
Investments in Securities† | |
Domestic Equity | | $ | 892,275,795 | | | $ | — | | | $ | 11,163 | | | $ | 892,286,958 | |
Foreign Equity | | | 572,545,040 | | | | — | | | | 62,096 | | | | 572,607,136 | |
U.S. Treasuries | | | — | | | | 242,404,717 | | | | — | | | | 242,404,717 | |
U.S. Government Sponsored Agencies | | | — | | | | 975,166 | | | | — | | | | 975,166 | |
Agency Collateralized Mortgage Obligations | | | — | | | | 5,191,180 | | | | — | | | | 5,191,180 | |
Agency Mortgage Backed | | | — | | | | 215,367,127 | | | | — | | | | 215,367,127 | |
Asset Backed | | | — | | | | 3,985,983 | | | | — | | | | 3,985,983 | |
Corporate Notes | | | — | | | | 222,659,846 | | | | — | | | | 222,659,846 | |
Non-Agency Collateralized Mortgage Obligations | | | — | | | | 6,870,449 | | | | — | | | | 6,870,449 | |
Sovereign Bonds | | | — | | | | 9,421,018 | | | | — | | | | 9,421,018 | |
Municipal Bonds and Notes | | | — | | | | 6,697,509 | | | | — | | | | 6,697,509 | |
FNMA (TBA) | | | — | | | | — | | | | 12,152 | | | | 12,152 | |
Exchange Traded Funds | | | 73,733,356 | | | | — | | | | — | | | | 73,733,356 | |
Short-Term Investments | | | 72,119,782 | | | | — | | | | — | | | | 72,119,782 | |
| | | | | | | | | | | | | | | | |
Total Investments in Securities | | $ | 1,610,673,973 | | | $ | 713,572,995 | | | $ | 85,411 | | | $ | 2,324,332,379 | |
| | | | | | | | | | | | | | | | |
Other Financial Instruments* | |
Long Futures Contracts — Unrealized Depreciation | | $ | (79,303 | ) | | $ | — | | | $ | — | | | $ | (79,303 | ) |
Short Futures Contracts — Unrealized Appreciation | | | 368,522 | | | | — | | | | — | | | | 368,522 | |
| | | | | | | | | | | | | | | | |
Total Other Financial Instruments | | $ | 289,219 | | | $ | — | | | $ | — | | | $ | 289,219 | |
| | | | | | | | | | | | | | | | |
| | † | See Schedule of Investments for Industry Classification. |
| | * | Other financial instruments include derivative instruments such as futures contracts. Amounts shown represent unrealized appreciation (depreciation), at period end. |
Transfers between fair value levels were not significant in relation to net assets. Transfers between fair value levels are considered to occur at the beginning of the period.
Level 3 investments at the beginning and/or end of the period in relation to net assets were not significant and, accordingly, a reconciliation of Level 3 assets for the fiscal year ended December 31, 2016 is not presented.
| 4. | | Derivatives Disclosure |
Shown below are the derivative contracts entered into by the Fund, summarized by primary risk exposure as they appear on the Statement of Assets and Liabilities, none of which are accounted for as hedging instruments under FASB ASC No. 815 Derivatives and Hedging (“ASC 815”) as of December 31, 2016.
| | | | | | | | | | | | |
| | | Asset Derivatives December 31, 2016 | | | Liability Derivatives December 31, 2016 | |
Derivatives not accounted for as
hedging instruments under ASC 815 | | Location in the Statement
of Assets and Liabilities | | Fair
Value ($) | | | Location in the Statement
of Assets and Liabilities | | Fair
Value ($) | |
| Equity Contracts | | Assets, Net Assets — Net Unrealized Appreciation/ (Depreciation) on Futures | | | 368,522 | | | Liabilities, Net Assets — Net Unrealized Appreciation/ (Depreciation) on Futures | | | (79,303 | )* |
| | * | Includes cumulative unrealized appreciation/(depreciation) of futures contracts as reported in the Summary Schedule of Investments and within the components of the net assets section of the Statement of Assets and Liabilities. Only the current day’s variation margin is reported within the Assets and/or Liabilities section on the Statement of Assets and Liabilities. |
| | |
| 24 | | Notes to Financial Statements |
State Street Total Return V.I.S. Fund
Notes to Financial Statements, continued — December 31, 2016
Shown below are the effects of derivative instruments on the Fund’s Statement of Operations, summarized by primary risk exposure, none of which are accounted for as hedging instruments under ASC 815.
| | | | | | | | | | | | |
Derivatives not accounted for as hedging instruments under ASC 815 | | Location in the Statement of Operations | | Total Notional
Amount of
Futures Contracts
Purchased/(Sold) ($) | | Realized Gain (Loss)
on Derivatives
Recognized in
Income ($) | | | Change in Unrealized
Appreciation (Depreciation)
on Derivatives
Recognized in
Income ($) | |
| Equity Contracts | | Realized gain (loss) on Futures, Increase (decrease) in unrealized appreciation/ (depreciation) on Futures | | 522,251,418/
(528,931,851) | | | 11,347 | | | | 1,081,412 | |
During the fiscal year ended December 31, 2016, the Fund had an average notional value of $16,474,988 and $44,822,050 on long and short futures contracts, respectively. Please refer to the table following the Schedule of Investments for open futures contracts at December 31, 2016.
Prior to July 1, 2016, the Company shared a revolving credit facility of up to $150 million with a number of its affiliates. The credit facility was with the Company’s custodian bank, State Street Bank and Trust Company (“State Street”). The revolving credit facility required the payment of a commitment fee equal to 0.20% per annum on the daily unused portion of the credit facility, payable quarterly. The portion borne by each Fund generally was borne proportionally based upon net assets. Generally, borrowings under the credit facility would accrue interest at the higher of the 1-Month LIBOR plus 1.25% and the Overnight Federal Funds Rate plus 1.25% and would be borne by the borrowing Fund. The maximum amount allowed to be borrowed by any one Fund was the lesser of (i) 33.33% of its total assets or (ii) 20% of its net assets. The credit facility was not utilized by the Fund during the fiscal year ended December 31, 2016. The revolving credit facility with State Street was terminated effective June 30, 2016.
Currently, the Funds and other affiliated funds (each a “Participant” and, collectively, the “Participants”) participate in a $360 million revolving credit facility provided by a syndication of banks under which the Participants may borrow to fund shareholder redemptions. This agreement expires October 12, 2017, unless extended or renewed.
The Participants are charged an annual commitment fee which is calculated based on the unused portion of the shared credit line. Commitment fees are allocated among each of the Participants based on relative net assets. A Participant incurs and pays the interest expense related to its borrowing. Interest is calculated at a rate per annum equal to the sum of 1% plus the greater of the New York Fed Bank Rate and 1-month LIBOR rate. From July 1, 2016, the date the Funds were added to this credit facility, through October 12, 2016, interest was calculated at a rate per annum equal to the sum of the New York Fed Bank Rate plus 1%.
The credit facilities were not utilized by the Fund during the fiscal year ended December 31, 2016.
| 6. | | Compensation and Fees Paid to Affiliates |
SSGA FM, a registered investment adviser, was retained by the Company’s Board of Directors effective July 1, 2016 to act as investment adviser and administrator of the Fund. SSGA FM’s compensation for investment advisory and administrative services (“Management Fee”) is paid monthly based on the average daily net assets of the Fund at an annualized rate of 0.35%.
State Street serves as sub-administrator and custodian to the Funds. Amounts paid by the Fund to State Street for performing such services are included in the advisory and administration and custody and accounting expenses, respectively.
Prior to July 1, 2016, GEAM served as the Fund’s investment adviser and administrator and the Fund paid GEAM a Management Fee at an annualized rate of 0.35%.
Investor Service Plan — Class 1 and Class 3 Shares The Company adopted an Investor Service Plan (the “Service Plan”) on December 9, 2005 for Class 1 shares and on May 1, 2009 for Class 3 shares of the Fund (each an “Investor Service
| | | | |
| Notes to Financial Statements | | | 25 | |
State Street Total Return V.I.S. Fund
Notes to Financial Statements, continued — December 31, 2016
Plan”). The Investor Service Plans were not adopted pursuant to Rule 12b-1 under the 1940 Act. Each Investor Service Plan provides that, during any fiscal year, the amount of compensation paid under the Investor Service Plans by the Fund’s Class 1 or Class 3 shares may not exceed the annual rate of 0.20% of the average daily net assets of the Fund attributable to the share class offered.
Distribution and Shareholder Service (12b-1) Fees The Company has adopted a Distribution and Service (12b-1) Plan (the “12b-1 Plan”) pursuant to Rule 12b-1 under the 1940 Act with respect to each of Class 1 and Class 3 shares of the Fund. Under the 12b-1 Plan for Class 1 shares that became effective May 1, 2009, payments made under the Class 1 Investor Service Plan are covered in the event that any portion of compensation paid pursuant to the Class 1 Investor Service Plan is determined to be an indirect use of the assets attributable to the Class 1 shares to finance distribution of such shares. Under the 12b-1 Plan for Class 3 shares, the Company, on behalf of the Fund, may have compensated GE Investment Distributors, Inc. (“GEID”), the distributor of the shares of the Fund prior to July 1, 2016, and State Street Global Markets, LLC (“SSGM”), the distributor of the shares of the Fund effective July 1, 2016, for certain sales services provided by GEID, SSGM or other broker dealers and investor services provided by GEID, SSGM or other service providers relating to the Fund’s Class 3 shares, including services to owners or prospective owners of variable contracts issued by insurance companies that offer Class 3 shares as an investment option under such variable contracts. The amount of compensation paid under the 12b-1 Plan for Class 3 shares may not exceed 0.25%, of the average daily net assets of the Fund attributable to such share class. The 12b-1 Plan continues in effect from year to year for so long as such continuance is approved annually by the Board of Directors, including by those directors who are not interested persons of the Company and who have no direct or indirect financial interest in the operation of the 12b-1 Plan or in any agreement related to it. In addition, the Class 3 12b-1 Plan covers payments made under the Class 3 Investor Service Plan in the event that any portion of compensation paid pursuant to the Class 3 Investor Service Plan is determined to be an indirect use of the assets attributable to the Class 3 shares to finance distribution of such shares.
Directors’ Compensation The Fund pays no compensation to its Directors who are officers or employees of SSGA FM or its affiliates. Directors who are not such officers or employees also serve in a similar capacity for other funds advised by SSGA FM. Compensation paid to non-interested Directors is reflected on the Statement of Operations. These fees are allocated pro rata across all of the mutual fund platforms served by the Directors, including the Fund, and are based upon the relative net assets of each fund within such platforms. (For additional information about Directors’ compensation, please refer to the Funds’ Statement of Additional Information.)
Other Transactions with Affiliates In December 2015, State Street announced a review of the manner in which it invoiced certain expenses to certain of its Investment Servicing clients, primarily in the United States, during an 18-year period going back to 1998 and its determination that it had incorrectly invoiced clients for certain expenses. State Street informed its clients that it will pay to them the expenses it concluded were incorrectly invoiced to them, plus interest.
The Fund was impacted by this matter. The amounts in the table below represent the refunded expenses and interest received by the Fund for the periods in question.
| | | | | | | | | | | | | | | | | | |
Refunded
Custody
Expense* | | Interest* | | Total | | % of Net
Assets
at 12/31/16 |
| | $ | 275,881 | | | | $ | 128,152 | | | | $ | 404,034 | | | | | 0.018 | % |
| | * | Refunded Custody Expense and Interest appear on the Statement of Operations in custody and accounting expenses — net and Interest income, respectively. |
Prior to November 30, 2016, pursuant to an investment sub-advisory agreement with SSGA FM, BlackRock Investment Management, LLC (“BlackRock”) served as the sub-adviser to the Fund. Based on the asset allocation decisions by SSGA FM, BlackRock managed the Fund’s assets using an passive investment approach designed to track the performance of the desired broadbased indices representing asset classes. For its services, SSGA FM paid BlackRock monthly sub-advisory fees which were calculated as a percentage of the average daily net assets of the Fund. Effective November 30, 2016, BlackRock no longer serves as investment sub-adviser to the Fund and SSGA FM directly manages the underlying passive strategies of the Fund.
| | |
| 26 | | Notes to Financial Statements |
State Street Total Return V.I.S. Fund
Notes to Financial Statements, continued — December 31, 2016
| 8. | | Investment Transactions |
Purchases and Sales of Securities The cost of purchases and the proceeds from sales of investments, other than short-term securities, for the fiscal year ended December 31, 2016, were as follows:
| | | | | | | | | | | | | | | | | | |
| U.S. Government Securities | | Non-U.S. Government Securities |
| Purchases | | Sales | | Purchases | | Sales |
| | | | | | | | | | | | | | | | | | | |
| | $ | 821,693,808 | | | | $ | 202,989,980 | | | | $ | 183,114,390 | | | | $ | 913,457,864 | |
Affiliated Investments The Fund may invest in affiliated entities, including securities issued by State Street, affiliated funds, or entities deemed to be affiliates as a result of the Fund owning more than five percent of the entity’s voting securities or outstanding shares. Amounts relating to these transactions during the fiscal year ended December 31, 2016 are disclosed in the Schedule of Investments.
The Fund is subject to ASC 740, Income Taxes (“ASC 740”). ASC 740 provides guidance for financial accounting and reporting for the effects of income taxes that result from an entity’s activities during the year. ASC 740 also provides guidance regarding how uncertain tax positions should be recognized, measured, presented and disclosed in the financial statements. ASC 740 requires evaluation of tax positions taken or expected to be taken in the course of preparing the Fund’s tax returns to determine whether the tax positions are “more likely than not” of being sustained by the applicable tax authority. There are no adjustments to the Fund’s net assets required under ASC 740. The Fund’s 2013, 2014, 2015, and 2016 fiscal year tax returns are still open to examination by the Federal and applicable state tax authorities.
At December 31, 2016, information on the tax cost of investments and distributable earnings on a tax basis was as follows:
| | | | | | | | | | | | | | | | | | | | | | | | | | | | | | | | | | | | | | |
Cost of
Investments
For Tax
Purposes | | Gross Tax | | Net Tax
Appreciation/
(Depreciation) | | Undistributed
Income | | Undistributed
Accum.
Capital
Gain/(Loss) | | Late-Year
Losses |
| | Appreciation | | Depreciation | | Investments | | Derivatives/
Currency | | | |
| | | | | | | | | | | | | | | | | | | | | | | | | | | | | | | | | | | | | | | |
| | $ | 2,067,385,733 | | | | $
| 369,971,486
|
| | | $ | (113,024,840 | ) | | | $ | 256,946,646 | | | | $ | (74,318 | ) | | | $ | — | | | | $ | 3,588,376 | | | | $ | (1,122,560 | ) |
As of December 31, 2016, the Fund had no capital loss carryovers. Capital loss carryovers are available to offset future realized capital gains to the extent provided in the Internal Revenue Code and regulations thereunder. To the extent that these carryover losses are used to offset future capital gains, it is probable that the gains offset will not be distributed to shareholders because they would be taxable as ordinary income.
Any qualified late-year loss is deemed to arise on the first day of the Fund’s next tax year (if the Fund elects to defer such loss). Under this regime, generally, the Fund can elect to defer any post-October capital loss and/or any late-year ordinary loss as defined by the Internal Revenue Code.
The Fund elected to defer qualified late-year losses for the fiscal year ended December 31, 2016 as follows:
| | | | | | | | |
| Capital | | Ordinary |
| | $ | 997,930 | | | | $ | 124,630 | |
The tax character of distributions paid during the fiscal years ended December 31, 2016 and December 31, 2015 were as follows:
| | | | | | | | | | | | | | | | | | |
| Year | | Ordinary
Income | | Long-Term
Capital Gains | | Total |
| | | 2016 | | | | $ | 42,729,607 | | | | $ | 39,291,488 | | | | $ | 82,021,095 | |
| | | 2015 | | | | | 48,555,357 | | | | | 71,541,941 | | | | | 120,097,298 | |
Distributions to Shareholders The Fund declares and pays any dividends from net investment income annually. The Fund declares and pays any net realized capital gains in excess of capital loss carryforwards distributions annually. The character of income and gains to be distributed is determined in accordance with income tax regulations which may differ from GAAP. These differences include (but are not limited to) investments in futures, losses deferred due to wash sale transactions, real
| | | | |
| Notes to Financial Statements | | | 27 | |
State Street Total Return V.I.S. Fund
Notes to Financial Statements, continued — December 31, 2016
estate investment trust basis adjustments, foreign capital gains tax, distribution re-designations, foreign currency gains and losses, passive foreign investment company gains and losses, litigation proceeds, return of capital distributions from securities, corporate actions, straddle loss deferrals, partnership basis adjustments, and distributions from real estate investment trusts. Reclassifications due to permanent book/tax differences are made to the Fund’s capital accounts to reflect income and gains available for distribution (or available capital loss carryovers) under income tax regulations. These reclassifications have no impact on net investment income, realized gains or losses, or the NAV of the Fund. The calculation of net investment income per share in the Financial Highlights table excludes these adjustments.
The reclassifications for the fiscal year ended December 31, 2016 were as follows:
| | | | | | | | | | | | | |
Undistributed
Net Investment
Income | | Accumulated
Net Realized
Gain (Loss) | | Capital
Paid In |
| | | | | | | | | | | | | | |
| | $ | (357,470 | ) | | | $ | 357,470 | | | | $ | — | |
KPMG LLP (“KPMG”) served as the independent registered certified public accounting firm of the Company through its resignation as of June 30, 2016. On September 9, 2016, upon recommendation by the Audit Committee of the Company, the Company’s Board of Directors selected Ernst & Young LLP (“EY”) to replace KPMG as the independent public accountant for the fiscal year ended December 31, 2016.
The reports of KPMG on the financial statements for the fiscal years ended December 31, 2014 and December 31, 2015 contained no adverse opinion or disclaimer of opinion and were not qualified or modified as to uncertainty, audit scope or accounting principles.
During the Company’s fiscal years ended December 31, 2014 and December 31, 2015 and through the period ended June 30, 2016, there were no disagreements with KPMG on any matter of accounting principles or practices, financial statement disclosure, or auditing scope or procedure, which disagreements if not resolved to the satisfaction of KPMG would have caused them to make reference thereto in their reports on the financial statements for such years or periods.
During the Company’s fiscal years ended December 31, 2014 and December 31, 2015 and through the period ended June 30, 2016, there were no reportable events (as defined in Item 304(a)(1)(v) of Regulation S-K). The Funds requested and KPMG furnished a letter addressed to the Securities and Exchange Commission stating whether or not it agreed with the above statements. A copy of such letter was filed as Exhibit 77 to Form N-SAR for the period ended December 31, 2016.
During the Company’s fiscal years ended December 31, 2014 and December 31, 2015 and through September 9, 2016, neither the Company nor anyone on its behalf has consulted EY on items which: (i) concerned the application of accounting principles to a specified transaction, either completed or proposed, or the type of audit opinion that might be rendered on the Company’s financial statements or (ii) concerned the subject of a disagreement (as defined in paragraph (a)(1)(iv) of Item 304 of Regulations S-K) or reportable events (as described in paragraph (a)(1)(v) of said Item 304).
| | |
| 28 | | Notes to Financial Statements |
State Street Total Return V.I.S. Fund
Report of Independent Registered Public Accounting Firm
To the Board of Directors of State Street Variable Insurance Series Funds, Inc. and Shareholders of State Street Total Return V.I.S. Fund:
We have audited the accompanying statement of assets and liabilities of the State Street Total Return V.I.S. Fund (formerly GE Investments Total Return Fund) (one of the funds constituting State Street Variable Insurance Series Funds, Inc. (formerly GE Investment Funds, Inc.)) (the “Fund”), including the summary schedule of investments, as of December 31, 2016, and the related statements of operations, changes in net assets and the financial highlights for the year then ended. These financial statements and financial highlights are the responsibility of the Fund’s management. Our responsibility is to express an opinion on these financial statements and financial highlights based on our audit. The statement of changes in net assets for the year ended December 31, 2015 and the financial highlights for periods ended prior to January 1, 2016 were audited by another independent registered public accounting firm whose report, dated February 19, 2016, expressed an unqualified opinion on that statement of changes in net assets and those financial highlights.
We conducted our audit in accordance with the standards of the Public Company Accounting Oversight Board (United States). Those standards require that we plan and perform the audit to obtain reasonable assurance about whether the financial statements and financial highlights are free of material misstatement. We were not engaged to perform an audit of the Fund’s internal control over financial reporting. Our audit included consideration of internal control over financial reporting as a basis for designing audit procedures that are appropriate in the circumstances, but not for the purpose of expressing an opinion on the effectiveness of the Fund’s internal control over financial reporting. Accordingly, we express no such opinion. An audit also includes examining, on a test basis, evidence supporting the amounts and disclosures in the financial statements and financial highlights, assessing the accounting principles used and significant estimates made by management, and evaluating the overall financial statement presentation. Our procedures included confirmation of securities owned as of December 31, 2016, by correspondence with the custodian and brokers or by other appropriate auditing procedures where replies from brokers were not received. We believe that our audit provides a reasonable basis for our opinion.
In our opinion, the financial statements and financial highlights referred to above present fairly, in all material respects, the financial position of the State Street Total Return V.I.S. Fund (one of the funds constituting State Street Variable Insurance Series Funds, Inc.) at December 31, 2016, the results of its operations, changes in its net assets and the financial highlights for the year then ended, in conformity with U.S. generally accepted accounting principles.

Boston, Massachusetts
February 17, 2017
| | | | |
| Report of Independent Registered Public Accounting Firm | | | 29 | |
State Street Total Return V.I.S. Fund
Tax Information — December 31, 2016 (Unaudited)
For the year ended December 31, 2016, the Fund hereby designates $39,291,488 as capital gain dividends, or the amount ultimately treated as capital gain net income.
The amounts presented herein may differ from amounts presented elsewhere in the financial statements due to differences between tax and financial accounting principles. Please consult a tax advisor if you have any questions about Federal or State income tax laws or on how to prepare your tax returns. If you have specific questions about your Fund account, please consult your investment representative.
State Street Total Return V.I.S. Fund
Special Meeting of Shareholders — Voting Results (Unaudited)
On November 2, 2016, the State Street Variable Insurance Series Funds, Inc. (formerly known as GE Investments Funds, Inc.) (the “Company”) held a special meeting of shareholders of each series portfolio of the Company (collectively, the “Funds”), including shareholders of the State Street Total Return V.I.S. Fund (formerly known as the Total Return Fund) (the “Fund”). Shareholders of record on August 31, 2016 were entitled to vote on the proposals. For each proposal shareholders of all Funds voted together and not by Fund or share class. At the meeting, all proposals were approved by the Fund’s shareholders and the following votes were recorded:
Proposal 1:
Approval of an amendment to the Articles of Incorporation of the Company to change the name of the Company from GE Investments Funds, Inc. to State Street Variable Insurance Series Funds, Inc.
Company Votes:
| | | | | | | | | | | | |
| | | No. of Shares | | | % of Outstanding Shares | | | % of Shares Present | |
Affirmative | | | 129,623,837.819 | | | | 89.283 | % | | | 89.283 | % |
Against | | | 10,047,818.534 | | | | 6.921 | % | | | 6.921 | % |
Abstain | | | 5,511,041.282 | | | | 3.796 | % | | | 3.796 | % |
Total | | | 145,182,697.634 | | | | 100.000 | % | | | 100.000 | % |
Fund votes:
| | | | | | | | | | | | |
| | | No. of Shares | | | % of Outstanding Shares | | | % of Shares Present | |
Affirmative | | | 114,120,508.497 | | | | 89.210 | % | | | 89.210 | % |
Against | | | 8,841,605.784 | | | | 6.912 | % | | | 6.912 | % |
Abstain | | | 4,962,034.598 | | | | 3.879 | % | | | 3.879 | % |
Total | | | 127,924,148.879 | | | | 100.000 | % | | | 100.000 | % |
Proposal 2:
Approval of an amendment to the Articles of Incorporation of the Company to permit the Board of Directors to change the name of the Company without seeking shareholder approval.
Company votes:
| | | | | | | | | | | | |
| | | No. of Shares | | | % of Outstanding Shares | | | % of Shares Present | |
Affirmative | | | 118,220,823.871 | | | | 81.429 | % | | | 81.429 | % |
Against | | | 21,486,028.150 | | | | 14.799 | % | | | 14.799 | % |
Abstain | | | 5,475,845.611 | | | | 3.772 | % | | | 3.772 | % |
Total | | | 145,182,697.634 | | | | 100.000 | % | | | 100.000 | % |
Fund votes:
| | | | | | | | | | | | |
| | | No. of Shares | | | % of Outstanding Shares | | | % of Shares Present | |
Affirmative | | | 103,713,979.653 | | | | 81.075 | % | | | 81.075 | % |
Against | | | 19,253,723.261 | | | | 15.051 | % | | | 15.051 | % |
Abstain | | | 4,956,445.964 | | | | 3.875 | % | | | 3.875 | % |
Total | | | 127,924,148.879 | | | | 100.000 | % | | | 100.000 | % |
| | | | |
| Special Meeting of Shareholders — Voting Results | | | 31 | |
State Street Total Return V.I.S. Fund
Additional Information — December 31, 2016 (Unaudited)
Information about Directors and Executive Officers:
The business and affairs of the Fund are managed under the direction of the Fund’s Board of Directors. Information pertaining to the Directors and officers of the Fund is set forth below. Matthew J. Simpson resigned as a Director of the Fund effective June 30, 2016.
| | | | | | | | | | | | |
Name, Address and Age | | Position(s) Held
with Fund | | Term of
Office and
Length of
Time Served | | Principal Occupation(s)
During Past 5 Years | | Number of
Portfolios
in Fund
Complex
Overseen
by Director | | | Other Directorships
Held by Director |
INTERESTED DIRECTORS AND EXECUTIVE OFFICERS |
Jeanne M. La Porta c/o SSGA FM 1600 Summer St. Stamford, CT 06905 Age 51 | | Director and President | | Until successor is elected and qualified – 2 years | | Senior Managing Director at State Street Global Advisors since July 2016; President of GE Retirement Savings Plan Funds since July 2016; Senior Vice President and Commercial Operations Leader at GEAM from March 2014 to July 2016; President of State Street Institutional Funds and State Street Variable Insurance Series Funds, Inc. since April 2014; President and Trustee of GEAM’s UCITs Funds from March 2014 to November 2014; Senior Vice President and Commercial Administrative Officer at GEAM from April 2010 to March 2014; Vice President of State Street Institutional Funds from July 2003 to April 2014; Vice President of Elfun Funds from October 2003 to July 2016; Vice President of GE Retirement Savings Plan Funds from October 2003 to July 2016; Secretary of GE Funds from July 2007 to September 2010 and Vice President from July 2007 to February 2011; Senior Vice President and Deputy General Counsel of GEAM from October 2007 to April 2010; Vice President and Assistant Secretary of Elfun Funds and GE Retirement Savings Plan Funds from July 2003 to June 2010; and Vice President and Associate General Counsel – Marketing and Client Services (formerly Asset Management Services) at GEAM from May 1997 to October 2007. | | | 22 | | | Trustee and President of State Street Institutional Funds since 2014; Trustee of Elfun Funds since 2014. |
| | |
| 32 | | Additional Information |
State Street Total Return V.I.S. Fund
Additional Information, continued — December 31, 2016 (Unaudited)
| | | | | | | | | | | | |
Name, Address and Age | | Position(s) Held
with Fund | | Term of
Office and
Length of
Time Served | | Principal Occupation(s)
During Past 5 Years | | Number of
Portfolios
in Fund
Complex
Overseen
by Director | | | Other Directorships
Held by Director |
INTERESTED DIRECTORS AND EXECUTIVE OFFICERS (continued) |
JoonWon Choe c/o SSGA FM 1600 Summer St. Stamford, CT 06905 Age 47 | | Vice President & Secretary | | Until successor is elected and qualified – 6 years | | Managing Director and Managing Counsel at State Street Global Advisors since July 2016; Senior Vice President and Deputy General Counsel at GEAM from March 2011 to July 2016; Vice President and Secretary of State Street Institutional Funds since September 2010; Vice President and Assistant Secretary of GE Retirement Savings Plan Funds since September 2010; Vice President and Assistant Secretary of Elfun Funds from September 2010 to July 2016; Senior Vice President and Associate General Counsel at GEAM from June 2010 to March 2011; Vice President and Associate General Counsel of GEAM from November 2005 to June 2010; and Vice President and Secretary of GE Funds from September 2010 to February 2011. | | | N/A | | | N/A |
| | | | | | | | | | | | | |
Robert Herlihy c/o SSGA FM 1600 Summer St. Stamford, CT 06905 Age 49 | | Chief Compliance Officer | | Until successor is elected and qualified –11 years | | Managing Director at State Street Global Advisors since July 2016; Deputy Chief Compliance Officer of Elfun Funds since July 2016; Chief Compliance Officer of State Street Institutional Funds and GE Retirement Savings Plan Funds since July 2005; Chief Compliance Officer of GEAM and Elfun Funds from July 2005 to July 2016; Chief Compliance Officer of GE Funds from July 2005 to February 2011; and Manager of Fund Administration at GEAM from 2002-2005. | | | N/A | | | N/A |
| | | | | | | | | | | | | |
Arthur A. Jensen c/o SSGA FM 1600 Summer St. Stamford, CT 06905 Age 50 | | Treasurer | | Until successor is elected and qualified – 5 years | | Vice President at State Street Global Advisors since July 2016; Deputy Treasurer of Elfun Funds since July 2016; Treasurer of State Street Institutional Funds and GE Retirement Savings Plan Funds since June 2011; Treasurer of Elfun Funds from June 2011 to July 2016; Mutual Funds Controller of GEAM from April 2011 to July 2016; Senior Vice President at Citigroup from 2008 to 2010; and Vice President at JPMorgan from 2005 to 2008. | | | N/A | | | N/A |
| | | | |
| Additional Information | | | 33 | |
State Street Total Return V.I.S. Fund
Additional Information, continued — December 31, 2016 (Unaudited)
| | | | | | | | | | | | |
Name, Address and Age | | Position(s) Held
with Fund | | Term of
Office and
Length of
Time Served | | Principal Occupation(s)
During Past 5 Years | | Number of
Portfolios
in Fund
Complex
Overseen
by Director | | | Other Directorships
Held by Director |
INTERESTED DIRECTORS AND EXECUTIVE OFFICERS (continued) |
Brian Harris c/o SSGA FM State Street Financial Center One Lincoln Street Boston, MA 02111-2900 Age 43 | | Deputy Chief Compliance Officer | | Until successor is elected and qualified – less than 1 year | | Managing Director, State Street Global Advisors and SSGA Funds Management, Inc. (June 2013 - present)*; Senior Vice President and Global Head of Investment Compliance, BofA Global Capital Management (2010-2013); Director of Compliance, AARP Financial Inc. (2008-2010). | | | N/A | | | N/A |
| | | | | | | | | | | | | |
Bruce S. Rosenberg c/o SSGA FM State Street Financial Center One Lincoln Street Boston, MA 02111-2900 Age 55 | | Assistant Treasurer | | Until successor is elected and qualified – less than 1 year | | Managing Director, State Street Global Advisors and SSGA Funds Management, Inc. (July 2015 – present); Director, Credit Suisse (April 2008 – July 2015). | | | N/A | | | N/A |
| | | | | | | | | | | | | |
Ann M. Carpenter c/o SSGA FM State Street Financial Center One Lincoln Street Boston, MA 02111-2900 Age 50 | | Assistant Treasurer | | Until successor is elected and qualified – less than 1 year | | Chief Operating Officer, SSGA Funds Management, Inc. (April 2014 – present); Managing Director, State Street Global Advisors and SSGA Funds Management, Inc. (2005 – present).* | | | N/A | | | N/A |
| | | | | | | | | | | | | |
Chad C. Hallett c/o SSGA FM State Street Financial Center One Lincoln Street Boston, MA 02111-2900 Age 47 | | Assistant Treasurer | | Until successor is elected and qualified – less than 1 year | | Vice President, State Street Global Advisors and SSGA Funds Management, Inc. (November 2014 – present); Vice President, State Street Bank and Trust Company (2001 – November 2014). | | | N/A | | | N/A |
| |
NON-INTERESTED DIRECTORS |
John R. Costantino c/o SSGA FM 1600 Summer St. Stamford, CT 06905 Age 70 | | Chairman of the Board | | Until successor is elected and qualified – 20 years | | General Partner, NGN Capital LLC since 2006; and Managing Director, Vice President of Walden Capital Management since 1996. | | | 16 | | | Trustee of State Street Institutional Funds since 1997; Trustee of Fordham University from 1989 to 1995 and from 2001 to 2007 and Trustee Emeritus since 2007; Trustee of NeuroScience Research Institute since 1986; Trustee of GE Funds from 1993 to February 2011; Director of Artes Medical from 2006 to 2008; and Trustee of Gregorian University Foundation from 1992 to 2007. |
| * | Served in various capacities and/or with various affiliated entities during noted time period. |
| | |
| 34 | | Additional Information |
State Street Total Return V.I.S. Fund
Additional Information, continued — December 31, 2016 (Unaudited)
| | | | | | | | | | | | |
Name, Address and Age | | Position(s) Held
with Fund | | Term of
Office and
Length of
Time Served | | Principal Occupation(s)
During Past 5 Years | | Number of
Portfolios
in Fund
Complex
Overseen
by Director | | | Other Directorships
Held by Director |
NON-INTERESTED DIRECTORS (continued) |
R. Sheldon Johnson c/o SSGA FM 1600 Summer St. Stamford, CT 06905 Age 70 | | Director | | Until successor is elected and qualified – 5 years | | Retired, 2006 to present; Head of Global Institutional Equity Sales and Marketing at Morgan Stanley & Co., Inc. from 2002 to 2006 and Managing Director at Morgan Stanley & Co., Inc. from 1988 to 2006. | | | 16 | | | Trustee of State Street Institutional Funds since April 2011 and Trustee of St. Lawrence University since 2003. |
| | | | | | | | | | | | | |
Donna M. Rapaccioli c/o SSGA FM 1600 Summer St. Stamford, CT 06905 Age 54 | | Director | | Until successor is elected and qualified — 5 years | | Dean of the Gabelli School of Business since 2007 and Accounting professor since 1987 at Fordham University. | | | 16 | | | Trustee of State Street Institutional Funds since January 2012 and Trustee of Emmanuel College since 2010. |
The Statement of Additional Information for the Funds includes additional information about the Directors and Officers and is available, without charge, upon request by calling 1-800-242-0134.
| | | | |
| Additional Information | | | 35 | |
State Street Total Return V.I.S. Fund
Investment Team (Unaudited)
Investment Adviser and Administrator
SSGA Funds Management, Inc.
Board of Directors
John R. Costantino, Chairman
R. Sheldon Johnson
Jeanne M. La Porta
Donna M. Rapaccioli
Secretary
JoonWon Choe
Chief Compliance Officer
Robert Herlihy
Deputy Chief Compliance Officer
Brian Harris
Treasurer
Arthur A. Jensen
Assistant Treasurers
Bruce S. Rosenberg
Ann M. Carpenter
Chad C. Hallett
Distributor
State Street Global Markets, LLC
Member FINRA and SIPC
Custodian
State Street Bank and Trust Company
Investment Adviser
SSGA Funds Management, Inc.
1600 Summer Street
Stamford, CT 06905
or at:
P.O. Box 7900
Stamford, CT 06904-7900
Distributor
State Street Global Markets, LLC
Member FINRA and SIPC
State Street Financial Center
One Lincoln Street
Boston, MA 02111
www.ssga.com/geam
The Fund files its complete schedule of portfolio holdings with the Securities and Exchange Commission for the first and third quarters of each fiscal year on Form N-Q. The Fund’s Forms N-Q, as well as a description of the policies and procedures that the Fund uses to determine how to vote proxies (if any) relating to portfolio securities is available without charge (i) upon request, by calling 1-800-242-0134; (ii) on the Fund’s website at http://www.ssga.com/geam; and (iii) on the Commission’s website at http://www.sec.gov. The Fund’s Forms N-Q may be reviewed and copied at the Commission’s Public Reference Room in Washington, DC — information on the operation of the Public Reference Room may be obtained by calling 1-800-SEC-0330.
Information (if any) regarding how the Fund voted proxies relating to portfolio securities during the most recently disclosed 12-month period ended June 30 is available without charge (i) through the Fund’s website at http://www.ssga.com/geam; and (ii) on the Commission’s website at http://www.sec.gov.
Annual Report
31 December 2016
State Street S&P 500 Index V.I.S. Fund (formerly the GE Investments S&P 500 Index Fund)

State Street S&P 500 Index V.I.S. Fund
Annual Report
December 31, 2016
Table of Contents
This report is prepared for Policyholders of certain variable contracts and may be distributed to others only if preceded or accompanied by the variable contract’s current prospectus and the current summary prospectus of the Fund available for investments thereunder.
State Street S&P 500 Index V.I.S. Fund
Notes to Performance — December 31, 2016 (Unaudited)
The information provided on the performance page relates to the State Street S&P 500 Index V.I.S. Fund (the “Fund”).
Total return performance shown in this report for the Fund takes into account changes in share price and assumes reinvestment of dividends and capital gains distributions, if any. Total returns shown are net of Fund fees and expenses but do not reflect fees and charges associated with the variable contracts such as administrative fees, account charges and surrender charges, which, if reflected, would reduce the Fund’s total returns for all periods shown.
The performance data quoted represents past performance; past performance does not guarantee future results. Investment return and principal value will fluctuate so your shares, when redeemed, may be worth more or less than their original cost. Current performance may be higher or lower than the performance data quoted. Periods less than one year are not annualized. Please call toll-free (800) 242-0134 or visit the Fund’s website at http://www.ssga.com/geam for the most recent month-end performance data.
An investment in the Fund is not a deposit of any bank and is not insured or guaranteed by the Federal Deposit Insurance Corporation (“FDIC”) or any other government agency. An investment in the Fund is subject to risk, including possible loss of principal invested.
The S&P 500® Index is an unmanaged, market capitalization-weighted index of stocks of 500 large U.S. companies, which is widely used as a measure of large-cap U.S. stock market performance.
The State Street S&P 500 Index V.I.S. Fund is not sponsored, endorsed, sold or promoted by S&P Global Ratings (“S&P”), and S&P makes no representation or warranty, express or implied, to the investors of the Fund or any member of the public regarding the advisability of investing in the securities generally or in this Fund particularly or the ability of the Fund to track general stock market performance.
The results shown for the foregoing index assume the reinvestment of net dividends or interest and do not reflect fees, expenses, or taxes. As such, the index returns do not reflect the actual cost of investing in the instruments that comprise the index.
The peer universe of the underlying annuity funds used for the peer group average annual total return calculation is based on a blend of Morningstar peer categories, as shown. Morningstar is an independent mutual fund rating service. The Fund’s performance may be compared to or ranked within a universe of mutual funds with investment objectives and policies similar but not necessarily identical to that of the Fund.
©2017 Morningstar, Inc. All Rights Reserved. The Morningstar information contained herein: (1) is proprietary to Morningstar and/or its content providers; (2) may not be copied or distributed; and (3) is not warranted to be accurate, complete or timely. Neither Morningstar nor its content providers are responsible for any damage or losses relating from any use of this information. Past performance is no guarantee or future results.
The views expressed in this document reflect our judgement as of the publication date and are subject to change at any time without notice.
State Street Global Markets, LLC, member of FINRA & SIPC is the principal underwriter and distributor of the State Street V.I.S. Funds and a wholly owned subsidiary of State Street Corporation. References to State Street may include State Street Corporation and its affiliates. The Funds pay State Street Bank and Trust Company for its services as custodian and Fund Accounting agent, and pay SSGA Funds Management, Inc. for investment advisory and administrative services.
State Street S&P 500 Index V.I.S. Fund
Portfolio Management Discussion and Analysis — December 31, 2016 (Unaudited)
| Q. | How did the State Street S&P 500 Index V.I.S. Fund perform compared to its benchmark and Morningstar peer group for the twelve-month period ended December 31, 2016? |
| A. | For the twelve-month period ended December 31, 2016, the State Street S&P 500 Index V.I.S. Fund returned 11.61%. The S&P 500® Index (the “S&P 500 Index”), the Fund’s benchmark, returned 11.96% and the Fund’s Morningstar peer group of 295 U.S. Insurance Large Blend Funds returned an average of 11.08% over the same period. |
| Q. | What market conditions affected the Fund’s performance? |
| A. | The opening month of 2016 was anything but reassuring for global investors, as growth assets sold off aggressively during the first two weeks of the year on a mosaic of uncertainties persisting from 2015. Front and center in the turmoil to open the New Year was a series of conflicting messages from China’s policy makers in both equity and currency markets. Looking at the year to date return for the S&P 500 Index at the end of the first quarter of 2016, performance of 1.4% could mistakenly indicate an uneventful time period in financial markets. That modest absolute outcome of course belies an aggressive selloff in global equities to open the year that took the S&P 500 Index down 6% during the first week of 2016, the worst opening week on record, and to an eventual decline of more than 10% for the year through February 11th, 2016. |
| | As the second quarter of 2016 opened, the “reflation trade” that commenced in mid-February of 2016 and closed out the end of the first quarter of 2016 continued apace in April with growth assets broadly posting positive returns, though with some signs of consolidation towards the end of the month. The second quarter posted a gain of 2.5%, marking a return of 3.8% for the first half of the year. |
| | Global markets entered the third quarter riding the tailwind of an aggressive snap back rally following the surprising June 23rd, 2016 U.K. referendum vote to leave the European Union. After world markets declined in the two days following the referendum, they turned around and surpassed the drop through the end of July. The improved tone was enough to propel the S&P 500 Index to a new all-time high, taking out the previous high set 14 months earlier in May of 2015. In contrast to August of 2015, when global equity markets witnessed their most volatile month since 2011, fast forward one year later and markets demonstrated an air of complacency in August 2016. In fact, the S&P 500 Index did not experience a daily price move of greater than 1%, up or down, between July 8th and September 8th. Using 30 day realized volatility as a measure, it was chronicled by the Wall Street Journal on August 23rd that the 30 preceding trading days had been the least volatile for the S&P 500 Index in over two decades. It was perhaps no coincidence that the relative stability markets exhibited in August occurred during a month in which the central banking calendar was relatively light. Following this, September was a relatively flat month and the S&P 500 Index ended up 7.8% year-to-date through September 30, 2016. |
| | As the final quarter of 2016 commenced, October provided investors few places to avoid negative returns as both safe haven investments and riskier growth assets came under pressure during the month. In a year notable for unexpected challenges to the established political order, November 8th, 2016 delivered another entry to that ledger in the largely unanticipated victory of Donald Trump over Hillary Clinton to close out the highly contentious U.S. presidential election campaign. The initial reaction in overnight financial markets as the surprising election results were reported was a sharp risk off trade suggesting considerable concern among unwitting investors. To-wit, from 10:00 p.m. EST when the first hints of the unexpected election outcome began to resonate, to midnight when the election outcome was all but certain, futures on the S&P 500 Index declined nearly 6%, the 10 year U.S. Treasury Yield plunged nearly 20 basis points and the common risk haven gold surged 5%. About the time Donald Trump made what was broadly judged to be a conciliatory acceptance speech, all these markets performed an abrupt about face, sending the S&P 500 Index to a gain of more than 1%, gold prices lower and bond yields higher when all was said and done on November 9th, 2016. Far from a one day relief rally, the trading days following the election saw a persistent rise in growth assets, a sharp rise in U.S. Treasury yields and a thirteen year high in the broad U.S. dollar index reached in late November — a trend that would continue through the end of the year. |
| Q. | What were the primary drivers of the Fund’s performance? |
| A. | The expenses of managing the Fund, managing cash inflows to and outflows from the Fund, futures and small security misweights contributed to the difference between the Fund’s performance and that of the S&P 500 Index. All sectors but Health Care had positive returns in 2016. Information Technology, Financials and Energy were the strongest contributing sectors in the S&P 500 Index. Health Care, real Estate and Materials were the weakest contributors to the performance. JP Morgan Chase, Exxon Mobil, and AT&T were the strongest contributors to the Fund’s performance. Allergan, Gilead Sciences and Alexion Pharmaceuticals were the main detractors from the Fund’s performance. |
| | |
| 2 | | State Street S&P 500 Index V.I.S. Fund |
State Street S&P 500 Index V.I.S. Fund
Understanding Your Fund’s Expenses — (Unaudited)
As a shareholder of the Fund, you incur ongoing costs. Ongoing costs include portfolio management fees, professional fees, administrative fees and other Fund expenses. The following example is intended to help you understand your ongoing costs (in dollars) of investing in the Fund and to compare these costs with the ongoing costs of investing in other mutual funds.
To illustrate these ongoing costs, we have provided an example and calculated the expenses paid by investors in the Fund during the period. The information in the following table is based on an investment of $1,000, which is invested at the beginning of the period and held for the entire six-month period ended December 31, 2016.
Actual Expenses
The first section of the table provides information about actual account values and actual expenses. You may use the information in this section, together with the amount you invested, to estimate the expenses that you paid over the period. To do so, simply divide your account value by $1,000 (for example, an $8,600 account value divided by $1,000 = 8.6), then multiply the result by the number given under the heading “Expenses paid during the period” to estimate the expenses you paid on your account during the period.
Hypothetical Example for Comparison Purposes
The second section of the table provides information about hypothetical account values and hypothetical expenses based on the Fund’s actual expense ratio and an assumed rate of return of 5% per year before expenses, which is not the Fund’s actual return. The hypothetical account values and expenses may not be used to estimate the actual ending account balance or expenses you paid for the period. You may use this information to compare the ongoing costs of investing in the Fund and other funds. To do so, compare this 5% hypothetical example with the 5% hypothetical examples that appear in the shareholder reports of other funds.
Please note that the expenses shown in the table are meant to highlight and help you compare ongoing costs only and do not reflect transaction costs, such as sales charges or redemption fees, if any. Therefore, the second section of the table is useful in comparing ongoing costs only, and will not help you determine the relative total costs of owning different funds. Additionally, the expenses shown do not reflect the fees or charges associated with variable contracts through which shares of the Fund are offered.
| | | | | | | | |
| | | Actual
Fund Return | | | Hypothetical
5% Return
(2.5% for
the period) | |
Account value at the beginning of the period July 1, 2016 | | $ | 1,000.00 | | | $ | 1,000.00 | |
Account value at the end of the period December 31, 2016 | | $ | 1,076.80 | | | $ | 1,023.58 | |
Expenses paid during the period* | | $ | 1.62 | | | $ | 1.58 | |
| * | Expenses are equal to the Fund’s annualized net expense ratio of 0.31%** (for the period July 1, 2016 — December 31, 2016), multiplied by the average account value over the period, multiplied by 184/366 (to reflect the one-half year period). |
| ** | May differ from expense ratio disclosed in the financial highlights, which is calculated based on the entire fiscal year’s data. |
| | | | |
| State Street S&P 500 Index V.I.S. Fund | | | 3 | |
State Street S&P 500 Index V.I.S. Fund
Performance Summary — December 31, 2016 (Unaudited)
Morningstar Performance Comparison
Based on average annual returns for periods ended 12/31/16
| | | | | | | | | | | | |
| | | One
Year | | | Five
Year | | | Ten
Year | |
Number of funds in peer group | | | 295 | | | | 274 | | | | 246 | |
Peer group average annual total return | | | 11.08 | % | | | 13.15 | % | | | 5.81 | % |
Morningstar Category in peer group: U.S. Insurance Large Blend | |
Top Ten Largest Holdings
as of December 31, 2016 (as a % of Fair Value) (a)(b)
| | | | |
Apple Inc. | | | 3.14 | % |
Microsoft Corp. | | | 2.46 | % |
Exxon Mobil Corp. | | | 1.90 | % |
Johnson & Johnson | | | 1.59 | % |
Berkshire Hathaway Inc., Class B | | | 1.57 | % |
JPMorgan Chase & Co. | | | 1.57 | % |
Amazon.com Inc. | | | 1.50 | % |
General Electric Co. | | | 1.42 | % |
Facebook Inc., Class A | | | 1.36 | % |
AT&T Inc. | | | 1.33 | % |
Sector Allocation as of December 31, 2016
Portfolio composition as a % of Fair Value of $180,532 (December 31, 2016 (a)(b)
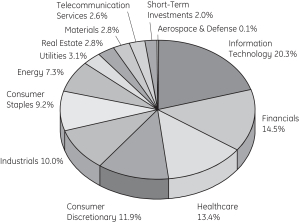
Average Annual Total Return for the periods ended December 31, 2016
Class 1 Shares (Inception date: 4/15/85)
| | | | | | | | | | | | | | | | |
| | | One
Year | | | Five
Year | | | Ten
Year | | | Ending Value
of a $10,000
Investment | |
State Street S&P 500 Index V.I.S. Fund | | | 11.61 | % | | | 14.30 | % | | | 6.59 | % | | $ | 18,936 | |
S&P 500® Index | | | 11.96 | % | | | 14.66 | % | | | 6.95 | % | | $ | 19,572 | |
| | |
| 4 | | State Street S&P 500 Index V.I.S. Fund |
State Street S&P 500 Index V.I.S. Fund
Performance Summary, continued — December 31, 2016 (Unaudited)
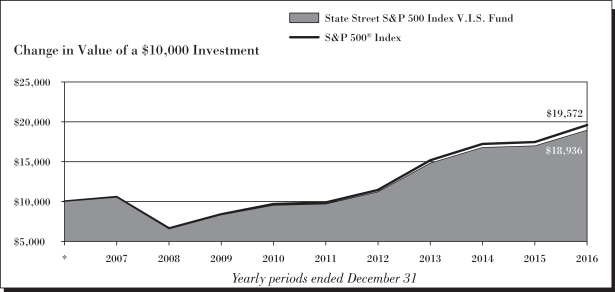
| (a) | Fair Value basis is inclusive of short-term investment in State Street Institutional U.S. Government Money Market Fund Class G Shares. |
| (b) | The securities information regarding holdings, allocations and other characteristics is presented to illustrate examples of securities that the Fund has bought and the diversity of areas in which the Fund may invest as of a particular date. It may not be representative of the Fund’s current or future investments and should not be construed as a recommendation to purchase or sell a particular security. |
See Notes to Performance beginning on page 1 for further information, including an explanation of Morningstar peer categories.
Past performance does not predict future performance. The performance shown in the graphs and tables does not reflect the deduction of taxes that a shareholder would pay on Fund distributions or the redemption of Fund shares and does not reflect the fees or charges that would be associated with variable contracts through which shares of the Fund are offered.
| | | | |
| State Street S&P 500 Index V.I.S. Fund | | | 5 | |
State Street S&P 500 Index V.I.S. Fund
Schedule of Investments — December 31, 2016
| | | | | | | | |
| | | Number
of Shares | | | Fair
Value
$ | |
| | | | | | | | |
| Common Stock - 97.9%† | | | | | | | | |
Advertising - 0.2% | | | | | | | | |
Omnicom Group Inc. | | | 2,230 | | | | 189,795 | |
The Interpublic Group of Companies Inc. | | | 3,820 | | | | 89,426 | |
| | | | | | | | |
| | | | | | | 279,221 | |
| | | | | | | | |
| | |
Aerospace & Defense - 2.2% | | | | | | | | |
Arconic Inc. | | | 4,380 | | | | 81,205 | |
General Dynamics Corp. | | | 2,600 | | | | 448,916 | |
L3 Technologies Inc. | | | 689 | | | | 104,804 | |
Lockheed Martin Corp. | | | 2,354 | | | | 588,359 | |
Northrop Grumman Corp. | | | 1,597 | | | | 371,430 | |
Raytheon Co. | | | 2,661 | | | | 377,862 | |
Rockwell Collins Inc. | | | 1,236 | | | | 114,651 | |
Textron Inc. | | | 2,325 | | | | 112,902 | |
The Boeing Co. | | | 5,241 | | | | 815,919 | |
TransDigm Group Inc. | | | 500 | | | | 124,480 | |
United Technologies Corp. | | | 6,989 | | | | 766,134 | |
| | | | | | | | |
| | | | | | | 3,906,662 | |
| | | | | | | | |
|
Agricultural & Farm Machinery - 0.2% | |
Deere & Co. | | | 2,606 | | | | 268,522 | |
| | | | | | | | |
| | |
Agricultural Products - 0.1% | | | | | | | | |
Archer-Daniels-Midland Co. | | | 5,224 | | | | 238,476 | |
| | | | | | | | |
| | |
Air Freight & Logistics - 0.7% | | | | | | | | |
CH Robinson Worldwide Inc. | | | 1,229 | | | | 90,036 | |
Expeditors International of Washington Inc. | | | 1,799 | | | | 95,275 | |
FedEx Corp. | | | 2,188 | | | | 407,406 | |
United Parcel Service Inc., Class B | | | 6,402 | | | | 733,925 | |
| | | | | | | | |
| | | | | | | 1,326,642 | |
| | | | | | | | |
| | |
Airlines - 0.6% | | | | | | | | |
Alaska Air Group Inc. | | | 1,200 | | | | 106,476 | |
American Airlines Group Inc. | | | 4,846 | | | | 226,260 | |
Delta Air Lines Inc. | | | 6,830 | | | | 335,968 | |
Southwest Airlines Co. | | | 5,649 | | | | 281,546 | |
United Continental Holdings Inc. (a) | | | 2,650 | | | | 193,132 | |
| | | | | | | | |
| | | | | | | 1,143,382 | |
| | | | | | | | |
| | |
Alternative Carriers - 0.1% | | | | | | | | |
Level 3 Communications Inc. (a) | | | 2,800 | | | | 157,808 | |
| | | | | | | | |
| | |
Aluminum - 0.0%* | | | | | | | | |
Alcoa Corp. | | | 1 | | | | 28 | |
| | | | | | | | |
| | |
Apparel Retail - 0.6% | | | | | | | | |
Foot Locker Inc. | | | 1,300 | | | | 92,157 | |
L Brands Inc. | | | 2,188 | | | | 144,058 | |
| | | | | | | | |
| | | Number
of Shares | | | Fair
Value
$ | |
Ross Stores Inc. | | | 3,724 | | | | 244,294 | |
The Gap Inc. | | | 2,196 | | | | 49,278 | |
The TJX Companies Inc. | | | 5,922 | | | | 444,920 | |
Urban Outfitters Inc. (a) | | | 846 | | | | 24,094 | |
| | | | | | | | |
| | | | | | | 998,801 | |
| | | | | | | | |
|
Apparel, Accessories & Luxury Goods - 0.3% | |
Coach Inc. | | | 2,689 | | | | 94,169 | |
Hanesbrands Inc. | | | 3,400 | | | | 73,338 | |
Michael Kors Holdings Ltd. (a) | | | 1,622 | | | | 69,713 | |
PVH Corp. | | | 769 | | | | 69,395 | |
Ralph Lauren Corp. | | | 600 | | | | 54,192 | |
Under Armour Inc., Class A (a) | | | 1,700 | | | | 49,385 | |
Under Armour Inc., Class C (a) | | | 1,712 | | | | 43,091 | |
VF Corp. | | | 3,215 | | | | 171,520 | |
| | | | | | | | |
| | | | | | | 624,803 | |
| | | | | | | | |
| | |
Application Software - 0.8% | | | | | | | | |
Adobe Systems Inc. (a) | | | 4,584 | | | | 471,923 | |
Autodesk Inc. (a) | | | 1,748 | | | | 129,370 | |
Citrix Systems Inc. (a) | | | 1,407 | | | | 125,659 | |
Intuit Inc. | | | 2,200 | | | | 252,142 | |
salesforce.com Inc. (a) | | | 5,909 | | | | 404,530 | |
Verint Systems Inc. (a) | | | 1 | | | | 35 | |
| | | | | | | | |
| | | | | | | 1,383,659 | |
| | | | | | | | |
|
Asset Management & Custody Banks - 1.1% | |
Affiliated Managers Group Inc. (a) | | | 500 | | | | 72,650 | |
Ameriprise Financial Inc. | | | 1,405 | | | | 155,871 | |
BlackRock Inc. | | | 1,096 | | | | 417,072 | |
Franklin Resources Inc. | | | 3,100 | | | | 122,698 | |
Invesco Ltd. | | | 3,850 | | | | 116,809 | |
Northern Trust Corp. | | | 1,896 | | | | 168,839 | |
State Street Corp. (b) | | | 3,311 | | | | 257,331 | |
T Rowe Price Group Inc. | | | 2,240 | | | | 168,582 | |
The Bank of New York Mellon Corp. | | | 9,604 | | | | 455,037 | |
| | | | | | | | |
| | | | | | | 1,934,889 | |
| | | | | | | | |
|
Auto Parts & Equipment - 0.1% | |
BorgWarner Inc. | | | 1,747 | | | | 68,902 | |
Delphi Automotive PLC | | | 2,456 | | | | 165,411 | |
| | | | | | | | |
| | | | | | | 234,313 | |
| | | | | | | | |
|
Automobile Manufacturers - 0.5% | |
Ford Motor Co. | | | 35,994 | | | | 436,607 | |
General Motors Co. | | | 12,601 | | | | 439,019 | |
| | | | | | | | |
| | | | | | | 875,626 | |
| | | | | | | | |
| | |
Automotive Retail - 0.4% | | | | | | | | |
Advance Auto Parts Inc. | | | 722 | | | | 122,105 | |
AutoNation Inc. (a) | | | 486 | | | | 23,644 | |
See notes to schedule of investments and notes to financial statements.
| | |
| 6 | | State Street S&P 500 Index V.I.S. Fund |
State Street S&P 500 Index V.I.S. Fund
Schedule of Investments, continued — December 31, 2016
| | | | | | | | |
| | | Number
of Shares | | | Fair
Value
$ | |
| | | | | | | | |
AutoZone Inc. (a) | | | 275 | | | | 217,192 | |
CarMax Inc. (a) | | | 1,690 | | | | 108,819 | |
O’Reilly Automotive Inc. (a) | | | 900 | | | | 250,569 | |
| | | | | | | | |
| | | | | | | 722,329 | |
| | | | | | | | |
| | |
Biotechnology - 2.7% | | | | | | | | |
AbbVie Inc. | | | 15,073 | | | | 943,871 | |
Alexion Pharmaceuticals Inc. (a) | | | 2,101 | | | | 257,057 | |
Amgen Inc. | | | 6,800 | | | | 994,228 | |
Biogen Inc. (a) | | | 2,015 | | | | 571,414 | |
Celgene Corp. (a) | | | 7,057 | | | | 816,848 | |
Gilead Sciences Inc. | | | 12,105 | | | | 866,839 | |
Regeneron Pharmaceuticals Inc. (a) | | | 650 | | | | 238,609 | |
Vertex Pharmaceuticals Inc. (a) | | | 2,300 | | | | 169,441 | |
| | | | | | | | |
| | | | | | | 4,858,307 | |
| | | | | | | | |
| | |
Brewers - 0.1% | | | | | | | | |
Molson Coors Brewing Co., Class B | | | 1,598 | | | | 155,501 | |
| | | | | | | | |
| | |
Broadcasting - 0.2% | | | | | | | | |
CBS Corp., Class B | | | 3,632 | | | | 231,068 | |
Discovery Communications Inc., Class A (a) | | | 1,497 | | | | 41,033 | |
Discovery Communications Inc., Class C (a) | | | 2,397 | | | | 64,192 | |
Scripps Networks Interactive Inc., Class A | | | 1,000 | | | | 71,370 | |
TEGNA Inc. | | | 1,870 | | | | 39,999 | |
| | | | | | | | |
| | | | | | | 447,662 | |
| | | | | | | | |
| | |
Building Products - 0.3% | | | | | | | | |
Allegion PLC | | | 933 | | | | 59,712 | |
Fortune Brands Home & Security Inc. | | | 1,400 | | | | 74,844 | |
Johnson Controls International PLC | | | 8,542 | | | | 351,845 | |
Masco Corp. | | | 2,985 | | | | 94,386 | |
| | | | | | | | |
| | | | | | | 580,787 | |
| | | | | | | | |
| | |
Cable & Satellite - 1.2% | | | | | | | | |
Charter Communications Inc., Class A (a) | | | 2,000 | | | | 575,840 | |
Comcast Corp., Class A | | | 21,828 | | | | 1,507,223 | |
| | | | | | | | |
| | | | | | | 2,083,063 | |
| | | | | | | | |
| | |
Casinos & Gaming - 0.0%* | | | | | | | | |
Wynn Resorts Ltd. | | | 791 | | | | 68,429 | |
| | | | | | | | |
|
Commodity Chemicals - 0.1% | |
LyondellBasell Industries N.V., Class A | | | 3,010 | | | | 258,198 | |
| | | | | | | | |
| | | | | | | | |
| | | Number
of Shares | | | Fair
Value
$ | |
Communications Equipment - 1.0% | |
Cisco Systems Inc. | | | 46,437 | | | | 1,403,326 | |
F5 Networks Inc. (a) | | | 600 | | | | 86,832 | |
Harris Corp. | | | 1,100 | | | | 112,717 | |
Juniper Networks Inc. | | | 3,500 | | | | 98,910 | |
Motorola Solutions Inc. | | | 1,444 | | | | 119,693 | |
| | | | | | | | |
| | | | | | | 1,821,478 | |
| | | | | | | | |
|
Computer & Electronics Retail - 0.1% | |
Best Buy Company Inc. | | | 2,495 | | | | 106,462 | |
| | | | | | | | |
|
Construction & Engineering - 0.1% | |
Fluor Corp. | | | 1,178 | | | | 61,869 | |
Jacobs Engineering Group Inc. (a) | | | 1,150 | | | | 65,550 | |
Quanta Services Inc. (a) | | | 1,200 | | | | 41,820 | |
| | | | | | | | |
| | | | | | | 169,239 | |
| | | | | | | | |
|
Construction Machinery & Heavy Trucks - 0.5% | |
Caterpillar Inc. | | | 5,402 | | | | 500,981 | |
Cummins Inc. | | | 1,356 | | | | 185,325 | |
PACCAR Inc. | | | 3,203 | | | | 204,672 | |
| | | | | | | | |
| | | | | | | 890,978 | |
| | | | | | | | |
|
Construction Materials - 0.2% | |
Martin Marietta Materials Inc. | | | 600 | | | | 132,918 | |
Vulcan Materials Co. | | | 1,173 | | | | 146,801 | |
| | | | | | | | |
| | | | | | | 279,719 | |
| | | | | | | | |
|
Consumer Electronics - 0.1% | |
Garmin Ltd. | | | 1,000 | | | | 48,490 | |
Harman International Industries Inc. | | | 700 | | | | 77,812 | |
| | | | | | | | |
| | | | | | | 126,302 | |
| | | | | | | | |
| | |
Consumer Finance - 0.8% | | | | | | | | |
American Express Co. | | | 7,058 | | | | 522,857 | |
Capital One Financial Corp. | | | 4,373 | | | | 381,500 | |
Discover Financial Services | | | 3,677 | | | | 265,075 | |
Navient Corp. | | | 2,743 | | | | 45,067 | |
Synchrony Financial | | | 7,158 | | | | 259,621 | |
| | | | | | | | |
| | | | | | | 1,474,120 | |
| | | | | | | | |
| | |
Copper - 0.1% | | | | | | | | |
Freeport-McMoRan Inc. (a) | | | 10,498 | | | | 138,469 | |
| | | | | | | | |
|
Data Processing & Outsourced Services - 2.3% | |
Alliance Data Systems Corp. | | | 525 | | | | 119,963 | |
Automatic Data Processing Inc. | | | 4,226 | | | | 434,348 | |
Fidelity National Information Services Inc. | | | 3,000 | | | | 226,920 | |
Fiserv Inc. (a) | | | 2,026 | | | | 215,323 | |
Global Payments Inc. | | | 1,463 | | | | 101,547 | |
Mastercard Inc., Class A | | | 8,786 | | | | 907,155 | |
See notes to schedule of investments and notes to financial statements.
| | | | |
| State Street S&P 500 Index V.I.S. Fund | | | 7 | |
State Street S&P 500 Index V.I.S. Fund
Schedule of Investments, continued — December 31, 2016
| | | | | | | | |
| | | Number
of Shares | | | Fair
Value
$ | |
| | | | | | | | |
Paychex Inc. | | | 3,125 | | | | 190,250 | |
PayPal Holdings Inc. (a) | | | 10,260 | | | | 404,962 | |
The Western Union Co. | | | 4,224 | | | | 91,745 | |
Total System Services Inc. | | | 1,602 | | | | 78,546 | |
Visa Inc., Class A | | | 17,095 | | | | 1,333,752 | |
Xerox Corp. | | | 7,247 | | | | 63,266 | |
| | | | | | | | |
| | | | | | | 4,167,777 | |
| | | | | | | | |
| | |
Department Stores - 0.1% | | | | | | | | |
Kohl’s Corp. | | | 1,573 | | | | 77,675 | |
Macy’s Inc. | | | 3,030 | | | | 108,504 | |
Nordstrom Inc. | | | 992 | | | | 47,547 | |
| | | | | | | | |
| | | | | | | 233,726 | |
| | | | | | | | |
| | |
Distillers & Vintners - 0.2% | | | | | | | | |
Brown-Forman Corp., Class B | | | 1,540 | | | | 69,177 | |
Constellation Brands Inc., Class A | | | 1,694 | | | | 259,707 | |
| | | | | | | | |
| | | | | | | 328,884 | |
| | | | | | | | |
| | |
Distributors - 0.1% | | | | | | | | |
Genuine Parts Co. | | | 1,345 | | | | 128,501 | |
LKQ Corp. (a) | | | 2,900 | | | | 88,885 | |
| | | | | | | | |
| | | | | | | 217,386 | |
| | | | | | | | |
| | |
Diversified Banks - 5.3% | | | | | | | | |
Bank of America Corp. | | | 92,630 | | | | 2,047,123 | |
Citigroup Inc. | | | 26,101 | | | | 1,551,182 | |
Comerica Inc. | | | 1,556 | | | | 105,979 | |
JPMorgan Chase & Co. | | | 32,823 | | | | 2,832,297 | |
U.S. Bancorp | | | 14,746 | | | | 757,502 | |
Wells Fargo & Co. (c) | | | 41,444 | | | | 2,283,979 | |
| | | | | | | | |
| | | | | | | 9,578,062 | |
| | | | | | | | |
| | |
Diversified Chemicals - 0.7% | | | | | | | | |
Eastman Chemical Co. | | | 1,318 | | | | 99,127 | |
EI du Pont de Nemours & Co. | | | 7,935 | | | | 582,429 | |
The Dow Chemical Co. | | | 10,404 | | | | 595,317 | |
| | | | | | | | |
| | | | | | | 1,276,873 | |
| | | | | | | | |
|
Diversified Support Services - 0.1% | |
Cintas Corp. | | | 764 | | | | 88,288 | |
| | | | | | | | |
| | |
Drug Retail - 0.8% | | | | | | | | |
CVS Health Corp. | | | 9,789 | | | | 772,450 | |
Walgreens Boots Alliance Inc. | | | 7,874 | | | | 651,652 | |
| | | | | | | | |
| | | | | | | 1,424,102 | |
| | | | | | | | |
| | |
Electric Utilities - 2.0% | | | | | | | | |
Alliant Energy Corp. | | | 2,100 | | | | 79,569 | |
American Electric Power Company Inc. | | | 4,641 | | | | 292,197 | |
Duke Energy Corp. | | | 6,304 | | | | 489,316 | |
| | | | | | | | |
| | | Number
of Shares | | | Fair
Value
$ | |
Edison International | | | 2,942 | | | | 211,795 | |
Entergy Corp. | | | 1,785 | | | | 131,144 | |
Eversource Energy | | | 2,930 | | | | 161,824 | |
Exelon Corp. | | | 8,725 | | | | 309,650 | |
FirstEnergy Corp. | | | 3,754 | | | | 116,261 | |
NextEra Energy Inc. | | | 4,362 | | | | 521,085 | |
PG&E Corp. | | | 4,554 | | | | 276,747 | |
Pinnacle West Capital Corp. | | | 1,100 | | | | 85,833 | |
PPL Corp. | | | 6,237 | | | | 212,370 | |
The Southern Co. | | | 8,958 | | | | 440,644 | |
Xcel Energy Inc. | | | 4,780 | | | | 194,546 | |
| | | | | | | | |
| | | | | | | 3,522,981 | |
| | | | | | | | |
|
Electrical Components & Equipment - 0.5% | |
Acuity Brands Inc. | | | 400 | | | | 92,344 | |
AMETEK Inc. | | | 2,100 | | | | 102,060 | |
Eaton Corporation PLC | | | 4,245 | | | | 284,797 | |
Emerson Electric Co. | | | 5,826 | | | | 324,799 | |
Rockwell Automation Inc. | | | 1,219 | | | | 163,834 | |
| | | | | | | | |
| | | | | | | 967,834 | |
| | | | | | | | |
|
Electronic Components - 0.2% | |
Amphenol Corp., Class A | | | 2,800 | | | | 188,160 | |
Corning Inc. | | | 8,534 | | | | 207,120 | |
| | | | | | | | |
| | | | | | | 395,280 | |
| | | | | | | | |
|
Electronic Equipment & Instruments - 0.0%* | |
FLIR Systems Inc. | | | 1,100 | | | | 39,809 | |
| | | | | | | | |
|
Electronic Manufacturing Services - 0.1% | |
TE Connectivity Ltd. | | | 3,389 | | | | 234,790 | |
| | | | | | | | |
|
Environmental & Facilities Services - 0.3% | |
Republic Services Inc. | | | 2,215 | | | | 126,366 | |
Stericycle Inc. (a) | | | 800 | | | | 61,632 | |
Waste Management Inc. | | | 3,703 | | | | 262,579 | |
| | | | | | | | |
| | | | | | | 450,577 | |
| | | | | | | | |
|
Fertilizers & Agricultural Chemicals - 0.4% | |
CF Industries Holdings Inc. | | | 2,385 | | | | 75,080 | |
FMC Corp. | | | 1,400 | | | | 79,184 | |
Monsanto Co. | | | 4,028 | | | | 423,786 | |
The Mosaic Co. | | | 3,300 | | | | 96,789 | |
| | | | | | | | |
| | | | | | | 674,839 | |
| | | | | | | | |
|
Financial Exchanges & Data - 0.6% | |
CME Group Inc. | | | 3,074 | | | | 354,586 | |
Intercontinental Exchange Inc. | | | 5,255 | | | | 296,487 | |
Moody’s Corp. | | | 1,529 | | | | 144,139 | |
Nasdaq Inc. | | | 968 | | | | 64,972 | |
S&P Global Inc. | | | 2,333 | | | | 250,891 | |
| | | | | | | | |
| | | | | | | 1,111,075 | |
| | | | | | | | |
See notes to schedule of investments and notes to financial statements.
| | |
| 8 | | State Street S&P 500 Index V.I.S. Fund |
State Street S&P 500 Index V.I.S. Fund
Schedule of Investments, continued — December 31, 2016
| | | | | | | | |
| | | Number
of Shares | | | Fair
Value
$ | |
| | | | | | | | |
Food Distributors - 0.1% | |
Sysco Corp. | | | 4,649 | | | | 257,415 | |
| | | | | | | | |
|
Food Retail - 0.2% | |
The Kroger Co. | | | 8,590 | | | | 296,441 | |
Whole Foods Market Inc. | | | 2,988 | | | | 91,911 | |
| | | | | | | | |
| | | | | | | 388,352 | |
| | | | | | | | |
|
Footwear - 0.4% | |
NIKE Inc., Class B | | | 12,457 | | | | 633,189 | |
| | | | | | | | |
|
General Merchandise Stores - 0.4% | |
Dollar General Corp. | | | 2,300 | | | | 170,361 | |
Dollar Tree Inc. (a) | | | 2,148 | | | | 165,783 | |
Target Corp. | | | 5,249 | | | | 379,135 | |
| | | | | | | | |
| | | | | | | 715,279 | |
| | | | | | | | |
|
Gold - 0.1% | |
Newmont Mining Corp. | | | 4,919 | | | | 167,590 | |
| | | | | | | | |
|
Health Care REITs - 0.3% | |
HCP Inc. | | | 4,600 | | | | 136,712 | |
Ventas Inc. | | | 3,029 | | | | 189,373 | |
Welltower Inc. | | | 3,300 | | | | 220,869 | |
| | | | | | | | |
| | | | | | | 546,954 | |
| | | | | | | | |
| | |
Healthcare Distributors - 0.4% | | | | | | | | |
AmerisourceBergen Corp. | | | 1,461 | | | | 114,236 | |
Cardinal Health Inc. | | | 2,868 | | | | 206,410 | |
Henry Schein Inc. (a) | | | 800 | | | | 121,368 | |
McKesson Corp. | | | 2,141 | | | | 300,703 | |
Patterson Companies Inc. | | | 700 | | | | 28,721 | |
| | | | | | | | |
| | | | | | | 771,438 | |
| | | | | | | | |
|
Healthcare Equipment - 2.3% | |
Abbott Laboratories | | | 13,691 | | | | 525,871 | |
Baxter International Inc. | | | 4,377 | | | | 194,076 | |
Becton Dickinson and Co. | | | 2,012 | | | | 333,087 | |
Boston Scientific Corp. (a) | | | 12,399 | | | | 268,190 | |
CR Bard Inc. | | | 660 | | | | 148,276 | |
Danaher Corp. | | | 5,600 | | | | 435,904 | |
Edwards Lifesciences Corp. (a) | | | 2,000 | | | | 187,400 | |
Hologic Inc. (a) | | | 2,400 | | | | 96,288 | |
Intuitive Surgical Inc. (a) | | | 370 | | | | 234,643 | |
Medtronic PLC | | | 12,688 | | | | 903,766 | |
St Jude Medical Inc. | | | 2,547 | | | | 204,244 | |
Stryker Corp. | | | 2,937 | | | | 351,882 | |
Varian Medical Systems Inc. (a) | | | 834 | | | | 74,877 | |
Zimmer Biomet Holdings Inc. | | | 1,840 | | | | 189,888 | |
| | | | | | | | |
| | | | | | | 4,148,392 | |
| | | | | | | | |
| | | | | | | | |
| | | Number
of Shares | | | Fair
Value
$ | |
Healthcare Facilities - 0.2% | |
HCA Holdings Inc. (a) | | | 2,807 | | | | 207,774 | |
Universal Health Services Inc., Class B | | | 898 | | | | 95,529 | |
| | | | | | | | |
| | | | | | | 303,303 | |
| | | | | | | | |
|
Healthcare Services - 0.4% | |
DaVita Inc. (a) | | | 1,458 | | | | 93,604 | |
Envision Healthcare Corp. (a) | | | 1,085 | | | | 68,670 | |
Express Scripts Holding Co. (a) | | | 5,588 | | | | 384,398 | |
Laboratory Corporation of America Holdings (a) | | | 900 | | | | 115,542 | |
Quest Diagnostics Inc. | | | 1,200 | | | | 110,280 | |
| | | | | | | | |
| | | | | | | 772,494 | |
| | | | | | | | |
|
Healthcare Supplies - 0.1% | |
DENTSPLY SIRONA Inc. | | | 2,032 | | | | 117,307 | |
The Cooper Companies Inc. | | | 500 | | | | 87,465 | |
| | | | | | | | |
| | | | | | | 204,772 | |
| | | | | | | | |
|
Healthcare Technology - 0.1% | |
Cerner Corp. (a) | | | 2,700 | | | | 127,899 | |
| | | | | | | | |
|
Home Building - 0.1% | |
DR Horton Inc. | | | 2,900 | | | | 79,257 | |
Lennar Corp., Class A | | | 1,800 | | | | 77,274 | |
PulteGroup Inc. | | | 3,135 | | | | 57,621 | |
| | | | | | | | |
| | | | | | | 214,152 | |
| | | | | | | | |
|
Home Entertainment Software - 0.2% | |
Activision Blizzard Inc. | | | 6,200 | | | | 223,882 | |
Electronic Arts Inc. (a) | | | 2,838 | | | | 223,521 | |
| | | | | | | | |
| | | | | | | 447,403 | |
| | | | | | | | |
|
Home Furnishing Retail - 0.0%* | |
Bed Bath & Beyond Inc. | | | 1,613 | | | | 65,552 | |
| | | | | | | | |
|
Home Furnishings - 0.1% | |
Leggett & Platt Inc. | | | 1,400 | | | | 68,432 | |
Mohawk Industries Inc. (a) | | | 600 | | | | 119,808 | |
| | | | | | | | |
| | | | | | | 188,240 | |
| | | | | | | | |
|
Home Improvement Retail - 1.1% | |
Lowe’s Companies Inc. | | | 8,031 | | | | 571,165 | |
The Home Depot Inc. | | | 11,156 | | | | 1,495,796 | |
| | | | | | | | |
| | | | | | | 2,066,961 | |
| | | | | | | | |
|
Hotel & Resort REITs - 0.1% | |
Host Hotels & Resorts Inc. | | | 6,717 | | | | 126,548 | |
| | | | | | | | |
|
Hotels, Resorts & Cruise Lines - 0.4% | |
Carnival Corp. | | | 3,900 | | | | 203,034 | |
See notes to schedule of investments and notes to financial statements.
| | | | |
| State Street S&P 500 Index V.I.S. Fund | | | 9 | |
State Street S&P 500 Index V.I.S. Fund
Schedule of Investments, continued — December 31, 2016
| | | | | | | | |
| | | Number
of Shares | | | Fair
Value
$ | |
| | | | | | | | |
Marriott International Inc., Class A | | | 2,882 | | | | 238,284 | |
Royal Caribbean Cruises Ltd. | | | 1,634 | | | | 134,053 | |
Wyndham Worldwide Corp. | | | 975 | | | | 74,461 | |
| | | | | | | | |
| | | | | | | 649,832 | |
| | | | | | | | |
|
Household Appliances - 0.1% | |
Whirlpool Corp. | | | 743 | | | | 135,055 | |
| | | | | | | | |
|
Household Products - 1.8% | |
Church & Dwight Company Inc. | | | 2,600 | | | | 114,894 | |
Colgate-Palmolive Co. | | | 8,145 | | | | 533,009 | |
Kimberly-Clark Corp. | | | 3,375 | | | | 385,155 | |
The Clorox Co. | | | 1,167 | | | | 140,063 | |
The Procter & Gamble Co. | | | 24,662 | | | | 2,073,581 | |
| | | | | | | | |
| | | | | | | 3,246,702 | |
| | | | | | | | |
|
Housewares & Specialties - 0.1% | |
Newell Brands Inc. | | | 4,334 | | | | 193,513 | |
| | | | | | | | |
|
Human Resource & Employment Services - 0.0%* | |
Robert Half International Inc. | | | 1,275 | | | | 62,195 | |
| | | | | | | | |
|
Hypermarkets & Super Centers - 0.9% | |
Costco Wholesale Corp. | | | 4,008 | | | | 641,721 | |
Wal-Mart Stores Inc. | | | 13,951 | | | | 964,293 | |
| | | | | | | | |
| | | | | | | 1,606,014 | |
| | | | | | | | |
|
Independent Power Producers & Energy Traders - 0.1% | |
AES Corp. | | | 5,500 | | | | 63,910 | |
NRG Energy Inc. | | | 3,615 | | | | 44,320 | |
| | | | | | | | |
| | | | | | | 108,230 | |
| | | | | | | | |
|
Industrial Conglomerates - 2.5% | |
3M Co. | | | 5,497 | | | | 981,599 | |
General Electric Co. (d) | | | 81,133 | | | | 2,563,803 | |
Honeywell International Inc. | | | 6,994 | | | | 810,255 | |
Roper Technologies Inc. | | | 903 | | | | 165,321 | |
| | | | | | | | |
| | | | | | | 4,520,978 | |
| | | | | | | | |
|
Industrial Gases - 0.3% | |
Air Products & Chemicals Inc. | | | 1,941 | | | | 279,155 | |
Praxair Inc. | | | 2,674 | | | | 313,366 | |
| | | | | | | | |
| | | | | | | 592,521 | |
| | | | | | | | |
|
Industrial Machinery - 0.8% | |
Dover Corp. | | | 1,509 | | | | 113,069 | |
Flowserve Corp. | | | 1,300 | | | | 62,465 | |
Fortive Corp. | | | 2,800 | | | | 150,164 | |
Illinois Tool Works Inc. | | | 2,860 | | | | 350,236 | |
Ingersoll-Rand PLC | | | 2,400 | | | | 180,096 | |
Parker-Hannifin Corp. | | | 1,234 | | | | 172,760 | |
Pentair PLC | | | 1,407 | | | | 78,891 | |
| | | | | | | | |
| | | Number
of Shares | | | Fair
Value
$ | |
Snap-on Inc. | | | 509 | | | | 87,176 | |
Stanley Black & Decker Inc. | | | 1,399 | | | | 160,451 | |
Xylem Inc. | | | 1,581 | | | | 78,291 | |
| | | | | | | | |
| | | | | | | 1,433,599 | |
| | | | | | | | |
|
Industrial REITs - 0.1% | |
Prologis Inc. REIT | | | 4,829 | | | | 254,923 | |
| | | | | | | | |
|
Insurance Brokers - 0.5% | |
Aon PLC | | | 2,434 | | | | 271,464 | |
Arthur J Gallagher & Co. | | | 1,700 | | | | 88,332 | |
Marsh & McLennan Companies Inc. | | | 4,853 | | | | 328,015 | |
Willis Towers Watson PLC | | | 1,158 | | | | 141,600 | |
| | | | | | | | |
| | | | | | | 829,411 | |
| | | | | | | | |
|
Integrated Oil & Gas - 3.3% | |
Chevron Corp. | | | 17,332 | | | | 2,039,976 | |
Exxon Mobil Corp. | | | 38,119 | | | | 3,440,621 | |
Occidental Petroleum Corp. | | | 7,126 | | | | 507,585 | |
| | | | | | | | |
| | | | | | | 5,988,182 | |
| | | | | | | | |
|
Integrated Telecommunication Services - 2.5% | |
AT&T Inc. | | | 56,310 | | | | 2,394,864 | |
CenturyLink Inc. | | | 4,962 | | | | 117,997 | |
Frontier Communications Corp. | | | 11,474 | | | | 38,782 | |
Verizon Communications Inc. | | | 37,621 | | | | 2,008,209 | |
| | | | | | | | |
| | | | | | | 4,559,852 | |
| | | | | | | | |
|
Internet & Direct Marketing Retail - 2.2% | |
Amazon.com Inc. (a) | | | 3,604 | | | | 2,702,531 | |
Expedia Inc. | | | 1,050 | | | | 118,944 | |
Netflix Inc. (a) | | | 3,943 | | | | 488,143 | |
The Priceline Group Inc. (a) | | | 450 | | | | 659,727 | |
TripAdvisor Inc. (a) | | | 1,150 | | | | 53,326 | |
| | | | | | | | |
| | | | | | | 4,022,671 | |
| | | | | | | | |
|
Internet Software & Services - 4.1% | |
Akamai Technologies Inc. (a) | | | 1,733 | | | | 115,557 | |
Alphabet Inc., Class A (a) | | | 2,714 | | | | 2,150,709 | |
Alphabet Inc., Class C (a) | | | 2,721 | | | | 2,100,122 | |
eBay Inc. (a) | | | 9,760 | | | | 289,774 | |
Facebook Inc., Class A (a) | | | 21,335 | | | | 2,454,592 | |
VeriSign Inc. (a) | | | 862 | | | | 65,572 | |
Yahoo! Inc. (a) | | | 8,289 | | | | 320,536 | |
| | | | | | | | |
| | | | | | | 7,496,862 | |
| | | | | | | | |
|
Investment Banking & Brokerage - 1.0% | |
E*TRADE Financial Corp. (a) | | | 2,340 | | | | 81,081 | |
Morgan Stanley | | | 13,129 | | | | 554,701 | |
The Charles Schwab Corp. | | | 11,111 | | | | 438,551 | |
The Goldman Sachs Group Inc. | | | 3,376 | | | | 808,383 | |
| | | | | | | | |
| | | | | | | 1,882,716 | |
| | | | | | | | |
See notes to schedule of investments and notes to financial statements.
| | |
| 10 | | State Street S&P 500 Index V.I.S. Fund |
State Street S&P 500 Index V.I.S. Fund
Schedule of Investments, continued — December 31, 2016
| | | | | | | | |
| | | Number
of Shares | | | Fair
Value
$ | |
| | | | | | | | |
IT Consulting & Other Services - 1.3% | |
Accenture PLC, Class A | | | 5,645 | | | | 661,199 | |
Cognizant Technology Solutions Corp., Class A (a) | | | 5,714 | | | | 320,155 | |
CSRA Inc. | | | 1,382 | | | | 44,003 | |
International Business Machines Corp. | | | 7,920 | | | | 1,314,641 | |
Teradata Corp. (a) | | | 1,400 | | | | 38,038 | |
| | | | | | | | |
| | | | | | | 2,378,036 | |
| | | | | | | | |
|
Leisure Products - 0.1% | |
Hasbro Inc. | | | 1,096 | | | | 85,258 | |
Mattel Inc. | | | 3,296 | | | | 90,805 | |
| | | | | | | | |
| | | | | | | 176,063 | |
| | | | | | | | |
|
Life & Health Insurance - 0.9% | |
Aflac Inc. | | | 3,674 | | | | 255,710 | |
Lincoln National Corp. | | | 2,059 | | | | 136,450 | |
MetLife Inc. | | | 10,008 | | | | 539,331 | |
Principal Financial Group Inc. | | | 2,411 | | | | 139,501 | |
Prudential Financial Inc. | | | 3,901 | | | | 405,938 | |
Torchmark Corp. | | | 966 | | | | 71,252 | |
Unum Group | | | 1,989 | | | | 87,377 | |
| | | | | | | | |
| | | | | | | 1,635,559 | |
| | | | | | | | |
|
Life Sciences Tools & Services - 0.6% | |
Agilent Technologies Inc. | | | 3,185 | | | | 145,108 | |
Illumina Inc. (a) | | | 1,400 | | | | 179,256 | |
Mettler-Toledo International Inc. (a) | | | 237 | | | | 99,199 | |
PerkinElmer Inc. | | | 1,011 | | | | 52,724 | |
Thermo Fisher Scientific Inc. | | | 3,628 | | | | 511,911 | |
Waters Corp. (a) | | | 800 | | | | 107,512 | |
| | | | | | | | |
| | | | | | | 1,095,710 | |
| | | | | | | | |
|
Managed Healthcare - 1.6% | |
Aetna Inc. | | | 3,227 | | | | 400,180 | |
Anthem Inc. | | | 2,478 | | | | 356,262 | |
Centene Corp. (a) | | | 1,600 | | | | 90,416 | |
Cigna Corp. | | | 2,309 | | | | 307,997 | |
Humana Inc. | | | 1,327 | | | | 270,748 | |
UnitedHealth Group Inc. | | | 8,714 | | | | 1,394,589 | |
| | | | | | | | |
| | | | | | | 2,820,192 | |
| | | | | | | | |
|
Metal & Glass Containers - 0.1% | |
Ball Corp. | | | 1,341 | | | | 100,669 | |
| | | | | | | | |
|
Motorcycle Manufacturers - 0.1% | |
Harley-Davidson Inc. | | | 1,535 | | | | 89,552 | |
| | | | | | | | |
|
Movies & Entertainment - 1.4% | |
The Walt Disney Co. | | | 13,405 | | | | 1,397,069 | |
Time Warner Inc. | | | 7,107 | | | | 686,039 | |
| | | | | | | | |
| | | Number
of Shares | | | Fair
Value
$ | |
Twenty-First Century Fox Inc., Class A | | | 9,590 | | | | 268,903 | |
Twenty-First Century Fox Inc., Class B | | | 4,192 | | | | 114,232 | |
Viacom Inc., Class B | | | 3,346 | | | | 117,445 | |
| | | | | | | | |
| | | | | | | 2,583,688 | |
| | | | | | | | |
|
Multi-Line Insurance - 0.5% | |
American International Group Inc. | | | 8,887 | | | | 580,410 | |
Assurant Inc. | | | 500 | | | | 46,430 | |
Loews Corp. | | | 2,726 | | | | 127,658 | |
The Hartford Financial Services Group Inc. | | | 3,589 | | | | 171,016 | |
| | | | | | | | |
| | | | | | | 925,514 | |
| | | | | | | | |
|
Multi-Sector Holdings - 1.6% | |
Berkshire Hathaway Inc., Class B (a) | | | 17,419 | | | | 2,838,949 | |
Leucadia National Corp. | | | 3,000 | | | | 69,750 | |
| | | | | | | | |
| | | | | | | 2,908,699 | |
| | | | | | | | |
|
Multi-Utilities - 1.1% | |
Ameren Corp. | | | 2,242 | | | | 117,615 | |
CenterPoint Energy Inc. | | | 3,718 | | | | 91,612 | |
CMS Energy Corp. | | | 2,700 | | | | 112,374 | |
Consolidated Edison Inc. | | | 2,855 | | | | 210,356 | |
Dominion Resources Inc. | | | 5,682 | | | | 435,184 | |
DTE Energy Co. | | | 1,566 | | | | 154,267 | |
NiSource Inc. | �� | | 3,315 | | | | 73,394 | |
Public Service Enterprise Group Inc. | | | 4,692 | | | | 205,885 | |
SCANA Corp. | | | 1,400 | | | | 102,592 | |
Sempra Energy | | | 2,132 | | | | 214,565 | |
WEC Energy Group Inc. | | | 3,075 | | | | 180,349 | |
| | | | | | | | |
| | | | | | | 1,898,193 | |
| | | | | | | | |
|
Office REITs - 0.3% | |
Boston Properties Inc. | | | 1,398 | | | | 175,840 | |
SL Green Realty Corp. | | | 1,000 | | | | 107,550 | |
Vornado Realty Trust | | | 1,669 | | | | 174,194 | |
| | | | | | | | |
| | | | | | | 457,584 | |
| | | | | | | | |
|
Office Services & Supplies - 0.0%* | |
Pitney Bowes Inc. | | | 2,032 | | | | 30,866 | |
| | | | | | | | |
|
Oil & Gas Drilling - 0.1% | |
Helmerich & Payne Inc. | | | 900 | | | | 69,660 | |
Transocean Ltd. (a) | | | 3,804 | | | | 56,071 | |
| | | | | | | | |
| | | | | | | 125,731 | |
| | | | | | | | |
|
Oil & Gas Equipment & Services - 1.1% | |
Baker Hughes Inc. | | | 3,981 | | | | 258,645 | |
FMC Technologies Inc. (a) | | | 2,086 | | | | 74,116 | |
Halliburton Co. | | | 8,067 | | | | 436,344 | |
National Oilwell Varco Inc. | | | 3,346 | | | | 125,274 | |
See notes to schedule of investments and notes to financial statements.
| | | | |
| State Street S&P 500 Index V.I.S. Fund | | | 11 | |
State Street S&P 500 Index V.I.S. Fund
Schedule of Investments, continued — December 31, 2016
| | | | | | | | |
| | | Number
of Shares | | | Fair
Value
$ | |
| | | | | | | | |
Schlumberger Ltd. | | | 12,901 | | | | 1,083,039 | |
| | | | | | | | |
| | | | | | | 1,977,418 | |
| | | | | | | | |
|
Oil & Gas Exploration & Production - 1.8% | |
Anadarko Petroleum Corp. | | | 4,757 | | | | 331,706 | |
Apache Corp. | | | 3,448 | | | | 218,844 | |
Cabot Oil & Gas Corp. | | | 3,600 | | | | 84,096 | |
Chesapeake Energy Corp. (a) | | | 5,615 | | | | 39,417 | |
Cimarex Energy Co. | | | 900 | | | | 122,310 | |
Concho Resources Inc. (a) | | | 1,300 | | | | 172,380 | |
ConocoPhillips | | | 11,514 | | | | 577,312 | |
Devon Energy Corp. | | | 4,692 | | | | 214,284 | |
EOG Resources Inc. | | | 5,100 | | | | 515,610 | |
EQT Corp. | | | 1,514 | | | | 99,016 | |
Hess Corp. | | | 2,449 | | | | 152,548 | |
Marathon Oil Corp. | | | 7,042 | | | | 121,897 | |
Murphy Oil Corp. | | | 1,700 | | | | 52,921 | |
Newfield Exploration Co. (a) | | | 1,300 | | | | 52,650 | |
Noble Energy Inc. | | | 3,700 | | | | 140,822 | |
Pioneer Natural Resources Co. | | | 1,500 | | | | 270,105 | |
Range Resources Corp. | | | 1,800 | | | | 61,848 | |
Southwestern Energy Co. (a) | | | 4,100 | | | | 44,362 | |
| | | | | | | | |
| | | | | | | 3,272,128 | |
| | | | | | | | |
|
Oil & Gas Refining & Marketing - 0.5% | |
Marathon Petroleum Corp. | | | 4,790 | | | | 241,177 | |
Phillips 66 | | | 4,061 | | | | 350,911 | |
Tesoro Corp. | | | 1,014 | | | | 88,674 | |
Valero Energy Corp. | | | 4,300 | | | | 293,776 | |
| | | | | | | | |
| | | | | | | 974,538 | |
| | | | | | | | |
|
Oil & Gas Storage & Transportation - 0.5% | |
Kinder Morgan Inc. | | | 16,837 | | | | 348,694 | |
ONEOK Inc. | | | 2,000 | | | | 114,820 | |
Spectra Energy Corp. | | | 6,277 | | | | 257,922 | |
The Williams Companies Inc. | | | 6,171 | | | | 192,165 | |
| | | | | | | | |
| | | | | | | 913,601 | |
| | | | | | | | |
|
Packaged Foods & Meats - 1.5% | |
Campbell Soup Co. | | | 1,615 | | | | 97,659 | |
Conagra Brands Inc. | | | 3,754 | | | | 148,471 | |
General Mills Inc. | | | 5,536 | | | | 341,959 | |
Hormel Foods Corp. | | | 2,400 | | | | 83,544 | |
Kellogg Co. | | | 2,390 | | | | 176,167 | |
McCormick & Company Inc. | | | 1,100 | | | | 102,663 | |
Mead Johnson Nutrition Co. | | | 1,815 | | | | 128,429 | |
Mondelez International Inc., Class A | | | 14,398 | | | | 638,263 | |
The Hershey Co. | | | 1,381 | | | | 142,837 | |
The JM Smucker Co. | | | 947 | | | | 121,273 | |
The Kraft Heinz Co. | | | 5,530 | | | | 482,879 | |
Tyson Foods Inc., Class A | | | 2,584 | | | | 159,381 | |
| | | | | | | | |
| | | | | | | 2,623,525 | |
| | | | | | | | |
| | | | | | | | |
| | | Number
of Shares | | | Fair
Value
$ | |
Paper Packaging - 0.2% | |
Avery Dennison Corp. | | | 854 | | | | 59,968 | |
International Paper Co. | | | 3,730 | | | | 197,914 | |
Sealed Air Corp. | | | 1,731 | | | | 78,483 | |
WestRock Co. | | | 2,175 | | | | 110,425 | |
| | | | | | | | |
| | | | | | | 446,790 | |
| | | | | | | | |
|
Personal Products - 0.1% | |
Coty Inc., Class A | | | 4,445 | | | | 81,388 | |
The Estee Lauder Companies Inc., Class A | | | 2,079 | | | | 159,023 | |
| | | | | | | | |
| | | | | | | 240,411 | |
| | | | | | | | |
|
Pharmaceuticals - 5.0% | |
Allergan PLC (a) | | | 3,451 | | | | 724,745 | |
Bristol-Myers Squibb Co. | | | 15,526 | | | | 907,339 | |
Eli Lilly & Co. | | | 8,946 | | | | 657,978 | |
Endo International PLC (a) | | | 1,700 | | | | 27,999 | |
Johnson & Johnson | | | 24,956 | | | | 2,875,181 | |
Mallinckrodt PLC (a) | | | 965 | | | | 48,076 | |
Merck & Company Inc. | | | 25,350 | | | | 1,492,355 | |
Mylan N.V. (a) | | | 3,904 | | | | 148,938 | |
Perrigo Company PLC | | | 1,275 | | | | 106,118 | |
Pfizer Inc. | | | 56,043 | | | | 1,820,277 | |
Zoetis Inc. | | | 4,146 | | | | 221,935 | |
| | | | | | | | |
| | | | | | | 9,030,941 | |
| | | | | | | | |
|
Property & Casualty Insurance - 0.8% | |
Chubb Ltd. | | | 4,261 | | | | 562,963 | |
Cincinnati Financial Corp. | | | 1,392 | | | | 105,444 | |
The Allstate Corp. | | | 3,386 | | | | 250,970 | |
The Progressive Corp. | | | 5,373 | | | | 190,742 | |
The Travelers Companies Inc. | | | 2,567 | | | | 314,252 | |
XL Group Ltd. | | | 2,456 | | | | 91,511 | |
| | | | | | | | |
| | | | | | | 1,515,882 | |
| | | | | | | | |
|
Publishing - 0.0%* | |
News Corp., Class A | | | 3,400 | | | | 38,964 | |
| | | | | | | | |
|
Railroads - 0.8% | |
CSX Corp. | | | 8,609 | | | | 309,321 | |
Kansas City Southern | | | 1,000 | | | | 84,850 | |
Norfolk Southern Corp. | | | 2,645 | | | | 285,845 | |
Union Pacific Corp. | | | 7,622 | | | | 790,249 | |
| | | | | | | | |
| | | | | | | 1,470,265 | |
| | | | | | | | |
|
Real Estate Services - 0.1% | |
CBRE Group Inc., Class A (a) | | | 3,044 | | | | 95,856 | |
| | | | | | | | |
|
Regional Banks - 1.3% | |
BB&T Corp. | | | 7,500 | | | | 352,650 | |
Citizens Financial Group Inc. | | | 4,600 | | | | 163,898 | |
Fifth Third Bancorp | | | 6,750 | | | | 182,048 | |
See notes to schedule of investments and notes to financial statements.
| | |
| 12 | | State Street S&P 500 Index V.I.S. Fund |
State Street S&P 500 Index V.I.S. Fund
Schedule of Investments, continued — December 31, 2016
| | | | | | | | |
| | | Number
of Shares | | | Fair
Value
$ | |
| | | | | | | | |
Huntington Bancshares Inc. | | | 9,534 | | | | 126,039 | |
KeyCorp | | | 10,228 | | | | 186,866 | |
M&T Bank Corp. | | | 1,390 | | | | 217,438 | |
People’s United Financial Inc. | | | 3,200 | | | | 61,952 | |
Regions Financial Corp. | | | 11,268 | | | | 161,808 | |
SunTrust Banks Inc. | | | 4,529 | | | | 248,416 | |
The PNC Financial Services Group Inc. | | | 4,439 | | | | 519,185 | |
Zions Bancorporation | | | 1,900 | | | | 81,776 | |
| | | | | | | | |
| | | | | | | 2,302,076 | |
| | | | | | | | |
|
Research & Consulting Services - 0.2% | |
Equifax Inc. | | | 1,169 | | | | 138,211 | |
Nielsen Holdings PLC | | | 3,300 | | | | 138,435 | |
The Dun & Bradstreet Corp. | | | 400 | | | | 48,528 | |
Verisk Analytics Inc. (a) | | | 1,400 | | | | 113,638 | |
| | | | | | | | |
| | | | | | | 438,812 | |
| | | | | | | | |
|
Residential REITs - 0.5% | |
Apartment Investment & Management Co., Class A | | | 1,477 | | | | 67,129 | |
AvalonBay Communities Inc. | | | 1,272 | | | | 225,335 | |
Equity Residential | | | 3,308 | | | | 212,903 | |
Essex Property Trust Inc. | | | 600 | | | | 139,500 | |
Mid-America Apartment Communities Inc. | | | 1,100 | | | | 107,712 | |
UDR Inc. | | | 2,500 | | | | 91,200 | |
| | | | | | | | |
| | | | | | | 843,779 | |
| | | | | | | | |
|
Restaurants - 1.1% | |
Chipotle Mexican Grill Inc. (a) | | | 260 | | | | 98,103 | |
Darden Restaurants Inc. | | | 1,229 | | | | 89,373 | |
McDonald’s Corp. | | | 7,588 | | | | 923,611 | |
Starbucks Corp. | | | 13,461 | | | | 747,355 | |
Yum! Brands Inc. | | | 3,174 | | | | 201,010 | |
| | | | | | | | |
| | | | | | | 2,059,452 | |
| | | | | | | | |
|
Retail REITs - 0.6% | |
Federal Realty Investment Trust | | | 700 | | | | 99,477 | |
General Growth Properties Inc. | | | 5,300 | | | | 132,394 | |
Kimco Realty Corp. | | | 3,931 | | | | 98,904 | |
Realty Income Corp. | | | 2,400 | | | | 137,952 | |
Simon Property Group Inc. | | | 2,879 | | | | 511,512 | |
The Macerich Co. | | | 1,144 | | | | 81,041 | |
| | | | | | | | |
| | | | | | | 1,061,280 | |
| | | | | | | | |
|
Semiconductor Equipment - 0.3% | |
Applied Materials Inc. | | | 10,081 | | | | 325,314 | |
KLA-Tencor Corp. | | | 1,378 | | | | 108,421 | |
Lam Research Corp. | | | 1,447 | | | | 152,991 | |
| | | | | | | | |
| | | | | | | 586,726 | |
| | | | | | | | |
| | | | | | | | |
| | | Number
of Shares | | | Fair
Value
$ | |
Semiconductors - 2.9% | |
Analog Devices Inc. | | | 2,800 | | | | 203,336 | |
Broadcom Ltd. | | | 3,665 | | | | 647,862 | |
First Solar Inc. (a) | | | 710 | | | | 22,784 | |
Intel Corp. | | | 43,652 | | | | 1,583,258 | |
Linear Technology Corp. | | | 2,100 | | | | 130,935 | |
Microchip Technology Inc. | | | 1,800 | | | | 115,470 | |
Micron Technology Inc. (a) | | | 9,526 | | | | 208,810 | |
NVIDIA Corp. | | | 4,638 | | | | 495,060 | |
Qorvo Inc. (a) | | | 1,100 | | | | 58,003 | |
QUALCOMM Inc. | | | 13,510 | | | | 880,852 | |
Skyworks Solutions Inc. | | | 1,700 | | | | 126,922 | |
Texas Instruments Inc. | | | 9,182 | | | | 670,011 | |
Xilinx Inc. | | | 2,287 | | | | 138,066 | |
| | | | | | | | |
| | | | | | | 5,281,369 | |
| | | | | | | | |
|
Soft Drinks - 1.8% | |
Dr Pepper Snapple Group Inc. | | | 1,700 | | | | 154,139 | |
Monster Beverage Corp. (a) | | | 3,738 | | | | 165,743 | |
PepsiCo Inc. | | | 13,232 | | | | 1,384,464 | |
The Coca-Cola Co. | | | 35,618 | | | | 1,476,722 | |
| | | | | | | | |
| | | | | | | 3,181,068 | |
| | | | | | | | |
|
Specialized Consumer Services - 0.0%* | |
H&R Block Inc. | | | 2,179 | | | | 50,095 | |
| | | | | | | | |
| | |
Specialized REITs - 1.0% | | | | | | | | |
American Tower Corp. | | | 3,955 | | | | 417,964 | |
Crown Castle International Corp. | | | 3,100 | | | | 268,987 | |
Digital Realty Trust Inc. | | | 1,400 | | | | 137,564 | |
Equinix Inc. | | | 616 | | | | 220,165 | |
Extra Space Storage Inc. | | | 1,200 | | | | 92,688 | |
Iron Mountain Inc. | | | 1,886 | | | | 61,257 | |
Public Storage | | | 1,406 | | | | 314,241 | |
Weyerhaeuser Co. | | | 6,685 | | | | 201,152 | |
| | | | | | | | |
| | | | | | | 1,714,018 | |
| | | | | | | | |
|
Specialty Chemicals - 0.5% | |
Albemarle Corp. | | | 1,100 | | | | 94,688 | |
Ecolab Inc. | | | 2,402 | | | | 281,562 | |
International Flavors & Fragrances Inc. | | | 647 | | | | 76,236 | |
PPG Industries Inc. | | | 2,410 | | | | 228,372 | |
The Sherwin-Williams Co. | | | 763 | | | | 205,049 | |
| | | | | | | | |
| | | | | | | 885,907 | |
| | | | | | | | |
|
Specialty Stores - 0.2% | |
Signet Jewelers Ltd. | | | 600 | | | | 56,556 | |
Staples Inc. | | | 5,450 | | | | 49,322 | |
Tiffany & Co. | | | 1,086 | | | | 84,089 | |
Tractor Supply Co. | | | 1,137 | | | | 86,196 | |
See notes to schedule of investments and notes to financial statements.
| | | | |
| State Street S&P 500 Index V.I.S. Fund | | | 13 | |
State Street S&P 500 Index V.I.S. Fund
Schedule of Investments, continued — December 31, 2016
| | | | | | | | |
| | | Number
of Shares | | | Fair
Value
$ | |
| | | | | | | | |
Ulta Salon Cosmetics & Fragrance Inc. (a) | | | 500 | | | | 127,470 | |
| | | | | | | | |
| | | | | | | 403,633 | |
| | | | | | | | |
|
Steel - 0.1% | |
Nucor Corp. | | | 2,859 | | | | 170,168 | |
| | | | | | | | |
|
Systems Software - 3.2% | |
CA Inc. | | | 2,703 | | | | 85,874 | |
Microsoft Corp. | | | 71,373 | | | | 4,435,118 | |
Oracle Corp. | | | 27,703 | | | | 1,065,180 | |
Red Hat Inc. (a) | | | 1,600 | | | | 111,520 | |
Symantec Corp. | | | 6,051 | | | | 144,559 | |
| | | | | | | | |
| | | | | | | 5,842,251 | |
| | | | | | | | |
|
Technology Hardware, Storage & Peripherals - 3.7% | |
Apple Inc. | | | 48,959 | | | | 5,670,432 | |
Hewlett Packard Enterprise Co. | | | 15,417 | | | | 356,749 | |
HP Inc. | | | 15,600 | | | | 231,504 | |
NetApp Inc. | | | 2,570 | | | | 90,644 | |
Seagate Technology PLC | | | 2,894 | | | | 110,464 | |
Western Digital Corp. | | | 2,677 | | | | 181,902 | |
| | | | | | | | |
| | | | | | | 6,641,695 | |
| | | | | | | | |
| | |
Tires & Rubber - 0.0%* | | | | | | | | |
The Goodyear Tire & Rubber Co. | | | 2,619 | | | | 80,849 | |
| | | | | | | | |
| | |
Tobacco - 1.6% | | | | | | | | |
Altria Group Inc. | | | 17,880 | | | | 1,209,046 | |
Philip Morris International Inc. | | | 14,319 | | | | 1,310,045 | |
Reynolds American Inc. | | | 7,622 | | | | 427,137 | |
| | | | | | | | |
| | | | | | | 2,946,228 | |
| | | | | | | | |
| | | | | | | | |
| | | Number
of Shares | | | Fair
Value
$ | |
Trading Companies & Distributors - 0.2% | |
Fastenal Co. | | | 2,700 | | | | 126,846 | |
United Rentals Inc. (a) | | | 800 | | | | 84,464 | |
WW Grainger Inc. | | | 482 | | | | 111,944 | |
| | | | | | | | |
| | | | | | | 323,254 | |
| | | | | | | | |
| | |
Trucking - 0.1% | | | | | | | | |
JB Hunt Transport Services Inc. | | | 900 | | | | 87,363 | |
Ryder System Inc. | | | 431 | | | | 32,084 | |
| | | | | | | | |
| | | | | | | 119,447 | |
| | | | | | | | |
| | |
Water Utilities - 0.1% | | | | | | | | |
American Water Works Company Inc. | | | 1,700 | | | | 123,012 | |
| | | | | | | | |
Total Common Stock
(Cost $94,126,119) | | | | | | | 176,876,841 | |
| | | | | | | | |
|
| Short-Term Investments - 2.0% | |
State Street Institutional U.S. Government Money Market Fund - Class G Shares 0.46%
(Cost $3,654,858) (c)(e)(f) | | | 3,654,858 | | | | 3,654,858 | |
| | | | | | | | |
| | |
Total Investments
(Cost $97,780,977) | | | | | | | 180,531,699 | |
| |
| Other Assets and Liabilities, net - 0.1% | | | | 229,293 | |
| | | | | | | | |
| | |
| NET ASSETS - 100.0% | | | | | | | 180,760,992 | |
| | | | | | | | |
Other Information:
The Fund had the following long futures contracts open at December 31, 2016:
| | | | | | | | | | | | | | | | |
| Description | | Expiration
date | | | Number of
Contracts | | | Current
Notional
Value | | | Unrealized
Appreciation | |
| | | | | | | | | | | | | | | | |
S&P 500 Emini Index Futures | | | March 2017 | | | | 37 | | | $ | 4,136,970 | | | $ | 48,086 | |
| | | | | | | | | | | | | | | | |
See notes to schedule of investments and notes to financial statements.
| | |
| 14 | | State Street S&P 500 Index V.I.S. Fund |
State Street S&P 500 Index V.I.S. Fund
Notes to Schedule of Investments — December 31, 2016
The views expressed in this document reflect our judgment as of the publication date and are subject to change at any time without notice. The securities cited may not be representative of the Fund’s future investments and should not be construed as a recommendation to purchase or sell a particular security. See the Fund’s summary prospectus and statutory prospectus for complete descriptions of investment objectives, policies, risks and permissible investments.
| (a) | Non-income producing security. |
| (b) | State Street Corp. is the parent company of SSGA Funds Management, Inc., the Fund’s investment adviser and administrator effective July 1, 2016, and State Street Bank & Trust Co., the Fund’s sub-administrator, custodian and accounting agent. |
| (c) | At December 31, 2016, all or a portion of this security was pledged to cover collateral requirements for futures. |
| (d) | General Electric Co. is the parent company of GE Asset Management Incorporated (“GEAM”), the Fund’s investment adviser, prior to July 1, 2016. |
| (e) | Sponsored by SSGA Funds Management, Inc., the Fund’s investment adviser and administrator, effective July 1, 2016, and an affiliate of State Street Bank & Trust Co., the Fund’s sub-administrator, custodian and accounting agent. |
| (f) | Coupon amount represents effective yield. |
| † | Percentages are based on net assets as of December 31, 2016. |
Abbreviations:
REIT - Real Estate Investment Trust
Affiliate Table
| | | | | | | | | | | | | | | | | | | | | | | | | | | | | | | | |
| | | Number of
Shares Held
at 12/31/15 | | | Value At
12/31/15 | | | Shares
Purchased | | | Shares
Sold | | | Number of
Shares Held
at 12/31/16 | | | Value at
12/31/16 | | | Dividend/
Interest
Income | | | Realized
Gain (Loss) | |
General Electric Co.* | | | 92,896 | | | $ | 2,893,710 | | | | — | | | | 11,763 | | | | 81,133 | | | $ | 2,563,803 | | | $ | 81,025 | | | $ | (22,679 | ) |
State Street Corp. | | | 4,011 | | | | 266,170 | | | | — | | | | 700 | | | | 3,311 | | | | 257,331 | | | | 5,142 | | | | (2,730 | ) |
State Street Institutional U.S. Government Money Market Fund - Class G Shares | | | 1,200,750 | | | | 1,200,750 | | | | 25,916,642 | | | | 23,462,534 | | | | 3,654,858 | | | | 3,654,858 | | | | 10,056 | | | | — | |
| | | | | | | | | | | | | | | | | | | | | | | | | | | | | | | | |
| | | | | | $ | 4,360,630 | | | | | | | | | | | | | | | $ | 6,475,992 | | | $ | 96,223 | | | $ | (25,409 | ) |
| | | | | | | | | | | | | | | | | | | | | | | | | | | | | | | | |
| * | Non-affiliated investment as of December 31, 2016. |
| | | | |
| Notes to Schedule of Investments | | | 15 | |
State Street S&P 500 Index V.I.S. Fund
Financial Highlights
Selected data based on a share outstanding throughout the fiscal years indicated
| | | | | | | | | | | | | | | | | | | | |
| | | 12/31/16 | | | 12/31/15* | | | 12/31/14* | | | 12/31/13* | | | 12/31/12* | |
| Inception date | | | | | | | | | | | | | | 4/15/85 | |
Net asset value, beginning of period | | $ | 36.16 | | | $ | 36.60 | | | $ | 32.83 | | | $ | 25.29 | | | $ | 22.31 | |
| | | | | | | | | | | | | | | | | | | | |
| | | | | |
Income/(loss) from investment operations: | | | | | | | | | | | | | | | | | | | | |
Net investment income | | | 0.72 | | | | 0.69 | | | | 0.61 | | | | 0.55 | | | | 0.52 | |
Net realized and unrealized gains/(losses) on investments | | | 3.49 | | | | (0.28 | ) | | | 3.76 | | | | 7.53 | | | | 2.98 | |
| | | | | | | | | | | | | | | | | | | | |
Total income from investment operations | | | 4.21 | | | | 0.41 | | | | 4.37 | | | | 8.08 | | | | 3.50 | |
| | | | | | | | | | | | | | | | | | | | |
| | | | | |
Less distributions from: | | | | | | | | | | | | | | | | | | | | |
Net investment income | | | 0.73 | | | | 0.85 | | | | 0.60 | | | | 0.54 | | | | 0.52 | |
Net realized gains | | | 1.42 | | | | – | | | | – | | | | – | | | | – | |
| | | | | | | | | | | | | | | | | | | | |
Total distributions | | | 2.15 | | | | 0.85 | | | | 0.60 | | | | 0.54 | | | | 0.52 | |
| | | | | | | | | | | | | | | | | | | | |
Net asset value, end of period | | $ | 38.22 | | | $ | 36.16 | | | $ | 36.60 | | | $ | 32.83 | | | $ | 25.29 | |
| | | | | | | | | | | | | | | | | | | | |
Total return(a) | | | 11.61 | % | | | 1.07 | % | | | 13.28 | % | | | 31.97 | % | | | 15.70 | % |
| | | | | |
Ratios/Supplemental Data: | | | | | | | | | | | | | | | | | | | | |
Net assets, end of period (in thousands) | | $ | 180,761 | | | $ | 179,395 | | | $ | 203,262 | | | $ | 206,556 | | | $ | 183,040 | |
| | | | | |
Ratios to average net assets: | | | | | | | | | | | | | | | | | | | | |
Net expenses | | | 0.34 | %(c) | | | 0.37 | %(c) | | | 0.41 | %(b)(c) | | | 0.35 | %(b)(c) | | | 0.38 | %(b)(c) |
Gross expenses | | | 0.37 | % | | | 0.42 | % | | | 0.46 | % | | | 0.40 | % | | | 0.43 | % |
Net investment income | | | 1.86 | % | | | 1.72 | % | | | 1.65 | % | | | 1.75 | % | | | 1.93 | % |
Portfolio turnover rate | | | 2 | % | | | 2 | % | | | 2 | % | | | 3 | % | | | 6 | % |
Notes to Financial Highlights
| (a) | | Total returns are historical and assume changes in share price, reinvestment of dividends and capital gains distributions and do not include the effect of insurance contract charges. Past performance does not guarantee future results. |
| (b) | | Includes contractual management fee waiver related to the Fund’s investments in the GE Institutional Money Market Fund (the “Money Market Fund”). The fee waiver agreement was terminated effective June 30, 2014 with the closure of the Money Market Fund. |
| (c) | | Reflects GE Asset Management’s (“GEAM”) contractual arrangement with the Company to limit the advisory and administrative fee charged to the Fund to 0.30% of the average daily net assets of the Fund. This arrangement terminated effective June 30, 2016, upon the termination of the investment advisory and administration agreement with GEAM. |
| * | | Beginning with the fiscal year ended December 31, 2016, the Fund was audited by Ernst & Young LLP. The previous years were audited by another independent registered public accounting firm. |
The accompanying notes are an integral part of these financial statements.
State Street S&P 500 Index V.I.S. Fund
Statement of Assets and Liabilities — December 31, 2016
| | | | |
| | | | |
Assets | | | | |
Investments in securities, at fair value (cost $93,929,397) | | $ | 176,619,510 | |
Investments in affiliated securities, at fair value (cost $196,722) | | | 257,331 | |
Short-term affiliated investments, at fair value | | | 3,654,858 | |
Cash | | | 4,364 | |
Restricted cash(1) | | | 175,750 | |
Income receivable | | | 225,934 | |
Income receivable from affiliated investments | | | 2,296 | |
Other assets | | | 8,467 | |
| | | | |
Total assets | | | 180,948,510 | |
| | | | |
| |
Liabilities | | | | |
Payable for fund shares redeemed | | | 83,069 | |
Payable for variation margin on open futures contracts | | | 16,488 | |
Payable to the Adviser (Note 6) | | | 38,534 | |
Payable to the Custodian (Note 6) | | | 20,229 | |
Accrued other expenses | | | 29,198 | |
| | | | |
Total liabilities | | | 187,518 | |
| | | | |
| | | | |
Net Assets | | $ | 180,760,992 | |
| | | | |
| |
Net Assets Consist of: | | | | |
Capital paid in | | $ | 103,546,984 | |
Undistributed (distributions in excess of) net investment income | | | (4,361 | ) |
Accumulated net realized loss | | | (5,580,439 | ) |
Net unrealized appreciation (depreciation) on: | | | | |
Investments | | | 82,750,722 | |
Futures | | | 48,086 | |
| | | | |
Net Assets | | $ | 180,760,992 | |
| | | | |
| | | | |
Shares outstanding ($0.01 par value; unlimited shares authorized) | | | 4,729,207 | |
Net asset value per share | | $ | 38.22 | |
| | | | | |
(1) Deposits at broker for futures contracts. | |
The accompanying notes are an integral part of these financial statements.
| | | | |
| Statement of Assets and Liabilities | | | 17 | |
State Street S&P 500 Index V.I.S. Fund
Statement of Operations — For the year ended December 31, 2016
| | | | |
Investment Income | | | | |
| | | | |
Income | | | | |
Dividend | | $ | 3,865,034 | |
Interest | | | 2,178 | |
Income from affiliated investments | | | 15,198 | |
| | | | |
Total income | | | 3,882,410 | |
| | | | |
| |
Expenses | | | | |
Advisory and administration fees (Note 6) | | | 531,890 | |
Directors’ fees (Note 6) | | | 7,550 | |
Custody and accounting expenses — net (Note 6) | | | 49,953 | |
Professional fees | | | 23,528 | |
Other expenses | | | 36,831 | |
| | | | |
Total expenses before waivers | | | 649,752 | |
| | | | |
Less: Fees waived by the adviser (Note 6) | | | (43,042 | ) |
| | | | |
Net expenses | | | 606,710 | |
| | | | |
Net investment income | | $ | 3,275,700 | |
| | | | |
| |
Net Realized and Unrealized Gain (loss) on Investments | | | | |
Realized gain (loss) on: | | | | |
Investments | | $ | 9,423,965 | |
Affiliated investments | | | (2,730 | ) |
Futures | | | 483,985 | |
Increase (decrease) in unrealized appreciation/depreciation on: | | | | |
Investments | | | 6,134,838 | |
Futures | | | 50,761 | |
| | | | |
| |
Net realized and unrealized gain (loss) on investments | | | 16,090,819 | |
| | | | |
Net Increase in Net Assets Resulting from Operations | | $ | 19,366,519 | |
| | | | |
The accompanying notes are an integral part of these financial statements.
| | |
| 18 | | Statement of Operations |
State Street S&P 500 Index V.I.S. Fund
Statements of Changes in Net Assets
| | | | | | | | |
| | | Year Ended
December 31, 2016 | | | Year Ended
December 31, 2015* | |
Increase (Decrease) in Net Assets | | | | | | | | |
| | |
Operations: | | | | | | | | |
Net investment income | | $ | 3,275,700 | | | $ | 3,301,007 | |
Net realized gain (loss) on investments and futures | | | 9,905,220 | | | | 12,885,288 | |
Net increase (decrease) in unrealized appreciation/depreciation on investments and futures | | | 6,185,599 | | | | (14,024,575 | ) |
| | | | | | | | |
Net increase (decrease) from operations | | | 19,366,519 | | | | 2,161,720 | |
| | | | | | | | |
| | |
Distributions to shareholders from: | | | | | | | | |
Net investment income | | | (3,293,797 | ) | | | (4,111,312 | ) |
Net realized gains | | | (6,347,185 | ) | | | — | |
| | | | | | | | |
Total distributions | | | (9,640,982 | ) | | | (4,111,312 | ) |
| | | | | | | | |
Increase (decrease) in assets from operations and distributions | | | 9,725,537 | | | | (1,949,592 | ) |
| | | | | | | | |
| | |
Share transactions: | | | | | | | | |
Proceeds from sale of shares | | | 9,068,070 | | | | 2,633,756 | |
Value of distributions reinvested | | | 9,640,982 | | | | 4,111,312 | |
Cost of shares redeemed | | | (27,068,972 | ) | | | (28,662,267 | ) |
| | | | | | | | |
Net increase (decrease) from share transactions | | | (8,359,920 | ) | | | (21,917,199 | ) |
| | | | | | | | |
| | |
Total increase (decrease) in net assets | | | 1,365,617 | | | | (23,866,791 | ) |
| | |
Net Assets | | | | | | | | |
Beginning of year | | | 179,395,375 | | | | 203,262,166 | |
| | | | | | | | |
| | |
End of year | | $ | 180,760,992 | | | $ | 179,395,375 | |
| | | | | | | | |
| | |
Undistributed (distributions in excess of) net investment income, end of year | | $ | (4,361 | ) | | $ | (19,106 | ) |
| | |
Changes in Fund Shares | | | | | | | | |
Shares sold | | | 244,141 | | | | 71,650 | |
Issued for distributions reinvested | | | 251,002 | | | | 111,842 | |
Shares redeemed | | | (727,621 | ) | | | (775,479 | ) |
| | | | | | | | |
Net decrease in fund shares | | | (232,478 | ) | | | (591,987 | ) |
| | | | | | | | |
| * | | Beginning with the year ended December 31, 2016, the Fund was audited by Ernst & Young LLP. The previous years were audited by another independent registered public accounting firm. |
The accompanying notes are an integral part of these financial statements.
| | | | |
| Statements of Changes in Net Assets | | | 19 | |
State Street S&P 500 Index V.I.S. Fund
Notes to Financial Statements — December 31, 2016
| 1. | | Organization of the Company |
State Street Variable Insurance Series Funds, Inc. (the “Company”) was incorporated under the laws of the Commonwealth of Virginia on May 14, 1984 and is registered under the Investment Company Act of 1940, as amended (the “1940 Act”), as an open-end management investment company. Prior to November 30, 2016, the Company was named GE Investments Funds, Inc. The Company is currently composed of the following eight investment portfolios (collectively, the “Funds”): State Street U.S. Equity V.I.S. Fund, State Street S&P 500 Index V.I.S. Fund (the “Fund”), State Street Premier Growth Equity V.I.S. Fund, State Street Core Value Equity V.I.S. Fund, State Street Small-Cap Equity V.I.S. Fund, State Street Total Return V.I.S. Fund, State Street Income V.I.S. Fund and State Street Real Estate Securities V.I.S. Fund. Each Fund is an investment company and accordingly follows the investment company accounting and reporting guidance of the Financial Accounting Standards Board (“FASB”) Accounting Standard Codification (“ASC”) Topic 946 Financial Services — Investment Companies. Each Fund is a diversified investment company within the meaning of the 1940 Act.
Effective November 30, 2016, each individual Fund changed its respective name as follows:
| | |
| Old Name | | New Name |
GE Investments U.S. Equity Fund | | State Street U.S. Equity V.I.S. Fund |
GE Investments S&P 500 Index Fund | | State Street S&P 500 Index V.I.S. Fund |
GE Investments Premier Growth Equity Fund | | State Street Premier Growth Equity V.I.S. Fund |
GE Investments Core Value Equity Fund | | State Street Core Value Equity V.I.S. Fund |
GE Investments Small-Cap Equity Fund | | State Street Small-Cap Equity V.I.S. Fund |
GE Investments Total Return Fund | | State Street Total Return V.I.S. Fund |
GE Investments Income Fund | | State Street Income V.I.S. Fund |
GE Investments Real Estate Securities Fund | | State Street Real Estate Securities V.I.S. Fund |
Shares of the Funds of the Company are offered only to insurance company separate accounts that fund certain variable life insurance contracts and variable annuity contracts. SSGA Funds Management, Inc. (“SSGA FM”) is the investment adviser and administrator of each of the Funds effective July 1, 2016. Prior to July 1, 2016, GE Asset Management Incorporated (“GEAM”) served as the investment adviser and administrator to each Fund.
| 2. | | Summary of Significant Accounting Policies |
The preparation of financial statements in conformity with U.S. generally accepted accounting principles (“GAAP”) requires management to make estimates and assumptions that affect the reported amounts of assets and liabilities and disclosure of contingent assets and liabilities at the date of the financial statements and the reported amounts of increases and decreases in net assets from operations during the reporting period. Actual results may differ from those estimates.
Subsequent events after the balance sheet date through the date the financial statements were issued have been evaluated in the preparation of the financial statements. There are no items to report.
The following summarizes the significant accounting policies of the Company:
Securities Valuation and Transactions All investments in securities are recorded at their estimated fair value, as described in Note 3.
Securities transactions are accounted for as of the trade date. Realized gains and losses on investments sold are recorded on the basis of identified cost for both financial statement and federal tax purposes.
Derivatives The Fund is subject to equity price risk in the normal course of pursuing its investment objectives. The Fund may enter into various types of derivative transactions (such as futures) to gain exposure to certain types of securities as an alternative to investing directly in or selling securities comprising the S&P 500® Index.
Futures Contracts A futures contract is an agreement to buy or sell a specific amount of a commodity, financial instrument, currency or index at a particular price and future date. During the fiscal year ended December 31, 2016, the Fund invested in stock index futures contracts to gain equity exposure for accumulating and residual cash positions. Buying futures tends to increase the Fund’s exposure to the underlying instrument while selling futures tends to decrease the Fund’s exposure to the underlying instrument, or hedge other Fund investments. With futures contracts, there is minimal counterparty credit risk to
| | |
| 20 | | Notes to Financial Statements |
State Street S&P 500 Index V.I.S. Fund
Notes to Financial Statements, continued — December 31, 2016
the Fund since futures contracts are exchange traded and the exchange’s clearinghouse, as counterparty to all traded futures, guarantees the futures against default. The Fund’s risks in using these contracts include changes in the value of the underlying instruments, non-performance of the counterparties under the contracts’ terms and changes in the liquidity of the secondary market for the contracts. Futures contracts are valued at the settlement price established each day by the board of trade or exchange on which they principally trade.
Upon entering into a financial futures contract, the Fund is required to pledge to the broker an amount of cash and/or other assets equal to a certain percentage of the contract amount, known as initial margin deposit. Subsequent payments, known as variation margin, are made or received by the Fund each day, depending on the daily fluctuation in the fair value of the underlying security. The Fund records an unrealized gain or loss equal to the daily variation margin. Should market conditions move unexpectedly, the Fund may not achieve the anticipated benefits of the futures contracts and may incur a loss. The Fund recognizes a realized gain or loss on the expiration or closing of a futures contract.
Investment Income Corporate actions (including cash dividends) are recorded on the ex-dividend date, net of applicable withholding taxes, except for certain foreign corporate actions which are recorded as soon after the ex-dividend date as such information becomes available. Withholding taxes on foreign dividends, if any, have been provided for in accordance with the Fund’s understanding of the applicable country’s tax rules and rates.
Interest income is recorded on the accrual basis. Accretion of discounts and amortization of premiums on taxable bonds are to the call or maturity date, whichever is shorter, using the effective yield method.
Expenses Fund specific expenses are charged to the Fund that incurs such expenses. Such expenses may include custodial fees, legal and accounting fees, printing costs and registration fees. Expenses that are not fund specific are allocated pro rata across the Funds. Expenses of the Fund are generally paid directly by the Fund, however, expenses may be paid by the investment adviser and reimbursed by the Fund.
Federal Income Taxes The Fund intends to comply with all sections of the Internal Revenue Code of 1986, as amended (the “Internal Revenue Code”) applicable to regulated investment companies, including the distribution of substantially all of its taxable net investment income and net realized capital gains to its shareholders. Therefore, no provision for federal income tax has been made. The Fund is treated as a separate taxpayer for federal income tax purposes.
The Fund utilizes various methods to measure the fair value of most of its investments on a recurring basis. GAAP establishes a framework for measuring fair value and providing related disclosures. Broadly, the framework requires fair value to be determined based on the exchange price that would be received for an asset or paid to transfer a liability (an exit price) in the principal or most advantageous market for the asset or liability in an orderly transaction between market participants at the measurement date. In the absence of active markets for the identical assets or liabilities, such measurements involve developing assumptions based on market observable data and, in the absence of such data, internal information that is consistent with what market participants would use in a hypothetical transaction that occurs at the measurement date. It also establishes a three-level valuation hierarchy based upon observable and non-observable inputs.
Observable inputs reflect market data obtained from independent sources, while unobservable inputs reflect our market assumptions. Preference is given to observable inputs. These two types of inputs create the following fair value hierarchy:
| | • | | Level 1 — Quoted prices for identical investments in active markets. |
| | • | | Level 2 — Quoted prices for similar investments in active markets; quoted prices for identical or similar investments in markets that are not active; and model-derived valuations whose inputs are observable or whose significant value drivers are observable. |
| | • | | Level 3 — Significant inputs to the valuation model are unobservable. |
Policies and procedures are maintained to value investments using the best and most relevant data available. In addition, pricing vendors are utilized to assist in valuing investments. The investment adviser performs periodic reviews of the methodologies used by independent pricing services including price validation of individual securities.
| | | | |
| Notes to Financial Statements | | | 21 | |
State Street S&P 500 Index V.I.S. Fund
Notes to Financial Statements, continued — December 31, 2016
Fair Value Measurement The following section describes the valuation methodologies the Fund uses to measure different financial investments at fair value.
The Fund’s portfolio securities are valued generally on the basis of market quotations. Equity securities generally are valued at the last reported sale price on the primary market in which they are traded. Portfolio securities listed on NASDAQ are valued using the NASDAQ Official Closing Price. Level 1 securities primarily include publicly-traded equity securities, which may not necessarily represent the last sales price. If no sales occurred on the exchange or NASDAQ that day, the portfolio security generally is valued using the last reported bid price. In those circumstances, the Fund typically classifies the investment securities in Level 2.
Short-term securities of sufficient credit quality with remaining maturities of sixty days or less at the time of purchase are typically valued on the basis of amortized cost which approximates fair value and these are included in Level 2. If it is determined that amortized cost does not approximate fair value, securities may be valued based on dealer supplied valuations or quotations. In these infrequent circumstances, pricing services may provide the Fund with valuations that are based on significant unobservable inputs, and in those circumstances the investment securities are classified in Level 3.
Investments in registered investment companies are valued at the published daily net asset value (“NAV”) and classified in Level 1.
If prices are not readily available for a portfolio security, or if it is believed that a price for a portfolio security does not represent its fair value, the security may be valued using procedures approved by the Company’s Board of Directors that are designed to establish its “fair” value. These securities are typically classified in Level 3. Those procedures require that the fair value of a security be established by a valuation committee of the investment adviser. The valuation committee follows different protocols for different types of investments and circumstances. The fair value procedures may be used to value any investment of the Fund in the appropriate circumstances.
Fair value determinations generally are used for securities whose value is affected by a significant event that will materially affect the value of a security and which occurs subsequent to the time of the close of the principal market on which such security trades but prior to the calculation of the Fund’s NAV.
The value established for such a portfolio security valued other than by use of a market quotation (as described above) may be different than what would be produced through the use of market quotations or another methodology. Portfolio securities that are valued using techniques other than market quotations, including “fair valued” securities, may be subject to greater fluctuation in their value from one day to the next than would be the case if market quotations were used. In addition, there is no assurance that the Fund could sell a portfolio security for the value established for it at any time and it is possible that the Fund would incur a loss because a portfolio security is sold at a discount to its established value.
Other financial investments are derivative instruments that are not reflected in total investments, such as futures, forwards, swaps, and written options contracts, which are valued based on fair value as discussed above.
The Fund uses closing prices for derivatives included in Level 1, which are traded either on exchanges or liquid over-the-counter markets. Derivative assets and liabilities included in Level 2 primarily represent interest rate swaps, cross-currency swaps and foreign currency and commodity forward and option contracts. Derivative assets and liabilities included in Level 3 primarily represent interest rate products that contain embedded optionality or prepayment features.
The inputs or methodology used for valuing securities are not an indication of the risk associated with investing in those securities.
The following table presents the Fund’s investments measured at fair value on a recurring basis at December 31, 2016:
| | | | | | | | | | | | | | | | |
| Investments | | Level 1 | | | Level 2 | | | Level 3 | | | Total | |
| | | | | | | | | | | | | | | | |
Investments in Securities† | | | | | | | | | | | | | | | | |
Common Stock | | $ | 176,876,841 | | | $ | — | | | $ | — | | | $ | 176,876,841 | |
Short-Term Investments | | | 3,654,858 | | | | — | | | | — | | | | 3,654,858 | |
| | | | | | | | | | | | | | | | |
Total Investments in Securities | | $ | 180,531,699 | | | $ | — | | | $ | — | | | $ | 180,531,699 | |
| | | | | | | | | | | | | | | | |
| | | | |
Other Financial Instruments* | | | | | | | | | | | | | | | | |
Long Futures Contracts — Unrealized Appreciation | | $ | 48,086 | | | $ | — | | | $ | — | | | $ | 48,086 | |
| | | | | | | | | | | | | | | | |
| | † | See Schedule of Investments for Industry Classification. |
| | * | Other financial instruments include derivative instruments such as futures contracts. Amounts shown represent unrealized appreciation (depreciation), at period end. |
| | |
| 22 | | Notes to Financial Statements |
State Street S&P 500 Index V.I.S. Fund
Notes to Financial Statements, continued — December 31, 2016
There were no transfers between fair value levels during the period. Transfers between fair value levels are recognized at the beginning of the period.
| 4. | | Derivatives Disclosure |
Shown below are the derivative contracts entered into by the Fund, summarized by primary risk exposure as they appear on the Statement of Assets and Liabilities, none of which are accounted for as hedging instruments under FASB ASC No. 815 Derivatives and Hedging (“ASC 815”) as of December 31, 2016.
| | | | | | | | | | | | |
| | | Asset Derivatives December 31, 2016 | | | Liability Derivatives December 31, 2016 | |
Derivatives not accounted for as
hedging instruments under ASC 815 | | Location in the Statement
of Assets and Liabilities | | Fair
Value ($) | | | Location in the Statement
of Assets and Liabilities | | Fair
Value ($) | |
| Equity Contracts | | Assets, Net Assets — Net Unrealized Appreciation/ (Depreciation) on Futures | | | 48,086 | | | Liabilities, Net Assets — Net Unrealized Appreciation/ (Depreciation) on Futures | | | — | |
Shown below are the effects of derivative instruments on the Fund’s Statement of Operations, summarized by primary risk exposure, none of which are accounted for as hedging instruments under ASC 815.
| | | | | | | | | | | | |
Derivatives not accounted
for as hedging instruments
under ASC 815 | | Location in the Statement of Operations | | Total Notional
Amount of
Futures Contracts
Purchased/(Sold) ($) | | Realized Gain (Loss)
on Derivatives
Recognized in
Income ($) | | | Change in
Unrealized
Appreciation
(Depreciation)
on Derivatives
Recognized in
Income ($) | |
| Equity Contracts | | Realized gain (loss) on Futures, Increase (decrease) in unrealized appreciation/ (depreciation) on Futures | | 24,308,275/(22,640,644) | | | 483,985 | | | | 50,761 | |
During the fiscal year ended December 31, 2016, the Fund had an average notional value of $3,849,591 on long futures contracts. Please refer to the table following the Schedule of Investments for open futures contracts at December 31, 2016.
Currently, the Funds and other affiliated funds (each a “Participant” and, collectively, the “Participants”) participate in a $360 million revolving credit facility provided by a syndication of banks under which the Participants may borrow to fund shareholder redemptions. This agreement expires October 12, 2017, unless extended or renewed.
The Participants are charged an annual commitment fee which is calculated based on the unused portion of the shared credit line. Commitment fees are allocated among each of the Participants based on relative net assets. A Participant incurs and pays the interest expense related to its borrowing. Interest is calculated at a rate per annum equal to the sum of 1% plus the greater of the New York Fed Bank Rate and 1-month LIBOR rate. From July 1, 2016, the date the Funds were added to this credit facility, through October 12, 2016, interest was calculated at a rate per annum equal to the sum of the New York Fed Bank Rate plus 1%.
The credit facilities were not utilized by the Fund during the period from July 1, 2016 through December 31, 2016.
| 6. | | Compensation and Fees Paid to Affiliates |
SSGA FM, a registered investment adviser, was retained by the Company’s Board of Directors effective July 1, 2016 to act as investment adviser and administrator of the Fund. SSGA FM’s compensation for investment advisory and administrative services (“Management Fee”) is paid monthly based on the average daily net assets of the Fund at an annualized rate of 0.25%.
State Street Bank and Trust Company (“State Street”) serves as the sub-administrator and custodian to the Funds. Amounts paid by the Fund to State Street for performing such services are included in advisory and administration and custody and accounting expenses, respectively.
Prior to July 1, 2016, GEAM served as the Fund’s investment adviser and administrator, and the Fund paid GEAM a Management Fee at an annualized rate of 0.35%.
| | | | |
| Notes to Financial Statements | | | 23 | |
State Street S&P 500 Index V.I.S. Fund
Notes to Financial Statements, continued — December 31, 2016
GEAM had entered into a contractual arrangement with the Company to limit the Management Fee charged to the Fund to 0.30% of the average daily net assets of the Fund (the “Management Fee Limitation Agreement”). The Management Fee Limitation Agreement was terminated effective June 30, 2016, upon the termination of the investment advisory and administrator agreement with GEAM.
Directors’ Compensation The Fund pays no compensation to its Directors who are officers or employees of SSGA FM or its affiliates. Directors who are not such officers or employees also serve in a similar capacity for other funds advised by SSGA FM. Compensation paid to non-interested Directors is reflected on the Statement of Operations. These fees are allocated pro rata across all of the mutual fund platforms served by the Directors, including the Fund, and are based upon the relative net assets of each fund within such platforms. (For additional information about Directors’ compensation, please refer to the Funds’ Statement of Additional Information.)
Other Transactions with Affiliates In December 2015, State Street announced a review of the manner in which it invoiced certain expenses to certain of its Investment Servicing clients, primarily in the United States, during an 18-year period going back to 1998 and its determination that it had incorrectly invoiced clients for certain expenses. State Street informed its clients that it will pay to them the expenses it concluded were incorrectly invoiced to them, plus interest.
The Fund was impacted by this matter. The amounts in the table below represent the refunded expenses and interest received by the Fund for the periods in question.
| | | | | | | | | | | | | | | | | | |
Refunded
Custody
Expense* | | Interest* | | Total | | % of Net
Assets at
12/31/16 |
| | | 3,926 | | | | | 2,178 | | | | | 6,104 | | | | | 0.003 | % |
| | * | Refunded Custody Expense and Interest appear on the Statement of Operations in Accounting and Custody fees — net and Interest income, respectively. |
Prior to July 1, 2016, SSGA FM served as the sub-adviser to the Fund, and was paid monthly sub-advisory fees by the investment adviser which were calculated as a percentage of the average daily net assets of the Fund.
| 8. | | Investment Transactions |
Purchases and Sales of Securities The cost of purchases and the proceeds from sales of investments, other than short-term securities, for the fiscal year ended December 31, 2016, were as follows:
| | | | | | | | |
| Non-U.S. Government Securities |
| Purchases | | Sales |
| | | | | | | | | |
| | $ | 3,859,156 | | | | $ | 18,927,499 | |
Affiliated Investments The Fund may invest in affiliated entities, including securities issued by State Street, affiliated funds, or entities deemed to be affiliates as a result of the Fund owning more than five percent of the entity’s voting securities or outstanding shares. Amounts relating to these transactions during the fiscal year ended December 31, 2016 are disclosed in the Schedule of Investments.
The Fund is subject to ASC 740, Income Taxes (“ASC 740”). ASC 740 provides guidance for financial accounting and reporting for the effects of income taxes that result from an entity’s activities during the year. ASC 740 also provides guidance regarding how uncertain tax positions should be recognized, measured, presented and disclosed in the financial statements. ASC 740 requires evaluation of tax positions taken or expected to be taken in the course of preparing the Fund’s tax returns to determine whether the tax positions are “more likely than not” of being sustained by the applicable tax authority. There are no adjustments to the Fund’s net assets required under ASC 740. The Fund’s 2013, 2014, 2015, and 2016 fiscal year tax returns are still open to examination by the Federal and applicable state tax authorities.
| | |
| 24 | | Notes to Financial Statements |
State Street S&P 500 Index V.I.S. Fund
Notes to Financial Statements, continued — December 31, 2016
At December 31, 2016, information on the tax cost of investments and distributable earnings on a tax basis was as follows:
| | | | | | | | | | | | | | | | | | | | | | | | | | | | | | | | | | | | | | |
Cost of
Investments
For Tax
Purposes | | Gross Tax | | Net Tax
Appreciation/
(Depreciation) | | Undistributed
Income | | Undistributed
Accum.
Capital Gain/
(Loss) | | Late-Year
Losses |
| | Appreciation | | Depreciation | | Investments | | Derivatives/
Currency | | | |
| | $ | 104,554,854 | | | | $ | 79,680,026 | | | | $ | (3,703,181 | ) | | | $ | 75,976,845 | | | | $ | — | | | | $ | 12,423 | | | | $ | 1,224,740 | | | | $ | — | |
As of December 31, 2016, the Fund had no capital loss carryovers, as indicated below. Capital loss carryovers are available to offset future realized capital gains to the extent provided in the Internal Revenue Code and regulations thereunder. To the extent that these carryover losses are used to offset future capital gains, it is probable that the gains offset will not be distributed to shareholders.
During the year ended December 31, 2016, the Fund utilized $1,038,870 of prior year capital loss carryovers.
Any qualified late-year loss is deemed to arise on the first day of the Fund’s next tax year (if the Fund elects to defer such loss). Under this regime, generally, the Fund can elect to defer any post-October capital loss and/or any late-year ordinary loss as defined by the Internal Revenue Code.
The Fund incurned no such losses for the fiscal year ended December 31, 2016.
The tax character of distributions paid during the fiscal years ended December 31, 2016 and December 31, 2015 were as follows:
| | | | | | | | | | | | | | | | | | |
| Year | | Ordinary
Income | | Long-Term
Capital Gains | | Total |
| | | | | | | | | | | | | | | | | | | |
| | | 2016 | | | | $ | 3,293,797 | | | | $ | 6,347,185 | | | | $ | 9,640,982 | |
| | | 2015 | | | | | 4,111,312 | | | | | – | | | | | 4,111,312 | |
Distributions to Shareholders The Fund declares and pays any dividends from net investment income annually. The Fund declares and pays any net realized capital gains in excess of capital loss carryforwards distributions annually. The character of income and gains to be distributed is determined in accordance with income tax regulations which may differ from GAAP. These differences include (but are not limited to) investments in futures, distributions from real estate investment trusts and other equity investments, investments in passive foreign investment companies and losses due to wash sale transactions. Reclassifications due to permanent book/tax differences are made to the Fund’s capital accounts to reflect income and gains available for distribution (or available capital loss carryovers) under income tax regulations. These reclassifications have no impact on net investment income, realized gains or losses, or the NAV of the Fund. The calculation of net investment income per share in the Financial Highlights table excludes these adjustments.
The reclassifications for the fiscal year ended December 31, 2016 were as follows:
| | | | | | | | | | | | | |
Undistributed
Net Investment
Income | | Accumulated
Net Realized
Gain (Loss) | | Capital
Paid In |
| | $ | 32,842 | | | | $ | (14,249 | ) | | | $ | (18,593 | ) |
KPMG LLP (“KPMG”) served as the independent registered certified public accounting firm of the Company through its resignation as of June 30, 2016. On September 9, 2016, upon recommendation by the Audit Committee of the Company, the Company’s Board of Directors selected Ernst & Young LLP (“EY”) to replace KPMG as the independent public accountant for the fiscal year ended December 31, 2016.
The reports of KPMG on the financial statements for the fiscal years ended December 31, 2014 and December 31, 2015 contained no adverse opinion or disclaimer of opinion and were not qualified or modified as to uncertainty, audit scope or accounting principles.
During the Company’s fiscal years ended December 31, 2014 and December 31, 2015 and through the period ended June 30, 2016, there were no disagreements with KPMG on any matter of accounting principles or practices, financial statement
| | | | |
| Notes to Financial Statements | | | 25 | |
State Street S&P 500 Index V.I.S. Fund
Notes to Financial Statements, continued — December 31, 2016
disclosure, or auditing scope or procedure, which disagreements if not resolved to the satisfaction of KPMG would have caused them to make reference thereto in their reports on the financial statements for such years or periods.
During the Company’s fiscal years ended December 31, 2014 and December 31, 2015 and through the period ended June 30, 2016, there were no reportable events (as defined in Item 304(a)(1)(v) of Regulation S-K). The Funds requested and KPMG furnished a letter addressed to the Securities and Exchange Commission stating whether or not it agreed with the above statements. A copy of such letter was filed as Exhibit 77 to Form N-SAR for the period ended December 31, 2016.
During the Company’s fiscal years ended December 31, 2014 and December 31, 2015 and through September 9, 2016, neither the Company nor anyone on its behalf has consulted EY on items which: (i) concerned the application of accounting principles to a specified transaction, either completed or proposed, or the type of audit opinion that might be rendered on the Company’s financial statements or (ii) concerned the subject of a disagreement (as defined in paragraph (a)(1)(iv) of Item 304 of Regulations S-K) or reportable events (as described in paragraph (a)(1)(v) of said Item 304).
| | |
| 26 | | Notes to Financial Statements |
State Street S&P 500 Index V.I.S. Fund
Report of Independent Registered Public Accounting Firm
To the Board of Directors of State Street Variable Insurance Series Funds, Inc. and Shareholders of State Street S&P 500 Index V.I.S. Fund:
We have audited the accompanying statement of assets and liabilities of the State Street S&P 500 Index V.I.S. Fund (formerly GE Investments S&P 500 Index Fund) (one of the funds constituting State Street Variable Insurance Series Funds, Inc. (formerly GE Investment Funds, Inc.)) (the “Fund”), including the schedule of investments, as of December 31, 2016, and the related statements of operations, changes in net assets and the financial highlights for the year then ended. These financial statements and financial highlights are the responsibility of the Fund’s management. Our responsibility is to express an opinion on these financial statements and financial highlights based on our audit. The statement of changes in net assets for the year ended December 31, 2015 and the financial highlights for periods ended prior to January 1, 2016 were audited by another independent registered public accounting firm whose report, dated February 19, 2016, expressed an unqualified opinion on that statement of changes in net assets and those financial highlights.
We conducted our audit in accordance with the standards of the Public Company Accounting Oversight Board (United States). Those standards require that we plan and perform the audit to obtain reasonable assurance about whether the financial statements and financial highlights are free of material misstatement. We were not engaged to perform an audit of the Fund’s internal control over financial reporting. Our audit included consideration of internal control over financial reporting as a basis for designing audit procedures that are appropriate in the circumstances, but not for the purpose of expressing an opinion on the effectiveness of the Fund’s internal control over financial reporting. Accordingly, we express no such opinion. An audit also includes examining, on a test basis, evidence supporting the amounts and disclosures in the financial statements and financial highlights, assessing the accounting principles used and significant estimates made by management, and evaluating the overall financial statement presentation. Our procedures included confirmation of securities owned as of December 31, 2016, by correspondence with the custodian and brokers or by other appropriate auditing procedures where replies from brokers were not received. We believe that our audit provides a reasonable basis for our opinion.
In our opinion, the financial statements and financial highlights referred to above present fairly, in all material respects, the financial position of the State Street S&P 500 Index V.I.S. Fund (one of the funds constituting State Street Variable Insurance Series Funds, Inc.) at December 31, 2016, the results of its operations, changes in its net assets and the financial highlights for the year then ended, in conformity with U.S. generally accepted accounting principles.

Boston, Massachusetts
February 17, 2017
| | | | |
| Report of Independent Registered Public Accounting Firm | | | 27 | |
State Street S&P 500 Index V.I.S. Fund
Tax Information — December 31, 2016 (Unaudited)
For the fiscal year ended December 31, 2016, the Fund hereby designates $6,347,185 as capital gain dividends, or the amount ultimately treated as capital gain net income.
The amounts presented herein may differ from amounts presented elsewhere in the financial statements due to differences between tax and financial accounting principles. Please consult a tax advisor if you have any questions about Federal or State income tax laws or on how to prepare your tax returns. If you have specific questions about your Fund account, please consult your investment representative.
State Street S&P 500 Index V.I.S. Fund
Special Meeting of Shareholders — Voting Results (Unaudited)
On November 2, 2016, the State Street Variable Insurance Series Funds, Inc. (formerly known as GE Investments Funds, Inc.) (the “Company”) held a special meeting of shareholders of each series portfolio of the Company (collectively, the “Funds”), including shareholders of the State Street S&P 500 Index V.I.S. Fund (formerly known as the S&P 500 Index Fund) (the “Fund”). Shareholders of record on August 31, 2016 were entitled to vote on the proposals. For each proposal shareholders of all Funds voted together and not by Fund or share class. At the meeting, all proposals were approved by the Fund’s shareholders and the following votes were recorded:
Proposal 1:
Approval of an amendment to the Articles of Incorporation of the Company to change the name of the Company from GE Investments Funds, Inc. to State Street Variable Insurance Series Funds, Inc.
Company Votes:
| | | | | | | | | | | | |
| | | No. of Shares | | | % of Outstanding Shares | | | % of Shares Present | |
Affirmative | | | 129,623,837.819 | | | | 89.283 | % | | | 89.283 | % |
Against | | | 10,047,818.534 | | | | 6.921 | % | | | 6.921 | % |
Abstain | | | 5,511,041.282 | | | | 3.796 | % | | | 3.796 | % |
Total | | | 145,182,697.634 | | | | 100.000 | % | | | 100.000 | % |
Fund votes:
| | | | | | | | | | | | |
| | | No. of Shares | | | % of Outstanding Shares | | | % of Shares Present | |
Affirmative | | | 4,129,723.968 | | | | 89.566 | % | | | 89.566 | % |
Against | | | 328,752.097 | | | | 7.130 | % | | | 7.130 | % |
Abstain | | | 152,315.883 | | | | 3.303 | % | | | 3.303 | % |
Total | | | 4,610,791.948 | | | | 100.000 | % | | | 100.000 | % |
Proposal 2:
Approval of an amendment to the Articles of Incorporation of the Company to permit the Board of Directors to change the name of the Company without seeking shareholder approval.
Company votes:
| | | | | | | | | | | | |
| | | No. of Shares | | | % of Outstanding Shares | | | % of Shares Present | |
Affirmative | | | 118,220,823.871 | | | | 81.429 | % | | | 81.429 | % |
Against | | | 21,486,028.150 | | | | 14.799 | % | | | 14.799 | % |
Abstain | | | 5,475,845.611 | | | | 3.772 | % | | | 3.772 | % |
Total | | | 145,182,697.634 | | | | 100.000 | % | | | 100.000 | % |
Fund votes:
| | | | | | | | | | | | |
| | | No. of Shares | | | % of Outstanding Shares | | | % of Shares Present | |
Affirmative | | | 3,876,302.761 | | | | 84.070 | % | | | 84.070 | % |
Against | | | 591,340.759 | | | | 12.825 | % | | | 12.825 | % |
Abstain | | | 143,148.428 | | | | 3.105 | % | | | 3.105 | % |
Total | | | 4,610,791.948 | | | | 100.000 | % | | | 100.000 | % |
| | | | |
| Special Meeting of Shareholders — Voting Results | | | 29 | |
State Street S&P 500 Index V.I.S. Fund
Additional Information — December 31, 2016 (Unaudited)
Information about Directors and Executive Officers:
The business and affairs of the Fund are managed under the direction of the Fund’s Board of Directors. Information pertaining to the Directors and officers of the Fund is set forth below. Matthew J. Simpson resigned as a Director of the Fund effective June 30, 2016.
| | | | | | | | | | | | |
Name,
Address,
and Age | | Position(s) Held
with Fund | | Term of
Office and
Length of
Time Served | | Principal Occupation(s)
During Past 5 Years | | Number of
Portfolios
in Fund
Complex
Overseen
by Director | | | Other Directorships Held by Director |
INTERESTED DIRECTORS AND EXECUTIVE OFFICERS |
Jeanne M. La Porta c/o SSGA FM 1600 Summer St. Stamford, CT 06905 Age 51 | | Director and President | | Until successor is elected and qualified – 2 years | | Senior Managing Director at State Street Global Advisors since July 2016; President of GE Retirement Savings Plan Funds since July 2016; Senior Vice President and Commercial Operations Leader at GEAM from March 2014 to July 2016; President of State Street Institutional Funds and State Street Variable Insurance Series Funds, Inc. since April 2014; President and Trustee of GEAM’s UCITs Funds from March 2014 to November 2014; Senior Vice President and Commercial Administrative Officer at GEAM from April 2010 to March 2014; Vice President of State Street Institutional Funds from July 2003 to April 2014; Vice President of Elfun Funds from October 2003 to July 2016; Vice President of GE Retirement Savings Plan Funds from October 2003 to July 2016; Secretary of GE Funds from July 2007 to September 2010 and Vice President from July 2007 to February 2011; Senior Vice President and Deputy General Counsel of GEAM from October 2007 to April 2010; Vice President and Assistant Secretary of Elfun Funds and GE Retirement Savings Plan Funds from July 2003 to June 2010; and Vice President and Associate General Counsel – Marketing and Client Services (formerly Asset Management Services) at GEAM from May 1997 to October 2007. | | | 22 | | | Trustee and President of State Street Institutional Funds since 2014; Trustee of Elfun Funds since 2014. |
| | |
| 30 | | Additional Information |
State Street S&P 500 Index V.I.S. Fund
Additional Information, continued — December 31, 2016 (Unaudited)
| | | | | | | | | | | | |
Name,
Address,
and Age | | Position(s) Held
with Fund | | Term of
Office and
Length of
Time Served | | Principal Occupation(s)
During Past 5 Years | | Number of
Portfolios
in Fund
Complex
Overseen
by Director | | | Other Directorships Held by Director |
INTERESTED DIRECTORS AND EXECUTIVE OFFICERS (continued) |
JoonWon Choe c/o SSGA FM 1600 Summer St. Stamford, CT 06905 Age 47 | | Vice President & Secretary | | Until successor is elected and qualified –6years | | Managing Director and Managing Counsel at State Street Global Advisors since July 2016; Senior Vice President and Deputy General Counsel at GEAM from March 2011 to July 2016; Vice President and Secretary of State Street Institutional Funds since September 2010; Vice President and Assistant Secretary of GE Retirement Savings Plan Funds since September 2010; Vice President and Assistant Secretary of Elfun Funds from September 2010 to July 2016; Senior Vice President and Associate General Counsel at GEAM from June 2010 to March 2011; Vice President and Associate General Counsel of GEAM from November 2005 to June 2010; and Vice President and Secretary of GE Funds from September 2010 to February 2011. | | | N/A | | | N/A |
| | | | | | | | | | | | | |
Robert Herlihy c/o SSGA FM 1600 Summer St. Stamford, CT 06905 Age 49 | | Chief Compliance Officer | | Until successor is elected and qualified –11years | | Managing Director at State Street Global Advisors since July 2016; Deputy Chief Compliance Officer of Elfun Funds since July 2016; Chief Compliance Officer of State Street Institutional Funds and GE Retirement Savings Plan Funds since July 2005; Chief Compliance Officer of GEAM and Elfun Funds from July 2005 to July 2016; Chief Compliance Officer of GE Funds from July 2005 to February 2011; and Manager of Fund Administration at GEAM from 2002-2005. | | | N/A | | | N/A |
| | | | | | | | | | | | | |
Arthur A. Jensen c/o SSGA FM 1600 Summer St. Stamford, CT 06905 Age 50 | | Treasurer | | Until successor is elected and qualified – 5 years | | Vice President at State Street Global Advisors since July 2016; Deputy Treasurer of Elfun Funds since July 2016; Treasurer of State Street Institutional Funds and GE Retirement Savings Plan Funds since June 2011; Treasurer of Elfun Funds from June 2011 to July 2016; Mutual Funds Controller of GEAM from April 2011 to July 2016; Senior Vice President at Citigroup from 2008 to 2010; and Vice President at JPMorgan from 2005 to 2008. | | | N/A | | | N/A |
| | | | |
| Additional Information | | | 31 | |
State Street S&P 500 Index V.I.S. Fund
Additional Information, continued — December 31, 2016 (Unaudited)
| | | | | | | | | | | | |
Name,
Address,
and Age | | Position(s) Held
with Fund | | Term of
Office and
Length of
Time Served | | Principal Occupation(s)
During Past 5 Years | | Number of
Portfolios
in Fund
Complex
Overseen
by Director | | | Other Directorships Held by Director |
INTERESTED DIRECTORS AND EXECUTIVE OFFICERS (continued) |
Brian Harris c/o SSGA FM State Street Financial Center One Lincoln Street Boston, MA 02111-2900 Age 43 | | Deputy Chief Compliance Officer | | Until successor is elected and qualified – less than 1 year | | Managing Director, State Street Global Advisors and SSGA Funds Management, Inc. (June 2013 – present)*; Senior Vice President and Global Head of Investment Compliance, BofA Global Capital Management (2010 – 2013); Director of Compliance, AARP Financial Inc. (2008 – 2010). | | | N/A | | | N/A |
| |
Bruce S. Rosenberg c/o SSGA FM State Street Financial Center One Lincoln Street Boston, MA 02111-2900 Age 55 | | Assistant Treasurer | | Until successor is elected and qualified – less than 1 year | | Managing Director, State Street Global Advisors and SSGA Funds Management, Inc. (July 2015 – present); Director, Credit Suisse (April 2008 – July 2015). | | | N/A | | | N/A |
| |
Ann M. Carpenter c/o SSGA FM State Street Financial Center One Lincoln Street Boston, MA 02111-2900 Age 50 | | Assistant Treasurer | | Until successor is elected and qualified – less than 1 year | | Chief Operating Officer, SSGA Funds Management, Inc. (April 2014 – present); Managing Director, State Street Global Advisors and SSGA Funds Management, Inc. (2005 – present).* | | | N/A | | | N/A |
| | | | | | | | | | | | | |
Chad C. Hallett c/o SSGA FM State Street Financial Center One Lincoln Street Boston, MA 02111-2900 Age 47 | | Assistant Treasurer | | Until successor is elected and qualified – less than 1 year | | Vice President, State Street Global Advisors and SSGA Funds Management, Inc. (November 2014 – present); Vice President, State Street Bank and Trust Company (2001 – November 2014). | | | N/A | | | N/A |
| * | | Served in various capacities and/or with various affiliated entities during noted time period. |
| | |
| 32 | | Additional Information |
State Street S&P 500 Index V.I.S. Fund
Additional Information, continued — December 31, 2016 (Unaudited)
| | | | | | | | | | | | |
Name,
Address,
and Age | | Position(s) Held
with Fund | | Term of
Office and
Length of
Time Served | | Principal Occupation(s)
During Past 5 Years | | Number of
Portfolios
in Fund
Complex
Overseen
by Director | | | Other Directorships Held by Director |
NON-INTERESTED DIRECTORS |
John R. Costantino c/o SSGA FM 1600 Summer St. Stamford, CT 06905 Age 70 | | Chairman of the Board | | Until successor is elected and qualified – 20 years | | General Partner, NGN Capital LLC since 2006; and Managing Director, Vice President of Walden Capital Management since 1996. | | | 16 | | | Trustee of State Street Institutional Funds since 1997; Trustee of Fordham University from 1989 to 1995 and from 2001 to 2007 and Trustee Emeritus since 2007; Trustee of NeuroScience Research Institute since 1986; Trustee of GE Funds from 1993 to February 2011; Director of Artes Medical from 2006 to 2008; and Trustee of Gregorian University Foundation from 1992 to 2007. |
| | | | | | | | | | | | | |
R. Sheldon Johnson c/o SSGA FM 1600 Summer St. Stamford, CT 06905 Age 70 | | Director | | Until successor is elected and qualified – 5 years | | Retired, 2006 to present; Head of Global Institutional Equity Sales and Marketing at Morgan Stanley & Co., Inc. from 2002 to 2006 and Managing Director at Morgan Stanley & Co., Inc. from 1988 to 2006. | | | 16 | | | Trustee of State Street Institutional Funds since April 2011 and Trustee of St. Lawrence University since 2003. |
| | | | | | | | | | | | | |
Donna M. Rapaccioli c/o SSGA FM 1600 Summer St. Stamford, CT 06905 Age 54 | | Director | | Until successor is elected and qualified – 5 years | | Dean of the Gabelli School of Business since 2007 and Accounting professor since 1987 at Fordham University. | | | 16 | | | Trustee of State Street Institutional Funds since January 2012 and Trustee of Emmanuel College since 2010. |
The Statement of Additional Information for the Funds includes additional information about the Directors and Officers and is available, without charge, upon request by calling 1-800-242-0134.
| | | | |
| Additional Information | | | 33 | |
State Street S&P 500 Index V.I.S. Fund
Investment Team (Unaudited)
Investment Adviser and Administrator
SSGA Funds Management, Inc.
Board of Directors
John R. Costantino, Chairman
R. Sheldon Johnson
Jeanne M. La Porta
Donna M. Rapaccioli
Secretary
JoonWon Choe
Chief Compliance Officer
Robert Herlihy
Deputy Chief Compliance Officer
Brian Harris
Treasurer
Arthur A. Jensen
Assistant Treasurers
Bruce S. Rosenberg
Ann M. Carpenter
Chad C. Hallett
Distributor
State Street Global Markets, LLC
Member FINRA and SIPC
Custodian
State Street Bank and Trust Company
Investment Adviser
SSGA Funds Management, Inc.
1600 Summer Street
Stamford, CT 06905
or at:
P.O. Box 7900
Stamford, CT 06904-7900
Distributor
State Street Global Markets, LLC
Member FINRA and SIPC
State Street Financial Center
One Lincoln Street
Boston, MA 02111
www.ssga.com/geam
The Fund files its complete schedule of portfolio holdings with the Securities and Exchange Commission for the first and third quarters of each fiscal year on Form N-Q. The Fund’s Forms N-Q, as well as a description of the policies and procedures that the Fund uses to determine how to vote proxies (if any) relating to portfolio securities is available without charge (i) upon request, by calling 1-800-242-0134; (ii) on the Fund’s website at http://www.ssga.com/geam; and (iii) on the Commission’s website at http://www.sec.gov. The Fund’s Forms N-Q may be reviewed and copied at the Commission’s Public Reference Room in Washington, DC — information on the operation of the Public Reference Room may be obtained by calling 1-800-SEC-0330.
Information (if any) regarding how the Fund voted proxies relating to portfolio securities during the most recently disclosed 12-month period ended June 30 is available without charge (i) through the Fund’s website at http://www.ssga.com/geam; and (ii) on the Commission’s website at http://www.sec.gov.
IBG-22834
Annual Report
31 December 2016
State Street Small-Cap Equity V.I.S. Fund
(formerly the GE Investments Small-Cap Equity Fund)

State Street Small-Cap Equity V.I.S. Fund
Annual Report
December 31, 2016
Table of Contents
This report is prepared for Policyholders of certain variable contracts and may be distributed to others only if preceded or accompanied by the variable contract’s current prospectus and the current summary prospectus of the Fund available for investments thereunder.
State Street Small-Cap Equity V.I.S. Fund
Notes to Performance — December 31, 2016 (Unaudited)
The information provided on the performance page relates to the State Street Small-Cap Equity V.I.S. Fund (the “Fund”).
Total return performance shown in this report for the Fund takes into account changes in share price and assumes reinvestment of dividends and capital gains distributions, if any. Total returns shown are net of Fund fees and expenses but do not reflect fees and charges associated with the variable contracts such as administrative fees, account charges and surrender charges, which, if reflected, would reduce the Fund’s total returns for all periods shown.
The performance data quoted represents past performance; past performance does not guarantee future results. Investment return and principal value will fluctuate so your shares, when redeemed, may be worth more or less than their original cost. Current performance may be higher or lower than the performance data quoted. Periods less than one year are not annualized. Please call toll-free (800) 242-0134 or visit the Fund’s website at http://www.ssga.com/geam for the most recent month-end performance data.
An investment in the Fund is not a deposit of any bank and is not insured or guaranteed by the Federal Deposit Insurance Corporation (“FDIC”) or any other government agency. An investment in the Fund is subject to risk, including possible loss of principal invested.
The Russell 2000® Index is an unmanaged market capitalization-weighted index consisting of 2,000 of the smallest U.S.-domiciled publicly traded common stocks that are included in the Russell 3000® Index. The Russell 3000® Index is comprised of the 3,000 largest U.S. domiciled companies.
Russell Investment Group owns the Russell Index data, including all applicable trademarks and copyrights, used by SSGA Funds Management, Inc. (“SSGA FM”) in these materials. Any unauthorized use or redistribution of such Russell Index data is strictly prohibited. Russell Investment Group is not responsible for the configuration of this material or for any inaccuracy in SSGA FM’s presentation thereof.
The results shown for the foregoing index assume the reinvestment of net dividends or interest and do not reflect fees, expenses, or taxes. As such, the index returns do not reflect the actual cost of investing in the instruments that comprise each index.
The peer universe of the underlying annuity funds used for the peer group average annual total return calculation is based on a blend of Morningstar peer categories, as shown. Morningstar is an independent mutual fund rating service. The Fund’s performance may be compared to or ranked within a universe of mutual funds with investment objectives and policies similar but not necessarily identical to that of the Fund.
©2017 Morningstar, Inc. All Rights Reserved. The Morningstar information contained herein: (1) is proprietary to Morningstar and/or its content providers; (2) may not be copied or distributed; and (3) is not warranted to be accurate, complete or timely. Neither Morningstar nor its content providers are responsible for any damage or losses relating from any use of this information. Past performance is no guarantee of future results.
The views expressed in this document reflect our judgment as of the publication date and are subject to change at any time without notice.
State Street Global Markets, LLC, member of FINRA & SIPC is the principal underwriter and distributor of the State Street V.I.S. Funds and a wholly owned subsidiary of State Street Corporation. References to State Street may include State Street Corporation and its affiliates. The Funds pay State Street Bank and Trust Company for its services as custodian and Fund Accounting agent, and pay SSGA Funds Management, Inc. for investment advisory and administrative services.
State Street Small-Cap Equity V.I.S. Fund
Portfolio Management Discussion and Analysis — December 31, 2016 (Unaudited)
| Q. | How did the State Street Small-Cap Equity V.I.S. Fund perform compared to its benchmark and Morningstar peer group for the twelve-month period ended December 31, 2016? |
| A. | For the twelve-month period ended December 31, 2016, the State Street Small-Cap Equity V.I.S. Fund returned 23.77%. The Russell 2000® Index, the Fund’s benchmark, returned 21.31% and the Fund’s Morningstar peer group of 139 Small Blend Funds returned an average of 21.85% over the same period. |
| Q. | What market conditions affected the Fund’s performance? |
| A. | A strong risk appetite coupled with increased expectations for U.S. domestic growth and even potentially some protectionism led to the strong rally across equities especially in Small-Cap equities, which drove the Fund’s performance higher. Within small-cap, value led growth as stocks that appeared cheaper were in demand when compared to their higher valued peers. The Fund was well positioned to take advantage of that rally by being underweight in biotech (which had low/no earnings and high valuations) and underweight real estate investment trusts (“REITs”) (which fell on increasing rates). |
| Q. | What were the primary drivers of the Fund’s performance? |
| A. | Full year performance for 2016 was strong as the Fund handily beat the benchmark. Across the underlying managers within the Fund, Kennedy Capital Management, Inc. led the pack returning 31.46%, followed closely by Champlain Investment Partners, LLC returning 29.76%. Even GlobeFlex Capital, L.P., who faced a style headwind throughout the year returned 14.34%. |
| | The only derivatives used in the Fund are Russell 2000 Index e-Mini futures. These futures are used to equitize the cash sleeve that is designed to handle day to day cash flows coming in and out of the Fund. The cash sleeve is targeted to be a 2% weighting in the portfolio. We don’t believe the impact of these derivatives is material on the overall fund performance as the cash return will roughly match the index return over time. This does prevent unintentional drag from cash in years where the market is up significantly such as 2016, where the cash sleeve contributed ~40 basis points (“bps”) to the overall return of the Fund. The reverse holds up in down years, where if the small cap index was down significantly, the return on the equitized cash would also be negative (matching the index return). This type of exposure management through the use of the index futures ensures that the investor will not be substantially disadvantaged by large flows into or out of the Fund. However, these futures are not used with the intent to add excess return to the performance of the Fund or for any other speculative purposes. |
| Q. | Were there any significant changes to the Fund during the period? |
| A. | There were no significant changes to the Fund during the period, however the Fund ended the year with a 3.5% underweight to financials, which is down from the historical average of 8% underweight. This decrease is not related to the way the Fund is managed but rather due to Russell (the index provider) moving REITs into their own sector. As a result, the Fund is 5% underweight in REITS in addition to the 3.5% underweight in financials, which in the aggregate was close to the historical average of the Fund’s underweight to financials. |
| | |
| 2 | | State Street Small-Cap Equity V.I.S. Fund |
State Street Small-Cap Equity V.I.S. Fund
Understanding Your Fund’s Expenses — December 31, 2016 (Unaudited)
As a shareholder of the Fund, you incur ongoing costs. Ongoing costs include portfolio management fees, professional fees, administrative fees and other Fund expenses. The following example is intended to help you understand your ongoing costs (in dollars) of investing in the Fund and to compare these costs with the ongoing costs of investing in other mutual funds.
To illustrate these ongoing costs, we have provided an example and calculated the expenses paid by investors in the Fund during the period. The information in the following table is based on an investment of $1,000, which is invested at the beginning of the period and held for the entire six-month period ended December 31, 2016.
Actual Expenses
The first section of the table provides information about actual account values and actual expenses. You may use the information in this section, together with the amount you invested, to estimate the expenses that you paid over the period. To do so, simply divide your account value by $1,000 (for example, an $8,600 account value divided by $1,000 = 8.6), then multiply the result by the number given under the heading “Expenses paid during the period” to estimate the expenses you paid on your account during the period.
Hypothetical Example for Comparison Purposes
The second section of the table provides information about hypothetical account values and hypothetical expenses based on the Fund’s actual expense ratio and an assumed rate of return of 5% per year before expenses, which is not the Fund’s actual return. The hypothetical account values and expenses may not be used to estimate the actual ending account balance or expenses you paid for the period. You may use this information to compare the ongoing costs of investing in the Fund and other funds. To do so, compare this 5% hypothetical example with the 5% hypothetical examples that appear in the shareholder reports of other funds.
Please note that the expenses shown in the table are meant to highlight and help you compare ongoing costs only and do not reflect transaction costs, such as sales charges or redemption fees, if any. Therefore, the second section of the table is useful in comparing ongoing costs only, and will not help you determine the relative total costs of owning different funds. Additionally, the expenses shown do not reflect the fees or charges associated with variable contracts through which shares of the Fund are offered.
| | | | | | | | |
| | | Actual
Fund Return | | | Hypothetical
5% Return
(2.5% for
the period) | |
Account value at the beginning of the period July 1, 2016 | | $ | 1,000.00 | | | $ | 1,000.00 | |
Account value at the end of the period December 31, 2016 | | $ | 1,167.80 | | | $ | 1,018.35 | |
Expenses paid during the period** | | $ | 7.36 | | | $ | 6.85 | |
| * | Expenses are equal to the Fund’s annualized net expense ratio of 1.35%** (for the period July 1, 2016-December 31, 2016), multiplied by the average account value over the period, multiplied by 184/366 (to reflect the one-half year period). |
| ** | May differ from expense ratio disclosed in the financial highlights, which is calculated based on the entire fiscal year’s data. |
| | | | |
| State Street Small-Cap Equity V.I.S. Fund | | | 3 | |
State Street Small-Cap Equity V.I.S. Fund
Performance Summary — December 31, 2016 (Unaudited)
Morningstar Performance Comparison
Based on average annual returns for periods ended 12/31/16
| | | | | | | | | | | | |
| | | One
Year | | | Five
Year | | | Ten
Year | |
Number of funds in peer group | | | 139 | | | | 131 | | | | 116 | |
Peer group average annual total return | | | 21.85 | % | | | 14.14 | % | | | 6.75 | % |
Morningstar Category in peer group: U.S. Insurance Fund Small Blend | |
Top Ten Largest Holdings
as of December 31, 2016 (as a % of Fair Value) (a)(b)
| | | | |
iShares Russell 2000 ETF | | | 2.42 | % |
John Wiley & Sons Inc., Class A | | | 1.16 | % |
Blackbaud Inc. | | | 1.11 | % |
Allied World Assurance Company Holdings AG | | | 1.02 | % |
Raymond James Financial Inc. | | | 0.93 | % |
Endurance Specialty Holdings Ltd. | | | 0.93 | % |
CLARCOR Inc. | | | 0.90 | % |
Integra LifeSciences Holdings Corp. | | | 0.85 | % |
Hill-Rom Holdings Inc. | | | 0.85 | % |
Clean Harbors Inc. | | | 0.82 | % |
Sector Allocation as of December 31, 2015
Portfolio composition as a % of Fair Value of $42,267 (in thousands) as of December 31, 2016 (a)(b)
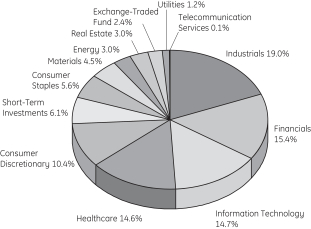
Average Annual Total Return for the periods ended December 31, 2016
Class 1 Shares (Inception Date 4/28/00)
| | | | | | | | | | | | | | | | |
| | | One Year | | | Five Year | | | Ten Year | | | Ending Value
of a $10,000
Investment | |
State Street Small-Cap Equity V.I.S. Fund | | | 23.77 | % | | | 14.07 | % | | | 7.82 | % | | $ | 21,232 | |
Russell 2000® Index | | | 21.31 | % | | | 14.46 | % | | | 7.07 | % | | $ | 19,793 | |
| | |
| 4 | | State Street Small-Cap Equity V.I.S. Fund |
State Street Small-Cap Equity V.I.S. Fund
Performance Summary, continued — December 31, 2016 (Unaudited)
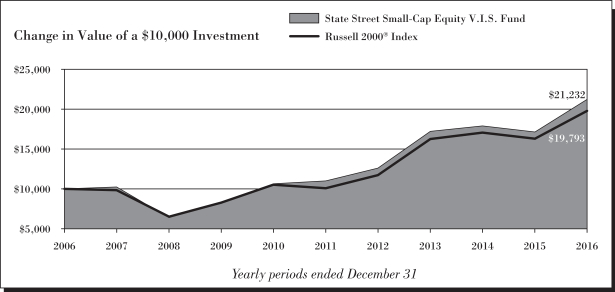
| (a) | Fair Value basis is inclusive of short-term investment in State Street Institutional U.S. Government Money Market Fund Class G Shares. |
| (b) | The securities information regarding holdings, allocations and other characteristics is presented to illustrate examples of securities that the Fund has bought and the diversity of areas in which the Fund may invest as of a particular date. It may not be representative of the Fund’s current or future investments and should not be construed as a recommendation to purchase or sell a particular security. |
See Notes to Performance beginning on page 1 for further information, including an explanation of Morningstar peer categories.
Past performance does not predict future performance. The performance shown in the graphs and tables does not reflect the deduction of taxes that a shareholder would pay on Fund distributions or the redemption of Fund shares and does not reflect the fees or charges that would be associated with variable contracts through which shares of the Fund are offered.
| | | | |
| State Street Small-Cap Equity V.I.S. Fund | | | 5 | |
State Street Small-Cap Equity V.I.S. Fund
Schedule of Investments — December 31, 2016
| | | | | | | | |
| | | Number
of Shares | | | Fair
Value
$ | |
| | | | | | | | |
| Common Stock - 91.4%† | |
Aerospace & Defense - 0.5% | |
Esterline Technologies Corp. (a) | | | 171 | | | | 15,253 | |
Teledyne Technologies Inc. (a) | | | 1,372 | | | | 168,756 | |
Vectrus Inc. (a) | | | 698 | | | | 16,648 | |
| | | | | | | | |
| | | | | | | 200,657 | |
| | | | | | | | |
|
Agricultural & Farm Machinery - 0.6% | |
AGCO Corp. | | | 4,343 | | | | 251,286 | |
| | | | | | | | |
|
Agricultural Products - 0.8% | |
Darling Ingredients Inc. (a) | | | 24,595 | | | | 317,522 | |
Fresh Del Monte Produce Inc. | | | 453 | | | | 27,465 | |
| | | | | | | | |
| | | | | | | 344,987 | |
| | | | | | | | |
|
Airlines - 0.1% | |
Hawaiian Holdings Inc. (a) | | | 450 | | | | 25,650 | |
| | | | | | | | |
|
Alternative Carriers - 0.0%* | |
Vonage Holdings Corp. (a) | | | 2,740 | | | | 18,769 | |
| | | | | | | | |
|
Apparel Retail - 0.7% | |
American Eagle Outfitters Inc. | | | 528 | | | | 8,010 | |
Burlington Stores Inc. (a) | | | 1,045 | | | | 88,564 | |
Genesco Inc. (a) | | | 1,352 | | | | 83,959 | |
The Buckle Inc. | | | 4,318 | | | | 98,450 | |
| | | | | | | | |
| | | | | | | 278,983 | |
| | | | | | | | |
|
Apparel, Accessories & Luxury Goods - 0.3% | |
G-III Apparel Group Ltd. (a) | | | 3,902 | | | | 115,343 | |
| | | | | | | | |
|
Application Software - 4.0% | |
8x8 Inc. (a) | | | 1,600 | | | | 22,880 | |
ACI Worldwide Inc. (a) | | | 8,571 | | | | 155,564 | |
Blackbaud Inc. | | | 7,352 | | | | 470,528 | |
Exa Corp. (a) | | | 1,600 | | | | 24,576 | |
Guidewire Software Inc. (a) | | | 3,300 | | | | 162,789 | |
Jive Software Inc. (a) | | | 11,573 | | | | 50,342 | |
Mentor Graphics Corp. | | | 4,600 | | | | 169,694 | |
PTC Inc. (a) | | | 3,089 | | | | 142,928 | |
RealPage Inc. (a) | | | 9,670 | | | | 290,100 | |
SS&C Technologies Holdings Inc. | | | 5,507 | | | | 157,500 | |
Zix Corp. (a) | | | 6,300 | | | | 31,122 | |
| | | | | | | | |
| | | | | | | 1,678,023 | |
| | | | | | | | |
|
Asset Management & Custody Banks - 0.6% | |
Fifth Street Asset Management Inc. | | | 3,100 | | | | 20,770 | |
Financial Engines Inc. | | | 5,800 | | | | 213,150 | |
| | | | | | | | |
| | | | | | | 233,920 | |
| | | | | | | | |
| | | | | | | | |
| | | Number
of Shares | | | Fair
Value
$ | |
Auto Parts & Equipment - 1.0% | |
Cooper-Standard Holdings Inc. (a) | | | 161 | | | | 16,644 | |
Gentherm Inc. (a) | | | 597 | | | | 20,208 | |
Horizon Global Corp. (a) | | | 1,411 | | | | 33,864 | |
LCI Industries | | | 401 | | | | 43,208 | |
Tenneco Inc. (a) | | | 4,735 | | | | 295,795 | |
Tower International Inc. | | | 1,019 | | | | 28,889 | |
| | | | | | | | |
| | | | | | | 438,608 | |
| | | | | | | | |
|
Automobile Manufacturers - 0.8% | |
Thor Industries Inc. | | | 2,911 | | | | 291,246 | |
Winnebago Industries Inc. | | | 1,551 | | | | 49,089 | |
| | | | | | | | |
| | | | | | | 340,335 | |
| | | | | | | | |
|
Automotive Retail - 0.8% | |
America’s Car-Mart Inc. (a) | | | 492 | | | | 21,525 | |
CST Brands Inc. | | | 2,600 | | | | 125,190 | |
Group 1 Automotive Inc. | | | 1,587 | | | | 123,691 | |
Murphy USA Inc. (a) | | | 1,195 | | | | 73,456 | |
| | | | | | | | |
| | | | | | | 343,862 | |
| | | | | | | | |
|
Biotechnology - 1.3% | |
Achillion Pharmaceuticals Inc. (a) | | | 2,400 | | | | 9,912 | |
Aduro Biotech Inc. (a) | | | 1,000 | | | | 11,400 | |
Applied Genetic Technologies Corp. (a) | | | 2,900 | | | | 27,115 | |
BioSpecifics Technologies Corp. (a) | | | 600 | | | | 33,420 | |
Coherus Biosciences Inc. (a) | | | 400 | | | | 11,260 | |
Cytokinetics Inc. (a) | | | 2,400 | | | | 29,160 | |
Eagle Pharmaceuticals Inc. (a) | | | 300 | | | | 23,802 | |
Exelixis Inc. (a) | | | 1,200 | | | | 17,892 | |
FibroGen Inc. (a) | | | 800 | | | | 17,120 | |
Five Prime Therapeutics Inc. (a) | | | 500 | | | | 25,055 | |
Halozyme Therapeutics Inc. (a) | | | 1,500 | | | | 14,820 | |
Insys Therapeutics Inc. (a) | | | 1,500 | | | | 13,800 | |
MacroGenics Inc. (a) | | | 800 | | | | 16,352 | |
Momenta Pharmaceuticals Inc. (a) | | | 2,100 | | | | 31,605 | |
Natera Inc. (a) | | | 1,200 | | | | 14,052 | |
Pfenex Inc. (a) | | | 2,200 | | | | 19,954 | |
Progenics Pharmaceuticals Inc. (a) | | | 2,700 | | | | 23,328 | |
Repligen Corp. (a) | | | 6,063 | | | | 186,862 | |
Vanda Pharmaceuticals Inc. (a) | | | 1,000 | | | | 15,950 | |
Voyager Therapeutics Inc. (a) | | | 1,600 | | | | 20,384 | |
| | | | | | | | |
| | | | | | | 563,243 | |
| | | | | | | | |
|
Brewers - 0.4% | |
Craft Brew Alliance Inc. (a) | | | 410 | | | | 6,929 | |
The Boston Beer Company Inc., Class A (a) | | | 1,025 | | | | 174,096 | |
| | | | | | | | |
| | | | | | | 181,025 | |
| | | | | | | | |
See Notes to Schedule of Investments and Notes to Financial Statements.
| | |
| 6 | | State Street Small-Cap Equity V.I.S. Fund |
State Street Small-Cap Equity V.I.S. Fund
Schedule of Investments, continued — December 31, 2016
| | | | | | | | |
| | | Number
of Shares | | | Fair
Value
$ | |
| | | | | | | | |
Building Products - 0.4% | |
American Woodmark Corp. (a) | | | 363 | | | | 27,316 | |
Apogee Enterprises Inc. | | | 793 | | | | 42,473 | |
Builders FirstSource Inc. (a) | | | 1,970 | | | | 21,611 | |
NCI Building Systems Inc. (a) | | | 1,496 | | | | 23,412 | |
Simpson Manufacturing Company Inc. | | | 443 | | | | 19,381 | |
Universal Forest Products Inc. | | | 528 | | | | 53,951 | |
| | | | | | | | |
| | | | | | | 188,144 | |
| | | | | | | | |
|
Casinos & Gaming - 0.1% | |
Churchill Downs Inc. | | | 175 | | | | 26,329 | |
Pinnacle Entertainment Inc. (a) | | | 1,208 | | | | 17,516 | |
| | | | | | | | |
| | | | | | | 43,845 | |
| | | | | | | | |
|
Commercial Printing - 0.5% | |
Brady Corp., Class A | | | 3,900 | | | | 146,445 | |
Deluxe Corp. | | | 404 | | | | 28,931 | |
LSC Communications Inc. | | | 502 | | | | 14,899 | |
| | | | | | | | |
| | | | | | | 190,275 | |
| | | | | | | | |
|
Commodity Chemicals - 0.1% | |
Trinseo S.A. | | | 668 | | | | 39,612 | |
| | | | | | | | |
|
Communications Equipment - 0.4% | |
ADTRAN Inc. | | | 1,635 | | | | 36,542 | |
Extreme Networks Inc. (a) | | | 5,800 | | | | 29,174 | |
Lumentum Holdings Inc. (a) | | | 1,488 | | | | 57,511 | |
Plantronics Inc. | | | 825 | | | | 45,177 | |
| | | | | | | | |
| | | | | | | 168,404 | |
| | | | | | | | |
|
Construction & Engineering - 0.6% | |
Chicago Bridge & Iron Company N.V. | | | 8,600 | | | | 273,050 | |
| | | | | | | | |
|
Construction Machinery & Heavy Trucks - 1.6% | |
Alamo Group Inc. | | | 570 | | | | 43,377 | |
Astec Industries Inc. | | | 696 | | | | 46,952 | |
Commercial Vehicle Group Inc. (a) | | | 5,600 | | | | 30,968 | |
Federal Signal Corp. | | | 13,843 | | | | 216,089 | |
Trinity Industries Inc. | | | 10,153 | | | | 281,847 | |
Wabash National Corp. (a) | | | 2,314 | | | | 36,608 | |
| | | | | | | | |
| | | | | | | 655,841 | |
| | | | | | | | |
|
Construction Materials - 0.1% | |
Summit Materials Inc., Class A (a) | | | 1,262 | | | | 30,022 | |
| | | | | | | | |
|
Consumer Finance - 0.1% | |
Enova International Inc. (a) | | | 2,786 | | | | 34,964 | |
| | | | | | | | |
|
Data Processing & Outsourced Services - 1.6% | |
Broadridge Financial Solutions Inc. | | | 3,460 | | | | 229,398 | |
CoreLogic Inc. (a) | | | 4,075 | | | | 150,082 | |
WEX Inc. (a) | | | 2,700 | | | | 301,320 | |
| | | | | | | | |
| | | | | | | 680,800 | |
| | | | | | | | |
| | | | | | | | |
| | | Number
of Shares | | | Fair
Value
$ | |
Distributors - 0.6% | |
LKQ Corp. (a) | | | 7,661 | | | | 234,810 | |
| | | | | | | | |
|
Diversified Chemicals - 0.1% | |
The Chemours Co. | | | 2,409 | | | | 53,215 | |
| | | | | | | | |
|
Diversified REITs - 0.2% | |
American Assets Trust Inc. | | | 629 | | | | 27,097 | |
Gramercy Property Trust | | | 3,706 | | | | 34,021 | |
PS Business Parks Inc. | | | 230 | | | | 26,800 | |
| | | | | | | | |
| | | | | | | 87,918 | |
| | | | | | | | |
|
Diversified Support Services - 1.3% | |
Healthcare Services Group Inc. | | | 6,049 | | | | 236,939 | |
Ritchie Bros Auctioneers Inc. | | | 7,824 | | | | 266,016 | |
UniFirst Corp. | | | 238 | | | | 34,189 | |
| | | | | | | | |
| | | | | | | 537,144 | |
| | | | | | | | |
|
Education Services - 0.5% | |
Capella Education Co. | | | 350 | | | | 30,730 | |
K12 Inc. (a) | | | 10,395 | | | | 178,378 | |
| | | | | | | | |
| | | | | | | 209,108 | |
| | | | | | | | |
|
Electric Utilities - 1.1% | |
ALLETE Inc. | | | 469 | | | | 30,105 | |
IDACORP Inc. | | | 3,969 | | | | 319,703 | |
MGE Energy Inc. | | | 400 | | | | 26,120 | |
PNM Resources Inc. | | | 878 | | | | 30,115 | |
Portland General Electric Co. | | | 474 | | | | 20,539 | |
Spark Energy Inc., Class A | | | 900 | | | | 27,270 | |
The Empire District Electric Co. | | | 468 | | | | 15,954 | |
| | | | | | | | |
| | | | | | | 469,806 | |
| | | | | | | | |
|
Electrical Components & Equipment - 0.3% | |
Encore Wire Corp. | | | 934 | | | | 40,489 | |
EnerSys | | | 284 | | | | 22,180 | |
General Cable Corp. | | | 1,589 | | | | 30,271 | |
Regal Beloit Corp. | | | 412 | | | | 28,531 | |
| | | | | | | | |
| | | | | | | 121,471 | |
| | | | | | | | |
|
Electronic Components - 0.7% | |
Belden Inc. | | | 424 | | | | 31,702 | |
Littelfuse Inc. | | | 1,557 | | | | 236,306 | |
Rogers Corp. (a) | | | 485 | | | | 37,253 | |
| | | | | | | | |
| | | | | | | 305,261 | |
| | | | | | | | |
|
Electronic Equipment & Instruments - 0.6% | |
Coherent Inc. (a) | | | 300 | | | | 41,216 | |
Control4 Corp. (a) | | | 4,144 | | | | 42,269 | |
FARO Technologies Inc. (a) | | | 263 | | | | 9,468 | |
VeriFone Systems Inc. (a) | | | 5,473 | | | | 97,036 | |
Zebra Technologies Corp., Class A (a) | | | 679 | | | | 58,231 | |
| | | | | | | | |
| | | | | | | 248,220 | |
| | | | | | | | |
See Notes to Schedule of Investments and Notes to Financial Statements.
| | | | |
| State Street Small-Cap Equity V.I.S. Fund | | | 7 | |
State Street Small-Cap Equity V.I.S. Fund
Schedule of Investments, continued — December 31, 2016
| | | | | | | | |
| | | Number
of Shares | | | Fair
Value
$ | |
| | | | | | | | |
Electronic Manufacturing Services - 0.2% | |
Benchmark Electronics Inc. (a) | | | 455 | | | | 13,878 | |
Methode Electronics Inc. | | | 816 | | | | 33,742 | |
Plexus Corp. (a) | | | 837 | | | | 45,231 | |
| | | | | | | | |
| | | | | | | 92,851 | |
| | | | | | | | |
|
Environmental & Facilities Services - 0.8% | |
Clean Harbors Inc. (a) | | | 6,216 | | | | 345,920 | |
| | | | | | | | |
|
Fertilizers & Agricultural Chemicals - 0.1% | |
American Vanguard Corp. | | | 1,516 | | | | 29,031 | |
| | | | | | | | |
|
Food Distributors - 0.8% | |
Performance Food Group Co. (a) | | | 3,010 | | | | 72,240 | |
SpartanNash Co. | | | 6,388 | | | | 252,582 | |
| | | | | | | | |
| | | | | | | 324,822 | |
| | | | | | | | |
|
Food Retail - 0.1% | |
Casey’s General Stores Inc. | | | 271 | | | | 32,216 | |
| | | | | | | | |
| | |
Footwear - 1.1% | | | | | | | | |
Deckers Outdoor Corp. (a) | | | 2,248 | | | | 124,517 | |
Skechers U.S.A. Inc., Class A (a) | | | 419 | | | | 10,299 | |
Wolverine World Wide Inc. | | | 14,717 | | | | 323,038 | |
| | | | | | | | |
| | | | | | | 457,854 | |
| | | | | | | | |
|
Gas Utilities - 0.1% | |
South Jersey Industries Inc. | | | 834 | | | | 28,097 | |
| | | | | | | | |
|
Health Care REITs - 0.5% | |
CareTrust REIT Inc. | | | 2,886 | | | | 44,214 | |
Omega Healthcare Investors Inc. | | | 3,520 | | | | 110,035 | |
Sabra Health Care REIT Inc. | | | 2,182 | | | | 53,284 | |
| | | | | | | | |
| | | | | | | 207,533 | |
| | | | | | | | |
|
Healthcare Distributors - 0.2% | |
Aceto Corp. | | | 4,300 | | | | 94,471 | |
Owens & Minor Inc. | | | 301 | | | | 10,622 | |
| | | | | | | | |
| | | | | | | 105,093 | |
| | | | | | | | |
|
Healthcare Equipment - 5.1% | |
Abaxis Inc. | | | 600 | | | | 31,662 | |
AtriCure Inc. (a) | | | 1,300 | | | | 25,441 | |
Cantel Medical Corp. | | | 2,200 | | | | 173,250 | |
Cardiovascular Systems Inc. (a) | | | 6,400 | | | | 154,944 | |
CONMED Corp. | | | 5,000 | | | | 220,850 | |
Glaukos Corp. (a) | | | 464 | | | | 15,915 | |
Hill-Rom Holdings Inc. | | | 6,381 | | | | 358,230 | |
Insulet Corp. (a) | | | 3,300 | | | | 124,344 | |
Integra LifeSciences Holdings Corp. (a) | | | 4,200 | | | | 360,318 | |
iRadimed Corp. (a) | | | 900 | | | | 9,990 | |
LeMaitre Vascular Inc. | | | 1,800 | | | | 45,612 | |
Masimo Corp. (a) | | | 3,600 | | | | 242,640 | |
| | | | | | | | |
| | | Number
of Shares | | | Fair
Value
$ | |
Natus Medical Inc. (a) | | | 374 | | | | 13,015 | |
NuVasive Inc. (a) | | | 4,350 | | | | 293,016 | |
NxStage Medical Inc. (a) | | | 1,300 | | | | 34,073 | |
Penumbra Inc. (a) | | | 1,000 | | | | 63,800 | |
| | | | | | | | |
| | | | | | | 2,167,100 | |
| | | | | | | | |
|
Healthcare Services - 2.3% | |
Addus HomeCare Corp. (a) | | | 500 | | | | 17,525 | |
Air Methods Corp. (a) | | | 2,530 | | | | 80,580 | |
AMN Healthcare Services Inc. (a) | | | 1,299 | | | | 49,947 | |
BioTelemetry Inc. (a) | | | 2,300 | | | | 51,405 | |
Diplomat Pharmacy Inc. (a) | | | 708 | | | | 8,921 | |
Envision Healthcare Corp. (a) | | | 4,553 | | | | 288,159 | |
LHC Group Inc. (a) | | | 600 | | | | 27,420 | |
MEDNAX Inc. (a) | | | 4,991 | | | | 332,700 | |
RadNet Inc. (a) | | | 3,000 | | | | 19,350 | |
Team Health Holdings Inc. (a) | | | 2,140 | | | | 92,983 | |
| | | | | | | | |
| | | | | | | 968,990 | |
| | | | | | | | |
|
Healthcare Supplies - 1.0% | |
Endologix Inc. (a) | | | 11,337 | | | | 64,848 | |
ICU Medical Inc. (a) | | | 1,850 | | | | 272,597 | |
Lantheus Holdings Inc. (a) | | | 2,000 | | | | 17,200 | |
Merit Medical Systems Inc. (a) | | | 889 | | | | 23,559 | |
OraSure Technologies Inc. (a) | | | 4,200 | | | | 36,876 | |
| | | | | | | | |
| | | | | | | 415,080 | |
| | | | | | | | |
|
Healthcare Technology - 1.4% | |
Cotiviti Holdings Inc. (a) | | | 782 | | | | 26,901 | |
HMS Holdings Corp. (a) | | | 12,451 | | | | 226,110 | |
Medidata Solutions Inc. (a) | | | 3,200 | | | | 158,944 | |
Omnicell Inc. (a) | | | 5,300 | | | | 179,670 | |
Quality Systems Inc. | | | 666 | | | | 8,758 | |
| | | | | | | | |
| | | | | | | 600,383 | |
| | | | | | | | |
|
Home Building - 0.2% | |
Meritage Homes Corp. (a) | | | 736 | | | | 25,613 | |
TopBuild Corp. (a) | | | 1,592 | | | | 56,675 | |
| | | | | | | | |
| | | | | | | 82,288 | |
| | | | | | | | |
|
Home Entertainment Software - 0.1% | |
Rosetta Stone Inc. (a) | | | 2,687 | | | | 23,941 | |
| | | | | | | | |
|
Home Furnishing Retail - 0.3% | |
Aaron’s Inc. | | | 4,176 | | | | 133,590 | |
| | | | | | | | |
|
Home Furnishings - 0.1% | |
Ethan Allen Interiors Inc. | | | 910 | | | | 33,534 | |
| | | | | | | | |
|
Hotel & Resort REITs - 0.3% | |
Ashford Hospitality Trust Inc. | | | 1,421 | | | | 11,027 | |
RLJ Lodging Trust | | | 5,358 | | | | 131,217 | |
| | | | | | | | |
| | | | | | | 142,244 | |
| | | | | | | | |
See Notes to Schedule of Investments and Notes to Financial Statements.
| | |
| 8 | | State Street Small-Cap Equity V.I.S. Fund |
State Street Small-Cap Equity V.I.S. Fund
Schedule of Investments, continued — December 31, 2016
| | | | | | | | |
| | | Number
of Shares | | | Fair
Value
$ | |
| | | | | | | | |
Hotels, Resorts & Cruise Lines - 0.2% | |
ILG Inc. | | | 5,004 | | | | 90,923 | |
| | | | | | | | |
|
Household Appliances - 0.3% | |
Helen of Troy Ltd. (a) | | | 1,675 | | | | 141,454 | |
| | | | | | | | |
|
Household Products - 0.1% | |
Central Garden & Pet Co. (a) | | | 980 | | | | 32,428 | |
| | | | | | | | |
|
Housewares & Specialties - 0.0%* | |
Tupperware Brands Corp. | | | 302 | | | | 15,891 | |
| | | | | | | | |
|
Human Resource & Employment Services - 0.1% | |
Insperity Inc. | | | 442 | | | | 31,360 | |
| | | | | | | | |
|
Industrial Conglomerates - 0.1% | |
Raven Industries Inc. | | | 1,100 | | | | 27,720 | |
| | | | | | | | |
|
Industrial Machinery - 7.6% | |
Actuant Corp., Class A | | | 6,000 | | | | 155,700 | |
Altra Industrial Motion Corp. | | | 707 | | | | 26,088 | |
Barnes Group Inc. | | | 3,445 | | | | 163,362 | |
CLARCOR Inc. | | | 4,594 | | | | 378,867 | |
Crane Co. | | | 925 | | | | 66,711 | |
Energy Recovery Inc. (a) | | | 1,500 | | | | 15,525 | |
Franklin Electric Company Inc. | | | 810 | | | | 31,509 | |
IDEX Corp. | | | 2,271 | | | | 204,526 | |
John Bean Technologies Corp. | | | 1,700 | | | | 146,115 | |
LB Foster Co., Class A | | | 1,130 | | | | 15,368 | |
Luxfer Holdings PLC ADR | | | 6,006 | | | | 65,405 | |
Lydall Inc. (a) | | | 3,100 | | | | 191,735 | |
Manitowoc Foodservice Inc. (a) | | | 10,500 | | | | 202,965 | |
Mueller Industries Inc. | | | 4,989 | | | | 199,361 | |
Nordson Corp. | | | 2,091 | | | | 234,297 | |
RBC Bearings Inc. (a) | | | 1,300 | | | | 120,653 | |
Standex International Corp. | | | 2,000 | | | | 175,700 | |
The Gorman-Rupp Co. | | | 1,700 | | | | 52,615 | |
The Timken Co. | | | 6,980 | | | | 277,106 | |
TriMas Corp. (a) | | | 9,800 | | | | 230,300 | |
Woodward Inc. | | | 3,773 | | | | 260,526 | |
| | | | | | | | |
| | | | | | | 3,214,434 | |
| | | | | | | | |
|
Industrial REITs - 0.1% | |
Rexford Industrial Realty Inc. | | | 956 | | | | 22,170 | |
STAG Industrial Inc. | | | 1,488 | | | | 35,518 | |
| | | | | | | | |
| | | | | | | 57,688 | |
| | | | | | | | |
|
Internet & Direct Marketing Retail - 0.0%* | |
Shutterfly Inc. (a) | | | 400 | | | | 20,072 | |
| | | | | | | | |
|
Internet Software & Services - 3.2% | |
Blucora Inc. (a) | | | 2,100 | | | | 30,975 | |
Brightcove Inc. (a) | | | 2,900 | | | | 23,345 | |
| | | | | | | | |
| | | Number
of Shares | | | Fair
Value
$ | |
comScore Inc. (a) | | | 600 | | | | 18,948 | |
Cornerstone OnDemand Inc. (a) | | | 5,044 | | | | 213,412 | |
Envestnet Inc. (a) | | | 2,900 | | | | 102,225 | |
Five9 Inc. (a) | | | 1,400 | | | | 19,866 | |
GoDaddy Inc., Class A (a) | | | 1,060 | | | | 37,047 | |
Internap Corp. (a) | | | 9,300 | | | | 14,322 | |
LogMeIn Inc. | | | 2,700 | | | | 260,685 | |
MeetMe Inc. (a) | | | 3,000 | | | | 14,790 | |
New Relic Inc. (a) | | | 4,700 | | | | 132,775 | |
NIC Inc. | | | 10,025 | | | | 239,597 | |
SPS Commerce Inc. (a) | | | 2,200 | | | | 153,758 | |
Stamps.com Inc. (a) | | | 200 | | | | 22,930 | |
Web.com Group Inc. (a) | | | 1,700 | | | | 35,955 | |
Xactly Corp. (a) | | | 3,600 | | | | 39,600 | |
| | | | | | | | |
| | | | | | | 1,360,230 | |
| | | | | | | | |
|
Investment Banking & Brokerage - 1.3% | |
Greenhill & Company Inc. | | | 1,219 | | | | 33,766 | |
Piper Jaffray Cos. (a) | | | 757 | | | | 54,883 | |
Raymond James Financial Inc. | | | 5,686 | | | | 393,869 | |
Stifel Financial Corp. (a) | | | 1,070 | | | | 53,447 | |
| | | | | | | | |
| | | | | | | 535,965 | |
| | | | | | | | |
|
IT Consulting & Other Services - 0.1% | |
Perficient Inc. (a) | | | 1,296 | | | | 22,667 | |
The Hackett Group Inc. | | | 1,600 | | | | 28,256 | |
Virtusa Corp. (a) | | | 222 | | | | 5,577 | |
| | | | | | | | |
| | | | | | | 56,500 | |
| | | | | | | | |
|
Leisure Products - 0.7% | |
Brunswick Corp. | | | 366 | | | | 19,962 | |
Nautilus Inc. (a) | | | 593 | | | | 10,970 | |
Polaris Industries Inc. | | | 3,139 | | | | 258,622 | |
| | | | | | | | |
| | | | | | | 289,554 | |
| | | | | | | | |
|
Life & Health Insurance - 0.1% | |
American Equity Investment Life Holding Co. | | | 1,519 | | | | 34,238 | |
| | | | | | | | |
|
Life Sciences Tools & Services - 1.7% | |
Albany Molecular Research Inc. (a) | | | 7,570 | | | | 142,013 | |
Bruker Corp. | | | 4,722 | | | | 100,012 | |
Cambrex Corp. (a) | | | 420 | | | | 22,659 | |
Charles River Laboratories International Inc. (a) | | | 370 | | | | 28,190 | |
Enzo Biochem Inc. (a) | | | 3,966 | | | | 27,524 | |
ICON PLC (a) | | | 2,500 | | | | 188,000 | |
INC Research Holdings Inc., Class A (a) | | | 3,869 | | | | 203,510 | |
PAREXEL International Corp. (a) | | | 229 | | | | 15,050 | |
| | | | | | | | |
| | | | | | | 726,958 | |
| | | | | | | | |
See Notes to Schedule of Investments and Notes to Financial Statements.
| | | | |
| State Street Small-Cap Equity V.I.S. Fund | | | 9 | |
State Street Small-Cap Equity V.I.S. Fund
Schedule of Investments, continued — December 31, 2016
| | | | | | | | |
| | | Number
of Shares | | | Fair
Value
$ | |
| | | | | | | | |
Managed Healthcare - 1.0% | |
Centene Corp. (a) | | | 5,042 | | | | 284,923 | |
Magellan Health Inc. (a) | | | 547 | | | | 41,162 | |
Molina Healthcare Inc. (a) | | | 1,945 | | | | 105,536 | |
| | | | | | | | |
| | | | | | | 431,621 | |
| | | | | | | | |
|
Marine - 0.1% | |
Kirby Corp. (a) | | | 333 | | | | 22,145 | |
| | | | | | | | |
|
Multi-Line Insurance - 0.0%* | |
Horace Mann Educators Corp. | | | 475 | | | | 20,330 | |
| | | | | | | | |
|
Multi-Utilities - 0.1% | |
Avista Corp. | | | 642 | | | | 25,674 | |
| | | | | | | | |
|
Office REITs - 0.5% | |
Brandywine Realty Trust | | | 1,704 | | | | 28,133 | |
Corporate Office Properties Trust | | | 715 | | | | 22,323 | |
Cousins Properties Inc. | | | 17,865 | | | | 152,031 | |
| | | | | | | | |
| | | | | | | 202,487 | |
| | | | | | | | |
|
Office Services & Supplies - 1.0% | |
Herman Miller Inc. | | | 3,967 | | | | 135,671 | |
HNI Corp. | | | 619 | | | | 34,615 | |
Steelcase Inc., Class A | | | 1,600 | | | | 28,640 | |
West Corp. | | | 9,620 | | | | 238,191 | |
| | | | | | | | |
| | | | | | | 437,117 | |
| | | | | | | | |
|
Oil & Gas Drilling - 0.1% | |
Nabors Industries Ltd. | | | 2,810 | | | | 46,084 | |
| | | | | | | | |
|
Oil & Gas Equipment & Services - 1.3% | |
Dril-Quip Inc. (a) | | | 942 | | | | 56,567 | |
Forum Energy Technologies Inc. (a) | | | 12,075 | | | | 265,650 | |
Hornbeck Offshore Services Inc. (a) | | | 2,023 | | | | 14,606 | |
Natural Gas Services Group Inc. (a) | | | 821 | | | | 26,395 | |
Oil States International Inc. (a) | | | 4,766 | | | | 185,874 | |
TETRA Technologies Inc. (a) | | | 3,883 | | | | 19,493 | |
| | | | | | | | |
| | | | | | | 568,585 | |
| | | | | | | | |
|
Oil & Gas Exploration & Production - 1.5% | |
Carrizo Oil & Gas Inc. (a) | | | 2,667 | | | | 99,613 | |
Denbury Resources Inc. (a) | | | 19,306 | | | | 71,046 | |
Newfield Exploration Co. (a) | | | 6,886 | | | | 278,883 | |
Rice Energy Inc. (a) | | | 523 | | | | 11,166 | |
SM Energy Co. | | | 4,663 | | | | 160,780 | |
| | | | | | | | |
| | | | | | | 621,488 | |
| | | | | | | | |
|
Oil & Gas Refining & Marketing - 0.1% | |
Western Refining Inc. | | | 1,234 | | | | 46,707 | |
| | | | | | | | |
| | | | | | | | |
| | | Number
of Shares | | | Fair
Value
$ | |
Packaged Foods & Meats - 3.3% | |
AdvancePierre Foods Holdings Inc. | | | 4,500 | | | | 134,010 | |
Amplify Snack Brands Inc. (a) | | | 4,300 | | | | 37,883 | |
B&G Foods Inc. | | | 4,600 | | | | 201,480 | |
Cal-Maine Foods Inc. | | | 513 | | | | 22,662 | |
J&J Snack Foods Corp. | | | 688 | | | | 91,800 | |
Sanderson Farms Inc. | | | 3,181 | | | | 299,777 | |
Snyder’s-Lance Inc. | | | 7,800 | | | | 299,052 | |
TreeHouse Foods Inc. (a) | | | 4,500 | | | | 324,855 | |
| | | | | | | | |
| | | | | | | 1,411,519 | |
| | | | | | | | |
|
Paper Packaging - 0.3% | |
Packaging Corporation of America | | | 1,563 | | | | 132,574 | |
| | | | | | | | |
|
Paper Products - 0.1% | |
Neenah Paper Inc. | | | 577 | | | | 49,160 | |
| | | | | | | | |
|
Personal Products - 0.0%* | |
Natural Health Trends Corp. | | | 800 | | | | 19,880 | |
| | | | | | | | |
|
Pharmaceuticals - 0.5% | |
Amphastar Pharmaceuticals Inc. (a) | | | 1,100 | | | | 20,262 | |
Aratana Therapeutics Inc. (a) | | | 1,800 | | | | 12,924 | |
Corcept Therapeutics Inc. (a) | | | 4,500 | | | | 32,670 | |
Heska Corp. (a) | | | 400 | | | | 28,640 | |
Horizon Pharma PLC (a) | | | 900 | | | | 14,562 | |
Impax Laboratories Inc. (a) | | | 1,300 | | | | 17,225 | |
Innoviva Inc. (a) | | | 1,900 | | | | 20,330 | |
Intersect ENT Inc. (a) | | | 1,200 | | | | 14,520 | |
Pernix Therapeutics Holdings Inc. (a) | | | 6,480 | | | | 12,571 | |
Phibro Animal Health Corp., Class A | | | 405 | | | | 11,867 | |
Sucampo Pharmaceuticals Inc., Class A (a) | | | 900 | | | | 12,195 | |
| | | | | | | | |
| | | | | | | 197,766 | |
| | | | | | | | |
|
Property & Casualty Insurance - 2.7% | |
Allied World Assurance Company Holdings AG | | | 8,000 | | | | 429,680 | |
AMERISAFE Inc. | | | 2,575 | | | | 160,551 | |
Argo Group International Holdings Ltd. | | | 4,020 | | | | 264,918 | |
RLI Corp. | | | 1,735 | | | | 109,531 | |
The Navigators Group Inc. | | | 1,600 | | | | 188,400 | |
| | | | | | | | |
| | | | | | | 1,153,080 | |
| | | | | | | | |
|
Publishing - 1.2% | |
John Wiley & Sons Inc., Class A | | | 9,016 | | | | 491,372 | |
| | | | | | | | |
|
Railroads - 0.5% | |
Genesee & Wyoming Inc., Class A (a) | | | 3,196 | | | | 221,834 | |
| | | | | | | | |
See Notes to Schedule of Investments and Notes to Financial Statements.
| | |
| 10 | | State Street Small-Cap Equity V.I.S. Fund |
State Street Small-Cap Equity V.I.S. Fund
Schedule of Investments, continued — December 31, 2016
| | | | | | | | |
| | | Number
of Shares | | | Fair
Value
$ | |
| | | | | | | | |
Real Estate Services - 0.1% | |
Altisource Portfolio Solutions S.A. (a) | | | 800 | | | | 21,272 | |
Marcus & Millichap Inc. (a) | | | 482 | | | | 12,879 | |
| | | | | | | | |
| | | | | | | 34,151 | |
| | | | | | | | |
|
Regional Banks - 9.3% | |
1st Source Corp. | | | 431 | | | | 19,248 | |
Bank of the Ozarks Inc. | | | 858 | | | | 45,122 | |
BankUnited Inc. | | | 1,153 | | | | 43,457 | |
Banner Corp. | | | 617 | | | | 34,435 | |
Bryn Mawr Bank Corp. | | | 2,900 | | | | 122,235 | |
Camden National Corp. | | | 693 | | | | 30,804 | |
Capital Bank Financial Corp., Class A | | | 850 | | | | 33,362 | |
Cascade Bancorp (a) | | | 1,554 | | | | 12,618 | |
Columbia Banking System Inc. | | | 743 | | | | 33,197 | |
Community Bank System Inc. | | | 2,300 | | | | 142,117 | |
Cullen/Frost Bankers Inc. | | | 1,345 | | | | 118,669 | |
CVB Financial Corp. | | | 8,000 | | | | 183,440 | |
Enterprise Financial Services Corp. | | | 707 | | | | 30,401 | |
FCB Financial Holdings Inc., Class A (a) | | | 1,077 | | | | 51,373 | |
Fidelity Southern Corp. | | | 987 | | | | 23,362 | |
First Financial Bankshares Inc. | | | 2,600 | | | | 117,520 | |
Fulton Financial Corp. | | | 11,502 | | | | 216,238 | |
German American Bancorp Inc. | | | 1,300 | | | | 68,393 | |
Great Southern Bancorp Inc. | | | 577 | | | | 31,533 | |
Home BancShares Inc. | | | 1,642 | | | | 45,598 | |
Hope Bancorp Inc. | | | 1,613 | | | | 35,309 | |
IBERIABANK Corp. | | | 2,623 | | | | 219,676 | |
Independent Bank Corp. | | | 2,000 | | | | 140,900 | |
Lakeland Financial Corp. | | | 396 | | | | 18,755 | |
LegacyTexas Financial Group Inc. | | | 1,727 | | | | 74,365 | |
PacWest Bancorp | | | 812 | | | | 44,205 | |
Pinnacle Financial Partners Inc. | | | 550 | | | | 38,115 | |
Prosperity Bancshares Inc. | | | 4,684 | | | | 336,218 | |
Renasant Corp. | | | 7,563 | | | | 319,310 | |
South State Corp. | | | 231 | | | | 20,189 | |
Southwest Bancorp Inc. | | | 1,017 | | | | 29,493 | |
Stock Yards Bancorp Inc. | | | 2,400 | | | | 112,680 | |
SVB Financial Group (a) | | | 1,485 | | | | 254,915 | |
Texas Capital Bancshares Inc. (a) | | | 115 | | | | 9,016 | |
UMB Financial Corp. | | | 2,900 | | | | 223,648 | |
Umpqua Holdings Corp. | | | 2,452 | | | | 46,049 | |
United Community Banks Inc. | | | 2,119 | | | | 62,765 | |
Washington Trust Bancorp Inc. | | | 2,700 | | | | 151,335 | |
Westamerica Bancorporation | | | 2,582 | | | | 162,485 | |
Western Alliance Bancorp (a) | | | 3,420 | | | | 166,588 | |
Wintrust Financial Corp. | | | 791 | | | | 57,403 | |
| | | | | | | | |
| | | | | | | 3,926,541 | |
| | | | | | | | |
| | | | | | | | |
| | | Number
of Shares | | | Fair
Value
$ | |
Reinsurance - 1.0% | |
Endurance Specialty Holdings Ltd. | | | 4,250 | | | | 392,700 | |
Maiden Holdings Ltd. | | | 2,337 | | | | 40,781 | |
| | | | | | | | |
| | | | | | | 433,481 | |
| | | | | | | | |
|
Research & Consulting Services - 0.4% | |
Resources Connection Inc. | | | 8,180 | | | | 157,465 | |
| | | | | | | | |
|
Residential REITs - 0.6% | |
Education Realty Trust Inc. | | | 5,648 | | | | 238,910 | |
| | | | | | | | |
|
Restaurants - 1.2% | |
Buffalo Wild Wings Inc. (a) | | | 1,000 | | | | 154,400 | |
Cracker Barrel Old Country Store Inc. | | | 643 | | | | 107,368 | |
El Pollo Loco Holdings Inc. (a) | | | 4,300 | | | | 52,890 | |
Ruth’s Hospitality Group Inc. | | | 90 | | | | 1,647 | |
Texas Roadhouse Inc. | | | 4,058 | | | | 195,758 | |
| | | | | | | | |
| | | | | | | 512,063 | |
| | | | | | | | |
|
Retail REITs - 0.1% | |
Retail Opportunity Investments Corp. | | | 2,083 | | | | 44,014 | |
| | | | | | | | |
|
Security & Alarm Services - 0.7% | |
The Brink’s Co. | | | 7,021 | | | | 289,616 | |
| | | | | | | | |
|
Semiconductor Equipment - 0.4% | |
Advanced Energy Industries Inc. (a) | | | 700 | | | | 38,325 | |
Brooks Automation Inc. | | | 1,242 | | | | 21,201 | |
Rudolph Technologies Inc. (a) | | | 4,599 | | | | 107,387 | |
| | | | | | | | |
| | | | | | | 166,913 | |
| | | | | | | | |
|
Semiconductors - 1.5% | |
CEVA Inc. (a) | | | 900 | | | | 30,195 | |
Cirrus Logic Inc. (a) | | | 400 | | | | 22,616 | |
Exar Corp. (a) | | | 2,822 | | | | 30,421 | |
GigPeak Inc. (a) | | | 8,800 | | | | 22,176 | |
Lattice Semiconductor Corp. (a) | | | 2,448 | | | | 18,017 | |
MaxLinear Inc., Class A (a) | | | 1,135 | | | | 24,743 | |
Microsemi Corp. (a) | | | 4,071 | | | | 219,712 | |
NeoPhotonics Corp. (a) | | | 1,870 | | | | 20,215 | |
Semtech Corp. (a) | | | 7,490 | | | | 236,310 | |
| | | | | | | | |
| | | | | | | 624,405 | |
| | | | | | | | |
|
Specialized Finance - 0.0%* | |
NewStar Financial Inc. (a) | | | 1,054 | | | | 9,750 | |
| | | | | | | | |
|
Specialized REITs - 0.6% | |
CoreSite Realty Corp. | | | 2,080 | | | | 165,090 | |
DuPont Fabros Technology Inc. | | | 567 | | | | 24,908 | |
National Storage Affiliates Trust | | | 1,241 | | | | 27,389 | |
Potlatch Corp. | | | 1,180 | | | | 49,147 | |
| | | | | | | | |
| | | | | | | 266,534 | |
| | | | | | | | |
See Notes to Schedule of Investments and Notes to Financial Statements.
| | | | |
| State Street Small-Cap Equity V.I.S. Fund | | | 11 | |
State Street Small-Cap Equity V.I.S. Fund
Schedule of Investments, continued — December 31, 2016
| | | | | | | | |
| | | Number
of Shares | | | Fair
Value
$ | |
| | | | | | | | |
Specialty Chemicals - 3.2% | |
Balchem Corp. | | | 2,293 | | | | 192,429 | |
Chase Corp. | | | 400 | | | | 33,420 | |
GCP Applied Technologies Inc. (a) | | | 925 | | | | 24,744 | |
HB Fuller Co. | | | 4,493 | | | | 217,057 | |
Innospec Inc. | | | 2,700 | | | | 184,950 | |
KMG Chemicals Inc. | | | 933 | | | | 36,284 | |
PolyOne Corp. | | | 5,837 | | | | 187,017 | |
Quaker Chemical Corp. | | | 1,657 | | | | 211,997 | |
Rayonier Advanced Materials Inc. | | | 1,564 | | | | 24,179 | |
Sensient Technologies Corp. | | | 3,285 | | | | 258,135 | |
| | | | | | | | |
| | | | | | | 1,370,212 | |
| | | | | | | | |
|
Specialty Stores - 0.2% | |
Hibbett Sports Inc. (a) | | | 2,300 | | | | 85,790 | |
| | | | | | | | |
|
Steel - 0.5% | |
Commercial Metals Co. | | | 5,504 | | | | 119,877 | |
Ryerson Holding Corp. (a) | | | 2,897 | | | | 38,675 | |
Worthington Industries Inc. | | | 671 | | | | 31,832 | |
| | | | | | | | |
| | | | | | | 190,384 | |
| | | | | | | | |
|
Systems Software - 1.1% | |
A10 Networks Inc. (a) | | | 3,267 | | | | 27,149 | |
Barracuda Networks Inc. (a) | | | 1,010 | | | | 21,644 | |
CommVault Systems Inc. (a) | | | 2,500 | | | | 128,500 | |
Gigamon Inc. (a) | | | 1,213 | | | | 55,252 | |
Qualys Inc. (a) | | | 6,400 | | | | 202,560 | |
TiVo Corp. (a) | | | 1,200 | | | | 25,080 | |
| | | | | | | | |
| | | | | | | 460,185 | |
| | | | | | | | |
|
Technology Distributors - 0.1% | |
Insight Enterprises Inc. (a) | | | 434 | | | | 17,551 | |
ScanSource Inc. (a) | | | 449 | | | | 18,117 | |
| | | | | | | | |
| | | | | | | 35,668 | |
| | | | | | | | |
|
Technology Hardware, Storage & Peripherals - 0.7% | |
Diebold Nixdorf Inc. | | | 10,816 | | | | 272,023 | |
Super Micro Computer Inc. (a) | | | 1,504 | | | | 42,187 | |
| | | | | | | | |
| | | | | | | 314,210 | |
| | | | | | | | |
|
Thrifts & Mortgage Finance - 0.3% | |
Essent Group Ltd. (a) | | | 948 | | | | 30,687 | |
EverBank Financial Corp. | | | 1,187 | | | | 23,087 | |
| | | | | | | | |
| | | Number
of Shares | | | Fair
Value
$ | |
HomeStreet Inc. (a) | | | 1,679 | | | | 53,056 | |
Washington Federal Inc. | | | 742 | | | | 25,488 | |
| | | | | | | | |
| | | | | | | 132,318 | |
| | | | | | | | |
|
Tires & Rubber - 0.1% | |
Cooper Tire & Rubber Co. | | | 1,145 | | | | 44,483 | |
| | | | | | | | |
|
Trading Companies & Distributors - 1.0% | |
Applied Industrial Technologies Inc. | | | 5,697 | | | | 338,402 | |
Beacon Roofing Supply Inc. (a) | | | 308 | | | | 14,189 | |
GMS Inc. (a) | | | 857 | | | | 25,093 | |
Lawson Products Inc. (a) | | | 1,200 | | | | 28,560 | |
Neff Corp., Class A (a) | | | 2,201 | | | | 31,034 | |
| | | | | | | | |
| | | | | | | 437,278 | |
| | | | | | | | |
|
Trucking - 0.9% | |
Heartland Express Inc. | | | 1,538 | | | | 31,314 | |
Landstar System Inc. | | | 1,000 | | | | 85,300 | |
Old Dominion Freight Line Inc. (a) | | | 2,226 | | | | 190,968 | |
Saia Inc. (a) | | | 1,051 | | | | 46,402 | |
YRC Worldwide Inc. (a) | | | 2,100 | | | | 27,888 | |
| | | | | | | | |
| | | | | | | 381,872 | |
| | | | | | | | |
| |
Total Common Stock
(Cost $29,832,036) | | | | 38,668,249 | |
| | | | | | | | |
| Exchange Traded Fund - 2.4% | |
iShares Russell 2000 ETF
(Cost $1,000,912) | | | 7,587 | | | | 1,023,107 | |
| | | | | | | | |
| |
Total Investments in Securities
(Cost $30,832,948) | | | | 39,691,356 | |
| | | | | | | | |
| Short-Term Investments - 6.1% | |
State Street Institutional U.S. Government Money Market Fund - Class G Shares 0.46% (Cost $2,575,438) (b)(c)(d) | | | 2,575,438 | | | | 2,575,438 | |
| | | | | | | | |
| |
Total Investments
(Cost $33,408,386) | | | | 42,266,794 | |
| |
| Other Assets and Liabilities, net - 0.1% | | | | 53,547 | |
| | | | | | | | |
| |
| NET ASSETS - 100.0% | | | | 42,320,341 | |
| | | | | | | | |
Other Information:
The Fund had the following long futures contracts open at December 31, 2016:
| | | | | | | | | | | | | | | | |
| Description | | Expiration
date | | | Number of
Contracts | | | Current
Notional
Value | | | Unrealized
Depreciation | |
| | | | | | | | | | | | | | | | |
Russell 2000 Mini Index Futures | | | March 2017 | | | | 22 | | | $ | 1,492,590 | | | $ | (18,133 | ) |
| | | | | | | | | | | | | | | | |
See Notes to Schedule of Investments and Notes to Financial Statements.
| | |
| 12 | | State Street Small-Cap Equity V.I.S. Fund |
State Street Small-Cap Equity V.I.S. Fund
Notes to Schedule of Investments — December 31, 2016
The views expressed in this document reflect our judgment as of the publication date and are subject to change at any time without notice. The securities cited may not be representative of the Fund’s future investments and should not be construed as a recommendation to purchase or sell a particular security. See the Fund’s summary prospectus and statutory prospectus for complete descriptions of investment objectives, policies, risks and permissible investments.
| (a) | Non-income producing security. |
| (b) | At December 31, 2016, all or a portion of this security was pledged to cover collateral requirements for futures. |
| (c) | Sponsored by SSGA Funds Management, Inc., the Funds’ investment adviser and administrator, effective July 1, 2016, and an affiliate of State Street Bank & Trust Co., the Funds’ sub-administrator, custodian and accounting agent. |
| (d) | Coupon amount represents effective yield. |
| † | Percentages are based on net assets as of December 31, 2016. |
Abbreviations:
ADR - American Depositary Receipt
REIT - Real Estate Investment Trust
Affiliate Table
| | | | | | | | | | | | | | | | | | | | | | | | | | | | | | | | |
| | | Number of
Shares Held
at 12/31/15 | | | Value At
12/31/15 | | | Shares
Purchased | | | Shares
Sold | | | Number of
Shares Held
at 12/31/16 | | | Value at
12/31/16 | | | Dividend/
Interest
Income | | | Realized
Gain (Loss) | |
State Street Institutional U.S. Government Money Market Fund - Class G Shares | | | 2,439,080 | | | $ | 2,439,080 | | | | 15,138,495 | | | | 15,002,137 | | | | 2,575,438 | | | $ | 2,575,438 | | | $ | 6,480 | | | $ | — | |
| | | | | | | | | | | | | | | | | | | | | | | | | | | | | | | | |
| | | | | | $ | 2,439,080 | | | | | | | | | | | | | | | $ | 2,575,438 | | | $ | 6,480 | | | $ | — | |
| | | | | | | | | | | | | | | | | | | | | | | | | | | | | | | | |
| | | | |
| Notes to Schedule of Investments | | | 13 | |
State Street Small-Cap Equity V.I.S. Fund
Financial Highlights
Selected data based on a share outstanding throughout the fiscal years indicated
| | | | | | | | | | | | | | | | | | | | |
| | | 12/31/16 | | | 12/31/15* | | | 12/31/14* | | | 12/31/13* | | | 12/31/12* | |
Inception date | | | | | | | | | | | | | | | | | | | 4/28/00 | |
| | | | | |
Net asset value, beginning of period | | $ | 12.20 | | | $ | 14.39 | | | $ | 16.26 | | | $ | 13.37 | | | $ | 12.85 | |
| | | | | | | | | | | | | | | | | | | | |
|
Income/(loss) from investment operations: | |
Net investment income (loss) | | | (0.03 | ) | | | (0.04 | ) | | | (0.06 | ) | | | (0.03 | ) | | | 0.00 | †† |
Net realized and unrealized gains/(losses) on investments | | | 2.93 | | | | (0.52 | ) | | | 0.67 | | | | 4.96 | | | | 1.86 | |
| | | | | | | | | | | | | | | | | | | | |
Total income/(loss) from investment operations | | | 2.90 | | | | (0.56 | ) | | | 0.61 | | | | 4.93 | | | | 1.86 | |
| | | | | | | | | | | | | | | | | | | | |
|
Less distributions from: | |
Net investment income | | | — | | | | — | | | | — | | | | — | | | | 0.00 | †† |
Net realized gains | | | 0.70 | | | | 1.63 | | | | 2.48 | | | | 2.04 | | | | 1.34 | |
| | | | | | | | | | | | | | | | | | | | |
Total distributions | | | 0.70 | | | | 1.63 | | | | 2.48 | | | | 2.04 | | | | 1.34 | |
| | | | | | | | | | | | | | | | | | | | |
Net asset value, end of period | | $ | 14.40 | | | $ | 12.20 | | | $ | 14.39 | | | $ | 16.26 | | | $ | 13.37 | |
| | | | | | | | | | | | | | | | | | | | |
Total Return(a) | | | 23.77 | % | | | (4.12 | )% | | | 3.77 | % | | | 36.89 | % | | | 14.57 | % |
|
Ratios/Supplemental Data: | |
Net assets, end of period (in thousands) | | $ | 42,320 | | | $ | 38,359 | | | $ | 43,460 | | | $ | 50,248 | | | $ | 41,942 | |
|
Ratios to average net assets: | |
Net expenses | | | 1.40 | % | | | 1.36 | % | | | 1.33 | %(b) | | | 1.27 | %(b)(c) | | | 1.34 | %(b)(c) |
Gross expenses | | | 1.40 | % | | | 1.36 | % | | | 1.33 | % | | | 1.28 | % | | | 1.38 | % |
Net investment income (loss) | | | (0.22 | )% | | | (0.30 | )% | | | (0.35 | )% | | | (0.23 | )% | | | 0.01 | % |
Portfolio turnover rate | | | 36 | % | | | 42 | % | | | 37 | % | | | 39 | % | | | 36 | % |
Notes to Financial Highlights
| (a) | | Total returns are historical and assume changes in share price, reinvestment of dividends and capital gains distributions and do not include the effect of insurance contract charges. Past performance does not guarantee future results. |
| (b) | | Includes contractual management fee waiver related to the Fund’s investments in the GE Institutional Money Market Fund (the “Money Market Fund”). The fee waiver agreement was terminated effective June 30, 2014 with the closure of the Money Market Fund. |
| (c) | | Reflects a voluntary reimbursement of other operating expenses by GE Asset Management, Inc., the Fund’s investment adviser and administrator prior to July 1, 2016. |
| †† | | Rounds to less than $0.01. |
| * | | Beginning with the fiscal year ended December 31, 2016, the Fund was audited by Ernst & Young LLP. The previous years were audited by another independent registered public accounting firm. |
The accompanying Notes are an integral part of these financial statements.
State Street Small-Cap Equity V.I.S. Fund
Statement of Assets and Liabilities — December 31, 2016
| | | | |
| | | | |
Assets | | | | |
Investments in securities, at fair value (cost $30,832,948) | | $ | 39,691,356 | |
Short-term affiliated investments, at fair value | | | 2,575,438 | |
Restricted cash(1) | | | 160,000 | |
Receivable for investments sold | | | 14,241 | |
Income receivable | | | 32,122 | |
Receivable for fund shares sold | | | 4,224 | |
Income receivable from affiliated investments | | | 914 | |
Other assets | | | 1,753 | |
| | | | |
Total assets | | | 42,480,048 | |
| | | | |
| |
Liabilities | | | | |
Payable for investments purchased | | | 31,732 | |
Payable for fund shares redeemed | | | 494 | |
Payable for variation margin on open futures contracts | | | 5,753 | |
Payable to the Adviser (Note 6) | | | 34,132 | |
Payable to the Custodian (Note 6) | | | 52,093 | |
Accrued other expenses | | | 35,503 | |
| | | | |
Total liabilities | | | 159,707 | |
| | | | |
| | | | |
Net Assets | | $ | 42,320,341 | |
| | | | |
| |
Net Assets Consist of: | | | | |
Capital paid in | | | 33,105,260 | |
Undistributed (distributions in excess of) net investment income | | | — | |
Accumulated net realized gain | | | 374,806 | |
Net unrealized appreciation (depreciation) on: | | | | |
Investments | | | 8,858,408 | |
Futures | | | (18,133 | ) |
| | | | |
Net Assets | | $ | 42,320,341 | |
| | | | |
| | | | |
Shares outstanding ($0.01 par value; unlimited shares authorized) | | | 2,938,805 | |
Net asset value per share | | $ | 14.40 | |
(1) Deposits at broker for futures contracts. | | | | |
The accompanying Notes are an integral part of these financial statements.
| | | | |
| Statement of Assets and Liabilities | | | 15 | |
State Street Small-Cap Equity V.I.S. Fund
Statement of Operations — For the year ended December 31, 2016
| | | | |
| | | | |
Investment Income | |
Income | |
Dividend | | $ | 434,616 | |
Interest | | | 627 | |
Income from affiliated investments | | | 6,480 | |
Less: Foreign taxes withheld | | | (1,385 | ) |
| | | | |
Total income | | | 440,338 | |
| | | | |
|
Expenses | |
Advisory and administration fees (Note 6) | | | 356,583 | |
Directors’ fees (Note 6) | | | 2,501 | |
Custody and accounting expenses — net (Note 6) | | | 126,197 | |
Professional fees | | | 26,790 | |
Other expenses | | | 11,049 | |
| | | | |
Total Expenses | | | 523,120 | |
| | | | |
Net investment loss | | $ | (82,782 | ) |
| | | | |
|
Net Realized and Unrealized Gain (Loss) on Investments | |
Realized gain (loss) on: | |
Investments | | $ | 2,251,532 | |
Futures | | | 197,863 | |
Increase (decrease) in unrealized appreciation/depreciation on: | |
Investments | | | 5,678,200 | |
Futures | | | (29,048 | ) |
| | | | |
| |
Net realized and unrealized gain (loss) on investments | | | 8,098,547 | |
| | | | |
Net Increase in Net Assets Resulting from Operations | | $ | 8,015,765 | |
| | | | |
The accompanying Notes are an integral part of these financial statements.
| | |
| 16 | | Statement of Operations |
State Street Small-Cap Equity V.I.S. Fund
Statements of Changes in Net Assets
| | | | | | | | |
| | | Year Ended
December 31, 2016 | | | Year Ended
December 31, 2015* | |
| | | | | | | | |
Increase (Decrease) in Net Assets | |
|
Operations: | |
Net investment loss | | $ | (82,782 | ) | | $ | (126,996 | ) |
Net realized gain (loss) on investments and futures | | | 2,449,395 | | | | 4,284,766 | |
Net increase (decrease) in unrealized appreciation/depreciation on investments and futures | | | 5,649,152 | | | | (5,826,887 | ) |
| | | | | | | | |
Net increase (decrease) from operations | | | 8,015,765 | | | | (1,669,117 | ) |
| | | | | | | | |
|
Distributions to shareholders from: | |
Net realized gains | | | (1,956,940 | ) | | | (4,541,080 | ) |
| | | | | | | | |
Total distributions | | | (1,956,940 | ) | | | (4,541,080 | ) |
| | | | | | | | |
Increase (decrease) in assets from operations and distributions | | | 6,058,825 | | | | (6,210,197 | ) |
| | | | | | | | |
|
Share transactions: | |
Proceeds from sale of shares | | | 3,283,066 | | | | 3,230,274 | |
Value of distributions reinvested | | | 1,956,940 | | | | 4,541,080 | |
Cost of shares redeemed | | | (7,337,373 | ) | | | (6,661,996 | ) |
| | | | | | | | |
Net increase (decrease) from share transactions | | | (2,097,367 | ) | | | 1,109,358 | |
| | | | | | | | |
| | |
Total increase (decrease) in net assets | | | 3,961,458 | | | | (5,100,839 | ) |
|
Net Assets | |
Beginning of year | | | 38,358,883 | | | | 43,459,722 | |
| | | | | | | | |
| | |
End of year | | $ | 42,320,341 | | | $ | 38,358,883 | |
| | | | | | | | |
| | |
Undistributed (distributions in excess of) net investment income, end of year | | $ | — | | | $ | — | |
|
Changes in Fund Shares | |
Shares sold | | | 229,534 | | | | 219,291 | |
Issued for distributions reinvested | | | 135,616 | | | | 364,453 | |
Shares redeemed | | | (570,268 | ) | | | (460,537 | ) |
| | | | | | | | |
Net increase (decrease) in fund shares | | | (205,118 | ) | | | 123,207 | |
| | | | | | | | |
| * | | Beginning with the year ended December 31, 2016, the Fund was audited by Ernst & Young LLP. The previous years were audited by another independent registered public accounting firm. |
The accompanying Notes are an integral part of these financial statements.
| | | | |
| Statements of Changes in Net Assets | | | 17 | |
State Street Small-Cap Equity V.I.S. Fund
Notes to Financial Statements — December 31, 2016
| 1. | | Organization of the Company |
State Street Variable Insurance Series Funds, Inc. (the “Company”) was incorporated under the laws of the Commonwealth of Virginia on May 14, 1984 and is registered under the Investment Company Act of 1940, as amended (the “1940 Act”), as an open-end management investment company. Prior to November 30, 2016, the Company was named GE Investments Funds, Inc. The Company is currently composed of the following eight investment portfolios (collectively, the “Funds”): State Street U.S. Equity V.I.S. Fund, State Street S&P 500 Index V.I.S. Fund, State Street Premier Growth Equity V.I.S. Fund, State Street Core Value Equity V.I.S. Fund, State Street Small-Cap Equity V.I.S. Fund (the “Fund”), State Street Total Return V.I.S. Fund, State Street Income V.I.S. Fund and State Street Real Estate Securities V.I.S. Fund. Each Fund is an investment company and accordingly follows the investment company accounting and reporting guidance of the Financial Accounting Standards Board (“FASB”) Accounting Standard Codification (“ASC”) Topic 946 Financial Services—Investment Companies. Each Fund is a diversified investment company within the meaning of the 1940 Act.
Effective November 30, 2016, each individual Fund changed its respective name as follows:
| | |
| Old Name | | New Name |
GE Investments U.S. Equity Fund | | State Street U.S. Equity V.I.S. Fund |
GE Investments S&P 500 Index Fund | | State Street S&P 500 Index V.I.S. Fund |
GE Investments Premier Growth Equity Fund | | State Street Premier Growth Equity V.I.S. Fund |
GE Investments Core Value Equity Fund | | State Street Core Value Equity V.I.S. Fund |
GE Investments Small-Cap Equity Fund | | State Street Small-Cap Equity V.I.S. Fund |
GE Investments Total Return Fund | | State Street Total Return V.I.S. Fund |
GE Investments Income Fund | | State Street Income V.I.S. Fund |
GE Investments Real Estate Securities Fund | | State Street Real Estate Securities V.I.S. Fund |
Shares of the Funds of the Company are offered only to insurance company separate accounts that fund certain variable life insurance contracts and variable annuity contracts. SSGA Funds Management, Inc. (“SSGA FM”) is the investment adviser and administrator of each of the Funds effective July 1, 2016. Prior to July 1, 2016, GE Asset Management Incorporated (“GEAM”) served as the investment adviser and administrator to each Fund.
The Company currently offers one share class (Class 1) of the Fund as an investment option for variable life insurance and variable annuity contracts.
| 2. | | Summary of Significant Accounting Policies |
The preparation of financial statements in conformity with U.S. generally accepted accounting principles (“GAAP”) requires management to make estimates and assumptions that affect the reported amounts of assets and liabilities and disclosure of contingent assets and liabilities at the date of the financial statements and the reported amounts of increases and decreases in net assets from operations during the reporting period. Actual results may differ from those estimates.
Subsequent events after the balance sheet date through the date the financial statements were issued have been evaluated in the preparation of the financial statements. There are no items to report.
The following summarizes the significant accounting policies of the Company:
Securities Valuation and Transactions All investments in securities are recorded at their estimated fair value, as described in Note 3.
Securities transactions are accounted for as of the trade date. Realized gains and losses on investments sold are recorded on the basis of identified cost for both financial statement and federal tax purposes.
Derivatives The Fund is subject to equity price risk in the normal course of pursuing its investment objectives. The Fund may enter into various types of derivative transactions (such as futures) to gain or hedge exposure to certain types of securities as an alternative to investing directly in or selling such securities.
Futures Contracts A futures contract is an agreement to buy or sell a specific amount of a commodity, financial instrument, currency or index at a particular price and future date. During the fiscal year ended December 31, 2016, the Fund invested in stock index futures contracts to gain equity exposure for accumulating and residual cash positions. Buying futures tends to
| | |
| 18 | | Notes to Financial Statements |
State Street Small-Cap Equity V.I.S. Fund
Notes to Financial Statements, continued — December 31, 2016
increase the Fund’s exposure to the underlying instrument while selling futures tends to decrease the Fund’s exposure to the underlying instrument, or hedge other Fund investments. With futures contracts, there is minimal counterparty credit risk to the Fund since futures contracts are exchange traded and the exchange’s clearinghouse, as counterparty to all traded futures, guarantees the futures against default. The Fund’s risks in using these contracts include changes in the value of the underlying instruments, non-performance of the counterparties under the contracts’ terms and changes in the liquidity of the secondary market for the contracts. Futures contracts are valued at the settlement price established each day by the board of trade or exchange on which they principally trade.
Upon entering into a financial futures contract, the Fund is required to pledge to the broker an amount of cash and/or other assets equal to a certain percentage of the contract amount, known as initial margin deposit. Subsequent payments, known as variation margin, are made or received by the Fund each day, depending on the daily fluctuation in the fair value of the underlying security. The Fund records an unrealized gain or loss equal to the daily variation margin. Should market conditions move unexpectedly, the Fund may not achieve the anticipated benefits of the futures contracts and may incur a loss. The Fund recognizes a realized gain or loss on the expiration or closing of a futures contract.
Investment Income Corporate actions (including cash dividends) are recorded on the ex-dividend date, net of applicable withholding taxes, except for certain foreign corporate actions which are recorded as soon after the ex-dividend date as such information becomes available. Withholding taxes on foreign dividends, if any, have been provided for in accordance with the Fund’s understanding of the applicable country’s tax rules and rates.
Interest income is recorded on the accrual basis. Accretion of discounts and amortization of premiums on taxable bonds are to the call or maturity date, whichever is shorter, using the effective yield method.
Expenses Fund specific expenses are charged to the Fund that incurs such expenses. Such expenses may include custodial fees, legal and accounting fees, printing costs and registration fees. Expenses that are not fund specific are allocated pro rata across the Funds. Expenses of the Fund are generally paid directly by the Fund, however, expenses may be paid by the investment adviser and reimbursed by the Fund.
Federal Income Taxes The Fund intends to comply with all sections of the Internal Revenue Code of 1986, as amended (the “Internal Revenue Code”) applicable to regulated investment companies, including the distribution of substantially all of its taxable net investment income and net realized capital gains to its shareholders. Therefore, no provision for federal income tax has been made. The Fund is treated as a separate taxpayer for federal income tax purposes.
The Fund utilizes various methods to measure the fair value of most of its investments on a recurring basis. GAAP establishes a framework for measuring fair value and providing related disclosures. Broadly, the framework requires fair value to be determined based on the exchange price that would be received for an asset or paid to transfer a liability (an exit price) in the principal or most advantageous market for the asset or liability in an orderly transaction between market participants at the measurement date. In the absence of active markets for the identical assets or liabilities, such measurements involve developing assumptions based on market observable data and, in the absence of such data, internal information that is consistent with what market participants would use in a hypothetical transaction that occurs at the measurement date. It also establishes a three-level valuation hierarchy based upon observable and non-observable inputs.
Observable inputs reflect market data obtained from independent sources, while unobservable inputs reflect our market assumptions. Preference is given to observable inputs. These two types of inputs create the following fair value hierarchy:
| | • | | Level 1 — Quoted prices for identical investments in active markets. |
| | • | | Level 2 — Quoted prices for similar investments in active markets; quoted prices for identical or similar investments in markets that are not active; and model-derived valuations whose inputs are observable or whose significant value drivers are observable. |
| | • | | Level 3 — Significant inputs to the valuation model are unobservable. |
| | | | |
| Notes to Financial Statements | | | 19 | |
State Street Small-Cap Equity V.I.S. Fund
Notes to Financial Statements, continued — December 31, 2016
Policies and procedures are maintained to value investments using the best and most relevant data available. In addition, pricing vendors are utilized to assist in valuing investments. The investment adviser performs periodic reviews of the methodologies used by independent pricing services including price validation of individual securities.
Fair Value Measurement The following section describes the valuation methodologies the Fund uses to measure different financial investments at fair value.
The Fund’s portfolio securities are valued generally on the basis of market quotations. Equity securities generally are valued at the last reported sale price on the primary market in which they are traded. Portfolio securities listed on NASDAQ are valued using the NASDAQ Official Closing Price. Level 1 securities primarily include publicly-traded equity securities, which may not necessarily represent the last sales price. If no sales occurred on the exchange or NASDAQ that day, the portfolio security generally is valued using the last reported bid price. In those circumstances, the Fund typically classifies the investment securities in Level 2.
Short-term securities of sufficient credit quality with remaining maturities of sixty days or less at the time of purchase are typically valued on the basis of amortized cost which approximates fair value and these are included in Level 2. If it is determined that amortized cost does not approximate fair value, securities may be valued based on dealer supplied valuations or quotations. In these infrequent circumstances, pricing services may provide the Fund with valuations that are based on significant unobservable inputs, and in those circumstances the investment securities are classified in Level 3.
Investments in registered investment companies are valued at the published daily net asset value (“NAV”) and classified in Level 1.
If prices are not readily available for a portfolio security, or if it is believed that a price for a portfolio security does not represent its fair value, the security may be valued using procedures approved by the Company’s Board of Directors that are designed to establish its “fair” value. These securities are typically classified in Level 3. Those procedures require that the fair value of a security be established by a valuation committee of the investment adviser. The valuation committee follows different protocols for different types of investments and circumstances. The fair value procedures may be used to value any investment of the Fund in the appropriate circumstances.
Fair value determinations generally are used for securities whose value is affected by a significant event that will materially affect the value of a security and which occurs subsequent to the time of the close of the principal market on which such security trades but prior to the calculation of the Fund’s NAV.
The value established for such a portfolio security valued other than by use of a market quotation (as described above) may be different than what would be produced through the use of market quotations or another methodology. Portfolio securities that are valued using techniques other than market quotations, including “fair valued” securities, may be subject to greater fluctuation in their value from one day to the next than would be the case if market quotations were used. In addition, there is no assurance that the Fund could sell a portfolio security for the value established for it at any time and it is possible that the Fund would incur a loss because a portfolio security is sold at a discount to its established value.
Other financial investments are derivative instruments that are not reflected in total investments, such as futures, forwards, swaps, and written options contracts, which are valued based on fair value as discussed above.
The Fund uses closing prices for derivatives included in Level 1, which are traded either on exchanges or liquid over-the-counter markets. Derivative assets and liabilities included in Level 2 primarily represent interest rate swaps, cross-currency swaps and foreign currency and commodity forward and option contracts. Derivative assets and liabilities included in Level 3 primarily represent interest rate products that contain embedded optionality or prepayment features.
The inputs or methodology used for valuing securities are not an indication of the risk associated with investing in those securities.
| | |
| 20 | | Notes to Financial Statements |
State Street Small-Cap Equity V.I.S. Fund
Notes to Financial Statements, continued — December 31, 2016
The following table presents the Fund’s investments measured at fair value on a recurring basis at December 31, 2016:
| | | | | | | | | | | | | | | | |
| Investments | | Level 1 | | | Level 2 | | | Level 3 | | | Total | |
| | | | | | | | | | | | | | | | |
Investments in Securities† | | | | | | | | | | | | | | | | |
Common Stock | | $ | 38,668,249 | | | $ | — | | | $ | — | | | $ | 38,668,249 | |
Exchange Traded Funds | | | 1,023,107 | | | | — | | | | — | | | | 1,023,107 | |
Short-Term Investments | | | 2,575,438 | | | | — | | | | — | | | | 2,575,438 | |
| | | | | | | | | | | | | | | | |
Total Investments in Securities | | $ | 42,266,794 | | | $ | — | | | $ | — | | | $ | 42,266,794 | |
| | | | | | | | | | | | | | | | |
| | | | |
Other Financial Instruments* | | | | | | | | | | | | | | | | |
Long Futures Contracts — Unrealized Depreciation | | $ | (18,133 | ) | | $ | — | | | $ | — | | | $ | (18,133 | ) |
| | | | | | | | | | | | | | | | |
| | † | See Schedule of Investments for Industry Classification. |
| | * | Other financial instruments include derivative instruments such as futures contracts. Amounts shown represent unrealized appreciation (depreciation), at period end. |
There were no transfers between fair value levels during the period. Transfers between fair value levels are recognized at the beginning of the period.
| 4. | | Derivatives Disclosure |
Shown below are the derivative contracts entered into by the Fund, summarized by primary risk exposure as they appear on the Statement of Assets and Liabilities, none of which are accounted for as hedging instruments under FASB ASC No. 815 Derivatives and Hedging (“ASC 815”) as of December 31, 2016.
| | | | | | | | | | | | |
| | | Asset Derivatives December 31, 2016 | | | Liability Derivatives December 31, 2016 | |
Derivatives not accounted for as
hedging instruments under ASC 815 | | Location in the Statement
of Assets and Liabilities | | Fair Value ($) | | | Location in the Statement
of Assets and Liabilities | | Fair Value ($) | |
| Equity Contracts | | Assets, Net Assets — Net Unrealized Appreciation/ (Depreciation) on Futures | | | — | | | Liabilities, Net Assets — Net Unrealized Appreciation/ (Depreciation) on Futures | | | (18,133 | ) |
Shown below are the effects of derivative instruments on the Fund’s Statement of Operations, summarized by primary risk exposure, none of which are accounted for as hedging instruments under ASC 815.
| | | | | | | | | | | | | | |
Derivatives not accounted
for as hedging instruments
under ASC 815 | | Location in the Statement of Operations | | Total Notional
Amount of
Futures Contracts
Purchased/(Sold) ($) | | | Realized Gain (Loss)
on Derivatives
Recognized in
Income ($) | | | Change in
Unrealized
Appreciation
(Depreciation)
on Derivatives
Recognized
in Income ($) | |
| Equity Contracts | | Realized gain (loss) on Futures, Increase (decrease) in unrealized appreciation/ (depreciation) on Futures | |
| 14,560,380/
(13,802,523) |
| | | 197,863 | | | | (29,048 | ) |
During the fiscal year ended December 31, 2016, the Fund had an average notional value of $751,465 on long futures contracts. Please refer to the table following the Schedule of Investments for open futures contracts at December 31, 2016.
Prior to July 1, 2016, the Company shared a revolving credit facility of up to $150 million with a number of its affiliates. The credit facility was with the Company’s custodian bank, State Street Bank and Trust Company (“State Street”). The revolving credit facility required the payment of a commitment fee equal to 0.20% per annum on the daily unused portion of the credit facility, payable quarterly. The portion borne by each Fund generally was borne proportionally based upon net assets. Generally, borrowings under the credit facility would accrue interest at the higher of the 1-Month LIBOR plus 1.25% and the Overnight Federal Funds Rate plus 1.25% and would be borne by the borrowing Fund. The maximum amount allowed to be borrowed by any one Fund was the lesser of (i) 33.33% of its total assets or (ii) 20% of its net assets. The credit facility was not
| | | | |
| Notes to Financial Statements | | | 21 | |
State Street Small-Cap Equity V.I.S. Fund
Notes to Financial Statements, continued — December 31, 2016
utilized by the Fund during the fiscal year ended December 31, 2016. The revolving credit facility with State Street was terminated effective June 30, 2016.
Currently, the Funds and other affiliated funds (each a “Participant” and, collectively, the “Participants”) participate in a $360 million revolving credit facility provided by a syndication of banks under which the Participants may borrow to fund shareholder redemptions. This agreement expires October 12, 2017, unless extended or renewed.
The Participants are charged an annual commitment fee which is calculated based on the unused portion of the shared credit line. Commitment fees are allocated among each of the Participants based on relative net assets. A Participant incurs and pays the interest expense related to its borrowing. Interest is calculated at a rate per annum equal to the sum of 1% plus the greater of the New York Fed Bank Rate and 1-month LIBOR rate. From July 1, 2016, the date the Funds were added to this credit facility, through October 12, 2016, interest was calculated at a rate per annum equal to the sum of the New York Fed Bank Rate plus 1%.
The credit facilities were not utilized by the Fund during the year ended December 31, 2016.
| 6. | | Compensation and Fees Paid to Affiliates |
SSGM FM, a registered investment adviser, was retained by the Company’s Board of Directors effective July 1, 2016 to act as investment adviser and administrator of the Fund. SSGM FM’s compensation for investment advisory and administrative services (“Management Fee”) is paid monthly based on the average daily net assets of the Fund at an annualized rate of 0.95%.
State Street serves as sub-administrator and custodian to the Funds. Amounts paid by the Fund to State Street for performing such services are included in the advisory and administration and custody and accounting expenses, respectively.
Prior to July 1, 2016, GEAM served as the Fund’s investment adviser and administrator and the Fund paid GEAM a Management Fee at an annualized rate of 0.95%
Directors’ Compensation The Fund pays no compensation to its Directors who are officers or employees of SSGA FM or its affiliates. Directors who are not such officers or employees also serve in a similar capacity for other funds advised by SSGA FM. Compensation paid to non-interested Directors is reflected on the Statement of Operations. These fees are allocated pro rata across all of the mutual fund platforms served by the Directors, including the Fund, and are based upon the relative net assets of each fund within such platforms. (For additional information about Directors’ compensation, please refer to the Funds’ Statement of Additional Information.)
Other Transactions with Affiliates In December 2015, State Street announced a review of the manner in which it invoiced certain expenses to certain of its Investment Servicing clients, primarily in the United States, during an 18-year period going back to 1998 and its determination that it had incorrectly invoiced clients for certain expenses. State Street informed its clients that it will pay to them the expenses it concluded were incorrectly invoiced to them, plus interest.
The Fund was impacted by this matter. The amounts in the table below represent the refunded expenses and interest received by the Fund for the periods in question.
| | | | | | | | | | | | | | | | | | |
Refunded
Custody
Expense* | | Interest* | | Total | | % of Net
Assets at
12/31/16 |
| | | | | | | | | | | | | | | | | | | |
| | $ | 2,295 | | | | $ | 627 | | | | $ | 2,992 | | | | | 0.01 | % |
| | * | Refunded Custody Expenses and Interest appear on the Statements of Operations in Custody and accounting expenses — net and Interest income, respectively. |
Pursuant to investment sub-advisory agreements with SSGA FM, the assets of the Fund are allocated to and managed by each of the following sub-advisers: (i) Palisade Capital Management, L.L.C.; (ii) Champlain Investment Partners, LLC; (iii) GlobeFlex Capital, L.P.; (iv) Kennedy Capital Management, Inc. and (v) SouthernSun Asset Management, LLC. SSGA FM is responsible for allocating the Fund’s assets among the sub-advisers in its discretion (“Allocated Assets”), and for managing the Fund’s cash position, while each sub-adviser is responsible for the day-to-day management of their portion of the Allocated
| | |
| 22 | | Notes to Financial Statements |
State Street Small-Cap Equity V.I.S. Fund
Notes to Financial Statements, continued — December 31, 2016
Assets, under the general supervision and oversight of SSGA FM and the Board. For their services, SSGA FM pays each sub-adviser an investment sub-advisory fee, which is calculated as a percentage of the average daily net assets of the respective Allocated Assets that it manages.
| 8. | | Investment Transactions |
Purchases and Sales of Securities The cost of purchases and the proceeds from sales of investments, other than short-term securities, for the fiscal year ended December 31, 2016, were as follows:
| | | | | | | | |
| Non-U.S. Government Securities |
| Purchases | | Sales |
| | | | | | | | | |
| | $ | 12,651,906 | | | | $ | 16,858,248 | |
Affiliated Investments The Fund may invest in affiliated entities, including securities issued by State Street, affiliated funds, or entities deemed to be affiliates as a result of the Fund owning more than five percent of the entity’s voting securities or outstanding shares. Amounts relating to these transactions during the fiscal year ended December 31, 2016 are disclosed in the Schedule of Investments.
The Fund is subject to ASC 740, Income Taxes (“ASC 740”). ASC 740 provides guidance for financial accounting and reporting for the effects of income taxes that result from an entity’s activities during the year. ASC 740 also provides guidance regarding how uncertain tax positions should be recognized, measured, presented and disclosed in the financial statements. ASC 740 requires evaluation of tax positions taken or expected to be taken in the course of preparing the Fund’s tax returns to determine whether the tax positions are “more likely than not” of being sustained by the applicable tax authority. There are no adjustments to the Fund’s net assets required under ASC 740. The Fund’s 2013, 2014, 2015, and 2016 fiscal year tax returns are still open to examination by the Federal and applicable state tax authorities.
At December 31, 2016, information on the tax cost of investments and distributable earnings on a tax basis was as follows:
| | | | | | | | | | | | | | | | | | | | | | | | | | | | | | | | | | | | | | |
Cost of
Investments
For Tax
Purposes | | Gross Tax | | Net Tax
Appreciation/
(Depreciation) | | Undistributed Income | | Undistributed Accum. Capital Gain/(Loss) | | Late-Year Losses |
| | Appreciation | | Depreciation | | Investments | | Derivatives/ Currency | | | |
| | | | | | | | | | | | | | | | | | | | | | | | | | | | | | | | | | | | | | | |
| | $ | 33,758,878 | | | | $ | 9,652,574 | | | | $ | (1,144,658 | ) | | | $ | 8,507,916 | | | | $ | — | | | | $ | — | | | | $ | 707,165 | | | | $ | — | |
As of December 31, 2016, the Fund had no capital loss carryovers. Capital loss carryovers are available to offset future realized capital gains to the extent provided in the Internal Revenue Code and regulations thereunder. To the extent that these carryover losses are used to offset future capital gains, it is probable that the gains offset will not be distributed to shareholders because they would be taxable as ordinary income.
Any qualified late-year loss is deemed to arise on the first day of the Fund’s next tax year (if the Fund elects to defer such loss). Under this regime, generally, the Fund can elect to defer any post-October capital loss and/or any late-year ordinary loss as defined by the Internal Revenue Code.
The Fund incurred no such losses for the fiscal year ended December 31, 2016.
The tax character of distributions paid during the fiscal years ended December 31, 2016 and December 31, 2015 were as follows:
| | | | | | | | | | | | | | | | | | |
| Year | | Ordinary Income | | Long-Term Capital Gains | | Total |
| | | | | | | | | | | | | | | | | | | |
| | | 2016 | | | | $ | — | | | | $ | 1,956,940 | | | | $ | 1,956,940 | |
| | | 2015 | | | | | — | | | | | 4,541,080 | | | | | 4,541,080 | |
Distributions to Shareholders The Fund declares and pays any dividends from net investment income annually. The Fund declares and pays any net realized capital gains in excess of capital loss carryforwards distributions annually. The character of
| | | | |
| Notes to Financial Statements | | | 23 | |
State Street Small-Cap Equity V.I.S. Fund
Notes to Financial Statements, continued — December 31, 2016
income and gains to be distributed is determined in accordance with income tax regulations which may differ from GAAP. These differences include (but are not limited to) investments in futures, return of capital distributions from securities, net operating losses, and losses deferred due to wash sale transactions. Reclassifications due to permanent book/tax differences are made to the Fund’s capital accounts to reflect income and gains available for distribution (or available capital loss carryovers) under income tax regulations. These reclassifications have no impact on net investment income, realized gains or losses, or the NAV of the Fund. The calculation of net investment income per share in the Financial Highlights table excludes these adjustments.
The reclassifications for the fiscal year ended December 31, 2016 were as follows:
| | | | | | | | | | | | | |
Undistributed
Net Investment
Income | | Accumulated
Net Realized
Gain (Loss) | | Capital
Paid In |
| | $ | 82,782 | | | | $ | 3,261 | | | | | $ (86,043) | |
KPMG LLP (“KPMG”) served as the independent registered certified public accounting firm of the Company through its resignation as of June 30, 2016. On September 9, 2016, upon recommendation by the Audit Committee of the Company, the Company’s Board of Directors selected Ernst & Young LLP (“EY”) to replace KPMG as the independent public accountant for the fiscal year ended December 31, 2016.
The reports of KPMG on the financial statements for the fiscal years ended December 31, 2014 and December 31, 2015 contained no adverse opinion or disclaimer of opinion and were not qualified or modified as to uncertainty, audit scope or accounting principles.
During the Company’s fiscal years ended December 31, 2014 and December 31, 2015 and through the period ended June 30, 2016, there were no disagreements with KPMG on any matter of accounting principles or practices, financial statement disclosure, or auditing scope or procedure, which disagreements if not resolved to the satisfaction of KPMG would have caused them to make reference thereto in their reports on the financial statements for such years or periods.
During the Company’s fiscal years ended December 31, 2014 and December 31, 2015 and through the period ended June 30, 2016, there were no reportable events (as defined in Item 304(a)(1)(v) of Regulation S-K). The Funds requested and KPMG furnished a letter addressed to the Securities and Exchange Commission stating whether or not it agreed with the above statements. A copy of such letter was filed as Exhibit 77 to Form N-SAR for the period ended December 31, 2016.
During the Company’s fiscal years ended December 31, 2014 and December 31, 2015 and through September 9, 2016, neither the Company nor anyone on its behalf has consulted EY on items which: (i) concerned the application of accounting principles to a specified transaction, either completed or proposed, or the type of audit opinion that might be rendered on the Company’s financial statements or (ii) concerned the subject of a disagreement (as defined in paragraph (a)(1)(iv) of Item 304 of Regulations S-K) or reportable events (as described in paragraph (a)(1)(v) of said Item 304).
| | |
| 24 | | Notes to Financial Statements |
State Street Small-Cap Equity V.I.S. Fund
Report of Independent Registered Public Accounting Firm
To the Board of Directors of State Street Variable Insurance Series Funds, Inc. and Shareholders of State Street Small-Cap Equity V.I.S. Fund:
We have audited the accompanying statement of assets and liabilities of the State Street Small-Cap Equity V.I.S. Fund (formerly GE Investments Small-Cap Equity Fund) (one of the funds constituting State Street Variable Insurance Series Funds, Inc. (formerly GE Investment Funds, Inc.)) (the “Fund”), including the schedules of investments, as of December 31, 2016, and the related statements of operations, changes in net assets and the financial highlights for the year then ended. These financial statements and financial highlights are the responsibility of the Fund’s management. Our responsibility is to express an opinion on these financial statements and financial highlights based on our audit. The statement of changes in net assets for the year ended December 31, 2015 and the financial highlights for periods ended prior to January 1, 2016 were audited by another independent registered public accounting firm whose report, dated February 19, 2016, expressed an unqualified opinion on that statement of changes in net assets and those financial highlights.
We conducted our audit in accordance with the standards of the Public Company Accounting Oversight Board (United States). Those standards require that we plan and perform the audit to obtain reasonable assurance about whether the financial statements and financial highlights are free of material misstatement. We were not engaged to perform an audit of the Fund’s internal control over financial reporting. Our audit included consideration of internal control over financial reporting as a basis for designing audit procedures that are appropriate in the circumstances, but not for the purpose of expressing an opinion on the effectiveness of the Fund’s internal control over financial reporting. Accordingly, we express no such opinion. An audit also includes examining, on a test basis, evidence supporting the amounts and disclosures in the financial statements and financial highlights, assessing the accounting principles used and significant estimates made by management, and evaluating the overall financial statement presentation. Our procedures included confirmation of securities owned as of December 31, 2016, by correspondence with the custodian and brokers or by other appropriate auditing procedures where replies from brokers were not received. We believe that our audit provides a reasonable basis for our opinion.
In our opinion, the financial statements and financial highlights referred to above present fairly, in all material respects, the financial position of the State Street Small-Cap Equity V.I.S. Fund (one of the funds constituting State Street Variable Insurance Series Funds, Inc.) at December 31, 2016, the results of its operations, changes in its net assets and the financial highlights for the year then ended, in conformity with U.S. generally accepted accounting principles.

Boston, Massachusetts
February 17, 2017
| | | | |
| Report of Independent Registered Public Accounting Firm | | | 25 | |
State Street Small-Cap Equity V.I.S. Fund
Tax Information — December 31, 2016 (Unaudited)
For the year ended December 31, 2016, the Fund hereby designates $1,956,940 as capital gain dividends, or the amount ultimately treated as capital gain net income.
The amounts presented herein may differ from amounts presented elsewhere in the financial statements due to differences between tax and financial accounting principles. Please consult a tax advisor if you have any questions about Federal or State income tax laws or on how to prepare your tax returns. If you have specific questions about your Fund account, please consult your investment representative.
State Street Small-Cap Equity V.I.S. Fund
Special Meeting of Shareholders — Voting Results (Unaudited)
On November 2, 2016, the State Street Variable Insurance Series Funds, Inc. (formerly known as GE Investments Funds, Inc.) (the “Company”) held a special meeting of shareholders of each series portfolio of the Company (collectively, the “Funds”), including shareholders of the State Street Small-Cap Equity V.I.S. Fund (formerly known as the Small-Cap Equity Fund) (the “Fund”). Shareholders of record on August 31, 2016 were entitled to vote on the proposals. For each proposal shareholders of all Funds voted together and not by Fund or share class. At the meeting, all proposals were approved by the Fund’s shareholders and the following votes were recorded:
Proposal 1:
Approval of an amendment to the Articles of Incorporation of the Company to change the name of the Company from GE Investments Funds, Inc. to State Street Variable Insurance Series Funds, Inc.
Company Votes:
| | | | | | | | | | | | |
| | | No. of Shares | | | % of Outstanding Shares | | | % of Shares Present | |
Affirmative | | | 129,623,837.819 | | | | 89.283 | % | | | 89.283 | % |
Against | | | 10,047,818.534 | | | | 6.921 | % | | | 6.921 | % |
Abstain | | | 5,511,041.282 | | | | 3.796 | % | | | 3.796 | % |
Total | | | 145,182,697.634 | | | | 100.000 | % | | | 100.000 | % |
Fund votes:
| | | | | | | | | | | | |
| | | No. of Shares | | | % of Outstanding Shares | | | % of Shares Present | |
Affirmative | | | 2,498,737.296 | | | | 90.329 | % | | | 90.329 | % |
Against | | | 195,110.893 | | | | 7.053 | % | | | 7.053 | % |
Abstain | | | 72,423.893 | | | | 2.618 | % | | | 2.618 | % |
Total | | | 2,766,272.082 | | | | 100.000 | % | | | 100.000 | % |
Proposal 2:
Approval of an amendment to the Articles of Incorporation of the Company to permit the Board of Directors to change the name of the Company without seeking shareholder approval.
Company votes:
| | | | | | | | | | | | |
| | | No. of Shares | | | % of Outstanding Shares | | | % of Shares Present | |
Affirmative | | | 118,220,823.871 | | | | 81.429 | % | | | 81.429 | % |
Against | | | 21,486,028.150 | | | | 14.799 | % | | | 14.799 | % |
Abstain | | | 5,475,845.611 | | | | 3.772 | % | | | 3.772 | % |
Total | | | 145,182,697.634 | | | | 100.000 | % | | | 100.000 | % |
Fund votes:
| | | | | | | | | | | | |
| | | No. of Shares | | | % of Outstanding Shares | | | % of Shares Present | |
Affirmative | | | 2,307,435.945 | | | | 83.413 | % | | | 83.413 | % |
Against | | | 408,266.118 | | | | 14.759 | % | | | 14.759 | % |
Abstain | | | 50,570.019 | | | | 1.828 | % | | | 1.828 | % |
Total | | | 2,766,272.082 | | | | 100.000 | % | | | 100.000 | % |
| | | | |
| Special Meeting of Shareholders — Voting Results | | | 27 | |
State Street Small-Cap Equity V.I.S. Fund
Additional Information — December 31, 2016 (Unaudited)
Information about Directors and Executive Officers:
The business and affairs of the Fund are managed under the direction of the Fund’s Board of Directors. Information pertaining to the Directors and officers of the Fund is set forth below. Matthew J. Simpson resigned as a Director of the Fund effective June 30, 2016.
| | | | | | | | | | | | |
Name,
Address,
and Age | | Position(s) Held
with Fund | | Term of
Office and
Length of
Time Served | | Principal Occupation(s)
During Past 5 Years | | Number of
Portfolios
in Fund
Complex
Overseen
by Director | | | Other Directorships Held by Director |
INTERESTED DIRECTORS AND EXECUTIVE OFFICERS |
Jeanne M. La Porta c/o SSGA FM 1600 Summer St. Stamford, CT 06905 Age 51 | | Director and President | | Until successor is elected and qualified – 2 years | | Senior Managing Director at State Street Global Advisors since July 2016; President of GE Retirement Savings Plan Funds since July 2016; Senior Vice President and Commercial Operations Leader at GEAM from March 2014 to July 2016; President of State Street Institutional Funds and State Street Variable Insurance Series Funds, Inc. since April 2014; President and Trustee of GEAM’s UCITs Funds from March 2014 to November 2014; Senior Vice President and Commercial Administrative Officer at GEAM from April 2010 to March 2014; Vice President of State Street Institutional Funds from July 2003 to April 2014; Vice President of Elfun Funds from October 2003 to July 2016; Vice President of GE Retirement Savings Plan Funds from October 2003 to July 2016; Secretary of GE Funds from July 2007 to September 2010 and Vice President from July 2007 to February 2011; Senior Vice President and Deputy General Counsel of GEAM from October 2007 to April 2010; Vice President and Assistant Secretary of Elfun Funds and GE Retirement Savings Plan Funds from July 2003 to June 2010; and Vice President and Associate General Counsel – Marketing and Client Services (formerly Asset Management Services) at GEAM from May 1997 to October 2007. | | | 22 | | | Trustee and President of State Street Institutional Funds since 2014; Trustee of Elfun Funds since 2014. |
| | |
| 28 | | Additional Information |
State Street Small-Cap Equity V.I.S. Fund
Additional Information, continued — December 31, 2016 (Unaudited)
| | | | | | | | | | | | |
Name,
Address,
and Age | | Position(s) Held
with Fund | | Term of
Office and
Length of
Time Served | | Principal Occupation(s)
During Past 5 Years | | Number of
Portfolios
in Fund
Complex
Overseen
by Director | | | Other Directorships Held by Director |
INTERESTED DIRECTORS AND EXECUTIVE OFFICERS (continued) |
JoonWon Choe c/o SSGA FM 1600 Summer St. Stamford, CT 06905 Age 47 | | Vice President & Secretary | | Until successor is elected and qualified –6 years | | Managing Director and Managing Counsel at State Street Global Advisors since July 2016; Senior Vice President and Deputy General Counsel at GEAM from March 2011 to July 2016; Vice President and Secretary of State Street Institutional Funds since September 2010; Vice President and Assistant Secretary of GE Retirement Savings Plan Funds since September 2010; Vice President and Assistant Secretary of Elfun Funds from September 2010 to July 2016; Senior Vice President and Associate General Counsel at GEAM from June 2010 to March 2011; Vice President and Associate General Counsel of GEAM from November 2005 to June 2010; and Vice President and Secretary of GE Funds from September 2010 to February 2011. | | | N/A | | | N/A |
| | | | | | | | | | | | | |
Robert Herlihy c/o SSGA FM 1600 Summer St. Stamford, CT 06905 Age 49 | | Chief Compliance Officer | | Until successor is elected and qualified –11 years | | Managing Director at State Street Global Advisors since July 2016; Deputy Chief Compliance Officer of Elfun Funds since July 2016; Chief Compliance Officer of State Street Institutional Funds and GE Retirement Savings Plan Funds since July 2005; Chief Compliance Officer of GEAM and Elfun Funds from July 2005 to July 2016; Chief Compliance Officer of GE Funds from July 2005 to February 2011; and Manager of Fund Administration at GEAM from 2002-2005. | | | N/A | | | N/A |
| | | | | | | | | | | | | |
Arthur A. Jensen c/o SSGA FM 1600 Summer St. Stamford, CT 06905 Age 50 | | Treasurer | | Until successor is elected and qualified –5 years | | Vice President at State Street Global Advisors since July 2016; Deputy Treasurer of Elfun Funds since July 2016; Treasurer of State Street Institutional Funds and GE Retirement Savings Plan Funds since June 2011; Treasurer of Elfun Funds from June 2011 to July 2016; Mutual Funds Controller of GEAM from April 2011 to July 2016; Senior Vice President at Citigroup from 2008 to 2010; and Vice President at JPMorgan from 2005 to 2008. | | | N/A | | | N/A |
| | | | |
| Additional Information | | | 29 | |
State Street Small-Cap Equity V.I.S. Fund
Additional Information, continued — December 31, 2016 (Unaudited)
| | | | | | | | | | | | |
Name,
Address,
and Age | | Position(s) Held
with Fund | | Term of
Office and
Length of
Time Served | | Principal Occupation(s)
During Past 5 Years | | Number of
Portfolios
in Fund
Complex
Overseen
by Director | | | Other Directorships Held by Director |
Brian Harris c/o SSGA FM State Street Financial Center One Lincoln Street Boston, MA 02111-2900 Age 43 | | Deputy Chief Compliance Officer | | Until successor is elected and qualified – less than 1 year | | Managing Director, State Street Global Advisors and SSGA Funds Management, Inc. (June 2013 – present)*; Senior Vice President and Global Head of Investment Compliance, BofA Global Capital Management (2010 – 2013); Director of Compliance, AARP Financial Inc. (2008 – 2010). | | | N/A | | | N/A |
| |
Bruce S. Rosenberg c/o SSGA FM State Street Financial Center One Lincoln Street Boston, MA 02111-2900 Age 55 | | Assistant Treasurer | | Until successor is elected and qualified – less than 1 year | | Managing Director, State Street Global Advisors and SSGA Funds Management, Inc. (July 2015 – present); Director, Credit Suisse (April 2008 – July 2015). | | | N/A | | | N/A |
| |
Ann M. Carpenter c/o SSGA FM State Street Financial Center One Lincoln Street Boston, MA 02111-2900 Age 50 | | Assistant Treasurer | | Until successor is elected and qualified – less than 1 year | | Chief Operating Officer, SSGA Funds Management, Inc. (April 2014 – present); Managing Director, State Street Global Advisors and SSGA Funds Management, Inc. (2005 – present).* | | | N/A | | | N/A |
| | | | | | | | | | | | | |
Chad C. Hallett c/o SSGA FM State Street Financial Center One Lincoln Street Boston, MA 02111-2900 Age 47 | | Assistant Treasurer | | Until successor is elected and qualified – less than 1 year | | Vice President, State Street Global Advisors and SSGA Funds Management, Inc. (November 2014 – present); Vice President, State Street Bank and Trust Company (2001 – November 2014). | | | N/A | | | N/A |
| * | | Served in various capacities and/or with various affiliated entities during noted time period. |
| | |
| 30 | | Additional Information |
State Street Small-Cap Equity V.I.S. Fund
Additional Information, continued — December 31, 2016 (Unaudited)
| | | | | | | | | | | | |
Name,
Address,
and Age | | Position(s) Held
with Fund | | Term of
Office and
Length of
Time Served | | Principal Occupation(s)
During Past 5 Years | | Number of
Portfolios
in Fund
Complex
Overseen
by Director | | | Other Directorships Held by Director |
NON-INTERESTED DIRECTORS |
John R. Costantino c/o SSGA FM 1600 Summer St. Stamford, CT 06905 Age 70 | | Chairman of the Board | | Until successor is elected and qualified – 20 years | | General Partner, NGN Capital LLC since 2006; and Managing Director, Vice President of Walden Capital Management since 1996. | | | 16 | | | Trustee of State Street Institutional Funds since 1997; Trustee of Fordham University from 1989 to 1995 and from 2001 to 2007 and Trustee Emeritus since 2007; Trustee of NeuroScience Research Institute since 1986; Trustee of GE Funds from 1993 to February 2011; Director of Artes Medical from 2006 to 2008; and Trustee of Gregorian University Foundation from 1992 to 2007. |
| | | | | | | | | | | | | |
R. Sheldon Johnson c/o SSGA FM 1600 Summer St. Stamford, CT 06905 Age 70 | | Director | | Until successor is elected and qualified – 5 years | | Retired, 2006 to present; Head of Global Institutional Equity Sales and Marketing at Morgan Stanley & Co., Inc. from 2002 to 2006 and Managing Director at Morgan Stanley & Co., Inc. from 1988 to 2006. | | | 16 | | | Trustee of State Street Institutional Funds since April 2011 and Trustee of St. Lawrence University since 2003. |
| | | | | | | | | | | | | |
Donna M. Rapaccioli c/o SSGA FM 1600 Summer St. Stamford, CT 06905 Age 54 | | Director | | Until successor is elected and qualified – 5 years | | Dean of the Gabelli School of Business since 2007 and Accounting professor since 1987 at Fordham University. | | | 16 | | | Trustee of State Street Institutional Funds since January 2012 and Trustee of Emmanuel College since 2010. |
The Statement of Additional Information for the Funds includes additional information about the Directors and Officers and is available, without charge, upon request by calling 1-800-242-0134.
| | | | |
| Additional Information | | | 31 | |
State Street Small-Cap Equity V.I.S. Fund
Investment Team (Unaudited)
Investment Adviser and Administrator
SSGA Funds Management, Inc.
Board of Directors
John R. Costantino, Chairman
R. Sheldon Johnson
Jeanne M. La Porta
Donna M. Rapaccioli
Secretary
JoonWon Choe
Chief Compliance Officer
Robert Herlihy
Deputy Chief Compliance Officer
Brian Harris
Treasurer
Arthur A. Jensen
Assistant Treasurers
Bruce S. Rosenberg
Ann M. Carpenter
Chad C. Hallett
Distributor
State Street Global Markets, LLC
Member FINRA and SIPC
Custodian
State Street Bank and Trust Company
Investment Adviser
SSGA Funds Management, Inc.
1600 Summer Street
Stamford, CT 06905
or at:
P.O. Box 7900
Stamford, CT 06904-7900
Distributor
State Street Global Markets, LLC
Member FINRA and SIPC
State Street Financial Center
One Lincoln Street
Boston, MA 02111
www.ssga.com/geam
The Fund files its complete schedule of portfolio holdings with the Securities and Exchange Commission for the first and third quarters of each fiscal year on Form N-Q. The Fund’s Forms N-Q, as well as a description of the policies and procedures that the Fund uses to determine how to vote proxies (if any) relating to portfolio securities is available without charge (i) upon request, by calling 1-800-242-0134; (ii) on the Fund’s website at http://www.ssga.com/geam; and (iii) on the Commission’s website at http://www.sec.gov. The Fund’s Forms N-Q may be reviewed and copied at the Commission’s Public Reference Room in Washington, DC — information on the operation of the Public Reference Room may be obtained by calling 1-800-SEC-0330.
Information (if any) regarding how the Fund voted proxies relating to portfolio securities during the most recently disclosed 12-month period ended June 30 is available without charge (i) through the Fund’s website at http://www.ssga.com/geam; and (ii) on the Commission’s website at http://www.sec.gov.
IBG-22841
Annual Report
31 December 2016
State Street Real Estate Securities V.I.S. Fund
(formerly the GE Investments Real Estate Securities Fund)

State Street Real Estate Securities V.I.S Fund
Annual Report
December 31, 2016
Table of Contents
This report is prepared for Policyholders of certain variable contracts and may be distributed to others only if preceded or accompanied by the variable contract’s current prospectus and the current summary prospectus of the Fund available for investments thereunder.
State Street Real Estate Securities V.I.S. Fund
Notes to Performance — December 31, 2016 (Unaudited)
The information provided on the performance page relates to the State Street Real Estate Securities V.I.S Fund (the “Fund”).
Total return performance shown in this report for the Fund takes into account changes in share price and assumes reinvestment of dividends and capital gains distributions, if any. Total returns shown are net of Fund fees and expenses but do not reflect fees and charges associated with the variable contracts such as administrative fees, account charges and surrender charges, which, if reflected, would reduce the Fund’s total returns for all periods shown.
The performance data quoted represents past performance; past performance does not guarantee future results. Investment return and principal value will fluctuate so your shares, when redeemed, may be worth more or less than their original cost. Current performance may be higher or lower than the performance data quoted. Periods less than one year are not annualized. Please call toll-free (800) 242-0134 or visit the Fund’s website at http://www.ssga.com/geam for the most recent month-end performance data.
An investment in the Fund is not a deposit of any bank and is not insured or guaranteed by the Federal Deposit Insurance Corporation (“FDIC”) or any other government agency. An investment in the Fund is subject to risk, including possible loss of principal invested.
FTSE NAREIT Equity REITs Index is an unmanaged index of all tax-qualified equity real estate investment trusts (“REITs”) (except Timber REITs or Infrastructure REITs) listed on the New York Stock Exchange, American Stock Exchange and NASDAQ which have 75% or more of their gross invested book assets invested directly or indirectly in the equity ownership of real estate. The results shown for the foregoing index assume the reinvestment of net dividends or interest and do not reflect fees, expenses, or taxes. As such, the index returns do not reflect the actual cost of investing in the instruments that comprise the index.
The peer universe of the underlying annuity funds used for the peer group average annual total return calculation is based on a blend of Morningstar peer categories, as shown. Morningstar is an independent mutual fund rating service. The Fund’s performance may be compared to or ranked within a universe of mutual funds with investment objectives and policies similar but not necessarily identical to that of the Fund.
©2017 Morningstar, Inc. All Rights Reserved. The Morningstar information contained herein: (1) is proprietary to Morningstar and/or its content providers; (2) may not be copied or distributed; and (3) is not warranted to be accurate, complete, or timely. Neither Morningstar nor its content providers are responsible for any damage or losses relating from any use of this information. Past performance is no guarantee of future results.
The views expressed in this document reflect our judgment as of the publication date and are subject to change at any time without notice.
State Street Global Markets, LLC, member of FINRA & SIPC is the principal underwriter and distributor of the State Street V.I.S. Funds and a wholly owned subsidiary of State Street Corporation. References to State Street may include State Street Corporation and its affiliates. The Funds pay State Street Bank and Trust Company for its services as custodian and Fund Accounting agent, and pay SSGA Funds Management, Inc. for investment advisory and administrative services.
State Street Real Estate Securities V.I.S. Fund
Portfolio Management Discussion and Analysis — December 31, 2016 (Unaudited)
| Q. | How did the State Street Real Estate Securities V.I.S. Fund perform compared to its benchmark and Morningstar peer group for the twelve-month period ended December 31, 2016? |
| A. | For the twelve-month period ended December 31, 2016, the State Street Real Estate Securities V.I.S. Fund returned 8.00%. The FTSE NAREIT Equity REITs Index, the Fund’s benchmark, returned 8.52% and the Fund’s Morningstar peer group of 47 U.S. Insurance Real Estate funds returned an average of 6.61% over the same period. |
| Q. | What market factors affected the Fund’s performance? |
| A. | The U.S. real estate securities market generated a positive return with the FTSE NAREIT Equity REITs Index posting a total return of 8.52% during the twelve-month period ended December 31, 2016. The U.S. REIT market underperformed the broader equity markets as the S&P 500® Index and the Dow Jones Industrial Average posted total returns of 11.96% and 16.50%, respectively, for the year. The key event that impacted the asset class and the Fund was the U.S. Presidential election, and the related move in interest rates. The 10-year treasury yield rose over 100 basis points (“bps”) from its lowest to its highest point during the 4th quarter of 2016 and REIT total returns were negative in response. REITs did most poorly in October of 2016 due to the uncertainty about rates and growth. Then in November, the results of the election also increased variability, both on the upside and on the downside, concerning growth, international implications, regulation, etc. The election also directly impacted specific REIT sectors — for example, private prison REITs rallied following the election as they were deeply discounted due to expectations for a Clinton administration to end these companies all together. The health care sector was also directly impacted as the potential repeal of the Affordable Care Act changed the outlook for the various business models within that sector. In general, sharply increasing interest rates and improved expectations for growth resulted in underperformance in long-duration assets and outperformance in short duration assets. |
| Q. | What were the primary drivers of Fund performance? |
| A. | On a net-of-fees basis, the Fund underperformed its benchmark by 52 bps in 2016. Stock selection contributed 47 bps to alpha, while sector selection detracted 33 bps from alpha. The combined effect of fees, cash, capital flows, intraday trading profits and other items not directly captured by our attribution measurement system combined to reduce relative performance by roughly 66 bps. The positive contribution from stock selection was broad-based with office infill, apartment, shopping center picks generating strong alpha, offset by health care and regional mall picks. Sector selection underperformance was driven by an overweight to office infill and underweights to specialty and self storage, which more than offset the positive alpha from an underweight to freestanding and an overweight to industrial. |
| | Derivatives are not utilized in the Fund. |
| Q. | Were there any significant changes to the Fund during the period? |
| A. | We did not deviate from the investment process, philosophy or approach we have consistently applied since 1995. From a personnel standpoint, during 2016, we added an analyst to the investment team. These changes do not affect the management of the Fund. |
| | |
| 2 | | State Street Real Estate Securities V.I.S. Fund |
State Street Real Estate Securities V.I.S. Fund
Understanding Your Fund’s Expenses — December 31, 2016 (Unaudited)
As a shareholder of the Fund, you incur ongoing costs. Ongoing costs include portfolio management fees, professional fees, administrative fees and other Fund expenses. The following example is intended to help you understand your ongoing costs (in dollars) of investing in the Fund and to compare these costs with the ongoing costs of investing in other mutual funds.
To illustrate these ongoing costs, we have provided an example and calculated the expenses paid by investors in the Fund during the period. The information in the following table is based on an investment of $1,000, which is invested at the beginning of the period and held for the entire six-month period ended December 31, 2016.
Actual Expenses
The first section of the table provides information about actual account values and actual expenses. You may use the information in this section, together with the amount you invested, to estimate the expenses that you paid over the period. To do so, simply divide your account value by $1,000 (for example, an $8,600 account value divided by $1,000 = 8.6), then multiply the result by the number given under the heading “Expenses paid during the period” to estimate the expenses you paid on your account during the period.
Hypothetical Example for Comparison Purposes
The second section of the table provides information about hypothetical account values and hypothetical expenses based on the Fund’s actual expense ratio and an assumed rate of return of 5% per year before expenses, which is not the Fund’s actual return. The hypothetical account values and expenses may not be used to estimate the actual ending account balance or expenses you paid for the period. You may use this information to compare the ongoing costs of investing in the Fund and other funds. To do so, compare this 5% hypothetical example with the 5% hypothetical examples that appear in the shareholder reports of other funds.
Please note that the expenses shown in the table are meant to highlight and help you compare ongoing costs only and do not reflect transaction costs, such as sales charges or redemption fees, if any. Therefore, the second section of the table is useful in comparing ongoing costs only, and will not help you determine the relative total costs of owning different funds. Additionally, the expenses shown do not reflect the fees or charges associated with variable contracts through which shares of the Fund are offered.
July 1, 2016 — December 31, 2016
| | | | | | | | | | | | |
| | | Account value
at the beginning of
the period ($) | | | Account value
at the end of
the period ($) | | | Expenses paid
during
the period ($)* | |
Actual Fund Return | | | 1,000.00 | | | | 951.20 | | | | 4.81 | |
Hypothetical 5% Return
(2.5% for the period) | | | 1,000.00 | | | | 1,020.21 | | | | 4.98 | |
| * | Expenses are equal to the Fund’s annualized net expense ratio of 0.98%** (for the period July 1, 2016-December 31, 2016), multiplied by the average account value over the period, multiplied by 184/366 (to reflect the one-half year period). |
| ** | May differ from expense ratio disclosed in the financial highlights, which is calculated based on the entire fiscal year’s data. |
| | | | |
| State Street Real Estate Securities V.I.S. Fund | | | 3 | |
State Street Real Estate Securities V.I.S. Fund
Performance Summary — December 31, 2016 (Unaudited)
Morningstar Performance Comparison
Based on average annual returns for periods ended 12/31/16
| | | | | | | | | | | | |
| | | One
Year | | | Five
Year | | | Ten
Year | |
Number of funds in peer group | | | 47 | | | | 44 | | | | 39 | |
Peer group average annual total return | | | 6.61 | % | | | 10.96 | % | | | 4.05 | % |
Morningstar Category in peer group: U.S. Insurance Real Estate | |
Top Ten Largest Holdings
as of December 31, 2016 (as a % of Fair Value) (a)(b)
| | | | |
Simon Property Group Inc. | | | 6.67 | % |
AvalonBay Communities Inc. | | | 4.20 | % |
Welltower Inc. | | | 3.97 | % |
Public Storage | | | 3.90 | % |
Equinix Inc. | | | 3.78 | % |
Boston Properties Inc. | | | 3.38 | % |
Vornado Realty Trust | | | 3.23 | % |
Prologis Inc. REIT | | | 2.82 | % |
Host Hotels & Resorts Inc. | | | 2.74 | % |
CyrusOne Inc. | | | 2.62 | % |
Sector Allocation as of December 31, 2016
Portfolio composition as a % of Fair Value of $72,278 (in thousands) as of December 31, 2016 (a)(b)
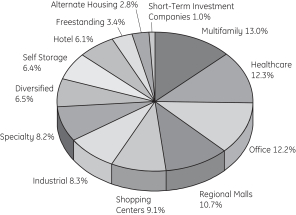
Average Annual Total Return For the Periods Ended December 31, 2016
Class 1 Shares (Inception date: 5/01/95)
| | | | | | | | | | | | | | | | |
| | | One Year | | | Five Year | | | Ten Year | | | Ending Value
of a $10,000
Investment | |
State Street Real Estate Securities V.I.S. Fund | | | 8.00 | % | | | 12.28 | % | | | 6.46 | % | | $ | 18,694 | |
FTSE NAREIT Equity REITs Index | | | 8.52 | % | | | 12.01 | % | | | 5.08 | % | | $ | 16,417 | |
| | |
| 4 | | State Street Real Estate Securities V.I.S. Fund |
State Street Real Estate Securities V.I.S. Fund
Performance Summary, continued — December 31, 2016 (Unaudited)
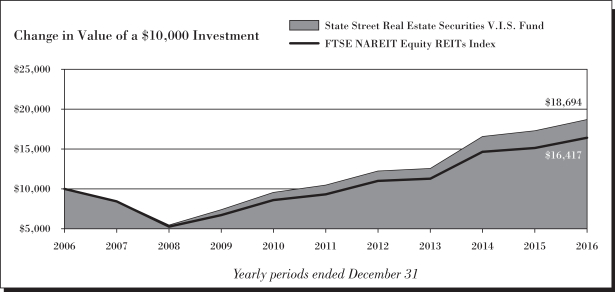
| (a) | Fair Value basis is inclusive of short-term investment in State Street Institutional U.S. Government Money Market Fund Class G Shares. |
| (b) | The securities information regarding holdings, allocations and other characteristics is presented to illustrate examples of securities that the Fund has bought and the diversity of areas in which the Fund may invest as of a particular date. It may not be representative of the Fund’s current or future investments and should not be construed as a recommendation to purchase or sell a particular security. |
See Notes to Performance beginning on page 1 for further information, including an explanation of Morningstar peer categories.
Past performance does not predict future performance. The performance shown in the graphs and tables does not reflect the deduction of taxes that a shareholder would pay on Fund distributions or the redemption of Fund shares and does not reflect the fees or charges that would be associated with variable contracts through which shares of the Fund are offered.
| | | | |
| State Street Real Estate Securities V.I.S. Fund | | | 5 | |
State Street Real Estate Securities V.I.S. Fund
Schedule of Investments — December 31, 2016
| | | | | | | | |
| | | Number
of Shares | | | Fair
Value
$ | |
| | | | | | | | |
| Common Stock (REITs) - 98.7%† | | | | | |
Alternate Housing - 2.8% | | | | | |
American Homes 4 Rent, Class A | | | 33,460 | | | | 701,991 | |
Colony Starwood Homes | | | 16,750 | | | | 482,567 | |
Education Realty Trust Inc. | | | 14,110 | | | | 596,853 | |
Silver Bay Realty Trust Corp. | | | 12,090 | | | | 207,223 | |
| | | | | | | | |
| | | | | | | 1,988,634 | |
| | | | | | | | |
| | |
Diversified - 6.5% | | | | | | | | |
American Assets Trust Inc. | | | 8,750 | | | | 376,950 | |
Forest City Realty Trust Inc. | | | 30,230 | | | | 629,993 | |
VEREIT Inc. | | | 106,330 | | | | 899,552 | |
Vornado Realty Trust | | | 22,360 | | | | 2,333,713 | |
Washington Real Estate Investment Trust | | | 14,600 | | | | 477,274 | |
| | | | | | | | |
| | | | | | | 4,717,482 | |
| | | | | | | | |
| | |
Freestanding - 3.4% | | | | | | | | |
National Retail Properties Inc. | | | 22,270 | | | | 984,334 | |
STORE Capital Corp. | | | 60,580 | | | | 1,496,932 | |
| | | | | | | | |
| | | | | | | 2,481,266 | |
| | | | | | | | |
| | |
Healthcare - 12.2% | | | | | | | | |
Care Capital Properties Inc. | | | 14,730 | | | | 368,250 | |
HCP Inc. | | | 62,174 | | | | 1,847,811 | |
Healthcare Realty Trust Inc. | | | 13,230 | | | | 401,134 | |
Healthcare Trust of America Inc., Class A | | | 32,100 | | | | 934,431 | |
Medical Properties Trust Inc. | | | 12,280 | | | | 151,044 | |
Omega Healthcare Investors Inc. | | | 15,500 | | | | 484,530 | |
Quality Care Properties Inc. | | | 9,164 | | | | 145,129 | (a) |
Ventas Inc. | | | 26,480 | | | | 1,655,530 | |
Welltower Inc. | | | 42,870 | | | | 2,869,289 | |
| | | | | | | | |
| | | | | | | 8,857,148 | |
| | | | | | | | |
| | |
Hotel - 6.1% | | | | | | | | |
Chesapeake Lodging Trust | | | 9,240 | | | | 238,946 | |
Hilton Worldwide Holdings Inc. | | | 17,860 | | | | 485,792 | |
Host Hotels & Resorts Inc. | | | 105,230 | | | | 1,982,533 | |
Hyatt Hotels Corp., Class A | | | 4,970 | | | | 274,642 | (a) |
RLJ Lodging Trust | | | 16,200 | | | | 396,738 | |
Sunstone Hotel Investors Inc. | | | 69,190 | | | | 1,055,148 | |
| | | | | | | | |
| | | | | | | 4,433,799 | |
| | | | | | | | |
| | |
Industrial - 8.3% | | | | | | | | |
Duke Realty Corp. | | | 59,820 | | | | 1,588,819 | |
First Industrial Realty Trust Inc. | | | 11,090 | | | | 311,075 | |
Liberty Property Trust | | | 17,150 | | | | 677,425 | |
Prologis Inc. REIT | | | 38,600 | | | | 2,037,694 | |
PS Business Parks Inc. | | | 6,160 | | | | 717,763 | |
STAG Industrial Inc. | | | 29,030 | | | | 692,946 | |
| | | | | | | | |
| | | | | | | 6,025,722 | |
| | | | | | | | |
| | | | | | | | |
| | | Number
of Shares | | | Fair
Value
$ | |
| | |
Multifamily - 13.0% | | | | | | | | |
AvalonBay Communities Inc. | | | 17,110 | | | | 3,031,036 | |
Camden Property Trust | | | 11,610 | | | | 976,053 | |
Equity Residential | | | 28,860 | | | | 1,857,429 | |
Essex Property Trust Inc. | | | 5,800 | | | | 1,348,500 | |
Mid-America Apartment Communities Inc. | | | 4,030 | | | | 394,618 | |
UDR Inc. | | | 48,810 | | | | 1,780,589 | |
| | | | | | | | |
| | | | | | | 9,388,225 | |
| | | | | | | | |
| | |
Office - 12.2% | | | | | | | | |
Alexandria Real Estate Equities Inc. | | | 4,340 | | | | 482,304 | |
Boston Properties Inc. | | | 19,420 | | | | 2,442,647 | |
Columbia Property Trust Inc. | | | 29,050 | | | | 627,480 | |
Corporate Office Properties Trust | | | 20,940 | | | | 653,747 | |
Douglas Emmett Inc. | | | 33,170 | | | | 1,212,695 | |
Highwoods Properties Inc. | | | 20,160 | | | | 1,028,362 | |
Hudson Pacific Properties Inc. | | | 23,920 | | | | 831,938 | |
Mack-Cali Realty Corp. | | | 12,540 | | | | 363,911 | |
Parkway Inc. | | | 22,360 | | | | 497,510 | (a) |
SL Green Realty Corp. | | | 6,200 | | | | 666,810 | |
| | | | | | | | |
| | | | | | | 8,807,404 | |
| | | | | | | | |
| | |
Regional Malls - 10.6% | | | | | | | | |
General Growth Properties Inc. | | | 56,340 | | | | 1,407,373 | |
Simon Property Group Inc. | | | 27,140 | | | | 4,821,964 | |
The Macerich Co. | | | 20,870 | | | | 1,478,431 | |
| | | | | | | | |
| | | | | | | 7,707,768 | |
| | | | | | | | |
| | |
Self Storage - 6.4% | | | | | | | | |
CubeSmart | | | 57,020 | | | | 1,526,426 | |
Life Storage Inc. | | | 3,350 | | | | 285,621 | |
Public Storage | | | 12,610 | | | | 2,818,335 | |
| | | | | | | | |
| | | | | | | 4,630,382 | |
| | | | | | | | |
| | |
Shopping Centers - 9.0% | | | | | | | | |
DDR Corp. | | | 78,420 | | | | 1,197,473 | |
Equity One Inc. | | | 27,630 | | | | 847,965 | |
Kimco Realty Corp. | | | 62,260 | | | | 1,566,462 | |
Kite Realty Group Trust | | | 16,840 | | | | 395,403 | |
Ramco-Gershenson Properties Trust | | | 20,510 | | | | 340,056 | |
Regency Centers Corp. | | | 14,490 | | | | 999,085 | |
Weingarten Realty Investors | | | 33,300 | | | | 1,191,807 | |
| | | | | | | | |
| | | | | | | 6,538,251 | |
| | | | | | | | |
| | |
Specialty - 8.2% | | | | | | | | |
CyrusOne Inc. | | | 42,360 | | | | 1,894,763 | |
Digital Realty Trust Inc. | | | 10,100 | | | | 992,426 | |
Equinix Inc. | | | 7,650 | | | | 2,734,186 | |
QTS Realty Trust Inc., Class A | | | 6,840 | | | | 339,606 | |
| | | | | | | | |
| | | | | | | 5,960,981 | |
| | | | | | | | |
| |
Total Common Stock (REITs) (Cost $68,165,638) | | | | 71,537,062 | |
| | | | | | | | |
See notes to schedule of investments and notes to financial statements.
| | |
| 6 | | State Street Real Estate Securities V.I.S. Fund |
State Street Real Estate Securities V.I.S. Fund
Schedule of Investments, continued — December 31, 2016
| | | | | | | | |
| | | Number
of Shares | | | Fair
Value
$ | |
| | | | | | | | |
| |
| Short-Term Investments - 1.0% | | | | | |
State Street Institutional U.S. Government Money Market Fund - Class G Shares 0.46%
(Cost $741,322) | | | 741,322 | | | | 741,322 | (b,c) |
| | | | | | | | |
| |
Total Investments (Cost $68,906,960) | | | | 72,278,384 | |
| |
| Other Assets and Liabilities, net - 0.3% | | | | 204,349 | |
| | | | | | | | |
| |
| NET ASSETS - 100.0% | | | | 72,482,733 | |
| | | | | | | | |
The views expressed in this document reflect our judgment as of the publication date and are subject to change at any time without notice. The securities cited may not be representative of the Fund’s future investments and should not be construed as a recommendation to purchase or sell a particular security. See the Fund’s summary prospectus and statutory prospectus for complete descriptions of investment objectives, policies, risks and permissible investments.
| (a) | Non-income producing security. |
| (b) | Sponsored by SSGA Funds Management, Inc., the Funds’ investment adviser and administrator effective July 1, 2016, and an affiliate of State Street Bank & Trust Co., the Funds’ sub-administrator, custodian and accounting agent. |
| (c) | Coupon amount represents effective yield. |
| † | Percentages are based on net assets as of December 31, 2016. |
Abbreviations:
REIT - Real Estate Investment Trust
See notes to schedule of investments and notes to financial statements.
| | | | |
| State Street Real Estate Securities V.I.S. Fund | | | 7 | |
State Street Real Estate Securities V.I.S. Fund
Schedule of Investments, continued — December 31, 2016
Affiliate Table
| | | | | | | | | | | | | | | | | | | | | | | | | | | | | | | | |
| |
| | | Number of
Shares Held
at 12/31/15 | | | Value At
12/31/15 | | | Shares
Purchased | | | Shares
Sold | | | Number of
Shares Held
at 12/31/16 | | | Value at
12/31/16 | | | Dividend/
Interest
Income | | | Realized
Gain (Loss) | |
State Street Institutional U.S. Government Money Market Fund - Class G Shares | | | 576,399 | | | $ | 576,399 | | | | 24,425,957 | | | | 24,261,034 | | | | 741,322 | | | $ | 741,322 | | | $ | 2,323 | | | $ | — | |
| | | | | | | | | | | | | | | | | | | | | | | | | | | | | | | | |
| | | | | | $ | 576,399 | | | | | | | | | | | | | | | $ | 741,322 | | | $ | 2,323 | | | $ | — | |
| | | | | | | | | | | | | | | | | | | | | | | | | | | | | | | | |
See notes to schedule of investments and notes to financial statements.
| | |
| 8 | | State Street Real Estate Securities V.I.S. Fund |
State Street Real Estate Securities V.I.S. Fund
Financial Highlights
Selected data based on a share outstanding throughout the fiscal years indicated
| | | | | | | | | | | | | | | | | | | | |
| | | 12/31/16 | | | 12/31/15* | | | 12/31/14* | | | 12/31/13* | | | 12/31/12* | |
Inception date | | | | | | | | | | | | | | | | | | | 5/1/95 | |
Net asset value, beginning of period | | $ | 13.30 | | | $ | 14.74 | | | $ | 12.68 | | | $ | 13.27 | | | $ | 11.58 | |
| | | | | | | | | | | | | | | | | | | | |
|
Income/(loss) from investment operations: | |
Net investment income | | | 0.31 | | | | 0.29 | | | | 0.28 | | | | 0.19 | | | | 0.29 | |
Net realized and unrealized gains/(losses) on investments | | | 0.71 | | | | 0.41 | | | | 3.79 | | | | 0.16 | | | | 1.65 | |
| | | | | | | | | | | | | | | | | | | | |
Total income from investment operations | | | 1.02 | | | | 0.70 | | | | 4.07 | | | | 0.35 | | | | 1.94 | |
| | | | | | | | | | | | | | | | | | | | |
|
Less distributions from: | |
Net investment income | | | 0.35 | | | | 0.28 | | | | 0.29 | | | | 0.20 | | | | 0.25 | |
Net realized gains | | | 1.60 | | | | 1.86 | | | | 1.72 | | | | 0.74 | | | | — | |
| | | | | | | | | | | | | | | | | | | | |
Total distributions | | | 1.95 | | | | 2.14 | | | | 2.01 | | | | 0.94 | | | | 0.25 | |
| | | | | | | | | | | | | | | | | | | | |
Net asset value, end of period | | $ | 12.37 | | | $ | 13.30 | | | $ | 14.74 | | | $ | 12.68 | | | $ | 13.27 | |
| | | | | | | | | | | | | | | | | | | | |
Total return(a) | | | 8.00 | % | | | 4.56 | % | | | 31.90 | % | | | 2.60 | % | | | 16.79 | % |
|
Ratios/supplemental data: | |
Net assets, end of period (in thousands) | | $ | 72,483 | | | $ | 78,912 | | | $ | 91,007 | | | $ | 102,603 | | | $ | 76,751 | |
|
Ratios to average net assets: | |
Net expenses | | | 0.97 | % | | | 0.95 | % | | | 0.94 | %(b) | | | 0.96 | %(b) | | | 0.98 | %(b) |
Gross expenses | | | 0.97 | % | | | 0.95 | % | | | 0.94 | % | | | 0.96 | % | | | 0.98 | % |
Net investment income | | | 1.95 | % | | | 1.80 | % | | | 1.57 | % | | | 1.50 | % | | | 2.13 | % |
Portfolio turnover rate | | | 67 | % | | | 57 | % | | | 53 | % | | | 82 | % | | | 49 | % |
Notes to Financial Highlights
| (a) | | Total returns are historical and assume changes in share price, reinvestment of dividends and capital gains distributions and do not include the effect of insurance contract charges. Past performance does not guarantee future results. |
| (b) | | Includes contractual management fee waiver related to the Fund’s investments in the GE Institutional Money Market Fund (the “Money Market Fund”). The fee waiver agreement was terminated effective June 30, 2014 with the closure of the Money Market Fund. |
| * | | Beginning with the fiscal year ended December 31, 2016, the Fund was audited by Ernst & Young LLP. The previous years were audited by another independent registered public accounting firm. |
See notes to schedule of investments and notes to financial statements.
State Street Real Estate Securities V.I.S. Fund
Statement of Assets and Liabilities — December 31, 2016
| | | | |
| | | | |
Assets | | | | |
Investments in securities, at fair value (cost $68,165,638) | | $ | 71,537,062 | |
Short-term affiliated investments, at fair value | | | 741,322 | |
Income receivables | | | 373,448 | |
Receivable for fund shares sold | | | 91 | |
Income receivable from affiliated investments | | | 221 | |
Other assets | | | 3,781 | |
| | | | |
Total assets | | | 72,655,925 | |
| | | | |
|
Liabilities | |
Payable for investments purchased | | | 39,772 | |
Payable for fund shares redeemed | | | 37,655 | |
Payable to the Adviser (Note 6) | | | 51,212 | |
Payable to the Custodian (Note 6) | | | 12,504 | |
Accrued other expenses | | | 32,049 | |
| | | | |
Total liabilities | | | 173,192 | |
| | | | |
| | | | |
Net Assets | | $ | 72,482,733 | |
| | | | |
|
Net Assets Consist Of: | |
Capital paid in | | $ | 68,218,932 | |
Undistributed (distributions in excess of) net investment income | | | — | |
Accumulated net realized gain | | | 892,377 | |
Net unrealized appreciation (depreciation) on: | |
Investments | | | 3,371,424 | |
| | | | |
Net Assets | | $ | 72,482,733 | |
| | | | |
| | | | |
Shares outstanding ($0.01 par value; unlimited shares authorized) | | | 5,861,399 | |
Net asset value per share | | $ | 12.37 | |
The accompanying notes are an integral part of these financial statements.
| | |
| 10 | | Statement of Assets and Liabilities |
State Street Real Estate Securities V.I.S. Fund
Statement of Operations — For the year ended December 31, 2016
| | | | |
| | | | |
Investment Income | | | | |
Income | | | | |
Dividend | | $ | 2,206,243 | |
Interest | | | 86 | |
Interest income from affiliated investments | | | 2,323 | |
| | | | |
Total income | | | 2,208,652 | |
| | | | |
| |
Expenses | | | | |
Advisory and administration fees (Note 6) | | | 645,134 | |
Directors’ fees (Note 6) | | | 5,205 | |
Custody and accounting expenses — net (Note 6) | | | 37,493 | |
Professional fees | | | 23,906 | |
Other expenses | | | 22,284 | |
| | | | |
Total Expenses | | | 734,022 | |
| | | | |
Net investment income | | $ | 1,474,630 | |
| | | | |
| |
Net Realized And Unrealized Gain (loss) On Investments | | | | |
Realized gain (loss) on investments | | $ | 7,834,371 | |
Increase (decrease) in unrealized appreciation/(depreciation) on investments | | | (3,629,734 | ) |
| | | | |
| |
Net realized and unrealized gain (loss) on investments | | | 4,204,637 | |
| | | | |
Net increase in net assets resulting from operations | | $ | 5,679,267 | |
| | | | |
The accompanying notes are an integral part of these financial statements.
| | | | |
| Statement of Operations | | | 11 | |
State Street Real Estate Securities V.I.S. Fund
Statements of Changes in Net Assets
| | | | | | | | |
| | | Year Ended December 31, 2016 | | | Year Ended December 31, 2015* | |
| | | | | | | | |
Increase (Decrease) in Net Assets | | | | | | | | |
| | |
Operations: | | | | | | | | |
Net investment income | | $ | 1,474,630 | | | $ | 1,519,783 | |
Net realized gain (loss) on investments | | | 7,834,371 | | | | 8,559,531 | |
Net increase (decrease) in unrealized appreciation/depreciation on investments | | | (3,629,734 | ) | | | (6,283,119 | ) |
| | | | | | | | |
Net increase (decrease) from operations | | | 5,679,267 | | | | 3,796,195 | |
| | | | | | | | |
| | |
Distributions to shareholders from: | | | | | | | | |
Net investment income | | | (1,747,854 | ) | | | (1,423,065 | ) |
Net realized gains | | | (8,094,477 | ) | | | (9,557,654 | ) |
| | | | | | | | |
Total distributions | | | (9,842,331 | ) | | | (10,980,719 | ) |
| | | | | | | | |
Increase (decrease) in assets from operations and distributions | | | (4,163,064 | ) | | | (7,184,524 | ) |
| | | | | | | | |
| | |
Share transactions: | | | | | | | | |
Proceeds from sale of shares | | | 7,409,090 | | | | 4,005,511 | |
Value of distributions reinvested | | | 9,842,331 | | | | 10,980,719 | |
Cost of shares redeemed | | | (19,518,072 | ) | | | (19,895,918 | ) |
| | | | | | | | |
Net increase (decrease) from share transactions | | | (2,266,651 | ) | | | (4,909,688 | ) |
| | | | | | | | |
| | |
Total increase (decrease) in net assets | | | (6,429,715 | ) | | | (12,094,212 | ) |
| | |
Net Assets | | | | | | | | |
Beginning of year | | | 78,912,448 | | | | 91,006,660 | |
| | | | | | | | |
| | |
End of year | | $ | 72,482,733 | | | $ | 78,912,448 | |
| | | | | | | | |
| | |
Undistributed (distributions in excess of) net investment income, end of year | | $ | — | | | $ | 150,065 | |
| | |
Changes in Fund Shares | | | | | | | | |
Shares sold | | | 500,614 | | | | 268,040 | |
Issued for distributions reinvested | | | 814,763 | | | | 815,198 | |
Shares redeemed | | | (1,385,424 | ) | | | (1,324,842 | ) |
| | | | | | | | |
Net decrease in fund shares | | | (70,047 | ) | | | (241,604 | ) |
| | | | | | | | |
| * | | Beginning with the year ended December 31, 2016, the Fund was audited by Ernst & Young LLP. The previous years were audited by another independent registered public accounting firm. |
The accompanying notes are an integral part of these financial statements.
| | |
| 12 | | Statements of Changes in Net Assets |
State Street Real Estate Securities V.I.S. Fund
Notes to Financial Statements — December 31, 2016
| 1. | | Organization of the Company |
State Street Variable Insurance Series Funds, Inc. (the “Company”) was incorporated under the laws of the Commonwealth of Virginia on May 14, 1984 and is registered under the Investment Company Act of 1940, as amended (the “1940 Act”), as an open-end management investment company. Prior to November 30, 2016, the Company was named GE Investments Funds, Inc. The Company is currently composed of the following eight investment portfolios (collectively, the “Funds”): State Street U.S. Equity V.I.S. Fund, State Street S&P 500 Index V.I.S. Fund, State Street Premier Growth Equity V.I.S. Fund, State Street Core Value Equity V.I.S. Fund, State Street Small-Cap Equity V.I.S. Fund, State Street Total Return V.I.S. Fund, State Street Income V.I.S. Fund and State Street Real Estate Securities V.I.S. Fund (the “Fund”). Each Fund is an investment company and accordingly follows the investment company accounting and reporting guidance of the Financial Accounting Standards Board (“FASB”) Accounting Standard Codification (“ASC”) Topic 946 Financial Services — Investment Companies. Each Fund is a diversified investment company within the meaning of the 1940 Act.
Effective November 30, 2016, each individual Fund changed its respective name as follows:
| | |
| Old Name | | New Name |
GE Investments U.S. Equity Fund | | State Street U.S. Equity V.I.S. Fund |
GE Investments S&P 500 Index Fund | | State Street S&P 500 Index V.I.S. Fund |
GE Investments Premier Growth Equity Fund | | State Street Premier Growth Equity V.I.S. Fund |
GE Investments Core Value Equity Fund | | State Street Core Value Equity V.I.S. Fund |
GE Investments Small-Cap Equity Fund | | State Street Small-Cap Equity V.I.S. Fund |
GE Investments Total Return Fund | | State Street Total Return V.I.S. Fund |
GE Investments Income Fund | | State Street Income V.I.S. Fund |
GE Investments Real Estate Securities Fund | | State Street Real Estate Securities V.I.S. Fund |
Shares of the Funds of the Company are offered only to insurance company separate accounts that fund certain variable life insurance contracts and variable annuity contracts. SSGA Funds Management, Inc. (“SSGA FM”) is the investment adviser and administrator of each of the Funds effective July 1, 2016. Prior to July 1, 2016, GE Asset Management Incorporated (“GEAM”) served as the investment adviser and administrator to each Fund.
The Company currently offers one share class (Class 1) of the Fund as an investment option for variable life insurance and variable annuity contracts.
| 2. | | Summary of Significant Accounting Policies |
The preparation of financial statements in conformity with U.S. generally accepted accounting principles (“GAAP”) requires management to make estimates and assumptions that affect the reported amounts of assets and liabilities and disclosure of contingent assets and liabilities at the date of the financial statements and the reported amounts of increases and decreases in net assets from operations during the reporting period. Actual results may differ from those estimates.
Subsequent events after the balance sheet date through the date the financial statements were issued have been evaluated in the preparation of the financial statements. There are no items to report.
The following summarizes the significant accounting policies of the Company:
Securities Valuation and Transactions All investments in securities are recorded at their estimated fair value, as described in Note 3.
Securities transactions are accounted for as of the trade date. Realized gains and losses on investments sold are recorded on the basis of identified cost for both financial statement and federal tax purposes.
Derivatives The Fund is subject to equity price risk in the normal course of pursuing its investment objective. The Fund may enter into various types of derivative transactions to gain market exposure for residual and accumulating cash positions.
Real Estate Investment Trusts Dividend income, attributable to real estate investment trusts (“REITs”), is recorded based on management’s estimate of the income included in the distributions received. Distributions received in excess of this amount are recorded as a reduction of the cost of the investments. The actual amounts of income and return of capital are determined by each REIT only after its fiscal year-end and may differ from the estimated amounts.
| | | | |
| Notes to Financial Statements | | | 13 | |
State Street Real Estate Securities V.I.S. Fund
Notes to Financial Statements, continued — December 31, 2016
Investment Income Corporate actions (including cash dividends) are recorded on the ex-dividend date, net of applicable withholding taxes, except for certain foreign corporate actions which are recorded as soon after the ex-dividend date as such information becomes available. Withholding taxes on foreign dividends, if any, have been provided for in accordance with the Fund’s understanding of the applicable country’s tax rules and rates.
Interest income is recorded on the accrual basis. Accretion of discounts and amortization of premiums on taxable bonds are to the call or maturity date, whichever is shorter, using the effective yield method.
Expenses Fund specific expenses are charged to the Fund that incurs such expenses. Such expenses may include custodial fees, legal and accounting fees, printing costs and registration fees.
Expenses that are not fund specific are allocated pro rata across the Funds. Expenses of the Fund are generally paid directly by the Fund, however, expenses may be paid by the investment adviser and reimbursed by the Fund.
Federal Income Taxes The Fund intends to comply with all sections of the Internal Revenue Code of 1986, as amended (the “Internal Revenue Code”) applicable to regulated investment companies, including the distribution of substantially all of its taxable net investment income and net realized capital gains to its shareholders. Therefore, no provision for federal income tax has been made. The Fund is treated as a separate taxpayer for federal income tax purposes.
The Fund utilizes various methods to measure the fair value of most of its investments on a recurring basis. GAAP establishes a framework for measuring fair value and providing related disclosures. Broadly, the framework requires fair value to be determined based on the exchange price that would be received for an asset or paid to transfer a liability (an exit price) in the principal or most advantageous market for the asset or liability in an orderly transaction between market participants at the measurement date. In the absence of active markets for the identical assets or liabilities, such measurements involve developing assumptions based on market observable data and, in the absence of such data, internal information that is consistent with what market participants would use in a hypothetical transaction that occurs at the measurement date. It also establishes a three-level valuation hierarchy based upon observable and non-observable inputs.
Observable inputs reflect market data obtained from independent sources, while unobservable inputs reflect our market assumptions. Preference is given to observable inputs. These two types of inputs create the following fair value hierarchy:
| | • | | Level 1 — Quoted prices for identical investments in active markets. |
| | • | | Level 2 — Quoted prices for similar investments in active markets; quoted prices for identical or similar investments in markets that are not active; and model-derived valuations whose inputs are observable or whose significant value drivers are observable. |
| | • | | Level 3 — Significant inputs to the valuation model are unobservable. |
Policies and procedures are maintained to value investments using the best and most relevant data available. In addition, pricing vendors are utilized to assist in valuing investments. The investment adviser performs periodic reviews of the methodologies used by independent pricing services including price validation of individual securities.
Fair Value Measurement The following section describes the valuation methodologies the Fund uses to measure different financial investments at fair value.
The Fund’s portfolio securities are valued generally on the basis of market quotations. Equity securities generally are valued at the last reported sale price on the primary market in which they are traded. Portfolio securities listed on NASDAQ are valued using the NASDAQ Official Closing Price. Level 1 securities primarily include publicly-traded equity securities, which may not necessarily represent the last sales price. If no sales occurred on the exchange or NASDAQ that day, the portfolio security generally is valued using the last reported bid price. In those circumstances, the Fund typically classifies the investment securities in Level 2.
Short-term securities of sufficient credit quality with remaining maturities of sixty days or less at the time of purchase are typically valued on the basis of amortized cost which approximates fair value and these are included in Level 2. If it is determined that amortized cost does not approximate fair value, securities may be valued based on dealer supplied valuations
| | |
| 14 | | Notes to Financial Statements |
State Street Real Estate Securities V.I.S. Fund
Notes to Financial Statements, continued — December 31, 2016
or quotations. In these infrequent circumstances, pricing services may provide the Fund with valuations that are based on significant unobservable inputs, and in those circumstances the investment securities are classified in Level 3.
Investments in registered investment companies are valued at the published daily net asset value (“NAV”) and classified in Level 1.
If prices are not readily available for a portfolio security, or if it is believed that a price for a portfolio security does not represent its fair value, the security may be valued using procedures approved by the Company’s Board of Directors that are designed to establish its “fair” value. These securities are typically classified in Level 3. Those procedures require that the fair value of a security be established by a valuation committee of the investment adviser. The valuation committee follows different protocols for different types of investments and circumstances. The fair value procedures may be used to value any investment of the Fund in the appropriate circumstances.
Fair value determinations generally are used for securities whose value is affected by a significant event that will materially affect the value of a security and which occurs subsequent to the time of the close of the principal market on which such security trades but prior to the calculation of the Fund’s NAV.
The value established for such a portfolio security valued other than by use of a market quotation (as described above) may be different than what would be produced through the use of market quotations or another methodology. Portfolio securities that are valued using techniques other than market quotations, including “fair valued” securities, may be subject to greater fluctuation in their value from one day to the next than would be the case if market quotations were used. In addition, there is no assurance that the Fund could sell a portfolio security for the value established for it at any time and it is possible that the Fund would incur a loss because a portfolio security is sold at a discount to its established value.
Other financial investments are derivative instruments that are not reflected in total investments, such as futures, forwards, swaps, and written options contracts, which are valued based on fair value as discussed above.
The Fund uses closing prices for derivatives included in Level 1, which are traded either on exchanges or liquid over-the-counter markets. Derivative assets and liabilities included in Level 2 primarily represent interest rate swaps, cross-currency swaps and foreign currency and commodity forward and option contracts. Derivative assets and liabilities included in Level 3 primarily represent interest rate products that contain embedded optionality or prepayment features.
The inputs or methodology used for valuing securities are not an indication of the risk associated with investing in those securities.
The following table presents the Fund’s investments measured at fair value on a recurring basis at December 31, 2016:
| | | | | | | | | | | | | | | | |
| Investments | | Level 1 | | | Level 2 | | | Level 3 | | | Total | |
| | | | | | | | | | | | | | | | |
Investments in Securities† | | | | | | | | | | | | | | | | |
Common Stock | | $ | 71,537,062 | | | $ | — | | | $ | — | | | $ | 71,537,062 | |
Short-Term Investments | | | 741,322 | | | | — | | | | — | | | | 741,322 | |
| | | | | | | | | | | | | | | | |
Total Investments in Securities | | $ | 72,278,384 | | | $ | — | | | $ | — | | | $ | 72,278,384 | |
| | | | | | | | | | | | | | | | |
| | † | See Schedule of Investments for Industry Classification. |
There were no transfers between fair value levels during the period. Transfers between fair value levels are recognized at the beginning of the period.
Prior to July 1, 2016, the Company shared a revolving credit facility of up to $150 million with a number of its affiliates. The credit facility was with the Company’s custodian bank, State Street Bank and Trust Company (“State Street”). The revolving credit facility required the payment of a commitment fee equal to 0.20% per annum on the daily unused portion of the credit facility, payable quarterly. The portion borne by each Fund generally was borne proportionally based upon net assets. Generally, borrowings under the credit facility would accrue interest at the higher of the 1-Month LIBOR plus 1.25% and the Overnight Federal Funds Rate plus 1.25% and would be borne by the borrowing Fund. The maximum amount allowed to be borrowed by any one Fund was the lesser of (i) 33.33% of its total assets or (ii) 20% of its net assets. The credit facility was not utilized by the Fund during the fiscal year ended December 31, 2016. The revolving credit facility with State Street was terminated effective June 30, 2016.
| | | | |
| Notes to Financial Statements | | | 15 | |
State Street Real Estate Securities V.I.S. Fund
Notes to Financial Statements, continued — December 31, 2016
Currently, the Funds and other affiliated funds (each a “Participant” and, collectively, the “Participants”) participate in a $360 million revolving credit facility provided by a syndication of banks under which the Participants may borrow to fund shareholder redemptions. This agreement expires October 12, 2017, unless extended or renewed.
The Participants are charged an annual commitment fee which is calculated based on the unused portion of the shared credit line. Commitment fees are allocated among each of the Participants based on relative net assets. A Participant incurs and pays the interest expense related to its borrowing. Interest is calculated at a rate per annum equal to the sum of 1% plus the greater of the New York Fed Bank Rate and 1-month LIBOR rate. From July 1, 2016, the date the Funds were added to this credit facility, through October 12, 2016, interest was calculated at a rate per annum equal to the sum of the New York Fed Bank Rate plus 1%.
The credit facilities were utilized by the Fund during the fiscal year ended December 31, 2016 as follows:
| | | | | | | | | | | | | | | | | | |
Average
Loan Balance | | Average
Interest Rate | | Number of
Days | | Interest
Paid |
| | | | | | | | | | | | | | | | | | | |
| | $ | 1,697,500 | | | | | 1.519% | | | | | 8 | | | | $ | 569 | |
The Fund did not have any outstanding loans as of December 31, 2016.
| 5. | | Compensation and Fees Paid to Affiliates |
SSGA FM, a registered investment adviser, was retained by the Company’s Board of Directors effective July 1, 2016 to act as investment adviser and administrator of the Fund. SSGA FM’s compensation for investment advisory and administrative services (“Management Fee”) is paid monthly based on the average daily net assets of the Fund. The Management Fee is stated in the following schedule:
| | | | | | | | |
Average Daily
Net Assets of Fund | | Management
Fees |
| | First $ | 100 million | | | | | 0.85 | % |
| | Next $ | 100 million | | | | | 0.80 | % |
| | Over $ | 200 million | | | | | 0.75 | % |
Prior to July 1, 2016, GEAM served as the Fund’s investment adviser and administrator and the Fund paid GEAM a Management Fee as stated in the following schedule:
| | | | | | | | |
Average Daily
Net Assets of Fund | | Management
Fees |
| | First $ | 100 million | | | | | 0.85 | % |
| | Next $ | 100 million | | | | | 0.80 | % |
| | Over $ | 200 million | | | | | 0.75 | % |
State Street serves as the sub-administrator and custodian to the Funds. Amounts paid by the Fund to State Street for performing such services are included in advisory and administration and custody and accounting expenses, respectively.
Directors’ Compensation The Fund pays no compensation to its Directors who are officers or employees of SSGA FM or its affiliates. Directors who are not such officers or employees also serve in a similar capacity for other funds advised by SSGA FM. Compensation paid to non-interested Directors is reflected on the Statement of Operations. These fees are allocated pro rata across all of the mutual fund platforms served by the Directors, including the Fund, and are based upon the relative net assets of each fund within such platforms. (For additional information about Directors’ compensation, please refer to the Funds’ Statement of Additional Information.)
Other Transactions with Affiliates In December 2015, State Street announced a review of the manner in which it invoiced certain expenses to certain of its Investment Servicing clients, primarily in the United States, during an 18-year period going back to 1998 and its determination that it had incorrectly invoiced clients for certain expenses. State Street informed its clients that it will pay to them the expenses it concluded were incorrectly invoiced to them, plus interest.
| | |
| 16 | | Notes to Financial Statements |
State Street Real Estate Securities V.I.S. Fund
Notes to Financial Statements, continued — December 31, 2016
The Fund was impacted by this matter. The amounts in the table below represent the refunded expenses and interest received by the Fund for the periods in question.
| | | | | | | | | | | | | | | | | | |
Refunded
Custody
Expense* | | Interest* | | Total | | % of Net
Assets at
12/31/16 |
| | $ | 181 | | | | $ | 86 | | | | $ | 267 | | | | | 0.0004 | % |
| | * | Refunded Custody Expense and Interest appear on the Statement of Operations in Custody and Accounting Expenses — net and Interest Income, respectively. |
Pursuant to an investment sub-advisory agreement with SSGA FM, CenterSquare Management, Inc. (“CenterSquare”) is the sub-adviser to the Fund. CenterSquare is responsible for the day-to-day portfolio management of the assets of the Fund, including the responsibility for making decisions to buy, sell or hold a particular security, under the general supervision of SSGA FM and the Board. For its services, SSGA FM pays CenterSquare monthly sub-advisory fees which are calculated as a percentage of the average daily net assets of the Fund.
| 7. | | Investment Transactions |
Purchases and Sales of Securities The cost of purchases and the proceeds from sales of investments, other than short-term securities, for the fiscal year ended December 31, 2016, were as follows:
| | | | | | | | |
| Non-U.S. Government Securities |
| Purchases | | Sales |
| | $ | 50,252,505 | | | | $ | 59,959,019 | |
Affiliated Investments The Fund may invest in affiliated entities, including securities issued by State Street, affiliated funds, or entities deemed to be affiliates as a result of the Fund owning more than five percent of the entity’s voting securities or outstanding shares. Amounts relating to these transactions during the fiscal year ended December 31, 2016 are disclosed in the Schedule of Investments.
The Fund is subject to ASC 740, Income Taxes (“ASC 740”). ASC 740 provides guidance for financial accounting and reporting for the effects of income taxes that result from an entity’s activities during the year. ASC 740 also provides guidance regarding how uncertain tax positions should be recognized, measured, presented and disclosed in the financial statements. ASC 740 requires evaluation of tax positions taken or expected to be taken in the course of preparing the Fund’s tax returns to determine whether the tax positions are “more likely than not” of being sustained by the applicable tax authority. There are no adjustments to the Fund’s net assets required under ASC 740. The Fund’s 2013, 2014, 2015, and 2016 fiscal year tax returns are still open to examination by the Federal and applicable state tax authorities.
At December 31, 2016, information on the tax cost of investments and distributable earnings on a tax basis was as follows:
| | | | | | | | | | | | | | | | | | | | | | | | | | | | | | | | | | | | | | |
Cost of
Investments
For Tax
Purposes | | Gross Tax | | Net Tax
Appreciation/
(Depreciation) | | Undistributed
Income | | Undistributed
Accum.
Capital
Gain/(Loss) | | Late-Year
Losses |
| | Appreciation | | Depreciation | | Investments | | Derivatives/
Currency | | | |
| | $ | 69,096,888 | | | | $ | 4,619,409 | | | | $ | (1,437,913 | ) | | | $ | 3,181,496 | | | | $ | — | | | | $ | — | | | | $ | 1,082,308 | | | | $ | — | |
As of December 31, 2016, the Fund had no capital loss carryovers. Capital loss carryovers are available to offset future realized capital gains to the extent provided in the Internal Revenue Code and regulations thereunder. To the extent that these carryover losses are used to offset future capital gains, it is probable that the gains offset will not be distributed to shareholders because they would be taxable as ordinary income.
| | | | |
| Notes to Financial Statements | | | 17 | |
State Street Real Estate Securities V.I.S. Fund
Notes to Financial Statements, continued — December 31, 2016
Any qualified late-year loss is deemed to arise on the first day of the Fund’s next tax year (if the Fund elects to defer such loss). Under this regime, generally, the Fund can elect to defer any post-October capital loss and/or any late-year ordinary loss as defined by the Internal Revenue Code.
The Fund incurred no such losses for the fiscal year ended December 31, 2016.
The tax character of distributions paid during the fiscal years ended December 31, 2016 and December 31, 2015 were as follows:
| | | | | | | | | | | | | | | | | | |
| Year | | Ordinary
Income | | Long-Term
Capital Gains | | Total |
| | | | | | | | | | | | | | | | | | | |
| | | 2016 | | | | $ | 3,258,333 | | | | $ | 6,583,998 | | | | $ | 9,842,331 | |
| | | 2015 | | | | | 2,565,244 | | | | | 8,415,475 | | | | | 10,980,719 | |
Distributions to Shareholders The Fund declares and pays any dividends from net investment income annually. The Fund declares and pays any net realized capital gains in excess of capital loss carryforwards distributions annually. The character of income and gains to be distributed is determined in accordance with income tax regulations which may differ from GAAP. These differences include (but are not limited to) distributions from REITs, dividend re-designations and losses deferred due to wash sale transactions. Reclassifications due to permanent book/tax differences are made to the Fund’s capital accounts to reflect income and gains available for distribution (or available capital loss carryovers) under income tax regulations. These reclassifications have no impact on net investment income, realized gains or losses, or the NAV of the Fund. The calculation of net investment income per share in the Financial Highlights table excludes these adjustments.
The reclassifications for the fiscal year ended December 31, 2016 were as follows:
| | | | | | | | | | | | | |
Undistributed
Net Investment
Income | | Accumulated
Net Realized
Gain (Loss) | | Capital
Paid In |
| | | | | | | | | | | | | | |
| | $ | 123,159 | | | | $ | (123,159 | ) | | | $ | — | |
KPMG LLP (“KPMG”) served as the independent registered certified public accounting firm of the Company through its resignation as of June 30, 2016. On September 9, 2016, upon recommendation by the Audit Committee of the Company, the Company’s Board of Directors selected Ernst & Young LLP (“EY”) to replace KPMG as the independent public accountant for the fiscal year ended December 31, 2016.
The reports of KPMG on the financial statements for the fiscal years ended December 31, 2014 and December 31, 2015 contained no adverse opinion or disclaimer of opinion and were not qualified or modified as to uncertainty, audit scope or accounting principles.
During the Company’s fiscal years ended December 31, 2014 and December 31, 2015 and through the period ended June 30, 2016, there were no disagreements with KPMG on any matter of accounting principles or practices, financial statement disclosure, or auditing scope or procedure, which disagreements if not resolved to the satisfaction of KPMG would have caused them to make reference thereto in their reports on the financial statements for such years or periods.
During the Company’s fiscal years ended December 31, 2014 and December 31, 2015 and through the period ended June 30, 2016, there were no reportable events (as defined in Item 304(a)(1)(v) of Regulation S-K). The Funds requested and KPMG furnished a letter addressed to the Securities and Exchange Commission stating whether or not it agreed with the above statements. A copy of such letter was filed as Exhibit 77 to Form N-SAR for the period ended December 31, 2016.
During the Company’s fiscal years ended December 31, 2014 and December 31, 2015 and through September 9, 2016, neither the Company nor anyone on its behalf has consulted EY on items which: (i) concerned the application of accounting principles to a specified transaction, either completed or proposed, or the type of audit opinion that might be rendered on the Company’s financial statements or (ii) concerned the subject of a disagreement (as defined in paragraph (a)(1)(iv) of Item 304 of Regulations S-K) or reportable events (as described in paragraph (a)(1)(v) of said Item 304).
| | |
| 18 | | Notes to Financial Statements |
State Street Real Estate Securities V.I.S. Fund
Report of Independent Registered Public Accounting Firm
To the Board of Directors of State Street Variable Insurance Series Funds, Inc. and Shareholders of State Street Real Estate Securities V.I.S. Fund:
We have audited the accompanying statement of assets and liabilities of the State Street Real Estate Securities V.I.S. Fund (formerly GE Investments Real Estate Securities Fund) (one of the funds constituting State Street Variable Insurance Series Funds, Inc. (formerly GE Investment Funds, Inc.)) (the “Fund”), including the schedule of investments, as of December 31, 2016, and the related statements of operations, changes in net assets and the financial highlights for the year then ended. These financial statements and financial highlights are the responsibility of the Fund’s management. Our responsibility is to express an opinion on these financial statements and financial highlights based on our audit. The statement of changes in net assets for the year ended December 31, 2015 and the financial highlights for periods ended prior to January 1, 2016 were audited by another independent registered public accounting firm whose report, dated February 19, 2016, expressed an unqualified opinion on that statement of changes in net assets and those financial highlights.
We conducted our audit in accordance with the standards of the Public Company Accounting Oversight Board (United States). Those standards require that we plan and perform the audit to obtain reasonable assurance about whether the financial statements and financial highlights are free of material misstatement. We were not engaged to perform an audit of the Fund’s internal control over financial reporting. Our audit included consideration of internal control over financial reporting as a basis for designing audit procedures that are appropriate in the circumstances, but not for the purpose of expressing an opinion on the effectiveness of the Fund’s internal control over financial reporting. Accordingly, we express no such opinion. An audit also includes examining, on a test basis, evidence supporting the amounts and disclosures in the financial statements and financial highlights, assessing the accounting principles used and significant estimates made by management, and evaluating the overall financial statement presentation. Our procedures included confirmation of securities owned as of December 31, 2016, by correspondence with the custodian and brokers or by other appropriate auditing procedures where replies from brokers were not received. We believe that our audit provides a reasonable basis for our opinion.
In our opinion, the financial statements and financial highlights referred to above present fairly, in all material respects, the financial position of the State Street Real Estate Securities V.I.S. Fund (one of the funds constituting State Street Variable Insurance Series Funds, Inc.) at December 31, 2016, the results of its operations, changes in its net assets and the financial highlights for the year then ended, in conformity with U.S. generally accepted accounting principles.

Boston, Massachusetts
February 17, 2017
| | | | |
| Report of Independent Registered Public Accounting Firm | | | 19 | |
State Street Real Estate Securities V.I.S. Fund
Tax Information — December 31, 2016 (Unaudited)
For the year ended December 31, 2016, the Fund hereby designates $6,583,998 as capital gain dividends, or the amount ultimately treated as capital gain net income.
The amounts presented herein may differ from amounts presented elsewhere in the financial statements due to differences between tax and financial accounting principles. Please consult a tax advisor if you have any questions about Federal or State income tax laws or on how to prepare your tax returns. If you have specific questions about your Fund account, please consult your investment representative.
State Street Real Estate Securities V.I.S. Fund
Special Meeting of Shareholders — Voting Results (Unaudited)
On November 2, 2016, the State Street Variable Insurance Series Funds, Inc. (formerly known as GE Investments Funds, Inc.) (the “Company”) held a special meeting of shareholders of each series portfolio of the Company (collectively, the “Funds”), including shareholders of the State Street Real Estate Securities V.I.S. Fund (formerly known as the Real Estate Securities Fund) (the “Fund”). Shareholders of record on August 31, 2016 were entitled to vote on the proposals. For each proposal shareholders of all Funds voted together and not by Fund or share class. At the meeting, all proposals were approved by the Fund’s shareholders and the following votes were recorded:
Proposal 1:
Approval of an amendment to the Articles of Incorporation of the Company to change the name of the Company from GE Investments Funds, Inc. to State Street Variable Insurance Series Funds, Inc.
Company Votes:
| | | | | | | | | | | | |
| | | No. of Shares | | | % of Outstanding Shares | | | % of Shares Present | |
Affirmative | | | 129,623,837.819 | | | | 89.283 | % | | | 89.283 | % |
Against | | | 10,047,818.534 | | | | 6.921 | % | | | 6.921 | % |
Abstain | | | 5,511,041.282 | | | | 3.796 | % | | | 3.796 | % |
Total | | | 145,182,697.634 | | | | 100.000 | % | | | 100.000 | % |
Fund votes:
| | | | | | | | | | | | |
| | | No. of Shares | | | % of Outstanding Shares | | | % of Shares Present | |
Affirmative | | | 4,789,178.584 | | | | 90.870 | % | | | 90.870 | % |
Against | | | 273,499.249 | | | | 5.189 | % | | | 5.189 | % |
Abstain | | | 207,712.174 | | | | 3.941 | % | | | 3.941 | % |
Total | | | 5,270,390.007 | | | | 100.000 | % | | | 100.000 | % |
Proposal 2:
Approval of an amendment to the Articles of Incorporation of the Company to permit the Board of Directors to change the name of the Company without seeking shareholder approval.
Company votes:
| | | | | | | | | | | | |
| | | No. of Shares | | | % of Outstanding Shares | | | % of Shares Present | |
Affirmative | | | 118,220,823.871 | | | | 81.429 | % | | | 81.429 | % |
Against | | | 21,486,028.150 | | | | 14.799 | % | | | 14.799 | % |
Abstain | | | 5,475,845.611 | | | | 3.772 | % | | | 3.772 | % |
Total | | | 145,182,697.634 | | | | 100.000 | % | | | 100.000 | % |
Fund votes:
| | | | | | | | | | | | |
| | | No. of Shares | | | % of Outstanding Shares | | | % of Shares Present | |
Affirmative | | | 4,498,890.363 | | | | 85.362 | % | | | 85.362 | % |
Against | | | 578,494.831 | | | | 10.976 | % | | | 10.976 | % |
Abstain | | | 193,004.813 | | | | 3.662 | % | | | 3.662 | % |
Total | | | 5,270,390.007 | | | | 100.000 | % | | | 100.000 | % |
| | | | |
| Special Meeting of Shareholders — Voting Results | | | 21 | |
State Street Real Estate Securities V.I.S. Fund
Additional Information — December 31, 2016 (Unaudited)
Information about Directors and Executive Officers:
The business and affairs of the Fund are managed under the direction of the Fund’s Board of Directors. Information pertaining to the Directors and officers of the Fund is set forth below. Matthew J. Simpson resigned as a Director of the Fund effective June 30, 2016.
| | | | | | | | | | | | |
Name,
Address,
and Age | | Position(s) Held
with Fund | | Term of
Office and
Length of
Time Served | | Principal Occupation(s)
During Past 5 Years | | Number of
Portfolios
in Fund
Complex
Overseen
by
Director/
Officer | | | Other Directorships Held by Director/Officer |
INTERESTED DIRECTORS AND EXECUTIVE OFFICERS |
Jeanne M. La Porta c/o SSGA FM 1600 Summer St. Stamford, CT 06905 Age 51 | | Director and President | | Until successor is elected and qualified – 2 years | | Senior Managing Director at State Street Global Advisors since July 2016; President of GE Retirement Savings Plan Funds since July 2016; Senior Vice President and Commercial Operations Leader at GEAM from March 2014 to July 2016; President of State Street Institutional Funds and State Street Variable Insurance Series Funds, Inc. since April 2014; President and Trustee of GEAM’s UCITs Funds from March 2014 to November 2014; Senior Vice President and Commercial Administrative Officer at GEAM from April 2010 to March 2014; Vice President of State Street Institutional Funds from July 2003 to April 2014; Vice President of Elfun Funds from October 2003 to July 2016; Vice President of GE Retirement Savings Plan Funds from October 2003 to July 2016; Secretary of GE Funds from July 2007 to September 2010 and Vice President from July 2007 to February 2011; Senior Vice President and Deputy General Counsel of GEAM from October 2007 to April 2010; Vice President and Assistant Secretary of Elfun Funds and GE Retirement Savings Plan Funds from July 2003 to June 2010; and Vice President and Associate General Counsel – Marketing and Client Services (formerly Asset Management Services) at GEAM from May 1997 to October 2007. | | | 22 | | | Trustee and President of State Street Institutional Funds since 2014; Trustee of Elfun Funds since 2014. |
| | |
| 22 | | Additional Information |
State Street Real Estate Securities V.I.S. Fund
Additional Information, continued — December 31, 2016 (Unaudited)
| | | | | | | | | | | | |
Name,
Address,
and Age | | Position(s) Held
with Fund | | Term of
Office and
Length of
Time Served | | Principal Occupation(s)
During Past 5 Years | | Number of
Portfolios
in Fund
Complex
Overseen
by
Director/
Officer | | | Other Directorships Held by Director/Officer |
INTERESTED DIRECTORS AND EXECUTIVE OFFICERS (continued) |
JoonWon Choe c/o SSGA FM 1600 Summer St. Stamford, CT 06905 Age 47 | | Vice President & Secretary | | Until successor is elected and qualified – 6 years | | Managing Director and Managing Counsel at State Street Global Advisors since July 2016; Senior Vice President and Deputy General Counsel at GEAM from March 2011 to July 2016; Vice President and Secretary of State Street Institutional Funds since September 2010; Vice President and Assistant Secretary of GE Retirement Savings Plan Funds since September 2010; Vice President and Assistant Secretary of Elfun Funds from September 2010 to July 2016; Senior Vice President and Associate General Counsel at GEAM from June 2010 to March 2011; Vice President and Associate General Counsel of GEAM from November 2005 to June 2010; and Vice President and Secretary of GE Funds from September 2010 to February 2011. | | | N/A | | | N/A |
| | | | | | | | | | | | | |
Robert Herlihy c/o SSGA FM 1600 Summer St. Stamford, CT 06905 Age 49 | | Chief Compliance Officer | | Until successor is elected and qualified – 11 years | | Managing Director at State Street Global Advisors since July 2016; Deputy Chief Compliance Officer of Elfun Funds since July 2016; Chief Compliance Officer of State Street Institutional Funds and GE Retirement Savings Plan Funds since July 2005; Chief Compliance Officer of GEAM and Elfun Funds from July 2005 to July 2016; Chief Compliance Officer of GE Funds from July 2005 to February 2011; and Manager of Fund Administration at GEAM from 2002 – 2005. | | | N/A | | | N/A |
| | | | | | | | | | | | | |
Arthur A. Jensen c/o SSGA FM 1600 Summer St. Stamford, CT 06905 Age 50 | | Treasurer | | Until successor is elected and qualified – 5 years | | Vice President at State Street Global Advisors since July 2016; Deputy Treasurer of Elfun Funds since July 2016; Treasurer of State Street Institutional Funds and GE Retirement Savings Plan Funds since June 2011; Treasurer of Elfun Funds from June 2011 to July 2016; Mutual Funds Controller of GEAM from April 2011 to July 2016; Senior Vice President at Citigroup from 2008 to 2010; and Vice President at JPMorgan from 2005 to 2008. | | | N/A | | | N/A |
| | | | |
| Additional Information | | | 23 | |
State Street Real Estate Securities V.I.S. Fund
Additional Information, continued — December 31, 2016 (Unaudited)
| | | | | | | | | | | | |
Name,
Address,
and Age | | Position(s) Held
with Fund | | Term of
Office and
Length of
Time Served | | Principal Occupation(s)
During Past 5 Years | | Number of
Portfolios
in Fund
Complex
Overseen
by
Director/
Officer | | | Other Directorships Held by Director/Officer |
INTERESTED DIRECTORS AND EXECUTIVE OFFICERS (continued) |
Brian Harris c/o SSGA FM State Street Financial Center
One Lincoln Street
Boston, MA 02111-2900 Age 43 | | Deputy Chief Compliance Officer | | Until successor is elected and qualified – less than 1 year | | Managing Director, State Street Global Advisors and SSGA Funds Management, Inc. (June 2013 – present)*; Senior Vice President and Global Head of Investment Compliance, BofA Global Capital Management (2010-2013); Director of Compliance, AARP Financial Inc. (2008-2010). | | | N/A | | | N/A |
| | | | | | | | | | | | | |
Bruce S. Rosenberg c/o SSGA FM State Street Financial Center
One Lincoln Street
Boston, MA 02111-2900 Age 55 | | Assistant Treasurer | | Until successor is elected and qualified – less than 1 year | | Managing Director, State Street Global Advisors and SSGA Funds Management, Inc. (July 2015 – present); Director, Credit Suisse (April 2008 – July 2015). | | | N/A | | | N/A |
| | | | | | | | | | | | | |
Ann M. Carpenter c/o SSGA FM State Street Financial Center
One Lincoln Street
Boston, MA 02111-2900 Age 50 | | Assistant Treasurer | | Until successor is elected and qualified – less than 1 year | | Chief Operating Officer, SSGA Funds Management, Inc. (April 2014 – present); Managing Director, State Street Global Advisors and SSGA Funds Management, Inc. (2005 – present).* | | | N/A | | | N/A |
| | | | | | | | | | | | | |
Chad C. Hallett c/o SSGA FM State Street Financial Center
One Lincoln Street
Boston, MA 02111-2900 Age 47 | | Assistant Treasurer | | Until successor is elected and qualified – less than 1 year | | Vice President, State Street Global Advisors and SSGA Funds Management, Inc. (November 2014 – present); Vice President, State Street Bank and Trust Company (2001 – November 2014). | | | N/A | | | N/A |
| |
NON-INTERESTED DIRECTORS |
John R. Costantino c/o SSGA FM 1600 Summer St. Stamford, CT 06905 Age 70 | | Chairman of the Board | | Until successor is elected
and qualified –
20 years | | General Partner, NGN Capital LLC since 2006; and Managing Director, Vice President of Walden Capital Management since 1996. | | | 16 | | | Trustee of State Street Institutional Funds since 1997; Trustee of Fordham University from 1989 to 1995 and from 2001 to 2007 and Trustee Emeritus since 2007; Trustee of NeuroScience Research Institute since 1986; Trustee of GE Funds from 1993 to February 2011; Director of Artes Medical from 2006 to 2008; and Trustee of Gregorian University Foundation from 1992 to 2007. |
| * | | Served in various capacities and/or with various affiliated entities during noted time period. |
| | |
| 24 | | Additional Information |
State Street Real Estate Securities V.I.S. Fund
Additional Information, continued — December 31, 2016 (Unaudited)
| | | | | | | | | | | | |
Name,
Address,
and Age | | Position(s) Held
with Fund | | Term of
Office and
Length of
Time Served | | Principal Occupation(s)
During Past 5 Years | | Number of
Portfolios
in Fund
Complex
Overseen
by
Director/
Officer | | | Other Directorships Held by Director/Officer |
NON-INTERESTED DIRECTORS (continued) |
R. Sheldon Johnson c/o SSGA FM 1600 Summer St. Stamford, CT 06905 Age 70 | | Director | | Until successor is elected
and qualified –
5 years | | Retired, 2006 to present; Head of Global Institutional Equity Sales and Marketing at Morgan Stanley & Co., Inc. from 2002 to 2006 and Managing Director at Morgan Stanley & Co., Inc. from 1988 to 2006. | | | 16 | | | Trustee of State Street Institutional Funds since April 2011 and Trustee of St. Lawrence University since 2003. |
| | | | | | | | | | | | | |
Donna M. Rapaccioli c/o SSGA FM 1600 Summer St. Stamford, CT 06905 Age 54 | | Director | | Until successor is elected and qualified –
5 years | | Dean of the Gabelli School of Business since 2007 and Accounting professor since 1987 at Fordham University. | | | 16 | | | Trustee of State Street Institutional Funds since January 2012 and Trustee of Emmanuel College since 2010. |
The Statement of Additional Information for the Funds includes additional information about the Directors and Officers and is available, without charge, upon request by calling 1-800-242-0134.
| | | | |
| Additional Information | | | 25 | |
State Street Real Estate Securities V.I.S. Fund
Investment Team (Unaudited)
Investment Adviser and Administrator
SSGA Funds Management, Inc.
Board of Directors
John R. Costantino, Chairman
R. Sheldon Johnson
Jeanne M. La Porta
Donna M. Rapaccioli
Secretary
JoonWon Choe
Chief Compliance Officer
Robert Herlihy
Deputy Chief Compliance Officer
Brian Harris
Treasurer
Arthur A. Jensen
Assistant Treasurers
Bruce S. Rosenberg
Ann M. Carpenter
Chad C. Hallett
Distributor
State Street Global Markets, LLC
Member FINRA and SIPC
Custodian
State Street Bank and Trust Company
Investment Adviser
SSGA Funds Management, Inc.
1600 Summer Street
Stamford, CT 06905
or at:
P.O. Box 7900
Stamford, CT 06904-7900
Distributor
State Street Global Markets, LLC
Member FINRA and SIPC
State Street Financial Center
One Lincoln Street
Boston, MA 02111
www.ssga.com/geam
The Fund files its complete schedule of portfolio holdings with the Securities and Exchange Commission for the first and third quarters of each fiscal year on Form N-Q. The Fund’s Forms N-Q, as well as a description of the policies and procedures that the Fund uses to determine how to vote proxies (if any) relating to portfolio securities is available without charge (i) upon request, by calling 1-800-242-0134; (ii) on the Fund’s website at http://www.ssga.com/geam; and (iii) on the Commission’s website at http://www.sec.gov. The Fund’s Forms N-Q may be reviewed and copied at the Commission’s Public Reference Room in Washington, DC — information on the operation of the Public Reference Room may be obtained by calling 1-800-SEC-0330.
Information (if any) regarding how the Fund voted proxies relating to portfolio securities during the most recently disclosed 12-month period ended June 30 is available without charge (i) through the Fund’s website at http://www.ssga.com/geam; and (ii) on the Commission’s website at http://www.sec.gov.
IBG-22837
Annual Report
31 December 2016
State Street Premier Growth Equity V.I.S. Fund
(formerly the GE Investments Premier Growth Equity Fund)

State Street Premier Growth Equity V.I.S. Fund
Annual Report
December 31, 2016
Table of Contents
This report is prepared for Policyholders of certain variable contracts and may be distributed to others only if preceded or accompanied by the variable contract’s current prospectus and the current summary prospectus of the Fund available for investments thereunder.
State Street Premier Growth Equity V.I.S. Fund
Notes to Performance — December 31, 2016 (Unaudited)
The information provided on the performance pages relates to the State Street Premier Growth Equity V.I.S. Fund (the “Fund”).
Total return performance shown in this report for the Fund takes into account changes in share price and assumes reinvestment of dividends and capital gains distributions, if any. Total returns shown are net of Fund fees and expenses but do not reflect fees and charges associated with the variable contracts such as administrative fees, account charges and surrender charges, which, if reflected, would reduce the Fund’s total returns for all periods shown.
The performance data quoted represents past performance; past performance does not guarantee future results. Investment return and principal value will fluctuate so your shares, when redeemed, may be worth more or less than their original cost. Current performance may be higher or lower than the performance data quoted. Periods less than one year are not annualized. Please call toll-free (800) 242-0134 or visit the Fund’s website at http://www.ssga.com/geam for the most recent month-end performance data.
An investment in the Fund is not a deposit of any bank and is not insured or guaranteed by the Federal Deposit Insurance Corporation (“FDIC”) or any other government agency. An investment in the Fund is subject to risk, including possible loss of principal invested.
The S&P 500® Index is an unmanaged, market capitalization-weighted index of stocks of 500 large U.S. companies, which is widely used as a measure of large-cap U.S. stock market performance.
The Russell 1000® Growth Index measures the performance of the large-cap growth segment of the U.S. equity universe. It includes those companies in the Russell 1000® Index (which measures the entire U.S. equity large-cap segment) with higher price-to-book ratios and higher forecasted growth values. It is a subset of the Russell 3000® Index and includes approximately 1,000 of the largest securities based on a combination of their market cap and current index membership.
The results shown for the foregoing indices assume the reinvestment of net dividends or interest and do not reflect fees, expenses, or taxes. As such, the index returns do not reflect the actual cost of investing in the instruments that comprise each index.
The peer universe of the underlying annuity funds used for the peer group average annual total return calculation is based on a blend of Morningstar peer categories, as shown. Morningstar is an independent mutual fund rating service. The Fund’s performance may be compared to or ranked within a universe of mutual funds with investment objectives and policies similar but not necessarily identical to that of the Fund.
©2017 Morningstar, Inc. All Rights Reserved. The Morningstar information contained herein: (1) is proprietary to Morningstar and/or its content providers; (2) may not be copied or distributed; and (3) is not warranted to be accurate, complete or timely. Neither Morningstar nor its content providers are responsible for any damage or losses relating from any use of this information. Past performance is no guarantee of future results.
The views expressed in this document reflect our judgment as of the publication date and are subject to change at any time without notice.
State Street Global Markets, LLC, member of FINRA & SIPC is the principal underwriter and distributor of the State Street V.I.S. Funds and a wholly owned subsidiary of State Street Corporation. References to State Street may include State Street Corporation and its affiliates. The Funds pay State Street Bank and Trust Company for its services as custodian and Fund Accounting agent, and pay SSGA Funds Management, Inc. for investment advisory and administrative services.
State Street Premier Growth Equity V.I.S. Fund
Portfolio Management Discussion and Analysis — December 31, 2016 (Unaudited)
| Q. | How did the State Street Premier Growth Equity V.I.S. Fund perform compared to its benchmark and Morningstar peer group for the twelve-month period ended December 31, 2016? |
| A. | For the twelve-month period ended December 31, 2016, the State Street Premier Growth Equity V.I.S. Fund returned 2.47%. The Fund’s broad based benchmarks, the S&P 500® Index (the “S&P 500 Index”) and the Russell 1000 Growth Index returned 11.96% and 7.08%, respectively. The Fund’s Morningstar peer group of 314 U.S. Insurance Large Growth Funds returned an average of 2.92% over the same period. |
| Q. | What market factors affected the Fund’s performance? |
| A. | 2016 was a year of rotating market regimes and mixed sector performance which posed challenges for the long-term fundamental investor. Issues buffeting U.S. equities ranged from China currency and growth concerns, to a growing wave of populism leading to the twin surprises of the United Kingdom’s June 2016 referendum vote to withdraw from the European Union and Donald Trump’s presidential victory. |
| | Early in the year, defensive stocks outperformed amid fears that a slowing China would crush global economies. However by year-end, telecommunications (+23%) was the only defensive “bond-proxy” to hold strong leadership, while real estate (+3%) and staples (+5%) lagged. Energy (+27%) and financials (+23%) won as interest rates rose and oil prices strengthened — bolstered by OPEC’s late-year production-cut pledge. Industrials (+19%) and materials (+17%) also rallied amid hopes for fiscal stimulus and infrastructure spending in the President-elect Trump era. Health care (-3%) was the index’s sole negative-returning sector, plagued by negative sentiment around drug pricing, and mixed M&A performance. In our opinion, the health care sector continues to offer the best combination of earnings growth (+8% for the next 12 months) and valuation at the low-end of its historical range. On a fundamental basis we continue to find attractive investment opportunities in the health care, and have added to core positions at low valuations this year. |
| | The market de-rated growth stocks this year, which is not surprising given relative outperformance in the energy, financials, materials and industrials sectors. The value style of investing beat growth across all market capitalization buckets — by significant margins; and small caps outperformed large capitalization stocks. In terms of size, the outlook for pro-domestic President-elect Trump policies benefitted small-cap and lower-quality stock performance. |
| Q. | What were the primary drivers of Fund performance? |
| A. | Health care positioning drove most of the Fund’s underperformance. Given the sector’s strong earnings-growth outlook, especially among innovative biotechnology and medical device companies, we were surprised at the degree of valuation erosion in 2016. We remain skeptical about how much Washington can inhibit drug price increases—the majority of prescriptions in the U.S. are written for generic drugs which are not bad actors. We also are careful to invest with quality management teams, and include companies where the government is not a major payer (e.g., a leader in branded cosmetic pharmaceuticals). In a concentrated portfolio, individual holdings can impact performance significantly, and one of our health care companies did suffer a broken M&A deal, which disappointed investors. The Fund’s technology selections also detracted from results as investors embraced “last year’s losers,” the slower growth legacy technology companies. A Chinese Internet company weighted heavily on returns, and was eliminated. |
| | At the end of 2016, health care and technology were the cheapest sectors versus history relative to the market. These sectors have exhibited sustainable growth throughout the tumult of the past decade, and low relative valuations support possible P/E multiple expansion. At this point, we view the superior earnings growth and reasonable valuations of information technology (“IT”) and health care as a winning combination. The Fund does not invest in derivatives securities as part of its strategy, but may hold futures contracts or exchange traded funds to equitize cash flows in advance of investment. The effect of derivatives on performance was deminimus for the year. |
| Q. | Were there any significant changes to the Fund during the period? |
| A. | There were no changes during the period in the portfolio management team or its approach to investing. Turnover remained relatively low in keeping with our long-term investment horizon, but did result in some changes in positioning. Among sectors, IT was the largest absolute weighting as the sector where we find many of the innovative, growth companies at reasonable valuations that we favor. Health care and consumer discretionary are also key market weightings within the Fund. |
| | We modestly reduced exposure to the financials and industrials sectors. We eliminated our sole materials holding, increasing the Fund’s underweight in this commodity oriented sector. Consumer staples has been a consistent sector underweight, but that underweight was reduced somewhat over the last year due to outperformance in our sole holding, a beverage company. |
| | |
| 2 | | State Street Premier Growth Equity V.I.S. Fund |
State Street Premier Growth Equity V.I.S. Fund
Understanding Your Fund’s Expenses — December 30, 2016 (Unaudited)
As a shareholder of the Fund, you incur ongoing costs. Ongoing costs include portfolio management fees, professional fees, administrative fees and other Fund expenses. The following example is intended to help you understand your ongoing costs (in dollars) of investing in the Fund and to compare these costs with the ongoing costs of investing in other mutual funds.
To illustrate these ongoing costs, we have provided an example and calculated the expenses paid by investors in the Fund during the period. The information in the following table is based on an investment of $1,000, which is invested at the beginning of the period and held for the entire six-month period ended December 31, 2016.
Actual Expenses
The first section of the table provides information about actual account values and actual expenses. You may use the information in this section, together with the amount you invested, to estimate the expenses that you paid over the period. To do so, simply divide your account value by $1,000 (for example, an $8,600 account value divided by $1,000 = 8.6), then multiply the result by the number given under the heading “Expenses paid during the period” to estimate the expenses you paid on your account during the period.
Hypothetical Example for Comparison Purposes
The second section of the table provides information about hypothetical account values and hypothetical expenses based on the Fund’s actual expense ratio and an assumed rate of return of 5% per year before expenses, which is not the Fund’s actual return. The hypothetical account values and expenses may not be used to estimate the actual ending account balance or expenses you paid for the period. You may use this information to compare the ongoing costs of investing in the Fund and other funds. To do so, compare this 5% hypothetical example with the 5% hypothetical examples that appear in the shareholder reports of other funds.
Please note that the expenses shown in the table are meant to highlight and help you compare ongoing costs only and do not reflect transaction costs, such as sales charges or redemption fees, if any. Therefore, the second section of the table is useful in comparing ongoing costs only, and will not help you determine the relative total costs of owning different funds. Additionally, the expenses shown do not reflect the fees or charges associated with variable contracts through which shares of the Fund are offered.
| | | | | | | | |
| | | Actual
Fund Return | | | Hypothetical
5% Return
(2.5% for
the period) | |
Account value at the
beginning of the period July 1, 2016 | | $ | 1,000.00 | | | $ | 1,000.00 | |
Account value at the
end of the period December 31, 2016 | | $ | 1,057.70 | | | $ | 1,020.86 | |
Expenses paid during the period* | | $ | 4.40 | | | $ | 4.32 | |
| * | Expenses are equal to the Fund’s annualized net expense ratio of 0.85%** (for the period July 1, 2016-December 31, 2016), multiplied by the average account value over the period, multiplied by 184/366 (to reflect the one-half year period). |
| ** | May differ from expense ratio disclosed in the financial highlights, which is calculated based on the entire fiscal year’s data. |
| | | | |
| State Street Premier Growth Equity V.I.S. Fund | | | 3 | |
State Street Premier Growth Equity V.I.S. Fund
Performance Summary — December 31,2016 (Unaudited)
Morningstar Performance Comparison
Based on average annual returns for periods ended 12/31/16
| | | | | | | | | | | | |
| | | One
Year | | | Five
Year | | | Ten
Year | |
Number of funds in peer group | | | 314 | | | | 305 | | | | 277 | |
Peer group average annual total return | | | 2.92 | % | | | 13.34 | % | | | 6.81 | % |
Morningstar Category in peer group: U.S. Insurance Large Growth | |
Top Ten Largest Holdings
as of December 31, 2016 (as a % of Fair Value) (a)(b)
| | | | |
Apple Inc. | | | 5.43 | % |
Alphabet Inc., Class C | | | 5.03 | % |
The Charles Schwab Corp. | | | 4.63 | % |
Visa Inc., Class A | | | 4.57 | % |
Amazon.com Inc. | | | 4.49 | % |
CME Group Inc. | | | 4.42 | % |
Allergan PLC | | | 4.16 | % |
PepsiCo Inc. | | | 4.09 | % |
Facebook Inc., Class A | | | 3.75 | % |
Charter Communications Inc., Class A | | | 3.60 | % |
Sector Allocation as of December 31, 2016
Portfolio composition as a % of Fair Value of $33,197 December 31, 2016 (a)(b)
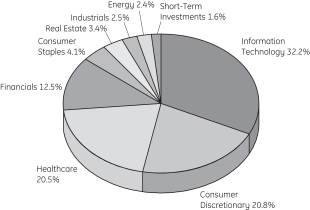
Average Annual Total Return for the periods ended December 31, 2016
Class 1 Shares (Inception date: 12/12/97)
| | | | | | | | | | | | | | | | |
| | | One Year | | | Five Year | | | Ten Year | | | Ending Value
of a $10,000
Investment | |
State Street Premier Growth Equity V.I.S. Fund | | | 2.47 | % | | | 14.50 | % | | | 7.41 | % | | $ | 20,431 | |
S&P 500® Index | | | 11.96 | % | | | 14.66 | % | | | 6.95 | % | | $ | 19,572 | |
Russell 1000 Growth Index | | | 7.08 | % | | | 14.50 | % | | | 8.33 | % | | $ | 22,266 | |
| | |
| 4 | | State Street Premier Growth Equity V.I.S. Fund |
State Street Premier Growth Equity V.I.S. Fund
Performance Summary, continued — December 31,2016 (Unaudited)
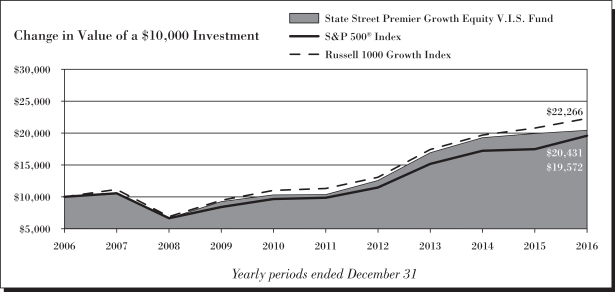
| (a) | Fair Value basis is inclusive of short-term investment in State Street Institutional U.S. Government Money Market Fund Class G Shares. |
| (b) | The securities information regarding holdings, allocations and other characteristics is presented to illustrate examples of securities that the Fund has bought and the diversity of areas in which the Fund may invest as of a particular date. It may not be representative of the Fund’s current or future investments and should not be construed as a recommendation to purchase or sell a particular security. |
See Notes to Performance beginning on page 1 for further information, including an explanation of Morningstar peer categories.
Past performance does not predict future performance. The performance shown in the graphs and tables does not reflect the deduction of taxes that a shareholder would pay on Fund distributions or the redemption of Fund shares and does not reflect the fees or charges that would be associated with variable contracts through which shares of the Fund are offered.
| | | | |
| State Street Premier Growth Equity V.I.S. Fund | | | 5 | |
State Street Premier Growth Equity V.I.S. Fund
Schedule of Investments — December 31, 2016
| | | | | | | | |
| | | Number
of Shares | | | Fair
Value
$ | |
| | | | | | | | |
| Common Stock - 98.3%† | | | | | |
Application Software - 4.1% | | | | | |
Intuit Inc. | | | 6,920 | | | | 793,101 | |
salesforce.com Inc. (a) | | | 8,267 | | | | 565,959 | |
| | | | | | | | |
| | | | | | | 1,359,060 | |
| | | | | | | | |
| |
Biotechnology - 9.1% | | | | | |
Alexion Pharmaceuticals Inc. (a) | | | 6,229 | | | | 762,118 | |
Amgen Inc. | | | 7,180 | | | | 1,049,788 | |
Gilead Sciences Inc. | | | 12,111 | | | | 867,268 | |
Vertex Pharmaceuticals Inc. (a) | | | 4,931 | | | | 363,267 | |
| | | | | | | | |
| | | | | | | 3,042,441 | |
| | | | | | | | |
| |
Cable & Satellite - 10.6% | | | | | |
Charter Communications Inc., Class A (a) | | | 4,153 | | | | 1,195,732 | |
Comcast Corp., Class A | | | 9,083 | | | | 627,181 | |
Liberty Global PLC, Class C (a) | | | 36,765 | | | | 1,091,920 | |
Sirius XM Holdings Inc. | | | 138,409 | | | | 615,920 | |
| | | | | | | | |
| | | | | | | 3,530,753 | |
| | | | | | | | |
|
Data Processing & Outsourced Services - 6.7% | |
PayPal Holdings Inc. (a) | | | 17,734 | | | | 699,961 | |
Visa Inc., Class A | | | 19,464 | | | | 1,518,581 | |
| | | | | | | | |
| | | | | | | 2,218,542 | |
| | | | | | | | |
| |
Financial Exchanges & Data - 7.9% | | | | | |
CME Group Inc. | | | 12,716 | | | | 1,466,791 | |
S&P Global Inc. | | | 10,813 | | | | 1,162,830 | |
| | | | | | | | |
| | | | | | | 2,629,621 | |
| | | | | | | | |
| |
Healthcare Equipment - 5.3% | | | | | |
Abbott Laboratories | | | 14,706 | | | | 564,858 | |
Medtronic PLC | | | 16,610 | | | | 1,183,130 | |
| | | | | | | | |
| | | | | | | 1,747,988 | |
| | | | | | | | |
| |
Healthcare Supplies - 1.9% | | | | | |
The Cooper Companies Inc. | | | 3,547 | | | | 620,477 | |
| | | | | | | | |
| |
Home Improvement Retail - 2.9% | | | | | |
Lowe’s Companies Inc. | | | 13,408 | | | | 953,577 | |
| | | | | | | | |
| |
Internet & Direct Marketing Retail - 4.5% | | | | | |
Amazon.com Inc. (a) | | | 1,989 | | | | 1,491,491 | |
| | | | | | | | |
| |
Internet Software & Services - 10.1% | | | | | |
Alibaba Group Holding Ltd. ADR (a) | | | 3,461 | | | | 303,910 | |
Alphabet Inc., Class A (a) | | | 173 | | | | 137,094 | |
| | | | | | | | |
| | | Number
of Shares | | | Fair
Value
$ | |
Alphabet Inc., Class C (a) | | | 2,163 | | | | 1,669,447 | |
Facebook Inc., Class A (a) | | | 10,813 | | | | 1,244,036 | |
| | | | | | | | |
| | | | | | | 3,354,487 | |
| | | | | | | | |
|
Investment Banking & Brokerage - 4.6% | |
The Charles Schwab Corp. | | | 38,928 | | | | 1,536,488 | |
| | | | | | | | |
|
Movies & Entertainment - 2.8% | |
The Walt Disney Co. | | | 8,824 | | | | 919,637 | |
| | | | | | | | |
|
Oil & Gas Equipment & Services - 2.4% | |
Schlumberger Ltd. | | | 9,516 | | | | 798,868 | |
| | | | | | | | |
| |
Pharmaceuticals - 4.1% | | | | | |
Allergan PLC (a) | | | 6,574 | | | | 1,380,606 | |
| | | | | | | | |
| |
Semiconductors - 2.8% | | | | | |
QUALCOMM Inc. | | | 14,273 | | | | 930,600 | |
| | | | | | | | |
| |
Soft Drinks - 4.1% | | | | | |
PepsiCo Inc. | | | 12,977 | | | | 1,357,784 | |
| | | | | | | | |
| |
Specialized REITs - 3.4% | | | | | |
American Tower Corp. | | | 10,813 | | | | 1,142,718 | |
| | | | | | | | |
| |
Systems Software - 3.1% | | | | | |
Microsoft Corp. | | | 16,436 | | | | 1,021,333 | |
| | | | | | | | |
|
Technology Hardware, Storage & Peripherals - 5.4% | |
Apple Inc. | | | 15,571 | | | | 1,803,433 | |
| | | | | | | | |
|
Trading Companies & Distributors – 2.5% | |
United Rentals Inc. (a) | | | 7,785 | | | | 821,940 | |
| | | | | | | | |
| | |
Total Common Stock
(Cost $24,238,775) | | | | | | | 32,661,844 | |
| | | | | | | | |
| |
| Short-Term Investments - 1.6% | | | | | |
State Street Institutional U.S. Government Money Market Fund - Class G Shares 0.46%
(Cost $535,474) (b,c,d) | | | 535,474 | | | | 535,474 | |
| | | | | | | | |
| | |
Total Investments
(Cost $24,774,249) | | | | | | | 33,197,318 | |
| |
| Other Assets and Liabilities, net - 0.1% | | | | 21,457 | |
| | | | | | | | |
| | |
| NET ASSETS - 100.0% | | | | | | | 33,218,775 | |
| | | | | | | | |
See notes to schedule of investments and notes to financial statements.
| | |
| 6 | | State Street Premier Growth Equity V.I.S. Fund |
State Street Premier Growth Equity V.I.S. Fund
Schedule of Investments, continued — December 31, 2016
Other Information:
The Fund had the following short futures contracts open at December 31, 2016:
| | | | | | | | | | | | | | | | |
| Description | | Expiration
date | | | Number of
Contracts | | | Current
Notional
Value | | | Unrealized
Appreciation | |
| | | | | | | | | | | | | | | | |
S&P 500 Emini Index Futures | | | March 2017 | | | | 3 | | | $ | (335,430 | ) | | $ | 1,896 | |
See notes to schedule of investments and notes to financial statements.
| | | | |
| State Street Premier Growth Equity V.I.S. Fund | | | 7 | |
State Street Premier Growth Equity V.I.S. Fund
Notes to Schedule of Investments — December 31, 2016
The views expressed in this document reflect our judgment as of the publication date and are subject to change at any time without notice. The securities cited may not be representative of the Fund’s future investments and should not be construed as a recommendation to purchase or sell a particular security. See the Fund’s summary prospectus and statutory prospectus for complete descriptions of investment objectives, policies, risks and permissible investments.
| (a) | Non-income producing security. |
| (b) | At December 31, 2016, all or a portion of this security was pledged to cover collateral requirements for futures. |
| (c) | Coupon amount represents effective yield. |
| (d) | Sponsored by SSGA Funds Management, Inc., the Funds’ investment adviser and administrator, effective July 1, 2016, and an affiliate of State Street Bank & Trust Co., the Funds’ sub-administrator, custodian and accounting agent. |
| † | Percentages are based on net assets as of December 31, 2016. |
Abbreviations:
ADR - American Depositary Receipt
REIT - Real Estate Investment Trust
Affiliate Table
| | | | | | | | | | | | | | | | | | | | | | | | | | | | | | | | |
| | | Number of
Shares Held
at 12/31/15 | | | Value At
12/31/15 | | | Shares
Purchased | | | Shares
Sold | | | Number of
Shares Held
at 12/31/16 | | | Value at
12/31/16 | | | Dividend/
Interest
Income | | | Realized
Gain (Loss) | |
State Street Corp. | | | 14,412 | | | $ | 956,380 | | | | — | | | | 14,412 | | | | — | | | $ | — | | | $ | 4,440 | | | $ | 242,122 | |
State Street Institutional U.S. Government Money Market Fund - Class G Shares | | | 1,389,078 | | | | 1,389,078 | | | | 5,386,088 | | | | 6,239,692 | | | | 535,474 | | | | 535,474 | | | | 2,669 | | | | — | |
| | | | | | | | | | | | | | | | | | | | | | | | | | | | | | | | |
| | | | | | $ | 2,345,458 | | | | | | | | | | | | | | | $ | 535,474 | | | $ | 7,109 | | | $ | 242,122 | |
| | | | | | | | | | | | | | | | | | | | | | | | | | | | | | | | |
| | |
| 8 | | Notes to Schedule of Investments |
State Street Premier Growth Equity V.I.S. Fund
Financial Highlights
Selected data based on a share outstanding throughout the fiscal years indicated
| | | | | | | | | | | | | | | | | | | | |
| | | 12/31/16 | | | 12/31/15* | | | 12/31/14* | | | 12/31/13* | | | 12/31/12* | |
Inception date | | | | | | | | | | | | | | | | | | | 12/12/97 | |
Net asset value, beginning of period | | $ | 94.07 | | | $ | 106.58 | | | $ | 107.84 | | | $ | 85.99 | | | $ | 71.78 | |
| | | | | | | | | | | | | | | | | | | | |
| | | | |
Income/(loss) from investment operations: | | | | | | | | | | | | | | | | | |
Net investment income | | | 0.50 | | | | 0.52 | | | | 0.63 | | | | 0.58 | | | | 0.78 | |
Net realized and unrealized gains/(losses) on investments | | | 1.90 | | | | 3.25 | | | | 14.71 | | | | 29.35 | | | | 14.20 | |
| | | | | | | | | | | | | | | | | | | | |
Total income from investment operations | | | 2.40 | | | | 3.77 | | | | 15.34 | | | | 29.93 | | | | 14.98 | |
| | | | | | | | | | | | | | | | | | | | |
| | | | | |
Less distributions from: | | | | | | | | | | | | | | | | | | | | |
Net investment income | | | 0.48 | | | | 0.53 | | | | 0.58 | | | | 0.58 | | | | 0.77 | |
Net realized gains | | | 9.91 | | | | 15.75 | | | | 16.02 | | | | 7.50 | | | | — | |
| | | | | | | | | | | | | | | | | | | | |
Total distributions | | | 10.39 | | | | 16.28 | | | | 16.60 | | | | 8.08 | | | | 0.77 | |
| | | | | | | | | | | | | | | | | | | | |
Net asset value, end of period | | $ | 86.08 | | | $ | 94.07 | | | $ | 106.58 | | | $ | 107.84 | | | $ | 85.99 | |
| | | | | | | | | | | | | | | | | | | | |
Total return(a) | | | 2.47 | % | | | 3.30 | % | | | 14.05 | % | | | 34.88 | % | | | 20.88 | % |
| | | | | |
Ratios/Supplemental Data: | | | | | | | | | | | | | | | | | | | | |
Net assets, end of period (in thousands) | | $ | 33,219 | | | $ | 36,858 | | | $ | 39,944 | | | $ | 40,852 | | | $ | 35,397 | |
| | | | | |
Ratios to average net assets: | | | | | | | | | | | | | | | | | | | | |
Net expenses | | | 0.84 | % | | | 0.81 | % | | | 0.81 | %(b) | | | 0.83 | %(b) | | | 0.85 | %(b) |
Gross expenses | | | 0.84 | % | | | 0.81 | % | | | 0.81 | % | | | 0.83 | % | | | 0.85 | % |
Net investment income | | | 0.52 | % | | | 0.46 | % | | | 0.52 | % | | | 0.54 | % | | | 0.84 | % |
Portfolio turnover rate | | | 22 | % | | | 19 | % | | | 19 | % | | | 21 | % | | | 17 | % |
Notes to Financial Highlights
| (a) | | Total returns are historical and assume changes in share price, reinvestment of dividends and capital gains distributions and do not include the effect of insurance contract charges. Past performance does not guarantee future results. |
| (b) | | Includes contractual management fee waiver related to the Fund’s investments in the GE Institutional Money Market Fund (the “Money Market Fund”). The fee waiver agreement was terminated effective June 30, 2014 with the closure of the Money Market Fund. |
| * | | Beginning with the fiscal year ended December 31, 2016, the Fund was audited by Ernst & Young LLP. The previous years were audited by another independent registered public accounting firm. |
The accompanying notes are an integral part of these financial statements.
State Street Premier Growth Equity V.I.S. Fund
Statement of Assets and Liabilities — December 31, 2016
| | | | |
| | | | |
Assets | | | | |
Investments in securities, at fair value (cost $24,238,775) | | $ | 32,661,844 | |
Short-term affiliated investments, at fair value | | | 535,474 | |
Income receivable | | | 78,645 | |
Income receivable from affiliated investments | | | 274 | |
Receivable for variation margin on open futures contracts | | | 1,040 | |
Other assets | | | 1,605 | |
| | | | |
Total assets | | | 33,278,882 | |
| | | | |
|
Liabilities | |
Payable for fund shares redeemed | | | 4,496 | |
Payable to the Adviser (Note 6) | | | 17,520 | |
Payable to the Custodian (Note 6) | | | 11,248 | |
Accrued other expenses | | | 26,843 | |
| | | | |
Total liabilities | | | 60,107 | |
| | | | |
| | | | |
Net Assets | | $ | 33,218,775 | |
| | | | |
|
Net Assets Consist of: | |
Capital paid in | | $ | 24,834,750 | |
Undistributed (distributions in excess of) net investment income | | | — | |
Accumulated net realized loss | | | (40,940 | ) |
Net unrealized appreciation (depreciation) on: | |
Investments | | | 8,423,069 | |
Futures | | | 1,896 | |
| | | | |
Net Assets | | $ | 33,218,775 | |
| | | | |
| | | | |
Shares outstanding ($0.01 par value; unlimited shares authorized) | | | 385,927 | |
Net asset value per share | | $ | 86.08 | |
The accompanying notes are an integral part of these financial statements.
| | |
| 10 | | Statement of Assets and Liabilities |
State Street Premier Growth Equity V.I.S. Fund
Statement of Operations — For the year ended December 31, 2016
| | | | |
| | | | |
Investment Income | | | | |
Income | | | | |
Dividend | | $ | 455,477 | |
Interest | | | 1,828 | |
Income from affiliated investments | | | 7,109 | |
| | | | |
Total income | | | 464,414 | |
| | | | |
| |
Expenses | | | | |
Advisory and administration fees (Note 6) | | | 222,178 | |
Directors’ fees (Note 6) | | | 2,337 | |
Custody and accounting expenses — net (Note 6) | | | 27,974 | |
Professional fees | | | 22,732 | |
Other expenses | | | 11,988 | |
| | | | |
Total Expenses | | | 287,209 | |
| | | | |
Net investment income | | $ | 177,205 | |
| | | | |
| |
Net Realized and Unrealized Gain (Loss) on Investments | | | | |
Realized gain (loss) on: | |
Investments | | $ | 2,830,065 | |
Affiliated investments | | | 242,122 | |
Futures | | | (21,990 | ) |
Increase (decrease) in unrealized appreciation/depreciation on: | | | | |
Investments | | | (2,513,512 | ) |
Futures | | | 9,246 | |
| | | | |
| |
Net realized and unrealized gain (loss) on investments | | | 545,931 | |
| | | | |
Net increase in net assets resulting from operations | | $ | 723,136 | |
| | | | |
The accompanying notes are an integral part of these financial statements.
| | | | |
| Statement of Operations | | | 11 | |
State Street Premier Growth Equity V.I.S. Fund
Statements of Changes in Net Assets
| | | | | | | | |
| | | Year Ended
December 31, 2016 | | | Year Ended
December 31, 2015* | |
| | | | | | | | |
Increase (Decrease) in Net Assets | | | | | | | | |
| | |
Operations: | | | | | | | | |
Net investment income | | $ | 177,205 | | | $ | 176,580 | |
Net realized gain (loss) on investments and futures | | | 3,050,197 | | | | 4,601,308 | |
Net increase (decrease) in unrealized appreciation/depreciation on investments and futures | | | (2,504,266 | ) | | | (3,484,923 | ) |
| | | | | | | | |
Net increase (decrease) from operations | | | 723,136 | | | | 1,292,965 | |
| | | | | | | | |
| | |
Distributions to shareholders from: | | | | | | | | |
Net investment income | | | (166,977 | ) | | | (178,995 | ) |
Net realized gains | | | (3,430,576 | ) | | | (5,274,307 | ) |
| | | | | | | | |
Total distributions | | | (3,597,553 | ) | | | (5,453,302 | ) |
| | | | | | | | |
Increase (decrease) in assets from operations and distributions | | | (2,874,418 | ) | | | (4,160,337 | ) |
| | | | | | | | |
| | |
Share transactions: | | | | | | | | |
Proceeds from sale of shares | | | 435,151 | | | | 320,646 | |
Value of distributions reinvested | | | 3,597,553 | | | | 5,453,302 | |
Cost of shares redeemed | | | (4,797,192 | ) | | | (4,700,325 | ) |
| | | | | | | | |
Net increase (decrease) from share transactions | | | (764,488 | ) | | | 1,073,623 | |
| | | | | | | | |
| | |
Total increase (decrease) in net assets | | | (3,638,905 | ) | | | (3,086,714 | ) |
| | |
Net Assets | | | | | | | | |
Beginning of year | | | 36,857,680 | | | | 39,944,394 | |
| | | | | | | | |
| | |
End of year | | $ | 33,218,775 | | | $ | 36,857,680 | |
| | | | | | | | |
| | |
Undistributed (distributions in excess of) net investment income, end of year | | $ | — | | | $ | — | |
| | |
Changes in Fund Shares | | | | | | | | |
Shares sold | | | 4,745 | | | | 2,954 | |
Issued for distributions reinvested | | | 41,480 | | | | 57,067 | |
Shares redeemed | | | (52,106 | ) | | | (42,981 | ) |
| | | | | | | | |
Net increase (decrease) in fund shares | | | (5,881 | ) | | | 17,040 | |
| | | | | | | | |
| * | | Beginning with the year ended December 31, 2016, the Fund was audited by Ernst & Young LLP. The previous years were audited by another independent registered public accounting firm. |
The accompanying notes are an integral part of these financial statements.
| | |
| 12 | | Statements of Changes in Net Assets |
State Street Premier Growth Equity V.I.S. Fund
Notes to Financial Statements — December 31, 2016
| 1. | | Organization of the Company |
State Street Variable Insurance Series Funds, Inc. (the “Company”) was incorporated under the laws of the Commonwealth of Virginia on May 14, 1984 and is registered under the Investment Company Act of 1940, as amended (the “1940 Act”), as an open-end management investment company. Prior to November 30, 2016, the Company was named GE Investments Funds, Inc. The Company is currently composed of the following eight investment portfolios (collectively, the “Funds”): State Street U.S. Equity V.I.S. Fund, State Street S&P 500 Index V.I.S. Fund, State Street Premier Growth Equity V.I.S. Fund (the “Fund”), State Street Core Value Equity V.I.S. Fund, State Street Small-Cap Equity V.I.S. Fund, State Street Total Return V.I.S. Fund, State Street Income V.I.S. Fund and State Street Real Estate Securities V.I.S. Fund. Each Fund is an investment company and accordingly follows the investment company accounting and reporting guidance of the Financial Accounting Standards Board (“FASB”) Accounting Standard Codification (“ASC”) Topic 946 Financial Services — Investment Companies. Each Fund is a diversified investment company within the meaning of the 1940 Act.
Effective November 30, 2016, each individual Fund changed its respective name as follows:
| | |
| Old Name | | New Name |
GE Investments U.S. Equity Fund | | State Street U.S. Equity V.I.S. Fund |
GE Investments S&P 500 Index Fund | | State Street S&P 500 Index V.I.S. Fund |
GE Investments Premier Growth Equity Fund | | State Street Premier Growth Equity V.I.S. Fund |
GE Investments Core Value Equity Fund | | State Street Core Value Equity V.I.S. Fund |
GE Investments Small-Cap Equity Fund | | State Street Small-Cap Equity V.I.S. Fund |
GE Investments Total Return Fund | | State Street Total Return V.I.S. Fund |
GE Investments Income Fund | | State Street Income V.I.S. Fund |
GE Investments Real Estate Securities Fund | | State Street Real Estate Securities V.I.S. Fund |
Shares of the Funds of the Company are offered only to insurance company separate accounts that fund certain variable life insurance contracts and variable annuity contracts. SSGA Funds Management, Inc. (“SSGA FM”) is the investment adviser and administrator of each of the Funds effective July 1, 2016. Prior to July 1, 2016, GE Asset Management Incorporated (“GEAM”) served as the investment adviser and administrator to each Fund.
The Company currently offers one share class (Class 1) of the Fund as an investment option for variable life insurance and variable annuity contracts.
| 2. | | Summary of Significant Accounting Policies |
The preparation of financial statements in conformity with U.S. generally accepted accounting principles (“GAAP”) requires management to make estimates and assumptions that affect the reported amounts of assets and liabilities and disclosure of contingent assets and liabilities at the date of the financial statements and the reported amounts of increases and decreases in net assets from operations during the reporting period. Actual results may differ from those estimates.
Subsequent events after the balance sheet date through the date the financial statements were issued have been evaluated in the preparation of the financial statements. There are no items to report.
The following summarizes the significant accounting policies of the Company:
Securities Valuation and Transactions All investments in securities are recorded at their estimated fair value, as described in Note 3.
Securities transactions are accounted for as of the trade date. Realized gains and losses on investments sold are recorded on the basis of identified cost for both financial statement and federal tax purposes.
Derivatives The Fund is subject to equity price risk in the normal course of pursuing its investment objectives. The Fund may enter into various types of derivative transactions (such as options, futures and options on futures) to gain or hedge exposure to certain types of securities as an alternative to investing directly in or selling such securities.
Futures Contracts A futures contract is an agreement to buy or sell a specific amount of a commodity, financial instrument, currency or index at a particular price and future date. During the fiscal year ended December 31, 2016, the Fund invested in stock index futures contracts to gain equity exposure for accumulating and residual cash positions. Buying futures tends to
| | | | |
| Notes to Financial Statements | | | 13 | |
State Street Premier Growth Equity V.I.S. Fund
Notes to Financial Statements, continued — December 31, 2016
increase the Fund’s exposure to the underlying instrument while selling futures tends to decrease the Fund’s exposure to the underlying instrument, or hedge other Fund investments. With futures contracts, there is minimal counterparty credit risk to the Fund since futures contracts are exchange traded and the exchange’s clearinghouse, as counterparty to all traded futures, guarantees the futures against default. The Fund’s risks in using these contracts include changes in the value of the underlying instruments, non-performance of the counterparties under the contracts’ terms and changes in the liquidity of the secondary market for the contracts. Futures contracts are valued at the settlement price established each day by the board of trade or exchange on which they principally trade.
Upon entering into a financial futures contract, the Fund is required to pledge to the broker an amount of cash and/or other assets equal to a certain percentage of the contract amount, known as initial margin deposit. Subsequent payments, known as variation margin, are made or received by the Fund each day, depending on the daily fluctuation in the fair value of the underlying security. The Fund records an unrealized gain or loss equal to the daily variation margin. Should market conditions move unexpectedly, the Fund may not achieve the anticipated benefits of the futures contracts and may incur a loss. The Fund recognizes a realized gain or loss on the expiration or closing of a futures contract.
Investment Income Corporate actions (including cash dividends) are recorded on the ex-dividend date, net of applicable withholding taxes, except for certain foreign corporate actions which are recorded as soon after the ex-dividend date as such information becomes available. Withholding taxes on foreign dividends, if any, have been provided for in accordance with the Fund’s understanding of the applicable country’s tax rules and rates.
Interest income is recorded on the accrual basis. Accretion of discounts and amortization of premiums on taxable bonds are to the call or maturity date, whichever is shorter, using the effective yield method.
Expenses Fund specific expenses are charged to the Fund that incurs such expenses. Such expenses may include custodial fees, legal and accounting fees, printing costs and registration fees. Expenses that are not fund specific are allocated pro rata across the Funds. Expenses of the Fund are generally paid directly by the Fund, however, expenses may be paid by the investment adviser and reimbursed by the Fund.
Federal Income Taxes The Fund intends to comply with all sections of the Internal Revenue Code of 1986, as amended (the “Internal Revenue Code”) applicable to regulated investment companies, including the distribution of substantially all of its taxable net investment income and net realized capital gains to its shareholders. Therefore, no provision for federal income tax has been made. The Fund is treated as a separate taxpayer for federal income tax purposes.
The Fund utilizes various methods to measure the fair value of most of its investments on a recurring basis. GAAP establishes a framework for measuring fair value and providing related disclosures. Broadly, the framework requires fair value to be determined based on the exchange price that would be received for an asset or paid to transfer a liability (an exit price) in the principal or most advantageous market for the asset or liability in an orderly transaction between market participants at the measurement date. In the absence of active markets for the identical assets or liabilities, such measurements involve developing assumptions based on market observable data and, in the absence of such data, internal information that is consistent with what market participants would use in a hypothetical transaction that occurs at the measurement date. It also establishes a three-level valuation hierarchy based upon observable and non-observable inputs.
Observable inputs reflect market data obtained from independent sources, while unobservable inputs reflect our market assumptions. Preference is given to observable inputs. These two types of inputs create the following fair value hierarchy:
| | • | | Level 1 — Quoted prices for identical investments in active markets. |
| | • | | Level 2 — Quoted prices for similar investments in active markets; quoted prices for identical or similar investments in markets that are not active; and model-derived valuations whose inputs are observable or whose significant value drivers are observable. |
| | • | | Level 3 — Significant inputs to the valuation model are unobservable. |
| | |
| 14 | | Notes to Financial Statements |
State Street Premier Growth Equity V.I.S. Fund
Notes to Financial Statements, continued — December 31, 2016
Policies and procedures are maintained to value investments using the best and most relevant data available. In addition, pricing vendors are utilized to assist in valuing investments. The investment adviser performs periodic reviews of the methodologies used by independent pricing services including price validation of individual securities.
Fair Value Measurement The following section describes the valuation methodologies the Fund uses to measure different financial investments at fair value.
The Fund’s portfolio securities are valued generally on the basis of market quotations. Equity securities generally are valued at the last reported sale price on the primary market in which they are traded. Portfolio securities listed on NASDAQ are valued using the NASDAQ Official Closing Price. Level 1 securities primarily include publicly-traded equity securities, which may not necessarily represent the last sales price. If no sales occurred on the exchange or NASDAQ that day, the portfolio security generally is valued using the last reported bid price. In those circumstances, the Fund typically classifies the investment securities in Level 2.
Short-term securities of sufficient credit quality with remaining maturities of sixty days or less at the time of purchase are typically valued on the basis of amortized cost which approximates fair value and these are included in Level 2. If it is determined that amortized cost does not approximate fair value, securities may be valued based on dealer supplied valuations or quotations. In these infrequent circumstances, pricing services may provide the Fund with valuations that are based on significant unobservable inputs, and in those circumstances the investment securities are classified in Level 3.
Investments in registered investment companies are valued at the published daily net asset value (“NAV”) and classified in Level 1.
If prices are not readily available for a portfolio security, or if it is believed that a price for a portfolio security does not represent its fair value, the security may be valued using procedures approved by the Company’s Board of Directors that are designed to establish its “fair” value. These securities are typically classified in Level 3. Those procedures require that the fair value of a security be established by a valuation committee of the investment adviser. The valuation committee follows different protocols for different types of investments and circumstances. The fair value procedures may be used to value any investment of the Fund in the appropriate circumstances.
Fair value determinations generally are used for securities whose value is affected by a significant event that will materially affect the value of a security and which occurs subsequent to the time of the close of the principal market on which such security trades but prior to the calculation of the Fund’s NAV.
The value established for such a portfolio security valued other than by use of a market quotation (as described above) may be different than what would be produced through the use of market quotations or another methodology. Portfolio securities that are valued using techniques other than market quotations, including “fair valued” securities, may be subject to greater fluctuation in their value from one day to the next than would be the case if market quotations were used. In addition, there is no assurance that the Fund could sell a portfolio security for the value established for it at any time and it is possible that the Fund would incur a loss because a portfolio security is sold at a discount to its established value.
Other financial investments are derivative instruments that are not reflected in total investments, such as futures, forwards, swaps, and written options contracts, which are valued based on fair value as discussed above.
The Fund uses closing prices for derivatives included in Level 1, which are traded either on exchanges or liquid over-the-counter markets. Derivative assets and liabilities included in Level 2 primarily represent interest rate swaps, cross-currency swaps and foreign currency and commodity forward and option contracts. Derivative assets and liabilities included in Level 3 primarily represent interest rate products that contain embedded optionality or prepayment features.
The inputs or methodology used for valuing securities are not an indication of the risk associated with investing in those securities.
| | | | |
| Notes to Financial Statements | | | 15 | |
State Street Premier Growth Equity V.I.S. Fund
Notes to Financial Statements, continued — December 31, 2016
The following table presents the Fund’s investments measured at fair value on a recurring basis at December 31, 2016:
| | | | | | | | | | | | | | | | |
| Investments | | Level 1 | | | Level 2 | | | Level 3 | | | Total | |
| | | | | | | | | | | | | | | | |
Investments in Securities† | | | | | | | | | | | | | | | | |
Common Stock | | $ | 32,661,844 | | | $ | — | | | $ | — | | | $ | 32,661,844 | |
Short-Term Investments | | | 535,474 | | | | — | | | | — | | | | 535,474 | |
| | | | | | | | | | | | | | | | |
Total Investments in Securities | | $ | 33,197,318 | | | $ | — | | | $ | — | | | $ | 33,197,318 | |
| | | | | | | | | | | | | | | | |
| | | | |
Other Financial Instruments* | | | | | | | | | | | | | | | | |
Short Futures Contracts — Unrealized Appreciation | | $ | 1,896 | | | $ | — | | | $ | — | | | $ | 1,896 | |
| | | | | | | | | | | | | | | | |
| | † | See Schedule of Investments for Industry Classification. |
| | * | Other financial instruments include derivative instruments such as futures contracts. Amounts shown represent unrealized appreciation (depreciation), at period end. |
There were no transfers between fair value levels during the period. Transfers between fair value levels are recognized at the beginning of the period.
| 4. | | Derivatives Disclosure |
Shown below are the derivative contracts entered into by the Fund, summarized by primary risk exposure as they appear on the Statement of Assets and Liabilities, none of which are accounted for as hedging instruments under FASB ASC No. 815 Derivatives and Hedging (“ASC 815”) as of December 31, 2016.
| | | | | | | | | | | | |
| | | Asset Derivatives December 31, 2016 | | | Liability Derivatives December 31, 2016 | |
Derivatives not accounted for as hedging instruments under ASC 815 | | Location in the Statements
of Assets and Liabilities | | Fair
Value ($) | | | Location in the Statements
of Assets and Liabilities | | Fair Value ($) | |
| Equity Contracts | | Assets, Net Assets — Net Unrealized Appreciation/ (Depreciation) on Futures | | | 1,896 | | | Liabilities, Net Assets — Net Unrealized Appreciation/ (Depreciation) on Futures | | | — | |
Shown below are the effects of derivative instruments on the Fund’s Statement of Operations, summarized by primary risk exposure, none of which are accounted for as hedging instruments under ASC 815.
| | | | | | | | | | | | |
Derivatives not accounted
for as hedging instruments
under ASC 815 | | Location in the Statement of Operations | | Total Notional
Amount of
Futures Contracts
Purchased/(Sold) ($) | | Realized Gain (Loss)
on Derivatives
Recognized in
Income ($) | | | Change in
Unrealized
Appreciation
(Depreciation)
on Derivatives
Recognized in
Income ($) | |
| Equity Contracts | | Realized gain (loss) on Futures, Increase (decrease) in unrealized appreciation/ (depreciation) on Futures | | 5,811,571/
(6,643,209) | | | (21,990 | ) | | | 9,246 | |
During the fiscal year ended December 31, 2016, the Fund had an average notional value of $243,225 and $104,694 on long and short futures contracts, respectively. Please refer to the table following the Schedule of Investments for open futures contracts at December 31, 2016.
Prior to July 1, 2016, the Company shared a revolving credit facility of up to $150 million with a number of its affiliates. The credit facility was with the Company’s custodian bank, State Street Bank and Trust Company (“State Street”). The revolving credit facility required the payment of a commitment fee equal to 0.20% per annum on the daily unused portion of the credit facility, payable quarterly. The portion borne by each Fund generally was borne proportionally based upon net assets. Generally, borrowings under the credit facility would accrue interest at the higher of the 1-Month LIBOR plus 1.25% and the Overnight Federal Funds Rate plus 1.25% and would be borne by the borrowing Fund. The maximum amount allowed to be borrowed by any one Fund was the lesser of (i) 33.33% of its total assets or (ii) 20% of its net assets. The credit facility was not utilized by the Fund during the fiscal year ended December 31, 2016. The revolving credit facility with State Street was terminated effective June 30, 2016.
| | |
| 16 | | Notes to Financial Statements |
State Street Premier Growth Equity V.I.S. Fund
Notes to Financial Statements, continued — December 31, 2016
Currently, the Funds and other affiliated funds (each a “Participant” and, collectively, the “Participants”) participate in a $360 million revolving credit facility provided by a syndication of banks under which the Participants may borrow to fund shareholder redemptions. This agreement expires October 12, 2017, unless extended or renewed.
The Participants are charged an annual commitment fee which is calculated based on the unused portion of the shared credit line. Commitment fees are allocated among each of the Participants based on relative net assets. A Participant incurs and pays the interest expense related to its borrowing. Interest is calculated at a rate per annum equal to the sum of 1% plus the greater of the New York Fed Bank Rate and 1-month LIBOR rate. From July 1, 2016, the date the Funds were added to this credit facility, through October 12, 2016, interest was calculated at a rate per annum equal to the sum of the New York Fed Bank Rate plus 1%.
The credit facilities were not utilized by the Fund during the fiscal year ended December 31, 2016.
| 6. | | Compensation and Fees Paid to Affiliates |
SSGA FM, a registered investment adviser, was retained by the Company’s Board of Directors effective July 1, 2016 to act as investment adviser and administrator of the Fund. SSGA FM’s compensation for investment advisory and administrative services (“Management Fee”) is paid monthly based on the average daily net assets of the Fund at an annualized rate of 0.65%.
State Street serves as the sub-administrator and custodian to the Funds. Amounts paid by the Fund to State Street for performing such services are included in advisory and administration and custody and accounting expenses, respectively.
Prior to July 1, 2016, GEAM served as the Fund’s investment adviser and administrator and the Fund paid GEAM a Management Fee at an annualized rate of 0.65%.
Directors’ Compensation The Fund pays no compensation to its Directors who are officers or employees of SSGA FM or its affiliates. Directors who are not such officers or employees also serve in a similar capacity for other funds advised by SSGA FM. Compensation paid to non-interested Directors is reflected on the Statement of Operations. These fees are allocated pro rata across all of the mutual fund platforms served by the Directors, including the Fund, and are based upon the relative net assets of each fund within such platforms. (For additional information about Directors’ compensation, please refer to the Funds’ Statement of Additional Information.)
Other Transactions with Affiliates In December 2015, State Street announced a review of the manner in which it invoiced certain expenses to certain of its Investment Servicing clients, primarily in the United States, during an 18-year period going back to 1998 and its determination that it had incorrectly invoiced clients for certain expenses. State Street informed its clients that it will pay to them the expenses it concluded were incorrectly invoiced to them, plus interest.
The amounts in the table below represent the refunded expenses and interest received by the Fund for the periods in question.
| | | | | | | | | | | | | | | | | | |
Refunded
Custody
Expense* | | Interest* | | Total | | % of Net
Assets at
12/31/16 |
| | | | | | | | | | | | | | | | | | | |
| | $ | 2,855 | | | | $ | 1,828 | | | | $ | 4,683 | | | | | 0.014 | % |
| | * | Refunded Custody Expense and Interest appear on the Statements of Operations in Custody and accounting expenses – net and Interest income, respectively. |
| 7. | | Investment Transactions |
Purchases and Sales of Securities The cost of purchases and the proceeds from sales of investments, other than short-term securities, for the fiscal year ended December 31, 2016, were as follows:
| | | | | | | | |
| Non-U.S. Government Securities |
| Purchases | | Sales |
| | $ | 7,215,914 | | | | $ | 10,624,440 | |
| | | | |
| Notes to Financial Statements | | | 17 | |
State Street Premier Growth Equity V.I.S. Fund
Notes to Financial Statements, continued — December 31, 2016
Affiliated Investments The Fund may invest in affiliated entities, including securities issued by State Street, affiliated funds, or entities deemed to be affiliates as a result of the Fund owning more than five percent of the entity’s voting securities or outstanding shares. Amounts relating to these transactions during the fiscal year ended December 31, 2016 are disclosed in the Schedule of Investments.
The Fund is subject to ASC 740, Income Taxes (“ASC 740”). ASC 740 provides guidance for financial accounting and reporting for the effects of income taxes that result from an entity’s activities during the year. ASC 740 also provides guidance regarding how uncertain tax positions should be recognized, measured, presented and disclosed in the financial statements. ASC 740 requires evaluation of tax positions taken or expected to be taken in the course of preparing the Fund’s tax returns to determine whether the tax positions are “more likely than not” of being sustained by the applicable tax authority. There are no adjustments to the Fund’s net assets required under ASC 740. The Fund’s 2013, 2014, 2015, and 2016 fiscal year tax returns are still open to examination by the Federal and applicable state tax authorities.
At December 31, 2016, information on the tax cost of investments and distributable earnings on a tax basis was as follows:
| | | | | | | | | | | | | | | | | | | | | | | | | | | | | | | | | | | | | | |
Cost of
Investments
For Tax
Purposes | | Gross Tax | | Net Tax
Appreciation/
(Depreciation) | | Undistributed
Income | | Undistributed
Accum.
Capital
Gain/(Loss) | | Late-Year
Losses |
| | Appreciation | | Depreciation | | Investments | | Derivatives/
Currency | | | |
| | | | | | | | | | | | | | | | | | | | | | | | | | | | | | | | | | | | | | | |
| | $ | 24,909,121 | | | | $ | 8,874,038 | | | | $ | (585,841 | ) | | | $ | 8,288,197 | | | | $ | — | | | | $ | — | | | | $ | 95,830 | | | | $ | — | |
As of December 31, 2016, the Fund had no capital loss carryovers. Capital loss carryovers are available to offset future realized capital gains to the extent provided in the Internal Revenue Code and regulations thereunder. To the extent that these carryover losses are used to offset future capital gains, it is probable that the gains offset will not be distributed to shareholders because they would be taxable as ordinary income.
Any qualified late-year loss is deemed to arise on the first day of the Fund’s next tax year (if the Fund elects to defer such loss). Under this regime, generally, the Fund can elect to defer any post-October capital loss and/or any late-year ordinary loss as defined by the Internal Revenue Code.
The Fund incurred no such losses for the fiscal year ended December 31, 2016.
The tax character of distributions paid during the fiscal years ended December 31, 2016 and December 31, 2015 were as follows:
| | | | | | | | | | | | | | | | | | |
| Year | | Ordinary
Income | | Long-Term
Capital Gains | | Total |
| | | | | | | | | | | | | | | | | | | |
| | | 2016 | | | | $ | 202,315 | | | | $ | 3,395,238 | | | | $ | 3,597,553 | |
| | | 2015 | | | | | 279,975 | | | | | 5,173,327 | | | | | 5,453,302 | |
Distributions to Shareholders The Fund declares and pays any dividends from net investment income annually. The Fund declares and pays any net realized capital gains in excess of capital loss carryforwards distributions annually. The character of income and gains to be distributed is determined in accordance with income tax regulations which may differ from GAAP. These differences include (but are not limited to) investments in futures, return of capital distributions from securities, dividend re-designations and losses deferred due to wash sale transactions. Reclassifications due to permanent book/tax differences are made to the Fund’s capital accounts to reflect income and gains available for distribution (or available capital loss carryovers) under income tax regulations. These reclassifications have no impact on net investment income, realized gains or losses, or the NAV of the Fund. The calculation of net investment income per share in the Financial Highlights table excludes these adjustments.
The reclassifications for the fiscal year ended December 31, 2016 were as follows:
| | | | | | | | | | | | | |
Undistributed
Net Investment
Income | | Accumulated
Net Realized
Gain (Loss) | | Capital
Paid In |
| | | | | | | | | | | | | | |
| | $ | (10,228 | ) | | | $ | 10,228 | | | | $ | — | |
| | |
| 18 | | Notes to Financial Statements |
State Street Premier Growth Equity V.I.S. Fund
Notes to Financial Statements, continued — December 31, 2016
KPMG LLP (“KPMG”) served as the independent registered certified public accounting firm of the Company through its resignation as of June 30, 2016. On September 9, 2016, upon recommendation by the Audit Committee of the Company, the Company’s Board of Directors selected Ernst & Young LLP (“EY”) to replace KPMG as the independent public accountant for the fiscal year ended December 31, 2016.
The reports of KPMG on the financial statements for the fiscal years ended December 31, 2014 and December 31, 2015 contained no adverse opinion or disclaimer of opinion and were not qualified or modified as to uncertainty, audit scope or accounting principles.
During the Company’s fiscal years ended December 31, 2014 and December 31, 2015 and through the period ended June 30, 2016, there were no disagreements with KPMG on any matter of accounting principles or practices, financial statement disclosure, or auditing scope or procedure, which disagreements if not resolved to the satisfaction of KPMG would have caused them to make reference thereto in their reports on the financial statements for such years or periods.
During the Company’s fiscal years ended December 31, 2014 and December 31, 2015 and through the period ended June 30, 2016, there were no reportable events (as defined in Item 304(a)(1)(v) of Regulation S-K). The Funds requested and KPMG furnished a letter addressed to the Securities and Exchange Commission stating whether or not it agreed with the above statements. A copy of such letter was filed as Exhibit 77 to Form N-SAR for the period ended December 31, 2016.
During the Company’s fiscal years ended December 31, 2014 and December 31, 2015 and through September 9, 2016, neither the Company nor anyone on its behalf has consulted EY on items which: (i) concerned the application of accounting principles to a specified transaction, either completed or proposed, or the type of audit opinion that might be rendered on the Company’s financial statements or (ii) concerned the subject of a disagreement (as defined in paragraph (a)(1)(iv) of Item 304 of Regulations S-K) or reportable events (as described in paragraph (a)(1)(v) of said Item 304).
| | | | |
| Notes to Financial Statements | | | 19 | |
State Street Premier Growth Equity V.I.S. Fund
Report of Independent Registered Public Accounting Firm
To the Board of Directors of State Street Variable Insurance Series Funds, Inc. and Shareholders of State Street Premier Growth Equity V.I.S. Fund:
We have audited the accompanying statement of assets and liabilities of the State Street Premier Growth Equity V.I.S. Fund (formerly GE Investments Premier Growth Equity Fund) (one of the funds constituting State Street Variable Insurance Series Funds, Inc. (formerly GE Investment Funds, Inc.)) (the “Fund”), including the schedule of investments, as of December 31, 2016, and the related statement of operations, changes in net assets and the financial highlights for the year then ended. These financial statements and financial highlights are the responsibility of the Fund’s management. Our responsibility is to express an opinion on these financial statements and financial highlights based on our audit. The statement of changes in net assets for the year ended December 31, 2015 and the financial highlights for periods ended prior to January 1, 2016 were audited by another independent registered public accounting firm whose report, dated February 19, 2016, expressed an unqualified opinion on that statement of changes in net assets and those financial highlights.
We conducted our audit in accordance with the standards of the Public Company Accounting Oversight Board (United States). Those standards require that we plan and perform the audit to obtain reasonable assurance about whether the financial statements and financial highlights are free of material misstatement. We were not engaged to perform an audit of the Fund’s internal control over financial reporting. Our audit included consideration of internal control over financial reporting as a basis for designing audit procedures that are appropriate in the circumstances, but not for the purpose of expressing an opinion on the effectiveness of the Fund’s internal control over financial reporting. Accordingly, we express no such opinion. An audit also includes examining, on a test basis, evidence supporting the amounts and disclosures in the financial statements and financial highlights, assessing the accounting principles used and significant estimates made by management, and evaluating the overall financial statement presentation. Our procedures included confirmation of securities owned as of December 31, 2016, by correspondence with the custodian and brokers or by other appropriate auditing procedures where replies from brokers were not received. We believe that our audit provides a reasonable basis for our opinion.
In our opinion, the financial statements and financial highlights referred to above present fairly, in all material respects, the financial position of the State Street Premier Growth Equity V.I.S. Fund (one of the funds constituting State Street Variable Insurance Series Funds, Inc.) at December 31, 2016, the results of its operations, changes in its net assets and the financial highlights for the year then ended, in conformity with U.S. generally accepted accounting principles.

Boston, Massachusetts
February 17, 2017
| | |
| 20 | | Report of Independent Registered Public Accounting Firm |
State Street Premier Growth Equity V.I.S. Fund
Tax Information (Unaudited)
For the year ended December 31, 2016, the Fund hereby designates $3,395,238 as capital gain dividends, or the amount ultimately treated as capital gain net income.
The amounts presented herein may differ from amounts presented elsewhere in the financial statements due to differences between tax and financial accounting principles. Please consult a tax advisor if you have any questions about Federal or State income tax laws or on how to prepare your tax returns. If you have specific questions about your Fund account, please consult your investment representative.
State Street Premier Growth Equity V.I.S. Fund
Special Meeting of Shareholders — Voting Results (Unaudited)
On November 2, 2016, the State Street Variable Insurance Series Funds, Inc. (formerly known as GE Investments Funds, Inc.) (the “Company”) held a special meeting of shareholders of each series portfolio of the Company (collectively, the “Funds”), including shareholders of the State Street Premier Growth Equity V.I.S. Fund (formerly known as the Premier Growth Equity Fund) (the “Fund”). Shareholders of record on August 31, 2016 were entitled to vote on the proposals. For each proposal shareholders of all Funds voted together and not by Fund or share class. At the meeting, all proposals were approved by the Fund’s shareholders and the following votes were recorded:
Proposal 1:
Approval of an amendment to the Articles of Incorporation of the Company to change the name of the Company from GE Investments Funds, Inc. to State Street Variable Insurance Series Funds, Inc.
Company Votes:
| | | | | | | | | | | | |
| | | No. of Shares | | | % of Outstanding Shares | | | % of Shares Present | |
Affirmative | | | 129,623,837.819 | | | | 89.283 | % | | | 89.283 | % |
Against | | | 10,047,818.534 | | | | 6.921 | % | | | 6.921 | % |
Abstain | | | 5,511,041.282 | | | | 3.796 | % | | | 3.796 | % |
Total | | | 145,182,697.634 | | | | 100.000 | % | | | 100.000 | % |
Fund votes:
| | | | | | | | | | | | |
| | | No. of Shares | | | % of Outstanding Shares | | | % of Shares Present | |
Affirmative | | | 328,875.938 | | | | 92.103 | % | | | 92.103 | % |
Against | | | 14,439.877 | | | | 4.044 | % | | | 4.044 | % |
Abstain | | | 13,756.795 | | | | 3.853 | % | | | 3.853 | % |
Total | | | 357,072.610 | | | | 100.000 | % | | | 100.000 | % |
Proposal 2:
Approval of an amendment to the Articles of Incorporation of the Company to permit the Board of Directors to change the name of the Company without seeking shareholder approval.
Company votes:
| | | | | | | | | | | | |
| | | No. of Shares | | | % of Outstanding Shares | | | % of Shares Present | |
Affirmative | | | 118,220,823.871 | | | | 81.429 | % | | | 81.429 | % |
Against | | | 21,486,028.150 | | | | 14.799 | % | | | 14.799 | % |
Abstain | | | 5,475,845.611 | | | | 3.772 | % | | | 3.772 | % |
Total | | | 145,182,697.634 | | | | 100.000 | % | | | 100.000 | % |
Fund votes:
| | | | | | | | | | | | |
| | | No. of Shares | | | % of Outstanding Shares | | | % of Shares Present | |
Affirmative | | | 306,621.803 | | | | 85.871 | % | | | 85.871 | % |
Against | | | 37,301.636 | | | | 10.447 | % | | | 10.447 | % |
Abstain | | | 13,149.170 | | | | 3.682 | % | | | 3.682 | % |
Total | | | 357,072.610 | | | | 100.000 | % | | | 100.000 | % |
| | |
| 22 | | Special Meeting of Shareholders — Voting Results |
State Street Premier Growth Equity V.I.S. Fund
Additional Information — December 31, 2016 (Unaudited)
Information about Directors and Executive Officers:
The business and affairs of the Fund are managed under the direction of the Fund’s Board of Directors. Information pertaining to the Directors and officers of the Fund is set forth below. Matthew J. Simpson resigned as a Director of the Fund effective June 30, 2016.
| | | | | | | | | | | | |
Name,
Address,
and Age | | Position(s) Held
with Fund | | Term of
Office and
Length of
Time Served | | Principal Occupation(s)
During Past 5 Years | | Number of
Portfolios
in Fund
Complex
Overseen
by Director | | | Other Directorships Held by Director |
INTERESTED DIRECTORS AND EXECUTIVE OFFICERS |
Jeanne M. La Porta c/o SSGA FM 1600 Summer St. Stamford, CT 06905 Age 51 | | Director and President | | Until successor is elected and qualified – 3 years | | Senior Managing Director at State Street Global Advisors since July 2016; President of GE Retirement Savings Plan Funds since July 2016; Senior Vice President and Commercial Operations Leader at GEAM from March 2014 to July 2016; President of State Street Institutional Funds and State Street Variable Insurance Series Funds, Inc. since April 2014; President and Trustee of GEAM’s UCITs Funds from March 2014 to November 2014; Senior Vice President and Commercial Administrative Officer at GEAM from April 2010 to March 2014; Vice President of State Street Institutional Funds from July 2003 to April 2014; Vice President of Elfun Funds from October 2003 to July 2016; Vice President of GE Retirement Savings Plan Funds from October 2003 to July 2016; Secretary of GE Funds from July 2007 to September 2010 and Vice President from July 2007 to February 2011; Senior Vice President and Deputy General Counsel of GEAM from October 2007 to April 2010; Vice President and Assistant Secretary of Elfun Funds and GE Retirement Savings Plan Funds from July 2003 to June 2010; and Vice President and Associate General Counsel – Marketing and Client Services (formerly Asset Management Services) at GEAM from May 1997 to October 2007. | | | 22 | | | Trustee and President of State Street Institutional Funds since 2014; Trustee of Elfun Funds since 2014. |
| | | | |
| Additional Information | | | 23 | |
State Street Premier Growth Equity V.I.S. Fund
Additional Information, continued — December 31, 2016 (Unaudited)
| | | | | | | | | | | | |
Name,
Address,
and Age | | Position(s) Held
with Fund | | Term of
Office and
Length of
Time Served | | Principal Occupation(s)
During Past 5 Years | | Number of
Portfolios
in Fund
Complex
Overseen
by Director | | | Other Directorships Held by Director |
INTERESTED DIRECTORS AND EXECUTIVE OFFICERS (continued) |
JoonWon Choe c/o SSGA FM 1600 Summer St. Stamford, CT 06905 Age 47 | | Vice President & Secretary | | Until successor is elected and qualified –
6 years | | Managing Director and Managing Counsel at State Street Global Advisors since July 2016; Senior Vice President and Deputy General Counsel at GEAM from March 2011 to July 2016; Vice President and Secretary of State Street Institutional Funds since September 2010; Vice President and Assistant Secretary of GE Retirement Savings Plan Funds since September 2010; Vice President and Assistant Secretary of Elfun Funds from September 2010 to July 2016; Senior Vice President and Associate General Counsel at GEAM from June 2010 to March 2011; Vice President and Associate General Counsel of GEAM from November 2005 to June 2010; and Vice President and Secretary of GE Funds from September 2010 to February 2011. | | | N/A | | | N/A |
| | | | | | | | | | | | | |
Robert Herlihy c/o SSGA FM 1600 Summer St. Stamford, CT 06905 Age 49 | | Chief Compliance Officer | | Until successor is elected and qualified –
11 years | | Managing Director at State Street Global Advisors since July 2016; Deputy Chief Compliance Officer of Elfun Funds since July 2016; Chief Compliance Officer of State Street Institutional Funds and GE Retirement Savings Plan Funds since July 2005; Chief Compliance Officer of GEAM and Elfun Funds from July 2005 to July 2016; Chief Compliance Officer of GE Funds from July 2005 to February 2011; and Manager of Fund Administration at GEAM from 2002 – 2005. | | | N/A | | | N/A |
| | | | | | | | | | | | | |
Arthur A. Jensen c/o SSGA FM 1600 Summer St. Stamford, CT 06905 Age 50 | | Treasurer | | Until successor is elected and qualified –
6 years | | Vice President at State Street Global Advisors since July 2016; Deputy Treasurer of Elfun Funds since July 2016; Treasurer of State Street Institutional Funds and GE Retirement Savings Plan Funds since June 2011; Treasurer of Elfun Funds from June 2011 to July 2016; Mutual Funds Controller of GEAM from April 2011 to July 2016; Senior Vice President at Citigroup from 2008 to 2010; and Vice President at JPMorgan from 2005 to 2008. | | | N/A | | | N/A |
| | |
| 24 | | Additional Information |
State Street Premier Growth Equity V.I.S. Fund
Additional Information, continued — December 31, 2016 (Unaudited)
| | | | | | | | | | | | |
Name,
Address,
and Age | | Position(s) Held
with Fund | | Term of
Office and
Length of
Time Served | | Principal Occupation(s)
During Past 5 Years | | Number of
Portfolios
in Fund
Complex
Overseen
by Director | | | Other Directorships Held by Director |
INTERESTED DIRECTORS AND EXECUTIVE OFFICERS (continued) |
Brian Harris c/o SSGA FM State Street Financial Center
One Lincoln Street Boston, MA 02111-2900 Age 43 | | Deputy Chief Compliance Officer | | Until successor is elected and qualified – less than 1 year | | Managing Director, State Street Global Advisors and SSGA Funds Management, Inc. (June 2013 – present)*; Senior Vice President and Global Head of Investment Compliance, BofA Global Capital Management (2010 – 2013); Director of Compliance, AARP Financial Inc. (2008 – 2010). | | | N/A | | | N/A |
| |
Bruce S. Rosenberg c/o SSGA FM State Street Financial Center
One Lincoln Street Boston, MA 02111-2900 Age 55 | | Assistant Treasurer | | Until successor is elected and qualified – less than 1 year | | Managing Director, State Street Global Advisors and SSGA Funds Management, Inc. (July 2015 – present); Director, Credit Suisse (April 2008 – July 2015). | | | N/A | | | N/A |
| |
Ann M. Carpenter c/o SSGA FM State Street Financial Center
One Lincoln Street Boston, MA 02111-2900 Age 50 | | Assistant Treasurer | | Until successor is elected and qualified – less than 1 year | | Chief Operating Officer, SSGA Funds Management, Inc. (April 2014 – present); Managing Director, State Street Global Advisors and SSGA Funds Management, Inc. (2005 – present).* | | | N/A | | | N/A |
| | | | | | | | | | | | | |
Chad C. Hallett c/o SSGA FM State Street Financial Center
One Lincoln Street Boston, MA 02111-2900 Age 47 | | Assistant Treasurer | | Until successor is elected and qualified – less than 1 year | | Vice President, State Street Global Advisors and SSGA Funds Management, Inc. (November 2014 – present); Vice President, State Street Bank and Trust Company (2001 – November 2014). | | | N/A | | | N/A |
| * | | Served in various capacities and/or with various affiliated entities during noted time period. |
| | | | |
| Additional Information | | | 25 | |
State Street Premier Growth Equity V.I.S. Fund
Additional Information, continued — December 31, 2016 (Unaudited)
| | | | | | | | | | | | |
Name,
Address,
and Age | | Position(s) Held
with Fund | | Term of
Office and
Length of
Time Served | | Principal Occupation(s)
During Past 5 Years | | Number of
Portfolios
in Fund
Complex
Overseen
by Director | | | Other Directorships Held by Director |
NON-INTERESTED DIRECTORS |
John R. Costantino c/o SSGA FM 1600 Summer St. Stamford, CT 06905 Age 70 | | Chairman of the Board | | Until successor is elected and qualified – 20 years | | General Partner, NGN Capital LLC since 2006; and Managing Director, Vice President of Walden Capital Management since 1996. | | | 16 | | | Trustee of State Street Institutional Funds since 1997; Trustee of Fordham University from 1989 to 1995 and from 2001 to 2007 and Trustee Emeritus since 2007; Trustee of NeuroScience Research Institute since 1986; Trustee of GE Funds from 1993 to February 2011; Director of Artes Medical from 2006 to 2008; and Trustee of Gregorian University Foundation from 1992 to 2007. |
| | | | | | | | | | | | | |
R. Sheldon Johnson c/o SSGA FM 1600 Summer St. Stamford, CT 06905 Age 70 | | Director | | Until successor is elected and qualified – 6 years | | Retired, 2006 to present; Head of Global Institutional Equity Sales and Marketing at Morgan Stanley & Co., Inc. from 2002 to 2006 and Managing Director at Morgan Stanley & Co., Inc. from 1988 to 2006. | | | 16 | | | Trustee of State Street Institutional Funds since April 2011 and Trustee of St. Lawrence University since 2003. |
| | | | | | | | | | | | | |
Donna M. Rapaccioli c/o SSGA FM 1600 Summer St. Stamford, CT 06905 Age 54 | | Director | | Until successor is elected and qualified – 5 years | | Dean of the Gabelli School of Business since 2007 and Accounting professor since 1987 at Fordham University. | | | 16 | | | Trustee of State Street Institutional Funds since January 2012 and Trustee of Emmanuel College since 2010. |
The Statement of Additional Information for the Funds includes additional information about the Directors and Officers and is available, without charge, upon request by calling 1-800-242-0134.
| | |
| 26 | | Additional Information |
State Street Premier Growth Equity V.I.S. Fund
Investment Team (Unaudited)
Investment Adviser and Administrator
SSGA Funds Management, Inc.
Board of Directors
John R. Costantino, Chairman
R. Sheldon Johnson
Jeanne M. La Porta
Donna M. Rapaccioli
Secretary
JoonWon Choe
Chief Compliance Officer
Robert Herlihy
Deputy Chief Compliance Officer
Brian Harris
Treasurer
Arthur A. Jensen
Assistant Treasurers
Bruce S. Rosenberg
Ann M. Carpenter
Chad C. Hallett
Distributor
State Street Global Markets, LLC
Member FINRA and SIPC
Custodian
State Street Bank and Trust Company
Investment Adviser
SSGA Funds Management, Inc.
1600 Summer Street
Stamford, CT 06905
or at:
P.O. Box 7900
Stamford, CT 06904-7900
Distributor
State Street Global Markets, LLC
Member FINRA and SIPC
State Street Financial Center
One Lincoln Street
Boston, MA 02111
www.ssga.com/geam
The Fund files its complete schedule of portfolio holdings with the Securities and Exchange Commission for the first and third quarters of each fiscal year on Form N-Q. The Fund’s Forms N-Q, as well as a description of the policies and procedures that the Fund uses to determine how to vote proxies (if any) relating to portfolio securities is available without charge (i) upon request, by calling 1-800-242-0134; (ii) on the Fund’s website at http://www.ssga.com/geam; and (iii) on the Commission’s website at http://www.sec.gov. The Fund’s Forms N-Q may be reviewed and copied at the Commission’s Public Reference Room in Washington, DC — information on the operation of the Public Reference Room may be obtained by calling 1-800-SEC-0330.
Information (if any) regarding how the Fund voted proxies relating to portfolio securities during the most recently disclosed 12-month period ended June 30 is available without charge (i) through the Fund’s website at http://www.ssga.com/geam; and (ii) on the Commission’s website at http://www.sec.gov.
IBG-22838
During the period covered by this report, and related to the approval of a new investment adviser, State Street Variable Insurance Series Funds, Inc. (formerly known as GE Investments Funds, Inc.) (the “Registrant” or the “Funds,” as applicable) has adopted a new code of ethics, as defined in Item 2 of Form N-CSR, applicable to its principal executive officer, principal financial officer, principal accounting officer or controller, or persons performing similar functions, which replaces the prior code of ethics. A copy of this code of ethics is filed as an exhibit to this Form N-CSR.
There have not been any waivers granted from a provision that relates to any element of the code of ethics definition set forth in paragraph (b) of Item 2 of Form N-CSR during the period covered by this report.
| Item 3. | Audit Committee Financial Expert. |
The Board of Directors of the Registrant has determined that John R. Costantino and Donna M. Rapaccioli are designated as the audit committee financial experts for the Registrant; and further that it is the finding of the Board of Directors that Mr. Costantino and Ms. Rapaccioli, the audit committee financial experts, qualify as being “independent” pursuant to paragraph (a)(2) of Item 3 to Form N-CSR.
| Item 4. | Principal Accountant Fees and Services. |
(a) AUDIT FEES. For the fiscal year ended December 31, 2016, the aggregate audit fees billed for professional services rendered by Ernst & Young LLP (“EY”), the Registrant’s principal accountant, for the audit of the Registrant’s annual financial statements, or services that are normally provided by EY in connection with the Registrant’s statutory and regulatory filings and engagements were $214,300. For the fiscal year ended December 31, 2015, the aggregate audit fees billed for professional services rendered by KPMG LLP (“KPMG”), the Registrant’s prior principal accountant, for the audit of the Registrant’s annual financial statements, or services that are normally provided in connection with the Registrant’s statutory and regulatory filings and engagements were $170,200.
(b) AUDIT RELATED FEES. There were no fees billed either by EY for the fiscal year ended December 31, 2016 or KPMG for the fiscal year ended December 31, 2015, for assurance and related services that were reasonably related to the performance of the audit of the Registrant.
(c) TAX FEES. The aggregate tax fees billed for professional services rendered by EY for tax compliance, tax advice and tax planning for the Registrant in the form of preparation of excise filings and income tax returns for the fiscal year ended December 31, 2016 were $53,172. There were no fees billed for professional services rendered by KPMG for tax compliance, tax advice or tax planning for the Registrant for the fiscal year ended December 31, 2015.
(d) ALL OTHER FEES. For the fiscal year ended December 31, 2016, there were no fees billed for professional services rendered by EY for products and services provided by EY to the Registrant, other than the services reported in paragraphs (a) through (c) of this Item. For the fiscal year ended December 31, 2016, the aggregate fees for professional services rendered by EY for products and services provided by EY to the Registrant’s investment adviser and any entity controlling, controlled by, or under common control with the Registrant’s investment adviser that provides ongoing services to the Registrant that (i) relate directly to the operations and financial reporting of the Registrant and (ii) were pre-approved by the Registrant’s audit committee were approximately $7,722,372. There were no fees billed for products and services provided by KPMG during the fiscal year ended December 31, 2015, for the Registrant, other than the services reported in paragraphs (a) through (c) of this Item.
(e)(1) AUDIT COMMITTEE PRE-APPROVAL POLICIES AND PROCEDURES.
The Audit Committee of the Funds Board of Directors is responsible for, among other things, the appointment, compensation and oversight of the work of the Funds’ Auditor. As part of this responsibility and to ensure that the Auditor’s independence is not impaired, the Audit Committee (1) pre-approves the audit and non-audit services provided to the Funds by the Auditor, and (2) all non-audit services provided to the Funds’ investment adviser and Covered Affiliates (as defined in the Audit Committee Charter) that provide ongoing services to the Funds if the services directly impact the Funds’ operations or financial reporting, in accordance with the Audit Committee Charter. The following excerpt from the Audit Committee Charter sets forth the pre-approval policies and procedures:
Pre-Approval of Audit Related Services and Permissible Non-Audit Services. The Audit Committee shall pre-approve both audit (including audit, review, and attest) services and permissible non-audit services provided to the Fund and, if the nature of the engagement relates directly to the operations and financial reporting of the Fund, permissible non-audit services provided to any Covered Affiliate.
The Audit Committee may determine to delegate the authority to grant pre-approvals to one or more Audit Committee members, each acting on behalf of the Audit Committee. In this event, the member of the Audit Committee so delegated shall report each delegated pre-approval to the Audit Committee at its next regularly scheduled meeting. The Audit Committee may also adopt and follow, in lieu of explicit pre-approval described above, written policies and procedures detailed as to the particular service, designed to safeguard the continued independence of the Auditor, consistent with the requirements of the Investment Company Act of 1940, as amended (the “1940 Act”), and SEC regulations there under.
Notwithstanding the foregoing, the pre-approval requirement concerning permissible non-audit services provided to the Fund or any Covered Affiliate is waived if: (1) the aggregate amount of all such non-audit services provided constitutes no more than five percent (5%) of the total amount of revenues paid to the Auditor by the Fund and the Covered Affiliates during the fiscal year in which the services are provided that would have to be pre-approved by the Audit Committee, (2) the non-audit services were not recognized as non-audit services at the time of the engagement, and (3) such non-audit services are promptly brought to the attention of the Audit Committee and approved by the Audit Committee or one or more designated members of the Audit Committee prior to the completion of the audit.
(2) PERCENTAGE OF SERVICES DESCRIBED IN PARAGRAPHS (b) THROUGH (d) APPROVED BY AUDIT COMMITTEE. The percentage of services described in each of paragraphs (b) through (d) of this Item rendered by EY for the fiscal year ended December 31, 2016 that were approved by the audit committee pursuant to paragraph (c)(7)(i)(C) of Rule 2-01 of Regulation S-X is as follows:
| | | | |
Audit Fees | | | 100 | % |
Audit-Related Fees | | | 100 | % |
Tax Fees | | | 100 | % |
All Other Fees | | | 100 | % |
There were no fees billed by KPMG for the fiscal year ended December 31, 2015 for audit related, tax or other services as indicated in paragraphs (b) through (d) of this Item.
(f) Not applicable.
(g) NON-AUDIT FEES. The aggregate non-audit fees billed by EY for services rendered to the Registrant, and rendered to the Registrant’s investment adviser and any entity controlling, controlled by, or under common control with the Registrant’s adviser (“Service Affiliates”), for the fiscal year ended December 31, 2016 were $25,696,758. The aggregate non-audit fees billed by KPMG for services rendered to the Registrant and rendered to any Service Affiliates for the fiscal year ended December 31, 2015 were $0.
(h) AUDITOR INDEPENDENCE. On July 1, 2016, State Street Corporation acquired the asset management and advisory services business conducted by GE Asset Management Incorporated (“GEAM”), a wholly owned subsidiary of General Electric Company, and certain of its subsidiaries (the “Transaction”). In connection with the Transaction, Shareholders of the Funds voted to approve SSGA Funds Management, Inc. (“SSGA FM”) as investment adviser of the Funds, replacing GEAM.
In connection with the appointment of EY, a member firm of Ernst & Young Global Limited, as the independent auditor of the Funds for their fiscal year ended December 31, 2016, EY evaluated its independence and identified the following matters that are inconsistent with the auditor independence rules of the Securities and Exchange Commission (“SEC”). All of the lobbying services and project management services described below occurred prior to the consummation of the Transaction.
Lobbying services
During the audit period, EY was a registered lobbyist for the parent company of the former investment adviser to the Funds (the “parent company”) under the Lobbying Disclosure Act of 1995 and provided lobbying services on behalf of the parent company. The services primarily included lobbying efforts, on behalf of the parent company, relating to tax reform and to changes to the tax code or regulations affecting the parent company and its affiliates. The services did not relate to the asset management business of the Funds.
Project management services
During the audit period, EY was engaged to provide project management support to the parent company and one of its affiliates in relation to certain information technology programs. The services did not relate to the asset management business of the Funds.
Loan Rule
EY has identified one record holder (the “record holder”) of greater than 10% of the shares of State Street Institutional Income Fund (formerly known as GE Institutional Income Fund) and State Street Institutional Premier Growth Equity Fund (formerly known as GE Institutional Premier Growth Equity Fund) (each a series of State Street Institutional Funds (formerly known as GE Institutional Funds)) (collectively, the “Two Funds”), with which EY and covered person professionals maintain lending relationships. These investments in the Two Funds are each held at an omnibus level by the record holder on behalf of its customers, who own the economic interest in the shares. There was one meeting of shareholders of the Two Funds during the audit period. At that meeting, shareholders voted on matters relating to the acquisition by State Street Corporation and its affiliates of substantially all of the asset management and advisory services business conducted by the former investment adviser to the Two Funds, including votes to (i) approve a new investment advisory and administration agreement with SSGA FM, (ii) elect the Trustees to the Board of Trustees, and (iii) approve manager-of-managers authority for SSGA FM with respect to the Two Funds. EY and SSGA FM, through discussion with the record holder, have determined that the record holder did not exercise discretionary authority over the shares it held in respect of any of those votes. EY believes that, while a lending arrangement with a record owner of greater than 10% of the shares is inconsistent with Rule 2-01(c)(1)(ii)(A) of Regulation S-X, the circumstances fall within the situations described in the relevant No Action Letter issued by the SEC Staff on June 20, 2016.
EY has reviewed the independence matters described above and the applicable guidance and has concluded that the services and relationship described above did not impair EY’s ability to exercise objective and impartial judgment in connection with the audits of the financial statements of the Funds under the SEC and Public Company Accounting Oversight Board standards for the fiscal year ended December 31, 2016. In light of the representations and determinations by EY, SSGA FM has determined that it shares that same belief.
The Audit Committee of the Board of the Funds has considered these independence matters and discussed these matters with EY and members of SSGA FM, and based on these discussions and the statements of SSGA FM and EY, the Audit Committee believes it was reasonable for it to accept the view of EY that EY was capable of exercising objective and impartial judgment in connection with the audits of the financial statements of the Funds in the specific circumstances described above.
| Item 5. | Audit Committee of Listed Registrants. |
Applicable only to Closed-End Management Investment Companies.
| Item 6. | Schedule of Investments. |
(a) The Schedule of Investments as of the close of the reporting period for the State Street Total Return V.I.S. Fund is listed below. The Schedules of Investments as of the close of the reporting period for the State Street U.S. Equity V.I.S. Fund, State Street S&P 500 Index V.I.S. Fund, State Street Premier Growth V.I.S. Fund, State Street Core Value Equity V.I.S. Fund, State Street Small-Cap Equity V.I.S. Fund, State Street Income V.I.S. Fund, and the State Street Real Estate Securities V.I.S. Fund and a Summary Schedule of Investments for the State Street Total Return V.I.S. Fund are included as part of the Report to Shareholders filed under Item 1 of this Form N-CSR.
(b) Not applicable.
Total Return V.I.S. Fund
Schedule of Investments December 31, 2016 (Unaudited)
| | | | | | | | |
| | | Number of
Shares | | | Fair Value | |
Domestic Equity—38.7% † | |
Common Stock—38.7% | | | | | | | | |
| | |
Advertising—0.1% | | | | | | | | |
MDC Partners Inc., Class A | | | 1,024 | | | $ | 6,707 | |
National CineMedia Inc. | | | 1,224 | | | | 18,029 | |
Omnicom Group Inc. | | | 10,599 | | | | 902,081 | |
The Interpublic Group of Companies Inc. | | | 17,924 | | | | 419,601 | |
| | | | 1,346,418 | |
| | |
Aerospace & Defense—0.9% | | | | | | | | |
AAR Corp. | | | 664 | | | | 21,945 | |
Aerojet Rocketdyne Holdings Inc. | | | 1,190 | | | | 21,361 | (a) |
Aerovironment Inc. | | | 410 | | | | 11,000 | (a) |
Arconic Inc. | | | 19,623 | | | | 363,810 | |
Astronics Corp. | | | 289 | | | | 9,780 | (a) |
B/E Aerospace Inc. | | | 891 | | | | 53,629 | |
Cubic Corp. | | | 503 | | | | 24,119 | |
Curtiss-Wright Corp. | | | 1,253 | | | | 123,245 | |
DigitalGlobe Inc. | | | 1,266 | | | | 36,271 | (a) |
Ducommun Inc. | | | 204 | | | | 5,214 | (a) |
Engility Holdings Inc. | | | 359 | | | | 12,098 | (a) |
Esterline Technologies Corp. | | | 788 | | | | 70,290 | (a) |
General Dynamics Corp. | | | 12,759 | | | | 2,202,969 | |
Huntington Ingalls Industries Inc. | | | 404 | | | | 74,413 | |
KLX Inc. | | | 1,451 | | | | 65,455 | (a) |
Kratos Defense & Security Solutions Inc. | | | 926 | | | | 6,852 | (a) |
L3 Technologies Inc. | | | 3,492 | | | | 531,168 | |
Lockheed Martin Corp. | | | 11,214 | | | | 2,802,827 | |
Mercury Systems Inc. | | | 779 | | | | 23,541 | (a) |
Moog Inc., Class A | | | 609 | | | | 39,999 | (a) |
National Presto Industries Inc. | | | 99 | | | | 10,534 | |
Northrop Grumman Corp. | | | 7,933 | | | | 1,845,057 | |
Orbital ATK Inc. | | | 506 | | | | 44,391 | |
Raytheon Co. | | | 13,201 | | | | 1,874,542 | |
Rockwell Collins Inc. | | | 5,802 | | | | 538,194 | |
Sparton Corp. | | | 188 | | | | 4,484 | (a) |
TASER International Inc. | | | 1,048 | | | | 25,404 | (a) |
Teledyne Technologies Inc. | | | 943 | | | | 115,989 | (a) |
Textron Inc. | | | 12,098 | | | | 587,479 | |
The Boeing Co. | | | 25,729 | | | | 4,005,491 | |
The KEYW Holding Corp. | | | 721 | | | | 8,501 | (a) |
TransDigm Group Inc. | | | 2,264 | | | | 563,645 | |
Triumph Group Inc. | | | 1,415 | | | | 37,497 | |
United Technologies Corp. | | | 34,177 | | | | 3,746,483 | |
Vectrus Inc. | | | 210 | | | | 5,009 | (a) |
Wesco Aircraft Holdings Inc. | | | 1,112 | | | | 16,624 | (a) |
| | | | 19,929,310 | |
| | |
Agricultural & Farm Machinery—0.1% | | | | | | | | |
AGCO Corp. | | | 585 | | | | 33,848 | |
Deere & Co. | | | 12,973 | | | | 1,336,738 | |
Lindsay Corp. | | | 214 | | | | 15,967 | |
The Toro Co. | | | 958 | | | | 53,600 | |
Titan International Inc. | | | 888 | | | | 9,954 | |
| | | | 1,450,107 | |
| | | | | | | | |
Agricultural Products—0.1% | | | | | | | | |
Alico Inc. | | | 66 | | | | 1,792 | |
Archer-Daniels-Midland Co. | | | 25,804 | | | | 1,177,953 | |
Darling Ingredients Inc. | | | 2,971 | | | | 38,356 | (a) |
Fresh Del Monte Produce Inc. | | | 645 | | | | 39,106 | |
Ingredion Inc. | | | 629 | | | | 78,600 | |
Limoneira Co. | | | 240 | | | | 5,162 | |
| | | | 1,340,969 | |
| | |
Air Freight & Logistics—0.3% | | | | | | | | |
Air Transport Services Group Inc. | | | 906 | | | | 14,460 | (a) |
Atlas Air Worldwide Holdings Inc. | | | 489 | | | | 25,501 | (a) |
CH Robinson Worldwide Inc. | | | 6,408 | | | | 469,450 | |
Echo Global Logistics Inc. | | | 572 | | | | 14,329 | (a) |
Expeditors International of Washington Inc. | | | 8,050 | | | | 426,328 | |
FedEx Corp. | | | 10,861 | | | | 2,022,318 | |
Forward Air Corp. | | | 592 | | | | 28,049 | |
Hub Group Inc., Class A | | | 667 | | | | 29,181 | (a) |
Park-Ohio Holdings Corp. | | | 172 | | | | 7,327 | |
Radiant Logistics Inc. | | | 505 | | | | 1,969 | (a) |
United Parcel Service Inc., Class B | | | 30,843 | | | | 3,535,842 | |
XPO Logistics Inc. | | | 1,812 | | | | 78,206 | (a) |
| | | | 6,652,960 | |
| | |
Airlines—0.3% | | | | | | | | |
Alaska Air Group Inc. | | | 5,566 | | | | 493,871 | |
Allegiant Travel Co. | | | 259 | | | | 43,097 | |
American Airlines Group Inc. | | | 22,843 | | | | 1,066,540 | |
Delta Air Lines Inc. | | | 32,637 | | | | 1,605,414 | |
Hawaiian Holdings Inc. | | | 1,036 | | | | 59,052 | (a) |
JetBlue Airways Corp. | | | 2,838 | | | | 63,628 | (a) |
SkyWest Inc. | | | 1,006 | | | | 36,669 | |
Southwest Airlines Co. | | | 27,633 | | | | 1,377,229 | |
United Continental Holdings Inc. | | | 12,961 | | | | 944,598 | (a) |
| | | | 5,690,098 | |
| | |
Alternative Carriers—0.0% * | | | | | | | | |
Cogent Communications Holdings Inc. | | | 830 | | | | 34,320 | |
Globalstar Inc. | | | 7,534 | | | | 11,904 | (a) |
Inteliquent Inc. | | | 660 | | | | 15,127 | |
Iridium Communications Inc. | | | 1,646 | | | | 15,802 | (a) |
Level 3 Communications Inc. | | | 12,990 | | | | 732,116 | (a) |
Lumos Networks Corp. | | | 373 | | | | 5,826 | (a) |
ORBCOMM Inc. | | | 886 | | | | 7,327 | (a) |
pdvWireless Inc. | | | 52 | | | | 1,173 | (a) |
Straight Path Communications Inc., Class B | | | 192 | | | | 6,511 | (a) |
Vonage Holdings Corp. | | | 3,845 | | | | 26,338 | (a) |
| | | | 856,444 | |
| | |
Aluminum—0.0% * | | | | | | | | |
Century Aluminum Co. | | | 999 | | | | 8,552 | (a) |
Kaiser Aluminum Corp. | | | 351 | | | | 27,269 | |
Real Industry Inc. | | | 521 | | | | 3,178 | (a) |
| | | | 38,999 | |
| | |
Apparel Retail—0.2% | | | | | | | | |
Abercrombie & Fitch Co., Class A | | | 1,369 | | | | 16,428 | |
American Eagle Outfitters Inc. | | | 4,764 | | | | 72,270 | |
Ascena Retail Group Inc. | | | 3,466 | | | | 21,454 | (a) |
Boot Barn Holdings Inc. | | | 265 | | | | 3,318 | (a) |
Caleres Inc. | | | 859 | | | | 28,192 | |
Chico’s FAS Inc. | | | 3,644 | | | | 52,437 | |
| | | | | | | | |
Citi Trends Inc. | | | 286 | | | | 5,388 | |
Destination XL Group Inc. | | | 720 | | | | 3,060 | (a) |
DSW Inc. | | | 1,275 | | | | 28,879 | |
Express Inc. | | | 1,496 | | | | 16,097 | (a) |
Foot Locker Inc. | | | 6,038 | | | | 428,034 | |
Francesca’s Holdings Corp. | | | 734 | | | | 13,234 | (a) |
Genesco Inc. | | | 409 | | | | 25,399 | (a) |
Guess? Inc. | | | 1,235 | | | | 14,943 | |
L Brands Inc. | | | 10,858 | | | | 714,891 | |
Ross Stores Inc. | | | 17,716 | | | | 1,162,170 | |
Shoe Carnival Inc. | | | 284 | | | | 7,662 | |
Stage Stores Inc. | | | 538 | | | | 2,351 | |
Stein Mart Inc. | | | 625 | | | | 3,425 | |
Tailored Brands Inc. | | | 985 | | | | 25,167 | |
The Buckle Inc. | | | 577 | | | | 13,156 | |
The Cato Corp., Class A | | | 510 | | | | 15,341 | |
The Children’s Place Inc. | | | 356 | | | | 35,938 | |
The Finish Line Inc., Class A | | | 840 | | | | 15,800 | |
The Gap Inc. | | | 9,907 | | | | 222,313 | |
The TJX Companies Inc. | | | 29,170 | | | | 2,191,542 | |
Tilly’s Inc., Class A | | | 209 | | | | 2,757 | (a) |
Urban Outfitters Inc. | | | 4,069 | | | | 115,885 | (a) |
Zumiez Inc. | | | 363 | | | | 7,932 | (a) |
| | | | 5,265,463 | |
| | |
Apparel, Accessories & Luxury Goods—0.1% | | | | | | | | |
Carter’s Inc. | | | 430 | | | | 37,148 | |
Coach Inc. | | | 12,609 | | | | 441,567 | |
Columbia Sportswear Co. | | | 539 | | | | 31,424 | |
Delta Apparel Inc. | | | 140 | | | | 2,902 | (a) |
Fossil Group Inc. | | | 1,180 | | | | 30,515 | (a) |
G-III Apparel Group Ltd. | | | 862 | | | | 25,481 | (a) |
Hanesbrands Inc. | | | 17,080 | | | | 368,416 | |
Iconix Brand Group Inc. | | | 856 | | | | 7,995 | (a) |
Kate Spade & Co. | | | 1,117 | | | | 20,854 | (a) |
Movado Group Inc. | | | 312 | | | | 8,970 | |
Oxford Industries Inc. | | | 246 | | | | 14,792 | |
Perry Ellis International Inc. | | | 249 | | | | 6,203 | (a) |
PVH Corp. | | | 3,588 | | | | 323,781 | |
Ralph Lauren Corp. | | | 2,518 | | | | 227,426 | |
Sequential Brands Group Inc. | | | 787 | | | | 3,683 | (a) |
Superior Uniform Group Inc. | | | 159 | | | | 3,119 | |
Under Armour Inc., Class A | | | 8,288 | | | | 240,766 | (a) |
Under Armour Inc., Class C | | | 8,331 | | | | 209,691 | (a) |
Vera Bradley Inc. | | | 408 | | | | 4,782 | (a) |
VF Corp. | | | 14,909 | | | | 795,395 | |
Vince Holding Corp. | | | 452 | | | | 1,831 | (a) |
| | | | 2,806,741 | |
| | |
Application Software—0.4% | | | | | | | | |
8x8 Inc. | | | 1,765 | | | | 25,240 | (a) |
ACI Worldwide Inc. | | | 3,217 | | | | 58,389 | (a) |
Adobe Systems Inc. | | | 22,142 | | | | 2,279,519 | (a) |
American Software Inc., Class A | | | 521 | | | | 5,382 | |
ANSYS Inc. | | | 751 | | | | 69,460 | (a) |
Aspen Technology Inc. | | | 1,499 | | | | 81,965 | (a) |
Autodesk Inc. | | | 8,826 | | | | 653,212 | (a) |
Blackbaud Inc. | | | 869 | | | | 55,616 | |
Blackline Inc. | | | 194 | | | | 5,360 | (a) |
Bottomline Technologies de Inc. | | | 806 | | | | 20,166 | (a) |
BroadSoft Inc. | | | 588 | | | | 24,255 | (a) |
| | | | | | | | |
Cadence Design Systems Inc. | | | 2,503 | | | | 63,126 | (a) |
Callidus Software Inc. | | | 1,171 | | | | 19,673 | (a) |
CDK Global Inc. | | | 1,296 | | | | 77,358 | |
Citrix Systems Inc. | | | 7,038 | | | | 628,564 | (a) |
Digimarc Corp. | | | 187 | | | | 5,610 | (a) |
Ebix Inc. | | | 505 | | | | 28,810 | |
Ellie Mae Inc. | | | 649 | | | | 54,308 | (a) |
EnerNOC Inc. | | | 532 | | | | 3,192 | (a) |
Exa Corp. | | | 277 | | | | 4,255 | (a) |
Fair Isaac Corp. | | | 850 | | | | 101,337 | |
Glu Mobile Inc. | | | 2,085 | | | | 4,045 | (a) |
Guidance Software Inc. | | | 429 | | | | 3,037 | (a) |
HubSpot Inc. | | | 579 | | | | 27,213 | (a) |
Intuit Inc. | | | 10,981 | | | | 1,258,532 | |
Jive Software Inc. | | | 1,170 | | | | 5,090 | (a) |
Manhattan Associates Inc. | | | 614 | | | | 32,560 | (a) |
Mentor Graphics Corp. | | | 2,926 | | | | 107,940 | |
MicroStrategy Inc., Class A | | | 190 | | | | 37,506 | (a) |
Mitek Systems Inc. | | | 595 | | | | 3,659 | (a) |
MobileIron Inc. | | | 892 | | | | 3,345 | (a) |
Model N Inc. | | | 444 | | | | 3,929 | (a) |
Monotype Imaging Holdings Inc. | | | 813 | | | | 16,138 | |
Park City Group Inc. | | | 224 | | | | 2,845 | (a) |
Paycom Software Inc. | | | 828 | | | | 37,666 | (a) |
Paylocity Holding Corp. | | | 431 | | | | 12,934 | (a) |
Pegasystems Inc. | | | 721 | | | | 25,956 | |
PROS Holdings Inc. | | | 506 | | | | 10,889 | (a) |
PTC Inc. | | | 1,018 | | | | 47,103 | (a) |
QAD Inc., Class A | | | 189 | | | | 5,746 | |
RealPage Inc. | | | 1,080 | | | | 32,400 | (a) |
RingCentral Inc., Class A | | | 1,174 | | | | 24,184 | (a) |
salesforce.com Inc. | | | 28,605 | | | | 1,958,298 | (a) |
Silver Spring Networks Inc. | | | 763 | | | | 10,156 | (a) |
Synchronoss Technologies Inc. | | | 828 | | | | 31,712 | (a) |
Synopsys Inc. | | | 1,323 | | | | 77,872 | (a) |
Tangoe Inc. | | | 561 | | | | 4,421 | (a) |
Telenav Inc. | | | 652 | | | | 4,597 | (a) |
The Ultimate Software Group Inc. | | | 251 | | | | 45,770 | (a) |
Tyler Technologies Inc. | | | 292 | | | | 41,689 | (a) |
Verint Systems Inc. | | | 1,192 | | | | 42,018 | (a) |
VirnetX Holding Corp. | | | 988 | | | | 2,174 | (a) |
Workiva Inc. | | | 439 | | | | 5,992 | (a) |
Zendesk Inc. | | | 1,626 | | | | 34,471 | (a) |
Zix Corp. | | | 1,087 | | | | 5,370 | (a) |
| | | | 8,232,054 | |
| | |
Asset Management & Custody Banks—0.4% | | | | | | | | |
Affiliated Managers Group Inc. | | | 2,435 | | | | 353,805 | (a) |
Ameriprise Financial Inc. | | | 7,093 | | | | 786,897 | |
Arlington Asset Investment Corp., Class A | | | 390 | | | | 5,780 | |
Associated Capital Group Inc., Class A | | | 101 | | | | 3,318 | |
BlackRock Inc. | | | 5,417 | | | | 2,061,385 | |
Calamos Asset Management Inc., Class A | | | 419 | | | | 3,582 | |
Cohen & Steers Inc. | | | 401 | | | | 13,474 | |
Diamond Hill Investment Group Inc. | | | 65 | | | | 13,675 | |
Eaton Vance Corp. | | | 999 | | | | 41,838 | |
Federated Investors Inc., Class B | | | 822 | | | | 23,246 | |
Fifth Street Asset Management Inc. | | | 78 | | | | 523 | |
Financial Engines Inc. | | | 1,046 | | | | 38,440 | |
Franklin Resources Inc. | | | 15,586 | | | | 616,894 | |
| | | | | | | | |
GAMCO Investors Inc., Class A | | | 102 | | | | 3,151 | |
Hennessy Advisors Inc. | | | 58 | | | | 1,841 | |
Invesco Ltd. | | | 18,264 | | | | 554,130 | |
Janus Capital Group Inc. | | | 4,052 | | | | 53,770 | |
Legg Mason Inc. | | | 770 | | | | 23,031 | |
Manning & Napier Inc. | | | 322 | | | | 2,431 | |
Medley Management Inc., Class A | | | 167 | | | | 1,653 | |
Northern Trust Corp. | | | 9,628 | | | | 857,373 | |
Pzena Investment Management Inc., Class A | | | 243 | | | | 2,700 | |
Safeguard Scientifics Inc. | | | 435 | | | | 5,851 | (a) |
SEI Investments Co. | | | 1,163 | | | | 57,406 | |
Silvercrest Asset Management Group Inc., Class A | | | 195 | | | | 2,564 | |
State Street Corp. | | | 16,264 | | | | 1,264,038 | (b) |
T Rowe Price Group Inc. | | | 10,937 | | | | 823,119 | |
The Bank of New York Mellon Corp. | | | 47,454 | | | | 2,248,371 | |
Virtus Investment Partners Inc. | | | 80 | | | | 9,444 | |
Waddell & Reed Financial Inc., Class A | | | 2,267 | | | | 44,229 | |
Westwood Holdings Group Inc. | | | 172 | | | | 10,318 | |
WisdomTree Investments Inc. | | | 3,279 | | | | 36,528 | |
| | | | 9,964,805 | |
| | |
Auto Parts & Equipment—0.0% * | | | | | | | | |
American Axle & Manufacturing Holdings Inc. | | | 1,446 | | | | 27,908 | (a) |
BorgWarner Inc. | | | 9,103 | | | | 359,022 | |
Cooper-Standard Holdings Inc. | | | 295 | | | | 30,497 | (a) |
Dana Inc. | | | 4,171 | | | | 79,166 | |
Dorman Products Inc. | | | 505 | | | | 36,895 | (a) |
Federal-Mogul Holdings Corp. | | | 614 | | | | 6,330 | (a) |
Fox Factory Holding Corp. | | | 447 | | | | 12,404 | (a) |
Gentex Corp. | | | 2,511 | | | | 49,442 | |
Gentherm Inc. | | | 731 | | | | 24,744 | (a) |
Horizon Global Corp. | | | 368 | | | | 8,832 | (a) |
LCI Industries | | | 454 | | | | 48,918 | |
Metaldyne Performance Group Inc. | | | 302 | | | | 6,931 | |
Modine Manufacturing Co. | | | 946 | | | | 14,095 | (a) |
Motorcar Parts of America Inc. | | | 367 | | | | 9,880 | (a) |
Spartan Motors Inc. | | | 666 | | | | 6,161 | |
Standard Motor Products Inc. | | | 430 | | | | 22,885 | |
Stoneridge Inc. | | | 539 | | | | 9,535 | (a) |
Strattec Security Corp. | | | 69 | | | | 2,781 | |
Superior Industries International Inc. | | | 503 | | | | 13,254 | |
Tenneco Inc. | | | 1,104 | | | | 68,967 | (a) |
Tower International Inc. | | | 412 | | | | 11,680 | |
Unique Fabricating Inc. | | | 107 | | | | 1,562 | |
Workhorse Group Inc. | | | 192 | | | | 1,356 | (a) |
| | | | 853,245 | |
| | |
Automobile Manufacturers—0.2% | | | | | | | | |
Ford Motor Co. | | | 174,810 | | | | 2,120,445 | |
General Motors Co. | | | 61,723 | | | | 2,150,429 | |
Thor Industries Inc. | | | 421 | | | | 42,121 | |
Winnebago Industries Inc. | | | 541 | | | | 17,123 | |
| | | | 4,330,118 | |
| | |
Automotive Retail—0.2% | | | | | | | | |
Advance Auto Parts Inc. | | | 3,329 | | | | 563,001 | |
America’s Car-Mart Inc. | | | 158 | | | | 6,913 | (a) |
Asbury Automotive Group Inc. | | | 400 | | | | 24,680 | (a) |
AutoNation Inc. | | | 3,035 | | | | 147,653 | (a) |
AutoZone Inc. | | | 1,321 | | | | 1,043,313 | (a) |
Camping World Holdings Inc., Class A | | | 233 | | | | 7,593 | |
| | | | | | | | |
CarMax Inc. | | | 8,528 | | | | 549,118 | (a) |
CST Brands Inc. | | | 668 | | | | 32,164 | |
Group 1 Automotive Inc. | | | 394 | | | | 30,708 | |
Lithia Motors Inc., Class A | | | 453 | | | | 43,864 | |
Monro Muffler Brake Inc. | | | 596 | | | | 34,091 | |
Murphy USA Inc. | | | 321 | | | | 19,732 | (a) |
O’Reilly Automotive Inc. | | | 4,191 | | | | 1,166,816 | (a) |
Sonic Automotive Inc., Class A | | | 560 | | | | 12,824 | |
| | | | | | | 3,682,470 | |
| | |
Biotechnology—1.1% | | | | | | | | |
AbbVie Inc. | | | 72,820 | | | | 4,559,988 | |
Acceleron Pharma Inc. | | | 549 | | | | 14,010 | (a) |
Achillion Pharmaceuticals Inc. | | | 2,351 | | | | 9,710 | (a) |
Acorda Therapeutics Inc. | | | 862 | | | | 16,206 | (a) |
Adamas Pharmaceuticals Inc. | | | 334 | | | | 5,645 | (a) |
Aduro Biotech Inc. | | | 716 | | | | 8,162 | (a) |
Advaxis Inc. | | | 737 | | | | 5,277 | (a) |
Adverum Biotechnologies Inc. | | | 417 | | | | 1,209 | (a) |
Aevi Genomic Medicine Inc. | | | 490 | | | | 2,538 | (a) |
Agenus Inc. | | | 1,467 | | | | 6,044 | (a) |
Aimmune Therapeutics Inc. | | | 529 | | | | 10,818 | (a) |
Akebia Therapeutics Inc. | | | 718 | | | | 7,474 | (a) |
Alder Biopharmaceuticals Inc. | | | 940 | | | | 19,552 | (a) |
Alexion Pharmaceuticals Inc. | | | 10,096 | | | | 1,235,246 | (a) |
AMAG Pharmaceuticals Inc. | | | 701 | | | | 24,395 | (a) |
Amgen Inc. | | | 33,319 | | | | 4,871,571 | |
Amicus Therapeutics Inc. | | | 2,861 | | | | 14,219 | (a) |
Anavex Life Sciences Corp. | | | 655 | | | | 2,594 | (a) |
Anthera Pharmaceuticals Inc. | | | 801 | | | | 520 | (a) |
Applied Genetic Technologies Corp. | | | 255 | | | | 2,384 | (a) |
Aptevo Therapeutics Inc. | | | 326 | | | | 795 | (a) |
Ardelyx Inc. | | | 639 | | | | 9,074 | (a) |
Arena Pharmaceuticals Inc. | | | 4,922 | | | | 6,989 | (a) |
Argos Therapeutics Inc. | | | 349 | | | | 1,710 | (a) |
ARIAD Pharmaceuticals Inc. | | | 3,395 | | | | 42,234 | (a) |
Array BioPharma Inc. | | | 3,330 | | | | 29,271 | (a) |
Arrowhead Pharmaceuticals Inc. | | | 1,215 | | | | 1,883 | (a) |
Asterias Biotherapeutics Inc. | | | 449 | | | | 2,065 | (a) |
Atara Biotherapeutics Inc. | | | 466 | | | | 6,617 | (a) |
Athersys Inc. | | | 1,530 | | | | 2,341 | (a) |
Avexis Inc. | | | 98 | | | | 4,678 | (a) |
Bellicum Pharmaceuticals Inc. | | | 423 | | | | 5,761 | (a) |
BioCryst Pharmaceuticals Inc. | | | 1,493 | | | | 9,451 | (a) |
Biogen Inc. | | | 9,708 | | | | 2,752,995 | (a) |
BioSpecifics Technologies Corp. | | | 109 | | | | 6,071 | (a) |
BioTime Inc. | | | 1,269 | | | | 4,581 | (a) |
Bluebird Bio Inc. | | | 789 | | | | 48,681 | (a) |
Blueprint Medicines Corp. | | | 401 | | | | 11,248 | (a) |
Cara Therapeutics Inc. | | | 451 | | | | 4,190 | (a) |
Celgene Corp. | | | 34,620 | | | | 4,007,265 | (a) |
Celldex Therapeutics Inc. | | | 1,930 | | | | 6,832 | (a) |
Cellular Biomedicine Group Inc. | | | 246 | | | | 3,223 | (a) |
ChemoCentryx Inc. | | | 422 | | | | 3,123 | (a) |
Chimerix Inc. | | | 862 | | | | 3,965 | (a) |
Cidara Therapeutics Inc. | | | 214 | | | | 2,226 | (a) |
Clovis Oncology Inc. | | | 639 | | | | 28,384 | (a) |
Coherus Biosciences Inc. | | | 591 | | | | 16,637 | (a) |
Concert Pharmaceuticals Inc. | | | 333 | | | | 3,427 | (a) |
Corvus Pharmaceuticals Inc. | | | 90 | | | | 1,287 | (a) |
| | | | | | | | |
Curis Inc. | | | 2,270 | | | | 6,992 | (a) |
Cytokinetics Inc. | | | 675 | | | | 8,201 | (a) |
CytomX Therapeutics Inc. | | | 410 | | | | 4,506 | (a) |
CytRx Corp. | | | 947 | | | | 352 | (a) |
Dimension Therapeutics Inc. | | | 206 | | | | 896 | (a) |
Dyax Corp. | | | 4,362 | | | | 4,842 | (j) |
Dynavax Technologies Corp. | | | 782 | | | | 3,089 | (a) |
Eagle Pharmaceuticals Inc. | | | 179 | | | | 14,202 | (a) |
Edge Therapeutics Inc. | | | 327 | | | | 4,088 | (a) |
Editas Medicine Inc. | | | 139 | | | | 2,256 | (a) |
Eiger BioPharmaceuticals Inc. | | | 108 | | | | 1,258 | (a) |
Emergent BioSolutions Inc. | | | 653 | | | | 21,445 | (a) |
Enanta Pharmaceuticals Inc. | | | 316 | | | | 10,586 | (a) |
Epizyme Inc. | | | 812 | | | | 9,825 | (a) |
Esperion Therapeutics Inc. | | | 292 | | | | 3,656 | (a) |
Exact Sciences Corp. | | | 2,083 | | | | 27,829 | (a) |
Exelixis Inc. | | | 4,409 | | | | 65,738 | (a) |
FibroGen Inc. | | | 1,050 | | | | 22,470 | (a) |
Five Prime Therapeutics Inc. | | | 541 | | | | 27,110 | (a) |
Flexion Therapeutics Inc. | | | 477 | | | | 9,073 | (a) |
Fortress Biotech Inc. | | | 629 | | | | 1,698 | (a) |
Foundation Medicine Inc. | | | 270 | | | | 4,779 | (a) |
Galena Biopharma Inc. | | | 154 | | | | 299 | (a) |
Genomic Health Inc. | | | 374 | | | | 10,992 | (a) |
Geron Corp. | | | 3,050 | | | | 6,313 | (a) |
Gilead Sciences Inc. | | | 59,127 | | | | 4,234,084 | |
Global Blood Therapeutics Inc. | | | 315 | | | | 4,552 | (a) |
GlycoMimetics Inc. | | | 155 | | | | 946 | (a) |
Halozyme Therapeutics Inc. | | | 2,192 | | | | 21,657 | (a) |
Heron Therapeutics Inc. | | | 638 | | | | 8,358 | (a) |
Idera Pharmaceuticals Inc. | | | 1,813 | | | | 2,720 | (a) |
Ignyta Inc. | | | 590 | | | | 3,127 | (a) |
Immune Design Corp. | | | 226 | | | | 1,243 | (a) |
ImmunoGen Inc. | | | 1,713 | | | | 3,495 | (a) |
Immunomedics Inc. | | | 1,766 | | | | 6,481 | (a) |
Infinity Pharmaceuticals Inc. | | | 764 | | | | 1,031 | (a) |
Inotek Pharmaceuticals Corp. | | | 347 | | | | 2,117 | (a) |
Inovio Pharmaceuticals Inc. | | | 1,336 | | | | 9,272 | (a) |
Insmed Inc. | | | 1,244 | | | | 16,458 | (a) |
Insys Therapeutics Inc. | | | 475 | | | | 4,370 | (a) |
Intellia Therapeutics Inc. | | | 141 | | | | 1,849 | (a) |
Invitae Corp. | | | 458 | | | | 3,637 | (a) |
Ironwood Pharmaceuticals Inc. | | | 2,435 | | | | 37,231 | (a) |
Karyopharm Therapeutics Inc. | | | 478 | | | | 4,493 | (a) |
Keryx Biopharmaceuticals Inc. | | | 1,588 | | | | 9,306 | (a) |
Kite Pharma Inc. | | | 784 | | | | 35,155 | (a) |
La Jolla Pharmaceutical Co. | | | 279 | | | | 4,891 | (a) |
Lexicon Pharmaceuticals Inc. | | | 843 | | | | 11,659 | (a) |
Ligand Pharmaceuticals Inc., Class B | | | 381 | | | | 38,713 | (a) |
Lion Biotechnologies Inc. | | | 1,018 | | | | 7,075 | (a) |
Loxo Oncology Inc. | | | 267 | | | | 8,575 | (a) |
MacroGenics Inc. | | | 640 | | | | 13,082 | (a) |
MannKind Corp. | | | 6,530 | | | | 4,158 | (a) |
MediciNova Inc. | | | 593 | | | | 3,576 | (a) |
Merrimack Pharmaceuticals Inc. | | | 2,451 | | | | 10,000 | (a) |
MiMedx Group Inc. | | | 2,051 | | | | 18,172 | (a) |
Minerva Neurosciences Inc. | | | 371 | | | | 4,359 | (a) |
Mirati Therapeutics Inc. | | | 225 | | | | 1,069 | (a) |
Momenta Pharmaceuticals Inc. | | | 1,309 | | | | 19,700 | (a) |
Myriad Genetics Inc. | | | 1,353 | | | | 22,555 | (a) |
| | | | | | | | |
NantKwest Inc. | | | 332 | | | | 1,899 | (a) |
Natera Inc. | | | 525 | | | | 6,148 | (a) |
NewLink Genetics Corp. | | | 438 | | | | 4,503 | (a) |
Novavax Inc. | | | 5,417 | | | | 6,825 | (a) |
OncoMed Pharmaceuticals Inc. | | | 57 | | | | 439 | (a) |
Ophthotech Corp. | | | 504 | | | | 2,434 | (a) |
Organovo Holdings Inc. | | | 1,876 | | | | 6,360 | (a) |
Otonomy Inc. | | | 257 | | | | 4,086 | (a) |
PDL BioPharma Inc. | | | 2,236 | | | | 4,740 | |
Pfenex Inc. | | | 369 | | | | 3,347 | (a) |
PharmAthene Inc. | | | 1,261 | | | | 4,098 | (a) |
Portola Pharmaceuticals Inc. | | | 987 | | | | 22,148 | (a) |
Progenics Pharmaceuticals Inc. | | | 1,405 | | | | 12,139 | (a) |
Protagonist Therapeutics Inc. | | | 151 | | | | 3,320 | (a) |
Proteostasis Therapeutics Inc. | | | 151 | | | | 1,851 | (a) |
PTC Therapeutics Inc. | | | 649 | | | | 7,081 | (a) |
Puma Biotechnology Inc. | | | 557 | | | | 17,100 | (a) |
Radius Health Inc. | | | 632 | | | | 24,035 | (a) |
Regeneron Pharmaceuticals Inc. | | | 3,412 | | | | 1,252,511 | (a) |
REGENXBIO Inc. | | | 409 | | | | 7,587 | (a) |
Regulus Therapeutics Inc. | | | 790 | | | | 1,778 | (a) |
Repligen Corp. | | | 678 | | | | 20,896 | (a) |
Retrophin Inc. | | | 726 | | | | 13,743 | (a) |
Rigel Pharmaceuticals Inc. | | | 1,870 | | | | 4,451 | (a) |
Sage Therapeutics Inc. | | | 591 | | | | 30,176 | (a) |
Sangamo BioSciences Inc. | | | 1,403 | | | | 4,279 | (a) |
Sarepta Therapeutics Inc. | | | 996 | | | | 27,320 | (a) |
Seres Therapeutics Inc. | | | 358 | | | | 3,544 | (a) |
Sorrento Therapeutics Inc. | | | 466 | | | | 2,283 | (a) |
Spark Therapeutics Inc. | | | 376 | | | | 18,762 | (a) |
Spectrum Pharmaceuticals Inc. | | | 1,488 | | | | 6,592 | (a) |
Stemline Therapeutics Inc. | | | 333 | | | | 3,563 | (a) |
Syndax Pharmaceuticals Inc. | | | 130 | | | | 932 | (a) |
Synergy Pharmaceuticals Inc. | | | 3,642 | | | | 22,180 | (a) |
Synthetic Biologics Inc. | | | 1,538 | | | | 1,173 | (a) |
T2 Biosystems Inc. | | | 304 | | | | 1,599 | (a) |
TESARO Inc. | | | 532 | | | | 71,543 | (a) |
TG Therapeutics Inc. | | | 746 | | | | 3,469 | (a) |
Tokai Pharmaceuticals Inc. | | | 120 | | | | 117 | (a) |
Trevena Inc. | | | 893 | | | | 5,251 | (a) |
Trovagene Inc. | | | 564 | | | | 1,184 | (a) |
Ultragenyx Pharmaceutical Inc. | | | 650 | | | | 45,701 | (a) |
United Therapeutics Corp. | | | 370 | | | | 53,069 | (a) |
Vanda Pharmaceuticals Inc. | | | 738 | | | | 11,771 | (a) |
Veracyte Inc. | | | 223 | | | | 1,726 | (a) |
Versartis Inc. | | | 550 | | | | 8,195 | (a) |
Vertex Pharmaceuticals Inc. | | | 11,154 | | | | 821,715 | (a) |
Vital Therapies Inc. | | | 481 | | | | 2,092 | (a) |
Voyager Therapeutics Inc. | | | 238 | | | | 3,032 | (a) |
vTv Therapeutics Inc., Class A | | | 106 | | | | 512 | (a) |
Xencor Inc. | | | 647 | | | | 17,029 | (a) |
Zafgen Inc. | | | 463 | | | | 1,472 | (a) |
ZIOPHARM Oncology Inc. | | | 2,449 | | | | 13,102 | (a) |
| | | | 25,313,129 | |
| | |
Brewers—0.0% * | | | | | | | | |
Craft Brew Alliance Inc. | | | 250 | | | | 4,225 | (a) |
Molson Coors Brewing Co., Class B | | | 8,269 | | | | 804,656 | |
The Boston Beer Company Inc., Class A | | | 254 | | | | 43,142 | (a) |
| | | | 852,023 | |
| | | | | | | | |
| | |
Broadcasting—0.1% | | | | | | | | |
AMC Networks Inc., Class A | | | 506 | | | | 26,484 | (a) |
CBS Corp., Class B | | | 17,290 | | | | 1,099,990 | |
Discovery Communications Inc., Class A | | | 6,819 | | | | 186,909 | (a) |
Discovery Communications Inc., Class C | | | 10,136 | | | | 271,442 | (a) |
Entercom Communications Corp., Class A | | | 522 | | | | 7,986 | |
Entravision Communications Corp., Class A | | | 1,320 | | | | 9,240 | |
Gray Television Inc. | | | 1,294 | | | | 14,040 | (a) |
Hemisphere Media Group Inc. | | | 122 | | | | 1,366 | (a) |
Media General Inc. | | | 2,076 | | | | 39,091 | (a) |
Nexstar Broadcasting Group Inc., Class A | | | 567 | | | | 35,891 | |
Radio One Inc., Class D | | | 396 | | | | 1,148 | (a) |
Saga Communications Inc., Class A | | | 76 | | | | 3,823 | |
Salem Media Group Inc. | | | 191 | | | | 1,194 | |
Scripps Networks Interactive Inc., Class A | | | 4,303 | | | | 307,105 | |
Sinclair Broadcast Group Inc., Class A | | | 1,259 | | | | 41,988 | |
TEGNA Inc. | | | 9,690 | | | | 207,269 | |
The EW Scripps Co., Class A | | | 1,199 | | | | 23,177 | (a) |
Townsquare Media Inc., Class A | | | 207 | | | | 2,155 | (a) |
| | | | 2,280,298 | |
| | |
Building Products—0.1% | | | | | | | | |
AAON Inc. | | | 809 | | | | 26,737 | |
Advanced Drainage Systems Inc. | | | 695 | | | | 14,317 | |
American Woodmark Corp. | | | 277 | | | | 20,844 | (a) |
AO Smith Corp. | | | 1,279 | | | | 60,561 | |
Apogee Enterprises Inc. | | | 569 | | | | 30,476 | |
Armstrong Flooring Inc. | | | 470 | | | | 9,358 | (a) |
Builders FirstSource Inc. | | | 1,678 | | | | 18,408 | (a) |
Continental Building Products Inc. | | | 708 | | | | 16,355 | (a) |
CSW Industrials Inc. | | | 290 | | | | 10,686 | (a) |
Fortune Brands Home & Security Inc. | | | 7,069 | | | | 377,909 | |
Gibraltar Industries Inc. | | | 629 | | | | 26,198 | (a) |
Griffon Corp. | | | 601 | | | | 15,746 | |
Insteel Industries Inc. | | | 351 | | | | 12,510 | |
Johnson Controls International PLC | | | 42,042 | | | | 1,731,710 | |
Lennox International Inc. | | | 337 | | | | 51,618 | |
Masco Corp. | | | 14,723 | | | | 465,541 | |
Masonite International Corp. | | | 608 | | | | 40,006 | (a) |
NCI Building Systems Inc. | | | 541 | | | | 8,467 | (a) |
Patrick Industries Inc. | | | 290 | | | | 22,127 | (a) |
PGT Innovations Inc. | | | 604 | | | | 6,916 | (a) |
Ply Gem Holdings Inc. | | | 438 | | | | 7,118 | (a) |
Quanex Building Products Corp. | | | 689 | | | | 13,987 | |
Simpson Manufacturing Company Inc. | | | 830 | | | | 36,312 | |
Trex Company Inc. | | | 561 | | | | 36,128 | (a) |
Universal Forest Products Inc. | | | 396 | | | | 40,463 | |
| | | | 3,100,498 | |
| | |
Cable & Satellite—0.4% | | | | | | | | |
Cable One Inc. | | | 41 | | | | 25,491 | |
Charter Communications Inc., Class A | | | 9,597 | | | | 2,763,168 | (a) |
Comcast Corp., Class A | | | 106,747 | | | | 7,370,880 | |
Loral Space & Communications Inc. | | | 261 | | | | 10,714 | (a) |
MSG Networks Inc., Class A | | | 1,193 | | | | 25,650 | (a) |
| | | | 10,195,903 | |
| | |
Casinos & Gaming—0.0% * | | | | | | | | |
Boyd Gaming Corp. | | | 1,565 | | | | 31,566 | (a) |
Caesars Acquisition Co., Class A | | | 964 | | | | 13,014 | (a) |
Caesars Entertainment Corp. | | | 1,126 | | | | 9,571 | (a) |
| | | | | | | | |
Century Casinos Inc. | | | 441 | | | | 3,629 | (a) |
Churchill Downs Inc. | | | 365 | | | | 54,914 | |
Eldorado Resorts Inc. | | | 572 | | | | 9,695 | (a) |
Empire Resorts Inc. | | | 39 | | | | 887 | (a) |
Golden Entertainment Inc. | | | 197 | | | | 2,386 | |
Isle of Capri Casinos Inc. | | | 503 | | | | 12,419 | (a) |
Monarch Casino & Resort Inc. | | | 216 | | | | 5,569 | (a) |
Penn National Gaming Inc. | | | 1,494 | | | | 20,602 | (a) |
Pinnacle Entertainment Inc. | | | 1,067 | | | | 15,472 | (a) |
Red Rock Resorts Inc., Class A | | | 604 | | | | 14,007 | |
Scientific Games Corp., Class A | | | 1,039 | | | | 14,546 | (a) |
Wynn Resorts Ltd. | | | 3,587 | | | | 310,311 | |
| | | | 518,588 | |
| | |
Coal & Consumable Fuels—0.0% * | | | | | | | | |
CONSOL Energy Inc. | | | 1,550 | | | | 28,256 | |
Westmoreland Coal Co. | | | 365 | | | | 6,450 | (a) |
| | | | 34,706 | |
| | |
Commercial Printing—0.0% * | | | | | | | | |
Brady Corp., Class A | | | 915 | | | | 34,358 | |
Deluxe Corp. | | | 1,332 | | | | 95,385 | |
Ennis Inc. | | | 518 | | | | 8,987 | |
InnerWorkings Inc. | | | 764 | | | | 7,525 | (a) |
Multi-Color Corp. | | | 271 | | | | 21,030 | |
Quad/Graphics Inc. | | | 579 | | | | 15,564 | |
| | | | 182,849 | |
| | |
Commodity Chemicals—0.1% | | | | | | | | |
Cabot Corp. | | | 547 | | | | 27,645 | |
Calgon Carbon Corp. | | | 1,018 | | | | 17,306 | |
Hawkins Inc. | | | 192 | | | | 10,359 | |
Koppers Holdings Inc. | | | 406 | | | | 16,362 | (a) |
Kronos Worldwide Inc. | | | 464 | | | | 5,540 | |
LyondellBasell Industries N.V., Class A | | | 14,795 | | | | 1,269,115 | |
Olin Corp. | | | 4,544 | | | | 116,372 | |
Trecora Resources | | | 399 | | | | 5,526 | (a) |
Tredegar Corp. | | | 513 | | | | 12,312 | |
Trinseo S.A. | | | 516 | | | | 30,599 | |
Tronox Ltd., Class A | | | 1,301 | | | | 13,413 | |
| | | | 1,524,549 | |
| | |
Communications Equipment—0.4% | | | | | | | | |
ADTRAN Inc. | | | 987 | | | | 22,059 | |
Aerohive Networks Inc. | | | 476 | | | | 2,713 | (a) |
Applied Optoelectronics Inc. | | | 335 | | | | 7,852 | (a) |
Bel Fuse Inc., Class B | | | 184 | | | | 5,686 | |
Black Box Corp. | | | 300 | | | | 4,575 | |
Brocade Communications Systems Inc. | | | 3,526 | | | | 44,040 | |
CalAmp Corp. | | | 717 | | | | 10,397 | (a) |
Calix Inc. | | | 830 | | | | 6,391 | (a) |
Ciena Corp. | | | 3,909 | | | | 95,419 | (a) |
Cisco Systems Inc. | | | 225,034 | | | | 6,800,527 | |
Clearfield Inc. | | | 229 | | | | 4,740 | (a) |
Comtech Telecommunications Corp. | | | 451 | | | | 5,344 | |
Digi International Inc. | | | 520 | | | | 7,150 | (a) |
EMCORE Corp. | | | 471 | | | | 4,098 | |
Extreme Networks Inc. | | | 2,073 | | | | 10,427 | (a) |
F5 Networks Inc. | | | 2,912 | | | | 421,425 | (a) |
Finisar Corp. | | | 2,115 | | | | 64,021 | (a) |
Harmonic Inc. | | | 1,543 | | | | 7,715 | (a) |
Harris Corp. | | | 5,542 | | | | 567,889 | |
| | | | | | | | |
Infinera Corp. | | | 2,823 | | | | 23,967 | (a) |
InterDigital Inc. | | | 965 | | | | 88,153 | |
Ixia | | | 1,288 | | | | 20,737 | (a) |
Juniper Networks Inc. | | | 17,303 | | | | 488,983 | |
KVH Industries Inc. | | | 306 | | | | 3,611 | (a) |
Lumentum Holdings Inc. | | | 950 | | | | 36,717 | (a) |
Motorola Solutions Inc. | | | 7,534 | | | | 624,493 | |
NETGEAR Inc. | | | 648 | | | | 35,219 | (a) |
NetScout Systems Inc. | | | 2,500 | | | | 78,750 | (a) |
Oclaro Inc. | | | 2,162 | | | | 19,350 | (a) |
Plantronics Inc. | | | 952 | | | | 52,132 | |
ShoreTel Inc. | | | 1,348 | | | | 9,638 | (a) |
Sonus Networks Inc. | | | 960 | | | | 6,048 | (a) |
Ubiquiti Networks Inc. | | | 519 | | | | 29,998 | (a) |
ViaSat Inc. | | | 1,456 | | | | 96,416 | (a) |
Viavi Solutions Inc. | | | 4,696 | | | | 38,413 | (a) |
| | | | 9,745,093 | |
| | |
Computer & Electronics Retail—0.0% * | | | | | | | | |
Best Buy Company Inc. | | | 12,268 | | | | 523,476 | |
Conn’s Inc. | | | 410 | | | | 5,186 | (a) |
GameStop Corp., Class A | | | 904 | | | | 22,835 | |
Rent-A-Center Inc. | | | 1,039 | | | | 11,689 | |
| | | | 563,186 | |
| | |
Construction & Engineering—0.1% | | | | | | | | |
AECOM | | | 1,341 | | | | 48,759 | (a) |
Aegion Corp. | | | 697 | | | | 16,519 | (a) |
Ameresco Inc., Class A | | | 412 | | | | 2,266 | (a) |
Argan Inc. | | | 270 | | | | 19,049 | |
Comfort Systems USA Inc. | | | 742 | | | | 24,709 | |
Dycom Industries Inc. | | | 828 | | | | 66,480 | (a) |
EMCOR Group Inc. | | | 1,718 | | | | 121,566 | |
Fluor Corp. | | | 6,133 | | | | 322,105 | |
Granite Construction Inc. | | | 1,098 | | | | 60,390 | |
Great Lakes Dredge & Dock Corp. | | | 1,192 | | | | 5,006 | (a) |
HC2 Holdings Inc. | | | 645 | | | | 3,825 | (a) |
IES Holdings Inc. | | | 156 | | | | 2,987 | (a) |
Jacobs Engineering Group Inc. | | | 5,490 | | | | 312,930 | (a) |
KBR Inc. | | | 1,234 | | | | 20,595 | |
Layne Christensen Co. | | | 358 | | | | 3,891 | (a) |
MasTec Inc. | | | 1,272 | | | | 48,654 | (a) |
MYR Group Inc. | | | 279 | | | | 10,513 | (a) |
NV5 Global Inc. | | | 147 | | | | 4,910 | (a) |
Orion Group Holdings Inc. | | | 522 | | | | 5,194 | (a) |
Primoris Services Corp. | | | 807 | | | | 18,383 | |
Quanta Services Inc. | | | 6,828 | | | | 237,956 | (a) |
Tutor Perini Corp. | | | 755 | | | | 21,140 | (a) |
Valmont Industries Inc. | | | 198 | | | | 27,898 | |
| | | | 1,405,725 | |
| | |
Construction Machinery & Heavy Trucks—0.2% | | | | | | | | |
Alamo Group Inc. | | | 188 | | | | 14,307 | |
American Railcar Industries Inc. | | | 157 | | | | 7,111 | |
Astec Industries Inc. | | | 387 | | | | 26,107 | |
Blue Bird Corp. | | | 119 | | | | 1,839 | (a) |
Caterpillar Inc. | | | 26,215 | | | | 2,431,179 | |
Cummins Inc. | | | 6,914 | | | | 944,936 | |
Douglas Dynamics Inc. | | | 446 | | | | 15,008 | |
Federal Signal Corp. | | | 1,207 | | | | 18,841 | |
FreightCar America Inc. | | | 248 | | | | 3,703 | |
| | | | | | | | |
Joy Global Inc. | | | 2,675 | | | | 74,900 | |
Meritor Inc. | | | 1,624 | | | | 20,170 | (a) |
Miller Industries Inc. | | | 220 | | | | 5,819 | |
Navistar International Corp. | | | 996 | | | | 31,245 | (a) |
Oshkosh Corp. | | | 650 | | | | 41,997 | |
PACCAR Inc. | | | 15,847 | | | | 1,012,623 | |
Supreme Industries Inc., Class A | | | 262 | | | | 4,113 | |
Terex Corp. | | | 911 | | | | 28,724 | |
The Greenbrier Companies Inc. | | | 523 | | | | 21,731 | |
The Manitowoc Company Inc. | | | 2,546 | | | | 15,225 | (a) |
Trinity Industries Inc. | | | 1,312 | | | | 36,421 | |
Wabash National Corp. | | | 1,298 | | | | 20,534 | (a) |
Wabtec Corp. | | | 773 | | | | 64,174 | |
| | | | 4,840,707 | |
| | |
Construction Materials—0.1% | | | | | | | | |
Eagle Materials Inc. | | | 417 | | | | 41,087 | |
Forterra Inc. | | | 361 | | | | 7,819 | (a) |
Headwaters Inc. | | | 1,457 | | | | 34,269 | (a) |
Martin Marietta Materials Inc. | | | 2,855 | | | | 632,468 | |
Summit Materials Inc., Class A | | | 1,512 | | | | 35,969 | (a) |
United States Lime & Minerals Inc. | | | 38 | | | | 2,879 | |
US Concrete Inc. | | | 286 | | | | 18,733 | (a) |
Vulcan Materials Co. | | | 5,976 | | | | 747,896 | |
| | | | 1,521,120 | |
| | |
Consumer Electronics—0.0% * | | | | | | | | |
GoPro Inc., Class A | | | 2,032 | | | | 17,699 | (a) |
Harman International Industries Inc. | | | 3,153 | | | | 350,487 | |
Universal Electronics Inc. | | | 282 | | | | 18,203 | (a) |
ZAGG Inc. | | | 571 | | | | 4,054 | (a) |
| | | | 390,443 | |
| | |
Consumer Finance—0.3% | | | | | | | | |
American Express Co. | | | 34,485 | | | | 2,554,649 | |
Capital One Financial Corp. | | | 21,475 | | | | 1,873,479 | |
Discover Financial Services | | | 17,682 | | | | 1,274,695 | |
Encore Capital Group Inc. | | | 477 | | | | 13,666 | (a) |
Enova International Inc. | | | 538 | | | | 6,752 | (a) |
EZCORP Inc., Class A | | | 1,014 | | | | 10,799 | (a) |
FirstCash Inc. | | | 861 | | | | 40,467 | |
Green Dot Corp., Class A | | | 854 | | | | 20,112 | (a) |
LendingClub Corp. | | | 6,305 | | | | 33,101 | (a) |
Navient Corp. | | | 13,529 | | | | 222,281 | |
Nelnet Inc., Class A | | | 401 | | | | 20,351 | |
PRA Group Inc. | | | 797 | | | | 31,163 | (a) |
Regional Management Corp. | | | 214 | | | | 5,624 | (a) |
SLM Corp. | | | 3,739 | | | | 41,204 | (a) |
Synchrony Financial | | | 35,221 | | | | 1,277,466 | |
World Acceptance Corp. | | | 123 | | | | 7,906 | (a) |
| | | | 7,433,715 | |
| | |
Copper—0.0% * | | | | | | | | |
Freeport-McMoRan Inc. | | | 55,248 | | | | 728,721 | (a) |
Southern Copper Corp. | | | 3,979 | | | | 127,089 | |
| | | | 855,810 | |
| | |
Data Processing & Outsourced Services—0.9% | | | | | | | | |
ALJ Regional Holdings Inc. | | | 363 | | | | 1,594 | (a) |
Alliance Data Systems Corp. | | | 2,559 | | | | 584,731 | |
Automatic Data Processing Inc. | | | 20,021 | | | | 2,057,758 | |
Blackhawk Network Holdings Inc. | | | 1,034 | | | | 38,956 | (a) |
| | | | | | | | |
Broadridge Financial Solutions Inc. | | | 1,033 | | | | 68,488 | |
Cardtronics PLC, Class A | | | 861 | | | | 46,985 | (a) |
Cass Information Systems Inc. | | | 216 | | | | 15,891 | |
Convergys Corp. | | | 2,612 | | | | 64,151 | |
CoreLogic Inc. | | | 749 | | | | 27,586 | (a) |
CSG Systems International Inc. | | | 638 | | | | 30,879 | |
DST Systems Inc. | | | 277 | | | | 29,681 | |
ExlService Holdings Inc. | | | 647 | | | | 32,635 | (a) |
Fidelity National Information Services Inc. | | | 14,810 | | | | 1,120,228 | |
Fiserv Inc. | | | 9,743 | | | | 1,035,486 | (a) |
Global Payments Inc. | | | 6,903 | | | | 479,137 | |
Information Services Group Inc. | | | 600 | | | | 2,184 | (a) |
Jack Henry & Associates Inc. | | | 681 | | | | 60,459 | |
Mastercard Inc., Class A | | | 42,552 | | | | 4,393,494 | |
MAXIMUS Inc. | | | 1,762 | | | | 98,302 | |
MoneyGram International Inc. | | | 597 | | | | 7,051 | (a) |
NeuStar Inc., Class A | | | 1,546 | | | | 51,636 | (a) |
Paychex Inc. | | | 14,462 | | | | 880,447 | |
PayPal Holdings Inc. | | | 50,313 | | | | 1,985,854 | (a) |
Planet Payment Inc. | | | 840 | | | | 3,427 | (a) |
Sykes Enterprises Inc. | | | 767 | | | | 22,136 | (a) |
Syntel Inc. | | | 641 | | | | 12,685 | |
TeleTech Holdings Inc. | | | 320 | | | | 9,760 | |
The Western Union Co. | | | 21,645 | | | | 470,129 | |
Total System Services Inc. | | | 7,481 | | | | 366,793 | |
Visa Inc., Class A | | | 83,577 | | | | 6,520,678 | |
WEX Inc. | | | 338 | | | | 37,721 | (a) |
Xerox Corp. | | | 38,471 | | | | 335,852 | |
| | | | 20,892,794 | |
| | |
Department Stores—0.1% | | | | | | | | |
JC Penney Company Inc. | | | 2,671 | | | | 22,196 | (a) |
Kohl’s Corp. | | | 7,918 | | | | 390,991 | |
Macy’s Inc. | | | 13,675 | | | | 489,702 | |
Nordstrom Inc. | | | 5,254 | | | | 251,824 | |
Sears Holdings Corp. | | | 223 | | | | 2,072 | (a) |
| | | | 1,156,785 | |
| | |
Distillers & Vintners—0.1% | | | | | | | | |
Brown-Forman Corp., Class B | | | 8,246 | | | | 370,410 | |
Constellation Brands Inc., Class A | | | 8,008 | | | | 1,227,707 | |
MGP Ingredients Inc. | | | 249 | | | | 12,445 | |
| | | | 1,610,562 | |
| |
Distributors—0.1% | | | | | |
Core-Mark Holding Company Inc. | | | 911 | | | | 39,237 | |
Genuine Parts Co. | | | 6,737 | | | | 643,653 | |
LKQ Corp. | | | 14,050 | | | | 430,632 | (a) |
Pool Corp. | | | 359 | | | | 37,458 | |
Weyco Group Inc. | | | 129 | | | | 4,038 | |
| | | | 1,155,018 | |
| |
Diversified Banks—2.0% | | | | | |
Bank of America Corp. | | | 452,519 | | | | 10,000,670 | |
Citigroup Inc. | | | 127,653 | | | | 7,586,418 | |
Comerica Inc. | | | 7,704 | | | | 524,719 | |
JPMorgan Chase & Co. | | | 160,258 | | | | 13,828,663 | |
U.S. Bancorp | | | 71,631 | | | | 3,679,684 | |
Wells Fargo & Co. | | | 202,406 | | | | 11,154,595 | |
| | | | 46,774,749 | |
| | | | | | | | |
Diversified Chemicals—0.3% | | | | | |
Eastman Chemical Co. | | | 6,568 | | | | 493,979 | |
EI du Pont de Nemours & Co. | | | 38,813 | | | | 2,848,874 | |
LSB Industries Inc. | | | 420 | | | | 3,537 | (a) |
The Chemours Co. | | | 3,503 | | | | 77,381 | |
The Dow Chemical Co. | | | 50,142 | | | | 2,869,125 | |
| | | | 6,292,896 | |
| |
Diversified Metals & Mining—0.0% * | | | | | |
Compass Minerals International Inc. | | | 294 | | | | 23,035 | |
Materion Corp. | | | 401 | | | | 15,880 | |
| | | | 38,915 | |
| |
Diversified Real Estate Activities—0.0% * | | | | | |
Alexander & Baldwin Inc. | | | 1,274 | | | | 57,164 | |
Consolidated-Tomoka Land Co. | | | 80 | | | | 4,274 | |
Tejon Ranch Co. | | | 280 | | | | 7,120 | (a) |
The RMR Group Inc. Class A | | | 135 | | | | 5,333 | |
The St Joe Co. | | | 1,006 | | | | 19,114 | (a) |
| | | | 93,005 | |
| |
Diversified REITs—0.0% * | | | | | |
American Assets Trust Inc. | | | 777 | | | | 33,473 | |
Armada Hoffler Properties Inc. | | | 631 | | | | 9,194 | |
First Potomac Realty Trust | | | 1,172 | | | | 12,857 | |
Gladstone Commercial Corp. | | | 448 | | | | 9,005 | |
Global Net Lease Inc. | | | 3,440 | | | | 26,935 | |
Gramercy Property Trust | | | 7,894 | | | | 72,467 | |
Investors Real Estate Trust | | | 2,456 | | | | 17,511 | |
iStar Inc. | | | 1,279 | | | | 15,821 | (a) |
Lexington Realty Trust | | | 4,164 | | | | 44,971 | |
Liberty Property Trust | | | 1,280 | | | | 50,560 | |
One Liberty Properties Inc. | | | 117 | | | | 2,939 | |
PS Business Parks Inc. | | | 355 | | | | 41,365 | |
RAIT Financial Trust | | | 1,861 | | | | 6,253 | |
Select Income REIT | | | 1,267 | | | | 31,928 | |
Washington Real Estate Investment Trust | | | 1,402 | | | | 45,831 | |
Whitestone REIT | | | 546 | | | | 7,852 | |
| | | | 428,962 | |
| |
Diversified Support Services—0.0% * | | | | | |
Cintas Corp. | | | 3,869 | | | | 447,102 | |
Copart Inc. | | | 894 | | | | 49,537 | (a) |
G&K Services Inc., Class A | | | 391 | | | | 37,712 | |
Healthcare Services Group Inc. | | | 1,284 | | | | 50,294 | |
Matthews International Corp., Class A | | | 610 | | | | 46,879 | |
McGrath RentCorp. | | | 471 | | | | 18,458 | |
Mobile Mini Inc. | | | 888 | | | | 26,862 | |
UniFirst Corp. | | | 285 | | | | 40,940 | |
Viad Corp. | | | 397 | | | | 17,508 | |
VSE Corp. | | | 166 | | | | 6,447 | |
| | | | 741,739 | |
| |
Drug Retail—0.3% | | | | | |
CVS Health Corp. | | | 47,588 | | | | 3,755,169 | |
Walgreens Boots Alliance Inc. | | | 38,053 | | | | 3,149,266 | |
| | | | 6,904,435 | |
| | |
Education Services—0.0% * | | | | | | | | |
American Public Education Inc. | | | 312 | | | | 7,660 | (a) |
Apollo Education Group Inc. | | | 1,717 | | | | 16,998 | (a) |
Bridgepoint Education Inc. | | | 363 | | | | 3,677 | (a) |
Bright Horizons Family Solutions Inc. | | | 809 | | | | 56,646 | (a) |
| | | | | | | | |
Cambium Learning Group Inc. | | | 198 | | | | 988 | (a) |
Capella Education Co. | | | 228 | | | | 20,018 | |
Career Education Corp. | | | 1,342 | | | | 13,541 | (a) |
Chegg Inc. | | | 1,625 | | | | 11,993 | (a) |
DeVry Education Group Inc. | | | 1,715 | | | | 53,508 | |
Graham Holdings Co., Class B | | | 40 | | | | 20,478 | |
Grand Canyon Education Inc. | | | 865 | | | | 50,559 | (a) |
Houghton Mifflin Harcourt Co. | | | 2,485 | | | | 26,962 | (a) |
K12 Inc. | | | 679 | | | | 11,652 | (a) |
Strayer Education Inc. | | | 212 | | | | 17,094 | (a) |
| | | | 311,774 | |
| |
Electric Utilities—0.8% | | | | | |
ALLETE Inc. | | | 916 | | | | 58,798 | |
Alliant Energy Corp. | | | 10,171 | | | | 385,379 | |
American Electric Power Company Inc. | | | 22,032 | | | | 1,387,135 | |
Duke Energy Corp. | | | 30,644 | | | | 2,378,587 | |
Edison International | | | 14,728 | | | | 1,060,269 | |
El Paso Electric Co. | | | 808 | | | | 37,572 | |
Entergy Corp. | | | 7,994 | | | | 587,319 | |
Eversource Energy | | | 14,333 | | | | 791,612 | |
Exelon Corp. | | | 41,316 | | | | 1,466,305 | |
FirstEnergy Corp. | | | 19,022 | | | | 589,111 | |
Genie Energy Ltd., Class B | | | 237 | | | | 1,363 | (a) |
Great Plains Energy Inc. | | | 1,837 | | | | 50,242 | |
Hawaiian Electric Industries Inc. | | | 944 | | | | 31,218 | |
IDACORP Inc. | | | 1,433 | | | | 115,428 | |
MGE Energy Inc. | | | 667 | | | | 43,555 | |
NextEra Energy Inc. | | | 20,781 | | | | 2,482,498 | |
OGE Energy Corp. | | | 1,743 | | | | 58,303 | |
Otter Tail Corp. | | | 650 | | | | 26,520 | |
PG&E Corp. | | | 22,535 | | | | 1,369,452 | |
Pinnacle West Capital Corp. | | | 5,026 | | | | 392,179 | |
PNM Resources Inc. | | | 2,156 | | | | 73,951 | |
Portland General Electric Co. | | | 1,673 | | | | 72,491 | |
PPL Corp. | | | 30,437 | | | | 1,036,380 | |
Spark Energy Inc., Class A | | | 99 | | | | 3,000 | |
The Empire District Electric Co. | | | 883 | | | | 30,101 | |
The Southern Co. | | | 43,436 | | | | 2,136,617 | |
Westar Energy Inc. | | | 1,231 | | | | 69,367 | |
Xcel Energy Inc. | | | 22,733 | | | | 925,233 | |
| | | | 17,659,985 | |
| |
Electrical Components & Equipment—0.2% | | | | | |
Acuity Brands Inc. | | | 1,966 | | | | 453,871 | |
Allied Motion Technologies Inc. | | | 124 | | | | 2,652 | |
American Superconductor Corp. | | | 226 | | | | 1,666 | (a) |
AMETEK Inc. | | | 10,523 | | | | 511,418 | |
Atkore International Group Inc. | | | 242 | | | | 5,786 | (a) |
Eaton Corporation PLC | | | 20,255 | | | | 1,358,908 | |
Emerson Electric Co. | | | 28,795 | | | | 1,605,321 | |
Encore Wire Corp. | | | 404 | | | | 17,513 | |
Energous Corp. | | | 298 | | | | 5,021 | (a) |
EnerSys | | | 1,223 | | | | 95,516 | |
FuelCell Energy Inc. | | | 559 | | | | 978 | (a) |
Generac Holdings Inc. | | | 1,189 | | | | 48,440 | (a) |
General Cable Corp. | | | 976 | | | | 18,593 | |
Hubbell Inc. | | | 451 | | | | 52,632 | |
LSI Industries Inc. | | | 481 | | | | 4,685 | |
Plug Power Inc. | | | 3,634 | | | | 4,361 | (a) |
Powell Industries Inc. | | | 173 | | | | 6,747 | |
| | | | | | | | |
Preformed Line Products Co. | | | 47 | | | | 2,732 | |
Regal Beloit Corp. | | | 389 | | | | 26,938 | |
Rockwell Automation Inc. | | | 5,749 | | | | 772,666 | |
Sunrun Inc. | | | 1,262 | | | | 6,701 | (a) |
Thermon Group Holdings Inc. | | | 642 | | | | 12,256 | (a) |
Vicor Corp. | | | 332 | | | | 5,013 | (a) |
| | | | 5,020,414 | |
| |
Electronic Components—0.1% | | | | | |
Amphenol Corp., Class A | | | 13,908 | | | | 934,618 | |
AVX Corp. | | | 927 | | | | 14,489 | |
Belden Inc. | | | 1,136 | | | | 84,939 | |
Corning Inc. | | | 42,992 | | | | 1,043,416 | |
II-VI Inc. | | | 1,190 | | | | 35,284 | (a) |
InvenSense Inc. | | | 1,655 | | | | 21,168 | (a) |
Knowles Corp. | | | 2,565 | | | | 42,861 | (a) |
Littelfuse Inc. | | | 603 | | | | 91,517 | |
Rogers Corp. | | | 361 | | | | 27,728 | (a) |
Universal Display Corp. | | | 797 | | | | 44,871 | (a) |
Vishay Intertechnology Inc. | | | 3,877 | | | | 62,807 | |
| | | | 2,403,698 | |
| | |
Electronic Equipment & Instruments—0.0% * | | | | | | | | |
Badger Meter Inc. | | | 562 | | | | 20,766 | |
Cognex Corp. | | | 754 | | | | 47,970 | |
Coherent Inc. | | | 441 | | | | 60,587 | (a) |
Control4 Corp. | | | 403 | | | | 4,111 | (a) |
Daktronics Inc. | | | 742 | | | | 7,939 | |
Electro Scientific Industries Inc. | | | 523 | | | | 3,096 | (a) |
FARO Technologies Inc. | | | 333 | | | | 11,988 | (a) |
FLIR Systems Inc. | | | 6,085 | | | | 220,216 | |
Itron Inc. | | | 667 | | | | 41,921 | (a) |
Keysight Technologies Inc. | | | 1,483 | | | | 54,233 | (a) |
Mesa Laboratories Inc. | | | 60 | | | | 7,365 | |
MTS Systems Corp. | | | 335 | | | | 18,995 | |
National Instruments Corp. | | | 922 | | | | 28,416 | |
Novanta Inc. | | | 630 | | | | 13,230 | (a) |
OSI Systems Inc. | | | 349 | | | | 26,566 | (a) |
VeriFone Systems Inc. | | | 962 | | | | 17,056 | (a) |
Vishay Precision Group Inc. | | | 239 | | | | 4,517 | (a) |
Zebra Technologies Corp., Class A | | | 466 | | | | 39,964 | (a) |
| | | | 628,936 | |
| | |
Electronic Manufacturing Services—0.0% * | | | | | | | | |
Benchmark Electronics Inc. | | | 987 | | | | 30,103 | (a) |
CTS Corp. | | | 627 | | | | 14,045 | |
IPG Photonics Corp. | | | 325 | | | | 32,081 | (a) |
Jabil Circuit Inc. | | | 1,614 | | | | 38,203 | |
Kimball Electronics Inc. | | | 561 | | | | 10,210 | (a) |
Maxwell Technologies Inc. | | | 632 | | | | 3,236 | (a) |
Methode Electronics Inc. | | | 731 | | | | 30,227 | |
Park Electrochemical Corp. | | | 391 | | | | 7,292 | |
Plexus Corp. | | | 665 | | | | 35,937 | (a) |
Radisys Corp. | | | 716 | | | | 3,172 | (a) |
Sanmina Corp. | | | 1,404 | | | | 51,457 | (a) |
Trimble Inc. | | | 2,176 | | | | 65,606 | (a) |
TTM Technologies Inc. | | | 1,448 | | | | 19,736 | (a) |
| | | | 341,305 | |
| | |
Environmental & Facilities Services—0.1% | | | | | | | | |
ABM Industries Inc. | | | 1,071 | | | | 43,740 | |
Advanced Disposal Services Inc. | | | 434 | | | | 9,643 | (a) |
| | | | | | | | |
Aqua Metals Inc. | | | 218 | | | | 2,858 | (a) |
Casella Waste Systems Inc., Class A | | | 768 | | | | 9,531 | (a) |
CECO Environmental Corp. | | | 591 | | | | 8,244 | |
Clean Harbors Inc. | | | 455 | | | | 25,321 | (a) |
Heritage-Crystal Clean Inc. | | | 258 | | | | 4,051 | (a) |
Republic Services Inc. | | | 10,346 | | | | 590,239 | |
Rollins Inc. | | | 837 | | | | 28,274 | |
SP Plus Corp. | | | 343 | | | | 9,655 | (a) |
Stericycle Inc. | | | 3,842 | | | | 295,988 | (a) |
Team Inc. | | | 581 | | | | 22,804 | (a) |
Tetra Tech Inc. | | | 1,044 | | | | 45,049 | |
TRC Companies Inc. | | | 375 | | | | 3,975 | (a) |
US Ecology Inc. | | | 437 | | | | 21,478 | |
Waste Management Inc. | | | 17,879 | | | | 1,267,800 | |
| | | | 2,388,650 | |
| | |
Fertilizers & Agricultural Chemicals—0.1% | | | | | | | | |
AgroFresh Solutions Inc. | | | 436 | | | | 1,155 | (a) |
American Vanguard Corp. | | | 568 | | | | 10,877 | |
CF Industries Holdings Inc. | | | 10,539 | | | | 331,768 | |
FMC Corp. | | | 6,166 | | | | 348,749 | |
Monsanto Co. | | | 19,441 | | | | 2,045,388 | |
The Mosaic Co. | | | 15,737 | | | | 461,566 | |
The Scotts Miracle-Gro Co., Class A | | | 387 | | | | 36,978 | |
| | | | 3,236,481 | |
| | |
Financial Exchanges & Data—0.3% | | | | | | | | |
CBOE Holdings Inc. | | | 704 | | | | 52,018 | |
CME Group Inc. | | | 15,259 | | | | 1,760,126 | |
FactSet Research Systems Inc. | | | 348 | | | | 56,874 | |
Intercontinental Exchange Inc. | | | 26,630 | | | | 1,502,464 | |
MarketAxess Holdings Inc. | | | 326 | | | | 47,896 | |
Moody’s Corp. | | | 7,462 | | | | 703,443 | |
MSCI Inc. | | | 815 | | | | 64,206 | |
Nasdaq Inc. | | | 5,160 | | | | 346,339 | |
S&P Global Inc. | | | 11,408 | | | | 1,226,816 | |
| | | | 5,760,182 | |
| | |
Food Distributors—0.1% | | | | | | | | |
Performance Food Group Co. | | | 746 | | | | 17,904 | (a) |
SpartanNash Co. | | | 737 | | | | 29,141 | |
Sysco Corp. | | | 22,177 | | | | 1,227,940 | |
The Andersons Inc. | | | 537 | | | | 24,004 | |
The Chefs’ Warehouse Inc. | | | 390 | | | | 6,162 | (a) |
United Natural Foods Inc. | | | 1,333 | | | | 63,611 | (a) |
| | | | 1,368,762 | |
| | |
Food Retail—0.1% | | | | | | | | |
Casey’s General Stores Inc. | | | 339 | | | | 40,300 | |
Ingles Markets Inc., Class A | | | 277 | | | | 13,324 | |
Natural Grocers by Vitamin Cottage Inc. | | | 188 | | | | 2,235 | (a) |
Smart & Final Stores Inc. | | | 456 | | | | 6,430 | (a) |
Sprouts Farmers Market Inc. | | | 1,159 | | | | 21,928 | (a) |
SUPERVALU Inc. | | | 5,348 | | | | 24,975 | (a) |
The Kroger Co. | | | 42,268 | | | | 1,458,669 | |
Village Super Market Inc., Class A | | | 143 | | | | 4,419 | |
Weis Markets Inc. | | | 188 | | | | 12,566 | |
Whole Foods Market Inc. | | | 14,303 | | | | 439,960 | |
| | | | 2,024,806 | |
| | | | | | | | |
Footwear—0.1% | | | | | | | | |
Crocs Inc. | | | 1,482 | | | | 10,167 | (a) |
Deckers Outdoor Corp. | | | 906 | | | | 50,183 | (a) |
NIKE Inc., Class B | | | 59,872 | | | | 3,043,294 | |
Skechers U.S.A. Inc., Class A | | | 1,157 | | | | 28,439 | (a) |
Steven Madden Ltd. | | | 1,111 | | | | 39,718 | (a) |
Wolverine World Wide Inc. | | | 1,891 | | | | 41,507 | |
| | | | 3,213,308 | |
| | |
Forest Products—0.0% * | | | | | | | | |
Boise Cascade Co. | | | 785 | | | | 17,662 | (a) |
Deltic Timber Corp. | | | 211 | | | | 16,262 | |
Louisiana-Pacific Corp. | | | 3,885 | | | | 73,543 | (a) |
| | | | 107,467 | |
| | |
Gas Utilities—0.0% * | | | | | | | | |
Atmos Energy Corp. | | | 907 | | | | 67,254 | |
Chesapeake Utilities Corp. | | | 295 | | | | 19,750 | |
Delta Natural Gas Company Inc. | | | 140 | | | | 4,106 | |
National Fuel Gas Co. | | | 749 | | | | 42,423 | |
New Jersey Resources Corp. | | | 2,409 | | | | 85,520 | |
Northwest Natural Gas Co. | | | 543 | | | | 32,471 | |
ONE Gas Inc. | | | 1,420 | | | | 90,823 | |
South Jersey Industries Inc. | | | 1,536 | | | | 51,748 | |
Southwest Gas Corp. | | | 1,338 | | | | 102,518 | |
Spire Inc. | | | 861 | | | | 55,578 | |
UGI Corp. | | | 1,514 | | | | 69,765 | |
WGL Holdings Inc. | | | 1,381 | | | | 105,343 | |
| | | | 727,299 | |
| | |
General Merchandise Stores—0.2% | | | | | | | | |
Big Lots Inc. | | | 1,253 | | | | 62,913 | |
Dollar General Corp. | | | 11,416 | | | | 845,583 | |
Dollar Tree Inc. | | | 10,648 | | | | 821,813 | (a) |
Fred’s Inc., Class A | | | 706 | | | | 13,103 | |
Ollie’s Bargain Outlet Holdings Inc. | | | 405 | | | | 11,522 | (a) |
Target Corp. | | | 25,190 | | | | 1,819,474 | |
Tuesday Morning Corp. | | | 903 | | | | 4,876 | (a) |
| | | | 3,579,284 | |
| | |
Gold—0.0% * | | | | | | | | |
Gold Resource Corp. | | | 1,024 | | | | 4,454 | |
Newmont Mining Corp. | | | 23,925 | | | | 815,125 | |
Royal Gold Inc. | | | 576 | | | | 36,490 | |
| | | | 856,069 | |
| | |
Health Care REITs—0.1% | | | | | | | | |
Care Capital Properties Inc. | | | 733 | | | | 18,325 | |
CareTrust REIT Inc. | | | 1,163 | | | | 17,817 | |
Community Healthcare Trust Inc. | | | 257 | | | | 5,919 | |
Global Medical REIT Inc. | | | 302 | | | | 2,694 | |
HCP Inc. | | | 21,138 | | | | 628,221 | |
Healthcare Realty Trust Inc. | | | 3,247 | | | | 98,449 | |
LTC Properties Inc. | | | 754 | | | | 35,423 | |
MedEquities Realty Trust Inc. | | | 402 | | | | 4,462 | |
Medical Properties Trust Inc. | | | 8,262 | | | | 101,623 | |
National Health Investors Inc. | | | 684 | | | | 50,732 | |
New Senior Investment Group Inc. | | | 1,540 | | | | 15,077 | |
Omega Healthcare Investors Inc. | | | 1,688 | | | | 52,767 | |
Physicians Realty Trust | | | 2,472 | | | | 46,869 | |
Quality Care Properties Inc. | | | 825 | | | | 12,788 | (a) |
Sabra Health Care REIT Inc. | | | 1,300 | | | | 31,746 | |
| | | | | | | | |
Senior Housing Properties Trust | | | 2,051 | | | | 38,825 | |
Universal Health Realty Income Trust REIT | | | 248 | | | | 16,266 | |
Ventas Inc. | | | 15,878 | | | | 992,693 | |
Welltower Inc. | | | 16,179 | | | | 1,082,860 | |
| | | | 3,253,556 | |
| | |
Healthcare Distributors—0.2% | | | | | | | | |
Aceto Corp. | | | 584 | | | | 12,831 | |
AmerisourceBergen Corp. | | | 7,350 | | | | 574,697 | |
Cardinal Health Inc. | | | 14,402 | | | | 1,036,512 | |
Henry Schein Inc. | | | 3,609 | | | | 547,521 | (a) |
McKesson Corp. | | | 10,103 | | | | 1,418,966 | |
Owens & Minor Inc. | | | 1,649 | | | | 58,193 | |
Patterson Companies Inc. | | | 3,915 | | | | 160,632 | |
PharMerica Corp. | | | 593 | | | | 14,914 | (a) |
| | | | 3,824,266 | |
| | |
Healthcare Equipment—0.7% | | | | | | | | |
Abaxis Inc. | | | 440 | | | | 23,219 | |
Abbott Laboratories | | | 65,371 | | | | 2,510,900 | |
ABIOMED Inc. | | | 354 | | | | 39,889 | (a) |
Accuray Inc. | | | 1,606 | | | | 7,388 | (a) |
Analogic Corp. | | | 249 | | | | 20,655 | |
AngioDynamics Inc. | | | 538 | | | | 9,076 | (a) |
AtriCure Inc. | | | 633 | | | | 12,388 | (a) |
Avinger Inc. | | | 360 | | | | 1,332 | (a) |
AxoGen Inc. | | | 476 | | | | 4,284 | (a) |
Baxter International Inc. | | | 22,133 | | | | 981,377 | |
Becton Dickinson and Co. | | | 9,525 | | | | 1,576,864 | |
Boston Scientific Corp. | | | 61,218 | | | | 1,324,145 | (a) |
Cantel Medical Corp. | | | 654 | | | | 51,502 | |
Cardiovascular Systems Inc. | | | 641 | | | | 15,519 | (a) |
ConforMIS Inc. | | | 723 | | | | 5,856 | (a) |
CONMED Corp. | | | 553 | | | | 24,426 | |
Corindus Vascular Robotics Inc. | | | 922 | | | | 644 | (a) |
CR Bard Inc. | | | 3,321 | | | | 746,096 | |
CryoLife Inc. | | | 638 | | | | 12,218 | |
Cutera Inc. | | | 215 | | | | 3,730 | (a) |
Cynosure Inc., Class A | | | 475 | | | | 21,660 | (a) |
Danaher Corp. | | | 26,970 | | | | 2,099,345 | |
Edwards Lifesciences Corp. | | | 9,623 | | | | 901,675 | (a) |
Entellus Medical Inc. | | | 169 | | | | 3,206 | (a) |
Exactech Inc. | | | 209 | | | | 5,706 | (a) |
GenMark Diagnostics Inc. | | | 807 | | | | 9,878 | (a) |
Glaukos Corp. | | | 336 | | | | 11,525 | (a) |
Globus Medical Inc., Class A | | | 2,006 | | | | 49,769 | (a) |
Hill-Rom Holdings Inc. | | | 525 | | | | 29,473 | |
Hologic Inc. | | | 12,541 | | | | 503,145 | (a) |
IDEXX Laboratories Inc. | | | 783 | | | | 91,822 | (a) |
Inogen Inc. | | | 326 | | | | 21,897 | (a) |
Insulet Corp. | | | 1,088 | | | | 40,996 | (a) |
Integer Holdings Corp. | | | 613 | | | | 18,053 | (a) |
Integra LifeSciences Holdings Corp. | | | 577 | | | | 49,501 | (a) |
Intuitive Surgical Inc. | | | 1,739 | | | | 1,102,822 | (a) |
Invacare Corp. | | | 640 | | | | 8,352 | |
InVivo Therapeutics Holdings Corp. | | | 656 | | | | 2,755 | (a) |
iRadimed Corp. | | | 88 | | | | 977 | (a) |
IRIDEX Corp. | | | 151 | | | | 2,123 | (a) |
K2M Group Holdings Inc. | | | 519 | | | | 10,401 | (a) |
LeMaitre Vascular Inc. | | | 275 | | | | 6,968 | |
Masimo Corp. | | | 785 | | | | 52,909 | (a) |
| | | | | | | | |
Natus Medical Inc. | | | 652 | | | | 22,690 | (a) |
Nevro Corp. | | | 481 | | | | 34,949 | (a) |
NuVasive Inc. | | | 1,354 | | | | 91,205 | (a) |
NxStage Medical Inc. | | | 1,275 | | | | 33,418 | (a) |
Orthofix International N.V. | | | 349 | | | | 12,627 | (a) |
Penumbra Inc. | | | 511 | | | | 32,602 | (a) |
ResMed Inc. | | | 1,230 | | | | 76,321 | |
Rockwell Medical Inc. | | | 970 | | | | 6,354 | (a) |
Second Sight Medical Products Inc. | | | 191 | | | | 376 | (a) |
St Jude Medical Inc. | | | 12,817 | | | | 1,027,795 | |
Stryker Corp. | | | 13,819 | | | | 1,655,654 | |
SurModics Inc. | | | 261 | | | | 6,629 | (a) |
Tandem Diabetes Care Inc. | | | 374 | | | | 804 | (a) |
Teleflex Inc. | | | 382 | | | | 61,559 | |
TransEnterix Inc. | | | 1,481 | | | | 1,925 | (a) |
Varian Medical Systems Inc. | | | 4,263 | | | | 382,732 | (a) |
Zeltiq Aesthetics Inc. | | | 711 | | | | 30,943 | (a) |
Zimmer Biomet Holdings Inc. | | | 9,043 | | | | 933,238 | |
| | | | 16,828,287 | |
| | |
Healthcare Facilities—0.1% | | | | | | | | |
AAC Holdings Inc. | | | 202 | | | | 1,462 | (a) |
Capital Senior Living Corp. | | | 563 | | | | 9,036 | (a) |
Community Health Systems Inc. | | | 2,220 | | | | 12,410 | (a) |
Genesis Healthcare Inc. | | | 651 | | | | 2,767 | (a) |
HCA Holdings Inc. | | | 13,145 | | | | 972,993 | (a) |
HealthSouth Corp. | | | 2,442 | | | | 100,708 | |
Kindred Healthcare Inc. | | | 1,691 | | | | 13,274 | |
LifePoint Health Inc. | | | 349 | | | | 19,823 | (a) |
National HealthCare Corp. | | | 223 | | | | 16,901 | |
Quorum Health Corp. | | | 595 | | | | 4,326 | (a) |
Select Medical Holdings Corp. | | | 2,144 | | | | 28,408 | (a) |
Surgery Partners Inc. | | | 372 | | | | 5,896 | (a) |
Surgical Care Affiliates Inc. | | | 535 | | | | 24,754 | (a) |
Tenet Healthcare Corp. | | | 720 | | | | 10,685 | (a) |
The Ensign Group Inc. | | | 957 | | | | 21,255 | |
Universal Health Services Inc., Class B | | | 4,049 | | | | 430,733 | |
US Physical Therapy Inc. | | | 243 | | | | 17,059 | |
VCA Inc. | | | 714 | | | | 49,016 | (a) |
| | | | 1,741,506 | |
| | |
Healthcare Services—0.2% | | | | | | | | |
Addus HomeCare Corp. | | | 151 | | | | 5,293 | (a) |
Adeptus Health Inc., Class A | | | 264 | | | | 2,017 | (a) |
Air Methods Corp. | | | 632 | | | | 20,129 | (a) |
Almost Family Inc. | | | 161 | | | | 7,100 | (a) |
Amedisys Inc. | | | 559 | | | | 23,830 | (a) |
American Renal Associates Holdings Inc. | | | 175 | | | | 3,724 | (a) |
AMN Healthcare Services Inc. | | | 949 | | | | 36,489 | (a) |
BioScrip Inc. | | | 1,987 | | | | 2,067 | (a) |
BioTelemetry Inc. | | | 541 | | | | 12,091 | (a) |
Chemed Corp. | | | 310 | | | | 49,727 | |
Civitas Solutions Inc. | | | 301 | | | | 5,990 | (a) |
CorVel Corp. | | | 198 | | | | 7,247 | (a) |
Cross Country Healthcare Inc. | | | 643 | | | | 10,037 | (a) |
DaVita Inc. | | | 7,106 | | | | 456,205 | (a) |
Diplomat Pharmacy Inc. | | | 915 | | | | 11,529 | (a) |
Envision Healthcare Corp. | | | 5,283 | | | | 334,361 | (a) |
Express Scripts Holding Co. | | | 27,629 | | | | 1,900,599 | (a) |
Healthways Inc. | | | 636 | | | | 14,469 | (a) |
Laboratory Corporation of America Holdings | | | 4,624 | | | | 593,629 | (a) |
| | | | | | | | |
Landauer Inc. | | | 192 | | | | 9,235 | |
LHC Group Inc. | | | 299 | | | | 13,664 | (a) |
MEDNAX Inc. | | | 814 | | | | 54,261 | (a) |
National Research Corp., Class A | | | 159 | | | | 3,021 | |
Quest Diagnostics Inc. | | | 6,252 | | | | 574,559 | |
RadNet Inc. | | | 744 | | | | 4,799 | (a) |
Team Health Holdings Inc. | | | 1,249 | | | | 54,269 | (a) |
Teladoc Inc. | | | 418 | | | | 6,897 | (a) |
The Providence Service Corp. | | | 257 | | | | 9,779 | (a) |
| | | | 4,227,017 | |
| | |
Healthcare Supplies—0.1% | | | | | | | | |
Align Technology Inc. | | | 657 | | | | 63,157 | (a) |
Anika Therapeutics Inc. | | | 281 | | | | 13,758 | (a) |
Atrion Corp. | | | 27 | | | | 13,694 | |
Cerus Corp. | | | 2,029 | | | | 8,826 | (a) |
DENTSPLY SIRONA Inc. | | | 10,334 | | | | 596,582 | |
Endologix Inc. | | | 1,626 | | | | 9,301 | (a) |
Haemonetics Corp. | | | 974 | | | | 39,155 | (a) |
Halyard Health Inc. | | | 1,340 | | | | 49,553 | (a) |
ICU Medical Inc. | | | 277 | | | | 40,816 | (a) |
Meridian Bioscience Inc. | | | 841 | | | | 14,886 | |
Merit Medical Systems Inc. | | | 863 | | | | 22,869 | (a) |
Neogen Corp. | | | 695 | | | | 45,870 | (a) |
OraSure Technologies Inc. | | | 620 | | | | 5,444 | (a) |
Quidel Corp. | | | 539 | | | | 11,545 | (a) |
RTI Surgical Inc. | | | 1,167 | | | | 3,793 | (a) |
Senseonics Holdings Inc. | | | 534 | | | | 1,426 | (a) |
STAAR Surgical Co. | | | 816 | | | | 8,854 | (a) |
The Cooper Companies Inc. | | | 2,202 | | | | 385,196 | |
The Spectranetics Corp. | | | 857 | | | | 20,996 | (a) |
Utah Medical Products Inc. | | | 69 | | | | 5,020 | |
Vascular Solutions Inc. | | | 337 | | | | 18,906 | (a) |
West Pharmaceutical Services Inc. | | | 634 | | | | 53,782 | |
| | | | 1,433,429 | |
| | |
Healthcare Technology—0.0% * | | | | | | | | |
Allscripts Healthcare Solutions Inc. | | | 1,576 | | | | 16,091 | (a) |
Castlight Health Inc., Class B | | | 806 | | | | 3,990 | (a) |
Cerner Corp. | | | 13,586 | | | | 643,569 | (a) |
Computer Programs & Systems Inc. | | | 227 | | | | 5,357 | |
Cotiviti Holdings Inc. | | | 248 | | | | 8,531 | (a) |
Evolent Health Inc. Class A | | | 150 | | | | 2,220 | (a) |
HealthStream Inc. | | | 513 | | | | 12,851 | (a) |
HMS Holdings Corp. | | | 1,686 | | | | 30,618 | (a) |
Medidata Solutions Inc. | | | 1,005 | | | | 49,918 | (a) |
Omnicell Inc. | | | 596 | | | | 20,204 | (a) |
Quality Systems Inc. | | | 1,030 | | | | 13,545 | |
Vocera Communications Inc. | | | 498 | | | | 9,208 | (a) |
| | | | 816,102 | |
| | |
Heavy Electrical Equipment—0.0% * | | | | | | | | |
AZZ Inc. | | | 518 | | | | 33,100 | |
Babcock & Wilcox Enterprises Inc. | | | 919 | | | | 15,246 | (a) |
Power Solutions International Inc. | | | 92 | | | | 690 | (a) |
TPI Composites Inc. | | | 120 | | | | 1,925 | (a) |
| | | | 50,961 | |
| | |
Home Building—0.1% | | | | | | | | |
Beazer Homes USA Inc. | | | 640 | | | | 8,512 | (a) |
CalAtlantic Group Inc. | | | 649 | | | | 22,072 | |
Cavco Industries Inc. | | | 169 | | | | 16,875 | (a) |
| | | | | | | | |
Century Communities Inc. | | | 304 | | | | 6,384 | (a) |
DR Horton Inc. | | | 15,315 | | | | 418,559 | |
Green Brick Partners Inc. | | | 472 | | | | 4,744 | (a) |
Hovnanian Enterprises Inc., Class A | | | 2,473 | | | | 6,751 | (a) |
Installed Building Products Inc. | | | 401 | | | | 16,561 | (a) |
KB Home | | | 2,323 | | | | 36,727 | |
Lennar Corp., Class A | | | 8,391 | | | | 360,226 | |
LGI Homes Inc. | | | 309 | | | | 8,877 | (a) |
M/I Homes Inc. | | | 473 | | | | 11,910 | (a) |
MDC Holdings Inc. | | | 835 | | | | 21,426 | |
Meritage Homes Corp. | | | 766 | | | | 26,657 | (a) |
NVR Inc. | | | 31 | | | | 51,739 | (a) |
PulteGroup Inc. | | | 13,281 | | | | 244,105 | |
Taylor Morrison Home Corp., Class A | | | 609 | | | | 11,729 | (a) |
The New Home Company Inc. | | | 290 | | | | 3,396 | (a) |
Toll Brothers Inc. | | | 1,298 | | | | 40,238 | (a) |
TopBuild Corp. | | | 771 | | | | 27,448 | (a) |
TRI Pointe Group Inc. | | | 4,094 | | | | 46,999 | (a) |
WCI Communities Inc. | | | 437 | | | | 10,248 | (a) |
William Lyon Homes, Class A | | | 483 | | | | 9,191 | (a) |
| | | | 1,411,374 | |
| | |
Home Entertainment Software—0.1% | | | | | | | | |
Activision Blizzard Inc. | | | 30,822 | | | | 1,112,982 | |
Electronic Arts Inc. | | | 13,602 | | | | 1,071,294 | (a) |
Rosetta Stone Inc. | | | 383 | | | | 3,413 | (a) |
Take-Two Interactive Software Inc. | | | 1,552 | | | | 76,498 | (a) |
| | | | 2,264,187 | |
| | |
Home Furnishing Retail—0.0% * | | | | | | | | |
Aaron’s Inc. | | | 1,813 | | | | 57,998 | |
Bed Bath & Beyond Inc. | | | 6,980 | | | | 283,667 | |
Haverty Furniture Companies Inc. | | | 344 | | | | 8,153 | |
Kirkland’s Inc. | | | 300 | | | | 4,653 | (a) |
Pier 1 Imports Inc. | | | 1,653 | | | | 14,117 | |
RH | | | 1,120 | | | | 34,384 | (a) |
Select Comfort Corp. | | | 930 | | | | 21,036 | (a) |
Williams-Sonoma Inc. | | | 703 | | | | 34,018 | |
| | | | 458,026 | |
Home Furnishings—0.0% * | | | | | | | | |
Bassett Furniture Industries Inc. | | | 206 | | | | 6,262 | |
Ethan Allen Interiors Inc. | | | 496 | | | | 18,278 | |
Flexsteel Industries Inc. | | | 129 | | | | 7,955 | |
Hooker Furniture Corp. | | | 228 | | | | 8,653 | |
La-Z-Boy Inc. | | | 929 | | | | 28,845 | |
Leggett & Platt Inc. | | | 6,043 | | | | 295,382 | |
Mohawk Industries Inc. | | | 2,856 | | | | 570,286 | (a) |
Tempur Sealy International Inc. | | | 443 | | | | 30,248 | (a) |
| | | | 965,909 | |
| | |
Home Improvement Retail—0.4% | | | | | | | | |
Lowe’s Companies Inc. | | | 38,936 | | | | 2,769,128 | |
Lumber Liquidators Holdings Inc. | | | 532 | | | | 8,374 | (a) |
Sears Hometown and Outlet Stores Inc. | | | 152 | | | | 714 | (a) |
The Home Depot Inc. | | | 54,607 | | | | 7,321,707 | |
Tile Shop Holdings Inc. | | | 650 | | | | 12,707 | (a) |
| | | | 10,112,630 | |
| | |
Hotel & Resort REITs—0.1% | | | | | | | | |
Ashford Hospitality Prime Inc. | | | 450 | | | | 6,143 | |
Ashford Hospitality Trust Inc. | | | 1,574 | | | | 12,214 | |
Chatham Lodging Trust | | | 758 | | | | 15,577 | |
| | | | | | | | |
Chesapeake Lodging Trust | | | 1,197 | | | | 30,954 | |
DiamondRock Hospitality Co. | | | 3,897 | | | | 44,932 | |
FelCor Lodging Trust Inc. | | | 2,755 | | | | 22,068 | |
Hersha Hospitality Trust | | | 842 | | | | 18,103 | |
Hospitality Properties Trust | | | 1,418 | | | | 45,007 | |
Host Hotels & Resorts Inc. | | | 33,169 | | | | 624,904 | |
LaSalle Hotel Properties | | | 3,068 | | | | 93,482 | |
Pebblebrook Hotel Trust | | | 1,370 | | | | 40,758 | |
RLJ Lodging Trust | | | 2,381 | | | | 58,311 | |
Ryman Hospitality Properties Inc. | | | 785 | | | | 49,463 | |
Summit Hotel Properties Inc. | | | 1,746 | | | | 27,988 | |
Sunstone Hotel Investors Inc. | | | 4,236 | | | | 64,599 | |
Xenia Hotels & Resorts Inc. | | | 1,976 | | | | 38,374 | |
| | | | 1,192,877 | |
| | |
Hotels, Resorts & Cruise Lines—0.1% | | | | | | | | |
Carnival Corp. | | | 18,469 | | | | 961,496 | |
ILG Inc. | | | 2,192 | | | | 39,829 | |
La Quinta Holdings Inc. | | | 1,712 | | | | 24,327 | (a) |
Lindblad Expeditions Holdings Inc. | | | 299 | | | | 2,826 | (a) |
Marriott International Inc., Class A | | | 14,452 | | | | 1,194,891 | |
Marriott Vacations Worldwide Corp. | | | 432 | | | | 36,655 | |
Red Lion Hotels Corp. | | | 265 | | | | 2,213 | (a) |
Royal Caribbean Cruises Ltd. | | | 7,454 | | | | 611,526 | |
The Marcus Corp. | | | 370 | | | | 11,655 | |
Wyndham Worldwide Corp. | | | 4,853 | | | | 370,624 | |
| | | | 3,256,042 | |
| | |
Household Appliances—0.0% * | | | | | | | | |
Helen of Troy Ltd. | | | 779 | | | | 65,786 | (a) |
iRobot Corp. | | | 538 | | | | 31,446 | (a) |
NACCO Industries Inc., Class A | | | 76 | | | | 6,882 | |
Whirlpool Corp. | | | 3,331 | | | | 605,476 | |
| | | | 709,590 | |
| | |
Household Products—0.7% | | | | | | | | |
Central Garden & Pet Co. | | | 194 | | | | 6,419 | (a) |
Central Garden & Pet Co., Class A | | | 675 | | | | 20,858 | (a) |
Church & Dwight Company Inc. | | | 11,642 | | | | 514,460 | |
Colgate-Palmolive Co. | | | 39,902 | | | | 2,611,187 | |
Energizer Holdings Inc. | | | 541 | | | | 24,134 | |
HRG Group Inc. | | | 2,363 | | | | 36,768 | (a) |
Kimberly-Clark Corp. | | | 16,019 | | | | 1,828,088 | |
Oil-Dri Corporation of America | | | 99 | | | | 3,783 | |
Orchids Paper Products Co. | | | 51 | | | | 1,335 | |
The Clorox Co. | | | 5,826 | | | | 699,237 | |
The Procter & Gamble Co. | | | 119,880 | | | | 10,079,510 | |
WD-40 Co. | | | 280 | | | | 32,732 | |
| | | | 15,858,511 | |
| | |
Housewares & Specialties—0.1% | | | | | | | | |
CSS Industries Inc. | | | 171 | | | | 4,629 | |
Libbey Inc. | | | 448 | | | | 8,718 | |
Lifetime Brands Inc. | | | 220 | | | | 3,905 | |
Newell Brands Inc. | | | 21,794 | | | | 973,102 | |
Tupperware Brands Corp. | | | 442 | | | | 23,258 | |
| | | | 1,013,612 | |
Human Resource & Employment Services—0.0% * | |
Barrett Business Services Inc. | | | 142 | | | | 9,102 | |
GP Strategies Corp. | | | 257 | | | | 7,350 | (a) |
Heidrick & Struggles International Inc. | | | 371 | | | | 8,960 | |
| | | | | | | | |
Insperity Inc. | | | 314 | | | | 22,278 | |
Kelly Services Inc., Class A | | | 582 | | | | 13,339 | |
Kforce Inc. | | | 495 | | | | 11,434 | |
Korn/Ferry International | | | 1,153 | | | | 33,933 | |
ManpowerGroup Inc. | | | 585 | | | | 51,989 | |
On Assignment Inc. | | | 899 | | | | 39,700 | (a) |
Robert Half International Inc. | | | 5,883 | | | | 286,973 | |
TriNet Group Inc. | | | 845 | | | | 21,649 | (a) |
TrueBlue Inc. | | | 847 | | | | 20,879 | (a) |
WageWorks Inc. | | | 702 | | | | 50,895 | (a) |
| | | | 578,481 | |
| | |
Hypermarkets & Super Centers—0.3% | | | | | | | | |
Costco Wholesale Corp. | | | 19,550 | | | | 3,130,150 | |
PriceSmart Inc. | | | 380 | | | | 31,730 | |
Wal-Mart Stores Inc. | | | 67,322 | | | | 4,653,297 | |
| | | | 7,815,177 | |
| | |
Independent Power Producers & Energy Traders—0.0% * | | | | | | | | |
AES Corp. | | | 29,366 | | | | 341,233 | |
Atlantic Power Corp. | | | 2,442 | | | | 6,105 | |
Dynegy Inc. | | | 2,347 | | | | 19,856 | (a) |
NRG Energy Inc. | | | 14,724 | | | | 180,516 | |
NRG Yield Inc., Class A | | | 688 | | | | 10,568 | |
NRG Yield Inc., Class C | | | 1,294 | | | | 20,445 | |
| | | | 578,723 | |
| | |
Industrial Conglomerates—1.0% | | | | | | | | |
3M Co. | | | 26,893 | | | | 4,802,283 | |
Carlisle Companies Inc. | | | 562 | | | | 61,983 | |
General Electric Co. | | | 396,151 | | | | 12,518,372 | (c) |
Honeywell International Inc. | | | 34,099 | | | | 3,950,369 | |
Raven Industries Inc. | | | 731 | | | | 18,421 | |
Roper Technologies Inc. | | | 4,557 | | | | 834,296 | |
| | | | 22,185,724 | |
| | |
Industrial Gases—0.1% | | | | | | | | |
Air Products & Chemicals Inc. | | | 9,787 | | | | 1,407,566 | |
Praxair Inc. | | | 12,826 | | | | 1,503,079 | |
| | | | 2,910,645 | |
| | |
Industrial Machinery—0.4% | | | | | | | | |
Actuant Corp., Class A | | | 1,179 | | | | 30,595 | |
Albany International Corp., Class A | | | 573 | | | | 26,530 | |
Altra Industrial Motion Corp. | | | 505 | | | | 18,634 | |
Barnes Group Inc. | | | 964 | | | | 45,713 | |
Briggs & Stratton Corp. | | | 853 | | | | 18,988 | |
Chart Industries Inc. | | | 612 | | | | 22,044 | (a) |
CIRCOR International Inc. | | | 331 | | | | 21,475 | |
CLARCOR Inc. | | | 1,301 | | | | 107,293 | |
Columbus McKinnon Corp. | | | 393 | | | | 10,627 | |
Crane Co. | | | 433 | | | | 31,228 | |
DMC Global Inc. | | | 281 | | | | 4,454 | |
Donaldson Company Inc. | | | 1,161 | | | | 48,855 | |
Dover Corp. | | | 6,913 | | | | 517,991 | |
Energy Recovery Inc. | | | 693 | | | | 7,173 | (a) |
EnPro Industries Inc. | | | 433 | | | | 29,167 | |
ESCO Technologies Inc. | | | 507 | | | | 28,722 | |
Flowserve Corp. | | | 5,891 | | | | 283,063 | |
Fortive Corp. | | | 13,426 | | | | 720,036 | |
Franklin Electric Company Inc. | | | 922 | | | | 35,866 | |
Gencor Industries Inc. | | | 118 | | | | 1,853 | (a) |
| | | | | | | | |
Global Brass & Copper Holdings Inc. | | | 420 | | | | 14,406 | |
Graco Inc. | | | 481 | | | | 39,966 | |
Graham Corp. | | | 195 | | | | 4,319 | |
Hardinge Inc. | | | 228 | | | | 2,526 | |
Harsco Corp. | | | 1,636 | | | | 22,250 | |
Hillenbrand Inc. | | | 1,125 | | | | 43,144 | |
Hurco Companies Inc. | | | 128 | | | | 4,237 | |
Hyster-Yale Materials Handling Inc. | | | 189 | | | | 12,053 | |
IDEX Corp. | | | 665 | | | | 59,890 | |
Illinois Tool Works Inc. | | | 14,041 | | | | 1,719,461 | |
Ingersoll-Rand PLC | | | 11,677 | | | | 876,242 | |
ITT Inc. | | | 765 | | | | 29,506 | |
John Bean Technologies Corp. | | | 528 | | | | 45,382 | |
Kadant Inc. | | | 215 | | | | 13,158 | |
Kennametal Inc. | | | 2,225 | | | | 69,553 | |
Lincoln Electric Holdings Inc. | | | 541 | | | | 41,478 | |
Lydall Inc. | | | 332 | | | | 20,534 | (a) |
Milacron Holdings Corp. | | | 292 | | | | 5,440 | (a) |
Mueller Industries Inc. | | | 1,081 | | | | 43,197 | |
Mueller Water Products Inc., Class A | | | 2,969 | | | | 39,517 | |
NN Inc. | | | 530 | | | | 10,097 | |
Nordson Corp. | | | 463 | | | | 51,879 | |
Omega Flex Inc. | | | 58 | | | | 3,234 | |
Parker-Hannifin Corp. | | | 5,995 | | | | 839,300 | |
Proto Labs Inc. | | | 495 | | | | 25,418 | (a) |
RBC Bearings Inc. | | | 452 | | | | 41,950 | (a) |
Rexnord Corp. | | | 1,661 | | | | 32,539 | (a) |
Snap-on Inc. | | | 2,626 | | | | 449,755 | |
SPX Corp. | | | 833 | | | | 19,759 | (a) |
SPX FLOW Inc. | | | 707 | | | | 22,666 | (a) |
Standex International Corp. | | | 254 | | | | 22,314 | |
Stanley Black & Decker Inc. | | | 6,801 | | | | 780,007 | |
Sun Hydraulics Corp. | | | 469 | | | | 18,746 | |
Tennant Co. | | | 352 | | | | 25,062 | |
The ExOne Co. | | | 197 | | | | 1,840 | (a) |
The Gorman-Rupp Co. | | | 355 | | | | 10,987 | |
The Timken Co. | | | 611 | | | | 24,257 | |
TriMas Corp. | | | 902 | | | | 21,197 | (a) |
Watts Water Technologies Inc., Class A | | | 554 | | | | 36,121 | |
Woodward Inc. | | | 1,461 | | | | 100,882 | |
Xylem Inc. | | | 8,099 | | | | 401,062 | |
| | | | 8,055,638 | |
| | |
Industrial REITs—0.1% | | | | | | | | |
DCT Industrial Trust Inc. | | | 797 | | | | 38,160 | |
Duke Realty Corp. | | | 3,067 | | | | 81,460 | |
EastGroup Properties Inc. | | | 596 | | | | 44,009 | |
First Industrial Realty Trust Inc. | | | 3,169 | | | | 88,890 | |
Monmouth Real Estate Investment Corp., Class A | | | 1,271 | | | | 19,370 | |
Prologis Inc. REIT | | | 23,706 | | | | 1,251,440 | |
Rexford Industrial Realty Inc. | | | 1,314 | | | | 30,472 | |
STAG Industrial Inc. | | | 1,381 | | | | 32,964 | |
Terreno Realty Corp. | | | 877 | | | | 24,986 | |
| | | | 1,611,751 | |
| | |
Insurance Brokers—0.1% | | | | | | | | |
Arthur J Gallagher & Co. | | | 8,123 | | | | 422,071 | |
Brown & Brown Inc. | | | 993 | | | | 44,546 | |
Crawford & Co., Class B | | | 241 | | | | 3,027 | |
eHealth Inc. | | | 364 | | | | 3,877 | (a) |
| | | | | | | | |
Marsh & McLennan Companies Inc. | | | 23,158 | | | | 1,565,249 | |
Patriot National Inc. | | | 265 | | | | 1,232 | (a) |
| | | | 2,040,002 | |
| | |
Integrated Oil & Gas—1.3% | | | | | | | | |
Chevron Corp. | | | 84,508 | | | | 9,946,592 | |
Exxon Mobil Corp. | | | 185,667 | | | | 16,758,303 | |
Occidental Petroleum Corp. | | | 34,254 | | | | 2,439,912 | |
| | | | 29,144,807 | |
| | |
Integrated Telecommunication Services—1.0% | | | | | | | | |
AT&T Inc. | | | 275,057 | | | | 11,698,174 | |
ATN International Inc. | | | 208 | | | | 16,667 | |
CenturyLink Inc. | | | 24,509 | | | | 582,824 | |
Cincinnati Bell Inc. | | | 845 | | | | 18,886 | (a) |
Consolidated Communications Holdings Inc. | | | 991 | | | | 26,608 | |
Fairpoint Communications Inc. | | | 425 | | | | 7,948 | (a) |
Frontier Communications Corp. | | | 53,029 | | | | 179,238 | |
General Communication Inc., Class A | | | 574 | | | | 11,164 | (a) |
Hawaiian Telcom Holdco Inc. | | | 118 | | | | 2,924 | (a) |
IDT Corp., Class B | | | 352 | | | | 6,526 | |
Verizon Communications Inc. | | | 182,550 | | | | 9,744,519 | |
Windstream Holdings Inc. | | | 1,914 | | | | 14,030 | |
| | | | 22,309,508 | |
| | |
Internet & Direct Marketing Retail—0.9% | | | | | | | | |
1-800-Flowers.com Inc., Class A | | | 148 | | | | 1,584 | (a) |
Amazon.com Inc. | | | 17,625 | | | | 13,216,459 | (a) |
Blue Nile Inc. | | | 222 | | | | 9,020 | |
Duluth Holdings Inc. | | | 194 | | | | 4,928 | (a) |
Etsy Inc. | | | 2,111 | | | | 24,867 | (a) |
Expedia Inc. | | | 5,447 | | | | 617,036 | |
FTD Companies Inc. | | | 345 | | | | 8,225 | (a) |
Gaia Inc. | | | 99 | | | | 856 | (a) |
HSN Inc. | | | 913 | | | | 31,316 | |
Lands’ End Inc. | | | 298 | | | | 4,515 | (a) |
Liberty TripAdvisor Holdings Inc., Class A | | | 1,456 | | | | 21,913 | (a) |
Netflix Inc. | | | 19,298 | | | | 2,389,092 | (a) |
Nutrisystem Inc. | | | 586 | | | | 20,305 | |
Overstock.com Inc. | | | 26 | | | | 455 | (a) |
PetMed Express Inc. | | | 401 | | | | 9,251 | |
Shutterfly Inc. | | | 656 | | | | 32,918 | (a) |
The Priceline Group Inc. | | | 2,214 | | | | 3,245,857 | (a) |
TripAdvisor Inc. | | | 5,284 | | | | 245,019 | (a) |
Wayfair Inc., Class A | | | 632 | | | | 22,151 | (a) |
| | | | 19,905,767 | |
| | |
Internet Software & Services—1.6% | | | | | | | | |
2U Inc. | | | 734 | | | | 22,130 | (a) |
Actua Corp. | | | 321 | | | | 4,494 | (a) |
Akamai Technologies Inc. | | | 7,839 | | | | 522,705 | (a) |
Alarm.com Holdings Inc. | | | 205 | | | | 5,705 | (a) |
Alphabet Inc., Class A | | | 13,276 | | | | 10,520,566 | (a) |
Alphabet Inc., Class C | | | 13,235 | | | | 10,215,038 | (a) |
Amber Road Inc. | | | 359 | | | | 3,260 | (a) |
Angie’s List Inc. | | | 803 | | | | 6,609 | (a) |
Appfolio Inc. Class A | | | 150 | | | | 3,578 | (a) |
Autobytel Inc. | | | 177 | | | | 2,381 | (a) |
Bankrate Inc. | | | 956 | | | | 10,564 | (a) |
Bazaarvoice Inc. | | | 1,658 | | | | 8,041 | (a) |
Benefitfocus Inc. | | | 257 | | | | 7,633 | (a) |
Blucora Inc. | | | 787 | | | | 11,608 | (a) |
| | | | | | | | |
Box Inc., Class A | | | 988 | | | | 13,694 | (a) |
Brightcove Inc. | | | 606 | | | | 4,878 | (a) |
Carbonite Inc. | | | 361 | | | | 5,920 | (a) |
Care.com Inc. | | | 232 | | | | 1,988 | (a) |
ChannelAdvisor Corp. | | | 467 | | | | 6,701 | (a) |
comScore Inc. | | | 1,365 | | | | 43,107 | (a) |
Cornerstone OnDemand Inc. | | | 948 | | | | 40,110 | (a) |
Coupa Software Inc. | | | 167 | | | | 4,177 | (a) |
DHI Group Inc. | | | 1,018 | | | | 6,363 | (a) |
EarthLink Holdings Corp. | | | 2,113 | | | | 11,917 | |
eBay Inc. | | | 46,614 | | | | 1,383,970 | (a) |
Endurance International Group Holdings Inc. | | | 1,207 | | | | 11,225 | (a) |
Envestnet Inc. | | | 831 | | | | 29,293 | (a) |
Facebook Inc., Class A | | | 104,862 | | | | 12,064,373 | (a) |
Five9 Inc. | | | 659 | | | | 9,351 | (a) |
Gogo Inc. | | | 1,134 | | | | 10,455 | (a) |
GrubHub Inc. | | | 1,547 | | | | 58,198 | (a) |
GTT Communications Inc. | | | 527 | | | | 15,151 | (a) |
Hortonworks Inc. | | | 811 | | | | 6,739 | (a) |
Instructure Inc. | | | 210 | | | | 4,106 | (a) |
IntraLinks Holdings Inc. | | | 839 | | | | 11,343 | (a) |
j2 Global Inc. | | | 1,296 | | | | 106,013 | |
Limelight Networks Inc. | | | 1,267 | | | | 3,193 | (a) |
Liquidity Services Inc. | | | 496 | | | | 4,836 | (a) |
LivePerson Inc. | | | 1,079 | | | | 8,146 | (a) |
LogMeIn Inc. | | | 458 | | | | 44,220 | |
Marchex Inc., Class B | | | 661 | | | | 1,752 | (a) |
MeetMe Inc. | | | 837 | | | | 4,126 | (a) |
MINDBODY Inc., Class A | | | 288 | | | | 6,134 | (a) |
New Relic Inc. | | | 440 | | | | 12,430 | (a) |
NIC Inc. | | | 1,271 | | | | 30,377 | |
Numerex Corp., Class A | | | 256 | | | | 1,894 | (a) |
Q2 Holdings Inc. | | | 511 | | | | 14,742 | (a) |
QuinStreet Inc. | | | 753 | | | | 2,831 | (a) |
Quotient Technology Inc. | | | 1,287 | | | | 13,835 | (a) |
RealNetworks Inc. | | | 415 | | | | 2,017 | (a) |
Reis Inc. | | | 170 | | | | 3,783 | |
RetailMeNot Inc. | | | 784 | | | | 7,291 | (a) |
Rightside Group Ltd. | | | 226 | | | | 1,869 | (a) |
Shutterstock Inc. | | | 381 | | | | 18,105 | (a) |
SPS Commerce Inc. | | | 331 | | | | 23,134 | (a) |
Stamps.com Inc. | | | 307 | | | | 35,198 | (a) |
TechTarget Inc. | | | 214 | | | | 1,825 | (a) |
TrueCar Inc. | | | 1,096 | | | | 13,700 | (a) |
VeriSign Inc. | | | 4,052 | | | | 308,236 | (a) |
Web.com Group Inc. | | | 852 | | | | 18,020 | (a) |
WebMD Health Corp. | | | 1,039 | | | | 51,503 | (a) |
Xactly Corp. | | | 455 | | | | 5,005 | (a) |
XO Group Inc. | | | 509 | | | | 9,900 | (a) |
Yahoo! Inc. | | | 39,276 | | | | 1,518,803 | (a) |
| | | | 37,360,289 | |
| | |
Investment Banking & Brokerage—0.4% | | | | | | | | |
B. Riley Financial Inc. | | | 155 | | | | 2,860 | |
BGC Partners Inc., Class A | | | 4,253 | | | | 43,508 | |
Cowen Group Inc., Class A | | | 531 | | | | 8,231 | (a) |
E*TRADE Financial Corp. | | | 12,225 | | | | 423,596 | (a) |
Evercore Partners Inc., Class A | | | 764 | | | | 52,487 | |
GAIN Capital Holdings Inc. | | | 758 | | | | 4,988 | |
Greenhill & Company Inc. | | | 545 | | | | 15,096 | |
| | | | | | | | |
Houlihan Lokey Inc. | | | 263 | | | | 8,185 | |
INTL. FCStone Inc. | | | 288 | | | | 11,405 | (a) |
Investment Technology Group Inc. | | | 683 | | | | 13,482 | |
KCG Holdings Inc., Class A | | | 1,010 | | | | 13,382 | (a) |
Ladenburg Thalmann Financial Services Inc. | | | 2,143 | | | | 5,229 | (a) |
Moelis & Co., Class A | | | 379 | | | | 12,848 | |
Morgan Stanley | | | 64,261 | | | | 2,715,027 | |
Piper Jaffray Cos. | | | 281 | | | | 20,372 | (a) |
PJT Partners Inc., Class A | | | 229 | | | | 7,072 | |
Raymond James Financial Inc. | | | 1,102 | | | | 76,336 | |
Stifel Financial Corp. | | | 1,834 | | | | 91,608 | (a) |
The Charles Schwab Corp. | | | 54,153 | | | | 2,137,419 | |
The Goldman Sachs Group Inc. | | | 16,547 | | | | 3,962,179 | |
Virtu Financial Inc., Class A | | | 539 | | | | 8,597 | |
| | | | 9,633,907 | |
| | |
IT Consulting & Other Services—0.4% | | | | | | | | |
Acxiom Corp. | | | 2,219 | | | | 59,469 | (a) |
CACI International Inc., Class A | | | 469 | | | | 58,297 | (a) |
Cognizant Technology Solutions Corp., Class A | | | 27,302 | | | | 1,529,731 | (a) |
Computer Sciences Corp. | | | 1,227 | | | | 72,908 | |
CSRA Inc. | | | 6,614 | | | | 210,590 | |
Datalink Corp. | | | 390 | | | | 4,391 | (a) |
EPAM Systems Inc. | | | 891 | | | | 57,300 | (a) |
Forrester Research Inc. | | | 194 | | | | 8,332 | |
Gartner Inc. | | | 722 | | | | 72,973 | (a) |
International Business Machines Corp. | | | 38,717 | | | | 6,426,635 | |
Leidos Holdings Inc. | | | 1,247 | | | | 63,772 | |
Lionbridge Technologies Inc. | | | 1,138 | | | | 6,601 | (a) |
ManTech International Corp., Class A | | | 493 | | | | 20,829 | |
NCI Inc., Class A | | | 105 | | | | 1,465 | |
Perficient Inc. | | | 706 | | | | 12,348 | (a) |
PFSweb Inc. | | | 271 | | | | 2,304 | (a) |
Science Applications International Corp. | | | 1,172 | | | | 99,386 | |
ServiceSource International Inc. | | | 1,215 | | | | 6,901 | (a) |
Teradata Corp. | | | 5,896 | | | | 160,194 | (a) |
The Hackett Group Inc. | | | 447 | | | | 7,894 | |
Unisys Corp. | | | 1,013 | | | | 15,144 | (a) |
Virtusa Corp. | | | 553 | | | | 13,891 | (a) |
| | | | 8,911,355 | |
| | |
Leisure Facilities—0.0% * | | | | | | | | |
ClubCorp Holdings Inc. | | | 1,297 | | | | 18,612 | |
International Speedway Corp., Class A | | | 759 | | | | 27,931 | |
Intrawest Resorts Holdings Inc. | | | 321 | | | | 5,730 | (a) |
Planet Fitness Inc., Class A | | | 350 | | | | 7,035 | |
SeaWorld Entertainment Inc. | | | 1,348 | | | | 25,517 | |
Speedway Motorsports Inc. | | | 234 | | | | 5,071 | |
| | | | 89,896 | |
| | |
Leisure Products—0.1% | | | | | | | | |
Acushnet Holdings Corp. | | | 436 | | | | 8,594 | (a) |
American Outdoor Brands Corp. | | | 1,099 | | | | 23,167 | (a) |
Arctic Cat Inc. | | | 268 | | | | 4,025 | |
Brunswick Corp. | | | 780 | | | | 42,541 | |
Callaway Golf Co. | | | 1,895 | | | | 20,769 | |
Escalade Inc. | | | 203 | | | | 2,680 | |
Hasbro Inc. | | | 5,103 | | | | 396,962 | |
JAKKS Pacific Inc. | | | 275 | | | | 1,416 | (a) |
Johnson Outdoors Inc., Class A | | | 98 | | | | 3,890 | |
Malibu Boats Inc., Class A | | | 367 | | | | 7,002 | (a) |
| | | | | | | | |
Marine Products Corp. | | | 125 | | | | 1,734 | |
Mattel Inc. | | | 15,399 | | | | 424,242 | |
MCBC Holdings Inc. | | | 148 | | | | 2,158 | |
Nautilus Inc. | | | 617 | | | | 11,415 | (a) |
Polaris Industries Inc. | | | 515 | | | | 42,431 | |
Sturm Ruger & Company Inc. | | | 374 | | | | 19,710 | |
Vista Outdoor Inc. | | | 525 | | | | 19,372 | (a) |
| | | | 1,032,108 | |
| | |
Life & Health Insurance—0.4% | | | | | | | | |
Aflac Inc. | | | 18,315 | | | | 1,274,724 | |
American Equity Investment Life Holding Co. | | | 1,611 | | | | 36,312 | |
Citizens Inc. | | | 936 | | | | 9,192 | (a) |
CNO Financial Group Inc. | | | 4,813 | | | | 92,169 | |
FBL Financial Group Inc., Class A | | | 194 | | | | 15,161 | |
Fidelity & Guaranty Life | | | 234 | | | | 5,546 | |
Genworth Financial Inc., Class A | | | 13,872 | | | | 52,852 | (a) |
Independence Holding Co. | | | 139 | | | | 2,717 | |
Lincoln National Corp. | | | 10,218 | | | | 677,147 | |
MetLife Inc. | | | 48,873 | | | | 2,633,766 | |
National Western Life Group Inc., Class A | | | 43 | | | | 13,364 | |
Primerica Inc. | | | 1,287 | | | | 88,996 | |
Principal Financial Group Inc. | | | 12,004 | | | | 694,551 | |
Prudential Financial Inc. | | | 19,152 | | | | 1,992,957 | |
Torchmark Corp. | | | 4,956 | | | | 365,555 | |
Trupanion Inc. | | | 287 | | | | 4,454 | (a) |
Unum Group | | | 10,347 | | | | 454,544 | |
| | | | 8,414,007 | |
| | |
Life Sciences Tools & Services—0.2% | | | | | | | | |
Accelerate Diagnostics Inc. | | | 464 | | | | 9,628 | (a) |
Agilent Technologies Inc. | | | 14,495 | | | | 660,392 | |
Albany Molecular Research Inc. | | | 521 | | | | 9,774 | (a) |
Bio-Rad Laboratories Inc., Class A | | | 181 | | | | 32,993 | (a) |
Bio-Techne Corp. | | | 330 | | | | 33,934 | |
Cambrex Corp. | | | 638 | | | | 34,420 | (a) |
Charles River Laboratories International Inc. | | | 418 | | | | 31,848 | (a) |
ChromaDex Corp. | | | 578 | | | | 1,913 | (a) |
Enzo Biochem Inc. | | | 798 | | | | 5,538 | (a) |
Fluidigm Corp. | | | 587 | | | | 4,273 | (a) |
Illumina Inc. | | | 6,628 | | | | 848,649 | (a) |
INC Research Holdings Inc., Class A | | | 779 | | | | 40,976 | (a) |
Luminex Corp. | | | 793 | | | | 16,042 | (a) |
Medpace Holdings Inc. | | | 162 | | | | 5,843 | (a) |
Mettler-Toledo International Inc. | | | 1,204 | | | | 503,946 | (a) |
NanoString Technologies Inc. | | | 296 | | | | 6,601 | (a) |
NeoGenomics Inc. | | | 1,061 | | | | 9,093 | (a) |
Pacific Biosciences of California Inc. | | | 1,184 | | | | 4,499 | (a) |
PAREXEL International Corp. | | | 1,435 | | | | 94,308 | (a) |
PerkinElmer Inc. | | | 4,946 | | | | 257,934 | |
PRA Health Sciences Inc. | | | 412 | | | | 22,710 | (a) |
Thermo Fisher Scientific Inc. | | | 17,522 | | | | 2,472,354 | |
Waters Corp. | | | 3,662 | | | | 492,136 | (a) |
| | | | 5,599,804 | |
| | |
Managed Healthcare—0.6% | | | | | | | | |
Aetna Inc. | | | 15,707 | | | | 1,947,825 | |
Anthem Inc. | | | 11,842 | | | | 1,702,524 | |
Centene Corp. | | | 7,628 | | | | 431,058 | (a) |
Cigna Corp. | | | 11,500 | | | | 1,533,985 | |
HealthEquity Inc. | | | 865 | | | | 35,050 | (a) |
| | | | | | | | |
Humana Inc. | | | 6,637 | | | | 1,354,147 | |
Magellan Health Inc. | | | 443 | | | | 33,336 | (a) |
Molina Healthcare Inc. | | | 1,156 | | | | 62,725 | (a) |
UnitedHealth Group Inc. | | | 42,621 | | | | 6,821,065 | |
Universal American Corp. | | | 822 | | | | 8,179 | (a) |
WellCare Health Plans Inc. | | | 386 | | | | 52,913 | (a) |
| | | | 13,982,807 | |
| | |
Marine—0.0% * | | | | | | | | |
Kirby Corp. | | | 472 | | | | 31,388 | (a) |
Matson Inc. | | | 867 | | | | 30,683 | |
Scorpio Bulkers Inc. | | | 1,043 | | | | 5,267 | (a) |
| | | | 67,338 | |
| | |
Metal & Glass Containers—0.0% * | | | | | | | | |
AptarGroup Inc. | | | 542 | | | | 39,810 | |
Ball Corp. | | | 7,876 | | | | 591,251 | |
Greif Inc., Class A | | | 746 | | | | 38,277 | |
Greif Inc., Class B | | | 112 | | | | 7,566 | |
Myers Industries Inc. | | | 439 | | | | 6,278 | |
Owens-Illinois Inc. | | | 1,400 | | | | 24,374 | (a) |
Silgan Holdings Inc. | | | 325 | | | | 16,633 | |
| | | | 724,189 | |
| | |
Mortgage REITs—0.0% * | | | | | | | | |
AG Mortgage Investment Trust Inc. | | | 593 | | | | 10,146 | |
Altisource Residential Corp. | | | 1,062 | | | | 11,725 | |
Anworth Mortgage Asset Corp. | | | 2,001 | | | | 10,345 | |
Apollo Commercial Real Estate Finance Inc. | | | 1,462 | | | | 24,298 | |
Ares Commercial Real Estate Corp. | | | 547 | | | | 7,510 | |
ARMOUR Residential REIT Inc. | | | 699 | | | | 15,161 | |
Capstead Mortgage Corp. | | | 1,974 | | | | 20,115 | |
Colony Capital Inc., Class A | | | 2,027 | | | | 41,047 | |
CYS Investments Inc. | | | 3,089 | | | | 23,878 | |
Dynex Capital Inc. | | | 967 | | | | 6,595 | |
Great Ajax Corp. | | | 272 | | | | 3,609 | |
Hannon Armstrong Sustainable Infrastructure Capital Inc. | | | 809 | | | | 15,363 | |
Invesco Mortgage Capital Inc. | | | 2,137 | | | | 31,200 | |
Ladder Capital Corp., Class A | | | 773 | | | | 10,606 | |
MTGE Investment Corp. | | | 935 | | | | 14,680 | |
New Residential Investment Corp. | | | 4,771 | | | | 75,000 | |
New York Mortgage Trust Inc. | | | 2,225 | | | | 14,685 | |
Orchid Island Capital Inc. | | | 173 | | | | 1,874 | |
Owens Realty Mortgage Inc. | | | 17 | | | | 315 | |
PennyMac Mortgage Investment Trust | | | 1,386 | | | | 22,689 | |
Redwood Trust Inc. | | | 1,536 | | | | 23,363 | |
Resource Capital Corp. | | | 613 | | | | 5,106 | |
Western Asset Mortgage Capital Corp. | | | 844 | | | | 8,499 | |
| | | | 397,809 | |
| | |
Motorcycle Manufacturers—0.0% * | | | | | | | | |
Harley-Davidson Inc. | | | 7,962 | | | | 464,503 | |
| | |
Movies & Entertainment—0.6% | | | | | | | | |
AMC Entertainment Holdings Inc., Class A | | | 597 | | | | 20,089 | |
Cinemark Holdings Inc. | | | 913 | | | | 35,023 | |
Global Eagle Entertainment Inc. | | | 944 | | | | 6,098 | (a) |
Liberty Media Corp.-Liberty Braves, Class A | | | 189 | | | | 3,873 | (a) |
Liberty Media Corp.-Liberty Braves, Class C | | | 635 | | | | 13,075 | (a) |
Liberty Media Corp.-Liberty Media, Class A | | | 450 | | | | 14,108 | (a) |
Liberty Media Corp.-Liberty Media, Class C | | | 925 | | | | 28,980 | (a) |
Live Nation Entertainment Inc. | | | 1,162 | | | | 30,909 | (a) |
| | | | | | | | |
Reading International Inc., Class A | | | 333 | | | | 5,528 | (a) |
The Walt Disney Co. | | | 65,605 | | | | 6,837,353 | |
Time Warner Inc. | | | 34,565 | | | | 3,336,559 | |
Twenty-First Century Fox Inc., Class A | | | 47,494 | | | | 1,331,732 | |
Twenty-First Century Fox Inc., Class B | | | 22,014 | | | | 599,881 | |
Viacom Inc., Class B | | | 15,603 | | | | 547,665 | |
World Wrestling Entertainment Inc., Class A | | | 730 | | | | 13,432 | |
| | | | 12,824,305 | |
| | |
Multi-Line Insurance—0.2% | | | | | | | | |
American Financial Group Inc. | | | 635 | | | | 55,956 | |
American International Group Inc. | | | 43,571 | | | | 2,845,622 | |
Assurant Inc. | | | 2,569 | | | | 238,557 | |
Horace Mann Educators Corp. | | | 813 | | | | 34,796 | |
Kemper Corp. | | | 1,216 | | | | 53,869 | |
Loews Corp. | | | 12,497 | | | | 585,235 | |
National General Holdings Corp. | | | 969 | | | | 24,215 | |
The Hartford Financial Services Group Inc. | | | 16,946 | | | | 807,477 | |
| | | | 4,645,727 | |
| | |
Multi-Sector Holdings—0.6% | | | | | | | | |
Berkshire Hathaway Inc., Class B | | | 85,043 | | | | 13,860,308 | (a) |
FNFV Group | | | 1,321 | | | | 18,098 | (a) |
Leucadia National Corp. | | | 14,667 | | | | 341,008 | |
PICO Holdings Inc. | | | 166 | | | | 2,515 | (a) |
| | | | 14,221,929 | |
| | |
Multi-Utilities—0.4% | | | | | | | | |
Ameren Corp. | | | 10,849 | | | | 569,139 | |
Avista Corp. | | | 1,156 | | | | 46,228 | |
Black Hills Corp. | | | 1,414 | | | | 86,735 | |
CenterPoint Energy Inc. | | | 19,467 | | | | 479,667 | |
CMS Energy Corp. | | | 12,613 | | | | 524,953 | |
Consolidated Edison Inc. | | | 13,660 | | | | 1,006,469 | |
Dominion Resources Inc. | | | 27,788 | | | | 2,128,283 | |
DTE Energy Co. | | | 8,059 | | | | 793,892 | |
MDU Resources Group Inc. | | | 1,691 | | | | 48,650 | |
NiSource Inc. | | | 14,814 | | | | 327,982 | |
NorthWestern Corp. | | | 1,315 | | | | 74,784 | |
Public Service Enterprise Group Inc. | | | 22,361 | | | | 981,201 | |
SCANA Corp. | | | 6,459 | | | | 473,315 | |
Sempra Energy | | | 11,291 | | | | 1,136,326 | |
Unitil Corp. | | | 278 | | | | 12,605 | |
Vectren Corp. | | | 716 | | | | 37,339 | |
WEC Energy Group Inc. | | | 14,278 | | | | 837,405 | |
| | | | 9,564,973 | |
| | |
Office REITs—0.1% | | | | | | | | |
Alexandria Real Estate Equities Inc. | | | 681 | | | | 75,679 | |
Boston Properties Inc. | | | 6,964 | | | | 875,932 | |
Corporate Office Properties Trust | | | 825 | | | | 25,756 | |
Cousins Properties Inc. | | | 9,155 | | | | 77,909 | |
Douglas Emmett Inc. | | | 1,251 | | | | 45,737 | |
Easterly Government Properties Inc. | | | 637 | | | | 12,753 | |
Franklin Street Properties Corp. | | | 1,965 | | | | 25,466 | |
Government Properties Income Trust | | | 1,404 | | | | 26,767 | |
Highwoods Properties Inc. | | | 872 | | | | 44,481 | |
Hudson Pacific Properties Inc. | | | 2,083 | | | | 72,447 | |
Kilroy Realty Corp. | | | 805 | | | | 58,942 | |
Mack-Cali Realty Corp. | | | 2,490 | | | | 72,260 | |
New York REIT Inc. | | | 3,330 | | | | 33,700 | |
NorthStar Realty Europe Corp. | | | 1,010 | | | | 12,696 | |
| | | | | | | | |
Parkway Inc. | | | 850 | | | | 18,912 | (a) |
SL Green Realty Corp. | | | 4,535 | | | | 487,739 | |
Tier REIT Inc. | | | 956 | | | | 16,625 | |
Vornado Realty Trust | | | 7,767 | | | | 810,642 | |
| | | | 2,794,443 | |
| | |
Office Services & Supplies—0.0% * | | | | | | | | |
ACCO Brands Corp. | | | 2,132 | | | | 27,823 | (a) |
ARC Document Solutions Inc. | | | 849 | | | | 4,313 | (a) |
Essendant Inc. | | | 742 | | | | 15,508 | |
Herman Miller Inc. | | | 1,647 | | | | 56,327 | |
HNI Corp. | | | 1,254 | | | | 70,124 | |
Interface Inc. | | | 1,301 | | | | 24,133 | |
Kimball International Inc., Class B | | | 741 | | | | 13,012 | |
Knoll Inc. | | | 964 | | | | 26,924 | |
MSA Safety Inc. | | | 860 | | | | 59,624 | |
NL Industries Inc. | | | 176 | | | | 1,434 | (a) |
Pitney Bowes Inc. | | | 8,388 | | | | 127,414 | |
Steelcase Inc., Class A | | | 1,731 | | | | 30,985 | |
West Corp. | | | 864 | | | | 21,393 | |
| | | | 479,014 | |
| | |
Oil & Gas Drilling—0.0% * | | | | | | | | |
Atwood Oceanics Inc. | | | 1,234 | | | | 16,203 | |
Diamond Offshore Drilling Inc. | | | 583 | | | | 10,319 | |
Helmerich & Payne Inc. | | | 4,884 | | | | 378,022 | |
Independence Contract Drilling Inc. | | | 607 | | | | 4,067 | (a) |
Nabors Industries Ltd. | | | 2,488 | | | | 40,803 | |
Parker Drilling Co. | | | 2,400 | | | | 6,240 | (a) |
Patterson-UTI Energy Inc. | | | 1,285 | | | | 34,592 | |
Pioneer Energy Services Corp. | | | 1,279 | | | | 8,761 | (a) |
Rowan Companies PLC, Class A | | | 1,088 | | | | 20,552 | |
Unit Corp. | | | 1,014 | | | | 27,246 | (a) |
| | | | 546,805 | |
| | |
Oil & Gas Equipment & Services—0.4% | | | | | | | | |
Archrock Inc. | | | 1,401 | | | | 18,493 | |
Baker Hughes Inc. | | | 18,941 | | | | 1,230,597 | |
Bristow Group Inc. | | | 682 | | | | 13,967 | |
CARBO Ceramics Inc. | | | 394 | | | | 4,121 | (a) |
Dawson Geophysical Co. | | | 401 | | | | 3,224 | (a) |
Dril-Quip Inc. | | | 326 | | | | 19,576 | (a) |
Era Group Inc. | | | 402 | | | | 6,822 | (a) |
Exterran Corp. | | | 630 | | | | 15,057 | (a) |
Fairmount Santrol Holdings Inc. | | | 1,496 | | | | 17,638 | (a) |
FMC Technologies Inc. | | | 10,199 | | | | 362,371 | (a) |
Forum Energy Technologies Inc. | | | 1,202 | | | | 26,444 | (a) |
Geospace Technologies Corp. | | | 263 | | | | 5,355 | (a) |
Halliburton Co. | | | 38,714 | | | | 2,094,040 | |
Helix Energy Solutions Group Inc. | | | 2,247 | | | | 19,819 | (a) |
Hornbeck Offshore Services Inc. | | | 660 | | | | 4,765 | (a) |
Matrix Service Co. | | | 535 | | | | 12,145 | (a) |
McDermott International Inc. | | | 4,855 | | | | 35,878 | (a) |
National Oilwell Varco Inc. | | | 16,865 | | | | 631,426 | |
Natural Gas Services Group Inc. | | | 245 | | | | 7,877 | (a) |
Newpark Resources Inc. | | | 1,666 | | | | 12,495 | (a) |
Oceaneering International Inc. | | | 853 | | | | 24,063 | |
Oil States International Inc. | | | 1,418 | | | | 55,302 | (a) |
PHI Inc. | | | 19 | | | | 342 | (a) |
RigNet Inc. | | | 255 | | | | 5,903 | (a) |
Schlumberger Ltd. | | | 62,265 | | | | 5,227,147 | |
| | | | | | | | |
SEACOR Holdings Inc. | | | 315 | | | | 22,453 | (a) |
Superior Energy Services Inc. | | | 1,319 | | | | 22,265 | |
Tesco Corp. | | | 871 | | | | 7,186 | |
TETRA Technologies Inc. | | | 1,871 | | | | 9,392 | (a) |
Tidewater Inc. | | | 970 | | | | 3,308 | |
U.S. Silica Holdings Inc. | | | 1,444 | | | | 81,846 | |
Willbros Group Inc. | | | 851 | | | | 2,757 | (a) |
| | | | 10,004,074 | |
| | |
Oil & Gas Exploration & Production—0.8% | | | | | | | | |
Abraxas Petroleum Corp. | | | 2,099 | | | | 5,394 | (a) |
Anadarko Petroleum Corp. | | | 24,660 | | | | 1,719,542 | |
Apache Corp. | | | 16,963 | | | | 1,076,642 | |
Bill Barrett Corp. | | | 986 | | | | 6,892 | (a) |
Cabot Oil & Gas Corp. | | | 21,027 | | | | 491,191 | |
California Resources Corp. | | | 639 | | | | 13,604 | (a) |
Callon Petroleum Co. | | | 2,838 | | | | 43,620 | (a) |
Carrizo Oil & Gas Inc. | | | 1,117 | | | | 41,720 | (a) |
Chesapeake Energy Corp. | | | 29,503 | | | | 207,111 | (a) |
Cimarex Energy Co. | | | 4,293 | | | | 583,419 | |
Clayton Williams Energy Inc. | | | 121 | | | | 14,430 | (a) |
Cobalt International Energy Inc. | | | 8,179 | | | | 9,978 | (a) |
Concho Resources Inc. | | | 6,426 | | | | 852,088 | (a) |
ConocoPhillips | | | 55,125 | | | | 2,763,967 | |
Contango Oil & Gas Co. | | | 449 | | | | 4,194 | (a) |
Denbury Resources Inc. | | | 10,632 | | | | 39,126 | (a) |
Devon Energy Corp. | | | 23,664 | | | | 1,080,735 | |
Earthstone Energy Inc. | | | 35 | | | | 481 | (a) |
Eclipse Resources Corp. | | | 1,210 | | | | 3,231 | (a) |
Energen Corp. | | | 839 | | | | 48,385 | |
EOG Resources Inc. | | | 25,717 | | | | 2,599,989 | |
EP Energy Corp., Class A | | | 772 | | | | 5,057 | (a) |
EQT Corp. | | | 7,700 | | | | 503,580 | |
Erin Energy Corp. | | | 422 | | | | 1,287 | (a) |
Evolution Petroleum Corp. | | | 511 | | | | 5,110 | |
EXCO Resources Inc. | | | 2,832 | | | | 2,474 | (a) |
Gulfport Energy Corp. | | | 1,350 | | | | 29,214 | (a) |
Hess Corp. | | | 11,970 | | | | 745,611 | |
Isramco Inc. | | | 13 | | | | 1,616 | (a) |
Jones Energy Inc., Class A | | | 1,010 | | | | 5,050 | (a) |
Marathon Oil Corp. | | | 37,952 | | | | 656,949 | |
Matador Resources Co. | | | 1,582 | | | | 40,752 | (a) |
Murphy Oil Corp. | | | 7,316 | | | | 227,747 | |
Newfield Exploration Co. | | | 8,911 | | | | 360,895 | (a) |
Noble Energy Inc. | | | 19,220 | | | | 731,513 | |
Northern Oil and Gas Inc. | | | 939 | | | | 2,582 | (a) |
Oasis Petroleum Inc. | | | 4,475 | | | | 67,751 | (a) |
Panhandle Oil and Gas Inc., Class A | | | 297 | | | | 6,994 | |
PDC Energy Inc. | | | 1,041 | | | | 75,556 | (a) |
Pioneer Natural Resources Co. | | | 7,567 | | | | 1,362,590 | |
QEP Resources Inc. | | | 2,110 | | | | 38,845 | |
Range Resources Corp. | | | 8,496 | | | | 291,923 | |
Ring Energy Inc. | | | 722 | | | | 9,379 | (a) |
RSP Permian Inc. | | | 1,830 | | | | 81,655 | (a) |
Sanchez Energy Corp. | | | 1,125 | | | | 10,159 | (a) |
SM Energy Co. | | | 848 | | | | 29,239 | |
Southwestern Energy Co. | | | 22,307 | | | | 241,362 | (a) |
Synergy Resources Corp. | | | 3,736 | | | | 33,288 | (a) |
W&T Offshore Inc. | | | 631 | | | | 1,748 | (a) |
WPX Energy Inc. | | | 2,974 | | | | 43,331 | (a) |
| | | | 17,218,996 | |
| | | | | | | | |
Oil & Gas Refining & Marketing—0.2% | | | | | | | | |
Adams Resources & Energy Inc. | | | 39 | | | | 1,546 | |
Alon USA Energy Inc. | | | 644 | | | | 7,329 | |
Clean Energy Fuels Corp. | | | 1,753 | | | | 5,014 | (a) |
CVR Energy Inc. | | | 324 | | | | 8,226 | |
Delek US Holdings Inc. | | | 1,241 | | | | 29,871 | |
Green Plains Inc. | | | 727 | | | | 20,247 | |
HollyFrontier Corp. | | | 1,540 | | | | 50,450 | |
Marathon Petroleum Corp. | | | 23,604 | | | | 1,188,461 | |
Pacific Ethanol Inc. | | | 556 | | | | 5,282 | (a) |
Par Pacific Holdings Inc. | | | 354 | | | | 5,147 | (a) |
Phillips 66 | | | 19,890 | | | | 1,718,695 | |
Renewable Energy Group Inc. | | | 729 | | | | 7,071 | (a) |
REX American Resources Corp. | | | 114 | | | | 11,258 | (a) |
Tesoro Corp. | | | 5,304 | | | | 463,835 | |
Valero Energy Corp. | | | 20,055 | | | | 1,370,158 | |
Western Refining Inc. | | | 2,264 | | | | 85,692 | |
World Fuel Services Corp. | | | 621 | | | | 28,510 | |
| | | | 5,006,792 | |
| | |
Oil & Gas Storage & Transportation—0.2% | | | | | | | | |
Dorian LPG Ltd. | | | 488 | | | | 4,006 | (a) |
GasLog Ltd. | | | 823 | | | | 13,250 | |
Gener8 Maritime Inc. | | | 799 | | | | 3,580 | (a) |
International Seaways Inc. | | | 128 | | | | 1,797 | (a) |
Kinder Morgan Inc. | | | 85,988 | | | | 1,780,811 | |
Nordic American Tankers Ltd. | | | 1,750 | | | | 14,700 | |
ONEOK Inc. | | | 9,457 | | | | 542,926 | |
Overseas Shipholding Group Inc., Class A | | | 385 | | | | 1,475 | |
SemGroup Corp., Class A | | | 1,254 | | | | 52,355 | |
Ship Finance International Ltd. | | | 1,206 | | | | 17,909 | |
Spectra Energy Corp. | | | 31,387 | | | | 1,289,692 | |
The Williams Companies Inc. | | | 30,800 | | | | 959,112 | |
| | | | 4,681,613 | |
| | |
Other Diversified Financial Services—0.0% * | | | | | | | | |
Tiptree Financial Inc., Class A | | | 455 | | | | 2,798 | |
| | |
Packaged Foods & Meats—0.6% | | | | | | | | |
AdvancePierre Foods Holdings Inc. | | | 431 | | | | 12,835 | |
Amplify Snack Brands Inc. | | | 588 | | | | 5,180 | (a) |
B&G Foods Inc. | | | 1,247 | | | | 54,619 | |
Cal-Maine Foods Inc. | | | 623 | | | | 27,521 | |
Calavo Growers Inc. | | | 310 | | | | 19,034 | |
Campbell Soup Co. | | | 8,785 | | | | 531,229 | |
Conagra Brands Inc. | | | 18,842 | | | | 745,201 | |
Dean Foods Co. | | | 2,505 | | | | 54,559 | |
Farmer Brothers Co. | | | 161 | | | | 5,909 | (a) |
Flowers Foods Inc. | | | 1,586 | | | | 31,672 | |
Freshpet Inc. | | | 458 | | | | 4,649 | (a) |
General Mills Inc. | | | 26,188 | | | | 1,617,633 | |
Hormel Foods Corp. | | | 12,208 | | | | 424,961 | |
Inventure Foods Inc. | | | 381 | | | | 3,753 | (a) |
J&J Snack Foods Corp. | | | 300 | | | | 40,029 | |
John B Sanfilippo & Son Inc. | | | 171 | | | | 12,037 | |
Kellogg Co. | | | 11,402 | | | | 840,441 | |
Lamb Weston Holdings Inc. | | | 1,197 | | | | 45,306 | (a) |
Lancaster Colony Corp. | | | 512 | | | | 72,392 | |
Landec Corp. | | | 537 | | | | 7,411 | (a) |
Lifeway Foods Inc. | | | 73 | | | | 840 | (a) |
McCormick & Company Inc. | | | 5,191 | | | | 484,476 | |
| | | | | | | | |
Mead Johnson Nutrition Co. | | | 8,228 | | | | 582,213 | |
Mondelez International Inc., Class A | | | 69,206 | | | | 3,067,902 | |
Omega Protein Corp. | | | 442 | | | | 11,072 | (a) |
Post Holdings Inc. | | | 570 | | | | 45,822 | (a) |
Sanderson Farms Inc. | | | 401 | | | | 37,790 | |
Seaboard Corp. | | | 5 | | | | 19,760 | (a) |
Seneca Foods Corp., Class A | | | 129 | | | | 5,166 | (a) |
Snyder’s-Lance Inc. | | | 2,231 | | | | 85,537 | |
The Hain Celestial Group Inc. | | | 891 | | | | 34,776 | (a) |
The Hershey Co. | | | 6,272 | | | | 648,713 | |
The JM Smucker Co. | | | 5,264 | | | | 674,108 | |
The Kraft Heinz Co. | | | 26,440 | | | | 2,308,741 | |
The WhiteWave Foods Co., Class A | | | 1,549 | | | | 86,124 | (a) |
Tootsie Roll Industries Inc. | | | 500 | | | | 19,875 | |
TreeHouse Foods Inc. | | | 500 | | | | 36,095 | (a) |
Tyson Foods Inc., Class A | | | 12,747 | | | | 786,235 | |
| | | | 13,491,616 | |
| | |
Paper Packaging—0.1% | | | | | | | | |
AEP Industries Inc. | | | 80 | | | | 9,288 | |
Avery Dennison Corp. | | | 4,016 | | | | 282,004 | |
Bemis Company Inc. | | | 815 | | | | 38,973 | |
International Paper Co. | | | 18,429 | | | | 977,843 | |
Multi Packaging Solutions International Ltd. | | | 423 | | | | 6,032 | (a) |
Packaging Corporation of America | | | 814 | | | | 69,044 | |
Sealed Air Corp. | | | 8,691 | | | | 394,050 | |
Sonoco Products Co. | | | 869 | | | | 45,796 | |
UFP Technologies Inc. | | | 127 | | | | 3,232 | (a) |
WestRock Co. | | | 11,333 | | | | 575,376 | |
| | | | 2,401,638 | |
| | |
Paper Products—0.0% * | | | | | | | | |
Clearwater Paper Corp. | | | 339 | | | | 22,222 | (a) |
Domtar Corp. | | | 547 | | | | 21,350 | |
KapStone Paper and Packaging Corp. | | | 1,623 | | | | 35,787 | |
Neenah Paper Inc. | | | 332 | | | | 28,286 | |
PH Glatfelter Co. | | | 874 | | | | 20,880 | |
Schweitzer-Mauduit International Inc. | | | 608 | | | | 27,682 | |
| | | | 156,207 | |
| | |
Personal Products—0.1% | | | | | | | | |
Avon Products Inc. | | | 12,509 | | | | 63,045 | |
Coty Inc., Class A | | | 21,301 | | | | 390,021 | |
Edgewell Personal Care Co. | | | 504 | | | | 36,787 | (a) |
elf Beauty Inc. | | | 188 | | | | 5,441 | (a) |
Inter Parfums Inc. | | | 351 | | | | 11,495 | |
Lifevantage Corp. | | | 272 | | | | 2,217 | (a) |
Medifast Inc. | | | 210 | | | | 8,742 | |
Natural Health Trends Corp. | | | 150 | | | | 3,727 | |
Nature’s Sunshine Products Inc. | | | 183 | | | | 2,745 | |
Nutraceutical International Corp. | | | 163 | | | | 5,697 | |
Revlon Inc., Class A | | | 232 | | | | 6,763 | (a) |
Synutra International Inc. | | | 366 | | | | 1,958 | (a) |
The Estee Lauder Companies Inc., Class A | | | 9,987 | | | | 763,906 | |
USANA Health Sciences Inc. | | | 208 | | | | 12,730 | (a) |
| | | | 1,315,274 | |
| | |
Pharmaceuticals—1.9% | | | | | | | | |
AcelRx Pharmaceuticals Inc. | | | 701 | | | | 1,823 | (a) |
Aclaris Therapeutics Inc. | | | 182 | | | | 4,939 | (a) |
Aerie Pharmaceuticals Inc. | | | 482 | | | | 18,244 | (a) |
Agile Therapeutics Inc. | | | 236 | | | | 1,345 | (a) |
| | | | | | | | |
Akorn Inc. | | | 773 | | | | 16,874 | (a) |
Allergan PLC | | | 16,800 | | | | 3,528,168 | (a) |
Amphastar Pharmaceuticals Inc. | | | 712 | | | | 13,115 | (a) |
Ampio Pharmaceuticals Inc. | | | 1,274 | | | | 1,147 | (a) |
ANI Pharmaceuticals Inc. | | | 159 | | | | 9,638 | (a) |
Aratana Therapeutics Inc. | | | 671 | | | | 4,818 | (a) |
Axsome Therapeutics Inc. | | | 180 | | | | 1,215 | (a) |
Bio-Path Holdings Inc. | | | 1,689 | | | | 2,280 | (a) |
Bristol-Myers Squibb Co. | | | 74,838 | | | | 4,373,533 | |
Catalent Inc. | | | 2,898 | | | | 78,130 | (a) |
Cempra Inc. | | | 867 | | | | 2,428 | (a) |
Clearside Biomedical Inc. | | | 164 | | | | 1,466 | (a) |
Collegium Pharmaceutical Inc. | | | 270 | | | | 4,204 | (a) |
Corcept Therapeutics Inc. | | | 1,502 | | | | 10,904 | (a) |
Depomed Inc. | | | 1,223 | | | | 22,038 | (a) |
Dermira Inc. | | | 470 | | | | 14,255 | (a) |
Durect Corp. | | | 2,560 | | | | 3,430 | (a) |
Egalet Corp. | | | 443 | | | | 3,389 | (a) |
Eli Lilly & Co. | | | 43,418 | | | | 3,193,394 | |
Endocyte Inc. | | | 764 | | | | 1,948 | (a) |
Flex Pharma Inc. | | | 215 | | | | 1,135 | (a) |
Heska Corp. | | | 121 | | | | 8,664 | (a) |
Horizon Pharma PLC | | | 2,960 | | | | 47,893 | (a) |
Impax Laboratories Inc. | | | 1,468 | | | | 19,451 | (a) |
Innoviva Inc. | | | 1,626 | | | | 17,398 | (a) |
Intersect ENT Inc. | | | 515 | | | | 6,231 | (a) |
Intra-Cellular Therapies Inc. | | | 686 | | | | 10,352 | (a) |
Johnson & Johnson | | | 121,823 | | | | 14,035,228 | |
Lannett Company Inc. | | | 560 | | | | 12,348 | (a) |
Lipocine Inc. | | | 291 | | | | 1,071 | (a) |
Mallinckrodt PLC | | | 4,828 | | | | 240,531 | (a) |
Merck & Company Inc. | | | 123,512 | | | | 7,271,151 | |
Mylan N.V. | | | 20,790 | | | | 793,138 | (a) |
MyoKardia Inc. | | | 227 | | | | 2,940 | (a) |
Nektar Therapeutics | | | 2,832 | | | | 34,749 | (a) |
Neos Therapeutics Inc. | | | 278 | | | | 1,626 | (a) |
Ocular Therapeutix Inc. | | | 319 | | | | 2,670 | (a) |
Omeros Corp. | | | 404 | | | | 4,008 | (a) |
Pacira Pharmaceuticals Inc. | | | 612 | | | | 19,768 | (a) |
Paratek Pharmaceuticals Inc. | | | 362 | | | | 5,575 | (a) |
Pfizer Inc. | | | 271,645 | | | | 8,823,030 | |
Phibro Animal Health Corp., Class A | | | 379 | | | | 11,105 | |
Prestige Brands Holdings Inc. | | | 1,432 | | | | 74,607 | (a) |
Reata Pharmaceuticals Inc., Class A | | | 106 | | | | 2,314 | (a) |
Revance Therapeutics Inc. | | | 413 | | | | 8,549 | (a) |
SciClone Pharmaceuticals Inc. | | | 1,007 | | | | 10,876 | (a) |
Sucampo Pharmaceuticals Inc., Class A | | | 472 | | | | 6,396 | (a) |
Supernus Pharmaceuticals Inc. | | | 939 | | | | 23,710 | (a) |
Teligent Inc. | | | 826 | | | | 5,460 | (a) |
Tetraphase Pharmaceuticals Inc. | | | 738 | | | | 2,974 | (a) |
The Medicines Co. | | | 1,285 | | | | 43,613 | (a) |
TherapeuticsMD Inc. | | | 3,005 | | | | 17,339 | (a) |
Titan Pharmaceuticals Inc. | | | 363 | | | | 1,452 | (a) |
WaVe Life Sciences Ltd. | | | 149 | | | | 3,896 | (a) |
Zoetis Inc. | | | 22,066 | | | | 1,181,193 | |
Zogenix Inc. | | | 499 | | | | 6,063 | (a) |
| | | | 44,071,229 | |
| | |
Precious Metals & Minerals—0.0% * | | | | | | | | |
Stillwater Mining Co. | | | 2,328 | | | | 37,504 | (a) |
| | | | | | | | |
Property & Casualty Insurance—0.2% | | | | | | | | |
Ambac Financial Group Inc. | | | 904 | | | | 20,340 | (a) |
AMERISAFE Inc. | | | 379 | | | | 23,631 | |
Atlas Financial Holdings Inc. | | | 214 | | | | 3,863 | (a) |
Baldwin & Lyons Inc., Class B | | | 179 | | | | 4,511 | |
Cincinnati Financial Corp. | | | 6,771 | | | | 512,903 | |
Donegal Group Inc., Class A | | | 163 | | | | 2,849 | |
EMC Insurance Group Inc. | | | 168 | | | | 5,042 | |
Employers Holdings Inc. | | | 646 | | | | 25,582 | |
Federated National Holding Co. | | | 257 | | | | 4,803 | |
First American Financial Corp. | | | 967 | | | | 35,421 | |
Hallmark Financial Services Inc. | | | 283 | | | | 3,291 | (a) |
HCI Group Inc. | | | 185 | | | | 7,304 | |
Heritage Insurance Holdings Inc. | | | 546 | | | | 8,556 | |
Infinity Property & Casualty Corp. | | | 215 | | | | 18,899 | |
Investors Title Co. | | | 28 | | | | 4,429 | |
Kinsale Capital Group Inc. | | | 133 | | | | 4,523 | |
MBIA Inc. | | | 2,646 | | | | 28,312 | (a) |
Mercury General Corp. | | | 315 | | | | 18,966 | |
Old Republic International Corp. | | | 2,110 | | | | 40,090 | |
OneBeacon Insurance Group Ltd., Class A | | | 399 | | | | 6,404 | |
RLI Corp. | | | 731 | | | | 46,148 | |
Safety Insurance Group Inc. | | | 289 | | | | 21,299 | |
Selective Insurance Group Inc. | | | 1,021 | | | | 43,954 | |
State Auto Financial Corp. | | | 310 | | | | 8,311 | |
State National Companies Inc. | | | 627 | | | | 8,690 | |
Stewart Information Services Corp. | | | 457 | | | | 21,059 | |
The Allstate Corp. | | | 16,516 | | | | 1,224,166 | |
The Hanover Insurance Group Inc. | | | 366 | | | | 33,310 | |
The Navigators Group Inc. | | | 222 | | | | 26,141 | |
The Progressive Corp. | | | 26,072 | | | | 925,556 | |
The Travelers Companies Inc. | | | 12,536 | | | | 1,534,657 | |
United Fire Group Inc. | | | 431 | | | | 21,192 | |
United Insurance Holdings Corp. | | | 350 | | | | 5,299 | |
Universal Insurance Holdings Inc. | | | 668 | | | | 18,971 | |
WR Berkley Corp. | | | 842 | | | | 56,001 | |
| | | | 4,774,473 | |
| | |
Publishing—0.0% * | | | | | | | | |
Daily Journal Corp. | | | 22 | | | | 5,320 | (a) |
Gannett Company Inc. | | | 2,364 | | | | 22,954 | |
John Wiley & Sons Inc., Class A | | | 389 | | | | 21,201 | |
Meredith Corp. | | | 1,041 | | | | 61,575 | |
New Media Investment Group Inc. | | | 781 | | | | 12,488 | |
News Corp., Class A | | | 17,200 | | | | 197,112 | |
News Corp., Class B | | | 5,375 | | | | 63,425 | |
Scholastic Corp. | | | 536 | | | | 25,455 | |
The New York Times Co., Class A | | | 3,411 | | | | 45,366 | |
Time Inc. | | | 2,910 | | | | 51,943 | |
tronc Inc. | | | 541 | | | | 7,504 | |
| | | | 514,343 | |
| | |
Railroads—0.3% | | | | | | | | |
CSX Corp. | | | 41,855 | | | | 1,503,850 | |
Genesee & Wyoming Inc., Class A | | | 536 | | | | 37,204 | (a) |
Kansas City Southern | | | 4,846 | | | | 411,183 | |
Norfolk Southern Corp. | | | 12,974 | | | | 1,402,100 | |
Union Pacific Corp. | | | 36,947 | | | | 3,830,665 | |
| | | | 7,185,002 | |
| | | | | | | | |
Real Estate Development—0.0% * | | | | | | | | |
AV Homes Inc. | | | 240 | | | | 3,792 | (a) |
Forestar Group Inc. | | | 678 | | | | 9,017 | (a) |
Stratus Properties Inc. | | | 122 | | | | 3,996 | (a) |
| | | | 16,805 | |
| | |
Real Estate Operating Companies—0.0% * | | | | | | | | |
FRP Holdings Inc. | | | 127 | | | | 4,788 | (a) |
Kennedy-Wilson Holdings Inc. | | | 1,650 | | | | 33,825 | |
Trinity Place Holdings Inc. | | | 367 | | | | 3,402 | (a) |
| | | | 42,015 | |
| | |
Real Estate Services—0.0% * | | | | | | | | |
CBRE Group Inc., Class A | | | 13,580 | | | | 427,634 | (a) |
HFF Inc. REIT, Class A | | | 722 | | | | 21,840 | |
Jones Lang LaSalle Inc. | | | 394 | | | | 39,810 | |
Marcus & Millichap Inc. | | | 308 | | | | 8,230 | (a) |
RE/MAX Holdings Inc., Class A | | | 356 | | | | 19,936 | |
| | | | 517,450 | |
| | |
Regional Banks—0.7% | | | | | | | | |
1st Source Corp. | | | 314 | | | | 14,023 | |
Access National Corp. | | | 168 | | | | 4,664 | |
ACNB Corp. | | | 119 | | | | 3,719 | |
Allegiance Bancshares Inc. | | | 220 | | | | 7,953 | (a) |
American National Bankshares Inc. | | | 166 | | | | 5,777 | |
Ameris Bancorp. | | | 681 | | | | 29,692 | |
Ames National Corp. | | | 174 | | | | 5,742 | |
Arrow Financial Corp. | | | 227 | | | | 9,194 | |
Associated Banc-Corp. | | | 1,308 | | | | 32,308 | |
Atlantic Capital Bancshares Inc. | | | 346 | | | | 6,574 | (a) |
Banc of California Inc. | | | 981 | | | | 17,020 | |
BancFirst Corp. | | | 157 | | | | 14,609 | |
BancorpSouth Inc. | | | 2,309 | | | | 71,694 | |
Bank of Hawaii Corp. | | | 377 | | | | 33,436 | |
Bank of Marin Bancorp. | | | 119 | | | | 8,300 | |
Bank of the Ozarks Inc. | | | 2,542 | | | | 133,684 | |
Bankwell Financial Group Inc. | | | 110 | | | | 3,575 | |
Banner Corp. | | | 600 | | | | 33,486 | |
Bar Harbor Bankshares | | | 117 | | | | 5,538 | |
BB&T Corp. | | | 36,354 | | | | 1,709,365 | |
Berkshire Hills Bancorp Inc. | | | 617 | | | | 22,736 | |
Blue Hills Bancorp Inc. | | | 487 | | | | 9,131 | |
BNC Bancorp | | | 786 | | | | 25,073 | |
Boston Private Financial Holdings Inc. | | | 1,663 | | | | 27,523 | |
Bridge Bancorp Inc. | | | 335 | | | | 12,697 | |
Brookline Bancorp Inc. | | | 1,394 | | | | 22,862 | |
Bryn Mawr Bank Corp. | | | 334 | | | | 14,078 | |
C&F Financial Corp. | | | 62 | | | | 3,091 | |
Camden National Corp. | | | 304 | | | | 13,513 | |
Capital Bank Financial Corp., Class A | | | 444 | | | | 17,427 | |
Capital City Bank Group Inc. | | | 221 | | | | 4,526 | |
Cardinal Financial Corp. | | | 633 | | | | 20,756 | |
Carolina Financial Corp. | | | 200 | | | | 6,158 | |
Cascade Bancorp | | | 621 | | | | 5,043 | (a) |
Cathay General Bancorp. | | | 1,982 | | | | 75,375 | |
CenterState Banks Inc. | | | 931 | | | | 23,433 | |
Central Pacific Financial Corp. | | | 604 | | | | 18,978 | |
Central Valley Community Bancorp | | | 178 | | | | 3,553 | |
Century Bancorp Inc., Class A | | | 55 | | | | 3,300 | |
Chemical Financial Corp. | | | 1,826 | | | | 98,914 | |
| | | | | | | | |
Chemung Financial Corp. | | | 55 | | | | 1,999 | |
Citizens & Northern Corp. | | | 239 | | | | 6,262 | |
Citizens Financial Group Inc. | | | 22,985 | | | | 818,956 | |
City Holding Co. | | | 295 | | | | 19,942 | |
CNB Financial Corp. | | | 281 | | | | 7,514 | |
CoBiz Financial Inc. | | | 753 | | | | 12,718 | |
Codorus Valley Bancorp Inc. | | | 159 | | | | 4,547 | |
Columbia Banking System Inc. | | | 1,114 | | | | 49,774 | |
Commerce Bancshares Inc. | | | 754 | | | | 43,589 | |
Community Bank System Inc. | | | 827 | | | | 51,100 | |
Community Trust Bancorp Inc. | | | 306 | | | | 15,178 | |
ConnectOne Bancorp Inc. | | | 572 | | | | 14,843 | |
County Bancorp Inc. | | | 84 | | | | 2,265 | |
CU Bancorp | | | 322 | | | | 11,528 | (a) |
Cullen/Frost Bankers Inc. | | | 490 | | | | 43,233 | |
Customers Bancorp Inc. | | | 487 | | | | 17,444 | (a) |
CVB Financial Corp. | | | 1,971 | | | | 45,195 | |
Eagle Bancorp Inc. | | | 611 | | | | 37,240 | (a) |
East West Bancorp Inc. | | | 1,264 | | | | 64,249 | |
Enterprise Bancorp Inc. | | | 170 | | | | 6,385 | |
Enterprise Financial Services Corp. | | | 384 | | | | 16,512 | |
Equity Bancshares Inc., Class A | | | 97 | | | | 3,263 | (a) |
Farmers Capital Bank Corp. | | | 144 | | | | 6,055 | |
Farmers National Banc Corp. | | | 506 | | | | 7,185 | |
FCB Financial Holdings Inc., Class A | | | 598 | | | | 28,525 | (a) |
Fidelity Southern Corp. | | | 420 | | | | 9,941 | |
Fifth Third Bancorp | | | 33,850 | | | | 912,934 | |
Financial Institutions Inc. | | | 280 | | | | 9,576 | |
First BanCorp | | | 394 | | | | 10,693 | |
First Bancorp Inc. | | | 207 | | | | 6,852 | |
First Busey Corp. | | | 624 | | | | 19,207 | |
First Business Financial Services Inc. | | | 163 | | | | 3,866 | |
First Citizens BancShares Inc., Class A | | | 145 | | | | 51,475 | |
First Commonwealth Financial Corp. | | | 1,786 | | | | 25,325 | |
First Community Bancshares Inc. | | | 315 | | | | 9,494 | |
First Community Financial Partners Inc. | | | 266 | | | | 3,112 | (a) |
First Connecticut Bancorp Inc. | | | 275 | | | | 6,229 | |
First Financial Bancorp. | | | 1,230 | | | | 34,993 | |
First Financial Bankshares Inc. | | | 1,157 | | | | 52,296 | |
First Financial Corp. | | | 201 | | | | 10,613 | |
First Financial Northwest Inc. | | | 175 | | | | 3,455 | |
First Foundation Inc. | | | 258 | | | | 7,353 | (a) |
First Horizon National Corp. | | | 2,048 | | | | 40,980 | |
First Internet Bancorp | | | 105 | | | | 3,360 | |
First Interstate Bancsystem Inc., Class A | | | 394 | | | | 16,765 | |
First Merchants Corp. | | | 815 | | | | 30,685 | |
First Mid-Illinois Bancshares Inc. | | | 139 | | | | 4,726 | |
First Midwest Bancorp Inc. | | | 1,513 | | | | 38,173 | |
First NBC Bank Holding Co. | | | 320 | | | | 2,336 | (a) |
First Northwest Bancorp | | | 210 | | | | 3,276 | (a) |
Flushing Financial Corp. | | | 557 | | | | 16,370 | |
FNB Corp. | | | 5,940 | | | | 95,218 | |
Franklin Financial Network Inc. | | | 187 | | | | 7,826 | (a) |
Fulton Financial Corp. | | | 4,668 | | | | 87,758 | |
German American Bancorp Inc. | | | 285 | | | | 14,994 | |
Glacier Bancorp Inc. | | | 1,484 | | | | 53,765 | |
Great Southern Bancorp Inc. | | | 216 | | | | 11,804 | |
Great Western Bancorp Inc. | | | 1,134 | | | | 49,431 | |
Green Bancorp Inc. | | | 425 | | | | 6,460 | (a) |
Guaranty Bancorp | | | 299 | | | | 7,236 | |
| | | | | | | | |
Hancock Holding Co. | | | 2,184 | | | | 94,130 | |
Hanmi Financial Corp. | | | 631 | | | | 22,022 | |
HarborOne Bancorp Inc. | | | 291 | | | | 5,628 | (a) |
Heartland Financial USA Inc. | | | 440 | | | | 21,120 | |
Heritage Commerce Corp. | | | 525 | | | | 7,576 | |
Heritage Financial Corp. | | | 594 | | | | 15,295 | |
Heritage Oaks Bancorp | | | 488 | | | | 6,017 | |
Hilltop Holdings Inc. | | | 1,430 | | | | 42,614 | |
Home BancShares Inc. | | | 2,213 | | | | 61,455 | |
HomeTrust Bancshares Inc. | | | 322 | | | | 8,340 | (a) |
Hope Bancorp Inc. | | | 2,499 | | | | 54,703 | |
Horizon Bancorp | | | 358 | | | | 10,024 | |
Huntington Bancshares Inc. | | | 48,860 | | | | 645,929 | |
IBERIABANK Corp. | | | 862 | | | | 72,192 | |
Independent Bank Corp. | | | 404 | | | | 8,767 | |
Independent Bank Corp. | | | 518 | | | | 36,493 | |
Independent Bank Group Inc. | | | 223 | | | | 13,915 | |
International Bancshares Corp. | | | 1,560 | | | | 63,648 | |
Investors Bancorp Inc. | | | 5,825 | | | | 81,259 | |
KeyCorp | | | 48,895 | | | | 893,312 | |
Lakeland Bancorp Inc. | | | 788 | | | | 15,366 | |
Lakeland Financial Corp. | | | 483 | | | | 22,875 | |
LCNB Corp. | | | 180 | | | | 4,185 | |
LegacyTexas Financial Group Inc. | | | 890 | | | | 38,323 | |
Live Oak Bancshares Inc. | | | 398 | | | | 7,363 | |
M&T Bank Corp. | | | 6,987 | | | | 1,092,976 | |
Macatawa Bank Corp. | | | 536 | | | | 5,580 | |
MainSource Financial Group Inc. | | | 464 | | | | 15,962 | |
MB Financial Inc. | | | 2,102 | | | | 99,277 | |
MBT Financial Corp. | | | 362 | | | | 4,109 | |
Mercantile Bank Corp. | | | 320 | | | | 12,064 | |
Merchants Bancshares Inc. | | | 117 | | | | 6,341 | |
Middleburg Financial Corp. | | | 92 | | | | 3,197 | |
Midland States Bancorp Inc. | | | 59 | | | | 2,135 | |
MidWestOne Financial Group Inc. | | | 166 | | | | 6,242 | |
MutualFirst Financial Inc. | | | 105 | | | | 3,476 | |
National Bank Holdings Corp., Class A | | | 463 | | | | 14,765 | |
National Bankshares Inc. | | | 137 | | | | 5,953 | |
National Commerce Corp. | | | 167 | | | | 6,204 | (a) |
NBT Bancorp Inc. | | | 850 | | | | 35,598 | |
Nicolet Bankshares Inc. | | | 151 | | | | 7,201 | (a) |
Northrim BanCorp Inc. | | | 136 | | | | 4,298 | |
OFG Bancorp | | | 880 | | | | 11,528 | |
Old Line Bancshares Inc. | | | 166 | | | | 3,981 | |
Old National Bancorp | | | 2,372 | | | | 43,052 | |
Old Second Bancorp Inc. | | | 574 | | | | 6,343 | |
Opus Bank | | | 333 | | | | 10,007 | |
Pacific Continental Corp. | | | 216 | | | | 4,720 | |
Pacific Premier Bancorp Inc. | | | 530 | | | | 18,735 | (a) |
PacWest Bancorp | | | 1,055 | | | | 57,434 | |
Park National Corp. | | | 266 | | | | 31,830 | |
Park Sterling Corp. | | | 1,041 | | | | 11,232 | |
Peapack Gladstone Financial Corp. | | | 317 | | | | 9,789 | |
Penns Woods Bancorp Inc. | | | 95 | | | | 4,798 | |
People’s United Financial Inc. | | | 14,049 | | | | 271,989 | |
People’s Utah Bancorp | | | 262 | | | | 7,035 | |
Peoples Bancorp Inc. | | | 321 | | | | 10,420 | |
Peoples Financial Services Corp. | | | 138 | | | | 6,721 | |
Pinnacle Financial Partners Inc. | | | 839 | | | | 58,143 | |
Preferred Bank | | | 242 | | | | 12,686 | |
| | | | | | | | |
Premier Financial Bancorp Inc. | | | 191 | | | | 3,839 | |
PrivateBancorp Inc. | | | 2,244 | | | | 121,602 | |
Prosperity Bancshares Inc. | | | 1,925 | | | | 138,176 | |
QCR Holdings Inc. | | | 235 | | | | 10,176 | |
Regions Financial Corp. | | | 55,175 | | | | 792,313 | |
Renasant Corp. | | | 817 | | | | 34,494 | |
Republic Bancorp Inc., Class A | | | 191 | | | | 7,552 | |
Republic First Bancorp Inc. | | | 678 | | | | 5,661 | (a) |
S&T Bancorp Inc. | | | 689 | | | | 26,899 | |
Sandy Spring Bancorp Inc. | | | 472 | | | | 18,875 | |
Seacoast Banking Corporation of Florida | | | 589 | | | | 12,993 | (a) |
ServisFirst Bancshares Inc. | | | 922 | | | | 34,520 | |
Shore Bancshares Inc. | | | 250 | | | | 3,813 | |
Sierra Bancorp | | | 237 | | | | 6,302 | |
Signature Bank | | | 468 | | | | 70,294 | (a) |
Simmons First National Corp., Class A | | | 587 | | | | 36,482 | |
South State Corp. | | | 473 | | | | 41,340 | |
Southern First Bancshares Inc. | | | 112 | | | | 4,032 | (a) |
Southern National Bancorp of Virginia Inc. | | | 226 | | | | 3,693 | |
Southside Bancshares Inc. | | | 491 | | | | 18,496 | |
Southwest Bancorp Inc. | | | 360 | | | | 10,440 | |
State Bank Financial Corp. | | | 703 | | | | 18,883 | |
Sterling Bancorp | | | 2,469 | | | | 57,775 | |
Stock Yards Bancorp Inc. | | | 428 | | | | 20,095 | |
Stonegate Bank | | | 226 | | | | 9,431 | |
Suffolk Bancorp | | | 232 | | | | 9,934 | |
Summit Financial Group Inc. | | | 166 | | | | 4,570 | |
Sun Bancorp Inc. | | | 209 | | | | 5,434 | |
SunTrust Banks Inc. | | | 21,984 | | | | 1,205,822 | |
SVB Financial Group | | | 457 | | | | 78,449 | (a) |
Synovus Financial Corp. | | | 1,058 | | | | 43,463 | |
TCF Financial Corp. | | | 1,490 | | | | 29,189 | |
Texas Capital Bancshares Inc. | | | 965 | | | | 75,656 | (a) |
The Bancorp Inc. | | | 713 | | | | 5,604 | (a) |
The First of Long Island Corp. | | | 429 | | | | 12,248 | |
The PNC Financial Services Group Inc. | | | 21,869 | | | | 2,557,798 | |
Tompkins Financial Corp. | | | 290 | | | | 27,417 | |
TowneBank | | | 1,118 | | | | 37,173 | |
Trico Bancshares | | | 405 | | | | 13,843 | |
TriState Capital Holdings Inc. | | | 439 | | | | 9,702 | (a) |
Triumph Bancorp Inc. | | | 309 | | | | 8,080 | (a) |
Trustmark Corp. | | | 1,877 | | | | 66,915 | |
UMB Financial Corp. | | | 1,252 | | | | 96,554 | |
Umpqua Holdings Corp. | | | 6,277 | | | | 117,882 | |
Union Bankshares Corp. | | | 868 | | | | 31,022 | |
Union Bankshares Inc. | | | 78 | | | | 3,545 | |
United Bankshares Inc. | | | 1,197 | | | | 55,361 | |
United Community Banks Inc. | | | 1,404 | | | | 41,586 | |
Univest Corporation of Pennsylvania | | | 499 | | | | 15,419 | |
Valley National Bancorp | | | 7,035 | | | | 81,887 | |
Veritex Holdings Inc. | | | 164 | | | | 4,380 | (a) |
Washington Trust Bancorp Inc. | | | 300 | | | | 16,815 | |
WashingtonFirst Bankshares Inc. | | | 166 | | | | 4,809 | |
Webster Financial Corp. | | | 2,608 | | | | 141,562 | |
WesBanco Inc. | | | 800 | | | | 34,448 | |
West Bancorporation Inc. | | | 325 | | | | 8,028 | |
Westamerica Bancorporation | | | 496 | | | | 31,213 | |
Wintrust Financial Corp. | | | 1,002 | | | | 72,715 | |
Xenith Bankshares Inc. | | | 129 | | | | 3,638 | (a) |
| | | | | | | | |
Yadkin Financial Corp. | | | 998 | | | | 34,191 | |
Zions Bancorporation | | | 9,271 | | | | 399,024 | |
| | | | 16,634,522 | |
| | |
Reinsurance—0.0% * | | | | | | | | |
Alleghany Corp. | | | 135 | | | | 82,096 | (a) |
Endurance Specialty Holdings Ltd. | | | 556 | | | | 51,375 | |
Enstar Group Ltd. | | | 226 | | | | 44,680 | (a) |
Everest Re Group Ltd. | | | 357 | | | | 77,255 | |
Greenlight Capital Re Ltd., Class A | | | 583 | | | | 13,292 | (a) |
Maiden Holdings Ltd. | | | 1,195 | | | | 20,853 | |
Reinsurance Group of America Inc. | | | 562 | | | | 70,717 | |
WMIH Corp. | | | 4,068 | | | | 6,305 | (a) |
| | | | 366,573 | |
| | |
Renewable Electricity—0.0% * | | | | | | | | |
Ormat Technologies Inc. | | | 692 | | | | 37,105 | |
Pattern Energy Group Inc. | | | 1,274 | | | | 24,193 | |
TerraForm Global Inc., Class A | | | 1,843 | | | | 7,280 | (a) |
TerraForm Power Inc., Class A | | | 1,764 | | | | 22,597 | (a) |
Vivint Solar Inc. | | | 358 | | | | 913 | (a) |
| | | | 92,088 | |
| | |
Research & Consulting Services—0.1% | | | | | | | | |
Acacia Research Corp. | | | 1,007 | | | | 6,545 | |
CBIZ Inc. | | | 981 | | | | 13,440 | (a) |
CEB Inc. | | | 919 | | | | 55,691 | |
Cogint Inc. | | | 233 | | | | 804 | (a) |
CRA International Inc. | | | 170 | | | | 6,222 | |
Equifax Inc. | | | 5,352 | | | | 632,767 | |
Exponent Inc. | | | 507 | | | | 30,572 | |
Franklin Covey Co. | | | 207 | | | | 4,171 | (a) |
FTI Consulting Inc. | | | 1,194 | | | | 53,825 | (a) |
Hill International Inc. | | | 639 | | | | 2,780 | (a) |
Huron Consulting Group Inc. | | | 429 | | | | 21,729 | (a) |
ICF International Inc. | | | 356 | | | | 19,651 | (a) |
Mistras Group Inc. | | | 343 | | | | 8,808 | (a) |
Navigant Consulting Inc. | | | 942 | | | | 24,662 | (a) |
Nielsen Holdings PLC | | | 15,189 | | | | 637,179 | |
Resources Connection Inc. | | | 710 | | | | 13,667 | |
RPX Corp. | | | 997 | | | | 10,768 | (a) |
The Advisory Board Co. | | | 817 | | | | 27,165 | (a) |
The Dun & Bradstreet Corp. | | | 1,641 | | | | 199,086 | |
Verisk Analytics Inc. | | | 7,004 | | | | 568,515 | (a) |
| | | | 2,338,047 | |
| | |
Residential REITs—0.2% | | | | | | | | |
American Campus Communities Inc. | | | 1,152 | | | | 57,335 | |
Apartment Investment & Management Co., Class A | | | 7,070 | | | | 321,332 | |
AvalonBay Communities Inc. | | | 6,207 | | | | 1,099,570 | |
Bluerock Residential Growth REIT Inc. | | | 381 | | | | 5,227 | |
Camden Property Trust | | | 759 | | | | 63,809 | |
Colony Starwood Homes | | | 1,296 | | | | 37,338 | |
Education Realty Trust Inc. | | | 2,080 | | | | 87,984 | |
Equity Residential | | | 16,330 | | | | 1,050,999 | |
Essex Property Trust Inc. | | | 2,959 | | | | 687,967 | |
Independence Realty Trust Inc. | | | 1,104 | | | | 9,848 | |
Mid-America Apartment Communities Inc. | | | 5,100 | | | | 499,392 | |
Monogram Residential Trust Inc. | | | 3,372 | | | | 36,485 | |
NexPoint Residential Trust Inc. | | | 358 | | | | 7,998 | |
Preferred Apartment Communities Inc., Class A | | | 439 | | | | 6,545 | |
Silver Bay Realty Trust Corp. | | | 668 | | | | 11,450 | |
| | | | | | | | |
UDR Inc. | | | 11,982 | | | | 437,103 | |
UMH Properties Inc. | | | 493 | | | | 7,420 | |
| | | | 4,427,802 | |
| | |
Restaurants—0.5% | | | | | | | | |
Biglari Holdings Inc. | | | 20 | | | | 9,464 | (a) |
BJ’s Restaurants Inc. | | | 467 | | | | 18,353 | (a) |
Bloomin’ Brands Inc. | | | 1,981 | | | | 35,717 | |
Bob Evans Farms Inc. | | | 399 | | | | 21,231 | |
Bojangles’ Inc. | | | 197 | | | | 3,674 | (a) |
Brinker International Inc. | | | 438 | | | | 21,694 | |
Buffalo Wild Wings Inc. | | | 507 | | | | 78,281 | (a) |
Carrols Restaurant Group Inc. | | | 676 | | | | 10,309 | (a) |
Chipotle Mexican Grill Inc. | | | 1,316 | | | | 496,553 | (a) |
Chuy’s Holdings Inc. | | | 327 | | | | 10,611 | (a) |
Cracker Barrel Old Country Store Inc. | | | 560 | | | | 93,509 | |
Darden Restaurants Inc. | | | 5,505 | | | | 400,324 | |
Dave & Buster’s Entertainment Inc. | | | 722 | | | | 40,649 | (a) |
Del Frisco’s Restaurant Group Inc. | | | 477 | | | | 8,109 | (a) |
Del Taco Restaurants Inc. | | | 463 | | | | 6,538 | (a) |
Denny’s Corp. | | | 1,515 | | | | 19,438 | (a) |
DineEquity Inc. | | | 348 | | | | 26,796 | |
Domino’s Pizza Inc. | | | 417 | | | | 66,403 | |
Dunkin’ Brands Group Inc. | | | 803 | | | | 42,109 | |
El Pollo Loco Holdings Inc. | | | 410 | | | | 5,043 | (a) |
Fiesta Restaurant Group Inc. | | | 537 | | | | 16,030 | (a) |
Fogo De Chao Inc. | | | 121 | | | | 1,736 | (a) |
J. Alexander’s Holdings Inc. | | | 273 | | | | 2,935 | (a) |
Jack in the Box Inc. | | | 888 | | | | 99,136 | |
Jamba Inc. | | | 242 | | | | 2,493 | (a) |
Kona Grill Inc. | | | 170 | | | | 2,134 | (a) |
Luby’s Inc. | | | 349 | | | | 1,494 | (a) |
McDonald’s Corp. | | | 37,177 | | | | 4,525,185 | |
Nathan’s Famous Inc. | | | 58 | | | | 3,764 | (a) |
Noodles & Co. | | | 224 | | | | 918 | (a) |
Panera Bread Co., Class A | | | 190 | | | | 38,967 | (a) |
Papa John’s International Inc. | | | 718 | | | | 61,446 | |
Popeyes Louisiana Kitchen Inc. | | | 386 | | | | 23,345 | (a) |
Potbelly Corp. | | | 479 | | | | 6,179 | (a) |
Red Robin Gourmet Burgers Inc. | | | 236 | | | | 13,310 | (a) |
Ruby Tuesday Inc. | | | 1,190 | | | | 3,844 | (a) |
Ruth’s Hospitality Group Inc. | | | 641 | | | | 11,730 | |
Shake Shack Inc., Class A | | | 317 | | | | 11,345 | (a) |
Sonic Corp. | | | 833 | | | | 22,083 | |
Starbucks Corp. | | | 65,296 | | | | 3,625,234 | |
Texas Roadhouse Inc. | | | 1,847 | | | | 89,099 | |
The Cheesecake Factory Inc. | | | 1,270 | | | | 76,048 | |
The Habit Restaurants Inc., Class A | | | 276 | | | | 4,761 | (a) |
The Wendy’s Co. | | | 1,768 | | | | 23,903 | |
Wingstop Inc. | | | 314 | | | | 9,291 | |
Yum China Holdings Inc. | | | 12,267 | | | | 320,414 | (a) |
Yum! Brands Inc. | | | 15,758 | | | | 997,954 | |
Zoe’s Kitchen Inc. | | | 384 | | | | 9,212 | (a) |
| | | | 11,418,795 | |
| | |
Retail REITs—0.3% | | | | | | | | |
Acadia Realty Trust | | | 1,546 | | | | 50,523 | |
Agree Realty Corp. | | | 455 | | | | 20,953 | |
Alexander’s Inc. | | | 42 | | | | 17,929 | |
CBL & Associates Properties Inc. | | | 3,312 | | | | 38,088 | |
Cedar Realty Trust Inc. | | | 1,656 | | | | 10,814 | |
| | | | | | | | |
Equity One Inc. | | | 802 | | | | 24,613 | |
Federal Realty Investment Trust | | | 3,158 | | | | 448,783 | |
General Growth Properties Inc. | | | 26,230 | | | | 655,225 | |
Getty Realty Corp. | | | 530 | | | | 13,510 | |
Kimco Realty Corp. | | | 18,987 | | | | 477,713 | |
Kite Realty Group Trust | | | 1,653 | | | | 38,812 | |
National Retail Properties Inc. | | | 1,275 | | | | 56,355 | |
Pennsylvania Real Estate Investment Trust | | | 1,370 | | | | 25,975 | |
Ramco-Gershenson Properties Trust | | | 1,576 | | | | 26,130 | |
Realty Income Corp. | | | 11,697 | | | | 672,344 | |
Regency Centers Corp. | | | 906 | | | | 62,469 | |
Retail Opportunity Investments Corp. | | | 2,087 | | | | 44,098 | |
Saul Centers Inc. | | | 185 | | | | 12,323 | |
Seritage Growth Properties REIT, Class A | | | 500 | | | | 21,355 | |
Simon Property Group Inc. | | | 14,009 | | | | 2,488,979 | |
Tanger Factory Outlet Centers Inc. | | | 838 | | | | 29,984 | |
Taubman Centers Inc. | | | 521 | | | | 38,518 | |
The Macerich Co. | | | 5,453 | | | | 386,290 | |
Urban Edge Properties | | | 2,512 | | | | 69,105 | |
Urstadt Biddle Properties Inc., Class A | | | 522 | | | | 12,585 | |
Washington Prime Group Inc. | | | 4,981 | | | | 51,852 | |
Weingarten Realty Investors | | | 1,040 | | | | 37,222 | |
| | | | 5,832,547 | |
| | |
Security & Alarm Services—0.0% * | | | | | | | | |
The Brink’s Co. | | | 903 | | | | 37,249 | |
| | |
Semiconductor Equipment—0.2% | | | | | | | | |
Advanced Energy Industries Inc. | | | 744 | | | | 40,734 | (a) |
Amkor Technology Inc. | | | 1,943 | | | | 20,499 | (a) |
Applied Materials Inc. | | | 48,446 | | | | 1,563,353 | |
Axcelis Technologies Inc. | | | 551 | | | | 8,017 | (a) |
Brooks Automation Inc. | | | 1,331 | | | | 22,720 | |
Cabot Microelectronics Corp. | | | 475 | | | | 30,006 | |
Cohu Inc. | | | 530 | | | | 7,367 | |
Entegris Inc. | | | 2,702 | | | | 48,366 | (a) |
FormFactor Inc. | | | 1,340 | | | | 15,008 | (a) |
KLA-Tencor Corp. | | | 6,933 | | | | 545,489 | |
Lam Research Corp. | | | 7,243 | | | | 765,802 | |
MKS Instruments Inc. | | | 975 | | | | 57,915 | |
Nanometrics Inc. | | | 473 | | | | 11,853 | (a) |
PDF Solutions Inc. | | | 362 | | | | 8,163 | (a) |
Photronics Inc. | | | 1,258 | | | | 14,215 | (a) |
Rudolph Technologies Inc. | | | 600 | | | | 14,010 | (a) |
Teradyne Inc. | | | 1,751 | | | | 44,475 | |
Tessera Holding Corp. | | | 963 | | | | 42,565 | |
Ultra Clean Holdings Inc. | | | 672 | | | | 6,518 | (a) |
Ultratech Inc. | | | 431 | | | | 10,335 | (a) |
Veeco Instruments Inc. | | | 770 | | | | 22,446 | (a) |
Versum Materials Inc. | | | 942 | | | | 26,442 | (a) |
Xcerra Corp. | | | 1,063 | | | | 8,121 | (a) |
| | | | 3,334,419 | |
| | |
Semiconductors—1.1% | | | | | | | | |
Acacia Communications Inc. | | | 106 | | | | 6,545 | (a) |
Advanced Micro Devices Inc. | | | 20,898 | | | | 236,983 | (a) |
Alpha & Omega Semiconductor Ltd. | | | 384 | | | | 8,168 | (a) |
Ambarella Inc. | | | 639 | | | | 34,589 | (a) |
Analog Devices Inc. | | | 13,900 | | | | 1,009,418 | |
Applied Micro Circuits Corp. | | | 1,463 | | | | 12,070 | (a) |
Cavium Inc. | | | 1,202 | | | | 75,053 | (a) |
| | | | | | | | |
CEVA Inc. | | | 394 | | | | 13,219 | (a) |
Cirrus Logic Inc. | | | 1,749 | | | | 98,888 | (a) |
Cree Inc. | | | 877 | | | | 23,144 | (a) |
Cypress Semiconductor Corp. | | | 2,815 | | | | 32,204 | |
Diodes Inc. | | | 764 | | | | 19,612 | (a) |
DSP Group Inc. | | | 475 | | | | 6,199 | (a) |
Exar Corp. | | | 775 | | | | 8,354 | (a) |
First Solar Inc. | | | 3,608 | | | | 115,781 | (a) |
GigPeak Inc. | | | 883 | | | | 2,225 | (a) |
Impinj Inc. | | | 111 | | | | 3,923 | (a) |
Inphi Corp. | | | 795 | | | | 35,473 | (a) |
Integrated Device Technology Inc. | | | 3,669 | | | | 86,442 | (a) |
Intel Corp. | | | 211,740 | | | | 7,679,810 | |
Intersil Corp., Class A | | | 3,666 | | | | 81,752 | |
IXYS Corp. | | | 464 | | | | 5,522 | |
Kopin Corp. | | | 1,142 | | | | 3,243 | (a) |
Lattice Semiconductor Corp. | | | 2,357 | | | | 17,348 | (a) |
Linear Technology Corp. | | | 10,764 | | | | 671,135 | |
MACOM Technology Solutions Holdings Inc. | | | 454 | | | | 21,011 | (a) |
MaxLinear Inc., Class A | | | 1,106 | | | | 24,111 | (a) |
Microchip Technology Inc. | | | 9,762 | | | | 626,232 | |
Micron Technology Inc. | | | 46,478 | | | | 1,018,798 | (a) |
Microsemi Corp. | | | 3,146 | | | | 169,790 | (a) |
Monolithic Power Systems Inc. | | | 1,094 | | | | 89,631 | |
NeoPhotonics Corp. | | | 622 | | | | 6,724 | (a) |
NVE Corp. | | | 97 | | | | 6,929 | |
NVIDIA Corp. | | | 23,781 | | | | 2,538,384 | |
Power Integrations Inc. | | | 484 | | | | 32,839 | |
Qorvo Inc. | | | 5,667 | | | | 298,821 | (a) |
QUALCOMM Inc. | | | 66,002 | | | | 4,303,330 | |
Rambus Inc. | | | 2,141 | | | | 29,482 | (a) |
Semtech Corp. | | | 1,217 | | | | 38,396 | (a) |
Sigma Designs Inc. | | | 683 | | | | 4,098 | (a) |
Silicon Laboratories Inc. | | | 1,152 | | | | 74,880 | (a) |
Skyworks Solutions Inc. | | | 8,084 | | | | 603,551 | |
Synaptics Inc. | | | 995 | | | | 53,312 | (a) |
Texas Instruments Inc. | | | 44,888 | | | | 3,275,477 | |
Xilinx Inc. | | | 11,339 | | | | 684,535 | |
| | | | 24,187,431 | |
| | |
Silver—0.0% * | | | | | | | | |
Coeur Mining Inc. | | | 3,191 | | | | 29,006 | (a) |
Hecla Mining Co. | | | 6,938 | | | | 36,355 | |
| | | | 65,361 | |
| | |
Soft Drinks—0.7% | | | | | | | | |
Coca-Cola Bottling Company Consolidated | | | 94 | �� | | | 16,812 | |
Dr Pepper Snapple Group Inc. | | | 8,276 | | | | 750,385 | |
Monster Beverage Corp. | | | 18,333 | | | | 812,885 | (a) |
National Beverage Corp. | | | 233 | | | | 11,902 | |
PepsiCo Inc. | | | 64,308 | | | | 6,728,546 | |
Primo Water Corp. | | | 424 | | | | 5,207 | (a) |
The Coca-Cola Co. | | | 173,911 | | | | 7,210,350 | |
| | | | 15,536,087 | |
| | |
Specialized Consumer Services—0.0% * | | | | | | | | |
Ascent Capital Group Inc., Class A | | | 203 | | | | 3,301 | (a) |
Carriage Services Inc. | | | 295 | | | | 8,449 | |
Collectors Universe Inc. | | | 149 | | | | 3,163 | |
H&R Block Inc. | | | 9,288 | | | | 213,531 | |
| | | | | | | | |
Liberty Tax Inc. | | | 107 | | | | 1,434 | |
LifeLock Inc. | | | 1,608 | | | | 38,463 | (a) |
Regis Corp. | | | 744 | | | | 10,803 | (a) |
Service Corporation International | | | 1,659 | | | | 47,116 | |
Sotheby’s | | | 1,328 | | | | 52,934 | |
Weight Watchers International Inc. | | | 562 | | | | 6,435 | (a) |
| | | | 385,629 | |
| | |
Specialized Finance—0.0% * | | | | | | | | |
Marlin Business Services Corp. | | | 174 | | | | 3,637 | |
NewStar Financial Inc. | | | 492 | | | | 4,551 | (a) |
On Deck Capital Inc. | | | 266 | | | | 1,231 | (a) |
| | | | 9,419 | |
| | |
Specialized REITs—0.4% | | | | | | | | |
American Tower Corp. | | | 19,030 | | | | 2,011,090 | |
CatchMark Timber Trust Inc., Class A | | | 789 | | | | 8,884 | |
Communications Sales & Leasing Inc. | | | 1,208 | | | | 30,695 | (a) |
CoreCivic Inc. | | | 1,010 | | | | 24,705 | |
CorEnergy Infrastructure Trust Inc. | | | 246 | | | | 8,581 | |
CoreSite Realty Corp. | | | 610 | | | | 48,416 | |
Crown Castle International Corp. | | | 16,195 | | | | 1,405,240 | |
Digital Realty Trust Inc. | | | 6,639 | | | | 652,348 | |
DuPont Fabros Technology Inc. | | | 1,375 | | | | 60,404 | |
EPR Properties | | | 549 | | | | 39,402 | |
Equinix Inc. | | | 3,213 | | | | 1,148,358 | |
Extra Space Storage Inc. | | | 5,649 | | | | 436,329 | |
Farmland Partners Inc. | | | 234 | | | | 2,611 | |
Four Corners Property Trust Inc. | | | 1,179 | | | | 24,193 | |
InfraREIT Inc. | | | 810 | | | | 14,507 | (a) |
Iron Mountain Inc. | | | 11,070 | | | | 359,554 | |
Lamar Advertising Co., Class A | | | 723 | | | | 48,615 | |
Life Storage Inc. | | | 410 | | | | 34,957 | |
National Storage Affiliates Trust | | | 704 | | | | 15,537 | |
Potlatch Corp. | | | 1,165 | | | | 48,522 | |
Public Storage | | | 6,640 | | | | 1,484,040 | |
QTS Realty Trust Inc., Class A | | | 933 | | | | 46,323 | |
Rayonier Inc. | | | 1,075 | | | | 28,595 | |
The Geo Group Inc. | | | 1,425 | | | | 51,200 | |
Weyerhaeuser Co. | | | 33,539 | | | | 1,009,189 | |
| | | | 9,042,295 | |
| | |
Specialty Chemicals—0.2% | | | | | | | | |
A Schulman Inc. | | | 577 | | | | 19,301 | |
Albemarle Corp. | | | 5,074 | | | | 436,770 | |
Ashland Global Holdings Inc. | | | 539 | | | | 58,907 | |
Balchem Corp. | | | 602 | | | | 50,520 | |
Chase Corp. | | | 141 | | | | 11,781 | |
Chemtura Corp. | | | 1,200 | | | | 39,840 | (a) |
Codexis Inc. | | | 675 | | | | 3,105 | (a) |
Ecolab Inc. | | | 11,793 | | | | 1,382,375 | |
Ferro Corp. | | | 1,673 | | | | 23,974 | (a) |
Flotek Industries Inc. | | | 1,049 | | | | 9,850 | (a) |
FutureFuel Corp. | | | 511 | | | | 7,103 | |
GCP Applied Technologies Inc. | | | 1,350 | | | | 36,112 | (a) |
HB Fuller Co. | | | 963 | | | | 46,523 | |
Ingevity Corp. | | | 817 | | | | 44,821 | (a) |
Innophos Holdings Inc. | | | 389 | | | | 20,329 | |
Innospec Inc. | | | 473 | | | | 32,400 | |
International Flavors & Fragrances Inc. | | | 3,567 | | | | 420,300 | |
| | | | | | | | |
KMG Chemicals Inc. | | | 181 | | | | 7,039 | |
Kraton Corp. | | | 595 | | | | 16,946 | (a) |
Minerals Technologies Inc. | | | 934 | | | | 72,151 | |
NewMarket Corp. | | | 80 | | | | 33,907 | |
OMNOVA Solutions Inc. | | | 854 | | | | 8,540 | (a) |
PolyOne Corp. | | | 2,261 | | | | 72,442 | |
PPG Industries Inc. | | | 11,839 | | | | 1,121,864 | |
Quaker Chemical Corp. | | | 259 | | | | 33,136 | |
Rayonier Advanced Materials Inc. | | | 871 | | | | 13,466 | |
RPM International Inc. | | | 1,163 | | | | 62,604 | |
Sensient Technologies Corp. | | | 1,220 | | | | 95,868 | |
Stepan Co. | | | 393 | | | | 32,022 | |
TerraVia Holdings Inc. | | | 1,568 | | | | 1,803 | (a) |
The Sherwin-Williams Co. | | | 3,624 | | | | 973,914 | |
The Valspar Corp. | | | 633 | | | | 65,585 | |
Valhi Inc. | | | 555 | | | | 1,920 | |
| | | | 5,257,218 | |
| | |
Specialty Stores—0.1% | | | | | | | | |
Barnes & Noble Education Inc. | | | 802 | | | | 9,199 | (a) |
Barnes & Noble Inc. | | | 1,274 | | | | 14,205 | |
Big 5 Sporting Goods Corp. | | | 360 | | | | 6,246 | |
Build-A-Bear Workshop Inc. | | | 274 | | | | 3,768 | (a) |
Cabela’s Inc. | | | 450 | | | | 26,347 | (a) |
Dick’s Sporting Goods Inc. | | | 767 | | | | 40,728 | |
Five Below Inc. | | | 1,021 | | | | 40,799 | (a) |
GNC Holdings Inc., Class A | | | 1,348 | | | | 14,882 | |
Hibbett Sports Inc. | | | 459 | | | | 17,121 | (a) |
MarineMax Inc. | | | 499 | | | | 9,656 | (a) |
Office Depot Inc. | | | 15,163 | | | | 68,537 | |
Party City Holdco Inc. | | | 541 | | | | 7,682 | (a) |
Sally Beauty Holdings Inc. | | | 1,251 | | | | 33,051 | (a) |
Signet Jewelers Ltd. | | | 2,847 | | | | 268,358 | |
Sportsman’s Warehouse Holdings Inc. | | | 518 | | | | 4,864 | (a) |
Staples Inc. | | | 29,902 | | | | 270,613 | |
The Container Store Group Inc. | | | 311 | | | | 1,975 | (a) |
Tiffany & Co. | | | 4,842 | | | | 374,916 | |
Tractor Supply Co. | | | 5,979 | | | | 453,268 | |
Ulta Salon Cosmetics & Fragrance Inc. | | | 2,650 | | | | 675,591 | (a) |
Vitamin Shoppe Inc. | | | 485 | | | | 11,519 | (a) |
West Marine Inc. | | | 364 | | | | 3,811 | (a) |
Winmark Corp. | | | 43 | | | | 5,424 | |
| | | | 2,362,560 | |
| | |
Steel—0.1% | | | | | | | | |
AK Steel Holding Corp. | | | 6,046 | | | | 61,730 | (a) |
Allegheny Technologies Inc. | | | 3,120 | | | | 49,702 | |
Ampco-Pittsburgh Corp. | | | 164 | | | | 2,747 | |
Carpenter Technology Corp. | | | 1,331 | | | | 48,142 | |
Cliffs Natural Resources Inc. | | | 4,389 | | | | 36,912 | (a) |
Commercial Metals Co. | | | 3,195 | | | | 69,587 | |
Handy & Harman Ltd. | | | 48 | | | | 1,226 | (a) |
Haynes International Inc. | | | 251 | | | | 10,790 | |
Nucor Corp. | | | 14,375 | | | | 855,600 | |
Olympic Steel Inc. | | | 182 | | | | 4,410 | |
Reliance Steel & Aluminum Co. | | | 633 | | | | 50,349 | |
Ryerson Holding Corp. | | | 218 | | | | 2,910 | (a) |
Schnitzer Steel Industries Inc., Class A | | | 521 | | | | 13,390 | |
Steel Dynamics Inc. | | | 2,114 | | | | 75,216 | |
SunCoke Energy Inc. | | | 1,301 | | | | 14,753 | |
TimkenSteel Corp. | | | 798 | | | | 12,353 | (a) |
| | | | | | | | |
United States Steel Corp. | | | 1,480 | | | | 48,855 | |
Worthington Industries Inc. | | | 1,248 | | | | 59,205 | |
| | | | 1,417,877 | |
| | |
Systems Software—1.3% | | | | | | | | |
A10 Networks Inc. | | | 886 | | | | 7,363 | (a) |
Barracuda Networks Inc. | | | 445 | | | | 9,536 | (a) |
CA Inc. | | | 14,205 | | | | 451,293 | |
CommVault Systems Inc. | | | 1,132 | | | | 58,185 | (a) |
Fortinet Inc. | | | 1,268 | | | | 38,192 | (a) |
Gigamon Inc. | | | 653 | | | | 29,744 | (a) |
Imperva Inc. | | | 576 | | | | 22,118 | (a) |
Microsoft Corp. | | | 348,195 | | | | 21,636,837 | |
Oracle Corp. | | | 134,110 | | | | 5,156,529 | |
Progress Software Corp. | | | 1,002 | | | | 31,994 | |
Proofpoint Inc. | | | 755 | | | | 53,341 | (a) |
Qualys Inc. | | | 546 | | | | 17,281 | (a) |
Rapid7 Inc. | | | 400 | | | | 4,868 | (a) |
Red Hat Inc. | | | 7,996 | | | | 557,321 | (a) |
SecureWorks Corp., Class A | | | 103 | | | | 1,091 | (a) |
Symantec Corp. | | | 27,492 | | | | 656,784 | |
The Rubicon Project Inc. | | | 747 | | | | 5,543 | (a) |
TiVo Corp. | | | 2,124 | | | | 44,392 | (a) |
Varonis Systems Inc. | | | 215 | | | | 5,762 | (a) |
VASCO Data Security International Inc. | | | 609 | | | | 8,313 | (a) |
| | | | 28,796,487 | |
| | |
Technology Distributors—0.0% * | | | | | | | | |
Agilysys Inc. | | | 301 | | | | 3,118 | (a) |
Anixter International Inc. | | | 553 | | | | 44,821 | (a) |
Arrow Electronics Inc. | | | 781 | | | | 55,685 | (a) |
Avnet Inc. | | | 1,116 | | | | 53,133 | |
ePlus Inc. | | | 126 | | | | 14,515 | (a) |
Insight Enterprises Inc. | | | 732 | | | | 29,602 | (a) |
PC Connection Inc. | | | 82 | | | | 2,303 | |
ScanSource Inc. | | | 500 | | | | 20,175 | (a) |
SYNNEX Corp. | | | 818 | | | | 98,994 | |
Systemax Inc. | | | 220 | | | | 1,930 | |
Tech Data Corp. | | | 947 | | | | 80,192 | (a) |
| | | | 404,468 | |
| | |
Technology Hardware, Storage & Peripherals—1.4% | | | | | | | | |
3D Systems Corp. | | | 3,074 | | | | 40,853 | (a) |
Apple Inc. | | | 238,817 | | | | 27,659,785 | |
Avid Technology Inc. | | | 661 | | | | 2,908 | (a) |
CPI Card Group Inc. | | | 398 | | | | 1,652 | |
Cray Inc. | | | 807 | | | | 16,705 | (a) |
Diebold Nixdorf Inc. | | | 2,013 | | | | 50,627 | |
Eastman Kodak Co. | | | 343 | | | | 5,317 | (a) |
Electronics for Imaging Inc. | | | 940 | | | | 41,228 | (a) |
Hewlett Packard Enterprise Co. | | | 74,933 | | | | 1,733,950 | |
HP Inc. | | | 76,645 | | | | 1,137,412 | |
Immersion Corp. | | | 589 | | | | 6,261 | (a) |
NCR Corp. | | | 1,079 | | | | 43,764 | (a) |
NetApp Inc. | | | 12,403 | | | | 437,454 | |
Nimble Storage Inc. | | | 1,276 | | | | 10,106 | (a) |
Pure Storage Inc., Class A | | | 1,368 | | | | 15,472 | (a) |
Stratasys Ltd. | | | 982 | | | | 16,242 | (a) |
Super Micro Computer Inc. | | | 774 | | | | 21,711 | (a) |
USA Technologies Inc. | | | 724 | | | | 3,113 | (a) |
Western Digital Corp. | | | 12,852 | | | | 873,293 | |
| | | | 32,117,853 | |
| | | | | | | | |
Textiles—0.0% * | | | | | | | | |
Culp Inc. | | | 217 | | | | 8,061 | |
Unifi Inc. | | | 314 | | | | 10,246 | (a) |
| | | | 18,307 | |
| | |
Thrifts & Mortgage Finance—0.0% * | | | | | | | | |
Astoria Financial Corp. | | | 1,840 | | | | 34,316 | |
Bank Mutual Corp. | | | 825 | | | | 7,796 | |
BankFinancial Corp. | | | 310 | | | | 4,594 | |
Bear State Financial Inc. | | | 359 | | | | 3,644 | |
Beneficial Bancorp Inc. | | | 1,396 | | | | 25,686 | |
BofI Holding Inc. | | | 1,207 | | | | 34,460 | (a) |
BSB Bancorp Inc. | | | 153 | | | | 4,429 | (a) |
Capitol Federal Financial Inc. | | | 2,541 | | | | 41,825 | |
Charter Financial Corp. | | | 269 | | | | 4,484 | |
Clifton Bancorp Inc. | | | 434 | | | | 7,343 | |
Dime Community Bancshares Inc. | | | 630 | | | | 12,663 | |
ESSA Bancorp Inc. | | | 149 | | | | 2,342 | |
EverBank Financial Corp. | | | 1,936 | | | | 37,655 | |
Federal Agricultural Mortgage Corp., Class C | | | 170 | | | | 9,736 | |
First Defiance Financial Corp. | | | 175 | | | | 8,880 | |
Flagstar Bancorp Inc. | | | 413 | | | | 11,126 | (a) |
Greene County Bancorp Inc. | | | 77 | | | | 1,763 | |
Hingham Institution for Savings | | | 25 | | | | 4,920 | |
Home Bancorp Inc. | | | 113 | | | | 4,363 | |
HomeStreet Inc. | | | 467 | | | | 14,757 | (a) |
Impac Mortgage Holdings Inc. | | | 161 | | | | 2,257 | (a) |
Kearny Financial Corp. | | | 1,646 | | | | 25,595 | |
Lake Sunapee Bank Group | | | 154 | | | | 3,633 | |
LendingTree Inc. | | | 128 | | | | 12,973 | (a) |
Meridian Bancorp Inc. | | | 959 | | | | 18,125 | |
Meta Financial Group Inc. | | | 164 | | | | 16,876 | |
MGIC Investment Corp. | | | 6,714 | | | | 68,416 | (a) |
Nationstar Mortgage Holdings Inc. | | | 618 | | | | 11,161 | (a) |
New York Community Bancorp Inc. | | | 4,256 | | | | 67,713 | |
NMI Holdings Inc., Class A | | | 998 | | | | 10,629 | (a) |
Northfield Bancorp Inc. | | | 841 | | | | 16,795 | |
Northwest Bancshares Inc. | | | 1,922 | | | | 34,654 | |
OceanFirst Financial Corp. | | | 414 | | | | 12,432 | |
Ocwen Financial Corp. | | | 2,018 | | | | 10,877 | (a) |
Oritani Financial Corp. | | | 546 | | | | 10,238 | |
PennyMac Financial Services Inc., Class A | | | 223 | | | | 3,713 | (a) |
PHH Corp. | | | 811 | | | | 12,295 | (a) |
Provident Financial Holdings Inc. | | | 127 | | | | 2,568 | |
Provident Financial Services Inc. | | | 1,222 | | | | 34,583 | |
Radian Group Inc. | | | 4,106 | | | | 73,826 | |
SI Financial Group Inc. | | | 213 | | | | 3,280 | |
Southern Missouri Bancorp Inc. | | | 117 | | | | 4,139 | |
Territorial Bancorp Inc. | | | 149 | | | | 4,893 | |
TrustCo Bank Corp. | | | 1,687 | | | | 14,761 | |
United Community Financial Corp. | | | 912 | | | | 8,153 | |
United Financial Bancorp Inc. | | | 1,003 | | | | 18,215 | |
Walker & Dunlop Inc. | | | 549 | | | | 17,129 | (a) |
Walter Investment Management Corp. | | | 335 | | | | 1,591 | (a) |
Washington Federal Inc. | | | 2,549 | | | | 87,558 | |
Waterstone Financial Inc. | | | 497 | | | | 9,145 | |
Western New England Bancorp Inc. | | | 301 | | | | 2,814 | |
WSFS Financial Corp. | | | 576 | | | | 26,698 | |
| | | | 924,517 | |
| | | | | | | | |
Tires & Rubber—0.0% * | | | | | | | | |
Cooper Tire & Rubber Co. | | | 1,072 | | | | 41,647 | |
The Goodyear Tire & Rubber Co. | | | 11,701 | | | | 361,210 | |
| | | | 402,857 | |
| | |
Tobacco—0.6% | | | | | | | | |
Alliance One International Inc. | | | 165 | | | | 3,168 | (a) |
Altria Group Inc. | | | 87,439 | | | | 5,912,625 | |
Philip Morris International Inc. | | | 69,445 | | | | 6,353,523 | |
Reynolds American Inc. | | | 37,074 | | | | 2,077,627 | |
Turning Point Brands Inc. | | | 96 | | | | 1,176 | (a) |
Universal Corp. | | | 441 | | | | 28,114 | |
Vector Group Ltd. | | | 1,852 | | | | 42,114 | |
| | | | 14,418,347 | |
| | |
Trading Companies & Distributors—0.1% | | | | | | | | |
Aircastle Ltd. | | | 957 | | | | 19,953 | |
Applied Industrial Technologies Inc. | | | 692 | | | | 41,105 | |
Beacon Roofing Supply Inc. | | | 1,090 | | | | 50,216 | (a) |
BMC Stock Holdings Inc. | | | 1,101 | | | | 21,470 | (a) |
CAI International Inc. | | | 316 | | | | 2,740 | (a) |
DXP Enterprises Inc. | | | 258 | | | | 8,963 | (a) |
Fastenal Co. | | | 12,935 | | | | 607,686 | |
GATX Corp. | | | 1,132 | | | | 69,709 | |
GMS Inc. | | | 141 | | | | 4,129 | (a) |
H&E Equipment Services Inc. | | | 637 | | | | 14,810 | |
Kaman Corp. | | | 535 | | | | 26,178 | |
Lawson Products Inc. | | | 125 | | | | 2,975 | (a) |
MRC Global Inc. | | | 1,871 | | | | 37,906 | (a) |
MSC Industrial Direct Company Inc., Class A | | | 393 | | | | 36,309 | |
Neff Corp., Class A | | | 198 | | | | 2,792 | (a) |
NOW Inc. | | | 2,981 | | | | 61,021 | (a) |
Rush Enterprises Inc., Class A | | | 588 | | | | 18,757 | (a) |
Rush Enterprises Inc., Class B | | | 129 | | | | 3,982 | (a) |
SiteOne Landscape Supply Inc. | | | 233 | | | | 8,092 | (a) |
Textainer Group Holdings Ltd. | | | 467 | | | | 3,479 | |
Titan Machinery Inc. | | | 349 | | | | 5,085 | (a) |
United Rentals Inc. | | | 3,851 | | | | 406,589 | (a) |
Univar Inc. | | | 859 | | | | 24,370 | (a) |
Veritiv Corp. | | | 160 | | | | 8,600 | (a) |
Watsco Inc. | | | 228 | | | | 33,771 | |
Willis Lease Finance Corp. | | | 81 | | | | 2,072 | (a) |
WW Grainger Inc. | | | 2,412 | | | | 560,187 | |
| | | | 2,082,946 | |
| | |
Trucking—0.0% * | | | | | | | | |
ArcBest Corp. | | | 491 | | | | 13,576 | |
Avis Budget Group Inc. | | | 776 | | | | 28,464 | (a) |
Celadon Group Inc. | | | 555 | | | | 3,968 | |
Covenant Transportation Group Inc., Class A | | | 237 | | | | 4,584 | (a) |
Heartland Express Inc. | | | 916 | | | | 18,650 | |
JB Hunt Transport Services Inc. | | | 3,927 | | | | 381,194 | |
Knight Transportation Inc. | | | 1,285 | | | | 42,469 | |
Landstar System Inc. | | | 369 | | | | 31,476 | |
Marten Transport Ltd. | | | 456 | | | | 10,625 | |
Old Dominion Freight Line Inc. | | | 599 | | | | 51,388 | (a) |
PAM Transportation Services Inc. | | | 35 | | | | 909 | (a) |
Roadrunner Transportation Systems Inc. | | | 615 | | | | 6,390 | (a) |
Ryder System Inc. | | | 2,527 | | | | 188,110 | |
Saia Inc. | | | 504 | | | | 22,252 | (a) |
Swift Transportation Co. | | | 1,401 | | | | 34,128 | (a) |
| | | | | | | | |
Universal Logistics Holdings Inc. | | | 169 | | | | 2,763 | |
USA Truck Inc. | | | 173 | | | | 1,507 | (a) |
Werner Enterprises Inc. | | | 1,292 | | | | 34,819 | |
YRC Worldwide Inc. | | | 655 | | | | 8,698 | (a) |
| | | | 885,970 | |
| | |
Water Utilities—0.0% * | | | | | | | | |
American States Water Co. | | | 733 | | | | 33,395 | |
American Water Works Company Inc. | | | 7,998 | | | | 578,735 | |
Aqua America Inc. | | | 1,553 | | | | 46,652 | |
Artesian Resources Corp., Class A | | | 156 | | | | 4,983 | |
California Water Service Group | | | 964 | | | | 32,680 | |
Connecticut Water Service Inc. | | | 216 | | | | 12,064 | |
Middlesex Water Co. | | | 318 | | | | 13,655 | |
SJW Group | | | 328 | | | | 18,361 | |
The York Water Co. | | | 260 | | | | 9,932 | |
| | | | 750,457 | |
| | |
Wireless Telecommunication Services—0.0% * | | | | | | | | |
Boingo Wireless Inc. | | | 716 | | | | 8,728 | (a) |
Leap Wireless International Inc. | | | 1,991 | | | | 6,321 | (j) |
NII Holdings Inc. | | | 1,100 | | | | 2,365 | (a) |
Shenandoah Telecommunications Co. | | | 925 | | | | 25,253 | |
Spok Holdings Inc. | | | 415 | | | | 8,611 | |
Telephone & Data Systems Inc. | | | 817 | | | | 23,587 | |
| | | | 74,865 | |
| | |
Total Domestic Equity | | | | | | | | |
(Cost $615,031,079) | | | | | | | 892,286,958 | |
| | |
Foreign Equity—24.8% | | | | | | | | |
| | |
Common Stock—24.5% | | | | | | | | |
| | |
Advertising—0.1% | | | | | | | | |
Cheil Worldwide Inc. | | | 2,021 | | | | 26,354 | |
Dentsu Inc. | | | 6,700 | | | | 315,943 | |
Hakuhodo DY Holdings Inc. | | | 8,600 | | | | 106,178 | |
JCDecaux S.A. | | | 2,402 | | | | 70,761 | |
Publicis Groupe S.A. | | | 6,697 | | | | 463,023 | |
REA Group Ltd. | | | 842 | | | | 33,673 | |
WPP PLC | | | 41,137 | | | | 923,089 | |
| | | | 1,939,021 | |
Aerospace & Defense—0.2% | | | | | | | | |
Airbus Group SE | | | 18,210 | | | | 1,206,968 | |
AviChina Industry & Technology Company Ltd., Class H | | | 76,000 | | | | 52,345 | |
BAE Systems PLC | | | 97,580 | | | | 713,199 | |
Bombardier Inc., Class B | | | 51,880 | | | | 83,562 | (a) |
CAE Inc. | | | 8,733 | | | | 122,296 | |
Cobham PLC | | | 37,409 | | | | 75,669 | |
Embraer S.A. | | | 22,900 | | | | 112,576 | |
Korea Aerospace Industries Ltd. | | | 1,660 | | | | 92,085 | |
Leonardo-Finmeccanica S.p.A. | | | 15,038 | | | | 211,590 | (a) |
Meggitt PLC | | | 16,811 | | | | 95,263 | |
Rolls-Royce Holdings PLC | | | 58,305 | | | | 481,258 | (a) |
Rolls-Royce Holdings PLC | | | 2,682,030 | | | | 3,314 | (a,j) |
Safran S.A. | | | 10,140 | | | | 731,763 | |
Singapore Technologies Engineering Ltd. | | | 63,000 | | | | 140,853 | |
Thales S.A. | | | 3,301 | | | | 320,772 | |
Zodiac Aerospace | | | 6,235 | | | | 143,463 | |
| | | | 4,586,976 | |
| | | | | | | | |
Agricultural & Farm Machinery—0.0% * | | | | | | | | |
CNH Industrial N.V. | | | 35,038 | | | | 305,444 | |
Kubota Corp. | | | 33,100 | | | | 473,506 | |
| | | | 778,950 | |
| | |
Agricultural Products—0.0% * | | | | | | | | |
Charoen Pokphand Indonesia Tbk PT | | | 289,500 | | | | 66,399 | |
Felda Global Ventures Holdings Bhd | | | 47,900 | | | | 16,550 | |
Genting Plantations Bhd | | | 8,500 | | | | 20,464 | |
Golden Agri-Resources Ltd. | | | 218,900 | | | | 65,153 | |
IOI Corporation Bhd | | | 127,900 | | | | 125,448 | |
Kuala Lumpur Kepong Bhd | | | 18,200 | | | | 97,370 | |
Wilmar International Ltd. | | | 66,200 | | | | 164,503 | |
| | | | 555,887 | |
| | |
Air Freight & Logistics—0.1% | | | | | | | | |
Bollore S.A. | | | 31,468 | | | | 111,189 | |
Deutsche Post AG | | | 32,236 | | | | 1,062,019 | |
Hyundai Glovis Company Ltd. | | | 540 | | | | 69,076 | |
Royal Mail PLC | | | 25,195 | | | | 143,862 | |
Yamato Holdings Company Ltd. | | | 10,800 | | | | 220,056 | |
| | | | 1,606,202 | |
| | |
Airlines—0.1% | | | | | | | | |
Air China Ltd., Class H | | | 70,000 | | | | 44,692 | |
AirAsia Bhd | | | 48,500 | | | | 24,758 | |
ANA Holdings Inc. | | | 46,000 | | | | 124,155 | |
Cathay Pacific Airways Ltd. | | | 24,000 | | | | 31,574 | |
China Airlines Ltd. | | | 104,000 | | | | 30,010 | |
China Southern Airlines Company Ltd., H Shares | | | 52,000 | | | | 27,029 | |
Deutsche Lufthansa AG | | | 8,754 | | | | 113,292 | |
easyJet PLC | | | 5,802 | | | | 72,051 | |
Eva Airways Corp. | | | 78,301 | | | | 35,471 | |
International Consolidated Airlines Group S.A. | | | 28,978 | | | | 156,766 | |
Japan Airlines Company Ltd. | | | 4,100 | | | | 120,045 | |
Korean Air Lines Company Ltd. | | | 1,579 | | | | 35,756 | (a) |
Latam Airlines Group S.A. | | | 11,360 | | | | 95,065 | (a) |
Qantas Airways Ltd. | | | 12,651 | | | | 30,505 | |
Singapore Airlines Ltd. | | | 11,400 | | | | 76,305 | |
Turk Hava Yollari AO | | | 23,896 | | | | 34,034 | (a) |
| | | | 1,051,508 | |
| | |
Airport Services—0.1% | | | | | | | | |
Aena S.A. | | | 2,198 | | | | 300,573 | (d) |
Aeroports de Paris | | | 1,084 | | | | 116,393 | |
Airports of Thailand PCL NVDR | | | 16,100 | | | | 178,936 | |
Auckland International Airport Ltd. | | | 32,076 | | | | 139,791 | |
Beijing Capital International Airport Company Ltd., Class H | | | 64,000 | | | | 64,717 | |
Fraport AG Frankfurt Airport Services Worldwide | | | 1,434 | | | | 84,958 | |
Grupo Aeroportuario del Pacifico SAB de C.V., Class B | | | 10,700 | | | | 88,502 | |
Grupo Aeroportuario del Sureste SAB de C.V., Class B | | | 7,500 | | | | 108,637 | |
Japan Airport Terminal Company Ltd. | | | 1,400 | | | | 50,714 | |
Malaysia Airports Holdings Bhd | | | 36,000 | | | | 48,631 | |
Sydney Airport | | | 37,110 | | | | 160,959 | |
TAV Havalimanlari Holding AS | | | 6,264 | | | | 24,984 | |
| | | | 1,367,795 | |
| | |
Alternative Carriers—0.0% * | | | | | | | | |
Iliad S.A. | | | 975 | | | | 187,834 | |
Inmarsat PLC | | | 16,632 | | | | 154,443 | |
Intelsat S.A. | | | 516 | | | | 1,378 | (a) |
| | | | 343,655 | |
| | | | | | | | |
Aluminum—0.0% * | | | | | | | | |
Alumina Ltd. | | | 91,959 | | | | 121,855 | |
Aluminum Corporation of China Ltd., Class H | | | 152,000 | | | | 62,736 | (a) |
Hindalco Industries Ltd. | | | 39,321 | | | | 89,684 | |
Norsk Hydro ASA | | | 48,652 | | | | 233,434 | |
| | | | 507,709 | |
| | |
Apparel Retail—0.1% | | | | | | | | |
ABC-Mart Inc. | | | 1,000 | | | | 56,758 | |
Fast Retailing Company Ltd. | | | 1,500 | | | | 537,961 | |
Hennes & Mauritz AB, Class B | | | 30,962 | | | | 863,634 | |
Industria de Diseno Textil S.A. | | | 36,216 | | | | 1,238,788 | |
Mr Price Group Ltd. | | | 8,676 | | | | 101,225 | |
Shimamura Company Ltd. | | | 800 | | | | 100,073 | |
The Foschini Group Ltd. | | | 7,946 | | | | 92,464 | |
Truworths International Ltd. | | | 16,496 | | | | 96,105 | |
| | | | 3,087,008 | |
| | |
Apparel, Accessories & Luxury Goods—0.3% | | | | | | | | |
Adidas AG | | | 5,943 | | | | 941,197 | |
Burberry Group PLC | | | 12,634 | | | | 233,700 | |
Christian Dior SE | | | 1,807 | | | | 379,757 | |
Cie Financiere Richemont S.A. | | | 16,654 | | | | 1,105,242 | |
Gildan Activewear Inc. | | | 9,242 | | | | 234,935 | |
Hermes International | | | 887 | | | | 364,870 | |
HUGO BOSS AG | | | 2,221 | | | | 136,175 | |
Kering | | | 2,221 | | | | 499,677 | |
Li & Fung Ltd. | | | 228,000 | | | | 100,279 | |
LPP S.A. | | | 33 | | | | 44,853 | |
Luxottica Group S.p.A. | | | 6,436 | | | | 346,886 | |
LVMH Moet Hennessy Louis Vuitton SE | | | 8,842 | | | | 1,691,754 | |
Michael Kors Holdings Ltd. | | | 7,340 | | | | 315,473 | (a) |
Pandora A/S | | | 3,837 | | | | 502,924 | |
Shenzhou International Group Holdings Ltd. | | | 16,000 | | | | 101,223 | |
The Swatch Group AG | | | 889 | | | | 277,017 | |
The Swatch Group AG | | | 1,612 | | | | 98,733 | |
| | | | 7,374,695 | |
| | |
Application Software—0.2% | | | | | | | | |
Constellation Software Inc. | | | 673 | | | | 306,186 | |
Dassault Systemes SE | | | 3,967 | | | | 302,894 | |
Gemalto N.V. | | | 3,114 | | | | 180,384 | |
Globant S.A. | | | 514 | | | | 17,142 | (a) |
Mobileye N.V. | | | 5,500 | | | | 209,660 | (a) |
Nice Ltd. | | | 2,227 | | | | 151,952 | |
Open Text Corp. | | | 4,812 | | | | 297,536 | |
SAP SE | | | 31,269 | | | | 2,731,155 | |
Sapiens International Corporation N.V. | | | 487 | | | | 6,984 | |
The Sage Group PLC | | | 37,466 | | | | 303,231 | |
| | | | 4,507,124 | |
| | |
Asset Management & Custody Banks—0.1% | | | | | | | | |
3i Group PLC | | | 31,087 | | | | 270,425 | |
Aberdeen Asset Management PLC | | | 18,224 | | | | 57,940 | |
Brait SE | | | 12,888 | | | | 82,521 | (a) |
Brookfield Asset Management Inc., Class A | | | 27,239 | | | | 899,808 | |
CETIP SA—Mercados Organizados | | | 8,013 | | | | 109,804 | |
China Cinda Asset Management Company Ltd., Class H | | | 422,000 | | | | 152,947 | |
CI Financial Corp. | | | 7,514 | | | | 161,761 | |
Coronation Fund Managers Ltd. | | | 10,031 | | | | 51,706 | |
Hargreaves Lansdown PLC | | | 9,137 | | | | 136,949 | |
IGM Financial Inc. | | | 4,620 | | | | 131,601 | |
| | | | | | | | |
Julius Baer Group Ltd. | | | 7,628 | | | | 339,464 | (a) |
Mirae Asset Securities Company Ltd. | | | 3,222 | | | | 57,394 | (j) |
OM Asset Management PLC | | | 742 | | | | 10,759 | |
Partners Group Holding AG | | | 533 | | | | 250,282 | |
SBI Holdings Inc. | | | 7,800 | | | | 99,444 | |
Schroders PLC | | | 4,311 | | | | 159,700 | |
| | | | 2,972,505 | |
| | |
Auto Parts & Equipment—0.3% | | | | | | | | |
Aisin Seiki Company Ltd. | | | 6,300 | | | | 273,854 | |
Bharat Forge Ltd. | | | 4,436 | | | | 59,347 | |
Bosch Ltd. | | | 136 | | | | 42,481 | |
Continental AG | | | 3,487 | | | | 675,633 | |
Delphi Automotive PLC | | | 12,248 | | | | 824,903 | |
Denso Corp. | | | 15,000 | | | | 651,134 | |
GKN PLC | | | 61,788 | | | | 253,247 | |
Hanon Systems | | | 6,000 | | | | 51,167 | |
Hyundai Mobis Company Ltd. | | | 2,290 | | | | 500,546 | |
Hyundai Wia Corp. | | | 332 | | | | 20,066 | |
Koito Manufacturing Company Ltd. | | | 4,000 | | | | 212,286 | |
Magna International Inc. | | | 13,581 | | | | 590,412 | |
Motherson Sumi Systems Ltd. | | | 6,492 | | | | 31,107 | |
NGK Spark Plug Company Ltd. | | | 7,000 | | | | 155,922 | |
NOK Corp. | | | 4,000 | | | | 81,142 | |
Stanley Electric Company Ltd. | | | 5,300 | | | | 145,184 | |
Sumitomo Electric Industries Ltd. | | | 19,900 | | | | 287,747 | |
Toyoda Gosei Company Ltd. | | | 2,500 | | | | 58,602 | |
Toyota Industries Corp. | | | 5,600 | | | | 267,433 | |
Valeo S.A. | | | 7,153 | | | | 412,012 | |
| | | | 5,594,225 | |
| | |
Automobile Manufacturers—0.7% | | | | | | | | |
Astra International Tbk PT | | | 702,900 | | | | 431,731 | |
Bayerische Motoren Werke AG | | | 10,579 | | | | 990,290 | |
Brilliance China Automotive Holdings Ltd. | | | 122,000 | | | | 168,056 | |
BYD Company Ltd., Class H | | | 19,500 | | | | 102,742 | |
Chongqing Changan Automobile Company Ltd., Class B | | | 30,000 | | | | 42,912 | |
Daimler AG | | | 30,417 | | | | 2,268,862 | |
Dongfeng Motor Group Company Ltd., Class H | | | 114,000 | | | | 111,307 | |
Ferrari N.V. | | | 3,488 | | | | 203,447 | |
Fiat Chrysler Automobiles N.V. | | | 34,881 | | | | 318,792 | |
Ford Otomotiv Sanayi AS | | | 2,547 | | | | 22,142 | |
Fuji Heavy Industries Ltd. | | | 18,500 | | | | 756,908 | |
Geely Automobile Holdings Ltd. | | | 160,000 | | | | 152,918 | |
Great Wall Motor Company Ltd., Class H | | | 124,500 | | | | 116,260 | |
Guangzhou Automobile Group Company Ltd., Class H | | | 82,000 | | | | 99,206 | |
Honda Motor Company Ltd. | | | 52,800 | | | | 1,545,951 | |
Hyundai Motor Co. | | | 4,756 | | | | 574,910 | |
Isuzu Motors Ltd. | | | 18,600 | | | | 236,178 | |
Kia Motors Corp. | | | 8,487 | | | | 275,803 | |
Mahindra & Mahindra Ltd. | | | 11,419 | | | | 198,465 | |
Maruti Suzuki India Ltd. | | | 1,900 | | | | 148,800 | |
Mazda Motor Corp. | | | 19,100 | | | | 313,107 | |
Mitsubishi Motors Corp. | | | 21,900 | | | | 125,052 | |
Nissan Motor Company Ltd. | | | 75,800 | | | | 763,946 | |
Peugeot S.A. | | | 15,358 | | | | 251,001 | (a) |
Renault S.A. | | | 5,433 | | | | 484,281 | |
Suzuki Motor Corp. | | | 11,700 | | | | 412,687 | |
Tata Motors Ltd. | | | 33,690 | | | | 233,254 | |
Tofas Turk Otomobil Fabrikasi AS | | | 4,588 | | | | 32,138 | |
Toyota Motor Corp. | | | 85,000 | | | | 5,012,475 | |
| | | | | | | | |
UMW Holdings Bhd | | | 21,300 | | | | 21,699 | |
Volkswagen AG | | | 1,146 | | | | 165,296 | |
Yulon Motor Company Ltd. | | | 32,000 | | | | 26,610 | |
| | | | 16,607,226 | |
| | |
Automotive Retail—0.0% * | | | | | | | | |
Hotai Motor Company Ltd. | | | 9,000 | | | | 103,044 | |
USS Company Ltd. | | | 7,800 | | | | 124,522 | |
| | | | 227,566 | |
| | |
Biotechnology—0.2% | | | | | | | | |
Actelion Ltd. | | | 3,023 | | | | 655,848 | (a) |
Axovant Sciences Ltd. | | | 492 | | | | 6,111 | (a) |
Celltrion Inc. | | | 2,822 | | | | 250,938 | (a) |
CSL Ltd. | | | 14,431 | | | | 1,049,233 | |
Genmab A/S | | | 1,800 | | | | 299,509 | (a) |
Grifols S.A. | | | 8,975 | | | | 178,725 | |
Prothena Corporation PLC | | | 696 | | | | 34,236 | (a) |
Shire PLC | | | 28,669 | | | | 1,659,299 | |
XBiotech Inc. | | | 351 | | | | 3,552 | (a) |
| | | | 4,137,451 | |
| | |
Brewers—0.2% | | | | | | | | |
AMBEV S.A. | | | 136,211 | | | | 686,349 | |
Anadolu Efes Biracilik Ve Malt Sanayii AS | | | 8,317 | | | | 41,684 | |
Anheuser-Busch InBev S.A. | | | 24,237 | | | | 2,570,458 | |
Asahi Group Holdings Ltd. | | | 10,100 | | | | 319,535 | |
Carlsberg A/S, Class B | | | 3,373 | | | | 291,628 | |
China Resources Beer Holdings Company Ltd. | | | 48,000 | | | | 95,342 | (a) |
Cia Cervecerias Unidas S.A. | | | 3,906 | | | | 40,793 | |
Heineken Holding N.V. | | | 3,184 | | | | 222,119 | |
Heineken N.V. | | | 7,858 | | | | 590,619 | |
Kirin Holdings Company Ltd. | | | 27,900 | | | | 454,854 | |
Tsingtao Brewery Company Ltd., Class H | | | 14,000 | | | | 52,907 | |
| | | | 5,366,288 | |
| | |
Broadcasting—0.1% | | | | | | | | |
Astro Malaysia Holdings Bhd | | | 30,600 | | | | 17,735 | |
BEC World PCL NVDR | | | 35,500 | | | | 16,456 | |
Central European Media Enterprises Ltd., Class A | | | 1,533 | | | | 3,909 | (a) |
Grupo Televisa SAB | | | 84,024 | | | | 352,631 | |
ITV PLC | | | 120,963 | | | | 308,502 | |
Media Nusantara Citra Tbk PT | | | 154,000 | | | | 20,061 | |
ProSiebenSat.1 Media SE | | | 7,909 | | | | 305,401 | |
RTL Group S.A. | | | 1,661 | | | | 122,163 | (a) |
Zee Entertainment Enterprises Ltd. | | | 20,876 | | | | 139,337 | |
| | | | 1,286,195 | |
| | |
Building Products—0.2% | | | | | | | | |
Allegion PLC | | | 4,251 | | | | 272,064 | |
Asahi Glass Company Ltd. | | | 30,000 | | | | 204,741 | |
Assa Abloy AB, Class B | | | 32,002 | | | | 595,683 | |
Caesarstone Ltd. | | | 480 | | | | 13,752 | (a) |
Cie de Saint-Gobain | | | 15,695 | | | | 732,611 | |
Daikin Industries Ltd. | | | 7,800 | | | | 717,906 | |
Geberit AG | | | 1,262 | | | | 506,861 | |
KCC Corp. | | | 194 | | | | 57,744 | |
LIXIL Group Corp. | | | 6,700 | | | | 152,457 | |
TOTO Ltd. | | | 4,500 | | | | 178,441 | |
| | | | 3,432,260 | |
| | | | | | | | |
Cable & Satellite—0.2% | | | | | | | | |
Altice N.V. Class A | | | 11,171 | | | | 221,867 | (a) |
Altice N.V. Class B | | | 140 | | | | 2,795 | (a) |
Cyfrowy Polsat S.A. | | | 6,693 | | | | 39,443 | (a) |
Eutelsat Communications S.A. | | | 5,802 | | | | 112,571 | |
Naspers Ltd., Class N | | | 14,264 | | | | 2,100,840 | |
SES S.A. | | | 9,706 | | | | 214,218 | |
Shaw Communications Inc., Class B | | | 15,097 | | | | 303,280 | |
Sky PLC | | | 36,036 | | | | 441,271 | |
Telenet Group Holding N.V. | | | 1,897 | | | | 105,485 | (a) |
| | | | 3,541,770 | |
| | |
Casinos & Gaming—0.1% | | | | | | | | |
Aristocrat Leisure Ltd. | | | 10,992 | | | | 123,369 | |
Berjaya Sports Toto Bhd | | | 26,072 | | | | 17,203 | |
Crown Resorts Ltd. | | | 12,361 | | | | 103,648 | |
Galaxy Entertainment Group Ltd. | | | 72,000 | | | | 313,885 | |
Genting Bhd | | | 88,600 | | | | 158,003 | |
Genting Malaysia Bhd | | | 109,600 | | | | 111,897 | |
Genting Singapore PLC | | | 165,000 | | | | 103,361 | |
Kangwon Land Inc. | | | 4,050 | | | | 119,877 | |
MGM China Holdings Ltd. | | | 39,200 | | | | 81,301 | |
OPAP S.A. | | | 10,054 | | | | 89,077 | |
Paddy Power Betfair PLC | | | 2,000 | | | | 214,114 | |
Sands China Ltd. | | | 74,400 | | | | 323,388 | |
SJM Holdings Ltd. | | | 82,000 | | | | 64,304 | |
Tabcorp Holdings Ltd. | | | 30,325 | | | | 105,620 | |
Tatts Group Ltd. | | | 55,779 | | | | 180,945 | |
William Hill PLC | | | 36,050 | | | | 129,270 | |
Wynn Macau Ltd. | | | 66,400 | | | | 105,683 | |
| | | | 2,344,945 | |
Coal & Consumable Fuels—0.0% * | |
Adaro Energy Tbk PT | | | 538,500 | | | | 67,750 | |
Banpu PCL NVDR | | | 38,000 | | | | 20,374 | |
Cameco Corp. | | | 14,809 | | | | 155,041 | |
China Coal Energy Company Ltd., Class H | | | 86,000 | | | | 40,819 | (a) |
China Shenhua Energy Company Ltd. | | | 133,500 | | | | 251,395 | |
Coal India Ltd. | | | 18,723 | | | | 82,898 | |
Exxaro Resources Ltd. | | | 4,703 | | | | 30,780 | |
United Tractors Tbk PT | | | 63,000 | | | | 99,369 | |
Yanzhou Coal Mining Company Ltd., Class H | | | 102,000 | | | | 69,595 | |
| | | | 818,021 | |
| | |
Commercial Printing—0.0% * | | | | | | | | |
Dai Nippon Printing Company Ltd. | | | 14,000 | | | | 138,638 | |
Toppan Printing Company Ltd. | | | 16,000 | | | | 153,093 | |
| | | | 291,731 | |
| | |
Commodity Chemicals—0.2% | | | | | | | | |
Asahi Kasei Corp. | | | 38,000 | | | | 332,156 | |
Formosa Chemicals & Fibre Corp. | | | 113,540 | | | | 339,257 | |
Formosa Plastics Corp. | | | 115,960 | | | | 320,942 | |
Hanwha Chemical Corp. | | | 3,760 | | | | 76,894 | |
Hyosung Corp. | | | 768 | | | | 92,519 | |
Indorama Ventures PCL NVDR | | | 55,500 | | | | 51,919 | |
Kaneka Corp. | | | 8,000 | | | | 65,298 | |
Kumho Petrochemical Company Ltd. | | | 572 | | | | 38,834 | |
Kuraray Company Ltd. | | | 10,600 | | | | 159,588 | |
LG Chem Ltd. | | | 1,269 | | | | 274,225 | |
Lotte Chemical Corp. | | | 473 | | | | 144,508 | |
| | | | | | | | |
Methanex Corp. | | | 3,627 | | | | 159,274 | |
Mexichem SAB de C.V. | | | 42,640 | | | | 97,340 | |
Mitsui Chemicals Inc. | | | 34,000 | | | | 153,042 | |
Nan Ya Plastics Corp. | | | 128,850 | | | | 284,654 | |
Orica Ltd. | | | 11,069 | | | | 141,706 | |
Petronas Chemicals Group Bhd | | | 112,500 | | | | 175,045 | |
PTT Global Chemical PCL NVDR | | | 62,900 | | | | 110,657 | |
Sinopec Shanghai Petrochemical Company Ltd., Class H | | | 129,000 | | | | 69,881 | |
Synthos S.A. | | | 17,899 | | | | 19,553 | |
Teijin Ltd. | | | 3,800 | | | | 77,183 | |
Toray Industries Inc. | | | 42,000 | | | | 340,724 | |
| | | | 3,525,199 | |
| | |
Communications Equipment—0.1% | | | | | | | | |
ARRIS International PLC | | | 1,652 | | | | 49,775 | (a) |
Nokia Oyj | | | 188,608 | | | | 912,710 | |
Silicom Ltd. | | | 112 | | | | 4,602 | |
Telefonaktiebolaget LM Ericsson, Class B | | | 90,438 | | | | 532,597 | |
ZTE Corp., Class H | | | 29,280 | | | | 50,908 | |
| | | | 1,550,592 | |
| | |
Computer & Electronics Retail—0.0% * | | | | | | | | |
Dixons Carphone PLC | | | 29,880 | | | | 130,923 | |
GOME Electrical Appliances Holding Ltd. | | | 456,000 | | | | 55,286 | |
Yamada Denki Company Ltd. | | | 25,500 | | | | 137,737 | |
| | | | 323,946 | |
| | |
Construction & Engineering—0.2% | | | | | | | | |
ACS Actividades de Construccion y Servicios S.A. | | | 7,044 | | | | 223,038 | |
Boskalis Westminster | | | 2,811 | | | | 97,812 | |
Bouygues S.A. | | | 6,436 | | | | 231,110 | |
China Communications Construction Company Ltd., Class H | | | 166,000 | | | | 190,983 | |
China Railway Construction Corporation Ltd., Class H | | | 73,500 | | | | 94,611 | |
China Railway Group Ltd., Class H | | | 149,000 | | | | 122,611 | |
China State Construction International Holdings Ltd. | | | 66,000 | | | | 98,747 | |
CIMIC Group Ltd. | | | 4,164 | | | | 105,349 | |
Daelim Industrial Company Ltd. | | | 460 | | | | 33,173 | |
Daewoo Engineering & Construction Company Ltd. | | | 5,220 | | | | 21,955 | (a) |
Ferrovial S.A. | | | 17,122 | | | | 306,920 | |
Gamuda Bhd | | | 63,600 | | | | 67,768 | |
GS Engineering & Construction Corp. | | | 2,019 | | | | 44,298 | (a) |
Hyundai Development Co-Engineering & Construction | | | 2,420 | | | | 90,064 | |
Hyundai Engineering & Construction Company Ltd. | | | 1,499 | | | | 53,119 | |
IJM Corporation Bhd | | | 83,000 | | | | 59,206 | |
JGC Corp. | | | 8,000 | | | | 145,685 | |
Kajima Corp. | | | 27,000 | | | | 187,277 | |
Larsen & Toubro Ltd. | | | 9,595 | | | | 190,691 | |
Obayashi Corp. | | | 21,000 | | | | 201,115 | |
Shimizu Corp. | | | 4,000 | | | | 36,661 | |
Skanska AB, Class B | | | 12,464 | | | | 295,116 | |
SNC-Lavalin Group Inc. | | | 6,167 | | | | 265,755 | |
Taisei Corp. | | | 35,000 | | | | 245,467 | |
Vinci S.A. | | | 14,773 | | | | 1,008,144 | |
| | | | 4,416,675 | |
| | |
Construction Machinery & Heavy Trucks—0.1% | | | | | | | | |
Alstom S.A. | | | 5,826 | | | | 160,845 | (a) |
CRRC Corporation Ltd., Class H | | | 164,950 | | | | 148,075 | |
Eicher Motors Ltd. | | | 567 | | | | 181,913 | |
Hino Motors Ltd. | | | 10,000 | | | | 102,028 | |
Hitachi Construction Machinery Company Ltd. | | | 4,100 | | | | 88,971 | |
Hyundai Heavy Industries Company Ltd. | | | 1,548 | | | | 186,483 | (a) |
| | | | | | | | |
Komatsu Ltd. | | | 29,000 | | | | 658,271 | |
Samsung Heavy Industries Company Ltd. | | | 5,036 | | | | 38,568 | (a) |
Volvo AB, Class B | | | 50,731 | | | | 594,168 | |
Weichai Power Company Ltd., Class H | | | 36,000 | | | | 55,441 | |
Yangzijiang Shipbuilding Holdings Ltd. | | | 82,000 | | | | 46,259 | |
| | | | 2,261,022 | |
| | |
Construction Materials—0.2% | | | | | | | | |
ACC Ltd. | | | 1,972 | | | | 38,644 | |
Ambuja Cements Ltd. | | | 22,724 | | | | 68,972 | |
Anhui Conch Cement Company Ltd., Class H | | | 52,000 | | | | 141,517 | |
Asia Cement Corp. | | | 78,030 | | | | 63,796 | |
Boral Ltd. | | | 47,888 | | | | 187,596 | |
Cementos Argos S.A. | | | 13,625 | | | | 53,828 | |
Cemex SAB de C.V. | | | 476,070 | | | | 383,139 | (a) |
China National Building Material Company Ltd., Class H | | | 126,000 | | | | 61,268 | |
CRH PLC | | | 26,191 | | | | 910,380 | |
Fletcher Building Ltd. | | | 25,315 | | | | 187,113 | |
Grupo Argos S.A. | | | 11,233 | | | | 72,143 | |
HeidelbergCement AG | | | 5,149 | | | | 481,341 | |
Imerys S.A. | | | 1,254 | | | | 95,324 | |
Indocement Tunggal Prakarsa Tbk PT | | | 55,500 | | | | 63,440 | |
James Hardie Industries PLC | | | 13,492 | | | | 214,637 | |
Lafarge Malaysia Bhd | | | 13,800 | | | | 22,118 | |
LafargeHolcim Ltd. | | | 14,133 | | | | 746,038 | (a) |
Semen Indonesia Persero Tbk PT | | | 110,500 | | | | 75,252 | |
Taiheiyo Cement Corp. | | | 47,000 | | | | 149,098 | |
Taiwan Cement Corp. | | | 134,000 | | | | 146,145 | |
The Siam Cement PCL | | | 7,500 | | | | 104,299 | |
The Siam Cement PCL NVDR | | | 2,600 | | | | 36,012 | |
Titan Cement Company S.A. | | | 1,510 | | | | 35,517 | |
Ultratech Cement Ltd. | | | 1,319 | | | | 63,161 | |
| | | | 4,400,778 | |
| | |
Consumer Electronics—0.1% | | | | | | | | |
Casio Computer Company Ltd. | | | 8,300 | | | | 117,631 | |
Garmin Ltd. | | | 5,207 | | | | 252,487 | |
LG Electronics Inc. | | | 2,888 | | | | 123,382 | |
Nikon Corp. | | | 10,100 | | | | 157,343 | |
Panasonic Corp. | | | 72,500 | | | | 739,390 | |
Sony Corp. | | | 40,400 | | | | 1,134,394 | |
| | | | 2,524,627 | |
| | |
Consumer Finance—0.0% * | | | | | | | | |
Acom Company Ltd. | | | 16,000 | | | | 70,099 | (a) |
AEON Financial Service Company Ltd. | | | 2,900 | | | | 51,642 | |
Credit Saison Company Ltd. | | | 6,100 | | | | 108,627 | |
Gentera SAB de C.V. | | | 41,300 | | | | 66,837 | |
Mahindra & Mahindra Financial Services Ltd. | | | 10,172 | | | | 40,444 | |
Provident Financial PLC | | | 5,000 | | | | 176,018 | |
Samsung Card Company Ltd. | | | 1,450 | | | | 47,661 | |
Shriram Transport Finance Company Ltd. | | | 4,730 | | | | 59,378 | |
| | | | 620,706 | |
| | |
Copper—0.0% * | | | | | | | | |
Antofagasta PLC | | | 12,579 | | | | 104,917 | |
First Quantum Minerals Ltd. | | | 21,644 | | | | 215,464 | |
Jiangxi Copper Company Ltd., Class H | | | 61,000 | | | | 85,129 | |
KGHM Polska Miedz S.A. | | | 5,917 | | | | 131,089 | |
| | �� | | 536,599 | |
| | | | | | | | |
Data Processing & Outsourced Services—0.1% | | | | | | | | |
Amadeus IT Group S.A. | | | 14,654 | | | | 667,249 | |
Cielo S.A. | | | 36,254 | | | | 310,666 | |
Computershare Ltd. | | | 18,369 | | | | 165,730 | |
EVERTEC Inc. | | | 1,278 | | | | 22,684 | |
Travelport Worldwide Ltd. | | | 2,313 | | | | 32,613 | |
Worldpay Group PLC | | | 54,354 | | | | 181,272 | (d) |
| | | | 1,380,214 | |
| | |
Department Stores—0.1% | | | | | | | | |
El Puerto de Liverpool SAB de C.V. | | | 6,900 | | | | 50,088 | |
Hyundai Department Store Company Ltd. | | | 375 | | | | 33,843 | |
Isetan Mitsukoshi Holdings Ltd. | | | 9,800 | | | | 105,869 | |
J Front Retailing Company Ltd. | | | 9,000 | | | | 121,533 | |
Lojas Renner S.A. | | | 16,540 | | | | 117,747 | |
Lotte Shopping Company Ltd. | | | 446 | | | | 81,793 | |
Marks & Spencer Group PLC | | | 53,208 | | | | 230,113 | |
Marui Group Company Ltd. | | | 8,400 | | | | 122,937 | |
Matahari Department Store Tbk PT | | | 50,000 | | | | 56,133 | |
Next PLC | | | 4,852 | | | | 298,749 | |
SACI Falabella | | | 17,913 | | | | 142,253 | |
Shinsegae Inc. | | | 309 | | | | 45,027 | |
Takashimaya Company Ltd. | | | 10,000 | | | | 82,651 | |
Woolworths Holdings Ltd. | | | 35,874 | | | | 186,309 | |
| | | | 1,675,045 | |
| | |
Distillers & Vintners—0.1% | | | | | | | | |
Diageo PLC | | | 79,882 | | | | 2,082,700 | |
Pernod Ricard S.A. | | | 6,647 | | | | 721,775 | |
Remy Cointreau S.A. | | | 964 | | | | 82,379 | |
Treasury Wine Estates Ltd. | | | 23,696 | | | | 183,250 | |
United Spirits Ltd. | | | 3,069 | | | | 87,905 | (a) |
| | | | 3,158,009 | |
| | |
Distributors—0.0% * | | | | | | | | |
Imperial Holdings Ltd. | | | 6,577 | | | | 87,745 | |
Jardine Cycle & Carriage Ltd. | | | 4,444 | | | | 126,826 | |
| | | | 214,571 | |
| | |
Diversified Banks—3.3% | | | | | | | | |
ABN AMRO Group N.V. | | | 8,511 | | | | 188,965 | (d) |
Abu Dhabi Commercial Bank PJSC | | | 90,716 | | | | 170,421 | |
Agricultural Bank of China Ltd., Class H | | | 654,000 | | | | 268,242 | |
Akbank TAS | | | 81,386 | | | | 180,930 | |
Alior Bank S.A. | | | 1,742 | | | | 22,614 | (a) |
Alliance Financial Group Bhd | | | 47,100 | | | | 39,057 | |
Alpha Bank AE | | | 47,969 | | | | 96,131 | (a) |
AMMB Holdings Bhd | | | 71,600 | | | | 68,791 | |
Aozora Bank Ltd. | | | 41,000 | | | | 145,179 | |
Australia & New Zealand Banking Group Ltd. | | | 92,724 | | | | 2,042,442 | |
Axis Bank Ltd. | | | 54,881 | | | | 364,121 | |
Banco Bilbao Vizcaya Argentaria S.A. | | | 203,875 | | | | 1,379,248 | |
Banco Bradesco S.A. | | | 12,284 | | | | 109,981 | |
Banco de Chile | | | 409,956 | | | | 47,754 | |
Banco de Credito e Inversiones | | | 1,111 | | | | 56,231 | |
Banco de Sabadell S.A. | | | 182,294 | | | | 254,379 | |
Banco do Brasil S.A. | | | 29,600 | | | | 255,466 | |
Banco Latinoamericano de Comercio Exterior S.A., Class E | | | 607 | | | | 17,870 | |
Banco Popular Espanol S.A. | | | 138,358 | | | | 133,967 | |
Banco Santander Brasil S.A. | | | 15,321 | | | | 139,008 | |
Banco Santander Chile | | | 2,798,504 | | | | 154,594 | |
Banco Santander S.A. | | | 461,365 | | | | 2,413,172 | |
| | | | | | | | |
Bangkok Bank PCL | | | 12,800 | | | | 57,726 | |
Bangkok Bank PCL NVDR | | | 1,300 | | | | 5,790 | |
Bank Central Asia Tbk PT | | | 439,500 | | | | 505,641 | |
Bank Danamon Indonesia Tbk PT | | | 138,000 | | | | 38,002 | |
Bank Handlowy w Warszawie S.A. | | | 1,235 | | | | 22,601 | |
Bank Hapoalim BM | | | 44,492 | | | | 264,849 | |
Bank Leumi Le-Israel BM | | | 47,822 | | | | 197,071 | (a) |
Bank Mandiri Persero Tbk PT | | | 301,400 | | | | 258,950 | |
Bank Millennium S.A. | | | 17,468 | | | | 21,718 | (a) |
Bank Negara Indonesia Persero Tbk PT | | | 294,500 | | | | 120,773 | |
Bank of China Ltd., Class H | | | 2,668,000 | | | | 1,183,767 | |
Bank of Communications Company Ltd., Class H | | | 277,000 | | | | 200,431 | |
Bank of Ireland | | | 888,173 | | | | 219,211 | (a) |
Bank of Montreal | | | 20,298 | | | | 1,461,674 | |
Bank of the Philippine Islands | | | 28,542 | | | | 50,984 | |
Bank Pekao S.A. | | | 5,497 | | | | 165,662 | |
Bank Rakyat Indonesia Persero Tbk PT | | | 367,100 | | | | 318,122 | |
Bank Zachodni WBK S.A. | | | 987 | | | | 74,717 | |
Bankia S.A. | | | 187,778 | | | | 192,315 | |
Bankinter S.A. | | | 21,316 | | | | 165,475 | |
Barclays Africa Group Ltd. | | | 16,356 | | | | 201,762 | |
Barclays PLC | | | 535,746 | | | | 1,479,226 | |
BDO Unibank Inc. | | | 56,200 | | | | 126,729 | |
BNP Paribas S.A. | | | 33,460 | | | | 2,136,927 | |
BOC Hong Kong Holdings Ltd. | | | 104,000 | | | | 372,236 | |
CaixaBank S.A. | | | 83,276 | | | | 275,803 | |
Canadian Imperial Bank of Commerce | | | 11,748 | | | | 959,778 | |
Chang Hwa Commercial Bank Ltd. | | | 219,100 | | | | 116,590 | |
China CITIC Bank Corporation Ltd., Class H | | | 336,000 | | | | 213,653 | |
China Construction Bank Corp., Class H | | | 2,587,000 | | | | 1,992,015 | |
China Development Financial Holding Corp. | | | 406,000 | | | | 101,535 | |
China Merchants Bank Company Ltd., Class H | | | 131,231 | | | | 307,717 | |
China Minsheng Banking Corporation Ltd., Class H | | | 244,200 | | | | 261,109 | |
CIMB Group Holdings Bhd | | | 125,293 | | | | 125,963 | |
Commercial International Bank Egypt SAE | | | 34,995 | | | | 141,003 | |
Commerzbank AG | | | 36,239 | | | | 276,964 | |
Commonwealth Bank of Australia | | | 54,430 | | | | 3,248,005 | |
Credicorp Ltd. | | | 1,351 | | | | 213,269 | |
Credit Agricole S.A. | | | 35,241 | | | | 437,868 | |
CTBC Financial Holding Company Ltd. | | | 600,661 | | | | 328,948 | |
Danske Bank A/S | | | 20,241 | | | | 615,021 | |
DBS Group Holdings Ltd. | | | 48,800 | | | | 585,722 | |
DNB ASA | | | 35,006 | | | | 522,180 | |
Doha Bank QSC | | | 4,274 | | | | 40,963 | |
Dubai Islamic Bank PJSC | | | 56,399 | | | | 85,530 | |
E.Sun Financial Holding Company Ltd. | | | 225,869 | | | | 128,601 | |
Erste Group Bank AG | | | 9,534 | | | | 279,808 | (a) |
Eurobank Ergasias S.A. | | | 2,173 | | | | 1,478 | (a) |
First Financial Holding Company Ltd. | | | 292,320 | | | | 156,006 | |
First Gulf Bank PJSC | | | 25,788 | | | | 90,222 | |
Grupo Financiero Banorte SAB de C.V., Class O | | | 84,000 | | | | 416,300 | |
Grupo Financiero Inbursa SAB de C.V., Class O | | | 94,700 | | | | 144,430 | |
Grupo Financiero Santander Mexico SAB de C.V., Class B | | | 68,900 | | | | 99,697 | |
Hana Financial Group Inc. | | | 9,676 | | | | 250,352 | |
Hang Seng Bank Ltd. | | | 23,800 | | | | 442,961 | |
Hong Leong Bank Bhd | | | 22,500 | | | | 67,711 | |
Hong Leong Financial Group Bhd | | | 8,200 | | | | 25,993 | |
HSBC Holdings PLC | | | 633,497 | | | | 5,142,083 | |
Hua Nan Financial Holdings Company Ltd. | | | 246,391 | | | | 124,231 | |
| | | | | | | | |
ICICI Bank Ltd. | | | 47,185 | | | | 177,317 | |
Industrial & Commercial Bank of China Ltd., Class H | | | 2,352,000 | | | | 1,410,627 | |
Industrial Bank of Korea | | | 6,426 | | | | 67,569 | |
ING Groep N.V. | | | 120,210 | | | | 1,695,202 | |
Intesa Sanpaolo S.p.A. | | | 422,956 | | | | 1,082,270 | |
Intesa Sanpaolo S.p.A. | | | 18,145 | | | | 42,755 | |
Itau CorpBanca | | | 5,524,790 | | | | 46,192 | |
Japan Post Bank Company Ltd. | | | 14,500 | | | | 174,420 | |
Kasikornbank PCL | | | 38,000 | | | | 188,353 | |
Kasikornbank PCL NVDR | | | 25,000 | | | | 123,916 | |
KB Financial Group Inc. | | | 13,042 | | | | 462,161 | |
KBC Group N.V. | | | 7,865 | | | | 488,031 | |
Komercni Banka AS | | | 2,365 | | | | 81,701 | |
Krung Thai Bank PCL NVDR | | | 138,400 | | | | 68,407 | |
Lloyds Banking Group PLC | | | 2,012,402 | | | | 1,554,388 | |
Malayan Banking Bhd | | | 68,900 | | | | 125,943 | |
Masraf Al Rayan QSC | | | 10,608 | | | | 109,535 | |
mBank S.A. | | | 587 | | | | 47,144 | (a) |
Mega Financial Holding Company Ltd. | | | 315,192 | | | | 224,935 | |
Metropolitan Bank & Trust Co. | | | 17,411 | | | | 25,427 | |
Mitsubishi UFJ Financial Group Inc. | | | 403,900 | | | | 2,494,009 | |
Mizrahi Tefahot Bank Ltd. | | | 4,951 | | | | 72,490 | |
Mizuho Financial Group Inc. | | | 773,800 | | | | 1,391,891 | |
National Australia Bank Ltd. | | | 84,371 | | | | 1,873,723 | |
National Bank of Abu Dhabi PJSC | | | 25,568 | | | | 69,543 | |
National Bank of Canada | | | 10,963 | | | | 445,779 | |
National Bank of Greece S.A. | | | 1,560 | | | | 408 | (a) |
Natixis S.A. | | | 35,140 | | | | 198,663 | |
Nedbank Group Ltd. | | | 9,395 | | | | 163,600 | |
Nordea Bank AB | | | 88,046 | | | | 981,778 | |
OTP Bank PLC | | | 8,571 | | | | 245,862 | |
Oversea-Chinese Banking Corporation Ltd. | | | 98,775 | | | | 609,866 | |
Piraeus Bank S.A. | | | 840 | | | | 185 | (a) |
Powszechna Kasa Oszczednosci Bank Polski S.A. | | | 35,676 | | | | 240,501 | (a) |
Public Bank Bhd | | | 81,840 | | | | 359,760 | |
Qatar Islamic Bank SAQ | | | 3,300 | | | | 94,159 | |
Qatar National Bank SAQ | | | 7,544 | | | | 337,485 | |
Raiffeisen Bank International AG | | | 5,172 | | | | 94,811 | (a) |
RHB Bank Bhd | | | 34,822 | | | | 36,561 | |
Royal Bank of Canada | | | 46,213 | | | | 3,131,408 | |
Royal Bank of Scotland Group PLC | | | 116,212 | | | | 322,520 | (a) |
Sberbank of Russia PJSC ADR | | | 88,322 | | | | 1,022,327 | |
Shinhan Financial Group Company Ltd. | | | 14,787 | | | | 553,992 | |
SinoPac Financial Holdings Company Ltd. | | | 324,436 | | | | 91,405 | |
Skandinaviska Enskilda Banken AB, Class A | | | 46,511 | | | | 489,193 | |
Societe Generale S.A. | | | 25,554 | | | | 1,259,922 | |
Standard Bank Group Ltd. | | | 39,937 | | | | 443,177 | |
Standard Chartered PLC | | | 103,603 | | | | 849,521 | (a) |
State Bank of India | | | 58,990 | | | | 217,551 | |
Sumitomo Mitsui Financial Group Inc. | | | 43,600 | | | | 1,667,218 | |
Sumitomo Mitsui Trust Holdings Inc. | | | 10,500 | | | | 376,572 | |
Svenska Handelsbanken AB, Class A | | | 50,030 | | | | 697,202 | |
Swedbank AB, Class A | | | 28,962 | | | | 702,324 | |
Taishin Financial Holding Company Ltd. | | | 269,038 | | | | 98,503 | |
Taiwan Business Bank | | | 163,289 | | | | 41,292 | |
Taiwan Cooperative Financial Holding Company Ltd. | | | 281,262 | | | | 122,614 | |
The Bank of East Asia Ltd. | | | 40,000 | | | | 153,228 | |
The Bank of Nova Scotia | | | 38,459 | | | | 2,143,988 | |
The Bank of NT Butterfield & Son Ltd. | | | 240 | | | | 7,546 | |
| | | | | | | | |
The Commercial Bank QSC | | | 702 | | | | 1,349 | (a,j) |
The Commercial Bank QSC | | | 3,901 | | | | 34,817 | |
The Siam Commercial Bank PCL NVDR | | | 60,100 | | | | 255,937 | |
The Toronto-Dominion Bank | | | 59,015 | | | | 2,914,115 | |
TMB Bank PCL NVDR | | | 250,000 | | | | 14,660 | |
Turkiye Garanti Bankasi AS | | | 68,113 | | | | 147,550 | |
Turkiye Halk Bankasi AS | | | 25,730 | | | | 68,319 | |
Turkiye Is Bankasi, Class C | | | 27,410 | | | | 40,364 | |
Turkiye Vakiflar Bankasi Tao, Class D | | | 28,976 | | | | 35,833 | |
UniCredit S.p.A. | | | 173,837 | | | | 501,291 | |
United Overseas Bank Ltd. | | | 38,431 | | | | 542,668 | |
VTB Bank PJSC GDR | | | 85,999 | | | | 205,280 | |
Westpac Banking Corp. | | | 105,590 | | | | 2,492,521 | |
Woori Bank | | | 10,759 | | | | 113,576 | |
Yapi ve Kredi Bankasi AS | | | 34,531 | | | | 33,671 | (a) |
Yes Bank Ltd. | | | 9,342 | | | | 158,981 | |
| | | | 76,470,233 | |
| | |
Diversified Capital Markets—0.2% | | | | | | | | |
China Everbright Ltd. | | | 36,000 | | | | 68,535 | |
Credit Suisse Group AG | | | 63,438 | | | | 911,919 | (a) |
Deutsche Bank AG | | | 45,238 | | | | 823,080 | (a) |
Investec Ltd. | | | 5,853 | | | | 38,841 | |
Investec PLC | | | 16,614 | | | | 110,036 | |
Macquarie Group Ltd. | | | 9,335 | | | | 588,885 | |
Mirae Asset Daewoo Company Ltd. | | | 7,490 | | | | 44,898 | |
UBS Group AG | | | 115,211 | | | | 1,808,054 | |
| | | | 4,394,248 | |
| | |
Diversified Chemicals—0.2% | | | | | | | | |
Arkema S.A. | | | 2,771 | | | | 271,637 | |
BASF SE | | | 29,218 | | | | 2,721,510 | |
Daicel Corp. | | | 11,000 | | | | 121,662 | |
Incitec Pivot Ltd. | | | 61,205 | | | | 159,547 | |
Lanxess AG | | | 3,347 | | | | 220,111 | |
Mitsubishi Chemical Holdings Corp. | | | 45,800 | | | | 297,650 | |
Mitsubishi Gas Chemical Company Inc. | | | 7,000 | | | | 119,732 | |
Nissan Chemical Industries Ltd. | | | 3,600 | | | | 120,530 | |
OCI Company Ltd. | | | 643 | | | | 41,898 | (a) |
Sasol Ltd. | | | 18,970 | | | | 553,355 | |
Solvay S.A. | | | 2,328 | | | | 273,415 | |
Sumitomo Chemical Company Ltd. | | | 50,000 | | | | 238,350 | |
| | | | 5,139,397 | |
| | |
Diversified Metals & Mining—0.4% | | | | | | | | |
Anglo American PLC | | | 47,262 | | | | 677,432 | (a) |
BHP Billiton Ltd. | | | 103,238 | | | | 1,873,351 | |
BHP Billiton PLC | | | 60,023 | | | | 968,997 | |
Boliden AB | | | 11,175 | | | | 292,642 | |
Ferroglobe PLC | | | 1,316 | | | | 14,252 | |
Ferroglobe PLC | | | 1,316 | | | | — | (j) |
Glencore PLC | | | 387,241 | | | | 1,327,104 | (a) |
Grupo Mexico SAB de C.V., Class B | | | 98,250 | | | | 268,451 | |
Korea Zinc Company Ltd. | | | 341 | | | | 134,107 | |
Mitsubishi Materials Corp. | | | 2,800 | | | | 86,183 | |
MMC Norilsk Nickel PJSC ADR | | | 20,445 | | | | 345,929 | |
Rio Tinto Ltd. | | | 12,764 | | | | 553,620 | |
Rio Tinto PLC | | | 38,910 | | | | 1,518,579 | |
South32 Ltd. | | | 188,208 | | | | 374,774 | |
Sumitomo Metal Mining Company Ltd. | | | 13,000 | | | | 167,968 | |
| | | | | | | | |
Teck Resources Ltd., Class B | | | 18,681 | | | | 374,303 | |
Turquoise Hill Resources Ltd. | | | 29,112 | | | | 93,563 | (a) |
Vedanta Ltd. | | | 42,022 | | | | 133,923 | |
| | | | 9,205,178 | |
| | |
Diversified Real Estate Activities—0.3% | | | | | | | | |
Aldar Properties PJSC | | | 118,736 | | | | 85,022 | |
Ayala Land Inc. | | | 254,600 | | | | 163,886 | |
Barwa Real Estate Co. | | | 6,158 | | | | 56,229 | |
CapitaLand Ltd. | | | 75,000 | | | | 156,780 | |
City Developments Ltd. | | | 16,000 | | | | 91,701 | |
Daito Trust Construction Company Ltd. | | | 2,500 | | | | 376,817 | |
Daiwa House Industry Company Ltd. | | | 17,700 | | | | 485,011 | |
Ezdan Holding Group QSC | | | 23,752 | | | | 98,559 | |
Hang Lung Properties Ltd. | | | 80,000 | | | | 169,634 | |
Henderson Land Development Company Ltd. | | | 35,318 | | | | 187,907 | |
Kerry Properties Ltd. | | | 29,500 | | | | 80,093 | |
LendLease Group | | | 16,540 | | | | 175,098 | |
Mitsubishi Estate Company Ltd. | | | 39,000 | | | | 778,261 | |
Mitsui Fudosan Company Ltd. | | | 30,000 | | | | 695,760 | |
New World Development Company Ltd. | | | 202,019 | | | | 213,662 | |
Nomura Real Estate Holdings Inc. | | | 5,000 | | | | 85,223 | |
Sumitomo Realty & Development Company Ltd. | | | 12,000 | | | | 319,561 | |
Sun Hung Kai Properties Ltd. | | | 46,000 | | | | 581,441 | |
Swire Pacific Ltd., Class A | | | 16,000 | | | | 152,815 | |
The Wharf Holdings Ltd. | | | 42,000 | | | | 279,254 | |
Tokyo Tatemono Company Ltd. | | | 8,500 | | | | 113,907 | |
Tokyu Fudosan Holdings Corp. | | | 18,000 | | | | 106,486 | |
UOL Group Ltd. | | | 18,000 | | | | 74,632 | |
Wheelock & Company Ltd. | | | 24,000 | | | | 135,119 | |
| | | | 5,662,858 | |
| | |
Diversified REITs—0.1% | | | | | | | | |
Fibra Uno Administracion S.A. de C.V. | | | 80,100 | | | | 123,174 | |
Fonciere Des Regions | | | 1,009 | | | | 88,268 | |
Gecina S.A. | | | 1,411 | | | | 195,631 | |
Growthpoint Properties Ltd. | | | 60,504 | | | | 114,548 | |
H&R Real Estate Investment Trust | | | 5,097 | | | | 85,023 | |
ICADE | | | 1,137 | | | | 81,297 | |
Land Securities Group PLC | | | 28,796 | | | | 379,302 | |
Mirvac Group | | | 110,757 | | | | 170,824 | |
Nomura Real Estate Master Fund Inc. | | | 120 | | | | 181,901 | |
Redefine Properties Ltd. | | | 110,314 | | | | 90,268 | |
Stockland | | | 73,217 | | | | 242,815 | |
Suntec Real Estate Investment Trust | | | 115,500 | | | | 131,913 | |
The GPT Group | | | 54,229 | | | | 197,514 | |
United Urban Investment Corp. | | | 89 | | | | 135,749 | |
| | | | 2,218,227 | |
| | |
Diversified Support Services—0.0% * | | | | | | | | |
Babcock International Group PLC | | | 10,408 | | | | 122,562 | |
Brambles Ltd. | | | 46,709 | | | | 419,392 | |
Edenred | | | 7,377 | | | | 146,553 | |
ISS A/S | | | 5,324 | | | | 180,046 | |
KEPCO Plant Service & Engineering Company Ltd. | | | 1,248 | | | | 56,004 | |
| | | | 924,557 | |
| | |
Drug Retail—0.0% * | | | | | | | | |
Raia Drogasil S.A. | | | 7,400 | | | | 139,124 | |
| | | | | | | | |
Education Services—0.0% * | | | | | | | | |
Benesse Holdings Inc. | | | 3,000 | | | | 82,823 | |
Kroton Educacional S.A. | | | 39,716 | | | | 162,661 | |
New Oriental Education & Technology Group Inc. ADR | | | 4,500 | | | | 189,450 | (a) |
| | | | 434,934 | |
| | |
Electric Utilities—0.4% | | | | | | | | |
AusNet Services | | | 64,560 | | | | 73,862 | |
CEZ AS | | | 6,598 | | | | 110,748 | |
Cheung Kong Infrastructure Holdings Ltd. | | | 22,000 | | | | 175,077 | |
Chubu Electric Power Company Inc. | | | 22,600 | | | | 316,421 | |
CLP Holdings Ltd. | | | 55,000 | | | | 505,440 | |
Contact Energy Ltd. | | | 14,241 | | | | 46,275 | |
CPFL Energia S.A. | | | 9,731 | | | | 75,374 | |
EDP—Energias de Portugal S.A. | | | 80,877 | | | | 246,873 | |
EDP—Energias do Brasil S.A. | | | 9,400 | | | | 38,701 | |
Electricite de France S.A. | | | 8,515 | | | | 86,938 | |
Endesa S.A. | | | 9,132 | | | | 193,844 | |
Enel Americas S.A. | | | 730,486 | | | | 114,516 | |
Enel Chile S.A. | | | 730,486 | | | | 66,637 | |
Enel S.p.A. | | | 230,606 | | | | 1,018,654 | |
Fortis Inc. | | | 8,347 | | | | 258,056 | |
Fortum Oyj | | | 11,864 | | | | 182,322 | |
Hokuriku Electric Power Co. | | | 6,200 | | | | 69,636 | |
Iberdrola S.A. | | | 173,263 | | | | 1,139,258 | |
Interconexion Electrica S.A. ESP | | | 12,838 | | | | 42,679 | |
Korea Electric Power Corp. | | | 8,344 | | | | 304,316 | |
Kyushu Electric Power Company Inc. | | | 17,100 | | | | 185,903 | |
PGE Polska Grupa Energetyczna S.A. | | | 27,532 | | | | 68,924 | |
Power Assets Holdings Ltd. | | | 43,000 | | | | 379,078 | |
Red Electrica Corp. S.A. | | | 16,860 | | | | 318,762 | |
RusHydro PJSC ADR | | | 52,229 | | | | 75,993 | |
SSE PLC | | | 31,774 | | | | 609,732 | |
Tata Power Company Ltd. | | | 40,698 | | | | 45,393 | |
Tauron Polska Energia S.A. | | | 37,527 | | | | 25,622 | (a) |
Tenaga Nasional Bhd | | | 88,500 | | | | 274,220 | |
Terna Rete Elettrica Nazionale S.p.A. | | | 57,316 | | | | 263,096 | |
The Chugoku Electric Power Company Inc. | | | 11,800 | | | | 138,705 | |
The Kansai Electric Power Company Inc. | | | 21,400 | | | | 234,485 | (a) |
Tohoku Electric Power Company Inc. | | | 17,000 | | | | 215,278 | |
Tokyo Electric Power Company Holdings Inc. | | | 54,100 | | | | 218,933 | (a) |
| | | | 8,119,751 | |
| | |
Electrical Components & Equipment—0.2% | | | | | | | | |
ABB Ltd. | | | 59,625 | | | | 1,260,142 | (a) |
Fuji Electric Company Ltd. | | | 21,000 | | | | 109,109 | |
Legrand S.A. | | | 9,580 | | | | 545,138 | |
Mabuchi Motor Company Ltd. | | | 1,800 | | | | 94,140 | |
Nidec Corp. | | | 7,900 | | | | 683,084 | |
OSRAM Licht AG | | | 2,597 | | | | 136,480 | |
Prysmian S.p.A. | | | 7,493 | | | | 192,839 | |
Schneider Electric SE | | | 17,374 | | | | 1,211,481 | |
Teco Electric and Machinery Company Ltd. | | | 64,000 | | | | 55,403 | |
Zhuzhou CRRC Times Electric Company Ltd., Class H | | | 17,000 | | | | 86,281 | |
| | | | 4,374,097 | |
| | |
Electronic Components—0.2% | | | | | | | | |
Alps Electric Company Ltd. | | | 5,800 | | | | 140,531 | |
AU Optronics Corp. | | | 313,000 | | | | 114,599 | |
Delta Electronics Inc. | | | 62,000 | | | | 306,835 | |
| | | | | | | | |
Hamamatsu Photonics KK | | | 5,200 | | | | 137,094 | |
Hirose Electric Company Ltd. | | | 1,200 | | | | 149,080 | |
Innolux Corp. | | | 289,212 | | | | 104,094 | |
Kyocera Corp. | | | 10,500 | | | | 523,222 | |
Largan Precision Company Ltd. | | | 3,000 | | | | 352,788 | |
LG Display Company Ltd. | | | 7,752 | | | | 201,855 | |
LG Innotek Company Ltd. | | | 512 | | | | 37,474 | |
Murata Manufacturing Company Ltd. | | | 6,100 | | | | 818,494 | |
Nippon Electric Glass Company Ltd. | | | 14,000 | | | | 75,861 | |
Omron Corp. | | | 6,300 | | | | 242,256 | |
Samsung Electro-Mechanics Company Ltd. | | | 1,559 | | | | 65,571 | |
Samsung SDI Company Ltd. | | | 1,803 | | | | 162,715 | |
TDK Corp. | | | 4,100 | | | | 282,625 | |
Yaskawa Electric Corp. | | | 8,000 | | | | 124,697 | |
Zhen Ding Technology Holding Ltd. | | | 7,350 | | | | 14,550 | |
| | | | 3,854,341 | |
| | |
Electronic Equipment & Instruments—0.1% | | | | | | | | |
Hexagon AB, Class B | | | 8,413 | | | | 301,437 | |
Hitachi High-Technologies Corp. | | | 2,400 | | | | 97,020 | |
Hitachi Ltd. | | | 156,000 | | | | 845,304 | |
Ingenico Group S.A. | | | 1,804 | | | | 144,363 | |
Keyence Corp. | | | 1,500 | | | | 1,031,423 | |
Shimadzu Corp. | | | 9,000 | | | | 143,679 | |
Yokogawa Electric Corp. | | | 9,000 | | | | 130,638 | |
| | | | 2,693,864 | |
| | |
Electronic Manufacturing Services—0.1% | | | | | | | | |
AAC Technologies Holdings Inc. | | | 24,000 | | | | 218,079 | |
Fabrinet | | | 697 | | | | 28,089 | (a) |
Hon Hai Precision Industry Company Ltd. | | | 503,844 | | | | 1,316,320 | |
TE Connectivity Ltd. | | | 15,873 | | | | 1,099,681 | |
| | | | 2,662,169 | |
| | |
Environmental��& Facilities Services—0.0% * | | | | | | | | |
China Everbright International Ltd. | | | 88,000 | | | | 99,769 | |
Park24 Company Ltd. | | | 3,100 | | | | 84,254 | |
| | | | 184,023 | |
| | |
Fertilizers & Agricultural Chemicals—0.1% | | | | | | | | |
Agrium Inc. | | | 4,351 | | | | 437,874 | |
Grupa Azoty S.A. | | | 816 | | | | 12,251 | |
Israel Chemicals Ltd. | | | 18,673 | | | | 76,659 | |
K+S AG | | | 6,950 | | | | 166,329 | |
Potash Corporation of Saskatchewan Inc. | | | 26,038 | | | | 471,618 | |
Syngenta AG | | | 3,083 | | | | 1,220,945 | |
Taiwan Fertilizer Company Ltd. | | | 28,000 | | | | 34,882 | |
UPL Ltd. | | | 8,010 | | | | 76,341 | |
Yara International ASA | | | 5,387 | | | | 212,784 | |
| | | | 2,709,683 | |
| | |
Financial Exchanges & Data—0.1% | | | | | | | | |
ASX Ltd. | | | 6,529 | | | | 235,153 | |
BM&FBovespa S.A. | | | 60,000 | | | | 304,175 | |
Deutsche Boerse AG | | | 6,462 | | | | 528,497 | (a) |
Hong Kong Exchanges & Clearing Ltd. | | | 37,700 | | | | 890,817 | |
Japan Exchange Group Inc. | | | 15,900 | | | | 227,659 | |
London Stock Exchange Group PLC | | | 9,750 | | | | 351,067 | |
Singapore Exchange Ltd. | | | 29,300 | | | | 145,212 | |
Thomson Reuters Corp. | | | 8,493 | | | | 372,133 | |
| | | | 3,054,713 | |
| | | | | | | | |
Food Distributors—0.0% * | | | | | | | | |
Bid Corporation Ltd. | | | 11,502 | | | | 206,195 | |
The Spar Group Ltd. | | | 6,247 | | | | 90,715 | |
| | | | 296,910 | |
| | |
Food Retail—0.3% | | | | | | | | |
Alimentation Couche-Tard Inc., Class B | | | 13,852 | | | | 628,843 | |
BIM Birlesik Magazalar AS | | | 7,874 | | | | 109,685 | |
Casino Guichard Perrachon S.A. | | | 2,125 | | | | 102,183 | |
Colruyt S.A. | | | 2,817 | | | | 139,663 | |
CP ALL PCL NVDR | | | 164,800 | | | | 287,625 | |
Empire Company Ltd., Class A | | | 3,981 | | | | 46,666 | |
Eurocash S.A. | | | 2,510 | | | | 23,655 | |
FamilyMart UNY Holdings Company Ltd. | | | 2,200 | | | | 146,748 | |
George Weston Ltd. | | | 1,978 | | | | 167,541 | |
ICA Gruppen AB | | | 2,095 | | | | 64,087 | |
J Sainsbury PLC | | | 48,231 | | | | 148,574 | |
Jeronimo Martins SGPS S.A. | | | 11,329 | | | | 176,132 | |
Koninklijke Ahold Delhaize N.V. | | | 40,413 | | | | 853,791 | |
Lawson Inc. | | | 1,900 | | | | 133,742 | |
Loblaw Companies Ltd. | | | 6,400 | | | | 338,075 | |
Magnit PJSC GDR | | | 9,333 | | | | 412,052 | |
Metro Inc. | | | 8,754 | | | | 262,153 | |
Pick n Pay Stores Ltd. | | | 9,438 | | | | 43,977 | |
President Chain Store Corp. | | | 21,000 | | | | 150,517 | |
Seven & I Holdings Company Ltd. | | | 24,800 | | | | 946,838 | |
Shoprite Holdings Ltd. | | | 16,646 | | | | 208,711 | |
Tesco PLC | | | 260,897 | | | | 666,837 | (a) |
WM Morrison Supermarkets PLC | | | 66,803 | | | | 190,432 | |
Woolworths Ltd. | | | 38,507 | | | | 671,978 | |
| | | | 6,920,505 | |
| | |
Footwear—0.0% * | | | | | | | | |
Anta Sports Products Ltd. | | | 34,000 | | | | 101,520 | |
Asics Corp. | | | 6,600 | | | | 132,130 | |
Belle International Holdings Ltd. | | | 203,000 | | | | 114,158 | |
Feng TAY Enterprise Company Ltd. | | | 12,320 | | | | 46,063 | |
Pou Chen Corp. | | | 80,000 | | | | 99,786 | |
Yue Yuen Industrial Holdings Ltd. | | | 31,000 | | | | 112,554 | |
| | | | 606,211 | |
| | |
Forest Products—0.0% * | | | | | | | | |
Duratex S.A. | | | 11,374 | | | | 23,764 | (a) |
West Fraser Timber Company Ltd. | | | 3,058 | | | | 109,477 | |
| | | | 133,241 | |
| | |
Gas Utilities—0.1% | | | | | | | | |
APA Group | | | 33,674 | | | | 208,965 | |
China Gas Holdings Ltd. | | | 58,000 | | | | 78,698 | |
China Resources Gas Group Ltd. | | | 34,000 | | | | 95,600 | |
Enagas S.A. | | | 7,905 | | | | 201,149 | |
ENN Energy Holdings Ltd. | | | 32,000 | | | | 131,663 | |
GAIL India Ltd. | | | 14,061 | | | | 90,442 | |
Gas Natural SDG S.A. | | | 10,427 | | | | 196,972 | |
Hong Kong & China Gas Company Ltd. | | | 241,688 | | | | 428,315 | |
Korea Gas Corp. | | | 1,143 | | | | 45,851 | |
Osaka Gas Company Ltd. | | | 57,000 | | | | 219,721 | |
Perusahaan Gas Negara Persero Tbk | | | 436,000 | | | | 87,378 | |
Petronas Gas Bhd | | | 24,000 | | | | 113,955 | |
Toho Gas Company Ltd. | | | 15,000 | | | | 122,305 | |
Tokyo Gas Company Ltd. | | | 67,000 | | | | 303,822 | |
| | | | 2,324,836 | |
| | | | | | | | |
General Merchandise Stores—0.0% * | | | | | | | | |
Canadian Tire Corporation Ltd., Class A | | | 2,622 | | | | 272,299 | |
Dollarama Inc. | | | 4,331 | | | | 317,724 | |
Don Quijote Holdings Company Ltd. | | | 4,000 | | | | 148,326 | |
Harvey Norman Holdings Ltd. | | | 20,526 | | | | 76,395 | |
Lojas Americanas S.A. | | | 5,850 | | | | 22,414 | |
Ryohin Keikaku Company Ltd. | | | 700 | | | | 137,497 | |
| | | | 974,655 | |
| | |
Gold—0.1% | | | | | | | | |
Agnico Eagle Mines Ltd. | | | 7,434 | | | | 312,926 | |
AngloGold Ashanti Ltd. | | | 14,863 | | | | 165,835 | (a) |
Barrick Gold Corp. | | | 40,239 | | | | 644,820 | |
Cia de Minas Buenaventura S.A. ADR | | | 8,589 | | | | 96,884 | |
Eldorado Gold Corp. | | | 25,001 | | | | 80,537 | (a) |
Franco-Nevada Corp. | | | 6,022 | | | | 360,498 | |
Gold Fields Ltd. | | | 31,089 | | | | 99,098 | |
Goldcorp Inc. | | | 27,809 | | | | 379,068 | |
Kinross Gold Corp. | | | 42,336 | | | | 132,275 | (a) |
Newcrest Mining Ltd. | | | 27,147 | | | | 398,057 | |
Randgold Resources Ltd. | | | 3,180 | | | | 252,069 | |
Yamana Gold Inc. | | | 28,763 | | | | 80,860 | |
Zijin Mining Group Company Ltd., Class H | | | 230,000 | | | | 74,163 | |
| | | | 3,077,090 | |
| | |
Healthcare Distributors—0.0% * | | | | | | | | |
Alfresa Holdings Corp. | | | 6,400 | | | | 106,122 | |
Medipal Holdings Corp. | | | 5,400 | | | | 85,328 | |
Shanghai Pharmaceuticals Holding Company Ltd., Class H | | | 22,700 | | | | 52,057 | |
Sinopharm Group Company Ltd., Class H | | | 41,600 | | | | 171,430 | |
Suzuken Company Ltd. | | | 2,800 | | | | 91,705 | |
| | | | 506,642 | |
| | |
Healthcare Equipment—0.3% | | | | | | | | |
Cochlear Ltd. | | | 1,696 | | | | 150,500 | |
Getinge AB, Class B | | | 7,959 | | | | 127,998 | |
LivaNova PLC | | | 384 | | | | 17,269 | (a) |
Medtronic PLC | | | 61,363 | | | | 4,370,887 | |
Novocure Ltd. | | | 1,017 | | | | 7,984 | (a) |
Olympus Corp. | | | 8,700 | | | | 301,350 | |
Oxford Immunotec Global PLC | | | 448 | | | | 6,698 | (a) |
Smith & Nephew PLC | | | 31,271 | | | | 471,794 | |
Sonova Holding AG | | | 1,517 | | | | 184,186 | |
STERIS PLC | | | 742 | | | | 50,003 | |
Sysmex Corp. | | | 5,200 | | | | 301,831 | |
Terumo Corp. | | | 9,100 | | | | 336,661 | |
William Demant Holding A/S | | | 6,135 | | | | 106,869 | (a) |
Wright Medical Group N.V. | | | 1,980 | | | | 45,500 | (a) |
| | | | 6,479,530 | |
| | |
Healthcare Facilities—0.0% * | | | | | | | | |
Apollo Hospitals Enterprise Ltd. | | | 2,610 | | | | 45,486 | |
Bangkok Dusit Medical Services PCL NVDR | | | 109,000 | | | | 70,312 | |
Bumrungrad Hospital PCL NVDR | | | 13,000 | | | | 65,707 | |
Healthscope Ltd. | | | 32,226 | | | | 53,437 | |
IHH Healthcare Bhd | | | 95,100 | | | | 134,615 | |
Life Healthcare Group Holdings Ltd. | | | 38,831 | | | | 92,570 | |
Mediclinic International PLC | | | 10,371 | | | | 98,803 | |
Netcare Ltd. | | | 33,031 | | | | 76,907 | |
Ramsay Health Care Ltd. | | | 4,955 | | | | 245,055 | |
Ryman Healthcare Ltd. | | | 4,493 | | | | 25,408 | |
| | | | 908,300 | |
| | | | | | | | |
Healthcare Services—0.1% | | | | | | | | |
Fresenius Medical Care AG & Company KGaA | | | 7,259 | | | | 615,960 | |
Fresenius SE & Company KGaA | | | 13,149 | | | | 1,029,905 | |
Miraca Holdings Inc. | | | 2,100 | | | | 94,526 | |
Nobilis Health Corp. | | | 1,159 | | | | 2,434 | (a) |
Sonic Healthcare Ltd. | | | 15,192 | | | | 235,411 | |
| | | | 1,978,236 | |
| | |
Healthcare Supplies—0.1% | | | | | | | | |
Coloplast A/S, Class B | | | 3,718 | | | | 251,205 | |
Essilor International S.A. | | | 6,936 | | | | 785,345 | |
Hoya Corp. | | | 12,700 | | | | 534,743 | |
Shandong Weigao Group Medical Polymer Company Ltd., Class H | | | 60,000 | | | | 40,087 | |
| | | | 1,611,380 | |
| | |
Healthcare Technology—0.0% * | | | | | | | | |
Alibaba Health Information Technology Ltd. | | | 44,000 | | | | 22,133 | (a) |
M3 Inc. | | | 4,800 | | | | 121,199 | |
| | | | 143,332 | |
| | |
Heavy Electrical Equipment—0.1% | | | | | | | | |
Bharat Heavy Electricals Ltd. | | | 22,240 | | | | 39,634 | |
Doosan Heavy Industries & Construction Company Ltd. | | | 2,060 | | | | 46,392 | |
Mitsubishi Electric Corp. | | | 57,000 | | | | 796,343 | |
Shanghai Electric Group Company Ltd., Class H | | | 108,000 | | | | 48,337 | (a) |
Vestas Wind Systems A/S | | | 7,811 | | | | 508,578 | |
| | | | 1,439,284 | |
| | |
Highways & Railtracks—0.1% | | | | | | | | |
Abertis Infraestructuras S.A. | | | 16,021 | | | | 224,661 | |
Atlantia S.p.A. | | | 13,697 | | | | 321,588 | |
CCR S.A. | | | 36,100 | | | | 177,023 | |
Groupe Eurotunnel SE | | | 16,536 | | | | 157,565 | |
Jasa Marga Persero Tbk PT | | | 86,987 | | | | 27,893 | |
Jiangsu Expressway Company Ltd., Class H | | | 44,000 | | | | 55,616 | |
OHL Mexico SAB de C.V. | | | 24,300 | | | | 24,051 | |
Promotora y Operadora de Infraestructura SAB de C.V. | | | 7,800 | | | | 65,500 | |
Transurban Group | | | 63,583 | | | | 475,137 | |
Zhejiang Expressway Company Ltd., Class H | | | 52,000 | | | | 49,631 | |
| | | | 1,578,665 | |
| | |
Home Building—0.1% | | | | | | | | |
Barratt Developments PLC | | | 32,674 | | | | 186,688 | |
Iida Group Holdings Company Ltd. | | | 5,300 | | | | 100,742 | |
Persimmon PLC | | | 9,736 | | | | 213,658 | |
Sekisui Chemical Company Ltd. | | | 12,300 | | | | 196,572 | |
Sekisui House Ltd. | | | 17,700 | | | | 295,240 | |
Taylor Wimpey PLC | | | 108,071 | | | | 204,981 | |
| | | | 1,197,881 | |
| | |
Home Entertainment Software—0.1% | | | | | | | | |
Kingsoft Corporation Ltd. | | | 27,000 | | | | 55,371 | |
Konami Holdings Corp. | | | 3,800 | | | | 153,779 | |
NCSoft Corp. | | | 441 | | | | 90,369 | |
Nexon Company Ltd. | | | 4,000 | | | | 58,095 | |
Nintendo Company Ltd. | | | 3,700 | | | | 778,480 | |
| | | | 1,136,094 | |
| | |
Home Furnishing Retail—0.0% * | | | | | | | | |
Nitori Holdings Company Ltd. | | | 2,600 | | | | 297,818 | |
| | |
Home Furnishings—0.0% * | | | | | | | | |
Hanssem Company Ltd. | | | 497 | | | | 81,887 | |
Steinhoff International Holdings N.V. | | | 81,878 | | | | 426,783 | |
| | | | 508,670 | |
| | | | | | | | |
| | |
Home Improvement Retail—0.0% * | | | | | | | | |
Home Product Center PCL NVDR | | | 107,359 | | | | 30,579 | |
Kingfisher PLC | | | 64,617 | | | | 279,694 | |
| | | | 310,273 | |
| | |
Hotels, Resorts & Cruise Lines—0.1% | | | | | | | | |
Accor S.A. | | | 4,749 | | | | 177,469 | |
Belmond Ltd., Class A | | | 1,687 | | | | 22,521 | (a) |
Carnival PLC | | | 6,284 | | | | 320,299 | |
Flight Centre Travel Group Ltd. | | | 2,032 | | | | 46,054 | |
InterContinental Hotels Group PLC | | | 7,005 | | | | 314,895 | |
Minor International PCL NVDR | | | 48,840 | | | | 48,758 | |
Shangri-La Asia Ltd. | | | 34,000 | | | | 35,872 | |
TUI AG | | | 18,655 | | | | 268,084 | |
| | | | 1,233,952 | |
| | |
Household Appliances—0.0% * | | | | | �� | | | |
Arcelik AS | | | 8,562 | | | | 51,602 | |
Coway Company Ltd. | | | 1,774 | | | | 129,694 | |
Electrolux AB, Class B | | | 6,513 | | | | 162,241 | |
Haier Electronics Group Company Ltd. | | | 31,000 | | | | 48,780 | |
Husqvarna AB, Class B | | | 15,105 | | | | 117,802 | |
Rinnai Corp. | | | 1,200 | | | | 97,021 | |
Techtronic Industries Company Ltd. | | | 44,000 | | | | 157,768 | |
| | | | 764,908 | |
| | |
Household Products—0.2% | | | | | | | | |
Henkel AG & Company KGaA | | | 3,382 | | | | 353,078 | |
Hindustan Unilever Ltd. | | | 22,472 | | | | 273,409 | |
Kimberly-Clark de Mexico SAB de C.V., Class A | | | 58,300 | | | | 105,640 | |
Lion Corp. | | | 7,000 | | | | 115,231 | |
Reckitt Benckiser Group PLC | | | 20,076 | | | | 1,708,203 | |
Svenska Cellulosa AB SCA, Class B | | | 19,853 | | | | 562,290 | |
Unicharm Corp. | | | 11,300 | | | | 247,779 | |
Unilever Indonesia Tbk PT | | | 56,500 | | | | 162,717 | |
| | | | 3,528,347 | |
| | |
Human Resource & Employment Services—0.1% | | | | | | | | |
Adecco Group AG | | | 5,309 | | | | 348,152 | |
Capita PLC | | | 22,774 | | | | 149,427 | |
Randstad Holding N.V. | | | 2,914 | | | | 158,380 | |
Recruit Holdings Company Ltd. | | | 11,500 | | | | 462,425 | |
Seek Ltd. | | | 13,036 | | | | 140,458 | |
| | | | 1,258,842 | |
| | |
Hypermarkets & Super Centers—0.1% | | | | | | | | |
Aeon Company Ltd. | | | 18,600 | | | | 264,085 | |
Carrefour S.A. | | | 18,716 | | | | 451,865 | |
Cencosud S.A. | | | 43,221 | | | | 121,316 | |
Distribuidora Internacional de Alimentacion S.A. | | | 22,662 | | | | 111,506 | |
E-MART Inc. | | | 682 | | | | 103,333 | |
Massmart Holdings Ltd. | | | 3,853 | | | | 35,546 | |
Metro AG | | | 6,586 | | | | 219,408 | |
Sun Art Retail Group Ltd. | | | 88,500 | | | | 77,620 | |
Wal-Mart de Mexico SAB de C.V. | | | 166,324 | | | | 299,523 | |
Wesfarmers Ltd. | | | 36,271 | | | | 1,106,758 | |
| | | | 2,790,960 | |
| | |
Independent Power Producers & Energy Traders—0.0% * | | | | | | | | |
Aboitiz Power Corp. | | | 66,300 | | | | 55,614 | |
AES Gener S.A. | | | 82,891 | | | | 29,702 | |
| | | | | | | | |
CGN Power Company Ltd., Class H | | | 390,000 | | | | 107,143 | (d) |
China Power International Development Ltd. | | | 121,000 | | | | 43,854 | |
China Resources Power Holdings Company Ltd. | | | 82,000 | | | | 130,301 | |
Colbun S.A. | | | 260,471 | | | | 51,232 | |
Electric Power Development Company Ltd. | | | 4,300 | | | | 99,173 | |
Enel Generacion Chile S.A. | | | 101,082 | | | | 66,932 | |
Glow Energy PCL NVDR | | | 17,700 | | | | 39,047 | |
Huaneng Power International Inc., Class H | | | 126,000 | | | | 83,532 | |
NTPC Ltd. | | | 44,321 | | | | 107,717 | |
| | | | 814,247 | |
| | |
Industrial Conglomerates—0.4% | | | | | | | | |
Aboitiz Equity Ventures Inc. | | | 66,580 | | | | 94,822 | |
Alfa SAB de C.V., Class A | | | 80,824 | | | | 100,670 | |
Alliance Global Group Inc. | | | 117,400 | | | | 30,181 | |
Beijing Enterprises Holdings Ltd. | | | 19,500 | | | | 92,179 | |
CITIC Ltd. | | | 91,000 | | | | 130,282 | |
CJ Corp. | | | 632 | | | | 97,851 | |
CK Hutchison Holdings Ltd. | | | 87,064 | | | | 987,073 | |
DCC PLC | | | 3,000 | | | | 223,900 | |
DMCI Holdings Inc. | | | 140,000 | | | | 37,343 | |
Far Eastern New Century Corp. | | | 119,916 | | | | 90,042 | |
Fosun International Ltd. | | | 84,500 | | | | 119,669 | |
Grupo Carso SAB de C.V. | | | 22,000 | | | | 89,029 | |
Hanwha Corp. | | | 2,100 | | | | 60,941 | |
Industries Qatar QSC | | | 5,401 | | | | 174,278 | |
Jardine Matheson Holdings Ltd. | | | 8,000 | | | | 442,000 | |
JG Summit Holdings Inc. | | | 62,960 | | | | 85,677 | |
Keihan Holdings Company Ltd. | | | 12,000 | | | | 79,016 | |
Keppel Corporation Ltd. | | | 52,800 | | | | 211,609 | |
KOC Holding AS | | | 23,474 | | | | 92,092 | |
Koninklijke Philips N.V. | | | 29,741 | | | | 909,710 | |
LG Corp. | | | 3,743 | | | | 185,941 | |
NWS Holdings Ltd. | | | 63,042 | | | | 102,778 | |
Samsung C&T Corp. | | | 2,705 | | | | 281,071 | |
Seibu Holdings Inc. | | | 5,300 | | | | 95,244 | |
Sembcorp Industries Ltd. | | | 42,000 | | | | 82,855 | |
Shanghai Industrial Holdings Ltd. | | | 20,000 | | | | 54,172 | |
Siemens AG | | | 24,052 | | | | 2,963,081 | |
Siemens Ltd. | | | 2,575 | | | | 42,152 | |
Sime Darby Bhd | | | 71,462 | | | | 129,033 | |
SK Holdings Company Ltd. | | | 1,185 | | | | 225,168 | |
SM Investments Corp. | | | 6,891 | | | | 90,794 | |
Smiths Group PLC | | | 15,368 | | | | 268,891 | |
The Bidvest Group Ltd. | | | 11,502 | | | | 152,449 | |
Toshiba Corp. | | | 126,000 | | | | 305,831 | (a) |
Turkiye Sise ve Cam Fabrikalari A/S | | | 23,244 | | | | 25,308 | |
| | | | 9,153,132 | |
| | |
Industrial Gases—0.1% | | | | | | | | |
Air Liquide S.A. | | | 12,811 | | | | 1,427,585 | |
Air Water Inc. | | | 6,000 | | | | 108,544 | |
Linde AG | | | 5,160 | | | | 849,576 | |
Taiyo Nippon Sanso Corp. | | | 5,400 | | | | 62,688 | |
| | | | 2,448,393 | |
| | |
Industrial Machinery—0.3% | | | | | | | | |
Alfa Laval AB | | | 7,568 | | | | 125,625 | |
Amada Holdings Company Ltd. | | | 13,000 | | | | 145,454 | |
Andritz AG | | | 2,017 | | | | 101,468 | |
| | | | | | | | |
Atlas Copco AB, Class A | | | 21,101 | | | | 644,555 | |
Atlas Copco AB, Class B | | | 9,403 | | | | 257,313 | |
China Conch Venture Holdings Ltd. | | | 53,500 | | | | 95,226 | |
FANUC Corp. | | | 6,400 | | | | 1,087,289 | |
GEA Group AG | | | 5,847 | | | | 235,769 | |
Hiwin Technologies Corp. | | | 7,800 | | | | 35,819 | |
Hoshizaki Corp. | | | 1,500 | | | | 118,961 | |
IHI Corp. | | | 53,000 | | | | 138,140 | (a) |
IMI PLC | | | 6,761 | | | | 86,884 | |
JTEKT Corp. | | | 8,400 | | | | 134,677 | |
Kawasaki Heavy Industries Ltd. | | | 41,000 | | | | 129,009 | |
Kone Oyj, Class B | | | 11,026 | | | | 495,075 | |
Kurita Water Industries Ltd. | | | 2,800 | | | | 61,793 | |
Makita Corp. | | | 3,600 | | | | 241,677 | |
Metso Oyj | | | 5,381 | | | | 153,809 | |
Minebea Company Ltd. | | | 13,000 | | | | 122,159 | |
Mitsubishi Heavy Industries Ltd. | | | 106,000 | | | | 484,037 | |
Nabtesco Corp. | | | 5,000 | | | | 116,560 | |
NGK Insulators Ltd. | | | 10,000 | | | | 194,367 | |
NSK Ltd. | | | 12,900 | | | | 149,754 | |
Pentair PLC | | | 7,532 | | | | 422,319 | |
Sandvik AB | | | 33,359 | | | | 413,839 | |
Schindler Holding AG | | | 1,241 | | | | 219,298 | |
Schindler Holding AG | | | 135 | | | | 23,630 | |
SKF AB, Class B | | | 9,665 | | | | 178,308 | |
SMC Corp. | | | 1,800 | | | | 430,651 | |
Sumitomo Heavy Industries Ltd. | | | 21,000 | | | | 135,577 | |
The Weir Group PLC | | | 8,910 | | | | 208,082 | |
THK Company Ltd. | | | 4,600 | | | | 101,990 | |
Wartsila Oyj Abp | | | 5,119 | | | | 230,441 | |
WEG S.A. | | | 20,540 | | | | 97,819 | |
Zardoya Otis S.A. | | | 7,066 | | | | 59,846 | |
| | | | 7,877,220 | |
| | |
Industrial REITs—0.0% * | | | | | | | | |
Ascendas Real Estate Investment Trust | | | 87,150 | | | | 136,935 | |
Goodman Group | | | 54,792 | | | | 282,882 | |
Nippon Prologis REIT Inc. | | | 35 | | | | 71,690 | |
Segro PLC | | | 27,782 | | | | 157,260 | |
| | | | 648,767 | |
| | |
Insurance Brokers—0.1% | | | | | | | | |
Aon PLC | | | 11,806 | | | | 1,316,723 | |
Willis Towers Watson PLC | | | 5,763 | | | | 704,700 | |
| | | | 2,021,423 | |
| | |
Integrated Oil & Gas—1.1% | | | | | | | | |
BP PLC | | | 585,477 | | | | 3,686,672 | |
Cenovus Energy Inc. | | | 26,809 | | | | 405,818 | |
China Petroleum & Chemical Corp., Class H | | | 805,400 | | | | 571,342 | |
Ecopetrol S.A. | | | 226,632 | | | | 104,181 | (a) |
Eni S.p.A. | | | 80,005 | | | | 1,305,440 | |
Galp Energia SGPS S.A. | | | 10,377 | | | | 155,311 | |
Gazprom PJSC ADR | | | 196,173 | | | | 990,674 | |
Husky Energy Inc. | | | 14,254 | | | | 173,146 | (a) |
Imperial Oil Ltd. | | | 8,844 | | | | 308,045 | |
Lukoil PJSC ADR | | | 14,156 | | | | 794,435 | |
MOL Hungarian Oil & Gas PLC | | | 1,514 | | | | 106,687 | |
OMV AG | | | 3,925 | | | | 138,935 | |
Origin Energy Ltd. | | | 53,651 | | | | 256,013 | |
| | | | | | | | |
PetroChina Company Ltd., Class H | | | 618,000 | | | | 460,721 | |
Petroleo Brasileiro S.A. | | | 92,900 | | | | 483,524 | (a) |
Polskie Gornictwo Naftowe i Gazownictwo S.A. | | | 63,407 | | | | 85,519 | |
PTT PCL NVDR | | | 34,800 | | | | 361,503 | |
Repsol S.A. | | | 36,497 | | | | 516,606 | |
Rosneft Oil Company PJSC GDR | | | 45,830 | | | | 297,895 | |
Royal Dutch Shell PLC, Class A | | | 137,644 | | | | 3,814,038 | |
Royal Dutch Shell PLC, Class B | | | 119,241 | | | | 3,468,385 | |
Statoil ASA | | | 37,716 | | | | 694,055 | |
Suncor Energy Inc. | | | 52,547 | | | | 1,720,155 | |
Surgutneftegas OJSC ADR | | | 3,950 | | | | 20,263 | |
Surgutneftegas OJSC ADR | | | 29,028 | | | | 145,140 | |
Total S.A. | | | 71,295 | | | | 3,663,666 | |
| | | | 24,728,169 | |
| | |
Integrated Telecommunication Services—0.6% | | | | | | | | |
BCE Inc. | | | 4,587 | | | | 198,489 | |
Bezeq The Israeli Telecommunication Corporation Ltd. | | | 71,154 | | | | 135,332 | |
Bharti Infratel Ltd. | | | 20,103 | | | | 102,040 | |
BT Group PLC | | | 272,662 | | | | 1,236,140 | |
China Communications Services Corporation Ltd., Class H | | | 84,000 | | | | 53,521 | |
China Telecom Corporation Ltd., Class H | | | 442,000 | | | | 204,092 | |
China Unicom Hong Kong Ltd. | | | 204,000 | | | | 237,596 | |
Chunghwa Telecom Company Ltd. | | | 122,000 | | | | 384,219 | |
Deutsche Telekom AG | | | 100,892 | | | | 1,740,431 | |
Elisa Oyj | | | 4,169 | | | | 136,007 | |
Emirates Telecommunications Group Co. PJSC | | | 34,000 | | | | 174,031 | |
Hellenic Telecommunications Organization S.A. | | | 10,479 | | | | 98,701 | |
HKT Trust & HKT Ltd. | | | 75,280 | | | | 92,241 | |
Koninklijke KPN N.V. | | | 115,628 | | | | 343,192 | |
KT Corp. | | | 1,110 | | | | 27,019 | |
LG Uplus Corp. | | | 8,060 | | | | 76,409 | |
Nippon Telegraph & Telephone Corp. | | | 23,000 | | | | 968,629 | |
Ooredoo QSC | | | 3,023 | | | | 84,512 | |
Orange Polska S.A. | | | 28,318 | | | | 37,379 | |
Orange S.A. | | | 63,869 | | | | 972,426 | |
PCCW Ltd. | | | 173,000 | | | | 93,717 | |
Proximus SADP | | | 4,685 | | | | 135,200 | |
Rostelecom PJSC ADR | | | 7,764 | | | | 64,131 | |
SFR Group S.A. | | | 3,660 | | | | 103,574 | (a) |
Singapore Telecommunications Ltd. | | | 272,800 | | | | 689,223 | |
Spark New Zealand Ltd. | | | 68,211 | | | | 162,192 | |
Swisscom AG | | | 780 | | | | 350,035 | |
TDC A/S | | | 28,766 | | | | 147,960 | (a) |
Telecom Italia S.p.A. | | | 350,948 | | | | 309,826 | (a) |
Telecom Italia S.p.A. | | | 190,334 | | | | 137,919 | (a) |
Telefonica Deutschland Holding AG | | | 18,390 | | | | 78,945 | |
Telefonica S.A. | | | 145,005 | | | | 1,348,966 | |
Telekom Malaysia Bhd | | | 42,600 | | | | 56,502 | |
Telekomunikasi Indonesia Persero Tbk PT | | | 1,797,500 | | | | 531,011 | |
Telenor ASA | | | 26,623 | | | | 398,988 | |
Telia Company AB | | | 69,057 | | | | 279,053 | |
Telstra Corporation Ltd. | | | 137,153 | | | | 506,494 | |
TELUS Corp. | | | 8,060 | | | | 256,937 | |
TPG Telecom Ltd. | | | 9,816 | | | | 48,475 | |
True Corporation PCL NVDR | | | 237,369 | | | | 47,394 | |
Turk Telekomunikasyon AS | | | 16,769 | | | | 25,171 | |
| | | | 13,074,119 | |
| | | | | | | | |
Internet & Direct Marketing Retail—0.1% | | | | | | | | |
Ctrip.com International Ltd. ADR | | | 11,426 | | | | 457,040 | (a) |
JD.com Inc. ADR | | | 23,258 | | | | 591,683 | (a) |
Rakuten Inc. | | | 30,600 | | | | 300,530 | |
Vipshop Holdings Ltd. ADR | | | 7,000 | | | | 77,070 | (a) |
| | | | 1,426,323 | |
| | |
Internet Software & Services—0.5% | | | | | | | | |
Alibaba Group Holding Ltd. ADR | | | 35,713 | | | | 3,135,959 | (a) |
Auto Trader Group PLC | | | 33,000 | | | | 166,776 | (d) |
Baidu Inc. ADR | | | 8,852 | | | | 1,455,357 | (a) |
Cimpress N.V. | | | 479 | | | | 43,881 | (a) |
Global Sources Ltd. | | | 131 | | | | 1,159 | (a) |
Kakaku.com Inc. | | | 3,100 | | | | 51,403 | |
Kakao Corp. | | | 1,370 | | | | 87,341 | |
NAVER Corp. | | | 965 | | | | 619,204 | |
NetEase Inc. ADR | | | 2,671 | | | | 575,173 | |
Tencent Holdings Ltd. | | | 179,800 | | | | 4,399,252 | |
United Internet AG | | | 4,602 | | | | 180,058 | |
Yahoo Japan Corp. | | | 28,300 | | | | 108,944 | |
| | | | 10,824,507 | |
| | |
Investment Banking & Brokerage—0.1% | | | | | | | | |
China Galaxy Securities Company Ltd., Class H | | | 108,000 | | | | 97,369 | |
CITIC Securities Company Ltd., Class H | | | 76,500 | | | | 155,503 | |
Daiwa Securities Group Inc. | | | 48,000 | | | | 296,433 | |
Haitong Securities Company Ltd., Class H | | | 98,000 | | | | 168,112 | |
Korea Investment Holdings Company Ltd. | | | 1,740 | | | | 60,363 | |
Mediobanca S.p.A. | | | 20,019 | | | | 163,747 | |
NEX Group PLC | | | 12,393 | | | | 71,128 | |
NH Investment & Securities Company Ltd. | | | 6,220 | | | | 49,696 | |
Nomura Holdings Inc. | | | 121,700 | | | | 719,025 | |
Samsung Securities Company Ltd. | | | 1,210 | | | | 31,758 | |
TP ICAP PLC | | | 10,127 | | | | 54,221 | |
Yuanta Financial Holding Company Ltd. | | | 369,211 | | | | 137,470 | |
| | | | 2,004,825 | |
| | |
IT Consulting & Other Services—0.3% | | | | | | | | |
Accenture PLC, Class A | | | 27,767 | | | | 3,252,349 | |
Atos SE | | | 2,821 | | | | 298,289 | |
Capgemini S.A. | | | 5,602 | | | | 473,583 | |
CGI Group Inc., Class A | | | 7,985 | | | | 383,694 | (a) |
Fujitsu Ltd. | | | 52,000 | | | | 289,570 | |
HCL Technologies Ltd. | | | 17,992 | | | | 218,756 | |
Infosys Ltd. | | | 57,596 | | | | 857,957 | |
Nomura Research Institute Ltd. | | | 4,510 | | | | 137,657 | |
NTT Data Corp. | | | 4,200 | | | | 203,455 | |
Otsuka Corp. | | | 1,800 | | | | 84,263 | |
Samsung SDS Company Ltd. | | | 1,113 | | | | 128,551 | |
Tata Consultancy Services Ltd. | | | 16,723 | | | | 583,112 | |
Tech Mahindra Ltd. | | | 9,252 | | | | 66,599 | |
Wipro Ltd. | | | 24,408 | | | | 171,111 | |
| | | | 7,148,946 | |
| | |
Leisure Facilities—0.0% * | | | | | | | | |
Merlin Entertainments PLC | | | 22,365 | | | | 123,972 | (d) |
Oriental Land Company Ltd. | | | 7,200 | | | | 407,795 | |
| | | | 531,767 | |
| | |
Leisure Products—0.0% * | | | | | | | | |
Bandai Namco Holdings Inc. | | | 6,600 | | | | 182,492 | |
Giant Manufacturing Company Ltd. | | | 10,000 | | | | 56,781 | |
| | | | | | | | |
Merida Industry Company Ltd. | | | 7,350 | | | | 32,840 | |
Sankyo Company Ltd. | | | 400 | | | | 12,946 | |
Sega Sammy Holdings Inc. | | | 7,400 | | | | 110,332 | |
Shimano Inc. | | | 2,400 | | | | 377,383 | |
Yamaha Corp. | | | 6,100 | | | | 186,711 | |
| | | | 959,485 | |
| | |
Life & Health Insurance—0.6% | | | | | | | | |
Aegon N.V. | | | 62,069 | | | | 342,263 | |
AIA Group Ltd. | | | 381,800 | | | | 2,154,447 | |
Cathay Financial Holding Company Ltd. | | | 205,417 | | | | 307,211 | |
China Life Insurance Company Ltd. | | | 107,593 | | | | 106,995 | |
China Life Insurance Company Ltd., Class H | | | 239,000 | | | | 622,689 | |
China Taiping Insurance Holdings Company Ltd. | | | 67,288 | | | | 138,861 | (a) |
CNP Assurances | | | 5,764 | | | | 107,001 | |
Dai-ichi Life Holdings Inc. | | | 32,500 | | | | 542,247 | |
Discovery Ltd. | | | 11,285 | | | | 94,489 | |
Great-West Lifeco Inc. | | | 10,027 | | | | 262,965 | |
Hanwha Life Insurance Company Ltd. | | | 8,480 | | | | 45,847 | |
Industrial Alliance Insurance & Financial Services Inc. | | | 3,775 | | | | 150,291 | |
Japan Post Holdings Company Ltd. | | | 16,000 | | | | 200,146 | |
Legal & General Group PLC | | | 170,057 | | | | 520,284 | |
Liberty Holdings Ltd. | | | 4,059 | | | | 32,947 | |
Manulife Financial Corp. | | | 58,393 | | | | 1,041,107 | |
Medibank Private Ltd. | | | 100,000 | | | | 204,196 | |
MMI Holdings Ltd. | | | 36,164 | | | | 62,384 | |
New China Life Insurance Company Ltd., Class H | | | 23,300 | | | | 106,986 | |
NN Group N.V. | | | 9,099 | | | | 308,981 | |
Old Mutual PLC | | | 165,291 | | | | 423,393 | |
Ping An Insurance Group Company of China Ltd., Class H | | | 177,000 | | | | 885,782 | |
Power Corporation of Canada | | | 12,324 | | | | 276,154 | |
Power Financial Corp. | | | 7,564 | | | | 189,290 | |
Prudential PLC | | | 82,007 | | | | 1,649,177 | |
Rand Merchant Investment Holdings Ltd. | | | 22,171 | | | | 64,527 | |
Samsung Life Insurance Company Ltd. | | | 2,185 | | | | 203,521 | |
Sanlam Ltd. | | | 55,316 | | | | 254,433 | |
Shin Kong Financial Holding Company Ltd. | | | 265,751 | | | | 65,141 | (a) |
Sony Financial Holdings Inc. | | | 6,500 | | | | 101,650 | |
St. James’s Place PLC | | | 18,140 | | | | 227,285 | |
Standard Life PLC | | | 63,545 | | | | 292,092 | |
Sun Life Financial Inc. | | | 19,923 | | | | 765,841 | |
Swiss Life Holding AG | | | 981 | | | | 278,176 | (a) |
T&D Holdings Inc. | | | 17,600 | | | | 233,213 | |
| | | | 13,262,012 | |
| | |
Life Sciences Tools & Services—0.0% * | | | | | | | | |
Divi’s Laboratories Ltd. | | | 2,856 | | | | 32,890 | |
Eurofins Scientific SE | | | 326 | | | | 139,259 | |
Lonza Group AG | | | 1,992 | | | | 345,540 | (a) |
QIAGEN N.V. | | | 7,713 | | | | 217,049 | (a) |
| | | | 734,738 | |
| | |
Managed Healthcare—0.0% * | | | | | | | | |
Odontoprev S.A. | | | 10,100 | | | | 39,100 | |
Qualicorp S.A. | | | 8,200 | | | | 48,499 | |
Triple-S Management Corp., Class B | | | 465 | | | | 9,626 | (a) |
| | | | 97,225 | |
| | |
Marine—0.0% * | | | | | | | | |
AP Moeller—Maersk A/S, Class A | | | 107 | | | | 161,952 | |
AP Moeller—Maersk A/S, Class B | | | 208 | | | | 332,526 | |
Costamare Inc. | | | 543 | | | | 3,041 | |
| | | | | | | | |
Evergreen Marine Corporation Taiwan Ltd. | | | 64,640 | | | | 22,263 | (a) |
Kuehne + Nagel International AG | | | 1,515 | | | | 200,638 | |
MISC Bhd | | | 11,500 | | | | 18,842 | |
Mitsui OSK Lines Ltd. | | | 28,000 | | | | 77,781 | |
Nippon Yusen KK | | | 69,000 | | | | 128,375 | |
| | | | 945,418 | |
| | |
Marine Ports & Services—0.0% * | | | | | | | | |
Adani Ports & Special Economic Zone Ltd. | | | 26,135 | | | | 102,988 | |
China Merchants Port Holdings Company Ltd. | | | 43,159 | | | | 107,102 | |
COSCO SHIPPING Ports Ltd. | | | 62,000 | | | | 62,295 | |
DP World Ltd. | | | 6,267 | | | | 109,735 | |
Hutchison Port Holdings Trust, Class U | | | 201,000 | | | | 87,435 | |
International Container Terminal Services Inc. | | | 26,800 | | | | 38,788 | |
Kamigumi Company Ltd. | | | 8,000 | | | | 76,410 | |
Mitsubishi Logistics Corp. | | | 5,000 | | | | 70,862 | |
| | | | 655,615 | |
| | |
Metal & Glass Containers—0.0% * | | | | | | | | |
CCL Industries Inc., Class B | | | 800 | | | | 157,369 | |
Toyo Seikan Group Holdings Ltd. | | | 5,800 | | | | 108,506 | |
| | | | 265,875 | |
| | |
Motorcycle Manufacturers—0.0% * | | | | | | | | |
Bajaj Auto Ltd. | | | 3,146 | | | | 122,095 | |
Hero Motocorp Ltd. | | | 1,341 | | | | 59,915 | |
Yamaha Motor Company Ltd. | | | 8,500 | | | | 187,585 | |
| | | | 369,595 | |
| | |
Movies & Entertainment—0.0% * | | | | | | | | |
Alibaba Pictures Group Ltd. | | | 360,000 | | | | 58,505 | (a) |
Eros International PLC | | | 595 | | | | 7,765 | (a) |
IMAX Corp. | | | 1,119 | | | | 35,137 | (a) |
Toho Company Ltd. | | | 4,400 | | | | 124,679 | |
Vivendi S.A. | | | 32,333 | | | | 615,734 | |
| | | | 841,820 | |
| | |
Multi-Line Insurance—0.4% | | | | | | | | |
Ageas | | | 5,999 | | | | 237,975 | |
Allianz SE | | | 14,774 | | | | 2,446,512 | |
Assicurazioni Generali S.p.A. | | | 39,174 | | | | 583,421 | |
Aviva PLC | | | 135,977 | | | | 817,249 | |
AXA S.A. | | | 63,136 | | | | 1,597,226 | |
Baloise Holding AG | | | 1,313 | | | | 165,748 | |
BB Seguridade Participacoes S.A. | | | 23,900 | | | | 207,813 | |
China Pacific Insurance Group Company Ltd., Class H | | | 91,800 | | | | 320,282 | |
Fairfax Financial Holdings Ltd. | | | 773 | | | | 373,805 | |
Gjensidige Forsikring ASA | | | 7,732 | | | | 123,062 | |
Mapfre S.A. | | | 49,475 | | | | 151,333 | |
Porto Seguro S.A. | | | 4,400 | | | | 36,366 | |
Powszechny Zaklad Ubezpieczen S.A. | | | 10,589 | | | | 84,244 | |
Sampo Oyj, Class A | | | 12,381 | | | | 556,177 | |
Sul America S.A. | | | 5,000 | | | | 27,652 | |
UnipolSai S.p.A. | | | 19,507 | | | | 41,767 | |
Zurich Insurance Group AG | | | 4,952 | | | | 1,366,203 | (a) |
| | | | 9,136,835 | |
| | |
Multi-Sector Holdings—0.1% | | | | | | | | |
Ayala Corp. | | | 7,150 | | | | 105,066 | |
Corporation Financiera Colombiana S.A. | | | 3,142 | | | | 38,809 | |
Eurazeo S.A. | | | 1,517 | | | | 88,931 | |
EXOR N.V. | | | 3,417 | | | | 147,695 | |
First Pacific Company Ltd. | | | 94,000 | | | | 65,713 | |
| | | | | | | | |
Groupe Bruxelles Lambert S.A. | | | 2,554 | | | | 214,752 | |
Grupo de Inversiones Suramericana S.A. | | | 8,633 | | | | 109,853 | |
GT Capital Holdings Inc. | | | 2,225 | | | | 56,842 | |
Haci Omer Sabanci Holding AS | | | 34,397 | | | | 89,474 | |
Industrivarden AB, Class C | | | 4,939 | | | | 92,315 | |
Investor AB, Class B | | | 15,625 | | | | 585,641 | |
Kinnevik AB, Class B | | | 8,574 | | | | 206,030 | |
Metro Pacific Investments Corp. | | | 129,200 | | | | 17,309 | |
Onex Corp. | | | 2,466 | | | | 168,035 | |
Pargesa Holding S.A. | | | 1,294 | | | | 84,412 | |
Remgro Ltd. | | | 15,705 | | | | 256,161 | |
Wendel S.A. | | | 781 | | | | 94,238 | |
| | | | 2,421,276 | |
| | |
Multi-Utilities—0.2% | | | | | | | | |
AGL Energy Ltd. | | | 22,062 | | | | 352,890 | |
Atco Ltd., Class I | | | 2,398 | | | | 79,859 | |
Canadian Utilities Ltd., Class A | | | 4,562 | | | | 123,112 | |
Centrica PLC | | | 178,420 | | | | 516,107 | |
E.ON SE | | | 59,815 | | | | 422,702 | |
Engie S.A. | | | 43,091 | | | | 550,857 | |
Innogy SE | | | 4,122 | | | | 143,517 | (a,d) |
National Grid PLC | | | 119,338 | | | | 1,403,229 | |
RWE AG | | | 16,339 | | | | 203,614 | (a) |
Suez | | | 10,531 | | | | 155,673 | |
Veolia Environnement S.A. | | | 13,696 | | | | 233,662 | |
YTL Corporation Bhd | | | 200,400 | | | | 69,242 | |
YTL Power International Bhd | | | 87,045 | | | | 28,911 | |
| | | | 4,283,375 | |
| | |
Office REITs—0.0% * | | | | | | | | |
CapitaLand Commercial Trust | | | 95,000 | | | | 97,321 | |
City Office REIT Inc. | | | 452 | | | | 5,953 | |
Dexus Property Group | | | 31,181 | | | | 217,202 | |
Japan Prime Realty Investment Corp. | | | 22 | | | | 86,860 | |
Japan Real Estate Investment Corp. | | | 35 | | | | 191,152 | |
Nippon Building Fund Inc. | | | 45 | | | | 249,625 | |
| | | | 848,113 | |
| | |
Office Services & Supplies—0.0% * | | | | | | | | |
Societe BIC S.A. | | | 1,095 | | | | 149,162 | |
| | |
Oil & Gas Drilling—0.0% * | | | | | | | | |
China Oilfield Services Ltd., Class H | | | 58,000 | | | | 53,862 | |
Ensco PLC, Class A | | | 2,649 | | | | 25,748 | |
Noble Corporation PLC | | | 2,190 | | | | 12,965 | |
Seadrill Ltd. | | | 7,580 | | | | 25,848 | (a) |
Transocean Ltd. | | | 16,339 | | | | 240,837 | (a) |
| | | | 359,260 | |
| | |
Oil & Gas Equipment & Services—0.0% * | | | | | | | | |
Petrofac Ltd. | | | 10,564 | | | | 113,434 | |
Saipem S.p.A. | | | 123,361 | | | | 69,612 | (a) |
Sapurakencana Petroleum Bhd | | | 127,700 | | | | 46,116 | (a) |
Technip S.A. | | | 4,256 | | | | 304,400 | |
Tenaris S.A. | | | 17,331 | | | | 310,209 | |
| | | | 843,771 | |
| | |
Oil & Gas Exploration & Production—0.3% | | | | | | | | |
ARC Resources Ltd. | | | 11,975 | | | | 206,362 | |
Cairn India Ltd. | | | 17,722 | | | | 63,256 | |
Canadian Natural Resources Ltd. | | | 34,895 | | | | 1,113,424 | |
CNOOC Ltd. | | | 566,000 | | | | 708,125 | |
| | | | | | | | |
Crescent Point Energy Corp. | | | 17,845 | | | | 242,848 | |
Encana Corp. | | | 28,724 | | | | 337,564 | |
Inpex Corp. | | | 28,900 | | | | 290,152 | |
Lundin Petroleum AB | | | 8,987 | | | | 195,972 | (a) |
Novatek PJSC GDR GDR | | | 3,285 | | | | 426,393 | |
Oil & Natural Gas Corporation Ltd. | | | 43,307 | | | | 121,746 | |
Oil Search Ltd. | | | 24,000 | | | | 124,603 | |
Peyto Exploration & Development Corp. | | | 4,880 | | | | 120,849 | |
PrairieSky Royalty Ltd. | | | 6,224 | | | | 148,238 | |
PTT Exploration & Production PCL NVDR | | | 52,000 | | | | 139,763 | |
Santos Ltd. | | | 50,308 | | | | 146,441 | |
Seven Generations Energy Ltd., Class A | | | 7,200 | | | | 168,101 | (a) |
Tatneft PJSC ADR | | | 7,219 | | | | 297,567 | |
Tourmaline Oil Corp. | | | 6,249 | | | | 167,333 | (a) |
Vermilion Energy Inc. | | | 4,105 | | | | 172,918 | |
Woodside Petroleum Ltd. | | | 19,860 | | | | 448,100 | |
| | | | 5,639,755 | |
| | |
Oil & Gas Refining & Marketing—0.1% | | | | | | | | |
Bharat Petroleum Corporation Ltd. | | | 12,960 | | | | 121,055 | |
Caltex Australia Ltd. | | | 9,305 | | | | 205,232 | |
Cosan S.A. Industria e Comercio | | | 5,500 | | | | 64,468 | |
Empresas COPEC S.A. | | | 11,610 | | | | 111,266 | |
Formosa Petrochemical Corp. | | | 43,000 | | | | 149,431 | |
Grupa Lotos S.A. | | | 2,254 | | | | 20,654 | (a) |
GS Holdings Corp. | | | 2,084 | | | | 93,347 | |
Idemitsu Kosan Company Ltd. | | | 3,200 | | | | 85,189 | |
IRPC PCL NVDR | | | 378,600 | | | | 50,747 | |
JX Holdings Inc. | | | 61,300 | | | | 260,000 | |
Keyera Corp. | | | 6,976 | | | | 210,469 | |
Neste Oyj | | | 4,893 | | | | 188,372 | |
Petronas Dagangan Bhd | | | 8,900 | | | | 47,218 | |
Polski Koncern Naftowy ORLEN S.A. | | | 9,561 | | | | 195,375 | |
Reliance Industries Ltd. | | | 43,251 | | | | 688,689 | |
S-Oil Corp. | | | 1,820 | | | | 127,632 | |
Showa Shell Sekiyu KK | | | 7,600 | | | | 70,829 | |
SK Innovation Company Ltd. | | | 2,421 | | | | 293,655 | |
Thai Oil PCL NVDR | | | 30,500 | | | | 61,536 | |
TonenGeneral Sekiyu KK | | | 11,000 | | | | 116,192 | |
Tupras Turkiye Petrol Rafinerileri AS | | | 3,135 | | | | 63,055 | |
| | | | 3,224,411 | |
| | |
Oil & Gas Storage & Transportation—0.2% | | | | | | | | |
AltaGas Ltd. | | | 4,683 | | | | 118,380 | |
Ardmore Shipping Corp. | | | 614 | | | | 4,544 | |
DHT Holdings Inc. | | | 1,868 | | | | 7,734 | |
Enbridge Inc. | | | 30,307 | | | | 1,276,869 | |
Frontline Ltd. | | | 1,321 | | | | 9,392 | |
Golar LNG Ltd. | | | 1,783 | | | | 40,902 | |
Inter Pipeline Ltd. | | | 11,848 | | | | 261,866 | |
Koninklijke Vopak N.V. | | | 2,589 | | | | 122,542 | |
Kunlun Energy Company Ltd. | | | 138,000 | | | | 103,235 | |
Navios Maritime Acquisition Corp. | | | 1,649 | | | | 2,803 | |
Pembina Pipeline Corp. | | | 12,074 | | | | 377,782 | |
Scorpio Tankers Inc. | | | 3,299 | | | | 14,945 | |
Snam S.p.A. | | | 74,890 | | | | 309,168 | |
Teekay Corp. | | | 991 | | | | 7,958 | |
Teekay Tankers Ltd., Class A | | | 2,370 | | | | 5,356 | |
TransCanada Corp. | | | 24,406 | | | | 1,101,778 | |
Ultrapar Participacoes S.A. | | | 11,400 | | | | 239,755 | |
Veresen Inc. | | | 9,523 | | | | 93,096 | |
| | | | 4,098,105 | |
| | | | | | | | |
Other Diversified Financial Services—0.1% | | | | | | | | |
African Bank Investments Ltd. | | | 52,786 | | | | 39 | (a,j) |
AMP Ltd. | | | 90,691 | | | | 330,973 | |
Challenger Ltd. | | | 16,883 | | | | 137,409 | |
FirstRand Ltd. | | | 120,303 | | | | 467,752 | |
Fubon Financial Holding Company Ltd. | | | 240,000 | | | | 379,782 | |
ORIX Corp. | | | 41,600 | | | | 650,563 | |
RMB Holdings Ltd. | | | 26,636 | | | | 129,333 | |
| | | | 2,095,851 | |
| | |
Packaged Foods & Meats—0.6% | | | | | | | | |
Ajinomoto Company Inc. | | | 19,000 | | | | 383,470 | |
Aryzta AG | | | 2,031 | | | | 89,625 | (a) |
Associated British Foods PLC | | | 11,143 | | | | 377,955 | |
Barry Callebaut AG | | | 87 | | | | 106,658 | (a) |
BRF S.A. | | | 20,100 | | | | 297,977 | |
Calbee Inc. | | | 2,400 | | | | 75,312 | |
Charoen Pokphand Foods PCL NVDR | | | 115,100 | | | | 94,817 | |
China Huishan Dairy Holdings Company Ltd. | | | 55,000 | | | | 21,353 | |
China Mengniu Dairy Company Ltd. | | | 106,000 | | | | 204,258 | |
Chocoladefabriken Lindt & Spruengli AG | | | 33 | | | | 171,275 | |
Chocoladefabriken Lindt & Spruengli AG | | | 3 | | | | 182,713 | |
CJ CheilJedang Corp. | | | 320 | | | | 94,718 | |
Danone S.A. | | | 18,890 | | | | 1,199,438 | |
Gruma SAB de C.V., Class B | | | 8,900 | | | | 113,791 | |
Grupo Bimbo SAB de C.V., Class A | | | 35,400 | | | | 80,555 | |
Indofood CBP Sukses Makmur Tbk PT | | | 64,000 | | | | 40,735 | |
Indofood Sukses Makmur Tbk PT | | | 165,000 | | | | 97,059 | |
JBS S.A. | | | 25,900 | | | | 90,718 | |
Kerry Group PLC, Class A | | | 5,644 | | | | 404,209 | |
Kikkoman Corp. | | | 4,000 | | | | 128,263 | |
Lotte Confectionery Company Ltd. | | | 350 | | | | 51,726 | |
M Dias Branco S.A. | | | 1,200 | | | | 42,404 | |
Marine Harvest ASA | | | 11,607 | | | | 209,953 | (a) |
MEIJI Holdings Company Ltd. | | | 4,000 | | | | 314,142 | |
Nestle India Ltd. | | | 845 | | | | 74,702 | |
Nestle S.A. | | | 99,269 | | | | 7,134,944 | |
NH Foods Ltd. | | | 7,000 | | | | 189,351 | |
Nisshin Seifun Group Inc. | | | 8,400 | | | | 126,322 | |
Nissin Foods Holdings Company Ltd. | | | 2,300 | | | | 121,079 | |
Orion Corp. | | | 139 | | | | 75,381 | |
Orkla ASA | | | 29,065 | | | | 264,052 | |
Pioneer Foods Group Ltd. | | | 4,038 | | | | 45,465 | |
PPB Group Bhd | | | 17,800 | | | | 62,931 | |
Saputo Inc. | | | 9,396 | | | | 332,876 | |
Standard Foods Corp. | | | 15,304 | | | | 36,374 | |
Tate & Lyle PLC | | | 19,062 | | | | 166,644 | |
Tiger Brands Ltd. | | | 6,889 | | | | 200,413 | |
Tingyi Cayman Islands Holding Corp. | | | 82,000 | | | | 99,735 | |
Toyo Suisan Kaisha Ltd. | | | 2,500 | | | | 90,775 | |
Ulker Biskuvi Sanayi AS | | | 3,012 | | | | 13,837 | |
Uni-President Enterprises Corp. | | | 141,303 | | | | 234,124 | |
Universal Robina Corp. | | | 30,200 | | | | 99,325 | |
Want Want China Holdings Ltd. | | | 242,000 | | | | 155,129 | |
WH Group Ltd. | | | 197,500 | | | | 159,719 | (d) |
Yakult Honsha Company Ltd. | | | 3,400 | | | | 157,997 | |
Yamazaki Baking Company Ltd. | | | 4,000 | | | | 77,438 | |
| | | | 14,791,737 | |
| | | | | | | | |
Paper Packaging—0.0% * | | | | | | | | |
Amcor Ltd. | | | 40,091 | | | | 433,997 | |
Klabin S.A. | | | 19,600 | | | | 106,711 | |
| | | | 540,708 | |
| | |
Paper Products—0.1% | | | | | | | | |
Empresas CMPC S.A. | | | 49,402 | | | | 100,392 | |
Fibria Celulose S.A. | | | 9,300 | | | | 91,123 | |
Mondi Ltd. | | | 2,641 | | | | 54,073 | |
Mondi PLC | | | 12,058 | | | | 248,225 | |
Nine Dragons Paper Holdings Ltd. | | | 63,000 | | | | 57,124 | |
Oji Holdings Corp. | | | 31,000 | | | | 126,514 | |
Sappi Ltd. | | | 19,577 | | | | 128,771 | (a) |
Stora Enso Oyj, Class R | | | 16,499 | | | | 177,678 | |
UPM-Kymmene Oyj | | | 13,305 | | | | 327,541 | |
| | | | 1,311,441 | |
| | |
Personal Products—0.3% | | | | | | | | |
AMOREPACIFIC Corp. | | | 1,045 | | | | 278,165 | |
AMOREPACIFIC Group | | | 1,200 | | | | 132,141 | |
Beiersdorf AG | | | 3,558 | | | | 302,476 | |
Dabur India Ltd. | | | 13,803 | | | | 56,182 | |
Godrej Consumer Products Ltd. | | | 4,709 | | | | 105,045 | |
Hengan International Group Company Ltd. | | | 19,500 | | | | 143,235 | |
Kao Corp. | | | 16,100 | | | | 764,866 | |
Kose Corp. | | | 900 | | | | 74,926 | |
L’Oreal S.A. | | | 8,169 | | | | 1,494,058 | |
LG Household & Health Care Ltd. | | | 359 | | | | 254,730 | |
Marico Ltd. | | | 10,808 | | | | 41,571 | |
Natura Cosmeticos S.A. | | | 7,200 | | | | 50,925 | |
Shiseido Company Ltd. | | | 12,000 | | | | 304,386 | |
Unilever N.V. | | | 51,442 | | | | 2,122,319 | |
Unilever PLC | | | 40,686 | | | | 1,655,259 | |
| | | | 7,780,284 | |
| | |
Pharmaceuticals—1.5% | | | | | | | | |
Aspen Pharmacare Holdings Ltd. | | | 11,107 | | | | 230,327 | |
Astellas Pharma Inc. | | | 68,800 | | | | 957,661 | |
AstraZeneca PLC | | | 39,998 | | | | 2,193,168 | |
Aurobindo Pharma Ltd. | | | 9,370 | | | | 92,223 | |
Bayer AG | | | 26,877 | | | | 2,810,188 | |
Chugai Pharmaceutical Company Ltd. | | | 8,200 | | | | 235,873 | |
Cipla Ltd. | | | 12,861 | | | | 107,443 | |
CSPC Pharmaceutical Group Ltd. | | | 134,000 | | | | 143,106 | |
Daiichi Sankyo Company Ltd. | | | 16,700 | | | | 342,419 | |
Dr Reddy’s Laboratories Ltd. | | | 3,837 | | | | 172,770 | |
Eisai Company Ltd. | | | 8,400 | | | | 483,107 | |
Endo International PLC | | | 8,958 | | | | 147,538 | (a) |
Galenica AG | | | 140 | | | | 158,272 | |
GlaxoSmithKline PLC | | | 155,169 | | | | 2,994,893 | |
Glenmark Pharmaceuticals Ltd. | | | 5,757 | | | | 75,485 | |
Hanmi Pharm Company Ltd. | | | 111 | | | | 28,076 | |
Hisamitsu Pharmaceutical Company Inc. | | | 2,400 | | | | 120,376 | |
Hypermarcas S.A. | | | 12,800 | | | | 102,763 | |
Kalbe Farma Tbk PT | | | 854,500 | | | | 96,090 | |
Kyowa Hakko Kirin Company Ltd. | | | 8,000 | | | | 110,841 | |
Lupin Ltd. | | | 9,440 | | | | 206,339 | |
Merck KGaA | | | 3,996 | | | | 417,896 | |
Mitsubishi Tanabe Pharma Corp. | | | 5,300 | | | | 104,196 | |
Novartis AG | | | 70,113 | | | | 5,111,795 | |
Novo Nordisk A/S, Class B | | | 61,737 | | | | 2,230,556 | |
| | | | | | | | |
Ono Pharmaceutical Company Ltd. | | | 14,500 | | | | 317,698 | |
Orion Oyj, Class B | | | 4,156 | | | | 185,380 | |
Otsuka Holdings Company Ltd. | | | 13,000 | | | | 567,660 | |
Perrigo Company PLC | | | 6,533 | | | | 543,742 | |
Piramal Enterprises Ltd. | | | 2,159 | | | | 51,534 | |
Richter Gedeon Nyrt | | | 2,156 | | | | 45,722 | |
Roche Holding AG | | | 22,405 | | | | 5,127,567 | |
Sanofi | | | 36,687 | | | | 2,975,693 | |
Santen Pharmaceutical Company Ltd. | | | 13,500 | | | | 165,516 | |
Shionogi & Company Ltd. | | | 9,300 | | | | 446,441 | |
Sino Biopharmaceutical Ltd. | | | 186,000 | | | | 130,987 | |
Sumitomo Dainippon Pharma Company Ltd. | | | 6,100 | | | | 105,123 | |
Sun Pharmaceutical Industries Ltd. | | | 33,128 | | | | 306,923 | |
Taisho Pharmaceutical Holdings Company Ltd. | | | 1,300 | | | | 108,115 | |
Takeda Pharmaceutical Company Ltd. | | | 22,500 | | | | 932,717 | |
Teva Pharmaceutical Industries Ltd. | | | 15,371 | | | | 552,352 | |
Teva Pharmaceutical Industries Ltd. ADR | | | 15,371 | | | | 557,199 | |
Theravance Biopharma Inc. | | | 722 | | | | 23,017 | (a) |
UCB S.A. | | | 4,241 | | | | 272,462 | |
Valeant Pharmaceuticals International Inc. | | | 11,948 | | | | 173,467 | (a) |
Yuhan Corp. | | | 181 | | | | 29,897 | |
| | | | 33,292,613 | |
| | |
Precious Metals & Minerals—0.0% * | | | | | | | | |
Anglo American Platinum Ltd. | | | 1,523 | | | | 29,448 | (a) |
Fresnillo PLC | | | 4,958 | | | | 74,803 | |
Impala Platinum Holdings Ltd. | | | 21,829 | | | | 68,224 | (a) |
Industrias Penoles SAB de C.V. | | | 2,630 | | | | 49,059 | |
| | | | 221,534 | |
| | |
Property & Casualty Insurance—0.4% | | | | | | | | |
Admiral Group PLC | | | 8,319 | | | | 187,804 | |
Argo Group International Holdings Ltd. | | | 575 | | | | 37,893 | |
Aspen Insurance Holdings Ltd. | | | 528 | | | | 29,040 | |
Chubb Ltd. | | | 20,724 | | | | 2,738,055 | |
Direct Line Insurance Group PLC | | | 40,658 | | | | 185,583 | |
Dongbu Insurance Company Ltd. | | | 1,106 | | | | 57,232 | |
Global Indemnity Ltd. | | | 165 | | | | 6,305 | (a) |
Hyundai Marine & Fire Insurance Company Ltd. | | | 1,762 | | | | 45,954 | |
Insurance Australia Group Ltd. | | | 85,299 | | | | 369,972 | |
Intact Financial Corp. | | | 3,974 | | | | 284,778 | |
James River Group Holdings Ltd. | | | 286 | | | | 11,883 | |
MS&AD Insurance Group Holdings Inc. | | | 16,500 | | | | 512,676 | |
PICC Property & Casualty Company Ltd., Class H | | | 152,600 | | | | 237,762 | |
Qatar Insurance Co. SAQ | | | 4,276 | | | | 99,578 | |
QBE Insurance Group Ltd. | | | 43,777 | | | | 393,701 | |
RSA Insurance Group PLC | | | 26,979 | | | | 195,352 | |
Samsung Fire & Marine Insurance Company Ltd. | | | 977 | | | | 217,192 | |
Sompo Holdings Inc. | | | 11,100 | | | | 376,868 | |
Suncorp Group Ltd. | | | 42,400 | | | | 415,089 | |
The People’s Insurance Company Group of China Ltd., Class H | | | 224,000 | | | | 88,408 | |
Tokio Marine Holdings Inc. | | | 21,500 | | | | 884,074 | |
Tryg A/S | | | 5,635 | | | | 102,076 | |
XL Group Ltd. | | | 12,029 | | | | 448,201 | |
| | | | | | | 7,925,476 | |
| | |
Publishing—0.0% * | | | | | | | | |
Axel Springer SE | | | 1,610 | | | | 78,335 | |
Lagardere SCA | | | 4,450 | | | | 123,889 | |
Pearson PLC | | | 26,187 | | | | 264,850 | |
Singapore Press Holdings Ltd. | | | 62,737 | | | | 153,292 | |
| | | | | | | 620,366 | |
| | | | | | | | |
Railroads—0.3% | | | | | | | | |
Aurizon Holdings Ltd. | | | 58,829 | | | | 215,120 | |
BTS Group Holdings PCL NVDR | | | 100,000 | | | | 23,876 | |
Canadian National Railway Co. | | | 24,728 | | | | 1,666,173 | |
Canadian Pacific Railway Ltd. | | | 4,792 | | | | 684,505 | |
Central Japan Railway Co. | | | 4,600 | | | | 758,417 | |
Container Corporation of India Ltd. | | | 1,215 | | | | 19,857 | |
East Japan Railway Co. | | | 10,500 | | | | 909,247 | |
Hankyu Hanshin Holdings Inc. | | | 7,000 | | | | 225,061 | |
Keikyu Corp. | | | 14,000 | | | | 162,644 | |
Keio Corp. | | | 23,000 | | | | 189,506 | |
Keisei Electric Railway Company Ltd. | | | 5,000 | | | | 121,619 | |
Kintetsu Group Holdings Company Ltd. | | | 61,000 | | | | 233,258 | |
MTR Corporation Ltd. | | | 43,500 | | | | 211,520 | |
Nagoya Railroad Company Ltd. | | | 32,000 | | | | 155,013 | |
Odakyu Electric Railway Company Ltd. | | | 8,900 | | | | 176,497 | |
Tobu Railway Company Ltd. | | | 32,000 | | | | 159,129 | |
Tokyu Corp. | | | 37,000 | | | | 272,500 | |
West Japan Railway Co. | | | 5,800 | | | | 356,697 | |
| | | | | | | 6,540,639 | |
| | |
Real Estate Development—0.1% | | | | | | | | |
Bumi Serpong Damai Tbk PT | | | 185,500 | | | | 24,164 | |
Cheung Kong Property Holdings Ltd. | | | 88,564 | | | | 543,162 | |
China Evergrande Group | | | 113,000 | | | | 70,396 | |
China Jinmao Holdings Group Ltd. | | | 114,000 | | | | 30,731 | |
China Overseas Land & Investment Ltd. | | | 118,000 | | | | 312,763 | |
China Resources Land Ltd. | | | 89,777 | | | | 201,945 | |
China Vanke Company Ltd., Class H | | | 49,400 | | | | 112,778 | |
Country Garden Holdings Company Ltd. | | | 181,333 | | | | 101,505 | |
Emaar Properties PJSC | | | 105,792 | | | | 205,368 | |
Guangzhou R&F Properties Company Ltd., Class H | | | 33,600 | | | | 40,650 | |
Highwealth Construction Corp. | | | 23,400 | | | | 32,963 | |
IOI Properties Group Bhd | | | 74,607 | | | | 34,925 | |
Lippo Karawaci Tbk PT | | | 374,000 | | | | 19,987 | |
Longfor Properties Company Ltd. | | | 50,000 | | | | 63,458 | |
Ruentex Development Company Ltd. | | | 27,874 | | | | 31,827 | (a) |
Shimao Property Holdings Ltd. | | | 51,500 | | | | 67,355 | |
Sino Land Company Ltd. | | | 116,000 | | | | 173,855 | |
Sino-Ocean Group Holding Ltd. | | | 104,500 | | | | 46,770 | |
SOHO China Ltd. | | | 76,000 | | | | 37,446 | |
Sunac China Holdings Ltd. | | | 51,000 | | | | 42,428 | |
Talaat Moustafa Group | | | 36,052 | | | | 18,056 | |
| | | | | | | 2,212,532 | |
| | |
Real Estate Operating Companies—0.1% | | | | | | | | |
Aeon Mall Company Ltd. | | | 4,000 | | | | 56,381 | |
BR Malls Participacoes S.A. | | | 22,360 | | | | 82,097 | (a) |
Central Pattana PCL NVDR | | | 44,200 | | | | 70,045 | |
Deutsche Wohnen AG | | | 12,164 | | | | 382,847 | |
First Capital Realty Inc. | | | 863 | | | | 13,302 | |
Global Logistic Properties Ltd. | | | 88,600 | | | | 134,921 | |
Hongkong Land Holdings Ltd. | | | 36,000 | | | | 227,880 | |
Hulic Company Ltd. | | | 10,000 | | | | 89,081 | |
Hysan Development Company Ltd. | | | 26,000 | | | | 107,479 | |
Multiplan Empreendimentos Imobiliarios S.A. | | | 3,200 | | | | 58,382 | |
SM Prime Holdings Inc. | | | 245,000 | | | | 139,718 | |
Swire Properties Ltd. | | | 30,800 | | | | 85,013 | |
Swiss Prime Site AG | | | 2,163 | | | | 177,386 | (a) |
Vonovia SE | | | 16,737 | | | | 545,577 | |
| | | | | | | 2,170,109 | |
| | | | | | | | |
Real Estate Services—0.0% * | | | | | | | | |
Altisource Portfolio Solutions S.A. | | | 231 | | | | 6,142 | (a) |
| | |
Regional Banks—0.1% | | | | | | | | |
Bank of Queensland Ltd. | | | 12,042 | | | | 103,502 | |
Bendigo & Adelaide Bank Ltd. | | | 15,355 | | | | 141,317 | |
BNK Financial Group Inc. | | | 7,204 | | | | 51,772 | |
Chongqing Rural Commercial Bank Company Ltd., Class H | | | 92,000 | | | | 53,991 | |
Concordia Financial Group Ltd. | | | 23,200 | | | | 111,907 | |
DGB Financial Group Inc. | | | 3,207 | | | | 25,942 | |
First BanCorp | | | 2,390 | | | | 15,798 | (a) |
Fukuoka Financial Group Inc. | | | 30,000 | | | | 133,493 | |
Mebuki Financial Group Inc. | | | 29,250 | | | | 108,589 | |
Resona Holdings Inc. | | | 68,000 | | | | 349,518 | |
Seven Bank Ltd. | | | 22,000 | | | | 63,189 | |
Shinsei Bank Ltd. | | | 64,000 | | | | 107,549 | |
Suruga Bank Ltd. | | | 7,000 | | | | 156,583 | |
The Bank of Kyoto Ltd. | | | 14,000 | | | | 104,188 | |
The Chiba Bank Ltd. | | | 27,000 | | | | 165,979 | |
The Chugoku Bank Ltd. | | | 7,000 | | | | 100,707 | |
The Hachijuni Bank Ltd. | | | 15,000 | | | | 87,195 | |
The Hiroshima Bank Ltd. | | | 19,000 | | | | 88,944 | |
The Shizuoka Bank Ltd. | | | 21,000 | | | | 176,808 | |
Yamaguchi Financial Group Inc. | | | 8,000 | | | | 87,315 | |
| | | | | | | 2,234,286 | |
| | |
Reinsurance—0.1% | | | | | | | | |
Blue Capital Reinsurance Holdings Ltd. | | | 114 | | | | 2,103 | |
Hannover Rueck SE | | | 2,353 | | | | 255,132 | |
Muenchener Rueckversicherungs-Gesellschaft AG | | | 5,242 | | | | 993,285 | |
RenaissanceRe Holdings Ltd. | | | 362 | | | | 49,312 | |
SCOR SE | | | 5,925 | | | | 205,167 | |
Swiss Re AG | | | 10,096 | | | | 958,591 | |
Third Point Reinsurance Ltd. | | | 1,326 | | | | 15,315 | (a) |
| | | | | | | 2,478,905 | |
| | |
Renewable Electricity—0.0% * | | | | | | | | |
Atlantica Yield PLC | | | 1,183 | | | | 22,891 | |
China Longyuan Power Group Corporation Ltd., Class H | | | 101,000 | | | | 78,943 | |
Energy Development Corp. | | | 270,200 | | | | 27,992 | |
Engie Brasil Energia S.A. | | | 6,100 | | | | 65,598 | |
Meridian Energy Ltd. | | | 39,224 | | | | 71,112 | |
| | | | | | | 266,536 | |
| | |
Research & Consulting Services—0.1% | | | | | | | | |
Bureau Veritas S.A. | | | 8,532 | | | | 165,674 | |
Experian PLC | | | 31,900 | | | | 620,427 | |
Intertek Group PLC | | | 5,415 | | | | 232,915 | |
RELX N.V. | | | 35,472 | | | | 598,251 | |
RELX PLC | | | 36,047 | | | | 645,406 | |
SGS S.A. | | | 183 | | | | 373,076 | |
Wolters Kluwer N.V. | | | 9,337 | | | | 338,975 | |
| | | | | | | 2,974,724 | |
| | |
Residential REITs—0.0% * | | | | | | | | |
Emlak Konut Gayrimenkul Yatirim Ortakligi AS | | | 58,985 | | | | 50,138 | |
| | |
Restaurants—0.1% | | | | | | | | |
Compass Group PLC | | | 51,803 | | | | 960,795 | |
Jollibee Foods Corp. | | | 15,290 | | | | 59,668 | |
McDonald’s Holdings Company Japan Ltd. | | | 2,600 | | | | 68,213 | |
Restaurant Brands International Inc. | | | 7,911 | | | | 377,248 | |
| | | | | | | | |
Sodexo SA | | | 3,320 | | | | 382,393 | |
Whitbread PLC | | | 6,273 | | | | 292,687 | |
| | | | | | | 2,141,004 | |
| | |
Retail REITs—0.2% | | | | | | | | |
CapitaLand Mall Trust | | | 82,400 | | | | 107,513 | |
Hammerson PLC | | | 30,144 | | | | 213,428 | |
Hyprop Investments Ltd. | | | 6,628 | | | | 56,858 | |
Intu Properties PLC | | | 36,016 | | | | 125,187 | |
Japan Retail Fund Investment Corp. | | | 77 | | | | 156,198 | |
Klepierre | | | 6,776 | | | | 266,904 | |
Link REIT | | | 70,000 | | | | 455,041 | |
Resilient REIT Ltd. | | | 11,324 | | | | 94,741 | |
RioCan Real Estate Investment Trust | | | 5,179 | | | | 102,842 | |
Scentre Group | | | 174,121 | | | | 585,016 | |
The British Land Company PLC | | | 25,193 | | | | 195,962 | |
Unibail-Rodamco SE | | | 3,104 | | | | 742,367 | |
Vicinity Centres | | | 121,693 | | | | 263,472 | |
Westfield Corp. | | | 69,643 | | | | 473,019 | |
| | | | 3,838,548 | |
| | |
Security & Alarm Services—0.0% * | | | | | | | | |
G4S PLC | | | 64,223 | | | | 186,489 | |
S-1 Corp. | | | 405 | | | | 29,408 | |
Secom Company Ltd. | | | 6,800 | | | | 498,361 | |
Securitas AB, Class B | | | 11,896 | | | | 187,778 | |
| | | | 902,036 | |
| | |
Semiconductor Equipment—0.1% | | | | | | | | |
ASM Pacific Technology Ltd. | | | 9,300 | | | | 98,540 | |
ASML Holding N.V. | | | 11,931 | | | | 1,342,107 | |
GCL-Poly Energy Holdings Ltd. | | | 394,000 | | | | 47,261 | (a) |
Hanergy Thin Film Power Group Ltd. | | | 64,000 | | | | — | (a,j) |
Tokyo Electron Ltd. | | | 5,400 | | | | 511,365 | |
| | | | 1,999,273 | |
| | |
Semiconductors—0.5% | | | | | | | | |
Advanced Semiconductor Engineering Inc. | | | 151,000 | | | | 154,847 | |
Broadcom Ltd. | | | 17,579 | | | | 3,107,440 | |
Infineon Technologies AG | | | 35,586 | | | | 619,692 | |
MediaTek Inc. | | | 44,352 | | | | 297,937 | |
Novatek Microelectronics Corp. | | | 22,000 | | | | 72,698 | |
NXP Semiconductors N.V. | | | 9,900 | | | | 970,299 | (a) |
Phison Electronics Corp. | | | 5,000 | | | | 39,638 | |
Powertech Technology Inc. | | | 27,000 | | | | 72,885 | |
Realtek Semiconductor Corp. | | | 16,160 | | | | 51,144 | |
Rohm Company Ltd. | | | 2,100 | | | | 121,173 | |
Semiconductor Manufacturing International Corp. | | | 99,200 | | | | 155,841 | (a) |
Siliconware Precision Industries Company Ltd. | | | 76,848 | | | | 114,095 | |
SK Hynix Inc. | | | 19,550 | | | | 723,534 | |
STMicroelectronics N.V. | | | 17,059 | | | | 193,874 | |
Taiwan Semiconductor Manufacturing Company Ltd. | | | 785,000 | | | | 4,420,786 | |
United Microelectronics Corp. | | | 501,000 | | | | 177,213 | |
Vanguard International Semiconductor Corp. | | | 19,000 | | | | 33,132 | |
| | | | 11,326,228 | |
| | |
Silver—0.0% * | | | | | | | | |
Silver Wheaton Corp. | | | 14,644 | | | | 283,260 | |
| | |
Soft Drinks—0.1% | | | | | | | | |
Arca Continental SAB de C.V. | | | 14,500 | | | | 75,901 | |
Coca-Cola Amatil Ltd. | | | 23,185 | | | | 169,897 | |
Coca-Cola European Partners PLC | | | 7,000 | | | | 221,645 | |
| | | | | | | | |
Coca-Cola Femsa SAB de C.V., Class L | | | 16,500 | | | | 105,240 | |
Coca-Cola HBC AG | | | 6,874 | | | | 150,341 | (a) |
Coca-Cola Icecek AS | | | 2,227 | | | | 20,956 | |
Fomento Economico Mexicano SAB de C.V. | | | 59,128 | | | | 452,870 | |
Suntory Beverage & Food Ltd. | | | 3,900 | | | | 162,340 | |
| | | | 1,359,190 | |
| | |
Specialized Finance—0.0% * | | | | | | | | |
Chailease Holding Company Ltd. | | | 32,718 | | | | 55,936 | |
Far East Horizon Ltd. | | | 53,000 | | | | 45,459 | |
Mitsubishi UFJ Lease & Finance Company Ltd. | | | 12,200 | | | | 63,178 | |
Power Finance Corporation Ltd. | | | 21,642 | | | | 38,807 | |
| | | | 203,380 | |
| | |
Specialty Chemicals—0.3% | | | | | | | | |
Akzo Nobel N.V. | | | 8,113 | | | | 508,211 | |
Asian Paints Ltd. | | | 10,450 | | | | 137,111 | |
Chr Hansen Holding A/S | | | 3,500 | | | | 194,175 | |
Covestro AG | | | 2,090 | | | | 143,685 | (d) |
Croda International PLC | | | 5,263 | | | | 207,843 | |
EMS-Chemie Holding AG | | | 324 | | | | 164,973 | |
Evonik Industries AG | | | 4,176 | | | | 125,004 | |
Givaudan S.A. | | | 322 | | | | 591,186 | |
Hitachi Chemical Company Ltd. | | | 4,000 | | | | 100,244 | |
Johnson Matthey PLC | | | 5,784 | | | | 227,417 | |
JSR Corp. | | | 6,700 | | | | 105,870 | |
Kansai Paint Company Ltd. | | | 6,000 | | | | 110,756 | |
Koninklijke DSM N.V. | | | 5,587 | | | | 335,659 | |
Nippon Paint Holdings Company Ltd. | | | 6,100 | | | | 166,575 | |
Nitto Denko Corp. | | | 5,500 | | | | 422,939 | |
Novozymes A/S, Class B | | | 7,835 | | | | 270,630 | |
Shin-Etsu Chemical Company Ltd. | | | 12,700 | | | | 987,276 | |
Sika AG | | | 73 | | | | 351,371 | |
Symrise AG | | | 3,997 | | | | 243,802 | |
Umicore S.A. | | | 3,664 | | | | 209,268 | |
| | | | 5,603,995 | |
| | |
Specialty Stores—0.0% * | | | | | | | | |
Dufry AG | | | 1,281 | | | | 160,070 | (a) |
FF Group | | | 1,860 | | | | 37,726 | (a) |
Hotel Shilla Company Ltd. | | | 1,000 | | | | 39,866 | |
JUMBO S.A. | | | 4,127 | | | | 65,555 | |
| | | | 303,217 | |
| | |
Steel—0.2% | | | | | | | | |
ArcelorMittal | | | 39,985 | | | | 295,894 | (a) |
China Steel Corp. | | | 381,796 | | | | 292,012 | |
Cia Siderurgica Nacional S.A. | | | 27,400 | | | | 91,342 | (a) |
Eregli Demir ve Celik Fabrikalari TAS | | | 70,254 | | | | 102,657 | |
Fortescue Metals Group Ltd. | | | 55,018 | | | | 234,649 | |
Hitachi Metals Ltd. | | | 8,000 | | | | 108,647 | |
Hyundai Steel Co. | | | 2,772 | | | | 130,820 | |
JFE Holdings Inc. | | | 15,900 | | | | 242,654 | |
JSW Steel Ltd. | | | 2,896 | | | | 69,151 | |
Kobe Steel Ltd. | | | 9,500 | | | | 90,980 | (a) |
Nippon Steel & Sumitomo Metal Corp. | | | 23,600 | | | | 527,502 | |
POSCO | | | 2,429 | | | | 517,857 | |
Severstal PJSC GDR | | | 7,140 | | | | 108,528 | |
Tata Steel Ltd. | | | 11,358 | | | | 65,433 | |
ThyssenKrupp AG | | | 10,422 | | | | 248,872 | |
Vale S.A. | | | 45,500 | | | | 359,001 | |
Voestalpine AG | | | 4,459 | | | | 175,380 | |
| | | | 3,661,379 | |
| | | | | | | | |
Systems Software—0.0% * | | | | | | | | |
Check Point Software Technologies Ltd. | | | 3,980 | | | | 336,151 | (a) |
Oracle Corporation Japan | | | 1,400 | | | | 70,699 | |
Trend Micro Inc. | | | 4,000 | | | | 142,496 | |
| | | | 549,346 | |
| | |
Technology Distributors—0.0% * | | | | | | | | |
Synnex Technology International Corp. | | | 50,400 | | | | 50,824 | |
WPG Holdings Ltd. | | | 51,000 | | | | 60,132 | |
| | | | 110,956 | |
| | |
Technology Hardware, Storage & Peripherals—0.4% | | | | | | | | |
Acer Inc. | | | 102,084 | | | | 41,494 | (a) |
Advantech Company Ltd. | | | 10,994 | | | | 86,815 | |
Asustek Computer Inc. | | | 26,000 | | | | 213,783 | |
BlackBerry Ltd. | | | 17,699 | | | | 121,948 | (a) |
Brother Industries Ltd. | | | 8,800 | | | | 159,122 | |
Canon Inc. | | | 31,900 | | | | 901,192 | |
Catcher Technology Company Ltd. | | | 28,000 | | | | 194,607 | |
Chicony Electronics Company Ltd. | | | 17,427 | | | | 40,554 | |
Compal Electronics Inc. | | | 158,000 | | | | 90,450 | |
Foxconn Technology Company Ltd. | | | 32,561 | | | | 86,179 | |
FUJIFILM Holdings Corp. | | | 14,800 | | | | 562,764 | |
HTC Corp. | | | 30,000 | | | | 73,536 | (a) |
Inventec Corp. | | | 80,000 | | | | 54,857 | |
Konica Minolta Inc. | | | 5,600 | | | | 55,743 | |
Lenovo Group Ltd. | | | 248,000 | | | | 150,339 | |
Lite-On Technology Corp. | | | 84,669 | | | | 127,677 | |
NEC Corp. | | | 76,000 | | | | 201,998 | |
Pegatron Corp. | | | 59,000 | | | | 140,960 | |
Quanta Computer Inc. | | | 112,000 | | | | 209,550 | |
Ricoh Company Ltd. | | | 22,400 | | | | 189,748 | |
Samsung Electronics Company Ltd. | | | 3,160 | | | | 4,714,622 | |
Seagate Technology PLC | | | 13,195 | | | | 503,653 | |
Seiko Epson Corp. | | | 10,000 | | | | 212,200 | |
Transcend Information Inc. | | | 6,000 | | | | 15,862 | |
Wistron Corp. | | | 89,820 | | | | 69,534 | |
| | | | 9,219,187 | |
| | |
Textiles—0.0% * | | | | | | | | |
Eclat Textile Company Ltd. | | | 5,200 | | | | 54,454 | |
Formosa Taffeta Company Ltd. | | | 25,000 | | | | 22,883 | |
Ruentex Industries Ltd. | | | 19,711 | | | | 32,843 | |
| | | | 110,180 | |
| | |
Thrifts & Mortgage Finance—0.1% | | | | | | | | |
Essent Group Ltd. | | | 1,427 | | | | 46,192 | (a) |
Housing Development Finance Corporation Ltd. | | | 47,459 | | | | 882,051 | |
Indiabulls Housing Finance Ltd. | | | 9,083 | | | | 86,855 | |
LIC Housing Finance Ltd. | | | 11,981 | | | | 98,326 | |
| | | | 1,113,424 | |
| | |
Tires & Rubber—0.1% | | | | | | | | |
Bridgestone Corp. | | | 21,500 | | | | 776,791 | |
Cheng Shin Rubber Industry Company Ltd. | | | 65,550 | | | | 123,660 | |
Cie Generale des Etablissements Michelin | | | 5,913 | | | | 659,223 | |
Hankook Tire Company Ltd. | | | 2,917 | | | | 140,078 | |
Nokian Renkaat Oyj | | | 3,864 | | | | 144,356 | |
Sumitomo Rubber Industries Ltd. | | | 6,400 | | | | 101,842 | |
The Yokohama Rubber Company Ltd. | | | 3,500 | | | | 62,897 | |
| | | | 2,008,847 | |
| | | | | | | | |
Tobacco—0.3% | | | | | | | | |
British American Tobacco Malaysia Bhd | | | 4,300 | | | | 42,751 | |
British American Tobacco PLC | | | 60,270 | | | | 3,441,751 | |
Gudang Garam Tbk PT | | | 18,500 | | | | 87,745 | |
Hanjaya Mandala Sampoerna Tbk PT | | | 190,000 | | | | 54,014 | |
Imperial Brands PLC | | | 31,335 | | | | 1,371,623 | |
ITC Ltd. | | | 117,714 | | | | 417,645 | |
Japan Tobacco Inc. | | | 35,400 | | | | 1,166,696 | |
KT&G Corp. | | | 3,742 | | | | 312,918 | |
Swedish Match AB | | | 6,585 | | | | 210,062 | |
| | | | 7,105,205 | |
| | |
Trading Companies & Distributors—0.2% | | | | | | | | |
AerCap Holdings N.V. | | | 4,860 | | | | 202,225 | (a) |
Ashtead Group PLC | | | 16,258 | | | | 317,409 | |
Brenntag AG | | | 4,792 | | | | 266,870 | |
Bunzl PLC | | | 10,462 | | | | 272,638 | |
Finning International Inc. | | | 6,330 | | | | 124,094 | |
ITOCHU Corp. | | | 47,400 | | | | 630,727 | |
Marubeni Corp. | | | 52,900 | | | | 300,614 | |
MISUMI Group Inc. | | | 8,200 | | | | 135,266 | |
Mitsubishi Corp. | | | 45,400 | | | | 969,229 | |
Mitsui & Company Ltd. | | | 57,000 | | | | 785,347 | |
Posco Daewoo Corp. | | | 2,030 | | | | 45,380 | |
Rexel S.A. | | | 8,008 | | | | 132,060 | |
SK Networks Company Ltd. | | | 6,600 | | | | 37,814 | |
Sumitomo Corp. | | | 34,200 | | | | 403,328 | |
Toyota Tsusho Corp. | | | 6,800 | | | | 177,528 | |
Travis Perkins PLC | | | 6,388 | | | | 114,611 | |
Triton International Ltd. | | | 766 | | | | 12,103 | |
Wolseley PLC | | | 8,935 | | | | 547,831 | |
| | | | 5,475,074 | |
| | |
Trucking—0.0% * | | | | | | | | |
ComfortDelGro Corporation Ltd. | | | 50,000 | | | | 85,485 | |
DSV A/S | | | 5,426 | | | | 241,838 | |
Localiza Rent a Car S.A. | | | 5,145 | | | | 54,095 | |
Nippon Express Company Ltd. | | | 32,000 | | | | 172,572 | |
| | | | 553,990 | |
| | |
Water Utilities—0.0% * | | | | | | | | |
Aguas Andinas S.A., Class A | | | 77,578 | | | | 40,527 | |
Beijing Enterprises Water Group Ltd. | | | 130,000 | | | | 86,520 | (a) |
Cia de Saneamento Basico do Estado de Sao Paulo | | | 13,500 | | | | 119,416 | |
Consolidated Water Company Ltd. | | | 301 | | | | 3,266 | |
Guangdong Investment Ltd. | | | 92,000 | | | | 121,509 | |
Severn Trent PLC | | | 7,131 | | | | 195,790 | |
United Utilities Group PLC | | | 23,476 | | | | 261,363 | |
| | | | 828,391 | |
| | |
Wireless Telecommunication Services—0.5% | | | | | | | | |
Advanced Info Service PCL NVDR | | | 38,900 | | | | 159,682 | |
America Movil SAB de C.V., Class L | | | 983,589 | | | | 621,621 | |
Axiata Group Bhd | | | 97,600 | | | | 102,691 | |
Bharti Airtel Ltd. | | | 29,526 | | | | 132,969 | |
China Mobile Ltd. | | | 198,500 | | | | 2,104,525 | |
DiGi.Com Bhd | | | 96,300 | | | | 103,685 | |
Empresa Nacional de Telecomunicaciones SA | | | 4,152 | | | | 44,131 | (a) |
Far EasTone Telecommunications Company Ltd. | | | 32,000 | | | | 71,985 | |
Global Telecom Holding SAE | | | 2,285 | | | | 895 | (a) |
Globe Telecom Inc. | | | 1,235 | | | | 37,488 | |
Idea Cellular Ltd. | | | 24,304 | | | | 26,499 | |
| | | | | | | | |
KDDI Corp. | | | 58,500 | | | | 1,484,381 | |
Maxis Bhd | | | 88,900 | | | | 118,507 | |
Millicom International Cellular S.A. | | | 2,635 | | | | 112,917 | |
Mobile TeleSystems PJSC ADR | | | 20,756 | | | | 189,087 | |
MTN Group Ltd. | | | 59,093 | | | | 545,211 | |
NTT DOCOMO Inc. | | | 44,100 | | | | 1,006,887 | |
PLDT Inc. | | | 3,770 | | | | 103,516 | |
Rogers Communications Inc., Class B | | | 12,899 | | | | 498,146 | |
Sistema PJSC FC GDR GDR | | | 8,110 | | | | 72,990 | |
SK Telecom Company Ltd. | | | 72 | | | | 13,353 | |
SoftBank Group Corp. | | | 30,400 | | | | 2,023,886 | |
StarHub Ltd. | | | 26,000 | | | | 50,571 | |
Taiwan Mobile Company Ltd. | | | 43,000 | | | | 138,757 | |
Tele2 AB, Class B | | | 11,746 | | | | 94,451 | |
Tim Participacoes S.A. | | | 31,600 | | | | 76,022 | |
Turkcell Iletisim Hizmetleri AS | | | 31,681 | | | | 87,813 | (a) |
Vodacom Group Ltd. | | | 9,090 | | | | 101,303 | |
Vodafone Group PLC | | | 842,342 | | | | 2,080,118 | |
XL Axiata Tbk PT | | | 93,500 | | | | 16,032 | (a) |
| | | | 12,220,119 | |
| |
Total Common Stock | | | | | |
(Cost $573,563,167) | | | | 565,430,589 | |
| | |
Preferred Stock—0.3% | | | | | | | | |
| | |
Automobile Manufacturers—0.1% | | | | | | | | |
Bayerische Motoren Werke AG | | | 1,658 | | | | 127,136 | |
Hyundai Motor Co. | | | 1,448 | | | | 119,168 | |
Hyundai Motor Co. | | | 666 | | | | 52,770 | |
Porsche Automobil Holding SE | | | 5,309 | | | | 289,727 | |
Volkswagen AG | | | 6,157 | | | | 865,988 | |
| | | | 1,454,789 | |
| | |
Commodity Chemicals—0.0% * | | | | | | | | |
Braskem S.A., Class A | | | 6,100 | | | | 64,192 | |
FUCHS PETROLUB SE | | | 2,446 | | | | 102,887 | |
LG Chem Ltd. | | | 274 | | | | 40,721 | |
| | | | 207,800 | |
| | |
Diversified Banks—0.1% | | | | | | | | |
Banco Bradesco S.A. | | | 87,504 | | | | 779,678 | |
Bancolombia S.A. | | | 12,485 | | | | 113,039 | |
Grupo Aval Acciones y Valores SA | | | 128,800 | | | | 52,129 | |
Itau Unibanco Holding S.A. | | | 102,897 | | | | 1,070,164 | |
Itausa—Investimentos Itau S.A. | | | 135,385 | | | | 344,421 | |
| | | | 2,359,431 | |
| | |
Electric Utilities—0.0% * | | | | | | | | |
Centrais Eletricas Brasileiras S.A., Class B | | | 8,100 | | | | 64,433 | (a) |
Cia Energetica de Minas Gerais | | | 28,508 | | | | 67,532 | |
Cia Paranaense de Energia, Class B | | | 3,900 | | | | 32,784 | |
| | | | 164,749 | |
| | |
Fertilizers & Agricultural Chemicals—0.0% * | | | | | | | | |
Sociedad Quimica y Minera de Chile S.A., Class B | | | 3,310 | | | | 94,380 | |
| | |
General Merchandise Stores—0.0% * | | | | | | | | |
Lojas Americanas S.A. | | | 23,550 | | | | 123,007 | |
| | |
Household Products—0.1% | | | | | | | | |
Henkel AG & Company KGaA | | | 5,912 | | | | 706,191 | |
| | |
Hypermarkets & Super Centers—0.0% * | | | | | | | | |
Cia Brasileira de Distribuicao | | | 4,800 | | | | 80,745 | |
| | | | | | | | |
Integrated Oil & Gas—0.0% * | | | | | | | | |
Petroleo Brasileiro S.A. | | | 117,938 | | | | 538,832 | (a) |
| | |
Integrated Telecommunication Services—0.0% * | | | | | | | | |
Telefonica Brasil S.A. | | | 11,900 | | | | 161,168 | |
| | |
Multi-Sector Holdings—0.0% * | | | | | | | | |
Grupo de Inversiones Suramericana S.A. | | | 3,025 | | | | 37,283 | |
| | |
Paper Products—0.0% * | | | | | | | | |
Suzano Papel e Celulose S.A., Class A | | | 9,200 | | | | 40,139 | |
| | |
Soft Drinks—0.0% * | | | | | | | | |
Embotelladora Andina S.A., Class B | | | 7,865 | | | | 30,531 | |
| | |
Steel—0.0% * | | | | | | | | |
Gerdau S.A. | | | 34,600 | | | | 114,813 | |
Vale S.A. | | | 54,807 | | | | 393,030 | |
| | | | 507,843 | |
| | |
Technology Hardware, Storage & Peripherals—0.0% * | | | | | | | | |
Samsung Electronics Company Ltd. | | | 553 | | | | 656,109 | |
| |
Total Preferred Stock | | | | | |
(Cost $9,739,510) | | | | 7,162,997 | |
| | |
Rights—0.0% * | | | | | | | | |
| | |
Integrated Oil & Gas—0.0% * | | | | | | | | |
Repsol S.A. | | | | | | | | |
(Cost $12,727) | | | 36,497 | | | | 13,550 | (a) |
| |
Total Foreign Equity | | | | | |
(Cost $583,315,404) | | | | 572,607,136 | |
| | | | | | | | | | | | |
| | | | | | Principal
Amount | | | Fair Value | |
| Bonds and Notes—31.0% | |
U.S. Treasuries—10.5% | |
U.S. Treasury Bonds | | | | | | | | | | | | |
2.25% | | | 08/15/46 | | | $ | 600,000 | | | $ | 503,203 | (e) |
2.50% | | | 02/15/45 - 05/15/46 | | | | 4,510,000 | | | | 4,000,138 | (e) |
2.75% | | | 11/15/42 | | | | 650,000 | | | | 612,614 | (e) |
2.88% | | | 08/15/45 - 11/15/46 | | | | 1,800,000 | | | | 1,728,705 | (e) |
3.00% | | | 05/15/42 - 11/15/45 | | | | 12,800,000 | | | | 12,636,740 | (e) |
3.13% | | | 08/15/44 | | | | 2,000,000 | | | | 2,019,738 | (e) |
3.38% | | | 05/15/44 | | | | 2,900,000 | | | | 3,068,603 | (e) |
3.63% | | | 08/15/43 - 02/15/44 | | | | 1,740,000 | | | | 1,924,836 | (e) |
3.75% | | | 11/15/43 | | | | 1,400,000 | | | | 1,584,006 | (e) |
4.38% | | | 11/15/39 | | | | 500,000 | | | | 616,118 | (e) |
4.50% | | | 02/15/36 | | | | 3,000,000 | | | | 3,789,252 | (e) |
4.63% | | | 02/15/40 | | | | 500,000 | | | | 637,843 | (e) |
5.25% | | | 02/15/29 | | | | 200,000 | | | | 255,219 | (e) |
5.50% | | | 08/15/28 | | | | 1,450,000 | | | | 1,874,286 | (e) |
6.00% | | | 02/15/26 | | | | 1,827,000 | | | | 2,359,293 | (e) |
6.38% | | | 08/15/27 | | | | 200,000 | | | | 271,868 | (e) |
7.63% | | | 11/15/22 - 02/15/25 | | | | 500,000 | | | | 669,921 | (e) |
7.88% | | | 02/15/21 | | | | 2,000,000 | | | | 2,479,170 | (e) |
8.75% | | | 05/15/20 | | | | 3,000,000 | | | | 3,699,801 | (e) |
9.00% | | | 11/15/18 | | | | 3,000,000 | | | | 3,433,533 | (e) |
U.S. Treasury Notes | | | | | | | | | | | | |
0.63% | | | 04/30/18 | | | | 3,000,000 | | | | 2,985,063 | |
0.75% | | | 01/31/18 - 03/31/18 | | | | 4,000,000 | | | | 3,989,708 | |
0.88% | | | 01/31/18 - 03/31/18 | | | | 3,000,000 | | | | 2,997,019 | |
1.00% | | | 03/15/18 - 10/15/19 | | | | 11,300,000 | | | | 11,258,468 | |
1.13% | | | 12/31/19 - 09/30/21 | | | | 22,000,000 | | | | 21,633,761 | |
1.25% | | | 10/31/18 - 10/31/21 | | | | 17,500,000 | | | | 17,329,581 | |
1.38% | | | 07/31/18 - 05/31/21 | | | | 17,700,000 | | | | 17,580,301 | |
1.50% | | | 11/30/19 - 08/15/26 | | | | 16,900,000 | | | | 16,529,183 | |
1.63% | | | 04/30/19 - 05/15/26 | | | | 17,240,000 | | | | 16,987,424 | |
1.75% | | | 10/31/20 - 09/30/22 | | | | 12,600,000 | | | | 12,563,238 | |
2.00% | | | 07/31/20 - 08/15/25 | | | | 26,844,000 | | | | 26,541,747 | |
2.13% | | | 08/31/20 - 12/31/22 | | | | 7,100,000 | | | | 7,163,185 | |
2.25% | | | 03/31/21 - 11/15/25 | | | | 13,890,000 | | | | 13,809,711 | |
2.38% | | | 05/31/18 - 08/15/24 | | | | 11,200,000 | | | | 11,361,911 | |
2.50% | | | 05/15/24 | | | | 2,500,000 | | | | 2,534,190 | |
2.63% | | | 08/15/20 - 11/15/20 | | | | 3,885,000 | | | | 4,013,079 | |
3.13% | | | 05/15/21 | | | | 4,000,000 | | | | 4,211,472 | |
3.63% | | | 02/15/21 | | | | 700,000 | | | | 750,789 | |
| | | | 242,404,717 | |
| | | |
U.S. Government Sponsored Agency—0.1% | | | | | | | | | | | | |
Tennessee Valley Authority | | | | | | | | | | | | |
3.50% | | | 12/15/42 | | | | 1,000,000 | | | | 975,166 | |
| | | |
Agency Collateralized Mortgage Obligations—0.2% | | | | | | | | | | | | |
Federal Home Loan Mortgage Corp. | | | | | | | | | | | | |
2.37% | | | 05/25/22 | | | | 600,000 | | | | 600,363 | |
2.60% | | | 10/25/23 | | | | 127,260 | | | | 129,251 | |
2.75% | | | 01/25/26 | | | | 300,000 | | | | 295,728 | |
2.79% | | | 10/25/20 | | | | 38,259 | | | | 38,876 | |
2.87% | | | 12/25/21 | | | | 800,000 | | | | 819,776 | |
3.06% | | | 07/25/23 | | | | 600,000 | | | | 618,450 | (f) |
3.30% | | | 04/25/23 | | | | 100,000 | | | | 104,509 | (f) |
3.39% | | | 03/25/24 | | | | 200,000 | | | | 209,247 | |
3.40% | | | 07/25/19 | | | | 106,767 | | | | 109,241 | |
| | | | | | | | | | | | |
3.41% | | | 05/25/19 | | | | 180,378 | | | | 184,852 | |
3.49% | | | 01/25/24 | | | | 300,000 | | | | 315,855 | |
3.53% | | | 07/25/23 | | | | 800,000 | | | | 846,363 | (f) |
3.97% | | | 01/25/21 | | | | 200,000 | | | | 213,587 | (f) |
4.25% | | | 01/25/20 | | | | 100,000 | | | | 105,798 | |
5.09% | | | 03/25/19 | | | | 100,000 | | | | 106,097 | |
Federal National Mortgage Assoc. | | | | | | | | | | | | |
2.78% | | | 06/25/21 | | | | 483,374 | | | | 493,187 | (f) |
| | | | 5,191,180 | |
| | | |
Agency Mortgage Backed—9.3% | | | | | | | | | | | | |
Federal Home Loan Banks | | | | | | | | | | | | |
1.25% | | | 01/16/19 | | | | 1,800,000 | | | | 1,798,322 | |
1.38% | | | 11/15/19 | | | | 1,200,000 | | | | 1,194,620 | |
Federal Home Loan Mortgage Corp. | | | | | | | | | | | | |
0.88% | | | 03/07/18 | | | | 2,000,000 | | | | 1,997,136 | |
1.13% | | | 08/12/21 | | | | 1,137,000 | | | | 1,093,611 | |
1.25% | | | 10/02/19 | | | | 1,500,000 | | | | 1,490,511 | |
2.38% | | | 01/13/22 | | | | 2,100,000 | | | | 2,132,298 | |
2.50% | | | 07/01/28 - 01/01/30 | | | | 2,982,266 | | | | 2,989,122 | |
2.51% | | | 11/25/22 | | | | 300,000 | | | | 300,754 | |
3.00% | | | 05/01/30 - 12/01/46 | | | | 12,460,390 | | | | 12,551,868 | |
3.50% | | | 10/01/42 - 11/01/46 | | | | 12,179,401 | | | | 12,490,981 | |
4.00% | | | 06/01/42 - 05/01/46 | | | | 7,261,725 | | | | 7,636,971 | |
4.50% | | | 05/01/42 - 01/01/45 | | | | 120,349 | | | | 129,640 | |
4.88% | | | 06/13/18 | | | | 2,000,000 | | | | 2,106,244 | |
5.00% | | | 12/01/22 - 06/01/41 | | | | 2,999,783 | | | | 3,276,583 | |
5.50% | | | 01/01/38 - 04/01/39 | | | | 553,241 | | | | 632,423 | |
6.00% | | | 06/01/37 - 11/01/37 | | | | 524,429 | | | | 607,390 | |
6.25% | | | 07/15/32 | | | | 250,000 | | | | 343,622 | |
Federal Home Loan Mortgage Corp. 1.50% + 12 month USD LIBOR | | | | | | | | | | | | |
1.80% | | | 06/01/43 | | | | 227,492 | | | | 232,524 | (f) |
Federal Home Loan Mortgage Corp. 1.60% + 12 month USD LIBOR | | | | | | | | | | | | |
2.52% | | | 08/01/43 | | | | 267,338 | | | | 270,874 | (f) |
Federal Home Loan Mortgage Corp. 1.65% + 12 month USD LIBOR | | | | | | | | | | | | |
2.45% | | | 05/01/43 | | | | 710,299 | | | | 718,277 | (f) |
Federal Home Loan Mortgage Corp. TBA | | | | | | | | | | | | |
2.50% | | | 01/01/47 | | | | 1,500,000 | | | | 1,502,100 | (g) |
3.00% | | | TBA | | | | 2,050,000 | | | | 2,047,575 | (g) |
3.50% | | | TBA | | | | 1,000,000 | | | | 1,032,950 | (g) |
Federal National Mortgage Assoc. | | | | | | | | | | | | |
0.88% | | | 05/21/18 | | | | 900,000 | | | | 897,341 | |
1.88% | | | 09/24/26 | | | | 1,000,000 | | | | 917,434 | |
2.13% | | | 04/24/26 | | | | 700,000 | | | | 660,975 | |
2.50% | | | 02/01/28 - 11/01/31 | | | | 7,435,945 | | | | 7,453,510 | |
2.68% | | | 05/25/21 | | | | 100,000 | | | | 101,103 | (f) |
3.00% | | | 01/01/28 - 12/01/46 | | | | 19,255,741 | | | | 19,415,814 | |
3.50% | | | 01/01/27 - 08/01/46 | | | | 22,830,970 | | | | 23,497,997 | |
4.00% | | | 10/01/41 - 09/01/46 | | | | 13,670,903 | | | | 14,407,734 | |
4.50% | | | 11/01/18 - 04/01/41 | | | | 9,802,130 | | | | 10,552,926 | |
5.00% | | | 12/01/39 - 06/01/41 | | | | 2,582,673 | | | | 2,862,650 | |
5.50% | | | 12/01/35 - 04/01/38 | | | | 3,624,371 | | | | 4,061,118 | |
6.00% | | | 03/01/34 - 08/01/37 | | | | 2,622,728 | | | | 2,990,718 | |
6.63% | | | 11/15/30 | | | | 100,000 | | | | 138,858 | |
Federal National Mortgage Assoc. 1.53% + 12 month USD LIBOR | | | | | | | | | | | | |
1.90% | | | 04/01/43 | | | | 450,629 | | | | 463,749 | (f) |
Federal National Mortgage Assoc. TBA | | | | | | | | | | | | |
2.50% | | | 01/01/47 | | | | 250,000 | | | | 250,275 | (g) |
3.00% | | | TBA | | | | 9,825,000 | | | | 9,756,588 | (g) |
3.50% | | | 01/01/47 | | | | 900,000 | | | | 921,870 | (g) |
4.50% | | | 01/01/47 | | | | 300,000 | | | | 322,560 | (g) |
| | | | | | | | | | | | |
Government National Mortgage Assoc. | | | | | | | | | | | | |
2.50% | | | 05/20/45 | | | | 320,737 | | | | 311,401 | |
3.00% | | | 10/15/42 - 11/20/46 | | | | 10,019,549 | | | | 10,156,265 | |
3.50% | | | 03/20/45 - 10/20/46 | | | | 17,640,188 | | | | 18,346,626 | |
4.00% | | | 12/20/40 - 09/20/46 | | | | 7,875,287 | | | | 8,400,799 | |
4.50% | | | 05/20/40 | | | | 1,982,625 | | | | 2,134,919 | |
5.00% | | | 08/15/41 | | | | 3,060,598 | | | | 3,376,061 | |
3.00% | | | TBA | | | | 6,000,000 | | | | 6,070,800 | (g) |
3.50% | | | TBA | | | | 7,600,000 | | | | 7,896,080 | (g) |
4.00% | | | TBA | | | | 400,000 | | | | 424,560 | (g) |
| | | | 215,367,127 | |
| | | |
Asset Backed—0.2% | | | | | | | | | | | | |
Capital One Multi-Asset Execution Trust 2015-A1 | | | | | | | | | | | | |
1.39% | | | 01/15/21 | | | | 1,000,000 | | | | 999,444 | |
Chase Issuance Trust 2016-A5 | | | | | | | | | | | | |
1.27% | | | 07/15/21 | | | | 500,000 | | | | 493,133 | |
Discover Card Execution Note Trust 2015-A2 | | | | | | | | | | | | |
1.90% | | | 10/17/22 | | | | 1,000,000 | | | | 995,080 | |
Ford Credit Auto Owner Trust 2016-C | | | | | | | | | | | | |
1.22% | | | 03/15/21 | | | | 1,000,000 | | | | 991,499 | |
Nissan Auto Receivables 2016-B Owner Trust | | | | | | | | | | | | |
1.32% | | | 01/15/21 | | | | 510,000 | | | | 506,827 | |
| | | | 3,985,983 | |
| | | |
Corporate Notes—9.7% | | | | | | | | | | | | |
21st Century Fox America Inc. | | | | | | | | | | | | |
3.38% | | | 11/15/26 | | | | 200,000 | | | | 195,759 | (d) |
4.75% | | | 11/15/46 | | | | 200,000 | | | | 200,205 | (d) |
6.65% | | | 11/15/37 | | | | 579,000 | | | | 711,413 | |
3M Co. | | | | | | | | | | | | |
3.00% | | | 08/07/25 | | | | 250,000 | | | | 251,302 | |
Abbott Laboratories | | | | | | | | | | | | |
2.55% | | | 03/15/22 | | | | 430,000 | | | | 419,826 | |
2.90% | | | 11/30/21 | | | | 200,000 | | | | 199,525 | |
3.75% | | | 11/30/26 | | | | 200,000 | | | | 198,510 | |
4.75% | | | 11/30/36 | | | | 200,000 | | | | 203,005 | |
4.90% | | | 11/30/46 | | | | 200,000 | | | | 204,868 | |
AbbVie Inc. | | | | | | | | | | | | |
2.30% | | | 05/14/21 | | | | 200,000 | | | | 195,785 | |
4.30% | | | 05/14/36 | | | | 200,000 | | | | 190,278 | |
4.40% | | | 11/06/42 | | | | 250,000 | | | | 234,750 | |
4.50% | | | 05/14/35 | | | | 70,000 | | | | 68,672 | |
4.70% | | | 05/14/45 | | | | 250,000 | | | | 244,813 | |
Actavis Funding SCS | | | | | | | | | | | | |
4.75% | | | 03/15/45 | | | | 350,000 | | | | 342,954 | |
Actavis Inc. | | | | | | | | | | | | |
3.25% | | | 10/01/22 | | | | 500,000 | | | | 497,405 | |
Adobe Systems Inc. | | | | | | | | | | | | |
3.25% | | | 02/01/25 | | | | 70,000 | | | | 69,944 | |
AerCap Ireland Capital Ltd./AerCap Global Aviation Trust | | | | | | | | | | | | |
3.95% | | | 02/01/22 | | | | 500,000 | | | | 504,375 | |
Aetna Inc. | | | | | | | | | | | | |
2.75% | | | 11/15/22 | | | | 500,000 | | | | 490,634 | |
3.20% | | | 06/15/26 | | | | 250,000 | | | | 246,953 | |
4.25% | | | 06/15/36 | | | | 250,000 | | | | 250,259 | |
Aflac Inc. | | | | | | | | | | | | |
3.63% | | | 11/15/24 | | | | 250,000 | | | | 256,980 | |
African Development Bank | | | | | | | | | | | | |
1.00% | | | 11/02/18 | | | | 500,000 | | | | 495,650 | |
| | | | | | | | | | | | |
Agrium Inc. | | | | | | | | | | | | |
6.75% | | | 01/15/19 | | | | 1,000,000 | | | | 1,080,194 | |
Air Lease Corp. | | | | | | | | | | | | |
3.88% | | | 04/01/21 | | | | 200,000 | | | | 205,482 | |
Alibaba Group Holding Ltd. | | | | | | | | | | | | |
3.13% | | | 11/28/21 | | | | 200,000 | | | | 199,859 | |
Alphabet Inc. | | | | | | | | | | | | |
3.38% | | | 02/25/24 | | | | 225,000 | | | | 233,002 | |
Altria Group Inc. | | | | | | | | | | | | |
4.25% | | | 08/09/42 | | | | 413,000 | | | | 405,664 | |
5.38% | | | 01/31/44 | | | | 70,000 | | | | 80,707 | |
Amazon.com Inc. | | | | | | | | | | | | |
4.80% | | | 12/05/34 | | | | 250,000 | | | | 274,754 | |
America Movil SAB de C.V. | | | | | | | | | | | | |
3.13% | | | 07/16/22 | | | | 750,000 | | | | 737,735 | |
American Express Co. | | | | | | | | | | | | |
3.63% | | | 12/05/24 | | | | 250,000 | | | | 250,726 | |
7.00% | | | 03/19/18 | | | | 1,000,000 | | | | 1,062,555 | |
American Honda Finance Corp. | | | | | | | | | | | | |
2.15% | | | 03/13/20 | | | | 200,000 | | | | 199,316 | |
American International Group Inc. | | | | | | | | | | | | |
4.50% | | | 07/16/44 | | | | 250,000 | | | | 246,042 | |
4.88% | | | 06/01/22 | | | | 500,000 | | | | 545,829 | |
American Tower Corp. (REIT) | | | | | | | | | | | | |
3.50% | | | 01/31/23 | | | | 500,000 | | | | 500,989 | |
Amgen Inc. | | | | | | | | | | | | |
4.66% | | | 06/15/51 | | | | 655,000 | | | | 631,225 | (d) |
Anadarko Petroleum Corp. | | | | | | | | | | | | |
6.20% | | | 03/15/40 | | | | 442,000 | | | | 505,405 | |
Analog Devices Inc. | | | | | | | | | | | | |
2.50% | | | 12/05/21 | | | | 200,000 | | | | 197,970 | |
3.50% | | | 12/05/26 | | | | 200,000 | | | | 197,409 | |
4.50% | | | 12/05/36 | | | | 200,000 | | | | 201,400 | |
Anheuser-Busch InBev Finance Inc. | | | | | | | | | | | | |
2.15% | | | 02/01/19 | | | | 200,000 | | | | 201,165 | |
2.65% | | | 02/01/21 | | | | 200,000 | | | | 200,918 | |
3.65% | | | 02/01/26 | | | | 200,000 | | | | 202,726 | |
3.70% | | | 02/01/24 | | | | 500,000 | | | | 517,416 | |
4.90% | | | 02/01/46 | | | | 720,000 | | | | 773,088 | |
Anheuser-Busch InBev Worldwide Inc. | | | | | | | | | | | | |
2.20% | | | 08/01/18 | | | | 200,000 | | | | 201,317 | |
2.50% | | | 07/15/22 | | | | 892,000 | | | | 876,950 | |
7.75% | | | 01/15/19 | | | | 500,000 | | | | 556,745 | |
Anthem Inc. | | | | | | | | | | | | |
1.88% | | | 01/15/18 | | | | 602,000 | | | | 602,222 | |
3.30% | | | 01/15/23 | | | | 500,000 | | | | 498,636 | |
3.70% | | | 08/15/21 | | | | 237,000 | | | | 244,831 | |
Aon PLC | | | | | | | | | | | | |
4.25% | | | 12/12/42 | | | | 250,000 | | | | 233,773 | |
Apache Corp. | | | | | | | | | | | | |
5.10% | | | 09/01/40 | | | | 250,000 | | | | 261,095 | |
Apple Inc. | | | | | | | | | | | | |
1.00% | | | 05/03/18 | | | | 250,000 | | | | 249,027 | |
1.10% | | | 08/02/19 | | | | 250,000 | | | | 246,154 | |
1.70% | | | 02/22/19 | | | | 200,000 | | | | 200,333 | |
2.25% | | | 02/23/21 | | | | 200,000 | | | | 199,867 | |
3.25% | | | 02/23/26 | | | | 160,000 | | | | 159,856 | |
4.38% | | | 05/13/45 | | | | 465,000 | | | | 476,738 | |
4.50% | | | 02/23/36 | | | | 300,000 | | | | 319,873 | |
4.65% | | | 02/23/46 | | | | 185,000 | | | | 199,370 | |
| | | | | | | | | | | | |
Applied Materials Inc. | | | | | | | | | | | | |
3.90% | | | 10/01/25 | | | | 160,000 | | | | 168,480 | |
Arch Capital Finance LLC | | | | | | | | | | | | |
4.01% | | | 12/15/26 | | | | 100,000 | | | | 101,291 | |
5.03% | | | 12/15/46 | | | | 200,000 | | | | 209,271 | |
Archer-Daniels-Midland Co. | | | | | | | | | | | | |
4.02% | | | 04/16/43 | | | | 370,000 | | | | 361,642 | |
Arrow Electronics Inc. | | | | | | | | | | | | |
3.00% | | | 03/01/18 | | | | 250,000 | | | | 252,816 | |
4.00% | | | 04/01/25 | | | | 40,000 | | | | 38,923 | |
Asian Development Bank | | | | | | | | | | | | |
0.88% | | | 10/05/18 | | | | 400,000 | | | | 396,241 | |
1.38% | | | 01/15/19 | | | | 800,000 | | | | 797,886 | |
2.13% | | | 03/19/25 | | | | 500,000 | | | | 481,966 | |
AstraZeneca PLC | | | | | | | | | | | | |
6.45% | | | 09/15/37 | | | | 250,000 | | | | 322,918 | |
AT&T Inc. | | | | | | | | | | | | |
2.30% | | | 03/11/19 | | | | 200,000 | | | | 200,691 | |
2.38% | | | 11/27/18 | | | | 300,000 | | | | 302,560 | |
2.45% | | | 06/30/20 | | | | 200,000 | | | | 198,466 | |
2.80% | | | 02/17/21 | | | | 200,000 | | | | 198,248 | |
3.60% | | | 02/17/23 | | | | 500,000 | | | | 503,744 | |
4.35% | | | 06/15/45 | | | | 750,000 | | | | 666,993 | |
4.50% | | | 05/15/35 - 03/09/48 | | | | 595,000 | | | | 542,421 | |
4.75% | | | 05/15/46 | | | | 250,000 | | | | 236,404 | |
5.15% | | | 03/15/42 | | | | 250,000 | | | | 248,611 | |
5.55% | | | 08/15/41 | | | | 454,000 | | | | 471,885 | |
Australia & New Zealand Banking Group Ltd. | | | | | | | | | | | | |
2.05% | | | 09/23/19 | | | | 200,000 | | | | 199,098 | |
3.70% | | | 11/16/25 | | | | 250,000 | | | | 259,187 | |
AvalonBay Communities Inc. | | | | | | | | | | | | |
3.45% | | | 06/01/25 | | | | 115,000 | | | | 114,980 | |
AXA S.A. | | | | | | | | | | | | |
8.60% | | | 12/15/30 | | | | 100,000 | | | | 137,500 | |
Baidu Inc. | | | | | | | | | | | | |
3.25% | | | 08/06/18 | | | | 205,000 | | | | 208,462 | |
Bank of America Corp. | | | | | | | | | | | | |
2.15% | | | 11/09/20 | | | | 200,000 | | | | 197,271 | |
3.50% | | | 04/19/26 | | | | 145,000 | | | | 142,862 | |
3.88% | | | 08/01/25 | | | | 250,000 | | | | 253,871 | |
3.95% | | | 04/21/25 | | | | 155,000 | | | | 154,103 | |
4.00% | | | 04/01/24 | | | | 350,000 | | | | 360,556 | |
4.13% | | | 01/22/24 | | | | 500,000 | | | | 519,046 | |
4.18% | | | 11/25/27 | | | | 200,000 | | | | 199,822 | |
5.70% | | | 01/24/22 | | | | 1,071,000 | | | | 1,201,847 | |
6.11% | | | 01/29/37 | | | | 250,000 | | | | 292,631 | |
Bank of Montreal | | | | | | | | | | | | |
1.45% | | | 04/09/18 | | | | 500,000 | | | | 498,751 | |
2.10% | | | 12/12/19 | | | | 200,000 | | | | 199,877 | |
Barclays PLC | | | | | | | | | | | | |
3.65% | | | 03/16/25 | | | | 500,000 | | | | 483,411 | |
Baxalta Inc. | | | | | | | | | | | | |
4.00% | | | 06/23/25 | | | | 100,000 | | | | 100,165 | |
Baxter International Inc. | | | | | | | | | | | | |
2.60% | | | 08/15/26 | | | | 230,000 | | | | 212,006 | |
BB&T Corp. | | | | | | | | | | | | |
2.05% | | | 06/19/18 | | | | 350,000 | | | | 351,757 | |
Becton Dickinson and Co. | | | | | | | | | | | | |
3.30% | | | 03/01/23 | | | | 250,000 | | | | 250,835 | |
3.73% | | | 12/15/24 | | | | 50,000 | | | | 51,087 | |
| | | | | | | | | | | | |
Bed Bath & Beyond Inc. | | | | | | | | | | | | |
3.75% | | | 08/01/24 | | | | 150,000 | | | | 151,278 | |
Berkshire Hathaway Energy Co. | | | | | | | | | | | | |
6.13% | | | 04/01/36 | | | | 500,000 | | | | 623,498 | |
Berkshire Hathaway Finance Corp. | | | | | | | | | | | | |
1.30% | | | 08/15/19 | | | | 350,000 | | | | 345,592 | |
3.00% | | | 05/15/22 | | | | 500,000 | | | | 508,929 | |
Berkshire Hathaway Inc. | | | | | | | | | | | | |
1.15% | | | 08/15/18 | | | | 500,000 | | | | 497,404 | |
BHP Billiton Finance USA Ltd. | | | | | | | | | | | | |
2.05% | | | 09/30/18 | | | | 325,000 | | | | 326,761 | |
Biogen Inc. | | | | | | | | | | | | |
4.05% | | | 09/15/25 | | | | 80,000 | | | | 82,258 | |
5.20% | | | 09/15/45 | | | | 150,000 | | | | 160,769 | |
BNP Paribas S.A. | | | | | | | | | | | | |
2.40% | | | 12/12/18 | | | | 250,000 | | | | 251,911 | |
Boeing Capital Corp. | | | | | | | | | | | | |
4.70% | | | 10/27/19 | | | | 250,000 | | | | 269,577 | |
Boston Properties LP (REIT) | | | | | | | | | | | | |
3.85% | | | 02/01/23 | | | | 250,000 | | | | 256,272 | |
Boston Scientific Corp. | | | | | | | | | | | | |
2.65% | | | 10/01/18 | | | | 500,000 | | | | 505,389 | |
4.13% | | | 10/01/23 | | | | 100,000 | | | | 103,632 | |
BP Capital Markets PLC | | | | | | | | | | | | |
1.38% | | | 05/10/18 | | | | 200,000 | | | | 199,354 | |
2.32% | | | 02/13/20 | | | | 250,000 | | | | 249,876 | |
2.50% | | | 11/06/22 | | | | 500,000 | | | | 489,529 | |
2.52% | | | 01/15/20 | | | | 115,000 | | | | 115,596 | |
3.06% | | | 03/17/22 | | | | 210,000 | | | | 212,198 | |
3.22% | | | 11/28/23 | | | | 200,000 | | | | 201,764 | |
BPCE S.A. | | | | | | | | | | | | |
4.00% | | | 04/15/24 | | | | 250,000 | | | | 259,503 | |
Bristol-Myers Squibb Co. | | | | | | | | | | | | |
2.00% | | | 08/01/22 | | | | 500,000 | | | | 486,672 | |
British Telecommunications PLC | | | | | | | | | | | | |
9.13% | | | 12/15/30 | | | | 250,000 | | | | 380,786 | |
Broadridge Financial Solutions Inc. | | | | | | | | | | | | |
3.40% | | | 06/27/26 | | | | 80,000 | | | | 77,089 | |
Buckeye Partners LP | | | | | | | | | | | | |
4.15% | | | 07/01/23 | | | | 250,000 | | | | 252,722 | |
Burlington Northern Santa Fe LLC | | | | | | | | | | | | |
5.75% | | | 05/01/40 | | | | 500,000 | | | | 609,156 | |
Canadian National Railway Co. | | | | | | | | | | | | |
2.95% | | | 11/21/24 | | | | 305,000 | | | | 306,018 | |
Canadian Natural Resources Ltd. | | | | | | | | | | | | |
3.80% | | | 04/15/24 | | | | 250,000 | | | | 248,856 | |
3.90% | | | 02/01/25 | | | | 250,000 | | | | 250,728 | |
Canadian Pacific Railway Co. | | | | | | | | | | | | |
2.90% | | | 02/01/25 | | | | 250,000 | | | | 244,714 | |
Capital One Bank USA NA | | | | | | | | | | | | |
2.30% | | | 06/05/19 | | | | 250,000 | | | | 250,510 | |
Capital One Financial Corp. | | | | | | | | | | | | |
3.75% | | | 07/28/26 | | | | 230,000 | | | | 222,638 | |
4.20% | | | 10/29/25 | | | | 90,000 | | | | 90,179 | |
Capital One NA | | | | | | | | | | | | |
2.35% | | | 08/17/18 | | | | 315,000 | | | | 316,757 | |
Cardinal Health Inc. | | | | | | | | | | | | |
3.20% | | | 03/15/23 | | | | 500,000 | | | | 503,977 | |
Caterpillar Financial Services Corp. | | | | | | | | | | | | |
3.25% | | | 12/01/24 | | | | 350,000 | | | | 353,013 | |
| | | | | | | | | | | | |
CBL & Associates LP | | | | | | | | | | | | |
5.95% | | | 12/15/26 | | | | 200,000 | | | | 201,176 | |
CBS Corp. | | | | | | | | | | | | |
3.38% | | | 03/01/22 | | | | 250,000 | | | | 253,934 | |
4.00% | | | 01/15/26 | | | | 250,000 | | | | 253,919 | |
Celgene Corp. | | | | | | | | | | | | |
2.13% | | | 08/15/18 | | | | 200,000 | | | | 200,768 | |
5.00% | | | 08/15/45 | | | | 150,000 | | | | 155,664 | |
5.25% | | | 08/15/43 | | | | 220,000 | | | | 231,653 | |
CenterPoint Energy Houston Electric LLC | | | | | | | | | | | | |
4.50% | | | 04/01/44 | | | | 250,000 | | | | 271,057 | |
Charter Communications Operating LLC/Charter Communications Operating Capital | | | | | | | | | | | | |
3.58% | | | 07/23/20 | | | | 200,000 | | | | 203,905 | |
4.46% | | | 07/23/22 | | | | 200,000 | | | | 208,793 | |
4.91% | | | 07/23/25 | | | | 235,000 | | | | 247,365 | |
6.48% | | | 10/23/45 | | | | 250,000 | | | | 288,521 | |
Chevron Corp. | | | | | | | | | | | | |
1.37% | | | 03/02/18 | | | | 200,000 | | | | 199,778 | |
1.72% | | | 06/24/18 | | | | 750,000 | | | | 752,184 | |
2.19% | | | 11/15/19 | | | | 55,000 | | | | 55,522 | |
2.41% | | | 03/03/22 | | | | 145,000 | | | | 143,600 | |
2.43% | | | 06/24/20 | | | | 75,000 | | | | 75,704 | |
2.95% | | | 05/16/26 | | | | 100,000 | | | | 98,222 | |
Chubb INA Holdings Inc. | | | | | | | | | | | | |
2.70% | | | 03/13/23 | | | | 250,000 | | | | 247,121 | |
4.35% | | | 11/03/45 | | | | 200,000 | | | | 210,827 | |
Cigna Corp. | | | | | | | | | | | | |
5.38% | | | 02/15/42 | | | | 250,000 | | | | 278,015 | |
Cisco Systems Inc. | | | | | | | | | | | | |
1.65% | | | 06/15/18 | | | | 200,000 | | | | 200,572 | |
2.13% | | | 03/01/19 | | | | 200,000 | | | | 202,589 | |
2.90% | | | 03/04/21 | | | | 125,000 | | | | 127,803 | |
5.90% | | | 02/15/39 | | | | 500,000 | | | | 633,928 | |
Citigroup Inc. | | | | | | | | | | | | |
2.65% | | | 10/26/20 | | | | 750,000 | | | | 749,950 | |
2.90% | | | 12/08/21 | | | | 200,000 | | | | 199,266 | |
3.88% | | | 03/26/25 | | | | 250,000 | | | | 248,034 | |
4.30% | | | 11/20/26 | | | | 200,000 | | | | 201,576 | |
4.45% | | | 09/29/27 | | | | 250,000 | | | | 254,168 | |
4.75% | | | 05/18/46 | | | | 200,000 | | | | 199,840 | |
5.88% | | | 01/30/42 | | | | 272,000 | | | | 321,697 | |
6.13% | | | 08/25/36 | | | | 255,000 | | | | 295,449 | |
CME Group Inc. | | | | | | | | | | | | |
3.00% | | | 03/15/25 | | | | 250,000 | | | | 249,544 | |
CNA Financial Corp. | | | | | | | | | | | | |
5.88% | | | 08/15/20 | | | | 781,000 | | | | 862,158 | |
Colgate-Palmolive Co. | | | | | | | | | | | | |
3.25% | | | 03/15/24 | | | | 250,000 | | | | 258,143 | |
Comcast Corp. | | | | | | | | | | | | |
4.25% | | | 01/15/33 | | | | 1,000,000 | | | | 1,039,161 | |
5.15% | | | 03/01/20 | | | | 500,000 | | | | 545,746 | |
Commonwealth Bank of Australia | | | | | | | | | | | | |
2.30% | | | 09/06/19 | | | | 350,000 | | | | 350,886 | |
Commonwealth Edison Co. | | | | | | | | | | | | |
3.10% | | | 11/01/24 | | | | 150,000 | | | | 150,056 | |
4.60% | | | 08/15/43 | | | | 250,000 | | | | 268,715 | |
4.70% | | | 01/15/44 | | | | 175,000 | | | | 192,394 | |
Compass Bank | | | | | | | | | | | | |
3.88% | | | 04/10/25 | | | | 250,000 | | | | 237,608 | |
| | | | | | | | | | | | |
ConocoPhillips | | | | | | | | | | | | |
6.50% | | | 02/01/39 | | | | 500,000 | | | | 631,948 | |
Consolidated Edison Company of New York Inc. | | | | | | | | | | | | |
3.30% | | | 12/01/24 | | | | 350,000 | | | | 355,312 | |
3.95% | | | 03/01/43 | | | | 250,000 | | | | 241,484 | |
Constellation Brands Inc. | | | | | | | | | | | | |
3.75% | | | 05/01/21 | | | | 220,000 | | | | 227,146 | |
3.88% | | | 11/15/19 | | | | 15,000 | | | | 15,526 | |
4.25% | | | 05/01/23 | | | | 270,000 | | | | 279,960 | |
4.75% | | | 11/15/24 - 12/01/25 | | | | 400,000 | | | | 424,300 | |
6.00% | | | 05/01/22 | | | | 220,000 | | | | 248,125 | |
Cooperatieve Rabobank UA | | | | | | | | | | | | |
2.25% | | | 01/14/19 | | | | 250,000 | | | | 251,250 | |
2.50% | | | 01/19/21 | | | | 250,000 | | | | 249,756 | |
3.95% | | | 11/09/22 | | | | 500,000 | | | | 513,787 | |
4.63% | | | 12/01/23 | | | | 250,000 | | | | 262,739 | |
Corning Inc. | | | | | | | | | | | | |
2.90% | | | 05/15/22 | | | | 255,000 | | | | 255,460 | |
Corporation Andina de Fomento | | | | | | | | | | | | |
2.13% | | | 09/27/21 | | | | 300,000 | | | | 290,451 | |
4.38% | | | 06/15/22 | | | | 250,000 | | | | 265,215 | |
Costco Wholesale Corp. | | | | | | | | | | | | |
2.25% | | | 02/15/22 | | | | 85,000 | | | | 84,161 | |
COX Communications Inc. | | | | | | | | | | | | |
4.70% | | | 12/15/42 | | | | 218,000 | | | | 189,231 | (d) |
Credit Suisse AG | | | | | | | | | | | | |
2.30% | | | 05/28/19 | | | | 350,000 | | | | 350,767 | |
3.63% | | | 09/09/24 | | | | 250,000 | | | | 251,364 | |
5.30% | | | 08/13/19 | | | | 500,000 | | | | 539,281 | |
Credit Suisse Group Funding Guernsey Ltd. | | | | | | | | | | | | |
4.88% | | | 05/15/45 | | | | 250,000 | | | | 256,127 | |
CSX Corp. | | | | | | | | | | | | |
2.60% | | | 11/01/26 | | | | 200,000 | | | | 186,931 | |
4.10% | | | 03/15/44 | | | | 318,000 | | | | 307,608 | |
CVS Health Corp. | | | | | | | | | | | | |
2.25% | | | 12/05/18 | | | | 500,000 | | | | 504,283 | |
2.75% | | | 12/01/22 | | | | 500,000 | | | | 491,993 | |
3.38% | | | 08/12/24 | | | | 250,000 | | | | 250,476 | |
Deere & Co. | | | | | | | | | | | | |
3.90% | | | 06/09/42 | | | | 471,000 | | | | 470,699 | |
Delmarva Power & Light Co. | | | | | | | | | | | | |
4.15% | | | 05/15/45 | | | | 200,000 | | | | 204,527 | |
Delphi Corp. | | | | | | | | | | | | |
4.15% | | | 03/15/24 | | | | 150,000 | | | | 154,439 | |
Deutsche Bank AG | | | | | | | | | | | | |
2.95% | | | 08/20/20 | | | | 250,000 | | | | 245,926 | |
3.38% | | | 05/12/21 | | | | 250,000 | | | | 247,260 | |
Deutsche Telekom International Finance BV | | | | | | | | | | | | |
8.75% | | | 06/15/30 | | | | 250,000 | | | | 366,929 | |
Devon Energy Corp. | | | | | | | | | | | | |
3.25% | | | 05/15/22 | | | | 500,000 | | | | 496,309 | |
5.00% | | | 06/15/45 | | | | 100,000 | | | | 98,051 | |
Diageo Investment Corp. | | | | | | | | | | | | |
2.88% | | | 05/11/22 | | | | 500,000 | | | | 502,468 | |
Diamond 1 Finance Corp./Diamond 2 Finance Corp. | | | | | | | | | | | | |
3.48% | | | 06/01/19 | | | | 200,000 | | | | 204,110 | (d) |
6.02% | | | 06/15/26 | | | | 190,000 | | | | 205,559 | (d) |
8.10% | | | 07/15/36 | | | | 200,000 | | | | 237,609 | (d) |
Discover Bank | | | | | | | | | | | | |
4.20% | | | 08/08/23 | | | | 350,000 | | | | 364,258 | |
| | | | | | | | | | | | |
Discovery Communications LLC | | | | | | | | | | | | |
3.25% | | | 04/01/23 | | | | 325,000 | | | | 316,516 | |
3.45% | | | 03/15/25 | | | | 135,000 | | | | 128,698 | |
Dr Pepper Snapple Group Inc. | | | | | | | | | | | | |
2.53% | | | 11/15/21 | | | | 200,000 | | | | 198,642 | |
3.13% | | | 12/15/23 | | | | 200,000 | | | | 199,808 | |
3.43% | | | 06/15/27 | | | | 200,000 | | | | 199,058 | |
DTE Electric Co. | | | | | | | | | | | | |
3.70% | | | 03/15/45 | | | | 145,000 | | | | 138,341 | |
DTE Energy Co. | | | | | | | | | | | | |
3.85% | | | 12/01/23 | | | | 250,000 | | | | 258,363 | |
Duke Energy Corp. | | | | | | | | | | | | |
3.05% | | | 08/15/22 | | | | 1,639,000 | | | | 1,645,612 | |
Duke Energy Florida LLC | | | | | | | | | | | | |
3.40% | | | 10/01/46 | | | | 400,000 | | | | 355,122 | |
eBay Inc. | | | | | | | | | | | | |
3.80% | | | 03/09/22 | | | | 145,000 | | | | 149,656 | |
Ecopetrol S.A. | | | | | | | | | | | | |
4.13% | | | 01/16/25 | | | | 250,000 | | | | 234,125 | |
7.63% | | | 07/23/19 | | | | 345,000 | | | | 386,814 | |
Eli Lilly & Co. | | | | | | | | | | | | |
2.75% | | | 06/01/25 | | | | 45,000 | | | | 43,806 | |
Emera US Finance LP | | | | | | | | | | | | |
3.55% | | | 06/15/26 | | | | 60,000 | | | | 58,896 | (d) |
Emerson Electric Co. | | | | | | | | | | | | |
2.63% | | | 02/15/23 | | | | 500,000 | | | | 495,597 | |
Enbridge Energy Partners LP | | | | | | | | | | | | |
5.88% | | | 10/15/25 | | | | 125,000 | | | | 139,192 | |
Enbridge Inc. | | | | | | | | | | | | |
3.50% | | | 06/10/24 | | | | 65,000 | | | | 63,230 | |
Energy Transfer Partners LP | | | | | | | | | | | | |
6.50% | | | 02/01/42 | | | | 250,000 | | | | 269,668 | |
6.70% | | | 07/01/18 | | | | 701,000 | | | | 744,601 | |
EnLink Midstream Partners LP | | | | | | | | | | | | |
5.60% | | | 04/01/44 | | | | 150,000 | | | | 144,222 | |
Entergy Louisiana LLC | | | | | | | | | | | | |
4.05% | | | 09/01/23 | | | | 250,000 | | | | 261,746 | |
Enterprise Products Operating LLC | | | | | | | | | | | | |
3.70% | | | 02/15/26 | | | | 35,000 | | | | 35,079 | |
3.90% | | | 02/15/24 | | | | 175,000 | | | | 180,293 | |
4.45% | | | 02/15/43 | | | | 442,000 | | | | 418,155 | |
EOG Resources Inc. | | | | | | | | | | | | |
2.45% | | | 04/01/20 | | | | 175,000 | | | | 175,150 | |
3.15% | | | 04/01/25 | | | | 80,000 | | | | 78,393 | |
ERP Operating LP (REIT) | | | | | | | | | | | | |
3.00% | | | 04/15/23 | | | | 250,000 | | | | 246,301 | |
European Bank for Reconstruction & Development | | | | | | | | | | | | |
1.13% | | | 08/24/20 | | | | 200,000 | | | | 194,980 | |
European Investment Bank | | | | | | | | | | | | |
1.25% | | | 05/15/19 | | | | 300,000 | | | | 297,215 | |
1.38% | | | 09/15/21 | | | | 1,000,000 | | | | 961,911 | |
1.63% | | | 12/15/20 | | | | 1,000,000 | | | | 984,821 | |
3.25% | | | 01/29/24 | | | | 1,000,000 | | | | 1,043,745 | |
Eversource Energy | | | | | | | | | | | | |
1.45% | | | 05/01/18 | | | | 250,000 | | | | 249,142 | |
3.15% | | | 01/15/25 | | | | 125,000 | | | | 123,256 | |
Exelon Generation Company LLC | | | | | | | | | | | | |
2.95% | | | 01/15/20 | | | | 250,000 | | | | 252,847 | |
Export-Import Bank of Korea | | | | | | | | | | | | |
2.38% | | | 08/12/19 | | | | 500,000 | | | | 505,025 | |
| | | | | | | | | | | | |
Express Scripts Holding Co. | | | | | | | | | | | | |
4.75% | | | 11/15/21 | | | | 474,000 | | | | 508,637 | |
Exxon Mobil Corp. | | | | | | | | | | | | |
1.31% | | | 03/06/18 | | | | 200,000 | | | | 199,927 | |
1.71% | | | 03/01/19 | | | | 200,000 | | | | 200,386 | |
2.71% | | | 03/06/25 | | | | 250,000 | | | | 243,044 | |
3.04% | | | 03/01/26 | | | | 50,000 | | | | 49,860 | |
3.18% | | | 03/15/24 | | | | 250,000 | | | | 252,776 | |
FedEx Corp. | | | | | | | | | | | | |
2.70% | | | 04/15/23 | | | | 200,000 | | | | 197,126 | |
4.75% | | | 11/15/45 | | | | 195,000 | | | | 201,563 | |
Fifth Third BanCorp | | | | | | | | | | | | |
4.50% | | | 06/01/18 | | | | 500,000 | | | | 515,772 | |
Fifth Third Bank | | | | | | | | | | | | |
2.88% | | | 10/01/21 | | | | 230,000 | | | | 232,520 | |
FirstEnergy Corp. | | | | | | | | | | | | |
2.75% | | | 03/15/18 | | | | 25,000 | | | | 25,224 | |
4.25% | | | 03/15/23 | | | | 30,000 | | | | 30,984 | |
7.38% | | | 11/15/31 | | | | 55,000 | | | | 70,763 | |
Florida Power & Light Co. | | | | | | | | | | | | |
4.13% | | | 02/01/42 | | | | 500,000 | | | | 511,870 | |
Ford Motor Co. | | | | | | | | | | | | |
4.35% | | | 12/08/26 | | | | 200,000 | | | | 201,810 | |
4.75% | | | 01/15/43 | | | | 450,000 | | | | 426,463 | |
5.29% | | | 12/08/46 | | | | 300,000 | | | | 303,335 | |
Ford Motor Credit Company LLC | | | | | | | | | | | | |
2.46% | | | 03/27/20 | | | | 250,000 | | | | 246,628 | |
2.60% | | | 11/04/19 | | | | 250,000 | | | | 249,508 | |
3.22% | | | 01/09/22 | | | | 250,000 | | | | 246,957 | |
5.00% | | | 05/15/18 | | | | 200,000 | | | | 207,799 | |
General Electric Co. | | | | | | | | | | | | |
1.63% | | | 04/02/18 | | | | 200,000 | | | | 200,627 | (c) |
5.50% | | | 01/08/20 | | | | 1,000,000 | | | | 1,095,041 | (c) |
6.75% | | | 03/15/32 | | | | 1,250,000 | | | | 1,661,781 | (c) |
General Mills Inc. | | | | | | | | | | | | |
3.65% | | | 02/15/24 | | | | 250,000 | | | | 259,602 | |
General Motors Co. | | | | | | | | | | | | |
3.50% | | | 10/02/18 | | | | 200,000 | | | | 203,942 | |
5.20% | | | 04/01/45 | | | | 250,000 | | | | 240,546 | |
General Motors Financial Company Inc. | | | | | | | | | | | | |
3.15% | | | 01/15/20 | | | | 150,000 | | | | 150,850 | |
3.70% | | | 05/09/23 | | | | 200,000 | | | | 196,586 | |
4.38% | | | 09/25/21 | | | | 100,000 | | | | 103,637 | |
5.25% | | | 03/01/26 | | | | 155,000 | | | | 163,012 | |
Georgia Power Co. | | | | | | | | | | | | |
4.30% | | | 03/15/42 | | | | 472,000 | | | | 480,896 | |
Georgia-Pacific LLC | | | | | | | | | | | | |
8.88% | | | 05/15/31 | | | | 150,000 | | | | 221,873 | |
Gilead Sciences Inc. | | | | | | | | | | | | |
1.85% | | | 09/04/18 | | | | 200,000 | | | | 200,719 | |
3.70% | | | 04/01/24 | | | | 500,000 | | | | 512,638 | |
4.80% | | | 04/01/44 | | | | 250,000 | | | | 259,102 | |
Great Plains Energy Inc. | | | | | | | | | | | | |
4.85% | | | 06/01/21 | | | | 1,004,000 | | | | 1,068,748 | |
Halliburton Co. | | | | | | | | | | | | |
3.50% | | | 08/01/23 | | | | 900,000 | | | | 912,929 | |
Harris Corp. | | | | | | | | | | | | |
3.83% | | | 04/27/25 | | | | 250,000 | | | | 253,647 | |
4.85% | | | 04/27/35 | | | | 40,000 | | | | 41,963 | |
| | | | | | | | | | | | |
HCP Inc. (REIT) | | | | | | | | | | | | |
2.63% | | | 02/01/20 | | | | 500,000 | | | | 500,378 | |
Hewlett Packard Enterprise Co. | | | | | | | | | | | | |
6.35% | | | 10/15/45 | | | | 250,000 | | | | 252,114 | |
Honeywell International Inc. | | | | | | | | | | | | |
3.35% | | | 12/01/23 | | | | 450,000 | | | | 462,239 | |
Hospitality Properties Trust | | | | | | | | | | | | |
4.65% | | | 03/15/24 | | | | 250,000 | | | | 248,896 | |
HP Inc. | | | | | | | | | | | | |
6.00% | | | 09/15/41 | | | | 262,000 | | | | 263,839 | |
HSBC Bank USA NA | | | | | | | | | | | | |
5.88% | | | 11/01/34 | | | | 500,000 | | | | 581,282 | |
HSBC Finance Corp. | | | | | | | | | | | | |
6.68% | | | 01/15/21 | | | | 250,000 | | | | 280,796 | |
HSBC Holdings PLC | | | | | | | | | | | | |
3.90% | | | 05/25/26 | | | | 250,000 | | | | 251,349 | |
5.10% | | | 04/05/21 | | | | 1,000,000 | | | | 1,079,819 | |
HSBC USA Inc. | | | | | | | | | | | | |
2.38% | | | 11/13/19 | | | | 350,000 | | | | 350,729 | |
Huntington Bancshares Inc. | | | | | | | | | | | | |
3.15% | | | 03/14/21 | | | | 250,000 | | | | 253,317 | |
Husky Energy Inc. | | | | | | | | | | | | |
4.00% | | | 04/15/24 | | | | 100,000 | | | | 101,704 | |
Illinois Tool Works Inc. | | | | | | | | | | | | |
2.65% | | | 11/15/26 | | | | 200,000 | | | | 190,885 | |
3.50% | | | 03/01/24 | | | | 250,000 | | | | 259,338 | |
Indiana Michigan Power Co. | | | | | | | | | | | | |
3.20% | | | 03/15/23 | | | | 750,000 | | | | 756,456 | |
Ingersoll-Rand Global Holding Company Ltd. | | | | | | | | | | | | |
4.25% | | | 06/15/23 | | | | 200,000 | | | | 211,310 | |
Intel Corp. | | | | | | | | | | | | |
2.60% | | | 05/19/26 | | | | 250,000 | | | | 241,433 | |
4.25% | | | 12/15/42 | | | | 186,000 | | | | 187,406 | |
Inter-American Development Bank | | | | | | | | | | | | |
1.00% | | | 05/13/19 | | | | 800,000 | | | | 788,594 | |
1.25% | | | 09/14/21 | | | | 400,000 | | | | 385,251 | |
2.13% | | | 01/15/25 | | | | 500,000 | | | | 483,544 | |
3.00% | | | 02/21/24 | | | | 500,000 | | | | 515,990 | |
International Bank for Reconstruction & Development | | | | | | | | | | | | |
0.88% | | | 07/19/18 | | | | 1,000,000 | | | | 993,589 | |
0.88% | | | 08/15/19 | | | | 1,000,000 | | | | 978,325 | |
2.25% | | | 06/24/21 | | | | 1,000,000 | | | | 1,005,789 | |
2.50% | | | 07/29/25 | | | | 500,000 | | | | 495,198 | |
International Business Machines Corp. | | | | | | | | | | | | |
4.00% | | | 06/20/42 | | | | 500,000 | | | | 499,144 | |
International Finance Corp. | | | | | | | | | | | | |
1.25% | | | 07/16/18 | | | | 500,000 | | | | 499,287 | |
International Paper Co. | | | | | | | | | | | | |
3.65% | | | 06/15/24 | | | | 500,000 | | | | 504,993 | |
Interstate Power & Light Co. | | | | | | | | | | | | |
3.25% | | | 12/01/24 | | | | 350,000 | | | | 350,488 | |
Intesa Sanpaolo S.p.A. | | | | | | | | | | | | |
3.88% | | | 01/15/19 | | | | 200,000 | | | | 203,513 | |
Invesco Finance PLC | | | | | | | | | | | | |
3.13% | | | 11/30/22 | | | | 500,000 | | | | 503,110 | |
Jabil Circuit Inc. | | | | | | | | | | | | |
4.70% | | | 09/15/22 | | | | 223,000 | | | | 227,460 | |
Jefferies Group LLC | | | | | | | | | | | | |
5.13% | | | 01/20/23 | | | | 250,000 | | | | 261,388 | |
| | | | | | | | | | | | |
John Deere Capital Corp. | | | | | | | | | | | | |
1.95% | | | 12/13/18 | | | | 500,000 | | | | 502,536 | |
Johnson & Johnson | | | | | | | | | | | | |
2.45% | | | 12/05/21 - 03/01/26 | | | | 425,000 | | | | 426,718 | |
4.38% | | | 12/05/33 | | | | 250,000 | | | | 273,726 | |
Johnson Controls International PLC | | | | | | | | | | | | |
3.63% | | | 07/02/24 | | | | 80,000 | | | | 81,036 | (h) |
JPMorgan Chase & Co. | | | | | | | | | | | | |
1.70% | | | 03/01/18 | | | | 200,000 | | | | 199,957 | |
2.25% | | | 01/23/20 | | | | 250,000 | | | | 249,255 | |
2.75% | | | 06/23/20 | | | | 250,000 | | | | 252,088 | |
2.97% | | | 01/15/23 | | | | 200,000 | | | | 199,097 | |
3.13% | | | 01/23/25 | | | | 250,000 | | | | 244,075 | |
3.25% | | | 09/23/22 | | | | 436,000 | | | | 440,433 | |
3.38% | | | 05/01/23 | | | | 250,000 | | | | 248,848 | |
4.50% | | | 01/24/22 | | | | 703,000 | | | | 757,402 | |
6.30% | | | 04/23/19 | | | | 1,000,000 | | | | 1,092,316 | |
6.40% | | | 05/15/38 | | | | 500,000 | | | | 646,861 | |
Kellogg Co. | | | | | | | | | | | | |
2.65% | | | 12/01/23 | | | | 200,000 | | | | 193,247 | |
KeyCorp | | | | | | | | | | | | |
2.30% | | | 12/13/18 | | | | 170,000 | | | | 170,979 | |
2.90% | | | 09/15/20 | | | | 125,000 | | | | 126,387 | |
Kimberly-Clark Corp. | | | | | | | | | | | | |
1.90% | | | 05/22/19 | | | | 220,000 | | | | 221,310 | |
2.65% | | | 03/01/25 | | | | 55,000 | | | | 53,428 | |
3.20% | | | 07/30/46 | | | | 125,000 | | | | 108,448 | |
Kinder Morgan Energy Partners LP | | | | | | | | | | | | |
2.65% | | | 02/01/19 | | | | 740,000 | | | | 743,627 | |
5.00% | | | 08/15/42 | | | | 442,000 | | | | 421,690 | |
Kinder Morgan Inc. | | | | | | | | | | | | |
4.30% | | | 06/01/25 | | | | 115,000 | | | | 118,252 | |
5.05% | | | 02/15/46 | | | | 150,000 | | | | 148,208 | |
5.30% | | | 12/01/34 | | | | 300,000 | | | | 304,026 | |
KLA-Tencor Corp. | | | | | | | | | | | | |
4.65% | | | 11/01/24 | | | | 215,000 | | | | 227,336 | |
Koninklijke Philips N.V. | | | | | | | | | | | | |
3.75% | | | 03/15/22 | | | | 500,000 | | | | 520,404 | |
5.75% | | | 03/11/18 | | | | 200,000 | | | | 209,579 | |
Kraft Heinz Foods Co. | | | | | | | | | | | | |
2.00% | | | 07/02/18 | | | | 200,000 | | | | 200,013 | |
5.00% | | | 06/04/42 | | | | 500,000 | | | | 511,051 | |
5.20% | | | 07/15/45 | | | | 150,000 | | | | 156,730 | |
Kreditanstalt fuer Wiederaufbau | | | | | | | | | | | | |
0.88% | | | 04/19/18 | | | | 500,000 | | | | 497,263 | |
1.00% | | | 09/07/18 | | | | 400,000 | | | | 397,404 | |
1.50% | | | 02/06/19 - 06/15/21 | | | | 700,000 | | | | 685,629 | |
2.00% | | | 10/04/22 - 05/02/25 | | | | 1,750,000 | | | | 1,709,048 | |
4.50% | | | 07/16/18 | | | | 1,567,000 | | | | 1,641,470 | |
L-3 Communications Corp. | | | | | | | | | | | | |
3.85% | | | 12/15/26 | | | | 200,000 | | | | 198,506 | |
5.20% | | | 10/15/19 | | | | 500,000 | | | | 537,534 | |
Laboratory Corporation of America Holdings | | | | | | | | | | | | |
4.00% | | | 11/01/23 | | | | 200,000 | | | | 204,682 | |
Lam Research Corp. | | | | | | | | | | | | |
3.80% | | | 03/15/25 | | | | 115,000 | | | | 114,979 | |
Landwirtschaftliche Rentenbank | | | | | | | | | | | | |
1.88% | | | 09/17/18 | | | | 500,000 | | | | 504,068 | |
| | | | | | | | | | | | |
Lincoln National Corp. | | | | | | | | | | | | |
3.63% | | | 12/12/26 | | | | 200,000 | | | | 199,233 | |
4.20% | | | 03/15/22 | | | | 317,000 | | | | 335,194 | |
Lloyds Bank PLC | | | | | | | | | | | | |
2.70% | | | 08/17/20 | | | | 250,000 | | | | 251,646 | |
Lloyds Banking Group PLC | | | | | | | | | | | | |
4.65% | | | 03/24/26 | | | | 250,000 | | | | 252,879 | |
Lockheed Martin Corp. | | | | | | | | | | | | |
3.60% | | | 03/01/35 | | | | 55,000 | | | | 52,165 | |
4.25% | | | 11/15/19 | | | | 500,000 | | | | 532,261 | |
4.70% | | | 05/15/46 | | | | 250,000 | | | | 271,383 | |
Loews Corp. | | | | | | | | | | | | |
2.63% | | | 05/15/23 | | | | 400,000 | | | | 388,300 | |
Lowe’s Companies Inc. | | | | | | | | | | | | |
2.50% | | | 04/15/26 | | | | 230,000 | | | | 218,097 | |
3.12% | | | 04/15/22 | | | | 750,000 | | | | 767,629 | |
3.38% | | | 09/15/25 | | | | 30,000 | | | | 30,473 | |
LyondellBasell Industries N.V. | | | | | | | | | | | | |
6.00% | | | 11/15/21 | | | | 250,000 | | | | 283,270 | |
Macy’s Retail Holdings Inc. | | | | | | | | | | | | |
3.88% | | | 01/15/22 | | | | 500,000 | | | | 511,637 | |
Marsh & McLennan Companies Inc. | | | | | | | | | | | | |
4.05% | | | 10/15/23 | | | | 250,000 | | | | 263,585 | |
Masco Corp. | | | | | | | | | | | | |
4.38% | | | 04/01/26 | | | | 15,000 | | | | 15,256 | |
Mastercard Inc. | | | | | | | | | | | | |
2.00% | | | 11/21/21 | | | | 200,000 | | | | 198,108 | |
2.95% | | | 11/21/26 | | | | 200,000 | | | | 197,456 | |
McDonald’s Corp. | | | | | | | | | | | | |
1.88% | | | 05/29/19 | | | | 500,000 | | | | 498,779 | |
3.70% | | | 02/15/42 | | | | 250,000 | | | | 222,339 | |
McKesson Corp. | | | | | | | | | | | | |
3.80% | | | 03/15/24 | | | | 250,000 | | | | 257,382 | |
Mead Johnson Nutrition Co. | | | | | | | | | | | | |
4.13% | | | 11/15/25 | | | | 110,000 | | | | 112,315 | |
Medtronic Inc. | | | | | | | | | | | | |
1.38% | | | 04/01/18 | | | | 200,000 | | | | 199,631 | |
1.50% | | | 03/15/18 | | | | 200,000 | | | | 199,977 | |
3.63% | | | 03/15/24 | | | | 200,000 | | | | 207,898 | |
4.50% | | | 03/15/42 | | | | 250,000 | | | | 260,371 | |
4.63% | | | 03/15/44 - 03/15/45 | | | | 400,000 | | | | 429,906 | |
Memorial Sloan-Kettering Cancer Center | | | | | | | | | | | | |
4.13% | | | 07/01/52 | | | | 395,000 | | | | 380,563 | |
Merck & Company Inc. | | | | | | | | | | | | |
1.30% | | | 05/18/18 | | | | 200,000 | | | | 199,763 | |
2.40% | | | 09/15/22 | | | | 878,000 | | | | 859,726 | |
2.75% | | | 02/10/25 | | | | 70,000 | | | | 68,640 | |
MetLife Inc. | | | | | | | | | | | | |
4.13% | | | 08/13/42 | | | | 250,000 | | | | 245,565 | |
6.50% | | | 12/15/32 | | | | 250,000 | | | | 313,565 | |
Microsoft Corp. | | | | | | | | | | | | |
1.10% | | | 08/08/19 | | | | 200,000 | | | | 197,221 | |
1.30% | | | 11/03/18 | | | | 200,000 | | | | 199,801 | |
1.55% | | | 08/08/21 | | | | 500,000 | | | | 484,500 | |
2.40% | | | 08/08/26 | | | | 200,000 | | | | 188,757 | |
3.45% | | | 08/08/36 | | | | 200,000 | | | | 189,743 | |
3.50% | | | 02/12/35 | | | | 65,000 | | | | 62,465 | |
3.75% | | | 05/01/43 | | | | 300,000 | | | | 283,024 | |
4.45% | | | 11/03/45 | | | | 425,000 | | | | 451,881 | |
| | | | | | | | | | |
Mitsubishi UFJ Financial Group Inc. | | | | | | | | | | |
2.76% | | 09/13/26 | | | 250,000 | | | | 234,474 | |
Molson Coors Brewing Co. | | | | | | | | | | |
3.00% | | 07/15/26 | | | 95,000 | | | | 89,671 | |
Monsanto Co. | | | | | | | | | | |
3.95% | | 04/15/45 | | | 150,000 | | | | 131,353 | |
4.20% | | 07/15/34 | | | 70,000 | | | | 67,186 | |
Moody’s Corp. | | | | | | | | | | |
4.88% | | 02/15/24 | | | 250,000 | | | | 269,984 | |
Morgan Stanley | | | | | | | | | | |
2.38% | | 07/23/19 | | | 350,000 | | | | 350,843 | |
2.63% | | 11/17/21 | | | 200,000 | | | | 197,401 | |
2.80% | | 06/16/20 | | | 230,000 | | | | 231,720 | |
3.13% | | 07/27/26 | | | 250,000 | | | | 238,489 | |
3.95% | | 04/23/27 | | | 250,000 | | | | 247,099 | |
4.00% | | 07/23/25 | | | 95,000 | | | | 97,248 | |
4.10% | | 05/22/23 | | | 250,000 | | | | 256,369 | |
4.35% | | 09/08/26 | | | 250,000 | | | | 254,733 | |
4.88% | | 11/01/22 | | | 250,000 | | | | 267,644 | |
5.50% | | 07/28/21 | | | 898,000 | | | | 994,241 | |
6.63% | | 04/01/18 | | | 433,000 | | | | 457,849 | |
Motorola Solutions Inc. | | | | | | | | | | |
3.50% | | 09/01/21 | | | 250,000 | | | | 251,798 | |
MUFG Americas Holdings Corp. | | | | | | | | | | |
3.00% | | 02/10/25 | | | 250,000 | | | | 239,697 | |
Nabors Industries Inc. | | | | | | | | | | |
5.50% | | 01/15/23 | | | 200,000 | | | | 208,250 | (d) |
National Australia Bank Ltd. | | | | | | | | | | |
2.30% | | 07/25/18 | | | 500,000 | | | | 503,810 | |
National Retail Properties Inc. | | | | | | | | | | |
3.60% | | 12/15/26 | | | 200,000 | | | | 196,725 | |
NetApp Inc. | | | | | | | | | | |
3.38% | | 06/15/21 | | | 210,000 | | | | 213,102 | |
Newmont Mining Corp. | | | | | | | | | | |
3.50% | | 03/15/22 | | | 250,000 | | | | 253,847 | |
Nexen Energy ULC | | | | | | | | | | |
6.40% | | 05/15/37 | | | 500,000 | | | | 592,598 | |
NIKE Inc. | | | | | | | | | | |
2.38% | | 11/01/26 | | | 250,000 | | | | 235,501 | |
Nisource Finance Corp. | | | | | | | | | | |
3.85% | | 02/15/23 | | | 574,000 | | | | 592,450 | |
Noble Energy Inc. | | | | | | | | | | |
8.25% | | 03/01/19 | | | 500,000 | | | | 561,411 | |
Nordic Investment Bank | | | | | | | | | | |
0.88% | | 09/27/18 | | | 300,000 | | | | 297,355 | |
Norfolk Southern Corp. | | | | | | | | | | |
4.80% | | 08/15/43 | | | 250,000 | | | | 271,612 | |
Northrop Grumman Corp. | | | | | | | | | | |
1.75% | | 06/01/18 | | | 750,000 | | | | 751,357 | |
Novartis Capital Corp. | | | | | | | | | | |
2.40% | | 09/21/22 | | | 552,000 | | | | 544,623 | |
3.00% | | 11/20/25 | | | 250,000 | | | | 247,896 | |
Occidental Petroleum Corp. | | | | | | | | | | |
1.50% | | 02/15/18 | | | 500,000 | | | | 500,398 | |
3.00% | | 02/15/27 | | | 200,000 | | | | 193,210 | |
3.40% | | 04/15/26 | | | 140,000 | | | | 140,857 | |
4.10% | | 02/15/47 | | | 200,000 | | | | 194,397 | |
Oesterreichische Kontrollbank AG | | | | | | | | | | |
1.13% | | 04/26/19 | | | 200,000 | | | | 197,307 | |
| | | | | | | | | | |
Omega Healthcare Investors Inc. | | | | | | | | | | |
4.50% | | 04/01/27 | | | 200,000 | | | | 191,653 | |
Omnicom Group Inc. | | | | | | | | | | |
3.63% | | 05/01/22 | | | 500,000 | | | | 512,975 | |
ONEOK Partners LP | | | | | | | | | | |
6.13% | | 02/01/41 | | | 312,000 | | | | 342,617 | |
Oracle Corp. | | | | | | | | | | |
1.90% | | 09/15/21 | | | 200,000 | | | | 195,252 | |
2.25% | | 10/08/19 | | | 250,000 | | | | 252,911 | |
2.65% | | 07/15/26 | | | 300,000 | | | | 284,331 | |
3.25% | | 05/15/30 | | | 250,000 | | | | 243,149 | |
3.63% | | 07/15/23 | | | 125,000 | | | | 130,864 | |
4.00% | | 07/15/46 | | | 200,000 | | | | 190,898 | |
4.30% | | 07/08/34 | | | 500,000 | | | | 516,217 | |
Orange S.A. | | | | | | | | | | |
9.00% | | 03/01/31 | | | 250,000 | | | | 375,250 | |
Owens Corning | | | | | | | | | | |
4.20% | | 12/15/22 | | | 250,000 | | | | 259,353 | |
Pacific Gas & Electric Co. | | | | | | | | | | |
6.05% | | 03/01/34 | | | 611,000 | | | | 763,566 | |
PacifiCorp | | | | | | | | | | |
6.25% | | 10/15/37 | | | 153,000 | | | | 197,875 | |
Parker-Hannifin Corp. | | | | | | | | | | |
4.20% | | 11/21/34 | | | 350,000 | | | | 357,090 | |
Pentair Finance S.A. | | | | | | | | | | |
3.15% | | 09/15/22 | | | 500,000 | | | | 489,125 | |
PepsiCo Inc. | | | | | | | | | | |
1.85% | | 04/30/20 | | | 250,000 | | | | 247,677 | |
2.75% | | 03/01/23 | | | 250,000 | | | | 249,459 | |
4.45% | | 04/14/46 | | | 250,000 | | | | 265,723 | |
Petroleos Mexicanos | | | | | | | | | | |
3.50% | | 07/18/18 | | | 500,000 | | | | 504,500 | |
4.50% | | 01/23/26 | | | 100,000 | | | | 91,100 | |
5.38% | | 03/13/22 | | | 300,000 | | | | 307,194 | (d) |
5.50% | | 01/21/21 - 06/27/44 | | | 558,000 | | | | 562,643 | |
6.38% | | 01/23/45 | | | 250,000 | | | | 227,500 | |
6.50% | | 03/13/27 | | | 200,000 | | | | 206,300 | (d) |
6.50% | | 06/02/41 | | | 167,000 | | | | 156,404 | |
6.75% | | 09/21/47 | | | 113,000 | | | | 106,762 | (d) |
6.88% | | 08/04/26 | | | 250,000 | | | | 263,750 | (d) |
Pfizer Inc. | | | | | | | | | | |
1.20% | | 06/01/18 | | | 200,000 | | | | 199,446 | |
1.70% | | 12/15/19 | | | 400,000 | | | | 399,419 | |
2.20% | | 12/15/21 | | | 400,000 | | | | 398,734 | |
3.00% | | 12/15/26 | | | 200,000 | | | | 197,233 | |
4.00% | | 12/15/36 | | | 400,000 | | | | 409,121 | |
4.13% | | 12/15/46 | | | 200,000 | | | | 203,018 | |
4.30% | | 06/15/43 | | | 350,000 | | | | 361,599 | |
Philip Morris International Inc. | | | | | | | | | | |
3.88% | | 08/21/42 | | | 442,000 | | | | 409,604 | |
Plains All American Pipeline LP/PAA Finance Corp. | | | | | | | | | | |
3.85% | | 10/15/23 | | | 500,000 | | | | 494,624 | |
4.50% | | 12/15/26 | | | 200,000 | | | | 202,600 | |
PNC Bank NA | | | | | | | | | | |
1.70% | | 12/07/18 | | | 500,000 | | | | 498,991 | |
2.25% | | 07/02/19 | | | 500,000 | | | | 502,839 | |
2.55% | | 12/09/21 | | | 250,000 | | | | 249,965 | |
2.95% | | 02/23/25 | | | 400,000 | | | | 392,259 | |
| | | | | | | | | | |
Potash Corporation of Saskatchewan Inc. | | | | | | | | | | |
3.63% | | 03/15/24 | | | 250,000 | | | | 248,159 | |
4.00% | | 12/15/26 | | | 200,000 | | | | 200,973 | |
PPL Capital Funding Inc. | | | | | | | | | | |
3.40% | | 06/01/23 | | | 500,000 | | | | 502,874 | |
President and Fellows of Harvard College | | | | | | | | | | |
3.15% | | 07/15/46 | | | 50,000 | | | | 44,633 | |
Principal Financial Group Inc. | | | | | | | | | | |
3.40% | | 05/15/25 | | | 250,000 | | | | 248,075 | |
Prologis LP (REIT) | | | | | | | | | | |
4.25% | | 08/15/23 | | | 250,000 | | | | 265,119 | |
Prudential Financial Inc. | | | | | | | | | | |
5.63% | | 05/12/41 | | | 225,000 | | | | 259,001 | |
7.38% | | 06/15/19 | | | 350,000 | | | | 393,838 | |
Public Service Company of Colorado | | | | | | | | | | |
3.95% | | 03/15/43 | | | 250,000 | | | | 248,979 | |
Public Service Electric & Gas Co. | | | | | | | | | | |
1.80% | | 06/01/19 | | | 250,000 | | | | 249,657 | |
2.38% | | 05/15/23 | | | 500,000 | | | | 488,166 | |
3.05% | | 11/15/24 | | | 250,000 | | | | 251,650 | |
Puget Energy Inc. | | | | | | | | | | |
3.65% | | 05/15/25 | | | 300,000 | | | | 295,270 | |
QUALCOMM Inc. | | | | | | | | | | |
1.40% | | 05/18/18 | | | 200,000 | | | | 199,943 | |
4.65% | | 05/20/35 | | | 150,000 | | | | 158,327 | |
Quest Diagnostics Inc. | | | | | | | | | | |
3.50% | | 03/30/25 | | | 150,000 | | | | 148,024 | |
4.25% | | 04/01/24 | | | 250,000 | | | | 260,457 | |
Qwest Corp. | | | | | | | | | | |
6.75% | | 12/01/21 | | | 500,000 | | | | 542,500 | |
Raytheon Co. | | | | | | | | | | |
3.15% | | 12/15/24 | | | 90,000 | | | | 91,504 | |
Realty Income Corp. (REIT) | | | | | | | | | | |
4.65% | | 08/01/23 | | | 500,000 | | | | 535,528 | |
Regions Bank | | | | | | | | | | |
2.25% | | 09/14/18 | | | 250,000 | | | | 250,777 | |
Republic Services Inc. | | | | | | | | | | |
3.20% | | 03/15/25 | | | 250,000 | | | | 247,642 | |
5.50% | | 09/15/19 | | | 500,000 | | | | 543,878 | |
Rio Tinto Finance USA Ltd. | | | | | | | | | | |
5.20% | | 11/02/40 | | | 650,000 | | | | 738,236 | |
Rogers Communications Inc. | | | | | | | | | | |
2.90% | | 11/15/26 | | | 200,000 | | | | 188,120 | |
3.00% | | 03/15/23 | | | 250,000 | | | | 248,122 | |
3.63% | | 12/15/25 | | | 60,000 | | | | 60,590 | |
Roper Technologies Inc. | | | | | | | | | | |
3.80% | | 12/15/26 | | | 200,000 | | | | 201,245 | |
Royal Bank of Canada | | | | | | | | | | |
1.80% | | 07/30/18 | | | 200,000 | | | | 200,607 | |
2.15% | | 03/06/20 | | | 250,000 | | | | 248,502 | |
Royal Bank of Scotland Group PLC | | | | | | | | | | |
3.88% | | 09/12/23 | | | 200,000 | | | | 191,837 | |
S&P Global Inc. | | | | | | | | | | |
4.40% | | 02/15/26 | | | 250,000 | | | | 264,109 | |
San Diego Gas & Electric Co. | | | | | | | | | | |
3.60% | | 09/01/23 | | | 500,000 | | | | 522,840 | |
Sanofi | | | | | | | | | | |
1.25% | | 04/10/18 | | | 500,000 | | | | 498,970 | |
Santander Holdings USA Inc. | | | | | | | | | | |
2.65% | | 04/17/20 | | | 150,000 | | | | 148,570 | |
| | | | | | | | | | |
Santander UK PLC | | | | | | | | | | |
2.38% | | 03/16/20 | | | 250,000 | | | | 248,461 | |
3.05% | | 08/23/18 | | | 250,000 | | | | 253,903 | |
Scripps Networks Interactive Inc. | | | | | | | | | | |
3.90% | | 11/15/24 | | | 250,000 | | | | 253,755 | |
Seagate HDD Cayman | | | | | | | | | | |
3.75% | | 11/15/18 | | | 125,000 | | | | 128,078 | |
4.75% | | 06/01/23 | | | 250,000 | | | | 247,813 | |
Sempra Energy | | | | | | | | | | |
4.05% | | 12/01/23 | | | 250,000 | | | | 260,816 | |
Shell International Finance BV | | | | | | | | | | |
1.63% | | 11/10/18 | | | 200,000 | | | | 200,328 | |
2.00% | | 11/15/18 | | | 225,000 | | | | 226,461 | |
4.00% | | 05/10/46 | | | 250,000 | | | | 238,564 | |
4.13% | | 05/11/35 | | | 250,000 | | | | 254,858 | |
4.38% | | 03/25/20 | | | 1,000,000 | | | | 1,067,568 | |
Shire Acquisitions Investments Ireland DAC | | | | | | | | | | |
3.20% | | 09/23/26 | | | 150,000 | | | | 139,977 | |
Simon Property Group LP (REIT) | | | | | | | | | | |
2.75% | | 02/01/23 | | | 621,000 | | | | 611,719 | |
South Carolina Electric & Gas Co. | | | | | | | | | | |
5.10% | | 06/01/65 | | | 150,000 | | | | 164,078 | |
Southern California Edison Co. | | | | | | | | | | |
3.60% | | 02/01/45 | | | 825,000 | | | | 778,699 | |
Southern Copper Corp. | | | | | | | | | | |
5.88% | | 04/23/45 | | | 255,000 | | | | 249,918 | |
Southwest Airlines Co. | | | | | | | | | | |
3.00% | | 11/15/26 | | | 200,000 | | | | 188,221 | |
Spectra Energy Capital LLC | | | | | | | | | | |
3.30% | | 03/15/23 | | | 250,000 | | | | 241,436 | |
Spectra Energy Partners LP | | | | | | | | | | |
3.50% | | 03/15/25 | | | 250,000 | | | | 243,870 | |
Stanley Black & Decker Inc. | | | | | | | | | | |
2.90% | | 11/01/22 | | | 250,000 | | | | 250,910 | |
Statoil ASA | | | | | | | | | | |
2.45% | | 01/17/23 | | | 750,000 | | | | 731,354 | |
Sumitomo Mitsui Banking Corp. | | | | | | | | | | |
2.45% | | 01/16/20 | | | 250,000 | | | | 249,322 | |
2.50% | | 07/19/18 | | | 500,000 | | | | 503,945 | |
Sumitomo Mitsui Financial Group Inc. | | | | | | | | | | |
3.01% | | 10/19/26 | | | 500,000 | | | | 477,748 | |
Suncor Energy Inc. | | | | | | | | | | |
6.85% | | 06/01/39 | | | 250,000 | | | | 330,888 | |
Sunoco Logistics Partners Operations LP | | | | | | | | | | |
5.95% | | 12/01/25 | | | 250,000 | | | | 278,177 | |
SunTrust Banks Inc. | | | | | | | | | | |
2.35% | | 11/01/18 | | | 350,000 | | | | 353,036 | |
Target Corp. | | | | | | | | | | |
4.00% | | 07/01/42 | | | 500,000 | | | | 496,243 | |
TD Ameritrade Holding Corp. | | | | | | | | | | |
2.95% | | 04/01/22 | | | 250,000 | | | | 252,859 | |
Telefonica Emisiones SAU | | | | | | | | | | |
3.19% | | 04/27/18 | | | 200,000 | | | | 202,848 | |
5.88% | | 07/15/19 | | | 1,000,000 | | | | 1,083,382 | |
Teva Pharmaceutical Finance Netherlands III BV | | | | | | | | | | |
1.40% | | 07/20/18 | | | 300,000 | | | | 297,504 | |
1.70% | | 07/19/19 | | | 300,000 | | | | 294,629 | |
3.15% | | 10/01/26 | | | 300,000 | | | | 276,163 | |
Texas Instruments Inc. | | | | | | | | | | |
1.75% | | 05/01/20 | | | 250,000 | | | | 247,095 | |
| | | | | | | | | | |
The Allstate Corp. | | | | | | | | | | |
3.28% | | 12/15/26 | | | 100,000 | | | | 100,181 | |
4.20% | | 12/15/46 | | | 100,000 | | | | 101,839 | |
The Allstate Corp. 2.94% + 3 month USD LIBOR | | | | | | | | | | |
5.75% | | 08/15/53 | | | 250,000 | | | | 258,475 | (f) |
The Bank of New York Mellon Corp. | | | | | | | | | | |
2.20% | | 05/15/19 | | | 500,000 | | | | 502,818 | |
2.80% | | 05/04/26 | | | 30,000 | | | | 28,848 | |
3.00% | | 02/24/25 | | | 105,000 | | | | 103,119 | |
The Bank of Nova Scotia | | | | | | | | | | |
1.95% | | 01/15/19 | | | 250,000 | | | | 250,154 | |
2.05% | | 10/30/18 | | | 250,000 | | | | 250,955 | |
The Boeing Co. | | | | | | | | | | |
0.95% | | 05/15/18 | | | 325,000 | | | | 323,490 | |
3.30% | | 03/01/35 | | | 65,000 | | | | 60,725 | |
3.38% | | 06/15/46 | | | 150,000 | | | | 136,300 | |
The Charles Schwab Corp. | | | | | | | | | | |
2.20% | | 07/25/18 | | | 200,000 | | | | 201,474 | |
The Clorox Co. | | | | | | | | | | |
3.50% | | 12/15/24 | | | 250,000 | | | | 255,229 | |
The Coca-Cola Co. | | | | | | | | | | |
1.15% | | 04/01/18 | | | 250,000 | | | | 249,400 | |
2.45% | | 11/01/20 | | | 500,000 | | | | 504,770 | |
The Dow Chemical Co. | | | | | | | | | | |
3.00% | | 11/15/22 | | | 437,000 | | | | 436,700 | |
4.38% | | 11/15/42 | | | 437,000 | | | | 423,404 | |
The Goldman Sachs Group Inc. | | | | | | | | | | |
2.30% | | 12/13/19 | | | 200,000 | | | | 199,813 | |
2.75% | | 09/15/20 | | | 750,000 | | | | 752,689 | |
3.50% | | 11/16/26 | | | 250,000 | | | | 244,875 | |
3.85% | | 07/08/24 | | | 250,000 | | | | 254,904 | |
5.75% | | 01/24/22 | | | 500,000 | | | | 561,575 | |
6.25% | | 02/01/41 | | | 350,000 | | | | 433,117 | |
6.75% | | 10/01/37 | | | 700,000 | | | | 863,096 | |
The Home Depot Inc. | | | | | | | | | | |
2.13% | | 09/15/26 | | | 245,000 | | | | 225,633 | |
2.63% | | 06/01/22 | | | 190,000 | | | | 190,714 | |
4.20% | | 04/01/43 | | | 250,000 | | | | 257,082 | |
4.40% | | 04/01/21 | | | 500,000 | | | | 541,698 | |
The Kroger Co. | | | | | | | | | | |
3.85% | | 08/01/23 | | | 500,000 | | | | 518,663 | |
The Pepsi Bottling Group Inc. | | | | | | | | | | |
7.00% | | 03/01/29 | | | 150,000 | | | | 204,748 | |
The Procter & Gamble Co. | | | | | | | | | | |
1.70% | | 11/03/21 | | | 200,000 | | | | 196,384 | |
2.45% | | 11/03/26 | | | 200,000 | | | | 191,352 | |
The Progressive Corp. | | | | | | | | | | |
4.35% | | 04/25/44 | | | 100,000 | | | | 103,515 | |
The Southern Co. 3.63% + 3 month USD LIBOR | | | | | | | | | | |
5.50% | | 03/15/57 | | | 400,000 | | | | 404,024 | (f) |
The Toronto-Dominion Bank | | | | | | | | | | |
2.25% | | 11/05/19 | | | 250,000 | | | | 251,365 | |
2.63% | | 09/10/18 | | | 250,000 | | | | 253,785 | |
The Travelers Companies Inc. | | | | | | | | | | |
5.35% | | 11/01/40 | | | 250,000 | | | | 293,966 | |
The Walt Disney Co. | | | | | | | | | | |
2.30% | | 02/12/21 | | | 130,000 | | | | 130,543 | |
3.00% | | 07/30/46 | | | 60,000 | | | | 50,910 | |
3.15% | | 09/17/25 | | | 165,000 | | | | 167,119 | |
| | | | | | | | | | |
Thermo Fisher Scientific Inc. | | | | | | | | | | |
3.30% | | 02/15/22 | | | 80,000 | | | | 81,196 | |
4.15% | | 02/01/24 | | | 25,000 | | | | 26,005 | |
Thomson Reuters Corp. | | | | | | | | | | |
4.50% | | 05/23/43 | | | 150,000 | | | | 140,429 | |
Time Warner Cable LLC | | | | | | | | | | |
4.50% | | 09/15/42 | | | 500,000 | | | | 452,010 | |
6.75% | | 07/01/18 | | | 788,000 | | | | 841,152 | |
Time Warner Inc. | | | | | | | | | | |
6.10% | | 07/15/40 | | | 650,000 | | | | 740,785 | |
Total Capital International S.A. | | | | | | | | | | |
2.75% | | 06/19/21 | | | 250,000 | | | | 252,726 | |
Toyota Motor Credit Corp. | | | | | | | | | | |
1.38% | | 01/10/18 | | | 1,000,000 | | | | 998,625 | |
1.55% | | 07/13/18 | | | 200,000 | | | | 199,917 | |
2.10% | | 01/17/19 | | | 200,000 | | | | 201,027 | |
TransAlta Corp. | | | | | | | | | | |
4.50% | | 11/15/22 | | | 873,000 | | | | 857,004 | |
TransCanada PipeLines Ltd. | | | | | | | | | | |
7.63% | | 01/15/39 | | | 350,000 | | | | 500,302 | |
Tyco Electronics Group S.A. | | | | | | | | | | |
2.38% | | 12/17/18 | | | 80,000 | | | | 80,755 | |
Tyson Foods Inc. | | | | | | | | | | |
2.65% | | 08/15/19 | | | 250,000 | | | | 252,274 | |
4.88% | | 08/15/34 | | | 70,000 | | | | 71,230 | |
Unilever Capital Corp. | | | | | | | | | | |
2.00% | | 07/28/26 | | | 250,000 | | | | 227,917 | |
2.20% | | 03/06/19 | | | 400,000 | | | | 403,895 | |
Union Electric Co. | | | | | | | | | | |
3.65% | | 04/15/45 | | | 135,000 | | | | 127,369 | |
Union Pacific Corp. | | | | | | | | | | |
4.75% | | 12/15/43 | | | 250,000 | | | | 271,718 | |
United Airlines 2013-1 Class A Pass Through Trust | | | | | | | | | | |
4.30% | | 02/15/27 | | | 225,539 | | | | 232,305 | |
United Parcel Service Inc. | | | | | | | | | | |
2.45% | | 10/01/22 | | | 875,000 | | | | 870,397 | |
United Technologies Corp. | | | | | | | | | | |
4.50% | | 06/01/42 | | | 458,000 | | | | 489,307 | |
UnitedHealth Group Inc. | | | | | | | | | | |
3.10% | | 03/15/26 | | | 350,000 | | | | 344,706 | |
3.45% | | 01/15/27 | | | 200,000 | | | | 202,953 | |
4.63% | | 07/15/35 | | | 45,000 | | | | 48,975 | |
6.88% | | 02/15/38 | | | 250,000 | | | | 339,669 | |
US Bank NA | | | | | | | | | | |
2.80% | | 01/27/25 | | | 350,000 | | | | 341,106 | |
Vale Overseas Ltd. | | | | | | | | | | |
6.88% | | 11/10/39 | | | 400,000 | | | | 389,000 | |
Valero Energy Corp. | | | | | | | | | | |
6.63% | | 06/15/37 | | | 500,000 | | | | 584,321 | |
Valero Energy Partners LP | | | | | | | | | | |
4.38% | | 12/15/26 | | | 200,000 | | | | 202,356 | |
Ventas Realty LP/Ventas Capital Corp. | | | | | | | | | | |
2.00% | | 02/15/18 | | | 500,000 | | | | 500,973 | |
VEREIT Operating Partnership LP | | | | | | | | | | |
3.00% | | 02/06/19 | | | 30,000 | | | | 29,925 | |
4.13% | | 06/01/21 | | | 15,000 | | | | 15,225 | |
4.60% | | 02/06/24 | | | 20,000 | | | | 20,100 | |
4.88% | | 06/01/26 | | | 25,000 | | | | 25,321 | |
| | | | | | | | | | | | |
Verizon Communications Inc. | | | | | | | | | | | | |
3.85% | | | 11/01/42 | | | | 436,000 | | | | 377,085 | |
4.40% | | | 11/01/34 | | | | 250,000 | | | | 246,373 | |
4.52% | | | 09/15/48 | | | | 150,000 | | | | 143,544 | |
5.05% | | | 03/15/34 | | | | 250,000 | | | | 262,885 | |
5.15% | | | 09/15/23 | | | | 1,250,000 | | | | 1,380,739 | |
6.40% | | | 09/15/33 | | | | 500,000 | | | | 602,446 | |
6.55% | | | 09/15/43 | | | | 250,000 | | | | 311,702 | |
Viacom Inc. | | | | | | | | | | | | |
3.25% | | | 03/15/23 | | | | 200,000 | | | | 190,007 | |
5.85% | | | 09/01/43 | | | | 100,000 | | | | 97,839 | |
Virginia Electric and Power Co. | | | | | | | | | | | | |
4.65% | | | 08/15/43 | | | | 500,000 | | | | 541,744 | |
Visa Inc. | | | | | | | | | | | | |
4.30% | | | 12/14/45 | | | | 350,000 | | | | 368,667 | |
Vodafone Group PLC | | | | | | | | | | | | |
2.50% | | | 09/26/22 | | | | 376,000 | | | | 360,187 | |
4.38% | | | 02/19/43 | | | | 250,000 | | | | 220,796 | |
Voya Financial Inc. | | | | | | | | | | | | |
2.90% | | | 02/15/18 | | | | 191,000 | | | | 193,343 | |
Wabtec Corp. | | | | | | | | | | | | |
3.45% | | | 11/15/26 | | | | 200,000 | | | | 191,963 | (d) |
Wal-Mart Stores Inc. | | | | | | | | | | | | |
6.50% | | | 08/15/37 | | | | 1,000,000 | | | | 1,353,074 | |
Walgreens Boots Alliance Inc. | | | | | | | | | | | | |
1.75% | | | 05/30/18 | | | | 200,000 | | | | 200,169 | |
3.45% | | | 06/01/26 | | | | 55,000 | | | | 53,910 | |
4.50% | | | 11/18/34 | | | | 155,000 | | | | 155,737 | |
Waste Management Inc. | | | | | | | | | | | | |
2.90% | | | 09/15/22 | | | | 500,000 | | | | 502,066 | |
Wells Fargo & Co. | | | | | | | | | | | | |
1.50% | | | 01/16/18 | | | | 500,000 | | | | 499,345 | |
2.15% | | | 01/30/20 | | | | 920,000 | | | | 915,074 | |
2.50% | | | 03/04/21 | | | | 240,000 | | | | 238,021 | |
4.13% | | | 08/15/23 | | | | 250,000 | | | | 258,408 | |
4.40% | | | 06/14/46 | | | | 250,000 | | | | 238,786 | |
4.65% | | | 11/04/44 | | | | 150,000 | | | | 147,353 | |
4.75% | | | 12/07/46 | | | | 200,000 | | | | 201,870 | |
5.61% | | | 01/15/44 | | | | 569,000 | | | | 643,529 | |
Wells Fargo Bank NA | | | | | | | | | | | | |
2.15% | | | 12/06/19 | | | | 250,000 | | | | 249,819 | |
Welltower Inc. (REIT) | | | | | | | | | | | | |
2.25% | | | 03/15/18 | | | | 500,000 | | | | 502,072 | |
5.13% | | | 03/15/43 | | | | 250,000 | | | | 257,235 | |
Western Gas Partners LP | | | | | | | | | | | | |
5.45% | | | 04/01/44 | | | | 150,000 | | | | 154,223 | |
Westpac Banking Corp. | | | | | | | | | | | | |
2.00% | | | 08/19/21 | | | | 500,000 | | | | 484,924 | |
4.32% | | | 11/23/31 | | | | 100,000 | | | | 99,793 | (f) |
Weyerhaeuser Co. (REIT) | | | | | | | | | | | | |
7.38% | | | 03/15/32 | | | | 100,000 | | | | 126,482 | |
Whirlpool Corp. | | | | | | | | | | | | |
3.70% | | | 05/01/25 | | | | 250,000 | | | | 251,917 | |
Williams Partners LP | | | | | | | | | | | | |
5.10% | | | 09/15/45 | | | | 150,000 | | | | 142,309 | |
5.80% | | | 11/15/43 | | | | 250,000 | | | | 255,263 | |
WPP Finance 2010 | | | | | | | | | | | | |
5.13% | | | 09/07/42 | | | | 191,000 | | | | 190,720 | |
Wyndham Worldwide Corp. | | | | | | | | | | | | |
4.25% | | | 03/01/22 | | | | 250,000 | | | | 258,270 | |
| | | | | | | | | | |
Xcel Energy Inc. | | | | | | | | | | |
3.30% | | 06/01/25 | | | 250,000 | | | | 249,740 | |
Zoetis Inc. | | | | | | | | | | |
4.70% | | 02/01/43 | | | 250,000 | | | | 242,897 | |
| | | | | | | | | 222,659,846 | |
| | | |
Non-Agency Collateralized Mortgage Obligations—0.3% | | | | | | | | | | |
Citigroup Commercial Mortgage Trust 2014-GC25 | | | | | | | | | | |
4.02% | | 10/10/47 | | | 800,000 | | | | 828,755 | |
COMM 2012-CR1 Mortgage Trust | | | | | | | | | | |
3.39% | | 05/15/45 | | | 500,000 | | | | 520,941 | |
COMM 2013-CCRE12 Mortgage Trust | | | | | | | | | | |
4.05% | | 10/10/46 | | | 200,000 | | | | 213,347 | |
COMM 2013-CR11 Mortgage Trust | | | | | | | | | | |
4.72% | | 10/10/46 | | | 1,000,000 | | | | 1,081,288 | (f) |
COMM 2013-CR8 Mortgage Trust | | | | | | | | | | |
3.61% | | 06/10/46 | | | 750,000 | | | | 783,515 | (f) |
COMM 2015-PC1 Mortgage Trust | | | | | | | | | | |
3.90% | | 07/10/50 | | | 500,000 | | | | 521,708 | |
JPMBB Commercial Mortgage Securities Trust 2013-C14 | | | | | | | | | | |
3.76% | | 08/15/46 | | | 750,000 | | | | 787,834 | (f) |
Morgan Stanley Capital I Trust 2008-T29 | | | | | | | | | | |
6.28% | | 01/11/43 | | | 470,000 | | | | 485,954 | (f) |
Wells Fargo Commercial Mortgage Trust 2012-LC5 | | | | | | | | | | |
4.69% | | 10/15/45 | | | 220,000 | | | | 226,191 | (f) |
WF-RBS Commercial Mortgage Trust 2012-C10 | | | | | | | | | | |
2.88% | | 12/15/45 | | | 1,200,000 | | | | 1,212,247 | |
WF-RBS Commercial Mortgage Trust 2012-C7 | | | | | | | | | | |
3.43% | | 06/15/45 | | | 200,000 | | | | 208,669 | |
| | | | | | | | | 6,870,449 | |
| | | |
Sovereign Bonds—0.4% | | | | | | | | | | |
Government of Chile | | | | | | | | | | |
3.63% | | 10/30/42 | | | 350,000 | | | | 325,325 | |
Government of Colombia | | | | | | | | | | |
4.38% | | 07/12/21 | | | 300,000 | | | | 314,250 | |
5.00% | | 06/15/45 | | | 250,000 | | | | 237,188 | |
6.13% | | 01/18/41 | | | 250,000 | | | | 270,000 | |
Government of Hungary | | | | | | | | | | |
5.38% | | 03/25/24 | | | 300,000 | | | | 327,000 | |
Government of Italy | | | | | | | | | | |
5.38% | | 06/15/33 | | | 250,000 | | | | 267,243 | |
Government of Mexico | | | | | | | | | | |
3.50% | | 01/21/21 | | | 250,000 | | | | 254,000 | |
4.35% | | 01/15/47 | | | 200,000 | | | | 171,500 | |
4.75% | | 03/08/44 | | | 702,000 | | | | 638,118 | |
5.75% | | 10/12/10 | | | 172,000 | | | | 158,670 | |
6.05% | | 01/11/40 | | | 130,000 | | | | 140,595 | |
Government of Panama | | | | | | | | | | |
6.70% | | 01/26/36 | | | 250,000 | | | | 303,375 | |
Government of Peru | | | | | | | | | | |
6.55% | | 03/14/37 | | | 297,000 | | | | 372,884 | |
7.35% | | 07/21/25 | | | 100,000 | | | | 128,400 | |
Government of Philippines | | | | | | | | | | |
3.70% | | 03/01/41 | | | 200,000 | | | | 191,515 | |
4.00% | | 01/15/21 | | | 500,000 | | | | 531,794 | |
7.75% | | 01/14/31 | | | 500,000 | | | | 702,866 | |
Government of Poland | | | | | | | | | | |
3.00% | | 03/17/23 | | | 147,000 | | | | 144,060 | |
3.25% | | 04/06/26 | | | 200,000 | | | | 191,806 | |
5.00% | | 03/23/22 | | | 500,000 | | | | 544,675 | |
6.38% | | 07/15/19 | | | 74,000 | | | | 82,214 | |
| | | | | | | | | | |
Government of South Africa | | | | | | | | | | |
4.88% | | 04/14/26 | | | 200,000 | | | | 199,000 | |
5.38% | | 07/24/44 | | | 250,000 | | | | 246,000 | |
Government of Uruguay | | | | | | | | | | |
4.50% | | 08/14/24 | | | 500,000 | | | | 521,250 | |
Japan Bank for International Cooperation | | | | | | | | | | |
1.50% | | 07/21/21 | | | 400,000 | | | | 383,154 | |
1.75% | | 07/31/18 | | | 500,000 | | | | 500,123 | |
Province of Ontario Canada | | | | | | | | | | |
1.25% | | 06/17/19 | | | 500,000 | | | | 493,650 | |
1.63% | | 01/18/19 | | | 300,000 | | | | 299,823 | |
Province of Quebec Canada | | | | | | | | | | |
2.50% | | 04/20/26 | | | 500,000 | | | | 480,540 | |
| | | | | | | | | 9,421,018 | |
| | | |
Municipal Bonds and Notes—0.3% | | | | | | | | | | |
American Municipal Power Inc. | | | | | | | | | | |
6.27% | | 02/15/50 | | | 200,000 | | | | 242,550 | |
Bay Area Toll Authority | | | | | | | | | | |
6.26% | | 04/01/49 | | | 250,000 | | | | 340,297 | |
Chicago Transit Authority | | | | | | | | | | |
6.90% | | 12/01/40 | | | 75,000 | | | | 93,879 | |
City of New York | | | | | | | | | | |
5.97% | | 03/01/36 | | | 250,000 | | | | 314,260 | |
City Public Service Board of San Antonio | | | | | | | | | | |
5.72% | | 02/01/41 | | | 200,000 | | | | 251,868 | |
Commonwealth of Massachusetts | | | | | | | | | | |
4.50% | | 08/01/31 | | | 200,000 | | | | 221,808 | |
Dallas Area Rapid Transit | | | | | | | | | | |
5.02% | | 12/01/48 | | | 75,000 | | | | 87,842 | |
6.00% | | 12/01/44 | | | 100,000 | | | | 131,679 | |
East Bay Municipal Utility District | | | | | | | | | | |
5.87% | | 06/01/40 | | | 100,000 | | | | 124,048 | |
Florida Hurricane Catastrophe Fund Finance Corp. | | | | | | | | | | |
3.00% | | 07/01/20 | | | 100,000 | | | | 102,605 | |
Los Angeles Department of Water & Power | | | | | | | | | | |
6.57% | | 07/01/45 | | | 100,000 | | | | 137,679 | |
6.60% | | 07/01/50 | | | 90,000 | | | | 126,023 | |
Los Angeles Unified School District | | | | | | | | | | |
5.76% | | 07/01/29 | | | 110,000 | | | | 131,858 | |
Metropolitan Transportation Authority | | | | | | | | | | |
6.81% | | 11/15/40 | | | 250,000 | | | | 331,990 | |
Municipal Electric Authority of Georgia | | | | | | | | | | |
6.64% | | 04/01/57 | | | 125,000 | | | | 155,026 | |
New Jersey Transportation Trust Fund Authority | | | | | | | | | | |
6.88% | | 12/15/39 | | | 270,000 | | | | 289,640 | |
New York City Water & Sewer System | | | | | | | | | | |
6.01% | | 06/15/42 | | | 250,000 | | | | 328,083 | |
North Texas Tollway Authority | | | | | | | | | | |
6.72% | | 01/01/49 | | | 100,000 | | | | 140,323 | |
Port Authority of New York & New Jersey | | | | | | | | | | |
4.46% | | 10/01/62 | | | 100,000 | | | | 101,140 | |
5.31% | | 08/01/46 | | | 200,000 | | | | 215,934 | |
San Diego County Water Authority Financing Corp. | | | | | | | | | | |
6.14% | | 05/01/49 | | | 100,000 | | | | 130,313 | |
South Carolina State Public Service Authority | | | | | | | | | | |
6.45% | | 01/01/50 | | | 150,000 | | | | 197,835 | |
State of California | | | | | | | | | | |
5.70% | | 11/01/21 | | | 605,000 | | | | 697,638 | |
7.55% | | 04/01/39 | | | 200,000 | | | | 295,930 | |
| | | | | | | | | | |
State of Illinois | | | | | | | | | | |
5.10% | | 06/01/33 | | | 550,000 | | | | 486,101 | |
State of Texas | | | | | | | | | | |
5.52% | | 04/01/39 | | | 200,000 | | | | 251,430 | |
Texas Transportation Commission | | | | | | | | | | |
5.03% | | 04/01/26 | | | 100,000 | | | | 115,249 | |
University of California | | | | | | | | | | |
4.60% | | 05/15/31 | | | 100,000 | | | | 110,269 | |
4.77% | | 05/15/15 | | | 100,000 | | | | 95,606 | |
6.58% | | 05/15/49 | | | 100,000 | | | | 130,024 | |
University of North Carolina at Chapel Hill | | | | | | | | | | |
3.85% | | 12/01/34 | | | 200,000 | | | | 203,932 | |
University of Texas System | | | | | | | | | | |
4.79% | | 08/15/46 | | | 100,000 | | | | 114,650 | |
| | | | | | | | | 6,697,509 | |
FNMA (TBA)—0.0% * | | | | | | | | | | |
Lehman | | | | | | | | | | |
5.50% | | TBA | | | 384,555 | | | | 12,152 | (i,j) |
Total Bonds and Notes | | | | | | | | | | |
(Cost $716,413,089) | | | | | | | | | 713,585,147 | |
| | | | | | | | |
| Exchange Traded Fund—3.2% | | Number of
Shares | | | Fair Value | |
SPDR Bloomberg Barclays High Yield Bond ETF | | | | | | | | |
(Cost $72,005,250) | | | 2,022,863 | | | $ | 73,733,356 | (k) |
| | |
Total Investments in Securities | | | | | | | | |
(Cost $1,986,764,822) | | | | | | | 2,252,212,597 | |
| | |
Short-Term Investments—3.1% | | | | | | | | |
State Street Institutional U.S. Government Money Market Fund - Class G Shares 0.46% | | | | | | | | |
(Cost $72,119,782) | | | | | | | 72,119,782 | (e,k,l) |
| | |
Total Investments | | | | | | | | |
(Cost $2,058,884,604) | | | | | | | 2,324,332,379 | |
| | |
Liabilities in Excess of Other Assets, net—(0.8)% | | | | | | | (18,455,886 | ) |
| | | | | | | | |
NET ASSETS—100.0% | | | | | | $ | 2,305,876,493 | |
| | | | | | | | |
Other Information:
The Fund had the following long futures contracts open at December 31, 2016:
| | | | | | | | | | | | | | | | |
Description | | Expiration date | | | Number of
Contracts | | | Current
Notional
Value | | | Unrealized
Depreciation | |
MSCI EAFE Mini Index Futures | | | March 2017 | | | | 41 | | | $ | 3,434,980 | | | $ | (10,287 | ) |
MSCI Emerging Market Mini Futures | | | March 2017 | | | | 23 | | | | 987,735 | | | | (28,112 | ) |
Russell 2000 Mini Index Futures | | | March 2017 | | | | 12 | | | | 814,140 | | | | (10,826 | ) |
S&P Mid 400 Emini Index Futures | | | March 2017 | | | | 1 | | | | 165,910 | | | | (2,647 | ) |
S&P 500 Emini Index Futures | | | March 2017 | | | | 41 | | | | 4,584,210 | | | | (27,431 | ) |
| | | | | | | | | | | | | | | | |
| | | | | | | | | | | | | | $ | (79,303 | ) |
| | | | | | | | | | | | | | | | |
The Fund had the following short futures contracts open at December 31, 2016:
| | | | | | | | | | | | | | | | |
Description | | Expiration date | | | Number of
Contracts | | | Current
Notional
Value | | | Unrealized
Appreciation | |
S&P 500 Emini Index Futures | | | March 2017 | | | | 470 | | | $ | (52,550,700 | ) | | $ | 368,522 | |
| | | | | | | | | | | | | | | | |
| | | | | | | | | | $ | 289,219 | |
| | | | | | | | | | | | | | | | |
The views expressed in this document reflect our judgment as of the publication date and are subject to change at any time without notice. The securities cited may not be representative of the Fund’s future investments and should not be construed as a recommendation to purchase or sell a particular security. See the Fund’s summary prospectus and statutory prospectus for complete descriptions of investment objectives, policies, risks and permissible investments.
| (a) | Non-income producing security. |
| (b) | State Street Corp. is the parent company of SSGA Funds Management, Inc., the Fund’s investment adviser and administrator effective July 1, 2016, and State Street Bank & Trust Co., the Fund’s sub-administrator, custodian and accounting agent. |
| (c) | General Electric Co. is the parent company of GE Asset Management Incorporated, the Fund’s investment adviser prior to July 1, 2016. |
| (d) | Pursuant to Rule 144A of the Securities Act of 1933, as amended, these securities may be resold in transactions exempt from registration, normally to qualified institutional buyers. At December 31, 2016, these securities amounted to $4,722,435 or 0.20% of the net assets of the GE Investments Total Return Fund. These securities have been determined to be liquid using procedures established by the Fund’s Board of Directors. |
| (e) | At December 31, 2016, all or a portion of this security was pledged to cover collateral requirements for futures and/or TBA’s. |
| (f) | Variable or floating rate security. The stated rate represents the rate at December 31, 2016. |
| (g) | Settlement is on a delayed delivery or when-issued basis with final maturity to be announced (TBA) in the future. |
| (i) | Security is in default. |
| (j) | Security is fair valued by the Valuation Committee, in accordance with the procedures approved by the State Street Variable Insurance Series Fund’s, Inc.’s Board of Directors. |
| (k) | Sponsored by SSGA Funds Management, Inc., the Funds’ investment adviser and administrator, effective July 1, 2016, and an affiliate of State Street Bank & Trust Co., the Funds’ sub-administrator, custodian and accounting agent. |
| (l) | Coupon amount represents effective yield. |
| † | Percentages are based on net assets as of December 31, 2016. |
| ** | Amount is less than $0.50. |
Abbreviations:
| ADR | American Depositary Receipt |
| GDR | Global Depositary Receipt |
| LIBOR | London Interbank Offered Rate |
| MBIA | Municipal Bond Investors Assurance Corporation |
| NVDR | Non-Voting Depositary Receipt |
| REIT | Real Estate Investment Trust |
| SPDR | Standard and Poor’s Depositary Receipt |
The Fund was invested in the following countries/territories at December 31, 2016 (unaudited):
| | | | |
Country/Territory | | Percentage
(based
on Fair
Value) | |
United States | | | 72.51 | % |
Japan | | | 4.17 | % |
United Kingdom | | | 3.44 | % |
Canada | | | 2.05 | % |
Germany | | | 1.82 | % |
| | | | |
Switzerland | | | 1.79 | % |
France | | | 1.75 | % |
China | | | 1.41 | % |
Australia | | | 1.35 | % |
South Korea | | | 0.80 | % |
Netherlands | | | 0.80 | % |
Taiwan | | | 0.66 | % |
Spain | | | 0.58 | % |
Hong Kong | | | 0.58 | % |
Supranational | | | 0.54 | % |
Ireland | | | 0.52 | % |
Sweden | | | 0.47 | % |
India | | | 0.44 | % |
Brazil | | | 0.43 | % |
South Africa | | | 0.40 | % |
Mexico | | | 0.38 | % |
Singapore | | | 0.34 | % |
Italy | | | 0.34 | % |
Denmark | | | 0.28 | % |
Russian Federation | | | 0.24 | % |
Belgium | | | 0.20 | % |
Finland | | | 0.16 | % |
Norway | | | 0.15 | % |
Indonesia | | | 0.14 | % |
Malaysia | | | 0.14 | % |
Philippines | | | 0.12 | % |
Thailand | | | 0.12 | % |
Israel | | | 0.11 | % |
Poland | | | 0.10 | % |
Colombia | | | 0.09 | % |
Chile | | | 0.08 | % |
Turkey | | | 0.06 | % |
Qatar | | | 0.05 | % |
Luxembourg | | | 0.04 | % |
United Arab Emirates | | | 0.04 | % |
Austria | | | 0.04 | % |
Peru | | | 0.04 | % |
Bermuda | | | 0.03 | % |
Hungary | | | 0.03 | % |
Cayman Islands | | | 0.03 | % |
New Zealand | | | 0.03 | % |
Portugal | | | 0.03 | % |
Uruguay | | | 0.02 | % |
Greece | | | 0.02 | % |
Panama | | | 0.01 | % |
Guernsey | | | 0.01 | % |
Czech Republic | | | 0.01 | % |
Egypt | | | 0.01 | % |
Malta | | | 0.00 | %*** |
Puerto Rico | | | 0.00 | %*** |
Monaco | | | 0.00 | %*** |
United States Virgin Islands | | | 0.00 | %*** |
Jersey | | | 0.00 | %*** |
| | | | |
| | | 100.00 | % |
| | | | |
The Fund’s % share of investment in the various categories, based on Fair Value, is as follows at December 31, 2016 (unaudited):
| | | | | | | | | | | | |
| Industry | | Domestic | | | Foreign | | | Total | |
Diversified Banks | | | 2.02 | % | | | 3.38 | % | | | 5.40 | % |
Pharmaceuticals | | | 1.86 | % | | | 1.47 | % | | | 3.33 | % |
Exchange Traded Funds | | | 3.17 | % | | | 0.00 | % | | | 3.17 | % |
Integrated Oil & Gas | | | 1.26 | % | | | 1.08 | % | | | 2.34 | % |
Internet Software & Services | | | 1.57 | % | | | 0.50 | % | | | 2.07 | % |
Technology Hardware, Storage & Peripherals | | | 1.37 | % | | | 0.44 | % | | | 1.81 | % |
Integrated Telecommunication Services | | | 0.96 | % | | | 0.57 | % | | | 1.53 | % |
Semiconductors | | | 1.01 | % | | | 0.52 | % | | | 1.53 | % |
Industrial Conglomerates | | | 0.96 | % | | | 0.39 | % | | | 1.35 | % |
Biotechnology | | | 1.02 | % | | | 0.25 | % | | | 1.27 | % |
Systems Software | | | 1.22 | % | | | 0.04 | % | | | 1.26 | % |
Packaged Foods & Meats | | | 0.55 | % | | | 0.67 | % | | | 1.22 | % |
Electric Utilities | | | 0.75 | % | | | 0.37 | % | | | 1.12 | % |
Aerospace & Defense | | | 0.83 | % | | | 0.22 | % | | | 1.05 | % |
Healthcare Equipment | | | 0.68 | % | | | 0.32 | % | | | 1.00 | % |
Oil & Gas Exploration & Production | | | 0.72 | % | | | 0.26 | % | | | 0.98 | % |
Automobile Manufacturers | | | 0.18 | % | | | 0.78 | % | | | 0.96 | % |
Data Processing & Outsourced Services | | | 0.88 | % | | | 0.08 | % | | | 0.96 | % |
Life & Health Insurance | | | 0.35 | % | | | 0.58 | % | | | 0.93 | % |
Tobacco | | | 0.61 | % | | | 0.32 | % | | | 0.93 | % |
Internet & Direct Marketing Retail | | | 0.85 | % | | | 0.07 | % | | | 0.92 | % |
Household Products | | | 0.67 | % | | | 0.19 | % | | | 0.86 | % |
Regional Banks | | | 0.54 | % | | | 0.27 | % | | | 0.81 | % |
Soft Drinks | | | 0.67 | % | | | 0.06 | % | | | 0.73 | % |
Multi-Sector Holdings | | | 0.61 | % | | | 0.11 | % | | | 0.72 | % |
IT Consulting & Other Services | | | 0.37 | % | | | 0.32 | % | | | 0.69 | % |
Industrial Machinery | | | 0.28 | % | | | 0.41 | % | | | 0.69 | % |
Managed Healthcare | | | 0.59 | % | | | 0.02 | % | | | 0.61 | % |
Multi-Utilities | | | 0.38 | % | | | 0.22 | % | | | 0.60 | % |
Multi-Line Insurance | | | 0.19 | % | | | 0.40 | % | | | 0.59 | % |
Cable & Satellite | | | 0.44 | % | | | 0.15 | % | | | 0.59 | % |
Railroads | | | 0.30 | % | | | 0.29 | % | | | 0.59 | % |
Movies & Entertainment | | | 0.54 | % | | | 0.05 | % | | | 0.59 | % |
Restaurants | | | 0.44 | % | | | 0.14 | % | | | 0.58 | % |
Asset Management & Custody Banks | | | 0.42 | % | | | 0.14 | % | | | 0.56 | % |
Application Software | | | 0.29 | % | | | 0.26 | % | | | 0.55 | % |
Property & Casualty Insurance | | | 0.18 | % | | | 0.37 | % | | | 0.55 | % |
Wireless Telecommunication Services | | | 0.00 | % | | | 0.53 | % | | | 0.53 | % |
Investment Banking & Brokerage | | | 0.40 | % | | | 0.10 | % | | | 0.50 | % |
Diversified Chemicals | | | 0.26 | % | | | 0.23 | % | | | 0.49 | % |
Communications Equipment | | | 0.38 | % | | | 0.11 | % | | | 0.49 | % |
Specialty Chemicals | | | 0.19 | % | | | 0.28 | % | | | 0.47 | % |
Oil & Gas Equipment & Services | | | 0.41 | % | | | 0.06 | % | | | 0.47 | % |
Hypermarkets & Super Centers | | | 0.33 | % | | | 0.13 | % | | | 0.46 | % |
Home Improvement Retail | | | 0.44 | % | | | 0.01 | % | | | 0.45 | % |
Apparel, Accessories & Luxury Goods | | | 0.11 | % | | | 0.33 | % | | | 0.44 | % |
Retail REITs | | | 0.23 | % | | | 0.19 | % | | | 0.42 | % |
Electrical Components & Equipment | | | 0.20 | % | | | 0.20 | % | | | 0.40 | % |
Diversified Metals & Mining | | | 0.00 | % | | | 0.40 | % | | | 0.40 | % |
Personal Products | | | 0.05 | % | | | 0.34 | % | | | 0.39 | % |
Specialized REITs | | | 0.39 | % | | | 0.00 | % | | | 0.39 | % |
Food Retail | | | 0.08 | % | | | 0.30 | % | | | 0.38 | % |
Financial Exchanges & Data | | | 0.23 | % | | | 0.15 | % | | | 0.38 | % |
Oil & Gas Storage & Transportation | | | 0.20 | % | | | 0.18 | % | | | 0.38 | % |
Apparel Retail | | | 0.21 | % | | | 0.15 | % | | | 0.36 | % |
Air Freight & Logistics | | | 0.28 | % | | | 0.08 | % | | | 0.36 | % |
Oil & Gas Refining & Marketing | | | 0.20 | % | | | 0.15 | % | | | 0.35 | % |
| | | | | | | | | | | | |
Consumer Finance | | | 0.31 | % | | | 0.04 | % | | | 0.35 | % |
Trading Companies & Distributors | | | 0.07 | % | | | 0.25 | % | | | 0.32 | % |
Construction Machinery & Heavy Trucks | | | 0.18 | % | | | 0.13 | % | | | 0.31 | % |
Drug Retail | | | 0.30 | % | | | 0.00 | % | | | 0.30 | % |
Airlines | | | 0.24 | % | | | 0.05 | % | | | 0.29 | % |
Building Products | | | 0.11 | % | | | 0.17 | % | | | 0.28 | % |
Auto Parts & Equipment | | | 0.02 | % | | | 0.26 | % | | | 0.28 | % |
Life Sciences Tools & Services | | | 0.23 | % | | | 0.04 | % | | | 0.27 | % |
Electronic Components | | | 0.08 | % | | | 0.19 | % | | | 0.27 | % |
Brewers | | | 0.03 | % | | | 0.24 | % | | | 0.27 | % |
Healthcare Services | | | 0.16 | % | | | 0.11 | % | | | 0.27 | % |
Fertilizers & Agricultural Chemicals | | | 0.14 | % | | | 0.12 | % | | | 0.26 | % |
Construction Materials | | | 0.06 | % | | | 0.19 | % | | | 0.25 | % |
Construction & Engineering | | | 0.04 | % | | | 0.21 | % | | | 0.25 | % |
Diversified Real Estate Activities | | | 0.00 | % | | | 0.25 | % | | | 0.25 | % |
Steel | | | 0.04 | % | | | 0.20 | % | | | 0.24 | % |
Industrial Gases | | | 0.12 | % | | | 0.11 | % | | | 0.23 | % |
Semiconductor Equipment | | | 0.12 | % | | | 0.11 | % | | | 0.23 | % |
Research & Consulting Services | | | 0.09 | % | | | 0.14 | % | | | 0.23 | % |
Commodity Chemicals | | | 0.06 | % | | | 0.17 | % | | | 0.23 | % |
Distillers & Vintners | | | 0.07 | % | | | 0.13 | % | | | 0.20 | % |
General Merchandise Stores | | | 0.16 | % | | | 0.04 | % | | | 0.20 | % |
Hotels, Resorts & Cruise Lines | | | 0.14 | % | | | 0.05 | % | | | 0.19 | % |
Residential REITs | | | 0.18 | % | | | 0.01 | % | | | 0.19 | % |
Diversified Capital Markets | | | 0.00 | % | | | 0.19 | % | | | 0.19 | % |
Healthcare Distributors | | | 0.15 | % | | | 0.04 | % | | | 0.19 | % |
Insurance Brokers | | | 0.09 | % | | | 0.08 | % | | | 0.17 | % |
Gold | | | 0.04 | % | | | 0.13 | % | | | 0.17 | % |
Automotive Retail | | | 0.14 | % | | | 0.03 | % | | | 0.17 | % |
Footwear | | | 0.13 | % | | | 0.03 | % | | | 0.16 | % |
Office REITs | | | 0.09 | % | | | 0.07 | % | | | 0.16 | % |
Broadcasting | | | 0.09 | % | | | 0.06 | % | | | 0.15 | % |
Home Entertainment Software | | | 0.10 | % | | | 0.05 | % | | | 0.15 | % |
Electronic Equipment & Instruments | | | 0.01 | % | | | 0.13 | % | | | 0.14 | % |
Advertising | | | 0.06 | % | | | 0.08 | % | | | 0.14 | % |
Health Care REITs | | | 0.14 | % | | | 0.00 | % | | | 0.14 | % |
Gas Utilities | | | 0.00 | % | | | 0.13 | % | | | 0.13 | % |
Healthcare Supplies | | | 0.05 | % | | | 0.08 | % | | | 0.13 | % |
Electronic Manufacturing Services | | | 0.00 | % | | | 0.13 | % | | | 0.13 | % |
Paper Packaging | | | 0.09 | % | | | 0.04 | % | | | 0.13 | % |
Consumer Electronics | | | 0.02 | % | | | 0.11 | % | | | 0.13 | % |
Casinos & Gaming | | | 0.01 | % | | | 0.11 | % | | | 0.12 | % |
Reinsurance | | | 0.00 | % | | | 0.12 | % | | | 0.12 | % |
Department Stores | | | 0.05 | % | | | 0.07 | % | | | 0.12 | % |
Specialty Stores | | | 0.09 | % | | | 0.02 | % | | | 0.11 | % |
Healthcare Facilities | | | 0.06 | % | | | 0.05 | % | | | 0.11 | % |
Diversified REITs | | | 0.00 | % | | | 0.11 | % | | | 0.11 | % |
Home Building | | | 0.05 | % | | | 0.06 | % | | | 0.11 | % |
Environmental & Facilities Services | | | 0.09 | % | | | 0.02 | % | | | 0.11 | % |
Tires & Rubber | | | 0.02 | % | | | 0.08 | % | | | 0.10 | % |
Industrial REITs | | | 0.05 | % | | | 0.05 | % | | | 0.10 | % |
Real Estate Development | | | 0.00 | % | | | 0.10 | % | | | 0.10 | % |
Agricultural & Farm Machinery | | | 0.06 | % | | | 0.04 | % | | | 0.10 | % |
Real Estate Operating Companies | | | 0.00 | % | | | 0.10 | % | | | 0.10 | % |
Other Diversified Financial Services | | | 0.00 | % | | | 0.09 | % | | | 0.09 | % |
Thrifts & Mortgage Finance | | | 0.00 | % | | | 0.09 | % | | | 0.09 | % |
Leisure Products | | | 0.04 | % | | | 0.05 | % | | | 0.09 | % |
Agricultural Products | | | 0.05 | % | | | 0.03 | % | | | 0.08 | % |
Human Resource & Employment Services | | | 0.01 | % | | | 0.07 | % | | | 0.08 | % |
Diversified Support Services | | | 0.02 | % | | | 0.05 | % | | | 0.07 | % |
| | | | | | | | | | | | |
Food Distributors | | | 0.05 | % | | | 0.02 | % | | | 0.07 | % |
Water Utilities | | | 0.02 | % | | | 0.05 | % | | | 0.07 | % |
Highways & Railtracks | | | 0.00 | % | | | 0.07 | % | | | 0.07 | % |
Paper Products | | | 0.00 | % | | | 0.06 | % | | | 0.06 | % |
Heavy Electrical Equipment | | | 0.00 | % | | | 0.06 | % | | | 0.06 | % |
Home Furnishings | | | 0.03 | % | | | 0.03 | % | | | 0.06 | % |
Household Appliances | | | 0.03 | % | | | 0.03 | % | | | 0.06 | % |
Trucking | | | 0.03 | % | | | 0.03 | % | | | 0.06 | % |
Independent Power Producers & Energy Traders | | | 0.02 | % | | | 0.04 | % | | | 0.06 | % |
Copper | | | 0.04 | % | | | 0.02 | % | | | 0.06 | % |
Distributors | | | 0.05 | % | | | 0.01 | % | | | 0.06 | % |
Airport Services | | | 0.00 | % | | | 0.06 | % | | | 0.06 | % |
Alternative Carriers | | | 0.03 | % | | | 0.02 | % | | | 0.05 | % |
Hotel & Resort REITs | | | 0.05 | % | | | 0.00 | % | | | 0.05 | % |
Publishing | | | 0.01 | % | | | 0.04 | % | | | 0.05 | % |
Housewares & Specialties | | | 0.04 | % | | | 0.00 | % | | | 0.04 | % |
Marine | | | 0.00 | % | | | 0.04 | % | | | 0.04 | % |
Metal & Glass Containers | | | 0.03 | % | | | 0.01 | % | | | 0.04 | % |
Healthcare Technology | | | 0.03 | % | | | 0.01 | % | | | 0.04 | % |
Security & Alarm Services | | | 0.00 | % | | | 0.04 | % | | | 0.04 | % |
Oil & Gas Drilling | | | 0.02 | % | | | 0.02 | % | | | 0.04 | % |
Computer & Electronics Retail | | | 0.02 | % | | | 0.02 | % | | | 0.04 | % |
Coal & Consumable Fuels | | | 0.00 | % | | | 0.04 | % | | | 0.04 | % |
Motorcycle Manufacturers | | | 0.02 | % | | | 0.02 | % | | | 0.04 | % |
Home Furnishing Retail | | | 0.01 | % | | | 0.02 | % | | | 0.03 | % |
Education Services | | | 0.00 | % | | | 0.03 | % | | | 0.03 | % |
Marine Ports & Services | | | 0.00 | % | | | 0.03 | % | | | 0.03 | % |
Office Services & Supplies | | | 0.01 | % | | | 0.02 | % | | | 0.03 | % |
Leisure Facilities | | | 0.00 | % | | | 0.03 | % | | | 0.03 | % |
Aluminum | | | 0.00 | % | | | 0.02 | % | | | 0.02 | % |
Real Estate Services | | | 0.02 | % | | | 0.00 | % | | | 0.02 | % |
Technology Distributors | | | 0.00 | % | | | 0.02 | % | | | 0.02 | % |
Commercial Printing | | | 0.00 | % | | | 0.02 | % | | | 0.02 | % |
Mortgage REITs | | | 0.02 | % | | | 0.00 | % | | | 0.02 | % |
Specialized Consumer Services | | | 0.02 | % | | | 0.00 | % | | | 0.02 | % |
Renewable Electricity | | | 0.00 | % | | | 0.02 | % | | | 0.02 | % |
Silver | | | 0.00 | % | | | 0.01 | % | | | 0.01 | % |
Precious Metals & Minerals | | | 0.00 | % | | | 0.01 | % | | | 0.01 | % |
Forest Products | | | 0.00 | % | | | 0.01 | % | | | 0.01 | % |
Specialized Finance | | | 0.00 | % | | | 0.01 | % | | | 0.01 | % |
Textiles | | | 0.00 | % | | | 0.01 | % | | | 0.01 | % |
| | | | | | | | | | | | |
| | | | | | | | | | | 66.20 | % |
| | | | | | | | | | | | |
| | | | |
| Sector | | Percentage
(based on Fair
Value) | |
U.S. Treasuries | | | 10.43 | % |
Corporate Notes | | | 9.58 | % |
Agency Mortgage Backed | | | 9.27 | % |
Sovereign Bonds | | | 0.40 | % |
Non-Agency Collateralized Mortgage Obligations | | | 0.30 | % |
Municipal Bonds and Notes | | | 0.29 | % |
Agency Collateralized Mortgage Obligations | | | 0.22 | % |
Asset Backed | | | 0.17 | % |
U.S. Government Sponsored Agencies | | | 0.04 | % |
FNMA (TBA) | | | 0.00 | %*** |
| | | | |
| | | 30.70 | % |
| | | | |
| |
| Short-Term Investments | | | |
Short-Term Investments | | | 3.10 | % |
| | | | |
| | | 3.10 | % |
| | | | |
| | | 100.00 | % |
| | | | |
| Item 7. | Disclosure of Proxy Voting Policies and Procedures for Closed-End Management Investment Companies. |
Applicable only to Closed-End Management Investment Companies.
| Item 8. | Portfolio Managers of Closed-End Management Investment Companies. |
Applicable only to Closed-End Management Investment Companies.
| Item 9. | Purchases of Equity Securities by Closed-End Management Investment Company and Affiliated Purchasers. |
Applicable only to Closed-End Management Investment Companies.
| Item 10. | Submission of Matters to a Vote of Security Holders. |
During the reporting period, there have been no material changes to the procedures by which the shareholders may recommend nominees to the Registrant’s Board of Directors.
| Item 11. | Controls and Procedures. |
(a) The Registrant’s principal executive officer and principal financial officer have concluded that the Registrant’s disclosure controls and procedures (as defined in Rule 30a-3(c) under the 1940 Act) are effective as of a date within 90 days of the filing date of the report included in Item 1 of this Form N-CSR, based on the evaluation of these controls and procedures required by Rule 30a-3(b) under the 1940 Act and Rules 13a-15(b) or 15d-15(b) under the Securities Exchange Act of 1934, as amended.
(b) There were no changes in the Registrant’s internal control over financial reporting (as defined in Rule 30a-3(d) under the 1940 Act) that occurred during the Registrant’s second fiscal quarter of the period covered by this Form N-CSR that have materially affected, or are reasonably likely to materially affect, the Registrant’s internal control over financial reporting.
(a)(1) The Code of Ethics that applies to the Registrant’s principal executive officer and principal financial officer is attached hereto.
(a)(2) The certifications required by Rule 30a-2(a) under the 1940 Act and Section 302 of the Sarbanes-Oxley Act of 2002 are attached hereto.
(a)(3) Not applicable.
(b) The certifications by the Registrant’s principal executive officer and principal financial officer, as required by Rule 30a-2(b) under the 1940 Act and Section 906 of the Sarbanes-Oxley Act of 2002, are attached hereto.
SIGNATURES
Pursuant to the requirements of the Securities Exchange Act of 1934 and the Investment Company Act of 1940, the Registrant has duly caused this report to be signed on its behalf by the undersigned, thereunto duly authorized.
| | |
| State Street Variable Insurance Series Funds, Inc. |
| |
| By: | | /s/ Jeanne M. La Porta |
| | Jeanne M. La Porta |
| | President, State Street Variable Insurance Series Funds, Inc. |
Date: February 17, 2017
Pursuant to the requirements of the Securities Exchange Act of 1934 and the Investment Company Act of 1940, this report has been signed below by the following persons on behalf of the Registrant and in the capacities and on the dates indicated.
| | |
| By: | | /s/ Jeanne M. La Porta |
| | Jeanne M. La Porta |
| | President, State Street Variable Insurance Series Funds, Inc. |
Date: February 17, 2017
| | |
| By: | | /s/ Arthur A. Jensen |
| | Arthur A. Jensen |
| | Treasurer, State Street Variable Insurance Series Funds, Inc. |
Date: February 17, 2017